As filed with the Securities and Exchange Commission on November 4, 2022
UNITED STATES
SECURITIES AND EXCHANGE COMMISSION
Washington, D.C. 20549
FORM N-CSR
CERTIFIED SHAREHOLDER REPORT OF
REGISTERED MANAGEMENT INVESTMENT COMPANIES
Investment Company Act file number: 811-00582
NEUBERGER BERMAN EQUITY FUNDS
(Exact Name of Registrant as specified in charter)
c/o Neuberger Berman Investment Advisers LLC
1290 Avenue of the Americas
New York, New York 10104-0002
(Address of Principal Executive Offices – Zip Code)
Registrant's telephone number, including area code: (212) 476-8800
Joseph V. Amato
Chief Executive Officer and President
Neuberger Berman Equity Funds
c/o Neuberger Berman Investment Advisers LLC
1290 Avenue of the Americas
New York, New York 10104-0002
Lori L. Schneider, Esq.
K&L Gates LLP
1601 K Street, N.W.
Washington, D.C. 20006-1600
(Names and Addresses of agents for service)
Date of fiscal year end: August 31
Date of reporting period: August 31, 2022
Form N-CSR is to be used by management investment companies to file reports with the Commission not later than 10 days after the transmission to stockholders of any report that is required to be transmitted to stockholders under Rule 30e-1 under the Investment Company Act of 1940, as amended (“Act”) (17 CFR 270.30e-1). The Commission may use the information provided on Form N-CSR in its regulatory, disclosure review, inspection, and policymaking roles.
A registrant is required to disclose the information specified by Form N-CSR, and the Commission will make this information public. A registrant is not required to respond to the collection of information contained in Form N-CSR unless the Form displays a currently valid Office of Management and Budget (“OMB”) control number. Please direct comments concerning the accuracy of the information collection burden estimate and any suggestions for reducing the burden to the Secretary, Securities and Exchange Commission, 100 F Street, NE, Washington, DC 20549-1090. The OMB has reviewed this collection of information under the clearance requirements of 44 U.S.C. § 3507.
Item 1. Report to Shareholders.
| (a) | Following is a copy of the annual report transmitted to shareholders pursuant to Rule 30e-1 under the Act. |

Neuberger Berman
Equity Funds
Equity Funds
Investor Class Shares | Class A Shares |
Trust Class Shares | Class C Shares |
Advisor Class Shares | Class R3 Shares |
Institutional Class Shares | Class R6 Shares |
Class E Shares |
Dividend Growth Fund |
Emerging Markets Equity Fund |
Equity Income Fund |
Focus Fund |
Genesis Fund |
Global Real Estate Fund |
Greater China Equity Fund |
International Equity Fund |
International Select Fund |
International Small Cap Fund |
Intrinsic Value Fund |
Large Cap Growth Fund (formerly Guardian Fund) |
Large Cap Value Fund |
Mid Cap Growth Fund |
Mid Cap Intrinsic Value Fund |
Multi-Cap Opportunities Fund |
Real Estate Fund |
Small Cap Growth Fund |
Sustainable Equity Fund |
U.S. Equity Impact Fund |

Annual Report
August 31, 2022

Contents
104 | |
105 | |
106 | |
109 | |
111 | |
113 | |
115 | |
117 | |
119 | |
121 | |
125 | |
130 | |
133 | |
136 | |
139 | |
141 | |
143 | |
146 | |
147 | |
149 | |
152 | |
182 | |
212 | |
212 | |
214 | |
216 | |
218 | |
220 | |
222 | |
222 | |
224 | |
228 | |
228 | |
230 | |
232 | |
236 |
Contents
238 | |
240 | |
242 | |
244 | |
248 | |
250 | |
255 | |
258 | |
259 | |
269 | |
269 | |
269 | |
270 | |
275 |
The "Neuberger Berman" name and logo and "Neuberger Berman Investment Advisers LLC" name are registered service marks of Neuberger Berman Group LLC. The individual Fund names in this piece are either service marks or registered service marks of Neuberger Berman Investment Advisers LLC, an affiliate of Neuberger Berman BD LLC, distributor, member FINRA. ©2022 Neuberger Berman BD LLC, distributor. All rights reserved.
President’s Letter
Dear Shareholder,
Following a strong showing in calendar year 2021, equity markets struggled through August this year as investors weighed intersecting concerns—the pandemic’s impacts on supply chains, high inflation, war in Ukraine, and fiscal tightening amidst a slowing global economy. The U.S., and developed and developing international markets, saw volatility and declines—and with increased risk aversion, a shift from economically sensitive to defensive stocks, from growth to value, and toward the relative stability of larger-cap names.
Tensions began in November, when Covid’s fast-spreading Omicron variant emerged, evading defenses. With vaccinations, improved treatments and immunity, it proved less deadly. However, it added to supply-chain disruptions, a key factor driving high inflation, especially as China imposed lockdowns under their zero-Covid policy.
Beginning in February, the war in Ukraine worsened sentiment and exacerbated inflation, particularly in Europe, which relies on Ukraine for grain and Russia for energy which is something to watch as another heating season approaches.
Central banks, whose stimulative policies powered global economies (and by extension, equity markets) through the depths of the pandemic, reversed course to combat inflation. This is a delicate balancing act that investors watch nervously, as too many rate hikes too quickly could push the global economy into recession.
At their July meeting, the U.S. Federal Reserve, hoping to reduce inflation to 2%, raised rates to between 2.25% and 2.5% from near zero in March, and set expectations for future rate increases. The Bank of Canada, Bank of England, and European Central Bank have also raised rates.
The International Monetary Fund forecasts global real Gross Domestic Product growth for 2022 at 3.2%, down from 6.1% in 2021. For the U.S., their estimate is 2.3%, down from last year’s 40-year high of 5.7%. Still, 2.3% is below the long-term average, and further slowing could be risky.
Although macroeconomic concerns are valid, fundamentals remain positive. Throughout the 12-month period ended August 31, 2022 (the reporting period), corporate earnings continued to beat estimates. Additionally, reshoring—driven by top-down policy (e.g., July’s CHIPS Act) and bottom-up supply-chain necessity—as well as a significant federal commitment to infrastructure, should support American businesses, labor and logistics. Wage growth slowed as the reporting period ended, which could help temper demand-side inflation; and unemployment increased slightly, a positive as more Americans began seeking work.
In our view, markets will likely remain volatile until inflation (and uncertainty) begins to fall meaningfully. But we believe that valuations are reasonable, with plenty of room to move as conditions improve. Until then, our managers will continue to employ strategies that have been tested across various cycles. With our research advantage, strict buy and sell disciplines, understanding of both portfolio and “wish list” companies, and longer-term view, we will continue working both to limit risk and to take advantage of the opportunities volatility always creates.
Thank you for your confidence in Neuberger Berman.
Sincerely,

Joseph V. Amato
President and CEO
Neuberger Berman Equity Funds
President and CEO
Neuberger Berman Equity Funds
1
Dividend Growth Fund Commentary (Unaudited)
Neuberger Berman Dividend Growth Fund Institutional Class generated a -9.99% total return for the fiscal year ended August 31, 2022 (the reporting period), outperforming its benchmark, the S&P 500® Index (the Index), which posted a -11.23% total return for the same period. (Performance for all share classes is provided in the table immediately following this letter.)
During the reporting period, the stock market declined as investors grappled with volatility driven in-part by mounting inflation and tighter monetary policies. By mid-2022, data from the Commerce Department showed that the U.S. economy shrank for the second quarter in a row. Excess inventories proved to be the culprit for the drop in real Gross Domestic Product, while higher borrowing costs weighed on housing activity. On the central bank front, the U.S. Federal Reserve Board (Fed) increased the Fed funds rate by 225 basis points (2.25%) during the reporting period as Fed chair Jerome Powell emphasized price stability to tame inflationary pressures.
The Fund seeks to provide gross current income in-line with the Index, while seeking capital appreciation driven by dividend per share growth. This approach seeks to identify companies with strong business models generating cash to both grow their business, while also providing rising dividend distributions to shareholders. Overall, we focus on companies with strong balance sheets, solid management teams, attractive free cash flow yields, and clear capital allocation strategies.
Top equity sector weights included 21% Information Technology, 16% Health Care, and 12% Financials at the end of the reporting period. Overall, the bulk of returns were generated from stocks across Energy and Utilities—while exposure to Communication Services, Materials, and Industrials dampened results.
During the reporting period, our Energy names posted outsized returns driven by stocks tied to production of oil and gas. Devon Energy was our top overall performer advancing more than 150% as the upstream business posted solid results with management reporting earnings growth driven by cost controls. Across the oil & gas complex, C-suites have articulated their commitment to balance sheet improvement while increasing shareholder returns through formalized fixed plus variable dividend models. From a capital allocation standpoint, Devon Energy has among the most transparent return of capital frameworks focused on stock buybacks and dividend increases, making this, in our view, an ideal holding given our investment style.
On the other end of the spectrum, within Industrials, Stanley Black & Decker declined by almost -50% during the reporting period as the company reported disappointing results related to supply chain cost increases. After revisiting our investment thesis, this position was sold during the reporting period with the proceeds allocated elsewhere.
We believe caution is warranted as the U.S. economy grapples with greater uncertainty. In our view, geopolitics, inflation, and central bank actions are likely to continue to present headwinds for corporate earnings. We remain focused on business fundamentals and portfolio construction to navigate potential market volatility. As always, we will continue to favor high-quality, cash-generative, dividend paying stocks with managements focused on disciplined capital allocation.
We thank you for investing in our Fund.
Sincerely,
William D. Hunter and Shawn Trudeau
Portfolio Managers
Portfolio Managers
Information about principal risks of investing in the Fund is set forth in the prospectus and statement of additional information.
The portfolio composition, industries and holdings of the Fund are subject to change without notice.
The opinions expressed are those of the Fund’s portfolio managers. The opinions are as of the date of this report and are subject to change without notice.
2
Dividend Growth Fund (Unaudited)
TICKER SYMBOLS | |
Institutional Class | NDGIX |
Class A | NDGAX |
Class C | NDGCX |
Class R6 | NRDGX |
SECTOR ALLOCATION | |
(as a % of Total Investments*) | |
Communication Services | 6.2% |
Consumer Discretionary | 10.1 |
Consumer Staples | 4.7 |
Energy | 4.7 |
Financials | 12.2 |
Health Care | 15.6 |
Industrials | 10.3 |
Information Technology | 20.8 |
Materials | 4.8 |
Real Estate | 3.8 |
Utilities | 3.0 |
Short-Term Investments | 3.8 |
Total | 100.0% |
* | Derivatives (other than options purchased), if any, are excluded from this chart. |
PERFORMANCE HIGHLIGHTS | ||||
Inception Date | Average Annual Total Return Ended 08/31/2022 | |||
1 Year | 5 Years | Life of Fund | ||
At NAV | ||||
Institutional Class | 12/15/2015 | -9.99% | 8.91% | 11.02% |
Class A | 12/15/2015 | -10.28% | 8.52% | 10.63% |
Class C | 12/15/2015 | -10.96% | 7.70% | 9.79% |
Class R6 | 12/15/2015 | -9.82% | 9.04% | 11.12% |
With Sales Charge | ||||
Class A | -15.44% | 7.24% | 9.66% | |
Class C | -11.82% | 7.70% | 9.79% | |
Index | ||||
S&P 500® Index1,15 | -11.23% | 11.82% | 12.58% | |
The performance data quoted represent past performance and do not indicate future results. Current performance may be lower or higher than the performance data quoted. For current performance data, including current to the most recent month-end, please visit www.nb.com/performance.
The results shown in the table reflect the reinvestment of income dividends and other distributions, if any. The results do not reflect the effect of taxes a shareholder would pay on Fund distributions or on the redemption of Fund shares.
The investment return and principal value of an investment will fluctuate and shares, when redeemed, may be worth more or less than their original cost.
Returns would have been lower if Neuberger Berman Investment Advisers LLC (“NBIA”) had not reimbursed certain expenses and/or waived a portion of the investment management fees during certain of the periods shown. Repayment by a class (of expenses previously reimbursed and/or fees previously waived by NBIA) will decrease the class’s returns. Please see Note B in the Notes to Financial Statements for specific information regarding expense reimbursement and/or fee waiver arrangements.
As stated in the Fund’s most recent prospectus, the total annual operating expense ratios for fiscal year 2021 were 1.13%, 1.59%, 2.25% and 1.42% for Institutional Class, Class A, Class C and Class R6 shares, respectively (before expense reimbursements and/or fee waivers, if any). The expense ratios were 0.70%, 1.06%, 1.81% and 0.60% for Institutional Class, Class A, Class C and Class R6 shares, respectively, after expense reimbursements and/or fee waivers. The expense ratios for the annual period ended August 31, 2022, can be found in the Financial Highlights section of this report.
Returns shown with a sales charge reflect the deduction of the current maximum initial sales charge of 5.75% for Class A shares and the contingent deferred sales charge (CDSC) for Class C shares. The CDSC for Class C shares is 1.00%, which is reduced to 0% after 1 year. The performance of the Fund’s share classes will differ primarily due to different sales charge structures and class expenses. Please see the prospectus for more information about sales charge structures, if any, and class expenses for your share class.
3
Dividend Growth Fund (Unaudited)
COMPARISON OF A $1,000,000 INVESTMENT
(000's omitted)

This graph shows the change in value of a hypothetical $1,000,000 investment in the Fund over the past 10 fiscal years, or since the Fund’s inception if it has not operated for 10 years. The graph is based on the Institutional Class shares only; the performance of the Fund’s share classes will differ primarily due to different sales charge structures and class expenses (see Performance Highlights chart on previous page). The result is compared with benchmarks, which include a broad-based market index and may include a more narrowly based index. Market indices have not been reduced to reflect any of the fees and costs of investing. The results shown in the graph reflect the reinvestment of income dividends and other distributions, if any. The results do not reflect the effect of taxes a shareholder would pay on Fund distributions or on the redemption of Fund shares. Results represent past performance and do not indicate future results.
4
Emerging Markets Equity Fund Commentary (Unaudited)
Neuberger Berman Emerging Markets Equity Fund Institutional Class generated a total return of -24.20% for the fiscal year ended August 31, 2022 (the reporting period), trailing its benchmark, the MSCI Emerging Markets (EM) Index (Net) (the Index), which reported a total return of -21.80% for the same period. (Performance for all share classes is provided in the table immediately following this letter.)
EM equities lagged developed markets this reporting period as investor anxiety and risk aversion increased. High inflation, aggressive central bank tightening, slowing economic growth, and the war in Ukraine drove a negative turn in sentiment in January that persisted through the rest of this volatile period.
China’s zero-Covid policy was another factor, with an outsize influence on EM equities, given that China, the world’s second largest economy, is more than 30% of the Index. The policy intermittently shut down major cities including Shanghai and Beijing. Restricted mobility hurt consumer spending, and shuttered workplaces compounded global supply chain issues. Finally, under severe sanctions, Russia’s market, over 3% of the Index pre-Ukraine invasion, was written down during this reporting period as well.*
Within the Index, Utilities posted positive results. Financials and Industrials outperformed, with relatively small losses, and Health Care, Consumer Discretionary, and Communication Services declined most—all dragged lower by their Chinese constituents. By country, commodity markets prospered: Qatar, Indonesia and Kuwait outperformed, up by double digits. Outside of Russia, Hungary and Poland saw the most significant drops. Amongst large constituents, China fell double digits, while India only lost a low single digit percentage of its value.
As risk aversion increased, investors shifted from growth to value stocks, putting the stocks of companies we prefer at a disadvantage. The Fund’s lag was largely due to stock selection within Industrials, Energy and Consumer Discretionary. By country, performance was hurt by an underweight versus the Index towards the better-performing cyclical stocks based in commodity-linked markets of Brazil and Indonesia, while penalized for our overweight early in the reporting period to the falling Russian market.
Individual detractors included Taiwan Semiconductor Manufacturing Co., which fell in sympathy with the broader Information Technology (IT) hardware sector on concerns about customer demand, and Tencent, which continued to face local Chinese regulatory scrutiny of the internet sector.
We outperformed the Index within Health Care, IT, and Financials, and by country, with names based in China, India and Chile.
Top contributors included India’s National Stock Exchange**, and Chile’s Sociedad Quimica y Minera. India’s financial bourse operator reported strong fiscal year results, with yearly revenues increasing 55%, and the Chilean lithium and fertilizer producer benefited from higher commodity prices due to the disruption in competing supply from Russia and Ukraine.
While Chinese policy has turned incrementally positive, current headlines remain negative given lockdowns and weak economic indicators. We believe the Chinese government’s preoccupation with the upcoming leadership transition means economic policy, which needs attention, has taken a back seat. The team continues to identify idiosyncratic opportunities there in the meanwhile. India remains our top overweight due to the rich set of fundamentally attractive opportunities there to us. Stronger relative returns for the portfolio’s key overweight sectors, IT and Consumer Staples, toward the end of this reporting period were heartening after recent struggles.
We continue employing our slow and steady bottom-up approach, trading at the margins where opportunities arise. While short-term performance is frustrating, we believe our strategy, research strength and diversification positions the Fund for strong risk-adjusted performance longer term. Should quality growth overtake value, as is typical in a slower growth global economy, prospects for the types of stocks that meet our parameters could improve sooner rather than later.
5
Sincerely,
Conrad Saldanha
Portfolio Manager
Portfolio Manager
* Effective after the close on March 9, 2022, MSCI reclassified MSCI Russia Indexes from Emerging Markets to Standalone Markets status. At that time, all Russian securities were removed from the Index at a final price of 0.00001, including both locally traded Russian equity constituents and Russian ADRs/GDRs constituents.
** National Stock Exchange of India is a private company. Investments in private companies involve greater risks than investments in securities of companies that have traded publicly on an exchange for extended periods of time. Investments in private companies are generally less liquid than investments in securities issued by public companies and may be difficult for the Fund to value.
Information about principal risks of investing in the Fund is set forth in the prospectus and statement of additional information.
The portfolio composition, industries and holdings of the Fund are subject to change without notice.
The opinions expressed are those of the Fund’s portfolio manager. The opinions are as of the date of this report and are subject to change without notice.
6
Emerging Markets Equity Fund (Unaudited)
TICKER SYMBOLS | |
Institutional Class | NEMIX |
Class A | NEMAX |
Class C | NEMCX |
Class R3 | NEMRX |
Class R6 | NREMX |
PERFORMANCE HIGHLIGHTS | |||||
Inception Date | Average Annual Total Return Ended 08/31/2022 | ||||
1 Year | 5 Years | 10 Years | Life of Fund | ||
At NAV | |||||
Institutional Class | 10/08/2008 | -24.20% | -1.36% | 2.49% | 5.73% |
Class A | 10/08/2008 | -24.42% | -1.64% | 2.23% | 5.46% |
Class C | 10/08/2008 | -24.97% | -2.36% | 1.46% | 4.67% |
Class R310 | 06/21/2010 | -24.73% | -2.03% | 1.80% | 5.10% |
Class R621 | 03/15/2013 | -24.13% | -1.27% | 2.57% | 5.79% |
With Sales Charge | |||||
Class A | -28.77% | -2.79% | 1.62% | 5.01% | |
Class C | -25.71% | -2.36% | 1.46% | 4.67% | |
Index | |||||
MSCI Emerging Markets Index (Net)1,15 | -21.80% | 0.59% | 2.92% | 5.50% | |
The performance data quoted represent past performance and do not indicate future results. Current performance may be lower or higher than the performance data quoted. For current performance data, including current to the most recent month-end, please visit www.nb.com/performance.
The results shown in the table reflect the reinvestment of income dividends and other distributions, if any. The results do not reflect the effect of taxes a shareholder would pay on Fund distributions or on the redemption of Fund shares.
The investment return and principal value of an investment will fluctuate and shares, when redeemed, may be worth more or less than their original cost.
Returns would have been lower if Neuberger Berman Investment Advisers LLC (“NBIA”) had not reimbursed certain expenses and/or waived a portion of the investment management fees during certain of the periods shown. Repayment by a class (of expenses previously reimbursed and/or fees previously waived by NBIA) will decrease the class’s returns. Please see Note B in the Notes to Financial Statements for specific information regarding expense reimbursement and/or fee waiver arrangements.
As stated in the Fund’s most recent prospectus, the total annual operating expense ratios for fiscal year 2021 were 1.23%, 1.57%, 2.32%, 1.92% and 1.10% for Institutional Class, Class A, Class C, Class R3 and Class R6 shares, respectively (before expense reimbursements and/or fee waivers, if any). The expense ratios were 1.51% and 2.26% for Class A and Class C shares, respectively, after expense reimbursements and/or fee waivers. The total annual operating expense ratios for each of Institutional Class, Class R3 and Class R6 include each class’s repayment of expenses previously reimbursed and/or fees previously waived under the contractual expense limitation by NBIA. The expense ratios for the annual period ended August 31, 2022, can be found in the Financial Highlights section of this report.
Returns shown with a sales charge reflect the deduction of the current maximum initial sales charge of 5.75% for Class A shares and the contingent deferred sales charge (CDSC) for Class C shares. The CDSC for Class C shares is 1.00%, which is reduced to 0% after 1 year. The performance of the Fund’s share classes will differ primarily due to different sales charge structures and class expenses. Please see the prospectus for more information about sales charge structures, if any, and class expenses for your share class.
7
Emerging Markets Equity Fund (Unaudited)
COMPARISON OF A $1,000,000 INVESTMENT
(000's omitted)

This graph shows the change in value of a hypothetical $1,000,000 investment in the Fund over the past 10 fiscal years, or since the Fund’s inception if it has not operated for 10 years. The graph is based on the Institutional Class shares only; the performance of the Fund’s share classes will differ primarily due to different sales charge structures and class expenses (see Performance Highlights chart on previous page). The result is compared with benchmarks, which include a broad-based market index and may include a more narrowly based index. Market indices have not been reduced to reflect any of the fees and costs of investing. The results shown in the graph reflect the reinvestment of income dividends and other distributions, if any. The results do not reflect the effect of taxes a shareholder would pay on Fund distributions or on the redemption of Fund shares. Results represent past performance and do not indicate future results.
8
Equity Income Fund Commentary (Unaudited)
Neuberger Berman Equity Income Fund Institutional Class generated a 0.12% total return for the fiscal year ended August 31, 2022 (the reporting period), outperforming its benchmark, the Russell 1000 Value® Index (the Index), which posted a -6.23% total return for the same period. (Performance for all share classes is provided in the table immediately following this letter.)
On April 1, 2022, the Fund began comparing its performance to the Index rather than the S&P 500® Index because the Index has characteristics that are more representative of the Fund’s investment strategy than the S&P 500 Index. From the close of April 1, 2022 (the effective date of the change) through the end of the reporting period, the Fund’s Institutional Class returned -10.00%, underperforming the Index, which returned -9.61%. For the entire reporting period, the Fund’s Institutional Class returned 0.12%, outperforming the prior benchmark, which returned -11.23% for the reporting period.
During the reporting period, the stock market declined as investors grappled with volatility driven in-part by mounting inflation and tighter monetary policies. By mid-2022, data from the Commerce Department showed that the U.S. economy shrank for the second quarter in a row. Excess inventories proved to be the culprit for the drop in real Gross Domestic Product, while higher borrowing costs weighed on housing activity. On the central bank front, the U.S. Federal Reserve Board (Fed) increased the Fed funds rate by 225 basis points (2.25%) during the reporting period as Fed chair Jerome Powell emphasized price stability to tame inflationary pressures.
The Fund is an objective-based strategy, targeting a total return between stocks and bonds with limited volatility relative to the Index. Overall, the portfolio is diversified among dividend-paying stocks selected through extensive analysis of cash flow prospects, that we believe have the ability to sustain and grow dividends.
Top equity sector holdings included approximately 15% Health Care, 12% Utilities, and 12% Industrials at the end of the reporting period. Overall, the bulk of the Fund’s total returns were generated from our allocations across Energy, Utilities, and Consumer Staples—while exposure to Consumer Discretionary, Industrials, and Financials modestly dampened results.
In aggregate, strong stock selection across Energy generated the bulk of returns. The Fund maintains an overweight to Energy as we believe exposure to this sector can help offset inflationary headwinds. Additionally, several C-suites across the oil and gas complex have articulated disciplined capital allocation plans focused on variable dividend programs tied to free cash flow. During the reporting period, ConocoPhillips proved to be our top performer, advancing by more than 100%. Overall, the world’s largest upstream oil gas producer posted handsome earnings, generating $5.9bn in free cash flow during the second quarter of 2022. ConocoPhillips also repurchased $2.3bn in stock while returning another $1bn to investors in the form of dividends.
Sticking with commodities, within Materials, our companies posted outsized returns relative to other sector constituents. While stock selection was strong across Materials, Newmont was an outlier as shares of the global miner proved to be our biggest loser, declining by more than -20%. During the reporting period, shares in the gold miner experienced selling pressure due to higher-than-expected operating costs tied to supply chain, labor shortages, and higher diesel fuel costs. This position was sold during the reporting period.
The Fund’s use of written options contributed positively to performance during the reporting period.
Despite a challenging macroeconomic backdrop, our analysis suggests stocks with dividend yields greater than 2.5% are priced close to their greatest standard deviation discount to the broader market since the “Tech Boom” of the late 1990s. We believe investors can benefit from purchasing high quality dividend paying companies, which we believe are now at reasonable, even cheap, valuations. Specifically, we firmly believe our approach to equity income provides an attractive inflationary hedge, while providing reasonable current income and the chance for capital appreciation.
We thank you for investing in our Fund.
9
Sincerely,
Richard Levine and Sandy Pomeroy
Portfolio Managers
Portfolio Managers
Information about principal risks of investing in the Fund is set forth in the prospectus and statement of additional information.
The portfolio composition, industries and holdings of the Fund are subject to change without notice.
The opinions expressed are those of the Fund’s portfolio managers. The opinions are as of the date of this report and are subject to change without notice.
10
Equity Income Fund (Unaudited)
TICKER SYMBOLS | |
Institutional Class | NBHIX |
Class A | NBHAX |
Class C | NBHCX |
Class R3 | NBHRX |
Class E | NBHEX |
SECTOR ALLOCATION | |
(as a % of Total Investments*) | |
Communication Services | 2.0% |
Consumer Discretionary | 5.6 |
Consumer Staples | 5.3 |
Energy | 11.4 |
Financials | 11.0 |
Health Care | 14.7 |
Industrials | 12.0 |
Information Technology | 7.9 |
Materials | 6.9 |
Real Estate | 7.6 |
Utilities | 12.6 |
Short-Term Investments | 3.0 |
Total | 100.0% |
* | Derivatives (other than options purchased), if any, are excluded from this chart. |
PERFORMANCE HIGHLIGHTS | |||||
Inception Date* | Average Annual Total Return Ended 08/31/2022 | ||||
1 Year | 5 Years | 10 Years | Life of Fund | ||
At NAV | |||||
Institutional Class13 | 06/09/2008 | 0.12% | 7.45% | 8.05% | 7.62% |
Class A13 | 06/09/2008 | -0.26% | 7.06% | 7.64% | 7.26% |
Class C13 | 06/09/2008 | -0.98% | 6.25% | 6.84% | 6.55% |
Class R313 | 06/21/2010 | -0.51% | 6.76% | 7.34% | 7.08% |
Class E13 | 01/11/2022 | 0.53% | 7.53% | 8.09% | 7.65% |
With Sales Charge | |||||
Class A13 | -5.98% | 5.79% | 7.01% | 6.86% | |
Class C13 | -1.88% | 6.25% | 6.84% | 6.55% | |
Index | |||||
Russell 1000® Value Index^1,15 | -6.23% | 7.86% | 10.52% | 6.74% | |
S&P 500® Index1,15 | -11.23% | 11.82% | 13.08% | 9.12% | |
*The performance data for each class includes the performance of the Fund’s oldest share class, Trust Class, from November 2, 2006 through June 9, 2008. The performance data for Class R3 also includes the performance of the Fund’s Institutional Class from June 9, 2008 through June 21, 2010. The performance data for Class E also includes the performance of the Fund's Institutional Class from June 9, 2008 through January 11, 2022. See endnote 13 for information about the effects of the different fees paid by each class.
^Effective April 1, 2022, the Fund began comparing its performance to the Russell 1000® Value Index rather than the S&P 500® Index because the Russell 1000 Value Index has characteristics that are more representative of the Fund’s investment strategy than its former index, the S&P 500 Index.
The performance data quoted represent past performance and do not indicate future results. Current performance may be lower or higher than the performance data quoted. For current performance data, including current to the most recent month-end, please visit www.nb.com/performance.
The results shown in the table reflect the reinvestment of income dividends and other distributions, if any. The results do not reflect the effect of taxes a shareholder would pay on Fund distributions or on the redemption of Fund shares.
The investment return and principal value of an investment will fluctuate and shares, when redeemed, may be worth more or less than their original cost.
Returns would have been lower if Neuberger Berman Investment Advisers LLC (“NBIA”) had not reimbursed certain expenses and/or waived a portion of the investment management fees during certain of the periods shown. Repayment by a class (of expenses previously reimbursed and/or fees previously waived by NBIA) will decrease the class’s returns. Please see Note B in the Notes to Financial Statements for specific information regarding expense reimbursement and/or fee waiver arrangements.
As stated in the Fund’s most recent prospectus, the total annual operating expense ratios for fiscal year 2021 were 0.70%, 1.06%, 1.81% and 1.34% for Institutional Class, Class A, Class C and Class R3 shares, respectively, and the estimated total annual operating expense ratio for fiscal year 2022 is 0.55% for Class E (before expense reimbursements and/or fee waivers, if any). The estimated expense ratio for fiscal year 2022 is 0.05% for Class E after expense reimbursements and/or fee waivers. The expense ratios for the annual period ended August 31, 2022, can be found in the Financial Highlights section of this report.
11
Equity Income Fund (Unaudited)
Returns shown with a sales charge reflect the deduction of the current maximum initial sales charge of 5.75% for Class A shares and the contingent deferred sales charge (CDSC) for Class C shares. The CDSC for Class C shares is 1.00%, which is reduced to 0% after 1 year. The performance of the Fund’s share classes will differ primarily due to different sales charge structures and class expenses. Please see the prospectus for more information about sales charge structures, if any, and class expenses for your share class.
COMPARISON OF A $1,000,000 INVESTMENT
(000's omitted)

This graph shows the change in value of a hypothetical $1,000,000 investment in the Fund over the past 10 fiscal years, or since the Fund’s inception if it has not operated for 10 years. The graph is based on the Institutional Class shares only; the performance of the Fund’s share classes will differ primarily due to different sales charge structures and class expenses (see Performance Highlights chart on previous page). The result is compared with benchmarks, which include a broad-based market index and may include a more narrowly based index. Market indices have not been reduced to reflect any of the fees and costs of investing. The results shown in the graph reflect the reinvestment of income dividends and other distributions, if any. The results do not reflect the effect of taxes a shareholder would pay on Fund distributions or on the redemption of Fund shares. Results represent past performance and do not indicate future results.
12
Focus Fund Commentary (Unaudited)
Neuberger Berman Focus Fund Investor Class generated a -29.67% total return for the fiscal year ended August 31, 2022 (the reporting period), underperforming the -15.88% total return of its benchmark, the MSCI All Country World Index (Net) (the Index), for the same period. (Performance for all share classes is provided in the table immediately following this letter.)
The global equity market generated weak results during the reporting period. While the market rallied several times, it was not enough to offset a number of sharp downturns. Investor sentiment was challenged by elevated inflation and aggressive central bank rate hikes that have negatively impacted and could continue to negatively impact the economy and corporate profits. Supply chain shortages, repercussions from the war in Ukraine, and other geopolitical issues also weighed on the market. All told, as noted above, the Index returned -15.88% for the reporting period.
A combination of stock selection and sector allocation drove the Fund’s relative underperformance versus the Index during the reporting period. Looking at stock selection, certain holdings in the Consumer Discretionary, Information Technology (IT) and Consumer Staples sectors were the largest detractors from relative performance. Individual stocks that negatively impacted returns included online travel company Expedia Group, Inc., U.K. online entertainment company, Entain PLC and IT services company Thoughtworks Holding, Inc. We eliminated our positions in Expedia Group, Inc. and Entain PLC during the reporting period. On the upside, certain positions in the Communication Services, Health Care and Real Estate sectors were the largest contributors to relative performance. In terms of individual stocks, IT services company EPAM Systems, Inc., insurance company Progressive Corp. and specialty retail Ulta Beauty were the most beneficial for returns.
In terms of sector allocation, lack of exposure to Energy during the reporting period was the largest negative for relative performance. An overweight to Consumer Discretionary versus the Index was also a headwind for returns. On the upside, an overweight to Industrials and a small cash position were additive to relative performance.
We are comfortable with our portfolio relative to baseline economic scenarios, which anticipate further central bank rate hikes and slower economic growth. While we could be surprised by further geopolitical developments, we believe our holdings are well positioned. We also invest in a number of companies that we believe already discount an adverse interest rate scenario. While a macroeconomic or geopolitical surprise could drive an incremental selloff in these companies, we believe they adequately discount the anticipated path of rate increases. Meanwhile, traditional defensive companies have already exhibited significant outperformance, and we believe they are trading at elevated valuations versus the broader market. While further outperformance is possible in a deep recession, we believe they are likely to underperform in less adverse scenarios. We therefore prefer more idiosyncratic situations that we believe have the potential to outperform in a wider range of economic scenarios.
With respect to overall portfolio positioning, we maintain an overweight in the Consumer Discretionary sector. We also maintain a sizeable position in the North American railways, a handful of idiosyncratic telecom companies, as well as three insurers. This is very much in keeping with our insight-orientated approach. While the market environment over the last year has been challenging, we remain laser-focused on delivering strong returns for our shareholders and outperforming the Index on a multi-year basis.
Sincerely,
Timothy Creedon and Hari Ramanan
Portfolio Managers
Portfolio Managers
Information about principal risks of investing in the Fund is set forth in the prospectus and statement of additional information.
The portfolio composition, industries and holdings of the Fund are subject to change without notice.
The opinions expressed are those of the Fund’s portfolio managers. The opinions are as of the date of this report and are subject to change without notice.
13
Focus Fund (Unaudited)
TICKER SYMBOLS | |
Investor Class | NBSSX |
Trust Class | NBFCX |
Advisor Class | NBFAX |
Institutional Class | NFALX |
Class A | NFAAX |
Class C | NFACX |
SECTOR ALLOCATION | |
(as a % of Total Investments*) | |
Communication Services | 17.1% |
Consumer Discretionary | 20.4 |
Consumer Staples | 4.9 |
Financials | 8.6 |
Health Care | 5.6 |
Industrials | 17.8 |
Information Technology | 21.3 |
Materials | 1.3 |
Short-Term Investments | 3.0 |
Total | 100.0% |
* | Derivatives (other than options purchased), if any, are excluded from this chart. |
PERFORMANCE HIGHLIGHTS8 | |||||
Inception Date | Average Annual Total Return Ended 08/31/2022 | ||||
1 Year | 5 Years | 10 Years | Life of Fund | ||
At NAV | |||||
Investor Class | 10/19/1955 | -29.67% | 5.28% | 9.50% | 10.09% |
Trust Class3 | 08/30/1993 | -29.82% | 5.08% | 9.29% | 10.06% |
Advisor Class4 | 09/03/1996 | -29.93% | 4.89% | 9.11% | 9.99% |
Institutional Class5 | 06/21/2010 | -29.57% | 5.44% | 9.67% | 10.13% |
Class A19 | 06/21/2010 | -29.83% | 5.06% | 9.27% | 10.05% |
Class C19 | 06/21/2010 | -30.35% | 4.27% | 8.47% | 9.90% |
With Sales Charge | |||||
Class A19 | -33.87% | 3.83% | 8.63% | 9.96% | |
Class C19 | -30.92% | 4.27% | 8.47% | 9.90% | |
Index | |||||
MSCI All Country World Index (Net)1,15 | -15.88% | 6.97% | 8.70% | N/A | |
The performance data quoted represent past performance and do not indicate future results. Current performance may be lower or higher than the performance data quoted. For current performance data, including current to the most recent month-end, please visit www.nb.com/performance.
The results shown in the table reflect the reinvestment of income dividends and other distributions, if any. The results do not reflect the effect of taxes a shareholder would pay on Fund distributions or on the redemption of Fund shares.
The investment return and principal value of an investment will fluctuate and shares, when redeemed, may be worth more or less than their original cost.
Returns would have been lower if Neuberger Berman Investment Advisers LLC (“NBIA”) had not reimbursed certain expenses and/or waived a portion of the investment management fees during certain of the periods shown. Repayment by a class (of expenses previously reimbursed and/or fees previously waived by NBIA) will decrease the class’s returns. Please see Note B in the Notes to Financial Statements for specific information regarding expense reimbursement and/or fee waiver arrangements.
As stated in the Fund’s most recent prospectus, the total annual operating expense ratios for fiscal year 2021 were 0.88%, 1.09%, 1.29%, 0.74%, 1.12%, and 1.89% for Investor Class, Trust Class, Advisor Class, Institutional Class, Class A and Class C shares, respectively (before expense reimbursements and/or fee waivers, if any). The total annual operating expense ratios for each of Institutional Class and Class A include each class’s repayment of expenses previously reimbursed and/or fees previously waived under the contractual expense limitation by NBIA. The expense ratio was 1.87% for Class C shares, after expense reimbursements and/or fee waivers. The expense ratios for the annual period ended August 31, 2022, can be found in the Financial Highlights section of this report.
Returns shown with a sales charge reflect the deduction of the current maximum initial sales charge of 5.75% for Class A shares and the contingent deferred sales charge (CDSC) for Class C shares. The CDSC for Class C shares is 1.00%, which is reduced to 0% after 1 year. The performance of the Fund’s share classes will differ primarily due to different sales charge structures and class expenses. Please see the prospectus for more information about sales charge structures, if any, and class expenses for your share class.
14
Focus Fund (Unaudited)
COMPARISON OF A $10,000 INVESTMENT

This graph shows the change in value of a hypothetical $10,000 investment in the Fund over the past 10 fiscal years, or since the Fund’s inception if it has not operated for 10 years. The graph is based on the Investor Class shares only; the performance of the Fund’s share classes will differ primarily due to different sales charge structures and class expenses (see Performance Highlights chart on previous page). The result is compared with benchmarks, which include a broad-based market index and may include a more narrowly based index. Market indices have not been reduced to reflect any of the fees and costs of investing. The results shown in the graph reflect the reinvestment of income dividends and other distributions, if any. The results do not reflect the effect of taxes a shareholder would pay on Fund distributions or on the redemption of Fund shares. Results represent past performance and do not indicate future results.
15
Genesis Fund Commentary (Unaudited)
Neuberger Berman Genesis Fund Investor Class generated a -14.63% total return for the fiscal year ended August 31, 2022 (the reporting period), outperforming the -17.88% total return of its benchmark, the Russell 2000® Index (the Index), for the same period. (Performance for all share classes is provided in the table immediately following this letter.)
The equity market generated weak results during the reporting period. While the market rallied several times, it was not enough to offset a number of sharp downturns. Investor sentiment was challenged by elevated inflation and aggressive U.S. Federal Reserve Board (Fed) rate hikes that have negatively impacted and could continue to negatively impact the economy and corporate profits. Supply chain shortages and repercussions from the war in Ukraine also weighed on the market. Within the Index, high quality (profitable with the highest return on equity) and less risky (higher market caps and lower volatility versus the S&P 500® Index) companies outperformed.
While the Fund couldn’t avoid the market’s steep decline, it outperformed the Index on a relative basis due to strong stock selection, which was partially offset by negative sector allocation. In particular, our high-quality bias that emphasizes companies with attractive financial characteristics, such as above average profitability, consistent free cash flow generation and conservative balance sheets, was rewarded. In terms of stock selection, the Fund’s strongest relative results were in the Information Technology (IT), Communication Services and Health Care sectors. Conversely, stock selection in the Industrials, Materials and Real Estate sectors were drags on results.
From a sector allocation perspective, the lack of Energy exposure throughout most of the reporting period was the largest drag on results. We initiated positions in the Energy sector in the second quarter of 2022, as we began to see evidence that management teams have become more disciplined, adopting more shareholder friendly capital allocation strategies. That said, we remain underweight in the sector, as we anticipate commodity prices to remain highly volatile. An overweight to IT versus the Index also detracted from results, as it was among the weakest performing sectors over the reporting period. Our bottom-up research approach and quality orientation lead us to the companies we own in the IT sector, rather than a desire to be overweight in this area of the market. Conversely, the Fund’s limited exposure to traditional Biotechnology companies, which in the small-cap space tend to be speculative and lower quality, added meaningfully to relative results, as these companies declined sharply during the reporting period.
The markets continue to grapple with several variables, including some that are counteracting in terms of economic growth and inflation. These include the U.S. dollar, interest rates, retail spending, and consumer/business confidence. The ongoing conflict in Ukraine has created supply shortages for many commodities, leading to inflationary pressures. China’s zero-Covid lockdown policy is disinflationary/deflationary for commodities, but inflationary for tradeable goods. However, if the Chinese lockdowns were to be lifted it could be inflationary for commodities and disinflationary/deflationary for tradeable goods. At the same time, the Fed is squarely focused on restoring price stability by increasing the Fed funds rates, with their expectation that this will depress demand and bring inflation under control. This cocktail of ingredients has understandably led to increasing concern around the potential for a recession in the U.S. and globally. With potential macro-outcomes highly uncertain and even diametrically opposed, we are striving to maintain balance in the portfolio across sectors. We are confident that investing in a diversified portfolio of financially strong companies, with sustainable and highly differentiated business models, is a prudent approach for long-term investment success.
Sincerely,
Judith M. Vale, Robert W. D'Alelio, Brett S. Reiner and Gregory G. Spiegel
Portfolio Co-Managers
Portfolio Co-Managers
Information about principal risks of investing in the Fund is set forth in the prospectus and statement of additional information.
The portfolio composition, industries and holdings of the Fund are subject to change without notice.
The opinions expressed are those of the Fund’s portfolio managers. The opinions are as of the date of this report and are subject to change without notice.
16
Genesis Fund (Unaudited)
TICKER SYMBOLS | |
Investor Class | NBGNX |
Trust Class | NBGEX |
Advisor Class | NBGAX |
Institutional Class | NBGIX |
Class R6 | NRGSX |
Class E | NRGEX |
SECTOR ALLOCATION | |
(as a % of Total Investments*) | |
Communication Services | 3.9% |
Consumer Discretionary | 11.3 |
Consumer Staples | 2.8 |
Energy | 2.3 |
Financials | 13.8 |
Health Care | 11.7 |
Industrials | 23.5 |
Information Technology | 23.7 |
Materials | 3.5 |
Real Estate | 1.3 |
Short-Term Investments | 2.2 |
Total | 100.0% |
* | Derivatives (other than options purchased), if any, are excluded from this chart. |
PERFORMANCE HIGHLIGHTS | |||||
Inception Date | Average Annual Total Return Ended 08/31/2022 | ||||
1 Year | 5 Years | 10 Years | Life of Fund | ||
At NAV | |||||
Investor Class | 09/27/1988 | -14.63% | 10.40% | 11.15% | 11.85% |
Trust Class3 | 08/26/1993 | -14.71% | 10.31% | 11.06% | 11.82% |
Advisor Class4 | 04/02/1997 | -14.93% | 10.02% | 10.76% | 11.59% |
Institutional Class5 | 07/01/1999 | -14.50% | 10.58% | 11.34% | 12.00% |
Class R622 | 03/15/2013 | -14.41% | 10.68% | 11.42% | 11.93% |
Class E24 | 01/11/2022 | -14.10% | 10.54% | 11.22% | 11.87% |
Index | |||||
Russell 2000® Index1,15 | -17.88% | 6.95% | 10.01% | 9.28% | |
The performance data quoted represent past performance and do not indicate future results. Current performance may be lower or higher than the performance data quoted. For current performance data, including current to the most recent month-end, please visit www.nb.com/performance.
The results shown in the table reflect the reinvestment of income dividends and other distributions, if any. The results do not reflect the effect of taxes a shareholder would pay on Fund distributions or on the redemption of Fund shares.
The investment return and principal value of an investment will fluctuate and shares, when redeemed, may be worth more or less than their original cost.
Returns would have been lower if Neuberger Berman Investment Advisers LLC (“NBIA”) had not reimbursed certain expenses and/or waived a portion of the investment management fees during certain of the periods shown. Repayment by a class (of expenses previously reimbursed and/or fees previously waived by NBIA) will decrease the class’s returns. Please see Note B in the Notes to Financial Statements for specific information regarding expense reimbursement and/or fee waiver arrangements.
As stated in the Fund’s most recent prospectus, the total annual operating expense ratios for fiscal year 2021 were 0.99%, 1.09%, 1.34%, 0.84% and 0.74% for Investor Class, Trust Class, Advisor Class, Institutional Class and Class R6 shares, respectively, and the estimated total annual operating expense ratio for fiscal year 2022 is 0.69% for Class E (before expense reimbursements and/or fee waivers, if any). The estimated expense ratio for fiscal year 2022 is 0.03% for Class E after expense reimbursements and/or fee waivers. The total annual operating expense ratio for Class R6 includes the class’s repayment of expenses previously reimbursed and/or fees previously waived under the contractual expense limitation by NBIA. The expense ratios for the annual period ended August 31, 2022, can be found in the Financial Highlights section of this report.
17
Genesis Fund (Unaudited)
COMPARISON OF A $10,000 INVESTMENT

This graph shows the change in value of a hypothetical $10,000 investment in the Fund over the past 10 fiscal years, or since the Fund’s inception if it has not operated for 10 years. The graph is based on the Investor Class shares only; the performance of the Fund’s share classes will differ primarily due to different class expenses (see Performance Highlights chart on previous page). The result is compared with benchmarks, which include a broad-based market index and may include a more narrowly based index. Market indices have not been reduced to reflect any of the fees and costs of investing. The results shown in the graph reflect the reinvestment of income dividends and other distributions, if any. The results do not reflect the effect of taxes a shareholder would pay on Fund distributions or on the redemption of Fund shares. Results represent past performance and do not indicate future results.
18
Global Real Estate Fund Commentary (Unaudited)
Neuberger Berman Global Real Estate Fund Institutional Class generated a -14.76% total return for the fiscal year ended August 31, 2022 (the reporting period), outperforming the -16.93% total return of its benchmark, the FTSE EPRA Nareit Developed Index (Net) (the Index), for the same period. (Performance for all share classes is provided in the table immediately following this letter.)
The global equity market, as measured by the MSCI All Country World Index (Net) (MSCI ACWI) generated weak results during the reporting period. While the market rallied several times, it was not enough to offset a number of sharp downturns. Investor sentiment was challenged by elevated inflation and aggressive central bank rate hikes that could negatively impact the economy and corporate profits. Supply chain shortages, repercussions from the war in Ukraine, and other geopolitical issues also weighed on the market. All told, the MSCI ACWI returned -15.88% for the reporting period. Comparatively, global real estate investment trusts (REITs), as measured by the Index, generated weaker results.
The Fund outperformed the Index on a relative basis during the reporting period. Both stock selection and country positioning contributed to the Fund’s relative returns. From a stock selection perspective, holdings in the Real Estate Holding & Development, Specialty REITs and Office REITs sectors were the most additive for returns versus the Index. In terms of individual holdings, Public Storage, VICI Properties, Inc., and Duke Realty Corp. were the largest contributors to performance. On the downside, holdings in the Industrial REITs, Residential REITs and Storage REITs sectors were the largest detractors from relative returns. Several individual holdings were headwinds for performance, including Mitsui Fudosan Logistics Park, Inc., Segro PLC and Vonovia SE.
In terms of the Fund’s positioning from a country perspective, underweights in Germany and Sweden versus the Index were the most beneficial for relative returns. On the downside, an overweight in the U.K and an underweight in the U.S. were the largest detractors from relative performance.
Looking ahead, we remain concerned about persistent inflation, slowing economic growth, and a likely hawkish stance by the U.S. Federal Reserve Board. Meanwhile, we believe real estate fundamentals remain solid for most property types. In addition, higher inflation can be viewed as positive for the owners of real estate assets, as landlords can raise the rent they charge tenants. As it relates to the possibility of a recession, they spare few asset classes and increased unemployment could lead to lower tenant demand. We believe REITs are better prepared for reduced business demand with stronger balance sheets, lower new construction activity and diverse demand drivers. Meanwhile, we are monitoring the potential long-term effects of pandemic-driven changes on real estate. We anticipate that over the long-term hybrid work arrangements are likely to temper overall demand for office space. Finally, we believe advancements in technology will lead to significant investments in network and infrastructure that benefit data center and infrastructure REITs.
Overseas, the Continental European real estate market has experienced a significant pullback. Concerns over Nordic companies’ leverage and German residential outlook have intensified as higher interest rates placed increasing pressure on capital values and higher fuel cost and inflation rates may erode affordability. In the U.K, newly elected Prime Minister, Liz Truss takes over during a period of high inflation, slowing growth, and continued market uncertainty. Overall, we maintain a preference for companies in sectors enjoying secular tailwinds, such as logistics, self-storage and student housing. For Asia, the U.S. interest rate outlook has replaced China’s regulatory risk as the main market overhang. U.S. rate hikes are expected to translate into higher rates in Hong Kong and Singapore, while putting pressure on Australia and Japan to normalize their monetary policy. In view of the uncertain macro backdrop, we have adopted a defensive positioning posture in Asia.
Sincerely,
Steve Shigekawa, Brian C. Jones and Anton Kwang
Portfolio Managers
Portfolio Managers
Information about principal risks of investing in the Fund is set forth in the prospectus and statement of additional information.
The portfolio composition, industries and holdings of the Fund are subject to change without notice.
The opinions expressed are those of the Fund’s portfolio managers. The opinions are as of the date of this report and are subject to change without notice.
19
Global Real Estate Fund (Unaudited)
TICKER SYMBOLS | |
Institutional Class | NGRIX |
Class A | NGRAX |
Class C | NGRCX |
PERFORMANCE HIGHLIGHTS9 | ||||
Inception Date | Average Annual Total Return Ended 08/31/2022 | |||
1 Year | 5 Years | Life of Fund | ||
At NAV | ||||
Institutional Class | 12/30/2014 | -14.76% | 4.75% | 4.84% |
Class A | 12/30/2014 | -15.09% | 4.34% | 4.45% |
Class C | 12/30/2014 | -15.75% | 3.57% | 3.67% |
With Sales Charge | ||||
Class A | -19.96% | 3.11% | 3.65% | |
Class C | -16.54% | 3.57% | 3.67% | |
Index | ||||
FTSE EPRA Nareit Developed Index (Net)1,15 | -16.93% | 1.75% | 2.29% | |
The performance data quoted represent past performance and do not indicate future results. Current performance may be lower or higher than the performance data quoted. For current performance data, including current to the most recent month-end, please visit www.nb.com/performance.
The results shown in the table reflect the reinvestment of income dividends and other distributions, if any. The results do not reflect the effect of taxes a shareholder would pay on Fund distributions or on the redemption of Fund shares.
The investment return and principal value of an investment will fluctuate and shares, when redeemed, may be worth more or less than their original cost.
Returns would have been lower if Neuberger Berman Investment Advisers LLC (“NBIA”) had not reimbursed certain expenses and/or waived a portion of the investment management fees during certain of the periods shown. Repayment by a class (of expenses previously reimbursed and/or fees previously waived by NBIA) will decrease the class’s returns. Please see Note B in the Notes to Financial Statements for specific information regarding expense reimbursement and/or fee waiver arrangements.
As stated in the Fund’s most recent prospectus, the total annual operating expense ratios for fiscal year 2021 were 10.46%, 11.06% and 11.69% for Institutional Class, Class A and Class C shares, respectively (before expense reimbursements and/or fee waivers, if any). The expense ratios were 1.01%, 1.37% and 2.12% for Institutional Class, Class A and Class C shares, respectively, after expense reimbursements and/or fee waivers. The expense ratios for the annual period ended August 31, 2022, can be found in the Financial Highlights section of this report.
Returns shown with a sales charge reflect the deduction of the current maximum initial sales charge of 5.75% for Class A shares and the contingent deferred sales charge (CDSC) for Class C shares. The CDSC for Class C shares is 1.00%, which is reduced to 0% after 1 year. The performance of the Fund’s share classes will differ primarily due to different sales charge structures and class expenses. Please see the prospectus for more information about sales charge structures, if any, and class expenses for your share class.
20
Global Real Estate Fund (Unaudited)
COMPARISON OF A $1,000,000 INVESTMENT
(000's omitted)

This graph shows the change in value of a hypothetical $1,000,000 investment in the Fund over the past 10 fiscal years, or since the Fund’s inception if it has not operated for 10 years. The graph is based on the Institutional Class shares only; the performance of the Fund’s share classes will differ primarily due to different sales charge structures and class expenses (see Performance Highlights chart on previous page). The result is compared with benchmarks, which include a broad-based market index and may include a more narrowly based index. Market indices have not been reduced to reflect any of the fees and costs of investing. The results shown in the graph reflect the reinvestment of income dividends and other distributions, if any. The results do not reflect the effect of taxes a shareholder would pay on Fund distributions or on the redemption of Fund shares. Results represent past performance and do not indicate future results.
21
Greater China Equity Fund Commentary (Unaudited)
Neuberger Berman Greater China Equity Fund Institutional Class generated a -28.71% total return for the fiscal year ended August 31, 2022 (the reporting period), underperforming its benchmark, the MSCI China All Shares Index (Net) (the Index), which returned -24.33% over the same period. (Performance for all share classes is provided in the table immediately following this letter.)
Over the reporting period, China equity markets experienced significant volatility given uncertainties on the government’s regulatory reform within the internet sector, as well as moderating economic growth driven by the property market slowdown and Covid-19 lockdowns. There were also heightened concerns about power shortage and geopolitical tensions.
In response to the slowing economic momentum, the People’s Bank of China cut the required reserve ratio, policy interest rates and 1-year and 5-year loan prime rates twice over the reporting period. Policymakers introduced fiscal policies to boost consumption and investments and targeted measures to stabilize the real estate market. On the regulatory front, the government’s tone on large platform companies has turned more supportive and senior leaders have vowed to support the healthy development of the digital economy in a number of high-level policymaker meetings. The U.S. and China regulators have also reached a deal on resolving the audit dispute at the end of August, potentially removing the delisting risk for U.S.-listed Chinese ADRs.
While the Covid-19 risk remains a near-term overhang, there have been modifications to the zero-Covid policy which includes the reduction of the quarantine period for inbound travelers and adoption of frequent mass testing in major cities and production hubs. There have also been positive developments on vaccines and oral treatments, which may lead to more meaningful relaxation of Covid containment measures albeit the timing remains uncertain.
For the reporting period, contributors to performance relative to the Index included Real Estate (stock selection), Information Technology (underweight versus the Index) and Consumer Staples (stock selection in the Food Products industry). Detractors from performance relative to the Index included Financials (significant underweight and stock selection in Banks and Insurance), Energy (underweight and stock selection in Oil, Gas & Consumable Fuels) and Industrials (stock selection in the Road & Rail and Machinery industries).
As of August 31, 2022, the Fund’s largest sector overweight relative to the Index was Materials, followed by Industrials and Consumer Staples. The largest sector underweight was Financials, followed by Communication Services and Utilities (where the Fund had no exposure). The Fund’s top 10 positions comprised more than 50% of total net assets at the end of the reporting period.
Looking ahead, we believe China’s economic recovery will likely pick up gradually after the 20th National Congress of the Chinese Communist Party in October where the government is expected to adopt a more pro-growth policy stance. That said, external demand for Chinese exports may see potential downside risk with heightened inflation and central bank tightening in many parts of the world. As such, the Fund continues to identify high quality companies with good earnings visibility and long-term growth prospects capable of weathering the uncertain macro environment in the horizon.
Sincerely,
Lihui Tang and Frank Yao
Portfolio Managers
Portfolio Managers
Information about principal risks of investing in the Fund is set forth in the prospectus and statement of additional information.
The portfolio composition, industries and holdings of the Fund are subject to change without notice.
The opinions expressed are those of the Fund’s portfolio managers. The opinions are as of the date of this report and are subject to change without notice.
22
Greater China Equity Fund (Unaudited)
TICKER SYMBOLS | |
Institutional Class | NCEIX |
Class A | NCEAX |
Class C | NCECX |
SECTOR ALLOCATION | |
(as a % of Total Investments*) | |
Communication Services | 4.1% |
Consumer Discretionary | 23.2 |
Consumer Staples | 12.3 |
Financials | 7.8 |
Health Care | 5.8 |
Industrials | 12.8 |
Information Technology | 6.9 |
Materials | 23.8 |
Real Estate | 3.2 |
Short-Term Investments | 0.1 |
Total | 100.0% |
* | Derivatives (other than options purchased), if any, are excluded from this chart. |
EXCHANGE ALLOCATION | |
(as a % of Long Term Investments) | |
Mainland China | 48.2% |
Hong Kong | 48.3% |
United States | 3.5% |
Total | 100.0% |
PERFORMANCE HIGHLIGHTS | ||||
Inception Date | Average Annual Total Return Ended 08/31/2022 | |||
1 Year | 5 Years | Life of Fund | ||
At NAV | ||||
Institutional Class | 07/17/2013 | -28.71% | 0.88% | 8.13% |
Class A | 07/17/2013 | -28.95% | 0.50% | 7.80% |
Class C | 07/17/2013 | -29.51% | -0.24% | 6.94% |
With Sales Charge | ||||
Class A | -33.03% | -0.68% | 7.10% | |
Class C | -30.18% | -0.24% | 6.94% | |
Index | ||||
MSCI China All Shares Index (Net)1,15 | -24.33% | -0.67% | 4.94% | |
The performance data quoted represent past performance and do not indicate future results. Current performance may be lower or higher than the performance data quoted. For current performance data, including current to the most recent month-end, please visit www.nb.com/performance.
The results shown in the table reflect the reinvestment of income dividends and other distributions, if any. The results do not reflect the effect of taxes a shareholder would pay on Fund distributions or on the redemption of Fund shares.
The investment return and principal value of an investment will fluctuate and shares, when redeemed, may be worth more or less than their original cost.
Returns would have been lower if Neuberger Berman Investment Advisers LLC (“NBIA”) had not reimbursed certain expenses and/or waived a portion of the investment management fees during certain of the periods shown. Repayment by a class (of expenses previously reimbursed and/or fees previously waived by NBIA) will decrease the class’s returns. Please see Note B in the Notes to Financial Statements for specific information regarding expense reimbursement and/or fee waiver arrangements.
As stated in the Fund’s most recent prospectus, the total annual operating expense ratios for fiscal year 2021 were 1.80%, 2.26% and 3.06% for Institutional Class, Class A and Class C shares, respectively (before expense reimbursements and/or fee waivers, if any). The expense ratios were 1.51%, 1.87% and 2.62% for Institutional Class, Class A and Class C shares, respectively, after expense reimbursements and/or fee waivers. The expense ratios for the annual period ended August 31, 2022, can be found in the Financial Highlights section of this report.
Returns shown with a sales charge reflect the deduction of the current maximum initial sales charge of 5.75% for Class A shares and the contingent deferred sales charge (CDSC) for Class C shares. The CDSC for Class C shares is 1.00%, which is reduced to 0% after 1 year. The performance of the Fund’s share classes will differ primarily due to different sales charge structures and class expenses. Please see the prospectus for more information about sales charge structures, if any, and class expenses for your share class.
23
Greater China Equity Fund (Unaudited)
COMPARISON OF A $1,000,000 INVESTMENT
(000's omitted)
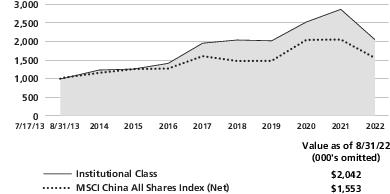
This graph shows the change in value of a hypothetical $1,000,000 investment in the Fund over the past 10 fiscal years, or since the Fund’s inception if it has not operated for 10 years. The graph is based on the Institutional Class shares only; the performance of the Fund’s share classes will differ primarily due to different sales charge structures and class expenses (see Performance Highlights chart on previous page). The result is compared with benchmarks, which include a broad-based market index and may include a more narrowly based index. Market indices have not been reduced to reflect any of the fees and costs of investing. The results shown in the graph reflect the reinvestment of income dividends and other distributions, if any. The results do not reflect the effect of taxes a shareholder would pay on Fund distributions or on the redemption of Fund shares. Results represent past performance and do not indicate future results.
24
International Equity Fund Commentary (Unaudited)
Neuberger Berman International Equity Fund Institutional Class generated a total return of -27.29% for the fiscal year ended August 31, 2022 (the reporting period), trailing its benchmark, the MSCI EAFE® Index (Net) (the Index), which posted a -19.80% total return for the same period. (Performance for all share classes is provided in the table immediately following this letter.)
International developed equity markets declined along with all other major markets this period, beginning in January. As central bank support from the pre-vaccine pandemic unwound, the markets began to shift.
Investor sentiment turned negative on high inflation data, and whether central bank actions aimed at slowing the economy (to curb inflation) would cause higher real rates1 and push developed economies toward recession. Ongoing Covid lockdowns in China and pandemic-remnant supply chain issues continued to plague markets, as did the war in Ukraine, which among other concerns, added inflationary pressures on food and energy.
The Index lagged the S&P 500® Index (which measures U.S. equity performance) but outperformed the MSCI Emerging Markets Index this reporting period. Within the Index, all sectors declined except for Energy, which advanced on oil and gas commodity price pressures. The defensive Consumer Staples and Utilities sectors saw smaller losses than average, as did Financials, benefiting from rising rates. Information Technology, Industrials, and Consumer Discretionary declined most, on fears of economic slowdown. By country, Norway, an oil economy, was slightly positive, and Portugal and the U.K. posted small losses. The Netherlands, Germany, and Austria saw the largest declines.
Since the January shift, investor preference for value stocks over quality and growth has meant an uphill battle for the Fund on a relative basis. While this trend lessened somewhat as the reporting period progressed, stock selection detracted for the full period, especially within Consumer Discretionary, Health Care, and Materials. Our underweight versus the Index to Energy was also a factor. By country, holdings based in the U.K. and Japan, and our zero allocation to Australia detracted.
Techtronic Industries, a Hong Kong listed power tool manufacturer was weak on concerns over slowing U.S. housing demand and retail/DIY spending amid an accelerated rate hike cycle. Techtronic and adidas, the German sports apparel name, were the largest detractors.
However, underweights to Real Estate, Communication Services, and Consumer Discretionary versus the Index benefited relative performance, as did holdings based in Sweden and Singapore, and an opportunistic allocation to U.S.-listed names.
Tokio Marine, the Japan-based global insurer, contributed most, with positive trends across its business lines and Japanese automaker Toyota was also a positive contributor given both stocks were sold before the broader market sell off in March.
Looking forward, we are evaluating a possible longer-term regime change in equity markets. The decade following 2008’s global financial crisis was characterized by low inflation, ultra-low interest rates and underinvestment. The possible shift to a new regime of higher inflation, higher rates and higher capital spending in areas including infrastructure, energy transition, reshoring, and housing could mean a brighter future for real economy stocks.
Seismic events, such as the pandemic and war in Ukraine, are upending many widely held norms. It is our duty as thoughtful investors to scrutinize the potentially changing landscape. As we consider related investment ideas, we adhere to our long-standing quality framework. In our view, the key challenge will be striking the right balance between attractive secular growth opportunities—where this year’s sell-off has pushed valuations on many quality growth names into more appealing territory—and companies with inflation-protecting hard assets that benefit from higher nominal growth in the long-term.
25
Although our recent performance has lagged the Index, we believe our quality at a reasonable price philosophy and disciplined, repeatable investment process can generate attractive long-term, risk-adjusted returns.
Sincerely,
Elias Cohen
Portfolio Manager
Portfolio Manager
1 A real interest rate is an interest rate that has been adjusted to remove the effects of inflation. Once adjusted, it reflects the real cost of funds to a borrower and the real yield to a lender or to an investor.
Information about principal risks of investing in the Fund is set forth in the prospectus and statement of additional information.
The portfolio composition, industries and holdings of the Fund are subject to change without notice.
The opinions expressed are those of the Fund’s portfolio manager. The opinions are as of the date of this report and are subject to change without notice.
26
International Equity Fund (Unaudited)
TICKER SYMBOLS | |
Investor Class | NIQVX |
Trust Class | NIQTX |
Institutional Class | NBIIX |
Class A | NIQAX |
Class C | NIQCX |
Class R6 | NRIQX |
Class E | NIQEX |
PERFORMANCE HIGHLIGHTS7 | |||||
Inception Date | Average Annual Total Return Ended 08/31/2022 | ||||
1 Year | 5 Years | 10 Years | Life of Fund | ||
At NAV | |||||
Investor Class12 | 01/28/2013 | -27.43% | 1.53% | 4.85% | 4.25% |
Trust Class12 | 01/28/2013 | -27.49% | 1.47% | 4.79% | 4.21% |
Institutional Class | 06/17/2005 | -27.29% | 1.76% | 5.04% | 4.35% |
Class A12 | 01/28/2013 | -27.53% | 1.41% | 4.67% | 4.15% |
Class C12 | 01/28/2013 | -28.09% | 0.65% | 3.92% | 3.71% |
Class R621 | 09/03/2013 | -27.18% | 1.87% | 5.13% | 4.41% |
Class E25 | 01/11/2022 | -26.90% | 1.87% | 5.09% | 4.39% |
With Sales Charge | |||||
Class A12 | -31.71% | 0.22% | 4.06% | 3.79% | |
Class C12 | -28.73% | 0.65% | 3.92% | 3.71% | |
Index | |||||
MSCI EAFE® Index (Net)1,15 | -19.80% | 1.63% | 5.00% | 4.08% | |
The performance data quoted represent past performance and do not indicate future results. Current performance may be lower or higher than the performance data quoted. For current performance data, including current to the most recent month-end, please visit www.nb.com/performance.
The results shown in the table reflect the reinvestment of income dividends and other distributions, if any. The results do not reflect the effect of taxes a shareholder would pay on Fund distributions or on the redemption of Fund shares.
The investment return and principal value of an investment will fluctuate and shares, when redeemed, may be worth more or less than their original cost.
Returns would have been lower if Neuberger Berman Investment Advisers LLC (“NBIA”) had not reimbursed certain expenses and/or waived a portion of the investment management fees during certain of the periods shown. Repayment by a class (of expenses previously reimbursed and/or fees previously waived by NBIA) will decrease the class’s returns. Please see Note B in the Notes to Financial Statements for specific information regarding expense reimbursement and/or fee waiver arrangements.
As stated in the Fund’s most recent prospectus, the total annual operating expense ratios for fiscal year 2021 were 1.16%, 1.24%, 0.99%, 1.35%, 2.11% and 0.89% for Investor Class, Trust Class, Institutional Class, Class A, Class C and Class R6 shares, respectively, and the estimated total annual operating expense ratio for fiscal year 2022 is 0.84% for Class E (before expense reimbursements and/or fee waivers, if any). The expense ratios were 0.86%, 1.22%, 1.97% and 0.76% for Institutional Class, Class A, Class C and Class R6 shares, respectively, and the estimated expense ratio for fiscal year 2022 is 0.06% for Class E, after expense reimbursements and/or fee waivers. The expense ratios for the annual period ended August 31, 2022, can be found in the Financial Highlights section of this report.
Returns shown with a sales charge reflect the deduction of the current maximum initial sales charge of 5.75% for Class A shares and the contingent deferred sales charge (CDSC) for Class C shares. The CDSC for Class C shares is 1.00%, which is reduced to 0% after 1 year. The performance of the Fund’s share classes will differ primarily due to different sales charge structures and class expenses. Please see the prospectus for more information about sales charge structures, if any, and class expenses for your share class.
27
International Equity Fund (Unaudited)
COMPARISON OF A $1,000,000 INVESTMENT
(000's omitted)

This graph shows the change in value of a hypothetical $1,000,000 investment in the Fund over the past 10 fiscal years, or since the Fund’s inception if it has not operated for 10 years. The graph is based on the Institutional Class shares only; the performance of the Fund’s share classes will differ primarily due to different sales charge structures and class expenses (see Performance Highlights chart on previous page). The result is compared with benchmarks, which include a broad-based market index and may include a more narrowly based index. Market indices have not been reduced to reflect any of the fees and costs of investing. The results shown in the graph reflect the reinvestment of income dividends and other distributions, if any. The results do not reflect the effect of taxes a shareholder would pay on Fund distributions or on the redemption of Fund shares. Results represent past performance and do not indicate future results.
28
International Select Fund Commentary (Unaudited)
Neuberger Berman International Select Fund Trust Class generated a total return of -26.93% for the fiscal year ended August 31, 2022 (the reporting period), trailing its benchmark, the MSCI EAFE® Index (Net) (the Index), which posted a -19.80% total return for the same period. (Performance for all share classes is provided in the table immediately following this letter.)
International developed equity markets declined along with all other major markets this period, beginning in January. As central bank support from the pre-vaccine pandemic unwound, the markets began to shift.
Investor sentiment turned negative on high inflation data, and whether central bank actions aimed at slowing the economy (to curb inflation) would cause higher real rates1 and push developed economies toward recession. Ongoing Covid lockdowns in China and pandemic-remnant supply chain issues continued to plague markets, as did the war in Ukraine, which among other concerns, added inflationary pressures on food and energy.
The EAFE Index lagged the S&P 500® Index (which measures U.S. equity performance) but outperformed the MSCI Emerging Markets Index this reporting period. Within the Index, all sectors declined except for Energy, which advanced on oil and gas commodity price pressures. The defensive Consumer Staples and Utilities sectors saw smaller losses than average, as did Financials, benefiting from rising rates. Information Technology, Industrials, and Consumer Discretionary declined most, on fears of economic slowdown. By country, Norway, an oil economy, was slightly positive, and Portugal and the U.K. posted small losses. The Netherlands, Germany, and Austria saw the largest declines.
Since the January shift, investor preference for value stocks over quality and growth has meant an uphill battle for the Fund on a relative basis. While this trend lessened somewhat as the period progressed, stock selection detracted for the full period, especially within Consumer Discretionary, Health Care, and Materials. Our underweight versus the Index to Energy was also a factor. By country, holdings based in the U.K., Japan, and Hong Kong detracted.
Techtronic Industries, a Hong Kong listed power tool manufacturer was weak on concerns over slowing U.S. housing demand and retail/DIY spending amid an accelerated rate hike cycle. Techtronic and adidas, the German sports apparel name, were the largest detractors.
A zero weighting to Real Estate and stock selection and an overweight in Financials versus the Index benefited relative performance, as did holdings based in Sweden and Singapore, and an opportunistic allocation to U.S.-listed names.
Tokio Marine, the Japan-based global insurer, contributed most, with positive trends across its business lines and Japanese automaker Toyota was also a positive contributor given both stocks were sold before the broader market sell off in March.
Looking forward, we are evaluating a possible longer-term regime change in equity markets. The decade following 2008’s global financial crisis was characterized by low inflation, ultra-low interest rates and underinvestment. The possible shift to a new regime of higher inflation, higher rates and higher capital spending in areas including infrastructure, energy transition, reshoring, and housing could mean a brighter future for real economy stocks.
Seismic events, such as the pandemic and war in Ukraine, are upending many widely held norms. It is our duty as thoughtful investors to scrutinize the potentially changing landscape. As we consider related investment ideas, we adhere to our long-standing quality framework. In our view, the key challenge will be striking the right balance between attractive secular growth opportunities—where this year’s sell-off has pushed valuations on many quality growth names into more appealing territory—and companies with inflation-protecting hard assets that benefit from higher nominal growth in the long-term.
29
Although our recent performance has lagged the Index, we believe our quality at a reasonable price philosophy and disciplined, repeatable investment process can generate attractive long-term, risk-adjusted returns.
Sincerely,
Elias Cohen
Portfolio Manager
Portfolio Manager
1 A real interest rate is an interest rate that has been adjusted to remove the effects of inflation. Once adjusted, it reflects the real cost of funds to a borrower and the real yield to a lender or to an investor.
Information about principal risks of investing in the Fund is set forth in the prospectus and statement of additional information.
The portfolio composition, industries and holdings of the Fund are subject to change without notice.
The opinions expressed are those of the Fund’s portfolio manager. The opinions are as of the date of this report and are subject to change without notice.
30
International Select Fund (Unaudited)
TICKER SYMBOLS | |
Trust Class | NILTX |
Institutional Class | NILIX |
Class A | NBNAX |
Class C | NBNCX |
Class R3 | NBNRX |
Class R6 | NRILX |
PERFORMANCE HIGHLIGHTS7 | |||||
Inception Date | Average Annual Total Return Ended 08/31/2022 | ||||
1 Year | 5 Years | 10 Years | Life of Fund | ||
At NAV | |||||
Trust Class | 08/01/2006 | -26.93% | 2.00% | 4.69% | 3.07% |
Institutional Class6 | 10/06/2006 | -26.61% | 2.36% | 5.06% | 3.43% |
Class A14 | 12/20/2007 | -26.89% | 1.98% | 4.67% | 3.06% |
Class C14 | 12/20/2007 | -27.45% | 1.22% | 3.89% | 2.36% |
Class R314 | 05/27/2009 | -27.06% | 1.74% | 4.42% | 2.84% |
Class R623 | 04/17/2017 | -26.59% | 2.44% | 4.93% | 3.22% |
With Sales Charge | |||||
Class A14 | -31.11% | 0.78% | 4.06% | 2.69% | |
Class C14 | -28.10% | 1.22% | 3.89% | 2.36% | |
Index | |||||
MSCI EAFE® Index (Net)1,15 | -19.80% | 1.63% | 5.00% | 2.77% | |
The performance data quoted represent past performance and do not indicate future results. Current performance may be lower or higher than the performance data quoted. For current performance data, including current to the most recent month-end, please visit www.nb.com/performance.
The results shown in the table reflect the reinvestment of income dividends and other distributions, if any. The results do not reflect the effect of taxes a shareholder would pay on Fund distributions or on the redemption of Fund shares.
The investment return and principal value of an investment will fluctuate and shares, when redeemed, may be worth more or less than their original cost.
Returns would have been lower if Neuberger Berman Investment Advisers LLC (“NBIA”) had not reimbursed certain expenses and/or waived a portion of the investment management fees during certain of the periods shown. Repayment by a class (of expenses previously reimbursed and/or fees previously waived by NBIA) will decrease the class’s returns. Please see Note B in the Notes to Financial Statements for specific information regarding expense reimbursement and/or fee waiver arrangements.
As stated in the Fund’s most recent prospectus, the total annual operating expense ratios for fiscal year 2021 were 1.41%, 0.97%, 1.34%, 2.12%, 1.60% and 0.88% for Trust Class, Institutional Class, Class A, Class C, Class R3 and Class R6 shares, respectively (before expense reimbursements and/or fee waivers, if any). The expense ratios were 1.16%, 0.81%, 1.17%, 1.92%, 1.42% and 0.71% for Trust Class, Institutional Class, Class A, Class C, Class R3 and Class R6 shares, respectively, after expense reimbursements and/or fee waivers. The expense ratios for the annual period ended August 31, 2022, can be found in the Financial Highlights section of this report.
Returns shown with a sales charge reflect the deduction of the current maximum initial sales charge of 5.75% for Class A shares and the contingent deferred sales charge (CDSC) for Class C shares. The CDSC for Class C shares is 1.00%, which is reduced to 0% after 1 year. The performance of the Fund’s share classes will differ primarily due to different sales charge structures and class expenses. Please see the prospectus for more information about sales charge structures, if any, and class expenses for your share class.
31
International Select Fund (Unaudited)
COMPARISON OF A $10,000 INVESTMENT
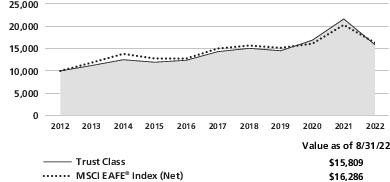
This graph shows the change in value of a hypothetical $10,000 investment in the Fund over the past 10 fiscal years, or since the Fund’s inception if it has not operated for 10 years. The graph is based on the Trust Class shares only; the performance of the Fund’s share classes will differ primarily due to different sales charge structures and class expenses (see Performance Highlights chart on previous page). The result is compared with benchmarks, which include a broad-based market index and may include a more narrowly based index. Market indices have not been reduced to reflect any of the fees and costs of investing. The results shown in the graph reflect the reinvestment of income dividends and other distributions, if any. The results do not reflect the effect of taxes a shareholder would pay on Fund distributions or on the redemption of Fund shares. Results represent past performance and do not indicate future results.
32
International Small Cap Fund Commentary (Unaudited)
Neuberger Berman International Small Cap Fund Institutional Class reported a total return of -30.79% for the fiscal year ended August 31, 2022 (the reporting period), trailing the -25.98% total return of its benchmark, the MSCI EAFE® Small Cap Index (Net) (the Index), for the same period. (Performance for all share classes is provided in the table immediately following this letter.)
International developed equity markets advanced in the early part of the reporting period, but along with other major markets, began declining in January as investor angst increased. Concerns about the global economy— including persistent supply chain issues, Covid lockdowns in China, high inflation, central banks’ shifts from loose monetary policy early in the pandemic to aggressive tightening, and the war in Ukraine driving food and energy costs higher—turned sentiment negative.
International developed markets trailed the S&P 500® Index (which measures U.S. equity performance). As sentiment worsened and interest rates increased, growth gave way to value, and smaller cap stocks lost ground to larger cap peers.
Within the Index, Energy—boosted by higher commodity prices—posted positive results, but all others declined. Defensive Utilities declined least, while Health Care, Information Technology (IT), and Consumer Discretionary fell farthest. By country, Israel advanced, and Singapore and Portugal outperformed with small losses. The sharpest selloffs occurred in Sweden, Finland, and Germany.
Within the Fund, sector allocation was a headwind this period, with our underweight versus the Index to Energy, and overweights in Health Care and IT detracting from relative results. The team is adapting to the evolving market’s backdrop, as evidenced by trimming Health Care and IT overweights, and narrowing underweights to Financials among other sectors.
Stock selection was mixed but detracted overall. Our holdings within Communication Services, Materials, and Industrials underperformed. By country, holdings based in Australia and Switzerland lagged, and our zero weighting to Israel detracted.
Individual detractors included Future, a British media company, hurt by weakening consumer sentiment and recession fears. Befesa, the Luxembourg-based steel dust recycler, declined on lower zinc prices, potentially lower steel production, and higher energy costs. Thule Group, a Swedish rack and luggage manufacturer, declined as growth normalized after an extraordinary pandemic period, and margins suffered from higher costs.
The Fund’s stock selection was strong within Financials, Real Estate, and Health Care. By country, holdings in France, Finland, and Italy were beneficial.
All three of our top contributors were M&A targets. Kito, a Japanese industrial hoists manufacturer; Clinigen, a British company offering services to pharmaceutical companies; and Intertrust, the Netherlands-based corporate and trust services advanced prior to being acquired. Clinigen and Intertrust were both sold during the reporting period.
Looking forward, we believe market volatility will continue if inflation doesn't subside. If interest rate policies show positive results, however, volatility could improve. Inflation generated by supply chain conditions could start decreasing with China’s re-opening and as overall global consumption switches from goods to services. Commodity inflation might take longer. Oil and gas companies have underinvested to preserve returns and must integrate more stringent environmental and safety regulations; and the war in Ukraine remains a factor.
We believe our strategy of focusing on well-managed quality companies could offer relative strength over an extended period of headline-driven volatility. We have broadened our research efforts to include companies that we believe are poised to improve their pricing power if inflation runs at a higher level, in turn generating sustained profitability.
33
Examples include interest-rate sensitive banks and oil services companies investing in renewable energy in Europe, and placement agencies that could benefit from worker shortages and wage inflation in Japan. This effort further diversifies the portfolio toward our goal of generating strong risk-adjusted returns over full market cycles.
Sincerely,
David Bunan
Portfolio Manager
Portfolio Manager
Information about principal risks of investing in the Fund is set forth in the prospectus and statement of additional information.
The portfolio composition, industries and holdings of the Fund are subject to change without notice.
The opinions expressed are those of the Fund’s portfolio manager. The opinions are as of the date of this report and are subject to change without notice.
34
International Small Cap Fund (Unaudited)
TICKER SYMBOLS | |
Institutional Class | NIOIX |
Class A | NIOAX |
Class C | NIOCX |
Class R6 | NIORX |
PERFORMANCE HIGHLIGHTS9 | ||||
Inception Date | Average Annual Total Return Ended 08/31/2022 | |||
1 Year | 5 Years | Life of Fund | ||
At NAV | ||||
Institutional Class | 12/08/2016 | -30.79% | 2.59% | 6.66% |
Class A | 12/08/2016 | -31.05% | 2.22% | 6.27% |
Class C | 12/08/2016 | -31.59% | 1.46% | 5.48% |
Class R6 | 12/08/2016 | -30.76% | 2.69% | 6.76% |
With Sales Charge | ||||
Class A | -35.00% | 1.02% | 5.18% | |
Class C | -32.25% | 1.46% | 5.48% | |
Index | ||||
MSCI EAFE® Small Cap Index (Net)1,15 | -25.98% | 1.21% | 4.85% | |
The performance data quoted represent past performance and do not indicate future results. Current performance may be lower or higher than the performance data quoted. For current performance data, including current to the most recent month-end, please visit www.nb.com/performance.
The results shown in the table reflect the reinvestment of income dividends and other distributions, if any. The results do not reflect the effect of taxes a shareholder would pay on Fund distributions or on the redemption of Fund shares.
The investment return and principal value of an investment will fluctuate and shares, when redeemed, may be worth more or less than their original cost.
Returns would have been lower if Neuberger Berman Investment Advisers LLC (“NBIA”) had not reimbursed certain expenses and/or waived a portion of the investment management fees during certain of the periods shown. Repayment by a class (of expenses previously reimbursed and/or fees previously waived by NBIA) will decrease the class’s returns. Please see Note B in the Notes to Financial Statements for specific information regarding expense reimbursement and/or fee waiver arrangements.
As stated in the Fund’s most recent prospectus, the total annual operating expense ratios for fiscal year 2021 were 13.09%, 13.62%, 14.29% and 13.03% for Institutional Class, Class A, Class C and Class R6 shares, respectively (before expense reimbursements and/or fee waivers, if any). The expense ratios were 1.07%, 1.44%, 2.19% and 0.98% for Institutional Class, Class A, Class C and Class R6 shares, respectively, after expense reimbursements and/or fee waivers. The expense ratios for the annual period ended August 31, 2022, can be found in the Financial Highlights section of this report.
Returns shown with a sales charge reflect the deduction of the current maximum initial sales charge of 5.75% for Class A shares and the contingent deferred sales charge (CDSC) for Class C shares. The CDSC for Class C shares is 1.00%, which is reduced to 0% after 1 year. The performance of the Fund’s share classes will differ primarily due to different sales charge structures and class expenses. Please see the prospectus for more information about sales charge structures, if any, and class expenses for your share class.
35
International Small Cap Fund (Unaudited)
COMPARISON OF A $1,000,000 INVESTMENT
(000's omitted)

This graph shows the change in value of a hypothetical $1,000,000 investment in the Fund over the past 10 fiscal years, or since the Fund’s inception if it has not operated for 10 years. The graph is based on the Institutional Class shares only; the performance of the Fund’s share classes will differ primarily due to different sales charge structures and class expenses (see Performance Highlights chart on previous page). The result is compared with benchmarks, which include a broad-based market index and may include a more narrowly based index. Market indices have not been reduced to reflect any of the fees and costs of investing. The results shown in the graph reflect the reinvestment of income dividends and other distributions, if any. The results do not reflect the effect of taxes a shareholder would pay on Fund distributions or on the redemption of Fund shares. Results represent past performance and do not indicate future results.
36
Intrinsic Value Fund Commentary (Unaudited)
Neuberger Berman Intrinsic Value Fund Institutional Class generated a -15.58% total return for the fiscal year ended August 31, 2022 (the reporting period), underperforming its benchmark, the Russell 2000® Value Index (the Index), which generated a -10.18% total return for the same period. (Performance for all share classes is provided in the table immediately following this letter.)
2022 has been a uniquely challenging year. Stock market valuations have de-rated twice, initially on rising inflation and interest rates (impacting growth stocks), and now on the growing fear of an economic contraction (impacting value stocks). Although we weathered the initial rise in interest rates this year no worse than many investors, the economic sensitivity of our companies has led to a significant compression in valuation and on a relative basis we underperformed the Index.
A number of the portfolio’s Information Technology stocks came under pressure which added to the difficult performance. Energy stocks performed well as oil prices soared and our underweight in this area versus the Index hurt despite positive stock selection. Our limited exposure to Real Estate stocks helped as this sector lost ground due to a decline in new and existing home sales. M&A activity continued to benefit performance—five of our companies agreed to be acquired at attractive premiums.
Historically, fear of recession engenders broad-based risk aversion. This has worked against small caps and our Fund over the short-term; this time is no exception. While economic slowdowns can result in challenging performance they have also led to attractive valuations. As of June 30, 2022, our portfolio’s discount to intrinsic value1 was 43%. If we look at the quarters when our valuations were highest as measured by our intrinsic value discount (˃40%), future 12- and 24-month relative and absolute returns historically have generally been positive.
We added 14 new ideas during the reporting period and eliminated 13, somewhat below our historic levels. Most of the name turnover occurred in the last four months of 2021 (nine new names, nine sells). Given current valuations, more of our activity calendar year-to date was adding to existing investments (15 investment decision-based adds) while new buys and elimination activity was more muted (five and four, respectively).
Looking ahead, our engagements with portfolio companies selling at deep discounts to our intrinsic value estimates will likely increase. When appropriate, we work with management on their capital allocation strategies and help them develop long-term narratives that can assist current and prospective investors understand the potential upside with a long-term investment. In some instances, we will directly invest in the company to enable a value-creating outcome. In mid-August, our strategy made a large investment in portfolio company Ribbon Communications (RBBN) that we believe will facilitate the company’s future growth prospects. There is a similar theme with some of our earlier capital injections—well-regarded management, excellent long-term growth opportunities, and too much debt. We were the lead anchor investor in a $52 million private placement financing of common stock investing about $30 million of capital which, combined with our existing ownership, equals 8% of RBBN. Ribbon is a global provider of software and network solutions to service providers. The company is experiencing continued strong operating profit and margins from its Cloud and Edge products but increasing losses in Optical driven by investments in new products and marketing. These losses are severely depressing the company’s valuation. This investment is another example of our willingness to work constructively with management and help them find a path to greater valuation.
Although this challenging period doesn’t come as a surprise, it remains difficult to stomach. We have a long history of overcoming trying markets and take comfort in what the past may imply but we do not take it for granted. Our focus and efforts will likely be on rebalancing our sector and company weightings and continued engagement with portfolio companies where we believe we can bring ideas and capital to the process of creating shareholder value.
37
Sincerely,
Benjamin H. Nahum, James F. McAree and Amit Solomon
Portfolio Co-Managers
Portfolio Co-Managers
1 Intrinsic value reflects the portfolio management team’s analysis and estimates of a company’s value. There is no guarantee that any intrinsic values will be realized; security prices may decrease regardless of intrinsic values.
Information about principal risks of investing in the Fund is set forth in the prospectus and statement of additional information.
The portfolio composition, industries and holdings of the Fund are subject to change without notice.
The opinions expressed are those of the Fund’s portfolio managers. The opinions are as of the date of this report and are subject to change without notice.
38
Intrinsic Value Fund (Unaudited)
TICKER SYMBOLS | |
Institutional Class | NINLX |
Class A | NINAX |
Class C | NINCX |
Class R6 | NRINX |
SECTOR ALLOCATION | |
(as a % of Total Investments*) | |
Communication Services | 4.1% |
Consumer Discretionary | 5.8 |
Consumer Staples | 1.7 |
Convertible Bonds | 1.4 |
Energy | 6.2 |
Financials | 5.9 |
Health Care | 10.3 |
Industrials | 14.9 |
Information Technology | 30.1 |
Materials | 6.3 |
Real Estate | 1.1 |
Utilities | 3.9 |
Short-Term Investments | 8.3 |
Total | 100.0% |
* | Derivatives (other than options purchased), if any, are excluded from this chart. |
PERFORMANCE HIGHLIGHTS | |||||
Inception Date* | Average Annual Total Return Ended 08/31/2022 | ||||
1 Year | 5 Years | 10 Years | Life of Fund | ||
At NAV | |||||
Institutional Class18 | 05/10/2010 | -15.58% | 9.56% | 11.49% | 10.89% |
Class A18 | 05/10/2010 | -15.90% | 9.16% | 11.10% | 10.69% |
Class C18 | 05/10/2010 | -16.52% | 8.34% | 10.27% | 10.29% |
Class R618,21 | 01/18/2019 | -15.49% | 9.66% | 11.54% | 10.91% |
With Sales Charge | |||||
Class A18 | -20.74% | 7.87% | 10.45% | 10.43% | |
Class C18 | -17.30% | 8.34% | 10.27% | 10.29% | |
Index | |||||
Russell 2000® Value Index1,15 | -10.18% | 6.56% | 9.49% | 8.34% | |
Russell 2000® Index1,15 | -17.88% | 6.95% | 10.01% | 7.70% | |
*The inception date for Neuberger Berman Intrinsic Value Fund Institutional Class, Class A, and Class C shares is May 10, 2010. The performance data for Class R6 also includes the performance of the Fund’s Institutional Class from May 10, 2010 through January 18, 2019. Performance prior to May 10, 2010 is that of the Fund’s predecessor, the DJG Small Cap Value Fund L.P., an unregistered limited partnership (“DJG Fund”); DJG Fund was the successor to The DJG Small Cap Value Fund, an unregistered commingled investment account (“DJG Account”), which had similar investment goals, strategies, and portfolio management team. See endnote 18 for more information.
The performance data quoted represent past performance and do not indicate future results. Current performance may be lower or higher than the performance data quoted. For current performance data, including current to the most recent month-end, please visit www.nb.com/performance.
The results shown in the table reflect the reinvestment of income dividends and other distributions, if any. The results do not reflect the effect of taxes a shareholder would pay on Fund distributions or on the redemption of Fund shares.
The investment return and principal value of an investment will fluctuate and shares, when redeemed, may be worth more or less than their original cost.
Returns would have been lower if Neuberger Berman Investment Advisers LLC (“NBIA”) had not reimbursed certain expenses and/or waived a portion of the investment management fees during certain of the periods shown. Repayment by a class (of expenses previously reimbursed and/or fees previously waived by NBIA) will decrease the class’s returns. Please see Note B in the Notes to Financial Statements for specific information regarding expense reimbursement and/or fee waiver arrangements.
As stated in the Fund’s most recent prospectus, the total annual operating expense ratios for fiscal year 2021 were 1.01%, 1.37%, 2.12% and 0.89% for Institutional Class, Class A, Class C and Class R6 shares, respectively (before expense reimbursements and/or fee waivers, if any). The total annual operating expense ratios for each of Institutional Class, Class C and Class R6 includes each class’s repayment of expenses previously reimbursed and/or fees previously waived under the contractual expense limitation by NBIA. The expense ratio was 1.37% for Class A shares after expense reimbursements and/or fee waivers. The expense ratios for the annual period ended August 31, 2022, can be found in the Financial Highlights section of this report.
Returns shown with a sales charge reflect the deduction of the current maximum initial sales charge of 5.75% for Class A shares and the contingent deferred sales charge (CDSC) for Class C shares. The CDSC for Class C shares is 1.00%, which is reduced to 0% after 1 year. The performance of the Fund’s share classes will differ primarily due to different sales charge structures and class expenses. Please see the prospectus for more information about sales charge structures, if any, and class expenses for your share class.
39
Intrinsic Value Fund (Unaudited)
COMPARISON OF A $1,000,000 INVESTMENT
(000's omitted)

This graph shows the change in value of a hypothetical $1,000,000 investment in the Fund over the past 10 fiscal years, or since the Fund’s inception if it has not operated for 10 years. The graph is based on the Institutional Class shares only; the performance of the Fund’s share classes will differ primarily due to different sales charge structures and class expenses (see Performance Highlights chart on previous page). The result is compared with benchmarks, which include a broad-based market index and may include a more narrowly based index. Market indices have not been reduced to reflect any of the fees and costs of investing. The results shown in the graph reflect the reinvestment of income dividends and other distributions, if any. The results do not reflect the effect of taxes a shareholder would pay on Fund distributions or on the redemption of Fund shares. Results represent past performance and do not indicate future results.
40
Large Cap Growth Fund* Commentary (Unaudited)
Neuberger Berman Large Cap Growth Fund (formerly Neuberger Berman Guardian Fund) Investor Class posted a -17.16% total return for the fiscal year ended August 31, 2022 (the reporting period), underperforming the -11.23% total return of its benchmark, the S&P 500® Index (the Index) for the same period. (Performance for all share classes is provided in the table immediately following this letter.)
The equity market generated weak results during the reporting period. While the market rallied several times, it was not enough to offset a number of sharp downturns. Investor sentiment was challenged by elevated inflation and aggressive rate hikes by the U.S. Federal Reserve Board (Fed) that have negatively impacted and could continue to negatively impact and could continue to negatively impact the economy and corporate profits. Supply chain shortages, repercussions from the war in Ukraine, and other geopolitical issues also weighed on the market. All told, as noted above, the Index returned -11.23% during the reporting period.
Both stock selection and sector allocation detracted from the Fund’s relative performance. From a stock selection perspective, certain holdings in the Information Technology sector were the largest detractors from relative performance. Certain positions in the Consumer Discretionary and Energy sectors were also negative for relative returns. Individual stocks that detracted from performance included Facebook parent company Meta Platforms, Inc., Google parent company Alphabet, Inc. and online legal technology company LegalZoom.com, Inc. We eliminated our position in LegalZoom.com, Inc. during the reporting period. On the upside, stock selection in the Health Care, Communication Services and Materials sectors were the most beneficial for relative returns. In terms of individual stocks, online sports retailer Fanatics Holdings, Inc.**, health care company UnitedHealth Group, Inc., and restaurant chain McDonald’s Corp. were the most additive for returns.
Looking at sector allocation, the Fund’s underweight to Energy versus the Index was the largest detractor from results. Out-of-benchmark positions in several privately held companies were also headwinds for performance. Conversely, a small cash position and an underweight to Communication Services on average during the reporting period were additive for returns.
Looking ahead, we recognize the economy is slowing. Yet, the primary debate is how much the economy will slow and how quickly inflation will reach more manageable levels. There are two competing views of where we go from here. At one end, we have inflation peaking sooner rather than later, allowing the Fed to pivot, thus leading to a soft landing. On the other hand, we have an aggressive Fed targeting inflation, leading to a more prolonged downturn (hard landing). The market opinion is well divided on these bifurcated possibilities—hence the excessive volatility. Stocks have seemingly priced in a lot of negative news, and investor sentiment recently hit a thirty-year low. The current S&P 500’s forward price to earnings valuation multiple1 is down to 17.7 times earnings, versus more than 20 times at the end of the first quarter. Meanwhile, consensus estimates1 for S&P 500 earnings in 2022 are still anticipated to increase more than 7% since 2021, which is above trend. In our view, this continued rise in earnings would be partly driven by ongoing demand and productivity initiatives (e.g., embracing digitization and new technologies to do more with less) as non-farm payrolls are still below pre-pandemic levels. We continue to be emboldened that our philosophies around “taking the long-term view” and being “reasonable optimists” will produce sound decision-making and reasonable investment results.
Sincerely,
Charles Kantor and Marc Regenbaum
Portfolio Managers
Portfolio Managers
* As previously disclosed in a supplement to the Fund’s prospectus, effective September 30, 2022, the name of Neuberger Berman Guardian Fund changed to Neuberger Berman Large Cap Growth Fund.
** Fanatics Holdings, Inc. is a private company. Investments in private companies involve greater risks than investments in securities of companies that have traded publicly on an exchange for extended periods of time. Investments in private companies are generally less liquid than investments in securities issued by public companies and may be difficult for the Fund to value.
41
1 Forward earnings estimates are based on consensus estimates, not Neuberger Berman’s own projections, and the forecasts may or may not be realized. By quoting them herein, Neuberger Berman does not offer an opinion as to the accuracy of, and does not guarantee, these forecasted numbers.
Information about principal risks of investing in the Fund is set forth in the prospectus and statement of additional information.
The portfolio composition, industries and holdings of the Fund are subject to change without notice.
The opinions expressed are those of the Fund’s portfolio managers. The opinions are as of the date of this report and are subject to change without notice.
42
Large Cap Growth Fund (Unaudited)
TICKER SYMBOLS | |
Investor Class | NGUAX |
Trust Class | NBGTX |
Advisor Class | NBGUX |
Institutional Class | NGDLX |
Class A | NGDAX |
Class C | NGDCX |
Class R3 | NGDRX |
Class R6 | NGRDX |
SECTOR ALLOCATION | |
(as a % of Total Investments*) | |
Communication Services | 10.3% |
Consumer Discretionary | 18.6 |
Consumer Staples | 4.3 |
Energy | 1.4 |
Financials | 8.2 |
Health Care | 8.3 |
Industrials | 5.8 |
Information Technology | 34.5 |
Materials | 0.8 |
Real Estate | 1.5 |
Utilities | 1.9 |
Short-Term Investments | 4.4 |
Total | 100.0% |
* | Derivatives (other than options purchased), if any, are excluded from this chart. |
PERFORMANCE HIGHLIGHTS11 | |||||
Inception Date | Average Annual Total Return Ended 08/31/2022 | ||||
1 Year | 5 Years | 10 Years | Life of Fund | ||
At NAV | |||||
Investor Class | 06/01/1950 | -17.16% | 14.08% | 13.56% | 11.27% |
Trust Class3 | 08/03/1993 | -17.31% | 13.87% | 13.36% | 11.21% |
Advisor Class4 | 09/03/1996 | -17.45% | 13.57% | 13.04% | 11.06% |
Institutional Class5 | 05/27/2009 | -17.06% | 14.27% | 13.76% | 11.30% |
Class A19 | 05/27/2009 | -17.33% | 13.84% | 13.34% | 11.23% |
Class C19 | 05/27/2009 | -17.97% | 12.99% | 12.49% | 11.08% |
Class R316 | 05/27/2009 | -17.60% | 13.50% | 13.01% | 11.17% |
Class R622 | 03/29/2019 | -17.01% | 14.22% | 13.64% | 11.28% |
With Sales Charge | |||||
Class A19 | -22.10% | 12.49% | 12.67% | 11.14% | |
Class C19 | -18.71% | 12.99% | 12.49% | 11.08% | |
Index | |||||
Russell 1000®Growth Index*1,15 | -19.06% | 14.78% | 15.09% | N/A | |
S&P 500® Index1,15 | -11.23% | 11.82% | 13.08% | 11.18% | |
*Effective September 30, 2022, the Fund began comparing its performance to the Russell 1000® Growth Index rather than the S&P 500® Index because the Russell 1000 Growth Index has characteristics that are more representative of the Fund’s investment strategy than its former index, the S&P 500 Index.
The performance data quoted represent past performance and do not indicate future results. Current performance may be lower or higher than the performance data quoted. For current performance data, including current to the most recent month-end, please visit www.nb.com/performance.
The results shown in the table reflect the reinvestment of income dividends and other distributions, if any. The results do not reflect the effect of taxes a shareholder would pay on Fund distributions or on the redemption of Fund shares.
The investment return and principal value of an investment will fluctuate and shares, when redeemed, may be worth more or less than their original cost.
Returns would have been lower if Neuberger Berman Investment Advisers LLC (“NBIA”) had not reimbursed certain expenses and/or waived a portion of the investment management fees during certain of the periods shown. Repayment by a class (of expenses previously reimbursed and/or fees previously waived by NBIA) will decrease the class’s returns. Please see Note B in the Notes to Financial Statements for specific information regarding expense reimbursement and/or fee waiver arrangements.
As stated in the Fund’s most recent prospectus, the total annual operating expense ratios for fiscal year 2021 were 0.82%, 1.03%, 1.19%, 0.67%, 1.05%, 1.80%, 1.38% and 0.68% for Investor Class, Trust Class, Advisor Class, Institutional Class, Class A, Class C, Class R3 and Class R6 shares, respectively (before expense reimbursements and/or fee waivers, if any). The expense ratios were 1.37 and 0.66% for Class R3 and Class R6 shares, respectively, after expense reimbursements and/or fee waivers. The expense ratios for the annual period ended August 31, 2022, can be found in the Financial Highlights section of this report.
Returns shown with a sales charge reflect the deduction of the current maximum initial sales charge of 5.75% for Class A shares and the contingent deferred sales charge (CDSC) for Class C shares. The CDSC for Class C shares is 1.00%, which is reduced to 0% after 1 year. The performance of the Fund’s share classes will differ primarily due to different sales charge structures and class expenses. Please see the prospectus for more information about sales charge structures, if any, and class expenses for your share class.
43
Large Cap Growth Fund (Unaudited)
COMPARISON OF A $10,000 INVESTMENT

This graph shows the change in value of a hypothetical $10,000 investment in the Fund over the past 10 fiscal years, or since the Fund’s inception if it has not operated for 10 years. The graph is based on the Investor Class shares only; the performance of the Fund’s share classes will differ primarily due to different sales charge structures and class expenses (see Performance Highlights chart on previous page). The result is compared with benchmarks, which include a broad-based market index and may include a more narrowly based index. Market indices have not been reduced to reflect any of the fees and costs of investing. The results shown in the graph reflect the reinvestment of income dividends and other distributions, if any. The results do not reflect the effect of taxes a shareholder would pay on Fund distributions or on the redemption of Fund shares. Results represent past performance and do not indicate future results.
* Effective September 30, 2022, the Fund began comparing its performance to the Russell 1000® Growth Index rather than the S&P 500® Index because the Russell 1000 Growth Index has characteristics that are more representative of the Fund’s investment strategy than its former index, the S&P 500 Index.
44
Large Cap Value Fund Commentary (Unaudited)
Neuberger Berman Large Cap Value Fund Investor Class generated a -4.38% total return for the fiscal year ended August 31, 2022 (the reporting period), outperforming the -6.23% total return of its benchmark, the Russell 1000® Value Index (the Index). (Performance for all share classes is provided in the table immediately following this letter.)
The U.S. equity market generated weak results during the reporting period. While the market rallied several times, it was not enough to offset a number of sharp downturns. Investor sentiment was challenged by elevated inflation and aggressive U.S. Federal Reserve Board rate hikes that negatively impacted and could continue to negatively impact the economy and corporate profits. Supply chain shortages, repercussions from the war in Ukraine, and other geopolitical issues also weighed on the market. Meanwhile, large-cap value stocks, as measured by the Index, returned -6.23% over the period. These stocks significantly outperformed the Russell 1000® Growth Index, which returned -19.06%.
The Fund outperformed its Index during the reporting period, driven by sector allocation. In contrast, stock selection was a headwind for returns. From a sector allocation perspective, underweights to Communication Services and Information Technology versus the Index, along with an overweight to Energy on average during the period, added meaningful value to relative results. This was only modestly offset by an underweight to the Health Care sector during the reporting period.
In terms of stock selection, holdings in the Industrials and Consumer Discretionary sectors were the largest detractors from relative returns mostly related to travel and leisure holdings in those two groups. Looking at individual stocks, these would include cruise line operators Royal Caribbean Group and Carnival Corporation, airlines Delta Air Lines and United Airlines and multinational conglomerate General Electric Company. Some positive offsets in stock selection came in the Energy and Financials sectors from large holdings in Exxon Mobil Corp. and Chevron Corp.
We consider ourselves to be in a very different world, one that has not been seen for decades—a world of inflation and de-globalization. The war in Ukraine amplified the threat of lower growth and energy prices stoked inflation further, leading to an unusual situation where, in our view, lower growth is unlikely to mean lower inflation and lower interest rates. As interest rates rise to stave off inflation, we believe that value remains a good place to be. In recent times we have been evaluating the implications of a weaker economy and becoming more cautious on our outlook, notably the shorter-term outlook implied by a weakening demand. As such, we have been assessing what is the appropriate risk for our holdings within the portfolio. We continue to monitor valuations and opportunities in the markets. The sectors we are currently seeing the most value in are defensive areas within Health Care, Utilities and Consumer Staples sectors. We believe market volatility will be heightened in this period and the movement between value and growth on any given day has already seen increased volatility year to date and we would expect that to continue.
Sincerely,
Eli M. Salzmann
Portfolio Manager
Portfolio Manager
Information about principal risks of investing in the Fund is set forth in the prospectus and statement of additional information.
The portfolio composition, industries and holdings of the Fund are subject to change without notice.
The opinions expressed are those of the Fund’s portfolio manager. The opinions are as of the date of this report and are subject to change without notice.
45
Large Cap Value Fund (Unaudited)
TICKER SYMBOLS | |
Investor Class | NPRTX |
Trust Class | NBPTX |
Advisor Class | NBPBX |
Institutional Class | NBPIX |
Class A | NPNAX |
Class C | NPNCX |
Class R3 | NPNRX |
Class R6 | NRLCX |
Class E | NPNEX |
SECTOR ALLOCATION | |
(as a % of Total Investments*) | |
Communication Services | 2.4% |
Consumer Discretionary | 1.8 |
Consumer Staples | 13.0 |
Energy | 7.8 |
Financials | 15.7 |
Health Care | 22.3 |
Industrials | 9.3 |
Materials | 8.2 |
Utilities | 11.6 |
Short-Term Investments | 7.9 |
Total | 100.0% |
* | Derivatives (other than options purchased), if any, are excluded from this chart. |
PERFORMANCE HIGHLIGHTS | |||||
Inception Date | Average Annual Total Return Ended 08/31/2022 | ||||
1 Year | 5 Years | 10 Years | Life of Fund | ||
At NAV | |||||
Investor Class | 01/20/19752 | -4.38% | 12.18% | 12.73% | 12.51% |
Trust Class3 | 08/30/1993 | -4.56% | 11.97% | 12.52% | 12.40% |
Advisor Class4 | 08/16/1996 | -4.70% | 11.81% | 12.35% | 12.27% |
Institutional Class5 | 06/07/2006 | -4.21% | 12.37% | 12.92% | 12.57% |
Class A19 | 06/21/2010 | -4.58% | 11.94% | 12.48% | 12.44% |
Class C19 | 06/21/2010 | -5.28% | 11.12% | 11.66% | 12.23% |
Class R316 | 06/21/2010 | -4.82% | 11.64% | 12.18% | 12.36% |
Class R622 | 01/18/2019 | -4.13% | 12.39% | 12.83% | 12.53% |
Class E24 | 01/11/2022 | -3.94% | 12.29% | 12.78% | 12.52% |
With Sales Charge | |||||
Class A19 | -10.07% | 10.61% | 11.82% | 12.30% | |
Class C19 | -6.18% | 11.12% | 11.66% | 12.23% | |
Index | |||||
Russell 1000® Value Index1,15 | -6.23% | 7.86% | 10.52% | N/A | |
The performance data quoted represent past performance and do not indicate future results. Current performance may be lower or higher than the performance data quoted. For current performance data, including current to the most recent month-end, please visit www.nb.com/performance.
The results shown in the table reflect the reinvestment of income dividends and other distributions, if any. The results do not reflect the effect of taxes a shareholder would pay on Fund distributions or on the redemption of Fund shares.
The investment return and principal value of an investment will fluctuate and shares, when redeemed, may be worth more or less than their original cost.
Returns would have been lower if Neuberger Berman Investment Advisers LLC (“NBIA”) had not reimbursed certain expenses and/or waived a portion of the investment management fees during certain of the periods shown. Repayment by a class (of expenses previously reimbursed and/or fees previously waived by NBIA) will decrease the class’s returns. Please see Note B in the Notes to Financial Statements for specific information regarding expense reimbursement and/or fee waiver arrangements.
As stated in the Fund’s most recent prospectus, the total annual operating expense ratios for fiscal year 2021 were 0.79%, 0.99%, 1.15%, 0.63%, 1.02%, 1.75%, 1.30% and 0.54% for Investor Class, Trust Class, Advisor Class, Institutional Class, Class A, Class C, Class R3 and Class R6 shares, respectively , and the estimated total annual operating expense ratio for fiscal year 2022 is 0.48% for Class E (before expense reimbursements and/or fee waivers, if any). The estimated expense ratio for fiscal year 2022 is 0.03% for Class E shares after expense reimbursements and/or fee waivers. The expense ratios for the annual period ended August 31, 2022, can be found in the Financial Highlights section of this report.
Returns shown with a sales charge reflect the deduction of the current maximum initial sales charge of 5.75% for Class A shares and the contingent deferred sales charge (CDSC) for Class C shares. The CDSC for Class C shares is 1.00%, which is reduced to 0% after 1 year. The performance of the Fund’s share classes will differ primarily due to different sales charge structures and class expenses. Please see the prospectus for more information about sales charge structures, if any, and class expenses for your share class.
46
Large Cap Value Fund (Unaudited)
COMPARISON OF A $10,000 INVESTMENT

This graph shows the change in value of a hypothetical $10,000 investment in the Fund over the past 10 fiscal years, or since the Fund’s inception if it has not operated for 10 years. The graph is based on the Investor Class shares only; the performance of the Fund’s share classes will differ primarily due to different sales charge structures and class expenses (see Performance Highlights chart on previous page). The result is compared with benchmarks, which include a broad-based market index and may include a more narrowly based index. Market indices have not been reduced to reflect any of the fees and costs of investing. The results shown in the graph reflect the reinvestment of income dividends and other distributions, if any. The results do not reflect the effect of taxes a shareholder would pay on Fund distributions or on the redemption of Fund shares. Results represent past performance and do not indicate future results.
47
Mid Cap Growth Fund Commentary (Unaudited)
Neuberger Berman Mid Cap Growth Fund Investor Class generated a -24.92% total return for the fiscal year ended August 31, 2022 (the reporting period), outpacing its benchmark, the Russell Midcap® Growth Index (the Index), which posted a -26.69% total return for the same period. (Performance for all share classes is provided in the table immediately following this letter.)
The reporting period was largely defined by persistent inflationary pressures, the geopolitical ramifications of Russia’s invasion of Ukraine, recessionary handwringing spurred by a hawkish U.S Federal Reserve Board (Fed) and shifting sentiment from an unsettled market recalibrating its focus, expectations, and risk tolerance. Digging deeper, the dynamic of strong demand significantly outpacing limited and constrained supply, be it raw materials, labor or finished products, served to boost inflation to a decades-high level and prod a hesitant Fed into meaningful action. While the Fed unquestionably embarked on an aggressive path to unwinding an era of overly accommodative policy and excess liquidity, its ability to foster demand destruction and quickly affect broad pricing relief was muted by continued healthy employment levels and robust wage growth. Additionally, those efforts were further hamstrung by vexing global events and continued supply chain disruptions out of their control. Inflation’s initial resistance to the Fed’s remedies further stoked fears that economic growth could be a casualty of prolonged aggressive monetary tightening. Against that fluid and challenging backdrop, the market generally proved to be more discriminating with respect to corporate execution, fundamentals, and forward guidance.
On a relative basis, positive stock selection within Industrials, Information Technology (IT), Consumer Staples and Consumer Discretionary and the additive effect of our underweight allocation to Communication Services versus the Index offset weakness across Health Care and Financials and the negative impact of our avoidance of Materials. At the industry-level, our overweight allocation to Semiconductors & Semiconductor Equipment was the leading contributor to relative performance as our holdings continued to execute and capitalize on robust demand that consistently outpaced available supply, while a mix of stock-specific issues and challenging market sentiment resulted in IT Services being the leading industry detractor. Drilling down to our holdings, Enphase Energy, which provides smart battery systems to pair with solar panels, was the leading contributor to performance as the company continued to exceed expectations throughout the period, while EPAM Systems, a provider of outsourced software product development and digital platform consulting services, with half their workforce based in the Ukraine and Russia, was negatively pressured by the market following Russia’s invasion and the escalation of hostilities. Given the lack of near-term visibility, we exited our position during the reporting period.
As we move forward, there are still likely more unknowns than knowns at a macro-economic and corporate fundamental level, which makes it challenging to handicap the exact path the Fed will be compelled to take and what the resulting near and long-term implications will be for the economy and the markets. Given that lack of clarity, we believe that an emphasis on active management, a more judicious approach to risk and reward within the portfolio and a bias towards higher qualitative characteristics, sustainable business models, balance sheet strength and managements capable of consistent execution will be key to navigating a market that will likely remain volatile in the months ahead. In closing, while market drawdowns of this magnitude are disheartening, we’re steadfast in our belief that they’re necessary for a healthy market and the eventual development of new opportunities.
Sincerely,
Kenneth J. Turek*, Chad Bruso and Trevor Moreno
Portfolio Co-Managers
Portfolio Co-Managers
* As previously disclosed in a supplement to the Fund's prospectus, Kenneth J. Turek has announced his decision to retire on or about January 31, 2023. Chad Bruso and Trevor Moreno will continue as co-Portfolio Managers of the Fund.
Information about principal risks of investing in the Fund is set forth in the prospectus and statement of additional information.
The portfolio composition, industries and holdings of the Fund are subject to change without notice.
The opinions expressed are those of the Fund’s portfolio managers. The opinions are as of the date of this report and are subject to change without notice.
48
Mid Cap Growth Fund (Unaudited)
TICKER SYMBOLS | |
Investor Class | NMANX |
Trust Class | NBMTX |
Advisor Class | NBMBX |
Institutional Class | NBMLX |
Class A | NMGAX |
Class C | NMGCX |
Class R3 | NMGRX |
Class R6 | NRMGX |
SECTOR ALLOCATION | |
(as a % of Total Investments*) | |
Consumer Discretionary | 13.6% |
Consumer Staples | 3.5 |
Energy | 4.9 |
Financials | 5.6 |
Health Care | 16.8 |
Industrials | 17.6 |
Information Technology | 35.5 |
Real Estate | 0.4 |
Short-Term Investments | 2.1 |
Total | 100.0% |
* | Derivatives (other than options purchased), if any, are excluded from this chart. |
PERFORMANCE HIGHLIGHTS7 | |||||
Inception Date | Average Annual Total Return Ended 08/31/2022 | ||||
1 Year | 5 Years | 10 Years | Life of Fund | ||
At NAV | |||||
Investor Class | 03/01/19792 | -24.92% | 10.53% | 11.18% | 11.56% |
Trust Class3 | 08/30/1993 | -24.98% | 10.45% | 11.11% | 11.48% |
Advisor Class4 | 09/03/1996 | -25.19% | 10.17% | 10.82% | 11.26% |
Institutional Class5 | 04/19/2007 | -24.81% | 10.73% | 11.39% | 11.66% |
Class A19 | 05/27/2009 | -25.08% | 10.32% | 10.98% | 11.51% |
Class C19 | 05/27/2009 | -25.67% | 9.49% | 10.15% | 11.26% |
Class R316 | 05/27/2009 | -25.25% | 10.03% | 10.70% | 11.42% |
Class R622 | 03/15/2013 | -24.71% | 10.83% | 11.47% | 11.63% |
With Sales Charge | |||||
Class A19 | -29.39% | 9.03% | 10.33% | 11.36% | |
Class C19 | -26.30% | 9.49% | 10.15% | 11.26% | |
Index | |||||
Russell Midcap® Growth Index1, 15 | -26.69% | 10.16% | 12.06% | N/A | |
Russell Midcap® Index1, 15 | -14.82% | 9.17% | 11.61% | 12.78% | |
The performance data quoted represent past performance and do not indicate future results. Current performance may be lower or higher than the performance data quoted. For current performance data, including current to the most recent month-end, please visit www.nb.com/performance.
The results shown in the table reflect the reinvestment of income dividends and other distributions, if any. The results do not reflect the effect of taxes a shareholder would pay on Fund distributions or on the redemption of Fund shares.
The investment return and principal value of an investment will fluctuate and shares, when redeemed, may be worth more or less than their original cost.
Returns would have been lower if Neuberger Berman Investment Advisers LLC (“NBIA”) had not reimbursed certain expenses and/or waived a portion of the investment management fees during certain of the periods shown. Repayment by a class (of expenses previously reimbursed and/or fees previously waived by NBIA) will decrease the class’s returns. Please see Note B in the Notes to Financial Statements for specific information regarding expense reimbursement and/or fee waiver arrangements.
As stated in the Fund’s most recent prospectus, the total annual operating expense ratios for fiscal year 2021 were 0.83%, 0.92%, 1.18%, 0.67%, 1.04%, 1.79%, 1.29% and 0.57% for Investor Class, Trust Class, Advisor Class, Institutional Class, Class A, Class C, Class R3 and Class R6 shares, respectively (before expense reimbursements and/or fee waivers, if any). The expense ratios for the annual period ended August 31, 2022, can be found in the Financial Highlights section of this report.
Returns shown with a sales charge reflect the deduction of the current maximum initial sales charge of 5.75% for Class A shares and the contingent deferred sales charge (CDSC) for Class C shares. The CDSC for Class C shares is 1.00%, which is reduced to 0% after 1 year. The performance of the Fund’s share classes will differ primarily due to different sales charge structures and class expenses. Please see the prospectus for more information about sales charge structures, if any, and class expenses for your share class.
49
Mid Cap Growth Fund (Unaudited)
COMPARISON OF A $10,000 INVESTMENT
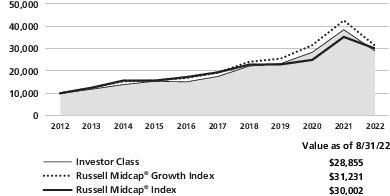
This graph shows the change in value of a hypothetical $10,000 investment in the Fund over the past 10 fiscal years, or since the Fund’s inception if it has not operated for 10 years. The graph is based on the Investor Class shares only; the performance of the Fund’s share classes will differ primarily due to different sales charge structures and class expenses (see Performance Highlights chart on previous page). The result is compared with benchmarks, which include a broad-based market index and may include a more narrowly based index. Market indices have not been reduced to reflect any of the fees and costs of investing. The results shown in the graph reflect the reinvestment of income dividends and other distributions, if any. The results do not reflect the effect of taxes a shareholder would pay on Fund distributions or on the redemption of Fund shares. Results represent past performance and do not indicate future results.
50
Mid Cap Intrinsic Value Fund Commentary (Unaudited)
Neuberger Berman Mid Cap Intrinsic Value Fund Investor Class generated a -3.67% total return for the fiscal year ended August 31, 2022 (the reporting period), outperforming its benchmark, the Russell Midcap® Value Index (the Index), which returned -7.80% for the same period. (Performance for all share classes is provided in the table immediately following this letter.)
2022 has been a uniquely challenging year. Stock market valuations have de-rated twice, initially on rising inflation and interest rates (impacting growth stocks), and now on the growing fear of an economic contraction (impacting value stocks). We weathered the initial rise in interest rates this year no worse than many investors and on a relative basis we outperformed the Index.
Since early 2021, our focus has been on the long-term opportunity and investments that have an attractive combination of valuation and growth potential. There was an ever-present possibility that higher inflation could prompt aggressive rate hikes by the U.S. Federal Reserve Board (Fed) and risk putting the economy into recession. Unfortunately, this has come to pass. Recent inflation data is unacceptably high; investors appear to have soured on the possibility of a “soft landing” for the economy and are now pricing in a recession.
How much inflation is out there and how aggressive does the Fed need to be, are questions that every investor is asking. Examining the recent performance of major commodities, commodity futures and commodity ETFs could help outline the inflation challenge and interest rate risks going forward. In almost every case, every commodity is down from its high. Short-term commodity price movements can be notoriously fickle and more noise than true signal; nevertheless, it’s not unreasonable to conclude commodity-driven inflation trends have peaked for the moment.
Wage growth and worker availability remain key focus points for the Fed in its quest to tame inflation. Hiring freezes and selective layoffs are increasingly in the news. Nevertheless, the most recent readings on job growth and unemployment claims demonstrate some level of labor market resiliency. Financial conditions are tightening as evidenced by growing credit spreads and the puncturing of speculative bubbles. Recent housing data on rents, a key component of inflationary measures, indicate a deceleration in the rate of increases.
In our view, some level of price stability is emerging. How much more tightening is required to get embedded inflation expectations to more acceptable levels is not clear. We fear that the Fed could get it wrong by being too tight on the way down, as we believe they were too loose on the way up.
Our Energy and Financials stocks performed well as oil prices and interest rates soared. The portfolio’s Information Technology stocks came under pressure due to the Tech sector sell-off. Strategic event activity in the portfolio has been robust; two companies agreed to be acquired and 14 others are either divesting significant assets or making synergistic acquisitions.
We introduced 12 new positions and added to 13 existing names while eliminating six and trimming 12 due to investment-based decisions. At the end of the reporting period, the portfolio’s discount to intrinsic value1 stood at approximately 30%.
Although this challenging period doesn’t come as a surprise, it remains challenging for investors. We have overcome trying markets before and take comfort in what the past may imply but do not take it for granted. Our focus and efforts will likely be on rebalancing our sector and company weightings and engaging with portfolio companies where we believe we can bring ideas and capital to the process of creating shareholder value.
Sincerely,
Michael C. Greene, Benjamin H. Nahum, James F. McAree, Amit Solomon and Rand W. Gesing
Portfolio Managers
Portfolio Managers
1 Intrinsic value reflects the portfolio management team’s analysis and estimates of a company’s value. There is no guarantee that any intrinsic values will be realized; security prices may decrease regardless of intrinsic values.
Information about principal risks of investing in the Fund is set forth in the prospectus and statement of additional information.
The portfolio composition, industries and holdings of the Fund are subject to change without notice.
The opinions expressed are those of the Fund’s portfolio managers. The opinions are as of the date of this report and are subject to change without notice.
51
Mid Cap Intrinsic Value Fund (Unaudited)
TICKER SYMBOLS | |
Investor Class | NBRVX |
Trust Class | NBREX |
Institutional Class | NBRTX |
Class A | NBRAX |
Class C | NBRCX |
Class R3 | NBRRX |
Class R6 | NBMRX |
SECTOR ALLOCATION | |
(as a % of Total Investments*) | |
Communication Services | 2.0% |
Consumer Discretionary | 11.3 |
Consumer Staples | 5.3 |
Energy | 12.8 |
Financials | 14.1 |
Health Care | 7.7 |
Industrials | 17.0 |
Information Technology | 13.2 |
Materials | 3.2 |
Real Estate | 2.8 |
Utilities | 10.5 |
Short-Term Investments | 0.1 |
Total | 100.0% |
* | Derivatives (other than options purchased), if any, are excluded from this chart. |
PERFORMANCE HIGHLIGHTS7 | |||||
Inception Date | Average Annual Total Return Ended 08/31/2022 | ||||
1 Year | 5 Years | 10 Years | Life of Fund | ||
At NAV | |||||
Investor Class | 06/01/1999 | -3.67% | 3.99% | 8.95% | 8.37% |
Trust Class3 | 06/10/1999 | -3.90% | 3.85% | 8.77% | 8.26% |
Institutional Class5 | 03/08/2010 | -3.55% | 4.24% | 9.20% | 8.52% |
Class A19 | 06/21/2010 | -3.88% | 3.87% | 8.80% | 8.31% |
Class C19 | 06/21/2010 | -4.63% | 3.09% | 7.99% | 7.89% |
Class R316 | 06/21/2010 | -4.11% | 3.61% | 8.54% | 8.17% |
Class R622 | 03/29/2019 | -3.42% | 4.21% | 9.06% | 8.42% |
With Sales Charge | |||||
Class A19 | -9.40% | 2.65% | 8.16% | 8.03% | |
Class C19 | -5.58% | 3.09% | 7.99% | 7.89% | |
Index | |||||
Russell Midcap® Value Index1,15 | -7.80% | 7.49% | 10.81% | 9.02% | |
Russell Midcap® Index1,15 | -14.82% | 9.17% | 11.61% | 9.02% | |
The performance data quoted represent past performance and do not indicate future results. Current performance may be lower or higher than the performance data quoted. For current performance data, including current to the most recent month-end, please visit www.nb.com/performance.
The results shown in the table reflect the reinvestment of income dividends and other distributions, if any. The results do not reflect the effect of taxes a shareholder would pay on Fund distributions or on the redemption of Fund shares.
The investment return and principal value of an investment will fluctuate and shares, when redeemed, may be worth more or less than their original cost.
Returns would have been lower if Neuberger Berman Investment Advisers LLC (“NBIA”) had not reimbursed certain expenses and/or waived a portion of the investment management fees during certain of the periods shown. Repayment by a class (of expenses previously reimbursed and/or fees previously waived by NBIA) will decrease the class’s returns. Please see Note B in the Notes to Financial Statements for specific information regarding expense reimbursement and/or fee waiver arrangements.
As stated in the Fund’s most recent prospectus, the total annual operating expense ratios for fiscal year 2021 were 1.49%, 1.69%, 1.32%, 1.73%, 2.47%, 1.98% and 1.73% for Investor Class, Trust Class, Institutional Class, Class A, Class C, Class R3 and Class R6 shares, respectively (before expense reimbursements and/or fee waivers, if any). The expense ratios were 1.26%, 0.86%, 1.22%, 1.97%, 1.47% and 0.76% for Trust Class, Institutional Class, Class A, Class C, Class R3 and Class R6 shares, respectively, after expense reimbursements and/or fee waivers. The expense ratios for the annual period ended August 31, 2022, can be found in the Financial Highlights section of this report.
Returns shown with a sales charge reflect the deduction of the current maximum initial sales charge of 5.75% for Class A shares and the contingent deferred sales charge (CDSC) for Class C shares. The CDSC for Class C shares is 1.00%, which is reduced to 0% after 1 year. The performance of the Fund’s share classes will differ primarily due to different sales charge structures and class expenses. Please see the prospectus for more information about sales charge structures, if any, and class expenses for your share class.
52
Mid Cap Intrinsic Value Fund (Unaudited)
COMPARISON OF A $10,000 INVESTMENT
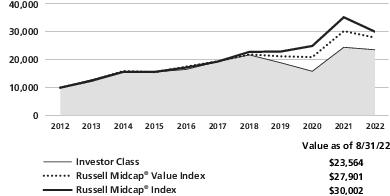
This graph shows the change in value of a hypothetical $10,000 investment in the Fund over the past 10 fiscal years, or since the Fund’s inception if it has not operated for 10 years. The graph is based on the Investor Class shares only; the performance of the Fund’s share classes will differ primarily due to different sales charge structures and class expenses (see Performance Highlights chart on previous page). The result is compared with benchmarks, which include a broad-based market index and may include a more narrowly based index. Market indices have not been reduced to reflect any of the fees and costs of investing. The results shown in the graph reflect the reinvestment of income dividends and other distributions, if any. The results do not reflect the effect of taxes a shareholder would pay on Fund distributions or on the redemption of Fund shares. Results represent past performance and do not indicate future results.
53
Multi-Cap Opportunities Fund Commentary (Unaudited)
Neuberger Berman Multi-Cap Opportunities Fund Institutional Class generated a -14.66% total return for the fiscal year ended August 31, 2022 (the reporting period), trailing the -11.23% total return of its benchmark, the S&P 500® Index (the Index) for the same period. (Performance for all share classes is provided in the table immediately following this letter.)
Investor sentiment for U.S. equities declined due to elevated inflation, higher interest rates, the conflict in Ukraine, and supply chain constraints. We continue to see differentiation within the market, which is creating opportunity. Throughout the second quarter of calendar year 2022 earnings season, we witnessed certain companies reduce earnings guidance and provide cautionary outlooks, while others demonstrated operational excellence, gained market share, and strengthened their underlying fundamentals. We believe this highlights the advantage of investing in companies with sound business models that we believe are well-positioned to respond to current challenges.
We believe companies within the portfolio are positioned to effectively respond to the challenges in the current environment. They are able to enhance earnings with company specific solutions such as deploying free cash flow, utilizing pricing power, proactively managing their supply chains, and implementing cost actions. Understanding how companies navigate evolving market dynamics provides our team the opportunity to identify investments with superior long-term upside.
Strong stock selection within the Communication Services, Consumer Discretionary, and Financials sectors benefitted relative performance. Relative performance was impacted by portfolio positioning, primarily due to having no exposure to the Energy sector. An overweight versus the Index to Communication Services and an underweight to Utilities also detracted. The Fund benefitted from an underweight position to the Information Technology (IT) sector. The Fund ended the reporting period with overweight positions in Financials, Industrials, and Materials, underweight positions to Health Care and IT, and no exposure to Energy or Real Estate.
Portfolio construction is an important component of our investment process and consists of three distinct investment categories: Special Situations, Opportunistic, and Classic. Special Situations have unique attributes that require specific valuation methodologies and customized investment research. Opportunistic investments have become inexpensive for a tangible reason that we believe is temporary. Classic investments have long histories of shareholder friendly policies, high quality management teams and exceptional operating performance. We believe maintaining a balance of these three categories helps to mitigate risk within the portfolio.
We apply our disciplined fundamental research to identify high quality business models with attractive free cash flow characteristics trading at compelling valuations. Select businesses are differentiating themselves with company-specific solutions in response to supply-chain constraints, inflationary pressures, and higher interest rates. The depth of our “Storehouse of Knowledge” remains robust. We believe the Fund is well positioned to benefit from an increasing investor focus on company fundamentals. Looking forward, there is the potential for clarity on the trajectory of interest rates, inflation, trends in the U.S. labor market, and the outcome of the U.S. mid-term elections. This removal of uncertainty, combined with a more favorable equity valuation environment presents opportunity.
Our style of investing is based on rigorous fundamental research centered on a company’s business model and ability to generate and effectively utilize free cash flow. As we evaluate potential new positions and current portfolio holdings, we continue to do so with a long-term investment perspective. Our focus is to grow the Fund’s assets through the disciplined application of our investment philosophy and process.
Sincerely,
Richard S. Nackenson
Portfolio Manager
Portfolio Manager
Information about principal risks of investing in the Fund is set forth in the prospectus and statement of additional information.
The portfolio composition, industries and holdings of the Fund are subject to change without notice.
The opinions expressed are those of the Fund’s portfolio manager. The opinions are as of the date of this report and are subject to change without notice.
54
Multi-Cap Opportunities Fund (Unaudited)
TICKER SYMBOLS | |
Institutional Class | NMULX |
Class A | NMUAX |
Class C | NMUCX |
Class E | NMUEX |
SECTOR ALLOCATION | |
(as a % of Total Investments*) | |
Communication Services | 8.6% |
Consumer Discretionary | 14.9 |
Consumer Staples | 8.1 |
Financials | 20.3 |
Health Care | 7.4 |
Industrials | 13.3 |
Information Technology | 17.6 |
Materials | 8.5 |
Utilities | 1.3 |
Total | 100.0% |
* | Derivatives (other than options purchased), if any, are excluded from this chart. |
PERFORMANCE HIGHLIGHTS | |||||
Inception Date* | Average Annual Total Return Ended 08/31/2022 | ||||
1 Year | 5 Years | 10 Years | Life of Fund | ||
At NAV | |||||
Institutional Class17 | 12/21/2009 | -14.66% | 9.46% | 12.29% | 8.92% |
Class A17 | 12/21/2009 | -14.92% | 9.07% | 11.90% | 8.60% |
Class C17 | 12/21/2009 | -15.58% | 8.25% | 11.05% | 7.95% |
Class E17 | 01/11/2022 | -14.29% | 9.56% | 12.34% | 8.95% |
With Sales Charge | |||||
Class A17 | -19.80% | 7.78% | 11.24% | 8.20% | |
Class C17 | -16.21% | 8.25% | 11.05% | 7.95% | |
Index | |||||
S&P 500® Index1,15 | -11.23% | 11.82% | 13.08% | 9.12% | |
*Prior to December 14, 2009, the Fund had different investment goals, strategies, and portfolio management team. The performance data for each class includes the performance of the Fund’s oldest share class, Trust Class, from November 2, 2006 through December 21, 2009. The performance data for Class E also includes the performance of the Fund's Institutional Class from December 21, 2009 through January 11, 2022. See endnote 17 for information about the effects of the different fees paid by each class.
The performance data quoted represent past performance and do not indicate future results. Current performance may be lower or higher than the performance data quoted. For current performance data, including current to the most recent month-end, please visit www.nb.com/performance.
The results shown in the table reflect the reinvestment of income dividends and other distributions, if any. The results do not reflect the effect of taxes a shareholder would pay on Fund distributions or on the redemption of Fund shares.
The investment return and principal value of an investment will fluctuate and shares, when redeemed, may be worth more or less than their original cost.
Returns would have been lower if Neuberger Berman Investment Advisers LLC (“NBIA”) had not reimbursed certain expenses and/or waived a portion of the investment management fees during certain of the periods shown. Repayment by a class (of expenses previously reimbursed and/or fees previously waived by NBIA) will decrease the class’s returns. Please see Note B in the Notes to Financial Statements for specific information regarding expense reimbursement and/or fee waiver arrangements.
As stated in the Fund’s most recent prospectus, the total annual operating expense ratios for fiscal year 2021 were 0.82%, 1.19% and 1.93% for Institutional Class, Class A and Class C shares, respectively, and the estimated total annual operating expense ratio for fiscal year 2022 is 0.65% for Class E (before expense reimbursements and/or fee waivers, if any). The estimated expense ratio for fiscal year 2022 is 0.07% for Class E after expense reimbursements and/or fee waivers. The expense ratios for the annual period ended August 31, 2022, can be found in the Financial Highlights section of this report.
Returns shown with a sales charge reflect the deduction of the current maximum initial sales charge of 5.75% for Class A shares and the contingent deferred sales charge (CDSC) for Class C shares. The CDSC for Class C shares is 1.00%, which is reduced to 0% after 1 year. The performance of the Fund’s share classes will differ primarily due to different sales charge structures and class expenses. Please see the prospectus for more information about sales charge structures, if any, and class expenses for your share class.
55
Multi-Cap Opportunities Fund (Unaudited)
COMPARISON OF A $1,000,000 INVESTMENT
(000's omitted)
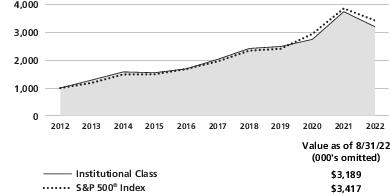
This graph shows the change in value of a hypothetical $1,000,000 investment in the Fund over the past 10 fiscal years, or since the Fund’s inception if it has not operated for 10 years. The graph is based on the Institutional Class shares only; the performance of the Fund’s share classes will differ primarily due to different sales charge structures and class expenses (see Performance Highlights chart on previous page). The result is compared with benchmarks, which include a broad-based market index and may include a more narrowly based index. Market indices have not been reduced to reflect any of the fees and costs of investing. The results shown in the graph reflect the reinvestment of income dividends and other distributions, if any. The results do not reflect the effect of taxes a shareholder would pay on Fund distributions or on the redemption of Fund shares. Results represent past performance and do not indicate future results.
56
Real Estate Fund Commentary (Unaudited)
Neuberger Berman Real Estate Fund Trust Class generated a -10.87% total return for the fiscal year ended August 31, 2022 (the reporting period), underperforming the -9.75% total return of its benchmark, the FTSE Nareit All Equity REITs Index (the Index), for the same period. (Performance for all share classes is provided in the table immediately following this letter.)
The U.S. equity market, as measured by the S&P 500® Index, generated weak results during the reporting period. While the market rallied several times, it was not enough to offset a number of sharp downturns. Investor sentiment was challenged by elevated inflation and aggressive U.S. Federal Reserve Board (Fed) rate hikes that have negatively impacted and could continue to negatively impact the economy and corporate profits. Supply chain shortages, repercussions from the war in Ukraine, and other geopolitical issues also weighed on the market. All told, the S&P 500 Index returned -11.23% during the reporting period. Comparatively, real estate investment trusts (REITs), as measured by the Index, experienced a smaller decline during the period.
The Fund modestly underperformed the Index on a relative basis during the reporting period. Sector positioning, overall, detracted from performance. In particular, the Fund’s overweight to Regional Malls versus the Index and an underweight to Specialty were among the largest negatives for relative returns. Conversely, an underweight to Office and an overweight to Self Storage were the most beneficial for relative performance.
Stock selection, overall, was additive to relative performance. Among those sectors contributing the most to relative results were Industrial, Specialty and Self Storage. In terms of individual holdings Duke Realty Corp., Public Storage and VICI Properties, Inc. were the most additive for returns. On the downside, holdings within the Health Care, Diversified and Apartment sectors were the largest detractors from excess performance. Several individual holdings were also negative for results, including Simon Property Group, Inc., Equinix, Inc. and American Tower Corp.
Looking ahead, we remain concerned about persistent inflation, slowing economic growth, and a likely hawkish stance by the Fed. Lower energy and commodity prices provide some support that inflation levels could be peaking. However, low unemployment levels may fuel continued wage pressure. Meanwhile, we believe real estate fundamentals remain solid for most property types. In addition, higher inflation can be viewed as positive for the owners of real estate assets, as landlords can capture higher inflation by raising the rents they charge tenants. As it relates to the possibility of a recession, these environments spare few asset classes and increased unemployment could lead to lower tenant demand for space. We believe REITs are better prepared for reduced business demand with stronger balance sheets, lower new construction activity and diverse demand drivers that lean more defensive sectors. We have increased our exposure to companies with secular demand drivers that we believe are better insulated to withstand market volatility, and that can grow cash flows well in excess of inflation. Meanwhile, we are monitoring the potential long-term effects of pandemic-driven changes on real estate. Shifts in preferences for working in an office versus at home or living in urban versus suburban markets could have lasting effects on preferred geographic markets, real estate cash flows, and asset values. We anticipate that over the long-term hybrid work arrangements are likely to temper overall demand for office space. Finally, we believe advancements in technology will lead to significant investments in network and infrastructure that benefit data center and infrastructure REITs.
Sincerely,
Steve Shigekawa and Brian C. Jones
Portfolio Co-Managers
Portfolio Co-Managers
Information about principal risks of investing in the Fund is set forth in the prospectus and statement of additional information.
The portfolio composition, industries and holdings of the Fund are subject to change without notice.
The opinions expressed are those of the Fund’s portfolio managers. The opinions are as of the date of this report and are subject to change without notice.
57
Real Estate Fund (Unaudited)
TICKER SYMBOLS | |
Trust Class | NBRFX |
Institutional Class | NBRIX |
Class A | NREAX |
Class C | NRECX |
Class R3 | NRERX |
Class R6 | NRREX |
Class E | NREEX |
SECTOR ALLOCATION | |
(as a % of Total Investments*) | |
Apartments | 10.6% |
Data Centers | 6.7 |
Diversified | 1.6 |
Free Standing | 4.0 |
Health Care | 9.2 |
Industrial | 12.2 |
Infrastructure | 18.9 |
Lodging/Resorts | 0.4 |
Manufactured Homes | 5.0 |
Office | 2.8 |
Regional Malls | 2.7 |
Self Storage | 9.1 |
Shopping Centers | 4.3 |
Single Family Homes | 3.7 |
Specialty | 5.3 |
Timber | 1.9 |
Short-Term Investments | 1.6 |
Total | 100.0% |
* | Derivatives (other than options purchased), if any, are excluded from this chart. |
PERFORMANCE HIGHLIGHTS7,20 | |||||
Inception Date | Average Annual Total Return Ended 08/31/2022 | ||||
1 Year | 5 Years | 10 Years | Life of Fund | ||
At NAV | |||||
Trust Class | 05/01/2002 | -10.87% | 7.84% | 7.91% | 10.42% |
Institutional Class6 | 06/04/2008 | -10.76% | 8.05% | 8.11% | 10.57% |
Class A14 | 06/21/2010 | -11.02% | 7.67% | 7.73% | 10.31% |
Class C14 | 06/21/2010 | -11.72% | 6.86% | 6.92% | 9.81% |
Class R314 | 06/21/2010 | -11.23% | 7.39% | 7.46% | 10.14% |
Class R623 | 03/15/2013 | -10.62% | 8.15% | 8.19% | 10.56% |
Class E26 | 01/11/2022 | -10.36% | 7.97% | 7.97% | 10.45% |
With Sales Charge | |||||
Class A14 | -16.12% | 6.41% | 7.09% | 9.99% | |
Class C14 | -12.57% | 6.86% | 6.92% | 9.81% | |
Index | |||||
FTSE Nareit All Equity REITs Index1,15 | -9.75% | 6.80% | 8.32% | 9.49% | |
The performance data quoted represent past performance and do not indicate future results. Current performance may be lower or higher than the performance data quoted. For current performance data, including current to the most recent month-end, please visit www.nb.com/performance.
The results shown in the table reflect the reinvestment of income dividends and other distributions, if any. The results do not reflect the effect of taxes a shareholder would pay on Fund distributions or on the redemption of Fund shares.
The investment return and principal value of an investment will fluctuate and shares, when redeemed, may be worth more or less than their original cost.
Returns would have been lower if Neuberger Berman Investment Advisers LLC (“NBIA”) had not reimbursed certain expenses and/or waived a portion of the investment management fees during certain of the periods shown. Repayment by a class (of expenses previously reimbursed and/or fees previously waived by NBIA) will decrease the class’s returns. Please see Note B in the Notes to Financial Statements for specific information regarding expense reimbursement and/or fee waiver arrangements.
As stated in the Fund’s most recent prospectus, the total annual operating expense ratios for fiscal year 2021 were 1.39%, 1.02%, 1.39%, 2.15%, 1.64% and 0.93% for Trust Class, Institutional Class, Class A, Class C, Class R3 and Class R6 shares, respectively, and the estimated total annual operating expense ratio for fiscal year 2022 is 0.88% for Class E (before expense reimbursements and/or fee waivers, if any). The expense ratios were 0.85%, 1.21%, 1.96%, 1.46% and 0.75% for Institutional Class, Class A, Class C, Class R3 and Class R6 shares, respectively, and the estimated expense ratio for fiscal year 2022 is 0.08% for Class E after expense reimbursements and/or fee waivers. The expense ratios for the annual period ended August 31, 2022, can be found in the Financial Highlights section of this report.
Returns shown with a sales charge reflect the deduction of the current maximum initial sales charge of 5.75% for Class A shares and the contingent deferred sales charge (CDSC) for Class C shares. The CDSC for Class C shares is 1.00%, which is reduced to 0% after 1 year. The performance of the Fund’s share classes will differ primarily due to different sales charge structures and class expenses. Please see the prospectus for more information about sales charge structures, if any, and class expenses for your share class.
58
Real Estate Fund (Unaudited)
COMPARISON OF A $10,000 INVESTMENT
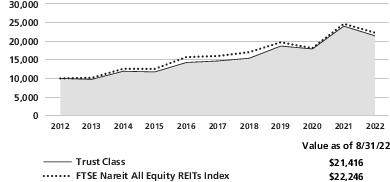
This graph shows the change in value of a hypothetical $10,000 investment in the Fund over the past 10 fiscal years, or since the Fund’s inception if it has not operated for 10 years. The graph is based on the Trust Class shares only; the performance of the Fund’s share classes will differ primarily due to different sales charge structures and class expenses (see Performance Highlights chart on previous page). The result is compared with benchmarks, which include a broad-based market index and may include a more narrowly based index. Market indices have not been reduced to reflect any of the fees and costs of investing. The results shown in the graph reflect the reinvestment of income dividends and other distributions, if any. The results do not reflect the effect of taxes a shareholder would pay on Fund distributions or on the redemption of Fund shares. Results represent past performance and do not indicate future results.
59
Small Cap Growth Fund Commentary (Unaudited)
Neuberger Berman Small Cap Growth Fund Investor Class posted a -19.94% total return for the fiscal year ended August 31, 2022 (the reporting period), outpacing its benchmark, the Russell 2000® Growth Index (the Index), which returned -25.26% for the same period. (Performance for all share classes is provided in the table immediately following this letter.)
The reporting period was largely defined by persistent inflationary pressures, the geopolitical ramifications of Russia’s invasion of Ukraine, recessionary handwringing spurred by a hawkish U.S. Federal Reserve Board (Fed) and shifting sentiment from an unsettled market recalibrating its focus, expectations and risk tolerance. Digging deeper, the dynamic of strong demand significantly outpacing limited and constrained supply, be it raw materials, labor or finished products, served to boost inflation to a decades-high level and prod a hesitant Fed into meaningful action. While the Fed unquestionably embarked on an aggressive path to unwinding an era of overly accommodative policy and excess liquidity, its ability to foster demand destruction and quickly affect broad pricing relief was muted by continued healthy employment levels and robust wage growth. Additionally, those efforts were further hamstrung by vexing global events and continued supply chain disruptions out of their control. Inflation’s initial resistance to the Fed’s remedies further stoked fears that economic growth could be a casualty of prolonged aggressive monetary tightening. Against that fluid and challenging backdrop, the market generally proved to be more discriminating with respect to corporate execution, fundamentals and forward guidance.
Our relative outperformance over the reporting period was driven by broad positive stock selection across the portfolio, led by our efforts in Health Care, Industrials, Materials, Financials, Consumer Discretionary, Financials and Energy. At the industry-level, strong stock selection within our overweight allocation versus the Index to Health Care Providers & Services resulted in that segment being the leading contributor to performance, while a mix of late-period stock-specific issues resulted in our overweight allocation to the Semiconductors & Semiconductor Equipment segment being the leading detractor. Drilling down to our holdings, Calix, Inc., a provider of broadband communications access systems and software that enables communications service providers to transform their networks and monetize customer data, was the leading contributor to performance as they consistently delivered strong results and raised their guidance throughout the period. The leading detractor was Ambarella, Inc., a provider of processors and software for video compression, image processing, and computer vision solutions, as the company sharply reduced their forward revenue guidance due to ongoing supply chain disruptions that were further amplified by rolling Covid lockdowns across China.
As we move forward, there are still likely more unknowns than knowns at a macro-economic and corporate fundamental level, which makes it challenging to handicap the exact path the Fed will be compelled to take and what the resulting near and long-term implications will be for the economy and the markets. Given that lack of clarity, we believe that an emphasis on active management, a more judicious approach to risk and reward within the portfolio and a bias towards higher qualitative characteristics, sustainable business models, balance sheet strength and managements capable of consistent execution will be key to navigating a market that will likely remain volatile in the months ahead. In closing, while market drawdowns of this magnitude are disheartening, we’re steadfast in our belief that they’re necessary for a healthy market and the eventual development of new opportunities.
Sincerely,
Kenneth J. Turek*, Chad Bruso and Trevor Moreno
Portfolio Co-Managers
Portfolio Co-Managers
* As previously disclosed in a supplement to the Fund's prospectus, Kenneth J. Turek has announced his decision to retire on or about January 31, 2023. Chad Bruso and Trevor Moreno will continue as co-Portfolio Managers of the Fund.
Information about principal risks of investing in the Fund is set forth in the prospectus and statement of additional information.
The portfolio composition, industries and holdings of the Fund are subject to change without notice.
The opinions expressed are those of the Fund’s portfolio managers. The opinions are as of the date of this report and are subject to change without notice.
60
Small Cap Growth Fund (Unaudited)
TICKER SYMBOLS | |
Investor Class | NBMIX |
Trust Class | NBMOX |
Advisor Class | NBMVX |
Institutional Class | NBSMX |
Class A | NSNAX |
Class C | NSNCX |
Class R3 | NSNRX |
Class R6 | NSRSX |
SECTOR ALLOCATION | |
(as a % of Total Investments*) | |
Communication Services | 1.8% |
Consumer Discretionary | 10.8 |
Consumer Staples | 4.7 |
Energy | 7.4 |
Financials | 6.2 |
Health Care | 23.5 |
Industrials | 18.5 |
Information Technology | 21.1 |
Materials | 3.3 |
Short-Term Investments | 2.7 |
Total | 100.0% |
* | Derivatives (other than options purchased), if any, are excluded from this chart. |
PERFORMANCE HIGHLIGHTS | |||||
Inception Date | Average Annual Total Return Ended 08/31/2022 | ||||
1 Year | 5 Years | 10 Years | Life of Fund | ||
At NAV | |||||
Investor Class | 10/20/1998 | -19.94% | 12.73% | 12.53% | 9.52% |
Trust Class3 | 11/03/1998 | -20.14% | 12.56% | 12.34% | 9.37% |
Advisor Class4 | 05/03/2002 | -20.26% | 12.38% | 12.18% | 9.25% |
Institutional Class5 | 04/01/2008 | -19.86% | 13.00% | 12.84% | 9.70% |
Class A19 | 05/27/2009 | -20.14% | 12.59% | 12.43% | 9.46% |
Class C19 | 05/27/2009 | -20.74% | 11.75% | 11.59% | 9.00% |
Class R316 | 05/27/2009 | -20.35% | 12.31% | 12.15% | 9.30% |
Class R622 | 09/07/2018 | -19.78% | 13.02% | 12.67% | 9.58% |
With Sales Charge | |||||
Class A19 | -24.73% | 11.26% | 11.77% | 9.19% | |
Class C19 | -21.40% | 11.75% | 11.59% | 9.00% | |
Index | |||||
Russell 2000® Growth Index1,15 | -25.26% | 6.69% | 10.16% | 7.65% | |
Russell 2000® Index1,15 | -17.88% | 6.95% | 10.01% | 8.60% | |
The performance data quoted represent past performance and do not indicate future results. Current performance may be lower or higher than the performance data quoted. For current performance data, including current to the most recent month-end, please visit www.nb.com/performance.
The results shown in the table reflect the reinvestment of income dividends and other distributions, if any. The results do not reflect the effect of taxes a shareholder would pay on Fund distributions or on the redemption of Fund shares.
The investment return and principal value of an investment will fluctuate and shares, when redeemed, may be worth more or less than their original cost.
Returns would have been lower if Neuberger Berman Investment Advisers LLC (“NBIA”) had not reimbursed certain expenses and/or waived a portion of the investment management fees during certain of the periods shown. Repayment by a class (of expenses previously reimbursed and/or fees previously waived by NBIA) will decrease the class’s returns. Please see Note B in the Notes to Financial Statements for specific information regarding expense reimbursement and/or fee waiver arrangements.
As stated in the Fund’s most recent prospectus, the total annual operating expense ratios for fiscal year 2021 were 1.28%, 1.47%, 1.63%, 1.10%, 1.50%, 2.21%, 1.74% and 1.09% for Investor Class, Trust Class, Advisor Class, Institutional Class, Class A, Class C, Class R3 and Class R6 shares, respectively (before expense reimbursements and/or fee waivers, if any). The expense ratios were 1.41%, 1.61%, 0.91%, 1.27%, 2.02%, 1.52% and 0.81% for Trust Class, Advisor Class, Institutional Class, Class A, Class C, Class R3 and Class R6 shares, respectively, after expense reimbursements and/or fee waivers. The expense ratios for the annual period ended August 31, 2022, can be found in the Financial Highlights section of this report.
Returns shown with a sales charge reflect the deduction of the current maximum initial sales charge of 5.75% for Class A shares and the contingent deferred sales charge (CDSC) for Class C shares. The CDSC for Class C shares is 1.00%, which is reduced to 0% after 1 year. The performance of the Fund’s share classes will differ primarily due to different sales charge structures and class expenses. Please see the prospectus for more information about sales charge structures, if any, and class expenses for your share class.
61
Small Cap Growth Fund (Unaudited)
COMPARISON OF A $10,000 INVESTMENT
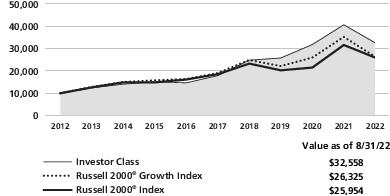
This graph shows the change in value of a hypothetical $10,000 investment in the Fund over the past 10 fiscal years, or since the Fund’s inception if it has not operated for 10 years. The graph is based on the Investor Class shares only; the performance of the Fund’s share classes will differ primarily due to different sales charge structures and class expenses (see Performance Highlights chart on previous page). The result is compared with benchmarks, which include a broad-based market index and may include a more narrowly based index. Market indices have not been reduced to reflect any of the fees and costs of investing. The results shown in the graph reflect the reinvestment of income dividends and other distributions, if any. The results do not reflect the effect of taxes a shareholder would pay on Fund distributions or on the redemption of Fund shares. Results represent past performance and do not indicate future results.
62
Sustainable Equity Fund Commentary (Unaudited)
Neuberger Berman Sustainable Equity Fund Investor Class reported a total return of -13.70% for the fiscal year ended August 31, 2022 (the reporting period), trailing the -11.23% total return of its benchmark, the S&P 500® Index (the Index) for the same period. (Performance for all share classes is provided in the table immediately following this letter.)
Global central bank stimulus supercharged the economy from March 2020 through the depths of the pandemic, resulting in increased risk taking. Some froth has come out of the market more recently as speculative sentiment is finally being reigned in.
Equity markets were volatile throughout the reporting period but began declining in January further added to concern that the U.S. Federal Reserve Board’s (Fed) aggressive rate hikes, aimed at controlling inflation, increased the potential for a recession. Sporadic Covid eruptions and persistent supply chain disruptions, along with the Russia/Ukraine war—especially as Europe approaches heating season—added to concerns.
Markets and the economy are cyclical, however, and sentiment shifts. So, for long-term fundamental investors, the current environment creates opportunity. We’ve been pleased with our portfolio companies’ performance and have acted quickly when high quality names have been sold off by the market indiscriminately.
Although we lagged the Index, stock selection added relative value this year, with certain Health Care, Financials and Information Technology holdings outperforming the most. Insurers Cigna Corp. and Progressive Corp. were top contributors. Both delivered solid results and we believe are well positioned within an inflationary environment.
Our relative underperformance derived primarily from our zero weighting to traditional Energy, a sector that dramatically outperformed as macro factors pushed commodity prices higher. Our Industrials holdings also lagged.
Detractors included Comcast Corp., which declined as new broadband subscriptions slowed following the early pandemic’s subscriptions surge, and Warner Brothers Discovery, Inc., which we sold during the reporting period. The stock declined following its merger, and on negative sentiment about its streaming services.
During the reporting period, we also sold Unilever PLC, Regeneron Pharmaceuticals, Inc. and ANSYS, Inc. to fund opportunities elsewhere; and Starbucks Corp. given governance concerns. We purchased Costco Wholesale Corp. on strong labor relations, long-term growth prospects, and a scale advantage that helps manage price inflation. We also bought Apple, Inc., Bank of America Corp., Amazon.com, Inc. and Berkshire Hathaway, Inc. on opportunistic valuation, compelling risk-reward profiles and leadership in management integrity and sustainability business practices material to each firm’s leading customer franchise. And lastly, we received shares of Embecta Corp., a spin-off from existing portfolio holding Becton, Dickinson & Co.
We anticipate continued market volatility in the near term, given current inflationary, global growth, and geopolitical concerns. The Fed’s hawkish stance, accelerating quantitative tightening, could increase the risk of a slowdown or recession, and high inflation along with uncertainty could hurt consumer/business confidence and adversely impact economic growth.
We anticipate equity returns will be driven by earnings growth rather than multiple expansion as higher interest rates and monetary tightening could potentially result in higher real rates.1 In our view, well-run companies with strong fundamentals should have relatively stronger earnings growth and thus outperform.
As a core all-weather strategy, we seek high quality businesses we can own through market cycles at reasonable prices. Given our long-term, pragmatic, fundamentals-focused discipline, we continue to focus on long-term secular growth, high return on investment capital, Environmental, Social and Governance (ESG) leadership and financial strength.
63
As always, we use our core commitment to sustainability and ESG as a lens for quality. We view the ability to help solve sustainability challenges—such as access to healthcare, digital transformation, enhanced efficiency, automation, greening of the economy, grid decarbonization and transition—as drivers of secular growth potential, and believe our long-term approach to identifying businesses with solid growth prospects at undemanding valuations, and ESG leadership, positions the Fund well going forward.
We look forward to continuing to serve your investment needs.
Sincerely,
Daniel P. Hanson*
Portfolio Manager
Portfolio Manager
1 A real interest rate is an interest rate that has been adjusted to remove the effects of inflation. Once adjusted, it reflects the real cost of funds to a borrower and the real yield to a lender or to an investor.
* As previously disclosed in a supplement to the Fund’s prospectus, Ingrid S. Dyott and Sajjad S. Ladiwala ceased their portfolio management responsibilities on March 31, 2022. Daniel P. Hanson became Senior Portfolio Manager of the Fund effective April 1, 2022.
Information about principal risks of investing in the Fund is set forth in the prospectus and statement of additional information.
The portfolio composition, industries and holdings of the Fund are subject to change without notice.
The opinions expressed are those of the Fund’s portfolio manager. The opinions are as of the date of this report and are subject to change without notice.
64
Sustainable Equity Fund (Unaudited)
TICKER SYMBOLS | |
Investor Class | NBSRX |
Trust Class | NBSTX |
Institutional Class | NBSLX |
Class A | NRAAX |
Class C | NRACX |
Class R3 | NRARX |
Class R6 | NRSRX |
SECTOR ALLOCATION | |
(as a % of Total Investments*) | |
Communication Services | 6.6% |
Consumer Discretionary | 9.1 |
Consumer Staples | 5.3 |
Financials | 12.0 |
Health Care | 18.3 |
Industrials | 14.0 |
Information Technology | 30.5 |
Materials | 1.8 |
Utilities | 2.0 |
Short-Term Investments | 0.4 |
Total | 100.0% |
* | Derivatives (other than options purchased), if any, are excluded from this chart. |
PERFORMANCE HIGHLIGHTS7 | |||||
Inception Date | Average Annual Total Return Ended 08/31/2022 | ||||
1 Year | 5 Years | 10 Years | Life of Fund | ||
At NAV | |||||
Investor Class | 03/16/1994 | -13.70% | 9.18% | 11.41% | 9.22% |
Trust Class3 | 03/03/1997 | -13.85% | 9.00% | 11.22% | 9.05% |
Institutional Class5 | 11/28/2007 | -13.55% | 9.38% | 11.62% | 9.32% |
Class A19 | 05/27/2009 | -13.86% | 8.98% | 11.20% | 9.13% |
Class C19 | 05/27/2009 | -14.49% | 8.17% | 10.37% | 8.75% |
Class R316 | 05/27/2009 | -14.08% | 8.71% | 10.93% | 9.00% |
Class R622 | 03/15/2013 | -13.47% | 9.48% | 11.69% | 9.32% |
With Sales Charge | |||||
Class A19 | -18.81% | 7.70% | 10.54% | 8.90% | |
Class C19 | -15.27% | 8.17% | 10.37% | 8.75% | |
Index | |||||
S&P 500® Index1,15 | -11.23% | 11.82% | 13.08% | 9.86% | |
The performance data quoted represent past performance and do not indicate future results. Current performance may be lower or higher than the performance data quoted. For current performance data, including current to the most recent month-end, please visit www.nb.com/performance.
The results shown in the table reflect the reinvestment of income dividends and other distributions, if any. The results do not reflect the effect of taxes a shareholder would pay on Fund distributions or on the redemption of Fund shares.
The investment return and principal value of an investment will fluctuate and shares, when redeemed, may be worth more or less than their original cost.
Returns would have been lower if Neuberger Berman Investment Advisers LLC (“NBIA”) had not reimbursed certain expenses and/or waived a portion of the investment management fees during certain of the periods shown. Repayment by a class (of expenses previously reimbursed and/or fees previously waived by NBIA) will decrease the class’s returns. Please see Note B in the Notes to Financial Statements for specific information regarding expense reimbursement and/or fee waiver arrangements.
As stated in the Fund’s most recent prospectus, the total annual operating expense ratios for fiscal year 2021 were 0.85%, 1.02%, 0.67%, 1.04%, 1.79%, 1.29% and 0.57% for Investor Class, Trust Class, Institutional Class, Class A, Class C, Class R3 and Class R6 shares, respectively (before expense reimbursements and/or fee waivers, if any). The expense ratios for the annual period ended August 31, 2022, can be found in the Financial Highlights section of this report.
Returns shown with a sales charge reflect the deduction of the current maximum initial sales charge of 5.75% for Class A shares and the contingent deferred sales charge (CDSC) for Class C shares. The CDSC for Class C shares is 1.00%, which is reduced to 0% after 1 year. The performance of the Fund’s share classes will differ primarily due to different sales charge structures and class expenses. Please see the prospectus for more information about sales charge structures, if any, and class expenses for your share class.
65
Sustainable Equity Fund (Unaudited)
COMPARISON OF A $10,000 INVESTMENT

This graph shows the change in value of a hypothetical $10,000 investment in the Fund over the past 10 fiscal years, or since the Fund’s inception if it has not operated for 10 years. The graph is based on the Investor Class shares only; the performance of the Fund’s share classes will differ primarily due to different sales charge structures and class expenses (see Performance Highlights chart on previous page). The result is compared with benchmarks, which include a broad-based market index and may include a more narrowly based index. Market indices have not been reduced to reflect any of the fees and costs of investing. The results shown in the graph reflect the reinvestment of income dividends and other distributions, if any. The results do not reflect the effect of taxes a shareholder would pay on Fund distributions or on the redemption of Fund shares. Results represent past performance and do not indicate future results.
66
U.S. Equity Impact Fund Commentary (Unaudited)
The Neuberger Berman U.S. Equity Impact Fund Institutional Class generated a -21.95% total return for the fiscal year ended August 31, 2022 (the reporting period) trailing the -13.28% total return of its benchmark, the Russell 3000® Index (the Index) for the same period. (Performance for all share classes is provided in the table immediately following this letter.)
Risk-off sentiment due to elevated inflation, higher interest rates, the conflict in Ukraine, and supply chain constraints resulted in a decline of the U.S. equity market for the reporting period. The U.S. Federal Open Market Committee has taken action to address inflation by implementing multiple interest rate increases in 2022. Investors have weighed the prospect of decelerating economic growth and recessionary headwinds and the corresponding implications on company fundamentals. Despite near-term challenges, we believe there remains a significant opportunity for companies whose products and services have the potential to generate incremental positive outcomes in lockstep with growing their profits.
The Fund benefitted from underweights versus the Index to Communication Services and Information Technology (IT), and overweight positions to Industrials and Utilities. The Fund’s zero exposure to the Energy sector detracted from relative performance. Certain types of energy and other companies are excluded from the Fund in accordance with the Fund’s Enhanced Sustainable Exclusion Policy. Combating climate change is a key Impact theme of our investment strategy, thus our portfolio construction incorporates the assessment of climate risks and seeks to reduce carbon emissions. Stock selection within the Consumer Discretionary, Industrials, and IT sectors also detracted from relative performance. Strong stock selection within the Health Care sector benefitted relative performance. The Fund ended the reporting period with overweight positions relative to the Index in the Health Care, Industrials, and Materials sectors and underweight positions in the Consumer Discretionary, Financials, and IT sectors. The Fund had no exposure to the Energy or Real Estate sectors at the end of the reporting period.
Impact investing1 offers the unique potential to support measurable progress against real-world environmental and social challenges while seeking market rate returns. This approach invests in companies with products or services that have the potential to deliver significantly positive outcomes for people and/or the planet, while reporting and measuring the tangible contributions that portfolio companies make. Our proprietary quantitative and qualitative impact analysis requires a deep understanding of the product outcomes for customers, which is a lens that adds insight to our fundamental investment process. Positive and negative impacts associated with the products and services of each major business line of a company are assessed.
A company’s contribution to specific positive outcomes is evaluated with reference to the United Nations Sustainable Development Goals (UNSDGs). We believe companies delivering solutions aligned with achieving the UNSDGs have the potential for outsized growth and returns as these UNSDG goals become spending priorities. We believe the potential for significant incremental capital deployed to achieve UNSDGs, along with an increasing investor focus on company fundamentals, is creating an attractive environment for the Fund.
We believe this is an exciting time for impact investing in public markets. We believe that the companies we seek to invest in will continue to benefit from secular demand growth for their products and services. We believe our rigorous, bottom-up analysis of business models and product outcomes will continue to help us identify the companies best positioned to benefit from these dynamics. This, combined with our focus on engagement to deliver real world outcomes, provides us with the opportunity to help investors achieve their impact and financial objectives.
Sincerely,
Richard S. Nackenson and Jonathan Bailey
Portfolio Managers
Portfolio Managers
1 Impact investing is the investment in a portfolio of companies whose products and services the portfolio managers believe have the potential to deliver positive social and environmental outcomes.
Information about principal risks of investing in the Fund is set forth in the prospectus and statement of additional information.
The portfolio composition, industries and holdings of the Fund are subject to change without notice.
The opinions expressed are those of the Fund’s portfolio managers. The opinions are as of the date of this report and are subject to change without notice.
67
U.S. Equity Impact Fund (Unaudited)
TICKER SYMBOLS | |
Institutional Class | NEQIX |
Class A | NEQAX |
Class C | NEQCX |
SECTOR ALLOCATION | |
(as a % of Total Investments*) | |
Communication Services | 1.7% |
Consumer Discretionary | 2.5 |
Consumer Staples | 5.5 |
Financials | 1.2 |
Health Care | 25.7 |
Industrials | 26.9 |
Information Technology | 14.6 |
Materials | 13.0 |
Utilities | 7.0 |
Short-Term Investments | 1.9 |
Total | 100.0% |
* | Derivatives (other than options purchased), if any, are excluded from this chart. |
PERFORMANCE HIGHLIGHTS | |||
Inception Date | Average Annual Total Return Ended 08/31/2022 | ||
1 Year | Life of Fund | ||
At NAV | |||
Institutional Class | 03/23/2021 | -21.95% | -8.05% |
Class A | 03/23/2021 | -22.28% | -8.43% |
Class C | 03/23/2021 | -22.80% | -9.08% |
With Sales Charge | |||
Class A | -26.74% | -12.11% | |
Class C | -23.58% | -9.08% | |
Index | |||
Russell 3000® Index1,15 | -13.28% | -0.98% | |
The performance data quoted represent past performance and do not indicate future results. Current performance may be lower or higher than the performance data quoted. For current performance data, including current to the most recent month-end, please visit www.nb.com/performance.
The results shown in the table reflect the reinvestment of income dividends and other distributions, if any. The results do not reflect the effect of taxes a shareholder would pay on Fund distributions or on the redemption of Fund shares.
The investment return and principal value of an investment will fluctuate and shares, when redeemed, may be worth more or less than their original cost.
Returns would have been lower if Neuberger Berman Investment Advisers LLC (“NBIA”) had not reimbursed certain expenses and/or waived a portion of the investment management fees during certain of the periods shown. Repayment by a class (of expenses previously reimbursed and/or fees previously waived by NBIA) will decrease the class’s returns. Please see Note B in the Notes to Financial Statements for specific information regarding expense reimbursement and/or fee waiver arrangements.
As stated in the Fund’s most recent prospectus, the estimated total annual operating expense ratios for fiscal year 2022 are 1.93%, 2.29% and 3.04% for Institutional Class, Class A and Class C shares, respectively (before expense reimbursements and/or fee waivers, if any). The estimated expense ratios for fiscal year 2022 are 0.90%, 1.26%, and 2.01% for Institutional Class, Class A and Class C shares, respectively, after expense reimbursements and/or fee waivers. The expense ratios for the annual period ended August 31, 2022, can be found in the Financial Highlights section of this report.
Returns shown with a sales charge reflect the deduction of the current maximum initial sales charge of 5.75% for Class A shares and the contingent deferred sales charge (CDSC) for Class C shares. The CDSC for Class C shares is 1.00%, which is reduced to 0% after 1 year. The performance of the Fund’s share classes will differ primarily due to different sales charge structures and class expenses. Please see the prospectus for more information about sales charge structures, if any, and class expenses for your share class.
68
U.S. Equity Impact Fund (Unaudited)
COMPARISON OF A $1,000,000 INVESTMENT
(000's omitted)
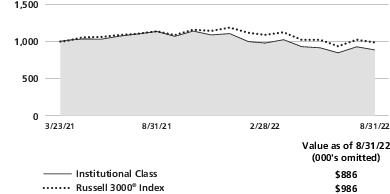
This graph shows the change in value of a hypothetical $1,000,000 investment in the Fund over the past 10 fiscal years, or since the Fund’s inception if it has not operated for 10 years. The graph is based on the Institutional Class shares only; the performance of the Fund’s share classes will differ primarily due to different sales charge structures and class expenses (see Performance Highlights chart on previous page). The result is compared with benchmarks, which include a broad-based market index and may include a more narrowly based index. Market indices have not been reduced to reflect any of the fees and costs of investing. The results shown in the graph reflect the reinvestment of income dividends and other distributions, if any. The results do not reflect the effect of taxes a shareholder would pay on Fund distributions or on the redemption of Fund shares. Results represent past performance and do not indicate future results.
69
Endnotes (Unaudited)
1 | Please see “Glossary of Indices” on page 74 for a description of indices. Please note that individuals cannot invest directly in any index. The indices described in this report do not take into account any fees, expenses or tax consequences of investing in the individual securities that they track. Data about the performance of an index are prepared or obtained by Neuberger Berman Investment Advisers LLC (“NBIA”) and reflect the reinvestment of income dividends and other distributions, if any. The Fund may invest in securities not included in a described index and generally does not invest in all securities included in a described index. |
2 | This date reflects when NBIA first became the investment manager to the Fund. |
3 | The performance information for the Trust Class prior to the class’s inception date is that of the Fund’s Investor Class. The performance information for the Investor Class has not been adjusted to take into account differences in class specific operating expenses. The Investor Class has lower expenses and typically higher returns than the Trust Class. |
4 | The performance information for the Advisor Class prior to the class’s inception date is that of the Fund’s Investor Class. The performance information for the Investor Class has not been adjusted to take into account differences in class specific operating expenses. The Investor Class has lower expenses and typically higher returns than the Advisor Class. |
5 | The performance information for the Institutional Class prior to the class’s inception date is that of the Fund’s Investor Class. The performance information for the Investor Class has not been adjusted to take into account differences in class specific operating expenses. The Investor Class has higher expenses and typically lower returns than the Institutional Class. |
6 | The performance information for the Institutional Class prior to the class’s inception date is that of the Fund’s Trust Class. The performance information for the Trust Class has not been adjusted to take into account differences in class specific operating expenses. The Trust Class has higher expenses and typically lower returns than the Institutional Class. |
7 | The investments for the Fund are managed by the same portfolio manager(s) who manage(s) one or more other registered funds that have names, investment objectives and investment styles that are similar to those of the Fund. You should be aware that the Fund is likely to differ from those other mutual fund(s) in size, cash flow pattern and tax matters. Accordingly, the holdings and performance of the Fund can be expected to vary from those of the other mutual fund(s). |
8 | The Fund had a policy of investing mainly in large-cap stocks prior to September 1998 and investing 90% of its assets in no more than six economic sectors prior to December 17, 2007. As of April 2, 2001, the Fund changed its investment policy to become “non-diversified” under the Investment Company Act of 1940 (“1940 Act”). Performance prior to these changes might have been different if current policies had been in effect. However, by operation of law under the 1940 Act, the Fund subsequently became, and currently operates as, a diversified fund. Please see the notes to the financial statements for information on a non-diversified fund becoming a diversified fund by operation of law. |
9 | Neuberger Berman Global Real Estate Fund and Neuberger Berman International Small Cap Fund are each relatively small. The same techniques used to produce returns in a small fund may not work to produce similar returns in a larger fund and could have an impact on performance. |
10 | The performance information for Class R3 prior to the class’s inception date is that of the Fund’s Institutional Class. The performance information for the Institutional Class has not been adjusted to take into account differences in class specific operating expenses (such as Rule 12b-1 fees). The Institutional Class has lower expenses and typically higher returns than Class R3. |
11 | The Fund had a policy of investing mainly in large-cap stocks prior to December 2002. Its performance prior to that date might have been different if current policies had been in effect. |
70
Endnotes (Unaudited) (cont’d)
12 | The performance information for Class A, Class C, Investor Class, and Trust Class prior to the classes’ inception date is that of the Fund’s Institutional Class. The performance information for the Institutional Class has been adjusted to reflect the appropriate sales charges applicable to Class A and Class C shares, but has not been adjusted to take into account differences in class specific operating expenses (such as Rule 12b-1 fees). The Institutional Class has lower expenses and typically higher returns than Class A, Class C, Investor Class, and Trust Class. |
13 | The performance information for Institutional Class, Class A, Class C, Class R3 and Class E prior to June 9, 2008 is that of the Fund’s Trust Class, which had an inception date of November 2, 2006, and converted into the Institutional Class on June 9, 2008. During the period from November 2, 2006 through June 9, 2008, the Trust Class had only one investor, which could have impacted Fund performance. The performance information for the Trust Class has been adjusted to reflect the appropriate sales charges applicable to Class A and Class C shares but has not been adjusted to take into account differences in class specific operating expenses (such as Rule 12b-1 fees). The Trust Class had higher expenses and typically lower returns than the Institutional Class and Class E. The Trust Class had lower expenses and typically higher returns than Class A, Class C and Class R3. The performance information for Class R3 and Class E from June 9, 2008, to the respective class’s inception date is that of the Fund’s Institutional Class. The performance information for the Institutional Class has not been adjusted to take into account differences in class specific operating expenses (such as Rule 12b-1 fees). The Institutional Class has lower expenses and typically higher returns than Class R3. The Institutional Class has higher expenses and typically lower returns than Class E. |
14 | The performance information for Class A, Class C and Class R3 prior to the classes’ respective inception dates is that of the Fund’s Trust Class. The performance information for the Trust Class has been adjusted to reflect the appropriate sales charges applicable to Class A and Class C shares, but has not been adjusted to take into account differences in class specific operating expenses (such as Rule 12b-1 fees). The Trust Class has lower expenses and typically higher returns than Class A, Class C and Class R3. |
15 | The date used to calculate Life of Fund performance for the index is the inception date of the oldest share class. |
16 | The performance information for Class R3 prior to the class’s inception date is that of the Fund’s Investor Class. The performance information for the Investor Class has not been adjusted to take into account differences in class specific operating expenses (such as Rule 12b-1 fees). The Investor Class has lower expenses and typically higher returns than Class R3. |
17 | Prior to December 14, 2009, the Fund had different investment goals, strategies and portfolio management team. The performance information for Institutional Class, Class A, Class C and Class E prior to December 21, 2009 is that of the Fund’s Trust Class, which had an inception date of November 2, 2006, and converted into the Institutional Class on December 21, 2009. During the period from November 2, 2006 through December 21, 2009, the Trust Class had only one investor, which could have impacted Fund performance. The performance information for the Trust Class has been adjusted to reflect the appropriate sales charges applicable to Class A and Class C shares but has not been adjusted to take into account differences in class specific operating expenses (such as Rule 12b-1 fees). NBIA had previously capped Trust Class expenses; absent this arrangement, the returns would have been lower. The Trust Class had lower capped expenses and typically higher returns than Class A and Class C. The Trust Class had equivalent capped expenses and typically similar returns to the Institutional Class. The Trust Class had higher expenses and typically lower returns than Class E. The performance information for Class E from December 14, 2009, to the class’s inception date is that of the Fund’s Institutional Class. The performance information for the Institutional Class has not been adjusted to take into account differences in class specific operating expenses (such as Rule 12b-1 fees). The Institutional Class has higher expenses and typically lower returns than Class E. |
71
Endnotes (Unaudited) (cont’d)
18 | The performance information for Institutional Class, Class A and Class C prior to the classes’ inception date is that of the Fund’s predecessor, the DJG Small Cap Value Fund L.P., an unregistered limited partnership (“DJG Fund”); DJG Fund was the successor to The DJG Small Cap Value Fund, an unregistered commingled investment account (“DJG Account”). The performance from July 8, 1997 (the commencement of operations) to September 11, 2008 is that of DJG Account, and the performance from September 12, 2008 to May 10, 2010 is that of DJG Fund. On May 10, 2010, the DJG Fund transferred its assets to the Fund in exchange for the Fund’s Institutional Class shares. The investment policies, objectives, guidelines and restrictions of the Fund are in all material respects equivalent to those of DJG Fund and DJG Account (the “Predecessors”). As a mutual fund registered under the 1940 Act, the Fund is subject to certain restrictions under the 1940 Act and the Internal Revenue Code (“Code”) to which the Predecessors were not subject. Had the Predecessors been registered under the 1940 Act and been subject to the provisions of the 1940 Act and the Code, their investment performance may have been adversely affected. The performance information reflects the actual expenses of the Predecessors, which were generally lower than those of the Fund. The performance for Class R6 from May 10, 2010 to January 18, 2019 includes the performance of the Fund’s Institutional Class, and prior to May 10, 2010 includes the performance of the Predecessors, as noted above. |
19 | The performance information for Class A and Class C prior to the classes’ inception date is that of the Fund’s Investor Class. The performance information for the Investor Class has been adjusted to reflect the appropriate sales charges applicable to Class A and Class C shares, but has not been adjusted to take into account differences in class specific operating expenses (such as Rule 12b-1 fees). The Investor Class has lower expenses and typically higher returns than Class A and Class C. |
20 | As of June 19, 2012, the Fund changed its investment policy to become “non-diversified” under the 1940 Act. A non-diversified fund is able to invest larger percentages of its assets in the securities of a single issuer, which could increase the fund’s risk of loss. Performance prior to this change might have been different if current policies had been in effect. |
21 | The performance information for Class R6 prior to the class’s inception date is that of the Fund’s Institutional Class. The performance information for the Institutional Class has not been adjusted to take into account differences in class specific operating expenses. The Institutional Class has higher expenses and typically lower returns than Class R6. |
22 | The performance information for Class R6 prior to the class’s inception date is that of the Fund’s Investor Class. The performance information for the Investor Class has not been adjusted to take into account differences in class specific operating expenses. The Investor Class has higher expenses and typically lower returns than Class R6. |
23 | The performance information for Class R6 prior to the class’s inception date is that of the Fund’s Trust Class. The performance information for the Trust Class has not been adjusted to take into account differences in class specific operating expenses. The Trust Class has higher expenses and typically lower returns than Class R6. |
24 | The performance information for Class E prior to the class’s inception date is that of the Fund’s Investor Class. The performance information for the Investor Class has not been adjusted to take into account differences in class specific operating expenses. The Investor Class has higher expenses and typically lower returns than Class E. |
25 | The performance information for Class E prior to the class’s inception date is that of the Fund’s Institutional Class. The performance information for the Institutional Class has not been adjusted to take into account differences in class specific operating expenses. The Institutional Class has higher expenses and typically lower returns than Class E. |
72
Endnotes (Unaudited) (cont’d)
26 | The performance information for Class E prior to the class’s inception date is that of the Fund’s Trust Class. The performance information for the Trust Class has not been adjusted to take into account differences in class specific operating expenses. The Trust Class has higher expenses and typically lower returns than Class E. |
For more complete information on any of the Neuberger Berman Equity Funds, call us at (800) 877-9700, or visit our website at www.nb.com.
73
Glossary of Indices (Unaudited)
FTSE EPRA Nareit Developed Index (Net): | The index is a free float-adjusted, market capitalization-weighted index that is designed to measure the performance of listed real estate companies and real estate investment trusts (REITs) in developed markets. Net total return indexes reinvest dividends after the deduction of withholding taxes, using (for international indexes) a tax rate applicable to non-resident institutional investors who do not benefit from double taxation treaties. |
FTSE Nareit All Equity REITs Index: | The index is a free-float adjusted, market capitalization-weighted index that tracks the performance of all tax-qualified equity real estate investment trusts (REITs) that are listed on the New York Stock Exchange, or NASDAQ. Equity REITs include all tax-qualified REITs with more than 50 percent of total assets in qualifying real estate assets other than mortgages secured by real property. |
MSCI All Country World Index (Net): | The index is a free float-adjusted, market capitalization-weighted index that is designed to measure the equity market performance of developed and emerging markets. The index consists of 47 country indexes comprising 23 developed and 24 emerging market country indexes. The developed market country indexes included are: Australia, Austria, Belgium, Canada, Denmark, Finland, France, Germany, Hong Kong, Ireland, Israel, Italy, Japan, the Netherlands, New Zealand, Norway, Portugal, Singapore, Spain, Sweden, Switzerland, the United Kingdom and the United States. The emerging market country indexes included are: Brazil, Chile, China, Colombia, the Czech Republic, Egypt, Greece, Hungary, India, Indonesia, Korea, Kuwait, Malaysia, Mexico, Peru, the Philippines, Poland, Qatar, Saudi Arabia, South Africa, Taiwan, Thailand, Turkey, and the UAE. China A shares are included starting from June 1, 2018 and are partially represented at 20% of their free float-adjusted market capitalization as of November 2019. Net total return indexes reinvest dividends after the deduction of withholding taxes, using (for international indexes) a tax rate applicable to non-resident institutional investors who do not benefit from double taxation treaties. Effective after the close on March 9, 2022, MSCI reclassified MSCI Russia Indexes from Emerging Markets to Standalone Markets status. At that time, all Russian securities were removed from this index at a final price of 0.00001, including both locally traded Russian equity constituents and Russian ADRs/GDRs constituents |
MSCI China All Shares Index (Net): | The index is a free float-adjusted, market capitalization weighted index that is designed to measure the equity market performance of China share classes listed in Hong Kong, Shanghai, Shenzhen and outside of China. It covers the integrated MSCI China equity universe comprising A-shares, B-shares, H-shares, Red chips, P-chips and foreign listings listed outside China or Hong Kong (e.g. ADRs). A-shares are incorporated in China and trade on the Shanghai and Shenzhen exchanges; they are quoted in local renminbi and entail foreign investment regulations (QFII). B-shares are incorporated in China, and trade on the Shanghai and Shenzhen exchanges; they are quoted in foreign currencies (Shanghai USD, Shenzhen HKD) and are open to foreign investors. H-shares are incorporated in China and trade on the Hong Kong exchange and other foreign exchanges. Red chips and P-chips are incorporated outside of China and trade on the Hong Kong exchange. Red chips are usually controlled by the state or a province or municipality. P-chips are non state-owned Chinese companies incorporated outside the mainland and traded in Hong Kong. Net total return indexes reinvest dividends after the deduction of withholding taxes, using (for international indexes) a tax rate applicable to non-resident institutional investors who do not benefit from double taxation treaties. |
74
Glossary of Indices (Unaudited) (cont’d)
MSCI EAFE® Index (Net) (Europe, Australasia, Far East): | The index is a free float-adjusted, market capitalization-weighted index that is designed to measure the equity market performance of developed markets, excluding the United States and Canada. The index consists of the following 21 developed market country indexes: Australia, Austria, Belgium, Denmark, Finland, France, Germany, Hong Kong, Ireland, Israel, Italy, Japan, the Netherlands, New Zealand, Norway, Portugal, Singapore, Spain, Sweden, Switzerland, and the United Kingdom. Net total return indexes reinvest dividends after the deduction of withholding taxes, using (for international indexes) a tax rate applicable to non-resident institutional investors who do not benefit from double taxation treaties. |
MSCI Emerging Markets Index (Net): | The index is a free float-adjusted, market capitalization-weighted index that is designed to measure the equity market performance of emerging markets. The index consists of the following 24 emerging market country indexes: Brazil, Chile, China, Colombia, the Czech Republic, Egypt, Greece, Hungary, India, Indonesia, Korea, Kuwait, Malaysia, Mexico, Peru, the Philippines, Poland, Qatar, Saudi Arabia, South Africa, Taiwan, Thailand, Turkey, and the UAE. China A shares are included starting from June 1, 2018 and are partially represented at 20% of their free float-adjusted market capitalization as of November 2019. Net total return indexes reinvest dividends after the deduction of withholding taxes, using (for international indexes) a tax rate applicable to non-resident institutional investors who do not benefit from double taxation treaties. Effective after the close on March 9, 2022, MSCI reclassified MSCI Russia Indexes from Emerging Markets to Standalone Markets status. At that time, all Russian securities were removed from this index at a final price of 0.00001, including both locally traded Russian equity constituents and Russian ADRs/GDRs constituents. |
MSCI EAFE® Small Cap Index (Net): | The index is a free float-adjusted, market capitalization-weighted index that is designed to measure the equity market performance of the small cap segment of developed markets, excluding the United States and Canada. The index consists of the following 21 developed market country indices: Australia, Austria, Belgium, Denmark, Finland, France, Germany, Hong Kong, Ireland, Israel, Italy, Japan, the Netherlands, New Zealand, Norway, Portugal, Singapore, Spain, Sweden, Switzerland, and the United Kingdom. Net total return indexes reinvest dividends after the deduction of withholding taxes, using (for international indexes) a tax rate applicable to non-resident institutional investors who do not benefit from double taxation treaties. |
Russell 1000® Index: | The index is a float-adjusted, market capitalization-weighted index that measures the performance of the large-cap segment of the U.S. equity market. It includes approximately 1,000 of the largest securities in the Russell 3000® Index (which measures the performance of the 3,000 largest U.S. public companies based on total market capitalization). The index is rebalanced annually in June. |
Russell 1000® Growth Index: | The index is a float-adjusted market capitalization-weighted index that measures the performance of the large-cap growth segment of the U.S. equity market. It includes those Russell 1000® Index companies with higher price-to-book ratios and higher forecasted growth values. The index is rebalanced annually in June. |
Russell 1000® Value Index: | The index is a float-adjusted, market capitalization-weighted index that measures the performance of the large-cap value segment of the U.S. equity market. It includes those Russell 1000 Index companies with lower price-to-book ratios and lower forecasted growth rates. The index is rebalanced annually in June. |
Russell 2000® Index: | The index is a float-adjusted, market capitalization-weighted index that measures the performance of the small-cap segment of the U.S. equity market. It includes approximately 2,000 of the smallest securities in the Russell 3000 Index (which measures the performance of the 3,000 largest U.S. public companies based on total market capitalization). The index is rebalanced annually in June. |
75
Glossary of Indices (Unaudited) (cont’d)
Russell 2000® Growth Index: | The index is a float-adjusted, market capitalization-weighted index that measures the performance of the small-cap growth segment of the U.S. equity market. It includes those Russell 2000 Index companies with higher price-to-book ratios and higher forecasted growth rates. The index is rebalanced annually in June. |
Russell 2000® Value Index: | The index is a float-adjusted, market capitalization-weighted index that measures the performance of the small-cap value segment of the U.S. equity market. It includes those Russell 2000 Index companies with lower price-to-book ratios and lower forecasted growth rates. The index is rebalanced annually in June. |
Russell 3000® Index: | The index is a float-adjusted, market-capitalization-weighted equity index that measures the performance of the 3,000 largest U.S. public companies based on total market capitalization which represent about 98% of all U.S incorporated equity securities. The index is rebalanced annually in June. |
Russell Midcap® Index: | The index is a float-adjusted, market capitalization-weighted index that measures the performance of the mid-cap segment of the U.S. equity market. It includes approximately 800 of the smallest securities in the Russell 1000 Index. The index is rebalanced annually in June. |
Russell Midcap® Growth Index: | The index is a float-adjusted, market capitalization-weighted index that measures the performance of the mid-cap growth segment of the U.S. equity market. It includes those Russell Midcap Index companies with higher price-to-book ratios and higher forecasted growth rates. The index is rebalanced annually in June. |
Russell Midcap® Value Index: | The index is a float-adjusted, market capitalization-weighted index that measures the performance of the mid-cap value segment of the U.S. equity market. It includes those Russell Midcap Index companies with lower price-to-book ratios and lower forecasted growth rates. The index is rebalanced annually in June. |
S&P 500® Index: | The index is a float-adjusted, market capitalization-weighted index that focuses on the large-cap segment of the U.S. equity market, and includes a significant portion of the total value of the market. |
76
Information About Your Fund’s Expenses (Unaudited)
As a Fund shareholder, you incur two types of costs: (1) transaction costs, including sales charges (loads) on purchase payments or redemption proceeds (if applicable); and (2) ongoing costs, including management fees, distribution and/or service (12b-1) fees (if applicable), and other Fund expenses. This example is intended to help you understand your ongoing costs (in U.S. dollars) of investing in a Fund and compare these costs with the ongoing costs of investing in other mutual funds.
This table is designed to provide information regarding costs related to your investments. The following examples are based on an investment of $1,000 made at the beginning of the six month period ended August 31, 2022 and held for the entire period. The table illustrates each Fund’s costs in two ways:
Actual Expenses and Performance: | The first section of the table provides information about actual account values and actual expenses in dollars, based on the Fund’s actual performance during the period indicated. You may use the information in this line, together with the amount you invested, to estimate the expenses you paid over the period. Simply divide your account value by $1,000 (for example, an $8,600 account value divided by $1,000 = 8.6), then multiply the result by the number in the first section of the table under the heading entitled “Expenses Paid During the Period” to estimate the expenses you paid over the period. |
Hypothetical Example for Comparison Purposes: | The second section of the table provides information about hypothetical account values and hypothetical expenses based on the Fund’s actual expense ratio and an assumed rate of return at 5% per year before expenses. This return is not the Fund’s actual return. The hypothetical account values and expenses may not be used to estimate the actual ending account balance or expenses you paid for the period. You may use this information to compare the ongoing costs of investing in a Fund versus other funds. To do so, compare the expenses shown in this 5% hypothetical example with the 5% hypothetical examples that appear in the shareholder reports of other funds. |
Please note that the expenses in the table are meant to highlight your ongoing costs only and do not include any transaction costs, such as sales charges (loads) (if applicable). Therefore, the information under the heading “Hypothetical (5% annual return before expenses)” is useful in comparing ongoing costs only, and will not help you determine the relative total costs of owning different funds. In addition, if these transaction costs were included, your costs would have been higher.
77
Expense Example (Unaudited)
Neuberger Berman Equity Funds
ACTUAL | HYPOTHETICAL (5% ANNUAL RETURN BEFORE EXPENSES) | |||||||
Beginning Account Value 3/1/22 | Ending Account Value 8/31/22 | Expenses Paid During the Period(1) 3/1/22 – 8/31/22 | Expense Ratio | Beginning Account Value 3/1/22 | Ending Account Value 8/31/22 | Expenses Paid During the Period(2) 3/1/22 – 8/31/22 | Expense Ratio | |
Dividend Growth Fund | ||||||||
Institutional Class | $1,000.00 | $907.60 | $3.32 | 0.69% | $1,000.00 | $1,021.73 | $3.52 | 0.69% |
Class A | $1,000.00 | $905.90 | $5.04 | 1.05% | $1,000.00 | $1,019.91 | $5.35 | 1.05% |
Class C | $1,000.00 | $902.40 | $8.63 | 1.80% | $1,000.00 | $1,016.13 | $9.15 | 1.80% |
Class R6 | $1,000.00 | $908.30 | $2.84 | 0.59% | $1,000.00 | $1,022.23 | $3.01 | 0.59% |
Emerging Markets Equity Fund | ||||||||
Institutional Class | $1,000.00 | $869.10 | $5.84 | 1.24% | $1,000.00 | $1,018.95 | $6.31 | 1.24% |
Class A | $1,000.00 | $867.60 | $7.06 | 1.50% | $1,000.00 | $1,017.64 | $7.63 | 1.50% |
Class C | $1,000.00 | $865.00 | $10.58 | 2.25% | $1,000.00 | $1,013.86 | $11.42 | 2.25% |
Class R3 | $1,000.00 | $865.80 | $8.98 | 1.91% | $1,000.00 | $1,015.58 | $9.70 | 1.91% |
Class R6 | $1,000.00 | $869.50 | $5.32 | 1.13% | $1,000.00 | $1,019.51 | $5.75 | 1.13% |
Equity Income Fund | ||||||||
Institutional Class | $1,000.00 | $945.40 | $3.53 | 0.72% | $1,000.00 | $1,021.58 | $3.67 | 0.72% |
Class A | $1,000.00 | $944.10 | $5.29 | 1.08% | $1,000.00 | $1,019.76 | $5.50 | 1.08% |
Class C | $1,000.00 | $939.90 | $8.95 | 1.83% | $1,000.00 | $1,015.98 | $9.30 | 1.83% |
Class R3 | $1,000.00 | $942.50 | $6.81 | 1.39% | $1,000.00 | $1,018.20 | $7.07 | 1.39% |
Class E | $1,000.00 | $948.60 | $0.34 | 0.07% | $1,000.00 | $1,024.85 | $0.36 | 0.07% |
Focus Fund | ||||||||
Investor Class | $1,000.00 | $842.20 | $4.27 | 0.92% | $1,000.00 | $1,020.57 | $4.69 | 0.92% |
Trust Class | $1,000.00 | $841.20 | $5.20 | 1.12% | $1,000.00 | $1,019.56 | $5.70 | 1.12% |
Advisor Class | $1,000.00 | $840.60 | $5.66 | 1.22% | $1,000.00 | $1,019.06 | $6.21 | 1.22% |
Institutional Class | $1,000.00 | $842.80 | $3.58 | 0.77% | $1,000.00 | $1,021.32 | $3.92 | 0.77% |
Class A | $1,000.00 | $841.30 | $5.15 | 1.11% | $1,000.00 | $1,019.61 | $5.65 | 1.11% |
Class C | $1,000.00 | $838.30 | $8.62 | 1.86% | $1,000.00 | $1,015.83 | $9.45 | 1.86% |
Genesis Fund | ||||||||
Investor Class | $1,000.00 | $918.40 | $4.84 | 1.00% | $1,000.00 | $1,020.16 | $5.09 | 1.00% |
Trust Class | $1,000.00 | $918.00 | $5.32 | 1.10% | $1,000.00 | $1,019.66 | $5.60 | 1.10% |
Advisor Class | $1,000.00 | $916.70 | $6.52 | 1.35% | $1,000.00 | $1,018.40 | $6.87 | 1.35% |
Institutional Class | $1,000.00 | $919.10 | $4.11 | 0.85% | $1,000.00 | $1,020.92 | $4.33 | 0.85% |
Class R6 | $1,000.00 | $919.60 | $3.63 | 0.75% | $1,000.00 | $1,021.42 | $3.82 | 0.75% |
Class E | $1,000.00 | $922.90 | $0.19 | 0.04% | $1,000.00 | $1,025.00 | $0.20 | 0.04% |
Global Real Estate Fund | ||||||||
Institutional Class | $1,000.00 | $904.30 | $4.85 | 1.01% | $1,000.00 | $1,020.11 | $5.14 | 1.01% |
Class A | $1,000.00 | $902.40 | $6.57 | 1.37% | $1,000.00 | $1,018.30 | $6.97 | 1.37% |
Class C | $1,000.00 | $898.20 | $10.14 | 2.12% | $1,000.00 | $1,014.52 | $10.76 | 2.12% |
Greater China Equity Fund | ||||||||
Institutional Class | $1,000.00 | $810.60 | $6.89 | 1.51% | $1,000.00 | $1,017.59 | $7.68 | 1.51% |
Class A | $1,000.00 | $809.10 | $8.53 | 1.87% | $1,000.00 | $1,015.78 | $9.50 | 1.87% |
Class C | $1,000.00 | $805.80 | $11.93 | 2.62% | $1,000.00 | $1,012.00 | $13.29 | 2.62% |
International Equity Fund | ||||||||
Investor Class | $1,000.00 | $824.40 | $5.10 | 1.11% | $1,000.00 | $1,019.61 | $5.65 | 1.11% |
Trust Class | $1,000.00 | $824.40 | $5.38 | 1.17% | $1,000.00 | $1,019.31 | $5.96 | 1.17% |
Institutional Class | $1,000.00 | $825.20 | $3.96 | 0.86% | $1,000.00 | $1,020.87 | $4.38 | 0.86% |
Class A | $1,000.00 | $824.40 | $5.61 | 1.22% | $1,000.00 | $1,019.06 | $6.21 | 1.22% |
Class C | $1,000.00 | $820.80 | $9.04 | 1.97% | $1,000.00 | $1,015.27 | $10.01 | 1.97% |
Class R6 | $1,000.00 | $826.10 | $3.50 | 0.76% | $1,000.00 | $1,021.37 | $3.87 | 0.76% |
Class E | $1,000.00 | $828.40 | $0.37 | 0.08% | $1,000.00 | $1,024.80 | $0.41 | 0.08% |
78
Expense Example (Unaudited) (cont’d)
Neuberger Berman Equity Funds
ACTUAL | HYPOTHETICAL (5% ANNUAL RETURN BEFORE EXPENSES) | |||||||
Beginning Account Value 3/1/22 | Ending Account Value 8/31/22 | Expenses Paid During the Period(1) 3/1/22 – 8/31/22 | Expense Ratio | Beginning Account Value 3/1/22 | Ending Account Value 8/31/22 | Expenses Paid During the Period(2) 3/1/22 – 8/31/22 | Expense Ratio | |
International Select Fund | ||||||||
Trust Class | $1,000.00 | $824.80 | $5.38 | 1.17% | $1,000.00 | $1,019.31 | $5.96 | 1.17% |
Institutional Class | $1,000.00 | $827.00 | $3.73 | 0.81% | $1,000.00 | $1,021.12 | $4.13 | 0.81% |
Class A | $1,000.00 | $825.20 | $5.38 | 1.17% | $1,000.00 | $1,019.31 | $5.96 | 1.17% |
Class C | $1,000.00 | $821.50 | $8.86 | 1.93% | $1,000.00 | $1,015.48 | $9.80 | 1.93% |
Class R3 | $1,000.00 | $824.30 | $6.58 | 1.43% | $1,000.00 | $1,018.00 | $7.27 | 1.43% |
Class R6 | $1,000.00 | $826.40 | $3.31 | 0.72% | $1,000.00 | $1,021.58 | $3.67 | 0.72% |
International Small Cap Fund | ||||||||
Institutional Class | $1,000.00 | $823.40 | $4.96 | 1.08% | $1,000.00 | $1,019.76 | $5.50 | 1.08% |
Class A | $1,000.00 | $821.90 | $6.61 | 1.44% | $1,000.00 | $1,017.95 | $7.32 | 1.44% |
Class C | $1,000.00 | $818.60 | $9.99 | 2.18% | $1,000.00 | $1,014.22 | $11.07 | 2.18% |
Class R6 | $1,000.00 | $823.90 | $4.51 | 0.98% | $1,000.00 | $1,020.27 | $4.99 | 0.98% |
Intrinsic Value Fund | ||||||||
Institutional Class | $1,000.00 | $867.60 | $4.71 | 1.00% | $1,000.00 | $1,020.16 | $5.09 | 1.00% |
Class A | $1,000.00 | $866.10 | $6.40 | 1.36% | $1,000.00 | $1,018.35 | $6.92 | 1.36% |
Class C | $1,000.00 | $862.30 | $9.90 | 2.11% | $1,000.00 | $1,014.57 | $10.71 | 2.11% |
Class R6 | $1,000.00 | $867.70 | $4.10 | 0.87% | $1,000.00 | $1,020.82 | $4.43 | 0.87% |
Large Cap Growth Fund | ||||||||
Investor Class | $1,000.00 | $905.90 | $4.08(3) | 0.85% | $1,000.00 | $1,020.92 | $4.33(3) | 0.85% |
Trust Class | $1,000.00 | $904.90 | $4.99(3) | 1.04% | $1,000.00 | $1,019.96 | $5.30(3) | 1.04% |
Advisor Class | $1,000.00 | $904.20 | $5.62(3) | 1.17% | $1,000.00 | $1,019.31 | $5.96(3) | 1.17% |
Institutional Class | $1,000.00 | $906.40 | $3.36(3) | 0.70% | $1,000.00 | $1,021.68 | $3.57(3) | 0.70% |
Class A | $1,000.00 | $904.70 | $5.14(3) | 1.07% | $1,000.00 | $1,019.81 | $5.45(3) | 1.07% |
Class C | $1,000.00 | $901.00 | $8.72(3) | 1.82% | $1,000.00 | $1,016.03 | $9.25(3) | 1.82% |
Class R3 | $1,000.00 | $903.30 | $6.52(3) | 1.36% | $1,000.00 | $1,018.35 | $6.92(3) | 1.36% |
Class R6 | $1,000.00 | $906.50 | $3.12(3) | 0.65% | $1,000.00 | $1,021.93 | $3.31(3) | 0.65% |
Large Cap Value Fund | ||||||||
Investor Class | $1,000.00 | $902.20 | $3.64 | 0.76% | $1,000.00 | $1,021.37 | $3.87 | 0.76% |
Trust Class | $1,000.00 | $901.20 | $4.60 | 0.96% | $1,000.00 | $1,020.37 | $4.89 | 0.96% |
Advisor Class | $1,000.00 | $900.60 | $5.32 | 1.11% | $1,000.00 | $1,019.61 | $5.65 | 1.11% |
Institutional Class | $1,000.00 | $902.90 | $2.93 | 0.61% | $1,000.00 | $1,022.13 | $3.11 | 0.61% |
Class A | $1,000.00 | $901.20 | $4.74 | 0.99% | $1,000.00 | $1,020.21 | $5.04 | 0.99% |
Class C | $1,000.00 | $898.10 | $8.23 | 1.72% | $1,000.00 | $1,016.53 | $8.74 | 1.72% |
Class R3 | $1,000.00 | $900.10 | $5.94 | 1.24% | $1,000.00 | $1,018.95 | $6.31 | 1.24% |
Class R6 | $1,000.00 | $903.50 | $2.45 | 0.51% | $1,000.00 | $1,022.63 | $2.60 | 0.51% |
Class E | $1,000.00 | $905.30 | $0.19 | 0.04% | $1,000.00 | $1,025.00 | $0.20 | 0.04% |
Mid Cap Growth Fund | ||||||||
Investor Class | $1,000.00 | $870.80 | $4.10 | 0.87% | $1,000.00 | $1,020.82 | $4.43 | 0.87% |
Trust Class | $1,000.00 | $870.60 | $4.57 | 0.97% | $1,000.00 | $1,020.32 | $4.94 | 0.97% |
Advisor Class | $1,000.00 | $869.70 | $5.80 | 1.23% | $1,000.00 | $1,019.00 | $6.26 | 1.23% |
Institutional Class | $1,000.00 | $872.00 | $3.40 | 0.72% | $1,000.00 | $1,021.58 | $3.67 | 0.72% |
Class A | $1,000.00 | $870.40 | $5.14 | 1.09% | $1,000.00 | $1,019.71 | $5.55 | 1.09% |
Class C | $1,000.00 | $866.70 | $8.66 | 1.84% | $1,000.00 | $1,015.93 | $9.35 | 1.84% |
Class R3 | $1,000.00 | $869.00 | $6.36 | 1.35% | $1,000.00 | $1,018.40 | $6.87 | 1.35% |
Class R6 | $1,000.00 | $872.20 | $2.93 | 0.62% | $1,000.00 | $1,022.08 | $3.16 | 0.62% |
79
Expense Example (Unaudited) (cont’d)
Neuberger Berman Equity Funds
ACTUAL | HYPOTHETICAL (5% ANNUAL RETURN BEFORE EXPENSES) | |||||||
Beginning Account Value 3/1/22 | Ending Account Value 8/31/22 | Expenses Paid During the Period(1) 3/1/22 – 8/31/22 | Expense Ratio | Beginning Account Value 3/1/22 | Ending Account Value 8/31/22 | Expenses Paid During the Period(2) 3/1/22 – 8/31/22 | Expense Ratio | |
Mid Cap Intrinsic Value Fund | ||||||||
Investor Class | $1,000.00 | $920.20 | $4.65 | 0.96% | $1,000.00 | $1,020.37 | $4.89 | 0.96% |
Trust Class | $1,000.00 | $919.00 | $5.80 | 1.20% | $1,000.00 | $1,019.16 | $6.11 | 1.20% |
Institutional Class | $1,000.00 | $920.90 | $4.12 | 0.85% | $1,000.00 | $1,020.92 | $4.33 | 0.85% |
Class A | $1,000.00 | $919.10 | $5.85 | 1.21% | $1,000.00 | $1,019.11 | $6.16 | 1.21% |
Class C | $1,000.00 | $915.50 | $9.46 | 1.96% | $1,000.00 | $1,015.32 | $9.96 | 1.96% |
Class R3 | $1,000.00 | $918.20 | $7.06 | 1.46% | $1,000.00 | $1,017.85 | $7.43 | 1.46% |
Class R6 | $1,000.00 | $921.30 | $3.63 | 0.75% | $1,000.00 | $1,021.42 | $3.82 | 0.75% |
Multi-Cap Opportunities Fund | ||||||||
Institutional Class | $1,000.00 | $881.80 | $3.98 | 0.84% | $1,000.00 | $1,020.97 | $4.28 | 0.84% |
Class A | $1,000.00 | $880.50 | $5.74 | 1.21% | $1,000.00 | $1,019.11 | $6.16 | 1.21% |
Class C | $1,000.00 | $877.10 | $9.27 | 1.96% | $1,000.00 | $1,015.32 | $9.96 | 1.96% |
Class E | $1,000.00 | $840.60 | $0.46 | 0.10% | $1,000.00 | $1,024.70 | $0.51 | 0.10% |
Real Estate Fund | ||||||||
Trust Class | $1,000.00 | $931.70 | $5.06 | 1.04% | $1,000.00 | $1,019.96 | $5.30 | 1.04% |
Institutional Class | $1,000.00 | $932.30 | $4.14 | 0.85% | $1,000.00 | $1,020.92 | $4.33 | 0.85% |
Class A | $1,000.00 | $930.80 | $5.89 | 1.21% | $1,000.00 | $1,019.11 | $6.16 | 1.21% |
Class C | $1,000.00 | $927.40 | $9.52 | 1.96% | $1,000.00 | $1,015.32 | $9.96 | 1.96% |
Class R3 | $1,000.00 | $929.80 | $7.10 | 1.46% | $1,000.00 | $1,017.85 | $7.43 | 1.46% |
Class R6 | $1,000.00 | $932.70 | $3.65 | 0.75% | $1,000.00 | $1,021.42 | $3.82 | 0.75% |
Class E | $1,000.00 | $936.10 | $0.44 | 0.09% | $1,000.00 | $1,024.75 | $0.46 | 0.09% |
Small Cap Growth Fund | ||||||||
Investor Class | $1,000.00 | $902.00 | $4.84 | 1.01% | $1,000.00 | $1,020.11 | $5.14 | 1.01% |
Trust Class | $1,000.00 | $900.70 | $5.99 | 1.25% | $1,000.00 | $1,018.90 | $6.36 | 1.25% |
Advisor Class | $1,000.00 | $900.00 | $6.70 | 1.40% | $1,000.00 | $1,018.15 | $7.12 | 1.40% |
Institutional Class | $1,000.00 | $902.40 | $4.32 | 0.90% | $1,000.00 | $1,020.67 | $4.58 | 0.90% |
Class A | $1,000.00 | $900.90 | $6.04 | 1.26% | $1,000.00 | $1,018.85 | $6.41 | 1.26% |
Class C | $1,000.00 | $897.40 | $9.61 | 2.01% | $1,000.00 | $1,015.07 | $10.21 | 2.01% |
Class R3 | $1,000.00 | $899.50 | $7.23 | 1.51% | $1,000.00 | $1,017.59 | $7.68 | 1.51% |
Class R6 | $1,000.00 | $902.90 | $3.84 | 0.80% | $1,000.00 | $1,021.17 | $4.08 | 0.80% |
Sustainable Equity Fund | ||||||||
Investor Class | $1,000.00 | $891.70 | $4.15 | 0.87% | $1,000.00 | $1,020.82 | $4.43 | 0.87% |
Trust Class | $1,000.00 | $891.00 | $5.00 | 1.05% | $1,000.00 | $1,019.91 | $5.35 | 1.05% |
Institutional Class | $1,000.00 | $892.50 | $3.34 | 0.70% | $1,000.00 | $1,021.68 | $3.57 | 0.70% |
Class A | $1,000.00 | $890.80 | $5.05 | 1.06% | $1,000.00 | $1,019.86 | $5.40 | 1.06% |
Class C | $1,000.00 | $887.50 | $8.61 | 1.81% | $1,000.00 | $1,016.08 | $9.20 | 1.81% |
Class R3 | $1,000.00 | $889.80 | $6.29 | 1.32% | $1,000.00 | $1,018.55 | $6.72 | 1.32% |
Class R6 | $1,000.00 | $893.00 | $2.86 | 0.60% | $1,000.00 | $1,022.18 | $3.06 | 0.60% |
U.S. Equity Impact Fund | ||||||||
Institutional Class | $1,000.00 | $904.90 | $4.37 | 0.91% | $1,000.00 | $1,020.62 | $4.63 | 0.91% |
Class A | $1,000.00 | $902.60 | $6.09 | 1.27% | $1,000.00 | $1,018.80 | $6.46 | 1.27% |
Class C | $1,000.00 | $899.80 | $9.62 | 2.01% | $1,000.00 | $1,015.07 | $10.21 | 2.01% |
(1) | For each class, expenses are equal to the annualized expense ratio for the class, multiplied by the average account value over the period, multiplied by 184/365 (to reflect the one-half year period shown), unless otherwise indicated. |
(2) | Hypothetical expenses are equal to the annualized expense ratios for each class, multiplied by the average account value over the period (assuming a 5% annual return), multiplied by 184/365 (to reflect the one-half year period shown). |
(3) | Includes expenses of the Fund’s Blocker (See Note A of the Notes to Financial Statements). |
80
Legend August 31, 2022 (Unaudited)
Neuberger Berman Equity Funds
Counterparties: | |
SSB | = State Street Bank and Trust Company |
Currency Abbreviations: | |
INR | = Indian Rupee |
Investment Methods: | |
PIPE | = Private investment in public equity |
Other Abbreviations: | |
ADR | = American Depositary Receipt |
Management or NBIA | = Neuberger Berman Investment Advisers LLC |
81
Schedule of Investments Dividend Growth Fund^
August 31, 2022
August 31, 2022
Number of Shares | Value | |
Common Stocks 96.6% | ||
Automobiles 1.5% | ||
28,400 | General Motors Co. | $1,085,164 |
Banks 3.5% | ||
10,500 | JPMorgan Chase & Co. | 1,194,165 |
7,975 | PNC Financial Services Group, Inc. | 1,260,050 |
2,454,215 | ||
Capital Markets 4.1% | ||
1,275 | BlackRock, Inc. | 849,647 |
8,475 | Cboe Global Markets, Inc. | 999,796 |
11,800 | Morgan Stanley | 1,005,596 |
2,855,039 | ||
Chemicals 1.6% | ||
20,140 | Novozymes A/S Class B | 1,155,907 |
Consumer Finance 1.3% | ||
6,050 | American Express Co. | 919,600 |
Distributors 2.0% | ||
26,850 | LKQ Corp. | 1,428,957 |
Diversified Financial Services 1.0% | ||
23,725 | Equitable Holdings, Inc. | 705,819 |
Electronic Equipment, Instruments & Components 7.2% | ||
26,900 | Amphenol Corp. Class A | 1,977,957 |
50,525 | Corning, Inc. | 1,734,018 |
4,500 | Zebra Technologies Corp. Class A* | 1,357,380 |
5,069,355 | ||
Energy Equipment & Services 1.0% | ||
18,675 | Schlumberger NV | 712,451 |
Entertainment 4.5% | ||
13,800 | Electronic Arts, Inc. | 1,750,806 |
12,700 | Walt Disney Co.* | 1,423,416 |
3,174,222 | ||
Equity Real Estate Investment Trusts 3.8% | ||
5,450 | American Tower Corp. | 1,384,572 |
1,980 | Equinix, Inc. | 1,301,593 |
2,686,165 | ||
Food & Staples Retailing 1.8% | ||
9,600 | Walmart, Inc. | 1,272,480 |
Number of Shares | Value | |
Food Products 2.9% | ||
20,150 | Mondelez International, Inc. Class A | $ 1,246,479 |
22,177 | Tootsie Roll Industries, Inc. | 794,602 |
2,041,081 | ||
Health Care Equipment & Supplies 4.5% | ||
3,000 | Becton, Dickinson & Co. | 757,260 |
14,450 | Medtronic PLC | 1,270,444 |
5,475 | STERIS PLC | 1,102,556 |
3,130,260 | ||
Hotels, Restaurants & Leisure 2.7% | ||
12,250 | Marriott International, Inc. Class A | 1,883,315 |
Industrial Conglomerates 2.2% | ||
8,200 | Honeywell International, Inc. | 1,552,670 |
Insurance 2.4% | ||
2,675 | Aon PLC Class A | 747,021 |
5,950 | Marsh & McLennan Cos., Inc. | 960,151 |
1,707,172 | ||
IT Services 1.5% | ||
4,300 | Automatic Data Processing, Inc. | 1,050,963 |
Life Sciences Tools & Services 1.9% | ||
10,525 | Agilent Technologies, Inc. | 1,349,831 |
Machinery 3.2% | ||
6,025 | Caterpillar, Inc. | 1,112,878 |
5,050 | Nordson Corp. | 1,147,208 |
2,260,086 | ||
Media 1.7% | ||
33,400 | Comcast Corp. Class A | 1,208,746 |
Metals & Mining 3.2% | ||
41,750 | Freeport-McMoRan, Inc. | 1,235,800 |
33,700 | Wheaton Precious Metals Corp. | 1,027,850 |
2,263,650 | ||
Multi-Utilities 3.0% | ||
24,300 | CenterPoint Energy, Inc. | 766,179 |
16,700 | Dominion Energy, Inc. | 1,366,060 |
2,132,239 | ||
Oil, Gas & Consumable Fuels 3.7% | ||
36,500 | Devon Energy Corp. | 2,577,630 |
See Notes to Financial Statements
82
Schedule of Investments Dividend Growth Fund^ (cont’d)
Number of Shares | Value | |
Pharmaceuticals 9.3% | ||
30,025 | AstraZeneca PLC ADR | $ 1,872,960 |
16,100 | Bristol-Myers Squibb Co. | 1,085,301 |
8,500 | Eli Lilly & Co. | 2,560,455 |
12,300 | Novartis AG ADR | 990,396 |
6,509,112 | ||
Road & Rail 3.7% | ||
42,425 | CSX Corp. | 1,342,751 |
24,100 | XPO Logistics, Inc.* | 1,263,322 |
2,606,073 | ||
Semiconductors & Semiconductor Equipment 6.0% | ||
13,275 | Analog Devices, Inc. | 2,011,561 |
16,450 | QUALCOMM, Inc. | 2,175,841 |
4,187,402 | ||
Software 3.1% | ||
8,200 | Microsoft Corp. | 2,144,054 |
Specialty Retail 1.9% | ||
21,100 | TJX Cos., Inc. | 1,315,585 |
Technology Hardware, Storage & Peripherals 3.2% | ||
14,250 | Apple, Inc. | 2,240,385 |
Number of Shares | Value | |
Textiles, Apparel & Luxury Goods 2.0% | ||
12,550 | Cie Financiere Richemont SA Class A | $1,403,447 |
Transportation Infrastructure 1.2% | ||
6,650 | Aena SME SA*(a) | 816,764 |
Total Common Stocks (Cost $51,128,832) | 67,899,839 | |
Short-Term Investments 3.8% | ||
Investment Companies 3.8% | ||
2,667,306 | State Street Institutional Treasury Money Market Fund Premier Class, 2.10%(b) (Cost $2,667,306) | 2,667,306 |
Total Investments 100.4% (Cost $53,796,138) | 70,567,145 | |
Liabilities Less Other Assets (0.4)% | (275,401) | |
Net Assets 100.0% | $70,291,744 | |
* | Non-income producing security. |
(a) | Security exempt from registration pursuant to Regulation S under the Securities Act of 1933, as amended. Regulation S applies to securities offerings that are made outside of the United States and do not involve directed selling efforts in the United States and as such may have restrictions on resale. Total value of all such securities at August 31, 2022 amounted to $816,764, which represents 1.2% of net assets of the Fund. |
(b) | Represents 7-day effective yield as of August 31, 2022. |
POSITIONS BY COUNTRY | ||
Country | Investments at Value | Percentage of Net Assets |
United States | $60,632,515 | 86.2% |
Switzerland | 2,393,843 | 3.4% |
United Kingdom | 1,872,960 | 2.7% |
Denmark | 1,155,907 | 1.6% |
Brazil | 1,027,850 | 1.5% |
Spain | 816,764 | 1.2% |
Short-Term Investments and Other Liabilities—Net | 2,391,905 | 3.4% |
$70,291,744 | 100.0% | |
See Notes to Financial Statements
83
Schedule of Investments Dividend Growth Fund^ (cont’d)
The following is a summary, categorized by Level (see Note A of the Notes to Financial Statements), of inputs used to value the Fund’s investments as of August 31, 2022:
Asset Valuation Inputs | Level 1 | Level 2 | Level 3 | Total |
Investments: | ||||
Common Stocks | ||||
Chemicals | $— | $1,155,907 | $— | $1,155,907 |
Textiles, Apparel & Luxury Goods | — | 1,403,447 | — | 1,403,447 |
Transportation Infrastructure | — | 816,764 | — | 816,764 |
Other Common Stocks# | 64,523,721 | — | — | 64,523,721 |
Total Common Stocks | 64,523,721 | 3,376,118 | — | 67,899,839 |
Short-Term Investments | — | 2,667,306 | — | 2,667,306 |
Total Investments | $64,523,721 | $6,043,424 | $— | $70,567,145 |
# | The Schedule of Investments provides information on the industry or sector categorization as well as a Positions by Country summary. |
^
A balance indicated with a “—”, reflects either a zero balance or an amount that rounds to less than 1.
See Notes to Financial Statements
84
Schedule of Investments Emerging Markets Equity Fund^
August 31, 2022
August 31, 2022
Number of Shares | Value | |
Common Stocks 95.0% | ||
Brazil 3.7% | ||
3,394,580 | B3 SA - Brasil Bolsa Balcao | $ 7,732,157 |
1,069,308 | Cia Brasileira de Aluminio | 2,641,206 |
1,662,972 | Klabin SA (a) | 6,019,099 |
306,833 | Pagseguro Digital Ltd. Class A* | 4,768,185 |
1,429,128 | Petroleo Brasileiro SA | 9,128,465 |
30,289,112 | ||
Canada 0.9% | ||
466,280 | Parex Resources, Inc. | 7,459,202 |
Chile 0.9% | ||
75,542 | Sociedad Quimica y Minera de Chile SA ADR | 7,530,027 |
China 30.2% | ||
1,620,500 | A-Living Smart City Services Co. Ltd.(b) | 1,669,252 |
2,303,136 | Alibaba Group Holding Ltd.* | 27,477,659 |
42,166 | Baidu, Inc. ADR* | 6,070,639 |
2,211,000 | China Mengniu Dairy Co. Ltd.* | 10,012,021 |
958,000 | Country Garden Services Holdings Co. Ltd. | 1,882,626 |
4,115,000 | Geely Automobile Holdings Ltd. | 8,267,931 |
454,472 | GigaDevice Semiconductor, Inc. Class A | 7,594,087 |
2,098,226 | Hengli Petrochemical Co. Ltd. Class A | 5,825,889 |
790,500 | JD.com, Inc. Class A | 25,023,377 |
6,735,279 | Jiangsu Changshu Rural Commercial Bank Co. Ltd. Class A | 7,607,598 |
39,577 | Kweichow Moutai Co. Ltd. Class A | 11,023,389 |
1,026,631 | Longfor Group Holdings Ltd.(b) | 3,332,201 |
1,320,149 | Luxshare Precision Industry Co. Ltd. Class A | 7,147,207 |
432,600 | Meituan Class B*(b) | 10,389,844 |
1,277,527 | Ping An Insurance Group Co. of China Ltd. Class A | 8,088,611 |
45,504 | Shenzhen SC New Energy Technology Corp. Class A | 871,300 |
3,868,200 | Shenzhen Topband Co. Ltd. Class A | 6,963,277 |
1,923,900 | Sichuan Kelun Pharmaceutical Co. Ltd. Class A | 5,976,269 |
1,092,800 | Tencent Holdings Ltd. | 45,166,239 |
291,298 | Trip.com Group Ltd. ADR* | 7,492,184 |
854,000 | Tsingtao Brewery Co. Ltd. H Shares | 8,293,167 |
Number of Shares | Value | |
China – cont'd | ||
774,351 | Wingtech Technology Co. Ltd. Class A | $ 7,220,260 |
1,772,288 | Xianhe Co. Ltd. Class A | 6,734,099 |
1,176,481 | Yifeng Pharmacy Chain Co. Ltd. Class A | 9,080,643 |
638,489 | Zhejiang HangKe Technology, Inc. Co. Class A | 5,722,551 |
1,881,068 | Zhejiang Juhua Co. Ltd. Class A | 4,267,319 |
249,199,639 | ||
Hong Kong 0.4% | ||
677,000 | China Merchants Bank Co. Ltd. H Shares | 3,462,253 |
Hungary 1.0% | ||
388,945 | Richter Gedeon Nyrt | 7,841,952 |
India 19.4% | ||
12,416,910 | API Holdings Private Ltd.*#(c)(d) | 8,046,332 |
85,620 | Apollo Hospitals Enterprise Ltd. | 4,586,496 |
1,521,945 | Aptus Value Housing Finance India Ltd.* | 6,864,900 |
235,531 | Cartrade Tech Ltd.* | 1,875,988 |
522,413 | DLF Ltd. | 2,523,207 |
1,733,428 | EPL Ltd. | 3,682,021 |
187,677 | GMM Pfaudler Ltd. | 3,870,940 |
689,988 | HDFC Bank Ltd. | 12,627,924 |
76,386 | Housing Development Finance Corp. Ltd. | 2,313,185 |
2,048,834 | ICICI Bank Ltd. | 22,509,215 |
515,178 | IndusInd Bank Ltd. | 7,044,443 |
521,210 | Infosys Ltd. ADR | 9,538,143 |
217,441 | JB Chemicals & Pharmaceuticals Ltd. | 4,784,489 |
1,942,017 | Motherson Sumi Wiring India Ltd. | 1,959,731 |
1,063,830 | National Stock Exchange *#(c)(d) | 37,153,247 |
4,084 | Pine Labs PTE Ltd.*#(c)(d) | 2,269,070 |
389,808 | Reliance Industries Ltd. | 12,789,733 |
1,789,841 | State Bank of India | 11,778,713 |
213,899 | United Breweries Ltd. | 4,406,450 |
160,624,227 | ||
Indonesia 1.5% | ||
7,625,300 | Bank Central Asia Tbk PT | 4,210,865 |
14,346,700 | Bank Negara Indonesia Persero Tbk PT | 8,228,776 |
12,439,641 | ||
Korea 9.8% | ||
192,125 | Hana Financial Group, Inc. | 5,599,800 |
20,731 | LG Chem Ltd. | 9,704,104 |
See Notes to Financial Statements
85
Schedule of Investments Emerging Markets Equity Fund^ (cont’d)
Number of Shares | Value | |
Korea – cont'd | ||
19,511 | NCSoft Corp. | $ 5,482,830 |
76,058 | Orion Corp. | 5,571,593 |
662,477 | Samsung Electronics Co. Ltd. | 29,348,223 |
175,112 | SK Hynix, Inc. | 12,311,762 |
59,995 | SK Square Co. Ltd.* | 1,802,788 |
192,186 | SK Telecom Co. Ltd. | 7,456,117 |
23,385 | Soulbrain Co. Ltd. | 3,756,698 |
81,033,915 | ||
Macau 0.8% | ||
1,220,000 | Galaxy Entertainment Group Ltd. | 6,819,412 |
Mexico 1.3% | ||
3,151,590 | Wal-Mart de Mexico SAB de CV | 10,327,748 |
Peru 0.8% | ||
49,393 | Credicorp Ltd. | 6,366,264 |
Poland 1.3% | ||
152,553 | Dino Polska SA*(b) | 11,129,282 |
Qatar 1.0% | ||
1,454,712 | Qatar National Bank QPSC | 8,231,895 |
Saudi Arabia 3.6% | ||
1,070,140 | Saudi Arabian Oil Co.(b) | 10,659,647 |
605,934 | Saudi National Bank | 11,236,356 |
134,579 | Saudi Tadawul Group Holding Co. | 8,130,044 |
30,026,047 | ||
South Africa 3.6% | ||
252,868 | Anglo American PLC | 8,125,778 |
496,401 | Bid Corp. Ltd. | 9,402,388 |
68,129 | Capitec Bank Holdings Ltd. | 8,100,903 |
31,755 | Naspers Ltd. N Shares | 4,477,659 |
30,106,728 | ||
Taiwan 13.1% | ||
500,600 | Accton Technology Corp. | 4,609,826 |
2,435,000 | Chunghwa Telecom Co. Ltd. | 9,662,295 |
641,779 | Hiwin Technologies Corp. | 4,331,721 |
407,000 | Keystone Microtech Corp. | 3,264,265 |
788,000 | RichWave Technology Corp. | 3,592,248 |
3,879,839 | Taiwan Semiconductor Manufacturing Co. Ltd. | 63,512,116 |
Number of Shares | Value | |
Taiwan – cont'd | ||
1,055,339 | Tong Hsing Electronic Industries Ltd.* | $ 7,316,399 |
5,113,000 | Uni-President Enterprises Corp. | 11,049,509 |
103,000 | Yageo Corp. | 1,101,607 |
108,439,986 | ||
United Arab Emirates 1.4% | ||
8,248,017 | Borouge PLC* | 6,893,744 |
1,523,455 | Network International Holdings PLC*(b) | 4,261,675 |
11,155,419 | ||
Zambia 0.3% | ||
161,692 | First Quantum Minerals Ltd. | 2,861,173 |
Total Common Stocks (Cost $775,252,210) | 785,343,922 | |
Preferred Stocks 2.2% | ||
India 2.2% | ||
217,973 | Gupshup, Inc. Ser. F*#(c)(d) | 4,983,996 |
9,762 | Pine Labs PTE Ltd. Ser. 1*#(c)(d) | 5,429,624 |
2,439 | Pine Labs PTE Ltd. Ser. A*#(c)(d) | 1,355,596 |
2,654 | Pine Labs PTE Ltd. Ser. B*#(c)(d) | 1,475,624 |
2,147 | Pine Labs PTE Ltd. Ser. B2*#(c)(d) | 1,193,732 |
3,993 | Pine Labs PTE Ltd. Ser. C*#(c)(d) | 2,223,702 |
841 | Pine Labs PTE Ltd. Ser. C1*#(c)(d) | 468,353 |
900 | Pine Labs PTE Ltd. Ser. D*#(c)(d) | 503,460 |
Total Preferred Stocks (Cost $13,478,212) | 17,634,087 | |
Short-Term Investments 3.0% | ||
Investment Companies 3.0% | ||
25,239,723 | State Street Institutional Treasury Money Market Fund Premier Class, 2.10%(e) (Cost $25,239,723) | 25,239,723 |
Total Investments 100.2% (Cost $813,970,145) | 828,217,732 | |
Liabilities Less Other Assets (0.2)% | (1,787,268) | |
Net Assets 100.0% | $826,430,464 | |
* | Non-income producing security. |
(a) | Security represented in Units. |
See Notes to Financial Statements
86
Schedule of Investments Emerging Markets Equity Fund^ (cont’d)
(b) | Security exempt from registration pursuant to Regulation S under the Securities Act of 1933, as amended. Regulation S applies to securities offerings that are made outside of the United States and do not involve directed selling efforts in the United States and as such may have restrictions on resale. Total value of all such securities at August 31, 2022 amounted to $41,441,901, which represents 5.0% of net assets of the Fund. |
(c) | Value determined using significant unobservable inputs. |
(d) | Security fair valued as of August 31, 2022 in accordance with procedures approved by the Board of Trustees. Total value of all such securities at August 31, 2022 amounted to $65,102,736, which represents 7.9% of net assets of the Fund. |
(e) | Represents 7-day effective yield as of August 31, 2022. |
#
These securities have been deemed by Management to be illiquid, and are subject to restrictions on resale. At August 31, 2022, these securities amounted to $65,102,736, which represents 7.9% of net assets of the Fund. Acquisition dates shown with a range, if any, represent securities that were acquired over the period shown in the table.
Restricted Security | Acquisition Date(s) | Acquisition Cost | Value as of 8/31/2022 | Fair Value Percentage of Net Assets as of 8/31/2022 |
API Holdings Private Ltd. | 10/18/2021 | $8,879,972 | $8,046,332 | 1.0% |
Gupshup, Inc. Ser. F (Ser. F Preferred Shares) | 7/16/2021 | 4,983,996 | 4,983,996 | 0.6% |
National Stock Exchange | 4/16/2018 | 15,536,312 | 37,153,247 | 4.5% |
Pine Labs PTE Ltd. | 7/6/2021 | 1,522,760 | 2,269,070 | 0.3% |
Pine Labs PTE Ltd. Ser. 1 (Ser. 1 Preferred Shares) | 7/6/2021 | 3,639,859 | 5,429,624 | 0.6% |
Pine Labs PTE Ltd. Ser. A (Ser. A Preferred Shares) | 7/6/2021 | 909,406 | 1,355,596 | 0.2% |
Pine Labs PTE Ltd. Ser. B (Ser. B Preferred Shares) | 7/6/2021 | 989,570 | 1,475,624 | 0.2% |
Pine Labs PTE Ltd. Ser. B2 (Ser. B2 Preferred Shares) | 7/6/2021 | 800,530 | 1,193,732 | 0.1% |
Pine Labs PTE Ltd. Ser. C (Ser. C Preferred Shares) | 7/6/2021 | 1,488,830 | 2,223,702 | 0.3% |
Pine Labs PTE Ltd. Ser. C1 (Ser. C1 Preferred Shares) | 7/6/2021 | 313,575 | 468,353 | 0.0% |
Pine Labs PTE Ltd. Ser. D (Ser. D Preferred Shares) | 7/6/2021 | 335,574 | 503,460 | 0.1% |
Total | $39,400,384 | $65,102,736 | 7.9% |
See Notes to Financial Statements
87
Schedule of Investments Emerging Markets Equity Fund^ (cont’d)
POSITIONS BY INDUSTRY | ||
Industry | Investments at Value | Percentage of Net Assets |
Banks | $117,005,005 | 14.2% |
Semiconductors & Semiconductor Equipment | 92,948,566 | 11.2% |
Internet & Direct Marketing Retail | 76,736,711 | 9.3% |
Capital Markets | 53,015,448 | 6.4% |
Interactive Media & Services | 51,236,878 | 6.2% |
Oil, Gas & Consumable Fuels | 40,037,047 | 4.8% |
Food & Staples Retailing | 39,940,061 | 4.8% |
IT Services | 38,471,160 | 4.7% |
Chemicals | 37,977,781 | 4.6% |
Electronic Equipment, Instruments & Components | 29,748,750 | 3.6% |
Technology Hardware, Storage & Peripherals | 29,348,223 | 3.6% |
Pharmaceuticals | 26,649,042 | 3.2% |
Food Products | 26,633,123 | 3.2% |
Beverages | 23,723,006 | 2.9% |
Metals & Mining | 13,628,157 | 1.6% |
Containers & Packaging | 9,701,120 | 1.2% |
Diversified Telecommunication Services | 9,662,295 | 1.2% |
Automobiles | 8,267,931 | 1.0% |
Machinery | 8,202,661 | 1.0% |
Insurance | 8,088,611 | 1.0% |
Wireless Telecommunication Services | 7,456,117 | 0.9% |
Thrifts & Mortgage Finance | 6,864,900 | 0.8% |
Hotels, Restaurants & Leisure | 6,819,412 | 0.8% |
Paper & Forest Products | 6,734,099 | 0.8% |
Real Estate Management & Development | 5,855,408 | 0.7% |
Electrical Equipment | 5,722,551 | 0.7% |
Entertainment | 5,482,830 | 0.7% |
Communications Equipment | 4,609,826 | 0.6% |
Health Care Providers & Services | 4,586,496 | 0.6% |
Commercial Services & Supplies | 3,551,878 | 0.4% |
Diversified Financial Services | 2,313,185 | 0.3% |
Auto Components | 1,959,731 | 0.2% |
Short-Term Investments and Other Liabilities—Net | 23,452,455 | 2.8% |
$826,430,464 | 100.0% | |
See Notes to Financial Statements
88
Schedule of Investments Emerging Markets Equity Fund^ (cont’d)
The following is a summary, categorized by Level (see Note A of the Notes to Financial Statements), of inputs used to value the Fund’s investments as of August 31, 2022:
Asset Valuation Inputs | Level 1 | Level 2 | Level 3(a) | Total |
Investments: | ||||
Common Stocks | ||||
China | $13,562,823 | $235,636,816 | $— | $249,199,639 |
Hong Kong | — | 3,462,253 | — | 3,462,253 |
Hungary | — | 7,841,952 | — | 7,841,952 |
India | 9,538,143 | 103,617,435 | 47,468,649 | 160,624,227 |
Indonesia | — | 12,439,641 | — | 12,439,641 |
Korea | — | 81,033,915 | — | 81,033,915 |
Macau | — | 6,819,412 | — | 6,819,412 |
Poland | — | 11,129,282 | — | 11,129,282 |
Qatar | — | 8,231,895 | — | 8,231,895 |
Saudi Arabia | — | 30,026,047 | — | 30,026,047 |
South Africa | — | 30,106,728 | — | 30,106,728 |
Taiwan | — | 108,439,986 | — | 108,439,986 |
Other Common Stocks# | 75,988,945 | — | — | 75,988,945 |
Total Common Stocks | 99,089,911 | 638,785,362 | 47,468,649 | 785,343,922 |
Preferred Stocks# | — | — | 17,634,087 | 17,634,087 |
Short-Term Investments | — | 25,239,723 | — | 25,239,723 |
Total Investments | $99,089,911 | $664,025,085 | $65,102,736 | $828,217,732 |
# | The Schedule of Investments provides a geographic categorization as well as a Positions by Industry summary. |
(a) | The following is a reconciliation between the beginning and ending balances of investments in which unobservable inputs (Level 3) were used in determining value: |
(000's omitted) | Beginning balance as of 9/1/2021 | Accrued discounts/ (premiums) | Realized gain/(loss) | Change in unrealized appreciation/ (depreciation) | Purchases | Sales | Transfers into Level 3 | Transfers out of Level 3 | Balance as of 8/31/2022 | Net change in unrealized appreciation/ (depreciation) from investments still held as of 8/31/2022 |
Investments in Securities: | ||||||||||
Common Stocks(1) | $24,837 | $— | $— | $13,751 | $8,880 | $— | $— | $— | $47,469 | $13,751 |
Preferred Stocks(1) | 13,461 | — | — | 4,173 | — | — | — | — | 17,634 | 4,173 |
Total | $38,298 | $— | $— | $17,924 | $8,880 | $— | $— | $— | $65,103 | $17,924 |
(1) Quantitative Information about Level 3 Fair Value Measurements: | ||||||
Investment type | Fair value at 8/31/2022 | Valuation approach | Unobservable input(s) | Input value/ range | Weighted average(a) | Impact to valuation from increase in input(b) |
Common Stocks | $10,315,402 | Market Approach | Enterprise value Revenue multiple(c) (EV/Revenue) | 5.0x - 37.0x | 12.0x | Increase |
Price Earnings | 32.0x | 32.0x | Increase | |||
Discount Rate | 12.0% | 12.0% | Decrease | |||
See Notes to Financial Statements
89
Schedule of Investments Emerging Markets Equity Fund^ (cont’d)
(1)Quantitative Information about Level 3 Fair Value Measurements (cont’d): | ||||||
Investment type | Fair value at 8/31/2022 | Valuation approach | Unobservable input(s) | Input value/ range | Weighted average(a) | Impact to valuation from increase in input(b) |
Expected Volatility | 70.0% | 70.0% | Decrease | |||
Common Stocks | $37,153,247 | Market Approach | Transaction Price | INR 2,775 | INR 2,775 | Increase |
Preferred Stocks | 17,634,087 | Market Approach | Enterprise value Revenue multiple(c) (EV/Revenue) | 5.0x - 37.0x | 28.0x | Increase |
Discount Rate | 12.0% | 12.0% | Decrease | |||
Expected Volatility | 70.0% | 70.0% | Decrease | |||
(a) The weighted averages disclosed in the table above were weighted by relative fair value. | ||||||
(b) Represents the expected directional change in the fair value of the Level 3 investments that would result from an increase or decrease in the corresponding input. Significant changes in these inputs could result in significantly higher or lower fair value measurements. | ||||||
(c) Represents amounts used when the reporting entity has determined that market participants would use such multiples when pricing the investments. | ||||||
^
A balance indicated with a “—”, reflects either a zero balance or an amount that rounds to less than 1.
See Notes to Financial Statements
90
Schedule of Investments Equity Income Fund^
August 31, 2022
August 31, 2022
Number of Shares | Value | |
Common Stocks 95.9% | ||
Aerospace & Defense 2.5% | ||
308,425 | Raytheon Technologies Corp. | $27,681,144 |
Banks 6.4% | ||
258,300 | Citizens Financial Group, Inc. | 9,474,444 |
139,255 | JPMorgan Chase & Co.(a) | 15,837,471 |
192,425 | PNC Financial Services Group, Inc.(a) | 30,403,150 |
354,400 | Wells Fargo & Co. | 15,490,824 |
71,205,889 | ||
Beverages 2.8% | ||
212,950 | Coca-Cola Co. | 13,141,145 |
105,850 | PepsiCo, Inc. | 18,234,779 |
31,375,924 | ||
Biotechnology 1.7% | ||
140,400 | AbbVie, Inc. | 18,878,184 |
Capital Markets 4.4% | ||
181,175 | CME Group, Inc. | 35,439,642 |
571,775 | Virtu Financial, Inc. Class A | 13,127,954 |
48,567,596 | ||
Chemicals 2.6% | ||
316,250 | Nutrien Ltd. | 29,022,262 |
Construction & Engineering 2.0% | ||
644,675 | Ferrovial SA | 16,165,155 |
182,250 | MDU Resources Group, Inc. | 5,494,838 |
21,659,993 | ||
Diversified Telecommunication Services 2.0% | ||
68,200 | Cogent Communications Holdings, Inc. | 3,631,650 |
822,325 | TELUS Corp. | 18,520,273 |
22,151,923 | ||
Electric Utilities 3.0% | ||
391,675 | NextEra Energy, Inc.(a) | 33,315,875 |
Electrical Equipment 3.5% | ||
135,675 | Eaton Corp. PLC | 18,538,632 |
250,275 | Emerson Electric Co. | 20,457,478 |
38,996,110 | ||
Electronic Equipment, Instruments & Components 0.8% | ||
261,800 | Corning, Inc. | 8,984,976 |
Number of Shares | Value | |
Equity Real Estate Investment Trusts 7.5% | ||
38,200 | Alexandria Real Estate Equities, Inc. | $ 5,859,880 |
1,104,650 | Brixmor Property Group, Inc. | 23,727,882 |
60,900 | Camden Property Trust | 7,826,259 |
66,625 | Crown Castle, Inc. | 11,381,549 |
56,850 | Duke Realty Corp. | 3,345,622 |
68,675 | Equity Residential | 5,025,636 |
116,025 | Prologis, Inc. | 14,446,273 |
73,525 | Terreno Realty Corp. | 4,484,290 |
217,345 | VICI Properties, Inc. | 7,170,212 |
83,267,603 | ||
Food Products 1.9% | ||
282,475 | Kellogg Co. | 20,547,232 |
Health Care Equipment & Supplies 1.0% | ||
15,000 | Becton, Dickinson & Co. | 3,786,300 |
85,500 | Medtronic PLC | 7,517,160 |
11,303,460 | ||
Health Care Providers & Services 1.9% | ||
217,550 | CVS Health Corp. | 21,352,533 |
Hotels, Restaurants & Leisure 1.4% | ||
61,850 | McDonald's Corp. | 15,603,518 |
Household Durables 0.6% | ||
157,250 | Leggett & Platt, Inc. | 6,010,095 |
Household Products 0.6% | ||
46,150 | Procter & Gamble Co. | 6,365,931 |
IT Services 2.2% | ||
194,525 | Paychex, Inc. | 23,992,713 |
Leisure Products 2.0% | ||
277,000 | Hasbro, Inc. | 21,833,140 |
Machinery 2.4% | ||
55,550 | Caterpillar, Inc. | 10,260,641 |
44,050 | Deere & Co. | 16,089,262 |
26,349,903 | ||
Metals & Mining 4.2% | ||
336,800 | Agnico Eagle Mines Ltd. | 13,879,528 |
367,150 | Rio Tinto PLC ADR | 20,666,873 |
260,325 | Southern Copper Corp. | 12,253,498 |
46,799,899 | ||
See Notes to Financial Statements
91
Schedule of Investments Equity Income Fund^ (cont’d)
Number of Shares | Value | |
Multi-Utilities 9.4% | ||
180,650 | Ameren Corp. | $ 16,731,803 |
1,299,600 | CenterPoint Energy, Inc. | 40,976,388 |
176,000 | Dominion Energy, Inc. | 14,396,800 |
105,100 | Public Service Enterprise Group, Inc. | 6,764,236 |
66,250 | Sempra Energy | 10,929,263 |
136,525 | WEC Energy Group, Inc. | 14,081,188 |
103,879,678 | ||
Oil, Gas & Consumable Fuels 11.3% | ||
284,525 | Chesapeake Energy Corp. | 28,591,917 |
116,700 | Chevron Corp. | 18,445,602 |
356,998 | ConocoPhillips | 39,073,431 |
102,375 | Pioneer Natural Resources Co. | 25,923,398 |
381,000 | Williams Cos., Inc. | 12,965,430 |
124,999,778 | ||
Pharmaceuticals 9.9% | ||
416,575 | AstraZeneca PLC ADR | 25,985,948 |
217,350 | Bristol-Myers Squibb Co. | 14,651,564 |
183,075 | Johnson & Johnson | 29,537,320 |
329,975 | Merck & Co., Inc. | 28,166,666 |
280,475 | Roche Holding AG ADR | 11,342,409 |
109,683,907 | ||
Semiconductors & Semiconductor Equipment 3.7% | ||
30,000 | Intel Corp. | 957,600 |
129,615 | QUALCOMM, Inc.(a) | 17,144,176 |
140,000 | Texas Instruments, Inc. | 23,129,400 |
41,231,176 | ||
Number of Shares | Value | |
Software 1.1% | ||
44,550 | Microsoft Corp. | $11,648,489 |
Specialty Retail 1.6% | ||
60,075 | Best Buy Co., Inc. | 4,246,702 |
45,600 | Home Depot, Inc. | 13,151,952 |
17,398,654 | ||
Trading Companies & Distributors 1.5% | ||
60,300 | Watsco, Inc. | 16,403,409 |
Total Common Stocks (Cost $786,402,556) | 1,060,510,994 | |
Short-Term Investments 3.0% | ||
Investment Companies 3.0% | ||
32,788,644 | State Street Institutional Treasury Money Market Fund Premier Class, 2.10%(b) (Cost $32,788,644) | 32,788,644 |
Total Investments 98.9% (Cost $819,191,200) | 1,093,299,638 | |
Other Assets Less Liabilities 1.1%(c) | 12,312,454 | |
Net Assets 100.0% | $1,105,612,092 | |
(a) | All or a portion of this security is pledged as collateral for options written. |
(b) | Represents 7-day effective yield as of August 31, 2022. |
(c) | Includes the impact of the Fund’s open positions in derivatives at August 31, 2022. |
See Notes to Financial Statements
92
Schedule of Investments Equity Income Fund^ (cont’d)
POSITIONS BY COUNTRY | ||
Country | Investments at Value | Percentage of Net Assets |
United States | $924,017,457 | 83.6% |
Canada | 61,422,063 | 5.5% |
United Kingdom | 25,985,948 | 2.3% |
Australia | 20,666,873 | 1.9% |
Spain | 16,165,155 | 1.5% |
Peru | 12,253,498 | 1.1% |
Short-Term Investments and Other Assets—Net | 45,101,098 | 4.1% |
$1,105,612,092 | 100.0% | |
See Notes to Financial Statements
93
Schedule of Investments Equity Income Fund^ (cont’d)
Derivative Instruments
Written option contracts (“options written”)
At August 31, 2022, the Fund had outstanding options written as follows:
Description | Number of Contracts | Notional Amount | Exercise Price | Expiration Date | Value |
Calls | |||||
Electric Utilities | |||||
Nextera Energy, Inc. | 200 | $(1,701,200) | $95 | 9/16/2022 | $(1,500) |
Electronic Equipment, Instruments & Components | |||||
Corning, Inc. | 800 | (2,745,600) | 42 | 10/21/2022 | —(a)(b) |
Machinery | |||||
Caterpillar, Inc. | 150 | (2,770,650) | 250 | 11/18/2022 | (6,225) |
Oil, Gas & Consumable Fuels | |||||
ConocoPhillips | 200 | (2,189,000) | 120 | 10/21/2022 | (60,600) |
ConocoPhillips | 200 | (2,189,000) | 130 | 10/21/2022 | (24,600) |
(85,200) | |||||
Total calls | $(92,925) | ||||
Puts | |||||
Distributors | |||||
Lkq Corp. | 700 | (3,725,400) | 45 | 10/21/2022 | (33,250) |
Food & Staples Retailing | |||||
Sysco Corp. | 500 | (4,111,000) | 70 | 9/16/2022 | (4,000)(a)(b) |
Health Care Equipment & Supplies | |||||
Becton, Dickinson & Co. | 150 | (3,786,300) | 220 | 9/16/2022 | (5,250)(a)(b) |
Becton, Dickinson & Co. | 150 | (3,786,300) | 230 | 9/16/2022 | (6,000) |
(11,250) | |||||
Hotels, Restaurants & Leisure | |||||
Darden Restaurants, Inc. | 300 | (3,711,300) | 105 | 9/16/2022 | (5,250)(a)(b) |
Darden Restaurants, Inc. | 300 | (3,711,300) | 100 | 10/21/2022 | (35,250) |
(40,500) | |||||
Media | |||||
Comcast Corp. | 1,000 | (3,619,000) | 32.5 | 9/16/2022 | (17,000) |
Road & Rail | |||||
Union Pacific Corp. | 150 | (3,367,650) | 195 | 9/16/2022 | (5,250) |
Union Pacific Corp. | 100 | (2,245,100) | 205 | 9/16/2022 | (7,750) |
Union Pacific Corp. | 100 | (2,245,100) | 200 | 10/21/2022 | (25,000) |
(38,000) | |||||
Specialty Retail | |||||
Home Depot, Inc. | 125 | (3,605,250) | 245 | 9/16/2022 | (3,313) |
See Notes to Financial Statements
94
Schedule of Investments Equity Income Fund^ (cont’d)
Description | Number of Contracts | Notional Amount | Exercise Price | Expiration Date | Value |
Specialty Retail (cont’d) | |||||
Home Depot, Inc. | 150 | $(4,326,300) | $250 | 10/21/2022 | $(37,425) |
(40,738) | |||||
Total puts | $(184,738) | ||||
Total options written (premium received $230,518) | $(277,663) | ||||
(a) | Value determined using significant unobservable inputs. |
(b) | Security fair valued as of August 31, 2022 in accordance with procedures approved by the Board of Trustees. |
For the year ended August 31, 2022, the average market value for the months where the Fund had options written outstanding was $(1,240,743). At August 31, 2022, the Fund had securities pledged in the amount of $30,363,966 to cover collateral requirements for options written.
The following is a summary, categorized by Level (see Note A of the Notes to Financial Statements), of inputs used to value the Fund’s investments as of August 31, 2022:
Asset Valuation Inputs | Level 1 | Level 2 | Level 3 | Total |
Investments: | ||||
Common Stocks | ||||
Construction & Engineering | $5,494,838 | $16,165,155 | $— | $21,659,993 |
Other Common Stocks# | 1,038,851,001 | — | — | 1,038,851,001 |
Total Common Stocks | 1,044,345,839 | 16,165,155 | — | 1,060,510,994 |
Short-Term Investments | — | 32,788,644 | — | 32,788,644 |
Total Investments | $1,044,345,839 | $48,953,799 | $— | $1,093,299,638 |
# | The Schedule of Investments provides information on the industry or sector categorization as well as a Positions by Country summary. |
The following is a summary, categorized by Level (see Note A of the Notes to Financial Statements), of inputs used to value the Fund’s derivatives as of August 31, 2022:
Other Financial Instruments | Level 1 | Level 2 | Level 3(a) | Total |
Options Written | ||||
Liabilities | $(263,163) | $— | $(14,500) | $(277,663) |
Total | $(263,163) | $— | $(14,500) | $(277,663) |
See Notes to Financial Statements
95
Schedule of Investments Equity Income Fund^ (cont’d)
(a) | The following is a reconciliation between the beginning and ending balances of investments in which unobservable inputs (Level 3) were used in determining value: |
(000's omitted) | Beginning balance as of 9/1/2021 | Accrued discounts/ (premiums) | Realized gain/(loss) | Change in unrealized appreciation/ (depreciation) | Purchases/ Closing of options | Sales/ Writing of options | Transfers into Level 3 | Transfers out of Level 3 | Balance as of 8/31/2022 | Net change in unrealized appreciation/ (depreciation) from investments still held as of 8/31/2022 |
Other Financial Instruments | ||||||||||
Written Option Contracts(1) | $— | $— | $— | $17 | $— | $(32) | $— | $— | $(15) | $17 |
Total | $— | $— | $— | $17 | $— | $(32) | $— | $— | $(15) | $17 |
(1) For the year ended August 31, 2022, these investments were valued in accordance with procedures approved by the Board of Trustees. These investments did not have a material impact on the Fund’s net assets and, therefore, disclosure of unobservable inputs used in formulating valuations is not presented. | ||||||||||
^
A balance indicated with a “—”, reflects either a zero balance or an amount that rounds to less than 1.
See Notes to Financial Statements
96
Schedule of Investments Focus Fund^
August 31, 2022
August 31, 2022
Number of Shares | Value | |
Common Stocks 97.4% | ||
Aerospace & Defense 2.1% | ||
130,091 | Airbus SE | $12,748,020 |
Automobiles 2.6% | ||
282,697 | Mercedes-Benz Group AG | 15,849,602 |
Beverages 3.0% | ||
428,132 | Diageo PLC | 18,600,788 |
Chemicals 1.3% | ||
65,615 | Air Liquide SA | 8,222,403 |
Computers 0.2% | ||
90,909 | Arctic Wolf Networks, Inc.*#(a)(b) | 999,999 |
Diversified Telecommunication Services 2.7% | ||
882,919 | Deutsche Telekom AG | 16,640,577 |
Electronic Equipment, Instruments & Components 0.9% | ||
114,856 | II-VI, Inc.* | 5,424,649 |
Entertainment 9.9% | ||
60,465 | Liberty Media Corp.-Liberty Formula One Class C* | 3,850,411 |
96,673 | Netflix, Inc.* | 21,612,216 |
52,191 | Take-Two Interactive Software, Inc.* | 6,396,529 |
251,164 | Walt Disney Co.* | 28,150,461 |
60,009,617 | ||
Health Care Providers & Services 4.3% | ||
32,553 | Elevance Health, Inc. | 15,791,786 |
51,181 | HCA Healthcare, Inc. | 10,127,184 |
25,918,970 | ||
Insurance 8.6% | ||
129,236 | Allstate Corp. | 15,572,938 |
43,335 | Aon PLC Class A | 12,101,732 |
201,227 | Progressive Corp. | 24,680,492 |
52,355,162 | ||
Internet & Direct Marketing Retail 8.9% | ||
278,992 | Amazon.com, Inc.* | 35,367,816 |
21,943 | MercadoLibre, Inc.* | 18,769,164 |
54,136,980 | ||
IT Services 8.7% | ||
8,451 | Adyen NV*(c) | 13,041,115 |
Number of Shares | Value | |
IT Services – cont'd | ||
23,142 | EPAM Systems, Inc.* | $ 9,870,063 |
127,405 | Okta, Inc.* | 11,644,817 |
78,705 | Snowflake, Inc. Class A* | 14,241,670 |
291,603 | Thoughtworks Holding, Inc.* | 3,837,495 |
52,635,160 | ||
Personal Products 1.9% | ||
33,666 | L'Oreal SA | 11,562,393 |
Pharmaceuticals 1.4% | ||
135,363 | AstraZeneca PLC ADR | 8,443,944 |
Road & Rail 15.8% | ||
69,395 | Canadian National Railway Co. | 8,252,793 |
131,601 | Canadian Pacific Railway Ltd. | 9,851,913 |
835,996 | CSX Corp. | 26,459,273 |
972,875 | Uber Technologies, Inc.* | 27,979,885 |
105,068 | Union Pacific Corp. | 23,588,817 |
96,132,681 | ||
Semiconductors & Semiconductor Equipment 1.5% | ||
108,724 | Taiwan Semiconductor Manufacturing Co. Ltd. ADR | 9,062,145 |
Software 10.0% | ||
25,515 | Constellation Software, Inc. | 38,408,395 |
116,336 | Datadog, Inc. Class A* | 12,209,463 |
38,050 | Microsoft Corp. | 9,948,933 |
60,566,791 | ||
Specialty Retail 6.5% | ||
80,732 | Floor & Decor Holdings, Inc. Class A* | 6,568,356 |
38,012 | RH* | 9,727,651 |
55,006 | Ulta Beauty, Inc.* | 23,095,369 |
39,391,376 | ||
Textiles, Apparel & Luxury Goods 2.4% | ||
22,654 | LVMH Moet Hennessy Louis Vuitton SE | 14,617,874 |
Wireless Telecommunication Services 4.7% | ||
196,832 | T-Mobile U.S., Inc.* | 28,335,935 |
Total Common Stocks (Cost $600,517,996) | 591,655,066 | |
Preferred Stocks 0.5% | ||
IT Services 0.1% | ||
106,691 | Druva, Inc., Ser. 5*#(a)(b) | 999,993 |
See Notes to Financial Statements
97
Schedule of Investments Focus Fund^ (cont’d)
Number of Shares | Value | |
Software 0.2% | ||
63,363 | Videoamp, Inc., Ser. F1*#(a)(b) | $999,995 |
Textiles, Apparel & Luxury Goods 0.2% | ||
1,000 | Fabletics LLC, Ser. G*#(a)(b) | 1,000,000 |
Total Preferred Stocks (Cost $2,999,995) | 2,999,988 | |
Short-Term Investments 3.1% | ||
Investment Companies 3.1% | ||
18,556,353 | State Street Institutional U.S. Government Money Market Fund Premier Class, 2.25%(d) (Cost $18,556,353) | 18,556,353 |
Total Investments 101.0% (Cost $622,074,344) | 613,211,407 | |
Liabilities Less Other Assets (1.0)% | (5,928,745) | |
Net Assets 100.0% | $607,282,662 | |
* | Non-income producing security. |
(a) | Value determined using significant unobservable inputs. |
(b) | Security fair valued as of August 31, 2022 in accordance with procedures approved by the Board of Trustees. Total value of all such securities at August 31, 2022 amounted to $3,999,987, which represents 0.7% of net assets of the Fund. |
(c) | Security exempt from registration pursuant to Regulation S under the Securities Act of 1933, as amended. Regulation S applies to securities offerings that are made outside of the United States and do not involve directed selling efforts in the United States and as such may have restrictions on resale. Total value of all such securities at August 31, 2022 amounted to $13,041,115, which represents 2.1% of net assets of the Fund. |
(d) | Represents 7-day effective yield as of August 31, 2022. |
#
These securities have been deemed by Management to be illiquid, and are subject to restrictions on resale. At August 31, 2022, these securities amounted to $3,999,987, which represents 0.7% of net assets of the Fund. Acquisition dates shown with a range, if any, represent securities that were acquired over the period shown in the table.
Restricted Security | Acquisition Date(s) | Acquisition Cost | Value as of 8/31/2022 | Fair Value Percentage of Net Assets as of 8/31/2022 |
Arctic Wolf Networks, Inc. | 12/31/2021 | $999,999 | $999,999 | 0.2% |
Druva, Inc. (Ser. 5 Preferred Shares) | 4/1/2021 | 1,000,000 | 999,993 | 0.1% |
Fabletics LLC (Ser. G Preferred Shares) | 1/10/2022 | 1,000,000 | 1,000,000 | 0.2% |
Videoamp, Inc. (Ser. F1 Preferred Shares) | 1/4/2022 | 999,995 | 999,995 | 0.2% |
Total | $3,999,994 | $3,999,987 | 0.7% |
See Notes to Financial Statements
98
Schedule of Investments Focus Fund^ (cont’d)
POSITIONS BY COUNTRY | ||
Country | Investments at Value | Percentage of Net Assets |
United States | $390,583,928 | 64.3% |
Canada | 56,513,101 | 9.3% |
France | 47,150,690 | 7.8% |
Germany | 32,490,179 | 5.3% |
United Kingdom | 27,044,732 | 4.5% |
Brazil | 18,769,164 | 3.1% |
Netherlands | 13,041,115 | 2.1% |
Taiwan | 9,062,145 | 1.5% |
Short-Term Investments and Other Liabilities—Net | 12,627,608 | 2.1% |
$607,282,662 | 100.0% | |
The following is a summary, categorized by Level (see Note A of the Notes to Financial Statements), of inputs used to value the Fund’s investments as of August 31, 2022:
Asset Valuation Inputs | Level 1 | Level 2 | Level 3(a) | Total |
Investments: | ||||
Common Stocks | ||||
Aerospace & Defense | $— | $12,748,020 | $— | $12,748,020 |
Automobiles | — | 15,849,602 | — | 15,849,602 |
Beverages | — | 18,600,788 | — | 18,600,788 |
Chemicals | — | 8,222,403 | — | 8,222,403 |
Computers | — | — | 999,999 | 999,999 |
Diversified Telecommunication Services | — | 16,640,577 | — | 16,640,577 |
IT Services | 39,594,045 | 13,041,115 | — | 52,635,160 |
Personal Products | — | 11,562,393 | — | 11,562,393 |
Textiles, Apparel & Luxury Goods | — | 14,617,874 | — | 14,617,874 |
Other Common Stocks# | 439,778,250 | — | — | 439,778,250 |
Total Common Stocks | 479,372,295 | 111,282,772 | 999,999 | 591,655,066 |
Preferred Stocks# | — | — | 2,999,988 | 2,999,988 |
Short-Term Investments | — | 18,556,353 | — | 18,556,353 |
Total Investments | $479,372,295 | $129,839,125 | $3,999,987 | $613,211,407 |
# | The Schedule of Investments provides information on the industry or sector categorization as well as a Positions by Country summary. |
(a) | The following is a reconciliation between the beginning and ending balances of investments in which unobservable inputs (Level 3) were used in determining value: |
(000's omitted) | Beginning balance as of 9/1/2021 | Accrued discounts/ (premiums) | Realized gain/(loss) | Change in unrealized appreciation/ (depreciation) | Purchases | Sales | Transfers into Level 3 | Transfers out of Level 3 | Balance as of 8/31/2022 | Net change in unrealized appreciation/ (depreciation) from investments still held as of 8/31/2022 |
Investments in Securities: | ||||||||||
Common Stocks(1) | $756 | $— | $— | $(256) | $1,000 | $— | $— | $(500) | $1,000 | $— |
Preferred Stocks(1) | 9,456 | — | — | (1,639) | 2,000 | — | — | (6,817) | 3,000 | — |
See Notes to Financial Statements
99
Schedule of Investments Focus Fund^ (cont’d)
(000's omitted) | Beginning balance as of 9/1/2021 | Accrued discounts/ (premiums) | Realized gain/(loss) | Change in unrealized appreciation/ (depreciation) | Purchases | Sales | Transfers into Level 3 | Transfers out of Level 3 | Balance as of 8/31/2022 | Net change in unrealized appreciation/ (depreciation) from investments still held as of 8/31/2022 |
Investments in Securities: | ||||||||||
Warrants(2) | $— | $— | $— | $— | $— | $— | $— | $— | $— | $— |
Total | $10,212 | $— | $— | $(1,895) | $3,000 | $— | $— | $(7,317) | $4,000 | $— |
(1) Quantitative Information about Level 3 Fair Value Measurements: | ||||||
Investment type | Fair value at 8/31/2022 | Valuation approach | Unobservable input(s) | Input value/ range | Weighted average(a) | Impact to valuation from increase in input(b) |
Common Stocks | $999,999 | Market Approach | Transaction Price | $11.00 | $11.00 | Increase |
Preferred Stocks | 999,993 | Market Approach | Enterprise value/ Revenue multiple(c) (EV/Revenue) | 11.0x | 11.0x | Increase |
Preferred Stocks | 1,999,995 | Market Approach | Transaction Price | $15.78 - $1,000.00 | $507.89 | Increase |
(a) The weighted averages disclosed in the table above were weighted by relative fair value. | ||||||
(b) Represents the expected directional change in the fair value of the Level 3 investments that would result from an increase or decrease in the corresponding input. Significant changes in these inputs could result in significantly higher or lower fair value measurements. | ||||||
(c) Represents amounts used when the reporting entity has determined that market participants would use such multiples when pricing the investments. | ||||||
(2) At the beginning of the period, these investments were valued in accordance with procedures approved by the Board of Trustees. The Fund no longer held these investments at August 31, 2022 and, therefore, disclosure of unobservable inputs used in formulating valuations is not presented. |
^
A balance indicated with a “—”, reflects either a zero balance or an amount that rounds to less than 1.
See Notes to Financial Statements
100
Schedule of Investments Genesis Fund^
August 31, 2022
August 31, 2022
Number of Shares | Value | |
Common Stocks 97.9% | ||
Air Freight & Logistics 0.9% | ||
881,451 | Forward Air Corp. | $85,536,005 |
Airlines 0.4% | ||
382,039 | Allegiant Travel Co.* | 36,866,763 |
Auto Components 3.2% | ||
1,644,823 | Fox Factory Holding Corp.* | 153,313,952 |
839,477 | LCI Industries | 97,270,200 |
955,915 | XPEL, Inc.* | 65,508,855 |
316,093,007 | ||
Banks 10.4% | ||
1,607,972 | Bank of Hawaii Corp. | 125,453,976 |
916,530 | BOK Financial Corp. | 81,452,021 |
510,368 | Columbia Banking System, Inc. | 15,285,522 |
1,644,692 | Community Bank System, Inc. | 107,529,963 |
1,013,296 | Cullen/Frost Bankers, Inc. | 131,687,948 |
3,468,891 | CVB Financial Corp. | 91,023,700 |
2,663,073 | First Financial Bankshares, Inc. | 113,207,233 |
459,454 | First Hawaiian, Inc. | 11,812,562 |
2,672,238 | Glacier Bancorp, Inc. | 135,429,022 |
954,574 | Lakeland Financial Corp. | 71,917,605 |
1,142,999 | Prosperity Bancshares, Inc. | 81,015,769 |
1,110,907 | Stock Yards Bancorp, Inc. | 73,608,698 |
1,039,424,019 | ||
Biotechnology 0.3% | ||
2,333,687 | Abcam PLC* | 34,435,408 |
Building Products 1.5% | ||
1,139,890 | AAON, Inc. | 65,520,877 |
633,206 | CSW Industrials, Inc. | 80,163,880 |
145,684,757 | ||
Capital Markets 1.8% | ||
829,603 | Artisan Partners Asset Management, Inc. Class A | 28,007,397 |
505,200 | Hamilton Lane, Inc. Class A | 35,151,816 |
740,828 | Houlihan Lokey, Inc. | 58,154,998 |
236,366 | MarketAxess Holdings, Inc. | 58,758,224 |
180,072,435 | ||
Chemicals 1.5% | ||
544,874 | Chase Corp.(a) | 48,036,092 |
572,471 | Quaker Chemical Corp. | 99,793,145 |
147,829,237 | ||
Number of Shares | Value | |
Commercial Services & Supplies 3.2% | ||
3,096,022 | Driven Brands Holdings, Inc.* | $ 97,307,971 |
3,544,038 | IAA, Inc.* | 132,050,856 |
2,726,054 | Rollins, Inc. | 92,031,583 |
321,390,410 | ||
Communications Equipment 1.2% | ||
3,668,182 | NetScout Systems, Inc.*(a) | 116,428,097 |
Construction & Engineering 1.8% | ||
633,729 | Valmont Industries, Inc. | 175,428,862 |
Construction Materials 1.2% | ||
975,719 | Eagle Materials, Inc. | 116,715,507 |
Containers & Packaging 1.2% | ||
825,977 | AptarGroup, Inc. | 84,918,695 |
426,336 | UFP Technologies, Inc.*(a) | 39,644,985 |
124,563,680 | ||
Distributors 2.5% | ||
735,821 | Pool Corp. | 249,583,125 |
Diversified Consumer Services 0.5% | ||
739,881 | Bright Horizons Family Solutions, Inc.* | 50,459,884 |
Electronic Equipment, Instruments & Components 4.1% | ||
633,318 | Littelfuse, Inc. | 150,235,696 |
1,342,764 | National Instruments Corp. | 53,388,297 |
1,068,964 | Novanta, Inc.* | 142,909,797 |
207,772 | Zebra Technologies Corp. Class A* | 62,672,346 |
409,206,136 | ||
Food & Staples Retailing 0.6% | ||
1,517,957 | Grocery Outlet Holding Corp.* | 60,900,435 |
Food Products 0.3% | ||
2,067,030 | Utz Brands, Inc. | 34,436,720 |
Health Care Equipment & Supplies 5.2% | ||
132,387 | Atrion Corp.(a) | 79,955,129 |
2,122,644 | Haemonetics Corp.* | 159,261,979 |
169,624 | IDEXX Laboratories, Inc.* | 58,964,695 |
1,520,877 | Neogen Corp.* | 31,786,329 |
622,111 | West Pharmaceutical Services, Inc. | 184,574,113 |
514,542,245 | ||
See Notes to Financial Statements
101
Schedule of Investments Genesis Fund^ (cont’d)
Number of Shares | Value | |
Health Care Providers & Services 1.7% | ||
345,569 | Chemed Corp. | $164,556,502 |
Health Care Technology 0.8% | ||
892,831 | Certara, Inc.* | 13,990,662 |
1,073,569 | Simulations Plus, Inc.(a) | 64,467,818 |
78,458,480 | ||
Hotels, Restaurants & Leisure 1.0% | ||
1,110,530 | Texas Roadhouse, Inc. | 98,570,643 |
Household Products 1.8% | ||
959,391 | Church & Dwight Co., Inc. | 80,310,621 |
535,289 | WD-40 Co. | 101,255,267 |
181,565,888 | ||
Insurance 1.6% | ||
919,529 | AMERISAFE, Inc. | 43,971,877 |
1,046,785 | RLI Corp. | 114,895,121 |
158,866,998 | ||
IT Services 1.2% | ||
606,991 | Jack Henry & Associates, Inc. | 116,663,670 |
Leisure Products 0.6% | ||
5,813,162 | Hayward Holdings, Inc.* | 61,096,333 |
Life Sciences Tools & Services 3.0% | ||
662,407 | Bio-Techne Corp. | 219,793,267 |
376,504 | ICON PLC* | 79,001,834 |
298,795,101 | ||
Machinery 7.5% | ||
1,265,509 | Graco, Inc. | 80,790,095 |
1,958,683 | Hillman Solutions Corp.* | 16,433,350 |
538,204 | Kadant, Inc. | 96,569,944 |
523,169 | Lindsay Corp. | 83,895,381 |
452,166 | Nordson Corp. | 102,718,550 |
310,341 | Omega Flex, Inc. | 31,350,648 |
901,986 | RBC Bearings, Inc.* | 217,089,990 |
1,475,180 | Toro Co. | 122,336,677 |
751,184,635 | ||
Marine 1.1% | ||
1,631,124 | Kirby Corp.* | 109,383,175 |
Media 3.9% | ||
66,020 | Cable One, Inc. | 74,932,700 |
1,266,647 | Nexstar Media Group, Inc. Class A | 242,334,904 |
Number of Shares | Value | |
Media – cont'd | ||
1,141,968 | TechTarget, Inc.* | $ 74,113,723 |
391,381,327 | ||
Oil, Gas & Consumable Fuels 2.3% | ||
1,241,453 | Matador Resources Co. | 73,990,599 |
8,870,323 | Southwestern Energy Co.* | 66,438,719 |
46,262 | Texas Pacific Land Corp. | 85,143,361 |
225,572,679 | ||
Professional Services 4.3% | ||
1,837,401 | Exponent, Inc. | 172,458,458 |
822,837 | FTI Consulting, Inc.* | 132,147,622 |
945,552 | Tetra Tech, Inc. | 128,415,417 |
433,021,497 | ||
Real Estate Management & Development 1.3% | ||
1,043,928 | FirstService Corp. | 130,564,075 |
Semiconductors & Semiconductor Equipment 5.6% | ||
669,315 | Advanced Energy Industries, Inc. | 60,097,794 |
1,393,057 | FormFactor, Inc.* | 40,788,709 |
3,343,984 | Lattice Semiconductor Corp.* | 180,240,738 |
1,100,078 | MKS Instruments, Inc. | 109,578,769 |
2,303,667 | Power Integrations, Inc. | 164,781,300 |
555,487,310 | ||
Software 12.0% | ||
828,409 | Altair Engineering, Inc. Class A* | 43,085,552 |
2,059,740 | American Software, Inc. Class A(a) | 34,871,398 |
634,427 | Aspen Technology, Inc.* | 133,610,326 |
1,580,676 | Definitive Healthcare Corp.* | 31,739,974 |
378,773 | Fair Isaac Corp.* | 170,220,586 |
1,550,515 | Manhattan Associates, Inc.* | 219,025,749 |
2,112,106 | Model N, Inc.*(a) | 63,151,970 |
1,383,307 | Qualys, Inc.* | 210,124,333 |
1,315,692 | SPS Commerce, Inc.* | 160,672,307 |
262,323 | Tyler Technologies, Inc.* | 97,455,618 |
2,456,133 | Vertex, Inc. Class A*(a) | 33,599,900 |
1,197,557,713 | ||
Specialty Retail 4.1% | ||
781,536 | Asbury Automotive Group, Inc.* | 136,362,401 |
1,062,593 | Floor & Decor Holdings, Inc. Class A* | 86,452,566 |
281,840 | Lithia Motors, Inc. | 74,811,610 |
2,438,223 | Petco Health & Wellness Co., Inc.* | 36,378,287 |
See Notes to Financial Statements
102
Schedule of Investments Genesis Fund^ (cont’d)
Number of Shares | Value | |
Specialty Retail – cont'd | ||
382,953 | Tractor Supply Co. | $ 70,903,748 |
404,908,612 | ||
Trading Companies & Distributors 2.3% | ||
1,614,800 | Richelieu Hardware Ltd. | 43,082,864 |
446,507 | SiteOne Landscape Supply, Inc.* | 55,884,816 |
486,244 | Transcat, Inc.*(a) | 36,025,818 |
330,094 | Watsco, Inc. | 89,795,471 |
224,788,969 | ||
Total Common Stocks (Cost $5,322,053,279) | 9,742,020,339 | |
Short-Term Investments 2.2% | ||
Investment Companies 2.2% | ||
5,638,532 | State Street Institutional Treasury Money Market Fund Premier Class, 2.10%(b) | 5,638,532 |
Number of Shares | Value | |
Investment Companies – cont'd | ||
208,851,458 | State Street Institutional Treasury Plus Money Market Fund Premier Class, 2.25%(b) | $ 208,851,458 |
Total Short-Term Investments (Cost $214,489,990) | 214,489,990 | |
Total Investments 100.1% (Cost $5,536,543,269) | 9,956,510,329 | |
Liabilities Less Other Assets (0.1)% | (7,385,680) | |
Net Assets 100.0% | $9,949,124,649 | |
* | Non-income producing security. |
(a) | Affiliated company (see Note A of the Notes to Financial Statements). |
(b) | Represents 7-day effective yield as of August 31, 2022. |
The following is a summary, categorized by Level (see Note A of the Notes to Financial Statements), of inputs used to value the Fund’s investments as of August 31, 2022:
Asset Valuation Inputs | Level 1 | Level 2 | Level 3 | Total |
Investments: | ||||
Common Stocks | ||||
Biotechnology | $— | $34,435,408 | $— | $34,435,408 |
Other Common Stocks# | 9,707,584,931 | — | — | 9,707,584,931 |
Total Common Stocks | 9,707,584,931 | 34,435,408 | — | 9,742,020,339 |
Short-Term Investments | — | 214,489,990 | — | 214,489,990 |
Total Investments | $9,707,584,931 | $248,925,398 | $— | $9,956,510,329 |
# | The Schedule of Investments provides information on the industry or sector categorization. |
^
A balance indicated with a “—”, reflects either a zero balance or an amount that rounds to less than 1.
See Notes to Financial Statements
103
Schedule of Investments Global Real Estate Fund^
August 31, 2022
August 31, 2022
Number of Shares | Value | |
Common Stocks 99.3% | ||
Australia 4.8% | ||
18,252 | Charter Hall Long Wale REIT | $ 55,334 |
24,710 | Charter Hall Retail REIT | 68,702 |
20,318 | Shopping Centres Australasia Property Group | 37,527 |
161,563 | ||
Canada 5.0% | ||
672 | Brookfield Asset Management, Inc. Class A | 32,327 |
845 | Canadian Apartment Properties REIT | 28,740 |
3,446 | RioCan REIT | 52,818 |
3,810 | Summit Industrial Income REIT | 53,436 |
167,321 | ||
France 0.9% | ||
314 | ARGAN SA | 28,731 |
Germany 0.6% | ||
746 | Vonovia SE | 20,195 |
Hong Kong 5.9% | ||
15,500 | CK Asset Holdings Ltd. | 104,621 |
7,769 | Sun Hung Kai Properties Ltd. | 91,272 |
195,893 | ||
Japan 9.6% | ||
57 | LaSalle Logiport REIT | 70,431 |
5,000 | Mitsubishi Estate Co. Ltd. | 67,334 |
5,400 | Mitsui Fudosan Co. Ltd. | 109,299 |
19 | Mitsui Fudosan Logistics Park, Inc. | 74,429 |
321,493 | ||
Singapore 4.1% | ||
26,400 | Mapletree Pan Asia Commercial Trust | 34,716 |
20,500 | UOL Group Ltd. | 101,430 |
136,146 | ||
Spain 1.5% | ||
1,265 | Cellnex Telecom SA(a) | 49,263 |
United Kingdom 8.2% | ||
4,348 | Land Securities Group PLC | 32,794 |
7,566 | Safestore Holdings PLC | 96,858 |
4,595 | Segro PLC | 50,145 |
7,833 | UNITE Group PLC | 95,500 |
275,297 | ||
Number of Shares | Value | |
United States 58.7% | ||
119 | Alexandria Real Estate Equities, Inc. | $ 18,255 |
843 | American Homes 4 Rent Class A | 29,977 |
776 | American Tower Corp. | 197,143 |
1,312 | Apartment Income REIT Corp. | 53,595 |
431 | Boston Properties, Inc. | 34,234 |
759 | Crown Castle, Inc. | 129,660 |
656 | Digital Realty Trust, Inc. | 81,101 |
1,413 | Duke Realty Corp. | 83,155 |
93 | Equinix, Inc. | 61,135 |
713 | Equity LifeStyle Properties, Inc. | 49,981 |
1,320 | Equity Residential | 96,598 |
244 | Essex Property Trust, Inc. | 64,675 |
321 | Extra Space Storage, Inc. | 63,792 |
1,174 | Invitation Homes, Inc. | 42,593 |
730 | Iron Mountain, Inc. | 38,405 |
2,979 | Kimco Realty Corp. | 62,797 |
1,192 | Prologis, Inc. | 148,416 |
363 | Public Storage | 120,091 |
796 | Realty Income Corp. | 54,351 |
1,081 | Retail Opportunity Investments Corp. | 18,107 |
546 | Rexford Industrial Realty, Inc. | 33,967 |
191 | SBA Communications Corp. | 62,123 |
623 | Simon Property Group, Inc. | 63,534 |
879 | Spirit Realty Capital, Inc. | 35,907 |
303 | Sun Communities, Inc. | 46,574 |
1,630 | Ventas, Inc. | 78,012 |
1,840 | VICI Properties, Inc. | 60,702 |
1,270 | Welltower, Inc. | 97,345 |
932 | Weyerhaeuser Co. | 31,837 |
1,958,062 | ||
Total Common Stocks (Cost $3,697,289) | 3,313,964 | |
Short-Term Investments 1.6% | ||
Investment Companies 1.6% | ||
52,250 | State Street Institutional U.S. Government Money Market Fund Premier Class, 2.25%(b) (Cost $52,250) | 52,250 |
Total Investments 100.9% (Cost $3,749,539) | 3,366,214 | |
Liabilities Less Other Assets (0.9)% | (28,465) | |
Net Assets 100.0% | $3,337,749 | |
(a) | Security exempt from registration pursuant to Regulation S under the Securities Act of 1933, as amended. Regulation S applies to securities offerings that are made outside of the United States and do not involve directed selling efforts in the United States and as such may have restrictions on resale. Total value of all such securities at August 31, 2022 amounted to $49,263, which represents 1.5% of net assets of the Fund. |
See Notes to Financial Statements
104
Schedule of Investments Global Real Estate Fund^ (cont’d)
(b) | Represents 7-day effective yield as of August 31, 2022. |
POSITIONS BY SECTOR | ||
Sector | Investments at Value | Percentage of Net Assets |
Specialty REITs | $1,177,196 | 35.3% |
Real Estate Holding & Development | 526,478 | 15.8% |
Industrial & Office REITs | 524,768 | 15.7% |
Residential REITs | 508,233 | 15.2% |
Retail REITs | 428,459 | 12.8% |
Diversified REITs | 88,128 | 2.7% |
Hotel & Lodging REITs | 60,702 | 1.8% |
Short-Term Investments and Other Liabilities-Net | 23,785 | 0.7% |
Total | $3,337,749 | 100.0% |
The following is a summary, categorized by Level (see Note A of the Notes to Financial Statements), of inputs used to value the Fund’s investments as of August 31, 2022:
Asset Valuation Inputs | Level 1 | Level 2 | Level 3 | Total |
Investments: | ||||
Common Stocks | ||||
Australia | $— | $161,563 | $— | $161,563 |
France | — | 28,731 | — | 28,731 |
Germany | — | 20,195 | — | 20,195 |
Hong Kong | — | 195,893 | — | 195,893 |
Japan | — | 321,493 | — | 321,493 |
Singapore | — | 136,146 | — | 136,146 |
Spain | — | 49,263 | — | 49,263 |
United Kingdom | — | 275,297 | — | 275,297 |
Other Common Stocks# | 2,125,383 | — | — | 2,125,383 |
Total Common Stocks | 2,125,383 | 1,188,581 | — | 3,313,964 |
Short-Term Investments | — | 52,250 | — | 52,250 |
Total Investments | $2,125,383 | $1,240,831 | $— | $3,366,214 |
# | The Schedule of Investments provides a geographic categorization as well as a Positions by Sector summary. |
^
A balance indicated with a “—”, reflects either a zero balance or an amount that rounds to less than 1.
See Notes to Financial Statements
105
Schedule of Investments Greater China Equity Fund^
August 31, 2022
August 31, 2022
Number of Shares | Value | |
Common Stocks 96.8% | ||
Air Freight & Logistics 4.9% | ||
28,037 | Milkyway Chemical Supply Chain Service Co. Ltd. Class A | $ 518,429 |
45,152 | ZTO Express Cayman, Inc. ADR | 1,176,210 |
1,694,639 | ||
Banks 4.5% | ||
302,000 | China Merchants Bank Co. Ltd. H Shares | 1,544,461 |
Beverages 5.3% | ||
262,000 | China Resources Beer Holdings Co. Ltd. | 1,826,407 |
Biotechnology 2.5% | ||
263,666 | Akeso, Inc.*(a) | 844,132 |
Chemicals 20.8% | ||
465,500 | Jiangsu Eastern Shenghong Co. Ltd. Class A | 1,293,063 |
447,971 | Satellite Chemical Co. Ltd. Class A | 1,420,154 |
154,300 | Shandong Hualu Hengsheng Chemical Co. Ltd. Class A | 651,201 |
172,000 | Wanhua Chemical Group Co. Ltd. Class A | 2,201,582 |
56,000 | Yunnan Energy New Material Co. Ltd. Class A | 1,561,982 |
7,127,982 | ||
Construction Materials 2.3% | ||
848,000 | China National Building Material Co. Ltd. H Shares | 800,741 |
Electrical Equipment 2.3% | ||
146,600 | JL Mag Rare-Earth Co. Ltd. Class A | 787,313 |
Electronic Equipment, Instruments & Components 5.2% | ||
265,000 | Luxshare Precision Industry Co. Ltd. Class A | 1,434,694 |
97,017 | Shenzhen Sunlord Electronics Co. Ltd. Class A | 348,810 |
1,783,504 | ||
Food Products 6.6% | ||
435,000 | Inner Mongolia Yili Industrial Group Co. Ltd. Class A | 2,251,121 |
Household Durables 11.1% | ||
20,800 | Chervon Holdings Ltd. | 91,204 |
Number of Shares | Value | |
Household Durables – cont'd | ||
500,000 | Haier Smart Home Co. Ltd. H Shares | $ 1,633,499 |
544,000 | Man Wah Holdings Ltd. | 429,897 |
214,013 | Midea Group Co. Ltd. Class A | 1,641,980 |
3,796,580 | ||
Insurance 3.0% | ||
493,000 | China Pacific Insurance Group Co. Ltd. H Shares | 1,044,330 |
Interactive Media & Services 4.0% | ||
33,000 | Tencent Holdings Ltd. | 1,363,915 |
Internet & Direct Marketing Retail 8.0% | ||
161,000 | Alibaba Group Holding Ltd.* | 1,920,817 |
25,709 | JD.com, Inc. Class A | 813,822 |
2,734,639 | ||
Machinery 4.0% | ||
50,000 | Shenzhen Inovance Technology Co. Ltd. Class A | 433,074 |
1,135,050 | Zoomlion Heavy Industry Science and Technology Co. Ltd. Class A | 945,791 |
1,378,865 | ||
Marine 1.1% | ||
150,000 | SITC International Holdings Co. Ltd. | 380,375 |
Pharmaceuticals 3.2% | ||
1,070,000 | CSPC Pharmaceutical Group Ltd. | 1,085,433 |
Real Estate Management & Development 3.1% | ||
258,000 | China Resources Land Ltd. | 1,056,316 |
Software 1.5% | ||
20,000 | Beijing Kingsoft Office Software, Inc. Class A | 520,310 |
Specialty Retail 2.9% | ||
1,424,000 | China Yongda Automobiles Services Holdings Ltd. | 1,004,307 |
Textiles, Apparel & Luxury Goods 0.5% | ||
20,000 | Li Ning Co. Ltd. | 182,166 |
Total Common Stocks (Cost $42,300,970) | 33,207,536 | |
See Notes to Financial Statements
106
Schedule of Investments Greater China Equity Fund^ (cont’d)
Number of Shares | Value | |
Short-Term Investments 0.1% | ||
Investment Companies 0.1% | ||
43,476 | State Street Institutional U.S. Government Money Market Fund Premier Class, 2.25%(b) (Cost $43,476) | $43,476 |
Total Investments 96.9% (Cost $42,344,446) | 33,251,012 | |
Other Assets Less Liabilities 3.1% | 1,063,741 | |
Net Assets 100.0% | $34,314,753 | |
* | Non-income producing security. |
(a) | Security exempt from registration pursuant to Regulation S under the Securities Act of 1933, as amended. Regulation S applies to securities offerings that are made outside of the United States and do not involve directed selling efforts in the United States and as such may have restrictions on resale. Total value of all such securities at August 31, 2022 amounted to $844,132, which represents 2.5% of net assets of the Fund. |
(b) | Represents 7-day effective yield as of August 31, 2022. |
See Notes to Financial Statements
107
Schedule of Investments Greater China Equity Fund^ (cont’d)
The following is a summary, categorized by Level (see Note A of the Notes to Financial Statements), of inputs used to value the Fund’s investments as of August 31, 2022:
Asset Valuation Inputs | Level 1 | Level 2 | Level 3 | Total |
Investments: | ||||
Common Stocks | ||||
Air Freight & Logistics | $1,176,210 | $518,429 | $— | $1,694,639 |
Banks | — | 1,544,461 | — | 1,544,461 |
Beverages | — | 1,826,407 | — | 1,826,407 |
Biotechnology | — | 844,132 | — | 844,132 |
Chemicals | — | 7,127,982 | — | 7,127,982 |
Construction Materials | — | 800,741 | — | 800,741 |
Electrical Equipment | — | 787,313 | — | 787,313 |
Electronic Equipment, Instruments & Components | — | 1,783,504 | — | 1,783,504 |
Food Products | — | 2,251,121 | — | 2,251,121 |
Household Durables | — | 3,796,580 | — | 3,796,580 |
Insurance | — | 1,044,330 | — | 1,044,330 |
Interactive Media & Services | — | 1,363,915 | — | 1,363,915 |
Internet & Direct Marketing Retail | — | 2,734,639 | — | 2,734,639 |
Machinery | — | 1,378,865 | — | 1,378,865 |
Marine | — | 380,375 | — | 380,375 |
Pharmaceuticals | — | 1,085,433 | — | 1,085,433 |
Real Estate Management & Development | — | 1,056,316 | — | 1,056,316 |
Software | — | 520,310 | — | 520,310 |
Specialty Retail | — | 1,004,307 | — | 1,004,307 |
Textiles, Apparel & Luxury Goods | — | 182,166 | — | 182,166 |
Total Common Stocks | 1,176,210 | 32,031,326 | — | 33,207,536 |
Short-Term Investments | — | 43,476 | — | 43,476 |
Total Investments | $1,176,210 | $32,074,802 | $— | $33,251,012 |
^
A balance indicated with a “—”, reflects either a zero balance or an amount that rounds to less than 1.
See Notes to Financial Statements
108
Schedule of Investments International Equity Fund^
August 31, 2022
August 31, 2022
Number of Shares | Value | |
Common Stocks 98.5% | ||
Austria 1.3% | ||
315,460 | BAWAG Group AG*(a) | $14,232,965 |
Belgium 0.6% | ||
346,490 | Azelis Group NV | 6,866,608 |
Canada 3.2% | ||
492,683 | Cenovus Energy, Inc. | 9,242,733 |
496,526 | MEG Energy Corp.* | 6,941,194 |
637,890 | Softchoice Corp.(b) | 8,922,252 |
171,665 | Toronto-Dominion Bank | 11,043,496 |
36,149,675 | ||
China 0.7% | ||
726,500 | Shenzhou International Group Holdings Ltd. | 7,592,874 |
Finland 1.4% | ||
1,655,131 | Nordea Bank Abp | 15,346,119 |
France 8.9% | ||
65,717 | Air Liquide SA | 8,235,185 |
674,571 | Bureau Veritas SA | 16,742,791 |
547,362 | Exclusive Networks SA | 9,494,236 |
27,450 | Kering SA | 13,773,105 |
128,669 | Pernod-Ricard SA | 23,609,268 |
50,496 | Teleperformance | 14,381,621 |
265,531 | TotalEnergies SE | 13,443,751 |
99,679,957 | ||
Germany 11.3% | ||
81,666 | adidas AG | 12,109,690 |
200,376 | Beiersdorf AG | 20,225,952 |
245,966 | Brenntag SE | 16,127,367 |
94,724 | Deutsche Boerse AG | 16,015,412 |
232,736 | HelloFresh SE* | 5,556,797 |
563,203 | QIAGEN NV* | 25,586,312 |
21,196 | SAP SE | 1,805,250 |
229,669 | SAP SE ADR | 19,572,392 |
182,361 | Stabilus SE | 9,327,497 |
126,326,669 | ||
Hong Kong 3.1% | ||
1,657,800 | AIA Group Ltd. | 15,950,086 |
1,542,800 | Techtronic Industries Co. Ltd. | 18,196,145 |
34,146,231 | ||
Ireland 4.6% | ||
235,627 | CRH PLC | 8,656,465 |
238,035 | Kerry Group PLC Class A | 24,546,581 |
527,699 | Smurfit Kappa Group PLC | 17,693,519 |
50,896,565 | ||
Number of Shares | Value | |
Italy 0.7% | ||
952,618 | Nexi SpA*(a) | $7,815,743 |
Japan 13.4% | ||
38,100 | Disco Corp. | 9,251,053 |
128,900 | Fujitsu Ltd. | 15,168,076 |
207,500 | Koito Manufacturing Co. Ltd. | 7,089,120 |
545,000 | Olympus Corp. | 11,606,994 |
377,300 | Otsuka Corp. | 12,195,820 |
976,700 | SCSK Corp. | 15,903,894 |
29,475 | SMC Corp. | 13,983,804 |
339,400 | Sony Group Corp. | 26,983,420 |
876,600 | TechnoPro Holdings, Inc. | 19,718,073 |
356,100 | Terumo Corp. | 11,431,402 |
18,100 | Tokyo Electron Ltd. | 5,676,828 |
149,008,484 | ||
Netherlands 6.9% | ||
149,356 | AerCap Holdings NV* | 6,579,132 |
21,684 | ASML Holding NV | 10,584,293 |
189,626 | Heineken NV | 17,043,407 |
97,790 | Koninklijke DSM NV | 12,469,764 |
513,427 | Shell PLC | 13,589,406 |
837,540 | Universal Music Group NV | 16,631,827 |
76,897,829 | ||
Singapore 1.6% | ||
771,607 | DBS Group Holdings Ltd. | 17,965,700 |
Sweden 0.7% | ||
105,681 | Autoliv, Inc. | 8,220,925 |
Switzerland 11.5% | ||
231,834 | Julius Baer Group Ltd. | 11,202,145 |
15,668 | Lonza Group AG | 8,356,053 |
432,968 | Novartis AG | 35,021,925 |
114,603 | Roche Holding AG | 36,929,826 |
574,007 | SIG Group AG* | 13,458,812 |
35,390 | Sonova Holding AG | 9,324,330 |
879,562 | UBS Group AG | 13,938,170 |
128,231,261 | ||
United Kingdom 21.8% | ||
171,365 | AstraZeneca PLC | 21,196,538 |
798,210 | Bunzl PLC | 26,471,967 |
798,497 | Compass Group PLC | 17,176,512 |
227,528 | DCC PLC | 13,095,229 |
509,056 | Diageo PLC | 22,116,643 |
508,108 | Experian PLC | 15,418,775 |
346,842 | Fevertree Drinks PLC | 3,669,417 |
26,688,943 | Lloyds Banking Group PLC | 13,524,778 |
264,975 | London Stock Exchange Group PLC | 24,855,062 |
4,992,320 | Petershill Partners PLC(a) | 13,033,706 |
See Notes to Financial Statements
109
Schedule of Investments International Equity Fund^ (cont’d)
Number of Shares | Value | |
United Kingdom – cont'd | ||
1,190,709 | Prudential PLC | $ 12,496,685 |
928,471 | RELX PLC | 24,349,256 |
456,205 | Savills PLC | 5,010,248 |
1,042,124 | Smith & Nephew PLC | 12,258,232 |
483,359 | St. James's Place PLC | 6,186,967 |
531,257 | Travis Perkins PLC | 5,224,789 |
155,317 | Unilever PLC | 7,072,283 |
243,157,087 | ||
United States 6.8% | ||
83,819 | Aon PLC Class A | 23,407,294 |
113,637 | Ferguson PLC | 13,160,087 |
17,471 | ICON PLC* | 3,665,940 |
95,742 | Nestle SA | 11,204,009 |
291,257 | Schlumberger NV | 11,111,455 |
113,122 | Schneider Electric SE | 13,445,381 |
75,994,166 | ||
Total Common Stocks (Cost $1,196,501,540) | 1,098,528,858 | |
Number of Shares | Value | |
Short-Term Investments 3.1% | ||
Investment Companies 3.1% | ||
33,082,699 | State Street Institutional Treasury Money Market Fund Premier Class, 2.10%(c) | $ 33,082,699 |
876,392 | State Street Navigator Securities Lending Government Money Market Portfolio, 2.34%(c)(d) | 876,392 |
Total Short-Term Investments (Cost $33,959,091) | 33,959,091 | |
Total Investments 101.6% (Cost $1,230,460,631) | 1,132,487,949 | |
Liabilities Less Other Assets (1.6)% | (17,704,533) | |
Net Assets 100.0% | $1,114,783,416 | |
* | Non-income producing security. |
(a) | Security exempt from registration pursuant to Regulation S under the Securities Act of 1933, as amended. Regulation S applies to securities offerings that are made outside of the United States and do not involve directed selling efforts in the United States and as such may have restrictions on resale. Total value of all such securities at August 31, 2022 amounted to $35,082,414, which represents 3.1% of net assets of the Fund. |
(b) | All or a portion of this security is on loan at August 31, 2022. Total value of all such securities at August 31, 2022 amounted to $837,631 for the Fund (see Note A of the Notes to Financial Statements). |
(c) | Represents 7-day effective yield as of August 31, 2022. |
(d) | Represents investment of cash collateral received from securities lending. |
See Notes to Financial Statements
110
Schedule of Investments International Equity Fund^ (cont’d)
POSITIONS BY INDUSTRY | ||
Industry | Investments at Value | Percentage of Net Assets |
Pharmaceuticals | $93,148,289 | 8.4% |
Professional Services | 90,610,516 | 8.1% |
Capital Markets | 85,231,462 | 7.6% |
Trading Companies & Distributors | 74,429,950 | 6.7% |
Banks | 72,113,058 | 6.5% |
Beverages | 66,438,735 | 6.0% |
IT Services | 60,577,769 | 5.4% |
Insurance | 51,854,065 | 4.6% |
Health Care Equipment & Supplies | 44,620,958 | 4.0% |
Oil, Gas & Consumable Fuels | 43,217,084 | 3.9% |
Machinery | 41,507,446 | 3.7% |
Life Sciences Tools & Services | 37,608,305 | 3.4% |
Food Products | 35,750,590 | 3.2% |
Textiles, Apparel & Luxury Goods | 33,475,669 | 3.0% |
Containers & Packaging | 31,152,331 | 2.8% |
Personal Products | 27,298,235 | 2.4% |
Household Durables | 26,983,420 | 2.4% |
Semiconductors & Semiconductor Equipment | 25,512,174 | 2.3% |
Software | 21,377,642 | 1.9% |
Chemicals | 20,704,949 | 1.9% |
Hotels, Restaurants & Leisure | 17,176,512 | 1.5% |
Entertainment | 16,631,827 | 1.5% |
Auto Components | 15,310,045 | 1.4% |
Electrical Equipment | 13,445,381 | 1.2% |
Industrial Conglomerates | 13,095,229 | 1.2% |
Energy Equipment & Services | 11,111,455 | 1.0% |
Electronic Equipment, Instruments & Components | 8,922,252 | 0.8% |
Construction Materials | 8,656,465 | 0.8% |
Food & Staples Retailing | 5,556,797 | 0.5% |
Real Estate Management & Development | 5,010,248 | 0.4% |
Short-Term Investments and Other Liabilities—Net | 16,254,558 | 1.5% |
$1,114,783,416 | 100.0% | |
See Notes to Financial Statements
111
Schedule of Investments International Equity Fund^ (cont’d)
The following is a summary, categorized by Level (see Note A of the Notes to Financial Statements), of inputs used to value the Fund’s investments as of August 31, 2022:
Asset Valuation Inputs | Level 1 | Level 2 | Level 3 | Total |
Investments: | ||||
Common Stocks | ||||
Austria | $— | $14,232,965 | $— | $14,232,965 |
China | — | 7,592,874 | — | 7,592,874 |
Finland | — | 15,346,119 | — | 15,346,119 |
France | 9,494,236 | 90,185,721 | — | 99,679,957 |
Germany | 45,158,704 | 81,167,965 | — | 126,326,669 |
Hong Kong | — | 34,146,231 | — | 34,146,231 |
Ireland | — | 50,896,565 | — | 50,896,565 |
Italy | — | 7,815,743 | — | 7,815,743 |
Japan | — | 149,008,484 | — | 149,008,484 |
Netherlands | 6,579,132 | 70,318,697 | — | 76,897,829 |
Singapore | — | 17,965,700 | — | 17,965,700 |
Switzerland | — | 128,231,261 | — | 128,231,261 |
United Kingdom | — | 243,157,087 | — | 243,157,087 |
United States | 38,184,689 | 37,809,477 | — | 75,994,166 |
Other Common Stocks# | 51,237,208 | — | — | 51,237,208 |
Total Common Stocks | 150,653,969 | 947,874,889 | — | 1,098,528,858 |
Short-Term Investments | — | 33,959,091 | — | 33,959,091 |
Total Investments | $150,653,969 | $981,833,980 | $— | $1,132,487,949 |
# | The Schedule of Investments provides a geographic categorization as well as a Positions by Industry summary. |
^
A balance indicated with a “—”, reflects either a zero balance or an amount that rounds to less than 1.
See Notes to Financial Statements
112
Schedule of Investments International Select Fund^
August 31, 2022
August 31, 2022
Number of Shares | Value | |
Common Stocks 96.9% | ||
Austria 1.3% | ||
35,922 | BAWAG Group AG*(a) | $1,620,733 |
Canada 2.6% | ||
93,617 | Cenovus Energy, Inc. | 1,756,255 |
24,834 | Toronto-Dominion Bank | 1,597,613 |
3,353,868 | ||
China 0.9% | ||
105,800 | Shenzhou International Group Holdings Ltd. | 1,105,748 |
Finland 1.3% | ||
188,307 | Nordea Bank Abp | 1,745,953 |
France 8.1% | ||
7,387 | Air Liquide SA | 925,686 |
79,577 | Bureau Veritas SA | 1,975,094 |
3,176 | Kering SA | 1,593,566 |
14,647 | Pernod-Ricard SA | 2,687,555 |
6,309 | Teleperformance | 1,796,848 |
30,730 | TotalEnergies SE | 1,555,850 |
10,534,599 | ||
Germany 11.0% | ||
9,279 | adidas AG | 1,375,919 |
22,809 | Beiersdorf AG | 2,302,340 |
35,334 | Brenntag SE | 2,316,761 |
12,939 | Deutsche Boerse AG | 2,187,655 |
25,844 | HelloFresh SE* | 617,051 |
64,504 | QIAGEN NV* | 2,930,417 |
3,165 | SAP SE | 269,561 |
25,902 | SAP SE ADR | 2,207,368 |
14,207,072 | ||
Hong Kong 3.3% | ||
226,500 | AIA Group Ltd. | 2,179,210 |
182,100 | Techtronic Industries Co. Ltd. | 2,147,730 |
4,326,940 | ||
Ireland 4.3% | ||
37,062 | CRH PLC | 1,361,584 |
22,115 | Kerry Group PLC Class A | 2,280,537 |
59,261 | Smurfit Kappa Group PLC | 1,986,996 |
5,629,117 | ||
Italy 0.7% | ||
108,272 | Nexi SpA*(a) | 888,316 |
Japan 13.4% | ||
4,400 | Disco Corp. | 1,068,363 |
14,700 | Fujitsu Ltd. | 1,729,796 |
23,800 | Koito Manufacturing Co. Ltd. | 813,114 |
77,700 | Olympus Corp. | 1,654,795 |
Number of Shares | Value | |
Japan – cont'd | ||
42,700 | Otsuka Corp. | $ 1,380,232 |
111,200 | SCSK Corp. | 1,810,702 |
4,000 | SMC Corp. | 1,897,717 |
42,600 | Sony Group Corp. | 3,386,841 |
57,200 | TechnoPro Holdings, Inc. | 1,286,646 |
50,700 | Terumo Corp. | 1,627,554 |
2,100 | Tokyo Electron Ltd. | 658,638 |
17,314,398 | ||
Netherlands 6.7% | ||
16,537 | AerCap Holdings NV* | 728,455 |
2,104 | ASML Holding NV | 1,026,995 |
21,598 | Heineken NV | 1,941,208 |
11,101 | Koninklijke DSM NV | 1,415,552 |
58,448 | Shell PLC | 1,547,004 |
98,802 | Universal Music Group NV(b) | 1,962,005 |
8,621,219 | ||
Singapore 1.7% | ||
96,072 | DBS Group Holdings Ltd. | 2,236,891 |
Sweden 0.7% | ||
11,912 | Autoliv, Inc. | 926,634 |
Switzerland 12.4% | ||
29,658 | Julius Baer Group Ltd. | 1,433,065 |
1,813 | Lonza Group AG | 966,909 |
49,968 | Novartis AG | 4,041,813 |
14,966 | Roche Holding AG | 4,822,664 |
65,442 | SIG Group AG* | 1,534,426 |
5,039 | Sonova Holding AG | 1,327,643 |
120,228 | UBS Group AG | 1,905,219 |
16,031,739 | ||
United Kingdom 21.5% | ||
19,832 | AstraZeneca PLC | 2,453,067 |
100,118 | Bunzl PLC | 3,320,330 |
90,648 | Compass Group PLC | 1,949,934 |
25,830 | DCC PLC | 1,486,629 |
58,913 | Diageo PLC | 2,559,557 |
57,682 | Experian PLC | 1,750,387 |
52,056 | Fevertree Drinks PLC | 550,727 |
3,516,871 | Lloyds Banking Group PLC | 1,782,195 |
30,666 | London Stock Exchange Group PLC | 2,876,518 |
551,555 | Petershill Partners PLC(a) | 1,439,973 |
143,921 | Prudential PLC | 1,510,474 |
107,658 | RELX PLC | 2,823,343 |
118,628 | Smith & Nephew PLC | 1,395,390 |
35,676 | St. James's Place PLC | 456,651 |
78,629 | Travis Perkins PLC | 773,298 |
17,216 | Unilever PLC | 783,922 |
27,912,395 | ||
See Notes to Financial Statements
113
Schedule of Investments International Select Fund^ (cont’d)
Number of Shares | Value | |
United States 7.0% | ||
9,494 | Aon PLC Class A | $ 2,651,295 |
12,957 | Ferguson PLC | 1,500,526 |
2,021 | ICON PLC* | 424,066 |
11,080 | Nestle SA | 1,296,614 |
42,134 | Schlumberger NV | 1,607,412 |
13,797 | Schneider Electric SE | 1,639,875 |
9,119,788 | ||
Total Common Stocks (Cost $136,943,170) | 125,575,410 | |
Short-Term Investments 3.7% | ||
Investment Companies 3.7% | ||
4,803,042 | State Street Institutional Treasury Money Market Fund Premier Class, 2.10%(c) (Cost $4,803,042) | 4,803,042 |
Total Investments 100.6% (Cost $141,746,212) | 130,378,452 | |
Liabilities Less Other Assets (0.6)% | (797,706) | |
Net Assets 100.0% | $129,580,746 | |
* | Non-income producing security. |
(a) | Security exempt from registration pursuant to Regulation S under the Securities Act of 1933, as amended. Regulation S applies to securities offerings that are made outside of the United States and do not involve directed selling efforts in the United States and as such may have restrictions on resale. Total value of all such securities at August 31, 2022 amounted to $3,949,022, which represents 3.0% of net assets of the Fund. |
(b) | All or a portion of this security is on loan at August 31, 2022. Total value of all such securities at August 31, 2022 amounted to $614,192, collateralized by non-cash (U.S. Treasury Securities) collateral of $638,280 for the Fund (see Note A of the Notes to Financial Statements). |
(c) | Represents 7-day effective yield as of August 31, 2022. |
See Notes to Financial Statements
114
Schedule of Investments International Select Fund^ (cont’d)
POSITIONS BY INDUSTRY | ||
Industry | Investments at Value | Percentage of Net Assets |
Pharmaceuticals | $11,317,544 | 8.7% |
Capital Markets | 10,299,081 | 8.0% |
Professional Services | 9,632,318 | 7.4% |
Banks | 8,983,385 | 6.9% |
Trading Companies & Distributors | 8,639,370 | 6.7% |
Beverages | 7,739,047 | 6.0% |
Insurance | 6,340,979 | 4.9% |
Health Care Equipment & Supplies | 6,005,382 | 4.6% |
IT Services | 5,809,046 | 4.5% |
Oil, Gas & Consumable Fuels | 4,859,109 | 3.8% |
Life Sciences Tools & Services | 4,321,392 | 3.3% |
Textiles, Apparel & Luxury Goods | 4,075,233 | 3.1% |
Machinery | 4,045,447 | 3.1% |
Food Products | 3,577,151 | 2.8% |
Containers & Packaging | 3,521,422 | 2.7% |
Household Durables | 3,386,841 | 2.6% |
Personal Products | 3,086,262 | 2.4% |
Semiconductors & Semiconductor Equipment | 2,753,996 | 2.1% |
Software | 2,476,929 | 1.9% |
Chemicals | 2,341,238 | 1.8% |
Entertainment | 1,962,005 | 1.5% |
Hotels, Restaurants & Leisure | 1,949,934 | 1.5% |
Auto Components | 1,739,748 | 1.3% |
Electrical Equipment | 1,639,875 | 1.3% |
Energy Equipment & Services | 1,607,412 | 1.2% |
Industrial Conglomerates | 1,486,629 | 1.2% |
Construction Materials | 1,361,584 | 1.1% |
Food & Staples Retailing | 617,051 | 0.5% |
Short-Term Investments and Other Liabilities—Net | 4,005,336 | 3.1% |
$129,580,746 | 100.0% | |
See Notes to Financial Statements
115
Schedule of Investments International Select Fund^ (cont’d)
The following is a summary, categorized by Level (see Note A of the Notes to Financial Statements), of inputs used to value the Fund’s investments as of August 31, 2022:
Asset Valuation Inputs | Level 1 | Level 2 | Level 3 | Total |
Investments: | ||||
Common Stocks | ||||
Austria | $— | $1,620,733 | $— | $1,620,733 |
China | — | 1,105,748 | — | 1,105,748 |
Finland | — | 1,745,953 | — | 1,745,953 |
France | — | 10,534,599 | — | 10,534,599 |
Germany | 5,137,785 | 9,069,287 | — | 14,207,072 |
Hong Kong | — | 4,326,940 | — | 4,326,940 |
Ireland | — | 5,629,117 | — | 5,629,117 |
Italy | — | 888,316 | — | 888,316 |
Japan | — | 17,314,398 | — | 17,314,398 |
Netherlands | 728,455 | 7,892,764 | — | 8,621,219 |
Singapore | — | 2,236,891 | — | 2,236,891 |
Switzerland | — | 16,031,739 | — | 16,031,739 |
United Kingdom | — | 27,912,395 | — | 27,912,395 |
United States | 4,682,773 | 4,437,015 | — | 9,119,788 |
Other Common Stocks# | 4,280,502 | — | — | 4,280,502 |
Total Common Stocks | 14,829,515 | 110,745,895 | — | 125,575,410 |
Short-Term Investments | — | 4,803,042 | — | 4,803,042 |
Total Investments | $14,829,515 | $115,548,937 | $— | $130,378,452 |
# | The Schedule of Investments provides a geographic categorization as well as a Positions by Industry summary. |
^
A balance indicated with a “—”, reflects either a zero balance or an amount that rounds to less than 1.
See Notes to Financial Statements
116
Schedule of Investments International Small Cap Fund^
August 31, 2022
August 31, 2022
Number of Shares | Value | |
Common Stocks 91.8% | ||
Australia 4.2% | ||
1,578 | ARB Corp. Ltd. | $ 32,291 |
2,325 | Corporate Travel Management Ltd.* | 30,286 |
8,593 | Hansen Technologies Ltd. | 28,684 |
13,441 | Steadfast Group Ltd. | 46,002 |
137,263 | ||
Belgium 1.4% | ||
945 | Shurgard Self Storage SA | 45,619 |
Bermuda 0.8% | ||
826 | Bank of NT Butterfield & Son Ltd. | 26,944 |
Brazil 0.5% | ||
1,646 | ERO Copper Corp.*(a) | 15,616 |
Canada 2.8% | ||
368 | Colliers International Group, Inc. | 42,868 |
309 | Descartes Systems Group, Inc.* | 21,768 |
1,838 | Softchoice Corp.(a) | 25,708 |
90,344 | ||
Denmark 1.6% | ||
216 | Chemometec A/S | 23,107 |
380 | Schouw & Co. A/S | 27,709 |
50,816 | ||
Finland 1.0% | ||
2,668 | Kemira OYJ | 32,114 |
France 7.8% | ||
783 | Chargeurs SA | 11,733 |
1,581 | Exclusive Networks SA | 27,423 |
818 | Interparfums SA | 38,299 |
1,182 | Lectra | 38,538 |
1,869 | Lhyfe SAS* | 15,079 |
1,465 | Lumibird* | 30,342 |
278 | Sopra Steria Group | 38,374 |
1,181 | Tikehau Capital SCA(a) | 28,775 |
67 | Virbac SA | 24,839 |
253,402 | ||
Germany 3.2% | ||
383 | Dermapharm Holding SE | 17,765 |
1,114 | Jenoptik AG | 23,575 |
290 | Nexus AG | 14,536 |
561 | Stabilus SE | 28,694 |
521 | Washtec AG | 20,894 |
105,464 | ||
Ireland 0.9% | ||
8,739 | Uniphar PLC | 29,860 |
Italy 2.9% | ||
3,224 | BFF Bank SpA(b) | 20,408 |
Number of Shares | Value | |
Italy – cont'd | ||
1,221 | Carel Industries SpA(b) | $ 26,167 |
2,572 | GVS SpA*(b) | 23,218 |
2,084 | Intercos SpA* | 25,816 |
95,609 | ||
Japan 27.2% | ||
1,550 | Aeon Delight Co. Ltd.(a) | 31,684 |
1,600 | Amano Corp. | 29,598 |
900 | Ariake Japan Co. Ltd. | 30,612 |
500 | As One Corp. | 22,931 |
1,100 | Azbil Corp.(a) | 31,343 |
1,100 | CKD Corp.(a) | 14,472 |
1,500 | Idec Corp. | 31,338 |
1,600 | Kito Corp. | 31,035 |
1,700 | Konishi Co. Ltd. | 19,888 |
1,000 | Nagaileben Co. Ltd. | 13,984 |
1,500 | Nakanishi, Inc. | 29,086 |
1,900 | Nichias Corp. | 32,812 |
4,200 | Nihon Parkerizing Co. Ltd. | 28,908 |
2,000 | Nohmi Bosai Ltd. | 23,670 |
1,100 | NS Solutions Corp. | 29,924 |
7,100 | Prestige International, Inc. | 34,104 |
1,700 | Relo Group, Inc. | 27,327 |
1,300 | Roland Corp.* | 37,989 |
2,300 | Shinnihonseiyaku Co. Ltd.*(a) | 27,118 |
1,100 | SHO-BOND Holdings Co. Ltd. | 47,478 |
1,700 | Shoei Co. Ltd. | 67,363 |
2,100 | Simplex Holdings, Inc.* | 31,665 |
3,700 | Sun Frontier Fudousan Co. Ltd. | 31,921 |
1,800 | T Hasegawa Co. Ltd. | 38,855 |
4,700 | Tanseisha Co. Ltd. | 26,809 |
1,200 | TechnoPro Holdings, Inc. | 26,993 |
1,300 | TKC Corp. | 32,491 |
3,400 | YAMABIKO Corp. | 27,756 |
2,000 | Yellow Hat Ltd. | 25,822 |
884,976 | ||
Korea 3.4% | ||
470 | Dentium Co. Ltd. | 30,570 |
478 | Innocean Worldwide, Inc. | 15,114 |
693 | Kyung Dong Navien Co. Ltd. | 22,302 |
1,813 | NICE Information Service Co. Ltd. | 19,385 |
2,331 | Vitzrocell Co. Ltd. | 24,336 |
111,707 | ||
Netherlands 0.9% | ||
1,077 | Corbion NV | 30,581 |
Norway 3.1% | ||
8,067 | Aker Horizons ASA* | 14,461 |
7,030 | Aker Solutions ASA | 27,570 |
2,655 | Borregaard ASA | 40,493 |
See Notes to Financial Statements
117
Schedule of Investments International Small Cap Fund^ (cont’d)
Number of Shares | Value | |
Norway – cont'd | ||
9,354 | Elopak ASA(a) | $ 18,728 |
101,252 | ||
Singapore 1.1% | ||
4,600 | Haw Par Corp. Ltd. | 35,974 |
Spain 2.7% | ||
4,642 | Applus Services SA | 31,045 |
782 | Befesa SA(b) | 32,185 |
25,456 | Unicaja Banco SA(b) | 22,922 |
86,152 | ||
Sweden 5.3% | ||
945 | Biotage AB | 15,897 |
769 | Cellavision AB | 24,123 |
15,602 | Cloetta AB B Shares | 27,275 |
5,180 | Dustin Group AB(b) | 29,953 |
3,679 | Sweco AB Class B(a) | 34,682 |
1,065 | Thule Group AB(a)(b) | 25,978 |
813 | Xvivo Perfusion AB* | 14,186 |
172,094 | ||
Switzerland 8.5% | ||
91 | Belimo Holding AG | 34,519 |
154 | Bossard Holding AG Class A | 30,654 |
54 | Burckhardt Compression Holding AG | 22,613 |
29 | Inficon Holding AG | 20,217 |
10 | Interroll Holding AG | 22,864 |
135 | Kardex Holding AG | 23,670 |
140 | Komax Holding AG | 36,475 |
166 | Medacta Group SA(b) | 14,656 |
156 | Medartis Holding AG*(b) | 11,149 |
53 | Tecan Group AG | 19,502 |
490 | VZ Holding AG | 39,197 |
275,516 | ||
Taiwan 0.5% | ||
4,000 | Bioteque Corp. | 14,679 |
Number of Shares | Value | |
United Arab Emirates 0.3% | ||
3,639 | Network International Holdings PLC*(b) | $10,180 |
United Kingdom 11.7% | ||
10,241 | Biffa PLC(b) | 47,873 |
2,495 | Big Yellow Group PLC | 38,433 |
54,282 | Coats Group PLC | 37,833 |
1,437 | Diploma PLC | 41,808 |
1,237 | Future PLC | 22,325 |
380 | Games Workshop Group PLC | 31,291 |
2,454 | GB Group PLC | 12,703 |
454 | Genus PLC | 13,239 |
21,997 | Johnson Service Group PLC | 24,579 |
8,051 | On the Beach Group PLC*(b) | 11,951 |
6,475 | OSB Group PLC | 41,283 |
6,473 | Restore PLC | 32,870 |
1,208 | Victrex PLC | 24,503 |
380,691 | ||
Total Common Stocks (Cost $3,421,640) | 2,986,853 | |
Short-Term Investments 16.1% | ||
Investment Companies 16.1% | ||
379,700 | State Street Institutional Treasury Money Market Fund Premier Class, 2.10%(c) | 379,700 |
142,230 | State Street Navigator Securities Lending Government Money Market Portfolio, 2.34%(c)(d) | 142,230 |
Total Short-Term Investments (Cost $521,930) | 521,930 | |
Total Investments 107.9% (Cost $3,943,570) | 3,508,783 | |
Liabilities Less Other Assets (7.9)% | (256,288) | |
Net Assets 100.0% | $3,252,495 | |
* | Non-income producing security. |
(a) | All or a portion of this security is on loan at August 31, 2022. Total value of all such securities at August 31, 2022 amounted to $226,327, collateralized by cash collateral of $142,230 and non-cash (U.S. Treasury Securities) collateral of $98,271 for the Fund (see Note A of the Notes to Financial Statements). |
(b) | Security exempt from registration pursuant to Regulation S under the Securities Act of 1933, as amended. Regulation S applies to securities offerings that are made outside of the United States and do not involve directed selling efforts in the United States and as such may have restrictions on resale. Total value of all such securities at August 31, 2022 amounted to $276,640, which represents 8.5% of net assets of the Fund. |
(c) | Represents 7-day effective yield as of August 31, 2022. |
See Notes to Financial Statements
118
Schedule of Investments International Small Cap Fund^ (cont’d)
(d) | Represents investment of cash collateral received from securities lending. |
POSITIONS BY INDUSTRY | ||
Industry | Investments at Value | Percentage of Net Assets |
Machinery | $251,691 | 7.7% |
Commercial Services & Supplies | 217,756 | 6.7% |
Chemicals | 215,342 | 6.6% |
Electronic Equipment, Instruments & Components | 210,620 | 6.5% |
IT Services | 170,057 | 5.2% |
Health Care Equipment & Supplies | 152,433 | 4.7% |
Real Estate Management & Development | 147,735 | 4.5% |
Professional Services | 104,232 | 3.2% |
Software | 101,693 | 3.1% |
Auto Components | 99,654 | 3.1% |
Leisure Products | 95,258 | 2.9% |
Personal Products | 91,233 | 2.8% |
Building Products | 89,633 | 2.8% |
Food Products | 85,596 | 2.6% |
Construction & Engineering | 82,160 | 2.5% |
Pharmaceuticals | 78,578 | 2.4% |
Trading Companies & Distributors | 72,462 | 2.2% |
Capital Markets | 67,972 | 2.1% |
Life Sciences Tools & Services | 58,506 | 1.8% |
Electrical Equipment | 55,674 | 1.7% |
Health Care Providers & Services | 52,791 | 1.6% |
Banks | 49,866 | 1.5% |
Textiles, Apparel & Luxury Goods | 49,566 | 1.5% |
Insurance | 46,002 | 1.4% |
Internet & Direct Marketing Retail | 41,904 | 1.3% |
Thrifts & Mortgage Finance | 41,283 | 1.3% |
Equity Real Estate Investment Trusts | 38,433 | 1.2% |
Media | 37,439 | 1.2% |
Hotels, Restaurants & Leisure | 30,286 | 0.9% |
Energy Equipment & Services | 27,570 | 0.9% |
Specialty Retail | 25,822 | 0.8% |
Diversified Financial Services | 20,408 | 0.6% |
Containers & Packaging | 18,728 | 0.6% |
Metals & Mining | 15,616 | 0.5% |
Oil, Gas & Consumable Fuels | 15,079 | 0.5% |
Health Care Technology | 14,536 | 0.5% |
Biotechnology | 13,239 | 0.4% |
Short-Term Investments and Other Liabilities—Net | 265,642 | 8.2% |
$3,252,495 | 100.0% | |
See Notes to Financial Statements
119
Schedule of Investments International Small Cap Fund^ (cont’d)
The following is a summary, categorized by Level (see Note A of the Notes to Financial Statements), of inputs used to value the Fund’s investments as of August 31, 2022:
Asset Valuation Inputs | Level 1 | Level 2 | Level 3 | Total |
Investments: | ||||
Common Stocks | ||||
Australia | $— | $137,263 | $— | $137,263 |
Belgium | — | 45,619 | — | 45,619 |
Denmark | — | 50,816 | — | 50,816 |
Finland | — | 32,114 | — | 32,114 |
France | 42,502 | 210,900 | — | 253,402 |
Germany | — | 105,464 | — | 105,464 |
Italy | — | 95,609 | — | 95,609 |
Japan | — | 884,976 | — | 884,976 |
Korea | — | 111,707 | — | 111,707 |
Netherlands | — | 30,581 | — | 30,581 |
Norway | — | 101,252 | — | 101,252 |
Singapore | — | 35,974 | — | 35,974 |
Spain | 31,045 | 55,107 | — | 86,152 |
Sweden | 14,186 | 157,908 | — | 172,094 |
Switzerland | 14,656 | 260,860 | — | 275,516 |
Taiwan | — | 14,679 | — | 14,679 |
United Kingdom | 47,873 | 332,818 | — | 380,691 |
Other Common Stocks# | 172,944 | — | — | 172,944 |
Total Common Stocks | 323,206 | 2,663,647 | — | 2,986,853 |
Short-Term Investments | — | 521,930 | — | 521,930 |
Total Investments | $323,206 | $3,185,577 | $— | $3,508,783 |
# | The Schedule of Investments provides a geographic categorization as well as a Positions by Industry summary. |
^
A balance indicated with a “—”, reflects either a zero balance or an amount that rounds to less than 1.
See Notes to Financial Statements
120
Schedule of Investments Intrinsic Value Fund^
August 31, 2022
August 31, 2022
Number of Shares | Value | |
Common Stocks 90.8% | ||
Aerospace & Defense 0.9% | ||
154,313 | Mercury Systems, Inc.* | $ 7,427,085 |
164,101 | Spirit AeroSystems Holdings, Inc. Class A | 4,939,440 |
12,366,525 | ||
Banks 5.5% | ||
516,461 | BankUnited, Inc. | 19,134,880 |
256,750 | Comerica, Inc. | 20,617,025 |
1,341,410 | Huntington Bancshares, Inc. | 17,974,894 |
297,531 | Texas Capital Bancshares, Inc.* | 17,563,255 |
75,290,054 | ||
Biotechnology 0.4% | ||
247,289 | Emergent BioSolutions, Inc.* | 5,939,882 |
Building Products 2.2% | ||
1,454,173 | Resideo Technologies, Inc.* | 30,275,882 |
Commercial Services & Supplies 4.1% | ||
128,351 | Clean Harbors, Inc.* | 15,070,974 |
1,106,419 | Harsco Corp.* | 6,273,396 |
1,161,981 | KAR Auction Services, Inc.* | 16,964,923 |
371,480 | Stericycle, Inc.* | 18,607,433 |
56,916,726 | ||
Communications Equipment 6.7% | ||
656,246 | Ciena Corp.* | 33,297,922 |
726,145 | EMCORE Corp.* | 1,728,225 |
914,463 | Infinera Corp.* | 5,011,257 |
339,782 | Radware Ltd.* | 7,291,722 |
1,378,684 | Ribbon Communications, Inc.* | 4,839,181 |
4,387,276 | Ribbon Communications, Inc.*(a)(b)(f) | 14,434,138 |
424,469 | Viasat, Inc.* | 16,121,333 |
707,962 | Viavi Solutions, Inc.* | 9,968,105 |
92,691,883 | ||
Construction & Engineering 0.8% | ||
40,139 | Valmont Industries, Inc. | 11,111,278 |
Consumer Finance 0.3% | ||
121,085 | Bread Financial Holdings, Inc. | 4,653,297 |
Containers & Packaging 4.6% | ||
156,590 | Avery Dennison Corp. | 28,753,056 |
Number of Shares | Value | |
Containers & Packaging – cont'd | ||
377,038 | Crown Holdings, Inc. | $ 34,155,872 |
62,908,928 | ||
Electrical Equipment 2.2% | ||
2,175,375 | Babcock & Wilcox Enterprises, Inc.* | 17,359,493 |
523,379 | Bloom Energy Corp. Class A* | 13,299,060 |
30,658,553 | ||
Electronic Equipment, Instruments & Components 3.3% | ||
143,239 | II-VI, Inc.* | 6,765,178 |
1,084,071 | Innoviz Technologies Ltd.* | 5,442,036 |
243,896 | Itron, Inc.* | 11,604,572 |
201,044 | nLight, Inc.* | 2,511,040 |
95,858 | OSI Systems, Inc.* | 7,986,888 |
30,089 | Teledyne Technologies, Inc.* | 11,083,584 |
45,393,298 | ||
Energy Equipment & Services 2.1% | ||
278,140 | Dril-Quip, Inc.* | 6,155,238 |
877,224 | Oil States International, Inc.* | 4,298,398 |
287,222 | Patterson-UTI Energy, Inc. | 4,279,608 |
1,194,030 | TechnipFMC PLC* | 9,767,165 |
1,186,158 | TETRA Technologies, Inc.* | 4,720,909 |
29,221,318 | ||
Entertainment 1.6% | ||
2,339,216 | Lions Gate Entertainment Corp. Class B* | 21,824,885 |
Equity Real Estate Investment Trusts 1.1% | ||
423,582 | Chatham Lodging Trust* | 5,150,757 |
417,116 | RLJ Lodging Trust | 5,030,419 |
476,964 | Sunstone Hotel Investors, Inc. | 5,194,138 |
15,375,314 | ||
Food Products 1.7% | ||
339,277 | Hain Celestial Group, Inc.* | 6,873,752 |
348,040 | TreeHouse Foods, Inc.* | 16,218,664 |
23,092,416 | ||
Health Care Equipment & Supplies 4.2% | ||
1,813,070 | Accuray, Inc.* | 4,315,107 |
191,656 | AtriCure, Inc.* | 8,743,347 |
302,320 | Avanos Medical, Inc.* | 7,446,141 |
280,925 | Cardiovascular Systems, Inc.* | 3,711,019 |
495,051 | CytoSorbents Corp.* | 940,597 |
262,274 | Haemonetics Corp.* | 19,678,418 |
1,158,090 | OraSure Technologies, Inc.* | 4,736,588 |
See Notes to Financial Statements
121
Schedule of Investments Intrinsic Value Fund^ (cont’d)
Number of Shares | Value | |
Health Care Equipment & Supplies – cont'd | ||
358,396 | Varex Imaging Corp.* | $ 7,558,572 |
57,129,789 | ||
Health Care Providers & Services 4.3% | ||
363,774 | Acadia Healthcare Co., Inc.* | 29,804,004 |
66,156 | Molina Healthcare, Inc.* | 22,319,050 |
264,827 | Patterson Cos., Inc. | 7,386,025 |
59,509,079 | ||
Hotels, Restaurants & Leisure 2.4% | ||
1,372,184 | International Game Technology PLC | 24,616,981 |
164,927 | SeaWorld Entertainment, Inc.* | 8,287,582 |
32,904,563 | ||
Household Durables 0.8% | ||
455,600 | Tempur Sealy International, Inc. | 11,394,556 |
Independent Power and Renewable Electricity Producers 4.0% | ||
365,679 | Ormat Technologies, Inc. | 34,183,673 |
815,486 | Vistra Corp. | 20,183,278 |
54,366,951 | ||
Insurance 0.1% | ||
242,783 | eHealth, Inc.* | 1,553,811 |
IT Services 3.7% | ||
4,505,003 | Conduent, Inc.* | 18,425,462 |
1,242,741 | Kyndryl Holdings, Inc.* | 12,949,361 |
1,636,273 | Unisys Corp.* | 15,233,702 |
72,064 | Wix.com Ltd.* | 4,560,931 |
51,169,456 | ||
Life Sciences Tools & Services 1.2% | ||
72,568 | Charles River Laboratories International, Inc.* | 14,894,582 |
1,341,143 | Standard BioTools, Inc.* | 1,891,012 |
16,785,594 | ||
Machinery 0.8% | ||
352,812 | Enerpac Tool Group Corp. | 6,844,553 |
1,169,345 | Markforged Holding Corp.* | 2,841,508 |
115,661 | Twin Disc, Inc.* | 1,075,647 |
10,761,708 | ||
Media 2.6% | ||
1,300,753 | Criteo SA ADR* | 35,146,346 |
Number of Shares | Value | |
Metals & Mining 1.7% | ||
1,364,111 | Cleveland-Cliffs, Inc.* | $23,558,197 |
Oil, Gas & Consumable Fuels 4.1% | ||
666,479 | CNX Resources Corp.* | 11,776,684 |
635,560 | Devon Energy Corp. | 44,883,247 |
56,659,931 | ||
Pharmaceuticals 0.2% | ||
1,206,999 | Amneal Pharmaceuticals, Inc.* | 2,619,188 |
Professional Services 2.7% | ||
767,878 | KBR, Inc. | 37,088,507 |
Semiconductors & Semiconductor Equipment 6.8% | ||
187,587 | CEVA, Inc.* | 5,490,671 |
36,431 | Entegris, Inc. | 3,456,573 |
465,485 | MACOM Technology Solutions Holdings, Inc.* | 25,671,498 |
1,258,958 | Rambus, Inc.* | 32,468,527 |
1,222,834 | Veeco Instruments, Inc.* | 25,850,711 |
92,937,980 | ||
Software 7.7% | ||
491,691 | Box, Inc. Class A* | 12,661,043 |
228,438 | Cerence, Inc.* | 4,571,044 |
1,586,340 | Cognyte Software Ltd.* | 8,280,695 |
215,631 | New Relic, Inc.* | 13,090,958 |
534,822 | OneSpan, Inc.* | 6,155,801 |
593,278 | Ping Identity Holding Corp.* | 16,694,843 |
420,056 | Verint Systems, Inc.* | 20,368,516 |
1,503,225 | Xperi Holding Corp. | 23,916,310 |
105,739,210 | ||
Specialty Retail 2.7% | ||
347,416 | Caleres, Inc. | 8,866,056 |
781,655 | Chico's FAS, Inc.* | 4,439,801 |
153,994 | Children's Place, Inc.* | 6,495,467 |
466,147 | ODP Corp.* | 16,664,755 |
36,466,079 | ||
Technology Hardware, Storage & Peripherals 2.1% | ||
7,453,714 | Quantum Corp.* | 11,702,331 |
1,005,771 | Stratasys Ltd.* | 17,359,607 |
29,061,938 | ||
Trading Companies & Distributors 1.2% | ||
387,589 | AerCap Holdings NV* | 17,073,295 |
Total Common Stocks (Cost $1,159,476,333) | 1,249,646,417 | |
See Notes to Financial Statements
122
Schedule of Investments Intrinsic Value Fund^ (cont’d)
Principal Amount | Value | |
Convertible Bonds 1.4% | ||
Communications Equipment 1.3% | ||
$9,304,000 | Infinera Corp., 2.50, due 3/1/2027 | $ 9,055,304 |
7,500,000 | Infinera Corp., 3.75, due 8/1/2028(c) | 8,043,750 |
17,099,054 | ||
Energy Equipment & Services 0.1% | ||
3,150,000 | ION Geophysical Corp., 8.00%, due 12/15/2025(d) | 1,568,773 |
Total Convertible Bonds (Cost $19,954,000) | 18,667,827 | |
Number of Shares | Value | |
Short-Term Investments 8.4% | ||
Investment Companies 8.4% | ||
114,781,031 | State Street Institutional Treasury Money Market Fund Premier Class, 2.10%(e) (Cost $114,781,031) | $114,781,031 |
Total Investments 100.6% (Cost $1,294,211,364) | 1,383,095,275 | |
Liabilities Less Other Assets (0.6)% | (7,610,137) | |
Net Assets 100.0% | $1,375,485,138 | |
* | Non-income producing security. |
(a) | Security fair valued as of August 31, 2022 in accordance with procedures approved by the Board of Trustees. Total value of all such securities at August 31, 2022 amounted to $14,434,138, which represents 1.0% of net assets of the Fund. |
(b) | Security acquired via a PIPE transaction. |
(c) | Securities were purchased under Rule 144A of the Securities Act of 1933, as amended, or are otherwise restricted and, unless registered under the Securities Act of 1933 or exempted from registration, may only be sold to qualified institutional investors or may have other restrictions on resale. At August 31, 2022, these securities amounted to $8,043,750, which represents 0.6% of net assets of the Fund. |
(d) | Defaulted security. |
(e) | Represents 7-day effective yield as of August 31, 2022. |
(f) | This security has been deemed by the Management to be illiquid, and is subject to restrictions on resale. At August 31, 2022, this security amounted to $14,434,138, which represents 1.0% of net assets of the Fund. |
Restricted Security | Acquisition Date(s) | Acquisition Cost | Value as of 8/31/2022 | Fair Value Percentage of Net Assets as of 8/31/2022 |
Ribbon Communications, Inc. | 8/16/2022 | $13,381,192 | $14,434,138 | 1.0% |
See Notes to Financial Statements
123
Schedule of Investments Intrinsic Value Fund^ (cont’d)
The following is a summary, categorized by Level (see Note A of the Notes to Financial Statements), of inputs used to value the Fund’s investments as of August 31, 2022:
Asset Valuation Inputs | Level 1 | Level 2 | Level 3 | Total |
Investments: | ||||
Common Stocks | ||||
Communications Equipment | $78,257,745 | $14,434,138 | $— | $92,691,883 |
Other Common Stocks# | 1,156,954,534 | — | — | 1,156,954,534 |
Total Common Stocks | 1,235,212,279 | 14,434,138 | — | 1,249,646,417 |
Convertible Bonds# | — | 18,667,827 | — | 18,667,827 |
Short-Term Investments | — | 114,781,031 | — | 114,781,031 |
Total Investments | $1,235,212,279 | $147,882,996 | $— | $1,383,095,275 |
# | The Schedule of Investments provides information on the industry or sector categorization. |
^
A balance indicated with a “—”, reflects either a zero balance or an amount that rounds to less than 1.
See Notes to Financial Statements
124
Consolidated Schedule of Investments Large Cap Growth Fund†^
August 31, 2022
August 31, 2022
Number of Shares | Value | |
Common Stocks 93.9% | ||
Banks 1.3% | ||
198,399 | JPMorgan Chase & Co. | $22,563,918 |
Beverages 1.4% | ||
629,874 | Keurig Dr Pepper, Inc. | 24,010,797 |
Capital Markets 5.3% | ||
272,332 | Brookfield Asset Management, Inc. Class A | 13,101,892 |
166,298 | CME Group, Inc. | 32,529,552 |
128,448 | S&P Global, Inc. | 45,236,817 |
90,868,261 | ||
Commercial Services & Supplies 2.1% | ||
212,924 | Waste Management, Inc. | 35,990,544 |
Computers 0.1% | ||
90,909 | Arctic Wolf Networks, Inc.*#(a)(b) | 999,999 |
Containers & Packaging 0.8% | ||
72,003 | Avery Dennison Corp. | 13,221,191 |
Diversified Financial Services 1.6% | ||
492,049 | Apollo Global Management, Inc. | 27,348,083 |
Electric Utilities 1.9% | ||
389,276 | NextEra Energy, Inc. | 33,111,817 |
Electronic Equipment, Instruments & Components 3.1% | ||
194,757 | CDW Corp. | 33,245,020 |
162,403 | TE Connectivity Ltd. | 20,496,883 |
53,741,903 | ||
Entertainment 1.8% | ||
208,186 | Activision Blizzard, Inc. | 16,340,519 |
60,526 | Netflix, Inc.* | 13,531,193 |
29,871,712 | ||
Equity Real Estate Investment Trusts 1.4% | ||
75,938 | SBA Communications Corp. | 24,698,834 |
Food & Staples Retailing 2.9% | ||
66,211 | Costco Wholesale Corp. | 34,568,763 |
119,165 | Walmart, Inc. | 15,795,321 |
50,364,084 | ||
Number of Shares | Value | |
Health Care Equipment & Supplies 1.4% | ||
277,102 | Medtronic PLC | $24,362,808 |
Health Care Providers & Services 3.1% | ||
102,434 | UnitedHealth Group, Inc. | 53,197,049 |
Hotels, Restaurants & Leisure 2.3% | ||
109,538 | McDonald's Corp. | 27,634,247 |
647,631 | Sweetgreen, Inc. Class A*(c) | 10,951,440 |
38,585,687 | ||
Interactive Media & Services 8.6% | ||
868,799 | Alphabet, Inc. Class A* | 94,021,428 |
182,774 | Match Group, Inc.* | 10,332,214 |
262,912 | Meta Platforms, Inc. Class A* | 42,836,252 |
147,189,894 | ||
Internet & Direct Marketing Retail 5.8% | ||
717,645 | Amazon.com, Inc.* | 90,975,856 |
223,005 | Chewy, Inc. Class A*(c) | 7,655,762 |
98,631,618 | ||
IT Services 4.8% | ||
76,706 | Fidelity National Information Services, Inc. | 7,008,627 |
99,151 | MasterCard, Inc. Class A | 32,161,610 |
140,215 | Okta, Inc.* | 12,815,651 |
155,160 | Visa, Inc. Class A | 30,831,844 |
82,817,732 | ||
Life Sciences Tools & Services 2.5% | ||
76,744 | Thermo Fisher Scientific, Inc. | 41,850,038 |
Oil, Gas & Consumable Fuels 0.2% | ||
329 | Venture Global LNG, Inc.*#(a)(b) | 3,245,256 |
Pharmaceuticals 1.3% | ||
141,906 | Johnson & Johnson | 22,895,114 |
Professional Services 1.7% | ||
149,621 | Equifax, Inc. | 28,240,964 |
Road & Rail 2.1% | ||
176,301 | Uber Technologies, Inc.* | 5,070,417 |
135,166 | Union Pacific Corp. | 30,346,118 |
35,416,535 | ||
Semiconductors & Semiconductor Equipment 1.2% | ||
134,319 | Analog Devices, Inc. | 20,353,358 |
See Notes to Consolidated Financial Statements
125
Consolidated Schedule of Investments Large Cap Growth Fund†^ (cont’d)
Number of Shares | Value | |
Software 18.0% | ||
89,042 | Adobe, Inc.* | $ 33,251,844 |
64,426 | Atlassian Corp. PLC Class A* | 15,955,743 |
142,022 | DoubleVerify Holdings, Inc.* | 3,671,269 |
106,995 | Grammarly, Inc. Class A*#(a)(b) | 2,243,632 |
24,771 | Intuit, Inc. | 10,695,622 |
467,113 | Microsoft Corp. | 122,136,036 |
757,395 | Paycor HCM, Inc.* | 22,441,614 |
232,179 | salesforce, Inc.* | 36,247,785 |
91,450 | ServiceNow, Inc.* | 39,745,999 |
125,567 | Workday, Inc. Class A* | 20,663,306 |
307,052,850 | ||
Specialty Retail 8.8% | ||
1,297,807 | Fanatics Holdings, Inc. Class A*#(a)(b) | 88,043,227 |
106,644 | Home Depot, Inc. | 30,758,262 |
504,102 | TJX Cos., Inc. | 31,430,760 |
150,232,249 | ||
Technology Hardware, Storage & Peripherals 6.9% | ||
751,653 | Apple, Inc. | 118,174,885 |
Textiles, Apparel & Luxury Goods 1.5% | ||
243,078 | NIKE, Inc. Class B | 25,875,653 |
Total Common Stocks (Cost $1,110,184,751) | 1,604,912,833 | |
Preferred Stocks 1.2% | ||
Capital Markets 0.1% | ||
20,788 | Savage X, Inc., Ser. C*#(a)(b) | 1,000,028 |
Entertainment 0.1% | ||
8,256 | A24 Films LLC*#(a)(b)(d) | 940,028 |
IT Services 0.4% | ||
287,787 | Druva, Inc., Ser. 4*#(a)(b) | 2,697,370 |
461,441 | Druva, Inc., Ser. 5*#(a)(b) | 4,324,994 |
7,022,364 | ||
Software 0.2% | ||
33,179 | Grammarly, Inc., Ser. 3*#(a)(b) | 869,684 |
90,310 | Signifyd, Inc., Ser. Seed*#(a)(b) | 1,266,146 |
39,343 | Signifyd, Inc., Ser. A*#(a)(b) | 552,376 |
Number of Shares | Value | |
Software – cont'd | ||
82,373 | Videoamp, Inc., Ser. F1*#(a)(b) | $ 1,300,011 |
3,988,217 | ||
Textiles, Apparel & Luxury Goods 0.4% | ||
7,000 | Fabletics LLC, Ser. G*#(a)(b) | 7,000,000 |
Total Preferred Stocks (Cost $20,934,539) | 19,950,637 | |
Number of Units | ||
Master Limited Partnerships and Limited Partnerships 1.2% | ||
Oil, Gas & Consumable Fuels 1.2% | ||
801,108 | Enterprise Products Partners L.P. (Cost $19,791,090) | 21,085,162 |
Number of Shares | ||
Warrants 0.0%(e) | ||
Food Products 0.0%(e) | ||
142,005 | Whole Earth Brands, Inc. Expires 6/25/2025* (Cost $204,203) | 32,377 |
Short-Term Investments 4.4% | ||
Investment Companies 4.4% | ||
63,639,971 | State Street Institutional Treasury Money Market Fund Premier Class, 2.10%(f) | 63,639,971 |
11,418,040 | State Street Navigator Securities Lending Government Money Market Portfolio, 2.34%(f)(g) | 11,418,040 |
Total Short-Term Investments (Cost $75,058,011) | 75,058,011 | |
Total Investments 100.7% (Cost $1,226,172,594) | 1,721,039,020 | |
Liabilities Less Other Assets (0.7)% | (11,431,578) | |
Net Assets 100.0% | $1,709,607,442 | |
* | Non-income producing security. |
(a) | Value determined using significant unobservable inputs. |
See Notes to Consolidated Financial Statements
126
Consolidated Schedule of Investments Large Cap Growth Fund†^ (cont’d)
(b) | Security fair valued as of August 31, 2022 in accordance with procedures approved by the Board of Trustees. Total value of all such securities at August 31, 2022 amounted to $114,482,751, which represents 6.7% of net assets of the Fund. |
(c) | All or a portion of this security is on loan at August 31, 2022. Total value of all such securities at August 31, 2022 amounted to $10,487,008 for the Fund (see Note A of the Notes to Financial Statements). |
(d) | Security represented in Units. |
(e) | Represents less than 0.05% of net assets of the Fund. |
(f) | Represents 7-day effective yield as of August 31, 2022. |
(g) | Represents investment of cash collateral received from securities lending. |
#
These securities have been deemed by Management to be illiquid, and are subject to restrictions on resale. At August 31, 2022, these securities amounted to $114,482,751, which represents 6.7% of net assets of the Fund. Acquisition dates shown with a range, if any, represent securities that were acquired over the period shown in the table.
Restricted Security | Acquisition Date(s) | Acquisition Cost | Value as of 8/31/2022 | Fair Value Percentage of Net Assets as of 8/31/2022 |
A24 Films LLC (Preferred Units) | 2/25/2022 | $940,028 | $940,028 | 0.1% |
Arctic Wolf Networks, Inc. | 12/31/2021 | 999,999 | 999,999 | 0.1% |
Druva, Inc. (Ser. 4 Preferred Shares) | 6/14/2019 | 1,500,003 | 2,697,370 | 0.2% |
Druva, Inc. (Ser. 5 Preferred Shares) | 4/1/2021 | 4,325,000 | 4,324,994 | 0.2% |
Fabletics LLC (Ser. G Preferred Shares) | 1/10/2022 | 7,000,000 | 7,000,000 | 0.4% |
Fanatics Holdings, Inc. Class A | 8/13/2020 | 23,018,871 | 88,043,227 | 5.1% |
Grammarly, Inc. Class A | 12/23/2021 - 1/24/2022 | 2,804,542 | 2,243,632 | 0.1% |
Grammarly, Inc. (Ser. 3 Preferred Shares) | 12/23/2021 - 1/24/2022 | 869,685 | 869,684 | 0.0% |
Savage X, Inc. (Ser. C Preferred Shares) | 11/30/2021 | 1,000,028 | 1,000,028 | 0.1% |
Signifyd, Inc. (Ser. Seed Preferred Shares) | 5/27/2021 | 2,786,053 | 1,266,146 | 0.1% |
Signifyd, Inc. (Ser. A Preferred Shares) | 5/27/2021 | 1,213,732 | 552,376 | 0.0% |
Venture Global LNG, Inc. | 11/21/2018 | 2,303,000 | 3,245,256 | 0.2% |
Videoamp, Inc. (Ser. F1 Preferred Shares) | 1/4/2022 | 1,300,011 | 1,300,011 | 0.1% |
Total | $50,060,952 | $114,482,751 | 6.7% |
See Notes to Consolidated Financial Statements
127
Consolidated Schedule of Investments Large Cap Growth Fund†^ (cont’d)
Derivative Instruments
Purchased option contracts (“options purchased”)
At August 31, 2022, the Fund did not have any open positions in options purchased.
Written option contracts (“options written”)
At August 31, 2022, the Fund did not have any open positions in options written.
For the year ended August 31, 2022, the average market value for the months where the Fund had options purchased and options written outstanding was $599,263 and $(632,115), respectively.
The following is a summary, categorized by Level (see Note A of the Notes to Financial Statements), of inputs used to value the Fund’s investments as of August 31, 2022:
Asset Valuation Inputs | Level 1 | Level 2 | Level 3(a) | Total |
Investments: | ||||
Common Stocks | ||||
Computers | $— | $— | $999,999 | $999,999 |
Oil, Gas & Consumable Fuels | — | — | 3,245,256 | 3,245,256 |
Software | 304,809,218 | — | 2,243,632 | 307,052,850 |
Specialty Retail | 62,189,022 | — | 88,043,227 | 150,232,249 |
Other Common Stocks# | 1,143,382,479 | — | — | 1,143,382,479 |
Total Common Stocks | 1,510,380,719 | — | 94,532,114 | 1,604,912,833 |
Preferred Stocks# | — | — | 19,950,637 | 19,950,637 |
Master Limited Partnerships and Limited Partnerships# | 21,085,162 | — | — | 21,085,162 |
Warrants# | 32,377 | — | — | 32,377 |
Short-Term Investments | — | 75,058,011 | — | 75,058,011 |
Total Investments | $1,531,498,258 | $75,058,011 | $114,482,751 | $1,721,039,020 |
# | The Consolidated Schedule of Investments provides information on the industry or sector categorization. |
(a) | The following is a reconciliation between the beginning and ending balances of investments in which unobservable inputs (Level 3) were used in determining value: |
(000's omitted) | Beginning balance as of 9/1/2021 | Accrued discounts/ (premiums) | Realized gain/(loss) | Change in unrealized appreciation/ (depreciation) | Purchases | Sales | Transfers into Level 3 | Transfers out of Level 3 | Balance as of 8/31/2022 | Net change in unrealized appreciation/ (depreciation) from investments still held as of 8/31/2022 |
Investments in Securities: | ||||||||||
Common Stocks(1) | $71,853 | $— | $4,769 | $22,905 | $3,805 | $(6,400) | $— | $(2,400) | $94,532 | $24,135 |
Preferred Stocks(1) | 36,010 | — | — | (8,166) | 11,110 | — | — | (19,003) | 19,951 | (2,181) |
Warrants(2) | — | — | — | — | — | — | — | — | — | — |
Total | $107,863 | $— | $4,769 | $14,739 | $14,915 | $(6,400) | $— | $(21,403) | $114,483 | $21,954 |
See Notes to Consolidated Financial Statements
128
Consolidated Schedule of Investments Large Cap Growth Fund†^ (cont’d)
(1) Quantitative Information about Level 3 Fair Value Measurements: | ||||||
Investment type | Fair value at 8/31/2022 | Valuation approach | Unobservable input(s) | Input value/ range | Weighted average(a) | Impact to valuation from increase in input(b) |
Common Stocks | $89,043,226 | Market Approach | Transaction Price | $11.00 - $67.84 | $67.20 | Increase |
Common Stocks | 3,245,256 | Market Approach | Enterprise value/ EBITDA multiple(c) (EV/EBITDA) | 11.0x | 11.0x | Increase |
Common Stocks | 2,243,632 | Market Approach | Enterprise value/ Revenue multiple(c) (EV/Revenue) | 11.0x | 11.0x | Increase |
Liquidation Preference Discount | 20.0% | 20.0% | Decrease | |||
Preferred Stocks | 10,169,723 | Market Approach | Transaction Price | $15.78 - $1,000.00 | $697.31 | Increase |
Preferred Stocks | 8,840,886 | Market Approach | Enterprise value/ Revenue multiple(c) (EV/Revenue) | 4.7x - 11.0x | 9.7x | Increase |
Expected Volatility | 70.0% | 70.0% | Decrease | |||
Option Term (Years) | 2.5 | 2.5 | Decrease | |||
Discount Rate | 0.3% | 0.3% | Decrease | |||
Preferred Units | 940,028 | Market Approach | Transaction Price | $113.86 | $113.86 | Increase |
(a) The weighted averages disclosed in the table above were weighted by relative fair value. | ||||||
(b) Represents the expected directional change in the fair value of the Level 3 investments that would result from an increase or decrease in the corresponding input. Significant changes in these inputs could result in significantly higher or lower fair value measurements. | ||||||
(c) Represents amounts used when the reporting entity has determined that market participants would use such multiples when pricing the investments. | ||||||
(2) At the beginning of the period, these investments were valued in accordance with the procedures approved by the Board of Directors. The Fund no longer held these investments at August 31, 2022 and, therefore, disclosure of unobservable inputs used in formulating valuations is not presented. |
†
Formerly Guardian Fund through September 30, 2022.
^
A balance indicated with a “—”, reflects either a zero balance or an amount that rounds to less than 1.
See Notes to Consolidated Financial Statements
129
Schedule of Investments Large Cap Value Fund^
August 31, 2022
August 31, 2022
Number of Shares | Value | |
Common Stocks 94.3% | ||
Aerospace & Defense 4.3% | ||
414,486 | Lockheed Martin Corp. | $ 174,129,713 |
3,036,753 | Raytheon Technologies Corp. | 272,548,582 |
446,678,295 | ||
Airlines 1.8% | ||
2,915,791 | Delta Air Lines, Inc.* | 90,593,626 |
2,586,941 | United Airlines Holdings, Inc.* | 90,568,805 |
181,162,431 | ||
Banks 12.4% | ||
7,420,704 | Bank of America Corp. | 249,409,861 |
2,499,080 | Fifth Third Bancorp | 85,343,582 |
2,702,776 | JPMorgan Chase & Co. | 307,386,715 |
285,610 | M&T Bank Corp. | 51,918,186 |
1,655,356 | PNC Financial Services Group, Inc. | 261,546,248 |
3,419,954 | Regions Financial Corp. | 74,110,403 |
4,133,039 | Truist Financial Corp. | 193,591,547 |
1,131,518 | U.S. Bancorp | 51,608,536 |
1,274,915,078 | ||
Beverages 4.8% | ||
1,124,942 | Constellation Brands, Inc. Class A | 276,791,979 |
5,618,336 | Keurig Dr Pepper, Inc. | 214,170,968 |
490,962,947 | ||
Biotechnology 1.1% | ||
384,279 | Biogen, Inc.* | 75,080,431 |
73,992 | Regeneron Pharmaceuticals, Inc.* | 42,993,791 |
118,074,222 | ||
Capital Markets 0.6% | ||
341,151 | CME Group, Inc. | 66,732,547 |
Chemicals 2.6% | ||
287,048 | Air Products & Chemicals, Inc. | 72,465,268 |
3,560,612 | Mosaic Co. | 191,810,168 |
264,275,436 | ||
Containers & Packaging 0.4% | ||
210,621 | Avery Dennison Corp. | 38,674,228 |
Diversified Financial Services 1.4% | ||
525,744 | Berkshire Hathaway, Inc. Class B* | 147,628,915 |
Number of Shares | Value | |
Diversified Telecommunication Services 1.7% | ||
8,047,658 | AT&T, Inc. | $ 141,155,922 |
929,383 | Verizon Communications, Inc. | 38,857,503 |
180,013,425 | ||
Electric Utilities 7.6% | ||
2,067,083 | American Electric Power Co., Inc. | 207,121,716 |
1,894,967 | Duke Energy Corp. | 202,590,922 |
3,214,401 | Exelon Corp. | 141,144,348 |
2,770,399 | NextEra Energy, Inc. | 235,650,139 |
786,507,125 | ||
Electrical Equipment 0.9% | ||
1,075,394 | Emerson Electric Co. | 87,902,706 |
Food & Staples Retailing 1.9% | ||
1,758,922 | Kroger Co. | 84,322,721 |
842,357 | Walmart, Inc. | 111,654,420 |
195,977,141 | ||
Food Products 1.9% | ||
3,103,179 | Mondelez International, Inc. Class A | 191,962,653 |
Health Care Equipment & Supplies 3.7% | ||
1,152,592 | Abbott Laboratories | 118,313,569 |
432,494 | Becton, Dickinson & Co. | 109,170,135 |
1,398,799 | Zimmer Biomet Holdings, Inc. | 148,720,310 |
376,204,014 | ||
Health Care Providers & Services 3.2% | ||
313,224 | Elevance Health, Inc. | 151,948,094 |
358,215 | Humana, Inc. | 172,580,823 |
324,528,917 | ||
Hotels, Restaurants & Leisure 1.0% | ||
1,969,206 | Yum China Holdings, Inc. | 98,676,913 |
Household Products 3.3% | ||
616,515 | Kimberly-Clark Corp. | 78,617,993 |
1,900,947 | Procter & Gamble Co. | 262,216,629 |
340,834,622 | ||
Industrial Conglomerates 1.3% | ||
553,505 | 3M Co. | 68,828,347(a) |
954,012 | General Electric Co. | 70,062,641 |
138,890,988 | ||
Insurance 1.6% | ||
253,393 | Aon PLC Class A | 70,762,529 |
See Notes to Financial Statements
130
Schedule of Investments Large Cap Value Fund^ (cont’d)
Number of Shares | Value | |
Insurance – cont'd | ||
1,459,614 | MetLife, Inc. | $ 93,896,969 |
164,659,498 | ||
Internet & Direct Marketing Retail 0.9% | ||
965,351 | Alibaba Group Holding Ltd. ADR* | 92,104,139 |
Life Sciences Tools & Services 3.0% | ||
509,994 | Danaher Corp. | 137,652,481 |
306,579 | Thermo Fisher Scientific, Inc. | 167,183,660 |
304,836,141 | ||
Machinery 1.2% | ||
554,972 | Cummins, Inc. | 119,524,320 |
Metals & Mining 5.4% | ||
4,684,683 | Barrick Gold Corp. | 69,567,543 |
4,915,368 | Freeport-McMoRan, Inc. | 145,494,893 |
3,304,948 | Newmont Corp. | 136,692,649 |
3,131,369 | Rio Tinto PLC ADR | 176,264,761 |
1,022,964 | Wheaton Precious Metals Corp. | 31,200,402 |
559,220,248 | ||
Multi-Utilities 4.2% | ||
1,654,737 | DTE Energy Co. | 215,678,420 |
1,325,470 | Sempra Energy | 218,662,786 |
434,341,206 | ||
Oil, Gas & Consumable Fuels 8.0% | ||
1,561,846 | Chevron Corp. | 246,865,379 |
508,217 | ConocoPhillips | 55,624,351 |
4,647,701 | Exxon Mobil Corp. | 444,273,738 |
843,376 | Phillips 66 | 75,448,417 |
822,211,885 | ||
Personal Products 0.5% | ||
190,703 | Estee Lauder Cos., Inc. Class A | 48,511,029 |
Number of Shares | Value | |
Pharmaceuticals 11.9% | ||
2,953,113 | Bristol-Myers Squibb Co. | $ 199,069,347 |
2,552,578 | Johnson & Johnson | 411,832,935 |
3,328,209 | Merck & Co., Inc. | 284,095,920 |
7,367,762 | Pfizer, Inc. | 333,243,875 |
1,228,242,077 | ||
Tobacco 1.0% | ||
1,098,763 | Philip Morris International, Inc. | 104,920,879 |
Wireless Telecommunication Services 0.7% | ||
506,332 | T-Mobile U.S., Inc.* | 72,891,555 |
Total Common Stocks (Cost $9,545,065,630) | 9,702,065,580 | |
Short-Term Investments 8.1% | ||
Investment Companies 8.1% | ||
793,800,836 | State Street Institutional U.S. Government Money Market Fund Premier Class, 2.25%(b) | 793,800,836 |
35,062,500 | State Street Navigator Securities Lending Government Money Market Portfolio, 2.34%(b)(c) | 35,062,500 |
Total Short-Term Investments (Cost $828,863,336) | 828,863,336 | |
Total Investments 102.4% (Cost $10,373,928,966) | 10,530,928,916 | |
Liabilities Less Other Assets (2.4)% | (248,214,237) | |
Net Assets 100.0% | $10,282,714,679 | |
* | Non-income producing security. |
(a) | All or a portion of this security is on loan at August 31, 2022. Total value of all such securities at August 31, 2022 amounted to $34,196,250 for the Fund (see Note A of the Notes to Financial Statements). |
(b) | Represents 7-day effective yield as of August 31, 2022. |
(c) | Represents investment of cash collateral received from securities lending. |
See Notes to Financial Statements
131
Schedule of Investments Large Cap Value Fund^ (cont’d)
The following is a summary, categorized by Level (see Note A of the Notes to Financial Statements), of inputs used to value the Fund’s investments as of August 31, 2022:
Asset Valuation Inputs | Level 1 | Level 2 | Level 3 | Total |
Investments: | ||||
Common Stocks# | $9,702,065,580 | $— | $— | $9,702,065,580 |
Short-Term Investments | — | 828,863,336 | — | 828,863,336 |
Total Investments | $9,702,065,580 | $828,863,336 | $— | $10,530,928,916 |
# | The Schedule of Investments provides information on the industry or sector categorization. |
^
A balance indicated with a “—”, reflects either a zero balance or an amount that rounds to less than 1.
See Notes to Financial Statements
132
Schedule of Investments Mid Cap Growth Fund^
August 31, 2022
August 31, 2022
Number of Shares | Value | |
Common Stocks 97.8% | ||
Aerospace & Defense 2.7% | ||
152,700 | Axon Enterprise, Inc.* | $ 17,817,036 |
170,000 | HEICO Corp. | 25,891,000 |
43,708,036 | ||
Auto Components 1.2% | ||
198,800 | Aptiv PLC* | 18,573,884 |
Banks 4.9% | ||
146,983 | First Republic Bank | 22,316,429 |
244,000 | Pinnacle Financial Partners, Inc. | 19,693,240 |
80,000 | Signature Bank | 13,948,800 |
57,500 | SVB Financial Group* | 23,374,900 |
79,333,369 | ||
Biotechnology 3.3% | ||
27,000 | Argenx SE ADR* | 10,202,490 |
197,700 | Fate Therapeutics, Inc.* | 5,167,878 |
267,000 | Horizon Therapeutics PLC* | 15,809,070 |
139,000 | Seagen, Inc.* | 21,446,310 |
52,625,748 | ||
Capital Markets 0.7% | ||
325,000 | Carlyle Group, Inc. | 10,572,250 |
Commercial Services & Supplies 4.6% | ||
97,500 | Cintas Corp. | 39,666,900 |
244,000 | Waste Connections, Inc. | 33,959,920 |
73,626,820 | ||
Communications Equipment 3.1% | ||
218,807 | Arista Networks, Inc.* | 26,230,583 |
824,313 | Juniper Networks, Inc. | 23,426,975 |
49,657,558 | ||
Distributors 1.1% | ||
337,000 | LKQ Corp. | 17,935,140 |
Electrical Equipment 2.9% | ||
217,000 | AMETEK, Inc. | 26,074,720 |
95,000 | Generac Holdings, Inc.* | 20,938,950 |
47,013,670 | ||
Electronic Equipment, Instruments & Components 4.1% | ||
203,587 | Amphenol Corp. Class A | 14,969,752 |
62,328 | CDW Corp. | 10,639,390 |
68,000 | Teledyne Technologies, Inc.* | 25,048,480 |
51,000 | Zebra Technologies Corp. Class A* | 15,383,640 |
66,041,262 | ||
Number of Shares | Value | |
Equity Real Estate Investment Trusts 0.4% | ||
134,200 | Iron Mountain, Inc. | $7,060,262 |
Food & Staples Retailing 2.3% | ||
495,500 | BJ's Wholesale Club Holdings, Inc.* | 36,909,795 |
Health Care Equipment & Supplies 5.4% | ||
365,000 | Axonics, Inc.* | 26,371,250 |
48,000 | IDEXX Laboratories, Inc.* | 16,685,760 |
75,000 | Insulet Corp.* | 19,160,250 |
150,539 | Penumbra, Inc.* | 24,713,988 |
86,931,248 | ||
Health Care Providers & Services 0.6% | ||
425,000 | R1 RCM, Inc.* | 9,286,250 |
Health Care Technology 0.9% | ||
73,269 | Veeva Systems, Inc. Class A* | 14,603,977 |
Hotels, Restaurants & Leisure 4.9% | ||
259,000 | Caesars Entertainment, Inc.* | 11,168,080 |
17,400 | Chipotle Mexican Grill, Inc.* | 27,784,320 |
167,000 | Darden Restaurants, Inc. | 20,659,570 |
130,000 | Marriott Vacations Worldwide Corp. | 18,514,600 |
78,126,570 | ||
Household Products 1.2% | ||
226,000 | Church & Dwight Co., Inc. | 18,918,460 |
Internet & Direct Marketing Retail 0.7% | ||
110,400 | Etsy, Inc.* | 11,659,344 |
IT Services 3.7% | ||
97,267 | Globant SA* | 20,500,966 |
65,233 | MongoDB, Inc.* | 21,061,126 |
102,986 | Snowflake, Inc. Class A* | 18,635,317 |
60,197,409 | ||
Leisure Products 1.0% | ||
146,000 | Polaris, Inc. | 16,537,420 |
Life Sciences Tools & Services 5.1% | ||
124,546 | Agilent Technologies, Inc. | 15,973,025 |
1,058,000 | Avantor, Inc.* | 26,354,780 |
43,009 | Bio-Rad Laboratories, Inc. Class A* | 20,861,085 |
85,000 | IQVIA Holdings, Inc.* | 18,076,100 |
81,264,990 | ||
See Notes to Financial Statements
133
Schedule of Investments Mid Cap Growth Fund^ (cont’d)
Number of Shares | Value | |
Machinery 2.2% | ||
52,191 | Chart Industries, Inc.* | $ 10,117,747 |
124,500 | IDEX Corp. | 25,050,645 |
35,168,392 | ||
Oil, Gas & Consumable Fuels 4.9% | ||
642,000 | Antero Resources Corp.* | 25,731,360 |
503,000 | Devon Energy Corp. | 35,521,860 |
131,774 | Diamondback Energy, Inc. | 17,562,839 |
78,816,059 | ||
Pharmaceuticals 1.5% | ||
80,000 | Catalent, Inc.* | 7,040,000 |
400,000 | Royalty Pharma PLC Class A | 16,724,000 |
23,764,000 | ||
Professional Services 1.5% | ||
344,000 | CoStar Group, Inc.* | 23,956,160 |
Road & Rail 1.7% | ||
101,000 | Old Dominion Freight Line, Inc. | 27,412,410 |
Semiconductors & Semiconductor Equipment 6.2% | ||
119,952 | Enphase Energy, Inc.* | 34,359,051 |
149,588 | Entegris, Inc. | 14,192,909 |
194,015 | Lattice Semiconductor Corp.* | 10,457,408 |
151,605 | Marvell Technology, Inc. | 7,098,146 |
36,570 | Monolithic Power Systems, Inc. | 16,572,793 |
249,457 | ON Semiconductor Corp.* | 17,155,158 |
99,835,465 | ||
Software 18.3% | ||
117,766 | Bill.com Holdings, Inc.* | 19,063,960 |
125,637 | Cadence Design Systems, Inc.* | 21,831,941 |
207,287 | Crowdstrike Holdings, Inc. Class A* | 37,852,679 |
Number of Shares | Value | |
Software – cont'd | ||
310,829 | Datadog, Inc. Class A* | $ 32,621,504 |
300,000 | Descartes Systems Group, Inc.* | 21,120,000 |
392,887 | Fortinet, Inc.* | 19,129,668 |
54,221 | HubSpot, Inc.* | 18,274,646 |
131,476 | Manhattan Associates, Inc.* | 18,572,300 |
39,103 | Palo Alto Networks, Inc.* | 21,772,941 |
84,051 | Paylocity Holding Corp.* | 20,256,291 |
585,209 | Trade Desk, Inc. Class A* | 36,692,604 |
161,879 | Zscaler, Inc.* | 25,777,612 |
292,966,146 | ||
Specialty Retail 4.7% | ||
104,000 | Five Below, Inc.* | 13,299,520 |
55,000 | Lithia Motors, Inc. | 14,599,200 |
42,000 | O'Reilly Automotive, Inc.* | 29,279,040 |
101,000 | Tractor Supply Co. | 18,700,150 |
75,877,910 | ||
Trading Companies & Distributors 2.0% | ||
108,500 | United Rentals, Inc.* | 31,686,340 |
Total Common Stocks (Cost $1,358,942,476) | 1,570,066,344 | |
Short-Term Investments 2.1% | ||
Investment Companies 2.1% | ||
33,360,522 | State Street Institutional U.S. Government Money Market Fund Premier Class, 2.25%(a) (Cost $33,360,522) | 33,360,522 |
Total Investments 99.9% (Cost $1,392,302,998) | 1,603,426,866 | |
Other Assets Less Liabilities 0.1% | 838,404 | |
Net Assets 100.0% | $1,604,265,270 | |
* | Non-income producing security. |
(a) | Represents 7-day effective yield as of August 31, 2022. |
See Notes to Financial Statements
134
Schedule of Investments Mid Cap Growth Fund^ (cont’d)
The following is a summary, categorized by Level (see Note A of the Notes to Financial Statements), of inputs used to value the Fund’s investments as of August 31, 2022:
Asset Valuation Inputs | Level 1 | Level 2 | Level 3 | Total |
Investments: | ||||
Common Stocks# | $1,570,066,344 | $— | $— | $1,570,066,344 |
Short-Term Investments | — | 33,360,522 | — | 33,360,522 |
Total Investments | $1,570,066,344 | $33,360,522 | $— | $1,603,426,866 |
# | The Schedule of Investments provides information on the industry or sector categorization. |
^
A balance indicated with a “—”, reflects either a zero balance or an amount that rounds to less than 1.
See Notes to Financial Statements
135
Schedule of Investments Mid Cap Intrinsic Value Fund^
August 31, 2022
August 31, 2022
Number of Shares | Value | |
Common Stocks 99.8% | ||
Aerospace & Defense 1.2% | ||
2,858 | General Dynamics Corp. | $654,282 |
Auto Components 1.8% | ||
10,624 | Aptiv PLC* | 992,600 |
Banks 8.3% | ||
26,951 | BankUnited, Inc. | 998,535 |
9,829 | Comerica, Inc. | 789,269 |
73,877 | Huntington Bancshares, Inc. | 989,952 |
5,826 | M&T Bank Corp. | 1,059,050 |
15,091 | Truist Financial Corp. | 706,862 |
4,543,668 | ||
Beverages 1.8% | ||
19,369 | Molson Coors Brewing Co. Class B | 1,000,796 |
Biotechnology 0.6% | ||
13,476 | Emergent BioSolutions, Inc.* | 323,694 |
Building Products 4.3% | ||
4,214 | Carlisle Cos., Inc. | 1,245,911 |
17,772 | Fortune Brands Home & Security, Inc. | 1,091,734 |
2,337,645 | ||
Chemicals 0.8% | ||
4,133 | Ashland, Inc. | 420,574 |
Commercial Services & Supplies 2.0% | ||
44,600 | KAR Auction Services, Inc.* | 651,160 |
8,657 | Stericycle, Inc.* | 433,629 |
1,084,789 | ||
Communications Equipment 2.9% | ||
16,400 | Ciena Corp.* | 832,136 |
3,058 | Motorola Solutions, Inc. | 744,348 |
1,576,484 | ||
Construction & Engineering 1.2% | ||
11,467 | Arcosa, Inc. | 670,246 |
Consumer Finance 0.5% | ||
6,581 | Bread Financial Holdings, Inc. | 252,908 |
Containers & Packaging 1.9% | ||
19,029 | Sealed Air Corp. | 1,023,950 |
Number of Shares | Value | |
Electric Utilities 3.9% | ||
24,300 | Evergy, Inc. | $ 1,665,279 |
12,100 | OGE Energy Corp. | 490,534 |
2,155,813 | ||
Electronic Equipment, Instruments & Components 3.2% | ||
4,163 | CDW Corp. | 710,624 |
5,775 | II-VI, Inc.* | 272,753 |
15,665 | Itron, Inc.* | 745,341 |
1,728,718 | ||
Energy Equipment & Services 1.6% | ||
33,603 | Baker Hughes Co. | 848,812 |
Entertainment 2.0% | ||
117,800 | Lions Gate Entertainment Corp. Class B* | 1,099,074 |
Equity Real Estate Investment Trusts 2.2% | ||
19,884 | Regency Centers Corp. | 1,209,743 |
Food Products 3.5% | ||
21,800 | Hain Celestial Group, Inc.* | 441,668 |
31,100 | TreeHouse Foods, Inc.* | 1,449,260 |
1,890,928 | ||
Health Care Equipment & Supplies 4.8% | ||
19,023 | Avanos Medical, Inc.* | 468,536 |
33,974 | Cardiovascular Systems, Inc.* | 448,797 |
9,766 | Haemonetics Corp.* | 732,743 |
9,200 | Zimmer Biomet Holdings, Inc. | 978,144 |
920 | Zimvie, Inc.* | 14,002 |
2,642,222 | ||
Health Care Providers & Services 2.3% | ||
2,900 | McKesson Corp. | 1,064,300 |
9,950 | Pediatrix Medical Group, Inc.* | 177,309 |
1,241,609 | ||
Hotels, Restaurants & Leisure 4.3% | ||
26,140 | International Game Technology PLC | 468,952 |
26,905 | MGM Resorts International | 878,179 |
23,613 | Travel & Leisure Co. | 1,001,191 |
2,348,322 | ||
Independent Power and Renewable Electricity Producers 3.7% | ||
46,100 | AES Corp. | 1,173,245 |
34,300 | Vistra Corp. | 848,925 |
2,022,170 | ||
Insurance 3.1% | ||
6,010 | Allstate Corp. | 724,205 |
See Notes to Financial Statements
136
Schedule of Investments Mid Cap Intrinsic Value Fund^ (cont’d)
Number of Shares | Value | |
Insurance – cont'd | ||
9,985 | Globe Life, Inc. | $ 970,442 |
1,694,647 | ||
IT Services 2.6% | ||
143,600 | Conduent, Inc.* | 587,324 |
20,743 | Kyndryl Holdings, Inc.* | 216,142 |
9,441 | Wix.com Ltd.* | 597,521 |
1,400,987 | ||
Machinery 2.3% | ||
17,472 | Allison Transmission Holdings, Inc. | 633,535 |
31,587 | Enerpac Tool Group Corp. | 612,788 |
1,246,323 | ||
Metals & Mining 0.5% | ||
16,803 | Cleveland-Cliffs, Inc.* | 290,188 |
Mortgage Real Estate Investment Trusts 2.2% | ||
53,200 | Starwood Property Trust, Inc. | 1,219,876 |
Multiline Retail 2.2% | ||
8,700 | Dollar Tree, Inc.* | 1,180,416 |
Multi-Utilities 2.9% | ||
49,700 | CenterPoint Energy, Inc. | 1,567,041 |
Oil, Gas & Consumable Fuels 11.2% | ||
24,255 | Devon Energy Corp. | 1,712,888 |
12,434 | EOG Resources, Inc. | 1,508,244 |
21,422 | ONEOK, Inc. | 1,311,669 |
8,126 | Phillips 66 | 726,952 |
26,100 | Williams Cos., Inc. | 888,183 |
6,147,936 | ||
Professional Services 3.8% | ||
33,426 | Dun & Bradstreet Holdings, Inc. | 476,321 |
33,400 | KBR, Inc. | 1,613,220 |
2,089,541 | ||
Real Estate Management & Development 0.5% | ||
72,768 | WeWork, Inc. Class A* | 298,349 |
Number of Shares | Value | |
Semiconductors & Semiconductor Equipment 2.8% | ||
4,132 | NXP Semiconductors NV | $ 680,044 |
8,723 | Skyworks Solutions, Inc. | 859,652 |
1,539,696 | ||
Software 1.2% | ||
29,579 | Dropbox, Inc. Class A* | 632,695 |
Specialty Retail 2.9% | ||
151,900 | Chico's FAS, Inc.* | 862,792 |
17,661 | Children's Place, Inc.* | 744,941 |
1,607,733 | ||
Technology Hardware, Storage & Peripherals 0.6% | ||
11,995 | Pure Storage, Inc. Class A* | 347,495 |
Trading Companies & Distributors 2.2% | ||
27,663 | AerCap Holdings NV* | 1,218,555 |
Total Common Stocks (Cost $46,718,196) | 54,550,525 | |
Warrants 0.0%(a) | ||
Diversified Consumer Services 0.0%(a) | ||
18,168 | OneSpaWorld Holdings Ltd. Expires 3/19/2024* (Cost $—) | 23,437 |
Short-Term Investments 0.1% | ||
Investment Companies 0.1% | ||
56,013 | State Street Institutional U.S. Government Money Market Fund Premier Class, 2.25%(b) (Cost $56,013) | 56,013 |
Total Investments 99.9% (Cost $46,774,209) | 54,629,975 | |
Other Assets Less Liabilities 0.1% | 33,119 | |
Net Assets 100.0% | $54,663,094 | |
* | Non-income producing security. |
(a) | Represents less than 0.05% of net assets of the Fund. |
(b) | Represents 7-day effective yield as of August 31, 2022. |
See Notes to Financial Statements
137
Schedule of Investments Mid Cap Intrinsic Value Fund^ (cont’d)
The following is a summary, categorized by Level (see Note A of the Notes to Financial Statements), of inputs used to value the Fund’s investments as of August 31, 2022:
Asset Valuation Inputs | Level 1 | Level 2 | Level 3 | Total |
Investments: | ||||
Common Stocks# | $54,550,525 | $— | $— | $54,550,525 |
Warrants# | 23,437 | — | — | 23,437 |
Short-Term Investments | — | 56,013 | — | 56,013 |
Total Investments | $54,573,962 | $56,013 | $— | $54,629,975 |
# | The Schedule of Investments provides information on the industry or sector categorization. |
^
A balance indicated with a “—”, reflects either a zero balance or an amount that rounds to less than 1.
See Notes to Financial Statements
138
Schedule of Investments Multi-Cap Opportunities Fund^
August 31, 2022
August 31, 2022
Number of Shares | Value | |
Common Stocks 99.9% | ||
Aerospace & Defense 3.3% | ||
124,000 | Raytheon Technologies Corp. | $11,129,000 |
Banks 2.8% | ||
84,000 | JPMorgan Chase & Co. | 9,553,320 |
Capital Markets 8.9% | ||
325,000 | Brookfield Asset Management, Inc. Class A | 15,635,750 |
135,000 | Charles Schwab Corp. | 9,578,250 |
47,000 | Intercontinental Exchange, Inc. | 4,739,950 |
29,953,950 | ||
Chemicals 1.5% | ||
22,000 | Sherwin-Williams Co. | 5,106,200 |
Communications Equipment 6.3% | ||
162,000 | Cisco Systems, Inc. | 7,244,640 |
58,000 | Motorola Solutions, Inc. | 14,117,780 |
21,362,420 | ||
Construction Materials 1.7% | ||
47,000 | Eagle Materials, Inc. | 5,622,140 |
Containers & Packaging 5.2% | ||
120,000 | Ball Corp. | 6,697,200 |
485,000 | Graphic Packaging Holding Co. | 10,800,950 |
17,498,150 | ||
Diversified Financial Services 6.6% | ||
77,000 | Apollo Global Management, Inc. | 4,279,660 |
64,000 | Berkshire Hathaway, Inc. Class B* | 17,971,200 |
22,250,860 | ||
Electrical Equipment 1.4% | ||
20,500 | Rockwell Automation, Inc. | 4,857,270 |
Entertainment 1.7% | ||
50,000 | Walt Disney Co.* | 5,604,000 |
Food & Staples Retailing 4.8% | ||
97,000 | BJ's Wholesale Club Holdings, Inc.* | 7,225,530 |
290,000 | US Foods Holding Corp.* | 8,879,800 |
16,105,330 | ||
Food Products 3.2% | ||
33,000 | Lamb Weston Holdings, Inc. | 2,624,490 |
117,000 | Mondelez International, Inc. Class A | 7,237,620 |
Number of Shares | Value | |
Food Products – cont'd | ||
35,000 | Simply Good Foods Co.* | $ 1,069,250 |
10,931,360 | ||
Health Care Equipment & Supplies 1.4% | ||
19,000 | Becton, Dickinson & Co. | 4,795,980 |
Health Care Providers & Services 3.7% | ||
63,000 | HCA Healthcare, Inc. | 12,465,810 |
Hotels, Restaurants & Leisure 6.6% | ||
300,000 | Aramark | 10,713,000 |
1,250 | Booking Holdings, Inc.* | 2,344,763 |
36,000 | McDonald's Corp. | 9,082,080 |
22,139,843 | ||
Household Products 0.1% | ||
2,000 | WD-40 Co. | 378,320 |
Independent Power and Renewable Electricity Producers 1.2% | ||
110,000 | Brookfield Renewable Corp. Class A | 4,222,900 |
Insurance 2.0% | ||
35,500 | Chubb Ltd. | 6,711,275 |
Interactive Media & Services 4.7% | ||
144,000 | Alphabet, Inc. Class C* | 15,717,600 |
Internet & Direct Marketing Retail 2.6% | ||
70,000 | Amazon.com, Inc.* | 8,873,900 |
IT Services 1.0% | ||
35,000 | PayPal Holdings, Inc.* | 3,270,400 |
Leisure Products 0.7% | ||
32,000 | Brunswick Corp. | 2,390,720 |
Machinery 4.9% | ||
9,000 | Deere & Co. | 3,287,250 |
31,500 | Nordson Corp. | 7,155,855 |
30,000 | Stanley Black & Decker, Inc. | 2,643,000 |
40,000 | Wabtec Corp. | 3,506,000 |
16,592,105 | ||
Metals & Mining 0.2% | ||
13,000 | Newmont Corp. | 537,680 |
See Notes to Financial Statements
139
Schedule of Investments Multi-Cap Opportunities Fund^ (cont’d)
Number of Shares | Value | |
Pharmaceuticals 2.3% | ||
170,000 | Pfizer, Inc. | $7,689,100 |
Road & Rail 3.6% | ||
384,000 | CSX Corp. | 12,153,600 |
Semiconductors & Semiconductor Equipment 0.9% | ||
23,000 | QUALCOMM, Inc. | 3,042,210 |
Software 4.3% | ||
56,000 | Microsoft Corp. | 14,642,320 |
Specialty Retail 2.9% | ||
35,000 | Lowe's Cos., Inc. | 6,794,900 |
47,000 | TJX Cos., Inc. | 2,930,450 |
9,725,350 | ||
Number of Shares | Value | |
Technology Hardware, Storage & Peripherals 5.0% | ||
107,000 | Apple, Inc. | $16,822,540 |
Textiles, Apparel & Luxury Goods 2.1% | ||
33,000 | Columbia Sportswear Co. | 2,350,920 |
45,000 | NIKE, Inc. Class B | 4,790,250 |
7,141,170 | ||
Wireless Telecommunication Services 2.3% | ||
53,000 | T-Mobile U.S., Inc.* | 7,629,880 |
Total Investments 99.9% (Cost $184,243,629) | 336,916,703 | |
Other Assets Less Liabilities 0.1% | 363,184 | |
Net Assets 100.0% | $337,279,887 | |
* | Non-income producing security. |
The following is a summary, categorized by Level (see Note A of the Notes to Financial Statements), of inputs used to value the Fund’s investments as of August 31, 2022:
Asset Valuation Inputs | Level 1 | Level 2 | Level 3 | Total |
Investments: | ||||
Common Stocks# | $336,916,703 | $— | $— | $336,916,703 |
Total Investments | $336,916,703 | $— | $— | $336,916,703 |
# | The Schedule of Investments provides information on the industry or sector categorization. |
^
A balance indicated with a “—”, reflects either a zero balance or an amount that rounds to less than 1.
See Notes to Financial Statements
140
Schedule of Investments Real Estate Fund^
August 31, 2022
August 31, 2022
Number of Shares | Value | |
Common Stocks 98.6% | ||
Apartments 10.6% | ||
639,892 | Apartment Income REIT Corp. | $ 26,139,588 |
54,651 | Camden Property Trust | 7,023,200 |
563,929 | Equity Residential | 41,268,324 |
133,066 | Essex Property Trust, Inc. | 35,270,474 |
237,569 | UDR, Inc. | 10,659,721 |
120,361,307 | ||
Capital Markets 1.6% | ||
374,669 | Brookfield Asset Management, Inc. Class A | 18,025,326 |
Data Centers 6.8% | ||
358,119 | Digital Realty Trust, Inc. | 44,274,252 |
49,484 | Equinix, Inc. | 32,529,297 |
76,803,549 | ||
Free Standing 4.0% | ||
483,896 | Realty Income Corp. | 33,040,419 |
294,984 | Spirit Realty Capital, Inc. | 12,050,096 |
45,090,515 | ||
Health Care 9.2% | ||
1,213,255 | Medical Properties Trust, Inc. | 17,725,655 |
829,310 | Ventas, Inc. | 39,690,777 |
622,882 | Welltower, Inc. | 47,743,905 |
105,160,337 | ||
Industrial 12.2% | ||
668,952 | Duke Realty Corp. | 39,367,825 |
38,139 | EastGroup Properties, Inc. | 6,294,079 |
592,609 | Prologis, Inc. | 73,785,747 |
316,487 | Rexford Industrial Realty, Inc. | 19,688,656 |
139,136,307 | ||
Infrastructure 18.9% | ||
424,344 | American Tower Corp. | 107,804,593 |
432,769 | Crown Castle, Inc. | 73,929,928 |
101,886 | SBA Communications Corp. | 33,138,422 |
214,872,943 | ||
Lodging/Resorts 0.4% | ||
56,663 | Ryman Hospitality Properties, Inc.* | 4,658,832 |
Manufactured Homes 5.0% | ||
400,201 | Equity LifeStyle Properties, Inc. | 28,054,090 |
184,464 | Sun Communities, Inc. | 28,353,962 |
56,408,052 | ||
Number of Shares | Value | |
Office 2.8% | ||
77,592 | Alexandria Real Estate Equities, Inc. | $ 11,902,613 |
258,002 | Boston Properties, Inc. | 20,493,099 |
32,395,712 | ||
Regional Malls 2.8% | ||
306,625 | Simon Property Group, Inc. | 31,269,617 |
Self Storage 9.1% | ||
173,224 | Extra Space Storage, Inc. | 34,424,806 |
208,515 | Public Storage | 68,983,017 |
103,407,823 | ||
Shopping Centers 4.3% | ||
1,295,190 | Kimco Realty Corp. | 27,302,605 |
175,971 | Regency Centers Corp. | 10,706,076 |
667,607 | Retail Opportunity Investments Corp. | 11,182,417 |
49,191,098 | ||
Single Family Homes 3.7% | ||
475,342 | American Homes 4 Rent Class A | 16,903,162 |
698,468 | Invitation Homes, Inc. | 25,340,419 |
42,243,581 | ||
Specialty 5.3% | ||
498,670 | Iron Mountain, Inc. | 26,235,029 |
1,029,814 | VICI Properties, Inc. | 33,973,564 |
60,208,593 | ||
Timber 1.9% | ||
634,084 | Weyerhaeuser Co. | 21,660,309 |
Total Common Stocks (Cost $1,098,586,812) | 1,120,893,901 | |
Short-Term Investments 1.5% | ||
Investment Companies 1.5% | ||
17,704,073 | State Street Institutional U.S. Government Money Market Fund Premier Class, 2.25%(a) (Cost $17,704,073) | 17,704,073 |
Total Investments 100.1% (Cost $1,116,290,885) | 1,138,597,974 | |
Liabilities Less Other Assets (0.1)% | (1,302,110) | |
Net Assets 100.0% | $1,137,295,864 | |
* | Non-income producing security. |
See Notes to Financial Statements
141
Schedule of Investments Real Estate Fund^ (cont’d)
(a) | Represents 7-day effective yield as of August 31, 2022. |
The following is a summary, categorized by Level (see Note A of the Notes to Financial Statements), of inputs used to value the Fund’s investments as of August 31, 2022:
Asset Valuation Inputs | Level 1 | Level 2 | Level 3 | Total |
Investments: | ||||
Common Stocks# | $1,120,893,901 | $— | $— | $1,120,893,901 |
Short-Term Investments | — | 17,704,073 | — | 17,704,073 |
Total Investments | $1,120,893,901 | $17,704,073 | $— | $1,138,597,974 |
# | The Schedule of Investments provides information on the industry or sector categorization. |
^
A balance indicated with a “—”, reflects either a zero balance or an amount that rounds to less than 1.
See Notes to Financial Statements
142
Schedule of Investments Small Cap Growth Fund^
August 31, 2022
August 31, 2022
Number of Shares | Value | |
Common Stocks 97.5% | ||
Aerospace & Defense 2.7% | ||
35,600 | Axon Enterprise, Inc.* | $ 4,153,808 |
32,100 | Curtiss-Wright Corp. | 4,724,799 |
8,878,607 | ||
Auto Components 1.9% | ||
37,180 | Dorman Products, Inc.* | 3,370,367 |
28,900 | Fox Factory Holding Corp.* | 2,693,769 |
6,064,136 | ||
Banks 6.2% | ||
81,027 | Pinnacle Financial Partners, Inc. | 6,539,689 |
180,981 | Seacoast Banking Corp. of Florida | 5,849,306 |
62,748 | Texas Capital Bancshares, Inc.* | 3,704,014 |
81,980 | Webster Financial Corp. | 3,857,159 |
19,950,168 | ||
Beverages 1.6% | ||
47,771 | MGP Ingredients, Inc. | 5,229,014 |
Biotechnology 11.0% | ||
423,452 | Amicus Therapeutics, Inc.* | 4,755,366 |
38,235 | Apellis Pharmaceuticals, Inc.* | 2,313,600 |
32,009 | Arcutis Biotherapeutics, Inc.* | 862,643 |
100,170 | Arrowhead Pharmaceuticals, Inc.* | 3,977,751 |
19,739 | Beam Therapeutics, Inc.* | 1,077,749 |
12,337 | Blueprint Medicines Corp.* | 903,315 |
106,210 | Fate Therapeutics, Inc.*(a) | 2,776,329 |
148,245 | Halozyme Therapeutics, Inc.* | 6,038,019 |
77,625 | Insmed, Inc.* | 1,911,127 |
17,848 | Intellia Therapeutics, Inc.* | 1,071,951 |
6,899 | Karuna Therapeutics, Inc.* | 1,759,659 |
95,188 | Natera, Inc.* | 4,688,961 |
124,088 | Xencor, Inc.* | 3,274,682 |
35,411,152 | ||
Building Products 1.3% | ||
147,670 | Zurn Elkay Water Solutions Corp. | 4,072,739 |
Chemicals 1.9% | ||
186,721 | Livent Corp.* | 6,008,682 |
Commercial Services & Supplies 2.2% | ||
86,645 | Casella Waste Systems, Inc. Class A* | 7,098,825 |
Number of Shares | Value | |
Communications Equipment 1.0% | ||
55,116 | Calix, Inc.* | $3,243,577 |
Construction & Engineering 2.7% | ||
197,468 | API Group Corp.* | 3,070,627 |
20,878 | Valmont Industries, Inc. | 5,779,448 |
8,850,075 | ||
Containers & Packaging 1.5% | ||
214,533 | Graphic Packaging Holding Co. | 4,777,650 |
Diversified Consumer Services 0.6% | ||
209,259 | OneSpaWorld Holdings Ltd.* | 1,843,572 |
Electronic Equipment, Instruments & Components 1.4% | ||
93,441 | II-VI, Inc.* | 4,413,218 |
Food & Staples Retailing 2.1% | ||
60,600 | Grocery Outlet Holding Corp.* | 2,431,272 |
84,892 | Performance Food Group Co.* | 4,242,902 |
6,674,174 | ||
Food Products 1.0% | ||
194,875 | Utz Brands, Inc.(a) | 3,246,617 |
Health Care Equipment & Supplies 4.4% | ||
121,138 | Axonics, Inc.* | 8,752,220 |
10,150 | Inspire Medical Systems, Inc.* | 1,943,624 |
79,550 | NuVasive, Inc.* | 3,381,670 |
14,077,514 | ||
Health Care Providers & Services 6.3% | ||
26,929 | Amedisys, Inc.* | 3,189,740 |
55,409 | HealthEquity, Inc.* | 3,661,427 |
136,970 | Option Care Health, Inc.* | 4,240,591 |
58,879 | Privia Health Group, Inc.* | 2,342,796 |
309,345 | R1 RCM, Inc.* | 6,759,188 |
20,193,742 | ||
Health Care Technology 0.6% | ||
75,517 | Phreesia, Inc.* | 1,937,766 |
Hotels, Restaurants & Leisure 4.6% | ||
65,422 | Boyd Gaming Corp. | 3,560,920 |
15,981 | Churchill Downs, Inc. | 3,149,695 |
24,679 | Marriott Vacations Worldwide Corp. | 3,514,783 |
52,108 | Texas Roadhouse, Inc. | 4,625,106 |
14,850,504 | ||
Household Durables 1.6% | ||
23,881 | Helen of Troy Ltd.* | 2,952,408 |
See Notes to Financial Statements
143
Schedule of Investments Small Cap Growth Fund^ (cont’d)
Number of Shares | Value | |
Household Durables – cont'd | ||
41,300 | Skyline Champion Corp.* | $ 2,340,471 |
5,292,879 | ||
IT Services 2.5% | ||
18,423 | ExlService Holdings, Inc.* | 3,089,721 |
125,849 | Flywire Corp.* | 3,128,606 |
20,451 | WNS Holdings Ltd. ADR* | 1,722,997 |
7,941,324 | ||
Life Sciences Tools & Services 0.8% | ||
17,111 | Medpace Holdings, Inc.* | 2,525,755 |
Machinery 1.9% | ||
31,883 | Chart Industries, Inc.* | 6,180,838 |
Media 1.8% | ||
290,520 | PubMatic, Inc. Class A* | 5,685,476 |
Oil, Gas & Consumable Fuels 7.4% | ||
125,837 | Antero Resources Corp.* | 5,043,547 |
77,022 | Denbury, Inc.* | 6,849,566 |
249,373 | Magnolia Oil & Gas Corp. Class A | 5,952,534 |
98,985 | Matador Resources Co. | 5,899,506 |
23,745,153 | ||
Pharmaceuticals 0.4% | ||
31,896 | Arvinas, Inc.* | 1,350,477 |
Professional Services 3.0% | ||
49,587 | Exponent, Inc. | 4,654,236 |
35,938 | Tetra Tech, Inc. | 4,880,740 |
9,534,976 | ||
Road & Rail 1.1% | ||
16,725 | Saia, Inc.* | 3,459,232 |
Semiconductors & Semiconductor Equipment 6.4% | ||
57,523 | Ambarella, Inc.* | 3,904,661 |
29,197 | Impinj, Inc.* | 2,606,708 |
27,782 | Lattice Semiconductor Corp.* | 1,497,450 |
38,172 | Silicon Laboratories, Inc.* | 4,784,097 |
Number of Shares | Value | |
Semiconductors & Semiconductor Equipment – cont'd | ||
36,411 | SiTime Corp.* | $ 3,874,494 |
33,624 | Synaptics, Inc.* | 3,887,271 |
20,554,681 | ||
Software 9.9% | ||
24,415 | CyberArk Software Ltd.* | 3,522,596 |
72,866 | Descartes Systems Group, Inc.* | 5,129,766 |
65,938 | Gitlab, Inc. Class A*(a) | 3,947,708 |
22,322 | Manhattan Associates, Inc.* | 3,153,206 |
155,660 | Paycor HCM, Inc.* | 4,612,206 |
148,388 | Sprout Social, Inc. Class A* | 8,909,216 |
64,797 | Tenable Holdings, Inc.* | 2,566,609 |
31,841,307 | ||
Specialty Retail 2.1% | ||
14,286 | Lithia Motors, Inc. | 3,792,076 |
202,000 | Petco Health & Wellness Co., Inc.* | 3,013,840 |
6,805,916 | ||
Trading Companies & Distributors 3.6% | ||
95,641 | Air Lease Corp. | 3,477,507 |
95,732 | H&E Equipment Services, Inc. | 3,030,875 |
37,660 | WESCO International, Inc.* | 4,959,069 |
11,467,451 | ||
Total Common Stocks (Cost $318,960,963) | 313,207,197 | |
Short-Term Investments 2.7% | ||
Investment Companies 2.7% | ||
6,453,629 | State Street Institutional U.S. Government Money Market Fund Premier Class, 2.25%(b) | 6,453,629 |
2,276,831 | State Street Navigator Securities Lending Government Money Market Portfolio, 2.34%(b)(c) | 2,276,831 |
Total Short-Term Investments (Cost $8,730,460) | 8,730,460 | |
Total Investments 100.2% (Cost $327,691,423) | 321,937,657 | |
Liabilities Less Other Assets (0.2)% | (588,364) | |
Net Assets 100.0% | $321,349,293 | |
* | Non-income producing security. |
(a) | All or a portion of this security is on loan at August 31, 2022. Total value of all such securities at August 31, 2022 amounted to $3,755,949, collateralized by cash collateral of $2,276,831 and non-cash (U.S. Treasury Securities) collateral of $1,676,359 for the Fund (see Note A of the Notes to Financial Statements). |
(b) | Represents 7-day effective yield as of August 31, 2022. |
See Notes to Financial Statements
144
Schedule of Investments Small Cap Growth Fund^ (cont’d)
(c) | Represents investment of cash collateral received from securities lending. |
The following is a summary, categorized by Level (see Note A of the Notes to Financial Statements), of inputs used to value the Fund’s investments as of August 31, 2022:
Asset Valuation Inputs | Level 1 | Level 2 | Level 3(a) | Total |
Investments: | ||||
Common Stocks# | $313,207,197 | $— | $— | $313,207,197 |
Short-Term Investments | — | 8,730,460 | — | 8,730,460 |
Total Investments | $313,207,197 | $8,730,460 | $— | $321,937,657 |
# | The Schedule of Investments provides information on the industry or sector categorization. |
(a) | The following is a reconciliation between the beginning and ending balances of investments in which unobservable inputs (Level 3) were used in determining value: |
(000's omitted) | Beginning balance as of 9/1/2021 | Accrued discounts/ (premiums) | Realized gain/(loss) | Change in unrealized appreciation/ (depreciation) | Purchases | Sales | Transfers into Level 3 | Transfers out of Level 3 | Balance as of 8/31/2022 | Net change in unrealized appreciation/ (depreciation) from investments still held as of 8/31/2022 |
Investments in Securities: | ||||||||||
Rights(1) | $143 | $— | $160 | $(17) | $— | $(286) | $— | $— | $— | $— |
Total | $143 | $— | $160 | $(17) | $— | $(286) | $— | $— | $— | $— |
(1) At the beginning of the year, these investments were valued based on a single quotation obtained from a dealer. The Fund held no Level 3 investments at August 31, 2022. | ||||||||||
^
A balance indicated with a “—”, reflects either a zero balance or an amount that rounds to less than 1.
See Notes to Financial Statements
145
Schedule of Investments Sustainable Equity Fund^
August 31, 2022
August 31, 2022
Number of Shares | Value | |
Common Stocks 99.5% | ||
Auto Components 2.2% | ||
329,238 | Aptiv PLC* | $30,760,706 |
Banks 3.8% | ||
453,376 | Bank of America Corp. | 15,237,967 |
347,055 | JPMorgan Chase & Co. | 39,470,565 |
54,708,532 | ||
Capital Markets 2.6% | ||
364,296 | Intercontinental Exchange, Inc. | 36,739,252 |
Chemicals 1.8% | ||
110,414 | Sherwin-Williams Co. | 25,627,089 |
Communications Equipment 1.2% | ||
136,878 | Arista Networks, Inc.* | 16,408,935 |
Diversified Financial Services 1.4% | ||
68,537 | Berkshire Hathaway, Inc. Class B* | 19,245,190 |
Electrical Equipment 1.5% | ||
876,575 | Vestas Wind Systems A/S | 21,932,870 |
Electronic Equipment, Instruments & Components 1.8% | ||
83,904 | Zebra Technologies Corp. Class A* | 25,308,803 |
Food & Staples Retailing 2.5% | ||
69,371 | Costco Wholesale Corp. | 36,218,599 |
Health Care Equipment & Supplies 4.8% | ||
175,799 | Becton, Dickinson & Co. | 44,375,184 |
38,398 | Embecta Corp. | 1,225,664 |
255,408 | Medtronic PLC | 22,455,471 |
68,056,319 | ||
Health Care Providers & Services 8.2% | ||
307,507 | AmerisourceBergen Corp. | 45,068,226 |
252,399 | Cigna Corp. | 71,542,496 |
116,610,722 | ||
Hotels, Restaurants & Leisure 3.4% | ||
2,238,224 | Compass Group PLC | 48,146,558 |
Number of Shares | Value | |
Household Products 2.8% | ||
503,540 | Colgate-Palmolive Co. | $39,381,863 |
Insurance 4.2% | ||
489,748 | Progressive Corp. | 60,067,592 |
Interactive Media & Services 5.1% | ||
674,440 | Alphabet, Inc. Class A* | 72,987,897 |
Internet & Direct Marketing Retail 1.3% | ||
150,352 | Amazon.com, Inc.* | 19,060,123 |
IT Services 12.5% | ||
82,321 | Accenture PLC Class A | 23,746,316 |
559,303 | Cognizant Technology Solutions Corp. Class A | 35,331,171 |
249,334 | Fiserv, Inc.* | 25,230,107 |
530,611 | GoDaddy, Inc. Class A* | 40,230,926 |
165,457 | MasterCard, Inc. Class A | 53,669,287 |
178,207,807 | ||
Life Sciences Tools & Services 3.0% | ||
156,008 | Danaher Corp. | 42,108,119 |
Machinery 3.2% | ||
344,384 | Otis Worldwide Corp. | 24,871,412 |
238,935 | Stanley Black & Decker, Inc. | 21,050,174 |
45,921,586 | ||
Media 1.5% | ||
602,326 | Comcast Corp. Class A | 21,798,178 |
Multi-Utilities 2.0% | ||
2,304,245 | National Grid PLC | 28,692,114 |
Pharmaceuticals 2.4% | ||
106,407 | Roche Holding AG | 34,288,736 |
Professional Services 2.7% | ||
550,295 | CoStar Group, Inc.* | 38,322,544 |
Road & Rail 2.4% | ||
1,074,089 | CSX Corp. | 33,994,917 |
Semiconductors & Semiconductor Equipment 4.7% | ||
408,271 | Texas Instruments, Inc. | 67,450,452 |
See Notes to Financial Statements
146
Schedule of Investments Sustainable Equity Fund^ (cont’d)
Number of Shares | Value | |
Software 7.7% | ||
63,926 | Intuit, Inc. | $ 27,601,968 |
316,815 | Microsoft Corp. | 82,837,618 |
110,439,586 | ||
Specialty Retail 2.2% | ||
187,564 | Advance Auto Parts, Inc. | 31,630,793 |
Technology Hardware, Storage & Peripherals 2.5% | ||
228,805 | Apple, Inc. | 35,972,722 |
Trading Companies & Distributors 4.1% | ||
37,037 | United Rentals, Inc.* | 10,816,286 |
86,181 | W.W. Grainger, Inc. | 47,825,284 |
58,641,570 | ||
Total Common Stocks (Cost $886,385,555) | 1,418,730,174 | |
Short-Term Investments 0.4% | ||
Principal Amount | ||
Certificates of Deposit 0.0%(a) | ||
$100,000 | Carver Federal Savings Bank, 0.05%, due 9/23/2022 | 100,000 |
Principal Amount | Value | |
Certificates of Deposit – cont'd | ||
$250,000 | Self Help Credit Union, 0.01%, due 11/16/2022 | $ 250,000 |
250,000 | Self Help Federal Credit Union, 0.10%, due 9/4/2022 | 250,000 |
600,000 | ||
Number of Shares | ||
Investment Companies 0.4% | ||
5,174,836 | State Street Institutional Treasury Money Market Fund Premier Class, 2.10%(b) | 5,174,836 |
Total Short-Term Investments (Cost $5,774,836) | 5,774,836 | |
Total Investments 99.9% (Cost $892,160,391) | 1,424,505,010 | |
Other Assets Less Liabilities 0.1% | 789,563 | |
Net Assets 100.0% | $1,425,294,573 | |
* | Non-income producing security. |
(a) | Represents less than 0.05% of net assets of the Fund. |
(b) | Represents 7-day effective yield as of August 31, 2022. |
POSITIONS BY COUNTRY | ||
Country | Investments at Value | Percentage of Net Assets |
United States | $1,285,669,896 | 90.2% |
United Kingdom | 76,838,672 | 5.4% |
Switzerland | 34,288,736 | 2.4% |
Denmark | 21,932,870 | 1.5% |
Short-Term Investments and Other Assets—Net | 6,564,399 | 0.5% |
$1,425,294,573 | 100.0% | |
See Notes to Financial Statements
147
Schedule of Investments Sustainable Equity Fund^ (cont’d)
The following is a summary, categorized by Level (see Note A of the Notes to Financial Statements), of inputs used to value the Fund’s investments as of August 31, 2022:
Asset Valuation Inputs | Level 1 | Level 2 | Level 3 | Total |
Investments: | ||||
Common Stocks | ||||
Electrical Equipment | $— | $21,932,870 | $— | $21,932,870 |
Hotels, Restaurants & Leisure | — | 48,146,558 | — | 48,146,558 |
Multi-Utilities | — | 28,692,114 | — | 28,692,114 |
Pharmaceuticals | — | 34,288,736 | — | 34,288,736 |
Other Common Stocks# | 1,285,669,896 | — | — | 1,285,669,896 |
Total Common Stocks | 1,285,669,896 | 133,060,278 | — | 1,418,730,174 |
Short-Term Investments | — | 5,774,836 | — | 5,774,836 |
Total Investments | $1,285,669,896 | $138,835,114 | $— | $1,424,505,010 |
# | The Schedule of Investments provides information on the industry or sector categorization as well as a Positions by Country summary. |
^
A balance indicated with a “—”, reflects either a zero balance or an amount that rounds to less than 1.
See Notes to Financial Statements
148
Schedule of Investments U.S. Equity Impact Fund^
August 31, 2022
August 31, 2022
Number of Shares | Value | |
Common Stocks 98.0% | ||
Auto Components 2.5% | ||
1,647 | Aptiv PLC* | $153,879 |
Building Products 4.6% | ||
1,801 | Trane Technologies PLC | 277,480 |
Chemicals 4.0% | ||
1,486 | Ecolab, Inc. | 243,451 |
Communications Equipment 4.4% | ||
1,083 | Motorola Solutions, Inc. | 263,613 |
Containers & Packaging 9.0% | ||
3,311 | Ball Corp. | 184,787 |
16,105 | Graphic Packaging Holding Co. | 358,658 |
543,445 | ||
Electric Utilities 2.3% | ||
1,623 | NextEra Energy, Inc. | 138,052 |
Electrical Equipment 0.8% | ||
1,410 | Sunrun, Inc.* | 46,572 |
Electronic Equipment, Instruments & Components 3.7% | ||
2,974 | II-VI, Inc.* | 140,462 |
1,281 | Trimble, Inc.* | 81,023 |
221,485 | ||
Food Products 2.2% | ||
4,389 | Simply Good Foods Co.* | 134,084 |
Health Care Equipment & Supplies 6.2% | ||
248 | ABIOMED, Inc.* | 64,301 |
5,625 | Boston Scientific Corp.* | 226,744 |
1,022 | Dexcom, Inc.* | 84,019 |
375,064 | ||
Health Care Providers & Services 5.9% | ||
1,338 | HCA Healthcare, Inc. | 264,750 |
973 | Universal Health Services, Inc. Class B | 95,198 |
359,948 | ||
Household Products 1.8% | ||
764 | Clorox Co. | 110,276 |
Number of Shares | Value | |
Independent Power and Renewable Electricity Producers 4.7% | ||
7,464 | Brookfield Renewable Corp. Class A | $286,543 |
Life Sciences Tools & Services 3.6% | ||
402 | Danaher Corp. | 108,504 |
203 | Thermo Fisher Scientific, Inc. | 110,700 |
219,204 | ||
Machinery 11.6% | ||
669 | Deere & Co. | 244,352 |
4,570 | Evoqua Water Technologies Corp.* | 160,316 |
2,908 | Pentair PLC | 129,406 |
1,918 | Wabtec Corp. | 168,113 |
702,187 | ||
Media 1.6% | ||
88 | Cable One, Inc. | 99,880 |
Mortgage Real Estate Investment Trusts 1.1% | ||
1,756 | Hannon Armstrong Sustainable Infrastructure Capital, Inc. | 69,397 |
Personal Products 1.5% | ||
3,847 | BellRing Brands, Inc.* | 91,136 |
Pharmaceuticals 10.0% | ||
729 | Eli Lilly & Co. | 219,596 |
1,613 | Merck & Co., Inc. | 137,686 |
3,428 | Organon & Co. | 97,801 |
3,277 | Pfizer, Inc. | 148,219 |
603,302 | ||
Professional Services 3.1% | ||
989 | Verisk Analytics, Inc. | 185,101 |
Road & Rail 6.9% | ||
2,584 | Canadian Pacific Railway Ltd. | 193,438 |
7,084 | CSX Corp. | 224,209 |
417,647 | ||
Semiconductors & Semiconductor Equipment 3.8% | ||
576 | First Solar, Inc.* | 73,469 |
1,281 | ON Semiconductor Corp.* | 88,094 |
248 | SolarEdge Technologies, Inc.* | 68,441 |
230,004 | ||
Software 2.7% | ||
447 | Tyler Technologies, Inc.* | 166,065 |
Total Common Stocks (Cost $6,191,759) | 5,937,815 | |
See Notes to Financial Statements
149
Schedule of Investments U.S. Equity Impact Fund^ (cont’d)
Number of Shares | Value | |
Short-Term Investments 1.9% | ||
Investment Companies 1.9% | ||
114,216 | State Street Institutional Treasury Money Market Fund Premier Class, 2.10%(a) (Cost $114,216) | $114,216 |
Total Investments 99.9% (Cost $6,305,975) | 6,052,031 | |
Other Assets Less Liabilities 0.1% | 8,155 | |
Net Assets 100.0% | $6,060,186 | |
* | Non-income producing security. |
(a) | Represents 7-day effective yield as of August 31, 2022. |
The following is a summary, categorized by Level (see Note A of the Notes to Financial Statements), of inputs used to value the Fund’s investments as of August 31, 2022:
Asset Valuation Inputs | Level 1 | Level 2 | Level 3 | Total |
Investments: | ||||
Common Stocks# | $5,937,815 | $— | $— | $5,937,815 |
Short-Term Investments | — | 114,216 | — | 114,216 |
Total Investments | $5,937,815 | $114,216 | $— | $6,052,031 |
# | The Schedule of Investments provides information on the industry or sector categorization. |
^
A balance indicated with a “—”, reflects either a zero balance or an amount that rounds to less than 1.
See Notes to Financial Statements
150
Statements of Assets and Liabilities
Neuberger Berman Equity Funds
Dividend Growth Fund | Emerging Markets Equity Fund | Equity Income Fund | |
August 31, 2022 | August 31, 2022 | August 31, 2022 | |
Assets | |||
Investments in securities, at value*† (Notes A & F)— see Schedule of Investments: | |||
Unaffiliated issuers(a) | $70,567,145 | $828,217,732 | $1,093,299,638 |
Affiliated issuers(b) | — | — | — |
70,567,145 | 828,217,732 | 1,093,299,638 | |
Cash | — | — | — |
Foreign currency(c) | — | 2,118,778 | — |
Dividends and interest receivable | 146,338 | 2,508,305 | 4,390,274 |
Receivable for securities sold | — | 71,905 | 8,035,575 |
Receivable from Management—net (Note B) | 10,529 | — | — |
Receivable for Fund shares sold | — | 553,131 | 1,165,685 |
Receivable for securities lending income (Note A) | — | 8 | — |
Prepaid expenses and other assets | 16,527 | 42,545 | 64,038 |
Total Assets | 70,740,539 | 833,512,404 | 1,106,955,210 |
Liabilities | |||
Payable to investment manager—net (Note B) | 30,904 | 690,105 | 473,830 |
Option contracts written, at value(d) (Note A) | — | — | 277,663 |
Due to custodian | 9 | — | — |
Payable for securities purchased | 343,760 | 326,042 | — |
Payable for Fund shares redeemed | — | 508,549 | 195,851 |
Payable to administrator—net (Note B) | — | 102,986 | 261,290 |
Payable to trustees | 5,375 | 5,374 | 5,374 |
Payable for audit fees | 44,135 | 53,274 | 56,885 |
Payable for custodian and accounting fees | 9,959 | 110,015 | 24,767 |
Payable for shareholder reports | 1,090 | 12,042 | 7,310 |
Payable for legal fees | 9,107 | 9,107 | 9,995 |
Payable for cash collateral on loaned securities (Note A) | — | — | — |
Accrued capital gains taxes (Note A) | — | 5,189,443 | — |
Other accrued expenses and payables | 4,456 | 75,003 | 30,153 |
Total Liabilities | 448,795 | 7,081,940 | 1,343,118 |
Net Assets | $70,291,744 | $826,430,464 | $1,105,612,092 |
Net Assets consist of: | |||
Paid-in capital | $52,736,561 | $899,627,844 | $777,277,862 |
Total distributable earnings/(losses) | 17,555,183 | (73,197,380) | 328,334,230 |
Net Assets | $70,291,744 | $826,430,464 | $1,105,612,092 |
Net Assets | |||
Investor Class | $— | $— | $— |
Trust Class | — | — | — |
Advisor Class | — | — | — |
Institutional Class | 67,755,643 | 652,510,886 | 834,836,939 |
Class A | 1,632,272 | 18,903,148 | 170,669,782 |
Class C | 868,535 | 3,490,156 | 67,522,153 |
Class R3 | — | 669,919 | 538,657 |
Class R6 | 35,294 | 150,856,355 | — |
Class E | — | — | 32,044,561 |
See Notes to Financial Statements
152
Focus Fund | Genesis Fund | Global Real Estate Fund | Greater China Equity Fund | International Equity Fund | International Select Fund | International Small Cap Fund |
August 31, 2022 | August 31, 2022 | August 31, 2022 | August 31, 2022 | August 31, 2022 | August 31, 2022 | August 31, 2022 |
$613,211,407 | $9,440,329,122 | $3,366,214 | $33,251,012 | $1,132,487,949 | $130,378,452 | $3,508,783 |
— | 516,181,207 | — | — | — | — | — |
613,211,407 | 9,956,510,329 | 3,366,214 | 33,251,012 | 1,132,487,949 | 130,378,452 | 3,508,783 |
— | 232,556 | — | — | — | — | — |
10,685 | — | 2,934 | 998,790 | 1,177 | 723,800 | 104,475 |
874,554 | 5,684,765 | 5,139 | 55,111 | 5,207,876 | 696,640 | 15,366 |
— | 2,887,246 | — | 85,514 | 22,779,926 | 2,540,868 | — |
— | — | 25,374 | 8,979 | — | 9,213 | 34,663 |
2,154 | 3,847,655 | — | — | 636,931 | 1,123 | 112 |
59 | — | — | — | 9,836 | 580 | 255 |
69,021 | 276,022 | 12,177 | 28,990 | 69,833 | 150,489 | 16,863 |
614,167,880 | 9,969,438,573 | 3,411,838 | 34,428,396 | 1,161,193,528 | 134,501,165 | 3,680,517 |
287,622 | 5,828,810 | 2,349 | 32,924 | 700,425 | 65,187 | 2,279 |
— | — | — | — | — | — | — |
— | — | — | — | — | — | — |
6,182,449 | 8,830,238 | — | — | 42,261,205 | 4,755,627 | 205,352 |
39,593 | 3,525,404 | — | — | 2,237,120 | 4,050 | — |
147,171 | 1,362,576 | — | — | 136,445 | — | — |
5,374 | 5,374 | 5,374 | 5,375 | 5,374 | 5,375 | 5,374 |
53,529 | 58,045 | 42,300 | 44,919 | 54,845 | 52,435 | 45,184 |
20,038 | 175,616 | 10,990 | 12,771 | 50,812 | 15,312 | 14,240 |
69,283 | 166,606 | 1,140 | 827 | 23,701 | 3,223 | 1,097 |
9,107 | 9,995 | 9,107 | 12,185 | 9,995 | 9,107 | 9,107 |
— | — | — | — | 876,392 | — | 142,230 |
— | — | — | — | — | — | — |
71,052 | 351,260 | 2,829 | 4,642 | 53,798 | 10,103 | 3,159 |
6,885,218 | 20,313,924 | 74,089 | 113,643 | 46,410,112 | 4,920,419 | 428,022 |
$607,282,662 | $9,949,124,649 | $3,337,749 | $34,314,753 | $1,114,783,416 | $129,580,746 | $3,252,495 |
$634,048,749 | $4,608,071,246 | $3,489,777 | $49,957,273 | $1,165,107,354 | $135,057,725 | $3,552,333 |
(26,766,087) | 5,341,053,403 | (152,028) | (15,642,520) | (50,323,938) | (5,476,979) | (299,838) |
$607,282,662 | $9,949,124,649 | $3,337,749 | $34,314,753 | $1,114,783,416 | $129,580,746 | $3,252,495 |
$553,026,639 | $1,664,646,809 | $— | $— | $67,518,864 | $— | $— |
31,899,535 | 1,008,357,672 | — | — | 21,793,513 | 4,532,644 | — |
976,681 | 108,617,703 | — | — | — | — | — |
19,007,321 | 2,569,745,246 | 2,797,026 | 32,407,289 | 953,744,122 | 119,932,684 | 2,678,831 |
2,098,314 | — | 303,097 | 1,887,459 | 11,068,552 | 3,110,364 | 197,740 |
274,172 | — | 237,626 | 20,005 | 4,908,721 | 540,328 | 116,402 |
— | — | — | — | — | 1,216,481 | — |
— | 4,463,765,578 | — | — | 27,685,099 | 248,245 | 259,522 |
— | 133,991,641 | — | — | 28,064,545 | — | — |
153
Statements of Assets and Liabilities (cont’d)
Neuberger Berman Equity Funds
Dividend Growth Fund | Emerging Markets Equity Fund | Equity Income Fund | |
August 31, 2022 | August 31, 2022 | August 31, 2022 | |
Shares Outstanding ($.001 par value; unlimited shares authorized) | |||
Investor Class | — | — | — |
Trust Class | — | — | — |
Advisor Class | — | — | — |
Institutional Class | 3,961,531 | 36,951,552 | 61,845,042 |
Class A | 95,282 | 1,067,729 | 12,701,795 |
Class C | 51,319 | 199,592 | 5,058,033 |
Class R3 | — | 38,012 | 40,092 |
Class R6 | 2,061 | 8,540,695 | — |
Class E | — | — | 2,371,767 |
Net Asset Value, offering and redemption price per share | |||
Investor Class | $— | $— | $— |
Trust Class | — | — | — |
Advisor Class | — | — | — |
Institutional Class | 17.10 | 17.66 | 13.50 |
Class R3 | — | 17.62 | 13.44 |
Class R6 | 17.13 | 17.66 | — |
Class E | — | — | 13.51 |
Net Asset Value and redemption price per share | |||
Class A | $17.13 | $17.70 | $13.44 |
Offering Price per share | |||
Class A‡ | $18.18 | $18.78 | $14.26 |
Net Asset Value and offering price per share | |||
Class C^ | $16.92 | $17.49 | $13.35 |
†Securities on loan, at value: | |||
Unaffiliated issuers | $— | $— | $— |
*Cost of Investments: | |||
(a) Unaffiliated issuers | $53,796,138 | $813,970,145 | $819,191,200 |
(b) Affiliated issuers | $— | $— | $— |
Total cost of investments | $53,796,138 | $813,970,145 | $819,191,200 |
(c) Total cost of foreign currency | $(9) | $2,144,897 | $— |
(d) Premium received from option contracts written | $— | $— | $230,518 |
‡ | On single retail sales of less than $50,000. On sales of $50,000 or more or in certain other circumstances described in the Fund's prospectus, offering price is reduced. |
^ | Redemption price per share is equal to net asset value less any applicable contingent deferred sales charge. |
See Notes to Financial Statements
154
Focus Fund | Genesis Fund | Global Real Estate Fund | Greater China Equity Fund | International Equity Fund | International Select Fund | International Small Cap Fund |
August 31, 2022 | August 31, 2022 | August 31, 2022 | August 31, 2022 | August 31, 2022 | August 31, 2022 | August 31, 2022 |
26,238,238 | 27,076,829 | — | — | 6,066,971 | — | — |
1,521,211 | 16,442,711 | — | — | 1,958,023 | 391,316 | — |
46,766 | 1,794,422 | — | — | — | — | — |
897,939 | 41,731,478 | 255,313 | 3,729,946 | 85,579,499 | 10,369,606 | 221,787 |
100,207 | — | 27,765 | 217,171 | 990,991 | 271,153 | 16,476 |
13,596 | — | 21,937 | 2,317 | 446,611 | 48,502 | 10,000 |
— | — | — | — | — | 107,209 | — |
— | 72,455,734 | — | — | 2,480,509 | 21,449 | 21,500 |
— | 2,165,071 | — | — | 2,505,110 | — | — |
$21.08 | $61.48 | $— | $— | $11.13 | $— | $— |
20.97 | 61.33 | — | — | 11.13 | 11.58 | — |
20.88 | 60.53 | — | — | — | — | — |
21.17 | 61.58 | 10.96 | 8.69 | 11.14 | 11.57 | 12.08 |
— | — | — | — | — | 11.35 | — |
— | 61.61 | — | — | 11.16 | 11.57 | 12.07 |
— | 61.89 | — | — | 11.20 | — | — |
$20.94 | $— | $10.92 | $8.69 | $11.17 | $11.47 | $12.00 |
$22.22 | $— | $11.59 | $9.22 | $11.85 | $12.17 | $12.73 |
$20.17 | $— | $10.83 | $8.63 | $10.99 | $11.14 | $11.64 |
$— | $— | $— | $— | $837,631 | $614,192 | $226,327 |
$622,074,344 | $5,036,603,073 | $3,749,539 | $42,344,446 | $1,230,460,631 | $141,746,212 | $3,943,570 |
$— | $499,940,196 | $— | $— | $— | $— | $— |
$622,074,344 | $5,536,543,269 | $3,749,539 | $42,344,446 | $1,230,460,631 | $141,746,212 | $3,943,570 |
$10,655 | $— | $2,945 | $1,001,701 | $1,204 | $729,546 | $108,569 |
$— | $— | $— | $— | $— | $— | $— |
155
Statements of Assets and Liabilities (cont’d)
Neuberger Berman Equity Funds
Intrinsic Value Fund | Large Cap Growth Fund** | Large Cap Value Fund | |
August 31, 2022 | August 31, 2022 | August 31, 2022 | |
Assets | |||
Investments in securities, at value*† (Note A)— see Schedule of Investments: | |||
Unaffiliated issuers(a) | $1,383,095,275 | $1,721,039,020 | $10,530,928,916 |
Cash | — | 131 | — |
Foreign currency(b) | — | — | — |
Dividends and interest receivable | 447,117 | 1,997,369 | 38,148,672 |
Receivable for securities sold | — | — | 9,311,265 |
Receivable from Management—net (Note B) | — | — | — |
Receivable for Fund shares sold | 870,922 | 87,665 | 22,679,469 |
Receivable for securities lending income (Note A) | — | 8,093 | 11,694 |
Prepaid expenses and other assets | 98,067 | 153,880 | 471,263 |
Total Assets | 1,384,511,381 | 1,723,286,158 | 10,601,551,279 |
Liabilities | |||
Payable to investment manager—net (Note B) | 898,098 | 733,667 | 3,688,819 |
Due to custodian | — | — | — |
Payable for securities purchased | 1,186,584 | — | 270,487,444 |
Payable for Fund shares redeemed | 6,615,860 | 718,064 | 7,133,880 |
Payable to administrator—net (Note B) | 208,412 | 387,828 | 1,818,854 |
Payable to trustees | 5,374 | 5,112 | 5,374 |
Payable for audit fees | 45,435 | 87,734 | 54,845 |
Payable for custodian and accounting fees | 32,036 | 45,495 | 155,480 |
Payable for shareholder reports | — | 109,986 | 136,251 |
Payable for legal fees | 9,107 | 9,107 | 9,995 |
Payable for cash collateral on loaned securities (Note A) | — | 11,418,040 | 35,062,500 |
Other accrued expenses and payables | 25,337 | 163,683 | 283,158 |
Total Liabilities | 9,026,243 | 13,678,716 | 318,836,600 |
Net Assets | $1,375,485,138 | $1,709,607,442 | $10,282,714,679 |
Net Assets consist of: | |||
Paid-in capital | $1,243,812,113 | $1,132,972,060 | $10,160,995,962 |
Total distributable earnings/(losses) | 131,673,025 | 576,635,382 | 121,718,717 |
Net Assets | $1,375,485,138 | $1,709,607,442 | $10,282,714,679 |
Net Assets | |||
Investor Class | $— | $1,408,139,395 | $1,556,548,067 |
Trust Class | — | 37,692,445 | 117,218,215 |
Advisor Class | — | 2,277,979 | 133,516,102 |
Institutional Class | 1,204,807,751 | 245,125,898 | 7,555,845,659 |
Class A | 49,002,818 | 12,415,692 | 201,490,324 |
Class C | 20,415,358 | 3,350,466 | 222,775,339 |
Class R3 | — | 436,747 | 6,831,381 |
Class R6 | 101,259,211 | 168,820 | 342,368,726 |
Class E | — | — | 146,120,866 |
See Notes to Financial Statements
156
Mid Cap Growth Fund | Mid Cap Intrinsic Value Fund | Multi-Cap Opportunities Fund | Real Estate Fund | Small Cap Growth Fund | Sustainable Equity Fund | U.S. Equity Impact Fund |
August 31, 2022 | August 31, 2022 | August 31, 2022 | August 31, 2022 | August 31, 2022 | August 31, 2022 | August 31, 2022 |
$1,603,426,866 | $54,629,975 | $336,916,703 | $1,138,597,974 | $321,937,657 | $1,424,505,010 | $6,052,031 |
— | — | — | — | — | — | — |
— | — | — | — | — | 309 | — |
858,989 | 71,561 | 460,009 | 479,360 | 92,200 | 2,053,048 | 7,651 |
1,610,784 | 547,844 | 838,636 | 33,726,459 | 1,832,251 | — | — |
— | 1,642 | — | 10,119 | 55,799 | — | 49,705 |
401,762 | 336 | 27,495 | 569,324 | 213,480 | 388,072 | — |
— | — | — | — | 1,334 | — | — |
154,453 | 52,765 | 22,256 | 99,247 | 58,644 | 81,384 | 19,297 |
1,606,452,854 | 55,304,123 | 338,265,099 | 1,173,482,483 | 324,191,365 | 1,427,027,823 | 6,128,684 |
693,724 | 26,799 | 141,892 | 800,459 | 240,842 | 631,456 | 3,585 |
— | — | 207,816 | — | — | — | — |
— | 525,263 | — | 34,561,128 | — | — | — |
924,833 | 3,214 | 483,555 | 655,157 | 187,574 | 536,140 | — |
255,106 | — | 64,822 | — | — | 335,585 | — |
5,374 | 5,374 | 5,375 | 5,374 | 5,374 | 5,374 | 5,374 |
50,435 | 41,390 | 42,435 | 52,145 | 46,435 | 50,435 | 30,790 |
32,031 | 10,733 | 12,871 | 27,748 | 13,904 | 33,311 | 8,868 |
118,597 | 6,259 | 5,003 | 39,421 | 31,246 | 43,997 | 1,126 |
12,865 | 12,220 | 9,995 | 9,995 | 12,785 | 9,107 | 15,808 |
— | — | — | — | 2,276,831 | — | — |
94,619 | 9,777 | 11,448 | 35,192 | 27,081 | 87,845 | 2,947 |
2,187,584 | 641,029 | 985,212 | 36,186,619 | 2,842,072 | 1,733,250 | 68,498 |
$1,604,265,270 | $54,663,094 | $337,279,887 | $1,137,295,864 | $321,349,293 | $1,425,294,573 | $6,060,186 |
$1,357,251,764 | $46,762,452 | $117,940,904 | $1,046,218,218 | $343,913,754 | $803,950,278 | $6,954,018 |
247,013,506 | 7,900,642 | 219,338,983 | 91,077,646 | (22,564,461) | 621,344,295 | (893,832) |
$1,604,265,270 | $54,663,094 | $337,279,887 | $1,137,295,864 | $321,349,293 | $1,425,294,573 | $6,060,186 |
$478,015,919 | $32,729,525 | $— | $— | $62,808,790 | $346,202,750 | $— |
53,366,943 | 6,057,997 | — | 127,401,807 | 3,856,011 | 108,456,610 | — |
8,074,778 | — | — | — | 2,619,809 | — | — |
469,696,943 | 13,108,579 | 208,868,230 | 738,108,867 | 146,464,397 | 608,196,826 | 5,923,685 |
38,990,167 | 1,161,618 | 41,241,368 | 78,435,718 | 18,212,808 | 133,112,292 | 109,488 |
7,689,232 | 912,625 | 15,556,454 | 10,558,085 | 4,244,781 | 36,381,996 | 27,013 |
9,917,310 | 663,922 | — | 16,931,471 | 5,394,879 | 18,587,941 | — |
538,513,978 | 28,828 | — | 146,855,347 | 77,747,818 | 174,356,158 | — |
— | — | 71,613,835 | 19,004,569 | — | — | — |
157
Statements of Assets and Liabilities (cont’d)
Neuberger Berman Equity Funds
Intrinsic Value Fund | Large Cap Growth Fund** | Large Cap Value Fund | |
August 31, 2022 | August 31, 2022 | August 31, 2022 | |
Shares Outstanding ($.001 par value; unlimited shares authorized) | |||
Investor Class | — | 64,424,918 | 38,176,591 |
Trust Class | — | 1,730,879 | 2,874,360 |
Advisor Class | — | 105,807 | 3,273,821 |
Institutional Class | 63,408,269 | 11,196,499 | 185,419,098 |
Class A | 2,620,490 | 571,153 | 4,943,197 |
Class C | 1,127,657 | 159,303 | 5,486,261 |
Class R3 | — | 20,322 | 168,099 |
Class R6 | 5,303,192 | 7,708 | 8,390,059 |
Class E | — | — | 3,569,608 |
Net Asset Value, offering and redemption price per share | |||
Investor Class | $— | $21.86 | $40.77 |
Trust Class | — | 21.78 | 40.78 |
Advisor Class | — | 21.53 | 40.78 |
Institutional Class | 19.00 | 21.89 | 40.75 |
Class R3 | — | 21.49 | 40.64 |
Class R6 | 19.09 | 21.90 | 40.81 |
Class E | — | — | 40.93 |
Net Asset Value and redemption price per share | |||
Class A | $18.70 | $21.74 | $40.76 |
Offering Price per share | |||
Class A‡ | $19.84 | $23.07 | $43.25 |
Net Asset Value and offering price per share | |||
Class C^ | $18.10 | $21.03 | $40.61 |
†Securities on loan, at value: | |||
Unaffiliated issuers | $— | $10,487,008 | $34,196,250 |
*Cost of Investments: | |||
(a) Unaffiliated issuers | $1,294,211,364 | $1,226,172,594 | $10,373,928,966 |
(b) Total cost of foreign currency | $— | $— | $— |
** | Consolidated financial statement, see Note A of the Notes to Financial Statements for additional information. |
‡ | On single retail sales of less than $50,000. On sales of $50,000 or more or in certain other circumstances described in the Fund's prospectus, offering price is reduced. |
^ | Redemption price per share is equal to net asset value less any applicable contingent deferred sales charge. |
See Notes to Financial Statements
158
Mid Cap Growth Fund | Mid Cap Intrinsic Value Fund | Multi-Cap Opportunities Fund | Real Estate Fund | Small Cap Growth Fund | Sustainable Equity Fund | U.S. Equity Impact Fund |
August 31, 2022 | August 31, 2022 | August 31, 2022 | August 31, 2022 | August 31, 2022 | August 31, 2022 | August 31, 2022 |
32,693,334 | 1,383,621 | — | — | 1,656,023 | 8,908,174 | — |
3,655,943 | 256,539 | — | 8,236,565 | 101,982 | 2,787,661 | — |
554,993 | — | — | — | 69,431 | — | — |
32,066,434 | 554,628 | 17,833,832 | 47,544,236 | 3,855,588 | 15,677,544 | 669,686 |
2,674,725 | 49,173 | 3,522,765 | 5,070,057 | 481,737 | 3,427,007 | 12,439 |
532,803 | 39,163 | 1,370,289 | 680,761 | 113,418 | 954,697 | 3,102 |
682,726 | 28,180 | — | 1,096,749 | 143,172 | 478,586 | — |
36,718,147 | 1,220 | — | 9,461,281 | 2,043,791 | 4,493,533 | — |
— | — | 6,087,171 | 1,223,494 | — | — | — |
$14.62 | $23.65 | $— | $— | $37.93 | $38.86 | $— |
14.60 | 23.61 | — | 15.47 | 37.81 | 38.91 | — |
14.55 | — | — | — | 37.73 | — | — |
14.65 | 23.63 | 11.71 | 15.52 | 37.99 | 38.79 | 8.85 |
14.53 | 23.56 | — | 15.44 | 37.68 | 38.84 | — |
14.67 | 23.64 | — | 15.52 | 38.04 | 38.80 | — |
— | — | 11.76 | 15.53 | — | — | — |
$14.58 | $23.62 | $11.71 | $15.47 | $37.81 | $38.84 | $8.80 |
$15.47 | $25.06 | $12.42 | $16.41 | $40.12 | $41.21 | $9.34 |
$14.43 | $23.30 | $11.35 | $15.51 | $37.43 | $38.11 | $8.71 |
$— | $— | $— | $— | $3,755,949 | $— | $— |
$1,392,302,998 | $46,774,209 | $184,243,629 | $1,116,290,885 | $327,691,423 | $892,160,391 | $6,305,975 |
$— | $— | $— | $— | $— | $317 | $— |
159
Statements of Operations
Neuberger Berman Equity Funds
Dividend Growth Fund | Emerging Markets Equity Fund | Equity Income Fund | |
For the Fiscal Year Ended August 31, 2022 | For the Fiscal Year Ended August 31, 2022 | For the Fiscal Year Ended August 31, 2022 | |
Investment Income: | |||
Income (Note A): | |||
Dividend income—unaffiliated issuers | $1,334,908 | $30,684,622 | $35,417,358 |
Dividend income—affiliated issuers (Note F) | — | — | — |
Interest and other income—unaffiliated issuers | 11,846 | 98,107 | 384,032 |
Income from securities loaned—net | — | 5,984 | — |
Foreign taxes withheld | (34,991) | (2,611,190) | (334,009) |
Total income | $1,311,763 | $28,177,523 | $35,467,381 |
Expenses: | |||
Investment management fees (Note B) | 360,123 | 10,388,053 | 5,844,655 |
Administration fees (Note B): | |||
Investor Class | — | — | — |
Trust Class | — | — | — |
Advisor Class | — | — | — |
Institutional Class | 104,108 | 1,223,080 | 1,316,975 |
Class A | 3,791 | 64,150 | 475,411 |
Class C | 2,919 | 13,152 | 201,798 |
Class R3 | — | 1,983 | 1,545 |
Class R6 | 19 | 119,983 | — |
Distribution fees (Note B): | |||
Trust Class | — | — | — |
Advisor Class | — | — | — |
Class A | 3,645 | 61,683 | 457,125 |
Class C | 11,227 | 50,586 | 776,147 |
Class R3 | — | 3,813 | 2,971 |
Shareholder servicing agent fees: | |||
Investor Class | — | — | — |
Trust Class | — | — | — |
Advisor Class | — | — | — |
Institutional Class | 667 | 121,209 | 6,079 |
Class A | 1,054 | 3,223 | 8,152 |
Class C | 185 | 445 | 2,719 |
Class R3 | — | 902 | 358 |
Class R6 | 120 | 3,037 | — |
Class E | — | — | 1,574 |
Audit fees | 45,135 | 54,024 | 57,885 |
Custodian and accounting fees | 59,542 | 718,368 | 137,690 |
Insurance | 1,805 | 33,369 | 35,654 |
Legal fees | 55,681 | 55,681 | 61,228 |
Registration and filing fees | 61,445 | 95,268 | 84,598 |
Shareholder reports | 2,262 | 28,184 | 87,517 |
Trustees' fees and expenses | 43,737 | 44,474 | 44,491 |
Interest | 178 | 18,681 | 23,130 |
Miscellaneous and other fees (Note A) | 13,246 | 111,788 | 88,004 |
Total expenses | 770,889 | 13,215,136 | 9,715,706 |
See Notes to Financial Statements
160
Focus Fund | Genesis Fund | Global Real Estate Fund | Greater China Equity Fund | International Equity Fund | International Select Fund | International Small Cap Fund |
For the Fiscal Year Ended August 31, 2022 | For the Fiscal Year Ended August 31, 2022 | For the Fiscal Year Ended August 31, 2022 | For the Fiscal Year Ended August 31, 2022 | For the Fiscal Year Ended August 31, 2022 | For the Fiscal Year Ended August 31, 2022 | For the Fiscal Year Ended August 31, 2022 |
$7,269,691 | $96,854,487 | $91,787 | $1,049,512 | $36,782,604 | $3,816,687 | $65,093 |
— | 2,834,929 | — | — | — | — | — |
86,995 | 684,982 | 332 | 299 | 585,827 | 174,502 | 1,543 |
50,010 | — | — | — | 270,729 | 53,884 | 2,125 |
(540,967) | (211,095) | (4,752) | (59,168) | (3,154,797) | (315,823) | (7,363) |
$6,865,729 | $100,163,303 | $87,367 | $990,643 | $34,484,363 | $3,729,250 | $61,398 |
4,030,737 | 74,978,771 | 31,591 | 529,386 | 12,479,279 | 881,828 | 29,824 |
1,821,402 | 4,871,671 | — | — | 222,613 | — | — |
169,011 | 4,646,990 | — | — | 108,432 | 22,231 | — |
6,842 | 505,346 | — | — | — | — | — |
36,823 | 4,614,631 | 5,044 | 68,143 | 2,070,351 | 222,011 | 4,082 |
6,525 | — | 841 | 6,788 | 43,455 | 10,484 | 870 |
1,340 | — | 683 | 226 | 17,484 | 1,914 | 378 |
— | — | — | — | — | 3,848 | — |
— | 2,508,024 | — | — | 24,663 | 259 | 154 |
42,253 | — | — | — | — | 5,558 | — |
4,276 | 315,841 | — | — | — | — | — |
6,274 | — | 809 | 6,527 | 41,784 | 10,080 | 837 |
5,154 | — | 2,627 | 868 | 67,246 | 7,361 | 1,453 |
— | — | — | — | — | 7,400 | — |
263,902 | 842,645 | — | — | 67,484 | — | — |
475 | 5,433 | — | — | 576 | 3,840 | — |
74 | 4,295 | — | — | — | — | — |
602 | 14,884 | 302 | 519 | 6,318 | 971 | 267 |
519 | — | 518 | 3,791 | 2,949 | 606 | 477 |
297 | — | 205 | 220 | 706 | 341 | 119 |
— | — | — | — | — | 497 | — |
— | 15,086 | — | — | 1,553 | 181 | 119 |
— | 1,574 | — | — | 1,574 | — | — |
55,279 | 59,045 | 42,300 | 46,669 | 55,845 | 53,435 | 45,934 |
123,540 | 1,077,065 | 68,886 | 82,360 | 304,821 | 94,646 | 84,711 |
21,901 | 321,704 | 104 | 1,419 | 46,383 | 4,342 | 87 |
55,681 | 57,548 | 55,681 | 65,616 | 57,548 | 55,682 | 55,681 |
106,396 | 222,129 | 49,501 | 55,137 | 104,222 | 102,066 | 63,482 |
82,417 | 648,471 | 2,681 | 1,103 | 48,588 | 5,466 | 2,998 |
44,258 | 51,990 | 43,689 | 43,720 | 44,784 | 43,797 | 43,689 |
8,146 | 6,699 | — | 1,661 | 57,465 | 9,115 | — |
66,123 | 713,065 | 13,964 | 19,053 | 322,555 | 103,616 | 21,909 |
6,960,247 | 96,482,907 | 319,426 | 933,206 | 16,198,678 | 1,651,575 | 357,071 |
161
Statements of Operations (cont’d)
Neuberger Berman Equity Funds
Dividend Growth Fund | Emerging Markets Equity Fund | Equity Income Fund | |
For the Fiscal Year Ended August 31, 2022 | For the Fiscal Year Ended August 31, 2022 | For the Fiscal Year Ended August 31, 2022 | |
Expenses reimbursed by Management (Note B) | (253,954) | (24,098) | — |
Investment management fees waived (Note B) | — | — | (105,382) |
Total net expenses | 516,935 | 13,191,038 | 9,610,324 |
Net investment income/(loss) | $794,828 | $14,986,485 | $25,857,057 |
Realized and Unrealized Gain/(Loss) on Investments (Note A): | |||
Net realized gain/(loss) on: | |||
Transactions in investment securities of unaffiliated issuers | 238,683 | (50,131,329)* | 66,217,416 |
Transactions in investment securities of affiliated issuers | — | — | — |
Settlement of foreign currency transactions | 2,980 | (1,267,069) | (32,900) |
Expiration or closing of option contracts written | — | — | 2,576,688 |
Change in net unrealized appreciation/(depreciation) in value of: | |||
Investment securities of unaffiliated issuers | (8,607,303) | (271,162,138)** | (92,822,317) |
Investment securities of affiliated issuers | — | — | — |
Foreign currency translations | (986) | (61,693) | (26,104) |
Option contracts written | — | — | 265,110 |
Net gain/(loss) on investments | (8,366,626) | (322,622,229) | (23,822,107) |
Net increase/(decrease) in net assets resulting from operations | $(7,571,798) | $(307,635,744) | $2,034,950 |
* | Net of foreign capital gains tax of $4,628,187 for Emerging Markets Equity. |
** | Change in accrued foreign capital gains tax amounted to $4,269,000 for Emerging Markets Equity. |
See Notes to Financial Statements
162
Focus Fund | Genesis Fund | Global Real Estate Fund | Greater China Equity Fund | International Equity Fund | International Select Fund | International Small Cap Fund |
For the Fiscal Year Ended August 31, 2022 | For the Fiscal Year Ended August 31, 2022 | For the Fiscal Year Ended August 31, 2022 | For the Fiscal Year Ended August 31, 2022 | For the Fiscal Year Ended August 31, 2022 | For the Fiscal Year Ended August 31, 2022 | For the Fiscal Year Ended August 31, 2022 |
(550) | — | (275,690) | (197,859) | (503,734) | (248,312) | (317,277) |
— | (586,773) | — | — | (1,730,866) | — | — |
6,959,697 | 95,896,134 | 43,736 | 735,347 | 13,964,078 | 1,403,263 | 39,794 |
$(93,968) | $4,267,169 | $43,631 | $255,296 | $20,520,285 | $2,325,987 | $21,604 |
33,429,405 | 1,211,503,919 | 363,502 | (2,696,193) | 113,721,173 | 10,011,932 | 161,445 |
— | (1,094,889) | — | — | — | — | — |
411,605 | (5,951) | (1,338) | (29,160) | (1,895,110) | (134,140) | (6,051) |
— | — | — | — | — | — | — |
(302,768,330) | (2,762,365,540) | (1,073,415) | (14,283,848) | (622,595,109) | (62,010,523) | (1,466,310) |
— | (224,359,534) | — | — | — | — | — |
(13,075) | — | (91) | (9,200) | (291,699) | (44,028) | (4,983) |
— | — | — | — | — | — | — |
(268,940,395) | (1,776,321,995) | (711,342) | (17,018,401) | (511,060,745) | (52,176,759) | (1,315,899) |
$(269,034,363) | $(1,772,054,826) | $(667,711) | $(16,763,105) | $(490,540,460) | $(49,850,772) | $(1,294,295) |
163
Statements of Operations (cont’d)
Neuberger Berman Equity Funds
Intrinsic Value Fund | Large Cap Growth Fund(a) | Large Cap Value Fund | |
For the Fiscal Year Ended August 31, 2022 | For the Fiscal Year Ended August 31, 2022 | For the Fiscal Year Ended August 31, 2022 | |
Investment Income: | |||
Income (Note A): | |||
Dividend income—unaffiliated issuers | $7,591,965 | $17,390,646 | $225,053,924 |
Interest and other income—unaffiliated issuers | 727,077 | 200,732 | 3,142,011 |
Income from securities loaned—net | — | 59,459 | 237,960 |
Foreign taxes withheld | — | (36,300) | (335,391) |
Total income | $8,319,042 | $17,614,537 | $228,098,504 |
Expenses: | |||
Investment management fees (Note B) | 9,813,934 | 8,988,202 | 37,104,915 |
Administration fees (Note B): | |||
Investor Class | — | 4,185,495 | 4,299,777 |
Trust Class | — | 183,093 | 482,796 |
Advisor Class | — | 23,517 | 572,685 |
Institutional Class | 1,719,606 | 307,156 | 9,230,751 |
Class A | 136,467 | 25,160 | 469,636 |
Class C | 54,692 | 7,949 | 449,932 |
Class R3 | — | 1,101 | 11,822 |
Class R6 | 48,801 | 95 | 123,868 |
Distribution fees (Note B): | |||
Trust Class | — | 45,773 | 120,699 |
Advisor Class | — | 14,698 | 357,928 |
Class A | 131,218 | 24,192 | 451,573 |
Class C | 210,353 | 30,575 | 1,730,506 |
Class R3 | — | 2,117 | 22,735 |
Shareholder servicing agent fees: | |||
Investor Class | — | 641,492 | 651,928 |
Trust Class | — | 561 | 1,338 |
Advisor Class | — | (19) | 1,776 |
Institutional Class | 16,523 | 1,036 | 38,373 |
Class A | 6,394 | 1,313 | 33,104 |
Class C | 1,246 | 324 | 6,452 |
Class R3 | — | 225 | 893 |
Class R6 | 605 | 166 | 4,070 |
Class E | — | — | 1,574 |
Audit fees | 46,435 | 88,734 | 55,845 |
Custodian and accounting fees | 218,300 | 220,317 | 836,898 |
Insurance | 28,404 | 49,904 | 183,817 |
Legal fees | 55,791 | 58,886 | 61,892 |
Registration and filing fees | 175,488 | 139,702 | 502,663 |
Repayment to Management of expenses previously assumed by Management (Note B) | 511,522 | 95 | — |
Shareholder reports | 165,912 | 158,227 | 710,453 |
Trustees' fees and expenses | 44,624 | 44,793 | 49,798 |
Interest | 1,257 | 13,137 | 10,104 |
Miscellaneous and other fees (Note A) | 87,427 | 128,399 | 518,699 |
Total expenses | 13,474,999 | 15,386,415 | 59,099,300 |
See Notes to Financial Statements
164
Mid Cap Growth Fund | Mid Cap Intrinsic Value Fund | Multi-Cap Opportunities Fund | Real Estate Fund | Small Cap Growth Fund | Sustainable Equity Fund | U.S. Equity Impact Fund |
For the Fiscal Year Ended August 31, 2022 | For the Fiscal Year Ended August 31, 2022 | For the Fiscal Year Ended August 31, 2022 | For the Fiscal Year Ended August 31, 2022 | For the Fiscal Year Ended August 31, 2022 | For the Fiscal Year Ended August 31, 2022 | For the Fiscal Year Ended August 31, 2022 |
$10,223,941 | $1,088,717 | $5,036,660 | $22,243,674 | $1,254,039 | $21,717,737 | $63,141 |
308,123 | 1,120 | 2,741 | 82,723 | 72,564 | 31,356 | 443 |
36,999 | — | — | — | 46,298 | — | — |
(32,692) | (2,007) | (42,949) | (30,695) | — | (306,142) | (1,417) |
$10,536,371 | $1,087,830 | $4,996,452 | $22,295,702 | $1,372,901 | $21,442,951 | $62,167 |
8,718,447 | 329,538 | 2,636,080 | 9,734,582 | 3,017,005 | 8,301,172 | 42,293 |
1,498,392 | 91,074 | — | — | 189,009 | 1,033,238 | — |
301,188 | 26,743 | — | 568,080 | 17,701 | 521,849 | — |
40,215 | — | — | — | 12,894 | — | — |
692,985 | 22,548 | 493,152 | 1,177,557 | 285,485 | 1,169,662 | 8,757 |
114,812 | 3,702 | 125,565 | 221,249 | 55,915 | 387,174 | 452 |
26,851 | 2,572 | 55,051 | 30,610 | 13,418 | 111,243 | 78 |
36,032 | 1,888 | — | 51,370 | 13,864 | 56,290 | — |
312,119 | 15 | — | 80,056 | 29,417 | 98,884 | — |
— | 6,686 | — | 142,020 | 4,425 | 130,462 | — |
25,133 | — | — | — | 8,059 | — | — |
110,397 | 3,559 | 120,735 | 212,739 | 53,764 | 372,282 | 434 |
103,273 | 9,893 | 211,734 | 117,733 | 51,609 | 427,857 | 301 |
69,292 | 3,631 | — | 98,788 | 26,661 | 108,250 | — |
257,517 | 20,156 | — | — | 59,610 | 256,554 | — |
520 | 224 | — | 15,906 | 286 | 3,781 | — |
717 | — | — | — | 386 | — | — |
5,913 | 737 | 3,413 | 9,673 | 3,863 | 8,069 | 172 |
4,118 | 642 | 5,279 | 10,788 | 9,109 | 7,520 | 261 |
872 | 348 | 1,416 | 1,806 | 502 | 2,299 | 120 |
2,311 | 379 | — | 2,860 | 1,443 | 1,725 | — |
12,203 | 114 | — | 11,964 | 3,185 | 6,717 | — |
— | — | 1,574 | 1,574 | — | — | — |
51,435 | 41,390 | 43,435 | 52,545 | 47,435 | 51,435 | 30,790 |
198,415 | 63,756 | 76,973 | 154,910 | 96,939 | 199,796 | 34,469 |
51,493 | 1,622 | 13,692 | 28,987 | 11,011 | 48,563 | 150 |
60,054 | 58,903 | 57,657 | 57,548 | 59,536 | 58,537 | 71,203 |
176,740 | 110,865 | 57,131 | 154,160 | 140,079 | 129,538 | 76,136 |
— | — | — | — | — | — | — |
253,911 | 10,812 | 18,981 | 166,559 | 75,883 | 114,144 | 414 |
44,991 | 43,730 | 44,009 | 44,573 | 43,948 | 44,949 | 43,690 |
— | 104 | 19,170 | 2,278 | 686 | — | 32 |
207,096 | 14,763 | 34,136 | 86,090 | 50,668 | 131,312 | 9,614 |
13,377,442 | 870,394 | 4,019,183 | 13,237,005 | 4,383,795 | 13,783,302 | 319,366 |
165
Statements of Operations (cont’d)
Neuberger Berman Equity Funds
Intrinsic Value Fund | Large Cap Growth Fund(a) | Large Cap Value Fund | |
For the Fiscal Year Ended August 31, 2022 | For the Fiscal Year Ended August 31, 2022 | For the Fiscal Year Ended August 31, 2022 | |
Expenses reimbursed by Management (Note B) | — | (17) | — |
Investment management fees waived (Note B) | — | — | (414,861) |
Total net expenses | 13,474,999 | 15,386,398 | 58,684,439 |
Net investment income/(loss) | $(5,155,957) | $2,228,139 | $169,414,065 |
Realized and Unrealized Gain/(Loss) on Investments (Note A): | |||
Net realized gain/(loss) on: | |||
Transactions in investment securities of unaffiliated issuers | 85,579,674 | 127,539,529 | (111,665,828) |
Redemption in-kind | ��� | — | 27,164,460 |
Settlement of foreign currency transactions | — | 57,168 | 7,811 |
Expiration or closing of option contracts written | — | 246,143 | — |
Change in net unrealized appreciation/(depreciation) in value of: | |||
Investment securities of unaffiliated issuers | (314,785,000) | (481,553,407) | (707,815,789) |
Foreign currency translations | — | — | — |
Option contracts written | — | (488,229) | — |
Net gain/(loss) on investments | (229,205,326) | (354,198,796) | (792,309,346) |
Net increase/(decrease) in net assets resulting from operations | $(234,361,283) | $(351,970,657) | $(622,895,281) |
(a) | Consolidated financial statement, see Note A of the Notes to Financial Statements for additional information. |
See Notes to Financial Statements
166
Mid Cap Growth Fund | Mid Cap Intrinsic Value Fund | Multi-Cap Opportunities Fund | Real Estate Fund | Small Cap Growth Fund | Sustainable Equity Fund | U.S. Equity Impact Fund |
For the Fiscal Year Ended August 31, 2022 | For the Fiscal Year Ended August 31, 2022 | For the Fiscal Year Ended August 31, 2022 | For the Fiscal Year Ended August 31, 2022 | For the Fiscal Year Ended August 31, 2022 | For the Fiscal Year Ended August 31, 2022 | For the Fiscal Year Ended August 31, 2022 |
— | (276,830) | — | (2,186,320) | (899,243) | — | (263,782) |
— | — | (295,763) | (104,237) | — | — | — |
13,377,442 | 593,564 | 3,723,420 | 10,946,448 | 3,484,552 | 13,783,302 | 55,584 |
$(2,841,071) | $494,266 | $1,273,032 | $11,349,254 | $(2,111,651) | $7,659,649 | $6,583 |
120,693,602 | 5,411,981 | 116,732,127 | 99,766,521 | (15,496,511) | 152,478,834 | (597,752) |
— | — | — | — | — | — | — |
139 | — | — | — | — | (170,394) | (3) |
— | — | — | — | — | — | — |
(644,296,602) | (7,787,076) | (182,950,963) | (252,274,950) | (63,277,164) | (393,823,828) | (1,031,673) |
(849) | — | — | — | — | (137,826) | — |
— | — | — | — | — | — | — |
(523,603,710) | (2,375,095) | (66,218,836) | (152,508,429) | (78,773,675) | (241,653,214) | (1,629,428) |
$(526,444,781) | $(1,880,829) | $(64,945,804) | $(141,159,175) | $(80,885,326) | $(233,993,565) | $(1,622,845) |
167
Statements of Changes in Net Assets
Neuberger Berman Equity Funds
Dividend Growth Fund | Emerging Markets Equity Fund | |||
Fiscal Year Ended | Fiscal Year Ended | Fiscal Year Ended | Fiscal Year Ended | |
August 31, 2022 | August 31, 2021 | August 31, 2022 | August 31, 2021 | |
Increase/(Decrease) in Net Assets: | ||||
From Operations (Note A): | ||||
Net investment income/(loss) | $794,828 | $548,751 | $14,986,485 | $3,541,278 |
Net realized gain/(loss) on investments | 241,663 | 4,445,612 | (51,398,398) | 109,334,442 |
Change in net unrealized appreciation/(depreciation) of investments | (8,608,289) | 12,675,786 | (271,223,831) | 65,053,158 |
Net increase/(decrease) in net assets resulting from operations | (7,571,798) | 17,670,149 | (307,635,744) | 177,928,878 |
Distributions to Shareholders From (Note A): | ||||
Distributable earnings: | ||||
Investor Class | — | — | — | — |
Trust Class | — | — | — | — |
Advisor Class | — | — | — | — |
Institutional Class | (2,499,888) | (742,840) | (9,669,709) | (3,568,091) |
Class A | (42,586) | (15,411) | (212,772) | (50,983) |
Class C | (34,444) | (8,635) | (30,600) | — |
Class R3 | — | — | (5,122) | — |
Class R6 | (1,484) | (486) | (3,216,808) | (1,128,741) |
Class E | — | — | — | — |
Total distributions to shareholders | (2,578,402) | (767,372) | (13,135,011) | (4,747,815) |
From Fund Share Transactions (Note D): | ||||
Proceeds from shares sold: | ||||
Investor Class | — | — | — | — |
Trust Class | — | — | — | — |
Advisor Class | — | — | — | — |
Institutional Class | 15,113,607 | 12,665,548 | 220,166,318 | 253,341,761 |
Class A | 610,251 | 76,124 | 8,516,327 | 9,959,942 |
Class C | 130,255 | 263,660 | 183,721 | 861,448 |
Class R3 | — | — | 192,374 | 199,614 |
Class R6 | — | — | 17,880,403 | 81,483,430 |
Class E | — | — | — | — |
Proceeds from reinvestment of dividends and distributions: | ||||
Investor Class | — | — | — | — |
Trust Class | — | — | — | — |
Advisor Class | — | — | — | — |
Institutional Class | 2,499,888 | 742,840 | 4,082,970 | 1,609,979 |
Class A | 42,140 | 15,234 | 120,780 | 27,707 |
Class C | 34,113 | 8,633 | 16,433 | — |
Class R3 | — | — | 4,489 | — |
Class R6 | — | — | 3,215,649 | 1,128,268 |
Class E | — | — | — | — |
See Notes to Financial Statements
168
Equity Income Fund | Focus Fund | Genesis Fund | Global Real Estate Fund | ||||
Fiscal Year Ended | Fiscal Year Ended | Fiscal Year Ended | Fiscal Year Ended | Fiscal Year Ended | Fiscal Year Ended | Fiscal Year Ended | Fiscal Year Ended |
August 31, 2022 | August 31, 2021 | August 31, 2022 | August 31, 2021 | August 31, 2022 | August 31, 2021 | August 31, 2022 | August 31, 2021 |
$25,857,057 | $28,079,620 | $(93,968) | $171,909 | $4,267,169 | $(2,007,257) | $43,631 | $40,415 |
68,761,204 | 149,933,417 | 33,841,010 | 140,474,557 | 1,210,403,079 | 1,404,370,563 | 362,164 | 183,502 |
(92,583,311) | 98,359,642 | (302,781,405) | 95,704,561 | (2,986,725,074) | 1,935,043,587 | (1,073,506) | 599,991 |
2,034,950 | 276,372,679 | (269,034,363) | 236,351,027 | (1,772,054,826) | 3,337,406,893 | (667,711) | 823,908 |
— | — | (136,402,309) | (38,144,099) | (210,590,154) | (71,771,065) | — | — |
— | — | (8,284,726) | (2,489,625) | (130,343,708) | (48,636,547) | — | — |
— | — | (329,117) | (103,205) | (14,473,125) | (5,333,753) | — | — |
(94,576,655) | (23,248,583) | (4,828,673) | (939,810) | (355,585,655) | (127,257,277) | (236,062) | (37,486) |
(18,543,833) | (3,156,079) | (483,064) | (162,544) | — | — | (22,530) | (3,156) |
(7,577,516) | (955,145) | (111,038) | (35,901) | — | — | (17,690) | (1,598) |
(58,479) | (19,034) | — | — | — | — | — | — |
— | — | — | — | (577,582,834) | (193,893,991) | — | — |
(514,706) | — | — | — | — | — | — | — |
(121,271,189) | (27,378,841) | (150,438,927) | (41,875,184) | (1,288,575,476) | (446,892,633) | (276,282) | (42,240) |
— | — | 3,923,521 | 3,347,825 | 101,204,610 | 144,737,447 | — | — |
— | — | 474,776 | 1,166,888 | 74,242,574 | 129,164,606 | — | — |
— | — | 512,955 | 448,121 | 11,554,468 | 12,471,197 | — | — |
186,553,982 | 120,356,881 | 11,819,673 | 10,079,306 | 538,949,248 | 614,864,775 | 1,538,533 | 2,255,839 |
20,860,780 | 30,504,003 | 296,104 | 289,727 | — | — | 86,211 | 53,185 |
2,083,562 | 2,994,173 | 22,350 | 49,290 | — | — | 21,573 | 2,500 |
179,617 | 392,656 | — | — | — | — | — | — |
— | — | — | — | 590,614,756 | 784,360,992 | — | — |
35,374,131 | — | — | — | 160,192,765 | — | — | — |
— | — | 125,304,527 | 35,051,668 | 203,748,253 | 68,987,845 | — | — |
— | — | 8,241,192 | 2,471,265 | 129,704,902 | 48,261,989 | — | — |
— | — | 328,694 | 103,087 | 13,984,630 | 5,168,087 | — | — |
85,542,072 | 21,134,547 | 4,738,106 | 914,496 | 321,339,017 | 114,901,501 | 236,062 | 37,486 |
13,812,516 | 2,255,417 | 464,724 | 157,731 | — | — | 20,446 | 1,370 |
7,204,351 | 902,821 | 106,757 | 30,125 | — | — | 16,643 | 459 |
58,480 | 19,024 | — | — | — | — | — | — |
— | — | — | — | 576,427,588 | 192,414,257 | — | — |
514,706 | — | — | — | — | — | — | — |
169
Statements of Changes in Net Assets (cont’d)
Neuberger Berman Equity Funds
Dividend Growth Fund | Emerging Markets Equity Fund | |||
Fiscal Year Ended | Fiscal Year Ended | Fiscal Year Ended | Fiscal Year Ended | |
August 31, 2022 | August 31, 2021 | August 31, 2022 | August 31, 2021 | |
Payments for shares redeemed: | ||||
Investor Class | $— | $— | $— | $— |
Trust Class | — | — | — | — |
Advisor Class | — | — | — | — |
Institutional Class | (8,397,568) | (10,245,133) | (304,832,175) | (271,782,156) |
Class A | (185,739) | (626,994) | (14,967,150) | (14,297,558) |
Class C | (491,119) | (1,985,342) | (1,850,840) | (1,249,710) |
Class R3 | — | — | (144,384) | (288,830) |
Class R6 | — | — | (88,786,933) | (18,202,755) |
Class E | — | — | — | — |
Net increase/(decrease) from Fund share transactions | 9,355,828 | 914,570 | (156,202,018) | 42,791,140 |
Net Increase/(Decrease) in Net Assets | (794,372) | 17,817,347 | (476,972,773) | 215,972,203 |
Net Assets: | ||||
Beginning of year | 71,086,116 | 53,268,769 | 1,303,403,237 | 1,087,431,034 |
End of year | $70,291,744 | $71,086,116 | $826,430,464 | $1,303,403,237 |
See Notes to Financial Statements
170
Equity Income Fund | Focus Fund | Genesis Fund | Global Real Estate Fund | ||||
Fiscal Year Ended | Fiscal Year Ended | Fiscal Year Ended | Fiscal Year Ended | Fiscal Year Ended | Fiscal Year Ended | Fiscal Year Ended | Fiscal Year Ended |
August 31, 2022 | August 31, 2021 | August 31, 2022 | August 31, 2021 | August 31, 2022 | August 31, 2021 | August 31, 2022 | August 31, 2021 |
$— | $— | $(61,579,212) | $(50,778,542) | $(240,595,196) | $(253,447,855) | $— | $— |
— | — | (7,158,880) | (8,346,044) | (229,615,864) | (386,826,991) | — | — |
— | — | (1,057,879) | (706,318) | (30,439,941) | (34,533,560) | — | — |
(245,596,003) | (437,488,734) | (10,523,531) | (3,310,264) | (996,777,698) | (1,028,789,559) | (1,815,587) | (683,223) |
(32,215,109) | (31,078,728) | (211,653) | (1,217,099) | — | — | (32,508) | (36,196) |
(17,190,006) | (38,629,239) | (252,234) | (913,415) | — | — | (7,314) | (2,650) |
(215,555) | (1,673,276) | — | — | — | — | — | — |
— | — | — | — | (1,109,692,772) | (903,064,717) | — | — |
(1,461,011) | — | — | — | (6,243,080) | — | — | — |
55,506,513 | (330,310,455) | 75,449,990 | (11,162,153) | 108,598,260 | (491,329,986) | 64,059 | 1,628,770 |
(63,729,726) | (81,316,617) | (344,023,300) | 183,313,690 | (2,952,032,042) | 2,399,184,274 | (879,934) | 2,410,438 |
1,169,341,818 | 1,250,658,435 | 951,305,962 | 767,992,272 | 12,901,156,691 | 10,501,972,417 | 4,217,683 | 1,807,245 |
$1,105,612,092 | $1,169,341,818 | $607,282,662 | $951,305,962 | $9,949,124,649 | $12,901,156,691 | $3,337,749 | $4,217,683 |
171
Statements of Changes in Net Assets (cont’d)
Neuberger Berman Equity Funds
Greater China Equity Fund | International Equity Fund | |||
Fiscal Year Ended | Fiscal Year Ended | Fiscal Year Ended | Fiscal Year Ended | |
August 31, 2022 | August 31, 2021 | August 31, 2022 | August 31, 2021 | |
Increase/(Decrease) in Net Assets: | ||||
From Operations (Note A): | ||||
Net investment income/(loss) | $255,296 | $375,914 | $20,520,285 | $15,726,857 |
Net realized gain/(loss) on investments | (2,725,353) | 6,828,230 | 111,826,063 | 155,814,490 |
Change in net unrealized appreciation/(depreciation) of investments | (14,293,048) | (207,330) | (622,886,808) | 273,988,989 |
Net increase/(decrease) in net assets resulting from operations | (16,763,105) | 6,996,814 | (490,540,460) | 445,530,336 |
Distributions to Shareholders From (Note A): | ||||
Distributable earnings: | ||||
Investor Class | — | — | (10,429,269) | (4,496,265) |
Trust Class | — | — | (3,197,489) | (1,340,247) |
Advisor Class | — | — | — | — |
Institutional Class | (3,174,613) | (299,749) | (179,015,926) | (68,692,513) |
Class A | (173,090) | (5,815) | (1,771,871) | (2,631,060) |
Class C | (8,089) | — | (784,476) | (317,340) |
Class R3 | — | — | — | — |
Class R6 | — | — | (8,501,484) | (3,831,586) |
Total distributions to shareholders | (3,355,792) | (305,564) | (203,700,515) | (81,309,011) |
From Fund Share Transactions (Note D): | ||||
Proceeds from shares sold: | ||||
Investor Class | — | — | 1,822,315 | 3,102,270 |
Trust Class | — | — | 2,259,414 | 1,036,142 |
Advisor Class | — | — | — | — |
Institutional Class | 253,136 | 17,025,211 | 214,499,849 | 255,795,695 |
Class A | 8 | — | 5,644,865 | 10,684,206 |
Class C | — | — | 673,087 | 1,291,950 |
Class R3 | — | — | — | — |
Class R6 | — | — | 7,728,572 | 9,851,318 |
Class E | — | — | 40,693,499 | — |
Proceeds from reinvestment of dividends and distributions: | ||||
Investor Class | — | — | 10,032,044 | 4,336,539 |
Trust Class | — | — | 2,876,056 | 1,218,086 |
Advisor Class | — | — | — | — |
Institutional Class | 2,816,308 | 246,922 | 143,209,921 | 54,430,100 |
Class A | 154,277 | 5,364 | 1,066,885 | 412,845 |
Class C | 6,854 | — | 557,232 | 249,091 |
Class R3 | — | — | — | — |
Class R6 | — | — | 8,494,315 | 3,828,300 |
See Notes to Financial Statements
172
International Select Fund | International Small Cap Fund | Intrinsic Value Fund | Large Cap Growth Fund(a) | ||||
Fiscal Year Ended | Fiscal Year Ended | Fiscal Year Ended | Fiscal Year Ended | Fiscal Year Ended | Fiscal Year Ended | Fiscal Year Ended | Fiscal Year Ended |
August 31, 2022 | August 31, 2021 | August 31, 2022 | August 31, 2021 | August 31, 2022 | August 31, 2021 | August 31, 2022 | August 31, 2021 |
$2,325,987 | $1,536,573 | $21,604 | $2,872 | $(5,155,957) | $(4,950,861) | $2,228,139 | $2,072,852 |
9,877,792 | 15,881,511 | 155,394 | 178,082 | 85,579,674 | 82,684,416 | 127,842,840 | 188,447,992 |
(62,054,551) | 22,164,455 | (1,471,293) | 679,530 | (314,785,000) | 299,164,253 | (482,041,636) | 366,327,114 |
(49,850,772) | 39,582,539 | (1,294,295) | 860,484 | (234,361,283) | 376,897,808 | (351,970,657) | 556,847,958 |
— | — | — | — | — | — | (178,778,865) | (107,074,493) |
(617,925) | (63,437) | — | — | — | — | (5,157,067) | (3,015,692) |
— | — | — | — | — | — | (803,272) | (442,228) |
(16,820,411) | (2,063,050) | (153,718) | (54,106) | (68,079,133) | (10,917,361) | (21,508,014) | (11,590,742) |
(472,995) | (39,418) | (22,055) | (5,639) | (3,376,608) | (438,276) | (998,244) | (660,372) |
(79,782) | (6,061) | (7,399) | (4,387) | (1,392,641) | (225,758) | (318,626) | (180,384) |
(158,470) | (16,174) | — | — | — | — | (44,453) | (12,381) |
(32,119) | (29,867) | (16,608) | (11,360) | (6,363,138) | (1,051,407) | (21,550) | (8,182) |
(18,181,702) | (2,218,007) | (199,780) | (75,492) | (79,211,520) | (12,632,802) | (207,630,091) | (122,984,474) |
— | — | — | — | — | — | 12,090,062 | 19,374,758 |
108,863 | 139,742 | — | — | — | — | 1,831,935 | 2,840,108 |
— | — | — | — | — | — | 476,229 | 6,816,834 |
40,164,115 | 9,898,820 | 1,040,993 | 733,340 | 766,429,770 | 411,294,676 | 121,088,768 | 30,918,935 |
1,275,263 | 1,327,077 | 68,718 | 296,114 | 29,809,963 | 30,536,745 | 9,090,730 | 5,448,853 |
372,325 | 342,465 | — | — | 10,993,145 | 6,497,288 | 1,498,605 | 578,065 |
243,570 | 364,416 | — | — | — | — | 141,052 | 291,382 |
92,786 | 410,307 | 20,837 | — | 42,911,494 | 70,343,766 | 6,563 | 136,190 |
— | — | — | — | — | — | — | — |
— | — | — | — | — | — | 167,191,877 | 100,836,713 |
586,702 | 60,282 | — | — | — | — | 5,115,567 | 2,995,621 |
— | — | — | — | — | — | 803,272 | 442,229 |
16,443,850 | 2,013,108 | 153,718 | 54,106 | 61,512,157 | 9,932,068 | 21,389,349 | 11,503,934 |
269,105 | 24,117 | 14,125 | 732 | 2,926,485 | 378,854 | 906,616 | 605,922 |
50,177 | 5,118 | — | — | 1,191,735 | 199,167 | 308,662 | 173,939 |
158,470 | 11,352 | — | — | — | — | 43,179 | 12,381 |
4,539 | 29,353 | — | — | 6,266,107 | 1,050,853 | 17,091 | 5,449 |
173
Statements of Changes in Net Assets (cont’d)
Neuberger Berman Equity Funds
Greater China Equity Fund | International Equity Fund | |||
Fiscal Year Ended | Fiscal Year Ended | Fiscal Year Ended | Fiscal Year Ended | |
August 31, 2022 | August 31, 2021 | August 31, 2022 | August 31, 2021 | |
Payments for shares redeemed: | ||||
Investor Class | $— | $— | $(10,242,547) | $(17,541,865) |
Trust Class | — | — | (4,138,726) | (4,687,933) |
Advisor Class | — | — | — | — |
Institutional Class | (12,996,637) | (14,385,935) | (451,450,624) | (282,988,235) |
Class A | (742,060) | (1,213,651) | (55,770,603) | (13,124,846) |
Class C | (116,313) | (51,969) | (1,596,172) | (2,286,150) |
Class R3 | — | — | — | — |
Class R6 | — | — | (53,711,424) | (20,138,246) |
Class E | — | — | (3,240,142) | — |
Net increase/(decrease) from Fund share transactions | (10,624,427) | 1,625,942 | (140,592,184) | 5,469,267 |
Net Increase/(Decrease) in Net Assets | (30,743,324) | 8,317,192 | (834,833,159) | 369,690,592 |
Net Assets: | ||||
Beginning of year | 65,058,077 | 56,740,885 | 1,949,616,575 | 1,579,925,983 |
End of year | $34,314,753 | $65,058,077 | $1,114,783,416 | $1,949,616,575 |
(a) | Consolidated financial statement, see Note A of the Notes to Financial Statements for additional information. |
See Notes to Financial Statements
174
International Select Fund | International Small Cap Fund | Intrinsic Value Fund | Large Cap Growth Fund(a) | ||||
Fiscal Year Ended | Fiscal Year Ended | Fiscal Year Ended | Fiscal Year Ended | Fiscal Year Ended | Fiscal Year Ended | Fiscal Year Ended | Fiscal Year Ended |
August 31, 2022 | August 31, 2021 | August 31, 2022 | August 31, 2021 | August 31, 2022 | August 31, 2021 | August 31, 2022 | August 31, 2021 |
$— | $— | $— | $— | $— | $— | $(105,998,207) | $(103,454,629) |
(479,631) | (299,960) | — | — | — | — | (7,884,493) | (6,930,177) |
— | — | — | — | — | — | (4,965,779) | (889,700) |
(26,280,916) | (32,462,356) | (117,404) | (49,552) | (328,320,558) | (312,262,059) | (40,316,145) | (29,152,453) |
(1,240,458) | (894,880) | (264,372) | (4,667) | (22,825,893) | (13,639,389) | (4,958,374) | (4,335,243) |
(387,370) | (619,228) | — | — | (4,898,169) | (5,606,735) | (631,132) | (598,462) |
(459,092) | (1,168,286) | — | — | — | — | (23,459) | (142,607) |
(974,414) | (1,395,055) | (46) | — | (10,140,938) | (17,399,031) | (8,600) | (11,244) |
— | — | — | — | — | — | — | — |
29,947,884 | (22,213,608) | 916,569 | 1,030,073 | 555,855,298 | 181,326,203 | 177,213,368 | 37,466,798 |
(38,084,590) | 15,150,924 | (577,506) | 1,815,065 | 242,282,495 | 545,591,209 | (382,387,380) | 471,330,282 |
167,665,336 | 152,514,412 | 3,830,001 | 2,014,936 | 1,133,202,643 | 587,611,434 | 2,091,994,822 | 1,620,664,540 |
$129,580,746 | $167,665,336 | $3,252,495 | $3,830,001 | $1,375,485,138 | $1,133,202,643 | $1,709,607,442 | $2,091,994,822 |
175
Statements of Changes in Net Assets (cont’d)
Neuberger Berman Equity Funds
Large Cap Value Fund | Mid Cap Growth Fund | |||
Fiscal Year Ended | Fiscal Year Ended | Fiscal Year Ended | Fiscal Year Ended | |
August 31, 2022 | August 31, 2021 | August 31, 2022 | August 31, 2021 | |
Increase/(Decrease) in Net Assets: | ||||
From Operations (Note A): | ||||
Net investment income/(loss) | $169,414,065 | $67,487,784 | $(2,841,071) | $(8,838,993) |
Net realized gain/(loss) on investments | (84,493,557) | 285,988,196 | 120,693,741 | 280,048,876 |
Change in net unrealized appreciation/(depreciation) of investments | (707,815,789) | 669,960,593 | (644,297,451) | 293,290,751 |
Net increase/(decrease) in net assets resulting from operations | (622,895,281) | 1,023,436,573 | (526,444,781) | 564,500,634 |
Distributions to Shareholders From (Note A): | ||||
Distributable earnings: | ||||
Investor Class | (79,869,457) | (20,430,235) | (94,164,177) | (58,050,416) |
Trust Class | (5,348,605) | (1,078,681) | (14,613,610) | (8,892,266) |
Advisor Class | (6,380,433) | (1,468,008) | (1,630,520) | (1,154,080) |
Institutional Class | (259,813,461) | (8,164,733) | (64,686,823) | (34,989,272) |
Class A | (7,290,938) | (370,906) | (6,369,020) | (3,702,867) |
Class C | (5,993,385) | (38,911) | (1,799,949) | (1,143,834) |
Class R3 | (195,609) | (8,965) | (2,379,066) | (1,395,759) |
Class R6 | (12,246,115) | (2,120,487) | (99,981,072) | (52,695,641) |
Class E | — | — | — | — |
Tax return of capital: | ||||
Investor Class | — | — | — | — |
Trust Class | — | — | — | — |
Advisor Class | — | — | — | — |
Institutional Class | — | — | — | — |
Class A | — | — | — | — |
Class C | — | — | — | — |
Class R3 | — | — | — | — |
Class R6 | — | — | — | — |
Total distributions to shareholders | (377,138,003) | (33,680,926) | (285,624,237) | (162,024,135) |
From Fund Share Transactions (Note D): | ||||
Proceeds from shares sold: | ||||
Investor Class | 155,089,826 | 181,721,255 | 4,297,779 | 8,427,112 |
Trust Class | 40,269,978 | 38,659,593 | 7,233,713 | 14,641,683 |
Advisor Class | 29,852,317 | 34,170,739 | 2,230,687 | 4,393,464 |
Institutional Class | 6,285,255,626 | 4,014,187,453 | 250,262,489 | 110,644,195 |
Class A | 140,351,829 | 150,482,658 | 16,434,847 | 12,205,286 |
Class C | 157,027,737 | 87,614,778 | 574,211 | 1,107,474 |
Class R3 | 6,868,851 | 1,697,270 | 2,272,855 | 5,366,627 |
Class R6 | 449,415,419 | 59,105,641 | 119,621,281 | 200,567,729 |
Class E | 165,979,332 | — | — | — |
Proceeds from reinvestment of dividends and distributions: | ||||
Investor Class | 76,831,816 | 19,601,816 | 90,001,157 | 55,465,169 |
Trust Class | 5,155,956 | 1,023,865 | 14,591,224 | 8,891,643 |
Advisor Class | 6,133,382 | 1,465,423 | 1,181,490 | 784,013 |
Institutional Class | 228,259,242 | 6,385,077 | 63,581,241 | 34,670,570 |
Class A | 4,083,769 | 202,660 | 5,450,366 | 3,254,839 |
Class C | 4,504,520 | 22,767 | 1,719,385 | 1,091,464 |
Class R3 | 193,310 | 8,610 | 2,347,697 | 1,371,835 |
Class R6 | 11,737,178 | 2,119,897 | 94,926,348 | 50,323,184 |
Class E | — | — | — | — |
See Notes to Financial Statements
176
Mid Cap Intrinsic Value Fund | Multi-Cap Opportunities Fund | Real Estate Fund | Small Cap Growth Fund | ||||
Fiscal Year Ended | Fiscal Year Ended | Fiscal Year Ended | Fiscal Year Ended | Fiscal Year Ended | Fiscal Year Ended | Fiscal Year Ended | Fiscal Year Ended |
August 31, 2022 | August 31, 2021 | August 31, 2022 | August 31, 2021 | August 31, 2022 | August 31, 2021 | August 31, 2022 | August 31, 2021 |
$494,266 | $362,555 | $1,273,032 | $1,455,196 | $11,349,254 | $11,257,811 | $(2,111,651) | $(3,020,583) |
5,411,981 | 6,938,039 | 116,732,127 | 169,829,130 | 99,766,521 | 38,018,132 | (15,496,511) | 89,473,676 |
(7,787,076) | 14,320,120 | (182,950,963) | 10,284,968 | (252,274,950) | 215,074,260 | (63,277,164) | 1,645,503 |
(1,880,829) | 21,620,714 | (64,945,804) | 181,569,294 | (141,159,175) | 264,350,203 | (80,885,326) | 88,098,596 |
(200,175) | (11,425) | — | — | — | — | (13,252,492) | (918,631) |
(16,858) | (4,162) | — | — | (6,173,221) | (2,198,156) | (813,679) | (57,855) |
— | — | — | — | — | — | (594,336) | (42,672) |
(110,063) | (37,826) | (118,597,894) | (115,191,642) | (34,780,310) | (9,593,060) | (37,037,913) | (2,177,438) |
(3,489) | (807) | (13,620,305) | (8,383,410) | (3,525,707) | (1,119,427) | (3,937,846) | (296,389) |
— | — | (6,605,137) | (5,779,393) | (394,612) | (89,071) | (981,790) | (62,596) |
(589) | (78) | — | — | (800,006) | (244,645) | (927,836) | (47,892) |
(214) | (102) | — | — | (7,642,072) | (2,684,462) | (8,436,522) | (599,444) |
— | — | — | — | (274,847) | — | — | — |
— | — | — | — | — | — | (5,639) | — |
— | — | — | — | — | — | (346) | — |
— | — | — | — | — | — | (253) | — |
— | — | — | — | — | — | (15,760) | — |
— | — | — | — | — | — | (1,676) | — |
— | — | — | — | — | — | (418) | — |
— | — | — | — | — | — | (3,588) | — |
— | — | — | — | — | — | (396) | — |
(331,388) | (54,400) | (138,823,336) | (129,354,445) | (53,590,775) | (15,928,821) | (66,010,490) | (4,202,917) |
1,057,233 | 2,605,124 | — | — | — | — | 1,106,128 | 3,247,751 |
105,959 | 407,063 | — | — | 19,158,056 | 25,470,008 | 128,516 | 242,499 |
— | — | — | — | — | — | 155,473 | 802,448 |
4,138,358 | 1,639,298 | 38,380,265 | 45,743,956 | 440,742,041 | 349,440,252 | 63,195,920 | 111,080,915 |
143,472 | 152,672 | 10,077,120 | 10,055,868 | 33,900,502 | 28,468,974 | 3,604,892 | 9,404,702 |
136,984 | 143,747 | 1,980,028 | 2,189,068 | 3,475,220 | 3,120,369 | 413,978 | 1,715,123 |
126,870 | 347,826 | — | — | 5,244,577 | 5,317,825 | 1,991,946 | 3,596,155 |
— | — | — | — | 61,643,170 | 62,761,594 | 54,162,673 | 47,160,598 |
— | — | 90,710,866 | — | 23,747,158 | — | — | — |
189,687 | 10,798 | — | — | — | — | 12,896,511 | 902,822 |
16,569 | 4,096 | — | — | 6,117,690 | 2,175,437 | 753,833 | 53,533 |
— | — | — | — | — | — | 594,589 | 42,672 |
109,688 | 37,825 | 108,211,753 | 108,174,760 | 29,398,689 | 8,292,727 | 36,984,717 | 2,173,942 |
2,902 | 705 | 12,220,548 | 7,411,395 | 3,187,621 | 1,026,529 | 3,842,732 | 291,535 |
— | — | 5,871,703 | 5,304,954 | 355,385 | 85,494 | 982,208 | 62,596 |
566 | 69 | — | — | 799,846 | 243,941 | 923,466 | 47,374 |
— | — | — | — | 7,591,814 | 2,676,754 | 8,431,806 | 599,116 |
— | — | — | — | 274,847 | — | — | — |
177
Statements of Changes in Net Assets (cont’d)
Neuberger Berman Equity Funds
Large Cap Value Fund | Mid Cap Growth Fund | |||
Fiscal Year Ended | Fiscal Year Ended | Fiscal Year Ended | Fiscal Year Ended | |
August 31, 2022 | August 31, 2021 | August 31, 2022 | August 31, 2021 | |
Payments for shares redeemed: | ||||
Investor Class | $(151,041,541) | $(173,343,216) | $(51,697,606) | $(76,486,949) |
Trust Class | (28,187,993) | (24,141,015) | (41,467,976) | (21,181,230) |
Advisor Class | (27,320,107) | (41,803,744) | (4,096,612) | (4,905,939) |
Institutional Class | (2,368,157,760) | (568,756,731) | (120,963,312) | (99,159,527) |
Class A | (58,887,241) | (53,784,445) | (12,138,167) | (12,250,293) |
Class C | (18,246,059) | (7,254,222) | (2,898,368) | (2,773,040) |
Class R3 | (1,570,289) | (627,631) | (6,799,119) | (5,258,817) |
Class R6 | (284,132,931) | (9,619,225) | (153,434,655) | (159,835,132) |
Class E | (3,214,680) | — | — | — |
Net increase/(decrease) from Fund share transactions | 4,826,251,487 | 3,719,139,273 | 283,230,955 | 131,355,360 |
Net Increase/(Decrease) in Net Assets | 3,826,218,203 | 4,708,894,920 | (528,838,063) | 533,831,859 |
Net Assets: | ||||
Beginning of year | 6,456,496,476 | 1,747,601,556 | 2,133,103,333 | 1,599,271,474 |
End of year | $10,282,714,679 | $6,456,496,476 | $1,604,265,270 | $2,133,103,333 |
See Notes to Financial Statements
178
Mid Cap Intrinsic Value Fund | Multi-Cap Opportunities Fund | Real Estate Fund | Small Cap Growth Fund | ||||
Fiscal Year Ended | Fiscal Year Ended | Fiscal Year Ended | Fiscal Year Ended | Fiscal Year Ended | Fiscal Year Ended | Fiscal Year Ended | Fiscal Year Ended |
August 31, 2022 | August 31, 2021 | August 31, 2022 | August 31, 2021 | August 31, 2022 | August 31, 2021 | August 31, 2022 | August 31, 2021 |
$(2,279,583) | $(2,644,136) | $— | $— | $— | $— | $(7,287,665) | $(9,869,961) |
(700,887) | (988,992) | — | — | (25,531,170) | (20,816,568) | (594,453) | (676,038) |
— | — | — | — | — | — | (760,637) | (945,169) |
(5,896,435) | (4,634,426) | (269,800,971) | (316,953,452) | (312,519,229) | (145,292,786) | (107,616,596) | (80,195,379) |
(458,949) | (940,752) | (12,818,961) | (11,570,881) | (29,638,792) | (24,700,337) | (6,836,895) | (12,360,984) |
(221,191) | (306,563) | (9,569,876) | (13,212,368) | (2,645,235) | (3,586,968) | (1,551,997) | (931,767) |
(185,894) | (436,957) | — | — | (6,334,592) | (5,669,905) | (1,355,768) | (2,224,519) |
— | — | — | — | (65,946,264) | (41,889,221) | (18,870,673) | (42,304,712) |
— | — | (5,148,156) | — | (1,721,374) | — | — | — |
(3,714,651) | (4,602,603) | (29,885,681) | (162,856,700) | 191,299,960 | 247,124,119 | 45,294,704 | 31,915,252 |
(5,926,868) | 16,963,711 | (233,654,821) | (110,641,851) | (3,449,990) | 495,545,501 | (101,601,112) | 115,810,931 |
60,589,962 | 43,626,251 | 570,934,708 | 681,576,559 | 1,140,745,854 | 645,200,353 | 422,950,405 | 307,139,474 |
$54,663,094 | $60,589,962 | $337,279,887 | $570,934,708 | $1,137,295,864 | $1,140,745,854 | $321,349,293 | $422,950,405 |
179
Statements of Changes in Net Assets (cont’d)
Neuberger Berman Equity Funds
Sustainable Equity Fund | U.S. Equity Impact Fund | |||
Fiscal Year Ended | Fiscal Year Ended | Fiscal Year Ended | Period from March 23, 2021 (Commencement of Operations) to | |
August 31, 2022 | August 31, 2021 | August 31, 2022 | August 31, 2021 | |
Increase/(Decrease) in Net Assets: | ||||
From Operations (Note A): | ||||
Net investment income/(loss) | $7,659,649 | $8,337,425 | $6,583 | $(5,093) |
Net realized gain/(loss) on investments | 152,308,440 | 211,390,784 | (597,755) | (38,197) |
Change in net unrealized appreciation/(depreciation) of investments | (393,961,654) | 303,276,347 | (1,031,673) | 777,729 |
Net increase/(decrease) in net assets resulting from operations | (233,993,565) | 523,004,556 | (1,622,845) | 734,439 |
Distributions to Shareholders From (Note A): | ||||
Distributable earnings: | ||||
Investor Class | (41,928,886) | (24,529,117) | — | — |
Trust Class | (13,525,658) | (7,540,489) | — | — |
Institutional Class | (87,816,876) | (47,256,605) | (6,797) | — |
Class A | (15,339,761) | (5,982,035) | (159) | — |
Class C | (4,388,872) | (2,383,226) | (20) | — |
Class R3 | (2,208,118) | (1,549,909) | — | — |
Class R6 | (21,494,518) | (15,797,953) | — | — |
Total distributions to shareholders | (186,702,689) | (105,039,334) | (6,976) | — |
From Fund Share Transactions (Note D): | ||||
Proceeds from shares sold: | ||||
Investor Class | 14,453,276 | 56,659,705 | — | — |
Trust Class | 8,787,439 | 18,321,793 | — | — |
Institutional Class | 111,826,607 | 194,252,822 | 2,085,561 | 5,346,069 |
Class A | 18,821,157 | 53,333,094 | 76,009 | 203,363 |
Class C | 3,015,058 | 5,416,990 | 1,000 | 30,000 |
Class R3 | 2,938,165 | 4,467,511 | — | — |
Class R6 | 50,771,999 | 142,685,592 | — | — |
Proceeds from reinvestment of dividends and distributions: | ||||
Investor Class | 40,342,855 | 23,325,011 | — | — |
Trust Class | 13,444,722 | 7,492,180 | — | — |
Institutional Class | 79,125,120 | 43,404,634 | 6,798 | — |
Class A | 13,944,295 | 5,347,193 | 139 | — |
Class C | 3,898,086 | 2,183,695 | — | — |
Class R3 | 2,199,353 | 1,531,321 | — | — |
Class R6 | 21,413,654 | 15,797,954 | — | — |
See Notes to Financial Statements
180
Sustainable Equity Fund | U.S. Equity Impact Fund | |||
Fiscal Year Ended | Fiscal Year Ended | Fiscal Year Ended | Period from March 23, 2021 (Commencement of Operations) to | |
August 31, 2022 | August 31, 2021 | August 31, 2022 | August 31, 2021 | |
Payments for shares redeemed: | ||||
Investor Class | $(48,505,455) | $(168,889,177) | $— | $— |
Trust Class | (30,484,958) | (31,876,980) | — | — |
Institutional Class | (287,074,737) | (215,483,275) | (655,580) | — |
Class A | (23,427,364) | (25,837,252) | (137,791) | — |
Class C | (7,706,464) | (10,252,728) | — | — |
Class R3 | (5,046,766) | (16,054,522) | — | — |
Class R6 | (116,238,749) | (186,725,154) | — | — |
Net increase/(decrease) from Fund share transactions | (133,502,707) | (80,899,593) | 1,376,136 | 5,579,432 |
Net Increase/(Decrease) in Net Assets | (554,198,961) | 337,065,629 | (253,685) | 6,313,871 |
Net Assets: | ||||
Beginning of year | 1,979,493,534 | 1,642,427,905 | 6,313,871 | — |
End of year | $1,425,294,573 | $1,979,493,534 | $6,060,186 | $6,313,871 |
181
Notes to Financial Statements Equity Fundsß
Note A—Summary of Significant Accounting Policies:
1
General: Neuberger Berman Equity Funds (the "Trust") is a Delaware statutory trust organized pursuant to
an Amended and Restated Trust Instrument dated March 27, 2014. The Trust is registered as an open-end management investment company under the Investment Company Act of 1940, as amended (the "1940
Act"), and its shares are registered under the Securities Act of 1933, as amended. Neuberger Berman Dividend Growth Fund ("Dividend Growth"), Neuberger Berman Emerging Markets Equity Fund ("Emerging Markets Equity"), Neuberger Berman Equity Income Fund ("Equity Income"), Neuberger Berman Focus Fund ("Focus"), Neuberger Berman Genesis Fund ("Genesis"), Neuberger Berman Global Real Estate Fund ("Global Real Estate"), Neuberger Berman Greater China Equity Fund ("Greater China Equity"), Neuberger Berman International Equity Fund ("International Equity"), Neuberger Berman International Select Fund ("International Select"), Neuberger Berman International Small Cap Fund ("International Small Cap"), Neuberger Berman Intrinsic Value Fund ("Intrinsic Value"), Neuberger Berman Large Cap Growth ("Large Cap Growth") (formerly Neuberger Berman Guardian Fund), Neuberger Berman Large Cap Value Fund ("Large Cap Value"), Neuberger Berman Mid Cap Growth Fund ("Mid Cap Growth"), Neuberger Berman Mid Cap Intrinsic Value Fund ("Mid Cap Intrinsic Value"), Neuberger Berman Multi-Cap Opportunities Fund ("Multi-Cap Opportunities"), Neuberger Berman Real Estate Fund ("Real Estate"), Neuberger Berman Small Cap Growth Fund ("Small Cap Growth"), Neuberger Berman Sustainable Equity Fund ("Sustainable Equity") and Neuberger Berman U.S. Equity Impact Fund ("U.S. Equity Impact") (each individually a "Fund," and collectively, the "Funds") are separate operating series of the Trust, each of which (except Greater China
Equity and Real Estate) is diversified. Under the 1940 Act, the status of a Fund that was registered as non-diversified may, under certain circumstances, change to that of a diversified fund (Global Real Estate and Multi-Cap Opportunities became diversified in December 2017 and December 2012, respectively). Nine Funds offer Investor Class shares, eleven offer Trust Class shares, six offer Advisor Class shares, twenty offer Institutional Class shares, nineteen offer Class A shares, nineteen offer Class C shares, ten offer Class R3 shares, fourteen offer Class R6 shares and six offer Class E shares. U.S. Equity Impact had no operations until March 23, 2021, other than matters relating to its organization and its registration of shares under the 1933 Act. The Trust’s Board of Trustees (the "Board") may establish additional series or classes of shares without the approval of shareholders.
A balance indicated with a "—", reflects either a zero balance or a balance that rounds to less than 1.
The assets of each Fund belong only to that Fund, and the liabilities of each Fund are borne solely by that Fund and no other series of the Trust.
Each Fund is an investment company and accordingly follows the investment company accounting and reporting guidance of the Financial Accounting Standards Board ("FASB") Accounting Standards Codification ("ASC") Topic 946 "Financial Services—Investment Companies."
The preparation of financial statements in accordance with U.S. generally accepted accounting principles ("GAAP") requires Management to make estimates and assumptions at the date of the financial statements. Actual results could differ from those estimates.
On February 25, 2022, to facilitate compliance with certain requirements necessary to maintain its status as a regulated investment company ("RIC"), Large Cap Growth formed NB A24 Guardian Blocker LLC (the "Blocker"), a Delaware limited liability company, to hold interests in certain private placements. The Blocker is a wholly owned subsidiary of Large Cap Growth and Large Cap Growth will remain its sole member.
ß
Notes to Consolidated Financial Statements for Large Cap Growth
182
As of August 31, 2022, the value of Large Cap Growth's investment in the Blocker was as follows:
Investment in Blocker | Percentage of Net Assets | |
$899,529 | 0.1% |
2
Consolidation: The accompanying financial statements of Large Cap Growth present the consolidated accounts of Large Cap Growth and the Blocker. All intercompany accounts and transactions have been eliminated in consolidation.
3
Portfolio valuation: In accordance with ASC 820 "Fair Value Measurement" ("ASC 820"), all investments held by each of the Funds are carried at the value that Management believes each Fund would receive upon selling an investment in an orderly transaction to an independent buyer in the principal or most advantageous market for the investment under current market conditions. Various inputs, including the volume and level of activity for the asset or liability in the market, are considered in valuing the Funds' investments, some of which are discussed below. Significant Management judgment may be necessary to value investments in accordance with ASC 820.
ASC 820 established a three-tier hierarchy of inputs to create a classification of value measurements for disclosure purposes. The three-tier hierarchy of inputs is summarized in the three broad Levels listed below.
•
Level 1 – unadjusted quoted prices in active markets for identical investments
•
Level 2 – other observable inputs (including quoted prices for similar investments, interest rates, prepayment speeds, credit risk, amortized cost, etc.)
•
Level 3 – unobservable inputs (including the Funds' own assumptions in determining the fair value of investments)
The inputs or methodology used for valuing an investment are not necessarily an indication of the risk associated with investing in those securities.
The value of the Funds’ investments in equity securities, preferred stocks, warrants, rights, master limited partnerships and limited partnerships, and exchange-traded options written, for which market quotations are readily available, is generally determined by Management by obtaining valuations from independent pricing services based on the latest sale price quoted on a principal exchange or market for that security
(Level 1 inputs). Securities traded primarily on the NASDAQ Stock Market are normally valued at the NASDAQ Official Closing Price ("NOCP") provided by NASDAQ each business day. The NOCP is the most recently reported price as of 4:00:02 p.m., Eastern Time, unless that price is outside the range of the "inside" bid and asked prices (i.e., the bid and asked prices that dealers quote to each other when trading for their own accounts); in that case, NASDAQ will adjust the price to equal the inside bid or asked price, whichever is closer. Because of delays in reporting trades, the NOCP may not be based on the price of the last trade to occur before the market closes. If there is no sale of a security on a particular day, the independent pricing services may value the security based on market quotations.
The value of the Funds’ investments in debt securities is determined by Management primarily by obtaining valuations from independent pricing services based on readily available bid quotations, or if quotations are not available, by methods which include various considerations based on security type (generally Level 2 inputs). In addition to the consideration of yields or prices of securities of comparable quality, coupon, maturity and type, indications as to values from dealers, and general market conditions, the following is a description of other Level 2 inputs and related valuation techniques used by independent pricing services to value certain types of debt securities held by the Funds:
Convertible Bonds. Inputs used to value convertible bonds generally include underlying stock data, conversion rates, credit specific details, relevant listed bond and preferred stock prices and other market information, which may include benchmark yield curves, reported trades, broker-dealer quotes, issuer spreads, comparable securities, and reference data, such as market research publications, when available.
183
Management has developed a process to periodically review information provided by independent pricing services for all types of securities.
Certificates of deposit are valued at amortized cost (Level 2 inputs).
Publicly traded securities acquired via a private investment in public equity (PIPE) transaction are typically valued at a discount to the market price of an issuer’s common stock. Discounts are applied due to certain trading restrictions imposed or a lack of marketability preceding the conversion to publicly traded securities. The primary inputs used in determining the discount are the length of the lock-up time period and volatility of the underlying security (Level 2 Inputs).
Investments in non-exchange traded investment companies with a readily determinable fair value are valued using the respective fund’s daily calculated net asset value ("NAV") per share (Level 2 inputs).
If a valuation is not available from an independent pricing service, or if Management has reason to believe that the valuation received does not represent the amount each of the Funds might reasonably expect to receive on a current sale in an orderly transaction, Management seeks to obtain quotations from brokers or dealers (generally considered Level 2 or Level 3 inputs depending on the number of quotes available). If such quotations are not readily available, the security is valued using methods the Board has approved in the good-faith belief that the resulting valuation will reflect the fair value of the security. Inputs and assumptions considered in determining the fair value of a security based on Level 2 or Level 3 inputs may include, but are not limited to, the type of the security; the initial cost of the security; the existence of any contractual restrictions on the security’s disposition; the price and extent of public trading in similar securities of the issuer or of comparable companies; quotations or evaluated prices from broker-dealers and/or pricing services; information obtained from the issuer and/or analysts; an analysis of the company’s or issuer’s financial statements; an evaluation of the inputs that influence the issuer and the market(s) in which the security is purchased and sold.
The value of the Funds’ investments in foreign securities is generally determined using the same valuation methods and inputs as other Fund investments, as discussed above. Foreign security prices expressed in local currency values are normally translated from the local currency into U.S. dollars using the exchange rates as of 4:00 p.m., Eastern Time on days the New York Stock Exchange ("NYSE") is open for business. The Board has approved the use of ICE Data Services ("ICE") to assist in determining the fair value of foreign equity securities when changes in the value of a certain index suggest that the closing prices on the foreign exchanges may no longer represent the amount that a Fund could expect to receive for those securities or on days when foreign markets are closed and U.S. markets are open. In each of these events, ICE will provide adjusted prices for certain foreign equity securities using a statistical analysis of historical correlations of multiple factors (Level 2 inputs). The Board has also approved the use of ICE to evaluate the prices of foreign debt securities as of the time as of which a Fund’s share price is calculated. ICE utilizes benchmark spread and yield curves and evaluates available market activity from the local close to the time as of which a Fund’s share price is calculated (Level 2 inputs) to assist in determining prices for certain foreign debt securities. In the case of both foreign equity and foreign debt securities, in the absence of precise information about the market values of these foreign securities as of the time as of which a Fund’s share price is calculated, the Board has determined on the basis of available data that prices adjusted or evaluated in this way are likely to be closer to the prices a Fund could realize on a current sale than are the prices of those securities established at the close of the foreign markets in which the securities primarily trade.
Fair value prices are necessarily estimates, and there is no assurance that such a price will be at or close to the price at which the security is next quoted or next trades.
In December 2020, the Securities and Exchange Commission ("SEC") adopted Rule 2a-5 under the 1940 Act, which establishes requirements for determining fair value in good faith for purposes of the 1940 Act, including related oversight and reporting requirements. The rule also defines when market quotations are "readily available" for purposes of the 1940 Act, which is the threshold for determining whether a fund must fair value a security. The compliance date for Rule 2a-5 was September 8, 2022 (the "Compliance Date"). Effective as of the Compliance Date, the Board approved changes to the Funds' valuation policy to
184
comply with Rule 2a-5 and designated Management as the Funds' valuation designee (as defined in the rule). The valuation designee will be responsible for determining fair value in good faith for any and all Fund investments, subject to oversight by the Board.
4
Foreign currency translations: The accounting records of the Funds and the Blocker are maintained in U.S. dollars. Foreign currency amounts are normally translated into U.S. dollars using the exchange rate as of 4:00 p.m. Eastern Time, on days the NYSE is open for business, to determine the value of investments, other assets and liabilities. Purchase and sale prices of securities, and income and expenses, are translated into U.S. dollars at the prevailing rate of exchange on the respective dates of such transactions. Net unrealized foreign currency gain/(loss), if any, arises from changes in the value of assets and liabilities, other than investments in securities, as a result of changes in exchange rates and is stated separately in the Statements of Operations.
5
Securities transactions and investment income: Securities transactions are recorded on trade date for financial reporting purposes. Dividend income is recorded on the ex-dividend date or, for certain foreign dividends, as soon as a Fund becomes aware of the dividends. Non-cash dividends included in dividend income, if any, are recorded at the fair market value of the securities received. Interest income, including accretion of discount (adjusted for original issue discount, where applicable) and amortization of premium, where applicable, is recorded on the accrual basis. Realized gains and losses from securities transactions and foreign currency transactions, if any, are recorded on the basis of identified cost and stated separately in the Statements of Operations. Included in net realized gain/(loss) on investments are proceeds from the settlement of class action litigation(s) in which certain of the Funds participated as a class member. The amounts of such proceeds for the year ended August 31, 2022, were $126,076, $479, $23,809, $495,597, $157,160, $542,437, $2,742, $2,056,882, and $25,218, for Focus, Genesis, Intrinsic Value, Large Cap Grwoth, Large Cap Value, Mid Cap Growth, Mid Cap Intrinsic, Multi-Cap Opportunities, and Small Cap Growth, respectively.
6
Income tax information: Each Fund is treated as a separate entity for U.S. federal income tax purposes. It is the policy of each Fund to continue to qualify for treatment as a RIC by complying with the requirements of the U.S. Internal Revenue Code applicable to RICs and to distribute substantially all of its net investment income and net realized capital gains to its shareholders. To the extent a Fund distributes substantially all of its net investment income and net realized capital gains to shareholders, no federal income or excise tax provision is required.
ASC 740 "Income Taxes" sets forth a minimum threshold for financial statement recognition of a tax position taken, or expected to be taken, in a tax return. The Funds recognize interest and penalties, if any, related to unrecognized tax positions as an income tax expense in the Statements of Operations. The Funds are subject to examination by U.S. federal and state tax authorities for returns filed for the tax years for which the applicable statutes of limitations have not yet expired. As of August 31, 2022, the Funds did not have any unrecognized tax positions.
For federal income tax purposes, the estimated cost and unrealized appreciation/(depreciation) in value of investments held at August 31, 2022 were as follows:
Cost | Gross Unrealized Appreciation | Gross Unrealized Depreciation | Net Unrealized Appreciation/ (Depreciation) | |
Dividend Growth | $53,804,264 | $19,764,020 | $3,001,139 | $16,762,881 |
Emerging Markets Equity | 818,611,306 | 160,461,952 | 156,045,016 | 4,416,936 |
Equity Income | 819,450,561 | 283,727,931 | 9,925,997 | 273,801,934 |
Focus | 623,573,736 | 31,764,482 | 42,126,811 | (10,362,329) |
Genesis | 5,542,904,051 | 4,684,926,269 | 271,319,991 | 4,413,606,278 |
Global Real Estate | 3,769,065 | 41,361 | 444,212 | (402,851) |
Greater China Equity | 43,481,725 | 678,156 | 10,908,869 | (10,230,713) |
International Equity | 1,234,795,862 | 109,155,014 | 211,494,959 | (102,339,945) |
185
Cost | Gross Unrealized Appreciation | Gross Unrealized Depreciation | Net Unrealized Appreciation/ (Depreciation) | |
International Select | $141,951,056 | $12,012,628 | $23,585,232 | $(11,572,604) |
International Small Cap | 3,948,365 | 273,583 | 713,132 | (439,549) |
Intrinsic Value | 1,300,484,879 | 273,575,243 | 190,964,847 | 82,610,396 |
Large Cap Growth | 1,228,119,497 | 557,647,401 | 64,727,878 | 492,919,523 |
Large Cap Value | 10,405,558,594 | 592,402,185 | 467,031,863 | 125,370,322 |
Mid Cap Growth | 1,398,161,713 | 329,991,001 | 124,725,848 | 205,265,153 |
Mid Cap Intrinsic Value | 46,628,315 | 14,078,080 | 6,076,420 | 8,001,660 |
Multi-Cap Opportunities | 184,159,974 | 155,388,845 | 2,632,116 | 152,756,729 |
Real Estate | 1,119,230,556 | 79,907,726 | 60,540,307 | 19,367,419 |
Small Cap Growth | 330,330,061 | 38,875,523 | 47,267,927 | (8,392,404) |
Sustainable Equity | 893,236,733 | 555,736,110 | 24,467,833 | 531,268,277 |
U.S. Equity Impact | 6,302,662 | 369,471 | 620,102 | (250,631) |
Income distributions and capital gain distributions are determined in accordance with income tax regulations, which may differ from GAAP. These differences are primarily due to differing treatments of income and gains on various investment securities held by each Fund, timing differences and differing characterization of distributions made by each Fund. The Funds may also utilize earnings and profits distributed to shareholders on redemption of their shares as a part of the dividends-paid deduction for income tax purposes.
Any permanent differences resulting from different book and tax treatment are reclassified at year-end and have no impact on net income, NAV or NAV per share of the Funds. For the year ended August 31, 2022, the Funds recorded permanent reclassifications primarily related to one or more of the following: deemed distributions on shareholder redemptions, prior year true up adjustments, net operating losses written off and gains (losses) & tax adjustments on securities redeemed in kind. For the year ended August 31, 2022, the Funds recorded the following permanent reclassifications:
Paid-in Capital | Total Distributable Earnings/(Losses) | |
Dividend Growth | $115,519 | $(115,519) |
Emerging Markets Equity | — | — |
Equity Income | 13,409,981 | (13,409,981) |
Focus | 3,557,924 | (3,557,924) |
Genesis | 137,630,416 | (137,630,416) |
Global Real Estate | — | — |
Greater China Equity | — | — |
International Equity | 25,647,010 | (25,647,010) |
International Select | 1,584,986 | (1,584,986) |
International Small Cap | — | — |
Intrinsic Value | 14,179,411 | (14,179,411) |
Large Cap Growth | 7,923,838 | (7,923,838) |
Large Cap Value | 26,272,460 | (26,272,460) |
Mid Cap Growth | 14,009,532 | (14,009,532) |
Mid Cap Intrinsic Value | — | — |
Multi-Cap Opportunities | 30,945,020 | (30,945,020) |
Real Estate | 12,096,928 | (12,096,928) |
Small Cap Growth | (977,893) | 977,893 |
Sustainable Equity | 28,417,182 | (28,417,182) |
U.S. Equity Impact | (1,550) | 1,550 |
186
The tax character of distributions paid during the years ended August 31, 2022, and August 31, 2021, was as follows:
Distributions Paid From: | ||||||||
Ordinary Income | Long-Term Capital Gain | Return of Capital | Total | |||||
2022 | 2021 | 2022 | 2021 | 2022 | 2021 | 2022 | 2021 | |
Dividend Growth | $615,923 | $767,372 | $1,962,479 | $— | $— | $— | $2,578,402 | $767,372 |
Emerging Markets Equity | 13,135,011 | 4,747,815 | — | — | — | — | 13,135,011 | 4,747,815 |
Equity Income | 25,174,166 | 27,378,841 | 96,097,023 | — | — | — | 121,271,189 | 27,378,841 |
Focus | 32,908,567 | — | 117,530,360 | 41,875,184 | — | — | 150,438,927 | 41,875,184 |
Genesis | 221,104 | 6,270,056 | 1,288,354,250 | 440,622,577 | — | — | 1,288,575,354 | 446,892,633 |
Global Real Estate | 81,587 | 42,240 | 194,695 | — | — | — | 276,282 | 42,240 |
Greater China Equity | 978,841 | 305,564 | 2,376,951 | — | — | — | 3,355,792 | 305,564 |
International Equity | 28,567,855 | 17,001,303 | 175,132,660 | 64,307,708 | — | — | 203,700,515 | 81,309,011 |
International Select | 2,771,908 | 1,262,624 | 15,409,794 | 955,383 | — | — | 18,181,702 | 2,218,007 |
International Small Cap | 31,731 | 10,984 | 168,049 | 64,508 | — | — | 199,780 | 75,492 |
Intrinsic Value | — | — | 79,211,520 | 12,632,802 | — | — | 79,211,520 | 12,632,802 |
Large Cap Growth | 82,004,314 | 29,507,447 | 125,625,777 | 93,477,027 | — | — | 207,630,091 | 122,984,474 |
Large Cap Value | 177,678,598 | 28,452,253 | 199,459,405 | 5,228,673 | — | — | 377,138,003 | 33,680,926 |
Mid Cap Growth | 19,485,079 | 2,963,183 | 266,139,158 | 159,060,952 | — | — | 285,624,237 | 162,024,135 |
Mid Cap Intrinsic Value | 331,388 | 54,400 | — | — | — | — | 331,388 | 54,400 |
Multi-Cap Opportunities | 5,051,790 | 1,439,115 | 133,771,546 | 127,915,330 | — | — | 138,823,336 | 129,354,445 |
Real Estate | 23,794,771 | 13,773,899 | 29,796,004 | 2,154,922 | — | — | 53,590,775 | 15,928,821 |
Small Cap Growth | 35,131,358 | — | 30,851,056 | 4,202,917 | 28,076 | — | 66,010,490 | 4,202,917 |
Sustainable Equity | 20,066,393 | 11,979,850 | 166,636,296 | 93,059,484 | — | — | 186,702,689 | 105,039,334 |
U.S. Equity Impact | 6,976 | —(a) | — | —(a) | — | —(a) | 6,976 | —(a) |
(a) | Period from March 23, 2021 (Commencement of Operations) to August 31, 2021. |
As of August 31, 2022, the components of distributable earnings (accumulated losses) on a U.S. federal income tax basis were as follows:
Undistributed Ordinary Income | Undistributed Long-Term Capital Gain | Unrealized Appreciation/ (Depreciation) | Loss Carryforwards and Deferrals | Other Temporary Differences | Total | |
Dividend Growth | $662,761 | $130,458 | $16,761,964 | $— | $— | $17,555,183 |
Emerging Markets Equity | 2,111,590 | — | 4,366,782 | (79,670,564) | (5,188) | (73,197,380) |
Equity Income | 1,159,588 | 53,140,416 | 274,034,229 | — | (3) | 328,334,230 |
Focus | — | 94,311,901 | (10,375,591) | (110,702,400) | 3 | (26,766,087) |
Genesis | 21,303,313 | 906,143,812 | 4,413,606,278 | — | — | 5,341,053,403 |
Global Real Estate | — | 291,048 | (402,930) | (38,881) | (1,265) | (152,028) |
Greater China Equity | 223,442 | — | (10,233,631) | (5,620,703) | (11,628) | (15,642,520) |
International Equity | 9,775,598 | 42,388,440 | (102,487,976) | — | — | (50,323,938) |
International Select | 1,040,814 | 5,083,649 | (11,601,441) | — | (1) | (5,476,979) |
International Small Cap | — | 154,815 | (443,844) | (10,809) | — | (299,838) |
Intrinsic Value | 13,156,875 | 35,940,670 | 82,610,396 | — | (34,916) | 131,673,025 |
Large Cap Growth | — | 94,084,368 | 492,919,523 | (10,368,509) | — | 576,635,382 |
Large Cap Value | 130,279,809 | — | 125,370,322 | (133,931,413) | (1) | 121,718,717 |
Mid Cap Growth | — | 42,949,429 | 205,264,324 | (1,200,247) | — | 247,013,506 |
187
Undistributed Ordinary Income | Undistributed Long-Term Capital Gain | Unrealized Appreciation/ (Depreciation) | Loss Carryforwards and Deferrals | Other Temporary Differences | Total | |
Mid Cap Intrinsic Value | $259,049 | $— | $8,001,660 | $(360,066) | $(1) | $7,900,642 |
Multi-Cap Opportunities | 929,671 | 65,652,585 | 152,756,728 | — | (1) | 219,338,983 |
Real Estate | — | 76,812,651 | 19,367,419 | (5,102,425) | 1 | 91,077,646 |
Small Cap Growth | — | — | (8,392,404) | (14,172,056) | (1) | (22,564,461) |
Sustainable Equity | — | 95,498,466 | 531,224,309 | (5,378,480) | — | 621,344,295 |
U.S. Equity Impact | — | — | (250,631) | (637,707) | (5,494) | (893,832) |
The temporary differences between book basis and tax basis distributable earnings are primarily due to: losses disallowed and/or recognized on wash sales, capital loss carryforwards, amortization of organization expenses, deemed distributions on shareholder redemptions, investments with nontaxable distributions, tax adjustments related to partnership basis adjustments and mark-to-market adjustments on forwards and passive foreign investment companies ("PFICs") and other investments.
To the extent each Fund’s net realized capital gains, if any, can be offset by capital loss carryforwards, it is the policy of each Fund not to distribute such gains. Capital loss carryforward rules allow for RICs to carry forward capital losses indefinitely and to retain the character of capital loss carryforwards as short-term or long-term. As determined at August 31, 2022, the following Funds had unused capital loss carryforwards available for federal income tax purposes to offset future net realized capital gains, if any, as follows:
Capital Loss Carryforwards | ||
Long-Term | Short-Term | |
Emerging Markets Equity | — | 79,670,564 |
Greater China Equity | 306,652 * | 5,314,051 * |
Mid Cap Intrinsic Value | 360,066 | — |
Small Cap Growth | — | 13,016,938 |
* | Future utilization is limited under current tax regulations. |
During the year ended August 31, 2022, Mid Cap Intrinsic Value and U.S. Equity Impact utilized capital loss carryforwards of $5,406,640 and $36,682, respectively.
Under current tax regulations, capital losses realized on investment transactions after October 31 may be deferred and treated as occurring on the first day of the following fiscal year. Under the current tax rules, the Funds may also defer any realized late-year ordinary losses as occurring on the first day of the following fiscal year. Late-year ordinary losses represent ordinary losses realized on investment transactions after December 31 and specified losses (ordinary losses from the sale, exchange, or other disposition of property, net foreign currency losses and net PFIC mark to market losses) realized on investment transactions after October 31. For the year ended August 31, 2022, the Funds elected to defer the following late-year ordinary losses and post October capital losses:
Late-Year Ordinary Loss Deferral | Post October Capital Loss Deferral | |
Focus | $— | $110,702,400 |
Global Real Estate | 16,287 | 22,594 |
International Small Cap | 10,809 | — |
Large Cap Growth | 3,608 | 10,364,901 |
Large Cap Value | — | 133,931,413 |
Mid Cap Growth | 1,200,247 | — |
Real Estate | — | 5,102,425 |
188
Late-Year Ordinary Loss Deferral | Post October Capital Loss Deferral | |
Small Cap Growth | $1,155,118 | $— |
Sustainable Equity | — | 5,378,480 |
U.S. Equity Impact | — | 637,707 |
The Blocker is taxed as a corporation under the U.S. Internal Revenue Code. As of August 31, 2022, Large Cap Growth had a gross deferred tax asset of $10,500 resulting from deferred interest expense, capital losses and net operating losses in the Blocker and had no deferred tax liability. As of August 31, 2022, the Blocker anticipated that it would be unable to fully utilize the deferred tax asset, therefore, the deferred tax asset was offset by a valuation allowance of $10,500. For the year ended August 31, 2022, Large Cap Growth did not record a provision for taxes related to the Blocker.
7
Foreign taxes: Foreign taxes withheld, if any, represent amounts withheld by foreign tax authorities, net of refunds recoverable.
Foreign capital gains on certain foreign securities may be subject to foreign taxes, which are accrued as applicable. Emerging Markets Equity accrues capital gains tax on unrealized and realized gains for certain securities. At August 31, 2022, Emerging Markets Equity had accrued capital gains taxes of $5,189,443, which is reflected in the Statements of Assets and Liabilities. For the year ended August 31, 2022, Emerging Markets Equity had realized capital gains taxes of $4,628,187, which is reflected in the Statements of Operations.
As a result of several European Court of Justice ("ECJ") court cases in certain countries across the European Union ("EU"), certain of the Funds have filed additional tax reclaims for previously withheld taxes on dividends earned in those countries ("ECJ tax reclaims"). These additional filings are subject to various administrative proceedings by the local jurisdictions' tax authorities within the EU, as well as a number of related judicial proceedings. When the ECJ tax reclaim is not “more likely than not” to be sustained assuming examination by tax authorities due to the uncertainty that exists as to the ultimate resolution of these proceedings, the likelihood of receipt of these ECJ tax reclaims, and the potential timing of payment, no amounts are reflected in the Statements of Assets and Liabilities. Certain of the funds have determined that certain ECJ tax reclaims in Sweden are "more likely than not" to be sustained after examination by tax authorities. The income recognized from these ECJ tax reclaims is reflected in "Interest and other income --unaffiliated issuers" in the Statements of Operations and the cost to file these additional ECJ tax reclaims is reflected in "Miscellaneous and other fees" in the Statements of Operations for certain of the Funds.
8
Distributions to shareholders: Each Fund may earn income, net of expenses, daily on its investments.
Distributions from net investment income and net realized capital gains, if any, are generally distributed once a year (usually in December) and are recorded on the ex-date. However, Equity Income, Global Real Estate and Real Estate generally distribute net investment income, if any, at the end of each calendar quarter.
For Funds that invest in real estate investment trusts ("REITs"), these Funds pass through to their shareholders substantially all REIT distributions and other income they receive, less operating expenses. The distributions received from REITs are generally composed of income, capital gains, and/or return of REIT capital, but the REITs do not report this information to these Funds until the following calendar year. At August 31, 2022, these Funds estimated these amounts for the period January 1, 2022 to August 31, 2022 within the financial statements because the 2022 information is not available from the REITs until after each Fund’s fiscal year-end. All estimates are based upon REIT information sources available to these Funds together with actual IRS Forms 1099-DIV received to date. For the year ended August 31, 2022, the character of distributions, if any, paid to shareholders of these Funds disclosed within the Statements of Changes in Net Assets is based on estimates made at that time. Based on past experience it is possible that a portion of these Funds' distributions during the current fiscal year, if any, will be considered tax return of capital, but the actual amount of the tax return of capital, if any, is not determinable until after each Fund’s fiscal year-end. After calendar year-end, when these Funds learn the nature of the distributions paid by REITs
189
during that year, distributions previously identified as income are often recharacterized as return of capital and/or capital gain. After all applicable REITs have informed these Funds of the actual breakdown of distributions paid to these Funds during their fiscal year, estimates previously recorded are adjusted to reflect actual results. As a result, the composition of these Funds' distributions as reported herein may differ from the final composition determined after calendar year-end and reported to these Funds shareholders on IRS Form 1099-DIV.
9
Expense allocation: Certain expenses are applicable to multiple funds within the complex of related investment companies. Expenses directly attributable to a fund are charged to that fund. Expenses of the Trust that are not directly attributable to a particular series of the Trust (e.g., the Fund) are allocated among the series of the Trust, on the basis of relative net assets, except where a more appropriate allocation of expenses to each of the series can otherwise be made fairly. Expenses borne by the complex of related investment companies, which includes open-end and closed-end investment companies for which NBIA serves as investment manager, that are not directly attributable to a particular investment company in the complex (e.g., the Trust) or series thereof are allocated among the investment companies in the complex or series thereof on the basis of relative net assets, except where a more appropriate allocation of expenses to each of the investment companies in the complex or series thereof can otherwise be made fairly. The Fund’s expenses (other than those specific to each class) are allocated proportionally each day among its classes based upon the relative net assets of each class.
10
Investments in foreign securities: Investing in foreign securities may involve sovereign and other risks, in addition to the credit and market risks normally associated with domestic securities. These additional risks include the possibility of adverse political and economic developments (including political instability, nationalization, expropriation, or confiscatory taxation) and the potentially adverse effects of unavailability of public information regarding issuers, less governmental supervision and regulation of financial markets, reduced liquidity of certain financial markets, and the lack of uniform accounting, auditing, and financial reporting standards or the application of standards that are different or less stringent than those applied in the United States. Foreign securities also may experience greater price volatility, higher rates of inflation, and delays in settlement.
11
Investment company securities and exchange-traded funds: The Funds may invest in shares of other registered investment companies, including exchange-traded funds ("ETFs"), within the limitations prescribed by the 1940 Act, in reliance on rules adopted by the SEC, particularly Rule 12d1-4 under the 1940 Act, which the Funds were required to comply with on January 19, 2022, or any other applicable exemptive relief. Prior to the compliance date of Rule 12d1-4, a Fund was permitted to invest in both affiliated and unaffiliated investment companies, including ETFs, in excess of the limits in Section 12(d)(1)(A) of the 1940 Act, subject to the terms and conditions of exemptive orders. These exemptive orders along with Rule 12d1-2 were rescinded upon the compliance date of Rule 12d1-4. Rule 12d1-4 contains elements from the SEC’s prior exemptive orders permitting fund of funds arrangements, and includes (i) limits on control and voting; (ii) required evaluations and findings; (iii) required fund of funds investment agreements; and (iv) limits on complex structures. Some ETFs seek to track the performance of a particular market index. These indices include both broad-based market indices and more narrowly-based indices, including those relating to particular sectors, markets, regions or industries. However, some ETFs have an actively-managed investment objective. ETF shares are traded like traditional equity securities on a national securities exchange or NASDAQ. A Fund will indirectly bear its proportionate share of any management fees and other expenses paid by such other investment companies, which will decrease returns.
12
Derivative instruments: Certain Funds' use of derivatives during the year ended August 31, 2022, is described below. Please see the Schedule of Investments for each Fund's open positions in derivatives, if any, at August 31, 2022. The disclosure requirements of ASC 815 "Derivatives and Hedging" ("ASC 815") distinguish between derivatives that qualify for hedge accounting and those that do not. Because investment companies value their derivatives at fair value and recognize changes in fair value through the Statements of Operations, they do not qualify for hedge accounting. Accordingly, even though a Fund's investments in derivatives may represent economic hedges, they are considered non-hedge transactions for purposes of this disclosure.
190
The SEC adopted Rule 18f-4 under the 1940 Act which, effective August 19, 2022, regulates the use of derivatives for certain funds registered under the 1940 Act ("Rule 18f-4"). The Funds have adopted a Rule 18f-4 Policy which provides, among other things, that unless a Fund qualifies as a "limited derivatives user" as defined in Rule 18f-4, the Fund is subject to a comprehensive derivatives risk management program, to comply with certain value-at-risk based leverage limits and to provide additional disclosure both publicly and to the SEC regarding its derivatives positions. If a Fund qualifies as a limited derivatives user, Rule 18f-4 requires the Fund to have policies and procedures to manage its aggregate derivatives risk.
Options: Equity Income used options written to generate incremental returns. Large Cap Growth used options written to enhance total return, to gain exposure more efficiently than through a direct purchase of the underlying security, to gain exposure to securities, markets, sectors or geographical areas and to manage or adjust the risk profile of the Fund or the risk of individual positions. Large Cap Growth used options purchased to gain exposure more efficiently than through a direct purchase of the underlying security, to gain exposure to securities, markets, sectors or geographical areas and to manage or adjust the risk profile of the Fund or the risk of individual positions.
Premiums paid by a Fund upon purchasing a call or put option are recorded in the asset section of the Fund’s Statement of Assets and Liabilities and are subsequently adjusted to the current market value. When an option is exercised, closed, or expired, a Fund realizes a gain or loss and the asset is eliminated. For purchased call options, a Fund's loss is limited to the amount of the option premium paid.
Premiums received by a Fund upon writing a call option or a put option are recorded in the liability section of the Fund’s Statement of Assets and Liabilities and are subsequently adjusted to the current market value. When an option is exercised, closed, or expired, a Fund realizes a gain or loss and the liability is eliminated.
When writing a covered call option, a Fund, in return for the premium, gives up the opportunity for profit from a price increase in the underlying security above the exercise price, but conversely retains the risk of loss should the price of the security decline. When writing a put option, a Fund, in return for the premium, takes the risk that it must purchase the underlying security at a price that may be higher than the current market price of the security. If a call or put option that a Fund has written expires unexercised, a Fund will realize a gain for the amount of the premium. All securities covering outstanding written options are held in escrow by the custodian bank.
At August 31, 2022, the Fund listed below had the following derivatives (which did not qualify as hedging instruments under ASC 815), grouped by primary risk exposure:
Asset Derivatives | Liability Derivatives | |||
Fund | Statements of Assets and Liabilities Location | Value | Statements of Assets and Liabilities Location | Value |
Equity Income | ||||
Options written | ||||
Equity risk | $— | Option contracts written, at value | $277,663 | |
The impact of the use of these derivative instruments on the during the year ended August 31, 2022, was as follows:
Fund | Net Realized Gain/ (Loss) on Derivatives(a) | Change in Net Unrealized Appreciation/ (Depreciation) on Derivatives(b) | |
Equity Income | |||
Options written | |||
Equity risk | $2,576,688 | $265,110 |
191
Fund | Net Realized Gain/ (Loss) on Derivatives(a) | Change in Net Unrealized Appreciation/ (Depreciation) on Derivatives(b) | |
Large Cap Growth | |||
Options purchased | |||
Equity risk | $1,568,657 | $282,651 | |
Options written | |||
Equity risk | 246,143 | (488,229) |
(a) | Realized gains/(losses) on derivatives are located in the Statements of Operations each under the caption, "Net realized gain/(loss) on:" |
Options purchased | Transactions in investment securities of unaffiliated issuers |
Options written | Expiration or closing of option contracts written |
(b) | Change in unrealized appreciation/(depreciation) is located in the Statements of Operations each under the caption, "Change in net unrealized appreciation/(depreciation) in value of:" |
Options purchased | Investment securities of unaffiliated issuers |
Options written | Option contracts written |
While the Funds may receive rights and warrants in connection with their investments in securities, these rights and warrants are not considered "derivative instruments" under ASC 815.
Management has concluded that Dividend Growth, Emerging Markets Equity, Focus, Genesis, Global Real Estate, Greater China Equity, International Equity, International Select, International Small Cap, Intrinsic Value, Large Cap Value, Mid Cap Growth, Mid Cap Intrinsic Value, Multi-Cap Opportunities, Real Estate, Small Cap Growth, Sustainable Equity and U.S. Equity Impact did not hold any derivative instruments during the year ended August 31, 2022 that require additional disclosures pursuant to ASC 815.
13
Securities lending: Each Fund, using State Street Bank and Trust Company ("State Street") as its lending agent, may loan securities to qualified brokers and dealers in exchange for negotiated lender’s fees. These fees, if any, would be disclosed within the Statements of Operations under the caption "Income from securities loaned-net" and are net of expenses retained by State Street as compensation for its services as lending agent.
The initial collateral received by a Fund at the beginning of each transaction shall have a value equal to at least 102% of the prior day’s market value of the loaned securities (105% in the case of international securities). Collateral in the form of cash and/or securities issued or guaranteed by the U.S. government or its agencies, equivalent to at least 100% of the market value of securities, is maintained at all times. Thereafter, the value of the collateral is monitored on a daily basis, and collateral is moved daily between a counterparty and a Fund until the close of the transaction. Cash collateral is generally invested in a money market fund registered under the 1940 Act that is managed by an affiliate of State Street and is included on the Statements of Assets and Liabilities . The total value of securities received as collateral for securities on loan is included in a footnote following the applicable Schedule of Investments, but is not included within the Statements of Assets and Liabilities because the receiving Fund does not have the right to sell or repledge the securities received as collateral. The risks associated with lending portfolio securities include, but are not limited to, possible delays in receiving additional collateral or in the recovery of the loaned securities. Any increase or decrease in the fair value of the securities loaned and any interest earned or dividends paid or owed on those securities during the term of the loan would accrue to that Fund.
192
As of August 31, 2022, the Funds listed below had outstanding loans of securities to certain approved brokers each with a value as follows:
Value of Securities Loaned | |
International Equity | $837,631 |
International Select | 614,192 |
International Small Cap | 226,327 |
Large Cap Growth | 10,487,008 |
Large Cap Value | 34,196,250 |
Small Cap Growth | 3,755,949 |
As of August 31, 2022, the Funds listed below had outstanding loans of securities to certain approved brokers for which each received collateral as follows:
Remaining Contractual Maturity of the Agreements | |||||
Overnight and Continuous | Less Than 30 Days | Between 30 & 90 days | Greater Than 90 Days | Total | |
International Equity | |||||
Securities Lending Transactions(a) | |||||
Common Stocks | $876,392 | $— | $— | $— | $876,392 |
International Select | |||||
Securities Lending Transactions(a) | |||||
Common Stocks | $638,280 | $— | $— | $— | $638,280 |
International Small Cap | |||||
Securities Lending Transactions(a) | |||||
Common Stocks | $240,501 | $— | $— | $— | $240,501 |
Large Cap Growth | |||||
Securities Lending Transactions(a) | |||||
Common Stocks | $11,418,040 | $— | $— | $— | $11,418,040 |
Large Cap Value | |||||
Securities Lending Transactions(a) | |||||
Common Stocks | $35,062,500 | $— | $— | $— | $35,062,500 |
Small Cap Growth | |||||
Securities Lending Transactions(a) | |||||
Common Stocks | $3,953,190 | $— | $— | $— | $3,953,190 |
(a) | Amounts represent the payable for loaned securities collateral received. |
14
Offsetting Assets and Liabilities: The Funds are required to disclose both gross and net information for assets and liabilities related to over-the-counter derivatives, repurchase and reverse repurchase agreements, and securities lending and securities borrowing transactions that are eligible for offset or subject to an enforceable master netting or similar agreement. Emerging Markets Equity, Focus, International Equity, International Select, International Small Cap, Large Cap Growth, Large Cap Value and Small Cap Growth held one or more of these investments at August 31, 2022. The Funds’ securities lending assets at fair value are reported gross in the Statements of Assets and Liabilities. The following tables present securities lending assets by counterparty and net of the related collateral received by a Fund as of August 31, 2022.
Description | Gross Amounts of Assets Presented in the Statements of Assets and Liabilities | Gross Amounts of Liabilities Presented in the Statements of Assets and Liabilities |
International Equity | ||
Securities lending | $837,631 | $— |
193
Description | Gross Amounts of Assets Presented in the Statements of Assets and Liabilities | Gross Amounts of Liabilities Presented in the Statements of Assets and Liabilities |
International Select | ||
Securities lending | $614,192 | $— |
International Small Cap | ||
Securities lending | $226,327 | $— |
Large Cap Growth | ||
Securities lending | $10,487,008 | $— |
Large Cap Value | ||
Securities lending | $34,196,250 | $— |
Small Cap Growth | ||
Securities lending | $3,755,949 | $— |
Gross Amounts Not Offset in the Statements of Assets and Liabilities: | ||||||||
Assets | Liabilities | |||||||
Counterparty | Gross Amounts Presented in the Statements of Assets and Liabilities | Liabilities Available for Offset | Collateral Received(a) | Net Amount(b) | Gross Amounts Presented in the Statements of Assets and Liabilities | Assets Available for Offset | Collateral Pledged(a) | Net Amount(b) |
International Equity | ||||||||
SSB | $837,631 | $— | $(837,631) | $— | $— | $— | $— | — |
Total | $837,631 | $— | $(837,631) | $— | $— | $— | $— | $— |
(a) | Collateral received (or pledged) is limited to an amount not to exceed 100% of the net amount of assets (or liabilities) in the tables presented above, for each respective counterparty. |
(b) | A net amount greater than zero represents amounts subject to loss as of August 31, 2022, in the event of a counterparty failure. A net amount less than zero represents amounts under-collateralized to each counterparty as of August 31, 2022. |
Gross Amounts Not Offset in the Statements of Assets and Liabilities: | ||||||||
Assets | Liabilities | |||||||
Counterparty | Gross Amounts Presented in the Statements of Assets and Liabilities | Liabilities Available for Offset | Collateral Received(a) | Net Amount(b) | Gross Amounts Presented in the Statements of Assets and Liabilities | Assets Available for Offset | Collateral Pledged(a) | Net Amount(b) |
International Select | ||||||||
SSB | $614,192 | $— | $(614,192) | $— | $— | $— | $— | — |
Total | $614,192 | $— | $(614,192) | $— | $— | $— | $— | $— |
(a) | Collateral received (or pledged) is limited to an amount not to exceed 100% of the net amount of assets (or liabilities) in the tables presented above, for each respective counterparty. |
(b) | A net amount greater than zero represents amounts subject to loss as of August 31, 2022, in the event of a counterparty failure. A net amount less than zero represents amounts under-collateralized to each counterparty as of August 31, 2022. |
194
Gross Amounts Not Offset in the Statements of Assets and Liabilities: | ||||||||
Assets | Liabilities | |||||||
Counterparty | Gross Amounts Presented in the Statements of Assets and Liabilities | Liabilities Available for Offset | Collateral Received(a) | Net Amount(b) | Gross Amounts Presented in the Statements of Assets and Liabilities | Assets Available for Offset | Collateral Pledged(a) | Net Amount(b) |
International Small Cap | ||||||||
SSB | $226,327 | $— | $(226,327) | $— | $— | $— | $— | — |
Total | $226,327 | $— | $(226,327) | $— | $— | $— | $— | $— |
(a) | Collateral received (or pledged) is limited to an amount not to exceed 100% of the net amount of assets (or liabilities) in the tables presented above, for each respective counterparty. |
(b) | A net amount greater than zero represents amounts subject to loss as of August 31, 2022, in the event of a counterparty failure. A net amount less than zero represents amounts under-collateralized to each counterparty as of August 31, 2022. |
Gross Amounts Not Offset in the Statements of Assets and Liabilities: | ||||||||
Assets | Liabilities | |||||||
Counterparty | Gross Amounts Presented in the Statements of Assets and Liabilities | Liabilities Available for Offset | Collateral Received(a) | Net Amount(b) | Gross Amounts Presented in the Statements of Assets and Liabilities | Assets Available for Offset | Collateral Pledged(a) | Net Amount(b) |
Large Cap Growth | ||||||||
SSB | $10,487,008 | $— | $(10,487,008) | $— | $— | $— | $— | — |
Total | $10,487,008 | $— | $(10,487,008) | $— | $— | $— | $— | $— |
(a) | Collateral received (or pledged) is limited to an amount not to exceed 100% of the net amount of assets (or liabilities) in the tables presented above, for each respective counterparty. |
(b) | A net amount greater than zero represents amounts subject to loss as of August 31, 2022, in the event of a counterparty failure. A net amount less than zero represents amounts under-collateralized to each counterparty as of August 31, 2022. |
Gross Amounts Not Offset in the Statements of Assets and Liabilities: | ||||||||
Assets | Liabilities | |||||||
Counterparty | Gross Amounts Presented in the Statements of Assets and Liabilities | Liabilities Available for Offset | Collateral Received(a) | Net Amount(b) | Gross Amounts Presented in the Statements of Assets and Liabilities | Assets Available for Offset | Collateral Pledged(a) | Net Amount(b) |
Large Cap Value | ||||||||
SSB | $34,196,250 | $— | $(34,196,250) | $— | $— | $— | $— | — |
Total | $34,196,250 | $— | $(34,196,250) | $— | $— | $— | $— | $— |
(a) | Collateral received (or pledged) is limited to an amount not to exceed 100% of the net amount of assets (or liabilities) in the tables presented above, for each respective counterparty. |
(b) | A net amount greater than zero represents amounts subject to loss as of August 31, 2022, in the event of a counterparty failure. A net amount less than zero represents amounts under-collateralized to each counterparty as of August 31, 2022. |
195
Gross Amounts Not Offset in the Statements of Assets and Liabilities: | ||||||||
Assets | Liabilities | |||||||
Counterparty | Gross Amounts Presented in the Statements of Assets and Liabilities | Liabilities Available for Offset | Collateral Received(a) | Net Amount(b) | Gross Amounts Presented in the Statements of Assets and Liabilities | Assets Available for Offset | Collateral Pledged(a) | Net Amount(b) |
Small Cap Growth | ||||||||
SSB | $3,755,949 | $— | $(3,755,949) | $— | $— | $— | $— | — |
Total | $3,755,949 | $— | $(3,755,949) | $— | $— | $— | $— | $— |
(a) | Collateral received (or pledged) is limited to an amount not to exceed 100% of the net amount of assets (or liabilities) in the tables presented above, for each respective counterparty. |
(b) | A net amount greater than zero represents amounts subject to loss as of August 31, 2022, in the event of a counterparty failure. A net amount less than zero represents amounts under-collateralized to each counterparty as of August 31, 2022. |
15
Indemnifications: Like many other companies, the Trust’s organizational documents provide that its officers ("Officers") and trustees ("Trustees") are indemnified against certain liabilities arising out of the performance of their duties to the Trust. In addition, both in some of its principal service contracts and in the normal course of its business, the Trust enters into contracts that provide indemnifications to other parties for certain types of losses or liabilities. The Trust’s maximum exposure under these arrangements is unknown as this could involve future claims against the Trust.
16
In-kind redemption: In accordance with guidelines described in a Fund’s prospectus and in accordance with procedures adopted by the Board, a Fund may distribute portfolio securities rather than cash as payment for a redemption of Fund shares ("in-kind redemption"). For financial reporting purposes, the Fund recognizes a gain on in-kind redemptions to the extent the value of the distributed securities on the date of redemption exceeds the cost of those securities. Gains and losses realized on in-kind redemptions are not recognized for tax purposes and are reclassified from undistributed realized gain/(loss) to paid-in capital. During the year ended August 31, 2022, Large Cap Value realized net gains of $27,164,460 on $94,882,781 of in-kind redemptions which is comprised of $90,055,715 in securities and $4,827,066 in cash. During the year ended August 31, 2021, Small Cap Growth realized net gains of $4,925,623 on $18,488,890 of in-kind redemptions.
17
Investments in private companies: Investments in private companies, including companies that have not yet issued securities publicly in an initial public offering, involve greater risks than investments in securities of companies that have traded publicly on an exchange for extended periods of time. Investments in these companies are generally less liquid than investments in securities issued by public companies and may be difficult for the Fund to value. Private placements and other restricted securities may not be listed on an exchange and may have no active trading market. As a result of the absence of a public trading market, the prices of these securities may be more difficult to determine than publicly traded securities and these securities may involve heightened risk as compared to investments in securities of publicly traded companies. Private placements and other restricted securities may be illiquid, and it frequently can be difficult to sell them at a time when it may otherwise be desirable to do so or the Fund may be able to sell them only at prices that are less than what the Fund regards as their fair market value.
18
Other: All net investment income and realized and unrealized capital gains and losses of each Fund are allocated, on the basis of relative net assets, pro rata among its respective classes.
196
Note B—Investment Management Fees, Administration Fees, Distribution Arrangements, and Other Transactions with Affiliates:
Each Fund retains NBIA as its investment manager under a Management Agreement. For such investment management services, each Fund pays NBIA an investment management fee as a percentage of average daily net assets according to the following table: | ||||||||||
First $250 million | Next $250 million | Next $250 million | Next $250 million | Next $500 million | Next $500 million | Next $500 million | Next $1.5 billion | Next $10 billion | Thereafter | |
For Genesis(a): | ||||||||||
0.85% | 0.80% | 0.75% | 0.70% | 0.65% | 0.65% | 0.65% | 0.65% | 0.65% | 0.60% | |
For Intrinsic Value and Small Cap Growth: | ||||||||||
0.85% | 0.80% | 0.75% | 0.70% | 0.65% | 0.65% | 0.65% | 0.65% | 0.65% | 0.65% | |
For Emerging Markets Equity: | ||||||||||
1.00% | 0.975% | 0.95% | 0.925% | 0.90% | 0.875% | 0.875% | 0.875% | 0.85% | 0.85% | |
For Global Real Estate and Real Estate(a): | ||||||||||
0.80% | 0.80% | 0.80% | 0.80% | 0.80% | 0.80% | 0.80% | 0.80% | 0.80% | 0.80% | |
For International Equity(a)(b): | ||||||||||
0.85% | 0.825% | 0.80% | 0.775% | 0.75% | 0.725% | 0.725% | 0.70% | 0.70% | 0.70% | |
For International Small Cap: | ||||||||||
0.85% | 0.825% | 0.80% | 0.775% | 0.75% | 0.725% | 0.725% | 0.725% | 0.70% | 0.70% | |
For Equity Income(a), Focus, International Select, Large Cap Growth, Large Cap Value(a), Mid Cap Growth, Mid Cap Intrinsic Value and Sustainable Equity: | ||||||||||
0.55% | 0.525% | 0.50% | 0.475% | 0.45% | 0.425% | 0.425% | 0.425% | 0.40% | 0.40% | |
For Multi-Cap Opportunities(a): | ||||||||||
0.60% | 0.575% | 0.55% | 0.525% | 0.50% | 0.475% | 0.475% | 0.475% | 0.45% | 0.45% | |
For Greater China Equity: | ||||||||||
1.10% | 1.10% | 1.10% | 1.10% | 0.95% | 0.95% | 0.95% | 0.95% | 0.95% | 0.95% | |
For Dividend Growth: | ||||||||||
0.50% | 0.50% | 0.50% | 0.50% | 0.50% | 0.475% | 0.475% | 0.475% | 0.45% | 0.45% | |
For U.S. Equity Impact: | ||||||||||
0.70% | 0.70% | 0.70% | 0.70% | 0.70% | 0.70% | 0.70% | 0.70% | 0.70% | 0.70% | |
(a)
NBIA has contractually agreed to waive its Class E management fee for the below Funds. This undertaking lasts until August 31, 2023 and may not be terminated during its term without the consent of the Board. Management fees contractually waived are not subject to recovery by NBIA.
Fund | Annualized Percentage of Average Daily Net Assets Waived | Effective Date(s) | Management Fees Waived for the Period from January 11, 2022 (Commencement of Operations) to August 31, 2022 |
Equity Income | 0.50% | 1/11/2022 | $ 105,382 |
Genesis | 0.66% | 1/11/2022 | $ 586,773 |
International Equity | 0.78% | 1/11/2022 | $ 165,164 |
Large Cap Value | 0.42% | 1/11/2022 | $ 414,861 |
Multi-Cap Opportunities | 0.59% | 1/11/2022 | $ 295,763 |
Real Estate | 0.80% | 1/11/2022 | $ 104,238 |
197
(b)
NBIA has voluntarily agreed to waive and/or reimburse its management fee for the below Fund. NBIA may, at its sole discretion, modify or terminate the voluntary waiver and/or reimbursement without notice to the Fund. Fees voluntarily waived and/or reimbursed are not subject to recovery by NBIA.
Fund | Percentage of Average Daily Net Assets Waived and/or Reimbursed | Effective Date(s) | Management Fees Waived and/or Reimbursed for the Year Ended August 31, 2022 |
International Equity | 0.10% | 10/22/19 | $1,565,702 |
Accordingly, for the year ended August 31, 2022, the investment management fee pursuant to the Management Agreement was equivalent to an annual effective rate of each Fund’s average daily net assets. | ||
Effective Rate | ||
Dividend Growth | 0.50% | |
Emerging Markets Equity | 0.96% | |
Equity Income | 0.50%(a) | |
Focus | 0.52% | |
Genesis | 0.66%(b) | |
Greater China Equity | 1.10% | |
International Equity | 0.79%(c) | |
International Select | 0.55% | |
International Small Cap | 0.85% | |
Intrinsic Value | 0.74% | |
Large Cap Growth | 0.48% | |
Large Cap Value | 0.42%(d) | |
Mid Cap Growth | 0.48% | |
Mid Cap Intrinsic Value | 0.55% | |
Multi-Cap Opportunities | 0.58%(e) | |
Real Estate | 0.80%(f) | |
Small Cap Growth | 0.83% | |
Sustainable Equity | 0.48% | |
(a) | 0.49% annual effective net rate of the Fund’s average daily net assets. |
(b) | 0.66% annual effective net rate of the Fund’s average daily net assets. |
(c) | 0.68% annual effective net rate of the Fund’s average daily net assets. |
(d) | 0.42% annual effective net rate of the Fund’s average daily net assets. |
(e) | 0.52% annual effective net rate of the Fund’s average daily net assets. |
(f) | 0.80% annual effective net rate of the Fund’s average daily net assets. |
Each Fund retains NBIA as its administrator under an Administration Agreement. The administration fee is assessed at the class level and each share class of a Fund, as applicable, pays NBIA an annual administration fee equal to the following: 0.26% for each of Investor Class, Class A, Class C and Class R3; 0.40% for Trust Class and Advisor Class; 0.15% for Institutional Class; and 0.05% for Class R6, each as a percentage of its average daily net assets. Class E shares do not pay an administration fee. Additionally, NBIA retains State Street as its sub-administrator under a Sub-Administration Agreement. NBIA pays State Street a fee for all services received under the Sub-Administration Agreement.
NBIA has contractually agreed to waive fees and/or reimburse certain expenses of the Investor Class of each of International Equity, Mid Cap Intrinsic Value and Small Cap Growth and the Trust Class, Advisor Class, Institutional Class, Class A, Class C, Class R3 and Class R6 of each Fund that offers those classes so that the
198
total annual operating expenses of those classes do not exceed the expense limitations as detailed in the following table. These undertakings apply to a Fund’s direct expenses and exclude interest, taxes, brokerage commissions, acquired fund fees and expenses, extraordinary expenses, and dividend and interest expenses relating to short sales, if any (commitment fees relating to borrowings are treated as interest for purposes of this exclusion) ("annual operating expenses"); consequently, net expenses may exceed the contractual expense limitations. The expenses of the Blocker are included in the total expenses used to calculate the reimbursement, which Large Cap Growth has agreed to share with the Blocker. For the period ended August 31, 2022, the expenses of the Blocker amounted to $41,999.
At August 31, 2022, contingent liabilities to NBIA under the agreements were as follows:
Expenses Reimbursed in Year Ended August 31, | |||||
2020 | 2021 | 2022 | |||
Subject to Repayment until August 31, | |||||
Class | Contractual Expense Limitation(a) | Expiration | 2023 | 2024 | 2025 |
Dividend Growth Institutional Class | 0.69% | 8/31/25 | $233,246 | $241,524 | $243,453 |
Dividend Growth Class A | 1.05% | 8/31/25 | 7,746 | 7,463 | 6,190 |
Dividend Growth Class C | 1.80% | 8/31/25 | 11,655 | 8,038 | 4,059 |
Dividend Growth Class R6 | 0.59%(b) | 8/31/25 | 191 | 294 | 252 |
Emerging Markets Equity Institutional Class | 1.25% | 8/31/25 | — | — | — |
Emerging Markets Equity Class A | 1.50% | 8/31/25 | 34,659 | 22,865 | 20,023 |
Emerging Markets Equity Class C | 2.25% | 8/31/25 | 6,296 | 3,949 | 3,857 |
Emerging Markets Equity Class R3 | 1.91% | 8/31/25 | 508 | — | 218 |
Emerging Markets Equity Class R6 | 1.15%(b) | 8/31/25 | — | — | — |
Equity Income Institutional Class | 0.80% | 8/31/25 | — | — | — |
Equity Income Class A | 1.16% | 8/31/25 | — | — | — |
Equity Income Class C | 1.91% | 8/31/25 | — | — | — |
Equity Income Class R3 | 1.41% | 8/31/25 | — | — | — |
Focus Trust Class | 1.50% | 8/31/25 | — | — | — |
Focus Advisor Class | 1.50% | 8/31/25 | — | — | — |
Focus Institutional Class | 0.75% | 8/31/25 | — | — | — |
Focus Class A | 1.11% | 8/31/25 | 272 | — | 323 |
Focus Class C | 1.86% | 8/31/25 | 96 | 162 | 227 |
Genesis Trust Class | 1.50% | 8/31/25 | — | — | — |
Genesis Advisor Class | 1.50% | 8/31/25 | — | — | — |
Genesis Institutional Class | 0.85% | 8/31/25 | — | — | — |
Genesis Class R6 | 0.75% | 8/31/25 | — | — | — |
Global Real Estate Institutional Class | 1.00% | 8/31/25 | 205,632 | 239,478 | 233,706 |
Global Real Estate Class A | 1.36% | 8/31/25 | 26,471 | 24,623 | 23,330 |
Global Real Estate Class C | 2.11% | 8/31/25 | 22,306 | 22,202 | 18,654 |
Greater China Equity Institutional Class | 1.50% | 8/31/25 | 144,843 | 165,224 | 183,057 |
Greater China Equity Class A | 1.86% | 8/31/25 | 21,307 | 16,015 | 14,274 |
Greater China Equity Class C | 2.61% | 8/31/25 | 603 | 768 | 528 |
International Equity Investor Class | 1.40% | 8/31/25 | — | — | — |
International Equity Trust Class | 2.00% | 8/31/25 | — | — | — |
International Equity Institutional Class | 0.85% | 8/31/25 | 342,202 | 394,617 | 478,075 |
International Equity Class A | 1.21% | 8/31/25 | 11,946 | 18,701 | 7,261 |
199
Expenses Reimbursed in Year Ended August 31, | |||||
2020 | 2021 | 2022 | |||
Subject to Repayment until August 31, | |||||
Class | Contractual Expense Limitation(a) | Expiration | 2023 | 2024 | 2025 |
International Equity Class C | 1.96% | 8/31/25 | $2,115 | $2,857 | $3,047 |
International Equity Class R6 | 0.75%(b) | 8/31/25 | 15,901 | 22,906 | 15,351 |
International Select Trust Class | 1.15% | 8/31/25 | 12,734 | 14,610 | 12,174 |
International Select Institutional Class | 0.80% | 8/31/25 | 176,566 | 225,741 | 224,500 |
International Select Class A | 1.16% | 8/31/25 | 4,320 | 6,545 | 6,598 |
International Select Class C | 1.91% | 8/31/25 | 2,173 | 1,554 | 1,453 |
International Select Class R3 | 1.41% | 8/31/25 | 3,284 | 3,504 | 2,725 |
International Select Class R6 | 0.70%(b) | 8/31/25 | 24,937 | 2,510 | 862 |
International Small Cap Institutional Class | 1.05% | 8/31/25 | 259,992 | 239,386 | 246,079 |
International Small Cap Class A | 1.41% | 8/31/25 | 6,925 | 27,225 | 30,271 |
International Small Cap Class C | 2.16% | 8/31/25 | 5,773 | 18,529 | 13,167 |
International Small Cap Class R6 | 0.95%(b) | 8/31/25 | 11,384 | 37,827 | 27,759 |
Intrinsic Value Institutional Class | 1.00% | 8/31/25 | — | — | — |
Intrinsic Value Class A | 1.36% | 8/31/25 | 9,288 | 923 | — |
Intrinsic Value Class C | 2.11% | 8/31/25 | 6,344 | — | — |
Intrinsic Value Class R6 | 0.90% | 8/31/25 | — | — | — |
Large Cap Growth Trust Class | 1.50% | 8/31/25 | — | — | — |
Large Cap Growth Advisor Class | 1.50% | 8/31/25 | — | — | — |
Large Cap Growth Institutional Class | 0.75% | 8/31/25 | — | — | — |
Large Cap Growth Class A | 1.11% | 8/31/25 | — | — | — |
Large Cap Growth Class C | 1.86% | 8/31/25 | — | — | — |
Large Cap Growth Class R3 | 1.36% | 8/31/25 | — | 34 | — |
Large Cap Growth Class R6 | 0.65% | 8/31/25 | — | 37 | 17 |
Large Cap Value Trust Class | 1.50% | 8/31/25 | — | — | — |
Large Cap Value Advisor Class | 1.50% | 8/31/25 | — | — | — |
Large Cap Value Institutional Class | 0.70% | 8/31/25 | — | — | — |
Large Cap Value Class A | 1.11% | 8/31/25 | — | — | — |
Large Cap Value Class C | 1.86% | 8/31/25 | — | — | — |
Large Cap Value Class R3 | 1.36% | 8/31/25 | — | — | — |
Large Cap Value Class R6 | 0.60% | 8/31/25 | — | — | — |
Mid Cap Growth Trust Class | 1.50% | 8/31/25 | — | — | — |
Mid Cap Growth Advisor Class | 1.50% | 8/31/25 | — | — | — |
Mid Cap Growth Institutional Class | 0.75% | 8/31/25 | — | — | — |
Mid Cap Growth Class A | 1.11% | 8/31/25 | — | — | — |
Mid Cap Growth Class C | 1.86% | 8/31/25 | — | — | — |
Mid Cap Growth Class R3 | 1.36% | 8/31/25 | — | — | — |
Mid Cap Growth Class R6 | 0.65%(b) | 8/31/25 | — | — | — |
Mid Cap Intrinsic Value Investor Class | 1.50%(c) | 8/31/25 | — | — | — |
Mid Cap Intrinsic Value Trust Class | 1.25%(c) | 8/31/25 | 1,060 | 16,735 | 25,266 |
Mid Cap Intrinsic Value Institutional Class | 0.85% | 8/31/25 | 21,517 | 41,436 | 64,185 |
Mid Cap Intrinsic Value Class A | 1.21% | 8/31/25 | 2,553 | 5,029 | 6,666 |
200
Expenses Reimbursed in Year Ended August 31, | |||||
2020 | 2021 | 2022 | |||
Subject to Repayment until August 31, | |||||
Class | Contractual Expense Limitation(a) | Expiration | 2023 | 2024 | 2025 |
Mid Cap Intrinsic Value Class C | 1.96% | 8/31/25 | $1,036 | $3,113 | $4,567 |
Mid Cap Intrinsic Value Class R3 | 1.46% | 8/31/25 | 551 | 2,485 | 3,454 |
Mid Cap Intrinsic Value Class R6 | 0.75% | 8/31/25 | — | 211 | 243 |
Multi-Cap Opportunities Institutional Class | 1.00% | 8/31/25 | — | — | — |
Multi-Cap Opportunities Class A | 1.36% | 8/31/25 | — | — | — |
Multi-Cap Opportunities Class C | 2.11% | 8/31/25 | — | — | — |
Real Estate Trust Class | 1.50%(c) | 8/31/25 | — | — | — |
Real Estate Institutional Class | 0.85% | 8/31/25 | 466,267 | 844,090 | 1,255,775 |
Real Estate Class A | 1.21% | 8/31/25 | 119,449 | 119,798 | 145,137 |
Real Estate Class C | 1.96% | 8/31/25 | 21,506 | 17,083 | 20,400 |
Real Estate Class R3 | 1.46% | 8/31/25 | 35,992 | 30,796 | 33,788 |
Real Estate Class R6 | 0.75%(b) | 8/31/25 | 180,533 | 225,255 | 264,583 |
Small Cap Growth Investor Class | 1.30%(c) | 8/31/25 | 68,298 | — | 13,701 |
Small Cap Growth Trust Class | 1.40%(c) | 8/31/25 | 5,823 | 3,373 | 3,686 |
Small Cap Growth Advisor Class | 1.60%(c) | 8/31/25 | 2,721 | 964 | 1,172 |
Small Cap Growth Institutional Class | 0.90% | 8/31/25 | 299,687 | 399,798 | 427,001 |
Small Cap Growth Class A | 1.26% | 8/31/25 | 94,216 | 63,269 | 57,562 |
Small Cap Growth Class C | 2.01% | 8/31/25 | 12,391 | 11,925 | 12,074 |
Small Cap Growth Class R3 | 1.51% | 8/31/25 | 8,531 | 11,036 | 13,738 |
Small Cap Growth Class R6 | 0.80%(b) | 8/31/25 | 70,197 | 105,409 | 146,406 |
Sustainable Equity Trust Class | 1.50% | 8/31/25 | — | — | — |
Sustainable Equity Institutional Class | 0.75% | 8/31/25 | — | — | — |
Sustainable Equity Class A | 1.11% | 8/31/25 | — | — | — |
Sustainable Equity Class C | 1.86% | 8/31/25 | — | — | — |
Sustainable Equity Class R3 | 1.36% | 8/31/25 | — | — | — |
Sustainable Equity Class R6 | 0.65%(b) | 8/31/25 | — | — | — |
U.S. Equity Impact Institutional Class | 0.90% | 8/31/25 | — | 197,957 | 254,523 |
U.S. Equity Impact Class A | 1.26% | 8/31/25 | — | 6,127 | 7,830 |
U.S. Equity Impact Class C | 2.01% | 8/31/25 | — | 2,706 | 1,429 |
(a) | Expense limitation per annum of the respective class’s average daily net assets. |
(b) | Classes that have had changes to their respective limitations are noted below. |
Class | Expense limitation | Prior to |
Dividend Growth Class R6 | 0.62 % | 12/6/18 |
Emerging Markets Equity Class R6 | 1.18 % | 12/6/18 |
International Equity Class R6 | 0.78 % | 12/6/18 |
International Select Class R6 | 0.73 % | 12/6/18 |
International Small Cap Class R6 | 0.98 % | 12/6/18 |
Mid Cap Growth Class R6 | 0.68 % | 12/6/18 |
Real Estate Class R6 | 0.78 % | 12/6/18 |
201
Class | Expense limitation | Prior to |
Small Cap Growth Class R6 | 0.83 % | 12/6/18 |
Sustainable Equity Class R6 | 0.68 % | 12/6/18 |
(c) | In addition to the contractual undertaking described above, NBIA has voluntarily undertaken to waive fees and/or reimburse certain expenses so that their Operating Expenses, per annum of their respective average daily net assets, are limited to the percentages indicated below. Voluntary reimbursements are not subject to recovery by NBIA and are terminable by NBIA upon notice to the Fund. |
Class | Voluntary Expense Limitation | Effective Date(s) | Fees Voluntarily Waived for Year Ended August 31, 2022 |
Mid Cap Intrinsic Value Investor Class | 0.96% | 1/19/21 | $169,805 |
Mid Cap Intrinsic Value Trust Class | 1.20% | 1/19/21 | 3,343 |
Real Estate Trust Class | 1.04% | 12/16/11 | 466,637 |
Small Cap Growth Investor Class | 1.01% | 1/19/21 | 210,818 |
Small Cap Growth Investor Class | 1.18% | 11/15/18 – 1/18/21 | — |
Small Cap Growth Trust Class | 1.25% | 1/19/21 | 6,638 |
Small Cap Growth Trust Class | 1.29% | 9/7/18 – 1/18/21 | — |
Small Cap Growth Advisor Class | 1.40% | 1/27/21 | 6,447 |
Small Cap Growth Advisor Class | 1.35% | 1/19/21 – 1/26/21 | — |
Small Cap Growth Advisor Class | 1.44% | 9/7/18 – 1/18/21 | — |
Each Fund has agreed that each of its respective classes will repay NBIA for fees and expenses waived or reimbursed for that class provided that repayment does not cause that class’s annual operating expenses to exceed its contractual expense limitation in place at the time the fees and expenses were waived or reimbursed, or the expense limitation in place at the time the Fund repays NBIA, whichever is lower. Any such repayment must be made within three years after the year in which NBIA incurred the expense.
During year ended August 31, 2022, the following classes repaid NBIA under their respective contractual expense limitation agreements as follows:
Class | Expenses Repaid to NBIA |
Intrinsic Value Institutional Class | $484,465 |
Intrinsic Value Class A | 18,523 |
Intrinsic Value Class C | 8,533 |
Large Cap Growth Class R3 | 95 |
NBIA retains Green Court Capital Management Limited ("Green Court") as the subadviser to Greater China Equity. Green Court is responsible for making and implementing investment decisions and for the day-to-day management of the Fund.
Each Fund also has a distribution agreement with Neuberger Berman BD LLC (the "Distributor") with respect to each class of shares. The Distributor acts as agent in arranging for the sale of class shares without sales commission or other compensation, except as described below, and bears the advertising and promotion expenses.
However, the Distributor receives fees from the Trust Class of each of Focus, International Select, Large Cap Growth, Large Cap Value, Mid Cap Intrinsic Value, Real Estate, Small Cap Growth and Sustainable Equity, and from the Advisor Class, Class A, Class C and Class R3 of each Fund that offers those classes under their distribution plans (each a "Plan", collectively, the "Plans") pursuant to Rule 12b-1 under the 1940 Act. The Plans provide that, as compensation for administrative and other services provided to these classes, the
202
Distributor’s activities and expenses related to the sale and distribution of these classes, and ongoing services provided to investors in these classes, the Distributor receives from each of these respective classes a fee at the annual rate of 0.10% of such Trust Class’s, 0.25% of such Advisor Class’s, 0.25% of such Class A’s, 1.00% of such Class C’s and 0.50% of such Class R3’s average daily net assets. The Distributor receives this amount to provide distribution and shareholder servicing for these classes and pays a portion of it to institutions that provide such services. Those institutions may use the payments for, among other purposes, compensating employees engaged in sales and/or shareholder servicing. The amount of fees paid by each class during any year may be more or less than the cost of distribution and other services provided to that class. FINRA rules limit the amount of annual distribution fees that may be paid by a mutual fund and impose a ceiling on the cumulative distribution fees paid. The Trust’s Plans comply with those rules.
Class A shares of each Fund are generally sold with an initial sales charge of up to 5.75% and no contingent deferred sales charge ("CDSC"), except that a CDSC of 1.00% applies to certain redemptions made within 18 months following purchases of $1 million or more without an initial sales charge. Class C shares of each Fund are sold with no initial sales charge and a 1.00% CDSC if shares are sold within one year after purchase.
For the year ended August 31, 2022, the Distributor, acting as underwriter and broker-dealer, received net initial sales charges from the purchase of Class A shares and CDSCs from the redemption of Class A and Class C shares as follows:
Underwriter | Broker-Dealer | |||
Net Initial Sales Charge | CDSC | Net Initial Sales Charge | CDSC | |
Dividend Growth Class A | $665 | $— | $— | $— |
Dividend Growth Class C | — | 296 | — | — |
Emerging Markets Equity Class A | 182 | — | — | — |
Emerging Markets Equity Class C | — | 427 | — | — |
Equity Income Class A | 15,906 | — | — | — |
Equity Income Class C | — | 1,771 | — | — |
Focus Class A | 407 | — | — | — |
Focus Class C | — | 22 | — | — |
Global Real Estate Class A | — | — | — | — |
Global Real Estate Class C | — | — | — | — |
Greater China Equity Class A | — | — | — | — |
Greater China Equity Class C | — | — | — | — |
International Equity Class A | 1,631 | — | — | — |
International Equity Class C | — | 794 | — | — |
International Select Class A | 1,399 | — | — | — |
International Select Class C | — | 142 | — | — |
International Small Cap Class A | — | — | — | — |
International Small Cap Class C | — | — | — | — |
Intrinsic Value Class A | 38,253 | — | — | — |
Intrinsic Value Class C | — | 3,554 | — | — |
Large Cap Growth Class A | 826 | — | — | — |
Large Cap Growth Class C | — | 1,044 | — | — |
Large Cap Value Class A | 170,991 | — | — | — |
Large Cap Value Class C | — | 58,635 | — | — |
Mid Cap Growth Class A | 2,339 | — | — | — |
Mid Cap Growth Class C | — | 304 | — | — |
Mid Cap Intrinsic Value Class A | 252 | — | — | — |
Mid Cap Intrinsic Value Class C | — | 109 | — | — |
203
Underwriter | Broker-Dealer | |||
Net Initial Sales Charge | CDSC | Net Initial Sales Charge | CDSC | |
Multi-Cap Opportunities Class A | $7,923 | $— | $— | $— |
Multi-Cap Opportunities Class C | — | 2,088 | — | — |
Real Estate Class A | 25,555 | — | — | — |
Real Estate Class C | — | 3,276 | — | — |
Small Cap Growth Class A | 5,027 | — | — | — |
Small Cap Growth Class C | — | 891 | — | — |
Sustainable Equity Class A | 11,932 | — | — | — |
Sustainable Equity Class C | — | 1,685 | — | — |
U.S. Equity Impact Class A | 595 | — | — | — |
U.S. Equity Impact Class C | — | — | — | — |
Note C — Securities Transactions:
During the year ended August 31, 2022, there were purchase and sale transactions of long-term securities (excluding written option contracts) as follows:
Purchases | Sales | |
Dividend Growth | $21,563,048 | $14,331,070 |
Emerging Markets Equity | 413,152,988 | 609,343,232 |
Equity Income | 496,964,114 | 557,918,643 |
Focus | 1,343,049,067 | 1,427,325,628 |
Genesis | 1,326,183,059 | 2,495,150,601 |
Global Real Estate | 3,078,235 | 3,189,350 |
Greater China Equity | 24,762,929 | 36,869,784 |
International Equity | 763,651,744 | 1,078,893,528 |
International Select | 96,338,939 | 84,693,341 |
International Small Cap | 1,338,787 | 721,435 |
Purchases | Sales | |
Intrinsic Value | $613,513,678 | $140,522,327 |
Large Cap Growth | 596,941,408 | 653,099,293 |
Large Cap Value | 11,224,467,616 | 6,765,956,933 |
Mid Cap Growth | 1,048,519,227 | 1,030,904,559 |
Mid Cap Intrinsic Value | 12,544,183 | 13,605,733 |
Multi-Cap Opportunities | 71,910,068 | 240,555,726 |
Real Estate | 599,760,162 | 445,034,529 |
Small Cap Growth | 422,376,492 | 442,468,939 |
Sustainable Equity | 229,053,864 | 502,922,547 |
U.S. Equity Impact | 3,063,059 | 1,706,949 |
During the year ended August 31, 2022, no brokerage commissions on securities transactions were paid to affiliated brokers.
Note D—Fund Share Transactions:
Share activity for the years ended August 31, 2022, and August 31, 2021, was as follows:
For the Year Ended August 31, 2022 | For the Year Ended August 31, 2021 | |||||||
Shares Sold | Shares Issued on Reinvestment of Dividends and Distributions | Shares Redeemed | Total | Shares Sold | Shares Issued on Reinvestment of Dividends and Distributions | Shares Redeemed | Total | |
Dividend Growth | ||||||||
Institutional Class | 805,940 | 128,727 | (446,437) | 488,230 | 701,714 | 46,399 | (612,456) | 135,657 |
Class A | 34,089 | 2,160 | (9,861) | 26,388 | 4,529 | 949 | (37,543) | (32,065) |
Class C | 6,934 | 1,761 | (26,169) | (17,474) | 15,755 | 539 | (117,804) | (101,510) |
Class R6 | — | — | — | — | — | — | — | — |
204
For the Year Ended August 31, 2022 | For the Year Ended August 31, 2021 | |||||||
Shares Sold | Shares Issued on Reinvestment of Dividends and Distributions | Shares Redeemed | Total | Shares Sold | Shares Issued on Reinvestment of Dividends and Distributions | Shares Redeemed | Total | |
Emerging Markets Equity | ||||||||
Institutional Class | 10,833,695 | 186,693 | (15,352,526) | (4,332,138) | 10,786,746 | 71,081 | (11,523,548) | (665,721) |
Class A | 413,448 | 5,497 | (714,168) | (295,223) | 428,664 | 1,218 | (619,405) | (189,523) |
Class C | 8,641 | 753 | (92,303) | (82,909) | 36,627 | — | (53,824) | (17,197) |
Class R3 | 9,401 | 205 | (7,261) | 2,345 | 8,594 | — | (11,968) | (3,374) |
Class R6 | 881,479 | 147,102 | (4,871,011) | (3,842,430) | 3,573,474 | 49,835 | (770,740) | 2,852,569 |
Equity Income | ||||||||
Institutional Class | 13,117,031 | 6,010,189 | (17,149,692) | 1,977,528 | 8,807,196 | 1,593,759 | (30,626,069) | (20,225,114) |
Class A | 1,456,252 | 973,893 | (2,228,647) | 201,498 | 2,242,167 | 170,226 | (2,291,839) | 120,554 |
Class C | 146,428 | 510,071 | (1,208,745) | (552,246) | 211,038 | 69,016 | (2,899,275) | (2,619,221) |
Class R3 | 12,464 | 4,122 | (15,336) | 1,250 | 29,454 | 1,478 | (120,381) | (89,449) |
Class E(a) | 2,437,259 | 37,011 | (102,503) | 2,371,767 | — | — | — | — |
Focus | ||||||||
Investor Class | 141,831 | 4,341,806 | (2,304,465) | 2,179,172 | 108,704 | 1,224,726 | (1,635,972) | (302,542) |
Trust Class | 16,833 | 286,650 | (270,812) | 32,671 | 38,119 | 86,438 | (271,787) | (147,230) |
Advisor Class | 18,463 | 11,469 | (42,930) | (12,998) | 13,997 | 3,607 | (22,236) | (4,632) |
Institutional Class | 426,146 | 163,665 | (435,797) | 154,014 | 327,126 | 31,909 | (103,706) | 255,329 |
Class A | 10,900 | 16,187 | (8,344) | 18,743 | 8,983 | 5,521 | (38,615) | (24,111) |
Class C | 885 | 3,840 | (11,208) | (6,483) | 1,720 | 1,075 | (32,090) | (29,295) |
Genesis | ||||||||
Investor Class | 1,505,767 | 2,832,197 | (3,536,739) | 801,225 | 2,031,072 | 1,017,520 | (3,507,339) | (458,747) |
Trust Class | 1,083,052 | 1,806,223 | (3,302,533) | (413,258) | 1,789,790 | 712,249 | (5,412,514) | (2,910,475) |
Advisor Class | 169,276 | 196,967 | (440,560) | (74,317) | 174,572 | 76,849 | (489,389) | (237,968) |
Institutional Class | 7,867,441 | 4,464,902 | (14,894,587) | (2,562,244) | 8,536,526 | 1,696,464 | (14,339,384) | (4,106,394) |
Class R6 | 8,500,815 | 8,010,389 | (15,735,959) | 775,245 | 10,774,140 | 2,844,261 | (12,532,462) | 1,085,939 |
Class E(a) | 2,262,355 | — | (97,284) | 2,165,071 | — | — | — | — |
Global Real Estate | ||||||||
Institutional Class | 121,719 | 18,251 | (147,512) | (7,542) | 188,306 | 3,101 | (52,666) | 138,741 |
Class A | 6,661 | 1,575 | (2,932) | 5,304 | 4,268 | 116 | (3,125) | 1,259 |
Class C | 1,600 | 1,281 | (546) | 2,335 | 198 | 39 | (247) | (10) |
Greater China Equity | ||||||||
Institutional Class | 20,894 | 251,681 | (1,272,696) | (1,000,121) | 1,273,004 | 20,577 | (1,112,044) | 181,537 |
Class A | 1 | 13,738 | (71,013) | (57,274) | — | 446 | (97,121) | (96,675) |
Class C | — | 612 | (11,153) | (10,541) | — | — | (4,501) | (4,501) |
International Equity | ||||||||
Investor Class | 131,670 | 680,139 | (734,892) | 76,917 | 204,397 | 300,522 | (1,121,553) | (616,634) |
Trust Class | 152,594 | 194,855 | (277,480) | 69,969 | 67,822 | 84,355 | (310,856) | (158,679) |
Institutional Class | 14,310,451 | 9,709,147 | (34,608,043) | (10,588,445) | 16,835,379 | 3,772,010 | (18,264,219) | 2,343,170 |
205
For the Year Ended August 31, 2022 | For the Year Ended August 31, 2021 | |||||||
Shares Sold | Shares Issued on Reinvestment of Dividends and Distributions | Shares Redeemed | Total | Shares Sold | Shares Issued on Reinvestment of Dividends and Distributions | Shares Redeemed | Total | |
Class A | 377,107 | 71,989 | (3,307,593) | (2,858,497) | 710,522 | 28,610 | (867,800) | (128,668) |
Class C | 44,073 | 38,010 | (119,196) | (37,113) | 85,153 | 17,334 | (151,448) | (48,961) |
Class R6 | 532,406 | 575,886 | (3,623,658) | (2,515,366) | 647,867 | 265,301 | (1,325,623) | (412,455) |
Class E(a) | 2,763,369 | — | (258,259) | 2,505,110 | — | — | — | — |
International Select | ||||||||
Trust Class | 8,346 | 38,372 | (31,752) | 14,966 | 8,872 | 4,073 | (19,586) | (6,641) |
Institutional Class | 2,605,964 | 1,079,701 | (1,981,889) | 1,703,776 | 645,941 | 136,482 | (2,116,945) | (1,334,522) |
Class A | 86,100 | 17,774 | (92,814) | 11,060 | 85,087 | 1,643 | (57,838) | 28,892 |
Class C | 27,664 | 3,395 | (30,099) | 960 | 22,402 | 355 | (41,804) | (19,047) |
Class R3 | 17,847 | 10,564 | (30,076) | (1,665) | 24,296 | 779 | (79,767) | (54,692) |
Class R6 | 6,004 | 298 | (57,590) | (51,288) | 24,751 | 1,989 | (92,497) | (65,757) |
International Small Cap | ||||||||
Institutional Class | 68,641 | 9,419 | (7,170) | 70,890 | 46,472 | 3,706 | (3,375) | 46,803 |
Class A | 4,130 | 869 | (16,884) | (11,885) | 17,117 | 50 | (287) | 16,880 |
Class C | — | — | — | — | — | — | — | — |
Class R6 | 1,504 | — | (4) | 1,500 | — | — | — | — |
Intrinsic Value | ||||||||
Institutional Class | 35,520,671 | 2,772,067 | (15,673,212) | 22,619,526 | 18,981,360 | 544,222 | (15,425,942) | 4,099,640 |
Class A | 1,391,592 | 133,629 | (1,068,648) | 456,573 | 1,404,670 | 20,943 | (663,137) | 762,476 |
Class C | 521,567 | 55,924 | (244,652) | 332,839 | 298,905 | 11,208 | (279,084) | 31,029 |
Class R6 | 2,037,103 | 281,243 | (501,055) | 1,817,291 | 4,159,611 | 57,424 | (736,243) | 3,480,792 |
Large Cap Growth | ||||||||
Investor Class | 478,890 | 6,435,407 | (4,203,139) | 2,711,158 | 766,585 | 4,409,197 | (4,179,916) | 995,866 |
Trust Class | 72,658 | 197,360 | (328,713) | (58,695) | 112,262 | 131,099 | (282,507) | (39,146) |
Advisor Class | 17,077 | 31,316 | (218,369) | (169,976) | 283,200 | 19,507 | (35,173) | 267,534 |
Institutional Class | 5,041,592 | 822,984 | (1,631,599) | 4,232,977 | 1,253,615 | 503,014 | (1,186,128) | 570,501 |
Class A | 394,406 | 35,045 | (201,134) | 228,317 | 227,442 | 26,552 | (173,566) | 80,428 |
Class C | 65,934 | 12,263 | (27,694) | 50,503 | 22,983 | 7,755 | (22,971) | 7,767 |
Class R3 | 5,753 | 1,684 | (913) | 6,524 | 12,304 | 546 | (6,030) | 6,820 |
Class R6 | 252 | 658 | (341) | 569 | 5,880 | 238 | (473) | 5,645 |
Large Cap Value | ||||||||
Investor Class | 3,499,541 | 1,786,787 | (3,417,442) | 1,868,886 | 4,233,504 | 552,320 | (4,261,448) | 524,376 |
Trust Class | 897,823 | 119,711 | (643,172) | 374,362 | 912,096 | 28,800 | (590,982) | 349,914 |
Advisor Class | 671,863 | 142,240 | (616,332) | 197,771 | 795,455 | 41,187 | (1,039,633) | (202,991) |
Institutional Class | 141,689,574 | 5,317,010 | (54,055,870) | 92,950,714 | 93,605,662 | 180,115 | (13,340,594) | 80,445,183 |
Class A | 3,152,996 | 94,839 | (1,346,562) | 1,901,273 | 3,533,705 | 5,697 | (1,267,702) | 2,271,700 |
Class C | 3,526,404 | 104,465 | (423,298) | 3,207,571 | 2,002,950 | 636 | (208,832) | 1,794,754 |
Class R3 | 153,502 | 4,495 | (35,080) | 122,917 | 39,712 | 242 | (15,848) | 24,106 |
Class R6 | 10,252,874 | 273,148 | (6,381,523) | 4,144,499 | 1,410,552 | 59,783 | (229,829) | 1,240,506 |
206
For the Year Ended August 31, 2022 | For the Year Ended August 31, 2021 | |||||||
Shares Sold | Shares Issued on Reinvestment of Dividends and Distributions | Shares Redeemed | Total | Shares Sold | Shares Issued on Reinvestment of Dividends and Distributions | Shares Redeemed | Total | |
Class E(a) | 3,644,315 | — | (74,707) | 3,569,608 | — | — | — | — |
Mid Cap Growth | ||||||||
Investor Class | 248,917 | 4,883,405 | (3,009,933) | 2,122,389 | 411,936 | 2,861,980 | (3,640,572) | (366,656) |
Trust Class | 416,509 | 792,571 | (2,352,514) | (1,143,434) | 719,919 | 458,559 | (1,022,593) | 155,885 |
Advisor Class | 130,145 | 64,281 | (218,108) | (23,682) | 217,171 | 40,383 | (237,204) | 20,350 |
Institutional Class | 14,765,986 | 3,448,007 | (7,260,393) | 10,953,600 | 5,274,574 | 1,790,010 | (4,820,898) | 2,243,686 |
Class A | 980,430 | 296,216 | (716,015) | 560,631 | 590,560 | 167,798 | (592,332) | 166,026 |
Class C | 31,366 | 93,904 | (173,392) | (48,122) | 54,023 | 56,072 | (135,011) | (24,916) |
Class R3 | 129,461 | 127,801 | (386,496) | (129,234) | 260,579 | 70,636 | (258,125) | 73,090 |
Class R6 | 7,202,165 | 5,145,059 | (8,685,483) | 3,661,741 | 9,724,103 | 2,600,459 | (7,768,052) | 4,556,510 |
Mid Cap Intrinsic Value | ||||||||
Investor Class | 42,042 | 7,553 | (90,541) | (40,946) | 113,399 | 566 | (125,594) | (11,629) |
Trust Class | 4,195 | 660 | (28,554) | (23,699) | 17,482 | 215 | (45,363) | (27,666) |
Institutional Class | 163,381 | 4,375 | (229,142) | (61,386) | 73,138 | 1,987 | (243,369) | (168,244) |
Class A | 5,945 | 116 | (18,288) | (12,227) | 7,358 | 36 | (52,882) | (45,488) |
Class C | 5,527 | — | (8,978) | (3,451) | 6,342 | — | (15,633) | (9,291) |
Class R3 | 5,016 | 23 | (7,395) | (2,356) | 15,154 | 4 | (18,537) | (3,379) |
Class R6 | — | — | — | — | — | — | — | — |
Multi-Cap Opportunities | ||||||||
Institutional Class | 2,633,719 | 7,796,236 | (19,054,830) | (8,624,875) | 2,794,722 | 7,333,881 | (19,467,812) | (9,339,209) |
Class A | 717,796 | 878,544 | (933,315) | 663,025 | 616,854 | 501,109 | (695,807) | 422,156 |
Class C | 141,304 | 433,016 | (693,984) | (119,664) | 134,731 | 362,856 | (802,113) | (304,526) |
Class E(a) | 6,495,425 | — | (408,254) | 6,087,171 | — | — | — | — |
Real Estate | ||||||||
Trust Class | 1,108,515 | 342,651 | (1,488,381) | (37,215) | 1,619,852 | 151,415 | (1,385,808) | 385,459 |
Institutional Class | 25,430,959 | 1,646,668 | (18,444,653) | 8,632,974 | 23,182,866 | 568,839 | (9,753,444) | 13,998,261 |
Class A | 1,954,621 | 178,182 | (1,737,707) | 395,096 | 1,864,479 | 71,530 | (1,667,781) | 268,228 |
Class C | 196,886 | 19,575 | (154,358) | 62,103 | 197,165 | 6,009 | (243,168) | (39,994) |
Class R3 | 301,399 | 44,544 | (375,312) | (29,369) | 352,253 | 17,048 | (384,783) | (15,482) |
Class R6 | 3,557,858 | 424,900 | (3,764,472) | 218,286 | 4,139,019 | 184,437 | (2,837,956) | 1,485,500 |
Class E(a) | 1,310,599 | 16,993 | (104,098) | 1,223,494 | — | — | — | — |
Small Cap Growth | ||||||||
Investor Class | 25,102 | 284,317 | (163,942) | 145,477 | 59,354 | 17,073 | (183,868) | (107,441) |
Trust Class | 2,846 | 16,641 | (12,390) | 7,097 | 4,272 | 1,011 | (12,446) | (7,163) |
Advisor Class | 3,519 | 13,140 | (16,894) | (235) | 15,039 | 805 | (17,583) | (1,739) |
Institutional Class | 1,435,230 | 814,641 | (2,551,084) | (301,213) | 2,039,306 | 41,131 | (1,457,165) | 623,272 |
Class A | 86,710 | 84,829 | (157,235) | 14,304 | 172,476 | 5,506 | (230,474) | (52,492) |
Class C | 9,737 | 21,788 | (34,805) | (3,280) | 30,996 | 1,178 | (17,187) | 14,987 |
Class R3 | 46,754 | 20,417 | (29,200) | 37,971 | 64,163 | 894 | (41,133) | 23,924 |
207
For the Year Ended August 31, 2022 | For the Year Ended August 31, 2021 | |||||||
Shares Sold | Shares Issued on Reinvestment of Dividends and Distributions | Shares Redeemed | Total | Shares Sold | Shares Issued on Reinvestment of Dividends and Distributions | Shares Redeemed | Total | |
Class R6 | 1,358,406 | 185,600 | (435,952) | 1,108,054 | 884,027 | 11,341 | (790,972) | 104,396 |
Sustainable Equity | ||||||||
Investor Class | 333,524 | 884,906 | (1,091,277) | 127,153 | 1,322,883 | 570,294 | (4,004,115) | (2,110,938) |
Trust Class | 199,074 | 294,195 | (686,137) | (192,868) | 409,142 | 182,781 | (726,298) | (134,375) |
Institutional Class | 2,491,456 | 1,740,927 | (6,559,506) | (2,327,123) | 4,371,109 | 1,064,100 | (4,941,667) | 493,542 |
Class A | 424,255 | 305,595 | (525,596) | 204,254 | 1,193,313 | 130,579 | (587,044) | 736,848 |
Class C | 68,689 | 86,605 | (175,674) | (20,380) | 121,227 | 53,746 | (233,004) | (58,031) |
Class R3 | 66,046 | 48,115 | (113,937) | 224 | 101,121 | 37,349 | (369,979) | (231,509) |
Class R6 | 1,203,827 | 471,355 | (2,490,110) | (814,928) | 3,282,238 | 387,490 | (4,287,956) | (618,228) |
U.S. Equity Impact | ||||||||
Institutional Class | 203,347 | 635 | (68,103) | 135,879 | 533,807 | — | — | 533,807(b) |
Class A | 6,982 | 13 | (14,157) | (7,162) | 19,601 | — | — | 19,601(b) |
Class C | 102 | — | — | 102 | 3,000 | — | — | 3,000(b) |
(a) | Period from January 11, 2022 (Commencement of Operations) to August 31, 2022. |
(b) | Period from March 23, 2021 (Commencement of Operations) to August 31, 2021. |
Note E—Line of Credit:
At August 31, 2022, each Fund was a participant in a syndicated committed, unsecured $700,000,000 line of credit (the "Credit Facility"), to be used only for temporary or emergency purposes. Series of other investment companies managed by NBIA also participate in this line of credit on substantially the same terms. Interest is charged on borrowings under this Credit Facility at the highest of (a) a federal funds effective rate plus 1.00% per annum, (b) a daily simple Secured Overnight Financing Rate ("SOFR") plus 1.10% per annum, and (c) an overnight bank funding rate plus 1.00% per annum; provided that should the Administrative Agent of the Credit Facility determine that the daily simple SOFR rate is unavailable, then the interest rate option described in (b) shall be replaced with a benchmark replacement determined to be applicable by such Administrative Agent. The Credit Facility has an annual commitment fee of 0.15% per annum of the available line of credit, which is paid quarterly. Each Fund that is a participant has agreed to pay its pro rata share of the annual commitment fee, based on the ratio of its individual net assets to the net assets of all participants at the time the fee is due, and interest charged on any borrowing made by such Fund and other costs incurred by such Fund. Because several mutual funds participate in the Credit Facility, there is no assurance that an individual fund will have access to all or any part of the $700,000,000 at any particular time. There were no loans outstanding under the Credit Facility at August 31, 2022. During the year ended August 31, 2022, no Fund utilized the Credit Facility.
208
Note F—Investments in Affiliates(a):
Value at August 31, 2021 | Purchase Cost | Sales Proceeds/ Return of Capital | Change in Net Unrealized Appreciation/ (Depreciation) from Investments in Affiliated Persons | Net Realized Gain/(Loss) from Investments in Affiliated Persons | Distributions from Investments in Affiliated Persons | Shares Held at August 31, 2022 | Value at August 31, 2022 | |
Genesis | ||||||||
American Software, Inc. | $46,037,163 | $6,293,409 | $— | $(17,459,174) | $— | $904,910 | 2,059,740 | $34,871,398 |
Atrion Corp. | 94,079,139 | 8,231,120 | 9,874,807 | (13,923,278) | 1,442,955 | 1,079,996 | 132,387 | 79,955,129 |
Chase Corp. | 67,627,479 | 1,121,096 | 5,404,766 | (14,442,401) | (865,316) | 585,245 | 544,874 | 48,036,092 |
Model N, Inc. | 73,192,599 | 6,107,813 | 6,406,497 | (9,503,154) | (238,791) | —* | 2,112,106 | 63,151,970 |
NetScout Systems, Inc. | 105,917,620 | 4,381,470 | 10,190,280 | 16,245,634 | 73,653 | —* | 3,668,182 | 116,428,097 |
Simulations Plus, Inc. | 41,597,257 | 10,725,528 | 5,081,742 | 16,486,460 | 740,315 | 264,779 | 1,073,569 | 64,467,818 |
Transcat, Inc. | 32,826,874 | 115,643 | — | 3,083,301 | — | —* | 486,244 | 36,025,818 |
UFP Technologies, Inc. | — | 30,901,111 | — | 8,743,874 | — | —* | 426,336 | 39,644,985 |
Vertex, Inc. | 50,504,812 | 3,379,671 | 3,453,949 | (14,582,929) | (2,247,705) | —* | 2,456,133 | 33,599,900 |
Sub-total for affiliates held as of 8/31/22(b) | $511,782,943 | $71,256,861 | $40,412,041 | $(25,351,667) | $(1,094,889) | $2,834,930 | $516,181,207 | |
AMERISAFE, Inc. | $58,693,173 | $181,359 | $5,296,753 | $(8,686,312) | $(919,590) | $5,225,212 | 919,529 | $43,971,877 |
CMC Materials, Inc. | 130,162,684 | 66,833,021 | 267,645,574 | (33,142,945) | 103,792,814 | 1,499,926 | — | — |
Kadant, Inc. | 114,568,692 | 8,886,729 | 9,630,803 | (21,403,825) | 4,149,151 | 564,067 | 538,204 | 96,569,944 |
Lindsay Corp. | 95,597,176 | 315,844 | 8,341,168 | (6,331,308) | 2,654,837 | 726,052 | 523,169 | 83,895,381 |
Rogers Corp. | 212,232,850 | 307,111 | 270,428,525 | (129,443,477) | 187,332,041 | —* | — | — |
Sub-total for securities no longer affiliated as of 8/31/22(c) | $611,254,575 | $76,524,064 | $561,342,823 | $(199,007,867) | $297,009,253 | $8,015,257 | 224,437,202 | |
Total | $1,123,037,518 | $147,780,925 | $601,754,864 | $(224,359,534) | $295,914,364 | $10,850,187 | $740,618,409 |
(a) | Affiliated persons, as defined in the 1940 Act. |
(b) | At August 31, 2022, these securities amounted to 5.19% of net assets of Genesis. |
(c) | At August 31, 2022, the issuers of these securities were no longer affiliated with Genesis. |
* | Non-income producing security. |
Other: At August 31, 2022, affiliated persons owned outstanding shares of the following Funds:
Affiliated Person(s) Percentage Ownership of Outstanding Shares | |
Dividend Growth | 0.06% |
209
Affiliated Person(s) Percentage Ownership of Outstanding Shares | |
Emerging Markets Equity | 3.47% |
Equity Income | 0.00% |
Focus | 0.00% |
Genesis | 0.16% |
Greater China Equity | 0.10% |
International Equity | 0.00% |
International Select | 0.02% |
Intrinsic Value | 0.00% |
Large Cap Growth | 0.00% |
Large Cap Value | 0.72% |
Mid Cap Growth | 0.00% |
Mid Cap Intrinsic Value | 0.10% |
Small Cap Growth | 0.01% |
U.S. Equity Impact | 72.97% |
Note G—Stock Splits:
In 2021, the Board approved stock splits and reverse stock splits (collectively, the "Stock Split") of the issued and outstanding shares of certain classes of Greater China Equity, Mid Cap Growth and Small Cap Growth (collectively, the "Stock Split Funds"). The Stock Split occurred after the close of business on July 23, 2021. The Stock Split was carried out in accordance with a stock split ratio calculated to result in net asset values per share that better aligned the share class prices of each of the Stock Split Funds.
After the close of business on July 23, 2021, the following classes of the Stock Split Funds underwent a stock split or reverse stock split as follows:
Fund Class | Stock Split Ratio (Old to New) |
Greater China Equity Class A | 1: 0.9942 |
Greater China Equity Class C | 1: 0.9311 |
Fund Class | Stock Split Ratio (Old to New) |
Mid Cap Growth Trust Class | 1: 0.9974 |
Mid Cap Growth Advisor Class | 1: 0.9869 |
Mid Cap Growth Institutional Class | 1: 1.0078 |
Mid Cap Growth Class A | 1: 0.9924 |
Mid Cap Growth Class C | 1: 0.9617 |
Mid Cap Growth Class R3 | 1: 0.9814 |
Mid Cap Growth Class R6 | 1: 1.0118 |
Fund Class | Stock Split Ratio (Old to New) |
Small Cap Growth Trust Class | 1: 0.9950 |
Small Cap Growth Advisor Class | 1: 0.9893 |
Small Cap Growth Institutional Class | 1: 1.0105 |
Small Cap Growth Class A | 1: 0.9967 |
Small Cap Growth Class C | 1: 0.9687 |
Small Cap Growth Class R3 | 1: 0.9872 |
Small Cap Growth Class R6 | 1: 1.0135 |
Note H—Recent Accounting Pronouncement:
In June 2022, FASB issued Accounting Standards Update No. 2022-03, "Fair Value Measurement of Equity Securities Subject to Contractual Sale Restrictions" ("ASU 2022-03"). ASU 2022-03 clarifies the guidance in ASC 820, related to the measurement of the fair value of an equity security subject to contractual sale restrictions, where it eliminates the ability to apply a discount to the fair value of these securities, and introduces disclosure requirements related to such equity securities. The guidance is effective for fiscal years,
210
and interim periods within those fiscal years, beginning after December 15, 2023, and allows for early adoption. Management is currently evaluating the impact of applying this update.
Note I—Other Matters:
Coronavirus: The outbreak of the novel coronavirus in many countries has, among other things, disrupted global travel and supply chains, and adversely impacted global commercial activity, the transportation industry and commodity prices in the energy sector. The impact of this virus has negatively affected and may continue to affect the economies of many nations, individual companies and the global securities and commodities markets, including liquidity and volatility. The development and fluidity of this situation precludes any prediction as to its ultimate impact, which may have a continued adverse effect on global economic and market conditions. Such conditions (which may be across industries, sectors or geographies) have impacted and may continue to impact certain issuers of the securities held by the Funds and in turn, may impact the financial performance of the Funds.
Russia's Invasion of Ukraine: Russia’s invasion of Ukraine, and corresponding events in late February 2022, have had, and could continue to have, severe adverse effects on regional and global economic markets for securities and commodities. Following Russia’s actions, various governments, including the United States, have issued broad-ranging economic sanctions against Russia. The current events have had, and could continue to have, an adverse effect on global markets performance and liquidity, thereby negatively affecting the value of a Fund's investments beyond any direct exposure to Russian or Ukrainian issuers. The duration of ongoing hostilities and the vast array of sanctions and related events cannot be predicted. Those events present material uncertainty and risk with respect to markets globally and the performance of a Fund and its investments or operations could be negatively impacted.
Note J—Subsequent Events:
As previously announced, effective September 30, 2022, Neuberger Berman Guardian Fund changed its name to Neuberger Berman Large Cap Growth Fund, changed its benchmark to the Russell 1000® Growth Index, and adopted a non-fundamental investment policy to normally invest at least 80% of its net assets in equity securities of large-capitalization companies.
211
Financial Highlights
The following tables include selected data for a share outstanding throughout each period and other performance information derived from the Financial Statements. Amounts that do not round to $0.01 or $(0.01) per share are presented as $0.00 or $(0.00), respectively. Ratios that do not round to 0.01% or (0.01)% are presented as 0.00% or (0.00)%, respectively. Net Assets with a zero balance, if any, may reflect actual amounts rounding to less than $0.1 million. A "—" indicates that the line item was not applicable in the corresponding period.
Net Asset Value, Beginning of Year | Net Investment Income/ (Loss)a | Net Gains or (Losses) on Securities (both realized and unrealized) | Total From Investment Operations | Dividends from Net Investment Income | Distributions from Net Realized Capital Gains | Tax Return of Capital | Total Distributions | |
Dividend Growth Fund | ||||||||
Institutional Class | ||||||||
8/31/2022 | $19.68 | $0.21 | $(2.09) | $(1.88) | $(0.17) | $(0.53) | $— | $(0.70) |
8/31/2021 | $14.76 | $0.17 | $4.97 | $5.14 | $(0.22) | $— | $— | $(0.22) |
8/31/2020 | $12.81 | $0.21 | $1.94 | $2.15 | $(0.20) | $— | $— | $(0.20) |
8/31/2019 | $13.93 | $0.21 | $(0.64) | $(0.43) | $(0.13) | $(0.56) | $— | $(0.69) |
8/31/2018 | $12.93 | $0.21 | $1.12 | $1.33 | $(0.15) | $(0.18) | $— | $(0.33) |
Class A | ||||||||
8/31/2022 | $19.68 | $0.15 | $(2.10) | $(1.95) | $(0.07) | $(0.53) | $— | $(0.60) |
8/31/2021 | $14.76 | $0.10 | $4.99 | $5.09 | $(0.17) | $— | $— | $(0.17) |
8/31/2020 | $12.81 | $0.16 | $1.93 | $2.09 | $(0.14) | $— | $— | $(0.14) |
8/31/2019 | $13.93 | $0.16 | $(0.62) | $(0.46) | $(0.10) | $(0.56) | $— | $(0.66) |
8/31/2018 | $12.94 | $0.15 | $1.13 | $1.28 | $(0.11) | $(0.18) | $— | $(0.29) |
Class C | ||||||||
8/31/2022 | $19.52 | $(0.00) | $(2.07) | $(2.07) | $— | $(0.53) | $— | $(0.53) |
8/31/2021 | $14.65 | $(0.03) | $4.95 | $4.92 | $(0.05) | $— | $— | $(0.05) |
8/31/2020 | $12.70 | $0.06 | $1.92 | $1.98 | $(0.03) | $— | $— | $(0.03) |
8/31/2019 | $13.85 | $0.07 | $(0.63) | $(0.56) | $(0.03) | $(0.56) | $— | $(0.59) |
8/31/2018 | $12.87 | $0.05 | $1.12 | $1.17 | $(0.01) | $(0.18) | $— | $(0.19) |
Class R6 | ||||||||
8/31/2022 | $19.70 | $0.23 | $(2.08) | $(1.85) | $(0.19) | $(0.53) | $— | $(0.72) |
8/31/2021 | $14.77 | $0.18 | $4.99 | $5.17 | $(0.24) | $— | $— | $(0.24) |
8/31/2020 | $12.82 | $0.21 | $1.95 | $2.16 | $(0.21) | $— | $— | $(0.21) |
8/31/2019 | $13.93 | $0.22 | $(0.63) | $(0.41) | $(0.14) | $(0.56) | $— | $(0.70) |
8/31/2018 | $12.93 | $0.21 | $1.13 | $1.34 | $(0.16) | $(0.18) | $— | $(0.34) |
Emerging Markets Equity Fund | ||||||||
Institutional Class | ||||||||
8/31/2022 | $23.55 | $0.28 | $(5.93) | $(5.65) | $(0.24) | $— | $— | $(0.24) |
8/31/2021 | $20.37 | $0.06 | $3.20 | $3.26 | $(0.08) | $— | $— | $(0.08) |
8/31/2020 | $18.76 | $0.28 | $1.70 | $1.98 | $(0.37) | $— | $— | $(0.37) |
8/31/2019 | $19.25 | $0.23 | $(0.54) | $(0.31) | $(0.18) | $— | $— | $(0.18) |
8/31/2018 | $19.87 | $0.20 | $(0.68) | $(0.48) | $(0.14) | $— | $— | $(0.14) |
See Notes to Financial Highlights
212
Voluntary Contribution from Management | Net Asset Value, End of Year | Total Returnb,c | Net Assets, End of Year (in millions) | Ratio of Gross Expenses to Average Net Assetsd | Ratio of Net Expenses to Average Net Assets | Ratio of Net Investment Income/ (Loss) to Average Net Assets | Portfolio Turnover Rate |
$— | $17.10 | (9.99)% | $67.8 | 1.04% | 0.69% | 1.13% | 21% |
$— | $19.68 | 35.18% | $68.3 | 1.12% | 0.70% | 0.96% | 32% |
$— | $14.76 | 16.91% | $49.3 | 1.17% | 0.69% | 1.57% | 39% |
$— | $12.81 | (2.45)% | $51.3 | 1.20% | 0.69% | 1.63% | 45% |
$— | $13.93 | 10.44% | $53.4 | 1.23% | 0.69% | 1.54% | 43% |
$— | $17.13 | (10.28)% | $1.6 | 1.48% | 1.05% | 0.79% | 21% |
$— | $19.68 | 34.73% | $1.4 | 1.59% | 1.06% | 0.60% | 32% |
$— | $14.76 | 16.41% | $1.5 | 1.62% | 1.05% | 1.19% | 39% |
$— | $12.81 | (2.75)% | $1.4 | 1.65% | 1.05% | 1.28% | 45% |
$— | $13.93 | 9.98% | $1.8 | 1.67% | 1.05% | 1.14% | 43% |
$— | $16.92 | (10.96)% | $0.9 | 2.16% | 1.80% | (0.02)% | 21% |
$— | $19.52 | 33.69% | $1.3 | 2.25% | 1.81% | (0.16)% | 32% |
$— | $14.65 | 15.63% | $2.5 | 2.28% | 1.80% | 0.44% | 39% |
$— | $12.70 | (3.55)% | $2.7 | 2.32% | 1.80% | 0.51% | 45% |
$— | $13.85 | 9.17% | $3.3 | 2.34% | 1.80% | 0.40% | 43% |
$— | $17.13 | (9.82)% | $0.0 | 1.25% | 0.59% | 1.22% | 21% |
$— | $19.70 | 35.34% | $0.0 | 1.42% | 0.60% | 1.06% | 32% |
$— | $14.77 | 16.98% | $0.0 | 1.18% | 0.59% | 1.61% | 39% |
$— | $12.82 | (2.33)% | $0.0 | 1.17% | 0.60% | 1.70% | 45% |
$— | $13.93 | 10.51% | $0.0 | 1.19% | 0.62% | 1.58% | 43% |
$— | $17.66 | (24.20)% | $652.5 | 1.23% | 1.23% | 1.37% | 39% |
$— | $23.55 | 16.04% | $972.1 | 1.23% | 1.23%e | 0.25% | 47% |
$— | $20.37 | 10.59% | $854.6 | 1.25% | 1.25%e | 1.45% | 41% |
$— | $18.76 | (1.56)% | $1,077.0 | 1.25% | 1.25%e | 1.22% | 37% |
$— | $19.25 | (2.49)% | $1,149.4 | 1.28% | 1.25% | 0.98% | 23% |
213
Financial Highlights (cont’d)
Net Asset Value, Beginning of Year | Net Investment Income/ (Loss)a | Net Gains or (Losses) on Securities (both realized and unrealized) | Total From Investment Operations | Dividends from Net Investment Income | Distributions from Net Realized Capital Gains | Tax Return of Capital | Total Distributions | |
Emerging Markets Equity Fund (cont’d) | ||||||||
Class A | ||||||||
8/31/2022 | $23.60 | $0.22 | $(5.95) | $(5.73) | $(0.17) | $— | $— | $(0.17) |
8/31/2021 | $20.43 | $(0.01) | $3.21 | $3.20 | $(0.03) | $— | $— | $(0.03) |
8/31/2020 | $18.82 | $0.24 | $1.69 | $1.93 | $(0.32) | $— | $— | $(0.32) |
8/31/2019f | $19.26 | $0.17 | $(0.52) | $(0.35) | $(0.09) | $— | $— | $(0.09) |
8/31/2018f | $19.90 | $0.10 | $(0.64) | $(0.54) | $(0.10) | $— | $— | $(0.10) |
Class C | ||||||||
8/31/2022 | $23.43 | $0.07 | $(5.90) | $(5.83) | $(0.11) | $— | $— | $(0.11) |
8/31/2021 | $20.40 | $(0.18) | $3.21 | $3.03 | $— | $— | $— | $— |
8/31/2020 | $18.77 | $0.10 | $1.68 | $1.78 | $(0.15) | $— | $— | $(0.15) |
8/31/2019f | $19.25 | $0.03 | $(0.51) | $(0.48) | $— | $— | $— | $— |
8/31/2018f | $20.00 | $(0.02) | $(0.68) | $(0.70) | $(0.05) | $— | $— | $(0.05) |
Class R3 | ||||||||
8/31/2022 | $23.56 | $0.14 | $(5.94) | $(5.80) | $(0.14) | $— | $— | $(0.14) |
8/31/2021 | $20.45 | $(0.11) | $3.22 | $3.11 | $— | $— | $— | $— |
8/31/2020 | $18.83 | $0.16 | $1.69 | $1.85 | $(0.23) | $— | $— | $(0.23) |
8/31/2019f | $19.26 | $0.09 | $(0.51) | $(0.42) | $(0.01) | $— | $— | $(0.01) |
8/31/2018f | $19.95 | $0.03 | $(0.65) | $(0.62) | $(0.07) | $— | $— | $(0.07) |
Class R6 | ||||||||
8/31/2022 | $23.56 | $0.30 | $(5.93) | $(5.63) | $(0.27) | $— | $— | $(0.27) |
8/31/2021 | $20.38 | $0.10 | $3.19 | $3.29 | $(0.11) | $— | $— | $(0.11) |
8/31/2020 | $18.77 | $0.30 | $1.71 | $2.01 | $(0.40) | $— | $— | $(0.40) |
8/31/2019f | $19.25 | $0.27 | $(0.56) | $(0.29) | $(0.19) | $— | $— | $(0.19) |
8/31/2018f | $19.87 | $0.19 | $(0.67) | $(0.48) | $(0.14) | $— | $— | $(0.14) |
Equity Income Fund | ||||||||
Institutional Class | ||||||||
8/31/2022 | $15.01 | $0.34 | $(0.27) | $0.07 | $(0.33) | $(1.25) | $— | $(1.58) |
8/31/2021 | $12.42 | $0.31 | $2.58 | $2.89 | $(0.30) | $— | $— | $(0.30) |
8/31/2020 | $12.98 | $0.29 | $(0.11) | $0.18 | $(0.32) | $(0.42) | $— | $(0.74) |
8/31/2019 | $13.53 | $0.33 | $0.00 | $0.33 | $(0.32) | $(0.56) | $— | $(0.88) |
8/31/2018 | $13.09 | $0.33 | $1.01 | $1.34 | $(0.40) | $(0.50) | $— | $(0.90) |
See Notes to Financial Highlights
214
Voluntary Contribution from Management | Net Asset Value, End of Year | Total Returnb,c | Net Assets, End of Year (in millions) | Ratio of Gross Expenses to Average Net Assetsd | Ratio of Net Expenses to Average Net Assets | Ratio of Net Investment Income/ (Loss) to Average Net Assets | Portfolio Turnover Rate |
$— | $17.70 | (24.42)% | $18.9 | 1.59% | 1.50% | 1.08% | 39% |
$— | $23.60 | 15.68% | $32.2 | 1.57% | 1.50% | (0.03)% | 47% |
$— | $20.43 | 10.28% | $31.7 | 1.60% | 1.50% | 1.27% | 41% |
$— | $18.82 | (1.77)% | $44.6 | 1.62% | 1.50% | 0.91% | 37% |
$— | $19.26 | (2.78)% | $47.6 | 1.65% | 1.50% | 0.49% | 23% |
$— | $17.49 | (24.97)% | $3.5 | 2.33% | 2.25% | 0.32% | 39% |
$— | $23.43 | 14.85% | $6.6 | 2.31% | 2.25% | (0.78)% | 47% |
$— | $20.40 | 9.47% | $6.1 | 2.33% | 2.25% | 0.53% | 41% |
$— | $18.77 | (2.50)% | $9.1 | 2.35% | 2.25% | 0.18% | 37% |
$— | $19.25 | (3.51)% | $10.9 | 2.37% | 2.25% | (0.08)% | 23% |
$— | $17.62 | (24.73)% | $0.7 | 1.94% | 1.91% | 0.70% | 39% |
$— | $23.56 | 15.21% | $0.8 | 1.91% | 1.91%e | (0.47)% | 47% |
$— | $20.45 | 9.85% | $0.8 | 1.97% | 1.91% | 0.81% | 41% |
$— | $18.83 | (2.19)% | $1.0 | 1.94% | 1.91% | 0.50% | 37% |
$— | $19.26 | (3.16)% | $1.4 | 1.91% | 1.91% | 0.14% | 23% |
$— | $17.66 | (24.13)% | $150.9 | 1.11% | 1.11% | 1.47% | 39% |
$— | $23.56 | 16.17% | $291.7 | 1.10% | 1.10%e | 0.43% | 47% |
$— | $20.38 | 10.72% | $194.2 | 1.15% | 1.15%e | 1.58% | 41% |
$— | $18.77 | (1.45)% | $219.1 | 1.16% | 1.16%e | 1.42% | 37% |
$— | $19.25 | (2.46)% | $166.9 | 1.19% | 1.18% | 0.91% | 23% |
$— | $13.50 | 0.12% | $834.8 | 0.71% | 0.71% | 2.35% | 44% |
$— | $15.01 | 23.62% | $898.6 | 0.70% | 0.70% | 2.28% | 35% |
$— | $12.42 | 1.53% | $994.9 | 0.69% | 0.69% | 2.35% | 56% |
$— | $12.98 | 3.06% | $1,147.4 | 0.70% | 0.70% | 2.58% | 37% |
$— | $13.53 | 10.58% | $1,172.8 | 0.69% | 0.69% | 2.52% | 41% |
215
Financial Highlights (cont’d)
Net Asset Value, Beginning of Year | Net Investment Income/ (Loss)a | Net Gains or (Losses) on Securities (both realized and unrealized) | Total From Investment Operations | Dividends from Net Investment Income | Distributions from Net Realized Capital Gains | Tax Return of Capital | Total Distributions | |
Equity Income Fund (cont’d) | ||||||||
Class A | ||||||||
8/31/2022 | $14.95 | $0.28 | $(0.26) | $0.02 | $(0.28) | $(1.25) | $— | $(1.53) |
8/31/2021 | $12.37 | $0.27 | $2.56 | $2.83 | $(0.25) | $— | $— | $(0.25) |
8/31/2020 | $12.93 | $0.24 | $(0.10) | $0.14 | $(0.28) | $(0.42) | $— | $(0.70) |
8/31/2019 | $13.48 | $0.28 | $0.01 | $0.29 | $(0.28) | $(0.56) | $— | $(0.84) |
8/31/2018 | $13.04 | $0.29 | $1.00 | $1.29 | $(0.35) | $(0.50) | $— | $(0.85) |
Class C | ||||||||
8/31/2022 | $14.85 | $0.17 | $(0.25) | $(0.08) | $(0.17) | $(1.25) | $— | $(1.42) |
8/31/2021 | $12.28 | $0.16 | $2.55 | $2.71 | $(0.14) | $— | $— | $(0.14) |
8/31/2020 | $12.83 | $0.15 | $(0.10) | $0.05 | $(0.18) | $(0.42) | $— | $(0.60) |
8/31/2019 | $13.38 | $0.18 | $0.01 | $0.19 | $(0.18) | $(0.56) | $— | $(0.74) |
8/31/2018 | $12.95 | $0.18 | $1.00 | $1.18 | $(0.25) | $(0.50) | $— | $(0.75) |
Class R3 | ||||||||
8/31/2022 | $14.94 | $0.24 | $(0.26) | $(0.02) | $(0.23) | $(1.25) | $— | $(1.48) |
8/31/2021 | $12.34 | $0.22 | $2.57 | $2.79 | $(0.19) | $— | $— | $(0.19) |
8/31/2020 | $12.90 | $0.21 | $(0.11) | $0.10 | $(0.24) | $(0.42) | $— | $(0.66) |
8/31/2019 | $13.45 | $0.24 | $0.01 | $0.25 | $(0.24) | $(0.56) | $— | $(0.80) |
8/31/2018 | $13.01 | $0.25 | $1.01 | $1.26 | $(0.32) | $(0.50) | $— | $(0.82) |
Class E | ||||||||
Period from 1/11/2022g to 8/31/2022 | $14.55 | $0.29 | $(1.11) | $(0.82) | $(0.22) | $— | $— | $(0.22) |
Focus Fund | ||||||||
Investor Class | ||||||||
8/31/2022 | $35.97 | $(0.00) | $(9.12) | $(9.12) | $— | $(5.77) | $— | $(5.77) |
8/31/2021 | $28.76 | $0.01 | $8.80 | $8.81 | $— | $(1.60) | $— | $(1.60) |
8/31/2020 | $25.74 | $0.03 | $6.22 | $6.25 | $(0.17) | $(3.06) | $— | $(3.23) |
8/31/2019 | $28.69 | $0.13 | $(1.06) | $(0.93) | $(0.10) | $(1.92) | $— | $(2.02) |
8/31/2018 | $27.50 | $0.12 | $3.28 | $3.40 | $(0.08) | $(2.13) | $— | $(2.21) |
Trust Class | ||||||||
8/31/2022 | $35.88 | $(0.06) | $(9.08) | $(9.14) | $— | $(5.77) | $— | $(5.77) |
8/31/2021 | $28.75 | $(0.05) | $8.78 | $8.73 | $— | $(1.60) | $— | $(1.60) |
8/31/2020 | $25.71 | $(0.01) | $6.20 | $6.19 | $(0.09) | $(3.06) | $— | $(3.15) |
8/31/2019 | $28.66 | $0.08 | $(1.05) | $(0.97) | $(0.06) | $(1.92) | $— | $(1.98) |
8/31/2018k | $29.18 | $0.07 | $3.35 | $3.42 | $(0.06) | $(3.88) | $— | $(3.94) |
Advisor Class | ||||||||
8/31/2022 | $35.80 | $(0.10) | $(9.05) | $(9.15) | $— | $(5.77) | $— | $(5.77) |
8/31/2021 | $28.75 | $(0.12) | $8.77 | $8.65 | $— | $(1.60) | $— | $(1.60) |
8/31/2020 | $25.69 | $(0.05) | $6.19 | $6.14 | $(0.02) | $(3.06) | $— | $(3.08) |
8/31/2019 | $28.62 | $0.04 | $(1.05) | $(1.01) | $— | $(1.92) | $— | $(1.92) |
8/31/2018k | $37.33 | $0.03 | $3.63 | $3.66 | $— | $(12.37) | $— | $(12.37) |
See Notes to Financial Highlights
216
Voluntary Contribution from Management | Net Asset Value, End of Year | Total Returnb,c | Net Assets, End of Year (in millions) | Ratio of Gross Expenses to Average Net Assetsd | Ratio of Net Expenses to Average Net Assets | Ratio of Net Investment Income/ (Loss) to Average Net Assets | Portfolio Turnover Rate |
$— | $13.44 | (0.26)% | $170.7 | 1.07% | 1.07% | 1.98% | 44% |
$— | $14.95 | 23.19% | $186.8 | 1.06% | 1.06% | 1.93% | 35% |
$— | $12.37 | 1.14% | $153.1 | 1.06% | 1.06% | 1.99% | 56% |
$— | $12.93 | 2.68% | $142.7 | 1.06% | 1.06% | 2.17% | 37% |
$— | $13.48 | 10.21% | $186.5 | 1.05% | 1.05% | 2.16% | 41% |
$— | $13.35 | (0.98)% | $67.5 | 1.82% | 1.82% | 1.22% | 44% |
$— | $14.85 | 22.26% | $83.3 | 1.81% | 1.81% | 1.15% | 35% |
$— | $12.28 | 0.38% | $101.1 | 1.81% | 1.81% | 1.24% | 56% |
$— | $12.83 | 1.91% | $178.5 | 1.81% | 1.81% | 1.45% | 37% |
$— | $13.38 | 9.36% | $246.7 | 1.80% | 1.80% | 1.40% | 41% |
$— | $13.44 | (0.51)% | $0.5 | 1.38% | 1.38% | 1.66% | 44% |
$— | $14.94 | 22.82% | $0.6 | 1.34% | 1.34% | 1.61% | 35% |
$— | $12.34 | 0.82% | $1.6 | 1.33% | 1.33% | 1.71% | 56% |
$— | $12.90 | 2.40% | $1.9 | 1.34% | 1.34% | 1.91% | 37% |
$— | $13.45 | 9.93% | $2.2 | 1.33% | 1.33% | 1.87% | 41% |
$— | $13.51 | (5.66)% | $32.0 | 0.57%h | 0.06%h | 3.16%h | 44%i,j |
$— | $21.08 | (29.67)% | $553.0 | 0.89% | 0.89% | (0.00)% | 176% |
$— | $35.97 | 32.06% | $865.3 | 0.88% | 0.88% | 0.03% | 123% |
$— | $28.76 | 26.17% | $700.6 | 0.92% | 0.92% | 0.14% | 130% |
$— | $25.74 | (2.35)% | $617.6 | 0.92% | 0.92% | 0.50% | 20% |
$— | $28.69 | 13.05% | $690.7 | 0.91% | 0.91% | 0.43% | 59% |
$— | $20.97 | (29.82)% | $31.9 | 1.10% | 1.10% | (0.21)% | 176% |
$— | $35.88 | 31.78% | $53.4 | 1.09% | 1.09% | (0.18)% | 123% |
$— | $28.75 | 25.90% | $47.0 | 1.10% | 1.10% | (0.04)% | 130% |
$— | $25.71 | (2.52)% | $46.4 | 1.10% | 1.10% | 0.32% | 20% |
$— | $28.66 | 12.88% | $57.7 | 1.10% | 1.10% | 0.25% | 59% |
$— | $20.88 | (29.93)% | $1.0 | 1.25% | 1.25% | (0.35)% | 176% |
$— | $35.80 | 31.49% | $2.1 | 1.29% | 1.29% | (0.38)% | 123% |
$— | $28.75 | 25.70% | $1.9 | 1.27% | 1.27% | (0.22)% | 130% |
$— | $25.69 | (2.68)% | $1.6 | 1.27% | 1.27% | 0.14% | 20% |
$— | $28.62 | 12.62% | $2.3 | 1.26% | 1.26% | 0.09% | 59% |
217
Financial Highlights (cont’d)
Net Asset Value, Beginning of Year | Net Investment Income/ (Loss)a | Net Gains or (Losses) on Securities (both realized and unrealized) | Total From Investment Operations | Dividends from Net Investment Income | Distributions from Net Realized Capital Gains | Tax Return of Capital | Total Distributions | |
Focus Fund (cont’d) | ||||||||
Institutional Class | ||||||||
8/31/2022 | $36.05 | $0.05 | $(9.16) | $(9.11) | $— | $(5.77) | $— | $(5.77) |
8/31/2021 | $28.78 | $0.06 | $8.81 | $8.87 | $— | $(1.60) | $— | $(1.60) |
8/31/2020 | $25.79 | $0.07 | $6.22 | $6.29 | $(0.24) | $(3.06) | $— | $(3.30) |
8/31/2019 | $28.72 | $0.17 | $(1.05) | $(0.88) | $(0.13) | $(1.92) | $— | $(2.05) |
8/31/2018k | $27.53 | $0.16 | $3.27 | $3.43 | $(0.12) | $(2.12) | $— | $(2.24) |
Class A | ||||||||
8/31/2022 | $35.84 | $(0.06) | $(9.07) | $(9.13) | $— | $(5.77) | $— | $(5.77) |
8/31/2021 | $28.73 | $(0.06) | $8.77 | $8.71 | $— | $(1.60) | $— | $(1.60) |
8/31/2020 | $25.69 | $(0.02) | $6.20 | $6.18 | $(0.08) | $(3.06) | $— | $(3.14) |
8/31/2019 | $28.65 | $0.08 | $(1.05) | $(0.97) | $(0.07) | $(1.92) | $— | $(1.99) |
8/31/2018k | $29.24 | $0.07 | $3.34 | $3.41 | $(0.06) | $(3.94) | $— | $(4.00) |
Class C | ||||||||
8/31/2022 | $34.97 | $(0.27) | $(8.76) | $(9.03) | $— | $(5.77) | $— | $(5.77) |
8/31/2021 | $28.27 | $(0.30) | $8.60 | $8.30 | $— | $(1.60) | $— | $(1.60) |
8/31/2020 | $25.42 | $(0.20) | $6.11 | $5.91 | $— | $(3.06) | $— | $(3.06) |
8/31/2019 | $28.50 | $(0.11) | $(1.05) | $(1.16) | $— | $(1.92) | $— | $(1.92) |
8/31/2018k | $38.78 | $(0.16) | $3.68 | $3.52 | $— | $(13.80) | $— | $(13.80) |
Genesis Fund | ||||||||
Investor Class | ||||||||
8/31/2022 | $80.18 | $(0.08) | $(10.47) | $(10.55) | $— | $(8.15) | $— | $(8.15) |
8/31/2021 | $62.74 | $(0.11) | $20.25 | $20.14 | $— | $(2.70) | $— | $(2.70) |
8/31/2020 | $58.54 | $0.02 | $7.59 | $7.61 | $(0.03) | $(3.38) | $— | $(3.41) |
8/31/2019 | $65.27 | $0.05 | $(0.91) | $(0.86) | $(0.03) | $(5.84) | $— | $(5.87) |
8/31/2018l | $58.73 | $0.07 | $14.47 | $14.54 | $(0.11) | $(7.89) | $— | $(8.00) |
Trust Class | ||||||||
8/31/2022 | $80.07 | $(0.14) | $(10.45) | $(10.59) | $— | $(8.15) | $— | $(8.15) |
8/31/2021 | $62.71 | $(0.18) | $20.24 | $20.06 | $— | $(2.70) | $— | $(2.70) |
8/31/2020 | $58.54 | $(0.03) | $7.59 | $7.56 | $(0.01) | $(3.38) | $— | $(3.39) |
8/31/2019 | $65.30 | $(0.00) | $(0.91) | $(0.91) | $(0.01) | $(5.84) | $— | $(5.85) |
8/31/2018l | $58.73 | $0.02 | $14.49 | $14.51 | $(0.05) | $(7.89) | $— | $(7.94) |
See Notes to Financial Highlights
218
Voluntary Contribution from Management | Net Asset Value, End of Year | Total Returnb,c | Net Assets, End of Year (in millions) | Ratio of Gross Expenses to Average Net Assetsd | Ratio of Net Expenses to Average Net Assets | Ratio of Net Investment Income/ (Loss) to Average Net Assets | Portfolio Turnover Rate |
$— | $21.17 | (29.57)% | $19.0 | 0.75% | 0.75% | 0.18% | 176% |
$— | $36.05 | 32.25% | $26.8 | 0.74% | 0.74%e | 0.17% | 123% |
$— | $28.78 | 26.32% | $14.1 | 0.75% | 0.75% | 0.26% | 130% |
$— | $25.79 | (2.15)% | $8.9 | 0.76% | 0.75% | 0.67% | 20% |
$— | $28.72 | 13.20% | $8.6 | 0.75% | 0.75%e | 0.60% | 59% |
$— | $20.94 | (29.83)% | $2.1 | 1.13% | 1.11% | (0.21)% | 176% |
$— | $35.84 | 31.73% | $2.9 | 1.11% | 1.11%e | (0.19)% | 123% |
$— | $28.73 | 25.90% | $3.0 | 1.12% | 1.11% | (0.06)% | 130% |
$— | $25.69 | (2.51)% | $2.7 | 1.12% | 1.11% | 0.32% | 20% |
$��� | $28.65 | 12.80% | $3.4 | 1.12% | 1.11% | 0.23% | 59% |
$— | $20.17 | (30.35)% | $0.3 | 1.91% | 1.86% | (1.01)% | 176% |
$— | $34.97 | 30.76% | $0.7 | 1.89% | 1.86% | (1.00)% | 123% |
$— | $28.27 | 24.96% | $1.4 | 1.87% | 1.86% | (0.81)% | 130% |
$— | $25.42 | (3.25)% | $1.2 | 1.88% | 1.86% | (0.43)% | 20% |
$— | $28.50 | 11.92% | $1.7 | 1.87% | 1.86% | (0.52)% | 59% |
$— | $61.48 | (14.63)% | $1,664.6 | 0.99% | 0.99% | (0.11)% | 12% |
$— | $80.18 | 32.89% | $2,106.8 | 0.99% | 0.99% | (0.15)% | 12% |
$— | $62.74 | 13.48% | $1,677.3 | 1.01% | 1.01% | 0.03% | 11% |
$— | $58.54 | 0.53% | $1,649.3 | 1.01% | 1.01% | 0.08% | 14% |
$— | $65.27 | 26.73% | $1,919.1 | 1.02% | 1.02% | 0.11% | 13% |
$— | $61.33 | (14.71)% | $1,008.4 | 1.09% | 1.09% | (0.21)% | 12% |
$— | $80.07 | 32.77% | $1,349.7 | 1.09% | 1.09% | (0.25)% | 12% |
$— | $62.71 | 13.38% | $1,239.6 | 1.09% | 1.09% | (0.06)% | 11% |
$— | $58.54 | 0.43% | $1,409.3 | 1.10% | 1.10% | (0.01)% | 14% |
$— | $65.30 | 26.64% | $1,561.6 | 1.10% | 1.10% | 0.03% | 13% |
219
Financial Highlights (cont’d)
Net Asset Value, Beginning of Year | Net Investment Income/ (Loss)a | Net Gains or (Losses) on Securities (both realized and unrealized) | Total From Investment Operations | Dividends from Net Investment Income | Distributions from Net Realized Capital Gains | Tax Return of Capital | Total Distributions | |
Genesis Fund (cont’d) | ||||||||
Advisor Class | ||||||||
8/31/2022 | $79.33 | $(0.31) | $(10.34) | $(10.65) | $— | $(8.15) | $— | $(8.15) |
8/31/2021 | $62.31 | $(0.36) | $20.08 | $19.72 | $— | $(2.70) | $— | $(2.70) |
8/31/2020 | $58.32 | $(0.18) | $7.55 | $7.37 | $— | $(3.38) | $— | $(3.38) |
8/31/2019 | $65.23 | $(0.15) | $(0.92) | $(1.07) | $— | $(5.84) | $— | $(5.84) |
8/31/2018l | $58.77 | $(0.14) | $14.49 | $14.35 | $— | $(7.89) | $— | $(7.89) |
Institutional Class | ||||||||
8/31/2022 | $80.18 | $0.03 | $(10.48) | $(10.45) | $— | $(8.15) | $— | $(8.15) |
8/31/2021 | $62.66 | $0.00 | $20.24 | $20.24 | $(0.02) | $(2.70) | $— | $(2.72) |
8/31/2020 | $58.48 | $0.11 | $7.58 | $7.69 | $(0.13) | $(3.38) | $— | $(3.51) |
8/31/2019 | $65.24 | $0.14 | $(0.92) | $(0.78) | $(0.14) | $(5.84) | $— | $(5.98) |
8/31/2018 | $58.71 | $0.17 | $14.47 | $14.64 | $(0.22) | $(7.89) | $— | $(8.11) |
Class R6 | ||||||||
8/31/2022 | $80.14 | $0.10 | $(10.48) | $(10.38) | $— | $(8.15) | $— | $(8.15) |
8/31/2021 | $62.62 | $0.07 | $20.23 | $20.30 | $(0.08) | $(2.70) | $— | $(2.78) |
8/31/2020 | $58.45 | $0.16 | $7.58 | $7.74 | $(0.19) | $(3.38) | $— | $(3.57) |
8/31/2019 | $65.23 | $0.19 | $(0.93) | $(0.74) | $(0.20) | $(5.84) | $— | $(6.04) |
8/31/2018l | $58.70 | $0.23 | $14.46 | $14.69 | $(0.27) | $(7.89) | $— | $(8.16) |
Class E | ||||||||
Period from 1/11/2022g to 8/31/2022 | $71.07 | $0.35 | $(9.53) | $(9.18) | $— | $— | $— | $— |
Global Real Estate Fund | ||||||||
Institutional Class | ||||||||
8/31/2022 | $13.84 | $0.15 | $(2.05) | $(1.90) | $(0.21) | $(0.77) | $— | $(0.98) |
8/31/2021 | $10.97 | $0.17 | $2.88 | $3.05 | $(0.18) | $— | $— | $(0.18) |
8/31/2020 | $11.94 | $0.17 | $(0.58) | $(0.41) | $(0.32) | $(0.21) | $(0.03) | $(0.56) |
8/31/2019 | $10.85 | $0.16 | $1.31 | $1.47 | $(0.26) | $(0.12) | $— | $(0.38) |
8/31/2018 | $10.64 | $0.17 | $0.35 | $0.52 | $(0.21) | $(0.10) | $— | $(0.31) |
Class A | ||||||||
8/31/2022 | $13.81 | $0.11 | $(2.06) | $(1.95) | $(0.17) | $(0.77) | $— | $(0.94) |
8/31/2021 | $10.95 | $0.16 | $2.85 | $3.01 | $(0.15) | $— | $— | $(0.15) |
8/31/2020 | $11.93 | $0.12 | $(0.58) | $(0.46) | $(0.28) | $(0.21) | $(0.03) | $(0.52) |
8/31/2019 | $10.84 | $0.12 | $1.31 | $1.43 | $(0.22) | $(0.12) | $— | $(0.34) |
8/31/2018 | $10.64 | $0.13 | $0.34 | $0.47 | $(0.17) | $(0.10) | $— | $(0.27) |
See Notes to Financial Highlights
220
Voluntary Contribution from Management | Net Asset Value, End of Year | Total Returnb,c | Net Assets, End of Year (in millions) | Ratio of Gross Expenses to Average Net Assetsd | Ratio of Net Expenses to Average Net Assets | Ratio of Net Investment Income/ (Loss) to Average Net Assets | Portfolio Turnover Rate |
$— | $60.53 | (14.93)% | $108.6 | 1.34% | 1.34% | (0.46)% | 12% |
$— | $79.33 | 32.43% | $148.2 | 1.34% | 1.34% | (0.50)% | 12% |
$— | $62.31 | 13.10% | $131.3 | 1.35% | 1.35% | (0.31)% | 11% |
$— | $58.32 | 0.18% | $157.0 | 1.35% | 1.35% | (0.26)% | 14% |
$— | $65.23 | 26.31% | $198.1 | 1.35% | 1.35% | (0.23)% | 13% |
$— | $61.58 | (14.50)% | $2,569.7 | 0.84% | 0.84% | 0.04% | 12% |
$— | $80.18 | 33.11% | $3,551.7 | 0.84% | 0.84% | 0.00% | 12% |
$— | $62.66 | 13.65% | $3,032.9 | 0.84% | 0.84% | 0.19% | 11% |
$— | $58.48 | 0.69% | $2,809.8 | 0.85% | 0.85% | 0.25% | 14% |
$— | $65.24 | 26.96% | $3,253.8 | 0.85% | 0.85% | 0.28% | 13% |
$— | $61.61 | (14.41)% | $4,463.8 | 0.74% | 0.74% | 0.14% | 12% |
$— | $80.14 | 33.23% | $5,744.7 | 0.74% | 0.74% | 0.09% | 12% |
$— | $62.62 | 13.74% | $4,420.9 | 0.75% | 0.75% | 0.28% | 11% |
$— | $58.45 | 0.80% | $4,221.1 | 0.75% | 0.75% | 0.34% | 14% |
$— | $65.23 | 27.07% | $4,372.3 | 0.78% | 0.75% | 0.38% | 13% |
$— | $61.89 | (12.92)% | $134.0 | 0.70%h | 0.03%h | 0.86%h | 12%i,j |
$— | $10.96 | (14.76)% | $2.8 | 7.95% | 1.00% | 1.21% | 78% |
$— | $13.84 | 28.06% | $3.6 | 10.46% | 1.01% | 1.41% | 51% |
$— | $10.97 | (3.48)% | $1.4 | 8.80% | 1.01% | 1.47% | 49% |
$— | $11.94 | 14.01% | $3.4 | 9.11% | 1.01% | 1.46% | 38% |
$— | $10.85 | 4.98% | $2.3 | 11.12% | 1.01% | 1.62% | 48% |
$— | $10.92 | (15.09)% | $0.3 | 8.58% | 1.36% | 0.86% | 78% |
$— | $13.81 | 27.70% | $0.3 | 11.06% | 1.36% | 1.32% | 51% |
$— | $10.95 | (3.93)% | $0.2 | 9.28% | 1.37% | 1.10% | 49% |
$— | $11.93 | 13.65% | $0.4 | 9.72% | 1.37% | 1.07% | 38% |
$— | $10.84 | 4.47% | $0.3 | 11.57% | 1.37% | 1.23% | 48% |
221
Financial Highlights (cont’d)
Net Asset Value, Beginning of Year | Net Investment Income/ (Loss)a | Net Gains or (Losses) on Securities (both realized and unrealized) | Total From Investment Operations | Dividends from Net Investment Income | Distributions from Net Realized Capital Gains | Tax Return of Capital | Total Distributions | |
Global Real Estate Fund (cont’d) | ||||||||
Class C | ||||||||
8/31/2022 | $13.73 | $0.01 | $(2.04) | $(2.03) | $(0.10) | $(0.77) | $— | $(0.87) |
8/31/2021 | $10.91 | $0.06 | $2.84 | $2.90 | $(0.08) | $— | $— | $(0.08) |
8/31/2020 | $11.89 | $0.04 | $(0.58) | $(0.54) | $(0.20) | $(0.21) | $(0.03) | $(0.44) |
8/31/2019 | $10.81 | $0.04 | $1.30 | $1.34 | $(0.14) | $(0.12) | $— | $(0.26) |
8/31/2018 | $10.62 | $0.06 | $0.34 | $0.40 | $(0.11) | $(0.10) | $— | $(0.21) |
Greater China Equity Fund | ||||||||
Institutional Class | ||||||||
8/31/2022 | $12.97 | $0.06 | $(3.62) | $(3.56) | $(0.09) | $(0.63) | $— | $(0.72) |
8/31/2021 | $11.49 | $0.09 | $1.46 | $1.55 | $(0.07) | $— | $— | $(0.07) |
8/31/2020 | $9.28 | $0.06 | $2.24 | $2.30 | $(0.09) | $— | $— | $(0.09) |
8/31/2019 | $14.80 | $0.09 | $(0.96) | $(0.87) | $— | $(4.65) | $— | $(4.65) |
8/31/2018 | $15.85 | $0.00 | $0.77 | $0.77 | $(0.18) | $(1.64) | $— | $(1.82) |
Class A | ||||||||
8/31/2022 | $12.95 | $0.02 | $(3.62) | $(3.60) | $(0.03) | $(0.63) | $— | $(0.66) |
8/31/2021n | $11.48 | $0.02 | $1.47 | $1.49 | $(0.02) | $— | $— | $(0.02) |
8/31/2020n | $9.26 | $(0.00) | $2.27 | $2.27 | $(0.05) | $— | $— | $(0.05) |
8/31/2019n | $14.86 | $0.06 | $(0.98) | $(0.92) | $— | $(4.68) | $— | $(4.68) |
8/31/2018n | $15.95 | $(0.08) | $0.81 | $0.73 | $(0.17) | $(1.65) | $— | $(1.82) |
Class C | ||||||||
8/31/2022 | $12.93 | $(0.11) | $(3.56) | $(3.67) | $— | $(0.63) | $— | $(0.63) |
8/31/2021n | $11.52 | $(0.07) | $1.48 | $1.41 | $— | $— | $— | $— |
8/31/2020n | $9.32 | $(0.05) | $2.25 | $2.20 | $— | $— | $— | $— |
8/31/2019n | $15.37 | $(0.02) | $(1.04) | $(1.06) | $— | $(4.99) | $— | $(4.99) |
8/31/2018n | $16.57 | $(0.17) | $0.81 | $0.64 | $(0.08) | $(1.76) | $— | $(1.84) |
International Equity Fund | ||||||||
Investor Class | ||||||||
8/31/2022 | $17.18 | $0.15 | $(4.43) | $(4.28) | $(0.14) | $(1.63) | $— | $(1.77) |
8/31/2021 | $14.04 | $0.11 | $3.72 | $3.83 | $(0.09) | $(0.60) | $— | $(0.69) |
8/31/2020 | $12.47 | $0.06 | $1.84 | $1.90 | $(0.12) | $(0.22) | $— | $(0.34) |
8/31/2019 | $13.16 | $0.11 | $(0.68) | $(0.57) | $(0.09) | $(0.03) | $— | $(0.12) |
8/31/2018k | $12.58 | $0.10 | $0.51 | $0.61 | $(0.03) | $— | $— | $(0.03) |
Trust Class | ||||||||
8/31/2022 | $17.18 | $0.14 | $(4.43) | $(4.29) | $(0.13) | $(1.63) | $— | $(1.76) |
8/31/2021 | $14.04 | $0.09 | $3.73 | $3.82 | $(0.08) | $(0.60) | $— | $(0.68) |
8/31/2020 | $12.46 | $0.05 | $1.85 | $1.90 | $(0.11) | $(0.22) | $— | $(0.33) |
8/31/2019 | $13.16 | $0.10 | $(0.69) | $(0.59) | $(0.08) | $(0.03) | $— | $(0.11) |
8/31/2018k | $12.57 | $0.09 | $0.52 | $0.61 | $(0.02) | $— | $— | $(0.02) |
See Notes to Financial Highlights
222
Voluntary Contribution from Management | Net Asset Value, End of Year | Total Returnb,c | Net Assets, End of Year (in millions) | Ratio of Gross Expenses to Average Net Assetsd | Ratio of Net Expenses to Average Net Assets | Ratio of Net Investment Income/ (Loss) to Average Net Assets | Portfolio Turnover Rate |
$— | $10.83 | (15.75)% | $0.2 | 9.21% | 2.11% | 0.09% | 78% |
$— | $13.73 | 26.73% | $0.3 | 11.69% | 2.11% | 0.54% | 51% |
$— | $10.91 | (4.65)% | $0.2 | 9.88% | 2.12% | 0.35% | 49% |
$— | $11.89 | 12.75% | $0.3 | 10.43% | 2.12% | 0.32% | 38% |
$— | $10.81 | 3.81% | $0.3 | 12.21% | 2.12% | 0.53% | 48% |
$— | $8.69 | (28.71)% | $32.4 | 1.91% | 1.51% | 0.55% | 53% |
$— | $12.97 | 13.54% | $61.3 | 1.80% | 1.51% | 0.66% | 81% |
$— | $11.49 | 24.93% | $52.3 | 1.81% | 1.51% | 0.64% | 82% |
$— | $9.28 | (1.03)% | $45.2 | 1.84% | 1.52%m | 0.85% | 46% |
$— | $14.80 | 4.37% | $79.0 | 1.58% | 1.51% | 0.03% | 60% |
$— | $8.69 | (28.95)% | $1.9 | 2.41% | 1.87% | 0.22% | 53% |
$— | $12.95 | 13.01% | $3.6 | 2.26% | 1.87% | 0.14% | 81% |
$— | $11.48 | 24.51% | $4.3 | 2.29% | 1.87% | (0.04)% | 82% |
$— | $9.26 | (1.40)% | $6.1 | 2.32% | 1.88%m | 0.54% | 46% |
$— | $14.86 | 4.02% | $10.2 | 2.01% | 1.87% | (0.47)% | 60% |
$— | $8.63 | (29.51)% | $0.0 | 3.22% | 2.61% | (1.02)% | 53% |
$— | $12.93 | 12.20% | $0.2 | 3.06% | 2.62% | (0.55)% | 81% |
$— | $11.52 | 23.62% | $0.2 | 2.95% | 2.62% | (0.53)% | 82% |
$— | $9.32 | (2.13)% | $0.2 | 3.07% | 2.63%m | (0.19)% | 46% |
$— | $15.37 | 3.26% | $0.3 | 2.80% | 2.62% | (0.99)% | 60% |
$— | $11.13 | (27.43)% | $67.5 | 1.19% | 1.09% | 1.09% | 49% |
$— | $17.18 | 28.24% | $102.9 | 1.16% | 1.06% | 0.70% | 26% |
$0.01 | $14.04 | 15.39%o | $92.8 | 1.19% | 1.08% | 0.43% | 45% |
$— | $12.47 | (4.23)% | $93.3 | 1.22% | 1.13% | 0.87% | 34% |
$— | $13.16 | 4.88% | $106.7 | 1.20% | 1.14% | 0.74% | 32% |
$— | $11.13 | (27.49)% | $21.8 | 1.26% | 1.16% | 1.04% | 49% |
$— | $17.18 | 28.17% | $32.4 | 1.24% | 1.14% | 0.61% | 26% |
$0.01 | $14.04 | 15.41%o | $28.7 | 1.23% | 1.13% | 0.40% | 45% |
$— | $12.46 | (4.35)% | $30.1 | 1.26% | 1.17% | 0.80% | 34% |
$— | $13.16 | 4.84% | $40.9 | 1.24% | 1.18% | 0.71% | 32% |
223
Financial Highlights (cont’d)
Net Asset Value, Beginning of Year | Net Investment Income/ (Loss)a | Net Gains or (Losses) on Securities (both realized and unrealized) | Total From Investment Operations | Dividends from Net Investment Income | Distributions from Net Realized Capital Gains | Tax Return of Capital | Total Distributions | |
International Equity Fund (cont’d) | ||||||||
Institutional Class | ||||||||
8/31/2022 | $17.20 | $0.18 | $(4.43) | $(4.25) | $(0.18) | $(1.63) | $— | $(1.81) |
8/31/2021 | $14.06 | $0.14 | $3.72 | $3.86 | $(0.12) | $(0.60) | $— | $(0.72) |
8/31/2020 | $12.48 | $0.09 | $1.85 | $1.94 | $(0.15) | $(0.22) | $— | $(0.37) |
8/31/2019 | $13.18 | $0.13 | $(0.67) | $(0.54) | $(0.13) | $(0.03) | $— | $(0.16) |
8/31/2018 | $12.66 | $0.14 | $0.51 | $0.65 | $(0.13) | $— | $— | $(0.13) |
Class A | ||||||||
8/31/2022 | $17.16 | $0.13 | $(4.44) | $(4.31) | $(0.05) | $(1.63) | $— | $(1.68) |
8/31/2021 | $14.03 | $0.08 | $3.73 | $3.81 | $(0.08) | $(0.60) | $— | $(0.68) |
8/31/2020 | $12.46 | $0.04 | $1.85 | $1.89 | $(0.11) | $(0.22) | $— | $(0.33) |
8/31/2019 | $13.15 | $0.09 | $(0.67) | $(0.58) | $(0.08) | $(0.03) | $— | $(0.11) |
8/31/2018k | $12.56 | $0.08 | $0.52 | $0.60 | $(0.01) | $— | $— | $(0.01) |
Class C | ||||||||
8/31/2022 | $17.00 | $0.03 | $(4.39) | $(4.36) | $(0.02) | $(1.63) | $— | $(1.65) |
8/31/2021 | $13.94 | $(0.03) | $3.69 | $3.66 | $— | $(0.60) | $— | $(0.60) |
8/31/2020 | $12.39 | $(0.06) | $1.83 | $1.77 | $(0.01) | $(0.22) | $— | $(0.23) |
8/31/2019 | $13.09 | $(0.00) | $(0.67) | $(0.67) | $(0.00) | $(0.03) | $— | $(0.03) |
8/31/2018k | $12.58 | $(0.01) | $0.52 | $0.51 | $— | $— | $— | $— |
Class R6 | ||||||||
8/31/2022 | $17.22 | $0.19 | $(4.43) | $(4.24) | $(0.19) | $(1.63) | $— | $(1.82) |
8/31/2021 | $14.08 | $0.15 | $3.73 | $3.88 | $(0.14) | $(0.60) | $— | $(0.74) |
8/31/2020 | $12.49 | $0.10 | $1.87 | $1.97 | $(0.17) | $(0.22) | $— | $(0.39) |
8/31/2019 | $13.20 | $0.16 | $(0.70) | $(0.54) | $(0.14) | $(0.03) | $— | $(0.17) |
8/31/2018k | $12.67 | $0.15 | $0.52 | $0.67 | $(0.14) | $— | $— | $(0.14) |
Class E | ||||||||
Period from 1/11/2022g to 8/31/2022 | $14.79 | $0.19 | $(3.78) | $(3.59) | $— | $— | $— | $— |
International Select Fund | ||||||||
Trust Class | ||||||||
8/31/2022 | $17.62 | $0.16 | $(4.49) | $(4.33) | $(0.09) | $(1.62) | $— | $(1.71) |
8/31/2021 | $13.91 | $0.10 | $3.78 | $3.88 | $(0.07) | $(0.10) | $— | $(0.17) |
8/31/2020 | $12.30 | $0.05 | $1.94 | $1.99 | $(0.19) | $(0.19) | $— | $(0.38) |
8/31/2019 | $12.97 | $0.12 | $(0.61) | $(0.49) | $(0.05) | $(0.13) | $— | $(0.18) |
8/31/2018 | $12.43 | $0.10 | $0.54 | $0.64 | $(0.10) | $— | $— | $(0.10) |
See Notes to Financial Highlights
224
Voluntary Contribution from Management | Net Asset Value, End of Year | Total Returnb,c | Net Assets, End of Year (in millions) | Ratio of Gross Expenses to Average Net Assetsd | Ratio of Net Expenses to Average Net Assets | Ratio of Net Investment Income/ (Loss) to Average Net Assets | Portfolio Turnover Rate |
$— | $11.14 | (27.29)% | $953.7 | 1.00% | 0.87% | 1.30% | 49% |
$— | $17.20 | 28.45% | $1,654.0 | 0.98% | 0.86% | 0.92% | 26% |
$0.01 | $14.06 | 15.74%o | $1,319.0 | 0.98% | 0.85% | 0.71% | 45% |
$— | $12.48 | (3.95)% | $1,518.8 | 1.00% | 0.85% | 1.08% | 34% |
$— | $13.18 | 5.12% | $1,772.4 | 0.99% | 0.85% | 1.03% | 32% |
$— | $11.17 | (27.53)% | $11.1 | 1.37% | 1.23% | 0.91% | 49% |
$— | $17.16 | 28.05% | $66.1 | 1.35% | 1.22% | 0.54% | 26% |
$0.01 | $14.03 | 15.27%o | $55.8 | 1.34% | 1.21% | 0.30% | 45% |
$— | $12.46 | (4.30)% | $52.2 | 1.37% | 1.21% | 0.76% | 34% |
$— | $13.15 | 4.77% | $67.2 | 1.35% | 1.21% | 0.63% | 32% |
$— | $10.99 | (28.09)% | $4.9 | 2.12% | 1.98% | 0.21% | 49% |
$— | $17.00 | 27.07% | $8.2 | 2.10% | 1.97% | (0.22)% | 26% |
$0.01 | $13.94 | 14.41%o | $7.4 | 2.09% | 1.96% | (0.47)% | 45% |
$— | $12.39 | (5.05)% | $9.6 | 2.12% | 1.96% | (0.02)% | 34% |
$— | $13.09 | 4.05% | $14.3 | 2.11% | 1.96% | (0.06)% | 32% |
$— | $11.16 | (27.18)% | $27.7 | 0.90% | 0.77% | 1.29% | 49% |
$— | $17.22 | 28.57% | $86.0 | 0.88% | 0.76% | 1.00% | 26% |
$0.01 | $14.08 | 15.91%o | $76.1 | 0.88% | 0.75% | 0.77% | 45% |
$— | $12.49 | (3.95)% | $80.4 | 0.92% | 0.76% | 1.28% | 34% |
$— | $13.20 | 5.26% | $74.3 | 0.92% | 0.78% | 1.15% | 32% |
$— | $11.20 | (24.27)%i | $28.1 | 0.86%h | 0.07%h | 2.42%h | 49%j |
$— | $11.58 | (26.93)% | $4.5 | 1.41% | 1.19% | 1.11% | 55% |
$— | $17.62 | 28.12% | $6.6 | 1.41% | 1.16% | 0.67% | 21% |
$— | $13.91 | 16.28% | $5.3 | 1.41% | 1.15% | 0.41% | 33% |
$— | $12.30 | (3.58)% | $5.0 | 1.42% | 1.15% | 0.97% | 32% |
$— | $12.97 | 5.17% | $8.0 | 1.38% | 1.16% | 0.74% | 44% |
225
Financial Highlights (cont’d)
Net Asset Value, Beginning of Year | Net Investment Income/ (Loss)a | Net Gains or (Losses) on Securities (both realized and unrealized) | Total From Investment Operations | Dividends from Net Investment Income | Distributions from Net Realized Capital Gains | Tax Return of Capital | Total Distributions | |
International Select Fund (cont’d) | ||||||||
Institutional Class | ||||||||
8/31/2022 | $17.60 | $0.21 | $(4.47) | $(4.26) | $(0.15) | $(1.62) | $— | $(1.77) |
8/31/2021 | $13.89 | $0.16 | $3.77 | $3.93 | $(0.12) | $(0.10) | $— | $(0.22) |
8/31/2020 | $12.28 | $0.10 | $1.93 | $2.03 | $(0.23) | $(0.19) | $— | $(0.42) |
8/31/2019 | $12.96 | $0.15 | $(0.60) | $(0.45) | $(0.10) | $(0.13) | $— | $(0.23) |
8/31/2018 | $12.42 | $0.13 | $0.55 | $0.68 | $(0.14) | $— | $— | $(0.14) |
Class A | ||||||||
8/31/2022 | $17.47 | $0.16 | $(4.44) | $(4.28) | $(0.10) | $(1.62) | $— | $(1.72) |
8/31/2021 | $13.80 | $0.10 | $3.74 | $3.84 | $(0.07) | $(0.10) | $— | $(0.17) |
8/31/2020 | $12.21 | $0.05 | $1.92 | $1.97 | $(0.19) | $(0.19) | $— | $(0.38) |
8/31/2019 | $12.87 | $0.10 | $(0.58) | $(0.48) | $(0.05) | $(0.13) | $— | $(0.18) |
8/31/2018 | $12.34 | $0.08 | $0.55 | $0.63 | $(0.10) | $— | $— | $(0.10) |
Class C | ||||||||
8/31/2022 | $17.09 | $0.05 | $(4.33) | $(4.28) | $(0.05) | $(1.62) | $— | $(1.67) |
8/31/2021 | $13.54 | $(0.02) | $3.67 | $3.65 | $— | $(0.10) | $— | $(0.10) |
8/31/2020 | $11.99 | $(0.04) | $1.87 | $1.83 | $(0.09) | $(0.19) | $— | $(0.28) |
8/31/2019 | $12.68 | $0.01 | $(0.57) | $(0.56) | $— | $(0.13) | $— | $(0.13) |
8/31/2018 | $12.16 | $(0.00) | $0.53 | $0.53 | $(0.01) | $— | $— | $(0.01) |
Class R3 | ||||||||
8/31/2022 | $17.32 | $0.12 | $(4.39) | $(4.27) | $(0.08) | $(1.62) | $— | $(1.70) |
8/31/2021 | $13.67 | $0.06 | $3.71 | $3.77 | $(0.02) | $(0.10) | $— | $(0.12) |
8/31/2020 | $12.10 | $0.02 | $1.89 | $1.91 | $(0.15) | $(0.19) | $— | $(0.34) |
8/31/2019 | $12.75 | $0.08 | $(0.58) | $(0.50) | $(0.02) | $(0.13) | $— | $(0.15) |
8/31/2018 | $12.22 | $0.05 | $0.55 | $0.60 | $(0.07) | $— | $— | $(0.07) |
Class R6 | ||||||||
8/31/2022 | $17.61 | $0.24 | $(4.49) | $(4.25) | $(0.17) | $(1.62) | $— | $(1.79) |
8/31/2021 | $13.90 | $0.13 | $3.81 | $3.94 | $(0.13) | $(0.10) | $— | $(0.23) |
8/31/2020 | $12.29 | $0.04 | $2.00 | $2.04 | $(0.24) | $(0.19) | $— | $(0.43) |
8/31/2019 | $12.96 | $0.23 | $(0.66) | $(0.43) | $(0.11) | $(0.13) | $— | $(0.24) |
8/31/2018 | $12.42 | $0.15 | $0.54 | $0.69 | $(0.15) | $— | $— | $(0.15) |
See Notes to Financial Highlights
226
Voluntary Contribution from Management | Net Asset Value, End of Year | Total Returnb,c | Net Assets, End of Year (in millions) | Ratio of Gross Expenses to Average Net Assetsd | Ratio of Net Expenses to Average Net Assets | Ratio of Net Investment Income/ (Loss) to Average Net Assets | Portfolio Turnover Rate |
$— | $11.57 | (26.61)% | $119.9 | 1.00% | 0.84% | 1.48% | 55% |
$— | $17.60 | 28.57% | $152.5 | 0.97% | 0.81% | 1.01% | 21% |
$— | $13.89 | 16.68% | $138.9 | 0.94% | 0.80% | 0.79% | 33% |
$— | $12.28 | (3.29)% | $128.1 | 0.97% | 0.80% | 1.27% | 32% |
$— | $12.96 | 5.52% | $142.4 | 0.93% | 0.81% | 0.99% | 44% |
$— | $11.47 | (26.89)% | $3.1 | 1.37% | 1.20% | 1.10% | 55% |
$— | $17.47 | 28.07% | $4.5 | 1.34% | 1.17% | 0.66% | 21% |
$— | $13.80 | 16.22% | $3.2 | 1.31% | 1.16% | 0.36% | 33% |
$— | $12.21 | (3.58)% | $3.2 | 1.35% | 1.16% | 0.85% | 32% |
$— | $12.87 | 5.12% | $3.9 | 1.31% | 1.17% | 0.63% | 44% |
$— | $11.14 | (27.45)% | $0.5 | 2.15% | 1.95% | 0.38% | 55% |
$— | $17.09 | 27.11% | $0.8 | 2.12% | 1.92% | (0.11)% | 21% |
$— | $13.54 | 15.37% | $0.9 | 2.06% | 1.91% | (0.34)% | 33% |
$— | $11.99 | (4.32)% | $1.5 | 2.09% | 1.91% | 0.10% | 32% |
$— | $12.68 | 4.37% | $2.4 | 2.06% | 1.92% | (0.02)% | 44% |
$— | $11.35 | (27.06)% | $1.2 | 1.64% | 1.45% | 0.87% | 55% |
$— | $17.32 | 27.74% | $1.9 | 1.60% | 1.42% | 0.38% | 21% |
$— | $13.67 | 15.93% | $2.2 | 1.57% | 1.41% | 0.18% | 33% |
$— | $12.10 | (3.81)% | $2.3 | 1.60% | 1.41% | 0.66% | 32% |
$— | $12.75 | 4.92% | $3.5 | 1.56% | 1.42% | 0.36% | 44% |
$— | $11.57 | (26.59)% | $0.2 | 0.89% | 0.73% | 1.58% | 55% |
$— | $17.61 | 28.65% | $1.3 | 0.88% | 0.71% | 0.83% | 21% |
$— | $13.90 | 16.77% | $1.9 | 0.84% | 0.70% | 0.28% | 33% |
$— | $12.29 | (3.11)% | $29.6 | 0.87% | 0.71% | 1.88% | 32% |
$— | $12.96 | 5.59% | $9.4 | 0.87% | 0.74% | 1.15% | 44% |
227
Financial Highlights (cont’d)
Net Asset Value, Beginning of Year | Net Investment Income/ (Loss)a | Net Gains or (Losses) on Securities (both realized and unrealized) | Total From Investment Operations | Dividends from Net Investment Income | Distributions from Net Realized Capital Gains | Tax Return of Capital | Total Distributions | |
International Small Cap Fund | ||||||||
Institutional Class | ||||||||
8/31/2022 | $18.34 | $0.11 | $(5.54) | $(5.43) | $(0.11) | $(0.72) | $— | $(0.83) |
8/31/2021 | $13.86 | $0.03 | $4.96 | $4.99 | $(0.07) | $(0.44) | $— | $(0.51) |
8/31/2020 | $11.28 | $0.02 | $2.66 | $2.68 | $(0.10) | $— | $— | $(0.10) |
8/31/2019 | $12.98 | $0.11 | $(1.60) | $(1.49) | $(0.03) | $(0.18) | $— | $(0.21) |
8/31/2018 | $12.74 | $0.11 | $1.02 | $1.13 | $(0.35) | $(0.54) | $— | $(0.89) |
Class A | ||||||||
8/31/2022 | $18.24 | $0.02 | $(5.47) | $(5.45) | $(0.07) | $(0.72) | $— | $(0.79) |
8/31/2021 | $13.82 | $(0.03) | $4.94 | $4.91 | $(0.05) | $(0.44) | $— | $(0.49) |
8/31/2020 | $11.24 | $(0.03) | $2.66 | $2.63 | $(0.05) | $— | $— | $(0.05) |
8/31/2019 | $12.93 | $0.06 | $(1.57) | $(1.51) | $— | $(0.18) | $— | $(0.18) |
8/31/2018 | $12.70 | $0.02 | $1.05 | $1.07 | $(0.30) | $(0.54) | $— | $(0.84) |
Class C | ||||||||
8/31/2022 | $17.81 | $(0.07) | $(5.36) | $(5.43) | $(0.02) | $(0.72) | $— | $(0.74) |
8/31/2021 | $13.55 | $(0.15) | $4.85 | $4.70 | $— | $(0.44) | $— | $(0.44) |
8/31/2020 | $11.06 | $(0.11) | $2.60 | $2.49 | $— | $— | $— | $— |
8/31/2019 | $12.83 | $(0.01) | $(1.580) | $(1.59) | $— | $(0.18) | $— | $(0.18) |
8/31/2018 | $12.63 | $(0.07) | $1.05 | $0.98 | $(0.24) | $(0.54) | $— | $(0.78) |
Class R6 | ||||||||
8/31/2022 | $18.32 | $0.12 | $(5.54) | $(5.42) | $(0.11) | $(0.72) | $— | $(0.83) |
8/31/2021 | $13.88 | $0.04 | $4.97 | $5.01 | $(0.13) | $(0.44) | $— | $(0.57) |
8/31/2020 | $11.29 | $0.03 | $2.67 | $2.70 | $(0.11) | $— | $— | $(0.11) |
8/31/2019 | $12.98 | $0.12 | $(1.59) | $(1.47) | $(0.04) | $(0.18) | $— | $(0.22) |
8/31/2018 | $12.74 | $0.08 | $1.06 | $1.14 | $(0.36) | $(0.54) | $— | $(0.90) |
Intrinsic Value Fund | ||||||||
Institutional Class | ||||||||
8/31/2022 | $24.01 | $(0.08) | $(3.45) | $(3.53) | $— | $(1.48) | $— | $(1.48) |
8/31/2021p | $15.13 | $(0.11) | $9.31 | $9.20 | $— | $(0.32) | $— | $(0.32) |
8/31/2020p | $14.50 | $(0.04) | $1.11 | $1.07 | $— | $(0.44) | $— | $(0.44) |
8/31/2019p | $18.54 | $(0.03) | $(2.14) | $(2.17) | $— | $(1.87) | $— | $(1.87) |
8/31/2018p | $16.12 | $(0.06) | $3.33 | $3.27 | $— | $(0.85) | $— | $(0.85) |
Class A | ||||||||
8/31/2022 | $23.74 | $(0.16) | $(3.40) | $(3.56) | $— | $(1.48) | $— | $(1.48) |
8/31/2021p | $15.02 | $(0.19) | $9.23 | $9.04 | $— | $(0.32) | $— | $(0.32) |
8/31/2020p | $14.44 | $(0.09) | $1.11 | $1.02 | $— | $(0.44) | $— | $(0.44) |
8/31/2019f,p | $18.54 | $(0.09) | $(2.14) | $(2.23) | $— | $(1.87) | $— | $(1.87) |
8/31/2018f,p | $16.20 | $(0.12) | $3.34 | $3.22 | $— | $(0.88) | $— | $(0.88) |
See Notes to Financial Highlights
228
Voluntary Contribution from Management | Net Asset Value, End of Year | Total Returnb,c | Net Assets, End of Year (in millions) | Ratio of Gross Expenses to Average Net Assetsd | Ratio of Net Expenses to Average Net Assets | Ratio of Net Investment Income/ (Loss) to Average Net Assets | Portfolio Turnover Rate |
$— | $12.08 | (30.79)% | $2.7 | 10.11% | 1.06% | 0.72% | 21% |
$— | $18.34 | 36.97% | $2.8 | 13.09% | 1.07% | 0.20% | 22% |
$— | $13.86 | 23.84% | $1.4 | 5.81% | 1.05%m | 0.14% | 14% |
$— | $11.28 | (11.26)% | $5.3 | 6.24% | 1.05% | 1.00% | 32% |
$— | $12.98 | 9.06% | $6.2 | 7.02% | 1.05% | 0.83% | 48% |
$— | $12.00 | (31.05)% | $0.2 | 10.46% | 1.42% | 0.11% | 21% |
$— | $18.24 | 36.43% | $0.5 | 13.62% | 1.43% | (0.17)% | 22% |
$— | $13.82 | 23.41% | $0.2 | 6.40% | 1.42%m | (0.23)% | 14% |
$— | $11.24 | (11.49)% | $0.1 | 6.77% | 1.41% | 0.54% | 32% |
$— | $12.93 | 8.60% | $0.2 | 7.56% | 1.41% | 0.16% | 48% |
$— | $11.64 | (31.59)% | $0.1 | 11.24% | 2.17% | (0.45)% | 21% |
$— | $17.81 | 35.48% | $0.2 | 14.29% | 2.19% | (0.96)% | 22% |
$— | $13.55 | 22.51% | $0.1 | 6.93% | 2.17%m | (0.97)% | 14% |
$— | $11.06 | (12.22)% | $0.1 | 7.38% | 2.16% | (0.10)% | 32% |
$— | $12.83 | 7.89% | $0.2 | 8.15% | 2.16% | (0.53)% | 48% |
$— | $12.07 | (30.76)% | $0.3 | 10.00% | 0.96% | 0.78% | 21% |
$— | $18.32 | 37.14% | $0.4 | 13.03% | 0.98% | 0.25% | 22% |
$— | $13.88 | 24.01% | $0.3 | 5.71% | 0.96%m | 0.24% | 14% |
$— | $11.29 | (11.13)% | $0.2 | 6.16% | 0.96% | 1.09% | 32% |
$— | $12.98 | 9.12% | $0.3 | 6.97% | 0.98% | 0.64% | 48% |
$— | $19.00 | (15.58)% | $1,204.8 | 1.00% | 1.00%e | (0.37)% | 12% |
$— | $24.01 | 61.43% | $979.4 | 1.01% | 1.01%e | (0.54)% | 23% |
$— | $15.13 | 7.36% | $555.2 | 1.05% | 1.00% | (0.29)% | 19% |
$— | $14.50 | (10.83)% | $574.1 | 1.05% | 1.01% | (0.20)% | 22% |
$— | $18.54 | 21.01% | $678.0 | 1.02% | 1.00% | (0.35)% | 25% |
$— | $18.70 | (15.90)% | $49.0 | 1.36% | 1.36%e | (0.73)% | 12% |
$— | $23.74 | 60.81% | $51.4 | 1.37% | 1.37% | (0.90)% | 23% |
$— | $15.02 | 7.04% | $21.0 | 1.43% | 1.36% | (0.65)% | 19% |
$— | $14.44 | (11.18)% | $19.7 | 1.44% | 1.37% | (0.56)% | 22% |
$— | $18.54 | 20.58% | $20.0 | 1.41% | 1.36% | (0.73)% | 25% |
229
Financial Highlights (cont’d)
Net Asset Value, Beginning of Year | Net Investment Income/ (Loss)a | Net Gains or (Losses) on Securities (both realized and unrealized) | Total From Investment Operations | Dividends from Net Investment Income | Distributions from Net Realized Capital Gains | Tax Return of Capital | Total Distributions | |
Intrinsic Value Fund (cont’d) | ||||||||
Class C | ||||||||
8/31/2022 | $23.19 | $(0.30) | $(3.31) | $(3.61) | $— | $(1.48) | $— | $(1.48) |
8/31/2021p | $14.79 | $(0.33) | $9.05 | $8.72 | $— | $(0.32) | $— | $(0.32) |
8/31/2020p | $14.34 | $(0.19) | $1.08 | $0.89 | $— | $(0.44) | $— | $(0.44) |
8/31/2019f,p | $18.54 | $(0.20) | $(2.13) | $(2.33) | $— | $(1.87) | $— | $(1.87) |
8/31/2018f,p | $16.39 | $(0.26) | $3.35 | $3.09 | $— | $(0.94) | $— | $(0.94) |
Class R6 | ||||||||
8/31/2022 | $24.09 | $(0.05) | $(3.47) | $(3.52) | $— | $(1.48) | $— | $(1.48) |
8/31/2021p | $15.17 | $(0.09) | $9.33 | $9.24 | $— | $(0.32) | $— | $(0.32) |
8/31/2020p | $14.52 | $(0.02) | $1.11 | $1.09 | $— | $(0.44) | $— | $(0.44) |
Period from 1/18/2019g to 8/31/2019p | $14.22 | $(0.01) | $0.31 | $0.30 | $— | $— | $— | $— |
Large Cap Growth Fund | ||||||||
Investor Class | ||||||||
8/31/2022q | $29.38 | $0.03 | $(4.60) | $(4.57) | $(0.02) | $(2.93) | $— | $(2.95) |
8/31/2021 | $23.38 | $0.03 | $7.76 | $7.79 | $(0.05) | $(1.74) | $— | $(1.79) |
8/31/2020 | $18.30 | $0.05 | $6.20 | $6.25 | $(0.07) | $(1.10) | $— | $(1.17) |
8/31/2019 | $19.52 | $0.10 | $0.32 | $0.42 | $(0.11) | $(1.53) | $— | $(1.64) |
8/31/2018 | $17.12 | $0.11 | $3.49 | $3.60 | $(0.11) | $(1.09) | $— | $(1.20) |
Trust Class | ||||||||
8/31/2022q | $29.31 | $(0.02) | $(4.58) | $(4.60) | $(0.00) | $(2.93) | $— | $(2.93) |
8/31/2021 | $23.36 | $(0.02) | $7.74 | $7.72 | $(0.03) | $(1.74) | $— | $(1.77) |
8/31/2020 | $18.28 | $0.02 | $6.20 | $6.22 | $(0.04) | $(1.10) | $— | $(1.14) |
8/31/2019 | $19.51 | $0.07 | $0.31 | $0.38 | $(0.08) | $(1.53) | $— | $(1.61) |
8/31/2018k | $17.82 | $0.08 | $3.57 | $3.65 | $(0.13) | $(1.83) | $— | $(1.96) |
Advisor Class | ||||||||
8/31/2022q | $29.05 | $(0.07) | $(4.53) | $(4.60) | $— | $(2.92) | $— | $(2.92) |
8/31/2021 | $23.20 | $(0.05) | $7.66 | $7.61 | $(0.02) | $(1.74) | $— | $(1.76) |
8/31/2020 | $18.20 | $(0.04) | $6.17 | $6.13 | $(0.03) | $(1.10) | $— | $(1.13) |
8/31/2019 | $19.46 | $0.01 | $0.31 | $0.32 | $(0.05) | $(1.53) | $— | $(1.58) |
8/31/2018k | $17.36 | $0.02 | $3.52 | $3.54 | $(0.05) | $(1.39) | $— | $(1.44) |
Institutional Class | ||||||||
8/31/2022q | $29.42 | $0.07 | $(4.62) | $(4.55) | $(0.05) | $(2.93) | $— | $(2.98) |
8/31/2021 | $23.41 | $0.06 | $7.77 | $7.83 | $(0.08) | $(1.74) | $— | $(1.82) |
8/31/2020 | $18.32 | $0.08 | $6.22 | $6.30 | $(0.11) | $(1.10) | $— | $(1.21) |
8/31/2019 | $19.55 | $0.13 | $0.32 | $0.45 | $(0.15) | $(1.53) | $— | $(1.68) |
8/31/2018k | $17.13 | $0.14 | $3.51 | $3.65 | $(0.14) | $(1.09) | $— | $(1.23) |
See Notes to Financial Highlights
230
Voluntary Contribution from Management | Net Asset Value, End of Year | Total Returnb,c | Net Assets, End of Year (in millions) | Ratio of Gross Expenses to Average Net Assetsd | Ratio of Net Expenses to Average Net Assets | Ratio of Net Investment Income/ (Loss) to Average Net Assets | Portfolio Turnover Rate |
$— | $18.10 | (16.52)% | $20.4 | 2.11% | 2.11%e | (1.48)% | 12% |
$— | $23.19 | 59.58% | $18.4 | 2.12% | 2.12%e | (1.65)% | 23% |
$— | $14.79 | 6.16% | $11.3 | 2.16% | 2.11% | (1.38)% | 19% |
$— | $14.34 | (11.78)% | $16.8 | 2.16% | 2.12% | (1.30)% | 22% |
$— | $18.54 | 19.65% | $24.5 | 2.13% | 2.11% | (1.47)% | 25% |
$— | $19.09 | (15.49)% | $101.3 | 0.86% | 0.86% | (0.23)% | 12% |
$— | $24.09 | 61.54% | $84.0 | 0.89% | 0.89%e | (0.44)% | 23% |
$— | $15.17 | 7.49% | $0.1 | 0.97% | 0.90% | (0.17)% | 19% |
$— | $14.52 | 2.11%i | $0.2 | 1.00%h | 0.91%h | (0.10)%h | 22%j |
$— | $21.86 | (17.16)% | $1,408.1 | 0.83% | 0.83% | 0.11% | 32% |
$— | $29.38 | 35.49% | $1,812.9 | 0.82% | 0.82% | 0.11% | 28% |
$— | $23.38 | 35.76% | $1,419.5 | 0.87% | 0.87% | 0.26% | 49% |
$— | $18.30 | 4.03% | $1,125.5 | 0.89% | 0.89% | 0.56% | 37% |
$— | $19.52 | 21.86% | $1,187.2 | 0.88% | 0.88% | 0.62% | 41% |
$— | $21.78 | (17.31)% | $37.7 | 1.03% | 1.03% | (0.10)% | 32% |
$— | $29.31 | 35.21% | $52.5 | 1.03% | 1.03% | (0.09)% | 28% |
$— | $23.36 | 35.55% | $42.7 | 1.05% | 1.05% | 0.08% | 49% |
$— | $18.28 | 3.77% | $45.5 | 1.06% | 1.06% | 0.38% | 37% |
$— | $19.51 | 21.76% | $56.6 | 1.06% | 1.06% | 0.44% | 41% |
$— | $21.53 | (17.45)% | $2.3 | 1.17% | 1.17% | (0.29)% | 32% |
$— | $29.05 | 34.95% | $8.0 | 1.19% | 1.19% | (0.18)% | 28% |
$— | $23.20 | 35.18% | $0.2 | 1.32% | 1.32% | (0.21)% | 49% |
$— | $18.20 | 3.41% | $0.2 | 1.40% | 1.40% | 0.05% | 37% |
$— | $19.46 | 21.34% | $0.2 | 1.40% | 1.40% | 0.12% | 41% |
$— | $21.89 | (17.06)% | $245.1 | 0.68% | 0.68% | 0.28% | 32% |
$— | $29.42 | 35.68% | $204.8 | 0.67% | 0.67% | 0.26% | 28% |
$— | $23.41 | 36.03% | $149.6 | 0.70% | 0.70% | 0.43% | 49% |
$— | $18.32 | 4.19% | $83.9 | 0.71% | 0.71% | 0.74% | 37% |
$— | $19.55 | 22.15% | $82.5 | 0.71% | 0.71% | 0.80% | 41% |
231
Financial Highlights (cont’d)
Net Asset Value, Beginning of Year | Net Investment Income/ (Loss)a | Net Gains or (Losses) on Securities (both realized and unrealized) | Total From Investment Operations | Dividends from Net Investment Income | Distributions from Net Realized Capital Gains | Tax Return of Capital | Total Distributions | |
Large Cap Growth Fund (cont’d) | ||||||||
Class A | ||||||||
8/31/2022q | $29.27 | $(0.02) | $(4.59) | $(4.61) | $— | $(2.92) | $— | $(2.92) |
8/31/2021 | $23.34 | $(0.03) | $7.73 | $7.70 | $(0.03) | $(1.74) | $— | $(1.77) |
8/31/2020 | $18.28 | $0.02 | $6.19 | $6.21 | $(0.05) | $(1.10) | $— | $(1.15) |
8/31/2019 | $19.50 | $0.06 | $0.33 | $0.39 | $(0.08) | $(1.53) | $— | $(1.61) |
8/31/2018k | $17.85 | $0.07 | $3.57 | $3.64 | $(0.13) | $(1.86) | $— | $(1.99) |
Class C | ||||||||
8/31/2022q | $28.61 | $(0.20) | $(4.46) | $(4.66) | $— | $(2.92) | $— | $(2.92) |
8/31/2021 | $22.98 | $(0.21) | $7.58 | $7.37 | $— | $(1.74) | $— | $(1.74) |
8/31/2020 | $18.10 | $(0.13) | $6.11 | $5.98 | $— | $(1.10) | $— | $(1.10) |
8/31/2019 | $19.40 | $(0.06) | $0.31 | $0.25 | $(0.02) | $(1.53) | $— | $(1.55) |
8/31/2018k | $17.42 | $(0.06) | $3.51 | $3.45 | $(0.01) | $(1.46) | $— | $(1.47) |
Class R3 | ||||||||
8/31/2022q | $29.05 | $(0.10) | $(4.54) | $(4.64) | $— | $(2.92) | $— | $(2.92) |
8/31/2021 | $23.22 | $(0.11) | $7.69 | $7.58 | $(0.01) | $(1.74) | $— | $(1.75) |
8/31/2020 | $18.22 | $(0.05) | $6.16 | $6.11 | $(0.01) | $(1.10) | $— | $(1.11) |
8/31/2019 | $19.46 | $0.01 | $0.33 | $0.34 | $(0.05) | $(1.53) | $— | $(1.58) |
8/31/2018k | $17.37 | $0.02 | $3.52 | $3.54 | $(0.05) | $(1.40) | $— | $(1.45) |
Class R6 | ||||||||
8/31/2022q | $29.42 | $0.07 | $(4.60) | $(4.53) | $(0.06) | $(2.93) | $— | $(2.99) |
8/31/2021 | $23.41 | $0.07 | $7.77 | $7.84 | $(0.09) | $(1.74) | $— | $(1.83) |
8/31/2020 | $18.32 | $0.09 | $6.22 | $6.31 | $(0.12) | $(1.10) | $— | $(1.22) |
Period from 3/29/2019g to 8/31/2019 | $16.73 | $0.06 | $1.53 | $1.59 | $— | $— | $— | $— |
Large Cap Value Fund | ||||||||
Investor Class | ||||||||
8/31/2022 | $44.85 | $0.80 | $(2.65) | $(1.85) | $(0.55) | $(1.68) | $— | $(2.23) |
8/31/2021 | $30.38 | $0.66 | $14.39 | $15.05 | $(0.49) | $(0.09) | $— | $(0.58) |
8/31/2020 | $30.58 | $0.59 | $0.46 | $1.05 | $(0.60) | $(0.65) | $— | $(1.25) |
8/31/2019 | $32.87 | $0.59 | $1.03 | $1.62 | $(0.53) | $(3.38) | $— | $(3.91) |
8/31/2018 | $31.61 | $0.46 | $3.47 | $3.93 | $(0.40) | $(2.27) | $— | $(2.67) |
See Notes to Financial Highlights
232
Voluntary Contribution from Management | Net Asset Value, End of Year | Total Returnb,c | Net Assets, End of Year (in millions) | Ratio of Gross Expenses to Average Net Assetsd | Ratio of Net Expenses to Average Net Assets | Ratio of Net Investment Income/ (Loss) to Average Net Assets | Portfolio Turnover Rate |
$— | $21.74 | (17.33)% | $12.4 | 1.05% | 1.05% | (0.09)% | 32% |
$— | $29.27 | 35.15% | $10.0 | 1.05% | 1.05% | (0.12)% | 28% |
$— | $23.34 | 35.49% | $6.1 | 1.07% | 1.07% | 0.12% | 49% |
$— | $18.28 | 3.79% | $4.1 | 1.09% | 1.09% | 0.34% | 37% |
$— | $19.50 | 21.67% | $5.5 | 1.09% | 1.09% | 0.41% | 41% |
$— | $21.03 | (17.97)% | $3.4 | 1.80% | 1.80% | (0.85)% | 32% |
$— | $28.61 | 34.17% | $3.1 | 1.79% | 1.79% | (0.86)% | 28% |
$— | $22.98 | 34.53% | $2.3 | 1.81% | 1.81% | (0.70)% | 49% |
$— | $18.10 | 3.00% | $1.8 | 1.84% | 1.84% | (0.38)% | 37% |
$— | $19.40 | 20.74% | $1.8 | 1.83% | 1.83% | (0.32)% | 41% |
$— | $21.49 | (17.60)% | $0.4 | 1.36% | 1.36%e | (0.41)% | 32% |
$— | $29.05 | 34.77% | $0.4 | 1.38% | 1.36% | (0.45)% | 28% |
$— | $23.22 | 35.06% | $0.2 | 1.36% | 1.36%e | (0.25)% | 49% |
$— | $18.22 | 3.51% | $0.1 | 1.40% | 1.36% | 0.06% | 37% |
$— | $19.46 | 21.33% | $0.4 | 1.37% | 1.36% | 0.13% | 41% |
$— | $21.90 | (17.01)% | $0.2 | 0.66% | 0.65% | 0.28% | 32% |
$— | $29.42 | 35.72% | $0.2 | 0.68% | 0.65% | 0.26% | 28% |
$— | $23.41 | 36.09% | $0.0 | 0.65% | 0.65%e | 0.47% | 49% |
$— | $18.32 | 9.50%i | $0.0 | 0.97%h | 0.65%h | 0.75%h | 37%j |
$— | $40.77 | (4.38)% | $1,556.5 | 0.75% | 0.75% | 1.81% | 82% |
$— | $44.85 | 50.05% | $1,628.3 | 0.78% | 0.78% | 1.67% | 89% |
$— | $30.38 | 3.23% | $1,087.2 | 0.85% | 0.85% | 1.99% | 157% |
$— | $30.58 | 6.25% | $1,174.3 | 0.86% | 0.86% | 1.93% | 109%r |
$— | $32.87 | 12.90% | $1,160.3 | 0.87% | 0.87% | 1.46% | 153% |
233
Financial Highlights (cont’d)
Net Asset Value, Beginning of Year | Net Investment Income/ (Loss)a | Net Gains or (Losses) on Securities (both realized and unrealized) | Total From Investment Operations | Dividends from Net Investment Income | Distributions from Net Realized Capital Gains | Tax Return of Capital | Total Distributions | |
Large Cap Value Fund (cont’d) | ||||||||
Trust Class | ||||||||
8/31/2022 | $44.86 | $0.72 | $(2.65) | $(1.93) | $(0.47) | $(1.68) | $— | $(2.15) |
8/31/2021 | $30.39 | $0.58 | $14.41 | $14.99 | $(0.43) | $(0.09) | $— | $(0.52) |
8/31/2020 | $30.59 | $0.54 | $0.45 | $0.99 | $(0.54) | $(0.65) | $— | $(1.19) |
8/31/2019 | $32.88 | $0.54 | $1.03 | $1.57 | $(0.48) | $(3.38) | $— | $(3.86) |
8/31/2018l | $31.63 | $0.40 | $3.47 | $3.87 | $(0.35) | $(2.27) | $— | $(2.62) |
Advisor Class | ||||||||
8/31/2022 | $44.85 | $0.64 | $(2.64) | $(2.00) | $(0.39) | $(1.68) | $— | $(2.07) |
8/31/2021 | $30.40 | $0.51 | $14.41 | $14.92 | $(0.38) | $(0.09) | $— | $(0.47) |
8/31/2020 | $30.60 | $0.49 | $0.46 | $0.95 | $(0.50) | $(0.65) | $— | $(1.15) |
8/31/2019 | $32.88 | $0.49 | $1.04 | $1.53 | $(0.43) | $(3.38) | $— | $(3.81) |
8/31/2018l | $31.62 | $0.35 | $3.49 | $3.84 | $(0.31) | $(2.27) | $— | $(2.58) |
Institutional Class | ||||||||
8/31/2022 | $44.84 | $0.88 | $(2.65) | $(1.77) | $(0.64) | $(1.68) | $— | $(2.32) |
8/31/2021 | $30.38 | $0.84 | $14.26 | $15.10 | $(0.55) | $(0.09) | $— | $(0.64) |
8/31/2020 | $30.57 | $0.64 | $0.47 | $1.11 | $(0.65) | $(0.65) | $— | $(1.30) |
8/31/2019 | $32.87 | $0.66 | $1.01 | $1.67 | $(0.59) | $(3.38) | $— | $(3.97) |
8/31/2018l | $31.60 | $0.52 | $3.47 | $3.99 | $(0.45) | $(2.27) | $— | $(2.72) |
Class A | ||||||||
8/31/2022 | $44.87 | $0.71 | $(2.65) | $(1.94) | $(0.49) | $(1.68) | $— | $(2.17) |
8/31/2021 | $30.39 | $0.64 | $14.33 | $14.97 | $(0.40) | $(0.09) | $— | $(0.49) |
8/31/2020 | $30.59 | $0.53 | $0.45 | $0.98 | $(0.53) | $(0.65) | $— | $(1.18) |
8/31/2019 | $32.88 | $0.58 | $0.97 | $1.55 | $(0.46) | $(3.38) | $— | $(3.84) |
8/31/2018l | $31.62 | $0.39 | $3.48 | $3.87 | $(0.34) | $(2.27) | $— | $(2.61) |
Class C | ||||||||
8/31/2022 | $44.90 | $0.39 | $(2.64) | $(2.25) | $(0.36) | $(1.68) | $— | $(2.04) |
8/31/2021 | $30.30 | $0.40 | $14.30 | $14.70 | $(0.01) | $(0.09) | $— | $(0.10) |
8/31/2020 | $30.61 | $0.31 | $0.44 | $0.75 | $(0.41) | $(0.65) | $— | $(1.06) |
8/31/2019 | $32.87 | $0.33 | $1.02 | $1.35 | $(0.23) | $(3.38) | $— | $(3.61) |
8/31/2018l | $31.67 | $0.15 | $3.48 | $3.63 | $(0.16) | $(2.27) | $— | $(2.43) |
Class R3 | ||||||||
8/31/2022 | $44.88 | $0.60 | $(2.64) | $(2.04) | $(0.52) | $(1.68) | $— | $(2.20) |
8/31/2021 | $30.42 | $0.52 | $14.36 | $14.88 | $(0.33) | $(0.09) | $— | $(0.42) |
8/31/2020 | $30.62 | $0.45 | $0.45 | $0.90 | $(0.45) | $(0.65) | $— | $(1.10) |
8/31/2019 | $32.89 | $0.43 | $1.06 | $1.49 | $(0.38) | $(3.38) | $— | $(3.76) |
8/31/2018l | $31.63 | $0.32 | $3.47 | $3.79 | $(0.26) | $(2.27) | $— | $(2.53) |
See Notes to Financial Highlights
234
Voluntary Contribution from Management | Net Asset Value, End of Year | Total Returnb,c | Net Assets, End of Year (in millions) | Ratio of Gross Expenses to Average Net Assetsd | Ratio of Net Expenses to Average Net Assets | Ratio of Net Investment Income/ (Loss) to Average Net Assets | Portfolio Turnover Rate |
$— | $40.78 | (4.56)% | $117.2 | 0.96% | 0.96% | 1.61% | 82% |
$— | $44.86 | 49.76% | $112.1 | 0.99% | 0.99% | 1.47% | 89% |
$— | $30.39 | 3.05% | $65.4 | 1.03% | 1.03% | 1.82% | 157% |
$— | $30.59 | 6.04% | $81.7 | 1.04% | 1.04% | 1.75% | 109%r |
$— | $32.88 | 12.68% | $68.4 | 1.05% | 1.05% | 1.26% | 153% |
$— | $40.78 | (4.70)% | $133.5 | 1.11% | 1.11% | 1.45% | 82% |
$— | $44.85 | 49.48% | $138.0 | 1.14% | 1.14% | 1.31% | 89% |
$— | $30.40 | 2.90% | $99.7 | 1.18% | 1.18% | 1.66% | 157% |
$— | $30.60 | 5.90% | $114.8 | 1.19% | 1.19% | 1.58% | 109%r |
$— | $32.88 | 12.56% | $125.2 | 1.20% | 1.20% | 1.11% | 153% |
$— | $40.75 | (4.21)% | $7,555.8 | 0.61% | 0.61% | 2.00% | 82% |
$— | $44.84 | 50.25% | $4,146.7 | 0.62% | 0.62% | 1.96% | 89% |
$— | $30.38 | 3.42% | $365.3 | 0.68% | 0.68% | 2.15% | 157% |
$— | $30.57 | 6.41% | $339.6 | 0.69% | 0.69% | 2.17% | 109%r |
$— | $32.87 | 13.11% | $98.5 | 0.70% | 0.70%e | 1.64% | 153% |
$— | $40.76 | (4.58)% | $201.5 | 0.98% | 0.98% | 1.61% | 82% |
$— | $44.87 | 49.67% | $136.5 | 1.01% | 1.01% | 1.51% | 89% |
$— | $30.39 | 3.03% | $23.4 | 1.05% | 1.05% | 1.73% | 157% |
$— | $30.59 | 5.99% | $52.5 | 1.08% | 1.08% | 1.89% | 109%r |
$— | $32.88 | 12.68% | $4.1 | 1.08% | 1.08% | 1.24% | 153% |
$— | $40.61 | (5.28)% | $222.8 | 1.72% | 1.72% | 0.90% | 82% |
$— | $44.90 | 48.59% | $102.3 | 1.74% | 1.74% | 0.94% | 89% |
$— | $30.30 | 2.27% | $14.7 | 1.81% | 1.81% | 1.04% | 157% |
$— | $30.61 | 5.24% | $19.7 | 1.82% | 1.82% | 1.08% | 109%r |
$— | $32.87 | 11.83% | $1.9 | 1.82% | 1.82% | 0.48% | 153% |
$— | $40.64 | (4.82)% | $6.8 | 1.24% | 1.24% | 1.36% | 82% |
$— | $44.88 | 49.26% | $2.0 | 1.29% | 1.29% | 1.29% | 89% |
$— | $30.42 | 2.74% | $0.6 | 1.34% | 1.34%e | 1.51% | 157% |
$— | $30.62 | 5.74% | $0.7 | 1.37% | 1.37%e | 1.42% | 109%r |
$— | $32.89 | 12.39% | $0.3 | 1.37% | 1.36% | 1.00% | 153% |
235
Financial Highlights (cont’d)
Net Asset Value, Beginning of Year | Net Investment Income/ (Loss)a | Net Gains or (Losses) on Securities (both realized and unrealized) | Total From Investment Operations | Dividends from Net Investment Income | Distributions from Net Realized Capital Gains | Tax Return of Capital | Total Distributions | |
Class R6 | ||||||||
8/31/2022 | $44.89 | $0.94 | $(2.67) | $(1.73) | $(0.67) | $(1.68) | $— | $(2.35) |
8/31/2021 | $30.41 | $0.78 | $14.37 | $15.15 | $(0.58) | $(0.09) | $— | $(0.67) |
8/31/2020 | $30.59 | $0.63 | $0.51 | $1.14 | $(0.67) | $(0.65) | $— | $(1.32) |
Period from 1/18/2019g to 8/31/2019 | $28.19 | $0.45 | $1.95 | $2.40 | $— | $— | $— | $— |
Class E | ||||||||
Period from 1/11/2022g to 8/31/2022 | $45.60 | $0.73 | $(5.40) | $(4.67) | $— | $— | $— | $— |
Mid Cap Growth Fund | ||||||||
Investor Class | ||||||||
8/31/2022 | $22.78 | $(0.05) | $(4.98) | $(5.03) | $— | $(3.13) | $— | $(3.13) |
8/31/2021p | $18.45 | $(0.12) | $6.36 | $6.24 | $— | $(1.91) | $— | $(1.91) |
8/31/2020p | $15.96 | $(0.06) | $3.40 | $3.34 | $— | $(0.85) | $— | $(0.85) |
8/31/2019p | $16.99 | $(0.05) | $0.47 | $0.42 | $— | $(1.45) | $— | $(1.45) |
8/31/2018l,p | $14.61 | $(0.04) | $3.74 | $3.70 | $— | $(1.32) | $— | $(1.32) |
Trust Class | ||||||||
8/31/2022 | $22.77 | $(0.07) | $(4.97) | $(5.04) | $— | $(3.13) | $— | $(3.13) |
8/31/2021n,p | $18.46 | $(0.14) | $6.36 | $6.22 | $— | $(1.91) | $— | $(1.91) |
8/31/2020n,p | $15.98 | $(0.07) | $3.40 | $3.33 | $— | $(0.85) | $— | $(0.85) |
8/31/2019n,p | $17.02 | $(0.06) | $0.47 | $0.41 | $— | $(1.45) | $— | $(1.45) |
8/31/2018l,n,p | $14.66 | $(0.05) | $3.73 | $3.68 | $— | $(1.32) | $— | $(1.32) |
Advisor Class | ||||||||
8/31/2022 | $22.76 | $(0.11) | $(4.97) | $(5.08) | $— | $(3.13) | $— | $(3.13) |
8/31/2021n,p | $18.51 | $(0.19) | $6.35 | $6.16 | $— | $(1.91) | $— | $(1.91) |
8/31/2020n,p | $16.07 | $(0.11) | $3.41 | $3.30 | $— | $(0.86) | $— | $(0.86) |
8/31/2019n,p | $17.16 | $(0.09) | $0.47 | $0.38 | $— | $(1.47) | $— | $(1.47) |
8/31/2018l,n,p | $14.81 | $(0.09) | $3.78 | $3.69 | $— | $(1.34) | $— | $(1.34) |
Institutional Class | ||||||||
8/31/2022 | $22.79 | $(0.02) | $(4.99) | $(5.01) | $— | $(3.13) | $— | $(3.13) |
8/31/2021n,p | $18.41 | $(0.08) | $6.37 | $6.29 | $— | $(1.91) | $— | $(1.91) |
8/31/2020n,p | $15.90 | $(0.03) | $3.38 | $3.35 | $— | $(0.84) | $— | $(0.84) |
8/31/2019n,p | $16.88 | $(0.02) | $0.48 | $0.46 | $— | $(1.44) | $— | $(1.44) |
8/31/2018l,n,p | $14.50 | $(0.01) | $3.70 | $3.69 | $— | $(1.31) | $— | $(1.31) |
See Notes to Financial Highlights
236
Voluntary Contribution from Management | Net Asset Value, End of Year | Total Returnb,c | Net Assets, End of Year (in millions) | Ratio of Gross Expenses to Average Net Assetsd | Ratio of Net Expenses to Average Net Assets | Ratio of Net Investment Income/ (Loss) to Average Net Assets | Portfolio Turnover Rate |
$— | $40.81 | (4.13)% | $342.4 | 0.51% | 0.51% | 2.14% | 82% |
$— | $44.89 | 50.39% | $190.6 | 0.53% | 0.53% | 1.95% | 89% |
$— | $30.41 | 3.54% | $91.4 | 0.59% | 0.59%e | 2.19% | 157% |
$— | $30.59 | 8.51%i | $0.3 | 0.67%h | 0.61%h | 2.39%h | 109%j,r |
$— | $40.93 | (10.24)%i | $146.1 | 0.46%h | 0.04%h | 2.62%h | 82%j |
$— | $14.62 | (24.92)% | $478.0 | 0.84% | 0.84% | (0.27)% | 58% |
$— | $22.78 | 35.63% | $696.4 | 0.83% | 0.83% | (0.57)% | 42% |
$— | $18.45 | 21.95% | $570.7 | 0.88% | 0.88% | (0.39)% | 55% |
$— | $15.96 | 4.84% | $513.3 | 0.90% | 0.90% | (0.31)% | 48% |
$— | $16.99 | 26.75% | $528.1 | 0.90% | 0.90% | (0.25)% | 50% |
$— | $14.60 | (24.98)% | $53.4 | 0.93% | 0.93% | (0.37)% | 58% |
$— | $22.77 | 35.53% | $109.3 | 0.92% | 0.92% | (0.66)% | 42% |
$— | $18.46 | 21.85% | $85.7 | 0.94% | 0.94% | (0.46)% | 55% |
$— | $15.98 | 4.78% | $77.7 | 0.95% | 0.95% | (0.37)% | 48% |
$— | $17.02 | 26.65% | $77.6 | 0.95% | 0.95% | (0.30)% | 50% |
$— | $14.55 | (25.19)% | $8.1 | 1.19% | 1.19% | (0.62)% | 58% |
$— | $22.76 | 35.19% | $13.2 | 1.17% | 1.17% | (0.92)% | 42% |
$— | $18.51 | 21.57% | $10.3 | 1.20% | 1.20% | (0.70)% | 55% |
$— | $16.07 | 4.53% | $12.0 | 1.21% | 1.21% | (0.62)% | 48% |
$— | $17.16 | 26.32% | $15.4 | 1.21% | 1.21% | (0.56)% | 50% |
$— | $14.65 | (24.81)% | $469.7 | 0.69% | 0.69% | (0.10)% | 58% |
$— | $22.79 | 35.91% | $481.1 | 0.67% | 0.67% | (0.41)% | 42% |
$— | $18.41 | 22.12% | $347.4 | 0.70% | 0.70% | (0.22)% | 55% |
$— | $15.90 | 5.09% | $273.4 | 0.70% | 0.70% | (0.11)% | 48% |
$— | $16.88 | 26.93% | $353.7 | 0.70% | 0.70% | (0.05)% | 50% |
237
Financial Highlights (cont’d)
Net Asset Value, Beginning of Year | Net Investment Income/ (Loss)a | Net Gains or (Losses) on Securities (both realized and unrealized) | Total From Investment Operations | Dividends from Net Investment Income | Distributions from Net Realized Capital Gains | Tax Return of Capital | Total Distributions | |
Mid Cap Growth Fund (cont’d) | ||||||||
Class A | ||||||||
8/31/2022 | $22.77 | $(0.08) | $(4.98) | $(5.06) | $— | $(3.13) | $— | $(3.13) |
8/31/2021n,p | $18.48 | $(0.16) | $6.36 | $6.20 | $— | $(1.91) | $— | $(1.91) |
8/31/2020n,p | $16.02 | $(0.09) | $3.41 | $3.32 | $— | $(0.86) | $— | $(0.86) |
8/31/2019n,p | $17.09 | $(0.07) | $0.46 | $0.39 | $— | $(1.46) | $— | $(1.46) |
8/31/2018l,n,p | $14.73 | $(0.07) | $3.76 | $3.69 | $— | $(1.33) | $— | $(1.33) |
Class C | ||||||||
8/31/2022 | $22.73 | $(0.22) | $(4.95) | $(5.17) | $— | $(3.13) | $— | $(3.13) |
8/31/2021n,p | $18.63 | $(0.32) | $6.33 | $6.01 | $— | $(1.91) | $— | $(1.91) |
8/31/2020n,p | $16.29 | $(0.21) | $3.43 | $3.22 | $— | $(0.88) | $— | $(0.88) |
8/31/2019n,p | $17.52 | $(0.19) | $0.47 | $0.28 | $— | $(1.51) | $— | $(1.51) |
8/31/2018l,n,p | $15.22 | $(0.20) | $3.87 | $3.67 | $— | $(1.37) | $— | $(1.37) |
Class R3 | ||||||||
8/31/2022 | $22.75 | $(0.13) | $(4.96) | $(5.09) | $— | $(3.13) | $— | $(3.13) |
8/31/2021n,p | $18.53 | $(0.21) | $6.34 | $6.13 | $— | $(1.91) | $— | $(1.91) |
8/31/2020n,p | $16.12 | $(0.12) | $3.40 | $3.28 | $— | $(0.87) | $— | $(0.87) |
8/31/2019n,p | $17.24 | $(0.12) | $0.48 | $0.36 | $— | $(1.48) | $— | $(1.48) |
8/31/2018l,n,p | $14.91 | $(0.11) | $3.79 | $3.68 | $— | $(1.35) | $— | $(1.35) |
Class R6 | ||||||||
8/31/2022 | $22.79 | $(0.00) | $(4.99) | $(4.99) | $— | $(3.13) | $— | $(3.13) |
8/31/2021n,p | $18.39 | $(0.06) | $6.37 | $6.31 | $— | $(1.91) | $— | $(1.91) |
8/31/2020n,p | $15.86 | $(0.02) | $3.39 | $3.37 | $— | $(0.84) | $— | $(0.84) |
8/31/2019n,p | $16.82 | $(0.00) | $0.47 | $0.47 | $— | $(1.43) | $— | $(1.43) |
8/31/2018l,n,p | $14.44 | $0.00 | $3.68 | $3.68 | $— | $(1.30) | $— | $(1.30) |
Mid Cap Intrinsic Value Fund | ||||||||
Investor Class | ||||||||
8/31/2022 | $24.69 | $0.21 | $(1.11) | $(0.90) | $(0.14) | $— | $— | $(0.14) |
8/31/2021p | $16.03 | $0.15 | $8.52 | $8.67 | $(0.01) | $— | $— | $(0.01) |
8/31/2020p | $19.32 | $0.22 | $(3.28) | $(3.06) | $(0.23) | $— | $— | $(0.23) |
8/31/2019f,p | $24.16 | $0.19 | $(3.39) | $(3.20) | $(0.13) | $(1.51) | $— | $(1.64) |
8/31/2018f,p | $23.02 | $0.12 | $2.57 | $2.69 | $(0.11) | $(1.44) | $— | $(1.55) |
Trust Class | ||||||||
8/31/2022 | $24.63 | $0.15 | $(1.11) | $(0.96) | $(0.06) | $— | $— | $(0.06) |
8/31/2021p | $16.02 | $0.10 | $8.52 | $8.62 | $(0.01) | $— | $— | $(0.01) |
8/31/2020p | $19.32 | $0.20 | $(3.30) | $(3.10) | $(0.20) | $— | $— | $(0.20) |
8/31/2019f,p | $24.16 | $0.17 | $(3.38) | $(3.21) | $(0.12) | $(1.51) | $— | $(1.63) |
8/31/2018f,p | $23.35 | $0.10 | $2.61 | $2.71 | $(0.12) | $(1.78) | $— | $(1.90) |
See Notes to Financial Highlights
238
Voluntary Contribution from Management | Net Asset Value, End of Year | Total Returnb,c | Net Assets, End of Year (in millions) | Ratio of Gross Expenses to Average Net Assetsd | Ratio of Net Expenses to Average Net Assets | Ratio of Net Investment Income/ (Loss) to Average Net Assets | Portfolio Turnover Rate |
$— | $14.58 | (25.08)% | $39.0 | 1.06% | 1.06% | (0.47)% | 58% |
$— | $22.77 | 35.42% | $48.1 | 1.04% | 1.04% | (0.78)% | 42% |
$— | $18.48 | 21.70% | $36.0 | 1.06% | 1.06% | (0.57)% | 55% |
$— | $16.02 | 4.65% | $33.0 | 1.07% | 1.07% | (0.47)% | 48% |
$— | $17.09 | 26.48% | $52.1 | 1.07% | 1.07% | (0.42)% | 50% |
$— | $14.43 | (25.67)% | $7.7 | 1.80% | 1.80% | (1.24)% | 58% |
$— | $22.73 | 34.42% | $13.2 | 1.79% | 1.79% | (1.53)% | 42% |
$— | $18.63 | 20.77% | $11.3 | 1.81% | 1.81% | (1.32)% | 55% |
$— | $16.29 | 3.91% | $10.8 | 1.82% | 1.82% | (1.24)% | 48% |
$— | $17.52 | 25.49% | $11.6 | 1.85% | 1.85%e | (1.20)% | 50% |
$— | $14.53 | (25.25)% | $9.9 | 1.31% | 1.31% | (0.75)% | 58% |
$— | $22.75 | 35.03% | $18.5 | 1.29% | 1.29% | (1.03)% | 42% |
$— | $18.53 | 21.36% | $13.7 | 1.31% | 1.31% | (0.77)% | 55% |
$— | $16.12 | 4.41% | $56.4 | 1.33% | 1.33%e | (0.79)% | 48% |
$— | $17.24 | 26.11% | $15.6 | 1.36% | 1.36%e | (0.71)% | 50% |
$— | $14.67 | (24.71)% | $538.5 | 0.59% | 0.59% | (0.01)% | 58% |
$— | $22.79 | 35.99% | $753.3 | 0.57% | 0.57% | (0.31)% | 42% |
$— | $18.39 | 22.27% | $524.1 | 0.60% | 0.60% | (0.11)% | 55% |
$— | $15.86 | 5.20% | $461.1 | 0.61% | 0.61% | (0.03)% | 48% |
$— | $16.82 | 26.99% | $433.5 | 0.63% | 0.63% | 0.02% | 50% |
$— | $23.65 | (3.67)% | $32.7 | 1.45% | 0.96% | 0.85% | 22% |
$— | $24.69 | 54.09% | $35.2 | 1.49% | 1.01% | 0.68% | 31% |
$— | $16.03 | (16.10)% | $23.0 | 1.37% | 1.11% | 1.26% | 16% |
$— | $19.32 | (12.97)% | $34.5 | 1.27% | 1.17% | 0.93% | 56% |
$— | $24.16 | 12.20% | $40.2 | 1.21% | 1.17% | 0.49% | 36% |
$— | $23.61 | (3.90)% | $6.1 | 1.63% | 1.20% | 0.61% | 22% |
$— | $24.63 | 53.86% | $6.9 | 1.69% | 1.22% | 0.48% | 31% |
$— | $16.02 | (16.26)% | $4.9 | 1.53% | 1.26% | 1.12% | 16% |
$— | $19.32 | (13.03)% | $8.0 | 1.42% | 1.27% | 0.82% | 56% |
$— | $24.16 | 12.17% | $10.2 | 1.37% | 1.25% | 0.42% | 36% |
239
Financial Highlights (cont’d)
Net Asset Value, Beginning of Year | Net Investment Income/ (Loss)a | Net Gains or (Losses) on Securities (both realized and unrealized) | Total From Investment Operations | Dividends from Net Investment Income | Distributions from Net Realized Capital Gains | Tax Return of Capital | Total Distributions | |
Mid Cap Intrinsic Value Fund (cont’d) | ||||||||
Institutional Class | ||||||||
8/31/2022 | $24.65 | $0.24 | $(1.11) | $(0.87) | $(0.15) | $— | $— | $(0.15) |
8/31/2021p | $16.02 | $0.18 | $8.51 | $8.69 | $(0.06) | $— | $— | $(0.06) |
8/31/2020p | $19.31 | $0.27 | $(3.28) | $(3.01) | $(0.28) | $— | $— | $(0.28) |
8/31/2019p | $24.17 | $0.25 | $(3.40) | $(3.15) | $(0.20) | $(1.51) | $— | $(1.71) |
8/31/2018p | $23.00 | $0.19 | $2.59 | $2.78 | $(0.17) | $(1.44) | $— | $(1.61) |
Class A | ||||||||
8/31/2022 | $24.63 | $0.15 | $(1.10) | $(0.95) | $(0.06) | $— | $— | $(0.06) |
8/31/2021p | $16.03 | $0.11 | $8.50 | $8.61 | $(0.01) | $— | $— | $(0.01) |
8/31/2020p | $19.32 | $0.21 | $(3.29) | $(3.08) | $(0.21) | $— | $— | $(0.21) |
8/31/2019f,p | $24.17 | $0.19 | $(3.41) | $(3.22) | $(0.12) | $(1.51) | $— | $(1.63) |
8/31/2018f,p | $23.34 | $0.11 | $2.60 | $2.71 | $(0.10) | $(1.78) | $— | $(1.88) |
Class C | ||||||||
8/31/2022 | $24.43 | $(0.04) | $(1.09) | $(1.13) | $— | $— | $— | $— |
8/31/2021p | $16.00 | $(0.06) | $8.49 | $8.43 | $— | $— | $— | $— |
8/31/2020p | $19.29 | $0.07 | $(3.30) | $(3.23) | $(0.06) | $— | $— | $(0.06) |
8/31/2019f,p | $24.18 | $0.02 | $(3.39) | $(3.37) | $(0.01) | $(1.51) | $— | $(1.52) |
8/31/2018f,p | $23.47 | $(0.06) | $2.61 | $2.55 | $(0.00) | $(1.84) | $— | $(1.84) |
Class R3 | ||||||||
8/31/2022 | $24.59 | $0.09 | $(1.10) | $(1.01) | $(0.02) | $— | $— | $(0.02) |
8/31/2021p | $16.03 | $0.05 | $8.51 | $8.56 | $— | $— | $— | $— |
8/31/2020p | $19.33 | $0.18 | $(3.32) | $(3.14) | $(0.16) | $— | $— | $(0.16) |
8/31/2019f,p | $24.17 | $0.13 | $(3.39) | $(3.26) | $(0.07) | $(1.51) | $— | $(1.58) |
8/31/2018f,p | $23.37 | $0.05 | $2.60 | $2.65 | $(0.06) | $(1.79) | $— | $(1.85) |
Class R6 | ||||||||
8/31/2022 | $24.65 | $0.26 | $(1.09) | $(0.83) | $(0.18) | $— | $— | $(0.18) |
8/31/2021p | $16.03 | $0.20 | $8.50 | $8.70 | $(0.08) | $— | $— | $(0.08) |
8/31/2020p | $19.32 | $0.28 | $(3.27) | $(2.99) | $(0.30) | $— | $— | $(0.30) |
Period from 3/29/2019g to 8/31/2019p | $20.50 | $0.10 | $(1.28) | $(1.18) | $— | $— | $— | $— |
Multi-Cap Opportunities Fund | ||||||||
Institutional Class | ||||||||
8/31/2022 | $18.55 | $0.04 | $(2.00) | $(1.96) | $(0.05) | $(4.83) | $— | $(4.88) |
8/31/2021p | $17.03 | $0.05 | $5.17 | $5.22 | $(0.05) | $(3.65) | $— | $(3.70) |
8/31/2020p | $18.64 | $0.09 | $1.76 | $1.85 | $(0.14) | $(3.32) | $— | $(3.46) |
8/31/2019p | $20.12 | $0.14 | $0.17 | $0.31 | $(0.14) | $(1.65) | $— | $(1.79) |
8/31/2018p | $18.67 | $0.12 | $3.28 | $3.40 | $(0.11) | $(1.84) | $— | $(1.95) |
See Notes to Financial Highlights
240
Voluntary Contribution from Management | Net Asset Value, End of Year | Total Returnb,c | Net Assets, End of Year (in millions) | Ratio of Gross Expenses to Average Net Assetsd | Ratio of Net Expenses to Average Net Assets | Ratio of Net Investment Income/ (Loss) to Average Net Assets | Portfolio Turnover Rate |
$— | $23.63 | (3.55)% | $13.1 | 1.28% | 0.85% | 0.97% | 22% |
$— | $24.65 | 54.34% | $15.2 | 1.32% | 0.86% | 0.84% | 31% |
$— | $16.02 | (15.88)% | $12.6 | 1.19% | 0.86% | 1.52% | 16% |
$— | $19.31 | (12.70)% | $40.2 | 1.07% | 0.86% | 1.21% | 56% |
$— | $24.17 | 12.60% | $52.5 | 1.02% | 0.85% | 0.81% | 36% |
$— | $23.62 | (3.88)% | $1.2 | 1.68% | 1.21% | 0.59% | 22% |
$— | $24.63 | 53.74% | $1.5 | 1.73% | 1.22% | 0.50% | 31% |
$— | $16.03 | (16.17)% | $1.7 | 1.54% | 1.22% | 1.15% | 16% |
$— | $19.32 | (13.03)% | $6.2 | 1.40% | 1.22% | 0.91% | 56% |
$— | $24.17 | 12.23% | $10.1 | 1.39% | 1.21% | 0.46% | 36% |
$— | $23.30 | (4.63)% | $0.9 | 2.42% | 1.96% | (0.15)% | 22% |
$— | $24.43 | 52.69% | $1.0 | 2.47% | 1.97% | (0.26)% | 31% |
$— | $16.00 | (16.81)% | $0.8 | 2.31% | 1.97% | 0.41% | 16% |
$— | $19.29 | (13.69)% | $1.5 | 2.19% | 1.97% | 0.10% | 56% |
$— | $24.18 | 11.37% | $2.4 | 2.14% | 1.96% | (0.29)% | 36% |
$— | $23.56 | (4.11)% | $0.7 | 1.94% | 1.46% | 0.35% | 22% |
$— | $24.59 | 53.42% | $0.8 | 1.98% | 1.47% | 0.22% | 31% |
$— | $16.03 | (16.42)% | $0.5 | 1.80% | 1.47% | 0.96% | 16% |
$— | $19.33 | (13.21)% | $1.9 | 1.70% | 1.48% | 0.61% | 56% |
$— | $24.17 | 11.92% | $2.3 | 1.65% | 1.46% | 0.21% | 36% |
$— | $23.64 | (3.42)% | $0.0 | 1.55% | 0.75% | 1.06% | 22% |
$— | $24.65 | 54.45% | $0.0 | 1.72% | 0.76% | 0.94% | 31% |
$— | $16.03 | (15.79)% | $0.0 | 1.02% | 0.76%e | 1.62% | 16% |
$— | $19.32 | (5.76)%i | $0.0 | 1.44%h | 0.78%h | 1.14%h | 56%j |
$— | $11.71 | (14.66)% | $208.9 | 0.82% | 0.82% | 0.28% | 16% |
$— | $18.55 | 36.24% | $490.7 | 0.81% | 0.81% | 0.33% | 15% |
$— | $17.03 | 10.23% | $609.7 | 0.76% | 0.76% | 0.53% | 27% |
$— | $18.64 | 2.91% | $1,098.2 | 0.74% | 0.74% | 0.75% | 36% |
$— | $20.12 | 19.15% | $1,866.7 | 0.72% | 0.72% | 0.61% | 23% |
241
Financial Highlights (cont’d)
Net Asset Value, Beginning of Year | Net Investment Income/ (Loss)a | Net Gains or (Losses) on Securities (both realized and unrealized) | Total From Investment Operations | Dividends from Net Investment Income | Distributions from Net Realized Capital Gains | Tax Return of Capital | Total Distributions | |
Multi-Cap Opportunities Fund (cont’d) | ||||||||
Class A | ||||||||
8/31/2022 | $18.55 | $(0.01) | $(1.99) | $(2.00) | $(0.01) | $(4.83) | $— | $(4.84) |
8/31/2021p | $17.05 | $(0.01) | $5.16 | $5.15 | $— | $(3.65) | $— | $(3.65) |
8/31/2020p | $18.65 | $0.03 | $1.76 | $1.79 | $(0.07) | $(3.32) | $— | $(3.39) |
8/31/2019f,p | $20.12 | $0.07 | $0.18 | $0.25 | $(0.07) | $(1.65) | $— | $(1.72) |
8/31/2018f,p | $18.69 | $0.05 | $3.28 | $3.33 | $(0.04) | $(1.86) | $— | $(1.90) |
Class C | ||||||||
8/31/2022 | $18.23 | $(0.11) | $(1.94) | $(2.05) | $— | $(4.83) | $— | $(4.83) |
8/31/2021p | $16.92 | $(0.13) | $5.09 | $4.96 | $— | $(3.65) | $— | $(3.65) |
8/31/2020p | $18.59 | $(0.09) | $1.74 | $1.65 | $— | $(3.32) | $— | $(3.32) |
8/31/2019f,p | $20.13 | $(0.06) | $0.17 | $0.11 | $— | $(1.65) | $— | $(1.65) |
8/31/2018f,p | $18.87 | $(0.10) | $3.30 | $3.20 | $— | $(1.94) | $— | $(1.94) |
Class E | ||||||||
Period from 1/11/2022g to 8/31/2022 | $13.99 | $0.09 | $(2.32) | $(2.23) | $— | $— | $— | $— |
Real Estate Fund | ||||||||
Trust Class | ||||||||
8/31/2022 | $18.10 | $0.14 | $(2.01) | $(1.87) | $(0.16) | $(0.60) | $— | $(0.76) |
8/31/2021 | $13.76 | $0.21 | $4.41 | $4.62 | $(0.20) | $(0.08) | $— | $(0.28) |
8/31/2020 | $15.13 | $0.17 | $(0.80) | $(0.63) | $(0.17) | $(0.57) | $— | $(0.74) |
8/31/2019 | $13.34 | $0.18 | $2.45 | $2.63 | $(0.18) | $(0.66) | $— | $(0.84) |
8/31/2018 | $13.52 | $0.20 | $0.45 | $0.65 | $(0.19) | $(0.64) | $— | $(0.83) |
Institutional Class | ||||||||
8/31/2022 | $18.17 | $0.17 | $(2.03) | $(1.86) | $(0.19) | $(0.60) | $— | $(0.79) |
8/31/2021 | $13.81 | $0.20 | $4.47 | $4.67 | $(0.23) | $(0.08) | $— | $(0.31) |
8/31/2020 | $15.19 | $0.19 | $(0.80) | $(0.61) | $(0.20) | $(0.57) | $— | $(0.77) |
8/31/2019 | $13.39 | $0.20 | $2.46 | $2.66 | $(0.20) | $(0.66) | $— | $(0.86) |
8/31/2018 | $13.56 | $0.23 | $0.46 | $0.69 | $(0.22) | $(0.64) | $— | $(0.86) |
Class A | ||||||||
8/31/2022 | $18.10 | $0.11 | $(2.01) | $(1.90) | $(0.13) | $(0.60) | $— | $(0.73) |
8/31/2021 | $13.76 | $0.18 | $4.41 | $4.59 | $(0.17) | $(0.08) | $— | $(0.25) |
8/31/2020 | $15.13 | $0.15 | $(0.81) | $(0.66) | $(0.14) | $(0.57) | $— | $(0.71) |
8/31/2019 | $13.34 | $0.15 | $2.46 | $2.61 | $(0.16) | $(0.66) | $— | $(0.82) |
8/31/2018 | $13.51 | $0.17 | $0.47 | $0.64 | $(0.17) | $(0.64) | $— | $(0.81) |
See Notes to Financial Highlights
242
Voluntary Contribution from Management | Net Asset Value, End of Year | Total Returnb,c | Net Assets, End of Year (in millions) | Ratio of Gross Expenses to Average Net Assetsd | Ratio of Net Expenses to Average Net Assets | Ratio of Net Investment Income/ (Loss) to Average Net Assets | Portfolio Turnover Rate |
$— | $11.71 | (14.92)% | $41.2 | 1.19% | 1.19% | (0.06)% | 16% |
$— | $18.55 | 35.69% | $53.1 | 1.18% | 1.18% | (0.04)% | 15% |
$— | $17.05 | 9.83% | $41.6 | 1.14% | 1.14% | 0.17% | 27% |
$— | $18.65 | 2.54% | $49.9 | 1.12% | 1.12% | 0.38% | 36% |
$— | $20.12 | 18.72% | $75.7 | 1.09% | 1.09% | 0.25% | 23% |
$— | $11.35 | (15.58)% | $15.6 | 1.94% | 1.94% | (0.82)% | 16% |
$— | $18.23 | 34.66% | $27.2 | 1.93% | 1.93% | (0.78)% | 15% |
$— | $16.92 | 9.04% | $30.4 | 1.88% | 1.88% | (0.57)% | 27% |
$— | $18.59 | 1.78% | $39.4 | 1.86% | 1.86% | (0.35)% | 36% |
$— | $20.13 | 17.83% | $44.7 | 1.83% | 1.83% | (0.49)% | 23% |
$— | $11.76 | (15.94)%i | $71.6 | 0.69% | 0.10%h | 1.11%h | 16%j |
$— | $15.47 | (10.87)% | $127.4 | 1.37% | 1.04% | 0.80% | 37% |
$— | $18.10 | 34.12% | $149.8 | 1.38% | 1.04% | 1.37% | 22% |
$— | $13.76 | (4.13)% | $108.6 | 1.40% | 1.04% | 1.21% | 26% |
$— | $15.13 | 21.21% | $130.3 | 1.43% | 1.04% | 1.32% | 38% |
$— | $13.34 | 5.01% | $133.7 | 1.42% | 1.04% | 1.58% | 47% |
$— | $15.52 | (10.76)% | $738.1 | 1.01% | 0.85% | 0.99% | 37% |
$— | $18.17 | 34.40% | $706.9 | 1.02% | 0.85% | 1.32% | 22% |
$— | $13.81 | (3.97)% | $344.1 | 1.04% | 0.85% | 1.37% | 26% |
$— | $15.19 | 21.44% | $213.6 | 1.06% | 0.85% | 1.49% | 38% |
$— | $13.39 | 5.28% | $177.7 | 1.06% | 0.85% | 1.81% | 47% |
$— | $15.47 | (11.02)% | $78.4 | 1.38% | 1.21% | 0.62% | 37% |
$— | $18.10 | 33.89% | $84.6 | 1.39% | 1.21% | 1.18% | 22% |
$— | $13.76 | (4.31)% | $60.7 | 1.40% | 1.21% | 1.04% | 26% |
$— | $15.13 | 21.01% | $63.9 | 1.42% | 1.21% | 1.13% | 38% |
$— | $13.34 | 4.90% | $58.8 | 1.42% | 1.21% | 1.31% | 47% |
243
Financial Highlights (cont’d)
Net Asset Value, Beginning of Year | Net Investment Income/ (Loss)a | Net Gains or (Losses) on Securities (both realized and unrealized) | Total From Investment Operations | Dividends from Net Investment Income | Distributions from Net Realized Capital Gains | Tax Return of Capital | Total Distributions | |
Real Estate Fund (cont’d) | ||||||||
Class C | ||||||||
8/31/2022 | $18.15 | $(0.02) | $(2.02) | $(2.04) | $(0.00) | $(0.60) | $— | $(0.60) |
8/31/2021 | $13.79 | $0.08 | $4.42 | $4.50 | $(0.06) | $(0.08) | $— | $(0.14) |
8/31/2020 | $15.16 | $0.04 | $(0.80) | $(0.76) | $(0.04) | $(0.57) | $— | $(0.61) |
8/31/2019 | $13.36 | $0.06 | $2.45 | $2.51 | $(0.05) | $(0.66) | $— | $(0.71) |
8/31/2018 | $13.52 | $0.08 | $0.47 | $0.55 | $(0.07) | $(0.64) | $— | $(0.71) |
Class R3 | ||||||||
8/31/2022 | $18.06 | $0.06 | $(2.00) | $(1.94) | $(0.08) | $(0.60) | $— | $(0.68) |
8/31/2021 | $13.73 | $0.15 | $4.40 | $4.55 | $(0.14) | $(0.08) | $— | $(0.22) |
8/31/2020 | $15.10 | $0.11 | $(0.80) | $(0.69) | $(0.11) | $(0.57) | $— | $(0.68) |
8/31/2019 | $13.31 | $0.12 | $2.45 | $2.57 | $(0.12) | $(0.66) | $— | $(0.78) |
8/31/2018 | $13.49 | $0.16 | $0.44 | $0.60 | $(0.14) | $(0.64) | $— | $(0.78) |
Class R6 | ||||||||
8/31/2022 | $18.16 | $0.19 | $(2.02) | $(1.83) | $(0.21) | $(0.60) | $— | $(0.81) |
8/31/2021 | $13.81 | $0.24 | $4.43 | $4.67 | $(0.24) | $(0.08) | $— | $(0.32) |
8/31/2020 | $15.19 | $0.20 | $(0.80) | $(0.60) | $(0.21) | $(0.57) | $— | $(0.78) |
8/31/2019 | $13.39 | $0.21 | $2.47 | $2.68 | $(0.22) | $(0.66) | $— | $(0.88) |
8/31/2018 | $13.56 | $0.23 | $0.47 | $0.70 | $(0.23) | $(0.64) | $— | $(0.87) |
Class E | ||||||||
Period from 1/11/2022g to 8/31/2022 | $18.24 | $0.11 | $(2.60) | $(2.49) | $(0.12) | $(0.10) | $— | $(0.22) |
Small Cap Growth Fund | ||||||||
Investor Class | ||||||||
8/31/2022 | $56.71 | $(0.28) | $(9.57) | $(9.85) | $— | $(8.93) | $(0.00) | $(8.93) |
8/31/2021p | $44.81 | $(0.45) | $12.93 | $12.48 | $— | $(0.58) | $— | $(0.58) |
8/31/2020p | $37.83 | $(0.30) | $8.82 | $8.52 | $— | $(1.54) | $— | $(1.54) |
8/31/2019p | $44.96 | $(0.30) | $0.29 | $(0.01) | $— | $(7.12) | $— | $(7.12) |
8/31/2018p | $32.90 | $(0.37) | $12.94 | $12.57 | $— | $(0.51) | $— | $(0.51) |
Trust Class | ||||||||
8/31/2022 | $56.68 | $(0.39) | $(9.55) | $(9.94) | $— | $(8.93) | $(0.00) | $(8.93) |
8/31/2021n,p | $44.87 | $(0.56) | $12.95 | $12.39 | $— | $(0.58) | $— | $(0.58) |
8/31/2020n,p | $37.94 | $(0.34) | $8.82 | $8.48 | $— | $(1.55) | $— | $(1.55) |
8/31/2019n,p | $45.14 | $(0.34) | $0.30 | $(0.04) | $— | $(7.16) | $— | $(7.16) |
8/31/2018k,n,p | $33.05 | $(0.43) | $12.99 | $12.56 | $— | $(0.47) | $— | $(0.47) |
See Notes to Financial Highlights
244
Voluntary Contribution from Management | Net Asset Value, End of Year | Total Returnb,c | Net Assets, End of Year (in millions) | Ratio of Gross Expenses to Average Net Assetsd | Ratio of Net Expenses to Average Net Assets | Ratio of Net Investment Income/ (Loss) to Average Net Assets | Portfolio Turnover Rate |
$— | $15.51 | (11.72)% | $10.6 | 2.14% | 1.96% | (0.13)% | 37% |
$— | $18.15 | 32.94% | $11.2 | 2.15% | 1.96% | 0.56% | 22% |
$— | $13.79 | (5.08)% | $9.1 | 2.16% | 1.96% | 0.28% | 26% |
$— | $15.16 | 20.12% | $10.5 | 2.18% | 1.96% | 0.43% | 38% |
$— | $13.36 | 4.14% | $13.5 | 2.18% | 1.96% | 0.59% | 47% |
$— | $15.44 | (11.23)% | $16.9 | 1.63% | 1.46% | 0.36% | 37% |
$— | $18.06 | 33.55% | $20.3 | 1.64% | 1.46% | 0.98% | 22% |
$— | $13.73 | (4.58)% | $15.7 | 1.67% | 1.46% | 0.81% | 26% |
$— | $15.10 | 20.76% | $20.5 | 1.69% | 1.46% | 0.87% | 38% |
$— | $13.31 | 4.58% | $18.0 | 1.69% | 1.46% | 1.21% | 47% |
$— | $15.52 | (10.62)% | $146.9 | 0.92% | 0.75% | 1.10% | 37% |
$— | $18.16 | 34.45% | $167.9 | 0.93% | 0.75% | 1.59% | 22% |
$— | $13.81 | (3.87)% | $107.1 | 0.94% | 0.75% | 1.45% | 26% |
$— | $15.19 | 21.55% | $74.0 | 0.97% | 0.76% | 1.55% | 38% |
$— | $13.39 | 5.35% | $56.6 | 0.99% | 0.78% | 1.82% | 47% |
$— | $15.53 | (13.67)% | $19.0 | 0.88% | 0.08%h | 1.00%h | 37%j |
$— | $37.93 | (19.94)% | $62.8 | 1.32% | 1.01% | (0.63)% | 121% |
$— | $56.71 | 27.95% | $85.7 | 1.28% | 1.07% | (0.85)% | 127% |
$— | $44.81 | 23.20% | $72.5 | 1.41% | 1.18% | (0.78)% | 128% |
$— | $37.83 | 4.06% | $65.6 | 1.58% | 1.19% | (0.78)% | 161% |
$— | $44.96 | 38.67% | $66.1 | 1.75% | 1.21% | (0.97)% | 217% |
$— | $37.81 | (20.14)% | $3.9 | 1.49% | 1.25% | (0.87)% | 121% |
$— | $56.68 | 27.70% | $5.4 | 1.47% | 1.27% | (1.04)% | 127% |
$— | $44.87 | 23.04% | $4.6 | 1.54% | 1.29% | (0.89)% | 128% |
$— | $37.94 | 3.99% | $4.6 | 1.70% | 1.29% | (0.89)% | 161% |
$— | $45.14 | 38.45% | $4.4 | 1.86% | 1.37% | (1.13)% | 217% |
245
Financial Highlights (cont’d)
Net Asset Value, Beginning of Year | Net Investment Income/ (Loss)a | Net Gains or (Losses) on Securities (both realized and unrealized) | Total From Investment Operations | Dividends from Net Investment Income | Distributions from Net Realized Capital Gains | Tax Return of Capital | Total Distributions | |
Small Cap Growth Fund (cont’d) | ||||||||
Advisor Class | ||||||||
8/31/2022 | $56.66 | $(0.46) | $(9.54) | $(10.00) | $— | $(8.93) | $(0.00) | $(8.93) |
8/31/2021n,p | $44.93 | $(0.64) | $12.95 | $12.31 | $— | $(0.58) | $— | $(0.58) |
8/31/2020n,p | $38.05 | $(0.39) | $8.83 | $8.44 | $— | $(1.56) | $— | $(1.56) |
8/31/2019n,p | $45.36 | $(0.40) | $0.29 | $(0.11) | $— | $(7.20) | $— | $(7.20) |
8/31/2018k,n,p | $33.51 | $(0.49) | $13.09 | $12.60 | $— | $(0.75) | $— | $(0.75) |
Institutional Class | ||||||||
8/31/2022 | $56.73 | $(0.24) | $(9.57) | $(9.81) | $— | $(8.93) | $(0.00) | $(8.93) |
8/31/2021n,p | $44.74 | $(0.36) | $12.93 | $12.57 | $— | $(0.58) | $— | $(0.58) |
8/31/2020n,p | $37.66 | $(0.20) | $8.80 | $8.60 | $— | $(1.52) | $— | $(1.52) |
8/31/2019n,p | $44.59 | $(0.17) | $0.29 | $0.12 | $— | $(7.05) | $— | $(7.05) |
8/31/2018k,n,p | $32.51 | $(0.25) | $12.81 | $12.56 | $— | $(0.48) | $— | $(0.48) |
Class A | ||||||||
8/31/2022 | $56.68 | $(0.39) | $(9.55) | $(9.94) | $— | $(8.93) | $(0.00) | $(8.93) |
8/31/2021n,p | $44.88 | $(0.56) | $12.94 | $12.38 | $— | $(0.58) | $— | $(0.58) |
8/31/2020n,p | $37.93 | $(0.32) | $8.82 | $8.50 | $— | $(1.55) | $— | $(1.55) |
8/31/2019n,p | $45.10 | $(0.29) | $0.26 | $(0.03) | $— | $(7.14) | $— | $(7.14) |
8/31/2018k,n,p | $32.98 | $(0.39) | $12.97 | $12.58 | $— | $(0.46) | $— | $(0.46) |
Class C | ||||||||
8/31/2022 | $56.58 | $(0.73) | $(9.49) | $(10.22) | $— | $(8.93) | $(0.00) | $(8.93) |
8/31/2021n,p | $45.14 | $(0.97) | $12.99 | $12.02 | $— | $(0.58) | $— | $(0.58) |
8/31/2020n,p | $38.45 | $(0.62) | $8.90 | $8.28 | $— | $(1.59) | $— | $(1.59) |
8/31/2019n,p | $46.16 | $(0.63) | $0.27 | $(0.36) | $— | $(7.35) | $— | $(7.35) |
8/31/2018k,n,p | $34.31 | $(0.69) | $13.33 | $12.64 | $— | $(0.79) | $— | $(0.79) |
Class R3 | ||||||||
8/31/2022 | $56.65 | $(0.50) | $(9.54) | $(10.04) | $— | $(8.93) | $(0.00) | $(8.93) |
8/31/2021n,p | $44.97 | $(0.70) | $12.96 | $12.26 | $— | $(0.58) | $— | $(0.58) |
8/31/2020n,p | $38.10 | $(0.43) | $8.86 | $8.43 | $— | $(1.56) | $— | $(1.56) |
8/31/2019n,p | $45.45 | $(0.43) | $0.29 | $(0.14) | $— | $(7.21) | $— | $(7.21) |
8/31/2018k,n,p | $33.57 | $(0.49) | $13.12 | $12.63 | $— | $(0.75) | $— | $(0.75) |
Class R6 | ||||||||
8/31/2022 | $56.74 | $(0.18) | $(9.59) | $(9.77) | $— | $(8.93) | $(0.00) | $(8.93) |
8/31/2021n,p | $44.71 | $(0.31) | $12.92 | $12.61 | $— | $(0.58) | $— | $(0.58) |
8/31/2020n,p | $37.59 | $(0.15) | $8.79 | $8.64 | $— | $(1.52) | $— | $(1.52) |
Period from 9/7/2018g to 8/31/2019n,p | $43.68 | $0.06 | $0.88 | $0.94 | $— | $(7.03) | $— | $(7.03) |
See Notes to Financial Highlights
246
Voluntary Contribution from Management | Net Asset Value, End of Year | Total Returnb,c | Net Assets, End of Year (in millions) | Ratio of Gross Expenses to Average Net Assetsd | Ratio of Net Expenses to Average Net Assets | Ratio of Net Investment Income/ (Loss) to Average Net Assets | Portfolio Turnover Rate |
$— | $37.73 | (20.26)% | $2.6 | 1.64% | 1.40% | (1.02)% | 121% |
$— | $56.66 | 27.50% | $3.9 | 1.63% | 1.42% | (1.19)% | 127% |
$— | $44.93 | 22.86% | $3.2 | 1.70% | 1.44% | (1.04)% | 128% |
$— | $38.05 | 3.81% | $2.8 | 1.87% | 1.44% | (1.04)% | 161% |
$— | $45.36 | 38.26% | $2.5 | 2.03% | 1.51% | (1.27)% | 217% |
$— | $37.99 | (19.86)% | $146.5 | 1.13% | 0.90% | (0.53)% | 121% |
$— | $56.73 | 28.18% | $235.8 | 1.09% | 0.90% | (0.68)% | 127% |
$— | $44.74 | 23.52% | $158.1 | 1.18% | 0.90% | (0.51)% | 128% |
$— | $37.66 | 4.38% | $87.7 | 1.28% | 0.90% | (0.43)% | 161% |
$— | $44.59 | 39.12% | $16.4 | 1.50% | 0.90% | (0.66)% | 217% |
$— | $37.81 | (20.14)% | $18.2 | 1.53% | 1.26% | (0.88)% | 121% |
$— | $56.68 | 27.69% | $26.5 | 1.49% | 1.26% | (1.04)% | 127% |
$— | $44.88 | 23.09% | $23.3 | 1.60% | 1.26% | (0.86)% | 128% |
$— | $37.93 | 4.01% | $50.1 | 1.65% | 1.26% | (0.76)% | 161% |
$— | $45.10 | 38.60% | $5.3 | 1.88% | 1.26% | (1.02)% | 217% |
$— | $37.43 | (20.74)% | $4.2 | 2.25% | 2.01% | (1.64)% | 121% |
$— | $56.58 | 26.75% | $6.6 | 2.21% | 2.01% | (1.79)% | 127% |
$— | $45.14 | 22.19% | $4.6 | 2.30% | 2.01% | (1.61)% | 128% |
$— | $38.45 | 3.20% | $4.2 | 2.45% | 2.01% | (1.60)% | 161% |
$— | $46.16 | 37.56% | $3.1 | 2.62% | 2.01% | (1.77)% | 217% |
$— | $37.68 | (20.35)% | $5.4 | 1.77% | 1.51% | (1.13)% | 121% |
$— | $56.65 | 27.38% | $6.0 | 1.74% | 1.51% | (1.29)% | 127% |
$— | $44.97 | 22.80% | $3.7 | 1.86% | 1.51% | (1.11)% | 128% |
$— | $38.10 | 3.73% | $2.4 | 2.01% | 1.51% | (1.10)% | 161% |
$— | $45.45 | 38.29% | $2.2 | 2.17% | 1.51% | (1.27)% | 217% |
$— | $38.04 | (19.78)% | $77.7 | 1.05% | 0.80% | (0.42)% | 121% |
$— | $56.74 | 28.29% | $53.1 | 0.99% | 0.80% | (0.58)% | 127% |
$— | $44.71 | 23.65% | $37.2 | 1.08% | 0.80% | (0.40)% | 128% |
$— | $37.59 | 6.35%i | $21.0 | 1.15%h | 0.81%h | 0.15%h | 161%j |
247
Financial Highlights (cont’d)
Net Asset Value, Beginning of Year | Net Investment Income/ (Loss)a | Net Gains or (Losses) on Securities (both realized and unrealized) | Total From Investment Operations | Dividends from Net Investment Income | Distributions from Net Realized Capital Gains | Tax Return of Capital | Total Distributions | |
Sustainable Equity Fund | ||||||||
Investor Class | ||||||||
8/31/2022 | $49.85 | $0.18 | $(6.29) | $(6.11) | $(0.34) | $(4.54) | $— | $(4.88) |
8/31/2021p | $39.44 | $0.18 | $12.84 | $13.02 | $(0.26) | $(2.35) | $— | $(2.61) |
8/31/2020p | $37.08 | $0.22 | $5.56 | $5.78 | $(0.25) | $(3.17) | $— | $(3.42) |
8/31/2019p | $41.86 | $0.30 | $(1.80) | $(1.50) | $(0.16) | $(3.12) | $— | $(3.28) |
8/31/2018l,p | $37.56 | $0.23 | $6.41 | $6.64 | $(0.31) | $(2.03) | $— | $(2.34) |
Trust Class | ||||||||
8/31/2022 | $49.90 | $0.10 | $(6.30) | $(6.20) | $(0.25) | $(4.54) | $— | $(4.79) |
8/31/2021p | $39.47 | $0.10 | $12.85 | $12.95 | $(0.17) | $(2.35) | $— | $(2.52) |
8/31/2020p | $37.10 | $0.15 | $5.58 | $5.73 | $(0.19) | $(3.17) | $— | $(3.36) |
8/31/2019p | $41.88 | $0.24 | $(1.80) | $(1.56) | $(0.10) | $(3.12) | $— | $(3.22) |
8/31/2018l,p | $37.56 | $0.23 | $6.41 | $6.64 | $(0.31) | $(2.03) | $— | $(2.34) |
Institutional Class | ||||||||
8/31/2022 | $49.78 | $0.25 | $(6.27) | $(6.02) | $(0.43) | $(4.54) | $— | $(4.97) |
8/31/2021p | $39.40 | $0.26 | $12.81 | $13.07 | $(0.34) | $(2.35) | $— | $(2.69) |
8/31/2020p | $37.02 | $0.28 | $5.57 | $5.85 | $(0.30) | $(3.17) | $— | $(3.47) |
8/31/2019p | $41.84 | $0.37 | $(1.81) | $(1.44) | $(0.26) | $(3.12) | $— | $(3.38) |
8/31/2018p | $37.55 | $0.30 | $6.41 | $6.71 | $(0.39) | $(2.03) | $— | $(2.42) |
Class A | ||||||||
8/31/2022 | $49.84 | $0.09 | $(6.28) | $(6.19) | $(0.27) | $(4.54) | $— | $(4.81) |
8/31/2021p | $39.43 | $0.10 | $12.83 | $12.93 | $(0.17) | $(2.35) | $— | $(2.52) |
8/31/2020p | $37.08 | $0.15 | $5.57 | $5.72 | $(0.20) | $(3.17) | $— | $(3.37) |
8/31/2019p | $41.88 | $0.23 | $(1.81) | $(1.58) | $(0.10) | $(3.12) | $— | $(3.22) |
8/31/2018l,p | $37.58 | $0.16 | $6.41 | $6.57 | $(0.24) | $(2.03) | $— | $(2.27) |
Class C | ||||||||
8/31/2022 | $49.19 | $(0.24) | $(6.17) | $(6.41) | $— | $(4.67) | $— | $(4.67) |
8/31/2021p | $39.07 | $(0.23) | $12.70 | $12.47 | $— | $(2.35) | $— | $(2.35) |
8/31/2020p | $36.85 | $(0.12) | $5.51 | $5.39 | $— | $(3.17) | $— | $(3.17) |
8/31/2019p | $41.81 | $(0.04) | $(1.80) | $(1.84) | $(0.10) | $(3.12) | $— | $(3.12) |
8/31/2018l,p | $37.63 | $(0.14) | $6.42 | $6.28 | $(0.07) | $(2.03) | $— | $(2.10) |
See Notes to Financial Highlights
248
Voluntary Contribution from Management | Net Asset Value, End of Year | Total Returnb,c | Net Assets, End of Year (in millions) | Ratio of Gross Expenses to Average Net Assetsd | Ratio of Net Expenses to Average Net Assets | Ratio of Net Investment Income/ (Loss) to Average Net Assets | Portfolio Turnover Rate |
$— | $38.86 | (13.70)% | $346.2 | 0.85% | 0.85% | 0.40% | 14% |
$— | $49.85 | 34.45% | $437.8 | 0.84% | 0.84% | 0.40% | 16% |
$— | $39.44 | 16.12% | $429.6 | 0.86% | 0.86% | 0.59% | 21% |
$— | $37.08 | (2.70)% | $446.1 | 0.86% | 0.86% | 0.80% | 20% |
$— | $41.86 | 18.36% | $679.3 | 0.85% | 0.85% | 0.59% | 12% |
$— | $38.91 | (13.85)% | $108.5 | 1.03% | 1.03% | 0.22% | 14% |
$— | $49.90 | 34.21% | $148.7 | 1.02% | 1.02% | 0.23% | 16% |
$— | $39.47 | 15.95% | $122.9 | 1.03% | 1.03% | 0.42% | 21% |
$— | $37.10 | (2.86)% | $161.3 | 1.03% | 1.03% | 0.65% | 20% |
$— | $41.88 | 18.36% | $679.3 | 0.85% | 0.85% | 0.59% | 12% |
$— | $38.79 | (13.55)% | $608.2 | 0.68% | 0.68% | 0.57% | 14% |
$— | $49.78 | 34.68% | $896.3 | 0.67% | 0.67% | 0.58% | 16% |
$— | $39.40 | 16.35% | $689.9 | 0.68% | 0.68% | 0.77% | 21% |
$— | $37.02 | (2.52)% | $768.3 | 0.68% | 0.68% | 1.00% | 20% |
$— | $41.84 | 18.56% | $950.5 | 0.67% | 0.67% | 0.76% | 12% |
$— | $38.84 | (13.86)% | $133.1 | 1.04% | 1.04% | 0.21% | 14% |
$— | $49.84 | 34.17% | $160.6 | 1.04% | 1.04% | 0.21% | 16% |
$— | $39.43 | 15.94% | $98.0 | 1.05% | 1.05% | 0.41% | 21% |
$— | $37.08 | (2.90)% | $95.1 | 1.05% | 1.05% | 0.61% | 20% |
$— | $41.88 | 18.14% | $126.4 | 1.04% | 1.04% | 0.40% | 12% |
$— | $38.11 | (14.49)% | $36.4 | 1.79% | 1.79% | (0.55)% | 14% |
$— | $49.19 | 33.19% | $48.0 | 1.79% | 1.79% | (0.53)% | 16% |
$— | $39.07 | 15.06% | $40.4 | 1.79% | 1.79% | (0.34)% | 21% |
$— | $36.85 | (3.62)% | $47.4 | 1.79% | 1.79% | (0.12)% | 20% |
$— | $41.81 | 17.26% | $62.4 | 1.78% | 1.78% | (0.35)% | 12% |
249
Financial Highlights (cont’d)
Net Asset Value, Beginning of Year | Net Investment Income/ (Loss)a | Net Gains or (Losses) on Securities (both realized and unrealized) | Total From Investment Operations | Dividends from Net Investment Income | Distributions from Net Realized Capital Gains | Tax Return of Capital | Total Distributions | |
Sustainable Equity Fund (cont’d) | ||||||||
Class R3 | ||||||||
8/31/2022 | $49.82 | $(0.02) | $(6.29) | $(6.31) | $— | $(4.67) | $— | $(4.67) |
8/31/2021p | $39.41 | $(0.01) | $12.84 | $12.83 | $(0.07) | $(2.35) | $— | $(2.42) |
8/31/2020p | $37.10 | $(0.06) | $5.56 | $5.62 | $(0.14) | $(3.17) | $— | $(3.31) |
8/31/2019p | $41.90 | $0.14 | $(1.79) | $(1.65) | $(0.03) | $(3.12) | $— | $(3.15) |
8/31/2018l,p | $37.59 | $0.06 | $6.42 | $6.48 | $(0.14) | $(2.03) | $— | $(2.17) |
Class R6 | ||||||||
8/31/2022 | $49.79 | $0.29 | $(6.27) | $(5.98) | $(0.47) | $(4.54) | $— | $(5.01) |
8/31/2021p | $39.41 | $0.30 | $12.82 | $13.12 | $(0.39) | $(2.35) | $— | $(2.74) |
8/31/2020p | $37.01 | $0.32 | $5.58 | $5.90 | $(0.33) | $(3.17) | $— | $(3.50) |
8/31/2019p | $41.83 | $0.40 | $(1.81) | $(1.41) | $(0.29) | $(3.12) | $— | $(3.41) |
8/31/2018l,p | $37.54 | $0.32 | $6.41 | $6.73 | $(0.41) | $(2.03) | $— | $(2.44) |
U.S. Equity Impact Fund | ||||||||
Institutional Class | ||||||||
8/31/2022 | $11.35 | $0.01 | $(2.50) | $(2.49) | $(0.00) | $(0.01) | $— | $(0.01) |
Period from 3/23/2021g to 8/31/2021 | $10.00 | $(0.01) | $1.36 | $1.35 | $— | $— | $— | $— |
Class A | ||||||||
8/31/2022 | $11.33 | $(0.03) | $(2.49) | $(2.52) | $— | $(0.01) | $— | $(0.01) |
Period from 3/23/2021g to 8/31/2021 | $10.00 | $(0.02) | $1.35 | $1.33 | $— | $— | $— | $— |
Class C | ||||||||
8/31/2022 | $11.29 | $(0.10) | $(2.47) | $(2.57) | $— | $(0.01) | $— | $(0.01) |
Period from 3/23/2021g to 8/31/2021 | $10.00 | $(0.06) | $1.35 | $1.29 | $— | $— | $— | $— |
See Notes to Financial Highlights
250
Voluntary Contribution from Management | Net Asset Value, End of Year | Total Returnb,c | Net Assets, End of Year (in millions) | Ratio of Gross Expenses to Average Net Assetsd | Ratio of Net Expenses to Average Net Assets | Ratio of Net Investment Income/ (Loss) to Average Net Assets | Portfolio Turnover Rate |
$— | $38.84 | (14.08)% | $18.6 | 1.30% | 1.30% | (0.05)% | 14% |
$— | $49.82 | 33.87% | $23.8 | 1.29% | 1.29% | (0.03)% | 16% |
$— | $39.41 | 15.63% | $28.0 | 1.30% | 1.30% | 0.16% | 21% |
$— | $37.10 | (3.12)% | $31.8 | 1.29% | 1.29% | 0.36% | 20% |
$— | $41.90 | 17.85% | $36.4 | 1.28% | 1.28% | 0.15% | 12% |
$— | $38.80 | (13.47)% | $174.4 | 0.58% | 0.58% | 0.66% | 14% |
$— | $49.79 | 34.82% | $264.3 | 0.57% | 0.57% | 0.68% | 16% |
$— | $39.41 | 16.48% | $233.6 | 0.58% | 0.58% | 0.88% | 21% |
$— | $37.01 | (2.44)% | $238.1 | 0.59% | 0.59% | 1.08% | 20% |
$— | $41.83 | 18.65% | $321.1 | 0.60% | 0.60% | 0.83% | 12% |
$— | $8.85 | (21.95)% | $5.9 | 5.26% | 0.90% | 0.13% | 28% |
$— | $11.35 | 13.50%i | $6.1 | 6.59%h,s | 0.90%h,s | (0.19)%h,s | 7%i |
$— | $8.80 | (22.28)% | $0.1 | 5.77% | 1.26% | (0.29)% | 28% |
$— | $11.33 | 13.30%i | $0.2 | 9.83%h,s | 1.26%h,s | (0.48)%h,s | 7%i |
$— | $8.71 | (22.80)% | $0.0 | 6.76% | 2.01% | (0.99)% | 28% |
$— | $11.29 | 12.90%i | $0.0 | 18.90%h,s | 2.01%h,s | (1.30)%h,s | 7%i |
251
Notes to Financial Highlights Equity Funds
a | Calculated based on the average number of shares outstanding during each fiscal period. |
b | Total return based on per share NAV reflects the effects of changes in NAV on the performance of each Fund during each fiscal period. Returns assume income dividends and other distributions, if any, were reinvested, but do not reflect the effect of sales charges. Results represent past performance and do not indicate future results. Current returns may be lower or higher than the performance data quoted. Investment returns and principal will fluctuate and shares, when redeemed, may be worth more or less than original cost. Total return would have been lower if Management had not reimbursed and/or waived certain expenses. Total return would have been higher if Management had not recouped previously reimbursed and/or waived expenses. |
c | Except for the Fund classes listed below, the class action proceeds listed in Note A of the Notes to Financial Statements, if any, had no impact on the Funds’ total returns for the year ended August 31, 2022. Had the Fund classes listed below not received class action proceeds in 2022, total return on per share NAV for the year ended August 31, 2022, would have been: |
Multi-Cap Opportunities Institutional Class | (15.17%) |
Multi-Cap Opportunities Class A | (15.43%) |
Multi-Cap Opportunities Class C | (16.11%) |
Multi-Cap Opportunities Class E | (16.37%) |
Except for the Fund classes listed below, the class action proceeds received in 2021, 2020, 2019, and/or 2018, if any, had no impact on the Funds’ total returns for the years ended August 31, 2021, and/or 2019. Had the Fund classes listed below not received class action proceeds in 2021, and/or 2019, total return based on per share NAV for the years ended August 31, 2021, and/or 2019 would have been: |
2021 | 2019 | |
International Equity Investor Class | 28.10% | — |
International Equity Trust Class | 28.02% | — |
International Equity Institutional Class | 28.30% | — |
International Equity Class A | 27.90% | — |
International Equity Class C | 26.92% | — |
International Equity Class R6 | 28.42% | — |
International Select Trust Class | 27.98% | — |
International Select Institutional Class | 28.42% | — |
International Select Class A | 28.00% | — |
International Select Class C | 26.96% | — |
International Select Class R3 | 27.59% | — |
International Select Class R6 | 28.43% | — |
Large Cap Value Investor Class | 49.98% | 6.21% |
Large Cap Value Trust Class | 49.69% | 6.00% |
Large Cap Value Advisor Class | 49.41% | 5.86% |
Large Cap Value Class A | 49.63% | — |
Large Cap Value Class R3 | 49.23% | — |
Multi-Cap Opportunities Institutional Class | 36.16% | — |
Small Cap Growth Investor Class | 27.90% | 3.98% |
Small Cap Growth Trust Class | 27.66% | 3.90% |
Small Cap Growth Advisor Class | 27.46% | 3.73% |
Small Cap Growth Institutional Class | 28.16% | 4.35% |
Small Cap Growth Class A | 27.64% | 3.98% |
252
Notes to Financial Highlights Equity Funds (cont’d)
2021 | 2019 | |
Small Cap Growth Class C | 26.71% | 3.11% |
Small Cap Growth Class R3 | 27.36% | 3.62% |
Small Cap Growth Class R6 | 28.25% | — |
d | Represents the annualized ratios of net expenses to average daily net assets if Management had not reimbursed certain expenses and/or waived a portion of the investment management fee. |
e | After repayment of expenses previously reimbursed and/or fees previously waived pursuant to the terms of the contractual expense limitation agreements by Management, as applicable. Had the Fund not made such repayments, the annualized ratios of net expenses to average daily net assets would have been: |
Year Ended August 31, | |||||
2022 | 2021 | 2020 | 2019 | 2018 | |
Emerging Markets Equity Institutional Class | — | 1.21% | 1.24% | 1.25% | — |
Emerging Markets Equity Class R3 | — | 1.90% | — | — | — |
Emerging Markets Equity Class R6 | — | 1.10% | 1.11% | 1.15% | — |
Focus Institutional Class | — | 0.74% | — | — | 0.75% |
Focus Class A | — | 1.11% | — | — | — |
Genesis Class R6 | — | — | 0.74% | — | — |
Intrinsic Value Institutional Class | 0.96% | 0.99% | — | — | — |
Intrinsic Value Class A | 1.33% | — | — | — | — |
Intrinsic Value Class C | 2.07% | 2.11% | — | — | — |
Intrinsic Value Class R6 | — | 0.89% | — | — | — |
Large Cap Growth Class R3 | 1.34% | — | 1.31% | — | — |
Large Cap Growth Class R6 | — | — | 0.56% | — | — |
Large Cap Value Institutional Class | — | — | — | — | 0.70% |
Large Cap Value Class R3 | — | — | 1.33% | 1.33% | — |
Large Cap Value Class R6 | — | — | 0.59% | — | — |
Mid Cap Growth Class C | — | — | — | — | 1.82% |
Mid Cap Growth Class R3 | — | — | — | 1.33% | 1.34% |
Mid Cap Intrinsic Value Class R6 | — | — | 0.74% | — | — |
f | After the close of business on December 7, 2018, the Funds' applicable classes underwent a stock split or reverse stock split. The per share data presented here has been retroactively adjusted to reflect this split. |
g | The date investment operations commenced. |
h | Annualized. |
i | Not annualized. |
j | Portfolio turnover is calculated at the Fund level. Percentage indicated was calculated for the year ended August 31, 2019, for Intrinsic Value, Large Cap Value, Mid Cap Intrinsic Value and Small Cap Growth and for the year ended August 31, 2022, for Equity Income, Genesis, International Equity, Large Cap Value, Multi-Cap Opportunities and Real Estate. |
k | After the close of business on February 23, 2018, the Funds’ applicable classes underwent a stock split or reverse stock split. The per share data presented here has been retroactively adjusted to reflect this split. |
l | After the close of business on December 8, 2017, the Funds’ applicable classes underwent a stock split or reverse stock split. The per share data presented here has been retroactively adjusted to reflect this split. |
253
Notes to Financial Highlights Equity Funds (cont’d)
m | Represents the annualized ratio of net expenses to average daily net assets after utilization of the line of credit by Greater China Equity (2019) and International Small Cap (2020) and/or reimbursement of expenses and/or waiver of a portion of the investment management fee by Management. Had Greater China Equity and International Small Cap not utilized the line of credit, and/or had Management not undertaken such action, the annualized ratios of net expenses to average daily net assets would have been: |
Year Ended August 31, | ||
2020 | 2019 | |
Greater China Equity Institutional Class | — | 1.50% |
Greater China Equity Class A | — | 1.86% |
Greater China Equity Class C | — | 2.61% |
International Small Cap Institutional Class | 1.05% | — |
International Small Cap Class A | 1.41% | — |
International Small Cap Class C | 2.16% | — |
International Small Cap Class R6 | 0.95% | — |
n | After the close of business on July 23, 2021, the Funds’ applicable classes underwent a stock split or reverse stock split. The per share data presented here has been retroactively adjusted to reflect this split. See Note G of the Notes to Financial Statements. |
o | Had International Equity not received the voluntary contribution in 2020, the total return based on per share NAV for the year ended August 31, 2020 would have been: |
Year Ended August 31, 2020 | |
International Equity Investor Class | 15.31% |
International Equity Trust Class | 15.33% |
International Equity Institutional Class | 15.66% |
International Equity Class A | 15.19% |
International Equity Class C | 14.33% |
International Equity Class R6 | 15.83% |
p | This information has been audited by a different independent public accounting firm. |
q | Consolidated financial highlights. See Note A in the Notes to Financial Statements. |
r | After the close of business on August 16, 2019, Large Cap Value acquired all of the net assets of Neuberger Berman Value Fund in a tax-free exchange of shares pursuant to a Plan of Reorganization and Dissolution approved by the Board. Portfolio turnover excludes purchases of $30,333,739 of securities acquired, and there were no sales made following a purchase-of-assets transaction relative to the merger. |
s | Organization expense, which is a non-recurring expense, is included in these ratios on a non-annualized basis. |
254
Report of Independent Registered Public Accounting Firm
To the Board of Trustees of
Neuberger Berman Equity Funds and the Shareholders of:
Neuberger Berman Dividend Growth Fund
Neuberger Berman Emerging Markets Equity Fund
Neuberger Berman Equity Income Fund
Neuberger Berman Focus Fund
Neuberger Berman Genesis Fund
Neuberger Berman Global Real Estate Fund
Neuberger Berman Greater China Equity Fund
Neuberger Berman International Equity Fund
Neuberger Berman International Select Fund
Neuberger Berman International Small Cap Fund
Neuberger Berman Intrinsic Value Fund
Neuberger Berman Large Cap Growth Fund
Neuberger Berman Large Cap Value Fund
Neuberger Berman Mid Cap Growth Fund
Neuberger Berman Mid Cap Intrinsic Value Fund
Neuberger Berman Multi-Cap Opportunities Fund
Neuberger Berman Real Estate Fund
Neuberger Berman Small Cap Growth Fund
Neuberger Berman Sustainable Equity Fund
Neuberger Berman U.S. Equity Impact Fund
Opinion on the Financial Statements
We have audited the accompanying consolidated statement of assets and liabilities of Neuberger Berman Large Cap Growth Fund (formerly, Neuberger Berman Guardian Fund) (one of the series constituting the Neuberger Berman Equity Funds (the "Trust")), including the consolidated schedule of investments, as of August 31, 2022, and the related consolidated statements of operations and changes in net assets, and the consolidated financial highlights for each of the periods indicated in the table below and the related notes (collectively referred to as the "consolidated financial statements"). We have audited the accompanying statements of assets and liabilities of Neuberger Berman Dividend Growth Fund, Neuberger Berman Emerging Markets Equity Fund, Neuberger Berman Equity Income Fund, Neuberger Berman Focus Fund, Neuberger Berman Genesis Fund, Neuberger Berman Global Real Estate Fund, Neuberger Berman Greater China Equity Fund, Neuberger Berman International Equity Fund, Neuberger Berman International Select Fund, Neuberger Berman International Small Cap Fund, Neuberger Berman Intrinsic Value Fund, Neuberger Berman Large Cap Value Fund, Neuberger Berman Mid Cap Growth Fund, Neuberger Berman Mid Cap Intrinsic Value Fund, Neuberger Berman Multi-Cap Opportunities Fund, Neuberger Berman Real Estate Fund, Neuberger Berman Small Cap Growth Fund, Neuberger Berman Sustainable Equity Fund, and Neuberger Berman U.S. Equity Impact Fund (collectively, together with Neuberger Berman Large Cap Growth Fund, referred to as the "Funds") (nineteen of the series constituting the Trust), including the schedules of investments, as of August 31, 2022, and the related statements of operations and changes in net assets, and the financial highlights for each of the periods indicated in the table below and the related notes (collectively, together with the consolidated financial statements, referred to as the "financial statements"). In our opinion, the financial statements present fairly, in all material respects, the financial position, or the consolidated financial position, of each of the Funds (twenty of the series constituting Neuberger Berman Equity Funds) at August 31, 2022, and the results, or the consolidated results, of their operations, changes in net assets and financial highlights for each of the periods indicated in the table below, in conformity with U.S. generally accepted accounting principles. The accompanying statements of changes in net assets of the Neuberger Berman
255
Intrinsic Value Fund, Neuberger Berman Mid Cap Growth Fund, Neuberger Berman Mid Cap Intrinsic Value Fund, Neuberger Berman Multi-Cap Opportunities Fund, Neuberger Berman Small Cap Growth Fund, and Neuberger Berman Sustainable Equity Fund for the year ended August 31, 2021 and the accompanying financial highlights of the Neuberger Berman Intrinsic Value Fund, Neuberger Berman Mid Cap Growth Fund, Neuberger Berman Mid Cap Intrinsic Value Fund, Neuberger Berman Multi-Cap Opportunities Fund, Neuberger Berman Small Cap Growth Fund, and Neuberger Berman Sustainable Equity Fund for each of the periods in the four years then ended were audited by another independent registered public accounting firm whose report, dated October 20, 2021, expressed an unqualified opinion on the financial statements containing those statements of changes in net assets and financial highlights.
Individual fund constituting Neuberger Berman Equity Funds | Statement of operations | Statements of changes in net assets | Financial highlights |
Neuberger Berman Dividend Growth Fund Neuberger Berman Emerging Markets Equity Fund Neuberger Berman Equity Income Fund Neuberger Berman Focus Fund Neuberger Berman Genesis Fund Neuberger Berman Global Real Estate Fund Neuberger Berman Greater China Equity Fund Neuberger Berman International Equity Fund Neuberger Berman International Select Fund Neuberger Berman International Small Cap Fund Neuberger Berman Large Cap Growth Fund Neuberger Berman Large Cap Value Fund Neuberger Berman Real Estate Fund | For the year ended August 31, 2022 | For each of the two years in the period ended August 31, 2022 | For each of the five years in the period ended August 31, 2022 |
Neuberger Berman U.S. Equity Impact Fund | For the year ended August 31, 2022 | For the year ended August 31, 2022 and the period from March 23, 2021 (commencement of operations) to August 31, 2021 | For the year ended August 31, 2022 and the period from March 23, 2021 (commencement of operations) to August 31, 2021 |
Neuberger Berman Intrinsic Value Fund Neuberger Berman Mid Cap Growth Fund Neuberger Berman Mid Cap Intrinsic Value Fund Neuberger Berman Multi-Cap Opportunities Fund Neuberger Berman Small Cap Growth Fund Neuberger Berman Sustainable Equity Fund | For the year ended August 31, 2022 | For the year ended August 31, 2022 | For the year ended August 31, 2022 |
Basis for Opinion
These financial statements are the responsibility of the Trust’s management. Our responsibility is to express an opinion on each of the Funds’ financial statements based on our audits. We are a public accounting firm registered with the Public Company Accounting Oversight Board (United States) ("PCAOB") and are required to be independent with respect to the Trust in accordance with the U.S. federal securities laws and the applicable rules and regulations of the Securities and Exchange Commission and the PCAOB.
We conducted our audits in accordance with the standards of the PCAOB. Those standards require that we plan and perform the audit to obtain reasonable assurance about whether the financial statements are free of material misstatement, whether due to error or fraud. The Trust is not required to have, nor were we engaged to perform,
256
an audit of the Trust’s internal control over financial reporting. As part of our audits, we are required to obtain an understanding of internal control over financial reporting but not for the purpose of expressing an opinion on the effectiveness of the Trust’s internal control over financial reporting. Accordingly, we express no such opinion.
Our audits included performing procedures to assess the risks of material misstatement of the financial statements, whether due to error or fraud, and performing procedures that respond to those risks. Such procedures included examining, on a test basis, evidence regarding the amounts and disclosures in the financial statements. Our procedures included confirmation of securities owned as of August 31, 2022, by correspondence with the custodian, brokers and others; when replies were not received from brokers and others, we performed other auditing procedures. Our audits also included evaluating the accounting principles used and significant estimates made by management, as well as evaluating the overall presentation of the financial statements. We believe that our audits provide a reasonable basis for our opinion.

We have served as the auditor of one or more Neuberger Berman investment companies since 1954.
Boston, Massachusetts
October 27, 2022
October 27, 2022
257
Directory
Investment Manager and Administrator
Neuberger Berman Investment Advisers LLC
1290 Avenue of the Americas
New York, NY 10104-0002
Shareholder Services
800.877.9700 or 212.476.8800
Intermediary Client Services 800.366.6264
1290 Avenue of the Americas
New York, NY 10104-0002
Shareholder Services
800.877.9700 or 212.476.8800
Intermediary Client Services 800.366.6264
Distributor
Neuberger Berman BD LLC
1290 Avenue of the Americas
New York, NY 10104-0002
Shareholder Services
800.877.9700 or 212.476.8800
Intermediary Client Services 800.366.6264
1290 Avenue of the Americas
New York, NY 10104-0002
Shareholder Services
800.877.9700 or 212.476.8800
Intermediary Client Services 800.366.6264
Subadviser
Green Court Capital Management Limited
20th Floor
Jardine House
1 Connaught Place
Hong Kong
20th Floor
Jardine House
1 Connaught Place
Hong Kong
Custodian
State Street Bank and Trust Company
One Lincoln Street
Boston, MA 02111
One Lincoln Street
Boston, MA 02111
Shareholder Servicing Agent
DST Asset Manager Solutions Inc.
430 West 7th Street, Suite 219189
Kansas City, MO 64105-1407
430 West 7th Street, Suite 219189
Kansas City, MO 64105-1407
For Investor, Trust, Advisor & Institutional Class Shareholders address correspondence to:
Neuberger Berman Funds
PO Box 219189
Kansas City, MO 64121-9189
Shareholder Services 800.877.9700 or 212.476.8800
Intermediary Client Services 800.366.6264
PO Box 219189
Kansas City, MO 64121-9189
Shareholder Services 800.877.9700 or 212.476.8800
Intermediary Client Services 800.366.6264
For Class A, Class C, Class R3 and Class R6 Shareholders:
Please contact your investment provider
Legal Counsel
K&L Gates LLP
1601 K Street, NW
Washington, DC 20006-1600
1601 K Street, NW
Washington, DC 20006-1600
Independent Registered Public Accounting Firm
Ernst & Young LLP
200 Clarendon Street
Boston, MA 02116
200 Clarendon Street
Boston, MA 02116
258
Trustees and Officers
The following tables set forth information concerning the Trustees and Officers of the Funds. All persons named as Trustees and Officers also serve in similar capacities for other funds administered or managed by NBIA. The Funds' Statement of Additional Information includes additional information about the Trustees as of the time of the Funds' most recent public offering and is available upon request, without charge, by calling (800) 877-9700.
Information about the Board of Trustees
Name, (Year of Birth), and Address(1) | Position(s) and Length of Time Served(2) | Principal Occupation(s)(3) | Number of Funds in Fund Complex Overseen by Fund Trustee | Other Directorships Held Outside Fund Complex by Fund Trustee(3) |
Independent Fund Trustees | ||||
Michael J. Cosgrove (1949) | Trustee since 2015 | President, Carragh Consulting USA, since 2014; formerly, Executive, General Electric Company, 1970 to 2014, including President, Mutual Funds and Global Investment Programs, GE Asset Management, 2011 to 2014, President and Chief Executive Officer, Mutual Funds and Intermediary Business, GE Asset Management, 2007 to 2011, President, Institutional Sales and Marketing, GE Asset Management, 1998 to 2007, and Chief Financial Officer, GE Asset Management, and Deputy Treasurer, GE Company, 1988 to 1993. | 50 | Director, America Press, Inc. (not-for-profit Jesuit publisher), 2015 to 2021; formerly, Director, Fordham University, 2001 to 2018; formerly, Director, The Gabelli Go Anywhere Trust, June 2015 to June 2016; formerly, Director, Skin Cancer Foundation (not-for-profit), 2006 to 2015; formerly, Director, GE Investments Funds, Inc., 1997 to 2014; formerly, Trustee, GE Institutional Funds, 1997 to 2014; formerly, Director, GE Asset Management, 1988 to 2014; formerly, Director, Elfun Trusts, 1988 to 2014; formerly, Trustee, GE Pension & Benefit Plans, 1988 to 2014; formerly, Member of Board of Governors, Investment Company Institute. |
259
Name, (Year of Birth), and Address(1) | Position(s) and Length of Time Served(2) | Principal Occupation(s)(3) | Number of Funds in Fund Complex Overseen by Fund Trustee | Other Directorships Held Outside Fund Complex by Fund Trustee(3) |
Marc Gary (1952) | Trustee since 2015 | Executive Vice Chancellor Emeritus, The Jewish Theological Seminary, since 2020; formerly, Executive Vice Chancellor and Chief Operating Officer, Jewish Theological Seminary, 2012 to 2020; formerly, Executive Vice President and General Counsel, Fidelity Investments, 2007 to 2012;formerly, Executive Vice President and General Counsel, BellSouth Corporation, 2004 to 2007; formerly, Vice President and Associate General Counsel, BellSouth Corporation, 2000 to 2004; formerly, Associate, Partner, and National Litigation Practice Co-Chair, Mayer, Brown LLP, 1981 to 2000; formerly, Associate Independent Counsel, Office of Independent Counsel, 1990 to 1992. | 50 | Chair and Director, USCJ Supporting Foundation, since 2021; Director, UJA Federation of Greater New York, since 2019; Trustee, Jewish Theological Seminary, since 2015; formerly, Director, Legility, Inc. (privately held for-profit company), 2012 to 2021; Director, Lawyers Committee for Civil Rights Under Law (not-for-profit), since 2005; formerly, Director, Equal Justice Works (not-for-profit), 2005 to 2014; formerly, Director, Corporate Counsel Institute, Georgetown University Law Center, 2007 to 2012; formerly, Director, Greater Boston Legal Services (not-for-profit), 2007 to 2012. |
260
Name, (Year of Birth), and Address(1) | Position(s) and Length of Time Served(2) | Principal Occupation(s)(3) | Number of Funds in Fund Complex Overseen by Fund Trustee | Other Directorships Held Outside Fund Complex by Fund Trustee(3) |
Martha Clarke Goss (1949) | Trustee since 2007 | President, Woodhill Enterprises Inc./Chase Hollow Associates LLC (personal investment vehicle), 2006 to 2020; formerly, Consultant, Resources Global Professionals (temporary staffing), 2002 to 2006; formerly, Chief Financial Officer, Booz-Allen & Hamilton, Inc., 1995 to 1999; formerly, Enterprise Risk Officer, Prudential Insurance, 1994 to1995; formerly, President, Prudential Asset Management Company, 1992 to 1994; formerly, President, Prudential Power Funding (investments in electric and gas utilities and alternative energy projects), 1989 to 1992; formerly, Treasurer, Prudential Insurance Company, 1983 to 1989. | 50 | Director, American Water (water utility), since 2003; Director, Allianz Life of New York (insurance), since 2005; formerly, Director, Berger Group Holdings, Inc. (engineering consulting firm), from 2013 to 2018; formerly, Director, Financial Women’s Association of New York (not-for-profit association), from 1987 to 1996, 2003 to 2019; ; Trustee Emerita, Brown University, since 1998; Director, Museum of American Finance (not-for-profit), since 2013; formerly, Non-Executive Chair and Director, Channel Reinsurance (financial guaranty reinsurance), 2006 to 2010; formerly, Director, Ocwen Financial Corporation (mortgage servicing), 2005 to 2010; formerly, Director, Claire’s Stores, Inc. (retailer), 2005 to 2007; formerly, Director, Parsons Brinckerhoff Inc. (engineering consulting firm), 2007 to 2010; formerly, Director, Bank Leumi (commercial bank), 2005 to 2007; formerly, Advisory Board Member, Attensity (software developer), 2005 to 2007; formerly, Director of Foster Wheeler Manufacturing, 1994 to 2004; formerly Director Dexter Corp., Manufacturer of Non-Wovens, Plastics, and Medical Supplies, 1992 to 2001. |
261
Name, (Year of Birth), and Address(1) | Position(s) and Length of Time Served(2) | Principal Occupation(s)(3) | Number of Funds in Fund Complex Overseen by Fund Trustee | Other Directorships Held Outside Fund Complex by Fund Trustee(3) |
Michael M. Knetter (1960) | Trustee since 2007 | President and Chief Executive Officer, University of Wisconsin Foundation, since 2010; formerly, Dean, School of Business, University of Wisconsin - Madison; formerly, Professor of International Economics and Associate Dean, Amos Tuck School of Business - Dartmouth College, 1998 to 2002. | 50 | Director, 1 William Street Credit Income Fund, since 2018; Board Member, American Family Insurance (a mutual company, not publicly traded), since March 2009; formerly, Trustee, Northwestern Mutual Series Fund, Inc., 2007 to 2011; formerly, Director, Wausau Paper, 2005 to 2011; formerly, Director, Great Wolf Resorts, 2004 to 2009. |
Deborah C. McLean (1954) | Trustee since 2015 | Member, Circle Financial Group (private wealth management membership practice), since 2011; Managing Director, Golden Seeds LLC (an angel investing group), since 2009; Adjunct Professor (Corporate Finance), Columbia University School of International and Public Affairs, since 2008; formerly, Visiting Assistant Professor, Fairfield University, Dolan School of Business, Fall 2007; formerly, Adjunct Associate Professor of Finance, Richmond, The American International University in London, 1999 to 2007. | 50 | Board member, The Maritime Aquarium at Norwalk, since 2020; Board member, Norwalk Community College Foundation, since 2014; Dean’s Advisory Council, Radcliffe Institute for Advanced Study, since 2014; formerly, Director and Treasurer, At Home in Darien (not-for-profit), 2012 to 2014; formerly, Director, National Executive Service Corps (not-for-profit), 2012 to 2013; formerly, Trustee, Richmond, The American International University in London, 1999 to 2013. |
262
Name, (Year of Birth), and Address(1) | Position(s) and Length of Time Served(2) | Principal Occupation(s)(3) | Number of Funds in Fund Complex Overseen by Fund Trustee | Other Directorships Held Outside Fund Complex by Fund Trustee(3) |
George W. Morriss (1947) | Trustee since 2007 | Formerly, adjunct Professor, Columbia University School of International and Public Affairs, from 2012 to 2018; formerly, Executive Vice President and Chief Financial Officer, People’s United Bank, Connecticut (a financial services company), 1991 to 2001. | 50 | Director, 1 WS Credit Income Fund; Chair, Audit Committee, since 2018; Director and Chair, Thrivent Church Loan and Income Fund, since 2018; formerly, Trustee, Steben Alternative Investment Funds, Steben Select Multi-Strategy Fund, and Steben Select Multi-Strategy Master Fund, 2013 to 2017; formerly, Treasurer, National Association of Corporate Directors, Connecticut Chapter, 2011 to 2015; formerly, Manager, Larch Lane Multi-Strategy Fund complex (which consisted of three funds), 2006 to 2011; formerly, Member, NASDAQ Issuers’ Affairs Committee, 1995 to 2003. |
Tom D. Seip (1950) | Trustee since inception; Chairman of the Board since 2008; formerly Lead Independent Trustee from 2006 to 2008 | Formerly, Managing Member, Ridgefield Farm LLC (a private investment vehicle), 2004 to 2016; formerly, President and CEO, Westaff, Inc. (temporary staffing), May 2001 to January 2002; formerly, Senior Executive, The Charles Schwab Corporation, 1983 to 1998, including Chief Executive Officer, Charles Schwab Investment Management, Inc.; Trustee, Schwab Family of Funds and Schwab Investments, 1997 to 1998; and Executive Vice President-Retail Brokerage, Charles Schwab & Co., Inc., 1994 to 1997. | 50 | Trustee, University of Maryland, Shore Regional Health System, since 2020; Formerly, Director, H&R Block, Inc. (tax services company), 2001 to 2018; formerly, Director, Talbot Hospice Inc., 2013 to 2016; formerly, Chairman, Governance and Nominating Committee, H&R Block, Inc., 2011 to 2015; formerly, Chairman, Compensation Committee, H&R Block, Inc., 2006 to 2010; formerly, Director, Forward Management, Inc. (asset management company), 1999 to 2006. |
263
Name, (Year of Birth), and Address(1) | Position(s) and Length of Time Served(2) | Principal Occupation(s)(3) | Number of Funds in Fund Complex Overseen by Fund Trustee | Other Directorships Held Outside Fund Complex by Fund Trustee(3) |
James G. Stavridis (1955) | Trustee since 2015 | Vice Chairman Global Affairs, The Carlyle Group, since 2018; Commentator, NBC News, since 2015; formerly, Dean, Fletcher School of Law and Diplomacy, Tufts University, 2013 to 2018; formerly, Admiral, United States Navy, 1976 to 2013, including Supreme Allied Commander, NATO and Commander, European Command, 2009 to 2013, and Commander, United States Southern Command, 2006 to 2009. | 50 | Director, Fortinet (cybersecurity), since 2021; Director, Ankura, since 2020; Director, Vigor Shipyard, since 2019; Director, Rockefeller Foundation, since 2018; Director, American Water (water utility), since 2018; Director, NFP Corp. (insurance broker and consultant), since 2017; Director, Onassis Foundation, since 2014; Director, Michael Baker International (construction) since 2014; Director, Vertical Knowledge, LLC, since 2013; formerly, Director, U.S. Naval Institute, 2014 to 2019; formerly, Director, Navy Federal Credit Union, 2000-2002; formerly, Director, BMC Software Federal, LLC, 2014-2019. |
264
Name, (Year of Birth), and Address(1) | Position(s) and Length of Time Served(2) | Principal Occupation(s)(3) | Number of Funds in Fund Complex Overseen by Fund Trustee | Other Directorships Held Outside Fund Complex by Fund Trustee(3) |
Fund Trustees who are "Interested Persons" | ||||
Joseph V. Amato* (1962) | Chief Executive Officer and President since 2018 and Trustee since 2009 | President and Director, Neuberger Berman Group LLC, since 2009; President and Chief Executive Officer, Neuberger Berman BD LLC and Neuberger Berman Holdings LLC (including its predecessor, Neuberger Berman Inc.), since 2007; Chief Investment Officer (Equities) and President (Equities), NBIA (formerly, Neuberger Berman Fixed Income LLC and including predecessor entities), since 2007, and Board Member of NBIA since 2006; formerly, Global Head of Asset Management of Lehman Brothers Holdings Inc.’s (“LBHI”) Investment Management Division, 2006 to 2009; formerly, member of LBHI’s Investment Management Division’s Executive Management Committee, 2006 to 2009; formerly, Managing Director, Lehman Brothers Inc. (“LBI”), 2006 to 2008; formerly, Chief Recruiting and Development Officer, LBI, 2005 to 2006; formerly, Global Head of LBI’s Equity Sales and a Member of its Equities Division Executive Committee, 2003 to 2005; President and Chief Executive Officer, twelve registered investment companies for which NBIA acts as investment manager and/or administrator. | 50 | Member of Board of Advisors, McDonough School of Business, Georgetown University, since 2001; Member of New York City Board of Advisors, Teach for America, since 2005; Trustee, Montclair Kimberley Academy (private school), since 2007; Member of Board of Regents, Georgetown University, since 2013. |
(1)
The business address of each listed person is 1290 Avenue of the Americas, New York, NY 10104.
(2)
Pursuant to the Trust’s Amended and Restated Trust Instrument ("Trust Instrument"), subject to any limitations on the term of service imposed by the By-Laws or any retirement policy adopted by the Fund Trustees, each Fund Trustee shall hold office for life or until his or her successor is elected or the Trust
265
terminates; except that (a) any Fund Trustee may resign by delivering a written resignation; (b) any Fund Trustee may be removed with or without cause at any time by a written instrument signed by at least two-thirds of the other Fund Trustees; (c) any Fund Trustee who requests to be retired, or who has become unable to serve, may be retired by a written instrument signed by a majority of the other Fund Trustees; and (d) any Fund Trustee may be removed at any shareholder meeting by a vote of at least two-thirds of the outstanding shares.
(3)
Except as otherwise indicated, each individual has held the positions shown during at least the last five years.
*
Indicates a Fund Trustee who is an "interested person" within the meaning of the 1940 Act. Mr. Amato is an interested person of the Trust by virtue of the fact that he is an officer of NBIA and/or its affiliates.
266
Information about the Officers of the Trust
Name, (Year of Birth), and Address(1) | Position(s) and Length of Time Served(2) | Principal Occupation(s)(3) |
Claudia A. Brandon (1956) | Executive Vice President since 2008 and Secretary since inception | Senior Vice President, Neuberger Berman, since 2007 and Employee since 1999; Senior Vice President, NBIA, since 2008 and Assistant Secretary since 2004; formerly, Vice President, Neuberger Berman, 2002 to 2006; formerly, Vice President — Mutual Fund Board Relations, NBIA, 2000 to 2008; formerly, Vice President, NBIA, 1986 to 1999 and Employee, 1984 to 1999; Executive Vice President and Secretary, thirty-three registered investment companies for which NBIA acts as investment manager and/or administrator. |
Agnes Diaz (1971) | Vice President since 2013 | Senior Vice President, Neuberger Berman, since 2012; Senior Vice President, NBIA, since 2012 and Employee since 1996; formerly, Vice President, Neuberger Berman, 2007 to 2012; Vice President, twelve registered investment companies for which NBIA acts as investment manager and/or administrator. |
Anthony DiBernardo (1979) | Assistant Treasurer since 2011 | Senior Vice President, Neuberger Berman, since 2014; Senior Vice President, NBIA, since 2014, and Employee since 2003; formerly, Vice President, Neuberger Berman, 2009 to 2014; Assistant Treasurer, twelve registered investment companies for which NBIA acts as investment manager and/or administrator. |
Savonne L. Ferguson (1973) | Chief Compliance Officer since 2018 | Senior Vice President, Chief Compliance Officer (Mutual Funds) and Associate General Counsel, NBIA, since November 2018; formerly, Vice President T. Rowe Price Group, Inc. (2018), Vice President and Senior Legal Counsel, T. Rowe Price Associates, Inc. (2014-2018), Vice President and Director of Regulatory Fund Administration, PNC Capital Advisors, LLC (2009-2014), Secretary, PNC Funds and PNC Advantage Funds (2010-2014); Chief Compliance Officer, thirty-three registered investment companies for which NBIA acts as investment manager and/or administrator. |
Corey A. Issing (1978) | Chief Legal Officer since 2016 (only for purposes of sections 307 and 406 of the Sarbanes-Oxley Act of 2002) | General Counsel— Mutual Funds since 2016 and Managing Director, NBIA, since 2017; formerly, Associate General Counsel (2015 to 2016), Counsel (2007 to 2015), Senior Vice President (2013-2016), Vice President (2009 — 2013); Chief Legal Officer (only for purposes of sections 307 and 406 of the Sarbanes-Oxley Act of 2002), thirty-three registered investment companies for which NBIA acts as investment manager and/or administrator. |
Sheila R. James (1965) | Assistant Secretary since inception | Vice President, Neuberger Berman, since 2008 and Employee since 1999; Vice President, NBIA, since 2008; formerly, Assistant Vice President, Neuberger Berman, 2007; Employee, NBIA, 1991 to 1999; Assistant Secretary, thirty-three registered investment companies for which NBIA acts as investment manager and/or administrator. |
267
Name, (Year of Birth), and Address(1) | Position(s) and Length of Time Served(2) | Principal Occupation(s)(3) |
Brian Kerrane (1969) | Chief Operating Officer since 2015 and Vice President since 2008 | Managing Director, Neuberger Berman, since 2013; Chief Operating Officer — Mutual Funds and Managing Director, NBIA, since 2015; formerly, Senior Vice President, Neuberger Berman, 2006 to 2014; Vice President, NBIA, 2008 to 2015 and Employee since 1991; Chief Operating Officer, twelve registered investment companies for which NBIA acts as investment manager and/or administrator; Vice President, thirty-three registered investment companies for which NBIA acts as investment manager and/or administrator. |
Anthony Maltese (1959) | Vice President since 2015 | Senior Vice President, Neuberger Berman, since 2014 and Employee since 2000; Senior Vice President, NBIA, since 2014; Vice President, twelve registered investment companies for which NBIA acts as investment manager and/or administrator. |
Josephine Marone (1963) | Assistant Secretary since 2017 | Senior Paralegal, Neuberger Berman, since 2007 and Employee since 2007; Assistant Secretary, thirty-three registered investment companies for which NBIA acts as investment manager and/or administrator. |
Owen F. McEntee, Jr. (1961) | Vice President since 2008 | Vice President, Neuberger Berman, since 2006; Vice President, NBIA, since 2006 and Employee since 1992; Vice President, twelve registered investment companies for which NBIA acts as investment manager and/or administrator. |
John M. McGovern (1970) | Treasurer and Principal Financial and Accounting Officer since inception | Managing Director, Neuberger Berman, since 2022; Senior Vice President, Neuberger Berman, 2007 to 2021; Senior Vice President, NBIA, since 2007 and Employee since 1993; formerly, Vice President, Neuberger Berman, 2004 to 2006; formerly, Assistant Treasurer, 2002 to 2005; Treasurer and Principal Financial and Accounting Officer, twelve registered investment companies for which NBIA acts as investment manager and/or administrator. |
Frank Rosato (1971) | Assistant Treasurer since inception | Vice President, Neuberger Berman, since 2006; Vice President, NBIA, since 2006 and Employee since 1995; Assistant Treasurer, twelve registered investment companies for which NBIA acts as investment manager and/or administrator. |
Niketh Velamoor (1979) | Anti-Money Laundering Compliance Officer since 2018 | Senior Vice President and Associate General Counsel, Neuberger Berman, since July 2018; Assistant United States Attorney, Southern District of New York, 2009 to 2018; Anti-Money Laundering Compliance Officer, five registered investment companies for which NBIA acts as investment manager and/or administrator. |
(1)
The business address of each listed person is 1290 Avenue of the Americas, New York, New York 10104.
(2)
Pursuant to the By-Laws of the Trust, each officer elected by the Fund Trustees shall hold office until his or her successor shall have been elected and qualified or until his or her earlier death, inability to serve, or resignation. Officers serve at the pleasure of the Fund Trustees and may be removed at any time with or without cause.
(3)
Except as otherwise indicated, each individual has held the positions shown during at least the last five years.
268
Proxy Voting Policies and Procedures
A description of the policies and procedures that the Trust uses to determine how to vote proxies relating to portfolio securities is available, without charge, by calling 800-877-9700 (toll-free) and on the SEC’s website at www.sec.gov. Information regarding how the Trust voted proxies relating to portfolio securities during the most recent 12-month period ended June 30 is also available upon request, without charge, by calling 800-877-9700 (toll-free), on the SEC’s website at www.sec.gov, and on Neuberger Berman’s website at www.nb.com.
Quarterly Portfolio Schedule
The Trust files a complete schedule of portfolio holdings with the SEC for the first and third quarters of each fiscal year as an exhibit to its report on Form N-PORT. The Trust’s Form N-PORT is available on the SEC’s website at www.sec.gov. The portfolio holdings information on Form N-PORT is available upon request, without charge, by calling 800-877-9700 (toll-free).
Liquidity Risk Management Program
Consistent with Rule 22e-4 under the Investment Company Act of 1940 (the "Liquidity Rule"), as amended, the Funds have established a liquidity risk management program (the "Program"). The Program seeks to assess and manage the Funds’ liquidity risk, which is defined as the risk that a Fund is unable to meet investor redemption requests without significantly diluting the remaining investors' interests in a Fund. The Board has approved the designation of NBIA Funds' Liquidity Committee, comprised of NBIA employees, as the program administrator (the "Program Administrator"). The Program Administrator is responsible for implementing and monitoring the Program and utilizes NBIA personnel to assess and review, on an ongoing basis, the Funds' liquidity risk.
The Program includes a number of elements that support the management and assessment of liquidity risk, including an annual assessment of the Funds' liquidity risk factors and the periodic classification (or re-classification, as necessary) of the Funds’ investments into buckets (highly liquid, moderately liquid, less liquid and illiquid) that reflect the Program Administrator's assessment of the investments' liquidity under current market conditions, which for the relevant period included, among other factors, market volatility as a result of geopolitical tensions (e.g., Russia’s invasion of Ukraine) and the emergence of new COVID variants. The Program Administrator also utilizes information about the Funds’ investment strategy, the characteristics of the Funds’ shareholder base and historical redemption activity.
The Program Administrator provided the Board with a written report that addressed the operation of the Program and assessed its adequacy and effectiveness of implementation from April 1, 2021 through March 31, 2022. During the period covered by this report, the Program Administrator reported that the Program effectively assisted the Program Administrator in monitoring whether a Fund maintained a level of liquidity appropriate for its shareholder base and historical redemption activity.
269
Report of Votes of Shareholders
A Special Meeting of Shareholders was held on June 30, 2022, adjourned to August 11, 2022, and further adjourned to August 30, 2022 for certain of the Neuberger Berman Equity Funds (the "Trust"). Shareholders voted to approve the election of four trustees to the Board of Trustees of the Trust and to approve the amendment of certain fundamental investment policies of each Fund.
Proposal 1 – To approve the election of Michael J. Cosgrove, Marc Gary, Deborah C. McLean, and James G. Stavridis as Trustees to the Board of Trustees of the Trust as follows:
Neuberger Berman Equity Funds | |||
Number of Shares | |||
Votes For | Votes Against | Abstentions | |
Michael J. Cosgrove | 613,443,223 | — | 9,975,435 |
Marc Gary | 612,260,084 | — | 11,158,574 |
Deborah C. McLean | 613,729,664 | — | 9,688,994 |
James G. Stavridis | 557,129,419 | — | 66,289,239 |
Proposal 2 – To approve the amendment of certain fundamental investment policies of each Fund (except Neuberger Berman U.S. Equity Impact Fund) as follows:
(A) To approve the amendment of the fundamental investment policy regarding borrowing;
(B) To approve the amendment of the fundamental investment policy regarding commodities;
(C) To approve the amendment of the fundamental investment policy regarding industry concentration;
(D) To approve the amendment of the fundamental investment policy regarding lending;
(E) To approve the amendment of the fundamental investment policy regarding investing in real estate;
(F) To approve the amendment of the fundamental investment policy regarding the issuance of senior securities to permit issuing senior securities; and
(G) To approve the amendment of the fundamental investment policy regarding underwriting.
Dividend Growth: | Number of Shares | ||
Proposal | Votes For | Votes Against | Abstentions |
A | 2,858,048 | 202 | 1,961 |
B | 2,856,259 | — | 3,953 |
C | 2,855,440 | — | 4,772 |
D | 2,855,237 | 202 | 4,772 |
E | 2,855,440 | — | 4,772 |
F | 2,855,237 | 202 | 4,772 |
G | 2,854,852 | 202 | 5,158 |
Emerging Markets Equity: | Number of Shares | ||
Proposal | Votes For | Votes Against | Abstentions |
A | 28,514,573 | 46,514 | 39,276 |
B | 28,514,285 | 27,351 | 58,727 |
C | 28,514,141 | 30,457 | 55,765 |
D | 28,513,136 | 31,463 | 55,765 |
E | 28,514,040 | 30,558 | 55,765 |
F | 28,512,511 | 32,088 | 55,765 |
270
Emerging Markets Equity (cont’d): | Number of Shares | ||
Proposal | Votes For | Votes Against | Abstentions |
G | 28,513,623 | 29,413 | 57,328 |
Equity Income: | Number of Shares | ||
Proposal | Votes For | Votes Against | Abstentions |
A | 33,082,103 | 348,429 | 490,930 |
B | 33,109,865 | 384,725 | 426,873 |
C | 33,124,893 | 350,102 | 446,467 |
D | 33,098,123 | 375,236 | 448,103 |
E | 33,211,422 | 263,925 | 446,115 |
F | 33,028,795 | 460,913 | 431,755 |
G | 33,046,554 | 410,708 | 464,201 |
Focus: | Number of Shares | ||
Proposal | Votes For | Votes Against | Abstentions |
A | 12,483,067 | 1,452,411 | 1,204,195 |
B | 12,921,978 | 1,592,509 | 1,447,122 |
C | 12,491,727 | 1,321,075 | 1,326,871 |
D | 12,931,971 | 1,607,689 | 1,421,949 |
E | 13,070,931 | 1,568,626 | 1,322,053 |
F | 12,997,366 | 1,620,768 | 1,343,475 |
G | 12,846,381 | 1,641,267 | 1,473,961 |
Genesis: | Number of Shares | ||
Proposal | Votes For | Votes Against | Abstentions |
A | 62,839,477 | 2,694,375 | 1,201,640 |
B | 62,776,617 | 2,628,873 | 1,330,002 |
C | 63,078,534 | 2,394,341 | 1,262,616 |
D | 62,419,510 | 2,904,746 | 1,411,236 |
E | 62,920,810 | 2,556,422 | 1,258,260 |
F | 62,778,388 | 2,657,295 | 1,299,810 |
G | 62,349,657 | 2,826,582 | 1,559,253 |
Global Real Estate: | Number of Shares | ||
Proposal | Votes For | Votes Against | Abstentions |
A | 168,154 | 664 | — |
B | 167,369 | 1,449 | — |
C | 167,369 | 1,449 | — |
D | 167,369 | 1,449 | — |
E | 167,369 | 1,449 | — |
F | 167,369 | 1,449 | — |
G | 167,369 | 1,449 | — |
271
Greater China Equity: | Number of Shares | ||
Proposal | Votes For | Votes Against | Abstentions |
A | 3,972,754 | 3,704 | — |
B | 3,972,754 | 3,704 | — |
C | 3,972,754 | 3,704 | — |
D | 3,972,754 | 3,704 | — |
E | 3,973,123 | 3,334 | — |
F | 3,973,123 | 3,334 | — |
G | 3,972,754 | 3,704 | — |
International Equity: | Number of Shares | ||
Proposal | Votes For | Votes Against | Abstentions |
A | 68,779,350 | 330,790 | 101,151 |
B | 68,939,891 | 169,282 | 102,119 |
C | 68,886,477 | 246,997 | 77,817 |
D | 68,936,534 | 177,070 | 97,688 |
E | 68,695,135 | 431,649 | 84,508 |
F | 68,890,503 | 220,345 | 100,444 |
G | 68,876,049 | 243,943 | 91,300 |
International Select: | Number of Shares | ||
Proposal | Votes For | Votes Against | Abstentions |
A | 7,499,907 | 188,769 | 19,391 |
B | 7,662,129 | 25,694 | 20,244 |
C | 7,502,617 | 185,206 | 20,244 |
D | 7,499,907 | 187,917 | 20,244 |
E | 7,500,792 | 187,032 | 20,244 |
F | 7,499,907 | 187,917 | 20,244 |
G | 7,499,907 | 187,917 | 20,244 |
International Small Cap: | Number of Shares | ||
Proposal | Votes For | Votes Against | Abstentions |
A | 147,457 | — | — |
B | 147,457 | — | — |
C | 147,457 | — | — |
D | 147,457 | — | — |
E | 146,183 | — | 1,274 |
F | 147,457 | — | — |
G | 147,457 | — | — |
Intrinsic Value: | Number of Shares | ||
Proposal | Votes For | Votes Against | Abstentions |
A | 31,183,518 | 188,968 | 159,261 |
B | 31,171,111 | 199,356 | 161,280 |
C | 31,200,445 | 174,799 | 156,503 |
272
Intrinsic Value (cont’d): | Number of Shares | ||
Proposal | Votes For | Votes Against | Abstentions |
D | 31,184,256 | 189,574 | 157,917 |
E | 31,190,202 | 182,814 | 158,731 |
F | 31,182,728 | 186,639 | 162,380 |
G | 31,167,774 | 208,193 | 155,781 |
Large Cap Growth: | Number of Shares | ||
Proposal | Votes For | Votes Against | Abstentions |
A | 28,594,782 | 3,292,644 | 1,608,300 |
B | 28,564,824 | 3,355,493 | 1,575,410 |
C | 28,876,546 | 3,009,206 | 1,609,975 |
D | 28,476,861 | 3,409,784 | 1,609,082 |
E | 28,663,446 | 3,274,473 | 1,557,809 |
F | 28,626,286 | 3,096,333 | 1,773,107 |
G | 28,317,780 | 3,465,054 | 1,712,893 |
Large Cap Value: | Number of Shares | ||
Proposal | Votes For | Votes Against | Abstentions |
A | 74,758,585 | 2,021,257 | 2,038,388 |
B | 74,607,578 | 2,201,703 | 2,008,949 |
C | 75,010,845 | 1,794,466 | 2,012,918 |
D | 74,645,671 | 2,127,497 | 2,045,061 |
E | 74,971,054 | 1,827,371 | 2,019,804 |
F | 74,828,718 | 1,881,399 | 2,108,112 |
G | 74,559,170 | 2,184,103 | 2,074,957 |
Mid Cap Growth: | Number of Shares | ||
Proposal | Votes For | Votes Against | Abstentions |
A | 41,754,791 | 5,507,267 | 1,251,648 |
B | 45,191,063 | 1,995,420 | 1,327,224 |
C | 41,943,299 | 5,199,216 | 1,371,192 |
D | 41,558,990 | 5,541,764 | 1,412,953 |
E | 45,371,103 | 1,768,004 | 1,374,600 |
F | 41,742,002 | 5,349,152 | 1,422,553 |
G | 41,889,726 | 5,242,631 | 1,381,350 |
Mid Cap Intrinsic Value: | Number of Shares | ||
Proposal | Votes For | Votes Against | Abstentions |
A | 1,033,309 | 59,381 | 15,130 |
B | 1,034,222 | 58,469 | 15,130 |
C | 1,056,021 | 36,669 | 15,130 |
D | 1,050,124 | 42,566 | 15,130 |
E | 1,053,503 | 39,187 | 15,130 |
F | 1,050,268 | 42,422 | 15,130 |
273
Mid Cap Intrinsic Value (cont’d): | Number of Shares | ||
Proposal | Votes For | Votes Against | Abstentions |
G | 1,050,268 | 42,422 | 15,130 |
Multi-Cap Opportunities: | Number of Shares | ||
Proposal | Votes For | Votes Against | Abstentions |
A | 13,785,801 | 220,200 | 69,044 |
B | 13,772,598 | 221,474 | 80,974 |
C | 13,791,104 | 202,746 | 81,195 |
D | 13,762,202 | 227,191 | 85,653 |
E | 13,772,394 | 224,611 | 78,040 |
F | 13,786,478 | 205,231 | 83,336 |
G | 13,807,864 | 181,169 | 86,012 |
Real Estate: | Number of Shares | ||
Proposal | Votes For | Votes Against | Abstentions |
A | 22,101,968 | 514,985 | 430,605 |
B | 21,889,856 | 755,752 | 401,950 |
C | 22,119,725 | 475,236 | 452,597 |
D | 21,875,325 | 766,457 | 405,776 |
E | 21,976,721 | 635,617 | 435,220 |
F | 22,111,568 | 495,443 | 440,546 |
G | 21,883,502 | 707,947 | 456,108 |
Small Cap Growth: | Number of Shares | ||
Proposal | Votes For | Votes Against | Abstentions |
A | 1,771,159 | 80,625 | 72,008 |
B | 1,779,091 | 71,148 | 73,553 |
C | 1,778,940 | 66,908 | 77,945 |
D | 1,760,380 | 88,699 | 74,713 |
E | 1,795,514 | 65,507 | 62,771 |
F | 1,780,653 | 72,627 | 70,513 |
G | 1,766,096 | 82,605 | 75,092 |
Sustainable Equity: | Number of Shares | ||
Proposal | Votes For | Votes Against | Abstentions |
A | 11,158,171 | 556,017 | 508,307 |
B | 10,543,801 | 1,048,056 | 630,637 |
C | 10,900,209 | 736,641 | 585,645 |
D | 11,046,792 | 502,966 | 672,737 |
E | 10,758,910 | 894,878 | 568,707 |
F | 10,799,163 | 832,470 | 590,863 |
G | 10,783,659 | 831,325 | 607,511 |
274
Notice to Shareholders
For the fiscal year ended August 31, 2022, each Fund makes the following designation, or up to the maximum amount of such dividends allowable pursuant to the Internal Revenue Code, as Capital Gains Distributions and Qualified Dividend Income. Complete information regarding each Fund’s Qualified Dividend Income distributions during the calendar year 2022 will be reported in conjunction with Form 1099-DIV.
Fund | Capital Gains Distributions | Qualified Dividend Income |
Dividend Growth | $2,078,082 | $796,530 |
Emerging Markets Equity | — | 12,772,276 |
Equity Income | 109,573,086 | 25,893,908 |
Focus | 121,088,284 | 5,705,076 |
Genesis | 1,426,023,001 | 21,524,418 |
Global Real Estate | 194,695 | 40,595 |
Greater China Equity | 2,376,951 | 224,171 |
International Equity | 200,779,670 | 18,624,094 |
International Select | 16,994,780 | 2,191,849 |
International Small Cap | 168,049 | 20,442 |
Intrinsic Value | 93,421,691 | 7,349,079 |
Large Cap Growth | 133,589,285 | 12,889,372 |
Large Cap Value | 199,459,405 | 173,541,759 |
Mid Cap Growth | 281,139,479 | — |
Mid Cap Intrinsic Value | — | 430,496 |
Multi-Cap Opportunities | 164,718,334 | 1,310,227 |
Real Estate(a) | 40,837,537 | 13,888,465 |
Small Cap Growth | 30,851,056 | — |
Sustainable Equity | 195,053,478 | 8,716,053 |
U.S. Equity Impact | — | 60,969 |
(a) | Section 1250 gain distribution of $1,155,198 for Real Estate. |
275
This page has been left blank intentionally
Neuberger Berman Investment Advisers LLC
1290 Avenue of the Americas
New York, NY 10104-0002
Retail Services: 800.877.9700
Broker-Dealer and Institutional Services: 800.366.6264/888.556.9030
www.nb.com
New York, NY 10104-0002
Retail Services: 800.877.9700
Broker-Dealer and Institutional Services: 800.366.6264/888.556.9030
www.nb.com
Statistics and projections in this report are derived from sources deemed to be reliable but cannot be regarded as a representation of future results of the Funds. This report is prepared for the general information of shareholders and is not an offer of shares of the Funds. Shares are sold only through the currently effective prospectus which you can obtain by calling 877.628.2583. An investor should consider carefully a Fund’s investment objectives, risks and fees and expenses, which are described in its prospectus, before investing.

H0599 10/22

(b) Not applicable to the Registrant.
Item 2. Code of Ethics.
The Board of Trustees (“Board”) of Neuberger Berman Equity Funds (“Registrant”) has adopted a code of ethics that applies to the Registrant’s principal executive officer, principal financial officer, principal accounting officer or controller, or persons performing similar functions (“Code of Ethics”). During the period covered by this Form N-CSR, there were no substantive amendments to the Code of Ethics and there were no waivers from the Code of Ethics granted to the Registrant’s principal executive officer, principal financial officer, principal accounting officer or controller, or persons performing similar functions.
A copy of the Code of Ethics is incorporated by reference to Neuberger Berman Income Funds’ Form N-CSR, Investment Company Act file number 811-03802 (filed June 30, 2020). The Code of Ethics is also available, without charge, by calling 1-800-877-9700 (toll-free).
Item 3. Audit Committee Financial Expert.
The Board has determined that the Registrant has three audit committee financial experts serving on its audit committee. The Registrant’s audit committee financial experts are Michael J. Cosgrove, Martha C. Goss and Deborah C. McLean. Mr. Cosgrove, Ms. Goss and Ms. McLean are independent trustees as defined by Form N-CSR.
Item 4. Principal Accountant Fees and Services.
Ernst & Young, LLP (“E&Y”) serves as independent registered public accounting firm to the Neuberger Berman Dividend Growth, Emerging Markets Equity, Equity Income, Focus, Genesis, Global Real Estate, Greater China Equity, Guardian, Integrated Large Cap, International Equity, International Select, International Small Cap, Large Cap Value, Real Estate, and U.S. Equity Impact Funds. Effective December 15, 2021, E&Y also serves as independent registered public accounting firm to the Neuberger Berman Intrinsic Value, Mid Cap Growth, Mid Cap Intrinsic Value, Multi-Cap Opportunities, Small Cap Growth, and Sustainable Equity Funds.
Prior to December 15, 2021, Tait, Weller & Baker LLP (“Tait Weller”) served as independent registered public accounting firm to the Neuberger Berman Intrinsic Value, Mid Cap Growth, Mid Cap Intrinsic Value, Multi-Cap Opportunities, Small Cap Growth, and Sustainable Equity Funds.
(a) Audit Fees
The aggregate fees billed for professional services rendered by E&Y, the Funds’ current Independent Registered Public Accounting Firm, for the audit of the annual financial statements or services that are normally provided by E&Y in connection with statutory and regulatory filings or engagements were $679,126 and $866,500 for the fiscal years ended 2021 and 2022, respectively.
The aggregate fees billed for professional services rendered by Tait Weller, certain of the Funds’ prior Independent Registered Public Accounting Firm, for the audit of the annual financial statements or services that are normally provided by Tait Weller in connection with statutory and regulatory filings or engagements were $130,950 for the fiscal year ended 2021.
(b) Audit-Related Fees
The aggregate fees billed to the Registrant for assurance and related services by E&Y that are reasonably related to the performance of the audit of the Registrant’s financial statements and are not reported above in Audit Fees were $0 and $0 for the fiscal years ended 2021 and 2022, respectively. The Audit Committee approved 0% and 0% of these services provided by E&Y for the fiscal years ended 2021 and 2022, respectively, pursuant to the waiver provisions of Rule 2-01(c)(7)(i)(C) of Regulation S-X.
The fees billed to other entities in the investment company complex for assurance and related services by E&Y that are reasonably related to the performance of the audit that the Audit Committee was required to approve because the engagement related directly to the operations and financial reporting of the Registrant were $0 and $0 for the fiscal years ended 2021 and 2022, respectively. The Audit Committee approved 0% and 0% of these services provided by E&Y for the fiscal years ended 2021 and 2022, respectively, pursuant to the waiver provisions of Rule 2-01(c)(7)(i)(C) of Regulation S-X.
The aggregate fees billed to the Registrant for assurance and related services by Tait Weller that are reasonably related to the performance of the audit of the Registrant’s financial statements and are not reported above in Audit Fees were $0 for the fiscal year ended 2021. The Audit Committee approved 0% of these services provided by Tait Weller for the fiscal year ended 2021, pursuant to the waiver provisions of Rule 2-01(c)(7)(i)(C) of Regulation S-X.
The fees billed to other entities in the investment company complex for assurance and related services by Tait Weller that are reasonably related to the performance of the audit that the Audit Committee was required to approve because the engagement related directly to the operations and financial reporting of the Registrant were $0 for the fiscal year ended 2021. The Audit Committee approved 0% of these services provided by Tait Weller for the fiscal year ended 2021, respectively, pursuant to the waiver provisions of Rule 2-01(c)(7)(i)(C) of Regulation S-X.
(c) Tax Fees
The aggregate fees billed to the Registrant for professional services rendered by E&Y for tax compliance, tax advice, and tax planning were $274,350 and $273,830 for the fiscal years ended 2021 and 2022, respectively. The nature of the services provided includes preparation of the Federal and State tax extensions and tax returns, review of annual excise tax calculations, and preparation of form 8613, in addition to assistance with the identification of Passive Foreign Investment Companies ("PFICs"), assistance with determination of various foreign withholding taxes, and assistance with Internal Revenue Code and tax regulation requirements for fund investments. The Audit Committee approved 0% and 0% of these services provided by E&Y for the fiscal years ended 2021 and 2022, respectively, pursuant to the waiver provisions of Rule 2-01(c)(7)(i)(C) of Regulation S-X.
The fees billed to other entities in the investment company complex for professional services rendered by E&Y for tax compliance, tax advice, and tax planning that the Audit Committee was required to approve because the engagement related directly to the operations and financial reporting of the Registrant were $0 and $0 for the fiscal years ended 2021 and 2022, respectively. The Audit Committee approved 0% and 0% of these services provided by E&Y for the fiscal years ended 2021 and 2022, respectively, pursuant to the waiver provisions of Rule 2-01(c)(7)(i)(C) of Regulation S-X.
The aggregate fees billed to the Registrant for professional services rendered by Tait Weller for tax compliance, tax advice, and tax planning were $0 for the fiscal year ended 2021, respectively. The nature of the services provided includes preparation of the Federal and State tax extensions and tax returns, review of annual excise tax calculations, and preparation of form 8613, in addition to assistance with the identification of PFICs, assistance with determination of various foreign withholding taxes, and assistance with Internal Revenue Code and tax regulation requirements for fund investments. The Audit Committee approved 0% of these services provided by Tait Weller for the fiscal year ended 2021, pursuant to the waiver provisions of Rule 2-01(c)(7)(i)(C) of Regulation S-X.
The fees billed to other entities in the investment company complex for professional services rendered by Tait Weller for tax compliance, tax advice, and tax planning that the Audit Committee was required to approve because the engagement related directly to the operations and financial reporting of the Registrant were $0 for the fiscal year ended 2021. The Audit Committee approved 0% of these services provided by Tait Weller for the fiscal year ended 2021, pursuant to the waiver provisions of Rule 2-01(c)(7)(i)(C) of Regulation S-X.
(d) All Other Fees
The aggregate fees billed to the Registrant for products and services provided by E&Y, other than services reported in Audit Fees, Audit-Related Fees, and Tax Fees were $0 and $0 for the fiscal years ended 2021 and 2022, respectively. The Audit Committee approved 0% and 0% of these services provided by E&Y for the fiscal years ended 2021 and 2022, respectively, pursuant to the waiver provisions of Rule 2-01(c)(7)(i)(C) of Regulation S-X.
The fees billed to other entities in the investment company complex for products and services provided by E&Y, other than services reported in Audit Fees, Audit-Related Fees, and Tax Fees that the Audit Committee was required to approve because the engagement related directly to the operations and financial reporting of the Registrant were $0 and $0 for the fiscal years ended 2021 and 2022, respectively. The Audit Committee approved 0% and 0% of these services provided by E&Y for the fiscal years ended 2021 and 2022, respectively, pursuant to the waiver provisions of Rule 2-01(c)(7)(i)(C) of Regulation S-X.
The aggregate fees billed to the Registrant for products and services provided by Tait Weller, other than services reported in Audit Fees, Audit-Related Fees, and Tax Fees were $0 for the fiscal year ended 2021. The Audit Committee approved 0% of these services provided by Tait Weller for the fiscal year ended 2021, pursuant to the waiver provisions of Rule 2-01(c)(7)(i)(C) of Regulation S-X.
The fees billed to other entities in the investment company complex for products and services provided by Tait Weller, other than services reported in Audit Fees, Audit-Related Fees, and Tax Fees that the Audit Committee was required to approve because the engagement related directly to the operations and financial reporting of the Registrant were $0 for the fiscal year ended 2021. The Audit Committee approved 0% of these services provided by Tait Weller for the fiscal year ended 2021, pursuant to the waiver provisions of Rule 2-01(c)(7)(i)(C) of Regulation S-X.
(e) Audit Committee’s Pre-Approval Policies and Procedures
(1) The Audit Committee’s pre-approval policies and procedures for the Registrant to engage an accountant to render audit and non-audit services delegate to each member of the Committee the power to pre-approve services between meetings of the Committee.
(2) None of the services described in paragraphs (b) through (d) above were approved by the Audit Committee pursuant to paragraph (c)(7)(i)(C) of Rule 2-01 of Regulation S-X.
(f) Hours Attributed to Other Persons
Not applicable.
(g) Non-Audit Fees
Non-audit fees billed by E&Y for services rendered to the Registrant were $274,350 and $273,830 for the fiscal years ended 2021 and 2022, respectively.
Non-audit fees billed by E&Y for services rendered to the Registrant’s investment adviser and any entity controlling, controlled by, or under common control with the adviser that provides ongoing services to the Registrant were $0 and $0 for the fiscal years ended 2021 and 2022, respectively.
Non-audit fees billed by Tait Weller for services rendered to the Registrant were $0 for the fiscal year ended 2021.
Non-audit fees billed by Tait Weller for services rendered to the Registrant’s investment adviser and any entity controlling, controlled by, or under common control with the adviser that provides ongoing services to the Registrant were $0 for the fiscal year ended 2021.
(h) The Audit Committee of the Board considered whether the provision of non-audit services rendered to the Registrant’s investment adviser and any entity controlling, controlled by, or under common control with the adviser that provides ongoing services to the Registrant that were not pre-approved by the Audit Committee because the engagement did not relate directly to the operations and financial reporting of the Registrant is compatible with maintaining E&Y’s and Tait Weller’s independence.
Item 5. Audit Committee of Listed Registrants.
Not applicable to the Registrant.
Item 6. Schedule of Investments.
The complete schedule of investments for each series is disclosed in the Registrant’s annual report, which is included as Item 1 of this Form N-CSR.
Item 7. Disclosure of Proxy Voting Policies and Procedures for Closed-End Management Investment Companies.
Not applicable to the Registrant.
Item 8. Portfolio Managers of Closed-End Management Investment Companies.
Not applicable to the Registrant.
Item 9. Purchases of Equity Securities by Closed-End Management Investment Company and Affiliated Purchasers.
Not applicable to the Registrant.
Item 10. Submission of Matters to a Vote of Security Holders.
There were no changes to the procedures by which shareholders may recommend nominees to the Board.
Item 11. Controls and Procedures.
| (a) | Based on an evaluation of the disclosure controls and procedures (as defined in Rule 30a-3(c) under the Act) as of a date within 90 days of the filing date of this report, the Chief Executive Officer and President and the Treasurer and Principal Financial and Accounting Officer of the Registrant have concluded that such disclosure controls and procedures are effectively designed to ensure that information required to be disclosed by the Registrant on Form N-CSR is accumulated and communicated to the Registrant’s management to allow timely decisions regarding required disclosure. |
| (b) | There were no significant changes in the Registrant’s internal controls over financial reporting (as defined in Rule 30a-3(d) under the Act) that occurred during the Registrant’s most recent fiscal half-year period covered by this report that have materially affected, or are reasonably likely to materially affect, the Registrant’s internal control over financial reporting. |
Item 12. Disclosure of Securities Lending Activities for Closed-End Management Investment Companies.
Not applicable to the Registrant.
Item 13. Exhibits.
| (a)(1) |
| (a)(2) |
| (a)(3) | Not applicable to the Registrant. |
| (a)(4) |
The certification furnished pursuant to Rule 30a-2(b) under the Act and Section 906 of the Sarbanes-Oxley Act will not be deemed “filed” for purposes of Section 18 of the Securities Exchange Act of 1934, as amended (“Exchange Act”), or otherwise subject to the liability of that section. Such certification will not be deemed to be incorporated by reference into any filing under the Securities Act of 1933, as amended, or the Exchange Act, except to the extent that the Registrant specifically incorporates it by reference.
SIGNATURES
Pursuant to the requirements of the Securities Exchange Act of 1934 and the Investment Company Act of 1940, the Registrant has duly caused this report to be signed on its behalf by the undersigned, thereunto duly authorized.
Neuberger Berman Equity Funds
By: /s/ Joseph V. Amato
Joseph V. Amato
Chief Executive Officer and President
Date: November 4, 2022
Pursuant to the requirements of the Securities Exchange Act of 1934 and the Investment Company Act of 1940, this report has been signed below by the following persons on behalf of the Registrant and in the capacities and on the dates indicated.
By: /s/ Joseph V. Amato
Joseph V. Amato
Chief Executive Officer and President
Date: November 4, 2022
By: /s/ John M. McGovern
John M. McGovern
Treasurer and Principal Financial and Accounting Officer
Date: November 4, 2022