As filed with the Securities and Exchange Commission on November 2, 2023
UNITED STATES
SECURITIES AND EXCHANGE COMMISSION
Washington, D.C. 20549
FORM N-CSR
CERTIFIED SHAREHOLDER REPORT OF
REGISTERED MANAGEMENT INVESTMENT COMPANIES
Investment Company Act file number: 811-00582
NEUBERGER BERMAN EQUITY FUNDS
(Exact Name of Registrant as specified in charter)
c/o Neuberger Berman Investment Advisers LLC
1290 Avenue of the Americas
New York, New York 10104-0002
(Address of Principal Executive Offices – Zip Code)
Joseph V. Amato
Chief Executive Officer and President
Neuberger Berman Equity Funds
c/o Neuberger Berman Investment Advisers LLC
1290 Avenue of the Americas
New York, New York 10104-0002
Lori L. Schneider, Esq.
K&L Gates LLP
1601 K Street, N.W.
Washington, D.C. 20006-1600
(Names and Addresses of agents for service)
Registrant's telephone number, including area code: (212) 476-8800
Date of fiscal year end: August 31
Date of reporting period: August 31, 2023
Form N-CSR is to be used by management investment companies to file reports with the Commission not later than 10 days after the transmission to stockholders of any report that is required to be transmitted to stockholders under Rule 30e-1 under the Investment Company Act of 1940, as amended (“Act”) (17 CFR 270.30e-1). The Commission may use the information provided on Form N-CSR in its regulatory, disclosure review, inspection, and policymaking roles.
A registrant is required to disclose the information specified by Form N-CSR, and the Commission will make this information public. A registrant is not required to respond to the collection of information contained in Form N-CSR unless the Form displays a currently valid Office of Management and Budget (“OMB”) control number. Please direct comments concerning the accuracy of the information collection burden estimate and any suggestions for reducing the burden to the Secretary, Securities and Exchange Commission, 450 Fifth Street, NW, Washington, DC 20549-0609. The OMB has reviewed this collection of information under the clearance requirements of 44 U.S.C. § 3507.
Item 1. Report to Shareholders.
| (a) | Following is a copy of the annual report transmitted to shareholders pursuant to Rule 30e-1 under the Act. |
Neuberger Berman
Equity Funds
| |
| |
| |
Institutional Class Shares | |
| |
|
Emerging Markets Equity Fund |
|
|
|
|
Greater China Equity Fund |
International Equity Fund |
International Select Fund |
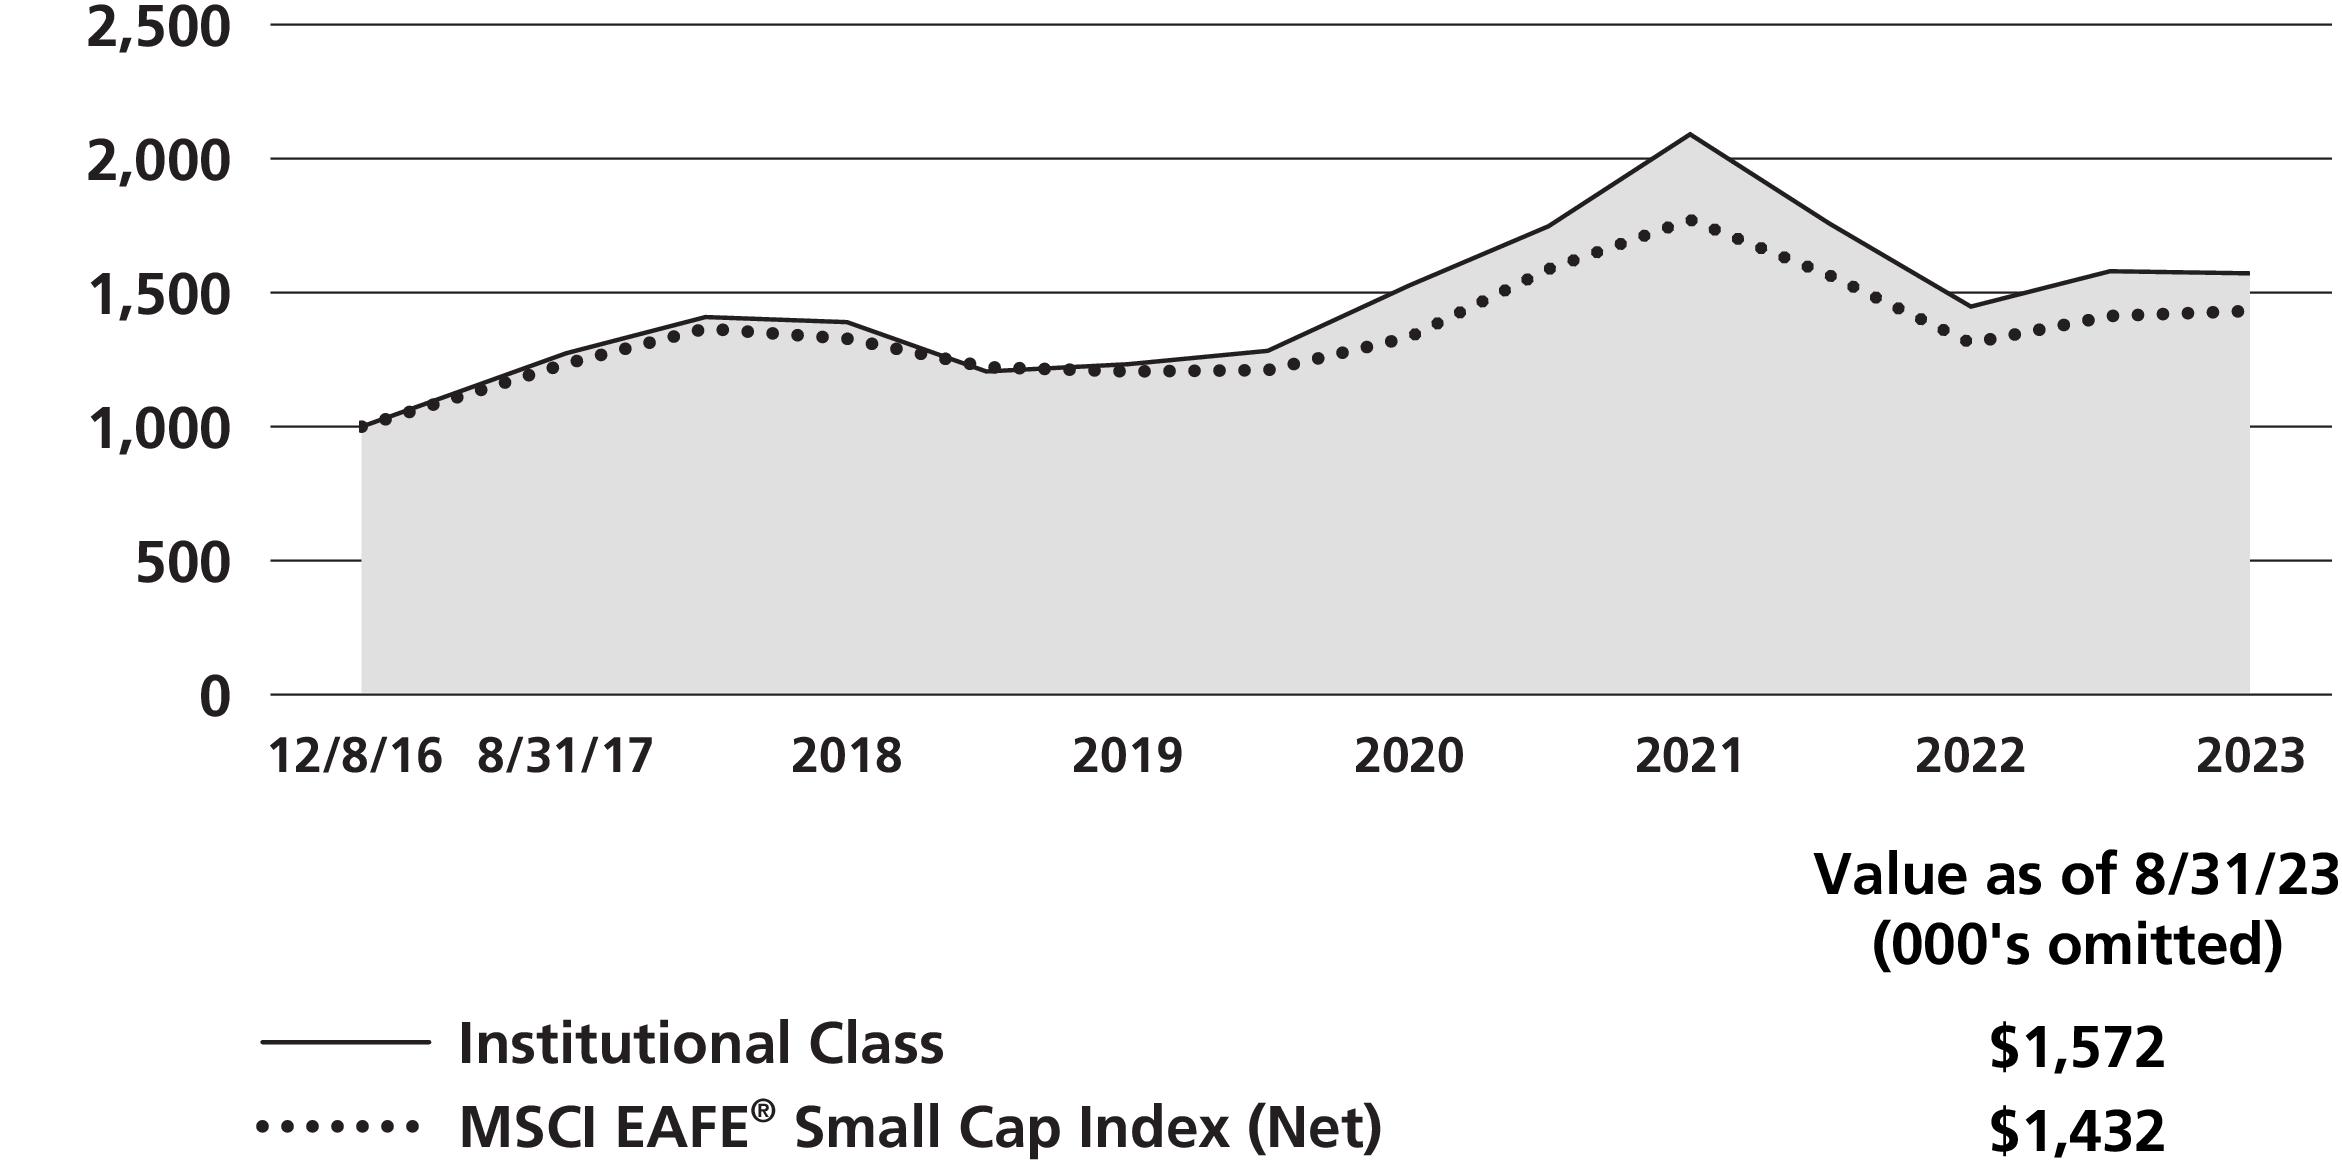
International Small Cap Fund |
|
|
|
|
Mid Cap Intrinsic Value Fund |
Multi-Cap Opportunities Fund |
|
|
|
|
Annual Report
August 31, 2023
The "Neuberger Berman" name and logo and "Neuberger Berman Investment Advisers LLC" name are registered service marks of Neuberger Berman Group LLC. The individual Fund names in this piece are either service marks or registered service marks of Neuberger Berman Investment Advisers LLC, an affiliate of Neuberger Berman BD LLC, distributor, member FINRA. ©2023 Neuberger Berman BD LLC, distributor. All rights reserved.
President’s Letter
Dear Shareholder,
Over the 12-month period ended August 31, 2023 (the reporting period), as data began to suggest the pandemic’s long economic hangover could be stabilizing, investors returned to equities with a volatile version of optimism. Though sentiment remained headline-sensitive, the S&P 500® Index gained nearly 16% this reporting period, and the CBOE Volatility Index (VIX®), essentially a gauge of investors’ fears, declined 48%.
For central banks like the U.S. Federal Reserve Board (Fed), orchestrating a soft landing is difficult; and factors including slower growth in China (which suppressed emerging markets equities returns for the reporting period), war in Ukraine, the inverted yield curve, severe weather, strikes, and the ramping up of the U.S. election cycle could increase uncertainty. Still, much has improved since this reporting period began, and much of the recent recession forecasting has abated.
Even as elevated inflation and rising interest rates continue to weigh on markets, businesses and consumers, inflation appears to be slowing enough that economists believe the Fed, which raised the federal funds rate from nearly zero in early 2022 to 5.25% – 5.5%, may feel comfortable pausing soon.
During the second quarter of 2023, U.S. real GDP is estimated to have increased at 2.1% annualized, up from 2.0% in the first quarter. Corporate earnings have shown remarkable resilience, with 80% of the S&P 500’s constituents meeting or exceeding expectations in the second quarter.
Productivity is up, jobs continue to be added, and jobs now exceed pre-pandemic levels. The rate of job growth (and of wage growth) is slowing, however, and unemployment has ticked up slightly, from 3.5% to a still historically low 3.8%, as the Fed works to cool the economy to fight inflation.
Supply chain snags have unraveled to near pre-pandemic levels, work that began with the Biden Administration’s efforts to expand port capacity and continues with a pandemic-informed corporate emphasis on on-shoring and near-shoring.
Government spending, through programs in the Biden Administration’s Build Back Better plan, is also having a measurable positive impact. Infrastructure spending—on roads, railroads, bridges, broadband, the power grid and more—is one example. The CHIPS and Science Act, which has already attracted $200 billion in new private sector investment in U.S. tech manufacturing and materials facilities, is another.
Looking to the future, our managers are closely watching real-time data at both the macroeconomic and corporate level. This information could foreshadow changes to current expectations on either the upside or downside.
But for the most part, we’re business as usual: meticulous bottom-up management, hands-on independent research, using volatility to its advantage in buy and sell decisions, and executing against investment disciplines that have been tested over full market cycles.
We appreciate your trust and confidence in Neuberger Berman and look forward to continuing our work together.
Sincerely,
Joseph V. Amato
President and CEO
Neuberger Berman Equity Funds
Dividend Growth Fund Commentary (Unaudited)
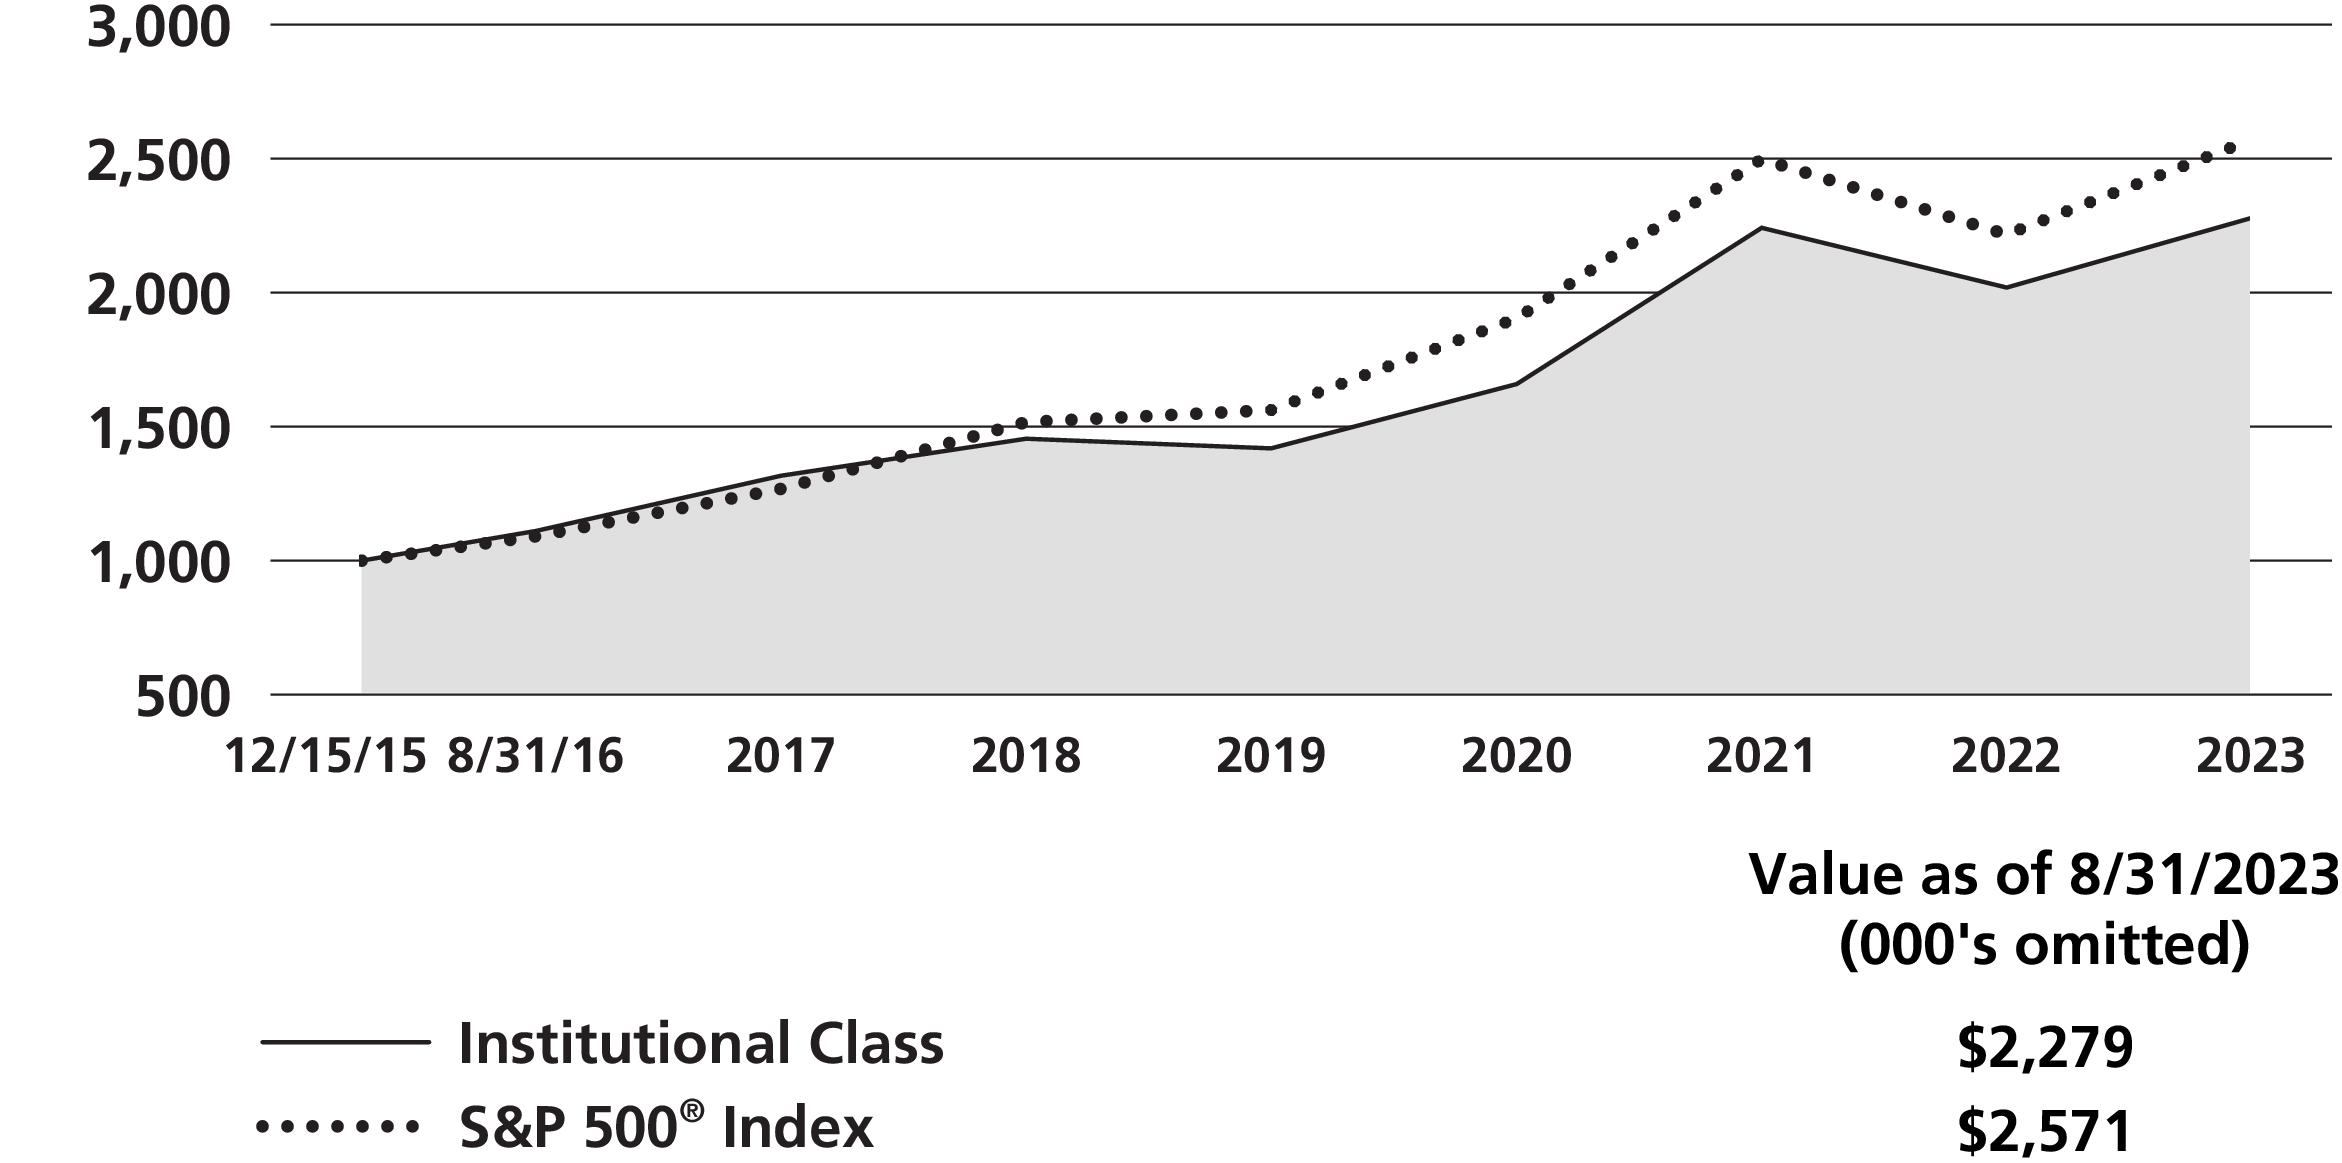
Neuberger Berman Dividend Growth Fund Institutional Class generated a 12.89% total return for the fiscal year ended August 31, 2023 (the reporting period), underperforming its benchmark, the S&P 500® Index (the Index), which posted a 15.94% total return for the same period. (Performance for all share classes is provided in the table immediately following this letter.)
The objective of the Fund is to generate capital appreciation and income from companies with attractive dividend per share growth. This investment discipline seeks to identify companies with strong business models generating cash to both grow their business, while also providing rising dividend distributions to shareholders. We focus on companies that we believe have strong balance sheets, solid management teams, attractive free cash flow yields and clear capital allocation strategies.
During the reporting period, the U.S. stock market, as measured by the Index, rose despite investors grappling with inflationary headwinds and tighter monetary policies. By early-2023, the U.S Federal Reserve Board’s (Fed) preferred inflation gauge, the Core Personal Consumption Expenditures index (PCE)1, which excludes food and energy costs, unexpectedly rose. In reaction, the central bank increased the Fed funds target rate by 3.00% during the reporting period as Fed Chair Jerome Powell emphasized price stability to tame inflation, bringing the Fed funds target rate range to 5.25% – 5.50%, while expressing higher for longer rates may be warranted.
The Fund’s top equity sector weights included approximately 27% Information Technology (IT), 14% Health Care, and 13% Financials at the end of the reporting period. Overall, the bulk of the Fund’s total returns were generated from stocks across IT, Health Care and Consumer Discretionary—while exposure to Communication Services, Utilities, and Real Estate dampened results.
Among our IT holdings, Applied Materials advanced by approximately 88%, as investors bid up the supplier of equipment, services, and software used to manufacture semiconductors. The company reported better than expected earnings results, hitting the high end of their revenue and earnings guidance range. The company’s CEO cited strategic investments in technologies to enhance the Internet of Things and artificial intelligence as key drivers. In addition, the company’s board of directors recently approved a 23% dividend per share increase. Such acceleration of free cash flow growth is a key component of the Fund’s investment philosophy.
Despite the broader Energy sector posting double-digit returns, Devon Energy, which is among our Energy holdings, experienced selling pressure, sliding by approximately -22%. Nonetheless, we remain constructive as the C-suite has articulated their commitment to balance sheet improvement while increasing shareholder returns through its formalized fixed plus variable dividend model. Through this lens, Devon Energy increased its quarterly dividend by 11% in 2023.
On a forward-looking basis, we remain focused on business fundamentals and portfolio construction. As always, we continue to favor what we believe are high-quality, cash-generative, dividend-paying stocks with managements focused on disciplined capital allocation. We believe this prudent approach can potentially provide outsized returns compounded over a full investment cycle.
We thank you for investing in our Fund.
Sincerely,
William D. Hunter and Shawn Trudeau
Portfolio Managers
1 Source: U.S. Bureau of Economic Analysis
Information about principal risks of investing in the Fund is set forth in the prospectus and statement of additional information.
The portfolio composition, industries and holdings of the Fund are subject to change without notice.
The opinions expressed are those of the Fund’s portfolio managers. The opinions are as of the date of this report and are subject to change without notice.
Dividend Growth Fund (Unaudited)
|
(as a % of Total Investments*) |
| |
| |
| |
| |
| |
| |
| |
| |
| |
| |
| |
| |
| |
| Derivatives (other than options purchased), if
any, are excluded from this chart. |
| | |
| | Average Annual Total Return
Ended 08/31/2023 |
| | | |
| | | | |
| | | | |
| | | | |
| | | | |
| | | | |
| | | |
| | | | |
| | | | |
| | | | |
| | | |
The performance data quoted represent past performance and do not indicate future results. Current performance may be lower or higher than the performance data quoted. For current performance data, including current to the most recent month-end, please visit www.nb.com/performance.
The results shown in the table reflect the reinvestment of income dividends and other distributions, if any. The results do not reflect the effect of taxes a shareholder would pay on Fund distributions or on the redemption of Fund shares.
The investment return and principal value of an investment will fluctuate and shares, when redeemed, may be worth more or less than their original cost.
Returns would have been lower if Neuberger Berman Investment Advisers LLC ("NBIA") had not reimbursed certain expenses and/or waived a portion of the investment management fees during certain of the periods shown. Repayment by a class (of expenses previously reimbursed and/or fees previously waived by NBIA) will decrease the class’s returns. Please see Note B in the Notes to Financial Statements for specific information regarding expense reimbursement and/or fee waiver arrangements.
As stated in the Fund’s most recent prospectus, the total annual operating expense ratios for fiscal year 2022 were 1.05%, 1.48%, 2.17% and 1.25% for Institutional Class, Class A, Class C and Class R6 shares, respectively (before expense reimbursements and/or fee waivers, if any). The expense ratios were 0.70%, 1.06%, 1.81% and 0.60% for Institutional Class, Class A, Class C and Class R6 shares, respectively, after expense reimbursements and/or fee waivers. The expense ratios for the annual period ended August 31, 2023, can be found in the Financial Highlights section of this report.
Returns shown with a sales charge reflect the deduction of the current maximum initial sales charge of 5.75% for Class A shares and the contingent deferred sales charge (CDSC) for Class C shares. The CDSC for Class C shares is 1.00%, which is reduced to 0% after 1 year. The performance of the Fund’s share classes will differ primarily due to different sales charge structures and class expenses. Please see the prospectus for more information about sales charge structures, if any, and class expenses for your share class.
Dividend Growth Fund (Unaudited)
COMPARISON OF A $1,000,000 INVESTMENT
(000's omitted)
This graph shows the change in value of a hypothetical $1,000,000 investment in the Fund over the past 10 fiscal years, or since the Fund’s inception if it has not operated for 10 years. The graph is based on the Institutional Class shares only; the performance of the Fund’s share classes will differ primarily due to different sales charge structures and class expenses (see Performance Highlights chart on previous page). The result is compared with benchmarks, which include a broad-based market index and may include a more narrowly based index. Market indices have not been reduced to reflect any of the fees and costs of investing. The results shown in the graph reflect the reinvestment of income dividends and other distributions, if any. The results do not reflect the effect of taxes a shareholder would pay on Fund distributions or on the redemption of Fund shares. Results represent past performance and do not indicate future results.
Emerging Markets Equity Fund Commentary (Unaudited)
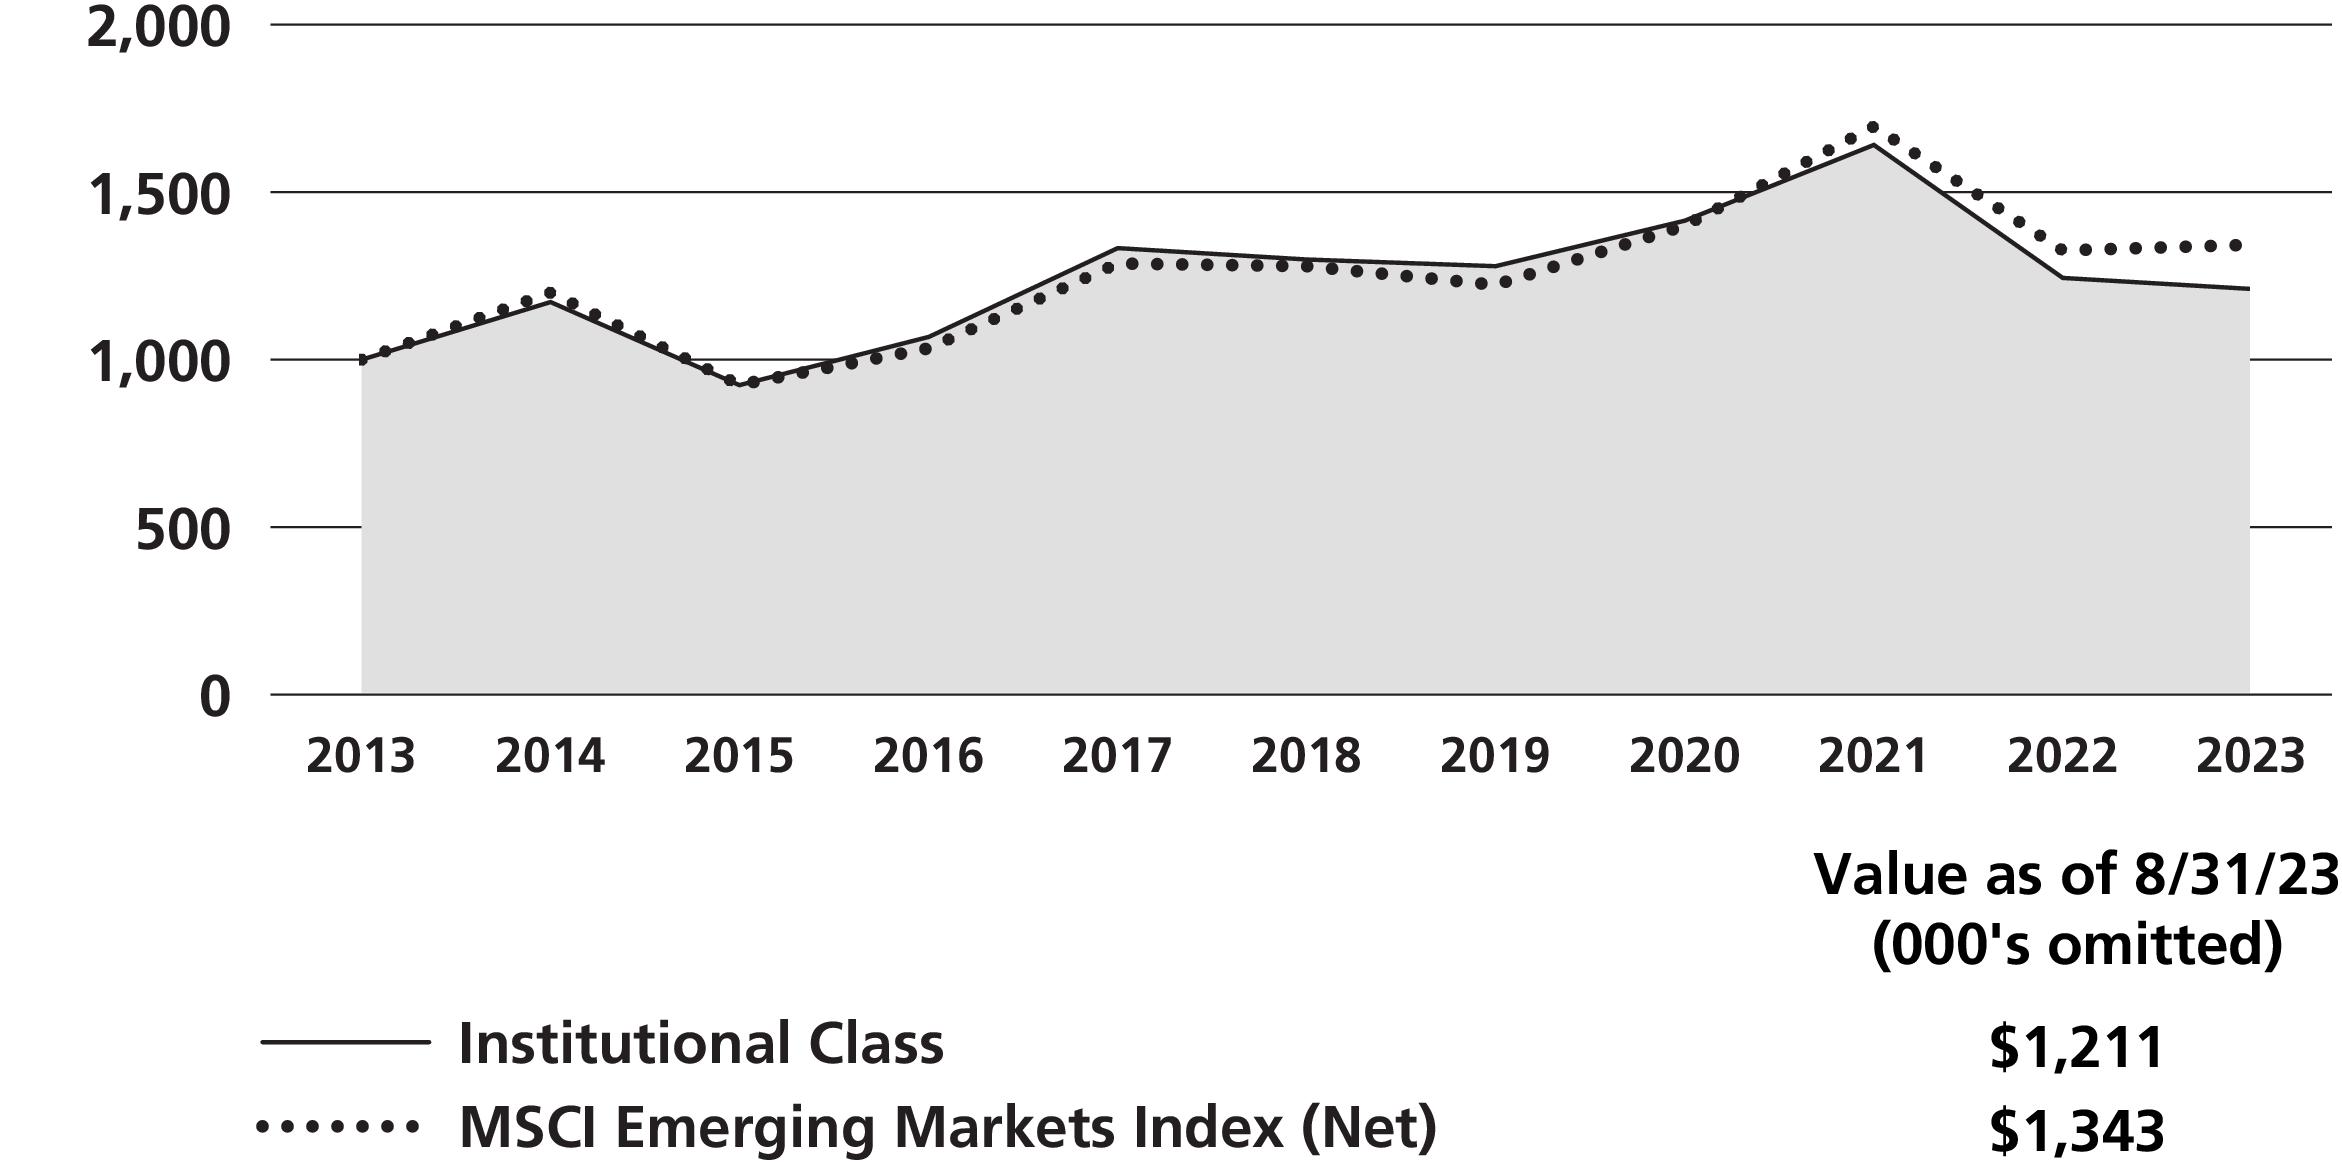
Neuberger Berman Emerging Markets Equity Fund Institutional Class generated a total return of -2.69% for the fiscal year ended August 31, 2023 (the reporting period), trailing its benchmark, the MSCI Emerging Markets (EM) Index (Net) (the Index), which reported a total return of 1.25% for the same period. (Performance for all share classes is provided in the table immediately following this letter.)
Optimism returned to global equity markets this reporting period, but EM equities, as measured by the Index, advanced only slightly, lagging the U.S. S&P 500® Index and developed markets, as measured by the MSCI EAFE® Index (Net). While EM investors cheered an improving outlook for U.S. interest rates as inflation slowed, sentiment was hampered by slower economic growth in China, which was under pressure as it emerged from COVID-19 lockdowns with issues in its property sector, high youth unemployment, and threats to consumer spending.
Results ranged widely by sector and by country. Information Technology (IT) and Energy led the Index for the reporting period as artificial intelligence (AI) hardware spending drove tech names to advance worldwide, and on rising energy commodity prices. Utilities, out of favor as investors sought higher growth potential, and Health Care declined the most. Greece, Turkey and Hungary outperformed significantly, each up 60% or higher. Qatar was weakest with a 21% decline, followed by smaller losses in Saudi Arabia and Kuwait.
The Fund’s performance shortfall resulted from stock selection, primarily in IT, Financials and Consumer Discretionary. By country, holdings based in India, China and Brazil, where the Fund was also underweight, were a headwind. Individual detractors included India’s API Holdings*, the largest Indian online digital healthcare platform, which declined in value on news that the firm may offer more equity at a lower price, and Chinese e-commerce names JD.com and Meituan, both of which were sold by the Fund during the reporting period. The team is closely monitoring the competitive dynamic in the Chinese e-commerce realm to determine how to position the Fund going forward.
Bottom-up driven sector positioning was an advantage during the reporting period, with an underweight versus the Index to falling Utilities and an overweight to rising IT the largest factors. Stock selection within Health Care, Energy and Consumer Staples also added relative value. By country, stock selection and an underweight to Saudi Arabia, stock selection in Korea, and an outside-Index exposure to a Colombian oil explorer domiciled in Canada helped most.
Korean electronics giant, Samsung, chipmaker, SK Hynix, and China’s Trip.com were among top contributors. Samsung and SK Hynix rallied on hopes that pricing for their semiconductor components had bottomed out and could improve going forward, while Trip.com benefited from increased travel post China’s economic reopening.
While we are cautious about and underweight the Chinese Real Estate sector and balance sheet-linked Financials, other segments of the Chinese economy appear to be still growing (e.g., Chinese tourism and global consumer product innovators), leading the Fund to be overweight select Consumer subsectors in that market.
Elsewhere, we believe artificial intelligence hype may be getting ahead of itself, but we have identified other niche opportunities across a variety of IT segments, which helped build back an overweight to that sector, at the expense of a previously larger overweight in Consumer Staples. At the end of the reporting period, the Fund remained underweight more cyclical segments such as metals and mining.
We believe these positioning decisions mean the Fund is poised to benefit from idiosyncratic opportunities, rather than a cyclical uplift, which feels appropriate given slower global growth.
Sincerely,
Conrad Saldanha
Portfolio Manager
*API Holdings is a private company. Investments in private companies involve greater risks than investments in securities of companies that have traded publicly on an exchange for extended periods of time. Investments in private companies are generally less liquid than investments in securities issued by public companies and may be difficult for the Fund to value.
Information about principal risks of investing in the Fund is set forth in the prospectus and statement of additional information.
The portfolio composition, industries and holdings of the Fund are subject to change without notice.
The opinions expressed are those of the Fund’s portfolio manager. The opinions are as of the date of this report and are subject to change without notice.
Emerging Markets Equity Fund (Unaudited)
| | | |
| | Average Annual Total Return
Ended 08/31/2023 |
| | | | |
| | | | | |
| | | | | |
| | | | | |
| | | | | |
| | | | | |
| | | | | |
| | | | |
| | | | | |
| | | | | |
| | | | | |
| | | | |
The performance data quoted represent past performance and do not indicate future results. Current performance may be lower or higher than the performance data quoted. For current performance data, including current to the most recent month-end, please visit www.nb.com/performance.
The results shown in the table reflect the reinvestment of income dividends and other distributions, if any. The results do not reflect the effect of taxes a shareholder would pay on Fund distributions or on the redemption of Fund shares.
The investment return and principal value of an investment will fluctuate and shares, when redeemed, may be worth more or less than their original cost.
Returns would have been lower if Neuberger Berman Investment Advisers LLC ("NBIA") had not reimbursed certain expenses and/or waived a portion of the investment management fees during certain of the periods shown. Repayment by a class (of expenses previously reimbursed and/or fees previously waived by NBIA) will decrease the class’s returns. Please see Note B in the Notes to Financial Statements for specific information regarding expense reimbursement and/or fee waiver arrangements.
As stated in the Fund’s most recent prospectus, the total annual operating expense ratios for fiscal year 2022 were 1.23%, 1.59%, 2.34%, 1.95% and 1.12% for Institutional Class, Class A, Class C, Class R3 and Class R6 shares, respectively (before expense reimbursements and/or fee waivers, if any). The expense ratios were 1.51%, 2.26% and 1.92% for Class A, Class C and Class R3 shares, respectively, after expense reimbursements and/or fee waivers. The expense ratios for the annual period ended August 31, 2023, can be found in the Financial Highlights section of this report.
Returns shown with a sales charge reflect the deduction of the current maximum initial sales charge of 5.75% for Class A shares and the contingent deferred sales charge (CDSC) for Class C shares. The CDSC for Class C shares is 1.00%, which is reduced to 0% after 1 year. The performance of the Fund’s share classes will differ primarily due to different sales charge structures and class expenses. Please see the prospectus for more information about sales charge structures, if any, and class expenses for your share class.
Emerging Markets Equity Fund (Unaudited)
COMPARISON OF A $1,000,000 INVESTMENT
(000's omitted)
This graph shows the change in value of a hypothetical $1,000,000 investment in the Fund over the past 10 fiscal years, or since the Fund’s inception if it has not operated for 10 years. The graph is based on the Institutional Class shares only; the performance of the Fund’s share classes will differ primarily due to different sales charge structures and class expenses (see Performance Highlights chart on previous page). The result is compared with benchmarks, which include a broad-based market index and may include a more narrowly based index. Market indices have not been reduced to reflect any of the fees and costs of investing. The results shown in the graph reflect the reinvestment of income dividends and other distributions, if any. The results do not reflect the effect of taxes a shareholder would pay on Fund distributions or on the redemption of Fund shares. Results represent past performance and do not indicate future results.
Equity Income Fund Commentary (Unaudited)
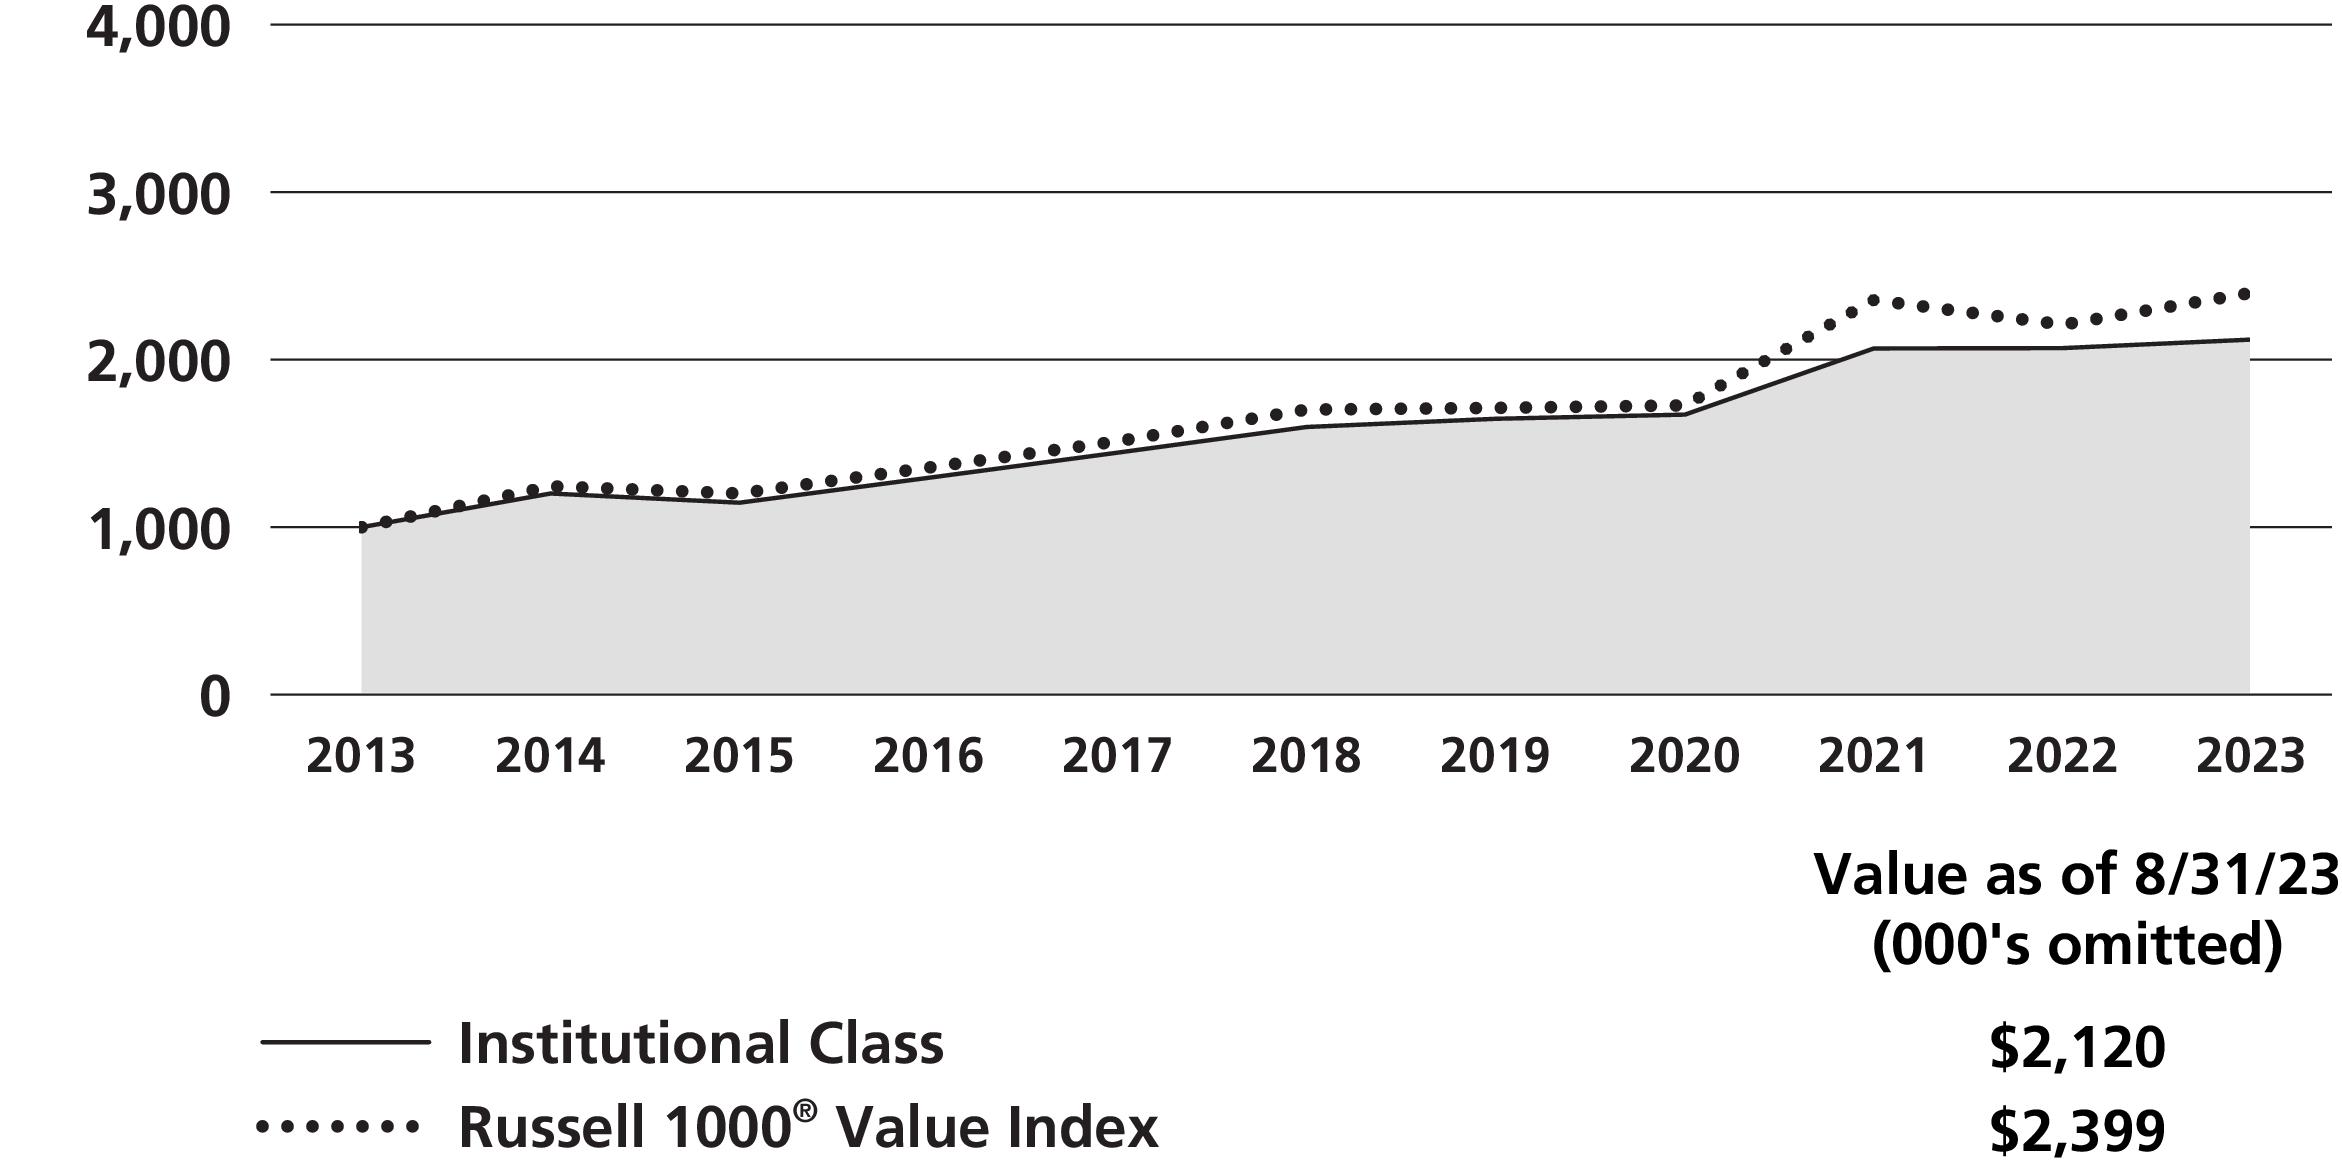
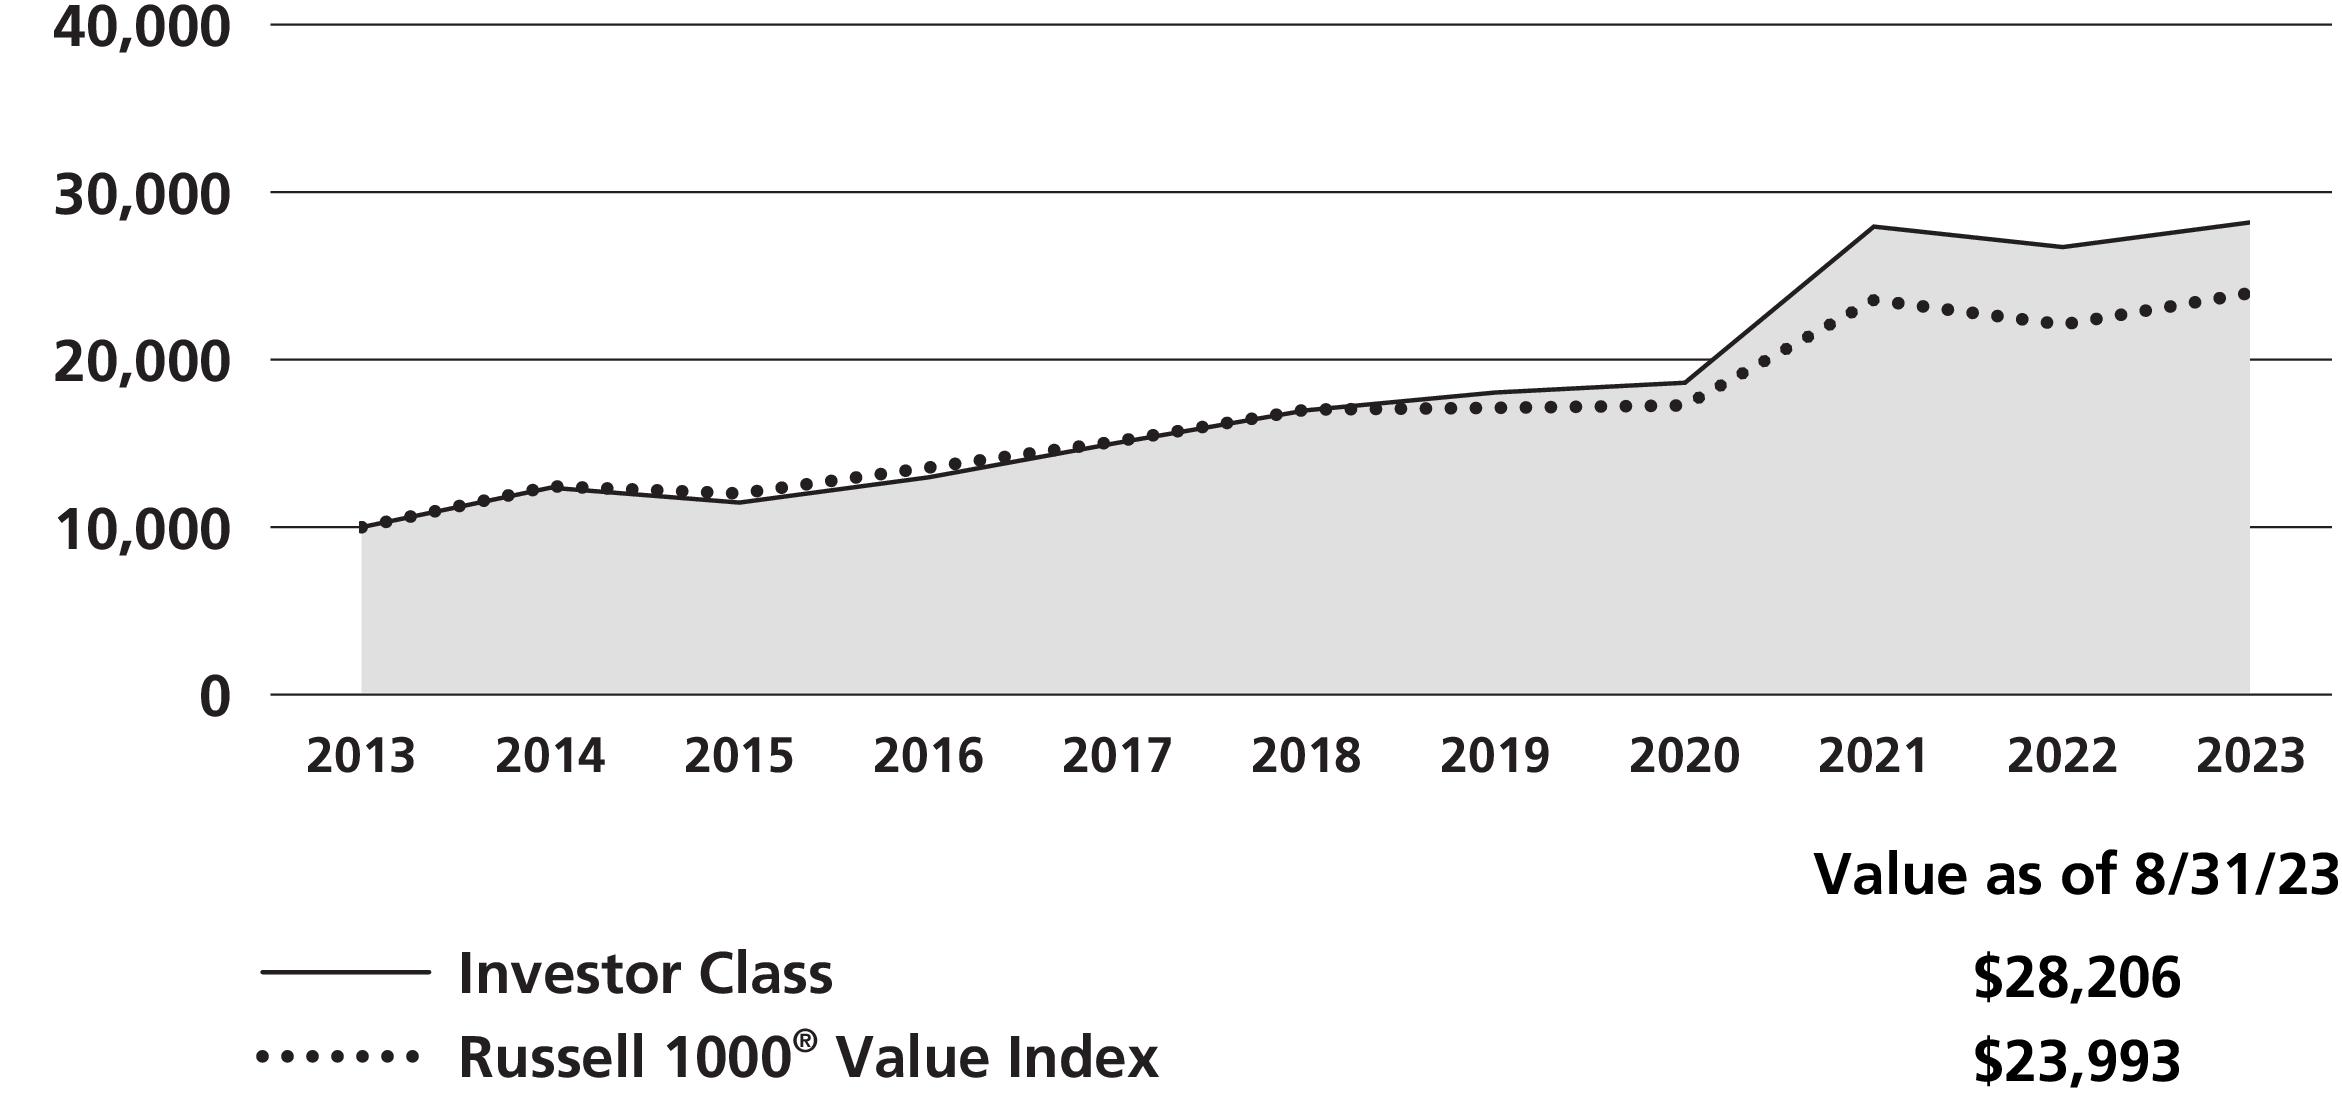
Neuberger Berman Equity Income Fund Institutional Class generated a 2.46% total return for the fiscal year ended August 31, 2023 (the reporting period), underperforming its benchmark, the Russell 1000® Value Index (the Index), which posted an 8.59% total return for the same period. (Performance for all share classes is provided in the table immediately following this letter.)
This Fund is an objective-based strategy, targeting a total return profile between stocks and bonds compounded over a full investment cycle with limited volatility relative to the Index. Overall, the Fund is diversified among dividend-paying stocks selected through extensive analysis of cash flow prospects, that we believe have the ability to sustain and grow dividends.
During the reporting period, the U.S. stock market, as measured by the Index, rose despite investors grappling with inflationary headwinds and tighter monetary policies. By early-2023, the U.S Federal Reserve Board’s (Fed) preferred inflation gauge, the Core Personal Consumption Expenditures index (PCE)1, which excludes food and energy costs, unexpectedly rose. In reaction, the central bank increased the Fed funds target rate by 3.00% during the reporting period as Fed Chair Jerome Powell emphasized price stability to tame inflation, bringing the Fed funds target rate range to 5.25% – 5.50%, while expressing higher for longer rates may be warranted.
The Fund’s top equity sector holdings included approximately 20% Industrials, 12% Financials, and 11% Energy at the end of the reporting period. The bulk of the Fund’s total returns were generated from stocks across Industrials, Health Care, and Materials—while exposure to Real Estate, Financials, and Utilities dampened results.
The Fund’s overweight to Industrials versus the Index contributed the most to relative returns. The Fund maintains an overweight to Industrials as we believe the sector can benefit from infrastructure initiatives supported by recent legislation, including the Inflation Reduction Act of 2022. Eaton Corp. PLC proved to be our top performer in this sector, advancing by more than 70%. This core holding represents an intelligent power management business that we believe can capitalize on infrastructure modernization underpinned by electrification and digitalization trends.
While Materials exposure was accretive to total return, Canada’s Nutrien was an outlier, declining approximately 30% during the reporting period. This business represents one of the world’s largest providers of crop inputs, playing a critical role in the agricultural supply chain through its production and distribution of potash, phosphate, and nitrogen products. Despite the challenging environment, we remain constructive as we believe fertilizer imbalances could support profitability throughout 2023 and beyond.
The Fund’s use of written options contributed positively to performance during the reporting period.
Our analysis suggests stocks with dividend yields greater than 2.5% are priced close to their greatest discount relative to the broader equity market since the "Tech Boom" of the late 1990s. We believe investors can benefit from purchasing high quality dividend paying companies, which we believe are now at reasonable, even cheap, valuations. Given today’s setup we believe our unique approach to equity income provides an inflationary hedge, while providing attractive current income and capital appreciation potential for more risk-averse investors.
We thank you for investing in our Fund.
Sincerely,
Richard Levine and Sandy Pomeroy
Portfolio Managers
1 Source: U.S. Bureau of Economic Analysis
Information about principal risks of investing in the Fund is set forth in the prospectus and statement of additional information.
The portfolio composition, industries and holdings of the Fund are subject to change without notice.
The opinions expressed are those of the Fund’s portfolio managers. The opinions are as of the date of this report and are subject to change without notice.
Equity Income Fund (Unaudited)
|
(as a % of Total Investments*) |
| |
| |
| |
| |
| |
| |
| |
| |
| |
| |
| |
| |
| |
| Derivatives (other than options purchased), if any, are excluded from this chart. |
| | | |
| | Average Annual Total Return
Ended 08/31/2023 |
| | | | |
| | | | | |
| | | | | |
| | | | | |
| | | | | |
| | | | | |
| | | | | |
| | | | |
| | | | | |
| | | | | |
| | | | | |
Russell 1000® Value Index1,2 | | | | |
*The performance data for the life of Fund for each class includes the performance of the Fund’s oldest share class, Trust Class, from November 2, 2006 through June 9, 2008. The performance data for Class R3 also includes the performance of the Fund’s Institutional Class from June 9, 2008 through June 21, 2010. The performance data for Class E also includes the performance of the Fund's Institutional Class from June 9, 2008 through January 11, 2022. See endnote 5 for information about the effects of the different fees paid by each class.
The performance data quoted represent past performance and do not indicate future results. Current performance may be lower or higher than the performance data quoted. For current performance data, including current to the most recent month-end, please visit www.nb.com/performance.
The results shown in the table reflect the reinvestment of income dividends and other distributions, if any. The results do not reflect the effect of taxes a shareholder would pay on Fund distributions or on the redemption of Fund shares.
The investment return and principal value of an investment will fluctuate and shares, when redeemed, may be worth more or less than their original cost.
Returns would have been lower if Neuberger Berman Investment Advisers LLC ("NBIA") had not reimbursed certain expenses and/or waived a portion of the investment management fees during certain of the periods shown. Repayment by a class (of expenses previously reimbursed and/or fees previously waived by NBIA) will decrease the class’s returns. Please see Note B in the Notes to Financial Statements for specific information regarding expense reimbursement and/or fee waiver arrangements.
As stated in the Fund’s most recent prospectus, the total annual operating expense ratios for fiscal year 2022 were 0.71%, 1.07%, 1.82%, 1.38% and 0.57% for Institutional Class, Class A, Class C, Class R3 and Class E shares, respectively (before expense reimbursements and/or fee waivers, if any). The expense ratio for fiscal year 2022 was 0.07% for Class E after expense reimbursements and/or fee waivers. The expense ratios for the annual period ended August 31, 2023, can be found in the Financial Highlights section of this report.
Returns shown with a sales charge reflect the deduction of the current maximum initial sales charge of 5.75% for Class A shares and the contingent deferred sales charge (CDSC) for Class C shares. The CDSC for Class C shares is 1.00%, which is reduced to 0% after 1 year. The performance of the Fund’s share classes will differ primarily due to different sales charge structures and class expenses. Please see the prospectus for more information about sales charge structures, if any, and class expenses for your share class.
Equity Income Fund (Unaudited)
COMPARISON OF A $1,000,000 INVESTMENT
(000's omitted)
This graph shows the change in value of a hypothetical $1,000,000 investment in the Fund over the past 10 fiscal years, or since the Fund’s inception if it has not operated for 10 years. The graph is based on the Institutional Class shares only; the performance of the Fund’s share classes will differ primarily due to different sales charge structures and class expenses (see Performance Highlights chart on previous page). The result is compared with benchmarks, which include a broad-based market index and may include a more narrowly based index. Market indices have not been reduced to reflect any of the fees and costs of investing. The results shown in the graph reflect the reinvestment of income dividends and other distributions, if any. The results do not reflect the effect of taxes a shareholder would pay on Fund distributions or on the redemption of Fund shares. Results represent past performance and do not indicate future results.
Focus Fund Commentary (Unaudited)
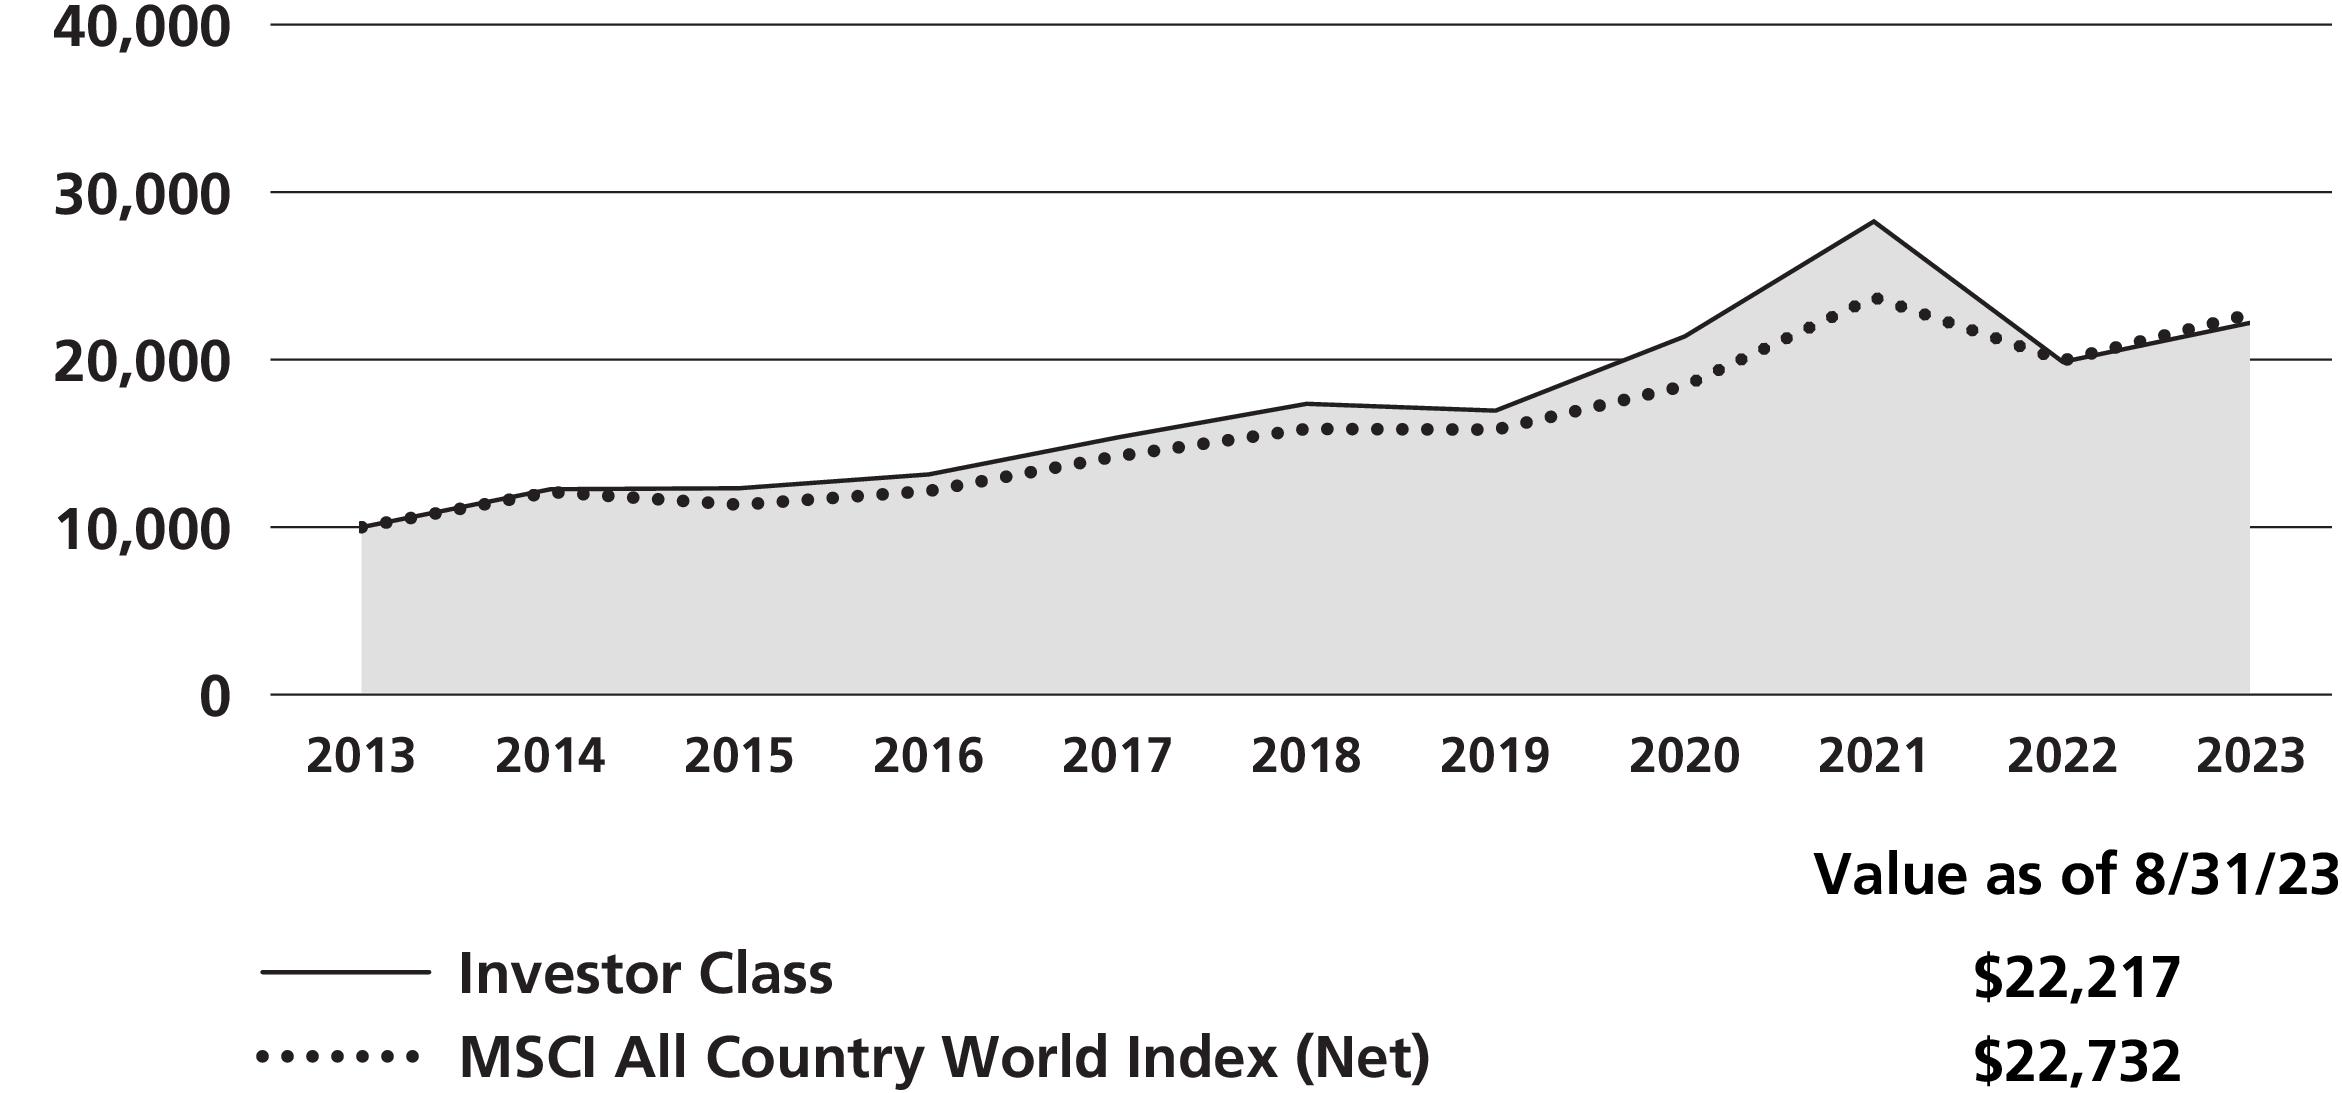
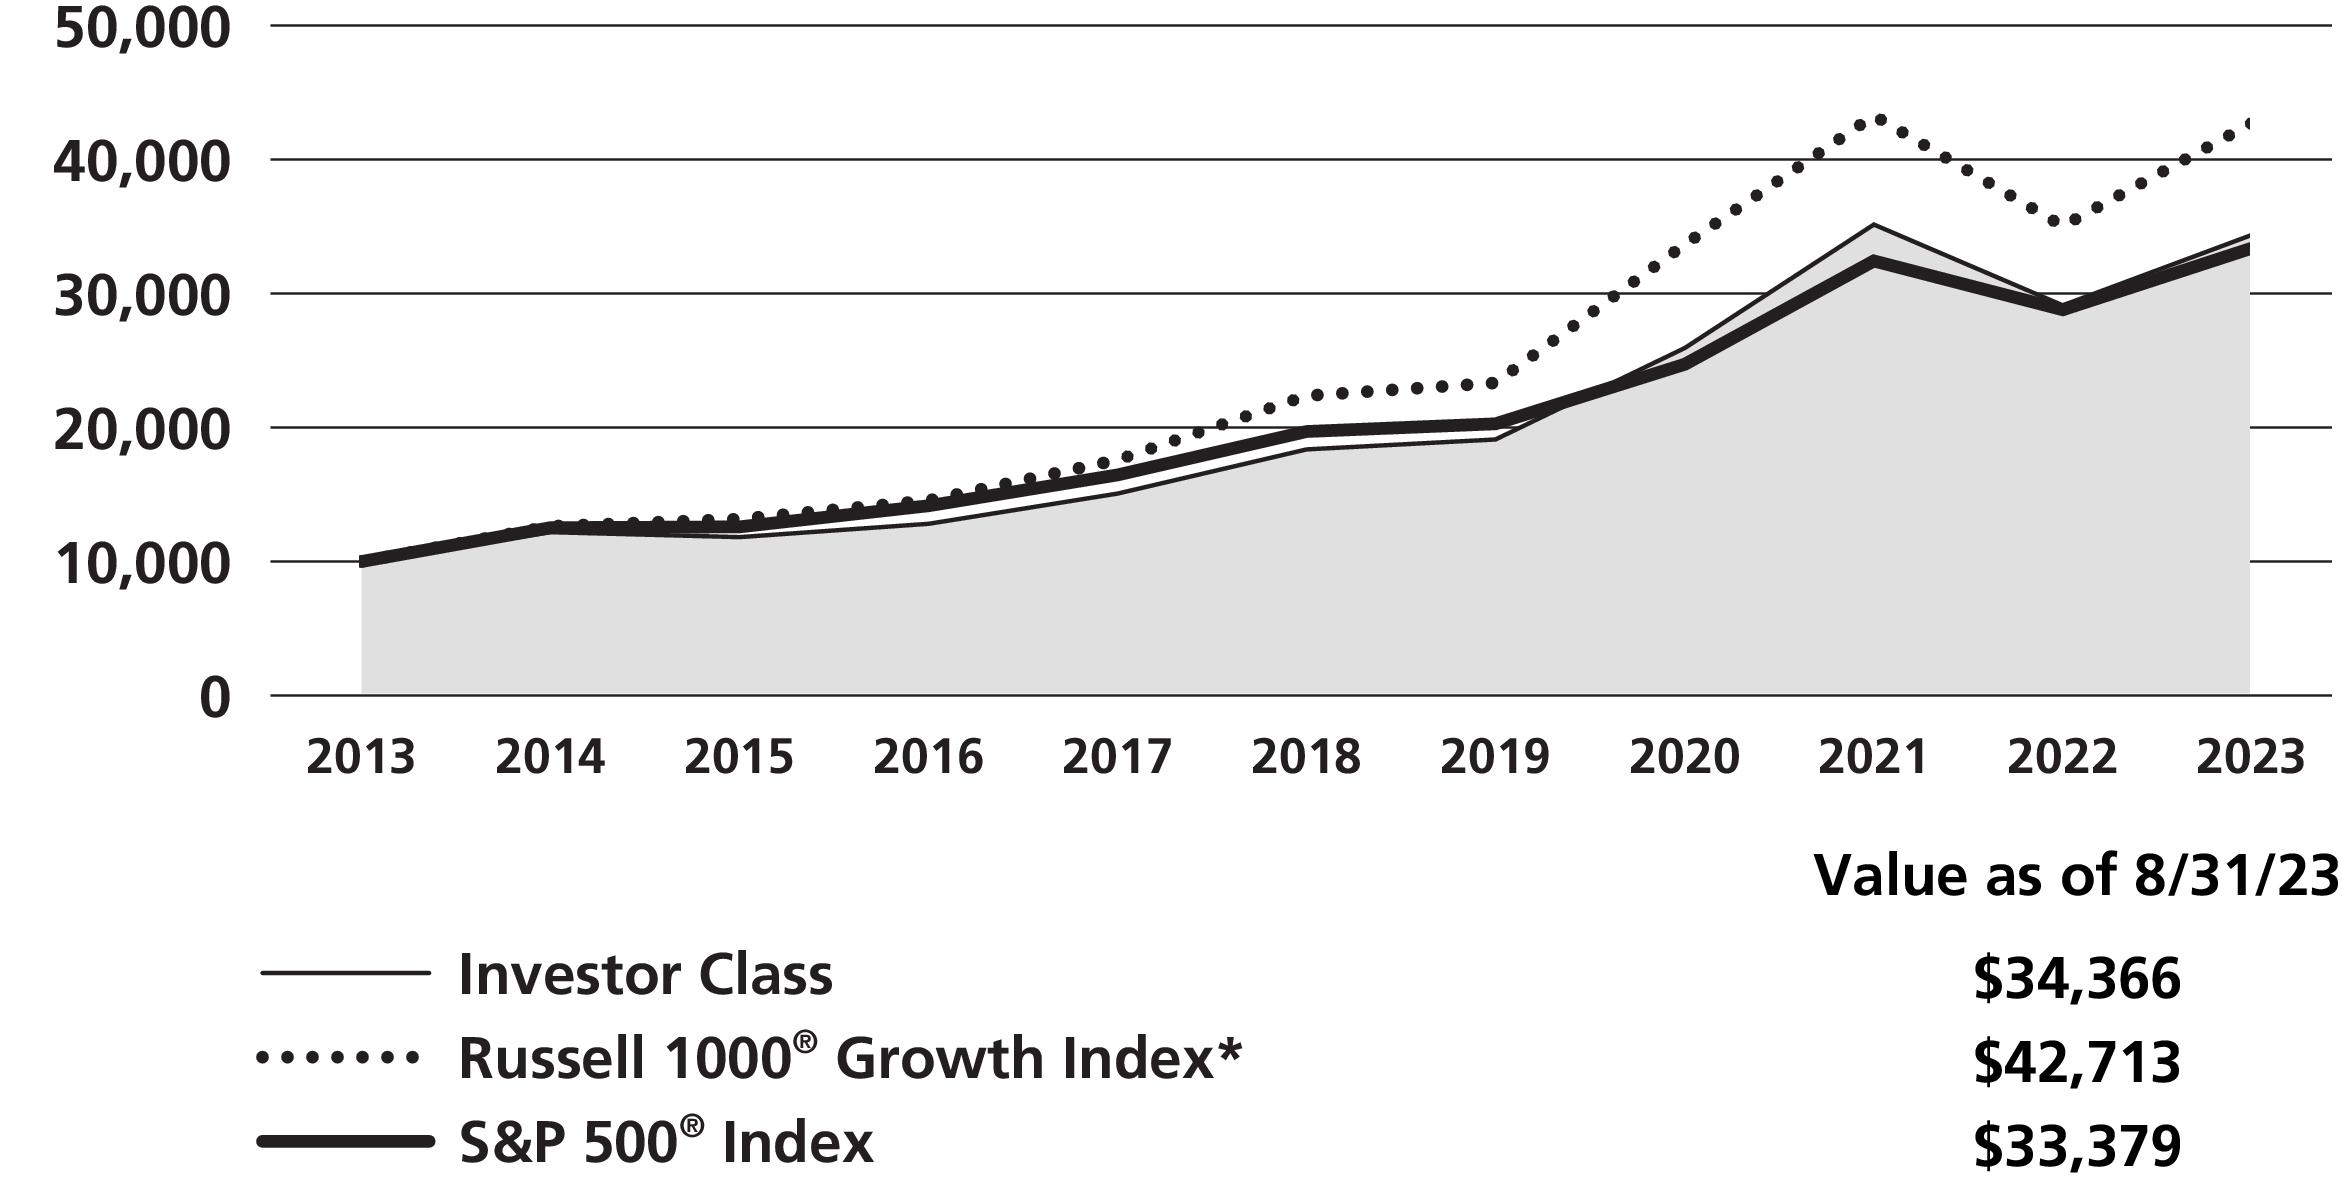
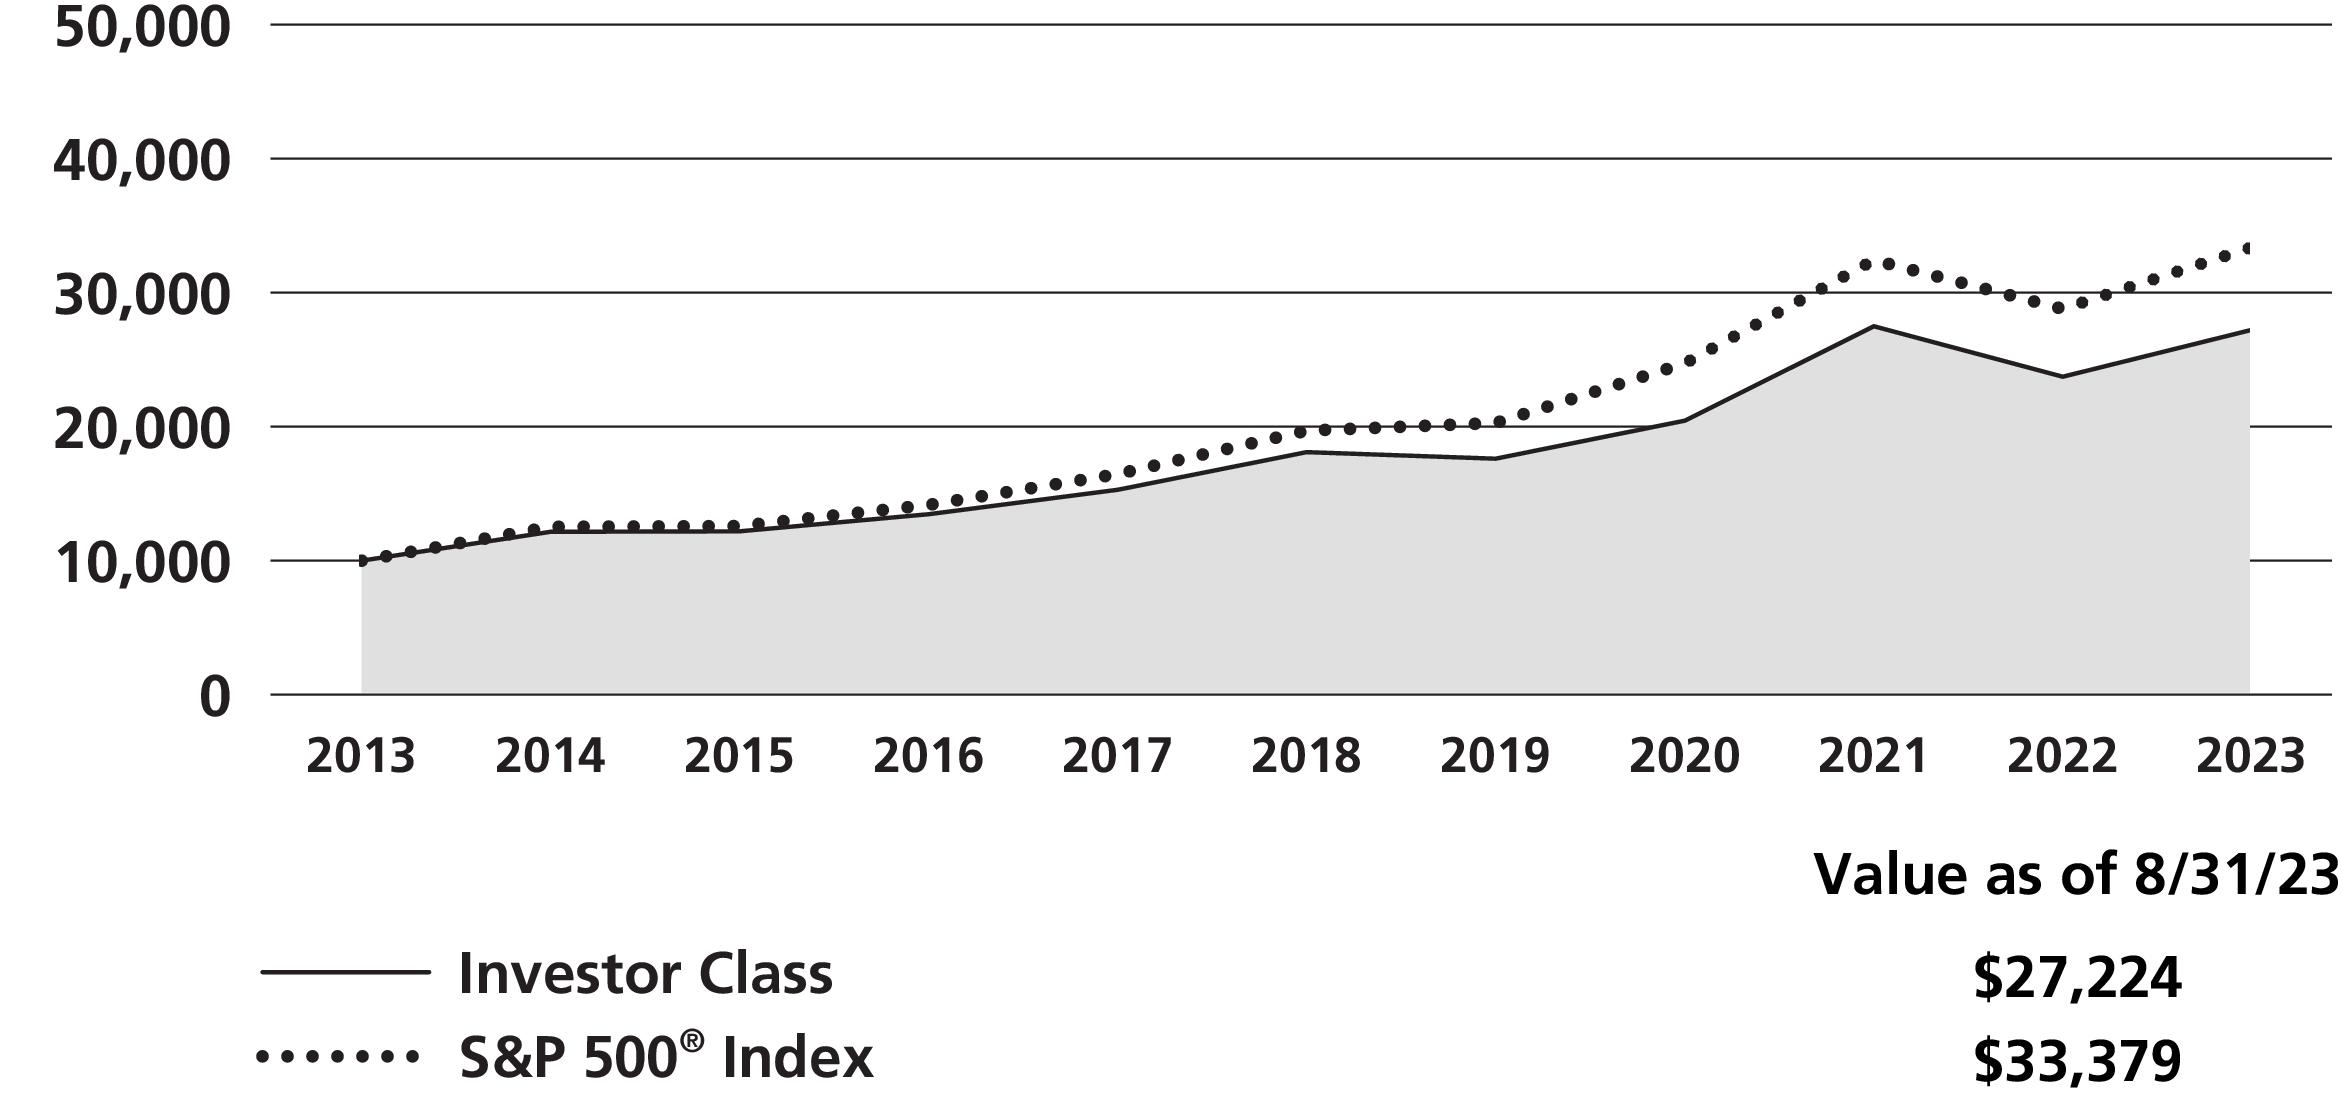
Neuberger Berman Focus Fund Investor Class generated a 11.82% total return for the fiscal year ended August 31, 2023 (the reporting period), underperforming the 13.95% total return of its benchmark, the MSCI All Country World Index (Net) (the Index), for the same period. (Performance for all share classes is provided in the table immediately following this letter.)
The global equity market, as measured by the Index, generated strong results during the reporting period. Investor sentiment was buoyed by the resilient economy, corporate earnings that often exceeded expectations, and moderating inflation. These factors offset concerns that interest rates may be "higher for longer," fears that central bank monetary tightening could push the global economy into a recession, and numerous geopolitical issues.
Sector allocation detracted from the Fund’s relative performance, whereas stock selection contributed to returns during the reporting period. In terms of sector allocation, a small cash position and an overweight to Consumer Discretionary versus the Index were the largest negatives for relative performance. On the upside, lack of exposure to Real Estate and an overweight to Industrials were the most additive to performance.
Looking at stock selection, positions in the Consumer Discretionary (led by Broadline Retail), Communication Services (led by Entertainment) and Materials (led by Chemicals) sectors were the largest contributors to relative performance. In terms of individual stocks, entertainment company Netflix, Inc., software firm Constellation Software Inc. and semiconductors & semiconductor equipment company NVIDIA Corp. were the most additive for total returns. On the downside, holdings in the Industrials (driven by Ground Transportation), Information Technology (IT) (driven by IT Services) and Utilities (driven by Electric Utilities) sectors were the largest detractors from performance. Individual stocks that negatively impacted total returns included online retail firm Amazon.com, Inc., IT services company Okta, Inc. and cloud-based data warehousing firm Snowflake, Inc. We eliminated our positions in Netflix, Inc., Okta, Inc. and Snowflake, Inc. during the reporting period.
Looking ahead, we see several interrelated reasons to be careful going forward, including the knock-on effects of sharply rising interest rates, persistent inflation, slowing corporate technology spending following the post-COVID-19 boom, continued geopolitical risks in Ukraine and Taiwan, the impact of rising corporate layoffs, and potentially slowing consumer discretionary spending. However, we believe it is important to be flexible in our thinking, and we continue to identify those companies that we believe will gain material market share whatever speed the global economy is growing.
Sincerely,
Timothy Creedon and Hari Ramanan
Portfolio Managers
Information about principal risks of investing in the Fund is set forth in the prospectus and statement of additional information.
The portfolio composition, industries and holdings of the Fund are subject to change without notice.
The opinions expressed are those of the Fund’s portfolio managers. The opinions are as of the date of this report and are subject to change without notice.
|
(as a % of Total Investments*) |
| |
| |
| |
| |
| |
| |
| |
| |
| |
| |
| |
| |
| Derivatives (other than options purchased), if any, are excluded from this chart. |
| | | |
| | Average Annual Total Return
Ended 08/31/2023 |
| | | | |
| | | | | |
| | | | | |
| | | | | |
| | | | | |
| | | | | |
| | | | | |
| | | | | |
| | | | |
| | | | | |
| | | | | |
| | | | | |
| | | | |
The performance data quoted represent past performance and do not indicate future results. Current performance may be lower or higher than the performance data quoted. For current performance data, including current to the most recent month-end, please visit www.nb.com/performance.
The results shown in the table reflect the reinvestment of income dividends and other distributions, if any. The results do not reflect the effect of taxes a shareholder would pay on Fund distributions or on the redemption of Fund shares.
The investment return and principal value of an investment will fluctuate and shares, when redeemed, may be worth more or less than their original cost.
Returns would have been lower if Neuberger Berman Investment Advisers LLC ("NBIA") had not reimbursed certain expenses and/or waived a portion of the investment management fees during certain of the periods shown. Repayment by a class (of expenses previously reimbursed and/or fees previously waived by NBIA) will decrease the class’s returns. Please see Note B in the Notes to Financial Statements for specific information regarding expense reimbursement and/or fee waiver arrangements.
As stated in the Fund’s most recent prospectus, the total annual operating expense ratios for fiscal year 2022 were 0.89%, 1.10%, 1.25%, 0.75%, 1.13%, and 1.91% for Investor Class, Trust Class, Advisor Class, Institutional Class, Class A and Class C shares, respectively (before expense reimbursements and/or fee waivers, if any). The expense ratio was 1.11% and 1.86% for Class A and Class C shares, after expense reimbursements and/or fee waivers. The expense ratios for the annual period ended August 31, 2023, can be found in the Financial Highlights section of this report.
Returns shown with a sales charge reflect the deduction of the current maximum initial sales charge of 5.75% for Class A shares and the contingent deferred sales charge (CDSC) for Class C shares. The CDSC for Class C shares is 1.00%, which is reduced to 0% after 1 year. The performance of the Fund’s share classes will differ primarily due to different sales charge structures and class expenses. Please see the prospectus for more information about sales charge structures, if any, and class expenses for your share class.
COMPARISON OF A $10,000 INVESTMENT
This graph shows the change in value of a hypothetical $10,000 investment in the Fund over the past 10 fiscal years, or since the Fund’s inception if it has not operated for 10 years. The graph is based on the Investor Class shares only; the performance of the Fund’s share classes will differ primarily due to different sales charge structures and class expenses (see Performance Highlights chart on previous page). The result is compared with benchmarks, which include a broad-based market index and may include a more narrowly based index. Market indices have not been reduced to reflect any of the fees and costs of investing. The results shown in the graph reflect the reinvestment of income dividends and other distributions, if any. The results do not reflect the effect of taxes a shareholder would pay on Fund distributions or on the redemption of Fund shares. Results represent past performance and do not indicate future results.
Genesis Fund Commentary (Unaudited)
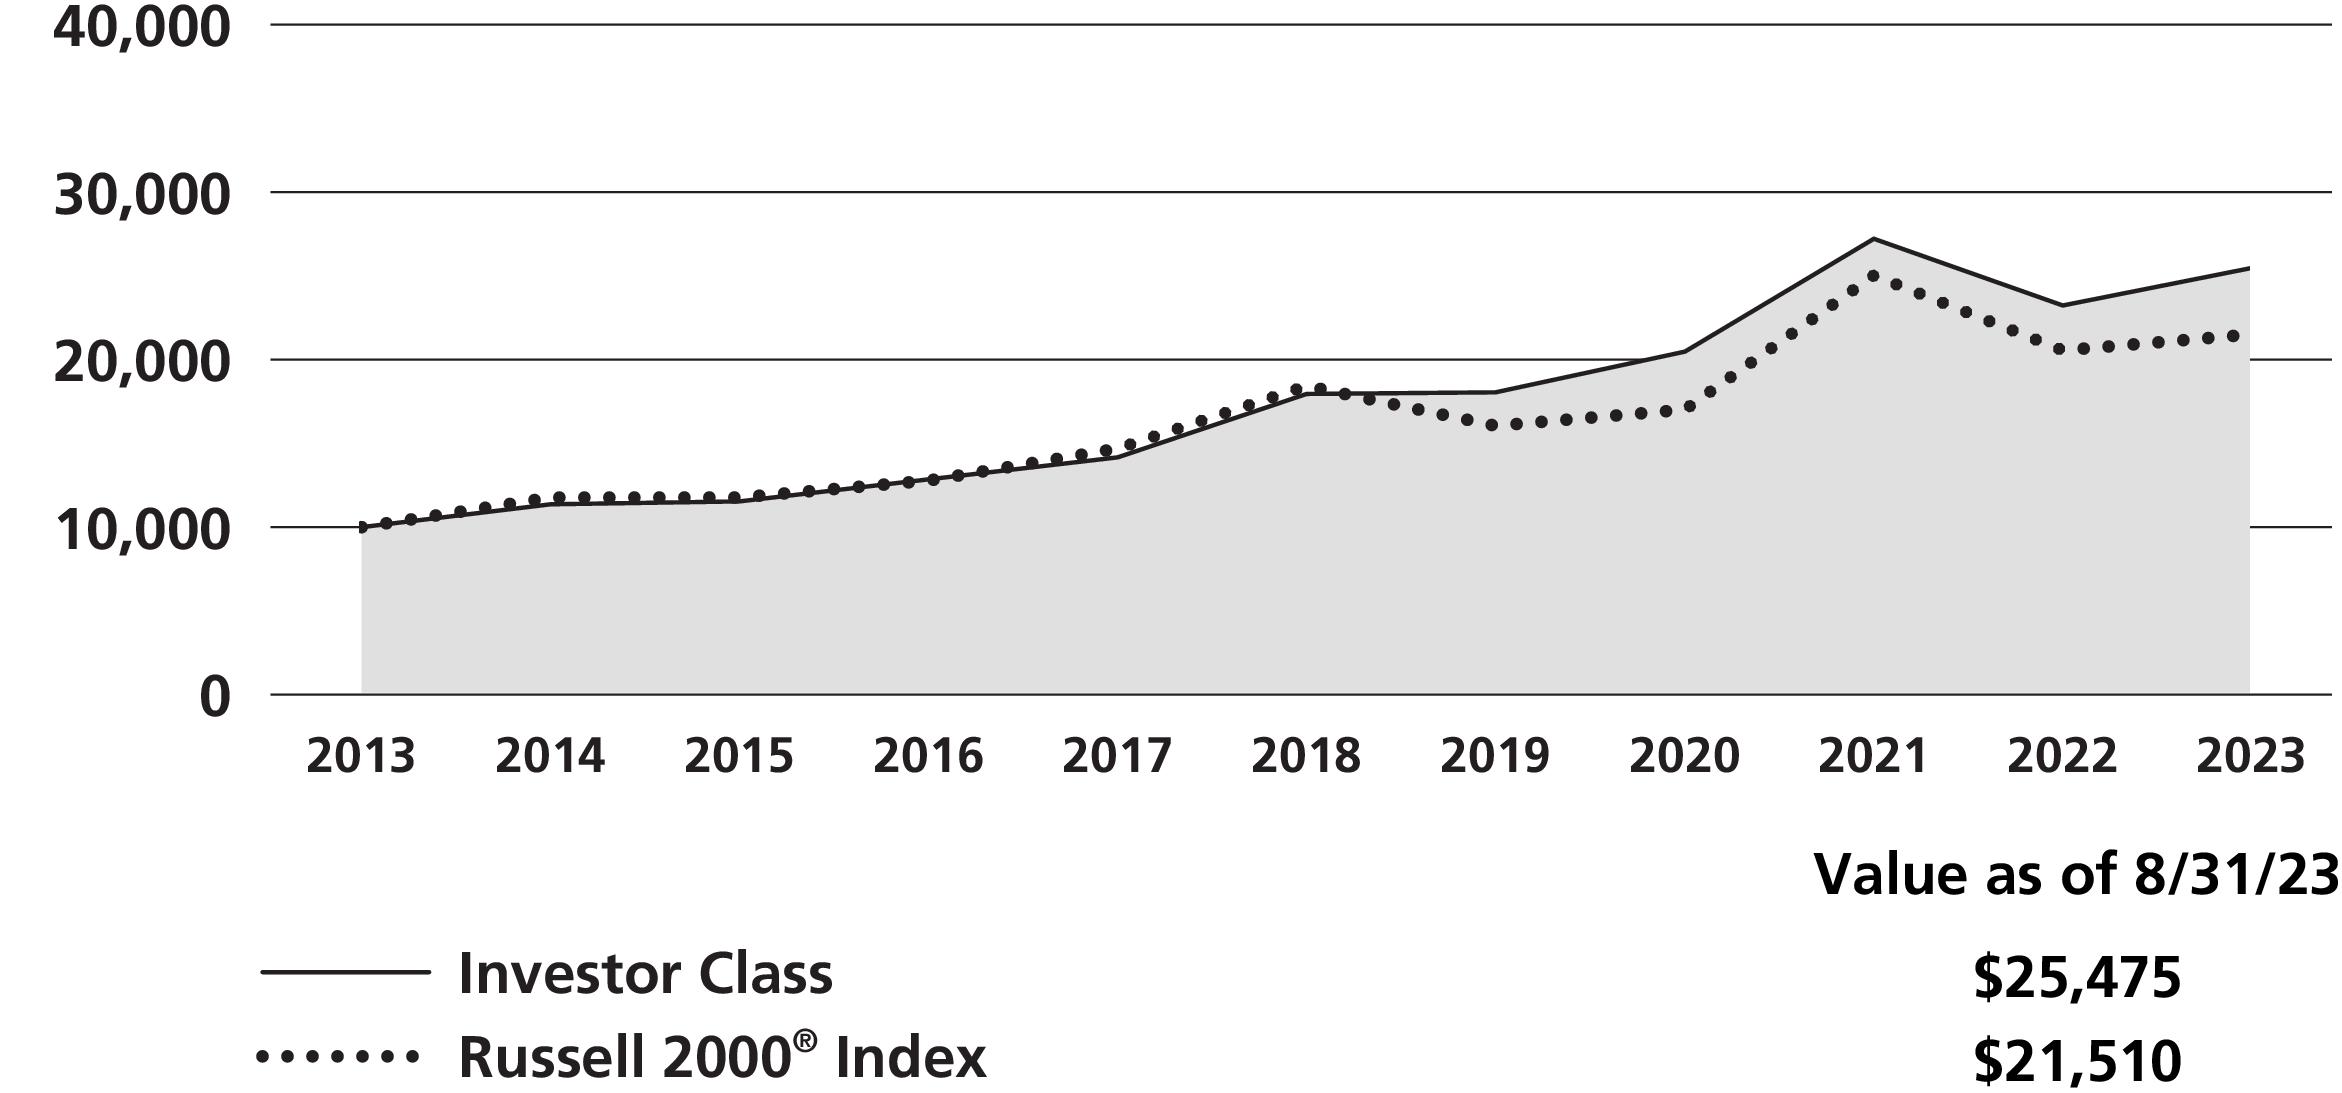
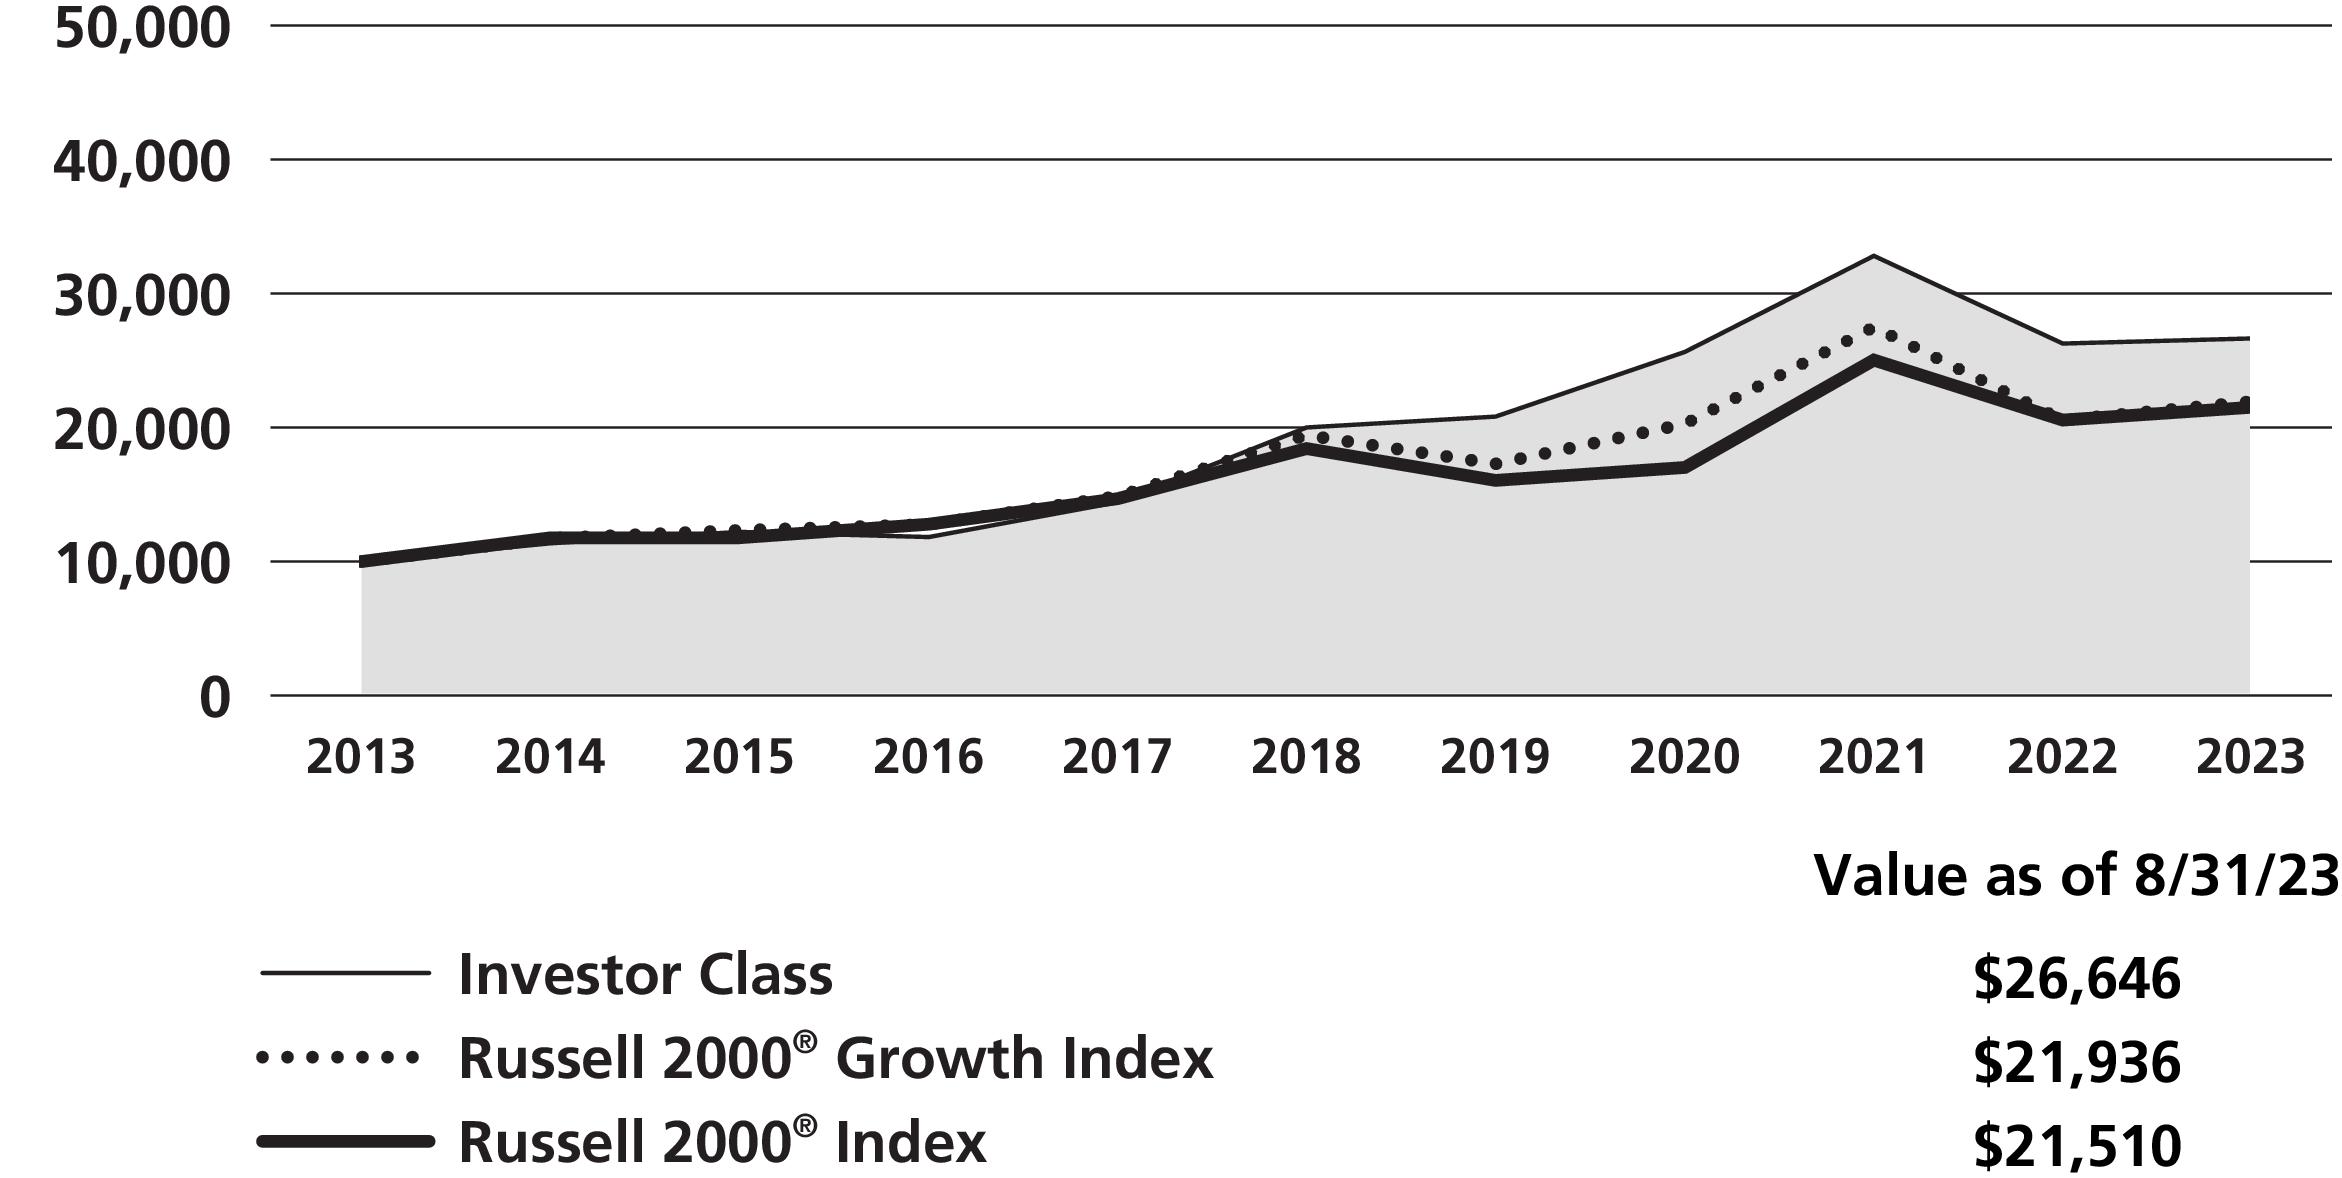
Neuberger Berman Genesis Fund Investor Class generated a 9.64% total return for the fiscal year ended August 31, 2023 (the reporting period), outperforming the 4.65% total return of its benchmark, the Russell 2000® Index (the Index), for the same period. (Performance for all share classes is provided in the table immediately following this letter.)
The overall U.S. equity market, as measured by the S&P 500® Index, generated solid results during the reporting period. Investor sentiment was buoyed by the resilient economy, corporate earnings that often exceeded expectations, moderating inflation, and hopes that the U.S. Federal Reserve Board (Fed) was nearing the end of its rate hike cycle. These factors offset concerns that interest rates may be "higher for longer," fears that the Fed’s monetary tightening could push the economy into a recession, and numerous geopolitical issues. All told, the S&P 500 Index gained 15.94% during the reporting period. In contrast, small-cap stocks, as measured by the Index, returned 4.65% total return over the same period.
The Fund outperformed the Index on a relative basis due to strong sector allocation and stock selection. From a sector allocation perspective, overweights to the Information Technology (IT) and Industrials sectors versus the Index were the largest contributors to results. Within IT, the Fund’s overweight to Software was the most additive for returns. Within Industrials, our overweight to Machinery companies added the most value. Our minimal exposure to the underperforming Biotechnology industry also added to relative returns. Small-cap biotechnology companies generally do not meet our high-quality investment criteria, as they tend to be speculative, typically do not generate earnings, and require considerable capital market funding to operate. On the downside, an underweight to the Energy sector versus the Index was a meaningful detractor from performance.
In terms of stock selection, the Fund’s strongest relative results were in the Health Care (led by Life Sciences Tools & Services and Health Care Equipment & Supplies), IT (led by Software and Semiconductors) and Materials (led by Chemicals) sectors. Conversely, stock selection in the Financials (driven by Banks), Industrials (driven by Construction & Engineering) and Communication Services (driven by Media) sectors were the largest drags on relative results.
Over the past eighteen months, the Fed has been squarely focused on restoring price stability with the goal of suppressing demand to bring inflation under control. Recent testimony from the Fed suggests it may be nearing the end of its tightening cycle. Overall economic activity remains stable, however, some economic indicators suggest an economic cooling, while some general macroeconomic data suggests continued resilience in the economy. Considering this backdrop, equity markets have remained highly sensitive to incoming inflation-related data points and economic indicators. Taking a step back, it is clear in our view that markets have entered a meaningfully different regime than the one present during the last decade. It appears risk aversion has returned, access to financing has become harder, and the cost of capital has risen materially. Furthermore, events in the banking sector might cause financial conditions to tighten further as lending standards become more stringent. The risk of recession both in the U.S. and globally has grown, but by no means is a certainty. With the macro trajectory clouded, we are striving to maintain balance in the Fund. We remain confident that our high-quality portfolio of businesses with attractive financial characteristics, differentiated and durable business models, and sustainable earnings growth is well positioned to weather these uncertain times and deliver above-average risk-adjusted returns.
Sincerely,
Judith M. Vale*, Robert W. D'Alelio, Brett S. Reiner and Gregory G. Spiegel
Portfolio Co-Managers
*As announced on July 18, 2023, Judith Vale intends to transition to a newly created Portfolio Strategist role starting in January 2024. In this role, she will focus on providing investment guidance and analysis to the portfolio managers and the broader investment team responsible for managing the Fund.
Information about principal risks of investing in the Fund is set forth in the prospectus and statement of additional information.
The portfolio composition, industries and holdings of the Fund are subject to change without notice.
The opinions expressed are those of the Fund’s portfolio managers. The opinions are as of the date of this report and are subject to change without notice.
|
(as a % of Total Investments*) |
| |
| |
| |
| |
| |
| |
| |
| |
| |
| |
| |
| |
| Derivatives (other than options purchased), if any, are excluded from this chart. |
| | | |
| | Average Annual Total Return
Ended 08/31/2023 |
| | | | |
| | | | | |
| | | | | |
| | | | | |
| | | | | |
| | | | | |
| | | | | |
| | | | | |
| | | | | |
| | | | |
The performance data quoted represent past performance and do not indicate future results. Current performance may be lower or higher than the performance data quoted. For current performance data, including current to the most recent month-end, please visit www.nb.com/performance.
The results shown in the table reflect the reinvestment of income dividends and other distributions, if any. The results do not reflect the effect of taxes a shareholder would pay on Fund distributions or on the redemption of Fund shares.
The investment return and principal value of an investment will fluctuate and shares, when redeemed, may be worth more or less than their original cost.
Returns would have been lower if Neuberger Berman Investment Advisers LLC ("NBIA") had not reimbursed certain expenses and/or waived a portion of the investment management fees during certain of the periods shown. Repayment by a class (of expenses previously reimbursed and/or fees previously waived by NBIA) will decrease the class’s returns. Please see Note B in the Notes to Financial Statements for specific information regarding expense reimbursement and/or fee waiver arrangements.
As stated in the Fund’s most recent prospectus, the total annual operating expense ratios for fiscal year 2022 were 1.00%, 1.09%, 1.34%, 0.84%, 0.74% and 0.70% for Investor Class, Trust Class, Advisor Class, Institutional Class, Class R6 and Class E shares, respectively, (before expense reimbursements and/or fee waivers, if any). The expense ratio for fiscal year 2022 was 0.04% for Class E after expense reimbursements and/or fee waivers. The expense ratios for the annual period ended August 31, 2023, can be found in the Financial Highlights section of this report.
COMPARISON OF A $10,000 INVESTMENT
This graph shows the change in value of a hypothetical $10,000 investment in the Fund over the past 10 fiscal years, or since the Fund’s inception if it has not operated for 10 years. The graph is based on the Investor Class shares only; the performance of the Fund’s share classes will differ primarily due to different class expenses (see Performance Highlights chart on previous page). The result is compared with benchmarks, which include a broad-based market index and may include a more narrowly based index. Market indices have not been reduced to reflect any of the fees and costs of investing. The results shown in the graph reflect the reinvestment of income dividends and other distributions, if any. The results do not reflect the effect of taxes a shareholder would pay on Fund distributions or on the redemption of Fund shares. Results represent past performance and do not indicate future results.
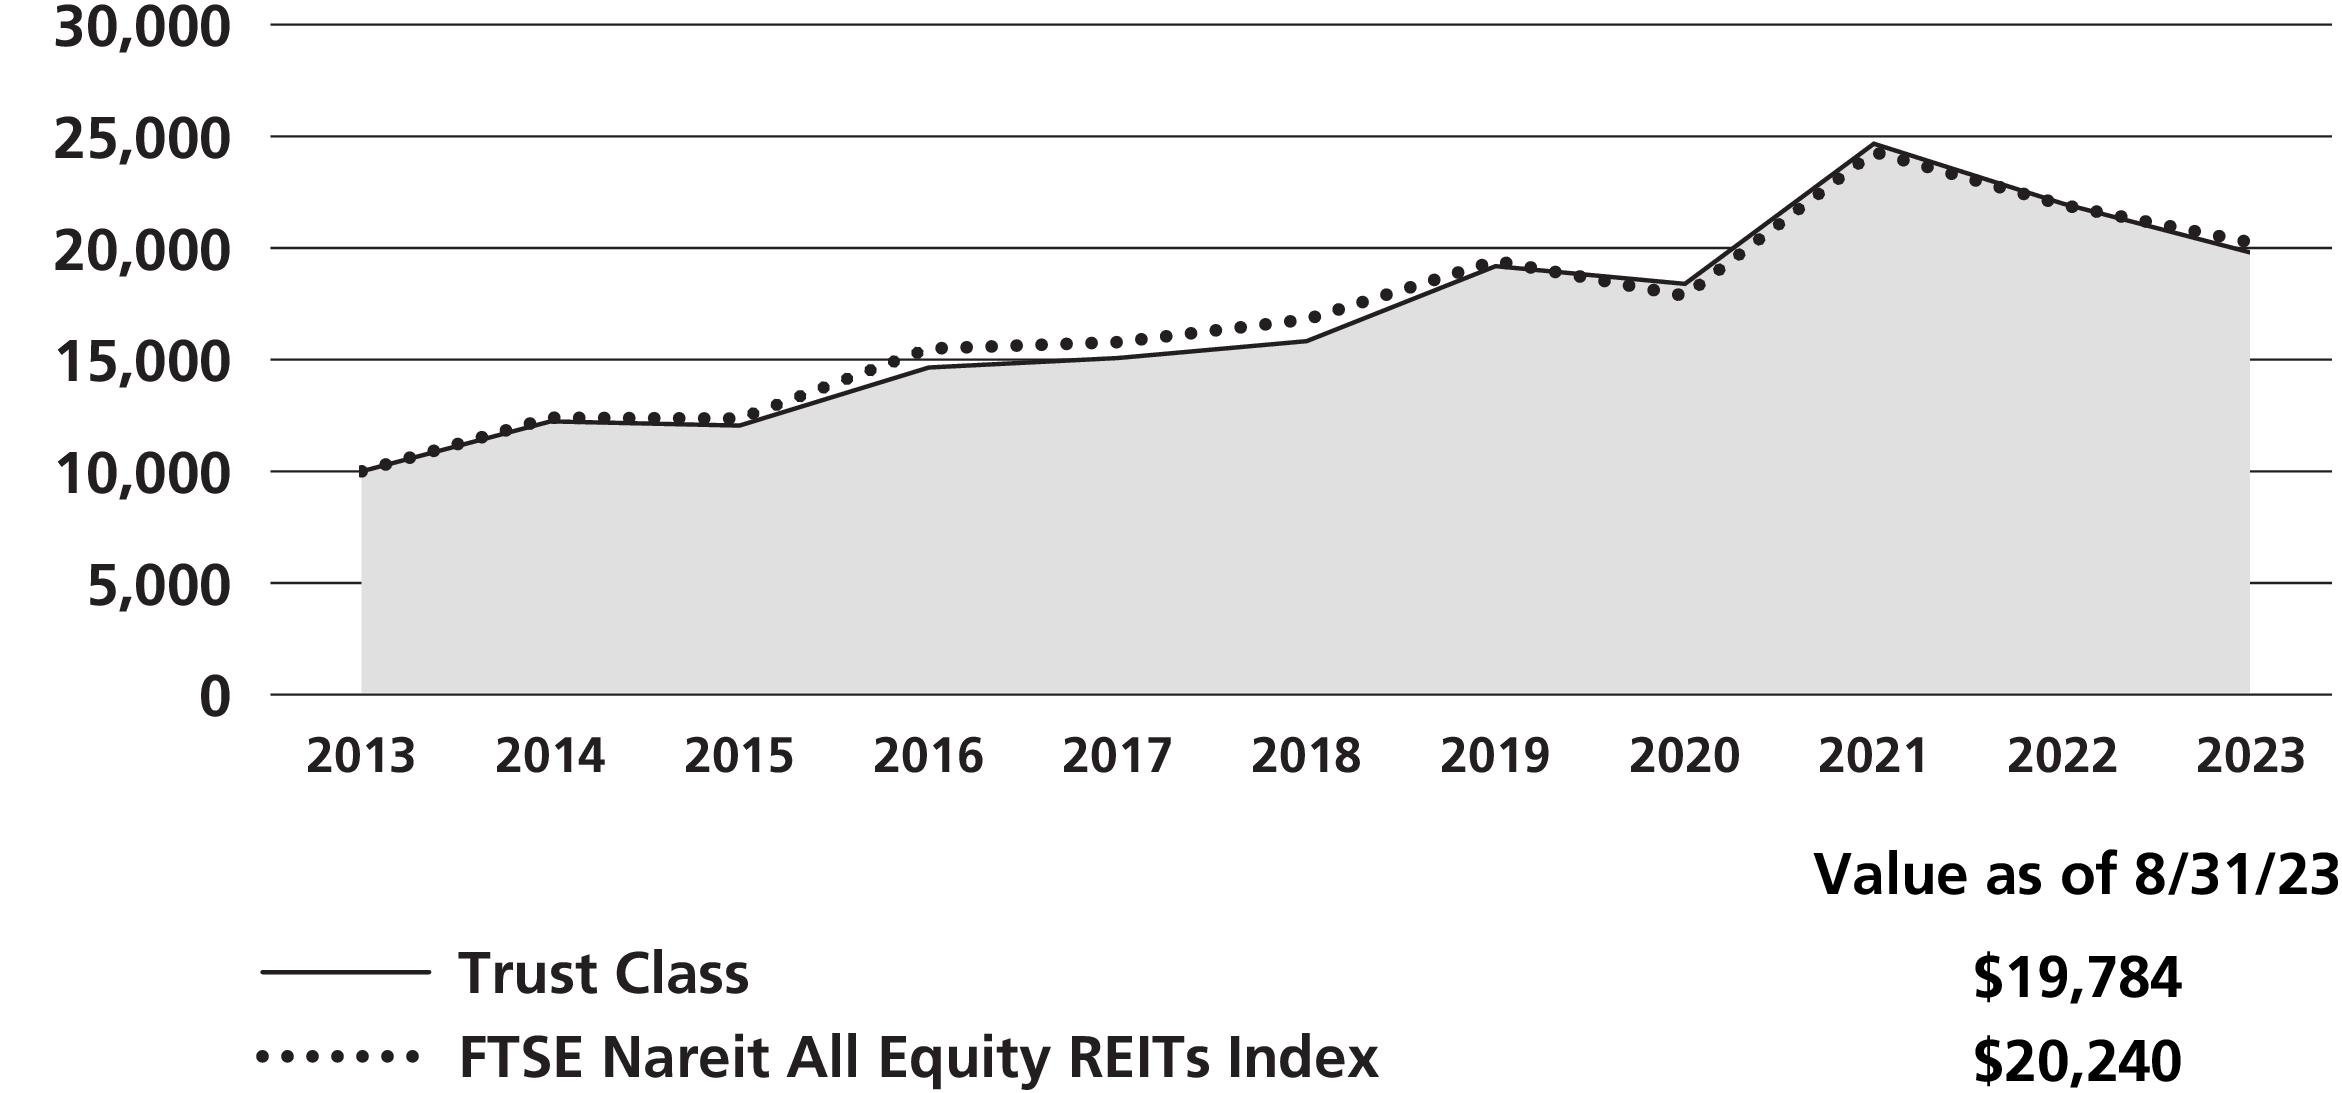
Global Real Estate Fund* Commentary (Unaudited)
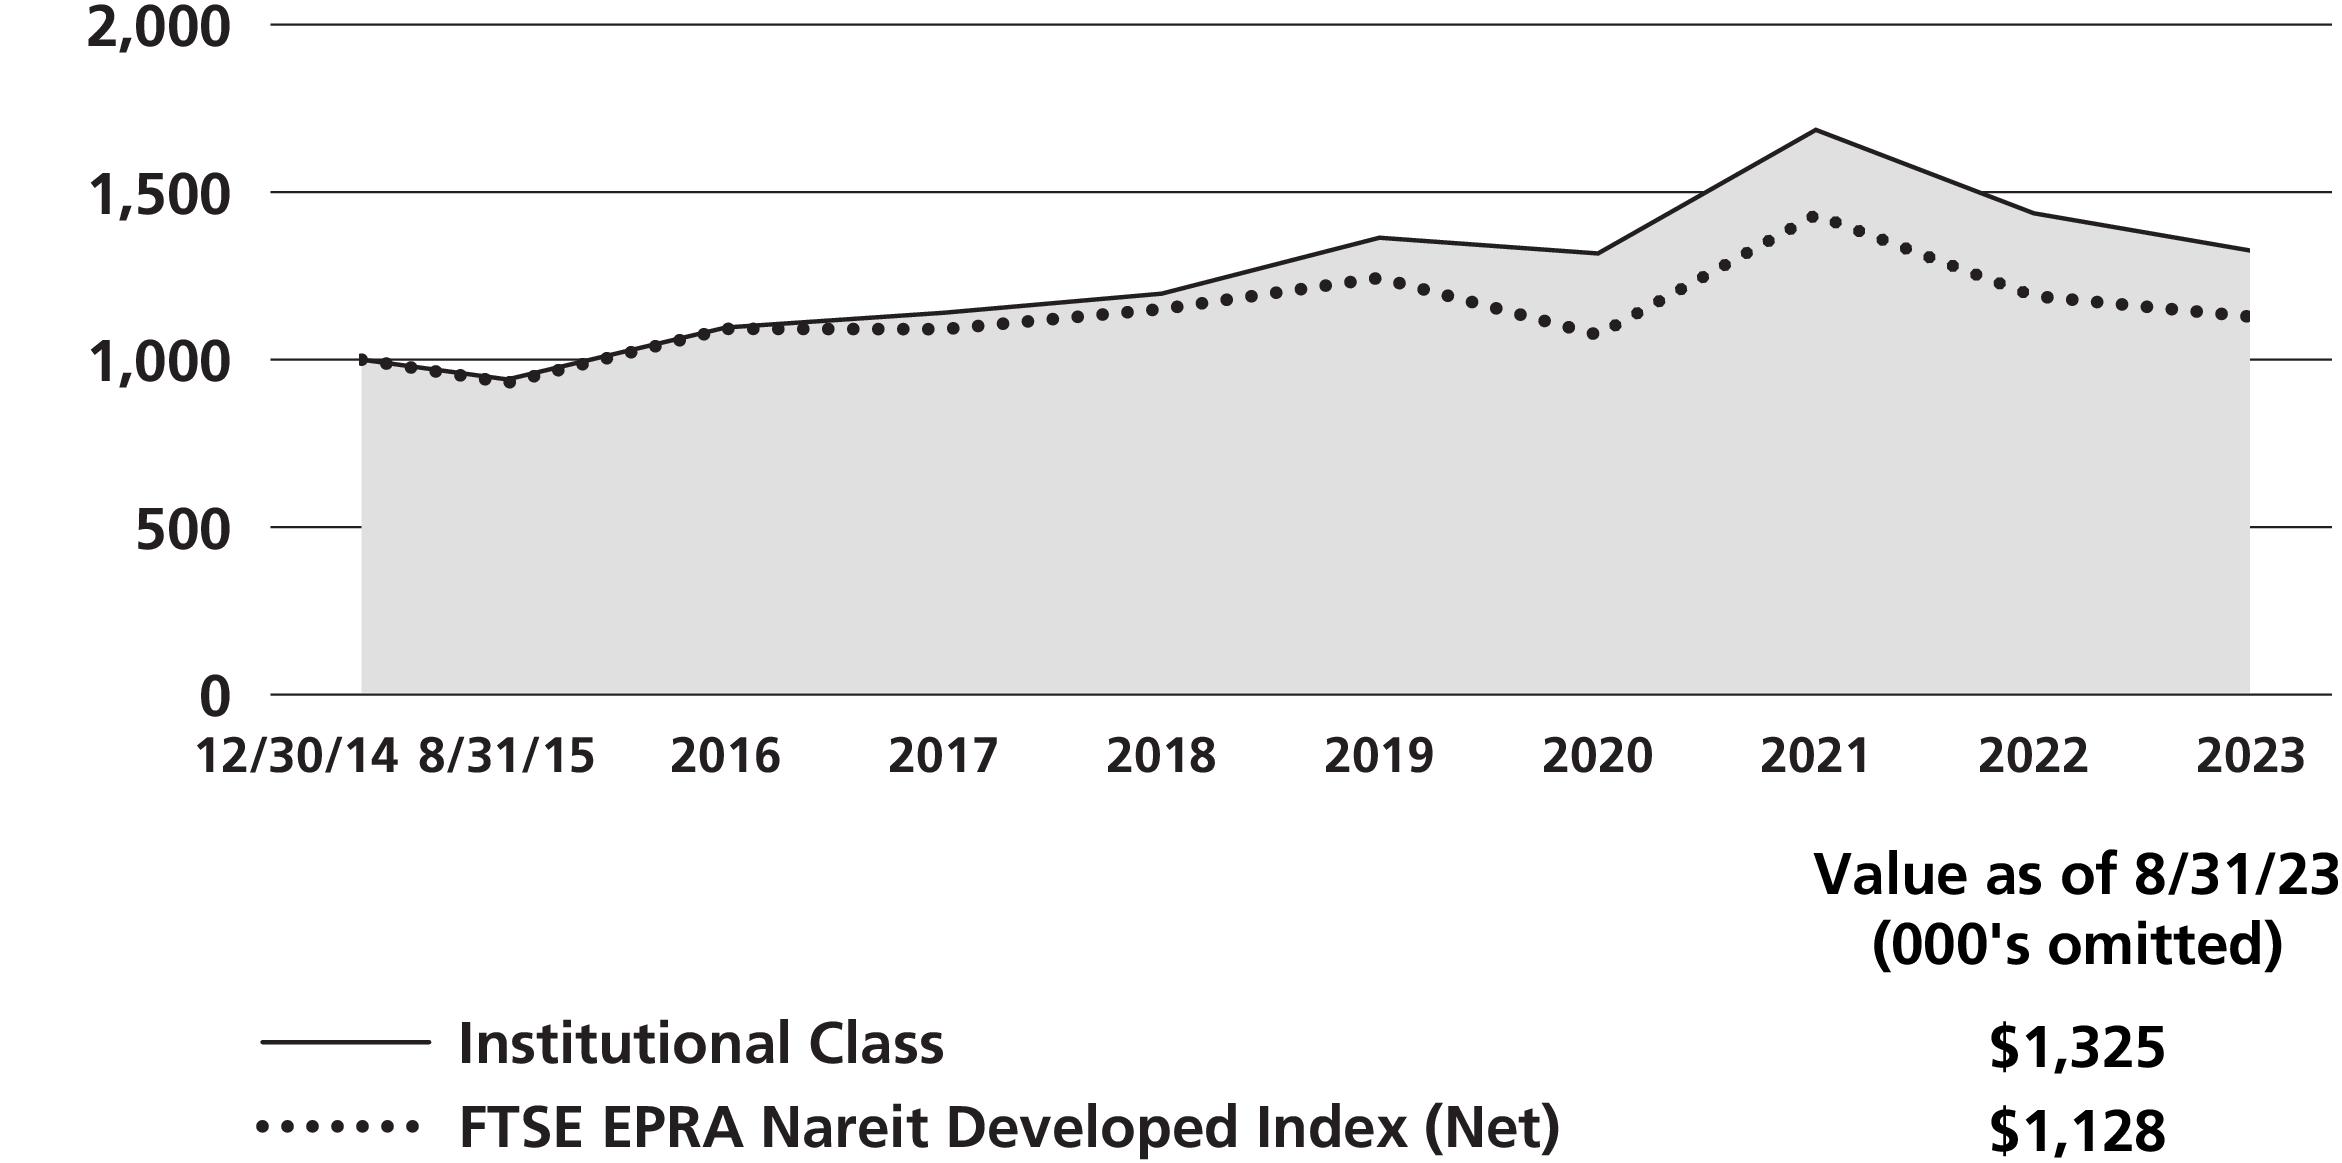
Neuberger Berman Global Real Estate Fund Institutional Class generated a -7.85% total return for the fiscal year ended August 31, 2023 (the reporting period), underperforming the -5.19% total return of its benchmark, the FTSE EPRA Nareit Developed Index (Net) (the Index), for the same period.
The global equity market, as measured by the MSCI All Country World Index (Net) generated a positive 13.95% total return. In most developed market economies inflation readings fell back, though core measures remained more persistent. Global bond yields moved higher at the short end of the curve, leading to deeper yield curve inversion for many developed markets. Credit performed well as spreads narrowed, with lower grade credits performing best as near-term recession risk receded. Comparatively, global real estate investment trusts (REITs), as measured by the Index, generated weaker results.
The Fund underperformed the Index on a relative basis during the reporting period. Stock selection and country positioning detracted from the Fund’s relative returns. From a sector selection perspective, an overweight in the Real Estate Holding and Development sector and underweights to Office REITs and Health Care REITs versus the Index were additive for relative returns. In terms of individual holdings, Prologis, Inc., Gecina SA, and Iron Mountain Inc. were the largest contributors to performance. On the downside, relative overweights to Infrastructure REITs, and underweights to Industrial REITs and Other Specialty REIT sectors were detractors. Individual holdings that detracted most from performance include Crown Castle, Inc., American Tower Corporation, and Extra Space Storage, Inc.
In terms of the Fund’s positioning from a country perspective, overweights in Spain and China and an underweight in Japan versus the Index were the most beneficial for relative returns. On the downside, an overweight in the U.K and lack of exposure to Switzerland were the largest detractors from relative performance.
We head into fall with continuing concerns related to an uncertain macro-economic backdrop, which is still weighed down by higher interest rates, slower economic growth and lack of liquidity in transaction markets and private investment vehicles. However, the banking sector stress, lower commodity prices and a slowing labor market could provide support for the view that inflation levels may have peaked. The broader commercial real estate sector has been viewed with caution as the failures of regional banks and subsequent tighter lending standards have increased concern that U.S. regional banks’ ability to lend to the sector is likely impaired. The effect on the listed REITs market is not expected to be pronounced as we believe such REITs own mainly high-quality assets, generally maintain strong balance sheets, and tend to use the larger banks. However, REITs continue to be weighed down by negative news headlines that suggest otherwise.
Within the UK, higher interest rates are beginning to bring inflation down but are also slowing economic activity and weighing on sentiment. On the European Continent, economic growth is expected to be relatively flat in 2023 and 2024. Real estate values are adjusting to the higher interest rate environment, but a lack of transactions makes ascertaining asset values challenging. However, many continental European real estate companies remain over leveraged. We maintain a preference for UK companies in sectors enjoying secular tailwinds with lower leverage levels. Asia is less impacted by the two important issues facing the global real estate sector, namely elevated office vacancies in the U.S. and excessive leverage in some European companies. We believe Japan is poised to emerge structurally from decades of deflation and subpar growth. We stay slightly cautious about Japanese REITs because of lower asset quality, richer valuations, and the possible sharp increase in Japanese bond yields as the Bank of Japan pursues a further pivot. Hong Kong experienced a healthy GDP rebound post China’s COVID-19 reopening but there are justifiable doubts about the medium-term outlook. Overall, we hold a constructive view for the strongest developers in Hong Kong, Singapore and Japan, which we believe could profit from opportunities made available in any forthcoming downturns, as well as the defensive incomes from grocery-anchored retail in Australia and logistics REITs in Japan.
While we believe the macro backdrop could continue to weigh on stocks, a near-term end to the U.S. Federal Reserve Board tightening cycle and attractive relative valuations versus the broader market could, in our view, support the REIT market later this year and into 2024.
Sincerely,
Steve Shigekawa, Brian C. Jones and Anton Kwang
Portfolio Managers
*Effective after the close of business on October 13, 2023, the Fund was reorganized into an exchange-traded fund. Please refer to Note H of the Notes to Financial Statements for additional important information. For more information, call us at 800-877-9700 or visit www.nb.com/ETF.
Information about principal risks of investing in the Fund is set forth in the prospectus and statement of additional information.
The portfolio composition, industries and holdings of the Fund are subject to change without notice.
The opinions expressed are those of the Fund’s portfolio managers. The opinions are as of the date of this report and are subject to change without notice.
Global Real Estate Fund (Unaudited)
| | |
| | Average Annual Total Return
Ended 08/31/2023 |
| | | |
| | | | |
| | | | |
| | | | |
FTSE EPRA Nareit
Developed Index
| | | |
The performance data quoted represent past performance and do not indicate future results. Current performance may be lower or higher than the performance data quoted. For current performance data, including current to the most recent month-end, please visit www.nb.com/performance.
The results shown in the table reflect the reinvestment of income dividends and other distributions, if any. The results do not reflect the effect of taxes a shareholder would pay on Fund distributions or on the redemption of Fund shares.
The investment return and principal value of an investment will fluctuate and shares, when redeemed, may be worth more or less than their original cost.
Returns would have been lower if Neuberger Berman Investment Advisers LLC ("NBIA") had not reimbursed certain expenses and/or waived a portion of the investment management fees during certain of the periods shown. Repayment by a class (of expenses previously reimbursed and/or fees previously waived by NBIA) will decrease the class’s returns. Please see Note B in the Notes to Financial Statements for specific information regarding expense reimbursement and/or fee waiver arrangements.
As stated in the Fund’s most recent prospectus, the total annual operating expense ratio for fiscal year 2022 was 7.96% (before expense reimbursements and/or fee waivers, if any). The expense ratio was 1.01% after expense reimbursements and/or fee waivers. The expense ratios for the annual period ended August 31, 2023, can be found in the Financial Highlights section of this report.
Global Real Estate Fund (Unaudited)
COMPARISON OF A $1,000,000 INVESTMENT
(000's omitted)
This graph shows the change in value of a hypothetical $1,000,000 investment in the Fund over the past 10 fiscal years, or since the Fund’s inception if it has not operated for 10 years. The graph is based on the Institutional Class shares only; the performance of the Fund’s share classes will differ primarily due to different sales charge structures and class expenses (see Performance Highlights chart on previous page). The result is compared with benchmarks, which include a broad-based market index and may include a more narrowly based index. Market indices have not been reduced to reflect any of the fees and costs of investing. The results shown in the graph reflect the reinvestment of income dividends and other distributions, if any. The results do not reflect the effect of taxes a shareholder would pay on Fund distributions or on the redemption of Fund shares. Results represent past performance and do not indicate future results.
Greater China Equity Fund* Commentary (Unaudited)
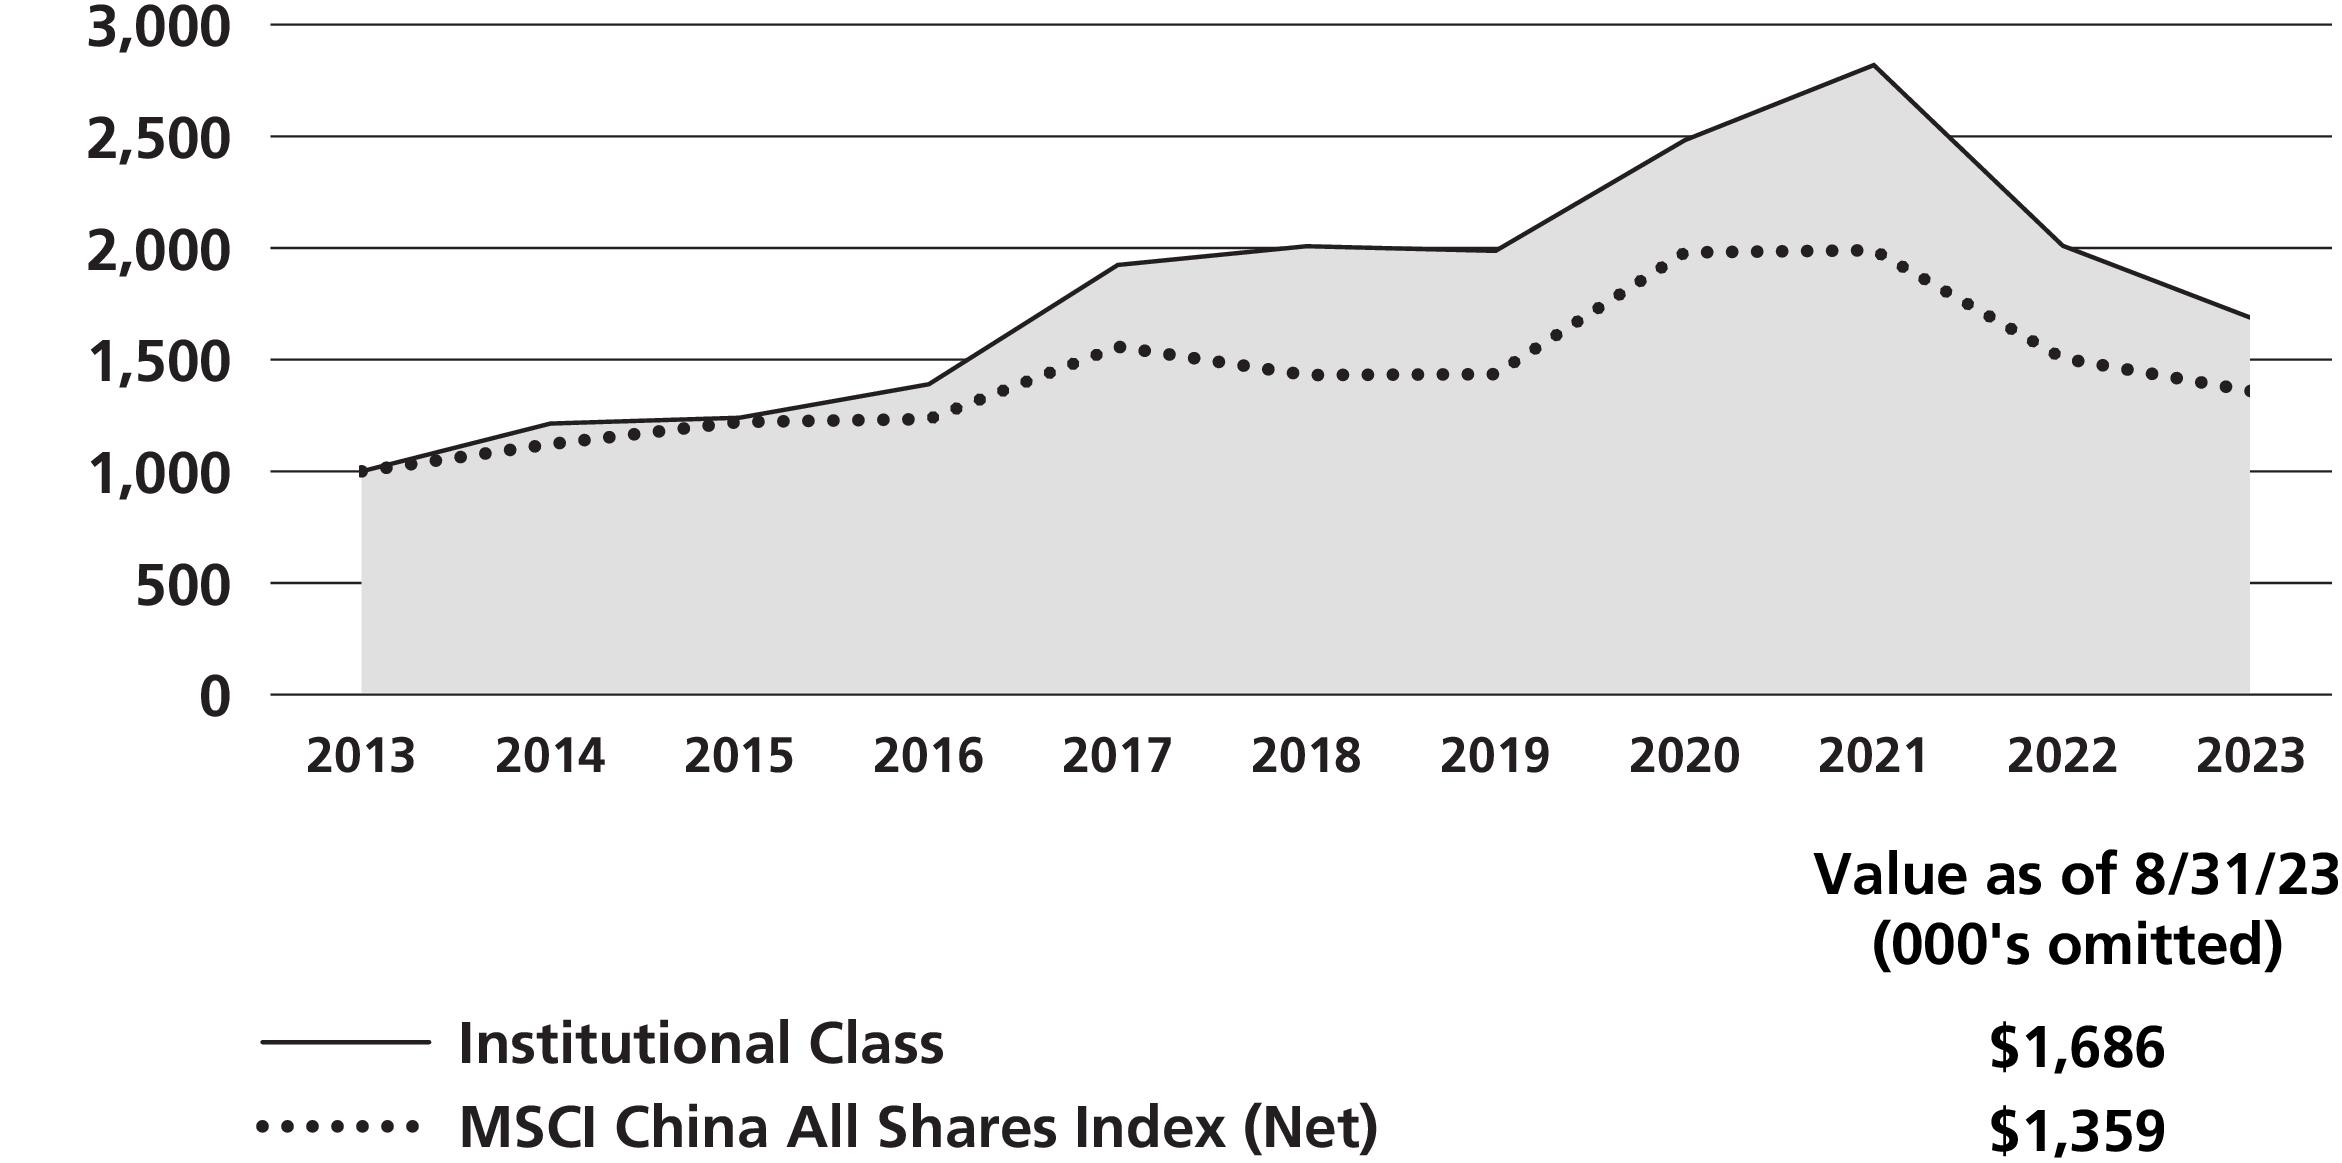
Neuberger Berman Greater China Equity Fund Institutional Class generated a -16.10% total return for the fiscal year ended August 31, 2023 (the reporting period), underperforming its benchmark, the MSCI China All Shares Index (Net) (the Index), which returned -9.75% over the same period.
Over the reporting period, contributors to performance relative to the Index included Health Care (stock selection in Biotechnology), Real Estate (stock selection) and Utilities (no exposure). Detractors from performance relative to the Index included Materials (significant overweight and stock selection in Construction Materials), Consumer Staples (stock selection in Food Products and Beverages) and Communication Services (significant underweight).
During the reporting period, China equity markets remained volatile. In September and October 2022, China equity markets underwent severe turbulence given China’s ongoing "zero-COVID policy" which posed significant challenges to domestic economic conditions. Investors were also concerned about the weak housing market, geopolitical tensions and implications of upcoming leadership changes following the 20th Party Congress. China equity markets subsequently rebounded in November as China accelerated its reopening process and rolled out supportive measures for property developers. Policymakers also took a concerted approach to promote growth and boost consumption. The market rally was carried into January 2023 as data showed a faster than expected recovery in China and macro indicators came in above expectations. However, China equity markets corrected in February 2023 as investors took profits following the strong rebound from November.
At a high level, domestic growth conditions were improving after China’s reopening although not necessarily at a pace anticipated by the market. Specifically, consumption and services-related sectors have been holding up well although manufacturing capital expenditures and private sector confidence remained relatively weak. During the National People’s Congress in March 2023, the government was also being intentionally conservative in setting a 5.0% growth target (versus consensus expectations of 5.5%) which was largely driven by its concerns around potential weaker external demand and its potential impact on exports. Collectively, year-to-date economic data and forward guidance by policymakers weighed on investor confidence.
While policymakers have become much more pro-business and announced substantive policy easing measures to revive the confidence of businesses and consumers at the July Politburo meeting, market observers remained concerned about the ailing housing market and its potential contagion to the broader economy. To provide further support for the economy, policymakers announced more stimulus measures in the last week of August including a reduction in stamp duty on stock transactions to help activate the A-shares stock market and measures to speed up special local government bond issuances. The People’s Bank of China also announced the first nationwide mortgage easing measures in eight years for both first and second homes, providing a strong signal that policymakers remain focused on providing support for the economy and restoring confidence from homebuyers and consumers.
We continue to identify what we believe are high quality companies with good earnings visibility. Across the Fund’s core holdings, most have been successful in capturing additional market share amidst the economic challenges in 2022, which we believe puts them in a better position to benefit from a prospective recovery that we anticipate later in 2023.
Sincerely,
Ning Meng**
Portfolio Manager
*Effective after the close of business on October 13, 2023, the Fund was reorganized into an exchange-traded fund. Please refer to Note H of the Notes to Financial Statements for additional important information. For more information, call us at 800-877-9700 or visit www.nb.com/ETF.
** Effective August 21, 2023, Green Court Capital Management Limited ceased its services as subadviser to the Fund. At that time, Portfolio Manager, Ning Meng and Associate Portfolio Manager, Yi Shi, began managing the Fund.
Information about principal risks of investing in the Fund is set forth in the prospectus and statement of additional information.
The portfolio composition, industries and holdings of the Fund are subject to change without notice.
The opinions expressed are those of the Fund’s portfolio manager. The opinions are as of the date of this report and are subject to change without notice.
Greater China Equity Fund (Unaudited)
|
(as a % of Total Investments*) |
| |
| |
| |
| |
| |
| |
| |
| |
| |
| |
| |
| Derivatives (other than options purchased), if any, are excluded from this chart. |
|
(as a % of Long Term Investments) |
| |
| |
| |
| | | |
| | Average Annual Total Return
Ended 08/31/2023 |
| | | | |
| | | | | |
| | | | | |
| | | | | |
MSCI China All Shares Index
| | | | |
The performance data quoted represent past performance and do not indicate future results. Current performance may be lower or higher than the performance data quoted. For current performance data, including current to the most recent month-end, please visit www.nb.com/performance.
The results shown in the table reflect the reinvestment of income dividends and other distributions, if any. The results do not reflect the effect of taxes a shareholder would pay on Fund distributions or on the redemption of Fund shares.
The investment return and principal value of an investment will fluctuate and shares, when redeemed, may be worth more or less than their original cost.
Returns would have been lower if Neuberger Berman Investment Advisers LLC ("NBIA") had not reimbursed certain expenses and/or waived a portion of the investment management fees during certain of the periods shown. Repayment by a class (of expenses previously reimbursed and/or fees previously waived by NBIA) will decrease the class’s returns. Please see Note B in the Notes to Financial Statements for specific information regarding expense reimbursement and/or fee waiver arrangements.
As stated in the Fund’s most recent prospectus, the total annual operating expense ratio for fiscal year 2022 was 1.91% (before expense reimbursements and/or fee waivers, if any). The expense ratio was 1.51% after expense reimbursements and/or fee waivers. The expense ratios for the annual period ended August 31, 2023, can be found in the Financial Highlights section of this report.
Greater China Equity Fund (Unaudited)
COMPARISON OF A $1,000,000 INVESTMENT
(000's omitted)
This graph shows the change in value of a hypothetical $1,000,000 investment in the Fund over the past 10 fiscal years, or since the Fund’s inception if it has not operated for 10 years. The graph is based on the Institutional Class shares only; the performance of the Fund’s share classes will differ primarily due to different sales charge structures and class expenses (see Performance Highlights chart on previous page). The result is compared with benchmarks, which include a broad-based market index and may include a more narrowly based index. Market indices have not been reduced to reflect any of the fees and costs of investing. The results shown in the graph reflect the reinvestment of income dividends and other distributions, if any. The results do not reflect the effect of taxes a shareholder would pay on Fund distributions or on the redemption of Fund shares. Results represent past performance and do not indicate future results.
International Equity Fund Commentary (Unaudited)
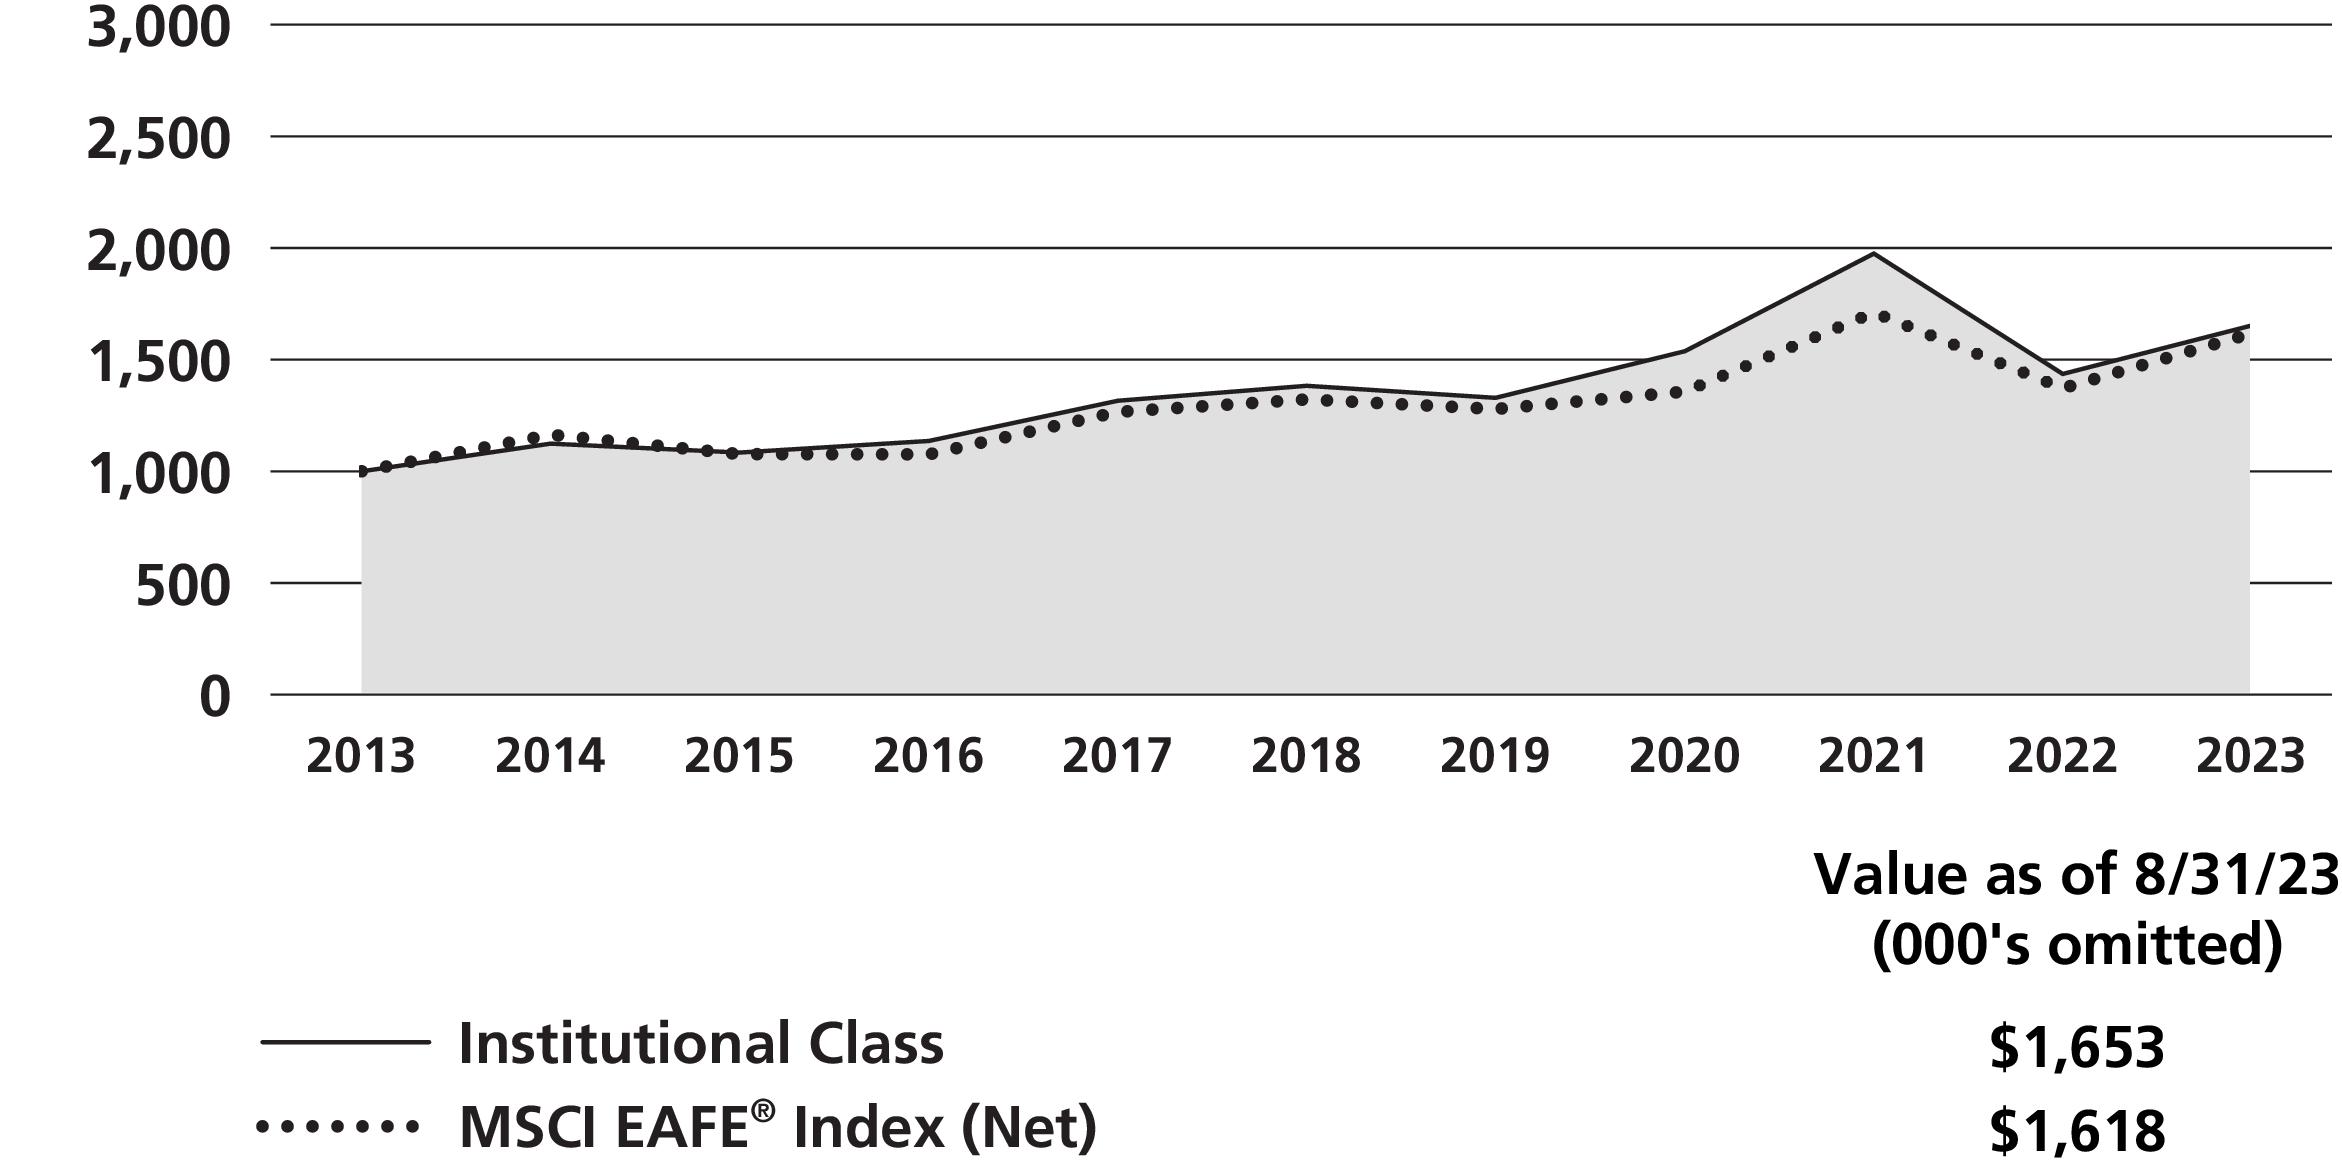
Neuberger Berman International Equity Fund Institutional Class generated a total return of 15.09% for the fiscal year ended August 31, 2023 (the reporting period), trailing its benchmark, the MSCI EAFE® Index (Net) (the Index), which posted a 17.92% total return for the same period. (Performance for all share classes is provided in the table immediately following this letter.)
As measured by the Index, developed international equities outperformed both the U.S. S&P 500® and MSCI Emerging Markets (Net) indices this reporting period. Investors favored value over growth stocks as rates rose sharply during the reporting period, and core inflation remained sticky, benefitting many "real economy" segments of the global markets that have been out of favor during the low rate era. As the reporting period progressed, evidence suggesting headline inflation was slowing faster than expected was welcomed by investors and corporate management teams hoping for relief from rising global interest rates.
On the cautionary side, a slowdown in China, with ripple effects from the meltdown of its real estate market and high unemployment among the nation’s young, loomed large within an interconnected global economy, adding to uncertainty. Toward the end of this reporting period, the Chinese government had begun aiming policy at resolving issues, but results remain unclear.
By country, Italy, Denmark and Ireland led the Index this reporting period, while Israel, Hong Kong and Norway declined most. From a sector perspective for the Index, Information Technology, Industrials and Consumer Discretionary outperformed, advancing over 20%. Real Estate declined, and Communication Services and Consumer Staples lagged.
The Fund’s underperformance relative to the Index resulted from stock selection. Our longer-term Quality at a Reasonable Price discipline means that the Fund can lag somewhat within markets where investors are willing to overpay, in our view, for growth. Accordingly, our holdings within the three "hottest" sectors—Industrials, Financials, and Consumer Discretionary—lagged. Stock selection within Italy and France, and lack of exposure to Denmark also limited relative returns.
Individual detractors included Teleperformance and DSM-Firmenich. Teleperformance, a French customer service solutions business, reported soft earnings, which was compounded by a surprise acquisition and concerns over artificial intelligence-related disruption. DSM-Firmenich, a newly merged, Dutch listed, flavors and fragrances specialist, issued a profit warning during the reporting period as customers worked through existing inventories.
Our holdings outperformed within Communication Services, Energy and Materials, and our sector allocation that resulted from bottom-up decision-making was another advantage. By country, a zero weighting to companies domiciled in Australia, a non-Index allocation to the U.S., and an overweight to Ireland versus the Index had the largest relative positive impacts.
Key contributors included Novartis and SAP. Novartis, the Swiss pharmaceutical giant, reported strong results and reiterated guidance. Strong earnings at SAP, a German software firm, demonstrated the resiliency of its cloud business despite a tougher macroeconomic backdrop.
As longer-term investors, we remain committed to our proven investment discipline. As such, we hold steady through short-term market swings whether they benefit or hinder relative performance. The Fund in our view is well diversified, and within an economic backdrop that remains somewhat uncertain, is built around what we believe to be quality businesses with resilient earnings streams.
We continue to develop and test new ideas that we believe can benefit in a period of higher inflation, higher interest rates, and higher nominal growth driven by increased capital investment aimed at the underinvestment of the recent past.
In our view, the current key challenge is striking a balance between what we believe to be quality defensive holdings, secular growth opportunities, and companies with business models that benefit from higher inflation
and increased capital expenditure, while avoiding cyclical companies with excessive leverage. We believe the Fund remains well positioned for both the risks and opportunities we foresee ahead.
Sincerely,
Elias Cohen and Thomas Hogan
Portfolio Managers
Information about principal risks of investing in the Fund is set forth in the prospectus and statement of additional information.
The portfolio composition, industries and holdings of the Fund are subject to change without notice.
The opinions expressed are those of the Fund’s portfolio managers. The opinions are as of the date of this report and are subject to change without notice.
International Equity Fund (Unaudited)
| | | |
| | Average Annual Total Return
Ended 08/31/2023 |
| | | | |
| | | | | |
| | | | | |
| | | | | |
| | | | | |
| | | | | |
| | | | | |
| | | | | |
| | | | | |
| | | | |
| | | | | |
| | | | | |
| | | | | |
MSCI EAFE® Index (Net)1,2 | | | | |
The performance data quoted represent past performance and do not indicate future results. Current performance may be lower or higher than the performance data quoted. For current performance data, including current to the most recent month-end, please visit www.nb.com/performance.
The results shown in the table reflect the reinvestment of income dividends and other distributions, if any. The results do not reflect the effect of taxes a shareholder would pay on Fund distributions or on the redemption of Fund shares.
The investment return and principal value of an investment will fluctuate and shares, when redeemed, may be worth more or less than their original cost.
Returns would have been lower if Neuberger Berman Investment Advisers LLC ("NBIA") had not reimbursed certain expenses and/or waived a portion of the investment management fees during certain of the periods shown. Repayment by a class (of expenses previously reimbursed and/or fees previously waived by NBIA) will decrease the class’s returns. Please see Note B in the Notes to Financial Statements for specific information regarding expense reimbursement and/or fee waiver arrangements.
As stated in the Fund’s most recent prospectus, the total annual operating expense ratios for fiscal year 2022 were 1.19%, 1.26%, 1.00%, 1.37%, 2.12%, 0.90% and 0.86% for Investor Class, Trust Class, Institutional Class, Class A, Class C, Class R6 and Class E shares, respectively (before expense reimbursements and/or fee waivers, if any). The expense ratios were 0.87%, 1.23%, 1.98%, 0.77% and 0.07% for Institutional Class, Class A, Class C, Class R6 and Class E shares, respectively, after expense reimbursements and/or fee waivers. The expense ratios for the annual period ended August 31, 2023, can be found in the Financial Highlights section of this report.
Returns shown with a sales charge reflect the deduction of the current maximum initial sales charge of 5.75% for Class A shares and the contingent deferred sales charge (CDSC) for Class C shares. The CDSC for Class C shares is 1.00%, which is reduced to 0% after 1 year. The performance of the Fund’s share classes will differ primarily due to different sales charge structures and class expenses. Please see the prospectus for more information about sales charge structures, if any, and class expenses for your share class.
International Equity Fund (Unaudited)
COMPARISON OF A $1,000,000 INVESTMENT
(000's omitted)
This graph shows the change in value of a hypothetical $1,000,000 investment in the Fund over the past 10 fiscal years, or since the Fund’s inception if it has not operated for 10 years. The graph is based on the Institutional Class shares only; the performance of the Fund’s share classes will differ primarily due to different sales charge structures and class expenses (see Performance Highlights chart on previous page). The result is compared with benchmarks, which include a broad-based market index and may include a more narrowly based index. Market indices have not been reduced to reflect any of the fees and costs of investing. The results shown in the graph reflect the reinvestment of income dividends and other distributions, if any. The results do not reflect the effect of taxes a shareholder would pay on Fund distributions or on the redemption of Fund shares. Results represent past performance and do not indicate future results.
International Select Fund Commentary (Unaudited)
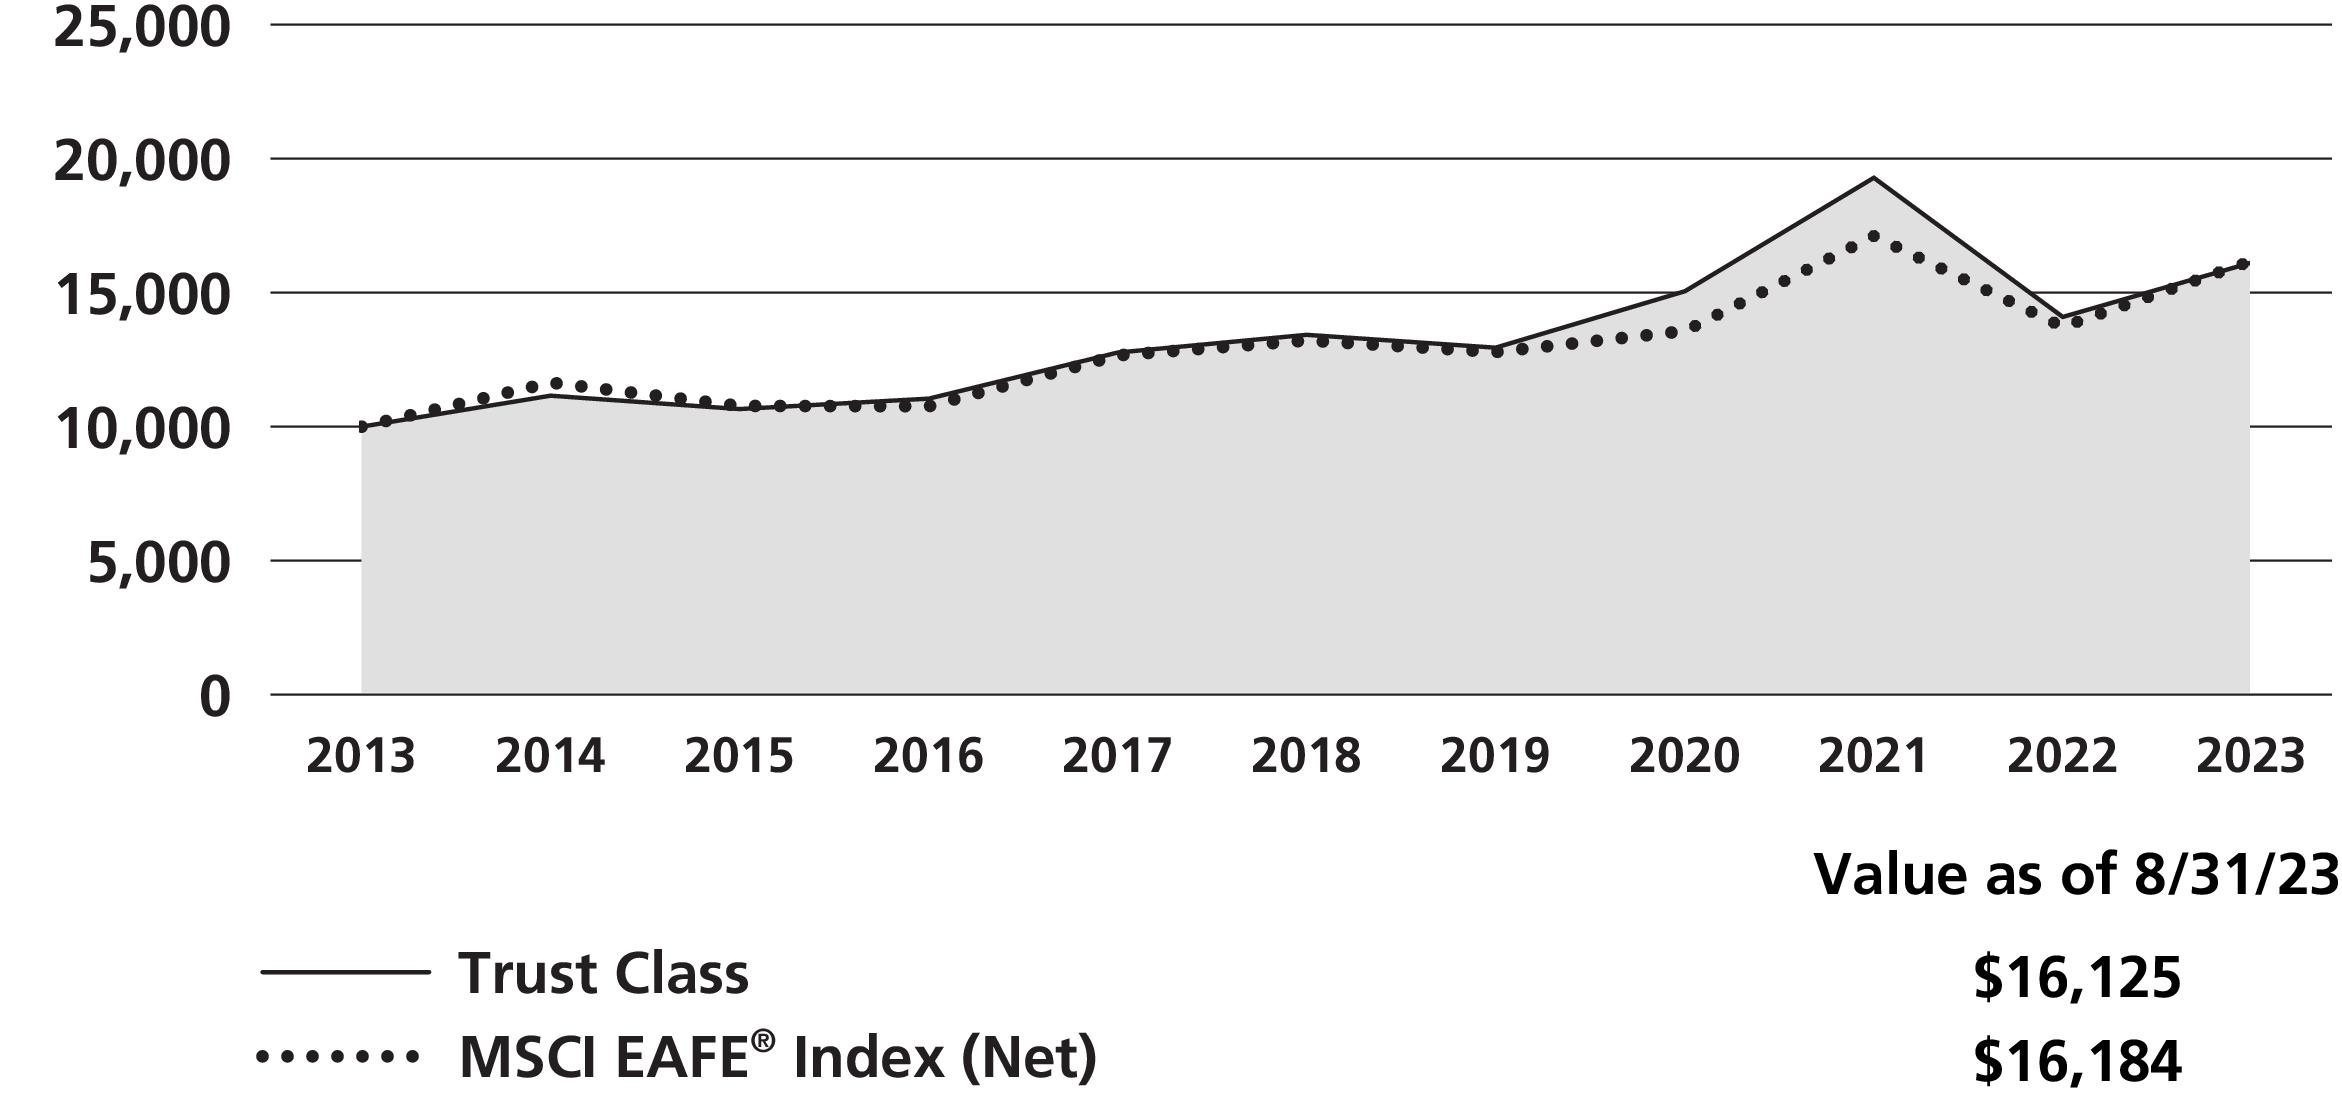
Neuberger Berman International Select Fund Trust Class generated a total return of 14.41% for the fiscal year ended August 31, 2023 (the reporting period), trailing its benchmark, the MSCI EAFE® Index (Net) (the Index), which posted a 17.92% total return for the same period. (Performance for all share classes is provided in the table immediately following this letter.)
As measured by the Index, developed international equities outperformed both the U.S. S&P 500® and MSCI Emerging Markets (Net) indices this reporting period. Investors favored value over growth stocks as rates rose sharply during the reporting period, and core inflation remained sticky, benefitting many "real economy" segments of the global markets that have been out of favor during the low rate era. As the reporting period progressed, evidence suggesting headline inflation was slowing faster than expected was welcomed by investors and corporate management teams hoping for relief from rising global interest rates.
On the cautionary side, a slowdown in China, with ripple effects from the meltdown of its real estate market and high unemployment among the nation’s young, loomed large within an interconnected global economy, adding to uncertainty. Toward the end of this reporting period, the Chinese government had begun aiming policy at resolving issues, but results remain unclear.
By country, Italy, Denmark and Ireland led the Index this reporting period, while Israel, Hong Kong and Norway declined most. From a sector perspective for the Index, Information Technology (IT), Industrials and Consumer Discretionary outperformed, advancing over 20%. Real Estate declined, and Communication Services and Consumer Staples lagged.
The Fund’s underperformance relative to the Index resulted from stock selection. Our longer-term Quality at a Reasonable Price discipline means that the Fund can lag somewhat within markets where investors are willing to overpay, in our view, for growth. Accordingly, our holdings within the three "hottest" sectors—Industrials, Financials, and Consumer Discretionary—lagged. Stock selection within Italy and France, and lack of exposure to Denmark also limited relative returns.
Individual detractors included Teleperformance and DSM-Firmenich. Teleperformance, a French customer service solutions business, reported soft earnings, which was compounded by a surprise acquisition and concerns over artificial intelligence-related disruption. DSM-Firmenich, a newly merged, Dutch listed, flavors and fragrances specialist, issued a profit warning during the reporting period as customers worked through existing inventories.
Our holdings outperformed within Communication Services, IT and Energy, and our sector allocation that resulted from bottom-up decision-making was another advantage. By country, a zero weighting to companies domiciled in Australia, a non-Index allocation to the U.S., and an overweight to Ireland versus the Index had the largest positive impacts.
Key contributors included Schlumberger and Novartis. Schlumberger, a U.S. listed global oil services specialist, reported strong results, exceeding analysts’ expectations. Novartis, the Swiss pharmaceutical giant, reported strong results and reiterated guidance.
As longer-term investors, we remain committed to our proven investment discipline. As such, we hold steady through short-term market swings whether they benefit or hinder relative performance. The Fund in our view is well diversified, and within an economic backdrop that remains somewhat uncertain, is built around what we believe to be quality businesses with resilient earnings streams.
We continue to develop and test new ideas that we believe can benefit in a period of higher inflation, higher interest rates, and higher nominal growth driven by increased capital investment aimed at the underinvestment of the recent past.
In our view, the current key challenge is striking a balance between what we believe to be quality defensive holdings, secular growth opportunities, and companies with business models that benefit from higher inflation
and increased capital expenditure, while avoiding cyclical companies with excessive leverage. We believe the Fund remains well positioned for both the risks and opportunities we foresee ahead.
Sincerely,
Elias Cohen and Thomas Hogan
Portfolio Managers
Information about principal risks of investing in the Fund is set forth in the prospectus and statement of additional information.
The portfolio composition, industries and holdings of the Fund are subject to change without notice.
The opinions expressed are those of the Fund’s portfolio managers. The opinions are as of the date of this report and are subject to change without notice.
International Select Fund (Unaudited)
| | | |
| | Average Annual Total Return
Ended 08/31/2023 |
| | | | |
| | | | | |
| | | | | |
| | | | | |
| | | | | |
| | | | | |
| | | | | |
| | | | | |
| | | | |
| | | | | |
| | | | | |
| | | | | |
| | | | |
The performance data quoted represent past performance and do not indicate future results. Current performance may be lower or higher than the performance data quoted. For current performance data, including current to the most recent month-end, please visit www.nb.com/performance.
The results shown in the table reflect the reinvestment of income dividends and other distributions, if any. The results do not reflect the effect of taxes a shareholder would pay on Fund distributions or on the redemption of Fund shares.
The investment return and principal value of an investment will fluctuate and shares, when redeemed, may be worth more or less than their original cost.
Returns would have been lower if Neuberger Berman Investment Advisers LLC ("NBIA") had not reimbursed certain expenses and/or waived a portion of the investment management fees during certain of the periods shown. Repayment by a class (of expenses previously reimbursed and/or fees previously waived by NBIA) will decrease the class’s returns. Please see Note B in the Notes to Financial Statements for specific information regarding expense reimbursement and/or fee waiver arrangements.
As stated in the Fund’s most recent prospectus, the total annual operating expense ratios for fiscal year 2022 were 1.42%, 1.00%, 1.37%, 2.15%, 1.64% and 0.91% for Trust Class, Institutional Class, Class A, Class C, Class R3 and Class R6 shares, respectively (before expense reimbursements and/or fee waivers, if any). The expense ratios were 1.20%, 0.85%, 1.20%, 1.95%, 1.46% and 0.74% for Trust Class, Institutional Class, Class A, Class C, Class R3 and Class R6 shares, respectively, after expense reimbursements and/or fee waivers. The expense ratios for the annual period ended August 31, 2023, can be found in the Financial Highlights section of this report.
Returns shown with a sales charge reflect the deduction of the current maximum initial sales charge of 5.75% for Class A shares and the contingent deferred sales charge (CDSC) for Class C shares. The CDSC for Class C shares is 1.00%, which is reduced to 0% after 1 year. The performance of the Fund’s share classes will differ primarily due to different sales charge structures and class expenses. Please see the prospectus for more information about sales charge structures, if any, and class expenses for your share class.
International Select Fund (Unaudited)
COMPARISON OF A $10,000 INVESTMENT
This graph shows the change in value of a hypothetical $10,000 investment in the Fund over the past 10 fiscal years, or since the Fund’s inception if it has not operated for 10 years. The graph is based on the Trust Class shares only; the performance of the Fund’s share classes will differ primarily due to different sales charge structures and class expenses (see Performance Highlights chart on previous page). The result is compared with benchmarks, which include a broad-based market index and may include a more narrowly based index. Market indices have not been reduced to reflect any of the fees and costs of investing. The results shown in the graph reflect the reinvestment of income dividends and other distributions, if any. The results do not reflect the effect of taxes a shareholder would pay on Fund distributions or on the redemption of Fund shares. Results represent past performance and do not indicate future results.
International Small Cap Fund Commentary (Unaudited)
Neuberger Berman International Small Cap Fund Institutional Class reported a total return of 8.63% for the fiscal year ended August 31, 2023 (the reporting period), trailing the 9.18% total return of its benchmark, the MSCI EAFE® Small Cap Index (Net) (the Index), for the same period. (Performance for all share classes is provided in the table immediately following this letter.)
Global equity markets advanced this reporting period, as weakened global growth remained relatively steady. This dovetailed with a slowing in high global inflation rates to inject markets with optimism—both about the possibility of sidestepping a recession, and that the cycle of interest rate increases might be nearing an end. The Index trailed the larger-cap MSCI EAFE® Index (Net) and the U.S. S&P 500® Index and surpassed the MSCI Emerging Markets Index (Net).
The Financials, Consumer Discretionary and Information Technology sectors led the Index this reporting period, as banks benefited from rising interest rates, U.S. consumer spending remained resilient, and the acceleration of artificial intelligence spending drove a tech rally. Damaged by fears of the impact of higher interest rates, Real Estate declined. Defensive sectors Health Care and Communication Services also underperformed. By country, Ireland, Italy and Spain significantly outperformed, while Israel declined sharply, followed by New Zealand and Norway, which posted smaller losses.
Stock selection caused the Fund’s relative lag, as our holdings in Communication Services, Industrials and Consumer Discretionary underperformed peers. We faced a headwind as value stocks that didn’t meet our quality guidelines outperformed in these sectors. By country, holdings based in Japan, Denmark and the UK detracted.
Individual detractors included Restore, the UK’s leading business records management firm, which lowered its full year profit target while its CEO resigned, and Cellavision, a Swedish automated blood analysis equipment manufacturer, which saw margins decrease as its customers’ businesses slowed. We continue to own both stocks but have placed both under review.
The Fund benefited most from stock selection in and an underweight versus the Index to Real Estate, and stock selection in Materials. By country, Switzerland-based holdings, our zero allocation to Israel, which performed poorly, and an underweight to the lagging Australia market were additive to relative returns.
Key contributors to returns included Games Workshop, the British designer and manufacturer of fantasy games and miniatures, whose recent sales updates buoyed investor confidence about strong full year 2023 returns; and Interparfums, a French branded perfumes manufacturer, that published solid results for 2022, which we believe could continue through 2023 driven by existing and newly licensed products.
Looking forward, we believe spending in areas such as energy, automation and onshoring could continue to be supported by fiscal stimulus and foresee continued improvements across various global supply chains. But at the same time, we remain cautious about the impact of rapid and steep monetary tightening on the health of the overall global economy. We continue monitoring real-time economic indicators and company earnings for early data on economic direction—a possible "soft landing" or ongoing risk of recession.
Within this view, we continue to focus our research efforts on finding names with solid balance sheets, cash flows and end markets, whose prospects are driven by the strength of their own businesses, and that we believe are less synchronized to the overall economic cycle. We will continue to attempt to use any volatility to benefit the Fund as we make our investment decisions, and believe the Fund is positioned to continue to deliver solid risk-adjusted results, regardless of the immediate direction of the macro environment.
Sincerely,
David Bunan
Portfolio Manager
Information about principal risks of investing in the Fund is set forth in the prospectus and statement of additional information.
The portfolio composition, industries and holdings of the Fund are subject to change without notice.
The opinions expressed are those of the Fund’s portfolio manager. The opinions are as of the date of this report and are subject to change without notice.
International Small Cap Fund (Unaudited)
| | |
| | Average Annual Total Return
Ended 08/31/2023 |
| | | |
| | | | |
| | | | |
| | | | |
| | | | |
| | | | |
| | | |
| | | | |
| | | | |
| | | | |
| | | |
The performance data quoted represent past performance and do not indicate future results. Current performance may be lower or higher than the performance data quoted. For current performance data, including current to the most recent month-end, please visit www.nb.com/performance.
The results shown in the table reflect the reinvestment of income dividends and other distributions, if any. The results do not reflect the effect of taxes a shareholder would pay on Fund distributions or on the redemption of Fund shares.
The investment return and principal value of an investment will fluctuate and shares, when redeemed, may be worth more or less than their original cost.
Returns would have been lower if Neuberger Berman Investment Advisers LLC ("NBIA") had not reimbursed certain expenses and/or waived a portion of the investment management fees during certain of the periods shown. Repayment by a class (of expenses previously reimbursed and/or fees previously waived by NBIA) will decrease the class’s returns. Please see Note B in the Notes to Financial Statements for specific information regarding expense reimbursement and/or fee waiver arrangements.
As stated in the Fund’s most recent prospectus, the total annual operating expense ratios for fiscal year 2022 were 10.11%, 10.47%, 11.24% and 10.00% for Institutional Class, Class A, Class C and Class R6 shares, respectively (before expense reimbursements and/or fee waivers, if any). The expense ratios were 1.07%, 1.42%, 2.18% and 0.97% for Institutional Class, Class A, Class C and Class R6 shares, respectively, after expense reimbursements and/or fee waivers. The expense ratios for the annual period ended August 31, 2023, can be found in the Financial Highlights section of this report.
Returns shown with a sales charge reflect the deduction of the current maximum initial sales charge of 5.75% for Class A shares and the contingent deferred sales charge (CDSC) for Class C shares. The CDSC for Class C shares is 1.00%, which is reduced to 0% after 1 year. The performance of the Fund’s share classes will differ primarily due to different sales charge structures and class expenses. Please see the prospectus for more information about sales charge structures, if any, and class expenses for your share class.
International Small Cap Fund (Unaudited)
COMPARISON OF A $1,000,000 INVESTMENT
(000's omitted)
This graph shows the change in value of a hypothetical $1,000,000 investment in the Fund over the past 10 fiscal years, or since the Fund’s inception if it has not operated for 10 years. The graph is based on the Institutional Class shares only; the performance of the Fund’s share classes will differ primarily due to different sales charge structures and class expenses (see Performance Highlights chart on previous page). The result is compared with benchmarks, which include a broad-based market index and may include a more narrowly based index. Market indices have not been reduced to reflect any of the fees and costs of investing. The results shown in the graph reflect the reinvestment of income dividends and other distributions, if any. The results do not reflect the effect of taxes a shareholder would pay on Fund distributions or on the redemption of Fund shares. Results represent past performance and do not indicate future results.
Intrinsic Value Fund Commentary (Unaudited)
Neuberger Berman Intrinsic Value Fund Institutional Class generated a 6.12% total return for the fiscal year ended August 31, 2023 (the reporting period), outperforming its benchmark, the Russell 2000® Value Index (the Index), which generated a 2.17% total return for the same period. (Performance for all share classes is provided in the table immediately following this letter.)
During the reporting period, performance favored larger capitalization equities and growth stocks. Financials, value stocks and smaller companies continued to lag their counterparts. Our overweighting of technology and underinvestment in banks and REITs served us well. The regional banking crises and fears of recession undermined confidence in the banking sector while the upward move in interest rates worked against dividend paying REITs. On the flip side, enthusiasm for technology and growth equities was driven by investor sentiment around artificial intelligence (AI) applications like ChatGPT which many believe will usher in a new wave of innovation and growth.
Looking at our better performers, several companies held in the Fund’s portfolio that were well-positioned to benefit from popular themes stand out. Rambus benefited from the perception that AI applications will require faster processing. Clean energy drives demand for hydrogen and the need for a more efficient electrical grid, hence KBR performed well. The growing popularity of gaming, both online and in the casino, benefitted International Game Technology.
In spite of AI mania, not all technology companies held in the Fund’s portfolio performed well. Unisys has faced multiple challenges including new pension funding requirements. The macro environment has been difficult for Verint, and the company has experienced elongated sales cycles. In addition, our modest exposure to banks proved to be very detrimental.
Merger and acquisition activity was muted during the reporting period. Two portfolio companies were acquired and a third received competing acquisition offers. During the reporting period, we added eight new names and eliminated seven. For the last several quarters more of our activity has been rebalancing current holdings rather than adding new names or sector repositioning. With greater clarity on the economic outlook, we would have acted more decisively, however we feel most economists and investment strategists we’ve listened to in the last year may have been wrong. Economic growth continues to surprise to the upside, earnings have been more resilient than expected, and employment remains strong. The wild card is the outlook for inflation. Although we believe the worst may have passed, improvement from current levels to the U.S. Federal Reserve Board’s stated two percent target may prove elusive.
Looking ahead, we continue to engage with the boards and management teams of several portfolio companies that have yet to generate positive returns but are selling at material discounts to our intrinsic value1 estimates. We offer constructive advice around messaging with a particular focus on setting long-term financial targets and helping companies craft better explanations for situations that investors may view as complex or confusing. With Unisys, we have asked the company to provide longer-term insights into their very profitable mainframe software business and better explanations for their pension funding requirements. While we remain guardedly optimistic for the possibility of realizable returns from these efforts, more patience will be required.
While today’s challenges may be daunting, as we lurch between war, banking crises and inflation, there will be winners and losers and more often than not, we believe investors with patience and discipline will be rewarded for the risk and volatility they underwrite. We’re happy to see the Fund recover since our last annual report and are guardedly optimistic that, to us, many portfolio companies remain significantly undervalued. We look forward to our next communication and as always are deeply committed as we attempt to grow your investment with us at an attractive long-term rate.
Sincerely,
Benjamin H. Nahum, James F. McAree and Amit Solomon
Portfolio Co-Managers
1 Intrinsic value reflects the portfolio management team’s analysis and estimates of a company’s value. There is no guarantee that any intrinsic values will be realized; security prices may decrease regardless of intrinsic values.
Information about principal risks of investing in the Fund is set forth in the prospectus and statement of additional information.
The portfolio composition, industries and holdings of the Fund are subject to change without notice.
The opinions expressed are those of the Fund’s portfolio managers. The opinions are as of the date of this report and are subject to change without notice.
Intrinsic Value Fund (Unaudited)
|
(as a % of Total Investments*) |
| |
| |
| |
| |
| |
| |
| |
| |
| |
| |
| |
| |
| |
| |
| Derivatives (other than options purchased), if any, are excluded from this chart. |
| | | |
| | Average Annual Total Return
Ended 08/31/2023 |
| | | | |
| | | | | |
| | | | | |
| | | | | |
| | | | | |
| | | | | |
| | | | |
| | | | | |
| | | | | |
| | | | | |
| | | | |
| | | | |
*Performance data for the life of Fund for each Class prior to May 10, 2010 is that of the Fund’s predecessor, the DJG Small Cap Value Fund L.P., an unregistered limited partnership ("DJG Fund"); DJG Fund was the successor to The DJG Small Cap Value Fund, an unregistered commingled investment account ("DJG Account"), which had similar investment goals, strategies, and portfolio management team. See endnote 20 for more information.
The performance data quoted represent past performance and do not indicate future results. Current performance may be lower or higher than the performance data quoted. For current performance data, including current to the most recent month-end, please visit www.nb.com/performance.
The results shown in the table reflect the reinvestment of income dividends and other distributions, if any. The results do not reflect the effect of taxes a shareholder would pay on Fund distributions or on the redemption of Fund shares.
The investment return and principal value of an investment will fluctuate and shares, when redeemed, may be worth more or less than their original cost.
Returns would have been lower if Neuberger Berman Investment Advisers LLC ("NBIA") had not reimbursed certain expenses and/or waived a portion of the investment management fees during certain of the periods shown. Repayment by a class (of expenses previously reimbursed and/or fees previously waived by NBIA) will decrease the class’s returns. Please see Note B in the Notes to Financial Statements for specific information regarding expense reimbursement and/or fee waiver arrangements.
As stated in the Fund’s most recent prospectus, the total annual operating expense ratios for fiscal year 2022 were 1.01%, 1.37%, 2.12% and 0.87% for Institutional Class, Class A, Class C and Class R6 shares, respectively (before expense reimbursements and/or fee waivers, if any). The total annual operating expense ratios for each of Institutional Class, Class A and Class C includes each class’s repayment of expenses previously reimbursed and/or fees previously waived under the contractual expense limitation by NBIA. The expense ratios for the annual period ended August 31, 2023, can be found in the Financial Highlights section of this report.
Returns shown with a sales charge reflect the deduction of the current maximum initial sales charge of 5.75% for Class A shares and the contingent deferred sales charge (CDSC) for Class C shares. The CDSC for Class C shares is 1.00%, which is reduced to 0% after 1 year. The performance of the Fund’s share classes will differ primarily due to different sales charge structures and class expenses. Please see the prospectus for more information about sales charge structures, if any, and class expenses for your share class.
Intrinsic Value Fund (Unaudited)
COMPARISON OF A $1,000,000 INVESTMENT
(000's omitted)
This graph shows the change in value of a hypothetical $1,000,000 investment in the Fund over the past 10 fiscal years, or since the Fund’s inception if it has not operated for 10 years. The graph is based on the Institutional Class shares only; the performance of the Fund’s share classes will differ primarily due to different sales charge structures and class expenses (see Performance Highlights chart on previous page). The result is compared with benchmarks, which include a broad-based market index and may include a more narrowly based index. Market indices have not been reduced to reflect any of the fees and costs of investing. The results shown in the graph reflect the reinvestment of income dividends and other distributions, if any. The results do not reflect the effect of taxes a shareholder would pay on Fund distributions or on the redemption of Fund shares. Results represent past performance and do not indicate future results.
Large Cap Growth Fund* Commentary (Unaudited)
Neuberger Berman Large Cap Growth Fund (formerly Neuberger Berman Guardian Fund) Investor Class posted a 18.03% total return for the fiscal year ended August 31, 2023 (the reporting period), trailing the 21.94% total return of its benchmark, the Russell 1000® Growth Index (the Index) for the same period. (Performance for all share classes is provided in the table immediately following this letter.)
On September 30, 2022, the Fund began comparing its performance to the Index rather than the S&P 500® Index because the Index has characteristics that are more representative of the Fund’s investment strategy than its former index, the S&P 500 Index. From the close of September 30, 2022 (the effective date of the change) through the end of the reporting period, the Fund’s Investor Class returned 30.05%, underperforming the Index, which returned 35.07%. For the entire reporting period, the Fund’s Investor Class returned 18.03%, outperforming the prior benchmark, which returned 15.94% for the reporting period.
The overall U.S. equity market, as measured by the S&P 500 Index, generated strong results during the reporting period. Investor sentiment was buoyed by the resilient economy, corporate earnings that often exceeded expectations, moderating inflation, and hopes that the U.S. Federal Reserve Board (Fed) was nearing the end of its rate hike cycle. These factors offset concerns that interest rates may be "higher for longer," fears that Fed monetary tightening could push the economy into a recession, and numerous geopolitical issues. All told, the S&P 500 Index gained 15.94% during the reporting period. In contrast, the Index returned 21.94% over the same period.
Stock selection drove the Fund’s relative underperformance, whereas sector allocation was a modest headwind for returns over the reporting period. Looking at sector allocation, the Fund’s overweight to Utilities and underweight to Information Technology (IT) versus the Index were the largest detractors from results. Conversely, underweights to Consumer Discretionary and Industrials were the most beneficial for performance.
In terms of stock selection, holdings in the Health Care, Industrials and IT sectors were the largest negatives for results. Individual stocks that detracted from returns included wireless infrastructure company SBA Communications Corp. (sold during the reporting period), renewable energy firm NextEra Energy, Inc., and human capital management software company Paycor HCM, Inc. On the upside, stock selection in the Communication Services and Consumer Discretionary sectors were the most beneficial for returns. In terms of individual stocks, software company Microsoft Corp., semiconductors & semiconductor equipment company NVIDIA Corp., and Facebook parent company Meta Platforms, Inc. were the most additive for performance.
The U.S. economy remained on solid footing and thus far has staved off recessionary predictions despite several unforeseen and adverse events. In fact, we believe there is plenty of evidence that the economy is better than pundits expected. Notably, in our view consumer confidence is steadfast, fueled by rising wages and low unemployment. A confident consumer is a critical ingredient for a consumer-led economy. We also believe the soundness of private sector balance sheets, coupled with steady fiscal support for rebuilding our infrastructure, have put the economy in a better position to handle higher interest rates. However, many of the same economic concerns from last year persist. The Fed has raised its benchmark fed funds rate to the highest level in 22 years, and the lagged effect of rate rises on the economy remains uncertain. While consumer cash savings are still above pre-pandemic levels, they are quickly diminishing. Our positive long-term view is not without challenges as we move through 2023 and beyond.
As always, we continue our efforts to best understand company and portfolio-specific factors, as we believe this environment is flush with a confluence of fiscal policy considerations, monetary policy stimulus, public health concerns, geopolitical uncertainty, commodity price volatility, inflation dynamics and sequencing question marks. As market dynamics change, we believe this can cause company market values to dislocate from their long-term potential values, creating a volatile environment with potential opportunities. We highlight these risks because the current environment, as always, necessitates a flexible approach in the complex global world in which we operate.
Sincerely,
Charles Kantor and Marc Regenbaum
Portfolio Managers
*As previously disclosed in a supplement to the Fund's prospectus, effective September 30, 2022, the name of Neuberger Berman Guardian
Fund changed to Neuberger Berman Large Cap Growth Fund.
Information about principal risks of investing in the Fund is set forth in the prospectus and statement of additional information.
The portfolio composition, industries and holdings of the Fund are subject to change without notice.
The opinions expressed are those of the Fund’s portfolio managers. The opinions are as of the date of this report and are subject to change without notice.
Large Cap Growth Fund (Unaudited)
|
(as a % of Total Investments*) |
| |
| |
| |
| |
| |
| |
| |
| |
| |
| |
| |
| |
| Derivatives (other than options purchased), if
any, are excluded from this chart. |
| | | |
| | Average Annual Total Return
Ended 08/31/2023 |
| | | | |
| | | | | |
| | | | | |
| | | | | |
| | | | | |
| | | | | |
| | | | | |
| | | | | |
| | | | | |
| | | | | |
| | | | |
| | | | | |
| | | | | |
| | | | | |
Russell 1000® Growth Index*1,2 | | | | |
| | | | |
* Effective September 30, 2022, the Fund began comparing its performance to the Russell 1000 Growth Index rather than the S&P 500 Index because the Russell 1000 Growth Index has characteristics that are more representative of the Fund's investment strategy than its former index, the S&P 500 Index.
The performance data quoted represent past performance and do not indicate future results. Current performance may be lower or higher than the performance data quoted. For current performance data, including current to the most recent month-end, please visit www.nb.com/performance.
The results shown in the table reflect the reinvestment of income dividends and other distributions, if any. The results do not reflect the effect of taxes a shareholder would pay on Fund distributions or on the redemption of Fund shares.
The investment return and principal value of an investment will fluctuate and shares, when redeemed, may be worth more or less than their original cost.
Returns would have been lower if Neuberger Berman Investment Advisers LLC ("NBIA") had not reimbursed certain expenses and/or waived a portion of the investment management fees during certain of the periods shown. Repayment by a class (of expenses previously reimbursed and/or fees previously waived by NBIA) will decrease the class’s returns. Please see Note B in the Notes to Financial Statements for specific information regarding expense reimbursement and/or fee waiver arrangements.
As stated in the Fund’s most recent prospectus, the total annual operating expense ratios for fiscal year 2022 were 0.83%, 1.03%, 1.17%, 0.68%, 1.05%, 1.80%, 1.36% and 0.66% for Investor Class, Trust Class, Advisor Class, Institutional Class, Class A, Class C, Class R3 and Class R6 shares, respectively (before expense reimbursements and/or fee waivers, if any). The total annual operating expense ratio for Class R3 includes the class’s repayment of expenses previously reimbursed and/or waived under the contractual expense limitation by NBIA. The expense ratio was 0.58% for Class R6 shares, after expense reimbursements and/or fee waivers. The expense ratios for the annual period ended August 31, 2023, can be found in the Financial Highlights section of this report.
Returns shown with a sales charge reflect the deduction of the current maximum initial sales charge of 5.75% for Class A shares and the contingent deferred sales charge (CDSC) for Class C shares. The CDSC for Class C shares is 1.00%, which is reduced to 0% after 1 year. The performance of the Fund’s share classes will differ primarily due to different sales charge structures and class expenses. Please see the prospectus for more information about sales charge structures, if any, and class expenses for your share class.
Large Cap Growth Fund (Unaudited)
COMPARISON OF A $10,000 INVESTMENT
This graph shows the change in value of a hypothetical $10,000 investment in the Fund over the past 10 fiscal years, or since the Fund’s inception if it has not operated for 10 years. The graph is based on the Investor Class shares only; the performance of the Fund’s share classes will differ primarily due to different sales charge structures and class expenses (see Performance Highlights chart on previous page). The result is compared with benchmarks, which include a broad-based market index and may include a more narrowly based index. Market indices have not been reduced to reflect any of the fees and costs of investing. The results shown in the graph reflect the reinvestment of income dividends and other distributions, if any. The results do not reflect the effect of taxes a shareholder would pay on Fund distributions or on the redemption of Fund shares. Results represent past performance and do not indicate future results.
* Effective September 30, 2022, the Fund began comparing its performance to the Russell 1000® Growth Index rather than the S&P 500® Index because the Russell 1000 Growth Index has characteristics that are more representative of the Fund’s investment strategy than its former index, the S&P 500 Index.
Large Cap Value Fund Commentary (Unaudited)
Neuberger Berman Large Cap Value Fund Investor Class generated a 5.56% total return for the fiscal year ended August 31, 2023 (the reporting period), versus the 8.59% total return of its benchmark, the Russell 1000® Value Index (the Index). (Performance for all share classes is provided in the table immediately following this letter.)
The overall U.S. equity market, as measured by the S&P 500® Index, generated strong results during the reporting period. Investor sentiment was buoyed by the resilient economy, corporate earnings that often exceeded expectations, moderating inflation, and hopes that the U.S. Federal Reserve Board (Fed) was nearing the end of its rate hike cycle. These factors offset concerns that interest rates may be "higher for longer," fears that Fed monetary tightening could push the economy into a recession, and numerous geopolitical issues. All told, the S&P 500 Index gained 15.94% during the reporting period. In contrast, large-cap value stocks, as measured by the Index, returned 8.59% over the same period.
The overall market’s ascent during the reporting period was led by large-cap growth stocks. In particular, a small number of mega-cap growth stocks, known as the "Magnificent 7," accounted for a disproportionate portion of the S&P 500’s gain. This was not isolated to just the core indices, but also impacted the Index, where a subset of those names were some of the top weights during much of the reporting period. The narrowness of the market’s rally favored cyclical sectors—driving their valuations sharply higher. In contrast, more defensive sectors, overall, were inexpensively valued from a historical perspective. We continue to be a disciplined value investor and have mostly avoided the Magnificent 7, several of which were very large weightings in our Index.
Against this backdrop, the Fund underperformed the Index during the reporting period, driven by both sector allocation and stock selection. From a sector allocation perspective, an overweight to Utilities and an underweight to Communication Services versus the Index were the largest detractors from returns. This was partially offset by the positive impact from an underweight to Real Estate and an overweight to Materials.
In terms of stock selection, the Materials, Financials, and Utilities sectors were the largest detractors from results. Individual stocks that negatively impacted performance included utilities DTE Energy Co. and NextEra Energy, Inc., and healthcare company Pfizer, Inc. In contrast, the Health Care, Consumer Staples and Communication Services sectors were the largest contributors to relative returns. Looking at individual stocks, financial services company JPMorgan Chase & Co., oil gas & consumable fuels firm Exxon Mobil Corp., and healthcare company Merck & Co., Inc. were the most additive for performance.
We continue to evaluate the implications of a weaker economy and remain cautious on our outlook, notably the outlook implied by weakening demand. As such, we have been assessing what is the appropriate risk for our holdings within the Fund and which stocks look most attractive given that backdrop. We continue to see a tougher environment for the remainder of this year and going into next year as prices have not reflected the potential for a weaker economy, in our opinion. We continue to be overweight in what we believe to be the less economically sensitive areas of the market in individual holdings that we find to be cheap on normalized earnings (sectors include Consumer Staples, Health Care and Utilities). We continue to be an active large-cap value manager, remaining disciplined and trying to position the portfolio in the best opportunities we see in the current environment.
Sincerely,
Eli M. Salzmann
Portfolio Manager
Information about principal risks of investing in the Fund is set forth in the prospectus and statement of additional information.
The portfolio composition, industries and holdings of the Fund are subject to change without notice.
The opinions expressed are those of the Fund’s portfolio manager. The opinions are as of the date of this report and are subject to change without notice.
Large Cap Value Fund (Unaudited)
|
(as a % of Total Investments*) |
| |
| |
| |
| |
| |
| |
| |
| |
| |
| |
| |
| |
| Derivatives (other than options purchased), if any, are excluded from this chart. |
| | | |
| | Average Annual Total Return
Ended 08/31/2023 |
| | | | |
| | | | | |
| | | | | |
| | | | | |
| | | | | |
| | | | | |
| | | | | |
| | | | | |
| | | | | |
| | | | | |
| | | | | |
| | | | |
| | | | | |
| | | | | |
| | | | | |
| | | | |
The performance data quoted represent past performance and do not indicate future results. Current performance may be lower or higher than the performance data quoted. For current performance data, including current to the most recent month-end, please visit www.nb.com/performance.
The results shown in the table reflect the reinvestment of income dividends and other distributions, if any. The results do not reflect the effect of taxes a shareholder would pay on Fund distributions or on the redemption of Fund shares.
The investment return and principal value of an investment will fluctuate and shares, when redeemed, may be worth more or less than their original cost.
Returns would have been lower if Neuberger Berman Investment Advisers LLC ("NBIA") had not reimbursed certain expenses and/or waived a portion of the investment management fees during certain of the periods shown. Repayment by a class (of expenses previously reimbursed and/or fees previously waived by NBIA) will decrease the class’s returns. Please see Note B in the Notes to Financial Statements for specific information regarding expense reimbursement and/or fee waiver arrangements.
As stated in the Fund’s most recent prospectus, the total annual operating expense ratios for fiscal year 2022 were 0.76%, 0.96%, 1.11%, 0.61%, 0.99%, 1.73%, 1.24%, 0.51% and 0.46% for Investor Class, Trust Class, Advisor Class, Institutional Class, Class A, Class C, Class R3, Class R6 and Class E shares, respectively (before expense reimbursements and/or fee waivers, if any). The expense ratio for fiscal year 2022 was 0.04% for Class E shares after expense reimbursements and/or fee waivers. The expense ratios for the annual period ended August 31, 2023, can be found in the Financial Highlights section of this report.
Returns shown with a sales charge reflect the deduction of the current maximum initial sales charge of 5.75% for Class A shares and the contingent deferred sales charge (CDSC) for Class C shares. The CDSC for Class C shares is 1.00%, which is reduced to 0% after 1 year. The performance of the Fund’s share classes will differ primarily due to different sales charge structures and class expenses. Please see the prospectus for more information about sales charge structures, if any, and class expenses for your share class.
Large Cap Value Fund (Unaudited)
COMPARISON OF A $10,000 INVESTMENT
This graph shows the change in value of a hypothetical $10,000 investment in the Fund over the past 10 fiscal years, or since the Fund’s inception if it has not operated for 10 years. The graph is based on the Investor Class shares only; the performance of the Fund’s share classes will differ primarily due to different sales charge structures and class expenses (see Performance Highlights chart on previous page). The result is compared with benchmarks, which include a broad-based market index and may include a more narrowly based index. Market indices have not been reduced to reflect any of the fees and costs of investing. The results shown in the graph reflect the reinvestment of income dividends and other distributions, if any. The results do not reflect the effect of taxes a shareholder would pay on Fund distributions or on the redemption of Fund shares. Results represent past performance and do not indicate future results.
Mid Cap Growth Fund Commentary (Unaudited)
Neuberger Berman Mid Cap Growth Fund Investor Class generated a 4.41% total return for the fiscal year ended August 31, 2023 (the reporting period), trailing its benchmark, the Russell Midcap® Growth Index (the Index), which posted a 13.00% total return for the same period. (Performance for all share classes is provided in the table immediately following this letter.)
To say that the reporting period has been frustrating would be an understatement, as we were significantly challenged by a highly rotational market eager to discount the prevailing "wall of worry" and primarily driven by a small subset of sustained investment trends. Over the reporting period, the Fund was presented with a diverse mix of hurdles highlighted by: continued stubborn inflationary pressures; the actions and impact of a hawkish U.S. Federal Reserve Board (Fed) intent on curbing inflation and finally ending the "Great-Financial-Crisis" era of free money; the ramifications of ongoing geopolitical flashpoints; a sudden and significant crisis of confidence across our regional banking system; political gamesmanship around the debt ceiling and government funding; and the foreboding handwringing associated with one of the most anticipated and debated recessions in history, that hasn’t actually come to fruition.
From a fundamental standpoint, our companies delivered significantly more hits than misses over the reporting period, but unfortunately many of our winners weren’t rewarded as this market held previous leaders and laggards to starkly different expectations, ultimately resulting in an unfavorable imbalance between the Fund’s contributors and detractors. As such, positive stock selection within segments of our overweight allocation versus the Index to Information Technology couldn’t completely offset stock-specific issues, broad negative sentiment and/or the performance drag associated with names that we didn’t own across Energy, Consumer Discretionary, Financials and Communication Services.
Drilling down to our holdings, Arista Networks, Inc., which develops and markets client-to-cloud, data-driven networking platform solutions, was the leading contributor to returns as the company consistently exceeded top- and bottom-line expectations, raised their forward guidance and offered bullish commentary around the macro environment and robust demand related to artificial intelligence (AI). Enphase Energy, Inc., which designs, manufactures and markets micro-inverter and smart battery systems that, when paired with solar panels, turn sunlight into a scalable source of energy, was one of the leading detractors as a rising-rate environment began to weigh on forward expectations, resulting in mixed guidance for a market simply not inclined to overlook any issues with higher expectation investments. It was sold during the reporting period.
Looking ahead, we’re open to a range of possibilities even as we remain wary of the market’s current buoyancy and apparent dearth of adverse effects from the Fed’s aggressive efforts to elicit demand destruction in order to effectively curb inflation. The big question is whether this current "bull" rally is sustainable or if it has been more of a mirage, fueled by overly optimistic investor sentiment, AI-mania and, more recently, "fear-of-missing-out" flows, potentially obscuring economic deterioration. While we believe that we aren’t completely out of the woods yet, we acknowledge that the probability of the most severe recessionary scenarios is ebbing and, as a result, we’re cautiously embracing the potential sustainability of this market’s upward trajectory and resiliency. We will continue to leverage our highest conviction ideas, which have experienced their own valuation resets in 2023 despite continuing to execute. We will also seek out new opportunities primed for the prevailing positive sentiment and reduced recessionary angst, while maintaining our bias towards investments that we believe have sustainable business models, balance sheet strength and managements capable of consistent execution across varied and potentially unsettled environments.
Sincerely,
Chad Bruso and Trevor Moreno
Portfolio Co-Managers
Information about principal risks of investing in the Fund is set forth in the prospectus and statement of additional information.
The portfolio composition, industries and holdings of the Fund are subject to change without notice.
The opinions expressed are those of the Fund’s portfolio managers. The opinions are as of the date of this report and are subject to change without notice.
Mid Cap Growth Fund (Unaudited)
|
(as a % of Total Investments*) |
| |
| |
| |
| |
| |
| |
| |
| |
| |
| |
| |
| Derivatives (other than options purchased), if any, are excluded from this chart. |
| | | |
| | Average Annual Total Return
Ended 08/31/2023 |
| | | | |
| | | | | |
| | | | | |
| | | | | |
| | | | | |
| | | | | |
| | | | | |
| | | | | |
| | | | | |
| | | | | |
| | | | |
| | | | | |
| | | | | |
| | | | | |
| | | | |
| | | | |
The performance data quoted represent past performance and do not indicate future results. Current performance may be lower or higher than the performance data quoted. For current performance data, including current to the most recent month-end, please visit www.nb.com/performance.
The results shown in the table reflect the reinvestment of income dividends and other distributions, if any. The results do not reflect the effect of taxes a shareholder would pay on Fund distributions or on the redemption of Fund shares.
The investment return and principal value of an investment will fluctuate and shares, when redeemed, may be worth more or less than their original cost.
Returns would have been lower if Neuberger Berman Investment Advisers LLC ("NBIA") had not reimbursed certain expenses and/or waived a portion of the investment management fees during certain of the periods shown. Repayment by a class (of expenses previously reimbursed and/or fees previously waived by NBIA) will decrease the class’s returns. Please see Note B in the Notes to Financial Statements for specific information regarding expense reimbursement and/or fee waiver arrangements.
As stated in the Fund’s most recent prospectus, the total annual operating expense ratios for fiscal year 2022 were 0.84%, 0.94%, 1.20%, 0.70%, 1.06%, 1.81%, 1.31% and 0.59% for Investor Class, Trust Class, Advisor Class, Institutional Class, Class A, Class C, Class R3 and Class R6 shares, respectively (before expense reimbursements and/or fee waivers, if any). The expense ratios for the annual period ended August 31, 2023, can be found in the Financial Highlights section of this report.
Returns shown with a sales charge reflect the deduction of the current maximum initial sales charge of 5.75% for Class A shares and the contingent deferred sales charge (CDSC) for Class C shares. The CDSC for Class C shares is 1.00%, which is reduced to 0% after 1 year. The performance of the Fund’s share classes will differ primarily due to different sales charge structures and class expenses. Please see the prospectus for more information about sales charge structures, if any, and class expenses for your share class.
Mid Cap Growth Fund (Unaudited)
COMPARISON OF A $10,000 INVESTMENT
This graph shows the change in value of a hypothetical $10,000 investment in the Fund over the past 10 fiscal years, or since the Fund’s inception if it has not operated for 10 years. The graph is based on the Investor Class shares only; the performance of the Fund’s share classes will differ primarily due to different sales charge structures and class expenses (see Performance Highlights chart on previous page). The result is compared with benchmarks, which include a broad-based market index and may include a more narrowly based index. Market indices have not been reduced to reflect any of the fees and costs of investing. The results shown in the graph reflect the reinvestment of income dividends and other distributions, if any. The results do not reflect the effect of taxes a shareholder would pay on Fund distributions or on the redemption of Fund shares. Results represent past performance and do not indicate future results.
Mid Cap Intrinsic Value Fund Commentary (Unaudited)
Neuberger Berman Mid Cap Intrinsic Value Fund Investor Class generated a 3.88% total return for the fiscal year ended August 31, 2023 (the reporting period), underperforming its benchmark, the Russell Midcap® Value Index (the Index), which returned 5.65% for the same period. (Performance for all share classes is provided in the table immediately following this letter.)
During the reporting period, our exposure to regional banks proved to be detrimental. The regional banking crisis and fears of recession undermined confidence in the banking sector, impacting a number of our financial holdings, including M&T Bank and BankUnited, which were sold during the reporting period. Companies with above average exposure to low-end consumer spending like The Children’s Place also lagged. Generally speaking, value stocks are perceived as more vulnerable to an economic slowdown than growth stocks. This historic divergence was further exaggerated by the enthusiasm around artificial intelligence applications like ChatGPT which many believe will usher in a new wave of innovation and growth.
Looking at our better performers during the reporting period, several companies held in the Fund’s portfolio that were well-positioned to benefit from popular themes stand out. Clean energy drives demand for hydrogen and the need for a more efficient electrical grid, hence KBR and Itron performed well. The growing popularity of gaming, both online and in the casino, benefitted International Game Technology.
During the reporting period, 14 portfolio companies entered into agreements to either divest significant assets or make synergistic acquisitions. We believe that these transactions are designed to enhance growth and if properly executed, will drive valuations higher. In addition, two companies were acquired but at a loss to our investment cost. New investments for the year totaled 13 and nine names were eliminated. Including trims and adds, we have rebalanced approximately 30% of the Fund.
We continue to engage with the boards and management teams of several portfolio companies that have yet to generate positive returns but are selling at material discounts to our estimates of their intrinsic value1. Generally speaking, we try to offer constructive advice around the company’s messaging with a particular focus on setting long-term financial targets and helping companies craft better explanations for situations that investors may view as complex or confusing. While we remain guardedly optimistic for the possibility of realizable returns from these efforts, more patience will be required.
Economic growth continues to surprise to the upside, earnings have been more resilient than expected, and employment remains strong. The wild card is the outlook for inflation. Although we believe the worst has passed, improvement from current levels to the U.S. Federal Reserve Board’s stated two percent target may prove elusive.
While today’s challenges may be daunting, as we lurch between war, banking crises and inflation there will be winners and losers and more often than not, we believe investors with patience and discipline will be rewarded for the risk and volatility they underwrite. While we are disappointed in our relative returns, we’re happy to see the Fund recover since our last annual report and are guardedly optimistic that, to us, many portfolio companies remain significantly undervalued. We look forward to our next communication and as always are deeply committed as we attempt to grow your investment with us at an attractive long-term rate.
Sincerely,
Michael C. Greene, Benjamin H. Nahum, James F. McAree, Amit Solomon and Rand W. Gesing
Portfolio Managers
1 Intrinsic value reflects the portfolio management team’s analysis and estimates of a company’s value. There is no guarantee that any intrinsic values will be realized; security prices may decrease regardless of intrinsic values.
Information about principal risks of investing in the Fund is set forth in the prospectus and statement of additional information.
The portfolio composition, industries and holdings of the Fund are subject to change without notice.
The opinions expressed are those of the Fund’s portfolio managers. The opinions are as of the date of this report and are subject to change without notice.
Mid Cap Intrinsic Value Fund (Unaudited)
|
(as a % of Total Investments*) |
| |
| |
| |
| |
| |
| |
| |
| |
| |
| |
| |
| |
| |
| Derivatives (other than options purchased), if any, are excluded from this chart. |
| | | |
| | Average Annual Total Return
Ended 08/31/2023 |
| | | | |
| | | | | |
| | | | | |
| | | | | |
| | | | | |
| | | | | |
| | | | | |
| | | | | |
| | | | | |
| | | | |
| | | | | |
| | | | | |
| | | | | |
| | | | |
| | | | |
The performance data quoted represent past performance and do not indicate future results. Current performance may be lower or higher than the performance data quoted. For current performance data, including current to the most recent month-end, please visit www.nb.com/performance.
The results shown in the table reflect the reinvestment of income dividends and other distributions, if any. The results do not reflect the effect of taxes a shareholder would pay on Fund distributions or on the redemption of Fund shares.
The investment return and principal value of an investment will fluctuate and shares, when redeemed, may be worth more or less than their original cost.
Returns would have been lower if Neuberger Berman Investment Advisers LLC ("NBIA") had not reimbursed certain expenses and/or waived a portion of the investment management fees during certain of the periods shown. Repayment by a class (of expenses previously reimbursed and/or fees previously waived by NBIA) will decrease the class’s returns. Please see Note B in the Notes to Financial Statements for specific information regarding expense reimbursement and/or fee waiver arrangements.
As stated in the Fund’s most recent prospectus, the total annual operating expense ratios for fiscal year 2022 were 1.45%, 1.63%, 1.28%, 1.68%, 2.43%, 1.94% and 1.55% for Investor Class, Trust Class, Institutional Class, Class A, Class C, Class R3 and Class R6 shares, respectively (before expense reimbursements and/or fee waivers, if any). The expense ratios were 1.25%, 0.85%, 1.21%, 1.96%, 1.46% and 0.75% for Trust Class, Institutional Class, Class A, Class C, Class R3 and Class R6 shares, respectively, after expense reimbursements and/or fee waivers. The expense ratios for the annual period ended August 31, 2023, can be found in the Financial Highlights section of this report.
Returns shown with a sales charge reflect the deduction of the current maximum initial sales charge of 5.75% for Class A shares and the contingent deferred sales charge (CDSC) for Class C shares. The CDSC for Class C shares is 1.00%, which is reduced to 0% after 1 year. The performance of the Fund’s share classes will differ primarily due to different sales charge structures and class expenses. Please see the prospectus for more information about sales charge structures, if any, and class expenses for your share class.
Mid Cap Intrinsic Value Fund (Unaudited)
COMPARISON OF A $10,000 INVESTMENT
This graph shows the change in value of a hypothetical $10,000 investment in the Fund over the past 10 fiscal years, or since the Fund’s inception if it has not operated for 10 years. The graph is based on the Investor Class shares only; the performance of the Fund’s share classes will differ primarily due to different sales charge structures and class expenses (see Performance Highlights chart on previous page). The result is compared with benchmarks, which include a broad-based market index and may include a more narrowly based index. Market indices have not been reduced to reflect any of the fees and costs of investing. The results shown in the graph reflect the reinvestment of income dividends and other distributions, if any. The results do not reflect the effect of taxes a shareholder would pay on Fund distributions or on the redemption of Fund shares. Results represent past performance and do not indicate future results.
Multi-Cap Opportunities Fund Commentary (Unaudited)
Neuberger Berman Multi-Cap Opportunities Fund Institutional Class generated a 12.81% total return for the fiscal year ended August 31, 2023 (the reporting period), trailing the 15.94% total return of its benchmark, the S&P 500® Index (the Index) for the same period. (Performance for all share classes is provided in the table immediately following this letter.)
The U.S. economy continues to demonstrate resiliency, highlighted by positive GDP growth and a robust labor market. Investor sentiment for U.S. equities has been supported by an improvement in the outlook for global growth, better-than-expected earnings results and moderating inflation. The U.S. equity market in 2023 has been driven by the disproportionate outperformance of large-cap growth, and technology-oriented stocks, leading to a significant concentration of market returns. With investors focused on these segments, many other areas of the market may have been overlooked. We believe this is creating the opportunity to identify differentiated, idiosyncratic investments across the market capitalization and style spectrum.
Strong stock selection within the Consumer Discretionary, Consumer Staples, Financials, Health Care, and Materials sectors benefitted relative performance. Relative performance was negatively impacted by portfolio positioning, primarily due to being underweight the Information Technology (IT) sector versus the Index. Stock selection in the Communication Services and Industrials sectors also detracted. The Fund benefitted from underweight positions to the Health Care and Utilities sectors, and by having no exposure to the Real Estate sector. The Fund ended the reporting period with overweight positions in Financials, Industrials, and Materials, underweight positions to Health Care and IT, and no exposure to Real Estate.
Portfolio construction is an important component of our investment process and consists of three distinct investment categories: Special Situations, Opportunistic, and Classic. Special Situation investments have unique attributes (e.g., restructuring, spin-offs, post-bankruptcy equities) that require specific valuation methodologies and customized investment research. Opportunistic investments are companies that have become inexpensive for a tangible reason that we believe is temporary. Classic investments are those companies with long histories of shareholder friendly policies, high quality management teams and exceptional operating performance. We believe maintaining a balance of these three categories helps to mitigate risk within the Fund. We continue to find investment opportunities across each investment category that we believe have attractive risk/return profiles.
We continue to apply our disciplined fundamental research to seek to identify companies we believe have high quality business models with attractive free cash flow characteristics trading at compelling valuations. We believe our investment strategy has the ability to effectively navigate the dynamic market environment and create long-term value for clients. Thus far in 2023, equity market returns have been predominantly driven by outsized performance by select Large-Cap growth and technology-oriented companies. This is creating opportunity. We believe our flexible approach is poised to capitalize on idiosyncratic investment opportunities across market-capitalizations, sectors, industries, and investment styles. In our view, select businesses within the portfolio are differentiating themselves with company-specific solutions in response to supply-chain constraints, inflationary pressures, higher interest rates, and ongoing shifts in consumer behavior. We believe our disciplined free cash flow focused approach, understanding of capital structures, and valuation discipline provides a potential benefit in the current environment. The depth of our "Storehouse of Knowledge" remains robust. We believe the Fund is well positioned to benefit from an increasing investor focus on company fundamentals.
As we evaluate both potential new positions and current portfolio holdings, we will continue to do so with a long-term investment perspective in mind. As always, our focus is to grow our clients’ assets through the disciplined application of our investment philosophy and process.
Sincerely,
Richard S. Nackenson
Portfolio Manager
Information about principal risks of investing in the Fund is set forth in the prospectus and statement of additional information.
The portfolio composition, industries and holdings of the Fund are subject to change without notice.
The opinions expressed are those of the Fund’s portfolio manager. The opinions are as of the date of this report and are subject to change without notice.
Multi-Cap Opportunities Fund (Unaudited)
|
(as a % of Total Investments*) |
| |
| |
| |
| |
| |
| |
| |
| |
| |
| |
| |
| |
| Derivatives (other than options purchased), if any, are excluded from this chart. |
| | | |
| | Average Annual Total Return
Ended 08/31/2023 |
| | | | |
| | | | | |
| | | | | |
| | | | | |
| | | | | |
| | | | | |
| | | | |
| | | | | |
| | | | | |
| | | | | |
| | | | |
*The performance data for the life of Fund for each class includes the performance of the Fund’s oldest share class, Trust Class, from November 2, 2006 through December 21, 2009. See endnote 23 for information about the effects of the different fees paid by each class.
The performance data quoted represent past performance and do not indicate future results. Current performance may be lower or higher than the performance data quoted. For current performance data, including current to the most recent month-end, please visit www.nb.com/performance.
The results shown in the table reflect the reinvestment of income dividends and other distributions, if any. The results do not reflect the effect of taxes a shareholder would pay on Fund distributions or on the redemption of Fund shares.
The investment return and principal value of an investment will fluctuate and shares, when redeemed, may be worth more or less than their original cost.
Returns would have been lower if Neuberger Berman Investment Advisers LLC ("NBIA") had not reimbursed certain expenses and/or waived a portion of the investment management fees during certain of the periods shown. Repayment by a class (of expenses previously reimbursed and/or fees previously waived by NBIA) will decrease the class’s returns. Please see Note B in the Notes to Financial Statements for specific information regarding expense reimbursement and/or fee waiver arrangements.
As stated in the Fund’s most recent prospectus, the total annual operating expense ratios for fiscal year 2022 were 0.82%, 1.19%, 1.94% and 0.69% for Institutional Class, Class A, Class C and Class E shares, respectively (before expense reimbursements and/or fee waivers, if any). The expense ratio for fiscal year 2022 was 0.10% for Class E after expense reimbursements and/or fee waivers. The expense ratios for the annual period ended August 31, 2023, can be found in the Financial Highlights section of this report.
Returns shown with a sales charge reflect the deduction of the current maximum initial sales charge of 5.75% for Class A shares and the contingent deferred sales charge (CDSC) for Class C shares. The CDSC for Class C shares is 1.00%, which is reduced to 0% after 1 year. The performance of the Fund’s share classes will differ primarily due to different sales charge structures and class expenses. Please see the prospectus for more information about sales charge structures, if any, and class expenses for your share class.
Multi-Cap Opportunities Fund (Unaudited)
COMPARISON OF A $1,000,000 INVESTMENT
(000's omitted)
This graph shows the change in value of a hypothetical $1,000,000 investment in the Fund over the past 10 fiscal years, or since the Fund’s inception if it has not operated for 10 years. The graph is based on the Institutional Class shares only; the performance of the Fund’s share classes will differ primarily due to different sales charge structures and class expenses (see Performance Highlights chart on previous page). The result is compared with benchmarks, which include a broad-based market index and may include a more narrowly based index. Market indices have not been reduced to reflect any of the fees and costs of investing. The results shown in the graph reflect the reinvestment of income dividends and other distributions, if any. The results do not reflect the effect of taxes a shareholder would pay on Fund distributions or on the redemption of Fund shares. Results represent past performance and do not indicate future results.
Real Estate Fund Commentary (Unaudited)
Neuberger Berman Real Estate Fund Trust Class generated a -10.02% total return for the fiscal year ended August 31, 2023 (the reporting period), underperforming the -7.71% total return of its benchmark, the FTSE Nareit All Equity REITs Index (the Index), for the same period. (Performance for all share classes is provided in the table immediately following this letter.)
The U.S. equity market, as measured by the S&P 500® Index, generated strong results, with a 15.94% total return led by mega-cap growth stocks, buoyed by excess liquidity, flows and optimism around artificial intelligence and its implications. However, this is against a backdrop where investor sentiment continues to be challenged by sticky inflation and aggressive U.S. Federal Reserve Board (Fed) hikes. The U.S. credit rating was downgraded by Fitch Ratings in early August, citing fiscal deterioration and a growing general government debt burden. Comparatively, real estate investment trusts (REITs), as measured by the Index, experienced a 7.71% decline, underperforming the S&P 500 Index by almost 24%.
The Fund underperformed the Index on a relative basis during the reporting period. Sector positioning, overall, detracted from performance. In particular, the Fund’s underweight to Data Centers versus the Index and an overweight to Infrastructure REITs were among the bigger detectors for relative returns. Conversely, underweights to Office and Diversified were the most beneficial for relative performance.
Stock selection also detracted from relative performance. Among those sectors contributing the most to relative results were Specialty and Office. In terms of individual holdings, Prologis, Inc., Equinix, Inc. and Iron Mountain, Inc. were the top contributors. On the downside, holdings within the Data Centers, Shopping Centers and Free Standing sectors were the largest detractors from relative performance. Individual holdings that detracted the most from results included Crown Castle, Inc, American Tower Corp. and Extra Space Storage, Inc.
We head into fall with continuing concerns related to an uncertain macro-economic backdrop, which is still weighed down by higher interest rates, slower economic growth and lack of liquidity in transaction markets and private investment vehicles. However, the banking sector stress, lower commodity prices and a slowing labor market could provide support for the view that inflation levels may have peaked. The broader commercial real estate sector has been viewed with caution as the failures of regional banks and subsequent tighter lending standards have increased concern that U.S. regional banks’ ability to lend to the sector is likely impaired. The effect on the listed REITs market is not expected to be pronounced as we believe such REITs own mainly high-quality assets, generally maintain strong balance sheets, and tend to use the larger banks. However, we believe REITs continue to be weighed down by negative news headlines that suggest otherwise. Recent real estate financing deals and a few sizable acquisitions may signal that the transaction markets continue to thaw, which could be a catalyst to improve investor sentiment. While we believe the macro backdrop could continue to weigh on stocks, a near-term end to the Fed tightening cycle and attractive relative valuations versus the broader market could, in our view, support the REIT market later this year and into 2024. We will continue to focus on select companies that we believe have better fundamentals, diverse demand drivers and strong balance sheets that can withstand increased market volatility.
Sincerely,
Steve Shigekawa and Brian C. Jones
Portfolio Co-Managers
Information about principal risks of investing in the Fund is set forth in the prospectus and statement of additional information.
The portfolio composition, industries and holdings of the Fund are subject to change without notice.
The opinions expressed are those of the Fund’s portfolio managers. The opinions are as of the date of this report and are subject to change without notice.
Real Estate Fund (Unaudited)
|
(as a % of Total Investments*) |
| |
| |
| |
| |
| |
| |
| |
| |
| |
| |
| |
| |
| |
| |
| |
| |
| Derivatives (other than options purchased), if any, are excluded from this chart. |
| | | |
| | Average Annual Total Return
Ended 08/31/2023 |
| | | | |
| | | | | |
| | | | | |
| | | | | |
| | | | | |
| | | | | |
| | | | | |
| | | | | |
| | | | | |
| | | | |
| | | | | |
| | | | | |
| | | | | |
| | | | |
The performance data quoted represent past performance and do not indicate future results. Current performance may be lower or higher than the performance data quoted. For current performance data, including current to the most recent month-end, please visit www.nb.com/performance.
The results shown in the table reflect the reinvestment of income dividends and other distributions, if any. The results do not reflect the effect of taxes a shareholder would pay on Fund distributions or on the redemption of Fund shares.
The investment return and principal value of an investment will fluctuate and shares, when redeemed, may be worth more or less than their original cost.
Returns would have been lower if Neuberger Berman Investment Advisers LLC ("NBIA") had not reimbursed certain expenses and/or waived a portion of the investment management fees during certain of the periods shown. Repayment by a class (of expenses previously reimbursed and/or fees previously waived by NBIA) will decrease the class’s returns. Please see Note B in the Notes to Financial Statements for specific information regarding expense reimbursement and/or fee waiver arrangements.
As stated in the Fund’s most recent prospectus, the total annual operating expense ratios for fiscal year 2022 were 1.37%, 1.01%, 1.38%, 2.14%, 1.64%, 0.92% and 0.88% for Trust Class, Institutional Class, Class A, Class C, Class R3, Class R6 and Class E shares, respectively. The expense ratios were 0.85%, 1.21%, 1.96%, 1.46%, 0.75% and 0.08% for Institutional Class, Class A, Class C, Class R3, Class R6 and Class E shares, respectively, after expense reimbursements and/or fee waivers. The expense ratios for the annual period ended August 31, 2023, can be found in the Financial Highlights section of this report.
Returns shown with a sales charge reflect the deduction of the current maximum initial sales charge of 5.75% for Class A shares and the contingent deferred sales charge (CDSC) for Class C shares. The CDSC for Class C shares is 1.00%, which is reduced to 0% after 1 year. The performance of the Fund’s share classes will differ primarily due to different sales charge structures and class expenses. Please see the prospectus for more information about sales charge structures, if any, and class expenses for your share class.
Real Estate Fund (Unaudited)
COMPARISON OF A $10,000 INVESTMENT
This graph shows the change in value of a hypothetical $10,000 investment in the Fund over the past 10 fiscal years, or since the Fund’s inception if it has not operated for 10 years. The graph is based on the Trust Class shares only; the performance of the Fund’s share classes will differ primarily due to different sales charge structures and class expenses (see Performance Highlights chart on previous page). The result is compared with benchmarks, which include a broad-based market index and may include a more narrowly based index. Market indices have not been reduced to reflect any of the fees and costs of investing. The results shown in the graph reflect the reinvestment of income dividends and other distributions, if any. The results do not reflect the effect of taxes a shareholder would pay on Fund distributions or on the redemption of Fund shares. Results represent past performance and do not indicate future results.
Small Cap Growth Fund Commentary (Unaudited)
Neuberger Berman Small Cap Growth Fund Investor Class posted a 1.45% total return for the fiscal year ended August 31, 2023 (the reporting period), trailing its benchmark, the Russell 2000® Growth Index (the Index), which returned 6.78% for the same period. (Performance for all share classes is provided in the table immediately following this letter.)
To say that the reporting period has been frustrating would be an understatement, as we were significantly challenged by a highly rotational market eager to discount the prevailing "wall of worry" and primarily driven by a small subset of sustained investment trends. Over the period, the Fund was presented with a diverse mix of hurdles highlighted by: continued stubborn inflationary pressures; the actions and impact of a hawkish U.S. Federal Reserve Board (Fed) intent on curbing inflation and finally ending the "Great-Financial-Crisis" era of free money; the ramifications of ongoing geopolitical flashpoints; a sudden and significant crisis of confidence across our regional banking system; political gamesmanship around the debt ceiling and government funding; and the foreboding handwringing associated with one of the most anticipated and debated recessions in history, that hasn’t actually come to fruition.
From a fundamental standpoint, our companies delivered significantly more hits than misses over the reporting period, but unfortunately many of our winners weren’t rewarded as this market held previous leaders and laggards to starkly different expectations, ultimately resulting in an unfavorable imbalance between the Fund’s contributors and detractors. As such, positive stock selection within our allocation to Industrials and Financials couldn’t offset stock-specific issues, broad negative sentiment and/or the performance drag associated with names that we didn’t own across Health Care, Energy, Information Technology and Consumer Discretionary.
Drilling down to our holdings, Manhattan Associates, which develops and markets cloud-based and on-premise supply chain, warehouse management and omnichannel commerce solutions to unite information across an enterprise and increase execution efficiency, was the leading contributor to returns as the company continued to strongly exceed earnings expectations and deliver confidence-boosting longer-term guidance. R1 RCM, Inc., which provides revenue-cycle management tools and advisory services to healthcare providers, was the leading detractor to returns as continued lagging patient participation and utilization trends resulted in fourth quarter 2022 results that fell short of already lowered expectations. Given the lack of visibility into 2023 and our waning confidence in management, we exited our position during the reporting period.
Looking ahead, we’re open to a range of possibilities even as we remain wary of the market’s current buoyancy and apparent dearth of adverse effects from the Fed’s aggressive efforts to elicit demand destruction in order to effectively curb inflation. The big question is whether this current "bull" rally is sustainable or if it has been more of a mirage, fueled by overly optimistic investor sentiment, artificial intelligence-mania and, more recently, "fear-of-missing-out" flows, potentially obscuring economic deterioration. While we believe that we aren’t completely out of the woods yet, we acknowledge that the probability of the most severe recessionary scenarios is ebbing and, as a result, we’re cautiously embracing the potential sustainability of this market’s upward trajectory and resiliency. We will continue to leverage our highest conviction ideas, which have experienced their own valuation resets in 2023 despite continuing to execute. We will also seek out new opportunities primed for the prevailing positive sentiment and reduced recessionary angst, while maintaining our bias towards investments that we believe have sustainable business models, balance sheet strength and managements capable of consistent execution across varied and potentially unsettled environments.
Sincerely,
Chad Bruso and Trevor Moreno
Portfolio Co-Managers
Information about principal risks of investing in the Fund is set forth in the prospectus and statement of additional information.
The portfolio composition, industries and holdings of the Fund are subject to change without notice.
The opinions expressed are those of the Fund’s portfolio managers. The opinions are as of the date of this report and are subject to change without notice.
Small Cap Growth Fund (Unaudited)
|
(as a % of Total Investments*) |
| |
| |
| |
| |
| |
| |
| |
| |
| |
| |
| Derivatives (other than options purchased), if any, are excluded from this chart. |
| | | |
| | Average Annual Total Return
Ended 08/31/2023 |
| | | | |
| | | | | |
| | | | | |
| | | | | |
| | | | | |
| | | | | |
| | | | | |
| | | | | |
| | | | | |
| | | | | |
| | | | |
| | | | | |
| | | | | |
| | | | | |
| | | | |
| | | | |
The performance data quoted represent past performance and do not indicate future results. Current performance may be lower or higher than the performance data quoted. For current performance data, including current to the most recent month-end, please visit www.nb.com/performance.
The results shown in the table reflect the reinvestment of income dividends and other distributions, if any. The results do not reflect the effect of taxes a shareholder would pay on Fund distributions or on the redemption of Fund shares.
The investment return and principal value of an investment will fluctuate and shares, when redeemed, may be worth more or less than their original cost.
Returns would have been lower if Neuberger Berman Investment Advisers LLC ("NBIA") had not reimbursed certain expenses and/or waived a portion of the investment management fees during certain of the periods shown. Repayment by a class (of expenses previously reimbursed and/or fees previously waived by NBIA) will decrease the class’s returns. Please see Note B in the Notes to Financial Statements for specific information regarding expense reimbursement and/or fee waiver arrangements.
As stated in the Fund’s most recent prospectus, the total annual operating expense ratios for fiscal year 2022 were 1.33%, 1.49%, 1.64%, 1.13%, 1.53%, 2.25%, 1.78% and 1.06% for Investor Class, Trust Class, Advisor Class, Institutional Class, Class A, Class C, Class R3 and Class R6 shares, respectively (before expense reimbursements and/or fee waivers, if any). The expense ratios were 1.31%, 1.41%, 1.61%, 0.91%, 1.27%, 2.02%, 1.52% and 0.81% for Investor Class, Trust Class, Advisor Class, Institutional Class, Class A, Class C, Class R3 and Class R6 shares, respectively, after expense reimbursements and/or fee waivers. The expense ratios for the annual period ended August 31, 2023, can be found in the Financial Highlights section of this report.
Returns shown with a sales charge reflect the deduction of the current maximum initial sales charge of 5.75% for Class A shares and the contingent deferred sales charge (CDSC) for Class C shares. The CDSC for Class C shares is 1.00%, which is reduced to 0% after 1 year. The performance of the Fund’s share classes will differ primarily due to different sales charge structures and class expenses. Please see the prospectus for more information about sales charge structures, if any, and class expenses for your share class.
Small Cap Growth Fund (Unaudited)
COMPARISON OF A $10,000 INVESTMENT
This graph shows the change in value of a hypothetical $10,000 investment in the Fund over the past 10 fiscal years, or since the Fund’s inception if it has not operated for 10 years. The graph is based on the Investor Class shares only; the performance of the Fund’s share classes will differ primarily due to different sales charge structures and class expenses (see Performance Highlights chart on previous page). The result is compared with benchmarks, which include a broad-based market index and may include a more narrowly based index. Market indices have not been reduced to reflect any of the fees and costs of investing. The results shown in the graph reflect the reinvestment of income dividends and other distributions, if any. The results do not reflect the effect of taxes a shareholder would pay on Fund distributions or on the redemption of Fund shares. Results represent past performance and do not indicate future results.
Sustainable Equity Fund Commentary (Unaudited)
Neuberger Berman Sustainable Equity Fund Investor Class reported a total return of 14.74% for the fiscal year ended August 31, 2023 (the reporting period), trailing the 15.94% total return of its benchmark, the S&P 500® Index (the Index) for the same period. (Performance for all share classes is provided in the table immediately following this letter.)
Equity markets rallied this reporting period. From a macro perspective, investor sentiment improved as inflation began showing signs of slowing; and as steady economic data lessened fears that rapid, steep central bank tightening combined with weak economic growth would result in recession.
As investors became more sanguine about risk, defensive sectors within the Index like Utilities lost value, while speculation drove growth sector rallies. This was particularly evident in Information Technology (IT), which more than doubled Index returns, fueled by interest in artificial intelligence (AI) and related advanced semiconductors.
During calendar year 2022’s indiscriminate selloff, we had selectively added large high quality tech names, reducing our IT underweight. We invested in companies with visible cash flows, deep economic and business moats, healthy balance sheets with pricing power, robust stakeholder relationships, and leadership in diversity, management skill and tenure, and operational efficiency. We were optimistic about what these holdings were positioned to deliver over time. However, our remaining underweight (and an unwillingness to overpay as prices surged) meant our IT holdings lagged the Index. We also underperformed within Health Care this reporting period, but outperformance within Financials, Real Estate and Consumer Discretionary largely backfilled these gaps.
Our top contributors during the reporting period were large tech-oriented names: Microsoft Corp., Amazon.com, Inc., and Alphabet, Inc., each with exposure to AI in addition to their strong primary businesses. Amazon.com, Inc. has also been investing in proprietary chip-making technology.
Weaker names in the Fund included Aptiv PLC, Comcast Corp., and Zebra Technologies Corp. Aptiv PLC and Comcast Corp. were sold during the reporting period in light of cyclical and secular end customer demand challenges. Zebra Technologies Corp. stock has been challenged as the current business is being compared against elevated levels of business during the pandemic.
Looking ahead, we will continue following economic and company-specific data closely as the year progresses. While sentiment has improved given better-than-expected U.S. economic data and the fact that a feared decline in second quarter earnings did not materialize, the yield curve remains inverted, which in the past has predicted recession.
As macro-aware, bottom-up fundamental investors, we believe economic and market cycles create opportunities for disciplined investors. We also believe an uncertain macroeconomic environment provides opportunities for strong, well-managed businesses to improve their competitive positioning and build long-term value.
We are pleased with the strength and structure of the current portfolio, and through our core/blend style box investing, we will continue to use any market disruption to invest in what we believe to be quality growth and asset-rich value businesses at attractive valuations. We believe this approach continues to position the portfolio to deliver strong performance over full market cycles, with lower risk than the benchmark.
Finally, we will also remain engaged with portfolio companies and prospects on Environmental, Social and Governance measures, both in our meetings and through our voting power, as we believe leadership in these areas is a key to advantaged long-term performance.
We look forward to continuing to serve your investment needs.
Sincerely,
Daniel P. Hanson
Portfolio Manager
Information about principal risks of investing in the Fund is set forth in the prospectus and statement of additional information.
The portfolio composition, industries and holdings of the Fund are subject to change without notice.
The opinions expressed are those of the Fund’s portfolio manager. The opinions are as of the date of this report and are subject to change without notice.
Sustainable Equity Fund (Unaudited)
|
(as a % of Total Investments*) |
| |
| |
| |
| |
| |
| |
| |
| |
| |
| |
| |
| |
| Derivatives (other than options purchased), if any, are excluded from this chart. |
| | | |
| | Average Annual Total Return
Ended 08/31/2023 |
| | | | |
| | | | | |
| | | | | |
| | | | | |
| | | | | |
| | | | | |
| | | | | |
| | | | | |
| | | | | |
| | | | |
| | | | | |
| | | | | |
| | | | | |
| | | | |
The performance data quoted represent past performance and do not indicate future results. Current performance may be lower or higher than the performance data quoted. For current performance data, including current to the most recent month-end, please visit www.nb.com/performance.
The results shown in the table reflect the reinvestment of income dividends and other distributions, if any. The results do not reflect the effect of taxes a shareholder would pay on Fund distributions or on the redemption of Fund shares.
The investment return and principal value of an investment will fluctuate and shares, when redeemed, may be worth more or less than their original cost.
Returns would have been lower if Neuberger Berman Investment Advisers LLC ("NBIA") had not reimbursed certain expenses and/or waived a portion of the investment management fees during certain of the periods shown. Repayment by a class (of expenses previously reimbursed and/or fees previously waived by NBIA) will decrease the class’s returns. Please see Note B in the Notes to Financial Statements for specific information regarding expense reimbursement and/or fee waiver arrangements.
As stated in the Fund’s most recent prospectus, the total annual operating expense ratios for fiscal year 2022 were 0.85%, 1.03%, 0.68%, 1.05%, 1.80%, 1.30% and 0.58% for Investor Class, Trust Class, Institutional Class, Class A, Class C, Class R3 and Class R6 shares, respectively (before expense reimbursements and/or fee waivers, if any). The expense ratios for the annual period ended August 31, 2023, can be found in the Financial Highlights section of this report.
Returns shown with a sales charge reflect the deduction of the current maximum initial sales charge of 5.75% for Class A shares and the contingent deferred sales charge (CDSC) for Class C shares. The CDSC for Class C shares is 1.00%, which is reduced to 0% after 1 year. The performance of the Fund’s share classes will differ primarily due to different sales charge structures and class expenses. Please see the prospectus for more information about sales charge structures, if any, and class expenses for your share class.
Sustainable Equity Fund (Unaudited)
COMPARISON OF A $10,000 INVESTMENT
This graph shows the change in value of a hypothetical $10,000 investment in the Fund over the past 10 fiscal years, or since the Fund’s inception if it has not operated for 10 years. The graph is based on the Investor Class shares only; the performance of the Fund’s share classes will differ primarily due to different sales charge structures and class expenses (see Performance Highlights chart on previous page). The result is compared with benchmarks, which include a broad-based market index and may include a more narrowly based index. Market indices have not been reduced to reflect any of the fees and costs of investing. The results shown in the graph reflect the reinvestment of income dividends and other distributions, if any. The results do not reflect the effect of taxes a shareholder would pay on Fund distributions or on the redemption of Fund shares. Results represent past performance and do not indicate future results.
U.S. Equity Impact Fund Commentary (Unaudited)
Neuberger Berman U.S. Equity Impact Fund Institutional Class generated a 13.72% total return for the fiscal year ended August 31, 2023 (the reporting period) versus a 14.76% total return of its benchmark, the Russell 3000® Index (the Index) for the same period. (Performance for all share classes is provided in the table immediately following this letter.)
The U.S. economy has proven to be resilient, highlighted by positive GDP growth and a strong labor market. Investor sentiment for U.S. equities has been supported by an improvement in the outlook for global growth, better-than-expected earnings results, moderating inflation, and the prospect of stabilizing interest rates. Disproportionate outperformance of large-cap growth, and technology-oriented stocks has led to significant market concentration in 2023. We believe the opportunity for Impact investing1 remains attractive due to the strong demand for products and services which have the potential to generate significant positive outcomes for people and the planet.
For the reporting period, superior stock selection benefitted relative performance, while portfolio positioning detracted. Stock selection within the Consumer Staples and Health Care sectors was notably strong and benefitted relative performance. The primary detractor from relative performance during the period was the Fund’s underexposure to large-cap growth and technology-oriented areas of the market, which have driven the majority of Index performance in 2023. Many of these large-cap technology stocks do not meet the impact criteria against which the Fund is managed. Relative performance was also negatively impacted by an overweight to Utilities versus the Index. The Fund benefitted from an underweight position to Financials and by having no exposure to Real Estate. The Fund ended the reporting period with overweight positions relative to the Index in the Health Care, Industrials, and Materials sectors and underweights to the Financials and Information Technology sectors. The Fund had no exposure to the Communication Services, Energy, or Real Estate sectors at the end of the reporting period.
Impact investing offers the unique potential to support measurable progress against real-world environmental and social challenges while seeking market rate returns. This approach invests in companies with products or services that have the potential to deliver significantly positive outcomes for people and the planet, while reporting and measuring the tangible contributions that portfolio companies make. Our proprietary quantitative and qualitative impact analysis requires a deep understanding of the product outcomes for customers, which is a lens that adds insight to our fundamental investment process. Positive and negative impacts associated with the products and services of each major business line of a company are assessed.
A company’s contribution to specific positive outcomes is evaluated with reference to the United Nations Sustainable Development Goals (SDGs). We believe companies delivering products and services with the potential to contribute measurable progress towards achieving the SDGs have the potential for outsized growth and returns as these goals become spending priorities for such companies. We believe the potential for significant incremental capital expenditure deployed to achieve the SDGs, along with an increasing investor focus on company fundamentals, is creating an attractive environment for the Fund. As equity markets continue to adapt to a more moderate set of expectations for economic growth and higher interest rates, we believe our investment strategy has the ability to effectively navigate the dynamic market environment and create long-term value for clients. We believe our flexible approach is poised to capitalize on idiosyncratic investment opportunities across market capitalizations, sectors, industries, and investment styles and allows investors to achieve both their impact and financial objectives.
Sincerely,
Richard S. Nackenson and Jonathan Bailey
Portfolio Managers
1 Impact investing is the investment in a portfolio of companies whose products and services the portfolio managers believe have the potential to deliver positive social and environmental outcomes.
Information about principal risks of investing in the Fund is set forth in the prospectus and statement of additional information.
The portfolio composition, industries and holdings of the Fund are subject to change without notice.
The opinions expressed are those of the Fund’s portfolio managers. The opinions are as of the date of this report and are subject to change without notice.
U.S. Equity Impact Fund (Unaudited)
|
(as a % of Total Investments*) |
| |
| |
| |
| |
| |
| |
| |
| |
| |
| |
| Derivatives (other than options purchased), if any, are excluded from this chart. |
| |
| | Average Annual Total Return
Ended 08/31/2023 |
| | |
| | | |
| | | |
| | | |
| | | |
| | |
| | | |
| | | |
| | | |
| | |
The performance data quoted represent past performance and do not indicate future results. Current performance may be lower or higher than the performance data quoted. For current performance data, including current to the most recent month-end, please visit www.nb.com/performance.
The results shown in the table reflect the reinvestment of income dividends and other distributions, if any. The results do not reflect the effect of taxes a shareholder would pay on Fund distributions or on the redemption of Fund shares.
The investment return and principal value of an investment will fluctuate and shares, when redeemed, may be worth more or less than their original cost.
Returns would have been lower if Neuberger Berman Investment Advisers LLC ("NBIA") had not reimbursed certain expenses and/or waived a portion of the investment management fees during certain of the periods shown. Repayment by a class (of expenses previously reimbursed and/or fees previously waived by NBIA) will decrease the class’s returns. Please see Note B in the Notes to Financial Statements for specific information regarding expense reimbursement and/or fee waiver arrangements.
As stated in the Fund’s most recent prospectus, the total annual operating expense ratios for fiscal year 2022 were 5.27%, 5.77% and 6.77% for Institutional Class, Class A and Class C shares, respectively (before expense reimbursements and/or fee waivers, if any). The expense ratios for fiscal year 2022 were 0.91%, 1.27%, and 2.02% for Institutional Class, Class A and Class C shares, respectively, after expense reimbursements and/or fee waivers. The expense ratios for the annual period ended August 31, 2023, can be found in the Financial Highlights section of this report.
Returns shown with a sales charge reflect the deduction of the current maximum initial sales charge of 5.75% for Class A shares and the contingent deferred sales charge (CDSC) for Class C shares. The CDSC for Class C shares is 1.00%, which is reduced to 0% after 1 year. The performance of the Fund’s share classes will differ primarily due to different sales charge structures and class expenses. Please see the prospectus for more information about sales charge structures, if any, and class expenses for your share class.
U.S. Equity Impact Fund (Unaudited)
COMPARISON OF A $1,000,000 INVESTMENT
(000's omitted)
This graph shows the change in value of a hypothetical $1,000,000 investment in the Fund over the past 10 fiscal years, or since the Fund’s inception if it has not operated for 10 years. The graph is based on the Institutional Class shares only; the performance of the Fund’s share classes will differ primarily due to different sales charge structures and class expenses (see Performance Highlights chart on previous page). The result is compared with benchmarks, which include a broad-based market index and may include a more narrowly based index. Market indices have not been reduced to reflect any of the fees and costs of investing. The results shown in the graph reflect the reinvestment of income dividends and other distributions, if any. The results do not reflect the effect of taxes a shareholder would pay on Fund distributions or on the redemption of Fund shares. Results represent past performance and do not indicate future results.
| Please see "Glossary of Indices" on page 72 for a description of indices. Please note that individuals cannot invest directly in any index. The indices described in this report do not take into account any fees, expenses or tax consequences of investing in the individual securities that they track. Data about the performance of an index are prepared or obtained by Neuberger Berman Investment Advisers LLC ("NBIA") and reflect the reinvestment of income dividends and other distributions, if any. The Fund may invest in securities not included in a described index and generally does not invest in all securities included in a described index. |
| The date used to calculate Life of Fund performance for the index is the inception date of the oldest share class. |
| The performance information for Class R3 prior to the class’s inception date is that of the Fund’s Institutional Class. The performance information for the Institutional Class has not been adjusted to take into account differences in class specific operating expenses (such as Rule 12b-1 fees). The Institutional Class has lower expenses and typically higher returns than Class R3. |
| The performance information for Class R6 prior to the class’s inception date is that of the Fund’s Institutional Class. The performance information for the Institutional Class has not been adjusted to take into account differences in class specific operating expenses. The Institutional Class has higher expenses and typically lower returns than Class R6. |
| The performance information for Institutional Class, Class A, Class C, Class R3 and Class E prior to June 9, 2008 is that of the Fund’s Trust Class, which had an inception date of November 2, 2006, and converted into the Institutional Class on June 9, 2008. During the period from November 2, 2006 through June 9, 2008, the Trust Class had only one investor, which could have impacted Fund performance. The performance information for the Trust Class has been adjusted to reflect the appropriate sales charges applicable to Class A and Class C shares but has not been adjusted to take into account differences in class specific operating expenses (such as Rule 12b-1 fees). The Trust Class had higher expenses and typically lower returns than the Institutional Class and Class E. The Trust Class had lower expenses and typically higher returns than Class A, Class C and Class R3. The performance information for Class R3 and Class E from June 9, 2008, to the respective class’s inception date is that of the Fund’s Institutional Class. The performance information for the Institutional Class has not been adjusted to take into account differences in class specific operating expenses (such as Rule 12b-1 fees). The Institutional Class has lower expenses and typically higher returns than Class R3. The Institutional Class has higher expenses and typically lower returns than Class E. |
| Neuberger Berman Focus Fund had a policy of investing mainly in large-cap stocks prior to September 1998 and investing 90% of its assets in no more than six economic sectors prior to December 17, 2007. As of April 2, 2001, the Fund changed its investment policy to become "non-diversified" under the Investment Company Act of 1940 ("1940 Act"). Performance prior to these changes might have been different if current policies had been in effect. However, by operation of law under the 1940 Act, the Fund subsequently became, and currently operates as, a diversified fund. Please see the notes to the financial statements for information on a non-diversified fund becoming a diversified fund by operation of law. |
| The performance information for the Trust Class prior to the class’s inception date is that of the Fund’s Investor Class. The performance information for the Investor Class has not been adjusted to take into account differences in class specific operating expenses. The Investor Class has lower expenses and typically higher returns than the Trust Class. |
| The performance information for the Advisor Class prior to the class’s inception date is that of the Fund’s Investor Class. The performance information for the Investor Class has not been adjusted to take into account differences in class specific operating expenses. The Investor Class has lower expenses and typically higher returns than the Advisor Class. |
Endnotes (Unaudited) (cont’d)
| The performance information for the Institutional Class prior to the class’s inception date is that of the Fund’s Investor Class. The performance information for the Investor Class has not been adjusted to take into account differences in class specific operating expenses. The Investor Class has higher expenses and typically lower returns than the Institutional Class. |
| The performance information for Class A and Class C prior to the classes’ inception date is that of the Fund’s Investor Class. The performance information for the Investor Class has been adjusted to reflect the appropriate sales charges applicable to Class A and Class C shares, but has not been adjusted to take into account differences in class specific operating expenses (such as Rule 12b-1 fees). The Investor Class has lower expenses and typically higher returns than Class A and Class C. |
| The performance information for Class R6 prior to the class’s inception date is that of the Fund’s Investor Class. The performance information for the Investor Class has not been adjusted to take into account differences in class specific operating expenses. The Investor Class has higher expenses and typically lower returns than Class R6. |
| The performance information for Class E prior to the class’s inception date is that of the Fund’s Investor Class. The performance information for the Investor Class has not been adjusted to take into account differences in class specific operating expenses. The Investor Class has higher expenses and typically lower returns than Class E. |
| Neuberger Berman Global Real Estate Fund, Neuberger Berman Greater China Equity Fund and Neuberger Berman International Small Cap Fund are each relatively small. The same techniques used to produce returns in a small fund may not work to produce similar returns in a larger fund and could have an impact on performance. |
| The investments for the Fund are managed by the same portfolio manager(s) who manage(s) one or more other registered funds that have names, investment objectives and investment styles that are similar to those of the Fund. You should be aware that the Fund is likely to differ from those other mutual fund(s) in size, cash flow pattern and tax matters. Accordingly, the holdings and performance of the Fund can be expected to vary from those of the other mutual fund(s). |
| The performance information for Class A, Class C, Investor Class, and Trust Class prior to the classes’ inception date is that of the Fund’s Institutional Class. The performance information for the Institutional Class has been adjusted to reflect the appropriate sales charges applicable to Class A and Class C shares, but has not been adjusted to take into account differences in class specific operating expenses (such as Rule 12b-1 fees). The Institutional Class has lower expenses and typically higher returns than Class A, Class C, Investor Class, and Trust Class. |
| The performance information for Class E prior to the class’s inception date is that of the Fund’s Institutional Class. The performance information for the Institutional Class has not been adjusted to take into account differences in class specific operating expenses. The Institutional Class has higher expenses and typically lower returns than Class E. |
| The performance information for the Institutional Class prior to the class’s inception date is that of the Fund’s Trust Class. The performance information for the Trust Class has not been adjusted to take into account differences in class specific operating expenses. The Trust Class has higher expenses and typically lower returns than the Institutional Class. |
| The performance information for Class A, Class C and Class R3 prior to the classes’ respective inception dates is that of the Fund’s Trust Class. The performance information for the Trust Class has been adjusted to reflect the appropriate sales charges applicable to Class A and Class C shares, but has not been adjusted to take into account differences in class specific operating expenses (such as Rule 12b-1 fees). The Trust Class has lower expenses and typically higher returns than Class A, Class C and Class R3. |
Endnotes (Unaudited) (cont’d)
| The performance information for Class R6 prior to the class’s inception date is that of the Fund’s Trust Class. The performance information for the Trust Class has not been adjusted to take into account differences in class specific operating expenses. The Trust Class has higher expenses and typically lower returns than Class R6. |
| The performance information for Institutional Class, Class A and Class C prior to the classes’ inception date is that of the Fund’s predecessor, the DJG Small Cap Value Fund L.P., an unregistered limited partnership ("DJG Fund"); DJG Fund was the successor to The DJG Small Cap Value Fund, an unregistered commingled investment account ("DJG Account"). The performance from July 8, 1997 (the commencement of operations) to September 11, 2008 is that of DJG Account, and the performance from September 12, 2008 to May 10, 2010 is that of DJG Fund. On May 10, 2010, the DJG Fund transferred its assets to the Fund in exchange for the Fund’s Institutional Class shares. The investment policies, objectives, guidelines and restrictions of the Fund are in all material respects equivalent to those of DJG Fund and DJG Account (the "Predecessors"). As a mutual fund registered under the 1940 Act, the Fund is subject to certain restrictions under the 1940 Act and the Internal Revenue Code ("Code") to which the Predecessors were not subject. Had the Predecessors been registered under the 1940 Act and been subject to the provisions of the 1940 Act and the Code, their investment performance may have been adversely affected. The performance information reflects the actual expenses of the Predecessors, which were generally lower than those of the Fund. The performance for Class R6 from May 10, 2010 to January 18, 2019 includes the performance of the Fund’s Institutional Class, and prior to May 10, 2010 includes the performance of the Predecessors, as noted above. |
| The performance information for Class R3 prior to the class’s inception date is that of the Fund’s Investor Class. The performance information for the Investor Class has not been adjusted to take into account differences in class specific operating expenses (such as Rule 12b-1 fees). The Investor Class has lower expenses and typically higher returns than Class R3. |
| This date reflects when NBIA first became the investment manager to the Fund. |
| Prior to December 14, 2009, the Fund had different investment goals, strategies and portfolio management team. The performance information for Institutional Class, Class A, Class C and Class E prior to December 21, 2009 is that of the Fund’s Trust Class, which had an inception date of November 2, 2006, and converted into the Institutional Class on December 21, 2009. During the period from November 2, 2006 through December 21, 2009, the Trust Class had only one investor, which could have impacted Fund performance. The performance information for the Trust Class has been adjusted to reflect the appropriate sales charges applicable to Class A and Class C shares but has not been adjusted to take into account differences in class specific operating expenses (such as Rule 12b-1 fees). NBIA had previously capped Trust Class expenses; absent this arrangement, the returns would have been lower. The Trust Class had lower capped expenses and typically higher returns than Class A and Class C. The Trust Class had equivalent capped expenses and typically similar returns to the Institutional Class. The Trust Class had higher expenses and typically lower returns than Class E. The performance information for Class E from December 14, 2009, to the class’s inception date is that of the Fund’s Institutional Class. The performance information for the Institutional Class has not been adjusted to take into account differences in class specific operating expenses (such as Rule 12b-1 fees). The Institutional Class has higher expenses and typically lower returns than Class E. |
| The performance information for Class E prior to the class’s inception date is that of the Fund’s Trust Class. The performance information for the Trust Class has not been adjusted to take into account differences in class specific operating expenses. The Trust Class has higher expenses and typically lower returns than Class E. |
For more complete information on any of the Neuberger Berman Equity Funds, call us at (800) 877-9700, or visit our website at www.nb.com.
Glossary of Indices (Unaudited)
FTSE EPRA Nareit Developed Index (Net): | The index is a free float-adjusted, market capitalization-weighted index that is designed to measure the performance of listed real estate companies and real estate investment trusts (REITs) in developed markets. Net total return indexes reinvest dividends after the deduction of withholding taxes, using (for international indexes) a tax rate applicable to non-resident institutional investors who do not benefit from double taxation treaties. |
FTSE Nareit All Equity REITs Index: | The index is a free-float adjusted, market capitalization-weighted index that tracks the performance of all tax-qualified equity real estate investment trusts (REITs) that are listed on the New York Stock Exchange, or NASDAQ. Equity REITs include all tax-qualified REITs with more than 50 percent of total assets in qualifying real estate assets other than mortgages secured by real property. |
MSCI All Country World Index (Net): | The index is a free float-adjusted, market capitalization-weighted index that is designed to measure the equity market performance of developed and emerging markets. The index consists of 47 country indexes comprising 23 developed and 24 emerging market country indexes. The developed market country indexes included are: Australia, Austria, Belgium, Canada, Denmark, Finland, France, Germany, Hong Kong, Ireland, Israel, Italy, Japan, the Netherlands, New Zealand, Norway, Portugal, Singapore, Spain, Sweden, Switzerland, the United Kingdom and the United States. The emerging market country indexes included are: Brazil, Chile, China, Colombia, the Czech Republic, Egypt, Greece, Hungary, India, Indonesia, Korea, Kuwait, Malaysia, Mexico, Peru, the Philippines, Poland, Qatar, Saudi Arabia, South Africa, Taiwan, Thailand, Turkey, and the UAE. China A shares are included starting from June 1, 2018 and are partially represented at 20% of their free float-adjusted market capitalization as of November 2019. Effective after the close on March 9, 2022, MSCI reclassified MSCI Russia Indexes from Emerging Markets to Standalone Markets status. At that time, all Russian securities were removed from this index at a final price of 0.00001, including both locally traded Russian equity constituents and Russian ADRs/GDRs constituents. Net total return indexes reinvest dividends after the deduction of withholding taxes, using (for international indexes) a tax rate applicable to non-resident institutional investors who do not benefit from double taxation treaties. |
MSCI China All Shares Index (Net): | The index is a free float-adjusted, market capitalization-weighted index that is designed to measure the equity market performance of China share classes listed in Hong Kong, Shanghai, Shenzhen and outside of China. It covers the integrated MSCI China equity universe comprising A-shares, B-shares, H-shares, Red chips, P-chips and foreign listings listed outside China or Hong Kong (e.g. ADRs). A-shares are incorporated in China and trade on the Shanghai and Shenzhen exchanges; they are quoted in local renminbi and entail foreign investment regulations (QFII). B-shares are incorporated in China, and trade on the Shanghai and Shenzhen exchanges; they are quoted in foreign currencies (Shanghai USD, Shenzhen HKD) and are open to foreign investors. H-shares are incorporated in China and trade on the Hong Kong exchange and other foreign exchanges. Red chips and P-chips are incorporated outside of China and trade on the Hong Kong exchange. Red chips are usually controlled by the state or a province or municipality. P-chips are non state-owned Chinese companies incorporated outside the mainland and traded in Hong Kong. Net total return indexes reinvest dividends after the deduction of withholding taxes, using (for international indexes) a tax rate applicable to non-resident institutional investors who do not benefit from double taxation treaties. |
Glossary of Indices (Unaudited) (cont’d)
MSCI EAFE® Index (Net) (Europe, Australasia, Far East): | The index is a free float-adjusted, market capitalization-weighted index that is designed to measure the equity market performance of developed markets, excluding the United States and Canada. The index consists of the following 21 developed market country indexes: Australia, Austria, Belgium, Denmark, Finland, France, Germany, Hong Kong, Ireland, Israel, Italy, Japan, the Netherlands, New Zealand, Norway, Portugal, Singapore, Spain, Sweden, Switzerland, and the United Kingdom. Net total return indexes reinvest dividends after the deduction of withholding taxes, using (for international indexes) a tax rate applicable to non-resident institutional investors who do not benefit from double taxation treaties. |
MSCI Emerging Markets Index (Net): | The index is a free float-adjusted, market capitalization-weighted index that is designed to measure the equity market performance of emerging markets. The index consists of the following 24 emerging market country indexes: Brazil, Chile, China, Colombia, the Czech Republic, Egypt, Greece, Hungary, India, Indonesia, Korea, Kuwait, Malaysia, Mexico, Peru, the Philippines, Poland, Qatar, Saudi Arabia, South Africa, Taiwan, Thailand, Turkey, and the UAE. China A shares are included starting from June 1, 2018 and are partially represented at 20% of their free float-adjusted market capitalization as of November 2019. Effective after the close on March 9, 2022, MSCI reclassified MSCI Russia Indexes from Emerging Markets to Standalone Markets status. At that time, all Russian securities were removed from this index at a final price of 0.00001, including both locally traded Russian equity constituents and Russian ADRs/GDRs constituents. Net total return indexes reinvest dividends after the deduction of withholding taxes, using (for international indexes) a tax rate applicable to non-resident institutional investors who do not benefit from double taxation treaties. |
MSCI EAFE® Small Cap Index (Net): | The index is a free float-adjusted, market capitalization-weighted index that is designed to measure the equity market performance of the small cap segment of developed markets, excluding the United States and Canada. The index consists of the following 21 developed market country indices: Australia, Austria, Belgium, Denmark, Finland, France, Germany, Hong Kong, Ireland, Israel, Italy, Japan, the Netherlands, New Zealand, Norway, Portugal, Singapore, Spain, Sweden, Switzerland, and the United Kingdom. Net total return indexes reinvest dividends after the deduction of withholding taxes, using (for international indexes) a tax rate applicable to non-resident institutional investors who do not benefit from double taxation treaties. |
| The index is a float-adjusted, market capitalization-weighted index that measures the performance of the large-cap segment of the U.S. equity market. It includes approximately 1,000 of the largest securities in the Russell 3000® Index (which measures the performance of the 3,000 largest U.S. public companies based on total market capitalization). The index is rebalanced annually in June. |
Russell 1000® Growth Index: | The index is a float-adjusted, market capitalization-weighted index that measures the performance of the large-cap growth segment of the U.S. equity market. It includes those Russell 1000 Index companies with higher price-to-book ratios and higher forecasted growth rates. The index is rebalanced annually in June. |
Russell 1000® Value Index: | The index is a float-adjusted, market capitalization-weighted index that measures the performance of the large-cap value segment of the U.S. equity market. It includes those Russell 1000 Index companies with lower price-to-book ratios and lower forecasted growth rates. The index is rebalanced annually in June. |
| The index is a float-adjusted, market capitalization-weighted index that measures the performance of the small-cap segment of the U.S. equity market. It includes approximately 2,000 of the smallest securities in the Russell 3000 Index (which measures the performance of the 3,000 largest U.S. public companies based on total market capitalization). The index is rebalanced annually in June. |
Glossary of Indices (Unaudited) (cont’d)
Russell 2000® Growth Index: | The index is a float-adjusted, market capitalization-weighted index that measures the performance of the small-cap growth segment of the U.S. equity market. It includes those Russell 2000 Index companies with higher price-to-book ratios and higher forecasted growth rates. The index is rebalanced annually in June. |
Russell 2000® Value Index: | The index is a float-adjusted, market capitalization-weighted index that measures the performance of the small-cap value segment of the U.S. equity market. It includes those Russell 2000 Index companies with lower price-to-book ratios and lower forecasted growth rates. The index is rebalanced annually in June. |
| The index is a float-adjusted, market-capitalization-weighted equity index that measures the performance of the 3,000 largest U.S. public companies based on total market capitalization which represent about 98% of all U.S incorporated equity securities. The index is rebalanced annually in June. |
| The index is a float-adjusted, market capitalization-weighted index that measures the performance of the mid-cap segment of the U.S. equity market. It includes approximately 800 of the smallest securities in the Russell 1000 Index. The index is rebalanced annually in June. |
Russell Midcap® Growth Index: | The index is a float-adjusted, market capitalization-weighted index that measures the performance of the mid-cap growth segment of the U.S. equity market. It includes those Russell Midcap Index companies with higher price-to-book ratios and higher forecasted growth rates. The index is rebalanced annually in June. |
Russell Midcap® Value Index: | The index is a float-adjusted, market capitalization-weighted index that measures the performance of the mid-cap value segment of the U.S. equity market. It includes those Russell Midcap Index companies with lower price-to-book ratios and lower forecasted growth rates. The index is rebalanced annually in June. |
| The index is a float-adjusted, market capitalization-weighted index that focuses on the large-cap segment of the U.S. equity market, and includes a significant portion of the total value of the market. |
Information About Your Fund’s Expenses (Unaudited)
As a Fund shareholder, you incur two types of costs: (1) transaction costs, including sales charges (loads) on purchase payments or redemption proceeds (if applicable); and (2) ongoing costs, including management fees, distribution and/or service (12b-1) fees (if applicable), and other Fund expenses. This example is intended to help you understand your ongoing costs (in U.S. dollars) of investing in a Fund and compare these costs with the ongoing costs of investing in other mutual funds.
This table is designed to provide information regarding costs related to your investments. The following examples are based on an investment of $1,000 made at the beginning of the six month period ended August 31, 2023 and held for the entire period. The table illustrates each Fund’s costs in two ways:
Actual Expenses and Performance: | The first section of the table provides information about actual account values and actual expenses in dollars, based on the Fund’s actual performance during the period indicated. You may use the information in this line, together with the amount you invested, to estimate the expenses you paid over the period. Simply divide your account value by $1,000 (for example, an $8,600 account value divided by $1,000 = 8.6), then multiply the result by the number in the first section of the table under the heading entitled "Expenses Paid During the Period" to estimate the expenses you paid over the period. |
Hypothetical Example for Comparison Purposes: | The second section of the table provides information about hypothetical account values and hypothetical expenses based on the Fund’s actual expense ratio and an assumed rate of return at 5% per year before expenses. This return is not the Fund’s actual return. The hypothetical account values and expenses may not be used to estimate the actual ending account balance or expenses you paid for the period. You may use this information to compare the ongoing costs of investing in a Fund versus other funds. To do so, compare the expenses shown in this 5% hypothetical example with the 5% hypothetical examples that appear in the shareholder reports of other funds. |
Please note that the expenses in the table are meant to highlight your ongoing costs only and do not include any transaction costs, such as sales charges (loads) (if applicable). Therefore, the information under the heading "Hypothetical (5% annual return before expenses)" is useful in comparing ongoing costs only, and will not help you determine the relative total costs of owning different funds. In addition, if these transaction costs were included, your costs would have been higher.
Expense Example (Unaudited)
Neuberger Berman Equity Funds
| | HYPOTHETICAL (5% ANNUAL RETURN BEFORE EXPENSES) |
| Beginning
Account
Value
3/1/23 | Ending
Account
Value
8/31/23 | Expenses Paid
During the
3/1/23 – 8/31/23 | | Beginning
Account
Value
3/1/23 | Ending
Account
Value
8/31/23 | Expenses Paid
During the
Period(2)
3/1/23 – 8/31/23 | |
|
| | | | | | | | |
| | | | | | | | |
| | | | | | | | |
| | | | | | | | |
Emerging Markets Equity Fund |
| | | | | | | | |
| | | | | | | | |
| | | | | | | | |
| | | | | | | | |
| | | | | | | | |
|
| | | | | | | | |
| | | | | | | | |
| | | | | | | | |
| | | | | | | | |
| | | | | | | | |
|
| | | | | | | | |
| | | | | | | | |
| | | | | | | | |
| | | | | | | | |
| | | | | | | | |
| | | | | | | | |
|
| | | | | | | | |
| | | | | | | | |
| | | | | | | | |
| | | | | | | | |
| | | | | | | | |
| | | | | | | | |
|
| | | | | | | | |
Greater China Equity Fund |
| | | | | | | | |
International Equity Fund |
| | | | | | | | |
| | | | | | | | |
| | | | | | | | |
| | | | | | | | |
| | | | | | | | |
| | | | | | | | |
| | | | | | | | |
Expense Example (Unaudited) (cont’d)
Neuberger Berman Equity Funds
| | HYPOTHETICAL (5% ANNUAL RETURN BEFORE EXPENSES) |
| Beginning Account Value 3/1/23 | Ending Account Value 8/31/23 | Expenses Paid During the Period(1) 3/1/23 – 8/31/23 | | Beginning Account Value 3/1/23 | Ending Account Value 8/31/23 | Expenses Paid During the Period(2) 3/1/23 – 8/31/23 | |
International Select Fund |
| | | | | | | | |
| | | | | | | | |
| | | | | | | | |
| | | | | | | | |
| | | | | | | | |
| | | | | | | | |
International Small Cap Fund |
| | | | | | | | |
| | | | | | | | |
| | | | | | | | |
| | | | | | | | |
|
| | | | | | | | |
| | | | | | | | |
| | | | | | | | |
| | | | | | | | |
|
| | | | | | | | |
| | | | | | | | |
| | | | | | | | |
| | | | | | | | |
| | | | | | | | |
| | | | | | | | |
| | | | | | | | |
| | | | | | | | |
|
| | | | | | | | |
| | | | | | | | |
| | | | | | | | |
| | | | | | | | |
| | | | | | | | |
| | | | | | | | |
| | | | | | | | |
| | | | | | | | |
| | | | | | | | |
|
| | | | | | | | |
| | | | | | | | |
| | | | | | | | |
| | | | | | | | |
| | | | | | | | |
| | | | | | | | |
| | | | | | | | |
| | | | | | | | |
Expense Example (Unaudited) (cont’d)
Neuberger Berman Equity Funds
| | HYPOTHETICAL (5% ANNUAL RETURN BEFORE EXPENSES) |
| Beginning Account Value 3/1/23 | Ending Account Value 8/31/23 | Expenses Paid During the Period(1) 3/1/23 – 8/31/23 | | Beginning Account Value 3/1/23 | Ending Account Value 8/31/23 | Expenses Paid During the Period(2) 3/1/23 – 8/31/23 | |
Mid Cap Intrinsic Value Fund |
| | | | | | | | |
| | | | | | | | |
| | | | | | | | |
| | | | | | | | |
| | | | | | | | |
| | | | | | | | |
| | | | | | | | |
Multi-Cap Opportunities Fund |
| | | | | | | | |
| | | | | | | | |
| | | | | | | | |
| | | | | | | | |
|
| | | | | | | | |
| | | | | | | | |
| | | | | | | | |
| | | | | | | | |
| | | | | | | | |
| | | | | | | | |
| | | | | | | | |
|
| | | | | | | | |
| | | | | | | | |
| | | | | | | | |
| | | | | | | | |
| | | | | | | | |
| | | | | | | | |
| | | | | | | | |
| | | | | | | | |
|
| | | | | | | | |
| | | | | | | | |
| | | | | | | | |
| | | | | | | | |
| | | | | | | | |
| | | | | | | | |
| | | | | | | | |
|
| | | | | | | | |
| | | | | | | | |
| | | | | | | | |
| For each class, expenses are equal to the annualized expense ratio for the class, multiplied by the average account value over the period, multiplied by 184/365 (to reflect the one-half year period shown), unless otherwise indicated. |
| Hypothetical expenses are equal to the annualized expense ratios for each class, multiplied by the average account value over the period (assuming a 5% annual return), multiplied by 184/365 (to reflect the one-half year period shown). |
| Includes expenses of the Fund’s Blocker (See Note A of the Notes to Consolidated Financial Statements). |
Legend August 31, 2023 (Unaudited)
Neuberger Berman Equity Funds
|
| = State Street Bank and Trust Company |
|
| = Private investment in public equity |
|
| = American Depositary Receipt |
| |
| = Neuberger Berman Investment Advisers LLC |
| = Public Joint Stock Company |
|
| |
Schedule of Investments Dividend Growth Fund^
August 31, 2023
| |
|
|
| | |
|
| | |
| PNC Financial Services Group, Inc. | |
| | |
|
| | |
| Cboe Global Markets, Inc. | |
| | |
| | |
| | |
|
| | |
|
| | |
Consumer Staples Distribution & Retail 1.8% |
| | |
|
| | |
Electronic Equipment, Instruments & Components 6.6% |
| | |
| | |
| Zebra Technologies Corp. Class A* | |
| | |
Energy Equipment & Services 1.3% |
| | |
|
| | |
| | |
| | |
|
| | |
|
| Mondelez International, Inc. Class A | |
| Tootsie Roll Industries, Inc. | |
| | |
Ground Transportation 1.5% |
| | |
| |
Health Care Equipment & Supplies 2.8% |
| | |
| | |
| | |
Health Care Providers & Services 1.2% |
| | |
Hotels, Restaurants & Leisure 2.4% |
| Marriott International, Inc. Class A | |
Industrial Conglomerates 1.8% |
| Honeywell International, Inc. | |
|
| | |
|
| | |
| Marsh & McLennan Cos., Inc. | |
| | |
Interactive Media & Services 0.5% |
| | |
Life Sciences Tools & Services 4.6% |
| Agilent Technologies, Inc. | |
| | |
| | |
|
| | |
| | |
| | |
|
| | |
|
| | |
| Wheaton Precious Metals Corp. | |
| | |
|
| | |
|
| | |
Oil, Gas & Consumable Fuels 2.7% |
| | |
| | |
| | |
| | |
|
| | |
See Notes to Financial Statements
Schedule of Investments Dividend Growth Fund^ (cont’d)
| |
|
| | |
| | |
| | |
Professional Services 1.3% |
| Automatic Data Processing, Inc. | |
Semiconductors & Semiconductor Equipment 12.0% |
| | |
| | |
| | |
| | |
| | |
|
| | |
| | |
| | |
|
| | |
|
| | |
Technology Hardware, Storage & Peripherals 3.1% |
| | |
| |
Textiles, Apparel & Luxury Goods 2.6% |
| Cie Financiere Richemont SA Class A | |
| | |
| | |
Transportation Infrastructure 0.5% |
| | |
|
Total Common Stocks (Cost $58,931,404) | |
Short-Term Investments 3.4% |
Investment Companies 3.4% |
| State Street Institutional Treasury Money Market Fund Premier Class, 5.22%(b)
(Cost $ 2,926,368) | |
Total Investments 99.8% (Cost $61,857,772) | |
Other Assets Less Liabilities 0.2% | |
| |
| Non-income producing security. |
| Security exempt from registration pursuant to Regulation S under the Securities Act of 1933, as amended. Regulation S applies to securities offerings that are made outside of the United States and do not involve directed selling efforts in the United States and as such may have restrictions on resale. Total value of all such securities at August 31, 2023 amounted to $404,869, which represents 0.5% of net assets of the Fund. |
| Represents 7-day effective yield as of August 31, 2023. |
The following is a summary, categorized by Level (see Note A of the Notes to Financial Statements), of inputs used to value the Fund’s investments as of August 31, 2023:
| The Schedule of Investments provides information on the industry or sector categorization. |
^
A balance indicated with a "—", reflects either a zero balance or an amount that rounds to less than 1.
See Notes to Financial Statements
Schedule of Investments Emerging Markets Equity Fund^
August 31, 2023
| |
|
|
| | |
|
| B3 SA - Brasil Bolsa Balcao | |
| | |
| | |
| Pagseguro Digital Ltd. Class A* | |
| | |
| | |
|
| | |
|
| Sociedad Quimica y Minera de Chile SA ADR | |
|
| Alibaba Group Holding Ltd.* | |
| | |
| Bank of Ningbo Co. Ltd. Class A | |
| | |
| China Mengniu Dairy Co. Ltd. | |
| CITIC Securities Co. Ltd. Class A | |
| Foxconn Industrial Internet Co. Ltd. Class A | |
| | |
| | |
| Kweichow Moutai Co. Ltd. Class A | |
| | |
| Midea Group Co. Ltd. Class A | |
| NARI Technology Co. Ltd. Class A | |
| | |
| Ping An Insurance Group Co. of China Ltd. Class A | |
| Shenzhen Inovance Technology Co. Ltd. Class A | |
| Shenzhen Mindray Bio-Medical Electronics Co. Ltd. Class A | |
| Shenzhen Topband Co. Ltd. Class A | |
| Sungrow Power Supply Co. Ltd. Class A | |
| | |
| | |
| |
|
| Tsingtao Brewery Co. Ltd. H Shares | |
| | |
|
| Hong Kong Exchanges & Clearing Ltd. | |
|
| | |
|
| API Holdings Ltd.*#(b)(c) | |
| Apollo Hospitals Enterprise Ltd. | |
| Aptus Value Housing Finance India Ltd. | |
| | |
| | |
| Cholamandalam Investment & Finance Co. Ltd. | |
| | |
| | |
| | |
| | |
| | |
| JB Chemicals & Pharmaceuticals Ltd. | |
| Jio Financial Services Ltd.* | |
| Jupiter Life Line Hospitals Ltd.*#(b)(c) | |
| | |
| National Stock Exchange of India Ltd.*#(b)(c) | |
| Pine Labs PTE Ltd.*#(b)(c) | |
| | |
| | |
| | |
| Sun Pharmaceutical Industries Ltd. | |
| Syrma SGS Technology Ltd.* | |
| | |
|
| | |
| Bank Negara Indonesia Persero Tbk PT | |
| | |
|
| | |
| | |
| Samsung Electronics Co. Ltd. | |
| Samsung Engineering Co. Ltd.* | |
See Notes to Financial Statements
Schedule of Investments Emerging Markets Equity Fund^ (cont’d)
| |
|
| | |
| | |
|
| Grupo Aeroportuario del Pacifico SAB de CV Class B | |
| Grupo Financiero Banorte SAB de CV Class O | |
| Wal-Mart de Mexico SAB de CV | |
| | |
|
| | |
|
| | |
| | |
| | |
|
| | |
|
| | |
| | |
| | |
| | |
|
| | |
| | |
| | |
| | |
| | |
|
| | |
| | |
| Chunghwa Telecom Co. Ltd. | |
| | |
| | |
| | |
| Jentech Precision Industrial Co. Ltd. | |
| Taiwan Semiconductor Manufacturing Co. Ltd. | |
| Uni-President Enterprises Corp. | |
| | |
|
| | |
| |
|
| PTT Exploration & Production PCL | |
| | |
United Arab Emirates 2.5% |
| | |
| Americana Restaurants International PLC | |
| | |
| Network International Holdings PLC*(d) | |
| | |
|
| | |
| | |
| | |
| | |
|
Total Common Stocks
(Cost $535,982,487) | |
|
|
| Gupshup, Inc., Series F*#(b)(c) | |
| Pine Labs PTE Ltd., Series 1*#(b)(c) | |
| Pine Labs PTE Ltd., Series A*#(b)(c) | |
| Pine Labs PTE Ltd., Series B*#(b)(c) | |
| Pine Labs PTE Ltd., Series B2*#(b)(c) | |
| Pine Labs PTE Ltd., Series C*#(b)(c) | |
| Pine Labs PTE Ltd., Series C1*#(b)(c) | |
| Pine Labs PTE Ltd., Series D*#(b)(c) | |
Total Preferred Stocks
(Cost $13,478,212) | |
|
|
Short-Term Investments 1.8% |
Investment Companies 1.8% |
| State Street Institutional Treasury Money Market Fund Premier Class, 5.22%(e)
(Cost $10,574,955) | |
Total Investments 100.7% (Cost $560,035,654) | |
Liabilities Less Other Assets (0.7)% | |
| |
See Notes to Financial Statements
Schedule of Investments Emerging Markets Equity Fund^ (cont’d)
| Non-income producing security. |
| All or a portion of this security is on loan at August 31, 2023. Total value of all such securities at August 31, 2023 amounted to $510,757, collateralized by non-cash (U.S. Treasury Securities) collateral of $539,460 for the Fund (see Note A of the Notes to Financial Statements). |
| Value determined using significant unobservable inputs. |
| Security fair valued as of August 31, 2023 in accordance with procedures approved by the valuation designee. Total value of all such securities at August 31, 2023 amounted to $33,960,816, which represents 5.8% of net assets of the Fund. |
| Security exempt from registration pursuant to Regulation S under the Securities Act of 1933, as amended. Regulation S applies to securities offerings that are made outside of the United States and do not involve directed selling efforts in the United States and as such may have restrictions on resale. Total value of all such securities at August 31, 2023 amounted to $16,262,754, which represents 2.8% of net assets of the Fund. |
| Represents 7-day effective yield as of August 31, 2023. |
#
This security has been deemed by Management to be illiquid, and is subject to restrictions on resale. Total value of all such securities at August 31, 2023 amounted to $33,960,816, which represents 5.8% of net assets of the Fund. Acquisition dates shown with a range, if any, represent securities that were acquired over the period shown in the table.
| | | | Fair Value
Percentage
of Net Assets
as of
8/31/2023 |
| | | | |
Gupshup, Inc. (Ser. F Preferred Shares) | | | | |
Jupiter Life Line Hospitals Ltd. | | | | |
National Stock Exchange of India Ltd. | | | | |
| | | | |
Pine Labs PTE Ltd. (Series 1 Preferred Shares) | | | | |
Pine Labs PTE Ltd. (Series A Preferred Shares) | | | | |
Pine Labs PTE Ltd. (Series B Preferred Shares) | | | | |
Pine Labs PTE Ltd. (Series B2 Preferred Shares) | | | | |
Pine Labs PTE Ltd. (Series C Preferred Shares) | | | | |
Pine Labs PTE Ltd. (Series C1 Preferred Shares) | | | | |
Pine Labs PTE Ltd. (Series D Preferred Shares) | | | | |
| | | | |
| | | | |
|
| | | |
See Notes to Financial Statements
Schedule of Investments Emerging Markets Equity Fund^ (cont’d)
|
| | |
| | |
Semiconductors & Semiconductor Equipment | | |
| | |
Technology Hardware, Storage & Peripherals | | |
| | |
Oil, Gas & Consumable Fuels | | |
Interactive Media & Services | | |
Electronic Equipment, Instruments & Components | | |
Hotels, Restaurants & Leisure | | |
| | |
| | |
| | |
Consumer Staples Distribution & Retail | | |
| | |
| | |
| | |
| | |
Construction & Engineering | | |
| | |
| | |
| | |
| | |
| | |
| | |
Transportation Infrastructure | | |
Health Care Providers & Services | | |
Textiles, Apparel & Luxury Goods | | |
Diversified Telecommunication Services | | |
Energy Equipment & Services | | |
| | |
| | |
Real Estate Management & Development | | |
| | |
Health Care Equipment & Supplies | | |
| | |
Short-Term Investments and Other Liabilities—Net | | |
| | |
See Notes to Financial Statements
Schedule of Investments Emerging Markets Equity Fund^ (cont’d)
The following is a summary, categorized by Level (see Note A of the Notes to Financial Statements), of inputs used to value the Fund’s investments as of August 31, 2023:
| |
| The Schedule of Investments provides a geographic categorization as well as a Positions by Industry summary. |
| The following is a reconciliation between the beginning and ending balances of investments in which unobservable inputs (Level 3) were used in determining value: |
| Beginning
balance as
of 9/1/2022 | Accrued
discounts/
(premiums) | | Change
in unrealized
appreciation/
(depreciation) | | | | | | Net change in
unrealized
appreciation/
(depreciation)
from
investments
still held as of
8/31/2023 |
Investments in Securities: |
| | | | | | | | | | |
| | | | | | | | | | |
| | | | | | | | | | |
(1) Quantitative Information about Level 3 Fair Value Measurements: |
| | | | | | Impact to
valuation
from
increase
in input(b) |
| | | Enterprise value
Revenue multiple(c) (EV/Revenue) | | | |
|
| | Price/Earnings
multiple(c) (P/E) | | | |
|
| | | | | |
|
| | | | | |
|
| | | | | |
| | | | | | |
| | | Enterprise value
Revenue multiple(c) (EV/Revenue) | | | |
|
| | | | | |
|
| | | | | |
|
| | | | | |
(a) The weighted averages disclosed in the table above were weighted by relative fair value. |
See Notes to Financial Statements
Schedule of Investments Emerging Markets Equity Fund^ (cont’d)
(b) Represents the expected directional change in the fair value of the Level 3 investments that would result from an increase or decrease in the corresponding input. Significant changes in these inputs could result in significantly higher or lower fair value measurements. |
(c) Represents amounts used when the reporting entity has determined that market participants would use such multiples when pricing the investments. |
^
A balance indicated with a "—", reflects either a zero balance or an amount that rounds to less than 1.
See Notes to Financial Statements
Schedule of Investments Equity Income Fund^
August 31, 2023
| |
|
|
| | |
| | |
| | |
|
| | |
| PNC Financial Services Group, Inc.(a) | |
| | |
| | |
|
| | |
| | |
| | |
| | |
|
| | |
|
| | |
| Goldman Sachs Group, Inc. | |
| | |
| | |
|
| | |
Communications Equipment 0.5% |
| | |
Construction & Engineering 3.4% |
| | |
| MDU Resources Group, Inc. | |
| | |
Construction Materials 3.1% |
| | |
| | |
| | |
| | |
|
| | |
Diversified Telecommunication Services 1.4% |
| Singapore Telecommunications Ltd. | |
|
| | |
Electrical Equipment 5.2% |
| | |
| |
Electrical Equipment – cont'd |
| | |
| | |
|
| | |
Ground Transportation 0.6% |
| | |
Health Care Equipment & Supplies 1.1% |
| | |
| | |
| | |
Hotels, Restaurants & Leisure 3.1% |
| | |
| | |
| | |
|
| | |
|
| | |
| | |
| | |
|
| American International Group, Inc. | |
| | |
| | |
|
| | |
| | |
| | |
|
| | |
| | |
| | |
| | |
|
| | |
| | |
| | |
| | |
Oil, Gas & Consumable Fuels 11.1% |
| | |
| | |
| | |
| Pioneer Natural Resources Co. | |
See Notes to Financial Statements
Schedule of Investments Equity Income Fund^ (cont’d)
| |
Oil, Gas & Consumable Fuels – cont'd |
| | |
| | |
Personal Care Products 0.5% |
| | |
|
| | |
| | |
| | |
| | |
| | |
Professional Services 2.0% |
| | |
|
| Brixmor Property Group, Inc. | |
Semiconductors & Semiconductor Equipment 3.9% |
| | |
| | |
| | |
| | |
| | |
|
| | |
|
| Lamar Advertising Co. Class A | |
| | |
| | |
|
| | |
| |
Textiles, Apparel & Luxury Goods 1.0% |
| Cie Financiere Richemont SA Class A | |
| | |
| | |
Trading Companies & Distributors 2.2% |
| | |
|
Total Common Stocks (Cost $712,560,593) | |
|
|
|
|
|
| Alliant Energy Corp., 3.88%, due 3/15/2026(b)
(Cost $7,355,000) | |
|
|
Short-Term Investments 0.2% |
Investment Companies 0.2% |
| State Street Institutional Treasury Money Market Fund Premier Class, 5.22%(c)
(Cost $1,939,953) | |
Total Investments 99.7% (Cost $721,855,546) | |
Other Assets Less Liabilities 0.3%(d) | |
| |
| Non-income producing security. |
| All or a portion of this security is pledged as collateral for options written. |
| Securities were purchased under Rule 144A of the Securities Act of 1933, as amended, or are otherwise restricted and, unless registered under the Securities Act of 1933 or exempted from registration, may only be sold to qualified institutional investors or may have other restrictions on resale. At August 31, 2023, these securities amounted to $7,160,093, which represents 0.7% of net assets of the Fund. |
| Represents 7-day effective yield as of August 31, 2023. |
| Includes the impact of the Fund’s open positions in derivatives at August 31, 2023. |
See Notes to Financial Statements
Schedule of Investments Equity Income Fund^ (cont’d)
|
| | |
| | |
| | |
| | |
| | |
| | |
| | |
| | |
| | |
| | |
Short-Term Investments and Other Assets—Net | | |
| | |
See Notes to Financial Statements
Schedule of Investments Equity Income Fund^ (cont’d)
Derivative Instruments
Written option contracts ("options written")
At August 31, 2023, the Fund had outstanding options written as follows:
| | | | | |
|
|
| | | | | |
| | | | | |
|
|
United Parcel Service, Inc. | | | | | |
United Parcel Service, Inc. | | | | | |
United Parcel Service, Inc. | | | | | |
| | | | | |
|
| | | | | |
| | | | | |
Total options written (premium received $68,876) | |
| |
| Value determined using significant unobservable inputs. |
| Security fair valued as of August 31, 2023 in accordance with procedures approved by the valuation designee. |
For the year ended August 31, 2023, the average market value for the months where the Fund had options written outstanding was $(205,529). At August 31, 2023, the Fund had securities pledged in the amount of $22,565,809 to cover collateral requirements for options written.
The following is a summary, categorized by Level (see Note A of the Notes to Financial Statements), of inputs used to value the Fund’s investments as of August 31, 2023:
| The Schedule of Investments provides information on the industry or sector categorization as well as a Positions by Country summary. |
See Notes to Financial Statements
Schedule of Investments Equity Income Fund^ (cont’d)
The following is a summary, categorized by Level (see Note A of the Notes to Financial Statements), of inputs used to value the Fund’s derivatives as of August 31, 2023:
Other Financial Instruments | | | | |
|
|
|
|
|
| | | | |
| | | | |
| The following is a reconciliation between the beginning and ending balances of derivative investments in which unobservable inputs (Level 3) were used in determining value: |
| Beginning
balance as
of 9/1/2022 | Accrued
discounts/
(premiums) | | Change
in unrealized
appreciation/
(depreciation) | Purchases/
Closing
of options | | | | | Net change in
unrealized
appreciation/
(depreciation)
from
investments
still held as of
8/31/2023 |
Other Financial Instruments |
| | | | | | | | | | |
| | | | | | | | | | |
(1) At August 31, 2023, these investments were valued in accordance with procedures approved by the valuation designee. These investments did not have a material impact on the Fund’s net assets and, therefore, disclosure of unobservable inputs used in formulating valuations is not presented. |
^
A balance indicated with a "—", reflects either a zero balance or an amount that rounds to less than 1.
See Notes to Financial Statements
Schedule of Investments Focus Fund^
August 31, 2023
| |
|
|
| | |
|
| | |
|
| | |
| | |
| | |
|
| | |
| | |
| | |
|
| | |
| | |
| | |
|
| | |
|
| Arctic Wolf Networks, Inc.*#(a)(b) | |
Construction Materials 1.9% |
| | |
Diversified Telecommunication Services 3.0% |
| | |
|
| | |
Electronic Equipment, Instruments & Components 1.0% |
| | |
|
| World Wrestling Entertainment, Inc. Class A | |
|
| Apollo Global Management, Inc. | |
| | |
| | |
| | |
|
| Lamb Weston Holdings, Inc. | |
Ground Transportation 4.7% |
| Canadian National Railway Co.(c) | |
| |
Ground Transportation – cont'd |
| Canadian Pacific Kansas City Ltd. | |
| | |
| | |
Health Care Equipment & Supplies 3.3% |
| | |
Health Care Providers & Services 5.7% |
| | |
| | |
| | |
Hotels, Restaurants & Leisure 0.6% |
| | |
|
| | |
| | |
| | |
|
| | |
Interactive Media & Services 5.1% |
| | |
| Meta Platforms, Inc. Class A* | |
| | |
| | |
Life Sciences Tools & Services 1.6% |
| Thermo Fisher Scientific, Inc. | |
Oil, Gas & Consumable Fuels 2.9% |
| | |
| | |
| | |
Personal Care Products 2.4% |
| | |
|
| | |
Semiconductors & Semiconductor Equipment 7.4% |
| | |
| | |
| | |
| | |
| Taiwan Semiconductor Manufacturing Co. Ltd. ADR | |
| | |
|
| Constellation Software, Inc. | |
| | |
| | |
See Notes to Financial Statements
Schedule of Investments Focus Fund^ (cont’d)
| |
|
| | |
| | |
| | |
Technology Hardware, Storage & Peripherals 4.4% |
| | |
Textiles, Apparel & Luxury Goods 2.6% |
| LVMH Moet Hennessy Louis Vuitton SE | |
Wireless Telecommunication Services 1.4% |
| | |
|
Total Common Stocks (Cost $527,686,841) | |
|
|
|
| Fabletics LLC, Series G*#(a)(b) | |
|
|
| Druva, Inc., Series 5*#(a)(b) | |
|
|
| Videoamp, Inc., Series F1*#(a)(b) | |
|
Total Preferred Stocks (Cost $2,999,995) | |
|
|
|
| Constellation Software, Inc. Expires 9/29/2023*
(Cost $4,554) | |
| |
|
|
|
|
| Constellation Software, Inc. Expires 3/31/2040*(a)(b) (Cost $0) | |
Short-Term Investments 5.6% |
Investment Companies 5.6% |
| State Street Institutional U.S. Government Money Market Fund Premier Class, 5.28%(e) | |
| State Street Navigator Securities Lending Government Money Market Portfolio, 5.34%(e)(f) | |
Total Short-Term Investments (Cost $34,665,932) | |
Total Investments 103.2% (Cost $565,357,322) | |
Liabilities Less Other Assets (3.2)% | |
| |
| Non-income producing security. |
| Value determined using significant unobservable inputs. |
| Security fair valued as of August 31, 2023 in accordance with procedures approved by the valuation designee. Total value of all such securities at August 31, 2023 amounted to $4,320,624, which represents 0.7% of net assets of the Fund. |
| All or a portion of this security is on loan at August 31, 2023. Total value of all such securities at August 31, 2023 amounted to $19,385,037, collateralized by cash collateral of $13,951,448 and non-cash (U.S. Treasury Securities) collateral of $6,196,959 for the Fund (see Note A of the Notes to Financial Statements). |
| Represents less than 0.05% of net assets of the Fund. |
| Represents 7-day effective yield as of August 31, 2023. |
| Represents investment of cash collateral received from securities lending. |
See Notes to Financial Statements
Schedule of Investments Focus Fund^ (cont’d)
#
This security has been deemed by Management to be illiquid, and is subject to restrictions on resale. Total value of all such securities at August 31, 2023 amounted to $4,320,623, which represents 0.7% of net assets of the Fund. Acquisition dates shown with a range, if any, represent securities that were acquired over the period shown in the table.
| | | | Fair Value
Percentage
of Net Assets
as of
8/31/2023 |
Arctic Wolf Networks, Inc. | | | | |
Druva, Inc. (Series 5 Preferred Shares) | | | | |
Fabletics LLC (Series G Preferred Shares) | | | | |
Videoamp, Inc. (Series F1 Preferred Shares) | | | | |
|
| | | |
|
| | |
| | |
| | |
| | |
| | |
| | |
| | |
| | |
| | |
| | |
| | |
| | |
| | |
Short-Term Investments and Other Liabilities—Net | | |
| | |
The following is a summary, categorized by Level (see Note A of the Notes to Financial Statements), of inputs used to value the Fund’s investments as of August 31, 2023:
| The Schedule of Investments provides information on the industry or sector categorization as well as a Positions by Country summary. |
See Notes to Financial Statements
Schedule of Investments Focus Fund^ (cont’d)
| The following is a reconciliation between the beginning and ending balances of investments in which unobservable inputs (Level 3) were used in determining value: |
| Beginning
balance as
of 9/1/2022 | Accrued
discounts/
(premiums) | | Change
in unrealized
appreciation/
(depreciation) | | | | | | Net change in
unrealized
appreciation/
(depreciation)
from
investments
still held as of
8/31/2023 |
Investments in Securities: |
| | | | | | | | | | |
| | | | | | | | | | |
| | | | | | | | | | |
| | | | | | | | | | |
(1) Quantitative Information about Level 3 Fair Value Measurements: |
| | | | | | Impact to
valuation
from
increase
in input(b) |
| | | Enterprise value
Revenue multiple(c) (EV/Revenue) | | | |
| | | Enterprise value
Revenue multiple(c) (EV/Revenue) | | | |
|
| | | | | |
|
| | | | | |
|
| | | | | |
(a) The weighted averages disclosed in the table above were weighted by relative fair value. |
(b) Represents the expected directional change in the fair value of the Level 3 investments that would result from an increase or decrease in the corresponding input. Significant changes in these inputs could result in significantly higher or lower fair value measurements. |
(c) Represents amounts used when the reporting entity has determined that market participants would use such multiples when pricing the investments. |
(2) At August 31, 2023, these investments were valued in accordance with procedures approved by the valuation designee. These investments did not have a material impact on the Fund's net assets and, therefore, disclosure of unobservable inputs used in formulating valuations is not presented. |
^
A balance indicated with a "—", reflects either a zero balance or an amount that rounds to less than 1.
See Notes to Financial Statements
Schedule of Investments Genesis Fund^
August 31, 2023
| |
|
Air Freight & Logistics 0.3% |
| | |
Automobile Components 3.3% |
| Fox Factory Holding Corp.* | |
| | |
| | |
| | |
|
| | |
| | |
| Community Bank System, Inc. | |
| Cullen/Frost Bankers, Inc. | |
| | |
| First Financial Bankshares, Inc. | |
| | |
| | |
| Prosperity Bancshares, Inc. | |
| Stock Yards Bancorp, Inc. | |
| United Community Banks, Inc. | |
| | |
|
| | |
|
| | |
| | |
| | |
|
| Hamilton Lane, Inc. Class A | |
| | |
| MarketAxess Holdings, Inc. | |
| | |
|
| | |
| | |
| | |
Commercial Services & Supplies 2.4% |
| Driven Brands Holdings, Inc.* | |
| | |
| |
Commercial Services & Supplies – cont'd |
| | |
| | |
Communications Equipment 1.0% |
| | |
Construction & Engineering 2.1% |
| | |
| | |
| | |
Construction Materials 1.8% |
| | |
Consumer Staples Distribution & Retail 0.4% |
| Grocery Outlet Holding Corp.* | |
Containers & Packaging 1.0% |
| | |
|
| | |
Diversified Consumer Services 0.6% |
| Bright Horizons Family Solutions, Inc.* | |
Electronic Equipment, Instruments & Components 3.8% |
| Advanced Energy Industries, Inc. | |
| | |
| | |
| Zebra Technologies Corp. Class A* | |
| | |
Energy Equipment & Services 2.9% |
| | |
| Oceaneering International, Inc.* | |
| | |
| | |
| | |
|
| Jack Henry & Associates, Inc. | |
| Shift4 Payments, Inc. Class A* | |
| | |
|
| | |
| | |
| | |
See Notes to Financial Statements
Schedule of Investments Genesis Fund^ (cont’d)
| |
Health Care Equipment & Supplies 3.7% |
| | |
| | |
| | |
| UFP Technologies, Inc.*(a) | |
| | |
Health Care Providers & Services 1.8% |
| | |
| | |
| | |
Health Care Technology 0.4% |
| | |
Hotels, Restaurants & Leisure 1.1% |
| | |
|
| | |
| | |
| | |
|
| | |
| | |
| | |
| Stewart Information Services Corp. | |
| | |
Life Sciences Tools & Services 4.7% |
| | |
| | |
| | |
| West Pharmaceutical Services, Inc. | |
| | |
|
| | |
| | |
| | |
| | |
| | |
| | |
| | |
| | |
| | |
| | |
| Standex International Corp. | |
| | |
| | |
| |
Marine Transportation 1.8% |
| | |
|
| | |
| Nexstar Media Group, Inc. Class A | |
| | |
| | |
Oil, Gas & Consumable Fuels 2.8% |
| | |
| Sitio Royalties Corp. Class A | |
| | |
| | |
| | |
|
| Amphastar Pharmaceuticals, Inc.* | |
Professional Services 3.4% |
| | |
| CRA International, Inc.(a) | |
| | |
| | |
| | |
Real Estate Management & Development 1.6% |
| | |
Semiconductors & Semiconductor Equipment 5.5% |
| Lattice Semiconductor Corp.* | |
| | |
| | |
| | |
|
| American Software, Inc. Class A | |
| | |
| | |
| | |
| Manhattan Associates, Inc.* | |
| | |
| | |
| | |
| Tyler Technologies, Inc.* | |
| | |
| | |
See Notes to Financial Statements
Schedule of Investments Genesis Fund^ (cont’d)
| |
|
| Asbury Automotive Group, Inc.* | |
| Floor & Decor Holdings, Inc. Class A* | |
| | |
| | |
| | |
Trading Companies & Distributors 2.8% |
| | |
| SiteOne Landscape Supply, Inc.* | |
| | |
| | |
| | |
|
Total Common Stocks (Cost $5,481,194,808) | |
| |
|
Short-Term Investments 1.5% |
Investment Companies 1.5% |
| State Street Institutional Treasury Money Market Fund Premier Class, 5.22%(b) | |
| State Street Institutional Treasury Plus Money Market Fund Premier Class, 5.28%(b) | |
Total Short-Term Investments (Cost $149,466,588) | |
Total Investments 99.9% (Cost $5,630,661,396) | |
Other Assets Less Liabilities 0.1% | |
| |
| Non-income producing security. |
| Affiliated company (see Note F of the Notes to Financial Statements). |
| Represents 7-day effective yield as of August 31, 2023. |
The following is a summary, categorized by Level (see Note A of the Notes to Financial Statements), of inputs used to value the Fund’s investments as of August 31, 2023:
| | | | |
| | | | |
|
|
|
|
|
Trading Companies & Distributors | | | | |
| | | | |
| | | | |
| | | | |
| | | | |
| The Schedule of Investments provides information on the industry or sector categorization. |
^
A balance indicated with a "—", reflects either a zero balance or an amount that rounds to less than 1.
See Notes to Financial Statements
Schedule of Investments Global Real Estate Fund^
August 31, 2023
| |
|
|
| | |
| | |
| | |
| | |
|
| Shurgard Self Storage Ltd. | |
|
| Canadian Apartment Properties REIT | |
| | |
| | |
| | |
|
| | |
|
| | |
| | |
| | |
| Sun Hung Kai Properties Ltd. | |
| | |
|
| | |
| | |
| Nippon Prologis REIT, Inc. | |
| Nomura Real Estate Holdings, Inc. | |
| | |
|
| Mapletree Pan Asia Commercial Trust | |
| | |
| | |
|
| | |
| Merlin Properties Socimi SA | |
| | |
|
| | |
| Great Portland Estates PLC | |
| | |
| | |
| | |
| | |
| |
|
| American Homes 4 Rent Class A | |
| | |
| Apartment Income REIT Corp. | |
| | |
| | |
| EastGroup Properties, Inc. | |
| | |
| Equity LifeStyle Properties, Inc. | |
| | |
| Essex Property Trust, Inc. | |
| Extra Space Storage, Inc. | |
| Healthpeak Properties, Inc. | |
| Hudson Pacific Properties, Inc. | |
| | |
| | |
| | |
| Omega Healthcare Investors, Inc. | |
| | |
| | |
| | |
| Retail Opportunity Investments Corp. | |
| Rexford Industrial Realty, Inc. | |
| | |
| Simon Property Group, Inc. | |
| | |
| | |
| | |
| | |
| | |
| | |
| | |
| | |
Total Common Stocks
(Cost $3,239,053) | |
|
|
Short-Term Investments 1.3% |
Investment Companies 1.3% |
| State Street Institutional U.S. Government Money Market Fund Premier Class, 5.28%(b)
(Cost $40,894) | |
Total Investments 101.0% (Cost $3,279,947) | |
Liabilities Less Other Assets (1.0)% | |
| |
See Notes to Financial Statements
Schedule of Investments Global Real Estate Fund^ (cont’d)
| Security exempt from registration pursuant to Regulation S under the Securities Act of 1933, as amended. Regulation S applies to securities offerings that are made outside of the United States and do not involve directed selling efforts in the United States and as such may have restrictions on resale. Total value of all such securities at August 31, 2023 amounted to $38,890, which represents 1.3% of net assets of the Fund. |
| Represents 7-day effective yield as of August 31, 2023. |
|
| | |
| | |
Industrial & Office REITs | | |
| | |
| | |
Real Estate Holding & Development | | |
| | |
| | |
Short-Term Investments and Other Liabilities-Net | | |
| | |
The following is a summary, categorized by Level (see Note A of the Notes to Financial Statements), of inputs used to value the Fund’s investments as of August 31, 2023:
| The Schedule of Investments provides a geographic categorization as well as a Positions by Sector summary. |
^
A balance indicated with a "—", reflects either a zero balance or an amount that rounds to less than 1.
See Notes to Financial Statements
Schedule of Investments Greater China Equity Fund^
August 31, 2023
| |
|
Air Freight & Logistics 1.6% |
| Milkyway Chemical Supply Chain Service Co. Ltd. Class A | |
| SF Holding Co. Ltd. Class A | |
| | |
Automobile Components 2.6% |
| Fuyao Glass Industry Group Co. Ltd. Class A | |
|
| China Merchants Bank Co. Ltd. H Shares | |
|
| China Resources Beer Holdings Co. Ltd. | |
| Jiangsu Yanghe Brewery Joint-Stock Co. Ltd. Class A | |
| Kweichow Moutai Co. Ltd. Class A | |
| Shanxi Xinghuacun Fen Wine Factory Co. Ltd. Class A | |
| Tsingtao Brewery Co. Ltd. Class A | |
| | |
|
| | |
|
| Alibaba Group Holding Ltd.* | |
|
| Zhejiang Weixing New Building Materials Co. Ltd. Class A | |
|
| Wanhua Chemical Group Co. Ltd. Class A | |
Commercial Services & Supplies 0.5% |
| Shanghai M&G Stationery, Inc. Class A | |
Construction Materials 3.1% |
| Beijing Oriental Yuhong Waterproof Technology Co. Ltd. Class A | |
| China Jushi Co. Ltd. Class A | |
| | |
Electrical Equipment 8.8% |
| Contemporary Amperex Technology Co. Ltd. Class A | |
| Dongfang Electric Corp. Ltd. Class A | |
| NARI Technology Co. Ltd. Class A | |
| Sungrow Power Supply Co. Ltd. Class A | |
| |
Electrical Equipment – cont'd |
| Suzhou Maxwell Technologies Co. Ltd. Class A | |
| | |
Electronic Equipment, Instruments & Components 6.6% |
| Foxconn Industrial Internet Co. Ltd. Class A | |
| Luxshare Precision Industry Co. Ltd. Class A | |
| Shenzhen Sunlord Electronics Co. Ltd. Class A | |
| | |
|
| Inner Mongolia Yili Industrial Group Co. Ltd. Class A | |
Health Care Equipment & Supplies 2.7% |
| Shenzhen Mindray Bio-Medical Electronics Co. Ltd. Class A | |
Health Care Providers & Services 2.1% |
| Aier Eye Hospital Group Co. Ltd. Class A | |
| Guangzhou Kingmed Diagnostics Group Co. Ltd. Class A | |
| | |
Hotels, Restaurants & Leisure 1.6% |
| | |
|
| Haier Smart Home Co. Ltd. H Shares | |
| Midea Group Co. Ltd. Class A | |
| | |
|
| China Pacific Insurance Group Co. Ltd. H Shares | |
Interactive Media & Services 5.2% |
| | |
|
| Sany Heavy Industry Co. Ltd. Class A | |
| Shenzhen Inovance Technology Co. Ltd. Class A | |
| Zhejiang Sanhua Intelligent Controls Co. Ltd. Class A | |
| Zoomlion Heavy Industry Science and Technology Co. Ltd. Class A | |
| | |
|
| CSPC Pharmaceutical Group Ltd. | |
See Notes to Financial Statements
Schedule of Investments Greater China Equity Fund^ (cont’d)
| |
Real Estate Management & Development 3.8% |
| China Resources Land Ltd. | |
Semiconductors & Semiconductor Equipment 2.6% |
| JCET Group Co. Ltd. Class A | |
| | |
| | |
Textiles, Apparel & Luxury Goods 1.1% |
| Shenzhou International Group Holdings Ltd. | |
|
Total Common Stocks (Cost $1,743,439) | |
| |
|
Short-Term Investments 12.6% |
Investment Companies 12.6% |
| State Street Institutional U.S. Government Money Market Fund Premier Class, 5.28%(b)
(Cost $211,378) | |
Total Investments 109.3% (Cost $1,954,817) | |
Liabilities Less Other Assets (9.3)% | |
| |
| Non-income producing security. |
| Security exempt from registration pursuant to Regulation S under the Securities Act of 1933, as amended. Regulation S applies to securities offerings that are made outside of the United States and do not involve directed selling efforts in the United States and as such may have restrictions on resale. Total value of all such securities at August 31, 2023 amounted to $95,035, which represents 5.7% of net assets of the Fund. |
| Represents 7-day effective yield as of August 31, 2023. |
The following is a summary, categorized by Level (see Note A of the Notes to Financial Statements), of inputs used to value the Fund’s investments as of August 31, 2023:
| The Schedule of Investments provides information on the industry or sector categorization. |
^
A balance indicated with a "—", reflects either a zero balance or an amount that rounds to less than 1.
See Notes to Financial Statements
Schedule of Investments International Equity Fund^
August 31, 2023
| |
|
|
| | |
|
| | |
|
| | |
|
| | |
| | |
| | |
| | |
|
| Shenzhou International Group Holdings Ltd. | |
|
| | |
|
| | |
| | |
| | |
| | |
| | |
| | |
| | |
|
| | |
| | |
| | |
| | |
| | |
| | |
| | |
| | |
| | |
| | |
| | |
| | |
|
| | |
| | |
| Techtronic Industries Co. Ltd. | |
| | |
|
| Bank of Ireland Group PLC | |
| |
|
| | |
| | |
| | |
| | |
|
| | |
|
| | |
| | |
| | |
| | |
| | |
| Koito Manufacturing Co. Ltd. | |
| | |
| | |
| | |
| | |
| | |
| | |
| | |
| | |
| | |
| | |
| | |
|
| | |
| | |
| | |
| | |
| | |
| | |
|
| | |
|
| | |
| | |
| | |
|
| | |
|
| | |
| | |
| | |
| | |
| | |
See Notes to Financial Statements
Schedule of Investments International Equity Fund^ (cont’d)
| |
|
| | |
| | |
|
| | |
| | |
| | |
| Coca-Cola Europacific Partners PLC | |
| | |
| | |
| | |
| London Stock Exchange Group PLC | |
| Petershill Partners PLC(a) | |
| | |
| | |
| | |
| | |
| | |
| | |
|
| | |
| | |
| | |
| |
|
| | |
| | |
| | |
Total Common Stocks
(Cost $1,007,960,329) | |
|
|
Short-Term Investments 1.1% |
Investment Companies 1.1% |
| State Street Institutional Treasury Money Market Fund Premier Class, 5.22%(c) | |
| State Street Navigator Securities Lending Government Money Market Portfolio, 5.34%(c)(d) | |
Total Short-Term Investments
(Cost $11,502,698) | |
Total Investments 99.7% (Cost $1,019,463,027) | |
Other Assets Less Liabilities 0.3% | |
| |
| Non-income producing security. |
| Security exempt from registration pursuant to Regulation S under the Securities Act of 1933, as amended. Regulation S applies to securities offerings that are made outside of the United States and do not involve directed selling efforts in the United States and as such may have restrictions on resale. Total value of all such securities at August 31, 2023 amounted to $31,098,711, which represents 3.0% of net assets of the Fund. |
| All or a portion of this security is on loan at August 31, 2023. Total value of all such securities at August 31, 2023 amounted to $477,176 for the Fund (see Note A of the Notes to Financial Statements). |
| Represents 7-day effective yield as of August 31, 2023. |
| Represents investment of cash collateral received from securities lending. |
See Notes to Financial Statements
Schedule of Investments International Equity Fund^ (cont’d)
|
| | |
| | |
| | |
| | |
| | |
| | |
Oil, Gas & Consumable Fuels | | |
Trading Companies & Distributors | | |
| | |
| | |
Semiconductors & Semiconductor Equipment | | |
| | |
| | |
Life Sciences Tools & Services | | |
| | |
Textiles, Apparel & Luxury Goods | | |
| | |
Energy Equipment & Services | | |
| | |
| | |
| | |
Health Care Equipment & Supplies | | |
| | |
| | |
Wireless Telecommunication Services | | |
| | |
Hotels, Restaurants & Leisure | | |
| | |
Diversified Telecommunication Services | | |
| | |
| | |
Electronic Equipment, Instruments & Components | | |
Consumer Staples Distribution & Retail | | |
| | |
Short-Term Investments and Other Assets—Net | | |
| | |
The following is a summary, categorized by Level (see Note A of the Notes to Financial Statements), of inputs used to value the Fund’s investments as of August 31, 2023:
| The Schedule of Investments provides a geographic categorization as well as a Positions by Industry summary. |
See Notes to Financial Statements
Schedule of Investments International Equity Fund^ (cont’d)
^
A balance indicated with a "—", reflects either a zero balance or an amount that rounds to less than 1.
See Notes to Financial Statements
Schedule of Investments International Select Fund^
August 31, 2023
| |
|
|
| | |
|
| | |
|
| | |
| | |
| | |
|
| Shenzhou International Group Holdings Ltd. | |
|
| | |
|
| | |
| | |
| | |
| | |
| | |
| | |
|
| | |
| | |
| | |
| | |
| | |
| | |
| | |
| | |
| | |
| | |
| | |
|
| | |
| | |
| Techtronic Industries Co. Ltd. | |
| | |
|
| Bank of Ireland Group PLC | |
| | |
| | |
| | |
| | |
|
| | |
| |
|
| | |
| | |
| | |
| | |
| Koito Manufacturing Co. Ltd. | |
| | |
| Nomura Research Institute Ltd. | |
| | |
| | |
| Renesas Electronics Corp.* | |
| | |
| Shin-Etsu Chemical Co. Ltd. | |
| | |
| | |
| | |
| | |
| | |
| | |
|
| | |
| | |
| | |
| | |
| | |
| | |
| | |
|
| | |
|
| | |
|
| | |
|
| | |
| | |
| | |
| | |
| | |
| | |
| | |
|
| | |
| | |
| | |
| Coca-Cola Europacific Partners PLC | |
| | |
| | |
See Notes to Financial Statements
Schedule of Investments International Select Fund^ (cont’d)
| |
|
| | |
| London Stock Exchange Group PLC | |
| Petershill Partners PLC(a) | |
| | |
| | |
| | |
| | |
| | |
| | |
|
| | |
| | |
| | |
| | |
| | |
| | |
Total Common Stocks
(Cost $140,317,395) | |
|
| |
|
Short-Term Investments 2.3% |
Investment Companies 2.3% |
| State Street Institutional Treasury Money Market Fund Premier Class, 5.22%(c) | |
| State Street Navigator Securities Lending Government Money Market Portfolio, 5.34%(c)(d) | |
Total Short-Term Investments
(Cost $3,424,106) | |
Total Investments 99.9% (Cost $143,741,501) | |
Other Assets Less Liabilities 0.1% | |
| |
| Non-income producing security. |
| Security exempt from registration pursuant to Regulation S under the Securities Act of 1933, as amended. Regulation S applies to securities offerings that are made outside of the United States and do not involve directed selling efforts in the United States and as such may have restrictions on resale. Total value of all such securities at August 31, 2023 amounted to $4,060,086, which represents 2.7% of net assets of the Fund. |
| All or a portion of this security is on loan at August 31, 2023. Total value of all such securities at August 31, 2023 amounted to $686,186 for the Fund (see Note A of the Notes to Financial Statements). |
| Represents 7-day effective yield as of August 31, 2023. |
| Represents investment of cash collateral received from securities lending. |
See Notes to Financial Statements
Schedule of Investments International Select Fund^ (cont’d)
|
| | |
| | |
| | |
| | |
| | |
Oil, Gas & Consumable Fuels | | |
Trading Companies & Distributors | | |
Semiconductors & Semiconductor Equipment | | |
| | |
| | |
| | |
Life Sciences Tools & Services | | |
| | |
| | |
| | |
Textiles, Apparel & Luxury Goods | | |
| | |
| | |
Energy Equipment & Services | | |
| | |
| | |
Health Care Equipment & Supplies | | |
| | |
Wireless Telecommunication Services | | |
| | |
| | |
| | |
Hotels, Restaurants & Leisure | | |
Diversified Telecommunication Services | | |
| | |
| | |
Consumer Staples Distribution & Retail | | |
| | |
Short-Term Investments and Other Assets—Net | | |
| | |
The following is a summary, categorized by Level (see Note A of the Notes to Financial Statements), of inputs used to value the Fund’s investments as of August 31, 2023:
| The Schedule of Investments provides a geographic categorization as well as a Positions by Industry summary. |
^
A balance indicated with a "—", reflects either a zero balance or an amount that rounds to less than 1.
See Notes to Financial Statements
Schedule of Investments International Small Cap Fund^
August 31, 2023
| |
|
|
| | |
| Corporate Travel Management Ltd. | |
| | |
| | |
| | |
| | |
|
| | |
| Shurgard Self Storage Ltd. | |
| | |
|
| Bank of NT Butterfield & Son Ltd. | |
|
| | |
|
| Colliers International Group, Inc. | |
| Descartes Systems Group, Inc.* | |
| | |
| | |
|
| | |
| | |
| | |
|
| | |
|
| | |
| | |
| | |
| | |
| | |
| | |
| | |
| | |
| | |
| | |
| | |
|
| | |
| | |
| | |
| | |
|
| | |
| |
|
| | |
| | |
| | |
| | |
| | |
|
| | |
| | |
| | |
| | |
| Casio Computer Co. Ltd.(a) | |
| | |
| | |
| | |
| | |
| | |
| | |
| Nippon Kanzai Holdings Co. Ltd. | |
| | |
| | |
| Prestige International, Inc. | |
| | |
| | |
| | |
| Shinnihonseiyaku Co. Ltd. | |
| SHO-BOND Holdings Co. Ltd. | |
| | |
| | |
| Sun Frontier Fudousan Co. Ltd. | |
| | |
| | |
| | |
| | |
| | |
|
| | |
|
| | |
| | |
| | |
|
| | |
|
| | |
| | |
| | |
| | |
See Notes to Financial Statements
Schedule of Investments International Small Cap Fund^ (cont’d)
| |
|
| | |
|
| | |
| | |
| | |
| | |
|
| | |
| | |
| | |
| | |
| | |
| | |
|
| | |
| | |
| Bossard Holding AG Class A | |
| Burckhardt Compression Holding AG | |
| | |
| | |
| | |
| | |
| | |
| | |
| | |
| | |
| | |
| |
|
| | |
| | |
| | |
| | |
| | |
| | |
| | |
| | |
| | |
| | |
Total Common Stocks
(Cost $3,333,736) | |
|
|
Short-Term Investments 3.7% |
Investment Companies 3.7% |
| State Street Institutional Treasury Money Market Fund Premier Class, 5.22%(c) | |
| State Street Navigator Securities Lending Government Money Market Portfolio, 5.34%(c)(d) | |
Total Short-Term Investments
(Cost $127,199) | |
Total Investments 100.6% (Cost $3,460,935) | |
Liabilities Less Other Assets (0.6)% | |
| |
| Non-income producing security. |
| All or a portion of this security is on loan at August 31, 2023. Total value of all such securities at August 31, 2023 amounted to $100,171, collateralized by cash collateral of $55,632 and non-cash (U.S. Treasury Securities) collateral of $50,144 for the Fund (see Note A of the Notes to Financial Statements). |
| Security exempt from registration pursuant to Regulation S under the Securities Act of 1933, as amended. Regulation S applies to securities offerings that are made outside of the United States and do not involve directed selling efforts in the United States and as such may have restrictions on resale. Total value of all such securities at August 31, 2023 amounted to $289,761, which represents 8.4% of net assets of the Fund. |
| Represents 7-day effective yield as of August 31, 2023. |
| Represents investment of cash collateral received from securities lending. |
See Notes to Financial Statements
Schedule of Investments International Small Cap Fund^ (cont’d)
|
| | |
| | |
Electronic Equipment, Instruments & Components | | |
| | |
Commercial Services & Supplies | | |
| | |
Real Estate Management & Development | | |
Construction & Engineering | | |
| | |
| | |
| | |
| | |
Health Care Equipment & Supplies | | |
| | |
Trading Companies & Distributors | | |
| | |
| | |
| | |
| | |
| | |
| | |
Health Care Providers & Services | | |
| | |
| | |
| | |
Textiles, Apparel & Luxury Goods | | |
Life Sciences Tools & Services | | |
| | |
| | |
Semiconductors & Semiconductor Equipment | | |
Hotels, Restaurants & Leisure | | |
| | |
Energy Equipment & Services | | |
| | |
| | |
| | |
Short-Term Investments and Other Liabilities—Net | | |
| | |
See Notes to Financial Statements
Schedule of Investments International Small Cap Fund^ (cont’d)
The following is a summary, categorized by Level (see Note A of the Notes to Financial Statements), of inputs used to value the Fund’s investments as of August 31, 2023:
| The Schedule of Investments provides a geographic categorization as well as a Positions by Industry summary. |
^
A balance indicated with a "—", reflects either a zero balance or an amount that rounds to less than 1.
See Notes to Financial Statements
Schedule of Investments Intrinsic Value Fund^
August 31, 2023
| |
|
|
| | |
|
| | |
| | |
| | |
| Huntington Bancshares, Inc. | |
| Texas Capital Bancshares, Inc.* | |
| | |
|
| Resideo Technologies, Inc.* | |
Commercial Services & Supplies 4.2% |
| | |
| | |
| | |
| | |
| | |
Communications Equipment 5.9% |
| | |
| | |
| | |
| Ribbon Communications, Inc.*(a) | |
| | |
| | |
| | |
Construction & Engineering 1.3% |
| | |
| | |
| | |
|
| Bread Financial Holdings, Inc. | |
Containers & Packaging 4.5% |
| | |
| | |
| | |
Electrical Equipment 1.3% |
| Babcock & Wilcox Enterprises, Inc.* | |
| Bloom Energy Corp. Class A* | |
| | |
Electronic Equipment, Instruments & Components 4.4% |
| | |
| |
Electronic Equipment, Instruments & Components – cont'd |
| Innoviz Technologies Ltd.* | |
| | |
| | |
| | |
| Teledyne Technologies, Inc.* | |
| | |
Energy Equipment & Services 4.1% |
| | |
| Oil States International, Inc.* | |
| Patterson-UTI Energy, Inc. | |
| | |
| TETRA Technologies, Inc.* | |
| | |
|
| Lions Gate Entertainment Corp. Class B* | |
|
| | |
|
| Hain Celestial Group, Inc.* | |
| | |
| | |
Health Care Equipment & Supplies 4.9% |
| | |
| | |
| | |
| | |
| | |
| Integra LifeSciences Holdings Corp.* | |
| OraSure Technologies, Inc.* | |
| | |
| | |
| | |
Health Care Providers & Services 4.4% |
| Acadia Healthcare Co., Inc.* | |
| | |
| | |
| | |
Hotel & Resort REITs 0.6% |
| | |
| | |
| | |
Hotels, Restaurants & Leisure 3.6% |
| International Game Technology PLC | |
See Notes to Financial Statements
Schedule of Investments Intrinsic Value Fund^ (cont’d)
| |
Hotels, Restaurants & Leisure – cont'd |
| SeaWorld Entertainment, Inc.* | |
| | |
|
| Tempur Sealy International, Inc. | |
Independent Power and Renewable Electricity |
| | |
| | |
| | |
|
| | |
| | |
| | |
| | |
Life Sciences Tools & Services 1.3% |
| Charles River Laboratories International, Inc.* | |
| | |
| | |
|
| | |
| Markforged Holding Corp.* | |
| | |
| | |
|
| | |
|
| | |
Oil, Gas & Consumable Fuels 3.0% |
| | |
| | |
| | |
|
| Amneal Pharmaceuticals, Inc.* | |
Professional Services 3.7% |
| | |
| | |
| | |
Semiconductors & Semiconductor Equipment 9.1% |
| | |
| | |
| MACOM Technology Solutions Holdings, Inc.* | |
| |
Semiconductors & Semiconductor Equipment – cont'd |
| | |
| | |
| | |
| | |
|
| | |
| | |
| | |
| | |
| | |
| | |
| | |
| | |
| | |
|
| | |
| | |
| | |
| | |
| | |
Technology Hardware, Storage & Peripherals 1.8% |
| | |
| | |
| | |
Textiles, Apparel & Luxury Goods 0.3% |
| Under Armour, Inc. Class C* | |
Trading Companies & Distributors 1.7% |
| | |
|
Total Common Stocks (Cost $1,277,045,046) | |
|
Communications Equipment 1.0% |
|
| Ribbon Communications, Inc., Series A*#(a)(c)(d) (Cost $14,135,352) | |
|
|
|
Communications Equipment 1.0% |
|
| Infinera Corp., 2.50%, due 3/1/2027 | |
See Notes to Financial Statements
Schedule of Investments Intrinsic Value Fund^ (cont’d)
| |
Communications Equipment – cont'd |
|
| Infinera Corp., 3.75%, due 8/1/2028 | |
|
Total Convertible Bonds (Cost $16,804,000) | |
|
|
|
Communications Equipment 0.1% |
|
| Ribbon Communications, Inc. Expires 3/31/2027*#(a)(c)(d) (Cost $2,464,258) | |
|
|
|
| Ion Geophysical(c)(d)
(Cost $0) | |
| |
|
Short-Term Investments 4.9% |
Investment Companies 4.9% |
| State Street Institutional Treasury Money Market Fund Premier Class, 5.22%(f)
(Cost $76,051,986) | |
Total Investments 100.3% (Cost $1,386,500,642) | |
Liabilities Less Other Assets (0.3)% | |
| |
| Non-income producing security. |
| Security acquired via a PIPE transaction. |
| Affiliated company (see Note F of the Notes to Financial Statements). |
| Value determined using significant unobservable inputs. |
| Security fair valued as of August 31, 2023 in accordance with procedures approved by the valuation designee. Total value of all such securities at August 31, 2023 amounted to $17,038,254, which represents 1.1% of net assets of the Fund. |
| Represents less than 0.05% of net assets of the Fund. |
| Represents 7-day effective yield as of August 31, 2023. |
#
This security has been deemed by Management to be illiquid, and is subject to restrictions on resale. Total value of all such securities at August 31, 2023 amounted to $17,038,254, which represents 1.1% of net assets of the Fund. Acquisition dates shown with a range, if any, represent securities that were acquired over the period shown in the table.
| | | | Fair Value
Percentage
of Net Assets
as of
8/31/2023 |
Ribbon Communications, Inc. (Series A Preferred Shares) | | | | |
Ribbon Communications, Inc. Expires 3/31/2027 (Warrants) | | | | |
|
| | | |
See Notes to Financial Statements
Schedule of Investments Intrinsic Value Fund^ (cont’d)
The following is a summary, categorized by Level (see Note A of the Notes to Financial Statements), of inputs used to value the Fund’s investments as of August 31, 2023:
| The Schedule of Investments provides information on the industry or sector categorization. |
| The following is a reconciliation between the beginning and ending balances of investments in which unobservable inputs (Level 3) were used in determining value: |
| Beginning
balance as
of 9/1/2022 | Accrued
discounts/
(premiums) | | Change
in unrealized
appreciation/
(depreciation) | | | | | | Net change in
unrealized
appreciation/
(depreciation)
from
investments
still held as of
8/31/2023 |
Investments in Securities: |
| | | | | | | | | | |
| | | | | | | | | | |
| | | | | | | | | | |
| | | | | | | | | | |
(1) Quantitative Information about Level 3 Fair Value Measurements: |
| | | | | | Impact to
valuation
from
increase
in input(b) |
| | | | | | |
| | | | | | |
(a) The weighted averages disclosed in the table above were weighted by relative fair value. |
(b) Represents the expected directional change in the fair value of the Level 3 investments that would result from an increase or decrease in the corresponding input. Significant changes in these inputs could result in significantly higher or lower fair value measurements. |
(2) At August 31, 2023, these investments were valued in accordance with procedures approved by the valuation designee. These investments did not have a material impact on the Fund's net assets and, therefore, disclosure of unobservable inputs used in formulating valuations is not presented. |
^
A balance indicated with a "—", reflects either a zero balance or an amount that rounds to less than 1.
See Notes to Financial Statements
Consolidated Schedule of Investments Large Cap Growth Fund†^
August 31, 2023
| |
|
|
| | |
|
| | |
|
| | |
|
| | |
| | |
| | |
Commercial Services & Supplies 1.2% |
| | |
|
| Arctic Wolf Networks, Inc.*#(a)(b) | |
Consumer Staples Distribution & Retail 3.9% |
| | |
| | |
| | |
| | |
Containers & Packaging 0.9% |
| | |
|
| | |
Electronic Equipment, Instruments & Components 2.6% |
| | |
| | |
| | |
|
| Activision Blizzard, Inc. | |
| | |
| | |
|
| | |
| | |
| | |
Ground Transportation 1.1% |
| | |
Health Care Equipment & Supplies 1.1% |
| | |
Health Care Providers & Services 3.1% |
| | |
| |
Hotels, Restaurants & Leisure 2.2% |
| | |
| Sweetgreen, Inc. Class A* | |
| | |
|
| | |
Interactive Media & Services 9.8% |
| | |
| | |
| Meta Platforms, Inc. Class A* | |
| | |
|
| | |
Life Sciences Tools & Services 1.7% |
| Thermo Fisher Scientific, Inc. | |
Personal Care Products 0.4% |
| | |
| Oddity Tech Ltd. Class A* | |
| | |
|
| | |
Professional Services 2.7% |
| | |
| | |
| | |
Semiconductors & Semiconductor Equipment 5.7% |
| | |
| | |
| | |
|
| | |
| | |
| | |
| | |
| | |
| | |
| | |
| | |
| | |
|
| | |
| Fanatics Holdings, Inc. Class A*#(a)(b) | |
| | |
See Notes to Consolidated Financial Statements
Consolidated Schedule of Investments Large Cap Growth Fund†^ (cont’d)
| |
Specialty Retail – cont'd |
| | |
| | |
Technology Hardware, Storage & Peripherals 4.4% |
| | |
Textiles, Apparel & Luxury Goods 0.9% |
| | |
|
Total Common Stocks (Cost $1,302,792,187) | |
|
|
|
| | |
|
|
| Fabletics LLC, Series G*#(a)(b) | |
| Savage X, Inc., Series C*#(a)(b) | |
| | |
|
|
| Druva, Inc., Series 4*#(a)(b) | |
| Druva, Inc., Series 5*#(a)(b) | |
| | |
|
|
| Grammarly, Inc., Series 3*#(a)(b) | |
| Signifyd, Inc., Series Seed*#(a)(b) | |
| Signifyd, Inc., Series A*#(a)(b) | |
| Videoamp, Inc., Series F1*#(a)(b) | |
| | |
|
Total Preferred Stocks (Cost $20,934,539) | |
| |
Master Limited Partnerships and Limited Partnerships 1.0% |
Oil, Gas & Consumable Fuels 1.0% |
|
| Enterprise Products Partners LP
(Cost $20,313,658) | |
|
Total Purchased Option Contracts 0.0%(e)(f) (Cost $225,255) | |
|
|
Short-Term Investments 0.5% |
Investment Companies 0.5% |
| State Street Institutional Treasury Money Market Fund Premier Class, 5.22%(g)
(Cost $10,275,855) | |
Total Investments 100.1% (Cost $1,354,541,494) | |
Liabilities Less Other Assets (0.1)%(h) | |
| |
| Non-income producing security. |
| Value determined using significant unobservable inputs. |
| Security fair valued as of August 31, 2023 in accordance with procedures approved by the valuation designee. Total value of all such securities at August 31, 2023 amounted to $128,508,593, which represents 6.3% of net assets of the Fund. |
| All or a portion of this security is pledged as collateral for options written. |
| Security represented in Units. |
| See "Purchased option contracts" under Derivative Instruments. |
| Represents less than 0.05% of net assets of the Fund. |
| Represents 7-day effective yield as of August 31, 2023. |
See Notes to Consolidated Financial Statements
Consolidated Schedule of Investments Large Cap Growth Fund†^ (cont’d)
| Includes the impact of the Fund’s open positions in derivatives at August 31, 2023. |
#
This security has been deemed by Management to be illiquid, and is subject to restrictions on resale. Total value of all such securities at August 31, 2023 amounted to $128,508,593, which represents 6.3% of net assets of the Fund. Acquisition dates shown with a range, if any, represent securities that were acquired over the period shown in the table.
| | | | Fair Value
Percentage
of Net Assets
as of
8/31/2023 |
A24 Films LLC (Preferred Units) | | | | |
Arctic Wolf Networks, Inc. | | | | |
Druva, Inc. (Series 4 Preferred Shares) | | | | |
Druva, Inc. (Series 5 Preferred Shares) | | | | |
Fabletics LLC (Series G Preferred Shares) | | | | |
Fanatics Holdings, Inc. Class A | | | | |
| | | | |
Grammarly, Inc. (Series 3 Preferred Shares) | | | | |
Savage X, Inc. (Series C Preferred Shares) | | | | |
Signifyd, Inc. (Series A Preferred Shares) | | | | |
Signifyd, Inc. (Series Seed Preferred Shares) | | | | |
Videoamp, Inc. (Series F1 Preferred Shares) | | | | |
|
| | | |
See Notes to Consolidated Financial Statements
Consolidated Schedule of Investments Large Cap Growth Fund†^ (cont’d)
Derivative Instruments
Purchased option contracts ("options purchased")
At August 31, 2023, the Fund had outstanding options purchased as follows:
| | | | | |
|
|
| | | | | |
Total options purchased (cost $225,255) | |
Written option contracts ("options written")
At August 31, 2023, the Fund had outstanding options written as follows:
| | | | | |
|
Interactive Media & Services |
| | | | | |
|
| | | | | |
Total options written (premium received $142,145) | |
For the year ended August 31, 2023, the average market value for the months where the Fund had options purchased and options written outstanding was $13,522 and $(460,119), respectively. At August 31, 2023, the Fund had securities pledged in the amount of $13,110,400 to cover collateral requirements for options written.
The following is a summary, categorized by Level (see Note A of the Notes to Financial Statements), of inputs used to value the Fund’s investments as of August 31, 2023:
| | | | |
| | | | |
|
|
|
|
|
| | | | |
| | | | |
| | | | |
| | | | |
| | | | |
| | | | |
Master Limited Partnerships and Limited Partnerships# | | | | |
| | | | |
| | | | |
| | | | |
| The Consolidated Schedule of Investments provides information on the industry or sector categorization. |
| The "Purchased option contracts" table under Derivative Instruments provides information on the industry or sector categorization. |
See Notes to Consolidated Financial Statements
Consolidated Schedule of Investments Large Cap Growth Fund†^ (cont’d)
| The following is a reconciliation between the beginning and ending balances of investments in which unobservable inputs (Level 3) were used in determining value: |
| Beginning
balance as
of 9/1/2022 | Accrued
discounts/
(premiums) | | Change
in unrealized
appreciation/
(depreciation) | | | | | | Net change in
unrealized
appreciation/
(depreciation)
from
investments
still held as of
8/31/2023 |
Investments in Securities: |
| | | | | | | | | | |
| | | | | | | | | | |
| | | | | | | | | | |
(1) Quantitative Information about Level 3 Fair Value Measurements: |
| | | | | | Impact to
valuation
from
increase
in input(b) |
| | | Enterprise value
Revenue multiple(c) (EV/Revenue) | | | |
|
| | | | | |
|
| | | | | |
|
| | | | | |
| | | Enterprise value/
Revenue multiple(c) (EV/Revenue) | | | |
|
| | | | | |
|
| | | | | |
|
| | | | | |
| | | Enterprise value/
Revenue multiple(c) (EV/Revenue) | | | |
|
| | | | | |
|
| | | | | |
|
| | | | | |
(a) The weighted averages disclosed in the table above were weighted by relative fair value. |
(b) Represents the expected directional change in the fair value of the Level 3 investments that would result from an increase or decrease in the corresponding input. Significant changes in these inputs could result in significantly higher or lower fair value measurements. |
(c) Represents amounts used when the reporting entity has determined that market participants would use such multiples when pricing the investments. |
The following is a summary, categorized by level (see Note A of the Notes to Consolidated Financial Statements), of inputs used to value the Fund’s derivatives as of August 31, 2023:
Other Financial Instruments | | | | |
|
|
|
|
|
| | | | |
| | | | |
†
Formerly Guardian Fund through September 30, 2022.
See Notes to Consolidated Financial Statements
Consolidated Schedule of Investments Large Cap Growth Fund†^ (cont’d)
^
A balance indicated with a "—", reflects either a zero balance or an amount that rounds to less than 1.
See Notes to Consolidated Financial Statements
Schedule of Investments Large Cap Value Fund^
August 31, 2023
| |
|
|
| | |
| | |
| | |
| | |
|
| | |
| | |
| PNC Financial Services Group, Inc. | |
| | |
|
| Constellation Brands, Inc. Class A | |
| | |
| | |
| | |
|
| | |
| Regeneron Pharmaceuticals, Inc.* | |
| | |
|
| | |
|
| Air Products & Chemicals, Inc. | |
| CF Industries Holdings, Inc. | |
| | |
| | |
Consumer Staples Distribution & Retail 4.9% |
| | |
| | |
| | |
Diversified Telecommunication Services 1.4% |
| Verizon Communications, Inc. | |
|
| American Electric Power Co., Inc. | |
| | |
| | |
| | |
| | |
| |
Electrical Equipment 0.6% |
| | |
Energy Equipment & Services 0.5% |
| | |
|
| Berkshire Hathaway, Inc. Class B* | |
|
| Mondelez International, Inc. Class A | |
Health Care Equipment & Supplies 7.0% |
| | |
| | |
| | |
| | |
| | |
| Zimmer Biomet Holdings, Inc. | |
| | |
Hotels, Restaurants & Leisure 3.3% |
| | |
| | |
| | |
| | |
|
| | |
Industrial Conglomerates 1.8% |
| | |
| | |
| | |
|
| | |
|
| | |
Life Sciences Tools & Services 0.9% |
| | |
| Thermo Fisher Scientific, Inc. | |
| | |
|
| Illinois Tool Works, Inc. | |
|
| | |
|
| | |
See Notes to Financial Statements
Schedule of Investments Large Cap Value Fund^ (cont’d)
| |
|
| | |
| | |
| | |
| | |
| Wheaton Precious Metals Corp. | |
| | |
|
| | |
| | |
| | |
| | |
Oil, Gas & Consumable Fuels 7.4% |
| | |
| | |
| | |
| | |
| | |
Personal Care Products 1.2% |
| | |
|
| | |
| | |
| | |
| | |
| | |
| |
Semiconductors & Semiconductor Equipment 1.7% |
| Advanced Micro Devices, Inc.* | |
| | |
| | |
| | |
|
| | |
|
| Philip Morris International, Inc. | |
|
Total Common Stocks (Cost $11,563,474,715) | |
Short-Term Investments 2.5% |
Investment Companies 2.5% |
| State Street Institutional U.S. Government Money Market Fund Premier Class, 5.28%(a)
(Cost $309,451,766) | |
Total Investments 100.7% (Cost $11,872,926,481) | |
Liabilities Less Other Assets (0.7)% | |
| |
| Non-income producing security. |
| Represents 7-day effective yield as of August 31, 2023. |
The following is a summary, categorized by Level (see Note A of the Notes to Financial Statements), of inputs used to value the Fund’s investments as of August 31, 2023:
| The Schedule of Investments provides information on the industry or sector categorization. |
^
A balance indicated with a "—", reflects either a zero balance or an amount that rounds to less than 1.
See Notes to Financial Statements
Schedule of Investments Mid Cap Growth Fund^
August 31, 2023
| |
|
|
| | |
| | |
| | |
Automobile Components 0.8% |
| | |
|
| Alnylam Pharmaceuticals, Inc.* | |
| BioMarin Pharmaceutical, Inc.* | |
| | |
| Neurocrine Biosciences, Inc.* | |
| Sarepta Therapeutics, Inc.* | |
| | |
|
| Builders FirstSource, Inc.* | |
|
| Ares Management Corp. Class A | |
Commercial Services & Supplies 2.5% |
| | |
| | |
| | |
Communications Equipment 1.7% |
| | |
Construction & Engineering 1.1% |
| | |
Consumer Staples Distribution & Retail 1.1% |
| BJ's Wholesale Club Holdings, Inc.* | |
|
| | |
Electrical Equipment 4.7% |
| | |
| | |
| Rockwell Automation, Inc. | |
| | |
| | |
|
| | |
Ground Transportation 2.7% |
| JB Hunt Transport Services, Inc. | |
| |
Ground Transportation – cont'd |
| Old Dominion Freight Line, Inc. | |
| | |
Health Care Equipment & Supplies 7.7% |
| | |
| | |
| | |
| IDEXX Laboratories, Inc.* | |
| Inspire Medical Systems, Inc.* | |
| | |
| | |
| | |
| | |
Health Care Providers & Services 1.0% |
| | |
Hotels, Restaurants & Leisure 4.6% |
| | |
| | |
| DraftKings, Inc. Class A* | |
| | |
| | |
|
| Church & Dwight Co., Inc. | |
|
| | |
| | |
| Kinsale Capital Group, Inc. | |
| | |
|
| | |
Life Sciences Tools & Services 5.8% |
| Agilent Technologies, Inc. | |
| | |
| Bio-Rad Laboratories, Inc. Class A* | |
| | |
| | |
| | |
|
| | |
|
| Trade Desk, Inc. Class A* | |
Oil, Gas & Consumable Fuels 2.3% |
| | |
See Notes to Financial Statements
Schedule of Investments Mid Cap Growth Fund^ (cont’d)
| |
Oil, Gas & Consumable Fuels – cont'd |
| | |
| | |
|
| Royalty Pharma PLC Class A | |
Professional Services 2.4% |
| | |
| | |
| | |
Real Estate Management & Development 1.0% |
| | |
Semiconductors & Semiconductor Equipment 5.3% |
| Lattice Semiconductor Corp.* | |
| Monolithic Power Systems, Inc. | |
| | |
| | |
|
| | |
| Cadence Design Systems, Inc.* | |
| Crowdstrike Holdings, Inc. Class A* | |
| | |
| Descartes Systems Group, Inc.* | |
| Manhattan Associates, Inc.* | |
| Palantir Technologies, Inc. Class A* | |
| Palo Alto Networks, Inc.* | |
| |
|
| | |
| | |
|
| O'Reilly Automotive, Inc.* | |
| | |
| | |
| | |
| | |
| | |
Textiles, Apparel & Luxury Goods 0.9% |
| | |
Trading Companies & Distributors 2.9% |
| | |
| | |
| | |
|
Total Common Stocks (Cost $1,343,920,098) | |
Short-Term Investments 0.7% |
Investment Companies 0.7% |
| State Street Institutional U.S. Government Money Market Fund Premier Class, 5.28%(a)
(Cost $10,279,218) | |
Total Investments 100.6% (Cost $1,354,199,316) | |
Liabilities Less Other Assets (0.6)% | |
| |
| Non-income producing security. |
| Represents 7-day effective yield as of August 31, 2023. |
The following is a summary, categorized by Level (see Note A of the Notes to Financial Statements), of inputs used to value the Fund’s investments as of August 31, 2023:
| The Schedule of Investments provides information on the industry or sector categorization. |
^
A balance indicated with a "—", reflects either a zero balance or an amount that rounds to less than 1.
See Notes to Financial Statements
Schedule of Investments Mid Cap Intrinsic Value Fund^
August 31, 2023
| |
|
|
| | |
| L3Harris Technologies, Inc. | |
| | |
Automobile Components 1.9% |
| | |
|
| | |
| Huntington Bancshares, Inc. | |
| | |
| | |
|
| Molson Coors Beverage Co. Class B | |
|
| | |
| Fortune Brands Innovations, Inc. | |
| | |
| Resideo Technologies, Inc.* | |
| | |
|
| | |
Commercial Services & Supplies 2.0% |
| | |
| | |
| | |
Communications Equipment 2.9% |
| | |
| | |
| | |
Construction & Engineering 1.9% |
| | |
|
| Bread Financial Holdings, Inc. | |
Consumer Staples Distribution & Retail 1.8% |
| | |
Containers & Packaging 3.5% |
| | |
| | |
| | |
| | |
|
| | |
| |
Electric Utilities – cont'd |
| | |
| | |
Electronic Equipment, Instruments & Components 3.6% |
| | |
| | |
| | |
| | |
Energy Equipment & Services 2.1% |
| | |
|
| Lions Gate Entertainment Corp. Class B* | |
|
| | |
|
| Hain Celestial Group, Inc.* | |
| | |
| | |
Health Care Equipment & Supplies 4.5% |
| | |
| | |
| Zimmer Biomet Holdings, Inc. | |
| | |
| | |
Health Care Providers & Services 2.1% |
| | |
Hotels, Restaurants & Leisure 5.3% |
| International Game Technology PLC | |
| MGM Resorts International* | |
| | |
| | |
Independent Power and Renewable Electricity |
| | |
| | |
| | |
|
| | |
| | |
| | |
|
| | |
| | |
| | |
See Notes to Financial Statements
Schedule of Investments Mid Cap Intrinsic Value Fund^ (cont’d)
| |
Life Sciences Tools & Services 0.3% |
| Charles River Laboratories International, Inc.* | |
|
| Allison Transmission Holdings, Inc. | |
| | |
| | |
|
| | |
|
| | |
Oil, Gas & Consumable Fuels 6.8% |
| | |
| | |
| | |
| | |
| | |
Personal Care Products 0.2% |
| | |
Professional Services 4.6% |
| | |
| Dun & Bradstreet Holdings, Inc. | |
| | |
| | |
|
| | |
Semiconductors & Semiconductor Equipment 2.8% |
| | |
| | |
| | |
| |
|
| | |
| | |
| Smartsheet, Inc. Class A* | |
| | |
|
| | |
| | |
| | |
| | |
Technology Hardware, Storage & Peripherals 3.2% |
| Hewlett Packard Enterprise Co. | |
| Pure Storage, Inc. Class A* | |
| | |
Textiles, Apparel & Luxury Goods 0.5% |
| Under Armour, Inc. Class C* | |
Trading Companies & Distributors 2.9% |
| | |
|
Total Common Stocks (Cost $46,279,487) | |
Short-Term Investments 0.5% |
Investment Companies 0.5% |
| State Street Institutional U.S. Government Money Market Fund Premier Class, 5.28%(a)
(Cost $276,953) | |
Total Investments 100.0% (Cost $46,556,440) | |
Other Assets Less Liabilities 0.0%(b) | |
| |
| Non-income producing security. |
| Represents 7-day effective yield as of August 31, 2023. |
| Represents less than 0.05% of net assets of the Fund. |
The following is a summary, categorized by Level (see Note A of the Notes to Financial Statements), of inputs used to value the Fund’s investments as of August 31, 2023:
| The Schedule of Investments provides information on the industry or sector categorization. |
See Notes to Financial Statements
Schedule of Investments Mid Cap Intrinsic Value Fund^ (cont’d)
^
A balance indicated with a "—", reflects either a zero balance or an amount that rounds to less than 1.
See Notes to Financial Statements
Schedule of Investments Multi-Cap Opportunities Fund^
August 31, 2023
| |
|
|
| | |
|
| | |
|
| | |
|
| | |
| | |
| Intercontinental Exchange, Inc. | |
| | |
Communications Equipment 3.0% |
| | |
Construction Materials 2.3% |
| | |
Consumer Staples Distribution & Retail 5.3% |
| BJ's Wholesale Club Holdings, Inc.* | |
| | |
| U.S. Foods Holding Corp.* | |
| | |
Containers & Packaging 6.4% |
| | |
| | |
| Graphic Packaging Holding Co. | |
| | |
Electrical Equipment 1.9% |
| Rockwell Automation, Inc. | |
|
| | |
| | |
| | |
|
| Apollo Global Management, Inc. | |
| Berkshire Hathaway, Inc. Class B* | |
| | |
|
| Mondelez International, Inc. Class A | |
| | |
| | |
| |
Ground Transportation 3.4% |
| | |
Health Care Equipment & Supplies 2.3% |
| | |
Health Care Providers & Services 3.5% |
| | |
Hotels, Restaurants & Leisure 6.2% |
| | |
| | |
| | |
| | |
|
| | |
Independent Power and Renewable Electricity |
| Brookfield Renewable Corp. Class A | |
|
| | |
Interactive Media & Services 5.5% |
| | |
|
| | |
| | |
| Westinghouse Air Brake Technologies Corp. | |
| | |
Oil, Gas & Consumable Fuels 1.4% |
| | |
|
| | |
Professional Services 2.7% |
| | |
| | |
| | |
Semiconductors & Semiconductor Equipment 0.4% |
| | |
|
| | |
|
| | |
| | |
| | |
See Notes to Financial Statements
Schedule of Investments Multi-Cap Opportunities Fund^ (cont’d)
| |
Technology Hardware, Storage & Peripherals 4.8% |
| | |
Textiles, Apparel & Luxury Goods 1.3% |
| | |
Wireless Telecommunication Services 2.9% |
| | |
|
Total Common Stocks (Cost $134,615,568) | |
Short-Term Investments 1.1% |
Investment Companies 1.1% |
| State Street Institutional Treasury Money Market Fund Premier Class, 5.22%(a)
(Cost $2,861,318) | |
Total Investments 100.1% (Cost $137,476,886) | |
Liabilities Less Other Assets (0.1)% | |
| |
| Non-income producing security. |
| Represents 7-day effective yield as of August 31, 2023. |
The following is a summary, categorized by Level (see Note A of the Notes to Financial Statements), of inputs used to value the Fund’s investments as of August 31, 2023:
| The Schedule of Investments provides information on the industry or sector categorization. |
^
A balance indicated with a "—", reflects either a zero balance or an amount that rounds to less than 1.
See Notes to Financial Statements
Schedule of Investments Real Estate Fund^
August 31, 2023
| |
|
|
| Healthpeak Properties, Inc. | |
| Omega Healthcare Investors, Inc. | |
| | |
| | |
| | |
|
| EastGroup Properties, Inc. | |
| | |
| Rexford Industrial Realty, Inc. | |
| | |
|
| | |
| Hudson Pacific Properties, Inc. | |
| | |
|
| American Homes 4 Rent Class A | |
| Apartment Income REIT Corp. | |
| Equity LifeStyle Properties, Inc. | |
| | |
| Essex Property Trust, Inc. | |
| | |
| | |
| | |
| | |
|
| | |
| | |
| |
|
| | |
| Retail Opportunity Investments Corp. | |
| Simon Property Group, Inc. | |
| | |
| | |
|
| | |
| | |
| | |
| Extra Space Storage, Inc. | |
| | |
| | |
| | |
| | |
| | |
| | |
|
Total Common Stocks (Cost $883,188,564) | |
Short-Term Investments 1.8% |
Investment Companies 1.8% |
| State Street Institutional U.S. Government Money Market Fund Premier Class, 5.28%(a)
(Cost $14,348,482) | |
Total Investments 99.9% (Cost $897,537,046) | |
Other Assets Less Liabilities 0.1% | |
| |
| Represents 7-day effective yield as of August 31, 2023. |
The following is a summary, categorized by Level (see Note A of the Notes to Financial Statements), of inputs used to value the Fund’s investments as of August 31, 2023:
| The Schedule of Investments provides information on the industry or sector categorization. |
^
A balance indicated with a "—", reflects either a zero balance or an amount that rounds to less than 1.
See Notes to Financial Statements
Schedule of Investments Small Cap Growth Fund^
August 31, 2023
| |
|
|
| | |
| | |
| | |
Automobile Components 0.8% |
| | |
|
| | |
|
| | |
| Amicus Therapeutics, Inc.* | |
| Arrowhead Pharmaceuticals, Inc.* | |
| Blueprint Medicines Corp.* | |
| | |
| Halozyme Therapeutics, Inc.* | |
| | |
| | |
| Ultragenyx Pharmaceutical, Inc.* | |
| | |
| Viking Therapeutics, Inc.* | |
| | |
|
| | |
| Zurn Elkay Water Solutions Corp. | |
| | |
|
| | |
Commercial Services & Supplies 1.3% |
| Casella Waste Systems, Inc. Class A* | |
Communications Equipment 1.9% |
| | |
Construction & Engineering 3.1% |
| | |
| Comfort Systems USA, Inc. | |
| | |
Containers & Packaging 1.0% |
| Graphic Packaging Holding Co. | |
Diversified Consumer Services 1.7% |
| Bright Horizons Family Solutions, Inc.* | |
| |
Diversified Consumer Services – cont'd |
| OneSpaWorld Holdings Ltd.* | |
| | |
Electrical Equipment 2.3% |
| | |
| Shoals Technologies Group, Inc. Class A* | |
| | |
Energy Equipment & Services 1.6% |
| | |
| Weatherford International PLC* | |
| | |
|
| | |
| Shift4 Payments, Inc. Class A* | |
| | |
|
| | |
Ground Transportation 1.2% |
| | |
Health Care Equipment & Supplies 7.6% |
| | |
| | |
| Inspire Medical Systems, Inc.* | |
| iRhythm Technologies, Inc.* | |
| | |
| | |
| | |
| Treace Medical Concepts, Inc.* | |
| | |
Health Care Providers & Services 2.8% |
| | |
| Option Care Health, Inc.* | |
| | |
| | |
Health Care Technology 1.3% |
| | |
| | |
| | |
Hotels, Restaurants & Leisure 4.4% |
| | |
| | |
| | |
| | |
| | |
See Notes to Financial Statements
Schedule of Investments Small Cap Growth Fund^ (cont’d)
| |
|
| Installed Building Products, Inc. | |
| | |
| | |
|
| Kinsale Capital Group, Inc. | |
Life Sciences Tools & Services 1.1% |
| Pacific Biosciences of California, Inc.* | |
Marine Transportation 1.3% |
| | |
|
| | |
Oil, Gas & Consumable Fuels 1.6% |
| Magnolia Oil & Gas Corp. Class A | |
| | |
| | |
|
| | |
Personal Care Products 1.9% |
| | |
|
| | |
| Prestige Consumer Healthcare, Inc.* | |
| | |
Professional Services 1.7% |
| | |
| | |
| | |
Semiconductors & Semiconductor Equipment 9.9% |
| | |
| Axcelis Technologies, Inc.* | |
| | |
| MACOM Technology Solutions Holdings, Inc.* | |
| | |
| |
Semiconductors & Semiconductor Equipment – cont'd |
| | |
| | |
|
| Altair Engineering, Inc. Class A* | |
| | |
| Descartes Systems Group, Inc.* | |
| DoubleVerify Holdings, Inc.* | |
| | |
| Manhattan Associates, Inc.* | |
| Sprout Social, Inc. Class A* | |
| | |
| | |
|
| Academy Sports & Outdoors, Inc. | |
Technology Hardware, Storage & Peripherals 3.5% |
| Super Micro Computer, Inc.* | |
Trading Companies & Distributors 4.0% |
| | |
| Applied Industrial Technologies, Inc. | |
| H&E Equipment Services, Inc. | |
| WESCO International, Inc. | |
| | |
|
Total Common Stocks (Cost $309,277,291) | |
Short-Term Investments 2.1% |
Investment Companies 2.1% |
| State Street Institutional U.S. Government Money Market Fund Premier Class, 5.28%(a)
(Cost $6,912,139) | |
Total Investments 100.1% (Cost $316,189,430) | |
Liabilities Less Other Assets (0.1)% | |
| |
| Non-income producing security. |
| Represents 7-day effective yield as of August 31, 2023. |
See Notes to Financial Statements
Schedule of Investments Small Cap Growth Fund^ (cont’d)
The following is a summary, categorized by Level (see Note A of the Notes to Financial Statements), of inputs used to value the Fund’s investments as of August 31, 2023:
| The Schedule of Investments provides information on the industry or sector categorization. |
^
A balance indicated with a "—", reflects either a zero balance or an amount that rounds to less than 1.
See Notes to Financial Statements
Schedule of Investments Sustainable Equity Fund^
August 31, 2023
| |
|
|
| | |
| | |
| | |
|
| | |
|
| Interactive Brokers Group, Inc. Class A | |
| Intercontinental Exchange, Inc. | |
| | |
|
| | |
Communications Equipment 2.0% |
| | |
Consumer Staples Distribution & Retail 1.7% |
| | |
Diversified Telecommunication Services 1.6% |
| Space Exploration Technologies Corp. Class A*#(a)(b) | |
| Space Exploration Technologies Corp. Class C*#(a)(b) | |
| | |
Electrical Equipment 1.3% |
| | |
Electronic Equipment, Instruments & Components 1.9% |
| Zebra Technologies Corp. Class A* | |
|
| Berkshire Hathaway, Inc. Class A* | |
| Berkshire Hathaway, Inc. Class B* | |
| | |
| | |
| | |
Ground Transportation 1.9% |
| | |
Health Care Equipment & Supplies 2.7% |
| | |
| | |
| |
Health Care Equipment & Supplies – cont'd |
| IDEXX Laboratories, Inc.* | |
| | |
Health Care Providers & Services 7.3% |
| | |
| | |
| | |
Hotels, Restaurants & Leisure 3.5% |
| | |
|
| | |
|
| | |
Interactive Media & Services 7.5% |
| | |
|
| | |
Life Sciences Tools & Services 3.0% |
| | |
| | |
| | |
|
| | |
|
| | |
Oil, Gas & Consumable Fuels 1.8% |
| | |
|
| | |
Semiconductors & Semiconductor Equipment 3.1% |
| | |
|
| | |
| | |
| | |
Technology Hardware, Storage & Peripherals 2.9% |
| | |
Trading Companies & Distributors 4.1% |
| | |
| | |
| | |
|
Total Common Stocks (Cost $770,580,298) | |
See Notes to Financial Statements
Schedule of Investments Sustainable Equity Fund^ (cont’d)
| |
Short-Term Investments 0.3% |
Certificates of Deposit 0.1% |
| Carver Federal Savings Bank, 1.25%, due 9/23/2023 | |
| Self Help Credit Union, 0.10%, due 11/16/2023 | |
| Self Help Federal Credit Union, 0.10%, due 9/1/2023 | |
|
| |
|
|
Investment Companies 0.2% |
| State Street Institutional Treasury Money Market Fund Premier Class, 5.22%(c) | |
Total Short-Term Investments (Cost $3,643,601) | |
Total Investments 100.0% (Cost $774,223,899) | |
Other Assets Less Liabilities 0.0%(d) | |
| |
| Non-income producing security. |
| Value determined using significant unobservable inputs. |
| Security fair valued as of August 31, 2023 in accordance with procedures approved by the valuation designee. Total value of all such securities at August 31, 2023 amounted to $21,499,992, which represents 1.6% of net assets of the Fund. |
| Represents 7-day effective yield as of August 31, 2023. |
| Represents less than 0.05% of net assets of the Fund. |
# This security has been deemed by Management to be illiquid, and is subject to restrictions on resale. Total value of all such securities at August 31, 2023 amounted to $21,499,992, which represents 1.6% of net assets of the Fund. Acquisition dates shown with a range, if any, represent a security that was acquired over the period shown.
| | | | Fair Value
Percentage
of Net Assets
as of
8/31/2023 |
Space Exploration Technologies Corp. Class A | | | | |
Space Exploration Technologies Corp. Class C | | | | |
|
| | | |
See Notes to Financial Statements
Schedule of Investments Sustainable Equity Fund^ (cont’d)
The following is a summary, categorized by Level (see Note A of the Notes to Financial Statements), of inputs used to value the Fund’s investments as of August 31, 2023:
| | | | |
| | | | |
|
|
|
|
|
Diversified Telecommunication Services | | | | |
| | | | |
| | | | |
| | | | |
| | | | |
| The Schedule of Investments provides information on the industry or sector categorization. |
| The following is a reconciliation between the beginning and ending balances of investments in which unobservable inputs (Level 3) were used in determining value: |
| Beginning
balance as
of 9/1/2022 | Accrued
discounts/
(premiums) | | Change
in unrealized
appreciation/
(depreciation) | | | | | | Net change in
unrealized
appreciation/
(depreciation)
from
investments
still held as of
8/31/2023 |
Investments in Securities: |
| | | | | | | | | | |
| | | | | | | | | | |
(1) Quantitative Information about Level 3 Fair Value Measurements: |
| | | | | | Impact to
valuation
from
increase
in input(b) |
| | | | | | |
(a) The weighted averages disclosed in the table above were weighted by relative fair value. |
(b) Represents the expected directional change in the fair value of the Level 3 investments that would result from an increase or decrease in the corresponding input. Significant changes in these inputs could result in significantly higher or lower fair value measurements. |
^
A balance indicated with a "—", reflects either a zero balance or an amount that rounds to less than 1.
See Notes to Financial Statements
Schedule of Investments U.S. Equity Impact Fund^
August 31, 2023
| |
|
Automobile Components 3.1% |
| | |
|
| | |
|
| | |
Commercial Services & Supplies 1.2% |
| | |
Communications Equipment 3.9% |
| | |
Containers & Packaging 6.9% |
| | |
| Graphic Packaging Holding Co. | |
| | |
|
| | |
Electrical Equipment 0.9% |
| | |
Electronic Equipment, Instruments & Components 2.5% |
| | |
| | |
| | |
|
| | |
Ground Transportation 7.1% |
| Canadian Pacific Kansas City Ltd. | |
| | |
| | |
| | |
Health Care Equipment & Supplies 6.2% |
| Baxter International, Inc. | |
| | |
| | |
| | |
Health Care Providers & Services 5.6% |
| | |
| | |
| | |
|
| | |
| |
Independent Power and Renewable Electricity |
| Brookfield Renewable Corp. Class A | |
Life Sciences Tools & Services 4.6% |
| | |
| Thermo Fisher Scientific, Inc. | |
| | |
|
| | |
| | |
| Westinghouse Air Brake Technologies Corp. | |
| | |
| | |
Mortgage Real Estate Investment Trusts 0.7% |
| Hannon Armstrong Sustainable Infrastructure Capital, Inc. | |
Personal Care Products 2.4% |
| | |
|
| | |
| | |
| | |
| | |
Professional Services 3.1% |
| | |
Semiconductors & Semiconductor Equipment 3.7% |
| | |
| | |
| SolarEdge Technologies, Inc.* | |
| | |
|
| | |
| | |
| Palo Alto Networks, Inc.* | |
| Tyler Technologies, Inc.* | |
| | |
|
Total Common Stocks (Cost $10,466,557) | |
|
Health Care Equipment & Supplies 0.0%(a) |
|
| Contra Abiomed, Inc., CVR*(b)
(Cost $253) | |
See Notes to Financial Statements
Schedule of Investments U.S. Equity Impact Fund^ (cont’d)
| |
|
Short-Term Investments 2.7% |
Investment Companies 2.7% |
| State Street Institutional Treasury Money Market Fund Premier Class, 5.22%(c)
(Cost $304,583) | |
Total Investments 101.1% (Cost $10,771,393) | |
Liabilities Less Other Assets (1.1)% | |
| |
| Non-income producing security. |
| Represents less than 0.05% of net assets of the Fund. |
| Value determined using significant unobservable inputs. |
| Represents 7-day effective yield as of August 31, 2023. |
The following is a summary, categorized by Level (see Note A of the Notes to Financial Statements), of inputs used to value the Fund’s investments as of August 31, 2023:
| The Schedule of Investments provides information on the industry or sector categorization. |
| The reconciliation between beginning and ending balances of investments in which unobservable inputs (Level 3) were used is not presented as all values rounded to less than $1,000. |
| Securities categorized as Level 3 were valued using a single quotation obtained from a dealer. The Fund does not have access to unobservable inputs and therefore cannot disclose such inputs used in formulating such quotation. |
^
A balance indicated with a "—", reflects either a zero balance or an amount that rounds to less than 1.
See Notes to Financial Statements
Statements of Assets and Liabilities
Neuberger Berman Equity Funds
| | Emerging Markets
Equity Fund | |
| | | |
|
|
|
|
Investments in securities, at value*† (Notes A & F)—
see Schedule of Investments: |
|
|
|
| | | |
| | | |
| | | |
| | | |
| | | |
Dividends and interest receivable | | | |
Receivable for securities sold | | | |
Receivable from Management—net (Note B) | | | |
Receivable for Fund shares sold | | | |
Receivable for securities lending income (Note A) | | | |
Prepaid expenses and other assets | | | |
| | | |
|
|
|
|
Payable to investment manager—net (Note B) | | | |
Option contracts written, at value(d) (Note A) | | | |
| | | |
Payable for securities purchased | | | |
Payable for Fund shares redeemed | | | |
Payable to administrator—net (Note B) | | | |
| | | |
| | | |
| | | |
Payable for shareholder servicing fees | | | |
Interest payable (Note E) | | | |
Payable for cash collateral on loaned securities (Note A) | | | |
Accrued capital gains taxes (Note A) | | | |
Other accrued expenses and payables | | | |
| | | |
| | | |
|
|
|
|
|
|
|
|
| | | |
Total distributable earnings/(losses) | | | |
| | | |
|
|
|
|
| | | |
| | | |
| | | |
| | | |
| | | |
| | | |
| | | |
| | | |
| | | |
|
|
|
|
See Notes to Financial Statements
| | | | | | International
Small Cap Fund |
| | | | | | |
|
|
|
|
|
|
|
|
|
|
|
|
|
|
| | | | | | |
| | | | | | |
| | | | | | |
| | | | | | |
| | | | | | |
| | | | | | |
| | | | | | |
| | | | | | |
| | | | | | |
| | | | | | |
| | | | | | |
| | | | | | |
|
|
|
|
|
|
|
| | | | | | |
| | | | | | |
| | | | | | |
| | | | | | |
| | | | | | |
| | | | | | |
| | | | | | |
| | | | | | |
| | | | | | |
| | | | | | |
| | | | | | |
| | | | | | |
| | | | | | |
| | | | | | |
| | | | | | |
| | | | | | |
|
|
|
|
|
|
|
|
|
|
|
|
|
|
| | | | | | |
| | | | | | |
| | | | | | |
|
|
|
|
|
|
|
| | | | | | |
| | | | | | |
| | | | | | |
| | | | | | |
| | | | | | |
| | | | | | |
| | | | | | |
| | | | | | |
| | | | | | |
|
|
|
|
|
|
|
Statements of Assets and Liabilities (cont’d)
Neuberger Berman Equity Funds
| | Emerging Markets
Equity Fund | |
| | | |
Shares Outstanding ($.001 par value; unlimited shares authorized) |
|
|
|
| | | |
| | | |
| | | |
| | | |
| | | |
| | | |
| | | |
| | | |
| | | |
Net Asset Value, offering and redemption price per share |
|
|
|
| | | |
| | | |
| | | |
| | | |
| | | |
| | | |
| | | |
Net Asset Value and redemption price per share |
|
|
|
| | | |
|
|
|
|
| | | |
Net Asset Value and offering price per share |
|
|
|
| | | |
†Securities on loan, at value: |
|
|
|
| | | |
|
|
|
|
| | | |
| | | |
Total cost of investments | | | |
(c) Total cost of foreign currency | | | |
(d) Premium received from option contracts written | | | |
| |
| Updated to reflect the effect of a reverse stock split that occurred after the close of business on October 6, 2023. See Note H of the Notes to Financial Statements. |
| On single retail sales of less than $50,000. On sales of $50,000 or more or in certain other circumstances described in the Fund's prospectus, offering price is reduced. |
| Redemption price per share is equal to net asset value less any applicable contingent deferred sales charge. |
See Notes to Financial Statements
| | | | | | International
Small Cap Fund |
| | | | | | |
|
|
|
|
|
|
|
| | | | | | |
| | | | | | |
| | | | | | |
| | | | | | |
| | | | | | |
| | | | | | |
| | | | | | |
| | | | | | |
| | | | | | |
|
|
|
|
|
|
|
| | | | | | |
| | | | | | |
| | | | | | |
| | | | | | |
| | | | | | |
| | | | | | |
| | | | | | |
|
|
|
|
|
|
|
| | | | | | |
|
|
|
|
|
|
|
| | | | | | |
|
|
|
|
|
|
|
| | | | | | |
|
|
|
|
|
|
|
| | | | | | |
|
|
|
|
|
|
|
| | | | | | |
| | | | | | |
| | | | | | |
| | | | | | |
| | | | | | |
Statements of Assets and Liabilities (cont’d)
Neuberger Berman Equity Funds
| | | |
| | | |
|
|
|
|
Investments in securities, at value* (Notes A & F)—
see Schedule of Investments: |
|
|
|
| | | |
| | | |
| | | |
| | | |
Dividends and interest receivable | | | |
Receivable for securities sold | | | |
Receivable from Management—net (Note B) | | | |
Receivable for Fund shares sold | | | |
Receivable for securities lending income (Note A) | | | |
Prepaid expenses and other assets | | | |
| | | |
|
|
|
|
Payable to investment manager—net (Note B) | | | |
Option contracts written, at value(d) (Note A) | | | |
| | | |
Payable for securities purchased | | | |
Payable for Fund shares redeemed | | | |
Payable to administrator—net (Note B) | | | |
| | | |
| | | |
| | | |
Payable for shareholder servicing fees | | | |
Other accrued expenses and payables | | | |
| | | |
| | | |
|
|
|
|
|
|
|
|
| | | |
Total distributable earnings/(losses) | | | |
| | | |
|
|
|
|
| | | |
| | | |
| | | |
| | | |
| | | |
| | | |
| | | |
| | | |
| | | |
|
|
|
|
See Notes to Financial Statements
| Mid Cap Intrinsic
Value Fund | Multi-Cap
Opportunities Fund | | | | |
| | | | | | |
|
|
|
|
|
|
|
|
|
|
|
|
|
|
| | | | | | |
| | | | | | |
| | | | | | |
| | | | | | |
| | | | | | |
| | | | | | |
| | | | | | |
| | | | | | |
| | | | | | |
| | | | | | |
| | | | | | |
|
|
|
|
|
|
|
| | | | | | |
| | | | | | |
| | | | | | |
| | | | | | |
| | | | | | |
| | | | | | |
| | | | | | |
| | | | | | |
| | | | | | |
| | | | | | |
| | | | | | |
| | | | | | |
| | | | | | |
|
|
|
|
|
|
|
|
|
|
|
|
|
|
| | | | | | |
| | | | | | |
| | | | | | |
|
|
|
|
|
|
|
| | | | | | |
| | | | | | |
| | | | | | |
| | | | | | |
| | | | | | |
| | | | | | |
| | | | | | |
| | | | | | |
| | | | | | |
|
|
|
|
|
|
|
Statements of Assets and Liabilities (cont’d)
Neuberger Berman Equity Funds
| | | |
| | | |
Shares Outstanding ($.001 par value; unlimited shares authorized) |
|
|
|
| | | |
| | | |
| | | |
| | | |
| | | |
| | | |
| | | |
| | | |
| | | |
Net Asset Value, offering and redemption price per share |
|
|
|
| | | |
| | | |
| | | |
| | | |
| | | |
| | | |
| | | |
Net Asset Value and redemption price per share |
|
|
|
| | | |
|
|
|
|
| | | |
Net Asset Value and offering price per share |
|
|
|
| | | |
|
|
|
|
| | | |
| | | |
Total cost of investments | | | |
(c) Total cost of foreign currency | | | |
(d) Premium received from option contracts written | | | |
| |
| Consolidated financial statement, see Note A of the Notes to Financial Statements for additional information. |
| On single retail sales of less than $50,000. On sales of $50,000 or more or in certain other circumstances described in the Fund's prospectus, offering price is reduced. |
| Redemption price per share is equal to net asset value less any applicable contingent deferred sales charge. |
See Notes to Financial Statements
| Mid Cap Intrinsic
Value Fund | Multi-Cap
Opportunities Fund | | | | |
| | | | | | |
|
|
|
|
|
|
|
| | | | | | |
| | | | | | |
| | | | | | |
| | | | | | |
| | | | | | |
| | | | | | |
| | | | | | |
| | | | | | |
| | | | | | |
|
|
|
|
|
|
|
| | | | | | |
| | | | | | |
| | | | | | |
| | | | | | |
| | | | | | |
| | | | | | |
| | | | | | |
|
|
|
|
|
|
|
| | | | | | |
|
|
|
|
|
|
|
| | | | | | |
|
|
|
|
|
|
|
| | | | | | |
|
|
|
|
|
|
|
| | | | | | |
| | | | | | |
| | | | | | |
| | | | | | |
| | | | | | |
Neuberger Berman Equity Funds
| | Emerging Markets
Equity Fund | |
| For the Fiscal
Year Ended
August 31,
2023 | For the Fiscal
Year Ended
August 31,
2023 | For the Fiscal
Year Ended
August 31,
2023 |
|
|
|
|
|
|
|
|
Dividend income—unaffiliated issuers | | | |
Dividend income—affiliated issuers (Note F) | | | |
Interest and other income—unaffiliated issuers | | | |
Income from securities loaned—net | | | |
| | | |
| | | |
|
|
|
|
Investment management fees (Note B) | | | |
Administration fees (Note B): |
|
|
|
| | | |
| | | |
| | | |
| | | |
| | | |
| | | |
| | | |
| | | |
Distribution fees (Note B): |
|
|
|
| | | |
| | | |
| | | |
| | | |
| | | |
Shareholder servicing agent fees: |
|
|
|
| | | |
| | | |
| | | |
| | | |
| | | |
| | | |
| | | |
| | | |
| | | |
| | | |
Custodian and accounting fees | | | |
| | | |
| | | |
Registration and filing fees | | | |
| | | |
Trustees' fees and expenses | | | |
| | | |
Miscellaneous and other fees (Note A) | | | |
| | | |
|
|
|
|
See Notes to Financial Statements
| | | | | | International
Small Cap Fund |
For the Fiscal
Year Ended
August 31,
2023 | For the Fiscal
Year Ended
August 31,
2023 | For the Fiscal
Year Ended
August 31,
2023 | For the Fiscal
Year Ended
August 31,
2023 | For the Fiscal
Year Ended
August 31,
2023 | For the Fiscal
Year Ended
August 31,
2023 | For the Fiscal
Year Ended
August 31,
2023 |
|
|
|
|
|
|
|
|
|
|
|
|
|
|
| | | | | | |
| | | | | | |
| | | | | | |
| | | | | | |
| | | | | | |
| | | | | | |
|
|
|
|
|
|
|
| | | | | | |
|
|
|
|
|
|
|
| | | | | | |
| | | | | | |
| | | | | | |
| | | | | | |
| | | | | | |
| | | | | | |
| | | | | | |
| | | | | | |
|
|
|
|
|
|
|
| | | | | | |
| | | | | | |
| | | | | | |
| | | | | | |
| | | | | | |
|
|
|
|
|
|
|
| | | | | | |
| | | | | | |
| | | | | | |
| | | | | | |
| | | | | | |
| | | | | | |
| | | | | | |
| | | | | | |
| | | | | | |
| | | | | | |
| | | | | | |
| | | | | | |
| | | | | | |
| | | | | | |
| | | | | | |
| | | | | | |
| | | | | | |
| | | | | | |
| | | | | | |
|
|
|
|
|
|
|
Statements of Operations (cont’d)
Neuberger Berman Equity Funds
| | Emerging Markets
Equity Fund | |
| For the Fiscal
Year Ended
August 31,
2023 | For the Fiscal
Year Ended
August 31,
2023 | For the Fiscal
Year Ended
August 31,
2023 |
Expenses reimbursed by Management (Note B) | | | |
| | | |
| | | |
Net investment income/(loss) | | | |
|
|
|
|
Realized and Unrealized Gain/(Loss) on Investments (Note A): |
|
|
|
Net realized gain/(loss) on: |
|
|
|
Transactions in investment securities of unaffiliated issuers | | | |
Transactions in investment securities of affiliated issuers | | | |
| | | |
Settlement of foreign currency transactions | | | |
Expiration or closing of option contracts written | | | |
Change in net unrealized appreciation/(depreciation) in value of: |
|
|
|
Investment securities of unaffiliated issuers | | | |
Investment securities of affiliated issuers | | | |
Foreign currency translations | | | |
| | | |
Net gain/(loss) on investments | | | |
Net increase/(decrease) in net assets resulting from operations | | | |
| |
| Net of foreign capital gains tax of $2,459,580 for Emerging Markets Equity. |
| Change in accrued foreign capital gains tax amounted to $2,361,456 for Emerging Markets Equity. |
See Notes to Financial Statements
| | | | | | International
Small Cap Fund |
For the Fiscal
Year Ended
August 31,
2023 | For the Fiscal
Year Ended
August 31,
2023 | For the Fiscal
Year Ended
August 31,
2023 | For the Fiscal
Year Ended
August 31,
2023 | For the Fiscal
Year Ended
August 31,
2023 | For the Fiscal
Year Ended
August 31,
2023 | For the Fiscal
Year Ended
August 31,
2023 |
| | | | | | |
| | | | | | |
| | | | | | |
| | | | | | |
|
|
|
|
|
|
|
|
|
|
|
|
|
|
|
|
|
|
|
|
|
| | | | | | |
| | | | | | |
| | | | | | |
| | | | | | |
| | | | | | |
|
|
|
|
|
|
|
| | | | | | |
| | | | | | |
| | | | | | |
| | | | | | |
| | | | | | |
| | | | | | |
Statements of Operations (cont’d)
Neuberger Berman Equity Funds
| | | |
| For the Fiscal
Year Ended
August 31,
2023 | For the Fiscal
Year Ended
August 31,
2023 | For the Fiscal
Year Ended
August 31,
2023 |
|
|
|
|
|
|
|
|
Dividend income—unaffiliated issuers | | | |
Interest and other income—unaffiliated issuers | | | |
Income from securities loaned—net | | | |
| | | |
| | | |
|
|
|
|
Investment management fees (Note B) | | | |
Administration fees (Note B): |
|
|
|
| | | |
| | | |
| | | |
| | | |
| | | |
| | | |
| | | |
| | | |
Distribution fees (Note B): |
|
|
|
| | | |
| | | |
| | | |
| | | |
| | | |
Shareholder servicing agent fees: |
|
|
|
| | | |
| | | |
| | | |
| | | |
| | | |
| | | |
| | | |
| | | |
| | | |
| | | |
Blocker administration fees | | | |
Custodian and accounting fees | | | |
| | | |
| | | |
Registration and filing fees | | | |
Repayment to Management of expenses previously assumed by Management (Note B) | | | |
| | | |
Trustees' fees and expenses | | | |
| | | |
Miscellaneous and other fees (Note A) | | | |
| | | |
|
|
|
|
See Notes to Financial Statements
| Mid Cap Intrinsic
Value Fund | Multi-Cap
Opportunities Fund | | | | |
For the Fiscal
Year Ended
August 31,
2023 | For the Fiscal
Year Ended
August 31,
2023 | For the Fiscal
Year Ended
August 31,
2023 | For the Fiscal
Year Ended
August 31,
2023 | For the Fiscal
Year Ended
August 31,
2023 | For the Fiscal
Year Ended
August 31,
2023 | For the Fiscal
Year Ended
August 31,
2023 |
|
|
|
|
|
|
|
|
|
|
|
|
|
|
| | | | | | |
| | | | | | |
| | | | | | |
| | | | | | |
| | | | | | |
|
|
|
|
|
|
|
| | | | | | |
|
|
|
|
|
|
|
| | | | | | |
| | | | | | |
| | | | | | |
| | | | | | |
| | | | | | |
| | | | | | |
| | | | | | |
| | | | | | |
|
|
|
|
|
|
|
| | | | | | |
| | | | | | |
| | | | | | |
| | | | | | |
| | | | | | |
|
|
|
|
|
|
|
| | | | | | |
| | | | | | |
| | | | | | |
| | | | | | |
| | | | | | |
| | | | | | |
| | | | | | |
| | | | | | |
| | | | | | |
| | | | | | |
| | | | | | |
| | | | | | |
| | | | | | |
| | | | | | |
| | | | | | |
| | | | | | |
| | | | | | |
| | | | | | |
| | | | | | |
| | | | | | |
| | | | | | |
|
|
|
|
|
|
|
Statements of Operations (cont’d)
Neuberger Berman Equity Funds
| | | |
| For the Fiscal
Year Ended
August 31,
2023 | For the Fiscal
Year Ended
August 31,
2023 | For the Fiscal
Year Ended
August 31,
2023 |
Expenses reimbursed by Management (Note B) | | | |
| | | |
| | | |
Net investment income/(loss) | | | |
|
|
|
|
Realized and Unrealized Gain/(Loss) on Investments (Note A): |
|
|
|
Net realized gain/(loss) on: |
|
|
|
Transactions in investment securities of unaffiliated issuers | | | |
Settlement of foreign currency transactions | | | |
Expiration or closing of option contracts written | | | |
Change in net unrealized appreciation/(depreciation) in value of: |
|
|
|
Investment securities of unaffiliated issuers | | | |
Investment securities of affiliated issuers | | | |
Foreign currency translations | | | |
| | | |
Net gain/(loss) on investments | | | |
Net increase/(decrease) in net assets resulting from operations | | | |
| |
| Consolidated financial statement, see Note A of the Notes to Financial Statements for additional information. |
See Notes to Financial Statements
| Mid Cap Intrinsic
Value Fund | Multi-Cap
Opportunities Fund | | | | |
For the Fiscal
Year Ended
August 31,
2023 | For the Fiscal
Year Ended
August 31,
2023 | For the Fiscal
Year Ended
August 31,
2023 | For the Fiscal
Year Ended
August 31,
2023 | For the Fiscal
Year Ended
August 31,
2023 | For the Fiscal
Year Ended
August 31,
2023 | For the Fiscal
Year Ended
August 31,
2023 |
| | | | | | |
| | | | | | |
| | | | | | |
| | | | | | |
|
|
|
|
|
|
|
|
|
|
|
|
|
|
|
|
|
|
|
|
|
| | | | | | |
| | | | | | |
| | | | | | |
|
|
|
|
|
|
|
| | | | | | |
| | | | | | |
| | | | | | |
| | | | | | |
| | | | | | |
| | | | | | |
Statements of Changes in Net Assets
Neuberger Berman Equity Funds
| | Emerging Markets
Equity Fund |
| | | | |
| | | | |
Increase/(Decrease) in Net Assets: |
|
|
|
|
From Operations (Note A): |
|
|
|
|
Net investment income/(loss) | | | | |
Net realized gain/(loss) on investments | | | | |
Change in net unrealized appreciation/(depreciation) of investments | | | | |
Net increase/(decrease) in net assets resulting from operations | | | | |
Distributions to Shareholders From (Note A): |
|
|
|
|
|
|
|
|
|
| | | | |
| | | | |
| | | | |
| | | | |
| | | | |
| | | | |
| | | | |
| | | | |
| | | | |
|
|
|
|
|
| | | | |
Total distributions to shareholders | | | | |
From Fund Share Transactions (Note D): |
|
|
|
|
Proceeds from shares sold: |
|
|
|
|
| | | | |
| | | | |
| | | | |
| | | | |
| | | | |
| | | | |
| | | | |
| | | | |
| | | | |
Proceeds from reinvestment of dividends and distributions: |
|
|
|
|
| | | | |
| | | | |
| | | | |
| | | | |
| | | | |
| | | | |
| | | | |
| | | | |
| | | | |
|
|
|
|
|
See Notes to Financial Statements
Statements of Changes in Net Assets (cont’d)
Neuberger Berman Equity Funds
| | Emerging Markets
Equity Fund |
| | | | |
| | | | |
Payments for shares redeemed: |
|
|
|
|
| | | | |
| | | | |
| | | | |
| | | | |
| | | | |
| | | | |
| | | | |
| | | | |
| | | | |
Net increase/(decrease) from Fund share transactions | | | | |
Net Increase/(Decrease) in Net Assets | | | | |
|
|
|
|
|
| | | | |
| | | | |
See Notes to Financial Statements
Statements of Changes in Net Assets (cont’d)
Neuberger Berman Equity Funds
| | |
| | | | |
| | | | |
Increase/(Decrease) in Net Assets: |
|
|
|
|
From Operations (Note A): |
|
|
|
|
Net investment income/(loss) | | | | |
Net realized gain/(loss) on investments | | | | |
Change in net unrealized appreciation/(depreciation) of investments | | | | |
Net increase/(decrease) in net assets resulting from operations | | | | |
Distributions to Shareholders From (Note A): |
|
|
|
|
|
|
|
|
|
| | | | |
| | | | |
| | | | |
| | | | |
| | | | |
| | | | |
| | | | |
| | | | |
| | | | |
|
|
|
|
|
| | | | |
Total distributions to shareholders | | | | |
From Fund Share Transactions (Note D): |
|
|
|
|
Proceeds from shares sold: |
|
|
|
|
| | | | |
| | | | |
| | | | |
| | | | |
| | | | |
| | | | |
| | | | |
| | | | |
| | | | |
Proceeds from reinvestment of dividends and distributions: |
|
|
|
|
| | | | |
| | | | |
| | | | |
| | | | |
| | | | |
| | | | |
| | | | |
| | | | |
| | | | |
|
|
|
|
|
See Notes to Financial Statements
| International
Small Cap Fund | | |
| | | | | | | |
| | | | | | | |
|
|
|
|
|
|
|
|
|
|
|
|
|
|
|
|
| | | | | | | |
| | | | | | | |
| | | | | | | |
| | | | | | | |
|
|
|
|
|
|
|
|
|
|
|
|
|
|
|
|
| | | | | | | |
| | | | | | | |
| | | | | | | |
| | | | | | | |
| | | | | | | |
| | | | | | | |
| | | | | | | |
| | | | | | | |
| | | | | | | |
|
|
|
|
|
|
|
|
| | | | | | | |
| | | | | | | |
|
|
|
|
|
|
|
|
|
|
|
|
|
|
|
|
| | | | | | | |
| | | | | | | |
| | | | | | | |
| | | | | | | |
| | | | | | | |
| | | | | | | |
| | | | | | | |
| | | | | | | |
| | | | | | | |
|
|
|
|
|
|
|
|
| | | | | | | |
| | | | | | | |
| | | | | | | |
| | | | | | | |
| | | | | | | |
| | | | | | | |
| | | | | | | |
| | | | | | | |
| | | | | | | |
|
|
|
|
|
|
|
|
Statements of Changes in Net Assets (cont’d)
Neuberger Berman Equity Funds
| | |
| | | | |
| | | | |
Payments for shares redeemed: |
|
|
|
|
| | | | |
| | | | |
| | | | |
| | | | |
| | | | |
| | | | |
| | | | |
| | | | |
| | | | |
Net increase/(decrease) from Fund share transactions | | | | |
Net Increase/(Decrease) in Net Assets | | | | |
|
|
|
|
|
| | | | |
| | | | |
| |
| Consolidated financial statement, see Note A of the Notes to Financial Statements for additional information. |
See Notes to Financial Statements
| International
Small Cap Fund | | |
| | | | | | | |
| | | | | | | |
|
|
|
|
|
|
|
|
| | | | | | | |
| | | | | | | |
| | | | | | | |
| | | | | | | |
| | | | | | | |
| | | | | | | |
| | | | | | | |
| | | | | | | |
| | | | | | | |
| | | | | | | |
| | | | | | | |
|
|
|
|
|
|
|
|
| | | | | | | |
| | | | | | | |
Statements of Changes in Net Assets (cont’d)
Neuberger Berman Equity Funds
| | |
| | | | |
| | | | |
Increase/(Decrease) in Net Assets: |
|
|
|
|
From Operations (Note A): |
|
|
|
|
Net investment income/(loss) | | | | |
Net realized gain/(loss) on investments | | | | |
Change in net unrealized appreciation/(depreciation) of investments | | | | |
Net increase/(decrease) in net assets resulting from operations | | | | |
Distributions to Shareholders From (Note A): |
|
|
|
|
|
|
|
|
|
| | | | |
| | | | |
| | | | |
| | | | |
| | | | |
| | | | |
| | | | |
| | | | |
| | | | |
|
|
|
|
|
| | | | |
| | | | |
| | | | |
| | | | |
| | | | |
| | | | |
| | | | |
| | | | |
Total distributions to shareholders | | | | |
From Fund Share Transactions (Note D): |
|
|
|
|
Proceeds from shares sold: |
|
|
|
|
| | | | |
| | | | |
| | | | |
| | | | |
| | | | |
| | | | |
| | | | |
| | | | |
| | | | |
Proceeds from reinvestment of dividends and distributions: |
|
|
|
|
| | | | |
| | | | |
| | | | |
| | | | |
| | | | |
| | | | |
| | | | |
| | | | |
| | | | |
|
|
|
|
|
See Notes to Financial Statements
Mid Cap Intrinsic
Value Fund | Multi-Cap
Opportunities Fund | | |
| | | | | | | |
| | | | | | | |
|
|
|
|
|
|
|
|
|
|
|
|
|
|
|
|
| | | | | | | |
| | | | | | | |
| | | | | | | |
| | | | | | | |
|
|
|
|
|
|
|
|
|
|
|
|
|
|
|
|
| | | | | | | |
| | | | | | | |
| | | | | | | |
| | | | | | | |
| | | | | | | |
| | | | | | | |
| | | | | | | |
| | | | | | | |
| | | | | | | |
|
|
|
|
|
|
|
|
| | | | | | | |
| | | | | | | |
| | | | | | | |
| | | | | | | |
| | | | | | | |
| | | | | | | |
| | | | | | | |
| | | | | | | |
| | | | | | | |
|
|
|
|
|
|
|
|
|
|
|
|
|
|
|
|
| | | | | | | |
| | | | | | | |
| | | | | | | |
| | | | | | | |
| | | | | | | |
| | | | | | | |
| | | | | | | |
| | | | | | | |
| | | | | | | |
|
|
|
|
|
|
|
|
| | | | | | | |
| | | | | | | |
| | | | | | | |
| | | | | | | |
| | | | | | | |
| | | | | | | |
| | | | | | | |
| | | | | | | |
| | | | | | | |
|
|
|
|
|
|
|
|
Statements of Changes in Net Assets (cont’d)
Neuberger Berman Equity Funds
| | |
| | | | |
| | | | |
Payments for shares redeemed: |
|
|
|
|
| | | | |
| | | | |
| | | | |
| | | | |
| | | | |
| | | | |
| | | | |
| | | | |
| | | | |
Net increase/(decrease) from Fund share transactions | | | | |
Net Increase/(Decrease) in Net Assets | | | | |
|
|
|
|
|
| | | | |
| | | | |
See Notes to Financial Statements
Mid Cap Intrinsic
Value Fund | Multi-Cap
Opportunities Fund | | |
| | | | | | | |
| | | | | | | |
|
|
|
|
|
|
|
|
| | | | | | | |
| | | | | | | |
| | | | | | | |
| | | | | | | |
| | | | | | | |
| | | | | | | |
| | | | | | | |
| | | | | | | |
| | | | | | | |
| | | | | | | |
| | | | | | | |
|
|
|
|
|
|
|
|
| | | | | | | |
| | | | | | | |
Statements of Changes in Net Assets (cont’d)
Neuberger Berman Equity Funds
| | |
| | | | |
| | | | |
Increase/(Decrease) in Net Assets: |
|
|
|
|
From Operations (Note A): |
|
|
|
|
Net investment income/(loss) | | | | |
Net realized gain/(loss) on investments | | | | |
Change in net unrealized appreciation/(depreciation) of investments | | | | |
Net increase/(decrease) in net assets resulting from operations | | | | |
Distributions to Shareholders From (Note A): |
|
|
|
|
|
|
|
|
|
| | | | |
| | | | |
| | | | |
| | | | |
| | | | |
| | | | |
| | | | |
Total distributions to shareholders | | | | |
From Fund Share Transactions (Note D): |
|
|
|
|
Proceeds from shares sold: |
|
|
|
|
| | | | |
| | | | |
| | | | |
| | | | |
| | | | |
| | | | |
| | | | |
Proceeds from reinvestment of dividends and distributions: |
|
|
|
|
| | | | |
| | | | |
| | | | |
| | | | |
| | | | |
| | | | |
| | | | |
|
|
|
|
|
See Notes to Financial Statements
| | |
| | | | |
| | | | |
Payments for shares redeemed: |
|
|
|
|
| | | | |
| | | | |
| | | | |
| | | | |
| | | | |
| | | | |
| | | | |
Net increase/(decrease) from Fund share transactions | | | | |
Net Increase/(Decrease) in Net Assets | | | | |
|
|
|
|
|
| | | | |
| | | | |
Notes to Financial Statements Equity Fundsß
Note A—Summary of Significant Accounting Policies:
1
General: Neuberger Berman Equity Funds (the "Trust") is a Delaware statutory trust organized pursuant to an Amended and Restated Trust Instrument dated March 27, 2014.The Trust is registered as an open-end management investment company under the Investment Company Act of 1940, as amended (the "1940 Act"), and its shares are registered under the Securities Act of 1933, as amended.Neuberger Berman Dividend Growth Fund ("Dividend Growth"), Neuberger Berman Emerging Markets Equity Fund ("Emerging Markets Equity"), Neuberger Berman Equity Income Fund ("Equity Income"), Neuberger Berman Focus Fund ("Focus"), Neuberger Berman Genesis Fund ("Genesis"), Neuberger Berman Global Real Estate Fund ("Global Real Estate"), Neuberger Berman Greater China Equity Fund ("Greater China Equity"), Neuberger Berman International Equity Fund ("International Equity"), Neuberger Berman International Select Fund ("International Select"), Neuberger Berman International Small Cap Fund ("International Small Cap"), Neuberger Berman Intrinsic Value Fund ("Intrinsic Value"), Neuberger Berman Large Cap Growth Fund ("Large Cap Growth") (formerly Neuberger Berman Guardian Fund), Neuberger Berman Large Cap Value Fund ("Large Cap Value"), Neuberger Berman Mid Cap Growth Fund ("Mid Cap Growth"), Neuberger Berman Mid Cap Intrinsic Value Fund ("Mid Cap Intrinsic Value"), Neuberger Berman Multi-Cap Opportunities Fund ("Multi-Cap Opportunities"), Neuberger Berman Real Estate Fund ("Real Estate"), Neuberger Berman Small Cap Growth Fund ("Small Cap Growth"), Neuberger Berman Sustainable Equity Fund ("Sustainable Equity") and Neuberger Berman U.S. Equity Impact Fund ("U.S. Equity Impact") (each individually a "Fund," and collectively, the "Funds") are separate operating series of the Trust, each of which (except Greater China Equity and Real Estate) is diversified.Under the 1940 Act, the status of a Fund that was registered as non-diversified may, under certain circumstances, change to that of a diversified fund (Global Real Estate and Multi-Cap Opportunities became diversified in December 2017 and December 2012, respectively). Nine Funds offer Investor Class shares, eleven offer Trust Class shares, six offer Advisor Class shares, twenty offer Institutional Class shares, seventeen offer Class A shares, seventeen offer Class C shares, ten offer Class R3 shares, fourteen offer Class R6 shares and six offer Class E shares. The Trust’s Board of Trustees (the "Board") may establish additional series or classes of shares without the approval of shareholders. After the close of business on May 19, 2023, Class A and Class C shares of both Greater China Equity and Global Real Estate converted into Institutional Class shares (without a contingent deferred sales charge or other charge). Accordingly, after that date, all shareholders of the respective funds owned Institutional Class shares.
A balance indicated with a "—", reflects either a zero balance or a balance that rounds to less than 1.
The assets of each Fund belong only to that Fund, and the liabilities of each Fund are borne solely by that Fund and no other series of the Trust.
Each Fund is an investment company and accordingly follows the investment company accounting and reporting guidance of the Financial Accounting Standards Board ("FASB") Accounting Standards Codification ("ASC") Topic 946 "Financial Services—Investment Companies."
The preparation of financial statements in accordance with U.S. generally accepted accounting principles ("GAAP") requires Management to make estimates and assumptions at the date of the financial statements. Actual results could differ from those estimates.
On February 25, 2022, to facilitate compliance with certain requirements necessary to maintain its status as a regulated investment company ("RIC"), Large Cap Growth formed NB A24 Guardian Blocker LLC (the "Blocker"), a Delaware limited liability company, to hold interests in certain private placements. The Blocker is a wholly owned subsidiary of Large Cap Growth and Large Cap Growth expects to remain its sole member.
ß
Notes to Consolidated Financial Statements for Large Cap Growth
As of August 31, 2023, the value of Large Cap Growth's investment in the Blocker was as follows:
2
Consolidation: The accompanying financial statements of Large Cap Growth present the consolidated accounts of Large Cap Growth and the Blocker. All intercompany accounts and transactions have been eliminated in consolidation.
3
Portfolio valuation: In accordance with ASC 820 "Fair Value Measurement" ("ASC 820"), all investments held by each of the Funds are carried at the value that Management believes a Fund would receive upon selling an investment in an orderly transaction to an independent buyer in the principal or most advantageous market for the investment under current market conditions. Various inputs, including the volume and level of activity for the asset or liability in the market, are considered in valuing the Funds' investments, some of which are discussed below. At times, Management may need to apply significant judgment to value investments in accordance with ASC 820.
ASC 820 established a three-tier hierarchy of inputs to create a classification of value measurements for disclosure purposes. The three-tier hierarchy of inputs is summarized in the three broad Levels listed below.
•
Level 1 – unadjusted quoted prices in active markets for identical investments
•
Level 2 – other observable inputs (including quoted prices for similar investments, interest rates, prepayment speeds, credit risk, amortized cost, etc.)
•
Level 3 – unobservable inputs (including a Fund's own assumptions in determining the fair value of investments)
The inputs or methodology used for valuing an investment are not necessarily an indication of the risk associated with investing in those securities.
The value of the Funds’ investments in equity securities, preferred stocks, warrants, rights, master limited partnerships and limited partnerships, escrow units, and exchange-traded options purchased and written, for which market quotations are available, is generally determined by Management by obtaining valuations from independent pricing services based on the latest sale price quoted on a principal exchange or market for that security (Level 1 inputs).Securities traded primarily on the NASDAQ Stock Market are normally valued at the NASDAQ Official Closing Price ("NOCP") provided by NASDAQ each business day. The NOCP is the most recently reported price as of 4:00:02 p.m., Eastern Time, unless that price is outside the range of the "inside" bid and asked prices (i.e., the bid and asked prices that dealers quote to each other when trading for their own accounts); in that case, NASDAQ will adjust the price to equal the inside bid or asked price, whichever is closer. Because of delays in reporting trades, the NOCP may not be based on the price of the last trade to occur before the market closes. If there is no sale of a security on a particular day, the independent pricing services may value the security based on market quotations.
The value of the Funds’ investments in debt securities is determined by Management primarily by obtaining valuations from independent pricing services based on bid quotations, or if quotations are not available, by methods that include various considerations based on security type (generally Level 2 inputs). In addition to the consideration of yields or prices of securities of comparable quality, coupon, maturity and type, indications as to values from dealers, and general market conditions, the following is a description of other Level 2 inputs and related valuation techniques used by independent pricing services to value certain types of debt securities held by the Funds:
Convertible Bonds. Inputs used to value convertible bonds generally include underlying stock data, conversion rates, credit-specific details, relevant listed bond and preferred stock prices and other market information, which may include benchmark yield curves, reported trades, broker-dealer quotes, issuer spreads, comparable securities, and reference data, such as market research publications, when available.
Management has developed a process to periodically review information provided by independent pricing services for all types of securities.
Certificates of deposit are valued at amortized cost (Level 2 inputs).
Publicly traded securities acquired via a private investment in public equity ("PIPE") transaction are typically valued at a discount to the market price of an issuer’s common stock. Discounts are applied due to certain trading restrictions imposed or a lack of marketability preceding the conversion to publicly traded securities. The primary inputs used in determining the discount are the length of the lock-up period and the volatility of the underlying security (Level 1 or Level 2 Inputs).
Investments in non-exchange traded investment companies are valued using the respective fund’s daily calculated net asset value ("NAV") per share (Level 2 inputs), when available.
If a valuation is not available from an independent pricing service, or if Management has reason to believe that the valuation received does not represent the amount a Fund might reasonably expect to receive on a current sale in an orderly transaction, Management seeks to obtain quotations from brokers or dealers (generally considered Level 2 or Level 3 inputs depending on the number of quotes available). If such quotations are not available, the security is valued using methods Management has approved in the good-faith belief that the resulting valuation will reflect the fair value of the security. Pursuant to Rule 2a-5 under the 1940 Act, the Board designated Management as the Funds' valuation designee. As the Funds' valuation designee, Management is responsible for determining fair value in good faith for all Fund investments. Inputs and assumptions considered in determining fair value of a security based on Level 2 or Level 3 inputs may include, but are not limited to, the type of security; the initial cost of the security; the existence of any contractual restrictions on the security’s disposition; the price and extent of public trading in similar securities of the issuer or of comparable companies; quotations or evaluated prices from broker-dealers or pricing services; information obtained from the issuer and analysts; an analysis of the company’s or issuer’s financial statements; an evaluation of the inputs that influence the issuer and the market(s) in which the security is purchased and sold.
The value of the Funds’ investments in foreign securities is generally determined using the same valuation methods and inputs as other Fund investments, as discussed above. Foreign security prices expressed in local currency values are normally translated from the local currency into U.S. dollars using the exchange rates as of 4:00 p.m., Eastern Time on days the New York Stock Exchange ("NYSE") is open for business. Management has approved the use of ICE Data Services ("ICE") to assist in determining the fair value of foreign equity securities when changes in the value of a certain index suggest that the closing prices on the foreign exchanges may no longer represent the amount that a Fund could expect to receive for those securities or when foreign markets are closed and U.S. markets are open. In each of these events, ICE will provide adjusted prices for certain foreign equity securities using a statistical analysis of historical correlations of multiple factors (Level 2 inputs). Management has also approved the use of ICE to evaluate the prices of foreign debt securities as of the time at which a Fund’s share price is calculated. ICE utilizes benchmark spread and yield curves and evaluates available market activity from the local close to the time as of which a Fund’s share price is calculated (Level 2 inputs) to assist in determining prices for certain foreign debt securities. In the case of both foreign equity and foreign debt securities, in the absence of precise information about the market values of these foreign securities as of the time at which a Fund’s share price is calculated, Management has determined based on available data that prices adjusted or evaluated in this way are likely to be closer to the prices a Fund could realize on a current sale than the prices of those securities established at the close of the foreign markets in which the securities primarily trade.
Fair value prices are necessarily estimates, and there is no assurance that such a price will be at or close to the price at which the security is next quoted or traded.
4
Foreign currency translations: The accounting records of the Funds and the Blocker are maintained in U.S. dollars. Foreign currency amounts are normally translated into U.S. dollars using the exchange rate as of 4:00 p.m. Eastern Time, on days the NYSE is open for business, to determine the value of investments, other assets and liabilities. Purchase and sale prices of securities, and income and expenses, are translated
into U.S. dollars at the prevailing rate of exchange on the respective dates of such transactions. Net unrealized foreign currency gain/(loss), if any, arises from changes in the value of assets and liabilities, other than investments in securities, as a result of changes in exchange rates and is stated separately in the Statements of Operations.
5
Securities transactions and investment income: Securities transactions are recorded on trade date for financial reporting purposes. Dividend income is recorded on the ex-dividend date or, for certain foreign dividends, as soon as a Fund becomes aware of the dividends. Non-cash dividends included in dividend income, if any, are recorded at the fair market value of the securities received. Interest income, including accretion of discount (adjusted for original issue discount, where applicable) and amortization of premium, where applicable, is recorded on the accrual basis. Realized gains and losses from securities transactions and foreign currency transactions, if any, are recorded on the basis of identified cost and stated separately in the Statements of Operations. Included in net realized gain/(loss) on investments are proceeds from the settlement of class action litigation(s) in which certain of the Funds participated as a class member. The amounts of such proceeds for the year ended August 31, 2023, were $453, $1,769, $8,580, $30,133, $249,912, $58,296, $6,392, $1,276, $29,878, $31,616, $255,165, $54,839, $958,365, $43,359, and $2,101 for Dividend Growth, Emerging Markets Equity, Equity Income, Focus, Genesis, International Equity, International Select, Intrinsic Value, Large Cap Growth, Large Cap Value, Mid Cap Growth, Mid Cap Intrinsic Value, Multi-Cap Opportunities, Small Cap Growth, and Sustainable Equity, respectively.
6
Income tax information: Each Fund is treated as a separate entity for U.S. federal income tax purposes. It is the policy of each Fund to continue to qualify for treatment as a RIC by complying with the requirements of the U.S. Internal Revenue Code applicable to RICs and to distribute substantially all of its net investment income and net realized capital gains to its shareholders. To the extent a Fund distributes substantially all of its net investment income and net realized capital gains to shareholders, no federal income or excise tax provision is required.
ASC 740 "Income Taxes" sets forth a minimum threshold for financial statement recognition of a tax position taken, or expected to be taken, in a tax return. The Funds recognize interest and penalties, if any, related to unrecognized tax positions as an income tax expense in the Statements of Operations. The Funds are subject to examination by U.S. federal and state tax authorities for returns filed for the tax years for which the applicable statutes of limitations have not yet expired. Management has analyzed each Fund's tax positions taken or expected to be taken on federal and state income tax returns for all open tax years (the current and the prior three tax years) and has concluded that no provision for income tax is required in the Funds' financial statements.
For federal income tax purposes, the estimated cost and unrealized appreciation/(depreciation) in value of investments held at August 31, 2023 were as follows:
| | Gross
Unrealized
Appreciation | Gross
Unrealized
Depreciation | Net Unrealized
Appreciation/
(Depreciation) |
| | | | |
| | | | |
| | | | |
| | | | |
| | | | |
| | | | |
| | | | |
| | | | |
| | | | |
| | | | |
| | | | |
| | | | |
| | | | |
| | Gross Unrealized Appreciation | Gross Unrealized Depreciation | Net Unrealized Appreciation/ (Depreciation) |
| | | | |
| | | | |
| | | | |
| | | | |
| | | | |
| | | | |
| | | | |
Income distributions and capital gain distributions are determined in accordance with income tax regulations, which may differ from GAAP. These differences are primarily due to differing treatments of income and gains on various investment securities held by each Fund, timing differences and differing characterization of distributions made by each Fund. The Funds may also utilize earnings and profits distributed to shareholders on redemption of their shares as a part of the dividends-paid deduction for income tax purposes.
Any permanent differences resulting from different book and tax treatment are reclassified at year-end and have no impact on net income, NAV or NAV per share of the Funds. For the year ended August 31, 2023, the Funds recorded permanent reclassifications primarily related to one or more of the following: deemed distributions on shareholder redemptions, prior year true up adjustments, net operating losses written off, non deductible excise taxes, and gains (losses) & tax adjustments on securities redeemed in kind. For the year ended August 31, 2023, the Funds recorded the following permanent reclassifications:
| | Total Distributable
Earnings/(Losses) |
| | |
| | |
| | |
| | |
| | |
| | |
| | |
| | |
| | |
| | |
| | |
| | |
| | |
| | |
| | |
| | |
| | |
| | |
| | |
| | |
The tax character of distributions paid during the years ended August 31, 2023, and August 31, 2022, was as follows:
As of August 31, 2023, the components of distributable earnings (accumulated losses) on a U.S. federal income tax basis were as follows:
| Undistributed
Ordinary
Income | Undistributed
Long-Term
Capital Gain | Unrealized
Appreciation/
(Depreciation) | Loss
Carryforwards
and Deferrals | Other
Temporary
Differences | |
| | | | | | |
| | | | | | |
| | | | | | |
| | | | | | |
| | | | | | |
| | | | | | |
| | | | | | |
| | | | | | |
| | | | | | |
| | | | | | |
| | | | | | |
| | | | | | |
| | | | | | |
| | | | | | |
| Undistributed Ordinary Income | Undistributed Long-Term Capital Gain | Unrealized Appreciation/ (Depreciation) | Loss Carryforwards and Deferrals | Other Temporary Differences | |
| | | | | | |
| | | | | | |
| | | | | | |
| | | | | | |
| | | | | | |
| | | | | | |
The temporary differences between book basis and tax basis distributable earnings are primarily due to: losses disallowed and/or recognized on wash sales and straddles, capital loss carryforwards, amortization of organization expenses, tax adjustments related to partnerships and other investments, and mark-to-market adjustments on passive foreign investment companies ("PFICs").
To the extent each Fund’s net realized capital gains, if any, can be offset by capital loss carryforwards, it is the policy of each Fund not to distribute such gains. Capital loss carryforward rules allow for RICs to carry forward capital losses indefinitely and to retain the character of capital loss carryforwards as short-term or long-term. As determined at August 31, 2023, the following Funds had unused capital loss carryforwards available for federal income tax purposes to offset future net realized capital gains, if any, as follows:
| Capital Loss Carryforwards |
| | |
| | |
| | |
| | |
| | |
| | |
| | |
| | |
| | |
| | |
| Future utilization is limited under current tax regulations. |
During the year ended August 31, 2023, Mid Cap Intrinsic Value utilized capital loss carryforwards of $367,112.
Under current tax regulations, capital losses realized on investment transactions after October 31 may be deferred and treated as occurring on the first day of the following fiscal year. Under the current tax rules, the Funds may also defer any realized late-year ordinary losses as occurring on the first day of the following fiscal year. Late-year ordinary losses represent ordinary losses realized on investment transactions after December 31 and specified losses (ordinary losses from the sale, exchange, or other disposition of property, net foreign currency losses and net PFIC mark to market losses) realized on investment transactions after October 31. For the year ended August 31, 2023, the Funds elected to defer the following late-year ordinary losses and post October capital losses:
| Late-Year
Ordinary Loss
Deferral | Post October
Capital Loss
Deferral |
| | |
| | |
| | |
| Late-Year Ordinary Loss Deferral | Post October Capital Loss Deferral |
| | |
| | |
The Blocker is taxed as a corporation under the U.S. Internal Revenue Code. As of August 31, 2023, Large Cap Growth had a gross deferred tax asset of $15,430 resulting from deferred interest expense, capital losses and net operating losses in the Blocker and a gross deferred tax liability of $19,287 resulting from appreciation of the underlying holding. As of August 31, 2023, the Blocker has a net deferred tax liability of $3,857.
7
Foreign taxes: Foreign taxes withheld, if any, represent amounts withheld by foreign tax authorities, net of refunds recoverable.
Foreign capital gains on certain foreign securities may be subject to foreign taxes, which are accrued as applicable. Emerging Markets Equity accrues capital gains tax on unrealized and realized gains for certain securities. At August 31, 2023, Emerging Markets Equity had accrued capital gains taxes of $2,856,827, which is reflected in the Statements of Assets and Liabilities. For the year ended August 31, 2023, Emerging Markets Equity had realized capital gains taxes of $2,459,580, which is reflected in the Statements of Operations.
As a result of several European Court of Justice ("ECJ") court cases in certain countries across the European Union ("EU"), certain of the Funds have filed tax reclaims for previously withheld taxes on dividends earned in those countries ("ECJ tax reclaims"). These additional filings are subject to various administrative proceedings by the local jurisdictions’ tax authorities within the EU, as well as a number of related judicial proceedings. When any such ECJ tax reclaims are not "more likely than not" to be sustained, no amounts are included in the Statements of Assets and Liabilities. The Funds have determined that certain ECJ tax reclaims are "more likely than not" to be sustained after examination by tax authorities and are included in "Prepaid expenses and other assets" and "Other accrued expenses and payables" in the Statements of Assets and Liabilities for certain of the Funds. The income recognized from these ECJ tax reclaims is included in "Interest and other income—unaffiliated issuers" in the Statements of Operations and the cost to file these additional ECJ tax reclaims (which are excluded from contractual expense limitations) is included in "Miscellaneous and other fees" in the Statements of Operations for certain of the Funds.
8
Distributions to shareholders: Each Fund may earn income, net of expenses, daily on its investments. Distributions from net investment income and net realized capital gains, if any, are generally distributed once a year (usually in December) and are recorded on the ex-date. However, Equity Income, Global Real Estate and Real Estate generally distribute net investment income, if any, at the end of each calendar quarter.
It is the policy of Funds that invest in real estate investment trusts ("REITs"), to pass through to their shareholders substantially all REIT distributions and other income they receive, less operating expenses. The distributions received from REITs are generally composed of income, capital gains, and/or return of REIT capital, but the REITs do not report this information to these Funds until the following calendar year. At August 31, 2023, these Funds estimated these amounts for the period January 1, 2023 to August 31, 2023 within the financial statements because the 2023 information is not available from the REITs until after each Fund’s fiscal year-end. All estimates are based upon REIT information sources available to these Funds together with actual IRS Forms 1099-DIV received to date. For the year ended August 31, 2023, the character of distributions, if any, paid to shareholders of these Funds disclosed within the Statements of Changes in Net Assets is based on estimates made at that time. Based on past experience it is possible that a portion of these Funds' distributions during the current fiscal year, if any, will be considered tax return of capital, but the actual amount of the tax return of capital, if any, is not determinable until after each Fund’s fiscal year-end. After calendar year-end, when these Funds learn the nature of the distributions paid by REITs during that year, distributions previously identified as income may be recharacterized as return of capital and/or capital gain. After all applicable REITs have informed these Funds of the actual breakdown of
distributions paid to these Funds during their fiscal year, estimates previously recorded are adjusted to reflect actual results. As a result, the composition of these Funds' distributions as reported herein may differ from the final composition determined after calendar year-end and reported to these Funds shareholders on IRS Form 1099-DIV.
9
Expense allocation: Certain expenses are applicable to multiple funds within the complex of related investment companies. Expenses directly attributable to a fund are charged to that fund. Expenses of the Trust that are not directly attributable to a particular series of the Trust (e.g., a Fund) are allocated among the series of the Trust, on the basis of relative net assets, except where a more appropriate allocation of expenses to each of the series can otherwise be made fairly. Expenses borne by the complex of related investment companies, which includes open-end and closed-end investment companies for which NBIA serves as investment manager, that are not directly attributable to a particular investment company in the complex (e.g., the Trust) or series thereof are allocated among the investment companies in the complex or series thereof on the basis of relative net assets, except where a more appropriate allocation of expenses to each of the investment companies in the complex or series thereof can otherwise be made fairly. Each Fund’s expenses (other than those specific to each class) are allocated proportionally each day among its classes based upon the relative net assets of each class.
10
Investments in foreign securities: Investing in foreign securities may involve sovereign and other risks, in addition to the credit and market risks normally associated with domestic securities. These additional risks include the possibility of adverse political and economic developments (including political instability, nationalization, expropriation, or confiscatory taxation) and the potentially adverse effects of unavailability of public information regarding issuers, less governmental supervision and regulation of financial markets, reduced liquidity of certain financial markets, and the lack of uniform accounting, auditing, and financial reporting standards or the application of standards that are different or less stringent than those applied in the United States. Foreign securities also may experience greater price volatility, higher rates of inflation, and delays in settlement.
11
Investment company securities and exchange-traded funds: The Funds may invest in shares of other registered investment companies, including exchange-traded funds ("ETFs"), within the limitations prescribed by the 1940 Act, in reliance on rules adopted by the SEC, particularly Rule 12d1-4 or any other applicable exemptive relief. Rule 12d1-4 permits investments in other registered investment companies in excess of the limitations of the 1940 Act if a Fund complies with the conditions of the Rule. Shareholders of a Fund will indirectly bear their proportionate share of any management fees and other expenses paid by such other investment companies, in addition to the management fees and expenses of the Fund.
12
Derivative instruments: Certain Funds' use of derivatives during the year ended August 31, 2023, is described below. Please see the Schedule of Investments for each Fund's open positions in derivatives, if any, at August 31, 2023. The disclosure requirements of ASC 815 "Derivatives and Hedging" ("ASC 815") distinguish between derivatives that qualify for hedge accounting and those that do not. Because investment companies value their derivatives at fair value and recognize changes in fair value through the Statements of Operations, they do not qualify for hedge accounting. Accordingly, even though a Fund's investments in derivatives may represent economic hedges, they are considered non-hedge transactions for purposes of this disclosure.
Rule 18f-4 under the 1940 Act regulates the use of derivatives for certain funds registered under the 1940 Act ("Rule 18f-4"). Unless a Fund qualifies as a "limited derivatives user" as defined in Rule 18f-4, the Fund is subject to a comprehensive derivatives risk management program, is required to comply with certain value-at-risk based leverage limits and is required to provide additional disclosure both publicly and to the SEC regarding its derivatives positions. If a Fund qualifies as a limited derivatives user, Rule 18f-4 requires the Fund to have policies and procedures to manage its aggregate derivatives risk.
Options: Equity Income used options written to generate incremental returns. Large Cap Growth used options purchased to gain exposure more efficiently than through a direct purchase of the underlying security, to gain exposure to securities, markets, sectors or geographical areas and to manage or adjust the risk profile of the Fund or the risk of individual positions. Large Cap Growth used options written to enhance total return, to gain exposure more efficiently than through a direct purchase of the underlying
security, to gain exposure to securities, markets, sectors or geographical areas and to manage or adjust the risk profile of the Fund or the risk of individual positions.
Premiums paid by a Fund upon purchasing a call or put option are recorded in the asset section of the Fund’s Statement of Assets and Liabilities and are subsequently adjusted to the current market value. When an option is exercised, closed, or expired, a Fund realizes a gain or loss and the asset is eliminated. For purchased call options, a Fund's loss is limited to the amount of the option premium paid.
Premiums received by a Fund upon writing a call option or a put option are recorded in the liability section of the Fund’s Statement of Assets and Liabilities and are subsequently adjusted to the current market value. When an option is exercised, closed, or expired, a Fund realizes a gain or loss and the liability is eliminated.
When writing a covered call option, a Fund, in return for the premium, gives up the opportunity for profit from a price increase in the underlying security above the exercise price, but conversely retains the risk of loss should the price of the security decline. When writing a put option, a Fund, in return for the premium, takes the risk that it must purchase the underlying security at a price that may be higher than the current market price of the security. If a call or put option that a Fund has written expires unexercised, a Fund will realize a gain for the amount of the premium. All securities covering outstanding written options are held in escrow by the custodian bank.
At August 31, 2023, the Funds listed below had the following derivatives (which did not qualify as hedging instruments under ASC 815), grouped by primary risk exposure:
| | |
| Statements of
Assets and Liabilities
Location | | Statements of
Assets and Liabilities
Location | |
| |
| |
|
| |
| |
|
| | | Option contracts written, at value | |
| |
| |
|
| |
| |
|
| Investments in securities, at value | | | |
| |
| |
|
| | | Option contracts written, at value | |
The impact of the use of these derivative instruments on the Statements of Operations during the year ended August 31, 2023, was as follows:
| | | Change in Net Unrealized
Appreciation/
(Depreciation) on
|
|
|
|
|
|
|
|
|
| |
| |
|
|
|
|
|
|
|
|
| |
| |
|
|
|
|
| |
| |
| Net realized gain/(loss) on derivatives is located in the Statements of Operations each under the caption, "Net realized gain/(loss) on:" |
| Transactions in investment securities of unaffiliated issuers |
| Expiration or closing of option contracts written |
| Change in net unrealized appreciation/(depreciation) is located in the Statements of Operations each under the caption, "Change in net unrealized appreciation/(depreciation) in value of:" |
| Investment securities of unaffiliated issuers |
| |
While the Funds may receive rights and warrants in connection with their investments in securities, these rights and warrants are not considered "derivative instruments" under ASC 815.
Management has concluded that Dividend Growth, Emerging Markets Equity, Focus, Genesis, Global Real Estate, Greater China Equity, International Equity, International Select, International Small Cap, Intrinsic Value, Large Cap Value, Mid Cap Growth, Mid Cap Intrinsic Value, Multi-Cap Opportunities, Real Estate, Small Cap Growth, Sustainable Equity and U.S. Equity Impact did not hold any derivative instruments during the year ended August 31, 2023 that require additional disclosures pursuant to ASC 815.
13
Securities lending: Each Fund, using State Street Bank and Trust Company ("State Street") as its lending agent, may loan securities to qualified brokers and dealers in exchange for negotiated lender’s fees. These fees, if any, would be disclosed within the Statements of Operations under the caption “Income from securities loaned-net” and are net of expenses retained by State Street as compensation for its services as lending agent.
The initial collateral received by a Fund at the beginning of each transaction shall have a value equal to at least 102% of the prior day’s market value of the loaned securities (105% in the case of international securities). Collateral in the form of cash and/or securities issued or guaranteed by the U.S. government or its agencies, equivalent to at least 100% of the market value of securities, is maintained at all times. Thereafter, the value of the collateral is monitored on a daily basis, and collateral is moved daily between a counterparty and a Fund until the close of the transaction. Cash collateral is generally invested in a money market fund registered under the 1940 Act that is managed by an affiliate of State Street and is included in the Statements of Assets and Liabilities under the caption "Investments in securities, at value—Unaffiliated issuers". The total value of securities received as collateral for securities on loan is included in a footnote following the applicable Schedule of Investments, but is not included within the Statements of Assets and Liabilities because the receiving Fund does not have the right to sell or repledge the securities received as collateral. The risks associated with lending portfolio securities include, but are not limited to, possible delays in receiving additional collateral or in the recovery of the loaned securities. Any increase or decrease in the fair value of the securities loaned and any interest earned or dividends paid or owed on those securities during the term of the loan would accrue to that Fund.
As of August 31, 2023, the Funds listed below had outstanding loans of securities to certain approved brokers each with a value as follows:
| Value of Securities
Loaned |
| |
| |
| |
| |
| |
As of August 31, 2023, the Funds listed below had outstanding loans of securities to certain approved brokers for which each received collateral as follows:
| Remaining Contractual Maturity of the Agreements |
| | | | | |
Securities Lending Transactions(a) |
|
|
|
|
|
|
|
|
|
|
|
| | | | | |
| | | | | |
| | | | | |
| | | | | |
| | | | | |
| Amounts represent the payable for loaned securities collateral received. |
14
Offsetting Assets and Liabilities: The Funds are required to disclose both gross and net information for assets and liabilities related to over-the-counter derivatives, and securities lending and securities borrowing transactions that are eligible for offset or subject to an enforceable master netting or similar agreement. Emerging Market Equity, Focus, International Equity, International Select, and International Small Cap held one or more of these investments at August 31, 2023. The Funds’ securities lending assets at fair value are reported gross in the Statements of Assets and Liabilities. The following tables present securities lending assets by counterparty and net of the related collateral received by a Fund as of August 31, 2023.
| Gross Amounts of Assets
Presented in the Statements
of Assets and Liabilities | Gross Amounts of Liabilities
Presented in the Statements
of Assets and Liabilities |
|
|
|
| | |
|
|
|
| | |
|
|
|
| | |
|
|
|
| | |
|
|
|
| | |
Gross Amounts Not Offset in the Statements of Assets and Liabilities: |
| | |
| Gross Amounts
Presented in
the Statements
of Assets and
Liabilities | Liabilities
Available
for Offset | | | Gross Amounts
Presented in
the Statements
of Assets and
Liabilities | Assets
Available
for Offset | | |
|
|
|
|
|
|
|
|
| | | | | | | | |
| | | | | | | | |
Gross Amounts Not Offset in the Statements of Assets and Liabilities: |
| | |
| Gross Amounts Presented in the Statements of Assets and Liabilities | Liabilities Available for Offset | | | Gross Amounts Presented in the Statements of Assets and Liabilities | Assets Available for Offset | | |
|
|
|
|
|
|
|
|
| | | | | | | | |
| | | | | | | | |
|
|
|
|
|
|
|
|
| | | | | | | | |
| | | | | | | | |
|
|
|
|
|
|
|
|
| | | | | | | | |
| | | | | | | | |
|
|
|
|
|
|
|
|
| | | | | | | | |
| | | | | | | | |
| Collateral received (or pledged) is limited to an amount not to exceed 100% of the net amount of assets (or liabilities) in the tables presented above, for each respective counterparty. |
| A net amount greater than zero represents amounts subject to loss as of August 31, 2023, in the event of a counterparty failure. A net amount less than zero represents amounts under-collateralized to each counterparty as of August 31, 2023. |
15
Indemnifications: Like many other companies, the Trust’s organizational documents provide that its officers ("Officers") and trustees ("Trustees") are indemnified against certain liabilities arising out of the performance of their duties to the Trust. In addition, both in some of its principal service contracts and in the normal course of its business, the Trust enters into contracts that provide indemnifications to other parties for certain types of losses or liabilities. The Trust’s maximum exposure under these arrangements is unknown as this could involve future claims against the Trust or a Fund.
16
In-kind redemption: In accordance with guidelines described in a Fund’s prospectus and in accordance with procedures adopted by the Board, a Fund may distribute portfolio securities rather than cash as payment for a redemption of Fund shares ("in-kind redemption"). For financial reporting purposes, the Fund recognizes a gain on in-kind redemptions to the extent the value of the distributed securities on the date of redemption exceeds the cost of those securities. Gains and losses realized on in-kind redemptions are not recognized for tax purposes and are reclassified from undistributed realized gain/(loss) to paid-in capital. During the year ended August 31, 2023, Genesis realized net gains of $445,030,369 on $544,192,312 of in-kind redemptions, which is comprised of $542,227,847 in securities and $1,964,465 in cash. During the year ended August 31, 2022, Large Cap Value realized net gains of $27,164,460 on $94,882,781 of in-kind redemptions which is comprised of $90,055,715 in securities and $4,827,066 in cash.
17
Investments in private companies: Investments in private companies, including companies that have not yet issued securities publicly in an initial public offering, involve greater risks than investments in securities of companies that have traded publicly on an exchange for extended periods of time. Investments in these companies are generally less liquid than investments in securities issued by public companies and may be difficult for the Fund to value. Private placements and other restricted securities may not be listed on an exchange and may have no active trading market. As a result of the absence of a public trading market, the prices of these securities may be more difficult to determine than publicly traded securities and these securities may involve heightened risk as compared to investments in securities of publicly traded
companies. Private placements and other restricted securities may be illiquid, and it frequently can be difficult to sell them at a time when it may otherwise be desirable to do so or the Fund may be able to sell them only at prices that are less than what the Fund regards as their fair market value.
18
Other: All net investment income and realized and unrealized capital gains and losses of each Fund are allocated, on the basis of relative net assets, pro rata among its respective classes.
Note B—Investment Management Fees, Administration Fees, Distribution Arrangements, and Other Transactions with Affiliates:
Each Fund retains NBIA as its investment manager under a Management Agreement. For such investment management services, each Fund pays NBIA an investment management fee as a percentage of average daily net assets according to the following table: |
| | | | | | | | | | |
|
| | | | | | | | | | |
Intrinsic Value and Small Cap Growth |
| | | | | | | | | | |
Emerging Markets Equity(c) |
| | | | | | | | | | |
Global Real Estate and Real Estate(a) |
| | | | | | | | | | |
International Equity(a)(b) |
| | | | | | | | | | |
|
| | | | | | | | | | |
Equity Income(a), Focus, International Select, Large Cap Growth, Large Cap Value(a), Mid Cap Growth, Mid Cap Intrinsic Value and Sustainable Equity |
| | | | | | | | | | |
Multi-Cap Opportunities(a) |
| | | | | | | | | | |
|
| | | | | | | | | | |
|
| | | | | | | | | | |
|
| | | | | | | | | | |
(a)
NBIA has contractually agreed to waive its Class E management fee for the below Funds. This undertaking lasts until August 31, 2023 and may not be terminated during its term without the consent of the Board. Management fees contractually waived are not subject to recovery by NBIA.
| Annualized
Percentage of
Average Daily
Net Assets
Waived | | Management Fees
Waived for the
Year Ended
August 31, 2023 |
| | | |
| Annualized Percentage of Average Daily Net Assets Waived | | Management Fees Waived for the Year Ended August 31, 2023 |
| | | |
| | | |
| | | |
| | | |
| | | |
(b)
NBIA has voluntarily agreed to waive and/or reimburse its management fee for the below Fund. NBIA may, at its sole discretion, modify or terminate the voluntary waiver and/or reimbursement without notice to the Fund. Fees voluntarily waived and/or reimbursed are not subject to recovery by NBIA.
| Percentage of
Average Daily
Net Assets
Waived
and/or
Reimbursed | | Management Fees
Waived and/or
Reimbursed
for the
Year Ended
August 31, 2023 |
| | | |
| | |
|
(c)
Effective September 1, 2023, NBIA has voluntarily agreed to waive and/or reimburse its management fee for Emerging Markets Equity by 0.10% of average daily net assets. NBIA may, at its sole discretion, modify or terminate the voluntary waiver and/or reimbursement without notice to the Fund. Fees voluntarily waived and/or reimbursed are not subject to recovery by NBIA.
Accordingly, for the year ended August 31, 2023, the investment management fee pursuant to the Management Agreement was equivalent to an annual effective rate of each Fund’s average daily net assets.
| After waivers, 0.49% annual effective net rate of the Fund’s average daily net assets. |
| After waivers, 0.65% annual effective net rate of the Fund’s average daily net assets. |
| After waivers, 0.41% annual effective net rate of the Fund’s average daily net assets. |
| After waivers, 0.43% annual effective net rate of the Fund’s average daily net assets. |
| After waivers, 0.79% annual effective net rate of the Fund’s average daily net assets. |
Investment management fee waivers are included in the Statements of Operations under the caption "Fees waived".
Each Fund retains NBIA as its administrator under an Administration Agreement. The administration fee is assessed at the class level and each share class of a Fund, as applicable, pays NBIA an annual administration fee equal to the following: 0.26% for each of Investor Class, Class A, Class C and Class R3; 0.40% for Trust Class and Advisor Class; 0.15% for Institutional Class; and 0.05% for Class R6, each as a percentage of its average daily net assets. Class E shares do not pay an administration fee. Additionally, NBIA retains State Street as its sub-administrator under a Sub-Administration Agreement. NBIA pays State Street a fee for all services received under the Sub-Administration Agreement.
NBIA has contractually agreed to waive fees and/or reimburse certain expenses of the Investor Class of each of International Equity, Mid Cap Intrinsic Value and Small Cap Growth and the Trust Class, Advisor Class, Institutional Class, Class A, Class C, Class R3 and Class R6 of each Fund that offers those classes so that the total annual operating expenses of those classes do not exceed the expense limitations as detailed in the following table. These undertakings apply to a Fund’s direct expenses and exclude interest, brokerage commissions, acquired fund fees and expenses, extraordinary expenses, taxes including any expenses relating to tax reclaims, and dividend and interest expenses relating to short sales, if any (commitment fees relating to borrowings are treated as interest for purposes of this exclusion) ("annual operating expenses"); consequently, net expenses may exceed the contractual expense limitations. The expenses of the Blocker are included in the total expenses used to calculate the reimbursement, which Large Cap Growth has agreed to share with the Blocker. For the year ended August 31, 2023, the expenses of the Blocker amounted to $3,104.
At August 31, 2023, the Funds' contingent liabilities to NBIA under the agreements were as follows:
| | | Expenses Reimbursed in
Year Ended August 31, |
| | | | | |
| | | Subject to Repayment until
August 31, |
| | | | | |
Dividend Growth Institutional Class | | | | | |
| | | | | |
| | | | | |
| | | | | |
Emerging Markets Equity Institutional Class | | | | | |
Emerging Markets Equity Class A | | | | | |
Emerging Markets Equity Class C | | | | | |
Emerging Markets Equity Class R3 | | | | | |
Emerging Markets Equity Class R6 | | | | | |
Equity Income Institutional Class | | | | | |
| | | | | |
| | | | | |
| | | | | |
| | | | | |
| | | | | |
| | | Expenses Reimbursed in Year Ended August 31, |
| | | | | |
| | | Subject to Repayment until August 31, |
| Contractual Expense Limitation(a) | | | | |
Focus Institutional Class | | | | | |
| | | | | |
| | | | | |
| | | | | |
| | | | | |
Genesis Institutional Class | | | | | |
| | | | | |
Global Real Estate Institutional Class | | | | | |
Greater China Equity Institutional Class | | | | | |
International Equity Investor Class | | | | | |
International Equity Trust Class | | | | | |
International Equity Institutional Class | | | | | |
International Equity Class A | | | | | |
International Equity Class C | | | | | |
International Equity Class R6 | | | | | |
International Select Trust Class | | | | | |
International Select Institutional Class | | | | | |
International Select Class A | | | | | |
International Select Class C | | | | | |
International Select Class R3 | | | | | |
International Select Class R6 | | | | | |
International Small Cap Institutional Class | | | | | |
International Small Cap Class A | | | | | |
International Small Cap Class C | | | | | |
International Small Cap Class R6 | | | | | |
Intrinsic Value Institutional Class | | | | | |
| | | | | |
| | | | | |
| | | | | |
Large Cap Growth Trust Class | | | | | |
Large Cap Growth Advisor Class | | | | | |
Large Cap Growth Institutional Class | | | | | |
| | | | | |
| | | | | |
Large Cap Growth Class R3 | | | | | |
Large Cap Growth Class R6 | | | | | |
Large Cap Value Trust Class | | | | | |
Large Cap Value Advisor Class | | | | | |
Large Cap Value Institutional Class | | | | | |
| | | | | |
| | | | | |
| | | Expenses Reimbursed in Year Ended August 31, |
| | | | | |
| | | Subject to Repayment until August 31, |
| Contractual Expense Limitation(a) | | | | |
| | | | | |
| | | | | |
Mid Cap Growth Trust Class | | | | | |
Mid Cap Growth Advisor Class | | | | | |
Mid Cap Growth Institutional Class | | | | | |
| | | | | |
| | | | | |
| | | | | |
| | | | | |
Mid Cap Intrinsic Value Investor Class | | | | | |
Mid Cap Intrinsic Value Trust Class | | | | | |
Mid Cap Intrinsic Value Institutional Class | | | | | |
Mid Cap Intrinsic Value Class A | | | | | |
Mid Cap Intrinsic Value Class C | | | | | |
Mid Cap Intrinsic Value Class R3 | | | | | |
Mid Cap Intrinsic Value Class R6 | | | | | |
Multi-Cap Opportunities Institutional Class | | | | | |
Multi-Cap Opportunities Class A | | | | | |
Multi-Cap Opportunities Class C | | | | | |
| | | | | |
Real Estate Institutional Class | | | | | |
| | | | | |
| | | | | |
| | | | | |
| | | | | |
Small Cap Growth Investor Class | | | | | |
Small Cap Growth Trust Class | | | | | |
Small Cap Growth Advisor Class | | | | | |
Small Cap Growth Institutional Class | | | | | |
| | | | | |
| | | | | |
Small Cap Growth Class R3 | | | | | |
Small Cap Growth Class R6 | | | | | |
Sustainable Equity Trust Class | | | | | |
Sustainable Equity Institutional Class | | | | | |
Sustainable Equity Class A | | | | | |
Sustainable Equity Class C | | | | | |
Sustainable Equity Class R3 | | | | | |
Sustainable Equity Class R6 | | | | | |
U.S. Equity Impact Institutional Class | | | | | |
U.S. Equity Impact Class A | | | | | |
| | | Expenses Reimbursed in Year Ended August 31, |
| | | | | |
| | | Subject to Repayment until August 31, |
| Contractual Expense Limitation(a) | | | | |
U.S. Equity Impact Class C | | | | | |
| Expense limitation per annum of the respective class’s average daily net assets. |
| Effective September 1, 2023, in addition to the contractual undertaking described above for Emerging Markets Equity, NBIA has voluntarily undertaken to waive fees and/or reimburse certain expenses so that their Operating Expenses, per annum of their respective average daily net assets, are limited to 1.15% for Institutional Class, 1.40% for Class A, 2.15% for Class C, 1.81% for Class R3 and 1.05% for Class R6. NBIA may, at its sole discretion, modify or terminate the voluntary waiver and/or reimbursement without notice to the Fund. Fees voluntarily waived and/or reimbursed are not subject to recovery by NBIA. |
| Effective January 1, 2024, the expense limitation will be 0.65%. |
| Classes that have had changes to their respective limitations are noted below. |
| | |
Large Cap Growth Class R6 | | |
| In addition to the contractual undertaking described above, NBIA has voluntarily undertaken to waive fees and/or reimburse certain expenses so that their Operating Expenses, per annum of their respective average daily net assets, are limited to the percentages indicated below. Voluntary reimbursements are not subject to recovery by NBIA and are terminable by NBIA upon notice to the Fund. |
| Voluntary Expense
Limitation | | Fees Voluntarily
Waived for the Year
Ended August 31,
2023 |
Mid Cap Intrinsic Value Investor Class | | | |
Mid Cap Intrinsic Value Trust Class | | | |
| | | |
Small Cap Growth Investor Class | | | |
Small Cap Growth Investor Class | | | |
Small Cap Growth Trust Class | | | |
Small Cap Growth Trust Class | | | |
Small Cap Growth Advisor Class | | | |
Small Cap Growth Advisor Class | | | |
Small Cap Growth Advisor Class | | | |
Each Fund has agreed that each of its respective classes will repay NBIA for fees and expenses waived or reimbursed for that class provided that repayment does not cause that class’s annual operating expenses to exceed its contractual expense limitation in place at the time the fees and expenses were waived or reimbursed, or the expense limitation in place at the time the Fund repays NBIA, whichever is lower. Any such repayment must be made within three years after the year in which NBIA incurred the expense.
During the year ended August 31, 2023, the following classes repaid NBIA under their respective contractual expense limitation agreements as follows:
| |
| |
| |
Large Cap Growth Class R3 | |
Large Cap Growth Class R6 | |
Effective August 21, 2023, Green Court Capital Management Limited stepped down as subadviser to Greater China Equity and the portfolio managers of China Equity ETF assumed day-to-day portfolio management responsibilities, of Greater China Equity.
Each Fund also has a distribution agreement with Neuberger Berman BD LLC (the "Distributor") with respect to each class of shares. The Distributor acts as agent in arranging for the sale of class shares without sales commission or other compensation, except as described below, and bears the advertising and promotion expenses.
However, the Distributor receives fees from the Trust Class of each of Focus, International Select, Large Cap Growth, Large Cap Value, Mid Cap Intrinsic Value, Real Estate, Small Cap Growth and Sustainable Equity, and from the Advisor Class, Class A, Class C and Class R3 of each Fund that offers those classes under their distribution plans (each a "Plan", collectively, the "Plans") pursuant to Rule 12b-1 under the 1940 Act. The Plans provide that, as compensation for administrative and other services provided to these classes, the Distributor’s activities and expenses related to the sale and distribution of these classes, and ongoing services provided to investors in these classes, the Distributor receives from each of these respective classes a fee at the annual rate of 0.10% of such Trust Class’s, 0.25% of such Advisor Class’s, 0.25% of such Class A’s, 1.00% of such Class C’s and 0.50% of such Class R3’s average daily net assets. The Distributor receives this amount to provide distribution and shareholder servicing for these classes and pays a portion of it to institutions that provide such services. Those institutions may use the payments for, among other purposes, compensating employees engaged in sales and/or shareholder servicing. The amount of fees paid by each class during any year may be more or less than the cost of distribution and other services provided to that class. FINRA rules limit the amount of annual distribution fees that may be paid by a mutual fund and impose a ceiling on the cumulative distribution fees paid. The Trust’s Plans comply with those rules. Effective from March 31, 2023 to May 19, 2023, the 12b-1 fees for Class A and Class C of Global Real Estate and Greater China Equity were voluntarily waived until Class A and Class C shares were converted into Institutional Class shares, which amounted to $413 and $617, respectively. These waivers are included in the Statements of Operations under the caption "Fees waived".
Class A shares of each Fund are generally sold with an initial sales charge of up to 5.75% and no contingent deferred sales charge ("CDSC"), except that a CDSC of 1.00% applies to certain redemptions made within 18 months following purchases of $1 million or more without an initial sales charge. Class C shares of each Fund are sold with no initial sales charge and a 1.00% CDSC if shares are sold within one year after purchase.
For the year ended August 31, 2023, the Distributor, acting as underwriter and broker-dealer, received net initial sales charges from the purchase of Class A shares and CDSCs from the redemption of Class A and Class C shares as follows:
| | |
| | | | |
| | | | |
| | | | |
Emerging Markets Equity Class A | | | | |
| | |
| | | | |
Emerging Markets Equity Class C | | | | |
| | | | |
| | | | |
| | | | |
| | | | |
International Equity Class A | | | | |
International Equity Class C | | | | |
International Select Class A | | | | |
International Select Class C | | | | |
International Small Cap Class A | | | | |
International Small Cap Class C | | | | |
| | | | |
| | | | |
| | | | |
| | | | |
| | | | |
| | | | |
| | | | |
| | | | |
Mid Cap Intrinsic Value Class A | | | | |
Mid Cap Intrinsic Value Class C | | | | |
Multi-Cap Opportunities Class A | | | | |
Multi-Cap Opportunities Class C | | | | |
| | | | |
| | | | |
| | | | |
| | | | |
Sustainable Equity Class A | | | | |
Sustainable Equity Class C | | | | |
U.S. Equity Impact Class A | | | | |
U.S. Equity Impact Class C | | | | |
Note C—Securities Transactions:
During the year ended August 31, 2023, there were purchase and sale transactions of long-term securities (excluding written option contracts) as follows:
During the year ended August 31, 2023, no brokerage commissions on securities transactions were paid to affiliated brokers.
Note D—Fund Share Transactions:
Share activity for the years ended August 31, 2023, and August 31, 2022, was as follows:
| For the Year Ended August 31, 2023 | For the Year Ended August 31, 2022 |
| | Shares
Issued on
Reinvestment
of Dividends
and
Distributions | | | | Shares
Issued on
Reinvestment
of Dividends
and
Distributions | | |
|
| | | | | | | | |
| | | | | | | | |
| | | | | | | | |
| | | | | | | | |
|
| | | | | | | | |
| | | | | | | | |
| | | | | | | | |
| | | | | | | | |
| | | | | | | | |
|
| | | | | | | | |
| | | | | | | | |
| | | | | | | | |
| | | | | | | | |
| | | | | | | | |
|
| | | | | | | | |
| | | | | | | | |
| | | | | | | | |
| | | | | | | | |
| | | | | | | | |
| | | | | | | | |
|
| | | | | | | | |
| | | | | | | | |
| | | | | | | | |
| | | | | | | | |
| | | | | | | | |
| | | | | | | | |
| For the Year Ended August 31, 2023 | For the Year Ended August 31, 2022 |
| | Shares Issued on Reinvestment of Dividends and Distributions | | | | Shares Issued on Reinvestment of Dividends and Distributions | | |
|
| | | | | | | | |
| | | | | | | | |
| | | | | | | | |
|
| | | | | | | | |
| | | | | | | | |
| | | | | | | | |
|
| | | | | | | | |
| | | | | | | | |
| | | | | | | | |
| | | | | | | | |
| | | | | | | | |
| | | | | | | | |
| | | | | | | | |
|
| | | | | | | | |
| | | | | | | | |
| | | | | | | | |
| | | | | | | | |
| | | | | | | | |
| | | | | | | | |
|
| | | | | | | | |
| | | | | | | | |
| | | | | | | | |
| | | | | | | | |
|
| | | | | | | | |
| | | | | | | | |
| | | | | | | | |
| | | | | | | | |
|
| | | | | | | | |
| | | | | | | | |
| | | | | | | | |
| | | | | | | | |
| For the Year Ended August 31, 2023 | For the Year Ended August 31, 2022 |
| | Shares Issued on Reinvestment of Dividends and Distributions | | | | Shares Issued on Reinvestment of Dividends and Distributions | | |
| | | | | | | | |
| | | | | | | | |
| | | | | | | | |
| | | | | | | | |
|
| | | | | | | | |
| | | | | | | | |
| | | | | | | | |
| | | | | | | | |
| | | | | | | | |
| | | | | | | | |
| | | | | | | | |
| | | | | | | | |
| | | | | | | | |
|
| | | | | | | | |
| | | | | | | | |
| | | | | | | | |
| | | | | | | | |
| | | | | | | | |
| | | | | | | | |
| | | | | | | | |
| | | | | | | | |
|
| | | | | | | | |
| | | | | | | | |
| | | | | | | | |
| | | | | | | | |
| | | | | | | | |
| | | | | | | | |
| | | | | | | | |
|
| | | | | | | | |
| | | | | | | | |
| | | | | | | | |
| | | | | | | | |
|
| | | | | | | | |
| | | | | | | | |
| For the Year Ended August 31, 2023 | For the Year Ended August 31, 2022 |
| | Shares Issued on Reinvestment of Dividends and Distributions | | | | Shares Issued on Reinvestment of Dividends and Distributions | | |
| | | | | | | | |
| | | | | | | | |
| | | | | | | | |
| | | | | | | | |
| | | | | | | | |
|
| | | | | | | | |
| | | | | | | | |
| | | | | | | | |
| | | | | | | | |
| | | | | | | | |
| | | | | | | | |
| | | | | | | | |
| | | | | | | | |
|
| | | | | | | | |
| | | | | | | | |
| | | | | | | | |
| | | | | | | | |
| | | | | | | | |
| | | | | | | | |
| | | | | | | | |
|
| | | | | | | | |
| | | | | | | | |
| | | | | | | | |
| Period from January 11, 2022 (Commencement of Operations) to August 31, 2022. |
| After the close of business on October 6, 2023, the Fund’s Institutional Class underwent a reverse stock split. The capital share activity presented here has been retroactively adjusted to reflect this split. See Note H of the Notes to Financial Statements. |
| After the close of business on May 19, 2023, Class A and Class C shares converted into Institutional Class shares. See Note A of the Notes to Financial Statements. |
Note E—Line of Credit:
At August 31, 2023, each Fund was a participant in a syndicated committed, unsecured $700,000,000 line of credit (the "Credit Facility"), to be used only for temporary or emergency purposes. Series of other investment companies managed by NBIA also participate in this line of credit on substantially the same terms. Interest is charged on borrowings under the Credit Facility at the highest of (a) a federal funds effective rate plus 1.00% per annum, (b) a daily simple Secured Overnight Financing Rate ("SOFR") plus 1.10% per annum, and (c) an overnight bank funding rate plus 1.00% per annum. The Credit Facility has an annual commitment fee of 0.15% per annum of the available line of credit, which is paid quarterly. Each
Fund that is a participant has agreed to pay its pro rata share of the annual commitment fee, based on the ratio of its individual net assets to the net assets of all participants at the time the fee is due, and interest charged on any borrowing made by such Fund and other costs incurred by such Fund. Because several funds participate in the Credit Facility, there is no assurance that an individual fund will have access to all or any part of the $700,000,000 at any particular time. There were no loans outstanding under the Credit Facility at August 31, 2023. During the year ended August 31, 2023, Global Real Estate and Greater China Equity utilized the Credit Facility.
Note F—Investments in Affiliates(a):
| | | Sales
Proceeds/
Return of
Capital | Change in
Net Unrealized
Appreciation/
(Depreciation)
from
Investments
in Affiliated
Persons | Net Realized
Gain/(Loss)
from
Investments
in Affiliated
Persons | Distributions
from
Investments
in Affiliated
Persons | Shares
Held at
August 31,
2023 | |
| | | | | | | | |
| | | | | | | | |
| | | | | | | | |
| | | | | | | | |
| | | | | | | | |
| | | | | | | | |
| | | | | | | | |
| | | | | | | | |
| | | | | | | | |
| | | | | | | | |
Sub-total for
affiliates held
as of 8/31/23(b) | | | | | | | | |
| | | | | | | | |
| | | | | | | | |
| | | | | | | | |
| | | | | | | | |
| | | | | | | | |
| | | | | | | | |
Sub-total for securities no longer affiliated as of 8/31/23(c) | | | | | | | | |
| | | | | | | | |
| | | Sales Proceeds/ Return of Capital | Change in Net Unrealized Appreciation/ (Depreciation) from Investments in Affiliated Persons | Net Realized Gain/(Loss) from Investments in Affiliated Persons | Distributions from Investments in Affiliated Persons | Shares Held at August 31, 2023 | |
|
|
|
|
|
|
|
|
|
| | | | | | | | |
Sub-total for
affiliates held
as of 8/31/23(d) | | | | | | | | |
| Non-income producing security. |
| Affiliated persons, as defined in the 1940 Act. |
| At August 31, 2023, these securities amounted to 6.30% of net assets of Genesis. |
| At August 31, 2023, the issuers of these securities were no longer affiliated with Genesis. |
| At August 31, 2023, these securities amounted to 0.30% of net assets of Intrinsic Value. |
Other: At August 31, 2023, affiliated persons (as defined in the 1940 Act) owned the listed percentage of the outstanding shares of the following Funds:
| Affiliated Person(s)
Percentage
Ownership of
Outstanding Shares(a) |
| |
| |
| |
| |
| |
| |
| |
| |
| |
| |
| |
| |
| |
| |
| |
| |
| |
| |
| |
| |
| Ratios that do not round to 0.01% are presented as 0.00%. |
Note G—Recent Accounting Pronouncement:
In June 2022, FASB issued Accounting Standards Update No. 2022-03, "Fair Value Measurement of Equity Securities Subject to Contractual Sale Restrictions" ("ASU 2022-03"). ASU 2022-03 clarifies the guidance in ASC 820, related to the measurement of the fair value of an equity security subject to contractual sale restrictions, where it eliminates the ability to apply a discount to the fair value of these securities, and introduces disclosure requirements related to such equity securities. The guidance is effective for fiscal years, and interim periods within those fiscal years, beginning after December 15, 2023, and allows for early adoption. Management is currently evaluating the impact of applying this update.
Note H—Subsequent Event:
As previously communicated, on March 30, 2023, the Board approved:
•
the conversion of Global Real Estate to a newly organized series of Neuberger Berman ETF Trust (the "Global Real Estate ETF"); and
•
the conversion of Greater China Equity to a newly organized series of Neuberger Berman ETF Trust (the "China Equity ETF"), (collectively, the "Conversions").
The Conversions occurred on October 13, 2023, and were effected through the reorganization of each of Greater China Equity and Global Real Estate into the respective ETF and conducted pursuant to an Agreement and Plan of Reorganization.
The Conversions were structured to be tax-free reorganizations under the U.S. Internal Revenue Code. After the Conversions, shareholders of each Fund hold shares of the respective ETF instead of the Fund. Global Real Estate ETF will continue to have the same portfolio managers and will be managed in a substantially similar manner as Global Real Estate. China Equity ETF will have a different principal investment strategy than Greater China Equity. More information regarding these changes has been provided to existing shareholders of each of Global Real Estate and Greater China Equity in a combined information statement/prospectus, which describes in detail both the Conversions and the respective ETF involved in each Conversion.
As described in the information statement/prospectus, the Conversions involved several important steps. First, after the close of business on May 19, 2023, each respective class of shares of Global Real Estate and Greater China Equity were consolidated into the respective Institutional class (without a contingent deferred sales charge or other charge). Accordingly, after that date, all Fund shareholders owned Institutional Class shares. Second, after the close of business on October 6, 2023, Global Real Estate conducted a reverse stock split pursuant to a stock split of 1:0.3665 (old to new) and Greater China Equity conducted a reverse stock split pursuant to a stock split of 1:0.2842 (old to new).
The shares outstanding, NAV per share and other per share information for Global Real Estate’s and Greater China Equity’s Institutional Class have been updated in the accompanying financial statements and financial highlights to reflect the effect of the stock split.
Finally, all whole Fund shares were converted into shares of the respective ETF in connection with the Conversions, which closed after the end of trading on Friday, October 13, 2023. Global Real Estate ETF and China Equity ETF opened for trading on NYSE Arca, Inc. on October 16, 2023. In connection with the Conversions, shareholders of each Fund received shares of the respective ETF equal in value to the number of shares of the Fund they owned, including a cash payment in lieu of fractional shares of the Fund.
The following tables include selected data for a share outstanding throughout each period and other performance information derived from the Financial Statements. Amounts that do not round to $0.01 or $(0.01) per share are presented as $0.00 or $(0.00), respectively. Ratios that do not round to 0.01% or (0.01)% are presented as 0.00% or (0.00)%, respectively. Net Assets with a zero balance, if any, may reflect actual amounts rounding to less than $0.1 million. A "—" indicates that the line item was not applicable in the corresponding period.
| Net Asset
Value,
Beginning
of Year | Net
Investment
Income/
(Loss)a | Net Gains
or
(Losses) on
Securities
(both
realized
and
unrealized) | Total From
Investment
Operations | Dividends
from Net
Investment
Income | Distributions
from Net
Realized
Capital
Gains | | |
|
|
| | | | | | | | |
| | | | | | | | |
| | | | | | | | |
| | | | | | | | |
| | | | | | | | |
|
|
| | | | | | | | |
| | | | | | | | |
| | | | | | | | |
| | | | | | | | |
| | | | | | | | |
|
|
| | | | | | | | |
| | | | | | | | |
| | | | | | | | |
| | | | | | | | |
| | | | | | | | |
|
|
| | | | | | | | |
| | | | | | | | |
| | | | | | | | |
| | | | | | | | |
| | | | | | | | |
|
Emerging Markets Equity Fund |
|
| | | | | | | | |
| | | | | | | | |
| | | | | | | | |
| | | | | | | | |
| | | | | | | | |
See Notes to Financial Highlights
Voluntary
Contribution
from
Management | Net Asset
Value,
End of
Year | | Net Assets,
End of
Year
(in millions) | Ratio
of Gross
Expenses to
Average Net
Assetsd | Ratio
of Net
Expenses to
Average
Net
Assets | Ratio
of Net
Investment
Income/
(Loss)
to
Average
Net
Assets | |
|
|
|
|
|
|
|
|
|
|
|
|
|
|
|
|
| | | | | | | |
| | | | | | | |
| | | | | | | |
| | | | | | | |
| | | | | | | |
|
|
|
|
|
|
|
|
|
| | | | | | | |
| | | | | | | |
| | | | | | | |
| | | | | | | |
| | | | | | | |
|
|
|
|
|
|
|
|
|
| | | | | | | |
| | | | | | | |
| | | | | | | |
| | | | | | | |
| | | | | | | |
|
|
|
|
|
|
|
|
|
| | | | | | | |
| | | | | | | |
| | | | | | | |
| | | | | | | |
| | | | | | | |
|
|
|
|
|
|
|
|
|
|
|
|
|
|
|
|
|
| | | | | | | |
| | | | | | | |
| | | | | | | |
| | | | | | | |
| | | | | | | |
Financial Highlights (cont’d)
| Net Asset
Value,
Beginning
of Year | Net
Investment
Income/
(Loss)a | Net Gains
or
(Losses) on
Securities
(both
realized
and
unrealized) | Total From
Investment
Operations | Dividends
from Net
Investment
Income | Distributions
from Net
Realized
Capital
Gains | | |
Emerging Markets Equity Fund (cont’d) |
|
| | | | | | | | |
| | | | | | | | |
| | | | | | | | |
| | | | | | | | |
| | | | | | | | |
|
|
| | | | | | | | |
| | | | | | | | |
| | | | | | | | |
| | | | | | | | |
| | | | | | | | |
|
|
| | | | | | | | |
| | | | | | | | |
| | | | | | | | |
| | | | | | | | |
| | | | | | | | |
|
|
| | | | | | | | |
| | | | | | | | |
| | | | | | | | |
| | | | | | | | |
| | | | | | | | |
|
|
|
| | | | | | | | |
| | | | | | | | |
| | | | | | | | |
| | | | | | | | |
| | | | | | | | |
See Notes to Financial Highlights
Voluntary
Contribution
from
Management | Net Asset
Value,
End of
Year | | Net Assets,
End of
Year
(in millions) | Ratio
of Gross
Expenses to
Average Net
Assetsd | Ratio
of Net
Expenses to
Average
Net
Assets | Ratio
of Net
Investment
Income/
(Loss)
to
Average
Net
Assets | |
|
|
|
|
|
|
|
|
|
| | | | | | | |
| | | | | | | |
| | | | | | | |
| | | | | | | |
| | | | | | | |
|
|
|
|
|
|
|
|
|
| | | | | | | |
| | | | | | | |
| | | | | | | |
| | | | | | | |
| | | | | | | |
|
|
|
|
|
|
|
|
|
| | | | | | | |
| | | | | | | |
| | | | | | | |
| | | | | | | |
| | | | | | | |
|
|
|
|
|
|
|
|
|
| | | | | | | |
| | | | | | | |
| | | | | | | |
| | | | | | | |
| | | | | | | |
|
|
|
|
|
|
|
|
|
|
|
|
|
|
|
|
|
| | | | | | | |
| | | | | | | |
| | | | | | | |
| | | | | | | |
| | | | | | | |
Financial Highlights (cont’d)
| Net Asset
Value,
Beginning
of Year | Net
Investment
Income/
(Loss)a | Net Gains
or
(Losses) on
Securities
(both
realized
and
unrealized) | Total From
Investment
Operations | Dividends
from Net
Investment
Income | Distributions
from Net
Realized
Capital
Gains | | |
Equity Income Fund (cont’d) |
|
| | | | | | | | |
| | | | | | | | |
| | | | | | | | |
| | | | | | | | |
| | | | | | | | |
|
|
| | | | | | | | |
| | | | | | | | |
| | | | | | | | |
| | | | | | | | |
| | | | | | | | |
|
|
| | | | | | | | |
| | | | | | | | |
| | | | | | | | |
| | | | | | | | |
| | | | | | | | |
|
|
| | | | | | | | |
| | | | | | | | |
|
|
|
| | | | | | | | |
| | | | | | | | |
| | | | | | | | |
| | | | | | | | |
| | | | | | | | |
|
|
| | | | | | | | |
| | | | | | | | |
| | | | | | | | |
| | | | | | | | |
| | | | | | | | |
See Notes to Financial Highlights
Voluntary
Contribution
from
Management | Net Asset
Value,
End of
Year | | Net Assets,
End of
Year
(in millions) | Ratio
of Gross
Expenses to
Average Net
Assetsd | Ratio
of Net
Expenses to
Average
Net
Assets | Ratio
of Net
Investment
Income/
(Loss)
to
Average
Net
Assets | |
|
|
|
|
|
|
|
|
|
| | | | | | | |
| | | | | | | |
| | | | | | | |
| | | | | | | |
| | | | | | | |
|
|
|
|
|
|
|
|
|
| | | | | | | |
| | | | | | | |
| | | | | | | |
| | | | | | | |
| | | | | | | |
|
|
|
|
|
|
|
|
|
| | | | | | | |
| | | | | | | |
| | | | | | | |
| | | | | | | |
| | | | | | | |
|
|
|
|
|
|
|
|
|
| | | | | | | |
| | | | | | | |
|
|
|
|
|
|
|
|
|
|
|
|
|
|
|
|
|
| | | | | | | |
| | | | | | | |
| | | | | | | |
| | | | | | | |
| | | | | | | |
|
|
|
|
|
|
|
|
|
| | | | | | | |
| | | | | | | |
| | | | | | | |
| | | | | | | |
| | | | | | | |
Financial Highlights (cont’d)
| Net Asset
Value,
Beginning
of Year | Net
Investment
Income/
(Loss)a | Net Gains
or
(Losses) on
Securities
(both
realized
and
unrealized) | Total From
Investment
Operations | Dividends
from Net
Investment
Income | Distributions
from Net
Realized
Capital
Gains | | |
|
|
| | | | | | | | |
| | | | | | | | |
| | | | | | | | |
| | | | | | | | |
| | | | | | | | |
|
|
| | | | | | | | |
| | | | | | | | |
| | | | | | | | |
| | | | | | | | |
| | | | | | | | |
|
|
| | | | | | | | |
| | | | | | | | |
| | | | | | | | |
| | | | | | | | |
| | | | | | | | |
|
|
| | | | | | | | |
| | | | | | | | |
| | | | | | | | |
| | | | | | | | |
| | | | | | | | |
|
|
|
| | | | | | | | |
| | | | | | | | |
| | | | | | | | |
| | | | | | | | |
| | | | | | | | |
|
|
| | | | | | | | |
| | | | | | | | |
| | | | | | | | |
| | | | | | | | |
| | | | | | | | |
See Notes to Financial Highlights
Voluntary
Contribution
from
Management | Net Asset
Value,
End of
Year | | Net Assets,
End of
Year
(in millions) | Ratio
of Gross
Expenses to
Average Net
Assetsd | Ratio
of Net
Expenses to
Average
Net
Assets | Ratio
of Net
Investment
Income/
(Loss)
to
Average
Net
Assets | |
|
|
|
|
|
|
|
|
|
| | | | | | | |
| | | | | | | |
| | | | | | | |
| | | | | | | |
| | | | | | | |
|
|
|
|
|
|
|
|
|
| | | | | | | |
| | | | | | | |
| | | | | | | |
| | | | | | | |
| | | | | | | |
|
|
|
|
|
|
|
|
|
| | | | | | | |
| | | | | | | |
| | | | | | | |
| | | | | | | |
| | | | | | | |
|
|
|
|
|
|
|
|
|
| | | | | | | |
| | | | | | | |
| | | | | | | |
| | | | | | | |
| | | | | | | |
|
|
|
|
|
|
|
|
|
|
|
|
|
|
|
|
|
| | | | | | | |
| | | | | | | |
| | | | | | | |
| | | | | | | |
| | | | | | | |
|
|
|
|
|
|
|
|
|
| | | | | | | |
| | | | | | | |
| | | | | | | |
| | | | | | | |
| | | | | | | |
Financial Highlights (cont’d)
| Net Asset
Value,
Beginning
of Year | Net
Investment
Income/
(Loss)a | Net Gains
or
(Losses) on
Securities
(both
realized
and
unrealized) | Total From
Investment
Operations | Dividends
from Net
Investment
Income | Distributions
from Net
Realized
Capital
Gains | | |
|
|
| | | | | | | | |
| | | | | | | | |
| | | | | | | | |
| | | | | | | | |
| | | | | | | | |
|
|
| | | | | | | | |
| | | | | | | | |
| | | | | | | | |
| | | | | | | | |
| | | | | | | | |
|
|
| | | | | | | | |
| | | | | | | | |
| | | | | | | | |
| | | | | | | | |
| | | | | | | | |
|
|
| | | | | | | | |
| | | | | | | | |
|
|
|
| | | | | | | | |
| | | | | | | | |
| | | | | | | | |
| | | | | | | | |
| | | | | | | | |
|
Greater China Equity Fund |
|
| | | | | | | | |
| | | | | | | | |
| | | | | | | | |
| | | | | | | | |
| | | | | | | | |
See Notes to Financial Highlights
Voluntary
Contribution
from
Management | Net Asset
Value,
End of
Year | | Net Assets,
End of
Year
(in millions) | Ratio
of Gross
Expenses to
Average Net
Assetsd | Ratio
of Net
Expenses to
Average
Net
Assets | Ratio
of Net
Investment
Income/
(Loss)
to
Average
Net
Assets | |
|
|
|
|
|
|
|
|
|
| | | | | | | |
| | | | | | | |
| | | | | | | |
| | | | | | | |
| | | | | | | |
|
|
|
|
|
|
|
|
|
| | | | | | | |
| | | | | | | |
| | | | | | | |
| | | | | | | |
| | | | | | | |
|
|
|
|
|
|
|
|
|
| | | | | | | |
| | | | | | | |
| | | | | | | |
| | | | | | | |
| | | | | | | |
|
|
|
|
|
|
|
|
|
| | | | | | | |
| | | | | | | |
|
|
|
|
|
|
|
|
|
|
|
|
|
|
|
|
|
| | | | | | | |
| | | | | | | |
| | | | | | | |
| | | | | | | |
| | | | | | | |
|
|
|
|
|
|
|
|
|
|
|
|
|
|
|
|
|
| | | | | | | |
| | | | | | | |
| | | | | | | |
| | | | | | | |
| | | | | | | |
Financial Highlights (cont’d)
| Net Asset
Value,
Beginning
of Year | Net
Investment
Income/
(Loss)a | Net Gains
or
(Losses) on
Securities
(both
realized
and
unrealized) | Total From
Investment
Operations | Dividends
from Net
Investment
Income | Distributions
from Net
Realized
Capital
Gains | | |
International Equity Fund |
|
| | | | | | | | |
| | | | | | | | |
| | | | | | | | |
| | | | | | | | |
| | | | | | | | |
|
|
| | | | | | | | |
| | | | | | | | |
| | | | | | | | |
| | | | | | | | |
| | | | | | | | |
|
|
| | | | | | | | |
| | | | | | | | |
| | | | | | | | |
| | | | | | | | |
| | | | | | | | |
|
|
| | | | | | | | |
| | | | | | | | |
| | | | | | | | |
| | | | | | | | |
| | | | | | | | |
|
|
| | | | | | | | |
| | | | | | | | |
| | | | | | | | |
| | | | | | | | |
| | | | | | | | |
See Notes to Financial Highlights
Voluntary
Contribution
from
Management | Net Asset
Value,
End of
Year | | Net Assets,
End of
Year
(in millions) | Ratio
of Gross
Expenses to
Average Net
Assetsd | Ratio
of Net
Expenses to
Average
Net
Assets | Ratio
of Net
Investment
Income/
(Loss)
to
Average
Net
Assets | |
|
|
|
|
|
|
|
|
|
|
|
|
|
|
|
|
| | | | | | | |
| | | | | | | |
| | | | | | | |
| | | | | | | |
| | | | | | | |
|
|
|
|
|
|
|
|
|
| | | | | | | |
| | | | | | | |
| | | | | | | |
| | | | | | | |
| | | | | | | |
|
|
|
|
|
|
|
|
|
| | | | | | | |
| | | | | | | |
| | | | | | | |
| | | | | | | |
| | | | | | | |
|
|
|
|
|
|
|
|
|
| | | | | | | |
| | | | | | | |
| | | | | | | |
| | | | | | | |
| | | | | | | |
|
|
|
|
|
|
|
|
|
| | | | | | | |
| | | | | | | |
| | | | | | | |
| | | | | | | |
| | | | | | | |
Financial Highlights (cont’d)
| Net Asset
Value,
Beginning
of Year | Net
Investment
Income/
(Loss)a | Net Gains
or
(Losses) on
Securities
(both
realized
and
unrealized) | Total From
Investment
Operations | Dividends
from Net
Investment
Income | Distributions
from Net
Realized
Capital
Gains | | |
International Equity Fund (cont’d) |
|
| | | | | | | | |
| | | | | | | | |
| | | | | | | | |
| | | | | | | | |
| | | | | | | | |
|
|
| | | | | | | | |
| | | | | | | | |
|
International Select Fund |
|
| | | | | | | | |
| | | | | | | | |
| | | | | | | | |
| | | | | | | | |
| | | | | | | | |
|
|
| | | | | | | | |
| | | | | | | | |
| | | | | | | | |
| | | | | | | | |
| | | | | | | | |
|
|
| | | | | | | | |
| | | | | | | | |
| | | | | | | | |
| | | | | | | | |
| | | | | | | | |
|
|
| | | | | | | | |
| | | | | | | | |
| | | | | | | | |
| | | | | | | | |
| | | | | | | | |
See Notes to Financial Highlights
Voluntary
Contribution
from
Management | Net Asset
Value,
End of
Year | | Net Assets,
End of
Year
(in millions) | Ratio
of Gross
Expenses to
Average Net
Assetsd | Ratio
of Net
Expenses to
Average
Net
Assets | Ratio
of Net
Investment
Income/
(Loss)
to
Average
Net
Assets | |
|
|
|
|
|
|
|
|
|
| | | | | | | |
| | | | | | | |
| | | | | | | |
| | | | | | | |
| | | | | | | |
|
|
|
|
|
|
|
|
|
| | | | | | | |
| | | | | | | |
|
|
|
|
|
|
|
|
|
|
|
|
|
|
|
|
|
| | | | | | | |
| | | | | | | |
| | | | | | | |
| | | | | | | |
| | | | | | | |
|
|
|
|
|
|
|
|
|
| | | | | | | |
| | | | | | | |
| | | | | | | |
| | | | | | | |
| | | | | | | |
|
|
|
|
|
|
|
|
|
| | | | | | | |
| | | | | | | |
| | | | | | | |
| | | | | | | |
| | | | | | | |
|
|
|
|
|
|
|
|
|
| | | | | | | |
| | | | | | | |
| | | | | | | |
| | | | | | | |
| | | | | | | |
Financial Highlights (cont’d)
| Net Asset
Value,
Beginning
of Year | Net
Investment
Income/
(Loss)a | Net Gains
or
(Losses) on
Securities
(both
realized
and
unrealized) | Total From
Investment
Operations | Dividends
from Net
Investment
Income | Distributions
from Net
Realized
Capital
Gains | | |
International Select Fund (cont’d) |
|
| | | | | | | | |
| | | | | | | | |
| | | | | | | | |
| | | | | | | | |
| | | | | | | | |
|
|
| | | | | | | | |
| | | | | | | | |
| | | | | | | | |
| | | | | | | | |
| | | | | | | | |
|
International Small Cap Fund |
|
| | | | | | | | |
| | | | | | | | |
| | | | | | | | |
| | | | | | | | |
| | | | | | | | |
|
|
| | | | | | | | |
| | | | | | | | |
| | | | | | | | |
| | | | | | | | |
| | | | | | | | |
|
|
| | | | | | | | |
| | | | | | | | |
| | | | | | | | |
| | | | | | | | |
| | | | | | | | |
|
|
| | | | | | | | |
| | | | | | | | |
| | | | | | | | |
| | | | | | | | |
| | | | | | | | |
See Notes to Financial Highlights
Voluntary
Contribution
from
Management | Net Asset
Value,
End of
Year | | Net Assets,
End of
Year
(in millions) | Ratio
of Gross
Expenses to
Average Net
Assetsd | Ratio
of Net
Expenses to
Average
Net
Assets | Ratio
of Net
Investment
Income/
(Loss)
to
Average
Net
Assets | |
|
|
|
|
|
|
|
|
|
| | | | | | | |
| | | | | | | |
| | | | | | | |
| | | | | | | |
| | | | | | | |
|
|
|
|
|
|
|
|
|
| | | | | | | |
| | | | | | | |
| | | | | | | |
| | | | | | | |
| | | | | | | |
|
|
|
|
|
|
|
|
|
|
|
|
|
|
|
|
|
| | | | | | | |
| | | | | | | |
| | | | | | | |
| | | | | | | |
| | | | | | | |
|
|
|
|
|
|
|
|
|
| | | | | | | |
| | | | | | | |
| | | | | | | |
| | | | | | | |
| | | | | | | |
|
|
|
|
|
|
|
|
|
| | | | | | | |
| | | | | | | |
| | | | | | | |
| | | | | | | |
| | | | | | | |
|
|
|
|
|
|
|
|
|
| | | | | | | |
| | | | | | | |
| | | | | | | |
| | | | | | | |
| | | | | | | |
Financial Highlights (cont’d)
| Net Asset
Value,
Beginning
of Year | Net
Investment
Income/
(Loss)a | Net Gains
or
(Losses) on
Securities
(both
realized
and
unrealized) | Total From
Investment
Operations | Dividends
from Net
Investment
Income | Distributions
from Net
Realized
Capital
Gains | | |
|
|
| | | | | | | | |
| | | | | | | | |
| | | | | | | | |
| | | | | | | | |
| | | | | | | | |
|
|
| | | | | | | | |
| | | | | | | | |
| | | | | | | | |
| | | | | | | | |
| | | | | | | | |
|
|
| | | | | | | | |
| | | | | | | | |
| | | | | | | | |
| | | | | | | | |
| | | | | | | | |
|
|
| | | | | | | | |
| | | | | | | | |
| | | | | | | | |
| | | | | | | | |
| | | | | | | | |
|
|
|
| | | | | | | | |
| | | | | | | | |
| | | | | | | | |
| | | | | | | | |
| | | | | | | | |
See Notes to Financial Highlights
Voluntary
Contribution
from
Management | Net Asset
Value,
End of
Year | | Net Assets,
End of
Year
(in millions) | Ratio
of Gross
Expenses to
Average Net
Assetsd | Ratio
of Net
Expenses to
Average
Net
Assets | Ratio
of Net
Investment
Income/
(Loss)
to
Average
Net
Assets | |
|
|
|
|
|
|
|
|
|
|
|
|
|
|
|
|
| | | | | | | |
| | | | | | | |
| | | | | | | |
| | | | | | | |
| | | | | | | |
|
|
|
|
|
|
|
|
|
| | | | | | | |
| | | | | | | |
| | | | | | | |
| | | | | | | |
| | | | | | | |
|
|
|
|
|
|
|
|
|
| | | | | | | |
| | | | | | | |
| | | | | | | |
| | | | | | | |
| | | | | | | |
|
|
|
|
|
|
|
|
|
| | | | | | | |
| | | | | | | |
| | | | | | | |
| | | | | | | |
| | | | | | | |
|
|
|
|
|
|
|
|
|
|
|
|
|
|
|
|
|
| | | | | | | |
| | | | | | | |
| | | | | | | |
| | | | | | | |
| | | | | | | |
Financial Highlights (cont’d)
| Net Asset
Value,
Beginning
of Year | Net
Investment
Income/
(Loss)a | Net Gains
or
(Losses) on
Securities
(both
realized
and
unrealized) | Total From
Investment
Operations | Dividends
from Net
Investment
Income | Distributions
from Net
Realized
Capital
Gains | | |
Large Cap Growth Fund (cont’d) |
|
| | | | | | | | |
| | | | | | | | |
| | | | | | | | |
| | | | | | | | |
| | | | | | | | |
|
|
| | | | | | | | |
| | | | | | | | |
| | | | | | | | |
| | | | | | | | |
| | | | | | | | |
|
|
| | | | | | | | |
| | | | | | | | |
| | | | | | | | |
| | | | | | | | |
| | | | | | | | |
|
|
| | | | | | | | |
| | | | | | | | |
| | | | | | | | |
| | | | | | | | |
| | | | | | | | |
|
|
| | | | | | | | |
| | | | | | | | |
| | | | | | | | |
| | | | | | | | |
| | | | | | | | |
|
|
| | | | | | | | |
| | | | | | | | |
| | | | | | | | |
| | | | | | | | |
| | | | | | | | |
See Notes to Financial Highlights
Voluntary
Contribution
from
Management | Net Asset
Value,
End of
Year | | Net Assets,
End of
Year
(in millions) | Ratio
of Gross
Expenses to
Average Net
Assetsd | Ratio
of Net
Expenses to
Average
Net
Assets | Ratio
of Net
Investment
Income/
(Loss)
to
Average
Net
Assets | |
|
|
|
|
|
|
|
|
|
| | | | | | | |
| | | | | | | |
| | | | | | | |
| | | | | | | |
| | | | | | | |
|
|
|
|
|
|
|
|
|
| | | | | | | |
| | | | | | | |
| | | | | | | |
| | | | | | | |
| | | | | | | |
|
|
|
|
|
|
|
|
|
| | | | | | | |
| | | | | | | |
| | | | | | | |
| | | | | | | |
| | | | | | | |
|
|
|
|
|
|
|
|
|
| | | | | | | |
| | | | | | | |
| | | | | | | |
| | | | | | | |
| | | | | | | |
|
|
|
|
|
|
|
|
|
| | | | | | | |
| | | | | | | |
| | | | | | | |
| | | | | | | |
| | | | | | | |
|
|
|
|
|
|
|
|
|
| | | | | | | |
| | | | | | | |
| | | | | | | |
| | | | | | | |
| | | | | | | |
Financial Highlights (cont’d)
| Net Asset
Value,
Beginning
of Year | Net
Investment
Income/
(Loss)a | Net Gains
or
(Losses) on
Securities
(both
realized
and
unrealized) | Total From
Investment
Operations | Dividends
from Net
Investment
Income | Distributions
from Net
Realized
Capital
Gains | | |
|
|
| | | | | | | | |
| | | | | | | | |
| | | | | | | | |
| | | | | | | | |
| | | | | | | | |
|
|
|
| | | | | | | | |
| | | | | | | | |
| | | | | | | | |
| | | | | | | | |
| | | | | | | | |
|
|
| | | | | | | | |
| | | | | | | | |
| | | | | | | | |
| | | | | | | | |
| | | | | | | | |
|
|
| | | | | | | | |
| | | | | | | | |
| | | | | | | | |
| | | | | | | | |
| | | | | | | | |
|
|
| | | | | | | | |
| | | | | | | | |
| | | | | | | | |
| | | | | | | | |
| | | | | | | | |
|
|
| | | | | | | | |
| | | | | | | | |
| | | | | | | | |
| | | | | | | | |
| | | | | | | | |
See Notes to Financial Highlights
Voluntary
Contribution
from
Management | Net Asset
Value,
End of
Year | | Net Assets,
End of
Year
(in millions) | Ratio
of Gross
Expenses to
Average Net
Assetsd | Ratio
of Net
Expenses to
Average
Net
Assets | Ratio
of Net
Investment
Income/
(Loss)
to
Average
Net
Assets | |
|
|
|
|
|
|
|
|
|
| | | | | | | |
| | | | | | | |
| | | | | | | |
| | | | | | | |
| | | | | | | |
|
|
|
|
|
|
|
|
|
|
|
|
|
|
|
|
|
| | | | | | | |
| | | | | | | |
| | | | | | | |
| | | | | | | |
| | | | | | | |
|
|
|
|
|
|
|
|
|
| | | | | | | |
| | | | | | | |
| | | | | | | |
| | | | | | | |
| | | | | | | |
|
|
|
|
|
|
|
|
|
| | | | | | | |
| | | | | | | |
| | | | | | | |
| | | | | | | |
| | | | | | | |
|
|
|
|
|
|
|
|
|
| | | | | | | |
| | | | | | | |
| | | | | | | |
| | | | | | | |
| | | | | | | |
|
|
|
|
|
|
|
|
|
| | | | | | | |
| | | | | | | |
| | | | | | | |
| | | | | | | |
| | | | | | | |
Financial Highlights (cont’d)
| Net Asset
Value,
Beginning
of Year | Net
Investment
Income/
(Loss)a | Net Gains
or
(Losses) on
Securities
(both
realized
and
unrealized) | Total From
Investment
Operations | Dividends
from Net
Investment
Income | Distributions
from Net
Realized
Capital
Gains | | |
Large Cap Value Fund (cont’d) |
|
| | | | | | | | |
| | | | | | | | |
| | | | | | | | |
| | | | | | | | |
| | | | | | | | |
|
|
| | | | | | | | |
| | | | | | | | |
| | | | | | | | |
| | | | | | | | |
| | | | | | | | |
|
|
| | | | | | | | |
| | | | | | | | |
| | | | | | | | |
| | | | | | | | |
| | | | | | | | |
|
|
| | | | | | | | |
| | | | | | | | |
|
|
|
| | | | | | | | |
| | | | | | | | |
| | | | | | | | |
| | | | | | | | |
| | | | | | | | |
|
|
| | | | | | | | |
| | | | | | | | |
| | | | | | | | |
| | | | | | | | |
| | | | | | | | |
See Notes to Financial Highlights
Voluntary
Contribution
from
Management | Net Asset
Value,
End of
Year | | Net Assets,
End of
Year
(in millions) | Ratio
of Gross
Expenses to
Average Net
Assetsd | Ratio
of Net
Expenses to
Average
Net
Assets | Ratio
of Net
Investment
Income/
(Loss)
to
Average
Net
Assets | |
|
|
|
|
|
|
|
|
|
| | | | | | | |
| | | | | | | |
| | | | | | | |
| | | | | | | |
| | | | | | | |
|
|
|
|
|
|
|
|
|
| | | | | | | |
| | | | | | | |
| | | | | | | |
| | | | | | | |
| | | | | | | |
|
|
|
|
|
|
|
|
|
| | | | | | | |
| | | | | | | |
| | | | | | | |
| | | | | | | |
| | | | | | | |
|
|
|
|
|
|
|
|
|
| | | | | | | |
| | | | | | | |
|
|
|
|
|
|
|
|
|
|
|
|
|
|
|
|
|
| | | | | | | |
| | | | | | | |
| | | | | | | |
| | | | | | | |
| | | | | | | |
|
|
|
|
|
|
|
|
|
| | | | | | | |
| | | | | | | |
| | | | | | | |
| | | | | | | |
| | | | | | | |
Financial Highlights (cont’d)
| Net Asset
Value,
Beginning
of Year | Net
Investment
Income/
(Loss)a | Net Gains
or
(Losses) on
Securities
(both
realized
and
unrealized) | Total From
Investment
Operations | Dividends
from Net
Investment
Income | Distributions
from Net
Realized
Capital
Gains | | |
Mid Cap Growth Fund (cont’d) |
|
| | | | | | | | |
| | | | | | | | |
| | | | | | | | |
| | | | | | | | |
| | | | | | | | |
|
|
| | | | | | | | |
| | | | | | | | |
| | | | | | | | |
| | | | | | | | |
| | | | | | | | |
|
|
| | | | | | | | |
| | | | | | | | |
| | | | | | | | |
| | | | | | | | |
| | | | | | | | |
|
|
| | | | | | | | |
| | | | | | | | |
| | | | | | | | |
| | | | | | | | |
| | | | | | | | |
|
|
| | | | | | | | |
| | | | | | | | |
| | | | | | | | |
| | | | | | | | |
| | | | | | | | |
See Notes to Financial Highlights
Voluntary
Contribution
from
Management | Net Asset
Value,
End of
Year | | Net Assets,
End of
Year
(in millions) | Ratio
of Gross
Expenses to
Average Net
Assetsd | Ratio
of Net
Expenses to
Average
Net
Assets | Ratio
of Net
Investment
Income/
(Loss)
to
Average
Net
Assets | |
|
|
|
|
|
|
|
|
|
| | | | | | | |
| | | | | | | |
| | | | | | | |
| | | | | | | |
| | | | | | | |
|
|
|
|
|
|
|
|
|
| | | | | | | |
| | | | | | | |
| | | | | | | |
| | | | | | | |
| | | | | | | |
|
|
|
|
|
|
|
|
|
| | | | | | | |
| | | | | | | |
| | | | | | | |
| | | | | | | |
| | | | | | | |
|
|
|
|
|
|
|
|
|
| | | | | | | |
| | | | | | | |
| | | | | | | |
| | | | | | | |
| | | | | | | |
|
|
|
|
|
|
|
|
|
| | | | | | | |
| | | | | | | |
| | | | | | | |
| | | | | | | |
| | | | | | | |
Financial Highlights (cont’d)
| Net Asset
Value,
Beginning
of Year | Net
Investment
Income/
(Loss)a | Net Gains
or
(Losses) on
Securities
(both
realized
and
unrealized) | Total From
Investment
Operations | Dividends
from Net
Investment
Income | Distributions
from Net
Realized
Capital
Gains | | |
|
|
| | | | | | | | |
| | | | | | | | |
| | | | | | | | |
| | | | | | | | |
| | | | | | | | |
|
Mid Cap Intrinsic Value Fund |
|
| | | | | | | | |
| | | | | | | | |
| | | | | | | | |
| | | | | | | | |
| | | | | | | | |
|
|
| | | | | | | | |
| | | | | | | | |
| | | | | | | | |
| | | | | | | | |
| | | | | | | | |
|
|
| | | | | | | | |
| | | | | | | | |
| | | | | | | | |
| | | | | | | | |
| | | | | | | | |
|
|
| | | | | | | | |
| | | | | | | | |
| | | | | | | | |
| | | | | | | | |
| | | | | | | | |
|
|
| | | | | | | | |
| | | | | | | | |
| | | | | | | | |
| | | | | | | | |
| | | | | | | | |
See Notes to Financial Highlights
Voluntary
Contribution
from
Management | Net Asset
Value,
End of
Year | | Net Assets,
End of
Year
(in millions) | Ratio
of Gross
Expenses to
Average Net
Assetsd | Ratio
of Net
Expenses to
Average
Net
Assets | Ratio
of Net
Investment
Income/
(Loss)
to
Average
Net
Assets | |
|
|
|
|
|
|
|
|
|
| | | | | | | |
| | | | | | | |
| | | | | | | |
| | | | | | | |
| | | | | | | |
|
|
|
|
|
|
|
|
|
|
|
|
|
|
|
|
|
| | | | | | | |
| | | | | | | |
| | | | | | | |
| | | | | | | |
| | | | | | | |
|
|
|
|
|
|
|
|
|
| | | | | | | |
| | | | | | | |
| | | | | | | |
| | | | | | | |
| | | | | | | |
|
|
|
|
|
|
|
|
|
| | | | | | | |
| | | | | | | |
| | | | | | | |
| | | | | | | |
| | | | | | | |
|
|
|
|
|
|
|
|
|
| | | | | | | |
| | | | | | | |
| | | | | | | |
| | | | | | | |
| | | | | | | |
|
|
|
|
|
|
|
|
|
| | | | | | | |
| | | | | | | |
| | | | | | | |
| | | | | | | |
| | | | | | | |
Financial Highlights (cont’d)
| Net Asset
Value,
Beginning
of Year | Net
Investment
Income/
(Loss)a | Net Gains
or
(Losses) on
Securities
(both
realized
and
unrealized) | Total From
Investment
Operations | Dividends
from Net
Investment
Income | Distributions
from Net
Realized
Capital
Gains | | |
Mid Cap Intrinsic Value Fund (cont’d) |
|
| | | | | | | | |
| | | | | | | | |
| | | | | | | | |
| | | | | | | | |
| | | | | | | | |
|
|
| | | | | | | | |
| | | | | | | | |
| | | | | | | | |
| | | | | | | | |
| | | | | | | | |
|
Multi-Cap Opportunities Fund |
|
| | | | | | | | |
| | | | | | | | |
| | | | | | | | |
| | | | | | | | |
| | | | | | | | |
|
|
| | | | | | | | |
| | | | | | | | |
| | | | | | | | |
| | | | | | | | |
| | | | | | | | |
|
|
| | | | | | | | |
| | | | | | | | |
| | | | | | | | |
| | | | | | | | |
| | | | | | | | |
|
|
| | | | | | | | |
| | | | | | | | |
See Notes to Financial Highlights
Voluntary
Contribution
from
Management | Net Asset
Value,
End of
Year | | Net Assets,
End of
Year
(in millions) | Ratio
of Gross
Expenses to
Average Net
Assetsd | Ratio
of Net
Expenses to
Average
Net
Assets | Ratio
of Net
Investment
Income/
(Loss)
to
Average
Net
Assets | |
|
|
|
|
|
|
|
|
|
| | | | | | | |
| | | | | | | |
| | | | | | | |
| | | | | | | |
| | | | | | | |
|
|
|
|
|
|
|
|
|
| | | | | | | |
| | | | | | | |
| | | | | | | |
| | | | | | | |
| | | | | | | |
|
|
|
|
|
|
|
|
|
|
|
|
|
|
|
|
|
| | | | | | | |
| | | | | | | |
| | | | | | | |
| | | | | | | |
| | | | | | | |
|
|
|
|
|
|
|
|
|
| | | | | | | |
| | | | | | | |
| | | | | | | |
| | | | | | | |
| | | | | | | |
|
|
|
|
|
|
|
|
|
| | | | | | | |
| | | | | | | |
| | | | | | | |
| | | | | | | |
| | | | | | | |
|
|
|
|
|
|
|
|
|
| | | | | | | |
| | | | | | | |
Financial Highlights (cont’d)
| Net Asset
Value,
Beginning
of Year | Net
Investment
Income/
(Loss)a | Net Gains
or
(Losses) on
Securities
(both
realized
and
unrealized) | Total From
Investment
Operations | Dividends
from Net
Investment
Income | Distributions
from Net
Realized
Capital
Gains | | |
|
|
| | | | | | | | |
| | | | | | | | |
| | | | | | | | |
| | | | | | | | |
| | | | | | | | |
|
|
| | | | | | | | |
| | | | | | | | |
| | | | | | | | |
| | | | | | | | |
| | | | | | | | |
|
|
| | | | | | | | |
| | | | | | | | |
| | | | | | | | |
| | | | | | | | |
| | | | | | | | |
|
|
| | | | | | | | |
| | | | | | | | |
| | | | | | | | |
| | | | | | | | |
| | | | | | | | |
|
|
| | | | | | | | |
| | | | | | | | |
| | | | | | | | |
| | | | | | | | |
| | | | | | | | |
|
|
| | | | | | | | |
| | | | | | | | |
| | | | | | | | |
| | | | | | | | |
| | | | | | | | |
See Notes to Financial Highlights
Voluntary
Contribution
from
Management | Net Asset
Value,
End of
Year | | Net Assets,
End of
Year
(in millions) | Ratio
of Gross
Expenses to
Average Net
Assetsd | Ratio
of Net
Expenses to
Average
Net
Assets | Ratio
of Net
Investment
Income/
(Loss)
to
Average
Net
Assets | |
|
|
|
|
|
|
|
|
|
|
|
|
|
|
|
|
| | | | | | | |
| | | | | | | |
| | | | | | | |
| | | | | | | |
| | | | | | | |
|
|
|
|
|
|
|
|
|
| | | | | | | |
| | | | | | | |
| | | | | | | |
| | | | | | | |
| | | | | | | |
|
|
|
|
|
|
|
|
|
| | | | | | | |
| | | | | | | |
| | | | | | | |
| | | | | | | |
| | | | | | | |
|
|
|
|
|
|
|
|
|
| | | | | | | |
| | | | | | | |
| | | | | | | |
| | | | | | | |
| | | | | | | |
|
|
|
|
|
|
|
|
|
| | | | | | | |
| | | | | | | |
| | | | | | | |
| | | | | | | |
| | | | | | | |
|
|
|
|
|
|
|
|
|
| | | | | | | |
| | | | | | | |
| | | | | | | |
| | | | | | | |
| | | | | | | |
Financial Highlights (cont’d)
| Net Asset
Value,
Beginning
of Year | Net
Investment
Income/
(Loss)a | Net Gains
or
(Losses) on
Securities
(both
realized
and
unrealized) | Total From
Investment
Operations | Dividends
from Net
Investment
Income | Distributions
from Net
Realized
Capital
Gains | | |
Real Estate Fund (cont’d) |
|
| | | | | | | | |
| | | | | | | | |
|
|
|
| | | | | | | | |
| | | | | | | | |
| | | | | | | | |
| | | | | | | | |
| | | | | | | | |
|
|
| | | | | | | | |
| | | | | | | | |
| | | | | | | | |
| | | | | | | | |
| | | | | | | | |
|
|
| | | | | | | | |
| | | | | | | | |
| | | | | | | | |
| | | | | | | | |
| | | | | | | | |
|
|
| | | | | | | | |
| | | | | | | | |
| | | | | | | | |
| | | | | | | | |
| | | | | | | | |
|
|
| | | | | | | | |
| | | | | | | | |
| | | | | | | | |
| | | | | | | | |
| | | | | | | | |
See Notes to Financial Highlights
Voluntary
Contribution
from
Management | Net Asset
Value,
End of
Year | | Net Assets,
End of
Year
(in millions) | Ratio
of Gross
Expenses to
Average Net
Assetsd | Ratio
of Net
Expenses to
Average
Net
Assets | Ratio
of Net
Investment
Income/
(Loss)
to
Average
Net
Assets | |
|
|
|
|
|
|
|
|
|
| | | | | | | |
| | | | | | | |
|
|
|
|
|
|
|
|
|
|
|
|
|
|
|
|
|
| | | | | | | |
| | | | | | | |
| | | | | | | |
| | | | | | | |
| | | | | | | |
|
|
|
|
|
|
|
|
|
| | | | | | | |
| | | | | | | |
| | | | | | | |
| | | | | | | |
| | | | | | | |
|
|
|
|
|
|
|
|
|
| | | | | | | |
| | | | | | | |
| | | | | | | |
| | | | | | | |
| | | | | | | |
|
|
|
|
|
|
|
|
|
| | | | | | | |
| | | | | | | |
| | | | | | | |
| | | | | | | |
| | | | | | | |
|
|
|
|
|
|
|
|
|
| | | | | | | |
| | | | | | | |
| | | | | | | |
| | | | | | | |
| | | | | | | |
Financial Highlights (cont’d)
| Net Asset
Value,
Beginning
of Year | Net
Investment
Income/
(Loss)a | Net Gains
or
(Losses) on
Securities
(both
realized
and
unrealized) | Total From
Investment
Operations | Dividends
from Net
Investment
Income | Distributions
from Net
Realized
Capital
Gains | | |
Small Cap Growth Fund (cont’d) |
|
| | | | | | | | |
| | | | | | | | |
| | | | | | | | |
| | | | | | | | |
| | | | | | | | |
|
|
| | | | | | | | |
| | | | | | | | |
| | | | | | | | |
| | | | | | | | |
| | | | | | | | |
|
|
| | | | | | | | |
| | | | | | | | |
| | | | | | | | |
| | | | | | | | |
| | | | | | | | |
|
|
|
| | | | | | | | |
| | | | | | | | |
| | | | | | | | |
| | | | | | | | |
| | | | | | | | |
|
|
| | | | | | | | |
| | | | | | | | |
| | | | | | | | |
| | | | | | | | |
| | | | | | | | |
See Notes to Financial Highlights
Voluntary
Contribution
from
Management | Net Asset
Value,
End of
Year | | Net Assets,
End of
Year
(in millions) | Ratio
of Gross
Expenses to
Average Net
Assetsd | Ratio
of Net
Expenses to
Average
Net
Assets | Ratio
of Net
Investment
Income/
(Loss)
to
Average
Net
Assets | |
|
|
|
|
|
|
|
|
|
| | | | | | | |
| | | | | | | |
| | | | | | | |
| | | | | | | |
| | | | | | | |
|
|
|
|
|
|
|
|
|
| | | | | | | |
| | | | | | | |
| | | | | | | |
| | | | | | | |
| | | | | | | |
|
|
|
|
|
|
|
|
|
| | | | | | | |
| | | | | | | |
| | | | | | | |
| | | | | | | |
| | | | | | | |
|
|
|
|
|
|
|
|
|
|
|
|
|
|
|
|
|
| | | | | | | |
| | | | | | | |
| | | | | | | |
| | | | | | | |
| | | | | | | |
|
|
|
|
|
|
|
|
|
| | | | | | | |
| | | | | | | |
| | | | | | | |
| | | | | | | |
| | | | | | | |
Financial Highlights (cont’d)
| Net Asset
Value,
Beginning
of Year | Net
Investment
Income/
(Loss)a | Net Gains
or
(Losses) on
Securities
(both
realized
and
unrealized) | Total From
Investment
Operations | Dividends
from Net
Investment
Income | Distributions
from Net
Realized
Capital
Gains | | |
Sustainable Equity Fund (cont’d) |
|
| | | | | | | | |
| | | | | | | | |
| | | | | | | | |
| | | | | | | | |
| | | | | | | | |
|
|
| | | | | | | | |
| | | | | | | | |
| | | | | | | | |
| | | | | | | | |
| | | | | | | | |
|
|
| | | | | | | | |
| | | | | | | | |
| | | | | | | | |
| | | | | | | | |
| | | | | | | | |
|
|
| | | | | | | | |
| | | | | | | | |
| | | | | | | | |
| | | | | | | | |
| | | | | | | | |
|
|
| | | | | | | | |
| | | | | | | | |
| | | | | | | | |
| | | | | | | | |
| | | | | | | | |
|
|
|
| | | | | | | | |
| | | | | | | | |
| | | | | | | | |
See Notes to Financial Highlights
Voluntary
Contribution
from
Management | Net Asset
Value,
End of
Year | | Net Assets,
End of
Year
(in millions) | Ratio
of Gross
Expenses to
Average Net
Assetsd | Ratio
of Net
Expenses to
Average
Net
Assets | Ratio
of Net
Investment
Income/
(Loss)
to
Average
Net
Assets | |
|
|
|
|
|
|
|
|
|
| | | | | | | |
| | | | | | | |
| | | | | | | |
| | | | | | | |
| | | | | | | |
|
|
|
|
|
|
|
|
|
| | | | | | | |
| | | | | | | |
| | | | | | | |
| | | | | | | |
| | | | | | | |
|
|
|
|
|
|
|
|
|
| | | | | | | |
| | | | | | | |
| | | | | | | |
| | | | | | | |
| | | | | | | |
|
|
|
|
|
|
|
|
|
| | | | | | | |
| | | | | | | |
| | | | | | | |
| | | | | | | |
| | | | | | | |
|
|
|
|
|
|
|
|
|
| | | | | | | |
| | | | | | | |
| | | | | | | |
| | | | | | | |
| | | | | | | |
|
|
|
|
|
|
|
|
|
|
|
|
|
|
|
|
|
| | | | | | | |
| | | | | | | |
| | | | | | | |
Financial Highlights (cont’d)
| Net Asset
Value,
Beginning
of Year | Net
Investment
Income/
(Loss)a | Net Gains
or
(Losses) on
Securities
(both
realized
and
unrealized) | Total From
Investment
Operations | Dividends
from Net
Investment
Income | Distributions
from Net
Realized
Capital
Gains | | |
U.S. Equity Impact Fund (cont’d) |
|
| | | | | | | | |
| | | | | | | | |
| | | | | | | | |
|
|
| | | | | | | | |
| | | | | | | | |
| | | | | | | | |
See Notes to Financial Highlights
Voluntary
Contribution
from
Management | Net Asset
Value,
End of
Year | | Net Assets,
End of
Year
(in millions) | Ratio
of Gross
Expenses to
Average Net
Assetsd | Ratio
of Net
Expenses to
Average
Net
Assets | Ratio
of Net
Investment
Income/
(Loss)
to
Average
Net
Assets | |
|
|
|
|
|
|
|
|
|
| | | | | | | |
| | | | | | | |
| | | | | | | |
|
|
|
|
|
|
|
|
|
| | | | | | | |
| | | | | | | |
| | | | | | | |
Notes to Financial Highlights Equity Funds
| Calculated based on the average number of shares outstanding during each fiscal period. |
| Total return based on per share NAV reflects the effects of changes in NAV on the performance of each Fund during each fiscal period. Returns assume income dividends and other distributions, if any, were reinvested, but do not reflect the effect of sales charges. Results represent past performance and do not indicate future results. Current returns may be lower or higher than the performance data quoted. Investment returns and principal will fluctuate and shares, when redeemed, may be worth more or less than original cost. Total return would have been lower if Management had not reimbursed and/or waived certain expenses. Total return would have been higher if Management had not recouped previously reimbursed and/or waived expenses. |
| Except for the Fund classes listed below, the class action proceeds listed in Note A of the Notes to Financial Statements, if any, had no impact on the Funds’ total returns for the year ended August 31, 2023. Had the Fund classes listed below not received class action proceeds in 2023, total return on per share NAV for the year ended August 31, 2023, would have been: |
| |
Mid Cap Intrinsic Value Investor Class | |
Mid Cap Intrinsic Value Trust Class | |
Mid Cap Intrinsic Value Institutional Class | |
Mid Cap Intrinsic Value Class A | |
Mid Cap Intrinsic Value Class C | |
Mid Cap Intrinsic Value Class R3 | |
Mid Cap Intrinsic Value Class R6 | |
Multi-Cap Opportunities Institutional Class | |
Multi-Cap Opportunities Class A | |
Multi-Cap Opportunities Class C | |
Multi-Cap Opportunities Class E | |
Notes to Financial Highlights Equity Funds (cont’d)
| Except for the Fund classes listed below, the class action proceeds received in 2022, 2021, and/or 2019, if any, had no impact on the Funds’ total returns for the years ended August 31, 2022, 2021, and/or 2019. Had the Fund classes listed below not received class action proceeds in 2022, 2021, and/or 2019, total return based on per share NAV for the years ended August 31, 2022, 2021 and/or 2019 would have been: |
| | | |
International Equity Investor Class | | | |
International Equity Trust Class | | | |
International Equity Institutional Class | | | |
International Equity Class A | | | |
International Equity Class C | | | |
International Equity Class R6 | | | |
International Select Trust Class | | | |
International Select Institutional Class | | | |
International Select Class A | | | |
International Select Class C | | | |
International Select Class R3 | | | |
International Select Class R6 | | | |
Large Cap Value Investor Class | | | |
Large Cap Value Trust Class | | | |
Large Cap Value Advisor Class | | | |
| | | |
| | | |
Multi-Cap Opportunities Institutional Class | | | |
Multi-Cap Opportunities Class A | | | |
Multi-Cap Opportunities Class C | | | |
Multi-Cap Opportunities Class E | | | |
Small Cap Growth Investor Class | | | |
Small Cap Growth Trust Class | | | |
Small Cap Growth Advisor Class | | | |
Small Cap Growth Institutional Class | | | |
| | | |
| | | |
Small Cap Growth Class R3 | | | |
Small Cap Growth Class R6 | | | |
|
|
|
|
|
|
|
|
| Represents the annualized ratios of net expenses to average daily net assets if Management had not reimbursed certain expenses and/or waived a portion of the investment management fee. |
| After repayment of expenses previously reimbursed and/or fees previously waived pursuant to the terms of the contractual expense limitation agreements by Management, as applicable. Had the Fund not made such repayments, the annualized ratios of net expenses to average net assets would have been: |
| |
| | | | | |
Emerging Markets Equity Institutional Class | | | | | |
Emerging Markets Equity Class R3 | | | | | |
Notes to Financial Highlights Equity Funds (cont’d)
| |
| | | | | |
Emerging Markets Equity Class R6 | | | | | |
Focus Institutional Class | | | | | |
| | | | | |
| | | | | |
Intrinsic Value Institutional Class | | | | | |
| | | | | |
| | | | | |
| | | | | |
Large Cap Growth Class R3 | | | | | |
Large Cap Growth Class R6 | | | | | |
| | | | | |
| | | | | |
| | | | | |
Mid Cap Intrinsic Value Class R6 | | | | | |
| After the close of business on December 7, 2018, the Funds' applicable classes underwent a stock split or reverse stock split. The per share data presented here has been retroactively adjusted to reflect this split. |
| The date investment operations commenced. |
| |
| |
| Portfolio turnover is calculated at the Fund level. Percentage indicated was calculated for the year ended August 31, 2019, for Intrinsic Value, Large Cap Value, Mid Cap Intrinsic Value and Small Cap Growth and for the year ended August 31, 2022, for Equity Income, Genesis, International Equity, Large Cap Value, Multi-Cap Opportunities and Real Estate. |
| After the close of business on October 6, 2023, the Fund’s Institutional Class underwent a reverse stock split. The per share data presented here has been retroactively adjusted to reflect this split. See Note H of the Notes to Financial Statements. |
| Represents the annualized ratio of net expenses to average daily net assets after utilization of the line of credit by Global Real Estate (2023), Greater China Equity (2023 and 2019) and International Small Cap (2020) and/or reimbursement of expenses and/or waiver of a portion of the investment management fee by Management. Had Global Real Estate, Greater China Equity and International Small Cap not utilized the line of credit, and/or had Management not undertaken such action, the annualized ratios of net expenses to average daily net assets would have been: |
| |
| | | |
Global Real Estate Institutional Class | | | |
Greater China Equity Institutional Class | | | |
International Small Cap Institutional Class | | | |
International Small Cap Class A | | | |
International Small Cap Class C | | | |
International Small Cap Class R6 | | | |
Notes to Financial Highlights Equity Funds (cont’d)
| Had International Equity not received the voluntary contribution in 2020, the total return based on per share NAV for the year ended August 31, 2020 would have been: |
| Year Ended August 31, 2020 |
International Equity Investor Class | |
International Equity Trust Class | |
International Equity Institutional Class | |
International Equity Class A | |
International Equity Class C | |
International Equity Class R6 | |
| This information has been audited by a different independent public accounting firm. |
| Consolidated financial highlights. See Note A in the Notes to Consolidated Financial Statements. |
| After the close of business on August 16, 2019, Large Cap Value acquired all of the net assets of Neuberger Berman Value Fund in a tax-free exchange of shares pursuant to a Plan of Reorganization and Dissolution approved by the Board. Portfolio turnover excludes purchases of $30,333,739 of securities acquired, and there were no sales made following a purchase-of-assets transaction relative to the merger. |
| After the close of business on July 23, 2021, the Funds’ applicable classes underwent a stock split or reverse stock split. The per share data presented here has been retroactively adjusted to reflect this split. |
| Organization expense, which is a non-recurring expense, is included in these ratios on a non-annualized basis. |
Report of Independent Registered Public Accounting Firm
To the Board of Trustees of
Neuberger Berman Equity Funds and the Shareholders of:
Neuberger Berman Dividend Growth Fund
Neuberger Berman Emerging Markets Equity Fund
Neuberger Berman Equity Income Fund
Neuberger Berman Focus Fund
Neuberger Berman Genesis Fund
Neuberger Berman Global Real Estate Fund
Neuberger Berman Greater China Equity Fund
Neuberger Berman International Equity Fund
Neuberger Berman International Select Fund
Neuberger Berman International Small Cap Fund
Neuberger Berman Intrinsic Value Fund
Neuberger Berman Large Cap Growth Fund
Neuberger Berman Large Cap Value Fund
Neuberger Berman Mid Cap Growth Fund
Neuberger Berman Mid Cap Intrinsic Value Fund
Neuberger Berman Multi-Cap Opportunities Fund
Neuberger Berman Real Estate Fund
Neuberger Berman Small Cap Growth Fund
Neuberger Berman Sustainable Equity Fund
Neuberger Berman U.S. Equity Impact Fund
Opinion on the Financial Statements
We have audited the accompanying consolidated statement of assets and liabilities of Neuberger Berman Large Cap Growth Fund (one of the series constituting the Neuberger Berman Equity Funds (the "Trust")), including the consolidated schedule of investments, as of August 31, 2023, and the related consolidated statements of operations and changes in net assets, and the consolidated financial highlights for each of the periods indicated in the table below and the related notes (collectively referred to as the "consolidated financial statements"). We have audited the accompanying statements of assets and liabilities of Neuberger Berman Dividend Growth Fund, Neuberger Berman Emerging Markets Equity Fund, Neuberger Berman Equity Income Fund, Neuberger Berman Focus Fund, Neuberger Berman Genesis Fund, Neuberger Berman Global Real Estate Fund, Neuberger Berman Greater China Equity Fund, Neuberger Berman International Equity Fund, Neuberger Berman International Select Fund, Neuberger Berman International Small Cap Fund, Neuberger Berman Intrinsic Value Fund, Neuberger Berman Large Cap Value Fund, Neuberger Berman Mid Cap Growth Fund, Neuberger Berman Mid Cap Intrinsic Value Fund, Neuberger Berman Multi-Cap Opportunities Fund, Neuberger Berman Real Estate Fund, Neuberger Berman Small Cap Growth Fund, Neuberger Berman Sustainable Equity Fund, and Neuberger Berman U.S. Equity Impact Fund (collectively, together with Neuberger Berman Large Cap Growth Fund, referred to as the "Funds") (nineteen of the series constituting the Trust), including the schedules of investments, as of August 31, 2023, and the related statements of operations and changes in net assets, and the financial highlights for each of the periods indicated in the table below and the related notes (collectively, together with the consolidated financial statements, referred to as the "financial statements"). In our opinion, the financial statements present fairly, in all material respects, the financial position, or the consolidated financial position, of each of the Funds (twenty of the series constituting Neuberger Berman Equity Funds) at August 31, 2023, and the results, or the consolidated results, of their operations, changes in net assets and financial highlights for each of the periods indicated in the table below, in conformity with U.S. generally accepted accounting principles. The accompanying financial highlights of the Neuberger Berman Intrinsic Value Fund, Neuberger Berman Mid Cap Growth Fund, Neuberger
Berman Mid Cap Intrinsic Value Fund, Neuberger Berman Multi-Cap Opportunities Fund, Neuberger Berman Small Cap Growth Fund, and Neuberger Berman Sustainable Equity Fund for each of the periods in the three years ended August 31, 2021 were audited by another independent registered public accounting firm whose report, dated October 20, 2021, expressed an unqualified opinion on the financial statements containing those financial highlights.
Individual fund constituting Neuberger Berman Equity Funds | | Statements of changes in net assets | |
Neuberger Berman Dividend Growth Fund
Neuberger Berman Emerging Markets Equity Fund
Neuberger Berman Equity Income Fund
Neuberger Berman Focus Fund
Neuberger Berman Genesis Fund
Neuberger Berman Global Real Estate Fund
Neuberger Berman Greater China Equity Fund
Neuberger Berman International Equity Fund
Neuberger Berman International Select Fund
Neuberger Berman International Small Cap Fund
Neuberger Berman Large Cap Growth Fund
Neuberger Berman Large Cap Value Fund
Neuberger Berman Real Estate Fund | For the year ended August 31, 2023 | For each of the two years in the period ended August 31, 2023 | For each of the five years in the period ended August 31, 2023 |
Neuberger Berman U.S. Equity Impact Fund | For the year ended August 31, 2023 | For each of the two years in the period ended August 31, 2023 | For each of the two years ended August 31, 2023 and the period from March 23, 2021 (commencement of operations) to August 31, 2021 |
Neuberger Berman Intrinsic Value Fund
Neuberger Berman Mid Cap Growth Fund
Neuberger Berman Mid Cap Intrinsic Value Fund
Neuberger Berman Multi-Cap Opportunities Fund
Neuberger Berman Small Cap Growth Fund
Neuberger Berman Sustainable Equity Fund | For the year ended August 31, 2023 | For each of the two years in the period ended August 31, 2023 | For each of the two years in the period ended August 31, 2023 |
Basis for Opinion
These financial statements are the responsibility of the Trust’s management. Our responsibility is to express an opinion on each of the Funds’ financial statements based on our audits. We are a public accounting firm registered with the Public Company Accounting Oversight Board (United States) ("PCAOB") and are required to be independent with respect to the Trust in accordance with the U.S. federal securities laws and the applicable rules and regulations of the Securities and Exchange Commission and the PCAOB.
We conducted our audits in accordance with the standards of the PCAOB. Those standards require that we plan and perform the audit to obtain reasonable assurance about whether the financial statements are free of material misstatement, whether due to error or fraud. The Trust is not required to have, nor were we engaged to perform, an audit of the Trust’s internal control over financial reporting. As part of our audits, we are required to obtain an understanding of internal control over financial reporting but not for the purpose of expressing an opinion on the effectiveness of the Trust’s internal control over financial reporting. Accordingly, we express no such opinion.
Our audits included performing procedures to assess the risks of material misstatement of the financial statements, whether due to error or fraud, and performing procedures that respond to those risks. Such procedures included examining, on a test basis, evidence regarding the amounts and disclosures in the financial statements. Our procedures included confirmation of securities owned as of August 31, 2023, by correspondence with the custodian, brokers and others; when replies were not received from brokers and others, we performed other auditing procedures. Our audits also included evaluating the accounting principles used and significant estimates made by management, as well as evaluating the overall presentation of the financial statements. We believe that our audits provide a reasonable basis for our opinion.
We have served as the auditor of one or more Neuberger Berman investment companies since 1954.
Boston, Massachusetts
October 24, 2023
Investment Manager and Administrator
Neuberger Berman Investment Advisers LLC
1290 Avenue of the Americas
New York, NY 10104-0002
Shareholder Services
800.877.9700 or 212.476.8800
Intermediary Client Services 800.366.6264
Distributor
Neuberger Berman BD LLC
1290 Avenue of the Americas
New York, NY 10104-0002
Shareholder Services
800.877.9700 or 212.476.8800
Intermediary Client Services 800.366.6264
Subadviser
Green Court Capital Management Limited*
20th Floor
Jardine House
1 Connaught Place
Hong Kong
Custodian
State Street Bank and Trust Company
One Congress Street, Suite 1
Boston, MA 02114-2016
*Prior to August 21, 2023, Green Court Capital
Management Limited was the subadviser to
Greater China Equity.
Shareholder Servicing Agent
SS&C Global Investor & Distribution Solutions, Inc.
430 West 7th Street, Suite 219189
Kansas City, MO 64105-1407
For Investor, Trust, Advisor & Institutional Class Shareholders address correspondence to:
Neuberger Berman Funds
PO Box 219189
Kansas City, MO 64121-9189
Shareholder Services 800.877.9700 or 212.476.8800
Intermediary Client Services 800.366.6264
For Class A, Class C, Class R3 and Class R6 Shareholders:
Please contact your investment provider
Legal Counsel
K&L Gates LLP
1601 K Street, NW
Washington, DC 20006-1600
Independent Registered Public Accounting Firm
Ernst & Young LLP
200 Clarendon Street
Boston, MA 02116
Trustees and Officers
The following tables set forth information concerning the Trustees and Officers of the Funds. All persons named as Trustees and Officers also serve in similar capacities for other funds administered or managed by NBIA. The Funds' Statement of Additional Information includes additional information about the Trustees as of the time of the Funds' most recent public offering and is available upon request, without charge, by calling (800) 877-9700.
Information about the Board of Trustees
| | Principal Occupation(s)(3) | Number of
Funds in
Fund Complex
Overseen by
Fund Trustee | Other Directorships Held
Outside Fund Complex by
|
Independent Fund Trustees |
Michael J. Cosgrove (1949) | | President, Carragh Consulting USA, since 2014; formerly, Executive, General Electric Company, 1970 to 2014, including President, Mutual Funds and Global Investment Programs, GE Asset Management, 2011 to 2014, President and Chief Executive Officer, Mutual Funds and Intermediary Business, GE Asset Management, 2007 to 2011, President, Institutional Sales and Marketing, GE Asset Management, 1998 to 2007, and Chief Financial Officer, GE Asset Management, and Deputy Treasurer, GE Company, 1988 to 1993. | | Member of Advisory Board, Burke Neurological Institute, since 2021; Parish Councilor, St. Pius X, since 2021; formerly, Director, America Press, Inc. (not-for-profit Jesuit publisher), 2015 to 2021; formerly, Director, Fordham University, 2001 to 2018; formerly, Director, The Gabelli Go Anywhere Trust, June 2015 to June 2016; formerly, Director, Skin Cancer Foundation (not-for-profit), 2006 to 2015; formerly, Director, GE Investments Funds, Inc., 1997 to 2014; formerly, Trustee, GE Institutional Funds, 1997 to 2014; formerly, Director, GE Asset Management, 1988 to 2014; formerly, Director, Elfun Trusts, 1988 to 2014; formerly, Trustee, GE Pension & Benefit Plans, 1988 to 2014; formerly, Member of Board of Governors, Investment Company Institute. |
Name, (Year of Birth), and Address(1) | Position(s) and Length of Time Served(2) | Principal Occupation(s)(3) | Number of Funds in Fund Complex Overseen by Fund Trustee | Other Directorships Held Outside Fund Complex by Fund Trustee(3) |
| | Executive Vice Chancellor Emeritus, The Jewish Theological Seminary, since 2020; formerly, Executive Vice Chancellor and Chief Operating Officer, The Jewish Theological Seminary, 2012 to 2020; formerly, Executive Vice President and General Counsel, Fidelity Investments, 2007 to 2012; formerly, Executive Vice President and General Counsel, BellSouth Corporation, 2004 to 2007; formerly, Vice President and Associate General Counsel, BellSouth Corporation, 2000 to 2004; formerly, Associate, Partner, and National Litigation Practice Co-Chair, Mayer, Brown LLP, 1981 to 2000; formerly, Associate Independent Counsel, Office of Independent Counsel, 1990 to 1992. | | Chair and Director, USCJ Supporting Foundation, since 2019; Director, UJA Federation of Greater New York, since 2019; Trustee, The Jewish Theological Seminary, since 2015; Director, Lawyers Committee for Civil Rights Under Law (not-for-profit), since 2005; formerly, Director, Legility, Inc. (privately held for-profit company), 2012 to 2021; formerly, Director, Equal Justice Works (not-for-profit), 2005 to 2014; formerly, Director, Corporate Counsel Institute, Georgetown University Law Center, 2007 to 2012; formerly, Director, Greater Boston Legal Services (not-for-profit), 2007 to 2012. |
Name, (Year of Birth), and Address(1) | Position(s) and Length of Time Served(2) | Principal Occupation(s)(3) | Number of Funds in Fund Complex Overseen by Fund Trustee | Other Directorships Held Outside Fund Complex by Fund Trustee(3) |
| | Formerly, President, Woodhill Enterprises Inc./Chase Hollow Associates LLC (personal investment vehicle), 2006 to 2020; formerly, Consultant, Resources Global Professionals (temporary staffing), 2002 to 2006; formerly, Chief Financial Officer, Booz-Allen & Hamilton, Inc., 1995 to 1999; formerly, Enterprise Risk Officer, Prudential Insurance, 1994 to1995; formerly, President, Prudential Asset Management Company, 1992 to 1994; formerly, President, Prudential Power Funding (investments in electric and gas utilities and alternative energy projects), 1989 to 1992; formerly, Treasurer, Prudential Insurance Company, 1983 to 1989. | | Director, American Water (water utility), since 2003; Director, Allianz Life of New York (insurance), since 2005; formerly, Director, Berger Group Holdings, Inc. (engineering consulting firm), 2013 to 2018; formerly, Director, Financial Women’s Association of New York (not-for-profit association), 1987 to 1996, and 2003 to 2019; Trustee Emerita, Brown University, since 1998; Director, Museum of American Finance (not-for-profit), since 2013; formerly, Non-Executive Chair and Director, Channel Reinsurance (financial guaranty reinsurance), 2006 to 2010; formerly, Director, Ocwen Financial Corporation (mortgage servicing), 2005 to 2010; formerly, Director, Claire’s Stores, Inc. (retailer), 2005 to 2007; formerly, Director, Parsons Brinckerhoff Inc. (engineering consulting firm), 2007 to 2010; formerly, Director, Bank Leumi (commercial bank), 2005 to 2007; formerly, Advisory Board Member, Attensity (software developer), 2005 to 2007; formerly, Director, Foster Wheeler Manufacturing, 1994 to 2004; formerly Director, Dexter Corp. (Manufacturer of Non-Wovens, Plastics, and Medical Supplies), 1992 to 2001. |
Name, (Year of Birth), and Address(1) | Position(s) and Length of Time Served(2) | Principal Occupation(s)(3) | Number of Funds in Fund Complex Overseen by Fund Trustee | Other Directorships Held Outside Fund Complex by Fund Trustee(3) |
| | Formerly, Partner, Deloitte LLP, 1982 to 2023, including Vice Chair, 2017 to 2020; formerly, President and Board Chair, Women's Forum of New York, 2014 to 2016. | | |
Michael M. Knetter (1960) | | President and Chief Executive Officer, University of Wisconsin Foundation, since 2010; formerly, Dean, School of Business, University of Wisconsin - Madison; formerly, Professor of International Economics and Associate Dean, Amos Tuck School of Business - Dartmouth College, 1998 to 2002. | | Director, 1WS Credit Income Fund, since 2018; Board Member, American Family Insurance (a mutual company, not publicly traded), since March 2009; formerly, Trustee, Northwestern Mutual Series Fund, Inc., 2007 to 2011; formerly, Director, Wausau Paper, 2005 to 2011; formerly, Director, Great Wolf Resorts, 2004 to 2009. |
| | Member, Circle Financial Group (private wealth management membership practice), since 2011; Managing Director, Golden Seeds LLC (an angel investing group), since 2009; Adjunct Professor (Corporate Finance), Columbia University School of International and Public Affairs, since 2008; formerly, Visiting Assistant Professor, Fairfield University, Dolan School of Business, Fall 2007; formerly, Adjunct Associate Professor of Finance, Richmond, The American International University in London, 1999 to 2007. | | Board Member, The Maritime Aquarium at Norwalk, since 2020; Board Member, Norwalk Community College Foundation, since 2014; Dean’s Advisory Council, Radcliffe Institute for Advanced Study, since 2014; formerly, Director and Treasurer, At Home in Darien (not-for-profit), 2012 to 2014; formerly, Director, National Executive Service Corps (not-for-profit), 2012 to 2013; formerly, Trustee, Richmond, The American International University in London, 1999 to 2013. |
Name, (Year of Birth), and Address(1) | Position(s) and Length of Time Served(2) | Principal Occupation(s)(3) | Number of Funds in Fund Complex Overseen by Fund Trustee | Other Directorships Held Outside Fund Complex by Fund Trustee(3) |
| | Formerly, Adjunct Professor, Columbia University School of International and Public Affairs, 2012 to 2018; formerly, Executive Vice President and Chief Financial Officer, People's United Bank, Connecticut (a financial services company), 1991 to 2001. | | Director, 1WS Credit Income Fund; Chair, Audit Committee, since 2018; Director and Chair, Thrivent Church Loan and Income Fund, since 2018; formerly, Trustee, Steben Alternative Investment Funds, Steben Select Multi-Strategy Fund, and Steben Select Multi-Strategy Master Fund, 2013 to 2017; formerly, Treasurer, National Association of Corporate Directors, Connecticut Chapter, 2011 to 2015; formerly, Manager, Larch Lane Multi-Strategy Fund complex (which consisted of three funds), 2006 to 2011; formerly, Member, NASDAQ Issuers’ Affairs Committee, 1995 to 2003. |
| Trustee since 2000; Chairman of the Board since 2008; formerly Lead Independent Trustee from 2006 to 2008 | Formerly, Managing Member, Ridgefield Farm LLC (a private investment vehicle), 2004 to 2016; formerly, President and CEO, Westaff, Inc. (temporary staffing), May 2001 to January 2002; formerly, Senior Executive, The Charles Schwab Corporation, 1983 to 1998, including Chief Executive Officer, Charles Schwab Investment Management, Inc.; Trustee, Schwab Family of Funds and Schwab Investments, 1997 to 1998; and Executive Vice President-Retail Brokerage, Charles Schwab & Co., Inc., 1994 to 1997. | | Trustee, University of Maryland, Shore Regional Health System, since 2020; formerly, Director, H&R Block, Inc. (tax services company), 2001 to 2018; formerly, Director, Talbot Hospice Inc., 2013 to 2016; formerly, Chairman, Governance and Nominating Committee, H&R Block, Inc., 2011 to 2015; formerly, Chairman, Compensation Committee, H&R Block, Inc., 2006 to 2010; formerly, Director, Forward Management, Inc. (asset management company), 1999 to 2006. |
| | Formerly, Partner, PricewaterhouseCoopers LLP, 1989 to 2021. | | |
Name, (Year of Birth), and Address(1) | Position(s) and Length of Time Served(2) | Principal Occupation(s)(3) | Number of Funds in Fund Complex Overseen by Fund Trustee | Other Directorships Held Outside Fund Complex by Fund Trustee(3) |
James G. Stavridis (1955) | | Vice Chairman Global Affairs, The Carlyle Group, since 2018; Commentator, NBC News, since 2015; formerly, Dean, Fletcher School of Law and Diplomacy, Tufts University, 2013 to 2018; formerly, Admiral, United States Navy, 1976 to 2013, including Supreme Allied Commander, NATO and Commander, European Command, 2009 to 2013, and Commander, United States Southern Command, 2006 to 2009. | | Director, Fortinet (cybersecurity), since 2021; Director, Ankura, since 2020; Director, Vigor Shipyard, since 2019; Director, Rockefeller Foundation, since 2018; Director, American Water (water utility), since 2018; Director, NFP Corp. (insurance broker and consultant), since 2017; Director, Onassis Foundation, since 2014; Director, Michael Baker International (construction) since 2014; Director, Vertical Knowledge, LLC, since 2013; formerly, Director, U.S. Naval Institute, 2014 to 2019; formerly, Director, Navy Federal Credit Union, 2000 to 2002; formerly, Director, BMC Software Federal, LLC, 2014 to 2019. |
Name, (Year of Birth), and Address(1) | Position(s) and Length of Time Served(2) | Principal Occupation(s)(3) | Number of Funds in Fund Complex Overseen by Fund Trustee | Other Directorships Held Outside Fund Complex by Fund Trustee(3) |
Fund Trustees who are "Interested Persons" |
| Chief Executive Officer and President since 2018 and Trustee since 2009 | President and Director, Neuberger Berman Group LLC, since 2009; President and Chief Executive Officer, Neuberger Berman BD LLC and Neuberger Berman Holdings LLC (including its predecessor, Neuberger Berman Inc.), since 2007; Chief Investment Officer (Equities) and President (Equities), NBIA (formerly, Neuberger Berman Fixed Income LLC and including predecessor entities), since 2007, and Board Member of NBIA since 2006; formerly, Global Head of Asset Management of Lehman Brothers Holdings Inc.’s ("LBHI") Investment Management Division, 2006 to 2009; formerly, member of LBHI’s Investment Management Division’s Executive Management Committee, 2006 to 2009; formerly, Managing Director, Lehman Brothers Inc. ("LBI"), 2006 to 2008; formerly, Chief Recruiting and Development Officer, LBI, 2005 to 2006; formerly, Global Head of LBI’s Equity Sales and a Member of its Equities Division Executive Committee, 2003 to 2005; President and Chief Executive Officer, twelve registered investment companies for which NBIA acts as investment manager and/or administrator. | | Member of Board of Advisors, McDonough School of Business, Georgetown University, since 2001; Member of New York City Board of Advisors, Teach for America, since 2005; Trustee, Montclair Kimberley Academy (private school), since 2007; Member of Board of Regents, Georgetown University, since 2013. |
(1)
The business address of each listed person is 1290 Avenue of the Americas, New York, NY 10104.
(2)
Pursuant to the Trust’s Amended and Restated Trust Instrument ("Trust Instrument"), subject to any limitations on the term of service imposed by the By-Laws or any retirement policy adopted by the Fund Trustees, each Fund Trustee shall hold office for life or until his or her successor is elected or the Trust
terminates; except that (a) any Fund Trustee may resign by delivering a written resignation; (b) any Fund Trustee may be removed with or without cause at any time by a written instrument signed by at least two-thirds of the other Fund Trustees; (c) any Fund Trustee who requests to be retired, or who has become unable to serve, may be retired by a written instrument signed by a majority of the other Fund Trustees; and (d) any Fund Trustee may be removed at any shareholder meeting by a vote of at least two-thirds of the outstanding shares.
(3)
Except as otherwise indicated, each individual has held the positions shown during at least the last five years.
*
Indicates a Fund Trustee who is an "interested person" within the meaning of the 1940 Act. Mr. Amato is an interested person of the Trust by virtue of the fact that he is an officer of NBIA and/or its affiliates.
Information about the Officers of the Trust
Name, (Year of Birth), and | Position(s) and Length of Time | Principal Occupation(s)(3) |
Claudia A. Brandon (1956) | Executive Vice President since 2008 and Secretary since 1985 | Senior Vice President, Neuberger Berman, since 2007 and Employee since 1999; Senior Vice President, NBIA, since 2008 and Assistant Secretary since 2004; formerly, Vice President, Neuberger Berman, 2002 to 2006; formerly, Vice President, Mutual Fund Board Relations, NBIA, 2000 to 2008; formerly, Vice President, NBIA, 1986 to 1999 and Employee, 1984 to 1999; Executive Vice President and Secretary, thirty-three registered investment companies for which NBIA acts as investment manager and/or administrator. |
| | Senior Vice President, Neuberger Berman, since 2012; Senior Vice President, NBIA, since 2012 and Employee since 1996; formerly, Vice President, Neuberger Berman, 2007 to 2012; Vice President, twelve registered investment companies for which NBIA acts as investment manager and/or administrator. |
Anthony DiBernardo (1979) | Assistant Treasurer since 2011 | Senior Vice President, Neuberger Berman, since 2014; Senior Vice President, NBIA, since 2014, and Employee since 2003; formerly, Vice President, Neuberger Berman, 2009 to 2014; Assistant Treasurer, twelve registered investment companies for which NBIA acts as investment manager and/or administrator. |
Savonne L. Ferguson (1973) | Chief Compliance Officer since 2018 | Senior Vice President, Chief Compliance Officer, Mutual Funds and Associate General Counsel, NBIA, since November 2018; formerly, Vice President, T. Rowe Price Group, Inc., 2018; Vice President and Senior Legal Counsel, T. Rowe Price Associates, Inc., 2014 to 2018; Vice President and Director of Regulatory Fund Administration, PNC Capital Advisors, LLC, 2009 to 2014; Secretary, PNC Funds and PNC Advantage Funds, 2010 to 2014; Chief Compliance Officer, thirty-three registered investment companies for which NBIA acts as investment manager and/or administrator. |
| Chief Legal Officer since 2016 (only for purposes of sections 307 and 406 of the Sarbanes-Oxley Act of 2002) | General Counsel, Mutual Funds, since 2016 and Managing Director, NBIA, since 2017; formerly, Associate General Counsel, 2015 to 2016; Counsel, 2007 to 2015; Senior Vice President, 2013 to 2016; Vice President, 2009 to 2013; Chief Legal Officer (only for purposes of sections 307 and 406 of the Sarbanes-Oxley Act of 2002), thirty-three registered investment companies for which NBIA acts as investment manager and/or administrator. |
| Assistant Secretary since 2002 | Senior Vice President, Neuberger Berman, since 2023 and Employee since 1999; Senior Vice President, NBIA, since 2023; formerly, Vice President, Neuberger Berman, 2008 to 2023; Assistant Vice President, Neuberger Berman, 2007; Employee, NBIA, 1991 to 1999; Assistant Secretary, thirty-three registered investment companies for which NBIA acts as investment manager and/or administrator. |
Name, (Year of Birth), and Address(1) | Position(s) and Length of Time Served(2) | Principal Occupation(s)(3) |
| Chief Operating Officer since 2015 and Vice President since 2008 | Managing Director, Neuberger Berman, since 2013; Chief Operating Officer, Mutual Funds and Managing Director, NBIA, since 2015; formerly, Senior Vice President, Neuberger Berman, 2006 to 2014; Vice President, NBIA, 2008 to 2015 and Employee since 1991; Chief Operating Officer, twelve registered investment companies for which NBIA acts as investment manager and/or administrator; Vice President, thirty-three registered investment companies for which NBIA acts as investment manager and/or administrator. |
| | Senior Vice President, Neuberger Berman, since 2014 and Employee since 2000; Senior Vice President, NBIA, since 2014; Vice President, twelve registered investment companies for which NBIA acts as investment manager and/or administrator. |
| Assistant Secretary since 2017 | Senior Paralegal, Neuberger Berman, since 2007 and Employee since 2007; Assistant Secretary, thirty-three registered investment companies for which NBIA acts as investment manager and/or administrator. |
Owen F. McEntee, Jr. (1961) | | Vice President, Neuberger Berman, since 2006; Vice President, NBIA, since 2006 and Employee since 1992; Vice President, twelve registered investment companies for which NBIA acts as investment manager and/or administrator. |
| Treasurer and Principal Financial and Accounting Officer since 2005 | Managing Director, Neuberger Berman, since 2022; Senior Vice President, Neuberger Berman, 2007 to 2021; Senior Vice President, NBIA, since 2007 and Employee since 1993; formerly, Vice President, Neuberger Berman, 2004 to 2006; formerly, Assistant Treasurer, 2002 to 2005; Treasurer and Principal Financial and Accounting Officer, twelve registered investment companies for which NBIA acts as investment manager and/or administrator. |
| Assistant Treasurer since 2005 | Vice President, Neuberger Berman, since 2006; Vice President, NBIA, since 2006 and Employee since 1995; Assistant Treasurer, twelve registered investment companies for which NBIA acts as investment manager and/or administrator. |
| Anti-Money Laundering Compliance Officer since 2023 | Senior Vice President and Head of Financial Regulation, Neuberger Berman, since February 2023; Assistant United States Attorney, Southern District of New York, 2016 to 2023; Trial Attorney, Department of Justice Antitrust Division, 2012 to 2015; Senior Anti-Money Laundering Compliance Officer, five registered investment companies for which NBIA acts as investment manager and/or administrator. |
(1)
The business address of each listed person is 1290 Avenue of the Americas, New York, NY 10104.
(2) Pursuant to the By-Laws of the Trust, each officer elected by the Fund Trustees shall hold office until his or her successor shall have been elected and qualified or until his or her earlier death, inability to serve, or resignation. Officers serve at the pleasure of the Fund Trustees and may be removed at any time with or without cause.
(3)
Except as otherwise indicated, each individual has held the positions shown during at least the last five years.
Proxy Voting Policies and Procedures
A description of the policies and procedures that the Trust uses to determine how to vote proxies relating to portfolio securities is available, without charge, by calling 800-877-9700 (toll-free) and on the SEC’s website at www.sec.gov. Information regarding how the Trust voted proxies relating to portfolio securities during the most recent 12-month period ended June 30 is also available upon request, without charge, by calling 800-877-9700 (toll-free), on the SEC’s website at www.sec.gov, and on Neuberger Berman’s website at www.nb.com.
Quarterly Portfolio Schedule
The Trust files a complete schedule of portfolio holdings for each Fund with the SEC for the first and third quarters of each fiscal year as an exhibit to its report on Form N-PORT. The Trust’s Form N-PORT is available on the SEC’s website at www.sec.gov. The portfolio holdings information on Form N-PORT is available upon request, without charge, by calling 800-877-9700 (toll-free).
Liquidity Risk Management Program
Consistent with Rule 22e-4 under the Investment Company Act of 1940 (the "Liquidity Rule"), as amended, the Funds have established a liquidity risk management program (the "Program"). The Program seeks to assess and manage the Funds’ liquidity risk, which is defined as the risk that a Fund is unable to meet investor redemption requests without significantly diluting the remaining investors' interests in a Fund. The Board has approved the designation of NBIA Funds' Liquidity Committee, comprised of NBIA employees, as the program administrator (the "Program Administrator"). The Program Administrator is responsible for implementing and monitoring the Program and utilizes NBIA personnel to assess and review, on an ongoing basis, the Funds' liquidity risk.
The Program includes a number of elements that support the management and assessment of liquidity risk, including an annual assessment of the Funds' liquidity risk factors and the periodic classification (or re-classification, as necessary) of the Funds’ investments into buckets (highly liquid, moderately liquid, less liquid and illiquid) that reflect the Program Administrator's assessment of the investments' liquidity under current market conditions, which for the relevant period included, among other factors, market volatility as a result of geopolitical tensions (e.g., Russia’s invasion of Ukraine) and rising inflation. The Program Administrator also utilizes information about the Funds’ investment strategy, the characteristics of the Funds’ shareholder base and historical redemption activity.
The Program Administrator provided the Board with a written report that addressed the operation of the Program and assessed its adequacy and effectiveness of implementation from April 1, 2022 through March 31, 2023. During the period covered by this report, the Program Administrator reported that the Program effectively assisted the Program Administrator in monitoring whether a Fund maintained a level of liquidity appropriate for its shareholder base and historical redemption activity.
Notice to Shareholders
For the fiscal year ended August 31, 2023, each Fund makes the following designation, or up to the maximum amount of such dividends allowable pursuant to the Internal Revenue Code, as Capital Gains Distributions and Qualified Dividend Income. Complete information regarding each Fund’s Qualified Dividend Income distributions during the calendar year 2023 will be reported in conjunction with Form 1099-DIV.
| Capital Gains
Distributions | |
| | |
| | |
| | |
| | |
| | |
| | |
| | |
| | |
| | |
| | |
| | |
| | |
| | |
| | |
| | |
| | |
| | |
This page has been left blank intentionally
Neuberger Berman Investment Advisers LLC
1290 Avenue of the Americas
New York, NY 10104-0002
Retail Services: 800.877.9700
Broker-Dealer and Institutional Services: 800.366.6264/888.556.9030
www.nb.com
Statistics and projections in this report are derived from sources deemed to be reliable but cannot be regarded as a representation of future results of the Funds. This report is prepared for the general information of shareholders and is not an offer of shares of the Funds. Shares are sold only through the currently effective prospectus which you can obtain by calling 877.628.2583. An investor should consider carefully a Fund’s investment objectives, risks and fees and expenses, which are described in its prospectus, before investing.
H0599 10/23
| (b) | Not applicable to the Registrant. |
Item 2. Code of Ethics.
The Board of Trustees (“Board”) of Neuberger Berman Equity Funds (“Registrant”) has adopted a code of ethics that applies to the Registrant’s principal executive officer, principal financial officer, principal accounting officer or controller, or persons performing similar functions (“Code of Ethics”). During the period covered by this Form N-CSR, there were no substantive amendments to the Code of Ethics and there were no waivers from the Code of Ethics granted to the Registrant’s principal executive officer, principal financial officer, principal accounting officer or controller, or persons performing similar functions.
Item 3. Audit Committee Financial Expert.
The Board has determined that the Registrant has three audit committee financial experts serving on its audit committee. The Registrant’s audit committee financial experts are Michael J. Cosgrove, Martha C. Goss and Deborah C. McLean. Mr. Cosgrove, Ms. Goss and Ms. McLean are independent trustees as defined by Form N-CSR.
Item 4. Principal Accountant Fees and Services.
Ernst & Young, LLP (“E&Y”) serves as independent registered public accounting firm to each series of the Registrant.
The aggregate fees billed for professional services rendered by E&Y for the audit of the annual financial statements or services that are normally provided by E&Y in connection with statutory and regulatory filings or engagements were $866,500 and $921,600 for the fiscal years ended 2022 and 2023, respectively.
The aggregate fees billed to the Registrant for assurance and related services by E&Y that are reasonably related to the performance of the audit of the Registrant’s financial statements and are not reported above in Audit Fees were $0 and $0 for the fiscal years ended 2022 and 2023, respectively. The Audit Committee approved 0% and 0% of these services provided by E&Y for the fiscal years ended 2022 and 2023, respectively, pursuant to the waiver provisions of Rule 2-01(c)(7)(i)(C) of Regulation S-X.
The fees billed to other entities in the investment company complex for assurance and related services by E&Y that are reasonably related to the performance of the audit that the Audit Committee was required to approve because the engagement related directly to the operations and financial reporting of the Registrant were $0 and $0 for the fiscal years ended 2022 and 2023, respectively. The Audit Committee approved 0% and 0% of these services provided by E&Y for the fiscal years ended 2022 and 2023, respectively, pursuant to the waiver provisions of Rule 2-01(c)(7)(i)(C) of Regulation S-X.
The aggregate fees billed to the Registrant for professional services rendered by E&Y for tax compliance, tax advice, and tax planning were $273,830 and $275,950 for the fiscal years ended 2022 and 2023, respectively. The nature of the services provided includes preparation of the Federal and State tax extensions and tax returns, review of annual excise tax calculations, and preparation of form 8613, in addition to assistance with the identification of Passive Foreign Investment Companies, assistance with determination of various foreign withholding taxes, and assistance with Internal Revenue Code and tax regulation requirements for fund investments. The Audit Committee approved 0% and 0% of these services provided by E&Y for the fiscal years ended 2022 and 2023, respectively, pursuant to the waiver provisions of Rule 2-01(c)(7)(i)(C) of Regulation S-X.
The fees billed to other entities in the investment company complex for professional services rendered by E&Y for tax compliance, tax advice, and tax planning that the Audit Committee was required to approve because the engagement related directly to the operations and financial reporting of the Registrant were $0 and $0 for the fiscal years ended 2022 and 2023, respectively. The Audit Committee approved 0% and 0% of these services provided by E&Y for the fiscal years ended 2022 and 2023, respectively, pursuant to the waiver provisions of Rule 2-01(c)(7)(i)(C) of Regulation S-X.
(d) All Other Fees
The aggregate fees billed to the Registrant for products and services provided by E&Y, other than services reported in Audit Fees, Audit-Related Fees, and Tax Fees were $0 and $0 for the fiscal years ended 2022 and 2023, respectively. The Audit Committee approved 0% and 0% of these services provided by E&Y for the fiscal years ended 2022 and 2023, respectively, pursuant to the waiver provisions of Rule 2-01(c)(7)(i)(C) of Regulation S-X.
The fees billed to other entities in the investment company complex for products and services provided by E&Y, other than services reported in Audit Fees, Audit-Related Fees, and Tax Fees that the Audit Committee was required to approve because the engagement related directly to the operations and financial reporting of the Registrant were $0 and $0 for the fiscal years ended 2022 and 2023, respectively. The Audit Committee approved 0% and 0% of these services provided by E&Y for the fiscal years ended 2022 and 2023, respectively, pursuant to the waiver provisions of Rule 2-01(c)(7)(i)(C) of Regulation S-X.
(e) Audit Committee’s Pre-Approval Policies and Procedures
(1) The Audit Committee’s pre-approval policies and procedures for the Registrant to engage an accountant to render audit and non-audit services delegate to each member of the Committee the power to pre-approve services between meetings of the Committee.
(2) None of the services described in paragraphs (b) through (d) above were approved by the Audit Committee pursuant to paragraph (c)(7)(i)(C) of Rule 2-01 of Regulation S-X.
(f) Hours Attributed to Other Persons
Not applicable.
(g) Non-Audit Fees
Non-audit fees billed by E&Y for services rendered to the Registrant were $273,830 and $275,950 for the fiscal years ended 2022 and 2023, respectively.
Non-audit fees billed by E&Y for services rendered to the Registrant’s investment adviser and any entity controlling, controlled by, or under common control with the adviser that provides ongoing services to the Registrant were $0 and $0 for the fiscal years ended 2022 and 2023, respectively.
(h) The Audit Committee of the Board considered whether the provision of non-audit services rendered to the Registrant’s investment adviser and any entity controlling, controlled by, or under common control with the adviser that provides ongoing services to the Registrant that were not pre-approved by the Audit Committee because the engagement did not relate directly to the operations and financial reporting of the Registrant is compatible with maintaining E&Y’s independence.
(i) Not applicable.
(j) Not applicable.
Item 5. Audit Committee of Listed Registrants.
(a) Not applicable to the Registrant.
(b) Not applicable to the Registrant.
Item 6. Investments.
The complete schedule of investments for each series is disclosed in the Registrant’s annual report, which is included in Item 1 of this Form N-CSR.
Item 7. Disclosure of Proxy Voting Policies and Procedures for Closed-End Management Investment Companies.
Not applicable to the Registrant.
Item 8. Portfolio Managers of Closed-End Management Investment Companies.
Not applicable to the Registrant.
Item 9. Purchases of Equity Securities by Closed-End Management Investment Company and Affiliated Purchasers.
Not applicable to the Registrant.
Item 10. Submission of Matters to a Vote of Security Holders.
There were no changes to the procedures by which shareholders may recommend nominees to the Board.
Item 11. Controls and Procedures.
| (a) | Based on an evaluation of the disclosure controls and procedures (as defined in Rule 30a-3(c) under the Act) as of a date within 90 days of the filing date of this report, the Chief Executive Officer and President and the Treasurer and Principal Financial and Accounting Officer of the Registrant have concluded that such disclosure controls and procedures are effectively designed to ensure that information required to be disclosed by the Registrant on Form N-CSR is accumulated and communicated to the Registrant’s management to allow timely decisions regarding required disclosure. |
| (b) | There were no significant changes in the Registrant’s internal controls over financial reporting (as defined in Rule 30a-3(d) under the Act) that occurred during the period covered by this report that have materially affected, or are reasonably likely to materially affect, the Registrant’s internal control over financial reporting. |
Item 12. Disclosure of Securities Lending Activities for Closed-End Management Investment Companies.
Not applicable to the Registrant.
Item 13. Exhibits.
| (a)(3) | Not applicable to the Registrant. |
| (a)(4) | Not applicable to the Registrant. |
The certification furnished pursuant to Rule 30a-2(b) under the Act and Section 906 of the Sarbanes-Oxley Act will not be deemed “filed” for purposes of Section 18 of the Securities Exchange Act of 1934, as amended (“Exchange Act”), or otherwise subject to the liability of that section. Such certification will not be deemed to be incorporated by reference into any filing under the Securities Act of 1933, as amended, or the Exchange Act, except to the extent that the Registrant specifically incorporates it by reference.
SIGNATURES
Pursuant to the requirements of the Securities Exchange Act of 1934 and the Investment Company Act of 1940, the Registrant has duly caused this report to be signed on its behalf by the undersigned, thereunto duly authorized.
Neuberger Berman Equity Funds
By:
| /s/ Joseph V. Amato | |
| Joseph V. Amato | |
| Chief Executive Officer and President | |
Date: November 2, 2023
Pursuant to the requirements of the Securities Exchange Act of 1934 and the Investment Company Act of 1940, this report has been signed below by the following persons on behalf of the Registrant and in the capacities and on the dates indicated.
By:
| /s/ Joseph V. Amato | |
| Joseph V. Amato | |
| Chief Executive Officer and President | |
Date: November 2, 2023
By:
| /s/ John M. McGovern | |
| John M. McGovern | |
| Treasurer and Principal Financial and Accounting Officer |
Date: November 2, 2023