Washington, D.C. 20549
Joseph V. Amato
Arthur C. Delibert, Esq.
1601 K Street, N.W.
Form N-CSR is to be used by management investment companies to file reports with the Commission not later than 10 days after the transmission to stockholders of any report that is required to be transmitted to stockholders under Rule 30e-1 under the Investment Company Act of 1940, as amended (“Act”) (17 CFR 270.30e-1). The Commission may use the information provided on Form N-CSR in its regulatory, disclosure review, inspection, and policymaking roles.
A registrant is required to disclose the information specified by Form N-CSR, and the Commission will make this information public. A registrant is not required to respond to the collection of information contained in Form N-CSR unless the Form displays a currently valid Office of Management and Budget
(“OMB”) control number. Please direct comments concerning the accuracy of the information collection burden estimate and any suggestions for reducing the burden to Secretary, Securities and Exchange Commission, 100 F Street, NE, Washington, DC 20549-1090. The OMB has reviewed this collection of information under the clearance requirements of 44 U.S.C. § 3507.
Item 1. Report to Shareholders.
Following is a copy of the annual report transmitted to shareholders pursuant to Rule 30e-1 under the Act.

Neuberger Berman
Equity Funds
Investor Class Shares
Trust Class Shares
Advisor Class Shares
Institutional Class Shares
Dividend Growth Fund
Emerging Markets Equity Fund
Equity Income Fund
Focus Fund
Genesis Fund
Global Real Estate Fund
Greater China Equity Fund
Guardian Fund
Integrated Large Cap Fund
International Equity Fund
Class A Shares
Class C Shares
Class R3 Shares
Class R6 Shares
International Select Fund
International Small Cap Fund
Intrinsic Value Fund
Large Cap Value Fund
Mid Cap Growth Fund
Mid Cap Intrinsic Value Fund
Multi-Cap Opportunities Fund
Real Estate Fund
Small Cap Growth Fund
Sustainable Equity Fund
Annual Report
August 31, 2020
Beginning on January 1, 2021, as permitted by regulations adopted by the U.S. Securities and Exchange Commission, paper copies of the Fund's annual and semi-annual shareholder reports will no longer be sent by mail, unless you specifically request paper copies of the reports. Instead, the reports will be made available on the Fund's website www.nb.com/fundliterature, and you will be notified by mail each time a report is posted and provided with a website link to access the report.
If you already elected to receive shareholder reports electronically, you will not be affected by this change and you need not take any action. You may elect to receive shareholder reports and other communications from the Fund electronically anytime by contacting your financial intermediary (such as a broker-dealer or bank) or, if you are a direct investor, by calling 800.877.9700 or by sending an e-mail request to fundinfo@nb.com.
You may elect to receive all future reports in paper free of charge. If you invest through a financial intermediary, you can contact your financial intermediary to request that you continue to receive paper copies of your shareholder reports. If you invest directly with the Fund, you can call 800.877.9700 or send an email request to fundinfo@nb.com to inform the Fund that you wish to continue receiving paper copies of your shareholder reports. Your election to receive reports in paper will apply to all funds held in your account if you invest through your financial intermediary or all funds held with the fund complex if you invest directly with the Fund.
Contents
THE FUNDS
President's Letter | | | 1 | | |
PORTFOLIO COMMENTARY | |
Dividend Growth Fund | | | 2 | | |
Emerging Markets Equity Fund | | | 6 | | |
Equity Income Fund | | | 10 | | |
Focus Fund | | | 14 | | |
Genesis Fund | | | 17 | | |
Global Real Estate Fund | | | 20 | | |
Greater China Equity Fund | | | 24 | | |
Guardian Fund | | | 28 | | |
Integrated Large Cap Fund | | | 32 | | |
International Equity Fund | | | 36 | | |
International Select Fund | | | 40 | | |
International Small Cap Fund | | | 44 | | |
Intrinsic Value Fund | | | 48 | | |
Large Cap Value Fund | | | 52 | | |
Mid Cap Growth Fund | | | 55 | | |
Mid Cap Intrinsic Value Fund | | | 58 | | |
Multi-Cap Opportunities Fund | | | 61 | | |
Real Estate Fund | | | 64 | | |
Small Cap Growth Fund | | | 67 | | |
Sustainable Equity Fund | | | 70 | | |
FUND EXPENSE INFORMATION | | | 80 | | |
LEGEND | | | 84 | | |
SCHEDULE OF INVESTMENTS | |
Dividend Growth Fund | | | 85 | | |
Positions by Country | | | 86 | | |
Emerging Markets Equity Fund | | | 87 | | |
Positions by Industry | | | 90 | | |
Equity Income Fund | | | 93 | | |
Positions by Country | | | 96 | | |
Focus Fund | | | 100 | | |
Positions by Country | | | 101 | | |
Genesis Fund | | | 104 | | |
Global Real Estate Fund | | | 107 | | |
Positions by Sector | | | 108 | | |
Greater China Equity Fund | | | 109 | | |
Guardian Fund | | | 111 | | |
Integrated Large Cap Fund | | | 117 | | |
International Equity Fund | | | 119 | | |
Positions by Industry | | | 121 | | |
International Select Fund | | | 123 | | |
Positions by Industry | | | 125 | | |
International Small Cap Fund | | | 127 | | |
Positions by Industry | | | 129 | | |
Intrinsic Value Fund | | | 131 | | |
Large Cap Value Fund | | | 134 | | |
Positions by Country | | | 136 | | |
Mid Cap Growth Fund | | | 137 | | |
Mid Cap Intrinsic Value Fund | | | 140 | | |
Multi-Cap Opportunities Fund | | | 142 | | |
Real Estate Fund | | | 144 | | |
Small Cap Growth Fund | | | 146 | | |
Sustainable Equity Fund | | | 149 | | |
Positions by Country | | | 150 | | |
FINANCIAL STATEMENTS | | | 153 | | |
FINANCIAL HIGHLIGHTS (ALL CLASSES)/PER SHARE DATA | |
Dividend Growth Fund | | | 213 | | |
Emerging Markets Equity Fund | | | 215 | | |
Equity Income Fund | | | 217 | | |
Focus Fund | | | 217 | | |
Genesis Fund | | | 221 | | |
Global Real Estate Fund | | | 223 | | |
Greater China Equity Fund | | | 223 | | |
Guardian Fund | | | 225 | | |
Integrated Large Cap Fund | | | 227 | | |
International Equity Fund | | | 229 | | |
International Select Fund | | | 231 | | |
International Small Cap Fund | | | 233 | | |
Intrinsic Value Fund | | | 235 | | |
Large Cap Value Fund | | | 237 | | |
Mid Cap Growth Fund | | | 241 | | |
Mid Cap Intrinsic Value Fund | | | 243 | | |
Multi-Cap Opportunities Fund | | | 247 | | |
Real Estate Fund | | | 247 | | |
Small Cap Growth Fund | | | 249 | | |
Sustainable Equity Fund | | | 253 | | |
Reports of Independent Registered Public Accounting Firms | | | 262 |
| |
Directory | | | 266 | | |
Trustees and Officers | | | 267 |
| |
Proxy Voting Policies and Procedures | | | 278 | | |
Quarterly Portfolio Schedule | | | 278 | | |
Liquidity Risk Management Program | | | 278 | | |
Notice to Shareholders | | | 279 | | |
The "Neuberger Berman" name and logo and "Neuberger Berman Investment Advisers LLC" name are registered service marks of Neuberger Berman Group LLC. The individual Fund names in this piece are either service marks or registered service marks of Neuberger Berman Investment Advisers LLC, an affiliate of Neuberger Berman BD LLC, distributor, member FINRA. ©2020 Neuberger Berman BD LLC, distributor. All rights reserved.
Dear Shareholder,
Global equity markets advanced this period, even after existing concerns about global growth rates, equity valuations and trade tensions were compounded by the economic dislocations—not to mention human toll—of the COVID-19 pandemic.
The World Bank estimates global GDP will decline by 5.2% in 2020, marking the worst recession since World War II. In the U.S., real GDP (gross domestic product, adjusted for inflation) declined 5% in first quarter, 31.7% in second, and by the Conference Board's estimates, which anticipate a significant improvement in third quarter, will close the year down 3.8%.
While that is an improvement over the first half, the Conference Board also reports consumer optimism about jobs, income and business conditions has declined from its June peak this year. Unemployment, at 3.6% in January, was at 8.4%—7.3% for white Americans and 13% for black Americans—as this period closed; high, but an improvement over earlier substantial job losses. Women, who were 47% of the workforce, have fared worse than men, comprising 54% of the unemployed.
Given numerous unknowns, economists' views about the length and curve shape of the economic recovery vary—from a bullish but unlikely V, to a U, L, or W, or even a K, where parts of the economy recover and others don't.
Since the sharp market correction in March, several key factors have supported investor sentiment (and thus equity prices) beyond the hope for a COVID-19 treatment or vaccine. Among the most important has been central bank policy.
Since March, the U.S. Federal Reserve Board (Fed) has provided an unprecedented level of support to fixed income markets, buying billions of dollars' worth of securities, lending directly to corporations, and reducing banking regulations; as well as committing to maintaining low interest rates. This has lessened existential worries for corporations and their shareholders. The European Central Bank has been similarly accommodative, and the European Union's grant and loan program is focused on supporting weaker states.
High frequency economic data, such as Purchasing Managers' Indexes, non-farm payrolls, and retail sales has also improved—but as stated above, much remains unknown.
As we look forward, we believe bottom-up stock picking skill and conscientious portfolio construction will remain paramount given the likelihood of ongoing volatility, heightened U.S. election rhetoric, any resurgence in COVID-19 infections, and any potential inflationary effects from the Fed's stimulus and supports. Pricing is also a concern in some sectors, where speculation has driven price-to-earnings ratios higher, so a focus on fundamental valuations remains key.
As always, our managers are both prudent and proactive, and focused on fundamental research, as they work to separate short-term speculation and dislocation from longer-term opportunities, using volatility to their advantage whenever possible.
Neuberger Berman continues to monitor the ongoing developments related to COVID-19 with a particular focus on two areas: the safety and health of its employees and clients, and the ability to continue to conduct effectively its investment and business operations, including all critical services. Neuberger Berman has a dedicated Business Continuity Management team staffed with full-time professionals, who partner with over 60 Business Continuity Coordinators covering all business functions across all geographies. Neuberger Berman currently has not experienced a significant impact on its operating model. Neuberger Berman will continue to watch the effectiveness of efforts to contain the spread of the COVID-19 virus and the potential long-term implications on global economies and will continue to monitor and adapt as necessary the firm's operations and processes to most effectively manage portfolios.
We appreciate your confidence in Neuberger Berman.
Sincerely,

JOSEPH V. AMATO
PRESIDENT AND CEO
NEUBERGER BERMAN EQUITY FUNDS
1
Dividend Growth Fund Commentary (Unaudited)
Neuberger Berman Dividend Growth Fund Institutional Class generated a 16.91% total return for the fiscal year ended August 31, 2020 (the reporting period), underperforming its benchmark, the S&P 500® Index (the Index), which posted a 21.94% total return for the same period. (Performance for all share classes is provided in the table immediately following this letter.)
It's worth highlighting that by far the largest part of the performance in the Index over the reporting period came in stocks not suitable for the Fund because they have limited, and in many cases, no dividend programs. Specifically, over the same timeframe the Russell 1000® Growth Index returned 4,350 bps more than the Russell 1000® Value Index.
The Fund seeks to provide gross current income in-line with the Index, while seeking capital appreciation driven by dividend per share growth. This approach seeks to identify companies with strong business models generating cash to grow their businesses while providing rising dividend distributions to shareholders. Overall, we focus on companies that we believe have strong balance sheets, solid management teams, attractive free cash flow yields, and clear capital allocation strategies.
By mid-February 2020, the expansion cycle officially became the longest in US history. Shortly thereafter, equities tumbled as mounting concerns from the impact of COVID-19 weighed on the global economy. However, by late August the Index had rallied over 50% from its March lows, driven in part by monetary and fiscal stimulus, a fifth COVID-19 relief bill, and vaccine optimism working in concert. On the macro front, investors looked past the worst economic downturn since the Great Depression, as the rally stood in contrast with high unemployment. Elsewhere, the U.S. Federal Reserve Board struck a dovish tone, keeping the door open for accommodative measures, while the dollar touched a two-year low, and the 10-year U.S. Treasury yield settled near 0.70%.
From a portfolio construction standpoint, top equity sector weights included 28% Information Technology (IT), 15% Health Care, and 14% Financials at the end of the reporting period. Overall, the bulk of returns were generated from stocks across IT, Materials, and Health Care—while exposure to Industrials, Communication Services, and Energy weighed on results.
Overall, Apple proved to be our biggest winner, as growth was underpinned by robust sales across several segments. When evaluating future growth prospects, we believe this IT name remains well positioned to benefit from new 5G smartphones that will likely be rolled out to consumers in the near future. Moreover, we believe management has the wherewithal to potentially increase its dividend policy as the tech giant currently has ~$100bn in cash on its balance sheet, making this an ideal holding given our mandate.
In contrast, stock selection across Communication Services weighed on results as the media giant ViacomCBS was among our losers. Recently, the iconic media company faced investor scrutiny amid increased competition in the era of streaming services. Given disappointing results, this holding was sold in April 2020.
In closing, the global capital markets are facing significant headwinds: a weak economy, political turmoil and novel central bank policies. Despite the challenging environment, we are encouraged by the potential for economic reopening—albeit at a measured pace—and remain optimistic as the medical community races towards a potential COVID-19 vaccine. The longer-term impact of central bank policies remain uncertain, and we feel dividend-paying stocks provide an attractive inflationary hedge relative to bonds.
We thank you for investing in our Fund.
Sincerely,
2
DAVID A. KIEFER AND WILLIAM D. HUNTER
PORTFOLIO MANAGERS
Information about principal risks of investing in the Fund is set forth in the prospectus and statement of additional information.
The portfolio composition, industries and holdings of the Fund are subject to change without notice.
The opinions expressed are those of the Fund's portfolio managers. The opinions are as of the date of this report and are subject to change without notice.
3
Dividend Growth Fund (Unaudited)
TICKER SYMBOLS
Institutional Class | | NDGIX | |
Class A | | NDGAX | |
Class C | | NDGCX | |
Class R6 | | NRDGX | |
SECTOR ALLOCATION
(as a % of Total Investments*) | |
Communication Services | | | 2.2 | % | |
Consumer Discretionary | | | 6.9 | | |
Consumer Staples | | | 6.2 | | |
Energy | | | 4.3 | | |
Financials | | | 14.0 | | |
Health Care | | | 15.1 | | |
Industrials | | | 6.2 | | |
Information Technology | | | 27.9 | | |
Materials | | | 6.2 | | |
Real Estate | | | 5.5 | | |
Utilities | | | 4.9 | | |
Short-Term Investments | | | 0.6 | | |
Total | | | 100.0 | % | |
* Derivatives (other than options purchased), if any, are excluded from this chart.
PERFORMANCE HIGHLIGHTS
| | | | | Average Annual Total Return
Ended 08/31/2020 | |
| | | Inception
Date | | 1 Year | | Life of
Fund | |
At NAV | |
Institutional Class | | 12/15/2015 | | | 16.91 | % | | | 11.32 | % | |
Class A | | 12/15/2015 | | | 16.41 | % | | | 10.92 | % | |
Class C | | 12/15/2015 | | | 15.63 | % | | | 10.08 | % | |
Class R6 | | 12/15/2015 | | | 16.98 | % | | | 11.40 | % | |
With Sales Charge | |
Class A | | | | | 9.73 | % | | | 9.54 | % | |
Class C | | | | | 14.63 | % | | | 10.08 | % | |
Index | |
| S&P 500® Index1,15 | | | | | 21.94 | % | | | 14.63 | % | |
The performance data quoted represent past performance and do not indicate future results. Current performance may be lower or higher than the performance data quoted. For current performance data, please visit www.nb.com/performance.
The results shown in the table reflect the reinvestment of income dividends and other distributions, if any. The results do not reflect the effect of taxes a shareholder would pay on Fund distributions or on the redemption of Fund shares.
The investment return and principal value of an investment will fluctuate and shares, when redeemed, may be worth more or less than their original cost.
Returns would have been lower if Neuberger Berman Investment Advisers LLC ("Management") had not reimbursed certain expenses and/or waived a portion of the investment management fees during certain of the periods shown. Repayment by a class (of expenses previously reimbursed and/or fees previously waived by Management) will decrease the class's returns. Please see Note B in the Notes to Financial Statements for specific information regarding expense reimbursement and/or fee waiver arrangements.
As stated in the Fund's most recent prospectus, the total annual operating expense ratios for fiscal year 2019 were 1.21%, 1.65%, 2.32% and 1.16% for Institutional Class, Class A, Class C and Class R6 shares, respectively (before expense reimbursements and/or fee waivers, if any, and after restatement for Class R6 shares). The expense ratios were 0.70%, 1.06%, 1.81% and 0.60% for Institutional Class, Class A, Class C and Class R6 shares, respectively, after expense reimbursements and/or fee waivers and/or restatement. The expense ratios for the annual period ended August 31, 2020 can be found in the Financial Highlights section of this report.
Returns shown with a sales charge reflect the deduction of the current maximum initial sales charge of 5.75% for Class A shares and the contingent deferred sales charge (CDSC) for Class C shares. The CDSC for Class C shares is 1.00%, which is reduced to 0% after 1 year. The performance of the Fund's share classes will differ primarily due to different sales charge structures and class expenses. Please see the prospectus for more information about sales charge structures, if any, and class expenses for your share class.
4
Dividend Growth Fund (Unaudited)
COMPARISON OF A $1,000,000 INVESTMENT
(000's omitted)
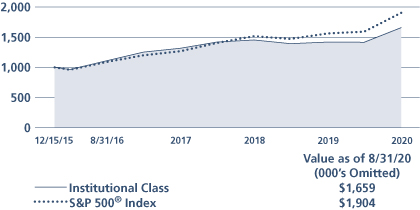
This graph shows the change in value of a hypothetical $1,000,000 investment in the Fund over the past 10 fiscal years, or since the Fund's inception if it has not operated for 10 years. The graph is based on the Institutional Class shares only; the performance of the Fund's share classes will differ primarily due to different sales charge structures and class expenses (see Performance Highlights chart on previous page). The result is compared with benchmarks, which include a broad-based market index and may include a more narrowly based index. Market indices have not been reduced to reflect any of the fees and costs of investing. The results shown in the graph reflect the reinvestment of income dividends and other distributions, if any. The results do not reflect the effect of taxes a shareholder would pay on Fund distributions or on the redemption of Fund shares. Results represent past performance and do not indicate future results.
5
Emerging Markets Equity Fund Commentary (Unaudited)
Neuberger Berman Emerging Markets Equity Fund Institutional Class generated a total return of 10.59% for the fiscal year ended August 31, 2020 (the reporting period), trailing its benchmark, the MSCI Emerging Markets (EM) Index (Net) (the Index), which reported a total return of 14.49% for the same period. (Performance for all share classes is provided in the table immediately following this letter.)
EM equities recovered well from the strain of 2019's U.S./China trade tensions to end the calendar year strongly—with additional underpinning from monetary easing and a weak dollar. As 2020 began, however, COVID-19 began to dominate sentiment. With the outbreak initially centered in China, EM equities were particularly hard hit. As this reporting period progressed, however, optimism improved. Investors cheered re-opening plans in several major markets, and China evolved to the point of small, contained outbreaks. Aggressive central bank support in many markets, plus an uptick in manufacturing survey data and other high frequency economic indicators, also spurred investor enthusiasm, boosting equity markets globally.
Health Care, Consumer Discretionary (driven by internet-related names) and Information Technology (IT) stocks outperformed this reporting period, and on an individual market basis, Taiwan, China and Korea led the Index. By contrast, Utilities, Financials and Energy declined most during the reporting period. The countries within the Index with largest losses were Latin American commodity-linked markets of Colombia, Chile and Brazil.
Sector allocation benefited the Fund's relative performance this reporting period, primarily our overweight to IT versus the Index. Stock selection detracted, particularly within Consumer Discretionary, where our underweight to rallying Chinese internet retail names was a headwind, and in Health Care. Our Materials and Energy holdings outperformed.
By country, stock selection within Taiwan and Russia benefited returns, but stock selection and an underweight in China versus the Index, and stock selection in Mexico detracted.
Top contributors included Tencent, Taiwan Semiconductor and Alibaba. Tencent, the Chinese social media and gaming leader, beat earnings expectations as users remained loyal to the gaming and social-media platform during the COVID-19 economic downturn. Taiwan Semiconductor, the Taiwanese contract semiconductor manufacturer, saw investors grow more optimistic about its growth prospects as it continued to execute well, while competitors have struggled. Alibaba, the Chinese e-commerce giant, beat expectations driven by solid growth across all business units and good cost control. Despite U.S./China trade tensions, the fundamental drivers of the e-commerce business in China remain strong.
Detractors included Medy-Tox, PT Bank Mandiri and Energisa. Medy-Tox, the Korean Botox maker, disappointed investors with poor execution across a number of issues. We lost conviction in the name, and it was sold along with Indonesia's PT Bank Mandiri, where investors grew concerned with the impact of COVID-19 on the country. Energisa, the Brazilian electric power distributor, struggled to rebound since March's COVID-19 related market selloff due to growth concerns.
With U.S./China political tensions likely to remain in the headlines for the next few months, and the COVID-19 pandemic ongoing, we anticipate volatility, and shifts in direction driven by changes in sentiment ahead.
While we are cautiously optimistic given the fact that global economic indicators are improving, we also know that certain EM segments have rallied on hopes for specific policy changes. Rather than being distracted by names which may be driven by short-term speculation, we remain focused on identifying what we believe are sustainable quality businesses, and taking advantage of what we think are temporary price dislocations to add to our high conviction names, and to trade up in quality in specific geographies and sub-sectors.
6
Sincerely,
CONRAD SALDANHA
PORTFOLIO MANAGER
Information about principal risks of investing in the Fund is set forth in the prospectus and statement of additional information.
The portfolio composition, industries and holdings of the Fund are subject to change without notice.
The opinions expressed are those of the Fund's portfolio manager. The opinions are as of the date of this report and are subject to change without notice.
7
Emerging Markets Equity Fund (Unaudited)
TICKER SYMBOLS
Institutional Class | | NEMIX | |
Class A | | NEMAX | |
Class C | | NEMCX | |
Class R3 | | NEMRX | |
Class R6 | | NREMX | |
PERFORMANCE HIGHLIGHTS
| | | | Average Annual Total Return
Ended 08/31/2020 | |
| | Inception
Date | | 1 Year | | 5 Years | | 10 Years | | Life of
Fund | |
At NAV | |
Institutional Class | | 10/08/2008 | | | 10.59 | % | | | 8.90 | % | | | 3.68 | % | | | 7.88 | % | |
Class A | | 10/08/2008 | | | 10.28 | % | | | 8.62 | % | | | 3.41 | % | | | 7.61 | % | |
Class C | | 10/08/2008 | | | 9.47 | % | | | 7.81 | % | | | 2.65 | % | | | 6.81 | % | |
| Class R310 | | 06/21/2010 | | | 9.85 | % | | | 8.18 | % | | | 2.99 | % | | | 7.26 | % | |
| Class R621 | | 03/15/2013 | | | 10.72 | % | | | 8.98 | % | | | 3.75 | % | | | 7.93 | % | |
With Sales Charge | |
Class A | | | | | 3.93 | % | | | 7.33 | % | | | 2.80 | % | | | 7.08 | % | |
Class C | | | | | 8.47 | % | | | 7.81 | % | | | 2.65 | % | | | 6.81 | % | |
Index | |
MSCI Emerging Markets
Index (Net)1,15 | | | | | | | 14.49 | % | | | 8.66 | % | | | 3.76 | % | | | 6.94 | % | |
The performance data quoted represent past performance and do not indicate future results. Current performance may be lower or higher than the performance data quoted. For current performance data, please visit www.nb.com/performance.
The results shown in the table reflect the reinvestment of income dividends and other distributions, if any. The results do not reflect the effect of taxes a shareholder would pay on Fund distributions or on the redemption of Fund shares.
The investment return and principal value of an investment will fluctuate and shares, when redeemed, may be worth more or less than their original cost.
Returns would have been lower if Neuberger Berman Investment Advisers LLC ("Management") had not reimbursed certain expenses and/or waived a portion of the investment management fees during certain of the periods shown. Repayment by a class (of expenses previously reimbursed and/or fees previously waived by Management) will decrease the class's returns. Please see Note B in the Notes to Financial Statements for specific information regarding expense reimbursement and/or fee waiver arrangements.
As stated in the Fund's most recent prospectus, the total annual operating expense ratios for fiscal year 2019 were 1.27%, 1.63%, 2.36%, 1.95% and 1.17% for Institutional Class, Class A, Class C, Class R3 and Class R6 shares, respectively (before expense reimbursements and/or fee waivers, if any, and after restatement for Class R6 shares). The expense ratios were 1.52%, 2.27% and 1.93% for Class A, Class C and Class R3 shares, respectively, after expense reimbursements and/or fee waivers. The total annual operating expense ratio for each of Institutional Class and Class R6 includes each class's repayment of expenses previously reimbursed and/or fees previously waived by Management. The expense ratios for the annual period ended August 31, 2020 can be found in the Financial Highlights section of this report.
Returns shown with a sales charge reflect the deduction of the current maximum initial sales charge of 5.75% for Class A shares and the contingent deferred sales charge (CDSC) for Class C shares. The CDSC for Class C shares is 1.00%, which is reduced to 0% after 1 year. The performance of the Fund's share classes will differ primarily due to different sales charge structures and class expenses. Please see the prospectus for more information about sales charge structures, if any, and class expenses for your share class.
8
Emerging Markets Equity Fund (Unaudited)
COMPARISON OF A $1,000,000 INVESTMENT
(000's omitted)
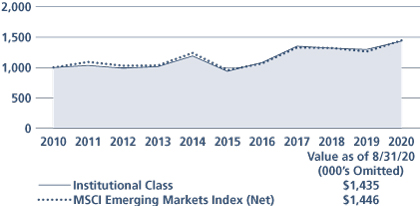
This graph shows the change in value of a hypothetical $1,000,000 investment in the Fund over the past 10 fiscal years, or since the Fund's inception if it has not operated for 10 years. The graph is based on the Institutional Class shares only; the performance of the Fund's share classes will differ primarily due to different sales charge structures and class expenses (see Performance Highlights chart on previous page). The result is compared with benchmarks, which include a broad-based market index and may include a more narrowly based index. Market indices have not been reduced to reflect any of the fees and costs of investing. The results shown in the graph reflect the reinvestment of income dividends and other distributions, if any. The results do not reflect the effect of taxes a shareholder would pay on Fund distributions or on the redemption of Fund shares. Results represent past performance and do not indicate future results.
9
Equity Income Fund Commentary (Unaudited)
Neuberger Berman Equity Income Fund Institutional Class generated a 1.53% total return for the fiscal year ended August 31, 2020 (the reporting period), underperforming its benchmark, the S&P 500® Index (the Index), which posted a 21.94% total return for the same period. (Performance for all share classes is provided in the table immediately following this letter.)
It's worth highlighting that by far the largest part of the performance in the Index over the reporting period came in stocks not suitable for the Fund because they have limited, and in many cases, no dividend programs. Specifically, over the same timeframe the Russell 1000® Growth Index returned 4,350 bps more than the Russell 1000® Value Index .
The Fund seeks total returns between stocks and bonds with lower volatility relative to the Index. The Fund is diversified among dividend-paying stocks and convertible securities, selected through extensive analysis of cash flow prospects, with the ability to sustain and grow dividends.
By mid-February 2020, the expansion cycle officially became the longest in U.S. history. Shortly thereafter equities tumbled as mounting concerns from the impact of COVID-19 weighed on the global economy. However, by late August the Index had rallied over 50% from its March-lows, driven in part by monetary and fiscal stimulus, a fifth COVID-19 relief bill, and vaccine optimism working in concert. On the macro front, investors looked past the worst economic downturn since the Great Depression, as the rally stood in contrast with high unemployment. Elsewhere, the U.S. Federal Reserve Board struck a dovish tone, keeping the door open for accommodative measures, while the dollar touched a two-year low, and the 10-year U.S. Treasury yield settled near 0.70%.
From a portfolio construction standpoint, top equity sector holdings included approximately 13% Real Estate, 12% Information Technology (IT), and 11% Utilities at the end of the reporting period. The Fund also had a roughly 11% allocation to convertible securities, which we believe provides a differentiated approach to an equity income portfolio. Additionally, the Fund's ability to own securities issued under Rule 144A, where retail investors often have limited exposure, allows broad exposure to the asset class.
Overall, this reporting period, the bulk of total returns were generated from our allocation across IT, Health Care, and Industrials—while exposure to Utilities, Financials, and Energy stocks weighed on results.
Exposure to Industrials was additive to results as our holdings outperformed the Index in this sector. Watsco proved to be our top overall performer as the distributor of air conditioning, heating and refrigeration equipment posted impressive results. During the reporting period, Watsco generated its highest level of cash flow in the company's history as the HVAC giant reported better than expected earnings and revenues, beating analyst estimates. Based on our analysis, we believe Watsco remains positioned to capitalize on home improvement trends as record-low mortgage rates have been a tailwind for housing market activity.
On the other end of the spectrum, stock selection within Financials was a headwind to relative returns, as Blackstone Mortgage Trust was among our biggest losers. After revisiting our assumptions, this position was sold during the reporting period with the proceeds allocated elsewhere. Within this space, we believe recent dislocations have created potential opportunities as our approach remains focused on balance sheet strength. Given this backdrop, the health of the financial system remains vital, and we believe valuations appear compelling for long-term investors.
Elsewhere, exposure to convertible securities was accretive to total returns over the reporting period, and dampened volatility. In retrospect, the prior year was a banner one for new deal flow as the Fund capitalized on an uptick of quality issuance. Historically, this sleeve has been among the most conservative aspects of the Fund as we favor convertibles trading at a discount to par value with attractive yields and reasonable conversion premiums.
The Fund's use of written options detracted from performance during the period.
10
In closing, the global capital markets are facing significant headwinds: a weak economy, political turmoil and novel central bank policies. Despite the challenging environment, we are encouraged by the potential for economic reopening—albeit at a measured pace—and remain optimistic as the medical community races towards a potential COVID-19 vaccine. The longer-term impact of central banks policies remains uncertain, and we feel dividend-paying stocks provide an attractive inflationary hedge relative to bonds.
We thank you for investing in our Fund.
Sincerely,
RICHARD LEVINE AND SANDY POMEROY
PORTFOLIO MANAGERS
Information about principal risks of investing in the Fund is set forth in the prospectus and statement of additional information.
The portfolio composition, industries and holdings of the Fund are subject to change without notice.
The opinions expressed are those of the Fund's portfolio managers. The opinions are as of the date of this report and are subject to change without notice.
11
Equity Income Fund (Unaudited)
TICKER SYMBOLS
Institutional Class | | NBHIX | |
Class A | | NBHAX | |
Class C | | NBHCX | |
Class R3 | | NBHRX | |
SECTOR ALLOCATION
(as a % of Total Investments*) | |
Communication Services | | | 3.9 | % | |
Consumer Discretionary | | | 5.8 | | |
Consumer Staples | | | 4.3 | | |
Energy | | | 3.3 | | |
Financials | | | 10.6 | | |
Health Care | | | 10.6 | | |
Industrials | | | 10.5 | | |
Information Technology | | | 11.9 | | |
Materials | | | 4.2 | | |
Real Estate | | | 13.3 | | |
Utilities | | | 10.6 | | |
Convertible Bonds | | | 10.5 | | |
Short-Term Investments | | | 0.5 | | |
Total | | | 100.0 | % | |
* Derivatives (other than options purchased), if any, are excluded from this chart.
PERFORMANCE HIGHLIGHTS
| | | | Average Annual Total Return
Ended 08/31/2020 | |
| | Inception
Date* | | 1 Year | | 5 Years | | 10 Years | | Life of
Fund | |
At NAV | |
| Institutional Class13 | | 06/09/2008 | | | 1.53 | % | | | 7.85 | % | | | 8.38 | % | | | 7.11 | % | |
| Class A13 | | 06/09/2008 | | | 1.14 | % | | | 7.46 | % | | | 7.98 | % | | | 6.75 | % | |
| Class C13 | | 06/09/2008 | | | 0.38 | % | | | 6.65 | % | | | 7.18 | % | | | 6.06 | % | |
| Class R313 | | 06/21/2010 | | | 0.82 | % | | | 7.15 | % | | | 7.67 | % | | | 6.59 | % | |
With Sales Charge | |
| Class A13 | | | | | –4.69 | % | | | 6.20 | % | | | 7.34 | % | | | 6.29 | % | |
| Class C13 | | | | | –0.57 | % | | | 6.65 | % | | | 7.18 | % | | | 6.06 | % | |
Index | |
| S&P 500® Index1,15 | | | | | 21.94 | % | | | 14.46 | % | | | 15.16 | % | | | 9.30 | % | |
*The performance data for each class includes the performance of the Fund's oldest share class, Trust Class, from November 2, 2006 through June 9, 2008. The performance data for Class R3 also includes the performance of the Fund's Institutional Class from June 9, 2008 through June 21, 2010. See endnote 13 for information about the effects of the different fees paid by each class.
The performance data quoted represent past performance and do not indicate future results. Current performance may be lower or higher than the performance data quoted. For current performance data, please visit www.nb.com/performance.
The results shown in the table reflect the reinvestment of income dividends and other distributions, if any. The results do not reflect the effect of taxes a shareholder would pay on Fund distributions or on the redemption of Fund shares.
The investment return and principal value of an investment will fluctuate and shares, when redeemed, may be worth more or less than their original cost.
Returns would have been lower if Neuberger Berman Investment Advisers LLC ("Management") had not reimbursed certain expenses and/or waived a portion of the investment management fees during certain of the periods shown. Repayment by a class (of expenses previously reimbursed and/or fees previously waived by Management) will decrease the class's returns. Please see Note B in the Notes to Financial Statements for specific information regarding expense reimbursement and/or fee waiver arrangements.
As stated in the Fund's most recent prospectus, the total annual operating expense ratios for fiscal year 2019 were 0.70%, 1.06%, 1.81% and 1.35% for Institutional Class, Class A, Class C and Class R3 shares, respectively (before expense reimbursements and/or fee waivers, if any). The expense ratios for the annual period ended August 31, 2020 can be found in the Financial Highlights section of this report.
Returns shown with a sales charge reflect the deduction of the current maximum initial sales charge of 5.75% for Class A shares and the contingent deferred sales charge (CDSC) for Class C shares. The CDSC for Class C shares is 1.00%, which is reduced to 0% after 1 year. The performance of the Fund's share classes will differ primarily due to different sales charge structures and class expenses. Please see the prospectus for more information about sales charge structures, if any, and class expenses for your share class.
12
Equity Income Fund (Unaudited)
COMPARISON OF A $1,000,000 INVESTMENT
(000's omitted)
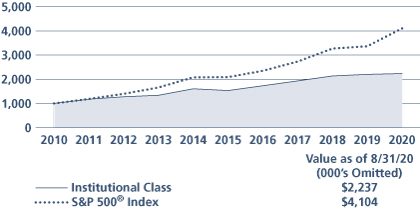
This graph shows the change in value of a hypothetical $1,000,000 investment in the Fund over the past 10 fiscal years, or since the Fund's inception if it has not operated for 10 years. The graph is based on the Institutional Class shares only; the performance of the Fund's share classes will differ primarily due to different sales charge structures and class expenses (see Performance Highlights chart on previous page). The result is compared with benchmarks, which include a broad-based market index and may include a more narrowly based index. Market indices have not been reduced to reflect any of the fees and costs of investing. The results shown in the graph reflect the reinvestment of income dividends and other distributions, if any. The results do not reflect the effect of taxes a shareholder would pay on Fund distributions or on the redemption of Fund shares. Results represent past performance and do not indicate future results.
13
Focus Fund Commentary (Unaudited)
Neuberger Berman Focus Fund Investor Class generated a 26.17% total return for the fiscal year ended August 31, 2020 (the reporting period), outperforming the 16.52% total return of its benchmark, the MSCI All Country World Index (Net) (the Index) for the same period. (Performance for all share classes is provided in the table immediately following this letter.)
On April 15, 2020, the Fund changed its principal investment strategy. Effective that date, it began comparing its performance to the Index, rather than the S&P 500® Index, to correspond with the Fund's revised principal investment strategy. From the close of April 15, 2020 (the effective date of the changes) through the end of the reporting period, the Fund's Investor Class returned 31.81%, outperforming the Index, which returned 26.00% for the same period. For the entire reporting period, the Fund's Investor Class returned 26.17%, outperforming the prior benchmark, which returned 21.94% for the same period.
The overall equity market, as measured by the Index, experienced periods of heightened volatility, but ultimately generated a strong return over the reporting period. After a positive start, beginning in mid-February 2020 the repercussions from the COVID-19 pandemic triggered a rapid and severe downturn, with the market posting its fastest fall on record from an all-time high to a bear market. However, the market then had an equally dramatic rally over the last five months of the reporting period. This turnaround was triggered by several factors, including unprecedented monetary policy accommodation by the U.S. Federal Reserve Board, a $2 trillion fiscal stimulus package, phased economic re-openings, and hopes for a COVID-19 vaccine. All told, the Index gained 16.52% over the period.
Both stock selection and sector allocation contributed to relative performance during the reporting period. In terms of stock selection, holdings in the Financials, Communication Services and Industrials sectors added the most value. Looking at individual stocks, e-commerce giant Amazon.com, Inc., Information Technology (IT) leader Microsoft Corp., and semiconductor company ASML Holding were the most beneficial for returns. From a sector allocation perspective, an overweight to IT and an underweight to Energy versus the Index were the largest contributors to relative results.
While the Fund's positioning in IT was positive overall, certain holdings within the sector were headwinds for relative results. Stock selection in the Energy sector was also negative for relative returns. Looking at individual stocks, aerospace and defense company Safran SA, IT service management firm WEX, Inc., and Indian multinational banking and financial services company ICICI Ltd. were the largest detractors from results. All three positions were sold during the reporting period. In terms of sector allocation, underweights to Health Care and Communication Services versus the Index were the largest negatives for performance.
Although we do not plan for long-term interest rates to remain low, we believe this environment is supportive of resilient businesses with attractive cash flow growth characteristics. We remain steadfast in our focus on owning what we believe to be quality businesses as our fundamental, data-science and Environmental, Social and Governance (ESG) process has been honed over time to be sensitive to inflections and resilience in the earnings-power of such companies.
Sincerely,
TIMOTHY CREEDON AND HARI RAMANAN
PORTFOLIO MANAGERS
Information about principal risks of investing in the Fund is set forth in the prospectus and statement of additional information.
The portfolio composition, industries and holdings of the Fund are subject to change without notice.
The opinions expressed are those of the Fund's portfolio managers. The opinions are as of the date of this report and are subject to change without notice.
14
TICKER SYMBOLS
Investor Class | | NBSSX | |
Trust Class | | NBFCX | |
Advisor Class | | NBFAX | |
Institutional Class | | NFALX | |
Class A | | NFAAX | |
Class C | | NFACX | |
SECTOR ALLOCATION
(as a % of Total Investments*) | |
Communication Services | | | 2.5 | % | |
Consumer Discretionary | | | 21.2 | | |
Consumer Staples | | | 10.0 | | |
Financials | | | 2.2 | | |
Health Care | | | 3.0 | | |
Industrials | | | 9.9 | | |
Information Technology | | | 41.7 | | |
Materials | | | 5.1 | | |
Real Estate | | | 3.7 | | |
Short-Term Investments | | | 0.7 | | |
Total | | | 100.0 | % | |
* Derivatives (other than options purchased), if any, are excluded from this chart.
PERFORMANCE HIGHLIGHTS8
| | | | Average Annual Total Return
Ended 08/31/2020 | |
| | Inception
Date | | 1 Year | | 5 Years | | 10 Years | | Life of
Fund | |
At NAV | |
Investor Class | | 10/19/1955 | | | 26.17 | % | | | 11.66 | % | | | 13.80 | % | | | 10.54 | % | |
| Trust Class3 | | 08/30/1993 | | | 25.90 | % | | | 11.46 | % | | | 13.58 | % | | | 10.52 | % | |
| Advisor Class4 | | 09/03/1996 | | | 25.70 | % | | | 11.28 | % | | | 13.40 | % | | | 10.45 | % | |
| Institutional Class5 | | 06/21/2010 | | | 26.32 | % | | | 11.84 | % | | | 14.00 | % | | | 10.57 | % | |
| Class A19 | | 06/21/2010 | | | 25.90 | % | | | 11.45 | % | | | 13.59 | % | | | 10.51 | % | |
| Class C19 | | 06/21/2010 | | | 24.96 | % | | | 10.62 | % | | | 12.75 | % | | | 10.38 | % | |
With Sales Charge | |
| Class A19 | | | | | 18.65 | % | | | 10.14 | % | | | 12.91 | % | | | 10.41 | % | |
| Class C19 | | | | | 23.96 | % | | | 10.62 | % | | | 12.75 | % | | | 10.38 | % | |
Index | |
| MSCI All Country World Index (Net)1,15 * | |
| | | 16.52 | % | | | 10.21 | % | | | 9.90 | % | | | N/A | | |
| S&P 500® Index1,15 | | | | | 21.94 | % | | | 14.46 | % | | | 15.16 | % | | | 10.37 | % | |
*On April 15, 2020, the Fund changed its principal investment strategy. Effective that date, it began comparing its performance to the MSCI All Country World Index (Net) rather than the S&P 500® Index to correspond with the Fund's revised principal investment strategy.
The performance data quoted represent past performance and do not indicate future results. Current performance may be lower or higher than the performance data quoted. For current performance data, please visit www.nb.com/performance.
The results shown in the table reflect the reinvestment of income dividends and other distributions, if any. The results do not reflect the effect of taxes a shareholder would pay on Fund distributions or on the redemption of Fund shares.
The investment return and principal value of an investment will fluctuate and shares, when redeemed, may be worth more or less than their original cost.
Returns would have been lower if Neuberger Berman Investment Advisers LLC ("Management") had not reimbursed certain expenses and/or waived a portion of the investment management fees during certain of the periods shown. Repayment by a class (of expenses previously reimbursed and/or fees previously waived by Management) will decrease the class's returns. Please see Note B in the Notes to Financial Statements for specific information regarding expense reimbursement and/or fee waiver arrangements.
As stated in the Fund's most recent prospectus, the total annual operating expense ratios for fiscal year 2019 were 0.92%, 1.10%, 1.27%, 0.76%, 1.12%, and 1.88% for Investor Class, Trust Class, Advisor Class, Institutional Class, Class A and Class C shares, respectively (before expense reimbursements and/or fee waivers, if any). The expense ratios were 0.76%, 1.12% and 1.87% for Institutional Class, Class A and Class C shares, respectively, after expense reimbursements and/or fee waivers. The expense ratios for the annual period ended August 31, 2020 can be found in the Financial Highlights section of this report.
Returns shown with a sales charge reflect the deduction of the current maximum initial sales charge of 5.75% for Class A shares and the contingent deferred sales charge (CDSC) for Class C shares. The CDSC for Class C shares is 1.00%, which is reduced to 0% after 1 year. The performance of the Fund's share classes will differ primarily due to different sales charge structures and class expenses. Please see the prospectus for more information about sales charge structures, if any, and class expenses for your share class.
15
COMPARISON OF A $10,000 INVESTMENT
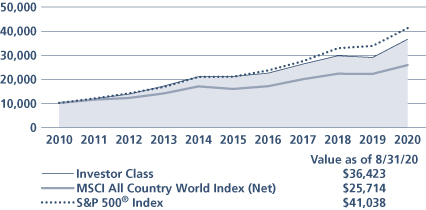
This graph shows the change in value of a hypothetical $10,000 investment in the Fund over the past 10 fiscal years, or since the Fund's inception if it has not operated for 10 years. The graph is based on the Investor Class shares only; the performance of the Fund's share classes will differ primarily due to different sales charge structures and class expenses (see Performance Highlights chart on previous page). The result is compared with benchmarks, which include a broad-based market index and may include a more narrowly based index. Market indices have not been reduced to reflect any of the fees and costs of investing. The results shown in the graph reflect the reinvestment of income dividends and other distributions, if any. The results do not reflect the effect of taxes a shareholder would pay on Fund distributions or on the redemption of Fund shares. Results represent past performance and do not indicate future results.
16
Genesis Fund Commentary (Unaudited)
Neuberger Berman Genesis Fund Investor Class generated a 13.48% total return for the fiscal year ended August 31, 2020 (the reporting period), outperforming the 6.02% total return of its benchmark, the Russell 2000® Index (the Index), for the same period. (Performance for all share classes is provided in the table immediately following this letter.)
The overall equity market experienced periods of heightened volatility, but ultimately generated a strong return over the reporting period. After a positive start, beginning in mid-February 2020 the repercussions from the COVID-19 pandemic triggered a rapid and severe downturn, with the market posting its fastest fall on record from an all-time high to a bear market. However, the market then had an equally dramatic rally over the last five months of the reporting period. This turnaround was triggered by several factors, including unprecedented monetary policy accommodation by the U.S. Federal Reserve Board, a $2 trillion fiscal stimulus package, phased economic re-openings, and hopes for a COVID-19 vaccine. All told, the S&P 500® Index gained 21.94% during the reporting period. Small-cap stocks posted less robust results, as the Index returned 6.02%.
The Fund outperformed the Index during the reporting period. As we have seen in the past, the Fund tends to outperform in periods of slower economic growth, or in periods characterized by investor fear and uncertainty. During those times, our high quality bias has provided a strong tailwind to the Fund's relative results. This can be largely attributed to investors' preference for less speculative/less cyclical companies with stronger balance sheets. However, the Fund tends to underperform in significant up markets, where lower quality non-earners, less profitable, and highly cyclical companies have tended to outperform. For the full year, the Fund's outperformance was due to a combination of strong stock selection and sector allocation. Stock selection was particularly strong in the Financials, Consumer Discretionary and Communication Services sectors. In the Financials sector, our Banks and Capital Markets positions were positive for relative returns. Within Consumer Discretionary, our pool supplier holding added the most value. In the Communication Services sector, our Media holdings were the largest contributors to results. Conversely, holdings in the Health Care, Consumer Staples and Materials sectors were the largest detractors from excess returns. Within Health Care, Health Care Provider & Services names negatively impacted results. Within the Consumer Staples sector, our Food and Household Product names were a headwind for performance. Within Materials, our Containers & Packaging positions negatively impacted results.
Sector allocation was also a large contributor to performance, largely driven by an overweight to the Information Technology sector and not holding positions in either mortgage or equity real estate investment trusts. On the downside, a significant underweight to traditional Biotechnology companies was a meaningful drag on relative performance.
While recent economic data has improved, the duration and severity of the economic impact COVID-19 will have on the global economy remain key unknowns regarding the timing and scale of the recovery. Despite this uncertainty, fiscal and monetary support has been meaningful, and likely to remain in place during these uncertain times. This has helped fuel the market's rally from its March low, although it has more recently started to correct. Some type of bipartisan cooperation will likely be necessary, along with improved treatment and progress on a COVID-19 vaccine, to support economic conditions and market sentiment going forward. We remain steadfast that a diversified portfolio of financially strong companies, with durable and highly differentiated business models, will weather the storm.
Sincerely,
JUDITH M. VALE, ROBERT W. D'ALELIO, BRETT S. REINER AND GREGORY G. SPIEGEL
PORTFOLIO CO-MANAGERS
Information about principal risks of investing in the Fund is set forth in the prospectus and statement of additional information.
The portfolio composition, industries and holdings of the Fund are subject to change without notice.
The opinions expressed are those of the Fund's portfolio managers. The opinions are as of the date of this report and are subject to change without notice.
17
TICKER SYMBOLS
Investor Class | | NBGNX | |
Trust Class | | NBGEX | |
Advisor Class | | NBGAX | |
Institutional Class | | NBGIX | |
Class R6 | | NRGSX | |
SECTOR ALLOCATION
(as a % of Total Investments*) | |
Communication Services | | | 3.4 | % | |
Consumer Discretionary | | | 12.9 | | |
Consumer Staples | | | 4.5 | | |
Energy | | | 0.2 | | |
Financials | | | 13.4 | | |
Health Care | | | 17.0 | | |
Industrials | | | 16.5 | | |
Information Technology | | | 26.2 | | |
Materials | | | 3.8 | | |
Real Estate | | | 1.3 | | |
Short-Term Investments | | | 0.8 | | |
Total | | | 100.0 | % | |
* Derivatives (other than options purchased), if any, are excluded from this chart.
PERFORMANCE HIGHLIGHTS
| | | | Average Annual Total Return
Ended 08/31/2020 | |
| | Inception
Date | | 1 Year | | 5 Years | | 10 Years | | Life of
Fund | |
At NAV | |
Investor Class | | 09/27/1988 | | | 13.48 | % | | | 12.16 | % | | | 13.34 | % | | | 12.19 | % | |
| Trust Class3 | | 08/26/1993 | | | 13.38 | % | | | 12.07 | % | | | 13.25 | % | | | 12.16 | % | |
| Advisor Class4 | | 04/02/1997 | | | 13.10 | % | | | 11.78 | % | | | 12.94 | % | | | 11.94 | % | |
| Institutional Class5 | | 07/01/1999 | | | 13.65 | % | | | 12.35 | % | | | 13.53 | % | | | 12.34 | % | |
| Class R622 | | 03/15/2013 | | | 13.74 | % | | | 12.44 | % | | | 13.55 | % | | | 12.26 | % | |
Index | |
| Russell 2000® Index1,15 | | | | | 6.02 | % | | | 7.65 | % | | | 11.53 | % | | | 9.24 | % | |
The performance data quoted represent past performance and do not indicate future results. Current performance may be lower or higher than the performance data quoted. For current performance data, please visit www.nb.com/performance.
The results shown in the table reflect the reinvestment of income dividends and other distributions, if any. The results do not reflect the effect of taxes a shareholder would pay on Fund distributions or on the redemption of Fund shares.
The investment return and principal value of an investment will fluctuate and shares, when redeemed, may be worth more or less than their original cost.
Returns would have been lower if Neuberger Berman Investment Advisers LLC ("Management") had not reimbursed certain expenses and/or waived a portion of the investment management fees during certain of the periods shown. Repayment by a class (of expenses previously reimbursed and/or fees previously waived by Management) will decrease the class's returns. Please see Note B in the Notes to Financial Statements for specific information regarding expense reimbursement and/or fee waiver arrangements.
As stated in the Fund's most recent prospectus, the total annual operating expense ratios for fiscal year 2019 were 1.02%, 1.10%, 1.35%, 0.85% and 0.75% for Investor Class, Trust Class, Advisor Class, Institutional Class and Class R6 shares, respectively (before expense reimbursements and/or fee waivers, if any, and after restatement for Class R6 shares). The expense ratios for the annual period ended August 31, 2020 can be found in the Financial Highlights section of this report.
18
COMPARISON OF A $10,000 INVESTMENT

This graph shows the change in value of a hypothetical $10,000 investment in the Fund over the past 10 fiscal years, or since the Fund's inception if it has not operated for 10 years. The graph is based on the Investor Class shares only; the performance of the Fund's share classes will differ primarily due to different class expenses (see Performance Highlights chart on previous page). The result is compared with benchmarks, which include a broad-based market index and may include a more narrowly based index. Market indices have not been reduced to reflect any of the fees and costs of investing. The results shown in the graph reflect the reinvestment of income dividends and other distributions, if any. The results do not reflect the effect of taxes a shareholder would pay on Fund distributions or on the redemption of Fund shares. Results represent past performance and do not indicate future results.
19
Global Real Estate Fund Commentary (Unaudited)
Neuberger Berman Global Real Estate Fund Institutional Class generated a –3.48% total return for the fiscal year ended August 31, 2020 (the reporting period), outperforming the –13.68% total return of its benchmark, the FTSE EPRA/Nareit Developed Index (Net) (the Index), for the same period. (Performance for all share classes is provided in the table immediately following this letter.)
Global equity markets experienced periods of heighted volatility, but ultimately generated a positive return over the reporting period. After a positive start, beginning in mid-February 2020 the repercussions from the COVID-19 pandemic triggered a rapid and severe downturn. However, the market then had an equally dramatic rally over the last five months of the reporting period. This turnaround was triggered by several factors, including aggressive global monetary policy accommodation, phased economic re-openings, and hopes for a COVID-19 vaccine. All told, the MSCI All Country World Index (Net) returned 16.52% for the reporting period. Comparatively, global real estate investment trusts (REITs) generated significantly weaker results.
The Fund meaningfully outperformed the Index during the reporting period. Stock selection, overall, was the largest contributor to the Fund's relative results. In particular, holdings in the Specialty REITs, Industrial & Office REITs and Residential REITs sectors were the most additive for returns. In terms of individual holdings, Equinix, Inc., Segro plc., Prologis, Inc., Goodman Group and Mitsui Fudosan Logistics Park, Inc. were the largest contributors to performance. The sectors that detracted from results from a stock selection perspective were Real Estate Holding & Development, Diversified REITs and Retail REITs. Several individual holdings were also negative for results, including Equity Residential, National Retail Properties, Inc., Dexus, Mitsui Fudosan Co., Ltd. and CK Asset Holdings Limited. Dexus and CK Asset Holdings Limited were both sold during the reporting period.
The Fund's positioning from a country perspective also contributed to relative results. In particular versus the Index, overweights to the UK and Belgium, along with an underweight to the U.S., were the most additive for results. On the downside, underweights in Germany, Singapore and Sweden were the largest detractors from relative performance.
A likely extended global economic slowdown triggered by the COVID-19 outbreak, the coming U.S. election, and growing tensions between the world's two largest economies (U.S. and China), has us redoubling our efforts to position the Fund to better withstand these headwinds. We believe massive global stimulus, if it continues, could help ease the impact on markets. In addition, with worldwide quarantines, we are seeing the increased importance of technology infrastructure, logistics and e-commerce. We continue to focus on companies with secular demand drivers that we believe will result in above average cash flow and dividend growth. We remain focused on companies with strong, flexible balance sheets that we believe can better withstand increased market volatility.
Overseas, in the UK and Europe, equity markets are facing pressure from disruptions from COVID-19. To position for these challenging times, we continue to focus on businesses where we see a structural growth angle and a strong rental growth profile. Our preferred strategy is still to concentrate on owning those companies investing in sectors with robust fundamentals, with business models that can handle both near term disruption and potential longer-term structural changes that could emerge. For Asia, the economic disruptions caused by COVID-19 added to existing concerns posed by growth deceleration, Hong Kong's uncertain political situation and the elevated office supply outlook in Australia and Singapore. Stocks have been trading at significant discounts to underlying real estate values, but a clear catalyst is lacking until the pandemic is brought under control. We retain our bias for high quality companies that appear to be more resilient to a macro downturn and not overvalued.
20
Sincerely,
STEVE SHIGEKAWA, BRIAN C. JONES, GILLIAN TILTMAN AND ANTON KWANG
PORTFOLIO MANAGERS
Information about principal risks of investing in the Fund is set forth in the prospectus and statement of additional information.
The portfolio composition, industries and holdings of the Fund are subject to change without notice.
The opinions expressed are those of the Fund's portfolio managers. The opinions are as of the date of this report and are subject to change without notice.
21
Global Real Estate Fund (Unaudited)
TICKER SYMBOLS
Institutional Class | | NGRIX | |
Class A | | NGRAX | |
Class C | | NGRCX | |
PERFORMANCE HIGHLIGHTS9
| | | | | Average Annual Total Return
Ended 08/31/2020 | |
| | | Inception
Date | | 1 Year5 YearsLife of
Fund | |
At NAV | |
Institutional Class | | 12/30/2014 | | | – | 3.48% | | | 6.96 | % | | | 4.97 | % | |
Class A | | 12/30/2014 | | | – | 3.93% | | | 6.55 | % | | | 4.57 | % | |
Class C | | 12/30/2014 | | | – | 4.65% | | | 5.76 | % | | | 3.79 | % | |
With Sales Charge | |
Class A | | | | | –9.47 | % | | | 5.29 | % | | | 3.48 | % | |
Class C | | | | | –5.57 | % | | | 5.76 | % | | | 3.79 | % | |
Index | |
FTSE EPRA/Nareit
Developed Index
(Net)1,15 | | | | | –13.68% | | | | 2.91% | | | | 1.27% | | |
The performance data quoted represent past performance and do not indicate future results. Current performance may be lower or higher than the performance data quoted. For current performance data, please visit www.nb.com/performance.
The results shown in the table reflect the reinvestment of income dividends and other distributions, if any. The results do not reflect the effect of taxes a shareholder would pay on Fund distributions or on the redemption of Fund shares.
The investment return and principal value of an investment will fluctuate and shares, when redeemed, may be worth more or less than their original cost.
Returns would have been lower if Neuberger Berman Investment Advisers LLC ("Management") had not reimbursed certain expenses and/or waived a portion of the investment management fees during certain of the periods shown. Repayment by a class (of expenses previously reimbursed and/or fees previously waived by Management) will decrease the class's returns. Please see Note B in the Notes to Financial Statements for specific information regarding expense reimbursement and/or fee waiver arrangements.
As stated in the Fund's most recent prospectus, the total annual operating expense ratios for fiscal year 2019 were 9.11%, 9.72% and 10.43% for Institutional Class, Class A and Class C shares, respectively (before expense reimbursements and/or fee waivers, if any). The expense ratios were 1.01%, 1.37% and 2.12% for Institutional Class, Class A and Class C shares, respectively, after expense reimbursements and/or fee waivers. The expense ratios for the annual period ended August 31, 2020 can be found in the Financial Highlights section of this report.
Returns shown with a sales charge reflect the deduction of the current maximum initial sales charge of 5.75% for Class A shares and the contingent deferred sales charge (CDSC) for Class C shares. The CDSC for Class C shares is 1.00%, which is reduced to 0% after 1 year. The performance of the Fund's share classes will differ primarily due to different sales charge structures and class expenses. Please see the prospectus for more information about sales charge structures, if any, and class expenses for your share class.
22
Global Real Estate Fund (Unaudited)
COMPARISON OF A $1,000,000 INVESTMENT
(000's omitted)
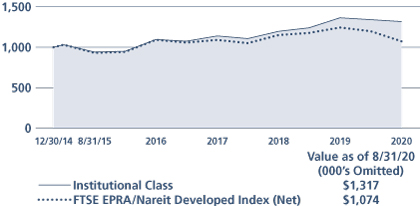
This graph shows the change in value of a hypothetical $1,000,000 investment in the Fund over the past 10 fiscal years, or since the Fund's inception if it has not operated for 10 years. The graph is based on the Institutional Class shares only; the performance of the Fund's share classes will differ primarily due to different sales charge structures and class expenses (see Performance Highlights chart on previous page). The result is compared with benchmarks, which include a broad-based market index and may include a more narrowly based index. Market indices have not been reduced to reflect any of the fees and costs of investing. The results shown in the graph reflect the reinvestment of income dividends and other distributions, if any. The results do not reflect the effect of taxes a shareholder would pay on Fund distributions or on the redemption of Fund shares. Results represent past performance and do not indicate future results.
23
Greater China Equity Fund Commentary (Unaudited)
Neuberger Berman Greater China Equity Fund Institutional Class generated a 24.93% total return for the fiscal year ended August 31, 2020 (the reporting period), underperforming its benchmark, the MSCI China Index (Net) (the Index), which returned 37.30% over the same period. (Performance for all share classes is provided in the table immediately following this letter.)
During the Fund's reporting period, the China equity markets continued to experience volatility. In September, the China equity markets rebounded as Sino-U.S. trade talks resumed. The State Council signaled targeted reserve requirement ratio (RRR) cuts and the State Administration of Foreign Exchange announced the removal of quotas on certain foreign investors, but most of the gains reversed ahead of the China National Day holidays amid ongoing trade tensions, policy easing and continued social unrest in Hong Kong. After the Golden Week holidays in October 2019, both offshore and onshore markets rallied strongly because of solid 3Q earnings results, and investors awaited guidance from the 4th Plenary Session of the 19th Central Committee of the Communist Party of China. Markets extended gains into November as China and the U.S. both stated plans to lift tariffs as part of a phase one trade deal, but corrected sharply later in the month after the U.S. passed a bill in support of the Hong Kong protest movement. In December, Chinese equities rallied strongly as China and the U.S. reached a phase one trade deal which prevented additional U.S. tariffs on $160 billion worth of Chinese imports from coming into effect, and both countries agreed to scale back existing tariffs. Encouraging China macroeconomic data and expectations of additional fiscal and monetary stimulus from Beijing, further lifted investor sentiment which led markets to end calendar year 2019 on a strong note. Going into 2020, China equity markets extended gains as the government announced a broad-based 50 bps RRR cut and trade tensions eased after China and the U.S. signed the trade deal, but markets took a downturn later in January ahead of the Lunar New Year holidays as investors assessed the impact of the COVID-19 outbreak to the global economy. Throughout February, investors were focused on the COVID-19 pandemic and Chinese equities were sold off after resuming trading from the extended New Year holidays. Global markets also declined as the outbreak spread to more countries and the spike in number of infections heightened concerns over disruptions to global supply chains.
In March, China's containment of the outbreak outside Hubei was largely effective and factory production gradually resumed, but the number of cases accelerated outside China and the eruption of an oil price war between Russia and Saudi Arabia triggered a heavy sell-off in all asset classes. Towards calendar quarter-end, markets stabilized as government stimulus and easing measures such as targeted RRR cuts by the People's Bank of China (PBoC) and two aggressive rate cuts by the U.S. Federal Reserve Board (Fed) helped investors gain some risk appetite. In April, despite a historic collapse in U.S. West Texas Intermediate crude oil prices which settled negative for the first time, Chinese equities traded higher because March Manufacturing and Non-Manufacturing Purchasing Managers Indices (PMIs) rebounded, the additional government stimulus, optimism over corporate earnings and the reopening of global economies. The China equity markets corrected in May, primarily due to tensions between China and the U.S. resurfacing after President Trump expressed doubts over phase one of the trade agreement and the proposal of the Hong Kong national security legislation, and the "Two Sessions" meeting in Beijing fell short of markets' expectations as the government did not set a 2020 GDP growth target. Markets rallied in June as solid macroeconomic data released for May fueled optimism of a sustainable global economic recovery and better than expected Exports and Industrial Profits data. In July, the market rally continued due to ongoing economic recovery indicated by solid PMI data, rebounding 2Q GDP growth and accelerated Industrial Profit growth, and risk appetite resumed following positive news of vaccine trials and anticipation of further fiscal stimulus and policy support from central banks and governments. Strong market returns extended into August despite increasing China-U.S. tensions and concerns over high borrowing cost and a wave of new share listings. The positive returns were primarily because of better than expected corporate interim results, solid performance of the ChiNext Board after new initial public offering listing and trading rules, and accommodative monetary policy from the Fed supported risk appetite globally.
For the reporting period, contributors to performance relative to the Index included Materials (stock selection within the Construction Materials industry), Communication Services (stock selection within Interactive Media & Services and
24
Entertainment) and Utilities (an underweight versus the Index). Detractors from performance relative to the Index included Consumer Discretionary (stock selection, primarily from Internet & Direct Marketing Retail, Automobiles, Diversified Consumer Services and Household Durables), Information Technology (IT) (an underweight versus the Index and stock selection within Electronic Equipment Instruments & Components) and Health Care (stock selection within Biotechnology and Pharmaceuticals).
The Fund continues to focus on companies that have sustainable top and bottom line growth by looking at the companies' operating cash flow from their recurring core businesses. As of August 31, 2020, the Fund's largest sector overweight relative to the Index was Consumer Staples, followed by Materials and Real Estate. The largest sector underweight was Communication Services, followed by Consumer Discretionary and IT. The Fund's top 10 positions comprised more than 55% of total portfolio assets at the end of August.
Economic growth in China likely continued to recover in 2Q 2020. Median estimates put GDP growth for the quarter at 2.5% year over year and the trajectory points comfortably towards a path to recovery. In particular, Manufacturing PMI unexpectedly picked-up in June, led by large- and medium-sized enterprises. On the other hand, PMI for small-sized enterprises contracted, indicating that additional policy stimulus for this segment may be necessary. Other bright spots include improving property sales in China's 30 major cities, strong fixed asset investment and the resumption of construction activities. Meanwhile, there are signs that domestic consumption in China is recovering as contraction in retail sales started to plateau in June. In view of the need for more balance in recovery, the PBoC announced on July 1 that it has reduced both the re-discount and re-lending rates by 25 bps, a targeted measure meant to provide credit support to the small and medium enterprises space (SME). The State Council has also approved the use of local government special bonds to shore up the capital base of small and medium-sized banks, thereby cushioning the finances of SMEs, which is expected to have indirect flow-through effects to support employment.
Looking ahead, we anticipate the policy environment to continue to be accommodative and future policy stimulus to be led by further loosening of fiscal policy, particularly in the form of ongoing local government special bond issuance to ensure robust credit growth in the second half of 2020. On the back of improving economic conditions and improved earnings visibility, China equity market returns have exhibited strength over the last three months of the reporting period. Domestic investor sentiment has also been positive as evidenced by an uptick of new mutual fund launches in China and acceleration in the opening of brokerage accounts, both of which have been in conjunction with ongoing capital market reforms. Taken together, these are anticipated to provide ongoing liquidity support for China A-shares. Despite this optimism, we continue to be in an uncertain environment. In recent periods, the emergence of a string of new COVID-19 cases that led to a partial lockdown in Beijing is a stark reminder of the potential downside risks associated with COVID-19. Moreover, escalating geopolitical tensions between the U.S. and China continue to be a source of risk, which may be further complicated by the upcoming U.S. presidential election. With this in mind, we continue to focus on identifying and owning what we believe to be high quality companies with good earnings visibility capable of weathering the cloudy outlook in the horizon.
Sincerely,
LIHUI TANG AND FRANK YAO
PORTFOLIO MANAGERS
Information about principal risks of investing in the Fund is set forth in the prospectus and statement of additional information.
The portfolio composition, industries and holdings of the Fund are subject to change without notice.
The opinions expressed are those of the Fund's portfolio managers. The opinions are as of the date of this report and are subject to change without notice.
25
Greater China Equity Fund (Unaudited)
TICKER SYMBOLS
Institutional Class | | NCEIX | |
Class A | | NCEAX | |
Class C | | NCECX | |
SECTOR ALLOCATION
(as a % of Total Investments*) | |
Communication Services | | | 9.7 | % | |
Consumer Discretionary | | | 29.7 | | |
Consumer Staples | | | 14.9 | | |
Energy | | | 1.7 | | |
Financials | | | 12.4 | | |
Health Care | | | 5.9 | | |
Industrials | | | 8.0 | | |
Information Technology | | | 1.1 | | |
Materials | | | 8.6 | | |
Real Estate | | | 7.9 | | |
Short-Term Investments | | | 0.1 | | |
Total | | | 100.0 | % | |
* Derivatives (other than options purchased), if any, are excluded from this chart.
EXCHANGE ALLOCATION
(as a % of Long Term Investments) | |
Mainland China | | | 19.7 | % | |
Hong Kong | | | 78.8 | | |
United States | | | 1.5 | | |
Total | | | 100.0 | % | |
PERFORMANCE HIGHLIGHTS
| | | | Average Annual Total Return
Ended 08/31/2020 | |
| | Inception
Date | | 1 Year | | 5 Years | | Life of
Fund | |
At NAV | | | | | | | |
| |
Institutional Class | | 07/17/2013 | | | 24.93 | % | | | 14.90 | % | | | 13.85 | % | |
Class A | | 07/17/2013 | | | 24.51 | % | | | 14.59 | % | | | 13.53 | % | |
Class C | | 07/17/2013 | | | 23.62 | % | | | 13.66 | % | | | 12.62 | % | |
With Sales Charge | | | | | | | |
| |
Class A | | | | | 17.37 | % | | | 13.24 | % | | | 12.59 | % | |
Class C | | | | | 22.62 | % | | | 13.66 | % | | | 12.62 | % | |
Index | |
MSCI China Index
(Net)1,15 | | | | | | | 37.30 | % | | | 13.72 | % | | | 11.14 | % | |
The performance data quoted represent past performance and do not indicate future results. Current performance may be lower or higher than the performance data quoted. For current performance data, please visit www.nb.com/performance.
The results shown in the table reflect the reinvestment of income dividends and other distributions, if any. The results do not reflect the effect of taxes a shareholder would pay on Fund distributions or on the redemption of Fund shares.
The investment return and principal value of an investment will fluctuate and shares, when redeemed, may be worth more or less than their original cost.
Returns would have been lower if Neuberger Berman Investment Advisers LLC ("Management") had not reimbursed certain expenses and/or waived a portion of the investment management fees during certain of the periods shown. Repayment by a class (of expenses previously reimbursed and/or fees previously waived by Management) will decrease the class's returns. Please see Note B in the Notes to Financial Statements for specific information regarding expense reimbursement and/or fee waiver arrangements.
As stated in the Fund's most recent prospectus, the total annual operating expense ratios for fiscal year 2019 were 1.84%, 2.32% and 3.08% for Institutional Class, Class A and Class C shares, respectively (before expense reimbursements and/or fee waivers, if any). The expense ratios were 1.52%, 1.88% and 2.63% for Institutional Class, Class A and Class C shares, respectively, after expense reimbursements and/or fee waivers. The expense ratios for the annual period ended August 31, 2020 can be found in the Financial Highlights section of this report.
Returns shown with a sales charge reflect the deduction of the current maximum initial sales charge of 5.75% for Class A shares and the contingent deferred sales charge (CDSC) for Class C shares. The CDSC for Class C shares is 1.00%, which is reduced to 0% after 1 year. The performance of the Fund's share classes will differ primarily due to different sales charge structures and class expenses. Please see the prospectus for more information about sales charge structures, if any, and class expenses for your share class.
26
Greater China Equity Fund (Unaudited)
COMPARISON OF A $1,000,000 INVESTMENT
(000's omitted)

This graph shows the change in value of a hypothetical $1,000,000 investment in the Fund over the past 10 fiscal years, or since the Fund's inception if it has not operated for 10 years. The graph is based on the Institutional Class shares only; the performance of the Fund's share classes will differ primarily due to different sales charge structures and class expenses (see Performance Highlights chart on previous page). The result is compared with benchmarks, which include a broad-based market index and may include a more narrowly based index. Market indices have not been reduced to reflect any of the fees and costs of investing. The results shown in the graph reflect the reinvestment of income dividends and other distributions, if any. The results do not reflect the effect of taxes a shareholder would pay on Fund distributions or on the redemption of Fund shares. Results represent past performance and do not indicate future results.
27
Guardian Fund Commentary (Unaudited)
Neuberger Berman Guardian Fund Investor Class posted a 35.76% total return for the fiscal year ended August 31, 2020 (the reporting period), outperforming the 21.94% total return of its benchmark, the S&P 500® Index (the Index), for the same period. (Performance for all share classes is provided in the table immediately following this letter.)
The overall equity market experienced periods of heighted volatility, but ultimately generated a strong return over the reporting period. After a positive start, beginning in mid-February 2020 the repercussions from the COVID-19 pandemic triggered a rapid and severe downturn, with the market posting its fastest fall on record from an all-time high to a bear market. However, the market then had an equally dramatic rally over the last five months of the reporting period. This turnaround was triggered by several factors, including unprecedented monetary policy accommodation by the U.S. Federal Reserve Board, a $2 trillion fiscal stimulus package, phased economic re-openings, and hopes for a COVID-19 vaccine. All told, the Index returned 21.94% during the reporting period.
The Fund's investment themes fall into three buckets: Growth, Total Return and Opportunistic. Growth companies are those companies that are growing their revenues and, as they do so, generate free cash flow that is reinvested in the business at what we identify as attractive risk-adjusted returns. Total Return investments demonstrate sustainable and/or growing streams of income that are underpinned by asset value and which may result in growing cash returns to shareholders (e.g., increased dividends, share repurchases, return of capital). Finally, Opportunistic investments are those with identifiable catalysts. This bucket may include companies with management changes, company reorganizations, merger and acquisition activity, "hidden assets", or other market dislocations that we believe have the potential to unlock intrinsic value.1
Stock selection drove the Fund's outperformance during the reporting period, with positive relative results in eight of the ten sectors in which we were invested. In particular, selection in the Communication Services, Financials and Energy sectors were among the most beneficial for returns. Conversely, stock selection in the Industrial sector and, to a lesser extent, the Materials sector were the only detractors from the Fund's relative results.
Sector allocation, overall, also meaningfully contributed to the Fund's results during the reporting period. This was primarily driven by an underweight to Energy versus the Index and lack of exposure to Real Estate. Conversely, the Fund's small cash position and an overweight to Industrials were the largest detractors from relative results.
The Fund's use of purchased and written options contributed positively to performance during the reporting period.
With states now open for business, we will be watching for a "second wave" of COVID-19 infections. In our view, after finally reopening the economy, a second shutdown would be highly problematic for the economy. However, states should be better prepared for a potential round two given the experiences gained from round one. Each sector and business will be impacted differently, and certain firms will rebound quicker than others in response to both demand and supply side forces. Some companies will emerge with stronger competitive moats as they capitalize on an accelerated pace of secular change. We want to own companies that we believe are "outcome makers" and not "outcome takers." We believe management experience, forward thinking strategies, and prudent capital structure and capital allocation has never been more important. Nevertheless, we are very mindful of the complex world in which we live and invest. The myriad of ongoing geopolitical issues around the world remain top of mind. In these difficult economic and financial conditions, we remain dedicated to thinking deeply and creatively and strive always to deliver attractive risk-adjusted returns. We remain flexible in our decision making and open-minded to new ideas across different asset classes and geographies.
28
Sincerely,
CHARLES KANTOR
PORTFOLIO MANAGER
1 Intrinsic value reflects the portfolio management team's analysis and estimates of a company's value. There is no guarantee that any intrinsic values will be realized; security prices may decrease regardless of intrinsic values.
Information about principal risks of investing in the Fund is set forth in the prospectus and statement of additional information.
The portfolio composition, industries and holdings of the Fund are subject to change without notice.
The opinions expressed are those of the Fund's portfolio managers. The opinions are as of the date of this report and are subject to change without notice.
29
Guardian Fund (Unaudited)
TICKER SYMBOLS
Investor Class | | NGUAX | |
Trust Class | | NBGTX | |
Advisor Class | | NBGUX | |
Institutional Class | | NGDLX | |
Class A | | NGDAX | |
Class C | | NGDCX | |
Class R3 | | NGDRX | |
Class R6 | | NGRDX | |
SECTOR ALLOCATION
(as a % of Total Investments*) | |
Communication Services | | | 9.9 | % | |
Consumer Discretionary | | | 17.5 | | |
Consumer Staples | | | 3.4 | | |
Energy | | | 0.1 | | |
Financials | | | 9.2 | | |
Health Care | | | 11.4 | | |
Industrials | | | 9.0 | | |
Information Technology | | | 30.5 | | |
Materials | | | 2.9 | | |
Utilities | | | 3.1 | | |
Options Purchased | | | 0.2 | | |
Short-Term Investments | | | 2.8 | | |
Total | | | 100.0 | % | |
* Derivatives (other than options purchased), if any, are excluded from this chart.
PERFORMANCE HIGHLIGHTS11
| | | | Average Annual Total Return
Ended 08/31/2020 | |
| | Inception
Date | | 1 Year | | 5 Years | | 10 Years | | Life of
Fund | |
At NAV | |
Investor Class | | 06/01/1950 | | | 35.76 | % | | | 17.03 | % | | | 15.53 | % | | | 11.42 | % | |
| Trust Class3 | | 08/03/1993 | | | 35.55 | % | | | 16.84 | % | | | 15.33 | % | | | 11.37 | % | |
| Advisor Class4 | | 09/03/1996 | | | 35.18 | % | | | 16.53 | % | | | 14.95 | % | | | 11.22 | % | |
| Institutional Class5 | | 05/27/2009 | | | 36.03 | % | | | 17.24 | % | | | 15.73 | % | | | 11.46 | % | |
| Class A19 | | 05/27/2009 | | | 35.49 | % | | | 16.80 | % | | | 15.31 | % | | | 11.39 | % | |
| Class C19 | | 05/27/2009 | | | 34.53 | % | | | 15.95 | % | | | 14.44 | % | | | 11.26 | % | |
| Class R316 | | 05/27/2009 | | | 35.06 | % | | | 16.47 | % | | | 15.00 | % | | | 11.34 | % | |
| Class R622 | | 03/29/2019 | | | 36.09 | % | | | 17.10 | % | | | 15.57 | % | | | 11.43 | % | |
With Sales Charge | |
| Class A19 | | | | | 27.67 | % | | | 15.42 | % | | | 14.63 | % | | | 11.30 | % | |
| Class C19 | | | | | 33.53 | % | | | 15.95 | % | | | 14.44 | % | | | 11.26 | % | |
Index | |
| S&P 500® Index1,15 | | | | | 21.94 | % | | | 14.46 | % | | | 15.16 | % | | | 11.28 | % | |
The performance data quoted represent past performance and do not indicate future results. Current performance may be lower or higher than the performance data quoted. For current performance data, please visit www.nb.com/performance.
The results shown in the table reflect the reinvestment of income dividends and other distributions, if any. The results do not reflect the effect of taxes a shareholder would pay on Fund distributions or on the redemption of Fund shares.
The investment return and principal value of an investment will fluctuate and shares, when redeemed, may be worth more or less than their original cost.
Returns would have been lower if Neuberger Berman Investment Advisers LLC ("Management") had not reimbursed certain expenses and/or waived a portion of the investment management fees during certain of the periods shown. Repayment by a class (of expenses previously reimbursed and/or fees previously waived by Management) will decrease the class's returns. Please see Note B in the Notes to Financial Statements for specific information regarding expense reimbursement and/or fee waiver arrangements.
As stated in the Fund's most recent prospectus, the total annual operating expense ratios for fiscal year 2019 were 0.89%, 1.07%, 1.41%, 0.72%, 1.09%, 1.84% and 1.40% for Investor Class, Trust Class, Advisor Class, Institutional Class, Class A, Class C and Class R3 shares, respectively, and the estimated total annual operating expense ratio for fiscal year 2020 is 0.62% for Class R6 shares (before expense reimbursements and/or fee waivers, if any, and after restatement for Class R6 shares). The expense ratio was 1.37% for Class R3 shares after expense reimbursements and/or fee waivers. The expense ratios for the annual period ended August 31, 2020 can be found in the Financial Highlights section of this report.
Returns shown with a sales charge reflect the deduction of the current maximum initial sales charge of 5.75% for Class A shares and the contingent deferred sales charge (CDSC) for Class C shares. The CDSC for Class C shares is 1.00%, which is reduced to 0% after 1 year. The performance of the Fund's share classes will differ primarily due to different sales charge structures and class expenses. Please see the prospectus for more information about sales charge structures, if any, and class expenses for your share class.
30
Guardian Fund (Unaudited)
COMPARISON OF A $10,000 INVESTMENT
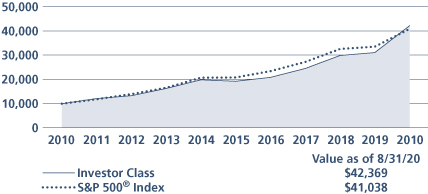
This graph shows the change in value of a hypothetical $10,000 investment in the Fund over the past 10 fiscal years, or since the Fund's inception if it has not operated for 10 years. The graph is based on the Investor Class shares only; the performance of the Fund's share classes will differ primarily due to different sales charge structures and class expenses (see Performance Highlights chart on previous page). The result is compared with benchmarks, which include a broad-based market index and may include a more narrowly based index. Market indices have not been reduced to reflect any of the fees and costs of investing. The results shown in the graph reflect the reinvestment of income dividends and other distributions, if any. The results do not reflect the effect of taxes a shareholder would pay on Fund distributions or on the redemption of Fund shares. Results represent past performance and do not indicate future results.
31
Integrated Large Cap Fund Commentary (Unaudited)
Neuberger Berman Integrated Large Cap Fund Institutional Class generated a 19.16% total return for the fiscal year ended August 31, 2020 (the reporting period), trailing the 22.50% total return of its benchmark, the Russell 1000® Index (the Index), for the same period. (Performance for all share classes is provided in the table immediately following this letter.)
On September 3, 2019, the Fund transitioned to the Integrated Large Cap strategy focusing on U.S. large cap equity securities using a combination of Fundamental and Quantitative investing approaches, and began comparing its performance to the Index, rather than its prior benchmark, the MSCI All Country World Index (Net), to correspond with the Fund's revised principal investment strategy. From the close of September 3, 2019 (the effective date of the changes) through the end of the reporting period, the Fund's Institutional Class returned 19.79% versus a 23.38% total return for the Index. For the entire reporting period, the Fund's Institutional Class returned 19.16%, outperforming the prior benchmark, which returned 16.52% for the same period.
From September 2019 through January 2020, markets grinded higher as trade tensions eased and the U.S. Federal Reserve Board struck a largely dovish tone; however, February and March saw the worst sell-off in risk assets since the global financial crisis as the rapid spread of the COVID-19 pandemic drove fear and uncertainty across the globe. Impaired global growth prospects and the untold negative impact on corporate earnings weighed on investor behavior as the S&P 500® Index was down nearly –34% peak-to-trough. Markets sharply rebounded over the next several months on the back of unprecedented monetary and fiscal stimulus. Despite staggering unemployment and continued economic uncertainty, investors largely brushed off fears of a second wave as optimism regarding vaccine development continued to shift focus towards the reopening of economies around the globe.
During the reporting period, the Fund benefited from strong security selection in Financials, Energy and Consumer Staples, as high-quality names with stable balance sheets and strong management teams were able to navigate COVID-19 better than their more leveraged counterparts. Balanced sector, thematic and factor exposures helped ensure the Fund maintained exposure to higher momentum tech and discretionary stocks; these positions outperformed during the rally as many people shifted to remote working arrangements and increased online shopping. The Fund continues to take relatively small tilts away from Index sector weights so allocation effects were relatively muted during the reporting period.
Security selection in Communication Services, Information Technology and Health Care struggled throughout the entire reporting period with high growth tech securities leading the market upward. The February/March sell-off was largely indiscriminate with low risk securities, traditionally a resilient factor in periods of market stress, selling off in tandem with higher risk names. Despite the numerous (albeit brief) value rotations throughout the reporting period, the growth cohort continued to outperform during the subsequent rebound while many value names remained depressed. Holdings in cyclical industries such as airlines and restaurants were particularly hurt during the reporting period as nationwide lockdowns halted consumer spending and business travel.
The long-term goal and focus of the Fund remains unchanged; however, the team continues to pursue evolutionary research in an effort to enhance the strategy. In this vein, we have taken steps to reduce the number of holdings in the Fund (from 100+ names down to approximately 80 names as of August 31, 2020) and marginally increase tracking error (or the volatility of the Fund's excess returns versus the Index) by placing additional active weight in smaller cap names. We anticipate these small enhancements to the portfolio have the potential to lead to increased risk-adjusted returns in the future.
We believe the outlook for the strategy remains strong as our Quantimental framework allows us to more aggressively pivot into certain factors, like value, should market conditions change and growth begin to underperform. The ongoing COVID-19 pandemic, upcoming U.S. elections and continued tensions with China create a lot of uncertainty in the
32
market but we believe an integrated approach that combines both Quantitative and Fundamental analysis is uniquely equipped to navigate this type of volatile environment.
Sincerely,
SIMON GRIFFITHS AND JACOB GAMERMAN
PORTFOLIO MANAGERS
Information about principal risks of investing in the Fund is set forth in the prospectus and statement of additional information.
The portfolio composition, industries and holdings of the Fund are subject to change without notice.
The opinions expressed are those of the Fund's portfolio managers. The opinions are as of the date of this report and are subject to change without notice.
33
Integrated Large Cap Fund (Unaudited)
TICKER SYMBOLS
Institutional Class | | NGQIX | |
Class A | | NGQAX | |
Class C | | NGQCX | |
PERFORMANCE HIGHLIGHTS9, 24*
| | | | | Average Annual Total Return
Ended 08/31/2020 | |
| | | Inception
Date | | 1 Year | | 5 Years | | Life of
Fund | |
At NAV | |
Institutional Class | | 06/30/2011 | | | 19.16 | % | | | 9.85 | % | | | 7.46 | % | |
Class A | | 06/30/2011 | | | 18.86 | % | | | 9.51 | % | | | 7.10 | % | |
Class C | | 06/30/2011 | | | 17.87 | % | | | 8.64 | % | | | 6.29 | % | |
With Sales Charge | |
Class A | | | | | 12.06 | % | | | 8.22 | % | | | 6.41 | % | |
Class C | | | | | 16.92 | % | | | 8.64 | % | | | 6.29 | % | |
Index | |
| Russell 1000® Index1,15 | | | | | 22.50 | % | | | 14.31 | % | | | 13.57 | % | |
MSCI All Country
World Index (Net)1,15 | | | | | | | 16.52 | % | | | 10.21 | % | | | 8.35 | % | |
*Prior to September 3, 2019, the Fund had a different investment strategy, portfolio management team, benchmark and fees and expenses. On September 3, 2019, the Fund began comparing its performance to the Russell 1000® Index rather than the MSCI All Country World Index (Net) to correspond with the Fund's revised principal investment strategy. Please also see Endnote 24.
The performance data quoted represent past performance and do not indicate future results. Current performance may be lower or higher than the performance data quoted. For current performance data, please visit www.nb.com/performance.
The results shown in the table reflect the reinvestment of income dividends and other distributions, if any. The results do not reflect the effect of taxes a shareholder would pay on Fund distributions or on the redemption of Fund shares.
The investment return and principal value of an investment will fluctuate and shares, when redeemed, may be worth more or less than their original cost.
Returns would have been lower if Neuberger Berman Investment Advisers LLC ("Management") had not reimbursed certain expenses and/or waived a portion of the investment management fees during certain of the periods shown. Repayment by a class (of expenses previously reimbursed and/or fees previously waived by Management) will decrease the class's returns. Please see Note B in the Notes to Financial Statements for specific information regarding expense reimbursement and/or fee waiver arrangements.
As stated in the Fund's most recent prospectus, the total annual operating expense ratios for fiscal year 2019 were 7.13%, 7.62% and 8.30% for Institutional Class, Class A and Class C shares, respectively (before expense reimbursements and/or fee waivers, if any, and after restatement). The expense ratios for fiscal year 2019 were 0.41%, 0.77% and 1.52% for Institutional Class, Class A and Class C shares, respectively, after expense reimbursements and/or fee waivers and/or restatement. The expense ratios for the annual period ended August 31, 2020 can be found in the Financial Highlights section of this report.
Returns shown with a sales charge reflect the deduction of the current maximum initial sales charge of 5.75% for Class A shares and the contingent deferred sales charge (CDSC) for Class C shares. The CDSC for Class C shares is 1.00%, which is reduced to 0% after 1 year. The performance of the Fund's share classes will differ primarily due to different sales charge structures and class expenses. Please see the prospectus for more information about sales charge structures, if any, and class expenses for your share class.
34
Integrated Large Cap Fund (Unaudited)
COMPARISON OF A $1,000,000 INVESTMENT
(000's omitted)

This graph shows the change in value of a hypothetical $1,000,000 investment in the Fund over the past 10 fiscal years, or since the Fund's inception if it has not operated for 10 years. The graph is based on the Institutional Class shares only; the performance of the Fund's share classes will differ primarily due to different sales charge structures and class expenses (see Performance Highlights chart on previous page). The result is compared with benchmarks, which include a broad-based market index and may include a more narrowly based index. Market indices have not been reduced to reflect any of the fees and costs of investing. The results shown in the graph reflect the reinvestment of income dividends and other distributions, if any. The results do not reflect the effect of taxes a shareholder would pay on Fund distributions or on the redemption of Fund shares. Results represent past performance and do not indicate future results.
35
International Equity Fund Commentary (Unaudited)
Neuberger Berman International Equity Fund Institutional Class generated a total return of 15.74% for the fiscal year ended August 31, 2020 (the reporting period), outperforming its benchmark, the MSCI EAFE® Index (the Index), which posted a total return of 6.13% for the same period. (Performance for all share classes is provided in the table immediately following this letter.)
As this reporting period began, international equity markets were generally positive, measuring slow, steady growth against potential impacts of U.S. trade/tariff wars. Sentiment shifted quickly in early 2020, as COVID-19 began spreading, and remained volatile through this period, as investors weighed the impacts of economic contraction against hopeful news on containment and vaccine development. Continued monetary stimulus from central banks and government fiscal efforts, including the European Union's large grant and loan program, helped support sentiment.
Information Technology (IT) significantly outperformed within the Index, as investors favored large growth stocks. Health Care and Materials also outperformed. By contrast, Energy, Real Estate and Financials posted negative returns. From an individual market perspective, Denmark, New Zealand and Sweden were the Index's top performers, and Austria, Belgium and Spain declined most.
Both stock selection and sector positioning benefited Fund performance, with both holdings and an overweight to IT versus the Index being the largest factors. Financials and Industrials also outperformed. By country, UK-based, German and Swiss holdings contributed most to relative returns.
Key contributors included ASML, Techtronic Industries and Kinaxis. ASML, a Netherlands-based semiconductor equipment manufacturer, reported solid results and strong orders for extreme ultraviolet lithography tools (an advanced technology used in chipmaking), with no pandemic-driven reduction in demand. Techtronic Industries, a Hong Kong-headquartered power tool maker, outperformed on a resurgence in demand given increased homeowner DIY projects during lockdowns. New product launches remained on schedule. Kinaxis, a Canadian software firm, saw strong results with higher demand from companies addressing challenges and global supply chain disruptions caused by the pandemic.
Stock selection within Consumer Discretionary and Utilities detracted this reporting period. Holdings in Japan, and our underweight to Denmark and Sweden detracted from relative performance.
We exited our largest detractors this reporting period. Samsonite, a Hong Kong-based luggage maker, lagged on concerns that the reduction in worldwide travel demand could extend the replacement period of luggage even if tourism recovers in 2021. Compass Group, a UK-based global contract caterer, declined as stay-at-home and social-distancing orders impacted revenues from sports, business, education, and entertainment clients. Continental, a German global automotive parts manufacturer, declined as COVID-19 closed automotive factories.
Given the extent of the rally in U.S. equity markets and stretched valuations, in our view, developed international equities look relatively better positioned over the coming quarters.
First, Europe and Japan are ahead of the U.S. in controlling the virus, so the Eurozone and North Asia are reopening faster as of the reporting period end. Next, the European Central Bank expanded its pandemic Quantitative Easing program in June and, given very low inflation, we believe it is likely to continue with sizeable sovereign bond purchases. Additionally, the European Commission's proposed Recovery Plan is significant in size, focused on grants and skewed toward weaker countries.
Given sharply negative global earnings revisions resulting from the pandemic, and the recent market recovery, price-to-earnings multiples have risen substantially—faster in the U.S., which as of the end of the reporting period was trading on average at a wider than normal premium to the Index. In our view, U.S. and global valuations, especially on growth stocks, are stretched. We believe our 'quality at a reasonable price' discipline, which allowed us to lock in profits throughout this year and recycle proceeds into more attractively valued areas of the market, will continue to serve the Fund well.
36
Sincerely,
BENJAMIN SEGAL AND ELIAS COHEN
PORTFOLIO MANAGERS
Information about principal risks of investing in the Fund is set forth in the prospectus and statement of additional information.
The portfolio composition, industries and holdings of the Fund are subject to change without notice.
The opinions expressed are those of the Fund's portfolio managers. The opinions are as of the date of this report and are subject to change without notice.
37
International Equity Fund (Unaudited)
TICKER SYMBOLS
Investor Class | | NIQVX | |
Trust Class | | NIQTX | |
Institutional Class | | NBIIX | |
Class A | | NIQAX | |
Class C | | NIQCX | |
Class R6 | | NRIQX | |
PERFORMANCE HIGHLIGHTS7
| | | | Average Annual Total Return
Ended 08/31/2020 | |
| | Inception
Date | | 1 Year | | 5 Years | | 10 Years | | Life of
Fund | |
At NAV | |
| Investor Class12 | | 01/28/2013 | | | 15.39 | % | | | 7.05 | % | | | 7.23 | % | | | 5.31 | % | |
| Trust Class12 | | 01/28/2013 | | | 15.41 | % | | | 7.01 | % | | | 7.19 | % | | | 5.28 | % | |
Institutional Class | | 06/17/2005 | | | 15.74 | % | | | 7.24 | % | | | 7.39 | % | | | 5.41 | % | |
| Class A12 | | 01/28/2013 | | | 15.27 | % | | | 6.85 | % | | | 7.09 | % | | | 5.22 | % | |
| Class C12 | | 01/28/2013 | | | 14.41 | % | | | 6.06 | % | | | 6.47 | % | | | 4.82 | % | |
| Class R621 | | 09/03/2013 | | | 15.91 | % | | | 7.35 | % | | | 7.45 | % | | | 5.46 | % | |
With Sales Charge | |
| Class A12 | | | | | 8.65 | % | | | 5.59 | % | | | 6.45 | % | | | 4.81 | % | |
| Class C12 | | | | | 13.41 | % | | | 6.06 | % | | | 6.47 | % | | | 4.82 | % | |
Index | |
| MSCI EAFE® Index (Net)1,15 | | | | | 6.13 | % | | | 4.72 | % | | | 5.88 | % | | | 4.55 | % | |
The performance data quoted represent past performance and do not indicate future results. Current performance may be lower or higher than the performance data quoted. For current performance data, please visit www.nb.com/performance.
The results shown in the table reflect the reinvestment of income dividends and other distributions, if any. The results do not reflect the effect of taxes a shareholder would pay on Fund distributions or on the redemption of Fund shares.
The investment return and principal value of an investment will fluctuate and shares, when redeemed, may be worth more or less than their original cost.
Returns would have been lower if Neuberger Berman Investment Advisers LLC ("Management") had not reimbursed certain expenses and/or waived a portion of the investment management fees during certain of the periods shown. Repayment by a class (of expenses previously reimbursed and/or fees previously waived by Management) will decrease the class's returns. Please see Note B in the Notes to Financial Statements for specific information regarding expense reimbursement and/or fee waiver arrangements.
As stated in the Fund's most recent prospectus, the total annual operating expense ratios for fiscal year 2019 were 1.22%, 1.26%, 1.01%, 1.37%, 2.12% and 0.91% for Investor Class, Trust Class, Institutional Class, Class A, Class C and Class R6 shares, respectively (before expense reimbursements and/or fee waivers, if any, and after restatement for Class R6 shares). The expense ratios were 0.86%, 1.22%, 1.97% and 0.76% for Institutional Class, Class A, Class C and Class R6 shares, respectively, after expense reimbursements and/or fee waivers and/or restatement. The expense ratios for the annual period ended August 31, 2020 can be found in the Financial Highlights section of this report.
Returns shown with a sales charge reflect the deduction of the current maximum initial sales charge of 5.75% for Class A shares and the contingent deferred sales charge (CDSC) for Class C shares. The CDSC for Class C shares is 1.00%, which is reduced to 0% after 1 year. The performance of the Fund's share classes will differ primarily due to different sales charge structures and class expenses. Please see the prospectus for more information about sales charge structures, if any, and class expenses for your share class.
38
International Equity Fund (Unaudited)
COMPARISON OF A $1,000,000 INVESTMENT
(000's omitted)
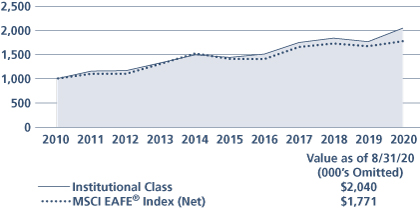
This graph shows the change in value of a hypothetical $1,000,000 investment in the Fund over the past 10 fiscal years, or since the Fund's inception if it has not operated for 10 years. The graph is based on the Institutional Class shares only; the performance of the Fund's share classes will differ primarily due to different sales charge structures and class expenses (see Performance Highlights chart on previous page). The result is compared with benchmarks, which include a broad-based market index and may include a more narrowly based index. Market indices have not been reduced to reflect any of the fees and costs of investing. The results shown in the graph reflect the reinvestment of income dividends and other distributions, if any. The results do not reflect the effect of taxes a shareholder would pay on Fund distributions or on the redemption of Fund shares. Results represent past performance and do not indicate future results.
39
International Select Fund Commentary (Unaudited)
Neuberger Berman International Select Fund Trust Class generated a total return of 16.28% for the fiscal year ended August 31, 2020 (the reporting period), outperforming its benchmark, the MSCI EAFE® Index (the Index), which posted a total return of 6.13% for the same period. (Performance for all share classes is provided in the table immediately following this letter.)
As this reporting period began, international equity markets were generally positive, measuring slow, steady growth against potential impacts of U.S. trade/tariff wars. Sentiment shifted quickly in early 2020, as COVID-19 began spreading, and remained volatile through this period, as investors weighed the impacts of economic contraction against hopeful news on containment and vaccine development. Continued monetary stimulus from central banks and government fiscal efforts, including the European Union's large grant and loan program, helped support sentiment.
Information Technology (IT) significantly outperformed within the Index, as investors favored large growth stocks. Health Care and Materials also outperformed. By contrast, Energy, Real Estate and Financials posted negative returns. From an individual market perspective, Denmark, New Zealand and Sweden were the Index's top performers, and Austria, Belgium and Spain declined most.
Both stock selection and sector positioning benefited Fund performance, with both holdings and an overweight to IT versus the Index being the largest factors. Financials and Industrials also outperformed. By country, UK-based, German and Swiss holdings contributed most to relative returns.
Key contributors included ASML, Techtronic Industries and Gerresheimer. ASML, a Netherlands-based semiconductor equipment manufacturer, reported solid results and strong orders for extreme ultraviolet lithography tools (an advanced technology used in chipmaking), with no pandemic-driven reduction in demand. Techtronic Industries, a Hong Kong-headquartered power tool maker, outperformed on a resurgence in demand given increased homeowner DIY projects during lockdowns. New product launches remained on schedule. Gerresheimer, a German medical specialty container maker, saw higher demand from pharmaceutical customers due to COVID-19.
Stock selection within Consumer Discretionary and a zero weighting in Utilities detracted this reporting period. Holdings in Japan and Canada, and our underweight to Denmark detracted from relative performance.
We exited our largest detractors this reporting period. Samsonite, a Hong Kong-based luggage maker, lagged on concerns that the reduction in worldwide travel demand could extend the replacement period of luggage even if tourism recovers in 2021. Compass Group, a UK-based global contract caterer, declined as stay-at-home and social-distancing orders impacted revenues from sports, business, education, and entertainment clients. Persol Holdings, a Japanese recruitment firm, fell given uncertainty about the pandemic's impact on hiring.
Given the extent of the rally in U.S. equity markets and stretched valuations, in our view, developed international equities look relatively better positioned over the coming quarters.
First, Europe and Japan are ahead of the U.S. in controlling the virus, so the Eurozone and North Asia are reopening faster as of the reporting period end. Next, the European Central Bank expanded its pandemic Quantitative Easing program in June and, given very low inflation, we believe it is likely to continue with sizeable sovereign bond purchases. Additionally, the European Commission's proposed Recovery Plan is significant in size, focused on grants and skewed toward weaker countries.
Given sharply negative global earnings revisions resulting from the pandemic, and the recent market recovery, price-to-earnings multiples have risen substantially—faster in the U.S., which as of the end of the reporting period was trading on average at a wider than normal premium to the Index. In our view, U.S. and global valuations, especially on growth stocks, are stretched. We believe our 'quality at a reasonable price' discipline, which allowed us to lock in profits throughout this year and recycle proceeds into more attractively valued areas of the market, will continue to serve the Fund well.
40
Sincerely,
BENJAMIN SEGAL AND ELIAS COHEN
PORTFOLIO MANAGERS
Information about principal risks of investing in the Fund is set forth in the prospectus and statement of additional information.
The portfolio composition, industries and holdings of the Fund are subject to change without notice.
The opinions expressed are those of the Fund's portfolio managers. The opinions are as of the date of this report and are subject to change without notice.
41
International Select Fund (Unaudited)
TICKER SYMBOLS
Trust Class | | NILTX | |
Institutional Class | | NILIX | |
Class A | | NBNAX | |
Class C | | NBNCX | |
Class R3 | | NBNRX | |
Class R6 | | NRILX | |
PERFORMANCE HIGHLIGHTS7
| | | | Average Annual Total Return
Ended 08/31/2020 | |
| | Inception
Date | | 1 Year | | 5 Years | | 10 Years | | Life of
Fund | |
At NAV | |
Trust Class | | 08/01/2006 | | | 16.28 | % | | | 7.15 | % | | | 6.57 | % | | | 4.00 | % | |
| Institutional Class6 | | 10/06/2006 | | | 16.68 | % | | | 7.53 | % | | | 6.94 | % | | | 4.35 | % | |
| Class A14 | | 12/20/2007 | | | 16.22 | % | | | 7.15 | % | | | 6.56 | % | | | 3.99 | % | |
| Class C14 | | 12/20/2007 | | | 15.37 | % | | | 6.34 | % | | | 5.77 | % | | | 3.29 | % | |
| Class R314 | | 05/27/2009 | | | 15.93 | % | | | 6.86 | % | | | 6.29 | % | | | 3.77 | % | |
| Class R623 | | 04/17/2017 | | | 16.77 | % | | | 7.47 | % | | | 6.73 | % | | | 4.11 | % | |
With Sales Charge | |
| Class A14 | | | | | 9.58 | % | | | 5.89 | % | | | 5.94 | % | | | 3.55 | % | |
| Class C14 | | | | | 14.37 | % | | | 6.34 | % | | | 5.77 | % | | | 3.29 | % | |
Index | |
MSCI EAFE® Index
(Net)1,15 | | | | | 6.13 | % | | | 4.72 | % | | | 5.88 | % | | | 3.09 | % | |
The performance data quoted represent past performance and do not indicate future results. Current performance may be lower or higher than the performance data quoted. For current performance data, please visit www.nb.com/performance.
The results shown in the table reflect the reinvestment of income dividends and other distributions, if any. The results do not reflect the effect of taxes a shareholder would pay on Fund distributions or on the redemption of Fund shares.
The investment return and principal value of an investment will fluctuate and shares, when redeemed, may be worth more or less than their original cost.
Returns would have been lower if Neuberger Berman Investment Advisers LLC ("Management") had not reimbursed certain expenses and/or waived a portion of the investment management fees during certain of the periods shown. Repayment by a class (of expenses previously reimbursed and/or fees previously waived by Management) will decrease the class's returns. Please see Note B in the Notes to Financial Statements for specific information regarding expense reimbursement and/or fee waiver arrangements.
As stated in the Fund's most recent prospectus, the total annual operating expense ratios for fiscal year 2019 were 1.42%, 0.98%, 1.35%, 2.10%, 1.60% and 0.88% for Trust Class, Institutional Class, Class A, Class C, Class R3 and Class R6 shares, respectively (before expense reimbursements and/or fee waivers, if any, and after restatement for Class R6 shares). The expense ratios were 1.16%, 0.81%, 1.17%, 1.92%, 1.42% and 0.71% for Trust Class, Institutional Class, Class A, Class C, Class R3 and Class R6 shares, respectively, after expense reimbursements and/or fee waivers and/or restatement. The expense ratios for the annual period ended August 31, 2020 can be found in the Financial Highlights section of this report.
Returns shown with a sales charge reflect the deduction of the current maximum initial sales charge of 5.75% for Class A shares and the contingent deferred sales charge (CDSC) for Class C shares. The CDSC for Class C shares is 1.00%, which is reduced to 0% after 1 year. The performance of the Fund's share classes will differ primarily due to different sales charge structures and class expenses. Please see the prospectus for more information about sales charge structures, if any, and class expenses for your share class.
42
International Select Fund (Unaudited)
COMPARISON OF A $10,000 INVESTMENT
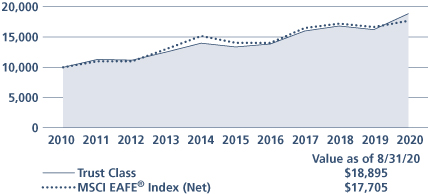
This graph shows the change in value of a hypothetical $10,000 investment in the Fund over the past 10 fiscal years, or since the Fund's inception if it has not operated for 10 years. The graph is based on the Trust Class shares only; the performance of the Fund's share classes will differ primarily due to different sales charge structures and class expenses (see Performance Highlights chart on previous page). The result is compared with benchmarks, which include a broad-based market index and may include a more narrowly based index. Market indices have not been reduced to reflect any of the fees and costs of investing. The results shown in the graph reflect the reinvestment of income dividends and other distributions, if any. The results do not reflect the effect of taxes a shareholder would pay on Fund distributions or on the redemption of Fund shares. Results represent past performance and do not indicate future results.
43
International Small Cap Fund Commentary (Unaudited)
Neuberger Berman International Small Cap Fund Institutional Class generated a total return of 23.84% for the fiscal year ended August 31, 2020 (the reporting period), outperforming the 10.66% total return of the MSCI EAFE® Small Cap Index (the Index) for the same period. (Performance for all share classes is provided in the table immediately following this letter.)
Steady-to-improving economic data buoyed investor sentiment as this period began. However, by February, fears about global health and the economic toll of the COVID-19 pandemic began to take hold, and in early March, markets nosedived. Since then, the environment has been volatile and reactive, but generally positive—with hopeful news about re-openings, vaccine development and central bank support balancing concerns about economic contraction and unemployment.
Within the Index, the biggest sector gains came from Information Technology (IT), Health Care and Utilities. Energy detracted the most as oil declined on oversupply and weak demand. Real Estate also lost value and, even while positive, Financials also underperformed. Sweden, Denmark and Finland were the top individual markets this period, while Portugal, Austria and France declined most.
The Fund's outperformance versus the Index resulted from both stock selection and sector allocation. Stock selection was most advantageous in Industrials, IT and Consumer Discretionary, as were significant overweights to IT and Health Care versus the Index. By market, holdings based in Switzerland, the UK and France contributed most to relative returns.
Top contributors included Kinaxis, Sweco and Games Workshop. Kinaxis, a Canadian software firm, reported solid results and saw higher demand as companies work to address the challenges and the global supply chain disruption from COVID-19. Sweco, a Swedish engineering and consulting company, generated strong results on solid margin performance. Games Workshop, a British fantasy miniatures company and designer and manufacturer of Warhammer, enjoyed a better-than-expected recovery since partially re-opening its stores.
Our zero weighting to Utilities and underweight to Materials versus the Index, and stock selection within Consumer Staples detracted from relative results. By country, an out-of-benchmark allocation in Korea, along with weak stock picking in Singapore and Finland also detracted.
Individual detractors included Applegreen, Applus and Johnson Service. Applegreen, an Irish gas station operator with locations in Ireland, the UK and the U.S., underperformed and was sold. Applus, a Spanish industrial testing firm, underperformed due to its exposure to the oil, automotive and aerospace industries. We believe the company should be able to weather the economic slow-down. Johnson Service, a British work wear and linen rental firm, declined on the pandemic-related downturn in its hospitality and industrial end-markets. We believe the firm can adapt its cost structure during the downturn and may see earnings recover when economic activity picks up.
As global COVID-19 cases declined during the reporting period, industrial and services data, as well as business confidence improved. Nevertheless, the recovery in demand to pre-crisis levels may take longer than investors expect. First, the pandemic has not been eradicated. In the absence of a vaccine, cases could increase or rebound, potentially leading to further lockdowns. Second, unemployment may indicate a worrying trend, with an uptick in permanent versus temporary layoffs. Third, whether global central banks' ongoing support can tide economies through these challenges remains a key question.
Given conditions as of the end of the reporting period, the team has endeavored to position the Fund to navigate a range of outcomes. For example, we believe our overweight to Health Care should provide a level of downside mitigation, while our Industrials exposure—focused around factory automation and process and efficiency improvement—should benefit from an economic recovery. In IT, software developers focused on process optimization should continue to perform well under either scenario, in our opinion. We believe this approach, along with our quality-at-a-reasonable-price discipline, positions the Fund for solid risk-adjusted returns should the near-term market be up, down or volatile.
44
Sincerely,
DAVID BUNAN
PORTFOLIO MANAGER
Information about principal risks of investing in the Fund is set forth in the prospectus and statement of additional information.
The portfolio composition, industries and holdings of the Fund are subject to change without notice.
The opinions expressed are those of the Fund's portfolio manager. The opinions are as of the date of this report and are subject to change without notice.
45
International Small Cap Fund (Unaudited)
TICKER SYMBOLS
Institutional Class | | NIOIX | |
Class A | | NIOAX | |
Class C | | NIOCX | |
Class R6 | | NIORX | |
PERFORMANCE HIGHLIGHTS9
| | | | | Average Annual Total Return
Ended 08/31/2020 | |
| | | Inception
Date | | 1 Year | | Life of
Fund | |
At NAV | |
Institutional Class | | 12/08/2016 | | | 23.84 | % | | | 12.00 | % | |
Class A | | 12/08/2016 | | | 23.41 | % | | | 11.60 | % | |
Class C | | 12/08/2016 | | | 22.51 | % | | | 10.78 | % | |
Class R6 | | 12/08/2016 | | | 24.01 | % | | | 12.10 | % | |
With Sales Charge | |
Class A | | | | | 16.28 | % | | | 9.84 | % | |
Class C | | | | | 21.51 | % | | | 10.78 | % | |
Index | |
MSCI EAFE® Small
Cap Index1,15 | | | | | 10.66 | % | | | 8.03 | % | |
The performance data quoted represent past performance and do not indicate future results. Current performance may be lower or higher than the performance data quoted. For current performance data, please visit www.nb.com/performance.
The results shown in the table reflect the reinvestment of income dividends and other distributions, if any. The results do not reflect the effect of taxes a shareholder would pay on Fund distributions or on the redemption of Fund shares.
The investment return and principal value of an investment will fluctuate and shares, when redeemed, may be worth more or less than their original cost.
Returns would have been lower if Neuberger Berman Investment Advisers LLC ("Management") had not reimbursed certain expenses and/or waived a portion of the investment management fees during certain of the periods shown. Repayment by a class (of expenses previously reimbursed and/or fees previously waived by Management) will decrease the class's returns. Please see Note B in the Notes to Financial Statements for specific information regarding expense reimbursement and/or fee waiver Arrangements.
As stated in the Fund's most recent prospectus, the total annual operating expense ratios for fiscal year 2019 were 6.25%, 6.78%, 7.39% and 6.16% for Institutional Class, Class A, Class C and Class R6 shares, respectively (before expense reimbursements and/or fee waivers, if any, and after restatement for Class R6 shares). The expense ratios were 1.06%, 1.42%, 2.17% and 0.96% for Institutional Class, Class A, Class C and Class R6 shares, respectively, after expense reimbursements and/or fee waivers and/or restatement. The expense ratios for the annual period ended August 31, 2020 can be found in the Financial Highlights section of this report.
Returns shown with a sales charge reflect the deduction of the current maximum initial sales charge of 5.75% for Class A shares and the contingent deferred sales charge (CDSC) for Class C shares. The CDSC for Class C shares is 1.00%, which is reduced to 0% after 1 year. The performance of the Fund's share classes will differ primarily due to different sales charge structures and class expenses. Please see the prospectus for more information about sales charge structures, if any, and class expenses for your share class.
46
International Small Cap Fund (Unaudited)
COMPARISON OF A $1,000,000 INVESTMENT
(000's omitted)

This graph shows the change in value of a hypothetical $1,000,000 investment in the Fund over the past 10 fiscal years, or since the Fund's inception if it has not operated for 10 years. The graph is based on the Institutional Class shares only; the performance of the Fund's share classes will differ primarily due to different sales charge structures and class expenses (see Performance Highlights chart on previous page). The result is compared with benchmarks, which include a broad-based market index and may include a more narrowly based index. Market indices have not been reduced to reflect any of the fees and costs of investing. The results shown in the graph reflect the reinvestment of income dividends and other distributions, if any. The results do not reflect the effect of taxes a shareholder would pay on Fund distributions or on the redemption of Fund shares. Results represent past performance and do not indicate future results.
47
Intrinsic Value Fund Commentary (Unaudited)
Neuberger Berman Intrinsic Value Fund Institutional Class generated a 7.36% total return for the fiscal year ended August 31, 2020 (the reporting period), outperforming its benchmark, the Russell 2000® Value Index (the Index), which returned –6.14% for the same period. (Performance for all share classes is provided in the table immediately following this letter.)
The market experienced a robust recovery in calendar year 2019. However, early this year the COVID-19 pandemic dealt a powerful challenge to the world and our country. Stocks plummeted only to surge again on the idea that history's most precipitous economic slowdown is behind us. Small value stocks, which were hardest hit, have shown strong performance off their March lows.
We have been inspired by our fellow citizens, from the front-line workers to the scientific and business community, everyone helping us maintain our day-to-day lives and solve the challenges presented by the COVID-19 pandemic. However, heartbreaking and tragic events resulting in powerful expressions of rage and declarations that America is an unjust and systematically racist society have saddened many of us. Ultimately, markets are, in our view, proxies for the economic and social health of a country. If in the upcoming months we fail to find a thoughtful and balanced set of policies that advance the general health, education and welfare of our citizens, then our prosperity will be jeopardized.
Returning to work is a good and necessary first step in healing. Job reports have certainly been encouraging. In spite of seemingly premature re-openings of certain states, extending shelter-in-place was simply not an option. The country needed to limit the spread of COVID-19 so our medical and testing infrastructure could be fortified. Much has been accomplished on this front. There has also been progress on treatments. Some drugs appear to be shortening the average hospital stay and reducing the mortality rate. Several vaccine candidates have been developed and some are in phase three trials.
Looking at sector performance, our Fund's overweight versus the Index to Information Technology and Health Care companies helped on a relative basis. We have often said that companies in these sectors are innovators and solution providers while traditional companies and industries are often less in control of their destinies and many times victims of change and disruption. This time is no different. Our underweighting to the sectors most impacted by the lockdown—Financials, Real Estate and Energy—also helped relative performance.
The economic shutdown took a big toll on our Industrials companies and stock selection in this area hurt relative performance. While the COVID-19 pandemic initially had a severe impact on Consumer Discretionary businesses, many of these companies rebounded over the past two months as retail stores and restaurants began to reopen. Hence our underweight in Consumer Discretionary names also hurt on a relative basis.
One must hope that the COVID-19 pandemic will not result in another government-mandated or self-imposed economic shutdown. Given our long-term investment horizon, we are also mindful of the upcoming U.S. presidential election. This interesting factor adds to the binary nature of the cyclical/value versus defensive/quality debate. Adding it all up, selectivity and gradualism is our likely path forward. There are too many uncertainties and fast changing facts on the ground to aggressively tilt the Fund to deeper value. We believe maintaining a balance between the companies that are more expensive, but well equipped to handle the challenges of slower growth and a resurgence of COVID-19 and our current cyclical and more leveraged companies seems prudent.
We thank you for your investment in our Fund and look forward to reporting our future results.
48
Sincerely,
BENJAMIN H. NAHUM, JAMES F. MCAREE AND AMIT SOLOMON
PORTFOLIO CO-MANAGERS
Information about principal risks of investing in the Fund is set forth in the prospectus and statement of additional information.
The portfolio composition, industries and holdings of the Fund are subject to change without notice.
The opinions expressed are those of the Fund's portfolio managers. The opinions are as of the date of this report and are subject to change without notice.
49
Intrinsic Value Fund (Unaudited)
TICKER SYMBOLS
Institutional Class | | NINLX | |
Class A | | NINAX | |
Class C | | NINCX | |
Class R6 | | NRINX | |
SECTOR ALLOCATION
(as a % of Total Investments*)
Communication Services | | | 2.5 | % | |
Consumer Discretionary | | | 3.3 | | |
Consumer Staples | | | 2.3 | | |
Energy | | | 1.3 | | |
Financial Services | | | 5.3 | | |
Health Care | | | 16.8 | | |
Industrials | | | 15.6 | | |
Information Technology | | | 40.4 | | |
Materials | | | 6.8 | | |
Utilities | | | 3.2 | | |
Convertible Bonds | | | 1.8 | | |
Short-Term Investments | | | 0.7 | | |
Total | | | 100.0 | % | |
* Derivatives (other than options purchased), if any, are excluded from this chart.
PERFORMANCE HIGHLIGHTS
| | | | Average Annual Total Return
Ended 08/31/2020 | |
| | Inception
Date* | | 1 Year | | 5 Years | | 10 Years | | Life of
Fund | |
At NAV | |
| Institutional Class18 | | 05/10/2010 | | | 7.36 | % | | | 6.82 | % | | | 10.70 | % | | | 10.40 | % | |
| Class A18 | | 05/10/2010 | | | 7.04 | % | | | 6.44 | % | | | 10.30 | % | | | 10.22 | % | |
| Class C18 | | 05/10/2010 | | | 6.16 | % | | | 5.65 | % | | | 9.49 | % | | | 9.86 | % | |
| Class R618,21 | | 01/18/2019 | | | 7.49 | % | | | 6.87 | % | | | 10.73 | % | | | 10.41 | % | |
With Sales Charge | |
| Class A18 | | | | | 0.89 | % | | | 5.19 | % | | | 9.66 | % | | | 9.94 | % | |
| Class C18 | | | | | 5.16 | % | | | 5.65 | % | | | 9.49 | % | | | 9.86 | % | |
Index | |
Russell 2000® Value
Index1,15 | | | | | –6.14 | % | | | 4.37 | % | | | 8.71 | % | | | 7.42 | % | |
| Russell 2000® Index1,15 | | | | | 6.02 | % | | | 7.65 | % | | | 11.53 | % | | | 7.51 | % | |
*The inception date for Neuberger Berman Intrinsic Value Fund Institutional Class, Class A, and Class C shares is May 10, 2010. The performance data for Class R6 also includes the performance of the Fund's Institutional Class from May 10, 2010 through January 18, 2019. Performance prior to May 10, 2010 is that of the Fund's predecessor, the DJG Small Cap Value Fund L.P., an unregistered limited partnership ("DJG Fund"); DJG Fund was the successor to The DJG Small Cap Value Fund, an unregistered commingled investment account ("DJG Account"), which had similar investment goals, strategies, and portfolio management team. See endnote 18 for more information.
The performance data quoted represent past performance and do not indicate future results. Current performance may be lower or higher than the performance data quoted. For current performance data, please visit www.nb.com/performance.
The results shown in the table reflect the reinvestment of income dividends and other distributions, if any. The results do not reflect the effect of taxes a shareholder would pay on Fund distributions or on the redemption of Fund shares.
The investment return and principal value of an investment will fluctuate and shares, when redeemed, may be worth more or less than their original cost.
Returns would have been lower if Neuberger Berman Investment Advisers LLC ("Management") had not reimbursed certain expenses and/or waived a portion of the investment management fees during certain of the periods shown. Repayment by a class (of expenses previously reimbursed and/or fees previously waived by Management) will decrease the class's returns. Please see Note B in the Notes to Financial Statements for specific information regarding expense reimbursement and/or fee waiver arrangements.
As stated in the Fund's most recent prospectus, the total annual operating expense ratios for fiscal year 2019 were 1.05%, 1.44%, 2.16% and 1.00% for Institutional Class, Class A, Class C and Class R6 shares, respectively (before expense reimbursements and/or fee waivers, if any, and after restatement for Class R6 shares). The expense ratios were 1.01%, 1.37%, 2.12% and 0.91% for Institutional Class, Class A, Class C and Class R6 shares, respectively, after expense reimbursements and/or fee waivers and/or restatement. The expense ratios for the annual period ended August 31, 2020 can be found in the Financial Highlights section of this report.
Returns shown with a sales charge reflect the deduction of the current maximum initial sales charge of 5.75% for Class A shares and the contingent deferred sales charge (CDSC) for Class C shares. The CDSC for Class C shares is 1.00%, which is reduced to 0% after 1 year. The performance of the Fund's share classes will differ primarily due to different sales charge structures and class expenses. Please see the prospectus for more information about sales charge structures, if any, and class expenses for your share class.
50
Intrinsic Value Fund (Unaudited)
COMPARISON OF A $1,000,000 INVESTMENT
(000's omitted)
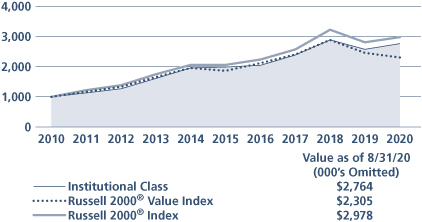
This graph shows the change in value of a hypothetical $1,000,000 investment in the Fund over the past 10 fiscal years, or since the Fund's inception if it has not operated for 10 years. The graph is based on the Institutional Class shares only; the performance of the Fund's share classes will differ primarily due to different sales charge structures and class expenses (see Performance Highlights chart on previous page). The result is compared with benchmarks, which include a broad-based market index and may include a more narrowly based index. Market indices have not been reduced to reflect any of the fees and costs of investing. The results shown in the graph reflect the reinvestment of income dividends and other distributions, if any. The results do not reflect the effect of taxes a shareholder would pay on Fund distributions or on the redemption of Fund shares. Results represent past performance and do not indicate future results.
51
Large Cap Value Fund Commentary (Unaudited)
Neuberger Berman Large Cap Value Fund Investor Class generated a 3.23% total return for the fiscal year ended August 31, 2020 (the reporting period), outperforming the 0.84% total return of its benchmark, the Russell 1000® Value Index (the Index) for the same period. (Performance for all share classes is provided in the table immediately following this letter.)
The overall equity market experienced periods of heightened volatility, but ultimately generated a strong return over the reporting period. After a positive start, beginning in mid-February 2020 the repercussions from the COVID-19 pandemic triggered a rapid and severe downturn, with the market posting its fastest fall on record from an all-time high to a bear market. However, the market then experienced its fasted move from a bear market back to a bull market, as it rose sharply over the last five months of the period. This turnaround was triggered by several factors, including unprecedented monetary policy accommodation by the U.S. Federal Reserve Board, a $2 trillion fiscal stimulus package, phased economic reopenings, and hopes for a COVID-19 vaccine. All told, the S&P 500® Index gained 21.94% during the reporting period. It's important to note that this strong performance was concentrated in relatively few growth-oriented companies, many of which were in the Information Technology (IT) sector—the likes of which we haven't seen in the last 20 years. Meanwhile, large-cap value stocks, as measured by the Index, returned 0.84% over the reporting period.
The Fund outperformed its Index during the reporting period, driven by both stock selection and sector allocation. In terms of stock selection, holdings in the Materials, Consumer Discretionary and Real Estate sectors added the most value. Looking at individual stocks, Materials companies Newmont Corp., Franco-Nevada Corp. and Southern Copper Corp. were the most beneficial for returns. From a sector allocation perspective, overweights to Materials and Consumer Staples versus the Index were the largest contributors to results.
On the downside, holdings in the Industrials, Energy and Health Care sectors were the largest detractors from relative returns. Looking at individual stocks, multinational conglomerate General Electric Company, energy company Occidental Petroleum Corp. and airline United Airlines Holdings, Inc. were the largest detractors from results. In terms of sector allocation, an underweight to IT and an overweight to Energy were the largest negatives for relative performance.
We came into 2020 with a mix of defensive and cyclical exposure in the portfolio. We used the market pullback in the first calendar quarter of the year to take advantage of the opportunities we found in the more cyclically exposed areas (Financials, Industrials and small pockets of Energy). We continue to monitor valuations and opportunities in the markets. With our continued belief that the stimulus will likely cause an acceleration in economic growth we are currently experiencing, it may be time to think about the prospects over the coming months of value outperforming growth after an unprecedented period of growth outperforming value. In our view, increased market volatility will continue as the year progresses. Against this backdrop, we anticipate seeing a continuation of price dislocations that could turn into attractive investment opportunities. We remain disciplined bottom-up managers, looking for opportunities to buy stocks that we believe are trading below their fair value to generate results for the Fund's investors. We also believe that equities remain the most attractive asset class over the long term given their potential to generate capital appreciation.
Sincerely,
ELI M. SALZMANN
PORTFOLIO MANAGER
Information about principal risks of investing in the Fund is set forth in the prospectus and statement of additional information.
The portfolio composition, industries and holdings of the Fund are subject to change without notice.
The opinions expressed are those of the Fund's portfolio manager. The opinions are as of the date of this report and are subject to change without notice.
52
Large Cap Value Fund (Unaudited)
TICKER SYMBOLS
Investor Class | | NPRTX | |
Trust Class | | NBPTX | |
Advisor Class | | NBPBX | |
Institutional Class | | NBPIX | |
Class A | | NPNAX | |
Class C | | NPNCX | |
Class R3 | | NPNRX | |
Class R6 | | NRLCX | |
SECTOR ALLOCATION
(as a % of Total Investments*) | |
Communication Services | | | 1.3 | % | |
Consumer Discretionary | | | 6.1 | | |
Consumer Staples | | | 6.9 | | |
Energy | | | 7.6 | | |
Financials | | | 20.8 | | |
Health Care | | | 9.8 | | |
Industrials | | | 15.0 | | |
Information Technology | | | 0.8 | | |
Materials | | | 17.0 | | |
Real Estate | | | 3.2 | | |
Utilities | | | 1.5 | | |
Short-Term Investments | | | 10.0 | | |
Total | | | 100.0 | % | |
* Derivatives (other than options purchased), if any, are excluded from this chart.
PERFORMANCE HIGHLIGHTS
| | | | Average Annual Total Return
Ended 08/31/2020 | |
| | Inception
Date | | 1 Year | | 5 Years | | 10 Years | | Life of
Fund | |
At NAV | |
Investor Class | | 01/20/19752 | | | 3.23 | % | | | 10.18 | % | | | 10.81 | % | | | 12.20 | % | |
| Trust Class3 | | 08/30/1993 | | | 3.05 | % | | | 10.00 | % | | | 10.61 | % | | | 12.10 | % | |
| Advisor Class4 | | 08/16/1996 | | | 2.90 | % | | | 9.83 | % | | | 10.44 | % | | | 11.97 | % | |
| Institutional Class5 | | 06/07/2006 | | | 3.42 | % | | | 10.37 | % | | | 10.99 | % | | | 12.26 | % | |
| Class A19 | | 06/21/2010 | | | 3.03 | % | | | 9.95 | % | | | 10.56 | % | | | 12.14 | % | |
| Class C19 | | 06/21/2010 | | | 2.27 | % | | | 9.15 | % | | | 9.75 | % | | | 11.96 | % | |
| Class R316 | | 06/21/2010 | | | 2.74 | % | | | 9.64 | % | | | 10.27 | % | | | 12.07 | % | |
| Class R622 | | 01/18/2019 | | | 3.54 | % | | | 10.28 | % | | | 10.86 | % | | | 12.21 | % | |
With Sales Charge | |
| Class A19 | | | | | –2.91 | % | | | 8.66 | % | | | 9.91 | % | | | 12.00 | % | |
| Class C19 | | | | | 1.28 | % | | | 9.15 | % | | | 9.75 | % | | | 11.96 | % | |
Index | |
Russell 1000®
Value Index1,15 | | | | | 0.84 | % | | | 7.53 | % | | | 11.05 | % | | | N/A | | |
The performance data quoted represent past performance and do not indicate future results. Current performance may be lower or higher than the performance data quoted. For current performance data, please visit www.nb.com/performance.
The results shown in the table reflect the reinvestment of income dividends and other distributions, if any. The results do not reflect the effect of taxes a shareholder would pay on Fund distributions or on the redemption of Fund shares.
The investment return and principal value of an investment will fluctuate and shares, when redeemed, may be worth more or less than their original cost.
Returns would have been lower if Neuberger Berman Investment Advisers LLC ("Management") had not reimbursed certain expenses and/or waived a portion of the investment management fees during certain of the periods shown. Repayment by a class (of expenses previously reimbursed and/or fees previously waived by Management) will decrease the class's returns. Please see Note B in the Notes to Financial Statements for specific information regarding expense reimbursement and/or fee waiver arrangements.
As stated in the Fund's most recent prospectus, the total annual operating expense ratios for fiscal year 2019 were 0.87%, 1.05%, 1.20%, 0.70%, 1.08%, 1.82%, 1.37% and 0.67%for Investor Class, Trust Class, Advisor Class, Institutional Class, Class A, Class C, Class R3 and Class R6 shares, respectively (before expense reimbursements and/or fee waivers, if any, and after restatement for Class R6 shares). The expense ratio was 0.61% for Class R6 shares after expense reimbursements and/or fee waivers and/or restatement. The total annual operating expense ratio for Class R3 includes the class's repayment of expenses previously reimbursed and/or fees previously waived by Management. The expense ratios for the annual period ended August 31, 2020 can be found in the Financial Highlights section of this report.
Returns shown with a sales charge reflect the deduction of the current maximum initial sales charge of 5.75% for Class A shares and the contingent deferred sales charge (CDSC) for Class C shares. The CDSC for Class C shares is 1.00%, which is reduced to 0% after 1 year. The performance of the Fund's share classes will differ primarily due to different sales charge structures and class expenses. Please see the prospectus for more information about sales charge structures, if any, and class expenses for your share class.
53
Large Cap Value Fund (Unaudited)
COMPARISON OF A $10,000 INVESTMENT

This graph shows the change in value of a hypothetical $10,000 investment in the Fund over the past 10 fiscal years, or since the Fund's inception if it has not operated for 10 years. The graph is based on the Investor Class shares only; the performance of the Fund's share classes will differ primarily due to different sales charge structures and class expenses (see Performance Highlights chart on previous page). The result is compared with benchmarks, which include a broad-based market index and may include a more narrowly based index. Market indices have not been reduced to reflect any of the fees and costs of investing. The results shown in the graph reflect the reinvestment of income dividends and other distributions, if any. The results do not reflect the effect of taxes a shareholder would pay on Fund distributions or on the redemption of Fund shares. Results represent past performance and do not indicate future results.
54
Mid Cap Growth Fund Commentary (Unaudited)
Neuberger Berman Mid Cap Growth Fund Investor Class generated a 21.95% total return for the fiscal year ended August 31, 2020 (the reporting period), trailing its benchmark, the Russell Midcap® Growth Index (the Index), which returned 23.56% for the same period. (Performance for all share classes is provided in the table immediately following this letter.)
Any discussion of recent performance ultimately settles on the onset and spread of COVID-19 and the resulting unprecedented social and business constraints, mounting debt burdens and solvency concerns, robust monetary and fiscal stimulus efforts and inevitable shifting of consumer behavior and business trends in response to new emerging fears and drivers of growth. Of equal note would be the magnitude and whipsaw frequency of the volatility that subsequently occurred, with exaggerated fear and optimism driving both a stunning market decline and surprisingly swift recovery. While the reporting period ended with a prevailing wave of positive reopening momentum, that sentiment feels tenuous as we still face a legitimate wall of worry highlighted by resurgent COVID-19 hotspots, elevated unemployment, a looming contentious election and an uncertain landscape for small- and medium-sized businesses.
For the reporting period, the Fund remained focused on Information Technology (IT), Health Care, Industrials and Consumer Discretionary names, and those allocation decisions remain reflective of the secular trends and intriguing catalysts that we continued to identify across those sectors. With few modern parallels to serve as a guide, we elected to primarily focus on higher qualitative characteristics, balance sheet strength and a combination of COVID-19 resilient and resistant catalysts and business models. Within IT and Consumer Staples, that focus translated to compelling absolute and relative performance, but that effort was unable to completely offset COVID-19-induced weakness across other sectors, especially within Consumer Discretionary and Financials. Drilling down to the industry level, the accelerated pace of digital transformation was a tailwind for multiple IT segments, while groups reliant on elective medical procedures, financing and credit, travel and leisure and non-essential discretionary spending were broadly challenged by the new COVID-19 reality. With respect to our holdings, Advanced Micro Designs (AMD) was the top contributor to performance while Bright Horizons Family Solutions was the leading detractor. AMD, a semiconductor company, has consistently exceeded expectations as their chip performance and pricing improvements continued to translate to meaningful market share gains. Bright Horizons, which primarily provides full-service and back-up child-care, was significantly challenged by COVID-19 social distancing restrictions and the broad corporate shift towards work-from-home. We remain holders of Bright Horizons, but with a market capitalization well north of $50 billion, we exited our position in AMD due to its size in June.
Looking ahead, we anticipate uncertainty to remain a constant and believe that such an environment underscores the value of active management and the importance of bottom-up fundamental and qualitative analysis. Fully vetting catalysts, operating strategies, management, balance sheet strength and financial self-reliance should continue to prove invaluable in navigating the business constraints associated with an unprecedented social and economic environment and, ultimately, in distinguishing between the corporate "haves and have-nots." Lastly, with fluctuating "reopening/recovery" versus "fear of a resurgence" market sentiment now seemingly part of the new normal, our research emphasis will remain on seeking to identify a compelling mix of higher quality COVID-19 resilient and resistant plays capable of capitalizing on either pent-up demand, evolving needs or new opportunities.
Sincerely,
KENNETH J. TUREK
PORTFOLIO MANAGER
Information about principal risks of investing in the Fund is set forth in the prospectus and statement of additional information.
The portfolio composition, industries and holdings of the Fund are subject to change without notice.
The opinions expressed are those of the Fund's portfolio manager. The opinions are as of the date of this report and are subject to change without notice.
55
Mid Cap Growth Fund (Unaudited)
NTICKER SYMBOLS
Investor Class | | NMANX | |
Trust Class | | NBMTX | |
Advisor Class | | NBMBX | |
Institutional Class | | NBMLX | |
Class A | | NMGAX | |
Class C | | NMGCX | |
Class R3 | | NMGRX | |
Class R6 | | NRMGX | |
SECTOR ALLOCATION
(as a % of Total Investments*) | |
Communication Services | | | 4.7 | % | |
Consumer Discretionary | | | 11.7 | | |
Consumer Staples | | | 3.5 | | |
Financials | | | 4.1 | | |
Health Care | | | 20.7 | | |
Industrials | | | 16.3 | | |
Information Technology | | | 35.3 | | |
Materials | | | 1.0 | | |
Real Estate | | | 0.6 | | |
Short-Term Investments | | | 2.1 | | |
Total | | | 100.0 | % | |
* Derivatives (other than options purchased), if any, are excluded from this chart.
PERFORMANCE HIGHLIGHTS7
| | | | Average Annual Total Return
Ended 08/31/2020 | |
| | Inception
Date | | 1 Year | | 5 Years | | 10 Years | | Life of
Fund | |
At NAV | |
Investor Class | | 03/01/19792 | | | 21.95 | % | | | 13.03 | % | | | 14.97 | % | | | 12.10 | % | |
| Trust Class3 | | 08/30/1993 | | | 21.85 | % | | | 12.95 | % | | | 14.90 | % | | | 12.02 | % | |
| Advisor Class4 | | 09/03/1996 | | | 21.57 | % | | | 12.67 | % | | | 14.57 | % | | | 11.81 | % | |
| Institutional Class5 | | 04/19/2007 | | | 22.12 | % | | | 13.23 | % | | | 15.20 | % | | | 12.19 | % | |
| Class A19 | | 05/27/2009 | | | 21.70 | % | | | 12.80 | % | | | 14.78 | % | | | 12.06 | % | |
| Class C19 | | 05/27/2009 | | | 20.77 | % | | | 11.96 | % | | | 13.92 | % | | | 11.83 | % | |
| Class R316 | | 05/27/2009 | | | 21.36 | % | | | 12.52 | % | | | 14.49 | % | | | 11.98 | % | |
| Class R622 | | 03/15/2013 | | | 22.27 | % | | | 13.33 | % | | | 15.21 | % | | | 12.16 | % | |
With Sales Charge | |
| Class A19 | | | | | 14.71 | % | | | 11.47 | % | | | 14.10 | % | | | 11.90 | % | |
| Class C19 | | | | | 19.77 | % | | | 11.96 | % | | | 13.92 | % | | | 11.83 | % | |
Index | |
Russell Midcap®
Growth Index1,15 | | | | | 23.56 | % | | | 14.94 | % | | | 16.03 | % | | | N/A | | |
Russell Midcap®
Index1,15 | | | | | 8.73 | % | | | 9.76 | % | | | 13.11 | % | | | 12.93 | % | |
The performance data quoted represent past performance and do not indicate future results. Current performance may be lower or higher than the performance data quoted. For current performance data, please visit www.nb.com/performance.
The results shown in the table reflect the reinvestment of income dividends and other distributions, if any. The results do not reflect the effect of taxes a shareholder would pay on Fund distributions or on the redemption of Fund shares.
The investment return and principal value of an investment will fluctuate and shares, when redeemed, may be worth more or less than their original cost.
Returns would have been lower if Neuberger Berman Investment Advisers LLC ("Management") had not reimbursed certain expenses and/or waived a portion of the investment management fees during certain of the periods shown. Repayment by a class (of expenses previously reimbursed and/or fees previously waived by Management) will decrease the class's returns. Please see Note B in the Notes to Financial Statements for specific information regarding expense reimbursement and/or fee waiver arrangements.
As stated in the Fund's most recent prospectus, the total annual operating expense ratios for fiscal year 2019 were 0.90%, 0.96%, 1.22%, 0.71%, 1.08%, 1.83%, 1.34% and 0.61% for Investor Class, Trust Class, Advisor Class, Institutional Class, Class A, Class C, Class R3 and Class R6 shares, respectively (before expense reimbursements and/or fee waivers, if any, and after restatement for Class R6 shares). The total annual operating expense ratio for Class R3 includes the class's repayment of expenses previously reimbursed and/or fees previously waived by Management. The expense ratios for the annual period ended August 31, 2020 can be found in the Financial Highlights section of this report.
Returns shown with a sales charge reflect the deduction of the current maximum initial sales charge of 5.75% for Class A shares and the contingent deferred sales charge (CDSC) for Class C shares. The CDSC for Class C shares is 1.00%, which is reduced to 0% after 1 year. The performance of the Fund's share classes will differ primarily due to different sales charge structures and class expenses. Please see the prospectus for more class. information about sales charge structures, if any, and class expenses for your share
56
Mid Cap Growth Fund (Unaudited)
COMPARISON OF A $10,000 INVESTMENT
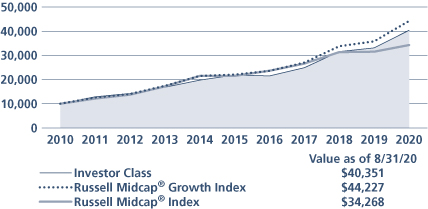
This graph shows the change in value of a hypothetical $10,000 investment in the Fund over the past 10 fiscal years, or since the Fund's inception if it has not operated for 10 years. The graph is based on the Investor Class shares only; the performance of the Fund's share classes will differ primarily due to different sales charge structures and class expenses (see Performance Highlights chart on previous page). The result is compared with benchmarks, which include a broad-based market index and may include a more narrowly based index. Market indices have not been reduced to reflect any of the fees and costs of investing. The results shown in the graph reflect the reinvestment of income dividends and other distributions, if any. The results do not reflect the effect of taxes a shareholder would pay on Fund distributions or on the redemption of Fund shares. Results represent past performance and do not indicate future results.
57
Mid Cap Intrinsic Value Fund Commentary (Unaudited)
Neuberger Berman Mid Cap Intrinsic Value Fund Investor Class generated a –16.10% total return for the fiscal year ended August 31, 2020 (the reporting period), underperforming its benchmark, the Russell Midcap® Value Index (the Index), which returned –1.30% for the same period. (Performance for all share classes is provided in the table immediately following this letter.)
COVID-19 has significantly altered our way of life. The stringent shelter in place rules were largely successful in reducing the spread of COVID-19. However, economic activity was severely impacted, quickly inducing a severe global recession. Equity markets dropped sharply. Monetary authorities and governments around the world were quick to flood the markets with record amounts of liquidity. This policy response, coupled with extraordinary medical efforts leading to positive advances in treating COVID-19 and developing a vaccine, led investors to quickly bid up stocks ending the bear market.
We believe that a sustained economic expansion is possible only when one of the treatments or vaccines under development proves to be effective. We have seen when states reopen, COVID-19 cases and hospitalizations increase. While we do not believe that the entire country will be shut down again, partial shutdowns are possible. Under this scenario, many sectors of the economy will probably remain depressed and a more gradual recovery is probable. This is likely to create ongoing market volatility and a more drawn out economic recovery.
Until COVID-19 is behind us, it appears that economic growth will remain subdued. Inflationary expectations and interest rates should remain low as we believe it will take time for the slack in the labor markets and the excess capacity in the industrial sector to diminish. In a low interest rate environment, investors are willing to pay a substantial premium for high growth companies. For the most part, the market continues to ignore valuation as a factor.
Value investing has trailed growth for over ten years and, for the most part, this trend has accelerated during the current crisis. The discrepancy between growth and value and the valuation gap between the growth and valuation universes are at record highs. Together with our bottom-up stock picking, which has led us to invest in smaller, more cyclical companies, this is responsible for the strategy's recent underperformance. Typically, these extreme investment conditions reverse over time. In fact, during certain periods within the second half of the reporting period, when investors focused on a post-COVID-19 economic recovery, value stocks in general, and ours, in particular, did extremely well, while highly valued growth and momentum stocks performed poorly.
The outbreak of COVID-19 had a severe negative impact on several of our travel-related holdings which were previously performing well and were on track to deliver strong performance. Our Aerospace & Defense stocks all declined sharply as air travel has been severely curtailed. Several of our Consumer Discretionary names were also severely punished. Our underweight versus the Index in Real Estate, one of the Index's worst performing sectors, helped relative performance and our large contingent of Information Technology names also had a positive impact.
We anticipate the market to remain volatile as quantitative factor strategies continue to move between risk-off and risk-on characteristics depending on the latest news related to COVID-19 and the potential impact on worldwide economic growth. The outcome of the upcoming U.S. presidential election also creates uncertainty. We believe that the recent massive fiscal and monetary stimulus should result in robust GDP growth once COVID-19 is under control. In our view, the potential for strong economic growth, coupled with a record valuation gap between value and growth equities, creates a very attractive opportunity for our style of value investing.
Sincerely,
MICHAEL C. GREENE
PORTFOLIO MANAGER
Information about principal risks of investing in the Fund is set forth in the prospectus and statement of additional information.
The portfolio composition, industries and holdings of the Fund are subject to change without notice.
The opinions expressed are those of the Fund's portfolio managers. The opinions are as of the date of this report and are subject to change without notice.
58
Mid Cap Intrinsic Value Fund (Unaudited)
TICKER SYMBOLS
Investor Class | | NBRVX | |
Trust Class | | NBREX | |
Institutional Class | | NBRTX | |
Class A | | NBRAX | |
Class C | | NBRCX | |
Class R3 | | NBRRX | |
Class R6 | | NBMRX | |
SECTOR ALLOCATION
(as a % of Total Investments*) | |
Communication Services | | | 2.9 | % | |
Consumer Discretionary | | | 11.6 | | |
Consumer Staples | | | 8.7 | | |
Energy | | | 5.9 | | |
Financial Services | | | 9.1 | | |
Health Care | | | 9.8 | | |
Industrials | | | 15.1 | | |
Information Technology | | | 20.2 | | |
Materials | | | 3.2 | | |
Real Estate | | | 1.0 | | |
Utilities | | | 9.2 | | |
Short-Term Investments | | | 3.3 | | |
Total | | | 100.0 | % | |
* Derivatives (other than options purchased), if any, are excluded from this chart.
PERFORMANCE HIGHLIGHTS7
| | | | Average Annual Total Return
Ended 08/31/2020 | |
| | Inception
Date | | 1 Year | | 5 Years | | 10 Years | | Life of
Fund | |
At NAV | |
Investor Class | | 06/01/1999 | | | –16.10 | % | | | 0.32 | % | | | 7.55 | % | | | 7.18 | % | |
| Trust Class3 | | 06/10/1999 | | | –16.26 | % | | | 0.20 | % | | | 7.39 | % | | | 7.09 | % | |
| Institutional Class5 | | 03/08/2010 | | | –15.88 | % | | | 0.61 | % | | | 7.84 | % | | | 7.33 | % | |
| Class A19 | | 06/21/2010 | | | –16.17 | % | | | 0.24 | % | | | 7.44 | % | | | 7.14 | % | |
| Class C19 | | 06/21/2010 | | | –16.81 | % | | | –0.51 | % | | | 6.64 | % | | | 6.75 | % | |
| Class R316 | | 06/21/2010 | | | –16.42 | % | | | –0.02 | % | | | 7.17 | % | | | 7.01 | % | |
| Class R622 | | 03/29/2019 | | | –15.79 | % | | | 0.43 | % | | | 7.61 | % | | | 7.21 | % | |
With Sales Charge | |
| Class A19 | | | | | –21.00 | % | | | –0.94 | % | | | 6.80 | % | | | 6.84 | % | |
| Class C19 | | | | | –17.64 | % | | | –0.51 | % | | | 6.64 | % | | | 6.75 | % | |
Index | |
Russell Midcap® Value
Index1,15 | | | | | –1.30 | % | | | 6.14 | % | | | 10.94 | % | | | 8.43 | % | |
| Russell Midcap® Index1,15 | | | | | 8.73 | % | | | 9.76 | % | | | 13.11 | % | | | 8.96 | % | |
The performance data quoted represent past performance and do not indicate future results. Current performance may be lower or higher than the performance data quoted. For current performance data, please visit www.nb.com/performance.
The results shown in the table reflect the reinvestment of income dividends and other distributions, if any. The results do not reflect the effect of taxes a shareholder would pay on Fund distributions or on the redemption of Fund shares.
The investment return and principal value of an investment will fluctuate and shares, when redeemed, may be worth more or less than their original cost.
Returns would have been lower if Neuberger Berman Investment Advisers LLC ("Management") had not reimbursed certain expenses and/or waived a portion of the investment management fees during certain of the periods shown. Repayment by a class (of expenses previously reimbursed and/or fees previously waived by Management) will decrease the class's returns. Please see Note B in the Notes to Financial Statements for specific information regarding expense reimbursement and/or fee waiver arrangements.
As stated in the Fund's most recent prospectus, the total annual operating expense ratios for fiscal year 2019 were 1.27%, 1.43%, 1.07%, 1.41%, 2.19% and 1.71% for Investor Class, Trust Class, Institutional Class, Class A, Class C and Class R3 shares, respectively, and the estimated total annual operating expense ratio for fiscal year 2020 is 0.96% for Class R6 shares (before expense reimbursements and/or fee waivers, if any, and after restatement for Class R6 shares). The expense ratios were 1.27%, 0.87%, 1.23%, 1.98% and 1.48% for Trust Class, Institutional Class, Class A, Class C and Class R3 shares, respectively, and the estimated total annual operating expense ratio for fiscal year 2020 is 0.77% for Class R6 after expense reimbursements and/or fee waivers and/or restatement. The expense ratios for the annual period ended August 31, 2020 can be found in the Financial Highlights section of this report.
Returns shown with a sales charge reflect the deduction of the current maximum initial sales charge of 5.75% for Class A shares and the contingent deferred sales charge (CDSC) for Class C shares. The CDSC for Class C shares is 1.00%, which is reduced to 0% after 1 year. The performance of the Fund's share classes will differ primarily due to different sales charge structures and class expenses. Please see the prospectus for more information about sales charge structures, if any, and class expenses for your share class.
59
Mid Cap Intrinsic Value Fund (Unaudited)
COMPARISON OF A $10,000 INVESTMENT

This graph shows the change in value of a hypothetical $10,000 investment in the Fund over the past 10 fiscal years, or since the Fund's inception if it has not operated for 10 years. The graph is based on the Investor Class shares only; the performance of the Fund's share classes will differ primarily due to different sales charge structures and class expenses (see Performance Highlights chart on previous page). The result is compared with benchmarks, which include a broad-based market index and may include a more narrowly based index. Market indices have not been reduced to reflect any of the fees and costs of investing. The results shown in the graph reflect the reinvestment of income dividends and other distributions, if any. The results do not reflect the effect of taxes a shareholder would pay on Fund distributions or on the redemption of Fund shares. Results represent past performance and do not indicate future results.
60
Multi-Cap Opportunities Fund Commentary (Unaudited)
Neuberger Berman Multi-Cap Opportunities Fund Institutional Class generated a 10.23% total return for the fiscal year ended August 31, 2020 (the reporting period), versus a 21.94% total return for its benchmark, the S&P 500® Index (the Index) for the same period. (Performance for all share classes is provided in the table immediately following this letter.)
Over the last year, U.S. equity market performance, as measured by the Index, was positive despite periods of elevated volatility and macro uncertainty. Following strong performance in the fourth quarter of calendar year 2019, U.S. equity markets experienced rapid declines in the first quarter of calendar year 2020 due to concerns related to COVID-19. Subsequently, equity markets rebounded, as the U.S. government and U.S. Federal Reserve acted swiftly in response to the economic dislocation caused by COVID-19 by providing unprecedented support to U.S. consumers and businesses. We believe the current setting for U.S. equities, which is characterized by extraordinary fiscal and monetary stimulus, historically low interest rates, and individual stock price dislocations, provides a favorable environment for our strategy.
Following a challenging first quarter of 2020, performance for the Fund rebounded, generating strong absolute returns, and outperforming the Index from the market bottom in March through the end of the reporting period. For the full reporting period, superior stock selection within Financials benefited relative performance. Consumer Discretionary and Consumer Staples were the primary detractors from relative performance as select stocks were impacted by social distancing requirements. The Fund benefited from an overweight position to Consumer Discretionary versus the Index, an underweight to Energy, and by having zero exposure to Real Estate and Utilities during the reporting period. The Fund ended the fiscal year with overweight positions relative to the Index to the Financials, Industrials, and Materials sectors and underweight positions to the Health Care and Information Technology sectors. The Fund had no exposure to the Energy, Real Estate or Utilities sectors at the end of the fiscal year.
Portfolio construction is an important component of our investment process and consists of three distinct investment categories: Special Situations, Opportunistic, and Classic. Special Situations have unique attributes (e.g., restructuring, spin-offs, post-bankruptcy equities) that require specific valuation methodologies and customized investment research. Opportunistic investments are companies that have become inexpensive for a tangible reason that we believe is temporary. Classic investments are those companies with long histories of shareholder friendly policies, high quality management teams and exceptional operating performance. We believe maintaining a balance of these three categories helps to mitigate risk within the portfolio. We continue to find investment opportunities across each investment category that we believe have attractive risk/return profiles.
We believe the current market environment is creating opportunity to drive differentiated performance through stock selection. We continue to apply disciplined fundamental research to identify what we believe are high quality business models with attractive free cash flow characteristics trading at compelling valuations. We believe our investment strategy has the ability to create long-term value for clients and effectively navigate the dynamic market environment.
Our style of investing is based on rigorous fundamental research. The analysis centers on a company's business model and ability to generate and effectively utilize free cash flow. As we evaluate both potential new positions and current portfolio holdings, we will continue to do so with a long-term investment perspective in mind. As always, our focus is to grow the Fund's assets through the disciplined application of our investment philosophy and process.
Sincerely,
RICHARD S. NACKENSON
PORTFOLIO MANAGER
Information about principal risks of investing in the Fund is set forth in the prospectus and statement of additional information.
The portfolio composition, industries and holdings of the Fund are subject to change without notice.
The opinions expressed are those of the Fund's portfolio managers. The opinions are as of the date of this report and are subject to change without notice.
61
Multi-Cap Opportunities Fund (Unaudited)
TICKER SYMBOLS
Institutional Class | | NMULX | |
Class A | | NMUAX | |
Class C | | NMUCX | |
SECTOR ALLOCATION
(as a % of Total Investments*) | |
Communication Services | | | 12.2 | % | |
Consumer Discretionary | | | 13.4 | | |
Consumer Staples | | | 6.2 | | |
Financials | | | 17.2 | | |
Health Care | | | 8.8 | | |
Industrials | | | 12.4 | | |
Information Technology | | | 22.3 | | |
Materials | | | 7.0 | | |
Short-Term Investments | | | 0.5 | | |
Total | | | 100.0 | % | |
* Derivatives (other than options purchased), if any, are excluded from this chart.
PERFORMANCE HIGHLIGHTS
| | | | Average Annual Total Return
Ended 08/31/2020 | |
| | Inception
Date* | | 1 Year | | 5 Years | | 10 Years | | Life of
Fund | |
At NAV | |
| Institutional Class17 | | 12/21/2009 | | | 10.23 | % | | | 12.11 | % | | | 14.30 | % | | | 9.08 | % | |
| Class A17 | | 12/21/2009 | | | 9.83 | % | | | 11.70 | % | | | 13.87 | % | | | 8.77 | % | |
| Class C17 | | 12/21/2009 | | | 9.04 | % | | | 10.88 | % | | | 13.04 | % | | | 8.15 | % | |
With Sales Charge | |
| Class A17 | | | | | 3.50 | % | | | 10.38 | % | | | 13.20 | % | | | 8.31 | % | |
| Class C17 | | | | | 8.13 | % | | | 10.88 | % | | | 13.04 | % | | | 8.15 | % | |
Index | |
| S&P 500® Index1,15 | | | | | 21.94 | % | | | 14.46 | % | | | 15.16 | % | | | 9.30 | % | |
*Prior to December 14, 2009, the Fund had different investment goals, strategies, and portfolio management team. The performance data for each class includes the performance of the Fund's oldest share class, Trust Class, from November 2, 2006 through December 21, 2009. See endnote 17 for information about the effects of the different fees paid by each class.
The performance data quoted represent past performance and do not indicate future results. Current performance may be lower or higher than the performance data quoted. For current performance data, please visit www.nb.com/performance.
The results shown in the table reflect the reinvestment of income dividends and other distributions, if any. The results do not reflect the effect of taxes a shareholder would pay on Fund distributions or on the redemption of Fund shares.
The investment return and principal value of an investment will fluctuate and shares, when redeemed, may be worth more or less than their original cost.
Returns would have been lower if Neuberger Berman Investment Advisers LLC ("Management") had not reimbursed certain expenses and/or waived a portion of the investment management fees during certain of the periods shown. Repayment by a class (of expenses previously reimbursed and/or fees previously waived by Management) will decrease the class's returns. Please see Note B in the Notes to Financial Statements for specific information regarding expense reimbursement and/or fee waiver arrangements.
As stated in the Fund's most recent prospectus, the total annual operating expense ratios for fiscal year 2019 were 0.75%, 1.12% and 1.86% for Institutional Class, Class A and Class C shares, respectively (before expense reimbursements and/or feewaivers, if any). The expense ratios for the annual period ended August 31, 2020 can be found in the Financial Highlights section of this report.
Returns shown with a sales charge reflect the deduction of the current maximum initial sales charge of 5.75% for Class A shares and the contingent deferred sales charge (CDSC) for Class C shares. The CDSC for Class C shares is 1.00%, which is reduced to 0% after 1 year. The performance of the Fund's share classes will differ primarily due to different sales charge structures and class expenses. Please see the prospectus for more information about sales charge structures, if any, and class expenses for your share class.
62
Multi-Cap Opportunities Fund (Unaudited)
COMPARISON OF A $1,000,000 INVESTMENT
(000's omitted)
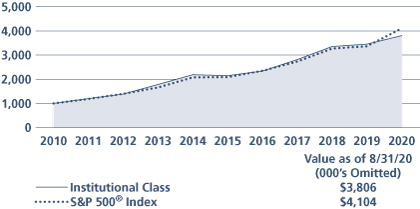
This graph shows the change in value of a hypothetical $1,000,000 investment in the Fund over the past 10 fiscal years, or since the Fund's inception if it has not operated for 10 years. The graph is based on the Institutional Class shares only; the performance of the Fund's share classes will differ primarily due to different sales charge structures and class expenses (see Performance Highlights chart on previous page). The result is compared with benchmarks, which include a broad-based market index and may include a more narrowly based index. Market indices have not been reduced to reflect any of the fees and costs of investing. The results shown in the graph reflect the reinvestment of income dividends and other distributions, if any. The results do not reflect the effect of taxes a shareholder would pay on Fund distributions or on the redemption of Fund shares. Results represent past performance and do not indicate future results.
63
Real Estate Fund Commentary (Unaudited)
Neuberger Berman Real Estate Fund Trust Class generated a –4.13% total return for the fiscal year ended August 31, 2020 (the reporting period), outperforming the –8.05% total return of its benchmark, the FTSE Nareit All Equity REITs Index (the Index) for the same period. (Performance for all share classes is provided in the table immediately following this letter.)
The overall equity market experienced periods of heightened volatility, but ultimately generated a strong return over the reporting period. After a positive start, beginning in mid-February 2020 the repercussions from the COVID-19 pandemic triggered a rapid and severe downturn, with the market posting its fastest fall on record from an all-time high to a bear market. However, the market then had an equally dramatic rally over the last five months of the reporting period. This turnaround was triggered by several factors, including unprecedented monetary policy accommodation by the U.S. Federal Reserve Board, a $2 trillion fiscal stimulus package, phased economic reopenings, and hopes for a COVID-19 vaccine. All told, the S&P 500® Index gained 21.94% during the reporting period. Comparatively, real estate investment trusts (REITs), as measured by the Index, posted much weaker results during the period.
The Fund generated a negative total return but outperformed the Index on a relative basis during the reporting period. Sector positioning, overall, was the largest contributor to performance. In particular, an overweight to Data Centers and an underweight to Diversified versus the Index were the most beneficial for relative performance. Conversely, the Fund's underweight to the Industrial sector and a small cash position were headwinds for returns.
Stock selection, overall, was also beneficial for results. Contributing the most to relative results were our holdings in the Regional Malls, Diversified and Lodging/Resorts sectors. In terms of individual holdings, Equinix, Inc., Prologis, Inc., Crown Castle International Corp., Digital Realty Trust, Inc. and American Tower Corp. were the most additive for returns. On the downside, holdings within the Office, Apartments and Free Standing sectors were the largest detractors from relative performance. Several individual holdings were also negative for results, including Equity Residential, Essex Property Trust, Inc., National Retail Properties, Inc., Simon Property Group, Inc. and Douglas Emmett, Inc.
A likely extended global economic slowdown triggered by the COVID-19 outbreak, the coming U.S. election, and growing tensions between the world's two largest economies (U.S. and China), has us redoubling our efforts to position the Fund to better withstand these headwinds. We believe massive global stimulus, if it continues, could help ease the impact on markets. In addition, with worldwide quarantines, we are seeing the increased importance of technology infrastructure, logistics and e-commerce. We continue to focus on companies with secular demand drivers that we believe will result in above average cash flow and dividend growth. We remain focused on companies with strong, flexible balance sheets that we believe can better withstand increased market volatility.
Sincerely,
STEVE SHIGEKAWA AND BRIAN C. JONES
PORTFOLIO CO-MANAGERS
Information about principal risks of investing in the Fund is set forth in the prospectus and statement of additional information.
The portfolio composition, industries and holdings of the Fund are subject to change without notice.
The opinions expressed are those of the Fund's portfolio managers. The opinions are as of the date of this report and are subject to change without notice.
64
Real Estate Fund (Unaudited)
TICKER SYMBOLS
Trust Class | | NBRFX | |
Institutional Class | | NBRIX | |
Class A | | NREAX | |
Class C | | NRECX | |
Class R3 | | NRERX | |
Class R6 | | NRREX | |
SECTOR ALLOCATION
(as a % of Total Investments*) | |
Apartments | | | 9.3 | % | |
Data Centers | | | 14.8 | | |
Diversified | | | 1.5 | | |
Free Standing | | | 3.3 | | |
Health Care | | | 7.9 | | |
Industrial | | | 10.6 | | |
Infrastructure | | | 21.1 | | |
Manufactured Homes | | | 5.3 | | |
Office | | | 3.6 | | |
Regional Malls | | | 1.0 | | |
Self Storage | | | 6.4 | | |
Shopping Centers | | | 2.8 | | |
Single Family Homes | | | 5.2 | | |
Timber | | | 3.4 | | |
Short-Term Investments | | | 3.8 | | |
Total | | | 100.0 | % | |
* Derivatives (other than options purchased), if any, are excluded from this chart.
PERFORMANCE HIGHLIGHTS7, 20
| | | | Average Annual Total Return
Ended 08/31/2020 | |
| | Inception
Date | | 1 Year | | 5 Years | | 10 Years | | Life of
Fund | |
At NAV | |
Trust Class | | 05/01/2002 | | | –4.13 | % | | | 8.83 | % | | | 9.67 | % | | | 10.54 | % | |
| Institutional Class6 | | 06/04/2008 | | | –3.97 | % | | | 9.03 | % | | | 9.88 | % | | | 10.68 | % | |
| Class A14 | | 06/21/2010 | | | –4.31 | % | | | 8.64 | % | | | 9.48 | % | | | 10.43 | % | |
| Class C14 | | 06/21/2010 | | | –5.08 | % | | | 7.82 | % | | | 8.66 | % | | | 9.97 | % | |
| Class R314 | | 06/21/2010 | | | –4.58 | % | | | 8.36 | % | | | 9.21 | % | | | 10.28 | % | |
| Class R623 | | 03/15/2013 | | | –3.87 | % | | | 9.13 | % | | | 9.90 | % | | | 10.67 | % | |
With Sales Charge | |
| Class A14 | | | | | –9.80 | % | | | 7.36 | % | | | 8.84 | % | | | 10.08 | % | |
| Class C14 | | | | | –5.99 | % | | | 7.82 | % | | | 8.66 | % | | | 9.97 | % | |
Index | |
FTSE Nareit All Equity
REITs Index1,15 | | | | | –8.05 | % | | | 7.64 | % | | | 9.97 | % | | | 9.35 | % | |
The performance data quoted represent past performance and do not indicate future results. Current performance may be lower or higher than the performance data quoted. For current performance data, please visit www.nb.com/performance.
The results shown in the table reflect the reinvestment of income dividends and other distributions, if any. The results do not reflect the effect of taxes a shareholder would pay on Fund distributions or on the redemption of Fund shares.
The investment return and principal value of an investment will fluctuate and shares, when redeemed, may be worth more or less than their original cost.
Returns would have been lower if Neuberger Berman Investment Advisers LLC ("Management") had not reimbursed certain expenses and/or waived a portion of the investment management fees during certain of the periods shown. Repayment by a class (of expenses previously reimbursed and/or fees previously waived by Management) will decrease the class's returns. Please see Note B in the Notes to Financial Statements for specific information regarding expense reimbursement and/or fee waiver arrangements.
As stated in the Fund's most recent prospectus, the total annual operating expense ratios for fiscal year 2019 were 1.43%, 1.06%, 1.43%, 2.19%, 1.69% and 0.96% for Trust Class, Institutional Class, Class A, Class C, Class R3 and Class R6 shares, respectively (before expense reimbursements and/or fee waivers, if any, and after restatement for Class R6 shares). The expense ratios were 0.86%, 1.22%, 1.97%, 1.47% and 0.76% for Institutional Class, Class A, Class C, Class R3 and Class R6 shares, respectively, after expense reimbursements and/or fee waivers and/or restatement. The expense ratios for the annual period ended August 31, 2020 can be found in the Financial Highlights section of this report.
Returns shown with a sales charge reflect the deduction of the current maximum initial sales charge of 5.75% for Class A shares and the contingent deferred sales charge (CDSC) for Class C shares. The CDSC for Class C shares is 1.00%, which is reduced to 0% after 1 year. The performance of the Fund's share classes will differ primarily due to different sales charge structures and class expenses. Please see the prospectus for more information about sales charge structures, if any, and class expenses for your share class.
65
Real Estate Fund (Unaudited)
COMPARISON OF A $10,000 INVESTMENT
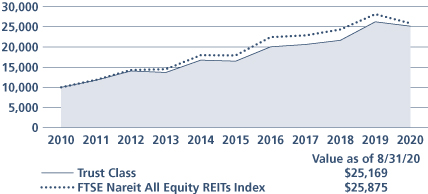
This graph shows the change in value of a hypothetical $10,000 investment in the Fund over the past 10 fiscal years, or since the Fund's inception if it has not operated for 10 years. The graph is based on the Trust Class shares only; the performance of the Fund's share classes will differ primarily due to different sales charge structures and class expenses (see Performance Highlights chart on previous page). The result is compared with benchmarks, which include a broad-based market index and may include a more narrowly based index. Market indices have not been reduced to reflect any of the fees and costs of investing. The results shown in the graph reflect the reinvestment of income dividends and other distributions, if any. The results do not reflect the effect of taxes a shareholder would pay on Fund distributions or on the redemption of Fund shares. Results represent past performance and do not indicate future results.
66
Small Cap Growth Fund Commentary (Unaudited)
Neuberger Berman Small Cap Growth Fund Investor Class generated a 23.20% total return for the fiscal year ended August 31, 2020 (the reporting period), outperforming its benchmark, the Russell 2000® Growth Index (the Index), which returned 17.28% for the same period. (Performance for all share classes is provided in the table immediately following this letter.)
Any discussion of recent performance ultimately settles on the onset and spread of COVID-19 and the resulting unprecedented social and business constraints, mounting debt burdens and solvency concerns, robust monetary and fiscal stimulus efforts and inevitable shifting of consumer behavior and business trends in response to new emerging fears and drivers of growth. Of equal note would be the magnitude and whipsaw frequency of the volatility that subsequently occurred, with exaggerated fear and optimism driving both a stunning market decline and surprisingly swift recovery. While the period ended with a prevailing wave of positive reopening momentum, that sentiment feels tenuous as we still face a legitimate wall of worry highlighted by resurgent COVID-19 hotspots, elevated unemployment, a looming contentious election and an uncertain landscape for small- and medium-sized businesses.
Over the reporting period, the Fund remained focused on Information Technology (IT), Health Care, Industrials and Consumer Discretionary names, and those allocation decisions remain reflective of the secular trends and intriguing catalysts that we continued to identify across those sectors. With few modern parallels to serve as a guide, we elected to primarily focus on higher qualitative characteristics, balance sheet strength and a combination of compelling COVID-19 resilient and resistant catalysts and business models. That effort resulted in positive stock selection within IT, Health Care, Consumer Staples and Communication Services, which more than offset pandemic-driven weakness in Consumer Discretionary and Financials. Drilling down to the industry-level, an accelerated pace of digital transformation presented a meaningful tailwind for multiple IT segments, while industry groups reliant on in-person consumer experiences, financing and credit or traditional "brick and mortar" capital expenditures were broadly challenged by the new COVID-19 reality. With respect to our holdings, Cardlytics, Inc. was the top contributor to performance while MGIC Investment Corp was the leading detractor. Cardlytics, which offers data-driven targeted marketing and advertising solutions, delivered positive results that continued to validate the potential of both their business model and addressable market, while MGIC, a private mortgage insurer serving lenders throughout the United States, was pressured by worries that COVID-19-induced economic hardships would increase the potential for loan defaults. Given that persistent uncertainty and lack of visibility, we exited MGIC.
Looking ahead, we anticipate uncertainty to remain a constant and believe that such an environment underscores the value of active management and the importance of bottom-up fundamental and qualitative analysis. We believe fully vetting catalysts, operating strategies, management, balance sheet strength and financial self-reliance should continue to prove invaluable in navigating the business constraints associated with an unprecedented social and economic environment and, ultimately, in distinguishing between the corporate "haves and have-nots." Lastly, with fluctuating "reopening/recovery" versus "fear of a resurgence" market sentiment now seemingly part of the new normal, our research emphasis will remain on seeking to identify what we believe are a compelling mix of higher quality COVID-19 resilient and resistant plays capable of capitalizing on either pent-up demand, evolving needs or new opportunities.
Sincerely,
KENNETH J. TUREK, CHAD BRUSO AND TREVOR MORENO
CO-PORTFOLIO MANAGERS
Information about principal risks of investing in the Fund is set forth in the prospectus and statement of additional information.
The portfolio composition, industries and holdings of the Fund are subject to change without notice.
The opinions expressed are those of the Fund's portfolio managers. The opinions are as of the date of this report and are subject to change without notice.
67
Small Cap Growth Fund (Unaudited)
TICKER SYMBOLS
Investor Class | | NBMIX | |
Trust Class | | NBMOX | |
Advisor Class | | NBMVX | |
Institutional Class | | NBSMX | |
Class A | | NSNAX | |
Class C | | NSNCX | |
Class R3 | | NSNRX | |
Class R6 | | NSRSX | |
SECTOR ALLOCATION
(as a % of Total Investments*) | |
Communication Services | | | 6.4 | % | |
Consumer Discretionary | | | 13.3 | | |
Consumer Staples | | | 4.3 | | |
Financials | | | 2.3 | | |
Health Care | | | 31.5 | | |
Industrials | | | 14.9 | | |
Information Technology | | | 23.0 | | |
Materials | | | 1.0 | | |
Short-Term Investments | | | 3.3 | | |
Total | | | 100.0 | % | |
* Derivatives (other than options purchased), if any, are excluded from this chart.
PERFORMANCE HIGHLIGHTS
| | | | Average Annual Total Return
Ended 08/31/2020 | |
| | Inception
Date | | 1 Year | | 5 Years | | 10 Years | | Life of
Fund | |
At NAV | |
Investor Class | | 10/20/1998 | | | 23.20 | % | | | 16.00 | % | | | 16.30 | % | | | 10.32 | % | |
| Trust Class3 | | 11/03/1998 | | | 23.04 | % | | | 15.84 | % | | | 16.12 | % | | | 10.17 | % | |
| Advisor Class4 | | 05/03/2002 | | | 22.86 | % | | | 15.67 | % | | | 15.94 | % | | | 10.06 | % | |
| Institutional Class5 | | 04/01/2008 | | | 23.52 | % | | | 16.35 | % | | | 16.66 | % | | | 10.49 | % | |
| Class A19 | | 05/27/2009 | | | 23.09 | % | | | 15.93 | % | | | 16.24 | % | | | 10.27 | % | |
| Class C19 | | 05/27/2009 | | | 22.19 | % | | | 15.06 | % | | | 15.37 | % | | | 9.84 | % | |
| Class R316 | | 05/27/2009 | | | 22.80 | % | | | 15.64 | % | | | 15.95 | % | | | 10.12 | % | |
| Class R622 | | 09/07/2018 | | | 23.65 | % | | | 16.18 | % | | | 16.39 | % | | | 10.35 | % | |
With Sales Charge | |
| Class A19 | | | | | 16.00 | % | | | 14.56 | % | | | 15.55 | % | | | 9.97 | % | |
| Class C19 | | | | | 21.19 | % | | | 15.06 | % | | | 15.37 | % | | | 9.84 | % | |
Index | |
Russell 2000® Growth
Index1,15 | | | | | 17.28 | % | | | 10.45 | % | | | 14.08 | % | | | 8.31 | % | |
| Russell 2000® Index1,15 | | | | | 6.02 | % | | | 7.65 | % | | | 11.53 | % | | | 8.48 | % | |
The performance data quoted represent past performance and do not indicate future results. Current performance may be lower or higher than the performance data quoted. For current performance data, please visit www.nb.com/performance.
The results shown in the table reflect the reinvestment of income dividends and other distributions, if any. The results do not reflect the effect of taxes a shareholder would pay on Fund distributions or on the redemption of Fund shares.
The investment return and principal value of an investment will fluctuate and shares, when redeemed, may be worth more or less than their original cost.
Returns would have been lower if Neuberger Berman Investment Advisers LLC ("Management") had not reimbursed certain expenses and/or waived a portion of the investment management fees during certain of the periods shown. Repayment by a class (of expenses previously reimbursed and/or fees previously waived by Management) will decrease the class's returns. Please see Note B in the Notes to Financial Statements for specific information regarding expense reimbursement and/or fee waiver arrangements.
As stated in the Fund's most recent prospectus, the total annual operating expense ratios for fiscal year 2019 were 1.59%, 1.72%, 1.88%, 1.30%, 1.66%, 2.47%, 2.02% and 1.16% for Investor Class, Trust Class, Advisor Class, Institutional Class, Class A, Class C, Class R3 and Class R6 shares, respectively (before expense reimbursements and/or fee waivers, if any, and after restatement for Class R6 shares). The expense ratios were 1.32%, 1.42%, 1.62%, 0.92%, 1.28%, 2.03%,1.53% and 0.82% for Investor Class, Trust Class, Advisor Class, Institutional Class, Class A, Class C, Class R3 and Class R6 shares, respectively, after expense reimbursements and/or fee waivers and/or restatement. The expense ratios for the annual period ended August 31, 2020 can be found in the Financial Highlights section of this report.
Returns shown with a sales charge reflect the deduction of the current maximum initial sales charge of 5.75% for Class A shares and the contingent deferred sales charge (CDSC) for Class C shares. The CDSC for Class C shares is 1.00%, which is reduced to 0% after 1 year. The performance of the Fund's share classes will differ primarily due to different sales charge structures and class expenses. Please see the prospectus for more information about sales charge structures, if any, and class expenses for your share class.
68
Small Cap Growth Fund (Unaudited)
COMPARISON OF A $10,000 INVESTMENT
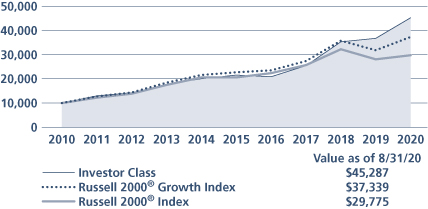
This graph shows the change in value of a hypothetical $10,000 investment in the Fund over the past 10 fiscal years, or since the Fund's inception if it has not operated for 10 years. The graph is based on the Investor Class shares only; the performance of the Fund's share classes will differ primarily due to different sales charge structures and class expenses (see Performance Highlights chart on previous page). The result is compared with benchmarks, which include a broad-based market index and may include a more narrowly based index. Market indices have not been reduced to reflect any of the fees and costs of investing. The results shown in the graph reflect the reinvestment of income dividends and other distributions, if any. The results do not reflect the effect of taxes a shareholder would pay on Fund distributions or on the redemption of Fund shares. Results represent past performance and do not indicate future results.
69
Sustainable Equity Fund Commentary (Unaudited)
Neuberger Berman Sustainable Equity Fund Investor Class generated a total return of 16.12% for the fiscal year ended August 31, 2020 (the reporting period), trailing the 21.94% total return of its benchmark, the S&P 500® Index (the Index) during the same period. (Performance for all share classes is provided in the table immediately following this letter.)
U.S. equity markets reached new highs in August, capping a strong but volatile reporting period overshadowed by the coronavirus pandemic and policy response. Along with hopeful news about therapies and vaccines, the U.S. Federal Reserve Board's (Fed) unprecedented support of fixed income markets—which provided liquidity and lowered the cost of capital—fostered optimism against the economic stress of shutdowns and record unemployment.
The Fed's commitment to keeping rates low propelled mega-cap growth momentum, further narrowing markets, and accelerating investor appetite for growth in a market in which price appreciation already was outpacing earnings growth. Information Technology (IT) stocks continued to lead the Index, up over 50% during the reporting period.
The Fund performed well on an absolute basis, despite our valuation-sensitive discipline in a market favoring growth at any price. By sector, stock selection in Industrials and Real Estate contributed the most to relative performance, while underweights versus the Index and stock selection within the IT and Consumer Discretionary sectors were top detractors from excess returns.
Top individual contributors included Microsoft and Vestas Wind Systems. Microsoft delivered strong operating performance benefitting from the COVID-19 driven accelerated demand for cloud services as well as work-from-home productivity tools. Vestas Wind Systems, a global leader in wind power, with best-in-class profitability and a pristine balance sheet, saw growth in order backlogs, boding well for future revenues.
Individual detractors included Noble Energy and Compass Group. We sold Noble, as disruption in energy markets caused by geopolitical concerns, then exacerbated by the COVID-19 pandemic, created an unfavorable outlook for this sector. Compass Group, the global contract caterer, detracted, as global shutdowns impacted clients in business and industry, sports and leisure, education and healthcare.
We also sold Premier Inc., Schlumberger, Manpower Group, American Express, Ryanair, Gildan Activewear, Kroger, and EQT during the reporting period. We were able to use market volatility to add new positions in National Grid, Regeneron Pharmaceuticals, Discovery Inc., Accenture, Starbucks, Colgate-Palmolive, Eversource Energy, Otis Worldwide and Booking Holdings, all high quality names from our watch list, at attractive prices.
Looking ahead, we anticipate continued volatility as the pandemic unfolds. In periods of dislocation, second order effects can be challenging to predict. Excesses that have been building in good times, typically involving financial leverage, can result in forced liquidations—dislocating prices from fundamentals.
While this creates opportunities for fundamental investors, we are extremely cautious and deliberate in decisions, knowing markets can dislocate far below fundamental valuation. We also remain mindful of the impact of potential inflation across the portfolio, given the Fed's increased monetization of growing deficits.
Within this outlook and our long-term horizon, we continue to position the portfolio toward what we consider best-in-class businesses likely to be beneficiaries in both the existing disruption and in the event of a quicker rebound, while being mindful of valuation.
From an ESG1 perspective, 63% of the portfolio companies by weight are ranked as Trendsetters or First Tier by the CPA-Zicklin Index2, 65% of the portfolio companies by weight provide disclosure around TCFD3 physical and transition risks and 58% of the portfolio companies by weight have internal and/or external gender pay gap analysis in place. In addition to our standard measurements, we are evaluating future sustainability by assessing corporate responses as socioeconomic disruption impacts individuals and communities.
70
We believe our team's process of identifying businesses with good growth prospects, high return on invested capital, strong balance sheets, and ESG leadership and diversification, positions the Fund well for the longer term.
We look forward to continuing to serve your investment needs.
Sincerely,
INGRID S. DYOTT AND SAJJAD S. LADIWALA
CO-PORTFOLIO MANAGERS
1 Environmental, Social and Governance practices
2 The CPA-Zicklin Index benchmarks the political disclosure and accountability policies and practices of leading U.S. public companies. Issued annually, it is produced by the Center for Political Accountability in conjunction with the Zicklin Center for Business Ethics Research at The Wharton School at the University of Pennsylvania. Companies receiving a score of 90% or higher for political disclosure and accountability received the "Trendsetter" designation, while companies that scored between 80-100% were ranked in the "First Tier." https://politicalaccountability.net/index
3 Task Force on Climate-Related Financial Disclosures (TCFD) develops recommendations for climate related financial risk disclosures for use by companies in providing information to investors, lenders, insurers and other stakeholders. https://www.fsb-tcfd.org
Information about principal risks of investing in the Fund is set forth in the prospectus and statement of additional information.
The portfolio composition, industries and holdings of the Fund are subject to change without notice.
The opinions expressed are those of the Fund's portfolio managers. The opinions are as of the date of this report and are subject to change without notice.
71
Sustainable Equity Fund (Unaudited)
TICKER SYMBOLS
Investor Class | | NBSRX | |
Trust Class | | NBSTX | |
Institutional Class | | NBSLX | |
Class A | | NRAAX | |
Class C | | NRACX | |
Class R3 | | NRARX | |
Class R6 | | NRSRX | |
SECTOR ALLOCATION
(as a % of Total Investments*) | |
Communication Services | | | 9.8 | % | |
Consumer Discretionary | | | 9.2 | | |
Consumer Staples | | | 4.3 | | |
Financials | | | 10.3 | | |
Health Care | | | 17.1 | | |
Industrials | | | 16.0 | | |
Information Technology | | | 25.6 | | |
Materials | | | 3.1 | | |
Real Estate | | | 1.0 | | |
Utilities | | | 2.7 | | |
Short-Term Investments | | | 0.9 | | |
Total | | | 100.0 | % | |
* Derivatives (other than options purchased), if any, are excluded from this chart.
PERFORMANCE HIGHLIGHTS7
| | | | Average Annual Total Return
Ended 08/31/2020 | |
| | Inception
Date | | 1 Year | | 5 Years | | 10 Years | | Life of
Fund | |
At NAV | |
Investor Class | | 03/16/1994 | | | 16.12 | % | | | 10.90 | % | | | 12.64 | % | | | 9.34 | % | |
| Trust Class3 | | 03/03/1997 | | | 15.95 | % | | | 10.72 | % | | | 12.46 | % | | | 9.16 | % | |
| Institutional Class5 | | 11/28/2007 | | | 16.35 | % | | | 11.11 | % | | | 12.85 | % | | | 9.43 | % | |
| Class A19 | | 05/27/2009 | | | 15.94 | % | | | 10.70 | % | | | 12.42 | % | | | 9.25 | % | |
| Class C19 | | 05/27/2009 | | | 15.06 | % | | | 9.88 | % | | | 11.59 | % | | | 8.90 | % | |
| Class R316 | | 05/27/2009 | | | 15.63 | % | | | 10.42 | % | | | 12.15 | % | | | 9.14 | % | |
| Class R622 | | 03/15/2013 | | | 16.48 | % | | | 11.20 | % | | | 12.86 | % | | | 9.42 | % | |
With Sales Charge | |
| Class A19 | | | | | 9.28 | % | | | 9.40 | % | | | 11.76 | % | | | 9.01 | % | |
| Class C19 | | | | | 14.06 | % | | | 9.88 | % | | | 11.59 | % | | | 8.90 | % | |
Index | |
| S&P 500® Index1,15 | | | | | 21.94 | % | | | 14.46 | % | | | 15.16 | % | | | 10.01 | % | |
The performance data quoted represent past performance and do not indicate future results. Current performance may be lower or higher than the performance data quoted. For current performance data, please visit www.nb.com/performance.
The results shown in the table reflect the reinvestment of income dividends and other distributions, if any. The results do not reflect the effect of taxes a shareholder would pay on Fund distributions or on the redemption of Fund shares.
The investment return and principal value of an investment will fluctuate and shares, when redeemed, may be worth more or less than their original cost.
Returns would have been lower if Neuberger Berman Investment Advisers LLC ("Management") had not reimbursed certain expenses and/or waived a portion of the investment management fees during certain of the periods shown. Repayment by a class (of expenses previously reimbursed and/or fees previously waived by Management) will decrease the class's returns. Please see Note B in the Notes to Financial Statements for specific information regarding expense reimbursement and/or fee waiver arrangements.
As stated in the Fund's most recent prospectus, the total annual operating expense ratios for fiscal year 2019 were 0.86%, 1.03%, 0.68%, 1.05%, 1.79%, 1.30% and 0.59% for Investor Class, Trust Class, Institutional Class, Class A, Class C, Class R3 and Class R6 shares, respectively (before expense reimbursements and/or fee waivers, if any, and after restatement for Class R6 shares). The expense ratios for the annual period ended August 31, 2020 can be found in the Financial Highlights section of this report.
Returns shown with a sales charge reflect the deduction of the current maximum initial sales charge of 5.75% for Class A shares and the contingent deferred sales charge (CDSC) for Class C shares. The CDSC for Class C shares is 1.00%, which is reduced to 0% after 1 year. The performance of the Fund's share classes will differ primarily due to different sales charge structures and class expenses. Please see the prospectus for more information about sales charge structures, if any, and class expenses for your share class.
72
Sustainable Equity Fund (Unaudited)
COMPARISON OF A $10,000 INVESTMENT
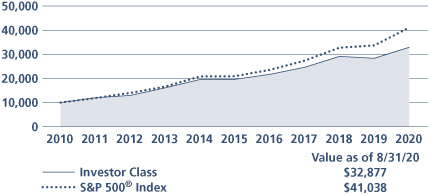
This graph shows the change in value of a hypothetical $10,000 investment in the Fund over the past 10 fiscal years, or since the Fund's inception if it has not operated for 10 years. The graph is based on the Investor Class shares only; the performance of the Fund's share classes will differ primarily due to different sales charge structures and class expenses (see Performance Highlights chart on previous page). The result is compared with benchmarks, which include a broad-based market index and may include a more narrowly based index. Market indices have not been reduced to reflect any of the fees and costs of investing. The results shown in the graph reflect the reinvestment of income dividends and other distributions, if any. The results do not reflect the effect of taxes a shareholder would pay on Fund distributions or on the redemption of Fund shares. Results represent past performance and do not indicate future results.
73
1 Please see "Glossary of Indices" on page 77 for a description of indices. Please note that individuals cannot invest directly in any index. The indices described in this report do not take into account any fees, expenses or tax consequences of investing in the individual securities that they track. Data about the performance of an index are prepared or obtained by Neuberger Berman Investment Advisers LLC ("Management") and reflect the reinvestment of income dividends and other distributions, if any. The Fund may invest in securities not included in a described index and generally does not invest in all securities included in a described index.
2 This date reflects when Management first became the investment manager to the Fund.
3 The performance information for the Trust Class prior to the class's inception date is that of the Fund's Investor Class. The performance information for the Investor Class has not been adjusted to take into account differences in class specific operating expenses. The Investor Class has lower expenses and typically higher returns than the Trust Class.
4 The performance information for the Advisor Class prior to the class's inception date is that of the Fund's Investor Class. The performance information for the Investor Class has not been adjusted to take into account differences in class specific operating expenses. The Investor Class has lower expenses and typically higher returns than the Advisor Class.
5 The performance information for the Institutional Class prior to the class's inception date is that of the Fund's Investor Class. The performance information for the Investor Class has not been adjusted to take into account differences in class specific operating expenses. The Investor Class has higher expenses and typically lower returns than the Institutional Class.
6 The performance information for the Institutional Class prior to the class's inception date is that of the Fund's Trust Class. The performance information for the Trust Class has not been adjusted to take into account differences in class specific operating expenses. The Trust Class has higher expenses and typically lower returns than the Institutional Class.
7 The investments for the Fund are managed by the same portfolio manager(s) who manage(s) one or more other registered funds that have names, investment objectives and investment styles that are similar to those of the Fund. You should be aware that the Fund is likely to differ from those other mutual fund(s) in size, cash flow pattern and tax matters. Accordingly, the holdings and performance of the Fund can be expected to vary from those of the other mutual fund(s).
8 The Fund had a policy of investing mainly in large-cap stocks prior to September 1998 and investing 90% of its assets in no more than six economic sectors prior to December 17, 2007. As of April 2, 2001, the Fund changed its investment policy to become "non-diversified" under the Investment Company Act of 1940 ("1940 Act"). Performance prior to these changes might have been different if current policies had been in effect. However, by operation of law under the 1940 Act, the Fund subsequently became, and currently operates as, a diversified fund. Please see the notes to the financial statements for information on a non-diversified fund becoming a diversified fund by operation of law.
9 Neuberger Berman Global Real Estate Fund, Neuberger Berman Integrated Large Cap and Neuberger Berman International Small Cap Fund are each relatively small. The same techniques used to produce returns in a small fund may not work to produce similar returns in a larger fund and could have an impact on performance.
10 The performance information for Class R3 prior to the class's inception date is that of the Fund's Institutional Class. The performance information for the Institutional Class has not been adjusted to take into account differences in class specific operating expenses (such as Rule 12b-1 fees). The Institutional Class has lower expenses and typically higher returns than Class R3.
74
11 The Fund had a policy of investing mainly in large-cap stocks prior to December 2002. Its performance prior to that date might have been different if current policies had been in effect.
12 The performance information for Class A, Class C, Investor Class, and Trust Class prior to the classes' inception date is that of the Fund's Institutional Class. The performance information for the Institutional Class has been adjusted to reflect the appropriate sales charges applicable to Class A and Class C shares, but has not been adjusted to take into account differences in class specific operating expenses (such as Rule 12b-1 fees). The Institutional Class has lower expenses and typically higher returns than Class A, Class C, Investor Class, and Trust Class.
13 The performance information for Institutional Class, Class A, Class C and Class R3 prior to June 9, 2008 is that of the Fund's Trust Class, which had an inception date of November 2, 2006, and converted into the Institutional Class on June 9, 2008. During the period from November 2, 2006 through June 9, 2008, the Trust Class had only one investor, which could have impacted Fund performance. The performance information for the Trust Class has been adjusted to reflect the appropriate sales charges applicable to Class A and Class C shares, but has not been adjusted to take into account differences in class specific operating expenses (such as Rule 12b-1 fees). The Trust Class had higher expenses and typically lower returns than the Institutional Class. The Trust Class had lower expenses and typically higher returns than Class A, Class C and Class R3. The performance information for Class R3 from June 9, 2008 to the class's inception date is that of the Fund's Institutional Class. The performance information for the Institutional Class has not been adjusted to take into account differences in class specific operating expenses (such as Rule 12b-1 fees). The Institutional Class has lower expenses and typically higher returns than Class R3.
14 The performance information for Class A, Class C and Class R3 prior to the classes' respective inception dates is that of the Fund's Trust Class. The performance information for the Trust Class has been adjusted to reflect the appropriate sales charges applicable to Class A and Class C shares, but has not been adjusted to take into account differences in class specific operating expenses (such as Rule 12b-1 fees). The Trust Class has lower expenses and typically higher returns than Class A, Class C and Class R3.
15 The date used to calculate Life of Fund performance for the index is the inception date of the oldest share class.
16 The performance information for Class R3 prior to the class's inception date is that of the Fund's Investor Class. The performance information for the Investor Class has not been adjusted to take into account differences in class specific operating expenses (such as Rule 12b-1 fees). The Investor Class has lower expenses and typically higher returns than Class R3.
17 Prior to December 14, 2009, the Fund had different investment goals, strategies and portfolio management team. The performance information for Institutional Class, Class A and Class C prior to December 21, 2009 is that of the Fund's Trust Class, which had an inception date of November 2, 2006, and converted into the Institutional Class on December 21, 2009. During the period from November 2, 2006 through December 21, 2009, the Trust Class had only one investor, which could have impacted Fund performance. The performance information for the Trust Class has been adjusted to reflect the appropriate sales charges applicable to Class A and Class C shares, but has not been adjusted to take into account differences in class specific operating expenses (such as Rule 12b-1 fees). Management had previously capped Trust Class expenses; absent this arrangement, the returns would have been lower. The Trust Class had lower capped expenses and typically higher returns than Class A and Class C. The Trust Class had equivalent capped expenses and typically similar returns to the Institutional Class.
18 The performance information for Institutional Class, Class A and Class C prior to the classes' inception date is that of the Fund's predecessor, the DJG Small Cap Value Fund L.P., an unregistered limited partnership ("DJG Fund"); DJG Fund was the successor to The DJG Small Cap Value Fund, an unregistered commingled investment account ("DJG Account"). The performance from July 8, 1997 (the commencement of operations) to September 11, 2008 is that of DJG Account, and the performance from September 12, 2008 to May 10, 2010 is that of DJG Fund. On
75
May 10, 2010, the DJG Fund transferred its assets to the Fund in exchange for the Fund's Institutional Class shares. The investment policies, objectives, guidelines and restrictions of the Fund are in all material respects equivalent to those of DJG Fund and DJG Account (the "Predecessors"). As a mutual fund registered under the 1940 Act, the Fund is subject to certain restrictions under the 1940 Act and the Internal Revenue Code ("Code") to which the Predecessors were not subject. Had the Predecessors been registered under the 1940 Act and been subject to the provisions of the 1940 Act and the Code, their investment performance may have been adversely affected. The performance information reflects the actual expenses of the Predecessors, which were generally lower than those of the Fund. The performance for Class R6 from May 10, 2010 to January 18, 2019 includes the performance of the Fund's Institutional Class, and prior to May 10, 2010 includes the performance of the Predecessors, as noted above.
19 The performance information for Class A and Class C prior to the classes' inception date is that of the Fund's Investor Class. The performance information for the Investor Class has been adjusted to reflect the appropriate sales charges applicable to Class A and Class C shares, but has not been adjusted to take into account differences in class specific operating expenses (such as Rule 12b-1 fees). The Investor Class has lower expenses and typically higher returns than Class A and Class C.
20 As of June 19, 2012, the Fund changed its investment policy to become "non-diversified" under the 1940 Act. A non-diversified fund is able to invest larger percentages of its assets in the securities of a single issuer, which could increase the fund's risk of loss. Performance prior to this change might have been different if current policies had been in effect.
21 The performance information for Class R6 prior to the class's inception date is that of the Fund's Institutional Class. The performance information for the Institutional Class has not been adjusted to take into account differences in class specific operating expenses. The Institutional Class has higher expenses and typically lower returns than Class R6.
22 The performance information for Class R6 prior to the class's inception date is that of the Fund's Investor Class. The performance information for the Investor Class has not been adjusted to take into account differences in class specific operating expenses. The Investor Class has higher expenses and typically lower returns than Class R6.
23 The performance information for Class R6 prior to the class's inception date is that of the Fund's Trust Class. The performance information for the Trust Class has not been adjusted to take into account differences in class specific operating expenses. The Trust Class has higher expenses and typically lower returns than Class R6.
24 Effective September 3, 2019, Neuberger Berman Global Equity Fund changed its name to Neuberger Berman Integrated Large Cap Fund and changed its investment strategy, benchmark, portfolio management team and fees and expenses. Prior to that date, the Fund had a higher management fee, different expenses, a different investment strategy and benchmark, and different risks. Its performance prior to that date might have been different if the current investment strategy and fees and expenses had been in effect.
For more complete information on any of the Neuberger Berman Equity Funds, call us at (800) 877-9700, or visit our website at www.nb.com.
76
FTSE EPRA/Nareit Developed Index (Net): | | The index is a free float-adjusted, market capitalization-weighted index that is designed to measure the performance of listed real estate companies and real estate investment trusts (REITs) in developed markets. Net total return indexes reinvest dividends after the deduction of withholding taxes, using (for international indexes) a tax rate applicable to non-resident institutional investors who do not benefit from double taxation treaties. | |
FTSE Nareit All Equity REITs Index: | | The index is a free-float adjusted, market capitalization-weighted index that tracks the performance of all tax-qualified equity real estate investment trusts (REITs) that are listed on the New York Stock Exchange, or NASDAQ. Equity REITs include all tax-qualified REITs with more than 50 percent of total assets in qualifying real estate assets other than mortgages secured by real property. | |
MSCI All Country World Index (Net): | | The index is a free float-adjusted, market capitalization-weighted index that is designed to measure the equity market performance of developed and emerging markets. The index consists of 49 country indexes comprising 23 developed and 26 emerging market country indexes. The developed market country indexes included are: Australia, Austria, Belgium, Canada, Denmark, Finland, France, Germany, Hong Kong, Ireland, Israel, Italy, Japan, the Netherlands, New Zealand, Norway, Portugal, Singapore, Spain, Sweden, Switzerland, the United Kingdom and the United States. The emerging market country indexes included are: Argentina, Brazil, Chile, China, Colombia, Czech Republic, Egypt, Greece, Hungary, India, Indonesia, Korea, Malaysia, Mexico, Pakistan, Peru, the Philippines, Poland, Qatar, Russia, Saudi Arabia, South Africa, Taiwan, Thailand, Turkey, and the UAE. China A shares are included starting from June 1, 2018 and are partially represented at 20% of their free float-adjusted market capitalization as of November 2019. Net total return indexes reinvest dividends after the deduction of withholding taxes, using (for international indexes) a tax rate applicable to non-resident institutional investors who do not benefit from double taxation treaties. | |
MSCI China Index (Net): | | The index is a free float-adjusted, market capitalization-weighted index that is designed to measure the equity market performance of Chinese securities readily accessible to nondomestic investors. The index includes equity securities issued by companies incorporated in the People's Republic of China ("PRC"), and listed in the form of China B shares on the Shanghai Stock Exchange (in US$) or Shenzhen Stock Exchange (in HK$), or China H shares on the Hong Kong Stock Exchange (in HK$) and other foreign exchanges. It also includes Red-Chips and P-Chips, which are not incorporated in the PRC and are listed on the Hong Kong Stock Exchange. Red-Chips include companies that are directly or indirectly controlled by organizations or enterprises that are owned by the state, provinces, or municipalities of the PRC. P-Chips include non-state-owned Chinese companies incorporated outside the mainland and traded in Hong Kong. U.S.-listed China stocks are also included in the index. China A shares are included starting from June 1, 2018 and are partially represented at 20% of their free float-adjusted market capitalization as of November 2019. Net total return indexes reinvest dividends after the deduction of withholding taxes, using (for international indexes) a tax rate applicable to non-resident institutional investors who do not benefit from double taxation treaties. | |
77
Glossary of Indices (cont'd)
MSCI EAFE® Index (Net)
(Europe, Australasia, Far East): | | The index is a free float-adjusted, market capitalization-weighted index that is designed to measure the equity market performance of developed markets, excluding the United States and Canada. The index consists of the following 21 developed market country indexes: Australia, Austria, Belgium, Denmark, Finland, France, Germany, Hong Kong, Ireland, Israel, Italy, Japan, the Netherlands, New Zealand, Norway, Portugal, Singapore, Spain, Sweden, Switzerland, and the United Kingdom. Net total return indexes reinvest dividends after the deduction of withholding taxes, using (for international indexes) a tax rate applicable to non-resident institutional investors who do not benefit from double taxation treaties. | |
MSCI Emerging Markets
Index (Net): | | The index is a free float-adjusted, market capitalization-weighted index that is designed to measure the equity market performance of emerging markets. The index consists of the following 26 emerging market country indexes: Argentina, Brazil, Chile, China, Colombia, Czech Republic, Egypt, Greece, Hungary, India, Indonesia, Korea, Malaysia, Mexico, Pakistan, Peru, the Philippines, Poland, Qatar, Russia, Saudi Arabia, South Africa, Taiwan, Thailand, Turkey, and the UAE. China A shares are included starting from June 1, 2018 and are partially represented at 20% of their free float-adjusted market capitalization as of November 2019. Net total return indexes reinvest dividends after the deduction of withholding taxes, using (for international indexes) a tax rate applicable to non-resident institutional investors who do not benefit from double taxation treaties. | |
| MSCI EAFE® Small Cap Index (Net): | | The index is a free float-adjusted, market capitalization-weighted index that is designed to measure the equity market performance of the small cap segment of developed markets, excluding the United States and Canada. The index consists of the following 21 developed market country indices: Australia, Austria, Belgium, Denmark, Finland, France, Germany, Hong Kong, Ireland, Israel, Italy, Japan, the Netherlands, New Zealand, Norway, Portugal, Singapore, Spain, Sweden, Switzerland, and the United Kingdom. Net total return indexes reinvest dividends after the deduction of withholding taxes, using (for international indexes) a tax rate applicable to non-resident institutional investors who do not benefit from double taxation treaties. | |
| Russell 1000® Index: | | The index is a float-adjusted, market capitalization-weighted index that measures the performance of the large-cap segment of the U.S. equity market. It includes approximately 1,000 of the largest securities in the Russell 3000® Index (which measures the performance of the 3,000 largest U.S. public companies based on total market capitalization). The index is rebalanced annually in June. | |
| Russell 1000® Value Index: | | The index is a float-adjusted, market capitalization-weighted index that measures the performance of the large-cap value segment of the U.S. equity market. It includes those Russell 1000 Index companies with lower price-to-book ratios and lower forecasted growth rates. The index is rebalanced annually in June. | |
| Russell 2000® Index: | | The index is a float-adjusted, market capitalization-weighted index that measures the performance of the small-cap segment of the U.S. equity market. It includes approximately 2,000 of the smallest securities in the Russell 3000 Index (which measures the performance of the 3,000 largest U.S. public companies based on total market capitalization). The index is rebalanced annually in June. | |
Russell 2000® Growth Index: | | The index is a float-adjusted, market capitalization-weighted index that measures the performance of the small-cap growth segment of the U.S. equity market. It includes those Russell 2000 Index companies with higher price-to-book ratios and higher forecasted growth rates. The index is rebalanced annually in June. | |
78
Glossary of Indices (cont'd)
| Russell 2000® Value Index: | | The index is a float-adjusted, market capitalization-weighted index that measures the performance of the small-cap value segment of the U.S. equity market. It includes those Russell 2000 Index companies with lower price-to-book ratios and lower forecasted growth rates. The index is rebalanced annually in June. | |
| Russell Midcap® Index: | | The index is a float-adjusted, market capitalization-weighted index that measures the performance of the mid-cap segment of the U.S. equity market. It includes approximately 800 of the smallest securities in the Russell 1000 Index. The index is rebalanced annually in June. | |
| Russell Midcap® Growth Index: | | The index is a float-adjusted, market capitalization-weighted index that measures the performance of the mid-cap growth segment of the U.S. equity market. It includes those Russell Midcap Index companies with higher price-to-book ratios and higher forecasted growth rates. The index is rebalanced annually in June. | |
| Russell Midcap® Value Index: | | The index is a float-adjusted, market capitalization-weighted index that measures the performance of the mid-cap value segment of the U.S. equity market. It includes those Russell Midcap Index companies with lower price-to-book ratios and lower forecasted growth rates. The index is rebalanced annually in June. | |
| S&P 500® Index: | | The index is a float-adjusted, market capitalization-weighted index that focuses on the large-cap segment of the U.S. equity market, and includes a significant portion of the total value of the market. | |
79
Information About Your Fund's Expenses (Unaudited)
As a Fund shareholder, you incur two types of costs: (1) transaction costs, including sales charges (loads) on purchase payments or redemption proceeds (if applicable); and (2) ongoing costs, including management fees, distribution and/or service (12b-1) fees (if applicable), and other Fund expenses. This example is intended to help you understand your ongoing costs (in U.S. dollars) of investing in a Fund and compare these costs with the ongoing costs of investing in other mutual funds.
This table is designed to provide information regarding costs related to your investments. The following examples are based on an investment of $1,000 made at the beginning of the six month period ended August 31, 2020 and held for the entire period. The table illustrates the Fund's costs in two ways:
Actual Expenses and Performance: | | The first section of the table provides information about actual account values and actual expenses in dollars, based on the Fund's actual performance during the period indicated. You may use the information in this line, together with the amount you invested, to estimate the expenses you paid over the period. Simply divide your account value by $1,000 (for example, an $8,600 account value divided by $1,000 = 8.6), then multiply the result by the number in the first section of the table under the heading entitled "Expenses Paid During the Period" to estimate the expenses you paid over the period. | |
Hypothetical Example for Comparison Purposes: | | The second section of the table provides information about hypothetical account values and hypothetical expenses based on the Fund's actual expense ratio and an assumed rate of return at 5% per year before expenses. This return is not the Fund's actual return. The hypothetical account values and expenses may not be used to estimate the actual ending account balance or expenses you paid for the period. You may use this information to compare the ongoing costs of investing in a Fund versus other funds. To do so, compare the expenses shown in this 5% hypothetical example with the 5% hypothetical examples that appear in the shareholder reports of other funds. | |
Please note that the expenses in the table are meant to highlight your ongoing costs only and do not include any transaction costs, such as sales charges (loads) (if applicable). Therefore, the information under the heading "Hypothetical (5% annual return before expenses)" is useful in comparing ongoing costs only, and will not help you determine the relative total costs of owning different funds. In addition, if these transaction costs were included, your costs would have been higher.
80
Expense Example (Unaudited)
Neuberger Berman Equity Funds | |
| | | ACTUAL | | HYPOTHETICAL (5% ANNUAL RETURN BEFORE EXPENSES) | |
| | | Beginning
Account
Value
3/1/20 | | Ending
Account
Value
8/31/20 | | Expenses Paid
During the
Period(1)
3/1/20 - 8/31/20 | | Expense
Ratio | | Beginning
Account
Value
3/1/20 | | Ending
Account
Value
8/31/20 | | Expenses Paid
During the
Period(2)
3/1/20 - 8/31/20 | | Expense
Ratio | |
Dividend Growth Fund | |
Institutional Class | | $ | 1,000.00 | | | $ | 1,171.40 | | | $ | 3.82 | | | | 0.70 | % | | $ | 1,000.00 | | | $ | 1,021.62 | | | $ | 3.56 | | | | 0.70 | % | |
Class A | | $ | 1,000.00 | | | $ | 1,168.60 | | | $ | 5.78 | | | | 1.06 | % | | $ | 1,000.00 | | | $ | 1,019.81 | | | $ | 5.38 | | | | 1.06 | % | |
Class C | | $ | 1,000.00 | | | $ | 1,164.50 | | | $ | 9.85 | | | | 1.81 | % | | $ | 1,000.00 | | | $ | 1,016.04 | | | $ | 9.17 | | | | 1.81 | % | |
Class R6 | | $ | 1,000.00 | | | $ | 1,171.30 | | | $ | 3.22 | | | | 0.59 | % | | $ | 1,000.00 | | | $ | 1,022.17 | | | $ | 3.00 | | | | 0.59 | % | |
Emerging Markets Equity Fund | |
Institutional Class | | $ | 1,000.00 | | | $ | 1,075.50 | | | $ | 6.52 | | | | 1.25 | % | | $ | 1,000.00 | | | $ | 1,018.85 | | | $ | 6.34 | | | | 1.25 | % | |
Class A | | $ | 1,000.00 | | | $ | 1,074.10 | | | $ | 7.82 | | | | 1.50 | % | | $ | 1,000.00 | | | $ | 1,017.60 | | | $ | 7.61 | | | | 1.50 | % | |
Class C | | $ | 1,000.00 | | | $ | 1,069.70 | | | $ | 11.71 | | | | 2.25 | % | | $ | 1,000.00 | | | $ | 1,013.83 | | | $ | 11.39 | | | | 2.25 | % | |
Class R3 | | $ | 1,000.00 | | | $ | 1,071.80 | | | $ | 9.95 | | | | 1.91 | % | | $ | 1,000.00 | | | $ | 1,015.53 | | | $ | 9.68 | | | | 1.91 | % | |
Class R6 | | $ | 1,000.00 | | | $ | 1,076.00 | | | $ | 6.05 | | | | 1.16 | % | | $ | 1,000.00 | | | $ | 1,019.30 | | | $ | 5.89 | | | | 1.16 | % | |
Equity Income Fund | |
Institutional Class | | $ | 1,000.00 | | | $ | 1,028.60 | | | $ | 3.57 | | | | 0.70 | % | | $ | 1,000.00 | | | $ | 1,021.62 | | | $ | 3.56 | | | | 0.70 | % | |
Class A | | $ | 1,000.00 | | | $ | 1,027.40 | | | $ | 5.45 | | | | 1.07 | % | | $ | 1,000.00 | | | $ | 1,019.76 | | | $ | 5.43 | | | | 1.07 | % | |
Class C | | $ | 1,000.00 | | | $ | 1,023.10 | | | $ | 9.20 | | | | 1.81 | % | | $ | 1,000.00 | | | $ | 1,016.04 | | | $ | 9.17 | | | | 1.81 | % | |
Class R3 | | $ | 1,000.00 | | | $ | 1,025.50 | | | $ | 6.82 | | | | 1.34 | % | | $ | 1,000.00 | | | $ | 1,018.40 | | | $ | 6.80 | | | | 1.34 | % | |
Focus Fund | |
Investor Class | | $ | 1,000.00 | | | $ | 1,195.80 | | | $ | 5.08 | | | | 0.92 | % | | $ | 1,000.00 | | | $ | 1,020.51 | | | $ | 4.67 | | | | 0.92 | % | |
Trust Class | | $ | 1,000.00 | | | $ | 1,194.90 | | | $ | 6.07 | | | | 1.10 | % | | $ | 1,000.00 | | | $ | 1,019.61 | | | $ | 5.58 | | | | 1.10 | % | |
Advisor Class | | $ | 1,000.00 | | | $ | 1,193.90 | | | $ | 7.00 | | | | 1.27 | % | | $ | 1,000.00 | | | $ | 1,018.75 | | | $ | 6.44 | | | | 1.27 | % | |
Institutional Class | | $ | 1,000.00 | | | $ | 1,196.70 | | | $ | 4.14 | | | | 0.75 | % | | $ | 1,000.00 | | | $ | 1,021.37 | | | $ | 3.81 | | | | 0.75 | % | |
Class A | | $ | 1,000.00 | | | $ | 1,194.60 | | | $ | 6.12 | | | | 1.11 | % | | $ | 1,000.00 | | | $ | 1,019.56 | | | $ | 5.63 | | | | 1.11 | % | |
Class C | | $ | 1,000.00 | | | $ | 1,190.30 | | | $ | 10.24 | | | | 1.86 | % | | $ | 1,000.00 | | | $ | 1,015.79 | | | $ | 9.42 | | | | 1.86 | % | |
Genesis Fund | |
Investor Class | | $ | 1,000.00 | | | $ | 1,166.00 | | | $ | 5.44 | | | | 1.00 | % | | $ | 1,000.00 | | | $ | 1,020.11 | | | $ | 5.08 | | | | 1.00 | % | |
Trust Class | | $ | 1,000.00 | | | $ | 1,165.40 | | | $ | 5.93 | | | | 1.09 | % | | $ | 1,000.00 | | | $ | 1,019.66 | | | $ | 5.53 | | | | 1.09 | % | |
Advisor Class | | $ | 1,000.00 | | | $ | 1,164.00 | | | $ | 7.29 | | | | 1.34 | % | | $ | 1,000.00 | | | $ | 1,018.40 | | | $ | 6.80 | | | | 1.34 | % | |
Institutional Class | | $ | 1,000.00 | | | $ | 1,166.90 | | | $ | 4.58 | | | | 0.84 | % | | $ | 1,000.00 | | | $ | 1,020.91 | | | $ | 4.27 | | | | 0.84 | % | |
Class R6 | | $ | 1,000.00 | | | $ | 1,167.20 | | | $ | 4.09 | | | | 0.75 | % | | $ | 1,000.00 | | | $ | 1,021.37 | | | $ | 3.81 | | | | 0.75 | % | |
Global Real Estate Fund | |
Institutional Class | | $ | 1,000.00 | | | $ | 982.10 | | | $ | 5.03 | | | | 1.01 | % | | $ | 1,000.00 | | | $ | 1,020.06 | | | $ | 5.13 | | | | 1.01 | % | |
Class A | | $ | 1,000.00 | | | $ | 980.20 | | | $ | 6.82 | | | | 1.37 | % | | $ | 1,000.00 | | | $ | 1,018.25 | | | $ | 6.95 | | | | 1.37 | % | |
Class C | | $ | 1,000.00 | | | $ | 976.60 | | | $ | 10.53 | | | | 2.12 | % | | $ | 1,000.00 | | | $ | 1,014.48 | | | $ | 10.74 | | | | 2.12 | % | |
Greater China Equity Fund | |
Institutional Class | | $ | 1,000.00 | | | $ | 1,157.10 | | | $ | 8.13 | | | | 1.50 | % | | $ | 1,000.00 | | | $ | 1,017.60 | | | $ | 7.61 | | | | 1.50 | % | |
Class A | | $ | 1,000.00 | | | $ | 1,156.00 | | | $ | 10.08 | | | | 1.86 | % | | $ | 1,000.00 | | | $ | 1,015.79 | | | $ | 9.42 | | | | 1.86 | % | |
Class C | | $ | 1,000.00 | | | $ | 1,152.50 | | | $ | 14.18 | | | | 2.62 | % | | $ | 1,000.00 | | | $ | 1,011.97 | | | $ | 13.25 | | | | 2.62 | % | |
Guardian Fund | |
Investor Class | | $ | 1,000.00 | | | $ | 1,274.10 | | | $ | 4.92 | | | | 0.86 | % | | $ | 1,000.00 | | | $ | 1,020.81 | | | $ | 4.37 | | | | 0.86 | % | |
Trust Class | | $ | 1,000.00 | | | $ | 1,273.00 | | | $ | 5.94 | | | | 1.04 | % | | $ | 1,000.00 | | | $ | 1,019.91 | | | $ | 5.28 | | | | 1.04 | % | |
Advisor Class | | $ | 1,000.00 | | | $ | 1,271.20 | | | $ | 7.42 | | | | 1.30 | % | | $ | 1,000.00 | | | $ | 1,018.60 | | | $ | 6.60 | | | | 1.30 | % | |
Institutional Class | | $ | 1,000.00 | | | $ | 1,275.70 | | | $ | 3.95 | | | | 0.69 | % | | $ | 1,000.00 | | | $ | 1,021.67 | | | $ | 3.51 | | | | 0.69 | % | |
Class A | | $ | 1,000.00 | | | $ | 1,272.60 | | | $ | 6.11 | | | | 1.07 | % | | $ | 1,000.00 | | | $ | 1,019.76 | | | $ | 5.43 | | | | 1.07 | % | |
Class C | | $ | 1,000.00 | | | $ | 1,268.20 | | | $ | 10.32 | | | | 1.81 | % | | $ | 1,000.00 | | | $ | 1,016.04 | | | $ | 9.17 | | | | 1.81 | % | |
Class R3 | | $ | 1,000.00 | | | $ | 1,270.90 | | | $ | 7.76 | | | | 1.36 | % | | $ | 1,000.00 | | | $ | 1,018.30 | | | $ | 6.90 | | | | 1.36 | % | |
Class R6 | | $ | 1,000.00 | | | $ | 1,275.10 | | | $ | 3.77 | | | | 0.66 | % | | $ | 1,000.00 | | | $ | 1,021.82 | | | $ | 3.35 | | | | 0.66 | % | |
81
Expense Example (Unaudited) (cont'd)
Neuberger Berman Equity Funds | |
| | | ACTUAL | | HYPOTHETICAL (5% ANNUAL RETURN BEFORE EXPENSES) | |
| | | Beginning
Account
Value
3/1/20 | | Ending
Account
Value
8/31/20 | | Expenses Paid
During the
Period(1)
3/1/20 - 8/31/20 | | Expense
Ratio | | Beginning
Account
Value
3/1/20 | | Ending
Account
Value
8/31/20 | | Expenses Paid
During the
Period(2)
3/1/20 - 8/31/20 | | Expense
Ratio | |
Integrated Large Cap Fund | |
Institutional Class | | $ | 1,000.00 | | | $ | 1,190.50 | | | $ | 2.26 | | | | 0.41 | % | | $ | 1,000.00 | | | $ | 1,023.08 | | | $ | 2.08 | | | | 0.41 | % | |
Class A | | $ | 1,000.00 | | | $ | 1,190.60 | | | $ | 4.24 | | | | 0.77 | % | | $ | 1,000.00 | | | $ | 1,021.27 | | | $ | 3.91 | | | | 0.77 | % | |
Class C | | $ | 1,000.00 | | | $ | 1,184.60 | | | $ | 8.29 | | | | 1.51 | % | | $ | 1,000.00 | | | $ | 1,017.55 | | | $ | 7.66 | | | | 1.51 | % | |
International Equity Fund | |
Investor Class | | $ | 1,000.00 | | | $ | 1,122.30 | | | $ | 5.81 | | | | 1.09 | % | | $ | 1,000.00 | | | $ | 1,019.66 | | | $ | 5.53 | | | | 1.09 | % | |
Trust Class | | $ | 1,000.00 | | | $ | 1,122.30 | | | $ | 6.03 | | | | 1.13 | % | | $ | 1,000.00 | | | $ | 1,019.46 | | | $ | 5.74 | | | | 1.13 | % | |
Institutional Class | | $ | 1,000.00 | | | $ | 1,123.90 | | | $ | 4.59 | | | | 0.86 | % | | $ | 1,000.00 | | | $ | 1,020.81 | | | $ | 4.37 | | | | 0.86 | % | |
Class A | | $ | 1,000.00 | | | $ | 1,121.50 | | | $ | 6.51 | | | | 1.22 | % | | $ | 1,000.00 | | | $ | 1,019.00 | | | $ | 6.19 | | | | 1.22 | % | |
Class C | | $ | 1,000.00 | | | $ | 1,117.90 | | | $ | 10.49 | | | | 1.97 | % | | $ | 1,000.00 | | | $ | 1,015.23 | | | $ | 9.98 | | | | 1.97 | % | |
Class R6 | | $ | 1,000.00 | | | $ | 1,124.60 | | | $ | 4.06 | | | | 0.76 | % | | $ | 1,000.00 | | | $ | 1,021.32 | | | $ | 3.86 | | | | 0.76 | % | |
International Select Fund | |
Trust Class | | $ | 1,000.00 | | | $ | 1,131.80 | | | $ | 6.22 | | | | 1.16 | % | | $ | 1,000.00 | | | $ | 1,019.30 | | | $ | 5.89 | | | | 1.16 | % | |
Institutional Class | | $ | 1,000.00 | | | $ | 1,133.90 | | | $ | 4.34 | | | | 0.81 | % | | $ | 1,000.00 | | | $ | 1,021.06 | | | $ | 4.12 | | | | 0.81 | % | |
Class A | | $ | 1,000.00 | | | $ | 1,132.10 | | | $ | 6.27 | | | | 1.17 | % | | $ | 1,000.00 | | | $ | 1,019.25 | | | $ | 5.94 | | | | 1.17 | % | |
Class C | | $ | 1,000.00 | | | $ | 1,127.40 | | | $ | 10.27 | | | | 1.92 | % | | $ | 1,000.00 | | | $ | 1,015.48 | | | $ | 9.73 | | | | 1.92 | % | |
Class R3 | | $ | 1,000.00 | | | $ | 1,130.70 | | | $ | 7.61 | | | | 1.42 | % | | $ | 1,000.00 | | | $ | 1,018.00 | | | $ | 7.20 | | | | 1.42 | % | |
Class R6 | | $ | 1,000.00 | | | $ | 1,134.70 | | | $ | 3.81 | | | | 0.71 | % | | $ | 1,000.00 | | | $ | 1,021.57 | | | $ | 3.61 | | | | 0.71 | % | |
International Small Cap Fund | |
Institutional Class | | $ | 1,000.00 | | | $ | 1,189.70 | | | $ | 5.83 | | | | 1.06 | % | | $ | 1,000.00 | | | $ | 1,019.81 | | | $ | 5.38 | | | | 1.06 | % | |
Class A | | $ | 1,000.00 | | | $ | 1,188.30 | | | $ | 7.81 | | | | 1.42 | % | | $ | 1,000.00 | | | $ | 1,018.00 | | | $ | 7.20 | | | | 1.42 | % | |
Class C | | $ | 1,000.00 | | | $ | 1,183.40 | | | $ | 11.91 | | | | 2.17 | % | | $ | 1,000.00 | | | $ | 1,014.23 | | | $ | 10.99 | | | | 2.17 | % | |
Class R6 | | $ | 1,000.00 | | | $ | 1,190.40 | | | $ | 5.29 | | | | 0.96 | % | | $ | 1,000.00 | | | $ | 1,020.31 | | | $ | 4.88 | | | | 0.96 | % | |
Intrinsic Value Fund | |
Institutional Class | | $ | 1,000.00 | | | $ | 1,076.10 | | | $ | 5.27 | | | | 1.01 | % | | $ | 1,000.00 | | | $ | 1,020.06 | | | $ | 5.13 | | | | 1.01 | % | |
Class A | | $ | 1,000.00 | | | $ | 1,074.40 | | | $ | 7.14 | | | | 1.37 | % | | $ | 1,000.00 | | | $ | 1,018.25 | | | $ | 6.95 | | | | 1.37 | % | |
Class C | | $ | 1,000.00 | | | $ | 1,070.20 | | | $ | 11.03 | | | | 2.12 | % | | $ | 1,000.00 | | | $ | 1,014.48 | | | $ | 10.74 | | | | 2.12 | % | |
Class R6 | | $ | 1,000.00 | | | $ | 1,077.40 | | | $ | 4.75 | | | | 0.91 | % | | $ | 1,000.00 | | | $ | 1,020.56 | | | $ | 4.62 | | | | 0.91 | % | |
Large Cap Value Fund | |
Investor Class | | $ | 1,000.00 | | | $ | 1,073.50 | | | $ | 4.48 | | | | 0.86 | % | | $ | 1,000.00 | | | $ | 1,020.81 | | | $ | 4.37 | | | | 0.86 | % | |
Trust Class | | $ | 1,000.00 | | | $ | 1,072.70 | | | $ | 5.42 | | | | 1.04 | % | | $ | 1,000.00 | | | $ | 1,019.91 | | | $ | 5.28 | | | | 1.04 | % | |
Advisor Class | | $ | 1,000.00 | | | $ | 1,071.90 | | | $ | 6.20 | | | | 1.19 | % | | $ | 1,000.00 | | | $ | 1,019.15 | | | $ | 6.04 | | | | 1.19 | % | |
Institutional Class | | $ | 1,000.00 | | | $ | 1,074.60 | | | $ | 3.60 | | | | 0.69 | % | | $ | 1,000.00 | | | $ | 1,021.67 | | | $ | 3.51 | | | | 0.69 | % | |
Class A | | $ | 1,000.00 | | | $ | 1,072.30 | | | $ | 5.68 | | | | 1.09 | % | | $ | 1,000.00 | | | $ | 1,019.66 | | | $ | 5.53 | | | | 1.09 | % | |
Class C | | $ | 1,000.00 | | | $ | 1,068.80 | | | $ | 9.52 | | | | 1.83 | % | | $ | 1,000.00 | | | $ | 1,015.94 | | | $ | 9.27 | | | | 1.83 | % | |
Class R3 | | $ | 1,000.00 | | | $ | 1,071.10 | | | $ | 6.98 | | | | 1.34 | % | | $ | 1,000.00 | | | $ | 1,018.40 | | | $ | 6.80 | | | | 1.34 | % | |
Class R6 | | $ | 1,000.00 | | | $ | 1,075.30 | | | $ | 3.08 | | | | 0.59 | % | | $ | 1,000.00 | | | $ | 1,022.17 | | | $ | 3.00 | | | | 0.59 | % | |
Mid Cap Growth Fund | |
Investor Class | | $ | 1,000.00 | | | $ | 1,230.80 | | | $ | 4.93 | | | | 0.88 | % | | $ | 1,000.00 | | | $ | 1,020.71 | | | $ | 4.47 | | | | 0.88 | % | |
Trust Class | | $ | 1,000.00 | | | $ | 1,229.80 | | | $ | 5.27 | | | | 0.94 | % | | $ | 1,000.00 | | | $ | 1,020.41 | | | $ | 4.77 | | | | 0.94 | % | |
Advisor Class | | $ | 1,000.00 | | | $ | 1,228.60 | | | $ | 6.72 | | | | 1.20 | % | | $ | 1,000.00 | | | $ | 1,019.10 | | | $ | 6.09 | | | | 1.20 | % | |
Institutional Class | | $ | 1,000.00 | | | $ | 1,231.70 | | | $ | 3.93 | | | | 0.70 | % | | $ | 1,000.00 | | | $ | 1,021.62 | | | $ | 3.56 | | | | 0.70 | % | |
Class A | | $ | 1,000.00 | | | $ | 1,229.20 | | | $ | 5.94 | | | | 1.06 | % | | $ | 1,000.00 | | | $ | 1,019.81 | | | $ | 5.38 | | | | 1.06 | % | |
Class C | | $ | 1,000.00 | | | $ | 1,224.90 | | | $ | 10.12 | | | | 1.81 | % | | $ | 1,000.00 | | | $ | 1,016.04 | | | $ | 9.17 | | | | 1.81 | % | |
Class R3 | | $ | 1,000.00 | | | $ | 1,227.40 | | | $ | 7.39 | | | | 1.32 | % | | $ | 1,000.00 | | | $ | 1,018.50 | | | $ | 6.70 | | | | 1.32 | % | |
Class R6 | | $ | 1,000.00 | | | $ | 1,232.50 | | | $ | 3.37 | | | | 0.60 | % | | $ | 1,000.00 | | | $ | 1,022.12 | | | $ | 3.05 | | | | 0.60 | % | |
82
Expense Example (Unaudited) (cont'd)
Neuberger Berman Equity Funds | |
| | | ACTUAL | | HYPOTHETICAL (5% ANNUAL RETURN BEFORE EXPENSES) | |
| | | Beginning
Account
Value
3/1/20 | | Ending
Account
Value
8/31/20 | | Expenses Paid
During the
Period(1)
3/1/20 - 8/31/20 | | Expense
Ratio | | Beginning
Account
Value
3/1/20 | | Ending
Account
Value
8/31/20 | | Expenses Paid
During the
Period(2)
3/1/20 - 8/31/20 | | Expense
Ratio | |
Mid Cap Intrinsic Value Fund | |
Investor Class | | $ | 1,000.00 | | | $ | 917.60 | | | $ | 5.54 | | | | 1.15 | % | | $ | 1,000.00 | | | $ | 1,019.36 | | | $ | 5.84 | | | | 1.15 | % | |
Trust Class | | $ | 1,000.00 | | | $ | 917.00 | | | $ | 6.07 | | | | 1.26 | % | | $ | 1,000.00 | | | $ | 1,018.80 | | | $ | 6.39 | | | | 1.26 | % | |
Institutional Class | | $ | 1,000.00 | | | $ | 919.10 | | | $ | 4.15 | | | | 0.86 | % | | $ | 1,000.00 | | | $ | 1,020.81 | | | $ | 4.37 | | | | 0.86 | % | |
Class A | | $ | 1,000.00 | | | $ | 917.00 | | | $ | 5.88 | | | | 1.22 | % | | $ | 1,000.00 | | | $ | 1,019.00 | | | $ | 6.19 | | | | 1.22 | % | |
Class C | | $ | 1,000.00 | | | $ | 913.80 | | | $ | 9.48 | | | | 1.97 | % | | $ | 1,000.00 | | | $ | 1,015.23 | | | $ | 9.98 | | | | 1.97 | % | |
Class R3 | | $ | 1,000.00 | | | $ | 916.00 | | | $ | 7.08 | | | | 1.47 | % | | $ | 1,000.00 | | | $ | 1,017.75 | | | $ | 7.46 | | | | 1.47 | % | |
Class R6 | | $ | 1,000.00 | | | $ | 919.70 | | | $ | 3.62 | | | | 0.75 | % | | $ | 1,000.00 | | | $ | 1,021.37 | | | $ | 3.81 | | | | 0.75 | % | |
Multi-Cap Opportunities Fund | |
Institutional Class | | $ | 1,000.00 | | | $ | 1,100.10 | | | $ | 4.06 | | | | 0.77 | % | | $ | 1,000.00 | | | $ | 1,021.27 | | | $ | 3.91 | | | | 0.77 | % | |
Class A | | $ | 1,000.00 | | | $ | 1,097.90 | | | $ | 6.06 | | | | 1.15 | % | | $ | 1,000.00 | | | $ | 1,019.36 | | | $ | 5.84 | | | | 1.15 | % | |
Class C | | $ | 1,000.00 | | | $ | 1,093.70 | | | $ | 9.95 | | | | 1.89 | % | | $ | 1,000.00 | | | $ | 1,015.63 | | | $ | 9.58 | | | | 1.89 | % | |
Real Estate Fund | |
Trust Class | | $ | 1,000.00 | | | $ | 994.10 | | | $ | 5.21 | | | | 1.04 | % | | $ | 1,000.00 | | | $ | 1,019.91 | | | $ | 5.28 | | | | 1.04 | % | |
Institutional Class | | $ | 1,000.00 | | | $ | 995.20 | | | $ | 4.31 | | | | 0.86 | % | | $ | 1,000.00 | | | $ | 1,020.81 | | | $ | 4.37 | | | | 0.86 | % | |
Class A | | $ | 1,000.00 | | | $ | 993.10 | | | $ | 6.06 | | | | 1.21 | % | | $ | 1,000.00 | | | $ | 1,019.05 | | | $ | 6.14 | | | | 1.21 | % | |
Class C | | $ | 1,000.00 | | | $ | 989.40 | | | $ | 9.80 | | | | 1.96 | % | | $ | 1,000.00 | | | $ | 1,015.28 | | | $ | 9.93 | | | | 1.96 | % | |
Class R3 | | $ | 1,000.00 | | | $ | 991.60 | | | $ | 7.31 | | | | 1.46 | % | | $ | 1,000.00 | | | $ | 1,017.80 | | | $ | 7.41 | | | | 1.46 | % | |
Class R6 | | $ | 1,000.00 | | | $ | 995.80 | | | $ | 3.76 | | | | 0.75 | % | | $ | 1,000.00 | | | $ | 1,021.37 | | | $ | 3.81 | | | | 0.75 | % | |
Small Cap Growth Fund | |
Investor Class | | $ | 1,000.00 | | | $ | 1,213.40 | | | $ | 6.57 | | | | 1.18 | % | | $ | 1,000.00 | | | $ | 1,019.20 | | | $ | 5.99 | | | | 1.18 | % | |
Trust Class | | $ | 1,000.00 | | | $ | 1,212.30 | | | $ | 7.17 | | | | 1.29 | % | | $ | 1,000.00 | | | $ | 1,018.65 | | | $ | 6.55 | | | | 1.29 | % | |
Advisor Class | | $ | 1,000.00 | | | $ | 1,211.80 | | | $ | 8.01 | | | | 1.44 | % | | $ | 1,000.00 | | | $ | 1,017.90 | | | $ | 7.30 | | | | 1.44 | % | |
Institutional Class | | $ | 1,000.00 | | | $ | 1,215.00 | | | $ | 5.01 | | | | 0.90 | % | | $ | 1,000.00 | | | $ | 1,020.61 | | | $ | 4.57 | | | | 0.90 | % | |
Class A | | $ | 1,000.00 | | | $ | 1,212.90 | | | $ | 7.01 | | | | 1.26 | % | | $ | 1,000.00 | | | $ | 1,018.80 | | | $ | 6.39 | | | | 1.26 | % | |
Class C | | $ | 1,000.00 | | | $ | 1,208.30 | | | $ | 11.16 | | | | 2.01 | % | | $ | 1,000.00 | | | $ | 1,015.03 | | | $ | 10.18 | | | | 2.01 | % | |
Class R3 | | $ | 1,000.00 | | | $ | 1,211.20 | | | $ | 8.39 | | | | 1.51 | % | | $ | 1,000.00 | | | $ | 1,017.55 | | | $ | 7.66 | | | | 1.51 | % | |
Class R6 | | $ | 1,000.00 | | | $ | 1,215.40 | | | $ | 4.46 | | | | 0.80 | % | | $ | 1,000.00 | | | $ | 1,021.11 | | | $ | 4.06 | | | | 0.80 | % | |
Sustainable Equity Fund | |
Investor Class | | $ | 1,000.00 | | | $ | 1,150.20 | | | $ | 4.65 | | | | 0.86 | % | | $ | 1,000.00 | | | $ | 1,020.81 | | | $ | 4.37 | | | | 0.86 | % | |
Trust Class | | $ | 1,000.00 | | | $ | 1,149.40 | | | $ | 5.62 | | | | 1.04 | % | | $ | 1,000.00 | | | $ | 1,019.91 | | | $ | 5.28 | | | | 1.04 | % | |
Institutional Class | | $ | 1,000.00 | | | $ | 1,151.40 | | | $ | 3.68 | | | | 0.68 | % | | $ | 1,000.00 | | | $ | 1,021.72 | | | $ | 3.46 | | | | 0.68 | % | |
Class A | | $ | 1,000.00 | | | $ | 1,149.20 | | | $ | 5.67 | | | | 1.05 | % | | $ | 1,000.00 | | | $ | 1,019.86 | | | $ | 5.33 | | | | 1.05 | % | |
Class C | | $ | 1,000.00 | | | $ | 1,144.70 | | | $ | 9.70 | | | | 1.80 | % | | $ | 1,000.00 | | | $ | 1,016.09 | | | $ | 9.12 | | | | 1.80 | % | |
Class R3 | | $ | 1,000.00 | | | $ | 1,147.60 | | | $ | 7.02 | | | | 1.30 | % | | $ | 1,000.00 | | | $ | 1,018.60 | | | $ | 6.60 | | | | 1.30 | % | |
Class R6 | | $ | 1,000.00 | | | $ | 1,152.00 | | | $ | 3.19 | | | | 0.59 | % | | $ | 1,000.00 | | | $ | 1,022.17 | | | $ | 3.00 | | | | 0.59 | % | |
(1) For each class, expenses are equal to the annualized expense ratio for the class, multiplied by the average account value over the period, multiplied by 184/366 (to reflect the one-half year period shown), unless otherwise indicated.
(2) Hypothetical expenses are equal to the annualized expense ratios for each class, multiplied by the average account value over the period (assuming a 5% annual return), multiplied by 184/366 (to reflect the one-half year period shown).
83
Legend August 31, 2020 (Unaudited)
Neuberger Berman Equity Funds | |
Counterparties:
SSB = State Street Bank and Trust Company
84
Schedule of Investments Dividend Growth Fund^ August 31, 2020
| | |
Number
of Shares | |
Value | |
Common Stocks 99.4% | |
Auto Components 1.9% | |
Aptiv PLC | | | 11,800 | | | $ | 1,016,216 | | |
Banks 3.8% | |
JPMorgan
Chase & Co. | | | 10,500 | | | | 1,051,995 | | |
PNC Financial
Services Group,
Inc. | | | 8,900 | | | | 989,680 | | |
| | | | 2,041,675 | | |
Beverages 1.5% | |
Coca-Cola Co. | | | 15,800 | | | | 782,574 | | |
Capital Markets 2.3% | |
Morgan Stanley | | | 23,200 | | | | 1,212,432 | | |
Diversified Financial Services 1.9% | |
Equitable
Holdings, Inc. | | | 47,700 | | | | 1,010,763 | | |
Electronic Equipment, Instruments & Components 4.7% | |
Amphenol Corp.
Class A | | | 10,900 | | | | 1,196,820 | | |
Corning, Inc. | | | 40,700 | | | | 1,321,122 | | |
| | | | 2,517,942 | | |
Equity Real Estate Investment Trusts 5.5% | |
American Tower
Corp. | | | 5,450 | | | | 1,357,868 | | |
Equinix, Inc. | | | 1,980 | | | | 1,563,764 | | |
| | | | 2,921,632 | | |
Food & Staples Retailing 2.5% | |
Walmart, Inc. | | | 9,600 | | | | 1,332,960 | | |
Food Products 2.2% | |
Mondelez
International, Inc.
Class A | | | 20,150 | | | | 1,177,163 | | |
Health Care Equipment & Supplies 4.2% | |
Baxter
International,
Inc. | | | 12,600 | | | | 1,097,082 | | |
STERIS PLC | | | 7,000 | | | | 1,117,480 | | |
| | | | 2,214,562 | | |
Hotels, Restaurants & Leisure 2.1% | |
Marriott
International, Inc.
Class A | | | 11,100 | | | | 1,142,301 | | |
| | |
Number
of Shares | |
Value | |
Industrial Conglomerates 2.1% | |
Honeywell
International, Inc. | | | 6,800 | | | $ | 1,125,740 | | |
Insurance 6.0% | |
Aon PLC Class A | | | 5,600 | | | | 1,119,944 | | |
Assurant, Inc. | | | 9,500 | | | | 1,154,820 | | |
Chubb Ltd. | | | 7,600 | | | | 950,000 | | |
| | | | 3,224,764 | | |
IT Services 3.5% | |
Automatic Data
Processing, Inc. | | | 4,300 | | | | 598,087 | | |
Fidelity National
Information
Services, Inc. | | | 8,300 | | | | 1,252,055 | | |
| | | | 1,850,142 | | |
Life Sciences Tools & Services 2.6% | |
Agilent
Technologies, Inc. | | | 13,900 | | | | 1,395,838 | | |
Machinery 4.1% | |
Caterpillar, Inc. | | | 6,300 | | | | 896,553 | | |
Stanley Black &
Decker, Inc. | | | 8,000 | | | | 1,290,400 | | |
| | | | 2,186,953 | | |
Media 2.2% | |
Comcast Corp.
Class A | | | 25,700 | | | | 1,151,617 | | |
Metals & Mining 6.2% | |
Freeport-
McMoRan, Inc. | | | 86,600 | | | | 1,351,826 | | |
Wheaton Precious
Metals Corp. | | | 36,700 | | | | 1,958,679 | | |
| | | | 3,310,505 | | |
Multi-Utilities 4.9% | |
CenterPoint
Energy, Inc. | | | 64,400 | | | | 1,292,508 | | |
Dominion
Energy, Inc. | | | 16,700 | | | | 1,309,948 | | |
| | | | 2,602,456 | | |
Oil, Gas & Consumable Fuels 4.3% | |
Brigham
Minerals, Inc.
Class A | | | 52,100 | | | | 615,301 | | |
Devon Energy
Corp. | | | 45,100 | | | | 490,237 | | |
EOG Resources,
Inc. | | | 12,500 | | | | 566,750 | | |
Suncor Energy,
Inc. | | | 37,900 | | | | 607,537 | | |
| | | | 2,279,825 | | |
| | |
Number
of Shares | |
Value | |
Pharmaceuticals 8.4% | |
AstraZeneca PLC
ADR | | | 20,300 | | | $ | 1,136,800 | | |
Bristol-Myers
Squibb Co. | | | 16,100 | | | | 1,001,420 | | |
Eli Lilly & Co. | | | 8,500 | | | | 1,261,315 | | |
Novartis AG ADR | | | 12,300 | | | | 1,058,538 | | |
| | | | 4,458,073 | | |
Semiconductors & Semiconductor Equipment 11.6% | |
Applied Materials,
Inc. | | | 21,300 | | | | 1,312,080 | | |
| ASML Holding NV | | | 3,900 | | | | 1,459,302 | | |
QUALCOMM, Inc. | | | 15,500 | | | | 1,846,050 | | |
Taiwan
Semiconductor
Manufacturing
Co. Ltd. ADR | | | 20,000 | | | | 1,585,000 | | |
| | | | 6,202,432 | | |
Software 3.5% | |
Microsoft Corp. | | | 8,200 | | | | 1,849,346 | | |
Specialty Retail 2.8% | |
Home Depot, Inc. | | | 5,300 | | | | 1,510,712 | | |
Technology Hardware, Storage & Peripherals 4.6% | |
Apple, Inc. | | | 19,100 | | | | 2,464,664 | | |
Total Common Stocks
(Cost $40,280,693) | | | | | 52,983,287 | | |
Short-Term Investments 0.6% | |
Investment Companies 0.6% | |
State Street
Institutional
Treasury Money
Market Fund
Premier Class,
0.03%(a)
(Cost $300,594) | | | 300,594 | | | | 300,594 | | |
Total Investments 100.0%
(Cost $40,581,287) | | | | | 53,283,881 | | |
Liabilities Less Other
Assets (0.0%)(b) | | | | | (15,112 | ) | |
Net Assets 100.0% | | | | $ | 53,268,769 | | |
(a) Represents 7-day effective yield as of August 31, 2020.
(b) Represents less than 0.05% of net assets of the Fund.
See Notes to Financial Statements
85
Schedule of Investments Dividend Growth Fund^ (cont'd)
POSITIONS BY COUNTRY
Country | | Investments at
Value | | Percentage of
Net Assets | |
United States | | $ | 45,177,431 | | | | 84.8 | % | |
Brazil | | | 1,958,679 | | | | 3.7 | % | |
Taiwan | | | 1,585,000 | | | | 3.0 | % | |
Netherlands | | | 1,459,302 | | | | 2.7 | % | |
United Kingdom | | | 1,136,800 | | | | 2.1 | % | |
Switzerland | | | 1,058,538 | | | | 2.0 | % | |
Canada | | | 607,537 | | | | 1.1 | % | |
Short-Term Investments and Other Liabilities—Net | | | 285,482 | | | | 0.6 | % | |
| | | $ | 53,268,769 | | | | 100.0 | % | |
The following is a summary, categorized by Level (see Note A of Notes to Financial Statements), of inputs used to value the Fund's investments as of August 31, 2020:
Asset Valuation Inputs | | Level 1 | | Level 2 | | Level 3 | | Total | |
Investments: | |
| Common Stocks(a) | | $ | 52,983,287 | | | $ | — | | | $ | — | | | $ | 52,983,287 | | |
Short-Term Investments | | | — | | | | 300,594 | | | | — | | | | 300,594 | | |
Total Investments | | $ | 52,983,287 | | | $ | 300,594 | | | $ | — | | | $ | 53,283,881 | | |
(a) The Schedule of Investments provides information on the industry or sector categorization as well as a Positions by Country summary.
^ A balance indicated with a "—", reflects either a zero balance or an amount that rounds to less than 1.
See Notes to Financial Statements
86
Schedule of Investments Emerging Markets Equity Fund^ August 31, 2020
| | |
Number
of Shares | |
Value | |
Common Stocks 95.5% | |
Australia 0.6% | |
Rio Tinto PLC | | | 108,810 | | | $ | 6,766,937 | | |
Brazil 3.7% | |
Atacadao
SA | | | 1,210,776 | | | | 4,320,648 | | |
B3 SA—
Brasil Bolsa
Balcao | | | 1,417,641 | | | | 15,215,349 | | |
Pagseguro
Digital Ltd.,
Class A* | | | 181,635 | | | | 7,654,099 | | |
Rumo SA* | | | 1,952,200 | | | | 8,053,248 | | |
Vasta
Platform
Ltd.* | | | 303,288 | | | | 4,764,655 | | |
| | | 40,007,999 | | |
Canada 0.5% | |
Parex
Resources,
Inc.* | | | 385,789 | | | | 5,279,514 | | |
China 36.8% | |
3SBio,
Inc.*(a) | | | 7,015,000 | | | | 8,221,467 | | |
A-Living
Services
Co. Ltd.,
H Shares(a) | | | 2,788,500 | | | | 14,369,032 | | |
Alibaba
Group
Holding
Ltd. ADR* | | | 259,117 | | | | 74,374,353 | | |
Baozun, Inc.
ADR*(b) | | | 234,574 | | | | 9,720,747 | | |
Chaozhou
Three-Circle
Group Co.
Ltd.,
Class A | | | 1,190,520 | | | | 4,854,949 | | |
China Gas
Holdings
Ltd. | | | 2,843,400 | | | | 7,784,321 | | |
China
Merchants
Bank Co.
Ltd.,
H Shares | | | 2,362,500 | | | | 11,271,376 | | |
China
Mobile Ltd. | | | 2,623,500 | | | | 18,359,027 | | |
CNOOC Ltd. | | | 7,294,600 | | | | 8,266,279 | | |
Greentown
Management
Holdings
Co. Ltd.*(a) | | | 21,576,000 | | | | 8,268,267 | | |
| | |
Number
of Shares | |
Value | |
Huatai
Securities
Co. Ltd.,
H Shares(a) | | | 6,880,000 | | | $ | 12,059,626 | | |
JD.com, Inc.,
Class A* | | | 247,800 | | | | 9,930,928 | | |
Jiangsu
Changshu
Rural
Commercial
Bank Co.
Ltd.,
Class A | | | 7,847,596 | | | | 9,749,181 | | |
Kweichow
Moutai Co.
Ltd. Class A | | | 28,956 | | | | 7,541,510 | | |
Momo, Inc.
ADR | | | 283,030 | | | | 5,773,812 | | |
NARI
Technology
Co. Ltd.,
Class A | | | 3,370,209 | | | | 11,000,248 | | |
Ping An
Insurance
Group Co.
of China Ltd.,
H Shares | | | 2,113,842 | | | | 22,568,224 | | |
Poly
Developments
and
Holdings
Group
Co. Ltd.,
Class A | | | 4,433,810 | | | | 10,416,752 | | |
| Prosus NV*(b) | | | 118,199 | | | | 11,825,867 | | |
Sichuan
Kelun
Pharmaceutical
Co. Ltd.,
Class A | | | 2,463,900 | | | | 8,881,584 | | |
Sunny
Optical
Technology
Group Co.
Ltd. | | | 677,000 | | | | 10,016,277 | | |
Suofeiya
Home
Collection
Co. Ltd.,
Class A | | | 2,090,600 | | | | 8,105,475 | | |
Tencent
Holdings
Ltd. | | | 1,188,200 | | | | 81,175,868 | | |
Trip.com
Group Ltd.
ADR* | | | 242,093 | | | | 7,320,892 | | |
Tsingtao
Brewery
Co. Ltd.,
H Shares | | | 492,000 | | | | 4,475,002 | | |
| | |
Number
of Shares | |
Value | |
Yonghui
Superstores
Co. Ltd.,
Class A | | | 4,704,114 | | | $ | 6,091,722 | | |
Zhejiang
Juhua
Co. Ltd.,
Class A | | | 7,503,300 | | | | 7,653,310 | | |
| | | | 400,076,096 | | |
Czech Republic 0.8% | |
Moneta
Money
Bank A/S(a) | | | 3,315,964 | | | | 8,361,035 | | |
Hong Kong 1.9% | |
AIA Group
Ltd. | | | 572,800 | | | | 5,868,192 | | |
ASM Pacific
Technology
Ltd. | | | 783,200 | | | | 8,425,044 | | |
Link REIT | | | 859,405 | | | | 6,836,781 | | |
| | | | 21,130,017 | | |
Hungary 1.0% | |
Richter
Gedeon
Nyrt | | | 423,974 | | | | 10,344,954 | | |
India 11.5% | |
Apollo
Hospitals
Enterprise
Ltd. | | | 324,472 | | | | 7,133,969 | | |
HDFC
Bank Ltd.* | | | 636,680 | | | | 9,624,676 | | |
Hero
MotoCorp
Ltd. | | | 241,552 | | | | 9,878,285 | | |
Housing
Development
Finance
Corp. Ltd. | | | 413,026 | | | | 10,259,795 | | |
ICICI
Bank Ltd. | | | 2,988,490 | | | | 15,816,454 | | |
IndusInd
Bank Ltd. | | | 1,008,500 | | | | 8,675,764 | | |
JM Financial
Ltd. | | | 1,210,182 | | | | 1,341,834 | | |
Mahindra &
Mahindra
Ltd. | | | 776,792 | | | | 6,388,979 | | |
Metropolis
Healthcare
Ltd.(a) | | | 169,752 | | | | 4,346,002 | | |
National
Stock
Exchange*(c)(d)(i) | | | 1,063,830 | | | | 12,753,964 | | |
Reliance
Industries
Ltd. | | | 43,464 | | | | 702,321 | | |
See Notes to Financial Statements
87
Schedule of Investments Emerging Markets Equity Fund^ (cont'd)
| | |
Number
of Shares | |
Value | |
Reliance
Industries
Ltd. | | | 517,900 | | | $ | 14,552,627 | | |
Spandana
Sphoorty
Financial
Ltd.* | | | 278,662 | | | | 2,338,412 | | |
Tata
Consultancy
Services Ltd. | | | 273,205 | | | | 8,341,732 | | |
UltraTech
Cement Ltd. | | | 154,026 | | | | 8,180,538 | | |
United
Breweries
Ltd. | | | 363,550 | | | | 5,016,643 | | |
| | | | 125,351,995 | | |
Indonesia 0.5% | |
Bank
Central
Asia
Tbk PT | | | 2,492,900 | | | | 5,369,626 | | |
Korea 11.7% | |
Com2uS
Corp. | | | 80,373 | | | | 7,508,457 | | |
Coway Co.
Ltd. | | | 172,048 | | | | 11,545,793 | | |
LG Chem
Ltd. | | | 38,231 | | | | 23,779,394 | | |
Orion Corp. | | | 94,417 | | | | 11,158,126 | | |
Samsung
Electronics
Co. Ltd. | | | 1,028,892 | | | | 46,718,014 | | |
SK Hynix,
Inc. | | | 228,574 | | | | 14,444,954 | | |
SK Telecom
Co. Ltd. | | | 56,045 | | | | 11,685,474 | | |
| | | | 126,840,212 | | |
Malaysia 0.7% | |
Inari
Amertron
Bhd | | | 14,149,925 | | | | 7,669,888 | | |
Peru 0.8% | |
Credicorp
Ltd. | | | 62,928 | | | | 8,210,845 | | |
| Philippines 0.0%(e) | |
Metropolitan
Bank &
Trust Co. | | | 376,902 | | | | 260,323 | | |
| | |
Number
of Shares | |
Value | |
Poland 2.3% | |
Dino Polska
SA*(a) | | | 295,200 | | | $ | 17,922,485 | | |
Powszechny
Zaklad
Ubezpieczen
SA* | | | 1,022,452 | | | | 7,542,975 | | |
| | | | 25,465,460 | | |
Russia 5.5% | |
Detsky
Mir PJSC(a)(c) | | | 3,533,778 | | | | 5,550,233 | | |
LUKOIL
PJSC ADR | | | 1,834 | | | | 123,300 | | |
LUKOIL
PJSC ADR | | | 230,335 | | | | 15,760,003 | | |
Sberbank of
Russia
PJSC*(c) | | | 1,535,732 | | | | 4,664,884 | | |
TCS Group
Holding
PLC(c)(f) | | | 212,413 | | | | 5,214,739 | | |
X5 Retail
Group
NV GDR(a) | | | 177,334 | | | | 6,490,425 | | |
Yandex NV
Class A* | | | 324,140 | | | | 22,116,072 | | |
| | | | 59,919,656 | | |
South Africa 3.0% | |
Bid Corp.
Ltd. | | | 465,158 | | | | 7,680,990 | | |
Capitec
Bank
Holdings
Ltd. | | | 105,140 | | | | 5,179,081 | | |
Naspers Ltd.,
N Shares | | | 107,823 | | | | 19,672,271 | | |
| | | | 32,532,342 | | |
Taiwan 12.3% | |
Accton
Technology
Corp. | | | 1,608,600 | �� | | | 12,828,156 | | |
Chailease
Holding
Co. Ltd. | | | 34,820 | | | | 153,796 | | |
Chilisin
Electronics
Corp. | | | 1,138,000 | | | | 3,826,794 | | |
Chunghwa
Telecom
Co. Ltd. | | | 2,783,000 | | | | 10,288,397 | | |
eMemory
Technology,
Inc. | | | 225,400 | | | | 3,985,669 | | |
| | |
Number
of Shares | |
Value | |
LandMark
Optoelectronics
Corp. | | | 730,000 | | | $ | 6,104,955 | | |
Parade
Technologies
Ltd. | | | 337,000 | | | | 11,945,895 | | |
Taiwan
Semiconductor
Manufacturing
Co. Ltd. | | | 4,701,839 | | | | 68,529,652 | | |
Tong Hsing
Electronic
Industries
Ltd. | | | 509,000 | | | | 2,298,106 | | |
Uni-
President
Enterprises
Corp. | | | 6,172,000 | | | | 14,017,204 | | |
| | | | 133,978,624 | | |
Thailand 1.1% | |
CP ALL
PCL*(c) | | | 3,093,500 | | | | 6,311,744 | | |
Thai
Beverage
PCL | | | 12,232,522 | | | | 5,520,742 | | |
| | | | 11,832,486 | | |
Turkey 0.4% | |
Migros
Ticaret AS* | | | 838,388 | | | | 4,479,169 | | |
United Arab Emirates 0.4% | |
Network
International
Holdings
PLC*(a) | | | 796,248 | | | | 3,948,380 | | |
Total Common Stocks
(Cost $817,607,801) | |
| | | 1,037,825,558 | | |
| | Number
of Units | |
| |
| Common Stock Units 1.6% | |
Brazil 0.9% | |
Energisa
SA | | | 1,226,631 | | | | 9,728,414 | | |
Mexico 0.7% | |
Fomento
Economico
Mexicano
SAB de CV | | | 1,337,444 | | | | 7,778,225 | | |
Total Common Stocks
Units
(Cost $22,247,142) | | | | | 17,506,639 | | |
See Notes to Financial Statements
88
Schedule of Investments Emerging Markets Equity Fund^ (cont'd)
| | |
Number
of Shares | |
Value | |
Warrants 0.6% | |
Hong Kong 0.6% | |
CICC
Financial
Trading Ltd.
Expires
4/27/2023*(c)
(Cost $6,852,903) | | | 2,732,500 | | | $ | 6,852,375 | | |
Short-Term Investments 3.1% | |
Investment Companies 3.1% | |
State
Street
Institutional
Treasury
Money
Market
Fund Premier
Class, 0.03%(g) | | | 23,389,133 | | | | 23,389,133 | | |
| | |
Number
of Shares | |
Value | |
State
Street
Navigator
Securities
Lending
Government
Money
Market
Portfolio,
0.10%(g)(h) | | | 10,017,929 | | | $ | 10,017,929 | | |
Total Short-Term
Investments
(Cost $33,407,062) | | | | | 33,407,062 | | |
Total
Investments 100.8%
(Cost $880,114,908) | | | | | 1,095,591,634 | | |
Liabilities Less
Other Assets (0.8)% | | | | | (8,160,600 | ) | |
Net Assets 100.0% | | | | $ | 1,087,431,034 | | |
* Non-income producing security.
(a) Security exempt from registration pursuant to Regulation S under the Securities Act of 1933, as amended. Regulation S applies to securities offerings that are made outside of the United States and do not involve directed selling efforts in the United States and as such may have restrictions on resale. Total value of all such securities at August 31, 2020 amounted to $89,536,952, which represents 8.2% of net assets of the Fund.
(b) The security or a portion of this security is on loan at August 31, 2020. Total value of all such securities at August 31, 2020 amounted to $9,874,256 for the Fund (see Note A of Notes to Financial Statements).
(c) Security fair valued as of August 31, 2020 in accordance with procedures approved by the Board of Trustees. Total value of all such securities at August 31, 2020 amounted to $41,347,939, which represents 3.8% of net assets of the Fund.
(d) Value determined using significant unobservable inputs.
(e) Represents less than 0.05% of net assets of the Fund.
(f) Securities were purchased under Rule 144A of the Securities Act of 1933, as amended, or are otherwise restricted and, unless registered under the Securities Act of 1933 or exempted from registration, may only be sold to qualified institutional investors or may have other restrictions on resale. At August 31, 2020, these securities amounted to $5,214,739, which represents 0.5% of net assets of the Fund.
(g) Represents 7-day effective yield as of August 31, 2020.
(h) Represents investment of cash collateral received from securities lending.
(i) This security has been deemed by the investment manager to be illiquid, and is subject to restrictions on resale.
At August 31, 2020, this security amounted to $12,753,964, which represents 1.2% of net assets of the Fund.
See Notes to Financial Statements
89
Schedule of Investments Emerging Markets Equity Fund^ (cont'd)
Restricted Security | | Acquisition
Date | | Acquisition
Cost | | Acquisition
Cost
Percentage
of Net Assets
as of
Acquisition
Date | | Value as of
8/31/2020 | | Fair Value
Percentage
of Net Assets
as of
8/31/2020 | |
National Stock Exchange | | 4/16/2018 | | $ | 15,536,312 | | | | 1.1 | % | | $ | 12,753,964 | | | | 1.2 | % | |
Total | | | | $ | 15,536,312 | | | | 1.1 | % | | $ | 12,753,964 | | | | 1.2 | % | |
POSITIONS BY INDUSTRY
Industry | | Investments at
Values | | Percentage of
Net Assets | |
Internet & Direct Marketing Retail | | $ | 132,845,058 | | | | 12.2 | % | |
Semiconductors & Semiconductor Equipment | | | 113,436,169 | | | | 10.4 | % | |
Interactive Media & Services | | | 109,065,752 | | | | 10.0 | % | |
Banks | | | 92,397,984 | | | | 8.5 | % | |
Food & Staples Retailing | | | 53,297,183 | | | | 4.9 | % | |
Technology Hardware, Storage & Peripherals | | | 46,718,014 | | | | 4.3 | % | |
Oil, Gas & Consumable Fuels | | | 44,684,044 | | | | 4.1 | % | |
Capital Markets | | | 41,370,773 | | | | 3.8 | % | |
Insurance | | | 35,979,391 | | | | 3.3 | % | |
Chemicals | | | 31,432,704 | | | | 2.9 | % | |
Beverages | | | 30,332,122 | | | | 2.8 | % | |
Wireless Telecommunication Services | | | 30,044,501 | | | | 2.8 | % | |
Electronic Equipment, Instruments & Components | | | 28,666,014 | | | | 2.6 | % | |
Food Products | | | 25,175,330 | | | | 2.3 | % | |
IT Services | | | 19,944,211 | | | | 1.8 | % | |
Household Durables | | | 19,651,268 | | | | 1.8 | % | |
Pharmaceuticals | | | 19,226,538 | | | | 1.8 | % | |
Automobiles | | | 16,267,264 | | | | 1.5 | % | |
Commercial Services & Supplies | | | 14,369,032 | | | | 1.3 | % | |
Communications Equipment | | | 12,828,156 | | | | 1.2 | % | |
Health Care Providers & Services | | | 11,479,971 | | | | 1.1 | % | |
Electrical Equipment | | | 11,000,248 | | | | 1.0 | % | |
Real Estate Management & Development | | | 10,416,752 | | | | 1.0 | % | |
Diversified Telecommunication Services | | | 10,288,397 | | | | 1.0 | % | |
Thrifts & Mortgage Finance | | | 10,259,795 | | | | 0.9 | % | |
Electric Utilities | | | 9,728,414 | | | | 0.9 | % | |
Construction & Engineering | | | 8,268,267 | | | | 0.8 | % | |
Biotechnology | | | 8,221,467 | | | | 0.8 | % | |
Construction Materials | | | 8,180,538 | | | | 0.8 | % | |
Road & Rail | | | 8,053,248 | | | | 0.8 | % | |
Gas Utilities | | | 7,784,321 | | | | 0.7 | % | |
Entertainment | | | 7,508,457 | | | | 0.7 | % | |
Diversified Financial Services | | | 7,006,171 | | | | 0.6 | % | |
Equity Real Estate Investment Trusts | | | 6,836,781 | | | | 0.6 | % | |
Metals & Mining | | | 6,766,937 | | | | 0.6 | % | |
Specialty Retail | | | 5,550,233 | | | | 0.5 | % | |
Diversified Consumer Services | | | 4,764,655 | | | | 0.4 | % | |
Consumer Finance | | | 2,338,412 | | | | 0.2 | % | |
Short-Term Investments and Other Liabilities—Net | | | 25,246,462 | | | | 2.3 | % | |
| | | $ | 1,087,431,034 | | | | 100.0 | % | |
See Notes to Financial Statements
90
Schedule of Investments Emerging Markets Equity Fund^ (cont'd)
The following is a summary, categorized by Level (see Note A of Notes to Financial Statements), of inputs used to value the Fund's investments as of August 31, 2020:
Asset Valuation Inputs | | Level 1 | | Level 2 | | Level 3(b) | | Total | |
Investments: | | | | | | | | | |
Common Stocks | | | | | | | | | |
Australia | | $ | — | | | $ | 6,766,937 | | | $ | — | | | $ | 6,766,937 | | |
China | | | 127,214,866 | | | | 272,861,230 | | | | — | | | | 400,076,096 | | |
Hong Kong | | | — | | | | 21,130,017 | | | | — | | | | 21,130,017 | | |
India | | | 702,321 | | | | 111,895,710 | | | | 12,753,964 | | | | 125,351,995 | | |
Indonesia | | | — | | | | 5,369,626 | | | | — | | | | 5,369,626 | | |
Korea | | | — | | | | 126,840,212 | | | | — | | | | 126,840,212 | | |
Malaysia | | | — | | | | 7,669,888 | | | �� | — | | | | 7,669,888 | | |
Philippines | | | — | | | | 260,323 | | | | — | | | | 260,323 | | |
Russia | | | 28,729,797 | | | | 31,189,859 | | | | — | | | | 59,919,656 | | |
Taiwan | | | — | | | | 133,978,624 | | | | — | | | | 133,978,624 | | |
Thailand | | | — | | | | 11,832,486 | | | | — | | | | 11,832,486 | | |
United Arab Emirates | | | — | | | | 3,948,380 | | | | — | | | | 3,948,380 | | |
| Other Common Stocks(a) | | | 134,681,318 | | | | — | | | | — | | | | 134,681,318 | | |
Total Common Stocks | | | 291,328,302 | | | | 733,743,292 | | | | 12,753,964 | | | | 1,037,825,558 | | |
| Common Stock Units(a) | | | 17,506,639 | | | | — | | | | — | | | | 17,506,639 | | |
| Warrants(a) | | | — | | | | 6,852,375 | | | | — | | | | 6,852,375 | | |
Short-Term Investments | | | — | | | | 33,407,062 | | | | — | | | | 33,407,062 | | |
Total Investments | | $ | 308,834,941 | | | $ | 774,002,729 | | | $ | 12,753,964 | | | $ | 1,095,591,634 | | |
(a) The Schedule of Investments provides a geographic categorization as well as a Positions by Industry summary.
(b) The following is a reconciliation between the beginning and ending balances of investments in which unobservable inputs (Level 3) were used in determining value:
| | | Beginning
balance, as
of 9/1/2019 | | Accrued
discounts/
(premiums) | | Realized
gain/
(loss) | | Change
in unrealized
appreciation/
(depreciation) | | Purchases | | Sales | | Transfers
into
Level 3 | | Transfers
out of
Level 3 | | Balance,
as of
8/31/2020 | | Net change in
unrealized
appreciation/
(depreciation)
from
investments
still held as
of 8/31/2020 | |
Investments in Securities:
(000's omitted) | |
Common
Stocks | | $ | 13,839 | | | $ | — | | | $ | — | | | $ | (1,085 | ) | | $ | — | | | $ | — | | | $ | — | | | $ | — | | | $ | 12,754 | | | $ | (1,085 | ) | |
Total | | $ | 13,839 | | | $ | — | | | $ | — | | | $ | (1,085 | ) | | $ | — | | | $ | — | | | $ | — | | | $ | — | | | $ | 12,754 | | | $ | (1,085 | ) | |
See Notes to Financial Statements
91
Schedule of Investments Emerging Markets Equity Fund^ (cont'd)
The following table presents additional information about the valuation approach and inputs used for investments that are measured at fair value and categorized within Level 3 as of August 31, 2020:
Asset
class | | Fair value
at 8/31/2020 | | Valuation
approach | | Unobservable
input | | Amount or
range | | Weighted
average | | Impact to
valuation
from
increase
in input(c) | |
Common
Stocks | | $ | 12,753,964
|
| | Market
Comparables | | Enterprise value/EBITDA
multiple (EV/EBITDA) | |
| 16.1
| x | |
| 16.1
| x | | Increase
| |
(c) Represents the expected directional change in the fair value of the Level 3 investments that would result from an increase in the corresponding input. A decrease to the unobservable input would have the opposite effect. Significant changes in these inputs could result in significantly higher or lower fair value measurements.
^ A balance indicated with a "—", reflects either a zero balance or an amount that rounds to less than 1.
See Notes to Financial Statements
92
Schedule of Investments Equity Income Fund^ August 31, 2020
| | | Number
of Shares | | Value | |
Common Stocks 88.8% | |
Aerospace & Defense 2.3% | |
Lockheed
Martin Corp. | | | 73,000 | | | $ | 28,488,980 | | |
Banks 4.7% | |
Bank of
America
Corp. | | | 246,000 | | | | 6,332,040 | | |
JPMorgan
Chase &
Co.(a) | | | 271,300 | | | | 27,181,547 | | |
PNC Financial
Services
Group, Inc. | | | 233,200 | | | | 25,931,840 | | |
| | | | 59,445,427 | | |
Capital Markets 1.8% | |
CME Group,
Inc. | | | 53,300 | | | | 9,373,871 | | |
Virtu Financial,
Inc. Class A | | | 495,200 | | | | 12,791,016 | | |
| | | | 22,164,887 | | |
Chemicals 1.1% | |
Nutrien Ltd. | | | 371,000 | | | | 13,678,770 | | |
Construction & Engineering 1.6% | |
Ferrovial SA | | | 743,323 | | | | 19,852,059 | | |
Diversified Telecommunication Services 3.9% | |
TELUS
Corp. | | | 1,180,000 | | | | 21,730,057 | | |
TELUS
Corp.(b) | | | 230,000 | | | | 4,234,300 | | |
Verizon
Communications,
Inc. | | | 384,600 | | | | 22,795,242 | | |
| | | | 48,759,599 | | |
Electric Utilities 3.2% | |
NextEra
Energy,
Inc.(a) | | | 143,900 | | | | 40,172,563 | | |
Electrical Equipment 2.0% | |
Eaton Corp.
PLC | | | 242,000 | | | | 24,708,200 | | |
Equity Real Estate Investment
Trusts 13.4% | |
Alexandria
Real Estate
Equities, Inc. | | | 120,800 | | | | 20,340,304 | | |
Americold
Realty Trust | | | 342,200 | | | | 13,123,370 | | |
Camden
Property
Trust | | | 139,000 | | | | 12,640,660 | | |
| | | Number
of Shares | | Value | |
Crown Castle
International
Corp. | | | 158,400 | | | $ | 25,858,800 | | |
CyrusOne,
Inc. | | | 223,000 | | | | 18,627,190 | | |
EastGroup
Properties,
Inc. | | | 26,000 | | | | 3,462,160 | | |
| Equinix, Inc.(a) | | | 26,200 | | | | 20,692,236 | | |
Equity
LifeStyle
Properties,
Inc. | | | 285,900 | | | | 18,952,311 | | |
MGM Growth
Properties
LLC Class A | | | 438,100 | | | | 12,297,467 | | |
Prologis, Inc. | | | 163,500 | | | | 16,654,110 | | |
Terreno Realty
Corp. | | | 82,300 | | | | 4,908,372 | | |
| | | | 167,556,980 | | |
Food & Staples Retailing 0.8% | |
Walmart, Inc. | | | 73,500 | | | | 10,205,475 | | |
Food Products 1.3% | |
Flowers Foods,
Inc. | | | 660,000 | | | | 16,143,600 | | |
Health Care Equipment &
Supplies 1.1% | |
Medtronic PLC | | | 125,300 | | | | 13,465,991 | | |
Health Care Providers & Services 1.0% | |
CVS Health
Corp. | | | 195,000 | | | | 12,113,400 | | |
Hotels, Restaurants & Leisure 0.8% | |
McDonald's
Corp. | | | 45,300 | | | | 9,672,456 | | |
Household Durables 1.6% | |
Leggett &
Platt, Inc. | | | 490,500 | | | | 20,110,500 | | |
Household Products 1.1% | |
Procter &
Gamble Co. | | | 98,000 | | | | 13,556,340 | | |
Insurance 4.1% | |
Assurant, Inc. | | | 104,900 | | | | 12,751,644 | | |
Chubb Ltd. | | | 198,300 | | | | 24,787,500 | | |
Progressive
Corp. | | | 141,600 | | | | 13,457,664 | | |
| | | | 50,996,808 | | |
IT Services 2.1% | |
Paychex, Inc. | | | 351,100 | | | | 26,848,617 | | |
Machinery 1.8% | |
Caterpillar,
Inc. | | | 160,000 | | | | 22,769,600 | | |
| | | Number
of Shares | | Value | |
Metals & Mining 3.1% | |
Rio Tinto PLC
ADR | | | 414,450 | | | $ | 25,376,773 | | |
Southern
Copper
Corp. | | | 281,200 | | | | 13,525,720 | | |
| | | | 38,902,493 | | |
Multi-Utilities 7.4% | |
Ameren Corp. | | | 174,800 | | | | 13,828,428 | | |
CenterPoint
Energy, Inc. | | | 1,299,600 | | | | 26,082,972 | | |
Dominion
Energy, Inc. | | | 302,400 | | | | 23,720,256 | | |
NiSource, Inc. | | | 423,200 | | | | 9,378,112 | | |
Sempra
Energy | | | 64,100 | | | | 7,925,965 | | |
WEC Energy
Group, Inc. | | | 132,100 | | | | 12,427,968 | | |
| | | | 93,363,701 | | |
Oil, Gas & Consumable Fuels 3.3% | |
Chevron Corp. | | | 140,000 | | | | 11,750,200 | | |
Pembina
Pipeline Corp. | | | 319,500 | | | | 7,911,872 | | |
Suncor Energy,
Inc. | | | 441,700 | | | | 7,080,451 | | |
Valero Energy
Corp. | | | 268,900 | | | | 14,141,451 | | |
| | | | 40,883,974 | | |
Personal Products 1.1% | |
Unilever NV | | | 250,000 | | | | 14,500,000 | | |
Pharmaceuticals 8.6% | |
AstraZeneca
PLC ADR | | | 539,600 | | | | 30,217,600 | | |
Bristol-Myers
Squibb Co. | | | 546,000 | | | | 33,961,200 | | |
Johnson &
Johnson | | | 207,500 | | | | 31,832,575 | | |
Novartis AG
ADR | | | 132,700 | | | | 11,420,162 | | |
| | | | 107,431,537 | | |
Semiconductors & Semiconductor Equipment 8.4% | |
Maxim
Integrated
Products, Inc. | | | 405,000 | | | | 27,718,200 | | |
QUALCOMM,
Inc. | | | 282,600 | | | | 33,657,660 | | |
Taiwan
Semiconductor
Manufacturing
Co. Ltd. ADR | | | 236,300 | | | | 18,726,775 | | |
Texas
Instruments,
Inc. | | | 177,000 | | | | 25,160,550 | | |
| | | | 105,263,185 | | |
See Notes to Financial Statements
93
Schedule of Investments Equity Income Fund^ (cont'd)
| | | Number
of Shares | | Value | |
Software 1.4% | |
Microsoft
Corp.(a) | | | 76,100 | | | $ | 17,162,833 | | |
Specialty Retail 3.4% | |
Best Buy Co.,
Inc. | | | 138,200 | | | | 15,327,762 | | |
Home Depot,
Inc. | | | 97,100 | | | | 27,677,384 | | |
| | | | 43,005,146 | | |
Trading Companies &
Distributors 2.4% | |
Watsco, Inc. | | | 121,000 | | | | 29,643,790 | | |
Total Common Stocks
(Cost $849,922,855) | | | 1,110,866,911 | | |
Convertible Preferred Stocks 0.5% | |
Machinery 0.5% | |
Stanley Black &
Decker, Inc.,
Ser. C, 5.00%,
due 5/15/2021(c)(g)
(Cost $5,485,000) | | | 5,485 | | | | 6,477,785 | | |
| | | Principal
Amount | | | |
Convertible Bonds 10.6% | |
Biotechnology 1.0% | |
BioMarin
Pharmaceutical,
Inc., 1.25%,
due
5/15/2027(d) | | $ | 2,350,000 | | | | 2,333,792 | | |
Exact
Sciences
Corp., 0.38%,
due
3/1/2028 | | | 10,565,000 | | | | 9,734,057 | | |
| | | | 12,067,849 | | |
Diversified Consumer Services 0.2% | |
K12, Inc.,
1.13%,
due
9/1/2027(d) | | | 1,882,000 | | | | 1,893,230 | | |
Electronic Equipment, Instruments &
Components 1.3% | |
Vishay
Intertechnology,
Inc., 2.25%,
due
6/15/2025 | | | 16,000,000 | | | | 15,602,768 | | |
| | | Principal
Amount | | Value | |
Health Care Equipment &
Supplies 0.3% | |
DexCom,
Inc.,
0.25%,
due
11/15/2025(d) | | $ | 3,755,000 | | | $ | 3,993,623 | | |
Health Care Providers & Services 1.2% | |
1Life
Healthcare,
Inc.,
3.00%,
due
6/15/2025(d) | | | 14,100,000 | | | | 14,331,668 | | |
Health Care Technology 0.3% | |
Teladoc
Health,
Inc.,
1.25%,
due
6/1/2027(d) | | | 3,055,000 | | | | 3,835,134 | | |
IT Services 0.5% | |
Okta,
Inc.,
0.38%,
due
6/15/2026(d) | | | 5,760,000 | | | | 6,624,565 | | |
Life Sciences Tools & Services 0.1% | |
NanoString
Technologies,
Inc.,
2.63%,
due
3/1/2025(d) | | | 1,400,000 | | | | 1,575,268 | | |
Machinery 0.2% | |
Fortive
Corp.,
0.88%,
due
2/15/2022 | | | 2,300,000 | | | | 2,294,333 | | |
Media 1.8% | |
Liberty Media Corp. | |
due
3/31/2048(d) 2.13%, | | | 11,700,000 | | | | 11,690,632 | | |
due
12/1/2049(d) 2.75%, | | | 11,230,000 | | | | 11,074,932 | | |
| | | | 22,765,564 | | |
Metals & Mining 1.3% | |
Endeavour
Mining
Corp.,
3.00%,
due
2/15/2023(d) | | | 13,105,000 | | | | 16,758,674 | | |
| | | Principal
Amount | | Value | |
Road & Rail 0.1% | |
Lyft, Inc.,
1.50%,
due
5/15/2025(d) | | $ | 1,415,000 | | | $ | 1,530,532 | | |
Semiconductors & Semiconductor
Equipment 0.3% | |
SMART
Global
Holdings,
Inc.,
2.25%,
due
2/15/2026(d) | | | 4,825,000 | | | | 4,303,418 | | |
Software 2.0% | |
Envestnet,
Inc., 0.75%,
due
8/15/2025(d) | | | 1,420,000 | | | | 1,484,321 | | |
RealPage,
Inc.,
1.50%,
due
5/15/2025 | | | 3,760,000 | | | | 4,049,050 | | |
SailPoint
Technologies
Holding,
Inc.,
0.13%, due
9/15/2024(d) | | | 295,000 | | | | 447,232 | | |
Splunk,
Inc.,
1.13%,
due
6/15/2027(d) | | | 2,820,000 | | | | 3,295,147 | | |
Verint
Systems,
Inc.,
1.50%,
due
6/1/2021 | | | 8,700,000 | | | | 8,770,979 | | |
Workiva,
Inc.,
1.13%,
due
8/15/2026(d) | | | 3,630,000 | | | | 3,707,540 | | |
Zscaler,
Inc.,
0.13%,
due
7/1/2025(d) | | | 2,355,000 | | | | 2,834,712 | | |
| | | | 24,588,981 | | |
Total Convertible Bonds
(Cost $124,071,175) | | | 132,165,607 | | |
See Notes to Financial Statements
94
Schedule of Investments Equity Income Fund^ (cont'd)
| | | Number
of Shares | | Value | |
Short-Term Investments 0.5% | |
Investment Companies 0.5% | |
State
Street
Institutional
Treasury
Money
Market
Fund
Premier
Class,
0.03%(b)(e)
(Cost $5,827,682) | | | 5,827,682 | | | $ | 5,827,682 | | |
Total
Investments 100.4%
(Cost $985,306,712) | | | 1,255,337,985 | | |
Liabilities Less Other
Assets(f) (0.4)% | | | | | (4,679,550 | ) | |
Net Assets 100.0% | | $ | 1,250,658,435 | | |
(a) All or a portion of the security is pledged as collateral for options written.
(b) All or a portion of this security is segregated in connection with obligations for options written with a total value of $10,061,982.
(c) Step security. Coupon rate is a fixed rate for an initial period that either resets at a specific date or may reset in the future contingent upon a predetermined trigger. The interest rate shown was the current rate as of August 31, 2020.
(d) Securities were purchased under Rule 144A of the Securities Act of 1933, as amended, or are otherwise restricted and, unless registered under the Securities Act of 1933 or exempted from registration, may only be sold to qualified institutional investors or may have other restrictions on resale. At August 31, 2020, these securities amounted to $91,714,420, which represents 7.3% of net assets of the Fund.
(e) Represents 7-day effective yield as of August 31, 2020.
(f) Includes the impact of the Fund's open positions in derivatives at August 31, 2020.
(g) Perpetual security. The rate reflected was the rate in effect on August 31, 2020. The maturity date reflects the next call date.
See Notes to Financial Statements
95
Schedule of Investments Equity Income Fund^ (cont'd)
POSITIONS BY COUNTRY
Country | | Investments at
Value | | Percentage of
Net Assets | |
United States | | $ | 1,044,497,090 | | | | 83.5 | % | |
Canada | | | 54,635,450 | | | | 4.4 | % | |
United Kingdom | | | 44,717,600 | | | | 3.6 | % | |
Australia | | | 25,376,773 | | | | 2.0 | % | |
Spain | | | 19,852,059 | | | | 1.6 | % | |
Taiwan | | | 18,726,775 | | | | 1.5 | % | |
Cayman Islands | | | 16,758,674 | | | | 1.3 | % | |
Peru | | | 13,525,720 | | | | 1.1 | % | |
Switzerland | | | 11,420,162 | | | | 0.9 | % | |
Short-Term Investments and Other Liabilities—Net | | | 1,148,132 | | | | 0.1 | % | |
| | | $ | 1,250,658,435 | | | | 100.0 | % | |
Derivative Instruments
Written option contracts ("options written")
At August 31, 2020, the Fund had outstanding options written as follows:
Description | | Number of
Contracts | | Notional
Amount | | Exercise
Price | | Expiration
Date | | Value | |
Calls | |
Electric Utilities | |
NextEra Energy, Inc. | | | 100 | | | $ | (2,791,700 | ) | | $ | 320 | | | 12/18/2020 | | $ | (32,750 | ) | |
NextEra Energy, Inc. | | | 100 | | | | (2,791,700 | ) | | | 330 | | | 12/18/2020 | | | (20,250 | ) | |
NextEra Energy, Inc. | | | 100 | | | | (2,791,700 | ) | | | 350 | | | 3/19/2021 | | | (25,000 | ) | |
| | | | | | | | | | | | (78,000 | ) | |
Equity Real Estate Investment Trusts | |
Alexandria Real Estate Equities, Inc. | | | 100 | | | | (1,683,800 | ) | | | 200 | | | 1/15/2021 | | | (15,750 | ) | |
Equinix, Inc. | | | 50 | | | | (3,948,900 | ) | | | 860 | | | 12/18/2020 | | | (103,750 | ) | |
Equinix, Inc. | | | 20 | | | | (1,579,560 | ) | | | 880 | | | 12/18/2020 | | | (30,800 | ) | |
Equinix, Inc. | | | 20 | | | | (1,579,560 | ) | | | 870 | | | 1/15/2021 | | | (46,000 | ) | |
Equinix, Inc. | | | 20 | | | | (1,579,560 | ) | | | 890 | | | 1/15/2021 | | | (36,500 | ) | |
Equinix, Inc. | | | 20 | | | | (1,579,560 | ) | | | 900 | | | 1/15/2021 | | | (32,400 | ) | |
Equinix, Inc. | | | 20 | | | | (1,579,560 | ) | | | 910 | | | 1/15/2021 | | | (26,800 | ) | |
Prologis, Inc. | | | 150 | | | | (1,527,900 | ) | | | 120 | | | 2/19/2021 | | | (26,250 | ) | |
Terreno Realty Corp. | | | 1 | | | | (5,964 | ) | | | 65 | | | 12/18/2020 | | | (135 | ) | |
| | | | | | | | | | | | (318,385 | ) | |
Food & Staples Retailing | |
Walmart, Inc. | | | 100 | | | | (1,388,500 | ) | | | 145 | | | 10/16/2020 | | | (36,000 | ) | |
Walmart, Inc. | | | 100 | | | | (1,388,500 | ) | | | 150 | | | 12/18/2020 | | | (52,750 | ) | |
Walmart, Inc. | | | 100 | | | | (1,388,500 | ) | | | 155 | | | 1/15/2021 | | | (46,500 | ) | |
Walmart, Inc. | | | 100 | | | | (1,388,500 | ) | | | 160 | | | 3/19/2021 | | | (52,500 | ) | |
| | | | | | | | | | | | (187,750 | ) | |
See Notes to Financial Statements
96
Schedule of Investments Equity Income Fund^ (cont'd)
Description | | Number of
Contracts | | Notional
Amount | | Exercise
Price | | Expiration
Date | | Value | |
Insurance | |
Assurant, Inc. | | | 125 | | | $ | (1,519,500 | ) | | $ | 145 | | | 12/18/2020 | | $ | (19,375 | )(a)(b) | |
Assurant, Inc. | | | 16 | | | | (194,496 | ) | | | 155 | | | 3/19/2021 | | | — | (a)(b) | |
Progressive Corp. | | | 150 | | | | (1,425,600 | ) | | | 100 | | | 11/20/2020 | | | (40,500 | ) | |
Progressive Corp. | | | 150 | | | | (1,425,600 | ) | | | 105 | | | 1/15/2021 | | | (30,375 | ) | |
Progressive Corp. | | | 150 | | | | (1,425,600 | ) | | | 110 | | | 2/19/2021 | | | (21,000 | ) | |
| | | | | | | | | | | | (111,250 | ) | |
Metals & Mining | |
Rio Tinto PLC | | | 250 | | | | (1,530,750 | ) | | | 65 | | | 10/16/2020 | �� | | (25,625 | ) | |
Pharmaceuticals | |
AstraZeneca PLC | | | 250 | | | | (1,400,000 | ) | | | 60 | | | 10/16/2020 | | | (39,375 | ) | |
AstraZeneca PLC | | | 500 | | | | (2,800,000 | ) | | | 62.5 | | | 10/16/2020 | | | (51,250 | ) | |
AstraZeneca PLC | | | 500 | | | | (2,800,000 | ) | | | 65 | | | 1/15/2021 | | | (113,750 | ) | |
AstraZeneca PLC | | | 500 | | | | (2,800,000 | ) | | | 67.5 | | | 1/15/2021 | | | (77,500 | ) | |
AstraZeneca PLC | | | 500 | | | | (2,800,000 | ) | | | 70 | | | 1/15/2021 | | | (67,500 | ) | |
| | | | | | | | | | | | (349,375 | ) | |
Semiconductors & Semiconductor Equipment | |
Maxim Integrated Products, Inc. | | | 70 | | | | (479,080 | ) | | | 70 | | | 11/20/2020 | | | (24,325 | ) | |
Maxim Integrated Products, Inc. | | | 125 | | | | (855,500 | ) | | | 80 | | | 11/20/2020 | | | (9,062 | ) | |
Maxim Integrated Products, Inc. | | | 125 | | | | (855,500 | ) | | | 80 | | | 1/15/2021 | | | (19,063 | ) | |
Maxim Integrated Products, Inc. | | | 125 | | | | (855,500 | ) | | | 85 | | | 2/19/2021 | | | (14,375 | ) | |
Taiwan Semiconductor Manufacturing Co. Ltd. | | | 200 | | | | (1,585,000 | ) | | | 65 | | | 10/16/2020 | | | (294,000 | ) | |
Taiwan Semiconductor Manufacturing Co. Ltd. | | | 200 | | | | (1,585,000 | ) | | | 70 | | | 1/15/2021 | | | (248,500 | ) | |
Taiwan Semiconductor Manufacturing Co. Ltd. | | | 150 | | | | (1,188,750 | ) | | | 95 | | | 1/15/2021 | | | (40,425 | ) | |
Taiwan Semiconductor Manufacturing Co. Ltd. | | | 150 | | | | (1,188,750 | ) | | | 100 | | | 1/15/2021 | | | (29,325 | ) | |
Taiwan Semiconductor Manufacturing Co. Ltd. | | | 150 | | | | (1,188,750 | ) | | | 105 | | | 1/15/2021 | | | (20,475 | ) | |
Taiwan Semiconductor Manufacturing Co. Ltd. | | | 150 | | | | (1,188,750 | ) | | | 110 | | | 1/15/2021 | | | (15,825 | ) | |
Taiwan Semiconductor Manufacturing Co. Ltd. | | | 150 | | | | (1,188,750 | ) | | | 115 | | | 1/15/2021 | | | (13,725 | ) | |
Texas Instruments, Inc. | | | 200 | | | | (2,843,000 | ) | | | 145 | | | 10/16/2020 | | | (93,000 | ) | |
Texas Instruments, Inc. | | | 200 | | | | (2,843,000 | ) | | | 150 | | | 11/20/2020 | | | (93,000 | ) | |
| | | | | | | | | | | | (915,100 | ) | |
Software | |
Microsoft Corp. | | | 100 | | | | (2,255,300 | ) | | | 240 | | | 10/16/2020 | | | (68,500 | ) | |
Microsoft Corp. | | | 100 | | | | (2,255,300 | ) | | | 245 | | | 11/20/2020 | | | (103,250 | ) | |
Microsoft Corp. | | | 100 | | | | (2,255,300 | ) | | | 250 | | | 12/18/2020 | | | (106,750 | ) | |
Microsoft Corp. | | | 100 | | | | (2,255,300 | ) | | | 260 | | | 12/18/2020 | | | (85,000 | ) | |
Microsoft Corp. | | | 100 | | | | (2,255,300 | ) | | | 260 | | | 1/15/2021 | | | (101,250 | ) | |
Microsoft Corp. | | | 50 | | | | (1,127,650 | ) | | | 265 | | | 2/19/2021 | | | (59,125 | ) | |
| | | | | | | | | | | | (523,875 | ) | |
See Notes to Financial Statements
97
Schedule of Investments Equity Income Fund^ (cont'd)
Description | | Number of
Contracts | | Notional
Amount | | Exercise
Price | | Expiration
Date | | Value | |
Specialty Retail | |
Best Buy Co., Inc. | | | 150 | | | $ | (1,663,650 | ) | | $ | 110 | | | 12/18/2020 | | $ | (148,125 | ) | |
Best Buy Co., Inc. | | | 100 | | | | (1,109,100 | ) | | | 125 | | | 12/18/2020 | | | (41,750 | ) | |
Best Buy Co., Inc. | | | 150 | | | | (1,663,650 | ) | | | 120 | | | 1/15/2021 | | | (105,000 | ) | |
Best Buy Co., Inc. | | | 100 | | | | (1,109,100 | ) | | | 135 | | | 1/15/2021 | | | (35,350 | ) | |
Best Buy Co., Inc. | | | 125 | | | | (1,386,375 | ) | | | 130 | | | 3/19/2021 | | | (82,500 | ) | |
Best Buy Co., Inc. | | | 100 | | | | (1,109,100 | ) | | | 140 | | | 3/19/2021 | | | (38,000 | ) | |
Home Depot, Inc. | | | 100 | | | | (2,850,400 | ) | | | 285 | | | 9/18/2020 | | | (57,250 | ) | |
Home Depot, Inc. | | | 100 | | | | (2,850,400 | ) | | | 300 | | | 11/20/2020 | | | (92,500 | ) | |
Home Depot, Inc. | | | 100 | | | | (2,850,400 | ) | | | 320 | | | 1/15/2021 | | | (68,000 | ) | |
| | | | | | | | | | | | (668,475 | ) | |
Trading Companies & Distributors | |
Watsco, Inc. | | | 100 | | | | (2,449,900 | ) | | | 210 | | | 11/20/2020 | | | (385,000 | ) | |
Watsco, Inc. | | | 100 | | | | (2,449,900 | ) | | | 220 | | | 11/20/2020 | | | (310,500 | ) | |
Watsco, Inc. | | | 100 | | | | (2,449,900 | ) | | | 270 | | | 2/19/2021 | | | (96,500 | ) | |
Watsco, Inc. | | | 100 | | | | (2,449,900 | ) | | | 280 | | | 2/19/2021 | | | (73,000 | ) | |
Watsco, Inc. | | | 100 | | | | (2,449,900 | ) | | | 290 | | | 2/19/2021 | | | (51,750 | ) | |
| | | | | | | | | | | | (916,750 | ) | |
Total calls | | | | | | | | | | $ | (4,094,585 | ) | |
Puts | |
Capital Markets | |
CME Group, Inc. | | | 100 | | | $ | (1,758,700 | ) | | $ | 140 | | | 12/18/2020 | | $ | (22,000 | ) | |
CME Group, Inc. | | | 100 | | | | (1,758,700 | ) | | | 130 | | | 1/15/2021 | | | (20,750 | ) | |
| | | | | | | | | | | | (42,750 | ) | |
Road & Rail | |
Union Pacific Corp. | | | 70 | | | | (1,347,080 | ) | | | 150 | | | 11/20/2020 | | | (12,495 | ) | |
Union Pacific Corp. | | | 100 | | | | (1,924,400 | ) | | | 140 | | | 1/15/2021 | | | (24,350 | ) | |
Union Pacific Corp. | | | 100 | | | | (1,924,400 | ) | | | 145 | | | 1/15/2021 | | | (28,300 | ) | |
| | | | | | | | | | | | (65,145 | ) | |
Total puts | | | | | | | | | | $ | (107,895 | ) | |
Total options written (premium received $2,429,726) | | | | | | | | | | $ | (4,202,480 | ) | |
(a) Security fair valued as of August 31, 2020 in accordance with procedures approved by the Board of Trustees.
(b) Value determined using significant unobservable inputs.
For the year ended August 31, 2020, the average market value for the months where the Fund had options written outstanding was $(2,215,879). At August 31, 2020, the Fund had securities pledged in the amount of $37,516,798 to cover collateral requirements for options written.
See Notes to Financial Statements
98
Schedule of Investments Equity Income Fund^ (cont'd)
The following is a summary, categorized by Level (see Note A of Notes to Financial Statements), of inputs used to value the Fund's investments as of August 31, 2020:
Asset Valuation Inputs | | Level 1 | | Level 2 | | Level 3 | | Total | |
Investments: | |
| Common Stocks(a) | | $ | 1,110,866,911 | | | $ | — | | | $ | — | | | $ | 1,110,866,911 | | |
| Convertible Preferred Stocks(a) | | | 6,477,785 | | | | — | | | | — | | | | 6,477,785 | | |
| Convertible Bonds(a) | | | — | | | | 132,165,607 | | | | — | | | | 132,165,607 | | |
Short-Term Investments | | | — | | | | 5,827,682 | | | | — | | | | 5,827,682 | | |
Total Investments | | $ | 1,117,344,696 | | | $ | 137,993,289 | | | $ | — | | | $ | 1,255,337,985 | | |
(a) The Schedule of Investments provides information on the industry categorization as well as a Positions by Country summary.
The following is a summary, categorized by Level (see Note A of Notes to Financial Statements), of inputs used to value the Fund's derivatives as of August 31, 2020:
Other Financial Instruments | | Level 1 | | Level 2 | | Level 3(b) | | Total | |
Options Written | |
Liabilities | | $ | (4,183,105 | ) | | $ | — | | | $ | (19,375 | ) | | $ | (4,202,480 | ) | |
Total | | $ | (4,183,105 | ) | | $ | — | | | $ | (19,375 | ) | | $ | (4,202,480 | ) | |
(b) The following is a reconciliation between the beginning and ending balances of investments in which unobservable inputs (Level 3) were used in determining value:
| | | Beginning
balance, as
of 9/1/2019 | | Accrued
discounts/
(premiums) | | Realized
gain/
(loss) | | Change in
unrealized
appreciation/
(depreciation) | | Purchases | | Sales | | Transfers
into
Level 3 | | Transfers
out of
Level 3 | | Balance,
as of
8/31/2020 | | Net change in
unrealized
appreciation/
(depreciation)
from
investments
still held as
of 8/31/2020 | |
Other Financial Instruments:
(000's omitted) | |
Options
Written(c) | | $ | — | | | $ | — | | | $ | — | | | $ | 13 | | | $ | — | | | $ | (32 | ) | | $ | — | | | $ | — | | | $ | (19 | ) | | $ | 13 | | |
Total | | $ | — | | | $ | — | | | $ | — | | | $ | 13 | | | $ | — | | | $ | (32 | ) | | $ | — | | | $ | — | | | $ | (19 | ) | | $ | 13 | | |
(c) As of the year ended August 31, 2020, these investments were valued in accordance with procedures approved by the Board of Trustees. These investments did not have a material impact on the Fund's net assets and, therefore, disclosure of unobservable inputs used in formulating valuations is not presented.
^ A balance indicated with a "—", reflects either a zero balance or an amount that rounds to less than 1.
See Notes to Financial Statements
99
Schedule of Investments Focus Fund^ August 31, 2020
| | | Number
of Shares | | Value | |
Common Stocks 98.0% | |
Banks 1.5% | |
First Republic
Bank | | | 101,600 | | | $ | 11,471,656 | | |
Chemicals 5.1% | |
Ecolab, Inc. | | | 64,200 | | | | 12,652,536 | | |
Linde PLC | | | 105,200 | | | | 26,272,648 | | |
| | | | 38,925,184 | | |
Commercial Services 0.4% | |
LegalZoom.com,
Inc.*(a)(b)(e) | | | 286,288 | | | | 2,819,507 | | |
Diversified Telecommunication Services 2.5% | |
Cellnex
Telecom SA(c) | | | 296,330 | | | | 18,982,614 | | |
Electronic Equipment, Instruments & Components 1.2% | |
Keysight
Technologies,
Inc.* | | | 95,800 | | | | 9,438,216 | | |
Equity Real Estate Investment
Trusts 3.7% | |
Equity LifeStyle
Properties, Inc. | | | 54,600 | | | | 3,619,434 | | |
Prologis, Inc. | | | 241,200 | | | | 24,568,632 | | |
| | | | 28,188,066 | | |
Food Products 2.6% | |
Nestle SA | | | 168,100 | | | | 20,187,993 | | |
Household Products 2.8% | |
Procter &
Gamble Co. | | | 154,400 | | | | 21,358,152 | | |
Industrial Conglomerates 1.6% | |
Roper
Technologies,
Inc. | | | 28,100 | | | | 12,004,039 | | |
Internet & Direct Marketing
Retail 11.7% | |
Alibaba Group
Holding Ltd.
ADR* | | | 77,800 | | | | 22,330,934 | | |
Amazon.com,
Inc.* | | | 13,600 | | | | 46,933,056 | | |
Booking
Holdings,
Inc.* | | | 11,000 | | | | 21,014,950 | | |
| | | | 90,278,940 | | |
IT Services 15.3% | |
| Adyen NV*(c) | | | 1,700 | | | | 2,866,547 | | |
EPAM Systems,
Inc.* | | | 61,300 | | | | 20,051,230 | | |
Fidelity National
Information
Services, Inc. | | | 207,838 | | | | 31,352,362 | | |
| | | Number
of Shares | | Value | |
MasterCard,
Inc. Class A | | | 67,100 | | | $ | 24,034,549 | | |
Visa, Inc.
Class A | | | 153,512 | | | | 32,543,009 | | |
Wix.com Ltd.* | | | 24,100 | | | | 7,100,583 | | |
| | | | 117,948,280 | | |
Life Sciences Tools & Services 1.0% | |
IQVIA Holdings,
Inc.* | | | 45,600 | | | | 7,467,000 | | |
Personal Products 4.6% | |
Estee Lauder
Cos., Inc.
Class A | | | 73,100 | | | | 16,207,732 | | |
L'Oreal SA | | | 57,800 | | | | 19,099,355 | | |
| | | | 35,307,087 | | |
Pharmaceuticals 2.0% | |
Zoetis, Inc. | | | 96,800 | | | | 15,497,680 | | |
Professional Services 6.4% | |
IHS Markit Ltd. | | | 228,000 | | | | 18,221,760 | | |
TransUnion | | | 223,600 | | | | 19,390,592 | | |
Verisk Analytics,
Inc. | | | 60,900 | | | | 11,368,203 | | |
| | | | 48,980,555 | | |
Semiconductors & Semiconductor Equipment 4.2% | |
ASML
Holding NV | | | 86,500 | | | | 32,366,570 | | |
Software 20.6% | |
Adobe, Inc.* | | | 44,200 | | | | 22,691,838 | | |
AvidXchange,
Inc.*(a)(b)(e) | | | 10,202 | | | | 625,026 | | |
Constellation
Software, Inc. | | | 25,000 | | | | 28,941,427 | | |
Duck Creek
Technologies,
Inc.*(a)(e) | | | 278,652 | | | | 10,059,328 | | |
Duck Creek
Technologies,
Inc.* | | | 77,958 | | | | 3,039,582 | | |
Fair Isaac Corp.* | | | 59,400 | | | | 24,994,926 | | |
Intuit, Inc. | | | 34,500 | | | | 11,915,955 | | |
Microsoft Corp. | | | 178,600 | | | | 40,279,658 | | |
ServiceNow,
Inc.* | | | 32,600 | | | | 15,713,852 | | |
| | | | 158,261,592 | | |
Textiles, Apparel & Luxury Goods 8.8% | |
LVMH Moet
Hennessy Louis
Vuitton SE | | | 47,500 | | | $ | 22,265,527 | | |
Moncler SpA* | | | 82,800 | | | | 3,206,365 | | |
NIKE, Inc.
Class B | | | 264,900 | | | | 29,639,661 | | |
Puma SE* | | | 147,800 | | | | 12,201,772 | | |
| | | | 67,313,325 | | |
| | | Number
of Shares | | Value | |
Trading Companies &
Distributors 2.0% | |
IMCD NV | | | 142,700 | | | $ | 15,237,645 | | |
Total Common Stocks
(Cost $554,484,146) | | | 752,034,101 | | |
| | | Number
of Units | | | |
Limited Partnerships Units 0.7% | |
Capital Markets 0.7% | |
CC DNB
Holdings,
L.P.*(a)(e)
(Cost
$5,000,006) | | | 230,734 | | | | 5,650,676 | | |
| | | Number
of Shares | | | |
Preferred Stocks 0.7% | |
Food Products 0.4% | |
Sweetgreen,
Inc.
Ser. D*(a)(b)(e) | | | 250,000 | | | | 2,500,000 | | |
Sweetgreen,
Inc.
Ser. I*(a)(b)(e) | | | 27,151 | | | | 464,282 | | |
| | | | 2,964,282 | | |
Software 0.3% | |
AvidXchange,
Inc.
Ser. F*(a)(b)(e) | | | 40,808 | | | | 2,500,102 | | |
Total Preferred Stocks
(Cost $5,464,364) | | | 5,464,384 | | |
Short-Term Investments 0.7% | |
Investment Companies 0.7% | |
State Street
Institutional
U.S.
Government
Money
Market Fund
Premier
Class,
0.04%(d)
(Cost
$5,466,808) | | | 5,466,808 | | | | 5,466,808 | | |
Total
Investments 100.1%
(Cost $570,415,324) | | | | | 768,615,969 | | |
Liabilities Less
Other Assets (0.1)% | | | | | (623,697 | ) | |
Net Assets 100.0% | | | | $ | 767,992,272 | | |
See Notes to Financial Statements
100
Schedule of Investments Focus Fund^ (cont'd)
* Non-income producing security.
(a) Security fair valued as of August 31, 2020 in accordance with procedures approved by the Board of Trustees. Total value of all such securities at August 31, 2020 amounted to $24,618,921, which represents 3.2% of net assets of the Fund.
(b) Value determined using significant unobservable inputs.
(c) Security exempt from registration pursuant to Regulation S under the Securities Act of 1933, as amended. Regulation S applies to securities offerings that are made outside of the United States and do not involve directed selling efforts in the United States and as such may have restrictions on resale. Total value of all such securities at August 31, 2020 amounted to $21,849,161, which represents 2.8% of net assets of the Fund.
(d) Represents 7-day effective yield as of August 31, 2020.
(e) These securities have been deemed by the investment manager to be illiquid, and are subject to restrictions on resale.
At August 31, 2020, these securities amounted to $24,618,921, which represents 3.2% of net assets of the Fund.
| Restricted Security | | Acquisition
Date | | Acquisition
Cost | | Acquisition
Cost
Percentage
of Net Assets
as of
Acquisition
Date | | Value as of
8/31/2020 | | Fair Value
Percentage
of Net Assets
as of
8/31/2020 | |
AvidXchange, Inc. | | 4/7/2020 | | $ | 500,020 | | | | 0.1 | % | | $ | 625,026 | | | | 0.1 | % | |
AvidXchange, Inc.
(Ser. F Preferred Shares) | | 4/7/2020 | | | 2,000,082 | | | | 0.3 | % | | | 2,500,102 | | | | 0.3 | % | |
CC DNB Holdings, L.P. | | 7/6/2020 | | | 5,000,006 | | | | 0.7 | % | | | 5,650,676 | | | | 0.7 | % | |
Duck Creek Technologies, Inc. | | 8/18/2020 | | | 3,333,333 | | | | 0.4 | % | | | 10,059,328 | | | | 1.3 | % | |
LegalZoom.com, Inc. | | 8/22/2018 | | | 2,819,507 | | | | 0.4 | % | | | 2,819,507 | | | | 0.4 | % | |
Sweetgreen, Inc.
(Ser. D Preferred Shares) | | 11/30/2018 | | | 3,000,000 | | | | 0.4 | % | | | 2,500,000 | | | | 0.3 | % | |
Sweetgreen, Inc.
(Ser. I Preferred Shares) | | 9/13/2019 | | | 464,282 | | | | 0.1 | % | | | 464,282 | | | | 0.1 | % | |
Total | | | | $ | 17,117,230 | | | | 2.4 | % | | $ | 24,618,921 | | | | 3.2 | % | |
POSITIONS BY COUNTRY
Country | | Investments at
Value | | Percentage of
Net Assets | |
United States | | $ | 532,089,181 | | | | 69.3 | % | |
Netherlands | | | 50,470,762 | | | | 6.6 | % | |
France | | | 41,364,882 | | | | 5.4 | % | |
Canada | | | 28,941,427 | | | | 3.8 | % | |
United Kingdom | | | 26,272,648 | | | | 3.4 | % | |
China | | | 22,330,934 | | | | 2.9 | % | |
Switzerland | | | 20,187,993 | | | | 2.6 | % | |
Spain | | | 18,982,614 | | | | 2.5 | % | |
Germany | | | 12,201,772 | | | | 1.6 | % | |
Israel | | | 7,100,583 | | | | 0.9 | % | |
Italy | | | 3,206,365 | | | | 0.4 | % | |
Short-Term Investments and Other Liabilities—Net | | | 4,843,111 | | | | 0.6 | % | |
| | | $ | 767,992,272 | | | | 100.0 | % | |
See Notes to Financial Statements
101
Schedule of Investments Focus Fund^ (cont'd)
The following is a summary, categorized by Level (see Note A of Notes to Financial Statements), of inputs used to value the Fund's investments as of August 31, 2020:
Asset Valuation Inputs | | Level 1 | | Level 2 | | Level 3(b) | | Total | |
Investments: | |
Common Stocks | |
Commercial Services | | $ | — | | | $ | — | | | $ | 2,819,507 | | | $ | 2,819,507 | | |
Software | | | 147,577,238 | | | | 10,059,328 | | | | 625,026 | | | | 158,261,592 | | |
| Other Common Stocks(a) | | | 590,953,002 | | | | — | | | | — | | | | 590,953,002 | | |
Total Common Stocks | | | 738,530,240 | | | | 10,059,328 | | | | 3,444,533 | | | | 752,034,101 | | |
| Limited Partnerships Units(a) | | | — | | | | 5,650,676 | | | | — | | | | 5,650,676 | | |
| Preferred Stocks(a) | | | — | | | | — | | | | 5,464,384 | | | | 5,464,384 | | |
Short-Term Investments | | | — | | | | 5,466,808 | | | | — | | | | 5,466,808 | | |
Total Investments | | $ | 738,530,240 | | | $ | 21,176,812 | | | $ | 8,908,917 | | | $ | 768,615,969 | | |
(a) The Schedule of Investments provides information on the industry categorization as well as a Positions by Country Summary.
(b) The following is reconciliation between the beginning and ending balances of investments in which unobservable inputs (Level 3) were used in determining value:
| | | Beginning
balance, as
of 9/1/2019 | | Accrued
discounts/
(premiums) | | Realized
gain/
(loss) | | Change
in unrealized
appreciation/
(depreciation) | | Purchases | | Sales | | Transfers
into
Level 3 | | Transfers
out of
Level 3 | | Balance,
as of
8/31/2020 | | Net change in
unrealized
appreciation/
(depreciation)
from
investments
still held as
of 8/31/2020 | |
Investments in Securities:
(000's omitted) | |
Common
Stocks | | $ | 2,820 | | | $ | — | | | $ | — | | | $ | 125 | | | $ | 500 | | | $ | — | | | $ | — | | | $ | — | | | $ | 3,445 | | | $ | 125 | | |
Preferred
Stocks | | | 3,000 | | | | — | | | | — | | | | — | | | | 2,464 | | | | — | | | | — | | | | — | | | | 5,464 | | | | — | | |
Total | | $ | 5,820 | | | $ | — | | | $ | — | | | $ | 125 | | | $ | 2,964 | | | $ | — | | | $ | — | | | $ | — | | | $ | 8,909 | | | $ | 125 | | |
The following table presents additional information about the valuation approach and inputs used for investments that are measured at fair value and categorized within Level 3 as of August 31, 2020.
See Notes to Financial Statements
102
Schedule of Investments Focus Fund^ (cont'd)
Asset
class | | Fair value
at 8/31/2020 | | Valuation
approach | | Unobservable
input | | Amount or
range | | Weighted
average | | Impact to
valuation
from
increase
in input(c) | |
Common
Stocks | | $ | 2,819,507 |
| | Market
Comparables | | Enterprise value/Revenue
multiple (EV/Revenue) | | 5.3x | | 5.3x | | Increase | |
| |
| 625,026 |
| | Market
Comparables | | Enterprise value/EBITDA
multiple (EV/EBITDA) | | 11.8x | | 11.8x | | Increase | |
Preferred
Stocks | |
| 5,000,102 |
| | Market
Comparables | | Enterprise value/EBITDA
multiple (EV/EBITDA) | | 4.7x - 11.8x | | 8.3x | | Increase | |
| |
| 464,282 |
| | Market
Approach | | Transaction Price | | $17.10 | | $17.10 | | Increase | |
(c) Represents the expected directional change in the fair value of the Level 3 investments that would result from an increase in the corresponding input. A decrease to the unobservable input would have the opposite effect. Significant changes in these inputs could result in significantly higher or lower fair value measurements.
^ A balance indicated with a "—", reflects either a zero balance or an amount that rounds to less than 1.
See Notes to Financial Statements
103
Schedule of Investments Genesis Fund^ August 31, 2020
| | | Number
of Shares | | Value | |
Common Stocks 99.0% | |
Air Freight & Logistics 0.5% | |
Forward Air
Corp. | | | 823,079 | | | $ | 48,553,430 | | |
Airlines 0.5% | |
Allegiant
Travel Co. | | | 431,679 | | | | 55,513,919 | | |
Auto Components 3.1% | |
Fox Factory
Holding
Corp.*(a) | | | 2,114,136 | | | | 213,126,050 | | |
LCI Industries | | | 992,226 | | | | 112,746,641 | | |
| | | | 325,872,691 | | |
Banks 7.5% | |
Bank of
Hawaii
Corp. | | | 1,750,952 | | | | 96,372,398 | | |
BOK
Financial
Corp. | | | 861,608 | | | | 48,370,673 | | |
Columbia
Banking
System, Inc. | | | 1,760,889 | | | | 49,146,412 | | |
Community
Bank System,
Inc. | | | 1,608,907 | | | | 96,807,934 | | |
Cullen/Frost
Bankers, Inc. | | | 1,174,673 | | | | 81,592,787 | | |
CVB Financial
Corp. | | | 4,244,697 | | | | 77,295,933 | | |
First Financial
Bankshares,
Inc. | | | 3,570,630 | | | | 108,100,823 | | |
First Hawaiian,
Inc. | | | 3,254,364 | | | | 53,794,637 | | |
Glacier
Bancorp, Inc. | | | 1,966,969 | | | | 69,011,107 | | |
Lakeland
Financial
Corp. | | | 648,329 | | | | 29,622,152 | | |
Prosperity
Bancshares,
Inc. | | | 1,398,643 | | | | 76,254,016 | | |
| | | | 786,368,872 | | |
Biotechnology 2.6% | |
Abcam PLC | | | 2,644,846 | | | | 44,123,016 | | |
Emergent
BioSolutions,
Inc.* | | | 2,020,530 | | | | 230,441,446 | | |
| | | | 274,564,462 | | |
| | | Number
of Shares | | Value | |
Building Products 1.4% | |
AAON, Inc. | | | 2,257,119 | | | $ | 128,497,784 | | |
CSW
Industrials,
Inc. | | | 194,515 | | | | 14,053,709 | | |
| | | | 142,551,493 | | |
Capital Markets 4.0% | |
Artisan
Partners Asset
Management,
Inc. Class A | | | 1,015,157 | | | | 39,296,727 | | |
FactSet
Research
Systems, Inc. | | | 131,900 | | | | 46,217,760 | | |
Hamilton Lane,
Inc. Class A | | | 618,180 | | | | 45,195,140 | | |
Houlihan
Lokey, Inc. | | | 1,076,138 | | | | 63,061,687 | | |
MarketAxess
Holdings, Inc. | | | 464,833 | | | | 225,880,948 | | |
| | | | 419,652,262 | | |
Chemicals 2.0% | |
| Chase Corp.(a) | | | 498,305 | | | | 48,619,619 | | |
NewMarket
Corp. | | | 103,674 | | | | 38,617,528 | | |
Quaker
Chemical
Corp. | | | 659,529 | | | | 125,310,510 | | |
| | | | 212,547,657 | | |
Commercial Services & Supplies 4.2% | |
IAA, Inc.* | | | 1,972,815 | | | | 103,217,681 | | |
MSA Safety,
Inc. | | | 1,028,133 | | | | 129,493,351 | | |
Rollins, Inc. | | | 2,636,901 | | | | 145,398,721 | | |
Tetra Tech, Inc. | | | 704,270 | | | | 65,011,164 | | |
| | | | 443,120,917 | | |
Communications Equipment 1.0% | |
NetScout
Systems,
Inc.*(a) | | | 4,465,671 | | | | 103,335,627 | | |
Construction & Engineering 0.6% | |
Valmont
Industries, Inc. | | | 525,396 | | | | 66,751,562 | | |
Construction Materials 0.7% | |
Eagle
Materials, Inc. | | | 870,814 | | | | 71,206,461 | | |
Containers & Packaging 1.1% | |
AptarGroup,
Inc. | | | 1,010,704 | | | | 119,657,247 | | |
Distributors 3.6% | |
Pool Corp. | | | 1,144,639 | | | | 375,258,450 | | |
| | | Number
of Shares | | Value | |
Diversified Consumer Services 1.2% | |
Bright
Horizons
Family
Solutions, Inc.* | | | 905,345 | | | $ | 120,419,938 | | |
Electronic Equipment, Instruments & Components 5.9% | |
Cognex Corp. | | | 1,812,600 | | | | 125,413,794 | | |
Littelfuse, Inc. | | | 695,297 | | | | 125,737,509 | | |
Novanta, Inc.* | | | 1,327,647 | | | | 142,283,929 | | |
Rogers
Corp.*(a) | | | 1,102,336 | | | | 124,905,692 | | |
Zebra
Technologies
Corp. Class A* | | | 370,162 | | | | 106,062,518 | | |
| | | | 624,403,442 | | |
Energy Equipment & Services 0.3% | |
Cactus, Inc.
Class A | | | 1,235,419 | | | | 27,290,406 | | |
Food & Staples Retailing 0.6% | |
Grocery Outlet
Holding
Corp.* | | | 1,468,108 | | | | 60,383,282 | | |
Food Products 1.4% | |
J & J Snack
Foods Corp. | | | 333,640 | | | | 45,358,358 | | |
Lancaster
Colony Corp. | | | 598,975 | | | | 106,449,837 | | |
| | | | 151,808,195 | | |
Health Care Equipment & Supplies 8.5% | |
| Atrion Corp.(a) | | | 116,949 | | | | 73,879,022 | | |
Haemonetics
Corp.* | | | 1,998,919 | | | | 179,223,078 | | |
Heska Corp.* | | | 337,797 | | | | 34,995,769 | | |
IDEXX
Laboratories,
Inc.* | | | 471,983 | | | | 184,573,672 | | |
Neogen Corp.* | | | 684,699 | | | | 52,174,064 | | |
West
Pharmaceutical
Services, Inc. | | | 1,279,354 | | | | 363,285,362 | | |
| | | | 888,130,967 | | |
Health Care Providers & Services 2.5% | |
Chemed Corp. | | | 422,855 | | | | 218,662,549 | | |
National
Research Corp. | | | 721,849 | | | | 40,423,544 | | |
| | | | 259,086,093 | | |
Health Care Technology 0.5% | |
Simulations
Plus, Inc. | | | 830,310 | | | | 49,469,870 | | |
Hotels, Restaurants & Leisure 0.9% | |
Texas
Roadhouse,
Inc. | | | 1,420,504 | | | | 89,477,547 | | |
See Notes to Financial Statements
104
Schedule of Investments Genesis Fund^ (cont'd)
| | | Number
of Shares | | Value | |
Household Products 2.4% | |
Church &
Dwight Co.,
Inc. | | | 1,444,305 | | | $ | 138,407,748 | | |
WD-40 Co. | | | 577,807 | | | | 118,092,195 | | |
| | | | 256,499,943 | | |
Insurance 1.9% | |
AMERISAFE,
Inc.(a) | | | 1,125,190 | | | | 75,083,929 | | |
RLI Corp. | | | 1,280,891 | | | | 120,134,767 | | |
| | | | 195,218,696 | | |
IT Services 1.6% | |
Computer
Services, Inc. | | | 723,000 | | | | 43,741,500 | | |
Jack Henry &
Associates, Inc. | | | 777,509 | | | | 128,615,539 | | |
| | | | 172,357,039 | | |
Life Sciences Tools & Services 2.9% | |
Bio-Techne
Corp. | | | 874,783 | | | | 223,472,065 | | |
ICON PLC* | | | 460,702 | | | | 85,879,460 | | |
| | | | 309,351,525 | | |
Machinery 5.3% | |
Graco, Inc. | | | 1,576,682 | | | | 91,479,090 | | |
Kadant, Inc. | | | 429,074 | | | | 49,961,377 | | |
Lindsay Corp. | | | 461,195 | | | | 46,087,216 | | |
Nordson Corp. | | | 564,063 | | | | 105,192,109 | | |
Omega Flex, Inc. | | | 7,635 | | | | 1,005,835 | | |
RBC Bearings,
Inc.* | | | 997,207 | | | | 131,671,212 | | |
Toro Co. | | | 1,805,087 | | | | 135,886,949 | | |
| | | | 561,283,788 | | |
Media 3.4% | |
Cable One, Inc. | | | 80,692 | | | | 148,499,908 | | |
Gray Television,
Inc. * | | | 2,115,284 | | | | 32,829,208 | | |
Nexstar Media
Group, Inc.
Class A | | | 1,365,848 | | | | 131,135,067 | | |
TechTarget,
Inc.* | | | 1,051,500 | | | | 41,723,520 | | |
| | | | 354,187,703 | | |
Multiline Retail 0.5% | |
Ollie's Bargain
Outlet
Holdings, Inc.* | | | 596,010 | | | | 56,942,795 | | |
Professional Services 1.8% | |
Exponent, Inc. | | | 2,306,102 | | | | 185,537,436 | | |
Real Estate Management &
Development 1.3% | |
FirstService
Corp. | | | 1,087,779 | | | | 136,113,786 | | |
| | | Number
of Shares | | Value | |
Semiconductors & Semiconductor Equipment 5.2% | |
Cabot
Microelectronics
Corp. | | | 1,013,637 | | | $ | 154,366,779 | | |
Lattice
Semiconductor
Corp.* | | | 3,361,115 | | | | 96,127,889 | | |
MKS
Instruments,
Inc. | | | 930,071 | | | | 111,171,386 | | |
Power
Integrations,
Inc.(a) | | | 3,215,964 | | | | 179,997,505 | | |
| | | | 541,663,559 | | |
Software 12.4% | |
Altair
Engineering,
Inc. Class A* | | | 1,365,727 | | | | 57,387,849 | | |
Aspen
Technology,
Inc.* | | | 1,898,251 | | | | 241,134,825 | | |
Fair Isaac
Corp.* | | | 602,843 | | | | 253,670,306 | | |
Manhattan
Associates,
Inc.* | | | 2,437,024 | | | | 237,000,584 | | |
Model N, Inc.* | | | 1,642,236 | | | | 64,572,719 | | |
Qualys, Inc.* | | | 1,597,384 | | | | 169,546,338 | | |
SPS Commerce,
Inc.* | | | 867,880 | | | | 69,326,254 | | |
Tyler
Technologies,
Inc.* | | | 609,280 | | | | 210,390,477 | | |
| | | | 1,303,029,352 | | |
Specialty Retail 3.6% | |
Asbury
Automotive
Group, Inc.* | | | 891,723 | | | | 94,335,376 | | |
Floor & Decor
Holdings, Inc.
Class A* | | | 1,300,241 | | | | 95,229,651 | | |
Lithia Motors,
Inc. Class A | | | 426,617 | | | | 106,210,568 | | |
Monro, Inc. | | | 276,954 | | | | 12,764,810 | | |
Tractor
Supply Co. | | | 489,799 | | | | 72,896,785 | | |
| | | | 381,437,190 | | |
Trading Companies & Distributors 2.1% | |
Applied
Industrial
Technologies,
Inc. | | | 324,427 | | | | 19,533,750 | | |
Richelieu
Hardware
Ltd.(b) | | | 1,428,292 | | | | 38,117,717 | | |
| | | Number
of Shares | | Value | |
SiteOne
Landscape
Supply, Inc.* | | | 546,365 | | | $ | 68,322,943 | | |
Watsco, Inc. | | | 403,912 | | | | 98,954,401 | | |
| | | | 224,928,811 | | |
Total Common Stocks
(Cost $4,922,327,866) | | | 10,393,976,413 | | |
Short-Term Investments 0.8% | |
Investment Companies 0.8% | |
State Street
Institutional
Treasury Money
Market Fund
Premier Class,
0.03%(c) | | | 5,622,615 | | | | 5,622,615 | | |
State Street
Institutional
Treasury Plus
Money Market
Fund Premier
Class, 0.03%(c) | | | 82,475,578 | | | | 82,475,578 | | |
Total Short-Term Investments
(Cost $88,098,193) | | | 88,098,193 | | |
Total Investments 99.8%
(Cost $5,010,426,059) | | | 10,482,074,606 | | |
Other Assets Less
Liabilities 0.2% | | | | | 19,897,811 | | |
Net Assets 100.0% | | $ | 10,501,972,417 | | |
See Notes to Financial Statements
105
Schedule of Investments Genesis Fund^ (cont'd)
* Non-income producing security.
(a) Affiliated company (see Note F of Notes to Financial Statements).
(b) Security fair valued as of August 31, 2020 in accordance with procedures approved by the Board of Trustees. Total value of all such securities at August 31, 2020 amounted to $38,117,717, which represents 0.4% of net assets of the Fund.
(c) Represents 7-day effective yield as of August 31, 2020.
The following is a summary, categorized by Level (see Note A of Notes to Financial Statements), of inputs used to value the Fund's investments as of August 31, 2020:
Asset Valuation Inputs | | Level 1 | | Level 2 | | Level 3 | | Total | |
Investments: | |
Common Stocks | |
Biotechnology | | $ | 230,441,446 | | | $ | 44,123,016 | | | $ | — | | | $ | 274,564,462 | | |
Trading Companies & Distributors | | | 186,811,094 | | | | 38,117,717 | | | | — | | | | 224,928,811 | | |
| Other Common Stocks(a) | | | 9,894,483,140 | | | | — | | | | — | | | | 9,894,483,140 | | |
Total Common Stocks | | | 10,311,735,680 | | | | 82,240,733 | | | | — | | | | 10,393,976,413 | | |
Short-Term Investments | | | — | | | | 88,098,193 | | | | — | | | | 88,098,193 | | |
Total Investments | | $ | 10,311,735,680 | | | $ | 170,338,926 | | | $ | — | | | $ | 10,482,074,606 | | |
(a) The Schedule of Investments provides information on the industry categorization for the portfolio.
^ A balance indicated with a "—", reflects either a zero balance or an amount that rounds to less than 1.
See Notes to Financial Statements
106
Schedule of Investments Global Real Estate Fund^ August 31, 2020
| | | Number
of Shares | | Value | |
Common Stocks 101.4% | |
Australia 5.2% | |
Charter Hall Long
Wale REIT | | | 6,500 | | | $ | 23,668 | | |
Goodman Group | | | 3,367 | | | | 45,326 | | |
Mirvac Group | | | 16,024 | | | | 24,875 | | |
| | | | 93,869 | | |
Belgium 2.7% | |
Shurgard Self
Storage SA | | | 1,097 | | | | 48,241 | | |
Canada 3.7% | |
Allied Properties
Real Estate
Investment Trust | | | 456 | | | | 12,865 | | |
Brookfield Asset
Management, Inc.
Class A | | | 528 | | | | 17,819 | | |
Canadian
Apartment
Properties REIT | | | 472 | | | | 16,284 | | |
Summit Industrial
Income REIT | | | 2,140 | | | | 19,475 | | |
| | | | 66,443 | | |
France 1.3% | |
ARGAN SA | | | 218 | | | | 23,153 | | |
Germany 1.2% | |
LEG Immobilien AG | | | 145 | | | | 21,329 | | |
Hong Kong 4.8% | |
Sun Hung Kai
Properties Ltd. | | | 2,904 | | | | 38,962 | | |
SUNeVision
Holdings Ltd. | | | 36,000 | | | | 26,727 | | |
Swire Properties Ltd. | | | 7,850 | | | | 21,248 | | |
| | | | 86,937 | | |
Japan 12.3% | |
Japan Real Estate
Investment Corp. | | | 3 | | | | 16,800 | | |
Keihanshin Building
Co. Ltd. | | | 750 | | | | 10,660 | | |
LaSalle Logiport REIT | | | 14 | | | | 23,489 | | |
Mitsubishi Estate
Co. Ltd. | | | 1,880 | | | | 29,421 | | |
Mitsui Fudosan
Co. Ltd. | | | 2,061 | | | | 37,284 | | |
Mitsui Fudosan
Logistics Park, Inc. | | | 9 | | | | 44,990 | | |
Nippon
Accommodations
Fund, Inc. | | | 4 | | | | 24,641 | | |
Nomura Real
Estate Holdings,
Inc. | | | 1,800 | | | | 34,340 | | |
| | | | 221,625 | | |
| | | Number
of Shares | | Value | |
Singapore 3.1% | |
CapitaLand Ltd. | | | 11,507 | | | $ | 23,396 | | |
Keppel DC REIT | | | 9,000 | | | | 19,232 | | |
Mapletree Industrial
Trust | | | 6,300 | | | | 14,100 | | |
| | | 56,728 | | |
Spain 0.8% | |
Merlin Properties
Socimi SA | | | 1,659 | | | | 14,888 | | |
Sweden 1.0% | |
Hufvudstaden AB,
A Shares | | | 1,432 | | | | 17,747 | | |
United Kingdom 9.8% | |
Safestore
Holdings PLC | | | 3,855 | | | | 40,355 | | |
Segro PLC | | | 6,725 | | | | 85,503 | | |
UNITE Group PLC | | | 3,987 | | | | 51,375 | | |
| | | | 177,233 | | |
United States 55.5% | |
American Homes 4
Rent Class A | | | 1,064 | | | | 30,473 | | |
American Tower
Corp. | | | 404 | | | | 100,657 | | |
Apartment
Investment &
Management Co.
Class A | | | 488 | | | | 17,583 | | |
Boston Properties,
Inc. | | | 116 | | | | 10,077 | | |
Camden Property
Trust | | | 201 | | | | 18,279 | | |
Crown Castle
International Corp. | | | 446 | | | | 72,809 | | |
CyrusOne, Inc. | | | 377 | | | | 31,491 | | |
Digital Realty
Trust, Inc. | | | 382 | | | | 59,458 | | |
Douglas Emmett,
Inc. | | | 603 | | | | 16,836 | | |
Duke Realty Corp. | | | 804 | | | | 30,994 | | |
Equinix, Inc. | | | 108 | | | | 85,296 | | |
Equity LifeStyle
Properties, Inc. | | | 854 | | | | 56,612 | | |
Equity Residential | | | 617 | | | | 34,830 | | |
Essex Property Trust,
Inc. | | | 120 | | | | 25,981 | | |
Extra Space
Storage, Inc. | | | 193 | | | | 20,564 | | |
Healthcare Trust
of America, Inc.
Class A | | | 644 | | | | 16,995 | | |
Healthpeak
Properties, Inc. | | | 893 | | | | 24,682 | | |
Highwoods
Properties, Inc. | | | 290 | | | | 10,805 | | |
| | | Number
of Shares | | Value | |
Invitation Homes,
Inc. | | | 692 | | | $ | 19,812 | | |
National Retail
Properties, Inc. | | | 393 | | | | 13,928 | | |
Omega Healthcare
Investors, Inc. | | | 242 | | | | 7,495 | | |
Prologis, Inc. | | | 722 | | | | 73,543 | | |
Public Storage | | | 223 | | | | 47,365 | | |
Regency Centers
Corp. | | | 708 | | | | 28,115 | | |
SBA
Communications
Corp. | | | 170 | | | | 52,032 | | |
Simon Property
Group, Inc. | | | 162 | | | | 10,992 | | |
Spirit Realty
Capital, Inc. | | | 371 | | | | 13,174 | | |
Welltower, Inc. | | | 570 | | | | 32,786 | | |
Weyerhaeuser Co. | | | 1,310 | | | | 39,706 | | |
| | | | 1,003,370 | | |
Total Common Stocks
(Cost $1,741,612) | | | 1,831,563 | | |
| | Number
of Units | | | |
Common Stock Units 0.5% | |
Singapore 0.5% | |
Ascendas
India Trust
(Cost $9,583) | | | 9,800 | | | | 9,638 | | |
| | | Number
of Shares | | | |
Short-Term Investments 2.4% | |
Investment Companies 2.4% | |
State Street
Institutional U.S.
Government
Money Market
Fund Premier
Class, 0.04%(a)
(Cost $43,655) | | | 43,655 | | | | 43,655 | | |
Total Investments 104.3%
(Cost $1,794,850) | | | 1,884,856 | | |
Liabilities Less
Other Assets (4.3)% | | | | | (77,611 | ) | |
Net Assets 100.0% | | $ | 1,807,245 | | |
(a) Represents 7-day effective yield as of August 31, 2020.
See Notes to Financial Statements
107
Schedule of Investments Global Real Estate Fund^ (cont'd)
POSITIONS BY SECTOR
Sector | | Investments at
Value | | Percentage of
Net Assets | |
Specialty REITs | | $ | 722,653 | | | | 40.0 | % | |
Industrial & Office REITs | | | 404,467 | | | | 22.4 | % | |
Residential REITs | | | 320,745 | | | | 17.7 | % | |
Real Estate Holding & Development | | | 288,571 | | | | 16.0 | % | |
Retail REITs | | | 66,209 | | | | 3.7 | % | |
Diversified REITs | | | 38,556 | | | | 2.1 | % | |
Short-Term Investments and Other Liabilities—Net | | | (33,956 | ) | | | (1.9 | )% | |
| | | $ | 1,807,245 | | | | 100.0 | % | |
The following is a summary, categorized by Level (see Note A of Notes to Financial Statements), of inputs used to value the Fund's investments as of August 31, 2020:
Asset Valuation Inputs | | Level 1 | | Level 2 | | Level 3 | | Total | |
Investments: | |
Common Stocks | |
Australia | | $ | — | | | $ | 93,869 | | | $ | — | | | $ | 93,869 | | |
Hong Kong | | | — | | | | 86,937 | | | | — | | | | 86,937 | | |
Japan | | | — | | | | 221,625 | | | | — | | | | 221,625 | | |
Singapore | | | — | | | | 56,728 | | | | — | | | | 56,728 | | |
United Kingdom | | | — | | | | 177,233 | | | | — | | | | 177,233 | | |
| Other Common Stocks(a) | | | 1,195,171 | | | | — | | | | — | | | | 1,195,171 | | |
Total Common Stocks | | | 1,195,171 | | | | 636,392 | | | | — | | | | 1,831,563 | | |
Common Stock Units | |
Singapore | | | — | | | | 9,638 | | | | — | | | | 9,638 | | |
Short-Term Investments | | | — | | | | 43,655 | | | | — | | | | 43,655 | | |
Total Investments | | $ | 1,195,171 | | | $ | 689,685 | | | $ | — | | | $ | 1,884,856 | | |
(a) The Schedule of Investments provides a geographic categorization as well as a Positions by Sector summary.
^ A balance indicated with a "—", reflects either a zero balance or an amount that rounds to less than 1.
See Notes to Financial Statements
108
Schedule of Investments Greater China Equity Fund^ August 31, 2020
| | | Number
of Shares | | Value | |
Common Stocks 95.6% | |
Auto Components 2.1% | |
Minth Group
Ltd. | | | 350,000 | | | $ | 1,179,939 | | |
Automobiles 1.3% | |
Brilliance China
Automotive
Holdings Ltd. | | | 800,000 | | | | 720,673 | | |
Banks 3.0% | |
China Merchants
Bank Co. Ltd.,
H Shares | | | 360,000 | | | | 1,717,543 | | |
Beverages 5.5% | |
China
Resources
Beer Holdings
Co. Ltd. | | | 242,000 | | | | 1,573,030 | | |
Kweichow
Moutai Co. Ltd.
Class A | | | 6,000 | | | | 1,562,684 | | |
| | | | 3,135,714 | | |
Biotechnology 1.9% | |
| Akeso, Inc.*(a) | | | 200,000 | | | | 760,634 | | |
CanSino
Biologics, Inc.,
H Shares*(a) | | | 15,000 | | | | 316,908 | | |
| | | | 1,077,542 | | |
Commercial Services & Supplies 2.5% | |
China
Everbright
International
Ltd. | | | 2,348,370 | | | | 1,416,241 | | |
Construction Materials 6.0% | |
China
National
Building
Material Co.
Ltd., H Shares | | | 2,420,000 | | | | 3,396,670 | | |
Containers & Packaging 2.2% | |
Yunnan
Energy New
Material Co.
Ltd. Class A | | | 110,000 | | | | 1,255,174 | | |
Diversified Consumer Services 1.4% | |
New Oriental
Education &
Technology Group,
Inc. ADR* | | | 5,400 | | | | 791,802 | | |
| | | Number
of Shares | | Value | |
Electronic Equipment, Instruments & Components 1.1% | |
Sunny Optical
Technology
Group Co. Ltd. | | | 39,000 | | | $ | 577,009 | | |
Zhejiang
Dahua
Technology Co.
Ltd. Class A | | | 6,200 | | | | 20,660 | | |
| | | | 597,669 | | |
Food Products 8.8% | |
Inner Mongolia
Yili Industrial
Group Co. Ltd.
Class A | | | 443,000 | | | | 2,709,782 | | |
Tingyi Cayman
Islands
Holding Corp. | | | 590,000 | | | | 1,107,232 | | |
Wens
Foodstuffs
Group Co. Ltd.
Class A | | | 323,000 | | | | 1,161,847 | | |
| | | | 4,978,861 | | |
Household Durables 7.0% | |
Gree Electric
Appliances,
Inc. of Zhuhai
Class A | | | 322,081 | | | | 2,558,904 | | |
Haier Smart
Home Co.
Ltd. Class A | | | 440,000 | | | | 1,430,208 | | |
| | | | 3,989,112 | | |
Insurance 8.9% | |
China Pacific
Insurance
Group Co. Ltd.,
H Shares | | | 626,000 | | | | 1,736,571 | | |
China Taiping
Insurance
Holdings
Co. Ltd. | | | 780,000 | | | | 1,237,120 | | |
Ping An
Insurance
Group Co. of
China Ltd.,
H Shares | | | 195,000 | | | | 2,081,898 | | |
| | | | 5,055,589 | | |
Interactive Media & Services 9.3% | |
Tencent
Holdings Ltd. | | | 77,400 | | | | 5,287,841 | | |
Internet & Direct Marketing Retail 9.8% | |
Alibaba Group
Holding Ltd.* | | | 155,000 | | | | 5,579,200 | | |
| | | Number
of Shares | | Value | |
Machinery 5.1% | |
Weichai Power
Co. Ltd.,
H Shares | | | 1,450,000 | | | $ | 2,910,587 | | |
Oil, Gas & Consumable Fuels 1.6% | |
China
Petroleum &
Chemical
Corp., H Shares | | | 2,000,000 | | | | 918,284 | | |
Pharmaceuticals 3.8% | |
CSPC
Pharmaceutical
Group Ltd. | | | 968,000 | | | | 2,138,716 | | |
Real Estate Management & Development 7.6% | |
China
Overseas
Property
Holdings Ltd. | | | 475,000 | | | | 427,799 | | |
China Resources
Land Ltd. | | | 604,000 | | | | 2,790,244 | | |
CIFI Holdings
Group Co. Ltd. | | | 1,249,411 | | | | 1,061,995 | | |
| | | | 4,280,038 | | |
Specialty Retail 3.1% | |
China Yongda
Automobiles
Services
Holdings Ltd. | | | 1,209,000 | | | | 1,445,567 | | |
Li Ning Co. Ltd. | | | 79,500 | | | | 335,801 | | |
| | | | 1,781,368 | | |
Textiles, Apparel & Luxury Goods 3.6% | |
Shenzhou
International
Group Holdings
Ltd. | | | 128,000 | | | | 2,060,883 | | |
Total Common Stocks
(Cost $48,876,619) | | | | | 54,269,446 | | |
Short-Term Investments 1.0% | |
Investment Companies 1.0% | |
State Street
Institutional U.S.
Government
Money Market
Fund Premier
Class, 0.04%(b)
(Cost $550,534) | | | 550,534 | | | | 550,534 | | |
Total Investments 96.6%
(Cost $49,427,153) | | | | | 54,819,980 | | |
Other Assets Less
Liabilities 3.4% | | | | | 1,920,905 | | |
Net Assets 100.0% | | | | $ | 56,740,885 | | |
See Notes to Financial Statements
109
Schedule of Investments Greater China Equity Fund^ (cont'd)
* Non-income producing security.
(a) Security exempt from registration pursuant to Regulation S under the Securities Act of 1933, as amended. Regulation S applies to securities offerings that are made outside of the United States and do not involve directed selling efforts in the United States and as such may have restrictions on resale. Total value of all such securities at August 31, 2020 amounted to $1,077,542, which represents 1.9% of net assets of the Fund.
(b) Represents 7-day effective yield as of August 31, 2020.
The following is a summary, categorized by Level (see Note A of Notes to Financial Statements), of inputs used to value the Fund's investments as of August 31, 2020:
Asset Valuation Inputs | | Level 1 | | Level 2 | | Level 3 | | Total | |
Investments: | |
Common Stocks | |
Auto Components | | $ | — | | | $ | 1,179,939 | | | $ | — | | | $ | 1,179,939 | | |
Automobiles | | | — | | | | 720,673 | | | | — | | | | 720,673 | | |
Banks | | | — | | | | 1,717,543 | | | | — | | | | 1,717,543 | | |
Beverages | | | — | | | | 3,135,714 | | | | — | | | | 3,135,714 | | |
Biotechnology | | | — | | | | 1,077,542 | | | | — | | | | 1,077,542 | | |
Commercial Services & Supplies | | | — | | | | 1,416,241 | | | | — | | | | 1,416,241 | | |
Construction Materials | | | — | | | | 3,396,670 | | | | — | | | | 3,396,670 | | |
Containers & Packaging | | | — | | | | 1,255,174 | | | | — | | | | 1,255,174 | | |
Electronic Equipment, Instruments & Components | | | — | | | | 597,669 | | | | — | | | | 597,669 | | |
Food Products | | | — | | | | 4,978,861 | | | | — | | | | 4,978,861 | | |
Household Durables | | | — | | | | 3,989,112 | | | | — | | | | 3,989,112 | | |
Insurance | | | — | | | | 5,055,589 | | | | — | | | | 5,055,589 | | |
Interactive Media & Services | | | — | | | | 5,287,841 | | | | — | | | | 5,287,841 | | |
Internet & Direct Marketing Retail | | | — | | | | 5,579,200 | | | | — | | | | 5,579,200 | | |
Machinery | | | — | | | | 2,910,587 | | | | — | | | | 2,910,587 | | |
Oil, Gas & Consumable Fuels | | | — | | | | 918,284 | | | | — | | | | 918,284 | | |
Pharmaceuticals | | | — | | | | 2,138,716 | | | | — | | | | 2,138,716 | | |
Real Estate Management & Development | | | — | | | | 4,280,038 | | | | — | | | | 4,280,038 | | |
Specialty Retail | | | — | | | | 1,781,368 | | | | — | | | | 1,781,368 | | |
Textiles, Apparel & Luxury Goods | | | — | | | | 2,060,883 | | | | — | | | | 2,060,883 | | |
| Other Common Stocks(a) | | | 791,802 | | | | — | | | | — | | | | 791,802 | | |
Total Common Stocks | | | 791,802 | | | | 53,477,644 | | | | — | | | | 54,269,446 | | |
Short-Term Investments | | | — | | | | 550,534 | | | | — | | | | 550,534 | | |
Total Investments | | $ | 791,802 | | | $ | 54,028,178 | | | $ | — | | | $ | 54,819,980 | | |
(a) The Schedule of Investments provides information on the industry categorization for the portfolio.
^ A balance indicated with a "—", reflects either a zero balance or an amount that rounds to less than 1.
See Notes to Financial Statements
110
Schedule of Investments Guardian Fund^ August 31, 2020
| | | Number
of Shares | | Value | |
Common Stocks 93.7% | |
Aerospace & Defense 1.2% | |
L3Harris
Technologies,
Inc. | | | 109,910 | | | $ | 19,865,133 | | |
Biotechnology 1.0% | |
Gilead Sciences,
Inc. | | | 241,485 | | | | 16,119,124 | | |
Capital Markets 7.1% | |
BlackRock, Inc. | | | 44,815 | | | | 26,628,625 | | |
Blackstone
Group, Inc.
Class A | | | 382,795 | | | | 20,268,995 | | |
Brookfield Asset
Management,
Inc. Class A | | | 519,660 | | | | 17,533,328 | | |
CME Group, Inc. | | | 104,000 | | | | 18,290,480 | | |
S&P Global, Inc. | | | 37,800 | | | | 13,850,676 | | |
Tradeweb
Markets, Inc.
Class A | | | 332,380 | | | | 19,042,050 | | |
| | | 115,614,154 | | |
Chemicals 3.0% | |
Air Products &
Chemicals, Inc. | | | 58,675 | | | | 17,148,355 | | |
Ashland Global
Holdings, Inc. | | | 424,275 | | | | 31,264,825 | | |
| | | | 48,413,180 | | |
Commercial Services 1.3% | |
LegalZoom.com,
Inc.*(a)(b)(k) | | | 2,176,736 | | | | 21,437,584 | | |
Commercial Services & Supplies 0.9% | |
Waste
Management,
Inc. | | | 133,070 | | | | 15,169,980 | | |
Communications Equipment 0.9% | |
Motorola
Solutions, Inc. | | | 94,430 | | | | 14,613,042 | | |
Electric Utilities 2.0% | |
NextEra
Energy, Inc. | | | 117,000 | | | | 32,662,890 | | |
Electronic Equipment, Instruments & Components 1.7% | |
CDW Corp. | | | 235,000 | | | | 26,707,750 | | |
Entertainment 3.2% | |
Activision
Blizzard, Inc. | | | 350,000 | | | | 29,232,000 | | |
Spotify
Technology SA* | | | 81,000 | | | | 22,854,960 | | |
| | | | 52,086,960 | | |
| | | Number
of Shares | | Value | |
Food & Staples Retailing 2.9% | |
Costco
Wholesale
Corp.(c) | | | 74,620 | | | $ | 25,942,389 | | |
Walmart, Inc. | | | 149,000 | | | | 20,688,650 | | |
| | | | 46,631,039 | | |
Food Products 0.6% | |
Mondelez
International,
Inc. Class A | | | 130,000 | | | | 7,594,600 | | |
Whole Earth
Brands, Inc.* | | | 288,800 | | | | 2,313,288 | | |
| | | | 9,907,888 | | |
Health Care Equipment & Supplies 5.3% | |
Baxter
International,
Inc.(c) | | | 238,620 | | | | 20,776,643 | | |
Becton,
Dickinson & Co. | | | 95,470 | | | | 23,177,252 | | |
Intuitive
Surgical, Inc.* | | | 19,530 | | | | 14,273,305 | | |
Medtronic PLC | | | 256,320 | | | | 27,546,711 | | |
| | | | 85,773,911 | | |
Health Care Providers & Services 2.6% | |
Humana, Inc. | | | 46,180 | | | | 19,172,551 | | |
UnitedHealth
Group, Inc. | | | 73,000 | | | | 22,816,150 | | |
| | | | 41,988,701 | | |
Hotels, Restaurants & Leisure 2.9% | |
Dunkin' Brands
Group, Inc. | | | 108,870 | | | | 8,282,830 | | |
McDonald's
Corp. | | | 178,000 | | | | 38,006,560 | | |
| | | | 46,289,390 | | |
Industrial Conglomerates 0.5% | |
Honeywell
International,
Inc. | | | 46,700 | | | | 7,731,185 | | |
Interactive Media & Services 6.8% | |
Alphabet, Inc.
Class A*(c) | | | 40,985 | | | | 66,786,287 | | |
Facebook, Inc.
Class A*(c) | | | 147,000 | | | | 43,100,400 | | |
| | | | 109,886,687 | | |
Internet & Direct Marketing Retail 7.6% | |
Alibaba Group
Holding Ltd.
ADR* | | | 47,620 | | | | 13,668,369 | | |
Amazon.com,
Inc.* | | | 19,500 | | | | 67,293,720 | | |
Chewy, Inc.
Class A*(d) | | | 398,000 | | | | 24,305,860 | | |
Expedia Group,
Inc. | | | 185,840 | | | | 18,240,196 | | |
| | | | 123,508,145 | | |
| | | Number
of Shares | | Value | |
IT Services 4.7% | |
Druva, Inc.
Ser.4
Preference
Shares*(a)(b)(k) | | | 287,787 | | | $ | 1,500,004 | | |
PayPal
Holdings, Inc.* | | | 47,150 | | | | 9,625,201 | | |
Repay Holdings
Corp.* | | | 377,670 | | | | 9,555,051 | | |
Visa, Inc.
Class A(c) | | | 146,670 | | | | 31,092,573 | | |
WEX, Inc.* | | | 156,890 | | | | 25,056,902 | | |
| | | | 76,829,731 | | |
Leisure Products 0.2% | |
Peloton
Interactive,
Inc. Class A* | | | 50,000 | | | | 3,833,500 | | |
Life Sciences Tools & Services 1.3% | |
Thermo Fisher
Scientific, Inc. | | | 49,370 | | | | 21,178,743 | | |
Multi-Utilities 1.2% | |
WEC Energy
Group, Inc. | | | 200,000 | | | | 18,816,000 | | |
Oil, Gas & Consumable Fuels 0.1% | |
Venture Global
LNG, Inc.
Ser. C*(a)(b)(k) | | | 329 | | | | 1,612,100 | | |
Pharmaceuticals 1.4% | |
Johnson &
Johnson | | | 146,325 | | | | 22,447,718 | | |
Professional Services 4.3% | |
Equifax, Inc. | | | 192,165 | | | | 32,335,605 | | |
IHS Markit Ltd. | | | 475,400 | | | | 37,993,968 | | |
| | | | 70,329,573 | | |
Road & Rail 1.0% | |
Union Pacific
Corp. | | | 79,880 | | | | 15,372,107 | | |
Software 18.8% | |
Adobe, Inc.* | | | 58,000 | | | | 29,776,620 | | |
Anaplan, Inc.* | | | 500,630 | | | | 30,663,587 | | |
Atlassian Corp.
PLC Class A* | | | 71,935 | | | | 13,794,256 | | |
AvidXchange,
Inc.*(a)(b)(k) | | | 48,968 | | | | 3,000,024 | | |
Duck Creek
Technologies,
Inc.(a)(k) | | | 1,243,177 | | | | 44,878,672 | | |
Intuit, Inc. | | | 22,510 | | | | 7,774,729 | | |
Microsoft
Corp.(c) | | | 365,000 | | | | 82,318,450 | | |
salesforce.com,
Inc.* | | | 145,000 | | | | 39,534,250 | | |
ServiceNow,
Inc.* | | | 62,000 | | | | 29,885,240 | | |
See Notes to Financial Statements
111
Schedule of Investments Guardian Fund^ (cont'd)
| | | Number
of Shares | | Value | |
Workday, Inc.
Class A* | | | 93,000 | | | $ | 22,293,030 | | |
| | | | 303,918,858 | | |
Specialty Retail 2.1% | |
Home Depot, Inc. | | | 118,000 | | | | 33,634,720 | | |
Technology Hardware, Storage & Peripherals 4.2% | |
Apple, Inc. | | | 533,000 | | | | 68,778,320 | | |
Textiles, Apparel & Luxury Goods 1.7% | |
NIKE, Inc. Class B | | | 252,000 | | | | 28,196,280 | | |
Trading Companies & Distributors 1.2% | |
HD Supply
Holdings, Inc.* | | | 297,130 | | | | 11,784,176 | | |
Univar
Solutions, Inc.* | | | 396,350 | | | | 7,209,606 | | |
| | | | 18,993,782 | | |
Total Common Stocks
(Cost $915,265,811) | | | 1,518,348,175 | | |
| | Number
of Units | |
| |
Limited Partnerships Units 2.2% | |
Capital Markets 2.2% | |
CC DNB
Holdings,
L.P.*(a)(k)
(Cost
$31,000,018) | | | 1,430,550 | | | | 35,034,170 | | |
| | | Number
of Shares | | Value | |
Preferred Stocks 2.6% | |
Food Products 0.4% | |
Sweetgreen, Inc.
Ser. D*(a)(b)(k) | | | 626,667 | | | $ | 6,266,670 | | |
Sweetgreen,
Inc. Ser. I*(a)(b)(k) | | | 59,031 | | | | 1,009,430 | | |
| | | | 7,276,100 | | |
Software 0.7% | |
AvidXchange,
Inc. Ser. F*(a)(b)(k) | | | 195,872 | | | | 12,000,098 | | |
Specialty Retail 1.5% | |
Fanatics, Inc.
Ser. E*(a)(b)(k) | | | 1,359,167 | | | | 23,499,998 | | |
Total Preferred Stocks
(Cost $41,629,510) | | | 42,776,196 | | |
| Warrants 0.0%(e) | |
| Food Products 0.0%(e) | |
Whole Earth
Brands, Inc.*
(Cost $207,647) | | | 144,400 | | | | 119,852 | | |
Total Options
Purchased(f) 0.2%
(Cost $707,983) | | | 3,519,375 | | |
| | | Number
of Shares | | Value | |
Short-Term Investments 2.9% | |
Investment Companies 2.9% | |
State Street
Institutional
Treasury Money
Market Fund
Premier Class,
0.03%(g)(h) | | | 22,451,488 | | | $ | 22,451,488 | | |
State Street
Navigator
Securities
Lending
Government
Money Market
Portfolio,
0.10%(g)(i) | | | 24,275,560 | | | | 24,275,560 | | |
Total Short-Term Investments
(Cost $46,727,048) | | | 46,727,048 | | |
Total Investments 101.6%
(Cost $1,035,538,017) | | | 1,646,524,816 | | |
Liabilities Less
Other Assets(j) (1.6)% | | | | | (25,860,276 | ) | |
Net Assets 100.0% | | $ | 1,620,664,540 | | |
* Non-income producing security.
(a) Security fair valued as of August 31, 2020 in accordance with procedures approved by the Board of Trustees. Total value of all such securities at August 31, 2020 amounted to $150,238,750, which represents 9.3% of net assets of the Fund.
(b) Value determined using significant unobservable inputs.
(c) All or a portion of the security is pledged as collateral for options written.
(d) The security or a portion of this security is on loan at August 31, 2020. Total value of all such securities at August 31, 2020 amounted to $24,303,417 for the Fund (see Note A of the Notes to Financial Statements).
(e) Represents less than 0.05% of net assets of the Fund.
(f) See "Purchased option contracts" under Derivative Instruments.
(g) Represents 7-day effective yield as of August 31, 2020.
(h) All or a portion of this security is segregated in connection with obligations for options written with a total value of $22,451,488.
(i) Represents investment of cash collateral received from securities lending.
(j) Includes the impact of the Fund's open positions in derivatives at August 31, 2020.
See Notes to Financial Statements
112
Schedule of Investments Guardian Fund^ (cont'd)
(k) These securities have been deemed by the investment manager to be illiquid, and are subject to restrictions on resale. At August 31, 2020, these securities amounted to $150,238,750, which represents 9.2% of net assets of the Fund.
| Restricted Security | | Acquisition
Date | | Acquisition
Cost | | Acquisition
Cost
Percentage
of Net Assets
as of
Acquisition
Date | | Value as of
8/31/2020 | | Fair Value
Percentage
of Net Assets
as of
8/31/2020 | |
AvidXchange, Inc. | | 4/7/2020 | | $ | 2,400,020 | | | | 0.2 | % | | $ | 3,000,024 | | | | 0.2 | % | |
AvidXchange, Inc. (Ser. F Preferred Shares) | | 4/7/2020 | | | 9,600,079 | | | | 0.8 | % | | | 12,000,098 | | | | 0.7 | % | |
CC DNB Holdings, L.P. | | 7/6/2020 | | | 31,000,019 | | | | 2.1 | % | | | 35,034,170 | | | | 2.2 | % | |
Druva, Inc. | | 6/14/2019 | | | 1,500,003 | | | | 0.1 | % | | | 1,500,004 | | | | 0.1 | % | |
Duck Creek Technologies, Inc. | | 8/18/2020 | | | 15,450,014 | | | | 1.0 | % | | | 44,878,672 | | | | 2.7 | % | |
Fanatics (Ser. E Preferred Shares) | | 8/13/2020 | | | 23,499,998 | | | | 1.6 | % | | | 23,499,998 | | | | 1.5 | % | |
LegalZoom.com, Inc. | | 8/22/2018 | | | 21,437,584 | | | | 1.7 | % | | | 21,437,584 | | | | 1.3 | % | |
Sweetgreen, Inc. (Ser. D Preferred Shares) | | 11/30/2018 | | | 7,520,004 | | | | 0.6 | % | | | 6,266,670 | | | | 0.3 | % | |
Sweetgreen, Inc. (Ser. I Preferred Shares) | | 9/13/2019 | | | 1,009,430 | | | | 0.1 | % | | | 1,009,430 | | | | 0.1 | % | |
Venture Global LNG, Inc. Ser. C | | 11/21/2018 | | | 2,303,000 | | | | 0.2 | % | | | 1,612,100 | | | | 0.1 | % | |
Total | | | | $ | 115,720,151 | | | | 8.4 | % | | $ | 150,238,750 | | | | 9.2 | % | |
Derivative Instruments
Purchased option contracts ("options purchased")
At August 31, 2020, the Fund had outstanding options purchased as follows:
Description | | Number of
Contracts | | Notional
Amount | | Exercise
Price | | Expiration
Date | | Value | |
Calls | |
Hotels, Restaurants & Leisure | |
Dunkin' Brands Group, Inc. | | | 1,000 | | | $ | 7,608,000 | | | $ | 75 | | | 9/18/2020 | | $ | 277,500 | | |
Leisure Products | |
Peloton Interactive, Inc. | | | 750 | | | | 5,750,250 | | | | 35 | | | 10/16/2020 | | | 3,241,875 | | |
Total options purchased (cost $707,983) | | | | | | | | | | $ | 3,519,375 | | |
Written option contracts ("options written")
At August 31, 2020, the Fund had outstanding options written as follows:
Description | | Number of
Contracts | | Notional
Amount | | Exercise
Price | | Expiration
Date | | Value | |
Calls | |
Industrial Conglomerates | |
Honeywell International, Inc. | | | 245 | | | $ | (4,055,975 | ) | | $ | 155 | | | 9/18/2020 | | $ | (276,238 | ) | |
Interactive Media & Services | |
Facebook, Inc. | | | 58 | | | | (1,700,560 | ) | | | 220 | | | 9/18/2020 | | | (427,895 | ) | |
See Notes to Financial Statements
113
Schedule of Investments Guardian Fund^ (cont'd)
Description | | Number of
Contracts | | Notional
Amount | | Exercise
Price | | Expiration
Date | | Value | |
IT Services | |
Visa, Inc. | | | 182 | | | $ | (3,858,218 | ) | | $ | 200 | | | 12/18/2020 | | $ | (373,100 | ) | |
Trading Companies & Distributors | |
Univar Solutions, Inc. | | | 1,750 | | | | (3,183,250 | ) | | | 17.5 | | | 9/18/2020 | | | (236,250 | ) | |
Total calls | | | | | | | | | | $ | (1,313,483 | ) | |
Puts | |
Chemicals | |
Air Products & Chemicals, Inc. | | | 249 | | | $ | (7,277,274 | ) | | $ | 170 | | | 9/18/2020 | | $ | — | (a)(b) | |
Entertainment | |
Activision Blizzard, Inc. | | | 525 | | | | (4,384,800 | ) | | | 50 | | | 11/20/2020 | | | (35,700 | ) | |
Total puts | | | | | | | | | | $ | (35,700 | ) | |
Total options written (premium received $943,332) | | | | | | | | | | $ | (1,349,183 | ) | |
(a) Security fair valued as of August 31, 2020 in accordance with procedures approved by the Board of Trustees.
(b) Value determined using significant unobservable inputs.
For the year ended August 31, 2020, the average market value for the months where the Fund had options purchased and options written outstanding was $1,828,991 and $(1,257,598), respectively. At August 31, 2020, the Fund had securities pledged in the amount of $36,499,400 to cover collateral requirements for options written.
The following is a summary, categorized by Level (see Note A of Notes to Financial Statements), of inputs used to value the Fund's investments as of August 31, 2020:
Asset Valuation Inputs | | Level 1 | | Level 2 | | Level 3(c) | | Total | |
Investments: | |
Common Stocks | |
Capital Markets | | $ | 115,614,154 | | | $ | — | | | $ | — | | | $ | 115,614,154 | | |
Commercial Services | | | — | | | | — | | | | 21,437,584 | | | | 21,437,584 | | |
IT Services | | | 75,329,727 | | | | — | | | | 1,500,004 | | | | 76,829,731 | | |
Oil, Gas & Consumable Fuels | | | — | | | | — | | | | 1,612,100 | | | | 1,612,100 | | |
Software | | | 256,040,162 | | | | 44,878,672 | | | | 3,000,024 | | | | 303,918,858 | | |
| Other Common Stocks(a) | | | 998,935,748 | | | | — | | | | — | | | | 998,935,748 | | |
Total Common Stocks | | | 1,445,919,791 | | | | 44,878,672 | | | | 27,549,712 | | | | 1,518,348,175 | | |
| Limited Partnerships Units(a) | | | | | 35,034,170 | | | | | | 35,034,170 | | |
| Preferred Stocks(a) | | | — | | | | — | | | | 42,776,196 | | | | 42,776,196 | | |
| Warrants(a) | | | 119,852 | | | | — | | | | — | | | | 119,852 | | |
| Options Purchased(b) | | | 3,519,375 | | | | — | | | | — | | | | 3,519,375 | | |
Short-Term Investments | | | — | | | | 46,727,048 | | | | — | | | | 46,727,048 | | |
Total Investments | | $ | 1,449,559,018 | | | $ | 126,639,890 | | | $ | 70,325,908 | | | $ | 1,646,524,816 | | |
(a) The Schedule of Investments provides information on the industry categorization for the portfolio.
(b) The "purchased option contracts" table under Derivative Instruments provides information on the industry or sector categorization for the portfolio.
See Notes to Financial Statements
114
Schedule of Investments Guardian Fund^ (cont'd)
(c) The following is a reconciliation between the beginning and ending balances of investments in which unobservable inputs (Level 3) were used in determining value:
| | Beginning
balance, as
of 9/1/2019 | | Accrued
discounts/
(premiums) | | Realized
gain/
(loss) | | Change
in unrealized
appreciation/
(depreciation) | | Purchases | | Sales | | Transfers
into
Level 3 | | Transfers
out of
Level 3 | | Balance, as
of 8/31/2020 | | Net change in
unrealized
appreciation/
(depreciation)
from
investments
still held as of
8/31/2020 | |
Investments in Securities:
(000's omitted) | |
| Common Stocks(d) | | $ | 25,241 | | | $ | — | | | $ | — | | | $ | (91 | ) | | $ | 2,400 | | | $ | — | | | $ | — | | | $ | — | | | $ | 27,550 | | | $ | (91 | ) | |
| Preferred Stocks(d) | | | 7,520 | | | | — | | | | — | | | | 1,147 | | | | 34,109 | | | | — | | | | — | | | | — | | | | 42,776 | | | | 1,147 | | |
| Options Purchased(e) | | | — | | | | — | | | | (202 | ) | | | 202 | | | | — | | | | — | | | | — | | �� | | — | | | | — | | | | — | | |
Total | | $ | 32,761 | | | $ | — | | | $ | (202 | ) | | $ | 1,258 | | | $ | 36,509 | | | $ | — | | | $ | — | | | $ | — | | | $ | 70,326 | | | $ | 1,056 | | |
(d) The following table presents additional information about the valuation approach and inputs used for investments that are measured at fair value and categorized within Level 3 as of August 31, 2020.
Asset
class | | Fair value
at 8/31/2020 | | Valuation
approach | | Unobservable
input | | Amount or
range | | Weighted
average | | Impact to
valuation
from
increase
in input(c) | |
Common
Stocks | | $ | 4,612,125 |
| | Market
Comparables | | Enterprise value/EBITDA
multiple (EV/EBITDA) | | 11.8x - 12.5x | | 12.0x | | Increase | |
| |
| 22,937,588 |
| | Market
Comparables | | Enterprise value/Revenue
multiple (EV/Revenue) | | 5.3x - 12.1x | | 5.7x | | Increase | |
Preferred
Stocks | |
| 18,266,768 |
| | Market
Comparables | | Enterprise value/EBITDA
multiple (EV/EBITDA) | | 4.1x - 11.8x | | 9.2x | | Increase | |
| |
| 24,509,428 |
| | Market
Approach | | Transaction Price | | $17.10 - $17.29 | | $17.28 | | Increase | |
(e) At the beginning of the period, these investments were valued in accordance with the procedures approved by the Board of Trustees.
(f) Represents the expected directional change in the fair value of the Level 3 investments that would result from an increase in the corresponding input. A decrease to the unobservable input would have the opposite effect. Significant changes in these inputs could result in significantly higher or lower fair value measurements.
See Notes to Financial Statements
115
Schedule of Investments Guardian Fund^ (cont'd)
The following is a summary, categorized by Level (see Note A of Notes to Financial Statements), of inputs used to value the Fund's derivatives as of August 31, 2020:
Other Financial Instruments | | Level 1 | | Level 2 | | Level 3(a) | | Total | |
Options Written | |
Liabilities | | $ | (1,349,183 | ) | | $ | — | | | $ | — | | | $ | (1,349,183 | ) | |
Total | | $ | (1,349,183 | ) | | $ | — | | | $ | — | | | $ | (1,349,183 | ) | |
(a) The following is a reconciliation between the beginning and ending balances of investments in which unobservable inputs (Level 3) were used in determining value:
| | Beginning
balance, as
of 9/1/2019 | | Accrued
discounts/
(premiums) | | Realized
gain/
(loss) | | Change
in unrealized
appreciation/
(depreciation) | | Purchases | | Sales | | Transfers
into
Level 3 | | Transfers
out of
Level 3 | | Balance, as
of 8/31/2020 | | Net change
in unrealized
appreciation/
(depreciation)
from
investments
still held as of
8/31/2020 | |
Other Financial Instruments:
(000's omitted) | |
| Options Written(b) | | $ | — | | | $ | — | | | $ | — | | | $ | 218 | | | $ | — | | | $ | (218 | ) | | $ | — | | | $ | — | | | $ | — | | | $ | 218 | | |
Total | | $ | — | | | $ | — | | | $ | — | | | $ | 218 | | | $ | — | | | $ | (218 | ) | | $ | — | | | $ | — | | | $ | — | | | $ | 218 | | |
(b) As of the year ended August 31, 2020, these investments were valued in accordance with procedures approved by the Board of Trustees. These investments did not have a material impact on the Fund's net assets and, therefore, disclosure of unobservable inputs used in formulating valuations is not presented.
^ A balance indicated with a "—", reflects either a zero balance or an amount that rounds to less than 1.
See Notes to Financial Statements
116
Schedule of Investments Integrated Large Cap Fund^(a) August 31, 2020
| | | Number
of Shares | | Value | |
Common Stocks 100.1% | |
Banks 1.7% | |
Citigroup, Inc. | | | 1,157 | | | $ | 59,146 | | |
Beverages 0.9% | |
PepsiCo, Inc. | | | 213 | | | | 29,833 | | |
Biotechnology 3.1% | |
AbbVie, Inc. | | | 652 | | | | 62,442 | | |
Regeneron
Pharmaceuticals,
Inc.* | | | 73 | | | | 45,255 | | |
| | | | 107,697 | | |
Capital Markets 3.9% | |
Blackstone Group,
Inc. Class A | | | 343 | | | | 18,162 | | |
Intercontinental
Exchange, Inc. | | | 207 | | | | 21,989 | | |
Morgan Stanley | | | 815 | | | | 42,592 | | |
S&P Global, Inc. | | | 142 | | | | 52,032 | | |
| | | | 134,775 | | |
Chemicals 2.1% | |
Air Products &
Chemicals, Inc. | | | 185 | | | | 54,068 | | |
Ecolab, Inc. | | | 87 | | | | 17,146 | | |
| | | | 71,214 | | |
Communications Equipment 2.3% | |
Cisco Systems, Inc. | | | 891 | | | | 37,618 | | |
Motorola Solutions,
Inc. | | | 275 | | | | 42,556 | | |
| | | | 80,174 | | |
Distributors 0.6% | |
LKQ Corp.* | | | 617 | | | | 19,584 | | |
Diversified Telecommunication
Services 1.2% | |
Verizon
Communications,
Inc. | | | 670 | | | | 39,711 | | |
Electric Utilities 0.9% | |
NextEra Energy,
Inc. | | | 108 | | | | 30,150 | | |
Electrical Equipment 1.4% | |
AMETEK, Inc. | | | 204 | | | | 20,543 | | |
Eaton Corp. PLC | | | 284 | | | | 28,996 | | |
| | | | 49,539 | | |
Electronic Equipment, Instruments & Components 2.7% | |
Amphenol Corp.
Class A | | | 347 | | | | 38,101 | | |
CDW Corp. | | | 152 | | | | 17,275 | | |
TE Connectivity Ltd. | | | 220 | | | | 21,252 | | |
Zebra Technologies
Corp. Class A* | | | 61 | | | | 17,478 | | |
| | | | 94,106 | | |
| | | Number
of Shares | | Value | |
Entertainment 0.9% | |
Electronic Arts,
Inc.* | | | 227 | | | $ | 31,660 | | |
Equity Real Estate Investment Trusts 3.5% | |
American Homes
4 Rent Class A | | | 551 | | | | 15,781 | | |
American Tower
Corp. | | | 93 | | | | 23,171 | | |
Equity LifeStyle
Properties, Inc. | | | 274 | | | | 18,163 | | |
Mid-America
Apartment
Communities, Inc. | | | 125 | | | | 14,640 | | |
Prologis, Inc. | | | 331 | | | | 33,716 | | |
Sun Communities,
Inc. | | | 108 | | | | 16,100 | | |
| | | | 121,571 | | |
Food & Staples Retailing 2.1% | |
Walmart, Inc. | | | 520 | | | | 72,202 | | |
Health Care Equipment & Supplies 1.6% | |
Hill-Rom Holdings,
Inc. | | | 250 | | | | 23,447 | | |
Medtronic PLC | | | 304 | | | | 32,671 | | |
| | | | 56,118 | | |
Health Care Providers & Services 1.7% | |
Humana, Inc. | | | 47 | | | | 19,513 | | |
UnitedHealth
Group, Inc. | | | 129 | | | | 40,319 | | |
| | | | 59,832 | | |
Hotels, Restaurants & Leisure 1.3% | |
McDonald's Corp. | | | 214 | | | | 45,693 | | |
Household Durables 0.7% | |
Lennar Corp.
Class A | | | 337 | | | | 25,214 | | |
Household Products 2.6% | |
Procter &
Gamble Co. | | | 637 | | | | 88,116 | | |
Independent Power and Renewable Electricity Producers 1.1% | |
Vistra Energy Corp. | | | 2,023 | | | | 38,902 | | |
Industrial Conglomerates 1.7% | |
Honeywell
International, Inc. | | | 346 | | | | 57,280 | | |
Insurance 3.4% | |
Aon PLC Class A | | | 98 | | | | 19,599 | | |
Assurant, Inc. | | | 161 | | | | 19,571 | | |
Hartford Financial
Services Group,
Inc. | | | 437 | | | | 17,677 | | |
Progressive Corp. | | | 624 | | | | 59,305 | | |
| | | | 116,152 | | |
| | | Number
of Shares | | Value | |
Interactive Media & Services 4.5% | |
Alphabet, Inc.
Class A* | | | 95 | | | $ | 154,805 | | |
Internet & Direct Marketing Retail 6.1% | |
Amazon.com, Inc.* | | | 61 | | | | 210,509 | | |
IT Services 2.4% | |
Fidelity National
Information
Services, Inc. | | | 131 | | | | 19,761 | | |
Visa, Inc. Class A | | | 302 | | | | 64,021 | | |
| | | | 83,782 | | |
Life Sciences Tools & Services 2.5% | |
Illumina, Inc.* | | | 62 | | | | 22,148 | | |
Thermo Fisher
Scientific, Inc. | | | 148 | | | | 63,489 | | |
| | | | 85,637 | | |
Machinery 0.6% | |
Dover Corp. | | | 180 | | | | 19,771 | | |
Media 2.7% | |
Altice USA, Inc.
Class A* | | | 723 | | | | 19,940 | | |
Cable One, Inc. | | | 9 | | | | 16,563 | | |
Comcast Corp.
Class A | | | 1,296 | | | | 58,074 | | |
| | | | 94,577 | | |
Metals & Mining 0.7% | |
Steel Dynamics, Inc. | | | 764 | | | | 22,553 | | |
Multi-Utilities 0.5% | |
Dominion Energy, Inc. | | | 216 | | | | 16,943 | | |
Multiline Retail 0.6% | |
Dollar General Corp. | | | 101 | | | | 20,390 | | |
Oil, Gas & Consumable Fuels 2.7% | |
Cabot Oil &
Gas Corp. | | | 1,288 | | | | 24,433 | | |
Chevron Corp. | | | 419 | | | | 35,167 | | |
Phillips 66 | | | 249 | | | | 14,559 | | |
Pioneer Natural
Resources Co. | | | 172 | | | | 17,876 | | |
| | | | 92,035 | | |
Pharmaceuticals 5.3% | |
Bristol-Myers
Squibb Co. | | | 381 | | | | 23,698 | | |
Johnson & Johnson | | | 598 | | | | 91,739 | | |
Novartis AG ADR | | | 196 | | | | 16,868 | | |
Zoetis, Inc. | | | 305 | | | | 48,831 | | |
| | | | 181,136 | | |
Professional Services 1.2% | |
IHS Markit Ltd. | | | 257 | | | | 20,539 | | |
Verisk Analytics, Inc. | | | 110 | | | | 20,534 | | |
| | | | 41,073 | | |
See Notes to Financial Statements
117
Schedule of Investments Integrated Large Cap Fund^(a) (cont'd)
| | | Number
of Shares | | Value | |
Road & Rail 3.4% | |
CSX Corp. | | | 719 | | | $ | 54,975 | | |
Union Pacific Corp. | | | 315 | | | | 60,618 | | |
| | | | 115,593 | | |
Semiconductors & Semiconductor Equipment 4.6% | |
Analog Devices, Inc. | | | 229 | | | | 26,766 | | |
| ASML Holding NV | | | 129 | | | | 48,269 | | |
Lam Research Corp. | | | 51 | | | | 17,153 | | |
Texas Instruments,
Inc. | | | 458 | | | | 65,105 | | |
| | | | 157,293 | | |
Software 8.5% | |
Adobe, Inc.* | | | 85 | | | | 43,638 | | |
CDK Global, Inc. | | | 359 | | | | 16,737 | | |
Microsoft Corp. | | | 1,031 | | | | 232,521 | | |
| | | | 292,896 | | |
| | | Number
of Shares | | Value | |
Specialty Retail 2.2% | |
Home Depot, Inc. | | | 266 | | | $ | 75,821 | | |
Technology Hardware, Storage & Peripherals 7.3% | |
Apple, Inc. | | | 1,956 | | | | 252,402 | | |
Textiles, Apparel & Luxury Goods 0.9% | |
NIKE, Inc. Class B | | | 283 | | | | 31,665 | | |
Tobacco 0.7% | |
Philip Morris
International, Inc. | | | 291 | | | | 23,219 | | |
Trading Companies & Distributors 0.5% | |
Fastenal Co. | | | 367 | | | | 17,932 | | |
Wireless Telecommunication
Services 0.8% | |
T-Mobile U.S., Inc.* | | | 223 | | | | 26,020 | | |
Total Common Stocks
(Cost $2,788,375) | | | | | 3,444,721 | | |
| | | Number
of Shares | | Value | |
Short-Term Investments 1.8% | |
Investment Companies 1.8% | |
State Street
Institutional
Treasury Money
Market Fund
Premier Class,
0.03%(b)
(Cost $60,620) | | | 60,620 | | | $ | 60,620 | | |
Total Investments 101.9%
(Cost $2,848,995) | | | 3,505,341 | | |
Liabilities Less Other
Assets (1.9)% | | | | | (65,513 | ) | |
Net Assets 100.0% | | $ | 3,439,828 | | |
* Non-income producing security.
(a) Formerly Global Equity Fund through September 2, 2019.
(b) Represents 7-day effective yield as of August 31, 2020.
The following is a summary, categorized by Level (see Note A of Notes to Financial Statements), of inputs used to value the Fund's investments as of August 31, 2020:
Asset Valuation Inputs | | Level 1 | | Level 2 | | Level 3 | | Total | |
Investments: | |
| Common Stocks(a) | | $ | 3,444,721 | | | $ | — | | | $ | — | | | $ | 3,444,721 | | |
Short-Term Investments | | | — | | | | 60,620 | | | | — | | | | 60,620 | | |
Total Investments | | $ | 3,444,721 | | | $ | 60,620 | | | $ | — | | | $ | 3,505,341 | | |
(a) The Schedule of Investments provides information on the industry categorization for the portfolio.
^ A balance indicated with a "—", reflects either a zero balance or an amount that rounds to less than 1.
See Notes to Financial Statements
118
Schedule of Investments International Equity Fund^ August 31, 2020
| | | Number
of Shares | | Value | |
Common Stocks 97.1% | |
Austria 1.3% | |
BAWAG
Group AG*(a) | | | 524,983 | | | $ | 19,771,979 | | |
Belgium 0.8% | |
KBC
Group NV | | | 229,774 | | | | 13,189,061 | | |
Canada 1.3% | |
Alimentation
Couche-Tard,
Inc. Class B | | | 225,803 | | | | 7,369,520 | | |
Kinaxis, Inc.* | | | 90,200 | | | | 13,756,650 | | |
| | | | 21,126,170 | | |
China 1.2% | |
Alibaba
Group
Holding
Ltd.* | | | 512,580 | | | | 18,450,235 | | |
France 7.5% | |
Air Liquide SA | | | 79,889 | | | | 13,256,409 | | |
Arkema SA | | | 68,289 | | | | 7,570,671 | | |
Pernod-
Ricard SA | | | 166,865 | | | | 28,574,922 | | |
Schneider
Electric SE | | | 181,144 | | | | 22,427,453 | | |
Tele
performance | | | 109,276 | | | | 33,696,532 | | |
TOTAL SE | | | 339,431 | | | | 13,407,487 | | |
| | | | 118,933,474 | | |
Germany 11.7% | |
adidas AG* | | | 54,361 | | | | 16,516,337 | | |
Brenntag AG | | | 328,918 | | | | 20,591,303 | | |
CTS Eventim
AG & Co.
KGaA* | | | 290,903 | | | | 14,448,347 | | |
Deutsche
Boerse AG | | | 66,457 | | | | 12,562,145 | | |
Gerresheimer
AG | | | 301,725 | | | | 35,592,285 | | |
Infineon
Technologies
AG | | | 693,905 | | | | 19,178,140 | | |
SAP SE | | | 27,567 | | | | 4,541,114 | | |
SAP SE ADR | | | 203,954 | | | | 33,736,031 | | |
| Scout24 AG(a) | | | 237,364 | | | | 22,079,990 | | |
Stabilus SA | | | 107,769 | | | | 5,722,974 | | |
| | | | 184,968,666 | | |
Hong Kong 3.8% | |
AIA Group
Ltd. | | | 1,636,000 | | | | 16,760,408 | | |
HKBN Ltd. | | | 3,838,800 | | | | 7,188,827 | | |
Techtronic
Industries
Co. Ltd. | | | 2,865,800 | | | | 36,292,875 | | |
| | | | 60,242,110 | | |
| | | Number
of Shares | | Value | |
India 1.2% | |
Infosys Ltd.
ADR | | | 1,472,689 | | | $ | 18,555,881 | | |
Ireland 4.5% | |
CRH PLC | | | 769,727 | | | | 28,725,456 | | |
Kerry Group
PLC Class A | | | 234,631 | | | | 30,799,664 | | |
Smurfit Kappa
Group PLC | | | 340,235 | | | | 12,050,658 | | |
| | | | 71,575,778 | | |
Israel 2.1% | |
Check Point
Software
Technologies
Ltd.* | | | 267,326 | | | | 33,752,581 | | |
Italy 1.2% | |
| Nexi SpA*(a) | | | 1,033,715 | | | | 18,398,905 | | |
Japan 11.2% | |
Bridgestone
Corp. | | | 509,900 | | | | 16,142,143 | | |
Daikin
Industries Ltd. | | | 114,300 | | | | 21,530,148 | | |
Hoya Corp. | | | 206,400 | | | | 20,304,411 | | |
Ichigo, Inc. | | | 2,603,400 | | | | 6,969,374 | | |
Kao Corp. | | | 94,000 | | | | 7,162,553 | | |
Sanwa
Holdings
Corp. | | | 2,194,400 | | | | 22,052,192 | | |
SCSK Corp. | | | 230,400 | | | | 12,477,162 | | |
Shionogi &
Co. Ltd. | | | 189,700 | | | | 10,533,649 | | |
TechnoPro
Holdings, Inc. | | | 177,100 | | | | 9,427,709 | | |
Terumo Corp. | | | 357,800 | | | | 14,555,503 | | |
Tokio Marine
Holdings, Inc. | | | 305,800 | | | | 14,113,611 | | |
Toyota Motor
Corp. | | | 325,600 | | | | 21,504,054 | | |
| | | | 176,772,509 | | |
Netherlands 6.6% | |
AerCap
Holdings NV* | | | 219,939 | | | | 6,503,596 | | |
ASML
Holding NV | | | 90,961 | | | | 34,116,739 | | |
Heineken NV | | | 228,323 | | | | 21,132,718 | | |
| Intertrust NV(a) | | | 577,427 | | | | 10,363,652 | | |
Koninklijke
Philips NV | | | 302,156 | | | | 14,291,506 | | |
NXP
Semiconductors
NV | | | 148,098 | | | | 18,624,804 | | |
| | | | 105,033,015 | | |
Norway 0.7% | |
Sbanken
ASA*(a) | | | 1,482,493 | | | | 11,438,125 | | |
| | | Number
of Shares | | Value | |
Singapore 0.9% | |
DBS Group
Holdings Ltd. | | | 890,700 | | | $ | 13,649,947 | | |
Spain 0.6% | |
| Befesa SA(a) | | | 235,425 | | | | 9,790,915 | | |
Sweden 2.1% | |
Assa Abloy
AB Class B | | | 1,125,484 | | | | 26,023,353 | | |
Autoliv, Inc. | | | 101,451 | | | | 7,947,671 | | |
| | | | 33,971,024 | | |
Switzerland 13.7% | |
Julius Baer
Group Ltd. | | | 346,404 | | | | 16,593,056 | | |
Lonza
Group AG | | | 30,442 | | | | 18,872,390 | | |
Novartis AG | | | 275,008 | | | | 23,742,048 | | |
Partners
Group
Holding AG | | | 19,624 | | | | 19,924,672 | | |
Roche
Holding AG | | | 97,850 | | | | 34,173,621 | | |
SGS SA | | | 5,343 | | | | 13,819,275 | | |
SIG
Combibloc
Group AG* | | | 1,386,784 | | | | 27,215,607 | | |
Sonova
Holding AG | | | 108,112 | | | | 25,247,462 | | |
Tecan
Group AG | | | 51,466 | | | | 23,240,690 | | |
UBS Group
AG | | | 1,069,799 | | | | 13,000,434 | | |
| | | | 215,829,255 | | |
United Kingdom 21.0% | |
Barratt
Developments
PLC | | | 972,418 | | | | 6,790,492 | | |
| Biffa PLC(a) | | | 2,050,758 | | | | 5,566,398 | | |
Bunzl PLC | | | 1,194,238 | | | | 38,525,212 | | |
Clinigen
Group PLC | | | 1,451,544 | | | | 13,360,304 | | |
DCC PLC | | | 318,183 | | | | 28,267,458 | | |
Diageo PLC | | | 488,742 | | | | 16,329,419 | | |
Electro-
components
PLC | | | 2,847,002 | | | | 25,755,967 | | |
Fevertree
Drinks PLC | | | 1,088,985 | | | | 30,093,150 | | |
Ibstock
PLC*(a) | | | 4,539,780 | | | | 9,252,222 | | |
London
Stock
Exchange
Group PLC | | | 138,127 | | | | 16,315,685 | | |
Prudential
PLC | | | 1,023,888 | | | | 16,506,482 | | |
See Notes to Financial Statements
119
Schedule of Investments International Equity Fund^ (cont'd)
| | | Number
of Shares | | Value | |
Reckitt
Benckiser
Group PLC | | | 283,566 | | | $ | 28,464,040 | | |
RELX PLC | | | 789,118 | | | | 17,907,321 | | |
Rightmove
PLC | | | 981,127 | | | | 8,233,655 | | |
Savills PLC | | | 307,318 | | | | 3,348,768 | | |
Smith &
Nephew PLC | | | 876,424 | | | | 17,686,780 | | |
Spectris PLC | | | 408,037 | | | | 13,868,453 | | |
St. James's
Place PLC | | | 905,208 | | | | 11,730,221 | | |
Unilever NV | | | 406,999 | | | | 23,560,935 | | |
| | | | 331,562,962 | | |
United States 3.7% | |
Aon PLC
Class A | | | 142,609 | | | | 28,520,374 | | |
Ferguson PLC | | | 297,439 | | | | 29,168,464 | | |
| | | | 57,688,838 | | |
Total Common Stocks
(Cost $1,284,308,357) | | | | | 1,534,701,430 | | |
| | | Number
of Shares | | Value | |
Short-Term Investments 2.4% | |
Investment Companies 2.4% | |
State
Street
Institutional
Treasury
Money
Market
Fund
Premier
Class, 0.03%(b)
(Cost $38,078,993) | | | 38,078,993 | | | $ | 38,078,993 | | |
Total
Investments 99.5%
(Cost $1,322,387,350) | | | 1,572,780,423 | | |
Other Assets Less
Liabilities 0.5% | | | | | 7,145,560 | | |
Net Assets 100.0% | | | | $ | 1,579,925,983 | | |
* Non-income producing security.
(a) Security exempt from registration pursuant to Regulation S under the Securities Act of 1933, as amended. Regulation S applies to securities offerings that are made outside of the United States and do not involve directed selling efforts in the United States and as such may have restrictions on resale. Total value of all such securities at August 31, 2020 amounted to $106,662,186, which represents 6.8% of net assets of the Fund.
(b) Represents 7-day effective yield as of August 31, 2020.
See Notes to Financial Statements
120
Schedule of Investments International Equity Fund^ (cont'd)
POSITIONS BY INDUSTRY
Industry | | Investments at
Value | | Percentage of
Net Assets | |
Trading Companies & Distributors | | $ | 120,544,542 | | | | 7.6 | % | |
Beverages | | | 96,130,209 | | | | 6.1 | % | |
Health Care Equipment & Supplies | | | 92,085,662 | | | | 5.8 | % | |
Life Sciences Tools & Services | | | 91,065,669 | | | | 5.8 | % | |
Capital Markets | | | 90,126,213 | | | | 5.7 | % | |
Software | | | 85,786,376 | | | | 5.4 | % | |
Professional Services | | | 85,214,489 | | | | 5.4 | % | |
Insurance | | | 75,900,875 | | | | 4.8 | % | |
Semiconductors & Semiconductor Equipment | | | 71,919,683 | | | | 4.6 | % | |
Building Products | | | 69,605,693 | | | | 4.4 | % | |
Pharmaceuticals | | | 68,449,318 | | | | 4.3 | % | |
Banks | | | 58,049,112 | | | | 3.7 | % | |
IT Services | | | 49,431,948 | | | | 3.1 | % | |
Machinery | | | 42,015,849 | | | | 2.7 | % | |
Containers & Packaging | | | 39,266,265 | | | | 2.5 | % | |
Construction Materials | | | 37,977,678 | | | | 2.4 | % | |
Food Products | | | 30,799,664 | | | | 1.9 | % | |
Personal Products | | | 30,723,488 | | | | 1.9 | % | |
Interactive Media & Services | | | 30,313,645 | | | | 1.9 | % | |
Household Products | | | 28,464,040 | | | | 1.8 | % | |
Industrial Conglomerates | | | 28,267,458 | | | | 1.8 | % | |
Auto Components | | | 24,089,814 | | | | 1.5 | % | |
Electrical Equipment | | | 22,427,453 | | | | 1.4 | % | |
Automobiles | | | 21,504,054 | | | | 1.4 | % | |
Chemicals | | | 20,827,080 | | | | 1.3 | % | |
Internet & Direct Marketing Retail | | | 18,450,235 | | | | 1.2 | % | |
Textiles, Apparel & Luxury Goods | | | 16,516,337 | | | | 1.0 | % | |
Commercial Services & Supplies | | | 15,357,313 | | | | 1.0 | % | |
Entertainment | | | 14,448,347 | | | | 0.9 | % | |
Electronic Equipment, Instruments & Components | | | 13,868,453 | | | | 0.9 | % | |
Oil, Gas & Consumable Fuels | | | 13,407,487 | | | | 0.8 | % | |
Real Estate Management & Development | | | 10,318,142 | | | | 0.7 | % | |
Food & Staples Retailing | | | 7,369,520 | | | | 0.5 | % | |
Diversified Telecommunication Services | | | 7,188,827 | | | | 0.5 | % | |
Household Durables | | | 6,790,492 | | | | 0.4 | % | |
Short-Term Investments and Other Assets—Net | | | 45,224,553 | | | | 2.9 | % | |
| | | $ | 1,579,925,983 | | | | 100.0 | % | |
See Notes to Financial Statements
121
Schedule of Investments International Equity Fund^ (cont'd)
The following is a summary, categorized by Level (see Note A of Notes to Financial Statements), of inputs used to value the Fund's investments as of August 31, 2020:
Asset Valuation Inputs | | Level 1 | | Level 2 | | Level 3 | | Total | |
Investments: | |
Common Stocks | |
China | | $ | — | | | $ | 18,450,235 | | | $ | — | | | $ | 18,450,235 | | |
Hong Kong | | | — | | | | 60,242,110 | | | | — | | | | 60,242,110 | | |
Ireland | | | 42,850,322 | | | | 28,725,456 | | | | — | | | | 71,575,778 | | |
Japan | | | — | | | | 176,772,509 | | | | — | | | | 176,772,509 | | |
Singapore | | | — | | | | 13,649,947 | | | | — | | | | 13,649,947 | | |
United Kingdom | | | 23,560,935 | | | | 308,002,027 | | | | — | | | | 331,562,962 | | |
United States | | | 28,520,374 | | | | 29,168,464 | | | | — | | | | 57,688,838 | | |
| Other Common Stocks(a) | | | 804,759,051 | | | | — | | | | — | | | | 804,759,051 | | |
Total Common Stocks | | | 899,690,682 | | | | 635,010,748 | | | | — | | | | 1,534,701,430 | | |
Short-Term Investments | | | — | | | | 38,078,993 | | | | — | | | | 38,078,993 | | |
Total Investments | | $ | 899,690,682 | | | $ | 673,089,741 | | | $ | — | | | $ | 1,572,780,423 | | |
(a) The Schedule of Investments provides a geographic categorization as well as a Positions by Industry summary.
^ A balance indicated with a "—", reflects either a zero balance or an amount that rounds to less than 1.
See Notes to Financial Statements
122
Schedule of Investments International Select Fund^ August 31, 2020
| | | Number
of Shares | | Value | |
Common Stocks 97.7% | |
Austria 1.3% | |
BAWAG
Group AG*(a) | | | 51,935 | | | $ | 1,955,983 | | |
Belgium 0.8% | |
KBC Group NV | | | 22,023 | | | | 1,264,123 | | |
Canada 0.5% | |
Alimentation
Couche-Tard,
Inc. Class B | | | 21,623 | | | | 705,709 | | |
China 1.4% | |
Alibaba Group
Holding Ltd.* | | | 61,364 | | | | 2,208,787 | | |
France 8.5% | |
Air Liquide SA | | | 7,588 | | | | 1,259,117 | | |
Arkema SA | | | 6,555 | | | | 726,702 | | |
L'Oreal SA | | | 2,201 | | | | 727,296 | | |
Pernod-
Ricard SA | | | 13,430 | | | | 2,299,830 | | |
Schneider
Electric SE | | | 20,225 | | | | 2,504,059 | | |
Teleperformance | | | 11,867 | | | | 3,659,328 | | |
TOTAL SE | | | 45,099 | | | | 1,781,406 | | |
| | | | 12,957,738 | | |
Germany 12.2% | |
adidas AG* | | | 5,240 | | | | 1,592,053 | | |
Brenntag AG | | | 31,822 | | | | 1,992,157 | | |
CTS Eventim
AG & Co.
KGaA* | | | 27,931 | | | | 1,387,256 | | |
Deutsche
Boerse AG | | | 8,794 | | | | 1,662,301 | | |
Gerresheimer
AG | | | 33,583 | | | | 3,961,540 | | |
Infineon
Technologies
AG | | | 64,355 | | | | 1,778,643 | | |
SAP SE | | | 3,579 | | | | 589,569 | | |
SAP SE ADR | | | 21,311 | | | | 3,525,052 | | |
| Scout24 AG(a) | | | 22,917 | | | | 2,131,777 | | |
| | | | 18,620,348 | | |
Hong Kong 3.8% | |
AIA Group Ltd. | | | 213,700 | | | | 2,189,303 | | |
Techtronic
Industries Co.
Ltd. | | | 289,100 | | | | 3,661,201 | | |
| | | | 5,850,504 | | |
India 1.3% | |
Infosys Ltd.
ADR | | | 155,221 | | | | 1,955,785 | | |
| | | Number
of Shares | | Value | |
Ireland 4.8% | |
CRH PLC | | | 84,415 | | | $ | 3,150,285 | | |
Kerry Group
PLC Class A | | | 22,571 | | | | 2,962,862 | | |
Smurfit Kappa
Group PLC | | | 32,766 | | | | 1,160,527 | | |
| | | | 7,273,674 | | |
Israel 2.4% | |
Check Point
Software
Technologies
Ltd.* | | | 28,627 | | | | 3,614,445 | | |
Italy 1.1% | |
| Nexi SpA*(a) | | | 98,599 | | | | 1,754,946 | | |
Japan 10.4% | |
Bridgestone
Corp. | | | 60,100 | | | | 1,902,614 | | |
Daikin
Industries
Ltd. | | | 9,400 | | | | 1,770,633 | | |
Hoya Corp. | | | 21,200 | | | | 2,085,531 | | |
Kao Corp. | | | 13,400 | | | | 1,021,045 | | |
Sanwa
Holdings
Corp. | | | 167,100 | | | | 1,679,239 | | |
SCSK Corp. | | | 22,200 | | | | 1,202,227 | | |
Shionogi &
Co. Ltd. | | | 24,500 | | | | 1,360,434 | | |
Terumo Corp. | | | 32,800 | | | | 1,334,322 | | |
Tokio Marine
Holdings, Inc. | | | 29,400 | | | | 1,356,900 | | |
Toyota Motor
Corp. | | | 33,300 | | | | 2,199,278 | | |
| | | | 15,912,223 | | |
Netherlands 6.4% | |
AerCap
Holdings NV* | | | 20,989 | | | | 620,645 | | |
ASML Holding
NV | | | 8,766 | | | | 3,287,863 | | |
Heineken NV | | | 25,269 | | | | 2,338,803 | | |
Koninklijke
Philips NV | | | 36,245 | | | | 1,714,332 | | |
NXP
Semiconductors
NV | | | 14,233 | | | | 1,789,942 | | |
| | | | 9,751,585 | | |
Singapore 1.1% | |
DBS Group
Holdings Ltd. | | | 107,200 | | | | 1,642,836 | | |
Sweden 2.2% | |
Assa Abloy AB
Class B | | | 110,889 | | | | 2,563,967 | | |
Autoliv, Inc. | | | 9,756 | | | | 764,285 | | |
| | | | 3,328,252 | | |
| | | Number
of Shares | | Value | |
Switzerland 14.5% | |
Julius Baer
Group Ltd. | | | 37,601 | | | $ | 1,801,121 | | |
Lonza Group
AG | | | 3,885 | | | | 2,408,489 | | |
Novartis AG | | | 33,511 | | | | 2,893,079 | | |
Partners
Group
Holding AG | | | 1,879 | | | | 1,907,789 | | |
Roche
Holding AG | | | 12,575 | | | | 4,391,756 | | |
SGS SA | | | 645 | | | | 1,668,245 | | |
SIG Combibloc
Group AG* | | | 134,971 | | | | 2,648,803 | | |
Sonova
Holding AG | | | 12,299 | | | | 2,872,193 | | |
UBS Group AG | | | 129,473 | | | | 1,573,385 | | |
| | | | 22,164,860 | | |
United Kingdom 21.2% | |
Barratt
Developments
PLC | | | 139,972 | | | | 977,438 | | |
Bunzl PLC | | | 134,985 | | | | 4,354,514 | | |
DCC PLC | | | 37,476 | | | | 3,329,377 | | |
Diageo PLC | | | 47,107 | | | | 1,573,898 | | |
Electro-
components
PLC | | | 269,093 | | | | 2,434,403 | | |
Fevertree
Drinks PLC | | | 90,000 | | | | 2,487,072 | | |
London Stock
Exchange
Group PLC | | | 13,278 | | | | 1,568,409 | | |
Prudential PLC | | | 117,615 | | | | 1,896,116 | | |
Reckitt
Benckiser
Group PLC | | | 31,619 | | | | 3,173,880 | | |
RELX PLC | | | 93,294 | | | | 2,117,105 | | |
Rightmove PLC | | | 142,348 | | | | 1,194,590 | | |
Smith &
Nephew PLC | | | 82,250 | | | | 1,659,856 | | |
Spectris PLC | | | 39,027 | | | | 1,326,458 | | |
St. James's
Place PLC | | | 87,050 | | | | 1,128,045 | | |
| Unilever NV(b) | | | 39,199 | | | | 2,269,207 | | |
Weir Group
PLC | | | 52,865 | | | | 902,052 | | |
| | | | 32,392,420 | | |
United States 3.8% | |
Aon PLC
Class A | | | 13,734 | | | | 2,746,662 | | |
Ferguson PLC | | | 30,349 | | | | 2,976,186 | | |
| | | | 5,722,848 | | |
Total Common Stocks
(Cost $120,611,746) | | | 149,077,066 | | |
See Notes to Financial Statements
123
Schedule of Investments International Select Fund^ (cont'd)
| | | Number
of Shares | | Value | |
Short-Term Investments 2.6% | |
Investment Companies 2.6% | |
State Street
Institutional
Treasury Money
Market Fund
Premier Class,
0.03%(c) | | | 3,469,873 | | | $ | 3,469,873 | | |
State Street
Navigator
Securities
Lending
Government
Money
Market
Portfolio,
0.10%(c)(d) | | | 447,618 | | | | 447,618 | | |
Total Short-Term
Investments
(Cost $3,917,491) | | | 3,917,491 | | |
Total Investments 100.3%
(Cost $124,529,237) | | | 152,994,557 | | |
Liabilities Less
Other Assets (0.3)% | | | | | (480,145 | ) | |
Net Assets 100.0% | | $ | 152,514,412 | | |
* Non-income producing security.
(a) Security exempt from registration pursuant to Regulation S under the Securities Act of 1933, as amended. Regulation S applies to securities offerings that are made outside of the United States and do not involve directed selling efforts in the United States and as such may have restrictions on resale. Total value of all such securities at August 31, 2020 amounted to $5,842,706, which represents 3.8% of net assets of the Fund.
(b) The security or a portion of this security is on loan at August 31, 2020. Total value of all such securities at August 31, 2020 amounted to $423,821 for the Fund (see Note A of the Notes to Financial Statements).
(c) Represents 7-day effective yield as of August 31, 2020.
(d) Represents investment of cash collateral received from securities lending.
See Notes to Financial Statements
124
Schedule of Investments International Select Fund^ (cont'd)
POSITIONS BY INDUSTRY
Industry | | Investments at
Value | | Percentage of
Net Assets | |
Trading Companies & Distributors | | $ | 12,377,905 | | | | 8.1 | % | |
Health Care Equipment & Supplies | | | 9,666,234 | | | | 6.3 | % | |
Capital Markets | | | 9,641,050 | | | | 6.3 | % | |
Beverages | | | 8,699,603 | | | | 5.7 | % | |
Pharmaceuticals | | | 8,645,269 | | | | 5.7 | % | |
Insurance | | | 8,188,981 | | | | 5.4 | % | |
Software | | | 7,729,066 | | | | 5.1 | % | |
Professional Services | | | 7,444,678 | | | | 4.9 | % | |
Semiconductors & Semiconductor Equipment | | | 6,856,448 | | | | 4.5 | % | |
Life Sciences Tools & Services | | | 6,370,029 | | | | 4.2 | % | |
Building Products | | | 6,013,839 | | | | 3.9 | % | |
IT Services | | | 4,912,958 | | | | 3.2 | % | |
Banks | | | 4,862,942 | | | | 3.2 | % | |
Machinery | | | 4,563,253 | | | | 3.0 | % | |
Personal Products | | | 4,017,548 | | | | 2.6 | % | |
Containers & Packaging | | | 3,809,330 | | | | 2.5 | % | |
Industrial Conglomerates | | | 3,329,377 | | | | 2.2 | % | |
Interactive Media & Services | | | 3,326,367 | | | | 2.2 | % | |
Household Products | | | 3,173,880 | | | | 2.1 | % | |
Construction Materials | | | 3,150,285 | | | | 2.1 | % | |
Food Products | | | 2,962,862 | | | | 1.9 | % | |
Auto Components | | | 2,666,899 | | | | 1.8 | % | |
Electrical Equipment | | | 2,504,059 | | | | 1.6 | % | |
Internet & Direct Marketing Retail | | | 2,208,787 | | | | 1.4 | % | |
Automobiles | | | 2,199,278 | | | | 1.4 | % | |
Chemicals | | | 1,985,819 | | | | 1.3 | % | |
Oil, Gas & Consumable Fuels | | | 1,781,406 | | | | 1.2 | % | |
Textiles, Apparel & Luxury Goods | | | 1,592,053 | | | | 1.0 | % | |
Entertainment | | | 1,387,256 | | | | 0.9 | % | |
Electronic Equipment, Instruments & Components | | | 1,326,458 | | | | 0.9 | % | |
Household Durables | | | 977,438 | | | | 0.6 | % | |
Food & Staples Retailing | | | 705,709 | | | | 0.5 | % | |
Short-Term Investments and Other Liabilities—Net | | | 3,437,346 | | | | 2.3 | % | |
| | | $ | 152,514,412 | | | | 100.0 | % | |
See Notes to Financial Statements
125
Schedule of Investments International Select Fund^ (cont'd)
The following is a summary, categorized by Level (see Note A of Notes to Financial Statements), of inputs used to value the Fund's investments as of August 31, 2020:
Asset Valuation Inputs | | Level 1 | | Level 2 | | Level 3 | | Total | |
Investments: | |
Common Stocks | |
China | | $ | — | | | $ | 2,208,787 | | | $ | — | | | $ | 2,208,787 | | |
Hong Kong | | | — | | | | 5,850,504 | | | | — | | | | 5,850,504 | | |
Ireland | | | 4,123,389 | | | | 3,150,285 | | | | — | | | | 7,273,674 | | |
Japan | | | — | | | | 15,912,223 | | | | — | | | | 15,912,223 | | |
Singapore | | | — | | | | 1,642,836 | | | | — | | | | 1,642,836 | | |
United Kingdom | | | 2,269,207 | | | | 30,123,213 | | | | — | | | | 32,392,420 | | |
United States | | | 2,746,662 | | | | 2,976,186 | | | | — | | | | 5,722,848 | | |
| Other Common Stocks(a) | | | 78,073,774 | | | | — | | | | — | | | | 78,073,774 | | |
Total Common Stocks | | | 87,213,032 | | | | 61,864,034 | | | | — | | | | 149,077,066 | | |
Short-Term Investments | | | — | | | | 3,917,491 | | | | — | | | | 3,917,491 | | |
Total Investments | | $ | 87,213,032 | | | $ | 65,781,525 | | | $ | — | | | $ | 152,994,557 | | |
(a) The Schedule of Investments provides a geographic categorization as well as a Positions by Industry summary.
^ A balance indicated with a "—", reflects either a zero balance or an amount that rounds to less than 1.
See Notes to Financial Statements
126
Schedule of Investments International Small Cap Fund^ August 31, 2020
| | | Number
of Shares | | Value | |
Common Stocks 97.0% | |
Australia 3.2% | |
ARB Corp. Ltd. | | | 1,215 | | | $ | 23,549 | | |
Corporate Travel
Management Ltd.(a) | | | 1,151 | | | | 13,528 | | |
Hansen
Technologies
Ltd. | | | 5,042 | | | | 15,488 | | |
Steadfast Group
Ltd. | | | 4,823 | | | | 12,716 | | |
| | | | 65,281 | | |
Austria 0.3% | |
Schoeller-Bleckmann
Oilfield
Equipment AG | | | 192 | | | | 5,728 | | |
Belgium 1.2% | |
Shurgard Self
Storage SA | | | 567 | | | | 24,934 | | |
Canada 5.6% | |
Colliers
International
Group, Inc. | | | 353 | | | | 22,384 | | |
Computer
Modelling
Group Ltd. | | | 1,798 | | | | 7,195 | | |
Descartes
Systems
Group, Inc.* | | | 317 | | | | 19,343 | | |
Enghouse
Systems Ltd. | | | 481 | | | | 26,839 | | |
Kinaxis, Inc.* | | | 242 | | | | 36,908 | | |
| | | | 112,669 | | |
Denmark 2.5% | |
Chemometec A/S | | | 197 | | | | 12,554 | | |
Schouw & Co. A/S | | | 227 | | | | 22,054 | | |
SimCorp A/S | | | 125 | | | | 15,891 | | |
| | | | 50,499 | | |
Finland 0.8% | |
Kemira OYJ | | | 1,095 | | | | 15,132 | | |
France 7.6% | |
Esker SA | | | 137 | | | | 25,014 | | |
Interparfums SA* | | | 492 | | | | 24,571 | | |
Lectra | | | 702 | | | | 16,621 | | |
Lumibird* | | | 876 | | | | 12,335 | | |
Pharmagest
Interactive | | | 199 | | | | 18,951 | | |
Sopra Steria Group* | | | 103 | | | | 16,753 | | |
Tikehau Capital
SCA(a) | | | 539 | | | | 14,087 | | |
Virbac SA* | | | 106 | | | | 23,781 | | |
| | | | 152,113 | | |
| | | Number
of Shares | | Value | |
Germany 4.9% | |
Dermapharm
Holding SE | | | 309 | | | $ | 16,435 | | |
Jenoptik AG | | | 501 | | | | 13,368 | | |
Nexus AG | | | 457 | | | | 23,178 | | |
Stabilus SA | | | 215 | | | | 11,417 | | |
STRATEC SE | | | 187 | | | | 22,941 | | |
Washtec AG* | | | 237 | | | | 10,620 | | |
| | | | 97,959 | | |
Ireland 1.4% | |
Uniphar PLC | | | 10,104 | | | | 27,732 | | |
Italy 3.5% | |
Carel Industries
SpA(b) | | | 1,731 | | | | 42,347 | | |
Cerved Group SpA* | | | 2,113 | | | | 18,017 | | |
| GVS SpA*(b) | | | 779 | | | | 9,900 | | |
| | | | 70,264 | | |
Japan 19.5% | |
Aeon Delight
Co. Ltd. | | | 650 | | | | 19,221 | | |
Amano Corp. | | | 800 | | | | 16,678 | | |
Ariake Japan
Co. Ltd. | | | 300 | | | | 20,622 | | |
Azbil Corp. | | | 900 | | | | 28,261 | | |
Broadleaf Co. Ltd. | | | 1,900 | | | | 9,060 | | |
CKD Corp. | | | 500 | | | | 6,898 | | |
Digital Arts, Inc. | | | 200 | | | | 15,447 | | |
EM Systems Co. Ltd. | | | 1,000 | | | | 8,208 | | |
Konishi Co. Ltd. | | | 600 | | | | 8,405 | | |
Medikit Co. Ltd. | | | 500 | | | | 15,592 | | |
Nagaileben Co. Ltd. | | | 600 | | | | 15,423 | | |
Nakanishi, Inc. | | | 900 | | | | 14,424 | | |
Nihon Parkerizing
Co. Ltd. | | | 800 | | | | 7,696 | | |
| Nohmi Bosai Ltd.(a) | | | 1,200 | | | | 25,225 | | |
Okamoto
Industries, Inc. | | | 200 | | | | 7,987 | | |
Optex Group
Co. Ltd. | | | 700 | | | | 8,956 | | |
Prestige
International, Inc. | | | 3,400 | | | | 28,675 | | |
Relo Group, Inc. | | | 1,100 | | | | 24,968 | | |
SHO-BOND
Holdings Co. Ltd. | | | 700 | | | | 33,098 | | |
Shoei Co. Ltd. | | | 1,000 | | | | 30,560 | | |
Software
Service, Inc. | | | 200 | | | | 20,311 | | |
Sun Frontier
Fudousan Co. Ltd. | | | 1,300 | | | | 9,983 | | |
| TKC Corp.(a) | | | 300 | | | | 16,823 | | |
| | | | 392,521 | | |
| | | Number
of Shares | | Value | |
Jersey 1.1% | |
Sanne Group PLC | | | 2,447 | | | $ | 22,802 | | |
Korea 0.4% | |
Dentium Co. Ltd.* | | | 225 | | | | 7,076 | | |
Luxembourg 1.0% | |
| Befesa SA(b) | | | 470 | | | | 19,546 | | |
Netherlands 2.4% | |
Corbion NV | | | 644 | | | | 29,818 | | |
| Intertrust NV(b) | | | 989 | | | | 17,751 | | |
| | | | 47,569 | | |
Norway 2.5% | |
Borregaard ASA | | | 1,921 | | | | 27,971 | | |
Pexip Holding ASA* | | | 439 | | | | 4,152 | | |
| Sbanken ASA*(b) | | | 2,405 | | | | 18,556 | | |
| | | | 50,679 | | |
Singapore 0.9% | |
Haw Par Corp. Ltd. | | | 2,700 | | | | 18,665 | | |
Spain 1.0% | |
Applus Services SA* | | | 2,550 | | | | 21,012 | | |
Sweden 8.2% | |
Biotage AB* | | | 1,230 | | | | 23,947 | | |
Cellavision AB* | | | 465 | | | | 16,998 | | |
Cloetta AB,
B Shares* | | | 6,538 | | | | 18,231 | | |
| Dustin Group AB(b) | | | 2,661 | | | | 17,351 | | |
Sweco AB, B Shares | | | 727 | | | | 44,882 | | |
| Thule Group AB(b) | | | 923 | | | | 29,153 | | |
Xvivo Perfusion AB* | | | 661 | | | | 15,436 | | |
| | | | 165,998 | | |
Switzerland 10.7% | |
Belimo Holding AG | | | 4 | | | | 34,914 | | |
Bossard Holding
AG Class A | | | 77 | | | | 13,629 | | |
Inficon Holding AG | | | 26 | | | | 22,205 | | |
Interroll Holding AG | | | 9 | | | | 24,094 | | |
Kardex Holding AG | | | 93 | | | | 19,260 | | |
Komax Holding AG* | | | 64 | | | | 10,811 | | |
Medacta Group
SA*(b) | | | 183 | | | | 17,329 | | |
Medartis Holding
AG*(a)(b) | | | 276 | | | | 12,641 | | |
Tecan Group AG | | | 77 | | | | 34,771 | | |
VZ Holding AG | | | 291 | | | | 26,043 | | |
| | | | 215,697 | | |
Taiwan 0.2% | |
Bioteque Corp. | | | 1,000 | | | | 4,762 | | |
See Notes to Financial Statements
127
Schedule of Investments International Small Cap Fund^ (cont'd)
| | | Number
of Shares | | Value | |
United Kingdom 18.1% | |
| Biffa PLC(b) | | | 6,880 | | | $ | 18,674 | | |
Big Yellow
Group PLC | | | 1,495 | | | | 21,263 | | |
Bloomsbury
Publishing PLC | | | 4,592 | | | | 12,921 | | |
Clinigen Group PLC | | | 1,974 | | | | 18,169 | | |
| Craneware PLC(a) | | | 573 | | | | 13,213 | | |
Dechra
Pharmaceuticals
PLC | | | 529 | | | | 22,090 | | |
Diploma PLC | | | 1,027 | | | | 26,503 | | |
Essentra PLC | | | 4,050 | | | | 16,502 | | |
Future PLC | | | 688 | | | | 13,483 | | |
Games Workshop
Group PLC | | | 285 | | | | 35,019 | | |
GB Group PLC* | | | 1,978 | | | | 19,073 | | |
Genus PLC | | | 551 | | | | 24,486 | | |
Gocompare.com
Group PLC | | | 16,667 | | | | 25,960 | | |
Ideagen PLC | | | 4,736 | | | | 14,240 | | |
Johnson Service
Group PLC | | | 10,499 | | | | 14,961 | | |
Learning
Technologies
Group PLC | | | 9,459 | | | | 19,198 | | |
On the Beach
Group PLC(b) | | | 2,113 | | | | 8,615 | | |
OneSavings
Bank PLC* | | | 2,566 | | | | 10,444 | | |
Restore PLC | | | 3,560 | | | | 17,314 | | |
Savills PLC | | | 745 | | | | 8,118 | | |
Sensyne Health
PLC* | | | 5,805 | | | | 5,102 | | |
| | | | 365,348 | | |
Total Common Stocks
(Cost $1,602,284) | | | 1,953,986 | | |
| | | Number
of Shares | | Value | |
Short-Term Investments 6.3% | |
Investment Companies 6.3% | |
State Street
Institutional
Treasury Money
Market Fund
Premier Class,
0.03%(c) | | | 38,708 | | | $ | 38,708 | | |
State Street
Navigator
Securities
Lending
Government
Money Market
Portfolio,
0.10%(c)(d) | | | 88,669 | | | | 88,669 | | |
Total Short-Term Investments
(Cost $127,377) | | | 127,377 | | |
Total Investments 103.3%
(Cost $1,729,661) | | | 2,081,363 | | |
Liabilities Less
Other Assets (3.3)% | | | | | (66,427 | ) | |
Net Assets 100.0% | | $ | 2,014,936 | | |
* Non-income producing security.
(a) The security or a portion of this security is on loan at August 31, 2020. Total value of all such securities at August 31, 2020 amounted to $84,556 for the Fund (see Note A of Notes to Financial Statements).
(b) Security exempt from registration pursuant to Regulation S under the Securities Act of 1933, as amended. Regulation S applies to securities offerings that are made outside of the United States and do not involve directed selling efforts in the United States and as such may have restrictions on resale. Total value of all such securities at August 31, 2020 amounted to $211,863, which represents 10.5% of net assets of the Fund.
(c) Represents 7-day effective yield as of August 31, 2020.
(d) Represents investment of cash collateral received from securities lending.
See Notes to Financial Statements
128
Schedule of Investments International Small Cap Fund^ (cont'd)
POSITIONS BY INDUSTRY
Industry | | Investments at
Value | | Percentage of
Net Assets | |
Software | | $ | 237,274 | | | | 11.8 | % | |
Electronic Equipment, Instruments & Components | | | 169,375 | | | | 8.4 | % | |
Health Care Equipment & Supplies | | | 152,522 | | | | 7.6 | % | |
Commercial Services & Supplies | | | 118,391 | | | | 5.9 | % | |
Chemicals | | | 113,511 | | | | 5.6 | % | |
Real Estate Management & Development | | | 90,387 | | | | 4.5 | % | |
Life Sciences Tools & Services | | | 89,441 | | | | 4.4 | % | |
Health Care Technology | | | 88,963 | | | | 4.4 | % | |
Machinery | | | 83,100 | | | | 4.1 | % | |
Pharmaceuticals | | | 80,971 | | | | 4.0 | % | |
Construction & Engineering | | | 77,980 | | | | 3.9 | % | |
Leisure Products | | | 64,172 | | | | 3.2 | % | |
Capital Markets | | | 62,932 | | | | 3.1 | % | |
Food Products | | | 60,907 | | | | 3.0 | % | |
Auto Components | | | 54,109 | | | | 2.7 | % | |
Internet & Direct Marketing Retail | | | 51,926 | | | | 2.6 | % | |
Trading Companies & Distributors | | | 40,132 | | | | 2.0 | % | |
Professional Services | | | 38,763 | | | | 1.9 | % | |
Building Products | | | 34,914 | | | | 1.7 | % | |
IT Services | | | 33,576 | | | | 1.7 | % | |
Health Care Providers & Services | | | 27,732 | | | | 1.4 | % | |
Media | | | 26,404 | | | | 1.3 | % | |
Personal Products | | | 24,571 | | | | 1.2 | % | |
Biotechnology | | | 24,486 | | | | 1.2 | % | |
Equity Real Estate Investment Trusts | | | 21,263 | | | | 1.1 | % | |
Banks | | | 18,556 | | | | 0.9 | % | |
Diversified Financial Services | | | 18,017 | | | | 0.9 | % | |
Hotels, Restaurants & Leisure | | | 13,528 | | | | 0.7 | % | |
Energy Equipment & Services | | | 12,923 | | | | 0.7 | % | |
Insurance | | | 12,716 | | | | 0.6 | % | |
Thrifts & Mortgage Finance | | | 10,444 | | | | 0.5 | % | |
Short-Term Investments and Other Liabilities—Net | | | 60,950 | | | | 3.0 | % | |
| | | $ | 2,014,936 | | | | 100.0 | % | |
See Notes to Financial Statements
129
Schedule of Investments International Small Cap Fund^ (cont'd)
The following is a summary, categorized by Level (see Note A of Notes to Financial Statements), of inputs used to value the Fund's investments as of August 31, 2020:
Asset Valuation Inputs | | Level 1 | | Level 2 | | Level 3 | | Total | |
Investments: | |
Common Stocks | |
Australia | | $ | — | | | $ | 65,281 | | | $ | — | | | $ | 65,281 | | |
Japan | | | — | | | | 392,521 | | | | — | | | | 392,521 | | |
Jersey | | | — | | | | 22,802 | | | | — | | | | 22,802 | | |
Korea | | | — | | | | 7,076 | | | | — | | | | 7,076 | | |
Singapore | | | — | | | | 18,665 | | | | — | | | | 18,665 | | |
Taiwan | | | — | | | | 4,762 | | | | — | | | | 4,762 | | |
United Kingdom | | | — | | | | 365,348 | | | | — | | | | 365,348 | | |
| Other Common Stocks(a) | | | 1,077,531 | | | | — | | | | — | | | | 1,077,531 | | |
Total Common Stocks | | | 1,077,531 | | | | 876,455 | | | | — | | | | 1,953,986 | | |
Short-Term Investments | | | — | | | | 127,377 | | | | — | | | | 127,377 | | |
Total Investments | | $ | 1,077,531 | | | $ | 1,003,832 | | | $ | — | | | $ | 2,081,363 | | |
(a) The Schedule of Investments provides a geographic categorization as well as a Positions by Industry summary.
^ A balance indicated with a "—", reflects either a zero balance or an amount that rounds to less than 1.
See Notes to Financial Statements
130
Schedule of Investments Intrinsic Value Fund^ August 31, 2020
| | | Number
of Shares | | Value | |
Common Stocks 97.4% | |
Aerospace & Defense 2.2% | |
Mercury
Systems, Inc.* | | | 70,847 | | | $ | 5,365,952 | | |
Spirit
AeroSystems
Holdings, Inc.
Class A | | | 123,790 | | | | 2,545,122 | | |
Teledyne
Technologies,
Inc.* | | | 16,152 | | | | 5,065,429 | | |
| | | | 12,976,503 | | |
Banks 5.3% | |
BankUnited,
Inc. | | | 391,408 | | | | 9,151,119 | | |
Comerica, Inc. | | | 193,974 | | | | 7,667,792 | | |
TCF Financial
Corp. | | | 264,670 | | | | 7,114,330 | | |
Texas Capital
Bancshares,
Inc.* | | | 224,400 | | | | 7,268,316 | | |
| | | | 31,201,557 | | |
Building Products 1.6% | |
Resideo
Technologies,
Inc.* | | | 685,700 | | | | 9,160,952 | | |
| Capital Markets 0.0%(a) | |
Alimco Financial
Corp.* | | | 6,537 | | | | 47,393 | | |
Commercial Services & Supplies 4.6% | |
Clean Harbors,
Inc.* | | | 81,009 | | | | 4,949,650 | | |
Covanta
Holding
Corp. | | | 373,836 | | | | 3,529,012 | | |
Harsco Corp.* | | | 284,600 | | | | 4,027,090 | | |
Stericycle, Inc.* | | | 224,799 | | | | 14,411,864 | | |
| | | | 26,917,616 | | |
Communications Equipment 7.4% | |
Ciena Corp.* | | | 410,900 | | | | 23,326,793 | | |
Infinera Corp.* | | | 1,021,883 | | | | 7,449,527 | | |
Radware Ltd.* | | | 93,900 | | | | 2,433,888 | | |
Ribbon
Communications,
Inc.* | | | 779,351 | | | | 3,335,623 | | |
Viavi Solutions,
Inc.* | | | 536,499 | | | | 7,154,214 | | |
| | | | 43,700,045 | | |
| | | Number
of Shares | | Value | |
Construction & Engineering 0.7% | |
Valmont
Industries, Inc. | | | 30,200 | | | $ | 3,836,910 | | |
Containers & Packaging 6.3% | |
Avery
Dennison Corp. | | | 118,136 | | | | 13,631,713 | | |
Crown
Holdings, Inc.* | | | 302,970 | | | | 23,283,245 | | |
| | | | 36,914,958 | | |
Diversified Telecommunication Services 0.5% | |
Vonage
Holdings Corp.* | | | 280,200 | | | | 3,208,290 | | |
Electrical Equipment 1.0% | |
Babcock &
Wilcox
Enterprises, Inc.* | | | 366,581 | | | | 883,460 | | |
Bloom Energy
Corp. Class A* | | | 306,702 | | | | 4,802,954 | | |
| | | | 5,686,414 | | |
Electronic Equipment, Instruments & Components 3.4% | |
II-VI, Inc.* | | | 82,530 | | | | 3,672,585 | | |
Itron, Inc.* | | | 178,131 | | | | 10,611,264 | | |
OSI Systems,
Inc.* | | | 72,794 | | | | 5,732,527 | | |
| | | | 20,016,376 | | |
Energy Equipment & Services 0.8% | |
Dril-Quip, Inc.* | | | 76,100 | | | | 2,521,193 | | |
Forum Energy
Technologies,
Inc.* | | | 469,496 | | | | 256,861 | | |
ION
Geophysical
Corp.* | | | 112,331 | | | | 228,032 | | |
Oil States
International,
Inc.* | | | 164,900 | | | | 723,911 | | |
Patterson-UTI
Energy, Inc. | | | 216,600 | | | | 833,910 | | |
TETRA
Technologies,
Inc.* | | | 601,092 | | | | 408,743 | | |
| | | | 4,972,650 | | |
Food Products 2.3% | |
Hain Celestial
Group, Inc.* | | | 240,094 | | | | 7,872,682 | | |
TreeHouse
Foods, Inc.* | | | 128,962 | | | | 5,520,863 | | |
| | | | 13,393,545 | | |
| | | Number
of Shares | | Value | |
Health Care Equipment & Supplies 3.4% | |
Accuray, Inc.* | | | 1,367,739 | | | $ | 3,186,832 | | |
AtriCure, Inc.* | | | 180,400 | | | | 8,069,292 | | |
Avanos
Medical, Inc.* | | | 115,700 | | | | 3,748,680 | | |
CytoSorbents
Corp.* | | | 135,600 | | | | 1,144,464 | | |
OraSure
Technologies,
Inc.* | | | 313,400 | | | | 3,673,048 | | |
| | | | 19,822,316 | | |
Health Care Providers & Services 5.0% | |
Acadia
Healthcare
Co., Inc.* | | | 274,950 | | | | 8,498,705 | | |
MEDNAX, Inc.* | | | 196,400 | | | | 3,649,112 | | |
Molina
Healthcare,
Inc.* | | | 49,861 | | | | 9,222,789 | | |
Patterson
Cos., Inc. | | | 279,200 | | | | 8,099,592 | | |
| | | | 29,470,198 | | |
Hotels, Restaurants & Leisure 1.0% | |
International
Game
Technology
PLC | | | 306,573 | | | | 3,412,157 | | |
SeaWorld
Entertainment,
Inc.* | | | 125,000 | | | | 2,550,000 | | |
| | | | 5,962,157 | | |
Household Durables 1.3% | |
Tempur Sealy
International,
Inc.* | | | 86,500 | | | | 7,399,210 | | |
Independent Power and Renewable Electricity Producers 3.2% | |
Atlantic
Power Corp.* | | | 1,785,635 | | | | 3,696,264 | | |
Ormat
Technologies,
Inc. | | | 113,041 | | | | 6,880,806 | | |
Vistra Energy
Corp. | | | 439,531 | | | | 8,452,181 | | |
| | | | 19,029,251 | | |
IT Services 4.4% | |
Conduent,
Inc.* | | | 1,576,100 | | | | 5,327,218 | | |
KBR, Inc. | | | 473,400 | | | | 11,830,266 | | |
Unisys Corp.* | | | 746,899 | | | | 8,708,842 | | |
| | | | 25,866,326 | | |
See Notes to Financial Statements
131
Schedule of Investments Intrinsic Value Fund^ (cont'd)
| | | Number
of Shares | | Value | |
Life Sciences Tools & Services 7.0% | |
Charles River
Laboratories
International,
Inc.* | | | 101,092 | | | $ | 22,134,093 | | |
Fluidigm
Corp.* | | | 1,113,537 | | | | 8,741,266 | | |
Luminex Corp. | | | 226,439 | | | | 6,043,657 | | |
NanoString
Technologies,
Inc.* | | | 98,800 | | | | 3,999,424 | | |
| | | | 40,918,440 | | |
Machinery 2.2% | |
Enerpac Tool
Group Corp. | | | 236,775 | | | | 4,924,920 | | |
Lydall, Inc.* | | | 260,891 | | | | 4,899,533 | | |
Twin Disc, Inc.* | | | 107,809 | | | | 652,244 | | |
Welbilt, Inc.* | | | 367,100 | | | | 2,709,198 | | |
| | | | 13,185,895 | | |
Media 1.9% | |
Criteo SA ADR* | | | 868,500 | | | | 11,307,870 | | |
Metals & Mining 0.6% | |
Cleveland-
Cliffs, Inc. | | | 492,300 | | | | 3,239,334 | | |
Oil, Gas & Consumable Fuels 0.5% | |
Devon
Energy Corp. | | | 249,100 | | | | 2,707,717 | | |
Pharmaceuticals 1.4% | |
Amneal
Pharmaceuticals,
Inc.* | | | 910,510 | | | | 3,742,196 | | |
Intersect
ENT, Inc.* | | | 219,988 | | | | 4,417,359 | | |
| | | | 8,159,555 | | |
Professional Services 1.3% | |
CoreLogic, Inc. | | | 115,325 | | | | 7,657,580 | | |
Road & Rail 1.5% | |
Avis Budget
Group, Inc.* | | | 197,341 | | | | 6,731,301 | | |
Ryder System,
Inc. | | | 55,704 | | | | 2,278,294 | | |
| | | | 9,009,595 | | |
| | | Number
of Shares | | Value | |
Semiconductors & Semiconductor Equipment 7.4% | |
CEVA, Inc.* | | | 114,300 | | | $ | 4,829,175 | | |
Entegris, Inc. | | | 102,549 | | | | 6,859,502 | | |
Impinj, Inc.* | | | 90,400 | | | | 2,210,280 | | |
MACOM
Technology
Solutions
Holdings, Inc.* | | | 405,000 | | | | 14,430,150 | | |
Rambus, Inc.* | | | 691,118 | | | | 9,281,715 | | |
Veeco
Instruments,
Inc.* | | | 486,210 | | | | 5,781,037 | | |
| | | | 43,391,859 | | |
Software 15.6% | |
Box, Inc.
Class A* | | | 268,927 | | | | 5,279,037 | | |
Cloudera,
Inc.* | | | 1,165,734 | | | | 15,399,346 | | |
FireEye, Inc.* | | | 783,516 | | | | 11,502,015 | | |
MobileIron,
Inc.* | | | 487,400 | | | | 3,182,722 | | |
New Relic,
Inc.* | | | 27,000 | | | | 1,658,610 | | |
Nuance
Communications,
Inc.* | | | 817,562 | | | | 24,494,158 | | |
OneSpan, Inc.* | | | 264,300 | | | | 5,695,665 | | |
Talend SA
ADR* | | | 107,607 | | | | 4,431,256 | | |
Verint
Systems, Inc.* | | | 290,061 | | | | 13,795,301 | | |
Xperi
Holding Corp. | | | 493,149 | | | | 6,179,157 | | |
| | | | 91,617,267 | | |
Specialty Retail 1.0% | |
Chico's FAS,
Inc. | | | 479,226 | | | | 613,409 | | |
Children's
Place, Inc. | | | 68,700 | | | | 1,371,596 | | |
Express, Inc.* | | | 285,300 | | | | 316,683 | | |
ODP Corp. | | | 163,956 | | | | 3,833,291 | | |
| | | | 6,134,979 | | |
| | | Number
of Shares | | Value | |
Technology Hardware, Storage & Peripherals 2.1% | |
Diebold
Nixdorf, Inc.* | | | 616,117 | | | $ | 5,138,416 | | |
Quantum
Corp.* | | | 478,335 | | | | 2,611,709 | | |
Stratasys Ltd.* | | | 316,518 | | | | 4,703,457 | | |
| | | | 12,453,582 | | |
Trading Companies & Distributors 0.5% | |
AerCap
Holdings NV* | | | 98,800 | | | | 2,921,516 | | |
Total Common Stocks
(Cost $469,318,381) | | | 572,287,856 | | |
| | | Principal
Amount | | | |
Convertible Bonds 1.8% | |
Communications Equipment 1.8% | |
Infinera
Corp.,
2.50%, due
3/1/2027(b)
(Cost $9,304,000) | | $ | 9,304,000 | | | | 10,839,183 | | |
| | | Number
of Shares | | | |
Short-Term Investments 0.7% | |
Investment Companies 0.7% | |
State Street
Institutional
Treasury
Money Market
Fund Premier
Class, 0.03%(c)
(Cost $3,875,210) | | | 3,875,210 | | | | 3,875,210 | | |
Total Investments 99.9%
(Cost $482,497,591) | | | 587,002,249 | | |
Other Assets
Less Liabilities 0.1% | | | | | 609,185 | | |
Net Assets 100.0% | | $ | 587,611,434 | | |
* Non-income producing security.
(a) Represents less than 0.05% of net assets of the Fund.
(b) Securities were purchased under Rule 144A of the Securities Act of 1933, as amended, or are otherwise restricted and, unless registered under the Securities Act of 1933 or exempted from registration, may only be sold to qualified institutional investors or may have other restrictions on resale. At August 31, 2020, these securities amounted to $10,839,183, which represents 1.8% of net assets of the Fund.
See Notes to Financial Statements
132
Schedule of Investments Intrinsic Value Fund^ (cont'd)
(c) Represents 7-day effective yield as of August 31, 2020.
The following is a summary, categorized by Level (see Note A of Notes to Financial Statements), of inputs used to value the Fund's investments as of August 31, 2020:
Asset Valuation Inputs | | Level 1 | | Level 2 | | Level 3 | | Total | |
Investments: | |
| Common Stocks(a) | | $ | 572,287,856 | | | $ | — | | | $ | — | | | $ | 572,287,856 | | |
| Convertible Bonds(a) | | | — | | | | 10,839,183 | | | | — | | | | 10,839,183 | | |
Short-Term Investments | | | — | | | | 3,875,210 | | | | — | | | | 3,875,210 | | |
Total Investments | | $ | 572,287,856 | | | $ | 14,714,393 | | | $ | — | | | $ | 587,002,249 | | |
(a) The Schedule of Investments provides information on the industry categorization for the portfolio.
^ A balance indicated with a "—", reflects either a zero balance or an amount that rounds to less than 1.
See Notes to Financial Statements
133
Schedule of Investments Large Cap Value Fund^ August 31, 2020
| | |
Number
of Shares | |
Value | |
Common Stocks 94.7% | |
Aerospace & Defense 1.2% | |
Boeing Co. | | | 121,492 | | | $ | 20,874,755 | | |
Airlines 2.8% | |
Delta Air
Lines, Inc. | | | 998,150 | | | | 30,792,927 | | |
United
Airlines
Holdings,
Inc.* | | | 522,584 | | | | 18,813,024 | | |
| | | | 49,605,951 | | |
Automobiles 1.8% | |
General
Motors Co. | | | 799,902 | | | | 23,701,096 | | |
Thor
Industries,
Inc. | | | 89,436 | | | | 8,445,442 | | |
| | | | 32,146,538 | | |
Banks 14.4% | |
Bank of
America
Corp. | | | 1,278,650 | | | | 32,912,451 | | |
Citigroup,
Inc. | | | 960,427 | | | | 49,097,028 | | |
Comerica,
Inc. | | | 702,361 | | | | 27,764,330 | | |
JPMorgan
Chase &
Co. | | | 725,860 | | | | 72,723,913 | | |
M&T Bank
Corp. | | | 67,987 | | | | 7,020,338 | | |
PNC
Financial
Services
Group, Inc. | | | 168,470 | | | | 18,733,864 | | |
Regions
Financial
Corp. | | | 599,444 | | | | 6,929,573 | | |
Truist
Financial
Corp. | | | 440,395 | | | | 17,091,730 | | |
U.S.
Bancorp | | | 521,917 | | | | 18,997,779 | | |
| | | | 251,271,006 | | |
Beverages 1.1% | |
Monster
Beverage
Corp.* | | | 229,124 | | | | 19,214,339 | | |
Capital Markets 1.5% | |
Goldman
Sachs
Group, Inc. | |
| 81,099
195,812 |
| |
| 16,614,752
10,233,135 |
| |
Morgan
Stanley | |
| | | | 26,847,887 | | |
| | |
Number
of Shares | |
Value | |
Chemicals 0.7% | |
DuPont de
Nemours,
Inc. | | | 232,266 | | | $ | 12,951,152 | | |
Communications Equipment 0.9% | |
Cisco
Systems,
Inc. | | | 365,980 | | | | 15,451,676 | | |
Construction & Engineering 0.5% | |
Fluor Corp. | | | 999,373 | | | | 9,514,031 | | |
Diversified Financial Services 0.6% | |
Equitable
Holdings,
Inc. | | | 500,928 | | | | 10,614,664 | | |
Electric Utilities 0.6% | |
American
Electric
Power Co.,
Inc. | | | 136,133 | | | | 10,731,364 | | |
Electrical Equipment 0.8% | |
Emerson
Electric Co. | | | 74,074 | | | | 5,145,921 | | |
Rockwell
Automation,
Inc. | | | 38,704 | | | | 8,922,433 | | |
| | | | 14,068,354 | | |
Energy Equipment & Services 1.3% | |
Schlumberger
Ltd. | | | 1,163,379 | | | | 22,115,835 | | |
Entertainment 1.4% | |
Walt Disney
Co. | | | 184,749 | | | | 24,362,851 | | |
Equity Real Estate Investment Trusts 3.4% | |
American
Homes 4
Rent
Class A | | | 845,937 | | | | 24,227,636 | | |
Prologis, Inc. | | | 343,405 | | | | 34,979,233 | | |
| | | | 59,206,869 | | |
Food Products 1.8% | |
General
Mills, Inc. | | | 131,106 | | | | 8,384,229 | | |
Mondelez
International,
Inc. Class A | | | 391,510 | | | | 22,872,014 | | |
| | | | 31,256,243 | | |
Health Care Equipment & Supplies 3.6% | |
Abbott
Laboratories | | | 173,158 | | | | 18,955,606 | | |
Baxter
International,
Inc. | | | 251,022 | | | | 21,856,486 | | |
| | |
Number
of Shares | |
Value | |
Medtronic
PLC | | | 211,240 | | | $ | 22,701,963 | | |
| | | | 63,514,055 | | |
Health Care Providers & Services 2.5% | |
Amerisource
Bergen
Corp. | | | 105,692 | | | | 10,255,295 | | |
HCA
Healthcare,
Inc. | | | 189,310 | | | | 25,693,153 | | |
UnitedHealth
Group, Inc. | | | 22,015 | | | | 6,880,788 | | |
| | | | 42,829,236 | | |
Hotels, Restaurants & Leisure 2.3% | |
Carnival
Corp. | | | 1,305,241 | | | | 21,510,372 | | |
Hilton
Worldwide
Holdings,
Inc. | | | 19,745 | | | | 1,784,158 | | |
Marriott
International,
Inc. Class A | | | 125,386 | | | | 12,903,473 | | |
Yum China
Holdings,
Inc. | | | 79,558 | | | | 4,591,292 | | |
| | | | 40,789,295 | | |
Household Durables 0.5% | |
PulteGroup,
Inc. | | | 201,833 | | | | 8,999,733 | | |
Household Products 1.3% | |
Procter &
Gamble Co. | | | 168,561 | | | | 23,317,043 | | |
Industrial Conglomerates 3.0% | |
3M Co. | | | 74,841 | | | | 12,200,580 | | |
General
Electric Co. | | | 6,223,394 | | | | 39,456,318 | | |
| | | | 51,656,898 | | |
Insurance 5.4% | |
Athene
Holding
Ltd.
Class A* | | | 355,585 | | | | 13,000,188 | | |
Chubb Ltd. | | | 120,302 | | | | 15,037,750 | | |
Lincoln
National
Corp. | | | 826,963 | | | | 29,812,016 | | |
MetLife, Inc. | | | 674,214 | | | | 25,930,270 | | |
Prudential
Financial,
Inc. | | | 152,838 | | | | 10,357,831 | | |
| | | | 94,138,055 | | |
See Notes to Financial Statements
134
Schedule of Investments Large Cap Value Fund^ (cont'd)
| | |
Number
of Shares | |
Value | |
Internet & Direct Marketing Retail 0.4% | |
Booking
Holdings,
Inc.* | | | 3,866 | | | $ | 7,385,800 | | |
Life Sciences Tools & Services 0.6% | |
Agilent
Technologies,
Inc. | | | 95,130 | | | | 9,552,955 | | |
Machinery 7.4% | |
Caterpillar,
Inc. | | | 250,669 | | | | 35,672,705 | | |
Cummins,
Inc. | | | 115,648 | | | | 23,968,048 | | |
Illinois Tool
Works, Inc. | | | 163,119 | | | | 32,224,159 | | |
Otis
Worldwide
Corp. | | | 54,344 | | | | 3,418,238 | | |
Parker-
Hannifin
Corp. | | | 166,624 | | | | 34,326,210 | | |
| | | | 129,609,360 | | |
Metals & Mining 17.1% | |
Agnico
Eagle
Mines Ltd. | | | 531,424 | | | | 43,842,480 | | |
Alcoa Corp.* | | | 493,702 | | | | 7,217,923 | | |
BHP Group
Ltd. ADR(a) | | | 1,007,360 | | | | 55,465,242 | | |
Franco-
Nevada
Corp. | | | 269,462 | | | | 40,548,642 | | |
Freeport-
McMoRan,
Inc. | | | 1,867,100 | | | | 29,145,431 | | |
Newmont
Corp. | | | 774,454 | | | | 52,105,265 | | |
Rio Tinto
PLC ADR | | | 374,032 | | | | 22,901,979 | | |
Southern
Copper
Corp. | | | 986,316 | | | | 47,441,800 | | |
| | | | 298,668,762 | | |
Multi-Utilities 1.0% | |
CenterPoint
Energy, Inc. | | | 434,209 | | | | 8,714,575 | | |
Dominion
Energy, Inc. | | | 100,718 | | | | 7,900,320 | | |
| | | | 16,614,895 | | |
Oil, Gas & Consumable Fuels 6.8% | |
Chevron
Corp. | | | 137,041 | | | | 11,501,851 | | |
Conoco
Phillips | | | 277,786 | | | | 10,525,312 | | |
| | |
Number
of Shares | |
Value | |
EOG
Resources,
Inc. | | | 694,562 | | | $ | 31,491,441 | | |
Hess Corp. | | | 361,250 | | | | 16,631,950 | | |
Phillips 66 | | | 470,628 | | | | 27,517,619 | | |
WPX
Energy,
Inc.* | | | 3,652,252 | | | | 20,306,521 | | |
| | | | 117,974,694 | | |
Pharmaceuticals 3.6% | |
Johnson &
Johnson | | | 347,702 | | | | 53,340,964 | | |
Teva
Pharmaceutical
Industries
Ltd. ADR* | | | 1,011,679 | | | | 9,985,271 | | |
| | | | 63,326,235 | | |
Specialty Retail 1.3% | |
American
Eagle
Outfitters,
Inc. | | | 631,224 | | | | 7,959,735 | | |
AutoZone,
Inc.* | | | 11,804 | | | | 14,121,243 | | |
| | | | 22,080,978 | | |
Tobacco 3.1% | |
Philip
Morris
International,
Inc. | | | 673,011 | | | | 53,699,548 | | |
Total Common Stocks
(Cost $1,459,535,911) | | | 1,654,391,057 | | |
Short-Term Investments 10.5% | |
Investment Companies 10.5% | |
State
Street
Institutional
U.S.
Government
Money
Market
Fund
Premier
Class,
0.04%(b) | | | 129,369,976 | | | | 129,369,976 | | |
| | |
Number
of Shares | |
Value | |
State
Street
Navigator
Securities
Lending
Government
Money
Market
Portfolio,
0.10%(b)(c) | | | 54,809,889 | | | $ | 54,809,889 | | |
Total Short-Term
Investments
(Cost $184,179,865) | | | 184,179,865 | | |
Total
Investments 105.2%
(Cost $1,643,715,776) | | | 1,838,570,922 | | |
Liabilities Less
Other Assets (5.2)% | | | | | (90,969,366 | ) | |
Net Assets 100.0% | | $ | 1,747,601,556 | | |
See Notes to Financial Statements
135
Schedule of Investments Large Cap Value Fund^ (cont'd)
* Non-income producing security.
(a) The security or a portion of this security is on loan at August 31, 2020. Total value of all such securities at August 31, 2020 amounted to $52,944,430 for the Fund (see Note A of Notes to Financial Statements).
(b) Represents 7-day effective yield as of August 31, 2020.
(c) Represents investment of cash collateral received from securities lending.
POSITIONS BY COUNTRY
Country | | Investments at
Value | | Percentage of
Net Assets | |
United States | | $ | 1,429,614,351 | | | | 81.8 | % | |
Canada | | | 84,391,122 | | | | 4.8 | % | |
Australia | | | 78,367,221 | | | | 4.5 | % | |
Peru | | | 47,441,800 | | | | 2.7 | % | |
Israel | | | 9,985,271 | | | | 0.6 | % | |
China | | | 4,591,292 | | | | 0.3 | % | |
Short-Term Investments and Other Liabilities—Net | | | 93,210,499 | | | | 5.3 | % | |
| | | $ | 1,747,601,556 | | | | 100.0 | % | |
The following is a summary, categorized by Level (see Note A of Notes to Financial Statements), of inputs used to value the Fund's investments as of August 31, 2020:
Asset Valuation Inputs | | Level 1 | | Level 2 | | Level 3 | | Total | |
Investments: | |
| Common Stocks(a) | | $ | 1,654,391,057 | | | $ | — | | | $ | — | | | $ | 1,654,391,057 | | |
Short-Term Investments | | | — | | | | 184,179,865 | | | | — | | | | 184,179,865 | | |
Total Investments | | $ | 1,654,391,057 | | | $ | 184,179,865 | | | $ | — | | | $ | 1,838,570,922 | | |
(a) The Schedule of Investments provides information on the industry categorization as well as a Positions by Country summary.
^ A balance indicated with a "—", reflects either a zero balance or an amount that rounds to less than 1.
See Notes to Financial Statements
136
Schedule of Investments Mid Cap Growth Fund^ August 31, 2020
| | | Number
of Shares | | Value | |
Common Stocks 98.4% | |
Aerospace & Defense 2.2% | |
Axon
Enterprise,
Inc.* | | | 105,000 | | | $ | 8,996,400 | | |
HEICO Corp. | | | 135,000 | | | | 14,839,200 | | |
Teledyne
Technologies,
Inc.* | | | 35,000 | | | | 10,976,350 | | |
| | | | 34,811,950 | | |
Auto Components 0.7% | |
Aptiv PLC | | | 125,000 | | | | 10,765,000 | | |
Banks 1.2% | |
SVB
Financial
Group* | | | 75,000 | | | | 19,153,500 | | |
Beverages 1.1% | |
Boston Beer
Co., Inc.
Class A* | | | 20,000 | | | | 17,639,600 | | |
Biotechnology 4.2% | |
ACADIA
Pharmaceuticals,
Inc.* | | | 225,000 | | | | 8,907,750 | | |
Ascendis
Pharma
A/S ADR* | | | 80,000 | | | | 11,854,400 | | |
Exact
Sciences
Corp.* | | | 195,000 | | | | 14,681,550 | | |
Global
Blood
Therapeutics,
Inc.* | | | 125,000 | | | | 7,847,500 | | |
Incyte Corp.* | | | 105,000 | | | | 10,116,750 | | |
Seattle
Genetics,
Inc.* | | | 92,500 | | | | 14,646,450 | | |
| | | | 68,054,400 | | |
Capital Markets 2.9% | |
Cboe Global
Markets,
Inc. | | | 125,000 | | | | 11,473,750 | | |
Houlihan
Lokey, Inc. | | | 150,000 | | | | 8,790,000 | | |
MarketAxess
Holdings,
Inc. | | | 30,000 | | | | 14,578,200 | | |
Raymond
James
Financial, Inc. | | | 146,700 | | | | 11,108,124 | | |
| | | | 45,950,074 | | |
| | | Number
of Shares | | Value | |
Commercial Services & Supplies 3.5% | |
Cintas Corp. | | | 100,000 | | | $ | 33,324,000 | | |
Waste
Connections,
Inc. | | | 225,000 | | | | 22,506,750 | | |
| | | | 55,830,750 | | |
Containers & Packaging 1.0% | |
Ball Corp. | | | 200,000 | | | | 16,074,000 | | |
Diversified Consumer Services 1.9% | |
Bright
Horizons
Family
Solutions,
Inc.* | | | 120,000 | | | | 15,961,200 | | |
Chegg, Inc.* | | | 200,000 | | | | 14,748,000 | | |
| | | | 30,709,200 | | |
Electrical Equipment 2.6% | |
AMETEK,
Inc. | | | 225,000 | | | | 22,657,500 | | |
Generac
Holdings,
Inc.* | | | 101,000 | | | | 19,187,980 | | |
| | | | 41,845,480 | | |
Electronic Equipment, Instruments & Components 3.2% | |
Amphenol
Corp.
Class A | | | 162,500 | | | | 17,842,500 | | |
CDW Corp. | | | 150,000 | | | | 17,047,500 | | |
Zebra
Technologies
Corp.
Class A* | | | 57,500 | | | | 16,475,475 | | |
| | | | 51,365,475 | | |
Entertainment 1.4% | |
Spotify
Technology
SA* | | | 80,000 | | | | 22,572,800 | | |
Equity Real Estate Investment Trusts 0.6% | |
SBA
Communications
Corp. | | | 30,000 | | | | 9,182,100 | | |
Food & Staples Retailing 1.2% | |
BJ's
Wholesale
Club
Holdings,
Inc.* | | | 437,500 | | | | 19,429,375 | | |
Health Care Equipment & Supplies 7.1% | |
IDEXX
Laboratories,
Inc.* | | | 55,000 | | | | 21,508,300 | | |
| | | Number
of Shares | | Value | |
Insulet Corp.* | | | 105,000 | | | $ | 22,916,250 | | |
Masimo Corp.* | | | 50,000 | | | | 11,200,000 | | |
Penumbra,
Inc.* | | | 85,000 | | | | 17,777,750 | | |
Quidel Corp.* | | | 45,000 | | | | 7,918,200 | | |
Teleflex, Inc. | | | 50,000 | | | | 19,647,500 | | |
West
Pharmaceutical
Services,
Inc. | | | 45,000 | | | | 12,778,200 | | |
| | | | 113,746,200 | | |
Health Care Providers & Services 1.3% | |
Encompass
Health
Corp. | | | 150,000 | | | | 9,786,000 | | |
Quest
Diagnostics,
Inc. | | | 95,000 | | | | 10,567,800 | | |
| | | | 20,353,800 | | |
Health Care Technology 3.1% | |
Teladoc
Health,
Inc.*(a) | | | 81,500 | | | | 17,578,735 | | |
Veeva
Systems,
Inc. Class A* | | | 112,500 | | | | 31,755,375 | | |
| | | | 49,334,110 | | |
Hotels, Restaurants & Leisure 2.4% | |
Chipotle
Mexican
Grill, Inc.* | | | 14,000 | | | | 18,343,920 | | |
Darden
Restaurants,
Inc. | | | 115,000 | | | | 9,967,050 | | |
Vail Resorts,
Inc. | | | 48,000 | | | | 10,448,160 | | |
| | | | 38,759,130 | | |
Household Products 1.2% | |
Church &
Dwight Co.,
Inc. | | | 200,000 | | | | 19,166,000 | | |
Industrial Conglomerates 1.1% | |
Roper
Technologies,
Inc. | | | 42,500 | | | | 18,155,575 | | |
Interactive Media & Services 2.5% | |
IAC/
InterActiveCorp.* | | | 95,000 | | | | 12,634,050 | | |
Match
Group,
Inc.* | | | 100,000 | | | | 11,168,000 | | |
Pinterest,
Inc.
Class A* | | | 425,000 | | | | 15,635,750 | | |
| | | | 39,437,800 | | |
See Notes to Financial Statements
137
Schedule of Investments Mid Cap Growth Fund^ (cont'd)
| | | Number
of Shares | | Value | |
Internet & Direct Marketing
Retail 0.5% | |
Etsy, Inc.* | | | 70,000 | | | $ | 8,379,000 | | |
IT Services 8.2% | |
EPAM
Systems,
Inc.* | | | 80,000 | | | | 26,168,000 | | |
Jack Henry &
Associates,
Inc. | | | 62,500 | | | | 10,338,750 | | |
MongoDB,
Inc.* | | | 90,000 | | | | 21,042,000 | | |
Okta, Inc.* | | | 130,000 | | | | 27,998,100 | | |
Twilio, Inc.
Class A* | | | 100,000 | | | | 26,976,000 | | |
Wix.com
Ltd.* | | | 65,000 | | | | 19,150,950 | | |
| | | | 131,673,800 | | |
Life Sciences Tools & Services 3.4% | |
Avantor,
Inc.* | | | 625,000 | | | | 14,106,250 | | |
Bio-Rad
Laboratories,
Inc. Class A* | | | 47,500 | | | | 24,158,025 | | |
PPD, Inc.* | | | 450,000 | | | | 15,453,000 | | |
| | | | 53,717,275 | | |
Machinery 2.1% | |
IDEX Corp. | | | 130,000 | | | | 23,429,900 | | |
Stanley
Black &
Decker, Inc. | | | 60,000 | | | | 9,678,000 | | |
| | | | 33,107,900 | | |
Media 0.8% | |
Nexstar Media
Group, Inc.
Class A | | | 141,500 | | | | 13,585,415 | | |
Multiline Retail 0.6% | |
Ollie's
Bargain
Outlet
Holdings, Inc.* | | | 100,000 | | | | 9,554,000 | | |
Pharmaceuticals 1.8% | |
Catalent, Inc.* | | | 150,000 | | | | 13,875,000 | | |
Horizon
Therapeutics
PLC* | | | 190,000 | | | | 14,272,800 | | |
| | | | 28,147,800 | | |
Professional Services 2.5% | |
Clarivate
PLC* | | | 450,000 | | | | 13,248,000 | | |
CoStar
Group,
Inc.* | | | 32,500 | | | | 27,579,500 | | |
| | | | 40,827,500 | | |
| | | Number
of Shares | | Value | |
Road & Rail 1.2% | |
Old
Dominion
Freight
Line, Inc. | | | 95,000 | | | $ | 19,207,100 | | |
Semiconductors & Semiconductor Equipment 7.4% | |
Entegris, Inc. | | | 180,000 | | | | 12,040,200 | | |
Inphi Corp.* | | | 165,000 | | | | 18,806,700 | | |
KLA Corp. | | | 105,000 | | | | 21,539,700 | | |
Marvell
Technology
Group Ltd. | | | 660,000 | | | | 25,594,800 | | |
Monolithic
Power
Systems,
Inc. | | | 95,000 | | | | 25,377,350 | | |
Teradyne,
Inc. | | | 175,000 | | | | 14,869,750 | | |
| | | | 118,228,500 | | |
Software 16.7% | |
Avalara, Inc.* | | | 135,000 | | | | 17,875,350 | | |
Cloudflare,
Inc. Class A* | | | 375,000 | | | | 14,347,500 | | |
Coupa
Software,
Inc.* | | | 72,500 | | | | 23,761,150 | | |
Crowdstrike
Holdings,
Inc. Class A* | | | 150,000 | | | | 18,859,500 | | |
DocuSign,
Inc.* | | | 125,000 | | | | 27,875,000 | | |
Everbridge,
Inc.* | | | 165,000 | | | | 24,520,650 | | |
Five9, Inc.* | | | 125,000 | | | | 15,930,000 | | |
HubSpot, Inc.* | | | 45,000 | | | | 13,485,600 | | |
Paylocity
Holding
Corp.* | | | 127,500 | | | | 18,774,375 | | |
Q2 Holdings,
Inc.* | | | 155,000 | | | | 15,079,950 | | |
RingCentral,
Inc. Class A* | | | 95,000 | | | | 27,623,150 | | |
Splunk, Inc.* | | | 130,000 | | | | 28,512,900 | | |
Trade Desk,
Inc. Class A* | | | 42,500 | | | | 20,455,250 | | |
| | | | 267,100,375 | | |
Specialty Retail 5.2% | |
Best
Buy Co., Inc. | | | 75,000 | | | | 8,318,250 | | |
Burlington
Stores,
Inc.* | | | 110,000 | | | | 21,662,300 | | |
CarMax,
Inc.* | | | 140,000 | | | | 14,970,200 | | |
| | | Number
of Shares | | Value | |
Five Below,
Inc.* | | | 132,500 | | | $ | 14,502,125 | | |
O'Reilly
Automotive,
Inc.* | | | 50,000 | | | | 23,281,500 | | |
| | | | 82,734,375 | | |
Textiles, Apparel & Luxury Goods 0.5% | |
Columbia
Sportswear Co. | | | 90,000 | | | | 7,701,300 | | |
Trading Companies &
Distributors 1.1% | |
United
Rentals, Inc.* | | | 102,500 | | | | 18,147,625 | | |
Total Common Stocks
(Cost $1,012,318,546) | | | | | 1,574,448,284 | | |
Short-Term Investments 2.2% | |
Investment Companies 2.2% | |
State
Street
Institutional
U.S.
Government
Money
Market
Fund
Premier
Class,
0.04%(b) | | | 17,069,463 | | | | 17,069,463 | | |
State
Street
Navigator
Securities
Lending
Government
Money
Market
Portfolio,
0.10%(b)(c) | | | 17,302,532 | | | | 17,302,532 | | |
Total Short-Term
Investments
(Cost $34,371,995) | | | | | 34,371,995 | | |
Total
Investments 100.6%
(Cost $1,046,690,541) | | | | | 1,608,820,279 | | |
Liabilities Less
Other Assets (0.6)% | | | | | (9,548,805 | ) | |
Net Assets 100.0% | | $ | 1,599,271,474 | | |
See Notes to Financial Statements
138
Schedule of Investments Mid Cap Growth Fund^ (cont'd)
* Non-income producing security.
(a) The security or a portion of this security is on loan at August 31, 2020. Total value of all such securities at August 31, 2020 amounted to $17,541,636 for the Fund (see Note A of Notes to Financial Statements).
(b) Represents 7-day effective yield as of August 31, 2020.
(c) Represents investment of cash collateral received from securities lending.
The following is a summary, categorized by Level (see Note A of Notes to Financial Statements), of inputs used to value the Fund's investments as of August 31, 2020:
Asset Valuation Inputs | | Level 1 | | Level 2 | | Level 3 | | Total | |
Investments: | |
| Common Stocks(a) | | $ | 1,574,448,284 | | | $ | — | | | $ | — | | | $ | 1,574,448,284 | | |
Short-Term Investments | | | — | | | | 34,371,995 | | | | — | | | | 34,371,995 | | |
Total Investments | | $ | 1,574,448,284 | | | $ | 34,371,995 | | | $ | — | | | $ | 1,608,820,279 | | |
(a) The Schedule of Investments provides information on the industry categorization for the portfolio.
^ A balance indicated with a "—", reflects either a zero balance or an amount that rounds to less than 1.
See Notes to Financial Statements
139
Schedule of Investments Mid Cap Intrinsic Value Fund^ August 31, 2020
| | |
Number
of Shares | |
Value | |
Common Stocks 98.7% | |
Aerospace & Defense 4.9% | |
General Dynamics
Corp. | | | 11,050 | | | $ | 1,650,317 | | |
Hexcel Corp. | | | 12,500 | | | | 492,375 | | |
| | | | 2,142,692 | | |
Auto Components 3.3% | |
Aptiv PLC | | | 16,700 | | | | 1,438,204 | | |
Banks 5.0% | |
BankUnited, Inc. | | | 44,600 | | | | 1,042,748 | | |
Comerica, Inc. | | | 18,200 | | | | 719,446 | | |
Truist Financial
Corp. | | | 11,200 | | | | 434,672 | | |
| | | | 2,196,866 | | |
Beverages 2.7% | |
Molson Coors
Brewing Co.
Class B | | | 31,100 | | | | 1,170,604 | | |
Biotechnology 4.0% | |
Alexion
Pharmaceuticals,
Inc.* | | | 15,200 | | | | 1,736,144 | | |
Building Products 2.9% | |
Johnson Controls
International PLC | | | 30,900 | | | | 1,258,557 | | |
Capital Markets 1.2% | |
State Street Corp. | | | 7,900 | | | | 537,911 | | |
Chemicals 3.3% | |
Ashland Global
Holdings, Inc. | | | 19,200 | | | | 1,414,848 | | |
Commercial Services & Supplies 1.8% | |
KAR Auction
Services, Inc. | | | 45,300 | | | | 785,502 | | |
Communications Equipment 3.9% | |
Ciena Corp.* | | | 16,700 | | | | 948,059 | | |
Motorola
Solutions, Inc. | | | 4,900 | | | | 758,275 | | |
| | | | 1,706,334 | | |
Construction & Engineering 1.0% | |
Valmont Industries,
Inc. | | | 3,500 | | | | 444,675 | | |
Electric Utilities 4.1% | |
Evergy, Inc. | | | 26,300 | | | | 1,399,686 | | |
OGE Energy Corp. | |
| 12,300 |
| |
| 391,878 |
| |
| | | | 1,791,564 | | |
Electronic Equipment, Instruments & Components 3.1% | |
CDW Corp. | | | 7,800 | | | | 886,470 | | |
Itron, Inc.* | | | 7,600 | | | | 452,732 | | |
| | | | 1,339,202 | | |
| | |
Number
of Shares | |
Value | |
Entertainment 3.0% | |
Lions Gate
Entertainment
Corp. Class A* | | | 20,700 | | | $ | 201,618 | | |
Lions Gate
Entertainment
Corp. Class B* | | | 119,800 | | | | 1,085,388 | | |
| | | | 1,287,006 | | |
Equity Real Estate Investment
Trusts 1.0% | |
Regency Centers
Corp. | | | 10,700 | | | | 424,897 | | |
Food & Staples Retailing 1.5% | |
BJ's Wholesale
Club Holdings,
Inc.* | | | 14,500 | | | | 643,945 | | |
Food Products 4.8% | |
Hain Celestial
Group, Inc.* | | | 22,100 | | | | 724,659 | | |
TreeHouse Foods,
Inc.* | | | 31,600 | | | | 1,352,796 | | |
| | | | 2,077,455 | | |
Health Care Equipment &
Supplies 4.6% | |
Zimmer Biomet
Holdings, Inc. | | | 14,200 | | | | 2,000,496 | | |
Health Care Providers & Services 1.4% | |
MEDNAX, Inc.* | | | 33,800 | | | | 628,004 | | |
Hotels, Restaurants & Leisure 5.2% | |
MGM Resorts
International | | | 54,500 | | | | 1,226,250 | | |
Wyndham
Destinations,
Inc. | | | 36,600 | | | | 1,061,034 | | |
| | | | 2,287,284 | | |
Independent Power and Renewable Electricity Producers 3.7% | |
AES Corp. | | | 54,000 | | | | 958,500 | | |
Vistra Energy
Corp. | | | 34,800 | | | | 669,204 | | |
| | | | 1,627,704 | | |
Industrial Conglomerates 1.2% | |
Carlisle Cos, Inc. | | | 4,100 | | | | 536,895 | | |
IT Services 4.7% | |
Amdocs Ltd. | | | 14,400 | | | | 881,712 | | |
Conduent, Inc.* | | | 143,600 | | | | 485,368 | | |
Perspecta, Inc. | | | 32,100 | | | | 666,717 | | |
| | | | 2,033,797 | | |
Machinery 0.9% | |
Stanley Black &
Decker, Inc. | | | 2,500 | | | | 403,250 | | |
| | |
Number
of Shares | |
Value | |
Mortgage Real Estate Investment Trusts 3.0% | |
Starwood Property
Trust, Inc. | | | 83,200 | | | $ | 1,297,920 | | |
Multi-Utilities 1.5% | |
CenterPoint
Energy, Inc. | | | 33,400 | | | | 670,338 | | |
Multiline Retail 1.9% | |
Dollar Tree, Inc.* | | | 8,800 | | | | 847,176 | | |
Oil, Gas & Consumable Fuels 6.1% | |
EOG Resources,
Inc. | | | 15,300 | | | | 693,702 | | |
ONEOK, Inc. | | | 37,100 | | | | 1,019,508 | | |
Phillips 66 | | | 6,400 | | | | 374,208 | | |
Williams Cos.,
Inc. | | | 26,500 | | | | 550,140 | | |
| | | | 2,637,558 | | |
Semiconductors & Semiconductor Equipment 4.8% | |
NXP
Semiconductors
NV | | | 6,800 | | | | 855,168 | | |
Skyworks
Solutions, Inc. | | | 8,400 | | | | 1,216,740 | | |
| | | | 2,071,908 | | |
Software 2.2% | |
Nuance
Communications,
Inc.* | | | 32,300 | | | | 967,708 | | |
Specialty Retail 1.3% | |
Chico's FAS,
Inc. | | | 154,600 | | | | 197,888 | | |
Children's Place,
Inc. | | | 19,300 | | | | 385,325 | | |
| | | | 583,213 | | |
Technology Hardware, Storage & Peripherals 2.0% | |
Western Digital
Corp. | | | 23,036 | | | | 885,043 | | |
Trading Companies &
Distributors 2.7% | |
AerCap Holdings
NV* | | | 17,500 | | | | 517,475 | | |
HD Supply
Holdings, Inc.* | | | 16,400 | | | | 650,424 | | |
| | | | 1,167,899 | | |
Total Common Stocks
(Cost $41,750,218) | | | | | | | 43,042,599 | | |
See Notes to Financial Statements
140
Schedule of Investments Mid Cap Intrinsic Value Fund^ (cont'd)
| | |
Number
of Shares | |
Value | |
Warrants 0.1% | |
Diversified Consumer Services 0.1% | |
OneSpaWorld
Holdings Ltd.
Expires 3/19/2024*
(Cost $—) | | | 18,168 | | | $ | 30,341 | | |
Short-Term Investments 3.3% | |
Investment Companies 3.3% | |
State Street
Institutional U.S.
Government
Money Market
Fund Premier
Class, 0.04%(a)
(Cost $1,451,952) | | | 1,451,952 | | | | 1,451,952 | | |
Total Investments 102.1%
(Cost $43,202,170) | | | | | 44,524,892 | | |
Liabilities Less
Other Assets (2.1)% | | | | | (898,641 | ) | |
Net Assets 100.0% | | | | $ | 43,626,251 | | |
* Non-income producing security.
(a) Represents 7-day effective yield as of August 31, 2020.
The following is a summary, categorized by Level (see Note A of Notes to Financial Statements), of inputs used to value the Fund's investments as of August 31, 2020:
Asset Valuation Inputs | | Level 1 | | Level 2 | | Level 3 | | Total | |
Investments: | |
| Common Stocks(a) | | $ | 43,042,599 | | | $ | — | | | $ | — | | | $ | 43,042,599 | | |
| Warrants(a) | | | 30,341 | | | | — | | | | — | | | | 30,341 | | |
Short-Term Investments | | | — | | | | 1,451,952 | | | | — | | | | 1,451,952 | | |
Total Investments | | $ | 43,072,940 | | | $ | 1,451,952 | | | $ | — | | | $ | 44,524,892 | | |
(a) The Schedule of Investments provides information on the industry categorization for the portfolio.
^ A balance indicated with a "—", reflects either a zero balance or an amount that rounds to less than 1.
See Notes to Financial Statements
141
Schedule of Investments Multi-Cap Opportunities Fund^ August 31, 2020
| | |
Number
of Shares | |
Value | |
Common Stocks 99.5% | |
Aerospace & Defense 2.2% | |
Raytheon
Technologies
Corp. | | | 245,154 | | | $ | 14,954,394 | | |
Banks 3.2% | |
JPMorgan
Chase &
Co. | | | 220,000 | | | | 22,041,800 | | |
Capital Markets 6.0% | |
Brookfield
Asset
Management,
Inc. Class A | | | 730,000 | | | | 24,630,200 | | |
Charles
Schwab
Corp. | | | 275,000 | | | | 9,770,750 | | |
Intercontinental
Exchange,
Inc. | | | 62,000 | | | | 6,586,260 | | |
| | | | 40,987,210 | | |
Communications Equipment 7.0% | |
Cisco
Systems,
Inc. | | | 540,000 | | | | 22,798,800 | | |
Motorola
Solutions,
Inc. | | | 160,000 | | | | 24,760,000 | | |
| | | | 47,558,800 | | |
Construction Materials 0.8% | |
Eagle
Materials,
Inc. | | | 68,000 | | | | 5,560,360 | | |
Containers & Packaging 4.2% | |
Ball Corp. | | | 355,000 | | | | 28,531,350 | | |
Diversified Financial Services 5.3% | |
Berkshire
Hathaway,
Inc. Class B* | | | 165,000 | | | | 35,976,600 | | |
Electrical Equipment 2.2% | |
Rockwell
Automation,
Inc. | | | 65,000 | | | | 14,984,450 | | |
Entertainment 3.1% | |
Activision
Blizzard,
Inc. | | | 150,000 | | | | 12,528,000 | | |
Walt Disney
Co. | | | 65,000 | | | | 8,571,550 | | |
| | | | 21,099,550 | | |
| | |
Number
of Shares | |
Value | |
Food & Staples Retailing 2.6% | |
BJ's
Wholesale
Club
Holdings,
Inc.* | | | 180,000 | | | $ | 7,993,800 | | |
US Foods
Holding
Corp.* | | | 400,000 | | | | 9,740,000 | | |
| | | | 17,733,800 | | |
Food Products 2.9% | |
Lamb
Weston
Holdings,
Inc. | | | 130,000 | | | | 8,170,500 | | |
Mondelez
International,
Inc. Class A | | | 200,000 | | | | 11,684,000 | | |
| | | | 19,854,500 | | |
Health Care Equipment &
Supplies 2.7% | |
Hill-Rom
Holdings, Inc. | | | 195,000 | | | | 18,289,050 | | |
Health Care Providers & Services 3.7% | |
HCA
Healthcare,
Inc. | | | 185,000 | | | | 25,108,200 | | |
Universal
Health Services,
Inc. Class B | | | 2,000 | | | | 220,700 | | |
| | | | 25,328,900 | | |
Hotels, Restaurants & Leisure 4.2% | |
Aramark | | | 270,000 | | | | 7,441,200 | | |
Las Vegas
Sands Corp. | | | 125,000 | | | | 6,338,750 | | |
McDonald's
Corp. | | | 70,000 | | | | 14,946,400 | | |
| | | | 28,726,350 | | |
Household Products 0.7% | |
WD-40 Co. | | | 22,000 | | | | 4,496,360 | | |
Insurance 2.7% | |
Chubb Ltd. | | | 90,000 | | | | 11,250,000 | | |
Progressive
Corp. | | | 75,000 | | | | 7,128,000 | | |
| | | | 18,378,000 | | |
Interactive Media & Services 5.0% | |
Alphabet,
Inc. Class C* | | | 21,000 | | | | 34,317,780 | | |
Internet & Direct Marketing
Retail 2.9% | |
Amazon.com,
Inc.* | | | 5,700 | | | | 19,670,472 | | |
| | |
Number
of Shares | |
Value | |
IT Services 3.4% | |
PayPal
Holdings,
Inc.* | | | 113,000 | | | $ | 23,067,820 | | |
Leisure Products 0.3% | |
Brunswick
Corp. | | | 30,000 | | | | 1,856,700 | | |
Machinery 5.1% | |
Allison
Transmission
Holdings,
Inc. | | | 170,000 | | | | 6,097,900 | | |
Nordson
Corp. | | | 34,000 | | | | 6,340,660 | | |
Stanley
Black &
Decker, Inc. | | | 140,000 | | | | 22,582,000 | | |
| | | | 35,020,560 | | |
Materials 2.0% | |
Sherwin-
Williams Co. | | | 20,000 | | | | 13,421,000 | | |
Media 4.0% | |
Cable One,
Inc. | | | 3,800 | | | | 6,993,254 | | |
Comcast
Corp.
Class A | | | 460,000 | | | | 20,612,600 | | |
| | | | 27,605,854 | | |
Pharmaceuticals 2.4% | |
Pfizer, Inc. | | | 425,000 | | | | 16,060,750 | | |
Road & Rail 2.9% | |
CSX Corp. | | | 260,000 | | | | 19,879,600 | | |
Software 5.5% | |
Microsoft
Corp. | | | 165,000 | | | | 37,212,450 | | |
Specialty Retail 2.9% | |
Lowe's
Cos., Inc. | | | 120,000 | | | | 19,762,800 | | |
Technology Hardware, Storage & Peripherals 6.5% | |
Apple, Inc. | | | 344,000 | | | | 44,389,760 | | |
Textiles, Apparel & Luxury Goods 3.1% | |
Columbia
Sportswear
Co. | | | 50,000 | | | | 4,278,500 | | |
NIKE, Inc.
Class B | | | 150,000 | | | | 16,783,500 | | |
| | | | 21,062,000 | | |
Total Common Stocks
(Cost $352,489,951) | | | 677,829,020 | | |
See Notes to Financial Statements
142
Schedule of Investments Multi-Cap Opportunities Fund^ (cont'd)
| | |
Number
of Shares | |
Value | |
Short-Term Investments 0.5% | |
Investment Companies 0.5% | |
State
Street
Institutional
Treasury
Money
Market
Fund
Premier
Class,
0.03%(a)
(Cost $3,464,199) | | | 3,464,199 | | | $ | 3,464,199 | | |
Total Investments 100.0%
(Cost $355,954,150) | | | | | 681,293,219 | | |
Other Assets Less
Liabilities 0.0%(b) | | | | | 283,340 | | |
Net Assets 100.0% | | $ | 681,576,559 | | |
* Non-income producing security.
(a) Represents 7-day effective yield as of August 31, 2020.
(b) Represents less than 0.05% of net assets of the Fund.
The following is a summary, categorized by Level (see Note A of Notes to Financial Statements), of inputs used to value the Fund's investments as of August 31, 2020:
Asset Valuation Inputs | | Level 1 | | Level 2 | | Level 3 | | Total | |
Investments: | |
| Common Stocks(a) | | $ | 677,829,020 | | | $ | — | | | $ | — | | | $ | 677,829,020 | | |
Short-Term Investments | | | — | | | | 3,464,199 | | | | — | | | | 3,464,199 | | |
Total Investments | | $ | 677,829,020 | | | $ | 3,464,199 | | | $ | — | | | $ | 681,293,219 | | |
(a) The Schedule of Investments provides information on the industry categorization for the portfolio.
^ A balance indicated with a "—", reflects either a zero balance or an amount that rounds to less than 1.
See Notes to Financial Statements
143
Schedule of Investments Real Estate Fund^ August 31, 2020
| | |
Number
of Shares | |
Value | |
Common Stocks 97.6% | |
Apartments 9.5% | |
Apartment
Investment &
Management
Co. Class A | | | 313,775 | | | $ | 11,305,313 | | |
Camden
Property Trust | | | 116,921 | | | | 10,632,796 | | |
Equity
Residential | | | 382,454 | | | | 21,589,528 | | |
Essex Property
Trust, Inc. | | | 81,138 | | | | 17,567,188 | | |
| | | | 61,094,825 | | |
Data Centers 15.0% | |
CyrusOne, Inc. | | | 240,585 | | | | 20,096,065 | | |
Digital Realty
Trust, Inc. | | | 174,736 | | | | 27,197,659 | | |
Equinix, Inc. | | | 62,671 | | | | 49,496,302 | | |
| | | | 96,790,026 | | |
Free Standing 3.3% | |
Four Corners
Property Trust,
Inc. | | | 309,629 | | | | 7,818,132 | | |
National Retail
Properties, Inc. | | | 191,851 | | | | 6,799,200 | | |
Spirit Realty
Capital, Inc. | | | 194,965 | | | | 6,923,207 | | |
| | | | 21,540,539 | | |
Health Care 8.0% | |
Healthcare Trust
of America,
Inc. Class A | | | 432,652 | | | | 11,417,686 | | |
Healthpeak
Properties, Inc. | | | 569,746 | | | | 15,747,779 | | |
Omega
Healthcare
Investors, Inc. | | | 232,082 | | | | 7,187,580 | | |
Welltower, Inc. | | | 304,501 | | | | 17,514,898 | | |
| | | | 51,867,943 | | |
| | |
Number
of Shares | |
Value | |
Industrial 10.7% | |
Duke Realty
Corp. | | | 469,912 | | | $ | 18,115,108 | | |
Prologis, Inc. | | | 401,124 | | | | 40,858,491 | | |
Rexford
Industrial
Realty, Inc. | | | 209,376 | | | | 10,045,860 | | |
| | | | 69,019,459 | | |
Infrastructure 21.4% | |
American
Tower Corp. | | | 227,430 | | | | 56,664,185 | | |
Crown Castle
International
Corp. | | | 303,853 | | | | 49,604,002 | | |
SBA
Communications
Corp. | | | 103,544 | | | | 31,691,712 | | |
| | | | 137,959,899 | | |
Manufactured Homes 5.3% | |
Equity LifeStyle
Properties, Inc. | | | 272,867 | | | | 18,088,354 | | |
Sun
Communities,
Inc. | | | 110,267 | | | | 16,438,604 | | |
| | | | 34,526,958 | | |
Office 3.7% | |
Boston
Properties, Inc. | | | 63,983 | | | | 5,558,203 | | |
Douglas
Emmett, Inc. | | | 410,952 | | | | 11,473,780 | | |
Highwoods
Properties, Inc. | | | 183,729 | | | | 6,845,742 | | |
| | | | 23,877,725 | | |
Real Estate Management & Development 1.5% | |
Brookfield
Asset
Management,
Inc. Class A | | | 289,605 | | | | 9,771,273 | | |
Regional Malls 1.0% | |
Simon Property
Group, Inc. | | | 94,483 | | | | 6,410,671 | | |
| | |
Number
of Shares | |
Value | |
Self Storage 6.5% | |
Extra Space
Storage, Inc. | | | 114,573 | | | $ | 12,207,753 | | |
Public Storage | | | 139,782 | | | | 29,689,697 | | |
| | | | 41,897,450 | | |
Shopping Centers 2.9% | |
Kimco Realty
Corp. | | | 765,527 | | | | 9,178,669 | | |
Regency
Centers Corp. | | | 234,100 | | | | 9,296,111 | | |
| | | | 18,474,780 | | |
Single Family Homes 5.3% | |
American
Homes 4 Rent
Class A | | | 722,147 | | | | 20,682,290 | | |
Invitation
Homes, Inc. | | | 461,322 | | | | 13,207,649 | | |
| | | | 33,889,939 | | |
Timber 3.5% | |
Weyerhaeuser
Co. | | | 738,103 | | | | 22,371,902 | | |
Total Common Stocks
(Cost $569,985,610) | | | | | 629,493,389 | | |
Short-Term Investments 3.8% | |
Investment Companies 3.8% | |
State Street
Institutional U.S.
Government
Money Market
Fund Premier
Class, 0.04%(a)
(Cost $24,830,136) | | | 24,830,136 | | | | 24,830,136 | | |
Total Investments 101.4%
(Cost $594,815,746) | | | | | 654,323,525 | | |
Liabilities Less
Other Assets (1.4)% | | | | | (9,123,172 | ) | |
Net Assets 100.0% | | | | $ | 645,200,353 | | |
(a) Represents 7-day effective yield as of August 31, 2020.
See Notes to Financial Statements
144
Schedule of Investments Real Estate Fund^ (cont'd)
The following is a summary, categorized by Level (see Note A of Notes to Financial Statements), of inputs used to value the Fund's investments as of August 31, 2020:
Asset Valuation Inputs | | Level 1 | | Level 2 | | Level 3 | | Total | |
Investments: | |
| Common Stocks(a) | | $ | 629,493,389 | | | $ | — | | | $ | — | | | $ | 629,493,389 | | |
Short-Term Investments | | | — | | | | 24,830,136 | | | | — | | | | 24,830,136 | | |
Total Investments | | $ | 629,493,389 | | | $ | 24,830,136 | | | $ | — | | | $ | 654,323,525 | | |
(a) The Schedule of Investments provides information on the industry categorization for the portfolio.
^ A balance indicated with a "—", reflects either a zero balance or an amount that rounds to less than 1.
See Notes to Financial Statements
145
Schedule of Investments Small Cap Growth Fund^ August 31, 2020
| | |
Number
of Shares | |
Value | |
Common Stocks 98.1% | |
Aerospace & Defense 1.8% | |
Axon
Enterprise,
Inc.* | | | 35,000 | | | $ | 2,998,800 | | |
Mercury
Systems, Inc.* | | | 35,000 | | | | 2,650,900 | | |
| | | | 5,649,700 | | |
Auto Components 1.0% | |
Dorman
Products, Inc.* | | | 35,000 | | | | 2,964,150 | | |
Banks 0.9% | |
Pinnacle
Financial
Partners, Inc. | | | 65,000 | | | | 2,596,750 | | |
Beverages 1.2% | |
Boston Beer
Co., Inc.
Class A* | | | 4,000 | | | | 3,527,920 | | |
Biotechnology 13.8% | |
ACADIA
Pharmaceuticals,
Inc.* | | | 78,000 | | | | 3,088,020 | | |
Amicus
Therapeutics,
Inc.* | | | 230,000 | | | | 3,358,000 | | |
Arena
Pharmaceuticals,
Inc.* | | | 44,000 | | | | 3,072,080 | | |
Arrowhead
Pharmaceuticals,
Inc.* | | | 71,000 | | | | 2,999,040 | | |
Ascendis
Pharma A/S
ADR* | | | 20,500 | | | | 3,037,690 | | |
Avrobio, Inc.* | | | 109,000 | | | | 1,887,880 | | |
ChemoCentryx,
Inc.* | | | 27,000 | | | | 1,444,500 | | |
Fate
Therapeutics,
Inc.* | | | 46,000 | | | | 1,674,400 | | |
Global Blood
Therapeutics,
Inc.* | | | 66,000 | | | | 4,143,480 | | |
Halozyme
Therapeutics,
Inc.* | | | 125,000 | | | | 3,624,375 | | |
Iovance
Biotherapeutics,
Inc.* | | | 110,000 | | | | 3,666,300 | | |
Krystal Biotech,
Inc.* | | | 51,000 | | | | 2,438,310 | | |
Novavax, Inc.* | | | 5,000 | | | | 551,700 | | |
PTC
Therapeutics,
Inc.* | | | 74,000 | | | | 3,657,450 | | |
| | |
Number
of Shares | |
Value | |
Ultragenyx
Pharmaceutical,
Inc.* | | | 27,000 | | | $ | 2,296,620 | | |
Veracyte, Inc.* | | | 45,000 | | | | 1,498,950 | | |
| | | 42,438,795 | | |
Building Products 2.5% | |
Builders
FirstSource,
Inc.* | | | 140,000 | | | | 4,286,800 | | |
Gibraltar
Industries,
Inc.* | | | 52,000 | | | | 3,247,140 | | |
| | | | 7,533,940 | | |
Capital Markets 0.6% | |
Houlihan
Lokey, Inc. | | | 32,500 | | | | 1,904,500 | | |
Commercial Services & Supplies 2.2% | |
Casella Waste
Systems, Inc.
Class A* | | | 55,000 | | | | 3,088,250 | | |
Heritage-
Crystal
Clean, Inc.* | | | 49,338 | | | | 724,282 | | |
Tetra Tech, Inc. | | | 32,000 | | | | 2,953,920 | | |
| | | | 6,766,452 | | |
Containers & Packaging 1.0% | |
Graphic
Packaging
Holding Co. | | | 225,000 | | | | 3,145,500 | | |
Diversified Consumer Services 2.1% | |
Bright
Horizons
Family
Solutions,
Inc.* | | | 17,000 | | | | 2,261,170 | | |
Chegg, Inc.* | | | 56,000 | | | | 4,129,440 | | |
| | | | 6,390,610 | | |
Diversified Telecommunication Services 2.6% | |
Bandwidth,
Inc. Class A* | | | 50,000 | | | | 7,874,000 | | |
Electrical Equipment 3.9% | |
Generac
Holdings,
Inc.* | | | 22,000 | | | | 4,179,560 | | |
Sensata
Technologies
Holding PLC* | | | 78,000 | | | | 3,247,920 | | |
Vicor Corp.* | | | 53,000 | | | | 4,612,590 | | |
| | | | 12,040,070 | | |
Electronic Equipment, Instruments & Components 0.9% | |
Littelfuse, Inc. | | | 16,000 | | | | 2,893,440 | | |
| | |
Number
of Shares | |
Value | |
Food & Staples Retailing 1.6% | |
BJ's Wholesale
Club Holdings,
Inc.* | | | 68,000 | | | $ | 3,019,880 | | |
Performance
Food Group
Co.* | | | 53,000 | | | | 1,935,030 | | |
| | | | 4,954,910 | | |
Food Products 0.9% | |
Freshpet, Inc.* | | | 25,000 | | | | 2,840,000 | | |
Health Care Equipment & Supplies 7.6% | |
Axonics
Modulation
Technologies,
Inc.*(b) | | | 92,500 | | | | 3,909,050 | | |
CONMED
Corp. | | | 37,000 | | | | 3,193,470 | | |
GenMark
Diagnostics,
Inc.* | | | 50,000 | | | | 648,500 | | |
ICU Medical,
Inc.* | | | 18,000 | | | | 3,604,320 | | |
iRhythm
Technologies,
Inc.* | | | 17,000 | | | | 3,743,060 | | |
Mesa
Laboratories,
Inc. | | | 12,800 | | | | 3,147,776 | | |
NuVasive, Inc.* | | | 52,500 | | | | 2,736,825 | | |
Oxford
Immunotec
Global PLC* | | | 177,000 | | | | 2,408,970 | | |
| | | | 23,391,971 | | |
Health Care Providers & Services 3.3% | |
Amedisys, Inc.* | | | 13,800 | | | | 3,338,220 | | |
Option Care
Health, Inc.* | | | 327,000 | | | | 3,799,740 | | |
R1 RCM, Inc.* | | | 215,000 | | | | 3,117,500 | | |
| | | | 10,255,460 | | |
Health Care Technology 2.1% | |
Inspire
Medical
Systems, Inc.* | | | 25,000 | | | | 2,986,250 | | |
Teladoc
Health, Inc.*(b) | | | 15,500 | | | | 3,343,195 | | |
| | | | 6,329,445 | | |
Hotels, Restaurants & Leisure 4.4% | |
Boyd Gaming
Corp. | | | 125,000 | | | | 3,347,500 | | |
Churchill
Downs, Inc. | | | 25,000 | | | | 4,369,000 | | |
Texas
Roadhouse,
Inc. | | | 50,000 | | | | 3,149,500 | | |
Wingstop, Inc. | | | 17,000 | | | | 2,777,800 | | |
| | | | 13,643,800 | | |
See Notes to Financial Statements
146
Schedule of Investments Small Cap Growth Fund^ (cont'd)
| | |
Number
of Shares | |
Value | |
Household Durables 1.2% | |
Helen of Troy
Ltd.* | | | 18,000 | | | $ | 3,722,760 | | |
Insurance 0.8% | |
Primerica, Inc. | | | 20,000 | | | | 2,497,000 | | |
Interactive Media & Services 1.9% | |
EverQuote,
Inc. Class A* | | | 165,000 | | | | 5,857,500 | | |
IT Services 1.0% | |
Fastly, Inc.
Class A* | | | 32,000 | | | | 2,970,880 | | |
Life Sciences Tools & Services 2.3% | |
NeoGenomics,
Inc.* | | | 92,000 | | | | 3,583,400 | | |
Repligen
Corp.* | | | 23,000 | | | | 3,562,930 | | |
| | | | 7,146,330 | | |
Machinery 2.8% | |
ESCO
Technologies,
Inc. | | | 35,000 | | | | 3,147,200 | | |
Meritor, Inc.* | | | 128,000 | | | | 2,913,280 | | |
Rexnord Corp. | | | 92,000 | | | | 2,664,320 | | |
| | | | 8,724,800 | | |
Media 2.0% | |
Cardlytics,
Inc.* | | | 81,000 | | | | 6,143,850 | | |
Multiline Retail 0.8% | |
Ollie's Bargain
Outlet
Holdings,
Inc.* | | | 26,000 | | | | 2,484,040 | | |
Pharmaceuticals 2.8% | |
Axsome
Therapeutics,
Inc.* | | | 34,500 | | | | 2,529,195 | | |
Collegium
Pharmaceutical,
Inc.* | | | 100,000 | | | | 1,906,000 | | |
Horizon
Therapeutics
PLC* | | | 55,000 | | | | 4,131,600 | | |
| | | | 8,566,795 | | |
| | |
Number
of Shares | |
Value | |
Professional Services 0.9% | |
Exponent, Inc. | | | 33,000 | | | $ | 2,655,015 | | |
Road & Rail 1.0% | |
Landstar
System, Inc. | | | 23,500 | | | | 3,127,615 | | |
Semiconductors & Semiconductor Equipment 6.4% | |
Enphase
Energy, Inc.* | | | 23,000 | | | | 1,776,290 | | |
Entegris, Inc. | | | 40,000 | | | | 2,675,600 | | |
| Impinj, Inc.*(b) | | | 132,000 | | | | 3,227,400 | | |
Inphi Corp.* | | | 74,000 | | | | 8,434,520 | | |
Lattice
Semiconductor
Corp.* | | | 122,000 | | | | 3,489,200 | | |
| | | | 19,603,010 | | |
Software 15.1% | |
Blackline, Inc.* | | | 60,000 | | | | 5,242,200 | | |
Descartes
Systems
Group, Inc.* | | | 79,300 | | | | 4,833,335 | | |
Everbridge,
Inc.* | | | 62,000 | | | | 9,213,820 | | |
Five9, Inc.* | | | 67,000 | | | | 8,538,480 | | |
Globant SA* | | | 19,000 | | | | 3,374,020 | | |
LivePerson,
Inc.* | | | 80,000 | | | | 4,772,800 | | |
Model N,
Inc.* | | | 117,000 | | | | 4,600,440 | | |
Q2 Holdings,
Inc.* | | | 60,000 | | | | 5,837,400 | | |
| | | | 46,412,495 | | |
Specialty Retail 4.0% | |
Five Below,
Inc.* | | | 20,000 | | | | 2,189,000 | | |
Lithia Motors,
Inc. Class A | | | 22,000 | | | | 5,477,120 | | |
RH* | | | 9,500 | | | | 3,140,225 | | |
Sportsman's
Warehouse
Holdings, Inc.* | | | 85,000 | | | | 1,334,075 | | |
| | | | 12,140,420 | | |
Tobacco 0.7% | |
Turning Point
Brands, Inc. | | | 75,000 | | | | 2,167,500 | | |
Total Common Stocks
(Cost $245,539,028) | |
| 301,361,423 |
| |
| | |
Number
of Shares | |
Value | |
Rights 0.1% | |
Biotechnology 0.1% | |
Alder
Biopharmaceuticals,
Inc.*(a)
(Cost $132,000) | | | 150,000 | | | $ | 187,500 | | |
Short-Term Investments 3.4% | |
Investment Companies 3.4% | |
State Street
Institutional
U.S.
Government
Money
Market
Fund
Premier
Class,
0.04%(c) | | | 5,476,868 | | | | 5,476,868 | | |
State Street
Navigator
Securities
Lending
Government
Money
Market
Portfolio,
0.10%(c)(d) | | | 4,939,633 | | | | 4,939,633 | | |
Total Short-Term
Investments
(Cost $10,416,501) | | | 10,416,501 | | |
Total
Investments 101.6%
(Cost $256,087,529) | | | 311,965,424 | | |
Liabilities Less
Other Assets (1.6)% | | | | | (4,825,950 | ) | |
Net Assets 100.0% | | $ | 307,139,474 | | |
* Non-income producing security.
(a) Value determined using significant unobservable inputs.
(b) The security or a portion of this security is on loan at August 31, 2020. Total value of all such securities at August 31, 2020 amounted to $4,928,842 for the Fund (see Note A of the Notes to Financial Statements).
(c) Represents 7-day effective yield as of August 31, 2020.
(d) Represents investment of cash collateral received from securities lending.
See Notes to Financial Statements
147
Schedule of Investments Small Cap Growth Fund^ (cont'd)
The following is a summary, categorized by Level (see Note A of Notes to Financial Statements), of inputs used to value the Fund's investments as of August 31, 2020:
Asset Valuation Inputs | | Level 1 | | Level 2 | | Level 3(b) | | Total | |
Investments: | |
| Common Stocks(a) | | $ | 301,361,423 | | | $ | — | | | $ | — | | | $ | 301,361,423 | | |
| Rights(a) | | | — | | | | — | | | | 187,500 | | | | 187,500 | | |
Short-Term Investments | | | — | | | | 10,416,501 | | | | — | | | | 10,416,501 | | |
Total Investments | | $ | 301,361,423 | | | $ | 10,416,501 | | | $ | 187,500 | | | $ | 311,965,424 | | |
(a) The Schedule of Investments provides information on the industry categorization for the portfolio.
(b) The following is a reconciliation between the beginning and ending balances of investments in which unobservable inputs (Level 3) were used in determining value:
| | | Beginning
balance, as
of 9/1/2019 | | Accrued
discounts/
(premiums) | | Realized
gain/
(loss) | | Change
in unrealized
appreciation/
(depreciation) | | Purchases | | Sales | | Transfers
into
Level 3 | | Transfers
out of
Level 3 | | Balance,
as of
8/31/2020 | | Net change in
unrealized
appreciation/
(depreciation)
from
investments
still held as
of 8/31/2020 | |
Investments in Securities:
(000's omitted) | |
Common
Stocks(c) | | $ | — | | | $ | — | | | $ | — | | | $ | 56 | | | $ | 132 | | | $ | — | | | $ | — | | | $ | — | | | $ | 188 | | | $ | 56 | | |
Total | | $ | — | | | $ | — | | | $ | — | | | $ | 56 | | | $ | 132 | | | $ | — | | | $ | — | | | $ | — | | | $ | 188 | | | $ | 56 | | |
(c) Securities categorized as Level 3 were valued based on a single quotation obtained from a dealer. The Fund does not have access to unobservable inputs and therefore cannot disclose such inputs used in formulating such quotation.
^ A balance indicated with a "—", reflects either a zero balance or an amount that rounds to less than 1.
See Notes to Financial Statements
148
Schedule of Investments Sustainable Equity Fund^ August 31, 2020
| | |
Number
of Shares | |
Value | |
Common Stocks 99.0% | |
Auto Components 2.1% | |
Aptiv PLC | | | 396,644 | | | $ | 34,158,981 | | |
Banks 4.6% | |
JPMorgan
Chase &
Co. | | | 480,995 | | | | 48,190,889 | | |
U.S. Bancorp | | | 751,016 | | | | 27,336,982 | | |
| | | | 75,527,871 | | |
Biotechnology 1.4% | |
Regeneron
Pharmaceuticals,
Inc.* | | | 37,018 | | | | 22,948,569 | | |
Capital Markets 3.1% | |
Inter-
continental
Exchange,
Inc. | | | 472,488 | | | | 50,192,400 | | |
Communications Equipment 1.8% | |
Arista
Networks,
Inc.* | | | 131,321 | | | | 29,343,677 | | |
Electric Utilities 1.0% | |
Eversource
Energy | | | 182,108 | | | | 15,608,477 | | |
Electrical Equipment 4.4% | |
Vestas Wind
Systems A/S | | | 474,429 | | | | 72,134,292 | | |
Electronic Equipment, Instruments & Components 3.2% | |
Zebra
Technologies
Corp. Class A* | | | 183,797 | | | | 52,663,354 | | |
Equity Real Estate Investment
Trusts 1.0% | |
Weyerhaeuser
Co. | | | 559,359 | | | | 16,954,171 | | |
Health Care Equipment &
Supplies 7.6% | |
Becton,
Dickinson &
Co. | | | 167,392 | | | | 40,637,756 | | |
Danaher
Corp. | | | 222,342 | | | | 45,906,953 | | |
Medtronic
PLC | | | 351,992 | | | | 37,828,580 | | |
| | | | 124,373,289 | | |
Health Care Providers & Services 5.2% | |
Amerisource
Bergen Corp. | | | 366,883 | | | | 35,598,658 | | |
Cigna Corp. | | | 279,168 | | | | 49,516,028 | | |
| | | | 85,114,686 | | |
| | |
Number
of Shares | |
Value | |
Hotels, Restaurants & Leisure 3.3% | |
Compass
Group
PLC | | | 1,857,562 | | | $ | 30,058,979 | | |
Starbucks
Corp. | | | 287,366 | | | | 24,273,806 | | |
| | | | 54,332,785 | | |
Household Products 1.4% | |
Colgate-
Palmolive Co. | | | 288,268 | | | | 22,848,122 | | |
Insurance 2.6% | |
Progressive
Corp. | | | 451,180 | | | | 42,880,147 | | |
Interactive Media & Services 4.1% | |
Alphabet,
Inc. Class A* | | | 41,568 | | | | 67,736,303 | | |
Internet & Direct Marketing
Retail 1.1% | |
Booking
Holdings,
Inc.* | | | 9,570 | | | | 18,283,007 | | |
IT Services 7.8% | |
Accenture
PLC Class A | | | 149,372 | | | | 35,838,824 | | |
Cognizant
Technology
Solutions
Corp.
Class A | | | 501,498 | | | | 33,530,156 | | |
MasterCard,
Inc. Class A | | | 164,410 | | | | 58,890,018 | | |
| | | | 128,258,998 | | |
Machinery 3.9% | |
Otis
Worldwide
Corp. | | | 284,917 | | | | 17,921,279 | | |
Stanley
Black &
Decker, Inc. | | | 285,068 | | | | 45,981,469 | | |
| | | | 63,902,748 | | |
Materials 1.9% | |
Sherwin-
Williams Co. | | | 46,726 | | | | 31,355,482 | | |
Media 5.7% | |
Comcast
Corp.
Class A | | | 1,336,541 | | | | 59,890,402 | | |
Discovery,
Inc. Class A* | | | 1,516,722 | | | | 33,466,471 | | |
| | | | 93,356,873 | | |
Multi-Utilities 1.7% | |
National
Grid
PLC | | | 2,561,652 | | | | 28,690,713 | | |
| | |
Number
of Shares | |
Value | |
Personal Products 2.9% | |
Unilever NV | | | 830,299 | | | $ | 48,157,342 | | |
Pharmaceuticals 2.9% | |
Roche
Holding AG | | | 138,384 | | | | 48,329,917 | | |
Road & Rail 2.0% | |
CSX Corp. | | | 427,164 | | | | 32,660,959 | | |
Semiconductors & Semiconductor Equipment 4.4% | |
Texas
Instruments,
Inc. | | | 509,549 | | | | 72,432,390 | | |
Software 8.4% | |
Intuit, Inc. | | | 120,575 | | | | 41,645,399 | | |
Microsoft
Corp. | | | 426,620 | | | | 96,215,609 | | |
| | | | 137,861,008 | | |
Specialty Chemicals 1.2% | |
Novozymes
A/S B Shares | | | 338,733 | | | | 20,043,823 | | |
Specialty Retail 2.6% | |
Advance
Auto Parts,
Inc. | | | 276,421 | | | | 43,207,367 | | |
Trading Companies & Distributors 5.7% | |
United
Rentals, Inc.* | | | 294,900 | | | | 52,212,045 | | |
W.W.
Grainger,
Inc. | | | 112,245 | | | | 41,017,690 | | |
| | | | 93,229,735 | | |
Total Common Stocks
(Cost $1,003,709,046) | | | 1,626,587,486 | | |
| | | Principal
Amount | | | |
Short-Term Investments 0.9% | |
| Certificates of Deposit 0.0%(a) | |
Carver
Federal
Savings
Bank,
0.25%, due
9/23/2020 | | $ | 100,000 | | | | 100,000 | | |
Self Help
Credit Union,
0.25%, due
11/16/2020 | | | 250,000 | | | | 250,000 | | |
Self Help
Federal
Credit Union,
0.25%, due
9/14/2020 | | | 250,000 | | | | 250,000 | | |
| | | | 600,000 | | |
See Notes to Financial Statements
149
Schedule of Investments Sustainable Equity Fund^ (cont'd)
| | |
Number
of Shares | |
Value | |
Investment Companies 0.9% | |
State
Street
Institutional
Treasury
Money
Market
Fund
Premier
Class,
0.03%(b) | | | 14,403,189 | | | $ | 14,403,189 | | |
Total Short-Term
Investments
(Cost $15,003,189) | | | 15,003,189 | | |
Total
Investments 99.9%
(Cost $1,018,712,235) | | | 1,641,590,675 | | |
Other Assets
Less Liabilities 0.1% | | | | | 837,230 | | |
Net Assets 100.0% | | $ | 1,642,427,905 | | |
* Non-income producing security.
(a) Represents less than 0.05% of net assets of the Fund.
(b) Represents 7-day effective yield as of August 31, 2020.
POSITIONS BY COUNTRY
Country | | Investments at
Value | | Percentage of
Net Assets | |
United States | | $ | 1,379,172,420 | | | | 84.0 | % | |
United Kingdom | | | 106,907,034 | | | | 6.5 | % | |
Denmark | | | 92,178,115 | | | | 5.6 | % | |
Switzerland | | | 48,329,917 | | | | 2.9 | % | |
Short-Term Investments and Other Assets—Net | | | 15,840,419 | | | | 1.0 | % | |
| | | $ | 1,642,427,905 | | | | 100.0 | % | |
See Notes to Financial Statements
150
Schedule of Investments Sustainable Equity Fund^ (cont'd)
The following is a summary, categorized by Level (see Note A of Notes to Financial Statements), of inputs used to value the Fund's investments as of August 31, 2020:
Asset Valuation Inputs | | Level 1 | | Level 2 | | Level 3 | | Total | |
Investments: | |
Common Stocks | |
Hotels, Restaurants & Leisure | | $ | 24,273,806 | | | $ | 30,058,979 | | | $ | — | | | $ | 54,332,785 | | |
Multi-Utilities | | | — | | | | 28,690,713 | | | | — | | | | 28,690,713 | | |
| Other Common Stocks(a) | | | 1,543,563,988 | | | | — | | | | — | | | | 1,543,563,988 | | |
Total Common Stocks | | | 1,567,837,794 | | | | 58,749,692 | | | | — | | | | 1,626,587,486 | | |
Short-Term Investments | | | — | | | | 15,003,189 | | | | — | | | | 15,003,189 | | |
Total Investments | | $ | 1,567,837,794 | | | $ | 73,752,881 | | | $ | — | | | $ | 1,641,590,675 | | |
(a) The Schedule of Investments provides information on the industry categorization as well as a Positions by Country summary.
^ A balance indicated with a "—", reflects either a zero balance or an amount that rounds to less than 1.
See Notes to Financial Statements
151
This page has been left blank intentionally
152
Statements of Assets and Liabilities
Neuberger Berman Equity Funds
| | | DIVIDEND
GROWTH FUND | | EMERGING
MARKETS
EQUITY FUND | | EQUITY
INCOME FUND | | FOCUS FUND | | GENESIS FUND | | GLOBAL REAL
ESTATE FUND | | GREATER
CHINA
EQUITY FUND | | GUARDIAN
FUND | | INTEGRATED
LARGE CAP
FUND | | INTERNATIONAL
EQUITY FUND | |
| | | August 31,
2020 | | August 31,
2020 | | August 31,
2020 | | August 31,
2020 | | August 31,
2020 | | August 31,
2020 | | August 31,
2020 | | August 31,
2020 | | August 31,
2020 | | August 31,
2020 | |
Assets | |
Investments in securities, at value*† (Notes A & F)—see Schedule of Investments: | |
| Unaffiliated issuers(a) | | $ | 53,283,881 | | | $ | 1,095,591,634 | | | $ | 1,255,337,985 | | | $ | 768,615,969 | | | $ | 9,663,127,162 | | | $ | 1,884,856 | | | $ | 54,819,980 | | | $ | 1,646,524,816 | | | $ | 3,505,341 | | | $ | 1,572,780,423 | | |
| Affiliated issuers(b) | | | — | | | | — | | | | — | | | | — | | | | 818,947,444 | | | | — | | | | — | | | | — | | | | — | | | | — | | |
| | | | 53,283,881 | | | | 1,095,591,634 | | | | 1,255,337,985 | | | | 768,615,969 | | | | 10,482,074,606 | | | | 1,884,856 | | | | 54,819,980 | | | | 1,646,524,816 | | | | 3,505,341 | | | | 1,572,780,423 | | |
Cash | | | — | | | | — | | | | — | | | | — | | | | — | | | | — | | | | — | | | | — | | | | — | | | | — | | |
| Foreign currency(c) | | | — | | | | 8,962,108 | | | | — | | | | — | | | | — | | | | 2,189 | | | | 2,473,632 | | | | — | | | | 563 | | | | 1,523,481 | | |
Receivable from investment manager—net (Note B) | | | — | | | | — | | | | — | | | | — | | | | — | | | | — | | | | — | | | | — | | | | — | | | | — | | |
Dividends and interest receivable | | | 99,106 | | | | 1,670,698 | | | | 3,650,510 | | | | 273,685 | | | | 6,587,509 | | | | 3,749 | | | | 37 | | | | 1,642,470 | | | | 8,052 | | | | 7,084,261 | | |
Receivable for securities sold | | | — | | | | 2,476,596 | | | | 854,073 | | | | — | | | | 28,451,787 | | | | — | | | | 370,788 | | | | 439,291 | | | | — | | | | 1,029,897 | | |
Receivable from Management—net (Note B) | | | — | | | | — | | | | — | | | | — | | | | — | | | | 7,714 | | | | — | | | | — | | | | 204 | | | | — | | |
Receivable for Fund shares sold | | | — | | | | 732,868 | | | | 153,467 | | | | 67,263 | | | | 7,195,988 | | | | — | | | | — | | | | 270,830 | | | | — | | | | 926,258 | | |
Receivable for securities lending income (Note A) | | | — | | | | 4,542 | | | | — | | | | 64 | | | | — | | | | — | | | | — | | | | 4,367 | | | | — | | | | 1,794 | | |
Prepaid expenses and other assets | | | 12,872 | | | | 76,534 | | | | 69,621 | | | | 74,111 | | | | 352,289 | | | | 10,730 | | | | 27,886 | | | | 156,001 | | | | 25,116 | | | | 90,129 | | |
Total Assets | | | 53,395,859 | | | | 1,109,514,980 | | | | 1,260,065,656 | | | | 769,031,092 | | | | 10,524,662,179 | | | | 1,909,238 | | | | 57,692,323 | | | | 1,649,037,775 | | | | 3,539,276 | | | | 1,583,436,243 | | |
Liabilities | |
Payable to investment manager—net (Note B) | | | 22,085 | | | | 943,204 | | | | 530,330 | | | | 331,782 | | | | 5,938,194 | | | | 1,208 | | | | 52,624 | | | | 637,539 | | | | 558 | | | | 1,128,803 | | |
| Option contracts written, at value(d) (Note A) | | | — | | | | — | | | | 4,202,480 | | | | — | | | | — | | | | — | | | | — | | | | 1,349,183 | | | | — | | | | — | | |
Payable for securities purchased | | | — | | | | 9,502,941 | | | | — | | | | — | | | | 5,711,084 | | | | — | | | | 775,179 | | | | — | | | | — | | | | — | | |
Payable for Fund shares redeemed | | | 6,500 | | | | 284,204 | | | | 4,145,773 | | | | 271,645 | | | | 8,373,932 | | | | — | | | | 4,240 | | | | 1,372,877 | | | | — | | | | 1,755,935 | | |
Payable to administrator—net (Note B) | | | 3,103 | | | | 460,152 | | | | 302,646 | | | | 174,572 | | | | 1,528,751 | | | | — | | | | 6,075 | | | | 336,365 | | | | — | | | | 249,995 | | |
Payable to trustees | | | 6,373 | | | | 6,373 | | | | 6,373 | | | | 6,373 | | | | 6,373 | | | | 6,373 | | | | 6,373 | | | | 6,373 | | | | 6,373 | | | | 6,373 | | |
Payable for audit fees | | | 44,850 | | | | 52,032 | | | | 55,095 | | | | 52,745 | | | | 58,587 | | | | 48,400 | | | | 48,774 | | | | 54,393 | | | | 49,838 | | | | 53,961 | | |
Payable for custodian fees | | | 28,420 | | | | 342,331 | | | | 71,595 | | | | 50,081 | | | | 428,444 | | | | 31,480 | | | | 38,874 | | | | 74,560 | | | | 27,458 | | | | 163,243 | | |
Payable for legal fees | | | 9,929 | | | | 9,929 | | | | 9,929 | | | | 13,698 | | | | 12,105 | | | | 9,929 | | | | 9,929 | | | | 12,105 | | | | 9,929 | | | | 9,929 | | |
Payable for shareholder servicing fees | | | 580 | | | | 78,014 | | | | 6,388 | | | | 106,967 | | | | 218,512 | | | | 255 | | | | 2,077 | | | | 198,186 | | | | 308 | | | | 44,046 | | |
Payable for loaned securities collateral (Note A) | | | — | | | | 10,017,929 | | | | — | | | | — | | | | — | | | | — | | | | — | | | | 24,275,560 | | | | — | | | | — | | |
Accrued capital gains taxes (Note A) | | | — | | | | 325,142 | | | | — | | | | — | | | | — | | | | — | | | | — | | | | — | | | | — | | | | — | | |
Other accrued expenses and payables | | | 5,250 | | | | 61,695 | | | | 76,612 | | | | 30,957 | | | | 413,780 | | | | 4,348 | | | | 7,293 | | | | 56,094 | | | | 4,984 | | | | 97,975 | | |
Total Liabilities | | | 127,090 | | | | 22,083,946 | | | | 9,407,221 | | | | 1,038,820 | | | | 22,689,762 | | | | 101,993 | | | | 951,438 | | | | 28,373,235 | | | | 99,448 | | | | 3,510,260 | | |
Net Assets | | $ | 53,268,769 | | | $ | 1,087,431,034 | | | $ | 1,250,658,435 | | | $ | 767,992,272 | | | $ | 10,501,972,417 | | | $ | 1,807,245 | | | $ | 56,740,885 | | | $ | 1,620,664,540 | | | $ | 3,439,828 | | | $ | 1,579,925,983 | | |
Net Assets consist of: | |
Paid-in capital | | $ | 42,291,498 | | | $ | 1,013,038,722 | | | $ | 1,014,759,473 | | | $ | 563,074,144 | | | $ | 4,725,063,275 | | | $ | 1,788,976 | | | $ | 58,807,792 | | | $ | 902,938,182 | | | $ | 2,747,740 | | | $ | 1,261,465,050 | | |
Total distributable earnings/(losses) | | | 10,977,271 | | | | 74,392,312 | | | | 235,898,962 | | | | 204,918,128 | | | | 5,776,909,142 | | | | 18,269 | | | | (2,066,907 | ) | | | 717,726,358 | | | | 692,088 | | | | 318,460,933 | | |
Net Assets | | $ | 53,268,769 | | | $ | 1,087,431,034 | | | $ | 1,250,658,435 | | | $ | 767,992,272 | | | $ | 10,501,972,417 | | | $ | 1,807,245 | | | $ | 56,740,885 | | | $ | 1,620,664,540 | | | $ | 3,439,828 | | | $ | 1,579,925,983 | | |
Net Assets | |
Investor Class | | $ | — | | | $ | — | | | $ | — | | | $ | 700,618,854 | | | $ | 1,677,255,972 | | | $ | — | | | $ | — | | | $ | 1,419,473,798 | | | $ | — | | | $ | 92,787,023 | | |
Trust Class | | | — | | | | — | | | | — | | | | 47,029,873 | | | | 1,239,627,927 | | | | — | | | | — | | | | 42,723,749 | | | | — | | | | 28,745,440 | | |
Advisor Class | | | — | | | | — | | | | — | | | | 1,851,380 | | | | 131,259,777 | | | | — | | | | — | | | | 191,347 | | | | — | | | | — | | |
Institutional Class | | | 49,252,841 | | | | 854,582,566 | | | | 994,863,019 | | | | 14,063,146 | | | | 3,032,937,453 | | | | 1,360,952 | | | | 52,282,513 | | | | 149,633,333 | | | | 3,061,663 | | | | 1,319,011,460 | | |
Class A | | | 1,490,477 | | | | 31,718,511 | | | | 153,129,773 | | | | 3,033,279 | | | | — | | | | 232,241 | | | | 4,258,353 | | | | 6,123,664 | | | | 291,922 | | | | 55,829,662 | | |
Class C | | | 2,495,003 | | | | 6,114,699 | | | | 101,082,277 | | | | 1,395,740 | | | | — | | | | 214,052 | | | | 200,019 | | | | 2,321,608 | | | | 86,243 | | | | 7,425,878 | | |
Class R3 | | | — | | | | 798,308 | | | | 1,583,366 | | | | — | | | | — | | | | — | | | | — | | | | 162,056 | | | | — | | | | — | | |
Class R6 | | | 30,448 | | | | 194,216,950 | | | | — | | | | — | | | | 4,420,891,288 | | | | — | | | | — | | | | 34,985 | | | | — | | | | 76,126,520 | | |
See Notes to Financial Statements
153
154
Statements of Assets and Liabilities (cont'd)
Neuberger Berman Equity Funds (cont'd)
| | | DIVIDEND
GROWTH FUND | | EMERGING
MARKETS
EQUITY FUND | | EQUITY
INCOME FUND | | FOCUS FUND | | GENESIS FUND | | GLOBAL REAL
ESTATE FUND | | GREATER
CHINA
EQUITY FUND | | GUARDIAN
FUND | | INTEGRATED
LARGE CAP
FUND | | INTERNATIONAL
EQUITY FUND | |
| | | August 31,
2020 | | August 31,
2020 | | August 31,
2020 | | August 31,
2020 | | August 31,
2020 | | August 31,
2020 | | August 31,
2020 | | August 31,
2020 | | August 31,
2020 | | August 31,
2020 | |
Shares Outstanding ($.001 par value; unlimited shares authorized) | | | |
Investor Class | | | — | | | | — | | | | — | | | | 24,361,608 | | | | 26,734,351 | | | | — | | | | — | | | | 60,717,894 | | | | — | | | | 6,606,688 | | |
Trust Class | | | — | | | | — | | | | — | | | | 1,635,770 | | | | 19,766,444 | | | | — | | | | — | | | | 1,828,720 | | | | — | | | | 2,046,733 | | |
Advisor Class | | | — | | | | — | | | | — | | | | 64,396 | | | | 2,106,707 | | | | — | | | | — | | | | 8,249 | | | | — | | | | — | | |
Institutional Class | | | 3,337,644 | | | | 41,949,411 | | | | 80,092,628 | | | | 488,596 | | | | 48,400,116 | | | | 124,114 | | | | 4,548,530 | | | | 6,393,021 | | | | 422,036 | | | | 93,824,774 | | |
Class A | | | 100,959 | | | | 1,552,475 | | | | 12,379,743 | | | | 105,575 | | | | — | | | | 21,202 | | | | 373,285 | | | | 262,408 | | | | 39,938 | | | | 3,978,156 | | |
Class C | | | 170,303 | | | | 299,698 | | | | 8,229,500 | | | | 49,374 | | | | — | | | | 19,612 | | | | 18,644 | | | | 101,033 | | | | 11,888 | | | | 532,685 | | |
Class R3 | | | — | | | | 39,041 | | | | 128,291 | | | | — | | | | — | | | | — | | | | — | | | | 6,978 | | | | — | | | | — | | |
Class R6 | | | 2,061 | | | | 9,530,556 | | | | — | | | | — | | | | 70,594,550 | | | | — | | | | — | | | | 1,494 | | | | — | | | | 5,408,330 | | |
Net Asset Value, offering and redemption price per share | | | |
Investor Class | | $ | — | | | $ | — | | | $ | — | | | $ | 28.76 | | | $ | 62.74 | | | $ | — | | | $ | — | | | $ | 23.38 | | | $ | — | | | $ | 14.04 | | |
Trust Class | | | — | | | | — | | | | — | | | | 28.75 | | | | 62.71 | | | | — | | | | — | | | | 23.36 | | | | — | | | | 14.04 | | |
Advisor Class | | | — | | | | — | | | | — | | | | 28.75 | | | | 62.31 | | | | — | | | | — | | | | 23.20 | | | | — | | | | — | | |
Institutional Class | | | 14.76 | | | | 20.37 | | | | 12.42 | | | | 28.78 | | | | 62.66 | | | | 10.97 | | | | 11.49 | | | | 23.41 | | | | 7.25 | | | | 14.06 | | |
Class R3 | | | — | | | | 20.45 | | | | 12.34 | | | | — | | | | — | | | | — | | | | — | | | | 23.22 | | | | — | | | | — | | |
Class R6 | | | 14.77 | | | | 20.38 | | | | — | | | | — | | | | 62.62 | | | | — | | | | — | | | | 23.41 | | | | — | | | | 14.08 | | |
Net Asset Value and redemption price per share | | | |
Class A | | $ | 14.76 | | | $ | 20.43 | | | $ | 12.37 | | | $ | 28.73 | | | $ | — | | | $ | 10.95 | | | $ | 11.41 | | | $ | 23.34 | | | $ | 7.31 | | | $ | 14.03 | | |
Offering Price per share | | | |
Class A‡ | | $ | 15.66 | | | $ | 21.68 | | | $ | 13.12 | | | $ | 30.48 | | | $ | — | | | $ | 11.62 | | | $ | 12.11 | | | $ | 24.76 | | | $ | 7.76 | | | $ | 14.89 | | |
Net Asset Value and offering price per share | | | |
Class C^ | | $ | 14.65 | | | $ | 20.40 | | | $ | 12.28 | | | $ | 28.27 | | | $ | — | | | $ | 10.91 | | | $ | 10.73 | | | $ | 22.98 | | | $ | 7.25 | | | $ | 13.94 | | |
† Securities on loan, at value: | | | |
Unaffiliated issuers | | $ | — | | | $ | 9,874,256 | | | $ | — | | | $ | — | | | $ | — | | | $ | — | | | $ | — | | | $ | 24,303,417 | | | $ | — | | | $ | — | | |
* Cost of Investments: | | | |
(a) Unaffiliated issuers | | $ | 40,581,287 | | | $ | 880,114,908 | | | $ | 985,306,712 | | | $ | 570,415,324 | | | $ | 4,425,382,284 | | | $ | 1,794,850 | | | $ | 49,427,153 | | | $ | 1,035,538,017 | | | $ | 2,848,995 | | | $ | 1,322,387,350 | | |
(b) Affiliated issuers | | | — | | | | — | | | | — | | | | — | | | | 585,043,775 | | | | — | | | | — | | | | — | | | | — | | | | — | | |
Total cost of investments | | $ | 40,581,287 | | | $ | 880,114,908 | | | $ | 985,306,712 | | | $ | 570,415,324 | | | $ | 5,010,426,059 | | | $ | 1,794,850 | | | $ | 49,427,153 | | | $ | 1,035,538,017 | | | $ | 2,848,995 | | | $ | 1,322,387,350 | | |
(c) Total cost of foreign currency | | $ | — | | | $ | 8,959,234 | | | $ | — | | | $ | — | | | $ | — | | | $ | 2,131 | | | $ | 2,462,433 | | | $ | — | | | $ | 519 | | | $ | 1,515,142 | | |
(d) Premium received from option contracts written | | $ | — | | | $ | — | | | $ | 2,429,726 | | | $ | — | | | $ | — | | | $ | — | | | $ | — | | | $ | 943,332 | | | $ | — | | | $ | — | | |
‡ On single retail sales of less than $50,000. On sales of $50,000 or more or in certain other circumstances described in the Fund's prospectus, offering price is reduced.
^ Redemption price per share is equal to net asset value less any applicable contingent deferred sales charge.
See Notes to Financial Statements
155
156
Statements of Assets and Liabilities (cont'd)
Neuberger Berman Equity Funds
| | | INTERNATIONAL
SELECT FUND | | INTERNATIONAL
SMALL CAP
FUND | | INTRINSIC
VALUE FUND | | LARGE CAP
VALUE FUND | | MID CAP
GROWTH FUND | | MID CAP
INTRINSIC
VALUE FUND | | MULTI-CAP
OPPORTUNITIES
FUND | | REAL ESTATE
FUND | | SMALL CAP
GROWTH
FUND | | SUSTAINABLE
EQUITY
FUND | |
| | | August 31,
2020 | | August 31,
2020 | | August 31,
2020 | | August 31,
2020 | | August 31,
2020 | | August 31,
2020 | | August 31,
2020 | | August 31,
2020 | | August 31,
2020 | | August 31,
2020 | |
Assets | |
Investments in securities, at value*† (Notes A & F)—see Schedule of Investments: | |
| Unaffiliated issuers(a) | | $ | 152,994,557 | | | $ | 2,081,363 | | | $ | 587,002,249 | | | $ | 1,838,570,922 | | | $ | 1,608,820,279 | | | $ | 44,524,892 | | | $ | 681,293,219 | | | $ | 654,323,525 | | | $ | 311,965,424 | | | $ | 1,641,590,675 | | |
| Affiliated issuers(b) | | | — | | | | — | | | | — | | | | — | | | | — | | | | — | | | | — | | | | — | | | | — | | | | — | | |
| | | | 152,994,557 | | | | 2,081,363 | | | | 587,002,249 | | | | 1,838,570,922 | | | | 1,608,820,279 | | | | 44,524,892 | | | | 681,293,219 | | | | 654,323,525 | | | | 311,965,424 | | | | 1,641,590,675 | | |
Cash | | | — | | | | — | | | | — | | | | 5,526,614 | | | | — | | | | — | | | | — | | | | — | | | | — | | | | — | | |
| Foreign currency(c) | | | 111,157 | | | | 73,447 | | | | — | | | | — | | | | — | | | | — | | | | — | | | | — | | | | — | | | | 597 | | |
Receivable from investment manager—net (Note B) | | | — | | | | — | | | | — | | | | — | | | | — | | | | 1,042 | | | | — | | | | — | | | | — | | | | — | | |
Dividends and interest receivable | | | 632,118 | | | | 11,268 | | | | 375,087 | | | | 3,643,254 | | | | 443,067 | | | | 53,599 | | | | 971,258 | | | | 329,664 | | | | 33,317 | | | | 2,811,584 | | |
Receivable for securities sold | | | 111 | | | | — | | | | 603,873 | | | | 15,085,817 | | | | 23,135,046 | | | | 8,188,503 | | | | — | | | | — | | | | 1,216,362 | | | | — | | |
Receivable from Management—net (Note B) | | | — | | | | 23,577 | | | | — | | | | — | | | | — | | | | — | | | | — | | | | — | | | | — | | | | — | | |
Receivable for Fund shares sold | | | 14,315 | | | | — | | | | 1,982,357 | | | | 1,053,174 | | | | 1,184,271 | | | | 12,831 | | | | 859,700 | | | | 1,031,404 | | | | 374,078 | | | | 610,110 | | |
Receivable for securities lending income (Note A) | | | 186 | | | | 35 | | | | — | | | | 7,883 | | | | 3,117 | | | | — | | | | — | | | | — | | | | 2,734 | | | | — | | |
Prepaid expenses and other assets | | | 47,131 | | | | 12,551 | | | | 41,121 | | | | 161,176 | | | | 96,597 | | | | 46,074 | | | | 34,123 | | | | 69,624 | | | | 63,858 | | | | 93,042 | | |
Total Assets | | | 153,799,575 | | | | 2,202,241 | | | | 590,004,687 | | | | 1,864,048,840 | | | | 1,633,682,377 | | | | 52,826,941 | | | | 683,158,300 | | | | 655,754,217 | | | | 313,655,773 | | | | 1,645,106,008 | | |
Liabilities | |
Payable to investment manager—net (Note B) | | | 70,684 | | | | 2,571 | | | | 407,681 | | | | 713,921 | | | | 650,155 | | | | — | | | | 330,085 | | | | 432,570 | | | | 214,113 | | | | 665,701 | | |
| Option contracts written, at value(d) (Note A) | | | — | | | | — | | | | — | | | | — | | | | — | | | | — | | | | — | | | | — | | | | — | | | | — | | |
Payable for securities purchased | | | — | | | | — | | | | 723,340 | | | | 57,927,163 | | | | 14,244,391 | | | | 537,394 | | | | — | | | | 5,401,421 | | | | 962,896 | | | | — | | |
Payable for Fund shares redeemed | | | 613,755 | | | | — | | | | 1,076,069 | | | | 2,165,599 | | | | 1,642,330 | | | | 8,539,548 | | | | 989,926 | | | | 4,531,134 | | | | 260,297 | | | | 1,380,184 | | |
Payable to administrator—net (Note B) | | | 18,580 | | | | — | | | | 49,020 | | | | 400,312 | | | | 258,861 | | | | 29,609 | | | | 126,267 | | | | 22,066 | | | | 10,564 | | | | 344,815 | | |
Payable to trustees | | | 6,373 | | | | 6,373 | | | | 6,373 | | | | 6,373 | | | | 6,373 | | | | 6,373 | | | | 6,373 | | | | 6,373 | | | | 6,373 | | | | 6,373 | | |
Payable for audit fees | | | 54,393 | | | | 43,250 | | | | 26,350 | | | | 53,145 | | | | 26,350 | | | | 26,750 | | | | 26,350 | | | | 52,413 | | | | 26,350 | | | | 26,750 | | |
Payable for custodian fees | | | 46,185 | | | | 29,817 | | | | 43,328 | | | | 87,649 | | | | 74,279 | | | | 31,339 | | | | 46,290 | | | | 47,201 | | | | 39,023 | | | | 90,494 | | |
Payable for legal fees | | | 9,929 | | | | 9,929 | | | | 9,929 | | | | 19,619 | | | | 9,929 | | | | 9,929 | | | | 9,929 | | | | 9,929 | | | | 9,929 | | | | 9,929 | | |
Payable for shareholder servicing fees | | | 2,722 | | | | 117 | | | | 3,965 | | | | 190,090 | | | | 125,456 | | | | 9,904 | | | | 4,937 | | | | 17,318 | | | | 29,572 | | | | 76,156 | | |
Payable for loaned securities collateral (Note A) | | | 447,618 | | | | 88,669 | | | | — | | | | 54,809,889 | | | | 17,302,532 | | | | — | | | | — | | | | — | | | | 4,939,633 | | | | — | | |
Accrued capital gains taxes (Note A) | | | — | | | | — | | | | — | | | | — | | | | — | | | | — | | | | — | | | | — | | | | — | | | | — | | |
Other accrued expenses and payables | | | 14,924 | | | | 6,579 | | | | 47,198 | | | | 73,524 | | | | 70,247 | | | | 9,844 | | | | 41,584 | | | | 33,439 | | | | 17,549 | | | | 77,701 | | |
Total Liabilities | | | 1,285,163 | | | | 187,305 | | | | 2,393,253 | | | | 116,447,284 | | | | 34,410,903 | | | | 9,200,690 | | | | 1,581,741 | | | | 10,553,864 | | | | 6,516,299 | | | | 2,678,103 | | |
Net Assets | | $ | 152,514,412 | | | $ | 2,014,936 | | | $ | 587,611,434 | | | $ | 1,747,601,556 | | | $ | 1,599,271,474 | | | $ | 43,626,251 | | | $ | 681,576,559 | | | $ | 645,200,353 | | | $ | 307,139,474 | | | $ | 1,642,427,905 | | |
Net Assets consist of: | |
Paid-in capital | | $ | 124,720,355 | | | $ | 1,605,691 | | | $ | 486,260,488 | | | $ | 1,564,238,055 | | | $ | 908,369,519 | | | $ | 55,083,627 | | | $ | 232,314,543 | | | $ | 589,983,006 | | | $ | 248,293,597 | | | $ | 961,619,908 | | |
Total distributable earnings/(losses) | | | 27,794,057 | | | | 409,245 | | | | 101,350,946 | | | | 183,363,501 | | | | 690,901,955 | | | | (11,457,376 | ) | | | 449,262,016 | | | | 55,217,347 | | | | 58,845,877 | | | | 680,807,997 | | |
Net Assets | | $ | 152,514,412 | | | $ | 2,014,936 | | | $ | 587,611,434 | | | $ | 1,747,601,556 | | | $ | 1,599,271,474 | | | $ | 43,626,251 | | | $ | 681,576,559 | | | $ | 645,200,353 | | | $ | 307,139,474 | | | $ | 1,642,427,905 | | |
Net Assets | |
Investor Class | | $ | — | | | $ | — | | | $ | — | | | $ | 1,087,200,440 | | | $ | 570,707,044 | | | $ | 23,021,987 | | | $ | — | | | $ | — | | | $ | 72,503,103 | | | $ | 429,625,155 | | |
Trust Class | | | 5,327,508 | | | | — | | | | — | | | | 65,351,212 | | | | 85,716,000 | | | | 4,934,080 | | | | — | | | | 108,560,889 | | | | 4,579,683 | | | | 122,941,294 | | |
Advisor Class | | | — | | | | — | | | | — | | | | 99,672,291 | | | | 10,335,547 | | | | — | | | | — | | | | — | | | | 3,208,183 | | | | — | | |
Institutional Class | | | 138,933,615 | | | | 1,443,150 | | | | 555,197,071 | | | | 365,290,637 | | | | 347,392,478 | | | | 12,563,352 | | | | 609,658,640 | | | | 344,100,462 | | | | 158,103,218 | | | | 689,949,797 | | |
Class A | | | 3,190,737 | | | | 158,646 | | | | 21,043,151 | | | | 23,407,341 | | | | 36,009,508 | | | | 1,713,040 | | | | 41,558,639 | | | | 60,655,020 | | | | 23,331,091 | | | | 98,007,073 | | |
Class C | | | 901,508 | | | | 135,499 | | | | 11,293,733 | | | | 14,661,663 | | | | 11,291,955 | | | | 830,531 | | | | 30,359,280 | | | | 9,085,584 | | | | 4,591,343 | | | | 40,367,231 | | |
Class R3 | | | 2,235,603 | | | | — | | | | — | | | | 641,046 | | | | 13,696,110 | | | | 543,718 | | | | — | | | | 15,678,463 | | | | 3,654,474 | | | | 27,978,331 | | |
Class R6 | | | 1,925,441 | | | | 277,641 | | | | 77,479 | | | | 91,376,926 | | | | 524,122,832 | | | | 19,543 | | | | — | | | | 107,119,935 | | | | 37,168,379 | | | | 233,559,024 | | |
See Notes to Financial Statements
157
158
Statements of Assets and Liabilities (cont'd)
Neuberger Berman Equity Funds (cont'd)
| | | INTERNATIONAL
SELECT FUND | | INTERNATIONAL
SMALL CAP
FUND | | INTRINSIC
VALUE FUND | | LARGE CAP
VALUE FUND | | MID CAP
GROWTH FUND | | MID CAP
INTRINSIC
VALUE FUND | | MULTI-CAP
OPPORTUNITIES
FUND | | REAL ESTATE
FUND | | SMALL CAP
GROWTH
FUND | | SUSTAINABLE
EQUITY
FUND | |
| | | August 31,
2020 | | August 31,
2020 | | August 31,
2020 | | August 31,
2020 | | August 31,
2020 | | August 31,
2020 | | August 31,
2020 | | August 31,
2020 | | August 31,
2020 | | August 31,
2020 | |
Shares Outstanding ($.001 par value; unlimited shares authorized) | | | |
Investor Class | | | — | | | | — | | | | — | | | | 35,783,329 | | | | 30,937,601 | | | | 1,436,196 | | | | — | | | | — | | | | 1,617,987 | | | | 10,891,959 | | |
Trust Class | | | 382,991 | | | | — | | | | — | | | | 2,150,084 | | | | 4,655,597 | | | | 307,904 | | | | — | | | | 7,888,321 | | | | 102,561 | | | | 3,114,904 | | |
Advisor Class | | | — | | | | — | | | | — | | | | 3,279,041 | | | | 565,736 | | | | — | | | | — | | | | — | | | | 72,177 | | | | — | | |
Institutional Class | | | 10,000,352 | | | | 104,094 | | | | 36,689,103 | | | | 12,023,201 | | | | 18,723,108 | | | | 784,258 | | | | 35,797,916 | | | | 24,913,001 | | | | 3,496,813 | | | | 17,511,125 | | |
Class A | | | 231,201 | | | | 11,481 | | | | 1,401,441 | | | | 770,224 | | | | 1,962,987 | | | | 106,888 | | | | 2,437,584 | | | | 4,406,733 | | | | 521,646 | | | | 2,485,905 | | |
Class C | | | 66,589 | | | | 10,000 | | | | 763,789 | | | | 483,936 | | | | 629,969 | | | | 51,905 | | | | 1,794,479 | | | | 658,652 | | | | 104,997 | | | | 1,033,108 | | |
Class R3 | | | 163,566 | | | | — | | | | — | | | | 21,076 | | | | 752,874 | | | | 33,915 | | | | — | | | | 1,141,600 | | | | 82,331 | | | | 709,871 | | |
Class R6 | | | 138,494 | | | | 20,000 | | | | 5,109 | | | | 3,005,054 | | | | 28,167,520 | | | | 1,220 | | | | — | | | | 7,757,495 | | | | 820,267 | | | | 5,926,689 | | |
Net Asset Value, offering and redemption price per share | | | |
Investor Class | | $ | — | | | $ | — | | | $ | — | | | $ | 30.38 | | | $ | 18.45 | | | $ | 16.03 | | | $ | — | | | $ | — | | | $ | 44.81 | | | $ | 39.44 | | |
Trust Class | | | 13.91 | | | | — | | | | — | | | | 30.39 | | | | 18.41 | | | | 16.02 | | | | — | | | | 13.76 | | | | 44.65 | | | | 39.47 | | |
Advisor Class | | | — | | | | — | | | | — | | | | 30.40 | | | | 18.27 | | | | — | | | | — | | | | — | | | | 44.45 | | | | — | | |
Institutional Class | | | 13.89 | | | | 13.86 | | | | 15.13 | | | | 30.38 | | | | 18.55 | | | | 16.02 | | | | 17.03 | | | | 13.81 | | | | 45.21 | | | | 39.40 | | |
Class R3 | | | 13.67 | | | | — | | | | — | | | | 30.42 | | | | 18.19 | | | | 16.03 | | | | — | | | | 13.73 | | | | 44.39 | | | | 39.41 | | |
Class R6 | | | 13.90 | | | | 13.88 | | | | 15.17 | | | | 30.41 | | | | 18.61 | | | | 16.03 | | | | — | | | | 13.81 | | | | 45.31 | | | | 39.41 | | |
Net Asset Value and redemption price per share | | | |
Class A | | $ | 13.80 | | | $ | 13.82 | | | $ | 15.02 | | | $ | 30.39 | | | $ | 18.34 | | | $ | 16.03 | | | $ | 17.05 | | | $ | 13.76 | | | $ | 44.73 | | | $ | 39.43 | | |
Offering Price per share | | | |
Class A‡ | | $ | 14.64 | | | $ | 14.66 | | | $ | 15.94 | | | $ | 32.24 | | | $ | 19.46 | | | $ | 17.01 | | | $ | 18.09 | | | $ | 14.60 | | | $ | 47.46 | | | $ | 41.84 | | |
Net Asset Value and offering price per share | | | |
Class C^ | | $ | 13.54 | | | $ | 13.55 | | | $ | 14.79 | | | $ | 30.30 | | | $ | 17.92 | | | $ | 16.00 | | | $ | 16.92 | | | $ | 13.79 | | | $ | 43.73 | | | $ | 39.07 | | |
† Securities on loan, at value: | | | |
Unaffiliated issuers | | $ | 423,821 | | | $ | 84,556 | | | $ | — | | | $ | 52,944,430 | | | $ | 17,541,636 | | | $ | — | | | $ | — | | | $ | — | | | $ | 4,928,842 | | | $ | — | | |
* Cost of Investments: | | | |
(a) Unaffiliated issuers | | $ | 124,529,237 | | | $ | 1,729,661 | | | $ | 482,497,591 | | | $ | 1,643,715,776 | | | $ | 1,046,690,541 | | | $ | 43,202,170 | | | $ | 355,954,150 | | | $ | 594,815,746 | | | $ | 256,087,529 | | | $ | 1,018,712,235 | | |
(b) Affiliated issuers | | | — | | | | — | | | | — | | | | — | | | | — | | | | — | | | | — | | | | — | | | | — | | | | — | | |
Total cost of investments | | $ | 124,529,237 | | | $ | 1,729,661 | | | $ | 482,497,591 | | | $ | 1,643,715,776 | | | $ | 1,046,690,541 | | | $ | 43,202,170 | | | $ | 355,954,150 | | | $ | 594,815,746 | | | $ | 256,087,529 | | | $ | 1,018,712,235 | | |
(c) Total cost of foreign currency | | $ | 110,551 | | | $ | 73,248 | | | $ | — | | | $ | — | | | $ | — | | | $ | — | | | $ | — | | | $ | — | | | $ | — | | | $ | 591 | | |
(d) Premium received from option contracts written | | $ | — | | | $ | — | | | $ | — | | | $ | — | | | $ | — | | | $ | — | | | $ | — | | | $ | — | | | $ | — | | | $ | — | | |
‡ On single retail sales of less than $50,000. On sales of $50,000 or more or in certain other circumstances described in the Fund's prospectus, offering price is reduced.
^ Redemption price per share is equal to net asset value less any applicable contingent deferred sales charge.
See Notes to Financial Statements
159
160
Neuberger Berman Equity Funds
| | | DIVIDEND
GROWTH FUND | | EMERGING
MARKETS
EQUITY FUND | | EQUITY
INCOME FUND | | FOCUS FUND | | GENESIS FUND | | GLOBAL REAL
ESTATE FUND | | GREATER
CHINA EQUITY
FUND | | GUARDIAN
FUND | | INTEGRATED
LARGE CAP
FUND | | INTERNATIONAL
EQUITY FUND | |
| | | For the Fiscal
Year Ended
August 31,
2020 | | For the Fiscal
Year Ended
August 31,
2020 | | For the Fiscal
Year Ended
August 31,
2020 | | For the Fiscal
Year Ended
August 31,
2020 | | For the Fiscal
Year Ended
August 31,
2020 | | For the Fiscal
Year Ended
August 31,
2020 | | For the Fiscal
Year Ended
August 31,
2020 | | For the Fiscal
Year Ended
August 31,
2020 | | For the Fiscal
Year Ended
August 31,
2020 | | For the Fiscal
Year Ended
August 31,
2020 | |
Investment Income: | |
Income (Note A): | |
Dividend income—unaffiliated issuers | | $ | 1,199,924 | | | $ | 37,060,450 | | | $ | 38,979,775 | | | $ | 7,120,889 | | | $ | 92,214,279 | | | $ | 83,566 | | | $ | 1,192,577 | | | $ | 14,832,675 | | | $ | 70,546 | | | $ | 32,478,546 | | |
Dividend income—affiliated issuers (Note F) | | | — | | | | — | | | | — | | | | — | | | | 9,757,520 | | | | — | | | | — | | | | — | | | | — | | | | — | | |
Interest and other income—unaffiliated issuers | | | 20,608 | | | | 525,821 | | | | 3,202,959 | | | | 233,786 | | | | 940,141 | | | | 814 | | | | 6,322 | | | | 320,847 | | | | 274 | | | | 615,443 | | |
Income from securities loaned—net | | | — | | | | 86,034 | | | | — | | | | 15,189 | | | | — | | | | — | | | | — | | | | 45,608 | | | | — | | | | 101,706 | | |
Foreign taxes withheld | | | (23,406 | ) | | | (3,128,154 | ) | | | (730,455 | ) | | | (156,642 | ) | | | (468,800 | ) | | | (3,806 | ) | | | (69,004 | ) | | | (112,558 | ) | | | (158 | ) | | | (2,719,223 | ) | |
Total income | | $ | 1,197,126 | | | $ | 34,544,151 | | | $ | 41,452,279 | | | $ | 7,213,222 | | | $ | 102,443,140 | | | $ | 80,574 | | | $ | 1,129,895 | | | $ | 15,086,572 | | | $ | 70,662 | | | $ | 30,476,472 | | |
Expenses: | |
Investment management fees (Note B) | | | 264,561 | | | | 12,082,774 | | | | 6,740,299 | | | | 3,615,372 | | | | 65,712,760 | | | | 26,070 | | | | 587,723 | | | | 6,661,446 | | | | 6,817 | | | | 15,215,805 | | |
Administration fees (Note B): | |
Investor Class | | | — | | | | — | | | | — | | | | 1,622,429 | | | | 4,122,987 | | | | — | | | | — | | | | 3,078,978 | | | | — | | | | 235,827 | | |
Trust Class | | | — | | | | — | | | | — | | | | 178,002 | | | | 5,025,756 | | | | — | | | | — | | | | 157,936 | | | | — | | | | 114,442 | | |
Advisor Class | | | — | | | | — | | | | — | | | | 6,610 | | | | 540,647 | | | | — | | | | — | | | | 713 | | | | — | | | | — | | |
Institutional Class | | | 73,580 | | | | 1,543,088 | | | | 1,606,923 | | | | 17,302 | | | | 4,169,064 | | | | 3,955 | | | | 72,263 | | | | 165,879 | | | | 4,604 | | | | 2,550,620 | | |
Class A | | | 3,585 | | | | 98,719 | | | | 353,455 | | | | 6,941 | | | | — | | | | 870 | | | | 13,196 | | | | 13,166 | | | | 656 | | | | 135,603 | | |
Class C | | | 6,363 | | | | 20,547 | | | | 391,057 | | | | 3,201 | | | | — | | | | 747 | | | | 464 | | | | 5,016 | | | | 226 | | | | 22,169 | | |
Class R3 | | | — | | | | 2,249 | | | | 4,870 | | | | — | | | | — | | | | — | | | | — | | | | 341 | | | | — | | | | — | | |
Class R6 | | | 16 | | | | 98,830 | | | | — | | | | — | | | | 2,080,303 | | | | — | | | | — | | | | 14 | | | | — | | | | 40,198 | | |
Distribution fees (Note B): | |
Trust Class | | | — | | | | — | | | | — | | | | 44,500 | | | | — | | | | — | | | | — | | | | 39,484 | | | | — | | | | — | | |
Advisor Class | | | — | | | | — | | | | — | | | | 4,131 | | | | 337,905 | | | | — | | | | — | | | | 445 | | | | — | | | | — | | |
Class A | | | 3,447 | | | | 94,922 | | | | 339,860 | | | | 6,674 | | | | — | | | | 837 | | | | 12,688 | | | | 12,660 | | | | 631 | | | | 130,387 | | |
Class C | | | 24,472 | | | | 79,026 | | | | 1,504,065 | | | | 12,310 | | | | — | | | | 2,874 | | | | 1,784 | | | | 19,293 | | | | 870 | | | | 85,264 | | |
Class R3 | | | — | | | | 4,325 | | | | 9,365 | | | | — | | | | — | | | | — | | | | — | | | | 656 | | | | — | | | | — | | |
Shareholder servicing agent fees: | |
Investor Class | | | — | | | | — | | | | — | | | | 347,517 | | | | 884,788 | | | | — | | | | — | | | | 696,972 | | | | — | | | | 93,414 | | |
Trust Class | | | — | | | | — | | | | — | | | | 666 | | | | 8,455 | | | | — | | | | — | | | | 835 | | | | — | | | | 1,152 | | |
Advisor Class | | | — | | | | — | | | | — | | | | 286 | | | | 7,735 | | | | — | | | | — | | | | 230 | | | | — | | | | — | | |
Institutional Class | | | 339 | | | | 215,341 | | | | 5,404 | | | | 422 | | | | 18,574 | | | | 132 | | | | 338 | | | | 688 | | | | 309 | | | | 47,243 | | |
Class A | | | 1,195 | | | | 7,406 | | | | 9,258 | | | | 373 | | | | — | | | | 529 | | | | 5,622 | | | | 813 | | | | 588 | | | | 2,864 | | |
Class C | | | 6 | | | | 411 | | | | 3,457 | | | | 146 | | | | — | | | | 41 | | | | 66 | | | | 162 | | | | 28 | | | | 712 | | |
Class R3 | | | — | | | | 1,286 | | | | 547 | | | | — | | | | — | | | | — | | | | — | | | | — | | | | — | | | | — | | |
Class R6 | | | 37 | | | | 4,604 | | | | — | | | | — | | | | 12,943 | | | | — | | | | — | | | | — | | | | — | | | | 2,093 | | |
Audit fees | | | 44,849 | | | | 52,031 | | | | 55,594 | | | | 53,244 | | | | 59,086 | | | | 48,399 | | | | 48,773 | | | | 54,892 | | | | 49,837 | | | | 54,460 | | |
Custodian and accounting fees | | | 62,069 | | | | 996,380 | | | | 169,856 | | | | 104,858 | | | | 955,083 | | | | 62,049 | | | | 77,904 | | | | 159,569 | | | | 58,796 | | | | 382,767 | | |
Insurance | | | 1,692 | | | | 44,563 | | | | 44,076 | | | | 22,113 | | | | 322,396 | | | | 121 | | | | 1,752 | | | | 41,365 | | | | 144 | | | | 58,446 | | |
Legal fees | | | 42,273 | | | | 42,273 | | | | 42,273 | | | | 60,712 | | | | 46,407 | | | | 42,444 | | | | 58,409 | | | | 45,734 | | | | 67,072 | | | | 42,444 | | |
Registration and filing fees | | | 59,968 | | | | 108,188 | | | | 89,846 | | | | 99,692 | | | | 231,687 | | | | 46,191 | | | | 49,208 | | | | 144,923 | | | | 51,048 | | | | 116,282 | | |
Repayment to Management of expenses previously assumed by
Management (Note B) | | | — | | | | 239,328 | | | | — | | | | — | | | | 525,381 | | | | — | | | | — | | | | 103 | | | | — | | | | — | | |
Shareholder reports | | | 3,596 | | | | 76,286 | | | | 117,363 | | | | 62,446 | | | | 668,929 | | | | 2,947 | | | | 2,617 | | | | 94,590 | | | | 2,618 | | | | 173,904 | | |
Trustees' fees and expenses | | | 51,601 | | | | 52,879 | | | | 52,969 | | | | 52,214 | | | | 61,399 | | | | 51,550 | | | | 51,599 | | | | 52,780 | | | | 51,550 | | | | 53,355 | | |
Interest | | | — | | | | 574 | | | | 5,195 | | | | 110 | | | | 131 | | | | — | | | | 737 | | | | 5,712 | | | | 154 | | | | 3,353 | | |
Miscellaneous | | | 8,462 | | | | 120,169 | | | | 76,320 | | | | 42,722 | | | | 461,494 | | | | 1,819 | | | | 6,074 | | | | 70,412 | | | | 1,781 | | | | 106,672 | | |
Total expenses | | | 652,111 | | | | 15,986,199 | | | | 11,622,052 | | | | 6,364,993 | | | | 86,253,910 | | | | 291,575 | | | | 991,217 | | | | 11,525,807 | | | | 297,729 | | | | 19,669,476 | | |
See Notes to Financial Statements
161
162
Statements of Operations (cont'd)
Neuberger Berman Equity Funds (cont'd)
| | | DIVIDEND
GROWTH FUND | | EMERGING
MARKETS
EQUITY FUND | | EQUITY
INCOME FUND | | FOCUS FUND | | GENESIS FUND | | GLOBAL REAL
ESTATE FUND | | GREATER
CHINA EQUITY
FUND | | GUARDIAN
FUND | | INTEGRATED
LARGE CAP
FUND | | INTERNATIONAL
EQUITY FUND | |
| | | For the Fiscal
Year Ended
August 31,
2020 | | For the Fiscal
Year Ended
August 31,
2020 | | For the Fiscal
Year Ended
August 31,
2020 | | For the Fiscal
Year Ended
August 31,
2020 | | For the Fiscal
Year Ended
August 31,
2020 | | For the Fiscal
Year Ended
August 31,
2020 | | For the Fiscal
Year Ended
August 31,
2020 | | For the Fiscal
Year Ended
August 31,
2020 | | For the Fiscal
Year Ended
August 31,
2020 | | For the Fiscal
Year Ended
August 31,
2020 | |
Expenses reimbursed by Management (Note B) | | | (252,838 | ) | | | (41,463 | ) | | | — | | | | (424 | ) | | | — | | | | (254,409 | ) | | | (166,753 | ) | | | — | | | | (281,818 | ) | | | (372,164 | ) | |
Investment management fees waived (Note B) | | | — | | | | — | | | | — | | | | — | | | | — | | | | — | | | | — | | | | — | | | | (68 | ) | | | (2,062,406 | ) | |
Total net expenses | | | 399,273 | | | | 15,944,736 | | | | 11,622,052 | | | | 6,364,569 | | | | 86,253,910 | | | | 37,166 | | | | 824,464 | | | | 11,525,807 | | | | 15,843 | | | | 17,234,906 | | |
Net investment income/(loss) | | $ | 797,853 | | | $ | 18,599,415 | | | $ | 29,830,227 | | | $ | 848,653 | | | $ | 16,189,230 | | | $ | 43,408 | | | $ | 305,431 | | | $ | 3,560,765 | | | $ | 54,819 | | | $ | 13,241,566 | | |
Realized and Unrealized Gain/(Loss) on Investments (Note A): | |
Net realized gain/(loss) on: | |
Transactions in investment securities of unaffiliated issuers | | | (1,910,440 | ) | | | (64,209,899 | ) | | | (19,067,978 | ) | | | 85,671,317 | | | | 384,234,535 | | | | 35,562 | | | | 3,710,382 | | | | 122,429,977 | | | | 404,506 | | | | 111,865,121 | | |
Transactions in investment securities of affiliated issuers | | | — | | | | — | | | | — | | | | — | | | | 66,635,193 | | | | — | | | | — | | | | — | | | | — | | | | — | | |
Redemption in-kind | | | — | | | | — | | | | — | | | | — | | | | — | | | | — | | | | — | | | | — | | | | — | | | | — | | |
Settlement of foreign currency transactions | | | (709 | ) | | | (1,204,419 | ) | | | (29,618 | ) | | | (81,482 | ) | | | 4,711 | | | | (1,022 | ) | | | 1,943 | | | | (3,911 | ) | | | 882 | | | | (275,446 | ) | |
Expiration or closing of option contracts written | | | — | | | | — | | | | (4,717,604 | ) | | | — | | | | — | | | | — | | | | — | | | | 2,535,750 | | | | — | | | | — | | |
Net increase from payments by affiliates (Note B) | | | — | | | | — | | | | — | | | | — | | | | — | | | | — | | | | — | | | | — | | | | — | | | | 1,010,727 | | |
Change in net unrealized appreciation/(depreciation) in value of: | |
Investment securities of unaffiliated issuers | | | 7,965,468 | | | | 137,469,097 | * | | | (2,790,443 | ) | | | 76,828,210 | | | | 807,893,441 | | | | (457,065 | ) | | | 7,940,885 | | | | 305,629,690 | | | | 63,561 | | | | 165,375,396 | | |
Investment securities of affiliated issuers | | | — | | | | — | | | | — | | | | — | | | | (12,788,129 | ) | | | — | | | | — | | | | — | | | | — | | | | — | | |
Foreign currency translations | | | (199 | ) | | | 66,781 | | | | (11,625 | ) | | | — | | | | 178 | | | | 108 | | | | 28,162 | | | | 277 | | | | 354 | | | | 413,693 | | |
Option contracts written | | | — | | | | — | | | | (140,123 | ) | | | — | | | | — | | | | — | | | | — | | | | 711,962 | | | | — | | | | — | | |
Net gain/(loss) on investments | | | 6,054,120 | | | | 72,121,560 | | | | (26,757,391 | ) | | | 162,418,045 | | | | 1,245,979,929 | | | | (422,417 | ) | | | 11,681,372 | | | | 431,303,745 | | | | 469,303 | | | | 278,389,491 | | |
Net increase/(decrease) in net assets resulting from operations | | $ | 6,851,973 | | | $ | 90,720,975 | | | $ | 3,072,836 | | | $ | 163,266,698 | | | $ | 1,262,169,159 | | | $ | (379,009 | ) | | $ | 11,986,803 | | | $ | 434,864,510 | | | $ | 524,122 | | | $ | 291,631,057 | | |
* Change in accrued foreign capital gains tax amounted to $(325,142) for Emerging Markets Equity.
See Notes to Financial Statements
163
164
Statements of Operations (cont'd)
Neuberger Berman Equity Funds
| | | INTERNATIONAL
SELECT FUND | | INTERNATIONAL
SMALL CAP
FUND | | INTRINSIC
VALUE FUND | | LARGE CAP
VALUE FUND | | MID CAP
GROWTH
FUND | | MID CAP
INTRINSIC
VALUE FUND | | MULTI-CAP
OPPORTUNITIES
FUND | | REAL ESTATE
FUND | | SMALL CAP
GROWTH
FUND | | SUSTAINABLE
EQUITY
FUND | |
| | | For the Fiscal
Year Ended
August 31,
2020 | | For the Fiscal
Year Ended
August 31,
2020 | | For the Fiscal
Year Ended
August 31,
2020 | | For the Fiscal
Year Ended
August 31,
2020 | | For the Fiscal
Year Ended
August 31,
2020 | | For the Fiscal
Year Ended
August 31,
2020 | | For the Fiscal
Year Ended
August 31,
2020 | | For the Fiscal
Year Ended
August 31,
2020 | | For the Fiscal
Year Ended
August 31,
2020 | | For the Fiscal
Year Ended
August 31,
2020 | |
Investment Income: | |
Income (Note A): | |
Dividend income—unaffiliated issuers | | $ | 2,599,946 | | | $ | 74,341 | | | $ | 3,660,026 | | | $ | 49,258,199 | | | $ | 6,618,744 | | | $ | 1,661,163 | | | $ | 12,181,091 | | | $ | 12,366,096 | | | $ | 794,595 | | | $ | 24,652,423 | | |
Dividend income—affiliated issuers (Note F) | | | — | | | | — | | | | — | | | | — | | | | — | | | | — | | | | — | | | | — | | | | — | | | | — | | |
Interest and other income—unaffiliated issuers | | | 63,878 | | | | 3,779 | | | | 527,349 | | | | 704,024 | | | | 284,155 | | | | 8,290 | | | | 80,641 | | | | 90,831 | | | | 137,632 | | | | 237,095 | | |
Income from securities loaned—net | | | 10,402 | | | | 1,807 | | | | — | | | | 392,002 | | | | 39,507 | | | | — | | | | — | | | | — | | | | 28,414 | | | | — | | |
Foreign taxes withheld | | | (220,277 | ) | | | (8,687 | ) | | | — | | | | (209,677 | ) | | | (24,965 | ) | | | (489 | ) | | | (86,250 | ) | | | (18,298 | ) | | | — | | | | (653,221 | ) | |
Total income | | $ | 2,453,949 | | | $ | 71,240 | | | $ | 4,187,375 | | | $ | 50,144,548 | | | $ | 6,917,441 | | | $ | 1,668,964 | | | $ | 12,175,482 | | | $ | 12,438,629 | | | $ | 960,641 | | | $ | 24,236,297 | | |
Expenses: | |
Investment management fees (Note B) | | | 886,544 | | | | 50,759 | | | | 4,735,864 | | | | 8,525,542 | | | | 7,007,470 | | | | 385,846 | | | | 5,282,537 | | | | 4,462,100 | | | | 2,028,993 | | | | 8,064,299 | | |
Administration fees (Note B): | |
Investor Class | | | — | | | | — | | | | — | | | | 2,883,544 | | | | 1,310,079 | | | | 71,998 | | | | — | | | | — | | | | 167,007 | | | | 1,099,148 | | |
Trust Class | | | 19,871 | | | | — | | | | — | | | | 293,954 | | | | 308,162 | | | | 25,229 | | | | — | | | | 469,620 | | | | 16,937 | | | | 553,490 | | |
Advisor Class | | | — | | | | — | | | | — | | | | 425,514 | | | | 42,640 | | | | — | | | | — | | | | — | | | | 11,225 | | | | — | | |
Institutional Class | | | 196,993 | | | | 8,208 | | | | 822,202 | | | | 538,437 | | | | 433,607 | | | | 45,709 | | | | 1,293,510 | | | | 380,149 | | | | 161,873 | | | | 1,073,041 | | |
Class A | | | 7,753 | | | | 361 | | | | 51,124 | | | | 105,088 | | | | 86,280 | | | | 9,332 | | | | 111,741 | | | | 163,757 | | | | 73,029 | | | | 235,530 | | |
Class C | | | 3,870 | | | | 315 | | | | 36,242 | | | | 55,735 | | | | 27,380 | | | | 3,185 | | | | 92,062 | | | | 28,184 | | | | 11,147 | | | | 113,224 | | |
Class R3 | | | 5,608 | | | | — | | | | — | | | | 1,893 | | | | 94,850 | | | | 2,201 | | | | — | | | | 45,561 | | | | 6,452 | | | | 76,629 | | |
Class R6 | | | 9,133 | | | | 120 | | | | 84 | | | | 30,425 | | | | 229,018 | | | | 10 | | | | — | | | | 47,789 | | | | 13,042 | | | | 111,676 | | |
Distribution fees (Note B): | |
Trust Class | | | 4,968 | | | | — | | | | — | | | | 73,489 | | | | — | | | | 6,307 | | | | — | | | | 117,405 | | | | 4,234 | | | | 138,372 | | |
Advisor Class | | | — | | | | — | | | | — | | | | 265,946 | | | | 26,650 | | | | — | | | | — | | | | — | | | | 7,016 | | | | — | | |
Class A | | | 7,455 | | | | 348 | | | | 49,157 | | | | 101,046 | | | | 82,961 | | | | 8,973 | | | | 107,443 | | | | 157,459 | | | | 70,220 | | | | 226,471 | | |
Class C | | | 14,886 | | | | 1,212 | | | | 139,393 | | | | 214,365 | | | | 105,307 | | | | 12,249 | | | | 354,082 | | | | 108,398 | | | | 42,872 | | | | 435,478 | | |
Class R3 | | | 10,783 | | | | — | | | | — | | | | 3,640 | | | | 182,405 | | | | 4,234 | | | | — | | | | 87,618 | | | | 12,408 | | | | 147,364 | | |
Shareholder servicing agent fees: | |
Investor Class | | | — | | | | — | | | | — | | | | 644,062 | | | | 382,537 | | | | 24,118 | | | | — | | | | — | | | | 77,068 | | | | 314,518 | | |
Trust Class | | | 6,115 | | | | — | | | | — | | | | 1,644 | | | | 1,012 | | | | 562 | | | | — | | | | 24,338 | | | | 454 | | | | 5,353 | | |
Advisor Class | | | — | | | | — | | | | — | | | | 2,361 | | | | 889 | | | | — | | | | — | | | | — | | | | 581 | | | | — | | |
Institutional Class | | | 853 | | | | — | | | | 5,934 | | | | 4,437 | | | | 7,830 | | | | 1,111 | | | | 3,714 | | | | 5,240 | | | | 3,430 | | | | 10,982 | | |
Class A | | | 398 | | | | 317 | | | | 3,440 | | | | 6,483 | | | | 3,499 | | | | 585 | | | | 7,906 | | | | 5,754 | | | | 16,632 | | | | 10,570 | | |
Class C | | | 156 | | | | 14 | | | | 678 | | | | 3,517 | | | | 864 | | | | 247 | | | | 1,477 | | | | 1,926 | | | | 532 | | | | 2,322 | | |
Class R3 | | | 403 | | | | — | | | | — | | | | 322 | | | | 3,786 | | | | 308 | | | | — | | | | 4,497 | | | | 1,710 | | | | 3,032 | | |
Class R6 | | | 55 | | | | 6 | | | | 50 | | | | 684 | | | | 13,396 | | | | — | | | | — | | | | 7,397 | | | | 811 | | | | 9,557 | | |
Audit fees | | | 54,892 | | | | 43,249 | | | | 26,850 | | | | 54,644 | | | | 26,850 | | | | 26,750 | | | | 26,850 | | | | 52,912 | | | | 26,850 | | | | 27,250 | | |
Custodian and accounting fees | | | 96,301 | | | | 60,794 | | | | 106,037 | | | | 203,048 | | | | 165,211 | | | | 67,851 | | | | 110,463 | | | | 100,026 | | | | 84,962 | | | | 210,409 | | |
Insurance | | | 5,402 | | | | 205 | | | | 21,928 | | | | 53,286 | | | | 45,056 | | | | 3,103 | | | | 31,939 | | | | 15,832 | | | | 6,004 | | | | 57,805 | | |
Legal fees | | | 42,444 | | | | 43,626 | | | | 42,273 | | | | 39,993 | | | | 43,455 | | | | 42,273 | | | | 42,273 | | | | 42,273 | | | | 43,455 | | | | 42,273 | | |
Registration and filing fees | | | 107,364 | | | | 61,697 | | | | 88,930 | | | | 190,552 | | | | 144,161 | | | | 116,526 | | | | 77,532 | | | | 112,561 | | | | 155,985 | | | | 145,615 | | |
Repayment to Management of expenses previously assumed by
Management (Note B) | | | — | | | | — | | | | — | | | | 33 | | | | — | | | | 4 | | | | — | | | | — | | | | — | | | | — | | |
Shareholder reports | | | 9,547 | | | | 3,580 | | | | 107,621 | | | | 143,995 | | | | 145,818 | | | | 10,881 | | | | 44,188 | | | | 66,021 | | | | 41,779 | | | | 120,409 | | |
Trustees' fees and expenses | | | 51,718 | | | | 51,552 | | | | 52,158 | | | | 53,341 | | | | 52,892 | | | | 51,634 | | | | 52,734 | | | | 52,036 | | | | 51,754 | | | | 53,324 | | |
Interest | | | — | | | | 43 | (Note E) | | | 5,680 | | | | 353 | | | | 94 | | | | 5,064 | | | | 28,891 | | | | — | | | | 1,112 | | | | 2,512 | | |
Miscellaneous | | | 15,742 | | | | 22,273 | | | | 33,603 | | | | 98,747 | | | | 75,783 | | | | 11,238 | | | | 41,472 | | | | 32,754 | | | | 21,253 | | | | 79,355 | | |
Total expenses | | | 1,559,254 | | | | 348,679 | | | | 6,329,248 | | | | 15,020,120 | | | | 11,049,942 | | | | 937,528 | | | | 7,710,814 | | | | 6,591,607 | | | | 3,160,827 | | | | 13,370,008 | | |
See Notes to Financial Statements
165
166
Statements of Operations (cont'd)
Neuberger Berman Equity Funds (cont'd)
| | | INTERNATIONAL
SELECT FUND | | INTERNATIONAL
SMALL CAP
FUND | | INTRINSIC
VALUE FUND | | LARGE CAP
VALUE FUND | | MID CAP
GROWTH
FUND | | MID CAP
INTRINSIC
VALUE FUND | | MULTI-CAP
OPPORTUNITIES
FUND | | REAL ESTATE
FUND | | SMALL CAP
GROWTH
FUND | | SUSTAINABLE
EQUITY
FUND | |
| | | For the Fiscal
Year Ended
August 31,
2020 | | For the Fiscal
Year Ended
August 31,
2020 | | For the Fiscal
Year Ended
August 31,
2020 | | For the Fiscal
Year Ended
August 31,
2020 | | For the Fiscal
Year Ended
August 31,
2020 | | For the Fiscal
Year Ended
August 31,
2020 | | For the Fiscal
Year Ended
August 31,
2020 | | For the Fiscal
Year Ended
August 31,
2020 | | For the Fiscal
Year Ended
August 31,
2020 | | For the Fiscal
Year Ended
August 31,
2020 | |
Expenses reimbursed by Management (Note B) | | | (224,014 | ) | | | (284,074 | ) | | | (256,731 | ) | | | — | | | | — | | | | (26,717 | ) | | | — | | | | (1,247,674 | ) | | | (648,092 | ) | | | — | | |
Investment management fees waived (Note B) | | | — | | | | — | | | | — | | | | — | | | | — | | | | (179,685 | ) | | | — | | | | — | | | | — | | | | — | | |
Total net expenses | | | 1,335,240 | | | | 64,605 | | | | 6,072,517 | | | | 15,020,120 | | | | 11,049,942 | | | | 731,126 | | | | 7,710,814 | | | | 5,343,933 | | | | 2,512,735 | | | | 13,370,008 | | |
Net investment income/(loss) | | $ | 1,118,709 | | | $ | 6,635 | | | $ | (1,885,142 | ) | | $ | 35,124,428 | | | $ | (4,132,501 | ) | | $ | 937,838 | | | $ | 4,464,668 | | | $ | 7,094,696 | | | $ | (1,552,094 | ) | | $ | 10,866,289 | | |
Realized and Unrealized Gain/(Loss) on Investments (Note A): | |
Net realized gain/(loss) on: | |
Transactions in investment securities of unaffiliated issuers | | | 2,080,501 | | | | 560,692 | | | | 8,476,391 | | | | (9,991,797 | ) | | | 154,260,283 | | | | (10,309,239 | ) | | | 217,155,413 | | | | 10,488,410 | | | | 5,562,877 | | | | 64,085,252 | | |
Transactions in investment securities of affiliated issuers | | | — | | | | — | | | | — | | | | — | | | | — | | | | — | | | | — | | | | — | | | | — | | | | — | | |
Redemption in-kind | | | (191,436 | ) | | | — | | | | — | | | | — | | | | — | | | | — | | | | — | | | | — | | | | — | | | | — | | |
Settlement of foreign currency transactions | | | 8,464 | | | | 5,500 | | | | — | | | | 1,219 | | | | 55 | | | | — | | | | — | | | | — | | | | — | | | | 96,714 | | |
Expiration or closing of option contracts written | | | — | | | | — | | | | — | | | | — | | | | — | | | | — | | | | — | | | | — | | | | — | | | | — | | |
Net increase from payments by affiliates (Note B) | | | — | | | | — | | | | — | | | | — | | | | — | | | | — | | | | — | | | | — | | | | — | | | | — | | |
Change in net unrealized appreciation/(depreciation) in value of: | |
Investment securities of unaffiliated issuers | | | 22,829,166 | | | | 565,699 | | | | 31,792,267 | | | | 15,231,759 | | | | 141,191,962 | | | | (2,158,411 | ) | | | (166,400,834 | ) | | | (41,527,845 | ) | | | 48,380,953 | | | | 165,053,156 | | |
Investment securities of affiliated issuers | | | — | | | | — | | | | — | | | | — | | | | — | | | | — | | | | — | | | | — | | | | — | | | | — | | |
Foreign currency translations | | | 36,410 | | | | 812 | | | | — | | | | — | | | | — | | | | — | | | | — | | | | — | | | | — | | | | 122,173 | | |
Option contracts written | | | — | | | | — | | | | — | | | | — | | | | — | | | | — | | | | — | | | | — | | | | — | | | | — | | |
Net gain/(loss) on investments | | | 24,763,105 | | | | 1,132,703 | | | | 40,268,658 | | | | 5,241,181 | | | | 295,452,300 | | | | (12,467,650 | ) | | | 50,754,579 | | | | (31,039,435 | ) | | | 53,943,830 | | | | 229,357,295 | | |
Net increase/(decrease) in net assets resulting from operations | | $ | 25,881,814 | | | $ | 1,139,338 | | | $ | 38,383,516 | | | $ | 40,365,609 | | | $ | 291,319,799 | | | $ | (11,529,812 | ) | | $ | 55,219,247 | | | $ | (23,944,739 | ) | | $ | 52,391,736 | | | $ | 240,223,584 | | |
See Notes to Financial Statements
167
168
Statements of Changes in Net Assets
Neuberger Berman Equity Funds
| | | DIVIDEND GROWTH FUND | | EMERGING MARKETS
EQUITY FUND | | EQUITY INCOME FUND | | FOCUS FUND | | GENESIS FUND | |
| | | Fiscal
Year Ended
August 31,
2020 | | Fiscal
Year Ended
August 31,
2019 | | Fiscal
Year Ended
August 31,
2020 | | Fiscal
Year Ended
August 31,
2019 | | Fiscal
Year Ended
August 31,
2020 | | Fiscal
Year Ended
August 31,
2019 | | Fiscal
Year Ended
August 31,
2020 | | Fiscal
Year Ended
August 31,
2019 | | Fiscal
Year Ended
August 31,
2020 | | Fiscal
Year Ended
August 31,
2019 | |
Increase/(Decrease) in Net Assets: | |
From Operations (Note A): | |
Net investment income/(loss) | | $ | 797,853 | | | $ | 850,372 | | | $ | 18,599,415 | | | $ | 17,213,658 | | | $ | 29,830,227 | | | $ | 35,050,514 | | | $ | 848,653 | | | $ | 3,385,324 | | | $ | 16,189,230 | | | $ | 21,693,090 | | |
Net realized gain/(loss) on investments | | | (1,911,149 | ) | | | (620,373 | ) | | | (65,414,318 | ) | | | (46,390,310 | ) | | | (23,815,200 | ) | | | 47,229,463 | | | | 85,589,835 | | | | 3,660,884 | | | | 450,874,439 | | | | 909,517,395 | | |
Net increase from payments by affiliates (Note B) | | | — | | | | — | | | | — | | | | — | | | | — | | | | — | | | | — | | | | — | | | | — | | | | — | | |
Change in net unrealized appreciation/(depreciation) of
investments | | | 7,965,269 | | | | (2,016,213 | ) | | | 137,535,878 | | | | 6,509,922 | | | | (2,942,191 | ) | | | (49,006,176 | ) | | | 76,828,210 | | | | (27,698,216 | ) | | | 795,105,490 | | | | (941,004,665 | ) | |
Net increase/(decrease) in net assets resulting from operations | | | 6,851,973 | | | | (1,786,214 | ) | | | 90,720,975 | | | | (22,666,730 | ) | | | 3,072,836 | | | | 33,273,801 | | | | 163,266,698 | | | | (20,652,008 | ) | | | 1,262,169,159 | | | | (9,794,180 | ) | |
Distributions to Shareholders From (Note A): | |
Distributable earnings: | |
Investor Class | | | — | | | | — | | | | — | | | | — | | | | — | | | | — | | | | (75,252,839 | ) | | | (47,553,306 | ) | | | (93,945,287 | ) | | | (163,650,822 | ) | |
Trust Class | | | — | | | | — | | | | — | | | | — | | | | — | | | | — | | | | (5,351,763 | ) | | | (3,791,448 | ) | | | (75,018,791 | ) | | | (133,145,278 | ) | |
Advisor Class | | | — | | | | — | | | | — | | | | — | | | | — | | | | — | | | | (188,376 | ) | | | (130,256 | ) | | | (8,290,810 | ) | | | (16,626,920 | ) | |
Institutional Class | | | (804,626 | ) | | | (2,644,389 | ) | | | (20,574,096 | ) | | | (10,212,461 | ) | | | (65,159,516 | ) | | | (75,478,635 | ) | | | (1,293,502 | ) | | | (594,783 | ) | | | (167,718,230 | ) | | | (289,491,380 | ) | |
Class A | | | (15,065 | ) | | | (82,986 | ) | | | (702,541 | ) | | | (221,548 | ) | | | (7,672,862 | ) | | | (10,531,062 | ) | | | (314,401 | ) | | | (237,335 | ) | | | — | | | | — | | |
Class C | | | (6,073 | ) | | | (140,477 | ) | | | (64,329 | ) | | | — | | | | (7,830,035 | ) | | | (12,834,034 | ) | | | (142,600 | ) | | | (110,917 | ) | | | — | | | | — | | |
Class R3 | | | — | | | | — | | | | (11,446 | ) | | | (424 | ) | | | (106,199 | ) | | | (116,014 | ) | | | — | | | | — | | | | — | | | | — | | |
Class R6 | | | (622 | ) | | | (1,443 | ) | | | (4,593,292 | ) | | | (1,646,005 | ) | | | — | | | | — | | | | — | | | | — | | | | (254,709,597 | ) | | | (401,113,849 | ) | |
Tax return of capital: | |
Institutional Class | | | — | | | | — | | | | — | | | | — | | | | — | | | | — | | | | — | | | | — | | | | — | | | | — | | |
Class A | | | — | | | | — | | | | — | | | | — | | | | — | | | | — | | | | — | | | | — | | | | — | | | | — | | |
Class C | | | — | | | | — | | | | — | | | | — | | | | — | | | | — | | | | — | | | | — | | | | — | | | | — | | |
Total distributions to shareholders | | | (826,386 | ) | | | (2,869,295 | ) | | | (25,945,704 | ) | | | (12,080,438 | ) | | | (80,768,612 | ) | | | (98,959,745 | ) | | | (82,543,481 | ) | | | (52,418,045 | ) | | | (599,682,715 | ) | | | (1,004,028,249 | ) | |
From Fund Share Transactions (Note D): | |
Proceeds from shares sold: | |
Investor Class | | | — | | | | — | | | | — | | | | — | | | | — | | | | — | | | | 4,139,817 | | | | 3,000,443 | | | | 102,268,952 | | | | 82,220,363 | | |
Trust Class | | | — | | | | — | | | | — | | | | — | | | | — | | | | — | | | | 1,053,739 | | | | 576,130 | | | | 136,697,167 | | | | 218,866,991 | | |
Advisor Class | | | — | | | | — | | | | — | | | | — | | | | — | | | | — | | | | 180,512 | | | | 192,619 | | | | 13,603,644 | | | | 16,047,333 | | |
Institutional Class | | | 3,466,772 | | | | 12,175,824 | | | | 399,887,559 | | | | 523,279,482 | | | | 136,438,292 | | | | 218,362,745 | | | | 6,456,482 | | | | 2,749,261 | | | | 773,708,973 | | | | 495,865,881 | | |
Class A | | | 166,365 | | | | 145,678 | | | | 15,390,961 | | | | 22,366,127 | | | | 49,580,339 | | | | 53,056,638 | | | | 210,846 | | | | 258,932 | | | | — | | | | — | | |
Class C | | | 41,993 | | | | 99,476 | | | | 799,699 | | | | 2,371,776 | | | | 5,678,074 | | | | 10,406,758 | | | | 87,139 | | | | 123,675 | | | | — | | | | — | | |
Class R3 | | | — | | | | — | | | | 244,741 | | | | 589,171 | | | | 861,924 | | | | 933,262 | | | | — | | | | — | | | | — | | | | — | | |
Class R6 | | | — | | | | 11,467 | | | | 33,376,229 | | | | 92,466,770 | | | | — | | | | — | | | | — | | | | — | | | | 484,217,840 | | | | 522,495,448 | | |
Proceeds from reinvestment of dividends and distributions: | |
Investor Class | | | — | | | | — | | | | — | | | | — | | | | — | | | | — | | | | 68,579,987 | | | | 43,190,016 | | | | 90,300,146 | | | | 158,366,013 | | |
Trust Class | | | — | | | | — | | | | — | | | | — | | | | — | | | | — | | | | 5,298,074 | | | | 3,771,745 | | | | 74,517,483 | | | | 132,025,298 | | |
Advisor Class | | | — | | | | — | | | | — | | | | — | | | | — | | | | — | | | | 188,151 | | | | 130,115 | | | | 8,065,695 | | | | 15,819,504 | | |
Institutional Class | | | 804,626 | | | | 2,644,389 | | | | 8,256,034 | | | | 4,226,257 | | | | 57,976,061 | | | | 65,239,109 | | | | 1,234,994 | | | | 548,125 | | | | 149,539,999 | | | | 260,982,348 | | |
Class A | | | 15,065 | | | | 81,362 | | | | 370,146 | | | | 140,782 | | | | 6,573,090 | | | | 9,046,492 | | | | 302,132 | | | | 204,692 | | | | — | | | | — | | |
Class C | | | 6,057 | | | | 140,476 | | | | 24,577 | | | | — | | | | 5,799,923 | | | | 9,790,118 | | | | 135,364 | | | | 105,670 | | | | — | | | | — | | |
Class R3 | | | — | | | | — | | | | 7,459 | | | | 219 | | | | 86,266 | | | | 80,874 | | | | — | | | | — | | | | — | | | | — | | |
Class R6 | | | — | | | | — | | | | 4,593,045 | | | | 1,646,005 | | | | — | | | | — | | | | — | | | | — | | | | 252,805,572 | | | | 398,405,440 | | |
See Notes to Financial Statements
169
170
Statements of Changes in Net Assets (cont'd)
Neuberger Berman Equity Funds (cont'd)
| | | DIVIDEND GROWTH FUND | | EMERGING MARKETS
EQUITY FUND | | EQUITY INCOME FUND | | FOCUS FUND | | GENESIS FUND | |
| | | Fiscal
Year Ended
August 31,
2020 | | Fiscal
Year Ended
August 31,
2019 | | Fiscal
Year Ended
August 31,
2020 | | Fiscal
Year Ended
August 31,
2019 | | Fiscal
Year Ended
August 31,
2020 | | Fiscal
Year Ended
August 31,
2019 | | Fiscal
Year Ended
August 31,
2020 | | Fiscal
Year Ended
August 31,
2019 | | Fiscal
Year Ended
August 31,
2020 | | Fiscal
Year Ended
August 31,
2019 | |
Proceeds from shares issued in connection with tax-free
reorganization (Note H): | |
Institutional Class | | | — | | | | — | | | | — | | | | — | | | | — | | | | — | | | | — | | | | — | | | | — | | | | — | | |
Class A | | | — | | | | — | | | | — | | | | — | | | | — | | | | — | | | | — | | | | — | | | | — | | | | — | | |
Class C | | | — | | | | — | | | | — | | | | — | | | | — | | | | — | | | | — | | | | — | | | | — | | | | — | | |
Payments for shares redeemed: | |
Investor Class | | | — | | | | — | | | | — | | | | — | | | | — | | | | — | | | | (63,517,841 | ) | | | (53,311,484 | ) | | | (265,797,622 | ) | | | (332,034,566 | ) | |
Trust Class | | | — | | | | — | | | | — | | | | — | | | | — | | | | — | | | | (10,528,972 | ) | | | (10,056,620 | ) | | | (451,824,046 | ) | | | (367,208,933 | ) | |
Advisor Class | | | — | | | | — | | | | — | | | | — | | | | — | | | | — | | | | (344,159 | ) | | | (816,081 | ) | | | (54,240,187 | ) | | | (54,039,996 | ) | |
Institutional Class | | | (11,700,532 | ) | | | (12,723,266 | ) | | | (676,546,774 | ) | | | (570,930,826 | ) | | | (285,743,568 | ) | | | (264,668,584 | ) | | | (3,966,267 | ) | | | (2,244,370 | ) | | | (901,003,192 | ) | | | (895,208,099 | ) | |
Class A | | | (348,697 | ) | | | (435,074 | ) | | | (30,800,365 | ) | | | (24,252,605 | ) | | | (39,550,918 | ) | | | (94,313,252 | ) | | | (450,261 | ) | | | (905,212 | ) | | | — | | | | — | | |
Class C | | | (587,237 | ) | | | (637,797 | ) | | | (4,264,529 | ) | | | (3,916,535 | ) | | | (78,670,313 | ) | | | (78,723,136 | ) | | | (219,461 | ) | | | (479,903 | ) | | | — | | | | — | | |
Class R3 | | | — | | | | — | | | | (476,813 | ) | | | (1,011,328 | ) | | | (1,109,389 | ) | | | (1,246,968 | ) | | | — | | | | — | | | | — | | | | — | | |
Class R6 | | | (12,366 | ) | | | — | | | | (78,903,918 | ) | | | (37,798,350 | ) | | | — | | | | — | | | | — | | | | — | | | | (819,950,245 | ) | | | (697,137,895 | ) | |
Net increase/(decrease) from Fund share transactions | | | (8,147,954 | ) | | | 1,502,535 | | | | (328,041,949 | ) | | | 9,176,945 | | | | (142,080,219 | ) | | | (72,035,944 | ) | | | 8,840,276 | | | | (12,962,247 | ) | | | (407,089,821 | ) | | | (44,534,870 | ) | |
Net Increase/(Decrease) in Net Assets | | | (2,122,367 | ) | | | (3,152,974 | ) | | | (263,266,678 | ) | | | (25,570,223 | ) | | | (219,775,995 | ) | | | (137,721,888 | ) | | | 89,563,493 | | | | (86,032,300 | ) | | | 255,396,623 | | | | (1,058,357,299 | ) | |
Net Assets: | |
Beginning of year | | | 55,391,136 | | | | 58,544,110 | | | | 1,350,697,712 | | | | 1,376,267,935 | | | | 1,470,434,430 | | | | 1,608,156,318 | | | | 678,428,779 | | | | 764,461,079 | | | | 10,246,575,794 | | | | 11,304,933,093 | | |
End of year | | $ | 53,268,769 | | | $ | 55,391,136 | | | $ | 1,087,431,034 | | | $ | 1,350,697,712 | | | $ | 1,250,658,435 | | | $ | 1,470,434,430 | | | $ | 767,992,272 | | | $ | 678,428,779 | | | $ | 10,501,972,417 | | | $ | 10,246,575,794 | | |
See Notes to Financial Statements
171
172
Statements of Changes in Net Assets (cont'd)
Neuberger Berman Equity Funds
| | | GLOBAL
REAL ESTATE FUND | | GREATER CHINA
EQUITY FUND | | GUARDIAN FUND | | INTEGRATED
LARGE CAP FUND | | INTERNATIONAL
EQUITY FUND | |
| | | Fiscal
Year Ended
August 31,
2020 | | Fiscal
Year Ended
August 31,
2019 | | Fiscal
Year Ended
August 31,
2020 | | Fiscal
Year Ended
August 31,
2019 | | Fiscal
Year Ended
August 31,
2020 | | Fiscal
Year Ended
August 31,
2019 | | Fiscal
Year Ended
August 31,
2020 | | Fiscal
Year Ended
August 31,
2019 | | Fiscal
Year Ended
August 31,
2020 | | Fiscal
Year Ended
August 31,
2019 | |
Increase/(Decrease) in Net Assets: | |
From Operations (Note A): | |
Net investment income/(loss) | | $ | 43,408 | | | $ | 45,602 | | | $ | 305,431 | | | $ | 491,388 | | | $ | 3,560,765 | | | $ | 6,782,720 | | | $ | 54,819 | | | $ | 34,145 | | | $ | 13,241,566 | | | $ | 18,657,528 | | |
Net realized gain/(loss) on investments | | | 34,540 | | | | 77,258 | | | | 3,712,325 | | | | (2,545,790 | ) | | | 124,961,816 | | | | 80,360,710 | | | | 405,388 | | | | 400,376 | | | | 111,589,675 | | | | 5,052,507 | | |
Net increase from payments by affiliates (Note B) | | | — | | | | — | | | | — | | | | — | | | | — | | | | — | | | | — | | | | — | | | | 1,010,727 | | | | — | | |
Change in net unrealized appreciation/(depreciation) of
investments | | | (456,957 | ) | | | 360,448 | | | | 7,969,047 | | | | (3,440,552 | ) | | | 306,341,929 | | | | (46,419,933 | ) | | | 63,915 | | | | (662,003 | ) | | | 165,789,089 | | | | (131,924,783 | ) | |
Net increase/(decrease) in net assets resulting from operations | | | (379,009 | ) | | | 483,308 | | | | 11,986,803 | | | | (5,494,954 | ) | | | 434,864,510 | | | | 40,723,497 | | | | 524,122 | | | | (227,482 | ) | | | 291,631,057 | | | | (108,214,748 | ) | |
Distributions to Shareholders From (Note A): | |
Distributable earnings: | |
Investor Class | | | — | | | | — | | | | — | | | | — | | | | (70,548,675 | ) | | | (97,976,219 | ) | | | — | | | | — | | | | (2,478,769 | ) | | | (935,746 | ) | |
Trust Class | | | — | | | | — | | | | — | | | | — | | | | (2,133,084 | ) | | | (4,377,526 | ) | | | — | | | | — | | | | (743,711 | ) | | | (328,708 | ) | |
Advisor Class | | | — | | | | — | | | | — | | | | — | | | | (9,889 | ) | | | (25,097 | ) | | | — | | | | — | | | | — | | | | — | | |
Institutional Class | | | (149,606 | ) | | | (89,182 | ) | | | (423,155 | ) | | | (22,189,678 | ) | | | (6,402,335 | ) | | | (7,149,786 | ) | | | (730,795 | ) | | | (279,612 | ) | | | (45,951,233 | ) | | | (20,276,255 | ) | |
Class A | | | (16,113 | ) | | | (9,999 | ) | | | (30,448 | ) | | | (2,407,400 | ) | | | (273,588 | ) | | | (466,832 | ) | | | (63,558 | ) | | | (22,278 | ) | | | (1,332,657 | ) | | | (543,627 | ) | |
Class C | | | (11,575 | ) | | | (7,444 | ) | | | — | | | | (65,820 | ) | | | (107,584 | ) | | | (141,247 | ) | | | (21,450 | ) | | | (6,324 | ) | | | (169,333 | ) | | | (33,825 | ) | |
Class R3 | | | — | | | | — | | | | — | | | | — | | | | (6,645 | ) | | | (26,896 | ) | | | — | | | | — | | | | — | | | | — | | |
Class R6 | | | — | | | | — | | | | — | | | | — | | | | (1,818 | ) | | | — | | | | — | | | | — | | | | (2,444,715 | ) | | | (1,072,623 | ) | |
Tax return of capital: | |
Institutional Class | | | (6,455 | ) | | | — | | | | — | | | | — | | | | — | | | | — | | | | — | | | | — | | | | — | | | | — | | |
Class A | | | (810 | ) | | | — | | | | — | | | | — | | | | — | | | | — | | | | — | | | | — | | | | — | | | | — | | |
Class C | | | (706 | ) | | | — | | | | — | | | | — | | | | — | | | | — | | | | — | | | | — | | | | — | | | | — | | |
Total distributions to shareholders | | | (185,265 | ) | | | (106,625 | ) | | | (453,603 | ) | | | (24,662,898 | ) | | | (79,483,618 | ) | | | (110,163,603 | ) | | | (815,803 | ) | | | (308,214 | ) | | | (53,120,418 | ) | | | (23,190,784 | ) | |
From Fund Share Transactions (Note D): | |
Proceeds from shares sold: | |
Investor Class | | | — | | | | — | | | | — | | | | — | | | | 14,003,256 | | | | 11,460,485 | | | | — | | | | — | | | | 1,799,889 | | | | 2,057,831 | | |
Trust Class | | | — | | | | — | | | | — | | | | — | | | | 3,789,973 | | | | 1,983,090 | | | | — | | | | — | | | | 1,565,793 | | | | 1,584,137 | | |
Advisor Class | | | — | | | | — | | | | — | | | | — | | | | 47,798 | | | | 135,837 | | | | — | | | | — | | | | — | | | | — | | |
Institutional Class | | | 423,861 | | | | 898,925 | | | | 10,128,281 | | | | 8,394,481 | | | | 51,904,203 | | | | 15,665,799 | | | | 761,952 | | | | 107,072 | | | | 716,689,277 | | | | 662,224,133 | | |
Class A | | | 123,714 | | | | 53,314 | | | | — | | | | — | | | | 6,649,437 | | | | 1,758,941 | | | | 83,308 | | | | 63,957 | | | | 17,436,239 | | | | 11,406,660 | | |
Class C | | | 25,421 | | | | 1,000 | | | | — | | | | — | | | | 587,042 | | | | 434,023 | | | | — | | | | — | | | | 678,952 | | | | 1,121,989 | | |
Class R3 | | | — | | | | — | | | | — | | | | — | | | | 17,195 | | | | 77,606 | | | | — | | | | — | | | | — | | | | — | | |
Class R6 | | | — | | | | — | | | | — | | | | — | | | | — | | | | 25,000 | | | | — | | | | — | | | | 17,794,708 | | | | 27,203,702 | | |
Proceeds from reinvestment of dividends and distributions: | |
Investor Class | | | — | | | | — | | | | — | | | | — | | | | 66,427,262 | | | | 92,683,222 | | | | — | | | | — | | | | 2,386,570 | | | | 893,470 | | |
Trust Class | | | — | | | | — | | | | — | | | | — | | | | 2,120,471 | | | | 4,325,182 | | | | — | | | | — | | | | 690,385 | | | | 309,973 | | |
Advisor Class | | | — | | | | — | | | | — | | | | — | | | | 9,889 | | | | 25,097 | | | | — | | | | — | | | | — | | | | — | | |
Institutional Class | | | 156,061 | | | | 89,182 | | | | 353,427 | | | | 21,067,612 | | | | 6,347,905 | | | | 7,064,009 | | | | 730,795 | | | | 279,612 | | | | 29,465,628 | | | | 14,014,957 | | |
Class A | | | 8,655 | | | | 3,728 | | | | 29,170 | | | | 2,279,172 | | | | 245,649 | | | | 441,733 | | | | 45,987 | | | | 18,008 | | | | 270,092 | | | | 156,955 | | |
Class C | | | 5,998 | | | | 3,285 | | | | — | | | | 56,012 | | | | 98,908 | | | | 130,069 | | | | 6,279 | | | | 2,307 | | | | 124,890 | | | | 24,633 | | |
Class R3 | | | — | | | | — | | | | — | | | | — | | | | 6,644 | | | | 16,792 | | | | — | | | | — | | | | — | | | | — | | |
Class R6 | | | — | | | | — | | | | — | | | | — | | | | — | | | | — | | | | — | | | | — | | | | 2,442,802 | | | | 1,072,234 | | |
See Notes to Financial Statements
173
174
Statements of Changes in Net Assets (cont'd)
Neuberger Berman Equity Funds (cont'd)
| | | GLOBAL
REAL ESTATE FUND | | GREATER CHINA
EQUITY FUND | | GUARDIAN FUND | | INTEGRATED
LARGE CAP FUND | | INTERNATIONAL
EQUITY FUND | |
| | | Fiscal
Year Ended
August 31,
2020 | | Fiscal
Year Ended
August 31,
2019 | | Fiscal
Year Ended
August 31,
2020 | | Fiscal
Year Ended
August 31,
2019 | | Fiscal
Year Ended
August 31,
2020 | | Fiscal
Year Ended
August 31,
2019 | | Fiscal
Year Ended
August 31,
2020 | | Fiscal
Year Ended
August 31,
2019 | | Fiscal
Year Ended
August 31,
2020 | | Fiscal
Year Ended
August 31,
2019 | |
Proceeds from shares issued in connection with tax-free | |
reorganization (Note H): | |
Institutional Class | | | — | | | | — | | | | — | | | | — | | | | — | | | | — | | | | — | | | | — | | | | — | | | | — | | |
Class A | | | — | | | | — | | | | — | | | | — | | | | — | | | | — | | | | — | | | | — | | | | — | | | | — | | |
Class C | | | — | | | | — | | | | — | | | | — | | | | — | | | | — | | | | — | | | | — | | | | — | | | | — | | |
Payments for shares redeemed: | |
Investor Class | | | — | | | | — | | | | — | | | | — | | | | (96,681,184 | ) | | | (104,354,132 | ) | | | — | | | | — | | | | (15,124,817 | ) | | | (10,562,233 | ) | |
Trust Class | | | — | | | | — | | | | — | | | | — | | | | (19,012,250 | ) | | | (14,134,405 | ) | | | — | | | | — | | | | (7,092,659 | ) | | | (10,326,842 | ) | |
Advisor Class | | | — | | | | — | | | | — | | | | — | | | | (67,873 | ) | | | (169,503 | ) | | | — | | | | — | | | | — | | | | — | | |
Institutional Class | | | (2,186,250 | ) | | | (120,337 | ) | | | (13,861,055 | ) | | | (35,993,420 | ) | | | (26,568,727 | ) | | | (17,146,374 | ) | | | (1,331,885 | ) | | | (1,499,700 | ) | | | (1,154,631,654 | ) | | | (815,615,134 | ) | |
Class A | | | (235,963 | ) | | | (15,746 | ) | | | (2,850,612 | ) | | | (3,581,975 | ) | | | (5,295,136 | ) | | | (3,095,566 | ) | | | (103,265 | ) | | | (182,014 | ) | | | (20,057,743 | ) | | | (22,623,553 | ) | |
Class C | | | (124,061 | ) | | | — | | | | (6,913 | ) | | | (64,045 | ) | | | (707,947 | ) | | | (481,808 | ) | | | (9,343 | ) | | | (16,246 | ) | | | (3,801,042 | ) | | | (4,892,701 | ) | |
Class R3 | | | — | | | | — | | | | — | | | | — | | | | (44,563 | ) | | | (331,602 | ) | | | — | | | | — | | | | — | | | | — | | |
Class R6 | | | — | | | | — | | | | — | | | | — | | | | — | | | | — | | | | — | | | | — | | | | (33,638,342 | ) | | | (18,009,247 | ) | |
Net increase/(decrease) from Fund share transactions | | | (1,802,564 | ) | | | 913,351 | | | | (6,207,702 | ) | | | (7,842,163 | ) | | | 3,877,952 | | | | (3,486,505 | ) | | | 183,828 | | | | (1,227,004 | ) | | | (443,001,032 | ) | | | (159,959,036 | ) | |
Net Increase/(Decrease) in Net Assets | | | (2,366,838 | ) | | | 1,290,034 | | | | 5,325,498 | | | | (38,000,015 | ) | | | 359,258,844 | | | | (72,926,611 | ) | | | (107,853 | ) | | | (1,762,700 | ) | | | (204,490,393 | ) | | | (291,364,568 | ) | |
Net Assets: | |
Beginning of year | | | 4,174,083 | | | | 2,884,049 | | | | 51,415,387 | | | | 89,415,402 | | | | 1,261,405,696 | | | | 1,334,332,307 | | | | 3,547,681 | | | | 5,310,381 | | | | 1,784,416,376 | | | | 2,075,780,944 | | |
End of year | | $ | 1,807,245 | | | $ | 4,174,083 | | | $ | 56,740,885 | | | $ | 51,415,387 | | | $ | 1,620,664,540 | | | $ | 1,261,405,696 | | | $ | 3,439,828 | | | $ | 3,547,681 | | | $ | 1,579,925,983 | | | $ | 1,784,416,376 | | |
See Notes to Financial Statements
175
176
Statements of Changes in Net Assets (cont'd)
Neuberger Berman Equity Funds
| | | INTERNATIONAL
SELECT FUND | | INTERNATIONAL
SMALL CAP FUND | | INTRINSIC VALUE FUND | | LARGE CAP VALUE FUND | | MID CAP GROWTH FUND | |
| | | Fiscal
Year Ended
August 31,
2020 | | Fiscal
Year Ended
August 31,
2019 | | Fiscal
Year Ended
August 31,
2020 | | Fiscal
Year Ended
August 31,
2019 | | Fiscal
Year Ended
August 31,
2020 | | Fiscal
Year Ended
August 31,
2019 | | Fiscal
Year Ended
August 31,
2020 | | Fiscal
Year Ended
August 31,
2019 | | Fiscal
Year Ended
August 31,
2020 | | Fiscal
Year Ended
August 31,
2019 | |
Increase/(Decrease) in Net Assets: | |
From Operations (Note A): | |
Net investment income/(loss) | | $ | 1,118,709 | | | $ | 2,165,287 | | | $ | 6,635 | | | $ | 57,398 | | | $ | (1,885,142 | ) | | $ | (1,575,073 | ) | | $ | 35,124,428 | | | $ | 29,858,687 | | | $ | (4,132,501 | ) | | $ | (2,932,463 | ) | |
Net realized gain/(loss) on investments | | | 1,897,529 | | | | 92,362 | | | | 566,192 | | | | (504,727 | ) | | | 8,476,391 | | | | 38,498,865 | | | | (9,990,578 | ) | | | 36,221,198 | | | | 154,260,338 | | | | 88,645,355 | | |
Net increase from payments by affiliates (Note B) | | | — | | | | — | | | | — | | | | — | | | | — | | | | — | | | | — | | | | — | | | | — | | | | — | | |
Change in net unrealized appreciation/(depreciation) of
investments | | | 22,865,576 | | | | (7,384,792 | ) | | | 566,511 | | | | (335,014 | ) | | | 31,792,267 | | | | (127,169,053 | ) | | | 15,231,759 | | | | 30,095,557 | | | | 141,191,962 | | | | (25,530,049 | ) | |
Net increase/(decrease) in net assets resulting from operations | | | 25,881,814 | | | | (5,127,143 | ) | | | 1,139,338 | | | | (782,343 | ) | | | 38,383,516 | | | | (90,245,261 | ) | | | 40,365,609 | | | | 96,175,442 | | | | 291,319,799 | | | | 60,182,843 | | |
Distributions to Shareholders From (Note A): | |
Distributable earnings: | |
Investor Class | | | — | | | | — | | | | — | | | | — | | | | — | | | | — | | | | (46,697,641 | ) | | | (134,999,774 | ) | | | (26,846,037 | ) | | | (44,034,806 | ) | |
Trust Class | | | (148,073 | ) | | | (112,588 | ) | | | — | | | | — | | | | — | | | | — | | | | (3,072,303 | ) | | | (7,863,053 | ) | | | (4,113,798 | ) | | | (6,739,091 | ) | |
Advisor Class | | | — | | | | — | | | | — | | | | — | | | | — | | | | — | | | | (4,213,347 | ) | | | (13,649,365 | ) | | | (614,615 | ) | | | (1,304,475 | ) | |
Institutional Class | | | (4,271,772 | ) | | | (2,534,554 | ) | | | (48,086 | ) | | | (102,176 | ) | | | (17,230,373 | ) | | | (66,824,067 | ) | | | (16,662,037 | ) | | | (13,794,547 | ) | | | (14,438,770 | ) | | | (30,077,793 | ) | |
Class A | | | (97,131 | ) | | | (50,866 | ) | | | (581 | ) | | | (2,957 | ) | | | (610,091 | ) | | | (2,297,554 | ) | | | (2,657,602 | ) | | | (545,749 | ) | | | (1,808,431 | ) | | | (3,791,055 | ) | |
Class C | | | (37,380 | ) | | | (22,153 | ) | | | — | | | | (2,143 | ) | | | (487,777 | ) | | | (2,355,295 | ) | | | (819,948 | ) | | | (266,394 | ) | | | (596,459 | ) | | | (979,858 | ) | |
Class R3 | | | (58,043 | ) | | | (36,086 | ) | | | — | | | | — | | | | — | | | | — | | | | (26,674 | ) | | | (41,214 | ) | | | (2,940,823 | ) | | | (1,260,005 | ) | |
Class R6 | | | (1,151,998 | ) | | | (169,118 | ) | | | (2,238 | ) | | | (4,406 | ) | | | (5,721 | ) | | | — | | | | (3,363,793 | ) | | | — | | | | (24,076,088 | ) | | | (37,921,326 | ) | |
Tax return of capital: | |
Institutional Class | | | — | | | | — | | | | — | | | | — | | | | — | | | | — | | | | — | | | | — | | | | — | | | | — | | |
Class A | | | — | | | | — | | | | — | | | | — | | | | — | | | | — | | | | — | | | | — | | | | — | | | | — | | |
Class C | | | — | | | | — | | | | — | | | | — | | | | — | | | | — | | | | — | | | | — | | | | — | | | | — | | |
Total distributions to shareholders | | | (5,764,397 | ) | | | (2,925,365 | ) | | | (50,905 | ) | | | (111,682 | ) | | | (18,333,962 | ) | | | (71,476,916 | ) | | | (77,513,345 | ) | | | (171,160,096 | ) | | | (75,435,021 | ) | | | (126,108,409 | ) | |
From Fund Share Transactions (Note D): | |
Proceeds from shares sold: | |
Investor Class | | | — | | | | — | | | | — | | | | — | | | | — | | | | — | | | | 21,973,394 | | | | 57,038,455 | | | | 7,662,038 | | | | 14,157,228 | | |
Trust Class | | | 220,557 | | | | 153,958 | | | | — | | | | — | | | | — | | | | — | | | | 7,261,960 | | | | 24,969,100 | | | | 11,240,993 | | | | 12,925,930 | | |
Advisor Class | | | — | | | | — | | | | — | | | | — | | | | — | | | | — | | | | 6,711,198 | | | | 10,000,035 | | | | 2,575,403 | | | | 4,248,722 | | |
Institutional Class | | | 16,705,060 | | | | 20,112,590 | | | | 271,428 | | | | 41,350 | | | | 158,508,399 | | | | 199,421,130 | | | | 231,763,696 | | | | 268,690,520 | | | | 88,459,369 | | | | 59,509,965 | | |
Class A | | | 1,069,501 | | | | 456,139 | | | | 5,503 | | | | 17,696 | | | | 11,162,084 | | | | 30,509,510 | | | | 32,432,910 | | | | 47,686,576 | | | | 8,395,486 | | | | 7,660,543 | | |
Class C | | | 88,945 | | | | 205,016 | | | | — | | | | — | | | | 2,041,070 | | | | 2,033,953 | | | | 7,025,508 | | | | 14,187,290 | | | | 1,379,107 | | | | 827,693 | | |
Class R3 | | | 451,427 | | | | 524,500 | | | | — | | | | — | | | | — | | | | — | | | | 47,320 | | | | 784,330 | | | | 5,501,528 | | | | 39,801,518 | | |
Class R6 | | | 4,115,978 | | | | 21,500,000 | | | | — | | | | — | | | | 38,908 | | | | 172,673 | | | | 95,242,456 | | | | 257,585 | | | | 91,657,921 | | | | 114,859,861 | | |
Proceeds from reinvestment of dividends and distributions: | |
Investor Class | | | — | | | | — | | | | — | | | | — | | | | — | | | | — | | | | 44,935,853 | | | | 130,095,377 | | | | 25,529,038 | | | | 41,798,280 | | |
Trust Class | | | 140,859 | | | | 74,260 | | | | — | | | | — | | | | — | | | | — | | | | 2,908,857 | | | | 7,709,653 | | | | 4,112,974 | | | | 6,736,065 | | |
Advisor Class | | | — | | | | — | | | | — | | | | — | | | | — | | | | — | | | | 4,194,554 | | | | 13,624,362 | | | | 420,031 | | | | 818,776 | | |
Institutional Class | | | 4,171,081 | | | | 2,481,369 | | | | 48,086 | | | | 102,176 | | | | 14,983,837 | | | | 57,901,089 | | | | 12,926,537 | | | | 12,691,856 | | | | 14,161,776 | | | | 29,536,054 | | |
Class A | | | 70,428 | | | | 37,876 | | | | 100 | | | | 1,117 | | | | 569,699 | | | | 2,241,925 | | | | 2,135,745 | | | | 365,686 | | | | 1,666,053 | | | | 3,663,112 | | |
Class C | | | 21,435 | | | | 11,483 | | | | — | | | | 303 | | | | 419,712 | | | | 2,089,821 | | | | 421,383 | | | | 148,351 | | | | 575,702 | | | | 945,129 | | |
Class R3 | | | 40,982 | | | | 27,555 | | | | — | | | | — | | | | — | | | | — | | | | 25,595 | | | | 33,911 | | | | 2,904,941 | | | | 1,164,496 | | |
Class R6 | | | 1,151,026 | | | | 168,583 | | | | — | | | | — | | | | 4,939 | | | | — | | | | 3,362,619 | | | | — | | | | 22,949,077 | | | | 36,543,004 | | |
See Notes to Financial Statements
177
178
Statements of Changes in Net Assets (cont'd)
Neuberger Berman Equity Funds (cont'd)
| | | INTERNATIONAL
SELECT FUND | | INTERNATIONAL
SMALL CAP FUND | | INTRINSIC VALUE FUND | | LARGE CAP VALUE FUND | | MID CAP GROWTH FUND | |
| | | Fiscal
Year Ended
August 31,
2020 | | Fiscal
Year Ended
August 31,
2019 | | Fiscal
Year Ended
August 31,
2020 | | Fiscal
Year Ended
August 31,
2019 | | Fiscal
Year Ended
August 31,
2020 | | Fiscal
Year Ended
August 31,
2019 | | Fiscal
Year Ended
August 31,
2020 | | Fiscal
Year Ended
August 31,
2019 | | Fiscal
Year Ended
August 31,
2020 | | Fiscal
Year Ended
August 31,
2019 | |
Proceeds from shares issued in connection with tax-free
reorganization (Note H): | |
Institutional Class | | | — | | | | — | | | | — | | | | — | | | | — | | | | — | | | | — | | | | 25,809,513 | | | | — | | | | — | | |
Class A | | | — | | | | — | | | | — | | | | — | | | | — | | | | — | | | | — | | | | 3,922,304 | | | | — | | | | — | | |
Class C | | | — | | | | — | | | | — | | | | — | | | | — | | | | — | | | | — | | | | 4,057,725 | | | | — | | | | — | | |
Payments for shares redeemed: | |
Investor Class | | | — | | | | — | | | | — | | | | — | | | | — | | | | — | | | | (141,379,869 | ) | | | (108,103,222 | ) | | | (51,645,252 | ) | | | (48,184,001 | ) | |
Trust Class | | | (601,433 | ) | | | (2,760,610 | ) | | | — | | | | — | | | | — | | | | — | | | | (24,245,862 | ) | | | (15,949,413 | ) | | | (18,986,114 | ) | | | (15,661,589 | ) | |
Advisor Class | | | — | | | | — | | | | — | | | | — | | | | — | | | | — | | | | (24,531,557 | ) | | | (26,840,169 | ) | | | (5,754,654 | ) | | | (7,652,437 | ) | |
Institutional Class | | | (27,943,432 | ) | | | (29,863,213 | ) | | | (5,200,163 | ) | | | (180,547 | ) | | | (212,115,226 | ) | | | (210,935,475 | ) | | | (203,718,206 | ) | | | (66,593,519 | ) | | | (89,293,824 | ) | | | (140,737,406 | ) | |
Class A | | | (1,418,753 | ) | | | (940,598 | ) | | | (16,907 | ) | | | (64,139 | ) | | | (10,904,319 | ) | | | (26,718,984 | ) | | | (64,528,418 | ) | | | (3,470,945 | ) | | | (11,718,186 | ) | | | (26,027,843 | ) | |
Class C | | | (865,456 | ) | | | (915,344 | ) | | | (10,644 | ) | | | (15,303 | ) | | | (7,795,495 | ) | | | (6,739,358 | ) | | | (11,426,103 | ) | | | (814,389 | ) | | | (2,863,607 | ) | | | (1,881,239 | ) | |
Class R3 | | | (844,478 | ) | | | (1,569,550 | ) | | | — | | | | — | | | | — | | | | — | | | | (160,165 | ) | | | (406,647 | ) | | | (39,814,821 | ) | | | (9,433,559 | ) | |
Class R6 | | | (33,984,514 | ) | | | (1,320,000 | ) | | | — | | | | — | | | | (140,417 | ) | | | — | | | | (2,222,639 | ) | | | (5 | ) | | | (123,332,489 | ) | | | (109,688,987 | ) | |
Net increase/(decrease) from Fund share transactions | | | (37,410,787 | ) | | | 8,384,014 | | | | (4,902,597 | ) | | | (97,347 | ) | | | (43,226,809 | ) | | | 49,976,284 | | | | 1,156,766 | | | | 399,894,320 | | | | (54,217,510 | ) | | | 15,929,315 | | |
Net Increase/(Decrease) in Net Assets | | | (17,293,370 | ) | | | 331,506 | | | | (3,814,164 | ) | | | (991,372 | ) | | | (23,177,255 | ) | | | (111,745,893 | ) | | | (35,990,970 | ) | | | 324,909,666 | | | | 161,667,268 | | | | (49,996,251 | ) | |
Net Assets: | |
Beginning of year | | | 169,807,782 | | | | 169,476,276 | | | | 5,829,100 | | | | 6,820,472 | | | | 610,788,689 | | | | 722,534,582 | | | | 1,783,592,526 | | | | 1,458,682,860 | | | | 1,437,604,206 | | | | 1,487,600,457 | | |
End of year | | $ | 152,514,412 | | | $ | 169,807,782 | | | $ | 2,014,936 | | | $ | 5,829,100 | | | $ | 587,611,434 | | | $ | 610,788,689 | | | $ | 1,747,601,556 | | | $ | 1,783,592,526 | | | $ | 1,599,271,474 | | | $ | 1,437,604,206 | | |
See Notes to Financial Statements
179
180
Statements of Changes in Net Assets (cont'd)
Neuberger Berman Equity Funds
| | | MID CAP
INTRINSIC VALUE FUND | | MULTI-CAP
OPPORTUNITIES FUND | | REAL ESTATE FUND | | SMALL CAP
GROWTH FUND | | SUSTAINABLE
EQUITY FUND | |
| | | Fiscal
Year Ended
August 31,
2020 | | Fiscal
Year Ended
August 31,
2019 | | Fiscal
Year Ended
August 31,
2020 | | Fiscal
Year Ended
August 31,
2019 | | Fiscal
Year Ended
August 31,
2020 | | Fiscal
Year Ended
August 31,
2019 | | Fiscal
Year Ended
August 31,
2020 | | Fiscal
Year Ended
August 31,
2019 | | Fiscal
Year Ended
August 31,
2020 | | Fiscal
Year Ended
August 31,
2019 | |
Increase/(Decrease) in Net Assets: | |
From Operations (Note A): | |
Net investment income/(loss) | | $ | 937,838 | | | $ | 1,145,193 | | | $ | 4,464,668 | | | $ | 10,549,707 | | | $ | 7,094,696 | | | $ | 6,097,499 | | | $ | (1,552,094 | ) | | $ | (998,581 | ) | | $ | 10,866,289 | | | $ | 17,524,475 | | |
Net realized gain/(loss) on investments | | | (10,309,239 | ) | | | (1,169,391 | ) | | | 217,155,413 | | | | 297,664,281 | | | | 10,488,410 | | | | 16,081,641 | | | | 5,562,877 | | | | 13,324,076 | | | | 64,181,966 | | | | 251,894,531 | | |
Net increase from payments by affiliates (Note B) | | | — | | | | — | | | | — | | | | — | | | | — | | | | — | | | | — | | | | — | | | | — | | | | — | | |
Change in net unrealized appreciation/(depreciation) of
investments | | | (2,158,411 | ) | | | (15,881,910 | ) | | | (166,400,834 | ) | | | (302,360,909 | ) | | | (41,527,845 | ) | | | 65,964,352 | | | | 48,380,953 | | | | (11,696,325 | ) | | | 165,175,329 | | | | (352,941,164 | ) | |
Net increase/(decrease) in net assets resulting from operations | | | (11,529,812 | ) | | | (15,906,108 | ) | | | 55,219,247 | | | | 5,853,079 | | | | (23,944,739 | ) | | | 88,143,492 | | | | 52,391,736 | | | | 629,170 | | | | 240,223,584 | | | | (83,522,158 | ) | |
Distributions to Shareholders From (Note A): | |
Distributable earnings: | |
Investor Class | | | (368,800 | ) | | | (2,762,307 | ) | | | — | | | | — | | | | — | | | | — | | | | (2,595,094 | ) | | | (10,344,517 | ) | | | (39,991,579 | ) | | | (47,001,729 | ) | |
Trust Class | | | (78,507 | ) | | | (667,977 | ) | | | — | | | | — | | | | (6,188,410 | ) | | | (7,851,890 | ) | | | (180,321 | ) | | | (672,894 | ) | | | (13,436,402 | ) | | | (16,512,046 | ) | |
Advisor Class | | | — | | | | — | | | | — | | | | — | | | | — | | | | — | | | | (110,899 | ) | | | (381,752 | ) | | | — | | | | — | | |
Institutional Class | | | (498,013 | ) | | | (3,917,175 | ) | | | (200,706,891 | ) | | | (147,622,516 | ) | | | (12,276,671 | ) | | | (11,382,684 | ) | | | (3,818,421 | ) | | | (2,841,930 | ) | | | (70,956,106 | ) | | | (76,096,584 | ) | |
Class A | | | (50,959 | ) | | | (527,988 | ) | | | (8,114,216 | ) | | | (6,423,764 | ) | | | (3,294,196 | ) | | | (3,521,373 | ) | | | (1,158,204 | ) | | | (821,529 | ) | | | (8,167,976 | ) | | | (9,516,206 | ) | |
Class C | | | (4,534 | ) | | | (137,143 | ) | | | (6,809,522 | ) | | | (3,583,140 | ) | | | (478,535 | ) | | | (666,531 | ) | | | (182,145 | ) | | | (539,151 | ) | | | (3,811,205 | ) | | | (4,556,532 | ) | |
Class R3 | | | (7,197 | ) | | | (155,006 | ) | | | — | | | | — | | | | (889,106 | ) | | | (1,017,476 | ) | | | (98,288 | ) | | | (274,291 | ) | | | (2,679,806 | ) | | | (2,534,234 | ) | |
Class R6 | | | (371 | ) | | | — | | | | — | | | | — | | | | (4,945,273 | ) | | | (3,773,194 | ) | | | (842,788 | ) | | | (4,380 | ) | | | (19,113,173 | ) | | | (23,974,385 | ) | |
Tax return of capital: | |
Institutional Class | | | — | | | | — | | | | — | | | | — | | | | — | | | | — | | | | — | | | | — | | | | — | | | | — | | |
Class A | | | — | | | | — | | | | — | | | | — | | | | — | | | | — | | | | — | | | | — | | | | — | | | | — | | |
Class C | | | — | | | | — | | | | — | | | | — | | | | — | | | | — | | | | — | | | | — | | | | — | | | | — | | |
Total distributions to shareholders | | | (1,008,381 | ) | | | (8,167,596 | ) | | | (215,630,629 | ) | | | (157,629,420 | ) | | | (28,072,191 | ) | | | (28,213,148 | ) | | | (8,986,160 | ) | | | (15,880,444 | ) | | | (158,156,247 | ) | | | (180,191,716 | ) | |
From Fund Share Transactions (Note D): | |
Proceeds from shares sold: | |
Investor Class | | | 1,339,854 | | | | 27,826,867 | | | | — | | | | — | | | | — | | | | — | | | | 2,907,583 | | | | 5,799,259 | | | | 32,153,952 | | | | 25,001,547 | | |
Trust Class | | | 218,636 | | | | 796,460 | | | | — | | | | — | | | | 26,231,662 | | | | 17,380,172 | | | | 140,270 | | | | 753,112 | | | | 12,221,022 | | | | 18,117,171 | | |
Advisor Class | | | — | | | | — | | | | — | | | | — | | | | — | | | | — | | | | 682,224 | | | | 1,854,561 | | | | — | | | | — | | |
Institutional Class | | | 6,241,860 | | | | 17,697,422 | | | | 143,585,948 | | | | 161,758,120 | | | | 271,791,923 | | | | 57,811,234 | | | | 104,169,857 | | | | 95,020,900 | | | | 142,867,928 | | | | 183,454,217 | | |
Class A | | | 701,730 | | | | 16,035,273 | | | | 11,512,018 | | | | 15,497,491 | | | | 32,906,523 | | | | 20,389,576 | | | | 10,078,973 | | | | 73,670,601 | | | | 17,506,200 | | | | 20,718,163 | | |
Class C | | | 166,683 | | | | 375,520 | | | | 4,241,249 | | | | 5,225,404 | | | | 5,276,711 | | | | 442,437 | | | | 1,534,966 | | | | 1,890,926 | | | | 3,851,028 | | | | 4,916,432 | | |
Class R3 | | | 289,245 | | | | 379,231 | | | | — | | | | — | | | | 5,925,863 | | | | 5,903,468 | | | | 1,875,473 | | | | 5,273,834 | | | | 6,062,242 | | | | 8,546,505 | | |
Class R6 | | | — | | | | 25,000 | | | | — | | | | — | | | | 64,676,493 | | | | 21,078,040 | | | | 19,318,647 | | | | 21,713,424 | | | | 108,933,404 | | | | 98,444,816 | | |
Proceeds from reinvestment of dividends and distributions: | |
Investor Class | | | 348,989 | | | | 2,645,874 | | | | — | | | | — | | | | — | | | | — | | | | 2,558,816 | | | | 10,178,236 | | | | 38,305,688 | | | | 45,673,575 | | |
Trust Class | | | 76,684 | | | | 657,091 | | | | — | | | | — | | | | 6,120,465 | | | | 7,805,052 | | | | 163,896 | | | | 641,874 | | | | 13,361,172 | | | | 16,406,292 | | |
Advisor Class | | | — | | | | — | | | | — | | | | — | | | | — | | | | — | | | | 110,899 | | | | 381,752 | | | | — | | | | — | | |
Institutional Class | | | 498,013 | | | | 3,905,772 | | | | 180,707,254 | | | | 137,937,886 | | | | 10,458,036 | | | | 10,228,119 | | | | 3,809,945 | | | | 2,796,980 | | | | 64,321,004 | | | | 68,420,988 | | |
Class A | | | 37,549 | | | | 404,569 | | | | 7,132,839 | | | | 5,674,280 | | | | 3,118,157 | | | | 3,379,123 | | | | 1,124,046 | | | | 803,524 | | | | 7,522,495 | | | | 8,675,604 | | |
Class C | | | 3,898 | | | | 122,003 | | | | 6,068,379 | | | | 3,273,945 | | | | 427,559 | | | | 594,593 | | | | 180,348 | | | | 507,926 | | | | 3,319,170 | | | | 4,058,782 | | |
Class R3 | | | 5,002 | | | | 133,711 | | | | — | | | | — | | | | 871,789 | | | | 967,298 | | | | 92,624 | | | | 248,431 | | | | 2,542,907 | | | | 2,369,964 | | |
Class R6 | | | — | | | | — | | | | — | | | | — | | | | 4,945,248 | | | | 3,773,194 | | | | 841,917 | | | | 360 | | | | 19,113,173 | | | | 23,974,384 | | |
See Notes to Financial Statements
181
182
Statements of Changes in Net Assets (cont'd)
Neuberger Berman Equity Funds (cont'd)
| | | MID CAP
INTRINSIC VALUE FUND | | MULTI-CAP
OPPORTUNITIES FUND | | REAL ESTATE FUND | | SMALL CAP
GROWTH FUND | | SUSTAINABLE
EQUITY FUND | |
| | | Fiscal
Year Ended
August 31,
2020 | | Fiscal
Year Ended
August 31,
2019 | | Fiscal
Year Ended
August 31,
2020 | | Fiscal
Year Ended
August 31,
2019 | | Fiscal
Year Ended
August 31,
2020 | | Fiscal
Year Ended
August 31,
2019 | | Fiscal
Year Ended
August 31,
2020 | | Fiscal
Year Ended
August 31,
2019 | | Fiscal
Year Ended
August 31,
2020 | | Fiscal
Year Ended
August 31,
2019 | |
Proceeds from shares issued in connection with tax-free
reorganization (Note H): | |
Institutional Class | | | — | | | | — | | | | — | | | | — | | | | — | | | | — | | | | — | | | | — | | | | — | | | | — | | |
Class A | | | — | | | | — | | | | — | | | | — | | | | — | | | | — | | | | — | | | | — | | | | — | | | | — | | |
Class C | | | — | | | | — | | | | — | | | | — | | | | — | | | | — | | | | — | | | | — | | | | — | | | | — | | |
Payments for shares redeemed: | |
Investor Class | | | (8,267,814 | ) | | | (27,913,700 | ) | | | — | | | | — | | | | — | | | | — | | | | (9,661,465 | ) | | | (8,499,590 | ) | | | (109,262,754 | ) | | | (230,755,317 | ) | |
Trust Class | | | (2,181,027 | ) | | | (1,809,524 | ) | | | — | | | | — | | | | (41,416,649 | ) | | | (43,660,266 | ) | | | (1,019,101 | ) | | | (678,028 | ) | | | (71,581,151 | ) | | | (79,129,575 | ) | |
Advisor Class | | | — | | | | — | | | | — | | | | — | | | | — | | | | — | | | | (832,128 | ) | | | (1,650,118 | ) | | | — | | | | — | | |
Institutional Class | | | (28,878,354 | ) | | | (22,720,460 | ) | | | (661,218,541 | ) | | | (926,728,677 | ) | | | (132,413,740 | ) | | | (56,374,056 | ) | | | (59,530,888 | ) | | | (23,029,634 | ) | | | (318,730,973 | ) | | | (328,752,676 | ) | |
Class A | | | (4,565,647 | ) | | | (18,399,829 | ) | | | (22,829,964 | ) | | | (39,627,262 | ) | | | (32,399,632 | ) | | | (26,351,626 | ) | | | (41,076,867 | ) | | | (27,770,395 | ) | | | (27,467,966 | ) | | | (45,596,429 | ) | |
Class C | | | (579,206 | ) | | | (949,309 | ) | | | (14,630,103 | ) | | | (10,964,525 | ) | | | (5,777,646 | ) | | | (5,200,385 | ) | | | (2,136,117 | ) | | | (834,499 | ) | | | (16,254,483 | ) | | | (16,910,284 | ) | |
Class R3 | | | (1,595,587 | ) | | | (451,458 | ) | | | — | | | | — | | | | (9,990,276 | ) | | | (6,941,139 | ) | | | (1,146,247 | ) | | | (4,968,586 | ) | | | (14,062,796 | ) | | | (11,720,277 | ) | |
Class R6 | | | — | | | | — | | | | — | | | | — | | | | (26,465,104 | ) | | | (16,506,493 | ) | | | (8,920,749 | ) | | | (473,984 | ) | | | (142,407,894 | ) | | | (171,115,032 | ) | |
Net increase/(decrease) from Fund share transactions | | | (36,139,492 | ) | | | (1,239,487 | ) | | | (345,430,921 | ) | | | (647,953,338 | ) | | | 184,287,382 | | | | (5,281,659 | ) | | | 25,266,922 | | | | 153,630,866 | | | | (227,686,632 | ) | | | (355,201,150 | ) | |
Net Increase/(Decrease) in Net Assets | | | (48,677,685 | ) | | | (25,313,191 | ) | | | (505,842,303 | ) | | | (799,729,679 | ) | | | 132,270,452 | | | | 54,648,685 | | | | 68,672,498 | | | | 138,379,592 | | | | (145,619,295 | ) | | | (618,915,024 | ) | |
Net Assets: | |
Beginning of year | | | 92,303,936 | | | | 117,617,127 | | | | 1,187,418,862 | | | | 1,987,148,541 | | | | 512,929,901 | | | | 458,281,216 | | | | 238,466,976 | | | | 100,087,384 | | | | 1,788,047,200 | | | | 2,406,962,224 | | |
End of year | | $ | 43,626,251 | | | $ | 92,303,936 | | | $ | 681,576,559 | | | $ | 1,187,418,862 | | | $ | 645,200,353 | | | $ | 512,929,901 | | | $ | 307,139,474 | | | $ | 238,466,976 | | | $ | 1,642,427,905 | | | $ | 1,788,047,200 | | |
See Notes to Financial Statements
183
184
Notes to Financial Statements Equity Funds
Note A—Summary of Significant Accounting Policies:
1 General: Neuberger Berman Equity Funds (the "Trust") is a Delaware statutory trust organized pursuant to an Amended and Restated Trust Instrument dated March 27, 2014. The Trust is registered as an open-end management investment company under the Investment Company Act of 1940, as amended (the "1940 Act"), and its shares are registered under the Securities Act of 1933, as amended. Neuberger Berman Dividend Growth Fund ("Dividend Growth"), Neuberger Berman Emerging Markets Equity Fund ("Emerging Markets Equity"), Neuberger Berman Equity Income Fund ("Equity Income"), Neuberger Berman Focus Fund ("Focus"), Neuberger Berman Genesis Fund ("Genesis"), Neuberger Berman Global Real Estate Fund ("Global Real Estate"), Neuberger Berman Greater China Equity Fund ("Greater China Equity"), Neuberger Berman Guardian Fund ("Guardian"), Neuberger Berman Integrated Large Cap Fund ("Integrated Large Cap") (formerly, Neuberger Berman Global Equity Fund), Neuberger Berman International Equity Fund ("International Equity"), Neuberger Berman International Select Fund ("International Select"), Neuberger Berman International Small Cap Fund ("International Small Cap"), Neuberger Berman Intrinsic Value Fund ("Intrinsic Value"), Neuberger Berman Large Cap Value Fund ("Large Cap Value"), Neuberger Berman Mid Cap Growth Fund ("Mid Cap Growth"), Neuberger Berman Mid Cap Intrinsic Value Fund ("Mid Cap Intrinsic Value"), Neuberger Berman Multi-Cap Opportunities Fund ("Multi-Cap Opportunities"), Neuberger Berman Real Estate Fund ("Real Estate"), Neuberger Berman Small Cap Growth Fund ("Small Cap Growth") and Neuberger Berman Sustainable Equity Fund ("Sustainable Equity") (each individually a "Fund," and collectively, the "Funds") are separate operating series of the Trust, each of which (except Greater China Equity and Real Estate) is diversified. Under the 1940 Act, the status of a Fund that was registered as non-diversified may, under certain circumstances, change to that of a diversified fund (Global Real Estate and Multi-Cap Opportunities became diversified in December 2017 and December 2012, respectively). Nine Funds offer Investor Class shares, eleven offer Trust Class shares, six offer Advisor Class shares, twenty offer Institutional Class shares, nineteen offer Class A shares, nineteen offer Class C shares, ten offer Class R3 shares and fourteen offer Class R6 shares. The Trust's Board of Trustees (the "Board") may establish additional series or classes of shares without the approval of shareholders.
Effective September 3, 2019, Neuberger Berman Global Equity Fund changed its name to Neuberger Berman Integrated Large Cap Fund and changed its investment strategy including its investment risks, portfolio management team, benchmark and fees and expenses.
A balance indicated with a "—", reflects either a zero balance or a balance that rounds to less than 1.
The assets of each Fund belong only to that Fund, and the liabilities of each Fund are borne solely by that Fund and no other series of the Trust.
Each Fund is an investment company and accordingly follows the investment company accounting and reporting guidance of the Financial Accounting Standards Board ("FASB") Accounting Standards Codification ("ASC") Topic 946 "Financial Services—Investment Companies."
The preparation of financial statements in accordance with U.S. generally accepted accounting principles ("GAAP") requires Neuberger Berman Investment Advisers LLC ("Management" or "NBIA") to make estimates and assumptions at the date of the financial statements. Actual results could differ from those estimates.
2 Portfolio valuation: In accordance with ASC 820 "Fair Value Measurement" ("ASC 820"), all investments held by each of the Funds are carried at the value that Management believes a Fund would receive upon selling an investment in an orderly transaction to an independent buyer in the principal or most advantageous market for the investment under current market conditions. Various inputs, including the volume and level of activity for the asset or liability in the market, are considered in valuing the Funds' investments, some of which are discussed below. Significant Management judgment may be necessary to value investments in accordance with ASC 820.
185
ASC 820 established a three-tier hierarchy of inputs to create a classification of value measurements for disclosure purposes. The three-tier hierarchy of inputs is summarized in the three broad Levels listed below.
• Level 1 – unadjusted quoted prices in active markets for identical investments
• Level 2 – other observable inputs (including quoted prices for similar investments, interest rates, prepayment speeds, credit risk, amortized cost, etc.)
• Level 3 – unobservable inputs (including a Fund's own assumptions in determining the fair value of investments)
The inputs or methodology used for valuing an investment are not necessarily an indication of the risk associated with investing in those securities.
The value of the Funds' investments in equity securities, preferred stocks, warrants, convertible preferred stocks, limited partnership units, and exchange-traded options purchased and written, for which market quotations are readily available, is generally determined by Management by obtaining valuations from independent pricing services based on the latest sale price quoted on a principal exchange or market for that security (Level 1 inputs). Securities traded primarily on the NASDAQ Stock Market are normally valued at the NASDAQ Official Closing Price ("NOCP") provided by NASDAQ each business day. The NOCP is the most recently reported price as of 4:00:02 p.m., Eastern Time, unless that price is outside the range of the "inside" bid and asked prices (i.e., the bid and asked prices that dealers quote to each other when trading for their own accounts); in that case, NASDAQ will adjust the price to equal the inside bid or asked price, whichever is closer. Because of delays in reporting trades, the NOCP may not be based on the price of the last trade to occur before the market closes. If there is no sale of a security on a particular day, the independent pricing services may value the security based on market quotations.
The value of the Funds' investments in debt securities is determined by Management primarily by obtaining valuations from independent pricing services based on readily available bid quotations, or if quotations are not available, by methods which include various considerations based on security type (generally Level 2 inputs). In addition to the consideration of yields or prices of securities of comparable quality, coupon, maturity and type, indications as to values from dealers, and general market conditions, the following is a description of other Level 2 inputs and related valuation techniques used by independent pricing services to value certain types of debt securities held by the Funds:
Convertible Bonds. Inputs used to value convertible bonds generally include underlying stock data, dealer quotes, conversion premiums, listed bond and preferred stock prices and other market information, which may include benchmark curves, trade execution data, and sensitivity analysis, when available.
Management has developed a process to periodically review information provided by independent pricing services for all types of securities.
Certificates of deposit are valued at amortized cost (Level 2 inputs).
Investments in non-exchange traded investment companies are valued using the respective fund's daily calculated net asset value ("NAV") per share (Level 2 inputs).
If a valuation is not available from an independent pricing service, or if Management has reason to believe that the valuation received does not represent the amount a Fund might reasonably expect to receive on a current sale in an orderly transaction, Management seeks to obtain quotations from brokers or dealers (generally considered Level 2 or Level 3 inputs depending on the number of quotes available). If such quotations are not readily available, the security is valued using methods the Board has approved in the good-faith belief that the resulting valuation will reflect the fair value of the security. Inputs and assumptions considered in determining the fair value of a security based on Level 2 or Level 3 inputs may include, but are not limited to, the type of the security; the initial cost of the security; the existence of any contractual restrictions on the security's disposition; the price and extent of public trading in similar securities of the issuer or of comparable companies; quotations or evaluated prices from broker-dealers and/or pricing services; information obtained from the issuer, and/or analysts; an analysis of the company's or issuer's financial statements; an evaluation of the inputs that influence the issuer and the market(s) in which the security is purchased and sold.
186
The value of the Funds' investments in foreign securities is generally determined using the same valuation methods and inputs as other Fund investments, as discussed above. Foreign security prices expressed in local currency values are normally translated from the local currency into U.S. dollars using the exchange rates as of 4:00 p.m., Eastern Time on days the New York Stock Exchange ("NYSE") is open for business. The Board has approved the use of ICE Data Pricing & Reference Data LLC ("ICE") to assist in determining the fair value of foreign equity securities when changes in the value of a certain index suggest that the closing prices on the foreign exchanges may no longer represent the amount that a Fund could expect to receive for those securities or on days when foreign markets are closed and U.S. markets are open. In each of these events, ICE will provide adjusted prices for certain foreign equity securities using a statistical analysis of historical correlations of multiple factors (Level 2 inputs). The Board has also approved the use of ICE to evaluate the prices of foreign debt securities as of the time as of which a Fund's share price is calculated. ICE utilizes benchmark spread and yield curves and evaluates available market activity from the local close to the time as of which a Fund's share price is calculated (Level 2 inputs) to assist in determining prices for certain foreign debt securities. In the case of both foreign equity and foreign debt securities, in the absence of precise information about the market values of these foreign securities as of the time as of which a Fund's share price is calculated, the Board has determined on the basis of available data that prices adjusted or evaluated in this way are likely to be closer to the prices a Fund could realize on a current sale than are the prices of those securities established at the close of the foreign markets in which the securities primarily trade.
Fair value prices are necessarily estimates, and there is no assurance that such a price will be at or close to the price at which the security is next quoted or next trades.
3 Foreign currency translations: The accounting records of the Funds are maintained in U.S. dollars. Foreign currency amounts are normally translated into U.S. dollars using the exchange rate as of 4:00 p.m. Eastern Time, on days the NYSE is open for business, to determine the value of investments, other assets and liabilities. Purchase and sale prices of securities, and income and expenses, are translated into U.S. dollars at the prevailing rate of exchange on the respective dates of such transactions. Net unrealized foreign currency gain/(loss), if any, arises from changes in the value of assets and liabilities, other than investments in securities, as a result of changes in exchange rates and is stated separately in the Statements of Operations.
4 Securities transactions and investment income: Securities transactions are recorded on trade date for financial reporting purposes. Dividend income is recorded on the ex-dividend date or, for certain foreign dividends, as soon as the Fund becomes aware of the dividends. Non-cash dividends included in dividend income, if any, are recorded at the fair market value of the securities received. Interest income, including accretion of discount (adjusted for original issue discount, where applicable) and amortization of premium, where applicable, is recorded on the accrual basis. Realized gains and losses from securities transactions and foreign currency transactions, if any, are recorded on the basis of identified cost and stated separately in the Statements of Operations. Included in net realized gain/(loss) on investments are proceeds from the settlement of class action litigation(s) in which certain of the Funds participated as class members. The amounts of such proceeds for the year ended August 31, 2020, were $35,505, $1,574 and $628, for Focus, Genesis and Large Cap Value, respectively.
5 Income tax information: Each Fund is treated as a separate entity for U.S. federal income tax purposes. It is the policy of each Fund to continue to qualify for treatment as a regulated investment company ("RIC") by complying with the requirements of the U.S. Internal Revenue Code applicable to RICs and to distribute substantially all of its net investment income and net realized capital gains to its shareholders. To the extent a Fund distributes substantially all of its net investment income and net realized capital gains to shareholders, no federal income or excise tax provision is required.
The Funds have adopted the provisions of ASC 740 "Income Taxes" ("ASC 740"). ASC 740 sets forth a minimum threshold for financial statement recognition of a tax position taken, or expected to be taken, in a tax return. The Funds recognize interest and penalties, if any, related to unrecognized tax positions as an income tax expense in the Statements of Operations. The Funds are subject to examination by U.S. federal and state tax authorities for returns filed for the tax years for which the applicable statutes of limitations have not yet expired. As of August 31, 2020, the Funds did not have any unrecognized tax positions.
187
For federal income tax purposes, the estimated cost and unrealized appreciation/(depreciation) in value of investments held at August 31, 2020 were as follows:
| | Cost | | Gross
Unrealized
Appreciation | | Gross
Unrealized
Depreciation | | Net Unrealized
Appreciation/
(Depreciation) | |
Dividend Growth | | $ | 40,596,395 | | | $ | 15,115,603 | | | $ | 2,428,117 | | | $ | 12,687,486 | | |
Emerging Markets Equity | | | 885,206,295 | | | | 283,500,061 | | | | 73,115,706 | | | | 210,384,355 | | |
Equity Income | | | 985,994,825 | | | | 291,893,408 | | | | 24,323,002 | | | | 267,570,406 | | |
Focus | | | 570,518,086 | | | | 199,512,090 | | | | 1,414,207 | | | | 198,097,883 | | |
Genesis | | | 5,019,093,621 | | | | 5,691,215,939 | | | | 228,234,954 | | | | 5,462,980,985 | | |
Global Real Estate | | | 1,851,446 | | | | 232,582 | | | | 199,172 | | | | 33,410 | | |
Greater China Equity | | | 50,502,735 | | | | 9,086,559 | | | | 4,769,314 | | | | 4,317,245 | | |
Guardian | | | 1,035,777,031 | | | | 626,697,247 | | | | 16,355,313 | | | | 610,341,934 | | |
Integrated Large Cap | | | 2,855,184 | | | | 722,572 | | | | 72,415 | | | | 650,157 | | |
International Equity | | | 1,325,189,675 | | | | 317,733,809 | | | | 70,147,439 | | | | 247,586,370 | | |
International Select | | | 124,725,411 | | | | 33,514,650 | | | | 5,245,504 | | | | 28,269,146 | | |
International Small Cap | | | 1,739,563 | | | | 507,513 | | | | 165,713 | | | | 341,800 | | |
Intrinsic Value | | | 489,731,112 | | | | 187,955,857 | | | | 90,684,720 | | | | 97,271,137 | | |
Large Cap Value | | | 1,670,174,738 | | | | 261,515,636 | | | | 93,119,452 | | | | 168,396,184 | | |
Mid Cap Growth | | | 1,046,685,900 | | | | 577,271,073 | | | | 15,136,694 | | | | 562,134,379 | | |
Mid Cap Intrinsic Value | | | 43,121,343 | | | | 11,382,853 | | | | 9,979,304 | | | | 1,403,549 | | |
Multi-Cap Opportunities | | | 355,975,188 | | | | 328,647,576 | | | | 3,329,545 | | | | 325,318,031 | | |
Real Estate | | | 597,754,053 | | | | 106,800,392 | | | | 50,230,920 | | | | 56,569,472 | | |
Small Cap Growth | | | 256,262,827 | | | | 63,954,224 | | | | 8,251,627 | | | | 55,702,597 | | |
Sustainable Equity | | | 1,020,790,651 | | | | 649,569,066 | | | | 28,769,042 | | | | 620,800,024 | | |
Income distributions and capital gain distributions are determined in accordance with income tax regulations, which may differ from GAAP. These differences are primarily due to differing treatments of income and gains on various investment securities held by each Fund, timing differences and differing characterization of distributions made by each Fund. The Funds may also utilize earnings and profits distributed to shareholders on redemption of their shares as a part of the dividends-paid deduction for income tax purposes.
Any permanent differences resulting from different book and tax treatment are reclassified at year-end and have no impact on net income, NAV or NAV per share of the Funds. For the year ended August 31, 2020, the Funds recorded permanent reclassifications primarily related to one or more of the following: deemed distributions on shareholder redemptions, prior year true up adjustment, net operating losses written off, and gains (losses) & tax adjustments on securities redeemed in kind. For the year ended August 31, 2020, the Funds recorded the following permanent reclassifications:
| | Paid-in Capital | | Total Distributable
Earnings/(Losses) | |
Dividend Growth | | $ | — | | | $ | — | | |
Emerging Markets Equity | | | — | | | | — | | |
Equity Income | | | 12,563 | | | | (12,563 | ) | |
Focus | | | 2,045,068 | | | | (2,045,068 | ) | |
Genesis | | | 56,634,866 | | | | (56,634,866 | ) | |
Global Real Estate | | | — | | | | — | | |
Greater China Equity | | | — | | | | — | | |
188
| | Paid-in Capital | | Total Distributable
Earnings/(Losses) | |
Guardian | | $ | 4,769,370 | | | $ | (4,769,370 | ) | |
Integrated Large Cap | | | — | | | | — | | |
International Equity | | | 21,574,303 | | | | (21,574,303 | ) | |
International Select | | | (191,492 | ) | | | 191,492 | | |
International Small Cap | | | 1 | | | | (1 | ) | |
Intrinsic Value | | | 2,278,244 | | | | (2,278,244 | ) | |
Large Cap Value | | | 11,321 | | | | (11,321 | ) | |
Mid Cap Growth | | | 5,798,998 | | | | (5,798,998 | ) | |
Mid Cap Intrinsic Value | | | — | | | | — | | |
Multi-Cap Opportunities | | | 77,931,689 | | | | (77,931,689 | ) | |
Real Estate | | | 3,029,451 | | | | (3,029,451 | ) | |
Small Cap Growth | | | 764,001 | | | | (764,001 | ) | |
Sustainable Equity | | | 16,321,141 | | | | (16,321,141 | ) | |
The tax character of distributions paid during the years ended August 31, 2020, and August 31, 2019, was as follows:
| | Distributions Paid From: | |
| | Ordinary Income | | Long-Term Capital Gain | | Return of Capital | | Total | |
| | 2020 | | 2019 | | 2020 | | 2019 | | 2020 | | 2019 | | 2020 | | 2019 | |
Dividend Growth | | $ | 826,386 | | | $ | 878,382 | | | $ | — | | | $ | 1,990,913 | | | $ | — | | | $ | — | | | $ | 826,386 | | | $ | 2,869,295 | | |
Emerging Markets
Equity | | | 25,945,704 | | | | 12,080,438 | | | | — | | | | — | | | | — | | | | — | | | | 25,945,704 | | | | 12,080,438 | | |
Equity Income | | | 33,695,072 | | | | 33,714,658 | | | | 47,073,540 | | | | 65,245,087 | | | | — | | | | — | | | | 80,768,612 | | | | 98,959,745 | | |
Focus | | | 12,478,831 | | | | 18,916,856 | | | | 70,064,650 | | | | 33,501,189 | | | | — | | | | — | | | | 82,543,481 | | | | 52,418,045 | | |
Genesis | | | 19,901,125 | | | | 20,419,535 | | | | 579,781,590 | | | | 983,608,714 | | | | — | | | | — | | | | 599,682,715 | | | | 1,004,028,249 | | |
Global Real Estate | | | 106,937 | | | | 73,452 | | | | 70,357 | | | | 33,173 | | | | 7,971 | | | | — | | | | 185,265 | | | | 106,625 | | |
Greater China
Equity | | | 453,603 | | | | 11,364,203 | | | | — | | | | 13,298,695 | | | | — | | | | — | | | | 453,603 | | | | 24,662,898 | | |
Guardian | | | 33,517,939 | | | | 29,808,349 | | | | 45,965,679 | | | | 80,355,254 | | | | — | | | | — | | | | 79,483,618 | | | | 110,163,603 | | |
Integrated
Large Cap | | | 70,376 | | | | 75,450 | | | | 745,427 | | | | 232,764 | | | | — | | | | — | | | | 815,803 | | | | 308,214 | | |
International
Equity | | | 23,260,718 | | | | 18,471,465 | | | | 29,859,700 | | | | 4,719,319 | | | | — | | | | — | | | | 53,120,418 | | | | 23,190,784 | | |
International Select | | | 3,198,388 | | | | 1,242,508 | | | | 2,566,009 | | | | 1,682,857 | | | | — | | | | — | | | | 5,764,397 | | | | 2,925,365 | | |
International
Small Cap | | | 50,905 | | | | 15,182 | | | | — | | | | 96,500 | | | | — | | | | — | | | | 50,905 | | | | 111,682 | | |
Intrinsic Value | | | 2,242,126 | | | | 11,727,225 | | | | 16,091,836 | | | | 59,749,691 | | | | — | | | | — | | | | 18,333,962 | | | | 71,476,916 | | |
Large Cap Value | | | 36,925,536 | | | | 48,424,781 | | | | 40,587,809 | | | | 122,735,314 | | | | — | | | | — | | | | 77,513,345 | | | | 171,160,095 | | |
Mid Cap Growth | | | — | | | | 20,803,058 | | | | 75,435,021 | | | | 105,305,351 | | | | — | | | | — | | | | 75,435,021 | | | | 126,108,409 | | |
Mid Cap Intrinsic
Value | | | 1,008,381 | | | | 3,594,717 | | | | — | | | | 4,572,879 | | | | — | | | | — | | | | 1,008,381 | | | | 8,167,596 | | |
Multi-Cap
Opportunities | | | 10,073,130 | | | | 11,530,044 | | | | 205,557,499 | | | | 146,099,376 | | | | — | | | | — | | | | 215,630,629 | | | | 157,629,420 | | |
Real Estate | | | 8,647,648 | | | | 6,014,323 | | | | 19,424,543 | | | | 22,198,825 | | | | — | | | | — | | | | 28,072,191 | | | | 28,213,148 | | |
Small Cap Growth | | | 7,190,578 | | | | 10,737,489 | | | | 1,795,582 | | | | 5,142,955 | | | | — | | | | — | | | | 8,986,160 | | | | 15,880,444 | | |
Sustainable Equity | | | 12,102,329 | | | | 11,102,674 | | | | 146,053,918 | | | | 169,089,043 | | | | — | | | | — | | | | 158,156,247 | | | | 180,191,717 | | |
189
As of August 31, 2020, the components of distributable earnings/(accumulated losses) on a U.S. federal income tax basis were as follows:
| | Undistributed
Ordinary
Income | | Undistributed
Long-Term
Capital Gain | | Unrealized
Appreciation/
(Depreciation) | | Loss
Carryforwards
and Deferrals | | Other
Temporary
Differences | | Total | |
Dividend Growth | | $ | 767,270 | | | $ | — | | | $ | 12,687,486 | | | $ | (2,477,485 | ) | | $ | — | | | $ | 10,977,271 | | |
Emerging Markets Equity | | | 3,925,622 | | | | — | | | | 210,087,232 | | | | (139,605,750 | ) | | | (14,792 | ) | | | 74,392,312 | | |
Equity Income | | | 83,744 | | | | — | | | | 267,569,784 | | | | (31,754,566 | ) | | | — | | | | 235,898,962 | | |
Focus | | | — | | | | 41,874,490 | | | | 198,097,883 | | | | (35,054,245 | ) | | | — | | | | 204,918,128 | | |
Genesis | | | 2,993,668 | | | | 310,934,489 | | | | 5,462,980,985 | | | | — | | | | — | | | | 5,776,909,142 | | |
Global Real Estate | | | — | | | | — | | | | 33,514 | | | | (13,636 | ) | | | (1,609 | ) | | | 18,269 | | |
Greater China Equity | | | 305,286 | | | | — | | | | 4,328,444 | | | | (6,685,077 | ) | | | (15,560 | ) | | | (2,066,907 | ) | |
Guardian | | | 14,301,436 | | | | 93,345,490 | | | | 610,341,934 | | | | — | | | | (262,502 | ) | | | 717,726,358 | | |
Integrated Large Cap | | | 11,988 | | | | 29,659 | | | | 650,440 | | | | — | | | | 1 | | | | 692,088 | | |
International Equity | | | 11,286,579 | | | | 59,230,301 | | | | 247,944,052 | | | | — | | | | 1 | | | | 318,460,933 | | |
International Select | | | — | | | | — | | | | 28,297,326 | | | | (497,552 | ) | | | (5,717 | ) | | | 27,794,057 | | |
International Small Cap | | | 5,532 | | | | 61,052 | | | | 342,661 | | | | — | | | | — | | | | 409,245 | | |
Intrinsic Value | | | — | | | | 10,263,326 | | | | 97,271,137 | | | | (6,122,412 | ) | | | (61,105 | ) | | | 101,350,946 | | |
Large Cap Value | | | 21,734,362 | | | | — | | | | 168,396,183 | | | | (6,767,044 | ) | | | — | | | | 183,363,501 | | |
Mid Cap Growth | | | — | | | | 132,297,833 | | | | 562,134,379 | | | | (3,530,257 | ) | | | — | | | | 690,901,955 | | |
Mid Cap Intrinsic Value | | | 19,120 | | | | — | | | | 1,403,549 | | | | (12,880,045 | ) | | | — | | | | (11,457,376 | ) | |
Multi-Cap Opportunities | | | 1,266,994 | | | | 122,676,992 | | | | 325,318,031 | | | | — | | | | (1 | ) | | | 449,262,016 | | |
Real Estate | | | — | | | | 1,779,479 | | | | 56,569,472 | | | | (3,131,601 | ) | | | (3 | ) | | | 55,217,347 | | |
Small Cap Growth | | | — | | | | 4,202,734 | | | | 55,702,597 | | | | (1,059,454 | ) | | | — | | | | 58,845,877 | | |
Sustainable Equity | | | 10,074,295 | | | | 49,826,160 | | | | 620,907,542 | | | | — | | | | — | | | | 680,807,997 | | |
The temporary differences between book basis and tax basis distributable earnings are primarily due to: losses disallowed and/or recognized on wash sales and straddles, capital loss carryforwards, amortization of organization expenses, partnership basis adjustments, loss limitation due to ownership change, contingent payment debt instrument adjustments, tax adjustments related to nontaxable distributions from corporate stock, passive foreign investment companies ("PFICs") and other investments.
To the extent each Fund's net realized capital gains, if any, can be offset by capital loss carryforwards, it is the policy of each Fund not to distribute such gains. Capital loss carryforward rules allow for RICs to carry forward capital losses indefinitely and to retain the character of capital loss carryforwards as short-term or long-term. As determined at August 31, 2020, the following Funds had unused capital loss carryforwards available for federal income tax purposes to offset future net realized capital gains, if any, as follows:
| | | Capital Loss Carryforwards | |
| | | Long-Term | | Short-Term | |
Dividend Growth | | $ | — | | | $ | 2,477,485 | | |
Emerging Markets Equity | | | 62,393,369 | | | | 77,212,381 | | |
Greater China Equity | | | 741,292 | * | | | 5,943,785 | * | |
Mid Cap Intrinsic Value | | | 12,083,243 | | | | 796,800 | | |
* Future utilization is limited under current tax regulation.
During the year ended August 31, 2020, Greater China Equity utilized capital loss carryforwards of $4,056,472.
190
Under current tax regulations, capital losses realized on investment transactions after October 31 may be deferred and treated as occurring on the first day of the following fiscal year. Under The Regulated Investment Company Modernization Act of 2010, the Funds may also defer any realized late-year ordinary losses as occurring on the first day of the following fiscal year. Late-year ordinary losses represent ordinary losses realized on investment transactions after December 31 and specified losses (ordinary losses from the sale, exchange, or other disposition of property, net foreign currency losses and net passive foreign investment company mark to market losses) realized on investment transactions after October 31. For the year ended August 31, 2020, the Funds elected to defer the following late-year ordinary losses and post October capital losses:
| | Late-Year
Ordinary Loss
Deferral | | Post October
Capital Loss
Deferral | |
Equity Income | | $ | — | | | $ | 31,754,566 | | |
Focus | | | 305,605 | | | | 34,748,640 | | |
Global Real Estate | | | 13,412 | | | | 224 | | |
International Select | | | — | | | | 497,552 | | |
Intrinsic Value | | | 1,599,656 | | | | 4,522,756 | | |
Large Cap Value | | | — | | | | 6,767,044 | | |
Mid Cap Growth | | | 3,530,257 | | | | — | | |
Real Estate | | | — | | | | 3,131,601 | | |
Small Cap Growth | | | 1,059,454 | | | | — | | |
6 Foreign taxes: Foreign taxes withheld, if any, represent amounts withheld by foreign tax authorities, net of refunds recoverable.
Foreign capital gains on certain foreign securities may be subject to foreign taxes, which are accrued as applicable. Emerging Markets Equity accrues capital gains tax on unrealized and realized gains for certain securities. At August 31, 2020, Emerging Markets Equity had accrued capital gains taxes of $325,142, which is reflected in the Statements of Assets and Liabilities.
7 Distributions to shareholders: Each Fund may earn income, net of expenses, daily on its investments.
Distributions from net investment income and net realized capital gains, if any, are generally distributed once a year (usually in December) and are recorded on the ex-date. However, Equity Income, Global Real Estate and Real Estate generally distribute net investment income, if any, at the end of each calendar quarter.
For Funds that invest in REITs, these Funds pass through to their shareholders substantially all REIT distributions and other income they receive, less operating expenses. The distributions received from REITs are generally composed of income, capital gains, and/or return of REIT capital, but the REITs do not report this information to these Funds until the following calendar year. At August 31, 2020, these Funds estimated these amounts for the period January 1, 2020 to August 31, 2020 within the financial statements because the 2020 information is not available from the REITs until after each Fund's fiscal year-end. All estimates are based upon REIT information sources available to these Funds together with actual IRS Forms 1099-DIV received to date. For the year ended August 31, 2020, the character of distributions, if any, paid to shareholders of these Funds disclosed within the Statements of Changes in Net Assets is based on estimates made at that time. Based on past experience it is possible that a portion of these Funds' distributions during the current fiscal year, if any, will be considered tax return of capital, but the actual amount of the tax return of capital, if any, is not determinable until after each Fund's fiscal year-end. After calendar year-end, when these Funds learn the nature of the distributions paid by REITs during that year, distributions previously identified as income are often recharacterized as return of capital and/or capital gain. After all applicable REITs have informed these Funds of the actual breakdown of distributions paid to these
191
Funds during their fiscal year, estimates previously recorded are adjusted to reflect actual results. As a result, the composition of these Funds' distributions as reported herein may differ from the final composition determined after calendar year-end and reported to these Funds shareholders on IRS Form 1099-DIV.
8 Expense allocation: Certain expenses are applicable to multiple funds within the complex of related investment companies. Expenses directly attributable to a fund are charged to that fund. Expenses of the Trust that are not directly attributable to a particular series of the Trust (e.g., a Fund) are allocated among the series of the Trust, on the basis of relative net assets, except where a more appropriate allocation of expenses to each of the series can otherwise be made fairly. Expenses borne by the complex of related investment companies, which includes open-end and closed-end investment companies for which NBIA serves as investment manager, that are not directly attributable to a particular investment company in the complex (e.g., the Trust) or series thereof are allocated among the investment companies in the complex or series thereof on the basis of relative net assets, except where a more appropriate allocation of expenses to each of the investment companies in the complex or series thereof can otherwise be made fairly. Each Fund's expenses (other than those specific to each class) are allocated proportionally each day among its classes based upon the relative net assets of each class.
9 Investments in foreign securities: Investing in foreign securities may involve sovereign and other risks, in addition to the credit and market risks normally associated with domestic securities. These additional risks include the possibility of adverse political and economic developments (including political instability, nationalization, expropriation, or confiscatory taxation) and the potentially adverse effects of unavailability of public information regarding issuers, less governmental supervision and regulation of financial markets, reduced liquidity of certain financial markets, and the lack of uniform accounting, auditing, and financial reporting standards or the application of standards that are different or less stringent than those applied in the United States. Foreign securities also may experience greater price volatility, higher rates of inflation, and delays in settlement.
10 Investment company securities and exchange-traded funds: The Funds may invest in shares of other registered investment companies, including exchange-traded funds ("ETFs"), within the limitations prescribed by (a) the 1940 Act, (b) the exemptive order from the Securities and Exchange Commission ("SEC") that permits the Funds to invest in both affiliated and unaffiliated investment companies, including ETFs, in excess of the limits in Section 12(d)(1)(A) of the 1940 Act, subject to the terms and conditions of such order, or (c) the ETF's exemptive order or other relief. Some ETFs seek to track the performance of a particular market index. These indices include both broad-based market indices and more narrowly-based indices, including those relating to particular sectors, markets, regions or industries. However, some ETFs have an actively-managed investment objective. ETF shares are traded like traditional equity securities on a national securities exchange or NASDAQ. A Fund will indirectly bear its proportionate share of any management fees and other expenses paid by such other investment companies, which will decrease returns.
11 Derivative instruments: Certain Funds' use of derivatives during the year ended August 31, 2020, is described below. Please see the Schedule of Investments for each Fund's open positions in derivatives, if any, at August 31, 2020. The Funds have adopted the provisions of ASC 815 "Derivatives and Hedging" ("ASC 815"). The disclosure requirements of ASC 815 distinguish between derivatives that qualify for hedge accounting and those that do not. Because investment companies value their derivatives at fair value and recognize changes in fair value through the Statements of Operations, they do not qualify for hedge accounting. Accordingly, even though a Fund's investments in derivatives may represent economic hedges, they are considered non-hedge transactions for purposes of this disclosure.
Options: Equity Income used options written to generate incremental returns. Guardian used options written to enhance total return, to gain exposure more efficiently than through a direct purchase of the underlying security, to gain exposure to securities, markets, sectors or geographical areas and to manage or adjust the risk profile of the Fund or the risk of individual positions. Guardian used options purchased to gain exposure more efficiently than through a direct purchase of the underlying security, to gain exposure to securities, markets, sectors or geographical areas and to manage or adjust the risk profile of the Fund or the risk of individual positions.
192
Premiums paid by a Fund upon purchasing a call or put option are recorded in the asset section of the Fund's Statement of Assets and Liabilities and are subsequently adjusted to the current market value. When an option is exercised, closed, or expired, a Fund realizes a gain or loss and the asset is eliminated. For purchased call options, a Fund's loss is limited to the amount of the option premium paid.
Premiums received by a Fund upon writing a call option or a put option are recorded in the liability section of the Fund's Statement of Assets and Liabilities and are subsequently adjusted to the current market value. When an option is exercised, closed, or expired, a Fund realizes a gain or loss and the liability is eliminated.
When a fund writes a call option on an underlying asset it does not own, its exposure on such an option is theoretically unlimited. When writing a covered call option, a Fund, in return for the premium, gives up the opportunity for profit from a price increase in the underlying security above the exercise price, but conversely retains the risk of loss should the price of the security decline. When writing a put option, a Fund, in return for the premium, takes the risk that it must purchase the underlying security at a price that may be higher than the current market price of the security. If a call or put option that a Fund has written expires unexercised, a Fund will realize a gain for the amount of the premium. All securities covering outstanding written options are held in escrow by the custodian bank.
At August 31, 2020, the Funds listed below had the following derivatives (which did not qualify as hedging instruments under ASC 815), grouped by primary risk exposure:
Asset Derivatives
Derivative Type | | Statements of Assets and Liabilities Location | | Equity Risk | | Total | |
Guardian | |
Options purchased | | Investments in securities, at value | | $ | 3,519,375 | | | $ | 3,519,375 | | |
Total Value—Assets | |
| | $ | 3,519,375 | | | $ | 3,519,375 | | |
Liability Derivatives
Derivative Type | | Statements of Assets and Liabilities Location | | Equity Risk | | Total | |
Equity Income | |
Options written | | Option contracts written, at value | | $ | (4,202,480 | ) | | $ | (4,202,480 | ) | |
Total Value—Liabilities | |
| | $ | (4,202,480 | ) | | $ | (4,202,480 | ) | |
Guardian | |
Options written | | Option contracts written, at value | | $ | (1,349,183 | ) | | $ | (1,349,183 | ) | |
Total Value—Liabilities | |
| | $ | (1,349,183 | ) | | $ | (1,349,183 | ) | |
The impact of the use of derivative instruments on the Statements of Operations during the year ended August 31, 2020, was as follows:
Realized Gain/(Loss)
Derivative Type | | Statements of Operations Location | | Equity Risk | | Total | |
Equity Income | |
Options written | | Net realized gain/(loss) on: Expiration or closing of
option contracts written | | $ | (4,717,604 | ) | | $ | (4,717,604 | ) | |
Total Realized Gain/(Loss) | |
| | $ | (4,717,604 | ) | | $ | (4,717,604 | ) | |
Guardian | |
Options purchased | | Net realized gain/(loss) on: Transactions in investment
securities of unaffiliated issuers | | $ | 2,010,159 |
| | $ | 2,010,159 |
| |
Options written | | Net realized gain/(loss) on: Expiration or closing of
option contracts written | |
| 2,535,750 |
| |
| 2,535,750 |
| |
Total Realized Gain/(Loss) | |
| | $ | 4,545,909 | | | $ | 4,545,909 | | |
193
Change in Appreciation/(Depreciation)
Derivative Type | | Statements of Operations Location | | Equity Risk | | Total | |
Equity Income | |
Options written | | Change in net unrealized appreciation/(depreciation)
in value of: Option contracts written | | $ | (140,123 | ) | | $ | (140,123 | ) | |
Total Change in Appreciation/(Depreciation) | |
| | $ | (140,123 | ) | | $ | (140,123 | ) | |
Guardian | |
Options purchased | | Change in net unrealized appreciation/(depreciation)
in value of: Investment securities of unaffiliated issuers | | $ | 2,486,774 |
| | $ | 2,486,774 |
| |
Options written | | Change in net unrealized appreciation/(depreciation)
in value of: Option contracts written | |
| 711,962 |
| |
| 711,962 |
| |
Total Change in Appreciation/(Depreciation) | |
| | $ | 3,198,736 | | | $ | 3,198,736 | | |
While the Funds may receive rights and warrants in connection with their investments in securities, these rights and warrants are not considered "derivative instruments" under ASC 815. Management has concluded that the Funds, except Equity Income and Guardian did not hold any derivative instruments during the year ended August 31, 2020, that require additional disclosures pursuant to ASC 815.
12 Securities lending: Each Fund, using State Street Bank and Trust Company ("State Street") as its lending agent, may loan securities to qualified brokers and dealers in exchange for negotiated lender's fees. These fees, if any, would be disclosed within the Statements of Operations under the caption "Income from securities loaned-net" and are net of expenses retained by State Street as compensation for its services as lending agent.
The initial cash collateral received by a Fund at the beginning of each transaction shall have a value equal to at least 102% of the prior day's market value of the loaned securities (105% in the case of international securities). Thereafter, the value of the cash collateral is monitored on a daily basis, and cash collateral is moved daily between a counterparty and a Fund until the close of the transaction. A Fund may only receive collateral in the form of cash (U.S. dollars). Cash collateral is generally invested in a money market fund registered under the 1940 Act that is managed by an affiliate of State Street. The risks associated with lending portfolio securities include, but are not limited to, possible delays in receiving additional collateral or in the recovery of the loaned securities. Any increase or decrease in the fair value of the securities loaned and any interest earned or dividends paid or owed on those securities during the term of the loan would accrue to the Fund.
As of August 31, 2020, the Funds listed below had outstanding loans of securities to certain approved brokers each with a value as follows:
| | Value of Securities
Loaned | |
Emerging Markets Equity | | $ | 9,874,256 | | |
Guardian | | | 24,303,417 | | |
International Select | | | 423,821 | | |
International Small Cap | | | 84,556 | | |
Large Cap Value | | | 52,944,430 | | |
Mid Cap Growth | | | 17,541,636 | | |
Small Cap Growth | | | 4,928,842 | | |
194
As of August 31, 2020, the Funds listed below had outstanding loans of securities to certain approved brokers for which each received collateral as follows:
| | | Remaining Contractual Maturity of the Agreements | |
| | Overnight
and
Continuous | | Less Than
30 Days | | Between 30 &
90 Days | | Greater Than
90 Days | | Total | |
| Securities Lending Transactions(a) | |
Common Stocks | |
Emerging Markets Equity | | $ | 10,017,929 | | | $ | — | | | $ | — | | | $ | — | | | $ | 10,017,929 | | |
Guardian | | | 24,275,560 | | | | — | | | | — | | | | — | | | | 24,275,560 | | |
International Select | | | 447,618 | | | | — | | | | — | | | | — | | | | 447,618 | | |
International Small Cap | | | 88,669 | | | | — | | | | — | | | | — | | | | 88,669 | | |
Large Cap Value | | | 54,809,889 | | | | — | | | | — | | | | — | | | | 54,809,889 | | |
Mid Cap Growth | | | 17,302,532 | | | | — | | | | — | | | | — | | | | 17,302,502 | | |
Small Cap Growth | | | 4,939,633 | | | | — | | | | — | | | | — | | | | 4,939,633 | | |
(a) Amounts represent the payable for loaned securities collateral received.
The Funds are required to disclose both gross and net information for assets and liabilities related to derivatives, repurchase and reverse repurchase agreements, and securities lending and securities borrowing transactions that are eligible for offset or subject to an enforceable master netting or similar agreement. Emerging Markets Equity, Guardian, International Select, International Small Cap, Large Cap Value, Mid Cap Growth and Small Cap Growth held one or more of these investments at August 31, 2020. The Funds' securities lending assets at fair value are reported gross in the Statements of Assets and Liabilities. The following tables present securities lending assets by counterparty and net of the related collateral received by a Fund for assets as of August 31, 2020.
Description | | Gross Amounts of
Recognized Assets | | Gross Amounts Offset
in the Statements of
Assets and Liabilities | | Net Amounts of Assets
Presented in the Statements
of Assets and Liabilities | |
Emerging Markets Equity | |
Securities Lending | | $ | 9,874,256 | | | $ | — | | | $ | 9,874,256 | | |
Total | | $ | 9,874,256 | | | $ | — | | | $ | 9,874,256 | | |
Guardian | |
Securities Lending | | $ | 24,303,417 | | | $ | — | | | $ | 24,303,417 | | |
Total | | $ | 24,303,417 | | | $ | — | | | $ | 24,303,417 | | |
International Select | |
Securities Lending | | $ | 423,821 | | | $ | — | | | $ | 423,821 | | |
Total | | $ | 423,821 | | | $ | — | | | $ | 423,821 | | |
International Small Cap | |
Securities Lending | | $ | 84,556 | | | $ | — | | | $ | 84,556 | | |
Total | | $ | 84,556 | | | $ | — | | | $ | 84,556 | | |
Large Cap Value | |
Securities Lending | | $ | 52,944,430 | | | $ | — | | | $ | 52,944,430 | | |
Total | | $ | 52,944,430 | | | $ | — | | | $ | 52,944,430 | | |
Mid Cap Growth | |
Securities Lending | | $ | 17,541,636 | | | $ | — | | | $ | 17,541,636 | | |
Total | | $ | 17,541,636 | | | $ | — | | | $ | 17,541,636 | | |
Small Cap Growth | |
Securities Lending | | $ | 4,928,842 | | | $ | — | | | $ | 4,928,842 | | |
Total | | $ | 4,928,842 | | | $ | — | | | $ | 4,928,842 | | |
195
Gross Amounts Not Offset in the Statements of Assets and Liabilities
Counterparty | | Net Amounts of
Assets Presented in
the Statements of Assets
and Liabilities | | Liabilities
Available
for Offset | | Cash
Collateral
Received(a) | | Net Amount(b) | |
Emerging Markets Equity | |
SSB | | $ | 9,874,256 | | | $ | — | | | $ | (9,874,256 | ) | | $ | — | | |
Total | | $ | 9,874,256 | | | $ | — | | | $ | (9,874,256 | ) | | $ | — | | |
Guardian | |
SSB | | $ | 24,303,417 | | | $ | — | | | $ | 24,275,560 | | | $ | 27,857 | | |
Total | | $ | 24,303,417 | | | $ | — | | | $ | 24,275,560 | | | $ | 27,857 | | |
International Select | |
SSB | | $ | 423,821 | | | $ | — | | | $ | (423,821 | ) | | $ | — | | |
Total | | $ | 423,821 | | | $ | — | | | $ | (423,821 | ) | | $ | — | | |
International Small Cap | |
SSB | | $ | 84,556 | | | $ | — | | | $ | (84,556 | ) | | $ | — | | |
Total | | $ | 84,556 | | | $ | — | | | $ | (84,556 | ) | | $ | — | | |
Large Cap Value | |
SSB | | $ | 52,944,430 | | | $ | — | | | $ | (52,944,430 | ) | | $ | — | | |
Total | | $ | 52,944,430 | | | $ | — | | | $ | (52,944,430 | ) | | $ | — | | |
Mid Cap Growth | |
SSB | | $ | 17,541,636 | | | $ | — | | | $ | 17,302,532 | | | $ | 239,104 | | |
Total | | $ | 17,541,636 | | | $ | — | | | $ | 17,302,532 | | | $ | 239,104 | | |
Small Cap Growth | |
SSB | | $ | 4,928,842 | | | $ | — | | | $ | (4,928,842 | ) | | $ | — | | |
Total | | $ | 4,928,842 | | | $ | — | | | $ | (4,928,842 | ) | | $ | — | | |
(a) Collateral received is limited to an amount not to exceed 100% of the net amount of assets in the tables presented above.
(b) Net Amount represents amounts subject to loss at August 31, 2020, in the event of a counterparty failure.
13 Indemnifications: Like many other companies, the Trust's organizational documents provide that its officers ("Officers") and trustees ("Trustees") are indemnified against certain liabilities arising out of the performance of their duties to the Trust. In addition, both in some of its principal service contracts and in the normal course of its business, the Trust enters into contracts that provide indemnifications to other parties for certain types of losses or liabilities. The Trust's maximum exposure under these arrangements is unknown as this could involve future claims against the Trust.
14 In-kind redemptions: In accordance with guidelines described in a Fund's prospectus and in accordance with procedures adopted by the Board, a Fund may distribute portfolio securities rather than cash as payment for a redemption of Fund shares ("in-kind redemption"). For financial reporting purposes, the Fund recognizes a gain on in-kind redemptions to the extent the value of the distributed securities on the date of redemption exceeds the cost of those securities. Gains and losses realized on in-kind redemptions are not recognized for tax purposes and are reclassified from undistributed realized gain/(loss) to paid-in capital. During the year ended August 31, 2019, Genesis and Sustainable Equity realized net gains of $51,385,073 and $26,393,200, respectively, on $88,171,756 and $74,230,454, respectively, of in-kind redemptions. During the year ended August 31, 2020, International Select realized net losses of $(191,436) on $30,830,767 of in-kind redemptions.
15 Other: All net investment income and realized and unrealized capital gains and losses of each Fund are allocated, on the basis of relative net assets, pro rata among its respective classes.
196
16 Other matters—Coronavirus: The outbreak of the novel coronavirus in many countries, which is a rapidly evolving situation, has, among other things, disrupted global travel and supply chains, and has adversely impacted global commercial activity, the transportation industry and commodity prices in the energy sector. The impact of this virus has negatively affected and may continue to affect the economies of many nations, individual companies and the global securities and commodities markets, including liquidity and volatility, in ways that cannot necessarily be foreseen at the present time. The rapid development and fluidity of this situation precludes any prediction as to its ultimate impact, which may have a continued adverse effect on economic and market conditions and trigger a period of global economic slowdown. Such conditions (which may be across industries, sectors or geographies) have impacted and may continue to impact the issuers of the securities held by the Funds.
Note B—Investment Management Fees, Administration Fees, Distribution Arrangements, and Other Transactions with Affiliates:
Each Fund retains NBIA as its investment manager under a Management Agreement. For such investment management services, each Fund pays NBIA an investment management fee as a percentage of average daily net assets according to the following table:
| | First
$250
million | | Next
$250
million | | Next
$250
million | | Next
$250
million | | Next
$500
million | | Next
$500
million | | Next
$500
million | | Next
$1.5
billion | | Next
$10
billion | | Thereafter | |
For Genesis | | | |
| | | | | | 0.85 | % | | | 0.80 | % | | | 0.75 | % | | | 0.70 | % | | | 0.65 | % | | | 0.65 | % | | | 0.65 | % | | | 0.65 | % | | | 0.65 | % | | | 0.60 | % | |
For Intrinsic Value and Small Cap Growth: | | | |
| | | | | | 0.85 | % | | | 0.80 | % | | | 0.75 | % | | | 0.70 | % | | | 0.65 | % | | | 0.65 | % | | | 0.65 | % | | | 0.65 | % | | | 0.65 | % | | | 0.65 | % | |
For Emerging Markets Equity: | | | |
| | | | | | 1.00 | % | | | 0.975 | % | | | 0.95 | % | | | 0.925 | % | | | 0.90 | % | | | 0.875 | % | | | 0.875 | % | | | 0.875 | % | | | 0.85 | % | | | 0.85 | % | |
For Global Real Estate and Real Estate: | | | |
| | | | | | 0.80 | % | | | 0.80 | % | | | 0.80 | % | | | 0.80 | % | | | 0.80 | % | | | 0.80 | % | | | 0.80 | % | | | 0.80 | % | | | 0.80 | % | | | 0.80 | % | |
| For International Equity(a): | | | |
| | | | | | 0.85 | % | | | 0.825 | % | | | 0.80 | % | | | 0.775 | % | | | 0.75 | % | | | 0.725 | % | | | 0.725 | % | | | 0.70 | % | | | 0.70 | % | | | 0.70 | % | |
For International Small Cap: | | | |
| | | | | | 0.85 | % | | | 0.825 | % | | | 0.80 | % | | | 0.775 | % | | | 0.75 | % | | | 0.725 | % | | | 0.725 | % | | | 0.725 | % | | | 0.70 | % | | | 0.70 | % | |
| For Equity Income, Focus, Guardian, International Select, Large Cap Value, Mid Cap Growth, Mid Cap Intrinsic Value(a) and Sustainable Equity: | | | |
| | | | | | 0.55 | % | | | 0.525 | % | | | 0.50 | % | | | 0.475 | % | | | 0.45 | % | | | 0.425 | % | | | 0.425 | % | | | 0.425 | % | | | 0.40 | % | | | 0.40 | % | |
For Multi-Cap Opportunities: | | | |
| | | | | | 0.60 | % | | | 0.575 | % | | | 0.55 | % | | | 0.525 | % | | | 0.50 | % | | | 0.475 | % | | | 0.475 | % | | | 0.475 | % | | | 0.45 | % | | | 0.45 | % | |
| For Integrated Large Cap(a)(b): | | | |
| | | | | | 0.20 | % | | | 0.20 | % | | | 0.20 | % | | | 0.20 | % | | | 0.20 | % | | | 0.20 | % | | | 0.20 | % | | | 0.20 | % | | | 0.20 | % | | | 0.20 | % | |
For Greater China Equity: | | | |
| | | | | | 1.10 | % | | | 1.10 | % | | | 1.10 | % | | | 1.10 | % | | | 0.95 | % | | | 0.95 | % | | | 0.95 | % | | | 0.95 | % | | | 0.95 | % | | | 0.95 | % | |
For Dividend Growth: | | | |
| | | | | | 0.50 | % | | | 0.50 | % | | | 0.50 | % | | | 0.50 | % | | | 0.50 | % | | | 0.475 | % | | | 0.475 | % | | | 0.475 | % | | | 0.45 | % | | | 0.45 | % | |
(a) NBIA has voluntarily agreed to waive and/or reimburse its management fee for the below Funds. NBIA may, at its sole discretion, modify or terminate the voluntary waiver and/or reimbursement without notice to these respective Funds. Fees voluntarily waived and/or reimbursed are not subject to recovery by NBIA.
197
Fund | | Percentage of
Average Daily
Net Assets
Waived
and/or
Reimbursed | | Effective Date(s) | | Management Fees
Waived and/or
Reimbursed
for the
Year Ended
August 31, 2020 | |
Integrated Large Cap | | | 0.35 | % | | 9/1/19 – 9/2/19 | | $ | 68 | | |
International Equity | | | 0.10 | % | | 10/22/19 | | $ | 2,062,406 | | |
| | | 0.14 | % | | 4/5/19 – 10/21/19 | | | |
| | | 0.07 | % | | 11/15/18 – 4/4/19 | | | |
| | | 0.04 | % | | 9/1/18 – 11/14/18 | | | |
| Mid Cap Intrinsic Value* | | | 12.01 | % | | 8/31/20 | | $ | 179,685 | | |
| | | 0.21 | % | | 10/22/19 – 8/30/20 | | | |
| | | 0.33 | % | | 9/1/19 – 10/21/19 | | | |
| | | 3.73 | % | | 8/30/19 – 8/31/19 | | | |
| | | 0.33 | % | | 6/18/19 – 8/29/19 | | | |
| | | 0.05 | % | | 4/5/19 – 6/17/19 | | | |
| | | 0.03 | % | | 11/15/18 – 4/4/19 | | | |
(b) Prior to September 3, 2019, the investment management fee was 0.55%.
* Effective September 1, 2020, Management changed the voluntary waiver to 0.21% of average daily net assets.
Accordingly, for the year ended August 31, 2020, the investment management fee pursuant to the Management Agreement was equivalent to an annual effective rate of each Fund's average daily net assets, as follows:
| | | Effective
Rate | | | | Effective
Rate | |
Dividend Growth | | | 0.50 | % | | International Small Cap | | | 0.85 | % | |
Emerging Markets Equity | | | 0.95 | % | | Intrinsic Value | | | 0.81 | % | |
Equity Income | | | 0.50 | % | | Large Cap Value | | | 0.48 | % | |
Focus | | | 0.53 | % | | Mid Cap Growth | | | 0.49 | % | |
Genesis | | | 0.66 | % | | Mid Cap Intrinsic Value | | | 0.55 | %(b) | |
Greater China Equity | | | 1.10 | % | | Multi-Cap Opportunities | | | 0.56 | % | |
Guardian | | | 0.50 | % | | Small Cap Growth | | | 0.85 | % | |
International Equity | | | 0.78 | %(a) | | Sustainable Equity | | | 0.48 | % | |
International Select | | | 0.55 | % | | | | | |
(a) 0.67% annual effective net rate of the Fund's average daily net assets.
(b) 0.29% annual effective net rate of the Fund's average daily net assets.
Each Fund retains NBIA as its administrator under an Administration Agreement. The administration fee is assessed at the class level and each share class of a Fund, as applicable, pays NBIA an annual administration fee equal to the following: 0.26% for each of Investor Class, Class A, Class C and Class R3; 0.40% for Trust Class and Advisor Class; 0.15% for Institutional Class; and 0.05% for Class R6, each as a percentage of its average daily net assets. Additionally, NBIA retains State Street as its sub-administrator under a Sub-Administration Agreement. NBIA pays State Street a fee for all services received under the Sub-Administration Agreement.
NBIA has contractually agreed to waive fees and/or reimburse certain expenses of the Investor Class of each of International Equity, Mid Cap Intrinsic Value and Small Cap Growth and the Trust Class, Advisor Class, Institutional Class, Class A, Class C, Class R3 and Class R6 of each Fund that offers those classes so that the total annual operating expenses of those classes do not exceed the expense limitations as detailed in the following table. These undertakings apply to a Fund's direct expenses and exclude interest, taxes, brokerage commissions, acquired
198
fund fees and expenses, extraordinary expenses, and dividend and interest expenses relating to short sales, if any (commitment fees relating to borrowings are treated as interest for purposes of this exclusion) ("annual operating expenses"); consequently, net expenses may exceed the contractual expense limitations.
At August 31, 2020, contingent liabilities to NBIA under the agreements were as follows:
| | | | | | | Expenses Reimbursed in
Year Ended August 31, | |
| | | | |
| | 2018 | | 2019 | | 2020 | |
| | | | | | | Subject to Repayment until
August 31, | |
Class | | Contractual
Expense
Limitation(a) | | Expiration | | 2021 | | 2022 | | 2023 | |
Dividend Growth Institutional Class | | | 0.69 | % | | 8/31/23 | | $ | 245,104 | | | $ | 253,857 | | | $ | 233,246 | | |
Dividend Growth Class A | | | 1.05 | % | | 8/31/23 | | | 11,408 | | | | 9,695 | | | | 7,746 | | |
Dividend Growth Class C | | | 1.80 | % | | 8/31/23 | | | 17,402 | | | | 15,075 | | | | 11,655 | | |
Dividend Growth Class R6 | | | 0.59 | %(b) | | 8/31/23 | | | 158 | | | | 158 | | | | 191 | | |
Emerging Markets Equity Institutional Class | | | 1.25 | % | | 8/31/23 | | | 231,794 | | | | — | | | | — | | |
Emerging Markets Equity Class A | | | 1.50 | % | | 8/31/23 | | | 92,255 | | | | 51,901 | | | | 34,659 | | |
Emerging Markets Equity Class C | | | 2.25 | % | | 8/31/23 | | | 12,202 | | | | 9,302 | | | | 6,296 | | |
Emerging Markets Equity Class R3 | | | 1.91 | % | | 8/31/23 | | | 24 | | | | 245 | | | | 508 | | |
Emerging Markets Equity Class R6 | | | 1.15 | %(b) | | 8/31/23 | | | 7,769 | | | | — | | | | — | | |
Equity Income Institutional Class | | | 0.80 | % | | 8/31/23 | | | — | | | | — | | | | — | | |
Equity Income Class A | | | 1.16 | % | | 8/31/23 | | | — | | | | — | | | | — | | |
Equity Income Class C | | | 1.91 | % | | 8/31/23 | | | — | | | | — | | | | — | | |
Equity Income Class R3 | | | 1.41 | % | | 8/31/23 | | | — | | | | — | | | | — | | |
Focus Trust Class | | | 1.50 | % | | 8/31/23 | | | — | | | | — | | | | — | | |
Focus Advisor Class | | | 1.50 | % | | 8/31/23 | | | — | | | | — | | | | — | | |
Focus Institutional Class | | | 0.75 | % | | 8/31/23 | | | — | | | | 114 | | | | 56 | | |
Focus Class A | | | 1.11 | % | | 8/31/23 | | | 312 | | | | 261 | | | | 272 | | |
Focus Class C | | | 1.86 | % | | 8/31/23 | | | 137 | | | | 193 | | | | 96 | | |
Genesis Trust Class | | | 1.50 | % | | 8/31/23 | | | — | | | | — | | | | — | | |
Genesis Advisor Class | | | 1.50 | % | | 8/31/23 | | | — | | | | — | | | | — | | |
Genesis Institutional Class | | | 0.85 | % | | 8/31/23 | | | — | | | | — | | | | — | | |
Genesis Class R6 | | | 0.75 | %(b) | | 8/31/23 | | | 347,225 | | | | 3,159 | | | | — | | |
Global Real Estate Institutional Class | | | 1.00 | % | | 8/31/23 | | | 220,996 | | | | 227,837 | | | | 205,632 | | |
Global Real Estate Class A | | | 1.36 | % | | 8/31/23 | | | 30,605 | | | | 27,482 | | | | 26,471 | | |
Global Real Estate Class C | | | 2.11 | % | | 8/31/23 | | | 28,315 | | | | 26,045 | | | | 22,306 | | |
Greater China Equity Institutional Class | | | 1.50 | % | | 8/31/23 | | | 79,507 | | | | 173,901 | | | | 144,843 | | |
Greater China Equity Class A | | | 1.86 | % | | 8/31/23 | | | 28,600 | | | | 30,826 | | | | 21,307 | | |
Greater China Equity Class C | | | 2.61 | % | | 8/31/23 | | | 536 | | | | 801 | | | | 603 | | |
Guardian Trust Class | | | 1.50 | % | | 8/31/23 | | | — | | | | — | | | | — | | |
Guardian Advisor Class | | | 1.50 | % | | 8/31/23 | | | — | | | | — | | | | — | | |
Guardian Institutional Class | | | 0.75 | % | | 8/31/23 | | | — | | | | — | | | | — | | |
Guardian Class A | | | 1.11 | % | | 8/31/23 | | | — | | | | — | | | | — | | |
199
| | | | | | | Expenses Reimbursed in
Year Ended August 31, | |
| | | | | | | 2018 | | 2019 | | 2020 | |
| | | | | | | Subject to Repayment until
August 31, | |
Class | | Contractual
Expense
Limitation(a) | | Expiration | | 2021 | | 2022 | | 2023 | |
Guardian Class C | | | 1.86 | % | | 8/31/23 | | $ | — | | | $ | — | | | $ | — | | |
Guardian Class R3 | | | 1.36 | % | | 8/31/23 | | | 20 | | | | 91 | | | | — | | |
Guardian Class R6 | | | 0.65 | % | | 8/31/23 | | | — | | | | 8 | (c) | | | — | | |
Integrated Large Cap Institutional Class | | | 0.40 | %(b)(e) | | 8/31/23 | | | 259,479 | | | | 286,177 | | | | 253,491 | | |
Integrated Large Cap Class A | | | 0.76 | %(b)(e) | | 8/31/23 | | | 30,042 | | | | 23,143 | | | | 21,140 | | |
Integrated Large Cap Class C | | | 1.51 | %(b)(e) | | 8/31/23 | | | 6,624 | | | | 7,214 | | | | 7,187 | | |
International Equity Investor Class | | | 1.40 | % | | 8/31/23 | | | — | | | | — | | | | — | | |
International Equity Trust Class | | | 2.00 | % | | 8/31/23 | | | — | | | | — | | | | — | | |
International Equity Institutional Class | | | 0.85 | % | | 8/31/23 | | | 1,186,829 | | | | 877,385 | | | | 342,202 | | |
International Equity Class A | | | 1.21 | % | | 8/31/23 | | | 59,940 | | | | 35,772 | | | | 11,946 | | |
International Equity Class C | | | 1.96 | % | | 8/31/23 | | | 12,453 | | | | 7,523 | | | | 2,115 | | |
International Equity Class R6 | | | 0.75 | %(b) | | 8/31/23 | | | 146,965 | | | | 48,635 | | | | 15,901 | | |
International Select Trust Class | | | 1.15 | % | | 8/31/23 | | | 18,565 | | | | 17,860 | | | | 12,734 | | |
International Select Institutional Class | | | 0.80 | % | | 8/31/23 | | | 244,239 | | | | 223,768 | | | | 176,566 | | |
International Select Class A | | | 1.16 | % | | 8/31/23 | | | 6,671 | | | | 5,946 | | | | 4,320 | | |
International Select Class C | | | 1.91 | % | | 8/31/23 | | | 3,656 | | | | 3,369 | | | | 2,173 | | |
International Select Class R3 | | | 1.41 | % | | 8/31/23 | | | 6,179 | | | | 5,140 | | | | 3,284 | | |
International Select Class R6 | | | 0.70 | %(b) | | 8/31/23 | | | 13,555 | | | | 31,580 | | | | 24,937 | | |
International Small Cap Institutional Class | | | 1.05 | % | | 8/31/23 | | | 257,330 | | | | 281,758 | | | | 259,992 | | |
International Small Cap Class A | | | 1.41 | % | | 8/31/23 | | | 16,926 | | | | 9,070 | | | | 6,925 | | |
International Small Cap Class C | | | 2.16 | % | | 8/31/23 | | | 8,534 | | | | 6,779 | | | | 5,773 | | |
International Small Cap Class R6 | | | 0.95 | %(b) | | 8/31/23 | | | 15,753 | | | | 11,852 | | | | 11,384 | | |
Intrinsic Value Institutional Class | | | 1.00 | % | | 8/31/23 | | | 93,339 | | | | 246,027 | | | | 238,438 | | |
Intrinsic Value Class A | | | 1.36 | % | | 8/31/23 | | | 8,931 | | | | 15,978 | | | | 11,833 | | |
Intrinsic Value Class C | | | 2.11 | % | | 8/31/23 | | | 4,695 | | | | 8,765 | | | | 6,344 | | |
Intrinsic Value Class R6 | | | 0.90 | % | | 8/31/23 | | | — | | | | 22 | (d) | | | 116 | | |
Large Cap Value Trust Class | | | 1.50 | % | | 8/31/23 | | | — | | | | — | | | | — | | |
Large Cap Value Advisor Class | | | 1.50 | % | | 8/31/23 | | | — | | | | — | | | | — | | |
Large Cap Value Institutional Class | | | 0.70 | % | | 8/31/23 | | | — | | | | — | | | | — | | |
Large Cap Value Class A | | | 1.11 | % | | 8/31/23 | | | — | | | | — | | | | — | | |
Large Cap Value Class C | | | 1.86 | % | | 8/31/23 | | | — | | | | — | | | | — | | |
Large Cap Value Class R3 | | | 1.36 | % | | 8/31/23 | | | — | | | | — | | | | — | | |
Large Cap Value Class R6 | | | 0.60 | % | | 8/31/23 | | | — | | | | — | (d) | | | — | | |
Mid Cap Growth Trust Class | | | 1.50 | % | | 8/31/23 | | | — | | | | — | | | | — | | |
Mid Cap Growth Advisor Class | | | 1.50 | % | | 8/31/23 | | | — | | | | — | | | | — | | |
Mid Cap Growth Institutional Class | | | 0.75 | % | | 8/31/23 | | | — | | | | — | | | | — | | |
Mid Cap Growth Class A | | | 1.11 | % | | 8/31/23 | | | — | | | | — | | | | — | | |
200
| | | | | | | Expenses Reimbursed in
Year Ended August 31, | |
| | | | | | | 2018 | | 2019 | | 2020 | |
| | | | | | | Subject to Repayment until
August 31, | |
Class | | Contractual
Expense
Limitation(a) | | Expiration | | 2021 | | 2022 | | 2023 | |
Mid Cap Growth Class C | | | 1.86 | % | | 8/31/23 | | $ | — | | | $ | — | | | $ | — | | |
Mid Cap Growth Class R3 | | | 1.36 | % | | 8/31/23 | | | — | | | | — | | | | — | | |
Mid Cap Growth Class R6 | | | 0.65 | %(b) | | 8/31/23 | | | — | | | | — | | | | — | | |
Mid Cap Intrinsic Value Investor Class | | | 1.50 | % | | 8/31/23 | | | — | | | | — | | | | — | | |
Mid Cap Intrinsic Value Trust Class | | | 1.25 | % | | 8/31/23 | | | 9,030 | | | | 5,026 | | | | 1,060 | | |
Mid Cap Intrinsic Value Institutional Class | | | 0.85 | % | | 8/31/23 | | | 61,130 | | | | 47,471 | | | | 21,517 | | |
Mid Cap Intrinsic Value Class A | | | 1.21 | % | | 8/31/23 | | | 13,941 | | | | 9,892 | | | | 2,553 | | |
Mid Cap Intrinsic Value Class C | | | 1.96 | % | | 8/31/23 | | | 3,434 | | | | 2,255 | | | | 1,036 | | |
Mid Cap Intrinsic Value Class R3 | | | 1.46 | % | | 8/31/23 | | | 3,348 | | | | 2,681 | | | | 551 | | |
Mid Cap Intrinsic Value Class R6 | | | 0.75 | % | | 8/31/23 | | | — | | | | 41 | (c) | | | — | | |
Multi-Cap Opportunities Institutional Class | | | 1.00 | % | | 8/31/23 | | | — | | | | — | | | | — | | |
Multi-Cap Opportunities Class A | | | 1.36 | % | | 8/31/23 | | | — | | | | — | | | | — | | |
Multi-Cap Opportunities Class C | | | 2.11 | % | | 8/31/23 | | | — | | | | — | | | | — | | |
Real Estate Trust Class | | | 1.50 | %(e) | | 8/31/23 | | | — | | | | — | | | | — | | |
Real Estate Institutional Class | | | 0.85 | % | | 8/31/23 | | | 355,600 | | | | 367,084 | | | | 466,267 | | |
Real Estate Class A | | | 1.21 | % | | 8/31/23 | | | 145,323 | | | | 122,879 | | | | 119,449 | | |
Real Estate Class C | | | 1.96 | % | | 8/31/23 | | | 33,477 | | | | 25,121 | | | | 21,506 | | |
Real Estate Class R3 | | | 1.46 | % | | 8/31/23 | | | 39,632 | | | | 41,328 | | | | 35,992 | | |
Real Estate Class R6 | | | 0.75 | %(b) | | 8/31/23 | | | 110,981 | | | | 127,316 | | | | 180,533 | | |
Small Cap Growth Investor Class | | | 1.30 | %(e) | | 8/31/23 | | | 248,687 | | | | 176,976 | | | | 68,298 | | |
Small Cap Growth Trust Class | | | 1.40 | %(e) | | 8/31/23 | | | 17,589 | | | | 13,037 | | | | 5,823 | | |
Small Cap Growth Advisor Class | | | 1.60 | %(e) | | 8/31/23 | | | 8,542 | | | | 6,659 | | | | 2,721 | | |
Small Cap Growth Institutional Class | | | 0.90 | % | | 8/31/23 | | | 81,452 | | | | 153,070 | | | | 299,687 | | |
Small Cap Growth Class A | | | 1.26 | % | | 8/31/23 | | | 25,896 | | | | 87,247 | | | | 94,216 | | |
Small Cap Growth Class C | | | 2.01 | % | | 8/31/23 | | | 14,080 | | | | 16,005 | | | | 12,391 | | |
Small Cap Growth Class R3 | | | 1.51 | % | | 8/31/23 | | | 9,492 | | | | 14,401 | | | | 8,531 | | |
Small Cap Growth Class R6 | | | 0.80 | %(b) | | 8/31/23 | | | — | | | | 5,523 | (f) | | | 70,197 | | |
Sustainable Equity Trust Class | | | 1.50 | % | | 8/31/23 | | | — | | | | — | | | | — | | |
Sustainable Equity Institutional Class | | | 0.75 | % | | 8/31/23 | | | — | | | | — | | | | — | | |
Sustainable Equity Class A | | | 1.11 | % | | 8/31/23 | | | — | | | | — | | | | — | | |
Sustainable Equity Class C | | | 1.86 | % | | 8/31/23 | | | — | | | | — | | | | — | | |
Sustainable Equity Class R3 | | | 1.36 | % | | 8/31/23 | | | — | | | | — | | | | — | | |
Sustainable Equity Class R6 | | | 0.65 | %(b) | | 8/31/23 | | | — | | | | — | | | | — | | |
(a) Expense limitation per annum of the respective class's average daily net assets.
(b) Classes that have had changes to their respective limitations are noted below.
201
| Class | | Expense
limitation | | Prior to | |
Dividend Growth Class R6 | | | 0.62 | % | | 12/6/18 | |
Emerging Markets Equity Class R6 | | | 1.18 | % | | 12/6/18 | |
Genesis Class R6 | | | 0.78 | % | | 10/16/17 | |
Integrated Large Cap Institutional Class | | | 0.75 | % | | 9/3/19 | |
Integrated Large Cap Class A | | | 1.11 | % | | 9/3/19 | |
Integrated Large Cap Class C | | | 1.86 | % | | 9/3/19 | |
International Equity Class R6 | | | 0.78 | % | | 12/6/18 | |
International Select Class R6 | | | 0.73 | % | | 12/6/18 | |
International Small Cap Class R6 | | | 0.98 | % | | 12/6/18 | |
Mid Cap Growth Class R6 | | | 0.68 | % | | 12/6/18 | |
Real Estate Class R6 | | | 0.78 | % | | 12/6/18 | |
Small Cap Growth Class R6 | | | 0.83 | % | | 12/6/18 | |
Sustainable Equity Class R6 | | | 0.68 | % | | 12/6/18 | |
(c) Period from March 29, 2019 (Commencement of Operations) to August 31, 2019.
(d) Period from January 18, 2019 (Commencement of Operations) to August 31, 2019.
(e) In addition to the contractual undertaking described above, NBIA has voluntarily undertaken to waive fees and/or reimburse certain expenses so that their Operating Expenses, per annum of their respective average daily net assets, are limited to the percentages indicated below. Voluntary reimbursements are not subject to recovery by NBIA and are terminable by NBIA upon notice to the Fund.
Class | | Voluntary Expense
Limitation | | Effective Date(s) | | Fees Voluntarily
Waived for Year
Ended August 31,
2020 | |
Integrated Large Cap Institutional Class | | | 0.40 | % | | 9/1/19 – 9/2/19 | | $ | 61 | | |
Integrated Large Cap Class A | | | 0.76 | % | | 9/1/19 – 9/2/19 | | | 5 | | |
Integrated Large Cap Class C | | | 1.51 | % | | 9/1/19 – 9/2/19 | | | 2 | | |
Real Estate Trust Class | | | 1.04 | % | | 12/16/11 | | | 423,927 | | |
Small Cap Growth Investor Class | | | 1.18 | % | | 11/15/18 | | | 77,080 | | |
Small Cap Growth Investor Class | | | 1.20 | % | | 9/7/18 – 11/14/18 | |
| |
Small Cap Growth Investor Class | | | 1.21 | % | | 9/1/18 – 9/6/18 | |
| |
Small Cap Growth Trust Class | | | 1.29 | % | | 9/7/18 | | | 4,658 | | |
Small Cap Growth Trust Class | | | 1.37 | % | | 9/1/18 – 9/6/18 | |
| |
Small Cap Growth Advisor Class | | | 1.44 | % | | 9/7/18 | | | 4,490 | | |
Small Cap Growth Advisor Class | | | 1.51 | % | | 9/1/18 – 9/6/18 | |
| |
(f) Period from September 7, 2018 (Commencement of Operations) to August 31, 2019.
Each Fund has agreed that each of its respective classes will repay NBIA for fees and expenses waived or reimbursed for that class provided that repayment does not cause that class's annual operating expenses to exceed its contractual expense limitation in place at the time the fees and expenses were waived or reimbursed, or the expense limitation in place at the time the Fund repays NBIA, whichever is lower. Any such repayment must be made within three years after the year in which NBIA incurred the expense.
202
During the year ended August 31, 2020, the following classes repaid NBIA under their contractual expense limitation agreements as follows:
Class | | Expenses
Repaid to
NBIA | |
Emerging Markets Equity Institutional Class | | $ | 161,356 | | |
Emerging Markets Equity Class R6 | | | 77,972 | | |
Genesis Class R6 | | | 525,381 | | |
Guardian Class R3 | | | 75 | | |
Guardian Class R6 | | | 28 | | |
Large Cap Value Class R3 | | | 16 | | |
Large Cap Value Class R6 | | | 17 | | |
Mid Cap Intrinsic Value Class R6 | | | 4 | | |
NBIA retains Green Court Capital Management Limited ("Green Court") as the subadviser to Greater China Equity. Green Court is responsible for making and implementing investment decisions and for the day-to-day management of the Fund.
Each Fund also has a distribution agreement with Neuberger Berman BD LLC (the "Distributor") with respect to each class of shares. The Distributor acts as agent in arranging for the sale of class shares without sales commission or other compensation, except as described below, and bears the advertising and promotion expenses.
However, the Distributor receives fees from the Trust Class of each of Focus, Guardian, International Select, Large Cap Value, Mid Cap Intrinsic Value, Real Estate, Small Cap Growth and Sustainable Equity, and from the Advisor Class, Class A, Class C and Class R3 of each Fund that offers those classes under their distribution plans (each a "Plan", collectively, the "Plans") pursuant to Rule 12b-1 under the 1940 Act. The Plans provide that, as compensation for administrative and other services provided to these classes, the Distributor's activities and expenses related to the sale and distribution of these classes, and ongoing services provided to investors in these classes, the Distributor receives from each of these respective classes a fee at the annual rate of 0.10% of such Trust Class's, 0.25% of such Advisor Class's, 0.25% of such Class A's, 1.00% of such Class C's and 0.50% of such Class R3's average daily net assets. The Distributor receives this amount to provide distribution and shareholder servicing for these classes and pays a portion of it to institutions that provide such services. Those institutions may use the payments for, among other purposes, compensating employees engaged in sales and/or shareholder servicing. The amount of fees paid by each class during any year may be more or less than the cost of distribution and other services provided to that class. FINRA rules limit the amount of annual distribution fees that may be paid by a mutual fund and impose a ceiling on the cumulative distribution fees paid. The Trust's Plans comply with those rules.
Class A shares of each Fund are generally sold with an initial sales charge of up to 5.75% and no contingent deferred sales charge ("CDSC"), except that a CDSC of 1.00% applies to certain redemptions made within 18 months following purchases of $1 million or more without an initial sales charge. Class C shares of each Fund are sold with no initial sales charge and a 1.00% CDSC if shares are sold within one year after purchase.
For the year ended August 31, 2020, the Distributor, acting as underwriter and broker-dealer, received net initial sales charges from the purchase of Class A shares and CDSCs from the redemption of Class A and Class C shares as follows:
| | | Underwriter | | Broker-Dealer | |
| | | Net Initial Sales
Charge | | CDSC | | Net Initial Sales
Charge | | CDSC | |
Dividend Growth Class A | | $ | 656 | | | $ | — | | | $ | — | | | $ | — | | |
Dividend Growth Class C | | | — | | | | 100 | | | | — | | | | — | | |
Emerging Markets Equity Class A | | | 1,478 | | | | — | | | | — | | | | — | | |
203
| | | Underwriter | | Broker-Dealer | |
| | | Net Initial Sales
Charge | | CDSC | | Net Initial Sales
Charge | | CDSC | |
Emerging Markets Equity Class C | | $ | — | | | $ | 309 | | | $ | — | | | $ | — | | |
Equity Income Class A | | | 67,421 | | | | — | | | | — | | | | — | | |
Equity Income Class C | | | — | | | | 4,030 | | | | — | | | | — | | |
Focus Class A | | | 138 | | | | — | | | | — | | | | — | | |
Focus Class C | | | — | | | | — | | | | — | | | | — | | |
Global Real Estate Class A | | | — | | | | — | | | | — | | | | — | | |
Global Real Estate Class C | | | — | | | | — | | | | — | | | | — | | |
Greater China Equity Class A | | | — | | | | — | | | | — | | | | — | | |
Greater China Equity Class C | | | — | | | | — | | | | — | | | | — | | |
Guardian Class A | | | 7,556 | | | | — | | | | — | | | | — | | |
Guardian Class C | | | — | | | | 656 | | | | — | | | | — | | |
Integrated Large Cap Class A | | | 66 | | | | — | | | | — | | | | — | | |
Integrated Large Cap Class C | | | — | | | | — | | | | — | | | | — | | |
International Equity Class A | | | 1,428 | | | | — | | | | — | | | | — | | |
International Equity Class C | | | — | | | | 1,122 | | | | — | | | | — | | |
International Select Class A | | | 59 | | | | — | | | | — | | | | — | | |
International Select Class C | | | — | | | | — | | | | — | | | | — | | |
International Small Cap Class A | | | — | | | | — | | | | — | | | | — | | |
International Small Cap Class C | | | — | | | | — | | | | — | | | | — | | |
Intrinsic Value Class A | | | 10,154 | | | | — | | | | — | | | | — | | |
Intrinsic Value Class C | | | — | | | | 1,870 | | | | — | | | | — | | |
Large Cap Value Class A | | | 19,295 | | | | — | | | | — | | | | — | | |
Large Cap Value Class C | | | — | | | | 12,526 | | | | — | | | | — | | |
Mid Cap Growth Class A | | | 2,797 | | | | — | | | | — | | | | — | | |
Mid Cap Growth Class C | | | — | | | | 586 | | | | — | | | | — | | |
Mid Cap Intrinsic Value Class A | | | 530 | | | | — | | | | — | | | | — | | |
Mid Cap Intrinsic Value Class C | | | — | | | | 237 | | | | — | | | | — | | |
Multi-Cap Opportunities Class A | | | 19,196 | | | | — | | | | — | | | | — | | |
Multi-Cap Opportunities Class C | | | — | | | | 1,435 | | | | — | | | | — | | |
Real Estate Class A | | | 27,242 | | | | — | | | | — | | | | — | | |
Real Estate Class C | | | — | | | | 7,090 | | | | — | | | | — | | |
Small Cap Growth Class A | | | 12,435 | | | | — | | | | — | | | | — | | |
Small Cap Growth Class C | | | — | | | | 578 | | | | — | | | | — | | |
Sustainable Equity Class A | | | 13,778 | | | | — | | | | — | | | | — | | |
Sustainable Equity Class C | | | — | | | | 2,635 | | | | — | | | | — | | |
For the year ended August 31, 2020, International Equity recorded a capital contribution from Management in the amount of $1,010,717. This amount was paid in connection with losses incurred in the execution of a trade.
204
Note C—Securities Transactions:
During the year ended August 31, 2020, there were purchase and sale transactions of long-term securities (excluding written option contracts) as follows:
| | Purchases | | Sales | |
| | Purchases | | Sales | |
Dividend Growth | | $ | 20,017,780 | | | $ | 24,570,416 | | | International Select | | | 51,424,593 | | | | 60,792,142 | | |
Emerging Markets Equity | | | 489,827,212 | | | | 804,013,532 | | | International Small Cap | | | 801,482 | | | | 5,457,416 | | |
Equity Income | | | 742,499,405 | | | | 878,688,883 | | | Intrinsic Value | | | 109,273,523 | | | | 171,663,701 | | |
Focus | | | 868,445,978 | | | | 941,033,288 | | | Large Cap Value | | | 2,656,446,639 | | | | 2,693,371,434 | | |
Genesis | | | 1,078,218,814 | | | | 2,062,165,356 | | | Mid Cap Growth | | | 763,633,777 | | | | 882,638,376 | | |
Global Real Estate | | | 1,572,648 | | | | 3,473,858 | | | Mid Cap Intrinsic Value | | | 10,872,807 | | | | 47,394,980 | | |
Greater China Equity | | | 41,763,576 | | | | 47,963,896 | | | Multi-Cap Opportunities | | | 254,224,111 | | | | 796,209,890 | | |
Guardian | | | 637,685,819 | | | | 675,200,618 | | | Real Estate | | | 299,975,748 | | | | 141,587,236 | | |
Integrated Large Cap | | | 5,290,102 | | | | 5,787,672 | | | Small Cap Growth | | | 302,801,007 | | | | 293,551,136 | | |
International Equity | | | 835,530,768 | | | | 1,356,089,197 | | | Sustainable Equity | | | 342,113,190 | | | | 700,724,171 | | |
During the year ended August 31, 2020, no brokerage commissions on securities transactions were paid to affiliated brokers.
Note D—Fund Share Transactions:
Share activity for the years ended August 31, 2020, and August 31, 2019, was as follows:
| | | For the Year Ended August 31, 2020 | | For the Year Ended August 31, 2019 | |
| | Shares
Sold | | Shares
Issued on
Reinvestment
of Dividends
and
Distributions | | Shares
Redeemed | | Total | | Shares
Sold | | Shares
Issued on
Reinvestment
of Dividends
and
Distributions | | Shares
Issued in
Connection
with
Tax-Free
Reorganization
(see
Note H) | | Shares
Redeemed | | Total | |
Dividend Growth | |
Institutional
Class | | | 265,103 | | | | 58,222 | | | | (988,022 | ) | | | (664,697 | ) | | | 989,402 | | | | 231,558 | | | | — | | | | (1,055,499 | ) | | | 165,461 | | |
Class A | | | 13,274 | | | | 1,090 | | | | (26,008 | ) | | | (11,644 | ) | | | 11,066 | | | | 7,106 | | | | �� | | | | (32,942 | ) | | | (14,770 | ) | |
Class C | | | 3,900 | | | | 435 | | | | (42,823 | ) | | | (38,488 | ) | | | 8,065 | | | | 12,300 | | | | — | | | | (50,680 | ) | | | (30,315 | ) | |
Class R6 | | | — | | | | — | | | | (864 | ) | | | (864 | ) | | | 864 | | | | — | | | | — | | | | — | | | | 864 | | |
| Emerging Markets Equity(a) | |
Institutional
Class | | | 21,134,967 | | | | 410,953 | | | | (37,001,256 | ) | | | (15,455,336 | ) | | | 28,354,468 | | | | 242,888 | | | | — | | | | (30,912,020 | ) | | | (2,314,664 | ) | |
Class A | | | 817,722 | | | | 18,342 | | | | (1,652,098 | ) | | | (816,034 | ) | | | 1,187,265 | | | | 8,055 | | | | — | | | | (1,300,630 | ) | | | (105,310 | ) | |
Class C | | | 39,805 | | | | 1,213 | | | | (224,200 | ) | | | (183,182 | ) | | | 127,821 | | | | — | | | | — | | | | (209,233 | ) | | | (81,412 | ) | |
Class R3 | | | 12,600 | | | | 368 | | | | (24,986 | ) | | | (12,018 | ) | | | 30,896 | | | | 13 | | | | — | | | | (54,584 | ) | | | (23,675 | ) | |
Class R6 | | | 1,754,547 | | | | 228,737 | | | | (4,123,220 | ) | | | (2,139,936 | ) | | | 4,906,485 | | | | 94,599 | | | | — | | | | (2,001,735 | ) | | | 2,999,349 | | |
205
| | | For the Year Ended August 31, 2020 | | For the Year Ended August 31, 2019 | |
| | Shares
Sold | | Shares
Issued on
Reinvestment
of Dividends
and
Distributions | | Shares
Redeemed | | Total | | Shares
Sold | | Shares
Issued on
Reinvestment
of Dividends
and
Distributions | | Shares
Issued in
Connection
with
Tax-Free
Reorganization
(see
Note H) | | Shares
Redeemed | | Total | |
Equity Income | |
Institutional
Class | | | 11,247,353 | | | | 4,674,484 | | | | (24,197,398 | ) | | | (8,275,561 | ) | | | 17,393,546 | | | | 5,385,380 | | | | — | | | | (21,061,871 | ) | | | 1,717,055 | | |
Class A | | | 4,083,332 | | | | 528,850 | | | | (3,265,732 | ) | | | 1,346,450 | | | | 4,127,472 | | | | 753,870 | | | | — | | | | (7,677,320 | ) | | | (2,795,978 | ) | |
Class C | | | 467,370 | | | | 464,608 | | | | (6,608,532 | ) | | | (5,676,554 | ) | | | 844,745 | | | | 824,074 | | | | — | | | | (6,192,869 | ) | | | (4,524,050 | ) | |
Class R3 | | | 69,726 | | | | 6,955 | | | | (93,448 | ) | | | (16,767 | ) | | | 73,080 | | | | 6,752 | | | | — | | | | (99,533 | ) | | | (19,701 | ) | |
Focus | |
Investor Class | | | 165,478 | | | | 2,745,462 | | | | (2,537,695 | ) | | | 373,245 | | | | 118,712 | | | | 1,893,469 | | | | — | | | | (2,099,234 | ) | | | (87,053 | ) | |
Trust Class | | | 42,847 | | | | 211,923 | | | | (424,820 | ) | | | (170,050 | ) | | | 22,253 | | | | 165,355 | | | | — | | | | (393,884 | ) | | | (206,276 | ) | |
Advisor Class | | | 7,156 | | | | 7,517 | | | | (13,608 | ) | | | 1,065 | | | | 7,425 | | | | 5,702 | | | | — | | | | (31,509 | ) | | | (18,382 | ) | |
Institutional
Class | | | 261,668 | | | | 49,459 | | | | (168,003 | ) | | | 143,124 | | | | 109,001 | | | | 24,019 | | | | — | | | | (87,645 | ) | | | 45,375 | | |
Class A | | | 7,946 | | | | 12,090 | | | | (17,660 | ) | | | 2,376 | | | | 10,450 | | | | 8,982 | | | | — | | | | (36,130 | ) | | | (16,698 | ) | |
Class C | | | 3,853 | | | | 5,476 | | | | (8,836 | ) | | | 493 | | | | 4,829 | | | | 4,661 | | | | — | | | | (19,710 | ) | | | (10,220 | ) | |
Genesis | |
Investor Class | | | 1,832,620 | | | | 1,556,094 | | | | (4,828,105 | ) | | | (1,439,391 | ) | | | 1,478,058 | | | | 3,260,573 | | | | — | | | | (5,966,074 | ) | | | (1,227,443 | ) | |
Trust Class | | | 2,436,160 | | | | 1,283,899 | | | | (8,026,116 | ) | | | (4,306,057 | ) | | | 3,943,864 | | | | 2,716,570 | | | | — | | | | (6,502,481 | ) | | | 157,953 | | |
Advisor Class | | | 242,155 | | | | 139,617 | | | | (967,347 | ) | | | (585,575 | ) | | | 291,820 | | | | 326,175 | | | | — | | | | (962,039 | ) | | | (344,044 | ) | |
Institutional
Class | | | 13,932,495 | | | | 2,583,175 | | | | (16,165,018 | ) | | | 350,652 | | | | 8,955,212 | | | | 5,385,521 | | | | — | | | | (16,169,512 | ) | | | (1,828,779 | ) | |
Class R6 | | | 8,851,372 | | | | 4,372,286 | | | | (14,851,484 | ) | | | (1,627,826 | ) | | | 9,277,395 | | | | 8,231,517 | | | | — | | | | (12,315,603 | ) | | | 5,193,309 | | |
Global Real Estate | |
Institutional
Class | | | 37,033 | | | | 13,877 | | | | (215,176 | ) | | | (164,266 | ) | | | 82,273 | | | | 8,309 | | | | — | | | | (10,954 | ) | | | 79,628 | | |
Class A | | | 10,866 | | | | 757 | | | | (22,897 | ) | | | (11,274 | ) | | | 4,734 | | | | 360 | | | | — | | | | (1,442 | ) | | | 3,652 | | |
Class C | | | 2,816 | | | | 521 | | | | (12,485 | ) | | | (9,148 | ) | | | 88 | | | | 322 | | | | — | | | | — | | | | 410 | | |
Greater China Equity | |
Institutional
Class | | | 1,058,154 | | | | 34,993 | | | | (1,410,209 | ) | | | (317,062 | ) | | | 859,231 | | | | 2,620,350 | | | | — | | | | (3,951,066 | ) | | | (471,485 | ) | |
Class A | | | — | | | | 2,902 | | | | (291,541 | ) | | | (288,639 | ) | | | — | | | | 284,897 | | | | — | | | | (311,531 | ) | | | (26,634 | ) | |
Class C | | | — | | | | — | | | | (805 | ) | | | (805 | ) | | | — | | | | 7,389 | | | | — | | | | (5,459 | ) | | | 1,930 | | |
Guardian | |
Investor Class | | | 749,150 | | | | 3,550,084 | | | | (5,107,798 | ) | | | (808,564 | ) | | | 666,396 | | | | 6,183,003 | | | | — | | | | (6,130,070 | ) | | | 719,329 | | |
Trust Class | | | 206,075 | | | | 113,273 | | | | (982,194 | ) | | | (662,846 | ) | | | 114,534 | | | | 288,345 | | | | — | | | | (813,409 | ) | | | (410,530 | ) | |
Advisor Class | | | 2,488 | | | | 531 | | | | (3,390 | ) | | | (371 | ) | | | 7,909 | | | | 1,676 | | | | — | | | | (10,732 | ) | | | (1,147 | ) | |
Institutional
Class | | | 2,853,280 | | | | 339,279 | | | | (1,381,225 | ) | | | 1,811,334 | | | | 929,673 | | | | 471,248 | | | | — | | | | (1,040,429 | ) | | | 360,492 | | |
Class A | | | 333,281 | | | | 13,129 | | | | (306,737 | ) | | | 39,673 | | | | 98,761 | | | | 29,449 | | | | — | | | | (189,075 | ) | | | (60,865 | ) | |
Class C | | | 30,574 | | | | 5,344 | | | | (36,513 | ) | | | (595 | ) | | | 27,419 | | | | 8,712 | | | | — | | | | (27,866 | ) | | | 8,265 | | |
Class R3 | | | 926 | | | | 356 | | | | (2,326 | ) | | | (1,044 | ) | | | 4,614 | | | | 1,121 | | | | — | | | | (19,389 | ) | | | (13,654 | ) | |
| Class R6(b) | | | — | | | | — | | | | — | | | | — | | | | 1,494 | | | | — | | | | — | | | | — | | | | 1,494 | | |
206
| | | For the Year Ended August 31, 2020 | | For the Year Ended August 31, 2019 | |
| | Shares
Sold | | Shares
Issued on
Reinvestment
of Dividends
and
Distributions | | Shares
Redeemed | | Total | | Shares
Sold | | Shares
Issued on
Reinvestment
of Dividends
and
Distributions | | Shares
Issued in
Connection
with
Tax-Free
Reorganization
(see
Note H) | | Shares
Redeemed | | Total | |
| Integrated Large Cap(a) | |
Institutional
Class | | | 114,017 | | | | 110,895 | | | | (213,788 | ) | | | 11,124 | | | | 14,597 | | | | 40,939 | | | | — | | | | (197,311 | ) | | | (141,775 | ) | |
Class A | | | 12,230 | | | | 6,905 | | | | (15,577 | ) | | | 3,558 | | | | 8,895 | | | | 2,618 | | | | — | | | | (24,530 | ) | | | (13,017 | ) | |
Class C | | | — | | | | 944 | | | | (1,865 | ) | | | (921 | ) | | | — | | | | 335 | | | | — | | | | (2,138 | ) | | | (1,803 | ) | |
International Equity | |
Investor Class | | | 144,782 | | | | 174,329 | | | | (1,197,372 | ) | | | (878,261 | ) | | | 167,570 | | | | 80,857 | | | | — | | | | (869,260 | ) | | | (620,833 | ) | |
Trust Class | | | 132,520 | | | | 50,430 | | | | (550,480 | ) | | | (367,530 | ) | | | 130,806 | | | | 28,051 | | | | — | | | | (853,106 | ) | | | (694,249 | ) | |
Institutional
Class | | | 58,221,663 | | | | 2,153,920 | | | | (88,238,680 | ) | | | (27,863,097 | ) | | | 53,997,745 | | | | 1,269,471 | | | | — | | | | (68,028,931 | ) | | | (12,761,715 | ) | |
Class A | | | 1,367,720 | | | | 19,729 | | | | (1,596,766 | ) | | | (209,317 | ) | | | 942,304 | | | | 14,204 | | | | — | | | | (1,880,769 | ) | | | (924,261 | ) | |
Class C | | | 52,508 | | | | 9,136 | | | | (305,626 | ) | | | (243,982 | ) | | | 91,838 | | | | 2,229 | | | | — | | | | (409,113 | ) | | | (315,046 | ) | |
Class R6 | | | 1,420,437 | | | | 178,437 | | | | (2,626,329 | ) | | | (1,027,455 | ) | | | 2,183,526 | | | | 97,035 | | | | — | | | | (1,472,232 | ) | | | 808,329 | | |
International Select | |
Trust Class | | | 17,970 | | | | 10,528 | | | | (48,830 | ) | | | (20,332 | ) | | | 13,164 | | | | 6,769 | | | | — | | | | (230,943 | ) | | | (211,010 | ) | |
Institutional
Class | | | 1,498,164 | | | | 312,909 | | | | (2,242,929 | ) | | | (431,856 | ) | | | 1,693,594 | | | | 227,232 | | | | — | | | | (2,477,744 | ) | | | (556,918 | ) | |
Class A | | | 81,072 | | | | 5,307 | | | | (120,404 | ) | | | (34,025 | ) | | | 37,279 | | | | 3,481 | | | | — | | | | (79,465 | ) | | | (38,705 | ) | |
Class C | | | 7,139 | | | | 1,637 | | | | (69,777 | ) | | | (61,001 | ) | | | 18,477 | | | | 1,068 | | | | — | | | | (78,464 | ) | | | (58,919 | ) | |
Class R3 | | | 37,780 | | | | 3,112 | | | | (68,151 | ) | | | (27,259 | ) | | | 44,853 | | | | 2,551 | | | | — | | | | (130,392 | ) | | | (82,988 | ) | |
Class R6 | | | 332,887 | | | | 86,349 | | | | (2,690,919 | ) | | | (2,271,683 | ) | | | 1,782,048 | | | | 15,438 | | | | — | | | | (109,870 | ) | | | 1,687,616 | | |
International Small Cap | |
Institutional
Class | | | 23,474 | | | | 3,730 | | | | (396,829 | ) | | | (369,625 | ) | | | 3,411 | | | | 10,057 | | | | — | | | | (16,956 | ) | | | (3,488 | ) | |
Class A | | | 489 | | | | 8 | | | | (1,351 | ) | | | (854 | ) | | | 1,517 | | | | 110 | | | | — | | | | (5,711 | ) | | | (4,084 | ) | |
Class C | | | — | | | | — | | | | (970 | ) | | | (970 | ) | | | — | | | | 30 | | | | — | | | | (1,259 | ) | | | (1,229 | ) | |
Class R6 | | | — | | | | — | | | | — | | | | — | | | | — | | | | — | | | | — | | | | — | | | | — | | |
| Intrinsic Value(a) | |
Institutional
Class | | | 12,205,423 | | | | 972,976 | | | | (16,081,683 | ) | | | (2,903,284 | ) | | | 13,096,492 | | | | 4,346,929 | | | | — | | | | (14,420,355 | ) | | | 3,023,066 | | |
Class A | | | 808,186 | | | | 37,187 | | | | (805,477 | ) | | | 39,896 | | | | 1,907,174 | | | | 168,571 | | | | — | | | | (1,791,217 | ) | | | 284,528 | | |
Class C | | | 149,914 | | | | 27,667 | | | | (586,692 | ) | | | (409,111 | ) | | | 134,950 | | | | 157,494 | | | | — | | | | (442,749 | ) | | | (150,305 | ) | |
| Class R6(c) | | | 2,736 | | | | 320 | | | | (9,629 | ) | | | (6,573 | ) | | | 11,682 | | | | — | | | | — | | | | — | | | | 11,682 | | |
207
| | | For the Year Ended August 31, 2020 | | For the Year Ended August 31, 2019 | |
| | Shares
Sold | | Shares
Issued on
Reinvestment
of Dividends
and
Distributions | | Shares
Redeemed | | Total | | Shares
Sold | | Shares
Issued on
Reinvestment
of Dividends
and
Distributions | | Shares
Issued in
Connection
with
Tax-Free
Reorganization
(see
Note H) | | Shares
Redeemed | | Total | |
Large Cap Value | |
Investor Class | | | 753,034 | | | | 1,407,324 | | | | (4,778,325 | ) | | | (2,617,967 | ) | | | 1,932,503 | | | | 4,723,870 | | | | — | | | | (3,550,068 | ) | | | 3,106,305 | | |
Trust Class | | | 239,611 | | | | 90,959 | | | | (850,438 | ) | | | (519,868 | ) | | | 838,613 | | | | 279,437 | | | | — | | | | (526,850 | ) | | | 591,200 | | |
Advisor Class | | | 229,784 | | | | 130,998 | | | | (835,350 | ) | | | (474,568 | ) | | | 325,840 | | | | 493,279 | | | | — | | | | (873,628 | ) | | | (54,509 | ) | |
Institutional
Class | | | 7,849,287 | | | | 405,348 | | | | (7,339,563 | ) | | | 915,072 | | | | 8,997,844 | | | | 461,354 | | | | 851,047 | | | | (2,197,547 | ) | | | 8,112,698 | | |
Class A | | | 1,045,621 | | | | 66,763 | | | | (2,057,060 | ) | | | (944,676 | ) | | | 1,565,801 | | | | 13,249 | | | | 129,228 | | | | (117,108 | ) | | | 1,591,170 | | |
Class C | | | 228,957 | | | | 13,148 | | | | (400,689 | ) | | | (158,584 | ) | | | 472,096 | | | | 5,345 | | | | 133,590 | | | | (27,234 | ) | | | 583,797 | | |
Class R3 | | | 1,596 | | | | 798 | | | | (5,659 | ) | | | (3,265 | ) | | | 26,112 | | | | 1,226 | | | | — | | | | (13,315 | ) | | | 14,023 | | |
| Class R6(c) | | | 2,967,811 | | | | 105,444 | | | | (76,691 | ) | | | 2,996,564 | | | | 8,490 | | | | — | | | | — | | | | — | | | | 8,490 | | |
Mid Cap Growth | |
Investor Class | | | 493,803 | | | | 1,643,853 | | | | (3,360,116 | ) | | | (1,222,460 | ) | | | 1,030,928 | | | | 3,343,862 | | | | — | | | | (3,302,750 | ) | | | 1,072,040 | | |
Trust Class | | | 723,555 | | | | 265,353 | | | | (1,209,040 | ) | | | (220,132 | ) | | | 815,098 | | | | 539,317 | | | | — | | | | (1,051,902 | ) | | | 302,513 | | |
Advisor Class | | | 165,748 | | | | 27,257 | | | | (381,225 | ) | | | (188,220 | ) | | | 294,478 | | | | 65,712 | | | | — | | | | (517,805 | ) | | | (157,615 | ) | |
Institutional
Class | | | 6,468,025 | | | | 907,806 | | | | (5,720,566 | ) | | | 1,655,265 | | | | 3,982,524 | | | | 2,357,227 | | | | — | | | | (10,064,837 | ) | | | (3,725,086 | ) | |
Class A | | | 531,232 | | | | 107,765 | | | | (750,426 | ) | | | (111,429 | ) | | | 504,537 | | | | 293,519 | | | | — | | | | (1,796,101 | ) | | | (998,045 | ) | |
Class C | | | 89,043 | | | | 37,900 | | | | (185,161 | ) | | | (58,218 | ) | | | 55,082 | | | | 76,467 | | | | — | | | | (130,569 | ) | | | 980 | | |
Class R3 | | | 353,583 | | | | 189,001 | | | | (3,353,055 | ) | | | (2,810,471 | ) | | | 3,183,369 | | | | 93,684 | | | | — | | | | (634,563 | ) | | | 2,642,490 | | |
Class R6 | | | 5,835,539 | | | | 1,468,271 | | | | (7,868,223 | ) | | | (564,413 | ) | | | 7,838,840 | | | | 2,911,793 | | | | — | | | | (7,480,660 | ) | | | 3,269,973 | | |
| Mid Cap Intrinsic Value(a) | |
Investor Class | | | 88,884 | | | | 17,074 | | | | (454,349 | ) | | | (348,391 | ) | | | 1,340,399 | | | | 142,789 | | | | — | | | | (1,359,917 | ) | | | 123,271 | | |
Trust Class | | | 12,821 | | | | 3,750 | | | | (120,465 | ) | | | (103,894 | ) | | | 40,445 | | | | 35,442 | | | | — | | | | (87,099 | ) | | | (11,212 | ) | |
Institutional
Class | | | 387,192 | | | | 24,436 | | | | (1,709,930 | ) | | | (1,298,302 | ) | | | 842,703 | | | | 211,351 | | | | — | | | | (1,143,899 | ) | | | (89,845 | ) | |
Class A | | | 42,984 | | | | 1,836 | | | | (260,443 | ) | | | (215,623 | ) | | | 774,602 | | | | 21,821 | | | | — | | | | (890,998 | ) | | | (94,575 | ) | |
Class C | | | 10,157 | | | | 190 | | | | (35,262 | ) | | | (24,915 | ) | | | 19,651 | | | | 6,556 | | | | — | | | | (46,639 | ) | | | (20,432 | ) | |
Class R3 | | | 17,504 | | | | 244 | | | | (82,812 | ) | | | (65,064 | ) | | | 17,812 | | | | 7,231 | | | | — | | | | (21,686 | ) | | | 3,357 | | |
| Class R6(b) | | | — | | | | — | | | | — | | | | — | | | | 1,220 | | | | — | | | | — | | | | — | | | | 1,220 | | |
| Multi-Cap Opportunities(a) | |
Institutional
Class | | | 8,525,872 | | | | 10,775,626 | | | | (42,431,436 | ) | | | (23,129,938 | ) | | | 9,107,572 | | | | 8,556,941 | | | | — | | | | (51,533,490 | ) | | | (33,868,977 | ) | |
Class A | | | 728,136 | | | | 423,817 | | | | (1,388,564 | ) | | | (236,611 | ) | | | 853,311 | | | | 350,914 | | | | — | | | | (2,291,703 | ) | | | (1,087,478 | ) | |
Class C | | | 254,020 | | | | 361,428 | | | | (938,914 | ) | | | (323,466 | ) | | | 294,582 | | | | 202,095 | | | | — | | | | (602,264 | ) | | | (105,587 | ) | |
208
| | | For the Year Ended August 31, 2020 | | For the Year Ended August 31, 2019 | |
| | Shares
Sold | | Shares
Issued on
Reinvestment
of Dividends
and
Distributions | | Shares
Redeemed | | Total | | Shares
Sold | | Shares
Issued on
Reinvestment
of Dividends
and
Distributions | | Shares
Issued in
Connection
with
Tax-Free
Reorganization
(see
Note H) | | Shares
Redeemed | | Total | |
Real Estate | |
Trust Class | | | 1,868,407 | | | | 443,651 | | | | (3,036,103 | ) | | | (724,045 | ) | | | 1,294,109 | | | | 631,961 | | | | — | | | | (3,333,149 | ) | | | (1,407,079 | ) | |
Institutional
Class | | | 19,704,283 | | | | 762,009 | | | | (9,617,448 | ) | | | 10,848,844 | | | | 4,272,565 | | | | 823,509 | | | | — | | | | (4,302,170 | ) | | | 793,904 | | |
Class A | | | 2,278,641 | | | | 225,239 | | | | (2,322,448 | ) | | | 181,432 | | | | 1,503,533 | | | | 273,535 | | | | — | | | | (1,961,816 | ) | | | (184,748 | ) | |
Class C | | | 367,096 | | | | 30,603 | | | | (431,625 | ) | | | (33,926 | ) | | | 32,092 | | | | 48,583 | | | | — | | | | (397,513 | ) | | | (316,838 | ) | |
Class R3 | | | 417,190 | | | | 62,841 | | | | (697,720 | ) | | | (217,689 | ) | | | 455,702 | | | | 78,550 | | | | — | | | | (524,167 | ) | | | 10,085 | | |
Class R6 | | | 4,465,217 | | | | 361,928 | | | | (1,943,414 | ) | | | 2,883,731 | | | | 1,556,354 | | | | 302,518 | | | | — | | | | (1,214,675 | ) | | | 644,197 | | |
Small Cap Growth | |
Investor Class | | | 77,344 | | | | 66,584 | | | | (259,189 | ) | | | (115,261 | ) | | | 155,402 | | | | 338,485 | | | | — | | | | (231,397 | ) | | | 262,490 | | |
Trust Class | | | 3,827 | | | | 4,276 | | | | (27,074 | ) | | | (18,971 | ) | | | 19,567 | | | | 21,382 | | | | — | | | | (18,122 | ) | | | 22,827 | | |
Advisor Class | | | 18,374 | | | | 2,904 | | | | (23,146 | ) | | | (1,868 | ) | | | 48,730 | | | | 12,738 | | | | — | | | | (44,083 | ) | | | 17,385 | | |
Institutional
Class | | | 2,744,506 | | | | 98,448 | | | | (1,651,800 | ) | | | 1,191,154 | | | | 2,454,116 | | | | 92,646 | | | | — | | | | (605,728 | ) | | | 1,941,034 | | |
Class A | | | 275,215 | | | | 29,287 | | | | (1,107,157 | ) | | | (802,655 | ) | | | 1,905,213 | | | | 26,731 | | | | — | | | | (725,496 | ) | | | 1,206,448 | | |
Class C | | | 42,652 | | | | 4,780 | | | | (56,427 | ) | | | (8,995 | ) | | | 52,319 | | | | 17,050 | | | | — | | | | (23,788 | ) | | | 45,581 | | |
Class R3 | | | 47,476 | | | | 2,428 | | | | (32,629 | ) | | | 17,275 | | | | 137,831 | | | | 8,292 | | | | — | | | | (129,990 | ) | | | 16,133 | | |
| Class R6(d) | | | 481,674 | | | | 21,721 | | | | (235,039 | ) | | | 268,356 | | | | 564,037 | | | | 12 | | | | — | | | | (12,138 | ) | | | 551,911 | | |
Sustainable Equity | |
Investor Class | | | 890,116 | | | | 1,026,137 | | | | (3,056,489 | ) | | | (1,140,236 | ) | | | 667,163 | | | | 1,371,991 | | | | — | | | | (6,235,658 | ) | | | (4,196,504 | ) | |
Trust Class | | | 340,429 | | | | 357,251 | | | | (1,929,246 | ) | | | (1,231,566 | ) | | | 485,785 | | | | 491,943 | | | | — | | | | (2,140,768 | ) | | | (1,163,040 | ) | |
Institutional
Class | | | 3,993,402 | | | | 1,727,202 | | | | (8,963,237 | ) | | | (3,242,633 | ) | | | 5,024,840 | | | | 2,060,873 | | | | — | | | | (9,047,775 | ) | | | (1,962,062 | ) | |
Class A | | | 482,477 | | | | 201,298 | | | | (761,647 | ) | | | (77,872 | ) | | | 555,930 | | | | 260,216 | | | | — | | | | (1,271,045 | ) | | | (454,899 | ) | |
Class C | | | 109,252 | | | | 89,153 | | | | (452,392 | ) | | | (253,987 | ) | | | 134,301 | | | | 121,849 | | | | — | | | | (462,507 | ) | | | (206,357 | ) | |
Class R3 | | | 166,305 | | | | 67,956 | | | | (382,213 | ) | | | (147,952 | ) | | | 233,296 | | | | 70,936 | | | | — | | | | (314,216 | ) | | | (9,984 | ) | |
Class R6 | | | 2,941,315 | | | | 513,381 | | | | (3,960,111 | ) | | | (505,415 | ) | | | 2,655,377 | | | | 722,773 | | | | — | | | | (4,622,304 | ) | | | (1,244,154 | ) | |
(a) After the close of business on December 7, 2018, the Funds' applicable classes underwent a stock split or reverse stock split. The capital share activity presented here for the year ended August 31, 2019, has been retroactively adjusted to reflect this split. See Note G of the Notes to Financial Statements.
(b) Period from March 29, 2019 (Commencement of Operations) to August 31, 2019, for the year ended August 31, 2019.
(c) Period from January 18, 2019 (Commencement of Operations) to August 31, 2019, for the year ended August 31, 2019.
(d) Period from September 7, 2018 (Commencement of Operations) to August 31, 2019, for the year ended August 31, 2019.
209
Note E—Line of Credit:
At August 31, 2020, each Fund was a participant in a syndicated committed, unsecured $700,000,000 line of credit (the "Credit Facility"), to be used only for temporary or emergency purposes. Series of other investment companies managed by Management also participate in this line of credit on substantially the same terms. Interest is charged on borrowings under this Credit Facility at the highest of (a) a federal funds effective rate plus 1.00% per annum, (b) a Eurodollar rate for a one-month period plus 1.00% per annum, and (c) an overnight bank funding rate plus 1.00% per annum. The Credit Facility has an annual commitment fee of 0.15% per annum of the available line of credit, which is paid quarterly. Each Fund that is a participant has agreed to pay its pro rata share of the annual commitment fee, based on the ratio of its individual net assets to the net assets of all participants at the time the fee is due, and interest charged on any borrowing made by such Fund and other costs incurred by such Fund. Because several mutual funds participate in the Credit Facility, there is no assurance that an individual Fund will have access to all or any part of the $700,000,000 at any particular time. There were no loans outstanding under the Credit Facility at August 31, 2020.
During the year ended August 31, 2020, the following Fund had borrowings under the Credit Facility:
Fund | | Number of
Days Borrowed | | Greatest
Amount Borrowed | | Average
Interest Rate | | Interest Paid(1) | |
International Small Cap | | | 2 | | | $ | 700,000 | | | | 1.2 | % | | $ | 43 | | |
(1) Interest paid is reflected in the Statements of Operations under the caption "Interest."
Note F—Investments in Affiliates(a):
| | Value at
August 31,
2019 | | Purchase
Cost | | Sales
Proceeds/
Return of
Capital | | Change in
Net
Unrealized
Appreciation/
(Depreciation)
from
Investments
in Affiliated
Persons | | Net Realized
Gain/(Loss)
from
Investments
in Affiliated
Persons | | Distributions
from
Investments
in Affiliated
Persons | | Shares
Held at
August 31,
2020 | | Value at
August 31,
2020 | |
| Genesis | |
AMERISAFE,
Inc. | | $ | 71,485,442 | | | $ | 12,314,994 | | | $ | 6,568,591 | | | $ | (2,531,217 | ) | | $ | 383,301 | | | $ | 5,093,343 | | | | 1,125,190 | | | $ | 75,083,929 | | |
Atrion Corp. | | | 90,448,603 | | | | 6,001,858 | | | | 5,871,450 | | | | (17,745,267 | ) | | | 1,045,278 | | | | 725,482 | | | | 116,949 | | | | 73,879,022 | | |
Chase Corp. | | | 51,955,050 | | | | 2,748,307 | | | | 4,490,674 | | | | (1,068,679 | ) | | | (524,385 | ) | | | 414,728 | | | | 498,305 | | | | 48,619,619 | | |
Fox Factory
Holding
Corp. | | | 164,784,728 | | | | 5,585,673 | | | | 20,793,885 | | | | 56,837,621 | | | | 6,711,913 | | | | — | * | | | 2,114,136 | | | | 213,126,050 | | |
NetScout
Systems, Inc. | | | 88,986,761 | | | | 19,809,921 | | | | 7,829,980 | | | | 4,617,722 | | | | (2,248,797 | ) | | | — | * | | | 4,465,671 | | | | 103,335,627 | | |
Power
Integrations,
Inc. | | | 176,585,146 | | | | — | | | | 38,012,947 | | | | 21,120,158 | | | | 20,305,148 | | | | 1,423,787 | | | | 3,215,964 | | | | 179,997,505 | | |
Rogers Corp. | | | 165,204,676 | | | | 386,522 | | | | 17,670,148 | | | | (28,115,164 | ) | | | 5,099,806 | | | | — | * | | | 1,102,336 | | | | 124,905,692 | | |
Sub-total for
affiliates
held as of
8/31/20(b) | | $ | 809,450,406 | | | $ | 46,847,275 | | | $ | 101,237,675 | | | $ | 33,115,174 | | | $ | 30,772,264 | | | $ | 7,657,340 | | | | | $ | 818,947,444 | | |
210
| | Value at
August 31,
2019 | | Purchase
Cost | | Sales
Proceeds/
Return of
Capital | | Change in
Net
Unrealized
Appreciation/
(Depreciation)
from
Investments
in Affiliated
Persons | | Net Realized
Gain/(Loss)
from
Investments
in Affiliated
Persons | | Distributions
from
Investments
in Affiliated
Persons | | Shares
Held at
August 31,
2020 | | Value at
August 31,
2020 | |
Exponent,
Inc. | | $ | 185,349,136 | | | $ | 572,186 | | | $ | 22,469,375 | | | $ | 3,070,112 | | | $ | 19,015,377 | | | $ | 1,744,811 | | | | 2,306,102 | | | $ | 185,537,436 | | |
U.S. Physical
Therapy, Inc. | | | 98,752,193 | | | | 1,034,497 | | | | 67,660,827 | | | | (48,973,415 | ) | | | 16,847,552 | | | | 355,369 | | | | — | | | | — | | |
Sub-total for
securities no
longer
affiliated
as of
8/31/20(c) | | $ | 284,101,329 | | | $ | 1,606,683 | | | $ | 90,130,202 | | | $ | (45,903,303 | ) | | $ | 35,862,929 | | | $ | 2,100,180 | | | | | $ | 185,537,436 | | |
Total | | $ | 1,093,551,735 | | | $ | 48,453,958 | | | $ | 191,367,877 | | | $ | (12,788,129 | ) | | $ | 66,635,193 | | | $ | 9,757,520 | | | | | $ | 1,004,484,880 | | |
(a) Affiliated persons, as defined in the 1940 Act.
(b) At August 31, 2020, these securities amounted to 7.80% of net assets of the Fund.
(c) At August 31, 2020, the issuers of these securities were no longer affiliated with Genesis.
* Non-income producing security.
Other: At August 31, 2020, Neuberger Berman Global Allocation Fund, which is also managed by NBIA, held 0.06%, 0.00% and 0.71%, of the outstanding shares of Emerging Markets Equity, Genesis and International Select, respectively.
In addition, at August 31, 2020, affiliated persons owned 0.06%, 2.25%, 0.00%, 0.00%, 0.00%, 66.61%, 0.09%, 0.00%, 88.83%, 0.00%, 0.02%, 66.09%, 0.00%, 0.01%, 0.00%, 0.09%, 0.00%, 0.01% and 0.00% of the outstanding shares of Dividend Growth, Emerging Markets Equity, Equity Income, Focus, Genesis, Global Real Estate, Greater China Equity, Guardian, Integrated Large Cap, International Equity, International Select, International Small Cap, Intrinsic Value, Large Cap Value, Mid Cap Growth, Mid Cap Intrinsic Value, Real Estate, Small Cap Growth and Sustainable Equity, respectively.
Note G—Stock Splits:
In 2018, the Board approved stock splits and reverse stock splits (collectively, the "Stock Split") of the issued and outstanding shares of certain classes of Emerging Markets Equity, Integrated Large Cap, Intrinsic Value, Mid Cap Intrinsic Value and Multi-Cap Opportunities (collectively, the "Stock Split Funds"). The Stock Split occurred after the close of business on December 7, 2018. The Stock Split was carried out in accordance with a stock split ratio calculated to result in net asset values per share that better aligned the share class prices of each of the Stock Split Funds.
After the close of business on December 7, 2018, the following classes of the Stock Split Funds underwent a stock split or reverse stock split as follows:
Fund Class | | Stock Split
Ratio
(Old to New) | | Fund Class | | Stock Split
Ratio
(Old to New) | | Fund Class | | Stock Split
Ratio
(Old to New) | |
Emerging Markets Equity Class A | | | 1 | : 0.9925 | | Integrated Large Cap | | | | Intrinsic Value Class A | | | 1 | : 0.9671 | |
Emerging Markets Equity Class C | | | 1 | : 0.9490 | | Class A | | | 1 | : 0.9873 | | Intrinsic Value Class C | | | 1 | : 0.9007 | |
Emerging Markets Equity Class R3 | | | 1 | : 0.9679 | | Integrated Large Cap | | | | | | | | | |
Emerging Markets Equity Class R6 | | | 1 | : 1.0009 | | Class C | | | 1 | : 0.9346 | | | | | | | |
211
Fund Class | | Stock Split
Ratio
(Old to New) | | Fund Class | | Stock Split
Ratio
(Old to New) | |
Mid Cap Intrinsic Value Investor Class | | | 1 | : 0.9982 | | Multi-Cap Opportunities Class A | | | 1 | : 0.9915 | |
Mid Cap Intrinsic Value Trust Class | | | 1 | : 0.8078 | | Multi-Cap Opportunities Class C | | | 1 | : 0.9455 | |
Mid Cap Intrinsic Value Class A | | | 1 | : 0.8071 | | | | | | | |
Mid Cap Intrinsic Value Class C | | | 1 | : 0.7826 | | | | | | | |
Mid Cap Intrinsic Value Class R3 | | | 1 | : 0.8036 | | | | | | | |
Note H—Reorganizations:
At a meeting held on June 26, 2019, the Board approved a tax-free reorganization of Neuberger Berman Value Fund ("Value Fund") (the "Merging Fund") into Large Cap Value (the "Surviving Fund," and together with the Merging Fund, the "Reorganization Funds"). The Reorganization Funds are each a series of the Trust. After the close of business on August 16, 2019, the Surviving Fund acquired all of the net assets of the Merging Fund in a tax-free exchange of shares pursuant to the Plan of Reorganization and Dissolution approved by the Board. Accordingly, shareholders of the Merging Fund became shareholders of the Surviving Fund.
| Value Fund | | Shares Prior to
Reorganization | | Shares Issued by
the Surviving Fund | | Net Assets Prior
to Reorganization | |
Institutional Class | | | 1,461,190 | | | | 851,047 | | | $ | 25,809,513 | | |
Class A | | | 222,472 | | | | 129,228 | | | | 3,922,304 | | |
Class C | | | 237,497 | | | | 133,590 | | | | 4,057,725 | | |
The appreciation of Value Fund was $1,039,412, as of the date of the reorganization. The combined net assets of the Surviving Fund immediately after the reorganization was $1,763,303,263. For financial reporting purposes, assets received and shares issued by the Surviving Fund were recorded at fair value; however, the cost basis of the investments received from the Merging Fund were carried forward to align ongoing reporting of the Surviving Fund's realized and unrealized gains and losses with amounts distributable to shareholders for tax purposes.
Because the combined investment portfolios have been managed as a single integrated portfolio since the reorganization was completed, it is not practicable to separate the amounts of revenue and earnings of the Merging Fund that have been included in the Surviving Fund's Statement of Changes as of August 31, 2019.
Note I—Recent Accounting Pronouncement:
In August 2018, FASB issued Accounting Standards Update No. 2018-13, Fair Value Measurement (Topic 820: "Disclosure Framework—Changes to the Disclosure Requirements for Fair Value Measurement") ("ASU 2018-13"). ASU 2018-13 eliminates the requirement to disclose the amount of and reasons for transfers between Level 1 and Level 2 of the fair value hierarchy, the timing of transfers between levels of the fair value hierarchy and the valuation processes for Level 3 fair value measurements. ASU 2018-13 will require the disclosure of the range and weighted average used to develop significant unobservable inputs for Level 3 fair value measurements and the changes in unrealized gains and losses for recurring Level 3 fair value measurements. ASU 2018-13 will also require that information is provided about the measurement uncertainty of Level 3 fair value measurements as of the reporting date. The guidance is effective for fiscal years, and interim periods within those fiscal years, beginning after December 15, 2019, and allows for early adoption of either the entire standard or only the provisions that eliminate or modify the disclosure requirements. Management has elected to adopt early the provisions that eliminate the disclosure requirements. Management is still currently evaluating the impact of applying the rest of the guidance.
212
The following tables include selected data for a share outstanding throughout each period and other performance information derived from the Financial Statements. Amounts that do not round to $0.01 or $(0.01) per share are presented as $0.00 or $(0.00), respectively. Ratios that do not round to 0.01% or (0.01)% are presented as 0.00% or (0.00)%, respectively. Net Asset amounts with a zero balance, if any, may reflect actual amounts rounding to less than $0.1 million. A "—" indicates that the line item was not applicable in the corresponding period.
| | | Net Asset
Value,
Beginning
of Year | | Net
Investment
Income/(Loss)@ | | Net Gains or
Losses on
Securities
(both realized
and
unrealized) | | Total From
Investment
Operations | | Dividends
from Net
Investment
Income | | Distributions
from Net
Realized
Capital Gains | | Tax
Return of
Capital | | Total
Distributions | | Voluntary
Contribution
from
Management | | Net Asset
Value, End of
Year | | Total Returnab | | Net Assets,
End of Year
(in millions) | | Ratio of Gross
Expenses to
Average Net
Assets# | | Ratio of Net
Expenses to
Average Net
Assets | | Ratio of Net
Investment
Income/
(Loss) to
Average Net
Assets | | Portfolio
Turnover
Rate | |
Dividend Growth Fund | |
Institutional Class | |
8/31/2020 | | $ | 12.81 | | | $ | 0.21 | | | $ | 1.94 | | | $ | 2.15 | | | $ | (0.20 | ) | | $ | — | | | $ | — | | | $ | (0.20 | ) | | $ | — | | | $ | 14.76 | | | | 16.91 | % | | $ | 49.3 | | | | 1.17 | % | | | 0.69 | % | | | 1.57 | % | | | 39 | % | |
8/31/2019 | | $ | 13.93 | | | $ | 0.21 | | | $ | (0.64 | ) | | $ | (0.43 | ) | | $ | (0.13 | ) | | $ | (0.56 | ) | | $ | — | | | $ | (0.69 | ) | | $ | — | | | $ | 12.81 | | | | (2.45 | )% | | $ | 51.3 | | | | 1.20 | % | | | 0.69 | % | | | 1.63 | % | | | 45 | % | |
8/31/2018 | | $ | 12.93 | | | $ | 0.21 | | | $ | 1.12 | | | $ | 1.33 | | | $ | (0.15 | ) | | $ | (0.18 | ) | | $ | — | | | $ | (0.33 | ) | | $ | — | | | $ | 13.93 | | | | 10.44 | % | | $ | 53.4 | | | | 1.23 | % | | | 0.69 | % | | | 1.54 | % | | | 43 | % | |
8/31/2017 | | $ | 11.11 | | | $ | 0.22 | | | $ | 1.82 | | | $ | 2.04 | | | $ | (0.22 | ) | | $ | — | | | $ | — | | | $ | (0.22 | ) | | $ | — | | | $ | 12.93 | | | | 18.54 | % | | $ | 32.5 | | | | 1.69 | % | | | 0.69 | % | | | 1.78 | % | | | 44 | % | |
Period from 12/15/2015^
to 8/31/2016 | | $ | 10.00 | | | $ | 0.18 | | | $ | 0.93 | | | $ | 1.11 | | | $ | — | | | $ | — | | | $ | — | | | $ | — | | | $ | — | | | $ | 11.11 | | | | 11.10 | %* | | $ | 20.3 | | | | 2.61 | %**‡ | | | 0.69 | %**‡ | | | 2.44 | %**‡ | | | 23 | %* | |
Class A | |
8/31/2020 | | $ | 12.81 | | | $ | 0.16 | | | $ | 1.93 | | | $ | 2.09 | | | $ | (0.14 | ) | | $ | — | | | $ | — | | | $ | (0.14 | ) | | $ | — | | | $ | 14.76 | | | | 16.41 | % | | $ | 1.5 | | | | 1.62 | % | | | 1.05 | % | | | 1.19 | % | | | 39 | % | |
8/31/2019 | | $ | 13.93 | | | $ | 0.16 | | | $ | (0.62 | ) | | $ | (0.46 | ) | | $ | (0.10 | ) | | $ | (0.56 | ) | | $ | — | | | $ | (0.66 | ) | | $ | — | | | $ | 12.81 | | | | (2.75 | )% | | $ | 1.4 | | | | 1.65 | % | | | 1.05 | % | | | 1.28 | % | | | 45 | % | |
8/31/2018 | | $ | 12.94 | | | $ | 0.15 | | | $ | 1.13 | | | $ | 1.28 | | | $ | (0.11 | ) | | $ | (0.18 | ) | | $ | — | | | $ | (0.29 | ) | | $ | — | | | $ | 13.93 | | | | 9.98 | % | | $ | 1.8 | | | | 1.67 | % | | | 1.05 | % | | | 1.14 | % | | | 43 | % | |
8/31/2017 | | $ | 11.09 | | | $ | 0.18 | | | $ | 1.81 | | | $ | 1.99 | | | $ | (0.14 | ) | | $ | — | | | $ | — | | | $ | (0.14 | ) | | $ | — | | | $ | 12.94 | | | | 18.10 | % | | $ | 1.6 | | | | 2.14 | % | | | 1.05 | % | | | 1.48 | % | | | 44 | % | |
Period from 12/15/2015^
to 8/31/2016 | | $ | 10.00 | | | $ | 0.16 | | | $ | 0.93 | | | $ | 1.09 | | | $ | — | | | $ | — | | | $ | — | | | $ | — | | | $ | — | | | $ | 11.09 | | | | 10.90 | %* | | $ | 0.2 | | | | 3.36 | %**‡ | | | 1.05 | %**‡ | | | 2.14 | %**‡ | | | 23 | %* | |
Class C | |
8/31/2020 | | $ | 12.70 | | | $ | 0.06 | | | $ | 1.92 | | | $ | 1.98 | | | $ | (0.03 | ) | | $ | — | | | $ | — | | | $ | (0.03 | ) | | $ | — | | | $ | 14.65 | | | | 15.63 | % | | $ | 2.5 | | | | 2.28 | % | | | 1.80 | % | | | 0.44 | % | | | 39 | % | |
8/31/2019 | | $ | 13.85 | | | $ | 0.07 | | | $ | (0.63 | ) | | $ | (0.56 | ) | | $ | (0.03 | ) | | $ | (0.56 | ) | | $ | — | | | $ | (0.59 | ) | | $ | — | | | $ | 12.70 | | | | (3.55 | )% | | $ | 2.7 | | | | 2.32 | % | | | 1.80 | % | | | 0.51 | % | | | 45 | % | |
8/31/2018 | | $ | 12.87 | | | $ | 0.05 | | | $ | 1.12 | | | $ | 1.17 | | | $ | (0.01 | ) | | $ | (0.18 | ) | | $ | — | | | $ | (0.19 | ) | | $ | — | | | $ | 13.85 | | | | 9.17 | % | | $ | 3.3 | | | | 2.34 | % | | | 1.80 | % | | | 0.40 | % | | | 43 | % | |
8/31/2017 | | $ | 11.00 | | | $ | 0.07 | | | $ | 1.85 | | | $ | 1.92 | | | $ | (0.05 | ) | | $ | — | | | $ | — | | | $ | (0.05 | ) | | $ | — | | | $ | 12.87 | | | | 17.47 | % | | $ | 3.1 | | | | 2.81 | % | | | 1.80 | % | | | 0.61 | % | | | 44 | % | |
Period from 12/15/2015^
to 8/31/2016 | | $ | 10.00 | | | $ | 0.08 | | | $ | 0.92 | | | $ | 1.00 | | | $ | — | | | $ | — | | | $ | — | | | $ | — | | | $ | — | | | $ | 11.00 | | | | 10.00 | %* | | $ | 0.0 | | | | 4.11 | %**‡ | | | 1.80 | %**‡ | | | 1.17 | %**‡ | | | 23 | %* | |
Class R6 | |
8/31/2020 | | $ | 12.82 | | | $ | 0.21 | | | $ | 1.95 | | | $ | 2.16 | | | $ | (0.21 | ) | | $ | — | | | $ | — | | | $ | (0.21 | ) | | $ | — | | | $ | 14.77 | | | | 16.98 | % | | $ | 0.0 | | | | 1.18 | % | | | 0.59 | % | | | 1.61 | % | | | 39 | % | |
8/31/2019 | | $ | 13.93 | | | $ | 0.22 | | | $ | (0.63 | ) | | $ | (0.41 | ) | | $ | (0.14 | ) | | $ | (0.56 | ) | | $ | — | | | $ | (0.70 | ) | | $ | — | | | $ | 12.82 | | | | (2.33 | )% | | $ | 0.0 | | | | 1.17 | % | | | 0.60 | % | | | 1.70 | % | | | 45 | % | |
8/31/2018 | | $ | 12.93 | | | $ | 0.21 | | | $ | 1.13 | | | $ | 1.34 | | | $ | (0.16 | ) | | $ | (0.18 | ) | | $ | — | | | $ | (0.34 | ) | | $ | — | | | $ | 13.93 | | | | 10.51 | % | | $ | 0.0 | | | | 1.19 | % | | | 0.62 | % | | | 1.58 | % | | | 43 | % | |
8/31/2017 | | $ | 11.11 | | | $ | 0.23 | | | $ | 1.81 | | | $ | 2.04 | | | $ | (0.22 | ) | | $ | — | | | $ | — | | | $ | (0.22 | ) | | $ | — | | | $ | 12.93 | | | | 18.60 | % | | $ | 0.0 | | | | 1.65 | % | | | 0.62 | % | | | 1.91 | % | | | 44 | % | |
Period from 12/15/2015^
to 8/31/2016 | | $ | 10.00 | | | $ | 0.15 | | | $ | 0.96 | | | $ | 1.11 | | | $ | — | | | $ | — | | | $ | — | | | $ | — | | | $ | — | | | $ | 11.11 | | | | 11.10 | %* | | $ | 0.1 | | | | 2.75 | %**‡ | | | 0.62 | %**‡ | | | 2.06 | %**‡ | | | 23 | %* | |
See Notes to Financial Highlights
213
214
Financial Highlights (cont'd)
| | | Net Asset
Value,
Beginning
of Year | | Net
Investment
Income/(Loss)@ | | Net Gains or
Losses on
Securities
(both realized
and
unrealized) | | Total From
Investment
Operations | | Dividends
from Net
Investment
Income | | Distributions
from Net
Realized
Capital Gains | | Tax
Return of
Capital | | Total
Distributions | | Voluntary
Contribution
from
Management | | Net Asset
Value, End of
Year | | Total Returnab | | Net Assets,
End of Year
(in millions) | | Ratio of Gross
Expenses to
Average Net
Assets# | | Ratio of Net
Expenses to
Average Net
Assets | | Ratio of Net
Investment
Income/
(Loss) to
Average Net
Assets | | Portfolio
Turnover
Rate | |
Emerging Markets Equity Fund | |
Institutional Class | |
8/31/2020 | | $ | 18.76 | | | $ | 0.28 | | | $ | 1.70 | | | $ | 1.98 | | | $ | (0.37 | ) | | $ | — | | | $ | — | | | $ | (0.37 | ) | | $ | — | | | $ | 20.37 | | | | 10.59 | % | | $ | 854.6 | | | | 1.25 | % | | | 1.25 | %§ | | | 1.45 | % | | | 41 | % | |
8/31/2019 | | $ | 19.25 | | | $ | 0.23 | | | $ | (0.54 | ) | | $ | (0.31 | ) | | $ | (0.18 | ) | | $ | — | | | $ | — | | | $ | (0.18 | ) | | $ | — | | | $ | 18.76 | | | | (1.56 | )% | | $ | 1,077.0 | | | | 1.25 | % | | | 1.25 | %§ | | | 1.22 | % | | | 37 | % | |
8/31/2018 | | $ | 19.87 | | | $ | 0.20 | | | $ | (0.68 | ) | | $ | (0.48 | ) | | $ | (0.14 | ) | | $ | — | | | $ | — | | | $ | (0.14 | ) | | $ | — | | | $ | 19.25 | | | | (2.49 | )% | | $ | 1,149.4 | | | | 1.28 | % | | | 1.25 | % | | | 0.98 | % | | | 23 | % | |
8/31/2017 | | $ | 16.01 | | | $ | 0.17 | | | $ | 3.77 | | | $ | 3.94 | | | $ | (0.08 | ) | | $ | — | | | $ | — | | | $ | (0.08 | ) | | $ | — | | | $ | 19.87 | | | | 24.76 | % | | $ | 670.6 | | | | 1.36 | % | | | 1.25 | % | | | 0.95 | % | | | 25 | % | |
8/31/2016 | | $ | 13.94 | | | $ | 0.11 | | | $ | 2.06 | | | $ | 2.17 | | | $ | (0.10 | ) | | $ | — | | | $ | — | | | $ | (0.10 | ) | | $ | — | | | $ | 16.01 | | | | 15.64 | % | | $ | 318.9 | | | | 1.43 | % | | | 1.25 | % | | | 0.74 | % | | | 43 | % | |
Class A | |
8/31/2020 | | $ | 18.82 | | | $ | 0.24 | | | $ | 1.69 | | | $ | 1.93 | | | $ | (0.32 | ) | | $ | — | | | $ | — | | | $ | (0.32 | ) | | $ | — | | | $ | 20.43 | | | | 10.28 | % | | $ | 31.7 | | | | 1.60 | % | | | 1.50 | % | | | 1.27 | % | | | 41 | % | |
| 8/31/2019i | | $ | 19.26 | | | $ | 0.17 | | | $ | (0.52 | ) | | $ | (0.35 | ) | | $ | (0.09 | ) | | $ | — | | | $ | — | | | $ | (0.09 | ) | | $ | — | | | $ | 18.82 | | | | (1.77 | )% | | $ | 44.6 | | | | 1.62 | % | | | 1.50 | % | | | 0.91 | % | | | 37 | % | |
| 8/31/2018i | | $ | 19.90 | | | $ | 0.10 | | | $ | (0.64 | ) | | $ | (0.54 | ) | | $ | (0.10 | ) | | $ | — | | | $ | — | | | $ | (0.10 | ) | | $ | — | | | $ | 19.26 | | | | (2.78 | )% | | $ | 47.6 | | | | 1.65 | % | | | 1.50 | % | | | 0.49 | % | | | 23 | % | |
| 8/31/2017i | | $ | 16.04 | | | $ | 0.13 | | | $ | 3.78 | | | $ | 3.91 | | | $ | (0.05 | ) | | $ | — | | | $ | — | | | $ | (0.05 | ) | | $ | — | | | $ | 19.90 | | | | 24.51 | % | | $ | 65.1 | | | | 1.73 | % | | | 1.50 | % | | | 0.74 | % | | | 25 | % | |
| 8/31/2016i | | $ | 13.98 | | | $ | 0.09 | | | $ | 2.03 | | | $ | 2.12 | | | $ | (0.06 | ) | | $ | — | | | $ | — | | | $ | (0.06 | ) | | $ | — | | | $ | 16.04 | | | | 15.31 | % | | $ | 23.5 | | | | 1.82 | % | | | 1.50 | % | | | 0.60 | % | | | 43 | % | |
Class C | |
8/31/2020 | | $ | 18.77 | | | $ | 0.10 | | | $ | 1.68 | | | $ | 1.78 | | | $ | (0.15 | ) | | $ | — | | | $ | — | | | $ | (0.15 | ) | | $ | — | | | $ | 20.40 | | | | 9.47 | % | | $ | 6.1 | | | | 2.33 | % | | | 2.25 | % | | | 0.53 | % | | | 41 | % | |
| 8/31/2019i | | $ | 19.25 | | | $ | 0.03 | | | $ | (0.51 | ) | | $ | (0.48 | ) | | $ | — | | | $ | — | | | $ | — | | | $ | — | | | $ | — | | | $ | 18.77 | | | | (2.50 | )% | | $ | 9.1 | | | | 2.35 | % | | | 2.25 | % | | | 0.18 | % | | | 37 | % | |
| 8/31/2018i | | $ | 20.00 | | | $ | (0.02 | ) | | $ | (0.68 | ) | | $ | (0.70 | ) | | $ | (0.05 | ) | | $ | — | | | $ | — | | | $ | (0.05 | ) | | $ | — | | | $ | 19.25 | | | | (3.51 | )% | | $ | 10.9 | | | | 2.37 | % | | | 2.25 | % | | | (0.08 | )% | | | 23 | % | |
| 8/31/2017i | | $ | 16.18 | | | $ | (0.03 | ) | | $ | 3.85 | | | $ | 3.82 | | | $ | — | | | $ | — | | | $ | — | | | $ | — | | | $ | — | | | $ | 20.00 | | | | 23.57 | % | | $ | 7.4 | | | | 2.45 | % | | | 2.25 | % | | | (0.18 | )% | | | 25 | % | |
| 8/31/2016i | | $ | 14.14 | | | $ | (0.04 | ) | | $ | 2.08 | | | $ | 2.04 | | | $ | — | | | $ | — | | | $ | — | | | $ | — | | | $ | — | | | $ | 16.18 | | | | 14.46 | % | | $ | 5.2 | | | | 2.51 | % | | | 2.25 | % | | | (0.30 | )% | | | 43 | % | |
Class R3 | |
8/31/2020 | | $ | 18.83 | | | $ | 0.16 | | | $ | 1.69 | | | $ | 1.85 | | | $ | (0.23 | ) | | $ | — | | | $ | — | | | $ | (0.23 | ) | | $ | — | | | $ | 20.45 | | | | 9.85 | % | | $ | 0.8 | | | | 1.97 | % | | | 1.91 | % | | | 0.81 | % | | | 41 | % | |
| 8/31/2019i | | $ | 19.26 | | | $ | 0.09 | | | $ | (0.51 | ) | | $ | (0.42 | ) | | $ | (0.01 | ) | | $ | — | | | $ | — | | | $ | (0.01 | ) | | $ | — | | | $ | 18.83 | | | | (2.19 | )% | | $ | 1.0 | | | | 1.94 | % | | | 1.91 | % | | | 0.50 | % | | | 37 | % | |
| 8/31/2018i | | $ | 19.95 | | | $ | 0.03 | | | $ | (0.65 | ) | | $ | (0.62 | ) | | $ | (0.07 | ) | | $ | — | | | $ | — | | | $ | (0.07 | ) | | $ | — | | | $ | 19.26 | | | | (3.16 | )% | | $ | 1.4 | | | | 1.91 | % | | | 1.91 | % | | | 0.14 | % | | | 23 | % | |
| 8/31/2017i | | $ | 16.11 | | | $ | 0.01 | | | $ | 3.84 | | | $ | 3.85 | | | $ | (0.01 | ) | | $ | — | | | $ | — | | | $ | (0.01 | ) | | $ | — | | | $ | 19.95 | | | | 23.94 | % | | $ | 1.5 | | | | 2.01 | % | | | 1.91 | % | | | 0.08 | % | | | 25 | % | |
| 8/31/2016i | | $ | 14.05 | | | $ | 0.02 | | | $ | 2.07 | | | $ | 2.09 | | | $ | (0.03 | ) | | $ | — | | | $ | — | | | $ | (0.03 | ) | | $ | — | | | $ | 16.11 | | | | 14.88 | % | | $ | 1.2 | | | | 2.06 | % | | | 1.91 | % | | | 0.16 | % | | | 43 | % | |
Class R6 | |
8/31/2020 | | $ | 18.77 | | | $ | 0.30 | | | $ | 1.71 | | | $ | 2.01 | | | $ | (0.40 | ) | | $ | — | | | $ | — | | | $ | (0.40 | ) | | $ | — | | | $ | 20.38 | | | | 10.72 | % | | $ | 194.2 | | | | 1.15 | % | | | 1.15 | %§ | | | 1.58 | % | | | 41 | % | |
| 8/31/2019i | | $ | 19.25 | | | $ | 0.27 | | | $ | (0.56 | ) | | $ | (0.29 | ) | | $ | (0.19 | ) | | $ | — | | | $ | — | | | $ | (0.19 | ) | | $ | — | | | $ | 18.77 | | | | (1.45 | )% | | $ | 219.1 | | | | 1.16 | % | | | 1.16 | %§ | | | 1.42 | % | | | 37 | % | |
| 8/31/2018i | | $ | 19.87 | | | $ | 0.19 | | | $ | (0.67 | ) | | $ | (0.48 | ) | | $ | (0.14 | ) | | $ | — | | | $ | — | | | $ | (0.14 | ) | | $ | — | | | $ | 19.25 | | | | (2.46 | )% | | $ | 166.9 | | | | 1.19 | % | | | 1.18 | % | | | 0.91 | % | | | 23 | % | |
| 8/31/2017i | | $ | 16.01 | | | $ | 0.15 | | | $ | 3.80 | | | $ | 3.95 | | | $ | (0.09 | ) | | $ | — | | | $ | — | | | $ | (0.09 | ) | | $ | — | | | $ | 19.87 | | | | 24.90 | % | | $ | 132.9 | | | | 1.26 | % | | | 1.18 | % | | | 0.86 | % | | | 25 | % | |
| 8/31/2016i | | $ | 13.95 | | | $ | 0.12 | | | $ | 2.05 | | | $ | 2.17 | | | $ | (0.11 | ) | | $ | — | | | $ | — | | | $ | (0.11 | ) | | $ | — | | | $ | 16.01 | | | | 15.64 | % | | $ | 107.4 | | | | 1.32 | % | | | 1.18 | % | | | 0.83 | % | | | 43 | % | |
See Notes to Financial Highlights
215
216
Financial Highlights (cont'd)
| | | Net Asset
Value,
Beginning
of Year | | Net
Investment
Income/(Loss)@ | | Net Gains or
Losses on
Securities
(both realized
and
unrealized) | | Total From
Investment
Operations | | Dividends
from Net
Investment
Income | | Distributions
from Net
Realized
Capital Gains | | Tax
Return of
Capital | | Total
Distributions | | Voluntary
Contribution
from
Management | | Net Asset
Value, End of
Year | | Total Returnab | | Net Assets,
End of Year
(in millions) | | Ratio of Gross
Expenses to
Average Net
Assets# | | Ratio of Net
Expenses to
Average Net
Assets | | Ratio of Net
Investment
Income/
(Loss) to
Average Net
Assets | | Portfolio
Turnover
Rate | |
Equity Income Fund | |
Institutional Class | |
8/31/2020 | | $ | 12.98 | | | $ | 0.29 | | | $ | (0.11 | ) | | $ | 0.18 | | | $ | (0.32 | ) | | $ | (0.42 | ) | | $ | — | | | $ | (0.74 | ) | | $ | — | | | $ | 12.42 | | | | 1.53 | % | | $ | 994.9 | | | | 0.69 | % | | | 0.69 | % | | | 2.35 | % | | | 56 | % | |
8/31/2019 | | $ | 13.53 | | | $ | 0.33 | | | $ | 0.00 | | | $ | 0.33 | | | $ | (0.32 | ) | | $ | (0.56 | ) | | $ | — | | | $ | (0.88 | ) | | $ | — | | | $ | 12.98 | | | | 3.06 | % | | $ | 1,147.4 | | | | 0.70 | % | | | 0.70 | % | | | 2.58 | % | | | 37 | % | |
8/31/2018 | | $ | 13.09 | | | $ | 0.33 | | | $ | 1.01 | | | $ | 1.34 | | | $ | (0.40 | ) | | $ | (0.50 | ) | | $ | — | | | $ | (0.90 | ) | | $ | — | | | $ | 13.53 | | | | 10.58 | % | | $ | 1,172.8 | | | | 0.69 | % | | | 0.69 | % | | | 2.52 | % | | | 41 | % | |
8/31/2017 | | $ | 12.45 | | | $ | 0.38 | | | $ | 1.01 | | | $ | 1.39 | | | $ | (0.33 | ) | | $ | (0.42 | ) | | $ | — | | | $ | (0.75 | ) | | $ | 0.00 | | | $ | 13.09 | | | | 11.56 | %hj | | $ | 1,208.7 | | | | 0.69 | % | | | 0.69 | %e | | | 2.99 | %e | | | 53 | % | |
8/31/2016 | | $ | 11.74 | | | $ | 0.37 | | | $ | 1.08 | | | $ | 1.45 | | | $ | (0.32 | ) | | $ | (0.42 | ) | | $ | — | | | $ | (0.74 | ) | | $ | — | | | $ | 12.45 | | | | 13.03 | % | | $ | 1,076.5 | | | | 0.69 | % | | | 0.69 | % | | | 3.18 | % | | | 49 | % | |
Class A | |
8/31/2020 | | $ | 12.93 | | | $ | 0.24 | | | $ | (0.10 | ) | | $ | 0.14 | | | $ | (0.28 | ) | | $ | (0.42 | ) | | $ | — | | | $ | (0.70 | ) | | $ | — | | | $ | 12.37 | | | | 1.14 | % | | $ | 153.1 | | | | 1.06 | % | | | 1.06 | % | | | 1.99 | % | | | 56 | % | |
8/31/2019 | | $ | 13.48 | | | $ | 0.28 | | | $ | 0.01 | | | $ | 0.29 | | | $ | (0.28 | ) | | $ | (0.56 | ) | | $ | — | | | $ | (0.84 | ) | | $ | — | | | $ | 12.93 | | | | 2.68 | % | | $ | 142.7 | | | | 1.06 | % | | | 1.06 | % | | | 2.17 | % | | | 37 | % | |
8/31/2018 | | $ | 13.04 | | | $ | 0.29 | | | $ | 1.00 | | | $ | 1.29 | | | $ | (0.35 | ) | | $ | (0.50 | ) | | $ | — | | | $ | (0.85 | ) | | $ | — | | | $ | 13.48 | | | | 10.21 | % | | $ | 186.5 | | | | 1.05 | % | | | 1.05 | % | | | 2.16 | % | | | 41 | % | |
8/31/2017 | | $ | 12.40 | | | $ | 0.32 | | | $ | 1.02 | | | $ | 1.34 | | | $ | (0.28 | ) | | $ | (0.42 | ) | | $ | — | | | $ | (0.70 | ) | | $ | 0.00 | | | $ | 13.04 | | | | 11.17 | %hj | | $ | 200.3 | | | | 1.05 | % | | | 1.05 | %e | | | 2.56 | %e | | | 53 | % | |
8/31/2016 | | $ | 11.69 | | | $ | 0.33 | | | $ | 1.08 | | | $ | 1.41 | | | $ | (0.28 | ) | | $ | (0.42 | ) | | $ | — | | | $ | (0.70 | ) | | $ | — | | | $ | 12.40 | | | | 12.64 | % | | $ | 243.1 | | | | 1.07 | % | | | 1.07 | % | | | 2.81 | % | | | 49 | % | |
Class C | |
8/31/2020 | | $ | 12.83 | | | $ | 0.15 | | | $ | (0.10 | ) | | $ | 0.05 | | | $ | (0.18 | ) | | $ | (0.42 | ) | | $ | — | | | $ | (0.60 | ) | | $ | — | | | $ | 12.28 | | | | 0.38 | % | | $ | 101.1 | | | | 1.81 | % | | | 1.81 | % | | | 1.24 | % | | | 56 | % | |
8/31/2019 | | $ | 13.38 | | | $ | 0.18 | | | $ | 0.01 | | | $ | 0.19 | | | $ | (0.18 | ) | | $ | (0.56 | ) | | $ | — | | | $ | (0.74 | ) | | $ | — | | | $ | 12.83 | | | | 1.91 | % | | $ | 178.5 | | | | 1.81 | % | | | 1.81 | % | | | 1.45 | % | | | 37 | % | |
8/31/2018 | | $ | 12.95 | | | $ | 0.18 | | | $ | 1.00 | | | $ | 1.18 | | | $ | (0.25 | ) | | $ | (0.50 | ) | | $ | — | | | $ | (0.75 | ) | | $ | — | | | $ | 13.38 | | | | 9.36 | % | | $ | 246.7 | | | | 1.80 | % | | | 1.80 | % | | | 1.40 | % | | | 41 | % | |
8/31/2017 | | $ | 12.32 | | | $ | 0.23 | | | $ | 1.01 | | | $ | 1.24 | | | $ | (0.19 | ) | | $ | (0.42 | ) | | $ | — | | | $ | (0.61 | ) | | $ | 0.00 | | | $ | 12.95 | | | | 10.34 | %hj | | $ | 282.3 | | | | 1.80 | % | | | 1.80 | %e | | | 1.82 | %e | | | 53 | % | |
8/31/2016 | | $ | 11.62 | | | $ | 0.24 | | | $ | 1.07 | | | $ | 1.31 | | | $ | (0.19 | ) | | $ | (0.42 | ) | | $ | — | | | $ | (0.61 | ) | | $ | — | | | $ | 12.32 | | | | 11.77 | % | | $ | 334.1 | | | | 1.81 | % | | | 1.81 | % | | | 2.07 | % | | | 49 | % | |
Class R3 | |
8/31/2020 | | $ | 12.90 | | | $ | 0.21 | | | $ | (0.11 | ) | | $ | 0.10 | | | $ | (0.24 | ) | | $ | (0.42 | ) | | $ | — | | | $ | (0.66 | ) | | $ | — | | | $ | 12.34 | | | | 0.82 | % | | $ | 1.6 | | | | 1.33 | % | | | 1.33 | % | | | 1.71 | % | | | 56 | % | |
8/31/2019 | | $ | 13.45 | | | $ | 0.24 | | | $ | 0.01 | | | $ | 0.25 | | | $ | (0.24 | ) | | $ | (0.56 | ) | | $ | — | | | $ | (0.80 | ) | | $ | — | | | $ | 12.90 | | | | 2.40 | % | | $ | 1.9 | | | | 1.34 | % | | | 1.34 | % | | | 1.91 | % | | | 37 | % | |
8/31/2018 | | $ | 13.01 | | | $ | 0.25 | | | $ | 1.01 | | | $ | 1.26 | | | $ | (0.32 | ) | | $ | (0.50 | ) | | $ | — | | | $ | (0.82 | ) | | $ | — | | | $ | 13.45 | | | | 9.93 | % | | $ | 2.2 | | | | 1.33 | % | | | 1.33 | % | | | 1.87 | % | | | 41 | % | |
8/31/2017 | | $ | 12.37 | | | $ | 0.28 | | | $ | 1.02 | | | $ | 1.30 | | | $ | (0.24 | ) | | $ | (0.42 | ) | | $ | — | | | $ | (0.66 | ) | | $ | 0.00 | | | $ | 13.01 | | | | 10.88 | %hj | | $ | 1.8 | | | | 1.34 | % | | | 1.34 | %e | | | 2.27 | %e | | | 53 | % | |
8/31/2016 | | $ | 11.67 | | | $ | 0.30 | | | $ | 1.07 | | | $ | 1.37 | | | $ | (0.25 | ) | | $ | (0.42 | ) | | $ | — | | | $ | (0.67 | ) | | $ | — | | | $ | 12.37 | | | | 12.26 | % | | $ | 2.7 | | | | 1.33 | % | | | 1.33 | % | | | 2.53 | % | | | 49 | % | |
Focus Fund | |
Investor Class | |
8/31/2020 | | $ | 25.74 | | | $ | 0.03 | | | $ | 6.22 | | | $ | 6.25 | | | $ | (0.17 | ) | | $ | (3.06 | ) | | $ | — | | | $ | (3.23 | ) | | $ | — | | | $ | 28.76 | | | | 26.17 | % | | $ | 700.6 | | | | 0.92 | % | | | 0.92 | % | | | 0.14 | % | | | 130 | % | |
8/31/2019 | | $ | 28.69 | | | $ | 0.13 | | | $ | (1.06 | ) | | $ | (0.93 | ) | | $ | (0.10 | ) | | $ | (1.92 | ) | | $ | — | | | $ | (2.02 | ) | | $ | — | | | $ | 25.74 | | | | (2.35 | )% | | $ | 617.6 | | | | 0.92 | % | | | 0.92 | % | | | 0.50 | % | | | 20 | % | |
8/31/2018 | | $ | 27.50 | | | $ | 0.12 | | | $ | 3.28 | | | $ | 3.40 | | | $ | (0.08 | ) | | $ | (2.13 | ) | | $ | — | | | $ | (2.21 | ) | | $ | — | | | $ | 28.69 | | | | 13.05 | % | | $ | 690.7 | | | | 0.91 | % | | | 0.91 | % | | | 0.43 | % | | | 59 | % | |
8/31/2017 | | $ | 25.81 | | | $ | 0.07 | | | $ | 3.93 | | | $ | 4.00 | | | $ | (0.09 | ) | | $ | (2.22 | ) | | $ | — | | | $ | (2.31 | ) | | $ | 0.00 | | | $ | 27.50 | | | | 16.81 | %hj | | $ | 667.7 | | | | 0.92 | % | | | 0.91 | %e | | | 0.28 | %e | | | 72 | % | |
8/31/2016 | | $ | 25.45 | | | $ | 0.16 | | | $ | 1.48 | | | $ | 1.64 | | | $ | (0.18 | ) | | $ | (1.10 | ) | | $ | — | | | $ | (1.28 | ) | | $ | — | | | $ | 25.81 | | | | 6.68 | % | | $ | 626.8 | | | | 0.94 | % | | | 0.94 | % | | | 0.63 | % | | | 89 | % | |
See Notes to Financial Highlights
217
218
Financial Highlights (cont'd)
| | | Net Asset
Value,
Beginning
of Year | | Net
Investment
Income/(Loss)@ | | Net Gains or
Losses on
Securities
(both realized
and
unrealized) | | Total From
Investment
Operations | | Dividends
from Net
Investment
Income | | Distributions
from Net
Realized
Capital Gains | | Tax
Return of
Capital | | Total
Distributions | | Voluntary
Contribution
from
Management | | Net Asset
Value, End of
Year | | Total Returnab | | Net Assets,
End of Year
(in millions) | | Ratio of Gross
Expenses to
Average Net
Assets# | | Ratio of Net
Expenses to
Average Net
Assets | | Ratio of Net
Investment
Income/
(Loss) to
Average Net
Assets | | Portfolio
Turnover
Rate | |
Focus Fund (cont'd) | |
Trust Class | |
8/31/2020 | | $ | 25.71 | | | $ | (0.01 | ) | | $ | 6.20 | | | $ | 6.19 | | | $ | (0.09 | ) | | $ | (3.06 | ) | | $ | — | | | $ | (3.15 | ) | | $ | — | | | $ | 28.75 | | | | 25.90 | % | | $ | 47.0 | | | | 1.10 | % | | | 1.10 | % | | | (0.04 | )% | | | 130 | % | |
8/31/2019 | | $ | 28.66 | | | $ | 0.08 | | | $ | (1.05 | ) | | $ | (0.97 | ) | | $ | (0.06 | ) | | $ | (1.92 | ) | | $ | — | | | $ | (1.98 | ) | | $ | — | | | $ | 25.71 | | | | (2.52 | )% | | $ | 46.4 | | | | 1.10 | % | | | 1.10 | % | | | 0.32 | % | | | 20 | % | |
| 8/31/2018g | | $ | 29.18 | | | $ | 0.07 | | | $ | 3.35 | | | $ | 3.42 | | | $ | (0.06 | ) | | $ | (3.88 | ) | | $ | — | | | $ | (3.94 | ) | | $ | — | | | $ | 28.66 | | | | 12.88 | % | | $ | 57.7 | | | | 1.10 | % | | | 1.10 | % | | | 0.25 | % | | | 59 | % | |
| 8/31/2017g | | $ | 29.14 | | | $ | 0.04 | | | $ | 4.19 | | | $ | 4.23 | | | $ | (0.14 | ) | | $ | (4.05 | ) | | $ | — | | | $ | (4.19 | ) | | $ | 0.00 | | | $ | 29.18 | | | | 16.61 | %hj | | $ | 63.0 | | | | 1.10 | % | | | 1.09 | %e | | | 0.10 | %e | | | 72 | % | |
| 8/31/2016g | | $ | 29.62 | | | $ | 0.12 | | | $ | 1.70 | | | $ | 1.82 | | | $ | (0.29 | ) | | $ | (2.01 | ) | | $ | — | | | $ | (2.30 | ) | | $ | — | | | $ | 29.14 | | | | 6.50 | % | | $ | 70.4 | | | | 1.11 | % | | | 1.11 | % | | | 0.47 | % | | | 89 | % | |
Advisor Class | |
8/31/2020 | | $ | 25.69 | | | $ | (0.05 | ) | | $ | 6.19 | | | $ | 6.14 | | | $ | (0.02 | ) | | $ | (3.06 | ) | | $ | — | | | $ | (3.08 | ) | | $ | — | | | $ | 28.75 | | | | 25.70 | % | | $ | 1.9 | | | | 1.27 | % | | | 1.27 | % | | | (0.22 | )% | | | 130 | % | |
8/31/2019 | | $ | 28.62 | | | $ | 0.04 | | | $ | (1.05 | ) | | $ | (1.01 | ) | | $ | — | | | $ | (1.92 | ) | | $ | — | | | $ | (1.92 | ) | | $ | — | | | $ | 25.69 | | | | (2.68 | )% | | $ | 1.6 | | | | 1.27 | % | | | 1.27 | % | | | 0.14 | % | | | 20 | % | |
| 8/31/2018g | | $ | 37.33 | | | $ | 0.03 | | | $ | 3.63 | | | $ | 3.66 | | | $ | — | | | $ | (12.37 | ) | | $ | — | | | $ | (12.37 | ) | | $ | — | | | $ | 28.62 | | | | 12.62 | % | | $ | 2.3 | | | | 1.26 | % | | | 1.26 | % | | | 0.09 | % | | | 59 | % | |
| 8/31/2017g | | $ | 45.35 | | | $ | (0.00 | ) | | $ | 5.52 | | | $ | 5.52 | | | $ | (0.64 | ) | | $ | (12.90 | ) | | $ | — | | | $ | (13.54 | ) | | $ | 0.00 | | | $ | 37.33 | | | | 16.51 | %hj | | $ | 3.5 | | | | 1.26 | % | | | 1.23 | %e | | | (0.04 | )%e | | | 72 | % | |
| 8/31/2016g | | $ | 50.00 | | | $ | 0.17 | | | $ | 2.62 | | | $ | 2.79 | | | $ | (1.05 | ) | | $ | (6.39 | ) | | $ | — | | | $ | (7.44 | ) | | $ | — | | | $ | 45.35 | | | | 6.33 | % | | $ | 3.9 | | | | 1.26 | % | | | 1.26 | % | | | 0.33 | % | | | 89 | % | |
Institutional Class | |
8/31/2020 | | $ | 25.79 | | | $ | 0.07 | | | $ | 6.22 | | | $ | 6.29 | | | $ | (0.24 | ) | | $ | (3.06 | ) | | $ | — | | | $ | (3.30 | ) | | $ | — | | | $ | 28.78 | | | | 26.32 | % | | $ | 14.1 | | | | 0.75 | % | | | 0.75 | % | | | 0.26 | % | | | 130 | % | |
8/31/2019 | | $ | 28.72 | | | $ | 0.17 | | | $ | (1.05 | ) | | $ | (0.88 | ) | | $ | (0.13 | ) | | $ | (1.92 | ) | | $ | — | | | $ | (2.05 | ) | | $ | — | | | $ | 25.79 | | | | (2.15 | )% | | $ | 8.9 | | | | 0.76 | % | | | 0.75 | % | | | 0.67 | % | | | 20 | % | |
| 8/31/2018g | | $ | 27.53 | | | $ | 0.16 | | | $ | 3.27 | | | $ | 3.43 | | | $ | (0.12 | ) | | $ | (2.12 | ) | | $ | — | | | $ | (2.24 | ) | | $ | — | | | $ | 28.72 | | | | 13.20 | % | | $ | 8.6 | | | | 0.75 | % | | | 0.75 | %§ | | | 0.60 | % | | | 59 | % | |
| 8/31/2017g | | $ | 25.83 | | | $ | 0.11 | | | $ | 3.95 | | | $ | 4.06 | | | $ | (0.14 | ) | | $ | (2.22 | ) | | $ | — | | | $ | (2.36 | ) | | $ | 0.00 | | | $ | 27.53 | | | | 17.04 | %j | | $ | 7.8 | | | | 0.76 | % | | | 0.75 | % | | | 0.44 | % | | | 72 | % | |
| 8/31/2016g | | $ | 25.47 | | | $ | 0.22 | | | $ | 1.46 | | | $ | 1.68 | | | $ | (0.22 | ) | | $ | (1.10 | ) | | $ | — | | | $ | (1.32 | ) | | $ | — | | | $ | 25.83 | | | | 6.86 | % | | $ | 6.8 | | | | 0.76 | % | | | 0.75 | % | | | 0.89 | % | | | 89 | % | |
Class A | |
8/31/2020 | | $ | 25.69 | | | $ | (0.02 | ) | | $ | 6.20 | | | $ | 6.18 | | | $ | (0.08 | ) | | $ | (3.06 | ) | | $ | — | | | $ | (3.14 | ) | | $ | — | | | $ | 28.73 | | | | 25.90 | % | | $ | 3.0 | | | | 1.12 | % | | | 1.11 | % | | | (0.06 | )% | | | 130 | % | |
8/31/2019 | | $ | 28.65 | | | $ | 0.08 | | | $ | (1.05 | ) | | $ | (0.97 | ) | | $ | (0.07 | ) | | $ | (1.92 | ) | | $ | — | | | $ | (1.99 | ) | | $ | — | | | $ | 25.69 | | | | (2.51 | )% | | $ | 2.7 | | | | 1.12 | % | | | 1.11 | % | | | 0.32 | % | | | 20 | % | |
| 8/31/2018g | | $ | 29.24 | | | $ | 0.07 | | | $ | 3.34 | | | $ | 3.41 | | | $ | (0.06 | ) | | $ | (3.94 | ) | | $ | — | | | $ | (4.00 | ) | | $ | — | | | $ | 28.65 | | | | 12.80 | % | | $ | 3.4 | | | | 1.12 | % | | | 1.11 | % | | | 0.23 | % | | | 59 | % | |
| 8/31/2017g | | $ | 29.28 | | | $ | 0.02 | | | $ | 4.22 | | | $ | 4.24 | | | $ | (0.17 | ) | | $ | (4.11 | ) | | $ | — | | | $ | (4.28 | ) | | $ | 0.00 | | | $ | 29.24 | | | | 16.58 | %j | | $ | 3.1 | | | | 1.13 | % | | | 1.11 | % | | | 0.07 | % | | | 72 | % | |
| 8/31/2016g | | $ | 29.80 | | | $ | 0.13 | | | $ | 1.70 | | | $ | 1.83 | | | $ | (0.31 | ) | | $ | (2.04 | ) | | $ | — | | | $ | (2.35 | ) | | $ | — | | | $ | 29.28 | | | | 6.52 | % | | $ | 3.2 | | | | 1.15 | % | | | 1.11 | % | | | 0.48 | % | | | 89 | % | |
Class C | |
8/31/2020 | | $ | 25.42 | | | $ | (0.20 | ) | | $ | 6.11 | | | $ | 5.91 | | | $ | — | | | $ | (3.06 | ) | | $ | — | | | $ | (3.06 | ) | | $ | — | | | $ | 28.27 | | | | 24.96 | % | | $ | 1.4 | | | | 1.87 | % | | | 1.86 | % | | | (0.81 | )% | | | 130 | % | |
8/31/2019 | | $ | 28.50 | | | $ | (0.11 | ) | | $ | (1.05 | ) | | $ | (1.16 | ) | | $ | — | | | $ | (1.92 | ) | | $ | — | | | $ | (1.92 | ) | | $ | — | | | $ | 25.42 | | | | (3.25 | )% | | $ | 1.2 | | | | 1.88 | % | | | 1.86 | % | | | (0.43 | )% | | | 20 | % | |
| 8/31/2018g | | $ | 38.78 | | | $ | (0.16 | ) | | $ | 3.68 | | | $ | 3.52 | | | $ | — | | | $ | (13.80 | ) | | $ | — | | | $ | (13.80 | ) | | $ | — | | | $ | 28.50 | | | | 11.92 | % | | $ | 1.7 | | | | 1.87 | % | | | 1.86 | % | | | (0.52 | )% | | | 59 | % | |
| 8/31/2017g | | $ | 48.05 | | | $ | (0.25 | ) | | $ | 5.77 | | | $ | 5.52 | | | $ | (0.39 | ) | | $ | (14.40 | ) | | $ | — | | | $ | (14.79 | ) | | $ | 0.00 | | | $ | 38.78 | | | | 15.76 | %j | | $ | 1.9 | | | | 1.88 | % | | | 1.86 | % | | | (0.67 | )% | | | 72 | % | |
| 8/31/2016g | | $ | 53.44 | | | $ | (0.13 | ) | | $ | 2.84 | | | $ | 2.71 | | | $ | (0.97 | ) | | $ | (7.13 | ) | | $ | — | | | $ | (8.10 | ) | | $ | — | | | $ | 48.05 | | | | 5.75 | % | | $ | 2.2 | | | | 1.90 | % | | | 1.86 | % | | | (0.27 | )% | | | 89 | % | |
See Notes to Financial Highlights
219
220
Financial Highlights (cont'd)
| | | Net Asset
Value,
Beginning
of Year | | Net
Investment
Income/(Loss)@ | | Net Gains or
Losses on
Securities
(both realized
and
unrealized) | | Total From
Investment
Operations | | Dividends
from Net
Investment
Income | | Distributions
from Net
Realized
Capital Gains | | Tax
Return of
Capital | | Total
Distributions | | Voluntary
Contribution
from
Management | | Net Asset
Value, End of
Year | | Total Returnab | | Net Assets,
End of Year
(in millions) | | Ratio of Gross
Expenses to
Average Net
Assets# | | Ratio of Net
Expenses to
Average Net
Assets | | Ratio of Net
Investment
Income/
(Loss) to
Average Net
Assets | | Portfolio
Turnover
Rate | |
Genesis Fund | |
Investor Class | |
8/31/2020 | | $ | 58.54 | | | $ | 0.02 | | | $ | 7.59 | | | $ | 7.61 | | | $ | (0.03 | ) | | $ | (3.38 | ) | | $ | — | | | $ | (3.41 | ) | | $ | — | | | $ | 62.74 | | | | 13.48 | % | | $ | 1,677.3 | | | | 1.01 | % | | | 1.01 | % | | | 0.03 | % | | | 11 | % | |
8/31/2019 | | $ | 65.27 | | | $ | 0.05 | | | $ | (0.91 | ) | | $ | (0.86 | ) | | $ | (0.03 | ) | | $ | (5.84 | ) | | $ | — | | | $ | (5.87 | ) | | $ | — | | | $ | 58.54 | | | | 0.53 | % | | $ | 1,649.3 | | | | 1.01 | % | | | 1.01 | % | | | 0.08 | % | | | 14 | % | |
| 8/31/2018f | | $ | 58.73 | | | $ | 0.07 | | | $ | 14.47 | | | $ | 14.54 | | | $ | (0.11 | ) | | $ | (7.89 | ) | | $ | — | | | $ | (8.00 | ) | | $ | — | | | $ | 65.27 | | | | 26.73 | % | | $ | 1,919.1 | | | | 1.02 | % | | | 1.02 | % | | | 0.11 | % | | | 13 | % | |
| 8/31/2017f | | $ | 59.25 | | | $ | 0.12 | | | $ | 5.73 | | | $ | 5.85 | | | $ | (0.26 | ) | | $ | (6.11 | ) | | $ | — | | | $ | (6.37 | ) | | $ | — | | | $ | 58.73 | | | | 10.19 | %h | | $ | 1,786.0 | | | | 1.02 | % | | | 1.01 | %e | | | 0.21 | %e | | | 20 | % | |
| 8/31/2016f | | $ | 63.04 | | | $ | 0.16 | | | $ | 5.95 | | | $ | 6.11 | | | $ | (0.26 | ) | | $ | (9.64 | ) | | $ | — | | | $ | (9.90 | ) | | $ | — | | | $ | 59.25 | | | | 11.43 | % | | $ | 1,752.8 | | | | 1.03 | % | | | 1.03 | % | | | 0.28 | % | | | 16 | % | |
Trust Class | |
8/31/2020 | | $ | 58.54 | | | $ | (0.03 | ) | | $ | 7.59 | | | $ | 7.56 | | | $ | (0.01 | ) | | $ | (3.38 | ) | | $ | — | | | $ | (3.39 | ) | | $ | — | | | $ | 62.71 | | | | 13.38 | % | | $ | 1,239.6 | | | | 1.09 | % | | | 1.09 | % | | | (0.06 | )% | | | 11 | % | |
8/31/2019 | | $ | 65.30 | | | $ | (0.00 | ) | | $ | (0.91 | ) | | $ | (0.91 | ) | | $ | (0.01 | ) | | $ | (5.84 | ) | | $ | — | | | $ | (5.85 | ) | | $ | — | | | $ | 58.54 | | | | 0.43 | % | | $ | 1,409.3 | | | | 1.10 | % | | | 1.10 | % | | | (0.01 | )% | | | 14 | % | |
| 8/31/2018f | | $ | 58.73 | | | $ | 0.02 | | | $ | 14.49 | | | $ | 14.51 | | | $ | (0.05 | ) | | $ | (7.89 | ) | | $ | — | | | $ | (7.94 | ) | | $ | — | | | $ | 65.30 | | | | 26.64 | % | | $ | 1,561.6 | | | | 1.10 | % | | | 1.10 | % | | | 0.03 | % | | | 13 | % | |
| 8/31/2017f | | $ | 56.48 | | | $ | 0.08 | | | $ | 5.54 | | | $ | 5.62 | | | $ | (0.03 | ) | | $ | (3.34 | ) | | $ | — | | | $ | (3.37 | ) | | $ | — | | | $ | 58.73 | | | | 10.11 | %h | | $ | 1,576.2 | | | | 1.09 | % | | | 1.08 | %e | | | 0.13 | %e | | | 20 | % | |
| 8/31/2016f | | $ | 56.00 | | | $ | 0.11 | | | $ | 5.67 | | | $ | 5.78 | | | $ | (0.03 | ) | | $ | (5.27 | ) | | $ | — | | | $ | (5.30 | ) | | $ | — | | | $ | 56.48 | | | | 11.35 | % | | $ | 1,761.0 | | | | 1.10 | % | | | 1.10 | % | | | 0.21 | % | | | 16 | % | |
Advisor Class | |
8/31/2020 | | $ | 58.32 | | | $ | (0.18 | ) | | $ | 7.55 | | | $ | 7.37 | | | $ | — | | | $ | (3.38 | ) | | $ | — | | | $ | (3.38 | ) | | $ | — | | | $ | 62.31 | | | | 13.10 | % | | $ | 131.3 | | | | 1.35 | % | | | 1.35 | % | | | (0.31 | )% | | | 11 | % | |
8/31/2019 | | $ | 65.23 | | | $ | (0.15 | ) | | $ | (0.92 | ) | | $ | (1.07 | ) | | $ | — | | | $ | (5.84 | ) | | $ | — | | | $ | (5.84 | ) | | $ | — | | | $ | 58.32 | | | | 0.18 | % | | $ | 157.0 | | | | 1.35 | % | | | 1.35 | % | | | (0.26 | )% | | | 14 | % | |
| 8/31/2018f | | $ | 58.77 | | | $ | (0.14 | ) | | $ | 14.49 | | | $ | 14.35 | | | $ | — | | | $ | (7.89 | ) | | $ | — | | | $ | (7.89 | ) | | $ | — | | | $ | 65.23 | | | | 26.31 | % | | $ | 198.1 | | | | 1.35 | % | | | 1.35 | % | | | (0.23 | )% | | | 13 | % | |
| 8/31/2017f | | $ | 62.10 | | | $ | (0.08 | ) | | $ | 5.93 | | | $ | 5.85 | | | $ | (0.19 | ) | | $ | (8.99 | ) | | $ | — | | | $ | (9.18 | ) | | $ | — | | | $ | 58.77 | | | | 9.81 | %h | | $ | 203.8 | | | | 1.36 | % | | | 1.35 | %e | | | (0.13 | )%e | | | 20 | % | |
| 8/31/2016f | | $ | 70.12 | | | $ | (0.05 | ) | | $ | 6.28 | | | $ | 6.23 | | | $ | (0.07 | ) | | $ | (14.18 | ) | | $ | — | | | $ | (14.25 | ) | | $ | — | | | $ | 62.10 | | | | 11.06 | % | | $ | 264.9 | | | | 1.38 | % | | | 1.38 | % | | | (0.07 | )% | | | 16 | % | |
Institutional Class | |
8/31/2020 | | $ | 58.48 | | | $ | 0.11 | | | $ | 7.58 | | | $ | 7.69 | | | $ | (0.13 | ) | | $ | (3.38 | ) | | $ | — | | | $ | (3.51 | ) | | $ | — | | | $ | 62.66 | | | | 13.65 | % | | $ | 3,032.9 | | | | 0.84 | % | | | 0.84 | % | | | 0.19 | % | | | 11 | % | |
8/31/2019 | | $ | 65.24 | | | $ | 0.14 | | | $ | (0.92 | ) | | $ | (0.78 | ) | | $ | (0.14 | ) | | $ | (5.84 | ) | | $ | — | | | $ | (5.98 | ) | | $ | — | | | $ | 58.48 | | | | 0.69 | % | | $ | 2,809.8 | | | | 0.85 | % | | | 0.85 | % | | | 0.25 | % | | | 14 | % | |
8/31/2018 | | $ | 58.71 | | | $ | 0.17 | | | $ | 14.47 | | | $ | 14.64 | | | $ | (0.22 | ) | | $ | (7.89 | ) | | $ | — | | | $ | (8.11 | ) | | $ | — | | | $ | 65.24 | | | | 26.96 | % | | $ | 3,253.8 | | | | 0.85 | % | | | 0.85 | % | | | 0.28 | % | | | 13 | % | |
8/31/2017 | | $ | 56.64 | | | $ | 0.22 | | | $ | 5.56 | | | $ | 5.78 | | | $ | (0.19 | ) | | $ | (3.52 | ) | | $ | — | | | $ | (3.71 | ) | | $ | — | | | $ | 58.71 | | | | 10.40 | %h | | $ | 3,650.3 | | | | 0.85 | % | | | 0.84 | %e§ | | | 0.38 | %e | | | 20 | % | |
8/31/2016 | | $ | 56.48 | | | $ | 0.25 | | | $ | 5.67 | | | $ | 5.92 | | | $ | (0.21 | ) | | $ | (5.55 | ) | | $ | — | | | $ | (5.76 | ) | | $ | — | | | $ | 56.64 | | | | 11.62 | % | | $ | 3,483.9 | | | | 0.85 | % | | | 0.85 | %§ | | | 0.47 | % | | | 16 | % | |
Class R6 | |
8/31/2020 | | $ | 58.45 | | | $ | 0.16 | | | $ | 7.58 | | | $ | 7.74 | | | $ | (0.19 | ) | | $ | (3.38 | ) | | $ | — | | | $ | (3.57 | ) | | $ | — | | | $ | 62.62 | | | | 13.74 | % | | $ | 4,420.9 | | | | 0.75 | % | | | 0.75 | %§ | | | 0.28 | % | | | 11 | % | |
8/31/2019 | | $ | 65.23 | | | $ | 0.19 | | | $ | (0.93 | ) | | $ | (0.74 | ) | | $ | (0.20 | ) | | $ | (5.84 | ) | | $ | — | | | $ | (6.04 | ) | | $ | — | | | $ | 58.45 | | | | 0.80 | % | | $ | 4,221.1 | | | | 0.75 | % | | | 0.75 | % | | | 0.34 | % | | | 14 | % | |
| 8/31/2018f | | $ | 58.70 | | | $ | 0.23 | | | $ | 14.46 | | | $ | 14.69 | | | $ | (0.27 | ) | | $ | (7.89 | ) | | $ | — | | | $ | (8.16 | ) | | $ | — | | | $ | 65.23 | | | | 27.07 | % | | $ | 4,372.3 | | | | 0.78 | % | | | 0.75 | % | | | 0.38 | % | | | 13 | % | |
| 8/31/2017f | | $ | 56.63 | | | $ | 0.26 | | | $ | 5.56 | | | $ | 5.82 | | | $ | (0.23 | ) | | $ | (3.52 | ) | | $ | — | | | $ | (3.75 | ) | | $ | — | | | $ | 58.70 | | | | 10.47 | %h | | $ | 3,603.6 | | | | 0.77 | % | | | 0.77 | %e§ | | | 0.45 | %e | | | 20 | % | |
| 8/31/2016f | | $ | 56.48 | | | $ | 0.29 | | | $ | 5.67 | | | $ | 5.96 | | | $ | (0.26 | ) | | $ | (5.55 | ) | | $ | — | | | $ | (5.81 | ) | | $ | — | | | $ | 56.63 | | | | 11.69 | % | | $ | 3,381.6 | | | | 0.78 | % | | | 0.78 | %§ | | | 0.54 | % | | | 16 | % | |
See Notes to Financial Highlights
221
222
Financial Highlights (cont'd)
| | | Net Asset
Value,
Beginning
of Year | | Net
Investment
Income/(Loss)@ | | Net Gains or
Losses on
Securities
(both realized
and
unrealized) | | Total From
Investment
Operations | | Dividends
from Net
Investment
Income | | Distributions
from Net
Realized
Capital Gains | | Tax
Return of
Capital | | Total
Distributions | | Voluntary
Contribution
from
Management | | Net Asset
Value, End of
Year | | Total Returnab | | Net Assets,
End of Year
(in millions) | | Ratio of Gross
Expenses to
Average Net
Assets# | | Ratio of Net
Expenses to
Average Net
Assets | | Ratio of Net
Investment
Income/
(Loss) to
Average Net
Assets | | Portfolio
Turnover
Rate | |
Global Real Estate Fund | |
Institutional Class | |
8/31/2020 | | $ | 11.94 | | | $ | 0.17 | | | $ | (0.58 | ) | | $ | (0.41 | ) | | $ | (0.32 | ) | | $ | (0.21 | ) | | $ | (0.03 | ) | | $ | (0.56 | ) | | $ | — | | | $ | 10.97 | | | | (3.48 | )% | | $ | 1.4 | | | | 8.80 | % | | | 1.01 | % | | | 1.47 | % | | | 49 | % | |
8/31/2019 | | $ | 10.85 | | | $ | 0.16 | | | $ | 1.31 | | | $ | 1.47 | | | $ | (0.26 | ) | | $ | (0.12 | ) | | $ | — | | | $ | (0.38 | ) | | $ | — | | | $ | 11.94 | | | | 14.01 | % | | $ | 3.4 | | | | 9.11 | % | | | 1.01 | % | | | 1.46 | % | | | 38 | % | |
8/31/2018 | | $ | 10.64 | | | $ | 0.17 | | | $ | 0.35 | | | $ | 0.52 | | | $ | (0.21 | ) | | $ | (0.10 | ) | | $ | — | | | $ | (0.31 | ) | | $ | — | | | $ | 10.85 | | | | 4.98 | % | | $ | 2.3 | | | | 11.12 | % | | | 1.01 | % | | | 1.62 | % | | | 48 | % | |
8/31/2017 | | $ | 10.62 | | | $ | 0.17 | | | $ | 0.22 | | | $ | 0.39 | | | $ | (0.33 | ) | | $ | (0.04 | ) | | $ | — | | | $ | (0.37 | ) | | $ | — | | | $ | 10.64 | | | | 4.01 | % | | $ | 2.2 | | | | 10.97 | % | | | 1.01 | % | | | 1.67 | % | | | 61 | % | |
8/31/2016 | | $ | 9.32 | | | $ | 0.17 | | | $ | 1.35 | | | $ | 1.52 | | | $ | (0.22 | ) | | $ | (0.00 | ) | | $ | — | | | $ | (0.22 | ) | | $ | — | | | $ | 10.62 | | | | 16.49 | % | | $ | 2.1 | | | | 10.93 | % | | | 1.00 | % | | | 1.68 | % | | | 44 | % | |
Class A | |
8/31/2020 | | $ | 11.93 | | | $ | 0.12 | | | $ | (0.58 | ) | | $ | (0.46 | ) | | $ | (0.28 | ) | | $ | (0.21 | ) | | $ | (0.03 | ) | | $ | (0.52 | ) | | $ | — | | | $ | 10.95 | | | | (3.93 | )% | | $ | 0.2 | | | | 9.28 | % | | | 1.37 | % | | | 1.10 | % | | | 49 | % | |
8/31/2019 | | $ | 10.84 | | | $ | 0.12 | | | $ | 1.31 | | | $ | 1.43 | | | $ | (0.22 | ) | | $ | (0.12 | ) | | $ | — | | | $ | (0.34 | ) | | $ | — | | | $ | 11.93 | | | | 13.65 | % | | $ | 0.4 | | | | 9.72 | % | | | 1.37 | % | | | 1.07 | % | | | 38 | % | |
8/31/2018 | | $ | 10.64 | | | $ | 0.13 | | | $ | 0.34 | | | $ | 0.47 | | | $ | (0.17 | ) | | $ | (0.10 | ) | | $ | — | | | $ | (0.27 | ) | | $ | — | | | $ | 10.84 | | | | 4.47 | % | | $ | 0.3 | | | | 11.57 | % | | | 1.37 | % | | | 1.23 | % | | | 48 | % | |
8/31/2017 | | $ | 10.61 | | | $ | 0.14 | | | $ | 0.22 | | | $ | 0.36 | | | $ | (0.29 | ) | | $ | (0.04 | ) | | $ | — | | | $ | (0.33 | ) | | $ | — | | | $ | 10.64 | | | | 3.71 | % | | $ | 0.5 | | | | 11.23 | % | | | 1.37 | % | | | 1.41 | % | | | 61 | % | |
8/31/2016 | | $ | 9.31 | | | $ | 0.13 | | | $ | 1.35 | | | $ | 1.48 | | | $ | (0.18 | ) | | $ | (0.00 | ) | | $ | — | | | $ | (0.18 | ) | | $ | — | | | $ | 10.61 | | | | 16.09 | % | | $ | 0.7 | | | | 11.31 | % | | | 1.36 | % | | | 1.32 | % | | | 44 | % | |
Class C | |
8/31/2020 | | $ | 11.89 | | | $ | 0.04 | | | $ | (0.58 | ) | | $ | (0.54 | ) | | $ | (0.20 | ) | | $ | (0.21 | ) | | $ | (0.03 | ) | | $ | (0.44 | ) | | $ | — | | | $ | 10.91 | | | | (4.65 | )% | | $ | 0.2 | | | | 9.88 | % | | | 2.12 | % | | | 0.35 | % | | | 49 | % | |
8/31/2019 | | $ | 10.81 | | | $ | 0.04 | | | $ | 1.30 | | | $ | 1.34 | | | $ | (0.14 | ) | | $ | (0.12 | ) | | $ | — | | | $ | (0.26 | ) | | $ | — | | | $ | 11.89 | | | | 12.75 | % | | $ | 0.3 | | | | 10.43 | % | | | 2.12 | % | | | 0.32 | % | | | 38 | % | |
8/31/2018 | | $ | 10.62 | | | $ | 0.06 | | | $ | 0.34 | | | $ | 0.40 | | | $ | (0.11 | ) | | $ | (0.10 | ) | | $ | — | | | $ | (0.21 | ) | | $ | — | | | $ | 10.81 | | | | 3.81 | % | | $ | 0.3 | | | | 12.21 | % | | | 2.12 | % | | | 0.53 | % | | | 48 | % | |
8/31/2017 | | $ | 10.59 | | | $ | 0.06 | | | $ | 0.23 | | | $ | 0.29 | | | $ | (0.22 | ) | | $ | (0.04 | ) | | $ | — | | | $ | (0.26 | ) | | $ | — | | | $ | 10.62 | | | | 2.96 | % | | $ | 0.3 | | | | 12.10 | % | | | 2.12 | % | | | 0.56 | % | | | 61 | % | |
8/31/2016 | | $ | 9.30 | | | $ | 0.06 | | | $ | 1.34 | | | $ | 1.40 | | | $ | (0.11 | ) | | $ | (0.00 | ) | | $ | — | | | $ | (0.11 | ) | | $ | — | | | $ | 10.59 | | | | 15.15 | % | | $ | 0.3 | | | | 12.04 | % | | | 2.11 | % | | | 0.56 | % | | | 44 | % | |
Greater China Equity Fund | |
Institutional Class | |
8/31/2020 | | $ | 9.28 | | | $ | 0.06 | | | $ | 2.24 | | | $ | 2.30 | | | $ | (0.09 | ) | | $ | — | | | $ | — | | | $ | (0.09 | ) | | $ | — | | | $ | 11.49 | | | | 24.93 | % | | $ | 52.3 | | | | 1.81 | % | | | 1.51 | % | | | 0.64 | % | | | 82 | % | |
8/31/2019 | | $ | 14.80 | | | $ | 0.09 | | | $ | (0.96 | ) | | $ | (0.87 | ) | | $ | — | | | $ | (4.65 | ) | | $ | — | | | $ | (4.65 | ) | | $ | — | | | $ | 9.28 | | | | (1.03 | )% | | $ | 45.2 | | | | 1.84 | % | | | 1.52 | %^^ | | | 0.85 | % | | | 46 | % | |
8/31/2018 | | $ | 15.85 | | | $ | 0.00 | | | $ | 0.77 | | | $ | 0.77 | | | $ | (0.18 | ) | | $ | (1.64 | ) | | $ | — | | | $ | (1.82 | ) | | $ | — | | | $ | 14.80 | | | | 4.37 | % | | $ | 79.0 | | | | 1.58 | % | | | 1.51 | % | | | 0.03 | % | | | 60 | % | |
8/31/2017 | | $ | 11.50 | | | $ | 0.09 | | | $ | 4.31 | | | $ | 4.40 | | | $ | (0.05 | ) | | $ | — | | | $ | — | | | $ | (0.05 | ) | | $ | — | | | $ | 15.85 | | | | 38.46 | % | | $ | 109.4 | | | | 1.69 | % | | | 1.51 | %^^ | | | 0.72 | % | | | 116 | % | |
8/31/2016 | | $ | 11.64 | | | $ | 0.05 | | | $ | 1.32 | | | $ | 1.37 | | | $ | (0.10 | ) | | $ | (1.41 | ) | | $ | — | | | $ | (1.51 | ) | | $ | — | | | $ | 11.50 | | | | 12.09 | % | | $ | 93.3 | | | | 1.76 | % | | | 1.51 | %^^ | | | 0.44 | % | | | 120 | % | |
Class A | |
8/31/2020 | | $ | 9.21 | | | $ | (0.00 | ) | | $ | 2.25 | | | $ | 2.25 | | | $ | (0.05 | ) | | $ | — | | | $ | — | | | $ | (0.05 | ) | | $ | — | | | $ | 11.41 | | | | 24.51 | % | | $ | 4.3 | | | | 2.29 | % | | | 1.87 | % | | | (0.04 | )% | | | 82 | % | |
8/31/2019 | | $ | 14.77 | | | $ | 0.06 | | | $ | (0.97 | ) | | $ | (0.91 | ) | | $ | — | | | $ | (4.65 | ) | | $ | — | | | $ | (4.65 | ) | | $ | — | | | $ | 9.21 | | | | (1.40 | )% | | $ | 6.1 | | | | 2.32 | % | | | 1.88 | %^^ | | | 0.54 | % | | | 46 | % | |
8/31/2018 | | $ | 15.86 | | | $ | (0.08 | ) | | $ | 0.80 | | | $ | 0.72 | | | $ | (0.17 | ) | | $ | (1.64 | ) | | $ | — | | | $ | (1.81 | ) | | $ | — | | | $ | 14.77 | | | | 4.02 | % | | $ | 10.2 | | | | 2.01 | % | | | 1.87 | % | | | (0.47 | )% | | | 60 | % | |
8/31/2017 | | $ | 11.50 | | | $ | 0.19 | | | $ | 4.17 | | | $ | 4.36 | | | $ | (0.00 | ) | | $ | — | | | $ | — | | | $ | (0.00 | ) | | $ | — | | | $ | 15.86 | | | | 37.95 | % | | $ | 21.7 | | | | 2.07 | % | | | 1.86 | %^^ | | | 1.38 | % | | | 116 | % | |
8/31/2016 | | $ | 11.56 | | | $ | (0.01 | ) | | $ | 1.39 | | | $ | 1.38 | | | $ | (0.03 | ) | | $ | (1.41 | ) | | $ | — | | | $ | (1.44 | ) | | $ | — | | | $ | 11.50 | | | | 12.19 | % | | $ | 2.1 | | | | 2.19 | % | | | 1.87 | %^^ | | | (0.08 | )% | | | 120 | % | |
See Notes to Financial Highlights
223
224
Financial Highlights (cont'd)
| | | Net Asset
Value,
Beginning
of Year | | Net
Investment
Income/(Loss)@ | | Net Gains or
Losses on
Securities
(both realized
and
unrealized) | | Total From
Investment
Operations | | Dividends
from Net
Investment
Income | | Distributions
from Net
Realized
Capital Gains | | Tax
Return of
Capital | | Total
Distributions | | Voluntary
Contribution
from
Management | | Net Asset
Value, End of
Year | | Total Returnab | | Net Assets,
End of Year
(in millions) | | Ratio of Gross
Expenses to
Average Net
Assets# | | Ratio of Net
Expenses to
Average Net
Assets | | Ratio of Net
Investment
Income/
(Loss) to
Average Net
Assets | | Portfolio
Turnover
Rate | |
Greater China Equity Fund (cont'd) | |
Class C | |
8/31/2020 | | $ | 8.68 | | | $ | (0.05 | ) | | $ | 2.10 | | | $ | 2.05 | | | $ | — | | | $ | — | | | $ | — | | | $ | — | | | $ | — | | | $ | 10.73 | | | | 23.62 | % | | $ | 0.2 | | | | 2.95 | % | | | 2.62 | % | | | (0.53 | )% | | | 82 | % | |
8/31/2019 | | $ | 14.31 | | | $ | (0.02 | ) | | $ | (0.96 | ) | | $ | (0.98 | ) | | $ | — | | | $ | (4.65 | ) | | $ | — | | | $ | (4.65 | ) | | $ | — | | | $ | 8.68 | | | | (2.13 | )% | | $ | 0.2 | | | | 3.07 | % | | | 2.63 | %^^ | | | (0.19 | )% | | | 46 | % | |
8/31/2018 | | $ | 15.43 | | | $ | (0.16 | ) | | $ | 0.75 | | | $ | 0.59 | | | $ | (0.07 | ) | | $ | (1.64 | ) | | $ | — | | | $ | (1.71 | ) | | $ | — | | | $ | 14.31 | | | | 3.26 | % | | $ | 0.3 | | | | 2.80 | % | | | 2.62 | % | | | (0.99 | )% | | | 60 | % | |
8/31/2017 | | $ | 11.27 | | | $ | (0.14 | ) | | $ | 4.30 | | | $ | 4.16 | | | $ | — | | | $ | — | | | $ | — | | | $ | — | | | $ | — | | | $ | 15.43 | | | | 36.91 | % | | $ | 0.3 | | | | 2.80 | % | | | 2.62 | %^^ | | | (1.18 | )% | | | 116 | % | |
8/31/2016 | | $ | 11.45 | | | $ | (0.07 | ) | | $ | 1.30 | | | $ | 1.23 | | | $ | — | | | $ | (1.41 | ) | | $ | — | | | $ | (1.41 | ) | | $ | — | | | $ | 11.27 | | | | 10.93 | % | | $ | 0.1 | | | | 2.86 | % | | | 2.62 | %^^ | | | (0.65 | )% | | | 120 | % | |
Guardian Fund | |
Investor Class | |
8/31/2020 | | $ | 18.30 | | | $ | 0.05 | | | $ | 6.20 | | | $ | 6.25 | | | $ | (0.07 | ) | | $ | (1.10 | ) | | $ | — | | | $ | (1.17 | ) | | $ | — | | | $ | 23.38 | | | | 35.76 | % | | $ | 1,419.5 | | | | 0.87 | % | | | 0.87 | % | | | 0.26 | % | | | 49 | % | |
8/31/2019 | | $ | 19.52 | | | $ | 0.10 | | | $ | 0.32 | | | $ | 0.42 | | | $ | (0.11 | ) | | $ | (1.53 | ) | | $ | — | | | $ | (1.64 | ) | | $ | — | | | $ | 18.30 | | | | 4.03 | % | | $ | 1,125.5 | | | | 0.89 | % | | | 0.89 | % | | | 0.56 | % | | | 37 | % | |
8/31/2018 | | $ | 17.12 | | | $ | 0.11 | | | $ | 3.49 | | | $ | 3.60 | | | $ | (0.11 | ) | | $ | (1.09 | ) | | $ | — | | | $ | (1.20 | ) | | $ | — | | | $ | 19.52 | | | | 21.86 | % | | $ | 1,187.2 | | | | 0.88 | % | | | 0.88 | % | | | 0.62 | % | | | 41 | % | |
8/31/2017 | | $ | 16.45 | | | $ | 0.12 | | | $ | 2.51 | | | $ | 2.63 | | | $ | (0.11 | ) | | $ | (1.85 | ) | | $ | — | | | $ | (1.96 | ) | | $ | — | | | $ | 17.12 | | | | 17.60 | %h | | $ | 1,052.4 | | | | 0.90 | % | | | 0.89 | %e | | | 0.77 | %e | | | 37 | % | |
8/31/2016 | | $ | 17.13 | | | $ | 0.09 | | | $ | 1.21 | | | $ | 1.30 | | | $ | (0.12 | ) | | $ | (1.86 | ) | | $ | — | | | $ | (1.98 | ) | | $ | — | | | $ | 16.45 | | | | 8.45 | % | | $ | 993.3 | | | | 0.93 | % | | | 0.93 | % | | | 0.58 | % | | | 99 | % | |
Trust Class | |
8/31/2020 | | $ | 18.28 | | | $ | 0.02 | | | $ | 6.20 | | | $ | 6.22 | | | $ | (0.04 | ) | | $ | (1.10 | ) | | $ | — | | | $ | (1.14 | ) | | $ | — | | | $ | 23.36 | | | | 35.55 | % | | $ | 42.7 | | | | 1.05 | % | | | 1.05 | % | | | 0.08 | % | | | 49 | % | |
8/31/2019 | | $ | 19.51 | | | $ | 0.07 | | | $ | 0.31 | | | $ | 0.38 | | | $ | (0.08 | ) | | $ | (1.53 | ) | | $ | — | | | $ | (1.61 | ) | | $ | — | | | $ | 18.28 | | | | 3.77 | % | | $ | 45.5 | | | | 1.06 | % | | | 1.06 | % | | | 0.38 | % | | | 37 | % | |
| 8/31/2018g | | $ | 17.82 | | | $ | 0.08 | | | $ | 3.57 | | | $ | 3.65 | | | $ | (0.13 | ) | | $ | (1.83 | ) | | $ | — | | | $ | (1.96 | ) | | $ | — | | | $ | 19.51 | | | | 21.76 | % | | $ | 56.6 | | | | 1.06 | % | | | 1.06 | % | | | 0.44 | % | | | 41 | % | |
| 8/31/2017g | | $ | 18.34 | | | $ | 0.10 | | | $ | 2.64 | | | $ | 2.74 | | | $ | (0.16 | ) | | $ | (3.10 | ) | | $ | — | | | $ | (3.26 | ) | | $ | — | | | $ | 17.82 | | | | 17.37 | %h | | $ | 57.8 | | | | 1.07 | % | | | 1.04 | %e | | | 0.60 | %e | | | 37 | % | |
| 8/31/2016g | | $ | 20.17 | | | $ | 0.07 | | | $ | 1.36 | | | $ | 1.43 | | | $ | (0.15 | ) | | $ | (3.11 | ) | | $ | — | | | $ | (3.26 | ) | | $ | — | | | $ | 18.34 | | | | 8.31 | % | | $ | 70.6 | | | | 1.08 | % | | | 1.08 | % | | | 0.41 | % | | | 99 | % | |
Advisor Class | |
8/31/2020 | | $ | 18.20 | | | $ | (0.04 | ) | | $ | 6.17 | | | $ | 6.13 | | | $ | (0.03 | ) | | $ | (1.10 | ) | | $ | — | | | $ | (1.13 | ) | | $ | — | | | $ | 23.20 | | | | 35.18 | % | | $ | 0.2 | | | | 1.32 | % | | | 1.32 | % | | | (0.21 | )% | | | 49 | % | |
8/31/2019 | | $ | 19.46 | | | $ | 0.01 | | | $ | 0.31 | | | $ | 0.32 | | | $ | (0.05 | ) | | $ | (1.53 | ) | | $ | — | | | $ | (1.58 | ) | | $ | — | | | $ | 18.20 | | | | 3.41 | % | | $ | 0.2 | | | | 1.40 | % | | | 1.40 | % | | | 0.05 | % | | | 37 | % | |
| 8/31/2018g | | $ | 17.36 | | | $ | 0.02 | | | $ | 3.52 | | | $ | 3.54 | | | $ | (0.05 | ) | | $ | (1.39 | ) | | $ | — | | | $ | (1.44 | ) | | $ | — | | | $ | 19.46 | | | | 21.34 | % | | $ | 0.2 | | | | 1.40 | % | | | 1.40 | % | | | 0.12 | % | | | 41 | % | |
| 8/31/2017g | | $ | 17.14 | | | $ | 0.09 | | | $ | 2.54 | | | $ | 2.63 | | | $ | (0.06 | ) | | $ | (2.35 | ) | | $ | — | | | $ | (2.41 | ) | | $ | — | | | $ | 17.36 | | | | 17.26 | %h | | $ | 0.1 | | | | 1.38 | % | | | 1.18 | %e | | | 0.51 | %e | | | 37 | % | |
| 8/31/2016g | | $ | 18.24 | | | $ | 0.04 | | | $ | 1.25 | | | $ | 1.29 | | | $ | (0.02 | ) | | $ | (2.37 | ) | | $ | — | | | $ | (2.39 | ) | | $ | — | | | $ | 17.14 | | | | 8.03 | % | | $ | 0.2 | | | | 1.31 | % | | | 1.31 | %§ | | | 0.20 | % | | | 99 | % | |
Institutional Class | |
8/31/2020 | | $ | 18.32 | | | $ | 0.08 | | | $ | 6.22 | | | $ | 6.30 | | | $ | (0.11 | ) | | $ | (1.10 | ) | | $ | — | | | $ | (1.21 | ) | | $ | — | | | $ | 23.41 | | | | 36.03 | % | | $ | 149.6 | | | | 0.70 | % | | | 0.70 | % | | | 0.43 | % | | | 49 | % | |
8/31/2019 | | $ | 19.55 | | | $ | 0.13 | | | $ | 0.32 | | | $ | 0.45 | | | $ | (0.15 | ) | | $ | (1.53 | ) | | $ | — | | | $ | (1.68 | ) | | $ | — | | | $ | 18.32 | | | | 4.19 | % | | $ | 83.9 | | | | 0.71 | % | | | 0.71 | % | | | 0.74 | % | | | 37 | % | |
| 8/31/2018g | | $ | 17.13 | | | $ | 0.14 | | | $ | 3.51 | | | $ | 3.65 | | | $ | (0.14 | ) | | $ | (1.09 | ) | | $ | — | | | $ | (1.23 | ) | | $ | — | | | $ | 19.55 | | | | 22.15 | % | | $ | 82.5 | | | | 0.71 | % | | | 0.71 | % | | | 0.80 | % | | | 41 | % | |
| 8/31/2017g | | $ | 16.47 | | | $ | 0.15 | | | $ | 2.50 | | | $ | 2.65 | | | $ | (0.14 | ) | | $ | (1.85 | ) | | $ | — | | | $ | (1.99 | ) | | $ | — | | | $ | 17.13 | | | | 17.72 | %h | | $ | 70.2 | | | | 0.72 | % | | | 0.71 | %e | | | 0.94 | %e | | | 37 | % | |
| 8/31/2016g | | $ | 17.14 | | | $ | 0.12 | | | $ | 1.22 | | | $ | 1.34 | | | $ | (0.15 | ) | | $ | (1.86 | ) | | $ | — | | | $ | (2.01 | ) | | $ | — | | | $ | 16.47 | | | | 8.68 | % | | $ | 59.0 | | | | 0.72 | % | | | 0.72 | % | | | 0.73 | % | | | 99 | % | |
See Notes to Financial Highlights
225
226
Financial Highlights (cont'd)
| | | Net Asset
Value,
Beginning
of Year | | Net
Investment
Income/(Loss)@ | | Net Gains or
Losses on
Securities
(both realized
and
unrealized) | | Total From
Investment
Operations | | Dividends
from Net
Investment
Income | | Distributions
from Net
Realized
Capital Gains | | Tax
Return of
Capital | | Total
Distributions | | Voluntary
Contribution
from
Management | | Net Asset
Value, End of
Year | | Total Returnab | | Net Assets,
End of Year
(in millions) | | Ratio of Gross
Expenses to
Average Net
Assets# | | Ratio of Net
Expenses to
Average Net
Assets | | Ratio of Net
Investment
Income/
(Loss) to
Average Net
Assets | | Portfolio
Turnover
Rate | |
Guardian Fund (cont'd) | |
Class A | |
8/31/2020 | | $ | 18.28 | | | $ | 0.02 | | | $ | 6.19 | | | $ | 6.21 | | | $ | (0.05 | ) | | $ | (1.10 | ) | | $ | — | | | $ | (1.15 | ) | | $ | — | | | $ | 23.34 | | | | 35.49 | % | | $ | 6.1 | | | | 1.07 | % | | | 1.07 | % | | | 0.12 | % | | | 49 | % | |
8/31/2019 | | $ | 19.50 | | | $ | 0.06 | | | $ | 0.33 | | | $ | 0.39 | | | $ | (0.08 | ) | | $ | (1.53 | ) | | $ | — | | | $ | (1.61 | ) | | $ | — | | | $ | 18.28 | | | | 3.79 | % | | $ | 4.1 | | | | 1.09 | % | | | 1.09 | % | | | 0.34 | % | | | 37 | % | |
| 8/31/2018g | | $ | 17.85 | | | $ | 0.07 | | | $ | 3.57 | | | $ | 3.64 | | | $ | (0.13 | ) | | $ | (1.86 | ) | | $ | — | | | $ | (1.99 | ) | | $ | — | | | $ | 19.50 | | | | 21.67 | % | | $ | 5.5 | | | | 1.09 | % | | | 1.09 | % | | | 0.41 | % | | | 41 | % | |
| 8/31/2017g | | $ | 18.43 | | | $ | 0.10 | | | $ | 2.64 | | | $ | 2.74 | | | $ | (0.17 | ) | | $ | (3.15 | ) | | $ | — | | | $ | (3.32 | ) | | $ | — | | | $ | 17.85 | | | | 17.28 | %h | | $ | 5.6 | | | | 1.10 | % | | | 1.09 | %e | | | 0.56 | %e | | | 37 | % | |
| 8/31/2016g | | $ | 20.31 | | | $ | 0.05 | | | $ | 1.39 | | | $ | 1.44 | | | $ | (0.15 | ) | | $ | (3.17 | ) | | $ | — | | | $ | (3.32 | ) | | $ | — | | | $ | 18.43 | | | | 8.32 | % | | $ | 6.6 | | | | 1.07 | % | | | 1.07 | % | | | 0.27 | % | | | 99 | % | |
Class C | |
8/31/2020 | | $ | 18.10 | | | $ | (0.13 | ) | | $ | 6.11 | | | $ | 5.98 | | | $ | — | | | $ | (1.10 | ) | | $ | — | | | $ | (1.10 | ) | | $ | — | | | $ | 22.98 | | | | 34.53 | % | | $ | 2.3 | | | | 1.81 | % | | | 1.81 | % | | | (0.70 | )% | | | 49 | % | |
8/31/2019 | | $ | 19.40 | | | $ | (0.06 | ) | | $ | 0.31 | | | $ | 0.25 | | | $ | (0.02 | ) | | $ | (1.53 | ) | | $ | — | | | $ | (1.55 | ) | | $ | — | | | $ | 18.10 | | | | 3.00 | % | | $ | 1.8 | | | | 1.84 | % | | | 1.84 | % | | | (0.38 | )% | | | 37 | % | |
| 8/31/2018g | | $ | 17.42 | | | $ | (0.06 | ) | | $ | 3.51 | | | $ | 3.45 | | | $ | (0.01 | ) | | $ | (1.46 | ) | | $ | — | | | $ | (1.47 | ) | | $ | — | | | $ | 19.40 | | | | 20.74 | % | | $ | 1.8 | | | | 1.83 | % | | | 1.83 | % | | | (0.32 | )% | | | 41 | % | |
| 8/31/2017g | | $ | 17.38 | | | $ | (0.03 | ) | | $ | 2.58 | | | $ | 2.55 | | | $ | (0.04 | ) | | $ | (2.47 | ) | | $ | — | | | $ | (2.51 | ) | | $ | — | | | $ | 17.42 | | | | 16.53 | %h | | $ | 1.6 | | | | 1.84 | % | | | 1.84 | %e | | | (0.20 | )%e | | | 37 | % | |
| 8/31/2016g | | $ | 18.64 | | | $ | (0.05 | ) | | $ | 1.27 | | | $ | 1.22 | | | $ | — | | | $ | (2.48 | ) | | $ | — | | | $ | (2.48 | ) | | $ | — | | | $ | 17.38 | | | | 7.47 | % | | $ | 2.4 | | | | 1.85 | % | | | 1.85 | % | | | (0.34 | )% | | | 99 | % | |
Class R3 | |
8/31/2020 | | $ | 18.22 | | | $ | (0.05 | ) | | $ | 6.16 | | | $ | 6.11 | | | $ | (0.01 | ) | | $ | (1.10 | ) | | $ | — | | | $ | (1.11 | ) | | $ | — | | | $ | 23.22 | | | | 35.06 | % | | $ | 0.2 | | | | 1.36 | % | | | 1.36 | %§ | | | (0.25 | )% | | | 49 | % | |
8/31/2019 | | $ | 19.46 | | | $ | 0.01 | | | $ | 0.33 | | | $ | 0.34 | | | $ | (0.05 | ) | | $ | (1.53 | ) | | $ | — | | | $ | (1.58 | ) | | $ | — | | | $ | 18.22 | | | | 3.51 | % | | $ | 0.1 | | | | 1.40 | % | | | 1.36 | % | | | 0.06 | % | | | 37 | % | |
| 8/31/2018g | | $ | 17.37 | | | $ | 0.02 | | | $ | 3.52 | | | $ | 3.54 | | | $ | (0.05 | ) | | $ | (1.40 | ) | | $ | — | | | $ | (1.45 | ) | | $ | — | | | $ | 19.46 | | | | 21.33 | % | | $ | 0.4 | | | | 1.37 | % | | | 1.36 | % | | | 0.13 | % | | | 41 | % | |
| 8/31/2017g | | $ | 17.20 | | | $ | 0.05 | | | $ | 2.55 | | | $ | 2.60 | | | $ | (0.06 | ) | | $ | (2.37 | ) | | $ | — | | | $ | (2.43 | ) | | $ | — | | | $ | 17.37 | | | | 17.02 | %h | | $ | 0.5 | | | | 1.38 | % | | | 1.36 | %e | | | 0.28 | %e | | | 37 | % | |
| 8/31/2016g | | $ | 18.34 | | | $ | 0.03 | | | $ | 1.27 | | | $ | 1.30 | | | $ | (0.05 | ) | | $ | (2.39 | ) | | $ | — | | | $ | (2.44 | ) | | $ | — | | | $ | 17.20 | | | | 8.00 | % | | $ | 0.6 | | | | 1.39 | % | | | 1.36 | % | | | 0.15 | % | | | 99 | % | |
Class R6 | |
8/31/2020 | | $ | 18.32 | | | $ | 0.09 | | | $ | 6.22 | | | $ | 6.31 | | | $ | (0.12 | ) | | $ | (1.10 | ) | | $ | — | | | $ | (1.22 | ) | | $ | — | | | $ | 23.41 | | | | 36.09 | % | | $ | 0.0 | | | | 0.65 | % | | | 0.65 | %§ | | | 0.47 | % | | | 49 | % | |
Period from 3/29/2019^
to 8/31/2019 | | $ | 16.73 | | | $ | 0.06 | | | $ | 1.53 | | | $ | 1.59 | | | $ | — | | | $ | — | | | $ | — | | | $ | — | | | $ | — | | | $ | 18.32 | | | | 9.50 | %* | | $ | 0.0 | | | | 0.97 | %** | | | 0.65 | %** | | | 0.75 | %** | | | 37 | %c | |
Integrated Large Cap Fundl | |
Institutional Class | |
8/31/2020 | | $ | 7.71 | | | $ | 0.11 | | | $ | 1.19 | | | $ | 1.30 | | | $ | (0.15 | ) | | $ | (1.61 | ) | | $ | — | | | $ | (1.76 | ) | | $ | — | | | $ | 7.25 | | | | 19.16 | % | | $ | 3.1 | | | | 8.67 | % | | | 0.41 | % | | | 1.66 | % | | | 155 | % | |
8/31/2019 | | $ | 8.61 | | | $ | 0.06 | | | $ | (0.45 | ) | | $ | (0.39 | ) | | $ | (0.07 | ) | | $ | (0.44 | ) | | $ | — | | | $ | (0.51 | ) | | $ | — | | | $ | 7.71 | | | | (3.74 | )% | | $ | 3.2 | | | | 7.48 | % | | | 0.76 | % | | | 0.78 | % | | | 18 | % | |
8/31/2018 | | $ | 7.56 | | | $ | 0.06 | | | $ | 1.04 | | | $ | 1.10 | | | $ | (0.05 | ) | | $ | (0.00 | ) | | $ | — | | | $ | (0.05 | ) | | $ | — | | | $ | 8.61 | | | | 14.53 | % | | $ | 4.8 | | | | 6.48 | % | | | 0.75 | % | | | 0.74 | % | | | 33 | % | |
8/31/2017 | | $ | 6.65 | | | $ | 0.05 | | | $ | 0.94 | | | $ | 0.99 | | | $ | (0.03 | ) | | $ | (0.05 | ) | | $ | — | | | $ | (0.08 | ) | | $ | — | | | $ | 7.56 | | | | 15.13 | % | | $ | 4.2 | | | | 7.05 | % | | | 0.85 | % | | | 0.65 | % | | | 16 | % | |
8/31/2016 | | $ | 6.30 | | | $ | 0.04 | | | $ | 0.32 | | | $ | 0.36 | | | $ | (0.01 | ) | | $ | — | | | $ | — | | | $ | (0.01 | ) | | $ | — | | | $ | 6.65 | | | | 5.76 | % | | $ | 3.6 | | | | 8.67 | % | | | 1.15 | % | | | 0.64 | % | | | 41 | % | |
See Notes to Financial Highlights
227
228
Financial Highlights (cont'd)
| | | Net Asset
Value,
Beginning
of Year | | Net
Investment
Income/(Loss)@ | | Net Gains or
Losses on
Securities
(both realized
and
unrealized) | | Total From
Investment
Operations | | Dividends
from Net
Investment
Income | | Distributions
from Net
Realized
Capital Gains | | Tax
Return of
Capital | | Total
Distributions | | Voluntary
Contribution
from
Management | | Net Asset
Value, End of
Year | | Total Returnab | | Net Assets,
End of Year
(in millions) | | Ratio of Gross
Expenses to
Average Net
Assets# | | Ratio of Net
Expenses to
Average Net
Assets | | Ratio of Net
Investment
Income/
(Loss) to
Average Net
Assets | | Portfolio
Turnover
Rate | |
Integrated Large Cap Fundl (cont'd) | |
Class A | |
8/31/2020 | | $ | 7.75 | | | $ | 0.09 | | | $ | 1.20 | | | $ | 1.29 | | | $ | (0.12 | ) | | $ | (1.61 | ) | | $ | — | | | $ | (1.73 | ) | | $ | — | | | $ | 7.31 | | | | 18.86 | % | | $ | 0.3 | | | | 9.15 | % | | | 0.77 | % | | | 1.29 | % | | | 155 | % | |
| 8/31/2019i | | $ | 8.62 | | | $ | 0.03 | | | $ | (0.45 | ) | | $ | (0.42 | ) | | $ | (0.01 | ) | | $ | (0.44 | ) | | $ | — | | | $ | (0.45 | ) | | $ | — | | | $ | 7.75 | | | | (4.19 | )% | | $ | 0.3 | | | | 7.96 | % | | | 1.12 | % | | | 0.37 | % | | | 18 | % | |
| 8/31/2018i | | $ | 7.58 | | | $ | 0.03 | | | $ | 1.04 | | | $ | 1.07 | | | $ | (0.03 | ) | | $ | (0.00 | ) | | $ | — | | | $ | (0.03 | ) | | $ | — | | | $ | 8.62 | | | | 14.17 | % | | $ | 0.4 | | | | 6.70 | % | | | 1.11 | % | | | 0.41 | % | | | 33 | % | |
| 8/31/2017i | | $ | 6.65 | | | $ | 0.01 | | | $ | 0.97 | | | $ | 0.98 | | | $ | — | | | $ | (0.05 | ) | | $ | — | | | $ | (0.05 | ) | | $ | — | | | $ | 7.58 | | | | 14.85 | % | | $ | 0.3 | | | | 7.74 | % | | | 1.25 | % | | | 0.19 | % | | | 16 | % | |
| 8/31/2016i | | $ | 6.31 | | | $ | 0.02 | | | $ | 0.32 | | | $ | 0.34 | | | $ | (0.00 | ) | | $ | (0.00 | ) | | $ | — | | | $ | (0.00 | ) | | $ | — | | | $ | 6.65 | | | | 5.46 | % | | $ | 0.5 | | | | 9.12 | % | | | 1.51 | % | | | 0.31 | % | | | 41 | % | |
Class C | |
8/31/2020 | | $ | 7.70 | | | $ | 0.04 | | | $ | 1.18 | | | $ | 1.22 | | | $ | (0.06 | ) | | $ | (1.61 | ) | | $ | — | | | $ | (1.67 | ) | | $ | — | | | $ | 7.25 | | | | 17.87 | % | | $ | 0.1 | | | | 9.78 | % | | | 1.52 | % | | | 0.55 | % | | | 155 | % | |
| 8/31/2019i | | $ | 8.61 | | | $ | (0.03 | ) | | $ | (0.44 | ) | | $ | (0.47 | ) | | $ | — | | | $ | (0.44 | ) | | $ | — | | | $ | (0.44 | ) | | $ | — | | | $ | 7.70 | | | | (4.84 | )% | | $ | 0.1 | | | | 8.64 | % | | | 1.87 | % | | | (0.34 | )% | | | 18 | % | |
| 8/31/2018i | | $ | 7.61 | | | $ | (0.04 | ) | | $ | 1.04 | | | $ | 1.00 | | | $ | — | | | $ | (0.00 | ) | | $ | — | | | $ | — | | | $ | — | | | $ | 8.61 | | | | 13.22 | % | | $ | 0.1 | | | | 7.61 | % | | | 1.86 | % | | | (0.40 | )% | | | 33 | % | |
| 8/31/2017i | | $ | 6.73 | | | $ | (0.03 | ) | | $ | 0.96 | | | $ | 0.93 | | | $ | — | | | $ | (0.05 | ) | | $ | — | | | $ | (0.05 | ) | | $ | — | | | $ | 7.61 | | | | 13.89 | % | | $ | 0.1 | | | | 8.34 | % | | | 1.98 | % | | | (0.47 | )% | | | 16 | % | |
| 8/31/2016i | | $ | 6.43 | | | $ | (0.03 | ) | | $ | 0.33 | | | $ | 0.30 | | | $ | (0.00 | ) | | $ | (0.00 | ) | | $ | — | | | $ | (0.00 | ) | | $ | — | | | $ | 6.73 | | | | 4.66 | % | | $ | 0.2 | | | | 9.80 | % | | | 2.26 | % | | | (0.45 | )% | | | 41 | % | |
International Equity Fund | |
Investor Class | |
8/31/2020 | | $ | 12.47 | | | $ | 0.06 | | | $ | 1.84 | | | $ | 1.90 | | | $ | (0.12 | ) | | $ | (0.22 | ) | | $ | — | | | $ | (0.34 | ) | | $ | 0.01 | | | $ | 14.04 | | | | 15.39 | %d | | $ | 92.8 | | | | 1.19 | % | | | 1.08 | % | | | 0.43 | % | | | 45 | % | |
8/31/2019 | | $ | 13.16 | | | $ | 0.11 | | | $ | (0.68 | ) | | $ | (0.57 | ) | | $ | (0.09 | ) | | $ | (0.03 | ) | | $ | — | | | $ | (0.12 | ) | | $ | — | | | $ | 12.47 | | | | (4.23 | )% | | $ | 93.3 | | | | 1.22 | % | | | 1.13 | % | | | 0.87 | % | | | 34 | % | |
| 8/31/2018g | | $ | 12.58 | | | $ | 0.10 | | | $ | 0.51 | | | $ | 0.61 | | | $ | (0.03 | ) | | $ | — | | | $ | — | | | $ | (0.03 | ) | | $ | — | | | $ | 13.16 | | | | 4.88 | % | | $ | 106.7 | | | | 1.20 | % | | | 1.14 | % | | | 0.74 | % | | | 32 | % | |
| 8/31/2017g | | $ | 10.90 | | | $ | 0.15 | | | $ | 1.58 | | | $ | 1.73 | | | $ | (0.05 | ) | | $ | — | | | $ | — | | | $ | (0.05 | ) | | $ | — | | | $ | 12.58 | | | | 15.97 | %h | | $ | 110.4 | | | | 1.23 | % | | | 0.73 | %e | | | 1.34 | %e | | | 27 | % | |
| 8/31/2016g | | $ | 10.46 | | | $ | 0.13 | | | $ | 0.36 | | | $ | 0.49 | | | $ | (0.05 | ) | | $ | — | | | $ | — | | | $ | (0.05 | ) | | $ | — | | | $ | 10.90 | | | | 4.60 | % | | $ | 104.0 | | | | 1.26 | % | | | 1.08 | % | | | 1.20 | % | | | 30 | % | |
Trust Class | |
8/31/2020 | | $ | 12.46 | | | $ | 0.05 | | | $ | 1.85 | | | $ | 1.90 | | | $ | (0.11 | ) | | $ | (0.22 | ) | | $ | — | | | $ | (0.33 | ) | | $ | 0.01 | | | $ | 14.04 | | | | 15.41 | %d | | $ | 28.7 | | | | 1.23 | % | | | 1.13 | % | | | 0.40 | % | | | 45 | % | |
8/31/2019 | | $ | 13.16 | | | $ | 0.10 | | | $ | (0.69 | ) | | $ | (0.59 | ) | | $ | (0.08 | ) | | $ | (0.03 | ) | | $ | — | | | $ | (0.11 | ) | | $ | — | | | $ | 12.46 | | | | (4.35 | )% | | $ | 30.1 | | | | 1.26 | % | | | 1.17 | % | | | 0.80 | % | | | 34 | % | |
| 8/31/2018g | | $ | 12.57 | | | $ | 0.09 | | | $ | 0.52 | | | $ | 0.61 | | | $ | (0.02 | ) | | $ | — | | | $ | — | | | $ | (0.02 | ) | | $ | — | | | $ | 13.16 | | | | 4.84 | % | | $ | 40.9 | | | | 1.24 | % | | | 1.18 | % | | | 0.71 | % | | | 32 | % | |
| 8/31/2017g | | $ | 10.88 | | | $ | 0.15 | | | $ | 1.58 | | | $ | 1.73 | | | $ | (0.04 | ) | | $ | — | | | $ | — | | | $ | (0.04 | ) | | $ | — | | | $ | 12.57 | | | | 15.92 | %h | | $ | 45.7 | | | | 1.27 | % | | | 0.74 | %e | | | 1.29 | %e | | | 27 | % | |
| 8/31/2016g | | $ | 10.43 | | | $ | 0.12 | | | $ | 0.35 | | | $ | 0.47 | | | $ | (0.02 | ) | | $ | — | | | $ | — | | | $ | (0.02 | ) | | $ | — | | | $ | 10.88 | | | | 4.59 | % | | $ | 48.4 | | | | 1.30 | % | | | 1.12 | % | | | 1.15 | % | | | 30 | % | |
Institutional Class | |
8/31/2020 | | $ | 12.48 | | | $ | 0.09 | | | $ | 1.85 | | | $ | 1.94 | | | $ | (0.15 | ) | | $ | (0.22 | ) | | $ | — | | | $ | (0.37 | ) | | $ | 0.01 | | | $ | 14.06 | | | | 15.74 | %d | | $ | 1,319.0 | | | | 0.98 | % | | | 0.85 | % | | | 0.71 | % | | | 45 | % | |
8/31/2019 | | $ | 13.18 | | | $ | 0.13 | | | $ | (0.67 | ) | | $ | (0.54 | ) | | $ | (0.13 | ) | | $ | (0.03 | ) | | $ | — | | | $ | (0.16 | ) | | $ | — | | | $ | 12.48 | | | | (3.95 | )% | | $ | 1,518.8 | | | | 1.00 | % | | | 0.85 | % | | | 1.08 | % | | | 34 | % | |
8/31/2018 | | $ | 12.66 | | | $ | 0.14 | | | $ | 0.51 | | | $ | 0.65 | | | $ | (0.13 | ) | | $ | — | | | $ | — | | | $ | (0.13 | ) | | $ | — | | | $ | 13.18 | | | | 5.12 | % | | $ | 1,772.4 | | | | 0.99 | % | | | 0.85 | % | | | 1.03 | % | | | 32 | % | |
8/31/2017 | | $ | 11.09 | | | $ | 0.14 | | | $ | 1.58 | | | $ | 1.72 | | | $ | (0.15 | ) | | $ | — | | | $ | — | | | $ | (0.15 | ) | | $ | — | | | $ | 12.66 | | | | 15.82 | %h | | $ | 1,449.0 | | | | 1.02 | % | | | 0.85 | %e§ | | | 1.19 | %e | | | 27 | % | |
8/31/2016 | | $ | 10.72 | | | $ | 0.16 | | | $ | 0.35 | | | $ | 0.51 | | | $ | (0.14 | ) | | $ | — | | | $ | — | | | $ | (0.14 | ) | | $ | — | | | $ | 11.09 | | | | 4.78 | % | | $ | 1,184.3 | | | | 1.03 | % | | | 0.85 | %§ | | | 1.46 | % | | | 30 | % | |
See Notes to Financial Highlights
229
230
Financial Highlights (cont'd)
| | | Net Asset
Value,
Beginning
of Year | | Net
Investment
Income/(Loss)@ | | Net Gains or
Losses on
Securities
(both realized
and
unrealized) | | Total From
Investment
Operations | | Dividends
from Net
Investment
Income | | Distributions
from Net
Realized
Capital Gains | | Tax
Return of
Capital | | Total
Distributions | | Voluntary
Contribution
from
Management | | Net Asset
Value, End of
Year | | Total Returnab | | Net Assets,
End of Year
(in millions) | | Ratio of Gross
Expenses to
Average Net
Assets# | | Ratio of Net
Expenses to
Average Net
Assets | | Ratio of Net
Investment
Income/
(Loss) to
Average Net
Assets | | Portfolio
Turnover
Rate | |
International Equity Fund (cont'd) | |
Class A | |
8/31/2020 | | $ | 12.46 | | | $ | 0.04 | | | $ | 1.85 | | | $ | 1.89 | | | $ | (0.11 | ) | | $ | (0.22 | ) | | $ | — | | | $ | (0.33 | ) | | $ | 0.01 | | | $ | 14.03 | | | | 15.27 | %d | | $ | 55.8 | | | | 1.34 | % | | | 1.21 | % | | | 0.30 | % | | | 45 | % | |
8/31/2019 | | $ | 13.15 | | | $ | 0.09 | | | $ | (0.67 | ) | | $ | (0.58 | ) | | $ | (0.08 | ) | | $ | (0.03 | ) | | $ | — | | | $ | (0.11 | ) | | $ | — | | | $ | 12.46 | | | | (4.30 | )% | | $ | 52.2 | | | | 1.37 | % | | | 1.21 | % | | | 0.76 | % | | | 34 | % | |
| 8/31/2018g | | $ | 12.56 | | | $ | 0.08 | | | $ | 0.52 | | | $ | 0.60 | | | $ | (0.01 | ) | | $ | — | | | $ | — | | | $ | (0.01 | ) | | $ | — | | | $ | 13.15 | | | | 4.77 | % | | $ | 67.2 | | | | 1.35 | % | | | 1.21 | % | | | 0.63 | % | | | 32 | % | |
| 8/31/2017g | | $ | 10.91 | | | $ | 0.07 | | | $ | 1.60 | | | $ | 1.67 | | | $ | (0.02 | ) | | $ | — | | | $ | — | | | $ | (0.02 | ) | | $ | — | | | $ | 12.56 | | | | 15.32 | % | | $ | 71.9 | | | | 1.39 | % | | | 1.21 | %§ | | | 0.65 | %e | | | 27 | % | |
| 8/31/2016g | | $ | 10.48 | | | $ | 0.11 | | | $ | 0.35 | | | $ | 0.46 | | | $ | (0.03 | ) | | $ | — | | | $ | — | | | $ | (0.03 | ) | | $ | — | | | $ | 10.91 | | | | 4.48 | % | | $ | 104.9 | | | | 1.40 | % | | | 1.21 | % | | | 1.05 | % | | | 30 | % | |
Class C | |
8/31/2020 | | $ | 12.39 | | | $ | (0.06 | ) | | $ | 1.83 | | | $ | 1.77 | | | $ | (0.01 | ) | | $ | (0.22 | ) | | $ | — | | | $ | (0.23 | ) | | $ | 0.01 | | | $ | 13.94 | | | | 14.41 | %d | | $ | 7.4 | | | | 2.09 | % | | | 1.96 | % | | | (0.47 | )% | | | 45 | % | |
8/31/2019 | | $ | 13.09 | | | $ | (0.00 | ) | | $ | (0.67 | ) | | $ | (0.67 | ) | | $ | (0.00 | ) | | $ | (0.03 | ) | | $ | — | | | $ | (0.03 | ) | | $ | — | | | $ | 12.39 | | | | (5.05 | )% | | $ | 9.6 | | | | 2.12 | % | | | 1.96 | % | | | (0.02 | )% | | | 34 | % | |
| 8/31/2018g | | $ | 12.58 | | | $ | (0.01 | ) | | $ | 0.52 | | | $ | 0.51 | | | $ | — | | | $ | — | | | $ | — | | | $ | — | | | $ | — | | | $ | 13.09 | | | | 4.05 | % | | $ | 14.3 | | | | 2.11 | % | | | 1.96 | % | | | (0.06 | )% | | | 32 | % | |
| 8/31/2017g | | $ | 10.99 | | | $ | 0.00 | | | $ | 1.59 | | | $ | 1.59 | | | $ | — | | | $ | — | | | $ | — | | | $ | — | | | $ | — | | | $ | 12.58 | | | | 14.48 | % | | $ | 13.2 | | | | 2.14 | % | | | 1.96 | %§ | | | 0.04 | %e | | | 27 | % | |
| 8/31/2016g | | $ | 10.60 | | | $ | 0.04 | | | $ | 0.35 | | | $ | 0.39 | | | $ | — | | | $ | — | | | $ | — | | | $ | — | | | $ | — | | | $ | 10.99 | | | | 3.70 | % | | $ | 14.7 | | | | 2.16 | % | | | 1.96 | % | | | 0.37 | % | | | 30 | % | |
Class R6 | |
8/31/2020 | | $ | 12.49 | | | $ | 0.10 | | | $ | 1.87 | | | $ | 1.97 | | | $ | (0.17 | ) | | $ | (0.22 | ) | | $ | — | | | $ | (0.39 | ) | | $ | 0.01 | | | $ | 14.08 | | | | 15.91 | %d | | $ | 76.1 | | | | 0.88 | % | | | 0.75 | % | | | 0.77 | % | | | 45 | % | |
8/31/2019 | | $ | 13.20 | | | $ | 0.16 | | | $ | (0.70 | ) | | $ | (0.54 | ) | | $ | (0.14 | ) | | $ | (0.03 | ) | | $ | — | | | $ | (0.17 | ) | | $ | — | | | $ | 12.49 | | | | (3.95 | )% | | $ | 80.4 | | | | 0.92 | % | | | 0.76 | % | | | 1.28 | % | | | 34 | % | |
| 8/31/2018g | | $ | 12.67 | | | $ | 0.15 | | | $ | 0.52 | | | $ | 0.67 | | | $ | (0.14 | ) | | $ | — | | | $ | — | | | $ | (0.14 | ) | | $ | — | | | $ | 13.20 | | | | 5.26 | % | | $ | 74.3 | | | | 0.92 | % | | | 0.78 | % | | | 1.15 | % | | | 32 | % | |
| 8/31/2017g | | $ | 11.11 | | | $ | 0.15 | | | $ | 1.57 | | | $ | 1.72 | | | $ | (0.16 | ) | | $ | — | | | $ | — | | | $ | (0.16 | ) | | $ | — | | | $ | 12.67 | | | | 15.85 | % | | $ | 134.6 | | | | 0.94 | % | | | 0.77 | % | | | 1.31 | %e | | | 27 | % | |
| 8/31/2016g | | $ | 10.72 | | | $ | 0.16 | | | $ | 0.38 | | | $ | 0.54 | | | $ | (0.15 | ) | | $ | — | | | $ | — | | | $ | (0.15 | ) | | $ | — | | | $ | 11.11 | | | | 5.02 | % | | $ | 46.7 | | | | 0.96 | % | | | 0.78 | % | | | 1.49 | % | | | 30 | % | |
International Select Fund | |
Trust Class | |
8/31/2020 | | $ | 12.30 | | | $ | 0.05 | | | $ | 1.94 | | | $ | 1.99 | | | $ | (0.19 | ) | | $ | (0.19 | ) | | $ | — | | | $ | (0.38 | ) | | $ | — | | | $ | 13.91 | | | | 16.28 | % | | $ | 5.3 | | | | 1.41 | % | | | 1.15 | % | | | 0.41 | % | | | 33 | % | |
8/31/2019 | | $ | 12.97 | | | $ | 0.12 | | | $ | (0.61 | ) | | $ | (0.49 | ) | | $ | (0.05 | ) | | $ | (0.13 | ) | | $ | — | | | $ | (0.18 | ) | | $ | — | | | $ | 12.30 | | | | (3.58 | )% | | $ | 5.0 | | | | 1.42 | % | | | 1.15 | % | | | 0.97 | % | | | 32 | % | |
8/31/2018 | | $ | 12.43 | | | $ | 0.10 | | | $ | 0.54 | | | $ | 0.64 | | | $ | (0.10 | ) | | $ | — | | | $ | — | | | $ | (0.10 | ) | | $ | — | | | $ | 12.97 | | | | 5.17 | % | | $ | 8.0 | | | | 1.38 | % | | | 1.16 | % | | | 0.74 | % | | | 44 | % | |
8/31/2017 | | $ | 10.88 | | | $ | 0.10 | | | $ | 1.57 | | | $ | 1.67 | | | $ | (0.12 | ) | | $ | — | | | $ | — | | | $ | (0.12 | ) | | $ | — | | | $ | 12.43 | | | | 15.57 | % | | $ | 8.2 | | | | 1.34 | % | | | 1.18 | % | | | 0.90 | % | | | 27 | % | |
8/31/2016 | | $ | 10.59 | | | $ | 0.11 | | | $ | 0.27 | | | $ | 0.38 | | | $ | (0.09 | ) | | $ | — | | | $ | — | | | $ | (0.09 | ) | | $ | — | | | $ | 10.88 | | | | 3.65 | % | | $ | 7.8 | | | | 1.39 | % | | | 1.25 | % | | | 1.06 | % | | | 22 | % | |
Institutional Class | |
8/31/2020 | | $ | 12.28 | | | $ | 0.10 | | | $ | 1.93 | | | $ | 2.03 | | | $ | (0.23 | ) | | $ | (0.19 | ) | | $ | — | | | $ | (0.42 | ) | | $ | — | | | $ | 13.89 | | | | 16.68 | % | | $ | 138.9 | | | | 0.94 | % | | | 0.80 | % | | | 0.79 | % | | | 33 | % | |
8/31/2019 | | $ | 12.96 | | | $ | 0.15 | | | $ | (0.60 | ) | | $ | (0.45 | ) | | $ | (0.10 | ) | | $ | (0.13 | ) | | $ | — | | | $ | (0.23 | ) | | $ | — | | | $ | 12.28 | | | | (3.29 | )% | | $ | 128.1 | | | | 0.97 | % | | | 0.80 | % | | | 1.27 | % | | | 32 | % | |
8/31/2018 | | $ | 12.42 | | | $ | 0.13 | | | $ | 0.55 | | | $ | 0.68 | | | $ | (0.14 | ) | | $ | — | | | $ | — | | | $ | (0.14 | ) | | $ | — | | | $ | 12.96 | | | | 5.52 | % | | $ | 142.4 | | | | 0.93 | % | | | 0.81 | % | | | 0.99 | % | | | 44 | % | |
8/31/2017 | | $ | 10.86 | | | $ | 0.14 | | | $ | 1.58 | | | $ | 1.72 | | | $ | (0.16 | ) | | $ | — | | | $ | — | | | $ | (0.16 | ) | | $ | — | | | $ | 12.42 | | | | 16.13 | % | | $ | 214.4 | | | | 0.90 | % | | | 0.83 | % | | | 1.27 | % | | | 27 | % | |
8/31/2016 | | $ | 10.58 | | | $ | 0.16 | | | $ | 0.25 | | | $ | 0.41 | | | $ | (0.13 | ) | | $ | — | | | $ | — | | | $ | (0.13 | ) | | $ | — | | | $ | 10.86 | | | | 3.94 | % | | $ | 211.7 | | | | 0.94 | % | | | 0.90 | % | | | 1.51 | % | | | 22 | % | |
See Notes to Financial Highlights
231
232
Financial Highlights (cont'd)
| | | Net Asset
Value,
Beginning
of Year | | Net
Investment
Income/(Loss)@ | | Net Gains or
Losses on
Securities
(both realized
and
unrealized) | | Total From
Investment
Operations | | Dividends
from Net
Investment
Income | | Distributions
from Net
Realized
Capital Gains | | Tax
Return of
Capital | | Total
Distributions | | Voluntary
Contribution
from
Management | | Net Asset
Value, End of
Year | | Total Returnab | | Net Assets,
End of Year
(in millions) | | Ratio of Gross
Expenses to
Average Net
Assets# | | Ratio of Net
Expenses to
Average Net
Assets | | Ratio of Net
Investment
Income/
(Loss) to
Average Net
Assets | | Portfolio
Turnover
Rate | |
International Select Fund (cont'd) | |
Class A | |
8/31/2020 | | $ | 12.21 | | | $ | 0.05 | | | $ | 1.92 | | | $ | 1.97 | | | $ | (0.19 | ) | | $ | (0.19 | ) | | $ | — | | | $ | (0.38 | ) | | $ | — | | | $ | 13.80 | | | | 16.22 | % | | $ | 3.2 | | | | 1.31 | % | | | 1.16 | % | | | 0.36 | % | | | 33 | % | |
8/31/2019 | | $ | 12.87 | | | $ | 0.10 | | | $ | (0.58 | ) | | $ | (0.48 | ) | | $ | (0.05 | ) | | $ | (0.13 | ) | | $ | — | | | $ | (0.18 | ) | | $ | — | | | $ | 12.21 | | | | (3.58 | )% | | $ | 3.2 | | | | 1.35 | % | | | 1.16 | % | | | 0.85 | % | | | 32 | % | |
8/31/2018 | | $ | 12.34 | | | $ | 0.08 | | | $ | 0.55 | | | $ | 0.63 | | | $ | (0.10 | ) | | $ | — | | | $ | — | | | $ | (0.10 | ) | | $ | — | | | $ | 12.87 | | | | 5.12 | % | | $ | 3.9 | | | | 1.31 | % | | | 1.17 | % | | | 0.63 | % | | | 44 | % | |
8/31/2017 | | $ | 10.80 | | | $ | 0.10 | | | $ | 1.56 | | | $ | 1.66 | | | $ | (0.12 | ) | | $ | — | | | $ | — | | | $ | (0.12 | ) | | $ | — | | | $ | 12.34 | | | | 15.60 | % | | $ | 4.9 | | | | 1.27 | % | | | 1.19 | % | | | 0.87 | % | | | 27 | % | |
8/31/2016 | | $ | 10.51 | | | $ | 0.13 | | | $ | 0.26 | | | $ | 0.39 | | | $ | (0.10 | ) | | $ | — | | | $ | — | | | $ | (0.10 | ) | | $ | — | | | $ | 10.80 | | | | 3.69 | % | | $ | 4.6 | | | | 1.33 | % | | | 1.24 | % | | | 1.25 | % | | | 22 | % | |
Class C | |
8/31/2020 | | $ | 11.99 | | | $ | (0.04 | ) | | $ | 1.87 | | | $ | 1.83 | | | $ | (0.09 | ) | | $ | (0.19 | ) | | $ | — | | | $ | (0.28 | ) | | $ | — | | | $ | 13.54 | | | | 15.37 | % | | $ | 0.9 | | | | 2.06 | % | | | 1.91 | % | | | (0.34 | )% | | | 33 | % | |
8/31/2019 | | $ | 12.68 | | | $ | 0.01 | | | $ | (0.57 | ) | | $ | (0.56 | ) | | $ | — | | | $ | (0.13 | ) | | $ | — | | | $ | (0.13 | ) | | $ | — | | | $ | 11.99 | | | | (4.32 | )% | | $ | 1.5 | | | | 2.09 | % | | | 1.91 | % | | | 0.10 | % | | | 32 | % | |
8/31/2018 | | $ | 12.16 | | | $ | (0.00 | ) | | $ | 0.53 | | | $ | 0.53 | | | $ | (0.01 | ) | | $ | — | | | $ | — | | | $ | (0.01 | ) | | $ | — | | | $ | 12.68 | | | | 4.37 | % | | $ | 2.4 | | | | 2.06 | % | | | 1.92 | % | | | (0.02 | )% | | | 44 | % | |
8/31/2017 | | $ | 10.64 | | | $ | 0.02 | | | $ | 1.54 | | | $ | 1.56 | | | $ | (0.04 | ) | | $ | — | | | $ | — | | | $ | (0.04 | ) | | $ | — | | | $ | 12.16 | | | | 14.70 | % | | $ | 2.5 | | | | 2.02 | % | | | 1.94 | % | | | 0.16 | % | | | 27 | % | |
8/31/2016 | | $ | 10.36 | | | $ | 0.04 | | | $ | 0.26 | | | $ | 0.30 | | | $ | (0.02 | ) | | $ | — | | | $ | — | | | $ | (0.02 | ) | | $ | — | | | $ | 10.64 | | | | 2.89 | % | | $ | 3.2 | | | | 2.06 | % | | | 2.00 | % | | | 0.39 | % | | | 22 | % | |
Class R3 | |
8/31/2020 | | $ | 12.10 | | | $ | 0.02 | | | $ | 1.89 | | | $ | 1.91 | | | $ | (0.15 | ) | | $ | (0.19 | ) | | $ | — | | | $ | (0.34 | ) | | $ | — | | | $ | 13.67 | | | | 15.93 | % | | $ | 2.2 | | | | 1.57 | % | | | 1.41 | % | | | 0.18 | % | | | 33 | % | |
8/31/2019 | | $ | 12.75 | | | $ | 0.08 | | | $ | (0.58 | ) | | $ | (0.50 | ) | | $ | (0.02 | ) | | $ | (0.13 | ) | | $ | — | | | $ | (0.15 | ) | | $ | — | | | $ | 12.10 | | | | (3.81 | )% | | $ | 2.3 | | | | 1.60 | % | | | 1.41 | % | | | 0.66 | % | | | 32 | % | |
8/31/2018 | | $ | 12.22 | | | $ | 0.05 | | | $ | 0.55 | | | $ | 0.60 | | | $ | (0.07 | ) | | $ | — | | | $ | — | | | $ | (0.07 | ) | | $ | — | | | $ | 12.75 | | | | 4.92 | % | | $ | 3.5 | | | | 1.56 | % | | | 1.42 | % | | | 0.36 | % | | | 44 | % | |
8/31/2017 | | $ | 10.71 | | | $ | 0.08 | | | $ | 1.53 | | | $ | 1.61 | | | $ | (0.10 | ) | | $ | — | | | $ | — | | | $ | (0.10 | ) | | $ | — | | | $ | 12.22 | | | | 15.26 | % | | $ | 5.0 | | | | 1.52 | % | | | 1.44 | % | | | 0.70 | % | | | 27 | % | |
8/31/2016 | | $ | 10.43 | | | $ | 0.10 | | | $ | 0.25 | | | $ | 0.35 | | | $ | (0.07 | ) | | $ | — | | | $ | — | | | $ | (0.07 | ) | | $ | — | | | $ | 10.71 | | | | 3.33 | % | | $ | 3.8 | | | | 1.57 | % | | | 1.51 | % | | | 0.95 | % | | | 22 | % | |
Class R6 | |
8/31/2020 | | $ | 12.29 | | | $ | 0.04 | | | $ | 2.00 | | | $ | 2.04 | | | $ | (0.24 | ) | | $ | (0.19 | ) | | $ | — | | | $ | (0.43 | ) | | $ | — | | | $ | 13.90 | | | | 16.77 | % | | $ | 1.9 | | | | 0.84 | % | | | 0.70 | % | | | 0.28 | % | | | 33 | % | |
8/31/2019 | | $ | 12.96 | | | $ | 0.23 | | | $ | (0.66 | ) | | $ | (0.43 | ) | | $ | (0.11 | ) | | $ | (0.13 | ) | | $ | — | | | $ | (0.24 | ) | | $ | — | | | $ | 12.29 | | | | (3.11 | )% | | $ | 29.6 | | | | 0.87 | % | | | 0.71 | % | | | 1.88 | % | | | 32 | % | |
8/31/2018 | | $ | 12.42 | | | $ | 0.15 | | | $ | 0.54 | | | $ | 0.69 | | | $ | (0.15 | ) | | $ | — | | | $ | — | | | $ | (0.15 | ) | | $ | — | | | $ | 12.96 | | | | 5.59 | % | | $ | 9.4 | | | | 0.87 | % | | | 0.74 | % | | | 1.15 | % | | | 44 | % | |
Period from 4/17/2017^
to 8/31/2017 | | $ | 11.12 | | | $ | 0.08 | | | $ | 1.22 | | | $ | 1.30 | | | $ | — | | | $ | — | | | $ | — | | | $ | — | | | $ | — | | | $ | 12.42 | | | | 11.69 | %* | | $ | 9.6 | | | | 0.79 | %** | | | 0.73 | %** | | | 1.70 | %** | | | 27 | %c | |
International Small Cap Fund | |
Institutional Class | |
8/31/2020 | | $ | 11.28 | | | $ | 0.02 | | | $ | 2.66 | | | $ | 2.68 | | | $ | (0.10 | ) | | $ | — | | | $ | — | | | $ | (0.10 | ) | | $ | — | | | $ | 13.86 | | | | 23.84 | % | | $ | 1.4 | | | | 5.81 | % | | | 1.05 | %^^ | | | 0.14 | % | | | 14 | % | |
8/31/2019 | | $ | 12.98 | | | $ | 0.11 | | | $ | (1.60 | ) | | $ | (1.49 | ) | | $ | (0.03 | ) | | $ | (0.18 | ) | | $ | — | | | $ | (0.21 | ) | | $ | — | | | $ | 11.28 | | | | (11.26 | )% | | $ | 5.3 | | | | 6.24 | % | | | 1.05 | % | | | 1.00 | % | | | 32 | % | |
8/31/2018 | | $ | 12.74 | | | $ | 0.11 | | | $ | 1.02 | | | $ | 1.13 | | | $ | (0.35 | ) | | $ | (0.54 | ) | | $ | — | | | $ | (0.89 | ) | | $ | — | | | $ | 12.98 | | | | 9.06 | % | | $ | 6.2 | | | | 7.02 | % | | | 1.05 | % | | | 0.83 | % | | | 48 | % | |
Period from 12/8/2016^
to 8/31/2017 | | $ | 10.00 | | | $ | 0.08 | | | $ | 2.66 | | | $ | 2.74 | | | $ | — | | | $ | — | | | $ | — | | | $ | — | | | $ | — | | | $ | 12.74 | | | | 27.40 | %* | | $ | 0.8 | | | | 29.10 | %‡** | | | 1.05 | %‡** | | | 0.93 | %‡** | | | 43 | %* | |
See Notes to Financial Highlights
233
234
Financial Highlights (cont'd)
| | | Net Asset
Value,
Beginning
of Year | | Net
Investment
Income/(Loss)@ | | Net Gains or
Losses on
Securities
(both realized
and
unrealized) | | Total From
Investment
Operations | | Dividends
from Net
Investment
Income | | Distributions
from Net
Realized
Capital Gains | | Tax
Return of
Capital | | Total
Distributions | | Voluntary
Contribution
from
Management | | Net Asset
Value, End of
Year | | Total Returnab | | Net Assets,
End of Year
(in millions) | | Ratio of Gross
Expenses to
Average Net
Assets# | | Ratio of Net
Expenses to
Average Net
Assets | | Ratio of Net
Investment
Income/
(Loss) to
Average Net
Assets | | Portfolio
Turnover
Rate | |
International Small Cap Fund (cont'd) | |
Class A | |
8/31/2020 | | $ | 11.24 | | | $ | (0.03 | ) | | $ | 2.66 | | | $ | 2.63 | | | $ | (0.05 | ) | | $ | — | | | $ | — | | | $ | (0.05 | ) | | $ | — | | | $ | 13.82 | | | | 23.41 | % | | $ | 0.2 | | | | 6.40 | % | | | 1.42 | %^^ | | | (0.23 | )% | | | 14 | % | |
8/31/2019 | | $ | 12.93 | | | $ | 0.06 | | | $ | (1.57 | ) | | $ | (1.51 | ) | | $ | — | | | $ | (0.18 | ) | | $ | — | | | $ | (0.18 | ) | | $ | — | | | $ | 11.24 | | | | (11.49 | )% | | $ | 0.1 | | | | 6.77 | % | | | 1.41 | % | | | 0.54 | % | | | 32 | % | |
8/31/2018 | | $ | 12.70 | | | $ | 0.02 | | | $ | 1.05 | | | $ | 1.07 | | | $ | (0.30 | ) | | $ | (0.54 | ) | | $ | — | | | $ | (0.84 | ) | | $ | — | | | $ | 12.93 | | | | 8.60 | % | | $ | 0.2 | | | | 7.56 | % | | | 1.41 | % | | | 0.16 | % | | | 48 | % | |
Period from 12/8/2016^
to 8/31/2017 | | $ | 10.00 | | | $ | 0.11 | | | $ | 2.59 | | | $ | 2.70 | | | $ | — | | | $ | — | | | $ | — | | | $ | — | | | $ | — | | | $ | 12.70 | | | | 27.00 | %* | | $ | 0.3 | | | | 29.48 | %‡** | | | 1.41 | %‡** | | | 1.21 | %‡** | | | 43 | %* | |
Class C | |
8/31/2020 | | $ | 11.06 | | | $ | (0.11 | ) | | $ | 2.60 | | | $ | 2.49 | | | $ | — | | | $ | — | | | $ | — | | | $ | — | | | $ | — | | | $ | 13.55 | | | | 22.51 | % | | $ | 0.1 | | | | 6.93 | % | | | 2.17 | %^^ | | | (0.97 | )% | | | 14 | % | |
8/31/2019 | | $ | 12.83 | | | $ | (0.01 | ) | | $ | (1.58 | ) | | $ | (1.59 | ) | | $ | — | | | $ | (0.18 | ) | | $ | — | | | $ | (0.18 | ) | | $ | — | | | $ | 11.06 | | | | (12.22 | )% | | $ | 0.1 | | | | 7.38 | % | | | 2.16 | % | | | (0.10 | )% | | | 32 | % | |
8/31/2018 | | $ | 12.63 | | | $ | (0.07 | ) | | $ | 1.05 | | | $ | 0.98 | | | $ | (0.24 | ) | | $ | (0.54 | ) | | $ | — | | | $ | (0.78 | ) | | $ | — | | | $ | 12.83 | | | | 7.89 | % | | $ | 0.2 | | | | 8.15 | % | | | 2.16 | % | | | (0.53 | )% | | | 48 | % | |
Period from 12/8/2016^
to 8/31/2017 | | $ | 10.00 | | | $ | (0.02 | ) | | $ | 2.65 | | | $ | 2.63 | | | $ | — | | | $ | — | | | $ | — | | | $ | — | | | $ | — | | | $ | 12.63 | | | | 26.30 | %* | | $ | 0.1 | | | | 30.21 | %‡** | | | 2.16 | %‡** | | | (0.19 | )%‡** | | | 43 | %* | |
Class R6 | |
8/31/2020 | | $ | 11.29 | | | $ | 0.03 | | | $ | 2.67 | | | $ | 2.70 | | | $ | (0.11 | ) | | $ | — | | | $ | — | | | $ | (0.11 | ) | | $ | — | | | $ | 13.88 | | | | 24.01 | % | | $ | 0.3 | | | | 5.71 | % | | | 0.96 | %^^ | | | 0.24 | % | | | 14 | % | |
8/31/2019 | | $ | 12.98 | | | $ | 0.12 | | | $ | (1.59 | ) | | $ | (1.47 | ) | | $ | (0.04 | ) | | $ | (0.18 | ) | | $ | — | | | $ | (0.22 | ) | | $ | — | | | $ | 11.29 | | | | (11.13 | )% | | $ | 0.2 | | | | 6.16 | % | | | 0.96 | % | | | 1.09 | % | | | 32 | % | |
8/31/2018 | | $ | 12.74 | | | $ | 0.08 | | | $ | 1.06 | | | $ | 1.14 | | | $ | (0.36 | ) | | $ | (0.54 | ) | | $ | — | | | $ | (0.90 | ) | | $ | — | | | $ | 12.98 | | | | 9.12 | % | | $ | 0.3 | | | | 6.97 | % | | | 0.98 | % | | | 0.64 | % | | | 48 | % | |
Period from 12/8/2016^
to 8/31/2017 | | $ | 10.00 | | | $ | 0.08 | | | $ | 2.66 | | | $ | 2.74 | | | $ | — | | | $ | — | | | $ | — | | | $ | — | | | $ | — | | | $ | 12.74 | | | | 27.40 | %* | | $ | 0.3 | | | | 29.02 | %‡** | | | 0.98 | %‡** | | | 0.99 | %‡** | | | 43 | %* | |
Intrinsic Value Fund | |
Institutional Class | |
8/31/2020 | | $ | 14.50 | | | $ | (0.04 | ) | | $ | 1.11 | | | $ | 1.07 | | | $ | — | | | $ | (0.44 | ) | | $ | — | | | $ | (0.44 | ) | | $ | — | | | $ | 15.13 | | | | 7.36 | % | | $ | 555.2 | | | | 1.05 | % | | | 1.00 | % | | | (0.29 | )% | | | 19 | % | |
8/31/2019 | | $ | 18.54 | | | $ | (0.03 | ) | | $ | (2.14 | ) | | $ | (2.17 | ) | | $ | — | | | $ | (1.87 | ) | | $ | — | | | $ | (1.87 | ) | | $ | — | | | $ | 14.50 | | | | (10.83 | )% | | $ | 574.1 | | | | 1.05 | % | | | 1.01 | % | | | (0.20 | )% | | | 22 | % | |
8/31/2018 | | $ | 16.12 | | | $ | (0.06 | ) | | $ | 3.33 | | | $ | 3.27 | | | $ | — | | | $ | (0.85 | ) | | $ | — | | | $ | (0.85 | ) | | $ | — | | | $ | 18.54 | | | | 21.01 | % | | $ | 678.0 | | | | 1.02 | % | | | 1.00 | % | | | (0.35 | )% | | | 25 | % | |
8/31/2017 | | $ | 14.02 | | | $ | (0.05 | ) | | $ | 2.36 | | | $ | 2.31 | | | $ | — | | | $ | (0.21 | ) | | $ | — | | | $ | (0.21 | ) | | $ | — | | | $ | 16.12 | | | | 16.59 | % | | $ | 841.9 | | | | 1.03 | % | | | 1.00 | % | | | (0.35 | )% | | | 26 | % | |
8/31/2016 | | $ | 14.34 | | | $ | (0.05 | ) | | $ | 0.43 | | | $ | 0.38 | | | $ | — | | | $ | (0.70 | ) | | $ | — | | | $ | (0.70 | ) | | $ | — | | | $ | 14.02 | | | | 2.96 | % | | $ | 611.3 | | | | 1.08 | % | | | 1.00 | % | | | (0.38 | )% | | | 17 | % | |
Class A | |
8/31/2020 | | $ | 14.44 | | | $ | (0.09 | ) | | $ | 1.11 | | | $ | 1.02 | | | $ | — | | | $ | (0.44 | ) | | $ | — | | | $ | (0.44 | ) | | $ | — | | | $ | 15.02 | | | | 7.04 | % | | $ | 21.0 | | | | 1.43 | % | | | 1.36 | % | | | (0.65 | )% | | | 19 | % | |
| 8/31/2019i | | $ | 18.54 | | | $ | (0.09 | ) | | $ | (2.14 | ) | | $ | (2.23 | ) | | $ | — | | | $ | (1.87 | ) | | $ | — | | | $ | (1.87 | ) | | $ | — | | | $ | 14.44 | | | | (11.18 | )% | | $ | 19.7 | | | | 1.44 | % | | | 1.37 | % | | | (0.56 | )% | | | 22 | % | |
| 8/31/2018i | | $ | 16.20 | | | $ | (0.12 | ) | | $ | 3.34 | | | $ | 3.22 | | | $ | — | | | $ | (0.88 | ) | | $ | — | | | $ | (0.88 | ) | | $ | — | | | $ | 18.54 | | | | 20.58 | % | | $ | 20.0 | | | | 1.41 | % | | | 1.36 | % | | | (0.73 | )% | | | 25 | % | |
| 8/31/2017i | | $ | 14.15 | | | $ | (0.11 | ) | | $ | 2.38 | | | $ | 2.27 | | | $ | — | | | $ | (0.22 | ) | | $ | — | | | $ | (0.22 | ) | | $ | — | | | $ | 16.20 | | | | 16.20 | % | | $ | 18.2 | | | | 1.43 | % | | | 1.36 | % | | | (0.68 | )% | | | 26 | % | |
| 8/31/2016i | | $ | 14.54 | | | $ | (0.10 | ) | | $ | 0.43 | | | $ | 0.33 | | | $ | — | | | $ | (0.72 | ) | | $ | — | | | $ | (0.72 | ) | | $ | — | | | $ | 14.15 | | | | 2.58 | % | | $ | 44.5 | | | | 1.48 | % | | | 1.36 | % | | | (0.72 | )% | | | 17 | % | |
See Notes to Financial Highlights
235
236
Financial Highlights (cont'd)
| | | Net Asset
Value,
Beginning
of Year | | Net
Investment
Income/(Loss)@ | | Net Gains or
Losses on
Securities
(both realized
and
unrealized) | | Total From
Investment
Operations | | Dividends
from Net
Investment
Income | | Distributions
from Net
Realized
Capital Gains | | Tax
Return of
Capital | | Total
Distributions | | Voluntary
Contribution
from
Management | | Net Asset
Value, End of
Year | | Total Returnab | | Net Assets,
End of Year
(in millions) | | Ratio of Gross
Expenses to
Average Net
Assets# | | Ratio of Net
Expenses to
Average Net
Assets | | Ratio of Net
Investment
Income/
(Loss) to
Average Net
Assets | | Portfolio
Turnover
Rate | |
Intrinsic Value Fund (cont'd) | |
Class C | |
8/31/2020 | | $ | 14.34 | | | $ | (0.19 | ) | | $ | 1.08 | | | $ | 0.89 | | | $ | — | | | $ | (0.44 | ) | | $ | — | | | $ | (0.44 | ) | | $ | — | | | $ | 14.79 | | | | 6.16 | % | | $ | 11.3 | | | | 2.16 | % | | | 2.11 | % | | | (1.38 | )% | | | 19 | % | |
| 8/31/2019i | | $ | 18.54 | | | $ | (0.20 | ) | | $ | (2.13 | ) | | $ | (2.33 | ) | | $ | — | | | $ | (1.87 | ) | | $ | — | | | $ | (1.87 | ) | | $ | — | | | $ | 14.34 | | | | (11.78 | )% | | $ | 16.8 | | | | 2.16 | % | | | 2.12 | % | | | (1.30 | )% | | | 22 | % | |
| 8/31/2018i | | $ | 16.39 | | | $ | (0.26 | ) | | $ | 3.35 | | | $ | 3.09 | | | $ | — | | | $ | (0.94 | ) | | $ | — | | | $ | (0.94 | ) | | $ | — | | | $ | 18.54 | | | | 19.65 | % | | $ | 24.5 | | | | 2.13 | % | | | 2.11 | % | | | (1.47 | )% | | | 25 | % | |
| 8/31/2017i | | $ | 14.42 | | | $ | (0.22 | ) | | $ | 2.42 | | | $ | 2.20 | | | $ | — | | | $ | (0.23 | ) | | $ | — | | | $ | (0.23 | ) | | $ | — | | | $ | 16.39 | | | | 15.36 | % | | $ | 22.4 | | | | 2.15 | % | | | 2.11 | % | | | (1.45 | )% | | | 26 | % | |
| 8/31/2016i | | $ | 14.97 | | | $ | (0.20 | ) | | $ | 0.43 | | | $ | 0.23 | | | $ | — | | | $ | (0.78 | ) | | $ | — | | | $ | (0.78 | ) | | $ | — | | | $ | 14.42 | | | | 1.85 | % | | $ | 25.2 | | | | 2.20 | % | | | 2.11 | % | | | (1.47 | )% | | | 17 | % | |
Class R6 | |
8/31/2020 | | $ | 14.52 | | | $ | (0.02 | ) | | $ | 1.11 | | | $ | 1.09 | | | $ | — | | | $ | (0.44 | ) | | $ | — | | | $ | (0.44 | ) | | $ | — | | | $ | 15.17 | | | | 7.49 | % | | $ | 0.1 | | | | 0.97 | % | | | 0.90 | % | | | (0.17 | )% | | | 19 | % | |
Period from 1/18/2019^
to 8/31/2019 | | $ | 14.22 | | | $ | (0.01 | ) | | $ | 0.31 | | | $ | 0.30 | | | $ | — | | | $ | — | | | $ | — | | | $ | — | | | $ | — | | | $ | 14.52 | | | | 2.11 | %* | | $ | 0.2 | | | | 1.00 | %** | | | 0.91 | %** | | | (0.10 | )%** | | | 22 | %c | |
Large Cap Value Fund | |
Investor Class | |
8/31/2020 | | $ | 30.58 | | | $ | 0.59 | | | $ | 0.46 | | | $ | 1.05 | | | $ | (0.60 | ) | | $ | (0.65 | ) | | $ | — | | | $ | (1.25 | ) | | $ | — | | | $ | 30.38 | | | | 3.23 | % | | $ | 1,087.2 | | | | 0.85 | % | | | 0.85 | % | | | 1.99 | % | | | 157 | % | |
8/31/2019 | | $ | 32.87 | | | $ | 0.59 | | | $ | 1.03 | | | $ | 1.62 | | | $ | (0.53 | ) | | $ | (3.38 | ) | | $ | — | | | $ | (3.91 | ) | | $ | — | | | $ | 30.58 | | | | 6.25 | % | | $ | 1,174.3 | | | | 0.86 | % | | | 0.86 | % | | | 1.93 | % | | | 109 | %k | |
8/31/2018 | | $ | 31.61 | | | $ | 0.46 | | | $ | 3.47 | | | $ | 3.93 | | | $ | (0.40 | ) | | $ | (2.27 | ) | | $ | — | | | $ | (2.67 | ) | | $ | — | | | $ | 32.87 | | | | 12.90 | % | | $ | 1,160.3 | | | | 0.87 | % | | | 0.87 | % | | | 1.46 | % | | | 153 | % | |
8/31/2017 | | $ | 28.25 | | | $ | 0.40 | | | $ | 4.03 | | | $ | 4.43 | | | $ | (0.20 | ) | | $ | (0.87 | ) | | $ | — | | | $ | (1.07 | ) | | $ | — | | | $ | 31.61 | | | | 15.88 | %h | | $ | 1,148.5 | | | | 0.87 | % | | | 0.86 | %e | | | 1.31 | %e | | | 74 | % | |
8/31/2016 | | $ | 27.46 | | | $ | 0.31 | | | $ | 2.85 | | | $ | 3.16 | | | $ | (0.31 | ) | | $ | (2.06 | ) | | $ | — | | | $ | (2.37 | ) | | $ | — | | | $ | 28.25 | | | | 13.16 | % | | $ | 1,069.8 | | | | 0.90 | % | | | 0.90 | % | | | 1.20 | % | | | 126 | % | |
Trust Class | |
8/31/2020 | | $ | 30.59 | | | $ | 0.54 | | | $ | 0.45 | | | $ | 0.99 | | | $ | (0.54 | ) | | $ | (0.65 | ) | | $ | — | | | $ | (1.19 | ) | | $ | — | | | $ | 30.39 | | | | 3.05 | % | | $ | 65.4 | | | | 1.03 | % | | | 1.03 | % | | | 1.82 | % | | | 157 | % | |
8/31/2019 | | $ | 32.88 | | | $ | 0.54 | | | $ | 1.03 | | | $ | 1.57 | | | $ | (0.48 | ) | | $ | (3.38 | ) | | $ | — | | | $ | (3.86 | ) | | $ | — | | | $ | 30.59 | | | | 6.04 | % | | $ | 81.7 | | | | 1.04 | % | | | 1.04 | % | | | 1.75 | % | | | 109 | %k | |
| 8/31/2018f | | $ | 31.63 | | | $ | 0.40 | | | $ | 3.47 | | | $ | 3.87 | | | $ | (0.35 | ) | | $ | (2.27 | ) | | $ | — | | | $ | (2.62 | ) | | $ | — | | | $ | 32.88 | | | | 12.68 | % | | $ | 68.4 | | | | 1.05 | % | | | 1.05 | % | | | 1.26 | % | | | 153 | % | |
| 8/31/2017f | | $ | 28.84 | | | $ | 0.36 | | | $ | 4.10 | | | $ | 4.46 | | | $ | (0.30 | ) | | $ | (1.37 | ) | | $ | — | | | $ | (1.67 | ) | | $ | — | | | $ | 31.63 | | | | 15.77 | %h | | $ | 75.0 | | | | 1.05 | % | | | 1.01 | %e | | | 1.16 | %e | | | 74 | % | |
| 8/31/2016f | | $ | 29.40 | | | $ | 0.28 | | | $ | 2.83 | | | $ | 3.11 | | | $ | (0.44 | ) | | $ | (3.23 | ) | | $ | — | | | $ | (3.67 | ) | | $ | — | | | $ | 28.84 | | | | 12.97 | % | | $ | 77.6 | | | | 1.07 | % | | | 1.07 | % | | | 1.03 | % | | | 126 | % | |
Advisor Class | |
8/31/2020 | | $ | 30.60 | | | $ | 0.49 | | | $ | 0.46 | | | $ | 0.95 | | | $ | (0.50 | ) | | $ | (0.65 | ) | | $ | — | | | $ | (1.15 | ) | | $ | — | | | $ | 30.40 | | | | 2.90 | % | | $ | 99.7 | | | | 1.18 | % | | | 1.18 | % | | | 1.66 | % | | | 157 | % | |
8/31/2019 | | $ | 32.88 | | | $ | 0.49 | | | $ | 1.04 | | | $ | 1.53 | | | $ | (0.43 | ) | | $ | (3.38 | ) | | $ | — | | | $ | (3.81 | ) | | $ | — | | | $ | 30.60 | | | | 5.90 | % | | $ | 114.8 | | | | 1.19 | % | | | 1.19 | % | | | 1.58 | % | | | 109 | %k | |
| 8/31/2018f | | $ | 31.62 | | | $ | 0.35 | | | $ | 3.49 | | | $ | 3.84 | | | $ | (0.31 | ) | | $ | (2.27 | ) | | $ | — | | | $ | (2.58 | ) | | $ | — | | | $ | 32.88 | | | | 12.56 | % | | $ | 125.2 | | | | 1.20 | % | | | 1.20 | % | | | 1.11 | % | | | 153 | % | |
| 8/31/2017f | | $ | 29.45 | | | $ | 0.30 | | | $ | 4.15 | | | $ | 4.45 | | | $ | (0.41 | ) | | $ | (1.87 | ) | | $ | — | | | $ | (2.28 | ) | | $ | — | | | $ | 31.62 | | | | 15.51 | %h | | $ | 144.1 | | | | 1.20 | % | | | 1.19 | %e | | | 0.98 | %e | | | 74 | % | |
| 8/31/2016f | | $ | 31.41 | | | $ | 0.24 | | | $ | 2.83 | | | $ | 3.07 | | | $ | (0.61 | ) | | $ | (4.42 | ) | | $ | — | | | $ | (5.03 | ) | | $ | — | | | $ | 29.45 | | | | 12.81 | % | | $ | 145.9 | | | | 1.22 | % | | | 1.22 | % | | | 0.88 | % | | | 126 | % | |
See Notes to Financial Highlights
237
238
Financial Highlights (cont'd)
| | | Net Asset
Value,
Beginning
of Year | | Net
Investment
Income/(Loss)@ | | Net Gains or
Losses on
Securities
(both realized
and
unrealized) | | Total From
Investment
Operations | | Dividends
from Net
Investment
Income | | Distributions
from Net
Realized
Capital Gains | | Tax
Return of
Capital | | Total
Distributions | | Voluntary
Contribution
from
Management | | Net Asset
Value, End of
Year | | Total Returnab | | Net Assets,
End of Year
(in millions) | | Ratio of Gross
Expenses to
Average Net
Assets# | | Ratio of Net
Expenses to
Average Net
Assets | | Ratio of Net
Investment
Income/
(Loss) to
Average Net
Assets | | Portfolio
Turnover
Rate | |
Large Cap Value Fund (cont'd) | |
Institutional Class | |
8/31/2020 | | $ | 30.57 | | | $ | 0.64 | | | $ | 0.47 | | | $ | 1.11 | | | $ | (0.65 | ) | | $ | (0.65 | ) | | $ | — | | | $ | (1.30 | ) | | $ | — | | | $ | 30.38 | | | | 3.42 | % | | $ | 365.3 | | | | 0.68 | % | | | 0.68 | % | | | 2.15 | % | | | 157 | % | |
8/31/2019 | | $ | 32.87 | | | $ | 0.66 | | | $ | 1.01 | | | $ | 1.67 | | | $ | (0.59 | ) | | $ | (3.38 | ) | | $ | — | | | $ | (3.97 | ) | | $ | — | | | $ | 30.57 | | | | 6.41 | % | | $ | 339.6 | | | | 0.69 | % | | | 0.69 | % | | | 2.17 | % | | | 109 | %k | |
| 8/31/2018f | | $ | 31.60 | | | $ | 0.52 | | | $ | 3.47 | | | $ | 3.99 | | | $ | (0.45 | ) | | $ | (2.27 | ) | | $ | — | | | $ | (2.72 | ) | | $ | — | | | $ | 32.87 | | | | 13.11 | % | | $ | 98.5 | | | | 0.70 | % | | | 0.70 | %§ | | | 1.64 | % | | | 153 | % | |
| 8/31/2017f | | $ | 28.25 | | | $ | 0.45 | | | $ | 4.02 | | | $ | 4.47 | | | $ | (0.26 | ) | | $ | (0.86 | ) | | $ | — | | | $ | (1.12 | ) | | $ | — | | | $ | 31.60 | | | | 16.04 | %h | | $ | 80.6 | | | | 0.70 | % | | | 0.69 | %e§ | | | 1.50 | %e | | | 74 | % | |
| 8/31/2016f | | $ | 27.42 | | | $ | 0.35 | | | $ | 2.85 | | | $ | 3.20 | | | $ | (0.33 | ) | | $ | (2.04 | ) | | $ | — | | | $ | (2.37 | ) | | $ | — | | | $ | 28.25 | | | | 13.38 | % | | $ | 56.2 | | | | 0.71 | % | | | 0.70 | % | | | 1.38 | % | | | 126 | % | |
Class A | |
8/31/2020 | | $ | 30.59 | | | $ | 0.53 | | | $ | 0.45 | | | $ | 0.98 | | | $ | (0.53 | ) | | $ | (0.65 | ) | | $ | — | | | $ | (1.18 | ) | | $ | — | | | $ | 30.39 | | | | 3.03 | % | | $ | 23.4 | | | | 1.05 | % | | | 1.05 | % | | | 1.73 | % | | | 157 | % | |
8/31/2019 | | $ | 32.88 | | | $ | 0.58 | | | $ | 0.97 | | | $ | 1.55 | | | $ | (0.46 | ) | | $ | (3.38 | ) | | $ | — | | | $ | (3.84 | ) | | $ | — | | | $ | 30.59 | | | | 5.99 | % | | $ | 52.5 | | | | 1.08 | % | | | 1.08 | % | | | 1.89 | % | | | 109 | %k | |
| 8/31/2018f | | $ | 31.62 | | | $ | 0.39 | | | $ | 3.48 | | | $ | 3.87 | | | $ | (0.34 | ) | | $ | (2.27 | ) | | $ | — | | | $ | (2.61 | ) | | $ | — | | | $ | 32.88 | | | | 12.68 | % | | $ | 4.1 | | | | 1.08 | % | | | 1.08 | % | | | 1.24 | % | | | 153 | % | |
| 8/31/2017f | | $ | 28.87 | | | $ | 0.34 | | | $ | 4.09 | | | $ | 4.43 | | | $ | (0.31 | ) | | $ | (1.37 | ) | | $ | — | | | $ | (1.68 | ) | | $ | — | | | $ | 31.62 | | | | 15.65 | %h | | $ | 3.8 | | | | 1.07 | % | | | 1.07 | %e | | | 1.11 | %e | | | 74 | % | |
| 8/31/2016f | | $ | 29.47 | | | $ | 0.27 | | | $ | 2.83 | | | $ | 3.10 | | | $ | (0.46 | ) | | $ | (3.24 | ) | | $ | — | | | $ | (3.70 | ) | | $ | — | | | $ | 28.87 | | | | 12.94 | % | | $ | 3.2 | | | | 1.09 | % | | | 1.09 | % | | | 1.02 | % | | | 126 | % | |
Class C | |
8/31/2020 | | $ | 30.61 | | | $ | 0.31 | | | $ | 0.44 | | | $ | 0.75 | | | $ | (0.41 | ) | | $ | (0.65 | ) | | $ | — | | | $ | (1.06 | ) | | $ | — | | | $ | 30.30 | | | | 2.27 | % | | $ | 14.7 | | | | 1.81 | % | | | 1.81 | % | | | 1.04 | % | | | 157 | % | |
8/31/2019 | | $ | 32.87 | | | $ | 0.33 | | | $ | 1.02 | | | $ | 1.35 | | | $ | (0.23 | ) | | $ | (3.38 | ) | | $ | — | | | $ | (3.61 | ) | | $ | — | | | $ | 30.61 | | | | 5.24 | % | | $ | 19.7 | | | | 1.82 | % | | | 1.82 | % | | | 1.08 | % | | | 109 | %k | |
| 8/31/2018f | | $ | 31.67 | | | $ | 0.15 | | | $ | 3.48 | | | $ | 3.63 | | | $ | (0.16 | ) | | $ | (2.27 | ) | | $ | — | | | $ | (2.43 | ) | | $ | — | | | $ | 32.87 | | | | 11.83 | % | | $ | 1.9 | | | | 1.82 | % | | | 1.82 | % | | | 0.48 | % | | | 153 | % | |
| 8/31/2017f | | $ | 29.66 | | | $ | 0.11 | | | $ | 4.18 | | | $ | 4.29 | | | $ | (0.29 | ) | | $ | (1.99 | ) | | $ | — | | | $ | (2.28 | ) | | $ | — | | | $ | 31.67 | | | | 14.84 | %h | | $ | 2.3 | | | | 1.81 | % | | | 1.81 | %e | | | 0.36 | %e | | | 74 | % | |
| 8/31/2016f | | $ | 31.83 | | | $ | 0.07 | | | $ | 2.83 | | | $ | 2.90 | | | $ | (0.37 | ) | | $ | (4.70 | ) | | $ | — | | | $ | (5.07 | ) | | $ | — | | | $ | 29.66 | | | | 12.09 | % | | $ | 2.1 | | | | 1.83 | % | | | 1.83 | % | | | 0.26 | % | | | 126 | % | |
Class R3 | |
8/31/2020 | | $ | 30.62 | | | $ | 0.45 | | | $ | 0.45 | | | $ | 0.90 | | | $ | (0.45 | ) | | $ | (0.65 | ) | | $ | — | | | $ | (1.10 | ) | | $ | — | | | $ | 30.42 | | | | 2.74 | % | | $ | 0.6 | | | | 1.34 | % | | | 1.34 | %§ | | | 1.51 | % | | | 157 | % | |
8/31/2019 | | $ | 32.89 | | | $ | 0.43 | | | $ | 1.06 | | | $ | 1.49 | | | $ | (0.38 | ) | | $ | (3.38 | ) | | $ | — | | | $ | (3.76 | ) | | $ | — | | | $ | 30.62 | | | | 5.74 | % | | $ | 0.7 | | | | 1.37 | % | | | 1.37 | %§ | | | 1.42 | % | | | 109 | %k | |
| 8/31/2018f | | $ | 31.63 | | | $ | 0.32 | | | $ | 3.47 | | | $ | 3.79 | | | $ | (0.26 | ) | | $ | (2.27 | ) | | $ | — | | | $ | (2.53 | ) | | $ | — | | | $ | 32.89 | | | | 12.39 | % | | $ | 0.3 | | | | 1.37 | % | | | 1.36 | % | | | 1.00 | % | | | 153 | % | |
| 8/31/2017f | | $ | 29.46 | | | $ | 0.28 | | | $ | 4.12 | | | $ | 4.40 | | | $ | (0.39 | ) | | $ | (1.84 | ) | | $ | — | | | $ | (2.23 | ) | | $ | — | | | $ | 31.63 | | | | 15.27 | %h | | $ | 0.2 | | | | 1.43 | % | | | 1.36 | %e | | | 0.90 | %e | | | 74 | % | |
| 8/31/2016f | | $ | 31.34 | | | $ | 0.21 | | | $ | 2.81 | | | $ | 3.02 | | | $ | (0.55 | ) | | $ | (4.35 | ) | | $ | — | | | $ | (4.90 | ) | | $ | — | | | $ | 29.46 | | | | 12.58 | % | | $ | 0.1 | | | | 1.54 | % | | | 1.36 | % | | | 0.75 | % | | | 126 | % | |
Class R6 | |
8/31/2020 | | $ | 30.59 | | | $ | 0.63 | | | $ | 0.51 | | | $ | 1.14 | | | $ | (0.67 | ) | | $ | (0.65 | ) | | $ | — | | | $ | (1.32 | ) | | $ | — | | | $ | 30.41 | | | | 3.54 | % | | $ | 91.4 | | | | 0.59 | % | | | 0.59 | %§ | | | 2.19 | % | | | 157 | % | |
Period from 1/18/2019^
to 8/31/2019 | | $ | 28.19 | | | $ | 0.45 | | | $ | 1.95 | | | $ | 2.40 | | | $ | — | | | $ | — | | | $ | — | | | $ | — | | | $ | — | | | $ | 30.59 | | | | 8.51 | %* | | $ | 0.3 | | | | 0.67 | %** | | | 0.61 | %** | | | 2.39 | %** | | | 109 | %ck | |
See Notes to Financial Highlights
239
240
Financial Highlights (cont'd)
| | | Net Asset
Value,
Beginning
of Year | | Net
Investment
Income/(Loss)@ | | Net Gains or
Losses on
Securities
(both realized
and
unrealized) | | Total From
Investment
Operations | | Dividends
from Net
Investment
Income | | Distributions
from Net
Realized
Capital Gains | | Tax
Return of
Capital | | Total
Distributions | | Voluntary
Contribution
from
Management | | Net Asset
Value, End of
Year | | Total Returnab | | Net Assets,
End of Year
(in millions) | | Ratio of Gross
Expenses to
Average Net
Assets# | | Ratio of Net
Expenses to
Average Net
Assets | | Ratio of Net
Investment
Income/
(Loss) to
Average Net
Assets | | Portfolio
Turnover
Rate | |
Mid Cap Growth Fund | |
Investor Class | |
8/31/2020 | | $ | 15.96 | | | $ | (0.06 | ) | | $ | 3.40 | | | $ | 3.34 | | | $ | — | | | $ | (0.85 | ) | | $ | — | | | $ | (0.85 | ) | | $ | — | | | $ | 18.45 | | | | 21.95 | % | | $ | 570.7 | | | | 0.88 | % | | | 0.88 | % | | | (0.39 | )% | | | 55 | % | |
8/31/2019 | | $ | 16.99 | | | $ | (0.05 | ) | | $ | 0.47 | | | $ | 0.42 | | | $ | — | | | $ | (1.45 | ) | | $ | — | | | $ | (1.45 | ) | | $ | — | | | $ | 15.96 | | | | 4.84 | % | | $ | 513.3 | | | | 0.90 | % | | | 0.90 | % | | | (0.31 | )% | | | 48 | % | |
| 8/31/2018f | | $ | 14.61 | | | $ | (0.04 | ) | | $ | 3.74 | | | $ | 3.70 | | | $ | — | | | $ | (1.32 | ) | | $ | — | | | $ | (1.32 | ) | | $ | — | | | $ | 16.99 | | | | 26.75 | % | | $ | 528.1 | | | | 0.90 | % | | | 0.90 | % | | | (0.25 | )% | | | 50 | % | |
| 8/31/2017f | | $ | 13.25 | | | $ | (0.04 | ) | | $ | 2.04 | | | $ | 2.00 | | | $ | — | | | $ | (0.64 | ) | | $ | — | | | $ | (0.64 | ) | | $ | — | | | $ | 14.61 | | | | 15.80 | %h | | $ | 445.9 | | | | 0.93 | % | | | 0.91 | %e | | | (0.28 | )%e | | | 47 | % | |
| 8/31/2016f | | $ | 14.70 | | | $ | (0.04 | ) | | $ | (0.27 | ) | | $ | (0.31 | ) | | $ | — | | | $ | (1.15 | ) | | $ | — | | | $ | (1.15 | ) | | $ | 0.01 | | | $ | 13.25 | | | | (1.70 | )%d | | $ | 415.1 | | | | 0.95 | % | | | 0.95 | % | | | (0.34 | )% | | | 63 | % | |
Trust Class | |
8/31/2020 | | $ | 15.94 | | | $ | (0.07 | ) | | $ | 3.39 | | | $ | 3.32 | | | $ | — | | | $ | (0.85 | ) | | $ | — | | | $ | (0.85 | ) | | $ | — | | | $ | 18.41 | | | | 21.85 | % | | $ | 85.7 | | | | 0.94 | % | | | 0.94 | % | | | (0.46 | )% | | | 55 | % | |
8/31/2019 | | $ | 16.98 | | | $ | (0.06 | ) | | $ | 0.47 | | | $ | 0.41 | | | $ | — | | | $ | (1.45 | ) | | $ | — | | | $ | (1.45 | ) | | $ | — | | | $ | 15.94 | | | | 4.78 | % | | $ | 77.7 | | | | 0.95 | % | | | 0.95 | % | | | (0.37 | )% | | | 48 | % | |
| 8/31/2018f | | $ | 14.62 | | | $ | (0.05 | ) | | $ | 3.73 | | | $ | 3.68 | | | $ | — | | | $ | (1.32 | ) | | $ | — | | | $ | (1.32 | ) | | $ | — | | | $ | 16.98 | | | | 26.65 | % | | $ | 77.6 | | | | 0.95 | % | | | 0.95 | % | | | (0.30 | )% | | | 50 | % | |
| 8/31/2017f | | $ | 12.98 | | | $ | (0.04 | ) | | $ | 2.04 | | | $ | 2.00 | | | $ | — | | | $ | (0.36 | ) | | $ | — | | | $ | (0.36 | ) | | $ | — | | | $ | 14.62 | | | | 15.75 | %h | | $ | 52.0 | | | | 0.97 | % | | | 0.97 | %e | | | (0.34 | )%e | | | 47 | % | |
| 8/31/2016f | | $ | 13.91 | | | $ | (0.05 | ) | | $ | (0.25 | ) | | $ | (0.30 | ) | | $ | — | | | $ | (0.65 | ) | | $ | — | | | $ | (0.65 | ) | | $ | 0.02 | | | $ | 12.98 | | | | (1.77 | )%d | | $ | 66.7 | | | | 0.98 | % | | | 0.98 | % | | | (0.37 | )% | | | 63 | % | |
Advisor Class | |
8/31/2020 | | $ | 15.86 | | | $ | (0.11 | ) | | $ | 3.37 | | | $ | 3.26 | | | $ | — | | | $ | (0.85 | ) | | $ | — | | | $ | (0.85 | ) | | $ | — | | | $ | 18.27 | | | | 21.57 | % | | $ | 10.3 | | | | 1.20 | % | | | 1.20 | % | | | (0.70 | )% | | | 55 | % | |
8/31/2019 | | $ | 16.94 | | | $ | (0.09 | ) | | $ | 0.46 | | | $ | 0.37 | | | $ | — | | | $ | (1.45 | ) | | $ | — | | | $ | (1.45 | ) | | $ | — | | | $ | 15.86 | | | | 4.53 | % | | $ | 12.0 | | | | 1.21 | % | | | 1.21 | % | | | (0.62 | )% | | | 48 | % | |
| 8/31/2018f | | $ | 14.62 | | | $ | (0.09 | ) | | $ | 3.73 | | | $ | 3.64 | | | $ | — | | | $ | (1.32 | ) | | $ | — | | | $ | (1.32 | ) | | $ | — | | | $ | 16.94 | | | | 26.32 | % | | $ | 15.4 | | | | 1.21 | % | | | 1.21 | % | | | (0.56 | )% | | | 50 | % | |
| 8/31/2017f | | $ | 13.01 | | | $ | (0.08 | ) | | $ | 2.05 | | | $ | 1.97 | | | $ | — | | | $ | (0.36 | ) | | $ | — | | | $ | (0.36 | ) | | $ | — | | | $ | 14.62 | | | | 15.47 | %h | | $ | 12.4 | | | | 1.23 | % | | | 1.23 | %e | | | (0.60 | )%e | | | 47 | % | |
| 8/31/2016f | | $ | 13.97 | | | $ | (0.08 | ) | | $ | (0.25 | ) | | $ | (0.33 | ) | | $ | — | | | $ | (0.64 | ) | | $ | — | | | $ | (0.64 | ) | | $ | 0.01 | | | $ | 13.01 | | | | (2.04 | )%d | | $ | 11.5 | | | | 1.24 | % | | | 1.24 | % | | | (0.63 | )% | | | 63 | % | |
Institutional Class | |
8/31/2020 | | $ | 16.02 | | | $ | (0.03 | ) | | $ | 3.41 | | | $ | 3.38 | | | $ | — | | | $ | (0.85 | ) | | $ | — | | | $ | (0.85 | ) | | $ | — | | | $ | 18.55 | | | | 22.12 | % | | $ | 347.4 | | | | 0.70 | % | | | 0.70 | % | | | (0.22 | )% | | | 55 | % | |
8/31/2019 | | $ | 17.01 | | | $ | (0.02 | ) | | $ | 0.48 | | | $ | 0.46 | | | $ | — | | | $ | (1.45 | ) | | $ | — | | | $ | (1.45 | ) | | $ | — | | | $ | 16.02 | | | | 5.09 | % | | $ | 273.4 | | | | 0.70 | % | | | 0.70 | % | | | (0.11 | )% | | | 48 | % | |
8/31/2018 | | $ | 14.61 | | | $ | (0.01 | ) | | $ | 3.73 | | | $ | 3.72 | | | $ | — | | | $ | (1.32 | ) | | $ | — | | | $ | (1.32 | ) | | $ | — | | | $ | 17.01 | | | | 26.93 | % | | $ | 353.7 | | | | 0.70 | % | | | 0.70 | % | | | (0.05 | )% | | | 50 | % | |
8/31/2017 | | $ | 13.20 | | | $ | (0.01 | ) | | $ | 2.04 | | | $ | 2.03 | | | $ | — | | | $ | (0.62 | ) | | $ | — | | | $ | (0.62 | ) | | $ | — | | | $ | 14.61 | | | | 16.03 | %h | | $ | 321.5 | | | | 0.72 | % | | | 0.72 | %e | | | (0.09 | )%e | | | 47 | % | |
8/31/2016 | | $ | 14.59 | | | $ | (0.02 | ) | | $ | (0.27 | ) | | $ | (0.29 | ) | | $ | — | | | $ | (1.12 | ) | | $ | — | | | $ | (1.12 | ) | | $ | 0.02 | | | $ | 13.20 | | | | (1.52 | )%d | | $ | 307.6 | | | | 0.75 | % | | | 0.75 | %§ | | | (0.14 | )% | | | 63 | % | |
Class A | |
8/31/2020 | | $ | 15.90 | | | $ | (0.09 | ) | | $ | 3.38 | | | $ | 3.29 | | | $ | — | | | $ | (0.85 | ) | | $ | — | | | $ | (0.85 | ) | | $ | — | | | $ | 18.34 | | | | 21.70 | % | | $ | 36.0 | | | | 1.06 | % | | | 1.06 | % | | | (0.57 | )% | | | 55 | % | |
8/31/2019 | | $ | 16.96 | | | $ | (0.07 | ) | | $ | 0.46 | | | $ | 0.39 | | | $ | — | | | $ | (1.45 | ) | | $ | — | | | $ | (1.45 | ) | | $ | — | | | $ | 15.90 | | | | 4.65 | % | | $ | 33.0 | | | | 1.07 | % | | | 1.07 | % | | | (0.47 | )% | | | 48 | % | |
| 8/31/2018f | | $ | 14.62 | | | $ | (0.07 | ) | | $ | 3.73 | | | $ | 3.66 | | | $ | — | | | $ | (1.32 | ) | | $ | — | | | $ | (1.32 | ) | | $ | — | | | $ | 16.96 | | | | 26.48 | % | | $ | 52.1 | | | | 1.07 | % | | | 1.07 | % | | | (0.42 | )% | | | 50 | % | |
| 8/31/2017f | | $ | 13.00 | | | $ | (0.06 | ) | | $ | 2.04 | | | $ | 1.98 | | | $ | — | | | $ | (0.36 | ) | | $ | — | | | $ | (0.36 | ) | | $ | — | | | $ | 14.62 | | | | 15.58 | %h | | $ | 54.4 | | | | 1.11 | % | | | 1.11 | %e§ | | | (0.49 | )%e | | | 47 | % | |
| 8/31/2016f | | $ | 13.95 | | | $ | (0.06 | ) | | $ | (0.25 | ) | | $ | (0.31 | ) | | $ | — | | | $ | (0.66 | ) | | $ | — | | | $ | (0.66 | ) | | $ | 0.02 | | | $ | 13.00 | | | | (1.91 | )%d | | $ | 76.9 | | | | 1.11 | % | | | 1.11 | %§ | | | (0.51 | )% | | | 63 | % | |
See Notes to Financial Highlights
241
242
Financial Highlights (cont'd)
| | | Net Asset
Value,
Beginning
of Year | | Net
Investment
Income/(Loss)@ | | Net Gains or
Losses on
Securities
(both realized
and
unrealized) | | Total From
Investment
Operations | | Dividends
from Net
Investment
Income | | Distributions
from Net
Realized
Capital Gains | | Tax
Return of
Capital | | Total
Distributions | | Voluntary
Contribution
from
Management | | Net Asset
Value, End of
Year | | Total Returnab | | Net Assets,
End of Year
(in millions) | | Ratio of Gross
Expenses to
Average Net
Assets# | | Ratio of Net
Expenses to
Average Net
Assets | | Ratio of Net
Investment
Income/
(Loss) to
Average Net
Assets | | Portfolio
Turnover
Rate | |
Mid Cap Growth Fund (cont'd) | |
Class C | |
8/31/2020 | | $ | 15.67 | | | $ | (0.20 | ) | | $ | 3.30 | | | $ | 3.10 | | | $ | — | | | $ | (0.85 | ) | | $ | — | | | $ | (0.85 | ) | | $ | — | | | $ | 17.92 | | | | 20.77 | % | | $ | 11.3 | | | | 1.81 | % | | | 1.81 | % | | | (1.32 | )% | | | 55 | % | |
8/31/2019 | | $ | 16.85 | | | $ | (0.18 | ) | | $ | 0.45 | | | $ | 0.27 | | | $ | — | | | $ | (1.45 | ) | | $ | — | | | $ | (1.45 | ) | | $ | — | | | $ | 15.67 | | | | 3.91 | % | | $ | 10.8 | | | | 1.82 | % | | | 1.82 | % | | | (1.24 | )% | | | 48 | % | |
| 8/31/2018f | | $ | 14.64 | | | $ | (0.19 | ) | | $ | 3.72 | | | $ | 3.53 | | | $ | — | | | $ | (1.32 | ) | | $ | — | | | $ | (1.32 | ) | | $ | — | | | $ | 16.85 | | | | 25.49 | % | | $ | 11.6 | | | | 1.85 | % | | | 1.85 | %§ | | | (1.20 | )% | | | 50 | % | |
| 8/31/2017f | | $ | 13.13 | | | $ | (0.17 | ) | | $ | 2.05 | | | $ | 1.88 | | | $ | — | | | $ | (0.37 | ) | | $ | — | | | $ | (0.37 | ) | | $ | — | | | $ | 14.64 | | | | 14.69 | % | | $ | 9.7 | | | | 1.86 | % | | | 1.86 | %§ | | | (1.24 | )% | | | 47 | % | |
| 8/31/2016f | | $ | 14.20 | | | $ | (0.16 | ) | | $ | (0.25 | ) | | $ | (0.41 | ) | | $ | — | | | $ | (0.67 | ) | | $ | — | | | $ | (0.67 | ) | | $ | 0.01 | | | $ | 13.13 | | | | (2.62 | )%d | | $ | 10.9 | | | | 1.88 | % | | | 1.86 | % | | | (1.24 | )% | | | 63 | % | |
Class R3 | |
8/31/2020 | | $ | 15.82 | | | $ | (0.12 | ) | | $ | 3.34 | | | $ | 3.22 | | | $ | — | | | $ | (0.85 | ) | | $ | — | | | $ | (0.85 | ) | | $ | — | | | $ | 18.19 | | | | 21.36 | % | | $ | 13.7 | | | | 1.31 | % | | | 1.31 | % | | | (0.77 | )% | | | 55 | % | |
8/31/2019 | | $ | 16.92 | | | $ | (0.12 | ) | | $ | 0.47 | | | $ | 0.35 | | | $ | — | | | $ | (1.45 | ) | | $ | — | | | $ | (1.45 | ) | | $ | — | | | $ | 15.82 | | | | 4.41 | % | | $ | 56.4 | | | | 1.33 | % | | | 1.33 | %§ | | | (0.79 | )% | | | 48 | % | |
| 8/31/2018f | | $ | 14.63 | | | $ | (0.11 | ) | | $ | 3.72 | | | $ | 3.61 | | | $ | — | | | $ | (1.32 | ) | | $ | — | | | $ | (1.32 | ) | | $ | — | | | $ | 16.92 | | | | 26.11 | % | | $ | 15.6 | | | | 1.36 | % | | | 1.36 | %§ | | | (0.71 | )% | | | 50 | % | |
| 8/31/2017f | | $ | 13.04 | | | $ | (0.10 | ) | | $ | 2.05 | | | $ | 1.95 | | | $ | — | | | $ | (0.36 | ) | | $ | — | | | $ | (0.36 | ) | | $ | — | | | $ | 14.63 | | | | 15.30 | % | | $ | 13.2 | | | | 1.36 | % | | | 1.36 | % | | | (0.73 | )% | | | 47 | % | |
| 8/31/2016f | | $ | 14.00 | | | $ | (0.09 | ) | | $ | (0.24 | ) | | $ | (0.33 | ) | | $ | — | | | $ | (0.64 | ) | | $ | — | | | $ | (0.64 | ) | | $ | 0.01 | | | $ | 13.04 | | | | (2.12 | )%d | | $ | 13.7 | | | | 1.38 | % | | | 1.36 | % | | | (0.74 | )% | | | 63 | % | |
Class R6 | |
8/31/2020 | | $ | 16.05 | | | $ | (0.02 | ) | | $ | 3.43 | | | $ | 3.41 | | | $ | — | | | $ | (0.85 | ) | | $ | — | | | $ | (0.85 | ) | | $ | — | | | $ | 18.61 | | | | 22.27 | % | | $ | 524.1 | | | | 0.60 | % | | | 0.60 | % | | | (0.11 | )% | | | 55 | % | |
8/31/2019 | | $ | 17.02 | | | $ | (0.00 | ) | | $ | 0.48 | | | $ | 0.48 | | | $ | — | | | $ | (1.45 | ) | | $ | — | | | $ | (1.45 | ) | | $ | — | | | $ | 16.05 | | | | 5.20 | % | | $ | 461.1 | | | | 0.61 | % | | | 0.61 | % | | | (0.03 | )% | | | 48 | % | |
| 8/31/2018f | | $ | 14.61 | | | $ | 0.00 | | | $ | 3.73 | | | $ | 3.73 | | | $ | — | | | $ | (1.32 | ) | | $ | — | | | $ | (1.32 | ) | | $ | — | | | $ | 17.02 | | | | 26.99 | % | | $ | 433.5 | | | | 0.63 | % | | | 0.63 | % | | | 0.02 | % | | | 50 | % | |
| 8/31/2017f | | $ | 13.19 | | | $ | (0.00 | ) | | $ | 2.04 | | | $ | 2.04 | | | $ | — | | | $ | (0.62 | ) | | $ | — | | | $ | (0.62 | ) | | $ | — | | | $ | 14.61 | | | | 16.13 | %h | | $ | 262.4 | | | | 0.65 | % | | | 0.65 | %e | | | (0.02 | )%e | | | 47 | % | |
| 8/31/2016f | | $ | 14.56 | | | $ | (0.00 | ) | | $ | (0.26 | ) | | $ | (0.26 | ) | | $ | — | | | $ | (1.12 | ) | | $ | — | | | $ | (1.12 | ) | | $ | 0.01 | | | $ | 13.19 | | | | (1.44 | )%d | | $ | 193.7 | | | | 0.66 | % | | | 0.66 | % | | | (0.02 | )% | | | 63 | % | |
Mid Cap Intrinsic Value Fund | |
Investor Class | |
8/31/2020 | | $ | 19.32 | | | $ | 0.22 | | | $ | (3.28 | ) | | $ | (3.06 | ) | | $ | (0.23 | ) | | $ | — | | | $ | — | | | $ | (0.23 | ) | | $ | — | | | $ | 16.03 | | | | (16.10 | )% | | $ | 23.0 | | | | 1.37 | % | | | 1.11 | % | | | 1.26 | % | | | 16 | % | |
| 8/31/2019i | | $ | 24.16 | | | $ | 0.19 | | | $ | (3.39 | ) | | $ | (3.20 | ) | | $ | (0.13 | ) | | $ | (1.51 | ) | | $ | — | | | $ | (1.64 | ) | | $ | — | | | $ | 19.32 | | | | (12.97 | )% | | $ | 34.5 | | | | 1.27 | % | | | 1.17 | % | | | 0.93 | % | | | 56 | % | |
| 8/31/2018i | | $ | 23.02 | | | $ | 0.12 | | | $ | 2.57 | | | $ | 2.69 | | | $ | (0.11 | ) | | $ | (1.44 | ) | | $ | — | | | $ | (1.55 | ) | | $ | — | | | $ | 24.16 | | | | 12.20 | % | | $ | 40.2 | | | | 1.21 | % | | | 1.17 | % | | | 0.49 | % | | | 36 | % | |
| 8/31/2017i | | $ | 19.75 | | | $ | 0.23 | | | $ | 3.16 | | | $ | 3.39 | | | $ | (0.12 | ) | | $ | — | | | $ | — | | | $ | (0.12 | ) | | $ | — | | | $ | 23.02 | | | | 17.19 | %h | | $ | 40.3 | | | | 1.25 | % | | | 1.01 | %e | | | 1.06 | %e | | | 31 | % | |
| 8/31/2016i | | $ | 21.03 | | | $ | 0.16 | | | $ | 0.79 | | | $ | 0.95 | | | $ | (0.10 | ) | | $ | (2.13 | ) | | $ | — | | | $ | (2.23 | ) | | $ | — | | | $ | 19.75 | | | | 5.85 | % | | $ | 37.9 | | | | 1.30 | % | | | 1.15 | % | | | 0.86 | % | | | 29 | % | |
Trust Class | |
8/31/2020 | | $ | 19.32 | | | $ | 0.20 | | | $ | (3.30 | ) | | $ | (3.10 | ) | | $ | (0.20 | ) | | $ | — | | | $ | — | | | $ | (0.20 | ) | | $ | — | | | $ | 16.02 | | | | (16.26 | )% | | $ | 4.9 | | | | 1.53 | % | | | 1.26 | % | | | 1.12 | % | | | 16 | % | |
| 8/31/2019i | | $ | 24.16 | | | $ | 0.17 | | | $ | (3.38 | ) | | $ | (3.21 | ) | | $ | (0.12 | ) | | $ | (1.51 | ) | | $ | — | | | $ | (1.63 | ) | | $ | — | | | $ | 19.32 | | | | (13.03 | )% | | $ | 8.0 | | | | 1.42 | % | | | 1.27 | % | | | 0.82 | % | | | 56 | % | |
| 8/31/2018i | | $ | 23.35 | | | $ | 0.10 | | | $ | 2.61 | | | $ | 2.71 | | | $ | (0.12 | ) | | $ | (1.78 | ) | | $ | — | | | $ | (1.90 | ) | | $ | — | | | $ | 24.16 | | | | 12.17 | % | | $ | 10.2 | | | | 1.37 | % | | | 1.25 | % | | | 0.42 | % | | | 36 | % | |
| 8/31/2017i | | $ | 20.10 | | | $ | 0.19 | | | $ | 3.19 | | | $ | 3.38 | | | $ | (0.13 | ) | | $ | — | | | $ | — | | | $ | (0.13 | ) | | $ | — | | | $ | 23.35 | | | | 16.85 | %h | | $ | 10.9 | | | | 1.43 | % | | | 1.25 | %§e | | | 0.82 | %e | | | 31 | % | |
| 8/31/2016i | | $ | 21.92 | | | $ | 0.15 | | | $ | 0.79 | | | $ | 0.94 | | | $ | (0.12 | ) | | $ | (2.64 | ) | | $ | — | | | $ | (2.76 | ) | | $ | — | | | $ | 20.10 | | | | 5.80 | % | | $ | 10.3 | | | | 1.48 | % | | | 1.25 | % | | | 0.77 | % | | | 29 | % | |
See Notes to Financial Highlights
243
244
Financial Highlights (cont'd)
| | | Net Asset
Value,
Beginning
of Year | | Net
Investment
Income/(Loss)@ | | Net Gains or
Losses on
Securities
(both realized
and
unrealized) | | Total From
Investment
Operations | | Dividends
from Net
Investment
Income | | Distributions
from Net
Realized
Capital Gains | | Tax
Return of
Capital | | Total
Distributions | | Voluntary
Contribution
from
Management | | Net Asset
Value, End of
Year | | Total Returnab | | Net Assets,
End of Year
(in millions) | | Ratio of Gross
Expenses to
Average Net
Assets# | | Ratio of Net
Expenses to
Average Net
Assets | | Ratio of Net
Investment
Income/
(Loss) to
Average Net
Assets | | Portfolio
Turnover
Rate | |
Mid Cap Intrinsic Value Fund (cont'd) | |
Institutional Class | |
8/31/2020 | | $ | 19.31 | | | $ | 0.27 | | | $ | (3.28 | ) | | $ | (3.01 | ) | | $ | (0.28 | ) | | $ | — | | | $ | — | | | $ | (0.28 | ) | | $ | — | | | $ | 16.02 | | | | (15.88 | )% | | $ | 12.6 | | | | 1.19 | % | | | 0.86 | % | | | 1.52 | % | | | 16 | % | |
8/31/2019 | | $ | 24.17 | | | $ | 0.25 | | | $ | (3.40 | ) | | $ | (3.15 | ) | | $ | (0.20 | ) | | $ | (1.51 | ) | | $ | — | | | $ | (1.71 | ) | | $ | — | | | $ | 19.31 | | | | (12.70 | )% | | $ | 40.2 | | | | 1.07 | % | | | 0.86 | % | | | 1.21 | % | | | 56 | % | |
8/31/2018 | | $ | 23.00 | | | $ | 0.19 | | | $ | 2.59 | | | $ | 2.78 | | | $ | (0.17 | ) | | $ | (1.44 | ) | | $ | — | | | $ | (1.61 | ) | | $ | — | | | $ | 24.17 | | | | 12.60 | % | | $ | 52.5 | | | | 1.02 | % | | | 0.85 | % | | | 0.81 | % | | | 36 | % | |
8/31/2017 | | $ | 19.75 | | | $ | 0.26 | | | $ | 3.16 | | | $ | 3.42 | | | $ | (0.17 | ) | | $ | — | | | $ | — | | | $ | (0.17 | ) | | $ | — | | | $ | 23.00 | | | | 17.40 | %h | | $ | 29.1 | | | | 1.05 | % | | | 0.85 | %e | | | 1.19 | %e | | | 31 | % | |
8/31/2016 | | $ | 21.02 | | | $ | 0.22 | | | $ | 0.79 | | | $ | 1.01 | | | $ | (0.15 | ) | | $ | (2.13 | ) | | $ | — | | | $ | (2.28 | ) | | $ | — | | | $ | 19.75 | | | | 6.18 | % | | $ | 22.7 | | | | 1.09 | % | | | 0.85 | % | | | 1.18 | % | | | 29 | % | |
Class A | |
8/31/2020 | | $ | 19.32 | | | $ | 0.21 | | | $ | (3.29 | ) | | $ | (3.08 | ) | | $ | (0.21 | ) | | $ | — | | | $ | — | | | $ | (0.21 | ) | | $ | — | | | $ | 16.03 | | | | (16.17 | )% | | $ | 1.7 | | | | 1.54 | % | | | 1.22 | % | | | 1.15 | % | | | 16 | % | |
| 8/31/2019i | | $ | 24.17 | | | $ | 0.19 | | | $ | (3.41 | ) | | $ | (3.22 | ) | | $ | (0.12 | ) | | $ | (1.51 | ) | | $ | — | | | $ | (1.63 | ) | | $ | — | | | $ | 19.32 | | | | (13.03 | )% | | $ | 6.2 | | | | 1.40 | % | | | 1.22 | % | | | 0.91 | % | | | 56 | % | |
| 8/31/2018i | | $ | 23.34 | | | $ | 0.11 | | | $ | 2.60 | | | $ | 2.71 | | | $ | (0.10 | ) | | $ | (1.78 | ) | | $ | — | | | $ | (1.88 | ) | | $ | — | | | $ | 24.17 | | | | 12.23 | % | | $ | 10.1 | | | | 1.39 | % | | | 1.21 | % | | | 0.46 | % | | | 36 | % | |
| 8/31/2017i | | $ | 20.08 | | | $ | 0.20 | | | $ | 3.20 | | | $ | 3.40 | | | $ | (0.14 | ) | | $ | — | | | $ | — | | | $ | (0.14 | ) | | $ | — | | | $ | 23.34 | | | | 16.95 | %h | | $ | 8.6 | | | | 1.43 | % | | | 1.21 | %e | | | 0.89 | %e | | | 31 | % | |
| 8/31/2016i | | $ | 21.93 | | | $ | 0.16 | | | $ | 0.77 | | | $ | 0.93 | | | $ | (0.14 | ) | | $ | (2.64 | ) | | $ | — | | | $ | (2.78 | ) | | $ | — | | | $ | 20.08 | | | | 5.76 | % | | $ | 13.3 | | | | 1.49 | % | | | 1.21 | % | | | 0.81 | % | | | 29 | % | |
Class C | |
8/31/2020 | | $ | 19.29 | | | $ | 0.07 | | | $ | (3.30 | ) | | $ | (3.23 | ) | | $ | (0.06 | ) | | $ | — | | | $ | — | | | $ | (0.06 | ) | | $ | — | | | $ | 16.00 | | | | (16.81 | )% | | $ | 0.8 | | | | 2.31 | % | | | 1.97 | % | | | 0.41 | % | | | 16 | % | |
| 8/31/2019i | | $ | 24.18 | | | $ | 0.02 | | | $ | (3.39 | ) | | $ | (3.37 | ) | | $ | (0.01 | ) | | $ | (1.51 | ) | | $ | — | | | $ | (1.52 | ) | | $ | — | | | $ | 19.29 | | | | (13.69 | )% | | $ | 1.5 | | | | 2.19 | % | | | 1.97 | % | | | 0.10 | % | | | 56 | % | |
| 8/31/2018i | | $ | 23.47 | | | $ | (0.06 | ) | | $ | 2.61 | | | $ | 2.55 | | | $ | (0.00 | ) | | $ | (1.84 | ) | | $ | — | | | $ | (1.84 | ) | | $ | — | | | $ | 24.18 | | | | 11.37 | % | | $ | 2.4 | | | | 2.14 | % | | | 1.96 | % | | | (0.29 | )% | | | 36 | % | |
| 8/31/2017i | | $ | 20.29 | | | $ | 0.04 | | | $ | 3.22 | | | $ | 3.26 | | | $ | (0.08 | ) | | $ | — | | | $ | — | | | $ | (0.08 | ) | | $ | — | | | $ | 23.47 | | | | 16.09 | %h | | $ | 2.5 | | | | 2.18 | % | | | 1.96 | %e | | | 0.15 | %e | | | 31 | % | |
| 8/31/2016i | | $ | 22.30 | | | $ | 0.01 | | | $ | 0.78 | | | $ | 0.79 | | | $ | (0.08 | ) | | $ | (2.72 | ) | | $ | — | | | $ | (2.80 | ) | | $ | — | | | $ | 20.29 | | | | 5.01 | % | | $ | 3.7 | | | | 2.23 | % | | | 1.96 | % | | | 0.05 | % | | | 29 | % | |
Class R3 | |
8/31/2020 | | $ | 19.33 | | | $ | 0.18 | | | $ | (3.32 | ) | | $ | (3.14 | ) | | $ | (0.16 | ) | | $ | — | | | $ | — | | | $ | (0.16 | ) | | $ | — | | | $ | 16.03 | | | | (16.42 | )% | | $ | 0.5 | | | | 1.80 | % | | | 1.47 | % | | | 0.96 | % | | | 16 | % | |
| 8/31/2019i | | $ | 24.17 | | | $ | 0.13 | | | $ | (3.39 | ) | | $ | (3.26 | ) | | $ | (0.07 | ) | | $ | (1.51 | ) | | $ | — | | | $ | (1.58 | ) | | $ | — | | | $ | 19.33 | | | | (13.21 | )% | | $ | 1.9 | | | | 1.70 | % | | | 1.48 | % | | | 0.61 | % | | | 56 | % | |
| 8/31/2018i | | $ | 23.37 | | | $ | 0.05 | | | $ | 2.60 | | | $ | 2.65 | | | $ | (0.06 | ) | | $ | (1.79 | ) | | $ | — | | | $ | (1.85 | ) | | $ | — | | | $ | 24.17 | | | | 11.92 | % | | $ | 2.3 | | | | 1.65 | % | | | 1.46 | % | | | 0.21 | % | | | 36 | % | |
| 8/31/2017i | | $ | 20.15 | | | $ | 0.13 | | | $ | 3.20 | | | $ | 3.33 | | | $ | (0.11 | ) | | $ | — | | | $ | — | | | $ | (0.11 | ) | | $ | — | | | $ | 23.37 | | | | 16.62 | % | | $ | 1.5 | | | | 1.69 | % | | | 1.46 | % | | | 0.63 | % | | | 31 | % | |
| 8/31/2016i | | $ | 22.03 | | | $ | 0.11 | | | $ | 0.77 | | | $ | 0.88 | | | $ | (0.11 | ) | | $ | (2.65 | ) | | $ | — | | | $ | (2.76 | ) | | $ | — | | | $ | 20.15 | | | | 5.54 | % | | $ | 1.4 | | | | 1.75 | % | | | 1.46 | % | | | 0.56 | % | | | 29 | % | |
Class R6 | |
8/31/2020 | | $ | 19.32 | | | $ | 0.28 | | | $ | (3.27 | ) | | $ | (2.99 | ) | | $ | (0.30 | ) | | $ | — | | | $ | — | | | $ | (0.30 | ) | | $ | — | | | $ | 16.03 | | | | (15.79 | )% | | $ | 0.0 | | | | 1.02 | % | | | 0.76 | %§ | | | 1.62 | % | | | 16 | % | |
Period from 3/29/2019^
to 8/31/2019 | | $ | 20.50 | | | $ | 0.10 | | | $ | (1.28 | ) | | $ | (1.18 | ) | | $ | — | | | $ | — | | | $ | — | | | $ | — | | | $ | — | | | $ | 19.32 | | | | (5.76 | )%* | | $ | 0.0 | | | | 1.44 | %** | | | 0.78 | %** | | | 1.14 | %** | | | 56 | %c | |
See Notes to Financial Highlights
245
246
Financial Highlights (cont'd)
| | | Net Asset
Value,
Beginning
of Year | | Net
Investment
Income/(Loss)@ | | Net Gains or
Losses on
Securities
(both realized
and
unrealized) | | Total From
Investment
Operations | | Dividends
from Net
Investment
Income | | Distributions
from Net
Realized
Capital Gains | | Tax
Return of
Capital | | Total
Distributions | | Voluntary
Contribution
from
Management | | Net Asset
Value, End of
Year | | Total Returnab | | Net Assets,
End of Year
(in millions) | | Ratio of Gross
Expenses to
Average Net
Assets# | | Ratio of Net
Expenses to
Average Net
Assets | | Ratio of Net
Investment
Income/
(Loss) to
Average Net
Assets | | Portfolio
Turnover
Rate | |
Multi-Cap Opportunities Fund | |
Institutional Class | |
8/31/2020 | | $ | 18.64 | | | $ | 0.09 | | | $ | 1.76 | | | $ | 1.85 | | | $ | (0.14 | ) | | $ | (3.32 | ) | | $ | — | | | $ | (3.46 | ) | | $ | — | | | $ | 17.03 | | | | 10.23 | % | | $ | 609.7 | | | | 0.76 | % | | | 0.76 | % | | | 0.53 | % | | | 27 | % | |
8/31/2019 | | $ | 20.12 | | | $ | 0.14 | | | $ | 0.17 | | | $ | 0.31 | | | $ | (0.14 | ) | | $ | (1.65 | ) | | $ | — | | | $ | (1.79 | ) | | $ | — | | | $ | 18.64 | | | | 2.91 | % | | $ | 1,098.2 | | | | 0.74 | % | | | 0.74 | % | | | 0.75 | % | | | 36 | % | |
8/31/2018 | | $ | 18.67 | | | $ | 0.12 | | | $ | 3.28 | | | $ | 3.40 | | | $ | (0.11 | ) | | $ | (1.84 | ) | | $ | — | | | $ | (1.95 | ) | | $ | — | | | $ | 20.12 | | | | 19.15 | % | | $ | 1,866.7 | | | | 0.72 | % | | | 0.72 | % | | | 0.61 | % | | | 23 | % | |
8/31/2017 | | $ | 16.08 | | | $ | 0.12 | | | $ | 3.06 | | | $ | 3.18 | | | $ | (0.14 | ) | | $ | (0.45 | ) | | $ | — | | | $ | (0.59 | ) | | $ | — | | | $ | 18.67 | | | | 20.27 | %h | | $ | 1,828.2 | | | | 0.75 | % | | | 0.75 | %e | | | 0.68 | %e | | | 23 | % | |
8/31/2016 | | $ | 15.31 | | | $ | 0.15 | | | $ | 1.18 | | | $ | 1.33 | | | $ | (0.15 | ) | | $ | (0.41 | ) | | $ | — | | | $ | (0.56 | ) | | $ | — | | | $ | 16.08 | | | | 8.94 | % | | $ | 1,757.2 | | | | 0.76 | % | | | 0.76 | % | | | 0.99 | % | | | 18 | % | |
Class A | |
8/31/2020 | | $ | 18.65 | | | $ | 0.03 | | | $ | 1.76 | | | $ | 1.79 | | | $ | (0.07 | ) | | $ | (3.32 | ) | | $ | — | | | $ | (3.39 | ) | | $ | — | | | $ | 17.05 | | | | 9.83 | % | | $ | 41.6 | | | | 1.14 | % | | | 1.14 | % | | | 0.17 | % | | | 27 | % | |
| 8/31/2019i | | $ | 20.12 | | | $ | 0.07 | | | $ | 0.18 | | | $ | 0.25 | | | $ | (0.07 | ) | | $ | (1.65 | ) | | $ | — | | | $ | (1.72 | ) | | $ | — | | | $ | 18.65 | | | | 2.54 | % | | $ | 49.9 | | | | 1.12 | % | | | 1.12 | % | | | 0.38 | % | | | 36 | % | |
| 8/31/2018i | | $ | 18.69 | | | $ | 0.05 | | | $ | 3.28 | | | $ | 3.33 | | | $ | (0.04 | ) | | $ | (1.86 | ) | | $ | — | | | $ | (1.90 | ) | | $ | — | | | $ | 20.12 | | | | 18.72 | % | | $ | 75.7 | | | | 1.09 | % | | | 1.09 | % | | | 0.25 | % | | | 23 | % | |
| 8/31/2017i | | $ | 16.09 | | | $ | 0.06 | | | $ | 3.06 | | | $ | 3.12 | | | $ | (0.07 | ) | | $ | (0.45 | ) | | $ | — | | | $ | (0.52 | ) | | $ | — | | | $ | 18.69 | | | | 19.85 | %h | | $ | 53.5 | | | | 1.10 | % | | | 1.10 | %e | | | 0.32 | %e | | | 23 | % | |
| 8/31/2016i | | $ | 15.31 | | | $ | 0.09 | | | $ | 1.18 | | | $ | 1.27 | | | $ | (0.08 | ) | | $ | (0.41 | ) | | $ | — | | | $ | (0.49 | ) | | $ | — | | | $ | 16.09 | | | | 8.53 | % | | $ | 73.0 | | | | 1.11 | % | | | 1.11 | % | | | 0.62 | % | | | 18 | % | |
Class C | |
8/31/2020 | | $ | 18.59 | | | $ | (0.09 | ) | | $ | 1.74 | | | $ | 1.65 | | | $ | — | | | $ | (3.32 | ) | | $ | — | | | $ | (3.32 | ) | | $ | — | | | $ | 16.92 | | | | 9.04 | % | | $ | 30.4 | | | | 1.88 | % | | | 1.88 | % | | | (0.57 | )% | | | 27 | % | |
| 8/31/2019i | | $ | 20.13 | | | $ | (0.06 | ) | | $ | 0.17 | | | $ | 0.11 | | | $ | — | | | $ | (1.65 | ) | | $ | — | | | $ | (1.65 | ) | | $ | — | | | $ | 18.59 | | | | 1.78 | % | | $ | 39.4 | | | | 1.86 | % | | | 1.86 | % | | | (0.35 | )% | | | 36 | % | |
| 8/31/2018i | | $ | 18.87 | | | $ | (0.10 | ) | | $ | 3.30 | | | $ | 3.20 | | | $ | — | | | $ | (1.94 | ) | | $ | — | | | $ | (1.94 | ) | | $ | — | | | $ | 20.13 | | | | 17.83 | % | | $ | 44.7 | | | | 1.83 | % | | | 1.83 | % | | | (0.49 | )% | | | 23 | % | |
| 8/31/2017i | | $ | 16.31 | | | $ | (0.07 | ) | | $ | 3.11 | | | $ | 3.04 | | | $ | (0.00 | ) | | $ | (0.48 | ) | | $ | — | | | $ | (0.48 | ) | | $ | — | | | $ | 18.87 | | | | 18.95 | %h | | $ | 40.7 | | | | 1.84 | % | | | 1.84 | %e | | | (0.40 | )%e | | | 23 | % | |
| 8/31/2016i | | $ | 15.58 | | | $ | (0.02 | ) | | $ | 1.19 | | | $ | 1.17 | | | $ | (0.01 | ) | | $ | (0.43 | ) | | $ | — | | | $ | (0.44 | ) | | $ | — | | | $ | 16.31 | | | | 7.73 | % | | $ | 39.6 | | | | 1.85 | % | | | 1.85 | % | | | (0.11 | )% | | | 18 | % | |
Real Estate Fund | |
Trust Class | |
8/31/2020 | | $ | 15.13 | | | $ | 0.17 | | | $ | (0.80 | ) | | $ | (0.63 | ) | | $ | (0.17 | ) | | $ | (0.57 | ) | | $ | — | | | $ | (0.74 | ) | | $ | — | | | $ | 13.76 | | | | (4.13 | )% | | $ | 108.6 | | | | 1.40 | % | | | 1.04 | % | | | 1.21 | % | | | 26 | % | |
8/31/2019 | | $ | 13.34 | | | $ | 0.18 | | | $ | 2.45 | | | $ | 2.63 | | | $ | (0.18 | ) | | $ | (0.66 | ) | | $ | — | | | $ | (0.84 | ) | | $ | — | | | $ | 15.13 | | | | 21.21 | % | | $ | 130.3 | | | | 1.43 | % | | | 1.04 | % | | | 1.32 | % | | | 38 | % | |
8/31/2018 | | $ | 13.52 | | | $ | 0.20 | | | $ | 0.45 | | | $ | 0.65 | | | $ | (0.19 | ) | | $ | (0.64 | ) | | $ | — | | | $ | (0.83 | ) | | $ | — | | | $ | 13.34 | | | | 5.01 | % | | $ | 133.7 | | | | 1.42 | % | | | 1.04 | % | | | 1.58 | % | | | 47 | % | |
8/31/2017 | | $ | 15.12 | | | $ | 0.20 | | | $ | 0.07 | | | $ | 0.27 | | | $ | (0.19 | ) | | $ | (1.68 | ) | | $ | — | | | $ | (1.87 | ) | | $ | — | | | $ | 13.52 | | | | 2.89 | % | | $ | 156.6 | | | | 1.42 | % | | | 1.04 | % | | | 1.46 | % | | | 45 | % | |
8/31/2016 | | $ | 13.60 | | | $ | 0.19 | | | $ | 2.60 | | | $ | 2.79 | | | $ | (0.20 | ) | | $ | (1.07 | ) | | $ | — | | | $ | (1.27 | ) | | $ | — | | | $ | 15.12 | | | | 21.59 | % | | $ | 212.4 | | | | 1.41 | % | | | 1.04 | % | | | 1.34 | % | | | 49 | % | |
Institutional Class | |
8/31/2020 | | $ | 15.19 | | | $ | 0.19 | | | $ | (0.80 | ) | | $ | (0.61 | ) | | $ | (0.20 | ) | | $ | (0.57 | ) | | $ | — | | | $ | (0.77 | ) | | $ | — | | | $ | 13.81 | | | | (3.97 | )% | | $ | 344.1 | | | | 1.04 | % | | | 0.85 | % | | | 1.37 | % | | | 26 | % | |
8/31/2019 | | $ | 13.39 | | | $ | 0.20 | | | $ | 2.46 | | | $ | 2.66 | | | $ | (0.20 | ) | | $ | (0.66 | ) | | $ | — | | | $ | (0.86 | ) | | $ | — | | | $ | 15.19 | | | | 21.44 | % | | $ | 213.6 | | | | 1.06 | % | | | 0.85 | % | | | 1.49 | % | | | 38 | % | |
8/31/2018 | | $ | 13.56 | | | $ | 0.23 | | | $ | 0.46 | | | $ | 0.69 | | | $ | (0.22 | ) | | $ | (0.64 | ) | | $ | — | | | $ | (0.86 | ) | | $ | — | | | $ | 13.39 | | | | 5.28 | % | | $ | 177.7 | | | | 1.06 | % | | | 0.85 | % | | | 1.81 | % | | | 47 | % | |
8/31/2017 | | $ | 15.17 | | | $ | 0.22 | | | $ | 0.06 | | | $ | 0.28 | | | $ | (0.21 | ) | | $ | (1.68 | ) | | $ | — | | | $ | (1.89 | ) | | $ | — | | | $ | 13.56 | | | | 3.01 | % | | $ | 191.3 | | | | 1.05 | % | | | 0.85 | % | | | 1.64 | % | | | 45 | % | |
8/31/2016 | | $ | 13.64 | | | $ | 0.22 | | | $ | 2.61 | | | $ | 2.83 | | | $ | (0.23 | ) | | $ | (1.07 | ) | | $ | — | | | $ | (1.30 | ) | | $ | — | | | $ | 15.17 | | | | 21.84 | % | | $ | 259.1 | | | | 1.05 | % | | | 0.85 | % | | | 1.53 | % | | | 49 | % | |
See Notes to Financial Highlights
247
248
Financial Highlights (cont'd)
| | | Net Asset
Value,
Beginning
of Year | | Net
Investment
Income/(Loss)@ | | Net Gains or
Losses on
Securities
(both realized
and
unrealized) | | Total From
Investment
Operations | | Dividends
from Net
Investment
Income | | Distributions
from Net
Realized
Capital Gains | | Tax
Return of
Capital | | Total
Distributions | | Voluntary
Contribution
from
Management | | Net Asset
Value, End of
Year | | Total Returnab | | Net Assets,
End of Year
(in millions) | | Ratio of Gross
Expenses to
Average Net
Assets# | | Ratio of Net
Expenses to
Average Net
Assets | | Ratio of Net
Investment
Income/
(Loss) to
Average Net
Assets | | Portfolio
Turnover
Rate | |
Real Estate Fund (cont'd) | |
Class A | |
8/31/2020 | | $ | 15.13 | | | $ | 0.15 | | | $ | (0.81 | ) | | $ | (0.66 | ) | | $ | (0.14 | ) | | $ | (0.57 | ) | | $ | — | | | $ | (0.71 | ) | | $ | — | | | $ | 13.76 | | | | (4.31 | )% | | $ | 60.7 | | | | 1.40 | % | | | 1.21 | % | | | 1.04 | % | | | 26 | % | |
8/31/2019 | | $ | 13.34 | | | $ | 0.15 | | | $ | 2.46 | | | $ | 2.61 | | | $ | (0.16 | ) | | $ | (0.66 | ) | | $ | — | | | $ | (0.82 | ) | | $ | — | | | $ | 15.13 | | | | 21.01 | % | | $ | 63.9 | | | | 1.42 | % | | | 1.21 | % | | | 1.13 | % | | | 38 | % | |
8/31/2018 | | $ | 13.51 | | | $ | 0.17 | | | $ | 0.47 | | | $ | 0.64 | | | $ | (0.17 | ) | | $ | (0.64 | ) | | $ | — | | | $ | (0.81 | ) | | $ | — | | | $ | 13.34 | | | | 4.90 | % | | $ | 58.8 | | | | 1.42 | % | | | 1.21 | % | | | 1.31 | % | | | 47 | % | |
8/31/2017 | | $ | 15.12 | | | $ | 0.18 | | | $ | 0.05 | | | $ | 0.23 | | | $ | (0.16 | ) | | $ | (1.68 | ) | | $ | — | | | $ | (1.84 | ) | | $ | — | | | $ | 13.51 | | | | 2.63 | % | | $ | 83.5 | | | | 1.42 | % | | | 1.21 | % | | | 1.32 | % | | | 45 | % | |
8/31/2016 | | $ | 13.60 | | | $ | 0.17 | | | $ | 2.60 | | | $ | 2.77 | | | $ | (0.18 | ) | | $ | (1.07 | ) | | $ | — | | | $ | (1.25 | ) | | $ | — | | | $ | 15.12 | | | | 21.37 | % | | $ | 118.8 | | | | 1.42 | % | | | 1.21 | % | | | 1.16 | % | | | 49 | % | |
Class C | |
8/31/2020 | | $ | 15.16 | | | $ | 0.04 | | | $ | (0.80 | ) | | $ | (0.76 | ) | | $ | (0.04 | ) | | $ | (0.57 | ) | | $ | — | | | $ | (0.61 | ) | | $ | — | | | $ | 13.79 | | | | (5.08 | )% | | $ | 9.1 | | | | 2.16 | % | | | 1.96 | % | | | 0.28 | % | | | 26 | % | |
8/31/2019 | | $ | 13.36 | | | $ | 0.06 | | | $ | 2.45 | | | $ | 2.51 | | | $ | (0.05 | ) | | $ | (0.66 | ) | | $ | — | | | $ | (0.71 | ) | | $ | — | | | $ | 15.16 | | | | 20.12 | % | | $ | 10.5 | | | | 2.18 | % | | | 1.96 | % | | | 0.43 | % | | | 38 | % | |
8/31/2018 | | $ | 13.52 | | | $ | 0.08 | | | $ | 0.47 | | | $ | 0.55 | | | $ | (0.07 | ) | | $ | (0.64 | ) | | $ | — | | | $ | (0.71 | ) | | $ | — | | | $ | 13.36 | | | | 4.14 | % | | $ | 13.5 | | | | 2.18 | % | | | 1.96 | % | | | 0.59 | % | | | 47 | % | |
8/31/2017 | | $ | 15.12 | | | $ | 0.08 | | | $ | 0.05 | | | $ | 0.13 | | | $ | (0.05 | ) | | $ | (1.68 | ) | | $ | — | | | $ | (1.73 | ) | | $ | — | | | $ | 13.52 | | | | 1.89 | % | | $ | 18.9 | | | | 2.17 | % | | | 1.96 | % | | | 0.57 | % | | | 45 | % | |
8/31/2016 | | $ | 13.60 | | | $ | 0.06 | | | $ | 2.60 | | | $ | 2.66 | | | $ | (0.07 | ) | | $ | (1.07 | ) | | $ | — | | | $ | (1.14 | ) | | $ | — | | | $ | 15.12 | | | | 20.45 | % | | $ | 29.3 | | | | 2.17 | % | | | 1.96 | % | | | 0.39 | % | | | 49 | % | |
Class R3 | |
8/31/2020 | | $ | 15.10 | | | $ | 0.11 | | | $ | (0.80 | ) | | $ | (0.69 | ) | | $ | (0.11 | ) | | $ | (0.57 | ) | | $ | — | | | $ | (0.68 | ) | | $ | — | | | $ | 13.73 | | | | (4.58 | )% | | $ | 15.7 | | | | 1.67 | % | | | 1.46 | % | | | 0.81 | % | | | 26 | % | |
8/31/2019 | | $ | 13.31 | | | $ | 0.12 | | | $ | 2.45 | | | $ | 2.57 | | | $ | (0.12 | ) | | $ | (0.66 | ) | | $ | — | | | $ | (0.78 | ) | | $ | — | | | $ | 15.10 | | | | 20.76 | % | | $ | 20.5 | | | | 1.69 | % | | | 1.46 | % | | | 0.87 | % | | | 38 | % | |
8/31/2018 | | $ | 13.49 | | | $ | 0.16 | | | $ | 0.44 | | | $ | 0.60 | | | $ | (0.14 | ) | | $ | (0.64 | ) | | $ | — | | | $ | (0.78 | ) | | $ | — | | | $ | 13.31 | | | | 4.58 | % | | $ | 18.0 | | | | 1.69 | % | | | 1.46 | % | | | 1.21 | % | | | 47 | % | |
8/31/2017 | | $ | 15.09 | | | $ | 0.13 | | | $ | 0.08 | | | $ | 0.21 | | | $ | (0.13 | ) | | $ | (1.68 | ) | | $ | — | | | $ | (1.81 | ) | | $ | — | | | $ | 13.49 | | | | 2.45 | % | | $ | 19.0 | | | | 1.68 | % | | | 1.46 | % | | | 1.01 | % | | | 45 | % | |
8/31/2016 | | $ | 13.58 | | | $ | 0.12 | | | $ | 2.60 | | | $ | 2.72 | | | $ | (0.14 | ) | | $ | (1.07 | ) | | $ | — | | | $ | (1.21 | ) | | $ | — | | | $ | 15.09 | | | | 21.03 | % | | $ | 25.0 | | | | 1.68 | % | | | 1.46 | % | | | 0.87 | % | | | 49 | % | |
Class R6 | |
8/31/2020 | | $ | 15.19 | | | $ | 0.20 | | | $ | (0.80 | ) | | $ | (0.60 | ) | | $ | (0.21 | ) | | $ | (0.57 | ) | | $ | — | | | $ | (0.78 | ) | | $ | — | | | $ | 13.81 | | | | (3.87 | )% | | $ | 107.1 | | | | 0.94 | % | | | 0.75 | % | | | 1.45 | % | | | 26 | % | |
8/31/2019 | | $ | 13.39 | | | $ | 0.21 | | | $ | 2.47 | | | $ | 2.68 | | | $ | (0.22 | ) | | $ | (0.66 | ) | | $ | — | | | $ | (0.88 | ) | | $ | — | | | $ | 15.19 | | | | 21.55 | % | | $ | 74.0 | | | | 0.97 | % | | | 0.76 | % | | | 1.55 | % | | | 38 | % | |
8/31/2018 | | $ | 13.56 | | | $ | 0.23 | | | $ | 0.47 | | | $ | 0.70 | | | $ | (0.23 | ) | | $ | (0.64 | ) | | $ | — | | | $ | (0.87 | ) | | $ | — | | | $ | 13.39 | | | | 5.35 | % | | $ | 56.6 | | | | 0.99 | % | | | 0.78 | % | | | 1.82 | % | | | 47 | % | |
8/31/2017 | | $ | 15.16 | | | $ | 0.22 | | | $ | 0.08 | | | $ | 0.30 | | | $ | (0.22 | ) | | $ | (1.68 | ) | | $ | — | | | $ | (1.90 | ) | | $ | — | | | $ | 13.56 | | | | 3.16 | % | | $ | 45.2 | | | | 0.98 | % | | | 0.78 | % | | | 1.62 | % | | | 45 | % | |
8/31/2016 | | $ | 13.64 | | | $ | 0.21 | | | $ | 2.62 | | | $ | 2.83 | | | $ | (0.24 | ) | | $ | (1.07 | ) | | $ | — | | | $ | (1.31 | ) | | $ | — | | | $ | 15.16 | | | | 21.85 | % | | $ | 45.0 | | | | 0.98 | % | | | 0.78 | % | | | 1.48 | % | | | 49 | % | |
Small Cap Growth Fund | |
Investor Class | |
8/31/2020 | | $ | 37.83 | | | $ | (0.30 | ) | | $ | 8.82 | | | $ | 8.52 | | | $ | — | | | $ | (1.54 | ) | | $ | — | | | $ | (1.54 | ) | | $ | — | | | $ | 44.81 | | | | 23.20 | % | | $ | 72.5 | | | | 1.41 | % | | | 1.18 | % | | | (0.78 | )% | | | 128 | % | |
8/31/2019 | | $ | 44.96 | | | $ | (0.30 | ) | | $ | 0.29 | | | $ | (0.01 | ) | | $ | — | | | $ | (7.12 | ) | | $ | — | | | $ | (7.12 | ) | | $ | — | | | $ | 37.83 | | | | 4.06 | % | | $ | 65.6 | | | | 1.58 | % | | | 1.19 | % | | | (0.78 | )% | | | 161 | % | |
8/31/2018 | | $ | 32.90 | | | $ | (0.37 | ) | | $ | 12.94 | | | $ | 12.57 | | | $ | — | | | $ | (0.51 | ) | | $ | — | | | $ | (0.51 | ) | | $ | — | | | $ | 44.96 | | | | 38.67 | % | | $ | 66.1 | | | | 1.75 | % | | | 1.21 | % | | | (0.97 | )% | | | 217 | % | |
8/31/2017 | | $ | 26.97 | | | $ | (0.26 | ) | | $ | 6.19 | | | $ | 5.93 | | | $ | — | | | $ | — | | | $ | — | | | $ | — | | | $ | — | | | $ | 32.90 | | | | 21.99 | %h | | $ | 49.8 | | | | 1.78 | % | | | 1.20 | %e | | | (0.86 | )%e | | | 215 | % | |
8/31/2016 | | $ | 29.50 | | | $ | (0.21 | ) | | $ | (0.77 | ) | | $ | (0.98 | ) | | $ | — | | | $ | (1.55 | ) | | $ | — | | | $ | (1.55 | ) | | $ | — | | | $ | 26.97 | | | | (3.16 | )% | | $ | 44.0 | | | | 1.87 | % | | | 1.21 | % | | | (0.83 | )% | | | 164 | % | |
See Notes to Financial Highlights
249
250
Financial Highlights (cont'd)
| | | Net Asset
Value,
Beginning
of Year | | Net
Investment
Income/(Loss)@ | | Net Gains or
Losses on
Securities
(both realized
and
unrealized) | | Total From
Investment
Operations | | Dividends
from Net
Investment
Income | | Distributions
from Net
Realized
Capital Gains | | Tax
Return of
Capital | | Total
Distributions | | Voluntary
Contribution
from
Management | | Net Asset
Value, End of
Year | | Total Returnab | | Net Assets,
End of Year
(in millions) | | Ratio of Gross
Expenses to
Average Net
Assets# | | Ratio of Net
Expenses to
Average Net
Assets | | Ratio of Net
Investment
Income/
(Loss) to
Average Net
Assets | | Portfolio
Turnover
Rate | |
Small Cap Growth Fund (cont'd) | |
Trust Class | |
8/31/2020 | | $ | 37.75 | | | $ | (0.34 | ) | | $ | 8.78 | | | $ | 8.44 | | | $ | — | | | $ | (1.54 | ) | | $ | — | | | $ | (1.54 | ) | | $ | — | | | $ | 44.65 | | | | 23.04 | % | | $ | 4.6 | | | | 1.54 | % | | | 1.29 | % | | | (0.89 | )% | | | 128 | % | |
8/31/2019 | | $ | 44.91 | | | $ | (0.34 | ) | | $ | 0.30 | | | $ | (0.04 | ) | | $ | — | | | $ | (7.12 | ) | | $ | — | | | $ | (7.12 | ) | | $ | — | | | $ | 37.75 | | | | 3.99 | % | | $ | 4.6 | | | | 1.70 | % | | | 1.29 | % | | | (0.89 | )% | | | 161 | % | |
| 8/31/2018g | | $ | 32.88 | | | $ | (0.43 | ) | | $ | 12.93 | | | $ | 12.50 | | | $ | — | | | $ | (0.47 | ) | | $ | — | | | $ | (0.47 | ) | | $ | — | | | $ | 44.91 | | | | 38.45 | % | | $ | 4.4 | | | | 1.86 | % | | | 1.37 | % | | | (1.13 | )% | | | 217 | % | |
| 8/31/2017g | | $ | 27.01 | | | $ | (0.30 | ) | | $ | 6.17 | | | $ | 5.87 | | | $ | — | | | $ | — | | | $ | — | | | $ | — | | | $ | — | | | $ | 32.88 | | | | 21.74 | % | | $ | 3.9 | | | | 1.88 | % | | | 1.37 | % | | | (1.04 | )% | | | 215 | % | |
| 8/31/2016g | | $ | 29.44 | | | $ | (0.25 | ) | | $ | (0.75 | ) | | $ | (1.00 | ) | | $ | — | | | $ | (1.43 | ) | | $ | — | | | $ | (1.43 | ) | | $ | — | | | $ | 27.01 | | | | (3.27 | )% | | $ | 4.4 | | | | 1.93 | % | | | 1.37 | % | | | (0.99 | )% | | | 164 | % | |
Advisor Class | |
8/31/2020 | | $ | 37.64 | | | $ | (0.39 | ) | | $ | 8.74 | | | $ | 8.35 | | | $ | — | | | $ | (1.54 | ) | | $ | — | | | $ | (1.54 | ) | | $ | — | | | $ | 44.45 | | | | 22.86 | % | | $ | 3.2 | | | | 1.70 | % | | | 1.44 | % | | | (1.04 | )% | | | 128 | % | |
8/31/2019 | | $ | 44.87 | | | $ | (0.40 | ) | | $ | 0.29 | | | $ | (0.11 | ) | | $ | — | | | $ | (7.12 | ) | | $ | — | | | $ | (7.12 | ) | | $ | — | | | $ | 37.64 | | | | 3.81 | % | | $ | 2.8 | | | | 1.87 | % | | | 1.44 | % | | | (1.04 | )% | | | 161 | % | |
| 8/31/2018g | | $ | 33.15 | | | $ | (0.48 | ) | | $ | 12.94 | | | $ | 12.46 | | | $ | — | | | $ | (0.74 | ) | | $ | — | | | $ | (0.74 | ) | | $ | — | | | $ | 44.87 | | | | 38.26 | % | | $ | 2.5 | | | | 2.03 | % | | | 1.51 | % | | | (1.27 | )% | | | 217 | % | |
| 8/31/2017g | | $ | 27.27 | | | $ | (0.35 | ) | | $ | 6.23 | | | $ | 5.88 | | | $ | — | | | $ | — | | | $ | — | | | $ | — | | | $ | — | | | $ | 33.15 | | | | 21.58 | %h | | $ | 1.7 | | | | 2.05 | % | | | 1.51 | %e | | | (1.18 | )%e | | | 215 | % | |
| 8/31/2016g | | $ | 30.63 | | | $ | (0.29 | ) | | $ | (0.81 | ) | | $ | (1.10 | ) | | $ | — | | | $ | (2.26 | ) | | $ | — | | | $ | (2.26 | ) | | $ | — | | | $ | 27.27 | | | | (3.40 | )% | | $ | 2.1 | | | | 2.08 | % | | | 1.51 | % | | | (1.13 | )% | | | 164 | % | |
Institutional Class | |
8/31/2020 | | $ | 38.06 | | | $ | (0.20 | ) | | $ | 8.89 | | | $ | 8.69 | | | $ | — | | | $ | (1.54 | ) | | $ | — | | | $ | (1.54 | ) | | $ | — | | | $ | 45.21 | | | | 23.52 | % | | $ | 158.1 | | | | 1.18 | % | | | 0.90 | % | | | (0.51 | )% | | | 128 | % | |
8/31/2019 | | $ | 45.06 | | | $ | (0.17 | ) | | $ | 0.29 | | | $ | 0.12 | | | $ | — | | | $ | (7.12 | ) | | $ | — | | | $ | (7.12 | ) | | $ | — | | | $ | 38.06 | | | | 4.38 | % | | $ | 87.7 | | | | 1.28 | % | | | 0.90 | % | | | (0.43 | )% | | | 161 | % | |
| 8/31/2018g | | $ | 32.85 | | | $ | (0.25 | ) | | $ | 12.95 | | | $ | 12.70 | | | $ | — | | | $ | (0.49 | ) | | $ | — | | | $ | (0.49 | ) | | $ | — | | | $ | 45.06 | | | | 39.12 | % | | $ | 16.4 | | | | 1.50 | % | | | 0.90 | % | | | (0.66 | )% | | | 217 | % | |
| 8/31/2017g | | $ | 26.86 | | | $ | (0.17 | ) | | $ | 6.16 | | | $ | 5.99 | | | $ | — | | | $ | — | | | $ | — | | | $ | — | | | $ | — | | | $ | 32.85 | | | | 22.31 | % | | $ | 11.8 | | | | 1.50 | % | | | 0.90 | % | | | (0.57 | )% | | | 215 | % | |
| 8/31/2016g | | $ | 29.24 | | | $ | (0.14 | ) | | $ | (0.73 | ) | | $ | (0.87 | ) | | $ | — | | | $ | (1.51 | ) | | $ | — | | | $ | (1.51 | ) | | $ | — | | | $ | 26.86 | | | | (2.82 | )% | | $ | 9.4 | | | | 1.55 | % | | | 0.90 | % | | | (0.53 | )% | | | 164 | % | |
Class A | |
8/31/2020 | | $ | 37.80 | | | $ | (0.32 | ) | | $ | 8.79 | | | $ | 8.47 | | | $ | — | | | $ | (1.54 | ) | | $ | — | | | $ | (1.54 | ) | | $ | — | | | $ | 44.73 | | | | 23.09 | % | | $ | 23.3 | | | | 1.60 | % | | | 1.26 | % | | | (0.86 | )% | | | 128 | % | |
8/31/2019 | | $ | 44.95 | | | $ | (0.29 | ) | | $ | 0.26 | | | $ | (0.03 | ) | | $ | — | | | $ | (7.12 | ) | | $ | — | | | $ | (7.12 | ) | | $ | — | | | $ | 37.80 | | | | 4.01 | % | | $ | 50.1 | | | | 1.65 | % | | | 1.26 | % | | | (0.76 | )% | | | 161 | % | |
| 8/31/2018g | | $ | 32.87 | | | $ | (0.39 | ) | | $ | 12.93 | | | $ | 12.54 | | | $ | — | | | $ | (0.46 | ) | | $ | — | | | $ | (0.46 | ) | | $ | — | | | $ | 44.95 | | | | 38.60 | % | | $ | 5.3 | | | | 1.88 | % | | | 1.26 | % | | | (1.02 | )% | | | 217 | % | |
| 8/31/2017g | | $ | 26.97 | | | $ | (0.27 | ) | | $ | 6.17 | | | $ | 5.90 | | | $ | — | | | $ | — | | | $ | — | | | $ | — | | | $ | — | | | $ | 32.87 | | | | 21.88 | % | | $ | 3.3 | | | | 1.90 | % | | | 1.26 | % | | | (0.93 | )% | | | 215 | % | |
| 8/31/2016g | | $ | 29.36 | | | $ | (0.23 | ) | | $ | (0.74 | ) | | $ | (0.97 | ) | | $ | — | | | $ | (1.42 | ) | | $ | — | | | $ | (1.42 | ) | | $ | — | | | $ | 26.97 | | | | (3.18 | )% | | $ | 3.5 | | | | 1.95 | % | | | 1.26 | % | | | (0.88 | )% | | | 164 | % | |
Class C | |
8/31/2020 | | $ | 37.25 | | | $ | (0.60 | ) | | $ | 8.62 | | | $ | 8.02 | | | $ | — | | | $ | (1.54 | ) | | $ | — | | | $ | (1.54 | ) | | $ | — | | | $ | 43.73 | | | | 22.19 | % | | $ | 4.6 | | | | 2.30 | % | | | 2.01 | % | | | (1.61 | )% | | | 128 | % | |
8/31/2019 | | $ | 44.72 | | | $ | (0.61 | ) | | $ | 0.26 | | | $ | (0.35 | ) | | $ | — | | | $ | (7.12 | ) | | $ | — | | | $ | (7.12 | ) | | $ | — | | | $ | 37.25 | | | | 3.20 | % | | $ | 4.2 | | | | 2.45 | % | | | 2.01 | % | | | (1.60 | )% | | | 161 | % | |
| 8/31/2018g | | $ | 33.24 | | | $ | (0.67 | ) | | $ | 12.92 | | | $ | 12.25 | | | $ | — | | | $ | (0.77 | ) | | $ | — | | | $ | (0.77 | ) | | $ | — | | | $ | 44.72 | | | | 37.56 | % | | $ | 3.1 | | | | 2.62 | % | | | 2.01 | % | | | (1.77 | )% | | | 217 | % | |
| 8/31/2017g | | $ | 27.47 | | | $ | (0.50 | ) | | $ | 6.27 | | | $ | 5.77 | | | $ | — | | | $ | — | | | $ | — | | | $ | — | | | $ | — | | | $ | 33.24 | | | | 21.00 | % | | $ | 2.0 | | | | 2.63 | % | | | 2.01 | % | | | (1.68 | )% | | | 215 | % | |
| 8/31/2016g | | $ | 31.11 | | | $ | (0.43 | ) | | $ | (0.85 | ) | | $ | (1.28 | ) | | $ | — | | | $ | (2.36 | ) | | $ | — | | | $ | (2.36 | ) | | $ | — | | | $ | 27.47 | | | | (3.92 | )% | | $ | 1.8 | | | | 2.68 | % | | | 2.01 | % | | | (1.63 | )% | | | 164 | % | |
See Notes to Financial Highlights
251
252
Financial Highlights (cont'd)
| | | Net Asset
Value,
Beginning
of Year | | Net
Investment
Income/(Loss)@ | | Net Gains or
Losses on
Securities
(both realized
and
unrealized) | | Total From
Investment
Operations | | Dividends
from Net
Investment
Income | | Distributions
from Net
Realized
Capital Gains | | Tax
Return of
Capital | | Total
Distributions | | Voluntary
Contribution
from
Management | | Net Asset
Value, End of
Year | | Total Returnab | | Net Assets,
End of Year
(in millions) | | Ratio of Gross
Expenses to
Average Net
Assets# | | Ratio of Net
Expenses to
Average Net
Assets | | Ratio of Net
Investment
Income/
(Loss) to
Average Net
Assets | | Portfolio
Turnover
Rate | |
Small Cap Growth Fund (cont'd) | |
Class R3 | |
8/31/2020 | | $ | 37.61 | | | $ | (0.42 | ) | | $ | 8.74 | | | $ | 8.32 | | | $ | — | | | $ | (1.54 | ) | | $ | — | | | $ | (1.54 | ) | | $ | — | | | $ | 44.39 | | | | 22.80 | % | | $ | 3.7 | | | | 1.86 | % | | | 1.51 | % | | | (1.11 | )% | | | 128 | % | |
8/31/2019 | | $ | 44.87 | | | $ | (0.42 | ) | | $ | 0.28 | | | $ | (0.14 | ) | | $ | — | | | $ | (7.12 | ) | | $ | — | | | $ | (7.12 | ) | | $ | — | | | $ | 37.61 | | | | 3.73 | % | | $ | 2.4 | | | | 2.01 | % | | | 1.51 | % | | | (1.10 | )% | | | 161 | % | |
| 8/31/2018g | | $ | 33.14 | | | $ | (0.48 | ) | | $ | 12.95 | | | $ | 12.47 | | | $ | — | | | $ | (0.74 | ) | | $ | — | | | $ | (0.74 | ) | | $ | — | | | $ | 44.87 | | | | 38.29 | % | | $ | 2.2 | | | | 2.17 | % | | | 1.51 | % | | | (1.27 | )% | | | 217 | % | |
| 8/31/2017g | | $ | 27.26 | | | $ | (0.35 | ) | | $ | 6.23 | | | $ | 5.88 | | | $ | — | | | $ | — | | | $ | — | | | $ | — | | | $ | — | | | $ | 33.14 | | | | 21.58 | % | | $ | 1.0 | | | | 2.19 | % | | | 1.51 | % | | | (1.17 | )% | | | 215 | % | |
| 8/31/2016g | | $ | 30.63 | | | $ | (0.29 | ) | | $ | (0.83 | ) | | $ | (1.12 | ) | | $ | — | | | $ | (2.25 | ) | | $ | — | | | $ | (2.25 | ) | | $ | — | | | $ | 27.26 | | | | (3.44 | )% | | $ | 1.1 | | | | 2.24 | % | | | 1.51 | % | | | (1.12 | )% | | | 164 | % | |
Class R6 | |
8/31/2020 | | $ | 38.10 | | | $ | (0.15 | ) | | $ | 8.90 | | | $ | 8.75 | | | $ | — | | | $ | (1.54 | ) | | $ | — | | | $ | (1.54 | ) | | $ | — | | | $ | 45.31 | | | | 23.65 | % | | $ | 37.2 | | | | 1.08 | % | | | 0.80 | % | | | (0.40 | )% | | | 128 | % | |
Period from 9/7/2018^
to 8/31/2019 | | $ | 44.27 | | | $ | 0.06 | | | $ | 0.89 | | | $ | 0.95 | | | $ | — | | | $ | (7.12 | ) | | $ | — | | | $ | (7.12 | ) | | $ | — | | | $ | 38.10 | | | | 6.35 | %* | | $ | 21.0 | | | | 1.15 | %** | | | 0.81 | %** | | | 0.15 | %** | | | 161 | %c | |
Sustainable Equity Fund | |
Investor Class | |
8/31/2020 | | $ | 37.08 | | | $ | 0.22 | | | $ | 5.56 | | | $ | 5.78 | | | $ | (0.25 | ) | | $ | (3.17 | ) | | $ | — | | | $ | (3.42 | ) | | $ | — | | | $ | 39.44 | | | | 16.12 | % | | $ | 429.6 | | | | 0.86 | % | | | 0.86 | % | | | 0.59 | % | | | 21 | % | |
8/31/2019 | | $ | 41.86 | | | $ | 0.30 | | | $ | (1.80 | ) | | $ | (1.50 | ) | | $ | (0.16 | ) | | $ | (3.12 | ) | | $ | — | | | $ | (3.28 | ) | | $ | — | | | $ | 37.08 | | | | (2.70 | )% | | $ | 446.1 | | | | 0.86 | % | | | 0.86 | % | | | 0.80 | % | | | 20 | % | |
| 8/31/2018f | | $ | 37.56 | | | $ | 0.23 | | | $ | 6.41 | | | $ | 6.64 | | | $ | (0.31 | ) | | $ | (2.03 | ) | | $ | — | | | $ | (2.34 | ) | | $ | — | | | $ | 41.86 | | | | 18.36 | % | | $ | 679.3 | | | | 0.85 | % | | | 0.85 | % | | | 0.59 | % | | | 12 | % | |
| 8/31/2017f | | $ | 34.56 | | | $ | 0.24 | | | $ | 4.31 | | | $ | 4.55 | | | $ | (0.23 | ) | | $ | (1.32 | ) | | $ | — | | | $ | (1.55 | ) | | $ | — | | | $ | 37.56 | | | | 13.54 | %h | | $ | 732.6 | | | | 0.85 | % | | | 0.84 | %e | | | 0.66 | %e | | | 26 | % | |
| 8/31/2016f | | $ | 33.29 | | | $ | 0.24 | | | $ | 3.10 | | | $ | 3.34 | | | $ | (0.22 | ) | | $ | (1.85 | ) | | $ | — | | | $ | (2.07 | ) | | $ | — | | | $ | 34.56 | | | | 10.49 | % | | $ | 739.0 | | | | 0.86 | % | | | 0.86 | % | | | 0.74 | % | | | 25 | % | |
Trust Class | |
8/31/2020 | | $ | 37.10 | | | $ | 0.15 | | | $ | 5.58 | | | $ | 5.73 | | | $ | (0.19 | ) | | $ | (3.17 | ) | | $ | — | | | $ | (3.36 | ) | | $ | — | | | $ | 39.47 | | | | 15.95 | % | | $ | 122.9 | | | | 1.03 | % | | | 1.03 | % | | | 0.42 | % | | | 21 | % | |
8/31/2019 | | $ | 41.88 | | | $ | 0.24 | | | $ | (1.80 | ) | | $ | (1.56 | ) | | $ | (0.10 | ) | | $ | (3.12 | ) | | $ | — | | | $ | (3.22 | ) | | $ | — | | | $ | 37.10 | | | | (2.86 | )% | | $ | 161.3 | | | | 1.03 | % | | | 1.03 | % | | | 0.65 | % | | | 20 | % | |
| 8/31/2018f | | $ | 37.58 | | | $ | 0.16 | | | $ | 6.41 | | | $ | 6.57 | | | $ | (0.24 | ) | | $ | (2.03 | ) | | $ | — | | | $ | (2.27 | ) | | $ | — | | | $ | 41.88 | | | | 18.13 | % | | $ | 230.8 | | | | 1.02 | % | | | 1.02 | % | | | 0.42 | % | | | 12 | % | |
| 8/31/2017f | | $ | 35.74 | | | $ | 0.18 | | | $ | 4.38 | | | $ | 4.56 | | | $ | (0.40 | ) | | $ | (2.32 | ) | | $ | — | | | $ | (2.72 | ) | | $ | — | | | $ | 37.58 | | | | 13.41 | %h | | $ | 234.6 | | | | 1.02 | % | | | 1.01 | %e | | | 0.51 | %e | | | 26 | % | |
| 8/31/2016f | | $ | 35.91 | | | $ | 0.19 | | | $ | 3.25 | | | $ | 3.44 | | | $ | (0.37 | ) | | $ | (3.24 | ) | | $ | — | | | $ | (3.61 | ) | | $ | — | | | $ | 35.74 | | | | 10.29 | % | | $ | 270.6 | | | | 1.03 | % | | | 1.03 | % | | | 0.58 | % | | | 25 | % | |
Institutional Class | |
8/31/2020 | | $ | 37.02 | | | $ | 0.28 | | | $ | 5.57 | | | $ | 5.85 | | | $ | (0.30 | ) | | $ | (3.17 | ) | | $ | — | | | $ | (3.47 | ) | | $ | — | | | $ | 39.40 | | | | 16.35 | % | | $ | 689.9 | | | | 0.68 | % | | | 0.68 | % | | | 0.77 | % | | | 21 | % | |
8/31/2019 | | $ | 41.84 | | | $ | 0.37 | | | $ | (1.81 | ) | | $ | (1.44 | ) | | $ | (0.26 | ) | | $ | (3.12 | ) | | $ | — | | | $ | (3.38 | ) | | $ | — | | | $ | 37.02 | | | | (2.52 | )% | | $ | 768.3 | | | | 0.68 | % | | | 0.68 | % | | | 1.00 | % | | | 20 | % | |
8/31/2018 | | $ | 37.55 | | | $ | 0.30 | | | $ | 6.41 | | | $ | 6.71 | | | $ | (0.39 | ) | | $ | (2.03 | ) | | $ | — | | | $ | (2.42 | ) | | $ | — | | | $ | 41.84 | | | | 18.56 | % | | $ | 950.5 | | | | 0.67 | % | | | 0.67 | % | | | 0.76 | % | | | 12 | % | |
8/31/2017 | | $ | 34.55 | | | $ | 0.30 | | | $ | 4.32 | | | $ | 4.62 | | | $ | (0.30 | ) | | $ | (1.32 | ) | | $ | — | | | $ | (1.62 | ) | | $ | — | | | $ | 37.55 | | | | 13.78 | %h | | $ | 848.8 | | | | 0.66 | % | | | 0.66 | %e | | | 0.84 | %e | | | 26 | % | |
8/31/2016 | | $ | 33.28 | | | $ | 0.30 | | | $ | 3.11 | | | $ | 3.41 | | | $ | (0.29 | ) | | $ | (1.85 | ) | | $ | — | | | $ | (2.14 | ) | | $ | — | | | $ | 34.55 | | | | 10.70 | % | | $ | 745.5 | | | | 0.67 | % | | | 0.67 | % | | | 0.93 | % | | | 25 | % | |
See Notes to Financial Highlights
253
254
Financial Highlights (cont'd)
| | | Net Asset
Value,
Beginning
of Year | | Net
Investment
Income/(Loss)@ | | Net Gains or
Losses on
Securities
(both realized
and
unrealized) | | Total From
Investment
Operations | | Dividends
from Net
Investment
Income | | Distributions
from Net
Realized
Capital Gains | | Tax
Return of
Capital | | Total
Distributions | | Voluntary
Contribution
from
Management | | Net Asset
Value, End of
Year | | Total Returnab | | Net Assets,
End of Year
(in millions) | | Ratio of Gross
Expenses to
Average Net
Assets# | | Ratio of Net
Expenses to
Average Net
Assets | | Ratio of Net
Investment
Income/
(Loss) to
Average Net
Assets | | Portfolio
Turnover
Rate | |
Sustainable Equity Fund (cont'd) | |
Class A | |
8/31/2020 | | $ | 37.08 | | | $ | 0.15 | | | $ | 5.57 | | | $ | 5.72 | | | $ | (0.20 | ) | | $ | (3.17 | ) | | $ | — | | | $ | (3.37 | ) | | $ | — | | | $ | 39.43 | | | | 15.94 | % | | $ | 98.0 | | | | 1.05 | % | | | 1.05 | % | | | 0.41 | % | | | 21 | % | |
8/31/2019 | | $ | 41.88 | | | $ | 0.23 | | | $ | (1.81 | ) | | $ | (1.58 | ) | | $ | (0.10 | ) | | $ | (3.12 | ) | | $ | — | | | $ | (3.22 | ) | | $ | — | | | $ | 37.08 | | | | (2.90 | )% | | $ | 95.1 | | | | 1.05 | % | | | 1.05 | % | | | 0.61 | % | | | 20 | % | |
| 8/31/2018f | | $ | 37.58 | | | $ | 0.16 | | | $ | 6.41 | | | $ | 6.57 | | | $ | (0.24 | ) | | $ | (2.03 | ) | | $ | — | | | $ | (2.27 | ) | | $ | — | | | $ | 41.88 | | | | 18.14 | % | | $ | 126.4 | | | | 1.04 | % | | | 1.04 | % | | | 0.40 | % | | | 12 | % | |
| 8/31/2017f | | $ | 35.78 | | | $ | 0.18 | | | $ | 4.37 | | | $ | 4.55 | | | $ | (0.41 | ) | | $ | (2.34 | ) | | $ | — | | | $ | (2.75 | ) | | $ | — | | | $ | 37.58 | | | | 13.36 | %h | | $ | 118.0 | | | | 1.03 | % | | | 1.03 | %e | | | 0.48 | %e | | | 26 | % | |
| 8/31/2016f | | $ | 36.02 | | | $ | 0.19 | | | $ | 3.25 | | | $ | 3.44 | | | $ | (0.39 | ) | | $ | (3.29 | ) | | $ | — | | | $ | (3.68 | ) | | $ | — | | | $ | 35.78 | | | | 10.27 | % | | $ | 131.6 | | | | 1.05 | % | | | 1.05 | % | | | 0.56 | % | | | 25 | % | |
Class C | |
8/31/2020 | | $ | 36.85 | | | $ | (0.12 | ) | | $ | 5.51 | | | $ | 5.39 | | | $ | — | | | $ | (3.17 | ) | | $ | — | | | $ | (3.17 | ) | | $ | — | | | $ | 39.07 | | | | 15.06 | % | | $ | 40.4 | | | | 1.79 | % | | | 1.79 | % | | | (0.34 | )% | | | 21 | % | |
8/31/2019 | | $ | 41.81 | | | $ | (0.04 | ) | | $ | (1.80 | ) | | $ | (1.84 | ) | | $ | — | | | $ | (3.12 | ) | | $ | — | | | $ | (3.12 | ) | | $ | — | | | $ | 36.85 | | | | (3.62 | )% | | $ | 47.4 | | | | 1.79 | % | | | 1.79 | % | | | (0.12 | )% | | | 20 | % | |
| 8/31/2018f | | $ | 37.63 | | | $ | (0.14 | ) | | $ | 6.42 | | | $ | 6.28 | | | $ | (0.07 | ) | | $ | (2.03 | ) | | $ | — | | | $ | (2.10 | ) | | $ | — | | | $ | 41.81 | | | | 17.26 | % | | $ | 62.4 | | | | 1.78 | % | | | 1.78 | % | | | (0.35 | )% | | | 12 | % | |
| 8/31/2017f | | $ | 35.92 | | | $ | (0.09 | ) | | $ | 4.39 | | | $ | 4.30 | | | $ | (0.17 | ) | | $ | (2.42 | ) | | $ | — | | | $ | (2.59 | ) | | $ | — | | | $ | 37.63 | | | | 12.53 | %h | | $ | 56.6 | | | | 1.78 | % | | | 1.78 | %e | | | (0.27 | )%e | | | 26 | % | |
| 8/31/2016f | | $ | 36.25 | | | $ | (0.07 | ) | | $ | 3.27 | | | $ | 3.20 | | | $ | (0.13 | ) | | $ | (3.40 | ) | | $ | — | | | $ | (3.53 | ) | | $ | — | | | $ | 35.92 | | | | 9.44 | % | | $ | 53.5 | | | | 1.79 | % | | | 1.79 | % | | | (0.19 | )% | | | 25 | % | |
Class R3 | |
8/31/2020 | | $ | 37.10 | | | $ | 0.06 | | | $ | 5.56 | | | $ | 5.62 | | | $ | (0.14 | ) | | $ | (3.17 | ) | | $ | — | | | $ | (3.31 | ) | | $ | — | | | $ | 39.41 | | | | 15.63 | % | | $ | 28.0 | | | | 1.30 | % | | | 1.30 | % | | | 0.16 | % | | | 21 | % | |
8/31/2019 | | $ | 41.90 | | | $ | 0.14 | | | $ | (1.79 | ) | | $ | (1.65 | ) | | $ | (0.03 | ) | | $ | (3.12 | ) | | $ | — | | | $ | (3.15 | ) | | $ | — | | | $ | 37.10 | | | | (3.12 | )% | | $ | 31.8 | | | | 1.29 | % | | | 1.29 | % | | | 0.36 | % | | | 20 | % | |
| 8/31/2018f | | $ | 37.59 | | | $ | 0.06 | | | $ | 6.42 | | | $ | 6.48 | | | $ | (0.14 | ) | | $ | (2.03 | ) | | $ | — | | | $ | (2.17 | ) | | $ | — | | | $ | 41.90 | | | | 17.85 | % | | $ | 36.4 | | | | 1.28 | % | | | 1.28 | % | | | 0.15 | % | | | 12 | % | |
| 8/31/2017f | | $ | 35.86 | | | $ | 0.07 | | | $ | 4.37 | | | $ | 4.44 | | | $ | (0.34 | ) | | $ | (2.37 | ) | | $ | — | | | $ | (2.71 | ) | | $ | — | | | $ | 37.59 | | | | 13.04 | %h | | $ | 41.3 | | | | 1.28 | % | | | 1.28 | %e | | | 0.21 | %e | | | 26 | % | |
| 8/31/2016f | | $ | 36.13 | | | $ | 0.11 | | | $ | 3.26 | | | $ | 3.37 | | | $ | (0.31 | ) | | $ | (3.33 | ) | | $ | — | | | $ | (3.64 | ) | | $ | — | | | $ | 35.86 | | | | 10.01 | % | | $ | 33.3 | | | | 1.29 | % | | | 1.29 | % | | | 0.30 | % | | | 25 | % | |
Class R6 | |
8/31/2020 | | $ | 37.01 | | | $ | 0.32 | | | $ | 5.58 | | | $ | 5.90 | | | $ | (0.33 | ) | | $ | (3.17 | ) | | $ | — | | | $ | (3.50 | ) | | $ | — | | | $ | 39.41 | | | | 16.48 | % | | $ | 233.6 | | | | 0.58 | % | | | 0.58 | % | | | 0.88 | % | | | 21 | % | |
8/31/2019 | | $ | 41.83 | | | $ | 0.40 | | | $ | (1.81 | ) | | $ | (1.41 | ) | | $ | (0.29 | ) | | $ | (3.12 | ) | | $ | — | | | $ | (3.41 | ) | | $ | — | | | $ | 37.01 | | | | (2.44 | )% | | $ | 238.1 | | | | 0.59 | % | | | 0.59 | % | | | 1.08 | % | | | 20 | % | |
| 8/31/2018f | | $ | 37.54 | | | $ | 0.32 | | | $ | 6.41 | | | $ | 6.73 | | | $ | (0.41 | ) | | $ | (2.03 | ) | | $ | — | | | $ | (2.44 | ) | | $ | — | | | $ | 41.83 | | | | 18.65 | % | | $ | 321.1 | | | | 0.60 | % | | | 0.60 | % | | | 0.83 | % | | | 12 | % | |
| 8/31/2017f | | $ | 34.54 | | | $ | 0.33 | | | $ | 4.31 | | | $ | 4.64 | | | $ | (0.32 | ) | | $ | (1.32 | ) | | $ | — | | | $ | (1.64 | ) | | $ | — | | | $ | 37.54 | | | | 13.84 | %h | | $ | 361.3 | | | | 0.59 | % | | | 0.59 | %e | | | 0.91 | %e | | | 26 | % | |
| 8/31/2016f | | $ | 33.27 | | | $ | 0.32 | | | $ | 3.11 | | | $ | 3.43 | | | $ | (0.31 | ) | | $ | (1.85 | ) | | $ | — | | | $ | (2.16 | ) | | $ | — | | | $ | 34.54 | | | | 10.78 | % | | $ | 373.4 | | | | 0.60 | % | | | 0.60 | % | | | 0.96 | % | | | 25 | % | |
See Notes to Financial Highlights
255
256
Notes to Financial Highlights Equity Funds
@ Calculated based on the average number of shares outstanding during each fiscal period.
# Represents the annualized ratios of net expenses to average daily net assets if Management had not reimbursed certain expenses and/or waived a portion of the investment management fee and/or if certain Funds had not received refunds, plus interest, from State Street noted in (h) below for custodian out-of-pocket expenses previously paid during the year ended August 31, 2017.
^ The date investment operations commenced.
* Not annualized.
** Annualized.
‡ Organization expense, which is a non-recurring expense, is included in these ratios on a non-annualized basis.
§ After repayment of expenses previously reimbursed and/or fees previously waived by Management, as applicable. Had the Fund not made such repayments, the annualized ratios of net expenses to average daily net assets would have been:
| | | Year Ended August 31, | |
| | | 2020 | | 2019 | | 2018 | | 2017 | | 2016 | |
Emerging Markets Equity Institutional Class | | | 1.24 | % | | | 1.25 | % | | | — | | | | — | | | | — | | |
Emerging Markets Equity Class R6 | | | 1.11 | % | | | 1.15 | % | | | — | | | | — | | | | — | | |
Focus Institutional Class | | | — | | | | — | | | | 0.75 | % | | | — | | | | — | | |
Genesis Institutional Class | | | — | | | | — | | | | — | | | | 0.84 | % | | | 0.85 | % | |
Genesis Class R6 | | | 0.74 | % | | | — | | | | — | | | | 0.77 | % | | | 0.78 | % | |
Guardian Advisor Class | | | — | | | | — | | | | — | | | | — | | | | 1.26 | % | |
Guardian Class R3 | | | 1.31 | % | | | — | | | | — | | | | — | | | | — | | |
Guardian Class R6 | | | 0.56 | % | | | — | | | | — | | | | — | | | | — | | |
International Equity Institutional Class | | | — | | | | — | | | | — | | | | 0.84 | % | | | 0.85 | % | |
International Equity Class A | | | — | | | | — | | | | — | | | | 1.20 | % | | | — | | |
International Equity Class C | | | — | | | | — | | | | — | | | | 1.96 | % | | | — | | |
Large Cap Value Institutional Class | | | — | | | | — | | | | 0.70 | % | | | 0.69 | % | | | — | | |
Large Cap Value Class R3 | | | 1.33 | % | | | 1.33 | % | | | — | | | | — | | | | — | | |
Large Cap Value Class R6 | | | 0.59 | % | | | — | | | | — | | | | — | | | | — | | |
Mid Cap Growth Institutional Class | | | — | | | | — | | | | — | | | | — | | | | 0.73 | % | |
Mid Cap Growth Class A | | | — | | | | — | | | | — | | | | 1.09 | % | | | 1.10 | % | |
Mid Cap Growth Class C | | | — | | | | — | | | | 1.82 | % | | | 1.86 | % | | | — | | |
Mid Cap Growth Class R3 | | | — | | | | 1.33 | % | | | 1.34 | % | | | — | | | | — | | |
Mid Cap Intrinsic Value Trust Class | | | — | | | | — | | | | — | | | | 1.24 | % | | | — | | |
Mid Cap Intrinsic Value Class R6 | | | 0.74 | % | | | — | | | | — | | | | — | | | | — | | |
^^ Represents the annualized ratio of net expenses to average daily net assets after utilization of the line of credit by Greater China Equity (2019, 2017 and 2016) and International Small Cap (2020) and/or reimbursement of expenses and/or waiver of a portion of the investment management fee by Management. Had Greater China Equity
257
Notes to Financial Highlights Equity Funds (cont'd)
and International Select not utilized the line of credit, and/or had Management not undertaken such action, the annualized ratios of net expenses to average daily net assets would have been:
| | | Year Ended August 31, | |
| | | 2020 | | 2019 | | 2018 | | 2017 | | 2016 | |
Greater China Equity Institutional Class | | | — | | | | 1.50 | % | | | — | | | | 1.50 | % | | | 1.51 | % | |
Greater China Equity Class A | | | — | | | | 1.86 | % | | | — | | | | 1.86 | % | | | 1.87 | % | |
Greater China Equity Class C | | | — | | | | 2.61 | % | | | — | | | | 2.61 | % | | | 2.62 | % | |
International Small Cap Institutional Class | | | 1.05 | % | | | — | | | | — | | | | — | | | | — | | |
International Small Cap Class A | | | 1.42 | % | | | — | | | | — | | | | — | | | | — | | |
International Small Cap Class C | | | 2.17 | % | | | — | | | | — | | | | — | | | | — | | |
International Small Cap Class R6 | | | 0.96 | % | | | — | | | | — | | | | — | | | | — | | |
a Total return based on per share NAV reflects the effects of changes in NAV on the performance of each Fund during each fiscal period. Returns assume income dividends and other distributions, if any, were reinvested, but do not reflect the effect of sales charges. Results represent past performance and do not indicate future results. Current returns may be lower or higher than the performance data quoted. Investment returns and principal will fluctuate and shares, when redeemed, may be worth more or less than original cost. Total return would have been lower if Management had not reimbursed and/or waived certain expenses. Total return would have been higher if Management had not recouped previously reimbursed and/or waived expenses.
b The class action proceeds listed in Note A of the Notes to Financial Statements, if any, had no impact on the Funds' total returns for the year ended August 31, 2020. Except for the Fund classes listed below, the class action proceeds received in 2019, 2018, 2017 and/or 2016, if any, had no impact on the Funds' total returns for the years ended August 31, 2019, 2018, 2017 and/or 2016. Had the Fund classes listed below not received class action proceeds in 2019, 2018, 2017 and/or 2016, total return based on per share NAV for the years ended August 31, 2019, 2018, 2017 and/or 2016 would have been:
| | | Year Ended August 31, | |
| | | 2019 | | 2018 | | 2017 | | 2016 | |
Large Cap Value Investor Class | | | 6.21 | % | | | — | | | | — | | | | — | | |
Large Cap Value Trust Class | | | 6.00 | % | | | — | | | | — | | | | — | | |
Large Cap Value Advisor Class | | | 5.86 | % | | | — | | | | — | | | | — | | |
Mid Cap Intrinsic Value Class A | | | — | | | | — | | | | 16.89 | % | | | — | | |
Small Cap Growth Investor Class | | | 3.98 | % | | | — | | | | 21.91 | % | | | (3.27 | )% | |
Small Cap Growth Trust Class | | | 3.90 | % | | | — | | | | 21.68 | % | | | (3.40 | )% | |
Small Cap Growth Advisor Class | | | 3.73 | % | | | — | | | | 21.47 | % | | | (3.50 | )% | |
Small Cap Growth Institutional Class | | | 4.35 | % | | | — | | | | 22.23 | % | | | (2.99 | )% | |
Small Cap Growth Class A | | | 3.98 | % | | | — | | | | 21.81 | % | | | (3.31 | )% | |
Small Cap Growth Class C | | | 3.11 | % | | | — | | | | 20.94 | % | | | (4.02 | )% | |
Small Cap Growth Class R3 | | | 3.62 | % | | | — | | | | 21.47 | % | | | (3.54 | )% | |
c Portfolio turnover is calculated at the Fund level. Percentage indicated was calculated for the year ended August 31, 2017, for International Select and for the year ended August 31, 2019, for Guardian, Intrinsic Value, Large Cap Value, Mid Cap Intrinsic Value and Small Cap Growth.
258
Notes to Financial Highlights Equity Funds (cont'd)
d Had International Equity not received the voluntary contribution in 2020 and had Mid Cap Growth not received the voluntary contribution in 2016, the total return based on per share NAV for the year ended August 31, 2020 for International Equity, and for the year ended August 31, 2016 for Mid Cap Growth, would have been:
| | | Year Ended August 31, | |
| | | 2020 | | 2016 | |
International Equity Investor Class | | | 15.31 | % | | | — | | |
International Equity Trust Class | | | 15.33 | % | | | — | | |
International Equity Institutional Class | | | 15.66 | % | | | — | | |
International Equity Class A | | | 15.19 | % | | | — | | |
International Equity Class C | | | 14.33 | % | | | — | | |
International Equity Class R6 | | | 15.83 | % | | | — | | |
Mid Cap Growth Investor Class | | | — | | | | (1.78 | )% | |
Mid Cap Growth Trust Class | | | — | | | | (1.90 | )% | |
Mid Cap Growth Advisor Class | | | — | | | | (2.13 | )% | |
Mid Cap Growth Institutional Class | | | — | | | | (1.66 | )% | |
Mid Cap Growth Class A | | | — | | | | (2.04 | )% | |
Mid Cap Growth Class C | | | — | | | | (2.66 | )% | |
Mid Cap Growth Class R3 | | | — | | | | (2.21 | )% | |
Mid Cap Growth Class R6 | | | — | | | | (1.51 | )% | |
e The custodian expenses refund noted in (h) below is non-recurring and is included in these ratios. Had certain Funds not received the refund, the annualized ratio of net expenses to average net assets and the annualized ratio of net investment income/(loss) to average net assets would have been:
| | | Ratio of Net
Expenses
to Average
Net Assets
Year Ended
August 31,
2017 | | Ratio of Net
Investment
Income/(Loss)
to Average
Net Assets
Year Ended
August 31,
2017 | |
Equity Income Institutional Class | | | 0.69 | % | | | 2.99 | % | |
Equity Income Class A | | | 1.05 | % | | | 2.56 | % | |
Equity Income Class C | | | 1.80 | % | | | 1.82 | % | |
Equity Income Class R3 | | | 1.34 | % | | | 2.27 | % | |
Focus Investor Class | | | 0.92 | % | | | 0.27 | % | |
Focus Trust Class | | | 1.10 | % | | | 0.09 | % | |
Focus Advisor Class | | | 1.26 | % | | | (0.08 | )% | |
Genesis Investor Class | | | 1.02 | % | | | 0.21 | % | |
Genesis Trust Class | | | 1.09 | % | | | 0.12 | % | |
Genesis Advisor Class | | | 1.36 | % | | | (0.14 | )% | |
Genesis Institutional Class | | | 0.85 | % | | | 0.38 | % | |
Genesis Class R6 | | | 0.77 | % | | | 0.45 | % | |
Guardian Investor Class | | | 0.90 | % | | | 0.75 | % | |
Guardian Trust Class | | | 1.07 | % | | | 0.57 | % | |
259
Notes to Financial Highlights Equity Funds (cont'd)
| | | Ratio of Net
Expenses
to Average
Net Assets
Year Ended
August 31,
2017 | | Ratio of Net
Investment
Income/(Loss)
to Average
Net Assets
Year Ended
August 31,
2017 | |
Guardian Advisor Class | | | 1.38 | % | | | 0.25 | % | |
Guardian Institutional Class | | | 0.72 | % | | | 0.94 | % | |
Guardian Class A | | | 1.10 | % | | | 0.55 | % | |
Guardian Class C | | | 1.84 | % | | | (0.20 | )% | |
Guardian Class R3 | | | 1.36 | % | | | 0.28 | % | |
International Equity Investor Class | | | 1.05 | % | | | 0.97 | % | |
International Equity Trust Class | | | 1.09 | % | | | 0.91 | % | |
International Equity Institutional Class | | | 0.85 | % | | | 1.19 | % | |
International Equity Class A | | | — | | | | 0.65 | % | |
International Equity Class C | | | — | | | | 0.04 | % | |
International Equity Class R6 | | | — | | | | 1.31 | % | |
Large Cap Value Investor Class | | | 0.87 | % | | | 1.30 | % | |
Large Cap Value Trust Class | | | 1.05 | % | | | 1.11 | % | |
Large Cap Value Advisor Class | | | 1.20 | % | | | 0.97 | % | |
Large Cap Value Institutional Class | | | 0.70 | % | | | 1.49 | % | |
Large Cap Value Class A | | | 1.07 | % | | | 1.11 | % | |
Large Cap Value Class C | | | 1.81 | % | | | 0.36 | % | |
Large Cap Value Class R3 | | | 1.36 | % | | | 0.90 | % | |
Mid Cap Growth Investor Class | | | 0.93 | % | | | (0.30 | )% | |
Mid Cap Growth Trust Class | | | 0.97 | % | | | (0.34 | )% | |
Mid Cap Growth Advisor Class | | | 1.23 | % | | | (0.60 | )% | |
Mid Cap Growth Institutional Class | | | 0.72 | % | | | (0.09 | )% | |
Mid Cap Growth Class A | | | 1.11 | % | | | (0.49 | )% | |
Mid Cap Growth Class R6 | | | 0.65 | % | | | (0.02 | )% | |
Mid Cap Intrinsic Value Investor Class | | | 1.07 | % | | | 1.00 | % | |
Mid Cap Intrinsic Value Trust Class | | | 1.25 | % | | | 0.82 | % | |
Mid Cap Intrinsic Value Institutional Class | | | 0.85 | % | | | 1.19 | % | |
Mid Cap Intrinsic Value Class A | | | 1.21 | % | | | 0.89 | % | |
Mid Cap Intrinsic Value Class C | | | 1.96 | % | | | 0.15 | % | |
Multi-Cap Opportunities Institutional Class | | | 0.75 | % | | | 0.68 | % | |
Multi-Cap Opportunities Class A | | | 1.10 | % | | | 0.32 | % | |
Multi-Cap Opportunities Class C | | | 1.84 | % | | | (0.40 | )% | |
Small Cap Growth Investor Class | | | 1.21 | % | | | (0.87 | )% | |
Small Cap Growth Advisor Class | | | 1.51 | % | | | (1.18 | )% | |
Sustainable Equity Investor Class | | | 0.85 | % | | | 0.66 | % | |
Sustainable Equity Trust Class | | | 1.02 | % | | | 0.49 | % | |
260
Notes to Financial Highlights Equity Funds (cont'd)
| | | Ratio of Net
Expenses
to Average
Net Assets
Year Ended
August 31,
2017 | | Ratio of Net
Investment
Income/(Loss)
to Average
Net Assets
Year Ended
August 31,
2017 | |
Sustainable Equity Institutional Class | | | 0.66 | % | | | 0.84 | % | |
Sustainable Equity Class A | | | 1.03 | % | | | 0.48 | % | |
Sustainable Equity Class C | | | 1.78 | % | | | (0.27 | )% | |
Sustainable Equity Class R3 | | | 1.28 | % | | | 0.21 | % | |
Sustainable Equity Class R6 | | | 0.59 | % | | | 0.91 | % | |
f After the close of business on December 8, 2017, the Funds' applicable classes underwent a stock split or reverse stock split. The per share data presented here has been retroactively adjusted to reflect this split.
g After the close of business on February 23, 2018, the Funds' applicable classes underwent a stock split or reverse stock split. The per share data presented here has been retroactively adjusted to reflect this split.
h In May 2016, the Fund's custodian, State Street, announced that it had identified inconsistencies in the way in which certain Funds were invoiced for categories of expenses, particularly those deemed "out-of-pocket" costs, from 1998 through November 2015, and refunded to those Funds certain expenses, plus interest, determined to be payable to the Funds for the period in question. These amounts were refunded to those Funds by State Street during the year ended August 31, 2017. Except for the Fund classes listed below, these amounts had no impact on the Fund's total return for the year ended August 31, 2017. Had the below Funds not received the refund, the total return based on per share NAV would have been:
| | | Year Ended August 31, 2017 | |
Guardian Advisor Class | | | 17.00 | % | |
International Equity Investor Class | | | 15.58 | % | |
International Equity Trust Class | | | 15.53 | % | |
Mid Cap Intrinsic Value Investor Class | | | 17.14 | % | |
i After the close of business on December 7, 2018, the Funds' applicable classes underwent a stock split or reverse stock split. The per share data presented here has been retroactively adjusted to reflect this split. See Note G of the Notes to Financial Statements.
j The voluntary contributions received in 2017 had no impact on the Funds' total returns for Equity Income and Focus for the year ended August 31, 2017.
k After the close of business on August 16, 2019, Large Cap Value acquired all of the net assets of Neuberger Berman Value Fund in a tax-free exchange of shares pursuant to a Plan of Reorganization and Dissolution approved by the Board. Portfolio turnover excludes purchases of $30,333,739 of securities acquired, and there were no sales made following a purchase-of-assets transaction relative to the merger.
l Effective September 3, 2019, Neuberger Berman Global Equity Fund changed its name to Integrated Large Cap and also made other changes as described in Note A of the Notes to Financial Statements. Please refer to Note A of Notes to Financial Statements for additional, important information.
261
Report of Independent Registered Public Accounting Firm
To the Board of Trustees of
Neuberger Berman Equity Funds and Shareholders of:
Neuberger Berman Dividend Growth Fund
Neuberger Berman Emerging Markets Equity Fund
Neuberger Berman Equity Income Fund
Neuberger Berman Focus Fund
Neuberger Berman Genesis Fund
Neuberger Berman Global Real Estate Fund
Neuberger Berman Greater China Equity Fund
Neuberger Berman Guardian Fund
Neuberger Berman Integrated Large Cap Fund
Neuberger Berman International Equity Fund
Neuberger Berman International Select Fund
Neuberger Berman International Small Cap Fund
Neuberger Berman Large Cap Value Fund
Neuberger Berman Real Estate Fund
Opinion on the Financial Statements
We have audited the accompanying statements of assets and liabilities of Neuberger Berman Dividend Growth Fund, Neuberger Berman Emerging Markets Equity Fund, Neuberger Berman Equity Income Fund, Neuberger Berman Focus Fund, Neuberger Berman Genesis Fund, Neuberger Berman Global Real Estate Fund, Neuberger Berman Greater China Equity Fund, Neuberger Berman Guardian Fund, Neuberger Berman Integrated Large Cap Fund (formerly, Neuberger Berman Global Equity Fund), Neuberger Berman International Equity Fund, Neuberger Berman International Select Fund, Neuberger Berman International Small Cap Fund, Neuberger Berman Large Cap Value Fund, and Neuberger Berman Real Estate Fund (collectively referred to as the "Funds") (fourteen of the series constituting Neuberger Berman Equity Funds (the "Trust")), including the schedules of investments, as of August 31, 2020 and the related statement of operations, the statements of changes in net assets, and the financial highlights for each of the periods indicated in the table below and the related notes (collectively referred to as the "financial statements"). In our opinion, the financial statements present fairly, in all material respects, the financial position of each of the Funds (fourteen of the series constituting Neuberger Berman Equity Funds) at August 31, 2020, the results of their operations, changes in net assets and financial highlights for each of the periods indicated in the table below, in conformity with U.S. generally accepted accounting principles.
262
Individual Fund constituting
Neuberger Berman
Equity Funds | | Statement of
operations | | Statement of
changes in net assets | | Financial highlights | |
Neuberger Berman Dividend Growth Fund | | For the year ended August 31, 2020 | | For each of the two years in the period ended August 31, 2020 | | For each of the four years in the period ended August 31, 2020 and the period from December 15, 2015 (commencement of operations) through August 31, 2016 | |
Neuberger Berman Emerging Markets Equity Fund
Neuberger Berman Equity Income Fund
Neuberger Berman Focus Fund
Neuberger Berman Genesis Fund
Neuberger Berman Global Real Estate Fund
Neuberger Berman Greater China Equity Fund
Neuberger Berman Guardian Fund
Neuberger Berman Integrated Large Cap Fund (formerly, Neuberger Berman Global Equity Fund)
Neuberger Berman International Equity Fund
Neuberger Berman International Select Fund
Neuberger Berman Large Cap Value Fund
Neuberger Berman Real Estate Fund | | For the year ended August 31, 2020 | | For each of the two years in the period ended August 31, 2020 | | For each of the five years in the period ended August 31, 2020 | |
Neuberger Berman International Small Cap Fund | | For the year ended August 31, 2020 | | For each of the two years in the period ended August 31, 2020 | | For each of the three years in the period ended August 31, 2020 and the period from December 8, 2016 (commencement of operations) through August 31, 2017 | |
Basis for Opinion
These financial statements are the responsibility of the Trust's management. Our responsibility is to express an opinion on each of the Funds' financial statements based on our audits. We are a public accounting firm registered with the Public Company Accounting Oversight Board (United States) ("PCAOB") and are required to be independent with respect to the Trust in accordance with the U.S. federal securities laws and the applicable rules and regulations of the Securities and Exchange Commission and the PCAOB.
We conducted our audits in accordance with the standards of the PCAOB. Those standards require that we plan and perform the audit to obtain reasonable assurance about whether the financial statements are free of material misstatement, whether due to error or fraud. The Trust is not required to have, nor were we engaged to perform, an audit of the Trust's internal control over financial reporting. As part of our audits, we are required to obtain an understanding
263
of internal control over financial reporting, but not for the purpose of expressing an opinion on the effectiveness of the Trust's internal control over financial reporting. Accordingly, we express no such opinion.
Our audits included performing procedures to assess the risks of material misstatement of the financial statements, whether due to error or fraud, and performing procedures that respond to those risks. Such procedures included examining, on a test basis, evidence regarding the amounts and disclosures in the financial statements. Our procedures included confirmation of securities owned as of August 31, 2020, by correspondence with the custodian and brokers or by other appropriate auditing procedures where replies from brokers were not received. Our audits also included evaluating the accounting principles used and significant estimates made by management, as well as evaluating the overall presentation of the financial statements. We believe that our audits provide a reasonable basis for our opinion.

We have served as the auditor of one or more Neuberger Berman investment companies since 1954.
Boston, Massachusetts
October 19, 2020
264
Report of Independent Registered Public Accounting Firm
To the Board of Trustees and Shareholders
Neuberger Berman Equity Funds
Opinion on the Financial Statements
We have audited the accompanying statements of assets and liabilities of the Neuberger Berman Intrinsic Value Fund, Neuberger Berman Mid Cap Growth Fund, Neuberger Berman Mid Cap Intrinsic Value Fund, Neuberger Berman Multi-Cap Opportunities Fund, Neuberger Berman Small Cap Growth Fund, and Neuberger Berman Sustainable Equity Fund (the "Funds"), each a series of Neuberger Berman Equity Funds (the "Trust"), including the schedules of investments, as of August 31, 2020, the related statements of operations for the year then ended, the statements of changes in net assets for each of the two years in the period then ended, financial highlights for each of the five years in the period then ended, and the related notes (collectively referred to as the "financial statements"). In our opinion, the financial statements present fairly, in all material respects, the financial position of the Funds as of August 31, 2020, the results of their operations for the year then ended, the changes in their net assets for each of the two years in the period then ended, and their financial highlights for each of the five years in the period then ended, in conformity with accounting principles generally accepted in the United States of America.
Basis for Opinion
These financial statements are the responsibility of the Funds' management. Our responsibility is to express an opinion on the Funds' financial statements based on our audits. We are a public accounting firm registered with the Public Company Accounting Oversight Board (United States) ("PCAOB") and are required to be independent with respect to the Funds in accordance with the U.S. federal securities laws and the applicable rules and regulations of the Securities and Exchange Commission and the PCAOB. We have served as the auditor of one or more of the funds in the Trust since 2004.
We conducted our audits in accordance with the standards of the PCAOB. Those standards require that we plan and perform the audits to obtain reasonable assurance about whether the financial statements are free of material misstatement, whether due to error or fraud. The Funds are not required to have, nor were we engaged to perform, an audit of the Funds' internal control over financial reporting. As part of our audits we are required to obtain an understanding of internal control over financial reporting, but not for the purpose of expressing an opinion on the effectiveness of the Funds' internal control over financial reporting. Accordingly, we express no such opinion.
Our audits included performing procedures to assess the risks of material misstatement of the financial statements, whether due to error or fraud, and performing procedures that respond to those risks. Such procedures included examining, on a test basis, evidence regarding the amounts and disclosures in the financial statements. Our audits also included evaluating the accounting principles used and significant estimates made by management, as well as evaluating the overall presentation of the financial statements. Our procedures included confirmation of securities owned as of August 31, 2020 by correspondence with the custodian, transfer agent, and brokers; when replies were not received, we performed other auditing procedures. We believe that our audits provide a reasonable basis for our opinion.

Philadelphia, Pennsylvania
October 19, 2020
265
Investment Manager and Administrator
Neuberger Berman Investment Advisers LLC
1290 Avenue of the Americas
New York, NY 10104-0002
800.877.9700 or 212.476.8800
Intermediary Client Services 800.366.6264
Distributor
Neuberger Berman BD LLC
1290 Avenue of the Americas
New York, NY 10104-0002
800.877.9700 or 212.476.8800
Intermediary Client Services
800.366.6264
Sub-Adviser
Green Court Capital Management Limited
Suites 4007-4008, 40/F
One Exchange Square
8 Connaught Place
Central Hong Kong
Custodian
State Street Bank and Trust Company
One Lincoln Street
Boston, MA 02111
Shareholder Servicing Agent
DST Asset Manager Solutions Inc.
430 West 7th Street, Suite 219189
Kansas City, MO 64105-1407
For Investor Class Shareholders
Address correspondence to:
Neuberger Berman Funds
P.O. Box 219189
Kansas City, MO 64121-9189
800.877.9700 or 212.476.8800
For Class A, Class C, Class R3 and Class R6 Shareholders:
Please contact your investment provider
For Trust Class, Advisor Class and Institutional Class Shareholders
Address correspondence to:
Neuberger Berman Funds
P.O. Box 219189
Kansas City, MO 64121-9189
Intermediary Client Services
800.366.6264
Legal Counsel
K&L Gates LLP
1601 K Street, NW
Washington, DC 20006-1600
Independent Registered Public Accounting Firms
Ernst & Young LLP
200 Clarendon Street
Boston, MA 02116
Tait, Weller & Baker LLP
Two Liberty Place
50 South 16th Street, Suite 2900
Philadelphia, PA 19102
266
The following tables set forth information concerning the Trustees and Officers of the Funds. All persons named as Trustees and Officers also serve in similar capacities for other funds administered or managed by NBIA. The Funds' Statement of Additional Information includes additional information about the Trustees as of the time of the Funds' most recent public offering and is available upon request, without charge, by calling (800) 877-9700.
Information about the Board of Trustees
Name, (Year of Birth),
and Address(1) | | Position(s)
and Length of
Time Served(2) | | Principal Occupation(s)(3) | | Number of
Funds in
Fund Complex
Overseen by
Fund Trustee | | Other Directorships Held
Outside Fund Complex by
Fund Trustee(3) | |
Independent Fund Trustees | | | | | | | | | |
Michael J. Cosgrove (1949) | | Trustee since 2015 | | President, Carragh Consulting USA, since 2014; formerly, Executive, General Electric Company, 1970 to 2014, including President, Mutual Funds and Global Investment Programs, GE Asset Management, 2011 to 2014, President and Chief Executive Officer, Mutual Funds and Intermediary Business, GE Asset Management, 2007 to 2011, President, Institutional Sales and Marketing, GE Asset Management, 1998 to 2007, and Chief Financial Officer, GE Asset Management, and Deputy Treasurer, GE Company, 1988 to 1993. | |
| 46 |
| | Director, America Press, Inc. (not-for-profit Jesuit publisher), since 2015; formerly, Director, Fordham University, 2001 to 2018; formerly, Director, The Gabelli Go Anywhere Trust, June 2015 to June 2016; formerly, Director, Skin Cancer Foundation (not-for-profit), 2006 to 2015; formerly, Director, GE Investments Funds, Inc., 1997 to 2014; formerly, Trustee, GE Institutional Funds, 1997 to 2014; formerly, Director, GE Asset Management, 1988 to 2014; formerly, Director, Elfun Trusts, 1988 to 2014; formerly, Trustee, GE Pension & Benefit Plans, 1988 to 2014; formerly, Member of Board of Governors, Investment Company Institute. | |
267
Name, (Year of Birth),
and Address(1) | | Position(s)
and Length of
Time Served(2) | | Principal Occupation(s)(3) | | Number of
Funds in
Fund Complex
Overseen by
Fund Trustee | | Other Directorships Held
Outside Fund Complex by
Fund Trustee(3) | |
Marc Gary (1952) | | Trustee since 2015 | | Executive Vice Chancellor and Chief Operating Officer, Jewish Theological Seminary, since 2012; formerly, Executive Vice President and General Counsel, Fidelity Investments, 2007 to 2012; formerly, Executive Vice President and General Counsel, BellSouth Corporation, 2004 to 2007; formerly, Vice President and Associate General Counsel, BellSouth Corporation, 2000 to 2004; formerly, Associate, Partner, and National Litigation Practice Co-Chair, Mayer, Brown LLP, 1981 to 2000; formerly, Associate Independent Counsel, Office of Independent Counsel, 1990 to 1992. | |
| 46 |
| | Trustee, Jewish Theological Seminary, since 2015; Director, Legility, Inc. (privately held for-profit company), since 2012; Director, Lawyers Committee for Civil Rights Under Law (not-for-profit), since 2005; formerly, Director, Equal Justice Works (not-for-profit), 2005 to 2014; formerly, Director, Corporate Counsel Institute, Georgetown University Law Center, 2007 to 2012; formerly, Director, Greater Boston Legal Services (not-for-profit), 2007 to 2012. | |
268
Name, (Year of Birth),
and Address(1) | | Position(s)
and Length of
Time Served(2) | | Principal Occupation(s)(3) | | Number of
Funds in
Fund Complex
Overseen by
Fund Trustee | | Other Directorships Held
Outside Fund Complex by
Fund Trustee(3) | |
Martha C. Goss (1949) | | Trustee since 2007 | | President, Woodhill Enterprises Inc./Chase Hollow Associates LLC (personal investment vehicle), since 2006; formerly, Consultant, Resources Global Professionals (temporary staffing), 2002 to 2006; formerly, Chief Financial Officer, Booz-Allen & Hamilton, Inc., 1995 to 1999; formerly, Enterprise Risk Officer, Prudential Insurance, 1994 to1995; formerly, President, Prudential Asset Management Company, 1992 to 1994; formerly, President, Prudential Power Funding (investments in electric and gas utilities and alternative energy projects), 1989 to 1992; formerly, Treasurer, Prudential Insurance Company, 1983 to 1989. | |
| 46 |
| | Director, American Water (water utility), since 2003; Director, Allianz Life of New York (insurance), since 2005; Director, Berger Group Holdings, Inc. (engineering consulting firm), since 2013; Director, Financial Women's Association of New York (not-for-profit association), since 2003; Trustee Emerita, Brown University, since 1998; Director, Museum of American Finance (not-for-profit), since 2013; formerly, Non-Executive Chair and Director, Channel Reinsurance (financial guaranty reinsurance), 2006 to 2010; formerly, Director, Ocwen Financial Corporation (mortgage servicing), 2005 to 2010; formerly, Director, Claire's Stores, Inc. (retailer), 2005 to 2007; formerly, Director, Parsons Brinckerhoff Inc. (engineering consulting firm), 2007 to 2010; formerly, Director, Bank Leumi (commercial bank), 2005 to 2007; formerly, Advisory Board Member, Attensity (software developer), 2005 to 2007. | |
269
Name, (Year of Birth),
and Address(1) | | Position(s)
and Length of
Time Served(2) | | Principal Occupation(s)(3) | | Number of
Funds in
Fund Complex
Overseen by
Fund Trustee | | Other Directorships Held
Outside Fund Complex by
Fund Trustee(3) | |
Michael M. Knetter (1960) | | Trustee since 2007 | | President and Chief Executive Officer, University of Wisconsin Foundation, since 2010; formerly, Dean, School of Business, University of Wisconsin—Madison; formerly, Professor of International Economics and Associate Dean, Amos Tuck School of Business—Dartmouth College, 1998 to 2002. | |
| 46 |
| | Director, 1 William Street Credit Income Fund, since 2018; Board Member, American Family Insurance (a mutual company, not publicly traded), since March 2009; formerly, Trustee, Northwestern Mutual Series Fund, Inc., 2007 to 2011; formerly, Director, Wausau Paper, 2005 to 2011; formerly, Director, Great Wolf Resorts, 2004 to 2009. | |
Deborah C. McLean (1954) | | Trustee since 2015 | | Member, Circle Financial Group (private wealth management membership practice), since 2011; Managing Director, Golden Seeds LLC (an angel investing group), since 2009; Adjunct Professor, Columbia University School of International and Public Affairs, since 2008; formerly, Visiting Assistant Professor, Fairfield University, Dolan School of Business, Fall 2007; formerly, Adjunct Associate Professor of Finance, Richmond, The American International University in London, 1999 to 2007. | |
| 46 |
| | Board member, Norwalk Community College Foundation, since 2014; Dean's Advisory Council, Radcliffe Institute for Advanced Study, since 2014; formerly, Director and Treasurer, At Home in Darien (not-for-profit), 2012 to 2014; formerly, Director, National Executive Service Corps (not-for-profit), 2012 to 2013; formerly, Trustee, Richmond, The American International University in London, 1999 to 2013. | |
270
Name, (Year of Birth),
and Address(1) | | Position(s)
and Length of
Time Served(2) | | Principal Occupation(s)(3) | | Number of
Funds in
Fund Complex
Overseen by
Fund Trustee | | Other Directorships Held
Outside Fund Complex by
Fund Trustee(3) | |
George W. Morriss (1947) | | Trustee since 2007 | | Adjunct Professor, Columbia University School of International and Public Affairs, since 2012; formerly, Executive Vice President and Chief Financial Officer, People's United Bank, Connecticut (a financial services company), 1991 to 2001. | |
| 46 |
| | Director, 1 William Street Credit Income Fund, since 2018; Director and Chair, Thrivent Church Loan and Income Fund, since 2018; formerly, Trustee, Steben Alternative Investment Funds, Steben Select Multi-Strategy Fund, and Steben Select Multi-Strategy Master Fund, 2013 to 2017; formerly, Treasurer, National Association of Corporate Directors, Connecticut Chapter, 2011 to 2015; formerly, Manager, Larch Lane Multi-Strategy Fund complex (which consisted of three funds), 2006 to 2011; formerly, Member, NASDAQ Issuers' Affairs Committee, 1995 to 2003. | |
Tom D. Seip (1950) | | Trustee since 2000; Chairman of the Board since 2008; formerly Lead Independent Trustee from 2006 to 2008 | | Formerly, Managing Member, Ridgefield Farm LLC (a private investment vehicle), 2004 to 2016; formerly, President and CEO, Westaff, Inc. (temporary staffing), May 2001 to January 2002; formerly, Senior Executive, The Charles Schwab Corporation, 1983 to 1998, including Chief Executive Officer, Charles Schwab Investment Management, Inc.; Trustee, Schwab Family of Funds and Schwab Investments, 1997 to 1998; and Executive Vice President-Retail Brokerage, Charles Schwab & Co., Inc., 1994 to 1997. | |
| 46 |
| | Formerly, Director, H&R Block, Inc. (tax services company), 2001 to 2018; formerly, Director, Talbot Hospice Inc., 2013 to 2016; formerly, Chairman, Governance and Nominating Committee, H&R Block, Inc., 2011 to 2015; formerly, Chairman, Compensation Committee, H&R Block, Inc., 2006 to 2010; formerly, Director, Forward Management, Inc. (asset management company), 1999 to 2006. | |
271
Name, (Year of Birth),
and Address(1) | | Position(s)
and Length of
Time Served(2) | | Principal Occupation(s)(3) | | Number of
Funds in
Fund Complex
Overseen by
Fund Trustee | | Other Directorships Held
Outside Fund Complex by
Fund Trustee(3) | |
James G. Stavridis (1955) | | Trustee since 2015 | | Operating Executive, The Carlyle Group, since 2018; Commentator, NBC News, since 2015; formerly, Dean, Fletcher School of Law and Diplomacy, Tufts University, 2013 to 2018; formerly, Admiral, United States Navy, 1976 to 2013, including Supreme Allied Commander, NATO and Commander, European Command, 2009 to 2013, and Commander, United States Southern Command, 2006 to 2009. | |
| 46 |
| | Director, American Water (water utility), since 2018; Director, NFP Corp. (insurance broker and consultant), since 2017; Director, U.S. Naval Institute, since 2014; Director, Onassis Foundation, since 2014; Director, BMC Software Federal, LLC, since 2014; Director, Vertical Knowledge, LLC, since 2013; formerly, Director, Navy Federal Credit Union, 2000-2002. | |
272
Name, (Year of Birth),
and Address(1) | | Position(s)
and Length of
Time Served(2) | | Principal Occupation(s)(3) | | Number of
Funds in
Fund Complex
Overseen by
Fund Trustee | | Other Directorships Held
Outside Fund Complex by
Fund Trustee(3) | |
Candace L. Straight (1947) | | Trustee since 2000 | | Private investor and consultant specializing in the insurance industry; formerly, Advisory Director, Securitas Capital LLC (a global private equity investment firm dedicated to making investments in the insurance sector), 1998 to 2003. | |
| 46 |
| | Director, ERA Coalition (not-for-profit), since January 2019; Director, Re belle Media (a privately held TV and film production company), since 2018; formerly, Public Member, Board of Governors and Board of Trustees, Rutgers University, 2011 to 2016; formerly, Director, Montpelier Re Holdings Ltd. (reinsurance company), 2006 to 2015; formerly, Director, National Atlantic Holdings Corporation (property and casualty insurance company), 2004 to 2008; formerly, Director, The Proformance Insurance Company (property and casualty insurance company), 2004 to 2008; formerly, Director, Providence Washington Insurance Company (property and casualty insurance company), 1998 to 2006; formerly, Director, Summit Global Partners (insurance brokerage firm), 2000 to 2005. | |
Peter P. Trapp (1944) | | Trustee since 2000 | | Retired; formerly, Regional Manager for Mid-Southern Region, Ford Motor Credit Company, September 1997 to 2007; formerly, President, Ford Life Insurance Company, April 1995 to August 1997. | |
| 46 |
| | None. | |
273
Name, (Year of Birth),
and Address(1) | | Position(s)
and Length of
Time Served(2) | | Principal Occupation(s)(3) | | Number of
Funds in
Fund Complex
Overseen by
Fund Trustee | | Other Directorships Held
Outside Fund Complex by
Fund Trustee(3) | |
Fund Trustees who are "Interested Persons" | | | | | | | | | |
Joseph V. Amato* (1962) | | Chief Executive Officer and President since 2018 and Trustee since 2009 | | President and Director, Neuberger Berman Group LLC, since 2009; President and Chief Executive Officer, Neuberger Berman BD LLC and Neuberger Berman Holdings LLC (including its predecessor, Neuberger Berman Inc.), since 2007; Chief Investment Officer (Equities) and President (Equities), Neuberger Berman Investment Advisers LLC ("NBIA") (formerly, Neuberger Berman Fixed Income LLC ("NBFI") and including predecessor entities), since 2007, and Board Member of NBIA since 2006; formerly, Global Head of Asset Management of Lehman Brothers Holdings Inc.'s ("LBHI") Investment Management Division, 2006 to 2009; formerly, member of LBHI's Investment Management Division's Executive Management Committee, 2006 to 2009; formerly, Managing Director, Lehman Brothers Inc. ("LBI"), 2006 to 2008; formerly, Chief Recruiting and Development Officer, LBI, 2005 to 2006; formerly, Global Head of LBI's Equity Sales and a Member of its Equities Division Executive Committee, 2003 to 2005; President and Chief Executive Officer, ten registered investment companies for which NBIA acts as investment manager and/or administrator. | |
| 46 |
| | Member of Board of Advisors, McDonough School of Business, Georgetown University, since 2001; Member of New York City Board of Advisors, Teach for America, since 2005; Trustee, Montclair Kimberley Academy (private school), since 2007; Member of Board of Regents, Georgetown University, since 2013. | |
274
(1) The business address of each listed person is 1290 Avenue of the Americas, New York, NY 10104.
(2) Pursuant to the Trust's Amended and Restated Trust Instrument, subject to any limitations on the term of service imposed by the By-Laws or any retirement policy adopted by the Fund Trustees, each Fund Trustee shall hold office for life or until his or her successor is elected or the Trust terminates; except that (a) any Fund Trustee may resign by delivering a written resignation; (b) any Fund Trustee may be removed with or without cause at any time by a written instrument signed by at least two-thirds of the other Fund Trustees; (c) any Fund Trustee who requests to be retired, or who has become unable to serve, may be retired by a written instrument signed by a majority of the other Fund Trustees; and (d) any Fund Trustee may be removed at any shareholder meeting by a vote of at least two-thirds of the outstanding shares.
(3) Except as otherwise indicated, each individual has held the positions shown during at least the last five years.
* Indicates a Fund Trustee who is an "interested person" within the meaning of the 1940 Act. Mr. Amato is an interested person of the Trust by virtue of the fact that he is an officer of NBIA and/or its affiliates.
275
Information about the Officers of the Trust
Name, (Year of Birth),
and Address(1) | | Position(s)
and Length of
Time Served(2) | | Principal Occupation(s)(3) | |
Claudia A. Brandon (1956) | | Executive Vice President since 2008 and Secretary since 1985 | | Senior Vice President, Neuberger Berman, since 2007 and Employee since 1999; Senior Vice President, NBIA, since 2008 and Assistant Secretary since 2004; formerly, Vice President, Neuberger Berman, 2002 to 2006; formerly, Vice President—Mutual Fund Board Relations, NBIA, 2000 to 2008; formerly, Vice President, NBIA, 1986 to 1999 and Employee, 1984 to 1999; Executive Vice President and Secretary, twenty-nine registered investment companies for which NBIA acts as investment manager and/or administrator. | |
Agnes Diaz (1971) | | Vice President since 2013 | | Senior Vice President, Neuberger Berman, since 2012; Senior Vice President, NBIA, since 2012 and Employee since 1996; formerly, Vice President, Neuberger Berman, 2007 to 2012; Vice President, ten registered investment companies for which NBIA acts as investment manager and/or administrator. | |
Anthony DiBernardo (1979) | | Assistant Treasurer since 2011 | | Senior Vice President, Neuberger Berman, since 2014; Senior Vice President, NBIA, since 2014, and Employee since 2003; formerly, Vice President, Neuberger Berman, 2009 to 2014; Assistant Treasurer, ten registered investment companies for which NBIA acts as investment manager and/or administrator. | |
Savonne L. Ferguson (1973) | | Chief Compliance Officer since 2018 | | Senior Vice President, Chief Compliance Officer (Mutual Funds) and Associate General Counsel, NBIA, since November 2018; formerly, Vice President T. Rowe Price Group, Inc. (2018), Vice President and Senior Legal Counsel, T. Rowe Price Associates, Inc. (2014-2018), Vice President and Director of Regulatory Fund Administration, PNC Capital Advisors, LLC (2009-2014), Secretary, PNC Funds and PNC Advantage Funds (2010-2014); Chief Compliance Officer, twenty-nine registered investment companies for which NBIA acts as investment manager and/or administrator. | |
Corey A. Issing (1978) | | Chief Legal Officer since 2016 (only for purposes of sections 307 and 406 of the Sarbanes-Oxley Act of 2002) | | General Counsel and Head of Compliance—Mutual Funds since 2016 and Managing Director, NBIA, since 2017; formerly, Associate General Counsel (2015 to 2016), Counsel (2007 to 2015), Senior Vice President (2013-2016), Vice President (2009-2013); Chief Legal Officer (only for purposes of sections 307 and 406 of the Sarbanes-Oxley Act of 2002), twenty-nine registered investment companies for which NBIA acts as investment manager and/or administrator. | |
Sheila R. James (1965) | | Assistant Secretary since 2002 | | Vice President, Neuberger Berman, since 2008 and Employee since 1999; Vice President, NBIA, since 2008; formerly, Assistant Vice President, Neuberger Berman, 2007; Employee, NBIA, 1991 to 1999; Assistant Secretary, twenty-nine registered investment companies for which NBIA acts as investment manager and/or administrator. | |
276
Name, (Year of Birth),
and Address(1) | | Position(s)
and Length of
Time Served(2) | | Principal Occupation(s)(3) | |
Brian Kerrane (1969) | | Chief Operating Officer since 2015 and Vice President since 2008 | | Managing Director, Neuberger Berman, since 2013; Chief Operating Officer—Mutual Funds and Managing Director, NBIA, since 2015; formerly, Senior Vice President, Neuberger Berman, 2006 to 2014; Vice President, NBIA, 2008 to 2015 and Employee since 1991; Chief Operating Officer, ten registered investment companies for which NBIA acts as investment manager and/or administrator; Vice President, twenty-nine registered investment companies for which NBIA acts as investment manager and/or administrator. | |
Anthony Maltese (1959) | | Vice President since 2015 | | Senior Vice President, Neuberger Berman, since 2014 and Employee since 2000; Senior Vice President, NBIA, since 2014; Vice President, ten registered investment companies for which NBIA acts as investment manager and/or administrator. | |
Josephine Marone (1963) | | Assistant Secretary since 2017 | | Senior Paralegal, Neuberger Berman, since 2007 and Employee since 2007; Assistant Secretary, twenty-nine registered investment companies for which NBIA acts as investment manager and/or administrator. | |
Owen F. McEntee, Jr. (1961) | | Vice President since 2008 | | Vice President, Neuberger Berman, since 2006; Vice President, NBIA, since 2006 and Employee since 1992; Vice President, ten registered investment companies for which NBIA acts as investment manager and/or administrator. | |
John M. McGovern (1970) | | Treasurer and Principal Financial and Accounting Officer since 2005 | | Senior Vice President, Neuberger Berman, since 2007; Senior Vice President, NBIA, since 2007 and Employee since 1993; formerly, Vice President, Neuberger Berman, 2004 to 2006; formerly, Assistant Treasurer, 2002 to 2005; Treasurer and Principal Financial and Accounting Officer, ten registered investment companies for which NBIA acts as investment manager and/or administrator. | |
Frank Rosato (1971) | | Assistant Treasurer since 2005 | | Vice President, Neuberger Berman, since 2006; Vice President, NBIA, since 2006 and Employee since 1995; Assistant Treasurer, ten registered investment companies for which NBIA acts as investment manager and/or administrator. | |
Niketh Velamoor (1979) | | Anti-Money Laundering Compliance Officer since 2018 | | Senior Vice President and Associate General Counsel, Neuberger Berman, since July 2018; Assistant United States Attorney, Southern District of New York, 2009 to 2018; Anti-Money Laundering Compliance Officer, four registered investment companies for which NBIA acts as investment manager and/or administrator. | |
(1) The business address of each listed person is 1290 Avenue of the Americas, New York, NY 10104.
(2) Pursuant to the By-Laws of the Trust, each officer elected by the Fund Trustees shall hold office until his or her successor shall have been elected and qualified or until his or her earlier death, inability to serve, or resignation. Officers serve at the pleasure of the Fund Trustees and may be removed at any time with or without cause.
(3) Except as otherwise indicated, each individual has held the positions shown during at least the last five years.
277
Proxy Voting Policies and Procedures
A description of the policies and procedures that the Trust uses to determine how to vote proxies relating to portfolio securities is available, without charge, by calling 800-877-9700 (toll-free) and on the SEC's website at www.sec.gov. Information regarding how the Trust voted proxies relating to portfolio securities during the most recent 12-month period ended June 30 is also available upon request, without charge, by calling 800-877-9700 (toll-free), on the SEC's website at www.sec.gov, and on Neuberger Berman's website at www.nb.com.
Quarterly Portfolio Schedule
The Trust files a complete schedule of portfolio holdings for each Fund with the SEC for the first and third quarters of each fiscal year as an exhibit to its report on Form N-PORT. The Trust's Form N-PORT is available on the SEC's website at www.sec.gov. The portfolio holdings information on Form N-PORT is available upon request, without charge, by calling 800-877-9700 (toll free).
Liquidity Risk Management Program
Consistent with Rule 22e-4 under the Investment Company Act of 1940 (the "Liquidity Rule"), as amended, the Funds have established a liquidity risk management program (the "Program"). The Program seeks to assess and manage the Funds' liquidity risk, which is defined as the risk that a Fund is unable to meet investor redemption requests without significantly diluting the remaining investors' interests in a Fund. The Board has approved the designation of NBIA Funds' Liquidity Committee, comprised of NBIA employees, as the program administrator (the "Program Administrator"). The Program Administrator is responsible for implementing and monitoring the Program and utilizes NBIA personnel to assess and review, on an ongoing basis, the Funds' liquidity risk.
The Program includes a number of elements that support the management and assessment of liquidity risk, including an annual assessment of the Funds' liquidity risk factors and the periodic classification (or re-classification, as necessary) of the Funds' investments into buckets (highly liquid, moderately liquid, less liquid and illiquid) that reflect the Program Administrator's assessment of the investments' liquidity under current market conditions. The Program Administrator also utilizes information about the Funds' investment strategy, the characteristics of the Funds' shareholder base and historical redemption activity.
The Program Administrator provided the Board with a written report that addressed the operation of the Program and assessed its adequacy and effectiveness of implementation from June 1, 2019 through March 31, 2020. During the period covered by this report, the Program Administrator reported that the Program effectively assisted the Program Administrator in monitoring whether a Fund maintained a level of liquidity appropriate for its shareholder base and historical redemption activity.
In addition, the Program Administrator provided the Board with supplemental information on the Program's operations for a more recent period due to the market volatility created by the COVID-19 pandemic. During the period affected by the COVID-19 pandemic, the Program Administrator reported that the Program effectively assisted the Program Administrator in monitoring whether a Fund maintained a level of liquidity appropriate to its shareholder base and historical redemption activity.
278
Notice to Shareholders
For the fiscal year ended August 31, 2020, each Fund makes the following designation, or up to the maximum amount of such dividends allowable pursuant to the Internal Revenue Code, as Capital Gains Distributions and Qualified Dividend Income. Complete information regarding each Fund's Qualified Dividend Income distributions during the calendar year 2020 will be reported in conjunction with Form 1099-DIV.
Fund | | Capital Gains
Distributions | | Qualified
Dividend Income | |
Dividend Growth | | $ | — | | | $ | 1,178,040 | | |
Emerging Markets Equity | | | — | | | | 37,060,450 | | |
Equity Income | | | 47,073,540 | | | | 37,780,158 | | |
Focus | | | 72,109,717 | | | | 7,005,314 | | |
Genesis | | | 636,317,187 | | | | 99,907,046 | | |
Global Real Estate | | | 70,357 | | | | 83,614 | | |
Greater China Equity | | | — | | | | 1,192,576 | | |
Guardian | | | 50,608,105 | | | | 13,762,204 | | |
Integrated Large Cap | | | 745,427 | | | | 69,106 | | |
International Equity | | | 51,434,001 | | | | 32,478,546 | | |
International Select | | | 2,566,009 | | | | 2,599,946 | | |
International Small Cap | | | — | | | | 74,342 | | |
Intrinsic Value | | | 18,526,615 | | | | 3,524,379 | | |
| Large Cap Value(a) | | | 40,587,809 | | | | 49,209,383 | | |
Mid Cap Growth | | | 84,534,273 | | | | 6,465,752 | | |
Mid Cap Intrinsic Value | | | — | | | | 1,413,757 | | |
Multi-Cap Opportunities | | | 283,489,185 | | | | 12,181,091 | | |
| Real Estate(a) | | | 22,661,739 | | | | 12,299,279 | | |
Small Cap Growth | | | 3,061,845 | | | | 784,975 | | |
Sustainable Equity | | | 161,490,891 | | | | 24,652,423 | | |
(a) Section 1250 gain distribution of $46,082 and $76,913 for Large Cap Value and Real Estate, respectively.
279
Neuberger Berman Investment Advisers LLC
1290 Avenue of the Americas
New York, NY 10104–0002
Retail Services: 800.877.9700
Broker-Dealer and Institutional Services: 800.366.6264/888.556.9030
Web site: www.nb.com
Statistics and projections in this report are derived from sources deemed to be reliable but cannot be regarded as a representation of future results of the Funds. This report is prepared for the general information of shareholders and is not an offer of shares of the Funds. Shares are sold only through the currently effective prospectus which you can obtain by calling 877.628.2583. An investor should consider carefully a Fund's investment objectives, risks and fees and expenses, which are described in its prospectus, before investing.
 H0599 10/20
Item 2. Code of Ethics.
The Board of Trustees (“Board”) of Neuberger Berman Equity Funds (“Registrant”) has adopted a code of ethics that applies to the Registrant’s principal executive officer, principal financial officer, principal accounting officer or controller, or persons performing similar functions (“Code of Ethics”). During the period covered by this Form N-CSR, there were no substantive amendments to the Code of Ethics and there were no waivers from the Code of Ethics granted to the Registrant’s principal executive officer, principal financial officer, principal accounting officer or controller, or persons performing similar functions.
Item 3. Audit Committee Financial Expert.
The Board has determined that the Registrant has three audit committee financial experts serving on its audit committee. The Registrant’s audit committee financial experts are Michael J. Cosgrove, Martha C. Goss and Deborah C. McLean. Mr. Cosgrove, Ms. Goss and Ms. McLean are independent trustees as defined by Form N-CSR.
Item 4. Principal Accountant Fees and Services.
Item 5. Audit Committee of Listed Registrants.
Not applicable to the Registrant.
Item 6. Schedule of Investments.
The complete schedule of investments for each series is disclosed in the Registrant’s annual report, which is included in Item 1 of this Form N-CSR.
Item 7. Disclosure of Proxy Voting Policies and Procedures for Closed-End Management Investment Companies.
Not applicable to the Registrant.
Item 8. Portfolio Managers of Closed-End Management Investment Companies.
Not applicable to the Registrant.
Item 9. Purchases of Equity Securities by Closed-End Management Investment Company and Affiliated Purchasers.
Not applicable to the Registrant.
Item 10. Submission of Matters to a Vote of Security Holders.
There were no changes to the procedures by which shareholders may recommend nominees to the Board.
Item 11. Controls and Procedures.
Item 12. Disclosure of Securities Lending Activities for Closed-End Management Investment Companies.
Not applicable to the Registrant.
Item 13. Exhibits.
The certification furnished pursuant to Rule 30a-2(b) under the Act and Section 906 of the Sarbanes-Oxley Act will not be deemed “filed” for purposes of Section 18 of the Securities Exchange Act of 1934, as amended (“Exchange Act”), or otherwise subject to the liability of that section. Such certification will not be deemed to be incorporated by reference into any filing under the Securities Act of 1933, as amended, or the Exchange Act, except to the extent that the Registrant specifically incorporates it by reference.