Washington, D.C. 20549
Joseph V. Amato
Arthur C. Delibert, Esq.
1601 K Street, N.W.
Form N-CSR is to be used by management investment companies to file reports with the Commission not later than 10 days after the transmission to stockholders of any report that is required to be transmitted to stockholders under Rule 30e-1 under the Investment Company Act of 1940, as amended (“Act”) (17 CFR 270.30e-1). The Commission may use the information provided on Form N-CSR in its regulatory, disclosure review, inspection, and policymaking roles.
A registrant is required to disclose the information specified by Form N-CSR, and the Commission will make this information public. A registrant is not required to respond to the collection of information contained in Form N-CSR unless the Form displays a currently valid Office of Management and Budget (“OMB”) control number. Please direct comments concerning the accuracy of the information collection burden estimate and any suggestions for reducing the burden to the Secretary, Securities and Exchange Commission, 100 F Street, NE, Washington, DC 20549-0609. The OMB has reviewed this collection of information under the clearance requirements of 44 U.S.C. § 3507.
Item 1. Report to Shareholders.
Following is a copy of the annual report transmitted to shareholders pursuant to Rule 30e-1 under the Act.

Neuberger Berman
Equity Funds
Investor Class Shares
Trust Class Shares
Advisor Class Shares
Institutional Class Shares
Dividend Growth Fund
Emerging Markets Equity Fund
Equity Income Fund
Focus Fund
Genesis Fund
Global Equity Fund
Global Real Estate Fund
Greater China Equity Fund
Guardian Fund
International Equity Fund
Class A Shares
Class C Shares
Class R3 Shares
Class R6 Shares
International Select Fund
International Small Cap Fund
Intrinsic Value Fund
Large Cap Value Fund
Mid Cap Growth Fund
Mid Cap Intrinsic Value Fund
Multi-Cap Opportunities Fund
Real Estate Fund
Small Cap Growth Fund
Sustainable Equity Fund
(Formerly Socially Responsive Fund)
Value Fund
Annual Report
August 31, 2018
Contents
THE FUNDS
President's Letter | | | 1 | | |
PORTFOLIO COMMENTARY | |
Dividend Growth Fund | | | 2 | | |
Emerging Markets Equity Fund | | | 6 | | |
Equity Income Fund | | | 10 | | |
Focus Fund | | | 14 | | |
Genesis Fund | | | 17 | | |
Global Equity Fund | | | 20 | | |
Global Real Estate Fund | | | 24 | | |
Greater China Equity Fund | | | 27 | | |
Guardian Fund | | | 31 | | |
International Equity Fund | | | 34 | | |
International Select Fund | | | 37 | | |
International Small Cap Fund | | | 40 | | |
Intrinsic Value Fund | | | 44 | | |
Large Cap Value Fund | | | 47 | | |
Mid Cap Growth Fund | | | 50 | | |
Mid Cap Intrinsic Value Fund | | | 53 | | |
Multi-Cap Opportunities Fund | | | 57 | | |
Real Estate Fund | | | 60 | | |
Small Cap Growth Fund | | | 63 | | |
Sustainable Equity Fund | | | 66 | | |
Value Fund | | | 70 | | |
FUND EXPENSE INFORMATION | | | 80 | | |
SCHEDULE OF INVESTMENTS | |
Dividend Growth Fund | | | 84 | | |
Emerging Markets Equity Fund | | | 86 | | |
Positions by Industry | | | 89 | | |
Equity Income Fund | | | 92 | | |
Focus Fund | | | 96 | | |
Genesis Fund | | | 100 | | |
Global Equity Fund | | | 103 | | |
Positions by Industry | | | 105 | | |
Global Real Estate Fund | | | 107 | | |
Positions by Sector | | | 109 | | |
Greater China Equity Fund | | | 111 | | |
Guardian Fund | | | 113 | | |
International Equity Fund | | | 119 | | |
Positions by Industry | | | 121 | | |
International Select Fund | | | 123 | | |
Positions by Industry | | | 125 | | |
International Small Cap Fund | | | 127 | | |
Positions by Industry | | | 129 | | |
Intrinsic Value Fund | | | 131 | | |
Large Cap Value Fund | | | 134 | | |
Mid Cap Growth Fund | | | 137 | | |
Mid Cap Intrinsic Value Fund | | | 140 | | |
Multi-Cap Opportunities Fund | | | 143 | | |
Real Estate Fund | | | 145 | | |
Small Cap Growth Fund | | | 147 | | |
Sustainable Equity Fund | | | 149 | | |
Value Fund | | | 151 | | |
FINANCIAL STATEMENTS | | | 153 | | |
FINANCIAL HIGHLIGHTS (ALL CLASSES)/PER SHARE DATA | |
Dividend Growth Fund | | | 221 | | |
Emerging Markets Equity Fund | | | 221 | | |
Equity Income Fund | | | 223 | | |
Focus Fund | | | 225 | | |
Genesis Fund | | | 227 | | |
Global Equity Fund | | | 229 | | |
Global Real Estate Fund | | | 231 | | |
Greater China Equity Fund | | | 233 | | |
Guardian Fund | | | 233 | | |
International Equity Fund | | | 237 | | |
International Select Fund | | | 239 | | |
International Small Cap Fund | | | 241 | | |
Intrinsic Value Fund | | | 243 | | |
Large Cap Value Fund | | | 243 | | |
Mid Cap Growth Fund | | | 247 | | |
Mid Cap Intrinsic Value Fund | | | 249 | | |
Multi-Cap Opportunities Fund | | | 251 | | |
Real Estate Fund | | | 253 | | |
Small Cap Growth Fund | | | 255 | | |
Sustainable Equity Fund | | | 259 | | |
Value Fund | | | 261 | | |
| Reports of Independent Registered Public Accounting Firms | | | 268 | | |
Directory | | | 272 | | |
Trustees and Officers | | | 273 | | |
Proxy Voting Policies and Procedures | | | 284 | | |
Quarterly Portfolio Schedule | | | 284 | | |
Notice to Shareholders | | | 285 | | |
The "Neuberger Berman" name and logo and "Neuberger Berman Investment Advisers LLC" name are registered service marks of Neuberger Berman Group LLC. The individual Fund names in this piece are either service marks or registered service marks of Neuberger Berman Investment Advisers LLC, an affiliate of Neuberger Berman BD LLC, distributor, member FINRA. ©2018 Neuberger Berman BD LLC, distributor. All rights reserved.
Dear Shareholder,
During the 12-month reporting period ended August 31, 2018, we saw a significant shift in investor sentiment—from increasing confidence around global growth and trade trends through January—to concern through the end of the period; as inflation, oil prices, and potentially disruptive U.S. trade policy made headlines and increased volatility.
The U.S. equity market remained positive, though its momentum slowed. Developed international markets returned some of their early gains, and fortunes reversed for emerging markets, the beneficiaries of risk appetite in the first half of the period.
Ten years after the global financial crisis, global economic trends are, in fact, very healthy. U.S. household income has finally returned to 2007 levels. Unemployment has dropped in the U.S. and Eurozone, consumer confidence has improved, GDP growth rates have climbed across the developed and developing world, and corporate profits and balance sheets are strong.
However, investors are understandably concerned that tariffs and trade protectionism could disrupt these positive trends. Policy uncertainty causes business leaders to delay expansion plans, and draw down inventories. This is happening in Europe now, leading the European Central Bank to reduce growth forecasts this September. Trade wars also cost jobs, damaging income and spending. Further, tariffs increase the cost of goods, adding to inflationary pressures, and decreasing purchasing power. Unintended consequences are another factor—such as the losses U.S. farmers faced this year when China placed retaliatory tariffs on U.S. agricultural exports.
Other trends impacting investor sentiment are the rise in oil price, which increases costs to both manufacturers and consumers; and rising interest rates, which the U.S. Federal Reserve suggests may increase two additional times in 2018 in response to signs of inflation. Debt is another concern. Student debt, for example, has doubled to $1.5 trillion since the financial crisis, and is now the second largest category of household debt behind mortgages. This stressor potentially delays major purchases and new household formation.
As markets measure optimistic data against various risk factors, we anticipate volatility will continue. The benefit of a strong team of managers with deep analyst bench strength is the ability to thoroughly investigate, and discriminate between investment opportunities, and to be ready to take advantage of pricing anomalies as they arise. Our teams work to identify the sectors of the economy that they believe can grow regardless of overarching pressures, and those companies best positioned within them; the parts of the economy best insulated from headline risk, and the companies with cash flows and reserves sufficient to survive and perhaps even benefit from economic dips; and companies with niche markets or undiscovered value.
As we wait for the cloud of policy uncertainty to diminish, our managers will continue to work to use volatility to investors' advantage, building portfolios of stocks they believe represent the most rewarding longer-term opportunities.
Thank you for your confidence in Neuberger Berman. We look forward to continuing to serve your investment needs.
Sincerely,

JOSEPH V. AMATO
PRESIDENT AND CEO
NEUBERGER BERMAN MUTUAL FUNDS
1
Dividend Growth Fund Commentary (Unaudited)
Neuberger Berman Dividend Growth Fund Institutional Class generated a 10.44% total return for the fiscal year ended August 31, 2018, underperforming its benchmark, the S&P 500® Index (the Index), which posted a 19.66 % total return for the same period. (Performance for all share classes is provided in the table immediately following this letter.)
During the reporting period, the market (as measured by the Index) set a new all-time high, as the current expansion officially became the longest in U.S. history, driven by "growth" stocks with limited, and, in many cases, no dividend programs. Overall within the Index, all eleven sectors posted gains with Information Technology (IT), Consumer Discretionary, and Energy benefitting the most.
The Fund seeks long term capital appreciation and current income in line with its benchmark. We believe this approach identifies companies with strong business models generating cash to grow their businesses while providing dividend distributions to shareholders. We focus on companies that we judge to have strong balance sheets, solid management teams, attractive free cash flow yields, and clear capital allocation strategies.
The Fund generated the bulk of its returns from its average ~19% allocation to IT as Microsoft drove results. Under the leadership of CEO Satya Nadella, the tech giant has become a dominant player in cloud computing services, gaining market share from rivals. Positive momentum reinforced investor enthusiasm as the company's double-digit free cash flow growth has been used aggressively towards growing its dividend policy.
On the other end of the spectrum, the flash memory producer Western Digital was among our losers as waning demand weighed on performance. However, we believe this pullback could present a buying opportunity as this business remains, in our view, well positioned to benefit from reaccelerating demand for high capacity enterprise devices.
Within Industrials, stock selection was strong as CSX was our top overall performer. Shares of the rail operator rallied sharply as industry veteran Hunter Harrison took the helm as CEO in early 2017. During the reporting period, Mr. Harrison sadly passed away; however, during his tenure he successfully streamlined operations—unlocking significant value for shareholders. In our view, this freight holding remains well positioned to benefit from an uptick in consumer confidence and infrastructure projects, transporting consumer goods and raw materials.
On the commodity front, the portfolio's Energy exposure generated significant positive returns. Several holdings posted attractive results, moving higher with oil prices, as West Texas Intermediate crude oil was priced at approximately $70 at the end of the reporting period. Stock selection across our oil/gas holdings lifted results as Devon Energy was among our top performers. This upstream business rallied as management raised their output guidance driven by improving well productivity from the Delaware Basin. From a capital allocation perspective, management remains aligned with shareholders through stock buybacks and dividend increases, making this, in our view, an ideal investment given our mandate.
However, Materials detracted from absolute and relative performance. Stock performance was largely driven by the commodities these companies produce, including gold, cobalt and copper, which all declined in price, primarily in the final months of the period. We continue to believe the supply of these metals is likely to face challenges in coming years, while demand is likely to be driven, in the case of cobalt and copper, by the trend towards electric vehicles.
Lastly, Health Care exposure negatively impacted relative results versus the Index as Allergan preferred stock was among our laggards. This position was eliminated with proceeds used to fund opportunities elsewhere.
Directionally, we remain positive on the health of the economy. In our view, valuations across equities remain supported by robust corporate results as the market rally has been driven by the strongest profit growth witnessed in several years. Moreover, earnings season provided further insight into capital allocation plans whereby we anticipate greater dividend growth potential. However, looking ahead, we feel the effects from tax reforms likely represented a one time benefit, and feel volatility could be stoked by protectionist rhetoric. Under this scenario, equities could face headwinds, making a compelling case for dividend paying stocks as a defensive ballast. Given this backdrop, we remain focused on the search for high-quality cash-generative companies for risk-adverse investors.
2
We thank you for your investment in our Fund.
Sincerely,
DAVID A. KIEFER AND WILLIAM D. HUNTER
PORTFOLIO MANAGERS
Information about principal risks of investing in the Fund is set forth in the prospectus and statement of additional information.
The portfolio composition, industries and holdings of the Fund are subject to change without notice.
The opinions expressed are those of the Fund's portfolio managers. The opinions are as of the date of this report and are subject to change without notice.
3
Dividend Growth Fund (Unaudited)
TICKER SYMBOLS
Institutional Class | | NDGIX | |
Class A | | NDGAX | |
Class C | | NDGCX | |
Class R6 | | NRDGX | |
SECTOR ALLOCATION
(as a % of Total Investments*) | |
Consumer Discretionary | | | 11.4 | % | |
Consumer Staples | | | 6.9 | | |
Energy | | | 9.7 | | |
Financials | | | 12.6 | | |
Health Care | | | 13.5 | | |
Industrials | | | 15.1 | | |
Information Technology | | | 18.8 | | |
Materials | | | 6.4 | | |
Short-Term Investments | | | 5.6 | | |
Total | | | 100.0 | % | |
* Derivatives (other than options purchased), if any, are excluded from this chart.
PERFORMANCE HIGHLIGHTS
| | | | Average Annual
Total Return
Ended 08/31/2018 | |
| | Inception
Date | | 1 Year | | Life of
Fund | |
At NAV | |
Institutional Class | | 12/15/2015 | | | 10.44 | % | | | 14.80 | % | |
Class A | | 12/15/2015 | | | 9.98 | % | | | 14.39 | % | |
Class C | | 12/15/2015 | | | 9.17 | % | | | 13.51 | % | |
Class R6 | | 12/15/2015 | | | 10.51 | % | | | 14.85 | % | |
With Sales Charge | |
Class A | | | | | 3.65 | % | | | 11.92 | % | |
Class C | | | | | 8.17 | % | | | 13.51 | % | |
Index | |
| S&P 500® Index1,15 | | | | | 19.66 | % | | | 16.60 | % | |
The performance data quoted represent past performance and do not indicate future results. Current performance may be lower or higher than the performance data quoted. For performance data current to the most recent month-end, please visit www.nb.com/performance.
The results shown in the table reflect the reinvestment of income dividends and other distributions, if any. The results do not reflect the effect of taxes a shareholder would pay on Fund distributions or on the redemption of Fund shares.
The investment return and principal value of an investment will fluctuate and shares, when redeemed, may be worth more or less than their original cost.
Returns would have been lower if Neuberger Berman Investment Advisers LLC ("Management") had not reimbursed certain expenses and/or waived a portion of the investment management fees during certain of the periods shown. Repayment by a class (of expenses previously reimbursed and/or fees previously waived by Management) will decrease the class's returns. Please see Note B in the Notes to Financial Statements for specific information regarding expense reimbursement and/or fee waiver arrangements.
As stated in the Fund's most recent prospectus, the total annual operating expense ratios for fiscal year 2017 were 1.70%, 2.16%, 2.82% and 1.67% for Institutional Class, Class A, Class C and Class R6 shares, respectively (before expense reimbursements and/or fee waivers, if any). The expense ratios were 0.70%, 1.06%, 1.81% and 0.64% for Institutional Class, Class A, Class C and Class R6 shares, respectively, after expense reimbursements and/or fee waivers. The expense ratios for the annual period ended August 31, 2018 can be found in the Financial Highlights section of this report.
Returns shown with a sales charge reflect the deduction of the current maximum initial sales charge of 5.75% for Class A shares and the contingent deferred sales charge (CDSC) for Class C shares. The CDSC for Class C shares is 1.00%, which is reduced to 0% after 1 year. The performance of the Fund's share classes will differ primarily due to different sales charge structures and class expenses. Please see the prospectus for more information about sales charge structures, if any, and class expenses for your share class.
4
Dividend Growth Fund (Unaudited)
COMPARISON OF A $1,000,000 INVESTMENT
(000's Omitted)
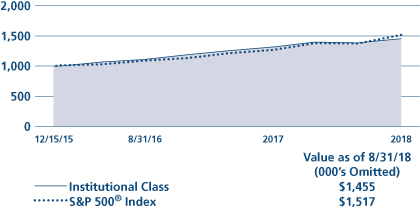
This graph shows the change in value of a hypothetical $1,000,000 investment in the Fund over the past 10 fiscal years, or since the Fund's inception if it has not operated for 10 years. The graph is based on the Institutional Class shares only; the performance of the Fund's share classes will differ primarily due to different sales charge structures and class expenses (see Performance Highlights chart on previous page). The result is compared with benchmarks, which include a broad-based market index and may include a more narrowly based index. Market indices have not been reduced to reflect any of the fees and costs of investing. The results shown in the graph reflect the reinvestment of income dividends and other distributions, if any. The results do not reflect the effect of taxes a shareholder would pay on Fund distributions or on the redemption of Fund shares. Results represent past performance and do not indicate future results.
5
Emerging Markets Equity Fund Commentary (Unaudited)
Neuberger Berman Emerging Markets Equity Fund Institutional Class generated a total return of –2.49% for the fiscal year ended August 31, 2018, lagging its benchmark, the MSCI Emerging Markets Index (Net) (the Index), which reported a total return of –0.68% for the same period. (Performance for all share classes is provided in the table immediately following this letter.)
Although Emerging Market (EM) equities performed extremely well during the first half of this period—as risk appetite, positive GDP growth revisions, and global growth trends attracted investors—the market reversed course in February 2018. Volatility and negative sentiment prevailed for the remainder of the period on fears of the global repercussions of U.S.-China trade tensions. U.S. policy toward other trading partners, a stronger U.S. dollar, rising U.S. interest rates, and rising oil prices compounded pressures through the end of the period.
Within the Index, the defensive Health Care sector and commodity price driven Energy sector were standout performers. Each posted double-digit positive returns for the period. Information Technology (IT) and Materials stocks also outperformed the Index overall. The interest rate sensitive Telecommunication Services and Real Estate sectors, and economically sensitive Industrials, declined significantly. Among individual markets, Qatar, Thailand, and Czech Republic were top performers. Turkey saw the sharpest losses, followed by Greece and Pakistan.
The portfolio lagged the Index most within the Consumer Discretionary and Consumer Staples sectors, and also due to a relative underweight to Energy. Relative returns were positive within Financials, due both to strong stock selection and our underweight on average during the period. Stock selection was advantageous within Health Care, and IT as well. By country, holdings based in China, South Africa, and Korea outperformed while those based in India, Russia, and Taiwan lagged.
Top contributors included China's Sinopharm, which demonstrated strong cost containment, enabling investors to focus on the robust growth prospects within its strong drug pipeline. Despite concerns over peak smartphone sales, Taiwan Semiconductor continues to benefit from demand for high-end semiconductor chips used in other application such as artificial intelligence and 5G communications. Ping An Insurance, a leading private property and casualty insurer, delivered better-than-expected earnings, aided by its financial technology products, which have been increasingly adopted by other Chinese financial institutions.
Detractors included X5 Retail, a Russian food retailer that retreated along with other Russian domestic names, as investors grew concerned about the impact of sanctions on the Russian economy. Elite Material, the Taiwanese eco-friendly printed circuit board supplier, fell as recent quarterly margins disappointed investors due to recently lost contracts; however, we believe the firm could potentially gain market share. China Everbright declined following a surprise rights issue and poor communication from the management team.
Looking ahead, while the recent selloff has left EM equities cheaper on a price to earnings basis, we would distinguish between market segments that are cheap for a reason, such as commodities (which suffer from underlying price volatility), and areas where we believe earnings can be sustained, such as smaller cap stocks. As such, part of our current emphasis is identifying small cap names with sufficient liquidity that were sold off based on sentiment rather than fundamentals.
Although we anticipate ongoing equity market volatility, the EM earnings growth forecast*, for both 2018 and 2019, remains in double-digit growth territory despite the U.S. dollar's strength, which speaks to the fundamental strength of EM companies. As the year progresses, we will continue to seek individual companies where we believe growth can be sustained regardless of tougher market conditions.
6
Sincerely,
CONRAD SALDANHA
PORTFOLIO MANAGER
* Source: Bank of America Merrill Lynch as of September 2018
Information about principal risks of investing in the Fund is set forth in the prospectus and statement of additional information.
The portfolio composition, industries and holdings of the Fund are subject to change without notice.
The opinions expressed are those of the Fund's portfolio manager. The opinions are as of the date of this report and are subject to change without notice.
7
Emerging Markets Equity Fund (Unaudited)
TICKER SYMBOLS
Institutional Class | | NEMIX | |
Class A | | NEMAX | |
Class C | | NEMCX | |
Class R3 | | NEMRX | |
Class R6 | | NREMX | |
PERFORMANCE HIGHLIGHTS9
| | | | Average Annual Total Return
Ended 08/31/2018 | |
| | Inception
Date | | 1 Year | | 5 Years | | Life of
Fund | |
At NAV | |
Institutional Class | | 10/08/2008 | | | –2.49 | % | | | 5.38 | % | | | 8.61 | % | |
Class A | | 10/08/2008 | | | –2.78 | % | | | 5.11 | % | | | 8.34 | % | |
Class C | | 10/08/2008 | | | –3.51 | % | | | 4.31 | % | | | 7.53 | % | |
| Class R310 | | 06/21/2010 | | | –3.16 | % | | | 4.68 | % | | | 8.01 | % | |
| Class R622 | | 03/15/2013 | | | –2.46 | % | | | 5.45 | % | | | 8.65 | % | |
With Sales Charge | |
Class A | | | | | –8.35 | % | | | 3.88 | % | | | 7.70 | % | |
Class C | | | | | –4.47 | % | | | 4.31 | % | | | 7.53 | % | |
Index | |
| MSCI Emerging Markets Index (Net)1,15 | | –0.68 | % | | | 5.04 | % | | | 7.41 | % | |
The performance data quoted represent past performance and do not indicate future results. Current performance may be lower or higher than the performance data quoted. For performance data current to the most recent month-end, please visit www.nb.com/performance.
The results shown in the table reflect the reinvestment of income dividends and other distributions, if any. The results do not reflect the effect of taxes a shareholder would pay on Fund distributions or on the redemption of Fund shares.
The investment return and principal value of an investment will fluctuate and shares, when redeemed, may be worth more or less than their original cost.
Returns would have been lower if Neuberger Berman Investment Advisers LLC ("Management") had not reimbursed certain expenses and/or waived a portion of the investment management fees during certain of the periods shown. Repayment by a class (of expenses previously reimbursed and/or fees previously waived by Management) will decrease the class's returns. Please see Note B in the Notes to Financial Statements for specific information regarding expense reimbursement and/or fee waiver arrangements.
As stated in the Fund's most recent prospectus, the total annual operating expense ratios for fiscal year 2017 were 1.37%, 1.74%, 2.46%, 2.02% and 1.27% for Institutional Class, Class A, Class C, Class R3 and Class R6 shares, respectively (before expense reimbursements and/or fee waivers, if any). The expense ratios were 1.26%, 1.51%, 2.26%, 1.92% and 1.19% for Institutional Class, Class A, Class C, Class R3 and Class R6 shares, respectively, after expense reimbursements and/or fee waivers. The expense ratios for the annual period ended August 31, 2018 can be found in the Financial Highlights section of this report.
Returns shown with a sales charge reflect the deduction of the current maximum initial sales charge of 5.75% for Class A shares and the contingent deferred sales charge (CDSC) for Class C shares. The CDSC for Class C shares is 1.00%, which is reduced to 0% after 1 year. The performance of the Fund's share classes will differ primarily due to different sales charge structures and class expenses. Please see the prospectus for more information about sales charge structures, if any, and class expenses for your share class.
8
Emerging Markets Equity Fund (Unaudited)
COMPARISON OF A $1,000,000 INVESTMENT
(000's Omitted)
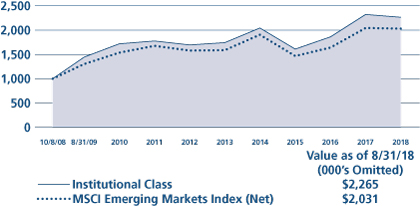
This graph shows the change in value of a hypothetical $1,000,000 investment in the Fund over the past 10 fiscal years, or since the Fund's inception if it has not operated for 10 years. The graph is based on the Institutional Class shares only; the performance of the Fund's share classes will differ primarily due to different sales charge structures and class expenses (see Performance Highlights chart on previous page). The result is compared with benchmarks, which include a broad-based market index and may include a more narrowly based index. Market indices have not been reduced to reflect any of the fees and costs of investing. The results shown in the graph reflect the reinvestment of income dividends and other distributions, if any. The results do not reflect the effect of taxes a shareholder would pay on Fund distributions or on the redemption of Fund shares. Results represent past performance and do not indicate future results.
9
Equity Income Fund Commentary (Unaudited)
Neuberger Berman Equity Income Fund Institutional Class generated a 10.58% total return for the fiscal year ended August 31, 2018, trailing its benchmark, the S&P 500® Index (the Index) which posted a 19.66% total return for the same period. (Performance for all share classes is provided in the table immediately following this letter.)
During this timeframe, the market (as measured by the Index) set a new all-time high, as the current expansion officially became the longest in U.S. history driven by "growth" stocks with lower, and, in many cases, no dividend programs. In fact, stocks with dividend yields below the S&P's aggregate yield of 1.8% contributed about 60% of the market return over that period.
The Fund has an objective-based strategy, targeting a total return between stocks and bonds with lower volatility relative to the broader equity market. This portfolio is diversified among dividend-paying stocks and convertible bonds, selected through extensive analysis of cash flow prospects, which we believe have the ability to sustain and grow dividends.
The Fund's largest contribution to total returns came from its average ~12% allocation to the Information Technology sector. The passage of tax reform and the resulting clarity around cash repatriation helped to drive sector earnings expectations and shares higher. Microsoft was a key contributor to the Fund's performance during the period. This company has become a dominant player in cloud computing services, leading to double-digit free cash flow growth, rising dividends, and share repurchases. On the other end of the spectrum, the flash memory producer Western Digital was among our losers as pricing of its key products remains a market concern.
On the commodity front, the Fund's stock selection across our oil/gas holdings lifted absolute and relative results. We believe several commodities have attractive supply-demand fundamentals, and the Fund's holdings in this sector can provide a potential hedge against inflation.
Elsewhere, our underweight to Consumer Discretionary holdings weighed on performance, as the sector was lifted by constituents with limited free cash flow and dividends. Within this space, L Brands dampened results of the Fund, as sales within its Pink brand faced mounting challenges, offset partially by improving sales at the company's Bath & Body Works segment.
Financials, and in particular Banks, continued to be a key component of the Fund. Over the period, stock selection contributed positively to performance. The sector has exhibited high correlation with 10-year U.S. Treasury note yields, which helps to offset the interest rate sensitivity inherent in the Fund.
The Fund increased its exposure to convertible bonds over the course of the year. Rising yields in the high yield market have led issuers to consider convertible bonds. We believe this trend is likely to continue, and have found attractive risk-reward opportunities in this eclectic asset class.
The Fund's use of written options contributed positively to performance during the period.
Directionally, we remain positive on the health of the economy. In our view, valuations across equities remain supported by robust corporate results as the market rally has been driven by the strongest profit growth witnessed in several years. Capital allocation plans for our companies continue to include dividends and importantly growth in dividends as a key component. However, we feel the effects from tax reforms likely represented a one time benefit, and feel volatility could be stoked by protectionist rhetoric. Under this scenario, equities could face headwinds, making a compelling case for dividend paying stocks as a defensive ballast. In our opinion, companies with growing free cash flow, strong balance sheets, and capital allocation strategies that benefit shareholders with current yield, while re-investing for the future, will deliver attractive returns in the future.
10
We thank you for your investment in our Fund.
Sincerely,
RICHARD LEVINE AND SANDY POMEROY
PORTFOLIO MANAGERS
Information about principal risks of investing in the Fund is set forth in the prospectus and statement of additional information.
The portfolio composition, industries and holdings of the Fund are subject to change without notice.
The opinions expressed are those of the Fund's portfolio managers. The opinions are as of the date of this report and are subject to change without notice.
11
Equity Income Fund (Unaudited)
TICKER SYMBOLS
Institutional Class | | NBHIX | |
Class A | | NBHAX | |
Class C | | NBHCX | |
Class R3 | | NBHRX | |
SECTOR ALLOCATION
(as a % of Total Investments*) | |
Consumer Discretionary | | | 6.4 | % | |
Consumer Staples | | | 3.5 | | |
Energy | | | 8.6 | | |
Financials | | | 12.0 | | |
Health Care | | | 6.6 | | |
Industrials | | | 16.5 | | |
Information Technology | | | 11.5 | | |
Materials | | | 5.2 | | |
Telecommunication Services | | | 1.7 | | |
Utilities | | | 13.2 | | |
Convertible Bonds | | | 11.1 | | |
Short-Term Investments | | | 3.7 | | |
Total | | | 100.0 | % | |
* Derivatives (other than options purchased), if any, are excluded from this chart.
PERFORMANCE HIGHLIGHTS9
| | | | Average Annual Total Return
Ended 08/31/2018 | |
| | Inception
Date* | | 1 Year | | 5 Years | | 10 Years | | Life of
Fund | |
At NAV | |
| Institutional Class13 | | 06/09/2008 | | | 10.58 | % | | | 9.83 | % | | | 7.93 | % | | | 7.95 | % | |
| Class A13 | | 06/09/2008 | | | 10.21 | % | | | 9.43 | % | | | 7.51 | % | | | 7.59 | % | |
| Class C13 | | 06/09/2008 | | | 9.36 | % | | | 8.61 | % | | | 6.73 | % | | | 6.92 | % | |
| Class R313 | | 06/21/2010 | | | 9.93 | % | | | 9.15 | % | | | 7.35 | % | | | 7.46 | % | |
With Sales Charge | |
| Class A13 | | | | | 3.84 | % | | | 8.15 | % | | | 6.88 | % | | | 7.05 | % | |
| Class C13 | | | | | 8.36 | % | | | 8.61 | % | | | 6.73 | % | | | 6.92 | % | |
Index | |
| S&P 500® Index1,15 | | 19.66 | % | | | 14.52 | % | | | 10.86 | % | | | 8.85 | % | |
*The performance data for each class includes the performance of the Fund's oldest share class, Trust Class, from November 2, 2006 through June 9, 2008. The performance data for Class R3 also includes the performance of the Fund's Institutional Class from June 9, 2008 through June 21, 2010. See endnote 13 for information about the effects of the different fees paid by each class.
The performance data quoted represent past performance and do not indicate future results. Current performance may be lower or higher than the performance data quoted. For performance data current to the most recent month-end, please visit www.nb.com/performance.
The results shown in the table reflect the reinvestment of income dividends and other distributions, if any. The results do not reflect the effect of taxes a shareholder would pay on Fund distributions or on the redemption of Fund shares.
The investment return and principal value of an investment will fluctuate and shares, when redeemed, may be worth more or less than their original cost.
Returns would have been lower if Neuberger Berman Investment Advisers LLC ("Management") had not reimbursed certain expenses and/or waived a portion of the investment management fees during certain of the periods shown. Repayment by a class (of expenses previously reimbursed and/or fees previously waived by Management) will decrease the class's returns. Please see Note B in the Notes to Financial Statements for specific information regarding expense reimbursement and/or fee waiver arrangements.
As stated in the Fund's most recent prospectus, the total annual operating expense ratios for fiscal year 2017 were 0.69%, 1.06%, 1.80% and 1.34% for Institutional Class, Class A, Class C and Class R3 shares, respectively (before expense reimbursements and/or fee waivers, if any). The expense ratios for the annual period ended August 31, 2018 can be found in the Financial Highlights section of this report.
Returns shown with a sales charge reflect the deduction of the current maximum initial sales charge of 5.75% for Class A shares and the contingent deferred sales charge (CDSC) for Class C shares. The CDSC for Class C shares is 1.00%, which is reduced to 0% after 1 year. The performance of the Fund's share classes will differ primarily due to different sales charge structures and class expenses. Please see the prospectus for more information about sales charge structures, if any, and class expenses for your share class.
12
Equity Income Fund (Unaudited)
COMPARISON OF A $1,000,000 INVESTMENT13
(000's Omitted)

This graph shows the change in value of a hypothetical $1,000,000 investment in the Fund over the past 10 fiscal years, or since the Fund's inception if it has not operated for 10 years. The graph is based on the Institutional Class shares only; the performance of the Fund's share classes will differ primarily due to different sales charge structures and class expenses (see Performance Highlights chart on previous page). The result is compared with benchmarks, which include a broad-based market index and may include a more narrowly based index. Market indices have not been reduced to reflect any of the fees and costs of investing. The results shown in the graph reflect the reinvestment of income dividends and other distributions, if any. The results do not reflect the effect of taxes a shareholder would pay on Fund distributions or on the redemption of Fund shares. Results represent past performance and do not indicate future results.
13
Focus Fund Commentary (Unaudited)
Neuberger Berman Focus Fund Investor Class generated a 13.05% total return for the fiscal year ended August 31, 2018, underperforming its benchmark, the S&P 500® Index (the Index), which provided a 19.66% total return for the same period. (Performance for all share classes is provided in the table immediately following this letter.)
The U.S. stock market generated strong results during the reporting period. After rising over the first five months of the period, the overall stock market fell sharply in February and March 2018. This occurred given concerns that the U.S. Federal Reserve may raise interest rates at a faster pace than previously expected. However, this was a short-term setback, as the market then rallied over the last five months of the period and reached several new all-time highs in August 2018. This rally was driven by a number of factors, including overall strong corporate profits and accelerating growth in the U.S.—both of which overshadowed concerns over a global trade war. All told, the Index gained 19.66% for the 12-month period.
Within the Index, Information Technology (IT), Consumer Discretionary and Energy led sector performance. These areas benefited from the solid U.S. economy, which bolstered consumers and enhanced operating conditions for many businesses. Defensive areas such as Utilities, Consumer Staples, and Telecommunication Services were the weakest segments of the Index over the period.
The greatest detractors from relative performance stemmed from IT, where our holdings generated softer returns than their counterparts in the Index. A notable shortfall was in the Software industry, where we owned cybersecurity firm Symantec Corp. Its shares fell sharply as the company released disappointing fiscal results and weaker than expected guidance. Symantec Corp. was sold during the period. Consumer Discretionary was also a source of relative weakness for the Fund. The greatest loss stemmed from the Household Durables industry, as shares of Whirlpool Corp. declined in the wake of disappointing earnings and concerns over potential trade issues.
Consumer Staples provided the largest lift to relative performance for the Fund owing to better overall stock selection. In particular, the Fund's holding in the Food Products industry added the most value. A standout performer was packaged foods company Conagra Brands, Inc. Its shares rallied sharply as the company released strong operational results. Stock selection in the Industrials sector was also beneficial, led by the Fund's positions in the Road & Rail industry. A top performer in this segment was CSX Corp. The company reported robust earnings that exceeded expectations.
The Fund's use of purchased and written options detracted from performance during the period.
Looking ahead, we believe the U.S. economy has the necessary momentum to continue expanding. While growth will likely moderate from the second quarter's robust rate, in our view it will still grow at a solid pace as the year progresses. This, in turn, would likely further bolster equity fundamentals and could continue to drive the stock market upward in our view. That being said, there are areas of uncertainty that could lead to periods of volatility. For example, the levying of additional tariffs and restrictions on key U.S. trade partners could backfire if it escalates into a trade war that results in rising prices for U.S. consumers. The geopolitical backdrop is also a source of apprehension with the rise of nationalist fervor in Europe. While the general equity market has at times been swayed by external macro conditions, we believe that our bottom-up investment strategy has the potential to mitigate these broader uncertainties. We therefore conduct extensive fundamental research on individual stocks to create a portfolio that we believe can generate positive returns over an economic cycle.
Sincerely,
TIMOTHY CREEDON AND DAVID LEVINE
PORTFOLIO MANAGERS
Information about principal risks of investing in the Fund is set forth in the prospectus and statement of additional information.
The portfolio composition, industries and holdings of the Fund are subject to change without notice.
The opinions expressed are those of the Fund's portfolio managers. The opinions are as of the date of this report and are subject to change without notice.
14
TICKER SYMBOLS
Investor Class | | NBSSX | |
Trust Class | | NBFCX | |
Advisor Class | | NBFAX | |
Institutional Class | | NFALX | |
Class A | | NFAAX | |
Class C | | NFACX | |
SECTOR ALLOCATION
(as a % of Total Investments*) | |
Consumer Discretionary | | | 16.5 | % | |
Consumer Staples | | | 6.4 | | |
Energy | | | 6.8 | | |
Financials | | | 15.3 | | |
Health Care | | | 14.7 | | |
Industrials | | | 8.6 | | |
Information Technology | | | 20.4 | | |
Materials | | | 3.0 | | |
Telecommunication Services | | | 4.4 | | |
Utilities | | | 2.7 | | |
Short-Term Investments | | | 1.2 | | |
Total | | | 100.0 | % | |
* Derivatives (other than options purchased), if any, are excluded from this chart.
PERFORMANCE HIGHLIGHTS8
| | | | Average Annual Total Return
Ended 08/31/2018 | |
| | Inception
Date | | 1 Year | | 5 Years | | 10 Years | | Life of
Fund | |
At NAV | |
Investor Class | | 10/19/1955 | | | 13.05 | % | | | 11.67 | % | | | 8.59 | % | | | 10.53 | % | |
| Trust Class3 | | 08/30/1993 | | | 12.88 | % | | | 11.46 | % | | | 8.37 | % | | | 10.51 | % | |
| Advisor Class4 | | 09/03/1996 | | | 12.62 | % | | | 11.30 | % | | | 8.18 | % | | | 10.44 | % | |
| Institutional Class5 | | 06/21/2010 | | | 13.20 | % | | | 11.85 | % | | | 8.75 | % | | | 10.56 | % | |
| Class A19 | | 06/21/2010 | | | 12.80 | % | | | 11.44 | % | | | 8.43 | % | | | 10.50 | % | |
| Class C19 | | 06/21/2010 | | | 11.92 | % | | | 10.62 | % | | | 7.77 | % | | | 10.40 | % | |
With Sales Charge | |
| Class A19 | | | | | 6.34 | % | | | 10.13 | % | | | 7.79 | % | | | 10.40 | % | |
| Class C19 | | | | | 11.18 | % | | | 10.62 | % | | | 7.77 | % | | | 10.40 | % | |
Index | |
| S&P 500® Index1,15 | | 19.66 | % | | | 14.52 | % | | | 10.86 | % | | | 10.32 | % | |
The performance data quoted represent past performance and do not indicate future results. Current performance may be lower or higher than the performance data quoted. For performance data current to the most recent month-end, please visit www.nb.com/performance.
The results shown in the table reflect the reinvestment of income dividends and other distributions, if any. The results do not reflect the effect of taxes a shareholder would pay on Fund distributions or on the redemption of Fund shares.
The investment return and principal value of an investment will fluctuate and shares, when redeemed, may be worth more or less than their original cost.
Returns would have been lower if Neuberger Berman Investment Advisers LLC ("Management") had not reimbursed certain expenses and/or waived a portion of the investment management fees during certain of the periods shown. Repayment by a class (of expenses previously reimbursed and/or fees previously waived by Management) will decrease the class's returns. Please see Note B in the Notes to Financial Statements for specific information regarding expense reimbursement and/or fee waiver arrangements.
As stated in the Fund's most recent prospectus, the total annual operating expense ratios for fiscal year 2017 were 0.93%, 1.11%, 1.27%, 0.76%, 1.14%, and 1.88% for Investor Class, Trust Class, Advisor Class, Institutional Class, Class A and Class C shares, respectively (before expense reimbursements and/or fee waivers, if any). The expense ratios were 0.76%, 1.12%, and 1.87% for Institutional Class, Class A and Class C shares, respectively, after expense reimbursements and/or fee waivers. The expense ratios for the annual period ended August 31, 2018 can be found in the Financial Highlights section of this report.
Returns shown with a sales charge reflect the deduction of the current maximum initial sales charge of 5.75% for Class A shares and the contingent deferred sales charge (CDSC) for Class C shares. The CDSC for Class C shares is 1.00%, which is reduced to 0% after 1 year. The performance of the Fund's share classes will differ primarily due to different sales charge structures and class expenses. Please see the prospectus for more information about sales charge structures, if any, and class expenses for your share class.
15
COMPARISON OF A $10,000 INVESTMENT
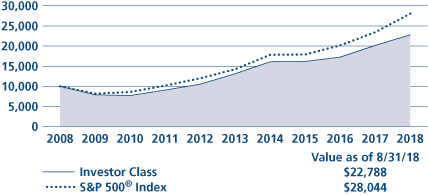
This graph shows the change in value of a hypothetical $10,000 investment in the Fund over the past 10 fiscal years, or since the Fund's inception if it has not operated for 10 years. The graph is based on the Investor Class shares only; the performance of the Fund's share classes will differ primarily due to different sales charge structures and class expenses (see Performance Highlights chart on previous page). The result is compared with benchmarks, which include a broad-based market index and may include a more narrowly based index. Market indices have not been reduced to reflect any of the fees and costs of investing. The results shown in the graph reflect the reinvestment of income dividends and other distributions, if any. The results do not reflect the effect of taxes a shareholder would pay on Fund distributions or on the redemption of Fund shares. Results represent past performance and do not indicate future results.
16
Genesis Fund Commentary (Unaudited)
Neuberger Berman Genesis Fund Investor Class generated a 26.73% total return for the fiscal year ended August 31, 2018, outperforming its benchmark, the Russell 2000® Index (the Index), which provided a 25.45% total return for the same period. (Performance for all share classes is provided in the table immediately following this letter.)
Despite weakness in early calendar year 2018, the U.S. stock market generated strong results during the reporting period. After rising over the first five months of the period, the overall stock market declined in February and March 2018. This turnaround occurred given concerns that the U.S. Federal Reserve may raise interest rates at a faster pace than previously expected. However, this proved to be a temporary setback, as the market then rallied during the last five months of the period and reached several new all-time highs in August 2018. This was driven by a number of factors, including corporate profits that often exceeded expectations and accelerating growth in the U.S.—both of which overshadowed concerns over a global trade war. All told, the S&P 500® Index gained 19.66% for the 12-month period. Small-cap stocks also produced even stronger results, as the Russell 2000 Index gained 25.45%.
The Fund outperformed the benchmark during the reporting period, as both sector allocation and stock selection were positive for results. From a sector allocation perspective, having no exposure to real estate investment trusts (REITs) was the most additive for results. We do not typically own REITs, as they do not meet our investment criteria. In addition, REITs are often viewed as bond-proxies and they underperformed given rising interest rates. Elsewhere, having no allocation to Utilities, another bond-proxy, was beneficial. Within the Information Technology (IT) sector, an overweight to higher quality Software companies was a meaningful contributor to performance. Conversely, within the IT sector, an underweight to the lower quality, more speculative Internet Software & Services industry was the largest detractor from results. Finally, an underweight to Biotechnology companies and a modest allocation to cash were headwinds to performance.
In terms of stock selection, our holding in the IT sector was the largest contributor to relative returns, partially driven by our Software and Electronic Equipment, Instruments & Components names. Within the Consumer Staples sector, several Food Products and Household Products holdings benefited relative performance. Looking at the Health Care sector, our Life Science Tools & Software names were the most additive for returns. On the downside, stock selection in the Industrials (mostly Machinery), Consumer Discretionary (mostly Specialty Retail and Hotels, Restaurants & Leisure) and Health Care (mostly Health Care Equipment & Supplies) sectors were the largest detractors from relative performance.
While the labor market in the U.S. has tightened amidst a vibrant domestic economy, economic activity outside the U.S. appears to be decelerating. We believe this is most likely due to increased uncertainty around trade disputes and a stronger U.S. dollar. The latter acts to increase the burden of dollar-based loans, particularly in many emerging markets. Domestically-oriented small-caps benefited from their perceived insulation from global trade wars. We will have to wait and see if trade rhetoric turns out to be part of a negotiating process or something more serious. Either way, companies with superior business models and strong balance sheets, as well as those with high returns defended by competitive moats that grow earnings and free cash flow faster than the market overall, in our view, will outperform in the long term. We began to see evidence of this in the tail end of the reporting period. Whether or not this is sustainable will depend on the direction of interest rates, whether there is a spillover effect from moderating growth overseas and other factors that could impact investor sentiment.
Sincerely,
JUDITH M. VALE AND ROBERT W. D'ALELIO
PORTFOLIO CO-MANAGERS
Information about principal risks of investing in the Fund is set forth in the prospectus and statement of additional information.
The portfolio composition, industries and holdings of the Fund are subject to change without notice.
The opinions expressed are those of the Fund's portfolio managers. The opinions are as of the date of this report and are subject to change without notice.
17
TICKER SYMBOLS
Investor Class | | NBGNX | |
Trust Class | | NBGEX | |
Advisor Class | | NBGAX | |
Institutional Class | | NBGIX | |
Class R6 | | NRGSX | |
SECTOR ALLOCATION
(as a % of Total Investments*) | |
Consumer Discretionary | | | 12.8 | % | |
Consumer Staples | | | 5.0 | | |
Energy | | | 4.9 | | |
Financials | | | 15.7 | | |
Health Care | | | 13.5 | | |
Industrials | | | 18.4 | | |
Information Technology | | | 21.8 | | |
Materials | | | 6.3 | | |
Real Estate | | | 0.6 | | |
Short-Term Investments | | | 1.0 | | |
Total | | | 100.0 | % | |
* Derivatives (other than options purchased), if any, are excluded from this chart.
PERFORMANCE HIGHLIGHTS
| | | | | Average Annual Total Return
Ended 08/31/2018 | |
| | Inception
Date | | 1 Year | | 5 Years | | 10 Years | | Life of
Fund | |
Investor Class | | 09/27/1988 | | | 26.73 | % | | | 12.42 | % | | | 9.46 | % | | | 12.56 | % | |
| Trust Class3 | | 08/26/1993 | | | 26.64 | % | | | 12.33 | % | | | 9.38 | % | | | 12.54 | % | |
| Advisor Class4 | | 04/02/1997 | | | 26.31 | % | | | 12.02 | % | | | 9.09 | % | | | 12.31 | % | |
| Institutional Class5 | | 07/01/1999 | | | 26.96 | % | | | 12.61 | % | | | 9.66 | % | | | 12.71 | % | |
| Class R623 | | 03/15/2013 | | | 27.07 | % | | | 12.69 | % | | | 9.61 | % | | | 12.61 | % | |
Index | |
| Russell 2000® Index1,15 | | 25.45 | % | | | 13.00 | % | | | 10.46 | % | | | 10.18 | % | |
The performance data quoted represent past performance and do not indicate future results. Current performance may be lower or higher than the performance data quoted. For performance data current to the most recent month-end, please visit www.nb.com/performance.
The results shown in the table reflect the reinvestment of income dividends and other distributions, if any. The results do not reflect the effect of taxes a shareholder would pay on Fund distributions or on the redemption of Fund shares.
The investment return and principal value of an investment will fluctuate and shares, when redeemed, may be worth more or less than their original cost.
Returns would have been lower if Neuberger Berman Investment Advisers LLC ("Management") had not reimbursed certain expenses and/or waived a portion of the investment management fees during certain of the periods shown. Repayment by a class (of expenses previously reimbursed and/or fees previously waived by Management) will decrease the class's returns. Please see Note B in the Notes to Financial Statements for specific information regarding expense reimbursement and/or fee waiver arrangements.
As stated in the Fund's most recent prospectus, the total annual operating expense ratios for fiscal year 2017 were 1.02%, 1.09%, 1.36%, 0.85% and 0.77% for Investor Class, Trust Class, Advisor Class, Institutional Class and Class R6 shares, respectively (before expense reimbursements and/or fee waivers, if any). The expense ratio was 0.75% for Class R6 shares after expense reimbursements and/or fee waivers. The total annual operating expense ratio for each of Institutional Class and Class R6 includes the class's repayment of expenses previously reimbursed and/or fees previously waived by Management. The expense ratios for the annual period ended August 31, 2018 can be found in the Financial Highlights section of this report.
18
COMPARISON OF A $10,000 INVESTMENT
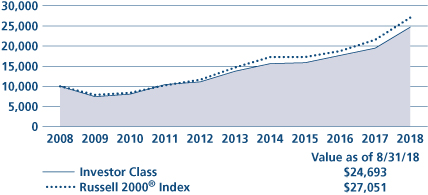
This graph shows the change in value of a hypothetical $10,000 investment in the Fund over the past 10 fiscal years, or since the Fund's inception if it has not operated for 10 years. The graph is based on the Investor Class shares only; the performance of the Fund's share classes will differ primarily due to different class expenses (see Performance Highlights chart on previous page). The result is compared with benchmarks, which include a broad-based market index and may include a more narrowly based index. Market indices have not been reduced to reflect any of the fees and costs of investing. The results shown in the graph reflect the reinvestment of income dividends and other distributions, if any. The results do not reflect the effect of taxes a shareholder would pay on Fund distributions or on the redemption of Fund shares. Results represent past performance and do not indicate future results.
19
Global Equity Fund Commentary (Unaudited)
Neuberger Berman Global Equity Fund Institutional Class generated a total return of 14.53% for the fiscal year ended August 31, 2018, outperforming the 11.41% total return of its benchmark, the MSCI All Country World Index (Net) (the Index) for the same period. (Performance for all share classes is provided in the table immediately following this letter.)
During the first half of this period, global equity markets climbed steadily on positive and improving economic data, healthy global trade, strong corporate earnings, and low interest rates. By February 2018, emerging markets and U.S. equities were up approximately 16 percent from the beginning of the period, with developed international markets not far behind. Since February, volatility increased sharply. Protectionist U.S. trade policy, higher oil prices, and early signs of inflation—suggesting higher interest rates—gave investors pause. This slowed U.S. equity momentum, damaged international developed market returns and pushed emerging markets into negative territory.
Within the Index, the Information Technology (IT), Energy, and Consumer Discretionary sectors outperformed, with cyclical sectors benefiting from generally positive economic data, and Energy from higher oil prices. Interest rate sensitive areas including Utilities and Telecommunication Services lagged, as did Consumer Staples. By country, Israel, Qatar, and the U.S. led the Index this period, while Turkey, Greece, and Pakistan were among markets posting losses.
Both stock selection and sector allocation benefited the portfolio's relative performance this period. Stock selection within Consumer Staples, Financials, and Industrials had the largest positive effect. By country, holdings from the U.S., UK, and Netherlands added to relative performance.
Individual contributors included Amazon.com, ASML, and Centene. Amazon, the e-commerce giant, posted better than expected results and guided targets higher, driven by revenue acceleration in the web services division. Dutch semiconductor specialist ASML benefited from solid earnings announcements, and managed care provider Centene's second quarter results beat analyst expectations.
Portfolio holdings lagged the benchmark in the IT, Health Care, and Energy sectors. By country, holdings based in Israel, France and Germany underperformed.
Detractors included Western Digital, Tower Semiconductor, and Valeo. Western Digital, the U.S. memory chip maker, declined on concerns that memory chip prices will fall. We believe these fears to be overdone, and added to the position. Tower Semiconductor, the Israeli headquartered semiconductor foundry, announced solid fourth quarter results but revised guidance downwards based on weaker first quarter demand, particularly in smartphones; and Valeo, the French auto parts supplier, was caught up in the selloff due to rising global trade tensions.
While a trade dispute between the U.S. and China is unhelpful for market sentiment in the near term, we anticipate that cooler heads will prevail and a major trade-driven global slowdown will be avoided. Still, the economic effects are uncertain until negotiations conclude.
Our focus generally remains on what we believe are the most innovative businesses in the healthier countries. We believe this helps insulate the portfolio from political uncertainty and helped reduce volatility and drive relative performance this period. We endeavor to avoid firms exposed to markets characterized by low economic growth, significant debt and limited appetite for reform.
Continued volatility should afford us opportunities to add or trim positions in core names. Our focus remains on quality businesses that we anticipate will benefit from secular growth, niche business models and/or defensive end-markets, which, historically, have typically helped our portfolios experience lower volatility than the market.
20
Sincerely,
BENJAMIN SEGAL
PORTFOLIO MANAGER
Information about principal risks of investing in the Fund is set forth in the prospectus and statement of additional information.
The portfolio composition, industries and holdings of the Fund are subject to change without notice.
The opinions expressed are those of the Fund's portfolio managers. The opinions are as of the date of this report and are subject to change without notice.
21
Global Equity Fund (Unaudited)
TICKER SYMBOLS
Institutional Class | | NGQIX | |
Class A | | NGQAX | |
Class C | | NGQCX | |
PERFORMANCE HIGHLIGHTS9
| | | | Average Annual Total
Return Ended 08/31/2018 | |
| | Inception
Date | | 1 Year | | 5 Years | | Life of
Fund | |
At NAV | |
Institutional Class | | 06/30/2011 | | | 14.53 | % | | | 10.08 | % | | | 7.57 | % | |
Class A | | 06/30/2011 | | | 14.17 | % | | | 9.73 | % | | | 7.21 | % | |
Class C | | 06/30/2011 | | | 13.22 | % | | | 8.88 | % | | | 6.40 | % | |
With Sales Charge | |
Class A | | | | | 7.55 | % | | | 8.43 | % | | | 6.33 | % | |
Class C | | | | | 12.22 | % | | | 8.88 | % | | | 6.40 | % | |
Index | |
| MSCI All Country World Index (Net)1,15 | | 11.41 | % | | | 9.67 | % | | | 8.51 | % | |
The performance data quoted represent past performance and do not indicate future results. Current performance may be lower or higher than the performance data quoted. For performance data current to the most recent month-end, please visit www.nb.com/performance.
The results shown in the table reflect the reinvestment of income dividends and other distributions, if any. The results do not reflect the effect of taxes a shareholder would pay on Fund distributions or on the redemption of Fund shares.
The investment return and principal value of an investment will fluctuate and shares, when redeemed, may be worth more or less than their original cost.
Returns would have been lower if Neuberger Berman Investment Advisers LLC ("Management") had not reimbursed certain expenses and/or waived a portion of the investment management fees during certain of the periods shown. Repayment by a class (of expenses previously reimbursed and/or fees previously waived by Management) will decrease the class's returns. Please see Note B in the Notes to Financial Statements for specific information regarding expense reimbursement and/or fee waiver arrangements.
As stated in the Fund's most recent prospectus, the total annual operating expense ratios for fiscal year 2017 were 7.12%, 7.54% and 8.27% for Institutional Class, Class A and Class C shares, respectively (before expense reimbursements and/or fee waivers, if any). The expense ratios were 0.75%, 1.11% and 1.86% for Institutional Class, Class A and Class C shares, respectively, after expense reimbursements and/or fee waivers. The expense ratios for the annual period ended August 31, 2018 can be found in the Financial Highlights section of this report.
Returns shown with a sales charge reflect the deduction of the current maximum initial sales charge of 5.75% for Class A shares and the contingent deferred sales charge (CDSC) for Class C shares. The CDSC for Class C shares is 1.00%, which is reduced to 0% after 1 year. The performance of the Fund's share classes will differ primarily due to different sales charge structures and class expenses. Please see the prospectus for more information about sales charge structures, if any, and class expenses for your share class.
22
Global Equity Fund (Unaudited)
COMPARISON OF A $1,000,000 INVESTMENT
(000's Omitted)
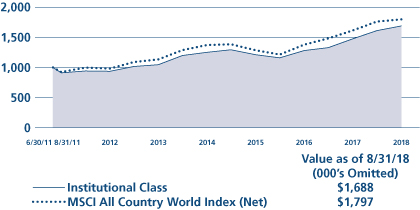
This graph shows the change in value of a hypothetical $1,000,000 investment in the Fund over the past 10 fiscal years, or since the Fund's inception if it has not operated for 10 years. The graph is based on the Institutional Class shares only; the performance of the Fund's share classes will differ primarily due to different sales charge structures and class expenses (see Performance Highlights chart on previous page). The result is compared with benchmarks, which include a broad-based market index and may include a more narrowly based index. Market indices have not been reduced to reflect any of the fees and costs of investing. The results shown in the graph reflect the reinvestment of income dividends and other distributions, if any. The results do not reflect the effect of taxes a shareholder would pay on Fund distributions or on the redemption of Fund shares. Results represent past performance and do not indicate future results.
23
Global Real Estate Fund Commentary (Unaudited)
Neuberger Berman Global Real Estate Fund Institutional Class generated a 4.98% total return for the fiscal year ended August 31, 2018, underperforming its benchmark, the FTSE EPRA/NAREIT Developed Index (Net) (the Index), which generated a 5.49% total return for the same period. (Performance for all share classes is provided in the table immediately following this letter.)
Despite periods of weakness, the global stock market, as measured by the MSCI All Country World Index (Net), generated strong results during the reporting period. After rising over the first five months of the period, the global stock market declined in February and March 2018. This turnaround occurred given concerns that the U.S. Federal Reserve (Fed) may raise interest rates at a faster pace than previously expected. This proved to be a temporary setback in the U.S, as its market then rallied during the last five months of the period and reached several new all-time highs in August 2018. This was driven by a number of factors, including corporate profits that often exceeded expectations and accelerating growth in the U.S. In contrast, equities outside the U.S. remained largely challenged, partially due to signs of moderating growth and concerns over a global trade war. Comparatively, global real estate investment trusts (REITs) posted less robust results during the period.
The Fund underperformed the benchmark during the reporting period. The Fund's positioning from a regional/country perspective relative to the Index detracted from results. In particular, an overweight to the Netherlands on average during the period, along with underweights to the U.S and Austria, were the largest detractors from relative performance. On the upside, overweights to Spain and Canada, coupled with an underweight to Singapore, were additive for results.
On the upside, stock selection contributed to the Fund's results. Our holdings in the Industrial & Office REITs, Residential REITs, and Retail REITs sectors were the most additive for returns. The largest detractors from performance were the Fund's holdings in the Real Estate Holding & Development, and Specialty REITs sectors.
We anticipate seeing solid economic growth for the U.S. as the year progresses, and for the Fed to take a measured approach in terms of further rate hikes. While interest rate movements could be a near-term headwind, we believe the drivers of this change, namely solid economic and job growth, combined with modest inflation, should be positive for real estate fundamentals. The tax cuts signed into law in late 2017 have had a positive impact on corporate profitability, while also increasing disposable income for most consumers. Improved consumer confidence, accelerating non-residential fixed investment and modest inflation, if they continue, should benefit tenant demand for real estate space. We are monitoring the potential impact from proposed trade tariffs, government deregulation and infrastructure that may affect the real estate sector. Overseas, we continue to see a positive economic environment for most of Europe in 2018. In our view, continued growth in assets under management on the direct property side will put pressure on investors to deploy capital. That being said, the prospect of higher long-term interest rates may start to pose a challenge to pricing. Among the Asia-Pacific markets, the solid labor market and rising inflation continues to bolster the case, in our minds, for Japan real estate stocks in 2018, especially with loose monetary policy and greater focus on shareholder returns. We anticipate that Hong Kong will come under moderate pressure due to the rising interbank rates and the threat of the U.S./China trade war. We believe the fundamental outlook for Australia and Singapore remains quite solid and the two markets will likely prove more defensive in the near term.
Sincerely,
STEVE SHIGEKAWA, BRIAN C. JONES, GILLIAN TILTMAN AND ANTON KWANG
PORTFOLIO MANAGERS
Information about principal risks of investing in the Fund is set forth in the prospectus and statement of additional information.
The portfolio composition, industries and holdings of the Fund are subject to change without notice.
The opinions expressed are those of the Fund's portfolio managers. The opinions are as of the date of this report and are subject to change without notice.
24
Global Real Estate Fund (Unaudited)
TICKER SYMBOLS
Institutional Class | | NGRIX | |
Class A | | NGRAX | |
Class C | | NGRCX | |
PERFORMANCE HIGHLIGHTS9
| | | | Average Annual Total
Return Ended 08/31/2018 | |
| | Inception
Date | | 1 Year | | Life of
Fund | |
At NAV | |
Institutional Class | | 12/30/2014 | | | 4.98 | % | | | 5.01 | % | |
Class A | | 12/30/2014 | | | 4.47 | % | | | 4.61 | % | |
Class C | | 12/30/2014 | | | 3.81 | % | | | 3.85 | % | |
With Sales Charge | |
Class A | | | | | –1.54 | % | | | 2.94 | % | |
Class C | | | | | 2.81 | % | | | 3.85 | % | |
Index | |
| FTSE EPRA/NAREIT Developed Index (Net)1,15 | | 5.49 | % | | | 3.90 | % | |
The performance data quoted represent past performance and do not indicate future results. Current performance may be lower or higher than the performance data quoted. For performance data current to the most recent month-end, please visit www.nb.com/performance.
The results shown in the table reflect the reinvestment of income dividends and other distributions, if any. The results do not reflect the effect of taxes a shareholder would pay on Fund distributions or on the redemption of Fund shares.
The investment return and principal value of an investment will fluctuate and shares, when redeemed, may be worth more or less than their original cost.
Returns would have been lower if Neuberger Berman Investment Advisers LLC ("Management") had not reimbursed certain expenses and/or waived a portion of the investment management fees during certain of the periods shown. Repayment by a class (of expenses previously reimbursed and/or fees previously waived by Management) will decrease the class's returns. Please see Note B in the Notes to Financial Statements for specific information regarding expense reimbursement and/or fee waiver arrangements.
As stated in the Fund's most recent prospectus, the total annual operating expense ratios for fiscal year 2017 were 10.97%, 11.23% and 12.10% for Institutional Class, Class A and Class C shares, respectively (before expense reimbursements and/or fee waivers, if any). The expense ratios were 1.01%, 1.37% and 2.12% for Institutional Class, Class A and Class C shares, respectively, after expense reimbursements and/or fee waivers. The expense ratios for the annual period ended August 31, 2018 can be found in the Financial Highlights section of this report.
Returns shown with a sales charge reflect the deduction of the current maximum initial sales charge of 5.75% for Class A shares and the contingent deferred sales charge (CDSC) for Class C shares. The CDSC for Class C shares is 1.00%, which is reduced to 0% after 1 year. The performance of the Fund's share classes will differ primarily due to different sales charge structures and class expenses. Please see the prospectus for more information about sales charge structures, if any, and class expenses for your share class.
25
Global Real Estate Fund (Unaudited)
COMPARISON OF A $1,000,000 INVESTMENT
(000's Omitted)
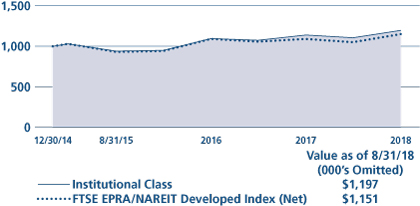
This graph shows the change in value of a hypothetical $1,000,000 investment in the Fund over the past 10 fiscal years, or since the Fund's inception if it has not operated for 10 years. The graph is based on the Institutional Class shares only; the performance of the Fund's share classes will differ primarily due to different sales charge structures and class expenses (see Performance Highlights chart on previous page). The result is compared with benchmarks, which include a broad-based market index and may include a more narrowly based index. Market indices have not been reduced to reflect any of the fees and costs of investing. The results shown in the graph reflect the reinvestment of income dividends and other distributions, if any. The results do not reflect the effect of taxes a shareholder would pay on Fund distributions or on the redemption of Fund shares. Results represent past performance and do not indicate future results.
26
Greater China Equity Fund Commentary25 (Unaudited)
Neuberger Berman Greater China Equity Fund Institutional Class generated a 4.37% total return for the fiscal year ended August 31, 2018, outperforming its benchmark, the MSCI China Index (Net) (the Index), which returned 0.22% over the same period. (Performance for all share classes is provided in the table immediately following this letter.)
Over the past 12 months, the China equity markets were quite volatile. In September 2017, profit taking led to markets consolidating, and investor sentiment was weighed down by Standard & Poor's downgrading China and Hong Kong's sovereign credit ratings, tighter restrictions on the sale of certain real property and escalating geopolitical risks. However, continued supply side reforms and the People's Bank of China (PBoC) eliminating foreign exchange derivative sales reserve requirements supported markets by month-end. Positive momentum continued into October due to policy support expectations from the 19th National Congress of the Communist Party of China, the State Council's supportive decision to cut reserve requirement ratio (RRR) aimed at small and medium enterprises financing, the PBoC's announcement of RRR reduction for certain banks and solid corporate earnings in the third quarter of 2017. News that the State Council is planning a pilot program for full convertibility of domestic shares to H-shares and announcements of significant business deals concluded with the U.S. after President Trump's visit to China led markets to trade higher in November, but they corrected sharply later as sentiment was impacted by purging of online microlenders, reduction of import tariffs, and property tightening policies. Towards year-end, despite concerns over liquidity, the PBoC raising rates for certain instruments and the U.S. Federal Reserve's third rate hike, China equity markets ended the year on a high note primarily due to the removal of uncertainty regarding U.S. tax reforms and bond yields surging after hawkish comments from European Central Bank policymakers. In January, both the domestic China A-shares market and offshore Hong Kong market rallied as macroeconomic indicators continued to reflect stable growth, most notably GDP growth of 6.9% for 2017. China equity markets corrected in February due to profit taking following January's markets rallying, options hedging and liquidity concerns. Macroeconomic data indicated mixed signals, and investors remained cautious ahead of earnings season and China's "Two Sessions" to be held in March.
Market performance continued to decline in March despite the State Council's approval of the China Securities Regulatory Commission's China depository receipts mechanism plans, and upcoming initial public offerings (IPOs) by Chinese tech unicorns as investors were concerned over trade war tensions between China and the U.S. Sentiment continued to weaken in April, as markets succumbed to pressure due to the U.S. ban on ZTE and investigations of Huawei. Towards month-end, the PBoC cut RRR for certain banks, but investors were cautious amid the ongoing earnings season. In May, investors took a risk-off position due to China-U.S. trade talks, U.S.-North Korea Summit developments, concerns over liquidity from heavy IPO pipeline in Hong Kong and the Eurozone geopolitical issues, but both the onshore and offshore markets pared some losses later in the month as the focus shifted towards A-shares inclusion into the MSCI Emerging Market Index ("MSCI"). Markets declined sharply in June primarily due to escalating trade war tensions. Despite A-shares having been effectively included in the MSCI and the PBoC continuing to cut RRR, sentiment was further weighed down by the continued depreciation of the Chinese Yuan (CNY), concerns over liquidity tightening, a hawkish Federal Open Market Committee, and weaker China economic data. China equity markets further consolidated in July from escalating Sino-U.S. trade tensions, CNY depreciation, weaker than expected Purchasing Managers Index and trade data, ongoing deleveraging, and tightening property policies. Later in the month, markets rebounded to pare some losses after the government announced a range of targeted measures to support the economy, including a shift to fiscal stimulus and credit easing. Weak performance of the markets extended into August despite positive company earnings results and a stabilizing CNY, but both onshore and offshore markets corrected towards month-end as trade tensions and emerging markets currency risks escalated once again.
For the 12-month period, contributors to performance relative to the Index included Consumer Discretionary (stock selection in Automobiles & Components, Hotels, Restaurants & Leisure, and Textiles, Apparel & Luxury Goods), Financials (stock selection within Insurance and Banks), Materials (an overweight to Construction Materials) and Health Care (an overweight). Detractors from performance relative to the Index included Energy (an underweight) and Utilities (an underweight and stock selection, primarily to environmental-related companies).
27
We continue to focus on companies that we believe have sustainable top and bottom line growth by looking at the companies' operating cash flow from their recurring core businesses. As of August 31, 2018, the Fund's largest sector overweight relative to the Index was Consumer Discretionary, followed by Consumer Staples and Industrials. The largest sector underweight was Information Technology, followed by Energy and Telecommunication Services. The Fund's top 10 positions comprised more than 50% of total portfolio assets at the end of August.
Economic activity in China for the second quarter of 2018 pointed towards slight moderation. Amongst the detracting factors were much lower than expected credit growth. While bank lending has moderated, the decrease in credit growth was primarily attributed to a decline in non-bank financing. This coincided with a drop in year over year growth in fixed asset investment, particularly infrastructure investment. At the same time, China retail sales were also softer than expected, driven primarily by weaker auto sales as certain tax subsidies on passenger vehicles came to an end. On the other hand, industrial production has remained resilient, led by strength within manufacturing. In addition, the property sector continues to be robust in terms of sales and new starts. Notwithstanding the relatively stable economic backdrop outlined above, all eyes have been on the rising trade tensions between China and the U.S. Investors have reacted via broad-based profit-taking which saw the MSCI China Index (Net) and CSI 300 Index (Net)* decline by –7.8% and –19.6%, respectively YTD. While we believe the implementation of tariffs is not productive and expected to weigh on global growth, their immediate impact on economic activity is expected to be relatively benign on China GDP growth, and slightly less for the US. The risk scenario is that the current situation further escalates from this point, either in the form of incremental tariffs announced and implemented by the U.S. (and Chinese countermeasures), or spillover effects into other areas of commerce between the world's two largest economies. Policy uncertainty has undoubtedly heightened, and the process towards de-escalation is expected to be lengthy. Nonetheless, we believe the Chinese government continues to have various tools at its disposal to dampen the potential economic impact of ongoing trade tensions. While deleveraging remains an important objective of policymakers, we may see a recalibration around its pace, leaving scope for potential cuts to the RRR for banks, more rapid issuance of local government bonds and open market injections. This would potentially mitigate the impact from a reduction in shadow bank financing. Policy moves on the fiscal side also seems to us to be probable through direct fiscal support to domestic investment and/or tax relief/subsidies to businesses and consumers. A combination of the above may help serve as a buffer to downside risk and restore calm to markets in the process. With the above in mind, we have continued to take advantage of recent market volatility by making incremental adjustments to the portfolio, seeking high quality companies we believe are capable of weathering shorter-term external shocks.
Sincerely,
LIHUI TANG AND FRANK YAO
PORTFOLIO MANAGERS
* The CSI 300 Index (Net) is a free-float weighted index that consists of 300 stocks with the largest market capitalization and liquidity from the entire universe of listed A share companies in China. Launched on April 8, 2005, the index aims to measure the performance of all the A shares traded on the Shanghai and Shenzhen stock exchanges.
Information about principal risks of investing in the Fund is set forth in the prospectus and statement of additional information.
The portfolio composition, industries and holdings of the Fund are subject to change without notice.
The opinions expressed are those of the Fund's portfolio managers. The opinions are as of the date of this report and are subject to change without notice.
28
Greater China Equity Fund (Unaudited)
TICKER SYMBOLS
Institutional Class | | NCEIX | |
Class A | | NCEAX | |
Class C | | NCECX | |
SECTOR ALLOCATION
(as a % of Total Investments*) | |
Consumer Discretionary | | | 17.8 | % | |
Consumer Staples | | | 7.0 | | |
Financials | | | 26.6 | | |
Health Care | | | 6.8 | | |
Industrials | | | 8.8 | | |
Information Technology | | | 23.4 | | |
Materials | | | 5.7 | | |
Real Estate | | | 2.6 | | |
Telecommunication Services | | | 0.5 | | |
Utilities | | | 0.4 | | |
Short-Term Investments | | | 0.4 | | |
Total | | | 100.0 | % | |
EXCHANGE ALLOCATION
(as a % of Long Term Investments) | |
Mainland China | | | 24.6 | % | |
Hong Kong | | | 59.2 | | |
United States | | | 16.2 | | |
Total | | | 100.0 | % | |
* Derivatives (other than options purchased), if any, are excluded from this chart.
PERFORMANCE HIGHLIGHTS25
| | | | Average Annual Total
Return Ended 08/31/2018 | |
| | Inception
Date | | 1 Year | | 5 Years | | Life of
Fund | |
At NAV | |
Institutional Class | | 07/17/2013 | | | 4.37 | % | | | 14.94 | % | | | 14.92 | % | |
Class A | | 07/17/2013 | | | 4.02 | % | | | 14.66 | % | | | 14.62 | % | |
Class C | | 07/17/2013 | | | 3.26 | % | | | 13.71 | % | | | 13.67 | % | |
With Sales Charge | |
Class A | | | | | –1.98 | % | | | 13.31 | % | | | 13.30 | % | |
Class C | | | | | 2.33 | % | | | 13.71 | % | | | 13.67 | % | |
Index | |
| MSCI China Index (Net)1,15 | | 0.22 | % | | | 9.27 | % | | | 10.03 | % | |
The performance data quoted represent past performance and do not indicate future results. Current performance may be lower or higher than the performance data quoted. For performance data current to the most recent month-end, please visit www.nb.com/performance.
The results shown in the table reflect the reinvestment of income dividends and other distributions, if any. The results do not reflect the effect of taxes a shareholder would pay on Fund distributions or on the redemption of Fund shares.
The investment return and principal value of an investment will fluctuate and shares, when redeemed, may be worth more or less than their original cost.
Returns would have been lower if Neuberger Berman Investment Advisers LLC ("Management") had not reimbursed certain expenses and/or waived a portion of the investment management fees during certain of the periods shown. Repayment by a class (of expenses previously reimbursed and/or fees previously waived by Management) will decrease the class's returns. Please see Note B in the Notes to Financial Statements for specific information regarding expense reimbursement and/or fee waiver arrangements.
As stated in the Fund's most recent prospectus, the total annual operating expense ratios for fiscal year 2017 were 1.69%, 2.07% and 2.80% for Institutional Class, Class A and Class C shares, respectively (before expense reimbursements and/or fee waivers, if any). The expense ratios were 1.51%, 1.87% and 2.62% for Institutional Class, Class A and Class C shares, respectively, after expense reimbursements and/or fee waivers. The expense ratios for the annual period ended August 31, 2018 can be found in the Financial Highlights section of this report.
Returns shown with a sales charge reflect the deduction of the current maximum initial sales charge of 5.75% for Class A shares and the contingent deferred sales charge (CDSC) for Class C shares. The CDSC for Class C shares is 1.00%, which is reduced to 0% after 1 year. The performance of the Fund's share classes will differ primarily due to different sales charge structures and class expenses. Please see the prospectus for more information about sales charge structures, if any, and class expenses for your share class.
29
Greater China Equity Fund (Unaudited)
COMPARISON OF A $1,000,000 INVESTMENT
(000's Omitted)
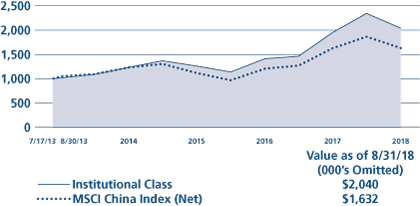
This graph shows the change in value of a hypothetical $1,000,000 investment in the Fund over the past 10 fiscal years, or since the Fund's inception if it has not operated for 10 years. The graph is based on the Institutional Class shares only; the performance of the Fund's share classes will differ primarily due to different sales charge structures and class expenses (see Performance Highlights chart on previous page). The result is compared with benchmarks, which include a broad-based market index and may include a more narrowly based index. Market indices have not been reduced to reflect any of the fees and costs of investing. The results shown in the graph reflect the reinvestment of income dividends and other distributions, if any. The results do not reflect the effect of taxes a shareholder would pay on Fund distributions or on the redemption of Fund shares. Results represent past performance and do not indicate future results.
30
Guardian Fund Commentary (Unaudited)
Neuberger Berman Guardian Fund Investor Class generated a 21.86% total return for the fiscal year ended August 31, 2018, outperforming the 19.66% total return of its benchmark, the S&P 500® Index (the Index), for the same period. (Performance for all share classes is provided in the table immediately following this letter.)
The U.S. stock market generated strong results during the reporting period. After rising over the first five months of the period, the overall stock market declined in February and March 2018. This turnaround occurred given concerns that the U.S. Federal Reserve (Fed) may raise interest rates at a faster pace than previously expected. However, this proved to be a short-term setback, as the market then rallied during the last five months of the period. This was due to a number of factors, including corporate profits that often exceeded expectations and improving growth in the U.S.—both of which overshadowed concerns over a global trade war. All told, the Index gained 19.66% for the 12-month period.
The Fund's investments fall into three buckets: Growth, Total Return and Opportunistic. Growth companies are those companies that are growing their revenues and, as they do so, generate free cash flow that is reinvested in the business at what we identify as attractive risk-adjusted returns. Total Return investments demonstrate sustainable and/or growing streams of income that are underpinned by asset value and which may result in growing cash returns to shareholders (e.g., increased dividends, share repurchases, return of capital). Finally, Opportunistic investments are those with identifiable catalysts. This bucket may include companies with management changes, company reorganizations, merger and acquisition activity, "hidden assets," or other market dislocations that have the potential to unlock intrinsic value.1
Stock selection, overall, was the largest contributor to the Fund's relative performance during the reporting period. In particular, holdings in the Industrials, Consumer Staples and Financials sectors were the most beneficial for performance. Conversely, stock selection in the Energy and Health Care sectors were the only meaningful detractors from relative results.
Sector allocation, overall, was also additive for performance during the period. This was primarily driven by underweights to Telecommunication Services and Consumer Staples, coupled with an overweight to Consumer Discretionary. Conversely, overweights to Industrials and Utilities detracted from results. The Fund's small cash position was also a headwind for performance as the market rallied sharply during the reporting period.
The Fund's use of purchased and written options contributed positively to performance during the period.
We entered the 2018 calendar year with a still constructive—albeit increasingly selective—outlook for U.S. equities. This was driven by solid global economic growth, lower corporate tax rates, repatriation of foreign earnings and the continued emergence of a more pro-business environment. Second quarter 2018 annualized GDP growth accelerated and, in our view, overall U.S. macroeconomic data has been steady. Meanwhile, strong growth helped move the economy to near full employment. However, we remain mindful that our constructive view on the equity market is not without its challenges. Despite positive U.S. and global economic data, the shift in Fed policy presents potential for spikes in volatility. The gulf between the social and economic agendas of the Republican and Democratic parties is wider than the historical norm. As a consequence, we believe that this adds a higher degree of risk to the timely implementation of legislative initiatives. We also continue to closely monitor the Trump administration's actions on global trade, as strong protectionist policies could impede economic growth and spur a trade war, both of which would hurt growth and the equity markets. Given the vicissitudes of an increasingly global economy, we will also remain flexible in our decisions and open-minded to new ideas across different asset classes and geographies.
Sincerely,
CHARLES KANTOR
PORTFOLIO MANAGER
1 Intrinsic value reflects the portfolio management team's analysis and estimates of a company's value. There is no guarantee that any intrinsic values will be realized; security prices may decrease regardless of intrinsic values.
Information about principal risks of investing in the Fund is set forth in the prospectus and statement of additional information.
The portfolio composition, industries and holdings of the Fund are subject to change without notice.
The opinions expressed are those of the Fund's portfolio manager. The opinions are as of the date of this report and are subject to change without notice.
31
Guardian Fund (Unaudited)
TICKER SYMBOLS
Investor Class | | NGUAX | |
Trust Class | | NBGTX | |
Advisor Class | | NBGUX | |
Institutional Class | | NGDLX | |
Class A | | NGDAX | |
Class C | | NGDCX | |
Class R3 | | NGDRX | |
SECTOR ALLOCATION
(as a % of Total Investments*) | |
Consumer Discretionary | | | 19.8 | % | |
Consumer Staples | | | 4.3 | | |
Energy | | | 3.5 | | |
Financials | | | 11.4 | | |
Health Care | | | 6.1 | | |
Industrials | | | 19.4 | | |
Information Technology | | | 27.2 | | |
Materials | | | 1.8 | | |
Utilities | | | 2.7 | | |
Options Purchased | | | 0.1 | | |
Short-Term Investments | | | 3.7 | | |
Total | | | 100.0 | % | |
* Derivatives (other than options purchased), if any, are excluded from this chart.
PERFORMANCE HIGHLIGHTS7,11
| | | | Average Annual Total
Return Ended 08/31/2018 | |
| | Inception
Date | | 1 Year | | 5 Years | | 10 Years | | Life of
Fund | |
At NAV | |
Investor Class | | 06/01/1950 | | | 21.86 | % | | | 12.93 | % | | | 9.62 | % | | | 11.21 | % | |
| Trust Class3 | | 08/03/1993 | | | 21.76 | % | | | 12.74 | % | | | 9.44 | % | | | 11.16 | % | |
| Advisor Class4 | | 09/03/1996 | | | 21.34 | % | | | 12.42 | % | | | 9.07 | % | | | 11.02 | % | |
| Institutional Class5 | | 05/27/2009 | | | 22.15 | % | | | 13.13 | % | | | 9.81 | % | | | 11.24 | % | |
| Class A19 | | 05/27/2009 | | | 21.67 | % | | | 12.71 | % | | | 9.43 | % | | | 11.19 | % | |
| Class C19 | | 05/27/2009 | | | 20.74 | % | | | 11.87 | % | | | 8.68 | % | | | 11.07 | % | |
| Class R316 | | 05/27/2009 | | | 21.33 | % | | | 12.40 | % | | | 9.17 | % | | | 11.15 | % | |
With Sales Charge | |
| Class A19 | | | | | 14.67 | % | | | 11.38 | % | | | 8.79 | % | | | 11.09 | % | |
| Class C19 | | | | | 19.74 | % | | | 11.87 | % | | | 8.68 | % | | | 11.07 | % | |
Index | |
| S&P 500® Index1,15 | | 19.66 | % | | | 14.52 | % | | | 10.86 | % | | | 11.26 | % | |
The performance data quoted represent past performance and do not indicate future results. Current performance may be lower or higher than the performance data quoted. For performance data current to the most recent month-end, please visit www.nb.com/performance.
The results shown in the table reflect the reinvestment of income dividends and other distributions, if any. The results do not reflect the effect of taxes a shareholder would pay on Fund distributions or on the redemption of Fund shares.
The investment return and principal value of an investment will fluctuate and shares, when redeemed, may be worth more or less than their original cost.
Returns would have been lower if Neuberger Berman Investment Advisers LLC ("Management") had not reimbursed certain expenses and/or waived a portion of the investment management fees during certain of the periods shown. Repayment by a class (of expenses previously reimbursed and/or fees previously waived by Management) will decrease the class's returns. Please see Note B in the Notes to Financial Statements for specific information regarding expense reimbursement and/or fee waiver arrangements.
As stated in the Fund's most recent prospectus, the total annual operating expense ratios for fiscal year 2017 were 0.90%, 1.07%, 1.39%, 0.72%, 1.10%, 1.84% and 1.38% for Investor Class, Trust Class, Advisor Class, Institutional Class, Class A, Class C and Class R3 shares, respectively (before expense reimbursements and/or fee waivers, if any). The expense ratio of the Class R3 shares was 1.37% after expense reimbursements and/or fee waivers. The expense ratios for the annual period ended August 31, 2018 can be found in the Financial Highlights section of this report.
Returns shown with a sales charge reflect the deduction of the current maximum initial sales charge of 5.75% for Class A shares and the contingent deferred sales charge (CDSC) for Class C shares. The CDSC for Class C shares is 1.00%, which is reduced to 0% after 1 year. The performance of the Fund's share classes will differ primarily due to different sales charge structures and class expenses. Please see the prospectus for more information about sales charge structures, if any, and class expenses for your share class.
32
Guardian Fund (Unaudited)
COMPARISON OF A $10,000 INVESTMENT
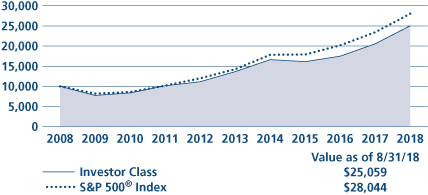
This graph shows the change in value of a hypothetical $10,000 investment in the Fund over the past 10 fiscal years, or since the Fund's inception if it has not operated for 10 years. The graph is based on the Investor Class shares only; the performance of the Fund's share classes will differ primarily due to different sales charge structures and class expenses (see Performance Highlights chart on previous page). The result is compared with benchmarks, which include a broad-based market index and may include a more narrowly based index. Market indices have not been reduced to reflect any of the fees and costs of investing. The results shown in the graph reflect the reinvestment of income dividends and other distributions, if any. The results do not reflect the effect of taxes a shareholder would pay on Fund distributions or on the redemption of Fund shares. Results represent past performance and do not indicate future results.
33
International Equity Fund Commentary (Unaudited)
Neuberger Berman International Equity Fund Institutional Class generated a total return of 5.12% for the fiscal year ended August 31, 2018, outperforming its benchmark, the MSCI EAFE® Index (Net) (the Index), which provided a 4.39% total return for the same period. (Performance for all share classes is provided in the table immediately following this letter.)
The fiscal year started on strong footing, with broadly positive global economic news buoying developed international equity markets. In the Eurozone, economic growth broadened to more countries, unemployment fell, and consumer confidence increased. Japan benefited from solid corporate earnings, strong global trade, and local economic and fiscal policies. From February through the period's end, however, the market shifted. Volatility increased as stronger U.S. economic data suggested the likelihood of higher interest rates, and concerns grew around aggressive U.S. trade policy. Investor fears resulted in a loss of much of the market's early gains.
Index returns were led by Energy, up over 26% on rising oil prices. Information Technology (IT) and Health Care also outperformed. There was wide dispersion between sector returns, however, with interest rate sensitive areas such as Telecommunication Services, Financials and Utilities posting losses. By country, Israel, Finland, and Norway saw the strongest returns, while Spain, Belgium, and Italy declined the most.
The Fund's outperformance resulted primarily from strong stock selection, with sector allocation a secondary benefit. Key areas of outperformance included Financials, Telecommunication Services and IT. By country, our holdings based in Switzerland, the Netherlands and Hong Kong outperformed.
Top individual contributors included HKBN, the Hong Kong telecom player, which reported solid earnings driven by increasing momentum in mobile and enterprise. Kose, the Japanese cosmetics firm, continued to expand sales in China, where penetration is still low, and internationally with their high-end brand, Decorte. Suncor Energy, the Canadian oil-sands player, rose with oil prices. Their production and free cash flows also look to be improving as new projects come on line.
Our Consumer Discretionary holdings underperformed the Index this period. The portfolio also underperformed slightly in Health Care, and an underweight to Energy had a small detrimental effect. From a country perspective, French and Israeli portfolio holdings underperformed, and an underweight to the robust Japanese market was also detrimental on a relative basis.
Individual detractors included Tower Semiconductor, the Israeli headquartered semiconductor foundry, which announced solid fourth quarter results but revised guidance downwards based on weaker first quarter demand, particularly in smartphones. SPIE, the French engineering services group, reported weaker than expected results for the first half of 2017 due to a challenging environment in their UK and oil and gas businesses. Valeo, the French auto parts supplier, was caught up in the selloff due to rising global trade tensions.
While a trade dispute between the U.S. and China is unhelpful for market sentiment in the near term, we anticipate cooler heads will prevail and a major trade-driven global slowdown will be avoided. Still, the economic effects are uncertain until negotiations conclude.
Our focus generally remains on the most innovative businesses in the healthier countries. We believe this helps insulate the portfolio from political uncertainty and helped reduce volatility and drive relative performance this period. We endeavor to avoid firms exposed to markets characterized by low economic growth, significant debt and limited appetite for reform.
Continued volatility should afford us opportunities to add or trim positions in core names. Our focus remains on quality businesses that we anticipate will benefit from secular growth, niche business models and/or defensive end-markets, which, historically, have typically helped our portfolios experience lower volatility than the market.
Sincerely,
BENJAMIN SEGAL
PORTFOLIO MANAGER
Information about principal risks of investing in the Fund is set forth in the prospectus and statement of additional information.
The portfolio composition, industries and holdings of the Fund are subject to change without notice.
The opinions expressed are those of the Fund's portfolio manager. The opinions are as of the date of this report and are subject to change without notice.
34
International Equity Fund (Unaudited)
TICKER SYMBOLS
Investor Class | | NIQVX | |
Trust Class | | NIQTX | |
Institutional Class | | NBIIX | |
Class A | | NIQAX | |
Class C | | NIQCX | |
Class R6 | | NRIQX | |
PERFORMANCE HIGHLIGHTS7
| | | | Average Annual Total
Return Ended 08/31/2018 | |
| | Inception
Date | | 1 Year | | 5 Years | | 10 Years | | Life of
Fund | |
At NAV | |
| Investor Class12 | | 01/28/2013 | | | 4.88 | % | | | 6.56 | % | | | 4.74 | % | | | 5.34 | % | |
| Trust Class12 | | 01/28/2013 | | | 4.84 | % | | | 6.49 | % | | | 4.70 | % | | | 5.32 | % | |
Institutional Class | | 06/17/2005 | | | 5.12 | % | | | 6.71 | % | | | 4.83 | % | | | 5.41 | % | |
| Class A12 | | 01/28/2013 | | | 4.77 | % | | | 6.32 | % | | | 4.61 | % | | | 5.25 | % | |
| Class C12 | | 01/28/2013 | | | 4.05 | % | | | 5.53 | % | | | 4.18 | % | | | 4.92 | % | |
| Class R622 | | 09/03/2013 | | | 5.26 | % | | | 6.81 | % | | | 4.88 | % | | | 5.45 | % | |
With Sales Charge | |
| Class A12 | | | | | –1.25 | % | | | 5.07 | % | | | 3.99 | % | | | 4.78 | % | |
| Class C12 | | | | | 3.05 | % | | | 5.53 | % | | | 4.18 | % | | | 4.92 | % | |
Index | |
| MSCI EAFE® Index (Net)1,15 | | 4.39 | % | | | 5.73 | % | | | 3.66 | % | | | 5.04 | % | |
The performance data quoted represent past performance and do not indicate future results. Current performance may be lower or higher than the performance data quoted. For performance data current to the most recent month-end, please visit www.nb.com/performance.
The results shown in the table reflect the reinvestment of income dividends and other distributions, if any. The results do not reflect the effect of taxes a shareholder would pay on Fund distributions or on the redemption of Fund shares.
The investment return and principal value of an investment will fluctuate and shares, when redeemed, may be worth more or less than their original cost.
Returns would have been lower if Neuberger Berman Investment Advisers LLC ("Management") had not reimbursed certain expenses and/or waived a portion of the investment management fees during certain of the periods shown. Repayment by a class (of expenses previously reimbursed and/or fees previously waived by Management) will decrease the class's returns. Please see Note B in the Notes to Financial Statements for specific information regarding expense reimbursement and/or fee waiver arrangements.
As stated in the Fund's most recent prospectus, the total annual operating expense ratios for fiscal year 2017 were 1.23%, 1.27%, 1.03%, 1.39%, 2.14% and 0.95% for Investor Class, Trust Class, Institutional Class, Class A, Class C and Class R6 shares, respectively (before expense reimbursements and/or fee waivers, if any). The expense ratios were 0.86%, 1.22%, 1.97% and 0.78% for Institutional Class, Class A, Class C and Class R6 shares, respectively, after expense reimbursements and/or fee waivers. The total annual operating expense ratio for each of Institutional Class, Class A and Class C includes the class's repayment of expenses previously reimbursed and/or fees previously waived by Management. The expense ratios for the annual period ended August 31, 2018 can be found in the Financial Highlights section of this report.
Returns shown with a sales charge reflect the deduction of the current maximum initial sales charge of 5.75% for Class A shares and the contingent deferred sales charge (CDSC) for Class C shares. The CDSC for Class C shares is 1.00%, which is reduced to 0% after 1 year. The performance of the Fund's share classes will differ primarily due to different sales charge structures and class expenses. Please see the prospectus for more information about sales charge structures, if any, and class expenses for your share class.
35
International Equity Fund (Unaudited)
COMPARISON OF A $1,000,000 INVESTMENT
(000's Omitted)
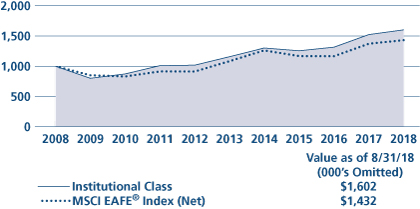
This graph shows the change in value of a hypothetical $1,000,000 investment in the Fund over the past 10 fiscal years, or since the Fund's inception if it has not operated for 10 years. The graph is based on the Institutional Class shares only; the performance of the Fund's share classes will differ primarily due to different sales charge structures and class expenses (see Performance Highlights chart on previous page). The result is compared with benchmarks, which include a broad-based market index and may include a more narrowly based index. Market indices have not been reduced to reflect any of the fees and costs of investing. The results shown in the graph reflect the reinvestment of income dividends and other distributions, if any. The results do not reflect the effect of taxes a shareholder would pay on Fund distributions or on the redemption of Fund shares. Results represent past performance and do not indicate future results.
36
International Select Fund Commentary (Unaudited)
Neuberger Berman International Select Fund Trust Class generated a total return of 5.17% for the fiscal year ended August 31, 2018, outperforming its benchmark, the MSCI EAFE® Index (Net) (the Index), which provided a 4.39% total return for the same period. (Performance for all share classes is provided in the table immediately following this letter.)
The fiscal year started on strong footing, with broadly positive global economic news buoying developed international equity markets. In the Eurozone, economic growth broadened to more countries, unemployment fell, and consumer confidence increased. Japan benefited from solid corporate earnings, strong global trade, and local economic and fiscal policies. From February through the period's end, however, the market shifted. Volatility increased as stronger U.S. economic data suggested the likelihood of higher interest rates, and concerns grew around aggressive U.S. trade policy. Investor fears resulted in a loss of much of the market's early gains.
Index returns were led by Energy, up over 26% on rising oil prices. Information Technology (IT) and Health Care also outperformed. There was wide dispersion between sector returns, however, with interest rate sensitive areas such as Telecommunication Services, Financials and Utilities posting losses. By country, Israel, Finland, and Norway saw the strongest returns, while Spain, Belgium, and Italy declined most.
The Fund's outperformance resulted primarily from strong stock selection, with sector allocation a secondary benefit. Key areas of outperformance included Consumer Staples, Financials, and Telecommunication Services. By country, our holdings based in the Netherlands, Switzerland, and the UK outperformed.
ASML, Kose and Suncor Energy were among standout contributors for the period. Dutch semiconductor equipment specialist, ASML, benefited from solid earnings announcements. Kose, the Japanese cosmetics firm, continued to expand sales in China where penetration is still low, and internationally with their high-end brand, Decorte. Suncor, the Canadian oil-sands player, rose with oil prices. Their production and free cash flows also look to be improving as new projects come on line.
Stock selection detracted from relative results within the Consumer Discretionary sector. Underweights to Energy and Health Care relative to the Index detracted as well. By country, holdings in France and Israel, and our underweight to Japan detracted.
Individual detractors included Tower Semiconductor, the Israeli headquartered semiconductor foundry, which announced solid fourth quarter results but revised guidance downwards based on weaker first quarter demand, particularly in smartphones. SPIE, the French engineering services group, reported weaker than expected results for the first half of 2017 due to a challenging environment in their UK and oil and gas businesses; and Japan's Kansai Paint suffered due to higher input costs.
While a trade dispute between the U.S. and China is unhelpful for market sentiment in the near term, we anticipate cooler heads will prevail and a major trade-driven global slowdown will be avoided. Still, the economic effects are uncertain until negotiations conclude.
Our focus generally remains on the most innovative businesses in the healthier countries. We believe this helps insulate the portfolio from political uncertainty and helped reduce volatility and drive relative performance this period. We endeavor to avoid firms exposed to markets characterized by low economic growth, significant debt and limited appetite for reform.
Continued volatility should afford us opportunities to add or trim positions in core names. Our focus remains on quality businesses that we anticipate will benefit from secular growth, niche business models and/or defensive end-markets, which, historically, have typically helped our portfolios experience lower volatility than the market.
Sincerely,
BENJAMIN SEGAL
PORTFOLIO MANAGER
Information about principal risks of investing in the Fund is set forth in the prospectus and statement of additional information.
The portfolio composition, industries and holdings of the Fund are subject to change without notice.
The opinions expressed are those of the Fund's portfolio manager. The opinions are as of the date of this report and are subject to change without notice.
37
International Select Fund (Unaudited)
TICKER SYMBOLS
Trust Class | | NILTX | |
Institutional Class | | NILIX | |
Class A | | NBNAX | |
Class C | | NBNCX | |
Class R3 | | NBNRX | |
Class R6 | | NRILX | |
PERFORMANCE HIGHLIGHTS7
| | | | Average Annual Total
Return Ended 08/31/2018 | |
| | Inception
Date | | 1 Year | | 5 Years | | 10 Years | | Life of
Fund | |
At NAV | |
Trust Class | | 08/01/2006 | | | 5.17 | % | | | 6.07 | % | | | 3.77 | % | | | 3.69 | % | |
| Institutional Class6 | | 10/06/2006 | | | 5.52 | % | | | 6.45 | % | | | 4.14 | % | | | 4.05 | % | |
| Class A14 | | 12/20/2007 | | | 5.12 | % | | | 6.07 | % | | | 3.77 | % | | | 3.69 | % | |
| Class C14 | | 12/20/2007 | | | 4.37 | % | | | 5.28 | % | | | 3.01 | % | | | 3.00 | % | |
| Class R314 | | 05/27/2009 | | | 4.92 | % | | | 5.80 | % | | | 3.52 | % | | | 3.48 | % | |
| Class R624 | | 04/17/2017 | | | 5.59 | % | | | 6.19 | % | | | 3.83 | % | | | 3.74 | % | |
With Sales Charge | |
| Class A14 | | | | | –0.90 | % | | | 4.83 | % | | | 3.16 | % | | | 3.18 | % | |
| Class C14 | | | | | 3.37 | % | | | 5.28 | % | | | 3.01 | % | | | 3.00 | % | |
Index | |
| MSCI EAFE® Index (Net)1,15 | | 4.39 | % | | | 5.73 | % | | | 3.66 | % | | | 3.38 | % | |
The performance data quoted represent past performance and do not indicate future results. Current performance may be lower or higher than the performance data quoted. For performance data current to the most recent month-end, please visit www.nb.com/performance.
The results shown in the table reflect the reinvestment of income dividends and other distributions, if any. The results do not reflect the effect of taxes a shareholder would pay on Fund distributions or on the redemption of Fund shares.
The investment return and principal value of an investment will fluctuate and shares, when redeemed, may be worth more or less than their original cost.
Returns would have been lower if Neuberger Berman Investment Advisers LLC ("Management") had not reimbursed certain expenses and/or waived a portion of the investment management fees during certain of the periods shown. Repayment by a class (of expenses previously reimbursed and/or fees previously waived by Management) will decrease the class's returns. Please see Note B in the Notes to Financial Statements for specific information regarding expense reimbursement and/or fee waiver arrangements.
As stated in the Fund's most recent prospectus, the total annual operating expense ratios for fiscal year 2017 were 1.35%, 0.90%, 1.28%, 2.02%, and 1.52% for Trust Class, Institutional Class, Class A, Class C, Class R3 shares, respectively, and the estimated total annual operating expense ratio for fiscal year 2017 is 0.79% for Class R6 (before expense reimbursements and/or fee waivers, if any). The expense ratios were 1.15%, 0.80%, 1.16%, 1.91%, and 1.41% for Trust Class, Institutional Class, Class A, Class C, Class R3 shares, respectively, and the estimated total annual operating expense ratio is 0.73% for Class R6 after expense reimbursements and/or fee waivers. The expense ratios for the annual period ended August 31, 2018 can be found in the Financial Highlights section of this report.
Returns shown with a sales charge reflect the deduction of the current maximum initial sales charge of 5.75% for Class A shares and the contingent deferred sales charge (CDSC) for Class C shares. The CDSC for Class C shares is 1.00%, which is reduced to 0% after 1 year. The performance of the Fund's share classes will differ primarily due to different sales charge structures and class expenses. Please see the prospectus for more information about sales charge structures, if any, and class expenses for your share class.
38
International Select Fund (Unaudited)
COMPARISON OF A $10,000 INVESTMENT
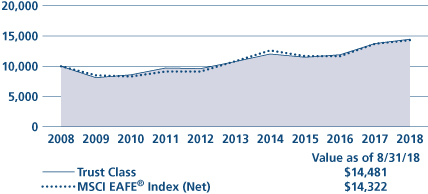
This graph shows the change in value of a hypothetical $10,000 investment in the Fund over the past 10 fiscal years, or since the Fund's inception if it has not operated for 10 years. The graph is based on the Trust Class shares only; the performance of the Fund's share classes will differ primarily due to different sales charge structures and class expenses (see Performance Highlights chart on previous page). The result is compared with benchmarks, which include a broad-based market index and may include a more narrowly based index. Market indices have not been reduced to reflect any of the fees and costs of investing. The results shown in the graph reflect the reinvestment of income dividends and other distributions, if any. The results do not reflect the effect of taxes a shareholder would pay on Fund distributions or on the redemption of Fund shares. Results represent past performance and do not indicate future results.
39
International Small Cap Fund Commentary (Unaudited)
Neuberger Berman International Small Cap Fund Institutional Class generated a total return of 9.06% for the fiscal year ended August 31, 2018, outperforming the 7.46% total return of its benchmark, the MSCI EAFE® Small Cap Index (Net) (the Index), for the same period. (Performance for all share classes is provided in the table immediately following this letter.)
The fiscal year started on strong footing, with broadly positive global economic news buoying international equity markets. In the Eurozone, economic growth broadened to more countries, unemployment fell, and consumer confidence increased. Japan benefited from solid corporate earnings, strong global trade, and local economic and fiscal policies. From February through the period's end, however, the market shifted. Volatility increased as stronger U.S. economic data suggested the likelihood of higher interest rates, and concerns grew around aggressive U.S. trade policy. International small cap stocks were somewhat insulated, as many domestically focused smaller-cap stocks—generally less likely to be impacted by trade policy—outperformed their larger-cap counterparts.
All sectors within the Index reported positive results this period, with a rebounding Energy sector significantly outperforming. Information Technology and Health Care were other areas of strong outperformance. Interest rate sensitive sectors, such as Financials, Utilities, and Telecommunication Services, lagged. By country, Israel and Denmark performed the best, while Hong Kong, Italy, and Finland saw losses.
Stock selection accounted for the portfolio's outperformance this period, particularly within Industrials and Real Estate. Consumer Discretionary holdings also outperformed. By country, the portfolio's Japanese, Swiss, and Canadian holdings outperformed.
Top contributors included Dechra Pharma, Interoll and Colliers. Dechra Pharma, a British veterinary drug company, delivered strong growth both organically and by acquisition, with solid margins. Interoll, a Swiss manufacturer of components for warehouse automation, continued to see strong organic growth both on revenues and orders, with positive development of its margins. Colliers, a Canadian real estate service provider, pursued its strategy of consolidation of the market with deals accretive to its margins.
The portfolio lagged the Index within Consumer Staples, Energy, and Health Care. Sector allocation was another small disadvantage to relative performance. By country, holdings based in the UK, Belgium, and Denmark detracted.
Individual detractors included CVS Group, Schouw & Co., and Byggmax Group. CVS Group, a British operator of veterinary clinics and laboratories, was negatively impacted by inflation pressure following the Brexit vote. We sold the stock, given our negative view on rising costs in the UK. Schouw & Co, a Danish holding, manufactures fish feed and non-woven textiles. The stock was negatively impacted by overcapacity in the fish feed business, and a combination of lower demand and rising input costs. Byggmax, a Swedish discount building-materials retailer, faced a more challenging local real estate market, and was sold.
While a trade dispute between the U.S. and China is unhelpful for market sentiment in the near term, we expect cooler heads will prevail and a major trade-driven global slowdown will be avoided. Still, the economic effects are uncertain until negotiations conclude.
Our focus generally remains on the most innovative businesses in the healthier countries. We believe this helps insulate the portfolio from political uncertainty and helped reduce volatility and drive relative performance this period. We endeavor to avoid firms exposed to markets characterized by low economic growth, significant debt and limited appetite for reform.
Continued volatility should afford us opportunities to add or trim positions in core names. Our focus remains on quality businesses that we anticipate will benefit from secular growth, niche business models and/or defensive end-markets, which, historically, have typically helped our portfolios experience lower volatility than the market.
40
Sincerely,
BENJAMIN SEGAL AND DAVID BUNAN
CO-PORTFOLIO MANAGERS
Information about principal risks of investing in the Fund is set forth in the prospectus and statement of additional information.
The portfolio composition, industries and holdings of the Fund are subject to change without notice.
The opinions expressed are those of the Fund's portfolio managers. The opinions are as of the date of this report and are subject to change without notice.
41
International Small Cap Fund (Unaudited)
TICKER SYMBOLS
Institutional Class | | NIOIX | |
Class A | | NIOAX | |
Class C | | NIOCX | |
Class R6 | | NIORX | |
PERFORMANCE HIGHLIGHTS9
| | | | Average Annual Total
Return Ended 08/31/2018 | |
| | Inception
Date | | 1 Year | | Life of
Fund | |
At NAV | |
Institutional Class | | 12/08/2016 | | | 9.06 | % | | | 20.92 | % | |
Class A | | 12/08/2016 | | | 8.60 | % | | | 20.40 | % | |
Class C | | 12/08/2016 | | | 7.89 | % | | | 19.57 | % | |
Class R6 | | 12/08/2016 | | | 9.12 | % | | | 20.96 | % | |
With Sales Charge | |
Class A | | | | | 2.39 | % | | | 16.35 | % | |
Class C | | | | | 6.89 | % | | | 19.57 | % | |
Index | |
| MSCI EAFE® Small Cap Index (Net)1,15 | | 7.46 | % | | | 17.77 | % | |
The performance data quoted represent past performance and do not indicate future results. Current performance may be lower or higher than the performance data quoted. For performance data current to the most recent month-end, please visit www.nb.com/performance.
The results shown in the table reflect the reinvestment of income dividends and other distributions, if any. The results do not reflect the effect of taxes a shareholder would pay on Fund distributions or on the redemption of Fund shares.
The investment return and principal value of an investment will fluctuate and shares, when redeemed, may be worth more or less than their original cost.
Returns would have been lower if Neuberger Berman Investment Advisers LLC ("Management") had not reimbursed certain expenses and/or waived a portion of the investment management fees during certain of the periods shown. Repayment by a class (of expenses previously reimbursed and/or fees previously waived by Management) will decrease the class's returns. Please see Note B in the Notes to Financial Statements for specific information regarding expense reimbursement and/or fee waiver arrangements.
As stated in the Fund's most recent prospectus, the total annual operating expense ratios for fiscal year 2017 were 24.00%, 24.37%, 25.11% and 23.91% for Institutional Class, Class A, Class C and Class R6 shares, respectively (before expense reimbursements and/or fee waivers, if any). The expense ratios were 1.08%, 1.44%, 2.19% and 1.01% for Institutional Class, Class A, Class C and Class R6 shares, respectively, after expense reimbursements and/or fee waivers. The expense ratios for fiscal year 2017 have been restated to reflect actual expenses excluding organization expenses incurred during that period. The expense ratios for the annual period ended August 31, 2018 can be found in the Financial Highlights section of this report.
Returns shown with a sales charge reflect the deduction of the current maximum initial sales charge of 5.75% for Class A shares and the contingent deferred sales charge (CDSC) for Class C shares. The CDSC for Class C shares is 1.00%, which is reduced to 0% after 1 year. The performance of the Fund's share classes will differ primarily due to different sales charge structures and class expenses. Please see the prospectus for more information about sales charge structures, if any, and class expenses for your share class.
42
International Small Cap Fund (Unaudited)
COMPARISON OF A $1,000,000 INVESTMENT
(000's Omitted)
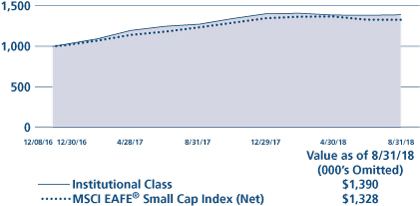
This graph shows the change in value of a hypothetical $1,000,000 investment in the Fund over the past 10 fiscal years, or since the Fund's inception if it has not operated for 10 years. The graph is based on the Institutional Class shares only; the performance of the Fund's share classes will differ primarily due to different sales charge structures and class expenses (see Performance Highlights chart on previous page). The result is compared with benchmarks, which include a broad-based market index and may include a more narrowly based index. Market indices have not been reduced to reflect any of the fees and costs of investing. The results shown in the graph reflect the reinvestment of income dividends and other distributions, if any. The results do not reflect the effect of taxes a shareholder would pay on Fund distributions or on the redemption of Fund shares. Results represent past performance and do not indicate future results.
43
Intrinsic Value Fund Commentary (Unaudited)
Neuberger Berman Intrinsic Value Fund Institutional Class generated a 21.01% total return for the fiscal year ended August 31, 2018, outperforming its benchmark, the Russell 2000® Value Index (the Index), which returned 20.05% for the same period. (Performance for all share classes is provided in the table immediately following this letter.)
While 2017 was a year of robust equity returns for most all investors, 2018 has been marked by volatility. Equities were down in the first calendar quarter, resumed their upward trend in the second quarter and continued to climb through August. At times market sentiment has been broadly bullish or bearish. Other times there were more specific preferences or avoidances—between growth or yield factors, global or domestic exposures and small or large capitalization. Thus far the result has been the outperformance of smaller and faster growing companies.
The market behavior is, in our view, the result of the Trump administration's high risk, high reward economic policies. Regardless of your politics, we can agree that the president's style is to upset the status quo. On one side we've seen positive, pro-growth oriented legislation (deregulation and tax reform) and on the other some higher risk initiatives with questionable economic benefit (trade negotiations and renewed Iran sanctions).
Although the prospect of tariffs makes global exposures a risk, that does not prevent companies with international revenues from contributing to performance. Two of our top contributors during the period have significant overseas sales (Ciena and Mellanox Technologies) while the global factor is hampering two of our laggards (Crown Holdings and MACOM Technology).
Our focus remains on finding long-term investment opportunities with the right mix of value and growth. The team continues to develop a robust set of new investment ideas. We introduced 19 new ideas and 13 positions were eliminated. At period end the portfolio's weighted average discount to intrinsic value stood at 26% versus 27% at the start.1
Finally, a few of words on our "activist" investments. Ciena has been executing well, winning new business and increasingly convincing investors that it is capable of generating attractive margins while returning capital to shareholders. VeriFone accepted our Director nominee late last year and in the second quarter agreed to an acquisition offer from private equity firm Francisco Partners. VeriFone was sold during the period. Verint posted solid quarterly earnings. Both of its segments, cyber and customer call center, are growing nicely. There are market rumors about Verint making a large acquisition. We don't know whether the deal mentioned in the press will come to pass but have made our opinions known to the company. Lastly, we recently engaged the Board of one of our largest and most undervalued investments and hope to have something positive to report in our next communication.
Wrapping it all up we're of mixed mind. We are encouraged by the opportunities we are finding in the market, the level of merger and acquisition activity seen in the portfolio and the absolute returns generated. On the other hand, we believe factors based strategies focused on shorter-term preferences can distort one's assessment of relative performance.
We thank you for your investment in our Fund and look forward to reporting our future results.
Sincerely,
BENJAMIN H. NAHUM, JAMES F. MCAREE AND AMIT SOLOMON
PORTFOLIO CO-MANAGERS
1 As of 8/31/2018, the Fund's discount to the team's calculated intrinsic value estimate was 26 percent. Intrinsic value reflects the team's analysis and estimates. There is no guarantee that any intrinsic values will be realized; security prices may decrease regardless of intrinsic values. This estimate of intrinsic value represents what we believe a company in the portfolio could be worth if it is acquired, if its profitability normalizes to its long-term average level, if its valuation moves in line with publicly traded peers' valuations, or if other investors recognize its potential for earnings growth. Intrinsic value is not a guarantee of performance of the Fund.
Information about principal risks of investing in the Fund is set forth in the prospectus and statement of additional information.
The portfolio composition, industries and holdings of the Fund are subject to change without notice.
The opinions expressed are those of the Fund's portfolio managers. The opinions are as of the date of this report and are subject to change without notice.
44
Intrinsic Value Fund (Unaudited)
TICKER SYMBOLS
Institutional Class | | NINLX | |
Class A | | NINAX | |
Class C | | NINCX | |
SECTOR ALLOCATION
(as a % of Total Investments*) | |
Consumer Discretionary | | | 7.6 | % | |
Consumer Staples | | | 1.8 | | |
Energy | | | 3.9 | | |
Financial Services | | | 8.7 | | |
Health Care | | | 15.0 | | |
Materials & Processing | | | 4.1 | | |
Producer Durables | | | 20.8 | | |
Technology | | | 34.3 | | |
Utilities | | | 3.2 | | |
Convertible Bonds | | | 0.6 | | |
Total | | | 100.0 | % | |
* Derivatives (other than options purchased), if any, are excluded from this chart.
PERFORMANCE HIGHLIGHTS
| | | | Average Annual Total
Return Ended 08/31/2018 | |
| | Inception
Date* | | 1 Year | | 5 Years | | 10 Years | | Life of
Fund | |
At NAV | |
| Institutional Class18 | | 05/10/2010 | | | 21.01 | % | | | 12.38 | % | | | 10.56 | % | | | 11.67 | % | |
| Class A18 | | 05/10/2010 | | | 20.58 | % | | | 11.97 | % | | | 10.23 | % | | | 11.51 | % | |
| Class C18 | | 05/10/2010 | | | 19.65 | % | | | 11.14 | % | | | 9.55 | % | | | 11.19 | % | |
With Sales Charge | |
| Class A18 | | | | | 13.62 | % | | | 10.66 | % | | | 9.58 | % | | | 11.20 | % | |
| Class C18 | | | | | 18.65 | % | | | 11.14 | % | | | 9.55 | % | | | 11.19 | % | |
Index | |
| Russell 2000® Value Index1,15 | | 20.05 | % | | | 11.72 | % | | | 9.27 | % | | | 9.30 | % | |
| Russell 2000® Index1,15 | | 25.45 | % | | | 13.00 | % | | | 10.46 | % | | | 8.66 | % | |
*The inception date for Neuberger Berman Intrinsic Value Fund Institutional Class, Class A, and Class C shares is May 10, 2010. Performance prior to that date is that of the Fund's predecessor, the DJG Small Cap Value Fund L.P., an unregistered limited partnership ("DJG Fund"); DJG Fund was the successor to The DJG Small Cap Value Fund, an unregistered commingled investment account ("DJG Account"), which had similar investment goals, strategies, and portfolio management team. See endnote 18 for more information.
The performance data quoted represent past performance and do not indicate future results. Current performance may be lower or higher than the performance data quoted. For performance data current to the most recent month-end, please visit www.nb.com/performance.
The results shown in the table reflect the reinvestment of income dividends and other distributions, if any. The results do not reflect the effect of taxes a shareholder would pay on Fund distributions or on the redemption of Fund shares.
The investment return and principal value of an investment will fluctuate and shares, when redeemed, may be worth more or less than their original cost.
Returns would have been lower if Neuberger Berman Investment Advisers LLC ("Management") had not reimbursed certain expenses and/or waived a portion of the investment management fees during certain of the periods shown. Repayment by a class (of expenses previously reimbursed and/or fees previously waived by Management) will decrease the class's returns. Please see Note B in the Notes to Financial Statements for specific information regarding expense reimbursement and/or fee waiver arrangements.
As stated in the Fund's most recent prospectus, the total annual operating expense ratios for fiscal year 2017 were 1.04%, 1.44% and 2.16% for Institutional Class, Class A and Class C shares, respectively (before expense reimbursements and/or fee waivers, if any). The expense ratios were 1.01%, 1.37% and 2.12% for Institutional Class, Class A and Class C shares, respectively, after expense reimbursements and/or fee waivers. The expense ratios for the annual period ended August 31, 2018 can be found in the Financial Highlights section of this report.
Returns shown with a sales charge reflect the deduction of the current maximum initial sales charge of 5.75% for Class A shares and the contingent deferred sales charge (CDSC) for Class C shares. The CDSC for Class C shares is 1.00%, which is reduced to 0% after 1 year. The performance of the Fund's share classes will differ primarily due to different sales charge structures and class expenses. Please see the prospectus for more information about sales charge structures, if any, and class expenses for your share class.
45
Intrinsic Value Fund (Unaudited)
COMPARISON OF A $1,000,000 INVESTMENT18
(000's Omitted)

This graph shows the change in value of a hypothetical $1,000,000 investment in the Fund over the past 10 fiscal years, or since the Fund's inception if it has not operated for 10 years. The graph is based on the Institutional Class shares only; the performance of the Fund's share classes will differ primarily due to different sales charge structures and class expenses (see Performance Highlights chart on previous page). The result is compared with benchmarks, which include a broad-based market index and may include a more narrowly based index. Market indices have not been reduced to reflect any of the fees and costs of investing. The results shown in the graph reflect the reinvestment of income dividends and other distributions, if any. The results do not reflect the effect of taxes a shareholder would pay on Fund distributions or on the redemption of Fund shares. Results represent past performance and do not indicate future results.
46
Large Cap Value Fund Commentary (Unaudited)
Neuberger Berman Large Cap Value Fund Investor Class generated a 12.90% total return for the fiscal year ended August 31, 2018, outperforming its benchmark, the Russell 1000® Value Index (the Index), which returned 12.47% for the same period. (Performance for all share classes is provided in the table immediately following this letter.)
The U.S. stock market generated strong results during the reporting period. After rising over the first five months of the period, the overall stock market fell sharply in February and March 2018. This occurred given concerns that the U.S. Federal Reserve may raise interest rates at a faster pace than previously expected. However, this was a short-term setback, as the market then rallied over the last five months of the period and reached several new all-time highs in August 2018. This rally was driven by a number of factors, including overall strong corporate profits and accelerating growth in the U.S.—both of which overshadowed concerns over a global trade war. All told, large-cap value stocks, as measured by the Index gained 12.47%.
Within the Index, Information Technology (IT) and Energy were among the strongest sectors of the market owing in part to the solid U.S. economy. Financials was another outperforming area due to the increasingly pro-business stance in Washington. Defensive segments including Consumer Staples, Telecommunication Services and Utilities were the weakest performers and underperformed the overall Index.
Consumer Discretionary was a top area of relative strength within the Fund over the 12-month period, owing in part to its exposure to the Textiles, Apparel & Luxury Goods industry. In particular, lululemon Athletica, Inc. generated strong results. The company reported strong results during the reporting period and remained well insulated from some of the factors that negatively impacted other retailers. Stock selection in the Consumer Staples sector gave an additional lift to returns versus the Index. Within the sector, the Fund's Personal Products holdings were additive for results. Elsewhere, stock selection in the Health Care sector meaningfully contributed to performance. A standout holding in the Fund was Centene Corp., a company that serves as an intermediary for both government-sponsored and privately insured health care programs. Its shares rallied sharply as some uncertainties surrounding health care reform were lifted.
On the downside, stock selection in the Materials sector was the largest detractor from relative returns over the period. Weakness in Materials stemmed from the Metals & Mining industry, where our investments in aggregate fell short of Index constituents. Elsewhere, the Fund's underweight exposures to Energy and IT negatively impacted results. Both sectors significantly outperformed the benchmark during the reporting period.
The Fund's use of written options contributed positively to performance during the period.
Strong earnings growth, with the help of corporate tax cuts and accelerating economic growth, have contributed to the rise in equities thus far in 2018. However, we remain cautious, as valuations in certain segments of the market have soared, and we believe these areas could be susceptible to a pullback if investors decide to take profits amidst growing uncertainty over the global economy. Particularly, we believe anxiety is mounting that the Trump administration's efforts to correct trade imbalances could result in a full-blown trade war, which could hamper global growth and lead to rising prices for certain U.S. goods. Rising interest rates also pose risks to domestic equities and underscore our defensive positioning. Within this environment, we are exploring all areas of the market for price dislocations that we believe could turn into rewarding investment opportunities. Our portfolio construction strategy entails seeking to uncover what we believe are underappreciated stocks with hidden value that can be realized as specific catalysts play out over time; it is our opinion that this approach is fundamental to generating favorable returns over the long term.
Sincerely,
ELI M. SALZMANN
PORTFOLIO MANAGER
Information about principal risks of investing in the Fund is set forth in the prospectus and statement of additional information.
The portfolio composition, industries and holdings of the Fund are subject to change without notice.
The opinions expressed are those of the Fund's portfolio manager. The opinions are as of the date of this report and are subject to change without notice.
47
Large Cap Value Fund (Unaudited)
TICKER SYMBOLS
Investor Class | | NPRTX | |
Trust Class | | NBPTX | |
Advisor Class | | NBPBX | |
Institutional Class | | NBPIX | |
Class A | | NPNAX | |
Class C | | NPNCX | |
Class R3 | | NPNRX | |
SECTOR ALLOCATION
(as a % of Total Investments*) | |
Consumer Discretionary | | | 3.6 | % | |
Consumer Staples | | | 16.2 | | |
Energy | | | 5.5 | | |
Financials | | | 18.9 | | |
Health Care | | | 21.4 | | |
Industrials | | | 8.6 | | |
Information Technology | | | 1.2 | | |
Materials | | | 3.1 | | |
Telecommunication Services | | | 5.3 | | |
Utilities | | | 13.6 | | |
Short-Term Investments | | | 2.6 | | |
Total | | | 100.0 | % | |
* Derivatives (other than options purchased), if any, are excluded from this chart.
PERFORMANCE HIGHLIGHTS7
| | | | Average Annual Total
Return Ended 08/31/2018 | |
| | Inception
Date | | 1 Year | | 5 Years | | 10 Years | | Life of
Fund | |
At NAV | |
Investor Class | | 01/20/19752 | | | 12.90 | % | | | 11.17 | % | | | 7.15 | % | | | 12.55 | % | |
| Trust Class3 | | 08/30/1993 | | | 12.68 | % | | | 10.98 | % | | | 6.96 | % | | | 12.50 | % | |
| Advisor Class4 | | 08/16/1996 | | | 12.56 | % | | | 10.81 | % | | | 6.80 | % | | | 12.33 | % | |
| Institutional Class5 | | 06/07/2006 | | | 13.11 | % | | | 11.35 | % | | | 7.33 | % | | | 12.60 | % | |
| Class A19 | | 06/21/2010 | | | 12.68 | % | | | 10.93 | % | | | 6.96 | % | | | 12.50 | % | |
| Class C19 | | 06/21/2010 | | | 11.83 | % | | | 10.11 | % | | | 6.31 | % | | | 12.35 | % | |
| Class R316 | | 06/21/2010 | | | 12.39 | % | | | 10.61 | % | | | 6.72 | % | | | 12.45 | % | |
With Sales Charge | |
| Class A19 | | | | | 6.19 | % | | | 9.63 | % | | | 6.32 | % | | | 12.35 | % | |
| Class C19 | | | | | 10.83 | % | | | 10.11 | % | | | 6.31 | % | | | 12.35 | % | |
Index | |
| Russell 1000® Value Index1,15 | | 12.47 | % | | | 11.22 | % | | | 8.93 | % | | | N/A | | |
The performance data quoted represent past performance and do not indicate future results. Current performance may be lower or higher than the performance data quoted. For performance data current to the most recent month-end, please visit www.nb.com/performance.
The results shown in the table reflect the reinvestment of income dividends and other distributions, if any. The results do not reflect the effect of taxes a shareholder would pay on Fund distributions or on the redemption of Fund shares.
The investment return and principal value of an investment will fluctuate and shares, when redeemed, may be worth more or less than their original cost.
Returns would have been lower if Neuberger Berman Investment Advisers LLC ("Management") had not reimbursed certain expenses and/or waived a portion of the investment management fees during certain of the periods shown. Repayment by a class (of expenses previously reimbursed and/or fees previously waived by Management) will decrease the class's returns. Please see Note B in the Notes to Financial Statements for specific information regarding expense reimbursement and/or fee waiver arrangements.
As stated in the Fund's most recent prospectus, the total annual operating expense ratios for fiscal year 2017 were 0.88%, 1.06%, 1.21%, 0.71%, 1.08%, 1.83% and 1.44% for Investor Class, Trust Class, Advisor Class, Institutional Class, Class A, Class C and Class R3 shares, respectively (before expense reimbursements and/or fee waivers, if any). The expense ratio was 1.37% for Class R3 shares after expense reimbursements and/or fee waivers. The total annual operating expense ratio for Institutional Class includes the class's repayment of expenses previously reimbursed and/or fees previously waived by Management. The expense ratios for the annual period ended August 31, 2018 can be found in the Financial Highlights section of this report.
Returns shown with a sales charge reflect the deduction of the current maximum initial sales charge of 5.75% for Class A shares and the contingent deferred sales charge (CDSC) for Class C shares. The CDSC for Class C shares is 1.00%, which is reduced to 0% after 1 year. The performance of the Fund's share classes will differ primarily due to different sales charge structures and class expenses. Please see the prospectus for more information about sales charge structures, if any, and class expenses for your share class.
48
Large Cap Value Fund (Unaudited)
COMPARISON OF A $10,000 INVESTMENT

This graph shows the change in value of a hypothetical $10,000 investment in the Fund over the past 10 fiscal years, or since the Fund's inception if it has not operated for 10 years. The graph is based on the Investor Class shares only; the performance of the Fund's share classes will differ primarily due to different sales charge structures and class expenses (see Performance Highlights chart on previous page). The result is compared with benchmarks, which include a broad-based market index and may include a more narrowly based index. Market indices have not been reduced to reflect any of the fees and costs of investing. The results shown in the graph reflect the reinvestment of income dividends and other distributions, if any. The results do not reflect the effect of taxes a shareholder would pay on Fund distributions or on the redemption of Fund shares. Results represent past performance and do not indicate future results.
49
Mid Cap Growth Fund Commentary (Unaudited)
Neuberger Berman Mid Cap Growth Fund Investor Class generated a 26.75% total return for the fiscal year ended August 31, 2018, outperforming its benchmark, the Russell Midcap® Growth Index (the Index), which returned 25.06% for the same period. (Performance for all share classes is provided in the table immediately following this letter.)
The fiscal year remained a positive environment for small- and mid-cap growth stocks, even with the reemergence of volatility, as inflation remained modest, underlying GDP growth continued to improve and the market, for the most part, remained willing to pay up for positive differentiation and compelling underlying corporate fundamentals. The continued durability of this bull market was further bolstered by the U.S. Federal Reserve's constructive tenor around the economy and the overall pace of their monetary tightening, which stayed consistent with the market's expectations. If there was one glaring warning sign, it would be the potential negative implications from the Trump Administration's highly protectionist approach to global trade. While we're not necessarily close to any "point-of-no-return," the market has clearly been uncomfortable with the escalating rhetoric.
During the period, the portfolio was materially overweight in the Health Care and Information Technology (IT) sectors versus the Index, and underweight in the Materials, Consumer Discretionary, Real Estate and Consumer Staples sectors. These decisions reflect the compelling catalysts and underlying fundamentals that we continue to discover in Health Care and IT, our persistent wariness around retail and consumer spending, and the fact that neither GDP-dependent commodities nor income-yielding real estate investment trusts (REITs) are an ideal fit with our earnings-centric philosophy. Looking at attribution, our Health Care effort could be felt at all levels of the Fund and ultimately helped to drive our positive results relative to the benchmark. At the industry-level, compelling science and the positive realization of catalysts within our overweight allocation to Biotechnology resulted in that segment being the leading contributor to performance, while stock specific issues resulted in IT's Electronic Equipment Instruments & Components segment being the leading detractor. Drilling down to our holdings, Square, Inc. was the top contributor to performance, while TESARO, Inc. was the leading detractor. Square, which combines software and hardware to enable business owners to turn mobile and computing devices into point-of-sale payment solutions, benefited from the expanding acceptance of their technology in the marketplace and continued to deliver compelling top-line growth, while TESARO, a biopharmaceutical company focused on the development and acquisition of oncology-related treatments, fell short of heightened "whisper" expectations in the fourth quarter of 2017. We subsequently exited our position in TESARO.
Looking ahead, we remain bullish on business sentiment, the potential for increased strategic capital expenditures and the continued broad strength of economic data and trends. We're neutral on valuations, as we believe they are somewhat range-bound by inflation largely still being a non-factor (floor) and the realities of a rising rate environment (ceiling). If we're bearish on anything, it would be the lingering risk that the current tit-for-tat tariff gamesmanship potentially intensifies and ultimately has a disruptive effect on business spending and consumer confidence. That said, we don't anticipate finding ourselves in a worst-case trade war scenario, and while we believe intermittent volatility is likely to persist, with the potential for continued intriguing catalysts, strong corporate fundamentals and fair valuations we're cautiously optimistic that this market still has room to grow.
Sincerely,
KENNETH J. TUREK
PORTFOLIO MANAGER
Information about principal risks of investing in the Fund is set forth in the prospectus and statement of additional information.
The portfolio composition, industries and holdings of the Fund are subject to change without notice.
The opinions expressed are those of the Fund's portfolio manager. The opinions are as of the date of this report and are subject to change without notice.
50
Mid Cap Growth Fund (Unaudited)
TICKER SYMBOLS
Investor Class | | NMANX | |
Trust Class | | NBMTX | |
Advisor Class | | NBMBX | |
Institutional Class | | NBMLX | |
Class A | | NMGAX | |
Class C | | NMGCX | |
Class R3 | | NMGRX | |
Class R6 | | NRMGX | |
SECTOR ALLOCATION
(as a % of Total Investments*) | |
Consumer Discretionary | | | 14.5 | % | |
Consumer Staples | | | 1.2 | | |
Energy | | | 1.8 | | |
Financials | | | 6.3 | | |
Health Care | | | 20.5 | | |
Industrials | | | 18.9 | | |
Information Technology | | | 30.1 | | |
Materials | | | 0.9 | | |
Telecommunication Services | | | 0.7 | | |
Utilities | | | 0.7 | | |
Exchange Traded Funds | | | 1.0 | | |
Short-Term Investments | | | 3.4 | | |
Total | | | 100.0 | % | |
* Derivatives (other than options purchased), if any, are excluded from this chart.
PERFORMANCE HIGHLIGHTS7
| | | | Average Annual Total
Return Ended 08/31/2018 | |
| | Inception
Date | | 1 Year | | 5 Years | | 10 Years | | Life of
Fund | |
At NAV | |
Investor Class | | 03/01/19792 | | | 26.75 | % | | | 13.43 | % | | | 10.81 | % | | | 12.06 | % | |
| Trust Class3 | | 08/30/1993 | | | 26.65 | % | | | 13.36 | % | | | 10.73 | % | | | 11.97 | % | |
| Advisor Class4 | | 09/03/1996 | | | 26.32 | % | | | 13.07 | % | | | 10.40 | % | | | 11.76 | % | |
| Institutional Class5 | | 04/19/2007 | | | 26.93 | % | | | 13.64 | % | | | 11.09 | % | | | 12.14 | % | |
| Class A19 | | 05/27/2009 | | | 26.48 | % | | | 13.22 | % | | | 10.67 | % | | | 12.02 | % | |
| Class C19 | | 05/27/2009 | | | 25.49 | % | | | 12.36 | % | | | 9.90 | % | | | 11.82 | % | |
| Class R316 | | 05/27/2009 | | | 26.11 | % | | | 12.93 | % | | | 10.41 | % | | | 11.95 | % | |
| Class R623 | | 03/15/2013 | | | 26.99 | % | | | 13.73 | % | | | 10.97 | % | | | 12.10 | % | |
With Sales Charge | |
| Class A19 | | | | | 19.23 | % | | | 11.88 | % | | | 10.02 | % | | | 11.85 | % | |
| Class C19 | | | | | 24.49 | % | | | 12.36 | % | | | 9.90 | % | | | 11.82 | % | |
Index | |
| Russell Midcap® Growth Index1,15 | | 25.06 | % | | | 14.19 | % | | | 11.64 | % | | | N/A | | |
| Russell Midcap® Index1,15 | | 17.89 | % | | | 12.80 | % | | | 10.92 | % | | | 13.38 | % | |
The performance data quoted represent past performance and do not indicate future results. Current performance may be lower or higher than the performance data quoted. For performance data current to the most recent month-end, please visit www.nb.com/performance.
The results shown in the table reflect the reinvestment of income dividends and other distributions, if any. The results do not reflect the effect of taxes a shareholder would pay on Fund distributions or on the redemption of Fund shares.
The investment return and principal value of an investment will fluctuate and shares, when redeemed, may be worth more or less than their original cost.
Returns would have been lower if Neuberger Berman Investment Advisers LLC ("Management") had not reimbursed certain expenses and/or waived a portion of the investment management fees during certain of the periods shown. Repayment by a class (of expenses previously reimbursed and/or fees previously waived by Management) will decrease the class's returns. Please see Note B in the Notes to Financial Statements for specific information regarding expense reimbursement and/or fee waiver arrangements.
As stated in the Fund's most recent prospectus, the total annual operating expense ratios for fiscal year 2017 were 0.93%, 0.98%, 1.24%, 0.73%, 1.12%, 1.87%, 1.37% and 0.65% for Investor Class, Trust Class, Advisor Class, Institutional Class, Class A, Class C, Class R3 and Class R6 shares, respectively (before expense reimbursements and/or fee waivers, if any). The expense ratio was 1.37% for Class R3 shares after expense reimbursements and/or fee waivers. The total annual operating expense ratio for each of Class A and Class C includes the class's repayment of expenses previously reimbursed and/or fees previously waived by Management. The expense ratios for the annual period ended August 31, 2018 can be found in the Financial Highlights section of this report.
Returns shown with a sales charge reflect the deduction of the current maximum initial sales charge of 5.75% for Class A shares and the contingent deferred sales charge (CDSC) for Class C shares. The CDSC for Class C shares is 1.00%, which is reduced to 0% after 1 year. The performance of the Fund's share classes will differ primarily due to different sales charge structures and class expenses. Please see the prospectus for more information about sales charge structures, if any, and class expenses for your share class.
51
Mid Cap Growth Fund (Unaudited)
COMPARISON OF A $10,000 INVESTMENT

This graph shows the change in value of a hypothetical $10,000 investment in the Fund over the past 10 fiscal years, or since the Fund's inception if it has not operated for 10 years. The graph is based on the Investor Class shares only; the performance of the Fund's share classes will differ primarily due to different sales charge structures and class expenses (see Performance Highlights chart on previous page). The result is compared with benchmarks, which include a broad-based market index and may include a more narrowly based index. Market indices have not been reduced to reflect any of the fees and costs of investing. The results shown in the graph reflect the reinvestment of income dividends and other distributions, if any. The results do not reflect the effect of taxes a shareholder would pay on Fund distributions or on the redemption of Fund shares. Results represent past performance and do not indicate future results.
52
Mid Cap Intrinsic Value Fund Commentary (Unaudited)
Neuberger Berman Mid Cap Intrinsic Value Fund Investor Class shares generated a 12.20% total return for the fiscal year ended August 31, 2018, slightly underperforming its benchmark, the Russell Midcap® Value Index (the Index), which returned 12.67% for the same period. (Performance for all share classes is provided in the table immediately following this letter.)
While 2017 was a year of robust returns, equities were down in first calendar quarter of 2018 but resumed their upward trend in the second quarter and continued to climb through August. Equity markets entered 2018 at above average valuation levels. As we near the end of the third calendar quarter, valuations have dropped to five-year average levels. Over the past several months, stocks reacted positively to strong earnings gains, fueled in part by the recently enacted corporate tax rate cuts.
During the period, stock selection in the Consumer Discretionary sector helped performance most with SeaWorld, Best Buy and Macy's posting strong returns. SeaWorld's results were driven by new strategic pricing strategies, new marketing and communications initiatives and the positive reception of new rides, attractions and events. The retailers rallied after reporting several strong quarters. Macy's results were bolstered by improving consumer spending and a strong fashion cycle, while Best Buy continued to see broad-based strength across all categories. Macy's was sold during the period. Stock selection in Health Care was also a positive for the strategy. Investors were encouraged by the pace of Molina's turnaround progress. The company recently reported earnings far in excess of street estimates and raised annual guidance significantly. Several of our bank stocks also performed well benefitting from the rising rate environment, strong loan growth and lower tax rates.
Stock selection in Technology presented the biggest headwind. Western Digital shares declined as cyclical solid state memory price declines continued to drive bearish sentiment. Flex (which was sold during the period) was hampered by delays in its Nike program sales ramp and uncertainty over tariffs on supply chain customers. Stock selection in Consumer Staples also hurt performance. Despite better recent results, both TreeHouse Foods and Hain Celestial continued to be plagued by rising costs, higher freight rates and operational headwinds. In the Energy sector, Cabot Oil & Gas traded down with natural gas prices.
Company specific events had a positive impact on the portfolio. Since our last communication, nine of the Fund's holdings were acquired, disposed of significant assets, or made large acquisitions. Notable events include: Envision Healthcare agreed to be acquired by KKR, Best Buy agreed to acquire GreatCall, and Molina Healthcare agreed to sell its Medicaid Solutions business to DXC Technology.
We introduced 15 new ideas during the period, six in the last six months. Alexion Pharmaceuticals is a biopharmaceutical company focused on developing drugs in the rare disease area. Vectren Corp. is an energy holding company with regulated utility operations in both gas and electric. The company recently agreed to a merger with CenterPoint Energy. ARRIS International is a leading provider of video and broadband processing and delivery. Chico's FAS is a leading retailer of private label women's apparel. Esterline Technologies is a manufacturer of aircraft parts and components and machine tool systems. We also participated in BJ's Wholesale Club's IPO, but sold the position after it opened at a significant premium to the IPO price and close to our near-term intrinsic value1 estimate.
We also eliminated nine positions as Quintiles, Avery Dennison, Avis Budget, CenterPoint, and Macy's reached our estimates of their intrinsic values. Office Depot, CBS and Valvoline were sold as our investment theses for these companies changed.
Many factors causing investor concerns remain in play including U.S. Federal Reserve rate hikes, ongoing trade negotiations and the upcoming U.S. mid-term elections. We anticipate that the merger and acquisition market will remain robust, which usually benefits a number of our holdings. We believe that we are in a stock pickers' market and that the changes we have made during the year have improved the risk/reward profile of the portfolio.
53
Sincerely,
MICHAEL C. GREENE
PORTFOLIO MANAGER
1 Intrinsic value reflects the portfolio management team's analysis and estimates of a company's value. There is no guarantee that any intrinsic values will be realized; security prices may decrease regardless of intrinsic values.
Information about principal risks of investing in the Fund is set forth in the prospectus and statement of additional information.
The portfolio composition, industries and holdings of the Fund are subject to change without notice.
The opinions expressed are those of the Fund's portfolio manager. The opinions are as of the date of this report and are subject to change without notice.
54
Mid Cap Intrinsic Value Fund (Unaudited)
TICKER SYMBOLS
Investor Class | | NBRVX | |
Trust Class | | NBREX | |
Institutional Class | | NBRTX | |
Class A | | NBRAX | |
Class C | | NBRCX | |
Class R3 | | NBRRX | |
SECTOR ALLOCATION
(as a % of Total Investments*) | |
Consumer Discretionary | | | 10.4 | % | |
Consumer Staples | | | 6.6 | | |
Energy | | | 7.2 | | |
Financial Services | | | 18.2 | | |
Health Care | | | 9.5 | | |
Materials & Processing | | | 5.7 | | |
Producer Durables | | | 14.5 | | |
Technology | | | 15.8 | | |
Utilities | | | 5.1 | | |
Short-Term Investments | | | 7.0 | | |
Total | | | 100.0 | % | |
* Derivatives (other than options purchased), if any, are excluded from this chart.
PERFORMANCE HIGHLIGHTS7
| | | | Average Annual Total
Return Ended 08/31/2018 | |
| | Inception
Date | | 1 Year | | 5 Years | | 10 Years | | Life of
Fund | |
At NAV | |
Investor Class | | 06/01/1999 | | | 12.20 | % | | | 11.08 | % | | | 9.58 | % | | | 9.74 | % | |
| Trust Class3 | | 06/10/1999 | | | 12.17 | % | | | 10.88 | % | | | 9.46 | % | | | 9.64 | % | |
| Institutional Class5 | | 03/08/2010 | | | 12.60 | % | | | 11.34 | % | | | 9.83 | % | | | 9.87 | % | |
| Class A19 | | 06/21/2010 | | | 12.23 | % | | | 10.94 | % | | | 9.49 | % | | | 9.69 | % | |
| Class C19 | | 06/21/2010 | | | 11.37 | % | | | 10.10 | % | | | 8.83 | % | | | 9.35 | % | |
| Class R316 | | 06/21/2010 | | | 11.92 | % | | | 10.65 | % | | | 9.27 | % | | | 9.58 | % | |
With Sales Charge | |
| Class A19 | | | | | 5.77 | % | | | 9.64 | % | | | 8.85 | % | | | 9.36 | % | |
| Class C19 | | | | | 10.37 | % | | | 10.10 | % | | | 8.83 | % | | | 9.35 | % | |
Index | |
| Russell Midcap® Value Index1,15 | | 12.67 | % | | | 11.81 | % | | | 10.33 | % | | | 9.60 | % | |
| Russell Midcap® Index1,15 | | 17.89 | % | | | 12.80 | % | | | 10.92 | % | | | 9.43 | % | |
The performance data quoted represent past performance and do not indicate future results. Current performance may be lower or higher than the performance data quoted. For performance data current to the most recent month-end, please visit www.nb.com/performance.
The results shown in the table reflect the reinvestment of income dividends and other distributions, if any. The results do not reflect the effect of taxes a shareholder would pay on Fund distributions or on the redemption of Fund shares.
The investment return and principal value of an investment will fluctuate and shares, when redeemed, may be worth more or less than their original cost.
Returns would have been lower if Neuberger Berman Investment Advisers LLC ("Management") had not reimbursed certain expenses and/or waived a portion of the investment management fees during certain of the periods shown. Repayment by a class (of expenses previously reimbursed and/or fees previously waived by Management) will decrease the class's returns. Please see Note B in the Notes to Financial Statements for specific information regarding expense reimbursement and/or fee waiver arrangements.
As stated in the Fund's most recent prospectus, the total annual operating expense ratios for fiscal year 2017 were 1.25%, 1.43%, 1.06%, 1.43%, 2.18% and 1.69% for Investor Class, Trust Class, Institutional Class, Class A, Class C and Class R3 shares, respectively (before expense reimbursements and/or fee waivers, if any). The expense ratios were 1.25%, 0.85%, 1.21%, 1.96% and 1.46% for Trust Class, Institutional Class, Class A, Class C and Class R3 shares, respectively, after expense reimbursements and/or fee waivers. The total annual operating expense ratio for Trust Class includes the class's repayment of expenses previously reimbursed and/or fees previously waived by Management. The expense ratios for the annual period ended August 31, 2018 can be found in the Financial Highlights section of this report.
Returns shown with a sales charge reflect the deduction of the current maximum initial sales charge of 5.75% for Class A shares and the contingent deferred sales charge (CDSC) for Class C shares. The CDSC for Class C shares is 1.00%, which is reduced to 0% after 1 year. The performance of the Fund's share classes will differ primarily due to different sales charge structures and class expenses. Please see the prospectus for more information about sales charge structures, if any, and class expenses for your share class.
55
Mid Cap Intrinsic Value Fund (Unaudited)
COMPARISON OF A $10,000 INVESTMENT
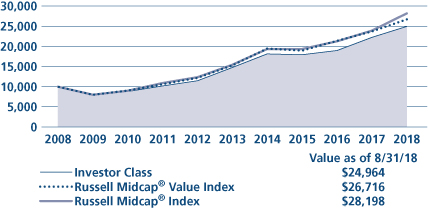
This graph shows the change in value of a hypothetical $10,000 investment in the Fund over the past 10 fiscal years, or since the Fund's inception if it has not operated for 10 years. The graph is based on the Investor Class shares only; the performance of the Fund's share classes will differ primarily due to different sales charge structures and class expenses (see Performance Highlights chart on previous page). The result is compared with benchmarks, which include a broad-based market index and may include a more narrowly based index. Market indices have not been reduced to reflect any of the fees and costs of investing. The results shown in the graph reflect the reinvestment of income dividends and other distributions, if any. The results do not reflect the effect of taxes a shareholder would pay on Fund distributions or on the redemption of Fund shares. Results represent past performance and do not indicate future results.
56
Multi-Cap Opportunities Fund Commentary (Unaudited)
Neuberger Berman Multi-Cap Opportunities Fund Institutional Class generated a 19.15% total return for the fiscal year ended August 31, 2018, versus a 19.66% total return for its benchmark, the S&P 500® Index (the Index), for the same period. (Performance for all share classes is provided in the table immediately following this letter.)
Positive performance for the Index was broad-based, with gains in all 11 sectors. U.S. equity fundamentals remain strong. Corporate earnings growth is positive and U.S. real Gross Domestic Product continues to expand at a solid rate. We believe this is broadly beneficial for the U.S. equity market.
Within the Index, Consumer Discretionary, Energy, and Information Technology (IT) were the top performing sectors. Consumer Staples, Financials, Health Care, Industrials, Materials, Real Estate, Telecommunication Services and Utilities were the bottom performing sectors within the Index.
Within the Fund, stock selection in Consumer Staples, Health Care and Industrials benefitted performance relative to the benchmark. Selection within IT detracted from relative performance during the year. From a positioning perspective, an underweight to Consumer Staples relative to the Index and no exposure to the Real Estate, Telecommunications Services, or Utilities sectors benefitted relative performance. An underweight to Consumer Discretionary and overweight to Materials detracted. The Fund ended the fiscal year with an overweight, relative to the Index, in the Financials, Industrials, and Materials sectors. The Fund ended the fiscal year with an underweight, relative to the Index, in the Consumer Discretionary, Consumer Staples, Energy, Health Care and IT sectors. The Fund continued to have no exposure to the Real Estate, Telecommunication Services, or Utilities sectors at fiscal year end.
Portfolio construction is an important component of our investment process and consists of three distinct investment categories: Special Situations, Opportunistic, and Classic. Special Situations have unique attributes (e.g., restructuring, spin-offs, post-bankruptcy equities) that require specific valuation methodologies and customized investment research. Opportunistic investments are companies that have become inexpensive for a tangible reason that we believe is temporary. Classic investments are those companies with long histories of shareholder friendly policies, high quality management teams and exceptional operating performance. We believe maintaining a balance of these three categories helps to mitigate risk within the portfolio. We continue to pursue investment opportunities across each investment category with attractive risk/return profiles.
We believe the current environment is attractive for free cash flow oriented investing. In our opinion, many company balance sheets appear healthy and free cash flow generation has been strong. As a result, we believe management teams have a significant opportunity to create value for shareholders by allocating capital effectively. Dividend increases, share repurchase programs, cash accumulation, debt retirement, organic growth initiatives, and selective and highly accretive acquisitions all can accrue to the benefit of equity holders. When company specific drivers are in focus, it is our view that high conviction active managers have the potential to add value for their clients through stock selection. We believe deep fundamental analysis centered on free cash flow and capital structure efficiency may be an important driver of performance going forward.
Our style of investing is based on rigorous fundamental research. The analysis centers on the business model and a company's ability to generate and effectively utilize free cash flow. As we evaluate both potential new positions and current portfolio holdings, we will continue to do so with a long-term investment perspective in mind. As always, our focus is to grow the Fund's assets through the disciplined application of our investment philosophy and process.
Sincerely,
RICHARD S. NACKENSON
PORTFOLIO MANAGER
Information about principal risks of investing in the Fund is set forth in the prospectus and statement of additional information.
The portfolio composition, industries and holdings of the Fund are subject to change without notice.
The opinions expressed are those of the Fund's portfolio manager. The opinions are as of the date of this report and are subject to change without notice.
57
Multi-Cap Opportunities Fund (Unaudited)
TICKER SYMBOLS
Institutional Class | | NMULX | |
Class A | | NMUAX | |
Class C | | NMUCX | |
SECTOR ALLOCATION
(as a % of Total Investments*) | |
Consumer Discretionary | | | 1.5 | % | |
Consumer Staples | | | 5.9 | | |
Energy | | | 2.4 | | |
Financials | | | 27.4 | | |
Health Care | | | 11.3 | | |
Industrials | | | 16.8 | | |
Information Technology | | | 24.7 | | |
Materials | | | 9.0 | | |
Short-Term Investments | | | 1.0 | | |
Total | | | 100.0 | % | |
* Derivatives (other than options purchased), if any, are excluded from this chart.
PERFORMANCE HIGHLIGHTS9
| | | | Average Annual Total
Return Ended 08/31/2018 | |
| | Inception
Date* | | 1 Year | | 5 Years | | 10 Years | | Life of
Fund | |
At NAV | |
| Institutional Class17 | | 12/21/2009 | | | 19.15 | % | | | 13.46 | % | | | 11.01 | % | | | 9.52 | % | |
| Class A17 | | 12/21/2009 | | | 18.72 | % | | | 13.04 | % | | | 10.67 | % | | | 9.23 | % | |
| Class C17 | | 12/21/2009 | | | 17.83 | % | | | 12.22 | % | | | 9.95 | % | | | 8.63 | % | |
With Sales Charge | |
| Class A17 | | | | | 11.89 | % | | | 11.71 | % | | | 10.01 | % | | | 8.68 | % | |
| Class C17 | | | | | 16.83 | % | | | 12.22 | % | | | 9.95 | % | | | 8.63 | % | |
Index | |
| S&P 500® Index1,15 | | 19.66 | % | | | 14.52 | % | | | 10.86 | % | | | 8.85 | % | |
*Prior to December 14, 2009, the Fund had different investment goals, strategies, and portfolio management team. The performance data for each class includes the performance of the Fund's oldest share class, Trust Class, from November 2, 2006 through December 21, 2009. See endnote 17 for information about the effects of the different fees paid by each class.
The performance data quoted represent past performance and do not indicate future results. Current performance may be lower or higher than the performance data quoted. For performance data current to the most recent month-end, please visit www.nb.com/performance.
The results shown in the table reflect the reinvestment of income dividends and other distributions, if any. The results do not reflect the effect of taxes a shareholder would pay on Fund distributions or on the redemption of Fund shares.
The investment return and principal value of an investment will fluctuate and shares, when redeemed, may be worth more or less than their original cost.
Returns would have been lower if Neuberger Berman Investment Advisers LLC ("Management") had not reimbursed certain expenses and/or waived a portion of the investment management fees during certain of the periods shown. Repayment by a class (of expenses previously reimbursed and/or fees previously waived by Management) will decrease the class's returns. Please see Note B in the Notes to Financial Statements for specific information regarding expense reimbursement and/or fee waiver arrangements.
As stated in the Fund's most recent prospectus, the total annual operating expense ratios for fiscal year 2017 were 0.75%, 1.10% and 1.84% for Institutional Class, Class A and Class C shares, respectively (before expense reimbursements and/or fee waivers, if any). The expense ratios for the annual period ended August 31, 2018 can be found in the Financial Highlights section of this report.
Returns shown with a sales charge reflect the deduction of the current maximum initial sales charge of 5.75% for Class A shares and the contingent deferred sales charge (CDSC) for Class C shares. The CDSC for Class C shares is 1.00%, which is reduced to 0% after 1 year. The performance of the Fund's share classes will differ primarily due to different sales charge structures and class expenses. Please see the prospectus for more information about sales charge structures, if any, and class expenses for your share class.
58
Multi-Cap Opportunities Fund (Unaudited)
COMPARISON OF A $1,000,000 INVESTMENT17
(000's Omitted)
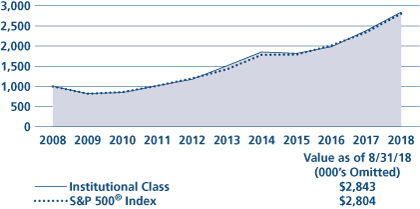
This graph shows the change in value of a hypothetical $1,000,000 investment in the Fund over the past 10 fiscal years, or since the Fund's inception if it has not operated for 10 years. The graph is based on the Institutional Class shares only; the performance of the Fund's share classes will differ primarily due to different sales charge structures and class expenses (see Performance Highlights chart on previous page). The result is compared with benchmarks, which include a broad-based market index and may include a more narrowly based index. Market indices have not been reduced to reflect any of the fees and costs of investing. The results shown in the graph reflect the reinvestment of income dividends and other distributions, if any. The results do not reflect the effect of taxes a shareholder would pay on Fund distributions or on the redemption of Fund shares. Results represent past performance and do not indicate future results.
59
Real Estate Fund Commentary (Unaudited)
Neuberger Berman Real Estate Fund Trust Class generated a 5.01% total return for the fiscal year ended August 31, 2018, underperforming its benchmark, the FTSE NAREIT All Equity REITs Index (the Index), which generated a 6.08% total return for the same period. (Performance for all share classes is provided in the table immediately following this letter.)
The U.S. stock market was volatile at times, but produced strong results during the reporting period. After rising over the first five months of the period, the overall stock market declined in February and March 2018. This occurred given concerns that the U.S. Federal Reserve (Fed) may raise interest rates at a faster pace than previously expected. However, this proved to be a temporary setback, as the market then moved higher during the last five months of the period. This was driven by a number of factors, including corporate profits that often exceeded expectations and accelerating growth in the U.S.—both of which overshadowed concerns over a global trade war. All told, the S&P 500® Index, gained 19.66% for the 12-month period. Comparatively, real estate investment trusts (REITs) posted less robust returns during the period. This was partially due to rising interest rates in the U.S.
The Fund generated a positive return but underperformed its benchmark during the reporting period. Stock selection, overall, was negative for relative performance during the period. In particular, holdings within the Health Care, Infrastructure REITs and Apartment subsectors were among the largest detractors from returns. Several individual holdings were also negative for results, including Equinix, Inc., a Data Center REIT; Ventas, Inc., a Health Care REIT and Highwoods Properties, Inc., an Office REIT. Contributing the most to results were our holdings in the Regional Malls, Diversified, and Industrial subsectors. Simon Property Group, Inc., a Regional Mall REIT; Marriott International, Inc., a Lodging/Reports company; and Extra Space Storage, a Self Storage REIT were the largest contributors to performance. Marriott International, Inc. was sold during the period.
On the upside, sector positioning, overall, contributed to the Fund's relative performance. In particular, an underweight to Diversified, an overweight to Regional Malls and an underweight to Health Care were beneficial for performance. Conversely, underweights to Lodging/Resorts and Self Storage, along with an overweight to Infrastructure REITs, were the largest headwinds from returns.
We anticipate seeing solid economic growth for the U.S. as the year progresses, and for the Fed to take a measured approach in terms of further rate hikes. While interest rate movements could be a near-term headwind, we believe the drivers of this change, namely solid economic and job growth, combined with modest inflation, should be positive for real estate fundamentals. The tax cuts signed into law in late 2017 have had a positive impact on corporate profitability, while also increasing disposable income for most consumers. We believe improved consumer confidence, accelerating non-residential fixed investment and modest inflation, if they continue, should benefit tenant demand for real estate space. We are monitoring the potential impact from proposed trade tariffs, government deregulation and infrastructure that may affect the real estate sector.
Sincerely,
STEVE SHIGEKAWA AND BRIAN C. JONES
PORTFOLIO CO-MANAGERS
Information about principal risks of investing in the Fund is set forth in the prospectus and statement of additional information.
The portfolio composition, industries and holdings of the Fund are subject to change without notice.
The opinions expressed are those of the Fund's portfolio managers. The opinions are as of the date of this report and are subject to change without notice.
60
Real Estate Fund (Unaudited)
TICKER SYMBOLS
Trust Class | | NBRFX | |
Institutional Class | | NBRIX | |
Class A | | NREAX | |
Class C | | NRECX | |
Class R3 | | NRERX | |
Class R6 | | NRREX | |
SECTOR ALLOCATION
(as a % of Total Investments*) | |
Apartments | | | 12.4 | % | |
Data Centers | | | 10.7 | | |
Diversified | | | 1.5 | | |
Free Standing | | | 3.7 | | |
Health Care | | | 8.7 | | |
Industrial | | | 6.6 | | |
Infrastructure | | | 14.9 | | |
Lodging/Resorts | | | 3.8 | | |
Manufactured Homes | | | 4.2 | | |
Office | | | 8.0 | | |
Regional Malls | | | 7.5 | | |
Self Storage | | | 4.3 | | |
Shopping Centers | | | 4.0 | | |
Single Family Homes | | | 4.3 | | |
Timber | | | 3.5 | | |
Short-Term Investments | | | 1.9 | | |
Total | | | 100.0 | % | |
* Derivatives (other than options purchased), if any, are excluded from this chart.
PERFORMANCE HIGHLIGHTS7,21
| | | | Average Annual Total
Return Ended 08/31/2018 | |
| | Inception
Date | | 1 Year | | 5 Years | | 10 Years | | Life of
Fund | |
At NAV | |
Trust Class | | 05/01/2002 | | | 5.01 | % | | | 9.62 | % | | | 8.36 | % | | | 10.88 | % | |
| Institutional Class6 | | 06/04/2008 | | | 5.28 | % | | | 9.84 | % | | | 8.57 | % | | | 11.02 | % | |
| Class A14 | | 06/21/2010 | | | 4.90 | % | | | 9.44 | % | | | 8.21 | % | | | 10.79 | % | |
| Class C14 | | 06/21/2010 | | | 4.14 | % | | | 8.63 | % | | | 7.55 | % | | | 10.37 | % | |
| Class R314 | | 06/21/2010 | | | 4.58 | % | | | 9.16 | % | | | 7.98 | % | | | 10.64 | % | |
| Class R624 | | 03/15/2013 | | | 5.35 | % | | | 9.92 | % | | | 8.53 | % | | | 10.99 | % | |
With Sales Charge | |
| Class A14 | | | | | –1.11 | % | | | 8.15 | % | | | 7.57 | % | | | 10.38 | % | |
| Class C14 | | | | | 3.16 | % | | | 8.63 | % | | | 7.55 | % | | | 10.37 | % | |
Index | |
| FTSE NAREIT All Equity REITs Index1,15 | 6.08 | % | | | 10.86 | % | | | 8.02 | % | | | 10.11 | % | |
The performance data quoted represent past performance and do not indicate future results. Current performance may be lower or higher than the performance data quoted. For performance data current to the most recent month-end, please visit www.nb.com/performance.
The results shown in the table reflect the reinvestment of income dividends and other distributions, if any. The results do not reflect the effect of taxes a shareholder would pay on Fund distributions or on the redemption of Fund shares.
The investment return and principal value of an investment will fluctuate and shares, when redeemed, may be worth more or less than their original cost.
Returns would have been lower if Neuberger Berman Investment Advisers LLC ("Management") had not reimbursed certain expenses and/or waived a portion of the investment management fees during certain of the periods shown. Repayment by a class (of expenses previously reimbursed and/or fees previously waived by Management) will decrease the class's returns. Please see Note B in the Notes to Financial Statements for specific information regarding expense reimbursement and/or fee waiver arrangements.
As stated in the Fund's most recent prospectus, the total annual operating expense ratios for fiscal year 2017 were 1.42%, 1.05%, 1.42%, 2.17%, 1.68% and 0.98% for Trust Class, Institutional Class, Class A, Class C, Class R3 and Class R6 shares, respectively (before expense reimbursements and/or fee waivers, if any). The expense ratios were 0.86%, 1.22%, 1.97%, 1.47% and 0.79% for Institutional Class, Class A, Class C, Class R3 and Class R6 shares, respectively, after expense reimbursements and/or fee waivers. The expense ratios for the annual period ended August 31, 2018 can be found in the Financial Highlights section of this report.
Returns shown with a sales charge reflect the deduction of the current maximum initial sales charge of 5.75% for Class A shares and the contingent deferred sales charge (CDSC) for Class C shares. The CDSC for Class C shares is 1.00%, which is reduced to 0% after 1 year. The performance of the Fund's share classes will differ primarily due to different sales charge structures and class expenses. Please see the prospectus for more information about sales charge structures, if any, and class expenses for your share class.
61
Real Estate Fund (Unaudited)
COMPARISON OF A $10,000 INVESTMENT
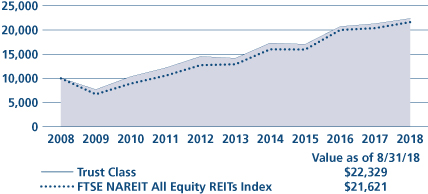
This graph shows the change in value of a hypothetical $10,000 investment in the Fund over the past 10 fiscal years, or since the Fund's inception if it has not operated for 10 years. The graph is based on the Trust Class shares only; the performance of the Fund's share classes will differ primarily due to different sales charge structures and class expenses (see Performance Highlights chart on previous page). The result is compared with benchmarks, which include a broad-based market index and may include a more narrowly based index. Market indices have not been reduced to reflect any of the fees and costs of investing. The results shown in the graph reflect the reinvestment of income dividends and other distributions, if any. The results do not reflect the effect of taxes a shareholder would pay on Fund distributions or on the redemption of Fund shares. Results represent past performance and do not indicate future results.
62
Small Cap Growth Fund Commentary (Unaudited)
Neuberger Berman Small Cap Growth Fund Investor Class generated a 38.67% total return for the fiscal year ended August 31, 2018, outperforming its benchmark, the Russell 2000® Growth Index (the Index), which returned 30.72% for the same period. (Performance for all share classes is provided in the table immediately following this letter.)
The trailing 12-month period remained a positive environment for small cap growth stocks, even with the reemergence of volatility, as inflation remained modest, underlying GDP growth continued to improve and the market, for the most part, remained willing to pay up for positive differentiation and compelling underlying corporate fundamentals. The continued durability of this bull market was further bolstered by the U.S. Federal Reserve's constructive tenor around the economy and the overall pace of their monetary tightening, which stayed consistent with the market's expectations. If there was one glaring warning sign, it would be the potential negative implications from the Trump Administration's highly protectionist approach to global trade. While we're not necessarily close to any "point-of-no-return," the market has clearly been uncomfortable with the escalating rhetoric.
During the period, the portfolio was materially overweight Health Care and Information Technology (IT) and underweight Materials and Real Estate, relative to the index. These decisions reflect the compelling catalysts and underlying fundamentals that we continue to see in Health Care and IT, our persistent wariness around retail and consumer spending and the fact that neither GDP-dependent commodities nor income-yielding real estate investment trusts (REITs) are an ideal fit with our earnings-centric philosophy. The Fund's outperformance over the last year was driven by strong stock selection, especially within Health Care, Consumer Discretionary, and IT, and broadly positive allocation decisions. At the industry-level, compelling science and the positive realization of catalysts within our overweight allocation to Biotechnology resulted in that segment being the leading contributor to performance, while stock specific issues resulted in the Media industry being the leading detractor. Drilling down to our holdings, RingCentral Inc., which offers cloud-based unified communication solutions to support an increasingly mobile workforce, was the top performing holding as their efforts to broaden their platform, expand cross-selling efforts and move upstream to larger clients translated to strong top- and bottom-line results. Impinj, Inc., a provider of ultra-high frequency radio solutions for real time inventory management and tracking data, was the leading detractor as the company fell short of expectations and lowered future guidance due to increased competition and a rise in customer order deferment. Given the uncertainty and ebbing confidence in management we elected to exit our position.
Looking ahead, we remain bullish on business sentiment, the potential for increased strategic capital expenditures and the continued broad strength of economic data and trends. We're neutral on valuations, as we believe they are somewhat range-bound by inflation largely still being a non-factor (floor) and the realities of a rising rate environment (ceiling). If we're bearish on anything, it would be the lingering risk that the current tit-for-tat tariff gamesmanship potentially intensifies and ultimately has a disruptive effect on business spending and consumer confidence. That said, we don't anticipate finding ourselves in a worst-case trade war scenario and while we believe intermittent volatility is likely to persist, with the potential for continued intriguing catalysts, strong corporate fundamentals and fair valuations we're cautiously optimistic that this market still has room to grow.
Sincerely,
KENNETH J. TUREK
PORTFOLIO MANAGER
Information about principal risks of investing in the Fund is set forth in the prospectus and statement of additional information.
The portfolio composition, industries and holdings of the Fund are subject to change without notice.
The opinions expressed are those of the Fund's portfolio manager. The opinions are as of the date of this report and are subject to change without notice.
63
Small Cap Growth Fund (Unaudited)
TICKER SYMBOLS
Investor Class | | NBMIX | |
Trust Class | | NBMOX | |
Advisor Class | | NBMVX | |
Institutional Class | | NBSMX | |
Class A | | NSNAX | |
Class C | | NSNCX | |
Class R3 | | NSNRX | |
SECTOR ALLOCATION
(as a % of Total Investments*) | |
Consumer Discretionary | | | 15.0 | % | |
Consumer Staples | | | 2.4 | | |
Energy | | | 1.0 | | |
Financials | | | 5.5 | | |
Health Care | | | 30.3 | | |
Industrials | | | 17.6 | | |
Information Technology | | | 23.2 | | |
Materials | | | 1.6 | | |
Short-Term Investments | | | 3.4 | | |
Total | | | 100.0 | % | |
* Derivatives (other than options purchased), if any, are excluded from this chart.
PERFORMANCE HIGHLIGHTS
| | | | Average Annual Total
Return Ended 08/31/2018 | |
| | Inception
Date | | 1 Year | | 5 Years | | 10 Years | | Life of
Fund | |
At NAV | |
Investor Class | | 10/20/1998 | | | 38.67 | % | | | 14.87 | % | | | 10.43 | % | | | 10.03 | % | |
| Trust Class3 | | 11/03/1998 | | | 38.45 | % | | | 14.67 | % | | | 10.20 | % | | | 9.87 | % | |
| Advisor Class4 | | 05/03/2002 | | | 38.26 | % | | | 14.53 | % | | | 10.02 | % | | | 9.78 | % | |
| Institutional Class5 | | 04/01/2008 | | | 39.12 | % | | | 15.23 | % | | | 10.74 | % | | | 10.19 | % | |
| Class A19 | | 05/27/2009 | | | 38.60 | % | | | 14.81 | % | | | 10.34 | % | | | 9.98 | % | |
| Class C19 | | 05/27/2009 | | | 37.56 | % | | | 13.96 | % | | | 9.57 | % | | | 9.60 | % | |
| Class R316 | | 05/27/2009 | | | 38.29 | % | | | 14.54 | % | | | 10.08 | % | | | 9.85 | % | |
With Sales Charge | |
| Class A19 | | | | | 30.62 | % | | | 13.46 | % | | | 9.69 | % | | | 9.65 | % | |
| Class C19 | | | | | 36.56 | % | | | 13.96 | % | | | 9.57 | % | | | 9.60 | % | |
Index | |
| Russell 2000® Growth Index1,15 | | 30.72 | % | | | 14.20 | % | | | 11.57 | % | | | 8.95 | % | |
| Russell 2000® Index1,15 | | 25.45 | % | | | 13.00 | % | | | 10.46 | % | | | 9.81 | % | |
The performance data quoted represent past performance and do not indicate future results. Current performance may be lower or higher than the performance data quoted. For performance data current to the most recent month-end, please visit www.nb.com/performance.
The results shown in the table reflect the reinvestment of income dividends and other distributions, if any. The results do not reflect the effect of taxes a shareholder would pay on Fund distributions or on the redemption of Fund shares.
The investment return and principal value of an investment will fluctuate and shares, when redeemed, may be worth more or less than their original cost.
Returns would have been lower if Neuberger Berman Investment Advisers LLC ("Management") had not reimbursed certain expenses and/or waived a portion of the investment management fees during certain of the periods shown. Repayment by a class (of expenses previously reimbursed and/or fees previously waived by Management) will decrease the class's returns. Please see Note B in the Notes to Financial Statements for specific information regarding expense reimbursement and/or fee waiver arrangements.
As stated in the Fund's most recent prospectus, the total annual operating expense ratios for fiscal year 2017 were 1.79%, 1.89%, 2.05%, 1.51%, 1.90%, 2.63% and 2.20% for Investor Class, Trust Class, Advisor Class, Institutional Class, Class A, Class C and Class R3 shares, respectively (before expense reimbursements and/or fee waivers, if any). The expense ratios were 1.31%, 1.41%, 1.61%, 0.91%, 1.27%, 2.02% and 1.52% for Investor Class, Trust Class, Advisor Class, Institutional Class, Class A, Class C and Class R3 shares, respectively, after expense reimbursements and/or fee waivers. The expense ratios for the annual period ended August 31, 2018 can be found in the Financial Highlights section of this report.
Returns shown with a sales charge reflect the deduction of the current maximum initial sales charge of 5.75% for Class A shares and the contingent deferred sales charge (CDSC) for Class C shares. The CDSC for Class C shares is 1.00%, which is reduced to 0% after 1 year. The performance of the Fund's share classes will differ primarily due to different sales charge structures and class expenses. Please see the prospectus for more information about sales charge structures, if any, and class expenses for your share class.
64
Small Cap Growth Fund (Unaudited)
COMPARISON OF A $10,000 INVESTMENT
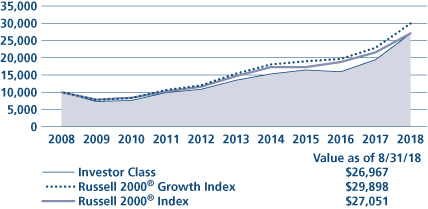
This graph shows the change in value of a hypothetical $10,000 investment in the Fund over the past 10 fiscal years, or since the Fund's inception if it has not operated for 10 years. The graph is based on the Investor Class shares only; the performance of the Fund's share classes will differ primarily due to different sales charge structures and class expenses (see Performance Highlights chart on previous page). The result is compared with benchmarks, which include a broad-based market index and may include a more narrowly based index. Market indices have not been reduced to reflect any of the fees and costs of investing. The results shown in the graph reflect the reinvestment of income dividends and other distributions, if any. The results do not reflect the effect of taxes a shareholder would pay on Fund distributions or on the redemption of Fund shares. Results represent past performance and do not indicate future results.
65
Sustainable Equity Fund* Commentary (Unaudited)
Neuberger Berman Sustainable Equity Fund Investor Class generated a total return of 18.36% for the fiscal year ended August 31, 2018, trailing the 19.66% total return of the S&P 500® Index (the Index) for the same period. (Performance for all share classes is provided in the table immediately following this letter.)
The Index saw upward momentum this fiscal year, as slow but steady economic growth, tax cuts and reduced regulation drove investor appetite. Positive sentiment outweighed concerns over the potential impacts of trade wars on several fronts, a lack of policy clarity, and upticks in inflation and interest rates in the U.S. Volatility was a factor throughout the period as investors grappled with headlines, and the market continued to be fairly narrow. This presented both a headwind and new opportunities for the Fund.
Stock selection caused our shortfall relative to the Index this period, primarily due to the market's narrowness. Investors favored high revenue growth names—without consideration of valuation. On the other hand, the volatility present throughout the year allowed us to buy and sell within core holdings and from our prospect list—at opportunistic prices.
Consumer Discretionary, Energy, and Information Technology sectors detracted from relative performance. Newell Brands, EQT, and NetScout Systems were key underperformers. Newell and NetScout were sold, as their execution was inconsistent with our investment premise. EQT's performance was impacted by a contraction in valuation multiples as investors worried about increase in U.S. gas supply while ignoring the potential demand for natural gas as a transition fuel replacing coal and nuclear generation.
The Fund outperformed the Index within Consumer Staples, Financials, and Industrials. Long-term holdings W.W. Grainger, Progressive, and Texas Instruments were our top contributors for the period, with performance driven by strong operating results and continued industry leadership. During the period, we added Compass Group and Sherwin-Williams to the portfolio. In addition to selling Newell Brands and NetScout Systems, we also sold Eversource Energy, Manpower Group, and Motorola Solutions on the back of rich valuation.
Looking ahead, notwithstanding the market volatility and absent an exogenous shock, we continue to anticipate a slow growth environment in the U.S. However, we are incrementally cautious about economic growth given a full labor market and a tightening in monetary policy. With inflationary indicators tracking up slightly, we continue to be mindful of its potential impact across our portfolio in terms of overall portfolio positioning.
On the international front, geopolitical volatility, particularly increasing tensions with China, continued uncertainty created by Brexit, as well as any potential disruptions to global trade as a result of the current U.S. administration's trade policies could be sources of market volatility.
From an environmental, social and governance (ESG) perspective we continually engage the companies we invest in. In this past period we engaged in portfolio-wide discussions around setting science based emission reduction targets, ensuring gender pay equity and discussing best practices related to engaging board of directors.
We continue to focus on the fundamentals of the businesses we own and believe they can translate top-line growth into stronger, advantaged bottom-line growth, supported by competitive advantages, attractive return on capital profiles, and demonstrated leadership practices in ESG. We believe our portfolio holdings also have the balance sheet strength and free cash flow generation that could enable them to weather global economic turmoil, should it occur.
We look forward to continuing to serve your investment needs.
66
Sincerely,
INGRID S. DYOTT AND SAJJAD S. LADIWALA
CO-PORTFOLIO MANAGERS
* As previously announced, effective May 1, 2018, the name of Neuberger Berman Socially Responsive Fund changed to Neuberger Berman Sustainable Equity Fund.
Information about principal risks of investing in the Fund is set forth in the prospectus and statement of additional information.
The portfolio composition, industries and holdings of the Fund are subject to change without notice.
The opinions expressed are those of the Fund's portfolio managers. The opinions are as of the date of this report and are subject to change without notice.
67
Sustainable Equity Fund (Unaudited)
TICKER SYMBOLS
Investor Class | | NBSRX | |
Trust Class | | NBSTX | |
Institutional Class | | NBSLX | |
Class A | | NRAAX | |
Class C | | NRACX | |
Class R3 | | NRARX | |
Class R6 | | NRSRX | |
SECTOR ALLOCATION
(as a % of Total Investments*) | |
Consumer Discretionary | | | 15.3 | % | |
Consumer Staples | | | 6.7 | | |
Energy | | | 7.0 | | |
Financials | | | 16.2 | | |
Health Care | | | 17.7 | | |
Industrials | | | 12.9 | | |
Information Technology | | | 18.3 | | |
Materials | | | 4.2 | | |
Short-Term Investments | | | 1.7 | | |
Total | | | 100.0 | % | |
* Derivatives (other than options purchased), if any, are excluded from this chart.
PERFORMANCE HIGHLIGHTS7
| | | | Average Annual Total
Return Ended 08/31/2018 | |
| | Inception
Date | | 1 Year | | 5 Years | | 10 Years | | Life of
Fund | |
At NAV | |
Investor Class | | 03/16/1994 | | | 18.36 | % | | | 12.60 | % | | | 9.62 | % | | | 9.59 | % | |
| Trust Class3 | | 03/03/1997 | | | 18.13 | % | | | 12.41 | % | | | 9.43 | % | | | 9.41 | % | |
| Institutional Class5 | | 11/28/2007 | | | 18.56 | % | | | 12.80 | % | | | 9.82 | % | | | 9.68 | % | |
| Class A19 | | 05/27/2009 | | | 18.14 | % | | | 12.39 | % | | | 9.43 | % | | | 9.51 | % | |
| Class C19 | | 05/27/2009 | | | 17.26 | % | | | 11.55 | % | | | 8.67 | % | | | 9.20 | % | |
| Class R316 | | 05/27/2009 | | | 17.85 | % | | | 12.11 | % | | | 9.18 | % | | | 9.41 | % | |
| Class R623 | | 03/15/2013 | | | 18.65 | % | | | 12.88 | % | | | 9.77 | % | | | 9.65 | % | |
With Sales Charge | |
| Class A19 | | | | | 11.35 | % | | | 11.06 | % | | | 8.79 | % | | | 9.25 | % | |
| Class C19 | | | | | 16.26 | % | | | 11.55 | % | | | 8.67 | % | | | 9.20 | % | |
Index | |
| S&P 500® Index1,15 | | 19.66 | % | | | 14.52 | % | | | 10.86 | % | | | 9.85 | % | |
The performance data quoted represent past performance and do not indicate future results. Current performance may be lower or higher than the performance data quoted. For performance data current to the most recent month-end, please visit www.nb.com/performance.
The results shown in the table reflect the reinvestment of income dividends and other distributions, if any. The results do not reflect the effect of taxes a shareholder would pay on Fund distributions or on the redemption of Fund shares.
The investment return and principal value of an investment will fluctuate and shares, when redeemed, may be worth more or less than their original cost.
Returns would have been lower if Neuberger Berman Investment Advisers LLC ("Management") had not reimbursed certain expenses and/or waived a portion of the investment management fees during certain of the periods shown. Repayment by a class (of expenses previously reimbursed and/or fees previously waived by Management) will decrease the class's returns. Please see Note B in the Notes to Financial Statements for specific information regarding expense reimbursement and/or fee waiver arrangements.
As stated in the Fund's most recent prospectus, the total annual operating expense ratios for fiscal year 2017 were 0.85%, 1.02%, 0.67%, 1.04%, 1.78%, 1.28% and 0.59% for Investor Class, Trust Class, Institutional Class, Class A, Class C, Class R3 and Class R6 shares, respectively (before expense reimbursements and/or fee waivers, if any). The expense ratios for the annual period ended August 31, 2018 can be found in the Financial Highlights section of this report.
Returns shown with a sales charge reflect the deduction of the current maximum initial sales charge of 5.75% for Class A shares and the contingent deferred sales charge (CDSC) for Class C shares. The CDSC for Class C shares is 1.00%, which is reduced to 0% after 1 year. The performance of the Fund's share classes will differ primarily due to different sales charge structures and class expenses. Please see the prospectus for more information about sales charge structures, if any, and class expenses for your share class.
68
Sustainable Equity Fund (Unaudited)
COMPARISON OF A $10,000 INVESTMENT
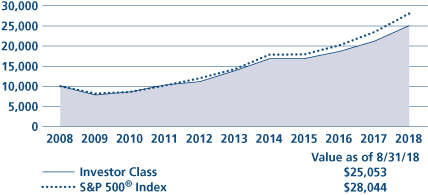
This graph shows the change in value of a hypothetical $10,000 investment in the Fund over the past 10 fiscal years, or since the Fund's inception if it has not operated for 10 years. The graph is based on the Investor Class shares only; the performance of the Fund's share classes will differ primarily due to different sales charge structures and class expenses (see Performance Highlights chart on previous page). The result is compared with benchmarks, which include a broad-based market index and may include a more narrowly based index. Market indices have not been reduced to reflect any of the fees and costs of investing. The results shown in the graph reflect the reinvestment of income dividends and other distributions, if any. The results do not reflect the effect of taxes a shareholder would pay on Fund distributions or on the redemption of Fund shares. Results represent past performance and do not indicate future results.
69
Value Fund Commentary (Unaudited)
Neuberger Berman Value Fund Institutional Class generated a 12.98% total return for the fiscal year ended August 31, 2018, outperforming its benchmark, the Russell 1000® Value Index (the Index), which returned 12.47% for the same period. (Performance for all share classes is provided in the table immediately following this letter.)
The U.S. stock market generated strong results during the reporting period. After rising over the first five months of the period, the overall stock market fell sharply in February and March 2018. This occurred given concerns that the U.S. Federal Reserve may raise interest rates at a faster pace than previously expected. However, this was a short-term setback, as the market then rallied over the last five months of the period and reached several new all-time highs in August 2018. This rally was driven by a number of factors, including overall strong corporate profits and accelerating growth in the U.S.—both of which overshadowed concerns over a global trade war. All told, large-cap value stocks, as measured by the Index gained 12.47%.
Within the Index, Information Technology (IT) and Energy were among the strongest sectors of the market owing in part to the solid U.S. economy. Financials was another outperforming area due to the increasingly pro-business stance in Washington. Defensive segments including Consumer Staples, Telecommunication Services and Utilities were the weakest performers and underperformed the overall Index.
Consumer Discretionary was a top area of relative strength within the Fund over the 12-month period, owing in part to its exposure to the Textiles, Apparel & Luxury Goods industry. In particular, lululemon Athletica, Inc. generated strong results. The company reported strong results during the reporting period and remained well insulated from some of the factors that negatively impacted other retailers. Stock selection in the Consumer Staples sector gave an additional lift to returns versus the Index. Within the sector, the Fund's Personal Products holdings were additive for results. Elsewhere, stock selection in the Health Care sector meaningfully contributed to performance. A standout holding in the Fund was Centene Corp., a company that serves as an intermediary for both government-sponsored and privately insured health care programs. Its shares rallied sharply as some uncertainties surrounding health care reform were lifted.
On the downside, stock selection in the Materials sector was the largest detractor from relative returns over the period. Weakness in Materials stemmed from the Metals & Mining industry, where our investments in aggregate fell short of Index constituents. Elsewhere, the Fund's underweight exposures to Energy and IT negatively impacted results. Both sectors significantly outperformed the benchmark during the reporting period.
The Fund's use of written options contributed positively to performance during the period.
Strong earnings growth, with the help of corporate tax cuts and accelerating economic growth, have contributed to the rise in equities thus far in 2018. However, we remain cautious, as valuations in certain segments of the market have soared, and we believe these areas could be susceptible to a pullback if investors decide to take profits amidst growing uncertainty over the global economy. Particularly, we believe anxiety is mounting that the Trump administration's efforts to correct trade imbalances could result in a full-blown trade war, which could hamper global growth and lead to rising prices for certain U.S. goods. Rising interest rates also pose risks to domestic equities and underscore our defensive positioning. Within this environment, we are exploring all areas of the market for price dislocations that we believe could turn into rewarding investment opportunities. Our portfolio construction strategy entails seeking to uncover what we believe are underappreciated stocks with hidden value that can be realized as specific catalysts play out over time; it is our opinion that this approach is fundamental to generating favorable returns over the long term.
Sincerely,
ELI M. SALZMANN
PORTFOLIO MANAGER
Information about principal risks of investing in the Fund is set forth in the prospectus and statement of additional information.
The portfolio composition, industries and holdings of the Fund are subject to change without notice.
The opinions expressed are those of the Fund's portfolio manager. The opinions are as of the date of this report and are subject to change without notice.
70
TICKER SYMBOLS
Institutional Class | | NLRLX | |
Class A | | NVAAX | |
Class C | | NVACX | |
SECTOR ALLOCATION
(as a % of Total Investments*) | |
Consumer Discretionary | | | 3.6 | % | |
Consumer Staples | | | 16.2 | | |
Energy | | | 5.5 | | |
Financials | | | 18.8 | | |
Health Care | | | 21.4 | | |
Industrials | | | 8.6 | | |
Information Technology | | | 1.2 | | |
Materials | | | 3.1 | | |
Telecommunication Services | | | 5.2 | | |
Utilities | | | 13.5 | | |
Short-Term Investments | | | 2.9 | | |
Total | | | 100.0 | % | |
* Derivatives (other than options purchased), if any, are excluded from this chart.
PERFORMANCE HIGHLIGHTS9
| | | | Average Annual Total
Return Ended 08/31/2018 | |
| | Inception
Date* | | 1 Year | | 5 Years | | 10 Years | | Life of
Fund | |
At NAV | |
| Institutional Class20 | | 04/19/2010 | | | 12.98 | % | | | 11.09 | % | | | 9.44 | % | | | 8.52 | % | |
| Class A20 | | 03/02/2011 | | | 12.56 | % | | | 10.67 | % | | | 9.13 | % | | | 8.26 | % | |
| Class C20 | | 03/02/2011 | | | 11.72 | % | | | 9.85 | % | | | 8.52 | % | | | 7.75 | % | |
With Sales Charge | |
| Class A20 | | | | | 6.09 | % | | | 9.37 | % | | | 8.49 | % | | | 7.72 | % | |
| Class C20 | | | | | 10.72 | % | | | 9.85 | % | | | 8.52 | % | | | 7.75 | % | |
Index | |
| Russell 1000® Value Index1,15 | | 12.47 | % | | | 11.22 | % | | | 8.93 | % | | | 6.74 | % | |
*The performance data for each class includes the performance of the Fund's oldest share class, Trust Class, from November 2, 2006 through April 19, 2010. The performance data for Class A and Class C also includes the performance of the Fund's Institutional Class from April 19, 2010 through March 2, 2011. See endnote 20 for information about the effects of the different fees paid by each class.
The performance data quoted represent past performance and do not indicate future results. Current performance may be lower or higher than the performance data quoted. For performance data current to the most recent month-end, please visit www.nb.com/performance.
The results shown in the table reflect the reinvestment of income dividends and other distributions, if any. The results do not reflect the effect of taxes a shareholder would pay on Fund distributions or on the redemption of Fund shares.
The investment return and principal value of an investment will fluctuate and shares, when redeemed, may be worth more or less than their original cost.
Returns would have been lower if Neuberger Berman Investment Advisers LLC ("Management") had not reimbursed certain expenses and/or waived a portion of the investment management fees during certain of the periods shown. Repayment by a class (of expenses previously reimbursed and/or fees previously waived by Management) will decrease the class's returns. Please see Note B in the Notes to Financial Statements for specific information regarding expense reimbursement and/or fee waiver arrangements.
As stated in the Fund's most recent prospectus, the total annual operating expense ratios for fiscal year 2017 were 2.22%, 2.62% and 3.33% for Institutional Class, Class A and Class C shares, respectively (before expense reimbursements and/or fee waivers, if any). The expense ratios were 0.77%, 1.13% and 1.88% for Institutional Class, Class A and Class C shares, respectively, after expense reimbursements and/or fee waivers. The expense ratios for the annual period ended August 31, 2018 can be found in the Financial Highlights section of this report.
Returns shown with a sales charge reflect the deduction of the current maximum initial sales charge of 5.75% for Class A shares and the contingent deferred sales charge (CDSC) for Class C shares. The CDSC for Class C shares is 1.00%, which is reduced to 0% after 1 year. The performance of the Fund's share classes will differ primarily due to different sales charge structures and class expenses. Please see the prospectus for more information about sales charge structures, if any, and class expenses for your share class.
71
COMPARISON OF A $1,000,000 INVESTMENT20
(000's Omitted)

This graph shows the change in value of a hypothetical $1,000,000 investment in the Fund over the past 10 fiscal years, or since the Fund's inception if it has not operated for 10 years. The graph is based on the Institutional Class shares only; the performance of the Fund's share classes will differ primarily due to different sales charge structures and class expenses (see Performance Highlights chart on previous page). The result is compared with benchmarks, which include a broad-based market index and may include a more narrowly based index. Market indices have not been reduced to reflect any of the fees and costs of investing. The results shown in the graph reflect the reinvestment of income dividends and other distributions, if any. The results do not reflect the effect of taxes a shareholder would pay on Fund distributions or on the redemption of Fund shares. Results represent past performance and do not indicate future results.
72
1 Please see "Glossary of Indices" on page 77 for a description of indices. Please note that individuals cannot invest directly in any index. The indices described in this report do not take into account any fees, expenses or tax consequences of investing in the individual securities that they track. Data about the performance of an index are prepared or obtained by Neuberger Berman Investment Advisers LLC ("NBIA" or "Management") and reflect the reinvestment of income dividends and other distributions, if any. The Fund may invest in securities not included in a described index and generally does not invest in all securities included in a described index.
2 This date reflects when Management first became the investment manager to the Fund.
3 The performance information for the Trust Class prior to the class's inception date is that of the Fund's Investor Class. The performance information for the Investor Class has not been adjusted to take into account differences in class specific operating expenses. The Investor Class has lower expenses and typically higher returns than the Trust Class.
4 The performance information for the Advisor Class prior to the class's inception date is that of the Fund's Investor Class. The performance information for the Investor Class has not been adjusted to take into account differences in class specific operating expenses. The Investor Class has lower expenses and typically higher returns than the Advisor Class.
5 The performance information for the Institutional Class prior to the class's inception date is that of the Fund's Investor Class. The performance information for the Investor Class has not been adjusted to take into account differences in class specific operating expenses. The Investor Class has higher expenses and typically lower returns than the Institutional Class.
6 The performance information for the Institutional Class prior to the class's inception date is that of the Fund's Trust Class. The performance information for the Trust Class has not been adjusted to take into account differences in class specific operating expenses. The Trust Class has higher expenses and typically lower returns than the Institutional Class.
7 The investments for the Fund are managed by the same portfolio manager(s) who manage(s) one or more other registered funds that have names, investment objectives and investment styles that are similar to those of the Fund. You should be aware that the Fund is likely to differ from those other mutual fund(s) in size, cash flow pattern and tax matters. Accordingly, the holdings and performance of the Fund can be expected to vary from those of the other mutual fund(s).
8 The Fund had a policy of investing mainly in large-cap stocks prior to September 1998 and investing 90% of its assets in no more than six economic sectors prior to December 17, 2007. As of April 2, 2001, the Fund changed its investment policy to become "non-diversified" under the Investment Company Act of 1940 ("1940 Act"). Performance prior to these changes might have been different if current policies had been in effect. However, by operation of law under the 1940 Act, the Fund subsequently became, and currently operates as, a diversified fund. Please see the notes to the financial statements for information on a non-diversified fund becoming a diversified fund by operation of law.
9 Neuberger Berman Global Real Estate Fund and Neuberger Berman International Small Cap Fund are relatively small. Each of Neuberger Berman Emerging Markets Equity Fund, Neuberger Berman Equity Income Fund, Neuberger Berman Global Equity Fund, Neuberger Berman Multi-Cap Opportunities Fund and Neuberger Berman Value Fund were relatively small prior to September 2010, June 2008, August 2013, January 2010 and April 2013, respectively. The same techniques used to produce returns in a small fund may not work to produce similar returns in a larger fund and could have an impact on performance.
10 The performance information for Class R3 prior to the class's inception date is that of the Fund's Institutional Class. The performance information for the Institutional Class has not been adjusted to take into account
73
differences in class specific operating expenses (such as Rule 12b-1 fees). The Institutional Class has lower expenses and typically higher returns than Class R3.
11 The Fund had a policy of investing mainly in large-cap stocks prior to December 2002. Its performance prior to that date might have been different if current policies had been in effect.
12 The performance information for Class A, Class C, Investor Class, and Trust Class prior to the classes' inception date is that of the Fund's Institutional Class. The performance information for the Institutional Class has been adjusted to reflect the appropriate sales charges applicable to Class A and Class C shares, but has not been adjusted to take into account differences in class specific operating expenses (such as Rule 12b-1 fees). The Institutional Class has lower expenses and typically higher returns than Class A, Class C, Investor Class, and Trust Class.
13 The performance information for Institutional Class, Class A, Class C and Class R3 prior to June 9, 2008 is that of the Fund's Trust Class, which had an inception date of November 2, 2006, and converted into the Institutional Class on June 9, 2008. During the period from November 2, 2006 through June 9, 2008, the Trust Class had only one investor, which could have impacted Fund performance. The performance information for the Trust Class has been adjusted to reflect the appropriate sales charges applicable to Class A and Class C shares, but has not been adjusted to take into account differences in class specific operating expenses (such as Rule 12b-1 fees). The Trust Class had higher expenses and typically lower returns than the Institutional Class. The Trust Class had lower expenses and typically higher returns than Class A, Class C and Class R3. The performance information for Class R3 from June 9, 2008 to the class's inception date is that of the Fund's Institutional Class. The performance information for the Institutional Class has not been adjusted to take into account differences in class specific operating expenses (such as Rule 12b-1 fees). The Institutional Class has lower expenses and typically higher returns than Class R3.
14 The performance information for Class A, Class C and Class R3 prior to the classes' respective inception dates is that of the Fund's Trust Class. The performance information for the Trust Class has been adjusted to reflect the appropriate sales charges applicable to Class A and Class C shares, but has not been adjusted to take into account differences in class specific operating expenses (such as Rule 12b-1 fees). The Trust Class has lower expenses and typically higher returns than Class A, Class C and Class R3.
15 The date used to calculate Life of Fund performance for the index is the inception date of the oldest share class.
16 The performance information for Class R3 prior to the class's inception date is that of the Fund's Investor Class. The performance information for the Investor Class has not been adjusted to take into account differences in class specific operating expenses (such as Rule 12b-1 fees). The Investor Class has lower expenses and typically higher returns than Class R3.
17 Prior to December 14, 2009, the Fund had different investment goals, strategies and portfolio management team. The performance information for Institutional Class, Class A and Class C prior to December 21, 2009 is that of the Fund's Trust Class, which had an inception date of November 2, 2006, and converted into the Institutional Class on December 21, 2009. During the period from November 2, 2006 through December 21, 2009, the Trust Class had only one investor, which could have impacted Fund performance. The performance information for the Trust Class has been adjusted to reflect the appropriate sales charges applicable to Class A and Class C shares, but has not been adjusted to take into account differences in class specific operating expenses (such as Rule 12b-1 fees). Management had previously capped Trust Class expenses; absent this arrangement, the returns would have been lower. The Trust Class had lower capped expenses and typically higher returns than Class A and Class C. The Trust Class had equivalent capped expenses and typically similar returns to the Institutional Class.
18 The performance information for Institutional Class, Class A and Class C prior to the classes' inception date is that of the Fund's predecessor, the DJG Small Cap Value Fund L.P., an unregistered limited partnership ("DJG Fund");
74
DJG Fund was the successor to The DJG Small Cap Value Fund, an unregistered commingled investment account ("DJG Account"). The performance from July 8, 1997 (the commencement of operations) to September 11, 2008 is that of DJG Account, and the performance from September 12, 2008 to May 10, 2010 is that of DJG Fund. On May 10, 2010, the DJG Fund transferred its assets to the Fund in exchange for the Fund's Institutional Class shares. The investment policies, objectives, guidelines and restrictions of the Fund are in all material respects equivalent to those of DJG Fund and DJG Account (the "Predecessors"). As a mutual fund registered under the 1940 Act, the Fund is subject to certain restrictions under the 1940 Act and the Internal Revenue Code ("Code") to which the Predecessors were not subject. Had the Predecessors been registered under the 1940 Act and been subject to the provisions of the 1940 Act and the Code, their investment performance may have been adversely affected. The performance information reflects the actual expenses of the Predecessors, which were generally lower than those of the Fund.
19 The performance information for Class A and Class C prior to the classes' inception date is that of the Fund's Investor Class. The performance information for the Investor Class has been adjusted to reflect the appropriate sales charges applicable to Class A and Class C shares, but has not been adjusted to take into account differences in class specific operating expenses (such as Rule 12b-1 fees). The Investor Class has lower expenses and typically higher returns than Class A and Class C.
20 The performance information for Institutional Class, Class A and Class C prior to April 19, 2010 is that of the Fund's Trust Class, which had an inception date of November 2, 2006, and converted into the Institutional Class on April 19, 2010. During the period from November 2, 2006 through April 19, 2010, the Trust Class had only one investor, which could have impacted Fund performance. The performance information for Class A and Class C from April 19, 2010 to the classes' inception date is that of the Fund's Institutional Class. During the period from April 19, 2010 through March 2, 2011, the Institutional Class had only one investor, which could have impacted Fund performance. The performance information for the Trust Class and the Institutional Class has been adjusted to reflect the appropriate sales charges applicable to Class A and Class C shares, but has not been adjusted to take into account differences in class specific operating expenses (such as Rule 12b-1 fees). The Trust Class had higher expenses and typically lower returns than the Institutional Class. The Trust Class had lower expenses and typically higher returns than Class A and Class C. The Institutional Class has lower expenses and typically higher returns than Class A and Class C.
21 As of June 19, 2012, the Fund changed its investment policy to become "non-diversified" under the 1940 Act. A non-diversified fund is able to invest larger percentages of its assets in the securities of a single issuer, which could increase the fund's risk of loss. Performance prior to this change might have been different if current policies had been in effect.
22 The performance information for Class R6 prior to the class's inception date is that of the Fund's Institutional Class. The performance information for the Institutional Class has not been adjusted to take into account differences in class specific operating expenses. The Institutional Class has higher expenses and typically lower returns than Class R6.
23 The performance information for Class R6 prior to the class's inception date is that of the Fund's Investor Class. The performance information for the Investor Class has not been adjusted to take into account differences in class specific operating expenses. The Investor Class has higher expenses and typically lower returns than Class R6.
24 The performance information for Class R6 prior to the class's inception date is that of the Fund's Trust Class. The performance information for the Trust Class has not been adjusted to take into account differences in class specific operating expenses. The Trust Class has higher expenses and typically lower returns than Class R6.
25 On April 28, 2017, NBIA retained Green Court Capital Management Limited ("Green Court") as the subadviser to Neuberger Berman Greater China Equity Fund, replacing Neuberger Berman Asia Limited. The nature and level of
75
the services provided under the new sub-advisory agreement are the same as under the previous sub-advisory agreement, and there was no change in the fees incurred by the Fund. Neuberger Berman Group LLC ("NBG LLC") retains an ongoing passive minority ownership stake in Green Court. Other than NBG LLC, all equity in Green Court is owned by its professionals.
For more complete information on any of the Neuberger Berman Equity Funds, call us at (800) 877-9700, or visit our website at www.nb.com.
76
FTSE EPRA/NAREIT Developed Index (Net): | | The index is a free float-adjusted market capitalization-weighted index that is designed to measure the performance of listed real estate companies and real estate investment trusts (REITs) in developed markets. Net total return indexes reinvest dividends after the deduction of withholding taxes, using (for international indexes) a tax rate applicable to non-resident institutional investors who do not benefit from double taxation treaties. | |
FTSE NAREIT All Equity REITs Index: | | The index is a free-float adjusted, market capitalization-weighted index that tracks the performance of all equity real estate investment trusts (REITs) that are listed on the New York Stock Exchange, the NYSE Arca or the NASDAQ National Market List. Equity REITs include all tax-qualified REITs with more than 50 percent of total assets in qualifying real estate assets other than mortgages secured by real property. | |
MSCI All Country World Index (Net): | | The index is a free float-adjusted market capitalization-weighted index that is designed to measure the equity market performance of developed and emerging markets. The index consists of 47 country indexes comprising 23 developed and 24 emerging market country indexes. The developed market country indexes included are: Australia, Austria, Belgium, Canada, Denmark, Finland, France, Germany, Hong Kong, Ireland, Israel, Italy, Japan, the Netherlands, New Zealand, Norway, Portugal, Singapore, Spain, Sweden, Switzerland, the United Kingdom and the United States. The emerging market country indexes included are: Brazil, Chile, China, Colombia, Czech Republic, Egypt, Greece, Hungary, India, Indonesia, Korea, Malaysia, Mexico, Pakistan, Peru, the Philippines, Poland, Qatar, Russia, South Africa, Taiwan, Thailand, Turkey, and the UAE. China A shares are included starting from June 1, 2018 and are partially represented at 5% of their free float-adjusted market capitalization. Net total return indexes reinvest dividends after the deduction of withholding taxes, using (for international indexes) a tax rate applicable to non-resident institutional investors who do not benefit from double taxation treaties. | |
MSCI China Index (Net): | | The index is a free float-adjusted market capitalization-weighted index that is designed to measure the equity market performance of Chinese securities readily accessible to nondomestic investors. The index includes equity securities issued by companies incorporated in the People's Republic of China ("PRC"), and listed in the form of China B shares on the Shanghai Stock Exchange (in US$) or Shenzhen Stock Exchange (in HK$), or China H shares on the Hong Kong Stock Exchange (in HK$) and other foreign exchanges. It also includes Red-Chips and P-Chips, which are not incorporated in the PRC and are listed on the Hong Kong Stock Exchange. Red-Chips include companies that are directly or indirectly controlled by organizations or enterprises that are owned by the state, provinces, or municipalities of the PRC. P-Chips include non-state-owned Chinese companies incorporated outside the mainland and traded in Hong Kong. U.S.-listed China stocks in the index. China A shares are included starting from June 1, 2018 and are partially represented at 5% of their free float-adjusted market capitalization. Net total return indexes reinvest dividends after the deduction of withholding taxes, using (for international indexes) a tax rate applicable to non-resident institutional investors who do not benefit from double taxation treaties. | |
77
Glossary of Indices (cont'd)
| MSCI EAFE® Index (Net) (Europe, Australasia, Far East): | | The index is a free float-adjusted market capitalization-weighted index that is designed to measure the equity market performance of developed markets, excluding the United States and Canada. The index consists of the following 21 developed market country indexes: Australia, Austria, Belgium, Denmark, Finland, France, Germany, Hong Kong, Ireland, Israel, Italy, Japan, the Netherlands, New Zealand, Norway, Portugal, Singapore, Spain, Sweden, Switzerland, and the United Kingdom. Net total return indexes reinvest dividends after the deduction of withholding taxes, using (for international indexes) a tax rate applicable to non-resident institutional investors who do not benefit from double taxation treaties. | |
MSCI Emerging Markets Index (Net): | | The index is a free float-adjusted market capitalization-weighted index that is designed to measure the equity market performance of emerging markets. The index consists of the following 24 emerging market country indexes: Brazil, Chile, China, Colombia, Czech Republic, Egypt, Greece, Hungary, India, Indonesia, Korea, Malaysia, Mexico, Pakistan, Peru, the Philippines, Poland, Qatar, Russia, South Africa, Taiwan, Thailand, Turkey, and the UAE. China A shares are included starting from June 1, 2018 and are partially represented at 5% of their free float-adjusted market capitalization. Net total return indexes reinvest dividends after the deduction of withholding taxes, using (for international indexes) a tax rate applicable to non-resident institutional investors who do not benefit from double taxation treaties. | |
| MSCI EAFE® Small Cap Index (Net): | | The index is a free float-adjusted market capitalization-weighted index that is designed to measure the equity market performance of the small cap segment of developed markets, excluding the United States and Canada. The index consists of the following 21 developed market country indices: Australia, Austria, Belgium, Denmark, Finland, France, Germany, Hong Kong, Ireland, Israel, Italy, Japan, the Netherlands, New Zealand, Norway, Portugal, Singapore, Spain, Sweden, Switzerland, and the United Kingdom. Net total return indexes reinvest dividends after the deduction of withholding taxes, using (for international indexes) a tax rate applicable to non-resident institutional investors who do not benefit from double taxation treaties. | |
| Russell 1000® Index: | | The index is a float-adjusted market capitalization-weighted index that measures the performance of the large-cap segment of the U.S. equity market. It includes approximately 1,000 of the largest securities in the Russell 3000® Index (which measures the performance of the 3,000 largest U.S. public companies based on total market capitalization). The index is rebalanced annually in June. | |
| Russell 1000® Value Index: | | The index is a float-adjusted market capitalization-weighted index that measures the performance of the large-cap value segment of the U.S. equity market. It includes those Russell 1000 Index companies with lower price-to-book ratios and lower forecasted growth rates. The index is rebalanced annually in June. | |
| Russell 2000® Index: | | The index is a float-adjusted market capitalization-weighted index that measures the performance of the small-cap segment of the U.S. equity market. It includes approximately 2,000 of the smallest securities in the Russell 3000 Index (which measures the performance of the 3,000 largest U.S. public companies based on total market capitalization). The index is rebalanced annually in June. | |
| Russell 2000® Growth Index: | | The index is a float-adjusted market capitalization-weighted index that measures the performance of the small-cap growth segment of the U.S. equity market. It includes those Russell 2000 Index companies with higher price-to-book ratios and higher forecasted growth rates. The index is rebalanced annually in June. | |
78
Glossary of Indices (cont'd)
| Russell 2000® Value Index: | | The index is a float-adjusted market capitalization-weighted index that measures the performance of the small-cap value segment of the U.S. equity market. It includes those Russell 2000 Index companies with lower price-to-book ratios and lower forecasted growth rates. The index is rebalanced annually in June. | |
| Russell Midcap® Index: | | The index is a float-adjusted market capitalization-weighted index that measures the performance of the mid-cap segment of the U.S. equity market. It includes approximately 800 of the smallest securities in the Russell 1000 Index. The index is rebalanced annually in June. | |
| Russell Midcap® Growth Index: | | The index is a float-adjusted market capitalization-weighted index that measures the performance of the mid-cap growth segment of the U.S. equity market. It includes those Russell Midcap Index companies with higher price-to-book ratios and higher forecasted growth rates. The index is rebalanced annually in June. | |
| Russell Midcap® Value Index: | | The index is a float-adjusted market capitalization-weighted index that measures the performance of the mid-cap value segment of the U.S. equity market. It includes those Russell Midcap Index companies with lower price-to-book ratios and lower forecasted growth rates. The index is rebalanced annually in June. | |
| S&P 500® Index: | | The index is a float-adjusted market capitalization-weighted index that focuses on the large-cap segment of the U.S. equity market, and includes a significant portion of the total value of the market. | |
79
Information About Your Fund's Expenses (Unaudited)
As a Fund shareholder, you incur two types of costs: (1) transaction costs, including sales charges (loads) on purchase payments or redemption proceeds (if applicable); and (2) ongoing costs, including management fees, distribution and/or service (12b-1) fees (if applicable), and other Fund expenses. This example is intended to help you understand your ongoing costs (in U.S. dollars) of investing in a Fund and compare these costs with the ongoing costs of investing in other mutual funds.
This table is designed to provide information regarding costs related to your investments. The following examples are based on an investment of $1,000 made at the beginning of the six month period ended August 31, 2018 and held for the entire period. The table illustrates the Fund's costs in two ways:
Actual Expenses and Performance: | | The first section of the table provides information about actual account values and actual expenses in dollars, based on the Fund's actual performance during the period indicated. You may use the information in this line, together with the amount you invested, to estimate the expenses you paid over the period. Simply divide your account value by $1,000 (for example, an $8,600 account value divided by $1,000 = 8.6), then multiply the result by the number in the first section of the table under the heading entitled "Expenses Paid During the Period" to estimate the expenses you paid over the period. | |
Hypothetical Example for Comparison Purposes: | | The second section of the table provides information about hypothetical account values and hypothetical expenses based on the Fund's actual expense ratio and an assumed rate of return at 5% per year before expenses. This return is not the Fund's actual return. The hypothetical account values and expenses may not be used to estimate the actual ending account balance or expenses you paid for the period. You may use this information to compare the ongoing costs of investing in a Fund versus other funds. To do so, compare the expenses shown in this 5% hypothetical example with the 5% hypothetical examples that appear in the shareholder reports of other funds. | |
Please note that the expenses in the table are meant to highlight your ongoing costs only and do not include any transaction costs, such as sales charges (loads) (if applicable). Therefore, the information under the heading "Hypothetical (5% annual return before expenses)" is useful in comparing ongoing costs only, and will not help you determine the relative total costs of owning different funds. In addition, if these transaction costs were included, your costs would have been higher.
80
Expense Example (Unaudited)
Neuberger Berman Equity Funds | |
| | | ACTUAL | | HYPOTHETICAL (5% ANNUAL RETURN BEFORE EXPENSES) | |
| | | Beginning
Account
Value
3/1/18 | | Ending
Account
Value
8/31/18 | | Expenses Paid
During the
Period(1)
3/1/18 - 8/31/18 | | Expense
Ratio | | Beginning
Account
Value
3/1/18 | | Ending
Account
Value
8/31/18 | | Expenses Paid
During the
Period(2)
3/1/18 - 8/31/18 | | Expense
Ratio | |
Dividend Growth Fund | |
Institutional Class | | $ | 1,000.00 | | | $ | 1,024.30 | | | $ | 3.52 | | | | 0.69 | % | | $ | 1,000.00 | | | $ | 1,021.73 | | | $ | 3.52 | | | | 0.69 | % | |
Class A | | $ | 1,000.00 | | | $ | 1,022.00 | | | $ | 5.35 | | | | 1.05 | % | | $ | 1,000.00 | | | $ | 1,019.91 | | | $ | 5.35 | | | | 1.05 | % | |
Class C | | $ | 1,000.00 | | | $ | 1,018.40 | | | $ | 9.16 | | | | 1.80 | % | | $ | 1,000.00 | | | $ | 1,016.13 | | | $ | 9.15 | | | | 1.80 | % | |
Class R6 | | $ | 1,000.00 | | | $ | 1,024.30 | | | $ | 3.21 | | | | 0.63 | % | | $ | 1,000.00 | | | $ | 1,022.03 | | | $ | 3.21 | | | | 0.63 | % | |
Emerging Markets Equity Fund | |
Institutional Class | | $ | 1,000.00 | | | $ | 877.00 | | | $ | 5.91 | | | | 1.25 | % | | $ | 1,000.00 | | | $ | 1,018.90 | | | $ | 6.36 | | | | 1.25 | % | |
Class A | | $ | 1,000.00 | | | $ | 875.80 | | | $ | 7.09 | | | | 1.50 | % | | $ | 1,000.00 | | | $ | 1,017.64 | | | $ | 7.63 | | | | 1.50 | % | |
Class C | | $ | 1,000.00 | | | $ | 872.50 | | | $ | 10.62 | | | | 2.25 | % | | $ | 1,000.00 | | | $ | 1,013.86 | | | $ | 11.42 | | | | 2.25 | % | |
Class R3 | | $ | 1,000.00 | | | $ | 874.30 | | | $ | 9.02 | | | | 1.91 | % | | $ | 1,000.00 | | | $ | 1,015.58 | | | $ | 9.70 | | | | 1.91 | % | |
Class R6 | | $ | 1,000.00 | | | $ | 877.50 | | | $ | 5.58 | | | | 1.18 | % | | $ | 1,000.00 | | | $ | 1,019.26 | | | $ | 6.01 | | | | 1.18 | % | |
Equity Income Fund | |
Institutional Class | | $ | 1,000.00 | | | $ | 1,052.20 | | | $ | 3.57 | | | | 0.69 | % | | $ | 1,000.00 | | | $ | 1,021.73 | | | $ | 3.52 | | | | 0.69 | % | |
Class A | | $ | 1,000.00 | | | $ | 1,050.50 | | | $ | 5.48 | | | | 1.06 | % | | $ | 1,000.00 | | | $ | 1,019.86 | | | $ | 5.40 | | | | 1.06 | % | |
Class C | | $ | 1,000.00 | | | $ | 1,046.90 | | | $ | 9.29 | | | | 1.80 | % | | $ | 1,000.00 | | | $ | 1,016.13 | | | $ | 9.15 | | | | 1.80 | % | |
Class R3 | | $ | 1,000.00 | | | $ | 1,049.40 | | | $ | 6.87 | | | | 1.33 | % | | $ | 1,000.00 | | | $ | 1,018.50 | | | $ | 6.77 | | | | 1.33 | % | |
Focus Fund | |
Investor Class | | $ | 1,000.00 | | | $ | 1,065.40 | | | $ | 4.74 | | | | 0.91 | % | | $ | 1,000.00 | | | $ | 1,020.62 | | | $ | 4.63 | | | | 0.91 | % | |
Trust Class | | $ | 1,000.00 | | | $ | 1,064.60 | | | $ | 5.72 | | | | 1.10 | % | | $ | 1,000.00 | | | $ | 1,019.66 | | | $ | 5.60 | | | | 1.10 | % | |
Advisor Class | | $ | 1,000.00 | | | $ | 1,063.50 | | | $ | 6.55 | | | | 1.26 | % | | $ | 1,000.00 | | | $ | 1,018.85 | | | $ | 6.41 | | | | 1.26 | % | |
Institutional Class | | $ | 1,000.00 | | | $ | 1,066.10 | | | $ | 3.91 | | | | 0.75 | % | | $ | 1,000.00 | | | $ | 1,021.42 | | | $ | 3.82 | | | | 0.75 | % | |
Class A | | $ | 1,000.00 | | | $ | 1,064.30 | | | $ | 5.78 | | | | 1.11 | % | | $ | 1,000.00 | | | $ | 1,019.61 | | | $ | 5.65 | | | | 1.11 | % | |
Class C | | $ | 1,000.00 | | | $ | 1,060.30 | | | $ | 9.66 | | | | 1.86 | % | | $ | 1,000.00 | | | $ | 1,015.83 | | | $ | 9.45 | | | | 1.86 | % | |
Genesis Fund | |
Investor Class | | $ | 1,000.00 | | | $ | 1,141.50 | | | $ | 5.51 | | | | 1.02 | % | | $ | 1,000.00 | | | $ | 1,020.06 | | | $ | 5.19 | | | | 1.02 | % | |
Trust Class | | $ | 1,000.00 | | | $ | 1,141.00 | | | $ | 5.94 | | | | 1.10 | % | | $ | 1,000.00 | | | $ | 1,019.66 | | | $ | 5.60 | | | | 1.10 | % | |
Advisor Class | | $ | 1,000.00 | | | $ | 1,139.60 | | | $ | 7.28 | | | | 1.35 | % | | $ | 1,000.00 | | | $ | 1,018.40 | | | $ | 6.87 | | | | 1.35 | % | |
Institutional Class | | $ | 1,000.00 | | | $ | 1,142.60 | | | $ | 4.59 | | | | 0.85 | % | | $ | 1,000.00 | | | $ | 1,020.92 | | | $ | 4.33 | | | | 0.85 | % | |
Class R6 | | $ | 1,000.00 | | | $ | 1,143.00 | | | $ | 4.05 | | | | 0.75 | % | | $ | 1,000.00 | | | $ | 1,021.42 | | | $ | 3.82 | | | | 0.75 | % | |
Global Equity Fund | |
Institutional Class | | $ | 1,000.00 | | | $ | 1,048.70 | | | $ | 3.92 | | | | 0.76 | % | | $ | 1,000.00 | | | $ | 1,021.37 | | | $ | 3.87 | | | | 0.76 | % | |
Class A | | $ | 1,000.00 | | | $ | 1,048.00 | | | $ | 5.78 | | | | 1.12 | % | | $ | 1,000.00 | | | $ | 1,019.56 | | | $ | 5.70 | | | | 1.12 | % | |
Class C | | $ | 1,000.00 | | | $ | 1,042.70 | | | $ | 9.63 | | | | 1.87 | % | | $ | 1,000.00 | | | $ | 1,015.78 | | | $ | 9.50 | | | | 1.87 | % | |
Global Real Estate Fund | |
Institutional Class | | $ | 1,000.00 | | | $ | 1,080.90 | | | $ | 5.30 | | | | 1.01 | % | | $ | 1,000.00 | | | $ | 1,020.11 | | | $ | 5.14 | | | | 1.01 | % | |
Class A | | $ | 1,000.00 | | | $ | 1,079.10 | | | $ | 7.18 | | | | 1.37 | % | | $ | 1,000.00 | | | $ | 1,018.30 | | | $ | 6.97 | | | | 1.37 | % | |
Class C | | $ | 1,000.00 | | | $ | 1,075.40 | | | $ | 11.09 | | | | 2.12 | % | | $ | 1,000.00 | | | $ | 1,014.52 | | | $ | 10.76 | | | | 2.12 | % | |
Greater China Equity Fund | |
Institutional Class | | $ | 1,000.00 | | | $ | 870.60 | | | $ | 7.12 | | | | 1.51 | % | | $ | 1,000.00 | | | $ | 1,017.59 | | | $ | 7.68 | | | | 1.51 | % | |
Class A | | $ | 1,000.00 | | | $ | 869.30 | | | $ | 8.81 | | | | 1.87 | % | | $ | 1,000.00 | | | $ | 1,015.78 | | | $ | 9.50 | | | | 1.87 | % | |
Class C | | $ | 1,000.00 | | | $ | 865.70 | | | $ | 12.32 | | | | 2.62 | % | | $ | 1,000.00 | | | $ | 1,012.00 | | | $ | 13.29 | | | | 2.62 | % | |
Guardian Fund | |
Investor Class | | $ | 1,000.00 | | | $ | 1,096.60 | | | $ | 4.70 | | | | 0.89 | % | | $ | 1,000.00 | | | $ | 1,020.72 | | | $ | 4.53 | | | | 0.89 | % | |
Trust Class | | $ | 1,000.00 | | | $ | 1,096.10 | | | $ | 5.60 | | | | 1.06 | % | | $ | 1,000.00 | | | $ | 1,019.86 | | | $ | 5.40 | | | | 1.06 | % | |
Advisor Class | | $ | 1,000.00 | | | $ | 1,093.90 | | | $ | 7.49 | | | | 1.42 | % | | $ | 1,000.00 | | | $ | 1,018.05 | | | $ | 7.22 | | | | 1.42 | % | |
Institutional Class | | $ | 1,000.00 | | | $ | 1,097.70 | | | $ | 3.75 | | | | 0.71 | % | | $ | 1,000.00 | | | $ | 1,021.63 | | | $ | 3.62 | | | | 0.71 | % | |
Class A | | $ | 1,000.00 | | | $ | 1,095.50 | | | $ | 5.70 | | | | 1.08 | % | | $ | 1,000.00 | | | $ | 1,019.76 | | | $ | 5.50 | | | | 1.08 | % | |
Class C | | $ | 1,000.00 | | | $ | 1,091.10 | | | $ | 9.65 | | | | 1.83 | % | | $ | 1,000.00 | | | $ | 1,015.98 | | | $ | 9.30 | | | | 1.83 | % | |
Class R3 | | $ | 1,000.00 | | | $ | 1,093.90 | | | $ | 7.18 | | | | 1.36 | % | | $ | 1,000.00 | | | $ | 1,018.35 | | | $ | 6.92 | | | | 1.36 | % | |
81
Expense Example (Unaudited) (cont'd)
Neuberger Berman Equity Funds | |
| | | ACTUAL | | HYPOTHETICAL (5% ANNUAL RETURN BEFORE EXPENSES) | |
| | | Beginning
Account
Value
3/1/18 | | Ending
Account
Value
8/31/18 | | Expenses Paid
During the
Period(1)
3/1/18 - 8/31/18 | | Expense
Ratio | | Beginning
Account
Value
3/1/18 | | Ending
Account
Value
8/31/18 | | Expenses Paid
During the
Period(2)
3/1/18 - 8/31/18 | | Expense
Ratio | |
International Equity Fund | |
Investor Class | | $ | 1,000.00 | | | $ | 983.60 | | | $ | 5.85 | | | | 1.17 | % | | $ | 1,000.00 | | | $ | 1,019.31 | | | $ | 5.96 | | | | 1.17 | % | |
Trust Class | | $ | 1,000.00 | | | $ | 983.60 | | | $ | 6.00 | | | | 1.20 | % | | $ | 1,000.00 | | | $ | 1,019.16 | | | $ | 6.11 | | | | 1.20 | % | |
Institutional Class | | $ | 1,000.00 | | | $ | 985.10 | | | $ | 4.25 | | | | 0.85 | % | | $ | 1,000.00 | | | $ | 1,020.92 | | | $ | 4.33 | | | | 0.85 | % | |
Class A | | $ | 1,000.00 | | | $ | 982.80 | | | $ | 6.05 | | | | 1.21 | % | | $ | 1,000.00 | | | $ | 1,019.11 | | | $ | 6.16 | | | | 1.21 | % | |
Class C | | $ | 1,000.00 | | | $ | 979.80 | | | $ | 9.78 | | | | 1.96 | % | | $ | 1,000.00 | | | $ | 1,015.32 | | | $ | 9.96 | | | | 1.96 | % | |
Class R6 | | $ | 1,000.00 | | | $ | 985.80 | | | $ | 3.90 | | | | 0.78 | % | | $ | 1,000.00 | | | $ | 1,021.27 | | | $ | 3.97 | | | | 0.78 | % | |
International Select Fund | |
Trust Class | | $ | 1,000.00 | | | $ | 984.80 | | | $ | 5.75 | | | | 1.15 | % | | $ | 1,000.00 | | | $ | 1,019.41 | | | $ | 5.85 | | | | 1.15 | % | |
Institutional Class | | $ | 1,000.00 | | | $ | 987.10 | | | $ | 4.01 | | | | 0.80 | % | | $ | 1,000.00 | | | $ | 1,021.17 | | | $ | 4.08 | | | | 0.80 | % | |
Class A | | $ | 1,000.00 | | | $ | 984.70 | | | $ | 5.80 | | | | 1.16 | % | | $ | 1,000.00 | | | $ | 1,019.36 | | | $ | 5.90 | | | | 1.16 | % | |
Class C | | $ | 1,000.00 | | | $ | 981.40 | | | $ | 9.54 | | | | 1.91 | % | | $ | 1,000.00 | | | $ | 1,015.58 | | | $ | 9.70 | | | | 1.91 | % | |
Class R3 | | $ | 1,000.00 | | | $ | 983.80 | | | $ | 7.05 | | | | 1.41 | % | | $ | 1,000.00 | | | $ | 1,018.10 | | | $ | 7.17 | | | | 1.41 | % | |
Class R6 | | $ | 1,000.00 | | | $ | 987.10 | | | $ | 3.66 | | | | 0.73 | % | | $ | 1,000.00 | | | $ | 1,021.53 | | | $ | 3.72 | | | | 0.73 | % | |
International Small Cap Fund | |
Institutional Class | | $ | 1,000.00 | | | $ | 986.30 | | | $ | 5.31 | | | | 1.06 | % | | $ | 1,000.00 | | | $ | 1,019.86 | | | $ | 5.40 | | | | 1.06 | % | |
Class A | | $ | 1,000.00 | | | $ | 983.30 | | | $ | 7.10 | | | | 1.42 | % | | $ | 1,000.00 | | | $ | 1,018.05 | | | $ | 7.22 | | | | 1.42 | % | |
Class C | | $ | 1,000.00 | | | $ | 980.10 | | | $ | 10.83 | | | | 2.17 | % | | $ | 1,000.00 | | | $ | 1,014.27 | | | $ | 11.02 | | | | 2.17 | % | |
Class R6 | | $ | 1,000.00 | | | $ | 985.60 | | | $ | 4.95 | | | | 0.99 | % | | $ | 1,000.00 | | | $ | 1,020.21 | | | $ | 5.04 | | | | 0.99 | % | |
Intrinsic Value Fund | |
Institutional Class | | $ | 1,000.00 | | | $ | 1,133.90 | | | $ | 5.38 | | | | 1.00 | % | | $ | 1,000.00 | | | $ | 1,020.16 | | | $ | 5.09 | | | | 1.00 | % | |
Class A | | $ | 1,000.00 | | | $ | 1,131.90 | | | $ | 7.31 | | | | 1.36 | % | | $ | 1,000.00 | | | $ | 1,018.35 | | | $ | 6.92 | | | | 1.36 | % | |
Class C | | $ | 1,000.00 | | | $ | 1,127.60 | | | $ | 11.32 | | | | 2.11 | % | | $ | 1,000.00 | | | $ | 1,014.57 | | | $ | 10.71 | | | | 2.11 | % | |
Large Cap Value Fund | |
Investor Class | | $ | 1,000.00 | | | $ | 1,072.10 | | | $ | 4.54 | | | | 0.87 | % | | $ | 1,000.00 | | | $ | 1,020.82 | | | $ | 4.43 | | | | 0.87 | % | |
Trust Class | | $ | 1,000.00 | | | $ | 1,071.00 | | | $ | 5.48 | | | | 1.05 | % | | $ | 1,000.00 | | | $ | 1,019.91 | | | $ | 5.35 | | | | 1.05 | % | |
Advisor Class | | $ | 1,000.00 | | | $ | 1,070.30 | | | $ | 6.26 | | | | 1.20 | % | | $ | 1,000.00 | | | $ | 1,019.16 | | | $ | 6.11 | | | | 1.20 | % | |
Institutional Class | | $ | 1,000.00 | | | $ | 1,072.80 | | | $ | 3.66 | | | | 0.70 | % | | $ | 1,000.00 | | | $ | 1,021.68 | | | $ | 3.57 | | | | 0.70 | % | |
Class A | | $ | 1,000.00 | | | $ | 1,071.00 | | | $ | 5.69 | | | | 1.09 | % | | $ | 1,000.00 | | | $ | 1,019.71 | | | $ | 5.55 | | | | 1.09 | % | |
Class C | | $ | 1,000.00 | | | $ | 1,066.90 | | | $ | 9.48 | | | | 1.82 | % | | $ | 1,000.00 | | | $ | 1,016.03 | | | $ | 9.25 | | | | 1.82 | % | |
Class R3 | | $ | 1,000.00 | | | $ | 1,069.60 | | | $ | 7.09 | | | | 1.36 | % | | $ | 1,000.00 | | | $ | 1,018.35 | | | $ | 6.92 | | | | 1.36 | % | |
Mid Cap Growth Fund | |
Investor Class | | $ | 1,000.00 | | | $ | 1,113.40 | | | $ | 4.79 | | | | 0.90 | % | | $ | 1,000.00 | | | $ | 1,020.67 | | | $ | 4.58 | | | | 0.90 | % | |
Trust Class | | $ | 1,000.00 | | | $ | 1,112.70 | | | $ | 5.06 | | | | 0.95 | % | | $ | 1,000.00 | | | $ | 1,020.42 | | | $ | 4.84 | | | | 0.95 | % | |
Advisor Class | | $ | 1,000.00 | | | $ | 1,111.50 | | | $ | 6.44 | | | | 1.21 | % | | $ | 1,000.00 | | | $ | 1,019.11 | | | $ | 6.16 | | | | 1.21 | % | |
Institutional Class | | $ | 1,000.00 | | | $ | 1,113.90 | | | $ | 3.73 | | | | 0.70 | % | | $ | 1,000.00 | | | $ | 1,021.68 | | | $ | 3.57 | | | | 0.70 | % | |
Class A | | $ | 1,000.00 | | | $ | 1,112.10 | | | $ | 5.70 | | | | 1.07 | % | | $ | 1,000.00 | | | $ | 1,019.81 | | | $ | 5.45 | | | | 1.07 | % | |
Class C | | $ | 1,000.00 | | | $ | 1,107.80 | | | $ | 9.83 | | | | 1.85 | % | | $ | 1,000.00 | | | $ | 1,015.88 | | | $ | 9.40 | | | | 1.85 | % | |
Class R3 | | $ | 1,000.00 | | | $ | 1,110.20 | | | $ | 7.23 | | | | 1.36 | % | | $ | 1,000.00 | | | $ | 1,018.35 | | | $ | 6.92 | | | | 1.36 | % | |
Class R6 | | $ | 1,000.00 | | | $ | 1,114.60 | | | $ | 3.36 | | | | 0.63 | % | | $ | 1,000.00 | | | $ | 1,022.03 | | | $ | 3.21 | | | | 0.63 | % | |
Mid Cap Intrinsic Value Fund | |
Investor Class | | $ | 1,000.00 | | | $ | 1,054.70 | | | $ | 6.21 | | | | 1.20 | % | | $ | 1,000.00 | | | $ | 1,019.16 | | | $ | 6.11 | | | | 1.20 | % | |
Trust Class | | $ | 1,000.00 | | | $ | 1,054.60 | | | $ | 6.47 | | | | 1.25 | % | | $ | 1,000.00 | | | $ | 1,018.90 | | | $ | 6.36 | | | | 1.25 | % | |
Institutional Class | | $ | 1,000.00 | | | $ | 1,056.80 | | | $ | 4.41 | | | | 0.85 | % | | $ | 1,000.00 | | | $ | 1,020.92 | | | $ | 4.33 | | | | 0.85 | % | |
Class A | | $ | 1,000.00 | | | $ | 1,055.20 | | | $ | 6.27 | | | | 1.21 | % | | $ | 1,000.00 | | | $ | 1,019.11 | | | $ | 6.16 | | | | 1.21 | % | |
Class C | | $ | 1,000.00 | | | $ | 1,051.10 | | | $ | 10.13 | | | | 1.96 | % | | $ | 1,000.00 | | | $ | 1,015.32 | | | $ | 9.96 | | | | 1.96 | % | |
Class R3 | | $ | 1,000.00 | | | $ | 1,053.10 | | | $ | 7.56 | | | | 1.46 | % | | $ | 1,000.00 | | | $ | 1,017.85 | | | $ | 7.43 | | | | 1.46 | % | |
Multi-Cap Opportunities Fund | |
Institutional Class | | $ | 1,000.00 | | | $ | 1,062.30 | | | $ | 3.69 | | | | 0.71 | % | | $ | 1,000.00 | | | $ | 1,021.63 | | | $ | 3.62 | | | | 0.71 | % | |
Class A | | $ | 1,000.00 | | | $ | 1,060.00 | | | $ | 5.66 | | | | 1.09 | % | | $ | 1,000.00 | | | $ | 1,019.71 | | | $ | 5.55 | | | | 1.09 | % | |
Class C | | $ | 1,000.00 | | | $ | 1,056.00 | | | $ | 9.48 | | | | 1.83 | % | | $ | 1,000.00 | | | $ | 1,015.98 | | | $ | 9.30 | | | | 1.83 | % | |
82
Expense Example (Unaudited) (cont'd)
Neuberger Berman Equity Funds | |
| | | ACTUAL | | HYPOTHETICAL (5% ANNUAL RETURN BEFORE EXPENSES) | |
| | | Beginning
Account
Value
3/1/18 | | Ending
Account
Value
8/31/18 | | Expenses Paid
During the
Period(1)
3/1/18 - 8/31/18 | | Expense
Ratio | | Beginning
Account
Value
3/1/18 | | Ending
Account
Value
8/31/18 | | Expenses Paid
During the
Period(2)
3/1/18 - 8/31/18 | | Expense
Ratio | |
Real Estate Fund | |
Trust Class | | $ | 1,000.00 | | | $ | 1,122.90 | | | $ | 5.62 | | | | 1.05 | % | | $ | 1,000.00 | | | $ | 1,019.91 | | | $ | 5.35 | | | | 1.05 | % | |
Institutional Class | | $ | 1,000.00 | | | $ | 1,124.40 | | | $ | 4.61 | | | | 0.86 | % | | $ | 1,000.00 | | | $ | 1,020.87 | | | $ | 4.38 | | | | 0.86 | % | |
Class A | | $ | 1,000.00 | | | $ | 1,121.80 | | | $ | 6.52 | | | | 1.22 | % | | $ | 1,000.00 | | | $ | 1,019.06 | | | $ | 6.21 | | | | 1.22 | % | |
Class C | | $ | 1,000.00 | | | $ | 1,118.20 | | | $ | 10.52 | | | | 1.97 | % | | $ | 1,000.00 | | | $ | 1,015.27 | | | $ | 10.01 | | | | 1.97 | % | |
Class R3 | | $ | 1,000.00 | | | $ | 1,120.00 | | | $ | 7.86 | | | | 1.47 | % | | $ | 1,000.00 | | | $ | 1,017.80 | | | $ | 7.48 | | | | 1.47 | % | |
Class R6 | | $ | 1,000.00 | | | $ | 1,124.80 | | | $ | 4.23 | | | | 0.79 | % | | $ | 1,000.00 | | | $ | 1,021.22 | | | $ | 4.02 | | | | 0.79 | % | |
Small Cap Growth Fund | |
Investor Class | | $ | 1,000.00 | | | $ | 1,212.50 | | | $ | 6.75 | | | | 1.21 | % | | $ | 1,000.00 | | | $ | 1,019.11 | | | $ | 6.16 | | | | 1.21 | % | |
Trust Class | | $ | 1,000.00 | | | $ | 1,211.50 | | | $ | 7.64 | | | | 1.37 | % | | $ | 1,000.00 | | | $ | 1,018.30 | | | $ | 6.97 | | | | 1.37 | % | |
Advisor Class | | $ | 1,000.00 | | | $ | 1,210.70 | | | $ | 8.41 | | | | 1.51 | % | | $ | 1,000.00 | | | $ | 1,017.59 | | | $ | 7.68 | | | | 1.51 | % | |
Institutional Class | | $ | 1,000.00 | | | $ | 1,214.20 | | | $ | 5.02 | | | | 0.90 | % | | $ | 1,000.00 | | | $ | 1,020.67 | | | $ | 4.58 | | | | 0.90 | % | |
Class A | | $ | 1,000.00 | | | $ | 1,212.20 | | | $ | 7.03 | | | | 1.26 | % | | $ | 1,000.00 | | | $ | 1,018.85 | | | $ | 6.41 | | | | 1.26 | % | |
Class C | | $ | 1,000.00 | | | $ | 1,207.70 | | | $ | 11.18 | | | | 2.01 | % | | $ | 1,000.00 | | | $ | 1,015.07 | | | $ | 10.21 | | | | 2.01 | % | |
Class R3 | | $ | 1,000.00 | | | $ | 1,210.70 | | | $ | 8.41 | | | | 1.51 | % | | $ | 1,000.00 | | | $ | 1,017.59 | | | $ | 7.68 | | | | 1.51 | % | |
Sustainable Equity Fund | |
Investor Class | | $ | 1,000.00 | | | $ | 1,074.40 | | | $ | 4.50 | | | | 0.86 | % | | $ | 1,000.00 | | | $ | 1,020.87 | | | $ | 4.38 | | | | 0.86 | % | |
Trust Class | | $ | 1,000.00 | | | $ | 1,073.30 | | | $ | 5.33 | | | | 1.02 | % | | $ | 1,000.00 | | | $ | 1,020.06 | | | $ | 5.19 | | | | 1.02 | % | |
Institutional Class | | $ | 1,000.00 | | | $ | 1,075.30 | | | $ | 3.50 | | | | 0.67 | % | | $ | 1,000.00 | | | $ | 1,021.83 | | | $ | 3.41 | | | | 0.67 | % | |
Class A | | $ | 1,000.00 | | | $ | 1,073.60 | | | $ | 5.44 | | | | 1.04 | % | | $ | 1,000.00 | | | $ | 1,019.96 | | | $ | 5.30 | | | | 1.04 | % | |
Class C | | $ | 1,000.00 | | | $ | 1,069.30 | | | $ | 9.28 | | | | 1.78 | % | | $ | 1,000.00 | | | $ | 1,016.23 | | | $ | 9.05 | | | | 1.78 | % | |
Class R3 | | $ | 1,000.00 | | | $ | 1,071.90 | | | $ | 6.74 | | | | 1.29 | % | | $ | 1,000.00 | | | $ | 1,018.70 | | | $ | 6.56 | | | | 1.29 | % | |
Class R6 | | $ | 1,000.00 | | | $ | 1,075.60 | | | $ | 3.14 | | | | 0.60 | % | | $ | 1,000.00 | | | $ | 1,022.18 | | | $ | 3.06 | | | | 0.60 | % | |
Value Fund | |
Institutional Class | | $ | 1,000.00 | | | $ | 1,069.50 | | | $ | 3.70 | | | | 0.71 | % | | $ | 1,000.00 | | | $ | 1,021.63 | | | $ | 3.62 | | | | 0.71 | % | |
Class A | | $ | 1,000.00 | | | $ | 1,067.30 | | | $ | 5.68 | | | | 1.09 | % | | $ | 1,000.00 | | | $ | 1,019.71 | | | $ | 5.55 | | | | 1.09 | % | |
Class C | | $ | 1,000.00 | | | $ | 1,063.40 | | | $ | 9.52 | | | | 1.83 | % | | $ | 1,000.00 | | | $ | 1,015.98 | | | $ | 9.30 | | | | 1.83 | % | |
(1) For each class, expenses are equal to the annualized expense ratio for the class, multiplied by the average account value over the period, multiplied by 184/365 (to reflect the one-half year period shown), unless otherwise indicated.
(2) Hypothetical expenses are equal to the annualized expense ratios for each class, multiplied by the average account value over the period (assuming a 5% annual return), multiplied by 184/365 (to reflect the one-half year period shown).
83
Schedule of Investments Dividend Growth Fund August 31, 2018
| | |
Number
of Shares | |
Value
(000's) | |
Common Stocks 95.3% | |
Aerospace & Defense 5.9% | |
Boeing Co. | | | 3,300 | | | $ | 1,131 | | |
General Dynamics
Corp. | | | 6,000 | | | | 1,160 | | |
Raytheon Co. | | | 5,900 | | | | 1,177 | | |
| | | | 3,468 | | |
Auto Components 1.7% | |
Aptiv PLC | | | 11,600 | | | | 1,021 | | |
Banks 7.9% | |
Bank of America
Corp. | | | 35,700 | | | | 1,104 | | |
Comerica, Inc. | | | 12,500 | | | | 1,218 | | |
JPMorgan
Chase & Co. | | | 10,900 | | | | 1,249 | | |
PNC Financial
Services Group,
Inc. | | | 7,500 | | | | 1,077 | | |
| | | | 4,648 | | |
Biotechnology 4.3% | |
AbbVie, Inc. | | | 10,600 | | | | 1,018 | | |
Gilead Sciences,
Inc. | | | 19,400 | | | | 1,469 | | |
| | | | 2,487 | | |
Diversified Consumer Services 1.1% | |
Service Corp.
International | | | 14,700 | | | | 617 | | |
Diversified Financial Services 2.0% | |
Voya Financial,
Inc. | | | 23,000 | | | | 1,152 | | |
Electronic Equipment, Instruments & Components 2.2% | |
Corning, Inc. | | | 38,700 | | | | 1,297 | | |
Energy Equipment & Services 1.6% | |
Schlumberger Ltd. | | | 15,000 | | | | 947 | | |
Equity Real Estate Investment Trusts 5.4% | |
American Tower
Corp. | | | 5,750 | | | | 857 | | |
Equinix, Inc. | | | 2,000 | | | | 872 | | |
Outfront Media,
Inc. | | | 71,000 | | | | 1,411 | | |
| | | | 3,140 | | |
Food & Staples Retailing 4.0% | |
Walgreens Boots
Alliance, Inc. | | | 17,600 | | | | 1,207 | | |
Walmart, Inc. | | | 11,500 | | | | 1,102 | | |
| | | | 2,309 | | |
| | |
Number
of Shares | |
Value
(000's) | |
Food Products 1.5% | |
Mondelez
International,
Inc. Class A | | | 21,050 | | | $ | 899 | | |
Health Care Equipment & Supplies 1.2% | |
STERIS PLC | | | 6,000 | | | | 686 | | |
Hotels, Restaurants & Leisure 4.1% | |
Carnival Corp. | | | 20,000 | | | | 1,230 | | |
MGM Resorts
International | | | 40,500 | | | | 1,174 | | |
| | | | 2,404 | | |
Industrial Conglomerates 1.6% | |
Honeywell
International, Inc. | | | 6,000 | | | | 954 | | |
Insurance 2.8% | |
Aon PLC | | | 7,500 | | | | 1,092 | | |
Hartford Financial
Services Group,
Inc. | | | 11,050 | | | | 556 | | |
| | | | 1,648 | | |
IT Services 5.2% | |
Automatic Data
Processing, Inc. | | | 8,400 | | | | 1,233 | | |
InterXion Holding
NV* | | | 14,000 | | | | 923 | | |
Leidos Holdings,
Inc. | | | 12,300 | | | | 870 | | |
| | | | 3,026 | | |
Media 3.1% | |
CBS Corp. Class B | | | 16,700 | | | | 885 | | |
Interpublic Group
of Cos., Inc. | | | 40,500 | | | | 946 | | |
| | | | 1,831 | | |
Metals & Mining 6.4% | |
Cobalt 27 Capital
Corp.* | | | 180,000 | | | | 883 | | |
First Quantum
Minerals Ltd. | | | 84,016 | | | | 1,054 | | |
Rio Tinto PLC
ADR | | | 19,150 | | | | 920 | | |
Royal Gold, Inc. | | | 12,000 | | | | 915 | | |
| | | | 3,772 | | |
Oil, Gas & Consumable Fuels 8.1% | |
Devon Energy
Corp. | | | 33,200 | | | | 1,425 | | |
EOG Resources,
Inc. | | | 9,700 | | | | 1,147 | | |
Occidental
Petroleum Corp. | | | 12,100 | | | | 967 | | |
Suncor Energy,
Inc. | | | 29,700 | | | | 1,223 | | |
| | | | 4,762 | | |
| | |
Number
of Shares | |
Value
(000's) | |
Pharmaceuticals 8.2% | |
Allergan PLC | | | 5,829 | | | $ | 1,118 | | |
AstraZeneca PLC
ADR | | | 30,000 | | | | 1,150 | | |
Bristol-Myers
Squibb Co. | | | 22,100 | | | | 1,338 | | |
Pfizer, Inc. | | | 29,000 | | | | 1,204 | | |
| | | | 4,810 | | |
Road & Rail 2.3% | |
CSX Corp. | | | 18,500 | | | | 1,372 | | |
Semiconductors & Semiconductor Equipment 3.3% | |
Maxim Integrated
Products, Inc. | | | 16,650 | | | | 1,007 | | |
Taiwan
Semiconductor
Manufacturing
Co. Ltd. ADR | | | 20,900 | | | | 911 | | |
| | | | 1,918 | | |
Software 4.4% | |
Microsoft Corp. | | | 12,100 | | | | 1,359 | | |
Oracle Corp. | | | 24,400 | | | | 1,186 | | |
| | | | 2,545 | | |
Specialty Retail 1.5% | |
Williams-Sonoma,
Inc. | | | 12,700 | | | | 892 | | |
Technology Hardware, Storage & Peripherals 4.0% | |
Apple, Inc. | | | 6,075 | | | | 1,383 | | |
Western Digital
Corp. | | | 15,100 | | | | 955 | | |
| | | | 2,338 | | |
Tobacco 1.5% | |
British American
Tobacco PLC | | | 17,800 | | | | 859 | | |
Total Common Stocks
(Cost $49,048) | | | | | 55,802 | | |
Short-Term Investments 5.6% | |
Investment Companies 5.6% | |
State Street
Institutional
Treasury Money
Market Fund
Premier Class,
1.87%(a)
(Cost $3,283) | | | 3,283,221 | | | | 3,283 | | |
Total Investments 100.9%
(Cost $52,331) | | | | | 59,085 | | |
Liabilities Less
Other Assets (0.9)% | | | | | (541 | ) | |
Net Assets 100.0% | | | | $ | 58,544 | | |
See Notes to Financial Statements
84
Schedule of Investments Dividend Growth Fund (cont'd)
* Non-income producing security.
(a) Represents 7-day effective yield as of August 31, 2018.
The following is a summary, categorized by Level (see Note A of Notes to Financial Statements), of inputs used to value the Fund's investments as of August 31, 2018:
Asset Valuation Inputs | |
(000's omitted) | | Level 1 | | Level 2 | | Level 3 | | Total | |
Investments: | |
| Common Stocks(a) | | $ | 55,802 | | | $ | — | | | $ | — | | | $ | 55,802 | | |
Short-Term Investments | | | — | | | | 3,283 | | | | — | | | | 3,283 | | |
Total Investments | | $ | 55,802 | | | $ | 3,283 | | | $ | — | | | $ | 59,085 | | |
(a) The Schedule of Investments provides information on the industry categorization for the portfolio.
As of the year ended August 31, 2018, no securities were transferred from one level (as of August 31, 2017) to another.
See Notes to Financial Statements
85
Schedule of Investments Emerging Markets Equity Fund August 31, 2018
| | |
Number
of Shares | |
Value
(000's) | |
Common Stocks 92.0% | |
Brazil 5.2% | |
Atacadao
Distribuicao
Comercio e
Industria Ltda | | | 2,737,100 | | | $ | 9,771 | | |
B3 SA—Brasil
Bolsa Balcao | | | 2,598,900 | | | | 13,884 | | |
BK Brasil
Operacao e
Assessoria a
Restaurantes
SA* | | | 2,001,685 | | | | 7,126 | | |
Energisa SA | | | 2,292,456 | | | | 16,998 | | |
Itau Unibanco
Holding SA,
Preference
Shares | | | 1,448,267 | | | | 15,030 | | |
Localiza Rent a
Car SA | | | 625,300 | | | | 3,305 | | |
Pagseguro
Digital Ltd.
Class A*(a) | | | 184,500 | | | | 5,330 | | |
| | | | 71,444 | | |
Chile 0.5% | |
SACI Falabella | | | 890,512 | | | | 7,087 | | |
China 26.5% | |
Alibaba Group
Holding Ltd.
ADR* | | | 192,752 | | | | 33,734 | | |
Baidu, Inc.
ADR* | | | 114,300 | | | | 25,887 | | |
Beijing
Enterprises
Holdings Ltd. | | | 440,800 | | | | 2,114 | | |
Changyou.com
Ltd. ADR | | | 167,700 | | | | 2,262 | | |
China
Everbright
International
Ltd. | | | 13,309,900 | | | | 11,209 | | |
China Medical
System
Holdings Ltd. | | | 4,006,800 | | | | 6,636 | | |
China Mobile
Ltd. | | | 1,917,500 | | | | 18,030 | | |
China State
Construction
International
Holdings Ltd. | | | 3,243,900 | | | | 3,377 | | |
CNOOC Ltd. | | | 8,179,600 | | | | 14,465 | | |
Huatai Securities
Co. Ltd.,
H Shares*(b) | | | 9,451,200 | | | | 14,161 | | |
Industrial &
Commercial
Bank of China
Ltd., H Shares | | | 35,306,400 | | | | 26,000 | | |
| | |
Number
of Shares | |
Value
(000's) | |
Lens Technology
Co. Ltd. Class A | | | 3,832,910 | | | $ | 6,606 | | |
Momo, Inc.
ADR* | | | 251,139 | | | | 11,625 | | |
Ping An
Insurance
Group Co. of
China Ltd.,
H Shares | | | 4,436,000 | | | | 42,728 | | |
Sinopharm
Group Co. Ltd.,
H Shares | | | 2,145,600 | | | | 10,675 | | |
Sunny Optical
Technology
Group Co. Ltd. | | | 1,844,800 | | | | 23,446 | | |
Tencent
Holdings Ltd. | | | 1,596,400 | | | | 69,154 | | |
Vipshop
Holdings Ltd.
ADR* | | | 1,225,725 | | | | 8,556 | | |
Zhejiang Huace
Film & TV Co.
Ltd., Class A | | | 8,076,117 | | | | 10,891 | | |
Zhuzhou CRRC
Times Electric
Co. Ltd.,
H Shares | | | 2,133,500 | | | | 11,512 | | |
ZTO Express
Cayman, Inc.
ADR | | | 640,075 | | | | 11,816 | | |
| | | | 364,884 | | |
Czech Republic 0.8% | |
Komercni
Banka A/S | | | 265,005 | | | | 11,030 | | |
Hong Kong 2.7% | |
ASM Pacific
Technology Ltd. | | | 1,154,100 | | | | 12,175 | | |
Haier Electronics
Group Co. Ltd.* | | | 2,502,200 | | | | 6,519 | | |
Sino
Biopharmaceutical
Ltd. | | | 14,572,200 | | | | 18,455 | | |
| | | | 37,149 | | |
India 9.0% | |
Ashok Leyland
Ltd. | | | 2,490,682 | | | | 4,549 | | |
Can Fin Homes
Ltd. | | | 62,200 | | | | 280 | | |
CreditAccess
Grameen
Ltd.*(c)(h) | | | 1,066,345 | | | | 5,624 | | |
Cummins India
Ltd. | | | 900,753 | | | | 9,800 | | |
Dabur India Ltd. | | | 1,561,927 | | | | 10,532 | | |
Dewan Housing
Finance Corp.
Ltd. | | | 750,713 | | | | 7,056 | | |
HDFC Bank Ltd. | | | 478,382 | | | | 13,894 | | |
| | |
Number
of Shares | |
Value
(000's) | |
Housing
Development
Finance Corp.
Ltd. | | | 668,675 | | | $ | 18,298 | | |
ICICI Bank Ltd. | | | 2,241,307 | | | | 10,795 | | |
JM Financial Ltd. | | | 2,037,607 | | | | 3,447 | | |
National Stock
Exchange(c)(d)(h) | | | 1,063,830 | | | | 14,099 | | |
Power Grid
Corp. of India
Ltd. | | | 4,154,189 | | | | 11,781 | | |
Prestige Estates
Projects Ltd. | | | 720,566 | | | | 2,406 | | |
SH Kelkar &
Co. Ltd.(b) | | | 706,370 | | | | 2,320 | | |
Vedanta Ltd. | | | 2,951,535 | | | | 9,501 | | |
| | | | 124,382 | | |
Indonesia 1.4% | |
PT Astra
International
Tbk | | | 14,904,500 | | | | 7,336 | | |
PT Bank Negara
Indonesia
Persero Tbk | | | 14,528,900 | | | | 7,694 | | |
PT Matahari
Department
Store Tbk | | | 8,593,200 | | | | 4,375 | | |
| | | | 19,405 | | |
Kazakhstan 0.4% | |
KAZ Minerals
PLC* | | | 904,358 | | | | 5,464 | | |
Korea 16.3% | |
Com2uS Corp. | | | 80,381 | | | | 11,258 | | |
Coway Co. Ltd. | | | 237,030 | | | | 19,462 | | |
DB Insurance
Co. Ltd. | | | 184,831 | | | | 10,627 | | |
Hankook Tire
Co. Ltd. | | | 140,598 | | | | 5,892 | | |
Hyundai Motor
Co. | | | 72,215 | | | | 8,109 | | |
Korea
Aerospace
Industries Ltd.* | | | 355,944 | | | | 13,350 | | |
LG Chem Ltd. | | | 59,251 | | | | 19,482 | | |
Mando Corp. | | | 245,786 | | | | 7,894 | | |
NAVER Corp. | | | 6,943 | | | | 4,690 | | |
Orion Corp. | | | 123,990 | | | | 11,918 | | |
Samsung
Electronics Co.
Ltd. | | | 1,473,415 | | | | 64,131 | | |
SFA Engineering
Corp. | | | 242,124 | | | | 8,309 | | |
SK Hynix, Inc. | | | 324,367 | | | | 24,186 | | |
SK Telecom
Co. Ltd. | | | 61,396 | | | | 14,478 | | |
| | | | 223,786 | | |
See Notes to Financial Statements
86
Schedule of Investments Emerging Markets Equity Fund (cont'd)
| | |
Number
of Shares | |
Value
(000's) | |
Malaysia 0.8% | |
Inari Amertron
Bhd | | | 19,438,425 | | | $ | 10,580 | | |
Mexico 3.2% | |
Fomento
Economico
Mexicano
SAB de CV | | | 1,754,730 | | | | 16,808 | | |
Grupo
Financiero
Banorte
SAB de CV,
O Shares | | | 2,152,904 | | | | 14,684 | | |
Grupo GICSA
SA de CV*(a) | | | 1,836,332 | | | | 862 | | |
Infraestructura
Energetica
Nova SAB
de CV | | | 2,379,478 | | | | 11,101 | | |
| | | | 43,455 | | |
Peru 0.9% | |
Credicorp Ltd. | | | 54,500 | | | | 11,882 | | |
Philippines 1.6% | |
Ayala Corp. | | | 241,510 | | | | 4,517 | | |
GT Capital
Holdings, Inc. | | | 354,611 | | | | 5,810 | | |
Metropolitan
Bank &
Trust Co. | | | 8,530,413 | | | | 11,686 | | |
| | | | 22,013 | | |
Poland 2.6% | |
Dino Polska
SA*(b) | | | 501,460 | | | | 12,352 | | |
PLAY
Communications
SA(b) | | | 1,240,544 | | | | 7,262 | | |
Powszechny
Zaklad
Ubezpieczen SA | | | 1,309,767 | | | | 15,781 | | |
| | | | 35,395 | | |
Russia 3.6% | |
Detsky Mir
PJSC(b)(c) | | | 3,154,260 | | | | 4,206 | | |
LUKOIL PJSC
ADR | | | 35,555 | | | | 2,456 | | |
| | |
Number
of Shares | |
Value
(000's) | |
LUKOIL PJSC
ADR | | | 262,580 | | | $ | 18,118 | | |
Sberbank of
Russia PJSC(c) | | | 3,006,843 | | | | 8,108 | | |
X5 Retail Group
NV GDR(b) | | | 480,405 | | | | 10,982 | | |
Yandex NV
Class A* | | | 173,803 | | | | 5,584 | | |
| | | | 49,454 | | |
South Africa 6.5% | |
Barloworld Ltd. | | | 568,765 | | | | 4,838 | | |
Bid Corp. Ltd. | | | 550,519 | | | | 11,748 | | |
FirstRand Ltd. | | | 3,416,850 | | | | 16,439 | | |
JSE Ltd. | | | 662,695 | | | | 7,304 | | |
Life Healthcare
Group
Holdings Ltd. | | | 1,892,232 | | | | 3,433 | | |
Naspers Ltd.,
N Shares | | | 117,430 | | | | 26,097 | | |
Sasol Ltd. | | | 516,586 | | | | 20,249 | | |
| | | | 90,108 | | |
Taiwan, Province of China 8.7% | |
Accton
Technology
Corp. | | | 4,381,600 | | | | 15,621 | | |
Advanced
Ceramic X
Corp. | | | 474,500 | | | | 3,885 | | |
Delta
Electronics, Inc. | | | 1,025,200 | | | | 4,105 | | |
Elite Advanced
Laser Corp. | | | 2,336,268 | | | | 5,644 | | |
Elite Material
Co. Ltd. | | | 3,344,100 | | | | 9,668 | | |
eMemory
Technology, Inc. | | | 634,400 | | | | 6,527 | | |
Hu Lane
Associate, Inc. | | | 511,000 | | | | 1,805 | | |
MediaTek, Inc. | | | 1,210,200 | | | | 9,909 | | |
Parade
Technologies
Ltd. | | | 794,000 | | | | 11,762 | | |
Taiwan
Semiconductor
Manufacturing
Co. Ltd. | | | 6,143,839 | | | | 51,207 | | |
| | | | 120,133 | | |
| | |
Number
of Shares | |
Value
(000's) | |
Thailand 0.9% | |
| CP ALL PCL(c) | | | 6,348,900 | | | $ | 13,093 | | |
Turkey 0.4% | |
Mavi Giyim
Sanayi Ve
Ticaret A/S
Class B(b) | | | 320,440 | | | | 1,234 | | |
Sok Marketler
Ticaret A/S* | | | 4,262,528 | | | | 4,622 | | |
| | | | 5,856 | | |
Total Common Stocks
(Cost $1,195,667) | | | | | 1,266,600 | | |
| Rights 0.0%(e) | |
| China 0.0%(e) | |
China Everbright
International
Ltd.*(c)
(Cost $0) | | | 4,929,592 | | | | 383 | | |
Short-Term Investments 7.0% | |
Investment Companies 7.0% | |
State Street
Institutional
Treasury Money
Market Fund
Premier Class,
1.87%(f) | | | 94,736,802 | | | | 94,737 | | |
State Street
Navigator
Securities
Lending
Government
Money Market
Portfolio,
1.93%(f)(g) | | | 1,243,231 | | | | 1,243 | | |
Total Short-Term
Investments
(Cost $95,980) | | | | | 95,980 | | |
Total Investments 99.0%
(Cost $1,291,647) | | | | | 1,362,963 | | |
Other Assets Less
Liabilities 1.0% | | | | | 13,305 | | |
Net Assets 100.0% | | | | $ | 1,376,268 | | |
* Non-income producing security.
(a) The security or a portion of this security is on loan at August 31, 2018. Total value of all such securities at August 31, 2018 amounted to approximately $1,338,000 for the Fund (see Note A of the Notes to Financial Statements).
See Notes to Financial Statements
87
Schedule of Investments Emerging Markets Equity Fund (cont'd)
(b) Security exempt from registration pursuant to Regulation S under the Securities Act of 1933, as amended. Regulation S applies to securities offerings that are made outside of the United States and do not involve direct selling efforts in the United States and as such may have restrictions on resale. Total value of all such securities at August 31, 2018 amounted to approximately $52,517,000, which represents 3.8% of net assets of the Fund.
(c) Security fair valued as of August 31, 2018 in accordance with procedures approved by the Board of Trustees. Total value of all such securities at August 31, 2018 amounted to approximately $45,513,000, which represents 3.3% of net assets of the Fund.
(d) Value determined using significant unobservable inputs.
(e) Represents less than 0.05% of net assets.
(f) Represents 7-day effective yield as of August 31, 2018.
(g) Represents investment of cash collateral received from securities lending.
(h) These securities have been deemed by the investment manager to be illiquid, and are subject to restrictions on resale.
At August 31, 2018, these securities amounted to approximately $19,723,000, which represents 1.4% of net assets of the Fund.
(000's omitted)
Restricted Security | | Acquisition
Date | | Acquisition
Cost | | Acquisition
Cost
Percentage
of Net Assets | | Value as of
8/31/2018 | | Fair Value
Percentage
of Net Assets
as of
8/31/2018 | |
CreditAccess Grameen Ltd. | | 8/07/2018 | | $ | 6,554 | | | | 0.5 | % | | $ | 5,624 | | | | 0.4 | % | |
National Stock Exchange | | 4/13/2018 | | | 15,536 | | | | 1.1 | | | | 14,099 | | | | 1.0 | | |
Total | | | | $ | 22,090 | | | | 1.6 | % | | $ | 19,723 | | | | 1.4 | % | |
See Notes to Financial Statements
88
Schedule of Investments Emerging Markets Equity Fund (cont'd)
POSITIONS BY INDUSTRY
Industry | | Investments at
Value
(000's omitted) | | Percentage of
Net Assets | |
Semiconductors & Semiconductor Equipment | | $ | 185,541 | | | | 13.5 | % | |
Internet Software & Services | | | 150,674 | | | | 10.9 | % | |
Banks | | | 130,803 | | | | 9.5 | % | |
Insurance | | | 69,136 | | | | 5.0 | % | |
Electronic Equipment, Instruments & Components | | | 62,714 | | | | 4.6 | % | |
Food & Staples Retailing | | | 62,568 | | | | 4.6 | % | |
Capital Markets | | | 52,895 | | | | 3.8 | % | |
Chemicals | | | 42,051 | | | | 3.1 | % | |
Wireless Telecommunication Services | | | 39,770 | | | | 2.9 | % | |
Media | | | 36,988 | | | | 2.7 | % | |
Oil, Gas & Consumable Fuels | | | 35,039 | | | | 2.6 | % | |
Electric Utilities | | | 28,779 | | | | 2.1 | % | |
Household Durables | | | 25,981 | | | | 1.9 | % | |
Thrifts & Mortgage Finance | | | 25,634 | | | | 1.9 | % | |
Pharmaceuticals | | | 25,091 | | | | 1.8 | % | |
Diversified Financial Services | | | 20,956 | | | | 1.5 | % | |
Communications Equipment | | | 19,506 | | | | 1.4 | % | |
Beverages | | | 16,808 | | | | 1.2 | % | |
Auto Components | | | 15,591 | | | | 1.1 | % | |
Automobiles | | | 15,445 | | | | 1.1 | % | |
Metals & Mining | | | 14,965 | | | | 1.1 | % | |
Machinery | | | 14,349 | | | | 1.0 | % | |
Health Care Providers & Services | | | 14,108 | | | | 1.0 | % | |
Software | | | 13,520 | | | | 1.0 | % | |
Aerospace & Defense | | | 13,350 | | | | 1.0 | % | |
Food Products | | | 11,918 | | | | 0.9 | % | |
Air Freight & Logistics | | | 11,816 | | | | 0.9 | % | |
Commercial Services & Supplies | | | 11,592 | | | | 0.8 | % | |
Electrical Equipment | | | 11,512 | | | | 0.8 | % | |
Multiline Retail | | | 11,462 | | | | 0.8 | % | |
Gas Utilities | | | 11,101 | | | | 0.8 | % | |
Personal Products | | | 10,532 | | | | 0.8 | % | |
Internet & Catalog Retail | | | 8,556 | | | | 0.6 | % | |
Hotels, Restaurants & Leisure | | | 7,126 | | | | 0.5 | % | |
Diversified Financials | | | 5,810 | | | | 0.4 | % | |
Consumer Finance | | | 5,624 | | | | 0.4 | % | |
IT Services | | | 5,330 | | | | 0.4 | % | |
Trading Companies & Distributors | | | 4,838 | | | | 0.4 | % | |
Specialty Retail | | | 4,206 | | | | 0.3 | % | |
Construction & Engineering | | | 3,377 | | | | 0.2 | % | |
Road & Rail | | | 3,305 | | | | 0.2 | % | |
Real Estate Management & Development | | | 3,268 | | | | 0.2 | % | |
Industrial Conglomerates | | | 2,114 | | | | 0.2 | % | |
Textiles, Apparel & Luxury Goods | | | 1,234 | | | | 0.1 | % | |
Short-Term Investments and Other Assets—Net | | | 109,285 | | | | 8.0 | % | |
| | | $ | 1,376,268 | | | | 100.0 | % | |
See Notes to Financial Statements
89
Schedule of Investments Emerging Markets Equity Fund (cont'd)
The following is a summary, categorized by Level (see Note A of Notes to Financial Statements), of inputs used to value the Fund's investments as of August 31, 2018:
Asset Valuation Inputs | |
(000's omitted) | | Level 1 | | Level 2 | | Level 3(b) | | Total | |
Investments: | |
Common Stocks | |
India | | $ | 104,659 | | | $ | 5,624 | | | $ | 14,099 | | | $ | 124,382 | | |
Malaysia | | | — | | | | 10,580 | | | | — | | | | 10,580 | | |
Russia | | | 37,140 | | | | 12,314 | | | | — | | | | 49,454 | | |
Thailand | | | — | | | | 13,093 | | | | — | | | | 13,093 | | |
| Other Common Stocks(a) | | | 1,069,091 | | | | — | | | | — | | | | 1,069,091 | | |
Total Common Stocks | | | 1,210,890 | | | | 41,611 | | | | 14,099 | | | | 1,266,600 | | |
| Rights(a) | | | — | | | | 383 | | | | — | | | | 383 | | |
Short-Term Investments | | | — | | | | 95,980 | | | | — | | | | 95,980 | | |
Total Investments | | $ | 1,210,890 | | | $ | 137,974 | | | $ | 14,099 | | | $ | 1,362,963 | | |
(a) The Schedule of Investments provides a geographic categorization as well as a Positions by Industry summary.
(b) The following is a reconciliation between the beginning and ending balances of investments in which unobservable inputs (Level 3) were used in determining value:
| | | Beginning
balance, as
of 9/1/2017 | | Accrued
discounts/
(premiums) | | Realized
gain/
(loss) | | Change
in unrealized
appreciation/
(depreciation) | | Purchases | | Sales | | Transfers
into
Level 3 | | Transfers
out of
Level 3 | | Balance,
as of
8/31/2018 | | Net change in
unrealized
appreciation/
(depreciation)
from
investments
still held as
of 8/31/2018 | |
Investments in Securities:
(000's omitted) | |
Common
Stocks | |
India | | $ | — | | | $ | — | | | $ | — | | | $ | (1,437 | ) | | $ | 15,536 | | | $ | — | | | $ | — | | | $ | — | | | $ | 14,099 | | | $ | (1,437 | ) | |
Total | | $ | — | | | $ | — | | | $ | — | | | $ | (1,437 | ) | | $ | 15,536 | | | $ | — | | | $ | — | | | $ | — | | | $ | 14,099 | | | $ | (1,437 | ) | |
As of the year ended August 31, 2018, no securities were transferred from one level (as of August 31, 2017) to another.
See Notes to Financial Statements
90
Schedule of Investments Emerging Markets Equity Fund (cont'd)
The following table presents additional information about valuation approach and inputs used for investments that are measured at fair value and categorized within Level 3 as of August 31, 2018.
Asset
class | | Fair value
at 8/31/2018 | | Valuation
approach | | Unobservable
input | | Amount or
range
per unit | | Input value
per unit | | Impact to
valuation
from
increase
in input(c) | |
Common
Stock | | $ | 14,099,000
| | | Market
Approach | | Transaction
Price | | $ | 13.25
| | | $ | 13.25
| | | Increase
| |
(c) Represents the expected directional change in the fair value of the Level 3 investments that would result from an increase in the corresponding input. A decrease to the unobservable input would have the opposite effect. Significant changes in these inputs could result in significantly higher or lower fair value measurements.
See Notes to Financial Statements
91
Schedule of Investments Equity Income Fund August 31, 2018
| | |
Number
of Shares | |
Value
(000's) | |
Common Stocks 85.7% | |
Aerospace & Defense 2.6% | |
BAE Systems
PLC | | | 3,315,000 | | | $ | 26,044 | | |
Lockheed
Martin Corp. | | | 51,000 | | | | 16,341 | | |
| | | | 42,385 | | |
Banks 8.5% | |
First Hawaiian,
Inc. | | | 729,200 | | | | 21,140 | | |
JPMorgan
Chase & Co.(a) | | | 374,000 | | | | 42,853 | | |
PNC Financial
Services
Group, Inc. | | | 115,000 | | | | 16,507 | | |
SunTrust Banks,
Inc. | | | 355,100 | | | | 26,121 | | |
Umpqua
Holdings
Corp. | | | 1,366,000 | | | | 29,232 | | |
| | | | 135,853 | | |
Beverages 1.5% | |
PepsiCo, Inc. | | | 220,000 | | | | 24,642 | | |
Biotechnology 2.2% | |
Gilead Sciences,
Inc. | | | 459,100 | | | | 34,768 | | |
Capital Markets 1.2% | |
Virtu Financial,
Inc. Class A | | | 890,250 | | | | 19,408 | | |
Chemicals 2.4% | |
LyondellBasell
Industries NV
Class A | | | 150,000 | | | | 16,917 | | |
Nutrien Ltd. | | | 326,000 | | | | 18,462 | | |
Umicore SA | | | 44,118 | | | | 2,460 | | |
| | | | 37,839 | | |
Communications Equipment 1.4% | |
Cisco Systems,
Inc.(a) | | | 479,500 | | | | 22,906 | | |
Construction & Engineering 0.7% | |
Ferrovial SA | | | 509,400 | | | | 11,013 | | |
Containers & Packaging 0.9% | |
International
Paper Co.(a) | | | 296,200 | | | | 15,148 | | |
Diversified Telecommunication Services 1.7% | |
Verizon
Communications,
Inc. | | | 500,000 | | | | 27,185 | | |
Electric Utilities 6.2% | |
Evergy, Inc. | | | 592,000 | | | | 33,774 | | |
Exelon Corp. | | | 427,000 | | | | 18,664 | | |
| | |
Number
of Shares | |
Value
(000's) | |
NextEra Energy,
Inc. | | | 275,000 | | | $ | 46,777 | | |
| | | | 99,215 | | |
Energy Equipment & Services 1.6% | |
Helmerich &
Payne, Inc. | | | 395,163 | | | | 25,911 | | |
Equity Real Estate Investment
Trusts 11.9% | |
Alexandria Real
Estate Equities,
Inc. | | | 202,000 | | | | 25,927 | | |
CoreSite Realty
Corp. | | | 155,398 | | | | 18,099 | | |
Crown Castle
International
Corp. | | | 243,900 | | | | 27,812 | | |
Douglas
Emmett, Inc. | | | 450,000 | | | | 17,577 | | |
| Equinix, Inc.(a) | | | 66,700 | | | | 29,090 | | |
Equity Lifestyle
Properties, Inc. | | | 175,000 | | | | 16,954 | | |
Host Hotels &
Resorts, Inc. | | | 1,378,300 | | | | 29,675 | | |
Outfront Media,
Inc. | | | 550,000 | | | | 10,928 | | |
Weyerhaeuser
Co. | | | 440,000 | | | | 15,272 | | |
| | | | 191,334 | | |
Food & Staples Retailing 1.2% | |
Walmart, Inc. | | | 200,000 | | | | 19,172 | | |
Food Products 0.8% | |
Flowers Foods,
Inc. | | | 660,000 | | | | 13,299 | | |
Hotels, Restaurants & Leisure 1.3% | |
Carnival Corp. | | | 260,000 | | | | 15,988 | | |
Las Vegas
Sands Corp. | | | 65,000 | | | | 4,252 | | |
| | | | 20,240 | | |
Industrial Conglomerates 1.0% | |
Siemens AG | | | 120,000 | | | | 15,598 | | |
IT Services 1.9% | |
Paychex, Inc. | | | 424,400 | | | | 31,087 | | |
Media 1.7% | |
Interpublic
Group of Cos.,
Inc. | | | 1,139,500 | | | | 26,607 | | |
Metals & Mining 2.0% | |
Rio Tinto PLC
ADR | | | 665,000 | | | | 31,940 | | |
Mortgage Real Estate Investment 1.4% | |
Blackstone
Mortgage
Trust, Inc.
Class A | | | 648,900 | | | | 22,102 | | |
| | |
Number
of Shares | |
Value
(000's) | |
Multi-Utilities 7.1% | |
Ameren Corp. | | | 295,000 | | | $ | 18,653 | | |
DTE Energy Co. | | | 317,000 | | | | 35,231 | | |
NiSource, Inc. | | | 1,250,000 | | | | 33,838 | | |
Sempra Energy | | | 82,300 | | | | 9,553 | | |
WEC Energy
Group, Inc. | | | 259,800 | | | | 17,557 | | |
| | | | 114,832 | | |
Oil, Gas & Consumable Fuels 6.9% | |
ONEOK, Inc. | | | 314,700 | | | | 20,742 | | |
Pembina
Pipeline Corp. | | | 710,000 | | | | 24,216 | | |
Suncor Energy,
Inc. | | | 1,033,900 | | | | 42,576 | | |
TOTAL SA | | | 384,000 | | | | 24,011 | | |
| | | | 111,545 | | |
Pharmaceuticals 4.4% | |
AstraZeneca
PLC ADR | | | 310,000 | | | | 11,885 | | |
Johnson &
Johnson | | | 229,100 | | | | 30,858 | | |
Pfizer, Inc. | | | 691,000 | | | | 28,690 | | |
| | | | 71,433 | | |
Road & Rail 0.5% | |
Union Pacific
Corp. | | | 52,000 | | | | 7,832 | | |
Semiconductors & Semiconductor Equipment 4.8% | |
Maxim
Integrated
Products, Inc. | | | 630,700 | | | | 38,138 | | |
QUALCOMM,
Inc. | | | 193,200 | | | | 13,275 | | |
Taiwan
Semiconductor
Manufacturing
Co. Ltd. ADR | | | 595,000 | | | | 25,942 | | |
| | | | 77,355 | | |
Software 2.5% | |
Microsoft
Corp.(a) | | | 361,100 | | | | 40,562 | | |
Specialty Retail 3.5% | |
Foot Locker,
Inc. | | | 327,000 | | | | 16,121 | | |
Home Depot,
Inc. | | | 86,500 | | | | 17,366 | | |
L Brands, Inc. | | | 157,500 | | | | 4,163 | | |
Williams-
Sonoma, Inc. | | | 264,000 | | | | 18,541 | | |
| | | | 56,191 | | |
Technology Hardware, Storage & Peripherals 0.9% | |
Western Digital
Corp.(a) | | | 219,162 | | | | 13,860 | | |
See Notes to Financial Statements
92
Schedule of Investments Equity Income Fund (cont'd)
| | |
Number
of Shares | |
Value
(000's) | |
Transportation Infrastructure 1.0% | |
Sydney Airport | | | 3,179,137 | | | $ | 16,478 | | |
Total Common Stocks
(Cost $1,062,031) | | | 1,377,740 | | |
Preferred Stocks 0.1% | |
Oil, Gas & Consumable Fuel 0.1% | |
El Paso Energy
Capital Trust I,
4.75%
(Cost $1,339) | | | 32,900 | | | | 1,507 | | |
| | | Principal
Amount | | | |
Convertible Bonds 11.2% | |
Banks 1.0% | |
Hope Bancorp,
Inc., 2.00%,
due 5/15/38(b) | | $ | 16,415,000 | | | | 15,839 | | |
Biotechnology 0.3% | |
BioMarin
Pharmaceutical,
Inc., 0.60%,
due 8/1/24 | | | 4,565,000 | | | | 4,843 | | |
Communications Equipment 0.1% | |
Finisar Corp.,
0.50%,
due 12/15/36 | | | 2,685,000 | | | | 2,474 | | |
Equity Real Estate Investment
Trusts 2.4% | |
Extra Space
Storage LP,
3.13%,
due 10/1/35(b) | | | 33,260,000 | | | | 36,519 | | |
IH Merger Sub
LLC, 3.50%,
due 1/15/22 | | | 2,600,000 | | | | 2,906 | | |
| | | | 39,425 | | |
Independent Power and Renewable Electricity Producers 1.0% | |
NextEra Energy
Partners L.P.,
1.50%,
due 9/15/20(b) | | | 16,535,000 | | | | 16,901 | | |
| | |
Principal
Amount | |
Value
(000's) | |
Internet & Direct Marketing
Retail 0.2% | |
Liberty Expedia
Holdings, Inc.,
1.00%,
due 6/30/47(b) | | $ | 3,615,000 | | | $ | 3,626 | | |
Internet Software & Services 1.7% | |
Envestnet, Inc.,
1.75%,
due 6/1/23(b) | | | 10,930,000 | | | | 12,048 | | |
LinkedIn Corp.,
0.50%,
due 11/1/19 | | | 8,600,000 | | | | 8,385 | | |
Zillow Group,
Inc., 1.50%,
due 7/1/23 | | | 6,850,000 | | | | 6,435 | | |
| | | | 26,868 | | |
Media 1.3% | |
Gannett Co.,
Inc., 4.75%,
due 4/15/24(b) | | | 2,730,000 | | | | 2,869 | | |
Liberty Media
Corp., 2.13%,
due 3/31/48(b) | | | 16,500,000 | | | | 16,760 | | |
Live Nation
Entertainment,
Inc., 2.50%,
due 3/15/23(b) | | | 860,000 | | | | 891 | | |
| | | | 20,520 | | |
Metals & Mining 0.8% | |
Endeavour
Mining Corp.,
3.00%,
due 2/15/23(b) | | | 13,765,000 | | | | 12,854 | | |
Oil, Gas & Consumable Fuels 0.8% | |
Golar LNG Ltd.,
2.75%,
due 2/15/22 | | | 8,950,000 | | | | 9,050 | | |
Teekay Corp.,
5.00%,
due 1/15/23(b) | | | 3,664,000 | | | | 3,321 | | |
| | | | 12,371 | | |
| | |
Principal
Amount | |
Value
(000's) | |
Semiconductors & Semiconductor Equipment 0.1% | |
Rambus, Inc.,
1.38%,
due 2/1/23(b) | | $ | 1,378,000 | | | $ | 1,293 | | |
Software 1.4% | |
Guidewire
Software, Inc.,
1.25%,
due 3/15/25 | | | 9,000,000 | | | | 9,697 | | |
PROS Holdings,
Inc., 2.00%,
due 6/1/47 | | | 4,265,000 | | | | 4,186 | | |
Verint Systems,
Inc., 1.50%,
due 6/1/21 | | | 8,700,000 | | | | 8,907 | | |
| | | | 22,790 | | |
Telecommunications 0.1% | |
GCI Liberty, Inc.,
1.75%,
due 9/30/46(b) | | | 913,000 | | | | 954 | | |
Total Convertible Bonds
(Cost $175,606) | | | 180,758 | | |
| | | Number
of Shares | | | |
Short-Term Investments 3.7% | |
Investment Companies 3.7% | |
State Street
Institutional
Treasury
Money Market
Fund Premier
Class, 1.87%(c)
(Cost $58,849) | | | 58,849,230 | | | | 58,849 | | |
Total Investments 100.7%
(Cost $1,297,825) | | 1,618,854 | |
Liabilities Less
Other Assets (0.7)%(d) | | | | | (10,698 | ) | |
Net Assets 100.0% | | | | $ | 1,608,156 | | |
(a) All or a portion of the security is pledged as collateral for options written.
(b) Securities were purchased under Rule 144A of the Securities Act of 1933, as amended, or are otherwise restricted and, unless registered under the Securities Act of 1933 or exempted from registration, may only be sold to qualified institutional investors or may have other restrictions on resale. At August 31, 2018, these securities amounted to approximately $123,875,000, which represents 7.7% of net assets of the Fund. These securities have been deemed by the investment manager to be liquid.
(c) Represents 7-day effective yield as of August 31, 2018.
(d) Includes the impact of the Fund's open positions in derivatives at August 31, 2018.
See Notes to Financial Statements
93
Schedule of Investments Equity Income Fund (cont'd)
Derivative Instruments
Written option contracts ("options written")
At August 31, 2018, the Fund had outstanding options written as follows:
Description | | Number of
Contracts | | Notional
Amount | | Exercise
Price | | Expiration
Date | | Value | |
Calls | |
Banks | |
SunTrust Banks, Inc. | | | 250 | | | $ | (1,839,000 | ) | | $ | 80 | | | 1/18/2019 | | $ | (28,750 | ) | |
Beverages | |
PepsiCo, Inc. | | | 150 | | | | (1,680,150 | ) | | | 130 | | | 6/21/2019 | | | (17,175 | ) | |
Chemicals | |
Nutrien Ltd. | | | 250 | | | | (1,415,750 | ) | | | 60 | | | 1/18/2019 | | | (41,875 | ) | |
Communications Equipment | |
Cisco Systems, Inc. | | | 250 | | | | (1,194,250 | ) | | | 50 | | | 1/18/2019 | | | (33,000 | ) | |
Electric Utilities | |
Exelon Corp. | | | 250 | | | | (1,092,750 | ) | | | 45 | | | 1/18/2019 | | | (24,375 | ) | |
NextEra Energy, Inc. | | | 200 | | | | (3,402,000 | ) | | | 180 | | | 12/21/2018 | | | (36,500 | ) | |
NextEra Energy, Inc. | | | 200 | | | | (3,402,000 | ) | | | 185 | | | 1/18/2019 | | | (24,000 | ) | |
NextEra Energy, Inc. | | | 200 | | | | (3,402,000 | ) | | | 190 | | | 3/15/2019 | | | (19,500 | ) | |
| | | | | | | | | | | | (104,375 | ) | |
Equity Real Estate Investment Trusts | |
CoreSite Realty Corp. | | | 150 | | | | (1,747,050 | ) | | | 130 | | | 1/18/2019 | | | (16,125 | ) | |
IT Services | |
Paychex, Inc. | | | 250 | | | | (1,831,250 | ) | | | 72.5 | | | 1/18/2019 | | | (91,250 | ) | |
Paychex, Inc. | | | 250 | | | | (1,831,250 | ) | | | 75 | | | 1/18/2019 | | | (58,125 | ) | |
| | | | | | | | | | | | (149,375 | ) | |
Oil, Gas & Consumable Fuels | |
ONEOK, Inc. | | | 150 | | | | (988,650 | ) | | | 72.5 | | | 1/18/2019 | | | (13,875 | ) | |
Suncor Energy, Inc. | | | 200 | | | | (823,600 | ) | | | 44 | | | 12/21/2018 | | | (17,000 | ) | |
Suncor Energy, Inc. | | | 250 | | | | (1,029,500 | ) | | | 46 | | | 1/18/2019 | | | (14,250 | ) | |
| | | | | | | | | | | | (45,125 | ) | |
Road & Rail | |
Union Pacific Corp. | | | 150 | | | | (2,259,300 | ) | | | 165 | | | 2/15/2019 | | | (45,225 | ) | |
Semiconductors & Semiconductor Equipment | |
QUALCOMM, Inc. | | | 200 | | | | (1,374,200 | ) | | | 70 | | | 10/19/2018 | | | (28,800 | ) | |
QUALCOMM, Inc. | | | 200 | | | | (1,374,200 | ) | | | 72.5 | | | 1/18/2019 | | | (43,800 | ) | |
QUALCOMM, Inc. | | | 200 | | | | (1,374,200 | ) | | | 75 | | | 1/18/2019 | | | (30,100 | ) | |
Taiwan Semiconductor Manufacturing Co. Ltd. ADR | | | 250 | | | | (1,090,000 | ) | | | 46 | | | 1/18/2019 | | | (40,000 | ) | |
| | | | | | | | | | | | (142,700 | ) | |
Software | |
Microsoft Corp. | | | 250 | | | | (2,808,250 | ) | | | 105 | | | 9/21/2018 | | | (191,875 | ) | |
Microsoft Corp. | | | 200 | | | | (2,246,600 | ) | | | 110 | | | 10/19/2018 | | | (91,000 | ) | |
Microsoft Corp. | | | 200 | | | | (2,246,600 | ) | | | 115 | | | 1/18/2019 | | | (91,000 | ) | |
| | | | | | | | | | | | (373,875 | ) | |
See Notes to Financial Statements
94
Schedule of Investments Equity Income Fund (cont'd)
Description | | Number of
Contracts | | Notional
Amount | | Exercise
Price | | Expiration
Date | | Value | |
Specialty Retail | |
Williams-Sonoma, Inc. | | | 250 | | | $ | (1,755,750 | ) | | $ | 62.5 | | | 11/16/2018 | | $ | (218,750 | ) | |
Williams-Sonoma, Inc. | | | 250 | | | | (1,755,750 | ) | | | 65 | | | 1/18/2019 | | | (206,250 | ) | |
Williams-Sonoma, Inc. | | | 250 | | | | (1,755,750 | ) | | | 70 | | | 1/18/2019 | | | (131,250 | ) | |
| | | | | | | | | | | | (556,250 | ) | |
Total options written (premiums received: $736,551) | | | | | | | | | | $ | (1,553,850 | ) | |
For the year ended August 31, 2018, the Fund had an average market value of $(1,811,591) in options written. At August 31, 2018, the Fund had securities pledged in the amount of $30,099,069 to cover collateral requirements for options written.
The following is a summary, categorized by Level (see Note A of Notes to Financial Statements), of inputs used to value the Fund's investments as of August 31, 2018:
Asset Valuation Inputs | |
(000's omitted) | | Level 1 | | Level 2 | | Level 3 | | Total | |
Investments: | |
| Common Stocks(a) | | $ | 1,377,740 | | | $ | — | | | $ | — | | | $ | 1,377,740 | | |
| Preferred Stocks(a) | | | 1,507 | | | | — | | | | — | | | | 1,507 | | |
| Convertible Bonds(a) | | | — | | | | 180,758 | | | | — | | | | 180,758 | | |
Short-Term Investments | | | — | | | | 58,849 | | | | — | | | | 58,849 | | |
Total Investments | | $ | 1,379,247 | | | $ | 239,607 | | | $ | — | | | $ | 1,618,854 | | |
(a) The Schedule of Investments provides information on the industry categorization for the portfolio.
As of the year ended August 31, 2018, no securities were transferred from one level (as of August 31, 2017) to another.
The following is a summary, categorized by Level (see Note A of Notes to Financial Statements), of inputs used to value the Fund's derivatives as of August 31, 2018:
Other Financial Instruments | |
(000's omitted) | | Level 1 | | Level 2 | | Level 3 | | Total | |
Options Written | |
Liabilities | | $ | (1,554 | ) | | $ | — | | | $ | — | | | $ | (1,554 | ) | |
Total | | $ | (1,554 | ) | | $ | — | | | $ | — | | | $ | (1,554 | ) | |
See Notes to Financial Statements
95
Schedule of Investments Focus Fund August 31,2018
| | |
Number
of Shares | |
Value
(000's) | |
Common Stocks 98.6% | |
Aerospace & Defense 0.9% | |
General Dynamics
Corp. | | | 36,600 | | | $ | 7,078 | | |
Auto Components 1.2% | |
Aptiv PLC | | | 100,000 | | | | 8,801 | | |
Banks 8.1% | |
Comerica, Inc. | | | 312,000 | | | | 30,414 | | |
JPMorgan
Chase & Co. | | | 272,000 | | | | 31,166 | | |
| | | | 61,580 | | |
Biotechnology 4.8% | |
BioMarin
Pharmaceutical,
Inc.* | | | 87,000 | | | | 8,698 | | |
Gilead Sciences,
Inc. | | | 366,000 | | | | 27,717 | | |
| | | | 36,415 | | |
Building Products 1.3% | |
Johnson Controls
International PLC | | | 271,000 | | | | 10,236 | | |
Capital Markets 4.5% | |
Intercontinental
Exchange, Inc. | | | 336,000 | | | | 25,613 | | |
Morgan Stanley | | | 173,000 | | | | 8,448 | | |
| | | | 34,061 | | |
Chemicals 2.1% | |
Air Products &
Chemicals, Inc. | | | 42,000 | | | | 6,984 | | |
Ashland Global
Holdings, Inc. | | | 108,000 | | | | 9,094 | | |
| | | | 16,078 | | |
Commercial Services 0.4% | |
LegalZoom.com,
Inc.*(a)(b)(d) | | | 71,572 | | | | 3,000 | | |
Communications Equipment 3.9% | |
Motorola
Solutions, Inc. | | | 235,000 | | | | 30,165 | | |
Containers & Packaging 0.9% | |
Packaging Corp.
of America | | | 64,000 | | | | 7,035 | | |
Distributors 3.2% | |
LKQ Corp.* | | | 720,000 | | | | 24,854 | | |
Food & Staples Retailing 1.3% | |
Walmart, Inc. | | | 106,000 | | | | 10,161 | | |
| | |
Number
of Shares | |
Value
(000's) | |
Food Products 5.0% | |
Conagra Brands,
Inc. | | | 413,000 | | | $ | 15,178 | | |
Mondelez
International, Inc.
Class A | | | 545,000 | | | | 23,282 | | |
| | | | 38,460 | | |
Health Care Equipment &
Supplies 2.7% | |
Zimmer Biomet
Holdings, Inc. | | | 167,000 | | | | 20,646 | | |
Health Care Providers &
Services 4.2% | |
Cigna Corp. | | | 170,000 | | | | 32,018 | | |
Hotels, Restaurants & Leisure 2.0% | |
Carnival Corp. | | | 247,000 | | | | 15,188 | | |
Household Durables 1.7% | |
Whirlpool Corp. | | | 107,000 | | | | 13,373 | | |
Insurance 2.8% | |
Athene Holding
Ltd. Class A* | | | 428,000 | | | | 21,255 | | |
Internet & Direct Marketing
Retail 4.5% | |
Amazon.com, Inc.* | | | 17,000 | | | | 34,216 | | |
Internet Software & Services 5.6% | |
Alphabet, Inc.
Class A* | | | 17,100 | | | | 21,064 | | |
Alphabet, Inc.
Class C* | | | 17,600 | | | | 21,440 | | |
| | | | 42,504 | | |
IT Services 1.7% | |
Worldpay, Inc.
Class A* | | | 135,000 | | | | 13,148 | | |
Media 3.5% | |
Charter
Communications,
Inc. Class A* | | | 43,000 | | | | 13,347 | | |
Twenty-First
Century Fox, Inc.
Class A | | | 290,000 | | | | 13,166 | | |
| | | | 26,513 | | |
Multi-Utilities 2.7% | |
DTE Energy Co. | | | 188,000 | | | | 20,894 | | |
Oil, Gas & Consumable Fuels 6.8% | |
Cabot Oil & Gas
Corp. | | | 675,000 | | | | 16,085 | | |
Concho Resources,
Inc.* | | | 91,000 | | | | 12,481 | | |
| | |
Number
of Shares | |
Value
(000's) | |
Phillips 66 | | | 90,000 | | | $ | 10,666 | | |
WPX Energy, Inc.* | | | 654,000 | | | | 12,472 | | |
| | | | 51,704 | | |
Pharmaceuticals 2.9% | |
Pfizer, Inc. | | | 543,000 | | | | 22,545 | | |
Professional Services 2.3% | |
Equifax, Inc. | | | 132,000 | | | | 17,684 | | |
Road & Rail 4.0% | |
CSX Corp. | | | 412,000 | | | | 30,554 | | |
Semiconductors & Semiconductor Equipment 2.8% | |
Analog Devices,
Inc. | | | 213,000 | | | | 21,055 | | |
Software 4.4% | |
Autodesk, Inc.* | | | 116,400 | | | | 17,966 | | |
Electronic Arts,
Inc.* | | | 138,000 | | | | 15,651 | | |
| | | | 33,617 | | |
Technology Hardware, Storage & Peripherals 2.0% | |
Western Digital
Corp. | | | 240,000 | | | | 15,178 | | |
Wireless Telecommunication
Services 4.4% | |
T-Mobile US, Inc.* | | | 510,000 | | | | 33,680 | | |
Total Common Stocks753,696
(Cost $604,625) | | | |
Short-Term Investments 1.2% | |
Investment Companies 1.2% | |
State Street
Institutional U.S.
Government
Money Market
Fund Premier
Class, 1.87%(c)
(Cost $9,522) | | | 9,522,300 | | | | 9,522 | | |
Total Investments 99.8%
(Cost $614,147) | | | | | 763,218 | | |
Other Assets Less
Liabilities 0.2% | | | | | 1,243 | | |
Net Assets 100.0% | | | | $ | 764,461 | | |
See Notes to Financial Statements
96
Schedule of Investments Focus Fund (cont'd)
* Non-income producing security.
(a) Value determined using significant unobservable inputs.
(b) Security fair valued as of August 31, 2018 in accordance with procedures approved by the Board of Trustees. Total value of all such securities at August 31, 2018 amounted to approximately $3,000,000, which represents 0.4% of net assets of the Fund.
(c) Represents 7-day effective yield as of August 31, 2018.
(d) These securities have been deemed by the investment manager to be illiquid, and are subject to restrictions on resale.
At August 31, 2018, these securities amounted to approximately $3,000,000, which represents 0.4% of net assets of the Fund.
(000's omitted)
Restricted Security | | Acquisition
Date | | Acquisition
Cost | | Acquisition
Cost
Percentage
of Net Assets | | Value as of
8/31/2018 | | Fair Value
Percentage
of Net Assets
as of
8/31/2018 | |
LegalZoom.com, Inc. | | 8/21/2018 | | $ | 3,000 | | | | 0.4 | % | | $ | 3,000 | | | | 0.4 | % | |
Total | | | | $ | 3,000 | | | | 0.4 | % | | $ | 3,000 | | | | 0.4 | % | |
Derivative Instruments
Purchased option contracts ("options purchased")
At August 31, 2018, the Fund did not have any outstanding options purchased. For the year ended August 31, 2018, the Fund had an average market value of $359,425 in options purchased.
Written option contracts ("options written")
At August 31, 2018, the Fund did not have any outstanding options written. For the year ended August 31, 2018, the Fund had an average market value of $(329,728) in options written.
The following is a summary, categorized by Level (see Note A of Notes to Financial Statements), of inputs used to value the Fund's investments as of August 31, 2018:
Asset Valuation Inputs | |
(000's omitted) | | Level 1 | | Level 2 | | Level 3(b) | | Total | |
Investments: | |
Common Stocks | |
Commercial Services | | $ | — | | | $ | — | | | $ | 3,000 | | | $ | 3,000 | | |
| Other Common Stocks(a) | | | 750,696 | | | | — | | | | — | | | | 750,696 | | |
Total Common Stocks | | | 750,696 | | | | — | | | | 3,000 | | | | 753,696 | | |
Short-Term Investments | | | — | | | | 9,522 | | | | — | | | | 9,522 | | |
Total Investments | | $ | 750,696 | | | $ | 9,522 | | | $ | 3,000 | | | $ | 763,218 | | |
(a) The Schedule of Investments provides information on the industry categorization for the portfolio.
See Notes to Financial Statements
97
Schedule of Investments Focus Fund (cont'd)
(b) The following is reconciliation between the beginning and ending balances of investments in which unobservable inputs (Level 3) were used in determining value:
| | | Beginning
balance, as
of 9/1/2017 | | Accrued
discounts/
(premiums) | | Realized
gain/
(loss) | | Change
in unrealized
appreciation/
(depreciation) | | Purchases | | Sales | | Transfers
into
Level 3 | | Transfers
out of
Level 3 | | Balance,
as of
8/31/2018 | | Net change in
unrealized
appreciation/
(depreciation)
from
investments
still held as
of 8/31/2018 | |
Investments in Securities:
(000's omitted) | |
Common
Stocks | |
Commercial
Services | | $ | — | | | $ | — | | | $ | — | | | $ | — | | | $ | 3,000 | | | $ | — | | | $ | — | | | $ | — | | | $ | 3,000 | | | $ | — | | |
Total | | $ | — | | | $ | — | | | $ | — | | | $ | — | | | $ | 3,000 | | | $ | — | | | $ | — | | | $ | — | | | $ | 3,000 | | | $ | — | | |
As of the year ended August 31, 2018, no securities were transferred from one level (as of August 31, 2017) to another.
The following table presents additional information about valuation techniques and inputs used for investments that are measured at fair value and categorized within Level 3 as of August 31, 2018.
Asset
class | | Fair value
at 8/31/2018 | | Valuation
techniques | | Unobservable
input | | Amount or
range
per unit | | Input value
per unit | | Impact to
valuation
from
increase
in input(c) | |
Common
Stocks | | $ | 3,000,298
| | | Market
Approach | | Transaction
Price | | $ | 41.92
| | | $ | 41.92
| | | Increase
| |
(c) Represents the expected directional change in the fair value of the Level 3 investments that would result from an increase in the corresponding input. A decrease to the unobservable input would have the opposite effect. Significant changes in these inputs could result in significantly higher or lower fair value measurements.
See Notes to Financial Statements
98
Schedule of Investments Focus Fund (cont'd)
Other Financial Instruments | |
The Fund held no Level 3 derivative investments at August 31, 2018.
The following is reconciliation between the beginning and ending balances of investments in which unobservable inputs (Level 3) were used in determining value:
| | | Beginning
balance, as
of 9/1/2017 | | Accrued
discounts/
(premiums) | | Realized
gain/
(loss) | | Change
in unrealized
appreciation/
(depreciation) | | Purchases | | Sales | | Transfers
into
Level 3 | | Transfers
out of
Level 3 | | Balance,
as of
8/31/2018 | | Net change in
unrealized
appreciation/
(depreciation)
from
investments
still held as
of 8/31/2018 | |
Other Financial Instruments:
(000's omitted) | |
| Options Written(a) | |
Puts | |
Food Products | | $ | (0 | ) | | $ | — | | | $ | 16 | | | $ | (16 | ) | | $ | 0 | | | $ | — | | | $ | — | | | $ | — | | | $ | — | | | $ | — | | |
Total | | $ | (0 | ) | | $ | — | | | $ | 16 | | | $ | (16 | ) | | $ | 0 | | | $ | — | | | $ | — | | | $ | — | | | $ | — | | | $ | — | | |
(a) At the beginning of the year, the Fund's Level 3 investments were valued based on using methods the Board of Trustees has approved in the good-faith belief that the resulting valuation will reflect the fair value of the security.
See Notes to Financial Statements
99
Schedule of Investments Genesis Fund August 31, 2018
| | |
Number
of Shares | |
Value
(000's) | |
Common Stocks 99.0% | |
Aerospace & Defense 0.3% | |
Astronics
Corp.* | | | 907,912 | | | $ | 39,503 | | |
Air Freight & Logistics 0.5% | |
Forward Air
Corp. | | | 962,425 | | | | 61,845 | | |
Airlines 0.6% | |
Allegiant
Travel Co. | | | 487,563 | | | | 66,430 | | |
Auto Components 1.7% | |
Fox Factory
Holding
Corp.* | | | 1,568,008 | | | | 103,567 | | |
LCI Industries | | | 975,348 | | | | 90,659 | | |
| | | | 194,226 | | |
Automobiles 0.3% | |
Thor Industries,
Inc. | | | 409,033 | | | | 39,038 | | |
Banks 11.6% | |
Bank of Hawaii
Corp. | | | 1,741,514 | | | | 144,772 | | |
Bank OZK | | | 2,409,380 | | | | 97,484 | | |
BOK Financial
Corp. | | | 1,101,049 | | | | 112,913 | | |
Columbia
Banking
System, Inc. | | | 1,983,400 | | | | 83,799 | | |
Community
Bank System,
Inc. | | | 1,357,700 | | | | 89,785 | | |
Cullen/Frost
Bankers, Inc. | | | 1,402,079 | | | | 155,477 | | |
CVB Financial
Corp. | | | 4,739,807 | | | | 113,992 | | |
First Financial
Bankshares,
Inc. | | | 2,287,231 | | | | 138,149 | | |
First Hawaiian,
Inc. | | | 1,909,274 | | | | 55,350 | | |
FNB Corp. | | | 4,181,743 | | | | 56,244 | | |
Glacier
Bancorp,
Inc. | | | 1,599,832 | | | | 73,080 | | |
Lakeland
Financial
Corp. | | | 724,769 | | | | 35,709 | | |
LegacyTexas
Financial
Group, Inc. | | | 1,983,734 | | | | 91,787 | | |
PacWest
Bancorp | | | 1,168,021 | | | | 58,973 | | |
| | | | 1,307,514 | | |
| | |
Number
of Shares | |
Value
(000's) | |
Beverages 0.5% | |
MGP
Ingredients, Inc. | | | 677,792 | | | $ | 52,265 | | |
Biotechnology 0.3% | |
Abcam PLC | | | 1,776,766 | | | | 34,921 | | |
Building Products 1.9% | |
AAON, Inc. | | | 2,579,198 | | | | 104,200 | | |
AO Smith Corp. | | | 1,328,323 | | | | 77,149 | | |
Patrick
Industries, Inc.* | | | 454,546 | | | | 29,091 | | |
| | | | 210,440 | | |
Capital Markets 2.7% | |
Artisan Partners
Asset
Management,
Inc. Class A | | | 1,299,691 | | | | 43,085 | | |
BrightSphere
Investment
Group PLC | | | 2,701,801 | | | | 34,286 | | |
FactSet
Research
Systems, Inc. | | | 310,681 | | | | 71,267 | | |
Houlihan
Lokey, Inc. | | | 836,393 | | | | 39,335 | | |
MarketAxess
Holdings, Inc. | | | 638,895 | | | | 121,275 | | |
| | | | 309,248 | | |
Chemicals 3.3% | |
Balchem Corp. | | | 624,056 | | | | 69,202 | | |
Chase Corp. | | | 371,278 | | | | 46,020 | | |
Innophos
Holdings, Inc. | | | 420,169 | | | | 18,366 | | |
NewMarket
Corp. | | | 117,537 | | | | 47,137 | | |
Quaker
Chemical Corp. | | | 477,147 | | | | 85,953 | | |
Sensient
Technologies
Corp. | | | 1,533,784 | | | | 108,929 | | |
| | | | 375,607 | | |
Commercial Services & Supplies 3.5% | |
Healthcare
Services
Group, Inc. | | | 2,090,181 | | | | 86,136 | | |
MSA Safety, Inc. | | | 661,441 | | | | 66,865 | | |
Rollins, Inc. | | | 2,949,828 | | | | 177,226 | | |
UniFirst Corp. | | | 347,634 | | | | 64,382 | | |
| | | | 394,609 | | |
Communications Equipment 0.9% | |
NetScout
Systems, Inc.*(a) | | | 4,073,838 | | | | 101,846 | | |
Construction & Engineering 0.8% | |
Valmont
Industries, Inc. | | | 669,896 | | | | 94,053 | | |
| | |
Number
of Shares | |
Value
(000's) | |
Construction Materials 1.1% | |
Eagle Materials,
Inc. | | | 1,327,432 | | | $ | 122,562 | | |
Containers & Packaging 1.1% | |
AptarGroup,
Inc. | | | 1,229,138 | | | | 128,703 | | |
Distributors 2.3% | |
Pool Corp. | | | 1,567,984 | | | | 257,557 | | |
Diversified Consumer Services 1.0% | |
Bright Horizons
Family Solutions,
Inc.* | | | 905,539 | | | | 108,149 | | |
Electrical Equipment 0.7% | |
| AZZ, Inc.(a) | | | 1,366,653 | | | | 73,458 | | |
Electronic Equipment, Instruments & Components 6.0% | |
Cognex Corp. | | | 2,059,972 | | | | 110,826 | | |
Littelfuse, Inc. | | | 831,136 | | | | 185,809 | | |
nLight, Inc.* | | | 324,540 | | | | 9,999 | | |
Novanta, Inc.* | | | 1,042,554 | | | | 79,860 | | |
| Rogers Corp.*(a) | | | 1,238,614 | | | | 171,015 | | |
Zebra
Technologies
Corp. Class A* | | | 709,960 | | | | 121,929 | | |
| | | | 679,438 | | |
Energy Equipment & Services 1.5% | |
Apergy Corp.* | | | 1,167,766 | | | | 52,806 | | |
Cactus, Inc.
Class A* | | | 851,055 | | | | 29,089 | | |
Computer
Modelling
Group Ltd.(b) | | | 3,773,999 | | | | 25,218 | | |
Pason Systems,
Inc. | | | 3,770,987 | | | | 61,995 | | |
| | | | 169,108 | | |
Food Products 2.4% | |
Calavo
Growers, Inc.(a) | | | 881,159 | | | | 93,271 | | |
J & J Snack
Foods Corp. | | | 454,567 | | | | 66,139 | | |
Lancaster
Colony Corp. | | | 735,052 | | | | 114,867 | | |
| | | | 274,277 | | |
Health Care Equipment & Supplies 7.3% | |
| Atrion Corp.(a) | | | 96,017 | | | | 62,896 | | |
Cantel Medical
Corp. | | | 1,134,226 | | | | 110,020 | | |
Haemonetics
Corp.* | | | 1,049,142 | | | | 117,126 | | |
| Heska Corp.*(a) | | | 432,416 | | | | 46,269 | | |
IDEXX
Laboratories,
Inc.* | | | 826,469 | | | | 209,956 | | |
See Notes to Financial Statements
100
Schedule of Investments Genesis Fund (cont'd)
| | |
Number
of Shares | |
Value
(000's) | |
Neogen Corp.* | | | 430,096 | | | $ | 40,188 | | |
West
Pharmaceutical
Services, Inc. | | | 2,058,984 | | | | 241,004 | | |
| | | | 827,459 | | |
Health Care Providers & Services 3.2% | |
Chemed Corp. | | | 497,209 | | | | 160,867 | | |
Henry Schein,
Inc.* | | | 994,760 | | | | 77,273 | | |
Tivity Health,
Inc.* | | | 1,309,211 | | | | 45,037 | | |
U.S. Physical
Therapy, Inc. | | | 632,275 | | | | 79,192 | | |
| | | | 362,369 | | |
Hotels, Restaurants & Leisure 1.7% | |
Cheesecake
Factory, Inc. | | | 603,422 | | | | 32,084 | | |
Cracker Barrel
Old Country
Store, Inc. | | | 402,909 | | | | 60,070 | | |
Texas
Roadhouse,
Inc. | | | 1,428,565 | | | | 98,499 | | |
| | | | 190,653 | | |
Household Durables 0.2% | |
Installed Building
Products, Inc.* | | | 567,770 | | | | 26,430 | | |
Household Products 2.1% | |
Church &
Dwight Co.,
Inc. | | | 2,706,171 | | | | 153,115 | | |
WD-40 Co. | | | 467,684 | | | | 82,991 | | |
| | | | 236,106 | | |
Industrial Conglomerates 0.5% | |
Raven
Industries, Inc. | | | 1,080,028 | | | | 52,273 | | |
Insurance 1.4% | |
AMERISAFE, Inc. | | | 794,599 | | | | 50,695 | | |
RLI Corp. | | | 1,429,895 | | | | 110,059 | | |
| | | | 160,754 | | |
IT Services 1.5% | |
Jack Henry &
Associates, Inc. | | | 1,045,122 | | | | 165,589 | | |
Life Sciences Tools & Services 2.6% | |
Bio-Techne
Corp. | | | 1,092,278 | | | | 209,903 | | |
ICON PLC* | | | 589,777 | | | | 87,889 | | |
| | | | 297,792 | | |
| | |
Number
of Shares | |
Value
(000's) | |
Machinery 6.3% | |
Graco, Inc. | | | 1,518,590 | | | $ | 71,389 | | |
Lindsay Corp. | | | 516,477 | | | | 49,463 | | |
Middleby Corp.* | | | 803,630 | | | | 97,673 | | |
Nordson Corp. | | | 739,831 | | | | 102,851 | | |
RBC Bearings,
Inc.* | | | 1,177,415 | | | | 176,388 | | |
Toro Co. | | | 2,018,503 | | | | 122,705 | | |
Wabtec Corp. | | | 847,856 | | | | 91,840 | | |
| | | | 712,309 | | |
Media 2.6% | |
Cable One, Inc. | | | 77,352 | | | | 64,801 | | |
Gray Television,
Inc.* | | | 3,544,424 | | | | 61,850 | | |
Nexstar Media
Group, Inc.
Class A | | | 2,062,289 | | | | 169,108 | | |
| | | | 295,759 | | |
Multiline Retail 0.4% | |
Ollie's Bargain
Outlet Holdings,
Inc.* | | | 464,015 | | | | 40,416 | | |
Oil, Gas & Consumable Fuels 3.4% | |
Centennial
Resource
Development,
Inc. Class A* | | | 7,852,450 | | | | 151,317 | | |
Concho
Resources,
Inc.* | | | 381,618 | | | | 52,339 | | |
Matador
Resources Co.* | | | 3,492,555 | | | | 114,346 | | |
WPX Energy,
Inc.* | | | 3,573,375 | | | | 68,144 | | |
| | | | 386,146 | | |
Paper & Forest Products 0.8% | |
Stella-Jones, Inc. | | | 2,584,965 | | | | 88,093 | | |
Professional Services 1.3% | |
| Exponent, Inc.(a) | | | 2,752,322 | | | | 144,084 | | |
Real Estate Management & Development 0.6% | |
FirstService Corp. | | | 773,955 | | | | 66,452 | | |
Semiconductors & Semiconductor Equipment 2.9% | |
Cabot
Microelectronics
Corp. | | | 830,022 | | | | 93,568 | | |
MKS Instruments,
Inc. | | | 838,291 | | | | 77,877 | | |
Power
Integrations,
Inc.(a) | | | 2,093,383 | | | | 153,550 | | |
| | | | 324,995 | | |
| | |
Number
of Shares | |
Value
(000's) | |
Software 10.6% | |
Altair
Engineering,
Inc. Class A* | | | 1,271,430 | | | $ | 53,108 | | |
Aspen
Technology,
Inc.* | | | 2,436,730 | | | | 281,101 | | |
Blackline, Inc.* | | | 137,345 | | | | 7,246 | | |
Constellation
Software,
Inc. | | | 71,560 | | | | 54,600 | | |
Fair Isaac
Corp.* | | | 856,985 | | | | 197,946 | | |
Manhattan
Associates,
Inc.*(a) | | | 3,405,346 | | | | 197,476 | | |
Monotype
Imaging
Holdings, Inc. | | | 1,569,325 | | | | 32,328 | | |
Qualys, Inc.* | | | 1,788,201 | | | | 162,816 | | |
Tyler
Technologies,
Inc.* | | | 851,200 | | | | 210,204 | | |
| | | | 1,196,825 | | |
Specialty Retail 2.6% | |
Asbury
Automotive
Group, Inc.* | | | 660,853 | | | | 49,234 | | |
Floor & Decor
Holdings, Inc.
Class A* | | | 779,500 | | | | 28,654 | | |
Lithia Motors,
Inc. Class A | | | 832,964 | | | | 71,968 | | |
Monro, Inc. | | | 1,051,956 | | | | 74,636 | | |
Tractor
Supply Co. | | | 755,228 | | | | 66,672 | | |
| | | | 291,164 | | |
Trading Companies & Distributors 2.0% | |
Applied
Industrial
Technologies,
Inc. | | | 421,737 | | | | 32,495 | | |
Richelieu
Hardware
Ltd.(b) | | | 1,250,478 | | | | 29,752 | | |
SiteOne
Landscape
Supply, Inc.* | | | 683,467 | | | | 61,765 | | |
Watsco, Inc. | | | 606,611 | | | | 106,151 | | |
| | | | 230,163 | | |
Total Common Stocks
(Cost $5,573,079) | | | | | 11,190,628 | | |
See Notes to Financial Statements
101
Schedule of Investments Genesis Fund (cont'd)
| | |
Number
of Shares | |
Value
(000's) | |
Short-Term Investments 1.0% | |
Investment Companies 1.0% | |
State Street
Institutional
Treasury
Money Market
Fund Premier
Class, 1.87%(c) | | | 5,438,722 | | | $ | 5,439 | | |
State Street
Institutional
Treasury Plus
Money Market
Fund Premier
Class, 1.88%(c) | | | 113,546,349 | | | | 113,546 | | |
Total Short-Term Investments
(Cost $118,985) | | | | | 118,985 | | |
Total Investments 100.0%
(Cost $5,692,064) | | | | | 11,309,613 | | |
Liabilities Less
Other Assets (0.0)%(d) | | | | | (4,680 | ) | |
Net Assets 100.0% | | | | $ | 11,304,933 | | |
* Non-income producing security.
(a) Affiliated company (see Note F of Notes to Financial Statements).
(b) Security fair valued as of August 31, 2018 in accordance with procedures approved by the Board of Trustees. Total value of all such securities at August 31, 2018 amounted to approximately $54,970,000, which represents 0.5% of net assets of the Fund.
(c) Represents 7-day effective yield as of August 31, 2018.
(d) Represents less than 0.05% of net assets.
The following is a summary, categorized by Level (see Note A of Notes to Financial Statements), of inputs used to value the Fund's investments as of August 31, 2018:
Asset Valuation Inputs | |
(000's omitted) | | Level 1 | | Level 2 | | Level 3 | | Total | |
Investments: | |
Common Stocks | |
Energy Equipment & Services | | $ | 143,890 | | | $ | 25,218 | | | $ | — | | | $ | 169,108 | | |
Trading Companies & Distributors | | | 200,411 | | | | 29,752 | | | | — | | | | 230,163 | | |
| Other Common Stocks(a) | | | 10,791,357 | | | | — | | | | — | | | | 10,791,357 | | |
Total Common Stocks | | | 11,135,658 | | | | 54,970 | | | | — | | | | 11,190,628 | | |
Short-Term Investments | | | — | | | | 118,985 | | | | — | | | | 118,985 | | |
Total Investments | | $ | 11,135,658 | | | $ | 173,955 | | | $ | — | | | $ | 11,309,613 | | |
(a) The Schedule of Investments provides information on the industry categorization for the portfolio.
As of the year ended August 31, 2018, no securities were transferred from one level (as of August 31, 2017) to another.
See Notes to Financial Statements
102
Schedule of Investments Global Equity Fund August 31, 2018
| | |
Number
of Shares | |
Value
(000's) | |
Common Stocks 99.6% | |
Australia 0.7% | |
Insurance Australia
Group Ltd. | | | 6,518 | | | $ | 36 | | |
Belgium 0.6% | |
KBC Group NV | | | 487 | | | | 35 | | |
Canada 4.8% | |
Alimentation
Couche-Tard, Inc.
Class B | | | 1,425 | | | | 68 | | |
Kinaxis, Inc.* | | | 931 | | | | 70 | | |
Suncor Energy, Inc. | | | 959 | | | | 40 | | |
Waste
Connections, Inc. | | | 997 | | | | 79 | | |
| | | | 257 | | |
China 2.7% | |
Alibaba Group
Holding Ltd.
ADR* | | | 540 | | | | 95 | | |
Baidu, Inc. ADR* | | | 209 | | | | 47 | | |
| | | | 142 | | |
France 1.5% | |
Air Liquide SA | | | 314 | | | | 40 | | |
Valeo SA | | | 868 | | | | 39 | | |
| | | | 79 | | |
Germany 4.0% | |
Continental AG | | | 245 | | | | 45 | | |
Gerresheimer AG | | | 320 | | | | 27 | | |
Henkel AG & Co.
KGaA, Preference
Shares | | | 469 | | | | 60 | | |
Infineon
Technologies AG | | | 2,061 | | | | 52 | | |
SAP SE ADR | | | 239 | | | | 29 | | |
| | | | 213 | | |
Hong Kong 3.5% | |
AIA Group Ltd. | | | 8,200 | | | | 71 | | |
Haier Electronics
Group Co. Ltd.* | | | 14,350 | | | | 37 | | |
Techtronic
Industries Co. Ltd. | | | 12,500 | | | | 77 | | |
| | | | 185 | | |
Ireland 0.7% | |
CRH PLC | | | 1,105 | | | | 37 | | |
Israel 2.0% | |
Check Point
Software
Technologies Ltd.* | | | 636 | | | | 74 | | |
Tower
Semiconductor
Ltd.* | | | 1,575 | | | | 34 | | |
| | | | 108 | | |
Italy 0.9% | |
Brembo SpA | | | 3,587 | | | | 48 | | |
| | |
Number
of Shares | |
Value
(000's) | |
Japan 7.0% | |
Bridgestone Corp. | | | 1,030 | | | $ | 38 | | |
Daikin
Industries Ltd. | | | 450 | | | | 57 | | |
Hoya Corp. | | | 900 | | | | 53 | | |
Ichigo, Inc. | | | 9,900 | | | | 40 | | |
Kao Corp. | | | 600 | | | | 47 | | |
Kose Corp. | | | 325 | | | | 60 | | |
Sanwa Holdings
Corp. | | | 2,650 | | | | 30 | | |
Toyota Motor Corp. | | | 750 | | | | 47 | | |
| | | | 372 | | |
Mexico 0.6% | |
Infraestructura
Energetica Nova
SAB de CV | | | 6,428 | | | | 30 | | |
Netherlands 6.6% | |
AerCap
Holdings NV* | | | 1,260 | | | | 72 | | |
| ASML Holding NV | | | 732 | | | | 149 | | |
Heineken NV | | | 450 | | | | 44 | | |
| Intertrust NV(a) | | | 1,633 | | | | 30 | | |
NXP
Semiconductors
NV* | | | 586 | | | | 55 | | |
| | | | 350 | | |
Norway 1.0% | |
| Sbanken ASA(a) | | | 5,067 | | | | 51 | | |
Singapore 0.7% | |
DBS Group
Holdings Ltd. | | | 2,100 | | | | 38 | | |
Switzerland 7.6% | |
Cie Financiere
Richemont SA | | | 598 | | | | 53 | | |
Ferguson PLC | | | 545 | | | | 44 | | |
Givaudan SA | | | 31 | | | | 75 | | |
Julius Baer
Group Ltd.* | | | 1,220 | | | | 65 | | |
Roche Holding AG | | | 221 | | | | 55 | | |
SGS SA | | | 24 | | | | 63 | | |
Sonova Holding AG | | | 245 | | | | 46 | | |
| | | | 401 | | |
United Kingdom 6.7% | |
Aon PLC | | | 540 | | | | 78 | | |
Bunzl PLC | | | 1,379 | | | | 43 | | |
Compass
Group PLC | | | 2,595 | | | | 56 | | |
Howden Joinery
Group PLC | | | 3,037 | | | | 19 | | |
Prudential PLC | | | 2,168 | | | | 49 | | |
RELX PLC | | | 2,568 | | | | 57 | | |
St. James's
Place PLC | | | 3,679 | | | | 54 | | |
| | | | 356 | | |
| | |
Number
of Shares | |
Value
(000's) | |
United States 48.0% | |
Activision
Blizzard, Inc. | | | 925 | | | $ | 67 | | |
Alphabet, Inc.
Class A* | | | 45 | | | | 55 | | |
Alphabet, Inc.
Class C* | | | 45 | | | | 55 | | |
Amazon.com,
Inc.* | | | 98 | | | | 197 | | |
Apple, Inc. | | | 479 | | | | 109 | | |
Biogen, Inc.* | | | 179 | | | | 63 | | |
BlackRock, Inc. | | | 145 | | | | 69 | | |
Cabot Oil &
Gas Corp. | | | 2,535 | | | | 60 | | |
CDW Corp. | | | 1,109 | | | | 97 | | |
Centene Corp.* | | | 575 | | | | 84 | | |
Comerica, Inc. | | | 586 | | | | 57 | | |
Core Laboratories
NV | | | 337 | | | | 39 | | |
CVS Health Corp. | | | 746 | | | | 56 | | |
EOG Resources, Inc. | | | 658 | | | | 78 | | |
Estee Lauder Cos.,
Inc. Class A | | | 503 | | | | 71 | | |
Expedia Group, Inc. | | | 163 | | | | 21 | | |
Exxon Mobil Corp. | | | 838 | | | | 67 | | |
Facebook, Inc.
Class A* | | | 230 | | | | 40 | | |
Fidelity National
Information
Services, Inc. | | | 770 | | | | 83 | | |
First Republic Bank | | | 402 | | | | 41 | | |
Gilead Sciences, Inc. | | | 395 | | | | 30 | | |
Graco, Inc. | | | 2,050 | | | | 96 | | |
Halliburton Co. | | | 770 | | | | 31 | | |
Henry Schein, Inc.* | | | 895 | | | | 70 | | |
Intercontinental
Exchange, Inc. | | | 1,040 | | | | 79 | | |
JPMorgan
Chase & Co. | | | 730 | | | | 84 | | |
Medtronic PLC | | | 816 | | | | 79 | | |
RPM International,
Inc. | | | 970 | | | | 66 | | |
Samsonite
International SA*(a) | | | 17,095 | | | | 69 | | |
Sealed Air Corp. | | | 1,285 | | | | 52 | | |
Sensata
Technologies
Holding PLC* | | | 2,129 | | | | 113 | | |
Service Corp.
International | | | 995 | | | | 42 | | |
T-Mobile US, Inc.* | | | 1,015 | | | | 67 | | |
VF Corp. | | | 600 | | | | 55 | | |
Visa, Inc. Class A | | | 625 | | | | 92 | | |
Western Digital
Corp. | | | 855 | | | | 54 | | |
Worldpay, Inc.
Class A* | | | 642 | | | | 62 | | |
| | | | 2,550 | | |
Total Common Stocks
(Cost $4,033) | | | | | 5,288 | | |
See Notes to Financial Statements
103
Schedule of Investments Global Equity Fund (cont'd)
| | |
Number
of Shares | |
Value
(000's) | |
Short-Term Investments 1.3% | |
Investment Companies 1.3% | |
State Street
Institutional
Treasury Money
Market Fund
Premier Class,
1.87%(b)
(Cost $70) | | | 70,326 | | | $ | 70 | | |
Total Investments 100.9%
(Cost $4,103) | | | | | 5,358 | | |
Liabilities Less Other
Assets (0.9)% | | | | | (48 | ) | |
Net Assets 100.0% | | | | $ | 5,310 | | |
* Non-income producing security.
(a) Security exempt from registration pursuant to Regulation S under the Securities Act of 1933, as amended. Regulation S applies to securities offerings that are made outside of the United States and do not involve direct selling efforts in the United States and as such may have restrictions on resale. Total value of all such securities at August 31, 2018 amounted to approximately $150,000, which represents 2.8% of net assets of the Fund.
(b) Represents 7-day effective yield as of August 31, 2018.
See Notes to Financial Statements
104
Schedule of Investments Global Equity Fund (cont'd)
POSITIONS BY INDUSTRY
Industry | | Investments at
Value
(000's omitted) | | Percentage of
Net Assets | |
Banks | | $ | 306 | | | | 5.8 | % | |
Internet Software & Services | | | 292 | | | | 5.5 | % | |
Semiconductors & Semiconductor Equipment | | | 290 | | | | 5.5 | % | |
Capital Markets | | | 267 | | | | 5.0 | % | |
Oil, Gas & Consumable Fuels | | | 245 | | | | 4.6 | % | |
Software | | | 240 | | | | 4.5 | % | |
IT Services | | | 237 | | | | 4.5 | % | |
Insurance | | | 234 | | | | 4.4 | % | |
Internet & Direct Marketing Retail | | | 218 | | | | 4.1 | % | |
Health Care Providers & Services | | | 210 | | | | 4.0 | % | |
Chemicals | | | 181 | | | | 3.4 | % | |
Health Care Equipment & Supplies | | | 178 | | | | 3.4 | % | |
Personal Products | | | 178 | | | | 3.4 | % | |
Trading Companies & Distributors | | | 178 | | | | 3.4 | % | |
Textiles, Apparel & Luxury Goods | | | 177 | | | | 3.3 | % | |
Auto Components | | | 170 | | | | 3.2 | % | |
Technology Hardware, Storage & Peripherals | | | 163 | | | | 3.1 | % | |
Professional Services | | | 150 | | | | 2.8 | % | |
Household Durables | | | 114 | | | | 2.1 | % | |
Electrical Equipment | | | 113 | | | | 2.1 | % | |
Electronic Equipment, Instruments & Components | | | 97 | | | | 1.8 | % | |
Machinery | | | 96 | | | | 1.8 | % | |
Biotechnology | | | 93 | | | | 1.8 | % | |
Building Products | | | 87 | | | | 1.6 | % | |
Commercial Services & Supplies | | | 79 | | | | 1.5 | % | |
Energy Equipment & Services | | | 70 | | | | 1.3 | % | |
Food & Staples Retailing | | | 68 | | | | 1.3 | % | |
Wireless Telecommunication Services | | | 67 | | | | 1.3 | % | |
Household Products | | | 60 | | | | 1.1 | % | |
Hotels, Restaurants & Leisure | | | 56 | | | | 1.0 | % | |
Pharmaceuticals | | | 55 | | | | 1.0 | % | |
Containers & Packaging | | | 52 | | | | 1.0 | % | |
Automobiles | | | 47 | | | | 0.9 | % | |
Beverages | | | 44 | | | | 0.8 | % | |
Diversified Consumer Services | | | 42 | | | | 0.8 | % | |
Real Estate Management & Development | | | 40 | | | | 0.7 | % | |
Construction Materials | | | 37 | | | | 0.7 | % | |
Gas Utilities | | | 30 | | | | 0.6 | % | |
Life Sciences Tools & Services | | | 27 | | | | 0.5 | % | |
Short-Term Investments and Other Liabilities—Net | | | 22 | | | | 0.4 | % | |
| | | $ | 5,310 | | | | 100.0 | % | |
See Notes to Financial Statements
105
Schedule of Investments Global Equity Fund (cont'd)
The following is a summary, categorized by Level (see Note A of Notes to Financial Statements), of inputs used to value the Fund's investments as of August 31, 2018:
Asset Valuation Inputs | |
(000's omitted) | | Level 1 | | Level 2 | | Level 3 | | Total | |
Investments: | |
| Common Stocks(a) | | $ | 5,288 | | | $ | — | | | $ | — | | | $ | 5,288 | | |
Short-Term Investments | | | — | | | | 70 | | | | — | | | | 70 | | |
Total Investments | | $ | 5,288 | | | $ | 70 | | | $ | — | | | $ | 5,358 | | |
(a) The Schedule of Investments provides a geographic categorization as well as a Positions by Industry summary.
As of the year ended August 31, 2018, no securities were transferred from one level (as of August 31, 2017) to another.
See Notes to Financial Statements
106
Schedule of Investments Global Real Estate Fund August 31, 2018
| | |
Number
of Shares | |
Value
(000's) | |
Common Stocks 99.7% | |
Australia 6.5% | |
Dexus | | | 7,700 | | | $ | 59 | | |
Goodman Group | | | 12,977 | | | | 100 | | |
Scentre Group | | | 9,960 | | | | 29 | | |
| | | | 188 | | |
Canada 3.5% | |
Allied Properties
Real Estate
Investment Trust | | | 910 | | | | 30 | | |
Brookfield Asset
Management, Inc.
Class A | | | 553 | | | | 24 | | |
Canadian
Apartment
Properties REIT | | | 1,283 | | | | 46 | | |
| | | | 100 | | |
France 4.4% | |
Gecina SA | | | 339 | | | | 58 | | |
ICADE | | | 705 | | | | 69 | | |
| | | | 127 | | |
Germany 4.9% | |
ADO Properties
SA(a) | | | 767 | | | | 49 | | |
Deutsche
Wohnen SE | | | 1,808 | | | | 92 | | |
| | | | 141 | | |
Hong Kong 6.9% | |
CK Asset
Holdings Ltd. | | | 14,572 | | | | 104 | | |
Sun Hung Kai
Properties Ltd. | | | 6,394 | | | | 95 | | |
| | | | 199 | | |
Japan 11.2% | |
Advance
Residence
Investment Corp. | | | 15 | | | | 38 | | |
Mitsubishi
Estate Co. Ltd. | | | 3,058 | | | | 51 | | |
Mitsui Fudosan
Co. Ltd. | | | 4,022 | | | | 92 | | |
Nippon
Accommodations
Fund, Inc. | | | 13 | | | | 59 | | |
Nippon Building
Fund, Inc. | | | 7 | | | | 41 | | |
Sumitomo
Realty &
Development
Co. Ltd. | | | 1,178 | | | | 41 | | |
| | | | 322 | | |
Netherlands 1.7% | |
InterXion
Holding NV* | | | 747 | | | | 49 | | |
| | |
Number
of Shares | |
Value
(000's) | |
Singapore 1.9% | |
Ascendas Real
Estate
Investment Trust | | | 14,071 | | | $ | 28 | | |
CapitaLand Ltd. | | | 11,037 | | | | 28 | | |
| | | | 56 | | |
Spain 1.5% | |
Merlin Properties
Socimi SA | | | 3,050 | | | | 42 | | |
Sweden 1.4% | |
Hufvudstaden
AB, A Shares | | | 2,622 | | | | 41 | | |
United Kingdom 4.4% | |
Safestore
Holdings PLC | | | 5,866 | | | | 40 | | |
SEGRO PLC | | | 6,274 | | | | 54 | | |
Shaftesbury PLC | | | 2,724 | | | | 33 | | |
| | | | 127 | | |
United States 51.4% | |
Alexandria Real
Estate Equities, Inc. | | | 406 | | | | 52 | | |
American
Tower Corp. | | | 957 | | | | 143 | | |
Apartment
Investment &
Management Co.
Class A | | | 692 | | | | 30 | | |
Crown Castle
International Corp. | | | 597 | | | | 68 | | |
CyrusOne, Inc. | | | 350 | | | | 24 | | |
Digital Realty
Trust, Inc. | | | 407 | | | | 51 | | |
Douglas
Emmett, Inc. | | | 1,251 | | | | 49 | | |
EastGroup
Properties, Inc. | | | 450 | | | | 44 | | |
Equinix, Inc. | | | 138 | | | | 60 | | |
Equity Lifestyle
Properties, Inc. | | | 653 | | | | 63 | | |
Equity Residential | | | 892 | | | | 60 | | |
Essex Property
Trust, Inc. | | | 232 | | | | 57 | | |
Extra Space
Storage, Inc. | | | 317 | | | | 29 | | |
Four Corners
Property Trust, Inc. | | | 887 | | | | 24 | | |
Healthcare Trust
of America, Inc.
Class A | | | 997 | | | | 29 | | |
Highwoods
Properties, Inc. | | | 585 | | | | 29 | | |
Hyatt Hotels Corp.
Class A | | | 360 | | | | 28 | | |
Invitation
Homes, Inc. | | | 2,637 | | | | 62 | | |
Kimco Realty Corp. | | | 2,246 | | | | 38 | | |
| | |
Number
of Shares | |
Value
(000's) | |
Mid-America
Apartment
Communities,
Inc. | | | 408 | | | $ | 42 | | |
National Retail
Properties, Inc. | | | 766 | | | | 35 | | |
Prologis, Inc. | | | 942 | | | | 63 | | |
Public Storage | | | 164 | | | | 35 | | |
Regency Centers
Corp. | | | 756 | | | | 50 | | |
Simon Property
Group, Inc. | | | 631 | | | | 116 | | |
Sunstone Hotel
Investors, Inc. | | | 1,810 | | | | 30 | | |
Ventas, Inc. | | | 876 | | | | 53 | | |
Welltower, Inc. | | | 769 | | | | 51 | | |
Weyerhaeuser Co. | | | 1,162 | | | | 40 | | |
Zayo Group
Holdings, Inc.* | | | 780 | | | | 27 | | |
| | | | 1,482 | | |
Total Common Stocks
(Cost $2,687) | | | | | 2,874 | | |
Short-Term Investments 2.6% | |
Investment Companies 2.6% | |
State Street
Institutional
U.S. Government
Money Market
Fund Premier
Class, 1.87%(b)
(Cost $75) | | | 75,352 | | | | 75 | | |
Total Investments 102.3%
(Cost $2,762) | | | | | 2,949 | | |
Liabilities Less Other
Assets (2.3)% | | | | | (65 | ) | |
Net Assets 100.0% | | | | $ | 2,884 | | |
See Notes to Financial Statements
107
Schedule of Investments Global Real Estate Fund (cont'd)
* Non-income producing security.
(a) Security exempt from registration pursuant to Regulation S under the Securities Act of 1933, as amended. Regulation S applies to securities offerings that are made outside of the United States and do not involve direct selling efforts in the United States and as such may have restrictions on resale. Total value of all such securities at August 31, 2018 amounted to approximately $49,000, which represents 1.7% of net assets of the Fund.
(b) Represents 7-day effective yield as of August 31, 2018.
See Notes to Financial Statements
108
Schedule of Investments Global Real Estate Fund (cont'd)
POSITIONS BY SECTOR
Sector | | Investments at
Value
(000's omitted) | | Percentage of
Net Assets | |
Real Estate Holding & Development | | $ | 617 | | | | 21.4 | % | |
Industrial & Office REITs | | | 597 | | | | 20.7 | % | |
Specialty REITs | | | 594 | | | | 20.6 | % | |
Residential REITs | | | 419 | | | | 14.5 | % | |
Retail REITs | | | 301 | | | | 10.5 | % | |
Diversified REITs | | | 239 | | | | 8.3 | % | |
Hotel & Lodging REITs | | | 58 | | | | 2.0 | % | |
Real Estate Services | | | 49 | | | | 1.7 | % | |
Short-Term Investments and Other Liabilities—Net | | | 10 | | | | 0.3 | % | |
| | | $ | 2,884 | | | | 100.0 | % | |
See Notes to Financial Statements
109
Schedule of Investments Global Real Estate Fund (cont'd)
The following is a summary, categorized by Level (see Note A of Notes to Financial Statements), of inputs used to value the Fund's investments as of August 31, 2018:
Asset Valuation Inputs | |
(000's omitted) | | Level 1 | | Level 2 | | Level 3 | | Total | |
Investments: | |
| Common Stocks(a) | | $ | 2,874 | | | $ | — | | | $ | — | | | $ | 2,874 | | |
Short-Term Investments | | | — | | | | 75 | | | | — | | | | 75 | | |
Total Investments | | $ | 2,874 | | | $ | 75 | | | $ | — | | | $ | 2,949 | | |
(a) The Schedule of Investments provides a geographic categorization as well as a Positions by Sector summary.
As of the year ended August 31, 2018, no securities were transferred from one level (as of August 31, 2017) to another.
See Notes to Financial Statements
110
Schedule of Investments Greater China Equity Fund August 31, 2018
| | | Number
of Shares | | Value
(000's) | |
Common Stocks 96.3% | |
Air Freight & Logistics 3.7% | |
ZTO Express
Cayman, Inc.
ADR | | | 180,034 | | | $ | 3,323 | | |
Auto Components 0.8% | |
Minth Group
Ltd. | | | 172,000 | | | | 705 | | |
Automobiles 7.9% | |
BAIC Motor
Corp. Ltd.,
H Shares(a) | | | 1,087,000 | | | | 914 | | |
Brilliance China
Automotive
Holdings Ltd. | | | 1,718,000 | | | | 2,723 | | |
Guangzhou
Automobile
Group Co. Ltd.,
H Shares | | | 3,170,000 | | | | 3,441 | | |
| | | | 7,078 | | |
Banks 11.4% | |
Bank of China
Ltd., H Shares | | | 2,319,000 | | | | 1,043 | | |
China
Construction
Bank Corp.,
H Shares | | | 6,871,000 | | | | 6,084 | | |
Industrial &
Commercial
Bank of China
Ltd., H Shares | | | 4,121,911 | | | | 3,036 | | |
| | | | 10,163 | | |
Beverages 2.2% | |
Kweichow
Moutai Co. Ltd.
Class A | | | 20,246 | | | | 1,954 | | |
Commercial Services & Supplies 1.5% | |
China Everbright
International
Ltd. | | | 1,609,000 | | | | 1,355 | | |
Construction Materials 5.5% | |
Anhui Conch
Cement Co. Ltd.
Class A | | | 571,700 | | | | 3,108 | | |
China National
Building Material
Co. Ltd.,
H Shares | | | 1,932,000 | | | | 1,807 | | |
| | | | 4,915 | | |
| | | Number
of Shares | | Value
(000's) | |
Diversified Telecommunication Services 0.5% | |
China Tower
Corp. Ltd.,
H Shares*(a) | | | 2,846,000 | | | $ | 435 | | |
Electrical Equipment 1.6% | |
Zhuzhou CRRC
Times Electric
Co. Ltd.,
H Shares | | | 261,400 | | | | 1,411 | | |
Food & Staples Retailing 1.1% | |
Yonghui
Superstores
Co. Ltd.
Class A | | | 884,334 | | | | 993 | | |
Food Products 3.4% | |
Inner Mongolia
Yili Industrial
Group Co. Ltd.
Class A | | | 869,800 | | | | 3,082 | | |
Health Care Providers & Services 3.4% | |
Huadong
Medicine
Co. Ltd.
Class A | | | 6,000 | | | | 39 | | |
Huadong
Medicine
Co. Ltd.
Class A | | | 454,877 | | | | 2,996 | | |
| | | | 3,035 | | |
Household Durables 6.1% | |
Gree Electric
Appliances, Inc.
of Zhuhai
Class A* | | | 644,103 | | | | 3,673 | | |
Midea Group
Co. Ltd.
Class A | | | 287,620 | | | | 1,752 | | |
| | | | 5,425 | | |
Independent Power and Renewable Electricity Producers 0.4% | |
China
Everbright
Greentech Ltd.(a) | | | 385,469 | | | | 380 | | |
Insurance 11.7% | |
China Pacific
Insurance Group
Co. Ltd.,
H Shares | | | 384,200 | | | | 1,432 | | |
China Taiping
Insurance
Holdings
Co. Ltd. | | | 944,600 | | | | 2,997 | | |
| | | Number
of Shares | | Value
(000's) | |
PICC Property &
Casualty
Co. Ltd.,
H Shares | | | 2,748,000 | | | $ | 3,095 | | |
Ping An
Insurance
Group Co.
of China Ltd.,
H Shares | | | 309,000 | | | | 2,976 | | |
| | | | 10,500 | | |
Internet Software & Services 22.7% | |
Alibaba Group
Holding Ltd.
ADR* | | | 49,518 | | | | 8,666 | | |
Baidu, Inc.
ADR* | | | 8,547 | | | | 1,936 | | |
SINA Corp.* | | | 29,821 | | | | 2,116 | | |
Tencent
Holdings Ltd. | | | 173,900 | | | | 7,533 | | |
| | | | 20,251 | | |
Pharmaceuticals 3.2% | |
China Medical
System
Holdings Ltd. | | | 1,075,000 | | | | 1,780 | | |
CSPC
Pharmaceutical
Group Ltd. | | | 430,000 | | | | 1,085 | | |
| | | | 2,865 | | |
Real Estate Management & Development 5.2% | |
China Jinmao
Holdings
Group Ltd. | | | 1,822,000 | | | | 859 | | |
China Resources
Land Ltd. | | | 314,000 | | | | 1,094 | | |
CIFI Holdings
Group Co. Ltd. | | | 2,146,000 | | | | 1,244 | | |
Longfor Group
Holdings Ltd. | | | 506,000 | | | | 1,406 | | |
| | | | 4,603 | | |
Textiles, Apparel & Luxury Goods 2.4% | |
Shenzhou
International
Group Holdings
Ltd. | | | 163,000 | | | | 2,139 | | |
Transportation Infrastructure 1.6% | |
Guangzhou
Baiyun
International
Airport
Co. Ltd.
Class A | | | 815,788 | | | | 1,459 | | |
Total Common Stocks
(Cost $85,249) | | | 86,071 | | |
See Notes to Financial Statements
111
Schedule of Investments Greater China Equity Fund (cont'd)
| | | Number
of Shares | | Value
(000's) | |
Rights 0.1% | |
Commercial Services & Supplies 0.1% | |
China Everbright
International
Ltd.*(b)
(Cost $0) | | | 620,370 | | | $ | 48 | | |
Short-Term Investments 0.3% | |
Investment Companies 0.3% | |
State Street
Institutional U.S.
Government
Money Market
Fund Premier
Class, 1.87%(c)
(Cost $304) | | | 303,680 | | | | 304 | | |
Total Investments 96.7%
(Cost $85,553) | | | 86,423 | | |
Other Assets
Less Liabilities 3.3% | | | | | 2,992 | | |
Net Assets 100.0% | | $ | 89,415 | | |
* Non-income producing security.
(a) Security exempt from registration pursuant to Regulation S under the Securities Act of 1933, as amended. Regulation
S applies to securities offerings that are made outside of the United States and do not involve direct selling efforts in the United States and as such may have restrictions on resale. Total value of all such securities at August 31, 2018 amounted to approximately $1,729,000, which represents 1.9% of net assets of the Fund.
(b) Security fair valued as of August 31, 2018 in accordance with procedures approved by the Board of Trustees. Total value of all such securities at August 31, 2018 amounted to approximately $48,000, which represents 0.1% of net assets of the Fund.
(c) Represents 7-day effective yield as of August 31, 2018.
The following is a summary, categorized by Level (see Note A of Notes to Financial Statements), of inputs used to value the Fund's investments as of August 31, 2018:
Asset Valuation Inputs | |
(000's omitted) | | Level 1 | | Level 2 | | Level 3 | | Total | |
Investments: | |
| Common Stocks(a) | | $ | 86,071 | | | $ | — | | | $ | — | | | $ | 86,071 | | |
| Rights(a) | | | — | | | | 48 | | | | — | | | | 48 | | |
Short-Term Investments | | | — | | | | 304 | | | | — | | | | 304 | | |
Total Investments | | $ | 86,071 | | | $ | 352 | | | $ | — | | | $ | 86,423 | | |
(a) The Schedule of Investments provides information on the industry categorization for the portfolio.
As of the year ended August 31, 2018, no securities were transferred from one level (as of August 31, 2017) to another.
See Notes to Financial Statements
112
Schedule of Investments Guardian Fund August 31, 2018
| | | Number
of Shares | | Value
(000's) | |
Common Stocks 94.8% | |
Aerospace & Defense 3.7% | |
General
Dynamics Corp. | | | 145,000 | | | $ | 28,043 | | |
Raytheon Co. | | | 107,300 | | | | 21,400 | | |
| | | | 49,443 | | |
Air Freight & Logistics 0.1% | |
Expeditors
International
of Washington,
Inc.(a) | | | 27,195 | | | | 1,993 | | |
Airlines 2.0% | |
Delta Air
Lines, Inc.(b) | | | 459,000 | | | | 26,842 | | |
Banks 4.6% | |
Comerica, Inc. | | | 268,475 | | | | 26,171 | | |
JPMorgan
Chase & Co. | | | 305,580 | | | | 35,013 | | |
| | | | 61,184 | | |
Biotechnology 1.4% | |
Gilead
Sciences, Inc. | | | 244,000 | | | | 18,478 | | |
Capital Markets 5.2% | |
BlackRock, Inc. | | | 38,895 | | | | 18,633 | | |
Brookfield Asset
Management,
Inc. Class A | | | 561,355 | | | | 24,009 | | |
CME Group,
Inc. | | | 156,700 | | | | 27,380 | | |
| | | | 70,022 | | |
Chemicals 1.8% | |
Ashland Global
Holdings, Inc. | | | 286,000 | | | | 24,081 | | |
Commercial Services 1.7% | |
LegalZoom.com,
Inc.*(c)(d)(h) | | | 544,184 | | | | 22,812 | | |
Diversified Financial Services 0.6% | |
CF Corp. Class A | | | 885,000 | | | | 7,708 | | |
Electric Utilities 1.0% | |
NextEra Energy, Inc. | | | 80,000 | | | | 13,608 | | |
Electrical Equipment 2.1% | |
Eaton Corp. PLC | | | 330,000 | | | | 27,436 | | |
Electronic Equipment, Instruments & Components 2.5% | |
CDW Corp. | | | 378,000 | | | | 33,098 | | |
Energy Equipment & Services 1.4% | |
Schlumberger Ltd. | | | 291,675 | | | | 18,422 | | |
Food & Staples Retailing 1.7% | |
Costco Wholesale
Corp. | | | 100,000 | | | | 23,313 | | |
| | | Number
of Shares | | Value
(000's) | |
Food Products 2.6% | |
Conagra Brands,
Inc.(b) | | | 830,000 | | | $ | 30,503 | | |
Hain Celestial
Group, Inc.* | | | 150,000 | | | | 4,284 | | |
| | | | 34,787 | | |
Health Care Providers & Services 4.0% | |
CVS Health
Corp. | | | 346,000 | | | | 26,033 | | |
UnitedHealth
Group, Inc. | | | 103,615 | | | | 27,817 | | |
| | | | 53,850 | | |
Hotels, Restaurants & Leisure 1.9% | |
McDonald's Corp. | | | 154,000 | | | | 24,983 | | |
Industrial Conglomerates 0.9% | |
3M Co. | | | 58,215 | | | | 12,279 | | |
Internet & Direct Marketing Retail 7.7% | |
Amazon.com,
Inc.*(a) | | | 24,500 | | | | 49,312 | | |
Booking
Holdings, Inc.* | | | 14,275 | | | | 27,858 | | |
Expedia Group,
Inc. | | | 196,600 | | | | 25,656 | | |
| | | | 102,826 | | |
Internet Software & Services 10.2% | |
Alphabet, Inc.
Class A* | | | 41,700 | | | | 51,366 | | |
eBay, Inc.* | | | 604,000 | | | | 20,904 | | |
Facebook,
Inc. Class A* | | | 219,335 | | | | 38,544 | | |
Spotify
Technology SA* | | | 131,300 | | | | 24,884 | | |
| | | | 135,698 | | |
IT Services 4.7% | |
PayPal Holdings,
Inc.* | | | 188,680 | | | | 17,421 | | |
| Visa, Inc. Class A(b) | | | 306,340 | | | | 44,998 | | |
| | | | 62,419 | | |
Machinery 0.5% | |
Gates Industrial
Corp. PLC* | | | 347,000 | | | | 6,326 | | |
Multi-Utilities 1.7% | |
Brookfield
Infrastructure
Partners LP | | | 569,815 | | | | 22,223 | | |
Oil, Gas & Consumable Fuel 2.2% | |
Enbridge, Inc. | | | 857,000 | | | | 29,284 | | |
Professional Services 5.8% | |
Equifax, Inc. | | | 242,000 | | | | 32,421 | | |
IHS Markit Ltd.* | | | 623,000 | | | | 34,265 | | |
| | | Number
of Shares | | Value
(000's) | |
Verisk Analytics,
Inc.*(a) | | | 92,570 | | | $ | 11,024 | | |
| | | | 77,710 | | |
Road & Rail 2.5% | |
| CSX Corp.(b) | | | 261,735 | | | | 19,410 | | |
Norfolk Southern
Corp. | | | 79,000 | | | | 13,734 | | |
| | | | 33,144 | | |
Software 6.5% | |
Activision
Blizzard, Inc.(a) | | | 166,000 | | | | 11,969 | | |
Microsoft Corp. | | | 484,000 | | | | 54,368 | | |
salesforce.com,
inc.* | | | 135,200 | | | | 20,642 | | |
| | | | 86,979 | | |
Specialty Retail 6.1% | |
Home Depot,
Inc. | | | 139,000 | | | | 27,907 | | |
Hudson Ltd.
Class A* | | | 681,000 | | | | 14,028 | | |
Lowe's Cos., Inc. | | | 198,765 | | | | 21,616 | | |
Tractor Supply
Co.(b) | | | 208,200 | | | | 18,380 | | |
| | | | 81,931 | | |
Technology Hardware, Storage & Peripherals 3.5% | |
Apple, Inc. | | | 205,000 | | | | 46,664 | | |
Textiles, Apparel & Luxury Goods 2.4% | |
| PVH Corp.(b) | | | 222,000 | | | | 31,782 | | |
Trading Companies & Distributors 1.8% | |
HD Supply
Holdings, Inc.* | | | 520,000 | | | | 23,707 | | |
Total Common Stocks
(Cost $916,320) | | | 1,265,032 | | |
Preferred Stocks 0.8% | |
Health Care 0.8% | |
Moderna, Inc.
Ser. F*(c)(d)(h) | | | 990,888 | | | | 9,968 | | |
Moderna, Inc.
Ser. G*(c)(d)(h) | | | 72,603 | | | | 730 | | |
Total Preferred Stocks
(Cost $9,430) | | | 10,698 | | |
Master Limited Partnerships 1.0% | |
Capital Markets 1.0% | |
Blackstone
Group LP
(Cost $13,110) | | | 363,745 | | | | 13,426 | | |
Total Options
Purchased 0.1%(e)
(Cost $1,468) | | | 1,304 | | |
See Notes to Financial Statements
113
Schedule of Investments Guardian Fund (cont'd)
| | | Number
of Shares | | Value
(000's) | |
Short-Term Investments 3.7% | |
Investment Companies 3.7% | |
State Street
Institutional
Treasury Money
Market Fund
Premier Class,
1.87%(a)(f)
(Cost $48,774) | | | 48,774,274 | | | $ | 48,774 | | |
Total Investments 100.4%
(Cost $989,102) | | | 1,339,234 | | |
Liabilities Less
Other Assets (0.4)%(g) | | | | | (4,902 | ) | |
Net Assets 100.0% | | $ | 1,334,332 | | |
* Non-income producing security.
(a) All or a portion of this security is segregated in connection with obligations for options written with a total value of approximately $116,716,000.
(b) All or a portion of the security is pledged as collateral for options written.
(c) Value determined using significant unobservable inputs.
(d) Security fair valued as of August 31, 2018 in accordance with procedures approved by the Board of Trustees.Total value of all such securities at August 31, 2018 amounted to approximately $33,510,000, which represents 2.5% of net assets of the Fund.
(e) See "Purchased option contracts" under Derivative Instruments.
(f) Represents 7-day effective yield as of August 31, 2018.
(g) Includes the impact of the Fund's open positions in derivatives at August 31, 2018.
(h) This security has been deemed by the investment manager to be illiquid, and is subject to restrictions on resale.
At August 31, 2018, these securities amounted to approximately $33,510,000, which represents 2.5% of net assets of the Fund.
(000's omitted)
Restricted Security | | Acquisition
Date | | Acquisition
Cost | | Acquisition
Cost
Percentage
of Net Assets | | Fair Value
Value as of
8/31/2018 | | Percentage
of Net Assets
as of
8/31/2018 | |
LegalZoom.com, Inc. | | 8/21/2018 | | $ | 22,812 | | | | 1.7 | % | | $ | 22,812 | | | | 1.7 | % | |
Moderna, Inc. (Ser. F
Preferred Shares) | | 8/10/2016 | | | 8,700 | | | | 0.8 | % | | | 9,968 | | | | 0.7 | % | |
Moderna, Inc. (Ser. G
Preferred Shares) | | 1/30/2018 | | | 730 | | | | 0.1 | % | | | 730 | | | | 0.1 | % | |
Total | | | | $ | 32,242 | | | | 2.6 | % | | $ | 33,510 | | | | 2.5 | % | |
See Notes to Financial Statements
114
Schedule of Investments Guardian Fund (cont'd)
Derivative Instruments
Purchased option contracts ("options purchased")
At August 31, 2018, the Fund had outstanding options purchased as follows:
Description | | Number of
Contracts | | Notional
Amount | | Exercise
Price | | Expiration
Date | | Value | |
Calls | |
Aerospace & Defense | |
General Dynamics Corp. | | | 220 | | | $ | 4,254,800 | | | $ | 205 | | | 11/16/2018 | | $ | 46,750 | | |
Capital Markets | |
BlackRock, Inc. | | | 127 | | | | 6,084,062 | | | | 500 | | | 1/18/2019 | | | 173,990 | | |
Food Products | |
Hain Celestial Group, Inc. | | | 600 | | | | 1,713,600 | | | | 36 | | | 11/16/2018 | | | 16,500 | | |
Hain Celestial Group, Inc. | | | 1,000 | | | | 2,856,000 | | | | 31 | | | 11/16/2018 | | | 112,500 | | |
| | | | | | | | | | | 129,000 | | |
Internet & Direct Marketing Retail | |
Booking Holdings, Inc. | | | 16 | | | | 3,122,480 | | | | 2,100 | | | 10/19/2018 | | | 16,480 | | |
Machinery | |
Caterpillar, Inc. | | | 472 | | | | 6,553,720 | | | | 150 | | | 11/16/2018 | | | 115,640 | | |
Professional Services | |
Equifax, Inc. | | | 621 | | | | 8,319,537 | | | | 130 | | | 1/18/2019 | | | 565,110 | | |
Specialty Retail | |
Lowe's Cos., Inc. | | | 473 | | | | 5,143,875 | | | | 110 | | | 1/18/2019 | | | 249,508 | | |
Textiles, Apparel & Luxury Goods | |
PVH Corp. | | | 185 | | | | 2,648,460 | | | | 155 | | | 9/21/2018 | | | 7,400 | | |
Total options purchased (cost $1,467,758) | | | | | | | | | | | $1,303,878 | | |
See Notes to Financial Statements
115
Schedule of Investments Guardian Fund (cont'd)
Written option contracts ("options written")
At August 31, 2018, the Fund had outstanding options written as follows:
Description | | Number of
Contracts | | Notional
Amount | | Exercise
Price | | Expiration
Date | | Value | |
Calls | |
Chemicals | |
Ashland Global Holdings, Inc. | | | 314 | | | $ | (2,643,880 | ) | | $ | 85 | | | 10/19/2018 | | $ | (57,305 | ) | |
Total calls | | | | | | | | | | $ | (57,305 | ) | |
Puts | |
Aerospace & Defense | |
General Dynamics Corp. | | | 220 | | | | (4,254,800 | ) | | $ | 180 | | | 11/16/2018 | | $ | (49,500 | ) | |
Banks | |
Comerica, Inc. | | | 315 | | | | (3,070,620 | ) | | | 90 | | | 1/18/2019 | | | (76,230 | ) | |
Capital Markets | |
BlackRock, Inc. | | | 127 | | | | (6,084,062 | ) | | | 430 | | | 1/18/2019 | | | (87,630 | ) | |
Food Products | |
Conagra Brands, Inc. | | | 800 | | | | (2,940,000 | ) | | | 33 | | | 9/21/2018 | | | (0 | )(a)(b) | |
Hain Celestial Group, Inc. | | | 600 | | | | (1,713,600 | ) | | | 28 | | | 11/16/2018 | | | (96,000 | ) | |
Hain Celestial Group, Inc. | | | 1,000 | | | | (2,856,000 | ) | | | 25 | | | 11/16/2018 | | | (60,000 | ) | |
| | | | | | | | | | | | (156,000 | ) | |
Internet & Direct Marketing Retail | |
Booking Holdings, Inc. | | | 17 | | | | (3,317,635 | ) | | | 1,900 | | | 10/19/2018 | | | (52,615 | ) | |
Internet Software & Services | |
Facebook, Inc. Class A | | | 253 | | | | (4,445,969 | ) | | | 160 | | | 11/16/2018 | | | (92,345 | ) | |
Machinery | |
Caterpillar, Inc. | | | 472 | | | | (6,553,720 | ) | | | 120 | | | 11/16/2018 | | | (59,236 | ) | |
Specialty Retail | |
Lowe's Cos., Inc. | | | 473 | | | | (5,143,875 | ) | | | 92.5 | | | 1/18/2019 | | | (50,848 | ) | |
Textiles, Apparel & Luxury Goods | |
PVH Corp. | | | 370 | | | | (5,296,920 | ) | | | 140 | | | 9/21/2018 | | | (66,600 | ) | |
Total puts | | | | | | | | | | $ | (691,004 | ) | |
Total options written
(premium received $1,273,548) | | | | | | | | | | $ | (748,309 | ) | |
(a) Security fair valued as of August 31, 2018 in accordance with procedures approved by the Board of Trustees.
(b) Value determined using significant unobservable inputs.
At August 31, 2018, the Fund had an average market value of $1,897,529 in options purchased and $(1,338,783) in options written. The Fund had securities pledged in the amount of $ 36,162,891 to cover collateral requirements for options written.
See Notes to Financial Statements
116
Schedule of Investments Guardian Fund (cont'd)
The following is a summary, categorized by Level (see Note A of Notes to Financial Statements), of inputs used to value the Fund's investments as of August 31, 2018:
Asset Valuation Inputs | |
(000's omitted) | | Level 1 | | Level 2 | | Level 3(c) | | Total | |
Investments: | |
Common Stocks | |
Commercial Services | | $ | — | | | $ | — | | | $ | 22,812 | | | $ | 22,812 | | |
Other Common Stocks(a) | | | 1,242,220 | | | | — | | | | — | | | | 1,242,220 | | |
Total Common Stocks | | | 1,242,220 | | | | — | | | | 22,812 | | | | 1,265,032 | | |
Preferred Stocks(a) | | | — | | | | — | | | | 10,698 | | | | 10,698 | | |
Master Limited Partnerships(a) | | | 13,426 | | | | — | | | | — | | | | 13,426 | | |
Options Purchased(b) | | | 1,304 | | | | — | | | | — | | | | 1,304 | | |
Short-Term Investments | | | — | | | | 48,774 | | | | — | | | | 48,774 | | |
Total Investments | | $ | 1,256,950 | | | $ | 48,774 | | | $ | 33,510 | | | $ | 1,339,234 | | |
(a) The Schedule of Investments provides information on the industry categorization for the portfolio.
(b) The "Purchased option contracts" table under Derivative Instruments provides information on the industry or sector categorization for the portfolio.
(c) The following is a reconciliation between the beginning and ending balances of investments in which unobservable inputs (Level 3) were used in determining value:
| | | Beginning
balance, as
of 9/1/2017 | | Accrued
discounts/
(premiums) | | Realized
gain/
(loss) | | Change
in unrealized
appreciation/
(depreciation) | | Purchases | | Sales | | Transfers
into
Level 3 | | Transfers
out of
Level 3 | | Balance,
as of
8/31/2018 | | Net change in
unrealized
appreciation/
(depreciation)
from
investments
still held as
of 8/31/2018 | |
Investments in Securities:
(000's omitted) | |
Common
Stocks | |
Commercial
Services | | $ | — | | | $ | — | | | $ | — | | | $ | — | | | $ | 22,812 | | | $ | — | | | $ | — | | | $ | — | | | $ | 22,812 | | | $ | — | | |
Health
Care | | | 8,700 | | | | — | | | | — | | | | 1,268 | | | | 730 | | | | — | | | | — | | | | — | | | | 10,698 | | | | 1,268 | | |
Total | | $ | 8,700 | | | $ | — | | | $ | — | | | $ | 1,268 | | | $ | 23,542 | | | $ | — | | | $ | — | | | $ | — | | | $ | 33,510 | | | $ | 1,268 | | |
See Notes to Financial Statements
117
Schedule of Investments Guardian Fund (cont'd)
The following table presents additional information about valuation approach and inputs used for investments that are measured at fair value and categorized within Level 3 as of August 31, 2018.
Asset
class | | Fair value
at 8/31/2018 | | Valuation
approach | | Unobservable
input | | Amount or
range
per unit | | Input value
per unit | | Impact to
valuation
from
increase
in input(a) | |
Common
Stocks | | $ | 22,812,193 | | | Market Approach | | Transaction Price | | $ | 41.92 | | | $ | 41.92 | | | Increase | |
Preferred Stocks | | | 9,968,333 | | | Market Approach | | Transaction Price | | | 10.06 | | | | 10.06 | | | Increase | |
Preferred Stocks | | | 730,387 | | | Market Approach | | Transaction Price | | | 10.06 | | | | 10.06 | | | Increase | |
(a) Represents the expected directional change in the fair value of the Level 3 investments that would result from an increase in the corresponding input. A decrease to the unobservable input would have the opposite effect. Significant changes in these inputs could result in significantly higher or lower fair value measurements.
As of the year ended August 31, 2018, no securities were transferred from one level (as of August 31, 2017) to another.
The following is a summary, categorized by Level (see Note A of Notes to Financial Statements), of inputs used to value the Fund's derivatives as of August 31, 2018:
Other Financial Instruments | |
(000's omitted) | | Level 1 | | Level 2 | | Level 3(a) | | Total | |
Options Written | |
Liabilities | | $ | (748 | ) | | $ | — | | | $ | (0 | ) | | $ | (748 | ) | |
Total | | $ | (748 | ) | | $ | — | | | $ | (0 | ) | | $ | (748 | ) | |
(a) The following is reconciliation between the beginning and ending balances of investments in which unobservable inputs (Level 3) were used in determining value:
| | | Beginning
balance, as
of 9/1/2017 | | Accrued
discounts/
(premiums) | | Realized
gain/
(loss) | | Change
in unrealized
appreciation/
(depreciation) | | Purchases | | Sales | | Transfers
into
Level 3 | | Transfers
out of
Level 3 | | Balance,
as of
8/31/2018 | | Net change in
unrealized
appreciation/
(depreciation)
from
investments
still held as
of 8/31/2018 | |
Other Financial Instruments:
(000's omitted) | |
Options
Written(b) | |
Food Products | | $ | — | | | $ | — | | | $ | — | | | $ | 56 | | | $ | — | | | $ | (56 | ) | | $ | — | | | $ | — | | | $ | (0 | ) | | $ | 56 | | |
Total | | $ | — | | | $ | — | | | $ | — | | | $ | 56 | | | $ | — | | | $ | (56 | ) | | $ | — | | | $ | — | | | $ | (0 | ) | | $ | 56 | | |
(b) As of the year ended August 31, 2018, these securities were valued in accordance with procedures approved by the Board of Trustees. These investments did not have a material impact on the Fund's net assets and, therefore, disclosure of unobservable inputs used in formulating valuations in not presented.
See Notes to Financial Statements
118
Schedule of Investments International Equity Fund August 31, 2018
| | | Number
of Shares | | Value
(000's) | |
Common Stocks 98.4% | |
Australia 0.9% | |
Insurance
Australia
Group Ltd. | | | 3,351,245 | | | $ | 18,599 | | |
Austria 1.3% | |
BAWAG
Group AG(a) | | | 567,663 | | | | 26,541 | | |
Belgium 0.9% | |
KBC Group NV | | | 258,056 | | | | 18,332 | | |
Canada 3.7% | |
Alimentation
Couche-Tard,
Inc. Class B | | | 548,535 | | | | 26,262 | | |
Kinaxis, Inc.* | | | 338,432 | | | | 25,537 | | |
Suncor Energy,
Inc. | | | 626,142 | | | | 25,775 | | |
| | | | 77,574 | | |
China 2.7% | |
Alibaba Group
Holding Ltd.
ADR* | | | 214,569 | | | | 37,552 | | |
Baidu, Inc.
ADR* | | | 82,186 | | | | 18,613 | | |
| | | | 56,165 | | |
Denmark 0.9% | |
Danske Bank A/S | | | 654,753 | | | | 19,264 | | |
Finland 0.6% | |
| Huhtamaki OYJ(b) | | | 364,985 | | | | 13,070 | | |
France 6.7% | |
Air Liquide SA | | | 177,380 | | | | 22,340 | | |
Arkema SA | | | 129,995 | | | | 16,281 | | |
Pernod-Ricard SA | | | 191,635 | | | | 30,252 | | |
SPIE SA | | | 886,713 | | | | 16,797 | | |
TOTAL SA | | | 494,507 | | | | 30,921 | | |
Valeo SA | | | 497,274 | | | | 22,575 | | |
| | | | 139,166 | | |
Germany 10.3% | |
Brenntag AG | | | 306,805 | | | | 18,497 | | |
Continental AG | | | 115,245 | | | | 21,143 | | |
CTS Eventim
AG & Co.
KGaA | | | 606,105 | | | | 26,875 | | |
Deutsche
Boerse AG | | | 125,226 | | | | 17,297 | | |
Gerresheimer AG | | | 244,543 | | | | 20,437 | | |
Henkel AG &
Co. KGaA,
Preference
Shares | | | 217,829 | | | | 27,800 | | |
Infineon
Technologies
AG | | | 1,034,166 | | | | 26,313 | | |
SAP SE ADR | | | 239,089 | | | | 28,629 | | |
| | | Number
of Shares | | Value
(000's) | |
| Scout24 AG(a) | | | 208,685 | | | $ | 10,794 | | |
Stabilus SA | | | 174,117 | | | | 15,299 | | |
| | | | 213,084 | | |
Hong Kong 3.0% | |
HKBN Ltd. | | | 18,178,800 | | | | 27,006 | | |
Techtronic
Industries
Co. Ltd. | | | 5,639,300 | | | | 34,488 | | |
| | | | 61,494 | | |
Ireland 2.1% | |
CRH PLC | | | 425,985 | | | | 14,100 | | |
Greencore
Group PLC | | | 5,062,632 | | | | 11,420 | | |
Kerry Group
PLC Class A | | | 165,927 | | | | 18,923 | | |
| | | | 44,443 | | |
Israel 2.1% | |
Check Point
Software
Technologies
Ltd.* | | | 255,401 | | | | 29,675 | | |
Tower
Semiconductor
Ltd.* | | | 636,400 | | | | 13,874 | | |
| | | | 43,549 | | |
Italy 0.5% | |
Brembo SpA | | | 696,614 | | | | 9,315 | | |
Japan 15.9% | |
Bridgestone Corp. | | | 750,500 | | | | 27,646 | | |
Daikin
Industries Ltd. | | | 321,400 | | | | 40,989 | | |
Hoya Corp. | | | 371,500 | | | | 21,723 | | |
| Ichigo, Inc.(b) | | | 5,519,900 | | | | 22,554 | | |
Kansai Paint
Co. Ltd. | | | 1,026,300 | | | | 20,293 | | |
Kao Corp. | | | 243,600 | | | | 18,910 | | |
Keyence Corp. | | | 67,600 | | | | 38,263 | | |
Kose Corp. | | | 140,700 | | | | 25,959 | | |
Nabtesco Corp. | | | 627,850 | | | | 16,370 | | |
Santen
Pharmaceutical
Co. Ltd. | | | 638,100 | | | | 9,832 | | |
Sanwa
Holdings Corp. | | | 919,200 | | | | 10,540 | | |
Shionogi &
Co. Ltd. | | | 504,500 | | | | 29,314 | | |
SMC Corp. | | | 76,500 | | | | 25,454 | | |
Toyota Motor
Corp. | | | 343,900 | | | | 21,449 | | |
| | | | 329,296 | | |
Luxembourg 0.9% | |
| Befesa SA*(a) | | | 446,508 | | | | 19,565 | | |
| | | Number
of Shares | | Value
(000's) | |
Mexico 0.7% | |
Infraestructura
Energetica
Nova SAB
de CV | | | 3,260,550 | | | $ | 15,211 | | |
Netherlands 7.6% | |
AerCap
Holdings NV* | | | 601,950 | | | | 34,293 | | |
ASML
Holding NV | | | 291,275 | | | | 59,384 | | |
Heineken NV | | | 282,836 | | | | 27,952 | | |
| Intertrust NV(a) | | | 849,875 | | | | 15,537 | | |
NXP
Semiconductors
NV* | | | 222,376 | | | | 20,712 | | |
| | | | 157,878 | | |
Norway 1.1% | |
| Sbanken ASA(a) | | | 2,181,980 | | | | 21,986 | | |
Portugal 1.3% | |
Galp Energia
SGPS SA | | | 1,289,885 | | | | 26,157 | | |
Singapore 0.9% | |
DBS Group
Holdings Ltd. | | | 1,079,000 | | | | 19,614 | | |
Switzerland 13.6% | |
Bucher
Industries AG | | | 28,576 | | | | 10,018 | | |
Cie Financiere
Richemont SA | | | 243,939 | | | | 21,569 | | |
Ferguson PLC | | | 290,402 | | | | 23,271 | | |
Givaudan SA | | | 13,960 | | | | 33,962 | | |
Julius Baer
Group Ltd.* | | | 417,162 | | | | 22,174 | | |
Novartis AG | | | 204,642 | | | | 16,971 | | |
Partners Group
Holding AG | | | 38,180 | | | | 29,977 | | |
Roche Holding AG | | | 91,960 | | | | 22,846 | | |
SGS SA | | | 9,976 | | | | 26,277 | | |
Sonova
Holding AG | | | 103,898 | | | | 19,713 | | |
Tecan Group AG | | | 149,800 | | | | 35,794 | | |
UBS Group AG* | | | 1,286,304 | | | | 20,086 | | |
| | | | 282,658 | | |
United Kingdom 16.8% | |
Aon PLC | | | 222,000 | | | | 32,314 | | |
| Biffa PLC(a) | | | 3,897,198 | | | | 12,581 | | |
Bunzl PLC | | | 1,136,828 | | | | 35,343 | | |
Clinigen
Group PLC | | | 2,136,427 | | | | 27,628 | | |
Compass
Group PLC | | | 1,550,956 | | | | 33,348 | | |
DCC PLC | | | 196,385 | | | | 17,708 | | |
Howden
Joinery Group
PLC | | | 650,693 | | | | 4,156 | | |
IMI PLC | | | 1,324,490 | | | | 20,743 | | |
See Notes to Financial Statements
119
Schedule of Investments International Equity Fund (cont'd)
| | | Number
of Shares | | Value
(000's) | |
Lloyds Banking
Group PLC | | | 23,321,129 | | | $ | 17,929 | | |
London Stock
Exchange
Group PLC | | | 391,899 | | | | 23,493 | | |
Prudential PLC | | | 1,256,742 | | | | 28,268 | | |
RELX PLC | | | 1,589,533 | | | | 35,239 | | |
Spectris PLC | | | 451,290 | | | | 13,773 | | |
St. James's
Place PLC | | | 2,012,469 | | | | 29,522 | | |
Unilever NV | | | 275,951 | | | | 15,870 | | |
| | | | 347,915 | | |
United States 3.9% | |
Core
Laboratories NV(b) | | | 132,446 | | | | 15,172 | | |
Samsonite
International
SA*(a) | | | 8,290,348 | | | | 33,536 | | |
| | | Number
of Shares | | Value
(000's) | |
Sensata
Technologies
Holding PLC* | | | 612,943 | | | $ | 32,455 | | |
| | | | 81,163 | | |
Total Common Stocks
(Cost $1,825,159) | | | | | 2,042,039 | | |
Short-Term Investments 2.3% | |
Investment Companies 2.3% | |
State Street
Institutional
Treasury Money
Market Fund
Premier
Class, 1.87%(c) | | | 29,275,386 | | | | 29,275 | | |
| | | Number
of Shares | | Value
(000's) | |
State Street
Navigator
Securities
Lending
Government
Money Market
Portfolio, 1.93%(c)(d) | | | 18,919,611 | | | $ | 18,920 | | |
Total Short-Term Investments
(Cost $48,195) | | | 48,195 | | |
Total Investments 100.7%
(Cost $1,873,354) | | | 2,090,234 | | |
Liabilities Less
Other Assets (0.7)% | | | | | (14,453 | ) | |
Net Assets 100.0% | | | | $ | 2,075,781 | | |
* Non-income producing security.
(a) Security exempt from registration pursuant to Regulation S under the Securities Act of 1933, as amended. Regulation S applies to securities offerings that are made outside of the United States and do not involve direct selling efforts in the United States and as such may have restrictions on resale. Total value of all such securities at August 31, 2018 amounted to approximately $140,540,000, which represents 6.8% of net assets of the Fund.
(b) The security or a portion of this security is on loan at August 31, 2018. Total value of all such securities at August 31, 2018 amounted to approximately $18,373,000 for the Fund (see Note A of the Notes to Financial Statements).
(c) Represents 7-day effective yield as of August 31, 2018.
(d) Represents investment of cash collateral received from securities lending.
See Notes to Financial Statements
120
Schedule of Investments International Equity Fund (cont'd)
POSITIONS BY INDUSTRY
Industry | | Investments at
Value
(000's omitted) | | Percentage of
Net Assets | |
Capital Markets | | $ | 142,549 | | | | 6.9 | % | |
Banks | | | 123,666 | | | | 6.0 | % | |
Semiconductors & Semiconductor Equipment | | | 120,283 | | | | 5.8 | % | |
Trading Companies & Distributors | | | 115,560 | | | | 5.6 | % | |
Chemicals | | | 92,876 | | | | 4.5 | % | |
Machinery | | | 87,884 | | | | 4.2 | % | |
Life Sciences Tools & Services | | | 83,859 | | | | 4.0 | % | |
Software | | | 83,841 | | | | 4.0 | % | |
Oil, Gas & Consumable Fuels | | | 82,853 | | | | 4.0 | % | |
Auto Components | | | 80,679 | | | | 3.9 | % | |
Insurance | | | 79,181 | | | | 3.8 | % | |
Pharmaceuticals | | | 78,963 | | | | 3.8 | % | |
Professional Services | | | 77,053 | | | | 3.7 | % | |
Internet Software & Services | | | 66,959 | | | | 3.2 | % | |
Personal Products | | | 60,739 | | | | 2.9 | % | |
Beverages | | | 58,204 | | | | 2.8 | % | |
Textiles, Apparel & Luxury Goods | | | 55,105 | | | | 2.7 | % | |
Electronic Equipment, Instruments & Components | | | 52,036 | | | | 2.5 | % | |
Building Products | | | 51,529 | | | | 2.5 | % | |
Commercial Services & Supplies | | | 48,943 | | | | 2.4 | % | |
Health Care Equipment & Supplies | | | 41,436 | | | | 2.0 | % | |
Household Durables | | | 34,488 | | | | 1.7 | % | |
Hotels, Restaurants & Leisure | | | 33,348 | | | | 1.6 | % | |
Electrical Equipment | | | 32,455 | | | | 1.6 | % | |
Food Products | | | 30,343 | | | | 1.5 | % | |
Household Products | | | 27,800 | | | | 1.3 | % | |
Diversified Telecommunication Services | | | 27,006 | | | | 1.3 | % | |
Media | | | 26,875 | | | | 1.3 | % | |
Food & Staples Retailing | | | 26,262 | | | | 1.3 | % | |
Real Estate Management & Development | | | 22,554 | | | | 1.1 | % | |
Automobiles | | | 21,449 | | | | 1.0 | % | |
Industrial Conglomerates | | | 17,708 | | | | 0.8 | % | |
Gas Utilities | | | 15,211 | | | | 0.7 | % | |
Energy Equipment & Services | | | 15,172 | | | | 0.7 | % | |
Construction Materials | | | 14,100 | | | | 0.7 | % | |
Containers & Packaging | | | 13,070 | | | | 0.6 | % | |
Short-Term Investments and Other Liabilities—Net | | | 33,742 | | | | 1.6 | % | |
| | | $ | 2,075,781 | | | | 100.0 | % | |
See Notes to Financial Statements
121
Schedule of Investments International Equity Fund (cont'd)
The following is a summary, categorized by Level (see Note A of Notes to Financial Statements), of inputs used to value the Fund's investments as of August 31, 2018:
Asset Valuation Inputs | |
(000's omitted) | | Level 1 | | Level 2 | | Level 3 | | Total | |
Investments: | |
| Common Stocks(a) | | $ | 2,042,039 | | | $ | — | | | $ | — | | | $ | 2,042,039 | | |
Short-Term Investments | | | — | | | | 48,195 | | | | — | | | | 48,195 | | |
Total Investments | | $ | 2,042,039 | | | $ | 48,195 | | | $ | — | | | $ | 2,090,234 | | |
(a) The Schedule of Investments provides a geographic categorization as well as a Positions by Industry summary.
As of the year ended August 31, 2018, no securities were transferred from one level (as of August 31, 2017) to another.
See Notes to Financial Statements
122
Schedule of Investments International Select Fund August 31, 2018
| | | Number
of Shares | | Value
(000's) | |
Common Stocks 98.5% | |
Australia 0.7% | |
Insurance
Australia Group
Ltd. | | | 224,652 | | | $ | 1,247 | | |
Austria 1.3% | |
BAWAG Group
AG(a) | | | 46,607 | | | | 2,179 | | |
Belgium 0.9% | |
KBC Group NV | | | 21,116 | | | | 1,500 | | |
Canada 2.8% | |
Alimentation
Couche-Tard,
Inc. Class B | | | 45,073 | | | | 2,158 | | |
Suncor Energy, Inc. | | | 62,490 | | | | 2,572 | | |
| | | | 4,730 | | |
China 2.9% | |
Alibaba Group
Holding Ltd.
ADR* | | | 19,876 | | | | 3,478 | | |
Baidu, Inc. ADR* | | | 6,666 | | | | 1,510 | | |
| | | | 4,988 | | |
Denmark 0.9% | |
Danske Bank A/S | | | 54,454 | | | | 1,602 | | |
France 9.4% | |
Air Liquide SA | | | 10,073 | | | | 1,269 | | |
Arkema SA | | | 10,811 | | | | 1,354 | | |
L'Oreal SA | | | 9,369 | | | | 2,248 | | |
Pernod-Ricard SA | | | 15,726 | | | | 2,482 | | |
Schneider
Electric SE | | | 23,720 | | | | 1,934 | | |
SPIE SA | | | 71,299 | | | | 1,351 | | |
TOTAL SA | | | 55,907 | | | | 3,496 | | |
Valeo SA | | | 40,563 | | | | 1,841 | | |
| | | | 15,975 | | |
Germany 10.4% | |
Brenntag AG | | | 24,993 | | | | 1,507 | | |
Continental AG | | | 10,185 | | | | 1,869 | | |
CTS Eventim AG &
Co. KGaA | | | 49,592 | | | | 2,199 | | |
Deutsche
Boerse AG | | | 13,613 | | | | 1,880 | | |
Gerresheimer AG | | | 19,948 | | | | 1,667 | | |
Henkel AG & Co.
KGaA, Preference
Shares | | | 20,757 | | | | 2,649 | | |
Infineon
Technologies AG | | | 84,505 | | | | 2,150 | | |
SAP SE ADR | | | 23,449 | | | | 2,808 | | |
| Scout24 AG(a) | | | 17,000 | | | | 879 | | |
| | | | 17,608 | | |
Hong Kong 3.3% | |
AIA Group Ltd. | | | 257,900 | | | | 2,225 | | |
| | | Number
of Shares | | Value
(000's) | |
Techtronic
Industries Co.
Ltd. | | | 542,100 | | | $ | 3,315 | | |
| | | | 5,540 | | |
Ireland 1.8% | |
CRH PLC | | | 51,063 | | | | 1,690 | | |
Kerry Group PLC
Class A | | | 12,208 | | | | 1,392 | | |
| | | | 3,082 | | |
Israel 2.7% | |
Check Point
Software
Technologies Ltd.* | | | 29,209 | | | | 3,394 | | |
Tower
Semiconductor
Ltd.* | | | 52,000 | | | | 1,134 | | |
| | | | 4,528 | | |
Italy 0.5% | |
Brembo SpA | | | 59,156 | | | | 791 | | |
Japan 16.2% | |
Bridgestone Corp. | | | 53,200 | | | | 1,960 | | |
Daikin Industries
Ltd. | | | 25,900 | | | | 3,303 | | |
Hoya Corp. | | | 29,600 | | | | 1,731 | | |
Kansai Paint Co.
Ltd. | | | 105,000 | | | | 2,076 | | |
Kao Corp. | | | 31,800 | | | | 2,469 | | |
Keyence Corp. | | | 6,300 | | | | 3,566 | | |
Kose Corp. | | | 12,300 | | | | 2,269 | | |
Nabtesco Corp. | | | 51,600 | | | | 1,345 | | |
Omron Corp. | | | 25,500 | | | | 1,142 | | |
Sanwa Holdings
Corp. | | | 75,600 | | | | 867 | | |
Shionogi & Co.
Ltd. | | | 41,500 | | | | 2,411 | | |
SMC Corp. | | | 7,600 | | | | 2,529 | | |
Toyota Motor
Corp. | | | 29,300 | | | | 1,827 | | |
| | | | 27,495 | | |
Netherlands 7.1% | |
AerCap Holdings
NV* | | | 51,624 | | | | 2,941 | | |
| ASML Holding NV | | | 25,031 | | | | 5,103 | | |
Heineken NV | | | 23,060 | | | | 2,279 | | |
NXP
Semiconductors
NV* | | | 18,198 | | | | 1,695 | | |
| | | | 12,018 | | |
Portugal 1.0% | |
Galp Energia
SGPS SA | | | 84,493 | | | | 1,713 | | |
Singapore 1.0% | |
DBS Group
Holdings Ltd. | | | 88,700 | | | | 1,612 | | |
| | | Number
of Shares | | Value
(000's) | |
Sweden 0.8% | |
Swedbank
AB, A Shares | | | 60,457 | | | $ | 1,407 | | |
Switzerland 13.3% | |
Cie Financiere
Richemont SA | | | 20,113 | | | | 1,779 | | |
Ferguson PLC | | | 23,860 | | | | 1,912 | | |
Givaudan SA | | | 1,132 | | | | 2,754 | | |
Julius Baer
Group Ltd.* | | | 32,373 | | | | 1,721 | | |
Novartis AG | | | 28,423 | | | | 2,357 | | |
Partners Group
Holding AG | | | 3,126 | | | | 2,454 | | |
Roche
Holding AG | | | 11,791 | | | | 2,929 | | |
SGS SA | | | 969 | | | | 2,552 | | |
Sonova
Holding AG | | | 10,704 | | | | 2,031 | | |
UBS Group AG* | | | 131,118 | | | | 2,048 | | |
| | | | 22,537 | | |
United Kingdom 17.1% | |
Aon PLC | | | 20,541 | | | | 2,990 | | |
Bunzl PLC | | | 108,327 | | | | 3,368 | | |
Compass Group
PLC | | | 126,273 | | | | 2,715 | | |
DCC PLC | | | 17,375 | | | | 1,567 | | |
Howden Joinery
Group PLC | | | 77,932 | | | | 498 | | |
IMI PLC | | | 136,208 | | | | 2,133 | | |
Lloyds Banking
Group PLC | | | 2,385,584 | | | | 1,834 | | |
London Stock
Exchange
Group PLC | | | 31,491 | | | | 1,888 | | |
Prudential PLC | | | 102,735 | | | | 2,311 | | |
Reckitt Benckiser
Group PLC | | | 22,112 | | | | 1,880 | | |
RELX PLC | | | 151,215 | | | | 3,352 | | |
Spectris PLC | | | 37,613 | | | | 1,148 | | |
St. James's
Place PLC | | | 165,617 | | | | 2,430 | | |
Unilever NV | | | 14,733 | | | | 847 | | |
| | | | 28,961 | | |
United States 4.4% | |
Core Laboratories
NV(b) | | | 13,526 | | | | 1,550 | | |
Samsonite
International SA(a) | | | 680,141 | | | | 2,751 | | |
Sensata
Technologies
Holding PLC* | | | 58,832 | | | | 3,115 | | |
| | | | 7,416 | | |
Total Common Stocks
(Cost $153,899) | | | | | 166,929 | | |
See Notes to Financial Statements
123
Schedule of Investments International Select Fund (cont'd)
| | | Number
of Shares | | Value
(000's) | |
Short-Term Investments 1.5% | |
Investment Companies 1.5% | |
State Street
Institutional
Treasury
Money Market
Fund Premier Class,
1.87%(c) | | | 1,032,345 | | | $ | 1,032 | | |
State Street
Navigator
Securities
Lending
Government
Money Market
Portfolio, 1.93%(c)(d) | | | 1,585,689 | | | | 1,586 | | |
Total Short-Term Investments
(Cost $2,618) | | | 2,618 | | |
Total Investments 100.0%
(Cost $156,517) | | | 169,547 | | |
Liabilities Less
Other Assets (0.0)%(e) | | | | | (71 | ) | |
Net Assets 100.0% | | $ | 169,476 | | |
* Non-income producing security.
(a) Security exempt from registration pursuant to Regulation S under the Securities Act of 1933, as amended. Regulation S applies to securities offerings that are made outside of the United States and do not involve direct selling efforts in the United States and as such may have restrictions on resale. Total value of all such securities at August 31, 2018 amounted to approximately $5,809,000, which represents 3.4% of net assets of the Fund.
(b) The security or a portion of this security is on loan at August 31, 2018. Total value of all such securities at August 31, 2018 amounted to approximately $1,549,000 for the Fund (see Note A of the Notes to Financial Statements).
(c) Represents 7-day effective yield as of August 31, 2018.
(d) Represents investment of cash collateral received from securities lending.
(e) Represents less than 0.05% of net assets.
See Notes to Financial Statements
124
Schedule of Investments International Select Fund (cont'd)
POSITIONS BY INDUSTRY
Industry | | Investments at
Value
(000's omitted) | | Percentage of
Net Assets | |
Capital Markets | | $ | 12,421 | | | | 7.3 | % | |
Trading Companies & Distributors | | | 10,226 | | | | 6.0 | % | |
Banks | | | 10,134 | | | | 6.0 | % | |
Semiconductors & Semiconductor Equipment | | | 10,082 | | | | 5.9 | % | |
Insurance | | | 8,773 | | | | 5.1 | % | |
Personal Products | | | 7,833 | | | | 4.6 | % | |
Oil, Gas & Consumable Fuels | | | 7,781 | | | | 4.6 | % | |
Pharmaceuticals | | | 7,697 | | | | 4.5 | % | |
Chemicals | | | 7,453 | | | | 4.4 | % | |
Auto Components | | | 6,461 | | | | 3.8 | % | |
Software | | | 6,202 | | | | 3.7 | % | |
Machinery | | | 6,007 | | | | 3.5 | % | |
Professional Services | | | 5,904 | | | | 3.5 | % | |
Internet Software & Services | | | 5,867 | | | | 3.5 | % | |
Electronic Equipment, Instruments & Components | | | 5,856 | | | | 3.5 | % | |
Electrical Equipment | | | 5,049 | | | | 3.0 | % | |
Beverages | | | 4,761 | | | | 2.8 | % | |
Textiles, Apparel & Luxury Goods | | | 4,530 | | | | 2.7 | % | |
Household Products | | | 4,529 | | | | 2.7 | % | |
Building Products | | | 4,170 | | | | 2.5 | % | |
Health Care Equipment & Supplies | | | 3,762 | | | | 2.2 | % | |
Household Durables | | | 3,315 | | | | 2.0 | % | |
Hotels, Restaurants & Leisure | | | 2,715 | | | | 1.6 | % | |
Media | | | 2,199 | | | | 1.3 | % | |
Food & Staples Retailing | | | 2,158 | | | | 1.3 | % | |
Automobiles | | | 1,827 | | | | 1.1 | % | |
Construction Materials | | | 1,690 | | | | 1.0 | % | |
Life Sciences Tools & Services | | | 1,667 | | | | 1.0 | % | |
Industrial Conglomerates | | | 1,567 | | | | 0.9 | % | |
Energy Equipment & Services | | | 1,550 | | | | 0.9 | % | |
Food Products | | | 1,392 | | | | 0.8 | % | |
Commercial Services & Supplies | | | 1,351 | | | | 0.8 | % | |
Short-Term Investments and Other Liabilities—Net | | | 2,547 | | | | 1.5 | % | |
| | | $ | 169,476 | | | | 100.0 | % | |
See Notes to Financial Statements
125
Schedule of Investments International Select Fund (cont'd)
The following is a summary, categorized by Level (see Note A of Notes to Financial Statements), of inputs used to value the Fund's investments as of August 31, 2018:
Asset Valuation Inputs | |
(000's omitted) | | Level 1 | | Level 2 | | Level 3 | | Total | |
Investments: | |
| Common Stocks(a) | | $ | 166,929 | | | $ | — | | | $ | — | | | $ | 166,929 | | |
Short-Term Investments | | | — | | | | 2,618 | | | | — | | | | 2,618 | | |
Total Investments | | $ | 166,929 | | | $ | 2,618 | | | $ | — | | | $ | 169,547 | | |
(a) The Schedule of Investments provides a geographic categorization as well as a Positions by Industry summary.
As of the year ended August 31, 2018, no securities were transferred from one level (as of August 31, 2017) to another.
See Notes to Financial Statements
126
Schedule of Investments International Small Cap Fund August 31, 2018
| | |
Number
of Shares | |
Value
(000's) | |
Common Stocks 96.5% | |
Australia 1.6% | |
SpeedCast
International
Ltd. | | | 13,963 | | | $ | 42 | | |
Steadfast
Group Ltd. | | | 31,775 | | | | 68 | | |
| | | | 110 | | |
Austria 0.9% | |
Schoeller-Bleckmann
Oilfield
Equipment AG | | | 549 | | | | 59 | | |
Canada 5.1% | |
ATS Automation
Tooling Systems,
Inc.* | | | 3,451 | | | | 58 | | |
Colliers International
Group, Inc. | | | 1,255 | | | | 102 | | |
Computer
Modelling Group
Ltd. | | | 11,201 | | | | 75 | | |
Kinaxis, Inc.* | | | 1,478 | | | | 112 | | |
| | | | 347 | | |
Denmark 3.4% | |
Schouw & Co. A/S | | | 1,108 | | | | 87 | | |
SimCorp A/S | | | 782 | | | | 74 | | |
Sydbank A/S | | | 2,345 | | | | 69 | | |
| | | | 230 | | |
Finland 1.3% | |
Kemira OYJ | | | 6,780 | | | | 90 | | |
France 3.7% | |
ESI Group* | | | 1,447 | | | | 73 | | |
Trigano SA | | | 626 | | | | 92 | | |
Virbac SA* | | | 555 | | | | 85 | | |
| | | | 250 | | |
Germany 7.1% | |
Dermapharm
Holding SE* | | | 2,544 | | | | 85 | | |
Jenoptik AG | | | 2,656 | | | | 104 | | |
SAF-Holland SA | | | 4,685 | | | | 73 | | |
Stabilus SA | | | 1,200 | | | | 106 | | |
Washtec AG | | | 1,195 | | | | 116 | | |
| | | | 484 | | |
Ireland 1.3% | |
| Applegreen PLC(a)(b) | | | 12,605 | | | | 89 | | |
Italy 3.2% | |
Anima Holding
SpA(c) | | | 10,391 | | | | 48 | | |
Carel Industries
SpA*(c) | | | 8,296 | | | | 87 | | |
Cerved Group
SpA | | | 7,818 | | | | 82 | | |
| | | | 217 | | |
| | |
Number
of Shares | |
Value
(000's) | |
Japan 21.9% | |
Aeon Delight Co.
Ltd. | | | 2,250 | | | $ | 81 | | |
Amano Corp. | | | 4,600 | | | | 96 | | |
Ariake Japan Co.
Ltd. | | | 1,200 | | | | 108 | | |
Azbil Corp. | | | 2,300 | | | | 100 | | |
Chugoku Marine
Paints Ltd. | | | 7,400 | | | | 73 | | |
Fukushima Industries
Corp. | | | 1,325 | | | | 64 | | |
Ichigo, Inc. | | | 16,100 | | | | 66 | | |
Konishi Co. Ltd. | | | 5,400 | | | | 85 | | |
Nihon Parkerizing
Co. Ltd. | | | 6,700 | | | | 89 | | |
Nohmi Bosai Ltd. | | | 4,600 | | | | 97 | | |
Okamoto Industries,
Inc. | | | 6,500 | | | | 72 | | |
Optex Group Co.
Ltd.(d) | | | 2,500 | | | | 56 | | |
Prestige International,
Inc. | | | 9,200 | | | | 106 | | |
Relo Group, Inc. | | | 3,900 | | | | 107 | | |
SHO-BOND Holdings
Co. Ltd. | | | 1,600 | | | | 112 | | |
| Shoei Co. Ltd.(d) | | | 2,300 | | | | 98 | | |
Sun Frontier
Fudousan Co. Ltd. | | | 7,000 | | | | 86 | | |
| | | | 1,496 | | |
Luxembourg 1.1% | |
| Befesa SA*(c) | | | 1,736 | | | | 76 | | |
Netherlands 2.3% | |
Corbion NV | | | 2,790 | | | | 88 | | |
| Intertrust NV(c) | | | 3,640 | | | | 66 | | |
| | | | 154 | | |
Norway 2.4% | |
Borregaard ASA | | | 8,225 | | | | 78 | | |
| Sbanken ASA(c) | | | 8,894 | | | | 90 | | |
| | | | 168 | | |
Singapore 1.5% | |
Haw Par Corp. Ltd. | | | 10,400 | | | | 103 | | |
Spain 1.4% | |
Applus Services SA | | | 6,895 | | | | 94 | | |
Sweden 6.5% | |
Cloetta AB, B
Shares | | | 28,245 | | | | 85 | | |
| Dustin Group AB(c) | | | 8,619 | | | | 85 | | |
Getinge AB, B
Shares | | | 5,791 | | | | 69 | | |
Sweco AB, B
Shares | | | 4,003 | | | | 102 | | |
| Thule Group AB(c) | | | 4,420 | | | | 104 | | |
| | | | 445 | | |
| | |
Number
of Shares | |
Value
(000's) | |
Switzerland 16.0% | |
Ascom Holding AG | | | 4,589 | | | $ | 91 | | |
Autoneum Holding
AG | | | 375 | | | | 89 | | |
Belimo Holding AG | | | 21 | | | | 107 | | |
Bossard Holding AG
Class A | | | 485 | | | | 100 | | |
Comet Holding
AG*(d) | | | 740 | | | | 73 | | |
Interroll Holding AG | | | 51 | | | | 106 | | |
Kardex AG* | | | 534 | | | | 96 | | |
Komax Holding AG | | | 300 | | | | 101 | | |
Medartis Holding
AG*(c) | | | 1,031 | | | | 78 | | |
Tecan Group AG | | | 470 | | | | 112 | | |
u-blox Holding AG* | | | 460 | | | | 69 | | |
VZ Holding AG | | | 217 | | | | 67 | | |
| | | | 1,089 | | |
United Kingdom 15.8% | |
Amigo Holdings
PLC*(c) | | | 18,411 | | | | 63 | | |
| Biffa PLC(c) | | | 29,805 | | | | 96 | | |
Big Yellow Group
PLC | | | 5,535 | | | | 68 | | |
Clarkson PLC | | | 2,040 | | | | 75 | | |
Clinigen Group PLC | | | 8,545 | | | | 110 | | |
Dechra
Pharmaceuticals
PLC | | | 2,589 | | | | 105 | | |
Diploma PLC | | | 4,906 | | | | 93 | | |
Essentra PLC | | | 14,014 | | | | 81 | | |
Gocompare.Com
Group PLC | | | 61,643 | | | | 82 | | |
Johnson Service
Group PLC | | | 51,245 | | | | 93 | | |
| Restore PLC(d) | | | 15,770 | | | | 105 | | |
| RPS Group PLC | | | 22,449 | | | | 68 | | |
Sensyne Health
Ltd.* | | | 15,331 | | | | 39 | | |
| | | | 1,078 | | |
Total Common Stocks
(Cost $6,458) | | | | | 6,579 | | |
Short-Term Investments 7.5% | |
Investment Companies 7.5% | |
State Street
Institutional
Treasury Money
Market Fund
Premier Class,
1.87%(e) | | | 288,246 | | | | 288 | | |
See Notes to Financial Statements
127
Schedule of Investments International Small Cap Fund (cont'd)
| | |
Number
of Shares | |
Value
(000's) | |
State Street
Navigator
Securities
Lending
Government
Money Market
Portfolio,
1.93%(e)(f) | | | 224,760 | | | $ | 225 | | |
Total Short-Term Investments
(Cost $513) | | | | | 513 | | |
Total Investments 104.0%
(Cost $6,971) | | | | | 7,092 | | |
Liabilities Less
Other Assets (4.0)% | | | | | (272 | ) | |
Net Assets 100.0% | | | | $ | 6,820 | | |
* Non-income producing security.
(a) Security fair valued as of August 31, 2018 in accordance with procedures approved by the Board of Trustees. Total value of all such securities at August 31, 2018 amounted to approximately $89,000, which represents 1.3% of net assets of the Fund.
(b) Value determined using significant unobservable inputs.
(c) Security exempt from registration pursuant to Regulation S under the Securities Act of 1933, as amended. Regulation S applies to securities offerings that are made outside of the United States and do not involve direct selling efforts in the United States and as such may have restrictions on resale. Total value of all such securities at August 31, 2018 amounted to approximately $793,000, which represents 11.6% of net assets of the Fund.
(d) The security or a portion of this security is on loan at August 31, 2018. Total value of all such securities at August 31, 2018 amounted to approximately $215,000 for the Fund (see Note A of the Notes to Financial Statements).
(e) Represents 7-day effective yield as of August 31, 2018.
(f) Represents investment of cash collateral received from securities lending.
See Notes to Financial Statements
128
Schedule of Investments International Small Cap Fund (cont'd)
POSITIONS BY INDUSTRY
Industry | | Investments at
Value
(000's omitted) | | Percentage of
Net Assets | |
Chemicals | | $ | 656 | | | | 9.6 | % | |
Machinery | | | 647 | | | | 9.5 | % | |
Commercial Services & Supplies | | | 625 | | | | 9.2 | % | |
Electronic Equipment, Instruments & Components | | | 613 | | | | 9.0 | % | |
Pharmaceuticals | | | 378 | | | | 5.5 | % | |
Real Estate Management & Development | | | 361 | | | | 5.3 | % | |
Food Products | | | 280 | | | | 4.1 | % | |
Auto Components | | | 260 | | | | 3.8 | % | |
Software | | | 259 | | | | 3.8 | % | |
Life Sciences Tools & Services | | | 222 | | | | 3.3 | % | |
Construction & Engineering | | | 214 | | | | 3.1 | % | |
Leisure Products | | | 196 | | | | 2.9 | % | |
Trading Companies & Distributors | | | 193 | | | | 2.8 | % | |
Professional Services | | | 160 | | | | 2.4 | % | |
Banks | | | 159 | | | | 2.3 | % | |
Health Care Equipment & Supplies | | | 147 | | | | 2.2 | % | |
Energy Equipment & Services | | | 134 | | | | 2.0 | % | |
Health Care Technology | | | 130 | | | | 1.9 | % | |
Capital Markets | | | 115 | | | | 1.7 | % | |
Building Products | | | 107 | | | | 1.6 | % | |
Specialty Retail | | | 89 | | | | 1.3 | % | |
Internet & Direct Marketing Retail | | | 85 | | | | 1.2 | % | |
Internet Software & Services | | | 82 | | | | 1.2 | % | |
Diversified Financial Services | | | 82 | | | | 1.2 | % | |
Marine | | | 75 | | | | 1.1 | % | |
Semiconductors & Semiconductor Equipment | | | 69 | | | | 1.0 | % | |
Equity Real Estate Investment Trusts | | | 68 | | | | 1.0 | % | |
Insurance | | | 68 | | | | 1.0 | % | |
Consumer Finance | | | 63 | | | | 0.9 | % | |
Diversified Telecommunication Services | | | 42 | | | | 0.6 | % | |
Short-Term Investments and Other Liabilities—Net | | | 241 | | | | 3.5 | % | |
| | | $ | 6,820 | | | | 100.0 | % | |
See Notes to Financial Statements
129
Schedule of Investments International Small Cap Fund (cont'd)
The following is a summary, categorized by Level (see Note A of Notes to Financial Statements), of inputs used to value the Fund's investments as of August 31, 2018:
Asset Valuation Inputs | |
(000's omitted) | | Level 1 | | Level 2 | | Level 3(b) | | Total | |
Investments: | |
Common Stocks | |
Ireland | | $ | — | | | $ | — | | | $ | 89 | | | $ | 89 | | |
| Other Common Stocks(a) | | | 6,490 | | | | — | | | | — | | | | 6,490 | | |
Total Common Stocks | | | 6,490 | | | | — | | | | 89 | | | | 6,579 | | |
Short-Term Investments | | | — | | | | 513 | | | | — | | | | 513 | | |
Total Investments | | $ | 6,490 | | | $ | 513 | | | $ | 89 | | | $ | 7,092 | | |
(a) The Schedule of Investments provides a geographic categorization as well as a Positions by Industry summary.
(b) The following is reconciliation between the beginning and ending balances of investments in which unobservable inputs (Level 3) were used in determining value:
| | | Beginning
balance, as
of 9/1/2017 | | Accrued
discounts/
(premiums) | | Realized
gain/
(loss) | | Change
in unrealized
appreciation/
(depreciation) | | Purchases | | Sales | | Transfers
into
Level 3 | | Transfers
out of
Level 3 | | Balance,
as of
8/31/2018 | | Net change in
unrealized
appreciation/
(depreciation)
from
investments
still held as
of 8/31/2018 | |
Investments in Securities
(000's omitted) | |
Common Stocks
Ireland | | $ | — | | | $ | — | | | $ | (0 | )(c) | | $ | (0 | )(c) | | $ | 89 | | | $ | (0 | )(c) | | $ | — | | | $ | — | | | $ | 89 | | | $ | (0 | )(c) | |
Total | | $ | — | | | $ | — | | | $ | (0 | )(c) | | $ | (0 | )(c) | | $ | 89 | | | $ | (0 | )(c) | | $ | — | | | $ | — | | | $ | 89 | | | $ | (0 | )(c) | |
(c) Amount less than one thousand.
As of the year ended August 31, 2018, no securities were transferred from one level (as of August 31, 2017) to another.
See Notes to Financial Statements
130
Schedule of Investments Intrinsic Value Fund August 31, 2018
| | |
Number
of Shares | |
Value
(000's) | |
Common Stocks 98.7% | |
Aerospace & Defense 5.7% | |
Esterline
Technologies
Corp.* | | | 48,000 | | | $ | 4,125 | | |
KEYW
Holding Corp.* | | | 881,906 | | | | 7,505 | | |
Mercury
Systems, Inc.* | | | 163,147 | | | | 8,893 | | |
Spirit AeroSystems
Holdings, Inc.
Class A | | | 136,490 | | | | 11,670 | | |
Teledyne
Technologies, Inc.* | | | 36,452 | | | | 8,649 | | |
| | | | 40,842 | | |
Banks 5.3% | |
BankUnited, Inc. | | | 178,104 | | | | 6,909 | | |
Comerica, Inc. | | | 69,974 | | | | 6,821 | | |
Huntington
Bancshares, Inc. | | | 432,730 | | | | 7,014 | | |
TCF Financial
Corp. | | | 409,900 | | | | 10,391 | | |
Texas Capital
Bancshares, Inc.* | | | 82,200 | | | | 7,308 | | |
| | | | 38,443 | | |
| Capital Markets 0.0%(a) | |
Alimco Financial
Corp.* | | | 6,637 | | | | 77 | | |
Commercial Services & Supplies 3.3% | |
Clean Harbors,
Inc.* | | | 161,814 | | | | 11,099 | | |
Covanta
Holding Corp. | | | 431,400 | | | | 7,614 | | |
Stericycle, Inc.* | | | 87,100 | | | | 5,373 | | |
| | | | 24,086 | | |
Communications Equipment 10.6% | |
ARRIS
International
PLC* | | | 893,471 | | | | 23,150 | | |
Ciena Corp.* | | | 1,002,583 | | | | 31,661 | | |
Infinera Corp.* | | | 1,141,900 | | | | 10,220 | | |
Ribbon
Communications,
Inc.* | | | 640,499 | | | | 4,432 | | |
Viavi Solutions,
Inc.* | | | 618,099 | | | | 6,923 | | |
| | | | 76,386 | | |
Construction & Engineering 2.2% | |
KBR, Inc. | | | 545,600 | | | | 11,447 | | |
Valmont Industries,
Inc. | | | 30,700 | | | | 4,310 | | |
| | | | 15,757 | | |
| | |
Number
of Shares | |
Value
(000's) | |
Containers & Packaging 4.3% | |
Avery Dennison
Corp. | | | 151,336 | | | $ | 15,918 | | |
Crown Holdings,
Inc.* | | | 349,526 | | | | 14,963 | | |
| | | | 30,881 | | |
Electrical Equipment 0.4% | |
Babcock &
Wilcox
Enterprises,
Inc.* | | | 2,131,540 | | | | 2,984 | | |
Electronic Equipment, Instruments & Components 3.1% | |
II-VI, Inc.* | | | 95,430 | | | | 4,748 | | |
Itron, Inc.* | | | 139,731 | | | | 9,278 | | |
Maxwell
Technologies,
Inc.* | | | 530,100 | | | | 1,892 | | |
OSI Systems, Inc.* | | | 83,900 | | | | 6,535 | | |
| | | | 22,453 | | |
Energy Equipment & Services 3.9% | |
Dril-Quip, Inc.* | | | 87,900 | | | | 4,628 | | |
Forum Energy
Technologies,
Inc.* | | | 298,600 | | | | 3,568 | | |
ION Geophysical
Corp.* | | | 115,431 | | | | 2,072 | | |
McDermott
International,
Inc.* | | | 189,366 | | | | 3,662 | | |
Oil States
International,
Inc.* | | | 136,700 | | | | 4,627 | | |
Patterson-UTI
Energy, Inc. | | | 180,300 | | | | 3,089 | | |
Superior Energy
Services, Inc.* | | | 383,100 | | | | 3,448 | | |
TETRA
Technologies,
Inc.* | | | 695,992 | | | | 3,195 | | |
| | | | 28,289 | | |
Equity Real Estate Investment
Trusts 1.5% | |
InfraREIT, Inc. | | | 234,100 | | | | 4,891 | | |
Uniti Group, Inc. | | | 271,000 | | | | 5,642 | | |
| | | | 10,533 | | |
Food Products 1.8% | |
Hain Celestial
Group, Inc.* | | | 193,100 | | | | 5,515 | | |
TreeHouse Foods,
Inc.* | | | 148,900 | | | | 7,758 | | |
| | | | 13,273 | | |
| | |
Number
of Shares | |
Value
(000's) | |
Health Care Equipment &
Supplies 1.8% | |
Accuray, Inc.* | | | 1,313,739 | | | $ | 5,255 | | |
AtriCure, Inc.* | | | 225,300 | | | | 7,784 | | |
| | | | 13,039 | | |
Health Care Providers & Services 2.9% | |
Acadia
Healthcare
Co., Inc.* | | | 225,300 | | | | 9,357 | | |
Molina
Healthcare, Inc.* | | | 77,161 | | | | 10,648 | | |
Patterson Cos., Inc. | | | 55,100 | | | | 1,242 | | |
| | | | 21,247 | | |
Health Care Technology 1.7% | |
Allscripts
Healthcare
Solutions, Inc.* | | | 842,400 | | | | 12,307 | | |
Hotels, Restaurants & Leisure 1.1% | |
SeaWorld
Entertainment,
Inc.* | | | 273,600 | | | | 8,022 | | |
Household Durables 0.8% | |
Tempur Sealy
International,
Inc.* | | | 101,200 | | | | 5,606 | | |
Independent Power and Renewable Electricity Producers 2.5% | |
Atlantic Power
Corp.* | | | 2,059,835 | | | | 4,532 | | |
Ormat
Technologies,
Inc. | | | 133,741 | | | | 7,041 | | |
Vistra Energy
Corp.* | | | 287,561 | | | | 6,769 | | |
| | | | 18,342 | | |
Internet Software & Services 0.4% | |
Cloudera, Inc.* | | | 179,600 | | | | 2,696 | | |
IT Services 6.2% | |
Acxiom Corp.* | | | 259,700 | | | | 11,866 | | |
Conduent, Inc.* | | | 524,800 | | | | 12,165 | | |
CoreLogic, Inc.* | | | 277,325 | | | | 14,099 | | |
Unisys Corp.* | | | 373,700 | | | | 6,951 | | |
| | | | 45,081 | | |
Life Sciences Tools & Services 5.8% | |
Charles River
Laboratories
International,
Inc.* | | | 149,771 | | | | 18,498 | | |
Fluidigm Corp.* | | | 1,334,159 | | | | 10,567 | | |
Luminex Corp. | | | 262,400 | | | | 7,402 | | |
NanoString
Technologies,
Inc.* | | | 354,000 | | | | 5,724 | | |
| | | | 42,191 | | |
See Notes to Financial Statements
131
Schedule of Investments Intrinsic Value Fund (cont'd)
| | |
Number
of Shares | |
Value
(000's) | |
Machinery 4.5% | |
Actuant Corp.
Class A | | | 273,075 | | | $ | 8,042 | | |
Harsco Corp.* | | | 359,300 | | | | 10,150 | | |
ITT, Inc. | | | 138,100 | | | | 8,163 | | |
Manitowoc Co.,
Inc.* | | | 134,975 | | | | 3,130 | | |
Twin Disc, Inc.* | | | 124,809 | | | | 3,189 | | |
| | | | 32,674 | | |
Marine 0.1% | |
Danaos Corp.* | | | 416,659 | | | | 688 | | |
Media 0.7% | |
MSG Networks,
Inc. Class A* | | | 192,753 | | | | 4,684 | | |
Metals & Mining 1.4% | |
Cleveland-Cliffs,
Inc.* | | | 999,600 | | | | 10,046 | | |
Pharmaceuticals 2.7% | |
Amneal
Pharmaceuticals,
Inc.* | | | 508,110 | | | | 11,737 | | |
Intersect ENT, Inc.* | | | 95,588 | | | | 2,801 | | |
Mallinckrodt PLC* | | | 142,700 | | | | 4,918 | | |
| | | | 19,456 | | |
Road & Rail 2.8% | |
Avis Budget
Group, Inc.* | | | 179,200 | | | | 5,575 | | |
Hertz Global
Holdings, Inc.* | | | 373,900 | | | | 6,584 | | |
Ryder System,
Inc. | | | 104,704 | | | | 8,046 | | |
| | | | 20,205 | | |
Semiconductors & Semiconductor Equipment 8.5% | |
CEVA, Inc.* | | | 131,900 | | | | 4,036 | | |
Cypress
Semiconductor
Corp. | | | 691,935 | | | | 11,908 | | |
Impinj, Inc.* | | | 138,500 | | | | 2,975 | | |
MACOM
Technology
Solutions
Holdings, Inc.* | | | 467,418 | | | | 10,774 | | |
Mellanox
Technologies
Ltd.* | | | 205,550 | | | | 17,102 | | |
Rambus, Inc.* | | | 719,544 | | | | 8,793 | | |
Veeco Instruments,
Inc.* | | | 484,300 | | | | 5,812 | | |
| | | | 61,400 | | |
| | |
Number
of Shares | |
Value
(000's) | |
Software 8.9% | |
FireEye, Inc.* | | | 679,700 | | | $ | 11,283 | | |
Nuance
Communications,
Inc.* | | | 940,400 | | | | 15,347 | | |
OneSpan, Inc.* | | | 255,300 | | | | 4,787 | | |
Seachange
International,
Inc.* | | | 608,767 | | | | 1,004 | | |
TiVo Corp. | | | 658,430 | | | | 8,988 | | |
Verint Systems,
Inc.* | | | 475,761 | | | | 23,098 | | |
| | | | 64,507 | | |
Specialty Retail 2.8% | |
Chico's FAS, Inc. | | | 417,300 | | | | 3,806 | | |
Express, Inc.* | | | 443,000 | | | | 4,970 | | |
New York &
Co., Inc.* | | | 247,000 | | | | 1,124 | | |
Office Depot,
Inc. | | | 1,892,367 | | | | 6,339 | | |
Party City
Holdco, Inc.* | | | 243,490 | | | | 3,738 | | |
| | | | 19,977 | | |
Technology Hardware, Storage & Peripherals 0.4% | |
Diebold Nixdorf,
Inc. | | | 468,800 | | | | 2,227 | | |
Quantum Corp.* | | | 194,175 | | | | 392 | | |
| | | | 2,619 | | |
Textiles, Apparel & Luxury Goods 0.6% | |
Crocs, Inc.* | | | 213,900 | | | | 4,419 | | |
Total Common Stocks
(Cost $512,865) | | | | | 713,210 | | |
Convertible Preferred Stocks 0.6% | |
Independent Power and Renewable Electricity Producers 0.6% | |
Vistra Energy
Corp., 7.00%,
due 7/1/19
(Cost $4,926) | | | 51,300 | | | | 4,875 | | |
| | |
Principal
Amount | |
Value
(000's) | |
Convertible Bonds 0.6% | |
Electronic Equipment, Instruments & Components 0.6% | |
Maxwell
Technologies,
Inc., 5.50%,
due 9/15/22(b)
(Cost $4,500) | | $ | 4,500,000 | | | $ | 4,088 | | |
Total Investments 99.9%
(Cost $522,291) | | | | | 722,173 | | |
Other Assets Less
Liabilities 0.1% | | | | | 362 | | |
Net Assets 100.0% | | | | $ | 722,535 | | |
See Notes to Financial Statements
132
Schedule of Investments Intrinsic Value Fund (cont'd)
* Non-income producing security.
(a) Represents less than 0.05% of net assets.
(b) Securities were purchased under Rule 144A of the Securities Act of 1933, as amended, or are otherwise restricted and, unless registered under the Securities Act of 1933 or exempted from registration, may only be sold to qualified institutional investors or may have other restrictions on resale. At August 31, 2018, these securities amounted to approximately $4,088,000, which represents 0.6% of net assets of the Fund. These securities have been deemed by the investment manager to be liquid.
The following is a summary, categorized by Level (see Note A of Notes to Financial Statements), of inputs used to value the Fund's investments as of August 31, 2018:
Asset Valuation Inputs | |
(000's omitted) | | Level 1 | | Level 2 | | Level 3 | | Total | |
Investments: | |
| Common Stocks(a) | | $ | 713,210 | | | $ | — | | | $ | — | | | $ | 713,210 | | |
| Convertible Preferred Stocks(a) | | | 4,875 | | | | — | | | | — | | | | 4,875 | | |
| Convertible Bonds(a) | | | — | | | | 4,088 | | | | — | | | | 4,088 | | |
Total Investments | | $ | 718,085 | | | $ | 4,088 | | | $ | — | | | $ | 722,173 | | |
(a) The Schedule of Investments provides information on the industry categorization for the portfolio.
As of the year ended August 31, 2018, no securities were transferred from one level (as of August 31, 2017) to another.
See Notes to Financial Statements
133
Schedule of Investments Large Cap Value Fund August 31, 2018
| | |
Number
of Shares | |
Value
(000's) | |
Common Stocks 98.2% | |
Airlines 0.9% | |
Delta Air Lines,
Inc. | | | 232,497 | | | $ | 13,596 | | |
Banks 9.0% | |
JPMorgan
Chase & Co. | | | 635,648 | | | | 72,832 | | |
M&T Bank Corp. | | | 107,884 | | | | 19,112 | | |
PNC Financial
Services Group,
Inc. | | | 110,553 | | | | 15,869 | | |
SunTrust Banks,
Inc. | | | 211,894 | | | | 15,587 | | |
Wells Fargo & Co. | | | 124,150 | | | | 7,260 | | |
| | | | 130,660 | | |
Biotechnology 1.1% | |
BioMarin
Pharmaceutical,
Inc.* | | | 162,426 | | | | 16,239 | | |
Capital Markets 1.5% | |
CME Group, Inc. | | | 122,710 | | | | 21,441 | | |
Communications Equipment 0.7% | |
Cisco Systems, Inc. | | | 216,973 | | | | 10,365 | | |
Diversified Telecommunication Services 5.3% | |
AT&T, Inc. | | | 662,428 | | | | 21,158 | | |
CenturyLink, Inc. | | | 984,755 | | | | 21,034 | | |
Verizon
Communications,
Inc. | | | 644,911 | | | | 35,064 | | |
| | | | 77,256 | | |
Electric Utilities 9.3% | |
American
Electric Power
Co., Inc. | | | 386,388 | | | | 27,716 | | |
Evergy, Inc. | | | 305,800 | | | | 17,446 | | |
Exelon Corp. | | | 999,500 | | | | 43,688 | | |
FirstEnergy Corp. | | | 913,131 | | | | 34,133 | | |
NextEra Energy,
Inc. | | | 76,570 | | | | 13,024 | | |
| | | | 136,007 | | |
Electrical Equipment 0.9% | |
Emerson Electric
Co. | | | 174,028 | | | | 13,353 | | |
Equity Real Estate Investment
Trusts 9.0% | |
American
Homes 4 Rent
Class A | | | 282,838 | | | | 6,562 | | |
AvalonBay
Communities,
Inc. | | | 47,683 | | | | 8,740 | | |
Equity Residential | | | 450,250 | | | | 30,504 | | |
| | |
Number
of Shares | |
Value
(000's) | |
Mid-America
Apartment
Communities,
Inc. | | | 42,713 | | | $ | 4,423 | | |
Prologis, Inc. | | | 234,393 | | | | 15,747 | | |
Public Storage | | | 122,562 | | | | 26,054 | | |
Simon Property
Group, Inc. | | | 116,363 | | | | 21,298 | | |
SL Green
Realty Corp. | | | 166,456 | | | | 17,378 | | |
| | | | 130,706 | | |
Food & Staples Retailing 4.6% | |
Costco
Wholesale Corp. | | | 52,991 | | | | 12,354 | | |
Walgreens
Boots Alliance,
Inc. | | | 167,854 | | | | 11,508 | | |
Walmart, Inc. | | | 456,546 | | | | 43,764 | | |
| | | | 67,626 | | |
Food Products 6.3% | |
Conagra
Brands, Inc. | | | 360,362 | | | | 13,243 | | |
Kraft Heinz Co. | | | 464,311 | | | | 27,056 | | |
Mondelez
International,
Inc. Class A | | | 1,208,108 | | | | 51,610 | | |
| | | | 91,909 | | |
Health Care Equipment &
Supplies 2.1% | |
Abbott
Laboratories | | | 315,374 | | | | 21,079 | | |
Medtronic PLC | | | 97,883 | | | | 9,437 | | |
| | | | 30,516 | | |
Health Care Providers & Services 9.4% | |
Centene Corp.* | | | 328,435 | | | | 48,109 | | |
Cigna Corp. | | | 104,485 | | | | 19,679 | | |
CVS Health Corp. | | | 104,394 | | | | 7,855 | | |
Express Scripts
Holding Co.* | | | 88,339 | | | | 7,775 | | |
HCA Healthcare,
Inc. | | | 334,847 | | | | 44,906 | | |
Quest Diagnostics,
Inc. | | | 73,621 | | | | 8,097 | | |
| | | | 136,421 | | |
Household Products 3.7% | |
Church &
Dwight Co., Inc. | | | 183,085 | | | | 10,359 | | |
Procter &
Gamble Co. | | | 521,686 | | | | 43,274 | | |
| | | | 53,633 | | |
Industrial Conglomerates 0.9% | |
Honeywell
International, Inc. | | | 86,608 | | | | 13,776 | | |
| | |
Number
of Shares | |
Value
(000's) | |
Insurance 4.3% | |
Aon PLC | | | 88,059 | | | $ | 12,818 | | |
Assurant, Inc. | | | 56,724 | | | | 5,832 | | |
Athene Holding
Ltd. Class A* | | | 367,646 | | | | 18,257 | | |
Chubb Ltd. | | | 185,727 | | | | 25,118 | | |
| | | | 62,025 | | |
Life Sciences Tools & Services 0.4% | |
Thermo Fisher
Scientific, Inc. | | | 25,244 | | | | 6,036 | | |
Machinery 1.3% | |
Caterpillar, Inc. | | | 93,290 | | | | 12,953 | | |
Deere & Co. | | | 41,192 | | | | 5,924 | | |
| | | | 18,877 | | |
Media 0.3% | |
Comcast Corp.
Class A | | | 122,534 | | | | 4,533 | | |
Metals & Mining 3.2% | |
Newmont
Mining Corp. | | | 1,484,255 | | | | 46,056 | | |
Multi-Utilities 4.3% | |
DTE Energy Co. | | | 246,265 | | | | 27,370 | | |
NiSource, Inc. | | | 904,329 | | | | 24,480 | | |
Sempra Energy | | | 99,307 | | | | 11,528 | | |
| | | | 63,378 | | |
Multiline Retail 1.2% | |
Nordstrom, Inc. | | | 277,528 | | | | 17,443 | | |
Oil, Gas & Consumable Fuels 5.6% | |
Cabot
Oil & Gas Corp. | | | 901,541 | | | | 21,484 | | |
EOG Resources,
Inc. | | | 147,486 | | | | 17,438 | | |
Exxon Mobil Corp. | | | 340,942 | | | | 27,333 | | |
Phillips 66 | | | 129,618 | | | | 15,361 | | |
| | | | 81,616 | | |
Personal Products 1.7% | |
Unilever NV | | | 437,441 | | | | 25,144 | | |
Pharmaceuticals 8.6% | |
Allergan PLC | | | 27,674 | | | | 5,305 | | |
Eli Lilly & Co. | | | 48,762 | | | | 5,152 | | |
Johnson &
Johnson | | | 302,038 | | | | 40,682 | | |
Merck & Co.,
Inc. | | | 389,436 | | | | 26,711 | | |
Pfizer, Inc. | | | 1,151,847 | | | | 47,825 | | |
| | | | 125,675 | | |
Software 0.5% | |
Microsoft Corp. | | | 69,836 | | | | 7,845 | | |
Specialty Retail 0.7% | |
Tiffany & Co. | | | 80,731 | | | | 9,902 | | |
See Notes to Financial Statements
134
Schedule of Investments Large Cap Value Fund (cont'd)
| | |
Number
of Shares | |
Value
(000's) | |
Textiles, Apparel & Luxury Goods 1.4% | |
lululemon
Athletica, Inc.* | | | 135,387 | | | $ | 20,976 | | |
Total Common Stocks | | | | | 1,433,010 | | |
(Cost $1,284,521) | |
Short-Term Investments 2.6% | |
Investment Companies 2.6% | |
State Street
Institutional U.S.
Government
Money Market
Fund Premier
Class, 1.87%(a)
(Cost $38,029) | | | 38,029,366 | | | | 38,029 | | |
Total Investments 100.8% | | | | | 1,471,039 | | |
(Cost $1,322,550) | |
Liabilities Less
Other Assets (0.8)% | | | | | (12,356 | ) | |
Net Assets 100.0% | | | | $ | 1,458,683 | | |
* Non-income producing security.
(a) Represents 7-day effective yield as of August 31, 2018.
Derivative Instruments
Written option contracts ("options written")
At August 31, 2018, the Fund did not have any outstanding options written.
For the year ended August 31, 2018, the Fund had an average market value of $(6,317,158) in options written.
The following is a summary, categorized by Level (see Note A of Notes to Financial Statements), of inputs used to value the Fund's investments as of August 31, 2018:
Asset Valuation Inputs | |
(000's omitted) | | Level 1 | | Level 2 | | Level 3 | | Total | |
Investments: | |
| Common Stocks(a) | | $ | 1,433,010 | | | $ | — | | | $ | — | | | $ | 1,433,010 | | |
Short-Term Investments | | | — | | | | 38,029 | | | | — | | | | 38,029 | | |
Total Investments | | $ | 1,433,010 | | | $ | 38,029 | | | $ | — | | | $ | 1,471,039 | | |
(a) The Schedule of Investments provides information on the industry categorization for the portfolio.
As of the year ended August 31, 2018, no securities were transferred from one level (as of August 31, 2017) to another.
See Notes to Financial Statements
135
Schedule of Investments Large Cap Value Fund (cont'd)
Other Financial Instruments
(000's omitted)
The following is a reconciliation between the beginning and ending balances of investments in which unobservable inputs (Level 3) were used in determining value:
| | | Beginning
balance, as
of 9/1/2017 | | Accrued
discounts/
(premiums) | | Realized
gain/
(loss) | | Change
in unrealized
appreciation/
(depreciation) | | Purchases | | Sales | | Transfers
into
Level 3 | | Transfers
out of
Level 3 | | Balance,
as of
8/31/2018 | | Net change in
unrealized
appreciation/
(depreciation)
from
investments
still held as
of 8/31/2018 | |
Other Financial Instruments:
(000's omitted) | |
Options Written(a)
Technology
Hardware,
Storage &
Peripherals | | $ | (0 | ) | | $ | — | | | $ | 217 | | | $ | (217 | ) | | $ | 0 | | | $ | — | | | $ | — | | | $ | — | | | $ | — | | | $ | — | | |
Total | | $ | (0 | ) | | $ | — | | | $ | 217 | | | $ | (217 | ) | | $ | 0 | | | $ | — | | | $ | — | | | $ | — | | | $ | — | | | $ | — | | |
(a) At the beginning of the year, these investments were valued using methods the Fund's Board of Trustees has approved in the good-faith belief that the resulting valuation will reflect the fair value of the security. The Fund held no Level 3 investments at August 31, 2018.
See Notes to Financial Statements
136
Schedule of Investments Mid Cap Growth Fund August 31, 2018
| | |
Number
of Shares | |
Value
(000's) | |
Common Stocks 96.4% | |
Aerospace & Defense 1.1% | |
Harris Corp. | | | 97,500 | | | $ | 15,845 | | |
Auto Components 1.2% | |
Aptiv PLC | | | 145,000 | | | | 12,762 | | |
Delphi
Technologies PLC | | | 128,333 | | | | 4,521 | | |
| | | | 17,283 | | |
Banks 3.3% | |
Comerica, Inc. | | | 130,000 | | | | 12,673 | | |
East West
Bancorp, Inc. | | | 175,000 | | | | 11,093 | | |
SVB Financial
Group* | | | 77,500 | | | | 25,013 | | |
| | | | 48,779 | | |
Biotechnology 6.6% | |
Agios
Pharmaceuticals,
Inc.* | | | 100,000 | | | | 8,072 | | |
Array BioPharma,
Inc.* | | | 475,000 | | | | 7,396 | | |
BioMarin
Pharmaceutical,
Inc.* | | | 160,000 | | | | 15,997 | | |
Exelixis, Inc.* | | | 600,000 | | | | 11,274 | | |
Incyte Corp.* | | | 220,000 | | | | 16,260 | | |
Neurocrine
Biosciences, Inc.* | | | 180,000 | | | | 22,131 | | |
Sarepta
Therapeutics,
Inc.* | | | 85,000 | | | | 11,733 | | |
Seattle
Genetics, Inc.* | | | 75,000 | | | | 5,757 | | |
| | | | 98,620 | | |
Capital Markets 3.0% | |
Affiliated Managers
Group, Inc. | | | 62,500 | | | | 9,130 | | |
Cboe Global
Markets, Inc. | | | 125,000 | | | | 12,600 | | |
MarketAxess
Holdings, Inc. | | | 35,000 | | | | 6,644 | | |
Raymond James
Financial, Inc. | | | 180,000 | | | | 16,747 | | |
| | | | 45,121 | | |
Commercial Services & Supplies 3.5% | |
Brink's Co. | | | 177,500 | | | | 13,330 | | |
Cintas Corp. | | | 100,000 | | | | 21,337 | | |
Waste
Connections, Inc. | | | 225,000 | | | | 17,863 | | |
| | | | 52,530 | | |
Communications Equipment 2.5% | |
Arista Networks,
Inc.* | | | 30,000 | | | | 8,969 | | |
| | |
Number
of Shares | |
Value
(000's) | |
Motorola
Solutions, Inc. | | | 160,000 | | | $ | 20,538 | | |
Palo Alto
Networks, Inc.* | | | 35,000 | | | | 8,090 | | |
| | | | 37,597 | | |
Construction & Engineering 0.6% | |
MasTec, Inc.* | | | 200,000 | | | | 8,760 | | |
Containers & Packaging 0.9% | |
Packaging
Corp. of
America | | | 125,000 | | | | 13,740 | | |
Diversified Consumer Services 2.3% | |
Bright Horizons
Family Solutions,
Inc.* | | | 162,000 | | | | 19,348 | | |
Service Corp.
International | | | 350,000 | | | | 14,686 | | |
| | | | 34,034 | | |
Diversified Telecommunication Services 0.7% | |
Zayo Group
Holdings, Inc.* | | | 300,000 | | | | 10,398 | | |
Electrical Equipment 1.8% | |
AMETEK, Inc. | | | 225,000 | | | | 17,316 | | |
Rockwell
Automation, Inc. | | | 55,000 | | | | 9,953 | | |
| | | | 27,269 | | |
Electronic Equipment, Instruments & Components 5.5% | |
Amphenol
Corp. Class A | | | 209,500 | | | | 19,815 | | |
CDW Corp. | | | 282,500 | | | | 24,736 | | |
Cognex Corp. | | | 245,000 | | | | 13,181 | | |
IPG Photonics
Corp.* | | | 30,000 | | | | 5,264 | | |
Trimble, Inc.* | | | 450,000 | | | | 18,945 | | |
| | | | 81,941 | | |
Equity Real Estate Investment
Trusts 0.7% | |
CyrusOne, Inc. | | | 150,000 | | | | 10,044 | | |
Food Products 0.6% | |
Lamb Weston
Holdings, Inc. | | | 130,000 | | | | 8,788 | | |
Health Care Equipment &
Supplies 5.5% | |
ABIOMED, Inc.* | | | 20,000 | | | | 8,132 | | |
Align Technology,
Inc.* | | | 30,000 | | | | 11,595 | | |
AxoGen, Inc.* | | | 125,000 | | | | 5,481 | | |
Edwards
Lifesciences
Corp.* | | | 80,000 | | | | 11,539 | | |
Hill-Rom Holdings,
Inc. | | | 135,000 | | | | 13,131 | | |
| | |
Number
of Shares | |
Value
(000's) | |
IDEXX Laboratories,
Inc.* | | | 30,000 | | | $ | 7,621 | | |
Insulet Corp.* | | | 70,000 | | | | 7,299 | | |
Merit Medical
Systems, Inc.* | | | 277,500 | | | | 16,331 | | |
| | | | 81,129 | | |
Health Care Providers & Services 2.5% | |
Encompass
Health Corp. | | | 150,000 | | | | 12,238 | | |
Tivity Health,
Inc.* | | | 375,000 | | | | 12,900 | | |
WellCare Health
Plans, Inc.* | | | 40,000 | | | | 12,103 | | |
| | | | 37,241 | | |
Health Care Technology 1.7% | |
Teladoc Health,
Inc.*(a) | | | 75,000 | | | | 5,816 | | |
Veeva Systems,
Inc. Class A* | | | 180,000 | | | | 18,785 | | |
| | | | 24,601 | | |
Hotels, Restaurants & Leisure 5.0% | |
Aramark | | | 300,000 | | | | 12,324 | | |
International
Game
Technology
PLC | | | 275,000 | | | | 5,786 | | |
MGM Resorts
International | | | 407,500 | | | | 11,813 | | |
Norwegian
Cruise Line
Holdings Ltd.* | | | 275,000 | | | | 14,743 | | |
Red Rock Resorts,
Inc. Class A | | | 300,000 | | | | 9,792 | | |
Vail Resorts, Inc. | | | 67,500 | | | | 20,118 | | |
| | | | 74,576 | | |
Household Products 0.7% | |
Church &
Dwight Co., Inc. | | | 175,000 | | | | 9,901 | | |
Independent Power and Renewable Electricity Producers 0.7% | |
Vistra Energy
Corp.* | | | 450,000 | | | | 10,593 | | |
Industrial Conglomerates 1.6% | |
Roper
Technologies,
Inc. | | | 80,000 | | | | 23,870 | | |
Internet Software & Services 3.1% | |
IAC/InterActive
Corp* | | | 70,000 | | | | 13,804 | | |
Nutanix, Inc.
Class A* | | | 350,000 | | | | 19,712 | | |
Okta, Inc.* | | | 200,000 | | | | 12,366 | | |
| | | | 45,882 | | |
See Notes to Financial Statements
137
Schedule of Investments Mid Cap Growth Fund (cont'd)
| | |
Number
of Shares | |
Value
(000's) | |
IT Services 5.1% | |
DXC Technology
Co. | | | 150,000 | | | $ | 13,663 | | |
Global Payments,
Inc. | | | 190,000 | | | | 23,670 | | |
Perspecta, Inc. | | | 150,000 | | | | 3,489 | | |
Square, Inc.
Class A* | | | 245,000 | | | | 21,717 | | |
Total System
Services,
Inc. | | | 135,000 | | | | 13,114 | | |
| | | | 75,653 | | |
Life Sciences Tools & Services 2.7% | |
Bio-Rad
Laboratories,
Inc. Class A* | | | 72,500 | | | | 23,584 | | |
PRA Health
Sciences, Inc.* | | | 161,000 | | | | 17,002 | | |
| | | | 40,586 | | |
Machinery 5.3% | |
Fortive Corp. | | | 215,000 | | | | 18,056 | | |
Gardner Denver
Holdings, Inc.* | | | 350,000 | | | | 9,786 | | |
IDEX Corp. | | | 130,000 | | | | 19,917 | | |
John Bean
Technologies
Corp. | | | 60,000 | | | | 7,098 | | |
Milacron
Holdings
Corp.* | | | 449,700 | | | | 9,534 | | |
Stanley
Black &
Decker, Inc. | | | 100,000 | | | | 14,053 | | |
| | | | 78,444 | | |
Media 0.7% | |
Altice USA,
Inc. Class A | | | 600,000 | | | | 10,752 | | |
Oil, Gas & Consumable Fuels 1.8% | |
Concho
Resources,
Inc.* | | | 75,000 | | | | 10,286 | | |
Devon
Energy Corp. | | | 400,000 | | | | 17,172 | | |
| | | | 27,458 | | |
Pharmaceuticals 1.7% | |
Aerie
Pharmaceuticals,
Inc.* | | | 220,000 | | | | 13,497 | | |
Jazz
Pharmaceuticals
PLC* | | | 67,500 | | | | 11,537 | | |
| | | | 25,034 | | |
| | |
Number
of Shares | |
Value
(000's) | |
Professional Services 2.1% | |
CoStar Group,
Inc.* | | | 70,000 | | | $ | 30,951 | | |
Road & Rail 1.5% | |
J.B. Hunt
Transport
Services, Inc. | | | 87,500 | | | | 10,566 | | |
Old Dominion
Freight Line,
Inc. | | | 80,000 | | | | 12,192 | | |
| | | | 22,758 | | |
Semiconductors & Semiconductor Equipment 3.8% | |
Advanced
Micro Devices,
Inc.* | | | 300,000 | | | | 7,551 | | |
Lam Research
Corp. | | | 53,500 | | | | 9,260 | | |
Microchip
Technology,
Inc(a) | | | 175,000 | | | | 15,055 | | |
Monolithic
Power Systems,
Inc. | | | 162,500 | | | | 24,354 | | |
| | | | 56,220 | | |
Software 10.3% | |
Autodesk, Inc.* | | | 117,500 | | | | 18,136 | | |
Proofpoint, Inc.* | | | 177,500 | | | | 21,060 | | |
RingCentral,
Inc. Class A* | | | 220,000 | | | | 20,493 | | |
ServiceNow, Inc.* | | | 135,000 | | | | 26,508 | | |
Splunk, Inc.* | | | 165,000 | | | | 21,145 | | |
Take-Two
Interactive
Software, Inc.* | | | 182,500 | | | | 24,375 | | |
Tyler Technologies,
Inc.* | | | 40,000 | | | | 9,878 | | |
Ultimate
Software Group,
Inc.* | | | 40,000 | | | | 12,387 | | |
| | | | 153,982 | | |
Specialty Retail 5.5% | |
Burlington
Stores, Inc.* | | | 140,000 | | | | 23,545 | | |
Five Below,
Inc.* | | | 180,000 | | | | 20,965 | | |
Hudson Ltd.
Class A* | | | 300,000 | | | | 6,180 | | |
O'Reilly
Automotive,
Inc.* | | | 25,000 | | | | 8,386 | | |
Ross Stores, Inc. | | | 230,000 | | | | 22,029 | | |
| | | | 81,105 | | |
| | |
Number
of Shares | |
Value
(000's) | |
Trading Companies &
Distributors 0.8% | |
United Rentals,
Inc.* | | | 80,000 | | | $ | 12,470 | | |
Total Common Stocks
(Cost $990,033) | | | | | 1,433,955 | | |
Exchange-Traded Funds 1.0% | |
iShares Russell
Mid-Cap Growth
ETF
(Cost $12,481) | | | 110,000 | | | | 15,027 | | |
Short-Term Investments 3.4% | |
Investment Companies 3.4% | |
State Street
Institutional U.S.
Government
Money Market
Fund Premier
Class, 1.87%(b) | | | 39,030,038 | | | | 39,030 | | |
State Street
Navigator
Securities
Lending
Government
Money Market
Portfolio,
1.93%(b)(c) | | | 11,478,818 | | | | 11,479 | | |
Total Short-Term Investments
(Cost $50,509) | | | | | 50,509 | | |
Total Investments 100.8%
(Cost $1,053,023) | | | | | 1,499,491 | | |
Liabilities Less
Other Assets (0.8)% | | | | | (11,891 | ) | |
Net Assets 100.0% | | | | $ | 1,487,600 | | |
See Notes to Financial Statements
138
Schedule of Investments Mid Cap Growth Fund (cont'd)
* Non-income producing security.
(a) The security or a portion of this security is on loan at August 31, 2018. Total value of all such securities at August 31, 2018 amounted to approximately $11,387,000 for the Fund (see Note A of the Notes to Financial Statements).
(b) Represents 7-day effective yield as of August 31, 2018.
(c) Represents investment of cash collateral received from securities lending.
The following is a summary, categorized by Level (see Note A of Notes to Financial Statements), of inputs used to value the Fund's investments as of August 31, 2018:
Asset Valuation Inputs | |
(000's omitted) | | Level 1 | | Level 2 | | Level 3 | | Total | |
Investments: | |
| Common Stocks(a) | | $ | 1,433,955 | | | $ | — | | | $ | — | | | $ | 1,433,955 | | |
Exchange-Traded Funds | | | 15,027 | | | | — | | | | — | | | | 15,027 | | |
Short-Term Investments | | | — | | | | 50,509 | | | | — | | | | 50,509 | | |
Total Investments | | $ | 1,448,982 | | | $ | 50,509 | | | $ | — | | | $ | 1,499,491 | | |
(a) The Schedule of Investments provides information on the industry categorization for the portfolio.
As of the year ended August 31, 2018, no securities were transferred from one level (as of August 31, 2017) to another.
See Notes to Financial Statements
139
Schedule of Investments Mid Cap Intrinsic Value Fund August 31, 2018
| | |
Number
of Shares | |
Value
(000's) | |
Common Stocks 92.8% | |
Aerospace & Defense 6.0% | |
Esterline
Technologies
Corp.* | | | 11,300 | | | $ | 971 | | |
General Dynamics
Corp. | | | 17,850 | | | | 3,452 | | |
Hexcel Corp. | | | 19,000 | | | | 1,256 | | |
Spirit AeroSystems
Holdings, Inc.
Class A | | | 15,700 | | | | 1,343 | | |
| | | | 7,022 | | |
Airlines 1.7% | |
American Airlines
Group, Inc. | | | 50,200 | | | | 2,032 | | |
Banks 7.5% | |
BankUnited, Inc. | | | 61,900 | | | | 2,401 | | |
BB&T Corp. | | | 34,700 | | | | 1,793 | | |
Comerica, Inc. | | | 23,200 | | | | 2,261 | | |
KeyCorp | | | 115,000 | | | | 2,423 | | |
| | | | 8,878 | | |
Beverages 2.0% | |
Molson Coors
Brewing Co.
Class B | | | 35,100 | | | | 2,343 | | |
Biotechnology 1.5% | |
Alexion
Pharmaceuticals,
Inc.* | | | 14,400 | | | | 1,760 | | |
Building Products 2.5% | |
Johnson Controls
International PLC | | | 78,308 | | | | 2,958 | | |
Capital Markets 1.5% | |
State Street Corp. | | | 19,700 | | | | 1,712 | | |
Chemicals 1.7% | |
Ashland Global
Holdings, Inc. | | | 23,100 | | | | 1,945 | | |
Commercial Services & Supplies 2.3% | |
Covanta Holding
Corp. | | | 154,600 | | | | 2,729 | | |
Communications Equipment 3.5% | |
ARRIS
International
PLC* | | | 65,100 | | | | 1,687 | | |
Ciena Corp.* | | | 76,500 | | | | 2,416 | | |
| | | | 4,103 | | |
Construction & Engineering 1.6% | |
Valmont
Industries, Inc. | | | 13,500 | | | | 1,895 | | |
Electric Utilities 1.6% | |
Edison
International | | | 28,000 | | | | 1,840 | | |
| | |
Number
of Shares | |
Value
(000's) | |
Electrical Equipment 1.4% | |
Acuity Brands, Inc. | | | 10,700 | | | $ | 1,635 | | |
Electronic Equipment, Instruments & Components 2.6% | |
Flex Ltd.* | | | 135,900 | | | | 1,874 | | |
Itron, Inc.* | | | 17,600 | | | | 1,169 | | |
| | | | 3,043 | | |
Equity Real Estate Investment
Trusts 2.9% | |
CoreCivic, Inc. | | | 74,300 | | | | 1,923 | | |
Invitation
Homes, Inc. | | | 66,100 | | | | 1,545 | | |
| | | | 3,468 | | |
Food Products 4.6% | |
Hain Celestial
Group, Inc.* | | | 86,900 | | | | 2,482 | | |
TreeHouse
Foods, Inc.* | | | 56,600 | | | | 2,949 | | |
| | | | 5,431 | | |
Health Care Equipment & Supplies 3.2% | |
Zimmer Biomet
Holdings, Inc. | | | 30,100 | | | | 3,721 | | |
Health Care Providers & Services 1.5% | |
Envision
Healthcare
Corp.* | | | 25,500 | | | | 1,157 | | |
Molina
Healthcare, Inc.* | | | 4,200 | | | | 579 | | |
| | | | 1,736 | | |
Hotels, Restaurants & Leisure 3.6% | |
MGM Resorts
International | | | 40,300 | | | | 1,168 | | |
SeaWorld
Entertainment,
Inc.* | | | 75,800 | | | | 2,222 | | |
Wyndham
Destinations, Inc. | | | 8,100 | | | | 358 | | |
Wyndham
Hotels &
Resorts, Inc. | | | 8,100 | | | | 460 | | |
| | | | 4,208 | | |
Household Durables 1.5% | |
Whirlpool Corp. | | | 14,600 | | | | 1,825 | | |
Independent Power and Renewable Electricity Producers 2.4% | |
AES Corp. | | | 211,900 | | | | 2,852 | | |
IT Services 4.4% | |
Amdocs Ltd. | | | 16,400 | | | | 1,071 | | |
Conduent, Inc.* | | | 102,100 | | | | 2,367 | | |
Teradata Corp.* | | | 43,100 | | | | 1,787 | | |
| | | | 5,225 | | |
| | |
Number
of Shares | |
Value
(000's) | |
Media 2.5% | |
Lions Gate
Entertainment
Corp. Class A | | | 24,600 | | | $ | 579 | | |
Lions Gate
Entertainment
Corp. Class B | | | 24,600 | | | | 552 | | |
MSG Networks,
Inc. Class A* | | | 75,400 | | | | 1,832 | | |
| | | | 2,963 | | |
Mortgage Real Estate Investment 2.4% | |
Starwood
Property Trust,
Inc. | | | 128,800 | | | | 2,837 | | |
Multi-Utilities 1.1% | |
Vectren Corp. | | | 17,500 | | | | 1,246 | | |
Oil, Gas & Consumable Fuels 7.2% | |
Cabot Oil &
Gas Corp. | | | 90,900 | | | | 2,166 | | |
Devon Energy
Corp. | | | 54,200 | | | | 2,327 | | |
ONEOK, Inc. | | | 32,200 | | | | 2,122 | | |
Williams Cos., Inc. | | | 62,300 | | | | 1,844 | | |
| | | | 8,459 | | |
Pharmaceuticals 3.3% | |
Perrigo Co. PLC | | | 30,100 | | | | 2,303 | | |
Teva
Pharmaceutical
Industries Ltd.
ADR* | | | 68,900 | | | | 1,578 | | |
| | | | 3,881 | | |
Semiconductors & Semiconductor Equipment 2.4% | |
ON
Semiconductor
Corp.* | | | 69,800 | | | | 1,490 | | |
Skyworks
Solutions, Inc. | | | 14,700 | | | | 1,342 | | |
| | | | 2,832 | | |
Software 4.0% | |
Check Point
Software
Technologies
Ltd.* | | | 19,400 | | | | 2,254 | | |
Nuance
Communications,
Inc.* | | | 147,400 | | | | 2,406 | | |
| | | | 4,660 | | |
Specialty Retail 3.1% | |
Best Buy Co., Inc. | | | 7,600 | | | | 605 | | |
Chico's FAS, Inc. | | | 133,800 | | | | 1,220 | | |
Party City
Holdco, Inc.* | | | 115,100 | | | | 1,767 | | |
| | | | 3,592 | | |
See Notes to Financial Statements
140
Schedule of Investments Mid Cap Intrinsic Value Fund (cont'd)
| | |
Number
of Shares | |
Value
(000's) | |
Technology Hardware, Storage & Peripherals 1.8% | |
Western Digital
Corp. | | | 34,436 | | | $ | 2,178 | | |
Trading Companies & Distributors 3.5% | |
AerCap Holdings
NV* | | | 71,900 | | | | 4,096 | | |
Total Common Stocks
(Cost $89,742) | | | | | 109,105 | | |
Short-Term Investments 7.0% | |
Investment Companies 7.0% | |
State Street
Institutional
U.S. Government
Money Market
Fund Premier
Class, 1.87%(a)
(Cost $8,295) | | | 8,294,933 | | | | 8,295 | | |
Total Investments 99.8%
(Cost $98,037) | | | | | 117,400 | | |
Other Assets Less
Liabilities 0.2% | | | | | 217 | | |
Net Assets 100.0% | | | | $ | 117,617 | | |
See Notes to Financial Statements
* Non-income producing security.
(a) Represents 7-day effective yield as of August 31, 2018.
The following is a summary, categorized by Level (see Note A of Notes to Financial Statements), of inputs used to value the Fund's investments as of August 31, 2018:
Asset Valuation Inputs | |
(000's omitted) | | Level 1 | | Level 2 | | Level 3(b) | | Total | |
Investments: | |
| Common Stocks(a) | | $ | 109,105 | | | $ | — | | | $ | — | | | $ | 109,105 | | |
Short-Term Investments | | | — | | | | 8,295 | | | | — | | | | 8,295 | | |
Total Investments | | $ | 109,105 | | | $ | 8,295 | | | $ | — | | | $ | 117,400 | | |
(a) The Schedule of Investments provides information on the industry categorization for the portfolio.
141
Schedule of Investments Mid Cap Intrinsic Value Fund (cont'd)
(b) The following is a reconciliation between the beginning and ending balances of investments in which unobservable inputs (Level 3) were used in determining value:
| | | Beginning
balance, as
of 9/1/2017 | | Accrued
discounts/
(premiums) | | Realized
gain/
(loss) | | Change
in unrealized
appreciation/
(depreciation) | | Purchases | | Sales | | Transfers
into
Level 3 | | Transfers
out of
Level 3 | | Balance,
as of
8/31/2018 | | Net change in
unrealized
appreciation/
(depreciation)
from
investments
still held as
of 8/31/2018 | |
Investments in Securities:
(000's omitted) | |
Rights(c)
Food &
Staples
Retailing | | $ | 11 | | | $ | — | | | $ | (2 | ) | | $ | 11 | | | $ | — | | | $ | (20 | ) | | $ | — | | | $ | — | | | $ | — | | | $ | — | | |
Total | | $ | 11 | | | $ | — | | | $ | (2 | ) | | $ | 11 | | | $ | — | | | $ | (20 | ) | | $ | — | | | $ | — | | | $ | — | | | $ | — | | |
(c) At the beginning of the period, these securities were valued based on a single quotation obtained from a dealer. The Fund held no Level 3 investments at August 31, 2018.
As of the year ended August 31, 2018, no securities were transferred from one level (as of August 31, 2017) to another.
See Notes to Financial Statements
142
Schedule of Investments Multi-Cap Opportunities Fund August 31, 2018
| | |
Number
of Shares | |
Value
(000's) | |
Common Stocks 98.9% | |
Aerospace & Defense 4.3% | |
Boeing Co. | | | 138,000 | | | $ | 47,305 | | |
Raytheon Co. | | | 195,000 | | | | 38,891 | | |
| | | | 86,196 | | |
Banks 6.4% | |
FCB Financial
Holdings, Inc.
Class A* | | | 575,000 | | | | 29,785 | | |
JPMorgan
Chase & Co. | | | 850,000 | | | | 97,393 | | |
| | | | 127,178 | | |
Building Products 0.5% | |
Masonite
International
Corp.* | | | 150,000 | | | | 10,042 | | |
Capital Markets 12.3% | |
Brookfield Asset
Management,
Inc. Class A | | | 1,200,000 | | | | 51,324 | | |
Charles Schwab
Corp. | | | 1,060,000 | | | | 53,837 | | |
Goldman Sachs
Group, Inc. | | | 333,000 | | | | 79,191 | | |
Intercontinental
Exchange, Inc. | | | 800,000 | | | | 60,984 | | |
| | | | 245,336 | | |
Chemicals 4.1% | |
Methanex Corp. | | | 385,000 | | | | 28,066 | | |
Scotts
Miracle-Gro Co. | | | 370,000 | | | | 27,646 | | |
Sherwin-Williams
Co. | | | 58,000 | | | | 26,424 | | |
| | | | 82,136 | | |
Communications Equipment 8.2% | |
Cisco Systems,
Inc. | | | 1,470,000 | | | | 70,222 | | |
Motorola
Solutions, Inc. | | | 725,000 | | | | 93,061 | | |
| | | | 163,283 | | |
Construction Materials 1.1% | |
Martin Marietta
Materials, Inc. | | | 105,000 | | | | 20,866 | | |
Containers & Packaging 3.8% | |
Ball Corp. | | | 1,010,000 | | | | 42,299 | | |
Sealed Air Corp. | | | 820,000 | | | | 32,890 | | |
| | | | 75,189 | | |
| | |
Number
of Shares | |
Value
(000's) | |
Diversified Financial Services 5.1% | |
Berkshire
Hathaway, Inc.
Class B* | | | 490,000 | | | $ | 102,273 | | |
Electrical Equipment 2.1% | |
Rockwell
Automation, Inc. | | | 230,000 | | | | 41,621 | | |
Energy Equipment & Services 0.6% | |
Schlumberger Ltd. | | | 200,000 | | | | 12,632 | | |
Food & Staples Retailing 4.2% | |
US Foods
Holding Corp.* | | | 2,550,000 | | | | 83,104 | | |
Food Products 1.7% | |
Mondelez
International, Inc.
Class A | | | 780,000 | | | | 33,322 | | |
Health Care Equipment & Supplies 1.5% | |
Hill-Rom
Holdings, Inc. | | | 300,000 | | | | 29,181 | | |
Health Care Providers & Services 7.4% | |
Aetna, Inc. | | | 220,000 | | | | 44,060 | | |
HCA Healthcare,
Inc. | | | 765,000 | | | | 102,594 | | |
| | | | 146,654 | | |
Industrial Conglomerates 2.6% | |
3M Co. | | | 240,000 | | | | 50,621 | | |
Insurance 3.5% | |
Chubb Ltd. | | | 510,000 | | | | 68,972 | | |
Internet Software & Services 4.5% | |
Alphabet, Inc.
Class C* | | | 74,000 | | | | 90,146 | | |
IT Services 2.3% | |
PayPal Holdings,
Inc.* | | | 490,000 | | | | 45,242 | | |
Machinery 3.5% | |
Stanley Black &
Decker, Inc. | | | 495,000 | | | | 69,562 | | |
Oil, Gas & Consumable Fuel 1.8% | |
EOG Resources,
Inc. | | | 295,000 | | | | 34,878 | | |
Pharmaceuticals 2.4% | |
Pfizer, Inc. | | | 1,150,000 | | | | 47,748 | | |
Road & Rail 3.8% | |
CSX Corp. | | | 1,020,000 | | | | 75,643 | | |
| | |
Number
of Shares | |
Value
(000's) | |
Semiconductors & Semiconductor Equipment 2.5% | |
Analog Devices,
Inc. | | | 500,000 | | | $ | 49,425 | | |
Software 3.0% | |
Activision
Blizzard, Inc. | | | 485,000 | | | | 34,968 | | |
Microsoft Corp. | | | 215,000 | | | | 24,151 | | |
| | | | 59,119 | | |
Technology Hardware, Storage & Peripherals 4.2% | |
Apple, Inc. | | | 370,000 | | | | 84,223 | | |
Textiles, Apparel & Luxury Goods 1.5% | |
NIKE, Inc. Class B | | | 365,000 | | | | 30,003 | | |
Total Common Stocks
(Cost $1,170,494) | | | 1,964,595 | | |
Short-Term Investments 1.0% | |
Investment Companies 1.0% | |
State Street
Institutional
Treasury Money
Market Fund
Premier Class,
1.87%(a)
(Cost $21,056) | | | 21,055,517 | | | | 21,056 | | |
Total Investments 99.9%
(Cost $1,191,550) | | | 1,985,651 | | |
Other Assets Less
Liabilities 0.1% | | | | | 1,498 | | |
Net Assets 100.0% | | $ | 1,987,149 | | |
See Notes to Financial Statements
143
Schedule of Investments Multi-Cap Opportunities Fund (cont'd)
* Non-income producing security.
(a) Represents 7-day effective yield as of August 31, 2018.
The following is a summary, categorized by Level (see Note A of Notes to Financial Statements), of inputs used to value the Fund's investments as of August 31, 2018:
Asset Valuation Inputs | |
(000's omitted) | | Level 1 | | Level 2 | | Level 3 | | Total | |
Investments: | |
| Common Stocks(a) | | $ | 1,964,595 | | | $ | — | | | $ | — | | | $ | 1,964,595 | | |
Short-Term Investments | | | — | | | | 21,056 | | | | — | | | | 21,056 | | |
Total Investments | | $ | 1,964,595 | | | $ | 21,056 | | | $ | — | | | $ | 1,985,651 | | |
(a) The Schedule of Investments provides information on the industry categorization for the portfolio.
As of the year ended August 31, 2018, no securities were transferred from one level (as of August 31, 2017) to another.
See Notes to Financial Statements
144
Schedule of Investments Real Estate Fund August 31, 2018
| | |
Number
of Shares | |
Value
(000's) | |
Common Stocks 98.2% | |
Apartments 12.4% | |
Apartment
Investment &
Management Co.
Class A | | | 235,840 | | | $ | 10,330 | | |
Equity Residential | | | 282,459 | | | | 19,137 | | |
Essex Property
Trust, Inc. | | | 57,175 | | | | 14,081 | | |
Mid-America
Apartment
Communities, Inc. | | | 129,212 | | | | 13,381 | | |
| | | | 56,929 | | |
Data Centers 9.0% | |
CyrusOne, Inc. | | | 109,400 | | | | 7,325 | | |
Digital Realty
Trust, Inc. | | | 123,005 | | | | 15,287 | | |
Equinix, Inc. | | | 43,099 | | | | 18,797 | | |
| | | | 41,409 | | |
Free Standing 3.7% | |
Four Corners
Property Trust,
Inc. | | | 263,200 | | | | 7,090 | | |
National Retail
Properties, Inc. | | | 211,671 | | | | 9,756 | | |
| | | | 16,846 | | |
Health Care 8.7% | |
Healthcare Trust
of America, Inc.
Class A | | | 368,145 | | | | 10,518 | | |
Ventas, Inc. | | | 256,280 | | | | 15,344 | | |
Welltower, Inc. | | | 212,415 | | | | 14,170 | | |
| | | | 40,032 | | |
Hotels, Restaurants & Leisure 1.7% | |
Hyatt Hotels Corp.
Class A | | | 102,059 | | | | 7,895 | | |
Industrial 6.6% | |
EastGroup
Properties, Inc. | | | 94,800 | | | | 9,221 | | |
Prologis, Inc. | | | 211,949 | | | | 14,239 | | |
Rexford Industrial
Realty, Inc. | | | 209,849 | | | | 6,820 | | |
| | | | 30,280 | | |
| | |
Number
of Shares | |
Value
(000's) | |
Infrastructure 14.9% | |
American Tower
Corp. | | | 218,430 | | | $ | 32,572 | | |
Crown Castle
International
Corp. | | | 159,321 | | | | 18,167 | | |
SBA
Communications
Corp.* | | | 59,122 | | | | 9,178 | | |
Zayo Group
Holdings, Inc.* | | | 244,300 | | | | 8,468 | | |
| | | | 68,385 | | |
IT Services 1.7% | |
InterXion Holding
NV* | | | 116,283 | | | | 7,667 | | |
Lodging/Resorts 2.1% | |
Sunstone Hotel
Investors, Inc. | | | 564,900 | | | | 9,479 | | |
Manufactured Homes 4.2% | |
Equity LifeStyle
Properties, Inc. | | | 97,935 | | | | 9,488 | | |
Sun Communities,
Inc. | | | 94,075 | | | | 9,707 | | |
| | | | 19,195 | | |
Office 8.0% | |
Alexandria Real
Estate Equities,
Inc. | | | 107,835 | | | | 13,841 | | |
Douglas Emmett,
Inc. | | | 349,565 | | | | 13,654 | | |
Highwoods
Properties, Inc. | | | 182,700 | | | | 9,087 | | |
| | | | 36,582 | | |
Real Estate Management & Development 1.5% | |
Brookfield Asset
Management,
Inc. Class A | | | 163,815 | | | | 7,006 | | |
Regional Malls 7.3% | |
Simon Property
Group, Inc. | | | 182,398 | | | | 33,384 | | |
| | |
Number
of Shares | |
Value
(000's) | |
Self Storage 4.3% | |
Extra Space
Storage, Inc. | | | 97,846 | | | $ | 9,022 | | |
Public Storage | | | 50,484 | | | | 10,732 | | |
| | | | 19,754 | | |
Shopping Centers 4.3% | |
Brookfield
Property REIT, Inc.
Class A | | | 58,759 | | | | 1,178 | | |
Kimco Realty
Corp. | | | 332,520 | | | | 5,689 | | |
Regency Centers
Corp. | | | 195,162 | | | | 12,887 | | |
| | | | 19,754 | | |
Single Family Homes 4.3% | |
American Homes
4 Rent Class A | | | 566,925 | | | | 13,153 | | |
Invitation Homes,
Inc. | | | 272,481 | | | | 6,368 | | |
| | | | 19,521 | | |
Timber 3.5% | |
Weyerhaeuser Co. | | | 457,849 | | | | 15,892 | | |
Total Common Stocks
(Cost $414,939) | | | 450,010 | | |
Short-Term Investments 1.9% | |
Investment Companies 1.9% | |
State Street
Institutional U.S.
Government
Money Market
Fund Premier
Class, 1.87%(a)
(Cost $8,693) | | | 8,693,226 | | | | 8,693 | | |
Total Investments 100.1%
(Cost $423,632) | | | 458,703 | | |
Liabilities Less Other
Assets (0.1)% | | | | | (422 | ) | |
Net Assets 100.0% | | $ | 458,281 | | |
See Notes to Financial Statements
145
Schedule of Investments Real Estate Fund (cont'd)
* Non-income producing security.
(a) Represents 7-day effective yield as of August 31, 2018.
The following is a summary, categorized by Level (see Note A of Notes to Financial Statements), of inputs used to value the Fund's investments as of August 31, 2018:
Asset Valuation Inputs | |
(000's omitted) | | Level 1 | | Level 2 | | Level 3 | | Total | |
Investments: | |
| Common Stocks(a) | | $ | 450,010 | | | $ | — | | | $ | — | | | $ | 450,010 | | |
Short-Term Investments | | | — | | | | 8,693 | | | | — | | | | 8,693 | | |
Total Investments | | $ | 450,010 | | | $ | 8,693 | | | $ | — | | | $ | 458,703 | | |
(a) The Schedule of Investments provides information on the sector categorization for the portfolio.
As of the year ended August 31, 2018, no securities were transferred from one level (as of August 31, 2017) to another.
See Notes to Financial Statements
146
Schedule of Investments Small Cap Growth Fund August 31, 2018
| | |
Number
of Shares | |
Value
(000's) | |
Common Stocks 99.0% | |
Aerospace & Defense 2.4% | |
HEICO Corp.
Class A | | | 13,000 | | | $ | 968 | | |
Teledyne
Technologies,
Inc.* | | | 6,000 | | | | 1,424 | | |
| | | | 2,392 | | |
Auto Components 1.1% | |
Dorman Products,
Inc.* | | | 14,000 | | | | 1,134 | | |
Banks 3.3% | |
Pinnacle Financial
Partners, Inc. | | | 12,500 | | | | 807 | | |
Seacoast Banking
Corp. of Florida* | | | 48,500 | | | | 1,533 | | |
TCF Financial
Corp. | | | 40,000 | | | | 1,014 | | |
| | | | 3,354 | | |
Beverages 0.5% | |
MGP Ingredients,
Inc.(a) | | | 7,000 | | | | 540 | | |
Biotechnology 13.0% | |
Amicus
Therapeutics,
Inc.*(a) | | | 95,000 | | | | 1,281 | | |
Arena
Pharmaceuticals,
Inc.* | | | 35,000 | | | | 1,359 | | |
Array BioPharma,
Inc.* | | | 60,000 | | | | 934 | | |
Fate Therapeutics,
Inc.* | | | 120,000 | | | | 1,547 | | |
Heron
Therapeutics,
Inc.* | | | 30,500 | | | | 1,176 | | |
Immunomedics,
Inc.* | | | 77,000 | | | | 2,060 | | |
Iovance
Biotherapeutics,
Inc.* | | | 80,000 | | | | 1,416 | | |
Stemline
Therapeutics,
Inc.* | | | 60,500 | | | | 1,035 | | |
Vanda
Pharmaceuticals,
Inc.* | | | 25,500 | | | | 493 | | |
Veracyte, Inc.* | | | 95,000 | | | | 1,201 | | |
Viking
Therapeutics,
Inc.* | | | 20,000 | | | | 261 | | |
Zymeworks, Inc.* | | | 20,000 | | | | 281 | | |
| | | | 13,044 | | |
| | |
Number
of Shares | |
Value
(000's) | |
Building Products 1.7% | |
AAON, Inc. | | | 22,000 | | | $ | 889 | | |
Trex Co, Inc.* | | | 9,500 | | | | 804 | | |
| | | | 1,693 | | |
Chemicals 1.6% | |
Ferro Corp.* | | | 31,000 | | | | 680 | | |
Ingevity Corp.* | | | 9,500 | | | | 960 | | |
| | | | 1,640 | | |
Commercial Services & Supplies 3.7% | |
Brink's Co. | | | 16,000 | | | | 1,202 | | |
Casella Waste
Systems, Inc.
Class A* | | | 50,000 | | | | 1,419 | | |
MSA Safety, Inc. | | | 11,000 | | | | 1,112 | | |
| | | | 3,733 | | |
Communications Equipment 2.4% | |
Lumentum
Holdings,
Inc.*(a) | | | 35,500 | | | | 2,410 | | |
Construction & Engineering 0.8% | |
MasTec, Inc.* | | | 18,000 | | | | 788 | | |
Consumer Finance 1.1% | |
Green Dot Corp.
Class A* | | | 12,500 | | | | 1,071 | | |
Diversified Consumer Services 3.8% | |
Bright Horizons
Family Solutions,
Inc.* | | | 8,000 | | | | 955 | | |
Carriage Services,
Inc. | | | 19,000 | | | | 433 | | |
Chegg, Inc.* | | | 38,000 | | | | 1,231 | | |
Grand Canyon
Education, Inc.* | | | 10,000 | | | | 1,191 | | |
| | | | 3,810 | | |
Food & Staples Retailing 0.9% | |
Performance Food
Group Co.* | | | 26,000 | | | | 861 | | |
Health Care Equipment & Supplies 8.5% | |
Glaukos Corp.* | | | 8,000 | | | | 547 | | |
Invuity, Inc.* | | | 294,998 | | | | 1,372 | | |
iRhythm
Technologies,
Inc.* | | | 4,500 | | | | 419 | | |
Merit Medical
Systems, Inc.* | | | 33,000 | | | | 1,942 | | |
Penumbra, Inc.* | | | 3,000 | | | | 416 | | |
Sientra, Inc.* | | | 72,000 | | | | 1,809 | | |
Wright Medical
Group NV*(a) | | | 70,000 | | | | 2,028 | | |
| | | | 8,533 | | |
| | |
Number
of Shares | |
Value
(000's) | |
Health Care Providers & Services 4.1% | |
R1 RCM, Inc.* | | | 180,000 | | | $ | 1,795 | | |
Tivity Health,
Inc.* | | | 66,000 | | | | 2,270 | | |
| | | | 4,065 | | |
Health Care Technology 0.8% | |
Teladoc Health,
Inc.*(a) | | | 10,000 | | | | 775 | | |
Hotels, Restaurants & Leisure 5.6% | |
Eldorado Resorts,
Inc.* | | | 29,000 | | | | 1,393 | | |
Hilton Grand
Vacations, Inc.* | | | 19,000 | | | | 620 | | |
International
Game Technology
PLC | | | 23,000 | | | | 484 | | |
Planet Fitness, Inc.
Class A* | | | 24,500 | | | | 1,259 | | |
Red Rock Resorts,
Inc. Class A | | | 26,000 | | | | 849 | | |
Texas Roadhouse,
Inc. | | | 14,000 | | | | 965 | | |
| | | | 5,570 | | |
Household Durables 0.9% | |
Cavco Industries,
Inc.* | | | 3,500 | | | | 859 | | |
Insurance 1.2% | |
Primerica, Inc. | | | 10,000 | | | | 1,222 | | |
Internet Software & Services 7.1% | |
2U, Inc.* | | | 18,800 | | | | 1,680 | | |
New Relic, Inc.* | | | 13,600 | | | | 1,397 | | |
Nutanix, Inc.
Class A* | | | 8,500 | | | | 479 | | |
Okta, Inc.* | | | 32,000 | | | | 1,979 | | |
Q2 Holdings, Inc.* | | | 25,200 | | | | 1,570 | | |
| | | | 7,105 | | |
IT Services 1.1% | |
EPAM Systems,
Inc.* | | | 7,700 | | | | 1,101 | | |
Life Sciences Tools & Services 1.6% | |
Fluidigm Corp.* | | | 197,000 | | | | 1,560 | | |
Machinery 3.2% | |
Gardner Denver
Holdings, Inc.* | | | 20,000 | | | | 559 | | |
John Bean
Technologies
Corp. | | | 8,000 | | | | 946 | | |
Milacron Holdings
Corp.* | | | 35,500 | | | | 753 | | |
Rexnord Corp.* | | | 34,000 | | | | 987 | | |
| | | | 3,245 | | |
Marine 1.0% | |
Kirby Corp.* | | | 12,000 | | | | 1,048 | | |
See Notes to Financial Statements
147
Schedule of Investments Small Cap Growth Fund (cont'd)
| | |
Number
of Shares | |
Value
(000's) | |
Media 0.8% | |
Marcus Corp. | | | 19,000 | | | $ | 771 | | |
Multiline Retail 0.9% | |
Ollie's Bargain
Outlet Holdings,
Inc.* | | | 10,000 | | | | 871 | | |
Oil, Gas & Consumable Fuel 1.1% | |
Matador
Resources Co.* | | | 32,500 | | | | 1,064 | | |
Pharmaceuticals 3.1% | |
Aerie
Pharmaceuticals,
Inc.* | | | 23,800 | | | | 1,460 | | |
Assembly
Biosciences, Inc.* | | | 11,000 | | | | 440 | | |
MyoKardia, Inc.* | | | 11,000 | | | | 678 | | |
Optinose, Inc.* | | | 34,000 | | | | 506 | | |
| | | | 3,084 | | |
Professional Services 2.1% | |
Exponent, Inc. | | | 13,000 | | | | 681 | | |
Insperity, Inc. | | | 12,000 | | | | 1,438 | | |
| | | | 2,119 | | |
Road & Rail 2.1% | |
Genesee &
Wyoming, Inc.
Class A* | | | 14,500 | | | | 1,274 | | |
Saia, Inc.* | | | 10,000 | | | | 793 | | |
| | | | 2,067 | | |
| | |
Number
of Shares | |
Value
(000's) | |
Semiconductors & Semiconductor Equipment 1.5% | |
Monolithic Power
Systems, Inc. | | | 9,900 | | | $ | 1,484 | | |
Software 11.6% | |
Descartes Systems
Group, Inc.* | | | 43,500 | | | | 1,522 | | |
Everbridge, Inc.* | | | 23,800 | | | | 1,433 | | |
| HubSpot, Inc.*(a) | | | 15,400 | | | | 2,213 | | |
Proofpoint, Inc.* | | | 15,600 | | | | 1,851 | | |
RingCentral, Inc.
Class A* | | | 25,000 | | | | 2,329 | | |
Upland Software,
Inc.* | | | 21,500 | | | | 800 | | |
Zendesk, Inc.* | | | 22,000 | | | | 1,516 | | |
| | | | 11,664 | | |
Specialty Retail 2.3% | |
At Home Group,
Inc.* | | | 20,000 | | | | 688 | | |
Five Below, Inc.* | | | 7,500 | | | | 874 | | |
Hudson Ltd.
Class A* | | | 36,300 | | | | 748 | | |
| | | | 2,310 | | |
Tobacco 1.1% | |
Turning Point
Brands, Inc. | | | 33,000 | | | | 1,111 | | |
| | |
Number
of Shares | |
Value
(000's) | |
Trading Companies & Distributors 1.0% | |
Air Lease Corp. | | | 22,000 | | | $ | 1,017 | | |
Total Common Stocks
(Cost $79,922) | | | 99,115 | | |
Short-Term Investments 3.4% | |
Investment Companies 3.4% | |
State Street
Institutional U.S.
Government
Money Market
Fund Premier
Class, 1.87%(b) | | | 1,482,156 | | | | 1,482 | | |
State Street
Navigator
Securities Lending
Government
Money Market
Portfolio,
1.93%(b)(c) | | | 1,869,358 | | | | 1,869 | | |
Total Short-Term Investments
(Cost $3,351) | | | 3,351 | | |
Total Investments 102.4%
(Cost $83,273) | | | 102,466 | | |
Liabilities Less
Other Assets (2.4)% | | | | | (2,379 | ) | |
Net Assets 100.0% | | $ | 100,087 | | |
* Non-income producing security.
(a) The security or a portion of this security is on loan at August 31, 2018. Total value of all such securities at August 31, 2018 amounted to approximately $1,855,000 for the Fund (see Note A of the Notes to Financial Statements).
(b) Represents 7-day effective yield as of August 31, 2018.
(c) Represents investment of cash collateral received from securities lending.
The following is a summary, categorized by Level (see Note A of Notes to Financial Statements), of inputs used to value the Fund's investments as of August 31, 2018:
Asset Valuation Inputs | |
(000's omitted) | | Level 1 | | Level 2 | | Level 3 | | Total | |
Investments: | |
| Common Stocks(a) | | $ | 99,115 | | | $ | — | | | $ | — | | | $ | 99,115 | | |
Short-Term Investments | | | — | | | | 3,351 | | | | — | | | | 3,351 | | |
Total Investments | | $ | 99,115 | | | $ | 3,351 | | | $ | — | | | $ | 102,466 | | |
(a) The Schedule of Investments provides information on the industry categorization for the portfolio.
As of the year ended August 31, 2018, no securities were transferred from one level (as of August 31, 2017) to another.
See Notes to Financial Statements
148
Schedule of Investments Sustainable Equity Fund(a) August 31, 2018
| | |
Number
of Shares | |
Value
(000's) | |
Common Stocks 97.7% | |
Airlines 1.9% | |
Ryanair Holdings
PLC ADR* | | | 449,107 | | | $ | 45,750 | | |
Auto Components 3.2% | |
Aptiv PLC | | | 884,191 | | | | 77,818 | | |
Banks 5.8% | |
JPMorgan
Chase & Co. | | | 650,027 | | | | 74,480 | | |
U.S. Bancorp | | | 1,180,138 | | | | 63,857 | | |
| | | | 138,337 | | |
Capital Markets 3.6% | |
Intercontinental
Exchange, Inc. | | | 1,151,511 | | | | 87,780 | | |
Chemicals 2.2% | |
Sherwin-Williams
Co. | | | 117,827 | | | | 53,680 | | |
Consumer Finance 2.5% | |
American Express
Co. | | | 564,476 | | | | 59,823 | | |
Energy Equipment & Services 2.3% | |
Schlumberger Ltd. | | | 875,557 | | | | 55,300 | | |
Equity Real Estate Investment Trust 2.5% | |
Weyerhaeuser
Co. | | | 1,724,548 | | | | 59,859 | | |
Food & Staples Retailing 3.6% | |
Kroger Co. | | | 2,727,518 | | | | 85,917 | | |
Health Care Equipment & Supplies 10.2% | |
Becton, Dickinson
& Co. | | | 341,431 | | | | 89,411 | | |
Danaher Corp. | | | 842,767 | | | | 87,260 | | |
Medtronic PLC | | | 713,299 | | | | 68,769 | | |
| | | | 245,440 | | |
Health Care Providers & Services 5.1% | |
AmerisourceBergen
Corp. | | | 863,556 | | | | 77,694 | | |
Premier, Inc.
Class A* | | | 1,023,136 | | | | 45,253 | | |
| | | | 122,947 | | |
Hotels, Restaurants & Leisure 2.1% | |
Compass Group
PLC | | | 2,358,626 | | | | 50,714 | | |
Industrial Conglomerates 3.1% | |
3M Co. | | | 357,768 | | | | 75,460 | | |
| | |
Number
of Shares | |
Value
(000's) | |
Insurance 4.3% | |
Progressive Corp. | | | 1,521,569 | | | $ | 102,752 | | |
Internet Software & Services 6.0% | |
Alphabet, Inc.
Class A* | | | 64,040 | | | | 78,884 | | |
eBay, Inc.* | | | 1,913,828 | | | | 66,238 | | |
| | | | 145,122 | | |
IT Services 6.0% | |
Cognizant
Technology
Solutions Corp.
Class A | | | 1,074,692 | | | | 84,288 | | |
MasterCard, Inc.
Class A | | | 282,856 | | | | 60,973 | | |
| | | | 145,261 | | |
Media 4.3% | |
Comcast Corp.
Class A | | | 2,790,824 | | | | 103,233 | | |
Oil, Gas & Consumable Fuels 4.7% | |
Cimarex Energy
Co. | | | 171,426 | | | | 14,482 | | |
EQT Corp. | | | 928,553 | | | | 47,375 | | |
Noble Energy,
Inc. | | | 1,712,796 | | | | 50,904 | | |
| | | | 112,761 | | |
Personal Products 3.0% | |
Unilever NV | | | 1,268,351 | | | | 72,905 | | |
Pharmaceuticals 2.3% | |
Roche Holding
AG | | | 217,799 | | | | 54,110 | | |
Road & Rail 1.8% | |
J.B. Hunt
Transport Services,
Inc. | | | 357,923 | | | | 43,219 | | |
Semiconductors & Semiconductor Equipment 3.8% | |
Texas Instruments,
Inc. | | | 823,106 | | | | 92,517 | | |
Software 2.3% | |
Intuit, Inc. | | | 254,384 | | | | 55,830 | | |
Specialty Chemicals 2.0% | |
Novozymes A/S
B Shares | | | 859,935 | | | | 47,133 | | |
Specialty Retail 4.3% | |
Advance Auto
Parts, Inc. | | | 627,449 | | | | 102,920 | | |
| | |
Number
of Shares | |
Value
(000's) | |
Textiles, Apparel & Luxury Goods 1.3% | |
Gildan
Activewear,
Inc. | | | 1,047,389 | | | $ | 30,846 | | |
Trading Companies & Distributors 3.5% | |
Fastenal Co. | | | 411,739 | | | | 24,029 | | |
W.W. Grainger,
Inc. | | | 169,634 | | | | 60,062 | | |
| | | | 84,091 | | |
Total Common Stocks
(Cost $1,540,786) | | | 2,351,525 | | |
| | | Principal
Amount | | | |
Short-Term Investments 1.7% | |
| Certificates of Deposit 0.0%(b) | |
Carver Federal
Savings Bank
0.25%,
due 9/23/18 | | $ | 100,000 | | | | 100 | | |
Self Help Credit
Union, 0.25%,
due 9/25/18 | | | 250,000 | | | | 250 | | |
Self Help Credit
Union, 0.25%,
due 11/16/18 | | | 250,000 | | | | 250 | | |
| | | | 600 | | |
| | | Number
of Shares | | | |
Investment Companies 1.7% | |
State Street
Institutional
Treasury
Money Market
Fund Premier
Class, 1.87%(c) | | | 41,567,987 | | | | 41,568 | | |
Total Short-Term Investments
(Cost $42,168) | | | 42,168 | | |
Total Investments 99.4%
(Cost $1,582,954) | | | 2,393,693 | | |
Other Assets
Less Liabilities
0.6% | | | | | 13,269 | | |
Net Assets 100.0% | | $ | 2,406,962 | | |
See Notes to Financial Statements
149
Schedule of Investments Sustainable Equity Fund(a)(cont'd)
* Non-income producing security.
(a) Formerly Socially Responsive Fund through April 30, 2018.
(b) Represents less than 0.05% of net assets.
(c) Represents 7-day effective yield as of August 31, 2018.
The following is a summary, categorized by Level (see Note A of Notes to Financial Statements), of inputs used to value the Fund's investments as of August 31, 2018:
Asset Valuation Inputs | |
(000's omitted) | | Level 1 | | Level 2 | | Level 3 | | Total | |
Investments: | |
| Common Stocks(a) | | $ | 2,351,525 | | | $ | — | | | $ | — | | | $ | 2,351,525 | | |
Short-Term Investments | | | — | | | | 42,168 | | | | — | | | | 42,168 | | |
Total Investments | | $ | 2,351,525 | | | $ | 42,168 | | | $ | — | | | $ | 2,393,693 | | |
(a) The Schedule of Investments provides information on the industry categorization for the portfolio.
As of the year ended August 31, 2018, no securities were transferred from one level (as of August 31, 2017) to another.
See Notes to Financial Statements
150
Schedule of Investments Value Fund August 31, 2018
| | |
Number
of Shares | |
Value
(000's) | |
Common Stocks 98.3% | |
Airlines 0.9% | |
Delta Air Lines, Inc. | | | 2,016 | | | $ | 118 | | |
Banks 9.0% | |
JPMorgan
Chase & Co. | | | 5,595 | | | | 641 | | |
M&T Bank Corp. | | | 949 | | | | 168 | | |
PNC Financial
Services Group,
Inc. | | | 971 | | | | 140 | | |
SunTrust Banks,
Inc. | | | 1,867 | | | | 137 | | |
Wells Fargo & Co. | | | 1,094 | | | | 64 | | |
| | | | 1,150 | | |
Biotechnology 1.1% | |
BioMarin
Pharmaceutical,
Inc.* | | | 1,411 | | | | 141 | | |
Capital Markets 1.5% | |
CME Group, Inc. | | | 1,074 | | | | 188 | | |
Communications Equipment 0.7% | |
Cisco Systems, Inc. | | | 1,906 | | | | 91 | | |
Diversified Telecommunication Services 5.3% | |
AT&T, Inc. | | | 5,721 | | | | 183 | | |
CenturyLink, Inc. | | | 8,681 | | | | 185 | | |
Verizon
Communications,
Inc. | | | 5,685 | | | | 309 | | |
| | | | 677 | | |
Electric Utilities 9.4% | |
American Electric
Power Co., Inc. | | | 3,403 | | | | 244 | | |
Evergy, Inc. | | | 2,686 | | | | 153 | | |
Exelon Corp. | | | 8,804 | | | | 385 | | |
FirstEnergy Corp. | | | 7,977 | | | | 298 | | |
NextEra Energy,
Inc. | | | 673 | | | | 115 | | |
| | | | 1,195 | | |
Electrical Equipment 0.9% | |
Emerson
Electric Co. | | | 1,526 | | | | 117 | | |
| | |
Number
of Shares | |
Value
(000's) | |
Equity Real Estate Investment
Trusts 8.9% | |
American Homes
4 Rent Class A | | | 2,457 | | | $ | 57 | | |
AvalonBay
Communities,
Inc. | | | 417 | | | | 76 | | |
Equity Residential | | | 3,890 | | | | 264 | | |
Mid-America
Apartment
Communities,
Inc. | | | 370 | | | | 38 | | |
Prologis, Inc. | | | 2,053 | | | | 138 | | |
Public Storage | | | 1,059 | | | | 225 | | |
Simon Property
Group, Inc. | | | 1,001 | | | | 183 | | |
SL Green Realty
Corp. | | | 1,443 | | | | 151 | | |
| | | | 1,132 | | |
Food & Staples Retailing 4.7% | |
Costco Wholesale
Corp. | | | 467 | | | | 109 | | |
Walgreens Boots
Alliance, Inc. | | | 1,480 | | | | 101 | | |
Walmart, Inc. | | | 4,014 | | | | 385 | | |
| | | | 595 | | |
Food Products 6.3% | |
Conagra Brands,
Inc. | | | 3,166 | | | | 116 | | |
Kraft Heinz Co. | | | 4,034 | | | | 235 | | |
Mondelez
International, Inc.
Class A | | | 10,594 | | | | 453 | | |
| | | | 804 | | |
Health Care Equipment & Supplies 2.1% | |
Abbott Laboratories | | | 2,810 | | | | 188 | | |
Medtronic PLC | | | 860 | | | | 83 | | |
| | | | 271 | | |
Health Care Providers & Services 9.4% | |
Centene Corp.* | | | 2,895 | | | | 424 | | |
Cigna Corp. | | | 921 | | | | 173 | | |
CVS Health Corp. | | | 919 | | | | 69 | | |
Express Scripts
Holding Co.* | | | 778 | | | | 69 | | |
HCA Healthcare,
Inc. | | | 2,935 | | | | 394 | | |
Quest Diagnostics,
Inc. | | | 645 | | | | 71 | | |
| | | | 1,200 | | |
| | |
Number
of Shares | |
Value
(000's) | |
Household Products 3.7% | |
Church & Dwight
Co., Inc. | | | 1,580 | | | $ | 89 | | |
Procter & Gamble
Co. | | | 4,602 | | | | 382 | | |
| | | | 471 | | |
Industrial Conglomerates 0.9% | |
Honeywell
International, Inc. | | | 748 | | | | 119 | | |
Insurance 4.3% | |
Aon PLC | | | 771 | | | | 112 | | |
Assurant, Inc. | | | 498 | | | | 51 | | |
Athene Holding
Ltd. Class A* | | | 3,230 | | | | 161 | | |
Chubb Ltd. | | | 1,627 | | | | 220 | | |
| | | | 544 | | |
Life Sciences Tools & Services 0.4% | |
Thermo Fisher
Scientific, Inc. | | | 222 | | | | 53 | | |
Machinery 1.3% | |
Caterpillar, Inc. | | | 822 | | | | 114 | | |
Deere & Co. | | | 362 | | | | 52 | | |
| | | | 166 | | |
Media 0.3% | |
Comcast Corp.
Class A | | | 1,080 | | | | 40 | | |
Metals & Mining 3.2% | |
Newmont Mining
Corp. | | | 13,039 | | | | 404 | | |
Multi-Utilities 4.3% | |
DTE Energy Co. | | | 2,171 | | | | 241 | | |
NiSource, Inc. | | | 7,827 | | | | 212 | | |
Sempra Energy | | | 859 | | | | 100 | | |
| | | | 553 | | |
Multiline Retail 1.2% | |
Nordstrom, Inc. | | | 2,445 | | | | 154 | | |
Oil, Gas & Consumable Fuels 5.6% | |
Cabot Oil &
Gas Corp. | | | 7,941 | | | | 189 | | |
EOG Resources,
Inc. | | | 1,296 | | | | 153 | | |
Exxon Mobil Corp. | | | 2,944 | | | | 236 | | |
Phillips 66 | | | 1,137 | | | | 135 | | |
| | | | 713 | | |
See Notes to Financial Statements
151
Schedule of Investments Value Fund (cont'd)
| | |
Number
of Shares | |
Value
(000's) | |
Personal Products 1.7% | |
Unilever NV | | | 3,856 | | | $ | 221 | | |
Pharmaceuticals 8.6% | |
Allergan PLC | | | 244 | | | | 47 | | |
Eli Lilly & Co. | | | 429 | | | | 45 | | |
Johnson & Johnson | | | 2,661 | | | | 358 | | |
Merck & Co., Inc. | | | 3,424 | | | | 235 | | |
Pfizer, Inc. | | | 10,084 | | | | 419 | | |
| | | | 1,104 | | |
Software 0.5% | |
Microsoft Corp. | | | 613 | | | | 69 | | |
Specialty Retail 0.7% | |
Tiffany & Co. | | | 710 | | | | 87 | | |
Textiles, Apparel & Luxury Goods 1.4% | |
lululemon
Athletica, Inc.* | | | 1,193 | | | | 185 | | |
Total Common Stocks
(Cost $11,435) | | | 12,562 | | |
| | |
Number
of Shares | |
Value
(000's) | |
Short-Term Investments 2.9% | |
Investment Companies 2.9% | |
State Street
Institutional
Treasury Money
Market Fund
Premier Class,
1.87%(a)
(Cost $371) | | | 370,818 | | | $ | 371 | | |
Total Investments 101.2%
(Cost $11,806) | | | 12,933 | | |
Liabilities Less
Other Assets (1.2)% | | | | | (151 | ) | |
Net Assets 100.0% | | $ | 12,782 | | |
* Non-income producing security.
(a) Represents 7-day effective yield as of August 31, 2018.
The following is a summary, categorized by Level (see Note A of Notes to Financial Statements), of inputs used to value the Fund's investments as of August 31, 2018:
Derivative Instruments
Written option contracts ("options written")
At August 31, 2018, the Fund did not have any outstanding options written. For the year ended August 31, 2018, the Fund had an average market value of $(69,490) in options written.
Asset Valuation Inputs | |
(000's omitted) | | Level 1 | | Level 2 | | Level 3 | | Total | |
Investments: | |
| Common Stocks(a) | | $ | 12,562 | | | $ | — | | | $ | — | | | $ | 12,562 | | |
Short-Term Investments | | | — | | | | 371 | | | | — | | | | 371 | | |
Total Investments | | $ | 12,562 | | | $ | 371 | | | $ | — | | | $ | 12,933 | | |
(a) The Schedule of Investments provides information on the industry categorization for the portfolio.
As of the year ended August 31, 2018, no securities were transferred from one level (as of August 31, 2017) to another.
See Notes to Financial Statements
152
Statements of Assets and Liabilities
Neuberger Berman Equity Funds
(000's omitted except per share amounts)
| | | DIVIDEND
GROWTH FUND | | EMERGING
MARKETS
EQUITY FUND | | EQUITY
INCOME FUND | | FOCUS FUND | | GENESIS FUND | | GLOBAL EQUITY
FUND | | GLOBAL REAL
ESTATE FUND | | GREATER
CHINA EQUITY
FUND | | GUARDIAN
FUND | | INTERNATIONAL
EQUITY
FUND | |
| | | August 31,
2018 | | August 31,
2018 | | August 31,
2018 | | August 31,
2018 | | August 31,
2018 | | August 31,
2018 | | August 31,
2018 | | August 31,
2018 | | August 31,
2018 | | August 31,
2018 | |
Assets | |
Investments in securities, at value*† (Notes A & F)—see Schedule of Investments: | |
| Unaffiliated issuers(a) | | $ | 59,085 | | | $ | 1,362,963 | | | $ | 1,618,854 | | | $ | 763,218 | | | $ | 10,265,748 | | | $ | 5,358 | | | $ | 2,949 | | | $ | 86,423 | | | $ | 1,339,234 | | | $ | 2,090,234 | | |
| Affiliated issuers(b) | | | — | | | | — | | | | — | | | | — | | | | 1,043,865 | | | | — | | | | — | | | | — | | | | — | | | | — | | |
| | | | 59,085 | | | | 1,362,963 | | | | 1,618,854 | | | | 763,218 | | | | 11,309,613 | | | | 5,358 | | | | 2,949 | | | | 86,423 | | | | 1,339,234 | | | | 2,090,234 | | |
Cash | | | — | | | | — | | | | — | | | | — | | | | — | | | | — | | | | — | | | | — | | | | — | | | | — | | |
| Foreign currency(c) | | | — | | | | 3,586 | | | | — | | | | — | | | | — | | | | — | | | | 1 | | | | 2,656 | | | | — | | | | 444 | | |
Dividends and interest receivable | | | 133 | | | | 1,882 | | | | 6,775 | | | | 846 | | | | 9,040 | | | | 9 | | | | 4 | | | | — | | | | 2,039 | | | | 6,910 | | |
Receivable for securities sold | | | — | | | | 9,944 | | | | 1,635 | | | | 1,231 | | | | 4,245 | | | | 6 | | | | — | | | | 654 | | | | — | | | | 1,370 | | |
Receivable for Fund shares sold | | | 2 | | | | 2,383 | | | | 350 | | | | 2 | | | | 2,967 | | | | — | | | | — | | | | — | | | | 269 | | | | 1,135 | | |
Receivable from Management—net (Note B) | | | 15 | | | | — | | | | — | | | | — | | | | — | | | | 24 | | | | 20 | | | | — | | | | — | | | | — | | |
Receivable for securities lending income (Note A) | | | — | | | | 1 | | | | — | | | | — | | | | — | | | | — | | | | — | | | | — | | | | 31 | | | | 6 | | |
Prepaid expenses and other assets | | | 12 | | | | 122 | | | | 86 | | | | 70 | | | | 374 | | | | 24 | | | | 8 | | | | 29 | | | | 135 | | | | 180 | | |
Total Assets | | | 59,247 | | | | 1,380,881 | | | | 1,627,700 | | | | 765,367 | | | | 11,326,239 | | | | 5,421 | | | | 2,982 | | | | 89,762 | | | | 1,341,708 | | | | 2,100,279 | | |
Liabilities | |
Payable to investment manager—net (Note B) | | | 25 | | | | 1,102 | | | | 664 | | | | 338 | | | | 6,213 | | | | 3 | | | | 2 | | | | 87 | | | | 557 | | | | 1,283 | | |
| Option contracts written, at value(d) (Note A) | | | — | | | | — | | | | 1,554 | | | | — | | | | — | | | | — | | | | — | | | | — | | | | 748 | | | | — | | |
Due to custodian | | | — | | | | 153 | | | | — | | | | — | | | | 133 | | | | — | | | | — | | | | — | | | | — | | | | — | | |
Payable for securities purchased | | | 584 | | | | 133 | | | | 14,680 | | | | — | | | | 2,205 | | | | — | | | | — | | | | — | | | | 5,015 | | | | 241 | | |
Payable for Fund shares redeemed | | | — | | | | 1,023 | | | | 1,916 | | | | 185 | | | | 10,017 | | | | 7 | | | | — | | | | 126 | | | | 457 | | | | 3,612 | | |
Payable to administrator—net (Note B) | | | — | | | | 126 | | | | 495 | | | | 182 | | | | 1,668 | | | | — | | | | — | | | | 17 | | | | 298 | | | | 137 | | |
Payable to trustees | | | 5 | | | | 5 | | | | 5 | | | | 5 | | | | 5 | | | | 5 | | | | 5 | | | | 5 | | | | 5 | | | | 5 | | |
Payable for loaned securities collateral (Note A) | | | — | | | | 1,243 | | | | — | | | | — | | | | — | | | | — | | | | — | | | | — | | | | — | | | | 18,920 | | |
Accrued capital gains taxes (Note A) | | | — | | | | 200 | | | | — | | | | — | | | | — | | | | — | | | | — | | | | — | | | | — | | | | — | | |
Accrued expenses and other payables | | | 89 | | | | 628 | | | | 230 | | | | 196 | | | | 1,065 | | | | 96 | | | | 91 | | | | 112 | | | | 296 | | | | 300 | | |
Total Liabilities | | | 703 | | | | 4,613 | | | | 19,544 | | | | 906 | | | | 21,306 | | | | 111 | | | | 98 | | | | 347 | | | | 7,376 | | | | 24,498 | | |
Net Assets | | $ | 58,544 | | | $ | 1,376,268 | | | $ | 1,608,156 | | | $ | 764,461 | | | $ | 11,304,933 | | | $ | 5,310 | | | $ | 2,884 | | | $ | 89,415 | | | $ | 1,334,332 | | | $ | 2,075,781 | | |
Net Assets consist of: | |
Paid-in capital | | $ | 48,936 | | | $ | 1,331,904 | | | $ | 1,222,119 | | | $ | 563,955 | | | $ | 4,974,643 | | | $ | 3,791 | | | $ | 2,686 | | | $ | 72,858 | | | $ | 893,277 | | | $ | 1,839,137 | | |
Undistributed net investment income/(loss) | | | 529 | | | | 8,343 | | | | 2,651 | | | | 2,414 | | | | 12,253 | | | | 31 | | | | — | | | | — | | | | 2,223 | | | | 15,225 | | |
Distributions in excess of net investment income | | | — | | | | — | | | | — | | | | — | | | | — | | | | — | | | | (16 | ) | | | (107 | ) | | | — | | | | — | | |
Accumulated net realized gains/(losses) on investments | | | 2,325 | | | | (35,112 | ) | | | 63,179 | | | | 49,021 | | | | 700,489 | | | | 233 | | | | 27 | | | | 15,789 | | | | 88,173 | | | | 4,538 | | |
Net unrealized appreciation/(depreciation) in value of investments | | | 6,754 | | | | 71,133 | | | | 320,207 | | | | 149,071 | | | | 5,617,548 | | | | 1,255 | | | | 187 | | | | 875 | | | | 350,659 | | | | 216,881 | | |
Net Assets | | $ | 58,544 | | | $ | 1,376,268 | | | $ | 1,608,156 | | | $ | 764,461 | | | $ | 11,304,933 | | | $ | 5,310 | | | $ | 2,884 | | | $ | 89,415 | | | $ | 1,334,332 | | | $ | 2,075,781 | | |
Net Assets | |
Investor Class | | $ | — | | | $ | — | | | $ | — | | | $ | 690,726 | | | $ | 1,919,090 | | | $ | — | | | $ | — | | | $ | — | | | $ | 1,187,229 | | | $ | 106,663 | | |
Trust Class | | | — | | | | — | | | | — | | | | 57,657 | | | | 1,561,603 | | | | — | | | | — | | | | — | | | | 56,612 | | | | 40,893 | | |
Advisor Class | | | — | | | | — | | | | — | | | | 2,338 | | | | 198,059 | | | | — | | | | — | | | | — | | | | 190 | | | | — | | |
Institutional Class | | | 53,430 | | | | 1,149,402 | | | | 1,172,819 | | | | 8,620 | | | | 3,253,834 | | | | 4,759 | | | | 2,265 | | | | 78,995 | | | | 82,537 | | | | 1,772,441 | | |
Class A | | | 1,775 | | | | 47,629 | | | | 186,465 | | | | 3,436 | | | | — | | | | 425 | | | | 313 | | | | 10,169 | | | | 5,531 | | | | 67,238 | | |
Class C | | | 3,310 | | | | 10,865 | | | | 246,657 | | | | 1,684 | | | | — | | | | 126 | | | | 306 | | | | 251 | | | | 1,811 | | | | 14,286 | | |
Class R3 | | | — | | | | 1,439 | | | | 2,215 | | | | — | | | | — | | | | — | | | | — | | | | — | | | | 422 | | | | — | | |
Class R6 | | | 29 | | | | 166,933 | | | | — | | | | — | | | | 4,372,347 | | | | — | | | | — | | | | — | | | | — | | | | 74,260 | | |
See Notes to Financial Statements
153
154
Statements of Assets and Liabilities (cont'd)
Neuberger Berman Equity Funds (cont'd)
(000's omitted except per share amounts)
| | | DIVIDEND
GROWTH FUND | | EMERGING
MARKETS
EQUITY FUND | | EQUITY
INCOME FUND | | FOCUS FUND | | GENESIS FUND | | GLOBAL EQUITY
FUND | | GLOBAL REAL
ESTATE FUND | | GREATER
CHINA EQUITY
FUND | | GUARDIAN
FUND | | INTERNATIONAL
EQUITY
FUND | |
| | | August 31,
2018 | | August 31,
2018 | | August 31,
2018 | | August 31,
2018 | | August 31,
2018 | | August 31,
2018 | | August 31,
2018 | | August 31,
2018 | | August 31,
2018 | | August 31,
2018 | |
Shares Outstanding ($.001 par value; unlimited shares authorized) | |
Investor Class | | | — | | | | — | | | | — | | | | 24,075 | | | | 29,401 | | | | — | | | | — | | | | — | | | | 60,807 | | | | 8,106 | | |
Trust Class | | | — | | | | — | | | | — | | | | 2,012 | | | | 23,915 | | | | — | | | | — | | | | — | | | | 2,902 | | | | 3,109 | | |
Advisor Class | | | — | | | | — | | | | — | | | | 82 | | | | 3,036 | | | | — | | | | — | | | | — | | | | 10 | | | | — | | |
Institutional Class | | | 3,837 | | | | 59,719 | | | | 86,651 | | | | 300 | | | | 49,878 | | | | 553 | | | | 209 | | | | 5,337 | | | | 4,221 | | | | 134,450 | | |
Class A | | | 127 | | | | 2,493 | | | | 13,829 | | | | 120 | | | | — | | | | 50 | | | | 29 | | | | 689 | | | | 284 | | | | 5,112 | | |
Class C | | | 239 | | | | 595 | | | | 18,430 | | | | 59 | | | | — | | | | 16 | | | | 28 | | | | 18 | | | | 93 | | | | 1,092 | | |
Class R3 | | | — | | | | 77 | | | | 165 | | | | — | | | | — | | | | — | | | | — | | | | — | | | | 22 | | | | — | | |
Class R6 | | | 2 | | | | 8,663 | | | | — | | | | — | | | | 67,029 | | | | — | | | | — | | | | — | | | | — | | | | 5,627 | | |
Net Asset Value, offering and redemption price per share | | | |
Investor Class | | $ | — | | | $ | — | | | $ | — | | | $ | 28.69 | | | $ | 65.27 | | | $ | — | | | $ | — | | | $ | — | | | $ | 19.52 | | | $ | 13.16 | | |
Trust Class | | | — | | | | — | | | | — | | | | 28.66 | | | | 65.30 | | | | — | | | | — | | | | — | | | | 19.51 | | | | 13.16 | | |
Advisor Class | | | — | | | | — | | | | — | | | | 28.62 | | | | 65.23 | | | | — | | | | — | | | | — | | | | 19.46 | | | | — | | |
Institutional Class | | | 13.93 | | | | 19.25 | | | | 13.53 | | | | 28.72 | | | | 65.24 | | | | 8.61 | | | | 10.85 | | | | 14.80 | | | | 19.55 | | | | 13.18 | | |
Class R3 | | | — | | | | 18.64 | | | | 13.45 | | | | — | | | | — | | | | — | | | | — | | | | — | | | | 19.46 | | | | — | | |
Class R6 | | | 13.93 | | | | 19.27 | | | | — | | | | — | | | | 65.23 | | | | — | | | | — | | | | — | | | | — | | | | 13.20 | | |
Net Asset Value and redemption price per share | | | |
Class A | | $ | 13.93 | | | $ | 19.11 | | | $ | 13.48 | | | $ | 28.65 | | | $ | — | | | $ | 8.51 | | | $ | 10.84 | | | $ | 14.77 | | | $ | 19.50 | | | $ | 13.15 | | |
Offering Price per share | | | |
Class A‡ | | $ | 14.78 | | | $ | 20.28 | | | $ | 14.30 | | | $ | 30.40 | | | $ | — | | | $ | 9.03 | | | $ | 11.50 | | | $ | 15.67 | | | $ | 20.69 | | | $ | 13.95 | | |
Net Asset Value and offering price per share | | | |
Class C^ | | $ | 13.85 | | | $ | 18.27 | | | $ | 13.38 | | | $ | 28.50 | | | $ | — | | | $ | 8.05 | | | $ | 10.81 | | | $ | 14.31 | | | $ | 19.40 | | | $ | 13.09 | | |
†Securities on loan, at value: | | | |
Unaffiliated issuers | | $ | — | | | $ | 1,338 | | | $ | — | | | $ | — | | | $ | — | | | $ | — | | | $ | — | | | $ | — | | | $ | — | | | $ | 18,373 | | |
* Cost of Investments: | | | |
(a) Unaffiliated issuers | | $ | 52,331 | | | $ | 1,291,647 | | | $ | 1,297,825 | | | $ | 614,147 | | | $ | 5,052,636 | | | $ | 4,103 | | | $ | 2,762 | | | $ | 85,553 | | | $ | 989,102 | | | $ | 1,873,354 | | |
(b) Affiliated issuers | | | — | | | | — | | | | — | | | | — | | | | 639,428 | | | | — | | | | — | | | | — | | | | — | | | | — | | |
Total cost of investments | | $ | 52,331 | | | $ | 1,291,647 | | | $ | 1,297,825 | | | $ | 614,147 | | | $ | 5,692,064 | | | $ | 4,103 | | | $ | 2,762 | | | $ | 85,553 | | | $ | 989,102 | | | $ | 1,873,354 | | |
(c) Total cost of foreign currency | | $ | — | | | $ | 3,583 | | | $ | — | | | $ | — | | | $ | — | | | $ | — | | | $ | 1 | | | $ | 2,651 | | | $ | — | | | $ | 445 | | |
(d) Premium received from option contracts written | | $ | — | | | $ | — | | | $ | 737 | | | $ | — | | | $ | — | | | $ | — | | | $ | — | | | $ | — | | | $ | 1,274 | | | $ | — | | |
‡ On single retail sales of less than $50,000. On sales of $50,000 or more or in certain other circumstances described in the Fund's prospectus, offering price is reduced.
^ Redemption price per share is equal to net asset value less any applicable contingent deferred sales charge.
See Notes to Financial Statements
155
156
Statements of Assets and Liabilities (cont'd)
Neuberger Berman Equity Funds
(000's omitted except per share amounts)
| | | INTERNATIONAL
SELECT FUND | | INTERNATIONAL
SMALL CAP
FUND | | INTRINSIC
VALUE FUND | | LARGE CAP
VALUE FUND | | MID CAP
GROWTH FUND | | MID CAP
INTRINSIC
VALUE FUND | | MULTI-CAP
OPPORTUNITIES
FUND | | REAL ESTATE
FUND | | SMALL CAP
GROWTH FUND | | SUSTAINABLE
EQUITY
FUND | |
| | | August 31,
2018 | | August 31,
2018 | | August 31,
2018 | | August 31,
2018 | | August 31,
2018 | | August 31,
2018 | | August 31,
2018 | | August 31,
2018 | | August 31,
2018 | | August 31,
2018 | |
Assets | |
Investments in securities, at value*† (Notes A & F)—see Schedule of Investments: | |
| Unaffiliated issuers(a) | | $ | 169,547 | | | $ | 7,092 | | | $ | 722,173 | | | $ | 1,471,039 | | | $ | 1,499,491 | | | $ | 117,400 | | | $ | 1,985,651 | | | $ | 458,703 | | | $ | 102,466 | | | $ | 2,393,693 | | |
| Affiliated issuers(b) | | | — | | | | — | | | | — | | | | — | | | | — | | | | — | | | | — | | | | — | | | | — | | | | — | | |
| | | | 169,547 | | | | 7,092 | | | | 722,173 | | | | 1,471,039 | | | | 1,499,491 | | | | 117,400 | | | | 1,985,651 | | | | 458,703 | | | | 102,466 | | | | 2,393,693 | | |
Cash | | | — | | | | — | | | | — | | | | — | | | | 957 | | | | — | | | | — | | | | — | | | | — | | | | — | | |
| Foreign currency(c) | | | 33 | | | | 1 | | | | — | | | | — | | | | — | | | | — | | | | — | | | | — | | | | — | | | | — | | |
Dividends and interest receivable | | | 1,176 | | | | 10 | | | | 286 | | | | 4,425 | | | | 393 | | | | 94 | | | | 2,921 | | | | 231 | | | | 22 | | | | 3,418 | | |
Receivable for securities sold | | | 592 | | | | — | | | | 1,205 | | | | 29,653 | | | | 4,488 | | | | 109 | | | | — | | | | — | | | | 1,111 | | | | 10,976 | | |
Receivable for Fund shares sold | | | 9 | | | | — | | | | 336 | | | | 31 | | | | 1,009 | | | | 169 | | | | 293 | | | | 350 | | | | 116 | | | | 1,437 | | |
Receivable from Management—net (Note B) | | | 29 | | | | 23 | | | | — | | | | — | | | | — | | | | — | | | | — | | | | — | | | | 48 | | | | — | | |
Receivable for securities lending income (Note A) | | | 1 | | | | — | | | | — | | | | — | | | | 3 | | | | — | | | | — | | | | — | | | | 2 | | | | — | | |
Prepaid expenses and other assets | | | 55 | | | | 11 | | | | 49 | | | | 114 | | | | 93 | | | | 49 | | | | 63 | | | | 58 | | | | 55 | | | | 136 | | |
Total Assets | | | 171,442 | | | | 7,137 | | | | 724,049 | | | | 1,505,262 | | | | 1,506,434 | | | | 117,821 | | | | 1,988,928 | | | | 459,342 | | | | 103,820 | | | | 2,409,660 | | |
Liabilities | |
Payable to investment manager—net (Note B) | | | 80 | | | | 5 | | | | 479 | | | | 607 | | | | 604 | | | | 54 | | | | 877 | | | | 311 | | | | 69 | | | | 942 | | |
| Option contracts written, at value(d) (Note A) | | | — | | | | — | | | | — | | | | — | | | | — | | | | — | | | | — | | | | — | | | | — | | | | — | | |
Due to custodian | | | — | | | | — | | | | 294 | | | | — | | | | — | | | | — | | | | — | | | | — | | | | — | | | | — | | |
Payable for securities purchased | | | 18 | | | | — | | | | — | | | | 41,867 | | | | 5,502 | | | | — | | | | — | | | | — | | | | 1,550 | | | | — | | |
Payable for Fund shares redeemed | | | 154 | | | | — | | | | 499 | | | | 3,438 | | | | 757 | | | | 50 | | | | 420 | | | | 567 | | | | 115 | | | | 897 | | |
Payable to administrator—net (Note B) | | | — | | | | — | | | | 81 | | | | 370 | | | | 263 | | | | 18 | | | | 315 | | | | 40 | | | | — | | | | 530 | | |
Payable to trustees | | | 5 | | | | 5 | | | | 5 | | | | 5 | | | | 5 | | | | 5 | | | | 5 | | | | 5 | | | | 5 | | | | 5 | | |
Payable for loaned securities collateral (Note A) | | | 1,586 | | | | 225 | | | | — | | | | — | | | | 11,479 | | | | — | | | | — | | | | — | | | | 1,869 | | | | — | | |
Accrued capital gains taxes (Note A) | | | — | | | | — | | | | — | | | | — | | | | — | | | | — | | | | — | | | | — | | | | — | | | | — | | |
Accrued expenses and other payables | | | 123 | | | | 82 | | | | 156 | | | | 292 | | | | 224 | | | | 77 | | | | 162 | | | | 138 | | | | 125 | | | | 324 | | |
Total Liabilities | | | 1,966 | | | | 317 | | | | 1,514 | | | | 46,579 | | | | 18,834 | | | | 204 | | | | 1,779 | | | | 1,061 | | | | 3,733 | | | | 2,698 | | |
Net Assets | | $ | 169,476 | | | $ | 6,820 | | | $ | 722,535 | | | $ | 1,458,683 | | | $ | 1,487,600 | | | $ | 117,617 | | | $ | 1,987,149 | | | $ | 458,281 | | | $ | 100,087 | | | $ | 2,406,962 | | |
Net Assets consist of: | |
Paid-in capital | | $ | 153,723 | | | $ | 6,606 | | | $ | 471,053 | | | $ | 1,155,244 | | | $ | 932,318 | | | $ | 92,476 | | | $ | 1,083,490 | | | $ | 405,816 | | | $ | 65,153 | | | $ | 1,462,704 | | |
Undistributed net investment income/(loss) | | | 1,062 | | | | — | | | | (87 | ) | | | 17,710 | | | | — | | | | 376 | | | | 7,856 | | | | — | | | | — | | | | 4,837 | | |
Distributions in excess of net investment income | | | — | | | | (3 | ) | | | — | | | | — | | | | — | | | | — | | | | — | | | | — | | | | — | | | | — | | |
Accumulated net realized gains/(losses) on investments | | | 1,679 | | | | 96 | | | | 51,687 | | | | 137,240 | | | | 108,814 | | | | 5,402 | | | | 101,702 | | | | 17,394 | | | | 15,741 | | | | 128,669 | | |
Net unrealized appreciation/(depreciation) in value of investments | | | 13,012 | | | | 121 | | | | 199,882 | | | | 148,489 | | | | 446,468 | | | | 19,363 | | | | 794,101 | | | | 35,071 | | | | 19,193 | | | | 810,752 | | |
Net Assets | | $ | 169,476 | | | $ | 6,820 | | | $ | 722,535 | | | $ | 1,458,683 | | | $ | 1,487,600 | | | $ | 117,617 | | | $ | 1,987,149 | | | $ | 458,281 | | | $ | 100,087 | | | $ | 2,406,962 | | |
Net Assets | |
Investor Class | | $ | — | | | $ | — | | | $ | — | | | $ | 1,160,307 | | | $ | 528,062 | | | $ | 40,150 | | | $ | — | | | $ | — | | | $ | 66,129 | | | $ | 679,343 | | |
Trust Class | | | 7,968 | | | | — | | | | — | | | | 68,352 | | | | 77,640 | | | | 10,223 | | | | — | | | | 133,687 | | | | 4,433 | | | | 230,762 | | |
Advisor Class | | | — | | | | — | | | | — | | | | 125,216 | | | | 15,444 | | | | — | | | | — | | | | — | | | | 2,542 | | | | — | | |
Institutional Class | | | 142,375 | | | | 6,192 | | | | 678,034 | | | | 98,471 | | | | 353,726 | | | | 52,502 | | | | 1,866,711 | | | | 177,684 | | | | 16,431 | | | | 950,507 | | |
Class A | | | 3,911 | | | | 212 | | | | 19,965 | | | | 4,068 | | | | 52,105 | | | | 10,080 | | | | 75,691 | | | | 58,842 | | | | 5,298 | | | | 126,409 | | |
Class C | | | 2,364 | | | | 157 | | | | 24,536 | | | | 1,930 | | | | 11,582 | | | | 2,351 | | | | 44,747 | | | | 13,484 | | | | 3,059 | | | | 62,441 | | |
Class R3 | | | 3,491 | | | | — | | | | — | | | | 339 | | | | 15,582 | | | | 2,311 | | | | — | | | | 17,964 | | | | 2,195 | | | | 36,364 | | |
Class R6 | | | 9,367 | | | | 259 | | | | — | | | | — | | | | 433,459 | | | | — | | | | — | | | | 56,620 | | | | — | | | | 321,136 | | |
See Notes to Financial Statements
157
158
Statements of Assets and Liabilities (cont'd)
Neuberger Berman Equity Funds (cont'd)
(000's omitted except per share amounts)
| | | INTERNATIONAL
SELECT FUND | | INTERNATIONAL
SMALL CAP
FUND | | INTRINSIC
VALUE FUND | | LARGE CAP
VALUE FUND | | MID CAP
GROWTH FUND | | MID CAP
INTRINSIC
VALUE FUND | | MULTI-CAP
OPPORTUNITIES
FUND | | REAL ESTATE
FUND | | SMALL CAP
GROWTH FUND | | SUSTAINABLE
EQUITY
FUND | |
| | | August 31,
2018 | | August 31,
2018 | | August 31,
2018 | | August 31,
2018 | | August 31,
2018 | | August 31,
2018 | | August 31,
2018 | | August 31,
2018 | | August 31,
2018 | | August 31,
2018 | |
Shares Outstanding ($.001 par value; unlimited shares authorized) | |
Investor Class | | | — | | | | — | | | | — | | | | 35,295 | | | | 31,088 | | | | 1,664 | | | | — | | | | — | | | | 1,471 | | | | 16,229 | | |
Trust Class | | | 614 | | | | — | | | | — | | | | 2,079 | | | | 4,573 | | | | 524 | | | | — | | | | 10,019 | | | | 99 | | | | 5,510 | | |
Advisor Class | | | — | | | | — | | | | — | | | | 3,808 | | | | 912 | | | | — | | | | — | | | | — | | | | 57 | | | | — | | |
Institutional Class | | | 10,989 | | | | 477 | | | | 36,569 | | | | 2,995 | | | | 20,793 | | | | 2,172 | | | | 92,797 | | | | 13,270 | | | | 365 | | | | 22,716 | | |
Class A | | | 304 | | | | 16 | | | | 1,114 | | | | 124 | | | | 3,072 | | | | 517 | | | | 3,794 | | | | 4,410 | | | | 118 | | | | 3,019 | | |
Class C | | | 187 | | | | 12 | | | | 1,469 | | | | 59 | | | | 687 | | | | 124 | | | | 2,352 | | | | 1,009 | | | | 68 | | | | 1,493 | | |
Class R3 | | | 274 | | | | — | | | | — | | | | 10 | | | | 921 | | | | 119 | | | | — | | | | 1,349 | | | | 49 | | | | 868 | | |
Class R6 | | | 723 | | | | 20 | | | | — | | | | — | | | | 25,462 | | | | — | | | | — | | | | 4,230 | | | | — | | | | 7,676 | | |
Net Asset Value, offering and redemption price per share | | | |
Investor Class | | $ | — | | | $ | — | | | $ | — | | | $ | 32.87 | | | $ | 16.99 | | | $ | 24.12 | | | $ | — | | | $ | — | | | $ | 44.96 | | | $ | 41.86 | | |
Trust Class | | | 12.97 | | | | — | | | | — | | | | 32.88 | | | | 16.98 | | | | 19.52 | | | | — | | | | 13.34 | | | | 44.91 | | | | 41.88 | | |
Advisor Class | | | — | | | | — | | | | — | | | | 32.88 | | | | 16.94 | | | | — | | | | — | | | | — | | | | 44.87 | | | | — | | |
Institutional Class | | | 12.96 | | | | 12.98 | | | | 18.54 | | | | 32.87 | | | | 17.01 | | | | 24.17 | | | | 20.12 | | | | 13.39 | | | | 45.06 | | | | 41.84 | | |
Class R3 | | | 12.75 | | | | — | | | | — | | | | 32.89 | | | | 16.92 | | | | 19.42 | | | | — | | | | 13.31 | | | | 44.87 | | | | 41.90 | | |
Class R6 | | | 12.96 | | | | 12.98 | | | | — | | | | — | | | | 17.02 | | | | — | | | | — | | | | 13.39 | | | | — | | | | 41.83 | | |
Net Asset Value and redemption price per share | | | |
Class A | | $ | 12.87 | | | $ | 12.93 | | | $ | 17.93 | | | $ | 32.88 | | | $ | 16.96 | | | $ | 19.51 | | | $ | 19.95 | | | $ | 13.34 | | | $ | 44.95 | | | $ | 41.88 | | |
Offering Price per share | | | |
Class A‡ | | $ | 13.66 | | | $ | 13.72 | | | $ | 19.02 | | | $ | 34.89 | | | $ | 17.99 | | | $ | 20.70 | | | $ | 21.17 | | | $ | 14.15 | | | $ | 47.69 | | | $ | 44.44 | | |
Net Asset Value and offering price per share | | | |
Class C^ | | $ | 12.68 | | | $ | 12.83 | | | $ | 16.70 | | | $ | 32.87 | | | $ | 16.85 | | | $ | 18.92 | | | $ | 19.03 | | | $ | 13.36 | | | $ | 44.72 | | | $ | 41.81 | | |
†Securities on loan, at value: | | | |
Unaffiliated issuers | | $ | 1,549 | | | $ | 215 | | | $ | — | | | $ | — | | | $ | 11,387 | | | $ | — | | | $ | — | | | $ | — | | | $ | 1,855 | | | $ | — | | |
* Cost of Investments: | | | |
(a) Unaffiliated issuers | | $ | 156,517 | | | $ | 6,971 | | | $ | 522,291 | | | $ | 1,322,550 | | | $ | 1,053,023 | | | $ | 98,037 | | | $ | 1,191,550 | | | $ | 423,632 | | | $ | 83,273 | | | $ | 1,582,954 | | |
(b) Affiliated issuers | | | — | | | | — | | | | — | | | | — | | | | — | | | | — | | | | — | | | | — | | | | — | | | | — | | |
Total cost of investments | | $ | 156,517 | | | $ | 6,971 | | | $ | 522,291 | | | $ | 1,322,550 | | | $ | 1,053,023 | | | $ | 98,037 | | | $ | 1,191,550 | | | $ | 423,632 | | | $ | 83,273 | | | $ | 1,582,954 | | |
(c) Total cost of foreign currency | | $ | 33 | | | $ | 1 | | | $ | — | | | $ | — | | | $ | — | | | $ | — | | | $ | — | | | $ | — | | | $ | — | | | $ | — | | |
(d) Premium received from option contracts written | | $ | — | | | $ | — | | | $ | — | | | $ | — | | | $ | — | | | $ | — | | | $ | — | | | $ | — | | | $ | — | | | $ | — | | |
‡ On single retail sales of less than $50,000. On sales of $50,000 or more or in certain other circumstances described in the Fund's prospectus, offering price is reduced.
^ Redemption price per share is equal to net asset value less any applicable contingent deferred sales charge.
See Notes to Financial Statements
159
160
Statements of Assets and Liabilities (cont'd)
Neuberger Berman Equity Funds
(000's omitted except per share amounts)
| | | VALUE FUND | |
| | | August 31, 2018 | |
Assets | |
Investments in securities, at value*† (Notes A & F)—see Schedule of Investments: | |
| Unaffiliated issuers(a) | | $ | 12,933 | | |
| Affiliated issuers(b) | | | — | | |
| | | | 12,933 | | |
Cash | | | — | | |
| Foreign currency(c) | | | — | | |
Dividends and interest receivable | | | 39 | | |
Receivable for securities sold | | | 252 | | |
Receivable for Fund shares sold | | | — | | |
Receivable from Management—net (Note B) | | | 22 | | |
Receivable for securities lending income (Note A) | | | — | | |
Prepaid expenses and other assets | | | 16 | | |
Total Assets | | | 13,262 | | |
Liabilities | |
Payable to investment manager—net (Note B) | | | 6 | | |
| Option contracts written, at value(d) (Note A) | | | — | | |
Due to custodian | | | — | | |
Payable for securities purchased | | | 375 | | |
Payable for Fund shares redeemed | | | — | | |
Payable to administrator—net (Note B) | | | — | | |
Payable to trustees | | | 5 | | |
Payable for loaned securities collateral (Note A) | | | — | | |
Accrued capital gains taxes (Note A) | | | — | | |
Accrued expenses and other payables | | | 94 | | |
Total Liabilities | | | 480 | | |
Net Assets | | $ | 12,782 | | |
Net Assets consist of: | |
Paid-in capital | | $ | 10,400 | | |
Undistributed net investment income/(loss) | | | 120 | | |
Distributions in excess of net investment income | | | — | | |
Accumulated net realized gains/(losses) on investments | | | 1,135 | | |
Net unrealized appreciation/(depreciation) in value of investments | | | 1,127 | | |
Net Assets | | $ | 12,782 | | |
Net Assets | |
Investor Class | | $ | — | | |
Trust Class | | | — | | |
Advisor Class | | | — | | |
Institutional Class | | | 7,188 | | |
Class A | | | 2,343 | | |
Class C | | | 3,251 | | |
Class R3 | | | — | | |
Class R6 | | | — | | |
See Notes to Financial Statements
161
Statements of Assets and Liabilities (cont'd)
Neuberger Berman Equity Funds (cont'd)
(000's omitted except per share amounts)
| | | VALUE FUND | |
| | | August 31, 2018 | |
Shares Outstanding ($.001 par value; unlimited shares authorized) | | | |
Investor Class | | | — | | |
Trust Class | | | — | | |
Advisor Class | | | — | | |
Institutional Class | | | 386 | | |
Class A | | | 126 | | |
Class C | | | 181 | | |
Class R3 | | | — | | |
Class R6 | | | — | | |
Net Asset Value, offering and redemption price per share | | | |
Investor Class | | $ | — | | |
Trust Class | | | — | | |
Advisor Class | | | — | | |
Institutional Class | | | 18.62 | | |
Class R3 | | | — | | |
Class R6 | | | — | | |
Net Asset Value and redemption price per share | | | |
Class A | | $ | 18.56 | | |
Offering Price per share | | | |
Class A‡ | | $ | 19.69 | | |
Net Asset Value and offering price per share | | | |
Class C^ | | $ | 17.96 | | |
†Securities on loan, at value: | | | |
Unaffiliated issuers | | $ | — | | |
* Cost of Investments: | | | |
(a) Unaffiliated issuers | | $ | 11,806 | | |
(b) Affiliated issuers | | | — | | |
Total cost of investments | | $ | 11,806 | | |
(c) Total cost of foreign currency | | $ | — | | |
(d) Premium received from option contracts written | | $ | — | | |
‡ On single retail sales of less than $50,000. On sales of $50,000 or more or in certain other circumstances described in the Fund's prospectus, offering price is reduced.
^ Redemption price per share is equal to net asset value less any applicable contingent deferred sales charge.
See Notes to Financial Statements
162
Neuberger Berman Equity Funds
(000's omitted)
| | | DIVIDEND
GROWTH FUND | | EMERGING
MARKETS
EQUITY FUND | | EQUITY
INCOME FUND | | FOCUS FUND | | GENESIS FUND | | GLOBAL EQUITY
FUND | | GLOBAL REAL
ESTATE FUND | | GREATER
CHINA EQUITY
FUND | | GUARDIAN
FUND | | INTERNATIONAL
EQUITY
FUND | |
| | | For the
Year Ended
August 31,
2018 | | For the
Year Ended
August 31,
2018 | | For the
Year Ended
August 31,
2018 | | For the
Year Ended
August 31,
2018 | | For the
Year Ended
August 31,
2018 | | For the
Year Ended
August 31,
2018 | | For the
Year Ended
August 31,
2018 | | For the
Year Ended
August 31,
2018 | | For the
Year Ended
August 31,
2018 | | For the
Year Ended
August 31,
2018 | |
Investment Income: | |
Income (Note A): | |
Dividend income—unaffiliated issuers | | $ | 1,103 | | | $ | 29,116 | | | $ | 50,755 | | | $ | 9,854 | | | $ | 97,023 | | | $ | 81 | | | $ | 76 | | | $ | 2,019 | | | $ | 18,784 | | | $ | 39,556 | | |
Dividend income—affiliated issuers (Note F) | | | — | | | | — | | | | — | | | | — | | | | 24,891 | | | | — | | | | — | | | | — | | | | — | | | | — | | |
Interest income—unaffiliated issuers | | | 46 | | | | 1,115 | | | | 3,629 | | | | 254 | | | | 1,459 | | | | 2 | | | | 1 | | | | 10 | | | | 367 | | | | 750 | | |
Income from securities loaned—net (Note A) | | | — | | | | 5 | | | | — | | | | 4 | | | | — | | | | — | | | | — | | | | — | | | | 53 | | | | 104 | | |
Foreign taxes withheld (Note A) | | | (10 | ) | | | (3,243 | ) | | | (1,292 | ) | | | (20 | ) | | | (832 | ) | | | (5 | ) | | | (4 | ) | | | (148 | ) | | | (316 | ) | | | (3,174 | ) | |
Total income | | $ | 1,139 | | | $ | 26,993 | | | $ | 53,092 | | | $ | 10,092 | | | $ | 122,541 | | | $ | 78 | | | $ | 73 | | | $ | 1,881 | | | $ | 18,888 | | | $ | 37,236 | | |
Expenses: | |
Investment management fees (Note B) | | | 256 | | | | 11,668 | | | | 8,032 | | | | 3,934 | | | | 71,899 | | | | 29 | | | | 22 | | | | 1,367 | | | | 6,280 | | | | 15,308 | | |
Administration fees (Note B): | |
Investor Class | | | — | | | | — | | | | — | | | | 1,750 | | | | 4,776 | | | | — | | | | — | | | | — | | | | 2,903 | | | | 292 | | |
Trust Class | | | — | | | | — | | | | — | | | | 240 | | | | 6,083 | | | | — | | | | — | | | | — | | | | 226 | | | | 186 | | |
Advisor Class | | | — | | | | — | | | | — | | | | 12 | | | | 801 | | | | — | | | | — | | | | — | | | | 1 | | | | — | | |
Institutional Class | | | 69 | | | | 1,480 | | | | 1,800 | | | | 13 | | | | 5,226 | | | | 7 | | | | 3 | | | | 157 | | | | 114 | | | | 2,303 | | |
Class A | | | 5 | | | | 159 | | | | 485 | | | | 8 | | | | — | | | | 1 | | | | 1 | | | | 51 | | | | 14 | | | | 191 | | |
Class C | | | 8 | | | | 27 | | | | 692 | | | | 4 | | | | — | | | | — | | | | 1 | | | | 1 | | | | 4 | | | | 38 | | |
Class R3 | | | — | | | | 4 | | | | 5 | | | | — | | | | — | | | | — | | | | — | | | | — | | | | 1 | | | | — | | |
Class R6 | | | — | | | | 134 | | | | — | | | | — | | | | 3,062 | | | | — | | | | — | | | | — | | | | — | | | | 153 | | |
Distribution fees (Note B): | |
Trust Class | | | — | | | | — | | | | — | | | | 60 | | | | — | | | | — | | | | — | | | | — | | | | 57 | | | | — | | |
Advisor Class | | | — | | | | — | | | | — | | | | 7 | | | | 501 | | | | — | | | | — | | | | — | | | | 1 | | | | — | | |
Class A | | | 5 | | | | 152 | | | | 467 | | | | 8 | | | | — | | | | 1 | | | | 1 | | | | 49 | | | | 13 | | | | 184 | | |
Class C | | | 32 | | | | 104 | | | | 2,663 | | | | 18 | | | | — | | | | 1 | | | | 3 | | | | 3 | | | | 17 | | | | 146 | | |
Class R3 | | | — | | | | 8 | | | | 9 | | | | — | | | | — | | | | — | | | | — | | | | — | | | | 2 | | | | — | | |
Shareholder servicing agent fees: | |
Investor Class | | | — | | | | — | | | | — | | | | 393 | | | | 1,133 | | | | — | | | | — | | | | — | | | | 765 | | | | 116 | | |
Trust Class | | | — | | | | — | | | | — | | | | 1 | | | | 15 | | | | — | | | | — | | | | — | | | | 1 | | | | 2 | | |
Advisor Class | | | — | | | | — | | | | — | | | | — | | | | 14 | | | | — | | | | — | | | | — | | | | — | | | | — | | |
Institutional Class | | | — | | | | 190 | | | | 8 | | | | 1 | | | | 46 | | | | — | | | | — | | | | 9 | | | | 1 | | | | 19 | | |
Class A | | | 2 | | | | 26 | | | | 13 | | | | 1 | | | | — | | | | 1 | | | | — | | | | 16 | | | | 1 | | | | 6 | | |
Class C | | | — | | | | — | | | | 7 | | | | — | | | | — | | | | — | | | | — | | | | — | | | | — | | | | 1 | | |
Class R3 | | | — | | | | 1 | | | | 1 | | | | — | | | | — | | | | — | | | | — | | | | — | | | | — | | | | — | | |
Class R6 | | | — | | | | 7 | | | | — | | | | — | | | | 8 | | | | — | | | | — | | | | — | | | | — | | | | 8 | | |
Audit fees | | | 54 | | | | 60 | | | | 67 | | | | 61 | | | | 68 | | | | 57 | | | | 56 | | | | 57 | | | | 63 | | | | 62 | | |
Custodian and accounting fees | | | 67 | | | | 1,387 | | | | 234 | | | | 111 | | | | 1,322 | | | | 74 | | | | 67 | | | | 125 | | | | 169 | | | | 438 | | |
Insurance expense | | | 1 | | | | 30 | | | | 57 | | | | 25 | | | | 374 | | | | — | | | | — | | | | 3 | | | | 40 | | | | 58 | | |
Legal fees | | | 71 | | | | 69 | | | | 69 | | | | 80 | | | | 91 | | | | 68 | | | | 69 | | | | 87 | | | | 83 | | | | 80 | | |
Registration and filing fees | | | 54 | | | | 152 | | | | 97 | | | | 100 | | | | 285 | | | | 48 | | | | 47 | | | | 58 | | | | 119 | | | | 239 | | |
Repayment to Management of expenses previously assumed by
Management (Note B) | | | — | | | | — | | | | — | | | | — | | | | — | | | | — | | | | — | | | | — | | | | — | | | | — | | |
Shareholder reports | | | — | | | | 61 | | | | 145 | | | | 55 | | | | 1,001 | | | | 3 | | | | — | | | | 12 | | | | 99 | | | | 131 | | |
Trustees' fees and expenses | | | 41 | | | | 42 | | | | 44 | | | | 42 | | | | 58 | | | | 41 | | | | 41 | | | | 41 | | | | 43 | | | | 44 | | |
Interest expense | | | — | | | | — | | | | 8 | | | | 3 | | | | 7 | | | | — | | | | — | | | | 5 | | | | 1 | | | | 1 | | |
Miscellaneous | | | 6 | | | | 118 | | | | 112 | | | | 48 | | | | 629 | | | | 8 | | | | 1 | | | | 15 | | | | 76 | | | | 148 | | |
Total expenses | | | 671 | | | | 15,879 | | | | 15,015 | | | | 6,975 | | | | 97,399 | | | | 339 | | | | 312 | | | | 2,056 | | | | 11,094 | | | | 20,154 | | |
See Notes to Financial Statements
163
164
Statements of Operations (cont'd)
Neuberger Berman Equity Funds (cont'd)
(000's omitted)
| | | DIVIDEND
GROWTH FUND | | EMERGING
MARKETS
EQUITY FUND | | EQUITY
INCOME FUND | | FOCUS FUND | | GENESIS FUND | | GLOBAL EQUITY
FUND | | GLOBAL REAL
ESTATE FUND | | GREATER
CHINA EQUITY
FUND | | GUARDIAN
FUND | | INTERNATIONAL
EQUITY
FUND | |
| | | For the
Year Ended
August 31,
2018 | | For the
Year Ended
August 31,
2018 | | For the
Year Ended
August 31,
2018 | | For the
Year Ended
August 31,
2018 | | For the
Year Ended
August 31,
2018 | | For the
Year Ended
August 31,
2018 | | For the
Year Ended
August 31,
2018 | | For the
Year Ended
August 31,
2018 | | For the
Year Ended
August 31,
2018 | | For the
Year Ended
August 31,
2018 | |
Expenses reimbursed by Management (Note B) | | | (274 | ) | | | (344 | ) | | | — | | | | — | | | | (873 | ) | | | (296 | ) | | | (280 | ) | | | (109 | ) | | | — | | | | (1,406 | ) | |
Investment management fees waived (Note B) | | | — | | | | — | | | | — | | | | — | | | | — | | | | — | | | | — | | | | — | | | | — | | | | (1,135 | ) | |
Total net expenses | | | 397 | | | | 15,535 | | | | 15,015 | | | | 6,975 | | | | 96,526 | | | | 43 | | | | 32 | | | | 1,947 | | | | 11,094 | | | | 17,613 | | |
Net investment income/(loss) | | $ | 742 | | | $ | 11,458 | | | $ | 38,077 | | | $ | 3,117 | | | $ | 26,015 | | | $ | 35 | | | $ | 41 | | | $ | (66 | ) | | $ | 7,794 | | | $ | 19,623 | | |
Realized and Unrealized Gain/(Loss) on Investments (Note A): | |
Net realized gain/(loss) on: | |
Transactions in investment securities of unaffiliated issuers | | | 2,726 | | | | 18,425 | * | | | 82,827 | | | | 60,285 | | | | 1,050,535 | | | | 342 | | | | 84 | | | | 33,545 | | | | 95,571 | | | | 79,798 | | |
Transactions in investment securities of affiliated issuers | | | — | | | | — | | | | — | | | | — | | | | 154,207 | | | | — | | | | — | | | | — | | | | — | | | | — | | |
Redemption in-kind | | | — | | | | — | | | | — | | | | — | | | | 266,799 | | | | — | | | | — | | | | — | | | | — | | | | 37,148 | | |
Settlement of foreign currency transactions | | | 4 | | | | (727 | ) | | | (224 | ) | | | 8 | | | | (28 | ) | | | (1 | ) | | | — | | | | (41 | ) | | | (17 | ) | | | (590 | ) | |
Expiration or closing of option contracts written | | | — | | | | — | | | | 1,385 | | | | (746 | ) | | | — | | | | — | | | | — | | | | — | | | | 5,819 | | | | — | | |
Change in net unrealized appreciation/(depreciation) in value of: | |
Investment securities of unaffiliated issuers | | | 1,307 | | | | (107,444 | )** | | | 43,375 | | | | 29,392 | | | | 766,202 | | | | 310 | | | | 6 | | | | (23,416 | ) | | | 140,197 | | | | (45,472 | ) | |
Investment securities of affiliated issuers | | | — | | | | — | | | | — | | | | — | | | | 346,723 | | | | — | | | | — | | | | — | | | | — | | | | — | | |
Foreign currency translations | | | — | | | | (47 | ) | | | (16 | ) | | | — | | | | (3 | ) | | | 1 | | | | — | | | | (4 | ) | | | 14 | | | | (41 | ) | |
Option contracts written | | | — | | | | — | | | | (44 | ) | | | (62 | ) | | | — | | | | — | | | | — | | | | — | | | | 18 | | | | — | | |
Net gain/(loss) on investments | | | 4,037 | | | | (89,793 | ) | | | 127,303 | | | | 88,877 | | | | 2,584,435 | | | | 652 | | | | 90 | | | | 10,084 | | | | 241,602 | | | | 70,843 | | |
Net increase/(decrease) in net assets resulting from operations | | $ | 4,779 | | | $ | (78,335 | ) | | $ | 165,380 | | | $ | 91,994 | | | $ | 2,610,450 | | | $ | 687 | | | $ | 131 | | | $ | 10,018 | | | $ | 249,396 | | | $ | 90,466 | | |
* Net of foreign capital gains tax $60,589.
** Change in accrued foreign capital gains tax amounted to $246,895.
See Notes to Financial Statements
165
166
Statements of Operations (cont'd)
Neuberger Berman Equity Funds
(000's omitted)
| | | INTERNATIONAL
SELECT FUND | | INTERNATIONAL
SMALL CAP
FUND | | INTRINSIC
VALUE FUND | | LARGE CAP
VALUE FUND | | MID CAP
GROWTH FUND | | MID CAP
INTRINSIC
VALUE FUND | | MULTI-CAP
OPPORTUNITIES
FUND | | REAL ESTATE
FUND | | SMALL CAP
GROWTH FUND | | SUSTAINABLE
EQUITY
FUND | |
| | | For the
Year Ended
August 31,
2018 | | For the
Year Ended
August 31,
2018 | | For the
Year Ended
August 31,
2018 | | For the
Year Ended
August 31,
2018 | | For the
Year Ended
August 31,
2018 | | For the
Year Ended
August 31,
2018 | | For the
Year Ended
August 31,
2018 | | For the
Year Ended
August 31,
2018 | | For the
Year Ended
August 31,
2018 | | For the
Year Ended
August 31,
2018 | |
Investment Income: | |
Income (Note A): | |
Dividend income—unaffiliated issuers | | $ | 4,275 | | | $ | 97 | | | $ | 4,959 | | | $ | 32,413 | | | $ | 7,813 | | | $ | 1,735 | | | $ | 25,992 | | | $ | 12,358 | | | $ | 169 | | | $ | 34,096 | | |
Dividend income—affiliated issuers (Note F) | | | — | | | | — | | | | — | | | | — | | | | — | | | | — | | | | — | | | | — | | | | — | | | | — | | |
Interest income—unaffiliated issuers | | | 49 | | | | 4 | | | | 532 | | | | 1,357 | | | | 763 | | | | 82 | | | | 246 | | | | 73 | | | | 23 | | | | 647 | | |
Income from securities loaned—net (Note A) | | | 9 | | | | — | | | | — | | | | 11 | | | | 56 | | | | — | | | | — | | | | — | | | | 9 | | | | — | | |
Foreign taxes withheld (Note A) | | | (359 | ) | | | (9 | ) | | | — | | | | (62 | ) | | | (23 | ) | | | (2 | ) | | | (178 | ) | | | (21 | ) | | | — | | | | (770 | ) | |
Total income | | $ | 3,974 | | | $ | 92 | | | $ | 5,491 | | | $ | 33,719 | | | $ | 8,609 | | | $ | 1,815 | | | $ | 26,060 | | | $ | 12,410 | | | $ | 201 | | | $ | 33,973 | | |
Expenses: | |
Investment management fees (Note B) | | | 1,212 | | | | 42 | | | | 6,634 | | | | 7,158 | | | | 6,567 | | | | 599 | | | | 10,253 | | | | 3,783 | | | | 710 | | | | 11,081 | | |
Administration fees (Note B): | |
Investor Class | | | — | | | | — | | | | — | | | | 2,973 | | | | 1,267 | | | | 105 | | | | — | | | | — | | | | 146 | | | | 1,868 | | |
Trust Class | | | 33 | | | | — | | | | — | | | | 288 | | | | 269 | | | | 43 | | | | — | | | | 555 | | | | 16 | | | | 937 | | |
Advisor Class | | | — | | | | — | | | | — | | | | 548 | | | | 59 | | | | — | | | | — | | | | — | | | | 8 | | | | — | | |
Institutional Class | | | 286 | | | | 6 | | | | 1,199 | | | | 141 | | | | 514 | | | | 66 | | | | 2,757 | | | | 264 | | | | 21 | | | | 1,340 | | |
Class A | | | 12 | | | | 1 | | | | 48 | | | | 9 | | | | 127 | | | | 25 | | | | 173 | | | | 182 | | | | 11 | | | | 316 | | |
Class C | | | 7 | | | | 1 | | | | 60 | | | | 6 | | | | 27 | | | | 6 | | | | 113 | | | | 40 | | | | 6 | | | | 155 | | |
Class R3 | | | 11 | | | | — | | | | — | | | | 1 | | | | 37 | | | | 5 | | | | — | | | | 46 | | | | 4 | | | | 100 | | |
Class R6 | | | 8 | | | | — | | | | — | | | | — | | | | 268 | | | | — | | | | — | | | | 44 | | | | — | | | | 245 | | |
Distribution fees (Note B): | |
Trust Class | | | 8 | | | | — | | | | — | | | | 72 | | | | — | | | | 11 | | | | — | | | | 138 | | | | 4 | | | | 234 | | |
Advisor Class | | | — | | | | — | | | | — | | | | 343 | | | | 37 | | | | — | | | | — | | | | — | | | | 5 | | | | — | | |
Class A | | | 11 | | | | 1 | | | | 46 | | | | 9 | | | | 122 | | | | 24 | | | | 166 | | | | 175 | | | | 10 | | | | 304 | | |
Class C | | | 25 | | | | 1 | | | | 231 | | | | 21 | | | | 105 | | | | 24 | | | | 434 | | | | 156 | | | | 23 | | | | 596 | | |
Class R3 | | | 22 | | | | — | | | | — | | | | 1 | | | | 72 | | | | 10 | | | | — | | | | 88 | | | | 7 | | | | 192 | | |
Shareholder servicing agent fees: | |
Investor Class | | | — | | | | — | | | | — | | | | 688 | | | | 435 | | | | 33 | | | | — | | | | — | | | | 82 | | | | 585 | | |
Trust Class | | | 7 | | | | — | | | | — | | | | 2 | | | | 2 | | | | 1 | | | | — | | | | 28 | | | | 1 | | | | 7 | | |
Advisor Class | | | — | | | | — | | | | — | | | | 3 | | | | 1 | | | | — | | | | — | | | | — | | | | 1 | | | | — | | |
Institutional Class | | | 1 | | | | 1 | | | | 8 | | | | 1 | | | | 10 | | | | 2 | | | | 160 | | | | 5 | | | | 1 | | | | 17 | | |
Class A | | | 1 | | | | — | | | | 6 | | | | 1 | | | | 5 | | | | 1 | | | | 12 | | | | 7 | | | | 1 | | | | 16 | | |
Class C | | | — | | | | — | | | | 2 | | | | — | | | | 1 | | | | — | | | | 3 | | | | 2 | | | | — | | | | 4 | | |
Class R3 | | | 1 | | | | — | | | | — | | | | — | | | | 5 | | | | 1 | | | | — | | | | 5 | | | | 1 | | | | 3 | | |
Class R6 | | | — | | | | — | | | | — | | | | — | | | | 8 | | | | — | | | | — | | | | 2 | | | | — | | | | 11 | | |
Audit fees | | | 62 | | | | 40 | | | | 29 | | | | 61 | | | | 29 | | | | 29 | | | | 29 | | | | 61 | | | | 29 | | | | 29 | | |
Custodian and accounting fees | | | 127 | | | | 84 | | | | 119 | | | | 200 | | | | 181 | | | | 74 | | | | 237 | | | | 100 | | | | 81 | | | | 337 | | |
Insurance expense | | | 7 | | | | — | | | | 25 | | | | 48 | | | | 40 | | | | 3 | | | | 63 | | | | 17 | | | | 3 | | | | 78 | | |
Legal fees | | | 68 | | | | 37 | | | | 68 | | | | 86 | | | | 83 | | | | 68 | | | | 67 | | | | 69 | | | | 120 | | | | 90 | | |
Registration and filing fees | | | 121 | | | | 90 | | | | 101 | | | | 139 | | | | 146 | | | | 102 | | | | 96 | | | | 116 | | | | 111 | | | | 168 | | |
Repayment to Management of expenses previously assumed by
Management (Note B) | | | — | | | | — | | | | — | | | | 1 | | | | 6 | | | | — | | | | — | | | | — | | | | — | | | | — | | |
Shareholder reports | | | 12 | | | | 2 | | | | 197 | | | | 108 | | | | 118 | | | | 14 | | | | 77 | | | | 47 | | | | 16 | | | | 207 | | |
Trustees' fees and expenses | | | 41 | | | | 41 | | | | 42 | | | | 43 | | | | 43 | | | | 41 | | | | 44 | | | | 42 | | | | 41 | | | | 45 | | |
Interest expense | | | 4 | | | | — | | | | — | | | | 7 | | | | — | | | | — | | | | 8 | | | | 4 | | | | — | | | | — | | |
Miscellaneous | | | 73 | | | | 7 | | | | 51 | | | | 87 | | | | 77 | | | | 11 | | | | 112 | | | | 32 | | | | 9 | | | | 141 | | |
Total expenses | | | 2,160 | | | | 354 | | | | 8,866 | | | | 13,045 | | | | 10,661 | | | | 1,298 | | | | 14,804 | | | | 6,008 | | | | 1,468 | | | | 19,106 | | |
See Notes to Financial Statements
167
168
Statements of Operations (cont'd)
Neuberger Berman Equity Funds (cont'd)
(000's omitted)
| | | INTERNATIONAL
SELECT FUND | | INTERNATIONAL
SMALL CAP
FUND | | INTRINSIC
VALUE FUND | | LARGE CAP
VALUE FUND | | MID CAP
GROWTH FUND | | MID CAP
INTRINSIC
VALUE FUND | | MULTI-CAP
OPPORTUNITIES
FUND | | REAL ESTATE
FUND | | SMALL CAP
GROWTH FUND | | SUSTAINABLE
EQUITY
FUND | |
| | | For the
Year Ended
August 31,
2018 | | For the
Year Ended
August 31,
2018 | | For the
Year Ended
August 31,
2018 | | For the
Year Ended
August 31,
2018 | | For the
Year Ended
August 31,
2018 | | For the
Year Ended
August 31,
2018 | | For the
Year Ended
August 31,
2018 | | For the
Year Ended
August 31,
2018 | | For the
Year Ended
August 31,
2018 | | For the
Year Ended
August 31,
2018 | |
Expenses reimbursed by Management (Note B) | | | (293 | ) | | | (299 | ) | | | (107 | ) | | | — | | | | — | | | | (91 | ) | | | — | | | | (1,211 | ) | | | (459 | ) | | | — | | |
Investment management fees waived (Note B) | | | — | | | | — | | | | — | | | | — | | | | — | | | | (31 | ) | | | — | | | | — | | | | — | | | | — | | |
Total net expenses | | | 1,867 | | | | 55 | | | | 8,759 | | | | 13,045 | | | | 10,661 | | | | 1,176 | | | | 14,804 | | | | 4,797 | | | | 1,009 | | | | 19,106 | | |
Net investment income/(loss) | | $ | 2,107 | | | $ | 37 | | | $ | (3,268 | ) | | $ | 20,674 | | | $ | (2,052 | ) | | $ | 639 | | | $ | 11,256 | | | $ | 7,613 | | | $ | (808 | ) | | $ | 14,867 | | |
Realized and Unrealized Gain/(Loss) on Investments (Note A): | |
Net realized gain/(loss) on: | |
Transactions in investment securities of unaffiliated issuers | | | 26,054 | | | | 97 | | | | 94,064 | | | | 169,975 | | | | 141,295 | | | | 8,362 | | | | 179,589 | | | | 26,044 | | | | 18,089 | | | | 186,572 | | |
Transactions in investment securities of affiliated issuers | | | — | | | | — | | | | (1,290 | ) | | | — | | | | — | | | | — | | | | — | | | | — | | | | — | | | | — | | |
Redemption in-kind | | | 22,204 | | | | — | | | | — | | | | — | | | | — | | | | — | | | | — | | | | — | | | | — | | | | 39,512 | | |
Settlement of foreign currency transactions | | | (43 | ) | | | (12 | ) | | | — | | | | — | | | | 1 | | | | — | | | | — | | | | — | | | | — | | | | (37 | ) | |
Expiration or closing of option contracts written | | | — | | | | — | | | | — | | | | 1,613 | | | | — | | | | — | | | | — | | | | — | | | | — | | | | — | | |
Change in net unrealized appreciation/(depreciation) in value of: | |
Investment securities of unaffiliated issuers | | | (36,139 | ) | | | (120 | ) | | | 65,159 | | | | (15,809 | ) | | | 173,664 | | | | 3,283 | | | | 154,176 | | | | (12,168 | ) | | | 10,573 | | | | 164,368 | | |
Investment securities of affiliated issuers | | | — | | | | — | | | | 6,327 | | | | — | | | | — | | | | — | | | | — | | | | — | | | | — | | | | — | | |
Foreign currency translations | | | (17 | ) | | | — | | | | — | | | | — | | | | — | | | | — | | | | — | | | | — | | | | — | | | | 7 | | |
Option contracts written | | | — | | | | — | | | | — | | | | (51 | ) | | | — | | | | — | | | | — | | | | — | | | | — | | | | — | | |
Net gain/(loss) on investments | | | 12,059 | | | | (35 | ) | | | 164,260 | | | | 155,728 | | | | 314,960 | | | | 11,645 | | | | 333,765 | | | | 13,876 | | | | 28,662 | | | | 390,422 | | |
Net increase/(decrease) in net assets resulting from operations | | $ | 14,166 | | | $ | 2 | | | $ | 160,992 | | | $ | 176,402 | | | $ | 312,908 | | | $ | 12,284 | | | $ | 345,021 | | | $ | 21,489 | | | $ | 27,854 | | | $ | 405,289 | | |
See Notes to Financial Statements
169
170
Statements of Operations (cont'd)
Neuberger Berman Equity Funds
(000's omitted)
| | | VALUE FUND | |
| | | For the
Year Ended
August 31,
2018 | |
Investment Income: | |
Income (Note A): | |
Dividend income—unaffiliated issuers | | $ | 329 | | |
Dividend income—affiliated issuers (Note F) | | | — | | |
Interest income—unaffiliated issuers | | | 11 | | |
Income from securities loaned—net (Note A) | | | — | | |
Foreign taxes withheld (Note A) | | | (1 | ) | |
Total income | | $ | 339 | | |
Expenses: | |
Investment management fees (Note B) | | | 81 | | |
Administration fees (Note B): | |
Investor Class | | | — | | |
Trust Class | | | — | | |
Advisor Class | | | — | | |
Institutional Class | | | 13 | | |
Class A | | | 6 | | |
Class C | | | 9 | | |
Class R3 | | | — | | |
Class R6 | | | — | | |
Distribution fees (Note B): | |
Trust Class | | | — | | |
Advisor Class | | | — | | |
Class A | | | 6 | | |
Class C | | | 33 | | |
Class R3 | | | — | | |
Shareholder servicing agent fees: | |
Investor Class | | | — | | |
Trust Class | | | — | | |
Advisor Class | | | — | | |
Institutional Class | | | — | | |
Class A | | | 2 | | |
Class C | | | — | | |
Class R3 | | | — | | |
Class R6 | | | — | | |
Audit fees | | | 57 | | |
Custodian and accounting fees | | | 65 | | |
Insurance expense | | | 1 | | |
Legal fees | | | 71 | | |
Registration and filing fees | | | 48 | | |
Repayment to Management of expenses previously assumed by Management (Note B) | | | — | | |
Shareholder reports | | | 3 | | |
Trustees' fees and expenses | | | 41 | | |
Interest expense | | | — | | |
Miscellaneous | | | 5 | | |
Total expenses | | | 441 | | |
See Notes to Financial Statements
171
Statements of Operations (cont'd)
Neuberger Berman Equity Funds (cont'd)
(000's omitted)
| | | VALUE FUND | |
| | | For the
Year Ended
August 31,
2018 | |
Expenses reimbursed by Management (Note B) | | | (292 | ) | |
Investment management fees waived (Note B) | | | — | | |
Total net expenses | | | 149 | | |
Net investment income/(loss) | | $ | 190 | | |
Realized and Unrealized Gain/(Loss) on Investments (Note A): | |
Net realized gain/(loss) on: | |
Transactions in investment securities of unaffiliated issuers | | | 1,783 | | |
Transactions in investment securities of affiliated issuers | | | — | | |
Redemption in-kind | | | — | | |
Settlement of foreign currency transactions | | | — | | |
Expiration or closing of option written | | | 18 | | |
Change in net unrealized appreciation/(depreciation) in value of: | |
Investment securities of unaffiliated issuers | | | (263 | ) | |
Investment securities of affiliated issuers | | | — | | |
Foreign currency translations | | | — | | |
Option contracts written | | | (1 | ) | |
Net gain/(loss) on investments | | | 1,537 | | |
Net increase/(decrease) in net assets resulting from operations | | $ | 1,727 | | |
See Notes to Financial Statements
172
Statements of Changes in Net Assets
Neuberger Berman Equity Funds
(000's omitted)
| | | DIVIDEND GROWTH FUND | | EMERGING MARKETS
EQUITY FUND | | EQUITY INCOME FUND | | FOCUS FUND | | GENESIS FUND | | GLOBAL EQUITY FUND | |
| | Year Ended
August 31,
2018 | | Year Ended
August 31,
2017 | | Year Ended
August 31,
2018 | | Year Ended
August 31,
2017 | | Year Ended
August 31,
2018 | | Year Ended
August 31,
2017 | | Year Ended
August 31,
2018 | | Year Ended
August 31,
2017 | | Year Ended
August 31,
2018 | | Year Ended
August 31,
2017 | | Year Ended
August 31,
2018 | | Year Ended
August 31,
2017 | |
Increase/(Decrease) in Net Assets: | |
From Operations: | |
Net investment income/(loss) (Note A) | | $ | 742 | | | $ | 487 | | | $ | 11,458 | | | $ | 5,440 | | | $ | 38,077 | | | $ | 45,803 | | | $ | 3,117 | | | $ | 1,864 | | | $ | 26,015 | | | $ | 35,868 | | | $ | 35 | | | $ | 25 | | |
Net realized gain/(loss) on investments (Note A) | | | 2,730 | | | | 491 | | | | 17,698 | | | | 16,413 | | | | 83,988 | | | | 66,004 | | | | 59,547 | | | | 68,542 | | | | 1,471,513 | | | | 1,485,004 | | | | 341 | | | | (69 | ) | |
Net increase from payments by affiliates (Note B) | | | — | | | | — | | | | — | | | | — | | | | — | | | | 1 | | | | — | | | | 1 | | | | — | | | | — | | | | — | | | | — | | |
Change in net unrealized appreciation/(depreciation) of
investments (Note A) | | | 1,307 | | | | 3,658 | | | | (107,491 | ) | | | 128,717 | | | | 43,315 | | | | 67,898 | | | | 29,330 | | | | 41,930 | | | | 1,112,922 | | | | (437,834 | ) | | | 311 | | | | 667 | | |
Net increase/(decrease) in net assets resulting from operations | | | 4,779 | | | | 4,636 | | | | (78,335 | ) | | | 150,570 | | | | 165,380 | | | | 179,706 | | | | 91,994 | | | | 112,337 | | | | 2,610,450 | | | | 1,083,038 | | | | 687 | | | | 623 | | |
Distributions to Shareholders From (Note A): | |
Net investment income: | |
Investor Class | | | — | | | | — | | | | — | | | | — | | | | — | | | | — | | | | (1,883 | ) | | | (2,166 | ) | | | (3,296 | ) | | | (7,859 | ) | | | — | | | | — | | |
Trust Class | | | — | | | | — | | | | — | | | | — | | | | — | | | | — | | | | (122 | ) | | | (337 | ) | | | (1,254 | ) | | | (894 | ) | | | — | | | | — | | |
Advisor Class | | | — | | | | — | | | | — | | | | — | | | | — | | | | — | | | | — | | | | (53 | ) | | | (9 | ) | | | (765 | ) | | | — | | | | — | | |
Institutional Class | | | (472 | ) | | | (420 | ) | | | (5,443 | ) | | | (1,629 | ) | | | (35,754 | ) | | | (29,632 | ) | | | (37 | ) | | | (38 | ) | | | (12,519 | ) | | | (11,370 | ) | | | (25 | ) | | | (20 | ) | |
Class A | | | (16 | ) | | | (4 | ) | | | (229 | ) | | | (105 | ) | | | (4,945 | ) | | | (4,918 | ) | | | (6 | ) | | | (18 | ) | | | — | | | | — | | | | (1 | ) | | | (1 | ) | |
Class C | | | (3 | ) | | | (0 | ) | | | (22 | ) | | | — | | | | (5,075 | ) | | | (4,676 | ) | | | — | | | | (16 | ) | | | — | | | | — | | | | — | | | | — | | |
Class R3 | | | — | | | | — | | | | (5 | ) | | | (1 | ) | | | (42 | ) | | | (40 | ) | | | — | | | | — | | | | — | | | | — | | | | — | | | | — | | |
Class R6 | | | (0 | ) | | | (1 | ) | | | (1,139 | ) | | | (595 | ) | | | — | | | | — | | | | — | | | | — | | | | (15,711 | ) | | | (14,130 | ) | | | — | | | | — | | |
Net realized gain on investments: | |
Investor Class | | | — | | | | — | | | | — | | | | — | | | | — | | | | — | | | | (50,530 | ) | | | (52,641 | ) | | | (224,852 | ) | | | (179,026 | ) | | | — | | | | — | | |
Trust Class | | | — | | | | — | | | | — | | | | — | | | | — | | | | — | | | | (7,959 | ) | | | (9,025 | ) | | | (186,429 | ) | | | (96,426 | ) | | | — | | | | — | | |
Advisor Class | | | — | | | | — | | | | — | | | | — | | | | — | | | | — | | | | (1,095 | ) | | | (1,043 | ) | | | (25,746 | ) | | | (36,943 | ) | | | — | | | | — | | |
Institutional Class | | | (570 | ) | | | — | | | | — | | | | — | | | | (45,883 | ) | | | (36,549 | ) | | | (673 | ) | | | (608 | ) | | | (438,796 | ) | | | (209,556 | ) | | | — | | | | (25 | ) | |
Class A | | | (26 | ) | | | — | | | | — | | | | — | | | | (6,999 | ) | | | (7,824 | ) | | | (397 | ) | | | (446 | ) | | | — | | | | — | | | | — | | | | (3 | ) | |
Class C | | | (43 | ) | | | — | | | | — | | | | — | | | | (10,330 | ) | | | (10,759 | ) | | | (635 | ) | | | (591 | ) | | | — | | | | — | | | | — | | | | (1 | ) | |
Class R3 | | | — | | | | — | | | | — | | | | — | | | | (58 | ) | | | (78 | ) | | | — | | | | — | | | | — | | | | — | | | | — | | | | — | | |
Class R6 | | | (0 | ) | | | — | | | | — | | | | — | | | | — | | | | — | | | | — | | | | — | | | | (447,218 | ) | | | (214,988 | ) | | | — | | | | — | | |
Total distributions to shareholders | | | (1,130 | ) | | | (425 | ) | | | (6,838 | ) | | | (2,330 | ) | | | (109,086 | ) | | | (94,476 | ) | | | (63,337 | ) | | | (66,982 | ) | | | (1,355,830 | ) | | | (771,957 | ) | | | (26 | ) | | | (50 | ) | |
From Fund Share Transactions (Note D): | |
Proceeds from shares sold: | |
Investor Class | | | — | | | | — | | | | — | | | | — | | | | — | | | | — | | | | 3,861 | | | | 5,643 | | | | 127,479 | | | | 202,685 | | | | — | | | | — | | |
Trust Class | | | — | | | | — | | | | — | | | | — | | | | — | | | | — | | | | 2,281 | | | | 1,253 | | | | 130,291 | | | | 147,223 | | | | — | | | | — | | |
Advisor Class | | | — | | | | — | | | | — | | | | — | | | | — | | | | — | | | | 340 | | | | 415 | | | | 30,289 | | | | 48,532 | | | | — | | | | — | | |
Institutional Class | | | 21,342 | | | | 9,350 | | | | 782,707 | | | | 330,877 | | | | 151,932 | | | | 280,182 | | | | 2,598 | | | | 2,633 | | | | 506,405 | | | | 774,017 | | | | 36 | | | | 177 | | |
Class A | | | 1,090 | | | | 1,581 | | | | 42,405 | | | | 42,186 | | | | 25,357 | | | | 27,595 | | | | 821 | | | | 234 | | | | — | | | | — | | | | 682 | | | | 56 | | |
Class C | | | 124 | | | | 2,908 | | | | 6,015 | | | | 2,423 | | | | 9,342 | | | | 16,974 | | | | 75 | | | | 312 | | | | — | | | | — | | | | 31 | | | | 9 | | |
Class R3 | | | — | | | | — | | | | 606 | | | | 657 | | | | 1,027 | | | | 300 | | | | — | | | | — | | | | — | | | | — | | | | — | | | | — | | |
Class R6 | | | — | | | | — | | | | 83,104 | | | | 9,077 | | | | — | | | | — | | | | — | | | | — | | | | 874,418 | | | | 654,289 | | | | — | | | | — | | |
See Notes to Financial Statements
173
174
Statements of Changes in Net Assets (cont'd)
Neuberger Berman Equity Funds (cont'd)
(000's omitted)
| | | DIVIDEND GROWTH FUND | | EMERGING MARKETS
EQUITY FUND | | EQUITY INCOME FUND | | FOCUS FUND | | GENESIS FUND | | GLOBAL EQUITY FUND | |
| | | Year Ended
August 31,
2018 | | Year Ended
August 31,
2017 | | Year Ended
August 31,
2018 | | Year Ended
August 31,
2017 | | Year Ended
August 31,
2018 | | Year Ended
August 31,
2017 | | Year Ended
August 31,
2018 | | Year Ended
August 31,
2017 | | Year Ended
August 31,
2018 | | Year Ended
August 31,
2017 | | Year Ended
August 31,
2018 | | Year Ended
August 31,
2017 | |
Proceeds from reinvestment of dividends and distributions: | |
Investor Class | | | — | | | | — | | | | — | | | | — | | | | — | | | | — | | | | 47,309 | | | | 49,229 | | | | 220,105 | | | | 180,857 | | | | — | | | | — | | |
Trust Class | | | — | | | | — | | | | — | | | | — | | | | — | | | | — | | | | 8,037 | | | | 9,313 | | | | 186,190 | | | | 96,408 | | | | — | | | | — | | |
Advisor Class | | | — | | | | — | | | | — | | | | — | | | | — | | | | — | | | | 1,093 | | | | 1,094 | | | | 24,454 | | | | 36,009 | | | | — | | | | — | | |
Institutional Class | | | 1,042 | | | | 419 | | | | 2,159 | | | | 845 | | | | 69,404 | | | | 55,466 | | | | 586 | | | | 510 | | | | 413,091 | | | | 202,793 | | | | 25 | | | | 45 | | |
Class A | | | 41 | | | | 4 | | | | 162 | | | | 87 | | | | 10,549 | | | | 11,330 | | | | 342 | | | | 451 | | | | — | | | | — | | | | 1 | | | | 3 | | |
Class C | | | 46 | | | | — | | | | 9 | | | | — | | | | 11,703 | | | | 10,921 | | | | 609 | | | | 542 | | | | — | | | | — | | | | — | | | | 1 | | |
Class R3 | | | — | | | | — | | | | 3 | | | | — | | | | 51 | | | | 71 | | | | — | | | | — | | | | — | | | | — | | | | — | | | | — | | |
Class R6 | | | — | | | | — | | | | 1,139 | | | | 595 | | | | — | | | | — | | | | — | | | | — | | | | 462,309 | | | | 229,031 | | | | — | | | | — | | |
Payments for shares redeemed: | |
Investor Class | | | — | | | | — | | | | — | | | | — | | | | — | | | | — | | | | (58,503 | ) | | | (58,894 | ) | | | (423,896 | ) | | | (340,454 | ) | | | — | | | | — | | |
Trust Class | | | — | | | | — | | | | — | | | | — | | | | — | | | | — | | | | (14,814 | ) | | | (18,668 | ) | | | (508,027 | ) | | | (494,926 | ) | | | — | | | | — | | |
Advisor Class | | | — | | | | — | | | | — | | | | — | | | | — | | | | — | | | | (1,836 | ) | | | (1,437 | ) | | | (81,711 | ) | | | (132,686 | ) | | | — | | | | — | | |
Institutional Class | | | (4,765 | ) | | | (1,414 | ) | | | (231,337 | ) | | | (90,148 | ) | | | (298,102 | ) | | | (262,887 | ) | | | (2,759 | ) | | | (2,687 | ) | | | (1,703,085 | ) | | | (944,849 | ) | | | (111 | ) | | | (153 | ) | |
Class A | | | (1,134 | ) | | | (263 | ) | | | (58,033 | ) | | | (11,389 | ) | | | (56,187 | ) | | | (92,482 | ) | | | (830 | ) | | | (792 | ) | | | — | | | | — | | | | (633 | ) | | | (286 | ) | |
Class C | | | (196 | ) | | | (70 | ) | | | (1,857 | ) | | | (1,437 | ) | | | (65,530 | ) | | | (94,582 | ) | | | (476 | ) | | | (813 | ) | | | — | | | | — | | | | (26 | ) | | | (71 | ) | |
Class R3 | | | — | | | | — | | | | (603 | ) | | | (627 | ) | | | (736 | ) | | | (1,330 | ) | | | — | | | | — | | | | — | | | | — | | | | — | | | | — | | |
Class R6 | | | — | | | | (38 | ) | | | (42,487 | ) | | | (10,117 | ) | | | — | | | | — | | | | — | | | | — | | | | (1,027,844 | ) | | | (794,413 | ) | | | — | | | | — | | |
Net increase/(decrease) from Fund share transactions | | | 17,590 | | | | 12,477 | | | | 583,992 | | | | 273,029 | | | | (141,190 | ) | | | (48,442 | ) | | | (11,266 | ) | | | (11,662 | ) | | | (769,532 | ) | | | (135,484 | ) | | | 5 | | | | (219 | ) | |
Net Increase/(Decrease) in Net Assets | | | 21,239 | | | | 16,688 | | | | 498,819 | | | | 421,269 | | | | (84,896 | ) | | | 36,788 | | | | 17,391 | | | | 33,693 | | | | 485,088 | | | | 175,597 | | | | 666 | | | | 354 | | |
Net Assets: | |
Beginning of year | | | 37,305 | | | | 20,617 | | | | 877,449 | | | | 456,180 | | | | 1,693,052 | | | | 1,656,264 | | | | 747,070 | | | | 713,377 | | | | 10,819,845 | | | | 10,644,248 | | | | 4,644 | | | | 4,290 | | |
End of year | | $ | 58,544 | | | $ | 37,305 | | | $ | 1,376,268 | | | $ | 877,449 | | | $ | 1,608,156 | | | $ | 1,693,052 | | | $ | 764,461 | | | $ | 747,070 | | | $ | 11,304,933 | | | $ | 10,819,845 | | | $ | 5,310 | | | $ | 4,644 | | |
Undistributed net investment income/(loss) at end of year | | $ | 529 | | | $ | 311 | | | $ | 8,343 | | | $ | 4,510 | | | $ | 2,651 | | | $ | 11,234 | | | $ | 2,414 | | | $ | 1,337 | | | $ | 12,253 | | | $ | 21,800 | | | $ | 31 | | | $ | 24 | | |
Distributions in excess of net investment income at end of year | | $ | — | | | $ | — | | | $ | — | | | $ | — | | | $ | — | | | $ | — | | | $ | — | | | $ | — | | | $ | — | | | $ | — | | | $ | — | | | $ | — | | |
See Notes to Financial Statements
175
176
Statements of Changes in Net Assets (cont'd)
Neuberger Berman Equity Funds
(000's omitted)
| | | GLOBAL
REAL ESTATE FUND | | GREATER CHINA
EQUITY FUND | | GUARDIAN FUND | | INTERNATIONAL
EQUITY FUND | | INTERNATIONAL
SELECT FUND | | INTERNATIONAL
SMALL CAP FUND | |
Period from
December 8, 2016
(Commencement | | Year Ended
August 31,
2018 | | Year Ended
August 31,
2017 | | Year Ended
August 31,
2018 | | Year Ended
August 31,
2017 | | Year Ended
August 31,
2018 | | Year Ended
August 31,
2017 | | Year Ended
August 31,
2018 | | Year Ended
August 31,
2017 | | Year Ended
August 31,
2018 | | Year Ended
August 31,
2017 | | Year Ended
August 31,
2018 | | of Operations) to
August 31,
2017 | |
Increase/(Decrease) in Net Assets: | |
From Operations: | |
Net investment income/(loss) (Note A) | | $ | 41 | | | $ | 41 | | | $ | (66 | ) | | $ | 708 | | | $ | 7,794 | | | $ | 8,775 | | | $ | 19,623 | | | $ | 18,387 | | | $ | 2,107 | | | $ | 2,901 | | | $ | 37 | | | $ | 9 | | |
Net realized gain/(loss) on investments (Note A) | | | 84 | | | | 23 | | | | 33,504 | | | | 13,360 | | | | 101,373 | | | | 86,107 | | | | 116,356 | | | | 47,042 | | | | 48,215 | | | | 6,765 | | | | 85 | | | | 72 | | |
Net increase from payments by affiliates (Note B) | | | — | | | | — | | | | — | | | | — | | | | — | | | | — | | | | — | | | | — | | | | — | | | | — | | | | — | | | | — | | |
Change in net unrealized appreciation/(depreciation) of
investments (Note A) | | | 6 | | | | (4 | ) | | | (23,420 | ) | | | 18,893 | | | | 140,229 | | | | 91,586 | | | | (45,513 | ) | | | 168,036 | | | | (36,156 | ) | | | 26,824 | | | | (120 | ) | | | 241 | | |
Net increase/(decrease) in net assets resulting from operations | | | 131 | | | | 60 | | | | 10,018 | | | | 32,961 | | | | 249,396 | | | | 186,468 | | | | 90,466 | | | | 233,465 | | | | 14,166 | | | | 36,490 | | | | 2 | | | | 322 | | |
Distributions to Shareholders From (Note A): | |
Net investment income: | |
Investor Class | | | — | | | | — | | | | — | | | | — | | | | (6,476 | ) | | | (6,263 | ) | | | (286 | ) | | | (449 | ) | | | — | | | | — | | | | — | | | | — | | |
Trust Class | | | — | | | | — | | | | — | | | | — | | | | (394 | ) | | | (588 | ) | | | (74 | ) | | | (155 | ) | | | (65 | ) | | | (84 | ) | | | — | | | | — | | |
Advisor Class | | | — | | | | — | | | | — | | | | — | | | | (0 | ) | | | (1 | ) | | | — | | | | — | | | | — | | | | — | | | | — | | | | — | | |
Institutional Class | | | (43 | ) | | | (66 | ) | | | (1,237 | ) | | | (359 | ) | | | (554 | ) | | | (523 | ) | | | (14,148 | ) | | | (16,444 | ) | | | (2,374 | ) | | | (3,092 | ) | | | (26 | ) | | | — | | |
Class A | | | (5 | ) | | | (11 | ) | | | (224 | ) | | | (1 | ) | | | (36 | ) | | | (49 | ) | | | (69 | ) | | | (159 | ) | | | (41 | ) | | | (48 | ) | | | (7 | ) | | | — | | |
Class C | | | (2 | ) | | | (5 | ) | | | (1 | ) | | | — | | | | (1 | ) | | | (6 | ) | | | — | | | | — | | | | (2 | ) | | | (11 | ) | | | (3 | ) | | | — | | |
Class R3 | | | — | | | | — | | | | — | | | | — | | | | (1 | ) | | | (2 | ) | | | — | | | | — | | | | (28 | ) | | | (42 | ) | | | — | | | | — | | |
Class R6 | | | — | | | | — | | | | — | | | | — | | | | — | | | | — | | | | (2,084 | ) | | | (776 | ) | | | (116 | ) | | | — | | | | (7 | ) | | | — | | |
Net realized gain on investments: | |
Investor Class | | | — | | | | — | | | | — | | | | — | | | | (65,843 | ) | | | (108,442 | ) | | | — | | | | — | | | | — | | | | — | | | | — | | | | — | | |
Trust Class | | | — | | | | — | | | | — | | | | — | | | | (5,485 | ) | | | (10,943 | ) | | | — | | | | — | | | | — | | | | — | | | | — | | | | — | | |
Advisor Class | | | — | | | | — | | | | — | | | | — | | | | (12 | ) | | | (29 | ) | | | — | | | | — | | | | — | | | | — | | | | — | | | | — | | |
Institutional Class | | | (21 | ) | | | (9 | ) | | | (10,798 | ) | | | — | | | | (4,438 | ) | | | (6,846 | ) | | | — | | | | — | | | | — | | | | — | | | | (40 | ) | | | — | | |
Class A | | | (2 | ) | | | (1 | ) | | | (2,099 | ) | | | — | | | | (515 | ) | | | (916 | ) | | | — | | | | — | | | | — | | | | — | | | | (13 | ) | | | — | | |
Class C | | | (3 | ) | | | (1 | ) | | | (28 | ) | | | — | | | | (136 | ) | | | (330 | ) | | | — | | | | — | | | | — | | | | — | | | | (5 | ) | | | — | | |
Class R3 | | | — | | | | — | | | | — | | | | — | | | | (32 | ) | | | (72 | ) | | | — | | | | — | | | | — | | | | — | | | | — | | | | — | | |
Class R6 | | | — | | | | — | | | | — | | | | — | | | | — | | | | — | | | | — | | | | — | | | | — | | | | — | | | | (11 | ) | | | — | | |
Total distributions to shareholders | | | (76 | ) | | | (93 | ) | | | (14,387 | ) | | | (360 | ) | | | (83,923 | ) | | | (135,010 | ) | | | (16,661 | ) | | | (17,983 | ) | | | (2,626 | ) | | | (3,277 | ) | | | (112 | ) | | | — | | |
From Fund Share Transactions (Note D): | |
Proceeds from shares sold: | |
Investor Class | | | — | | | | — | | | | — | | | | — | | | | 11,911 | | | | 10,414 | | | | 5,762 | | | | 5,500 | | | | — | | | | — | | | | — | | | | — | | |
Trust Class | | | — | | | | — | | | | — | | | | — | | | | 3,580 | | | | 4,820 | | | | 6,248 | | | | 6,540 | | | | 149 | | | | 276 | | | | — | | | | — | | |
Advisor Class | | | — | | | | — | | | | — | | | | — | | | | 23 | | | | 22 | | | | — | | | | — | | | | — | | | | — | | | | — | | | | — | | |
Institutional Class | | | 47 | | | | — | | | | 5,552 | | | | 22,865 | | | | 16,287 | | | | 17,432 | | | | 651,839 | | | | 464,902 | | | | 17,951 | | | | 48,560 | | | | 5,506 | | | | 643 | | |
Class A | | | 27 | | | | 213 | | | | 4,771 | | | | 20,057 | | | | 1,039 | | | | 1,444 | | | | 25,730 | | | | 28,258 | | | | 1,347 | | | | 1,941 | | | | 66 | | | | 624 | | |
Class C | | | 31 | | | | — | | | | 14 | | | | 283 | | | | 172 | | | | 376 | | | | 4,054 | | | | 2,776 | | | | 159 | | | | 481 | | | | 28 | | | | 111 | | |
Class R3 | | | — | | | | — | | | | — | | | | — | | | | 41 | | | | 209 | | | | — | | | | — | | | | 953 | | | | 2,170 | | | | — | | | | — | | |
Class R6 | | | — | | | | — | | | | — | | | | — | | | | — | | | | — | | | | 87,406 | | | | 94,389 | | | | 190 | | | | 9,237 | | | | — | | | | 200 | | |
See Notes to Financial Statements
177
178
Statements of Changes in Net Assets (cont'd)
Neuberger Berman Equity Funds (cont'd)
(000's omitted)
| | | GLOBAL
REAL ESTATE FUND | | GREATER CHINA
EQUITY FUND | | GUARDIAN FUND | | INTERNATIONAL
EQUITY FUND | | INTERNATIONAL
SELECT FUND | | INTERNATIONAL
SMALL CAP FUND | |
| | | Year Ended
August 31,
2018 | | Year Ended
August 31,
2017 | | Year Ended
August 31,
2018 | | Year Ended
August 31,
2017 | | Year Ended
August 31,
2018 | | Year Ended
August 31,
2017 | | Year Ended
August 31,
2018 | | Year Ended
August 31,
2017 | | Year Ended
August 31,
2018 | | Year Ended
August 31,
2017 | | Year Ended
August 31,
2018 | | Period from
December 8, 2016
(Commencement
of Operations) to
August 31,
2017 | |
Proceeds from reinvestment of dividends and distributions: | |
Investor Class | | | — | | | | — | | | | — | | | | — | | | | 68,235 | | | | 108,145 | | | | 273 | | | | 432 | | | | — | | | | — | | | | — | | | | — | | |
Trust Class | | | — | | | | — | | | | — | | | | — | | | | 5,813 | | | | 11,422 | | | | 70 | | | | 150 | | | | 62 | | | | 81 | | | | — | | | | — | | |
Advisor Class | | | — | | | | — | | | | — | | | | — | | | | 12 | | | | 30 | | | | — | | | | — | | | | — | | | | — | | | | — | | | | — | | |
Institutional Class | | | 64 | | | | 75 | | | | 11,338 | | | | 106 | | | | 4,838 | | | | 7,112 | | | | 11,700 | | | | 14,597 | | | | 2,312 | | | | 3,030 | | | | 67 | | | | — | | |
Class A | | | 3 | | | | 4 | | | | 2,261 | | | | — | | | | 523 | | | | 906 | | | | 30 | | | | 92 | | | | 36 | | | | 43 | | | | 9 | | | | — | | |
Class C | | | 3 | | | | 1 | | | | 25 | | | | — | | | | 127 | | | | 220 | | | | — | | | | — | | | | 1 | | | | 3 | | | | — | | | | — | | |
Class R3 | | | — | | | | — | | | | — | | | | — | | | | 23 | | | | 43 | | | | — | | | | — | | | | 23 | | | | 35 | | | | — | | | | — | | |
Class R6 | | | — | | | | — | | | | — | | | | — | | | | — | | | | — | | | | 2,084 | | | | 775 | | | | 115 | | | | — | | | | — | | | | — | | |
Payments for shares redeemed: | |
Investor Class | | | — | | | | — | | | | — | | | | — | | | | (94,582 | ) | | | (108,871 | ) | | | (14,869 | ) | | | (14,532 | ) | | | — | | | | — | | | | — | | | | — | | |
Trust Class | | | — | | | | — | | | | — | | | | — | | | | (15,794 | ) | | | (27,795 | ) | | | (13,234 | ) | | | (15,813 | ) | | | (791 | ) | | | (1,042 | ) | | | — | | | | — | | |
Advisor Class | | | — | | | | — | | | | — | | | | — | | | | (9 | ) | | | (141 | ) | | | — | | | | — | | | | — | | | | — | | | | — | | | | — | | |
Institutional Class | | | (39 | ) | | | (67 | ) | | | (43,135 | ) | | | (37,308 | ) | | | (19,040 | ) | | | (16,746 | ) | | | (393,626 | ) | | | (390,004 | ) | | | (102,410 | ) | | | (78,386 | ) | | | (71 | ) | | | — | | |
Class A | | | (210 | ) | | | (387 | ) | | | (18,374 | ) | | | (2,503 | ) | | | (2,155 | ) | | | (3,205 | ) | | | (33,923 | ) | | | (70,145 | ) | | | (2,627 | ) | | | (2,306 | ) | | | (177 | ) | | | (387 | ) | |
Class C | | | — | | | | (15 | ) | | | (77 | ) | | | (181 | ) | | | (305 | ) | | | (1,281 | ) | | | (3,521 | ) | | | (6,033 | ) | | | (360 | ) | | | (1,670 | ) | | | — | | | | (11 | ) | |
Class R3 | | | — | | | | — | | | | — | | | | — | | | | (161 | ) | | | (365 | ) | | | — | | | | — | | | | (2,748 | ) | | | (1,666 | ) | | | — | | | | — | | |
Class R6 | | | — | | | | — | | | | — | | | | — | | | | — | | | | — | | | | (158,868 | ) | | | (15,680 | ) | | | (1,000 | ) | | | (628 | ) | | | — | | | | — | | |
Net increase/(decrease) from Fund share transactions | | | (74 | ) | | | (176 | ) | | | (37,625 | ) | | | 3,319 | | | | (19,422 | ) | | | 4,191 | | | | 177,155 | | | | 106,204 | | | | (86,638 | ) | | | (19,841 | ) | | | 5,428 | | | | 1,180 | | |
Net Increase/(Decrease) in Net Assets | | | (19 | ) | | | (209 | ) | | | (41,994 | ) | | | 35,920 | | | | 146,051 | | | | 55,649 | | | | 250,960 | | | | 321,686 | | | | (75,098 | ) | | | 13,372 | | | | 5,318 | | | | 1,502 | | |
Net Assets: | |
Beginning of year | | | 2,903 | | | | 3,112 | | | | 131,409 | | | | 95,489 | | | | 1,188,281 | | | | 1,132,632 | | | | 1,824,821 | | | | 1,503,135 | | | | 244,574 | | | | 231,202 | | | | 1,502 | | | | — | | |
End of year | | $ | 2,884 | | | $ | 2,903 | | | $ | 89,415 | | | $ | 131,409 | | | $ | 1,334,332 | | | $ | 1,188,281 | | | $ | 2,075,781 | | | $ | 1,824,821 | | | $ | 169,476 | | | $ | 244,574 | | | $ | 6,820 | | | $ | 1,502 | | |
Undistributed net investment income/(loss) at end of year | | $ | — | | | $ | — | | | $ | — | | | $ | 850 | | | $ | 2,223 | | | $ | 2,985 | | | $ | 15,225 | | | $ | 12,844 | | | $ | 1,062 | | | $ | 1,624 | | | $ | — | | | $ | 15 | | |
Distributions in excess of net investment income at end of year | | $ | (16 | ) | | $ | (35 | ) | | $ | (107 | ) | | $ | — | | | $ | — | | | $ | — | | | $ | — | | | $ | — | | | $ | — | | | $ | — | | | $ | (3 | ) | | $ | — | | |
See Notes to Financial Statements
179
180
Statements of Changes in Net Assets (cont'd)
Neuberger Berman Equity Funds
(000's omitted)
| | | INTRINSIC VALUE FUND | | LARGE CAP VALUE FUND | | MID CAP GROWTH FUND | | MID CAP
INTRINSIC VALUE FUND | | MULTI-CAP
OPPORTUNITIES FUND | | REAL ESTATE FUND | |
| | | Year Ended
August 31,
2018 | | Year Ended
August 31,
2017 | | Year Ended
August 31,
2018 | | Year Ended
August 31,
2017 | | Year Ended
August 31,
2018 | | Year Ended
August 31,
2017 | | Year Ended
August 31,
2018 | | Year Ended
August 31,
2017 | | Year Ended
August 31,
2018 | | Year Ended
August 31,
2017 | | Year Ended
August 31,
2018 | | Year Ended
August 31,
2017 | |
Increase/(Decrease) in Net Assets: | |
From Operations: | |
Net investment income/(loss) (Note A) | | $ | (3,268 | ) | | $ | (2,945 | ) | | $ | 20,674 | | | $ | 18,367 | | | $ | (2,052 | ) | | $ | (2,312 | ) | | $ | 639 | | | $ | 931 | | | $ | 11,256 | | | $ | 12,016 | | | $ | 7,613 | | | $ | 8,324 | | |
Net realized gain/(loss) on investments (Note A) | | | 92,774 | | | | 39,725 | | | | 171,588 | | | | 143,330 | | | | 141,296 | | | | 110,017 | | | | 8,362 | | | | 4,958 | | | | 179,589 | | | | 137,938 | | | | 26,044 | | | | 40,372 | | |
Net increase from payments by affiliates (Note B) | | | — | | | | — | | | | — | | | | — | | | | — | | | | — | | | | — | | | | — | | | | — | | | | — | | | | — | | | | — | | |
Change in net unrealized appreciation/(depreciation) of
investments (Note A) | | | 71,486 | | | | 72,572 | | | | (15,860 | ) | | | 47,490 | | | | 173,664 | | | | 57,664 | | | | 3,283 | | | | 8,449 | | | | 154,176 | | | | 187,940 | | | | (12,168 | ) | | | (41,934 | ) | |
Net increase/(decrease) in net assets resulting from operations | | | 160,992 | | | | 109,352 | | | | 176,402 | | | | 209,187 | | | | 312,908 | | | | 165,369 | | | | 12,284 | | | | 14,338 | | | | 345,021 | | | | 337,894 | | | | 21,489 | | | | 6,762 | | |
Distributions to Shareholders From (Note A): | |
Net investment income: | |
Investor Class | | | — | | | | — | | | | (13,975 | ) | | | (7,325 | ) | | | — | | | | — | | | | (190 | ) | | | (201 | ) | | | — | | | | — | | | | — | | | | — | | |
Trust Class | | | — | | | | — | | | | (801 | ) | | | (794 | ) | | | — | | | | — | | | | (48 | ) | | | (67 | ) | | | — | | | | — | | | | (2,098 | ) | | | (2,367 | ) | |
Advisor Class | | | — | | | | — | | | | (1,341 | ) | | | (1,953 | ) | | | — | | | | — | | | | — | | | | — | | | | — | | | | — | | | | — | | | | — | | |
Institutional Class | | | — | | | | — | | | | (1,235 | ) | | | (560 | ) | | | — | | | | — | | | | (270 | ) | | | (194 | ) | | | (10,422 | ) | | | (14,963 | ) | | | (3,032 | ) | | | (3,355 | ) | |
Class A | | | — | | | | — | | | | (30 | ) | | | (35 | ) | | | — | | | | — | | | | (39 | ) | | | (78 | ) | | | (134 | ) | | | (286 | ) | | | (929 | ) | | | (1,130 | ) | |
Class C | | | — | | | | — | | | | (12 | ) | | | (21 | ) | | | — | | | | — | | | | (0 | ) | | | (11 | ) | | | — | | | | (1 | ) | | | (84 | ) | | | (89 | ) | |
Class R3 | | | — | | | | — | | | | (2 | ) | | | (1 | ) | | | — | | | | — | | | | (4 | ) | | | (7 | ) | | | — | | | | — | | | | (191 | ) | | | (199 | ) | |
Class R6 | | | — | | | | — | | | | — | | | | — | | | | — | | | | — | | | | — | | | | — | | | | — | | | | — | | | | (897 | ) | | | (676 | ) | |
Net realized gain on investments: | |
Investor Class | | | — | | | | — | | | | (79,556 | ) | | | (32,301 | ) | | | (39,598 | ) | | | (19,685 | ) | | | (2,455 | ) | | | — | | | | — | | | | — | | | | — | | | | — | | |
Trust Class | | | — | | | | — | | | | (5,204 | ) | | | (3,644 | ) | | | (5,336 | ) | | | (1,759 | ) | | | (811 | ) | | | — | | | | — | | | | — | | | | (7,008 | ) | | | (21,699 | ) | |
Advisor Class | | | — | | | | — | | | | (9,870 | ) | | | (8,877 | ) | | | (1,205 | ) | | | (310 | ) | | | — | | | | — | | | | — | | | | — | | | | — | | | | — | | |
Institutional Class | | | (43,660 | ) | | | (8,811 | ) | | | (6,298 | ) | | | (1,923 | ) | | | (28,019 | ) | | | (13,469 | ) | | | (2,339 | ) | | | — | | | | (177,856 | ) | | | (45,915 | ) | | | (8,671 | ) | | | (26,621 | ) | |
Class A | | | (908 | ) | | | (609 | ) | | | (200 | ) | | | (158 | ) | | | (3,926 | ) | | | (2,041 | ) | | | (681 | ) | | | — | | | | (5,678 | ) | | | (1,735 | ) | | | (3,711 | ) | | | (12,376 | ) | |
Class C | | | (1,255 | ) | | | (365 | ) | | | (168 | ) | | | (141 | ) | | | (859 | ) | | | (276 | ) | | | (188 | ) | | | — | | | | (4,128 | ) | | | (1,065 | ) | | | (814 | ) | | | (2,889 | ) | |
Class R3 | | | — | | | | — | | | | (15 | ) | | | (4 | ) | | | (1,127 | ) | | | (370 | ) | | | (111 | ) | | | — | | | | — | | | | — | | | | (866 | ) | | | (2,659 | ) | |
Class R6 | | | — | | | | — | | | | — | | | | — | | | | (24,371 | ) | | | (9,481 | ) | | | — | | | | — | | | | — | | | | — | | | | (2,282 | ) | | | (4,843 | ) | |
Total distributions to shareholders | | | (45,823 | ) | | | (9,785 | ) | | | (118,707 | ) | | | (57,737 | ) | | | (104,441 | ) | | | (47,391 | ) | | | (7,136 | ) | | | (558 | ) | | | (198,218 | ) | | | (63,965 | ) | | | (30,583 | ) | | | (78,903 | ) | |
From Fund Share Transactions (Note D): | |
Proceeds from shares sold: | |
Investor Class | | | — | | | | — | | | | 8,101 | | | | 17,941 | | | | 12,268 | | | | 9,599 | | | | 998 | | | | 1,561 | | | | — | | | | — | | | | — | | | | — | | |
Trust Class | | | — | | | | — | | | | 4,087 | | | | 6,699 | | | | 23,437 | | | | 9,850 | | | | 398 | | | | 546 | | | | — | | | | — | | | | 14,986 | | | | 12,240 | | |
Advisor Class | | | — | | | | — | | | | 5,499 | | | | 13,478 | | | | 5,456 | | | | 3,126 | | | | — | | | | — | | | | — | | | | — | | | | — | | | | — | | |
Institutional Class | | | 177,678 | | | | 293,161 | | | | 37,581 | | | | 41,776 | | | | 77,662 | | | | 68,136 | | | | 27,310 | | | | 8,815 | | | | 153,353 | | | | 171,779 | | | | 60,254 | | | | 51,910 | | |
Class A | | | 11,603 | | | | 15,111 | | | | 1,809 | | | | 2,779 | | | | 12,576 | | | | 10,173 | | | | 3,941 | | | | 2,066 | | | | 36,164 | | | | 25,355 | | | | 15,061 | | | | 21,145 | | |
Class C | | | 3,472 | | | | 3,229 | | | | 423 | | | | 1,131 | | | | 1,428 | | | | 1,070 | | | | 329 | | | | 507 | | | | 6,748 | | | | 6,279 | | | | 241 | | | | 954 | | |
Class R3 | | | — | | | | — | | | | 172 | | | | 196 | | | | 4,513 | | | | 3,705 | | | | 1,160 | | | | 434 | | | | — | | | | — | | | | 4,732 | | | | 5,625 | | |
Class R6 | | | — | | | | — | | | | — | | | | — | | | | 144,101 | | | | 66,750 | | | | — | | | | — | | | | — | | | | — | | | | 29,533 | | | | 10,995 | | |
See Notes to Financial Statements
181
182
Statements of Changes in Net Assets (cont'd)
Neuberger Berman Equity Funds (cont'd)
(000's omitted)
| | | INTRINSIC VALUE FUND | | LARGE CAP VALUE FUND | | MID CAP GROWTH FUND | | MID CAP
INTRINSIC VALUE FUND | | MULTI-CAP
OPPORTUNITIES FUND | | REAL ESTATE FUND | |
| | | Year Ended
August 31,
2018 | | Year Ended
August 31,
2017 | | Year Ended
August 31,
2018 | | Year Ended
August 31,
2017 | | Year Ended
August 31,
2018 | | Year Ended
August 31,
2017 | | Year Ended
August 31,
2018 | | Year Ended
August 31,
2017 | | Year Ended
August 31,
2018 | | Year Ended
August 31,
2017 | | Year Ended
August 31,
2018 | | Year Ended
August 31,
2017 | |
Proceeds from reinvestment of dividends and distributions: | |
Investor Class | | | — | | | | — | | | | 90,111 | | | | 38,220 | | | | 37,431 | | | | 18,588 | | | | 2,513 | | | | 191 | | | | — | | | | — | | | | — | | | | — | | |
Trust Class | | | — | | | | — | | | | 5,920 | | | | 4,359 | | | | 5,323 | | | | 1,758 | | | | 847 | | | | 67 | | | | — | | | | — | | | | 9,054 | | | | 23,899 | | |
Advisor Class | | | — | | | | — | | | | 11,200 | | | | 10,811 | | | | 787 | | | | 249 | | | | — | | | | — | | | | — | | | | — | | | | — | | | | — | | |
Institutional Class | | | 39,433 | | | | 7,762 | | | | 6,871 | | | | 2,396 | | | | 27,748 | | | | 13,315 | | | | 2,588 | | | | 190 | | | | 178,195 | | | | 11,082 | | | | 10,556 | | | | 25,843 | | |
Class A | | | 876 | | | | 589 | | | | 200 | | | | 190 | | | | 3,767 | | | | 1,933 | | | | 587 | | | | 68 | | | | 5,235 | | | | 1,939 | | | | 4,447 | | | | 12,849 | | |
Class C | | | 1,115 | | | | 298 | | | | 127 | | | | 132 | | | | 831 | | | | 264 | | | | 164 | | | | 8 | | | | 3,762 | | | | 955 | | | | 793 | | | | 2,569 | | |
Class R3 | | | — | | | | — | | | | 12 | | | | — | | | | 1,015 | | | | 323 | | | | 92 | | | | 6 | | | | — | | | | — | | | | 988 | | | | 2,647 | | |
Class R6 | | | — | | | | — | | | | — | | | | — | | | | 24,101 | | | | 9,371 | | | | — | | | | — | | | | — | | | | — | | | | 3,178 | | | | 5,519 | | |
Payments for shares redeemed: | |
Investor Class | | | — | | | | — | | | | (132,889 | ) | | | (102,947 | ) | | | (42,932 | ) | | | (40,667 | ) | | | (5,671 | ) | | | (5,318 | ) | | | — | | | | — | | | | — | | | | — | | |
Trust Class | | | — | | | | — | | | | (19,162 | ) | | | (20,992 | ) | | | (13,534 | ) | | | (33,896 | ) | | | (2,306 | ) | | | (1,582 | ) | | | — | | | | — | | | | (44,221 | ) | | | (69,683 | ) | |
Advisor Class | | | — | | | | — | | | | (40,447 | ) | | | (36,688 | ) | | | (5,383 | ) | | | (3,916 | ) | | | — | | | | — | | | | — | | | | — | | | | — | | | | — | | |
Institutional Class | | | (490,716 | ) | | | (162,730 | ) | | | (30,147 | ) | | | (27,421 | ) | | | (126,889 | ) | | | (98,781 | ) | | | (8,770 | ) | | | (6,333 | ) | | | (431,903 | ) | | | (370,505 | ) | | | (82,169 | ) | | | (118,324 | ) | |
Class A | | | (13,148 | ) | | | (46,279 | ) | | | (1,907 | ) | | | (2,708 | ) | | | (26,324 | ) | | | (41,744 | ) | | | (3,437 | ) | | | (8,521 | ) | | | (24,170 | ) | | | (56,386 | ) | | | (41,552 | ) | | | (56,424 | ) | |
Class C | | | (5,400 | ) | | | (9,286 | ) | | | (938 | ) | | | (1,276 | ) | | | (1,861 | ) | | | (3,623 | ) | | | (757 | ) | | | (2,112 | ) | | | (9,355 | ) | | | (11,958 | ) | | | (5,979 | ) | | | (10,807 | ) | |
Class R3 | | | — | | | | — | | | | (58 | ) | | | (66 | ) | | | (5,362 | ) | | | (6,143 | ) | | | (502 | ) | | | (579 | ) | | | — | | | | — | | | | (6,518 | ) | | | (11,595 | ) | |
Class R6 | | | — | | | | — | | | | — | | | | — | | | | (52,519 | ) | | | (32,175 | ) | | | — | | | | — | | | | — | | | | — | | | | (20,531 | ) | | | (12,130 | ) | |
Net increase/(decrease) from Fund share transactions | | | (275,087 | ) | | | 101,855 | | | | (53,435 | ) | | | (51,990 | ) | | | 107,640 | | | | (42,735 | ) | | | 19,484 | | | | (9,986 | ) | | | (81,971 | ) | | | (221,460 | ) | | | (47,147 | ) | | | (102,768 | ) | |
Net Increase/(Decrease) in Net Assets | | | (159,918 | ) | | | 201,422 | | | | 4,260 | | | | 99,460 | | | | 316,107 | | | | 75,243 | | | | 24,632 | | | | 3,794 | | | | 64,832 | | | | 52,469 | | | | (56,241 | ) | | | (174,909 | ) | |
Net Assets: | |
Beginning of year | | | 882,453 | | | | 681,031 | | | | 1,454,423 | | | | 1,354,963 | | | | 1,171,493 | | | | 1,096,250 | | | | 92,985 | | | | 89,191 | | | | 1,922,317 | | | | 1,869,848 | | | | 514,522 | | | | 689,431 | | |
End of year | | $ | 722,535 | | | $ | 882,453 | | | $ | 1,458,683 | | | $ | 1,454,423 | | | $ | 1,487,600 | | | $ | 1,171,493 | | | $ | 117,617 | | | $ | 92,985 | | | $ | 1,987,149 | | | $ | 1,922,317 | | | $ | 458,281 | | | $ | 514,522 | | |
Undistributed net investment income/(loss) at end of year | | $ | (87 | ) | | $ | (100 | ) | | $ | 17,710 | | | $ | 14,558 | | | $ | — | | | $ | — | | | $ | 376 | | | $ | 294 | | | $ | 7,856 | | | $ | 7,156 | | | $ | — | | | $ | — | | |
Distributions in excess of net investment income at end of year | | $ | — | | | $ | — | | | $ | — | | | $ | — | | | $ | — | | | $ | — | | | $ | — | | | $ | — | | | $ | — | | | $ | — | | | $ | — | | | $ | — | | |
See Notes to Financial Statements
183
184
Statements of Changes in Net Assets (cont'd)
Neuberger Berman Equity Funds
(000's omitted)
| | | SMALL CAP
GROWTH FUND | | SUSTAINABLE
EQUITY FUND | | VALUE FUND | |
| | | Year Ended | | Year Ended | | Year Ended | | Year Ended | | Year Ended | | Year Ended | |
| | | August 31,
2018 | | August 31,
2017 | | August 31,
2018 | | August 31,
2017 | | August 31,
2018 | | August 31,
2017 | |
Increase/(Decrease) in Net Assets: | |
From Operations: | |
Net investment income/(loss) (Note A) | | $ | (808 | ) | | $ | (597 | ) | | $ | 14,867 | | | $ | 16,348 | | | $ | 190 | | | $ | 226 | | |
Net realized gain/(loss) on investments (Note A) | | | 18,089 | | | | 14,135 | | | | 226,047 | | | | 145,869 | | | | 1,801 | | | | 2,275 | | |
Net increase from payments by affiliates (Note B) | | | — | | | | — | | | | — | | | | — | | | | — | | | | — | | |
Change in net unrealized appreciation/(depreciation) of
investments (Note A) | | | 10,573 | | | | 104 | | | | 164,375 | | | | 129,440 | | | | (264 | ) | | | 241 | | |
Net increase/(decrease) in net assets resulting from operations | | | 27,854 | | | | 13,642 | | | | 405,289 | | | | 291,657 | | | | 1,727 | | | | 2,742 | | |
Distributions to Shareholders From (Note A): | |
Net investment income: | |
Investor Class | | | — | | | | — | | | | (5,780 | ) | | | (4,454 | ) | | | — | | | | — | | |
Trust Class | | | — | | | | — | | | | (1,428 | ) | | | (2,808 | ) | | | — | | | | — | | |
Advisor Class | | | — | | | | — | | | | — | | | | — | | | | — | | | | — | | |
Institutional Class | | | — | | | | — | | | | (8,301 | ) | | | (6,309 | ) | | | (212 | ) | | | (84 | ) | |
Class A | | | — | | | | — | | | | (730 | ) | | | (1,404 | ) | | | (36 | ) | | | (25 | ) | |
Class C | | | — | | | | — | | | | (101 | ) | | | (226 | ) | | | (30 | ) | | | (19 | ) | |
Class R3 | | | — | | | | — | | | | (138 | ) | | | (316 | ) | | | — | | | | — | | |
Class R6 | | | — | | | | — | | | | (3,821 | ) | | | (2,872 | ) | | | — | | | | — | | |
Net realized gain on investments: | |
Investor Class | | | (749 | ) | | | — | | | | (38,305 | ) | | | (26,356 | ) | | | — | | | | — | | |
Trust Class | | | (49 | ) | | | — | | | | (12,216 | ) | | | (16,367 | ) | | | — | | | | — | | |
Advisor Class | | | (37 | ) | | | — | | | | — | | | | — | | | | — | | | | — | | |
Institutional Class | | | (180 | ) | | | — | | | | (44,279 | ) | | | (28,362 | ) | | | (753 | ) | | | — | | |
Class A | | | (48 | ) | | | — | | | | (6,220 | ) | | | (8,167 | ) | | | (195 | ) | | | — | | |
Class C | | | (42 | ) | | | — | | | | (3,045 | ) | | | (3,469 | ) | | | (264 | ) | | | — | | |
Class R3 | | | (24 | ) | | | — | | | | (2,065 | ) | | | (2,219 | ) | | | — | | | | — | | |
Class R6 | | | — | | | | — | | | | (18,997 | ) | | | (11,964 | ) | | | — | | | | — | | |
Total distributions to shareholders | | | (1,129 | ) | | | — | | | | (145,426 | ) | | | (115,293 | ) | | | (1,490 | ) | | | (128 | ) | |
From Fund Share Transactions (Note D): | |
Proceeds from shares sold: | |
Investor Class | | | 4,272 | | | | 2,555 | | | | 56,624 | | | | 62,120 | | | | — | | | | — | | |
Trust Class | | | 100 | | | | 142 | | | | 30,425 | | | | 34,508 | | | | — | | | | — | | |
Advisor Class | | | 833 | | | | 187 | | | | — | | | | — | | | | — | | | | — | | |
Institutional Class | | | 2,713 | | | | 3,103 | | | | 223,902 | | | | 212,400 | | | | 1,073 | | | | 7,485 | | |
Class A | | | 3,414 | | | | 1,104 | | | | 28,735 | | | | 30,087 | | | | 175 | | | | 5,668 | | |
Class C | | | 851 | | | | 551 | | | | 6,581 | | | | 10,542 | | | | 72 | | | | 2,937 | | |
Class R3 | | | 1,595 | | | | 444 | | | | 16,496 | | | | 14,587 | | | | — | | | | — | | |
Class R6 | | | — | | | | — | | | | 113,355 | | | | 91,598 | | | | — | | | | — | | |
See Notes to Financial Statements
185
186
Statements of Changes in Net Assets (cont'd)
Neuberger Berman Equity Funds (cont'd)
(000's omitted)
| | | SMALL CAP
GROWTH FUND | | SUSTAINABLE
EQUITY FUND | | VALUE FUND | |
| | | Year Ended | | Year Ended | | Year Ended | | Year Ended | | Year Ended | | Year Ended | |
| | | August 31,
2018 | | August 31,
2017 | | August 31,
2018 | | August 31,
2017 | | August 31,
2018 | | August 31,
2017 | |
Proceeds from reinvestment of dividends and distributions: | |
Investor Class | | | 736 | | | | — | | | | 43,405 | | | | 29,967 | | | | — | | | | — | | |
Trust Class | | | 47 | | | | — | | | | 13,567 | | | | 19,071 | | | | — | | | | — | | |
Advisor Class | | | 37 | | | | — | | | | — | | | | — | | | | — | | | | — | | |
Institutional Class | | | 177 | | | | — | | | | 48,046 | | | | 31,378 | | | | 965 | | | | 84 | | |
Class A | | | 47 | | | | — | | | | 6,304 | | | | 8,921 | | | | 231 | | | | 25 | | |
Class C | | | 41 | | | | — | | | | 2,762 | | | | 3,144 | | | | 294 | | | | 19 | | |
Class R3 | | | 17 | | | | — | | | | 2,076 | | | | 2,408 | | | | — | | | | — | | |
Class R6 | | | — | | | | — | | | | 22,818 | | | | 14,836 | | | | — | | | | — | | |
Payments for shares redeemed: | |
Investor Class | | | (6,627 | ) | | | (5,968 | ) | | | (231,636 | ) | | | (159,318 | ) | | | — | | | | — | | |
Trust Class | | | (797 | ) | | | (1,503 | ) | | | (73,283 | ) | | | (101,908 | ) | | | — | | | | — | | |
Advisor Class | | | (663 | ) | | | (937 | ) | | | — | | | | — | | | | — | | | | — | | |
Institutional Class | | | (2,711 | ) | | | (2,725 | ) | | | (270,163 | ) | | | (207,457 | ) | | | (5,765 | ) | | | (7,469 | ) | |
Class A | | | (2,793 | ) | | | (1,946 | ) | | | (39,847 | ) | | | (58,324 | ) | | | (823 | ) | | | (7,567 | ) | |
Class C | | | (543 | ) | | | (684 | ) | | | (9,878 | ) | | | (13,306 | ) | | | (676 | ) | | | (274 | ) | |
Class R3 | | | (934 | ) | | | (671 | ) | | | (27,732 | ) | | | (10,924 | ) | | | — | | | | — | | |
Class R6 | | | — | | | | — | | | | (208,482 | ) | | | (144,516 | ) | | | — | | | | — | | |
Net increase/(decrease) from Fund share transactions | | | (188 | ) | | | (6,348 | ) | | | (245,925 | ) | | | (130,186 | ) | | | (4,454 | ) | | | 908 | | |
Net Increase/(Decrease) in Net Assets | | | 26,537 | | | | 7,294 | | | | 13,938 | | | | 46,178 | | | | (4,217 | ) | | | 3,522 | | |
Net Assets: | |
Beginning of year | | | 73,550 | | | | 66,256 | | | | 2,393,024 | | | | 2,346,846 | | | | 16,999 | | | | 13,477 | | |
End of year | | $ | 100,087 | | | $ | 73,550 | | | $ | 2,406,962 | | | $ | 2,393,024 | | | $ | 12,782 | | | $ | 16,999 | | |
Undistributed net investment income/(loss) at end of year | | $ | — | | | $ | (405 | ) | | $ | 4,837 | | | $ | 10,306 | | | $ | 120 | | | $ | 210 | | |
Distributions in excess of net investment income at end of year | | $ | — | | | $ | — | | | $ | — | | | $ | — | | | $ | — | | | $ | — | | |
See Notes to Financial Statements
187
188
Notes to Financial Statements Equity Funds
Note A—Summary of Significant Accounting Policies:
1 General: Neuberger Berman Equity Funds (the "Trust") is a Delaware statutory trust organized pursuant to an Amended and Restated Trust Instrument dated March 27, 2014. The Trust is registered as an open-end management investment company under the Investment Company Act of 1940, as amended (the "1940 Act"), and its shares are registered under the Securities Act of 1933, as amended (the "1933 Act"). Neuberger Berman Dividend Growth Fund ("Dividend Growth"), Neuberger Berman Emerging Markets Equity Fund ("Emerging Markets Equity"), Neuberger Berman Equity Income Fund ("Equity Income"), Neuberger Berman Focus Fund ("Focus"), Neuberger Berman Genesis Fund ("Genesis"), Neuberger Berman Global Equity Fund ("Global Equity"), Neuberger Berman Global Real Estate Fund ("Global Real Estate"), Neuberger Berman Greater China Equity Fund ("Greater China Equity"), Neuberger Berman Guardian Fund ("Guardian"), Neuberger Berman International Equity Fund ("International Equity"), Neuberger Berman International Select Fund ("International Select"), Neuberger Berman International Small Cap Fund ("International Small Cap"), Neuberger Berman Intrinsic Value Fund ("Intrinsic Value"), Neuberger Berman Large Cap Value Fund ("Large Cap Value"), Neuberger Berman Mid Cap Growth Fund ("Mid Cap Growth"), Neuberger Berman Mid Cap Intrinsic Value Fund ("Mid Cap Intrinsic Value"), Neuberger Berman Multi-Cap Opportunities Fund ("Multi-Cap Opportunities"), Neuberger Berman Real Estate Fund ("Real Estate"), Neuberger Berman Small Cap Growth Fund ("Small Cap Growth"), Neuberger Berman Sustainable Equity Fund ("Sustainable Equity") (formerly, Neuberger Berman Socially Responsive Fund) and Neuberger Berman Value Fund ("Value") (each individually a "Fund," and collectively, the "Funds") are separate operating series of the Trust, each of which (except Greater China Equity and Real Estate) is diversified. Under the 1940 Act, the status of a Fund that was registered as non-diversified may, under certain circumstances, change to that of a diversified fund (Global Real Estate and Multi-Cap Opportunities became diversified in December 2017 and December 2012, respectively). Nine Funds offer Investor Class shares, eleven offer Trust Class shares, six offer Advisor Class shares, twenty-one offer Institutional Class shares, twenty offer Class A shares, twenty offer Class C shares, ten offer Class R3 shares and nine offer Class R6 shares. International Small Cap had no operations until December 8, 2016, other than matters relating to its organization and registration of shares under the 1933 Act. The Trust's Board of Trustees (the "Board") may establish additional series or classes of shares without the approval of shareholders.
A zero balance, if any, reflects an actual amount rounding to less than $1,000.
The assets of each Fund belong only to that Fund, and the liabilities of each Fund are borne solely by that Fund and no other.
Each Fund is an investment company and accordingly follows the investment company accounting and reporting guidance of the Financial Accounting Standards Board ("FASB") Accounting Standards Codification ("ASC") Topic 946 "Financial Services—Investment Companies."
The preparation of financial statements in accordance with U.S. generally accepted accounting principles ("GAAP") requires Neuberger Berman Investment Advisers LLC ("NBIA" or "Management") to make estimates and assumptions at the date of the financial statements. Actual results could differ from those estimates.
2 Portfolio valuation: In accordance with ASC 820 "Fair Value Measurement" ("ASC 820"), all investments held by each of the Funds are carried at the value that Management believes a Fund would receive upon selling an investment in an orderly transaction to an independent buyer in the principal or most advantageous market for the investment under current market conditions. Various inputs, including the volume and level of activity for the asset or liability in the market, are considered in valuing the Funds' investments, some of which are discussed below. Significant Management judgment may be necessary to value investments in accordance with ASC 820.
189
ASC 820 established a three-tier hierarchy of inputs to create a classification of value measurements for disclosure purposes. The three-tier hierarchy of inputs is summarized in the three broad Levels listed below.
• Level 1 – quoted prices in active markets for identical investments
• Level 2 – other observable inputs (including quoted prices for similar investments, interest rates, prepayment speeds, credit risk, amortized cost, etc.)
• Level 3 – unobservable inputs (including a Fund's own assumptions in determining the fair value of investments)
The inputs or methodology used for valuing an investment are not necessarily an indication of the risk associated with investing in those securities.
The value of the Funds' investments in equity securities, preferred stocks, master limited partnerships, exchange-traded funds, exchange-traded options purchased and options written, convertible preferred stocks and rights, for which market quotations are readily available, is generally determined by Management by obtaining valuations from independent pricing services based on the latest sale price quoted on a principal exchange or market for that security (Level 1 inputs). Securities traded primarily on the NASDAQ Stock Market are normally valued at the NASDAQ Official Closing Price ("NOCP") provided by NASDAQ each business day. The NOCP is the most recently reported price as of 4:00:02 p.m., Eastern Time, unless that price is outside the range of the "inside" bid and asked prices (i.e., the bid and asked prices that dealers quote to each other when trading for their own accounts); in that case, NASDAQ will adjust the price to equal the inside bid or asked price, whichever is closer. Because of delays in reporting trades, the NOCP may not be based on the price of the last trade to occur before the market closes. If there is no sale of a security on a particular day, the independent pricing services may value the security based on market quotations.
The value of the Funds' investments in convertible bonds is determined by Management primarily by obtaining valuations from independent pricing services based on readily available bid quotations or, if quotations are not available, by methods which include various considerations such as underlying stock data, conversion premiums, listed bond and preferred stock prices and other market information that may include trade execution data and sensitivity analysis and adjustments (generally Level 2 inputs), when available.
Management has developed a process to periodically review information provided by independent pricing services for all types of securities.
Certificates of deposit are valued at amortized cost (Level 2 inputs).
Investments in non-exchange traded investment companies are valued using the respective fund's daily calculated net asset value per share (Level 2 inputs).
If a valuation is not available from an independent pricing service, or if Management has reason to believe that the valuation received does not represent the amount a Fund might reasonably expect to receive on a current sale in an orderly transaction, Management seeks to obtain quotations from brokers or dealers (generally considered Level 2 or Level 3 inputs depending on the number of quotes available). If such quotations are not readily available, the security is valued using methods the Board has approved in the good-faith belief that the resulting valuation will reflect the fair value of the security. Numerous factors may be considered when determining the fair value of a security based on Level 2 or Level 3 inputs, including available analyst, media or other reports, securities within the same industry with recent highly correlated performance, trading in futures or American Depositary Receipts and whether the issuer of the security being fair valued has other securities outstanding.
The value of the Funds' investments in foreign securities is generally determined using the same valuation methods and inputs as other Fund investments, as discussed above. Foreign security prices expressed in local currency values are normally translated from the local currency into U.S. dollars using the exchange rates as of 4:00 p.m., Eastern Time on days the New York Stock Exchange ("NYSE") is open for business. The Board has approved the use of Interactive Data Pricing and Reference Data LLC ("Interactive") to assist in determining the fair value of foreign equity securities when changes in the value of a certain index suggest that the closing prices on the foreign
190
exchanges may no longer represent the amount that a Fund could expect to receive for those securities or on days when foreign markets are closed and U.S. markets are open. In each of these events, Interactive will provide adjusted prices for certain foreign equity securities using a statistical analysis of historical correlations of multiple factors (Level 2 inputs). The Board has also approved the use of Interactive to evaluate the prices of foreign debt securities as of the time as of which a Fund's share price is calculated. Interactive utilizes benchmark spread and yield curves and evaluates available market activity from the local close to the time as of which a Fund's share price is calculated (Level 2 inputs) to assist in determining prices for certain foreign debt securities. In the case of both foreign equity and foreign debt securities, in the absence of precise information about the market values of these foreign securities as of the time as of which a Fund's share price is calculated, the Board has determined on the basis of available data that prices adjusted or evaluated in this way are likely to be closer to the prices a Fund could realize on a current sale than are the prices of those securities established at the close of the foreign markets in which the securities primarily trade.
Fair value prices are necessarily estimates, and there is no assurance that such a price will be at or close to the price at which the security is next quoted or next trades.
3 Foreign currency translations: The accounting records of the Funds are maintained in U.S. dollars. Foreign currency amounts are normally translated into U.S. dollars using the exchange rate as of 4:00 p.m. Eastern Time, on days the NYSE is open for business, to determine the value of investments, other assets and liabilities. Purchase and sale prices of securities, and income and expenses, are translated into U.S. dollars at the prevailing rate of exchange on the respective dates of such transactions. Net unrealized foreign currency gain/(loss), if any, arises from changes in the value of assets and liabilities, other than investments in securities, as a result of changes in exchange rates and is stated separately in the Statements of Operations.
4 Securities transactions and investment income: Securities transactions are recorded on trade date for financial reporting purposes. Dividend income is recorded on the ex-dividend date or, for certain foreign dividends, as soon as the Fund becomes aware of the dividends. Non-cash dividends included in dividend income, if any, are recorded at the fair market value of the securities received. Interest income, including accretion of discount on securities for Equity Income, accretion of original issue discount, where applicable, and accretion of discount on short-term investments, is recorded on the accrual basis. Realized gains and losses from securities transactions and foreign currency transactions, if any, are recorded on the basis of identified cost and stated separately in the Statements of Operations. Included in net realized gain/(loss) on investments are proceeds from the settlements of class action litigation in which the Funds participated as class members. The amounts of such proceeds for the year ended August 31, 2018 were $199, $1,725, $9,494, $1,057, $8,420, $48,995, $220,972, $168,831, $81,812, $6,867, $51,093, $6,574, $10,721 and $828, for Emerging Markets Equity, Equity Income, Focus, Genesis, Guardian, International Equity, Intrinsic Value, Large Cap Value, Mid Cap Growth, Mid Cap Intrinsic Value, Multi-Cap Opportunities, Small Cap Growth, Sustainable Equity and Value, respectively.
5 Income tax information: Each Fund is treated as a separate entity for U.S. federal income tax purposes. It is the policy of each Fund to continue to qualify for treatment as a regulated investment company ("RIC") by complying with the requirements of the U.S. Internal Revenue Code applicable to RICs and to distribute substantially all of its net investment income and net realized capital gains to its shareholders. To the extent a Fund distributes substantially all of its net investment income and net realized capital gains to shareholders, no federal income or excise tax provision is required.
The Funds have adopted the provisions of ASC 740 "Income Taxes" ("ASC 740"). ASC 740 sets forth a minimum threshold for financial statement recognition of a tax position taken, or expected to be taken, in a tax return. The Funds recognize interest and penalties, if any, related to unrecognized tax positions as an income tax expense in the Statements of Operations. The Funds are subject to examination by U.S. federal and state tax authorities for returns filed for the tax years for which the applicable statutes of limitations have not yet expired. As of August 31, 2018, the Funds did not have any unrecognized tax positions.
191
At August 31, 2018, selected Fund information for all long security positions and derivative instruments (if any) for U.S. federal income tax purposes was as follows:
| (000's omitted) | | Cost | | Gross
Unrealized
Appreciation | | Gross
Unrealized
Depreciation | | Net Unrealized
Appreciation/
(Depreciation) | |
Dividend Growth | | $ | 52,346 | | | $ | 7,980 | | | $ | 1,241 | | | $ | 6,739 | | |
Emerging Markets Equity | | | 1,294,182 | | | | 169,757 | | | | 100,976 | | | | 68,781 | | |
Equity Income | | | 1,298,153 | | | | 325,386 | | | | 5,502 | | | | 319,884 | | |
Focus | | | 615,034 | | | | 156,915 | | | | 8,731 | | | | 148,184 | | |
Genesis | | | 5,707,912 | | | | 5,701,544 | | | | 99,843 | | | | 5,601,701 | | |
Global Equity | | | 4,111 | | | | 1,325 | | | | 78 | | | | 1,247 | | |
Global Real Estate | | | 2,800 | | | | 220 | | | | 71 | | | | 149 | | |
Greater China Equity | | | 86,364 | | | | 5,913 | | | | 5,854 | | | | 59 | | |
Guardian | | | 989,529 | | | | 361,671 | | | | 11,441 | | | | 350,230 | | |
International Equity | | | 1,873,522 | | | | 270,000 | | | | 53,288 | | | | 216,712 | | |
International Select | | | 156,520 | | | | 17,520 | | | | 4,493 | | | | 13,027 | | |
International Small Cap | | | 6,989 | | | | 444 | | | | 341 | | | | 103 | | |
Intrinsic Value | | | 527,991 | | | | 217,836 | | | | 23,654 | | | | 194,182 | | |
Large Cap Value | | | 1,327,570 | | | | 152,270 | | | | 8,801 | | | | 143,469 | | |
Mid Cap Growth | | | 1,053,795 | | | | 459,331 | | | | 13,635 | | | | 445,696 | | |
Mid Cap Intrinsic Value | | | 97,888 | | | | 22,249 | | | | 2,737 | | | | 19,512 | | |
Multi-Cap Opportunities | | | 1,191,683 | | | | 801,598 | | | | 7,630 | | | | 793,968 | | |
Real Estate | | | 424,293 | | | | 39,203 | | | | 4,794 | | | | 34,409 | | |
Small Cap Growth | | | 83,413 | | | | 20,463 | | | | 1,410 | | | | 19,053 | | |
Sustainable Equity | | | 1,583,233 | | | | 852,260 | | | | 41,800 | | | | 810,460 | | |
Value | | | 11,871 | | | | 1,185 | | | | 123 | | | | 1,062 | | |
Income distributions and capital gain distributions are determined in accordance with income tax regulations, which may differ from GAAP. These differences are primarily due to differing treatments of income and gains on various investment securities held by each Fund, timing differences and differing characterization of distributions made by each Fund. The Funds may also utilize earnings and profits distributed to shareholders on redemption of their shares as a part of the dividends-paid deduction for income tax purposes.
As determined on August 31, 2018, permanent differences resulting primarily from different book and tax accounting were reclassified at year end. Such differences may be attributed to the tax treatment of one or more of the following: net operating loss netted against short term capital gains, partnership adjustments, prior year real estate investment trusts ("REITs")/non REIT adjustments, non-taxable distributions from underlying investments, foreign currency gains and losses, gains and losses from passive foreign investment companies (PFICs), deemed distributions on shareholder redemptions, prior period adjustments, prior year partnership basis adjustments, return of capital distributions, tax adjustments related to REITs, redemptions in kind reversal, non-deductible
192
foreign capital gain taxes, class action payment and convertible bond adjustments. For the year ended August 31, 2018, the Funds recorded the following permanent reclassifications:
| | | Paid-in Capital | | Undistributed
Net Investment
Income/(Loss) | | Accumulated
Net Realized
Gains/(Losses)
on Investments | |
Dividend Growth | | $ | 189,275 | | | $ | (33,179 | ) | | $ | (156,096 | ) | |
Emerging Markets Equity | | | — | | | | (786,809 | ) | | | 786,809 | | |
Equity Income | | | 12,984,372 | | | | (843,824 | ) | | | (12,140,548 | ) | |
Focus | | | 4,606,442 | | | | 7,871 | | | | (4,614,313 | ) | |
Genesis | | | 475,154,590 | | | | (2,772,986 | ) | | | (472,381,604 | ) | |
Global Equity | | | 20,717 | | | | (1,472 | ) | | | (19,245 | ) | |
Global Real Estate | | | 1,726 | | | | 29,150 | | | | (30,876 | ) | |
Greater China Equity | | | 3,594,554 | | | | 571,555 | | | | (4,166,109 | ) | |
Guardian | | | 5,919,430 | | | | (1,094,403 | ) | | | (4,825,027 | ) | |
International Equity | | | 37,206,314 | | | | (580,575 | ) | | | (36,625,739 | ) | |
International Select | | | 21,992,369 | | | | (43,206 | ) | | | (21,949,163 | ) | |
International Small Cap | | | — | | | | (11,518 | ) | | | 11,518 | | |
Intrinsic Value | | | 20,359,455 | | | | 3,281,139 | | | | (23,640,594 | ) | |
Large Cap Value | | | 14,557,892 | | | | (125,828 | ) | | | (14,432,064 | ) | |
Mid Cap Growth | | | 11,952,539 | | | | 2,052,047 | | | | (14,004,586 | ) | |
Mid Cap Intrinsic Value | | | 528,075 | | | | (5,835 | ) | | | (522,240 | ) | |
Multi-Cap Opportunities | | | 14,775,843 | | | | — | | | | (14,775,843 | ) | |
Real Estate | | | 3,936,792 | | | | (382,840 | ) | | | (3,553,952 | ) | |
Small Cap Growth | | | 1,110,712 | | | | 1,212,789 | | | | (2,323,501 | ) | |
Sustainable Equity | | | 62,498,276 | | | | (37,380 | ) | | | (62,460,896 | ) | |
Value | | | 453,593 | | | | (1,427 | ) | | | (452,166 | ) | |
The tax character of distributions paid during the years ended August 31, 2018 and August 31, 2017 was as follows:
| | Distributions Paid From: | |
| | Ordinary Income | | Long-Term Capital Gain | | Return of Capital | | Total | |
| | 2018 | | 2017 | | 2018 | | 2017 | | 2018 | | 2017 | | 2018 | | 2017 | |
Dividend Growth | | $ | 505,410 | | | $ | 424,723 | | | $ | 624,343 | | | $ | — | | | $ | — | | | $ | — | | | $ | 1,129,753 | | | $ | 424,723 | | |
Emerging Markets
Equity | | | 6,837,681 | | | | 2,329,876 | | | | — | | | | — | | | | — | | | | — | | | | 6,837,681 | | | | 2,329,876 | | |
Equity Income | | | 45,816,093 | | | | 39,266,540 | | | | 63,269,560 | | | | 55,209,628 | | | | — | | | | — | | | | 109,085,653 | | | | 94,476,168 | | |
Focus | | | 33,895,157 | | | | 4,063,802 | | | | 29,442,423 | | | | 62,918,885 | | | | — | | | | — | | | | 63,337,580 | | | | 66,982,687 | | |
Genesis | | | 63,910,574 | | | | 43,971,041 | | | | 1,291,918,972 | | | | 727,986,249 | | | | — | | | | — | | | | 1,355,829,546 | | | | 771,957,290 | | |
Global Equity | | | 26,186 | | | | 20,547 | | | | — | | | | 29,438 | | | | — | | | | — | | | | 26,186 | | | | 49,985 | | |
Global Real Estate | | | 51,623 | | | | 93,198 | | | | 24,773 | | | | — | | | | — | | | | — | | | | 76,396 | | | | 93,198 | | |
Greater China
Equity | | | 8,294,757 | | | | 359,921 | | | | 6,092,283 | | | | — | | | | — | | | | — | | | | 14,387,040 | | | | 359,921 | | |
Guardian | | | 21,564,458 | | | | 9,321,117 | | | | 62,358,000 | | | | 125,688,817 | | | | — | | | | — | | | | 83,922,458 | | | | 135,009,934 | | |
International Equity | | | 16,661,495 | | | | 17,982,686 | | | | — | | | | — | | | | — | | | | — | | | | 16,661,495 | | | | 17,982,686 | | |
International Select | | | 2,625,735 | | | | 3,276,565 | | | | — | | | | — | | | | — | | | | — | | | | 2,625,735 | | | | 3,276,565 | | |
International
Small Cap | | | 112,414 | | | | — | (a) | | | — | | | | — | (a) | | | — | | | | — | (a) | | | 112,414 | | | | — | (a) | |
Intrinsic Value | | | 5,894,092 | | | | 2,063,474 | | | | 39,928,465 | | | | 7,721,689 | | | | — | | | | — | | | | 45,822,557 | | | | 9,785,163 | | |
Large Cap Value | | | 58,656,776 | | | | 35,514,012 | | | | 60,050,227 | | | | 22,223,369 | | | | — | | | | — | | | | 118,707,003 | | | | 57,737,381 | | |
193
| | Distributions Paid From: | |
| | Ordinary Income | | Long-Term Capital Gain | | Return of Capital | | Total | |
| | 2018 | | 2017 | | 2018 | | 2017 | | 2018 | | 2017 | | 2018 | | 2017 | |
Mid Cap Growth | | $ | 10,423,416 | | | $ | 2,131,672 | | | $ | 94,016,995 | | | $ | 45,259,954 | | | $ | — | | | $ | — | | | $ | 104,440,411 | | | $ | 47,391,626 | | |
Mid Cap Intrinsic
Value | | | 1,057,152 | | | | 558,393 | | | | 6,079,356 | | | | — | | | | — | | | | — | | | | 7,136,508 | | | | 558,393 | | |
Multi-Cap
Opportunities | | | 10,555,931 | | | | 15,250,634 | | | | 187,661,598 | | | | 48,714,824 | | | | — | | | | — | | | | 198,217,529 | | | | 63,965,458 | | |
Real Estate | | | 7,230,660 | | | | 17,350,353 | | | | 23,352,045 | | | | 61,552,296 | | | | — | | | | — | | | | 30,582,705 | | | | 78,902,649 | | |
Small Cap Growth | | | — | | | | — | | | | 1,129,421 | | | | — | | | | — | | | | — | | | | 1,129,421 | | | | — | | |
Sustainable Equity | | | 31,075,924 | | | | 18,388,890 | | | | 114,350,242 | | | | 96,903,943 | | | | — | | | | — | | | | 145,426,166 | | | | 115,292,833 | | |
Value | | | 1,066,913 | | | | 128,375 | | | | 423,175 | | | | — | | | | — | | | | — | | | | 1,490,088 | | | | 128,375 | | |
(a) Period from December 8, 2016 (Commencement of operations) to August 31, 2017.
As of August 31, 2018, the components of distributable earnings (accumulated losses) on a U.S. federal income tax basis were as follows:
| | Undistributed
Ordinary
Income | | Undistributed
Long-Term
Capital Gain | | Unrealized
Appreciation/
(Depreciation) | | Loss
Carryforwards
and Deferrals | | Other
Temporary
Differences | | Total | |
Dividend Growth | | $ | 877,894 | | | $ | 1,990,913 | | | $ | 6,738,906 | | | $ | — | | | $ | — | | | $ | 9,607,713 | | |
Emerging Markets
Equity | | | 8,368,162 | | | | — | | | | 68,598,350 | | | | (32,577,911 | ) | | | (24,392 | ) | | | 44,364,209 | | |
Equity Income | | | 3,293,463 | | | | 62,864,823 | | | | 319,878,855 | | | | — | | | | — | | | | 386,037,141 | | |
Focus | | | 18,915,201 | | | | 33,500,388 | | | | 148,183,737 | | | | — | | | | (93,052 | ) | | | 200,506,274 | | |
Genesis | | | 12,252,532 | | | | 716,337,104 | | | | 5,601,700,263 | | | | — | | | | — | | | | 6,330,289,899 | | |
Global Equity | | | 69,946 | | | | 202,361 | | | | 1,247,158 | | | | — | | | | — | | | | 1,519,465 | | |
Global Real Estate | | | 20,521 | | | | 30,668 | | | | 148,661 | | | | — | | | | (1,956 | ) | | | 197,894 | | |
Greater China Equity | | | 11,363,724 | | | | 13,298,695 | | | | 64,166 | | | | (8,149,349 | ) | | | (19,491 | ) | | | 16,557,745 | | |
Guardian | | | 21,328,032 | | | | 69,648,913 | | | | 350,230,942 | | | | — | | | | (152,856 | ) | | | 441,055,031 | | |
International Equity | | | 15,226,127 | | | | 4,706,282 | | | | 216,712,502 | | | | — | | | | (772 | ) | | | 236,644,139 | | |
International Select | | | 1,079,915 | | | | 1,682,043 | | | | 13,009,540 | | | | — | | | | (18,197 | ) | | | 15,753,301 | | |
International
Small Cap | | | 15,144 | | | | 96,500 | | | | 103,194 | | | | — | | | | — | | | | 214,838 | | |
Intrinsic Value | | | 10,369,130 | | | | 47,017,073 | | | | 194,182,125 | | | | — | | | | (87,292 | ) | | | 251,481,036 | | |
Large Cap Value | | | 42,752,899 | | | | 117,218,073 | | | | 143,468,307 | | | | — | | | | — | | | | 303,439,279 | | |
Mid Cap Growth | | | 20,884,520 | | | | 88,701,385 | | | | 445,696,405 | | | | — | | | | — | | | | 555,282,310 | | |
Mid Cap Intrinsic
Value | | | 2,732,619 | | | | 2,895,998 | | | | 19,512,200 | | | | — | | | | — | | | | 25,140,817 | | |
Multi-Cap
Opportunities | | | 7,855,793 | | | | 101,834,530 | | | | 793,968,140 | | | | — | | | | — | | | | 903,658,463 | | |
Real Estate | | | — | | | | 18,055,280 | | | | 34,409,454 | | | | — | | | | — | | | | 52,464,734 | | |
Small Cap Growth | | | 10,737,456 | | | | 5,142,866 | | | | 19,053,596 | | | | — | | | | — | | | | 34,933,918 | | |
Sustainable Equity | | | 4,836,081 | | | | 128,948,292 | | | | 810,473,210 | | | | — | | | | — | | | | 944,257,583 | | |
Value | | | 418,346 | | | | 901,545 | | | | 1,062,000 | | | | — | | | | — | | | | 2,381,891 | | |
The temporary differences between book basis and tax basis distributable earnings are primarily due to: losses disallowed and recognized on wash sales and straddles, capital loss carryforwards, unamortized organization
194
expenses, partnership basis adjustments, non-REIT income adjustments, convertible bond adjustments, non-REIT non-taxable adjustments, loss limitation due to ownership change and tax adjustments related to REITs, PFICs, partnerships and other investments.
To the extent each Fund's net realized capital gains, if any, can be offset by capital loss carryforwards, it is the policy of each Fund not to distribute such gains. The Regulated Investment Company Modernization Act of 2010 (the "Act") made changes to the capital loss carryforward rules allowing for RICs to carry forward capital losses indefinitely and to retain the character of capital loss carryforwards as short-term or long-term ("Post-Enactment"). As determined at August 31, 2018, the following Funds had unused capital loss carryforwards available for federal income tax purposes to offset net realized capital gains, if any, as follows:
| | | Post-Enactment (No Expiration Date) | |
| | | Long-Term | | Short-Term | |
Emerging Markets Equity | | $ | 11,086,286 | | | $ | 21,491,625 | | |
Greater China Equity | | | 1,175,932 | * | | | 6,973,417 | * | |
* Future utilization is limited under current tax regulations.
During the year ended August 31, 2018, Emerging Markets Equity, Global Equity, Greater China Equity, International Equity and International Select utilized capital loss carryforwards of $18,748,333, $77,199, $1,506,051, $74,012,423 and $23,982,792
6 Foreign taxes: Foreign taxes withheld, if any, represent amounts withheld by foreign tax authorities, net of refunds recoverable.
Emerging Markets Equity accrues capital gains tax on unrealized and realized gains for certain securities of issuers domiciled in India. At August 31, 2018, Emerging Markets Equity had accrued capital gains taxes of $199,844 which is reflected in the Statements of Assets and Liabilities. This amount reflects $139,255 and $60,589 of unrealized and realized gains respectively.
Effective November 17, 2014 ("Effective Date"), a change in the capital gains tax provision for Greater China Equity arose due to changes in the tax rules in the People's Republic of China ("PRC"). Capital gains derived from the trading of PRC equity investments after the Effective Date are temporarily exempt from PRC withholding tax. Prior to the Effective Date, Greater China Equity had accrued deferred capital gains tax on unrealized gains on participatory notes. During the year ended August 31, 2017, $6,061 of capital gains taxes on gains previously realized were reversed and are included as part of net realized gain/(loss) on investments in the Statements of Changes in Net Assets. The tax laws and regulations in the PRC are subject to change, possibly with retroactive effect.
7 Distributions to shareholders: Each Fund may earn income, net of expenses, daily on its investments.
Distributions from net investment income and net realized capital gains, if any, are generally distributed once a year (usually in December) and are recorded on the ex-date. However, Equity Income, Global Real Estate and Real Estate generally distribute net investment income, if any, at the end of each calendar quarter.
It is the policy of each of Equity Income, Global Real Estate, Intrinsic Value, Mid Cap Growth, Mid Cap Intrinsic Value, Real Estate and Sustainable Equity to pass through to its shareholders substantially all REIT distributions and other income it receives, less operating expenses. The distributions received from REITs are generally composed of income, capital gains, and/or return of REIT capital, but the REITs do not report this information to these Funds until the following calendar year. At August 31, 2018, these Funds estimated these amounts for the period January 1, 2018 to August 31, 2018 within the financial statements because the 2018 information is not available from the REITs until after each Fund's fiscal year-end. All estimates are based upon REIT information sources available to these Funds together with actual IRS Forms 1099-DIV received to date. For the year ended August 31, 2018, the character of distributions, if any, paid to shareholders of these Funds disclosed within the Statements of Changes in Net Assets is based on estimates made at that time. Based on past experience it is possible
195
that a portion of these Funds' distributions during the current fiscal year, if any, will be considered tax return of capital, but the actual amount of the tax return of capital, if any, is not determinable until after each Fund's fiscal year-end. After calendar year-end, when these Funds learn the nature of the distributions paid by REITs during that year, distributions previously identified as income are often recharacterized as return of capital and/or capital gain. After all applicable REITs have informed these Funds of the actual breakdown of distributions paid to these Funds during their fiscal year, estimates previously recorded are adjusted on the books of these Funds to reflect actual results. As a result, the composition of these Funds' distributions as reported herein may differ from the final composition determined after calendar year-end and reported to these Funds shareholders on IRS Form 1099-DIV.
8 Expense allocation: Certain expenses are applicable to multiple funds within the complex of related investment companies. Expenses directly attributable to a fund are charged to that fund. Expenses of the Trust that are not directly attributable to a particular series of the Trust (e.g., a Fund) are allocated among the series of the Trust, on the basis of relative net assets, except where a more appropriate allocation of expenses to each of the series can otherwise be made fairly. Expenses borne by the complex of related investment companies, which includes open-end and closed-end investment companies for which Management serves as investment manager, that are not directly attributable to a particular investment company in the complex (e.g., the Trust) or series thereof are allocated among the investment companies in the complex or series thereof on the basis of relative net assets, except where a more appropriate allocation of expenses to each of the investment companies in the complex or series thereof can otherwise be made fairly. Each Fund's expenses (other than those specific to each class) are allocated proportionally each day among the classes based upon the relative net assets of each class.
9 Investments in foreign securities: Investing in foreign securities may involve sovereign and other risks, in addition to the credit and market risks normally associated with domestic securities. These additional risks include the possibility of adverse political and economic developments (including political instability, nationalization, expropriation, or confiscatory taxation) and the potentially adverse effects of unavailability of public information regarding issuers, less governmental supervision and regulation of financial markets, reduced liquidity of certain financial markets, and the lack of uniform accounting, auditing, and financial reporting standards or the application of standards that are different or less stringent than those applied in the United States. Foreign securities also may experience greater price volatility, higher rates of inflation, and delays in settlement.
10 Investment company securities and exchange-traded funds: The Funds may invest in shares of other registered investment companies, including exchange-traded funds ("ETFs"), within the limitations prescribed by the 1940 Act or pursuant to an exemptive order from the Securities and Exchange Commission that permits the Funds to invest in both affiliated and unaffiliated investment companies, including ETFs, in excess of the limits in Section 12(d)(1)(A) of the 1940 Act, as amended, subject to the terms and conditions of such order. Some ETFs seek to track the performance of a particular market index. These indices include both broad-based market indices and more narrowly-based indices, including those relating to particular sectors, markets, regions or industries. However, some ETFs have an actively-managed investment objective. ETF shares are traded like traditional equity securities on a national securities exchange or NASDAQ. A Fund will indirectly bear its proportionate share of any management fees and other expenses paid by such other investment companies, which will increase expenses and decrease returns.
11 Derivative instruments: Certain Funds' use of derivatives during the year ended August 31, 2018, is described below. Please see the Schedule of Investments for each Fund's open positions in derivatives, if any, at August 31, 2018. The Funds have adopted the provisions of ASC 815 "Derivatives and Hedging" ("ASC 815"). The disclosure requirements of ASC 815 distinguish between derivatives that qualify for hedge accounting and those that do not. Because investment companies value their derivatives at fair value and recognize changes in fair value through the Statements of Operations, they do not qualify for hedge accounting. Accordingly, even though a Fund's investments in derivatives may represent economic hedges, they are considered non-hedge transactions for purposes of this disclosure.
196
Options: For the year ended August 31, 2018, Equity Income, Focus, Guardian, Large Cap Value and Value used options written and Focus and Guardian used options purchased. Equity Income used options written to generate incremental returns. Focus used options written to enhance total return; written calls were used for hedging purposes and to manage the risk profile of the Fund, and written puts were used to enhance returns and to gain exposure to certain securities. Focus used options purchased for hedging purposes and as a risk management tool. Guardian used options written to enhance total return, to gain exposure more efficiently than through a direct purchase of the underlying security, to gain exposure to securities, markets, sectors or geographical areas and to manage or adjust the risk profile of the Fund or the risk of individual positions. Guardian used options purchased to gain exposure more efficiently than through a direct purchase of the underlying security, to gain exposure to securities, markets, sectors or geographical areas and to manage or adjust the risk profile of the Fund or the risk of individual positions. Large Cap Value and Value used options written to enhance total return and to efficiently manage risk exposures.
Premiums paid by a fund upon purchasing a call or put option are recorded in the asset section of the Fund's Statement of Assets and Liabilities and are subsequently adjusted to the current market value. When an option is exercised, closed, or expired, a fund realizes a gain or loss and the asset is eliminated. For purchased call options, a fund's loss is limited to the amount of the option premium paid.
Premiums received by a fund upon writing a call option or a put option are recorded in the liability section of the Fund's Statement of Assets and Liabilities and are subsequently adjusted to the current market value. When an option is exercised, closed, or expired, a fund realizes a gain or loss and the liability is eliminated.
When a fund writes a call option on an underlying asset it does not own, its exposure on such an option is theoretically unlimited. When writing a covered call option, a fund, in return for the premium, gives up the opportunity for profit from a price increase in the underlying security above the exercise price, but conversely retains the risk of loss should the price of the security decline. When writing a put option, a fund, in return for the premium, takes the risk that it must purchase the underlying security at a price that may be higher than the current market price of the security. If a call or put option that a fund has written expires unexercised, a fund will realize a gain in the amount of the premium. All securities covering outstanding written options are held in escrow by the custodian bank.
At August 31, 2018, Equity Income, Focus, Guardian, Large Cap Value and Value had the following derivatives (which did not qualify as hedging instruments under ASC 815), grouped by primary risk exposure:
Asset Derivatives
(000's omitted)
Derivative Type | | Statements of Assets and Liabilities Location | | Equity Risk | | Total | |
Guardian | |
Options purchased | | Investments in securities, at value | | $ | 1,304 | | | $ | 1,304 | | |
Total Value—Assets | | | | $ | 1,304 | | | $ | 1,304 | | |
Liability Derivatives
(000's omitted)
Derivative Type | | Statements of Assets and Liabilities Location | | Equity Risk | | Total | |
Equity Income | |
Options written | | Option contracts written, at value | | $ | (1,554 | ) | | $ | (1,554 | ) | |
Total Value—Liabilities | | | | $ | (1,554 | ) | | $ | (1,554 | ) | |
197
Liability Derivatives
(000's omitted)
Derivative Type | | Statements of Assets and Liabilities Location | | Equity Risk | | Total | |
Guardian | |
Options written | | Option contracts written, at value | | $ | (748 | ) | | $ | (748 | ) | |
Total Value—Liabilities | | | | $ | (748 | ) | | $ | (748 | ) | |
The impact of the use of these derivative instruments on the Statements of Operations during the year ended August 31, 2018, was as follows:
Realized Gain/(Loss)
(000's omitted)
Derivative Type | | Statements of Operations Location | | Equity Risk | | Total | |
Equity Income | |
Options written | | Net realized gain/(loss) on: expiration or closing of
option contracts written | | $ | 1,385 | | | $ | 1,385 | | |
Total Realized Gain/(Loss) | | | | $ | 1,385 | | | $ | 1,385 | | |
Focus | |
Options purchased | | Net realized gain/(loss) on: transactions in investment
securities of unaffiliated issuers | | $ | (410 | ) | | $ | (410 | ) | |
Options written | | Net realized gain/(loss) on: expiration or closing of
option contracts written | | | (746 | ) | | | (746 | ) | |
Total Realized Gain/(Loss) | | | | $ | (1,156 | ) | | $ | (1,156 | ) | |
Guardian | |
Options purchased | | Net realized gain/(loss) on: transactions in investment
securities of unaffiliated issuers | | $ | 1,644 | | | $ | 1,644 | | |
Options written | | Net realized gain/(loss) on: expiration or closing of
option contracts written | | | 5,819 | | | | 5,819 | | |
Total Realized Gain/(Loss) | | | | $ | 7,463 | | | $ | 7,463 | | |
Large Cap Value | |
Options written | | Net realized gain/(loss) on: expiration or closing of
option contracts written | | $ | 1,613 | | | $ | 1,613 | | |
Total Realized Gain/(Loss) | | | | $ | 1,613 | | | $ | 1,613 | | |
Value | |
Options written | | Net realized gain/(loss) on: expiration or closing of
option contracts written | | $ | 18 | | | $ | 18 | | |
Total Realized Gain/(Loss) | | | | $ | 18 | | | $ | 18 | | |
Change in Appreciation/(Depreciation)
(000's omitted)
Derivative Type | | Statements of Operations Location | | Equity Risk | | Total | |
Equity Income | |
Options written | | Change in net unrealized appreciation/(depreciation) in
value of: option contracts written | | $ | (44 | ) | | $ | (44 | ) | |
Total Change in Appreciation/(Depreciation) | | | | $ | (44 | ) | | $ | (44 | ) | |
198
Change in Appreciation/(Depreciation)
(000's omitted)
Derivative Type | | Statements of Operations Location | | Equity Risk | | Total | |
Focus | |
Options purchased | | Change in net unrealized appreciation/(depreciation) in
value of: unaffiliated investment | | $ | 20 | | | $ | 20 | | |
Options written | | Change in net unrealized appreciation/(depreciation) in
value of: option contracts written | | | (62 | ) | | | (62 | ) | |
Total Change in Appreciation/(Depreciation) | | | | $ | (42 | ) | | $ | (42 | ) | |
Guardian | |
| Options purchased | | Change in net unrealized appreciation/(depreciation) in
value of: unaffiliated investment | | $ | 123 | | | $ | 123 | | |
| Options written | | Change in net unrealized appreciation/(depreciation) in
value of: option contracts written | | | 18 | | | | 18 | | |
Total Change in Appreciation/(Depreciation) | | | | $ | 141 | | | $ | 141 | | |
Large Cap Value | |
| Options written | | Change in net unrealized appreciation/(depreciation) in
value of: option contracts written | | $ | (51 | ) | | $ | (51 | ) | |
Total Change in Appreciation/(Depreciation) | | | | $ | (51 | ) | | $ | (51 | ) | |
Value | |
Options written | | Change in net unrealized appreciation/(depreciation) in
value of: option contracts written | | $ | (1 | ) | | $ | (1 | ) | |
Total Change in Appreciation/(Depreciation) | | | | $ | (1 | ) | | $ | (1 | ) | |
While the Funds may receive rights and warrants in connection with their investments in securities, these rights and warrants are not considered "derivative instruments" under ASC 815. Management has concluded that the Funds, except Equity Income, Focus, Guardian, Large Cap Value and Value did not hold any derivative instruments during the year ended August 31, 2018 that require additional disclosures pursuant to ASC 815.
12 Securities lending: Each Fund, using State Street Bank and Trust Company ("State Street") as its lending agent, may loan securities to qualified brokers and dealers in exchange for negotiated lender's fees. These fees, if any, would be disclosed within the Statements of Operations under the caption "Income from securities loaned—net" and are net of expenses retained by State Street as compensation for its services as lending agent. For the year ended August 31, 2018, the Funds listed below received income under the securities lending arrangement as follows:
(000's omitted) | |
Emerging Markets Equity | | $ | 5 | | |
Focus | | | 4 | | |
Guardian | | | 53 | | |
International Equity | | | 104 | | |
International Select | | | 9 | | |
International Small Cap | | | 0 | (a) | |
Large Cap Value | | | 11 | | |
Mid Cap Growth | | | 56 | | |
Small Cap Growth | | | 9 | | |
(a) Amount less than one thousand
199
The initial cash collateral received by a fund at the beginning of each transaction shall have a value equal to at least 102% of the prior day's market value of the loaned securities (105% in the case of international securities). Thereafter, the value of the cash collateral is monitored on a daily basis, and cash collateral is moved daily between a counterparty and a fund until the close of the transaction. A fund may only receive collateral in the form of cash (U.S. dollars). Cash collateral is generally invested in a money market fund registered under the 1940 Act that is managed by an affiliate of State Street. The risks associated with lending portfolio securities include, but are not limited to, possible delays in receiving additional collateral or in the recovery of the loaned securities. Any increase or decrease in the fair value of the securities loaned and any interest earned or dividends paid or owed on those securities during the term of the loan would accrue to the Fund.
As of August 31, 2018, the Funds listed below had outstanding loans of securities to certain approved brokers each with a value as follows:
(000's omitted) | | Value of
Securities
Loaned | |
Emerging Markets Equity | | $ | 1,338 | | |
International Equity | | | 18,373 | | |
International Select | | | 1,549 | | |
International Small Cap | | | 215 | | |
Mid Cap Growth | | | 11,387 | | |
Small Cap Growth | | | 1,855 | | |
As of August 31, 2018, the Funds listed below had outstanding loans of securities to certain approved brokers for which each received collateral as follows:
| | Remaining Contractual Maturity of the Agreements | |
| (000's omitted) | | Overnight
and
Continuous | | Less Than
30 Days | | Between 30 &
90 Days | | Greater Than
90 Days | | Total | |
| Securities Lending Transactions(a) | |
| Common Stocks | |
Emerging Markets Equity | | $ | 1,243 | | | $ | — | | | $ | — | | | $ | — | | | $ | 1,243 | | |
International Equity | | | 18,920 | | | | — | | | | — | | | | — | | | | 18,920 | | |
International Select | | | 1,586 | | | | — | | | | — | | | | — | | | | 1,586 | | |
International Small Cap | | | 225 | | | | — | | | | — | | | | — | | | | 225 | | |
Mid Cap Growth | | | 11,479 | | | | — | | | | — | | | | — | | | | 11,479 | | |
Small Cap Growth | | | 1,869 | | | | — | | | | — | | | | — | | | | 1,869 | | |
(a) Amounts represent the payable for loaned securities collateral received.
The Funds disclose both gross and net information for assets and liabilities related to derivatives, repurchase and reverse repurchase agreements, and securities lending and securities borrowing transactions that are eligible for offset or subject to an enforceable master netting or similar agreement. The following tables present Emerging Markets Equity's, International Equity's, International Select's, International Small Cap's, Mid Cap Growth's and Small Cap Growth's securities lending assets and liabilities by counterparty, net of amounts available for offset under a master netting or similar agreement and net of the related collateral received by Emerging Markets Equity, International Equity, International Select, International Small Cap, Mid Cap Growth and Small Cap Growth for assets and pledged by the Funds for liabilities as of August 31, 2018.
200
Description
(000's omitted) | | Gross Amounts of
Recognized Assets | | Gross Amounts Offset
in the Statements of
Assets and Liabilities | | Net Amounts of Assets
Presented in the Statements
of Assets and Liabilities | |
Emerging Markets Equity | |
Securities Lending | | $ | 1,338 | | | $ | — | | | $ | 1,338 | | |
Total | | $ | 1,338 | | | $ | — | | | $ | 1,338 | | |
International Equity | |
Securities Lending | | $ | 18,373 | | | $ | — | | | $ | 18,373 | | |
Total | | $ | 18,373 | | | $ | — | | | $ | 18,373 | | |
International Select | |
Securities Lending | | $ | 1,549 | | | $ | — | | | $ | 1,549 | | |
Total | | $ | 1,549 | | | $ | — | | | $ | 1,549 | | |
International Small Cap | |
Securities Lending | | $ | 215 | | | $ | — | | | $ | 215 | | |
Total | | $ | 215 | | | $ | — | | | $ | 215 | | |
Mid Cap Growth | |
Securities Lending | | $ | 11,387 | | | $ | — | | | $ | 11,387 | | |
Total | | $ | 11,387 | | | $ | — | | | $ | 11,387 | | |
Small Cap Growth | |
Securities Lending | | $ | 1,855 | | | $ | — | | | $ | 1,855 | | |
Total | | $ | 1,855 | | | $ | — | | | $ | 1,855 | | |
Gross Amounts Not Offset in the Statements of Assets and Liabilities
Counterparty
(000's omitted) | | Net Amounts of
Assets Presented in
the Statements of Assets
and Liabilities | | Liabilities
Available
for Offset | | Collateral
Received(a) | | Net Amount(b) | |
Emerging Markets Equity | |
State Street Bank and Trust Company | | $ | 1,338 | | | $ | — | | | $ | (1,243 | ) | | $ | 95 | | |
Total | | $ | 1,338 | | | $ | — | | | $ | (1,243 | ) | | $ | 95 | | |
International Equity | |
State Street Bank and Trust Company | | $ | 18,373 | | | $ | — | | | $ | (18,373 | ) | | $ | — | | |
Total | | $ | 18,373 | | | $ | — | | | $ | (18,373 | ) | | $ | — | | |
International Select | |
State Street Bank and Trust Company | | $ | 1,549 | | | $ | — | | | $ | (1,549 | ) | | $ | — | | |
Total | | $ | 1,549 | | | $ | — | | | $ | (1,549 | ) | | $ | — | | |
International Small Cap | |
State Street Bank and Trust Company | | $ | 215 | | | $ | — | | | $ | (215 | ) | | $ | — | | |
Total | | $ | 215 | | | $ | — | | | $ | (215 | ) | | $ | — | | |
Mid Cap Growth | |
State Street Bank and Trust Company | | $ | 11,387 | | | $ | — | | | $ | (11,387 | ) | | $ | — | | |
Total | | $ | 11,387 | | | $ | — | | | $ | (11,387 | ) | | $ | — | | |
Small Cap Growth | |
State Street Bank and Trust Company | | $ | 1,855 | | | $ | — | | | $ | (1,855 | ) | | $ | — | | |
Total | | $ | 1,855 | | | $ | — | | | $ | (1,855 | ) | | $ | — | | |
(a) Collateral received (or pledged) is limited to an amount not to exceed 100% of the net amount of assets (or liabilities) in the tables presented above.
(b) Net Amount represents amounts subject to loss at August 31, 2018, in the event of a counterparty failure.
201
13 Indemnifications: Like many other companies, the Trust's organizational documents provide that its officers ("Officers") and trustees ("Trustees") are indemnified against certain liabilities arising out of the performance of their duties to the Trust. In addition, both in some of its principal service contracts and in the normal course of its business, the Trust enters into contracts that provide indemnifications to other parties for certain types of losses or liabilities. The Trust's maximum exposure under these arrangements is unknown as this could involve future claims against the Trust.
14 In-kind subscription: Under certain circumstances, and when considered to be in the best interest of a Fund, a Fund may accept portfolio securities rather than cash as payment for the purchase of Fund shares (in-kind subscription). For financial reporting and tax purposes, the cost basis of contributed securities is equal to the market value of the securities, less any applicable foreign security taxes, on the date of contribution. In-kind subscriptions result in no gain or loss and no tax consequences for a Fund. During the year ended August 31, 2018, Genesis accepted $117,648,065 of in-kind subscriptions.
15 In-kind redemptions: In accordance with guidelines described in a Fund's prospectus and in accordance with procedures adopted by the Board, a Fund may distribute portfolio securities rather than cash as payment for a redemption of Fund shares ("in-kind redemption"). For financial reporting purposes, the Fund recognizes a gain on in-kind redemptions to the extent the value of the distributed securities on the date of redemption exceeds the cost of those securities. Gains and losses realized on in-kind redemptions are not recognized for tax purposes and are reclassified from undistributed realized gain/(loss) to paid-in capital. During the year ended August 31, 2017, Genesis realized a net gain of $129,534,612 on $216,264,840 of in-kind redemptions. During the year ended August 31, 2018, Genesis, International Equity, International Select and Sustainable Equity realized net gains of $266,798,836, $37,148,378, $22,204,328 and $39,512,498, respectively, on $475,404,196, $122,988,128, $70,976,192 and $103,913,811, respectively, of in-kind redemptions.
16 Other: All net investment income and realized and unrealized capital gains and losses of each Fund are allocated, on the basis of relative net assets, pro rata among its respective classes.
Note B—Investment Management Fees, Administration Fees, Distribution Arrangements, and Other Transactions with Affiliates:
Each Fund retains Management as its investment manager under a Management Agreement. For such investment management services, each Fund pays Management a fee according to the following table:
Investment Management Fee as a Percentage of Average Daily Net Assets:
| | First
$250
million | | Next
$250
million | | Next
$250
million | | Next
$250
million | | Next
$500
million | | Next
$500
million | | Next
$500
million | | Next
$1.5
billion | |
Thereafter | |
| For Genesis(a), Intrinsic Value, and Small Cap Growth: | |
| | | | 0.85 | % | | | 0.80 | % | | | 0.75 | % | | | 0.70 | % | | | 0.65 | % | | | 0.65 | % | | | 0.65 | % | | | 0.65 | % | | | 0.65 | % | |
For Emerging Markets Equity: | |
| | | | 1.00 | % | | | 0.975 | % | | | 0.95 | % | | | 0.925 | % | | | 0.90 | % | | | 0.875 | % | | | 0.875 | % | | | 0.875 | % | | | 0.85 | % | |
For Global Real Estate and Real Estate: | |
| | | | 0.80 | % | | | 0.80 | % | | | 0.80 | % | | | 0.80 | % | | | 0.80 | % | | | 0.80 | % | | | 0.80 | % | | | 0.80 | % | | | 0.80 | % | |
| For International Equity(b): | |
| | | | 0.85 | % | | | 0.825 | % | | | 0.80 | % | | | 0.775 | % | | | 0.75 | % | | | 0.725 | % | | | 0.725 | % | | | 0.70 | % | | | 0.70 | % | |
For International Small Cap: | |
| | | | 0.85 | % | | | 0.825 | % | | | 0.80 | % | | | 0.775 | % | | | 0.75 | % | | | 0.725 | % | | | 0.725 | % | | | 0.725 | % | | | 0.70 | % | |
| For Equity Income, Focus, Guardian, International Select, Large Cap Value, Mid Cap Growth, Mid Cap Intrinsic Value(b), Sustainable Equity and Value: | |
| | | | 0.55 | % | | | 0.525 | % | | | 0.50 | % | | | 0.475 | % | | | 0.45 | % | | | 0.425 | % | | | 0.425 | % | | | 0.425 | % | | | 0.40 | % | |
202
| | First
$250
million | | Next
$250
million | | Next
$250
million | | Next
$250
million | | Next
$500
million | | Next
$500
million | | Next
$500
million | | Next
$1.5
billion | |
Thereafter | |
For Multi-Cap Opportunities: | |
| | | | 0.60 | % | | | 0.575 | % | | | 0.55 | % | | | 0.525 | % | | | 0.50 | % | | | 0.475 | % | | | 0.475 | % | | | 0.475 | % | | | 0.45 | % | |
| For Global Equity(c): | |
| | | | 0.55 | % | | | 0.55 | % | | | 0.55 | % | | | 0.55 | % | | | 0.55 | % | | | 0.55 | % | | | 0.55 | % | | | 0.55 | % | | | 0.55 | % | |
For Greater China Equity: | |
| | | | 1.10 | % | | | 1.10 | % | | | 1.10 | % | | | 1.10 | % | | | 0.95 | % | | | 0.95 | % | | | 0.95 | % | | | 0.95 | % | | | 0.95 | % | |
For Dividend Growth: | |
| | | | 0.50 | % | | | 0.50 | % | | | 0.50 | % | | | 0.50 | % | | | 0.50 | % | | | 0.475 | % | | | 0.475 | % | | | 0.475 | % | | | 0.45 | % | |
(a) Effective April 25, 2017, the investment management fee is 0.60% of average daily net assets in excess of $14 billion for Genesis.
(b) Effective November 1, 2017, Management has voluntarily agreed to waive its management fee in the amount of 0.04% of the average daily net assets of International Equity (0.15% effective June 1, 2017). Effective November 1, 2017, Management has agreed to remove the voluntary waiver of its management fee of Mid Cap Intrinsic Value. Prior to that, Management voluntarily agreed to waive its management fee or to reimburse certain expenses for the following amounts, all as a percentage of average daily net assets, 0.19% effective December 19, 2016, 0.15% effective September 1, 2016. Management may, at its sole discretion, modify or terminate the voluntary waiver without notice to International Equity. For the year ended August 31, 2018, such waived fees amounted to $1,135,111 and $30,924 for International Equity and Mid Cap Intrinsic Value, respectively. These amounts are not subject to recovery by Management.
(c) Prior to December 8, 2016, Global Equity paid Management a fee at the annual rate of 0.750% of the first $250 million of the Fund's average daily net assets, 0.725% of the next $250 million, 0.700% of the next $250 million, 0.675% of the next $250 million, 0.650% of the next $500 million, 0.625% of the next $2.5 billion, and 0.600% of average daily net assets in excess of $4 billion.
Accordingly, for the year ended August 31, 2018, the investment management fee pursuant to the Management Agreement was equivalent to an annual effective rate of each Fund's average daily net assets, as follows:
| | Effective
Rate | | | | Effective
Rate | |
Dividend Growth | | | 0.50 | % | | International Small Cap | | | 0.85 | % | |
Emerging Markets Equity | | | 0.95 | % | | Intrinsic Value | | | 0.79 | % | |
Equity Income | | | 0.49 | % | | Large Cap Value | | | 0.49 | % | |
Focus | | | 0.52 | % | | Mid Cap Growth | | | 0.50 | % | |
Genesis | | | 0.66 | % | | Mid Cap Intrinsic Value | | | 0.55 | %(b) | |
Global Equity | | | 0.55 | % | | Multi-Cap Opportunities | | | 0.53 | % | |
Global Real Estate | | | 0.80 | % | | Real Estate | | | 0.80 | % | |
Greater China Equity | | | 1.10 | % | | Small Cap Growth | | | 0.85 | % | |
Guardian | | | 0.50 | % | | Sustainable Equity | | | 0.47 | % | |
International Equity | | | 0.78 | %(a) | | Value | | | 0.55 | % | |
International Select | | | 0.55 | % | | | | | | | |
(a) 0.72% annual effective net rate of the Fund's average daily net assets.
(b) 0.52% annual effective net rate of the Fund's average daily net assets.
203
Each Fund retains Management as its administrator under an Administration Agreement. Prior to July 1, 2017, each Fund paid Management an administration fee at the annual rate of 0.06% of its average daily net assets under this agreement in addition to an annual fee for certain class level services (specifically, 0.20% for each of Investor Class, Class A, Class C and Class R3; 0.34% for each of Trust Class and Advisor Class; 0.09% for Institutional Class and 0.02% for Class R6, each as a percentage of its average daily net assets). Effective July 1, 2017, the administration fee is only assessed at the Class level and each share class of a Fund, as applicable, pays Management an annual administration fee equal to the following: 0.26% for each of Investor Class, Class A, Class C and Class R3; 0.40% for each of Trust Class and Advisor Class; 0.15% for Institutional Class; and 0.08% for Class R6, each as a percentage of its average daily net assets. This did not result in an increase in the administration fee for any share class. Additionally, Management retains State Street as its sub-administrator under a Sub-Administration Agreement. Management pays State Street a fee for all services received under the Sub-Administration Agreement.
Management has contractually agreed to waive fees and/or reimburse certain expenses of the Investor Class of each of International Equity, Mid Cap Intrinsic Value and Small Cap Growth and the Trust Class, Advisor Class, Institutional Class, Class A, Class C, Class R3 and Class R6 of each Fund that offers those classes so that the total annual operating expenses of those classes do not exceed the expense limitations as detailed in the following table. These undertakings apply to a Fund's direct expenses and exclude interest, taxes, brokerage commissions, acquired fund fees and expenses, extraordinary expenses, and dividend and interest expenses relating to short sales, if any (commitment fees relating to borrowings are treated as interest for purposes of this exclusion) ("annual operating expenses"); consequently, net expenses may exceed the contractual expense limitations.
| | | | | | | Expenses Reimbursed in
Year Ended August 31, | |
| | | | | | 2016 | | 2017 | | 2018 | |
| | | | | | | Subject to Repayment until
August 31, | |
Class | | Contractual
Expense
Limitation(a) | | Expiration | | 2019 | | 2020 | | 2021 | |
Dividend Growth Institutional Class | | | 0.69 | % | | 8/31/21 | | $ | 215,047 | (b) | | $ | 258,355 | | | $ | 245,104 | | |
Dividend Growth Class A | | | 1.05 | % | | 8/31/21 | | | 9,994 | (b) | | | 8,372 | | | | 11,408 | | |
Dividend Growth Class C | | | 1.80 | % | | 8/31/21 | | | 9,444 | (b) | | | 20,432 | | | | 17,402 | | |
Dividend Growth Class R6 | | | 0.62 | % | | 8/31/21 | | | 15,585 | (b) | | | 484 | | | | 158 | | |
Emerging Markets Equity Institutional Class | | | 1.25 | % | | 8/31/21 | | | 528,129 | | | | 460,088 | | | | 231,794 | | |
Emerging Markets Equity Class A | | | 1.50 | % | | 8/31/21 | | | 54,600 | | | | 91,792 | | | | 92,255 | | |
Emerging Markets Equity Class C | | | 2.25 | % | | 8/31/21 | | | 13,399 | | | | 11,097 | | | | 12,202 | | |
Emerging Markets Equity Class R3 | | | 1.91 | % | | 8/31/21 | | | 1,403 | | | | 1,161 | | | | 24 | | |
Emerging Markets Equity Class R6 | | | 1.18 | % | | 8/31/21 | | | 127,742 | | | | 88,158 | | | | 7,769 | | |
Equity Income Institutional Class | | | 0.80 | % | | 8/31/21 | | | — | | | | — | | | | — | | |
Equity Income Class A | | | 1.16 | % | | 8/31/21 | | | — | | | | — | | | | — | | |
Equity Income Class C | | | 1.91 | % | | 8/31/21 | | | — | | | | — | | | | — | | |
Equity Income Class R3 | | | 1.41 | % | | 8/31/21 | | | — | | | | — | | | | — | | |
Focus Trust Class | | | 1.50 | % | | 8/31/21 | | | — | | | | — | | | | — | | |
Focus Advisor Class | | | 1.50 | % | | 8/31/22 | | | — | | | | — | | | | — | | |
Focus Institutional Class | | | 0.75 | % | | 8/31/21 | | | 755 | | | | 209 | | | | — | | |
Focus Class A | | | 1.11 | % | | 8/31/21 | | | 1,451 | | | | 580 | | | | 312 | | |
Focus Class C | | | 1.86 | % | | 8/31/21 | | | 893 | | | | 336 | | | | 137 | | |
204
| | | | | | | Expenses Reimbursed in
Year Ended August 31, | |
| | | | | | 2016 | | 2017 | | 2018 | |
| | | | | | Subject to Repayment until
August 31, | |
| Class | | Contractual
Expense
Limitation(a) | | Expiration | | 2019 | | 2020 | | 2021 | |
Genesis Trust Class | | | 1.50 | % | | 8/31/21 | | $ | — | | | $ | — | | | $ | — | | |
Genesis Advisor Class | | | 1.50 | % | | 8/31/22 | | | — | | | | — | | | | — | | |
Genesis Institutional Class | | | 0.85 | % | | 8/31/22 | | | — | | | | — | | | | — | | |
Genesis Class R6 | | | 0.75 | %(c) | | 8/31/21 | | | — | | | | — | | | | 872,606 | | |
Global Equity Institutional Class | | | 0.75 | %(d) | | 8/31/21 | | | 240,098 | | | | 239,590 | | | | 259,479 | | |
Global Equity Class A | | | 1.11 | %(d) | | 8/31/21 | | | 38,361 | | | | 24,676 | | | | 30,042 | | |
Global Equity Class C | | | 1.86 | %(d) | | 8/31/21 | | | 16,073 | | | | 8,112 | | | | 6,624 | | |
Global Real Estate Institutional Class | | | 1.00 | % | | 8/31/21 | | | 197,159 | | | | 202,973 | | | | 220,996 | | |
Global Real Estate Class A | | | 1.36 | % | | 8/31/21 | | | 64,529 | | | | 38,044 | | | | 30,605 | | |
Global Real Estate Class C | | | 2.11 | % | | 8/31/21 | | | 25,169 | | | | 25,661 | | | | 28,315 | | |
Greater China Equity Institutional Class | | | 1.50 | % | | 8/31/21 | | | 229,329 | | | | 164,058 | | | | 79,507 | | |
Greater China Equity Class A | | | 1.86 | % | | 8/31/21 | | | 7,590 | | | | 9,343 | | | | 28,600 | | |
Greater China Equity Class C | | | 2.61 | % | | 8/31/21 | | | 320 | | | | 321 | | | | 536 | | |
Guardian Trust Class | | | 1.50 | % | | 8/31/21 | | | — | | | | — | | | | — | | |
Guardian Advisor Class | | | 1.50 | % | | 8/31/22 | | | — | | | | — | | | | — | | |
Guardian Institutional Class | | | 0.75 | % | | 8/31/21 | | | — | | | | — | | | | — | | |
Guardian Class A | | | 1.11 | % | | 8/31/21 | | | — | | | | — | | | | — | | |
Guardian Class C | | | 1.86 | % | | 8/31/21 | | | — | | | | — | | | | — | | |
Guardian Class R3 | | | 1.36 | % | | 8/31/21 | | | 148 | | | | 88 | | | | 20 | | |
International Equity Investor Class | | | 1.40 | % | | 8/31/21 | | | — | | | | — | | | | — | | |
International Equity Trust Class | | | 2.00 | % | | 8/31/22 | | | — | | | | — | | | | — | | |
International Equity Institutional Class | | | 0.85 | % | | 8/31/22 | | | — | | | | — | | | | 1,186,829 | | |
International Equity Class A | | | 1.21 | % | | 8/31/21 | | | 10,042 | | | | — | | | | 59,940 | | |
International Equity Class C | | | 1.96 | % | | 8/31/21 | | | 2,521 | | | | — | | | | 12,453 | | |
International Equity Class R6 | | | 0.78 | % | | 8/31/21 | | | — | | | | — | | | | 146,965 | | |
International Select Trust Class | | | 1.15 | %(e) | | 8/31/21 | | | 12,258 | | | | 12,594 | | | | 18,565 | | |
International Select Institutional Class | | | 0.80 | %(e) | | 8/31/21 | | | 91,989 | | | | 141,368 | | | | 244,239 | | |
International Select Class A | | | 1.16 | %(e) | | 8/31/21 | | | 1,276 | | | | 3,083 | | | | 6,671 | | |
International Select Class C | | | 1.91 | %(e) | | 8/31/21 | | | 1,955 | | | | 2,278 | | | | 3,656 | | |
International Select Class R3 | | | 1.41 | %(e) | | 8/31/21 | | | 2,218 | | | | 3,513 | | | | 6,179 | | |
International Select Class R6 | | | 0.73 | %(e) | | 8/31/21 | | | — | | | | 1,906 | (g) | | | 13,555 | | |
International Small Cap Institutional Class | | | 1.05 | % | | 8/31/21 | | | — | | | | 159,342 | (h) | | | 257,330 | | |
International Small Cap Class A | | | 1.41 | % | | 8/31/21 | | | — | | | | 65,158 | (h) | | | 16,926 | | |
International Small Cap Class C | | | 2.16 | % | | 8/31/21 | | | — | | | | 25,270 | (h) | | | 8,534 | | |
International Small Cap Class R6 | | | 0.98 | % | | 8/31/21 | | | — | | | | 50,711 | (h) | | | 15,753 | | |
Intrinsic Value Institutional Class | | | 1.00 | % | | 8/31/21 | | | 357,588 | | | | 205,715 | | | | 93,339 | | |
Intrinsic Value Class A | | | 1.36 | % | | 8/31/21 | | | 58,200 | | | | 21,955 | | | | 8,931 | | |
205
| | | | | | Expenses Reimbursed in
Year Ended August 31, | |
| | | | | | 2016 | | 2017 | | 2018 | |
| | | | | | Subject to Repayment until
August 31, | |
| Class | | Contractual
Expense
Limitation(a) | | Expiration | | 2019 | | 2020 | | 2021 | |
Intrinsic Value Class C | | | 2.11 | % | | 8/31/21 | | $ | 22,495 | | | $ | 9,376 | | | $ | 4,695 | | |
Large Cap Value Trust Class | | | 1.50 | % | | 8/31/21 | | | — | | | | — | | | | — | | |
Large Cap Value Advisor Class | | | 1.50 | % | | 8/31/22 | | | — | | | | — | | | | — | | |
Large Cap Value Institutional Class | | | 0.70 | % | | 8/31/21 | | | — | | | | — | | | | — | | |
Large Cap Value Class A | | | 1.11 | % | | 8/31/21 | | | — | | | | — | | | | — | | |
Large Cap Value Class C | | | 1.86 | % | | 8/31/21 | | | — | | | | — | | | | — | | |
Large Cap Value Class R3 | | | 1.36 | % | | 8/31/21 | | | 126 | | | | 70 | | | | 3 | | |
Mid Cap Growth Trust Class | | | 1.50 | % | | 8/31/21 | | | — | | | | — | | | | — | | |
Mid Cap Growth Advisor Class | | | 1.50 | % | | 8/31/22 | | | — | | | | — | | | | — | | |
Mid Cap Growth Institutional Class | | | 0.75 | % | | 8/31/21 | | | — | | | | — | | | | — | | |
Mid Cap Growth Class A | | | 1.11 | % | | 8/31/21 | | | — | | | | — | | | | — | | |
Mid Cap Growth Class C | | | 1.86 | % | | 8/31/21 | | | — | | | | — | | | | — | | |
Mid Cap Growth Class R3 | | | 1.36 | % | | 8/31/21 | | | 865 | | | | 80 | | | | — | | |
Mid Cap Growth Class R6 | | | 0.68 | % | | 8/31/21 | | | — | | | | — | | | | — | | |
Mid Cap Intrinsic Value Investor Class | | | 1.50 | % | | 8/31/22 | | | — | | | | — | | | | — | | |
Mid Cap Intrinsic Value Trust Class | | | 1.25 | % | | 8/31/22 | | | 8,167 | | | | — | | | | 9,030 | | |
Mid Cap Intrinsic Value Institutional Class | | | 0.85 | % | | 8/31/21 | | | 24,711 | | | | 5,015 | | | | 61,130 | | |
Mid Cap Intrinsic Value Class A | | | 1.21 | % | | 8/31/21 | | | 17,891 | | | | 4,690 | | | | 13,941 | | |
Mid Cap Intrinsic Value Class C | | | 1.96 | % | | 8/31/21 | | | 4,388 | | | | 1,218 | | | | 3,434 | | |
Mid Cap Intrinsic Value Class R3 | | | 1.46 | % | | 8/31/21 | | | 1,736 | | | | 629 | | | | 3,348 | | |
Multi-Cap Opportunities Institutional Class | | | 1.00 | % | | 8/31/21 | | | — | | | | — | | | | — | | |
Multi-Cap Opportunities Class A | | | 1.36 | % | | 8/31/21 | | | — | | | | — | | | | — | | |
Multi-Cap Opportunities Class C | | | 2.11 | % | | 8/31/21 | | | — | | | | — | | | | — | | |
Real Estate Trust Class | | | 1.50 | %(f) | | 8/31/22 | | | — | | | | — | | | | — | | |
Real Estate Institutional Class | | | 0.85 | % | | 8/31/22 | | | 588,136 | | | | 418,961 | | | | 355,600 | | |
Real Estate Class A | | | 1.21 | % | | 8/31/21 | | | 261,138 | | | | 193,727 | | | | 145,323 | | |
Real Estate Class C | | | 1.96 | % | | 8/31/21 | | | 62,906 | | | | 47,102 | | | | 33,477 | | |
Real Estate Class R3 | | | 1.46 | % | | 8/31/21 | | | 50,219 | | | | 46,018 | | | | 39,632 | | |
Real Estate Class R6 | | | 0.78 | % | | 8/31/21 | | | 70,754 | | | | 85,221 | | | | 110,981 | | |
Small Cap Growth Investor Class | | | 1.30 | %(f) | | 8/31/22 | | | 243,435 | | | | 221,840 | | | | 248,687 | | |
Small Cap Growth Trust Class | | | 1.40 | %(f) | | 8/31/22 | | | 24,155 | | | | 19,320 | | | | 17,589 | | |
Small Cap Growth Advisor Class | | | 1.60 | %(f) | | 8/31/22 | | | 10,968 | | | | 8,126 | | | | 8,542 | | |
Small Cap Growth Institutional Class | | | 0.90 | % | | 8/31/21 | | | 94,448 | | | | 61,816 | | | | 81,452 | | |
Small Cap Growth Class A | | | 1.26 | % | | 8/31/21 | | | 26,066 | | | | 20,750 | | | | 25,896 | | |
Small Cap Growth Class C | | | 2.01 | % | | 8/31/21 | | | 13,463 | | | | 11,214 | | | | 14,080 | | |
Small Cap Growth Class R3 | | | 1.51 | % | | 8/31/21 | | | 8,774 | | | | 6,935 | | | | 9,492 | | |
Sustainable Equity Trust Class | | | 1.50 | % | | 8/31/21 | | | — | | | | — | | | | — | | |
206
| | | | | | Expenses Reimbursed in
Year Ended August 31, | |
| | | | | | 2016 | | 2017 | | 2018 | |
| | | | | | Subject to Repayment until
August 31, | |
| Class | | Contractual
Expense
Limitation(a) | | Expiration | | 2019 | | 2020 | | 2021 | |
Sustainable Equity Institutional Class | | | 0.75 | % | | 8/31/21 | | $ | — | | | $ | — | | | $ | — | | |
Sustainable Equity Class A | | | 1.11 | % | | 8/31/21 | | | — | | | | — | | | | — | | |
Sustainable Equity Class C | | | 1.86 | % | | 8/31/21 | | | — | | | | — | | | | — | | |
Sustainable Equity Class R3 | | | 1.36 | % | | 8/31/21 | | | — | | | | — | | | | — | | |
Sustainable Equity Class R6 | | | 0.68 | % | | 8/31/21 | | | — | | | | — | | | | — | | |
Value Institutional Class | | | 0.75 | %(f) | | 8/31/21 | | | 172,294 | | | | 165,002 | | | | 169,458 | | |
Value Class A | | | 1.11 | %(f) | | 8/31/21 | | | 87,821 | | | | 66,962 | | | | 50,138 | | |
Value Class C | | | 1.86 | %(f) | | 8/31/21 | | | 9,526 | | | | 41,187 | | | | 65,116 | | |
(a) Expense limitation per annum of the respective class's average daily net assets.
(b) Period from December 15, 2015 (Commencement of Operations) to August 31, 2016.
(c) Prior to October 16, 2017, the contractual expense limitation was 0.78%.
(d) Prior to December 8, 2016, the contractual expense limitation was 1.15% for Institutional Class, 1.51% for Class A and 2.26% for Class C.
(e) Prior to December 8, 2016, the contractual expense limitation was 1.25% for Trust Class, 0.90% for Institutional Class, 1.30% for Class A, 2.00% for Class C and 1.51% for Class R3 and 0.83% for Class R6.
(f) In addition, Management has voluntarily undertaken to waive current payment of fees and/or reimburse certain expenses, so that their Operating Expenses, per annum of their respective average daily net assets, are limited to the percentages indicated below:
Class | | Voluntary Expense
Limitation | | Expenses Voluntarily
Waived in Year
Ended August 31,
2018 Not Subject to
Repayment(i) | |
Real Estate Trust Class | | | 1.04 | % | | $ | 525,955 | | |
Small Cap Growth Investor Class | | | 1.21 | % | | | 50,426 | | |
Small Cap Growth Trust Class | | | 1.37 | % | | | 1,167 | | |
Small Cap Growth Advisor Class | | | 1.51 | % | | | 1,783 | | |
| | | Effective March 21, 2018 | | | |
| Value Institutional Class* | | | 0.70 | % | | | 4,647 | | |
| | | Effective March 21, 2018 | | | |
| Value Class A** | | | 1.08 | % | | | 1,171 | | |
| | | Effective March 21, 2018 | | | |
| Value Class C*** | | | 1.82 | % | | | 1,806 | | |
* 0.69% from January 2, 2018 to March 20, 2018; 0.70% from December 30, 2015 to January 1, 2018; 0.71% from September 18, 2015 to December 29, 2015; 0.70% from June 22, 2015 to September 17, 2015.
207
** 1.05% from September 12, 2017 to March 20, 2018; 1.07% from March 15, 2017 to September 11, 2017; 1.08% from June 15, 2016 to March 14, 2017; 1.09% from December 30, 2015 to June 14, 2016; 1.10% from September 18, 2015 to December 29, 2015; 1.07% from June 22, 2015 to September 17, 2015.
*** 1.80% from January 2, 2018 to March 20, 2018; 1.79% from September 12, 2017 to January 1, 2018; 1.82% from June 15, 2016 to September 11, 2017; 1.83% from September 18, 2015 to June 14, 2016; 1.82% from March 13, 2015 to September 17, 2015.
(g) Period from April 17, 2017 (Commencement of Operations) to August 31, 2017.
(h) Period from December 8, 2016 (Commencement of Operations) to August 31, 2017.
(i) Voluntary reimbursements are not subject to recovery by Management and are terminable by Management upon notice to Real Estate, Small Cap Growth and Value.
Each Fund has agreed that each of its respective classes will repay Management for fees and expenses waived or reimbursed for that class provided that repayment does not cause that class's annual operating expenses to exceed its contractual expense limitation in place at the time the fees and expenses were waived or reimbursed, or the expense limitation in place at the time the Fund repays Management, whichever is lower. Any such repayment must be made within three years after the year in which Management incurred the expense.
During the year ended August 31, 2018, the following classes repaid Management under their contractual expense limitation agreements as follows:
Class | | Expenses
Repaid to
Management | |
Focus Institutional Class | | $ | 315 | | |
Large Cap Value Institutional Class | | | 983 | | |
Mid Cap Growth Class C | | | 3,164 | | |
Mid Cap Growth Class R3 | | | 2,863 | | |
As previously announced, on April 28, 2017, NBIA retained Green Court Capital Management Limited as the sub-adviser to Greater China Equity, replacing Neuberger Berman Asia Limited. The nature and level of the services provided under the new Sub-Advisory Agreement are the same as under the previous Sub-Advisory Agreement, and there will be no change in the fees incurred by the Fund.
Each Fund also has a distribution agreement with Neuberger Berman BD LLC (the "Distributor") with respect to each class of shares. The Distributor acts as agent in arranging for the sale of class shares without sales commission or other compensation, except as described below, and bears the advertising and promotion expenses.
However, the Distributor receives fees from the Trust Class of each of Focus, Guardian, International Select, Large Cap Value, Mid Cap Intrinsic Value, Real Estate, Small Cap Growth and Sustainable Equity, and from the Advisor Class, Class A, Class C and Class R3 of each Fund that offers those classes under their distribution plans (each a "Plan", collectively, the "Plans") pursuant to Rule 12b-1 under the 1940 Act. The Plans provide that, as compensation for administrative and other services provided to these classes, the Distributor's activities and expenses related to the sale and distribution of these classes, and ongoing services provided to investors in these classes, the Distributor receives from each of these respective classes a fee at the annual rate of 0.10% of such Trust Class's, 0.25% of such Advisor Class's, 0.25% of such Class A's, 1.00% of such Class C's and 0.50% of such Class R3's average daily net assets. The Distributor receives this amount to provide distribution and shareholder servicing for these classes and pays a portion of it to institutions that provide such services. Those institutions may use the payments for, among other purposes, compensating employees engaged in sales and/or shareholder servicing. The amount of fees paid by each class during any year may be more or less than the cost of distribution and other services provided to that class. FINRA rules limit the amount of annual distribution fees that may be paid by a mutual fund and impose a ceiling on the cumulative distribution fees paid. The Trust's Plans comply with those rules.
208
Class A shares of each Fund are generally sold with an initial sales charge of up to 5.75% and no contingent deferred sales charge ("CDSC"), except that a CDSC of 1.00% applies to certain redemptions made within 18 months following purchases of $1 million or more without an initial sales charge. Class C shares of each Fund are sold with no initial sales charge and a 1.00% CDSC if shares are sold within one year after purchase.
For the year ended August 31, 2018, Neuberger Berman, acting as underwriter and broker-dealer, received net initial sales charges from the purchase of Class A shares and CDSCs from the redemption of Class A and Class C shares as follows:
| | | Underwriter | | Broker-Dealer | |
| | | Net Initial Sales
Charge | | CDSC | | Net Initial Sales
Charge | | CDSC | |
Dividend Growth Class A | | $ | 1,835 | | | $ | — | | | $ | — | | | $ | — | | |
Dividend Growth Class C | | | — | | | | 1,556 | | | | — | | | | — | | |
Emerging Markets Equity Class A | | | 35,657 | | | | — | | | | — | | | | — | | |
Emerging Markets Equity Class C | | | — | | | | 2,472 | | | | — | | | | — | | |
Equity Income Class A | | | 12,902 | | | | — | | | | — | | | | — | | |
Equity Income Class C | | | — | | | | 3,920 | | | | — | | | | — | | |
Focus Class A | | | 2,250 | | | | — | | | | — | | | | — | | |
Focus Class C | | | — | | | | 24 | | | | — | | | | — | | |
Global Equity Class A | | | 161 | | | | — | | | | — | | | | — | | |
Global Equity Class C | | | — | | | | — | | | | — | | | | — | | |
Global Real Estate Class A | | | 16 | | | | — | | | | — | | | | — | | |
Global Real Estate Class C | | | — | | | | — | | | | — | | | | — | | |
Greater China Equity Class A | | | 597 | | | | — | | | | — | | | | — | | |
Greater China Equity Class C | | | — | | | | 597 | | | | — | | | | — | | |
Guardian Class A | | | 1,061 | | | | — | | | | — | | | | — | | |
Guardian Class C | | | — | | | | — | | | | — | | | | — | | |
International Equity Class A | | | 6,261 | | | | — | | | | — | | | | — | | |
International Equity Class C | | | — | | | | 855 | | | | — | | | | — | | |
International Select Class A | | | 1,069 | | | | — | | | | — | | | | — | | |
International Select Class C | | | — | | | | 91 | | | | — | | | | — | | |
International Small Cap Class A | | | — | | | | — | | | | — | | | | — | | |
International Small Cap Class C | | | — | | | | — | | | | — | | | | — | | |
Intrinsic Value Class A | | | 7,514 | | | | — | | | | — | | | | — | | |
Intrinsic Value Class C | | | — | | | | 1,252 | | | | — | | | | — | | |
Large Cap Value Class A | | | 5,591 | | | | — | | | | — | | | | — | | |
Large Cap Value Class C | | | — | | | | 2,023 | | | | — | | | | — | | |
Mid Cap Growth Class A | | | 6,633 | | | | — | | | | — | | | | — | | |
Mid Cap Growth Class C | | | — | | | | 310 | | | | — | | | | — | | |
Mid Cap Intrinsic Value Class A | | | 2,493 | | | | — | | | | — | | | | — | | |
Mid Cap Intrinsic Value Class C | | | — | | | | 678 | | | | — | | | | — | | |
Multi-Cap Opportunities Class A | | | 26,656 | | | | — | | | | — | | | | — | | |
Multi-Cap Opportunities Class C | | | — | | | | 2,589 | | | | — | | | | — | | |
Real Estate Class A | | | 3,179 | | | | — | | | | — | | | | — | | |
Real Estate Class C | | | — | | | | 1,900 | | | | — | | | | — | | |
Small Cap Growth Class A | | | 4,926 | | | | — | | | | — | | | | — | | |
209
| | Underwriter | | Broker-Dealer | |
| | Net Initial Sales
Charge | | CDSC | | Net Initial Sales
Charge | | CDSC | |
Small Cap Growth Class C | | $ | — | | | $ | 505 | | | $ | — | | | $ | — | | |
Sustainable Equity Class A | | | 33,132 | | | | — | | | | — | | | | — | | |
Sustainable Equity Class C | | | — | | | | 6,551 | | | | — | | | | — | | |
Value Class A | | | 256 | | | | — | | | | — | | | | — | | |
Value Class C | | | — | | | | 583 | | | | — | | | | — | | |
For the year ended August 31, 2017, Equity Income and Focus each recorded a capital contribution from Management in the amount of $1,250 and $1,145, respectively. These amounts were paid in connection with losses incurred in the execution of a trade for Equity Income and valuation of a corporate action for Focus.
Note C—Securities Transactions:
During the year ended August 31, 2018, there were purchase and sale transactions of long-term securities (excluding option contracts) as follows:
(000's omitted) | | Purchases | | Sales | | (000's omitted) | | Purchases | | Sales | |
Dividend Growth | | $ | 38,726 | | | $ | 20,398 | | | International Small Cap | | $ | 7,330 | | | $ | 2,242 | | |
Emerging Markets Equity | | | 787,785 | | | | 260,661 | | | Intrinsic Value | | | 203,350 | | | | 475,143 | | |
Equity Income | | | 667,279 | | | | 853,139 | | | Large Cap Value | | | 2,131,931 | | | | 2,064,786 | | |
Focus | | | 432,828 | | | | 507,784 | | | Mid Cap Growth | | | 633,644 | | | | 633,991 | | |
Genesis | | | 1,373,279 | | | | 3,075,136 | | | Mid Cap Intrinsic Value | | | 46,342 | | | | 37,189 | | |
Global Equity | | | 1,784 | | | | 1,656 | | | Multi-Cap Opportunities | | | 437,880 | | | | 707,692 | | |
Global Real Estate | | | 1,314 | | | | 1,478 | | | Real Estate | | | 221,223 | | | | 289,692 | | |
Greater China Equity | | | 70,997 | | | | 120,447 | | | Small Cap Growth | | | 177,296 | | | | 179,428 | | |
Guardian | | | 501,059 | | | | 623,798 | | | Sustainable Equity | | | 276,776 | | | | 562,305 | | |
International Equity | | | 952,238 | | | | 610,817 | | | Value | | | 21,047 | | | | 24,670 | | |
International Select | | | 94,876 | | | | 106,667 | | | | | | | | | | | | |
During the year ended August 31, 2018, no brokerage commissions on securities transactions were paid to affiliated brokers.
Note D—Fund Share Transactions:
Share activity for the years ended August 31, 2018 and August 31, 2017 was as follows:
| | | For the Year Ended August 31, 2018 | | For the Year Ended August 31, 2017 | |
(000's omitted) | | Shares
Sold | | Shares
Issued on
Reinvestment
of Dividends
and
Distributions | | Shares
Redeemed | | Total | | Shares
Sold | | Shares
Issued on
Reinvestment
of Dividends
and
Distributions | | Shares
Redeemed | | Total | |
Dividend Growth | |
Institutional Class | | | 1,594 | | | | 79 | | | | (351 | ) | | | 1,322 | | | | 767 | | | | 36 | | | | (118 | ) | | | 685 | | |
Class A | | | 80 | | | | 3 | | | | (83 | ) | | | 0 | z | | | 128 | | | | 0 | z | | | (21 | ) | | | 107 | | |
Class C | | | 9 | | | | 3 | | | | (14 | ) | | | (2 | ) | | | 246 | | | | 0 | z | | | (5 | ) | | | 241 | | |
Class R6 | | | — | | | | — | | | | — | | | | — | | | | — | | | | — | | | | (3 | ) | | | (3 | ) | |
210
| | For the Year Ended August 31, 2018 | | For the Year Ended August 31, 2017 | |
| (000's omitted) | | Shares
Sold | | Shares
Issued on
Reinvestment
of Dividends
and
Distributions | | Shares
Redeemed | | Total | | Shares
Sold | | Shares
Issued on
Reinvestment
of Dividends
and
Distributions | | Shares
Redeemed | | Total | |
Emerging Markets Equity | |
Institutional Class | | | 37,031 | | | | 103 | | | | (11,160 | ) | | | 25,974 | | | | 19,088 | | | | 56 | | | | (5,318 | ) | | | 13,826 | | |
Class A | | | 2,007 | | | | 8 | | | | (2,817 | ) | | | (802 | ) | | | 2,492 | | | | 6 | | | | (679 | ) | | | 1,819 | | |
Class C | | | 296 | | | | 0 | z | | | (93 | ) | | | 203 | | | | 143 | | | | — | | | | (88 | ) | | | 55 | | |
Class R3 | | | 29 | | | | 0 | z | | | (30 | ) | | | (1 | ) | | | 39 | | | | 0 | z | | | (38 | ) | | | 1 | | |
Class R6 | | | 3,926 | | | | 54 | | | | (1,998 | ) | | | 1,982 | | | | 522 | | | | 39 | | | | (580 | ) | | | (19 | ) | |
Equity Income | |
Institutional Class | | | 11,451 | | | | 5,290 | | | | (22,423 | ) | | | (5,682 | ) | | | 22,175 | | | | 4,444 | | | | (20,756 | ) | | | 5,863 | | |
Class A | | | 1,919 | | | | 806 | | | | (4,251 | ) | | | (1,526 | ) | | | 2,203 | | | | 912 | | | | (7,356 | ) | | | (4,241 | ) | |
Class C | | | 713 | | | | 900 | | | | (4,985 | ) | | | (3,372 | ) | | | 1,365 | | | | 885 | | | | (7,568 | ) | | | (5,318 | ) | |
Class R3 | | | 79 | | | | 4 | | | | (55 | ) | | | 28 | | | | 24 | | | | 6 | | | | (107 | ) | | | (77 | ) | |
| Focus(d) | |
Investor Class | | | 140 | | | | 1,793 | | | | (2,136 | ) | | | (203 | ) | | | 217 | | | | 2,051 | | | | (2,278 | ) | | | (10 | ) | |
Trust Class | | | 82 | | | | 305 | | | | (533 | ) | | | (146 | ) | | | 45 | | | | 365 | | | | (669 | ) | | | (259 | ) | |
Advisor Class | | | 11 | | | | 41 | | | | (64 | ) | | | (12 | ) | | | 11 | | | | 34 | | | | (38 | ) | | | 7 | | |
Institutional Class | | | 95 | | | | 22 | | | | (101 | ) | | | 16 | | | | 103 | | | | 21 | | | | (104 | ) | | | 20 | | |
Class A | | | 29 | | | | 13 | | | | (29 | ) | | | 13 | | | | 8 | | | | 18 | | | | (29 | ) | | | (3 | ) | |
Class C | | | 3 | | | | 23 | | | | (16 | ) | | | 10 | | | | 8 | | | | 16 | | | | (21 | ) | | | 3 | | |
| Genesis(c) | |
Investor Class | | | 2,128 | | | | 3,861 | | | | (6,999 | ) | | | (1,010 | ) | | | 3,441 | | | | 3,171 | | | | (5,788 | ) | | | 824 | | |
Trust Class | | | 2,164 | | | | 3,263 | | | | (8,346 | ) | | | (2,919 | ) | | | 2,542 | | | | 1,689 | | | | (8,573 | ) | | | (4,342 | ) | |
Advisor Class | | | 505 | | | | 428 | | | | (1,364 | ) | | | (431 | ) | | | 811 | | | | 629 | | | | (2,240 | ) | | | (800 | ) | |
Institutional Class | | | 8,421 | | | | 7,259 | | | | (27,980 | ) | | | (12,300 | ) | | | 13,326 | | | | 3,561 | | | | (16,214 | ) | | | 673 | | |
Class R6 | | | 14,262 | | | | 8,129 | | | | (16,751 | ) | | | 5,640 | | | | 11,218 | | | | 4,024 | | | | (13,560 | ) | | | 1,682 | | |
Global Equity | |
Institutional Class | | | 5 | | | | 3 | | | | (14 | ) | | | (6 | ) | | | 25 | | | | 7 | | | | (21 | ) | | | 11 | | |
Class A | | | 83 | | | | 0 | z | | | (75 | ) | | | 8 | | | | 8 | | | | 1 | | | | (43 | ) | | | (34 | ) | |
Class C | | | 4 | | | | — | | | | (3 | ) | | | 1 | | | | 1 | | | | 0 | z | | | (10 | ) | | | (9 | ) | |
Global Real Estate | |
Institutional Class | | | 5 | | | | 6 | | | | (4 | ) | | | 7 | | | | — | | | | 8 | | | | (7 | ) | | | 1 | | |
Class A | | | 3 | | | | 0 | z | | | (20 | ) | | | (17 | ) | | | 21 | | | | 0 | z | | | (40 | ) | | | (19 | ) | |
Class C | | | 3 | | | | 0 | z | | | — | | | | 3 | | | | — | | | | 0 | z | | | (2 | ) | | | (2 | ) | |
Greater China Equity | |
Institutional Class | | | 343 | | | | 732 | | | | (2,643 | ) | | | (1,568 | ) | | | 1,738 | | | | 10 | | | | (2,950 | ) | | | (1,202 | ) | |
Class A | | | 296 | | | | 146 | | | | (1,120 | ) | | | (678 | ) | | | 1,367 | | | | 0 | z | | | (182 | ) | | | 1,185 | | |
Class C | | | 1 | | | | 2 | | | | (5 | ) | | | (2 | ) | | | 21 | | | | — | | | | (14 | ) | | | 7 | | |
211
| | For the Year Ended August 31, 2018 | | For the Year Ended August 31, 2017 | |
| (000's omitted) | | Shares
Sold | | Shares
Issued on
Reinvestment
of Dividends
and
Distributions | | Shares
Redeemed | | Total | | Shares
Sold | | Shares
Issued on
Reinvestment
of Dividends
and
Distributions | | Shares
Redeemed | | Total | |
| Guardian(d) | |
Investor Class | | | 662 | | | | 3,906 | | | | (5,244 | ) | | | (676 | ) | | | 644 | | | | 7,181 | | | | (6,730 | ) | | | 1,095 | | |
Trust Class | | | 197 | | | | 333 | | | | (870 | ) | | | (340 | ) | | | 278 | | | | 728 | | | | (1,610 | ) | | | (604 | ) | |
Advisor Class | | | 1 | | | | 1 | | | | (0 | )z | | | 2 | | | | 1 | | | | 2 | | | | (8 | ) | | | (5 | ) | |
Institutional Class | | | 903 | | | | 277 | | | | (1,054 | ) | | | 126 | | | | 1,076 | | | | 472 | | | | (1,037 | ) | | | 511 | | |
Class A | | | 56 | | | | 30 | | | | (118 | ) | | | (32 | ) | | | 86 | | | | 58 | | | | (184 | ) | | | (40 | ) | |
Class C | | | 9 | | | | 7 | | | | (17 | ) | | | (1 | ) | | | 23 | | | | 15 | | | | (80 | ) | | | (42 | ) | |
Class R3 | | | 3 | | | | 1 | | | | (9 | ) | | | (5 | ) | | | 12 | | | | 3 | | | | (22 | ) | | | (7 | ) | |
| International Equity(d) | |
Investor Class | | | 429 | | | | 21 | | | | (1,121 | ) | | | (671 | ) | | | 491 | | | | 42 | | | | (1,298 | ) | | | (765 | ) | |
Trust Class | | | 471 | | | | 5 | | | | (999 | ) | | | (523 | ) | | | 578 | | | | 14 | | | | (1,412 | ) | | | (820 | ) | |
Institutional Class | | | 48,906 | | | | 889 | | | | (29,829 | ) | | | 19,966 | | | | 40,572 | | | | 1,388 | | | | (34,232 | ) | | | 7,728 | | |
Class A | | | 1,947 | | | | 2 | | | | (2,560 | ) | | | (611 | ) | | | 2,525 | | | | 8 | | | | (6,421 | ) | | | (3,888 | ) | |
Class C | | | 305 | | | | — | | | | (265 | ) | | | 40 | | | | 239 | | | | — | | | | (529 | ) | | | (290 | ) | |
Class R6 | | | 6,784 | | | | 158 | | | | (11,940 | ) | | | (4,998 | ) | | | 7,739 | | | | 73 | | | | (1,397 | ) | | | 6,415 | | |
International Select | |
Trust Class | | | 11 | | | | 5 | | | | (62 | ) | | | (46 | ) | | | 26 | | | | 8 | | | | (95 | ) | | | (61 | ) | |
Institutional Class | | | 1,370 | | | | 180 | | | | (7,831 | ) | | | (6,281 | ) | | | 4,446 | | | | 295 | | | | (6,957 | ) | | | (2,216 | ) | |
Class A | | | 102 | | | | 3 | | | | (197 | ) | | | (92 | ) | | | 176 | | | | 4 | | | | (213 | ) | | | (33 | ) | |
Class C | | | 12 | | | | 0 | z | | | (27 | ) | | | (15 | ) | | | 47 | | | | 0 | z | | | (150 | ) | | | (103 | ) | |
Class R3 | | | 74 | | | | 2 | | | | (210 | ) | | | (134 | ) | | | 202 | | | | 3 | | | | (151 | ) | | | 54 | | |
Class R6 | | | 14 | | | | 9 | | | | (74 | ) | | | (51 | ) | | | 825 | | | | — | | | | (51 | ) | | | 774 | (a) | |
International Small Cap | |
Institutional Class | | | 414 | | | | 5 | | | | (6 | ) | | | 413 | | | | 64 | | | | — | | | | — | | | | 64 | (b) | |
Class A | | | 5 | | | | 1 | | | | (14 | ) | | | (8 | ) | | | 55 | | | | — | | | | (31 | ) | | | 24 | (b) | |
Class C | | | 2 | | | | — | | | | — | | | | 2 | | | | 11 | | | | — | | | | (1 | ) | | | 10 | (b) | |
Class R6 | | | — | | | | — | | | | — | | | | — | | | | 20 | | | | — | | | | — | | | | 20 | (b) | |
Intrinsic Value | |
Institutional Class | | | 10,567 | | | | 2,425 | | | | (28,642 | ) | | | (15,650 | ) | | | 18,969 | | | | 521 | | | | (10,867 | ) | | | 8,623 | | |
Class A | | | 706 | | | | 56 | | | | (807 | ) | | | (45 | ) | | | 1,026 | | | | 40 | | | | (3,161 | ) | | | (2,095 | ) | |
Class C | | | 225 | | | | 75 | | | | (351 | ) | | | (51 | ) | | | 229 | | | | 22 | | | | (669 | ) | | | (418 | ) | |
| Large Cap Value(c) | |
Investor Class | | | 257 | | | | 2,893 | | | | (4,192 | ) | | | (1,042 | ) | | | 593 | | | | 1,274 | | | | (3,403 | ) | | | (1,536 | ) | |
Trust Class | | | 127 | | | | 190 | | | | (609 | ) | | | (292 | ) | | | 221 | | | | 145 | | | | (687 | ) | | | (321 | ) | |
Advisor Class | | | 173 | | | | 359 | | | | (1,279 | ) | | | (747 | ) | | | 440 | | | | 359 | | | | (1,196 | ) | | | (397 | ) | |
Institutional Class | | | 1,178 | | | | 221 | | | | (956 | ) | | | 443 | | | | 1,385 | | | | 80 | | | | (903 | ) | | | 562 | | |
Class A | | | 58 | | | | 6 | | | | (59 | ) | | | 5 | | | | 90 | | | | 6 | | | | (88 | ) | | | 8 | | |
Class C | | | 13 | | | | 4 | | | | (29 | ) | | | (12 | ) | | | 37 | | | | 4 | | | | (42 | ) | | | (1 | ) | |
Class R3 | | | 5 | | | | 1 | | | | (2 | ) | | | 4 | | | | 6 | | | | 0 | z | | | (2 | ) | | | 4 | | |
212
| | For the Year Ended August 31, 2018 | | For the Year Ended August 31, 2017 | |
| (000's omitted) | | Shares
Sold | | Shares
Issued on
Reinvestment
of Dividends
and
Distributions | | Shares
Redeemed | | Total | | Shares
Sold | | Shares
Issued on
Reinvestment
of Dividends
and
Distributions | | Shares
Redeemed | | Total | |
| Mid Cap Growth(c) | |
Investor Class | | | 786 | | | | 2,564 | | | | (2,772 | ) | | | 578 | | | | 703 | | | | 1,440 | | | | (2,980 | ) | | | (837 | ) | |
Trust Class | | | 1,520 | | | | 365 | | | | (868 | ) | | | 1,017 | | | | 731 | | | | 136 | | | | (2,452 | ) | | | (1,585 | ) | |
Advisor Class | | | 357 | | | | 54 | | | | (346 | ) | | | 65 | | | | 230 | | | | 19 | | | | (287 | ) | | | (38 | ) | |
Institutional Class | | | 5,005 | | | | 1,900 | | | | (8,119 | ) | | | (1,214 | ) | | | 4,987 | | | | 1,034 | | | | (7,323 | ) | | | (1,302 | ) | |
Class A | | | 807 | | | | 258 | | | | (1,718 | ) | | | (653 | ) | | | 748 | | | | 149 | | | | (3,090 | ) | | | (2,193 | ) | |
Class C | | | 90 | | | | 57 | | | | (120 | ) | | | 27 | | | | 79 | | | | 20 | | | | (269 | ) | | | (170 | ) | |
Class R3 | | | 293 | | | | 70 | | | | (345 | ) | | | 18 | | | | 273 | | | | 25 | | | | (447 | ) | | | (149 | ) | |
Class R6 | | | 9,212 | | | | 1,651 | | | | (3,366 | ) | | | 7,497 | | | | 4,938 | | | | 728 | | | | (2,391 | ) | | | 3,275 | | |
Mid Cap Intrinsic Value | |
Investor Class | | | 43 | | | | 112 | | | | (246 | ) | | | (91 | ) | | | 73 | | | | 9 | | | | (249 | ) | | | (167 | ) | |
Trust Class | | | 21 | | | | 47 | | | | (123 | ) | | | (55 | ) | | | 30 | | | | 4 | | | | (87 | ) | | | (53 | ) | |
Institutional Class | | | 1,167 | | | | 115 | | | | (376 | ) | | | 906 | | | | 405 | | | | 9 | | | | (297 | ) | | | 117 | | |
Class A | | | 208 | | | | 32 | | | | (181 | ) | | | 59 | | | | 119 | | | | 4 | | | | (483 | ) | | | (360 | ) | |
Class C | | | 18 | | | | 9 | | | | (42 | ) | | | (15 | ) | | | 29 | | | | 0 | z | | | (124 | ) | | | (95 | ) | |
Class R3 | | | 63 | | | | 5 | | | | (26 | ) | | | 42 | | | | 24 | | | | 0 | z | | | (32 | ) | | | (8 | ) | |
Multi-Cap Opportunities | |
Institutional Class | | | 8,019 | | | | 9,663 | | | | (22,825 | ) | | | (5,143 | ) | | | 9,649 | | | | 669 | | | | (21,655 | ) | | | (11,337 | ) | |
Class A | | | 1,915 | | | | 285 | | | | (1,291 | ) | | | 909 | | | | 1,452 | | | | 118 | | | | (3,263 | ) | | | (1,693 | ) | |
Class C | | | 371 | | | | 214 | | | | (514 | ) | | | 71 | | | | 374 | | | | 60 | | | | (722 | ) | | | (288 | ) | |
Real Estate | |
Trust Class | | | 1,148 | | | | 689 | | | | (3,405 | ) | | | (1,568 | ) | | | 916 | | | | 1,899 | | | | (5,271 | ) | | | (2,456 | ) | |
Institutional Class | | | 4,745 | | | | 802 | | | | (6,386 | ) | | | (839 | ) | | | 3,910 | | | | 2,045 | | | | (8,926 | ) | | | (2,971 | ) | |
Class A | | | 1,168 | | | | 338 | | | | (3,275 | ) | | | (1,769 | ) | | | 1,582 | | | | 1,022 | | | | (4,282 | ) | | | (1,678 | ) | |
Class C | | | 18 | | | | 60 | | | | (467 | ) | | | (389 | ) | | | 73 | | | | 204 | | | | (815 | ) | | | (538 | ) | |
Class R3 | | | 369 | | | | 75 | | | | (504 | ) | | | (60 | ) | | | 419 | | | | 211 | | | | (876 | ) | | | (246 | ) | |
Class R6 | | | 2,267 | | | | 242 | | | | (1,612 | ) | | | 897 | | | | 835 | | | | 437 | | | | (906 | ) | | | 366 | | |
| Small Cap Growth(d) | |
Investor Class | | | 112 | | | | 21 | | | | (177 | ) | | | (44 | ) | | | 86 | | | | — | | | | (202 | ) | | | (116 | ) | |
Trust Class | | | 3 | | | | 1 | | | | (22 | ) | | | (18 | ) | | | 4 | | | | — | | | | (52 | ) | | | (48 | ) | |
Advisor Class | | | 21 | | | | 1 | | | | (17 | ) | | | 5 | | | | 6 | | | | — | | | | (31 | ) | | | (25 | ) | |
Institutional Class | | | 70 | | | | 5 | | | | (70 | ) | | | 5 | | | | 104 | | | | — | | | | (93 | ) | | | 11 | | |
Class A | | | 88 | | | | 1 | | | | (71 | ) | | | 18 | | | | 37 | | | | — | | | | (66 | ) | | | (29 | ) | |
Class C | | | 22 | | | | 1 | | | | (15 | ) | | | 8 | | | | 18 | | | | — | | | | (23 | ) | | | (5 | ) | |
Class R3 | | | 40 | | | | 1 | | | | (23 | ) | | | 18 | | | | 14 | | | | — | | | | (22 | ) | | | (8 | ) | |
213
| | For the Year Ended August 31, 2018 | | For the Year Ended August 31, 2017 | |
(000's omitted) | | Shares
Sold | | Shares
Issued on
Reinvestment
of Dividends
and
Distributions | | Shares
Redeemed | | Total | | Shares
Sold | | Shares
Issued on
Reinvestment
of Dividends
and
Distributions | | Shares
Redeemed | | Total | |
| Sustainable Equity(c) | |
Investor Class | | | 1,442 | | | | 1,148 | | | | (5,866 | ) | | | (3,276 | ) | | | 1,720 | | | | 867 | | | | (4,465 | ) | | | (1,878 | ) | |
Trust Class | | | 773 | | | | 358 | | | | (1,864 | ) | | | (733 | ) | | | 950 | | | | 551 | | | | (2,828 | ) | | | (1,327 | ) | |
Institutional Class | | | 5,701 | | | | 1,273 | | | | (6,864 | ) | | | 110 | | | | 5,894 | | | | 910 | | | | (5,774 | ) | | | 1,030 | | |
Class A | | | 731 | | | | 167 | | | | (1,018 | ) | | | (120 | ) | | | 829 | | | | 258 | | | | (1,624 | ) | | | (537 | ) | |
Class C | | | 168 | | | | 73 | | | | (253 | ) | | | (12 | ) | | | 290 | | | | 90 | | | | (365 | ) | | | 15 | | |
Class R3 | | | 416 | | | | 55 | | | | (701 | ) | | | (230 | ) | | | 399 | | | | 70 | | | | (301 | ) | | | 168 | | |
Class R6 | | | 2,887 | | | | 605 | | | | (5,439 | ) | | | (1,947 | ) | | | 2,524 | | | | 430 | | | | (4,139 | ) | | | (1,185 | ) | |
Value | |
Institutional Class | | | 59 | | | | 55 | | | | (324 | ) | | | (210 | ) | | | 442 | | | | 5 | | | | (430 | ) | | | 17 | | |
Class A | | | 9 | | | | 13 | | | | (46 | ) | | | (24 | ) | | | 355 | | | | 1 | | | | (452 | ) | | | (96 | ) | |
Class C | | | 4 | | | | 17 | | | | (39 | ) | | | (18 | ) | | | 179 | | | | 1 | | | | (17 | ) | | | 163 | | |
(a) Period from April 17, 2017 (Commencement of Operations) to August 31, 2017.
(b) Period from December 8, 2016 (Commencement of Operations) to August 31, 2017.
(c) After the close of business on December 8, 2017, the Funds' applicable classes underwent a stock split or reverse stock split. The capital share activity presented here has been retroactively adjusted to reflect this split. See Note H of the Notes to Financial Statements.
(d) After the close of business on February 23, 2018, the Funds' applicable classes underwent a stock split or reverse stock split. The capital share activity presented here has been retroactively adjusted to reflect this split. See Note H of the Notes to Financial Statements.
z Amount less than one thousand.
Note E—Line of Credit:
At August 31, 2018, each Fund was a participant in a syndicated committed, unsecured $700,000,000 line of credit (the "Credit Facility"), to be used only for temporary or emergency purposes. Series of other investment companies managed by Management also participate in this line of credit on substantially the same terms. Interest is charged on borrowings under this Credit Facility at the highest of (a) a federal funds effective rate plus 1.00% per annum, (b) a Eurodollar rate for a one-month period plus 1.00% per annum, and (c) an overnight bank funding rate plus 1.00% per annum. The Credit Facility has an annual commitment fee of 0.15% per annum of the available line of credit, which is paid quarterly. Each Fund that is a participant has agreed to pay its pro rata share of the annual commitment fee, based on the ratio of its individual net assets to the net assets of all participants at the time the fee is due, and interest charged on any borrowing made by such Fund and other costs incurred by such Fund. Because several mutual funds participate in the Credit Facility, there is no assurance that an individual Fund will have access to all or any part of the $700,000,000 at any particular time. There were no loans outstanding under the Credit Facility at August 31, 2018. During the year ended August 31, 2018, no Fund utilized the Credit Facility.
214
Note F—Investments in Affiliates(a):
| | | Balance of
Shares Held
August 31,
2017 | | Gross
Purchases
and
Additions | | Gross
Sales
and
Reductions | | Balance of
Shares Held
August 31,
2018 | | Value
August 31,
2018 | | Distributions
from
Investments
in Affiliated
Issuers | | Net Realized
Gain/(Loss)
from
Investments
in Affiliated
Issuers | | Change in
Net
Unrealized
Appreciation/
(Depreciation)
from
Investments
in Affiliated
Issuers | |
Genesis | |
Atrion
Corp. | | | 63,388 | | | | 35,392 | | | | 2,763 | | | | 96,017 | | | $ | 62,895,936 | | | $ | 341,206 | | | $ | 805,487 | | | $ | 3,448,876 | | |
AZZ, Inc. | | | 1,499,039 | | | | 143,640 | | | | 276,026 | | | | 1,366,653 | | | | 73,457,599 | | | | 957,832 | | | | (3,906,324 | ) | | | 9,448,549 | | |
Calavo
Growers,
Inc. | | | 1,104,279 | | | | 10,360 | | | | 233,480 | | | | 881,159 | | | | 93,270,680 | | | | 962,962 | | | | 5,859,005 | | | | 31,341,357 | | |
Exponent,
Inc. | | | 1,723,752 | | | | 1,475,200 | | | | 446,630 | | | | 2,752,322 | | | | 144,084,057 | | | | 1,089,809 | | | | 23,095,902 | | | | 31,420,753 | | |
Heska Corp. | | | 392,697 | | | | 124,550 | | | | 84,831 | | | | 432,416 | | | | 46,268,512 | | | | — | * | | | 1,137,832 | | | | 1,634,908 | | |
Manhattan
Associates,
Inc. | | | 3,347,374 | | | | 513,370 | | | | 455,398 | | | | 3,405,346 | | | | 197,476,015 | | | | — | * | | | 3,623,120 | | | | 49,758,831 | | |
NetScout
Systems,
Inc. | | | 4,272,673 | | | | 442,295 | | | | 641,130 | | | | 4,073,838 | | | | 101,845,950 | | | | — | * | | | (2,509,724 | ) | | | (29,230,059 | ) | |
Power
Integrations,
Inc. | | | 2,029,349 | | | | 247,690 | | | | 183,656 | | | | 2,093,383 | | | | 153,549,643 | | | | 1,283,787 | | | | 6,646,376 | | | | (5,056,661 | ) | |
Rogers Corp. | | | 1,145,268 | | | | 195,995 | | | | 102,649 | | | | 1,238,614 | | | | 171,015,435 | | | | — | * | | | 8,332,219 | | | | 17,286,007 | | |
Sub-total
for affiliates
held as of
8/31/18(b) | | | | | | | | | | $ | 1,043,863,827 | | | $ | 4,635,596 | | | $ | 43,083,893 | | | $ | 110,052,561 | | |
Astronics
Corp. | | | 1,138,109 | | | | 10,592 | | | | 240,789 | | | | 907,912 | | | $ | 39,503,251 | | | $ | — | * | | $ | (1,808,363 | ) | | $ | 19,827,781 | | |
Bank of
Hawaii Corp. | | | 2,181,636 | | | | 21,165 | | | | 461,287 | | | | 1,741,514 | | | | 144,772,059 | | | | 4,150,749 | | | | 12,709,231 | | | | (1,514,604 | ) | |
CommerceHub,
Inc. Series A | | | — | | | | 1,262,960 | | | | 1,262,960 | | | | — | | | | — | | | | — | * | | | 92,892 | | | | — | | |
Computer
Modelling
Group Ltd.(e) | | | 4,240,438 | | | | 438,280 | | | | 904,719 | | | | 3,773,999 | | | | 25,217,831 | | | | 1,303,452 | | | | 489,268 | | | | (2,530,471 | ) | |
CVB Financial
Corp. | | | 5,937,653 | | | | 58,575 | | | | 1,256,421 | | | | 4,739,807 | | | | 113,992,358 | | | | 2,908,298 | | | | 8,288,885 | | | | 11,152,914 | | |
Gray
Television,
Inc. | | | 4,247,791 | | | | 453,145 | | | | 1,156,512 | | | | 3,544,424 | | | | 61,850,199 | | | | — | * | | | 290,324 | | | | 9,662,081 | | |
215
| | | Balance of
Shares Held
August 31,
2017 | | Gross
Purchases
and
Additions | | Gross
Sales
and
Reductions | | Balance of
Shares Held
August 31,
2018 | | Value
August 31,
2018 | | Distributions
from
Investments
in Affiliated
Issuers | | Net Realized
Gain/(Loss)
from
Investments
in Affiliated
Issuers | | Change in
Net
Unrealized
Appreciation/
(Depreciation)
from
Investments
in Affiliated
Issuers | |
LegacyTexas
Financial
Group, Inc. | | | 2,481,903 | | | | 26,915 | | | | 525,084 | | | | 1,983,734 | | | $ | 91,787,372 | | | $ | 1,374,947 | | | $ | 5,497,042 | | | $ | 17,535,323 | | |
Lindsay Corp. | | | 594,944 | | | | 43,215 | | | | 121,682 | | | | 516,477 | | | | 49,463,002 | | | | 629,981 | | | | 2,897,872 | | | | 1,992,742 | | |
MGP
Ingredients,
Inc. | | | 847,383 | | | | 9,570 | | | | 179,161 | | | | 677,792 | | | | 52,264,541 | | | | 201,175 | | | | 4,450,515 | | | | 12,522,644 | | |
Monotype
Imaging
Holdings,
Inc. | | | 2,722,100 | | | | 20,770 | | | | 1,173,545 | | | | 1,569,325 | | | | 32,328,095 | | | | 940,701 | | | | (3,056,693 | ) | | | 12,647,471 | | |
Nexstar
Media
Group, Inc.
Class A | | | 2,523,996 | | | | 23,665 | | | | 485,372 | | | | 2,062,289 | | | | 169,107,698 | | | | 3,145,663 | | | | 10,624,434 | | | | 38,692,341 | | |
Pason
Systems,
Inc. | | | 4,695,341 | | | | 41,360 | | | | 965,714 | | | | 3,770,987 | | | | 61,995,026 | | | | 2,258,264 | | | | 263,477 | | | | 7,910,332 | | |
Qualys, Inc. | | | 1,745,452 | | | | 411,541 | | | | 368,792 | | | | 1,788,201 | | | | 162,815,701 | | | | — | * | | | 12,813,514 | | | | 72,892,653 | | |
RBC Bearings,
Inc. | | | 1,450,858 | | | | 51,877 | | | | 325,320 | | | | 1,177,415 | | | | 176,388,541 | | | | — | * | | | 16,826,504 | | | | 34,493,411 | | |
Sensient
Technologies
Corp. | | | 2,485,181 | | | | 58,898 | | | | 1,010,295 | | | | 1,533,784 | | | | 108,929,340 | | | | 2,739,449 | | | | 36,898,064 | | | | (38,780,891 | ) | |
U.S. Physical
Therapy, Inc. | | | 792,415 | | | | 7,335 | | | | 167,475 | | | | 632,275 | | | | 79,192,444 | | | | 602,582 | | | | 3,846,108 | | | | 40,166,374 | | |
Sub-total
for securities
no longer
affiliated
as of
8/31/18(c) | | | | | | | | | | $ | 1,369,607,458 | | | $ | 20,255,261 | | | $ | 111,123,074 | | | $ | 236,670,101 | | |
Total | | | | | | | | | | $ | 2,413,471,285 | | | $ | 24,890,857 | | | $ | 154,206,967 | | | $ | 346,722,662 | | |
Intrinsic Value | |
Fluidigm Corp. | | | 1,737,259 | | | | — | | | | 403,100 | | | | 1,334,159 | | | $ | 10,566,539 | | | $ | — | * | | $ | (1,289,721 | ) | | $ | 6,326,769 | | |
Total for
securities
no longer
affiliated
as of
8/31/18(d) | | | | | | | | | | $ | 10,566,539 | | | $ | — | | | $ | (1,289,721 | ) | | $ | 6,326,769 | | |
216
(a) Affiliated issuers, as defined in the 1940 Act.
(b) At August 31, 2018, these securities amounted to approximately 9.2% of net assets of Genesis.
(c) At August 31, 2018, the issuers of these securities were no longer affiliated with Genesis.
(d) At August 31, 2018, the issuers of these securities were no longer affiliated with Intrinsic Value.
(e) Security fair valued as of August 31, 2018, in accordance with procedures approved by the Board.
* Non-income producing security.
Other: At August 31, 2018, Neuberger Berman Global Allocation Fund, which is also managed by Management, held 0.08%, 0.01% and 1.74%, of the outstanding shares of Emerging Markets Equity, Genesis and International Select, respectively.
In addition, at August 31, 2018, affiliated investors owned 0.05%, 1.97%, 0.00%, 0.30%, 65.49%, 95.83%, 0.07%, 0.00%, 0.02%, 19.02%, 0.00%, 0.00%, 0.03% and 0.52% of the outstanding shares of Dividend Growth, Emerging Markets Equity, Focus, Genesis, Global Equity, Global Real Estate, Greater China Equity, International Equity, International Select, International Small Cap, Large Cap Value, Mid Cap Growth, Mid Cap Intrinsic Value and Value, respectively.
Note G—Custodian Out-of-Pocket Expenses Refunded:
In May 2016, the Funds' custodian, State Street, announced that it had identified inconsistencies in the way in which certain Funds were invoiced for categories of expenses, particularly those deemed "out-of-pocket" costs, from 1998 through November 2015. The amounts in the table below represent the refunded expenses and interest determined to be payable to certain Funds for the period in question. These amounts were refunded to those Funds by State Street during the year ended August 31, 2017.
| | | Expenses Refunded | | Interest Paid to the Funds | |
Equity Income | | $ | 1,268 | | | $ | 68 | | |
Focus | | | 73,297 | | | | 8,507 | | |
Genesis | | | 301,427 | | | | 22,289 | | |
Guardian | | | 127,308 | | | | 15,909 | | |
International Equity | | | 493,553 | | | | 60,646 | | |
Large Cap Value | | | 167,263 | | | | 14,872 | | |
Mid Cap Growth | | | 79,093 | | | | 8,282 | | |
Mid Cap Intrinsic Value | | | 21,954 | | | | 1,795 | | |
Multi-Cap Opportunities | | | 625 | | | | 5 | | |
Small Cap Growth | | | 4,397 | | | | 1,456 | | |
Sustainable Equity | | | 94,334 | | | | 7,420 | | |
Note H—Stock Splits:
In 2017, the Board approved stock splits and reverse stock splits (collectively, the "Stock Split") of the issued and outstanding shares of certain classes of Focus, Genesis, Guardian, International Equity, Large Cap Value, Mid Cap Growth, Small Cap Growth and Sustainable Equity (collectively, the "Stock Split Funds"). The Stock Split for certain classes of Genesis, Large Cap Value, Mid Cap Growth and Sustainable Equity occurred after the close of the business on December 8, 2017. The Stock Split for certain classes of the remaining Stock Split Funds occurred after the close of the business on February 23, 2018. The Stock Split was carried out in accordance with a stock split ratio
217
calculated to result in net asset values per share that better aligned the share class prices of each of the Stock Split Funds.
After the close of business on December 8, 2017, the following classes of Stock Split Funds underwent a stock split or reverse stock split as follows:
Fund Class | | Stock Split
Ratio
(Old to New) | | Fund Class | | Stock Split
Ratio
(Old to New) | | Fund Class | | Stock Split
Ratio
(Old to New) | | Fund Class | | Stock Split
Ratio
(Old to New) | |
Genesis
Investor Class | | | 1
| : 0.5760 | | Large Cap Value
Trust Class | | | 1
| : 0.6374 | | Mid Cap Growth
Investor Class | | | 1
| : 0.9724 | | Sustainable Equity
Investor Class | | | 1
| : 0.9982 | |
Genesis
Trust Class | | | 1
| : 1.0537 | | Large Cap Value
Advisor Class | | | 1
| : 0.4658 | | Mid Cap Growth
Trust Class | | | 1
| : 1.7186 | | Sustainable Equity
Trust Class | | | 1
| : 0.5700 | |
Genesis
Advisor Class | | | 1
| : 0.3915 | | Large Cap Value
Institutional Class | | | 1
| : 1.0080 | | Mid Cap Growth
Advisor Class | | | 1
| : 1.7406 | | Sustainable Equity
Class A | | | 1
| : 0.5631 | |
Genesis
Class R6 | | | 1
| : 1.0003 | | Large Cap Value
Class A | | | 1
| : 0.6359 | | Mid Cap Growth
Class A | | | 1
| : 1.7093 | | Sustainable Equity
Class C | | | 1
| : 0.5445 | |
| | | | | | | Large Cap Value
Class C | | | 1
| : 0.4379 | | Mid Cap Growth
Class C | | | 1
| : 1.6694 | | Sustainable Equity
Class R3 | | | 1
| : 0.5555 | |
| | | | | | | Large Cap Value
Class R3 | | | 1
| : 0.4729 | | Mid Cap Growth
Class R3 | | | 1
| : 1.7357 | | Sustainable Equity
Class R6 | | | 1
| : 1.0008 | |
| | | | | | | | | | | | | Mid Cap Growth
Class R6 | | | 1
| : 1.0040 | | | | | | | | | |
After the close of business on February 23, 2018, the following classes of Stock Split Funds underwent a stock split or reverse stock split as follows:
Fund Class | | Stock Split
Ratio
(Old to New) | | Fund Class | | Stock Split
Ratio
(Old to New) | | Fund Class | | Stock Split
Ratio
(Old to New) | | Fund Class | | Stock Split
Ratio
(Old to New) | |
Focus
Trust Class | | | 1
| : 0.5483 | | Guardian
Trust Class | | | 1
| : 0.5975 | | International Equity
Investor Class | | | 1
| : 1.8904 | | Small Cap Growth
Trust Class | | | 1
| : 1.0831 | |
Focus
Advisor Class | | | 1
| : 0.1720 | | Guardian
Advisor Class | | | 1
| : 0.7858 | | International Equity
Trust Class | | | 1
| : 2.1151 | | Small Cap Growth
Advisor Class | | | 1
| : 0.6866 | |
Focus
Institutional Class | | | 1
| : 1.0011 | | Guardian
Institutional Class | | | 1
| : 1.0017 | | International Equity
Class A | | | 1
| : 2.0998 | | Small Cap Growth
Institutional Class | | | 1
| : 1.0298 | |
Focus
Class A | | | 1
| : 0.5403 | | Guardian
Class A | | | 1
| : 0.5870 | | International Equity
Class C | | | 1
| : 2.0430 | | Small Cap Growth
Class A | | | 1
| : 1.0951 | |
Focus
Class C | | | 1
| : 0.1542 | | Guardian
Class C | | | 1
| : 0.7496 | | International Equity
Class R6 | | | 1
| : 1.0085 | | Small Cap Growth
Class C | | | 1
| : 0.6571 | |
| | | | | | | Guardian
Class R3 | | | 1
| : 0.7801 | | | | | | | | | | Small Cap Growth
Class R3 | | | 1
| : 0.6886 | |
Note I—Recent Accounting Pronouncement:
In August 2018, FASB issued Accounting Standards Update No. 2018-13, "Fair Value Measurement (Topic 820: Disclosure Framework—Changes to the Disclosure Requirements for Fair Value Measurement" ("ASU 2018-13"). ASU 2018-13 eliminates the requirement to disclose the amount of and reasons for transfers between Level 1 and Level 2 of the fair value hierarchy, the timing of transfers between levels of the fair value hierarchy and the valuation processes for Level 3 fair value measurements. ASU 2018-13 does not eliminate the requirement to disclose the range and weighted average used to develop significant unobservable inputs for Level 3 fair value measurements, and the changes in unrealized gains and losses for recurring Level 3 fair value measurements. ASU 2018-13 requires that information is provided about the measurement uncertainty of Level 3 fair value measurements as of the reporting date. The guidance is effective for fiscal years, and interim periods within those fiscal years, beginning after December 15, 2019. Management is currently evaluating the impact of applying this guidance.
218
Note J—Subsequent Event:
As previously announced, the Board approved stock splits and reverse stock splits (collectively, the "Stock Split") of the issued and outstanding shares of certain classes of Emerging Markets Equity, Global Equity, Intrinsic Value, Mid Cap Intrinsic Value, and Multi-Cap Opportunities (collectively, the "Stock Split Funds"). The Stock Split is anticipated to occur after the close of the business on December 7, 2018. The Stock Split will be carried out in accordance with a stock split ratio calculated to result in net asset values per share that better align the share class prices of each of the Stock Split Funds.
219
This page has been left blank intentionally
220
The following tables include selected data for a share outstanding throughout each year and other performance information derived from the Financial Statements. Amounts that do not round to $0.01 or $(0.01) per share are presented as $0.00 or $(0.00), respectively. Ratios that do not round to 0.01% or (0.01)% are presented as 0.00% or (0.00)%, respectively. Net Asset amounts with a zero balance, if any, may reflect actual amounts rounding to less than $0.1 million. A "—" indicates that the line item was not applicable in the corresponding period.
| | Net Asset
Value,
Beginning
of Year | | Net
Investment
Income/(Loss)@ | | Net Gains or
Losses on
Securities
(both realized
and
unrealized) | | Total From
Investment
Operations | | Dividends
from Net
Investment
Income | | Distributions
from Net
Realized
Capital Gains | | Total
Distributions | | Voluntary
Contribution
from
Management | | Net Asset
Value, End of
Year | | Total Returnab | | Net Assets,
End of Year
(in millions) | | Ratio of Gross
Expenses to
Average Net
Assets# | | Ratio of Net
Expenses to
Average Net
Assets | | Ratio of Net
Investment
Income/
(Loss) to
Average Net
Assets | | Portfolio
Turnover
Rate | |
Dividend Growth Fund | |
Institutional Class | |
8/31/2018 | $ | 12.93 | | $ | 0.21 | | $ | 1.12 | | $ | 1.33 | | $ | (0.15 | ) | | $ | (0.18 | ) | | $ | (0.33 | ) | | $ | — | | $ | 13.93 | | | 10.44 | % | | $ | 53.4 | | | 1.23 | % | | 0.69 | % | | 1.54 | % | | 43 | % | |
8/31/2017 | $ | 11.11 | | $ | 0.22 | | $ | 1.82 | | $ | 2.04 | | $ | (0.22 | ) | | $ | — | | | $ | (0.22 | ) | | $ | — | | $ | 12.93 | | | 18.54 | % | | $ | 32.5 | | | 1.69 | % | | 0.69 | % | | 1.78 | % | | 44 | % | |
Period from 12/15/2015^
to 8/31/2016 | $ | 10.00 | | $ | 0.18 | | $ | 0.93 | | $ | 1.11 | | $ | — | | | $ | — | | | $ | — | | | $ | — | | $ | 11.11 | | | 11.10 | %* | | $ | 20.3 | | | 2.61 | %**‡ | | 0.69 | %**‡ | | 2.44 | %**‡ | | 23 | %* | |
Class A | |
8/31/2018 | $ | 12.94 | | $ | 0.15 | | $ | 1.13 | | $ | 1.28 | | $ | (0.11 | ) | | $ | (0.18 | ) | | $ | (0.29 | ) | | $ | — | | $ | 13.93 | | | 9.98 | % | | $ | 1.8 | | | 1.67 | % | | 1.05 | % | | 1.14 | % | | 43 | % | |
8/31/2017 | $ | 11.09 | | $ | 0.18 | | $ | 1.81 | | $ | 1.99 | | $ | (0.14 | ) | | $ | — | | | $ | (0.14 | ) | | $ | — | | $ | 12.94 | | | 18.10 | % | | $ | 1.6 | | | 2.14 | % | | 1.05 | % | | 1.48 | % | | 44 | % | |
Period from 12/15/2015^
to 8/31/2016 | $ | 10.00 | | $ | 0.16 | | $ | 0.93 | | $ | 1.09 | | $ | — | | | $ | — | | | $ | — | | | $ | — | | $ | 11.09 | | | 10.90 | %* | | $ | 0.2 | | | 3.36 | %**‡ | | 1.05 | %**‡ | | 2.14 | %**‡ | | 23 | %* | |
Class C | |
8/31/2018 | $ | 12.87 | | $ | 0.05 | | $ | 1.12 | | $ | 1.17 | | $ | (0.01 | ) | | $ | (0.18 | ) | | $ | (0.19 | ) | | $ | — | | $ | 13.85 | | | 9.17 | % | | $ | 3.3 | | | 2.34 | % | | 1.80 | % | | 0.40 | % | | 43 | % | |
8/31/2017 | $ | 11.00 | | $ | 0.07 | | $ | 1.85 | | $ | 1.92 | | $ | (0.05 | ) | | $ | — | | | $ | (0.05 | ) | | $ | — | | $ | 12.87 | | | 17.47 | % | | $ | 3.1 | | | 2.81 | % | | 1.80 | % | | 0.61 | % | | 44 | % | |
Period from 12/15/2015^
to 8/31/2016 | $ | 10.00 | | $ | 0.08 | | $ | 0.92 | | $ | 1.00 | | $ | — | | | $ | — | | | $ | — | | | $ | — | | $ | 11.00 | | | 10.00 | %* | | $ | 0.0 | | | 4.11 | %**‡ | | 1.80 | %**‡ | | 1.17 | %**‡ | | 23 | %* | |
Class R6 | |
8/31/2018 | $ | 12.93 | | $ | 0.21 | | $ | 1.13 | | $ | 1.34 | | $ | (0.16 | ) | | $ | (0.18 | ) | | $ | (0.34 | ) | | $ | — | | $ | 13.93 | | | 10.51 | % | | $ | 0.0 | | | 1.19 | % | | 0.62 | % | | 1.58 | % | | 43 | % | |
8/31/2017 | $ | 11.11 | | $ | 0.23 | | $ | 1.81 | | $ | 2.04 | | $ | (0.22 | ) | | $ | — | | | $ | (0.22 | ) | | $ | — | | $ | 12.93 | | | 18.60 | % | | $ | 0.0 | | | 1.65 | % | | 0.62 | % | | 1.91 | % | | 44 | % | |
Period from 12/15/2015^
to 8/31/2016 | $ | 10.00 | | $ | 0.15 | | $ | 0.96 | | $ | 1.11 | | $ | — | | | $ | — | | | $ | — | | | $ | — | | $ | 11.11 | | | 11.10 | %* | | $ | 0.1 | | | 2.75 | %**‡ | | 0.62 | %**‡ | | 2.06 | %**‡ | | 23 | %* | |
Emerging Markets Equity Fund | |
Institutional Class | |
8/31/2018 | $ | 19.87 | | $ | 0.20 | | $ | (0.68 | | $ | (0.48 | | $ | (0.14 | ) | | $ | — | | | $ | (0.14 | ) | | $ | — | | $ | 19.25 | | | (2.49 | )% | | $ | 1,149.4 | | | 1.28 | % | | 1.25 | % | | 0.98 | % | | 23 | % | |
8/31/2017 | $ | 16.01 | | $ | 0.17 | | $ | 3.77 | | $ | 3.94 | | $ | (0.08 | ) | | $ | — | | | $ | (0.08 | ) | | $ | — | | $ | 19.87 | | | 24.76 | % | | $ | 670.6 | | | 1.36 | % | | 1.25 | % | | 0.95 | % | | 25 | % | |
8/31/2016 | $ | 13.94 | | $ | 0.11 | | $ | 2.06 | | $ | 2.17 | | $ | (0.10 | ) | | $ | — | | | $ | (0.10 | ) | | $ | — | | $ | 16.01 | | | 15.64 | % | | $ | 318.9 | | | 1.43 | % | | 1.25 | % | | 0.74 | % | | 43 | % | |
8/31/2015 | $ | 17.89 | | $ | 0.12 | | $ | (3.90 | | $ | (3.78 | | $ | (0.17 | ) | | $ | — | | | $ | (0.17 | ) | | $ | — | | $ | 13.94 | | | (21.22 | )% | | $ | 307.5 | | | 1.43 | % | | 1.25 | % | | 0.73 | % | | 36 | % | |
8/31/2014 | $ | 15.34 | | $ | 0.16 | | $ | 2.48 | | $ | 2.64 | | $ | (0.09 | ) | | $ | — | | | $ | (0.09 | ) | | $ | 0.00 | | $ | 17.89 | | | 17.24 | %c | | $ | 514.8 | | | 1.45 | % | | 1.25 | % | | 0.96 | % | | 36 | % | |
See Notes to Financial Highlights
221
222
Financial Highlights (cont'd)
| | | Net Asset
Value,
Beginning
of Year | | Net
Investment
Income/(Loss)@ | | Net Gains or
Losses on
Securities
(both realized
and
unrealized) | | Total From
Investment
Operations | | Dividends
from Net
Investment
Income | | Distributions
from Net
Realized
Capital Gains | | Total
Distributions | | Voluntary
Contribution
from
Management | | Net Asset
Value, End of
Year | | Total Returnab | | Net Assets,
End of Year
(in millions) | | Ratio of Gross
Expenses to
Average Net
Assets# | | Ratio of Net
Expenses to
Average Net
Assets | | Ratio of Net
Investment
Income/
(Loss) to
Average Net
Assets | | Portfolio
Turnover
Rate | |
Emerging Markets Equity Fund (cont'd) | |
Class A | |
8/31/2018 | | $ | 19.75 | | | $ | 0.10 | | | $ | (0.64 | ) | | $ | (0.54 | ) | | $ | (0.10 | ) | | $ | — | | | $ | (0.10 | ) | | $ | — | | | $ | 19.11 | | | | (2.78 | )% | | $ | 47.6 | | | | 1.65 | % | | | 1.50 | % | | | 0.49 | % | | | 23 | % | |
8/31/2017 | | $ | 15.92 | | | $ | 0.13 | | | $ | 3.75 | | | $ | 3.88 | | | $ | (0.05 | ) | | $ | — | | | $ | (0.05 | ) | | $ | — | | | $ | 19.75 | | | | 24.51 | % | | $ | 65.1 | | | | 1.73 | % | | | 1.50 | % | | | 0.74 | % | | | 25 | % | |
8/31/2016 | | $ | 13.87 | | | $ | 0.09 | | | $ | 2.02 | | | $ | 2.11 | | | $ | (0.06 | ) | | $ | — | | | $ | (0.06 | ) | | $ | — | | | $ | 15.92 | | | | 15.31 | % | | $ | 23.5 | | | | 1.82 | % | | | 1.50 | % | | | 0.60 | % | | | 43 | % | |
8/31/2015 | | $ | 17.80 | | | $ | 0.08 | | | $ | (3.88 | ) | | $ | (3.80 | ) | | $ | (0.13 | ) | | $ | — | | | $ | (0.13 | ) | | $ | — | | | $ | 13.87 | | | | (21.42 | )% | | $ | 13.4 | | | | 1.79 | % | | | 1.50 | % | | | 0.49 | % | | | 36 | % | |
8/31/2014 | | $ | 15.27 | | | $ | 0.15 | | | $ | 2.44 | | | $ | 2.59 | | | $ | (0.06 | ) | | $ | — | | | $ | (0.06 | ) | | $ | 0.00 | | | $ | 17.80 | | | | 16.99 | %c | | $ | 19.9 | | | | 1.82 | % | | | 1.50 | % | | | 0.88 | % | | | 36 | % | |
Class C | |
8/31/2018 | | $ | 18.98 | | | $ | (0.02 | ) | | $ | (0.64 | ) | | $ | (0.66 | ) | | $ | (0.05 | ) | | $ | — | | | $ | (0.05 | ) | | $ | — | | | $ | 18.27 | | | | (3.51 | )% | | $ | 10.9 | | | | 2.37 | % | | | 2.25 | % | | | (0.08 | )% | | | 23 | % | |
8/31/2017 | | $ | 15.36 | | | $ | (0.03 | ) | | $ | 3.65 | | | $ | 3.62 | | | $ | — | | | $ | — | | | $ | — | | | $ | — | | | $ | 18.98 | | | | 23.57 | % | | $ | 7.4 | | | | 2.45 | % | | | 2.25 | % | | | (0.18 | )% | | | 25 | % | |
8/31/2016 | | $ | 13.42 | | | $ | (0.04 | ) | | $ | 1.98 | | | $ | 1.94 | | | $ | — | | | $ | — | | | $ | — | | | $ | — | | | $ | 15.36 | | | | 14.46 | % | | $ | 5.2 | | | | 2.51 | % | | | 2.25 | % | | | (0.30 | )% | | | 43 | % | |
8/31/2015 | | $ | 17.26 | | | $ | (0.03 | ) | | $ | (3.77 | ) | | $ | (3.80 | ) | | $ | (0.04 | ) | | $ | — | | | $ | (0.04 | ) | | $ | — | | | $ | 13.42 | | | | (22.02 | )% | | $ | 6.2 | | | | 2.53 | % | | | 2.25 | % | | | (0.20 | )% | | | 36 | % | |
8/31/2014 | | $ | 14.87 | | | $ | 0.00 | | | $ | 2.39 | | | $ | 2.39 | | | $ | — | | | $ | — | | | $ | — | | | $ | 0.00 | | | $ | 17.26 | | | | 16.07 | %c | | $ | 7.0 | | | | 2.56 | % | | | 2.25 | % | | | 0.01 | % | | | 36 | % | |
Class R3 | |
8/31/2018 | | $ | 19.31 | | | $ | 0.03 | | | $ | (0.63 | ) | | $ | (0.60 | ) | | $ | (0.07 | ) | | $ | — | | | $ | (0.07 | ) | | $ | — | | | $ | 18.64 | | | | (3.16 | )% | | $ | 1.4 | | | | 1.91 | % | | | 1.91 | % | | | 0.14 | % | | | 23 | % | |
8/31/2017 | | $ | 15.59 | | | $ | 0.01 | | | $ | 3.72 | | | $ | 3.73 | | | $ | (0.01 | ) | | $ | — | | | $ | (0.01 | ) | | $ | — | | | $ | 19.31 | | | | 23.94 | % | | $ | 1.5 | | | | 2.01 | % | | | 1.91 | % | | | 0.08 | % | | | 25 | % | |
8/31/2016 | | $ | 13.60 | | | $ | 0.02 | | | $ | 2.00 | | | $ | 2.02 | | | $ | (0.03 | ) | | $ | — | | | $ | (0.03 | ) | | $ | — | | | $ | 15.59 | | | | 14.88 | % | | $ | 1.2 | | | | 2.06 | % | | | 1.91 | % | | | 0.16 | % | | | 43 | % | |
8/31/2015 | | $ | 17.47 | | | $ | 0.02 | | | $ | (3.80 | ) | | $ | (3.78 | ) | | $ | (0.09 | ) | | $ | — | | | $ | (0.09 | ) | | $ | — | | | $ | 13.60 | | | | (21.70 | )% | | $ | 0.8 | | | | 2.09 | % | | | 1.91 | % | | | 0.14 | % | | | 36 | % | |
8/31/2014 | | $ | 15.02 | | | $ | 0.07 | | | $ | 2.39 | | | $ | 2.46 | | | $ | (0.01 | ) | | $ | — | | | $ | (0.01 | ) | | $ | 0.00 | | | $ | 17.47 | | | | 16.42 | %c | | $ | 0.6 | | | | 2.13 | % | | | 1.91 | % | | | 0.45 | % | | | 36 | % | |
Class R6 | |
8/31/2018 | | $ | 19.89 | | | $ | 0.19 | | | $ | (0.67 | ) | | $ | (0.48 | ) | | $ | (0.14 | ) | | $ | — | | | $ | (0.14 | ) | | $ | — | | | $ | 19.27 | | | | (2.46 | )% | | $ | 166.9 | | | | 1.19 | % | | | 1.18 | % | | | 0.91 | % | | | 23 | % | |
8/31/2017 | | $ | 16.02 | | | $ | 0.15 | | | $ | 3.81 | | | $ | 3.96 | | | $ | (0.09 | ) | | $ | — | | | $ | (0.09 | ) | | $ | — | | | $ | 19.89 | | | | 24.90 | % | | $ | 132.9 | | | | 1.26 | % | | | 1.18 | % | | | 0.86 | % | | | 25 | % | |
8/31/2016 | | $ | 13.96 | | | $ | 0.12 | | | $ | 2.05 | | | $ | 2.17 | | | $ | (0.11 | ) | | $ | — | | | $ | (0.11 | ) | | $ | — | | | $ | 16.02 | | | | 15.64 | % | | $ | 107.4 | | | | 1.32 | % | | | 1.18 | % | | | 0.83 | % | | | 43 | % | |
8/31/2015 | | $ | 17.91 | | | $ | 0.14 | | | $ | (3.91 | ) | | $ | (3.77 | ) | | $ | (0.18 | ) | | $ | — | | | $ | (0.18 | ) | | $ | — | | | $ | 13.96 | | | | (21.14 | )% | | $ | 88.1 | | | | 1.34 | % | | | 1.18 | % | | | 0.88 | % | | | 36 | % | |
8/31/2014 | | $ | 15.35 | | | $ | 0.18 | | | $ | 2.47 | | | $ | 2.65 | | | $ | (0.09 | ) | | $ | — | | | $ | (0.09 | ) | | $ | 0.00 | | | $ | 17.91 | | | | 17.35 | %c | | $ | 83.8 | | | | 1.37 | % | | | 1.18 | % | | | 1.08 | % | | | 36 | % | |
Equity Income Fund | |
Institutional Class | |
8/31/2018 | | $ | 13.09 | | | $ | 0.33 | | | $ | 1.01 | | | $ | 1.34 | | | $ | (0.40 | ) | | $ | (0.50 | ) | | $ | (0.90 | ) | | $ | — | | | $ | 13.53 | | | | 10.58 | % | | $ | 1,172.8 | | | | 0.69 | % | | | 0.69 | % | | | 2.52 | % | | | 41 | % | |
8/31/2017 | | $ | 12.45 | | | $ | 0.38 | | | $ | 1.01 | | | $ | 1.39 | | | $ | (0.33 | ) | | $ | (0.42 | ) | | $ | (0.75 | ) | | $ | 0.00 | | | $ | 13.09 | | | | 11.56 | %ei | | $ | 1,208.7 | | | | 0.69 | % | | | 0.69 | %f | | | 2.99 | %f | | | 53 | % | |
8/31/2016 | | $ | 11.74 | | | $ | 0.37 | | | $ | 1.08 | | | $ | 1.45 | | | $ | (0.32 | ) | | $ | (0.42 | ) | | $ | (0.74 | ) | | $ | — | | | $ | 12.45 | | | | 13.03 | % | | $ | 1,076.5 | | | | 0.69 | % | | | 0.69 | % | | | 3.18 | % | | | 49 | % | |
8/31/2015 | | $ | 13.19 | | | $ | 0.34 | | | $ | (0.92 | ) | | $ | (0.58 | ) | | $ | (0.30 | ) | | $ | (0.57 | ) | | $ | (0.87 | ) | | $ | — | | | $ | 11.74 | | | | (4.60 | )% | | $ | 1,443.7 | | | | 0.68 | % | | | 0.68 | % | | | 2.66 | % | | | 48 | % | |
8/31/2014 | | $ | 11.76 | | | $ | 0.33 | | | $ | 1.94 | | | $ | 2.27 | | | $ | (0.33 | ) | | $ | (0.51 | ) | | $ | (0.84 | ) | | $ | 0.00 | | | $ | 13.19 | | | | 20.11 | %c | | $ | 1,578.5 | | | | 0.68 | % | | | 0.68 | % | | | 2.66 | % | | | 41 | % | |
See Notes to Financial Highlights
223
224
Financial Highlights (cont'd)
| | | Net Asset
Value,
Beginning
of Year | | Net
Investment
Income/(Loss)@ | | Net Gains or
Losses on
Securities
(both realized
and
unrealized) | | Total From
Investment
Operations | | Dividends
from Net
Investment
Income | | Distributions
from Net
Realized
Capital Gains | | Total
Distributions | | Voluntary
Contribution
from
Management | | Net Asset
Value, End of
Year | | Total Returnab | | Net Assets,
End of Year
(in millions) | | Ratio of Gross
Expenses to
Average Net
Assets# | | Ratio of Net
Expenses to
Average Net
Assets | | Ratio of Net
Investment
Income/
(Loss) to
Average Net
Assets | | Portfolio
Turnover
Rate | |
Equity Income Fund (cont'd) | |
Class A | |
8/31/2018 | | $ | 13.04 | | | $ | 0.29 | | | $ | 1.00 | | | $ | 1.29 | | | $ | (0.35 | ) | | $ | (0.50 | ) | | $ | (0.85 | ) | | $ | — | | | $ | 13.48 | | | | 10.21 | % | | $ | 186.5 | | | | 1.05 | % | | | 1.05 | % | | | 2.16 | % | | | 41 | % | |
8/31/2017 | | $ | 12.40 | | | $ | 0.32 | | | $ | 1.02 | | | $ | 1.34 | | | $ | (0.28 | ) | | $ | (0.42 | ) | | $ | (0.70 | ) | | $ | 0.00 | | | $ | 13.04 | | | | 11.17 | %ei | | $ | 200.3 | | | | 1.05 | % | | | 1.05 | %f | | | 2.56 | %f | | | 53 | % | |
8/31/2016 | | $ | 11.69 | | | $ | 0.33 | | | $ | 1.08 | | | $ | 1.41 | | | $ | (0.28 | ) | | $ | (0.42 | ) | | $ | (0.70 | ) | | $ | — | | | $ | 12.40 | | | | 12.64 | % | | $ | 243.1 | | | | 1.07 | % | | | 1.07 | % | | | 2.81 | % | | | 49 | % | |
8/31/2015 | | $ | 13.14 | | | $ | 0.29 | | | $ | (0.93 | ) | | $ | (0.64 | ) | | $ | (0.24 | ) | | $ | (0.57 | ) | | $ | (0.81 | ) | | $ | — | | | $ | 11.69 | | | | (5.02 | )% | | $ | 289.5 | | | | 1.05 | % | | | 1.05 | % | | | 2.26 | % | | | 48 | % | |
8/31/2014 | | $ | 11.71 | | | $ | 0.27 | | | $ | 1.95 | | | $ | 2.22 | | | $ | (0.28 | ) | | $ | (0.51 | ) | | $ | (0.79 | ) | | $ | 0.00 | | | $ | 13.14 | | | | 19.72 | %c | | $ | 462.6 | | | | 1.05 | % | | | 1.05 | % | | | 2.21 | % | | | 41 | % | |
Class C | |
8/31/2018 | | $ | 12.95 | | | $ | 0.18 | | | $ | 1.00 | | | $ | 1.18 | | | $ | (0.25 | ) | | $ | (0.50 | ) | | $ | (0.75 | ) | | $ | — | | | $ | 13.38 | | | | 9.36 | % | | $ | 246.7 | | | | 1.80 | % | | | 1.80 | % | | | 1.40 | % | | | 41 | % | |
8/31/2017 | | $ | 12.32 | | | $ | 0.23 | | | $ | 1.01 | | | $ | 1.24 | | | $ | (0.19 | ) | | $ | (0.42 | ) | | $ | (0.61 | ) | | $ | 0.00 | | | $ | 12.95 | | | | 10.34 | %ei | | $ | 282.3 | | | | 1.80 | % | | | 1.80 | %f | | | 1.82 | %f | | | 53 | % | |
8/31/2016 | | $ | 11.62 | | | $ | 0.24 | | | $ | 1.07 | | | $ | 1.31 | | | $ | (0.19 | ) | | $ | (0.42 | ) | | $ | (0.61 | ) | | $ | — | | | $ | 12.32 | | | | 11.77 | % | | $ | 334.1 | | | | 1.81 | % | | | 1.81 | % | | | 2.07 | % | | | 49 | % | |
8/31/2015 | | $ | 13.06 | | | $ | 0.20 | | | $ | (0.92 | ) | | $ | (0.72 | ) | | $ | (0.15 | ) | | $ | (0.57 | ) | | $ | (0.72 | ) | | $ | — | | | $ | 11.62 | | | | (5.65 | )% | | $ | 390.0 | | | | 1.79 | % | | | 1.79 | % | | | 1.55 | % | | | 48 | % | |
8/31/2014 | | $ | 11.65 | | | $ | 0.19 | | | $ | 1.92 | | | $ | 2.11 | | | $ | (0.19 | ) | | $ | (0.51 | ) | | $ | (0.70 | ) | | $ | 0.00 | | | $ | 13.06 | | | | 18.77 | %c | | $ | 450.1 | | | | 1.79 | % | | | 1.79 | % | | | 1.54 | % | | | 41 | % | |
Class R3 | |
8/31/2018 | | $ | 13.01 | | | $ | 0.25 | | | $ | 1.01 | | | $ | 1.26 | | | $ | (0.32 | ) | | $ | (0.50 | ) | | $ | (0.82 | ) | | $ | — | | | $ | 13.45 | | | | 9.93 | % | | $ | 2.2 | | | | 1.33 | % | | | 1.33 | % | | | 1.87 | % | | | 41 | % | |
8/31/2017 | | $ | 12.37 | | | $ | 0.28 | | | $ | 1.02 | | | $ | 1.30 | | | $ | (0.24 | ) | | $ | (0.42 | ) | | $ | (0.66 | ) | | $ | 0.00 | | | $ | 13.01 | | | | 10.88 | %ei | | $ | 1.8 | | | | 1.34 | % | | | 1.34 | %f | | | 2.27 | %f | | | 53 | % | |
8/31/2016 | | $ | 11.67 | | | $ | 0.30 | | | $ | 1.07 | | | $ | 1.37 | | | $ | (0.25 | ) | | $ | (0.42 | ) | | $ | (0.67 | ) | | $ | — | | | $ | 12.37 | | | | 12.26 | % | | $ | 2.7 | | | | 1.33 | % | | | 1.33 | % | | | 2.53 | % | | | 49 | % | |
8/31/2015 | | $ | 13.12 | | | $ | 0.26 | | | $ | (0.92 | ) | | $ | (0.66 | ) | | $ | (0.22 | ) | | $ | (0.57 | ) | | $ | (0.79 | ) | | $ | — | | | $ | 11.67 | | | | (5.22 | )% | | $ | 3.8 | | | | 1.31 | % | | | 1.31 | % | | | 2.05 | % | | | 48 | % | |
8/31/2014 | | $ | 11.69 | | | $ | 0.25 | | | $ | 1.93 | | | $ | 2.18 | | | $ | (0.24 | ) | | $ | (0.51 | ) | | $ | (0.75 | ) | | $ | 0.00 | | | $ | 13.12 | | | | 19.42 | %c | | $ | 3.4 | | | | 1.34 | % | | | 1.34 | %§ | | | 2.04 | % | | | 41 | % | |
Focus Fund | |
Investor Class | |
8/31/2018 | | $ | 27.50 | | | $ | 0.12 | | | $ | 3.28 | | | $ | 3.40 | | | $ | (0.08 | ) | | $ | (2.13 | ) | | $ | (2.21 | ) | | $ | — | | | $ | 28.69 | | | | 13.05 | % | | $ | 690.7 | | | | 0.91 | % | | | 0.91 | % | | | 0.43 | % | | | 59 | % | |
8/31/2017 | | $ | 25.81 | | | $ | 0.07 | | | $ | 3.93 | | | $ | 4.00 | | | $ | (0.09 | ) | | $ | (2.22 | ) | | $ | (2.31 | ) | | $ | 0.00 | | | $ | 27.50 | | | | 16.81 | %ei | | $ | 667.7 | | | | 0.92 | % | | | 0.91 | %f | | | 0.28 | %f | | | 72 | % | |
8/31/2016 | | $ | 25.45 | | | $ | 0.16 | | | $ | 1.48 | | | $ | 1.64 | | | $ | (0.18 | ) | | $ | (1.10 | ) | | $ | (1.28 | ) | | $ | — | | | $ | 25.81 | | | | 6.68 | % | | $ | 626.8 | | | | 0.94 | % | | | 0.94 | % | | | 0.63 | % | | | 89 | % | |
8/31/2015 | | $ | 29.77 | | | $ | 0.21 | | | $ | (0.15 | ) | | $ | 0.06 | | | $ | (0.16 | ) | | $ | (4.22 | ) | | $ | (4.38 | ) | | $ | — | | | $ | 25.45 | | | | 0.49 | % | | $ | 639.8 | | | | 0.91 | % | | | 0.91 | % | | | 0.77 | % | | | 52 | % | |
8/31/2014 | | $ | 26.90 | | | $ | 0.18 | | | $ | 5.57 | | | $ | 5.75 | | | $ | (0.20 | ) | | $ | (2.68 | ) | | $ | (2.88 | ) | | $ | 0.00 | | | $ | 29.77 | | | | 22.65 | %c | | $ | 699.4 | | | | 0.91 | % | | | 0.91 | % | | | 0.64 | % | | | 84 | % | |
Trust Class | |
| 8/31/2018h | | $ | 29.18 | | | $ | 0.07 | | | $ | 3.35 | | | $ | 3.42 | | | $ | (0.06 | ) | | $ | (3.88 | ) | | $ | (3.94 | ) | | $ | — | | | $ | 28.66 | | | | 12.88 | % | | $ | 57.7 | | | | 1.10 | % | | | 1.10 | % | | | 0.25 | % | | | 59 | % | |
| 8/31/2017h | | $ | 29.14 | | | $ | 0.04 | | | $ | 4.19 | | | $ | 4.23 | | | $ | (0.14 | ) | | $ | (4.05 | ) | | $ | (4.19 | ) | | $ | 0.00 | | | $ | 29.18 | | | | 16.61 | %ei | | $ | 63.0 | | | | 1.10 | % | | | 1.09 | %f | | | 0.10 | %f | | | 72 | % | |
| 8/31/2016h | | $ | 29.62 | | | $ | 0.12 | | | $ | 1.70 | | | $ | 1.82 | | | $ | (0.29 | ) | | $ | (2.01 | ) | | $ | (2.30 | ) | | $ | — | | | $ | 29.14 | | | | 6.50 | % | | $ | 70.4 | | | | 1.11 | % | | | 1.11 | % | | | 0.47 | % | | | 89 | % | |
| 8/31/2015h | | $ | 37.64 | | | $ | 0.18 | | | $ | (0.23 | ) | | $ | (0.05 | ) | | $ | (0.27 | ) | | $ | (7.70 | ) | | $ | (7.97 | ) | | $ | — | | | $ | 29.62 | | | | 0.26 | % | | $ | 92.7 | | | | 1.10 | % | | | 1.10 | % | | | 0.57 | % | | | 52 | % | |
| 8/31/2014h | | $ | 35.56 | | | $ | 0.16 | | | $ | 7.19 | | | $ | 7.35 | | | $ | (0.38 | ) | | $ | (4.89 | ) | | $ | (5.27 | ) | | $ | 0.00 | | | $ | 37.64 | | | | 22.40 | %c | | $ | 125.7 | | | | 1.11 | % | | | 1.11 | % | | | 0.47 | % | | | 84 | % | |
See Notes to Financial Highlights
225
226
Financial Highlights (cont'd)
| | | Net Asset
Value,
Beginning
of Year | | Net
Investment
Income/(Loss)@ | | Net Gains or
Losses on
Securities
(both realized
and
unrealized) | | Total From
Investment
Operations | | Dividends
from Net
Investment
Income | | Distributions
from Net
Realized
Capital Gains | | Total
Distributions | | Voluntary
Contribution
from
Management | | Net Asset
Value, End of
Year | | Total Returnab | | Net Assets,
End of Year
(in millions) | | Ratio of Gross
Expenses to
Average Net
Assets# | | Ratio of Net
Expenses to
Average Net
Assets | | Ratio of Net
Investment
Income/
(Loss) to
Average Net
Assets | | Portfolio
Turnover
Rate | |
Focus Fund (cont'd) | |
Advisor Class | |
| 8/31/2018h | | $ | 37.33 | | | $ | 0.03 | | | $ | 3.63 | | | $ | 3.66 | | | $ | — | | | $ | (12.37 | ) | | $ | (12.37 | ) | | $ | — | | | $ | 28.62 | | | | 12.62 | % | | $ | 2.3 | | | | 1.26 | % | | | 1.26 | % | | | 0.09 | % | | | 59 | % | |
| 8/31/2017h | | $ | 45.35 | | | $ | (0.00 | ) | | $ | 5.52 | | | $ | 5.52 | | | $ | (0.64 | ) | | $ | (12.90 | ) | | $ | (13.54 | ) | | $ | 0.00 | | | $ | 37.33 | | | | 16.51 | %ei | | $ | 3.5 | | | | 1.26 | % | | | 1.23 | %f | | | (0.04 | )%f | | | 72 | % | |
| 8/31/2016h | | $ | 50.00 | | | $ | 0.17 | | | $ | 2.62 | | | $ | 2.79 | | | $ | (1.05 | ) | | $ | (6.39 | ) | | $ | (7.44 | ) | | $ | — | | | $ | 45.35 | | | | 6.33 | % | | $ | 3.9 | | | | 1.26 | % | | | 1.26 | % | | | 0.33 | % | | | 89 | % | |
| 8/31/2015h | | $ | 75.76 | | | $ | 0.23 | | | $ | (0.52 | ) | | $ | (0.29 | ) | | $ | (0.93 | ) | | $ | (24.54 | ) | | $ | (25.47 | ) | | $ | — | | | $ | 50.00 | | | | 0.15 | % | | $ | 6.1 | | | | 1.27 | % | | | 1.27 | % | | | 0.39 | % | | | 52 | % | |
| 8/31/2014h | | $ | 77.15 | | | $ | 0.23 | | | $ | 14.94 | | | $ | 15.17 | | | $ | (0.98 | ) | | $ | (15.58 | ) | | $ | (16.56 | ) | | $ | 0.00 | | | $ | 75.76 | | | | 22.21 | %c | | $ | 7.1 | | | | 1.27 | % | | | 1.27 | % | | | 0.28 | % | | | 84 | % | |
Institutional Class | |
| 8/31/2018h | | $ | 27.53 | | | $ | 0.16 | | | $ | 3.27 | | | $ | 3.43 | | | $ | (0.12 | ) | | $ | (2.12 | ) | | $ | (2.24 | ) | | $ | — | | | $ | 28.72 | | | | 13.20 | % | | $ | 8.6 | | | | 0.75 | % | | | 0.75 | %§ | | | 0.60 | % | | | 59 | % | |
| 8/31/2017h | | $ | 25.83 | | | $ | 0.11 | | | $ | 3.95 | | | $ | 4.06 | | | $ | (0.14 | ) | | $ | (2.22 | ) | | $ | (2.36 | ) | | $ | 0.00 | | | $ | 27.53 | | | | 17.04 | %e | | $ | 7.8 | | | | 0.76 | % | | | 0.75 | % | | | 0.44 | % | | | 72 | % | |
| 8/31/2016h | | $ | 25.47 | | | $ | 0.22 | | | $ | 1.46 | | | $ | 1.68 | | | $ | (0.22 | ) | | $ | (1.10 | ) | | $ | (1.32 | ) | | $ | — | | | $ | 25.83 | | | | 6.86 | % | | $ | 6.8 | | | | 0.76 | % | | | 0.75 | % | | | 0.89 | % | | | 89 | % | |
| 8/31/2015h | | $ | 29.80 | | | $ | 0.26 | | | $ | (0.16 | ) | | $ | 0.10 | | | $ | (0.21 | ) | | $ | (4.22 | ) | | $ | (4.43 | ) | | $ | — | | | $ | 25.47 | | | | 0.65 | % | | $ | 28.7 | | | | 0.76 | % | | | 0.75 | % | | | 0.96 | % | | | 52 | % | |
| 8/31/2014h | | $ | 26.92 | | | $ | 0.21 | | | $ | 5.60 | | | $ | 5.81 | | | $ | (0.25 | ) | | $ | (2.68 | ) | | $ | (2.93 | ) | | $ | 0.00 | | | $ | 29.80 | | | | 22.86 | %c | | $ | 9.4 | | | | 0.76 | % | | | 0.75 | % | | | 0.72 | % | | | 84 | % | |
Class A | |
| 8/31/2018h | | $ | 29.24 | | | $ | 0.07 | | | $ | 3.34 | | | $ | 3.41 | | | $ | (0.06 | ) | | $ | (3.94 | ) | | $ | (4.00 | ) | | $ | — | | | $ | 28.65 | | | | 12.80 | % | | $ | 3.4 | | | | 1.12 | % | | | 1.11 | % | | | 0.23 | % | | | 59 | % | |
| 8/31/2017h | | $ | 29.28 | | | $ | 0.02 | | | $ | 4.22 | | | $ | 4.24 | | | $ | (0.17 | ) | | $ | (4.11 | ) | | $ | (4.28 | ) | | $ | 0.00 | | | $ | 29.24 | | | | 16.58 | %e | | $ | 3.1 | | | | 1.13 | % | | | 1.11 | % | | | 0.07 | % | | | 72 | % | |
| 8/31/2016h | | $ | 29.80 | | | $ | 0.13 | | | $ | 1.70 | | | $ | 1.83 | | | $ | (0.31 | ) | | $ | (2.04 | ) | | $ | (2.35 | ) | | $ | — | | | $ | 29.28 | | | | 6.52 | % | | $ | 3.2 | | | | 1.15 | % | | | 1.11 | % | | | 0.48 | % | | | 89 | % | |
| 8/31/2015h | | $ | 37.94 | | | $ | 0.19 | | | $ | (0.24 | ) | | $ | (0.05 | ) | | $ | (0.28 | ) | | $ | (7.81 | ) | | $ | (8.09 | ) | | $ | — | | | $ | 29.80 | | | | 0.24 | % | | $ | 4.4 | | | | 1.14 | % | | | 1.11 | % | | | 0.58 | % | | | 52 | % | |
| 8/31/2014h | | $ | 35.87 | | | $ | 0.17 | | | $ | 7.23 | | | $ | 7.40 | | | $ | (0.37 | ) | | $ | (4.96 | ) | | $ | (5.33 | ) | | $ | 0.00 | | | $ | 37.94 | | | | 22.40 | %c | | $ | 3.9 | | | | 1.13 | % | | | 1.11 | % | | | 0.47 | % | | | 84 | % | |
Class C | |
| 8/31/2018h | | $ | 38.78 | | | $ | (0.16 | ) | | $ | 3.68 | | | $ | 3.52 | | | $ | — | | | $ | (13.80 | ) | | $ | (13.80 | ) | | $ | — | | | $ | 28.50 | | | | 11.92 | % | | $ | 1.7 | | | | 1.87 | % | | | 1.86 | % | | | (0.52 | )% | | | 59 | % | |
| 8/31/2017h | | $ | 48.05 | | | $ | (0.25 | ) | | $ | 5.77 | | | $ | 5.52 | | | $ | (0.39 | ) | | $ | (14.40 | ) | | $ | (14.79 | ) | | $ | 0.00 | | | $ | 38.78 | | | | 15.76 | %e | | $ | 1.9 | | | | 1.88 | % | | | 1.86 | % | | | (0.67 | )% | | | 72 | % | |
| 8/31/2016h | | $ | 53.44 | | | $ | (0.13 | ) | | $ | 2.84 | | | $ | 2.71 | | | $ | (0.97 | ) | | $ | (7.13 | ) | | $ | (8.10 | ) | | $ | — | | | $ | 48.05 | | | | 5.75 | % | | $ | 2.2 | | | | 1.90 | % | | | 1.86 | % | | | (0.27 | )% | | | 89 | % | |
| 8/31/2015h | | $ | 82.36 | | | $ | (0.13 | ) | | $ | (0.64 | ) | | $ | (0.77 | ) | | $ | (0.78 | ) | | $ | (27.37 | ) | | $ | (28.15 | ) | | $ | — | | | $ | 53.44 | | | | (0.50 | )% | | $ | 2.9 | | | | 1.89 | % | | | 1.86 | % | | | (0.18 | )% | | | 52 | % | |
| 8/31/2014h | | $ | 84.50 | | | $ | (0.19 | ) | | $ | 16.34 | | | $ | 16.15 | | | $ | (0.91 | ) | | $ | (17.38 | ) | | $ | (18.29 | ) | | $ | 0.00 | | | $ | 82.36 | | | | 21.52 | %c | | $ | 1.5 | | | | 1.91 | % | | | 1.86 | % | | | (0.27 | )% | | | 84 | % | |
Genesis Fund | |
Investor Class | |
| 8/31/2018g | | $ | 58.73 | | | $ | 0.07 | | | $ | 14.47 | | | $ | 14.54 | | | $ | (0.11 | ) | | $ | (7.89 | ) | | $ | (8.00 | ) | | $ | — | | | $ | 65.27 | | | | 26.73 | % | | $ | 1,919.1 | | | | 1.02 | % | | | 1.02 | % | | | 0.11 | % | | | 13 | % | |
| 8/31/2017g | | $ | 59.25 | | | $ | 0.12 | | | $ | 5.73 | | | $ | 5.85 | | | $ | (0.26 | ) | | $ | (6.11 | ) | | $ | (6.37 | ) | | $ | — | | | $ | 58.73 | | | | 10.19 | %i | | $ | 1,786.0 | | | | 1.02 | % | | | 1.01 | %f | | | 0.21 | %f | | | 20 | % | |
| 8/31/2016g | | $ | 63.04 | | | $ | 0.16 | | | $ | 5.95 | | | $ | 6.11 | | | $ | (0.26 | ) | | $ | (9.64 | ) | | $ | (9.90 | ) | | $ | — | | | $ | 59.25 | | | | 11.43 | % | | $ | 1,752.8 | | | | 1.03 | % | | | 1.03 | % | | | 0.28 | % | | | 16 | % | |
| 8/31/2015g | | $ | 70.99 | | | $ | 0.19 | | | $ | 0.62 | | | $ | 0.81 | | | $ | (0.24 | ) | | $ | (8.52 | ) | | $ | (8.76 | ) | | $ | — | | | $ | 63.04 | | | | 1.52 | % | | $ | 2,023.6 | | | | 1.01 | % | | | 1.01 | % | | | 0.29 | % | | | 13 | % | |
| 8/31/2014g | | $ | 69.76 | | | $ | 0.14 | | | $ | 9.32 | | | $ | 9.46 | | | $ | (0.42 | ) | | $ | (7.81 | ) | | $ | (8.23 | ) | | $ | 0.00 | | | $ | 70.99 | | | | 13.65 | %c | | $ | 2,437.6 | | | | 1.01 | % | | | 1.01 | % | | | 0.20 | % | | | 14 | % | |
See Notes to Financial Highlights
227
228
Financial Highlights (cont'd)
| | | Net Asset
Value,
Beginning
of Year | | Net
Investment
Income/(Loss)@ | | Net Gains or
Losses on
Securities
(both realized
and
unrealized) | | Total From
Investment
Operations | | Dividends
from Net
Investment
Income | | Distributions
from Net
Realized
Capital Gains | | Total
Distributions | | Voluntary
Contribution
from
Management | | Net Asset
Value, End of
Year | | Total Returnab | | Net Assets,
End of Year
(in millions) | | Ratio of Gross
Expenses to
Average Net
Assets# | | Ratio of Net
Expenses to
Average Net
Assets | | Ratio of Net
Investment
Income/
(Loss) to
Average Net
Assets | | Portfolio
Turnover
Rate | |
Genesis Fund (cont'd) | |
Trust Class | |
| 8/31/2018g | | $ | 58.73 | | | $ | 0.02 | | | $ | 14.49 | | | $ | 14.51 | | | $ | (0.05 | ) | | $ | (7.89 | ) | | $ | (7.94 | ) | | $ | — | | | $ | 65.30 | | | | 26.64 | % | | $ | 1,561.6 | | | | 1.10 | % | | | 1.10 | % | | | 0.03 | % | | | 13 | % | |
| 8/31/2017g | | $ | 56.48 | | | $ | 0.08 | | | $ | 5.54 | | | $ | 5.62 | | | $ | (0.03 | ) | | $ | (3.34 | ) | | $ | (3.37 | ) | | $ | — | | | $ | 58.73 | | | | 10.11 | %i | | $ | 1,576.2 | | | | 1.09 | % | | | 1.08 | %f | | | 0.13 | %f | | | 20 | % | |
| 8/31/2016g | | $ | 56.00 | | | $ | 0.11 | | | $ | 5.67 | | | $ | 5.78 | | | $ | (0.03 | ) | | $ | (5.27 | ) | | $ | (5.30 | ) | | $ | — | | | $ | 56.48 | | | | 11.35 | % | | $ | 1,761.0 | | | | 1.10 | % | | | 1.10 | % | | | 0.21 | % | | | 16 | % | |
| 8/31/2015g | | $ | 59.99 | | | $ | 0.11 | | | $ | 0.60 | | | $ | 0.71 | | | $ | (0.04 | ) | | $ | (4.66 | ) | | $ | (4.70 | ) | | $ | — | | | $ | 56.00 | | | | 1.41 | % | | $ | 2,003.4 | | | | 1.10 | % | | | 1.10 | % | | | 0.19 | % | | | 13 | % | |
| 8/31/2014g | | $ | 56.78 | | | $ | 0.07 | | | $ | 7.59 | | | $ | 7.66 | | | $ | (0.18 | ) | | $ | (4.27 | ) | | $ | (4.45 | ) | | $ | 0.00 | | | $ | 59.99 | | | | 13.55 | %c | | $ | 2,935.3 | | | | 1.10 | % | | | 1.10 | % | | | 0.11 | % | | | 14 | % | |
Advisor Class | |
| 8/31/2018g | | $ | 58.77 | | | $ | (0.14 | ) | | $ | 14.49 | | | $ | 14.35 | | | $ | (0.00 | ) | | $ | (7.89 | ) | | $ | (7.89 | ) | | $ | — | | | $ | 65.23 | | | | 26.31 | % | | $ | 198.1 | | | | 1.35 | % | | | 1.35 | % | | | (0.23 | )% | | | 13 | % | |
| 8/31/2017g | | $ | 62.10 | | | $ | (0.08 | ) | | $ | 5.93 | | | $ | 5.85 | | | $ | (0.19 | ) | | $ | (8.99 | ) | | $ | (9.18 | ) | | $ | — | | | $ | 58.77 | | | | 9.81 | %i | | $ | 203.8 | | | | 1.36 | % | | | 1.35 | %f | | | (0.13 | )%f | | | 20 | % | |
| 8/31/2016g | | $ | 70.12 | | | $ | (0.05 | ) | | $ | 6.28 | | | $ | 6.23 | | | $ | (0.07 | ) | | $ | (14.18 | ) | | $ | (14.25 | ) | | $ | — | | | $ | 62.10 | | | | 11.06 | % | | $ | 264.9 | | | | 1.38 | % | | | 1.38 | % | | | (0.07 | )% | | | 16 | % | |
| 8/31/2015g | | $ | 82.20 | | | $ | (0.08 | ) | | $ | 0.64 | | | $ | 0.56 | | | $ | (0.10 | ) | | $ | (12.54 | ) | | $ | (12.64 | ) | | $ | — | | | $ | 70.12 | | | | 1.11 | % | | $ | 451.3 | | | | 1.39 | % | | | 1.39 | % | | | (0.09 | )% | | | 13 | % | |
| 8/31/2014g | | $ | 82.91 | | | $ | (0.13 | ) | | $ | 11.04 | | | $ | 10.91 | | | $ | (0.13 | ) | | $ | (11.49 | ) | | $ | (11.62 | ) | | $ | 0.00 | | | $ | 82.20 | | | | 13.24 | %c | | $ | 598.9 | | | | 1.37 | % | | | 1.37 | % | | | (0.16 | )% | | | 14 | % | |
Institutional Class | |
8/31/2018 | | $ | 58.71 | | | $ | 0.17 | | | $ | 14.47 | | | $ | 14.64 | | | $ | (0.22 | ) | | $ | (7.89 | ) | | $ | (8.11 | ) | | $ | — | | | $ | 65.24 | | | | 26.96 | % | | $ | 3,253.8 | | | | 0.85 | % | | | 0.85 | % | | | 0.28 | % | | | 13 | % | |
8/31/2017 | | $ | 56.64 | | | $ | 0.22 | | | $ | 5.56 | | | $ | 5.78 | | | $ | (0.19 | ) | | $ | (3.52 | ) | | $ | (3.71 | ) | | $ | — | | | $ | 58.71 | | | | 10.40 | %i | | $ | 3,650.3 | | | | 0.85 | % | | | 0.84 | %f§ | | | 0.38 | %f | | | 20 | % | |
8/31/2016 | | $ | 56.48 | | | $ | 0.25 | | | $ | 5.67 | | | $ | 5.92 | | | $ | (0.21 | ) | | $ | (5.55 | ) | | $ | (5.76 | ) | | $ | — | | | $ | 56.64 | | | | 11.62 | % | | $ | 3,483.9 | | | | 0.85 | % | | | 0.85 | %§ | | | 0.47 | % | | | 16 | % | |
8/31/2015 | | $ | 60.72 | | | $ | 0.26 | | | $ | 0.60 | | | $ | 0.86 | | | $ | (0.19 | ) | | $ | (4.91 | ) | | $ | (5.10 | ) | | $ | — | | | $ | 56.48 | | | | 1.68 | % | | $ | 3,685.0 | | | | 0.85 | % | | | 0.85 | % | | | 0.45 | % | | | 13 | % | |
8/31/2014 | | $ | 57.62 | | | $ | 0.22 | | | $ | 7.70 | | | $ | 7.92 | | | $ | (0.32 | ) | | $ | (4.50 | ) | | $ | (4.82 | ) | | $ | 0.00 | | | $ | 60.72 | | | | 13.82 | %c | | $ | 5,061.4 | | | | 0.85 | % | | | 0.85 | %§ | | | 0.36 | % | | | 14 | % | |
Class R6 | |
| 8/31/2018g | | $ | 58.70 | | | $ | 0.23 | | | $ | 14.46 | | | $ | 14.69 | | | $ | (0.27 | ) | | $ | (7.89 | ) | | $ | (8.16 | ) | | $ | — | | | $ | 65.23 | | | | 27.07 | % | | $ | 4,372.3 | | | | 0.78 | % | | | 0.75 | % | | | 0.38 | % | | | 13 | % | |
| 8/31/2017g | | $ | 56.63 | | | $ | 0.26 | | | $ | 5.56 | | | $ | 5.82 | | | $ | (0.23 | ) | | $ | (3.52 | ) | | $ | (3.75 | ) | | $ | — | | | $ | 58.70 | | | | 10.47 | %i | | $ | 3,603.6 | | | | 0.77 | % | | | 0.77 | %f§ | | | 0.45 | %f | | | 20 | % | |
| 8/31/2016g | | $ | 56.48 | | | $ | 0.29 | | | $ | 5.67 | | | $ | 5.96 | | | $ | (0.26 | ) | | $ | (5.55 | ) | | $ | (5.81 | ) | | $ | — | | | $ | 56.63 | | | | 11.69 | % | | $ | 3,381.6 | | | | 0.78 | % | | | 0.78 | %§ | | | 0.54 | % | | | 16 | % | |
| 8/31/2015g | | $ | 60.73 | | | $ | 0.30 | | | $ | 0.60 | | | $ | 0.90 | | | $ | (0.24 | ) | | $ | (4.91 | ) | | $ | (5.15 | ) | | $ | — | | | $ | 56.48 | | | | 1.75 | % | | $ | 2,798.0 | | | | 0.78 | % | | | 0.78 | % | | | 0.52 | % | | | 13 | % | |
| 8/31/2014g | | $ | 57.61 | | | $ | 0.28 | | | $ | 7.70 | | | $ | 7.98 | | | $ | (0.36 | ) | | $ | (4.50 | ) | | $ | (4.86 | ) | | $ | 0.00 | | | $ | 60.73 | | | | 13.92 | %c | | $ | 2,690.7 | | | | 0.78 | % | | | 0.78 | %§ | | | 0.45 | % | | | 14 | % | |
Global Equity Fund | |
Institutional Class | |
8/31/2018 | | $ | 7.56 | | | $ | 0.06 | | | $ | 1.04 | | | $ | 1.10 | | | $ | (0.05 | ) | | $ | — | | | $ | (0.05 | ) | | $ | — | | | $ | 8.61 | | | | 14.53 | % | | $ | 4.8 | | | | 6.48 | % | | | 0.75 | % | | | 0.74 | % | | | 33 | % | |
8/31/2017 | | $ | 6.65 | | | $ | 0.05 | | | $ | 0.94 | | | $ | 0.99 | | | $ | (0.03 | ) | | $ | (0.05 | ) | | $ | (0.08 | ) | | $ | — | | | $ | 7.56 | | | | 15.13 | % | | $ | 4.2 | | | | 7.05 | % | | | 0.85 | % | | | 0.65 | % | | | 16 | % | |
8/31/2016 | | $ | 6.30 | | | $ | 0.04 | | | $ | 0.32 | | | $ | 0.36 | | | $ | (0.01 | ) | | $ | — | | | $ | (0.01 | ) | | $ | — | | | $ | 6.65 | | | | 5.76 | % | | $ | 3.6 | | | | 8.67 | % | | | 1.15 | % | | | 0.64 | % | | | 41 | % | |
8/31/2015 | | $ | 11.22 | | | $ | 0.03 | | | $ | (0.38 | ) | | $ | (0.35 | ) | | $ | (0.73 | ) | | $ | (3.84 | ) | | $ | (4.57 | ) | | $ | — | | | $ | 6.30 | | | | (3.16 | )% | | $ | 3.2 | | | | 4.76 | % | | | 1.15 | % | | | 0.35 | % | | | 18 | % | |
8/31/2014 | | $ | 9.49 | | | $ | 0.06 | | | $ | 1.80 | | | $ | 1.86 | | | $ | (0.04 | ) | | $ | (0.09 | ) | | $ | (0.13 | ) | | $ | — | | | $ | 11.22 | | | | 19.67 | % | | $ | 38.9 | | | | 1.72 | % | | | 1.15 | % | | | 0.54 | % | | | 39 | % | |
See Notes to Financial Highlights
229
230
Financial Highlights (cont'd)
| | | Net Asset
Value,
Beginning
of Year | | Net
Investment
Income/(Loss)@ | | Net Gains or
Losses on
Securities
(both realized
and
unrealized) | | Total From
Investment
Operations | | Dividends
from Net
Investment
Income | | Distributions
from Net
Realized
Capital Gains | | Total
Distributions | | Voluntary
Contribution
from
Management | | Net Asset
Value, End of
Year | | Total Returnab | | Net Assets,
End of Year
(in millions) | | Ratio of Gross
Expenses to
Average Net
Assets# | | Ratio of Net
Expenses to
Average Net
Assets | | Ratio of Net
Investment
Income/
(Loss) to
Average Net
Assets | | Portfolio
Turnover
Rate | |
Global Equity Fund (cont'd) | |
Class A | |
8/31/2018 | | $ | 7.48 | | | $ | 0.03 | | | $ | 1.03 | | | $ | 1.06 | | | $ | (0.03 | ) | | $ | — | | | $ | (0.03 | ) | | $ | — | | | $ | 8.51 | | | | 14.17 | % | | $ | 0.4 | | | | 6.70 | % | | | 1.11 | % | | | 0.41 | % | | | 33 | % | |
8/31/2017 | | $ | 6.57 | | | $ | 0.01 | | | $ | 0.96 | | | $ | 0.97 | | | $ | (0.01 | ) | | $ | (0.05 | ) | | $ | (0.06 | ) | | $ | — | | | $ | 7.48 | | | | 14.85 | % | | $ | 0.3 | | | | 7.74 | % | | | 1.25 | % | | | 0.19 | % | | | 16 | % | |
8/31/2016 | | $ | 6.23 | | | $ | 0.02 | | | $ | 0.32 | | | $ | 0.34 | | | $ | — | | | $ | — | | | $ | — | | | $ | — | | | $ | 6.57 | | | | 5.46 | % | | $ | 0.5 | | | | 9.12 | % | | | 1.51 | % | | | 0.31 | % | | | 41 | % | |
8/31/2015 | | $ | 11.14 | | | $ | 0.01 | | | $ | (0.38 | ) | | $ | (0.37 | ) | | $ | (0.70 | ) | | $ | (3.84 | ) | | $ | (4.54 | ) | | $ | — | | | $ | 6.23 | | | | (3.47 | )% | | $ | 0.4 | | | | 5.24 | % | | | 1.51 | % | | | 0.09 | % | | | 18 | % | |
8/31/2014 | | $ | 9.43 | | | $ | 0.03 | | | $ | 1.77 | | | $ | 1.80 | | | $ | (0.00 | ) | | $ | (0.09 | ) | | $ | (0.09 | ) | | $ | — | | | $ | 11.14 | | | | 19.18 | % | | $ | 0.4 | | | | 2.18 | % | | | 1.51 | % | | | 0.28 | % | | | 39 | % | |
Class C | |
8/31/2018 | | $ | 7.11 | | | $ | (0.03 | ) | | $ | 0.97 | | | $ | 0.94 | | | $ | — | | | $ | — | | | $ | — | | | $ | — | | | $ | 8.05 | | | | 13.22 | % | | $ | 0.1 | | | | 7.61 | % | | | 1.86 | % | | | (0.40 | )% | | | 33 | % | |
8/31/2017 | | $ | 6.29 | | | $ | (0.03 | ) | | $ | 0.90 | | | $ | 0.87 | | | $ | — | | | $ | (0.05 | ) | | $ | (0.05 | ) | | $ | — | | | $ | 7.11 | | | | 13.89 | % | | $ | 0.1 | | | | 8.34 | % | | | 1.98 | % | | | (0.47 | )% | | | 16 | % | |
8/31/2016 | | $ | 6.01 | | | $ | (0.03 | ) | | $ | 0.31 | | | $ | 0.28 | | | $ | — | | | $ | — | | | $ | — | | | $ | — | | | $ | 6.29 | | | | 4.66 | % | | $ | 0.2 | | | | 9.80 | % | | | 2.26 | % | | | (0.45 | )% | | | 41 | % | |
8/31/2015 | | $ | 10.89 | | | $ | (0.05 | ) | | $ | (0.37 | ) | | $ | (0.42 | ) | | $ | (0.62 | ) | | $ | (3.84 | ) | | $ | (4.46 | ) | | $ | — | | | $ | 6.01 | | | | (4.21 | )% | | $ | 0.2 | | | | 6.00 | % | | | 2.26 | % | | | (0.68 | )% | | | 18 | % | |
8/31/2014 | | $ | 9.28 | | | $ | (0.06 | ) | | $ | 1.76 | | | $ | 1.70 | | | $ | — | | | $ | (0.09 | ) | | $ | (0.09 | ) | | $ | — | | | $ | 10.89 | | | | 18.39 | % | | $ | 0.2 | | | | 2.96 | % | | | 2.26 | % | | | (0.54 | )% | | | 39 | % | |
Global Real Estate Fund | |
Institutional Class | |
8/31/2018 | | $ | 10.64 | | | $ | 0.17 | | | $ | 0.35 | | | $ | 0.52 | | | $ | (0.21 | ) | | $ | (0.10 | ) | | $ | (0.31 | ) | | $ | — | | | $ | 10.85 | | | | 4.98 | % | | $ | 2.3 | | | | 11.12 | % | | | 1.01 | % | | | 1.62 | % | | | 48 | % | |
8/31/2017 | | $ | 10.62 | | | $ | 0.17 | | | $ | 0.22 | | | $ | 0.39 | | | $ | (0.33 | ) | | $ | (0.04 | ) | | $ | (0.37 | ) | | $ | — | | | $ | 10.64 | | | | 4.01 | % | | $ | 2.2 | | | | 10.97 | % | | | 1.01 | % | | | 1.67 | % | | | 61 | % | |
8/31/2016 | | $ | 9.32 | | | $ | 0.17 | | | $ | 1.35 | | | $ | 1.52 | | | $ | (0.22 | ) | | $ | (0.00 | ) | | $ | (0.22 | ) | | $ | — | | | $ | 10.62 | | | | 16.49 | % | | $ | 2.1 | | | | 10.93 | % | | | 1.00 | % | | | 1.68 | % | | | 44 | % | |
Period from 12/30/2014^
to 8/31/2015 | | $ | 10.00 | | | $ | 0.08 | | | $ | (0.67 | ) | | $ | (0.59 | ) | | $ | (0.09 | ) | | $ | — | | | $ | (0.09 | ) | | $ | — | | | $ | 9.32 | | | | (5.92 | )%* | | $ | 1.9 | | | | 13.21 | %**‡ | | | 1.00 | %**‡ | | | 1.22 | %**‡ | | | 16 | %* | |
Class A | |
8/31/2018 | | $ | 10.64 | | | $ | 0.13 | | | $ | 0.34 | | | $ | 0.47 | | | $ | (0.17 | ) | | $ | (0.10 | ) | | $ | (0.27 | ) | | $ | — | | | $ | 10.84 | | | | 4.47 | % | | $ | 0.3 | | | | 11.57 | % | | | 1.37 | % | | | 1.23 | % | | | 48 | % | |
8/31/2017 | | $ | 10.61 | | | $ | 0.14 | | | $ | 0.22 | | | $ | 0.36 | | | $ | (0.29 | ) | | $ | (0.04 | ) | | $ | (0.33 | ) | | $ | — | | | $ | 10.64 | | | | 3.71 | % | | $ | 0.5 | | | | 11.23 | % | | | 1.37 | % | | | 1.41 | % | | | 61 | % | |
8/31/2016 | | $ | 9.31 | | | $ | 0.13 | | | $ | 1.35 | | | $ | 1.48 | | | $ | (0.18 | ) | | $ | (0.00 | ) | | $ | (0.18 | ) | | $ | — | | | $ | 10.61 | | | | 16.09 | % | | $ | 0.7 | | | | 11.31 | % | | | 1.36 | % | | | 1.32 | % | | | 44 | % | |
Period from 12/30/2014^
to 8/31/2015 | | $ | 10.00 | | | $ | 0.06 | | | $ | (0.67 | ) | | $ | (0.61 | ) | | $ | (0.08 | ) | | $ | — | | | $ | (0.08 | ) | | $ | — | | | $ | 9.31 | | | | (6.19 | )%* | | $ | 0.6 | | | | 13.62 | %**‡ | | | 1.36 | %**‡ | | | 0.94 | %**‡ | | | 16 | %* | |
Class C | |
8/31/2018 | | $ | 10.62 | | | $ | 0.06 | | | $ | 0.34 | | | $ | 0.40 | | | $ | (0.11 | ) | | $ | (0.10 | ) | | $ | (0.21 | ) | | $ | — | | | $ | 10.81 | | | | 3.81 | % | | $ | 0.3 | | | | 12.21 | % | | | 2.12 | % | | | 0.53 | % | | | 48 | % | |
8/31/2017 | | $ | 10.59 | | | $ | 0.06 | | | $ | 0.23 | | | $ | 0.29 | | | $ | (0.22 | ) | | $ | (0.04 | ) | | $ | (0.26 | ) | | $ | — | | | $ | 10.62 | | | | 2.96 | % | | $ | 0.3 | | | | 12.10 | % | | | 2.12 | % | | | 0.56 | % | | | 61 | % | |
8/31/2016 | | $ | 9.30 | | | $ | 0.06 | | | $ | 1.34 | | | $ | 1.40 | | | $ | (0.11 | ) | | $ | (0.00 | ) | | $ | (0.11 | ) | | $ | — | | | $ | 10.59 | | | | 15.15 | % | | $ | 0.3 | | | | 12.04 | % | | | 2.11 | % | | | 0.56 | % | | | 44 | % | |
Period from 12/30/2014^
to 8/31/2015 | | $ | 10.00 | | | $ | 0.01 | | | $ | (0.67 | ) | | $ | (0.66 | ) | | $ | (0.04 | ) | | $ | — | | | $ | (0.04 | ) | | $ | — | | | $ | 9.30 | | | | (6.64 | )%* | | $ | 0.2 | | | | 15.16 | %**‡ | | | 2.11 | %**‡ | | | 0.11 | %**‡ | | | 16 | %* | |
See Notes to Financial Highlights
231
232
Financial Highlights (cont'd)
| | | Net Asset
Value,
Beginning
of Year | | Net
Investment
Income/(Loss)@ | | Net Gains or
Losses on
Securities
(both realized
and
unrealized) | | Total From
Investment
Operations | | Dividends
from Net
Investment
Income | | Distributions
from Net
Realized
Capital Gains | | Total
Distributions | | Voluntary
Contribution
from
Management | | Net Asset
Value, End of
Year | | Total Returnab | | Net Assets,
End of Year
(in millions) | | Ratio of Gross
Expenses to
Average Net
Assets# | | Ratio of Net
Expenses to
Average Net
Assets | | Ratio of Net
Investment
Income/
(Loss) to
Average Net
Assets | | Portfolio
Turnover
Rate | |
Greater China Equity Fund | |
Institutional Class | |
8/31/2018 | | $ | 15.85 | | | $ | 0.00 | | | $ | 0.77 | | | $ | 0.77 | | | $ | (0.18 | ) | | $ | (1.64 | ) | | $ | (1.82 | ) | | $ | — | | | $ | 14.80 | | | | 4.37 | % | | $ | 79.0 | | | | 1.58 | % | | | 1.51 | % | | | 0.03 | % | | | 60 | % | |
8/31/2017 | | $ | 11.50 | | | $ | 0.09 | | | $ | 4.31 | | | $ | 4.40 | | | $ | (0.05 | ) | | $ | — | | | $ | (0.05 | ) | | $ | — | | | $ | 15.85 | | | | 38.46 | % | | $ | 109.4 | | | | 1.69 | % | | | 1.51 | %^^ | | | 0.72 | % | | | 116 | % | |
8/31/2016 | | $ | 11.64 | | | $ | 0.05 | | | $ | 1.32 | | | $ | 1.37 | | | $ | (0.10 | ) | | $ | (1.41 | ) | | $ | (1.51 | ) | | $ | — | | | $ | 11.50 | | | | 12.09 | % | | $ | 93.3 | | | | 1.76 | % | | | 1.51 | %^^ | | | 0.44 | % | | | 120 | % | |
8/31/2015 | | $ | 12.17 | | | $ | 0.10 | | | $ | 0.17 | | | $ | 0.27 | | | $ | (0.09 | ) | | $ | (0.71 | ) | | $ | (0.80 | ) | | $ | — | | | $ | 11.64 | | | | 2.15 | % | | $ | 103.4 | | | | 1.61 | % | | | 1.50 | %^^ | | | 0.75 | % | | | 176 | % | |
8/31/2014 | | $ | 10.16 | | | $ | 0.10 | | | $ | 2.06 | | | $ | 2.16 | | | $ | — | | | $ | (0.15 | ) | | $ | (0.15 | ) | | $ | — | | | $ | 12.17 | | | | 21.37 | % | | $ | 72.1 | | | | 1.83 | % | | | 1.50 | % | | | 0.90 | % | | | 171 | % | |
Class A | |
8/31/2018 | | $ | 15.86 | | | $ | (0.08 | ) | | $ | 0.80 | | | $ | 0.72 | | | $ | (0.17 | ) | | $ | (1.64 | ) | | $ | (1.81 | ) | | $ | — | | | $ | 14.77 | | | | 4.02 | % | | $ | 10.2 | | | | 2.01 | % | | | 1.87 | % | | | (0.47 | )% | | | 60 | % | |
8/31/2017 | | $ | 11.50 | | | $ | 0.19 | | | $ | 4.17 | | | $ | 4.36 | | | $ | (0.00 | ) | | $ | — | | | $ | (0.00 | ) | | $ | — | | | $ | 15.86 | | | | 37.95 | % | | $ | 21.7 | | | | 2.07 | % | | | 1.86 | %^^ | | | 1.38 | % | | | 116 | % | |
8/31/2016 | | $ | 11.56 | | | $ | (0.01 | ) | | $ | 1.39 | | | $ | 1.38 | | | $ | (0.03 | ) | | $ | (1.41 | ) | | $ | (1.44 | ) | | $ | — | | | $ | 11.50 | | | | 12.19 | % | | $ | 2.1 | | | | 2.19 | % | | | 1.87 | %^^ | | | (0.08 | )% | | | 120 | % | |
8/31/2015 | | $ | 12.14 | | | $ | 0.05 | | | $ | 0.17 | | | $ | 0.22 | | | $ | (0.09 | ) | | $ | (0.71 | ) | | $ | (0.80 | ) | | $ | — | | | $ | 11.56 | | | | 1.68 | % | | $ | 4.0 | | | | 2.00 | % | | | 1.86 | %^^ | | | 0.34 | % | | | 176 | % | |
8/31/2014 | | $ | 10.16 | | | $ | 0.13 | | | $ | 2.00 | | | $ | 2.13 | | | $ | — | | | $ | (0.15 | ) | | $ | (0.15 | ) | | $ | — | | | $ | 12.14 | | | | 21.07 | % | | $ | 1.7 | | | | 2.30 | % | | | 1.86 | % | | | 1.19 | % | | | 171 | % | |
Class C | |
8/31/2018 | | $ | 15.43 | | | $ | (0.16 | ) | | $ | 0.75 | | | $ | 0.59 | | | $ | (0.07 | ) | | $ | (1.64 | ) | | $ | (1.71 | ) | | $ | — | | | $ | 14.31 | | | | 3.26 | % | | $ | 0.3 | | | | 2.80 | % | | | 2.62 | % | | | (0.99 | )% | | | 60 | % | |
8/31/2017 | | $ | 11.27 | | | $ | (0.14 | ) | | $ | 4.30 | | | $ | 4.16 | | | $ | — | | | $ | — | | | $ | — | | | $ | — | | | $ | 15.43 | | | | 36.91 | % | | $ | 0.3 | | | | 2.80 | % | | | 2.62 | %^^ | | | (1.18 | )% | | | 116 | % | |
8/31/2016 | | $ | 11.45 | | | $ | (0.07 | ) | | $ | 1.30 | | | $ | 1.23 | | | $ | — | | | $ | (1.41 | ) | | $ | (1.41 | ) | | $ | — | | | $ | 11.27 | | | | 10.93 | % | | $ | 0.1 | | | | 2.86 | % | | | 2.62 | %^^ | | | (0.65 | )% | | | 120 | % | |
8/31/2015 | | $ | 12.03 | | | $ | (0.07 | ) | | $ | 0.20 | | | $ | 0.13 | | | $ | — | | | $ | (0.71 | ) | | $ | (0.71 | ) | | $ | — | | | $ | 11.45 | | | | 0.93 | % | | $ | 0.2 | | | | 2.80 | % | | | 2.61 | %^^ | | | (0.52 | )% | | | 176 | % | |
8/31/2014 | | $ | 10.15 | | | $ | (0.02 | ) | | $ | 2.05 | | | $ | 2.03 | | | $ | — | | | $ | (0.15 | ) | | $ | (0.15 | ) | | $ | — | | | $ | 12.03 | | | | 20.09 | % | | $ | 0.1 | | | | 2.85 | % | | | 2.61 | % | | | (0.20 | )% | | | 171 | % | |
Guardian Fund | |
Investor Class | |
8/31/2018 | | $ | 17.12 | | | $ | 0.11 | | | $ | 3.49 | | | $ | 3.60 | | | $ | (0.11 | ) | | $ | (1.09 | ) | | $ | (1.20 | ) | | $ | — | | | $ | 19.52 | | | | 21.86 | % | | $ | 1,187.2 | | | | 0.88 | % | | | 0.88 | % | | | 0.62 | % | | | 41 | % | |
8/31/2017 | | $ | 16.45 | | | $ | 0.12 | | | $ | 2.51 | | | $ | 2.63 | | | $ | (0.11 | ) | | $ | (1.85 | ) | | $ | (1.96 | ) | | $ | — | | | $ | 17.12 | | | | 17.60 | %i | | $ | 1,052.4 | | | | 0.90 | % | | | 0.89 | %f | | | 0.77 | %f | | | 37 | % | |
8/31/2016 | | $ | 17.13 | | | $ | 0.09 | | | $ | 1.21 | | | $ | 1.30 | | | $ | (0.12 | ) | | $ | (1.86 | ) | | $ | (1.98 | ) | | $ | — | | | $ | 16.45 | | | | 8.45 | % | | $ | 993.3 | | | | 0.93 | % | | | 0.93 | % | | | 0.58 | % | | | 99 | % | |
8/31/2015 | | $ | 20.43 | | | $ | 0.12 | | | $ | (0.64 | ) | | $ | (0.52 | ) | | $ | (0.15 | ) | | $ | (2.63 | ) | | $ | (2.78 | ) | | $ | — | | | $ | 17.13 | | | | (3.03 | )% | | $ | 1,034.9 | | | | 0.87 | % | | | 0.87 | % | | | 0.65 | % | | | 31 | % | |
8/31/2014 | | $ | 18.58 | | | $ | 0.16 | | | $ | 3.70 | | | $ | 3.86 | | | $ | (0.10 | ) | | $ | (1.91 | ) | | $ | (2.01 | ) | | $ | 0.00 | | | $ | 20.43 | | | | 21.87 | %c | | $ | 1,165.1 | | | | 0.88 | % | | | 0.88 | % | | | 0.83 | % | | | 37 | % | |
Trust Class | |
| 8/31/2018h | | $ | 17.82 | | | $ | 0.08 | | | $ | 3.57 | | | $ | 3.65 | | | $ | (0.13 | ) | | $ | (1.83 | ) | | $ | (1.96 | ) | | $ | — | | | $ | 19.51 | | | | 21.76 | % | | $ | 56.6 | | | | 1.06 | % | | | 1.06 | % | | | 0.44 | % | | | 41 | % | |
| 8/31/2017h | | $ | 18.34 | | | $ | 0.10 | | | $ | 2.64 | | | $ | 2.74 | | | $ | (0.16 | ) | | $ | (3.10 | ) | | $ | (3.26 | ) | | $ | — | | | $ | 17.82 | | | | 17.37 | %i | | $ | 57.8 | | | | 1.07 | % | | | 1.04 | %f | | | 0.60 | %f | | | 37 | % | |
| 8/31/2016h | | $ | 20.17 | | | $ | 0.07 | | | $ | 1.36 | | | $ | 1.43 | | | $ | (0.15 | ) | | $ | (3.11 | ) | | $ | (3.26 | ) | | $ | — | | | $ | 18.34 | | | | 8.31 | % | | $ | 70.6 | | | | 1.08 | % | | | 1.08 | % | | | 0.41 | % | | | 99 | % | |
| 8/31/2015h | | $ | 25.44 | | | $ | 0.10 | | | $ | (0.75 | ) | | $ | (0.65 | ) | | $ | (0.22 | ) | | $ | (4.40 | ) | | $ | (4.62 | ) | | $ | — | | | $ | 20.17 | | | | (3.22 | )% | | $ | 103.8 | | | | 1.06 | % | | | 1.06 | % | | | 0.46 | % | | | 31 | % | |
| 8/31/2014h | | $ | 23.93 | | | $ | 0.15 | | | $ | 4.71 | | | $ | 4.86 | | | $ | (0.15 | ) | | $ | (3.20 | ) | | $ | (3.35 | ) | | $ | 0.00 | | | $ | 25.44 | | | | 21.61 | %c | | $ | 136.6 | | | | 1.06 | % | | | 1.06 | % | | | 0.64 | % | | | 37 | % | |
See Notes to Financial Highlights
233
234
Financial Highlights (cont'd)
| | | Net Asset
Value,
Beginning
of Year | | Net
Investment
Income/(Loss)@ | | Net Gains or
Losses on
Securities
(both realized
and
unrealized) | | Total From
Investment
Operations | | Dividends
from Net
Investment
Income | | Distributions
from Net
Realized
Capital Gains | | Total
Distributions | | Voluntary
Contribution
from
Management | | Net Asset
Value, End of
Year | | Total Returnab | | Net Assets,
End of Year
(in millions) | | Ratio of Gross
Expenses to
Average Net
Assets# | | Ratio of Net
Expenses to
Average Net
Assets | | Ratio of Net
Investment
Income/
(Loss) to
Average Net
Assets | | Portfolio
Turnover
Rate | |
Guardian Fund (cont'd) | |
Advisor Class | |
| 8/31/2018h | | $ | 17.36 | | | $ | 0.02 | | | $ | 3.52 | | | $ | 3.54 | | | $ | (0.05 | ) | | $ | (1.39 | ) | | $ | (1.44 | ) | | $ | — | | | $ | 19.46 | | | | 21.34 | % | | $ | 0.2 | | | | 1.40 | % | | | 1.40 | % | | | 0.12 | % | | | 41 | % | |
| 8/31/2017h | | $ | 17.14 | | | $ | 0.09 | | | $ | 2.54 | | | $ | 2.63 | | | $ | (0.06 | ) | | $ | (2.35 | ) | | $ | (2.41 | ) | | $ | — | | | $ | 17.36 | | | | 17.26 | %i | | $ | 0.1 | | | | 1.38 | % | | | 1.18 | %f | | | 0.51 | %f | | | 37 | % | |
| 8/31/2016h | | $ | 18.24 | | | $ | 0.04 | | | $ | 1.25 | | | $ | 1.29 | | | $ | (0.02 | ) | | $ | (2.37 | ) | | $ | (2.39 | ) | | $ | — | | | $ | 17.14 | | | | 8.03 | % | | $ | 0.2 | | | | 1.31 | % | | | 1.31 | %§ | | | 0.20 | % | | | 99 | % | |
| 8/31/2015h | | $ | 22.33 | | | $ | 0.00 | | | $ | (0.68 | ) | | $ | (0.68 | ) | | $ | (0.06 | ) | | $ | (3.35 | ) | | $ | (3.41 | ) | | $ | — | | | $ | 18.24 | | | | (3.66 | )% | | $ | 0.3 | | | | 1.54 | % | | | 1.50 | % | | | 0.03 | % | | | 31 | % | |
| 8/31/2014h | | $ | 20.71 | | | $ | 0.05 | | | $ | 4.12 | | | $ | 4.17 | | | $ | (0.12 | ) | | $ | (2.43 | ) | | $ | (2.55 | ) | | $ | 0.00 | | | $ | 22.33 | | | | 21.27 | %c | | $ | 0.4 | | | | 1.28 | % | | | 1.28 | % | | | 0.25 | % | | | 37 | % | |
Institutional Class | |
| 8/31/2018h | | $ | 17.13 | | | $ | 0.14 | | | $ | 3.51 | | | $ | 3.65 | | | $ | (0.14 | ) | | $ | (1.09 | ) | | $ | (1.23 | ) | | $ | — | | | $ | 19.55 | | | | 22.15 | % | | $ | 82.5 | | | | 0.71 | % | | | 0.71 | % | | | 0.80 | % | | | 41 | % | |
| 8/31/2017h | | $ | 16.47 | | | $ | 0.15 | | | $ | 2.50 | | | $ | 2.65 | | | $ | (0.14 | ) | | $ | (1.85 | ) | | $ | (1.99 | ) | | $ | — | | | $ | 17.13 | | | | 17.72 | %i | | $ | 70.2 | | | | 0.72 | % | | | 0.71 | %f | | | 0.94 | %f | | | 37 | % | |
| 8/31/2016h | | $ | 17.14 | | | $ | 0.12 | | | $ | 1.22 | | | $ | 1.34 | | | $ | (0.15 | ) | | $ | (1.86 | ) | | $ | (2.01 | ) | | $ | — | | | $ | 16.47 | | | | 8.68 | % | | $ | 59.0 | | | | 0.72 | % | | | 0.72 | % | | | 0.73 | % | | | 99 | % | |
| 8/31/2015h | | $ | 20.44 | | | $ | 0.16 | | | $ | (0.65 | ) | | $ | (0.49 | ) | | $ | (0.18 | ) | | $ | (2.63 | ) | | $ | (2.81 | ) | | $ | — | | | $ | 17.14 | | | | (2.84 | )% | | $ | 94.1 | | | | 0.71 | % | | | 0.71 | % | | | 0.82 | % | | | 31 | % | |
| 8/31/2014h | | $ | 18.59 | | | $ | 0.20 | | | $ | 3.70 | | | $ | 3.90 | | | $ | (0.14 | ) | | $ | (1.91 | ) | | $ | (2.05 | ) | | $ | 0.00 | | | $ | 20.44 | | | | 22.03 | %c | | $ | 129.4 | | | | 0.71 | % | | | 0.71 | % | | | 1.01 | % | | | 37 | % | |
Class A | |
| 8/31/2018h | | $ | 17.85 | | | $ | 0.07 | | | $ | 3.57 | | | $ | 3.64 | | | $ | (0.13 | ) | | $ | (1.86 | ) | | $ | (1.99 | ) | | $ | — | | | $ | 19.50 | | | | 21.67 | % | | $ | 5.5 | | | | 1.09 | % | | | 1.09 | % | | | 0.41 | % | | | 41 | % | |
| 8/31/2017h | | $ | 18.43 | | | $ | 0.10 | | | $ | 2.64 | | | $ | 2.74 | | | $ | (0.17 | ) | | $ | (3.15 | ) | | $ | (3.32 | ) | | $ | — | | | $ | 17.85 | | | | 17.28 | %i | | $ | 5.6 | | | | 1.10 | % | | | 1.09 | %f | | | 0.56 | %f | | | 37 | % | |
| 8/31/2016h | | $ | 20.31 | | | $ | 0.05 | | | $ | 1.39 | | | $ | 1.44 | | | $ | (0.15 | ) | | $ | (3.17 | ) | | $ | (3.32 | ) | | $ | — | | | $ | 18.43 | | | | 8.32 | % | | $ | 6.6 | | | | 1.07 | % | | | 1.07 | % | | | 0.27 | % | | | 99 | % | |
| 8/31/2015h | | $ | 25.69 | | | $ | 0.11 | | | $ | (0.77 | ) | | $ | (0.66 | ) | | $ | (0.24 | ) | | $ | (4.48 | ) | | $ | (4.72 | ) | | $ | — | | | $ | 20.31 | | | | (3.23 | )% | | $ | 79.3 | | | | 1.07 | % | | | 1.07 | % | | | 0.46 | % | | | 31 | % | |
| 8/31/2014h | | $ | 24.21 | | | $ | 0.15 | | | $ | 4.75 | | | $ | 4.90 | | | $ | (0.17 | ) | | $ | (3.25 | ) | | $ | (3.42 | ) | | $ | 0.00 | | | $ | 25.69 | | | | 21.62 | %c | | $ | 73.8 | | | | 1.09 | % | | | 1.09 | %§ | | | 0.64 | % | | | 37 | % | |
Class C | |
| 8/31/2018h | | $ | 17.42 | | | $ | (0.06 | ) | | $ | 3.51 | | | $ | 3.45 | | | $ | (0.01 | ) | | $ | (1.46 | ) | | $ | (1.47 | ) | | $ | — | | | $ | 19.40 | | | | 20.74 | % | | $ | 1.8 | | | | 1.83 | % | | | 1.83 | % | | | (0.32 | )% | | | 41 | % | |
| 8/31/2017h | | $ | 17.38 | | | $ | (0.03 | ) | | $ | 2.58 | | | $ | 2.55 | | | $ | (0.04 | ) | | $ | (2.47 | ) | | $ | (2.51 | ) | | $ | — | | | $ | 17.42 | | | | 16.53 | %i | | $ | 1.6 | | | | 1.84 | % | | | 1.84 | %f | | | (0.20 | )%f | | | 37 | % | |
| 8/31/2016h | | $ | 18.64 | | | $ | (0.05 | ) | | $ | 1.27 | | | $ | 1.22 | | | $ | — | | | $ | (2.48 | ) | | $ | (2.48 | ) | | $ | — | | | $ | 17.38 | | | | 7.47 | % | | $ | 2.4 | | | | 1.85 | % | | | 1.85 | % | | | (0.34 | )% | | | 99 | % | |
| 8/31/2015h | | $ | 22.92 | | | $ | (0.06 | ) | | $ | (0.71 | ) | | $ | (0.77 | ) | | $ | — | | | $ | (3.51 | ) | | $ | (3.51 | ) | | $ | — | | | $ | 18.64 | | | | (4.01 | )% | | $ | 2.4 | | | | 1.83 | % | | | 1.83 | % | | | (0.30 | )% | | | 31 | % | |
| 8/31/2014h | | $ | 21.29 | | | $ | (0.04 | ) | | $ | 4.22 | | | $ | 4.18 | | | $ | (0.00 | ) | | $ | (2.55 | ) | | $ | (2.55 | ) | | $ | 0.00 | | | $ | 22.92 | | | | 20.71 | %c | | $ | 2.9 | | | | 1.86 | % | | | 1.86 | %§ | | | (0.15 | )% | | | 37 | % | |
Class R3 | |
| 8/31/2018h | | $ | 17.37 | | | $ | 0.02 | | | $ | 3.52 | | | $ | 3.54 | | | $ | (0.05 | ) | | $ | (1.40 | ) | | $ | (1.45 | ) | | $ | — | | | $ | 19.46 | | | | 21.33 | % | | $ | 0.4 | | | | 1.37 | % | | | 1.36 | % | | | 0.13 | % | | | 41 | % | |
| 8/31/2017h | | $ | 17.20 | | | $ | 0.05 | | | $ | 2.55 | | | $ | 2.60 | | | $ | (0.06 | ) | | $ | (2.37 | ) | | $ | (2.43 | ) | | $ | — | | | $ | 17.37 | | | | 17.02 | %i | | $ | 0.5 | | | | 1.38 | % | | | 1.36 | %f | | | 0.28 | %f | | | 37 | % | |
| 8/31/2016h | | $ | 18.34 | | | $ | 0.03 | | | $ | 1.27 | | | $ | 1.30 | | | $ | (0.05 | ) | | $ | (2.39 | ) | | $ | (2.44 | ) | | $ | — | | | $ | 17.20 | | | | 8.00 | % | | $ | 0.6 | | | | 1.39 | % | | | 1.36 | % | | | 0.15 | % | | | 99 | % | |
| 8/31/2015h | | $ | 22.48 | | | $ | 0.02 | | | $ | (0.69 | ) | | $ | (0.67 | ) | | $ | (0.10 | ) | | $ | (3.37 | ) | | $ | (3.47 | ) | | $ | — | | | $ | 18.34 | | | | (3.53 | )% | | $ | 0.5 | | | | 1.37 | % | | | 1.36 | % | | | 0.15 | % | | | 31 | % | |
| 8/31/2014h | | $ | 20.83 | | | $ | 0.08 | | | $ | 4.11 | | | $ | 4.19 | | | $ | (0.09 | ) | | $ | (2.45 | ) | | $ | (2.54 | ) | | $ | 0.00 | | | $ | 22.48 | | | | 21.29 | %c | | $ | 0.7 | | | | 1.38 | % | | | 1.36 | % | | | 0.37 | % | | | 37 | % | |
See Notes to Financial Highlights
235
236
Financial Highlights (cont'd)
| | | Net Asset
Value,
Beginning
of Year | | Net
Investment
Income/(Loss)@ | | Net Gains or
Losses on
Securities
(both realized
and
unrealized) | | Total From
Investment
Operations | | Dividends
from Net
Investment
Income | | Distributions
from Net
Realized
Capital Gains | | Total
Distributions | | Voluntary
Contribution
from
Management | | Net Asset
Value, End of
Year | | Total Returnab | | Net Assets,
End of Year
(in millions) | | Ratio of Gross
Expenses to
Average Net
Assets# | | Ratio of Net
Expenses to
Average Net
Assets | | Ratio of Net
Investment
Income/
(Loss) to
Average Net
Assets | | Portfolio
Turnover
Rate | |
International Equity Fund | |
Investor Class | |
| 8/31/2018h | | $ | 12.58 | | | $ | 0.10 | | | $ | 0.51 | | | $ | 0.61 | | | $ | (0.03 | ) | | $ | — | | | $ | (0.03 | ) | | $ | — | | | $ | 13.16 | | | | 4.88 | % | | $ | 106.7 | | | | 1.20 | % | | | 1.14 | % | | | 0.74 | % | | | 32 | % | |
| 8/31/2017h | | $ | 10.90 | | | $ | 0.15 | | | $ | 1.58 | | | $ | 1.73 | | | $ | (0.05 | ) | | $ | — | | | $ | (0.05 | ) | | $ | — | | | $ | 12.58 | | | | 15.97 | %i | | $ | 110.4 | | | | 1.23 | % | | | 0.73 | %f | | | 1.34 | %f | | | 27 | % | |
| 8/31/2016h | | $ | 10.46 | | | $ | 0.13 | | | $ | 0.36 | | | $ | 0.49 | | | $ | (0.05 | ) | | $ | — | | | $ | (0.05 | ) | | $ | — | | | $ | 10.90 | | | | 4.60 | % | | $ | 104.0 | | | | 1.26 | % | | | 1.08 | % | | | 1.20 | % | | | 30 | % | |
| 8/31/2015h | | $ | 10.95 | | | $ | 0.10 | | | $ | (0.51 | ) | | $ | (0.41 | ) | | $ | (0.08 | ) | | $ | — | | | $ | (0.08 | ) | | $ | — | | | $ | 10.46 | | | | (3.71 | )% | | $ | 117.7 | | | | 1.25 | % | | | 1.02 | % | | | 0.93 | % | | | 25 | % | |
| 8/31/2014h | | $ | 9.85 | | | $ | 0.14 | | | $ | 1.05 | | | $ | 1.19 | | | $ | (0.09 | ) | | $ | — | | | $ | (0.09 | ) | | $ | 0.00 | | | $ | 10.95 | | | | 12.14 | %c | | $ | 124.4 | | | | 1.26 | % | | | 1.07 | % | | | 1.29 | % | | | 34 | % | |
Trust Class | |
| 8/31/2018h | | $ | 12.57 | | | $ | 0.09 | | | $ | 0.52 | | | $ | 0.61 | | | $ | (0.02 | ) | | $ | — | | | $ | (0.02 | ) | | $ | — | | | $ | 13.16 | | | | 4.84 | % | | $ | 40.9 | | | | 1.24 | % | | | 1.18 | % | | | 0.71 | % | | | 32 | % | |
| 8/31/2017h | | $ | 10.88 | | | $ | 0.15 | | | $ | 1.58 | | | $ | 1.73 | | | $ | (0.04 | ) | | $ | — | | | $ | (0.04 | ) | | $ | — | | | $ | 12.57 | | | | 15.92 | %i | | $ | 45.7 | | | | 1.27 | % | | | 0.74 | %f | | | 1.29 | %f | | | 27 | % | |
| 8/31/2016h | | $ | 10.43 | | | $ | 0.12 | | | $ | 0.35 | | | $ | 0.47 | | | $ | (0.02 | ) | | $ | — | | | $ | (0.02 | ) | | $ | — | | | $ | 10.88 | | | | 4.59 | % | | $ | 48.4 | | | | 1.30 | % | | | 1.12 | % | | | 1.15 | % | | | 30 | % | |
| 8/31/2015h | | $ | 10.88 | | | $ | 0.09 | | | $ | (0.50 | ) | | $ | (0.41 | ) | | $ | (0.04 | ) | | $ | — | | | $ | (0.04 | ) | | $ | — | | | $ | 10.43 | | | | (3.82 | )% | | $ | 55.3 | | | | 1.36 | % | | | 1.13 | % | | | 0.81 | % | | | 25 | % | |
| 8/31/2014h | | $ | 9.79 | | | $ | 0.13 | | | $ | 1.04 | | | $ | 1.17 | | | $ | (0.08 | ) | | $ | — | | | $ | (0.08 | ) | | $ | 0.00 | | | $ | 10.88 | | | | 12.02 | %c | | $ | 67.7 | | | | 1.36 | % | | | 1.16 | % | | | 1.23 | % | | | 34 | % | |
Institutional Class | |
8/31/2018 | | $ | 12.66 | | | $ | 0.14 | | | $ | 0.51 | | | $ | 0.65 | | | $ | (0.13 | ) | | $ | — | | | $ | (0.13 | ) | | $ | — | | | $ | 13.18 | | | | 5.12 | % | | $ | 1,772.4 | | | | 0.99 | % | | | 0.85 | % | | | 1.03 | % | | | 32 | % | |
8/31/2017 | | $ | 11.09 | | | $ | 0.14 | | | $ | 1.58 | | | $ | 1.72 | | | $ | (0.15 | ) | | $ | — | | | $ | (0.15 | ) | | $ | — | | | $ | 12.66 | | | | 15.82 | %i | | $ | 1,449.0 | | | | 1.02 | % | | | 0.85 | %f§ | | | 1.19 | %f | | | 27 | % | |
8/31/2016 | | $ | 10.72 | | | $ | 0.16 | | | $ | 0.35 | | | $ | 0.51 | | | $ | (0.14 | ) | | $ | — | | | $ | (0.14 | ) | | $ | — | | | $ | 11.09 | | | | 4.78 | % | | $ | 1,184.3 | | | | 1.03 | % | | | 0.85 | %§ | | | 1.46 | % | | | 30 | % | |
8/31/2015 | | $ | 11.32 | | | $ | 0.13 | | | $ | (0.53 | ) | | $ | (0.40 | ) | | $ | (0.20 | ) | | $ | — | | | $ | (0.20 | ) | | $ | — | | | $ | 10.72 | | | | (3.51 | )% | | $ | 886.5 | | | | 1.07 | % | | | 0.85 | %§ | | | 1.11 | % | | | 25 | % | |
8/31/2014 | | $ | 10.26 | | | $ | 0.17 | | | $ | 1.09 | | | $ | 1.26 | | | $ | (0.20 | ) | | $ | — | | | $ | (0.20 | ) | | $ | 0.00 | | | $ | 11.32 | | | | 12.38 | %c | | $ | 887.3 | | | | 1.07 | % | | | 0.85 | % | | | 1.49 | % | | | 34 | % | |
Class A | |
| 8/31/2018h | | $ | 12.56 | | | $ | 0.08 | | | $ | 0.52 | | | $ | 0.60 | | | $ | (0.01 | ) | | $ | — | | | $ | (0.01 | ) | | $ | — | | | $ | 13.15 | | | | 4.77 | % | | $ | 67.2 | | | | 1.35 | % | | | 1.21 | % | | | 0.63 | % | | | 32 | % | |
| 8/31/2017h | | $ | 10.91 | | | $ | 0.07 | | | $ | 1.60 | | | $ | 1.67 | | | $ | (0.02 | ) | | $ | — | | | $ | (0.02 | ) | | $ | — | | | $ | 12.56 | | | | 15.32 | % | | $ | 71.9 | | | | 1.39 | % | | | 1.21 | %§ | | | 0.65 | %f | | | 27 | % | |
| 8/31/2016h | | $ | 10.48 | | | $ | 0.11 | | | $ | 0.35 | | | $ | 0.46 | | | $ | (0.03 | ) | | $ | — | | | $ | (0.03 | ) | | $ | — | | | $ | 10.91 | | | | 4.48 | % | | $ | 104.9 | | | | 1.40 | % | | | 1.21 | % | | | 1.05 | % | | | 30 | % | |
| 8/31/2015h | | $ | 10.96 | | | $ | 0.12 | | | $ | (0.55 | ) | | $ | (0.43 | ) | | $ | (0.05 | ) | | $ | — | | | $ | (0.05 | ) | | $ | — | | | $ | 10.48 | | | | (3.90 | )% | | $ | 91.0 | | | | 1.43 | % | | | 1.21 | %§ | | | 1.09 | % | | | 25 | % | |
| 8/31/2014h | | $ | 9.85 | | | $ | 0.13 | | | $ | 1.05 | | | $ | 1.18 | | | $ | (0.07 | ) | | $ | — | | | $ | (0.07 | ) | | $ | 0.00 | | | $ | 10.96 | | | | 11.98 | %c | | $ | 26.2 | | | | 1.45 | % | | | 1.21 | % | | | 1.23 | % | | | 34 | % | |
Class C | |
| 8/31/2018h | | $ | 12.58 | | | $ | (0.01 | ) | | $ | 0.52 | | | $ | 0.51 | | | $ | — | | | $ | — | | | $ | — | | | $ | — | | | $ | 13.09 | | | | 4.05 | % | | $ | 14.3 | | | | 2.11 | % | | | 1.96 | % | | | (0.06 | )% | | | 32 | % | |
| 8/31/2017h | | $ | 10.99 | | | $ | 0.00 | | | $ | 1.59 | | | $ | 1.59 | | | $ | — | | | $ | — | | | $ | — | | | $ | — | | | $ | 12.58 | | | | 14.48 | % | | $ | 13.2 | | | | 2.14 | % | | | 1.96 | %§ | | | 0.04 | %f | | | 27 | % | |
| 8/31/2016h | | $ | 10.60 | | | $ | 0.04 | | | $ | 0.35 | | | $ | 0.39 | | | $ | — | | | $ | — | | | $ | — | | | $ | — | | | $ | 10.99 | | | | 3.70 | % | | $ | 14.7 | | | | 2.16 | % | | | 1.96 | % | | | 0.37 | % | | | 30 | % | |
| 8/31/2015h | | $ | 11.12 | | | $ | 0.00 | | | $ | (0.51 | ) | | $ | (0.51 | ) | | $ | (0.01 | ) | | $ | — | | | $ | (0.01 | ) | | $ | — | | | $ | 10.60 | | | | (4.61 | )% | | $ | 11.2 | | | | 2.18 | % | | | 1.96 | % | | | 0.02 | % | | | 25 | % | |
| 8/31/2014h | | $ | 10.03 | | | $ | 0.06 | | | $ | 1.06 | | | $ | 1.12 | | | $ | (0.03 | ) | | $ | — | | | $ | (0.03 | ) | | $ | 0.00 | | | $ | 11.12 | | | | 11.16 | %c | | $ | 6.1 | | | | 2.21 | % | | | 1.96 | % | | | 0.59 | % | | | 34 | % | |
See Notes to Financial Highlights
237
238
Financial Highlights (cont'd)
| | | Net Asset
Value,
Beginning
of Year | | Net
Investment
Income/(Loss)@ | | Net Gains or
Losses on
Securities
(both realized
and
unrealized) | | Total From
Investment
Operations | | Dividends
from Net
Investment
Income | | Distributions
from Net
Realized
Capital Gains | | Total
Distributions | | Voluntary
Contribution
from
Management | | Net Asset
Value, End of
Year | | Total Returnab | | Net Assets,
End of Year
(in millions) | | Ratio of Gross
Expenses to
Average Net
Assets# | | Ratio of Net
Expenses to
Average Net
Assets | | Ratio of Net
Investment
Income/
(Loss) to
Average Net
Assets | | Portfolio
Turnover
Rate | |
International Equity Fund (cont'd) | |
Class R6 | |
| 8/31/2018h | | $ | 12.67 | | | $ | 0.15 | | | $ | 0.52 | | | $ | 0.67 | | | $ | (0.14 | ) | | $ | — | | | $ | (0.14 | ) | | $ | — | | | $ | 13.20 | | | | 5.26 | % | | $ | 74.3 | | | | 0.92 | % | | | 0.78 | % | | | 1.15 | % | | | 32 | % | |
| 8/31/2017h | | $ | 11.11 | | | $ | 0.15 | | | $ | 1.57 | | | $ | 1.72 | | | $ | (0.16 | ) | | $ | — | | | $ | (0.16 | ) | | $ | — | | | $ | 12.67 | | | | 15.85 | % | | $ | 134.6 | | | | 0.94 | % | | | 0.77 | % | | | 1.31 | %f | | | 27 | % | |
| 8/31/2016h | | $ | 10.72 | | | $ | 0.16 | | | $ | 0.38 | | | $ | 0.54 | | | $ | (0.15 | ) | | $ | — | | | $ | (0.15 | ) | | $ | — | | | $ | 11.11 | | | | 5.02 | % | | $ | 46.7 | | | | 0.96 | % | | | 0.78 | % | | | 1.49 | % | | | 30 | % | |
| 8/31/2015h | | $ | 11.32 | | | $ | 0.14 | | | $ | (0.53 | ) | | $ | (0.39 | ) | | $ | (0.21 | ) | | $ | — | | | $ | (0.21 | ) | | $ | — | | | $ | 10.72 | | | | (3.49 | )% | | $ | 32.7 | | | | 0.99 | % | | | 0.77 | %§ | | | 1.24 | % | | | 25 | % | |
Period from 9/3/2013^
to 8/31/2014h | | $ | 10.17 | | | $ | 0.08 | | | $ | 1.18 | | | $ | 1.26 | | | $ | (0.11 | ) | | $ | — | | | $ | (0.11 | ) | | $ | 0.00 | | | $ | 11.32 | | | | 12.46 | %*c | | $ | 21.9 | | | | 1.12 | %** | | | 0.79 | %** | | | 0.73 | %** | | | 34 | %d | |
International Select Fund | |
Trust Class | |
8/31/2018 | | $ | 12.43 | | | $ | 0.10 | | | $ | 0.54 | | | $ | 0.64 | | | $ | (0.10 | ) | | $ | — | | | $ | (0.10 | ) | | $ | — | | | $ | 12.97 | | | | 5.17 | % | | $ | 8.0 | | | | 1.38 | % | | | 1.16 | % | | | 0.74 | % | | | 44 | % | |
8/31/2017 | | $ | 10.88 | | | $ | 0.10 | | | $ | 1.57 | | | $ | 1.67 | | | $ | (0.12 | ) | | $ | — | | | $ | (0.12 | ) | | $ | — | | | $ | 12.43 | | | | 15.57 | % | | $ | 8.2 | | | | 1.34 | % | | | 1.18 | % | | | 0.90 | % | | | 27 | % | |
8/31/2016 | | $ | 10.59 | | | $ | 0.11 | | | $ | 0.27 | | | $ | 0.38 | | | $ | (0.09 | ) | | $ | — | | | $ | (0.09 | ) | | $ | — | | | $ | 10.88 | | | | 3.65 | % | | $ | 7.8 | | | | 1.39 | % | | | 1.25 | % | | | 1.06 | % | | | 22 | % | |
8/31/2015 | | $ | 11.21 | | | $ | 0.09 | | | $ | (0.59 | ) | | $ | (0.50 | ) | | $ | (0.12 | ) | | $ | — | | | $ | (0.12 | ) | | $ | — | | | $ | 10.59 | | | | (4.47 | )% | | $ | 10.2 | | | | 1.33 | % | | | 1.25 | % | | | 0.76 | % | | | 24 | % | |
8/31/2014 | | $ | 10.14 | | | $ | 0.13 | | | $ | 1.04 | | | $ | 1.17 | | | $ | (0.10 | ) | | $ | — | | | $ | (0.10 | ) | | $ | 0.00 | | | $ | 11.21 | | | | 11.56 | %c | | $ | 13.0 | | | | 1.33 | % | | | 1.25 | % | | | 1.19 | % | | | 27 | % | |
Institutional Class | |
8/31/2018 | | $ | 12.42 | | | $ | 0.13 | | | $ | 0.55 | | | $ | 0.68 | | | $ | (0.14 | ) | | $ | — | | | $ | (0.14 | ) | | $ | — | | | $ | 12.96 | | | | 5.52 | % | | $ | 142.4 | | | | 0.93 | % | | | 0.81 | % | | | 0.99 | % | | | 44 | % | |
8/31/2017 | | $ | 10.86 | | | $ | 0.14 | | | $ | 1.58 | | | $ | 1.72 | | | $ | (0.16 | ) | | $ | — | | | $ | (0.16 | ) | | $ | — | | | $ | 12.42 | | | | 16.13 | % | | $ | 214.4 | | | | 0.90 | % | | | 0.83 | % | | | 1.27 | % | | | 27 | % | |
8/31/2016 | | $ | 10.58 | | | $ | 0.16 | | | $ | 0.25 | | | $ | 0.41 | | | $ | (0.13 | ) | | $ | — | | | $ | (0.13 | ) | | $ | — | | | $ | 10.86 | | | | 3.94 | % | | $ | 211.7 | | | | 0.94 | % | | | 0.90 | % | | | 1.51 | % | | | 22 | % | |
8/31/2015 | | $ | 11.21 | | | $ | 0.13 | | | $ | (0.60 | ) | | $ | (0.47 | ) | | $ | (0.16 | ) | | $ | — | | | $ | (0.16 | ) | | $ | — | | | $ | 10.58 | | | | (4.18 | )% | | $ | 216.4 | | | | 0.93 | % | | | 0.90 | % | | | 1.16 | % | | | 24 | % | |
8/31/2014 | | $ | 10.14 | | | $ | 0.18 | | | $ | 1.03 | | | $ | 1.21 | | | $ | (0.14 | ) | | $ | — | | | $ | (0.14 | ) | | $ | 0.00 | | | $ | 11.21 | | | | 11.98 | %c | | $ | 211.6 | | | | 0.93 | % | | | 0.90 | % | | | 1.58 | % | | | 27 | % | |
Class A | |
8/31/2018 | | $ | 12.34 | | | $ | 0.08 | | | $ | 0.55 | | | $ | 0.63 | | | $ | (0.10 | ) | | $ | — | | | $ | (0.10 | ) | | $ | — | | | $ | 12.87 | | | | 5.12 | % | | $ | 3.9 | | | | 1.31 | % | | | 1.17 | % | | | 0.63 | % | | | 44 | % | |
8/31/2017 | | $ | 10.80 | | | $ | 0.10 | | | $ | 1.56 | | | $ | 1.66 | | | $ | (0.12 | ) | | $ | — | | | $ | (0.12 | ) | | $ | — | | | $ | 12.34 | | | | 15.60 | % | | $ | 4.9 | | | | 1.27 | % | | | 1.19 | % | | | 0.87 | % | | | 27 | % | |
8/31/2016 | | $ | 10.51 | | | $ | 0.13 | | | $ | 0.26 | | | $ | 0.39 | | | $ | (0.10 | ) | | $ | — | | | $ | (0.10 | ) | | $ | — | | | $ | 10.80 | | | | 3.69 | % | | $ | 4.6 | | | | 1.33 | % | | | 1.24 | % | | | 1.25 | % | | | 22 | % | |
8/31/2015 | | $ | 11.14 | | | $ | 0.08 | | | $ | (0.59 | ) | | $ | (0.51 | ) | | $ | (0.12 | ) | | $ | — | | | $ | (0.12 | ) | | $ | — | | | $ | 10.51 | | | | (4.62 | )% | | $ | 3.8 | | | | 1.31 | % | | | 1.24 | % | | | 0.71 | % | | | 24 | % | |
8/31/2014 | | $ | 10.07 | | | $ | 0.14 | | | $ | 1.03 | | | $ | 1.17 | | | $ | (0.10 | ) | | $ | — | | | $ | (0.10 | ) | | $ | 0.00 | | | $ | 11.14 | | | | 11.69 | %c | | $ | 9.3 | | | | 1.30 | % | | | 1.24 | % | | | 1.25 | % | | | 27 | % | |
Class C | |
8/31/2018 | | $ | 12.16 | | | $ | (0.00 | ) | | $ | 0.53 | | | $ | 0.53 | | | $ | (0.01 | ) | | $ | — | | | $ | (0.01 | ) | | $ | — | | | $ | 12.68 | | | | 4.37 | % | | $ | 2.4 | | | | 2.06 | % | | | 1.92 | % | | | (0.02 | )% | | | 44 | % | |
8/31/2017 | | $ | 10.64 | | | $ | 0.02 | | | $ | 1.54 | | | $ | 1.56 | | | $ | (0.04 | ) | | $ | — | | | $ | (0.04 | ) | | $ | — | | | $ | 12.16 | | | | 14.70 | % | | $ | 2.5 | | | | 2.02 | % | | | 1.94 | % | | | 0.16 | % | | | 27 | % | |
8/31/2016 | | $ | 10.36 | | | $ | 0.04 | | | $ | 0.26 | | | $ | 0.30 | | | $ | (0.02 | ) | | $ | — | | | $ | (0.02 | ) | | $ | — | | | $ | 10.64 | | | | 2.89 | % | | $ | 3.2 | | | | 2.06 | % | | | 2.00 | % | | | 0.39 | % | | | 22 | % | |
8/31/2015 | | $ | 10.97 | | | $ | 0.01 | | | $ | (0.58 | ) | | $ | (0.57 | ) | | $ | (0.04 | ) | | $ | — | | | $ | (0.04 | ) | | $ | — | | | $ | 10.36 | | | | (5.23 | )% | | $ | 3.7 | | | | 2.04 | % | | | 2.00 | % | | | 0.06 | % | | | 24 | % | |
8/31/2014 | | $ | 9.93 | | | $ | 0.05 | | | $ | 1.02 | | | $ | 1.07 | | | $ | (0.03 | ) | | $ | — | | | $ | (0.03 | ) | | $ | 0.00 | | | $ | 10.97 | | | | 10.79 | %c | | $ | 4.6 | | | | 2.05 | % | | | 2.00 | % | | | 0.42 | % | | | 27 | % | |
See Notes to Financial Highlights
239
240
Financial Highlights (cont'd)
| | | Net Asset
Value,
Beginning
of Year | | Net
Investment
Income/(Loss)@ | | Net Gains or
Losses on
Securities
(both realized
and
unrealized) | | Total From
Investment
Operations | | Dividends
from Net
Investment
Income | | Distributions
from Net
Realized
Capital Gains | | Total
Distributions | | Voluntary
Contribution
from
Management | | Net Asset
Value, End of
Year | | Total Returnab | | Net Assets,
End of Year
(in millions) | | Ratio of Gross
Expenses to
Average Net
Assets# | | Ratio of Net
Expenses to
Average Net
Assets | | Ratio of Net
Investment
Income/
(Loss) to
Average Net
Assets | | Portfolio
Turnover
Rate | |
International Select Fund (cont'd) | |
Class R3 | |
8/31/2018 | | $ | 12.22 | | | $ | 0.05 | | | $ | 0.55 | | | $ | 0.60 | | | $ | (0.07 | ) | | $ | — | | | $ | (0.07 | ) | | $ | — | | | $ | 12.75 | | | | 4.92 | % | | $ | 3.5 | | | | 1.56 | % | | | 1.42 | % | | | 0.36 | % | | | 44 | % | |
8/31/2017 | | $ | 10.71 | | | $ | 0.08 | | | $ | 1.53 | | | $ | 1.61 | | | $ | (0.10 | ) | | $ | — | | | $ | (0.10 | ) | | $ | — | | | $ | 12.22 | | | | 15.26 | % | | $ | 5.0 | | | | 1.52 | % | | | 1.44 | % | | | 0.70 | % | | | 27 | % | |
8/31/2016 | | $ | 10.43 | | | $ | 0.10 | | | $ | 0.25 | | | $ | 0.35 | | | $ | (0.07 | ) | | $ | — | | | $ | (0.07 | ) | | $ | — | | | $ | 10.71 | | | | 3.33 | % | | $ | 3.8 | | | | 1.57 | % | | | 1.51 | % | | | 0.95 | % | | | 22 | % | |
8/31/2015 | | $ | 11.05 | | | $ | 0.06 | | | $ | (0.58 | ) | | $ | (0.52 | ) | | $ | (0.10 | ) | | $ | — | | | $ | (0.10 | ) | | $ | — | | | $ | 10.43 | | | | (4.71 | )% | | $ | 3.4 | | | | 1.55 | % | | | 1.51 | % | | | 0.56 | % | | | 24 | % | |
8/31/2014 | | $ | 10.01 | | | $ | 0.11 | | | $ | 1.02 | | | $ | 1.13 | | | $ | (0.09 | ) | | $ | — | | | $ | (0.09 | ) | | $ | 0.00 | | | $ | 11.05 | | | | 11.35 | %c | | $ | 2.2 | | | | 1.55 | % | | | 1.51 | % | | | 1.03 | % | | | 27 | % | |
Class R6 | |
8/31/2018 | | $ | 12.42 | | | $ | 0.15 | | | $ | 0.54 | | | $ | 0.69 | | | $ | (0.15 | ) | | $ | — | | | $ | (0.15 | ) | | $ | — | | | $ | 12.96 | | | | 5.59 | % | | $ | 9.4 | | | | 0.87 | % | | | 0.74 | % | | | 1.15 | % | | | 44 | % | |
Period from 4/17/2017^
to 8/31/2017 | | $ | 11.12 | | | $ | 0.08 | | | $ | 1.22 | | | $ | 1.30 | | | $ | — | | | $ | — | | | $ | — | | | $ | — | | | $ | 12.42 | | | | 11.69 | %* | | $ | 9.6 | | | | 0.79 | %** | | | 0.73 | %** | | | 1.70 | %** | | | 27 | %d | |
International Small Cap Fund | |
Institutional Class | |
8/31/2018 | | $ | 12.74 | | | $ | 0.11 | | | $ | 1.02 | | | $ | 1.13 | | | $ | (0.35 | ) | | $ | (0.54 | ) | | $ | (0.89 | ) | | $ | — | | | $ | 12.98 | | | | 9.06 | % | | $ | 6.2 | | | | 7.02 | % | | | 1.05 | % | | | 0.83 | % | | | 48 | % | |
Period from 12/8/2016^
to 8/31/2017 | | $ | 10.00 | | | $ | 0.08 | | | $ | 2.66 | | | $ | 2.74 | | | $ | — | | | $ | — | | | $ | — | | | $ | — | | | $ | 12.74 | | | | 27.40 | %* | | $ | 0.8 | | | | 29.10 | %‡** | | | 1.05 | %‡** | | | 0.93 | %‡** | | | 43 | %* | |
Class A | |
8/31/2018 | | $ | 12.70 | | | $ | 0.02 | | | $ | 1.05 | | | $ | 1.07 | | | $ | (0.30 | ) | | $ | (0.54 | ) | | $ | (0.84 | ) | | $ | — | | | $ | 12.93 | | | | 8.60 | % | | $ | 0.2 | | | | 7.56 | % | | | 1.41 | % | | | 0.16 | % | | | 48 | % | |
Period from 12/8/2016^
to 8/31/2017 | | $ | 10.00 | | | $ | 0.11 | | | $ | 2.59 | | | $ | 2.70 | | | $ | — | | | $ | — | | | $ | — | | | $ | — | | | $ | 12.70 | | | | 27.00 | %* | | $ | 0.3 | | | | 29.48 | %‡** | | | 1.41 | %‡** | | | 1.21 | %‡** | | | 43 | %* | |
Class C | |
8/31/2018 | | $ | 12.63 | | | $ | (0.07 | ) | | $ | 1.05 | | | $ | 0.98 | | | $ | (0.24 | ) | | $ | (0.54 | ) | | $ | (0.78 | ) | | $ | — | | | $ | 12.83 | | | | 7.89 | % | | $ | 0.2 | | | | 8.15 | % | | | 2.16 | % | | | (0.53 | )% | | | 48 | % | |
Period from 12/8/2016^
to 8/31/2017 | | $ | 10.00 | | | $ | (0.02 | ) | | $ | 2.65 | | | $ | 2.63 | | | $ | — | | | $ | — | | | $ | — | | | $ | — | | | $ | 12.63 | | | | 26.30 | %* | | $ | 0.1 | | | | 30.21 | %‡** | | | 2.16 | %‡** | | | (0.19 | )%‡** | | | 43 | %* | |
Class R6 | |
8/31/2018 | | $ | 12.74 | | | $ | 0.08 | | | $ | 1.06 | | | $ | 1.14 | | | $ | (0.36 | ) | | $ | (0.54 | ) | | $ | (0.90 | ) | | $ | — | | | $ | 12.98 | | | | 9.12 | % | | $ | 0.3 | | | | 6.97 | % | | | 0.98 | % | | | 0.64 | % | | | 48 | % | |
Period from 12/8/2016^
to 8/31/2017 | | $ | 10.00 | | | $ | 0.08 | | | $ | 2.66 | | | $ | 2.74 | | | $ | — | | | $ | — | | | $ | — | | | $ | — | | | $ | 12.74 | | | | 27.40 | %* | | $ | 0.3 | | | | 29.02 | %‡** | | | 0.98 | %‡** | | | 0.99 | %‡** | | | 43 | %* | |
See Notes to Financial Highlights
241
242
Financial Highlights (cont'd)
| | | Net Asset
Value,
Beginning
of Year | | Net
Investment
Income/(Loss)@ | | Net Gains or
Losses on
Securities
(both realized
and
unrealized) | | Total From
Investment
Operations | | Dividends
from Net
Investment
Income | | Distributions
from Net
Realized
Capital Gains | | Total
Distributions | | Voluntary
Contribution
from
Management | | Net Asset
Value, End of
Year | | Total Returnab | | Net Assets,
End of Year
(in millions) | | Ratio of Gross
Expenses to
Average Net
Assets# | | Ratio of Net
Expenses to
Average Net
Assets | | Ratio of Net
Investment
Income/
(Loss) to
Average Net
Assets | | Portfolio
Turnover
Rate | |
Intrinsic Value Fund | |
Institutional Class | |
8/31/2018 | | $ | 16.12 | | | $ | (0.06 | ) | | $ | 3.33 | | | $ | 3.27 | | | $ | — | | | $ | (0.85 | ) | | $ | (0.85 | ) | | $ | — | | | $ | 18.54 | | | | 21.01 | % | | $ | 678.0 | | | | 1.02 | % | | | 1.00 | % | | | (0.35 | )% | | | 25 | % | |
8/31/2017 | | $ | 14.02 | | | $ | (0.05 | ) | | $ | 2.36 | | | $ | 2.31 | | | $ | — | | | $ | (0.21 | ) | | $ | (0.21 | ) | | $ | — | | | $ | 16.12 | | | | 16.59 | % | | $ | 841.9 | | | | 1.03 | % | | | 1.00 | % | | | (0.35 | )% | | | 26 | % | |
8/31/2016 | | $ | 14.34 | | | $ | (0.05 | ) | | $ | 0.43 | | | $ | 0.38 | | | $ | — | | | $ | (0.70 | ) | | $ | (0.70 | ) | | $ | — | | | $ | 14.02 | | | | 2.96 | % | | $ | 611.3 | | | | 1.08 | % | | | 1.00 | % | | | (0.38 | )% | | | 17 | % | |
8/31/2015 | | $ | 14.98 | | | $ | (0.06 | ) | | $ | 0.21 | | | $ | 0.15 | | | $ | — | | | $ | (0.79 | ) | | $ | (0.79 | ) | | $ | — | | | $ | 14.34 | | | | 1.36 | % | | $ | 420.3 | | | | 1.10 | % | | | 1.00 | % | | | (0.41 | )% | | | 22 | % | |
8/31/2014 | | $ | 12.81 | | | $ | (0.06 | ) | | $ | 2.80 | | | $ | 2.74 | | | $ | (0.03 | ) | | $ | (0.54 | ) | | $ | (0.57 | ) | | $ | 0.00 | | | $ | 14.98 | | | | 21.74 | %c | | $ | 252.0 | | | | 1.13 | % | | | 1.00 | % | | | (0.40 | )% | | | 24 | % | |
Class A | |
8/31/2018 | | $ | 15.67 | | | $ | (0.12 | ) | | $ | 3.23 | | | $ | 3.11 | | | $ | — | | | $ | (0.85 | ) | | $ | (0.85 | ) | | $ | — | | | $ | 17.93 | | | | 20.58 | % | | $ | 20.0 | | | | 1.41 | % | | | 1.36 | % | | | (0.73 | )% | | | 25 | % | |
8/31/2017 | | $ | 13.68 | | | $ | (0.10 | ) | | $ | 2.30 | | | $ | 2.20 | | | $ | — | | | $ | (0.21 | ) | | $ | (0.21 | ) | | $ | — | | | $ | 15.67 | | | | 16.20 | % | | $ | 18.2 | | | | 1.43 | % | | | 1.36 | % | | | (0.68 | )% | | | 26 | % | |
8/31/2016 | | $ | 14.06 | | | $ | (0.10 | ) | | $ | 0.42 | | | $ | 0.32 | | | $ | — | | | $ | (0.70 | ) | | $ | (0.70 | ) | | $ | — | | | $ | 13.68 | | | | 2.58 | % | | $ | 44.5 | | | | 1.48 | % | | | 1.36 | % | | | (0.72 | )% | | | 17 | % | |
8/31/2015 | | $ | 14.76 | | | $ | (0.11 | ) | | $ | 0.20 | | | $ | 0.09 | | | $ | — | | | $ | (0.79 | ) | | $ | (0.79 | ) | | $ | — | | | $ | 14.06 | | | | 0.96 | % | | $ | 44.3 | | | | 1.50 | % | | | 1.36 | % | | | (0.77 | )% | | | 22 | % | |
8/31/2014 | | $ | 12.65 | | | $ | (0.11 | ) | | $ | 2.76 | | | $ | 2.65 | | | $ | (0.00 | ) | | $ | (0.54 | ) | | $ | (0.54 | ) | | $ | 0.00 | | | $ | 14.76 | | | | 21.31 | %c | | $ | 13.5 | | | | 1.51 | % | | | 1.36 | % | | | (0.77 | )% | | | 24 | % | |
Class C | |
8/31/2018 | | $ | 14.76 | | | $ | (0.23 | ) | | $ | 3.02 | | | $ | 2.79 | | | $ | — | | | $ | (0.85 | ) | | $ | (0.85 | ) | | $ | — | | | $ | 16.70 | | | | 19.65 | % | | $ | 24.5 | | | | 2.13 | % | | | 2.11 | % | | | (1.47 | )% | | | 25 | % | |
8/31/2017 | | $ | 12.99 | | | $ | (0.20 | ) | | $ | 2.18 | | | $ | 1.98 | | | $ | — | | | $ | (0.21 | ) | | $ | (0.21 | ) | | $ | — | | | $ | 14.76 | | | | 15.36 | % | | $ | 22.4 | | | | 2.15 | % | | | 2.11 | % | | | (1.45 | )% | | | 26 | % | |
8/31/2016 | | $ | 13.48 | | | $ | (0.18 | ) | | $ | 0.39 | | | $ | 0.21 | | | $ | — | | | $ | (0.70 | ) | | $ | (0.70 | ) | | $ | — | | | $ | 12.99 | | | | 1.85 | % | | $ | 25.2 | | | | 2.20 | % | | | 2.11 | % | | | (1.47 | )% | | | 17 | % | |
8/31/2015 | | $ | 14.29 | | | $ | (0.21 | ) | | $ | 0.19 | | | $ | (0.02 | ) | | $ | — | | | $ | (0.79 | ) | | $ | (0.79 | ) | | $ | — | | | $ | 13.48 | | | | 0.19 | % | | $ | 25.8 | | | | 2.22 | % | | | 2.11 | % | | | (1.52 | )% | | | 22 | % | |
8/31/2014 | | $ | 12.35 | | | $ | (0.21 | ) | | $ | 2.69 | | | $ | 2.48 | | | $ | — | | | $ | (0.54 | ) | | $ | (0.54 | ) | | $ | 0.00 | | | $ | 14.29 | | | | 20.40 | %c | | $ | 12.7 | | | | 2.26 | % | | | 2.11 | % | | | (1.51 | )% | | | 24 | % | |
Large Cap Value Fund | |
Investor Class | |
8/31/2018 | | $ | 31.61 | | | $ | 0.46 | | | $ | 3.47 | | | $ | 3.93 | | | $ | (0.40 | ) | | $ | (2.27 | ) | | $ | (2.67 | ) | | $ | — | | | $ | 32.87 | | | | 12.90 | % | | $ | 1,160.3 | | | | 0.87 | % | | | 0.87 | % | | | 1.46 | % | | | 153 | % | |
8/31/2017 | | $ | 28.25 | | | $ | 0.40 | | | $ | 4.03 | | | $ | 4.43 | | | $ | (0.20 | ) | | $ | (0.87 | ) | | $ | (1.07 | ) | | $ | — | | | $ | 31.61 | | | | 15.88 | %i | | $ | 1,148.5 | | | | 0.87 | % | | | 0.86 | %f | | | 1.31 | %f | | | 74 | % | |
8/31/2016 | | $ | 27.46 | | | $ | 0.31 | | | $ | 2.85 | | | $ | 3.16 | | | $ | (0.31 | ) | | $ | (2.06 | ) | | $ | (2.37 | ) | | $ | — | | | $ | 28.25 | | | | 13.16 | % | | $ | 1,069.8 | | | | 0.90 | % | | | 0.90 | % | | | 1.20 | % | | | 126 | % | |
8/31/2015 | | $ | 33.92 | | | $ | 0.33 | | | $ | (2.51 | ) | | $ | (2.18 | ) | | $ | (0.29 | ) | | $ | (3.99 | ) | | $ | (4.28 | ) | | $ | — | | | $ | 27.46 | | | | (7.19 | )% | | $ | 1,045.6 | | | | 0.86 | % | | | 0.86 | % | | | 1.08 | % | | | 153 | % | |
8/31/2014 | | $ | 32.40 | | | $ | 0.34 | | | $ | 6.62 | | | $ | 6.96 | | | $ | (0.42 | ) | | $ | (5.02 | ) | | $ | (5.44 | ) | | $ | 0.00 | | | $ | 33.92 | | | | 23.57 | %c | | $ | 1,238.3 | | | | 0.85 | % | | | 0.85 | % | | | 1.04 | % | | | 104 | % | |
Trust Class | |
| 8/31/2018g | | $ | 31.63 | | | $ | 0.40 | | | $ | 3.47 | | | $ | 3.87 | | | $ | (0.35 | ) | | $ | (2.27 | ) | | $ | (2.62 | ) | | $ | — | | | $ | 32.88 | | | | 12.68 | % | | $ | 68.4 | | | | 1.05 | % | | | 1.05 | % | | | 1.26 | % | | | 153 | % | |
| 8/31/2017g | | $ | 28.84 | | | $ | 0.36 | | | $ | 4.10 | | | $ | 4.46 | | | $ | (0.30 | ) | | $ | (1.37 | ) | | $ | (1.67 | ) | | $ | — | | | $ | 31.63 | | | | 15.77 | %i | | $ | 75.0 | | | | 1.05 | % | | | 1.01 | %f | | | 1.16 | %f | | | 74 | % | |
| 8/31/2016g | | $ | 29.40 | | | $ | 0.28 | | | $ | 2.83 | | | $ | 3.11 | | | $ | (0.44 | ) | | $ | (3.23 | ) | | $ | (3.67 | ) | | $ | — | | | $ | 28.84 | | | | 12.97 | % | | $ | 77.6 | | | | 1.07 | % | | | 1.07 | % | | | 1.03 | % | | | 126 | % | |
| 8/31/2015g | | $ | 38.50 | | | $ | 0.30 | | | $ | (2.73 | ) | | $ | (2.43 | ) | | $ | (0.41 | ) | | $ | (6.26 | ) | | $ | (6.67 | ) | | $ | — | | | $ | 29.40 | | | | (7.40 | )% | | $ | 108.2 | | | | 1.05 | % | | | 1.05 | % | | | 0.88 | % | | | 153 | % | |
| 8/31/2014g | | $ | 38.91 | | | $ | 0.31 | | | $ | 7.74 | | | $ | 8.05 | | | $ | (0.58 | ) | | $ | (7.88 | ) | | $ | (8.46 | ) | | $ | 0.00 | | | $ | 38.50 | | | | 23.36 | %c | | $ | 141.1 | | | | 1.05 | % | | | 1.05 | % | | | 0.83 | % | | | 104 | % | |
See Notes to Financial Highlights
243
244
Financial Highlights (cont'd)
| | | Net Asset
Value,
Beginning
of Year | | Net
Investment
Income/(Loss)@ | | Net Gains or
Losses on
Securities
(both realized
and
unrealized) | | Total From
Investment
Operations | | Dividends
from Net
Investment
Income | | Distributions
from Net
Realized
Capital Gains | | Total
Distributions | | Voluntary
Contribution
from
Management | | Net Asset
Value, End of
Year | | Total Returnab | | Net Assets,
End of Year
(in millions) | | Ratio of Gross
Expenses to
Average Net
Assets# | | Ratio of Net
Expenses to
Average Net
Assets | | Ratio of Net
Investment
Income/
(Loss) to
Average Net
Assets | | Portfolio
Turnover
Rate | |
Large Cap Value Fund (cont'd) | |
Advisor Class | |
| 8/31/2018g | | $ | 31.62 | | | $ | 0.35 | | | $ | 3.49 | | | $ | 3.84 | | | $ | (0.31 | ) | | $ | (2.27 | ) | | $ | (2.58 | ) | | $ | — | | | $ | 32.88 | | | | 12.56 | % | | $ | 125.2 | | | | 1.20 | % | | | 1.20 | % | | | 1.11 | % | | | 153 | % | |
| 8/31/2017g | | $ | 29.45 | | | $ | 0.30 | | | $ | 4.15 | | | $ | 4.45 | | | $ | (0.41 | ) | | $ | (1.87 | ) | | $ | (2.28 | ) | | $ | — | | | $ | 31.62 | | | | 15.51 | %i | | $ | 144.1 | | | | 1.20 | % | | | 1.19 | %f | | | 0.98 | %f | | | 74 | % | |
| 8/31/2016g | | $ | 31.41 | | | $ | 0.24 | | | $ | 2.83 | | | $ | 3.07 | | | $ | (0.61 | ) | | $ | (4.42 | ) | | $ | (5.03 | ) | | $ | — | | | $ | 29.45 | | | | 12.81 | % | | $ | 145.9 | | | | 1.22 | % | | | 1.22 | % | | | 0.88 | % | | | 126 | % | |
| 8/31/2015g | | $ | 43.19 | | | $ | 0.26 | | | $ | (2.94 | ) | | $ | (2.68 | ) | | $ | (0.54 | ) | | $ | (8.56 | ) | | $ | (9.10 | ) | | $ | — | | | $ | 31.41 | | | | (7.55 | )% | | $ | 162.3 | | | | 1.20 | % | | | 1.20 | % | | | 0.73 | % | | | 153 | % | |
| 8/31/2014g | | $ | 45.58 | | | $ | 0.30 | | | $ | 8.85 | | | $ | 9.15 | | | $ | (0.76 | ) | | $ | (10.78 | ) | | $ | (11.54 | ) | | $ | 0.00 | | | $ | 43.19 | | | | 23.17 | %c | | $ | 216.1 | | | | 1.20 | % | | | 1.20 | % | | | 0.69 | % | | | 104 | % | |
Institutional Class | |
| 8/31/2018g | | $ | 31.60 | | | $ | 0.52 | | | $ | 3.47 | | | $ | 3.99 | | | $ | (0.45 | ) | | $ | (2.27 | ) | | $ | (2.72 | ) | | $ | — | | | $ | 32.87 | | | | 13.11 | % | | $ | 98.5 | | | | 0.70 | % | | | 0.70 | %§ | | | 1.64 | % | | | 153 | % | |
| 8/31/2017g | | $ | 28.25 | | | $ | 0.45 | | | $ | 4.02 | | | $ | 4.47 | | | $ | (0.26 | ) | | $ | (0.86 | ) | | $ | (1.12 | ) | | $ | — | | | $ | 31.60 | | | | 16.04 | %i | | $ | 80.6 | | | | 0.70 | % | | | 0.69 | %f§ | | | 1.50 | %f | | | 74 | % | |
| 8/31/2016g | | $ | 27.42 | | | $ | 0.35 | | | $ | 2.85 | | | $ | 3.20 | | | $ | (0.33 | ) | | $ | (2.04 | ) | | $ | (2.37 | ) | | $ | — | | | $ | 28.25 | | | | 13.38 | % | | $ | 56.2 | | | | 0.71 | % | | | 0.70 | % | | | 1.38 | % | | | 126 | % | |
| 8/31/2015g | | $ | 33.84 | | | $ | 0.37 | | | $ | (2.49 | ) | | $ | (2.12 | ) | | $ | (0.34 | ) | | $ | (3.96 | ) | | $ | (4.30 | ) | | $ | — | | | $ | 27.42 | | | | (7.03 | )% | | $ | 86.4 | | | | 0.70 | % | | | 0.70 | %§ | | | 1.19 | % | | | 153 | % | |
| 8/31/2014g | | $ | 32.30 | | | $ | 0.38 | | | $ | 6.60 | | | $ | 6.98 | | | $ | (0.46 | ) | | $ | (4.98 | ) | | $ | (5.44 | ) | | $ | 0.00 | | | $ | 33.84 | | | | 23.74 | %c | | $ | 143.5 | | | | 0.70 | % | | | 0.70 | %§ | | | 1.18 | % | | | 104 | % | |
Class A | |
| 8/31/2018g | | $ | 31.62 | | | $ | 0.39 | | | $ | 3.48 | | | $ | 3.87 | | | $ | (0.34 | ) | | $ | (2.27 | ) | | $ | (2.61 | ) | | $ | — | | | $ | 32.88 | | | | 12.68 | % | | $ | 4.1 | | | | 1.08 | % | | | 1.08 | % | | | 1.24 | % | | | 153 | % | |
| 8/31/2017g | | $ | 28.87 | | | $ | 0.34 | | | $ | 4.09 | | | $ | 4.43 | | | $ | (0.31 | ) | | $ | (1.37 | ) | | $ | (1.68 | ) | | $ | — | | | $ | 31.62 | | | | 15.65 | %i | | $ | 3.8 | | | | 1.07 | % | | | 1.07 | %f | | | 1.11 | %f | | | 74 | % | |
| 8/31/2016g | | $ | 29.47 | | | $ | 0.27 | | | $ | 2.83 | | | $ | 3.10 | | | $ | (0.46 | ) | | $ | (3.24 | ) | | $ | (3.70 | ) | | $ | — | | | $ | 28.87 | | | | 12.94 | % | | $ | 3.2 | | | | 1.09 | % | | | 1.09 | % | | | 1.02 | % | | | 126 | % | |
| 8/31/2015g | | $ | 38.61 | | | $ | 0.32 | | | $ | (2.77 | ) | | $ | (2.45 | ) | | $ | (0.42 | ) | | $ | (6.27 | ) | | $ | (6.69 | ) | | $ | — | | | $ | 29.47 | | | | (7.44 | )% | | $ | 2.9 | | | | 1.09 | % | | | 1.09 | % | | | 0.96 | % | | | 153 | % | |
| 8/31/2014g | | $ | 39.05 | | | $ | 0.30 | | | $ | 7.77 | | | $ | 8.07 | | | $ | (0.61 | ) | | $ | (7.90 | ) | | $ | (8.51 | ) | | $ | 0.00 | | | $ | 38.61 | | | | 23.31 | %c | | $ | 2.7 | | | | 1.08 | % | | | 1.08 | %§ | | | 0.78 | % | | | 104 | % | |
Class C | |
| 8/31/2018g | | $ | 31.67 | | | $ | 0.15 | | | $ | 3.48 | | | $ | 3.63 | | | $ | (0.16 | ) | | $ | (2.27 | ) | | $ | (2.43 | ) | | $ | — | | | $ | 32.87 | | | | 11.83 | % | | $ | 1.9 | | | | 1.82 | % | | | 1.82 | % | | | 0.48 | % | | | 153 | % | |
| 8/31/2017g | | $ | 29.66 | | | $ | 0.11 | | | $ | 4.18 | | | $ | 4.29 | | | $ | (0.29 | ) | | $ | (1.99 | ) | | $ | (2.28 | ) | | $ | — | | | $ | 31.67 | | | | 14.84 | %i | | $ | 2.3 | | | | 1.81 | % | | | 1.81 | %f | | | 0.36 | %f | | | 74 | % | |
| 8/31/2016g | | $ | 31.83 | | | $ | 0.07 | | | $ | 2.83 | | | $ | 2.90 | | | $ | (0.37 | ) | | $ | (4.70 | ) | | $ | (5.07 | ) | | $ | — | | | $ | 29.66 | | | | 12.09 | % | | $ | 2.1 | | | | 1.83 | % | | | 1.83 | % | | | 0.26 | % | | | 126 | % | |
| 8/31/2015g | | $ | 44.30 | | | $ | 0.04 | | | $ | (3.01 | ) | | $ | (2.97 | ) | | $ | (0.39 | ) | | $ | (9.11 | ) | | $ | (9.50 | ) | | $ | — | | | $ | 31.83 | | | | (8.11 | )% | | $ | 2.7 | | | | 1.82 | % | | | 1.82 | %§ | | | 0.11 | % | | | 153 | % | |
| 8/31/2014g | | $ | 47.34 | | | $ | 0.00 | | | $ | 9.16 | | | $ | 9.16 | | | $ | (0.74 | ) | | $ | (11.46 | ) | | $ | (12.20 | ) | | $ | 0.00 | | | $ | 44.30 | | | | 22.37 | %c | | $ | 3.0 | | | | 1.86 | % | | | 1.86 | %§ | | | 0.03 | % | | | 104 | % | |
Class R3 | |
| 8/31/2018g | | $ | 31.63 | | | $ | 0.32 | | | $ | 3.47 | | | $ | 3.79 | | | $ | (0.26 | ) | | $ | (2.27 | ) | | $ | (2.53 | ) | | $ | — | | | $ | 32.89 | | | | 12.39 | % | | $ | 0.3 | | | | 1.37 | % | | | 1.36 | % | | | 1.00 | % | | | 153 | % | |
| 8/31/2017g | | $ | 29.46 | | | $ | 0.28 | | | $ | 4.12 | | | $ | 4.40 | | | $ | (0.39 | ) | | $ | (1.84 | ) | | $ | (2.23 | ) | | $ | — | | | $ | 31.63 | | | | 15.27 | %i | | $ | 0.2 | | | | 1.43 | % | | | 1.36 | %f | | | 0.90 | %f | | | 74 | % | |
| 8/31/2016g | | $ | 31.34 | | | $ | 0.21 | | | $ | 2.81 | | | $ | 3.02 | | | $ | (0.55 | ) | | $ | (4.35 | ) | | $ | (4.90 | ) | | $ | — | | | $ | 29.46 | | | | 12.58 | % | | $ | 0.1 | | | | 1.54 | % | | | 1.36 | % | | | 0.75 | % | | | 126 | % | |
| 8/31/2015g | | $ | 42.97 | | | $ | 0.19 | | | $ | (2.92 | ) | | $ | (2.73 | ) | | $ | (0.46 | ) | | $ | (8.44 | ) | | $ | (8.90 | ) | | $ | — | | | $ | 31.34 | | | | (7.64 | )% | | $ | 0.1 | | | | 1.51 | % | | | 1.36 | % | | | 0.53 | % | | | 153 | % | |
| 8/31/2014g | | $ | 45.27 | | | $ | 0.23 | | | $ | 8.80 | | | $ | 9.03 | | | $ | (0.72 | ) | | $ | (10.61 | ) | | $ | (11.33 | ) | | $ | 0.00 | | | $ | 42.97 | | | | 22.94 | %c | | $ | 0.1 | | | | 1.43 | % | | | 1.36 | % | | | 0.53 | % | | | 104 | % | |
See Notes to Financial Highlights
245
246
Financial Highlights (cont'd)
| | | Net Asset
Value,
Beginning
of Year | | Net
Investment
Income/(Loss)@ | | Net Gains or
Losses on
Securities
(both realized
and
unrealized) | | Total From
Investment
Operations | | Dividends
from Net
Investment
Income | | Distributions
from Net
Realized
Capital Gains | | Total
Distributions | | Voluntary
Contribution
from
Management | | Net Asset
Value, End of
Year | | Total Returnab | | Net Assets,
End of Year
(in millions) | | Ratio of Gross
Expenses to
Average Net
Assets# | | Ratio of Net
Expenses to
Average Net
Assets | | Ratio of Net
Investment
Income/
(Loss) to
Average Net
Assets | | Portfolio
Turnover
Rate | |
Mid Cap Growth Fund | |
Investor Class | |
| 8/31/2018g | | $ | 14.61 | | | $ | (0.04 | ) | | $ | 3.74 | | | $ | 3.70 | | | $ | — | | | $ | (1.32 | ) | | $ | (1.32 | ) | | $ | — | | | $ | 16.99 | | | | 26.75 | % | | $ | 528.1 | | | | 0.90 | % | | | 0.90 | % | | | (0.25 | )% | | | 50 | % | |
| 8/31/2017g | | $ | 13.25 | | | $ | (0.04 | ) | | $ | 2.04 | | | $ | 2.00 | | | $ | — | | | $ | (0.64 | ) | | $ | (0.64 | ) | | $ | — | | | $ | 14.61 | | | | 15.80 | %i | | $ | 445.9 | | | | 0.93 | % | | | 0.91 | %f | | | (0.28 | )%f | | | 47 | % | |
| 8/31/2016g | | $ | 14.70 | | | $ | (0.04 | ) | | $ | (0.27 | ) | | $ | (0.31 | ) | | $ | — | | | $ | (1.15 | ) | | $ | (1.15 | ) | | $ | 0.01 | | | $ | 13.25 | | | | (1.70 | )%e | | $ | 415.1 | | | | 0.95 | % | | | 0.95 | % | | | (0.34 | )% | | | 63 | % | |
| 8/31/2015g | | $ | 15.07 | | | $ | (0.07 | ) | | $ | 1.51 | | | $ | 1.44 | | | $ | — | | | $ | (1.81 | ) | | $ | (1.81 | ) | | $ | — | | | $ | 14.70 | | | | 10.74 | % | | $ | 437.5 | | | | 0.92 | % | | | 0.92 | % | | | (0.50 | )% | | | 50 | % | |
| 8/31/2014g | | $ | 13.73 | | | $ | (0.07 | ) | | $ | 2.41 | | | $ | 2.34 | | | $ | — | | | $ | (1.00 | ) | | $ | (1.00 | ) | | $ | 0.00 | | | $ | 15.07 | | | | 17.54 | %c | | $ | 415.6 | | | | 0.93 | % | | | 0.93 | % | | | (0.47 | )% | | | 63 | % | |
Trust Class | |
| 8/31/2018g | | $ | 14.62 | | | $ | (0.05 | ) | | $ | 3.73 | | | $ | 3.68 | | | $ | — | | | $ | (1.32 | ) | | $ | (1.32 | ) | | $ | — | | | $ | 16.98 | | | | 26.65 | % | | $ | 77.6 | | | | 0.95 | % | | | 0.95 | % | | | (0.30 | )% | | | 50 | % | |
| 8/31/2017g | | $ | 12.98 | | | $ | (0.04 | ) | | $ | 2.04 | | | $ | 2.00 | | | $ | — | | | $ | (0.36 | ) | | $ | (0.36 | ) | | $ | — | | | $ | 14.62 | | | | 15.75 | %i | | $ | 52.0 | | | | 0.97 | % | | | 0.97 | %f | | | (0.34 | )%f | | | 47 | % | |
| 8/31/2016g | | $ | 13.91 | | | $ | (0.05 | ) | | $ | (0.25 | ) | | $ | (0.30 | ) | | $ | — | | | $ | (0.65 | ) | | $ | (0.65 | ) | | $ | 0.02 | | | $ | 12.98 | | | | (1.77 | )%e | | $ | 66.7 | | | | 0.98 | % | | | 0.98 | % | | | (0.37 | )% | | | 63 | % | |
| 8/31/2015g | | $ | 13.58 | | | $ | (0.08 | ) | | $ | 1.43 | | | $ | 1.35 | | | $ | — | | | $ | (1.02 | ) | | $ | (1.02 | ) | | $ | — | | | $ | 13.91 | | | | 10.73 | % | | $ | 91.7 | | | | 0.99 | % | | | 0.99 | % | | | (0.58 | )% | | | 50 | % | |
| 8/31/2014g | | $ | 12.07 | | | $ | (0.07 | ) | | $ | 2.13 | | | $ | 2.06 | | | $ | — | | | $ | (0.55 | ) | | $ | (0.55 | ) | | $ | 0.00 | | | $ | 13.58 | | | | 17.40 | %c | | $ | 69.6 | | | | 1.00 | % | | | 1.00 | % | | | (0.54 | )% | | | 63 | % | |
Advisor Class | |
| 8/31/2018g | | $ | 14.62 | | | $ | (0.09 | ) | | $ | 3.73 | | | $ | 3.64 | | | $ | — | | | $ | (1.32 | ) | | $ | (1.32 | ) | | $ | — | | | $ | 16.94 | | | | 26.32 | % | | $ | 15.4 | | | | 1.21 | % | | | 1.21 | % | | | (0.56 | )% | | | 50 | % | |
| 8/31/2017g | | $ | 13.01 | | | $ | (0.08 | ) | | $ | 2.05 | | | $ | 1.97 | | | $ | — | | | $ | (0.36 | ) | | $ | (0.36 | ) | | $ | — | | | $ | 14.62 | | | | 15.47 | %i | | $ | 12.4 | | | | 1.23 | % | | | 1.23 | %f | | | (0.60 | )%f | | | 47 | % | |
| 8/31/2016g | | $ | 13.97 | | | $ | (0.08 | ) | | $ | (0.25 | ) | | $ | (0.33 | ) | | $ | — | | | $ | (0.64 | ) | | $ | (0.64 | ) | | $ | 0.01 | | | $ | 13.01 | | | | (2.04 | )%e | | $ | 11.5 | | | | 1.24 | % | | | 1.24 | % | | | (0.63 | )% | | | 63 | % | |
| 8/31/2015g | | $ | 13.66 | | | $ | (0.12 | ) | | $ | 1.44 | | | $ | 1.32 | | | $ | — | | | $ | (1.01 | ) | | $ | (1.01 | ) | | $ | — | | | $ | 13.97 | | | | 10.39 | % | | $ | 10.7 | | | | 1.25 | % | | | 1.25 | % | | | (0.84 | )% | | | 50 | % | |
| 8/31/2014g | | $ | 12.14 | | | $ | (0.10 | ) | | $ | 2.15 | | | $ | 2.05 | | | $ | — | | | $ | (0.53 | ) | | $ | (0.53 | ) | | $ | 0.00 | | | $ | 13.66 | | | | 17.16 | %c | | $ | 10.3 | | | | 1.26 | % | | | 1.26 | % | | | (0.81 | )% | | | 63 | % | |
Institutional Class | |
8/31/2018 | | $ | 14.61 | | | $ | (0.01 | ) | | $ | 3.73 | | | $ | 3.72 | | | $ | — | | | $ | (1.32 | ) | | $ | (1.32 | ) | | $ | — | | | $ | 17.01 | | | | 26.93 | % | | $ | 353.7 | | | | 0.70 | % | | | 0.70 | % | | | (0.05 | )% | | | 50 | % | |
8/31/2017 | | $ | 13.20 | | | $ | (0.01 | ) | | $ | 2.04 | | | $ | 2.03 | | | $ | — | | | $ | (0.62 | ) | | $ | (0.62 | ) | | $ | — | | | $ | 14.61 | | | | 16.03 | %i | | $ | 321.5 | | | | 0.72 | % | | | 0.72 | %f | | | (0.09 | )%f | | | 47 | % | |
8/31/2016 | | $ | 14.59 | | | $ | (0.02 | ) | | $ | (0.27 | ) | | $ | (0.29 | ) | | $ | — | | | $ | (1.12 | ) | | $ | (1.12 | ) | | $ | 0.02 | | | $ | 13.20 | | | | (1.52 | )%e | | $ | 307.6 | | | | 0.75 | % | | | 0.75 | %§ | | | (0.14 | )% | | | 63 | % | |
8/31/2015 | | $ | 14.89 | | | $ | (0.05 | ) | | $ | 1.51 | | | $ | 1.46 | | | $ | — | | | $ | (1.76 | ) | | $ | (1.76 | ) | | $ | — | | | $ | 14.59 | | | | 10.98 | % | | $ | 423.3 | | | | 0.75 | % | | | 0.75 | %§ | | | (0.34 | )% | | | 50 | % | |
8/31/2014 | | $ | 13.56 | | | $ | (0.04 | ) | | $ | 2.37 | | | $ | 2.33 | | | $ | — | | | $ | (1.00 | ) | | $ | (1.00 | ) | | $ | 0.00 | | | $ | 14.89 | | | | 17.74 | %c | | $ | 382.5 | | | | 0.75 | % | | | 0.75 | % | | | (0.29 | )% | | | 63 | % | |
Class A | |
| 8/31/2018g | | $ | 14.62 | | | $ | (0.07 | ) | | $ | 3.73 | | | $ | 3.66 | | | $ | — | | | $ | (1.32 | ) | | $ | (1.32 | ) | | $ | — | | | $ | 16.96 | | | | 26.48 | % | | $ | 52.1 | | | | 1.07 | % | | | 1.07 | % | | | (0.42 | )% | | | 50 | % | |
| 8/31/2017g | | $ | 13.00 | | | $ | (0.06 | ) | | $ | 2.04 | | | $ | 1.98 | | | $ | — | | | $ | (0.36 | ) | | $ | (0.36 | ) | | $ | — | | | $ | 14.62 | | | | 15.58 | %i | | $ | 54.4 | | | | 1.11 | % | | | 1.11 | %f§ | | | (0.49 | )%f | | | 47 | % | |
| 8/31/2016g | | $ | 13.95 | | | $ | (0.06 | ) | | $ | (0.25 | ) | | $ | (0.31 | ) | | $ | — | | | $ | (0.66 | ) | | $ | (0.66 | ) | | $ | 0.02 | | | $ | 13.00 | | | | (1.91 | )%e | | $ | 76.9 | | | | 1.11 | % | | | 1.11 | %§ | | | (0.51 | )% | | | 63 | % | |
| 8/31/2015g | | $ | 13.64 | | | $ | (0.09 | ) | | $ | 1.43 | | | $ | 1.34 | | | $ | — | | | $ | (1.03 | ) | | $ | (1.03 | ) | | $ | — | | | $ | 13.95 | | | | 10.55 | % | | $ | 102.3 | | | | 1.11 | % | | | 1.11 | %§ | | | (0.69 | )% | | | 50 | % | |
| 8/31/2014g | | $ | 12.13 | | | $ | (0.09 | ) | | $ | 2.15 | | | $ | 2.06 | | | $ | — | | | $ | (0.55 | ) | | $ | (0.55 | ) | | $ | — | | | $ | 13.64 | | | | 17.33 | %c | | $ | 100.7 | | | | 1.13 | % | | | 1.11 | % | | | (0.65 | )% | | | 63 | % | |
See Notes to Financial Highlights
247
248
Financial Highlights (cont'd)
| | | Net Asset
Value,
Beginning
of Year | | Net
Investment
Income/(Loss)@ | | Net Gains or
Losses on
Securities
(both realized
and
unrealized) | | Total From
Investment
Operations | | Dividends
from Net
Investment
Income | | Distributions
from Net
Realized
Capital Gains | | Total
Distributions | | Voluntary
Contribution
from
Management | | Net Asset
Value, End of
Year | | Total Returnab | | Net Assets,
End of Year
(in millions) | | Ratio of Gross
Expenses to
Average Net
Assets# | | Ratio of Net
Expenses to
Average Net
Assets | | Ratio of Net
Investment
Income/
(Loss) to
Average Net
Assets | | Portfolio
Turnover
Rate | |
Mid Cap Growth Fund (cont'd) | |
Class C | |
| 8/31/2018g | | $ | 14.64 | | | $ | (0.19 | ) | | $ | 3.72 | | | $ | 3.53 | | | $ | — | | | $ | (1.32 | ) | | $ | (1.32 | ) | | $ | — | | | $ | 16.85 | | | | 25.49 | % | | $ | 11.6 | | | | 1.85 | % | | | 1.85 | %§ | | | (1.20 | )% | | | 50 | % | |
| 8/31/2017g | | $ | 13.13 | | | $ | (0.17 | ) | | $ | 2.05 | | | $ | 1.88 | | | $ | — | | | $ | (0.37 | ) | | $ | (0.37 | ) | | $ | — | | | $ | 14.64 | | | | 14.69 | % | | $ | 9.7 | | | | 1.86 | % | | | 1.86 | %§ | | | (1.24 | )% | | | 47 | % | |
| 8/31/2016g | | $ | 14.20 | | | $ | (0.16 | ) | | $ | (0.25 | ) | | $ | (0.41 | ) | | $ | — | | | $ | (0.67 | ) | | $ | (0.67 | ) | | $ | 0.01 | | | $ | 13.13 | | | | (2.62 | )%e | | $ | 10.9 | | | | 1.88 | % | | | 1.86 | % | | | (1.24 | )% | | | 63 | % | |
| 8/31/2015g | | $ | 13.99 | | | $ | (0.20 | ) | | $ | 1.47 | | | $ | 1.27 | | | $ | — | | | $ | (1.06 | ) | | $ | (1.06 | ) | | $ | — | | | $ | 14.20 | | | | 9.72 | % | | $ | 8.4 | | | | 1.88 | % | | | 1.86 | % | | | (1.45 | )% | | | 50 | % | |
| 8/31/2014g | | $ | 12.47 | | | $ | (0.18 | ) | | $ | 2.20 | | | $ | 2.02 | | | $ | — | | | $ | (0.50 | ) | | $ | (0.50 | ) | | $ | 0.00 | | | $ | 13.99 | | | | 16.46 | %c | | $ | 6.0 | | | | 1.91 | % | | | 1.86 | % | | | (1.40 | )% | | | 63 | % | |
Class R3 | |
| 8/31/2018g | | $ | 14.63 | | | $ | (0.11 | ) | | $ | 3.72 | | | $ | 3.61 | | | $ | — | | | $ | (1.32 | ) | | $ | (1.32 | ) | | $ | — | | | $ | 16.92 | | | | 26.11 | % | | $ | 15.6 | | | | 1.36 | % | | | 1.36 | %§ | | | (0.71 | )% | | | 50 | % | |
| 8/31/2017g | | $ | 13.04 | | | $ | (0.10 | ) | | $ | 2.05 | | | $ | 1.95 | | | $ | — | | | $ | (0.36 | ) | | $ | (0.36 | ) | | $ | — | | | $ | 14.63 | | | | 15.30 | % | | $ | 13.2 | | | | 1.36 | % | | | 1.36 | % | | | (0.73 | )% | | | 47 | % | |
| 8/31/2016g | | $ | 14.00 | | | $ | (0.09 | ) | | $ | (0.24 | ) | | $ | (0.33 | ) | | $ | — | | | $ | (0.64 | ) | | $ | (0.64 | ) | | $ | 0.01 | | | $ | 13.04 | | | | (2.12 | )%e | | $ | 13.7 | | | | 1.38 | % | | | 1.36 | % | | | (0.74 | )% | | | 63 | % | |
| 8/31/2015g | | $ | 13.71 | | | $ | (0.13 | ) | | $ | 1.44 | | | $ | 1.31 | | | $ | — | | | $ | (1.02 | ) | | $ | (1.02 | ) | | $ | — | | | $ | 14.00 | | | | 10.29 | % | | $ | 12.7 | | | | 1.37 | % | | | 1.36 | % | | | (0.95 | )% | | | 50 | % | |
| 8/31/2014g | | $ | 12.19 | | | $ | (0.12 | ) | | $ | 2.16 | | | $ | 2.04 | | | $ | — | | | $ | (0.52 | ) | | $ | (0.52 | ) | | $ | 0.00 | | | $ | 13.71 | | | | 17.02 | %c | | $ | 8.3 | | | | 1.38 | % | | | 1.36 | % | | | (0.90 | )% | | | 63 | % | |
Class R6 | |
| 8/31/2018g | | $ | 14.61 | | | $ | 0.00 | | | $ | 3.73 | | | $ | 3.73 | | | $ | — | | | $ | (1.32 | ) | | $ | (1.32 | ) | | $ | — | | | $ | 17.02 | | | | 26.99 | % | | $ | 433.5 | | | | 0.63 | % | | | 0.63 | % | | | 0.02 | % | | | 50 | % | |
| 8/31/2017g | | $ | 13.19 | | | $ | (0.00 | ) | | $ | 2.04 | | | $ | 2.04 | | | $ | — | | | $ | (0.62 | ) | | $ | (0.62 | ) | | $ | — | | | $ | 14.61 | | | | 16.13 | %i | | $ | 262.4 | | | | 0.65 | % | | | 0.65 | %f | | | (0.02 | )%f | | | 47 | % | |
| 8/31/2016g | | $ | 14.56 | | | $ | (0.00 | ) | | $ | (0.26 | ) | | $ | (0.26 | ) | | $ | — | | | $ | (1.12 | ) | | $ | (1.12 | ) | | $ | 0.01 | | | $ | 13.19 | | | | (1.44 | )%e | | $ | 193.7 | | | | 0.66 | % | | | 0.66 | % | | | (0.02 | )% | | | 63 | % | |
| 8/31/2015g | | $ | 14.85 | | | $ | (0.04 | ) | | $ | 1.50 | | | $ | 1.46 | | | $ | — | | | $ | (1.75 | ) | | $ | (1.75 | ) | | $ | — | | | $ | 14.56 | | | | 11.04 | % | | $ | 88.6 | | | | 0.67 | % | | | 0.67 | %§ | | | (0.26 | )% | | | 50 | % | |
| 8/31/2014g | | $ | 13.52 | | | $ | (0.03 | ) | | $ | 2.37 | | | $ | 2.34 | | | $ | — | | | $ | (1.01 | ) | | $ | (1.01 | ) | | $ | 0.00 | | | $ | 14.85 | | | | 17.89 | %c | | $ | 22.5 | | | | 0.68 | % | | | 0.68 | % | | | (0.21 | )% | | | 63 | % | |
Mid Cap Intrinsic Value Fund | |
Investor Class | |
8/31/2018 | | $ | 22.98 | | | $ | 0.12 | | | $ | 2.57 | | | $ | 2.69 | | | $ | (0.11 | ) | | $ | (1.44 | ) | | $ | (1.55 | ) | | $ | — | | | $ | 24.12 | | | | 12.20 | % | | $ | 40.2 | | | | 1.21 | % | | | 1.17 | % | | | 0.49 | % | | | 36 | % | |
8/31/2017 | | $ | 19.71 | | | $ | 0.23 | | | $ | 3.15 | | | $ | 3.38 | | | $ | (0.11 | ) | | $ | — | | | $ | (0.11 | ) | | $ | — | | | $ | 22.98 | | | | 17.19 | %i | | $ | 40.3 | | | | 1.25 | % | | | 1.01 | %f | | | 1.06 | %f | | | 31 | % | |
8/31/2016 | | $ | 20.99 | | | $ | 0.16 | | | $ | 0.79 | | | $ | 0.95 | | | $ | (0.10 | ) | | $ | (2.13 | ) | | $ | (2.23 | ) | | $ | — | | | $ | 19.71 | | | | 5.85 | % | | $ | 37.9 | | | | 1.30 | % | | | 1.15 | % | | | 0.86 | % | | | 29 | % | |
8/31/2015 | | $ | 23.56 | | | $ | 0.08 | | | $ | (0.36 | ) | | $ | (0.28 | ) | | $ | (0.21 | ) | | $ | (2.08 | ) | | $ | (2.29 | ) | | $ | — | | | $ | 20.99 | | | | (1.09 | )% | | $ | 42.1 | | | | 1.24 | % | | | 1.05 | % | | | 0.37 | % | | | 50 | % | |
8/31/2014 | | $ | 20.29 | | | $ | 0.26 | | | $ | 4.20 | | | $ | 4.46 | | | $ | (0.32 | ) | | $ | (0.87 | ) | | $ | (1.19 | ) | | $ | 0.00 | | | $ | 23.56 | | | | 22.84 | %c | | $ | 43.4 | | | | 1.31 | % | | | 0.98 | % | | | 1.21 | % | | | 34 | % | |
Trust Class | |
8/31/2018 | | $ | 18.86 | | | $ | 0.08 | | | $ | 2.11 | | | $ | 2.19 | | | $ | (0.09 | ) | | $ | (1.44 | ) | | $ | (1.53 | ) | | $ | — | | | $ | 19.52 | | | | 12.17 | % | | $ | 10.2 | | | | 1.37 | % | | | 1.25 | % | | | 0.42 | % | | | 36 | % | |
8/31/2017 | | $ | 16.24 | | | $ | 0.15 | | | $ | 2.58 | | | $ | 2.73 | | | $ | (0.11 | ) | | $ | — | | | $ | (0.11 | ) | | $ | — | | | $ | 18.86 | | | | 16.85 | %i | | $ | 10.9 | | | | 1.43 | % | | | 1.25 | %§f | | | 0.82 | %f | | | 31 | % | |
8/31/2016 | | $ | 17.71 | | | $ | 0.12 | | | $ | 0.64 | | | $ | 0.76 | | | $ | (0.10 | ) | | $ | (2.13 | ) | | $ | (2.23 | ) | | $ | — | | | $ | 16.24 | | | | 5.80 | % | | $ | 10.3 | | | | 1.48 | % | | | 1.25 | % | | | 0.77 | % | | | 29 | % | |
8/31/2015 | | $ | 20.24 | | | $ | 0.03 | | | $ | (0.32 | ) | | $ | (0.29 | ) | | $ | (0.16 | ) | | $ | (2.08 | ) | | $ | (2.24 | ) | | $ | — | | | $ | 17.71 | | | | (1.31 | )% | | $ | 11.9 | | | | 1.48 | % | | | 1.25 | % | | | 0.17 | % | | | 50 | % | |
8/31/2014 | | $ | 17.61 | | | $ | 0.18 | | | $ | 3.61 | | | $ | 3.79 | | | $ | (0.29 | ) | | $ | (0.87 | ) | | $ | (1.16 | ) | | $ | 0.00 | | | $ | 20.24 | | | | 22.47 | %c | | $ | 14.4 | | | | 1.57 | % | | | 1.25 | %§ | | | 0.97 | % | | | 34 | % | |
See Notes to Financial Highlights
249
250
Financial Highlights (cont'd)
| | | Net Asset
Value,
Beginning
of Year | | Net
Investment
Income/(Loss)@ | | Net Gains or
Losses on
Securities
(both realized
and
unrealized) | | Total From
Investment
Operations | | Dividends
from Net
Investment
Income | | Distributions
from Net
Realized
Capital Gains | | Total
Distributions | | Voluntary
Contribution
from
Management | | Net Asset
Value, End of
Year | | Total Returnab | | Net Assets,
End of Year
(in millions) | | Ratio of Gross
Expenses to
Average Net
Assets# | | Ratio of Net
Expenses to
Average Net
Assets | | Ratio of Net
Investment
Income/
(Loss) to
Average Net
Assets | | Portfolio
Turnover
Rate | |
Mid Cap Intrinsic Value Fund (cont'd) | |
Institutional Class | |
8/31/2018 | | $ | 23.00 | | | $ | 0.19 | | | $ | 2.59 | | | $ | 2.78 | | | $ | (0.17 | ) | | $ | (1.44 | ) | | $ | (1.61 | ) | | $ | — | | | $ | 24.17 | | | | 12.60 | % | | $ | 52.5 | | | | 1.02 | % | | | 0.85 | % | | | 0.81 | % | | | 36 | % | |
8/31/2017 | | $ | 19.75 | | | $ | 0.26 | | | $ | 3.16 | | | $ | 3.42 | | | $ | (0.17 | ) | | $ | — | | | $ | (0.17 | ) | | $ | — | | | $ | 23.00 | | | | 17.40 | %i | | $ | 29.1 | | | | 1.05 | % | | | 0.85 | %f | | | 1.19 | %f | | | 31 | % | |
8/31/2016 | | $ | 21.02 | | | $ | 0.22 | | | $ | 0.79 | | | $ | 1.01 | | | $ | (0.15 | ) | | $ | (2.13 | ) | | $ | (2.28 | ) | | $ | — | | | $ | 19.75 | | | | 6.18 | % | | $ | 22.7 | | | | 1.09 | % | | | 0.85 | % | | | 1.18 | % | | | 29 | % | |
8/31/2015 | | $ | 23.59 | | | $ | 0.13 | | | $ | (0.37 | ) | | $ | (0.24 | ) | | $ | (0.25 | ) | | $ | (2.08 | ) | | $ | (2.33 | ) | | $ | — | | | $ | 21.02 | | | | (0.90 | )% | | $ | 34.0 | | | | 1.07 | % | | | 0.85 | % | | | 0.59 | % | | | 50 | % | |
8/31/2014 | | $ | 20.33 | | | $ | 0.33 | | | $ | 4.17 | | | $ | 4.50 | | | $ | (0.37 | ) | | $ | (0.87 | ) | | $ | (1.24 | ) | | $ | 0.00 | | | $ | 23.59 | | | | 22.99 | %c | | $ | 18.0 | | | | 1.17 | % | | | 0.85 | %§ | | | 1.48 | % | | | 34 | % | |
Class A | |
8/31/2018 | | $ | 18.84 | | | $ | 0.09 | | | $ | 2.10 | | | $ | 2.19 | | | $ | (0.08 | ) | | $ | (1.44 | ) | | $ | (1.52 | ) | | $ | — | | | $ | 19.51 | | | | 12.23 | % | | $ | 10.1 | | | | 1.39 | % | | | 1.21 | % | | | 0.46 | % | | | 36 | % | |
8/31/2017 | | $ | 16.21 | | | $ | 0.16 | | | $ | 2.58 | | | $ | 2.74 | | | $ | (0.11 | ) | | $ | — | | | $ | (0.11 | ) | | $ | — | | | $ | 18.84 | | | | 16.95 | %i | | $ | 8.6 | | | | 1.43 | % | | | 1.21 | %f | | | 0.89 | %f | | | 31 | % | |
8/31/2016 | | $ | 17.70 | | | $ | 0.13 | | | $ | 0.62 | | | $ | 0.75 | | | $ | (0.11 | ) | | $ | (2.13 | ) | | $ | (2.24 | ) | | $ | — | | | $ | 16.21 | | | | 5.76 | % | | $ | 13.3 | | | | 1.49 | % | | | 1.21 | % | | | 0.81 | % | | | 29 | % | |
8/31/2015 | | $ | 20.24 | | | $ | 0.04 | | | $ | (0.32 | ) | | $ | (0.28 | ) | | $ | (0.18 | ) | | $ | (2.08 | ) | | $ | (2.26 | ) | | $ | — | | | $ | 17.70 | | | | (1.25 | )% | | $ | 14.8 | | | | 1.47 | % | | | 1.21 | % | | | 0.20 | % | | | 50 | % | |
8/31/2014 | | $ | 17.60 | | | $ | 0.18 | | | $ | 3.63 | | | $ | 3.81 | | | $ | (0.30 | ) | | $ | (0.87 | ) | | $ | (1.17 | ) | | $ | 0.00 | | | $ | 20.24 | | | | 22.60 | %c | | $ | 5.2 | | | | 1.53 | % | | | 1.21 | %§ | | | 0.96 | % | | | 34 | % | |
Class C | |
8/31/2018 | | $ | 18.37 | | | $ | (0.05 | ) | | $ | 2.04 | | | $ | 1.99 | | | $ | (0.00 | ) | | $ | (1.44 | ) | | $ | (1.44 | ) | | $ | — | | | $ | 18.92 | | | | 11.37 | % | | $ | 2.4 | | | | 2.14 | % | | | 1.96 | % | | | (0.29 | )% | | | 36 | % | |
8/31/2017 | | $ | 15.88 | | | $ | 0.03 | | | $ | 2.52 | | | $ | 2.55 | | | $ | (0.06 | ) | | $ | — | | | $ | (0.06 | ) | | $ | — | | | $ | 18.37 | | | | 16.09 | %i | | $ | 2.5 | | | | 2.18 | % | | | 1.96 | %f | | | 0.15 | %f | | | 31 | % | |
8/31/2016 | | $ | 17.45 | | | $ | 0.01 | | | $ | 0.61 | | | $ | 0.62 | | | $ | (0.06 | ) | | $ | (2.13 | ) | | $ | (2.19 | ) | | $ | — | | | $ | 15.88 | | | | 5.01 | % | | $ | 3.7 | | | | 2.23 | % | | | 1.96 | % | | | 0.05 | % | | | 29 | % | |
8/31/2015 | | $ | 20.00 | | | $ | (0.10 | ) | | $ | (0.31 | ) | | $ | (0.41 | ) | | $ | (0.06 | ) | | $ | (2.08 | ) | | $ | (2.14 | ) | | $ | — | | | $ | 17.45 | | | | (2.02 | )% | | $ | 3.5 | | | | 2.20 | % | | | 1.96 | % | | | (0.53 | )% | | | 50 | % | |
8/31/2014 | | $ | 17.44 | | | $ | 0.05 | | | $ | 3.58 | | | $ | 3.63 | | | $ | (0.20 | ) | | $ | (0.87 | ) | | $ | (1.07 | ) | | $ | 0.00 | | | $ | 20.00 | | | | 21.64 | %c | | $ | 1.9 | | | | 2.28 | % | | | 1.96 | %§ | | | 0.24 | % | | | 34 | % | |
Class R3 | |
8/31/2018 | | $ | 18.78 | | | $ | 0.04 | | | $ | 2.09 | | | $ | 2.13 | | | $ | (0.05 | ) | | $ | (1.44 | ) | | $ | (1.49 | ) | | $ | — | | | $ | 19.42 | | | | 11.92 | % | | $ | 2.3 | | | | 1.65 | % | | | 1.46 | % | | | 0.21 | % | | | 36 | % | |
8/31/2017 | | $ | 16.19 | | | $ | 0.11 | | | $ | 2.57 | | | $ | 2.68 | | | $ | (0.09 | ) | | $ | — | | | $ | (0.09 | ) | | $ | — | | | $ | 18.78 | | | | 16.62 | % | | $ | 1.5 | | | | 1.69 | % | | | 1.46 | % | | | 0.63 | % | | | 31 | % | |
8/31/2016 | | $ | 17.70 | | | $ | 0.09 | | | $ | 0.62 | | | $ | 0.71 | | | $ | (0.09 | ) | | $ | (2.13 | ) | | $ | (2.22 | ) | | $ | — | | | $ | 16.19 | | | | 5.54 | % | | $ | 1.4 | | | | 1.75 | % | | | 1.46 | % | | | 0.56 | % | | | 29 | % | |
8/31/2015 | | $ | 20.23 | | | $ | 0.00 | | | $ | (0.32 | ) | | $ | (0.32 | ) | | $ | (0.13 | ) | | $ | (2.08 | ) | | $ | (2.21 | ) | | $ | — | | | $ | 17.70 | | | | (1.49 | )% | | $ | 1.2 | | | | 1.73 | % | | | 1.46 | % | | | 0.03 | % | | | 50 | % | |
8/31/2014 | | $ | 17.59 | | | $ | 0.15 | | | $ | 3.61 | | | $ | 3.76 | | | $ | (0.25 | ) | | $ | (0.87 | ) | | $ | (1.12 | ) | | $ | 0.00 | | | $ | 20.23 | | | | 22.23 | %c | | $ | 0.4 | | | | 1.80 | % | | | 1.46 | % | | | 0.80 | % | | | 34 | % | |
Multi-Cap Opportunities Fund | |
Institutional Class | |
8/31/2018 | | $ | 18.67 | | | $ | 0.12 | | | $ | 3.28 | | | $ | 3.40 | | | $ | (0.11 | ) | | $ | (1.84 | ) | | $ | (1.95 | ) | | $ | — | | | $ | 20.12 | | | | 19.15 | % | | $ | 1,866.7 | | | | 0.72 | % | | | 0.72 | % | | | 0.61 | % | | | 23 | % | |
8/31/2017 | | $ | 16.08 | | | $ | 0.12 | | | $ | 3.06 | | | $ | 3.18 | | | $ | (0.14 | ) | | $ | (0.45 | ) | | $ | (0.59 | ) | | $ | — | | | $ | 18.67 | | | | 20.27 | %i | | $ | 1,828.2 | | | | 0.75 | % | | | 0.75 | %f | | | 0.68 | %f | | | 23 | % | |
8/31/2016 | | $ | 15.31 | | | $ | 0.15 | | | $ | 1.18 | | | $ | 1.33 | | | $ | (0.15 | ) | | $ | (0.41 | ) | | $ | (0.56 | ) | | $ | — | | | $ | 16.08 | | | | 8.94 | % | | $ | 1,757.2 | | | | 0.76 | % | | | 0.76 | % | | | 0.99 | % | | | 18 | % | |
8/31/2015 | | $ | 16.27 | | | $ | 0.13 | | | $ | (0.43 | ) | | $ | (0.30 | ) | | $ | (0.15 | ) | | $ | (0.51 | ) | | $ | (0.66 | ) | | $ | — | | | $ | 15.31 | | | | (1.80 | )% | | $ | 2,191.4 | | | | 0.73 | % | | | 0.73 | % | | | 0.84 | % | | | 27 | % | |
8/31/2014 | | $ | 13.56 | | | $ | 0.16 | | | $ | 2.88 | | | $ | 3.04 | | | $ | (0.11 | ) | | $ | (0.22 | ) | | $ | (0.33 | ) | | $ | 0.00 | | | $ | 16.27 | | | | 22.65 | %c | | $ | 2,566.4 | | | | 0.74 | % | | | 0.74 | % | | | 1.06 | % | | | 17 | % | |
See Notes to Financial Highlights
251
252
Financial Highlights (cont'd)
| | | Net Asset
Value,
Beginning
of Year | | Net
Investment
Income/(Loss)@ | | Net Gains or
Losses on
Securities
(both realized
and
unrealized) | | Total From
Investment
Operations | | Dividends
from Net
Investment
Income | | Distributions
from Net
Realized
Capital Gains | | Total
Distributions | | Voluntary
Contribution
from
Management | | Net Asset
Value, End of
Year | | Total Returnab | | Net Assets,
End of Year
(in millions) | | Ratio of Gross
Expenses to
Average Net
Assets# | | Ratio of Net
Expenses to
Average Net
Assets | | Ratio of Net
Investment
Income/
(Loss) to
Average Net
Assets | | Portfolio
Turnover
Rate | |
Multi-Cap Opportunities Fund (cont'd) | |
Class A | |
8/31/2018 | | $ | 18.53 | | | $ | 0.05 | | | $ | 3.25 | | | $ | 3.30 | | | $ | (0.04 | ) | | $ | (1.84 | ) | | $ | (1.88 | ) | | $ | — | | | $ | 19.95 | | | | 18.72 | % | | $ | 75.7 | | | | 1.09 | % | | | 1.09 | % | | | 0.25 | % | | | 23 | % | |
8/31/2017 | | $ | 15.95 | | | $ | 0.06 | | | $ | 3.04 | | | $ | 3.10 | | | $ | (0.07 | ) | | $ | (0.45 | ) | | $ | (0.52 | ) | | $ | — | | | $ | 18.53 | | | | 19.85 | %i | | $ | 53.5 | | | | 1.10 | % | | | 1.10 | %f | | | 0.32 | %f | | | 23 | % | |
8/31/2016 | | $ | 15.18 | | | $ | 0.09 | | | $ | 1.17 | | | $ | 1.26 | | | $ | (0.08 | ) | | $ | (0.41 | ) | | $ | (0.49 | ) | | $ | — | | | $ | 15.95 | | | | 8.53 | % | | $ | 73.0 | | | | 1.11 | % | | | 1.11 | % | | | 0.62 | % | | | 18 | % | |
8/31/2015 | | $ | 16.13 | | | $ | 0.07 | | | $ | (0.43 | ) | | $ | (0.36 | ) | | $ | (0.08 | ) | | $ | (0.51 | ) | | $ | (0.59 | ) | | $ | — | | | $ | 15.18 | | | | (2.16 | )% | | $ | 102.8 | | | | 1.10 | % | | | 1.10 | % | | | 0.47 | % | | | 27 | % | |
8/31/2014 | | $ | 13.48 | | | $ | 0.11 | | | $ | 2.85 | | | $ | 2.96 | | | $ | (0.09 | ) | | $ | (0.22 | ) | | $ | (0.31 | ) | | $ | 0.00 | | | $ | 16.13 | | | | 22.17 | %c | | $ | 143.1 | | | | 1.10 | % | | | 1.10 | % | | | 0.71 | % | | | 17 | % | |
Class C | |
8/31/2018 | | $ | 17.84 | | | $ | (0.09 | ) | | $ | 3.12 | | | $ | 3.03 | | | $ | — | | | $ | (1.84 | ) | | $ | (1.84 | ) | | $ | — | | | $ | 19.03 | | | | 17.83 | % | | $ | 44.7 | | | | 1.83 | % | | | 1.83 | % | | | (0.49 | )% | | | 23 | % | |
8/31/2017 | | $ | 15.42 | | | $ | (0.07 | ) | | $ | 2.94 | | | $ | 2.87 | | | $ | (0.00 | ) | | $ | (0.45 | ) | | $ | (0.45 | ) | | $ | — | | | $ | 17.84 | | | | 18.95 | %i | | $ | 40.7 | | | | 1.84 | % | | | 1.84 | %f | | | (0.40 | )%f | | | 23 | % | |
8/31/2016 | | $ | 14.73 | | | $ | (0.02 | ) | | $ | 1.13 | | | $ | 1.11 | | | $ | (0.01 | ) | | $ | (0.41 | ) | | $ | (0.42 | ) | | $ | — | | | $ | 15.42 | | | | 7.73 | % | | $ | 39.6 | | | | 1.85 | % | | | 1.85 | % | | | (0.11 | )% | | | 18 | % | |
8/31/2015 | | $ | 15.71 | | | $ | (0.04 | ) | | $ | (0.41 | ) | | $ | (0.45 | ) | | $ | (0.02 | ) | | $ | (0.51 | ) | | $ | (0.53 | ) | | $ | — | | | $ | 14.73 | | | | (2.84 | )% | | $ | 46.1 | | | | 1.84 | % | | | 1.84 | % | | | (0.27 | )% | | | 27 | % | |
8/31/2014 | | $ | 13.20 | | | $ | (0.00 | ) | | $ | 2.79 | | | $ | 2.79 | | | $ | (0.06 | ) | | $ | (0.22 | ) | | $ | (0.28 | ) | | $ | 0.00 | | | $ | 15.71 | | | | 21.30 | %c | | $ | 50.5 | | | | 1.85 | % | | | 1.85 | % | | | (0.01 | )% | | | 17 | % | |
Real Estate Fund | |
Trust Class | |
8/31/2018 | | $ | 13.52 | | | $ | 0.20 | | | $ | 0.45 | | | $ | 0.65 | | | $ | (0.19 | ) | | $ | (0.64 | ) | | $ | (0.83 | ) | | $ | — | | | $ | 13.34 | | | | 5.01 | % | | $ | 133.7 | | | | 1.42 | % | | | 1.04 | % | | | 1.58 | % | | | 47 | % | |
8/31/2017 | | $ | 15.12 | | | $ | 0.20 | | | $ | 0.07 | | | $ | 0.27 | | | $ | (0.19 | ) | | $ | (1.68 | ) | | $ | (1.87 | ) | | $ | — | | | $ | 13.52 | | | | 2.89 | % | | $ | 156.6 | | | | 1.42 | % | | | 1.04 | % | | | 1.46 | % | | | 45 | % | |
8/31/2016 | | $ | 13.60 | | | $ | 0.19 | | | $ | 2.60 | | | $ | 2.79 | | | $ | (0.20 | ) | | $ | (1.07 | ) | | $ | (1.27 | ) | | $ | — | | | $ | 15.12 | | | | 21.59 | % | | $ | 212.4 | | | | 1.41 | % | | | 1.04 | % | | | 1.34 | % | | | 49 | % | |
8/31/2015 | | $ | 14.70 | | | $ | 0.18 | | | $ | (0.37 | ) | | $ | (0.19 | ) | | $ | (0.18 | ) | | $ | (0.73 | ) | | $ | (0.91 | ) | | $ | — | | | $ | 13.60 | | | | (1.54 | )% | | $ | 250.8 | | | | 1.39 | % | | | 1.04 | % | | | 1.24 | % | | | 33 | % | |
8/31/2014 | | $ | 12.96 | | | $ | 0.16 | | | $ | 2.56 | | | $ | 2.72 | | | $ | (0.17 | ) | | $ | (0.81 | ) | | $ | (0.98 | ) | | $ | 0.00 | | | $ | 14.70 | | | | 22.36 | %c | | $ | 314.3 | | | | 1.41 | % | | | 1.04 | % | | | 1.19 | % | | | 36 | % | |
Institutional Class | |
8/31/2018 | | $ | 13.56 | | | $ | 0.23 | | | $ | 0.46 | | | $ | 0.69 | | | $ | (0.22 | ) | | $ | (0.64 | ) | | $ | (0.86 | ) | | $ | — | | | $ | 13.39 | | | | 5.28 | % | | $ | 177.7 | | | | 1.06 | % | | | 0.85 | % | | | 1.81 | % | | | 47 | % | |
8/31/2017 | | $ | 15.17 | | | $ | 0.22 | | | $ | 0.06 | | | $ | 0.28 | | | $ | (0.21 | ) | | $ | (1.68 | ) | | $ | (1.89 | ) | | $ | — | | | $ | 13.56 | | | | 3.01 | % | | $ | 191.3 | | | | 1.05 | % | | | 0.85 | % | | | 1.64 | % | | | 45 | % | |
8/31/2016 | | $ | 13.64 | | | $ | 0.22 | | | $ | 2.61 | | | $ | 2.83 | | | $ | (0.23 | ) | | $ | (1.07 | ) | | $ | (1.30 | ) | | $ | — | | | $ | 15.17 | | | | 21.84 | % | | $ | 259.1 | | | | 1.05 | % | | | 0.85 | % | | | 1.53 | % | | | 49 | % | |
8/31/2015 | | $ | 14.74 | | | $ | 0.21 | | | $ | (0.37 | ) | | $ | (0.16 | ) | | $ | (0.21 | ) | | $ | (0.73 | ) | | $ | (0.94 | ) | | $ | — | | | $ | 13.64 | | | | (1.34 | )% | | $ | 336.5 | | | | 1.03 | % | | | 0.85 | % | | | 1.42 | % | | | 33 | % | |
8/31/2014 | | $ | 12.99 | | | $ | 0.18 | | | $ | 2.57 | | | $ | 2.75 | | | $ | (0.19 | ) | | $ | (0.81 | ) | | $ | (1.00 | ) | | $ | 0.00 | | | $ | 14.74 | | | | 22.63 | %c | | $ | 463.5 | | | | 1.05 | % | | | 0.85 | % | | | 1.35 | % | | | 36 | % | |
Class A | |
8/31/2018 | | $ | 13.51 | | | $ | 0.17 | | | $ | 0.47 | | | $ | 0.64 | | | $ | (0.17 | ) | | $ | (0.64 | ) | | $ | (0.81 | ) | | $ | — | | | $ | 13.34 | | | | 4.90 | % | | $ | 58.8 | | | | 1.42 | % | | | 1.21 | % | | | 1.31 | % | | | 47 | % | |
8/31/2017 | | $ | 15.12 | | | $ | 0.18 | | | $ | 0.05 | | | $ | 0.23 | | | $ | (0.16 | ) | | $ | (1.68 | ) | | $ | (1.84 | ) | | $ | — | | | $ | 13.51 | | | | 2.63 | % | | $ | 83.5 | | | | 1.42 | % | | | 1.21 | % | | | 1.32 | % | | | 45 | % | |
8/31/2016 | | $ | 13.60 | | | $ | 0.17 | | | $ | 2.60 | | | $ | 2.77 | | | $ | (0.18 | ) | | $ | (1.07 | ) | | $ | (1.25 | ) | | $ | — | | | $ | 15.12 | | | | 21.37 | % | | $ | 118.8 | | | | 1.42 | % | | | 1.21 | % | | | 1.16 | % | | | 49 | % | |
8/31/2015 | | $ | 14.69 | | | $ | 0.15 | | | $ | (0.35 | ) | | $ | (0.20 | ) | | $ | (0.16 | ) | | $ | (0.73 | ) | | $ | (0.89 | ) | | $ | — | | | $ | 13.60 | | | | (1.65 | )% | | $ | 137.0 | | | | 1.41 | % | | | 1.21 | % | | | 1.04 | % | | | 33 | % | |
8/31/2014 | | $ | 12.95 | | | $ | 0.14 | | | $ | 2.55 | | | $ | 2.69 | | | $ | (0.14 | ) | | $ | (0.81 | ) | | $ | (0.95 | ) | | $ | 0.00 | | | $ | 14.69 | | | | 22.17 | %c | | $ | 171.9 | | | | 1.43 | % | | | 1.21 | % | | | 1.02 | % | | | 36 | % | |
See Notes to Financial Highlights
253
254
Financial Highlights (cont'd)
| | | Net Asset
Value,
Beginning
of Year | | Net
Investment
Income/(Loss)@ | | Net Gains or
Losses on
Securities
(both realized
and
unrealized) | | Total From
Investment
Operations | | Dividends
from Net
Investment
Income | | Distributions
from Net
Realized
Capital Gains | | Total
Distributions | | Voluntary
Contribution
from
Management | | Net Asset
Value, End of
Year | | Total Returnab | | Net Assets,
End of Year
(in millions) | | Ratio of Gross
Expenses to
Average Net
Assets# | | Ratio of Net
Expenses to
Average Net
Assets | | Ratio of Net
Investment
Income/
(Loss) to
Average Net
Assets | | Portfolio
Turnover
Rate | |
Real Estate Fund (cont'd) | |
Class C | |
8/31/2018 | | $ | 13.52 | | | $ | 0.08 | | | $ | 0.47 | | | $ | 0.55 | | | $ | (0.07 | ) | | $ | (0.64 | ) | | $ | (0.71 | ) | | $ | — | | | $ | 13.36 | | | | 4.14 | % | | $ | 13.5 | | | | 2.18 | % | | | 1.96 | % | | | 0.59 | % | | | 47 | % | |
8/31/2017 | | $ | 15.12 | | | $ | 0.08 | | | $ | 0.05 | | | $ | 0.13 | | | $ | (0.05 | ) | | $ | (1.68 | ) | | $ | (1.73 | ) | | $ | — | | | $ | 13.52 | | | | 1.89 | % | | $ | 18.9 | | | | 2.17 | % | | | 1.96 | % | | | 0.57 | % | | | 45 | % | |
8/31/2016 | | $ | 13.60 | | | $ | 0.06 | | | $ | 2.60 | | | $ | 2.66 | | | $ | (0.07 | ) | | $ | (1.07 | ) | | $ | (1.14 | ) | | $ | — | | | $ | 15.12 | | | | 20.45 | % | | $ | 29.3 | | | | 2.17 | % | | | 1.96 | % | | | 0.39 | % | | | 49 | % | |
8/31/2015 | | $ | 14.68 | | | $ | 0.04 | | | $ | (0.35 | ) | | $ | (0.31 | ) | | $ | (0.04 | ) | | $ | (0.73 | ) | | $ | (0.77 | ) | | $ | — | | | $ | 13.60 | | | | (2.38 | )% | | $ | 29.9 | | | | 2.17 | % | | | 1.96 | % | | | 0.30 | % | | | 33 | % | |
8/31/2014 | | $ | 12.94 | | | $ | 0.04 | | | $ | 2.55 | | | $ | 2.59 | | | $ | (0.04 | ) | | $ | (0.81 | ) | | $ | (0.85 | ) | | $ | 0.00 | | | $ | 14.68 | | | | 21.24 | %c | | $ | 40.4 | | | | 2.20 | % | | | 1.96 | % | | | 0.26 | % | | | 36 | % | |
Class R3 | |
8/31/2018 | | $ | 13.49 | | | $ | 0.16 | | | $ | 0.44 | | | $ | 0.60 | | | $ | (0.14 | ) | | $ | (0.64 | ) | | $ | (0.78 | ) | | $ | — | | | $ | 13.31 | | | | 4.58 | % | | $ | 18.0 | | | | 1.69 | % | | | 1.46 | % | | | 1.21 | % | | | 47 | % | |
8/31/2017 | | $ | 15.09 | | | $ | 0.13 | | | $ | 0.08 | | | $ | 0.21 | | | $ | (0.13 | ) | | $ | (1.68 | ) | | $ | (1.81 | ) | | $ | — | | | $ | 13.49 | | | | 2.45 | % | | $ | 19.0 | | | | 1.68 | % | | | 1.46 | % | | | 1.01 | % | | | 45 | % | |
8/31/2016 | | $ | 13.58 | | | $ | 0.12 | | | $ | 2.60 | | | $ | 2.72 | | | $ | (0.14 | ) | | $ | (1.07 | ) | | $ | (1.21 | ) | | $ | — | | | $ | 15.09 | | | | 21.03 | % | | $ | 25.0 | | | | 1.68 | % | | | 1.46 | % | | | 0.87 | % | | | 49 | % | |
8/31/2015 | | $ | 14.68 | | | $ | 0.12 | | | $ | (0.37 | ) | | $ | (0.25 | ) | | $ | (0.12 | ) | | $ | (0.73 | ) | | $ | (0.85 | ) | | $ | — | | | $ | 13.58 | | | | (1.94 | )% | | $ | 22.4 | | | | 1.66 | % | | | 1.46 | % | | | 0.81 | % | | | 33 | % | |
8/31/2014 | | $ | 12.94 | | | $ | 0.10 | | | $ | 2.56 | | | $ | 2.66 | | | $ | (0.11 | ) | | $ | (0.81 | ) | | $ | (0.92 | ) | | $ | 0.00 | | | $ | 14.68 | | | | 21.89 | %c | | $ | 23.5 | | | | 1.67 | % | | | 1.46 | % | | | 0.71 | % | | | 36 | % | |
Class R6 | |
8/31/2018 | | $ | 13.56 | | | $ | 0.23 | | | $ | 0.47 | | | $ | 0.70 | | | $ | (0.23 | ) | | $ | (0.64 | ) | | $ | (0.87 | ) | | $ | — | | | $ | 13.39 | | | | 5.35 | % | | $ | 56.6 | | | | 0.99 | % | | | 0.78 | % | | | 1.82 | % | | | 47 | % | |
8/31/2017 | | $ | 15.16 | | | $ | 0.22 | | | $ | 0.08 | | | $ | 0.30 | | | $ | (0.22 | ) | | $ | (1.68 | ) | | $ | (1.90 | ) | | $ | — | | | $ | 13.56 | | | | 3.16 | % | | $ | 45.2 | | | | 0.98 | % | | | 0.78 | % | | | 1.62 | % | | | 45 | % | |
8/31/2016 | | $ | 13.64 | | | $ | 0.21 | | | $ | 2.62 | | | $ | 2.83 | | | $ | (0.24 | ) | | $ | (1.07 | ) | | $ | (1.31 | ) | | $ | — | | | $ | 15.16 | | | | 21.85 | % | | $ | 45.0 | | | | 0.98 | % | | | 0.78 | % | | | 1.48 | % | | | 49 | % | |
8/31/2015 | | $ | 14.74 | | | $ | 0.21 | | | $ | (0.36 | ) | | $ | (0.15 | ) | | $ | (0.22 | ) | | $ | (0.73 | ) | | $ | (0.95 | ) | | $ | — | | | $ | 13.64 | | | | (1.26 | )% | | $ | 29.9 | | | | 0.97 | % | | | 0.78 | % | | | 1.40 | % | | | 33 | % | |
8/31/2014 | | $ | 12.99 | | | $ | 0.18 | | | $ | 2.59 | | | $ | 2.77 | | | $ | (0.21 | ) | | $ | (0.81 | ) | | $ | (1.02 | ) | | $ | 0.00 | | | $ | 14.74 | | | | 22.72 | %c | | $ | 26.3 | | | | 0.98 | % | | | 0.78 | % | | | 1.33 | % | | | 36 | % | |
Small Cap Growth Fund | |
Investor Class | |
8/31/2018 | | $ | 32.90 | | | $ | (0.37 | ) | | $ | 12.94 | | | $ | 12.57 | | | $ | — | | | $ | (0.51 | ) | | $ | (0.51 | ) | | $ | — | | | $ | 44.96 | | | | 38.67 | % | | $ | 66.1 | | | | 1.75 | % | | | 1.21 | % | | | (0.97 | )% | | | 217 | % | |
8/31/2017 | | $ | 26.97 | | | $ | (0.26 | ) | | $ | 6.19 | | | $ | 5.93 | | | $ | — | | | $ | — | | | $ | — | | | $ | — | | | $ | 32.90 | | | | 21.99 | %i | | $ | 49.8 | | | | 1.78 | % | | | 1.20 | %f | | | (0.86 | )%f | | | 215 | % | |
8/31/2016 | | $ | 29.50 | | | $ | (0.21 | ) | | $ | (0.77 | ) | | $ | (0.98 | ) | | $ | — | | | $ | (1.55 | ) | | $ | (1.55 | ) | | $ | — | | | $ | 26.97 | | | | (3.16 | )% | | $ | 44.0 | | | | 1.87 | % | | | 1.21 | % | | | (0.83 | )% | | | 164 | % | |
8/31/2015 | | $ | 27.44 | | | $ | (0.28 | ) | | $ | 2.34 | | | $ | 2.06 | | | $ | — | | | $ | — | | | $ | — | | | $ | — | | | $ | 29.50 | | | | 7.51 | % | | $ | 49.3 | | | | 1.67 | % | | | 1.21 | % | | | (0.96 | )% | | | 336 | % | |
8/31/2014 | | $ | 24.16 | | | $ | (0.23 | ) | | $ | 3.51 | | | $ | 3.28 | | | $ | — | | | $ | — | | | $ | — | | | $ | 0.00 | | | $ | 27.44 | | | | 13.58 | %c | | $ | 50.7 | | | | 1.67 | % | | | 1.21 | % | | | (0.85 | )% | | | 284 | % | |
Trust Class | |
| 8/31/2018h | | $ | 32.88 | | | $ | (0.43 | ) | | $ | 12.93 | | | $ | 12.50 | | | $ | — | | | $ | (0.47 | ) | | $ | (0.47 | ) | | $ | — | | | $ | 44.91 | | | | 38.45 | % | | $ | 4.4 | | | | 1.86 | % | | | 1.37 | % | | | (1.13 | )% | | | 217 | % | |
| 8/31/2017h | | $ | 27.01 | | | $ | (0.30 | ) | | $ | 6.17 | | | $ | 5.87 | | | $ | — | | | $ | — | | | $ | — | | | $ | — | | | $ | 32.88 | | | | 21.74 | % | | $ | 3.9 | | | | 1.88 | % | | | 1.37 | % | | | (1.04 | )% | | | 215 | % | |
| 8/31/2016h | | $ | 29.44 | | | $ | (0.25 | ) | | $ | (0.75 | ) | | $ | (1.00 | ) | | $ | — | | | $ | (1.43 | ) | | $ | (1.43 | ) | | $ | — | | | $ | 27.01 | | | | (3.27 | )% | | $ | 4.4 | | | | 1.93 | % | | | 1.37 | % | | | (0.99 | )% | | | 164 | % | |
| 8/31/2015h | | $ | 27.44 | | | $ | (0.34 | ) | | $ | 2.34 | | | $ | 2.00 | | | $ | — | | | $ | — | | | $ | — | | | $ | — | | | $ | 29.44 | | | | 7.30 | % | | $ | 5.3 | | | | 1.86 | % | | | 1.40 | % | | | (1.15 | )% | | | 336 | % | |
| 8/31/2014h | | $ | 24.21 | | | $ | (0.28 | ) | | $ | 3.51 | | | $ | 3.23 | | | $ | — | | | $ | — | | | $ | — | | | $ | 0.00 | | | $ | 27.44 | | | | 13.35 | %c | | $ | 5.5 | | | | 1.95 | % | | | 1.40 | % | | | (1.02 | )% | | | 284 | % | |
See Notes to Financial Highlights
255
256
Financial Highlights (cont'd)
| | | Net Asset
Value,
Beginning
of Year | | Net
Investment
Income/(Loss)@ | | Net Gains or
Losses on
Securities
(both realized
and
unrealized) | | Total From
Investment
Operations | | Dividends
from Net
Investment
Income | | Distributions
from Net
Realized
Capital Gains | | Total
Distributions | | Voluntary
Contribution
from
Management | | Net Asset
Value, End of
Year | | Total Returnab | | Net Assets,
End of Year
(in millions) | | Ratio of Gross
Expenses to
Average Net
Assets# | | Ratio of Net
Expenses to
Average Net
Assets | | Ratio of Net
Investment
Income/
(Loss) to
Average Net
Assets | | Portfolio
Turnover
Rate | |
Small Cap Growth Fund (cont'd) | |
Advisor Class | |
| 8/31/2018h | | $ | 33.15 | | | $ | (0.48 | ) | | $ | 12.94 | | | $ | 12.46 | | | $ | — | | | $ | (0.74 | ) | | $ | (0.74 | ) | | $ | — | | | $ | 44.87 | | | | 38.26 | % | | $ | 2.5 | | | | 2.03 | % | | | 1.51 | % | | | (1.27 | )% | | | 217 | % | |
| 8/31/2017h | | $ | 27.27 | | | $ | (0.35 | ) | | $ | 6.23 | | | $ | 5.88 | | | $ | — | | | $ | — | | | $ | — | | | $ | — | | | $ | 33.15 | | | | 21.58 | %i | | $ | 1.7 | | | | 2.05 | % | | | 1.51 | %f | | | (1.18 | )%f | | | 215 | % | |
| 8/31/2016h | | $ | 30.63 | | | $ | (0.29 | ) | | $ | (0.81 | ) | | $ | (1.10 | ) | | $ | — | | | $ | (2.26 | ) | | $ | (2.26 | ) | | $ | — | | | $ | 27.27 | | | | (3.40 | )% | | $ | 2.1 | | | | 2.08 | % | | | 1.51 | % | | | (1.13 | )% | | | 164 | % | |
| 8/31/2015h | | $ | 28.59 | | | $ | (0.38 | ) | | $ | 2.42 | | | $ | 2.04 | | | $ | — | | | $ | — | | | $ | — | | | $ | — | | | $ | 30.63 | | | | 7.13 | % | | $ | 2.7 | | | | 2.00 | % | | | 1.51 | % | | | (1.26 | )% | | | 336 | % | |
| 8/31/2014h | | $ | 25.24 | | | $ | (0.32 | ) | | $ | 3.67 | | | $ | 3.35 | | | $ | — | | | $ | — | | | $ | — | | | $ | 0.00 | | | $ | 28.59 | | | | 13.27 | %c | | $ | 3.5 | | | | 1.96 | % | | | 1.51 | % | | | (1.15 | )% | | | 284 | % | |
Institutional Class | |
| 8/31/2018h | | $ | 32.85 | | | $ | (0.25 | ) | | $ | 12.95 | | | $ | 12.70 | | | $ | — | | | $ | (0.49 | ) | | $ | (0.49 | ) | | $ | — | | | $ | 45.06 | | | | 39.12 | % | | $ | 16.4 | | | | 1.50 | % | | | 0.90 | % | | | (0.66 | )% | | | 217 | % | |
| 8/31/2017h | | $ | 26.86 | | | $ | (0.17 | ) | | $ | 6.16 | | | $ | 5.99 | | | $ | — | | | $ | — | | | $ | — | | | $ | — | | | $ | 32.85 | | | | 22.31 | % | | $ | 11.8 | | | | 1.50 | % | | | 0.90 | % | | | (0.57 | )% | | | 215 | % | |
| 8/31/2016h | | $ | 29.24 | | | $ | (0.14 | ) | | $ | (0.73 | ) | | $ | (0.87 | ) | | $ | — | | | $ | (1.51 | ) | | $ | (1.51 | ) | | $ | — | | | $ | 26.86 | | | | (2.82 | )% | | $ | 9.4 | | | | 1.55 | % | | | 0.90 | % | | | (0.53 | )% | | | 164 | % | |
| 8/31/2015h | | $ | 27.11 | | | $ | (0.19 | ) | | $ | 2.32 | | | $ | 2.13 | | | $ | — | | | $ | — | | | $ | — | | | $ | — | | | $ | 29.24 | | | | 7.84 | % | | $ | 20.7 | | | | 1.44 | % | | | 0.90 | % | | | (0.65 | )% | | | 336 | % | |
| 8/31/2014h | | $ | 23.80 | | | $ | (0.15 | ) | | $ | 3.46 | | | $ | 3.31 | | | $ | — | | | $ | — | | | $ | — | | | $ | 0.00 | | | $ | 27.11 | | | | 13.91 | %c | | $ | 19.0 | | | | 1.48 | % | | | 0.90 | % | | | (0.54 | )% | | | 284 | % | |
Class A | |
| 8/31/2018h | | $ | 32.87 | | | $ | (0.39 | ) | | $ | 12.93 | | | $ | 12.54 | | | $ | — | | | $ | (0.46 | ) | | $ | (0.46 | ) | | $ | — | | | $ | 44.95 | | | | 38.60 | % | | $ | 5.3 | | | | 1.88 | % | | | 1.26 | % | | | (1.02 | )% | | | 217 | % | |
| 8/31/2017h | | $ | 26.97 | | | $ | (0.27 | ) | | $ | 6.17 | | | $ | 5.90 | | | $ | — | | | $ | — | | | $ | — | | | $ | — | | | $ | 32.87 | | | | 21.88 | % | | $ | 3.3 | | | | 1.90 | % | | | 1.26 | % | | | (0.93 | )% | | | 215 | % | |
| 8/31/2016h | | $ | 29.36 | | | $ | (0.23 | ) | | $ | (0.74 | ) | | $ | (0.97 | ) | | $ | — | | | $ | (1.42 | ) | | $ | (1.42 | ) | | $ | — | | | $ | 26.97 | | | | (3.18 | )% | | $ | 3.5 | | | | 1.95 | % | | | 1.26 | % | | | (0.88 | )% | | | 164 | % | |
| 8/31/2015h | | $ | 27.32 | | | $ | (0.30 | ) | | $ | 2.34 | | | $ | 2.04 | | | $ | — | | | $ | — | | | $ | — | | | $ | — | | | $ | 29.36 | | | | 7.45 | % | | $ | 5.1 | | | | 1.83 | % | | | 1.26 | % | | | (1.01 | )% | | | 336 | % | |
| 8/31/2014h | | $ | 24.07 | | | $ | (0.26 | ) | | $ | 3.51 | | | $ | 3.25 | | | $ | — | | | $ | — | | | $ | — | | | $ | 0.00 | | | $ | 27.32 | | | | 13.51 | %c | | $ | 4.4 | | | | 1.81 | % | | | 1.26 | % | | | (0.96 | )% | | | 284 | % | |
Class C | |
| 8/31/2018h | | $ | 33.24 | | | $ | (0.67 | ) | | $ | 12.92 | | | $ | 12.25 | | | $ | — | | | $ | (0.77 | ) | | $ | (0.77 | ) | | $ | — | | | $ | 44.72 | | | | 37.56 | % | | $ | 3.1 | | | | 2.62 | % | | | 2.01 | % | | | (1.77 | )% | | | 217 | % | |
| 8/31/2017h | | $ | 27.47 | | | $ | (0.50 | ) | | $ | 6.27 | | | $ | 5.77 | | | $ | — | | | $ | — | | | $ | — | | | $ | — | | | $ | 33.24 | | | | 21.00 | % | | $ | 2.0 | | | | 2.63 | % | | | 2.01 | % | | | (1.68 | )% | | | 215 | % | |
| 8/31/2016h | | $ | 31.11 | | | $ | (0.43 | ) | | $ | (0.85 | ) | | $ | (1.28 | ) | | $ | — | | | $ | (2.36 | ) | | $ | (2.36 | ) | | $ | — | | | $ | 27.47 | | | | (3.92 | )% | | $ | 1.8 | | | | 2.68 | % | | | 2.01 | % | | | (1.63 | )% | | | 164 | % | |
| 8/31/2015h | | $ | 29.16 | | | $ | (0.55 | ) | | $ | 2.50 | | | $ | 1.95 | | | $ | — | | | $ | — | | | $ | — | | | $ | — | | | $ | 31.11 | | | | 6.68 | % | | $ | 2.3 | | | | 2.58 | % | | | 2.01 | % | | | (1.76 | )% | | | 336 | % | |
| 8/31/2014h | | $ | 25.89 | | | $ | (0.49 | ) | | $ | 3.76 | | | $ | 3.27 | | | $ | — | | | $ | — | | | $ | — | | | $ | 0.00 | | | $ | 29.16 | | | | 12.64 | %c | | $ | 1.8 | | | | 2.57 | % | | | 2.01 | % | | | (1.68 | )% | | | 284 | % | |
Class R3 | |
| 8/31/2018h | | $ | 33.14 | | | $ | (0.48 | ) | | $ | 12.95 | | | $ | 12.47 | | | $ | — | | | $ | (0.74 | ) | | $ | (0.74 | ) | | $ | — | | | $ | 44.87 | | | | 38.29 | % | | $ | 2.2 | | | | 2.17 | % | | | 1.51 | % | | | (1.27 | )% | | | 217 | % | |
| 8/31/2017h | | $ | 27.26 | | | $ | (0.35 | ) | | $ | 6.23 | | | $ | 5.88 | | | $ | — | | | $ | — | | | $ | — | | | $ | — | | | $ | 33.14 | | | | 21.58 | % | | $ | 1.0 | | | | 2.19 | % | | | 1.51 | % | | | (1.17 | )% | | | 215 | % | |
| 8/31/2016h | | $ | 30.63 | | | $ | (0.29 | ) | | $ | (0.83 | ) | | $ | (1.12 | ) | | $ | — | | | $ | (2.25 | ) | | $ | (2.25 | ) | | $ | — | | | $ | 27.26 | | | | (3.44 | )% | | $ | 1.1 | | | | 2.24 | % | | | 1.51 | % | | | (1.12 | )% | | | 164 | % | |
| 8/31/2015h | | $ | 28.56 | | | $ | (0.39 | ) | | $ | 2.46 | | | $ | 2.07 | | | $ | — | | | $ | — | | | $ | — | | | $ | — | | | $ | 30.63 | | | | 7.22 | % | | $ | 1.0 | | | | 2.15 | % | | | 1.51 | % | | | (1.25 | )% | | | 336 | % | |
| 8/31/2014h | | $ | 25.22 | | | $ | (0.32 | ) | | $ | 3.66 | | | $ | 3.34 | | | $ | — | | | $ | — | | | $ | — | | | $ | 0.00 | | | $ | 28.56 | | | | 13.24 | %c | | $ | 0.5 | | | | 2.16 | % | | | 1.51 | % | | | (1.15 | )% | | | 284 | % | |
See Notes to Financial Highlights
257
258
Financial Highlights (cont'd)
| | | Net Asset
Value,
Beginning
of Year | | Net
Investment
Income/(Loss)@ | | Net Gains or
Losses on
Securities
(both realized
and
unrealized) | | Total From
Investment
Operations | | Dividends
from Net
Investment
Income | | Distributions
from Net
Realized
Capital Gains | | Total
Distributions | | Voluntary
Contribution
from
Management | | Net Asset
Value, End of
Year | | Total Returnab | | Net Assets,
End of Year
(in millions) | | Ratio of Gross
Expenses to
Average Net
Assets# | | Ratio of Net
Expenses to
Average Net
Assets | | Ratio of Net
Investment
Income/
(Loss) to
Average Net
Assets | | Portfolio
Turnover
Rate | |
Sustainable Equity Fund | |
Investor Class | |
| 8/31/2018g | | $ | 37.56 | | | $ | 0.23 | | | $ | 6.41 | | | $ | 6.64 | | | $ | (0.31 | ) | | $ | (2.03 | ) | | $ | (2.34 | ) | | $ | — | | | $ | 41.86 | | | | 18.36 | % | | $ | 679.3 | | | | 0.85 | % | | | 0.85 | % | | | 0.59 | % | | | 12 | % | |
| 8/31/2017g | | $ | 34.56 | | | $ | 0.24 | | | $ | 4.31 | | | $ | 4.55 | | | $ | (0.23 | ) | | $ | (1.32 | ) | | $ | (1.55 | ) | | $ | — | | | $ | 37.56 | | | | 13.54 | %i | | $ | 732.6 | | | | 0.85 | % | | | 0.84 | %f | | | 0.66 | %f | | | 26 | % | |
| 8/31/2016g | | $ | 33.29 | | | $ | 0.24 | | | $ | 3.10 | | | $ | 3.34 | | | $ | (0.22 | ) | | $ | (1.85 | ) | | $ | (2.07 | ) | | $ | — | | | $ | 34.56 | | | | 10.49 | % | | $ | 739.0 | | | | 0.86 | % | | | 0.86 | % | | | 0.74 | % | | | 25 | % | |
| 8/31/2015g | | $ | 37.01 | | | $ | 0.27 | | | $ | (0.12 | ) | | $ | 0.15 | | | $ | (0.26 | ) | | $ | (3.61 | ) | | $ | (3.87 | ) | | $ | — | | | $ | 33.29 | | | | 0.29 | % | | $ | 758.0 | | | | 0.85 | % | | | 0.85 | % | | | 0.76 | % | | | 28 | % | |
| 8/31/2014g | | $ | 32.72 | | | $ | 0.31 | | | $ | 6.49 | | | $ | 6.80 | | | $ | (0.30 | ) | | $ | (2.21 | ) | | $ | (2.51 | ) | | $ | 0.00 | | | $ | 37.01 | | | | 21.54 | %c | | $ | 821.1 | | | | 0.86 | % | | | 0.86 | % | | | 0.87 | % | | | 36 | % | |
Trust Class | |
| 8/31/2018g | | $ | 37.58 | | | $ | 0.16 | | | $ | 6.41 | | | $ | 6.57 | | | $ | (0.24 | ) | | $ | (2.03 | ) | | $ | (2.27 | ) | | $ | — | | | $ | 41.88 | | | | 18.13 | % | | $ | 230.8 | | | | 1.02 | % | | | 1.02 | % | | | 0.42 | % | | | 12 | % | |
| 8/31/2017g | | $ | 35.74 | | | $ | 0.18 | | | $ | 4.38 | | | $ | 4.56 | | | $ | (0.40 | ) | | $ | (2.32 | ) | | $ | (2.72 | ) | | $ | — | | | $ | 37.58 | | | | 13.41 | %i | | $ | 234.6 | | | | 1.02 | % | | | 1.01 | %f | | | 0.51 | %f | | | 26 | % | |
| 8/31/2016g | | $ | 35.91 | | | $ | 0.19 | | | $ | 3.25 | | | $ | 3.44 | | | $ | (0.37 | ) | | $ | (3.24 | ) | | $ | (3.61 | ) | | $ | — | | | $ | 35.74 | | | | 10.29 | % | | $ | 270.6 | | | | 1.03 | % | | | 1.03 | % | | | 0.58 | % | | | 25 | % | |
| 8/31/2015g | | $ | 42.53 | | | $ | 0.23 | | | $ | (0.11 | ) | | $ | 0.12 | | | $ | (0.42 | ) | | $ | (6.32 | ) | | $ | (6.74 | ) | | $ | — | | | $ | 35.91 | | | | 0.12 | % | | $ | 318.3 | | | | 1.03 | % | | | 1.03 | % | | | 0.58 | % | | | 28 | % | |
| 8/31/2014g | | $ | 38.95 | | | $ | 0.28 | | | $ | 7.62 | | | $ | 7.90 | | | $ | (0.44 | ) | | $ | (3.88 | ) | | $ | (4.32 | ) | | $ | 0.00 | | | $ | 42.53 | | | | 21.32 | %c | | $ | 418.4 | | | | 1.03 | % | | | 1.03 | % | | | 0.70 | % | | | 36 | % | |
Institutional Class | |
8/31/2018 | | $ | 37.55 | | | $ | 0.30 | | | $ | 6.41 | | | $ | 6.71 | | | $ | (0.39 | ) | | $ | (2.03 | ) | | $ | (2.42 | ) | | $ | — | | | $ | 41.84 | | | | 18.56 | % | | $ | 950.5 | | | | 0.67 | % | | | 0.67 | % | | | 0.76 | % | | | 12 | % | |
8/31/2017 | | $ | 34.55 | | | $ | 0.30 | | | $ | 4.32 | | | $ | 4.62 | | | $ | (0.30 | ) | | $ | (1.32 | ) | | $ | (1.62 | ) | | $ | — | | | $ | 37.55 | | | | 13.78 | %i | | $ | 848.8 | | | | 0.66 | % | | | 0.66 | %f | | | 0.84 | %f | | | 26 | % | |
8/31/2016 | | $ | 33.28 | | | $ | 0.30 | | | $ | 3.11 | | | $ | 3.41 | | | $ | (0.29 | ) | | $ | (1.85 | ) | | $ | (2.14 | ) | | $ | — | | | $ | 34.55 | | | | 10.70 | % | | $ | 745.5 | | | | 0.67 | % | | | 0.67 | % | | | 0.93 | % | | | 25 | % | |
8/31/2015 | | $ | 37.00 | | | $ | 0.33 | | | $ | (0.12 | ) | | $ | 0.21 | | | $ | (0.33 | ) | | $ | (3.60 | ) | | $ | (3.93 | ) | | $ | — | | | $ | 33.28 | | | | 0.46 | % | | $ | 714.8 | | | | 0.67 | % | | | 0.67 | % | | | 0.94 | % | | | 28 | % | |
8/31/2014 | | $ | 32.70 | | | $ | 0.37 | | | $ | 6.49 | | | $ | 6.86 | | | $ | (0.35 | ) | | $ | (2.21 | ) | | $ | (2.56 | ) | | $ | 0.00 | | | $ | 37.00 | | | | 21.76 | %c | | $ | 706.5 | | | | 0.68 | % | | | 0.68 | % | | | 1.06 | % | | | 36 | % | |
Class A | |
| 8/31/2018g | | $ | 37.58 | | | $ | 0.16 | | | $ | 6.41 | | | $ | 6.57 | | | $ | (0.24 | ) | | $ | (2.03 | ) | | $ | (2.27 | ) | | $ | — | | | $ | 41.88 | | | | 18.14 | % | | $ | 126.4 | | | | 1.04 | % | | | 1.04 | % | | | 0.40 | % | | | 12 | % | |
| 8/31/2017g | | $ | 35.78 | | | $ | 0.18 | | | $ | 4.37 | | | $ | 4.55 | | | $ | (0.41 | ) | | $ | (2.34 | ) | | $ | (2.75 | ) | | $ | — | | | $ | 37.58 | | | | 13.36 | %i | | $ | 118.0 | | | | 1.03 | % | | | 1.03 | %f | | | 0.48 | %f | | | 26 | % | |
| 8/31/2016g | | $ | 36.02 | | | $ | 0.19 | | | $ | 3.25 | | | $ | 3.44 | | | $ | (0.39 | ) | | $ | (3.29 | ) | | $ | (3.68 | ) | | $ | — | | | $ | 35.78 | | | | 10.27 | % | | $ | 131.6 | | | | 1.05 | % | | | 1.05 | % | | | 0.56 | % | | | 25 | % | |
| 8/31/2015g | | $ | 42.73 | | | $ | 0.23 | | | $ | (0.11 | ) | | $ | 0.12 | | | $ | (0.44 | ) | | $ | (6.39 | ) | | $ | (6.83 | ) | | $ | — | | | $ | 36.02 | | | | 0.11 | % | | $ | 140.9 | | | | 1.05 | % | | | 1.05 | % | | | 0.57 | % | | | 28 | % | |
| 8/31/2014g | | $ | 39.16 | | | $ | 0.28 | | | $ | 7.64 | | | $ | 7.92 | | | $ | (0.43 | ) | | $ | (3.92 | ) | | $ | (4.35 | ) | | $ | 0.00 | | | $ | 42.73 | | | | 21.28 | %c | | $ | 134.0 | | | | 1.05 | % | | | 1.05 | % | | | 0.68 | % | | | 36 | % | |
Class C | |
| 8/31/2018g | | $ | 37.63 | | | $ | (0.14 | ) | | $ | 6.42 | | | $ | 6.28 | | | $ | (0.07 | ) | | $ | (2.03 | ) | | $ | (2.10 | ) | | $ | — | | | $ | 41.81 | | | | 17.26 | % | | $ | 62.4 | | | | 1.78 | % | | | 1.78 | % | | | (0.35 | )% | | | 12 | % | |
| 8/31/2017g | | $ | 35.92 | | | $ | (0.09 | ) | | $ | 4.39 | | | $ | 4.30 | | | $ | (0.17 | ) | | $ | (2.42 | ) | | $ | (2.59 | ) | | $ | — | | | $ | 37.63 | | | | 12.53 | %i | | $ | 56.6 | | | | 1.78 | % | | | 1.78 | %f | | | (0.27 | )%f | | | 26 | % | |
| 8/31/2016g | | $ | 36.25 | | | $ | (0.07 | ) | | $ | 3.27 | | | $ | 3.20 | | | $ | (0.13 | ) | | $ | (3.40 | ) | | $ | (3.53 | ) | | $ | — | | | $ | 35.92 | | | | 9.44 | % | | $ | 53.5 | | | | 1.79 | % | | | 1.79 | % | | | (0.19 | )% | | | 25 | % | |
| 8/31/2015g | | $ | 43.29 | | | $ | (0.08 | ) | | $ | (0.09 | ) | | $ | (0.17 | ) | | $ | (0.26 | ) | | $ | (6.61 | ) | | $ | (6.87 | ) | | $ | — | | | $ | 36.25 | | | | (0.67 | )% | | $ | 52.2 | | | | 1.79 | % | | | 1.79 | % | | | (0.18 | )% | | | 28 | % | |
| 8/31/2014g | | $ | 39.72 | | | $ | (0.02 | ) | | $ | 7.75 | | | $ | 7.73 | | | $ | (0.11 | ) | | $ | (4.05 | ) | | $ | (4.16 | ) | | $ | 0.00 | | | $ | 43.29 | | | | 20.42 | %c | | $ | 44.5 | | | | 1.80 | % | | | 1.80 | % | | | (0.05 | )% | | | 36 | % | |
See Notes to Financial Highlights
259
260
Financial Highlights (cont'd)
| | | Net Asset
Value,
Beginning
of Year | | Net
Investment
Income/(Loss)@ | | Net Gains or
Losses on
Securities
(both realized
and
unrealized) | | Total From
Investment
Operations | | Dividends
from Net
Investment
Income | | Distributions
from Net
Realized
Capital Gains | | Total
Distributions | | Voluntary
Contribution
from
Management | | Net Asset
Value, End of
Year | | Total Returnab | | Net Assets,
End of Year
(in millions) | | Ratio of Gross
Expenses to
Average Net
Assets# | | Ratio of Net
Expenses to
Average Net
Assets | | Ratio of Net
Investment
Income/
(Loss) to
Average Net
Assets | | Portfolio
Turnover
Rate | |
Sustainable Equity Fund (cont'd) | |
Class R3 | |
| 8/31/2018g | | $ | 37.59 | | | $ | 0.06 | | | $ | 6.42 | | | $ | 6.48 | | | $ | (0.14 | ) | | $ | (2.03 | ) | | $ | (2.17 | ) | | $ | — | | | $ | 41.90 | | | | 17.85 | % | | $ | 36.4 | | | | 1.28 | % | | | 1.28 | % | | | 0.15 | % | | | 12 | % | |
| 8/31/2017g | | $ | 35.86 | | | $ | 0.07 | | | $ | 4.37 | | | $ | 4.44 | | | $ | (0.34 | ) | | $ | (2.37 | ) | | $ | (2.71 | ) | | $ | — | | | $ | 37.59 | | | | 13.04 | %i | | $ | 41.3 | | | | 1.28 | % | | | 1.28 | %f | | | 0.21 | %f | | | 26 | % | |
| 8/31/2016g | | $ | 36.13 | | | $ | 0.11 | | | $ | 3.26 | | | $ | 3.37 | | | $ | (0.31 | ) | | $ | (3.33 | ) | | $ | (3.64 | ) | | $ | — | | | $ | 35.86 | | | | 10.01 | % | | $ | 33.3 | | | | 1.29 | % | | | 1.29 | % | | | 0.30 | % | | | 25 | % | |
| 8/31/2015g | | $ | 42.93 | | | $ | 0.13 | | | $ | (0.09 | ) | | $ | 0.04 | | | $ | (0.36 | ) | | $ | (6.48 | ) | | $ | (6.84 | ) | | $ | — | | | $ | 36.13 | | | | (0.12 | )% | | $ | 30.4 | | | | 1.29 | % | | | 1.29 | % | | | 0.31 | % | | | 28 | % | |
| 8/31/2014g | | $ | 39.35 | | | $ | 0.18 | | | $ | 7.69 | | | $ | 7.87 | | | $ | (0.31 | ) | | $ | (3.98 | ) | | $ | (4.29 | ) | | $ | 0.00 | | | $ | 42.93 | | | | 21.02 | %c | | $ | 32.2 | | | | 1.29 | % | | | 1.29 | % | | | 0.45 | % | | | 36 | % | |
Class R6 | |
| 8/31/2018g | | $ | 37.54 | | | $ | 0.32 | | | $ | 6.41 | | | $ | 6.73 | | | $ | (0.41 | ) | | $ | (2.03 | ) | | $ | (2.44 | ) | | $ | — | | | $ | 41.83 | | | | 18.65 | % | | $ | 321.1 | | | | 0.60 | % | | | 0.60 | % | | | 0.83 | % | | | 12 | % | |
| 8/31/2017g | | $ | 34.54 | | | $ | 0.33 | | | $ | 4.31 | | | $ | 4.64 | | | $ | (0.32 | ) | | $ | (1.32 | ) | | $ | (1.64 | ) | | $ | — | | | $ | 37.54 | | | | 13.84 | %i | | $ | 361.3 | | | | 0.59 | % | | | 0.59 | %f | | | 0.91 | %f | | | 26 | % | |
| 8/31/2016g | | $ | 33.27 | | | $ | 0.32 | | | $ | 3.11 | | | $ | 3.43 | | | $ | (0.31 | ) | | $ | (1.85 | ) | | $ | (2.16 | ) | | $ | — | | | $ | 34.54 | | | | 10.78 | % | | $ | 373.4 | | | | 0.60 | % | | | 0.60 | % | | | 0.96 | % | | | 25 | % | |
| 8/31/2015g | | $ | 37.00 | | | $ | 0.36 | | | $ | (0.14 | ) | | $ | 0.22 | | | $ | (0.35 | ) | | $ | (3.60 | ) | | $ | (3.95 | ) | | $ | — | | | $ | 33.27 | | | | 0.51 | % | | $ | 222.4 | | | | 0.60 | % | | | 0.60 | % | | | 1.02 | % | | | 28 | % | |
| 8/31/2014g | | $ | 32.68 | | | $ | 0.39 | | | $ | 6.51 | | | $ | 6.90 | | | $ | (0.37 | ) | | $ | (2.21 | ) | | $ | (2.58 | ) | | $ | 0.00 | | | $ | 37.00 | | | | 21.88 | %c | | $ | 279.6 | | | | 0.60 | % | | | 0.60 | % | | | 1.11 | % | | | 36 | % | |
Value Fund | |
Institutional Class | |
8/31/2018 | | $ | 18.14 | | | $ | 0.29 | | | $ | 1.97 | | | $ | 2.26 | | | $ | (0.39 | ) | | $ | (1.39 | ) | | $ | (1.78 | ) | | $ | — | | | $ | 18.62 | | | | 12.98 | % | | $ | 7.2 | | | | 2.67 | % | | | 0.70 | % | | | 1.59 | % | | | 151 | % | |
8/31/2017 | | $ | 15.72 | | | $ | 0.25 | | | $ | 2.29 | | | $ | 2.54 | | | $ | (0.12 | ) | | $ | — | | | $ | (0.12 | ) | | $ | — | | | $ | 18.14 | | | | 16.18 | % | | $ | 10.8 | | | | 2.20 | % | | | 0.71 | % | | | 1.47 | % | | | 115 | % | |
8/31/2016 | | $ | 14.35 | | | $ | 0.20 | | | $ | 1.61 | | | $ | 1.81 | | | $ | (0.23 | ) | | $ | (0.21 | ) | | $ | (0.44 | ) | | $ | — | | | $ | 15.72 | | | | 13.23 | % | | $ | 9.1 | | | | 2.68 | % | | | 0.72 | %^^ | | | 1.40 | % | | | 118 | % | |
8/31/2015 | | $ | 16.51 | | | $ | 0.19 | | | $ | (1.35 | ) | | $ | (1.16 | ) | | $ | (0.15 | ) | | $ | (0.85 | ) | | $ | (1.00 | ) | | $ | — | | | $ | 14.35 | | | | (7.42 | )% | | $ | 13.1 | | | | 1.82 | % | | | 0.70 | % | | | 1.24 | % | | | 166 | % | |
8/31/2014 | | $ | 13.52 | | | $ | 0.17 | | | $ | 2.92 | | | $ | 3.09 | | | $ | (0.10 | ) | | $ | — | | | $ | (0.10 | ) | | $ | — | | | $ | 16.51 | | | | 22.98 | % | | $ | 12.6 | | | | 2.41 | % | | | 0.70 | % | | | 1.12 | % | | | 129 | % | |
Class A | |
8/31/2018 | | $ | 18.02 | | | $ | 0.23 | | | $ | 1.95 | | | $ | 2.18 | | | $ | (0.25 | ) | | $ | (1.39 | ) | | $ | (1.64 | ) | | $ | — | | | $ | 18.56 | | | | 12.56 | % | | $ | 2.3 | | | | 3.13 | % | | | 1.07 | % | | | 1.26 | % | | | 151 | % | |
8/31/2017 | | $ | 15.62 | | | $ | 0.18 | | | $ | 2.29 | | | $ | 2.47 | | | $ | (0.07 | ) | | $ | — | | | $ | (0.07 | ) | | $ | — | | | $ | 18.02 | | | | 15.83 | % | | $ | 2.7 | | | | 2.60 | % | | | 1.08 | % | | | 1.08 | % | | | 115 | % | |
8/31/2016 | | $ | 14.25 | | | $ | 0.14 | | | $ | 1.60 | | | $ | 1.74 | | | $ | (0.16 | ) | | $ | (0.21 | ) | | $ | (0.37 | ) | | $ | — | | | $ | 15.62 | | | | 12.70 | % | | $ | 3.8 | | | | 3.08 | % | | | 1.10 | %^^ | | | 1.02 | % | | | 118 | % | |
8/31/2015 | | $ | 16.40 | | | $ | 0.13 | | | $ | (1.33 | ) | | $ | (1.20 | ) | | $ | (0.10 | ) | | $ | (0.85 | ) | | $ | (0.95 | ) | | $ | — | | | $ | 14.25 | | | | (7.71 | )% | | $ | 7.3 | | | | 2.21 | % | | | 1.08 | % | | | 0.84 | % | | | 166 | % | |
8/31/2014 | | $ | 13.44 | | | $ | 0.11 | | | $ | 2.90 | | | $ | 3.01 | | | $ | (0.05 | ) | | $ | — | | | $ | (0.05 | ) | | $ | — | | | $ | 16.40 | | | | 22.43 | % | | $ | 8.0 | | | | 2.80 | % | | | 1.10 | % | | | 0.74 | % | | | 129 | % | |
Class C | |
8/31/2018 | | $ | 17.52 | | | $ | 0.09 | | | $ | 1.90 | | | $ | 1.99 | | | $ | (0.16 | ) | | $ | (1.39 | ) | | $ | (1.55 | ) | | $ | — | | | $ | 17.96 | | | | 11.72 | % | | $ | 3.3 | | | | 3.82 | % | | | 1.81 | % | | | 0.53 | % | | | 151 | % | |
8/31/2017 | | $ | 15.33 | | | $ | 0.06 | | | $ | 2.22 | | | $ | 2.28 | | | $ | (0.09 | ) | | $ | — | | | $ | (0.09 | ) | | $ | — | | | $ | 17.52 | | | | 14.92 | % | | $ | 3.5 | | | | 3.31 | % | | | 1.83 | % | | | 0.37 | % | | | 115 | % | |
8/31/2016 | | $ | 14.02 | | | $ | 0.04 | | | $ | 1.57 | | | $ | 1.61 | | | $ | (0.09 | ) | | $ | (0.21 | ) | | $ | (0.30 | ) | | $ | — | | | $ | 15.33 | | | | 11.92 | % | | $ | 0.5 | | | | 3.87 | % | | | 1.84 | %^^ | | | 0.29 | % | | | 118 | % | |
8/31/2015 | | $ | 16.18 | | | $ | 0.01 | | | $ | (1.32 | ) | | $ | (1.31 | ) | | $ | (0.00 | ) | | $ | (0.85 | ) | | $ | (0.85 | ) | | $ | — | | | $ | 14.02 | | | | (8.44 | )% | | $ | 0.5 | | | | 2.98 | % | | | 1.83 | % | | | 0.07 | % | | | 166 | % | |
8/31/2014 | | $ | 13.31 | | | $ | (0.01 | ) | | $ | 2.88 | | | $ | 2.87 | | | $ | — | | | $ | — | | | $ | — | | | $ | — | | | $ | 16.18 | | | | 21.56 | % | | $ | 0.6 | | | | 3.57 | % | | | 1.86 | % | | | (0.05 | )% | | | 129 | % | |
See Notes to Financial Highlights
261
262
Notes to Financial Highlights
@ Calculated based on the average number of shares outstanding during each fiscal period.
# Represents the annualized ratios of net expenses to average daily net assets if Management had not reimbursed certain expenses and/or waived a portion of the investment management fee and/or if certain Funds did not receive the Custodian Out-of-Pocket Expenses Refunded, as listed in Note G of the Notes to Financial Statements.
^ The date investment operations commenced.
* Not annualized.
** Annualized.
‡ Organization expense, which is a non-recurring expense, is included in these ratios on a non-annualized basis.
§ After repayment of expenses previously reimbursed and/or fees previously waived by Management, as applicable. Had the Fund not made such repayments, the annualized ratios of net expenses to average net assets would have been:
| | | Year Ended August 31, | |
| | | 2018 | | 2017 | | 2016 | | 2015 | | 2014 | |
Equity Income Class R3 | | | — | | | | — | | | | — | | | | — | | | | 1.32 | % | |
Focus Institutional Class | | | 0.75 | % | | | — | | | | — | | | | — | | | | — | | |
Genesis Institutional Class | | | — | | | | 0.84 | % | | | 0.85 | % | | | — | | | | 0.85 | % | |
Genesis Class R6 | | | — | | | | 0.77 | % | | | 0.78 | % | | | — | | | | 0.78 | % | |
Guardian Advisor Class | | | — | | | | — | | | | 1.26 | % | | | — | | | | — | | |
Guardian Class A | | | — | | | | — | | | | — | | | | — | | | | 1.08 | % | |
Guardian Class C | | | — | | | | — | | | | — | | | | — | | | | 1.84 | % | |
International Equity Institutional Class | | | — | | | | 0.84 | % | | | 0.85 | % | | | 0.83 | % | | | — | | |
International Equity Class A | | | — | | | | 1.20 | % | | | — | | | | 1.20 | % | | | — | | |
International Equity Class C | | — | | 1.96% | |
International Equity Class R6 | | | — | | | | — | | | | — | | | | 0.76 | % | | | — | | |
Large Cap Value Institutional Class | | | 0.70 | % | | | 0.69 | % | | | — | | | | 0.70 | % | | | 0.70 | % | |
Large Cap Value Class A | | | — | | | | — | | | | — | | | | — | | | | 1.08 | % | |
Large Cap Value Class C | | | — | | | | — | | | | — | | | | 1.82 | % | | | 1.82 | % | |
Mid Cap Growth Institutional Class | | | — | | | | — | | | | 0.73 | % | | | 0.73 | % | | | — | | |
Mid Cap Growth Class A | | | — | | | | 1.09 | % | | | 1.10 | % | | | 1.10 | % | | | — | | |
Mid Cap Growth Class C | | | 1.82 | % | | | 1.86 | % | | | — | | | | — | | | | — | | |
Mid Cap Growth Class R3 | | | 1.34 | % | | | — | | | | — | | | | — | | | | — | | |
Mid Cap Growth Class R6 | | | — | | | | — | | | | — | | | | 0.67 | % | | | — | | |
Mid Cap Intrinsic Value Trust Class | | | — | | | | 1.24 | % | | | — | | | | — | | | | 1.23 | % | |
Mid Cap Intrinsic Value Institutional Class | | | — | | | | — | | | | — | | | | — | | | | 0.82 | % | |
Mid Cap Intrinsic Value Class A | | | — | | | | — | | | | — | | | | — | | | | 1.21 | % | |
Mid Cap Intrinsic Value Class C | | | — | | | | — | | | | — | | | | — | | | | 1.94 | % | |
^^ Represents the annualized ratio of net expenses to average daily net assets after utilization of the Line of Credit by Greater China Equity (2015, 2016 and 2017) and Value (2016) and/or reimbursement of expenses and/or waiver of a portion of the investment management fee by Management. The Funds are required to calculate an expense ratio without taking into consideration any expense reductions related to expense offset arrangements. Had Greater
263
Notes to Financial Highlights (cont'd)
China Equity and Value not utilized the Line of Credit, or had Management not undertaken such action, the annualized ratios of net expenses to average daily net assets would have been:
| | | Year Ended August 31, | |
| | | 2017 | | 2016 | | 2015 | |
Greater China Equity Institutional Class | | | 1.50 | % | | | 1.51 | % | | | 1.50 | % | |
Greater China Equity Class A | | | 1.86 | % | | | 1.87 | % | | | 1.86 | % | |
Greater China Equity Class C | | | 2.61 | % | | | 2.62 | % | | | 2.61 | % | |
Value Institutional Class | | | — | | | | 0.71 | % | | | — | | |
Value Class A | | | — | | | | 1.10 | % | | | — | | |
Value Class C | | | — | | | | 1.84 | % | | | — | | |
a Total return based on per share NAV reflects the effects of changes in NAV on the performance of each Fund during each fiscal period. Returns assume income dividends and other distributions, if any, were reinvested, but do not reflect the effect of sales charges. Results represent past performance and do not indicate future results. Current returns may be lower or higher than the performance data quoted. Investment returns and principal will fluctuate and shares, when redeemed, may be worth more or less than original cost. Total return would have been lower if Management had not reimbursed and/or waived certain expenses. Total return would have been higher if Management had not recouped previously reimbursed and/or waived expenses.
b The class action proceeds listed in Note A of the Notes to Financial Statements had no impact on the Funds' total returns for the year ended August 31, 2018. Except for the Fund classes listed below, the class action proceeds received in 2017, 2016, 2015 and/or 2014, if any, had no impact on the respective Funds' total returns for the years ended August 31, 2017, 2016, 2015 and/or 2014. Had the Fund classes listed below not received class action proceeds in 2017, 2016, 2015 and/or 2014, total return based on per share NAV for the years ended August 31, 2017, 2016, 2015 and/or 2014 would have been:
| | | Year Ended August 31, | |
| | | 2017 | | 2016 | | 2015 | | 2014 | |
Genesis Investor Class | | | — | | | | — | | | | — | | | | 13.62 | % | |
Genesis Trust Class | | | — | | | | — | | | | — | | | | 13.51 | % | |
Genesis Advisor Class | | | — | | | | — | | | | — | | | | 13.21 | % | |
Genesis Institutional Class | | | — | | | | — | | | | — | | | | 13.78 | % | |
Genesis Class R6 | | | — | | | | — | | | | — | | | | 13.90 | % | |
Large Cap Value Investor Class | | | — | | | | — | | | | (7.26 | )% | | | — | | |
Large Cap Value Trust Class | | | — | | | | — | | | | (7.45 | )% | | | — | | |
Large Cap Value Advisor Class | | | — | | | | — | | | | — | | | | — | | |
Large Cap Value Institutional Class | | | — | | | | — | | | | (7.09 | )% | | | — | | |
Large Cap Value Class A | | | — | | | | — | | | | (7.49 | )% | | | — | | |
Large Cap Value Class R3 | | | — | | | | — | | | | (7.71 | )% | | | — | | |
Mid Cap Intrinsic Value Investor Class | | | — | | | | — | | | | — | | | | 22.79 | % | |
Mid Cap Intrinsic Value Trust Class | | | — | | | | — | | | | — | | | | 22.41 | % | |
Mid Cap Intrinsic Value Institutional Class | | | — | | | | — | | | | — | | | | — | | |
Mid Cap Intrinsic Value Class A | | | 16.89 | % | | | — | | | | — | | | | — | | |
Mid Cap Intrinsic Value Class R3 | | | — | | | | — | | | | — | | | | 22.17 | % | |
Small Cap Growth Investor Class | | | 21.91 | % | | | (3.27 | )% | | | 7.07 | % | | | — | | |
Small Cap Growth Trust Class | | | 21.68 | % | | | (3.40 | )% | | | 6.86 | % | | | — | | |
264
Notes to Financial Highlights (cont'd)
| | | Year Ended August 31, | |
| | | 2017 | | 2016 | | 2015 | | 2014 | |
Small Cap Growth Advisor Class | | | 21.47 | % | | | (3.50 | )% | | | 6.72 | % | | | — | | |
Small Cap Growth Institutional Class | | | 22.23 | % | | | (2.99 | )% | | | 7.41 | % | | | — | | |
Small Cap Growth Class A | | | 21.81 | % | | | (3.31 | )% | | | 7.05 | % | | | — | | |
Small Cap Growth Class C | | | 20.94 | % | | | (4.02 | )% | | | 6.37 | % | | | — | | |
Small Cap Growth Class R3 | | | 21.47 | % | | | (3.54 | )% | | | 6.81 | % | | | — | | |
c The voluntary contribution received in 2014 had no impact on the Funds' total return for the year ended August 31, 2014.
d Portfolio turnover is calculated at the Fund level. Percentage indicated was calculated for the year ended August 31, 2014 for International Equity and for the year ended August 31, 2017 for International Select.
e The voluntary contributions listed in Note B of the Notes to Financial Statements had no impact on the Fund's total returns for the year ended August 31, 2017. Had Mid Cap Growth not received the voluntary contribution in 2016, the total return based on per share NAV for the year ended August 31, 2016, would have been:
Mid Cap Growth Investor Class | | | (1.78 | )% | |
Mid Cap Growth Trust Class | | | (1.90 | )% | |
Mid Cap Growth Advisor Class | | | (2.13 | )% | |
Mid Cap Growth Institutional Class | | | (1.66 | )% | |
Mid Cap Growth Class A | | | (2.04 | )% | |
Mid Cap Growth Class C | | | (2.66 | )% | |
Mid Cap Growth Class R3 | | | (2.21 | )% | |
Mid Cap Growth Class R6 | | | (1.51 | )% | |
f Custodian Out-of-Pocket Expenses Refunded, as listed in Note G of the Notes to Financial Statements, is non-recurring, and is included in these ratios. Had the Funds not received the refund, the annualized ratios of net expenses to average net assets and net investment income/(loss) to average net assets would have been:
| | | Ratio of Net
Expenses
to Average
Net Assets
Year Ended
August 31,
2017 | | Ratio of Net
Investment
Income/(Loss)
to Average
Net Assets
Year Ended
August 31,
2017 | |
Equity Income Institutional Class | | | 0.69 | % | | | 2.99 | % | |
Equity Income Class A | | | 1.05 | % | | | 2.56 | % | |
Equity Income Class C | | | 1.80 | % | | | 1.82 | % | |
Equity Income Class R3 | | | 1.34 | % | | | 2.27 | % | |
Focus Investor Class | | | 0.92 | % | | | 0.27 | % | |
Focus Trust Class | | | 1.10 | % | | | 0.09 | % | |
Focus Advisor Class | | | 1.26 | % | | | (0.08 | )% | |
Genesis Investor Class | | | 1.02 | % | | | 0.21 | % | |
Genesis Trust Class | | | 1.09 | % | | | 0.12 | % | |
Genesis Advisor Class | | | 1.36 | % | | | (0.14 | )% | |
Genesis Institutional Class | | | 0.85 | % | | | 0.38 | % | |
265
Notes to Financial Highlights (cont'd)
| | | Ratio of Net
Expenses
to Average
Net Assets
Year Ended
August 31,
2017 | | Ratio of Net
Investment
Income/(Loss)
to Average
Net Assets
Year Ended
August 31,
2017 | |
Genesis Class R6 | | | 0.77 | % | | | 0.45 | % | |
Guardian Investor Class | | | 0.90 | % | | | 0.75 | % | |
Guardian Trust Class | | | 1.07 | % | | | 0.57 | % | |
Guardian Advisor Class | | | 1.38 | % | | | 0.25 | % | |
Guardian Institutional Class | | | 0.72 | % | | | 0.94 | % | |
Guardian Class A | | | 1.10 | % | | | 0.55 | % | |
Guardian Class C | | | 1.84 | % | | | (0.20 | )% | |
Guardian Class R3 | | | 1.36 | % | | | 0.28 | % | |
International Equity Investor Class | | | 1.05 | % | | | 0.97 | % | |
International Equity Trust Class | | | 1.09 | % | | | 0.91 | % | |
International Equity Institutional Class | | | 0.85 | % | | | 1.19 | % | |
International Equity Class A | | | — | | | | 0.65 | % | |
International Equity Class A | | | — | | | | 0.04 | % | |
International Equity Class R6 | | | — | | | | 1.31 | % | |
Large Cap Value Investor Class | | | 0.87 | % | | | 1.30 | % | |
Large Cap Value Trust Class | | | 1.05 | % | | | 1.11 | % | |
Large Cap Value Advisor Class | | | 1.20 | % | | | 0.97 | % | |
Large Cap Value Institutional Class | | | 0.70 | % | | | 1.49 | % | |
Large Cap Value Class A | | | 1.07 | % | | | 1.11 | % | |
Large Cap Value Class C | | | 1.81 | % | | | 0.36 | % | |
Large Cap Value Class R3 | | | 1.36 | % | | | 0.90 | % | |
Mid Cap Growth Investor Class | | | 0.93 | % | | | (0.30 | )% | |
Mid Cap Growth Trust Class | | | 0.97 | % | | | (0.34 | )% | |
Mid Cap Growth Advisor Class | | | 1.23 | % | | | (0.60 | )% | |
Mid Cap Growth Institutional Class | | | 0.72 | % | | | (0.09 | )% | |
Mid Cap Growth Class A | | | 1.11 | % | | | (0.49 | )% | |
Mid Cap Growth Class R6 | | | 0.65 | % | | | (0.02 | )% | |
Mid Cap Intrinsic Value Investor Class | | | 1.07 | % | | | 1.00 | % | |
Mid Cap Intrinsic Value Trust Class | | | 1.25 | % | | | 0.82 | % | |
Mid Cap Intrinsic Value Institutional Class | | | 0.85 | % | | | 1.19 | % | |
Mid Cap Intrinsic Value Class A | | | 1.21 | % | | | 0.89 | % | |
Mid Cap Intrinsic Value Class C | | | 1.96 | % | | | 0.15 | % | |
Multi-Cap Opportunities Institutional Class | | | 0.75 | % | | | 0.68 | % | |
Multi-Cap Opportunities Class A | | | 1.10 | % | | | 0.32 | % | |
Multi-Cap Opportunities Class C | | | 1.84 | % | | | (0.40 | )% | |
Small Cap Growth Investor Class | | | 1.21 | % | | | (0.87 | )% | |
266
Notes to Financial Highlights (cont'd)
| | | Ratio of Net
Expenses
to Average
Net Assets
Year Ended
August 31,
2017 | | Ratio of Net
Investment
Income/(Loss)
to Average
Net Assets
Year Ended
August 31,
2017 | |
Small Cap Growth Advisor Class | | | 1.51 | % | | | (1.18 | )% | |
Sustainable Equity Investor Class | | | 0.85 | % | | | 0.66 | % | |
Sustainable Equity Trust Class | | | 1.02 | % | | | 0.49 | % | |
Sustainable Equity Institutional Class | | | 0.66 | % | | | 0.84 | % | |
Sustainable Equity Class A | | | 1.03 | % | | | 0.48 | % | |
Sustainable Equity Class C | | | 1.78 | % | | | (0.27 | )% | |
Sustainable Equity Class R3 | | | 1.28 | % | | | 0.21 | % | |
Sustainable Equity Class R6 | | | 0.59 | % | | | 0.91 | % | |
g After the close of business on December 8, 2017, the Funds' applicable classes underwent a stock split or reverse stock split. The per share data presented here has been retroactively adjusted to reflect this split. See Note H of the Notes to Financial Statements.
h After the close of business on February 23, 2018, the Funds' applicable classes underwent a stock split or reverse stock split. The per share data presented here has been retroactively adjusted to reflect this split. See Note H of the Notes to Financial Statements.
i Except for the Fund classes listed below, total return would have been the same for the year ended August 31, 2017, if the Funds had not received the refund listed in Note G of the Notes to Financial Statements. Had the Funds not received the refund listed in Note G of the Notes to Financial Statements, the total return would have been:
| | | Year Ended August 31, 2017 | |
Guardian Advisor Class | | | 17.00 | % | |
International Equity Investor Class | | | 15.58 | % | |
International Equity Trust Class | | | 15.53 | % | |
Mid Cap Intrinsic Value Investor Class | | | 17.14 | % | |
267
Report of Independent Registered Public Accounting Firm
To the Board of Trustees
Neuberger Berman Equity Funds and Shareholders of:
Neuberger Berman Dividend Growth Fund
Neuberger Berman Emerging Markets Equity Fund
Neuberger Berman Equity Income Fund
Neuberger Berman Focus Fund
Neuberger Berman Genesis Fund
Neuberger Berman Global Equity Fund
Neuberger Berman Global Real Estate Fund
Neuberger Berman Greater China Equity Fund
Neuberger Berman Guardian Fund
Neuberger Berman International Equity Fund
Neuberger Berman International Select Fund
Neuberger Berman International Small Cap Fund
Neuberger Berman Large Cap Value Fund
Neuberger Berman Real Estate Fund
Neuberger Berman Value Fund
Opinion on the Financial Statements
We have audited the accompanying statements of assets and liabilities of Neuberger Berman Dividend Growth Fund, Neuberger Berman Emerging Markets Equity Fund, Neuberger Berman Equity Income Fund, Neuberger Berman Focus Fund, Neuberger Berman Genesis Fund, Neuberger Berman Global Equity Fund, Neuberger Berman Global Real Estate Fund, Neuberger Berman Greater China Equity Fund, Neuberger Berman Guardian Fund, Neuberger Berman International Equity Fund, Neuberger Berman International Select Fund, Neuberger Berman International Small Cap Fund, Neuberger Berman Large Cap Value Fund, Neuberger Berman Real Estate Fund, and Neuberger Berman Value Fund (collectively referred to as the "Funds") (fifteen of the series constituting Neuberger Berman Equity Funds (the "Trust"), including the schedules of investments, as of August 31, 2018 and the related statement of operations, the statements of changes in net assets, and the financial highlights for each of the periods indicated in the table below and the related notes (collectively referred to as the "financial statements"). In our opinion, the financial statements present fairly, in all material respects, the financial position of each of the Funds (fifteen of the series constituting Neuberger Berman Equity Funds) at August 31, 2018, the results of their operations, the changes in net assets and financial highlights for each of the periods indicated in the table below, in conformity with U.S. generally accepted accounting principles.
268
Individual Fund constituting
Neuberger Berman
Equity Funds | | Statement of
operations | | Statement of
changes in net assets | | Financial highlights | |
Neuberger Berman Dividend Growth Fund | | For the year ended August 31, 2018 | | For each of the two years in the period ended August 31, 2018 | | For each of the two years in the period ended August 31, 2018 and the period from December 15, 2015 (commencement of operations) through August 31, 2016 | |
Neuberger Berman Emerging Markets Equity Fund
Neuberger Berman Equity Income Fund
Neuberger Berman Focus Fund
Neuberger Berman Genesis Fund
Neuberger Berman Global Equity Fund
Neuberger Berman Greater China Equity Fund
Neuberger Berman Guardian Fund
Neuberger Berman International Equity Fund
Neuberger Berman International Select Fund
Neuberger Berman Large Cap Value Fund
Neuberger Berman Real Estate Fund
Neuberger Berman Value Fund | | For the year ended August 31, 2018 | | For each of the two years in the period ended August 31, 2018 | | For each of the five years in the period ended August 31, 2018 | |
Neuberger Berman Global Real Estate Fund | | For the year ended August 31, 2018 | | For each of the two years in the period ended August 31, 2018 | | For each of the three years in the period ended August 31, 2018 and the period from December 30, 2014 (commencement of operations) through August 31, 2015 | |
Neuberger Berman International Small Cap Fund | | For the year ended August 31, 2018 | | For the year ended August 31, 2018 and the period from December 8, 2016 (commencement of operations) through August 31, 2017 | | | |
Basis for Opinion
These financial statements are the responsibility of the Trust's management. Our responsibility is to express an opinion on each of the Funds' financial statements based on our audits. We are a public accounting firm registered with the Public Company Accounting Oversight Board (United States) ("PCAOB") and are required to be independent with respect to the Trust in accordance with the U.S. federal securities laws and the applicable rules and regulations of the Securities and Exchange Commission and the PCAOB.
We conducted our audits in accordance with the standards of the PCAOB. Those standards require that we plan and perform the audit to obtain reasonable assurance about whether the financial statements are free of material misstatement, whether due to error or fraud. The Trust is not required to have, nor were we engaged to perform, an audit of the Trust's internal control over financial reporting. As part of our audits, we are required to obtain an understanding
269
of internal control over financial reporting, but not for the purpose of expressing an opinion on the effectiveness of the Trust's internal control over financial reporting. Accordingly, we express no such opinion.
Our audits included performing procedures to assess the risks of material misstatement of the financial statements, whether due to error or fraud, and performing procedures that respond to those risks. Such procedures included examining, on a test basis, evidence regarding the amounts and disclosures in the financial statements. Our procedures included confirmation of securities owned as of August 31, 2018, by correspondence with the custodian and brokers or by other appropriate auditing procedures where replies from brokers were not received. Our audits also included evaluating the accounting principles used and significant estimates made by management, as well as evaluating the overall presentation of the financial statements. We believe that our audits provide a reasonable basis for our opinion.

We have served as the auditor of one or more Neuberger Berman investment companies since 1954.
Boston, Massachusetts
October 22, 2018
270
Reports of Independent Registered Public Accounting Firms
To the Board of Trustees and Shareholders
Neuberger Berman Equity Funds
Opinion on the Financial Statements
We have audited the accompanying statements of assets and liabilities of the Neuberger Berman Intrinsic Value Fund, Neuberger Berman Mid Cap Growth Fund, Neuberger Berman Mid Cap Intrinsic Value Fund , Neuberger Berman Multi-Cap Opportunities Fund, Neuberger Berman Small Cap Growth Fund, and Neuberger Berman Sustainable Equity Fund (formerly Neuberger Berman Socially Responsive Fund) (the "Funds"), each a series of Neuberger Berman Equity Funds (the "Trust"), including the schedules of investments, as of August 31, 2018, the related statements of operations for the year then ended, the statements of changes in net assets and financial highlights for the periods indicated therein, and the related notes (collectively referred to as the "financial statements"). In our opinion, the financial statements present fairly, in all material respects, the financial position of the Funds as of August 31, 2018, the results of their operations for the year then ended, the changes in their net assets and their financial highlights for the periods indicated therein, in conformity with accounting principles generally accepted in the United States of America.
Basis for Opinion
These financial statements are the responsibility of the Funds' management. Our responsibility is to express an opinion on the Funds' financial statements based on our audits. We are a public accounting firm registered with the Public Company Accounting Oversight Board (United States) ("PCAOB") and are required to be independent with respect to the Funds in accordance with the U.S. federal securities laws and the applicable rules and regulations of the Securities and Exchange Commission and the PCAOB. We have served as the auditor of one or more of the funds in the Trust since 2004.
We conducted our audits in accordance with the standards of the PCAOB. Those standards require that we plan and perform the audits to obtain reasonable assurance about whether the financial statements are free of material misstatement, whether due to error or fraud. The Funds are not required to have, nor were we engaged to perform, an audit of the Funds' internal control over financial reporting. As part of our audits we are required to obtain an understanding of internal control over financial reporting, but not for the purpose of expressing an opinion on the effectiveness of the Funds' internal control over financial reporting. Accordingly, we express no such opinion.
Our audits included performing procedures to assess the risks of material misstatement of the financial statements, whether due to error or fraud, and performing procedures that respond to those risks. Such procedures included examining, on a test basis, evidence regarding the amounts and disclosures in the financial statements. Our audits also included evaluating the accounting principles used and significant estimates made by management, as well as evaluating the overall presentation of the financial statements. Our procedures included confirmation of securities owned as of August 31, 2018 by correspondence with the custodian and brokers; when replies were not received from brokers, we performed other auditing procedures. We believe that our audits provide a reasonable basis for our opinion.

Philadelphia, Pennsylvania
October 19, 2018
271
Investment Manager and Administrator
Neuberger Berman Investment Advisers LLC
1290 Avenue of the Americas
New York, NY 10104-0002
212.476.8800
Intermediary Client Services 800.366.6264
Distributor
Neuberger Berman BD LLC
1290 Avenue of the Americas
New York, NY 10104-0002
800.877.9700 or 212.476.8800
Intermediary Client Services
800.366.6264
Sub-Adviser
Green Court Capital Management Limited
Jardine House, 1 Connaught Place
Suites 2010-2020, 20th Floor
Central Hong Kong
Custodian
State Street Bank and Trust Company
One Lincoln Street
Boston, MA 02111
Shareholder Servicing Agent
DST Asset Manager Solutions Inc.
430 West 7th Street, Suite 21989
Kansas City, MO 64105-1407
For Investor Class Shareholders
Address correspondence to:
Neuberger Berman Funds
P.O. Box 219189
Kansas City, MO 64121-9189
800.877.9700 or 212.476.8800
For Class A, Class C, Class R3 and Class R6 Shareholders:
Please contact your investment provider
For Trust Class, Advisor Class and Institutional Class Shareholders
Address correspondence to:
Neuberger Berman Investment Advisers LLC
1290 Avenue of the Americas
New York, NY 10104-0002
Attn: Intermediary Client Services
800.366.6264
Legal Counsel
K&L Gates LLP
1601 K Street, NW
Washington, DC 20006-1600
Independent Registered Public Accounting Firms
Ernst & Young LLP
200 Clarendon Street
Boston, MA 02116
Tait, Weller & Baker LLP
1818 Market Street
Suite 2400
Philadelphia, PA 19103
272
Information about the Board of Trustees
Name, (Year of Birth),
and Address(1) | | Position(s)
and Length of
Time Served(2) | | Principal Occupation(s)(3) | | Number of
Funds in
Fund Complex
Fund Trustee | | Other Directorships Held
Outside Fund Complex by
Fund Trustee(3)
Overseen by | |
Independent Fund Trustees | |
Michael J. Cosgrove (1949) | | Trustee since 2015 | | President, Carragh Consulting USA, since 2014; formerly, Executive, General Electric Company, 1970 to 2014, including President, Mutual Funds and Global Investment Programs, GE Asset Management, 2011 to 2014, President and Chief Executive Officer, Mutual Funds and Intermediary Business, GE Asset Management, 2007 to 2011, President, Institutional Sales and Marketing, GE Asset Management, 1998 to 2007, and Chief Financial Officer, GE Asset Management, and Deputy Treasurer, GE Company, 1988 to 1993. | | | 57 | | | Director, America Press, Inc. (not-for-profit Jesuit publisher), since 2015; Director, Fordham University, since 2001; formerly, Director, The Gabelli Go Anywhere Trust, June 2015 to June 2016; formerly, Director, Skin Cancer Foundation (not-for-profit), 2006 to 2015; formerly, Director, GE Investments Funds, Inc., 1997 to 2014; formerly, Trustee, GE Institutional Funds, 1997 to 2014; formerly, Director, GE Asset Management, 1988 to 2014; formerly, Director, Elfun Trusts, 1988 to 2014; formerly, Trustee, GE Pension & Benefit Plans, 1988 to 2014. | |
273
Name, (Year of Birth),
and Address(1) | | Position(s)
and Length of
Time Served(2) | | Principal Occupation(s)(3) | | Number of
Funds in
Fund Complex
Fund Trustee | | Other Directorships Held
Outside Fund Complex by
Fund Trustee(3)
Overseen by | |
Marc Gary (1952) | | Trustee since 2015 | | Executive Vice Chancellor and Chief Operating Officer, Jewish Theological Seminary, since 2012; formerly, Executive Vice President and General Counsel, Fidelity Investments, 2007 to 2012; formerly, Executive Vice President and General Counsel, BellSouth Corporation, 2004 to 2007; formerly, Vice President and Associate General Counsel, BellSouth Corporation, 2000 to 2004; formerly, Associate, Partner, and National Litigation Practice Co-Chair, Mayer, Brown LLP, 1981 to 2000; formerly, Associate Independent Counsel, Office of Independent Counsel, 1990 to 1992. | | | 57 | | | Trustee, Jewish Theological Seminary, since 2015; Director, Counsel on Call (privately held for-profit company), since 2012; Director, Lawyers Committee for Civil Rights Under Law (not-for-profit), since 2005; formerly, Director, Equal Justice Works (not-for-profit), 2005 to 2014; formerly, Director, Corporate Counsel Institute, Georgetown University Law Center, 2007 to 2012; formerly, Director, Greater Boston Legal Services (not-for-profit), 2007 to 2012. | |
274
Name, (Year of Birth),
and Address(1) | | Position(s)
and Length of
Time Served(2) | | Principal Occupation(s)(3) | | Number of
Funds in
Fund Complex
Fund Trustee | | Other Directorships Held
Outside Fund Complex by
Fund Trustee(3)
Overseen by | |
Martha C. Goss (1949) | | Trustee since 2007 | | President, Woodhill Enterprises Inc./Chase Hollow Associates LLC (personal investment vehicle), since 2006; formerly, Consultant, Resources Global Professionals (temporary staffing), 2002 to 2006; formerly, Chief Financial Officer, Booz-Allen & Hamilton, Inc., 1995 to 1999; formerly, Enterprise Risk Officer, Prudential Insurance, 1994 to1995; formerly, President, Prudential Asset Management Company, 1992 to 1994; formerly, President, Prudential Power Funding (investments in electric and gas utilities and alternative energy projects), 1989 to 1992; formerly, Treasurer, Prudential Insurance Company, 1983 to 1989. | | | 57 | | | Director, American Water (water utility), since 2003; Director, Allianz Life of New York (insurance), since 2005; Director, Berger Group Holdings, Inc. (engineering consulting firm), since 2013; Director, Financial Women's Association of New York (not-for-profit association), since 2003; Trustee Emerita, Brown University, since 1998; Director, Museum of American Finance (not-for-profit), since 2013; formerly, Non-Executive Chair and Director, Channel Reinsurance (financial guaranty reinsurance), 2006 to 2010; formerly, Director, Ocwen Financial Corporation (mortgage servicing), 2005 to 2010; formerly, Director, Claire's Stores, Inc. (retailer), 2005 to 2007; formerly, Director, Parsons Brinckerhoff Inc. (engineering consulting firm), 2007 to 2010; formerly, Director, Bank Leumi (commercial bank), 2005 to 2007; formerly, Advisory Board Member, Attensity (software developer), 2005 to 2007. | |
275
Name, (Year of Birth),
and Address(1) | | Position(s)
and Length of
Time Served(2) | | Principal Occupation(s)(3) | | Number of
Funds in
Fund Complex
Fund Trustee | | Other Directorships Held
Outside Fund Complex by
Fund Trustee(3)
Overseen by | |
Michael M. Knetter (1960) | | Trustee since 2007 | | President and Chief Executive Officer, University of Wisconsin Foundation, since October 2010; formerly, Dean, School of Business, University of Wisconsin—Madison; formerly, Professor of International Economics and Associate Dean, Amos Tuck School of Business—Dartmouth College, 1998 to 2002. | | | 57 | | | Board Member, American Family Insurance (a mutual company, not publicly traded), since March 2009; formerly, Trustee, Northwestern Mutual Series Fund, Inc., 2007 to 2011; formerly, Director, Wausau Paper, 2005 to 2011; formerly, Director, Great Wolf Resorts, 2004 to 2009. | |
Deborah C. McLean (1954) | | Trustee since 2015 | | Member, Circle Financial Group (private wealth management membership practice), since 2011; Managing Director, Golden Seeds LLC (an angel investing group), since 2009; Adjunct Professor, Columbia University School of International and Public Affairs, since 2008; formerly, Visiting Assistant Professor, Fairfield University, Dolan School of Business, Fall 2007; formerly, Adjunct Associate Professor of Finance, Richmond, The American International University in London, 1999 to 2007. | | | 57 | | | Board member, Norwalk Community College Foundation, since 2014; Dean's Advisory Council, Radcliffe Institute for Advanced Study, since 2014; formerly, Director and Treasurer, At Home in Darien (not-for-profit), 2012 to 2014; formerly, Director, National Executive Service Corps (not-for-profit), 2012 to 2013; formerly, Trustee, Richmond, The American International University in London, 1999 to 2013. | |
276
Name, (Year of Birth),
and Address(1) | | Position(s)
and Length of
Time Served(2) | | Principal Occupation(s)(3) | | Number of
Funds in
Fund Complex
Fund Trustee | | Other Directorships Held
Outside Fund Complex by
Fund Trustee(3)
Overseen by | |
George W. Morriss (1947) | | Trustee since 2007 | | Adjunct Professor, Columbia University School of International and Public Affairs, since October 2012; formerly, Executive Vice President and Chief Financial Officer, People's United Bank, Connecticut (a financial services company), 1991 to 2001. | | | 57 | | | Formerly, Trustee, Steben Alternative Investment Funds, Steben Select Multi-Strategy Fund, and Steben Select Multi-Strategy Master Fund, 2013 to 2017; formerly, Treasurer, National Association of Corporate Directors, Connecticut Chapter, 2011 to 2015; formerly, Manager, Larch Lane Multi-Strategy Fund complex (which consisted of three funds), 2006 to 2011; formerly, Member, NASDAQ Issuers' Affairs Committee, 1995 to 2003. | |
Tom D. Seip (1950) | | Trustee since 2000; Chairman of the Board since 2008; formerly Lead Independent Trustee from 2006 to 2008 | | Formerly, Managing Member, Ridgefield Farm LLC (a private investment vehicle), 2004 to 2016; formerly, President and CEO, Westaff, Inc. (temporary staffing), May 2001 to January 2002; formerly, Senior Executive, The Charles Schwab Corporation, 1983 to 1998, including Chief Executive Officer, Charles Schwab Investment Management, Inc.; Trustee, Schwab Family of Funds and Schwab Investments, 1997 to 1998; and Executive Vice President-Retail Brokerage, Charles Schwab & Co., Inc., 1994 to 1997. | | | 57 | | | Formerly, Director, H&R Block, Inc. (tax services company), 2001 to 2018; formerly, Director, Talbot Hospice Inc., 2013 to 2016; formerly, Chairman, Governance and Nominating Committee, H&R Block, Inc., 2011 to 2015; formerly, Chairman, Compensation Committee, H&R Block, Inc., 2006 to 2010; formerly, Director, Forward Management, Inc. (asset management company), 1999 to 2006. | |
277
Name, (Year of Birth),
and Address(1) | | Position(s)
and Length of
Time Served(2) | | Principal Occupation(s)(3) | | Number of
Funds in
Fund Complex
Fund Trustee | | Other Directorships Held
Outside Fund Complex by
Fund Trustee(3)
Overseen by | |
James G. Stavridis (1955) | | Trustee since 2015 | | Commentator, NBC News, since 2015; Dean, Fletcher School of Law and Diplomacy, Tufts University since 2013; formerly, Admiral, United States Navy, 2006 to 2013, including Supreme Allied Commander, NATO and Commander, European Command, 2009 to 2013, and Commander, United States Southern Command, 2006 to 2009. | | | 57 | | | Director, American Water (water utility), since 2018; Director, NFP Corp. (insurance broker and consultant), since 2017; Director, Utilidata Inc., since 2015; Director, U.S. Naval Institute, since 2014; Director, Onassis Foundation USA, since 2014; Director, BMC Software Federal, LLC, since 2014; Director, Vertical Knowledge, LLC, since 2013; formerly, Director, Navy Federal Credit Union, 2000-2002. | |
278
Name, (Year of Birth),
and Address(1) | | Position(s)
and Length of
Time Served(2) | | Principal Occupation(s)(3) | | Number of
Funds in
Fund Complex
Fund Trustee | | Other Directorships Held
Outside Fund Complex by
Fund Trustee(3)
Overseen by | |
Candace L. Straight (1947) | | Trustee since 2000 | | Private investor and consultant specializing in the insurance industry; formerly, Advisory Director, Securitas Capital LLC (a global private equity investment firm dedicated to making investments in the insurance sector), 1998 to 2003. | | | 57 | | | Formerly, Public Member, Board of Governors and Board of Trustees, Rutgers University, 2011 to 2016; formerly, Director, Montpelier Re Holdings Ltd. (reinsurance company), 2006 to 2015; formerly, Director, National Atlantic Holdings Corporation (property and casualty insurance company), 2004 to 2008; formerly, Director, The Proformance Insurance Company (property and casualty insurance company), 2004 to 2008; formerly, Director, Providence Washington Insurance Company (property and casualty insurance company), 1998 to 2006; formerly, Director, Summit Global Partners (insurance brokerage firm), 2000 to 2005. | |
Peter P. Trapp (1944) | | Trustee since 2000 | | Retired; formerly, Regional Manager for Mid-Southern Region, Ford Motor Credit Company, September 1997 to 2007; formerly, President, Ford Life Insurance Company, April 1995 to August 1997. | | | 57 | | | None. | |
279
Name, (Year of Birth),
and Address(1) | | Position(s)
and Length of
Time Served(2) | | Principal Occupation(s)(3) | | Number of
Funds in
Fund Complex
Fund Trustee | | Other Directorships Held
Outside Fund Complex by
Fund Trustee(3)
Overseen by | |
Fund Trustees who are "Interested Persons" | |
Joseph V. Amato* (1962) | | Chief Executive Officer and President since 2018 and Trustee since 2009 | | President and Director, Neuberger Berman Group LLC, since 2009; President and Chief Executive Officer, Neuberger Berman BD LLC ("Neuberger Berman") and Neuberger Berman Holdings LLC (including its predecessor, Neuberger Berman Inc.), since 2007; Chief Investment Officer (Equities) and President (Equities), Neuberger Berman Investment Advisers LLC ("NBIA") (formerly, Neuberger Berman Fixed Income LLC ("NBFI") and including predecessor entities), since 2007, and Board Member of NBIA since 2006; formerly, Global Head of Asset Management of Lehman Brothers Holdings Inc.'s ("LBHI") Investment Management Division, 2006 to 2009; formerly, member of LBHI's Investment Management Division's Executive Management Committee, 2006 to 2009; formerly, Managing Director, Lehman Brothers Inc. ("LBI"), 2006 to 2008; formerly, Chief Recruiting and Development Officer, LBI, 2005 to 2006; formerly, Global Head of LBI's Equity Sales and a Member of its Equities Division Executive Committee, 2003 to 2005; President and Chief Executive Officer, twenty-six registered investment companies for which NBIA acts as investment manager and/or administrator. | | | 57 | | | Member of Board of Advisors, McDonough School of Business, Georgetown University, since 2001; Member of New York City Board of Advisors, Teach for America, since 2005; Trustee, Montclair Kimberley Academy (private school), since 2007; Member of Board of Regents, Georgetown University, since 2013. | |
280
Name, (Year of Birth),
and Address(1) | | Position(s)
and Length of
Time Served(2) | | Principal Occupation(s)(3) | | Number of
Funds in
Fund Complex
Fund Trustee | | Other Directorships Held
Outside Fund Complex by
Fund Trustee(3)
Overseen by | |
Robert Conti* (1956) | | Trustee since 2008 | | Formerly, Managing Director, Neuberger Berman, 2007 to 2018; formerly, President—Mutual Funds, NBIA, 2008 to 2018; formerly, Senior Vice President, Neuberger Berman, 2003 to 2006; formerly, Vice President, Neuberger Berman, 1999 to 2003. | | | 57 | | | Director, Staten Island Mental Health Society, since 1994; formerly, Chairman of the Board, Staten Island Mental Health Society, 2008 to 2011. | |
(1) The business address of each listed person is 1290 Avenue of the Americas, New York, NY 10104.
(2) Pursuant to the Trust's Amended and Restated Trust Instrument, subject to any limitations on the term of service imposed by the By-Laws or any retirement policy adopted by the Fund Trustees, each Fund Trustees shall hold office for life or until his or her successor is elected or the Trust terminates; except that (a) any Fund Trustee may resign by delivering a written resignation; (b) any Fund Trustee may be removed with or without cause at any time by a written instrument signed by at least two-thirds of the other Fund Trustees; (c) any Fund Trustee who requests to be retired, or who has become unable to serve, may be retired by a written instrument signed by a majority of the other Fund Trustees; and (d) any Fund Trustee may be removed at any shareholder meeting by a vote of at least two-thirds of the outstanding shares.
(3) Except as otherwise indicated, each individual has held the positions shown during at least the last five years.
* Indicates a Fund Trustee who is an "interested person" within the meaning of the 1940 Act. Mr. Amato is an interested person of the Trust by virtue of the fact that he is an officer of NBIA and/or its affiliates. Mr. Conti is an interested person of the Trust by virtue of the fact that he was an officer of NBIA and/or its affiliates until 2018.
281
Information about the Officers of the Trust
Name, (Year of Birth),
and Address(1) | | Position(s)
Time Served(2) | | Principal Occupation(s)(3)
and Length of | |
Claudia A. Brandon (1956) | | Executive Vice President since 2008 and Secretary since 1985 | | Senior Vice President, Neuberger Berman, since 2007 and Employee since 1999; Senior Vice President, NBIA, since 2008 and Assistant Secretary since 2004; formerly, Vice President, Neuberger Berman, 2002 to 2006; formerly, Vice President—Mutual Fund Board Relations, NBIA, 2000 to 2008; formerly, Vice President, NBIA, 1986 to 1999 and Employee, 1984 to 1999; Executive Vice President and Secretary, twenty-six registered investment companies for which NBIA acts as investment manager and/or administrator. | |
Agnes Diaz (1971) | | Vice President since 2013 | | Senior Vice President, Neuberger Berman, since 2012; Senior Vice President, NBIA, since 2012 and Employee since 1996; formerly, Vice President, Neuberger Berman, 2007 to 2012; Vice President, ten registered investment companies for which NBIA acts as investment manager and/or administrator. | |
Anthony DiBernardo (1979) | | Assistant Treasurer since 2011 | | Senior Vice President, Neuberger Berman, since 2014; Senior Vice President, NBIA, since 2014, and Employee since 2003; formerly, Vice President, Neuberger Berman, 2009 to 2014; Assistant Treasurer, ten registered investment companies for which NBIA acts as investment manager and/or administrator. | |
Corey A. Issing (1978) | | Chief Compliance Officer since 2018; Chief Legal Officer since 2016 (only for purposes of sections 307 and 406 of the Sarbanes-Oxley Act of 2002) and Anti-Money Laundering Compliance Officer since 2016 | | General Counsel and Head of Compliance—Mutual Funds since 2016 and Managing Director, NBIA, since 2017, formerly, Associate General Counsel (2015 to 2016), Counsel (2007 to 2015), Senior Vice President (2013-2016); Vice President (2009-2013); Chief Legal Officer (only for purposes of sections 307 and 406 of the Sarbanes-Oxley Act of 2002), twenty-six registered investment companies for which NBIA acts as investment manager and/or administrator; Anti-Money Laundering Compliance Officer, twenty-six registered investment companies for which NBIA acts as investment manager and/or administrator. | |
Sheila R. James (1965) | | Assistant Secretary since 2002 | | Vice President, Neuberger Berman, since 2008 and Employee since 1999; Vice President, NBIA, since 2008; formerly, Assistant Vice President, Neuberger Berman, 2007; Employee, NBIA, 1991 to 1999; Assistant Secretary, twenty-six registered investment companies for which NBIA acts as investment manager and/or administrator. | |
282
Name, (Year of Birth),
and Address(1) | | Position(s)
Time Served(2) | | Principal Occupation(s)(3)
and Length of | |
Brian Kerrane (1969) | | Chief Operating Officer since 2015 and Vice President since 2008 | | Managing Director, Neuberger Berman, since 2013; Chief Operating Officer—Mutual Funds and Managing Director, NBIA, since 2015; formerly, Senior Vice President, Neuberger Berman, 2006 to 2014; Vice President, NBIA, 2008 to 2015 and Employee since 1991; Chief Operating Officer, ten registered investment companies for which NBIA acts as investment manager and/or administrator; Vice President, twenty-six registered investment companies for which NBIA acts as investment manager and/or administrator. | |
Anthony Maltese (1959) | | Vice President since 2015 | | Senior Vice President, Neuberger Berman, since 2014 and Employee since 2000; Senior Vice President, NBIA, since 2014; Vice President, ten registered investment companies for which NBIA acts as investment manager and/or administrator. | |
Josephine Marone (1963) | | Assistant Secretary since 2017 | | Senior Paralegal, Neuberger Berman, since 2007 and Employee since 2007; Assistant Secretary, twenty-six registered investment companies for which NBIA acts as investment manager and/or administrator. | |
Owen F. McEntee, Jr. (1961) | | Vice President since 2008 | | Vice President, Neuberger Berman, since 2006; Vice President, NBIA, since 2006 and Employee since 1992; Vice President, ten registered investment companies for which NBIA acts as investment manager and/or administrator. | |
John M. McGovern (1970) | | Treasurer and Principal Financial and Accounting Officer since 2005 | | Senior Vice President, Neuberger Berman, since 2007; Senior Vice President, NBIA, since 2007 and Employee since 1993; formerly, Vice President, Neuberger Berman, 2004 to 2006; formerly, Assistant Treasurer, 2002 to 2005; Treasurer and Principal Financial and Accounting Officer, twenty-six registered investment companies for which NBIA acts as investment manager and/or administrator. | |
Frank Rosato (1971) | | Assistant Treasurer since 2005 | | Vice President, Neuberger Berman, since 2006; Vice President, NBIA, since 2006 and Employee since 1995; Assistant Treasurer, ten registered investment companies for which NBIA acts as investment manager and/or administrator. | |
(1) The business address of each listed person is 1290 Avenue of the Americas, New York, NY 10104.
(2) Pursuant to the By-Laws of the Trust, each officer elected by the Fund Trustees shall hold office until his or her successor shall have been elected and qualified or until his or her earlier death, inability to serve, or resignation. Officers serve at the pleasure of the Fund Trustees and may be removed at any time with or without cause.
(3) Except as otherwise indicated, each individual has held the positions shown during at least the last five years.
283
Proxy Voting Policies and Procedures
A description of the policies and procedures that the Trust uses to determine how to vote proxies relating to portfolio securities is available, without charge, by calling 800-877-9700 (toll-free) and on the Securities and Exchange Commission's website, at www.sec.gov. Information regarding how the Trust voted proxies relating to portfolio securities during the most recent 12-month period ended June 30 is also available upon request, without charge, by calling 800-877-9700 (toll-free), on the Securities and Exchange Commission's website at www.sec.gov, and on Management's website at www.nb.com.
Quarterly Portfolio Schedule
The Trust files a complete schedule of portfolio holdings for each Fund with the Securities and Exchange Commission for the first and third quarters of each fiscal year on Form N-Q. The Trust's Forms N-Q are available on the Securities and Exchange Commission's website at www.sec.gov and may be reviewed and copied at the Securities and Exchange Commission's Public Reference Room in Washington, DC. Information on the operation of the Public Reference Room may be obtained by calling 800-SEC-0330. The information on Form N-Q is available upon request, without charge, by calling 800-877-9700 (toll-free).
284
Notice to Shareholders
Neuberger Berman Dividend Growth, Equity Income, Focus, Genesis, Global Equity, Global Real Estate, Greater China Equity, Guardian, International Equity, International Select, Intrinsic Value, Large Cap Value, Mid Cap Growth, Mid Cap Intrinsic Value, Multi-Cap Opportunities, Real Estate, Small Cap Growth, Sustainable Equity and Value hereby designate $813,920, $76,230,556, $34,048,865, $1,500,693,296, $20,717, $27,157, $9,686,837, $68,277,430, $264,289, $20,737, $60,301,469, $74,608,119, $105,969,534, $6,606,057, $202,437,441, $27,203,723, $2,240,133, $137,173,706 and $876,768, respectively, as a capital gain distribution.
For the fiscal year ended August 31, 2018, each Fund makes the following designation, or up to the maximum amount of such dividends allowable pursuant to the Internal Revenue Code, as qualified dividend income eligible for reduced tax rates. These lower rates range from 5% to 15% depending upon an individual's tax bracket. Complete information regarding each Funds distributions during the calendar year 2018 will be reported in conjunction with Form 1099-DIV.
| Fund | | Qualified
Dividend Income | |
Dividend Growth | | $ | 1,101,404 | | |
Emerging Markets Equity | | | 29,115,857 | | |
Equity Income | | | 49,714,750 | | |
Focus | | | 9,854,313 | | |
Genesis | | | 121,342,154 | | |
Global Equity | | | 81,089 | | |
Global Real Estate | | | 74,724 | | |
Greater China Equity | | | 2,019,267 | | |
Guardian | | | 18,578,878 | | |
International Equity | | | 39,556,376 | | |
International Select | | | 4,274,780 | | |
International Small Cap | | | 97,188 | | |
Intrinsic Value | | | 5,008,707 | | |
Large Cap Value | | | 32,289,107 | | |
Mid Cap Growth | | | 7,812,864 | | |
Mid Cap Intrinsic Value | | | 1,748,098 | | |
Multi-Cap Opportunities | | | 25,992,045 | | |
Real Estate | | | 11,975,214 | | |
Small Cap Growth | | | 171,941 | | |
Sustainable Equity | | | 34,095,645 | | |
Value | | | 326,921 | | |
285
This page has been left blank intentionally
286
This page has been left blank intentionally
287
This page has been left blank intentionally
288
Neuberger Berman Investment Advisers LLC
1290 Avenue of the Americas
New York, NY 10104–0002
Retail Services: 800.877.9700
Broker-Dealer and Institutional Services: 800.366.6264/888.556.9030
Web site: www.nb.com
Statistics and projections in this report are derived from sources deemed to be reliable but cannot be regarded as a representation of future results of the Funds. This report is prepared for the general information of shareholders and is not an offer of shares of the Funds. Shares are sold only through the currently effective prospectus which you can obtain by calling 877.628.2583. An investor should consider carefully a Fund's investment objectives, risks and fees and expenses, which are described in its prospectus, before investing.
 H0599 10/18
Item 2. Code of Ethics.
The Board of Trustees (“Board”) of Neuberger Berman Equity Funds (“Registrant”) has adopted a code of ethics that applies to the Registrant’s principal executive officer, principal financial officer, principal accounting officer or controller, or persons performing similar functions (“Code of Ethics”). During the period covered by this Form N-CSR, there were no substantive amendments to the Code of Ethics and there were no waivers from the Code of Ethics granted to the Registrant’s principal executive officer, principal financial officer, principal accounting officer or controller, or persons performing similar functions.
A copy of the Code of Ethics is incorporated by reference to Neuberger Berman Advisers Management Trust’s Form N-CSRS, Investment Company Act file number 811-04255 (filed August 25, 2016). The Code of Ethics is also available, without charge, by calling 1-800-877-9700 (toll-free).
Item 3. Audit Committee Financial Expert.
The Board has determined that the Registrant has four audit committee financial experts serving on its audit committee. The Registrant’s audit committee financial experts are Michael J. Cosgrove, Martha C. Goss, and Deborah C. McLean. Mr. Cosgrove, Ms. Goss, and Ms. McLean are independent trustees as defined by Form N-CSR.
Item 4. Principal Accountant Fees and Services.
Ernst & Young, LLP (“E&Y”) serves as independent registered public accounting firm to the Neuberger Berman Dividend Growth, Emerging Markets Equity, Equity Income, Focus, Genesis, Global Equity, Global Real Estate, Greater China Equity, Guardian, International Equity, International Select, International Small Cap, Large Cap Value, Real Estate, and Value Funds.
Tait, Weller & Baker LLP (“Tait Weller”) serves as independent registered public accounting firm to the Neuberger Berman Intrinsic Value, Mid Cap Growth, Mid Cap Intrinsic Value, Multi-Cap Opportunities, Small Cap Growth, and Sustainable Equity Funds.
The aggregate fees billed for professional services rendered by E&Y for the audit of the annual financial statements or services that are normally provided by E&Y in connection with statutory and regulatory filings or engagements were $692,555 and $716,555 for the fiscal years ended 2017 and 2018, respectively.
The aggregate fees billed for professional services rendered by Tait Weller for the audit of the annual financial statements or services that are normally provided by Tait Weller in connection with statutory and regulatory filings or engagements were $137,280 and $140,040 for the fiscal years ended 2017 and 2018, respectively.
The aggregate fees billed to the Registrant for assurance and related services by E&Y that are reasonably related to the performance of the audit of the Registrant’s financial statements and are not reported above in Audit Fees were $0 and $0 for the fiscal years ended 2017 and 2018, respectively. The Audit Committee approved 0% and 0% of these services provided by E&Y for the fiscal years ended 2017 and 2018, respectively, pursuant to the waiver provisions of Rule 2-01(c)(7)(i)(C) of Regulation S-X.
The fees billed to other entities in the investment company complex for assurance and related services by E&Y that are reasonably related to the performance of the audit that the Audit Committee was required to
approve because the engagement related directly to the operations and financial reporting of the Registrant were $0 and $0 for the fiscal years ended 2017 and 2018, respectively. The Audit Committee approved 0% and 0% of these services provided by E&Y for the fiscal years ended 2017 and 2018, respectively, pursuant to the waiver provisions of Rule 2-01(c)(7)(i)(C) of Regulation S-X.
The aggregate fees billed to the Registrant for assurance and related services by Tait Weller that are reasonably related to the performance of the audit of the Registrant’s financial statements and are not reported above in Audit Fees were $0 and $0 for the fiscal years ended 2017 and 2018, respectively. The Audit Committee approved 0% and 0% of these services provided by Tait Weller for the fiscal years ended 2017 and 2018, respectively, pursuant to the waiver provisions of Rule 2-01(c)(7)(i)(C) of Regulation S-X.
The fees billed to other entities in the investment company complex for assurance and related services by Tait Weller that are reasonably related to the performance of the audit that the Audit Committee was required to approve because the engagement related directly to the operations and financial reporting of the Registrant were $0 and $0 for the fiscal years ended 2017 and 2018, respectively. The Audit Committee approved 0% and 0% of these services provided by Tait Weller for the fiscal years ended 2017 and 2018, respectively, pursuant to the waiver provisions of Rule 2-01(c)(7)(i)(C) of Regulation S-X.
The aggregate fees billed to the Registrant for professional services rendered by E&Y for tax compliance, tax advice, and tax planning were $166,950 and $164,450 for the fiscal years ended 2017 and 2018, respectively. The nature of the services provided includes preparation of the Federal and State tax extensions and tax returns, review of annual excise tax calculations, and preparation of form 8613, in addition to guidance with the identification of Passive Foreign Investment Companies ("PFICs"), assistance with determination of various foreign withholding taxes, and assistance with Internal Revenue Code and tax regulation requirements for fund investments. The Audit Committee approved 0% and 0% of these services provided by E&Y for the fiscal years ended 2017 and 2018, respectively, pursuant to the waiver provisions of Rule 2-01(c)(7)(i)(C) of Regulation S-X.
The fees billed to other entities in the investment company complex for professional services rendered by E&Y for tax compliance, tax advice, and tax planning that the Audit Committee was required to approve because the engagement related directly to the operations and financial reporting of the Registrant were $0 and $0 for the fiscal years ended 2017 and 2018, respectively. The Audit Committee approved 0% and 0% of these services provided by E&Y for the fiscal years ended 2017 and 2018, respectively, pursuant to the waiver provisions of Rule 2-01(c)(7)(i)(C) of Regulation S-X.
The aggregate fees billed to the Registrant for professional services rendered by Tait Weller for tax compliance, tax advice, and tax planning were $33,000 and $33,600 for the fiscal years ended 2017 and 2018, respectively. The nature of the services provided includes preparation of the Federal and State tax extensions and tax returns, review of annual excise tax calculations, and preparation of form 8613, in addition to guidance with the identification of PFICs, assistance with determination of various foreign withholding taxes, and assistance with Internal Revenue Code and tax regulation requirements for fund investments. The Audit Committee approved 0% and 0% of these services provided by Tait Weller for the fiscal years ended 2017 and 2018, respectively, pursuant to the waiver provisions of Rule 2-01(c)(7)(i)(C) of Regulation S-X.
The fees billed to other entities in the investment company complex for professional services rendered by Tait Weller for tax compliance, tax advice, and tax planning that the Audit Committee was required to approve because the engagement related directly to the operations and financial reporting of the Registrant were $0 and $0 for the fiscal years ended 2017 and 2018, respectively. The Audit Committee approved 0% and 0% of these services provided by Tait Weller for the fiscal years ended 2017 and 2018, respectively, pursuant to the waiver provisions of Rule 2-01(c)(7)(i)(C) of Regulation S-X.
The aggregate fees billed to the Registrant for products and services provided by E&Y, other than services reported in Audit Fees, Audit-Related Fees, and Tax Fees were $0 and $0 for the fiscal years ended 2017 and 2018, respectively. The Audit Committee approved 0% and 0% of these services provided by E&Y for the fiscal years ended 2017 and 2018, respectively, pursuant to the waiver provisions of Rule 2-01(c)(7)(i)(C) of Regulation S-X.
The fees billed to other entities in the investment company complex for products and services provided by E&Y, other than services reported in Audit Fees, Audit-Related Fees, and Tax Fees that the Audit Committee was required to approve because the engagement related directly to the operations and financial reporting of the Registrant were $0 and $0 for the fiscal years ended 2017 and 2018, respectively. The Audit Committee approved 0% and 0% of these services provided by E&Y for the fiscal years ended 2017 and 2018, respectively, pursuant to the waiver provisions of Rule 2-01(c)(7)(i)(C) of Regulation S-X.
The aggregate fees billed to the Registrant for products and services provided by Tait Weller, other than services reported in Audit Fees, Audit-Related Fees, and Tax Fees were $0 and $0 for the fiscal years ended 2017 and 2018, respectively. The Audit Committee approved 0% and 0% of these services provided by Tait Weller for the fiscal years ended 2017 and 2018, respectively, pursuant to the waiver provisions of Rule 2-01(c)(7)(i)(C) of Regulation S-X.
The fees billed to other entities in the investment company complex for products and services provided by Tait Weller, other than services reported in Audit Fees, Audit-Related Fees, and Tax Fees that the Audit Committee was required to approve because the engagement related directly to the operations and financial reporting of the Registrant were $0 and $0 for the fiscal years ended 2017 and 2018, respectively. The Audit Committee approved 0% and 0% of these services provided by Tait Weller for the fiscal years ended 2017 and 2018, respectively, pursuant to the waiver provisions of Rule 2-01(c)(7)(i)(C) of Regulation S-X.
(1) The Audit Committee’s pre-approval policies and procedures for the Registrant to engage an accountant to render audit and non-audit services delegate to each member of the Committee the power to pre-approve services between meetings of the Committee.
(2) None of the services described in paragraphs (b) through (d) above were approved by the Audit Committee pursuant to paragraph (c)(7)(i)(C) of Rule 2-01 of Regulation S-X.
Not applicable.
Non-audit fees billed by E&Y for services rendered to the Registrant were $166,950 and $164,450 for the fiscal years ended 2017 and 2018, respectively.
Non-audit fees billed by E&Y for services rendered to the Registrant’s investment adviser and any entity controlling, controlled by, or under common control with the adviser that provides ongoing services to the Registrant were $0 and $0 for the fiscal years ended 2017 and 2018, respectively.
Non-audit fees billed by Tait Weller for services rendered to the Registrant were $33,000 and $33,600 for the fiscal years ended 2017 and 2018, respectively.
Non-audit fees billed by Tait Weller for services rendered to the Registrant’s investment adviser and any entity controlling, controlled by, or under common control with the adviser that provides ongoing services to the Registrant were $0 and $0 for the fiscal years ended 2017 and 2018, respectively.
(h) The Audit Committee of the Board considered whether the provision of non-audit services rendered to the Registrant’s investment adviser and any entity controlling, controlled by, or under common control with the adviser that provides ongoing services to the Registrant that were not pre-approved by the Audit Committee because the engagement did not relate directly to the operations and financial reporting of the Registrant is compatible with maintaining E&Y’s and Tait Weller’s independence.
Item 5. Audit Committee of Listed Registrants.
Not applicable to the Registrant.
Item 6. Schedule of Investments.
The complete schedule of investments for each series is disclosed in the Registrant’s annual report included as Item 1 of this Form N-CSR.
Item 7. Disclosure of Proxy Voting Policies and Procedures for Closed-End Management Investment Companies.
Not applicable to the Registrant.
Item 8. Portfolio Managers of Closed-End Management Investment Companies.
Not applicable to the Registrant.
Item 9. Purchases of Equity Securities by Closed-End Management Investment Company and Affiliated Purchasers.
Not applicable to the Registrant.
Item 10. Submission of Matters to a Vote of Security Holders.
There were no changes to the procedures by which shareholders may recommend nominees to the Board.
Item 11. Controls and Procedures.
Item 12. Disclosure of Securities Lending Activities for Closed-End Management Investment Companies.
Not applicable to the Registrant.
Item 13. Exhibits.
The certification furnished pursuant to Rule 30a-2(b) under the Act and Section 906 of the Sarbanes-Oxley Act will not be deemed “filed” for purposes of Section 18 of the Securities Exchange Act of 1934, as amended (“Exchange Act”), or otherwise subject to the liability of that section. Such certification will not be deemed to be incorporated by reference into any filing under the Securities Act of 1933, as amended, or the Exchange Act, except to the extent that the Registrant specifically incorporates it by reference.
Pursuant to the requirements of the Securities Exchange Act of 1934 and the Investment Company Act of 1940, the Registrant has duly caused this report to be signed on its behalf by the undersigned, thereunto duly authorized.
Pursuant to the requirements of the Securities Exchange Act of 1934 and the Investment Company Act of 1940, this report has been signed below by the following persons on behalf of the Registrant and in the capacities and on the dates indicated.