
Neuberger Berman
Equity Funds
Investor Class Shares
Trust Class Shares
Advisor Class Shares
Institutional Class Shares
Dividend Growth Fund
Emerging Markets Equity Fund
Equity Income Fund
Focus Fund
Genesis Fund
Global Equity Fund
Global Real Estate Fund
Greater China Equity Fund
Guardian Fund
International Equity Fund
Class A Shares
Class C Shares
Class R3 Shares
Class R6 Shares
International Select Fund
International Small Cap Fund
Intrinsic Value Fund
Large Cap Value Fund
Mid Cap Growth Fund
Mid Cap Intrinsic Value Fund
Multi-Cap Opportunities Fund
Real Estate Fund
Small Cap Growth Fund
Socially Responsive Fund
Value Fund
Annual Report
August 31, 2017
Contents
THE FUNDS
President's Letter | | | 1 | | |
PORTFOLIO COMMENTARY | |
Dividend Growth Fund | | | 2 | | |
Emerging Markets Equity Fund | | | 5 | | |
Equity Income Fund | | | 9 | | |
Focus Fund | | | 12 | | |
Genesis Fund | | | 15 | | |
Global Equity Fund | | | 19 | | |
Global Real Estate Fund | | | 22 | | |
Greater China Equity Fund | | | 25 | | |
Guardian Fund | | | 29 | | |
International Equity Fund | | | 32 | | |
International Select Fund | | | 35 | | |
International Small Cap Fund | | | 38 | | |
Intrinsic Value Fund | | | 42 | | |
Large Cap Value Fund | | | 45 | | |
Mid Cap Growth Fund | | | 48 | | |
Mid Cap Intrinsic Value Fund | | | 51 | | |
Multi-Cap Opportunities Fund | | | 54 | | |
Real Estate Fund | | | 57 | | |
Small Cap Growth Fund | | | 60 | | |
Socially Responsive Fund | | | 63 | | |
Value Fund | | | 67 | | |
FUND EXPENSE INFORMATION | | | 77 | | |
SCHEDULE OF INVESTMENTS | |
Dividend Growth Fund | | | 81 | | |
Emerging Markets Equity Fund | | | 83 | | |
Positions by Industry | | | 85 | | |
Equity Income Fund | | | 87 | | |
Focus Fund | | | 91 | | |
Genesis Fund | | | 94 | | |
Global Equity Fund | | | 97 | | |
Positions by Industry | | | 99 | | |
Global Real Estate Fund | | | 101 | | |
Positions by Sector | | | 103 | | |
Greater China Equity Fund | | | 105 | | |
Guardian Fund | | | 107 | | |
International Equity Fund | | | 112 | | |
Positions by Industry | | | 114 | | |
International Select Fund | | | 116 | | |
Positions by Industry | | | 118 | | |
International Small Cap Fund | | | 120 | | |
Positions by Industry | | | 122 | | |
Intrinsic Value Fund | | | 124 | | |
Large Cap Value Fund | | | 127 | | |
Mid Cap Growth Fund | | | 130 | | |
Mid Cap Intrinsic Value Fund | | | 133 | | |
Multi-Cap Opportunities Fund | | | 136 | | |
Real Estate Fund | | | 138 | | |
Small Cap Growth Fund | | | 140 | | |
Socially Responsive Fund | | | 142 | | |
Value Fund | | | 144 | | |
FINANCIAL STATEMENTS | | | 147 | | |
FINANCIAL HIGHLIGHTS (ALL CLASSES)/PER SHARE DATA | |
Dividend Growth Fund | | | 211 | | |
Emerging Markets Equity Fund | | | 211 | | |
Equity Income Fund | | | 213 | | |
Focus Fund | | | 215 | | |
Genesis Fund | | | 217 | | |
Global Equity Fund | | | 219 | | |
Global Real Estate Fund | | | 221 | | |
Greater China Equity Fund | | | 221 | | |
Guardian Fund | | | 223 | | |
International Equity Fund | | | 225 | | |
International Select Fund | | | 229 | | |
International Small Cap Fund | | | 231 | | |
Intrinsic Value Fund | | | 231 | | |
Large Cap Value Fund | | | 233 | | |
Mid Cap Growth Fund | | | 235 | | |
Mid Cap Intrinsic Value Fund | | | 239 | | |
Multi-Cap Opportunities Fund | | | 241 | | |
Real Estate Fund | | | 241 | | |
Small Cap Growth Fund | | | 245 | | |
Socially Responsive Fund | | | 247 | | |
Value Fund | | | 249 | | |
Reports of Independent Registered Public Accounting Firms | | | 258 | | |
Directory | | | 261 | | |
Trustees and Officers | | | 262 | | |
Proxy Voting Policies and Procedures | | | 271 | | |
Quarterly Portfolio Schedule | | | 271 | | |
Board Consideration of the Management and
Sub-Advisory Agreement | | | 272 | | |
Notice to Shareholders | | | 274 | | |
The "Neuberger Berman" name and logo and "Neuberger Berman Investment Advisers LLC" name are registered service marks of Neuberger Berman Group LLC. The individual Fund names in this piece are either service marks or registered service marks of Neuberger Berman Investment Advisers LLC, an affiliate of Neuberger Berman BD LLC, distributor, member FINRA. ©2017 Neuberger Berman BD LLC, distributor. All rights reserved.
Dear Shareholder,
Stocks surged globally in the first eight months of 2017, as a period of volatility and limited returns driven by the 2016 U.S. election gave way to optimism around supportive economic data.
With global economic data remaining steady both in the U.S. and overseas, investors became more sanguine. Even given the period's weak start, the S&P 500® Index advanced over 16% for the fiscal year ended August 31, 2017, just below developed international markets' returns. Emerging markets (measured by the MSCI Emerging Markets Index) outperformed significantly, up nearly 25%, as risk appetite grew on positive economic and earnings news. Cyclical sectors outperformed their defensive counterparts as part of this trend.
Focusing on the U.S., markets set new records several times despite serious geopolitical tensions, rising interest rates, persistent upheaval at the White House, and gridlock in Washington, D.C., placing meaningful reforms in doubt.
Taking a look at the data, U.S. GDP growth continued on its slow path at an annualized 3.0% in second quarter 2017. Although business and consumer confidence have improved, this has not yet translated into a significant uptick in economic growth. However, there appear to be some clear positives. Strong consumer balance sheets and moderate wage inflation, coupled with lower energy prices, are likely to continue to support consumer spending. An increase in commodity prices off of their 2015 lows has meant an increase in hiring in the mining and energy fields. In addition, U.S. manufacturers with overseas customers have benefited as the U.S. dollar has weakened from 2016 levels (in part due to the gridlock in Washington, D.C.).
Economic data weakened as this period closed, likely in response to Hurricane Harvey, which hit Houston, America's fourth largest city, on August 25th. August data shows an unanticipated decline in retail sales, along with the year's first drop in industrial output—both at least in part due to the hurricane's impact. While longer-term impacts of Harvey (and other hurricanes in Florida and the Caribbean) remain unknown, there will be winners and losers, ranging from retail and insurance to auto and appliance replacement and construction. Oil prices have also increased since Harvey, both on demand and damage to oil refineries.
Looking ahead, while political concerns have taken a back seat for investors—not just in the U.S., but also in France and the UK—geopolitical instability remains high, with tensions between the West and Russia, and North Korea among the most alarming. Absent an unforeseen shock, however, our expectations are generally positive.
Given both uncertainties and low equity correlations, we anticipate the continuation of a market where fund performance will be driven by stock picking skill, research, and discipline. Our managers will continue to work to use any volatility to their advantage as they seek long-term opportunities to outperform.
As always, thank you for your confidence in Neuberger Berman.
Sincerely,

ROBERT CONTI
PRESIDENT AND CEO
NEUBERGER BERMAN MUTUAL FUNDS
1
Dividend Growth Fund Commentary (Unaudited)
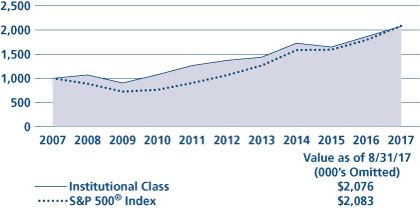
Neuberger Berman Dividend Growth Fund Institutional Class generated an 18.54% total return for the fiscal year ended August 31, 2017, outperforming its benchmark, the S&P 500® Index (the "Index"), which rose 16.23% for the same period. (Performance for all share classes is provided in the table immediately following this letter.)
The Fund seeks to provide capital appreciation and income in-line with its benchmark. We believe this approach identifies companies with strong business models generating cash both to grow their businesses, and provide growing dividend distributions to shareholders.
On the macro front, the U.S. economy was largely supported by strong labor statistics, while improving economic data prompted the Federal Reserve (Fed) to raise its benchmark interest rate three times since December. Furthermore, Fed Chair Janet Yellen set out details to unwind the central bank's massive $4.5 trillion balance sheet, signaling the strength of the world's largest economy.
During the twelve month timeframe, the market pushed further into record territory as "growth" stocks outperformed "value" by a wide margin. Overall, nine out of eleven sectors posted gains with Information Technology, Financials and Industrials benefitting the most.
The Fund generated the bulk of its returns from its approximately 21% Information Technology average allocation during the fiscal year. Stock selection within this space was positive. Apple was one of the Fund's top contributors, as investors bid-up the tech giant leading up to its highly anticipated iPhone X product launch. In contrast, telecom operator Frontier Communications experienced selling pressures and proved to be our greatest detractor. Ultimately, this security was sold after revisiting our initial investment thesis.
On the commodity front, our holdings delivered mixed results. Within Materials, stock selection was generally strong as Canada's Lundin Mining was our top overall contributor. This business enjoys an international footprint, producing copper, nickel and zinc. During the fiscal year, strong copper prices were a tailwind as the red metal reached its highest level in nearly three years, supported in-part by a weaker U.S. dollar, and improving Chinese economic data. Elsewhere, the Fund's Energy exposure hindered results as Devon Energy moved in lockstep with lower oil prices. As it stands, the Fund ended the fiscal year slightly overweight Energy and our diverse holdings remain well positioned in the event of an Energy rebound.
Elsewhere, banking stocks were also key contributors as Citizens Financial was among our top performers. This stock traded at 0.6x book value at the time of purchase, and still trades at a discount to most peers. As we enter the next phase of the business cycle, Financials remain a critical element to portfolio construction in what is likely a rising rate environment.
Overall, the Fund's exposure to Health Care detracted from relative returns. Israeli based Teva Pharmaceutical modestly dampened returns, and was ultimately sold in favor of opportunities elsewhere.
Looking ahead, we believe the Fund remains positioned for future interest rate hikes—despite muted expectations for further tightening. Elsewhere, political gridlock could test investor confidence in the months to come. However, we remain optimistic that elected officials can embrace a measured approach when addressing complex issues, including tax reforms. Under this scenario, we believe any headwinds on the policy front could support a rotation from "growth" to "value". In short, we remain steadfast in our commitment to focusing on businesses that have been exhibiting growing free cash flow and capital allocation policies prioritizing dividend increases. We feel stocks exhibiting these characteristics have the potential to provide a cushion in times of market stress for risk-adverse investors.
Sincerely,
DAVID A. KIEFER AND WILLIAM D. HUNTER
PORTFOLIO MANAGERS
Information about principal risks of investing in the Fund is set forth in the prospectus and statement of additional information.
The portfolio composition, industries and holdings of the Fund are subject to change without notice.
The opinions expressed are those of the Fund's portfolio managers. The opinions are as of the date of this report and are subject to change without notice.
2
Dividend Growth Fund (Unaudited)
TICKER SYMBOLS
Institutional Class | | NDGIX | |
Class A | | NDGAX | |
Class C | | NDGCX | |
Class R6 | | NRDGX | |
SECTOR ALLOCATION
(as a % of Total Investments*) | |
Consumer Discretionary | | | 12.8 | % | |
Consumer Staples | | | 6.7 | | |
Energy | | | 7.1 | | |
Financials | | | 14.8 | | |
Health Care | | | 7.4 | | |
Industrials | | | 10.5 | | |
Information Technology | | | 18.9 | | |
Materials | | | 8.6 | | |
Real Estate | | | 1.6 | | |
Utilities | | | 1.5 | | |
Short-Term Investment | | | 10.1 | | |
Total | | | 100.0 | % | |
* Derivatives (other than options purchased), if any, are excluded from this chart.
PERFORMANCE HIGHLIGHTS
| | | | | Average Annual
Total Return
Ended 08/31/2017 | |
| | | Inception
Date | | 1 Year | | Life of
Fund | |
At NAV | |
Institutional Class | | 12/15/2015 | | | 18.54 | % | | | 17.42 | % | |
Class A | | 12/15/2015 | | | 18.10 | % | | | 17.04 | % | |
Class C | | 12/15/2015 | | | 17.47 | % | | | 16.12 | % | |
Class R6 | | 12/15/2015 | | | 18.60 | % | | | 17.45 | % | |
With Sales Charge | |
Class A | | | | | | | 11.28 | % | | | 13.07 | % | |
Class C | | | | | | | 16.47 | % | | | 16.12 | % | |
Index | |
| S&P 500® Index1,15 | | | | | | | 16.23 | % | | | 14.84 | % | |
The performance data quoted represent past performance and do not indicate future results. Current performance may be lower or higher than the performance data quoted. For performance data current to the most recent month-end, please visit www.nb.com/performance.
The results shown in the table reflect the reinvestment of income dividends and other distributions, if any. The results do not reflect the effect of taxes a shareholder would pay on Fund distributions or on the redemption of Fund shares.
The investment return and principal value of an investment will fluctuate and shares, when redeemed, may be worth more or less than their original cost.
Returns would have been lower if Neuberger Berman Investment Advisers LLC ("Management") had not reimbursed certain expenses and/or waived a portion of the investment management fees during certain of the periods shown. Repayment by a class (of expenses previously reimbursed and/or fees previously waived by Management) will decrease the class's returns. Please see Note B in the Notes to Financial Statements for specific information regarding expense reimbursement and/or fee waiver arrangements.
As stated in the Fund's most recent prospectus, the total annual operating expense ratios for fiscal year 2016 were 2.24%, 2.99%, 3.74% and 2.38% for Institutional Class, Class A, Class C and Class R6 shares, respectively (before expense reimbursements and/or fee waivers, if any). The expense ratios were 0.71%, 1.07%, 1.82% and 0.64% for Institutional Class, Class A, Class C and Class R6 shares, respectively, after expense reimbursements and/or fee waivers. The expense ratios for fiscal year 2016 have been restated to reflect actual expenses excluding organization expenses incurred during that period. The expense ratios for the annual period ended August 31, 2017 can be found in the Financial Highlights section of this report.
Returns shown with a sales charge reflect the deduction of the current maximum initial sales charge of 5.75% for Class A shares and the contingent deferred sales charge (CDSC) for Class C shares. The CDSC for Class C shares is 1.00%, which is reduced to 0% after 1 year. The performance of the Fund's share classes will differ primarily due to different sales charge structures and class expenses. Please see the prospectus for more information about sales charge structures, if any, and class expenses for your share class.
3
Dividend Growth Fund (Unaudited)
COMPARISON OF A $1,000,000 INVESTMENT
(000's Omitted)

This graph shows the change in value of a hypothetical $1,000,000 investment in the Fund over the past 10 fiscal years, or since the Fund's inception if it has not operated for 10 years. The graph is based on the Institutional Class shares only; the performance of the Fund's share classes will differ primarily due to different sales charge structures and class expenses (see Performance Highlights chart on previous page). The result is compared with benchmarks, which include a broad-based market index and may include a more narrowly based index. Market indices have not been reduced to reflect any of the fees and costs of investing. The results shown in the graph reflect the reinvestment of income dividends and other distributions, if any. The results do not reflect the effect of taxes a shareholder would pay on Fund distributions or on the redemption of Fund shares. Results represent past performance and do not indicate future results.
4
Emerging Markets Equity Fund Commentary (Unaudited)
Neuberger Berman Emerging Markets Equity Fund Institutional Class generated a total return of 24.76% for the fiscal year ended August 31, 2017, outperforming its benchmark, the MSCI Emerging Markets (EM) Index (Net) (the "Index"), which reported returns of 24.53% for the same period. (Performance for all share classes is provided in the table immediately following this letter.)
Emerging markets equities solidly outperformed both developed international and U.S. equities this period. Negative sentiment in late 2016, driven by apprehension about the U.S. election (including anti-China and trade protectionism talk) caused EM equities to sell off briefly. However, as 2017 began, they rebounded decisively as an upsurge in EM earnings expectations and positive GDP revisions, inflows from investors with an appetite for higher risk/reward assets, and positive global growth trends overshadowed any concerns about rising U.S. interest rates.
Compared to the Index as a whole, the Information Technology (IT), Materials, and Financials sectors outperformed with the rotation to more cyclical areas. Defensive segments, such as Health Care, Utilities, and Consumer Staples, lagged. By country, Poland, Hungary, and Greece were top performers. At the other end of the spectrum, Pakistan (which was reclassified as an EM by MSCI at the end of May and added to the Index), Egypt and Qatar posted losses.
The Fund's outperformance was driven primarily by stock selection, with IT, Financials, Consumer Discretionary and Consumer Staples holdings most significant. By country, holdings from within China, Korea, and Taiwan strongly benefited Fund performance.
Top contributors included Tencent, the Chinese Internet consumer services giant, which continued to post strong top-line growth; Chinese electronics and lens company, Sunny Optical, which previewed new 3-D camera technologies; and Samsung, the Korean consumer electronics and semiconductor giant, on strong earnings and a perception of improving corporate governance.
On average, overweight positions in both Consumer Staples and Health Care, and stock selection within Telecommunication Services limited relative results. Our Philippines, UK-based and Indonesian holdings were weakest by country.
Individual detractors included PT Matahari, the Indonesian retailer, which disappointed on sales growth, but continues to invest in their properties; Ulker, the Turkish confectioner, which sold off on fears about weak Turkish consumer sentiment and subdued international demand; and Hikma Pharmaceuticals, the UK-listed Jordanian firm, which announced a delay in a key generic drug launch. We continue to own the names, believing they offer opportunity over the longer term.
While EM equities maintained their upward trajectory as investor flows continued to buoy markets and companies enjoyed earning upgrades, we are vigilant regarding several areas. First, the ongoing bribery scandal in Brazil potentially puts current reform initiatives at risk. We have not made any major trades but are closely monitoring the situation. Our second concern is the high level of debt permeating the Chinese economy, although we believe rising profitability for large corporates could aid their ability to service the debts investors are worried about.
Looking to the remainder of the year, we continue to prefer sectors tied to local market demand over global cyclically driven segments of the market. By sector, the largest portfolio overweights versus the Index are in Consumer Staples and IT. We believe both provide diverse opportunity sets. This overweight has been at the expense of the Financials and Energy sectors, which are the two largest underweights versus the Index. China remains the portfolio's largest underweight, in favor of a variety of smaller markets such as Mexico, where we have found attractive opportunities.
5
We are pleased with the quality and positioning of the current portfolio, as well as with the performance of our holdings this period. We anticipate that stock picking skills and research should continue to be advantageous as the year progresses.
Sincerely,
CONRAD SALDANHA
PORTFOLIO MANAGER
Information about principal risks of investing in the Fund is set forth in the prospectus and statement of additional information.
The portfolio composition, industries and holdings of the Fund are subject to change without notice.
The opinions expressed are those of the Fund's portfolio manager. The opinions are as of the date of this report and are subject to change without notice.
6
Emerging Markets Equity Fund (Unaudited)
TICKER SYMBOLS
Institutional Class | | NEMIX | |
Class A | | NEMAX | |
Class C | | NEMCX | |
Class R3 | | NEMRX | |
Class R6 | | NREMX | |
PERFORMANCE HIGHLIGHTS9
| | | | | Average Annual Total Return
Ended 08/31/2017 | |
| | | Inception
Date | | 1 Year | | 5 Years | | Life of
Fund | |
AT NAV | |
Institutional Class | | 10/08/2008 | | | 24.76 | % | | | 6.49 | % | | | 9.93 | % | |
Class A | | 10/08/2008 | | | 24.51 | % | | | 6.24 | % | | | 9.67 | % | |
Class C | | 10/08/2008 | | | 23.57 | % | | | 5.43 | % | | | 8.85 | % | |
| Class R310 | | 06/21/2010 | | | 23.94 | % | | | 5.79 | % | | | 9.34 | % | |
| Class R622 | | 03/15/2013 | | | 24.90 | % | | | 6.57 | % | | | 9.98 | % | |
With Sales Charge | |
Class A | | | | | 17.36 | % | | | 4.99 | % | | | 8.94 | % | |
Class C | | | | | 22.57 | % | | | 5.43 | % | | | 8.85 | % | |
Index | | | | | | | | | |
| MSCI Emerging Markets Index (Net)1,15 | | | | | 24.53 | % | | | 5.30 | % | | | 8.36 | % | |
| MSCI Emerging Markets Index1,15 | | | | | 24.99 | % | | | 5.67 | % | | | 8.73 | % | |
The performance data quoted represent past performance and do not indicate future results. Current performance may be lower or higher than the performance data quoted. For performance data current to the most recent month-end, please visit www.nb.com/performance.
The results shown in the table reflect the reinvestment of income dividends and other distributions, if any. The results do not reflect the effect of taxes a shareholder would pay on Fund distributions or on the redemption of Fund shares.
The investment return and principal value of an investment will fluctuate and shares, when redeemed, may be worth more or less than their original cost.
Returns would have been lower if Neuberger Berman Investment Advisers LLC ("Management") had not reimbursed certain expenses and/or waived a portion of the investment management fees during certain of the periods shown. Repayment by a class (of expenses previously reimbursed and/or fees previously waived by Management) will decrease the class's returns. Please see Note B in the Notes to Financial Statements for specific information regarding expense reimbursement and/or fee waiver arrangements.
As stated in the Fund's most recent prospectus, the total annual operating expense ratios for fiscal year 2016 were 1.44%, 1.82%, 2.51%, 2.06% and 1.33% for Institutional Class, Class A, Class C, Class R3 and Class R6 shares, respectively (before expense reimbursements and/or fee waivers, if any). The expense ratios were 1.26%, 1.51%, 2.26%, 1.92% and 1.19% for Institutional Class, Class A, Class C, Class R3 and Class R6 shares, respectively, after expense reimbursements and/or fee waivers. The expense ratios for the annual period ended August 31, 2017 can be found in the Financial Highlights section of this report.
Returns shown with a sales charge reflect the deduction of the current maximum initial sales charge of 5.75% for Class A shares and the contingent deferred sales charge (CDSC) for Class C shares. The CDSC for Class C shares is 1.00%, which is reduced to 0% after 1 year. The performance of the Fund's share classes will differ primarily due to different sales charge structures and class expenses. Please see the prospectus for more information about sales charge structures, if any, and class expenses for your share class.
7
Emerging Markets Equity Fund (Unaudited)
COMPARISON OF A $1,000,000 INVESTMENT
(000's Omitted)

This graph shows the change in value of a hypothetical $1,000,000 investment in the Fund over the past 10 fiscal years, or since the Fund's inception if it has not operated for 10 years. The graph is based on the Institutional Class shares only; the performance of the Fund's share classes will differ primarily due to different sales charge structures and class expenses (see Performance Highlights chart on previous page). The result is compared with benchmarks, which include a broad-based market index and may include a more narrowly based index. Market indices have not been reduced to reflect any of the fees and costs of investing. The results shown in the graph reflect the reinvestment of income dividends and other distributions, if any. The results do not reflect the effect of taxes a shareholder would pay on Fund distributions or on the redemption of Fund shares. Results represent past performance and do not indicate future results.
8
Equity Income Fund Commentary (Unaudited)
Neuberger Berman Equity Income Fund Institutional Class generated an 11.56% total return for the fiscal year ended August 31, 2017, underperforming its benchmark, the S&P 500® Index (the "Index"), which posted a 16.23% return for the same period. (Performance for all share classes is provided in the table immediately following this letter.)
The Fund strives to deliver a total return between stocks and bonds with limited volatility. This portfolio is diversified among dividend-paying stocks and convertible bonds, selected through extensive analysis of cash flow prospects, with the ability to sustain and grow dividends.
On the macro front, the U.S. economy was largely supported by strong labor statistics; while improving economic data prompted the Federal Reserve (Fed) to raise its benchmark interest rate three times since December. Furthermore, Fed Chair, Janet Yellen set out details to unwind the central bank's massive $4.5 trillion balance sheet, signaling the strength of the world's largest economy.
During the twelve month timeframe, the market pushed further into record territory as "growth" stocks outperformed "value" by a wide margin. Overall, nine out of eleven sectors posted gains with Information Technology (IT), Financials and Industrials benefitting the most.
Overall, the IT sector made the largest contribution to the Fund's absolute returns. The Fund's approximately 11% allocation to IT represents mature businesses with reduced cyclicality and attractive valuations. Within this space, flash memory producer Western Digital proved to be our top performer, with results driven by supply/demand imbalances. In our view, strong free cash flow metrics will likely be a tailwind for dividend growth potential. In contrast, QUALCOMM detracted from results as ongoing legal claims weighed on the chipmaker.
On the consumer front, Best Buy was among our top contributors. While e-commerce has gained market share from brick and mortar outlets—Best Buy has effectively bucked this trend becoming the destination of choice for big ticket items such as TVs and home appliances. Management has mitigated headwinds from online retailers via its price match guarantee and during the period its shares surged to an all-time high. In reaction, the Fund reduced exposure as Best Buy reached our price target.
Elsewhere, the Fund's approximately 12% allocation to Financials remains a critical element to portfolio construction, acting as a counterbalance to stocks with inverse correlations to interest rates. JPMorgan Chase, the largest U.S. bank by assets, rose to the top as investors supported its shares in the wake of the presidential election. As we enter the next phase of the business cycle, we feel several of our asset sensitive banks can benefit from an improving economic landscape whereby rising interest rates and potential regulatory reforms work in concert for this sector.
Within Energy, Ensco Plc. and Occidental Petroleum dampened returns, moving in lockstep with lower oil prices. They were both ultimately sold with the proceeds recycled elsewhere. As it stands, we believe the Fund with its diverse holdings is well positioned in the event of a rebound across the energy complex.
The Fund's use of written options contributed positively to performance during the period.
Looking ahead, we believe the Fund remains positioned for future interest rate hikes—despite muted expectations for further tightening. Elsewhere, political gridlock could test investor confidence in the months to come. However, we remain optimistic that elected officials can embrace a measured approach when addressing complex issues, including tax reforms. Under this scenario, we believe any headwinds on the policy front could support a rotation from "growth" to "value". In short, we remain steadfast in our commitment, focusing on businesses that have been exhibiting healthy free cash flow growth funding attractive dividend yields. We feel stocks with these characteristics have the potential to provide a cushion in times of market stress for risk-adverse investors.
Sincerely,
RICHARD LEVINE AND SANDY POMEROY
PORTFOLIO MANAGERS
Information about principal risks of investing in the Fund is set forth in the prospectus and statement of additional information.
The portfolio composition, industries and holdings of the Fund are subject to change without notice.
The opinions expressed are those of the Fund's portfolio managers. The opinions are as of the date of this report and are subject to change without notice.
9
Equity Income Fund (Unaudited)
TICKER SYMBOLS
Institutional Class | | NBHIX | |
Class A | | NBHAX | |
Class C | | NBHCX | |
Class R3 | | NBHRX | |
SECTOR ALLOCATION
(as a % of Total Investments*) | |
Consumer Discretionary | | | 2.5 | % | |
Consumer Staples | | | 5.5 | | |
Energy | | | 6.6 | | |
Financials | | | 11.5 | | |
Health Care | | | 8.1 | | |
Industrials | | | 7.7 | | |
Information Technology | | | 10.6 | | |
Materials | | | 5.8 | | |
Real Estate | | | 19.2 | | |
Utilities | | | 14.2 | | |
Convertible Bonds | | | 4.4 | | |
Short-Term Investment | | | 3.9 | | |
Total | | | 100.0 | % | |
* Derivatives (other than options purchased), if any, are excluded from this chart.
PERFORMANCE HIGHLIGHTS9
| | | | | Average Annual Total Return
Ended 08/31/2017 | |
| | | Inception
Date* | | 1 Year | | 5 Years | | 10 Years | | Life of
Fund | |
At NAV | |
| Institutional Class13 | | 06/09/2008 | | | 11.56 | % | | | 8.65 | % | | | 7.58 | % | | | 7.71 | % | |
| Class A13 | | 06/09/2008 | | | 11.17 | % | | | 8.24 | % | | | 7.19 | % | | | 7.35 | % | |
| Class C13 | | 06/09/2008 | | | 10.34 | % | | | 7.44 | % | | | 6.48 | % | | | 6.69 | % | |
| Class R313 | | 06/21/2010 | | | 10.88 | % | | | 7.93 | % | | | 7.06 | % | | | 7.23 | % | |
With Sales Charge | |
| Class A13 | | | | | | | 4.75 | % | | | 6.97 | % | | | 6.56 | % | | | 6.77 | % | |
| Class C13 | | | | | | | 9.34 | % | | | 7.44 | % | | | 6.48 | % | | | 6.69 | % | |
Index | |
| S&P 500® Index1,15 | | | | | | | 16.23 | % | | | 14.34 | % | | | 7.61 | % | | | 7.90 | % | |
*The performance data for each class includes the performance of the Fund's oldest share class, Trust Class, from November 2, 2006 through June 9, 2008. The performance data for Class R3 also includes the performance of the Fund's Institutional Class from June 9, 2008 through June 21, 2010. See endnote 13 for information about the effects of the different fees paid by each class.
The performance data quoted represent past performance and do not indicate future results. Current performance may be lower or higher than the performance data quoted. For performance data current to the most recent month-end, please visit www.nb.com/performance.
The results shown in the table reflect the reinvestment of income dividends and other distributions, if any. The results do not reflect the effect of taxes a shareholder would pay on Fund distributions or on the redemption of Fund shares.
The investment return and principal value of an investment will fluctuate and shares, when redeemed, may be worth more or less than their original cost.
Returns would have been lower if Neuberger Berman Investment Advisers LLC ("Management") had not reimbursed certain expenses and/or waived a portion of the investment management fees during certain of the periods shown. Repayment by a class (of expenses previously reimbursed and/or fees previously waived by Management) will decrease the class's returns. Please see Note B in the Notes to Financial Statements for specific information regarding expense reimbursement and/or fee waiver arrangements.
As stated in the Fund's most recent prospectus, the total annual operating expense ratios for fiscal year 2016 were 0.70%, 1.08%, 1.82% and 1.34% for Institutional Class, Class A, Class C and Class R3 shares, respectively (before expense reimbursements and/or fee waivers, if any). The expense ratios for the annual period ended August 31, 2017 can be found in the Financial Highlights section of this report.
Returns shown with a sales charge reflect the deduction of the current maximum initial sales charge of 5.75% for Class A shares and the contingent deferred sales charge (CDSC) for Class C shares. The CDSC for Class C shares is 1.00%, which is reduced to 0% after 1 year. The performance of the Fund's share classes will differ primarily due to different sales charge structures and class expenses. Please see the prospectus for more information about sales charge structures, if any, and class expenses for your share class.
10
Equity Income Fund (Unaudited)
COMPARISON OF A $1,000,000 INVESTMENT13
(000's Omitted)
This graph shows the change in value of a hypothetical $1,000,000 investment in the Fund over the past 10 fiscal years, or since the Fund's inception if it has not operated for 10 years. The graph is based on the Institutional Class shares only; the performance of the Fund's share classes will differ primarily due to different sales charge structures and class expenses (see Performance Highlights chart on previous page). The result is compared with benchmarks, which include a broad-based market index and may include a more narrowly based index. Market indices have not been reduced to reflect any of the fees and costs of investing. The results shown in the graph reflect the reinvestment of income dividends and other distributions, if any. The results do not reflect the effect of taxes a shareholder would pay on Fund distributions or on the redemption of Fund shares. Results represent past performance and do not indicate future results.
11
Focus Fund Commentary (Unaudited)
Neuberger Berman Focus Fund Investor Class generated a 16.81% total return for the fiscal year ended August 31, 2017, outperforming its benchmark, the S&P 500® Index (the "Index"), which provided a 16.23% return for the same period. (Performance for all share classes is provided in the table immediately following this letter.)
The bull market in U.S. equities persisted over the fiscal year with indexes breaking record levels throughout the period. The initial run-up in stocks occurred in the wake of President Trump's election victory, as investors grew increasingly hopeful that a new pro-business regime was forming in Washington, D.C. The stock market also benefited during the earlier months from a rise in oil prices after OPEC reached an agreement to curb production activity. Yet over the course of the year, the election afterglow faded for equities as news reports described turmoil within the new administration and policy changes faced legislative gridlock. Various geopolitical issues also surfaced and caused occasional pullbacks in the market. Overall, however, investor optimism remained steadfast in light of the more stable global economy and strong corporate earnings, and the U.S. Federal Reserve reaffirmed this sentiment as it continued to gradually increase interest rates in light of the healthier macro picture.
The best performing areas of the S&P 500 during the period were the Information Technology (IT) and Financials sectors, both of which benefited from the economic recovery and other macro factors. Energy was the weakest area of the market during the period due to a fall in oil prices, and the Telecommunication Services, Real Estate and Consumer Staples segments also underperformed as investors sought higher returns in more cyclical areas of the market.
The greatest contribution to Fund performance relative to the S&P 500 came from the Telecommunication Services sector. Specifically, our investment in T-Mobile yielded strong returns as the company gained market share, leading to robust earnings and revenue growth. IT also provided a significant lift to relative performance due in large part to our exposure to data storage provider Western Digital (WDC). We believe the future for WDC looks bright as it continues to grow its footprint in the ever-expanding flash memory industry through strategic acquisitions and internal initiatives. The largest detraction from relative performance stemmed from negative stock selection in Health Care. This was mainly due to Teva Pharmaceuticals (TEVA), which declined in the first half of the year alongside industry peers due to mounting pressure from a Federal investigation into possible illegal drug pricing practices. We exited our position in TEVA during the period. Financials was another area of relative loss for the Fund, as our holdings did not fare quite as well as those in that sector of the Index. Our lack of exposure to the capital markets industry had an adverse impact, and we were hurt within the insurance area as we owned Willis Tower Watson (which was sold during the period) and built up our position in American International Group.
The Fund's aggregate use of purchased and written options contributed positively to performance during the period.
We expect the domestic economy to continue progressing steadily while inflation remains subdued, which we believe is an auspicious environment for continued strength in corporate profits and further appreciation in stocks. However, as equities continue to climb, valuations are stretching, which could leave the market vulnerable to a sell-off if earnings fall short of expectations. The economic impact of tightening monetary policy also remains uncertain and could throw the stock market off course. We believe that our bottom-up investment strategy is the best way to navigate the current environment. We therefore conduct extensive fundamental research on individual stocks to create a portfolio that we believe can generate positive returns over an economic cycle.
Sincerely,
TIMOTHY CREEDON AND DAVID LEVINE
PORTFOLIO MANAGERS
Information about principal risks of investing in the Fund is set forth in the prospectus and statement of additional information.
The portfolio composition, industries and holdings of the Fund are subject to change without notice.
The opinions expressed are those of the Fund's portfolio managers. The opinions are as of the date of this report and are subject to change without notice.
12
TICKER SYMBOLS
Investor Class | | NBSSX | |
Trust Class | | NBFCX | |
Advisor Class | | NBFAX | |
Institutional Class | | NFALX | |
Class A | | NFAAX | |
Class C | | NFACX | |
SECTOR ALLOCATION
(as a % of Total Investments*) | |
Consumer Discretionary | | | 13.2 | % | |
Consumer Staples | | | 8.0 | | |
Energy | | | 5.9 | | |
Financials | | | 17.7 | | |
Health Care | | | 14.9 | | |
Industrials | | | 11.1 | | |
Information Technology | | | 17.7 | | |
Materials | | | 3.4 | | |
Telecommunication Services | | | 4.4 | | |
Utilities | | | 2.6 | | |
Short-Term Investment | | | 1.1 | | |
Options Purchased | | | 0.0 | | |
Total | | | 100.0 | % | |
* Derivatives (other than options purchased), if any, are excluded from this chart.
PERFORMANCE HIGHLIGHTS8
| | | | | Average Annual Total Return
Ended 08/31/2017 | |
| | | Inception
Date | | 1 Year | | 5 Years | | 10 Years | | Life of
Fund | |
At NAV | |
Investor Class | | 10/19/1955 | | | 16.81 | % | | | 13.88 | % | | | 6.47 | % | | | 10.49 | % | |
| Trust Class3 | | 08/30/1993 | | | 16.61 | % | | | 13.66 | % | | | 6.25 | % | | | 10.47 | % | |
| Advisor Class4 | | 09/03/1996 | | | 16.51 | % | | | 13.50 | % | | | 6.07 | % | | | 10.41 | % | |
| Institutional Class5 | | 06/21/2010 | | | 17.04 | % | | | 14.07 | % | | | 6.61 | % | | | 10.51 | % | |
| Class A19 | | 06/21/2010 | | | 16.58 | % | | | 13.65 | % | | | 6.33 | % | | | 10.47 | % | |
| Class C19 | | 06/21/2010 | | | 15.76 | % | | | 12.84 | % | | | 5.78 | % | | | 10.37 | % | |
With Sales Charge | |
| Class A19 | | | | | 9.84 | % | | | 12.31 | % | | | 5.71 | % | | | 10.36 | % | |
| Class C19 | | | | | 14.95 | % | | | 12.84 | % | | | 5.78 | % | | | 10.37 | % | |
Index | |
| S&P 500® Index1,15 | | | | | 16.23 | % | | | 14.34 | % | | | 7.61 | % | | | 10.17 | % | |
The performance data quoted represent past performance and do not indicate future results. Current performance may be lower or higher than the performance data quoted. For performance data current to the most recent month-end, please visit www.nb.com/performance.
The results shown in the table reflect the reinvestment of income dividends and other distributions, if any. The results do not reflect the effect of taxes a shareholder would pay on Fund distributions or on the redemption of Fund shares.
The investment return and principal value of an investment will fluctuate and shares, when redeemed, may be worth more or less than their original cost.
Returns would have been lower if Neuberger Berman Investment Advisers LLC ("Management") had not reimbursed certain expenses and/or waived a portion of the investment management fees during certain of the periods shown. Repayment by a class (of expenses previously reimbursed and/or fees previously waived by Management) will decrease the class's returns. Please see Note B in the Notes to Financial Statements for specific information regarding expense reimbursement and/or fee waiver arrangements.
As stated in the Fund's most recent prospectus, the total annual operating expense ratios for fiscal year 2016 were 0.94%, 1.11%, 1.26%, 0.76%, 1.15%, and 1.90% for Investor Class, Trust Class, Advisor Class, Institutional Class, Class A and Class C shares, respectively (before expense reimbursements and/or fee waivers, if any). The expense ratios were 0.75%, 1.11%, and 1.86% for Institutional Class, Class A and Class C shares, respectively, after expense reimbursements and/or fee waivers. The expense ratios for the annual period ended August 31, 2017 can be found in the Financial Highlights section of this report.
Returns shown with a sales charge reflect the deduction of the current maximum initial sales charge of 5.75% for Class A shares and the contingent deferred sales charge (CDSC) for Class C shares. The CDSC for Class C shares is 1.00%, which is reduced to 0% after 1 year. The performance of the Fund's share classes will differ primarily due to different sales charge structures and class expenses. Please see the prospectus for more information about sales charge structures, if any, and class expenses for your share class.
13
COMPARISON OF A $10,000 INVESTMENT
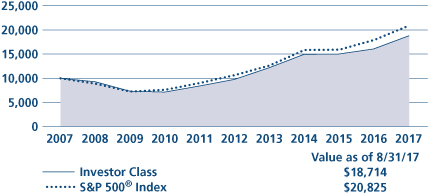
This graph shows the change in value of a hypothetical $10,000 investment in the Fund over the past 10 fiscal years, or since the Fund's inception if it has not operated for 10 years. The graph is based on the Investor Class shares only; the performance of the Fund's share classes will differ primarily due to different sales charge structures and class expenses (see Performance Highlights chart on previous page). The result is compared with benchmarks, which include a broad-based market index and may include a more narrowly based index. Market indices have not been reduced to reflect any of the fees and costs of investing. The results shown in the graph reflect the reinvestment of income dividends and other distributions, if any. The results do not reflect the effect of taxes a shareholder would pay on Fund distributions or on the redemption of Fund shares. Results represent past performance and do not indicate future results.
14
Genesis Fund Commentary (Unaudited)
Neuberger Berman Genesis Fund Investor Class generated a 10.19% total return for the fiscal year ended August 31, 2017, underperforming its benchmark, the Russell 2000® Index (the "Index"), which provided a 14.91% total return for the same period. (Performance for all share classes is provided in the table immediately following this letter.)
After some initial weakness, the U.S. stock market moved sharply higher over the last 10 months of the reporting period. This turnaround was partially driven by corporate profits that were generally better than expected and hopes for improving growth and less regulation under the Trump administration. The overall U.S. stock market, as measured by the S&P 500® Index, rose 16.23% for the 12-month period. Small-cap stocks also produced strong results, as the Russell 2000 Index gained 14.91%.
The Fund generated a positive absolute return during the reporting period but lagged the benchmark, driven by stock selection. The largest detractor was our holdings in the Financials sector. In particular, our more growth-oriented bank holdings underperformed, reflecting concerns around sustainability of growth and/or credit risk. Stock selection in the Materials sector was also a headwind for results as more cyclical, lower quality companies outperformed "Steady Eddie" type companies that we favor. Elsewhere, holdings in the Health Care sector were negative for relative results. The relatively strong performance of our investments in the sector was overshadowed by the outstanding performance of the benchmark's biotechnology names. Turning to individual stocks owned by the Fund, Tractor Supply Co., RLI Corp., and Manhattan Associates, Inc. performed poorly. Tractor Supply operates retail stores focused on supplying the lifestyle needs of recreational farmers and ranchers. The stock underperformed as the company delivered disappointing results due to weakness in energy-related markets and deflationary pressures. RLI Corp. is a specialty property and casualty insurer focused on hard-to-write niche products. The stock underperformed due to lingering adverse development in its transportation segment. Manhattan Associates provides software solutions that enable the efficient movement of goods through the supply chain. The company reported decent results, but this was overshadowed by guidance that implied a slowdown in its business.
On the upside, stock selection in the Energy sector was positive for performance. Within energy services, we believe our holdings possess differentiated technologies, leading market positions, and strong competitive barriers. Within oil and gas production, we believe our holdings are among the most efficient producers in the industry. Elsewhere, stock selection in the Information Technology and Consumer Staples sectors were additive for results. A number of the Fund's individual holdings also performed well, including Cognex Corp., Rollins, Inc., and Rogers Corp. Cognex Corp. is a global leader in machine vision systems and software that enable high-precision and high-speed manufacturing. The stock rallied as the company delivered stronger-than-expected earnings results and provided a constructive outlook. Rollins, Inc. is a leading provider of pest and termite control. The stock performed well as the company reported revenue and earnings growth that exceeded expectations. Rogers Corp. manufactures and markets specialty materials and components for applications in the communications, computer, imaging and transportation markets. The company reported excellent results and provided guidance that implied continued strong demand for its products.
Sector allocation, overall, modestly contributed to relative performance during the period. In particular, having no exposure to real estate investment trusts (REITs) was beneficial. We do not typically own REITs, as they do not meet our investment criteria. In addition, REITs are often viewed as bond-proxies and they underperformed given rising interest rates and investors' preference for more cyclical companies. Conversely, having no exposure to biotechnology stocks was the largest detractor from performance. We do not typically own biotechnology companies as they do not meet our investment criteria given their speculative nature, a general lack of earnings, and their need to often access the capital markets.
Looking ahead, recent hurricane activity will clearly pose a challenge in gauging near term economic trends. We also feel that a number of uncertainties could impact the market and possibly lead to increased volatility. As discussed in previous commentaries, the Trump pro-growth economic agenda has largely stalled. Against this backdrop, economic growth might remain muted for the foreseeable future. As of now, it is unclear how the recent Federal Reserve's (Fed) interest rate increases will impact financial conditions, loan demand, and overall economic growth. In addition, the Fed's
15
attempts to shrink its balance sheet could introduce another layer of uncertainty. Geopolitical risks also seem to be increasing, with North Korea being a major wildcard. Lastly, numerous unresolved issues remain outside the U.S., including continued challenges in the European banking sector. Based on our views, we believe that the stocks that we own in the portfolio represent high quality businesses that should perform relatively well. We will continue to maintain a diversified portfolio that emphasizes companies that have consistently generated solid free cash flow and high returns on capital.
Sincerely,
JUDITH M. VALE AND ROBERT W. D'ALELIO
PORTFOLIO CO-MANAGERS
Information about principal risks of investing in the Fund is set forth in the prospectus and statement of additional information.
The portfolio composition, industries and holdings of the Fund are subject to change without notice.
The opinions expressed are those of the Fund's portfolio managers. The opinions are as of the date of this report and are subject to change without notice.
16
TICKER SYMBOLS
Investor Class | | NBGNX | |
Trust Class | | NBGEX | |
Advisor Class | | NBGAX | |
Institutional Class | | NBGIX | |
Class R6 | | NRGSX | |
SECTOR ALLOCATION
(as a % of Total Investments*) | |
Consumer Discretionary | | | 12.0 | % | |
Consumer Staples | | | 6.5 | | |
Energy | | | 2.2 | | |
Financials | | | 16.8 | | |
Health Care | | | 12.9 | | |
Industrials | | | 21.0 | | |
Information Technology | | | 19.9 | | |
Materials | | | 7.3 | | |
Real Estate | | | 0.4 | | |
Short-Term Investments | | | 1.0 | | |
Total | | | 100.0 | % | |
* Derivatives (other than options purchased), if any, are excluded from this chart.
PERFORMANCE HIGHLIGHTS
| | | | | Average Annual Total Return
Ended 08/31/2017 | |
| | | Inception
Date | | 1 Year | | 5 Years | | 10 Years | | Life of
Fund | |
Investor Class | | 09/27/1988 | | | 10.19 | % | | | 11.91 | % | | | 7.94 | % | | | 12.10 | % | |
| Trust Class3 | | 08/26/1993 | | | 10.11 | % | | | 11.82 | % | | | 7.87 | % | | | 12.08 | % | |
| Advisor Class4 | | 04/02/1997 | | | 9.81 | % | | | 11.51 | % | | | 7.58 | % | | | 11.86 | % | |
| Institutional Class5 | | 07/01/1999 | | | 10.40 | % | | | 12.10 | % | | | 8.15 | % | | | 12.25 | % | |
| Class R623 | | 03/15/2013 | | | 10.47 | % | | | 12.15 | % | | | 8.05 | % | | | 12.14 | % | |
Index | |
| Russell 2000® Index1,15 | | | | | 14.91 | % | | | 13.15 | % | | | 7.38 | % | | | 9.68 | % | |
The performance data quoted represent past performance and do not indicate future results. Current performance may be lower or higher than the performance data quoted. For performance data current to the most recent month-end, please visit www.nb.com/performance.
The results shown in the table reflect the reinvestment of income dividends and other distributions, if any. The results do not reflect the effect of taxes a shareholder would pay on Fund distributions or on the redemption of Fund shares.
The investment return and principal value of an investment will fluctuate and shares, when redeemed, may be worth more or less than their original cost.
Returns would have been lower if Neuberger Berman Investment Advisers LLC ("Management") had not reimbursed certain expenses and/or waived a portion of the investment management fees during certain of the periods shown. Repayment by a class (of expenses previously reimbursed and/or fees previously waived by Management) will decrease the class's returns. Please see Note B in the Notes to Financial Statements for specific information regarding expense reimbursement and/or fee waiver arrangements.
As stated in the Fund's most recent prospectus, the total annual operating expense ratios for fiscal year 2016 were 1.03%, 1.10%, 1.38%, 0.85% and 0.78% for Investor Class, Trust Class, Advisor Class, Institutional Class and Class R6 shares, respectively (before expense reimbursements and/or fee waivers, if any). The total annual operating expense ratio for each of Institutional Class and Class R6 includes the class's repayment of expenses previously reimbursed and/or fees previously waived by Management. The expense ratios for the annual period ended August 31, 2017 can be found in the Financial Highlights section of this report.
17
COMPARISON OF A $10,000 INVESTMENT

This graph shows the change in value of a hypothetical $10,000 investment in the Fund over the past 10 fiscal years, or since the Fund's inception if it has not operated for 10 years. The graph is based on the Investor Class shares only; the performance of the Fund's share classes will differ primarily due to different class expenses (see Performance Highlights chart on previous page). The result is compared with benchmarks, which include a broad-based market index and may include a more narrowly based index. Market indices have not been reduced to reflect any of the fees and costs of investing. The results shown in the graph reflect the reinvestment of income dividends and other distributions, if any. The results do not reflect the effect of taxes a shareholder would pay on Fund distributions or on the redemption of Fund shares. Results represent past performance and do not indicate future results.
18
Global Equity Fund Commentary (Unaudited)
Neuberger Berman Global Equity Fund Institutional Class generated a total return of 15.13% for the fiscal year ended August 31, 2017, underperforming the 17.11% return of its benchmark, the MSCI All Country World Index (Net) (the "Index") for the same period. (Performance for all share classes is provided in the table immediately following this letter.)
Global equity markets fared well this fiscal year, as the volatility that limited results in 2016 gave way to a period of rapidly rising returns. As 2017 began, investors' concerns about the U.S. election—including what trade protectionism and nationalism rhetoric might mean for global economic growth—began to lessen. Instead, the focus thus far in 2017 has been on steady to positive economic data from the U.S., Eurozone, UK, Japan, and emerging markets, as well as strong corporate earnings.
Compared to the Index as a whole, Information Technology (IT), Financials, and Materials outperformed, benefiting from a shift in favor of more cyclical areas given economic data. All sectors posted positive returns, but Energy—on weak commodity pricing—and defensive areas such as Telecommunication Services and Consumer Staples underperformed. By country, Austria, Poland and Hungary led the Index; Pakistan (which was reclassified as an emerging market by MSCI at the end of May and added to the Index), Israel, and Egypt were weakest, with each posting losses for the period.
The Fund's underperformance this period resulted from stock selection, particularly within Materials, Energy, and Health Care. By country, holdings from France, Canada and the U.S. underperformed.
Individual detractors included Nielsen, the Netherlands-based TV and consumer ratings service, which announced weak results in retail measurement; Israeli-based Teva, which fell on news that three of its Copaxone patents had been invalidated; and Range Resources, which underperformed with the weak Energy sector. Teva and Range Resources were sold.
Sector allocation, especially our overweight to IT and underweight to Real Estate, along with strong stock selection within IT and Consumer Discretionary was a benefit to relative performance. By country, companies domiciled in China, the Netherlands and Hong Kong had the largest relative benefit.
Top individual contributors for the period included Apple, the U.S. computer/smartphone marketer, which announced better-than-expected earnings from the iPhone 7 launch; Alibaba, the Chinese e-commerce giant, which raised future revenue expectations; and Dutch semiconductor specialist ASML, which benefited from solid earnings announcements.
Global equity markets have been strong calendar year-to-date through the end of August, with the MSCI EAFE® Index and MSCI Emerging Markets Index outperforming U.S. equities by 5.12% and 16.36%, respectively. We think political risk is subsiding in the Eurozone and the European economic recovery is gathering momentum. Equity markets have reacted very positively. While valuations do not look particularly cheap in Europe, we believe they do look reasonable relative to U.S. peers. After several years of lackluster earnings, we are beginning to see the signs of what we think will be a significant rebound in European profits. While profit margins in Europe are still well below their mid 2000's peak, we believe that if the earnings recovery can be sustained, markets could yet move higher.
Given our efforts to achieve a lower risk profile of the Fund relative to the benchmark, it is gratifying that our stock selection is being rewarded and the portfolio is currently outpacing a fast-rising market year-to-date. We continue to look for opportunities across countries, sectors and the market cap spectrum. Given higher overall valuations, particularly in the U.S., we need to retain discipline around the prices we are paying for stocks. However, we continue to find companies that have had attractive secular growth drivers, stable demand and profit profiles, and proven management teams that appear underappreciated and, we believe, offer investors attractive risk/return characteristics.
Sincerely,
BENJAMIN SEGAL AND SAURIN D. SHAH
PORTFOLIO MANAGERS
Information about principal risks of investing in the Fund is set forth in the prospectus and statement of additional information.
The portfolio composition, industries and holdings of the Fund are subject to change without notice.
The opinions expressed are those of the Fund's portfolio managers. The opinions are as of the date of this report and are subject to change without notice.
19
Global Equity Fund (Unaudited)
TICKER SYMBOLS
Institutional Class | | NGQIX | |
Class A | | NGQAX | |
Class C | | NGQCX | |
PERFORMANCE HIGHLIGHTS9
| | | | | Average Annual Total
Return Ended 08/31/2017 | |
| | | Inception
Date | | 1 Year | | 5 Years | | Life of
Fund | |
At NAV | |
Institutional Class | | 06/30/2011 | | | 15.13 | % | | | 9.52 | % | | | 6.48 | % | |
Class A | | 06/30/2011 | | | 14.85 | % | | | 9.15 | % | | | 6.13 | % | |
Class C | | 06/30/2011 | | | 13.89 | % | | | 8.33 | % | | | 5.33 | % | |
With Sales Charge | |
Class A | | | | | | | 8.26 | % | | | 7.86 | % | | | 5.11 | % | |
Class C | | | | | | | 12.89 | % | | | 8.33 | % | | | 5.33 | % | |
Index | |
| MSCI All Country World Index (Net)1,15 | | | | | | | 17.11 | % | | | 10.46 | % | | | 8.05 | % | |
| MSCI All Country World Index1,15 | | | | | | | 17.75 | % | | | 11.06 | % | | | 8.64 | % | |
The performance data quoted represent past performance and do not indicate future results. Current performance may be lower or higher than the performance data quoted. For performance data current to the most recent month-end, please visit www.nb.com/performance.
The results shown in the table reflect the reinvestment of income dividends and other distributions, if any. The results do not reflect the effect of taxes a shareholder would pay on Fund distributions or on the redemption of Fund shares.
The investment return and principal value of an investment will fluctuate and shares, when redeemed, may be worth more or less than their original cost.
Returns would have been lower if Neuberger Berman Investment Advisers LLC ("Management") had not reimbursed certain expenses and/or waived a portion of the investment management fees during certain of the periods shown. Repayment by a class (of expenses previously reimbursed and/or fees previously waived by Management) will decrease the class's returns. Please see Note B in the Notes to Financial Statements for specific information regarding expense reimbursement and/or fee waiver arrangements.
As stated in the Fund's most recent prospectus, the total annual operating expense ratios for fiscal year 2016 were 8.47%, 8.92% and 9.60% for Institutional Class, Class A and Class C shares, respectively (before expense reimbursements and/or fee waivers, if any). The expense ratios were 0.75%, 1.11% and 1.86% for Institutional Class, Class A and Class C shares, respectively, after expense reimbursements and/or fee waivers. The expense ratios for the annual period ended August 31, 2017 can be found in the Financial Highlights section of this report.
Returns shown with a sales charge reflect the deduction of the current maximum initial sales charge of 5.75% for Class A shares and the contingent deferred sales charge (CDSC) for Class C shares. The CDSC for Class C shares is 1.00%, which is reduced to 0% after 1 year. The performance of the Fund's share classes will differ primarily due to different sales charge structures and class expenses. Please see the prospectus for more information about sales charge structures, if any, and class expenses for your share class.
20
Global Equity Fund (Unaudited)
COMPARISON OF A $1,000,000 INVESTMENT
(000's Omitted)

This graph shows the change in value of a hypothetical $1,000,000 investment in the Fund over the past 10 fiscal years, or since the Fund's inception if it has not operated for 10 years. The graph is based on the Institutional Class shares only; the performance of the Fund's share classes will differ primarily due to different sales charge structures and class expenses (see Performance Highlights chart on previous page). The result is compared with benchmarks, which include a broad-based market index and may include a more narrowly based index. Market indices have not been reduced to reflect any of the fees and costs of investing. The results shown in the graph reflect the reinvestment of income dividends and other distributions, if any. The results do not reflect the effect of taxes a shareholder would pay on Fund distributions or on the redemption of Fund shares. Results represent past performance and do not indicate future results.
21
Global Real Estate Fund Commentary (Unaudited)
Neuberger Berman Global Real Estate Fund Institutional Class generated a 4.01% total return for the fiscal year ended August 31, 2017, outperforming its benchmark, the FTSE EPRA/NAREIT Developed Index (Net) (the "Index"), which generated a –0.10% total return for the same period. (Performance for all share classes is provided in the table immediately following this letter.)
After a poor start, the global stock market rallied sharply and generated strong results during the reporting period. This turnaround was partially driven by corporate profits that were generally better than expected, strengthening global growth and hopes for improving growth and less regulation under the Trump administration. However, expectations for significant shifts in U.S. fiscal policy have been delayed, or the probability of success has been reduced. Comparatively, global real estate investment trusts (REITs) posted weak results during the period.
The Fund outperformed the benchmark during the reporting period. Stock selection was the primary driver of the Fund's results. On the upside, our holdings in the Specialty REITs, Hotel & Lodging REITs and Real Estate Holding & Development sectors were the most additive for returns. The largest detractors from relative performance were the Fund's holdings in the Industrial & Office REITs and Retail REITs sectors and lack of exposure to the Real Estate Services sector. The Fund's positioning from the regional/country perspective was relatively flat for results. From a regional perspective, an overweight to Asia Pacific ex-Japan was the most additive for results. In terms of country positioning, overweights to Hong Kong and Canada were rewarded, whereas an overweight to France and an underweight to Singapore detracted from performance.
We anticipate seeing modest economic growth in the U.S. for the year as a whole. The U.S. Federal Reserve (Fed), as expected, raised interest rates for a second time in calendar year 2017 at its meeting that concluded on June 14. Looking forward, we believe the Fed will likely take a measured approach in terms of further interest rate hikes. After moving higher following the U.S. presidential election, longer-term interest rates have declined thus far in 2017, balancing expectations for improved economic growth, with some level of political uncertainty. However, we believe real estate fundamentals, not interest rates, will be the long-term driver of performance in the REIT market. We think improved business and consumer confidence, potential fiscal stimulus, and modest inflation should be supportive for the U.S. commercial property market. We believe real estate companies with sustainable cash flow and dividend growth have the potential to perform well. Overseas, the UK continues to face uncertainty after the recent general election and as it becomes clear how Brexit will unfold. As a result, we are positive on structural change stories in the UK, but remain very wary of businesses exposed to the London office sector. We remain positive on residential properties in France and Germany, as well as mixed use properties in Sweden. Among the Asia-Pacific markets, we believe positive sentiment on Hong Kong and Singapore real estate stocks show no sign of abating. Meanwhile, the sharp rise in the bond yields of Australia and Japan have dented the performance of local real estate stocks. Long term, we still favor Australia for sector fundamentals that look to us to be healthy as well as Hong Kong for stock valuations that appear to us to be inexpensive.
Sincerely,
STEVE SHIGEKAWA, BRIAN C. JONES, GILLIAN TILTMAN AND ANTON KWANG
PORTFOLIO MANAGERS
Information about principal risks of investing in the Fund is set forth in the prospectus and statement of additional information.
The portfolio composition, industries and holdings of the Fund are subject to change without notice.
The opinions expressed are those of the Fund's portfolio managers. The opinions are as of the date of this report and are subject to change without notice.
22
Global Real Estate Fund (Unaudited)
TICKER SYMBOLS
Institutional Class | | NGRIX | |
Class A | | NGRAX | |
Class C | | NGRCX | |
PERFORMANCE HIGHLIGHTS9
| | | | | Average Annual Total
Return Ended 08/31/2017 | |
| | | Inception
Date | | 1 Year | | Life of
Fund | |
At NAV | |
Institutional Class | | 12/30/2014 | | | 4.01 | % | | | 5.02 | % | |
Class A | | 12/30/2014 | | | 3.71 | % | | | 4.66 | % | |
Class C | | 12/30/2014 | | | 2.96 | % | | | 3.87 | % | |
With Sales Charge | |
Class A | | | | | –2.28 | % | | | 2.37 | % | |
Class C | | | | | 1.96 | % | | | 3.87 | % | |
Index | |
| FTSE EPRA/NAREIT Developed Index (Net)1,15 | | | | | –0.10 | % | | | 3.31 | % | |
| FTSE EPRA/NAREIT Developed Index1,15 | | | | | 0.84 | % | | | 4.22 | % | |
The performance data quoted represent past performance and do not indicate future results. Current performance may be lower or higher than the performance data quoted. For performance data current to the most recent month-end, please visit www.nb.com/performance.
The results shown in the table reflect the reinvestment of income dividends and other distributions, if any. The results do not reflect the effect of taxes a shareholder would pay on Fund distributions or on the redemption of Fund shares.
The investment return and principal value of an investment will fluctuate and shares, when redeemed, may be worth more or less than their original cost.
Returns would have been lower if Neuberger Berman Investment Advisers LLC ("Management") had not reimbursed certain expenses and/or waived a portion of the investment management fees during certain of the periods shown. Repayment by a class (of expenses previously reimbursed and/or fees previously waived by Management) will decrease the class's returns. Please see Note B in the Notes to Financial Statements for specific information regarding expense reimbursement and/or fee waiver arrangements.
As stated in the Fund's most recent prospectus, the total annual operating expense ratios for fiscal year 2016 were 10.93%, 11.32% and 12.04% for Institutional Class, Class A and Class C shares, respectively (before expense reimbursements and/or fee waivers, if any). The expense ratios were 1.01%, 1.37% and 2.12% for Institutional Class, Class A and Class C shares, respectively, after expense reimbursements and/or fee waivers. The expense ratios for the annual period ended August 31, 2017 can be found in the Financial Highlights section of this report.
Returns shown with a sales charge reflect the deduction of the current maximum initial sales charge of 5.75% for Class A shares and the contingent deferred sales charge (CDSC) for Class C shares. The CDSC for Class C shares is 1.00%, which is reduced to 0% after 1 year. The performance of the Fund's share classes will differ primarily due to different sales charge structures and class expenses. Please see the prospectus for more information about sales charge structures, if any, and class expenses for your share class.
23
Global Real Estate Fund (Unaudited)
COMPARISON OF A $1,000,000 INVESTMENT
(000's Omitted)

This graph shows the change in value of a hypothetical $1,000,000 investment in the Fund over the past 10 fiscal years, or since the Fund's inception if it has not operated for 10 years. The graph is based on the Institutional Class shares only; the performance of the Fund's share classes will differ primarily due to different sales charge structures and class expenses (see Performance Highlights chart on previous page). The result is compared with benchmarks, which include a broad-based market index and may include a more narrowly based index. Market indices have not been reduced to reflect any of the fees and costs of investing. The results shown in the graph reflect the reinvestment of income dividends and other distributions, if any. The results do not reflect the effect of taxes a shareholder would pay on Fund distributions or on the redemption of Fund shares. Results represent past performance and do not indicate future results.
24
Greater China Equity Fund Commentary25 (Unaudited)
Neuberger Berman Greater China Equity Fund Institutional Class generated a 38.46% total return for the fiscal year ended August 31, 2017, outperforming its benchmark, the MSCI China Index (Net) (the "Index"), which returned 35.00% over the same period. (Performance for all share classes is provided in the table immediately following this letter.)
Over the past 12 months, the China equity markets performed relatively well. In September, profit taking prompted markets to consolidate after first-half interim results season concluded, and the offshore Hong Kong market outperformed the domestic China A-shares market primarily due to southbound flows (flows from mainland China to Hong Kong market using the Stock Connect program) following the China Insurance Regulatory Commission announcement allowing onshore insurers to invest via the Stock Connect program. After the China National Day holidays, China's State Council released guidelines for its debt-to-equity swap program, and the National Development and Reform Commission (NDRC) proposed mixed ownership reform for six state-owned enterprises (SOE). Furthermore, macroeconomic data such as September 2016's Purchasing Managers Index (PMI) and 3Q 2016 Gross Domestic Product (GDP) growth pointed towards a stabilizing economy. In November, the China A-shares market advanced as investors anticipated the Shenzhen-Hong Kong Stock Connect program and the NDRC accelerating infrastructure projects, while the offshore Hong Kong market was impacted by Donald Trump's victory in the U.S. presidential elections that led to uncertainty surrounding foreign policies. Towards calendar year-end 2016, concerns over liquidity and regulators imposing tighter leverage controls, continued renminbi depreciation leading to capital outflow and bond defaults resulted in a significant market correction. China equity markets rallied in January on the back of solid December macroeconomic data, better than expected 4Q 2016 GDP growth and improved investor sentiment due to the government tightening capital controls to alleviate capital outflow pressures. Despite the People's Bank of China (PBoC) raising interbank interest rates in early February, markets continued their upward trend because of January's PMI and trade data, additional supply side reforms, and policy expectations from the upcoming "two sessions" in March.
Market performance remained positive in March despite the U.S. Federal Reserve and PBoC tightening monetary policy, but the offshore Hong Kong market outperformed as company earnings and SOE dividend policies came into focus. In April, the announcement to create the Xiong'an special economic zone in Hebei province led the China equity markets to rally, but the onshore China A-shares market experienced a correction towards month-end despite strong 1Q 2017 GDP growth. In May, investor sentiment improved after China's agreement with the U.S. on trade deals, conclusion of the Belt and Road Forum, and approval of the Hong Kong-China Bond Connect program. Both markets traded higher in June after the China Securities Regulatory Commission tightened regulations on stock selling by major shareholders, MSCI's inclusion of A-shares into their regional and country indices (to be effective in June 2018) and the government's capital markets reforms to streamline mergers & acquisitions approval processes. Strong 2Q 2017 GDP growth and better than expected June macroeconomic indicators led to strong performance of large cap names in July, and the offshore Hong Kong market outperformed due to an increase in southbound volumes. China equity markets corrected briefly in August amid escalating geopolitical tensions in the Korean Peninsula, but rallied later in the month after strong corporate earnings announced for the first half of 2017 and ongoing SOE and supply side reforms lifted investor sentiment.
For the 12-month fiscal period, the Fund's average overweight to Consumer Discretionary and underweight to Telecommunication Services and Energy contributed to performance relative to the Index. In contrast, the Fund's underweight to Information Technology and overweight to Industrials and Real Estate detracted from relative returns. Stock selection had a positive impact in Consumer Discretionary, Consumer Staples and Financials, whereas stock selection had a negative impact in Real Estate.
The Fund continues to focus on companies that have sustainable top and bottom line growth by looking at companies' operating cash flows from their recurring core businesses. As of August 31, 2017, the Fund's largest sector overweight relative to the Index was Financials, followed by Health Care and Industrials. The largest sector underweight was Information Technology, followed by Energy and Telecommunication Services. The Fund's top ten positions comprised more than 55% of total portfolio assets at the end of August.
25
The pace of the economic recovery that materialized last year has not waned, with momentum continuing through to 2Q2017. Macroeconomic indicators have continued to indicate a healthy economy, such as GDP growth, retail sales growth, fixed asset investments, exports and industrial production. This is in spite of regulatory/supervisory tightening on the part of the Chinese government, which has been aimed at controlling the growth of China's shadow banking sector. We believe this should have a long-term positive impact on the country's financial sector, but warrants careful management and execution given its impact on borrowing costs and liquidity conditions. We anticipate that this trend will continue through the remainder of 2017, although the pace of tightening has slowed somewhat in recent periods. For the time being, we believe the impact on the corporate sector should be relatively limited, given that company earnings have remained healthy. Given the recent strength of the China equity markets, valuation levels for certain companies are beginning to test fundamentals. To that end, we believe investors may benefit from employing a higher degree of selectivity towards the type of stocks to own, which resonates with our investment approach across all our portfolios. This is supported by the wide investment opportunity set spanning the entire China equity universe across Mainland China, Hong Kong and overseas listed companies, providing us with substantial breadth for stock picking.
As of September 20, 2017, the Fund closed to new investors because of capacity constraints associated with the Fund's investment strategy. The Fund closed to new investments, including investments from existing shareholders, effective at the close of business on October 17, 2017.
Sincerely,
LIHUI TANG AND FRANK YAO
PORTFOLIO MANAGERS
Information about principal risks of investing in the Fund is set forth in the prospectus and statement of additional information.
The portfolio composition, industries and holdings of the Fund are subject to change without notice.
The opinions expressed are those of the Fund's portfolio managers. The opinions are as of the date of this report and are subject to change without notice.
26
Greater China Equity Fund (Unaudited)
TICKER SYMBOLS
Institutional Class | | NCEIX | |
Class A | | NCEAX | |
Class C | | NCECX | |
SECTOR ALLOCATION
(as a % of Total Investments*) | |
Consumer Discretionary | | | 13.1 | % | |
Consumer Staples | | | 3.5 | | |
Financials | | | 29.2 | | |
Health Care | | | 5.9 | | |
Industrials | | | 8.2 | | |
Information Technology | | | 26.9 | | |
Materials | | | 2.1 | | |
Real Estate | | | 3.2 | | |
Telecommunication Services | | | 2.0 | | |
Utilities | | | 2.4 | | |
Short-Term Investment | | | 3.5 | | |
Total | | | 100.0 | % | |
* Derivatives (other than options purchased), if any, are excluded from this chart.
EXCHANGE ALLOCATION
(as a % of Long Term Investments) | |
Mainland China | | | 21.7 | % | |
Hong Kong | | | 56.2 | | |
United States | | | 22.1 | | |
Total | | | 100.0 | % | |
PERFORMANCE HIGHLIGHTS25
| | |
| | Average Annual Total
Return Ended 08/31/2017 | |
| | | Inception
Date | | 1 Year | | Life of
Fund | |
At NAV | |
Institutional Class | | 07/17/2013 | | | 38.46 | % | | | 17.63 | % | |
Class A | | 07/17/2013 | | | 37.95 | % | | | 17.35 | % | |
Class C | | 07/17/2013 | | | 36.91 | % | | | 16.35 | % | |
With Sales Charge | |
Class A | | | | | | | 30.03 | % | | | 15.68 | % | |
Class C | | | | | | | 35.91 | % | | | 16.35 | % | |
Index | |
| MSCI China Index (Net)1,15 | | | | | | | 35.00 | % | | | 12.54 | % | |
| MSCI China Index1,15 | | | | | | | 35.24 | % | | | 12.79 | % | |
The performance data quoted represent past performance and do not indicate future results. Current performance may be lower or higher than the performance data quoted. For performance data current to the most recent month-end, please visit www.nb.com/performance.
The results shown in the table reflect the reinvestment of income dividends and other distributions, if any. The results do not reflect the effect of taxes a shareholder would pay on Fund distributions or on the redemption of Fund shares.
The investment return and principal value of an investment will fluctuate and shares, when redeemed, may be worth more or less than their original cost.
Returns would have been lower if Neuberger Berman Investment Advisers LLC ("Management") had not reimbursed certain expenses and/or waived a portion of the investment management fees during certain of the periods shown. Repayment by a class (of expenses previously reimbursed and/or fees previously waived by Management) will decrease the class's returns. Please see Note B in the Notes to Financial Statements for specific information regarding expense reimbursement and/or fee waiver arrangements.
As stated in the Fund's most recent prospectus, the total annual operating expense ratios for fiscal year 2016 were 1.77%, 2.19% and 2.86% for Institutional Class, Class A and Class C shares, respectively (before expense reimbursements and/or fee waivers, if any). The expense ratios were 1.51%, 1.88% and 2.62% for Institutional Class, Class A and Class C shares, respectively, after expense reimbursements and/or fee waivers. The expense ratios for the annual period ended August 31, 2017 can be found in the Financial Highlights section of this report.
Returns shown with a sales charge reflect the deduction of the current maximum initial sales charge of 5.75% for Class A shares and the contingent deferred sales charge (CDSC) for Class C shares. The CDSC for Class C shares is 1.00%, which is reduced to 0% after 1 year. The performance of the Fund's share classes will differ primarily due to different sales charge structures and class expenses. Please see the prospectus for more information about sales charge structures, if any, and class expenses for your share class.
27
Greater China Equity Fund (Unaudited)
COMPARISON OF A $1,000,000 INVESTMENT
(000's Omitted)

This graph shows the change in value of a hypothetical $1,000,000 investment in the Fund over the past 10 fiscal years, or since the Fund's inception if it has not operated for 10 years. The graph is based on the Institutional Class shares only; the performance of the Fund's share classes will differ primarily due to different sales charge structures and class expenses (see Performance Highlights chart on previous page). The result is compared with benchmarks, which include a broad-based market index and may include a more narrowly based index. Market indices have not been reduced to reflect any of the fees and costs of investing. The results shown in the graph reflect the reinvestment of income dividends and other distributions, if any. The results do not reflect the effect of taxes a shareholder would pay on Fund distributions or on the redemption of Fund shares. Results represent past performance and do not indicate future results.
28
Guardian Fund Commentary (Unaudited)
Neuberger Berman Guardian Fund Investor Class generated a 17.60% total return for the fiscal year ended August 31, 2017, outperforming the 16.23% return of its benchmark, the S&P 500® Index (the "Index"), for the same period. (Performance for all share classes is provided in the table immediately following this letter.)
After a volatile start, the U.S. stock market rallied sharply and reached several all-time highs during the reporting period. This turnaround was mainly driven by better-than-expected corporate profits and hopes for improving growth and less regulation under the Trump administration. However, it appears that expectations for significant shifts in fiscal policy have been delayed, or the probability of success has been reduced. Nevertheless, the overall U.S. stock market, as measured by the S&P 500 Index, rose 16.23% for the 12-month period.
The Fund's investments fall into three buckets: Growth, Total Return and Opportunistic. Growth companies are those companies that have been growing their revenues and, as they do so, generate free cash flow that have been reinvested in the business at what we identify as attractive risk-adjusted returns. Total Return investments have demonstrated sustainable and/or growing streams of income that are underpinned by asset value and which may result in growing cash returns to shareholders (e.g., increased dividends, share repurchases, return of capital). Finally, Opportunistic investments are those where we find identifiable catalysts. This bucket may include companies with management changes, company reorganizations, merger and acquisition activity, "hidden assets," or other market dislocations that have the potential to unlock intrinsic value.1
Stock selection, overall, drove the Fund's outperformance during the period. In particular, stock selection in the Telecommunication Services, Industrials and Utilities sectors were the most beneficial for relative performance. Conversely, holdings in the Health Care, Materials and Financials sectors were the largest detractors from results.
Sector allocation was a modest headwind for performance during the period. This was primarily driven by an underweight to Information Technology and overweight to Consumer Staples, on average during the fiscal period. The Fund's modest cash position was also a headwind for results. Conversely, underweights to Real Estate, Health Care and Energy contributed to results from a sector allocation perspective during the period.
The Fund's aggregate use of purchased and written options contributed positively to performance during the period.
We remain mindful that our constructive view for U.S. equities is not without risks. Despite generally positive U.S. and global economic data, the shift in policy from a highly transparent Federal Reserve to hazy fiscal policy presents potential for headline risks and spikes in volatility. There may be a disconnect between policy, rhetoric and implementation. We will be closely watching the Trump administration's actions on global trade as protectionist policies may impede economic growth or spur a trade war, both of which would hurt risk assets. Ultimately, we remain vigilant and continue to monitor key data points as we assess whether any geopolitical disruption, however small, could spill over into global markets.
Sincerely,
CHARLES KANTOR
PORTFOLIO MANAGER
1 Intrinsic value reflects the portfolio management team's analysis and estimates of a company's value. There is no guarantee that any intrinsic values will be realized; security prices may decrease regardless of intrinsic values.
Information about principal risks of investing in the Fund is set forth in the prospectus and statement of additional information.
The portfolio composition, industries and holdings of the Fund are subject to change without notice.
The opinions expressed are those of the Fund's portfolio manager. The opinions are as of the date of this report and are subject to change without notice.
29
Guardian Fund (Unaudited)
TICKER SYMBOLS
Investor Class | | NGUAX | |
Trust Class | | NBGTX | |
Advisor Class | | NBGUX | |
Institutional Class | | NGDLX | |
Class A | | NGDAX | |
Class C | | NGDCX | |
Class R3 | | NGDRX | |
SECTOR ALLOCATION
(as a % of Total Investments*) | |
Consumer Discretionary | | | 16.1 | % | |
Consumer Staples | | | 7.1 | | |
Energy | | | 5.5 | | |
Financials | | | 9.3 | | |
Health Care | | | 12.6 | | |
Industrials | | | 17.3 | | |
Information Technology | | | 22.5 | | |
Materials | | | 2.5 | | |
Real Estate | | | 1.8 | | |
Utilities | | | 4.4 | | |
Short-Term Investment | | | 0.9 | | |
Options Purchased | | | 0.0 | | |
Total | | | 100.0 | % | |
* Derivatives (other than options purchased), if any, are excluded from this chart.
PERFORMANCE HIGHLIGHTS7,11
| | | | | Average Annual Total
Return Ended 08/31/2017 | |
| | | Inception
Date | | 1 Year | | 5 Years | | 10 Years | | Life of
Fund | |
At NAV | |
Investor Class | | 06/01/1950 | | | 17.60 | % | | | 13.05 | % | | | 6.88 | % | | | 11.06 | % | |
| Trust Class3 | | 08/03/1993 | | | 17.37 | % | | | 12.86 | % | | | 6.70 | % | | | 11.01 | % | |
| Advisor Class4 | | 09/03/1996 | | | 17.26 | % | | | 12.51 | % | | | 6.32 | % | | | 10.87 | % | |
| Institutional Class5 | | 05/27/2009 | | | 17.72 | % | | | 13.25 | % | | | 7.04 | % | | | 11.09 | % | |
| Class A19 | | 05/27/2009 | | | 17.28 | % | | | 12.84 | % | | | 6.72 | % | | | 11.04 | % | |
| Class C19 | | 05/27/2009 | | | 16.53 | % | | | 12.00 | % | | | 6.06 | % | | | 10.94 | % | |
| Class R316 | | 05/27/2009 | | | 17.02 | % | | | 12.53 | % | | | 6.49 | % | | | 11.00 | % | |
With Sales Charge | |
| Class A19 | | | | | | | 10.54 | % | | | 11.51 | % | | | 6.09 | % | | | 10.94 | % | |
| Class C19 | | | | | | | 15.53 | % | | | 12.00 | % | | | 6.06 | % | | | 10.94 | % | |
Index | |
| S&P 500® Index1,15 | | | | | | | 16.23 | % | | | 14.34 | % | | | 7.61 | % | | | 11.14 | % | |
The performance data quoted represent past performance and do not indicate future results. Current performance may be lower or higher than the performance data quoted. For performance data current to the most recent month-end, please visit www.nb.com/performance.
The results shown in the table reflect the reinvestment of income dividends and other distributions, if any. The results do not reflect the effect of taxes a shareholder would pay on Fund distributions or on the redemption of Fund shares.
The investment return and principal value of an investment will fluctuate and shares, when redeemed, may be worth more or less than their original cost.
Returns would have been lower if Neuberger Berman Investment Advisers LLC ("Management") had not reimbursed certain expenses and/or waived a portion of the investment management fees during certain of the periods shown. Repayment by a class (of expenses previously reimbursed and/or fees previously waived by Management) will decrease the class's returns. Please see Note B in the Notes to Financial Statements for specific information regarding expense reimbursement and/or fee waiver arrangements.
As stated in the Fund's most recent prospectus, the total annual operating expense ratios for fiscal year 2016 were 0.93%, 1.08%, 1.31%, 0.73%, 1.08%, 1.86% and 1.40% for Investor Class, Trust Class, Advisor Class, Institutional Class, Class A, Class C and Class R3 shares, respectively (before expense reimbursements and/or fee waivers, if any). The expense ratio of the Class R3 shares was 1.37% after expense reimbursements and/or fee waivers. The total annual operating expense ratio for Advisor Class includes the class' repayment of expenses previously reimbursed and/or fees previously waived by Management. The expense ratios for the annual period ended August 31, 2017 can be found in the Financial Highlights section of this report.
Returns shown with a sales charge reflect the deduction of the current maximum initial sales charge of 5.75% for Class A shares and the contingent deferred sales charge (CDSC) for Class C shares. The CDSC for Class C shares is 1.00%, which is reduced to 0% after 1 year. The performance of the Fund's share classes will differ primarily due to different sales charge structures and class expenses. Please see the prospectus for more information about sales charge structures, if any, and class expenses for your share class.
30
Guardian Fund (Unaudited)
COMPARISON OF A $10,000 INVESTMENT

This graph shows the change in value of a hypothetical $10,000 investment in the Fund over the past 10 fiscal years, or since the Fund's inception if it has not operated for 10 years. The graph is based on the Investor Class shares only; the performance of the Fund's share classes will differ primarily due to different sales charge structures and class expenses (see Performance Highlights chart on previous page). The result is compared with benchmarks, which include a broad-based market index and may include a more narrowly based index. Market indices have not been reduced to reflect any of the fees and costs of investing. The results shown in the graph reflect the reinvestment of income dividends and other distributions, if any. The results do not reflect the effect of taxes a shareholder would pay on Fund distributions or on the redemption of Fund shares. Results represent past performance and do not indicate future results.
31
International Equity Fund Commentary (Unaudited)
Neuberger Berman International Equity Fund Institutional Class generated a total return of 15.82% for the fiscal year ended August 31, 2017, trailing its benchmark, the MSCI EAFE® Index (Net) (the "Index"), which provided a 17.64% return for the same period. (Performance for all share classes is provided in the table immediately following this letter.)
What began as a period of high volatility in international equity markets early this fiscal year slowly gave way to a period of steadily rising returns in calendar 2017. Early on, fears about a potential slowing in global economic growth—stemming primarily from U.S. election rhetoric and the likelihood of protectionist policy from the largest global economy—had ratcheted volatility upward. As the period continued, however, markets rebounded on strong corporate earnings and evidence of continued global economic growth in the U.S., UK, Eurozone, and Japan—and declining concerns over European elections and the shift toward tighter central bank policy.
Compared to the Index as a whole, Information Technology (IT), Materials, and Financials stocks outperformed, benefiting from a rotation toward cyclical stocks that began in late 2016. While all sectors saw positive results, Telecommunication Services, Health Care, and Real Estate lagged. Individually, Austria, Italy, and Spain saw the strongest returns within the Index. Weaker markets included Israel and New Zealand, both showing losses for the year, and Ireland.
The Fund benefited from strong stock selection within the Health Care, Consumer Discretionary, and IT sectors. Allocation decisions were generally additive, with an overweight to IT another significant positive for relative performance. By country, Swiss, UK-based, and French holdings contributed the most.
Standout contributors for the period included Alibaba, the Chinese e-commerce giant, which raised future revenue expectations; Keyence, the Japanese factory automation equipment supplier, which reported stronger-than-expected sales growth; and Dutch semiconductor specialist ASML, which benefited from solid earnings announcements.
Stock selection detracted from relative results within Energy, Telecommunication Services and Consumer Staples, but in each case, an underweight helped limit the effect. By country, the Fund's Canadian, German and French holdings underperformed.
Among individual detractors, Peyto, the Canadian dry-gas producer suffered as gas prices remained weak due to the mild winter, which left the firm vulnerable to a less profitable outlook if they could not cut costs. Home Capital, the Canadian specialty mortgage lender, struggled with regulatory and, ultimately, liquidity issues. A change of management and an investment from Berkshire Hathaway helped the shares rebound somewhat. Bezeq, the Israeli telecom, was held back by regulatory uncertainty. We exited all three positions.
Looking ahead, we believe political risk is subsiding in the Eurozone and the European economic recovery is gathering momentum. Equity markets have reacted very positively so far in 2017. In our opinion, while valuations do not look particularly cheap, they do look reasonable relative to U.S. peers. After several years of lackluster earnings, we believe we are beginning to see the signs of a significant rebound in European profits.
Given our efforts to achieve a lower risk profile of the portfolio relative to the Index, we are pleased with the portfolio's performance, especially within the fast-rising market year-to-date. We continue to look for opportunities across countries, sectors and the market cap spectrum.
Given higher overall valuations, we must retain discipline around the prices we are paying for stocks. However, we continue to find companies that have had attractive secular growth drivers, stable demand and profit profiles, and proven management teams, that appear to us to be underappreciated and that we believe offer investors attractive risk/return characteristics.
Sincerely,
BENJAMIN SEGAL
PORTFOLIO MANAGER
Information about principal risks of investing in the Fund is set forth in the prospectus and statement of additional information.
The portfolio composition, industries and holdings of the Fund are subject to change without notice.
The opinions expressed are those of the Fund's portfolio manager. The opinions are as of the date of this report and are subject to change without notice.
32
International Equity Fund (Unaudited)
TICKER SYMBOLS
Investor Class | | NIQVX | |
Trust Class | | NIQTX | |
Institutional Class | | NBIIX | |
Class A | | NIQAX | |
Class C | | NIQCX | |
Class R6 | | NRIQX | |
PERFORMANCE HIGHLIGHTS7
| | | | | Average Annual Total
Return Ended 08/31/2017 | |
| | | Inception
Date | | 1 Year | | 5 Years | | 10 Years | | Life of
Fund | |
At NAV | |
| Investor Class12 | | 01/28/2013 | | | 15.97 | % | | | 8.28 | % | | | 2.33 | % | | | 5.38 | % | |
| Trust Class12 | | 01/28/2013 | | | 15.92 | % | | | 8.22 | % | | | 2.30 | % | | | 5.36 | % | |
Institutional Class | | 06/17/2005 | | | 15.82 | % | | | 8.42 | % | | | 2.39 | % | | | 5.44 | % | |
| Class A12 | | 01/28/2013 | | | 15.32 | % | | | 8.04 | % | | | 2.22 | % | | | 5.29 | % | |
| Class C12 | | 01/28/2013 | | | 14.48 | % | | | 7.29 | % | | | 1.86 | % | | | 4.99 | % | |
| Class R622 | | 09/03/2013 | | | 15.85 | % | | | 8.49 | % | | | 2.43 | % | | | 5.46 | % | |
With Sales Charge | |
| Class A12 | | | | | | | 8.68 | % | | | 6.77 | % | | | 1.61 | % | | | 4.78 | % | |
| Class C12 | | | | | | | 13.48 | % | | | 7.29 | % | | | 1.86 | % | | | 4.99 | % | |
Index | |
| MSCI EAFE® Index (Net)1,15 | | | | | | | 17.64 | % | | | 8.48 | % | | | 1.62 | % | | | 5.10 | % | |
| MSCI EAFE® Index1,15 | | | | | | | 18.19 | % | | | 8.97 | % | | | 2.10 | % | | | 5.58 | % | |
The performance data quoted represent past performance and do not indicate future results. Current performance may be lower or higher than the performance data quoted. For performance data current to the most recent month-end, please visit www.nb.com/performance.
The results shown in the table reflect the reinvestment of income dividends and other distributions, if any. The results do not reflect the effect of taxes a shareholder would pay on Fund distributions or on the redemption of Fund shares.
The investment return and principal value of an investment will fluctuate and shares, when redeemed, may be worth more or less than their original cost.
Returns would have been lower if Neuberger Berman Investment Advisers LLC ("Management") had not reimbursed certain expenses and/or waived a portion of the investment management fees during certain of the periods shown. Repayment by a class (of expenses previously reimbursed and/or fees previously waived by Management) will decrease the class's returns. Please see Note B in the Notes to Financial Statements for specific information regarding expense reimbursement and/or fee waiver arrangements.
As stated in the Fund's most recent prospectus, the total annual operating expense ratios for fiscal year 2016 were 1.26%, 1.30%, 1.04%, 1.40%, 2.15% and 0.96% for Investor Class, Trust Class, Institutional Class, Class A, Class C and Class R6 shares, respectively (before expense reimbursements and/or fee waivers, if any). The expense ratios were 0.86%, 1.22%, 1.97% and 0.78% for Institutional Class, Class A, Class C and Class R6 shares, respectively, after expense reimbursements and/or fee waivers. The expense ratios for the annual period ended August 31, 2017 can be found in the Financial Highlights section of this report.
Returns shown with a sales charge reflect the deduction of the current maximum initial sales charge of 5.75% for Class A shares and the contingent deferred sales charge (CDSC) for Class C shares. The CDSC for Class C shares is 1.00%, which is reduced to 0% after 1 year. The performance of the Fund's share classes will differ primarily due to different sales charge structures and class expenses. Please see the prospectus for more information about sales charge structures, if any, and class expenses for your share class.
33
International Equity Fund (Unaudited)
COMPARISON OF A $1,000,000 INVESTMENT
(000's Omitted)

This graph shows the change in value of a hypothetical $1,000,000 investment in the Fund over the past 10 fiscal years, or since the Fund's inception if it has not operated for 10 years. The graph is based on the Institutional Class shares only; the performance of the Fund's share classes will differ primarily due to different sales charge structures and class expenses (see Performance Highlights chart on previous page). The result is compared with benchmarks, which include a broad-based market index and may include a more narrowly based index. Market indices have not been reduced to reflect any of the fees and costs of investing. The results shown in the graph reflect the reinvestment of income dividends and other distributions, if any. The results do not reflect the effect of taxes a shareholder would pay on Fund distributions or on the redemption of Fund shares. Results represent past performance and do not indicate future results.
34
International Select Fund Commentary (Unaudited)
Neuberger Berman International Select Fund Trust Class generated a total return of 15.57% for the fiscal year ended August 31, 2017, trailing its benchmark, the MSCI EAFE® Index (Net) (the "Index"), which provided a 17.64% return for the same period. (Performance for all share classes is provided in the table immediately following this letter.)
What began as a period of high volatility in international equity markets early this fiscal year slowly gave way to a period of steadily rising returns in calendar 2017. Early on, fears about a potential slowing in global economic growth—stemming primarily from U.S. election rhetoric and the likelihood of protectionist policy from the largest global economy—had ratcheted volatility upward. As the period continued, however, markets rebounded on strong corporate earnings and evidence of continued global economic growth in the U.S., UK, Eurozone, and Japan—and declining concerns over European elections and the shift toward tighter central bank policy.
Compared to the Index as a whole, Information Technology (IT), Materials, and Financials stocks outperformed, benefiting from a rotation toward cyclical stocks that began in late 2016. While all sectors saw positive results, Telecommunication Services, Health Care, and Real Estate lagged. Individually, Austria, Italy, and Spain saw the strongest returns within the Index. Weaker markets included Israel and New Zealand, both showing losses for the year, and Ireland.
The Fund benefited most from strong stock selection and an overweight in IT. Stock selection was also beneficial within the Health Care and Consumer Discretionary sectors. Underweights to the relatively weak Consumer Staples and Real Estate sectors also helped. By country, French, Japanese, and Swiss names added most.
Standout contributors for the period included Alibaba, the Chinese e-commerce giant, which raised future revenue expectations; Dutch semiconductor specialist ASML, which benefited from solid earnings announcements; and Keyence, the Japanese factory automation equipment supplier, which reported stronger-than-expected sales growth.
Stock selection and an overweight to Industrials detracted most from relative performance. Selection within Materials and Energy also detracted. By country, Canadian, German and Norwegian names underperformed.
Among individual detractors, Peyto, the Canadian dry-gas producer suffered as gas prices remained weak due to the mild winter, which left the firm vulnerable to a less profitable outlook if they could not cut costs. Teva, the Israeli pharmaceuticals manufacturer, was hurt by a mixture of continued price pressure, change of management and lowered forward guidance. The Fund exited positions in Teva and Peyto.
Looking ahead, we believe political risk is subsiding in the Eurozone and the European economic recovery is gathering momentum. Equity markets have reacted very positively so far in 2017. In our opinion, while valuations do not look particularly cheap, they do look reasonable relative to U.S. peers. After several years of lackluster earnings, we believe we are beginning to see the signs of a significant rebound in European profits.
Given our efforts to achieve a lower risk profile of the portfolio relative to the Index, we are pleased with the portfolio's performance, especially within the fast-rising market year-to-date. We continue to look for opportunities across countries, sectors and industries.
Given higher overall valuations, we must retain discipline around the prices we are paying for stocks. However, we continue to find companies that have had attractive secular growth drivers, stable demand and profit profiles, and proven management teams, that appear to us to be underappreciated and that we believe offer investors attractive risk/return characteristics.
Sincerely,
BENJAMIN SEGAL
PORTFOLIO MANAGER
Information about principal risks of investing in the Fund is set forth in the prospectus and statement of additional information.
The portfolio composition, industries and holdings of the Fund are subject to change without notice.
The opinions expressed are those of the Fund's portfolio manager. The opinions are as of the date of this report and are subject to change without notice.
35
International Select Fund (Unaudited)
TICKER SYMBOLS
Trust Class | | NILTX | |
Institutional Class | | NILIX | |
Class A | | NBNAX | |
Class C | | NBNCX | |
Class R3 | | NBNRX | |
Class R6 | | NRILX | |
PERFORMANCE HIGHLIGHTS7
| | | | | Average Annual Total
Return Ended 08/31/2017 | |
| | | Inception
Date | | 1 Year | | 5 Years | | 10 Years | | Life of
Fund | |
At NAV | |
Trust Class | | 08/01/2006 | | | 15.57 | % | | | 7.45 | % | | | 1.94 | % | | | 3.55 | % | |
| Institutional Class6 | | 10/06/2006 | | | 16.13 | % | | | 7.83 | % | | | 2.31 | % | | | 3.91 | % | |
| Class A14 | | 12/20/2007 | | | 15.60 | % | | | 7.44 | % | | | 1.95 | % | | | 3.56 | % | |
| Class C14 | | 12/20/2007 | | | 14.70 | % | | | 6.63 | % | | | 1.21 | % | | | 2.88 | % | |
| Class R314 | | 05/27/2009 | | | 15.26 | % | | | 7.16 | % | | | 1.72 | % | | | 3.35 | % | |
| Class R624 | | 04/17/2017 | | | 15.79 | % | | | 7.49 | % | | | 1.96 | % | | | 3.57 | % | |
With Sales Charge | |
| Class A14 | | | | | | | 8.95 | % | | | 6.18 | % | | | 1.35 | % | | | 3.01 | % | |
| Class C14 | | | | | | | 13.70 | % | | | 6.63 | % | | | 1.21 | % | | | 2.88 | % | |
Index | |
| MSCI EAFE® Index (Net)1,15 | | | | | | | 17.64 | % | | | 8.48 | % | | | 1.62 | % | | | 3.29 | % | |
| MSCI EAFE® Index1,15 | | | | | | | 18.19 | % | | | 8.97 | % | | | 2.10 | % | | | 3.77 | % | |
The performance data quoted represent past performance and do not indicate future results. Current performance may be lower or higher than the performance data quoted. For performance data current to the most recent month-end, please visit www.nb.com/performance.
The results shown in the table reflect the reinvestment of income dividends and other distributions, if any. The results do not reflect the effect of taxes a shareholder would pay on Fund distributions or on the redemption of Fund shares.
The investment return and principal value of an investment will fluctuate and shares, when redeemed, may be worth more or less than their original cost.
Returns would have been lower if Neuberger Berman Investment Advisers LLC ("Management") had not reimbursed certain expenses and/or waived a portion of the investment management fees during certain of the periods shown. Repayment by a class (of expenses previously reimbursed and/or fees previously waived by Management) will decrease the class's returns. Please see Note B in the Notes to Financial Statements for specific information regarding expense reimbursement and/or fee waiver arrangements.
As stated in the Fund's most recent prospectus, the total annual operating expense ratios for fiscal year 2016 were 1.39%, 0.95%, 1.33%, 2.06% and 1.57% for Trust Class, Institutional Class, Class A, Class C and Class R3 shares, respectively, and the estimated total annual operating expense ratio for fiscal year 2017 is 0.87% for Class R6 (before expense reimbursements and/or fee waivers, if any). The expense ratios were 1.15%, 0.80%, 1.16%, 1.91% and1.41% for Trust Class, Institutional Class, Class A, Class C and Class R3 shares, respectively, and the estimated total annual operating expense ratio for fiscal year 2017 is 0.73% for Class R6 after expense reimbursements and/or fee waivers. The expense ratios for the annual period ended August 31, 2017 can be found in the Financial Highlights section of this report.
Returns shown with a sales charge reflect the deduction of the current maximum initial sales charge of 5.75% for Class A shares and the contingent deferred sales charge (CDSC) for Class C shares. The CDSC for Class C shares is 1.00%, which is reduced to 0% after 1 year. The performance of the Fund's share classes will differ primarily due to different sales charge structures and class expenses. Please see the prospectus for more information about sales charge structures, if any, and class expenses for your share class.
36
International Select Fund (Unaudited)
COMPARISON OF A $10,000 INVESTMENT

This graph shows the change in value of a hypothetical $10,000 investment in the Fund over the past 10 fiscal years, or since the Fund's inception if it has not operated for 10 years. The graph is based on the Trust Class shares only; the performance of the Fund's share classes will differ primarily due to different sales charge structures and class expenses (see Performance Highlights chart on previous page). The result is compared with benchmarks, which include a broad-based market index and may include a more narrowly based index. Market indices have not been reduced to reflect any of the fees and costs of investing. The results shown in the graph reflect the reinvestment of income dividends and other distributions, if any. The results do not reflect the effect of taxes a shareholder would pay on Fund distributions or on the redemption of Fund shares. Results represent past performance and do not indicate future results.
37
International Small Cap Fund Commentary (Unaudited)
From its inception, December 8, 2016, through the close of the fiscal period ended August 31, 2017, Neuberger Berman International Small Cap Fund Institutional Class generated a total return of 27.40%, outperforming its benchmark, the MSCI EAFE® Small Cap Index (Net) (the "Index"), which provided a 23.53% return for the same period. (Performance for all share classes is provided in the table immediately following this letter.)
Designed to capitalize on the value inherent in stocks of smaller and often under-researched companies within developed international economies, the Fund is managed from the bottom up. Its management team focuses on company and stock fundamentals, with a strong emphasis on quality.
Looking at the market, U.S. election-related fears raised volatility during the early part of this period—with worries about trade protectionism and nationalism, both of which bode poorly for global economic growth. However, as 2017 began, the growth outlook improved, notably in Europe, which allowed a shift from volatility to a period of steadily rising returns. Small cap stocks outperformed their larger cap counterparts this period as the focus returned to domestic growth prospects.
All sectors within the Index posted positive results this period except Energy, with Utilities, Information Technology and Telecommunication Services outperforming the Index as a whole. In addition to Energy, Real Estate and Consumer Discretionary stocks, though posting double-digit returns, underperformed the Index. By country, Denmark, Italy and Germany were among the top performers, while Hong Kong, Norway, and Singapore lagged the Index.
The Fund outperformed the Index primarily on the basis of strong stock selection. Stock selection was especially advantageous within Industrials, Consumer Discretionary, and Financials. By country, stocks from Japan, the UK and Germany outperformed.
Top individual contributors this period included Daifuku, a Japanese automation specialist, which reported strong revenue and earnings growth; Trigano, a French recreational vehicle maker, which continued to consolidate the European market and benefited from an improving economy; and Jenoptik, a German industrial optics company, which benefited from solid results.
Holdings in Energy, Health Care, and Materials detracted somewhat from relative results, and by country, allocations to Austria, Belgium, and Switzerland underperformed. Individual detractors included Canada's Raging River Exploration, which suffered as oil prices weakened, and was sold; Ion Beam Applications, a Belgium-based medical technology company, which lowered sales and margin guidance due to project delays and increased competition; and Ichigo, a Japanese real estate investment trust, which reported soft results.
Looking ahead, we believe political risk is subsiding in the Eurozone and the European economic recovery is gathering momentum. Equity markets have reacted very positively so far in 2017. In our opinion, while valuations do not seem particularly cheap, they do seem reasonable relative to U.S. peers. After several years of lackluster earnings, we believe we are beginning to see the signs of a significant rebound in European profits.
Given our efforts to achieve a lower risk profile of the Fund relative to the Index, we are pleased with the Fund's performance, especially within the fast-rising market year-to-date. We continue to look for opportunities across countries, sectors and the market cap spectrum.
Given higher overall valuations, we must retain discipline around the prices we are paying for stocks. However, we continue to find companies that have had attractive secular growth drivers, stable demand and profit profiles, and proven management teams, that appear to us to be underappreciated and that we believe offer investors attractive risk/return characteristics.
38
Sincerely,
BENJAMIN SEGAL AND DAVID BUNAN
CO-PORTFOLIO MANAGERS
Information about principal risks of investing in the Fund is set forth in the prospectus and statement of additional information.
The portfolio composition, industries and holdings of the Fund are subject to change without notice.
The opinions expressed are those of the Fund's portfolio managers. The opinions are as of the date of this report and are subject to change without notice.
39
International Small Cap Fund (Unaudited)
TICKER SYMBOLS
Institutional Class | | NIOIX | |
Class A | | NIOAX | |
Class C | | NIOCX | |
Class R6 | | NIORX | |
PERFORMANCE HIGHLIGHTS9
| | | Inception
Date | | Cumulative Total
Return Ended
08/31/2017
Life of Fund | |
At NAV | |
Institutional Class | | 12/08/2016 | | | 27.40 | % | |
Class A | | 12/08/2016 | | | 27.00 | % | |
Class C | | 12/08/2016 | | | 26.30 | % | |
Class R6 | | 12/08/2016 | | | 27.40 | % | |
With Sales Charge | |
Class A | | | | | | | 19.70 | % | |
Class C | | | | | | | 25.30 | % | |
Index | |
| MSCI EAFE® Small Cap Index (Net)1,15 | | | | | | | 23.53 | % | |
The performance data quoted represent past performance and do not indicate future results. Current performance may be lower or higher than the performance data quoted. For performance data current to the most recent month-end, please visit www.nb.com/performance.
The results shown in the table reflect the reinvestment of income dividends and other distributions, if any. The results do not reflect the effect of taxes a shareholder would pay on Fund distributions or on the redemption of Fund shares.
The investment return and principal value of an investment will fluctuate and shares, when redeemed, may be worth more or less than their original cost.
Returns would have been lower if Neuberger Berman Investment Advisers LLC ("Management") had not reimbursed certain expenses and/or waived a portion of the investment management fees during certain of the periods shown. Repayment by a class (of expenses previously reimbursed and/or fees previously waived by Management) will decrease the class's returns. Please see Note B in the Notes to Financial Statements for specific information regarding expense reimbursement and/or fee waiver arrangements.
As stated in the Fund's most recent prospectus, the estimated total annual operating expense ratios for fiscal year 2017 are 2.57%, 2.93%, 3.68% and 2.50% for Institutional Class, Class A, Class C and Class R6 shares, respectively (before expense reimbursements and/or fee waivers, if any). The estimated expense ratios are 1.06%, 1.42%, 2.17% and 0.99% for Institutional Class, Class A, Class C and Class R6 shares, respectively, after expense reimbursements and/or fee waivers. The expense ratios for the period from December 8, 2016 through August 31, 2017 can be found in the Financial Highlights section of this report.
Returns shown with a sales charge reflect the deduction of the current maximum initial sales charge of 5.75% for Class A shares and the contingent deferred sales charge (CDSC) for Class C shares. The CDSC for Class C shares is 1.00%, which is reduced to 0% after 1 year. The performance of the Fund's share classes will differ primarily due to different sales charge structures and class expenses. Please see the prospectus for more information about sales charge structures, if any, and class expenses for your share class.
40
International Small Cap Fund (Unaudited)
COMPARISON OF A $1,000,000 INVESTMENT
(000's Omitted)

This graph shows the change in value of a hypothetical $1,000,000 investment in the Fund over the past 10 fiscal years, or since the Fund's inception if it has not operated for 10 years. The graph is based on the Institutional Class shares only; the performance of the Fund's share classes will differ primarily due to different sales charge structures and class expenses (see Performance Highlights chart on previous page). The result is compared with benchmarks, which include a broad-based market index and may include a more narrowly based index. Market indices have not been reduced to reflect any of the fees and costs of investing. The results shown in the graph reflect the reinvestment of income dividends and other distributions, if any. The results do not reflect the effect of taxes a shareholder would pay on Fund distributions or on the redemption of Fund shares. Results represent past performance and do not indicate future results.
41
Intrinsic Value Fund Commentary (Unaudited)
Neuberger Berman Intrinsic Value Fund Institutional Class generated a 16.59% total return for the fiscal year ended August 31, 2017 outperforming its benchmark, Russell 2000® Value Index (the "Index"), which returned 13.47% for the same period. (Performance for all share classes is provided in the table immediately following this letter.)
In our opinion, two thoughts seem to be gaining credibility with investors. First, the broader legislative agenda of the Republican administration is at risk and second, in broad measures, the world economy is improving. Against this backdrop it is not surprising that companies and sectors positioned to benefit from global growth outpaced domestically focused companies. Larger cap and growth indices with greater exposure to Technology and Health Care companies outperformed this fiscal year. The Fund, with a significant overweight in Technology, a market capitalization much larger than the Index and a relatively high percentage of its revenues derived from overseas, benefitted from these themes, making up much of the relative performance ground lost to last year's "Trump trade," which favored small domestic financials.
As discussed in our previous communication, many of the trends that led to the Fund's underperformance in 2016 helped the Fund in 2017. Financial sector performance remained depressed and our underweight in Financials helped the Fund's relative returns. The Energy sector continued to be plagued by weak oil and gas prices and the Fund benefitted from our minimal commitment to this sector. Many of the Fund's Technology companies, which performed poorly in 2016, rebounded this year. Mercury Systems, a defense electronics company, executed well and recent acquisitions nearly doubled its Radio Frequency and Microwave business. Verint, FormFactor and FireEye were also solid performers. However, a number of the Fund's Technology holdings struggled. KEYW Holding, TiVo and Rambus are a few of the names that seemed a bit out of sync with the Technology recovery this year. KEYW's government Cyber/IT unit was hurt by lack of forward progress on the U.S. government budget. Investors remain concerned about TiVo's legal dispute with Comcast and possible license revenue losses in 2018. Recently Bloomberg reported that Rambus retained advisers to explore strategic options.
The Fund benefitted most from its investments in Producer Durables. Aerovironment, a market leader in the manufacture of small Unmanned Aircraft System vehicles, Spirit AeroSystems, a company engaged in the design and manufacture of commercial aero structures and systems, and Itron, a technology and services company dedicated to the resourceful use of electricity, natural gas, and water, all performed well. Several of the Fund's Health Care investments posted solid absolute and relative gains. Notable contributors for the period were Molina Healthcare where the founding family was fired by their Board, Intersect ENT, whose management continues to execute well in the face of Medicare reimbursement pressure, and Charles River Laboratories, which delivered solid returns and we believe is well positioned to benefit from an anticipated recovery in early stage drug development. There were also some Health Care laggards—Accuray, Fluidigm and Analogic all underperformed.
During the period, a number of companies merged or were acquired. The Fund added new names at a reasonable pace, some in Health Care and Consumer-related sectors, further increasing our commitment to these sectors. Several positions were eliminated.
Despite near-term risks from conflicts in Washington, D.C. regarding a host of issues, the potential for further interest rate hikes, and geopolitical turmoil mainly due to the escalation of tensions with North Korea, we foresee ongoing economic growth and strong corporate earnings that will support a continuing bull market.
We look forward to our next communication and thank you for your commitment to the Fund.
Sincerely,
BENJAMIN H. NAHUM, JAMES F. MCAREE AND AMIT SOLOMON
PORTFOLIO CO-MANAGERS
Information about principal risks of investing in the Fund is set forth in the prospectus and statement of additional information.
The portfolio composition, industries and holdings of the Fund are subject to change without notice.
The opinions expressed are those of the Fund's portfolio managers. The opinions are as of the date of this report and are subject to change without notice.
42
Intrinsic Value Fund (Unaudited)
TICKER SYMBOLS
Institutional Class | | NINLX | |
Class A | | NINAX | |
Class C | | NINCX | |
SECTOR ALLOCATION
(as a % of Total Investments*) | |
Consumer Discretionary | | | 8.1 | % | |
Consumer Staples | | | 1.2 | | |
Energy | | | 0.5 | | |
Financial Services | | | 8.7 | | |
Health Care | | | 13.0 | | |
Materials & Processing | | | 4.1 | | |
Producer Durables | | | 18.9 | | |
Technology | | | 34.9 | | |
Utilities | | | 4.2 | | |
Short-Term Investment | | | 6.4 | | |
Total | | | 100.0 | % | |
* Derivatives (other than options purchased), if any, are excluded from this chart.
PERFORMANCE HIGHLIGHTS
| | | | | Average Annual Total
Return Ended 08/31/2017 | |
| | | Inception
Date* | | 1 Year | | 5 Years | | 10 Years | | Life of
Fund | |
At NAV | |
| Institutional Class18 | | 05/10/2010 | | | 16.59 | % | | | 13.46 | % | | | 7.71 | % | | | 11.22 | % | |
| Class A18 | | 05/10/2010 | | | 16.20 | % | | | 13.07 | % | | | 7.42 | % | | | 11.08 | % | |
| Class C18 | | 05/10/2010 | | | 15.36 | % | | | 12.23 | % | | | 6.85 | % | | | 10.78 | % | |
With Sales Charge | |
| Class A18 | | | | | | | 9.55 | % | | | 11.74 | % | | | 6.79 | % | | | 10.75 | % | |
| Class C18 | | | | | | | 14.36 | % | | | 12.23 | % | | | 6.85 | % | | | 10.78 | % | |
Index | |
| Russell 2000® Value Index1,15 | | | | | | | 13.47 | % | | | 12.51 | % | | | 6.46 | % | | | 8.79 | % | |
| Russell 2000® Index1,15 | | | | | | | 14.91 | % | | | 13.15 | % | | | 7.38 | % | | | 7.89 | % | |
*The inception date for Neuberger Berman Intrinsic Value Fund Institutional Class, Class A, and Class C shares is May 10, 2010. Performance prior to that date is that of the Fund's predecessor, the DJG Small Cap Value Fund L.P., an unregistered limited partnership ("DJG Fund"); DJG Fund was the successor to The DJG Small Cap Value Fund, an unregistered commingled investment account ("DJG Account"), which had similar investment goals, strategies, and portfolio management team. See endnote 18 for more information.
The performance data quoted represent past performance and do not indicate future results. Current performance may be lower or higher than the performance data quoted. For performance data current to the most recent month-end, please visit www.nb.com/performance.
The results shown in the table reflect the reinvestment of income dividends and other distributions, if any. The results do not reflect the effect of taxes a shareholder would pay on Fund distributions or on the redemption of Fund shares.
The investment return and principal value of an investment will fluctuate and shares, when redeemed, may be worth more or less than their original cost.
Returns would have been lower if Neuberger Berman Investment Advisers LLC ("Management") had not reimbursed certain expenses and/or waived a portion of the investment management fees during certain of the periods shown. Repayment by a class (of expenses previously reimbursed and/or fees previously waived by Management) will decrease the class's returns. Please see Note B in the Notes to Financial Statements for specific information regarding expense reimbursement and/or fee waiver arrangements.
As stated in the Fund's most recent prospectus, the total annual operating expense ratios for fiscal year 2016 were 1.09%, 1.49% and 2.21% for Institutional Class, Class A and Class C shares, respectively (before expense reimbursements and/or fee waivers, if any). The expense ratios were 1.01%, 1.37% and 2.12% for Institutional Class, Class A and Class C shares, respectively, after expense reimbursements and/or fee waivers. The expense ratios for the annual period ended August 31, 2017 can be found in the Financial Highlights section of this report.
Returns shown with a sales charge reflect the deduction of the current maximum initial sales charge of 5.75% for Class A shares and the contingent deferred sales charge (CDSC) for Class C shares. The CDSC for Class C shares is 1.00%, which is reduced to 0% after 1 year. The performance of the Fund's share classes will differ primarily due to different sales charge structures and class expenses. Please see the prospectus for more information about sales charge structures, if any, and class expenses for your share class.
43
Intrinsic Value Fund (Unaudited)
COMPARISON OF A $1,000,000 INVESTMENT18
(000's Omitted)
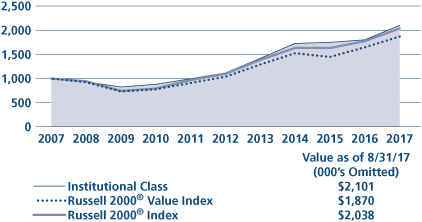
This graph shows the change in value of a hypothetical $1,000,000 investment in the Fund over the past 10 fiscal years, or since the Fund's inception if it has not operated for 10 years. The graph is based on the Institutional Class shares only; the performance of the Fund's share classes will differ primarily due to different sales charge structures and class expenses (see Performance Highlights chart on previous page). The result is compared with benchmarks, which include a broad-based market index and may include a more narrowly based index. Market indices have not been reduced to reflect any of the fees and costs of investing. The results shown in the graph reflect the reinvestment of income dividends and other distributions, if any. The results do not reflect the effect of taxes a shareholder would pay on Fund distributions or on the redemption of Fund shares. Results represent past performance and do not indicate future results.
44
Large Cap Value Fund Commentary (Unaudited)
Neuberger Berman Large Cap Value Fund Investor Class generated a 15.88% total return for the fiscal year ended August 31, 2017, outperforming its benchmark, the Russell 1000® Value Index (the "Index"), which returned 11.58% for the same period. (Performance for all share classes is provided in the table immediately following this letter.)
After a rather choppy start to the fiscal year, the U.S. stock market climbed sharply, propelled by optimism surrounding President Trump's election victory and his pro-business agenda of tax cuts, regulatory easing, and increased infrastructure spending. Rising commodity prices and a steadily improving global economy further bolstered equities and enabled the U.S. Federal Reserve to continue on its path of increasing interest rates. Geopolitical risks caused occasional dips in the market, however, and the post-election tailwind abated as the current administration grappled with internal struggles, fueling skepticism that there would be any meaningful policy changes in the near future. Nonetheless equity indexes continued to reach new heights as investors were enticed by strong corporate earnings against the backdrop of healthy employment levels, low inflation and moderately rising GDP, which fueled expectations for continued profit growth ahead.
Within the Index, sector performance was mixed with Financials generating the strongest returns owing to the anticipated easing of regulations, stable economy and rising interest rates. The favorable macro picture also drove outperformance relative to the overall Index in Materials and Information Technology. The Energy, Real Estate and Telecommunication Services sectors posted negative returns for the period. Energy faltered as oil prices fell and the latter two segments declined in large part due to sector rotation as investors favored other areas of the equity market.
Financials were the largest source of upside to Fund performance relative the Index. Our heavier exposure to banks, including Citigroup, was especially beneficial as the industry continued to soar on expectations of less strict oversight under President Trump as well as the improving macro environment and interest rate increases. Favorable stress test results during the period also lifted these stocks in the latter part of the year. Consumer Staples was another area of relative strength, with the largest boost coming from retailer Wal-Mart, whose stock rose as the company made strategic moves to enhance its business and adapt to the proliferation of online shopping. On the downside, negative stock selection within Health Care hurt relative performance. One weak spot in this area was health care equipment stock Zimmer Biomet Holdings, which declined during the year on disappointing earnings and lowered guidance, as well as the departure of its CEO. Underperformance within Materials was also negative for the Fund on a relative basis due in part to our underweight in the chemicals area, which was a strong component of the Index.
As the equity bull market enters another year, valuations are running high, yet we believe stocks seem poised to appreciate further as corporate earnings growth projections remain strong given the support of steady economic growth, tepid inflation, rising commodity prices and a weak U.S. dollar. Still, we remain cautious in light of the stock market's relentless ascent, which in our view could leave it vulnerable to sharp corrections if earnings expectations are not met or if tighter monetary policy begins to dampen the economy.
Therefore, we continue to explore all areas of the market for price dislocations that we believe could turn into rewarding investment opportunities. Our portfolio construction strategy entails uncovering underappreciated stocks with hidden value that can be realized as specific catalysts play out over time, and we believe that this approach is fundamental to generating favorable returns over the long term.
Sincerely,
ELI M. SALZMANN
PORTFOLIO MANAGER
Information about principal risks of investing in the Fund is set forth in the prospectus and statement of additional information.
The portfolio composition, industries and holdings of the Fund are subject to change without notice.
The opinions expressed are those of the Fund's portfolio manager. The opinions are as of the date of this report and are subject to change without notice.
45
Large Cap Value Fund (Unaudited)
TICKER SYMBOLS
Investor Class | | NPRTX | |
Trust Class | | NBPTX | |
Advisor Class | | NBPBX | |
Institutional Class | | NBPIX | |
Class A | | NPNAX | |
Class C | | NPNCX | |
Class R3 | | NPNRX | |
SECTOR ALLOCATION
(as a % of Total Investments*) | |
Consumer Discretionary | | | 7.9 | % | |
Consumer Staples | | | 11.6 | | |
Energy | | | 9.6 | | |
Financials | | | 19.8 | | |
Health Care | | | 13.3 | | |
Industrials | | | 5.4 | | |
Information Technology | | | 1.8 | | |
Materials | | | 7.6 | | |
Real Estate | | | 0.5 | | |
Telecommunication Services | | | 0.9 | | |
Utilities | | | 5.0 | | |
Short-Term Investment | | | 16.6 | | |
Total | | | 100.0 | % | |
* Derivatives (other than options purchased), if any, are excluded from this chart.
PERFORMANCE HIGHLIGHTS7
| | | | | Average Annual Total
Return Ended 08/31/2017 | |
| | | Inception
Date | | 1 Year | | 5 Years | | 10 Years | | Life of
Fund | |
At NAV | |
Investor Class | | 01/20/19752 | | | 15.88 | % | | | 13.28 | % | | | 5.18 | % | | | 12.54 | % | |
| Trust Class3 | | 08/30/1993 | | | 15.77 | % | | | 13.08 | % | | | 5.00 | % | | | 12.46 | % | |
| Advisor Class4 | | 08/16/1996 | | | 15.51 | % | | | 12.89 | % | | | 4.83 | % | | | 12.32 | % | |
| Institutional Class5 | | 06/07/2006 | | | 16.04 | % | | | 13.47 | % | | | 5.36 | % | | | 12.59 | % | |
| Class A19 | | 06/21/2010 | | | 15.65 | % | | | 13.02 | % | | | 5.01 | % | | | 12.50 | % | |
| Class C19 | | 06/21/2010 | | | 14.84 | % | | | 12.20 | % | | | 4.45 | % | | | 12.36 | % | |
| Class R316 | | 06/21/2010 | | | 15.27 | % | | | 12.72 | % | | | 4.81 | % | | | 12.45 | % | |
With Sales Charge | |
| Class A19 | | | | | | | 9.00 | % | | | 11.70 | % | | | 4.39 | % | | | 12.34 | % | |
| Class C19 | | | | | | | 13.84 | % | | | 12.20 | % | | | 4.45 | % | | | 12.36 | % | |
Index | |
| Russell 1000® Value Index1,15 | | | | | | | 11.58 | % | | | 13.25 | % | | | 5.96 | % | | | N/A | | |
The performance data quoted represent past performance and do not indicate future results. Current performance may be lower or higher than the performance data quoted. For performance data current to the most recent month-end, please visit www.nb.com/performance.
The results shown in the table reflect the reinvestment of income dividends and other distributions, if any. The results do not reflect the effect of taxes a shareholder would pay on Fund distributions or on the redemption of Fund shares.
The investment return and principal value of an investment will fluctuate and shares, when redeemed, may be worth more or less than their original cost.
Returns would have been lower if Neuberger Berman Investment Advisers LLC ("Management") had not reimbursed certain expenses and/or waived a portion of the investment management fees during certain of the periods shown. Repayment by a class (of expenses previously reimbursed and/or fees previously waived by Management) will decrease the class's returns. Please see Note B in the Notes to Financial Statements for specific information regarding expense reimbursement and/or fee waiver arrangements.
As stated in the Fund's most recent prospectus, the total annual operating expense ratios for fiscal year 2016 were 0.90%, 1.07%, 1.22%, 0.71%, 1.09%, 1.83% and 1.55% for Investor Class, Trust Class, Advisor Class, Institutional Class, Class A, Class C and Class R3 shares, respectively (before expense reimbursements and/or fee waivers, if any). The expense ratios were 0.70% and 1.37% for Institutional Class and Class R3 shares, respectively, after expense reimbursements and/or fee waivers. The expense ratios for the annual period ended August 31, 2017 can be found in the Financial Highlights section of this report.
Returns shown with a sales charge reflect the deduction of the current maximum initial sales charge of 5.75% for Class A shares and the contingent deferred sales charge (CDSC) for Class C shares. The CDSC for Class C shares is 1.00%, which is reduced to 0% after 1 year. The performance of the Fund's share classes will differ primarily due to different sales charge structures and class expenses. Please see the prospectus for more information about sales charge structures, if any, and class expenses for your share class.
46
Large Cap Value Fund (Unaudited)
COMPARISON OF A $10,000 INVESTMENT

This graph shows the change in value of a hypothetical $10,000 investment in the Fund over the past 10 fiscal years, or since the Fund's inception if it has not operated for 10 years. The graph is based on the Investor Class shares only; the performance of the Fund's share classes will differ primarily due to different sales charge structures and class expenses (see Performance Highlights chart on previous page). The result is compared with benchmarks, which include a broad-based market index and may include a more narrowly based index. Market indices have not been reduced to reflect any of the fees and costs of investing. The results shown in the graph reflect the reinvestment of income dividends and other distributions, if any. The results do not reflect the effect of taxes a shareholder would pay on Fund distributions or on the redemption of Fund shares. Results represent past performance and do not indicate future results.
47
Mid Cap Growth Fund Commentary (Unaudited)
Neuberger Berman Mid Cap Growth Fund Investor Class generated a 15.80% total return for the fiscal year ended August 31, 2017, outperforming its benchmark, the Russell Midcap® Growth Index (the "Index"), which returned 14.52% for the same period. (Performance for all share classes is provided in the table immediately following this letter.)
Over the 12-month reporting period, the highly resilient U.S. market continued its upward trajectory, but not without challenges to that positive momentum. Whether it was the fluctuating volatility associated with oil prices, the U.S. dollar and economic news out of China, nuclear gamesmanship on the Korean peninsula or the stunning outcome of a highly cynical and nationalistic campaign for the White House and subsequent legislative fits and starts of a governing party still trying to find its footing, it has been a wild ride. Fortunately, this bull market has largely turned a deaf ear to the macro noise and political gridlock and maintained the embedded optimism that has been a big part of this post-election surge. The good news, likely lost amid the headlines, is that economic trends remained broadly positive and companies generally continued to execute and deliver reasonably good earnings. Boosted by a clearer and hawkish-leaning path to sustained monetary tightening by the Federal Reserve, we also saw signs of a shift away from the now 8+ year post-financial crisis trend favoring financial reallocations in the forms of share-repurchase and dividend programs. The move towards more strategic and forward-thinking capital reinvestment, along with a return to relevancy for fundamentals, proved beneficial to the managers' style of investing. Lastly, there is no denying that valuations have become elevated, especially with growth handily outpacing value, but we believe that strong corporate earnings continue to provide the necessary counterbalance to prices.
During the fiscal year, the Fund was on average overweight versus the benchmark in Information Technology (IT), Health Care, Financials, Energy and Telecommunication Services and underweight Real Estate, Consumer Staples, Consumer Discretionary, Materials and Industrials. Driven by strong top- and bottom-line results, IT was the leading contributor to performance, while election headlines and the "repeal and replace" saga broadly weighed on our Health Care names. At the industry level, our underweight allocation, coupled with strong stock selection in Food Products effectively minimized the negative impact of continued deflation in staples, while a spate of sales management issues hindered top-line results across our Health Care Equipment & Supplies names. Drilling down to our holdings, NVIDIA, a semiconductor company engaged in visual computing applications, consistently delivered strong results from their gaming segment and benefited from positive expectations around the potential for their virtual and assisted reality technology, while O'Reilly Automotive, a specialty retailer and supplier of automotive aftermarket parts and supplies, fell short of expectations for the most recent quarter and was further pressured by the potential for increased competition from Amazon. We sold off both of these positions.
We remain cautiously optimistic that this resilient market can continue to be a conducive environment for active growth managers. Looking ahead, we believe a big unknown for the market remains the embedded optimism currently tied to anticipated pro-growth policies and what happens if that sentiment evaporates in the face of continued political missteps and policy delays. Since we don't hold much sway over Washington, D.C. or believe we can consistently predict market temperament swings, we will instead remain focused on seeking higher qualitative growth companies that we believe are capable of consistently delivering compelling fundamentals, as earnings will be the one highly visible and critical driver of this current bull market that we can evaluate objectively, as our ability to assess the top- and bottom-line potential and current results of companies, around which to build an investment portfolio, is something we believe we can do well, whereas we can't control all of the conflicting statements out of Washington, D.C. about policy.
Sincerely,
KENNETH J. TUREK
PORTFOLIO MANAGER
Information about principal risks of investing in the Fund is set forth in the prospectus and statement of additional information.
The portfolio composition, industries and holdings of the Fund are subject to change without notice.
The opinions expressed are those of the Fund's portfolio manager. The opinions are as of the date of this report and are subject to change without notice.
48
Mid Cap Growth Fund (Unaudited)
TICKER SYMBOLS
Investor Class | | NMANX | |
Trust Class | | NBMTX | |
Advisor Class | | NBMBX | |
Institutional Class | | NBMLX | |
Class A | | NMGAX | |
Class C | | NMGCX | |
Class R3 | | NMGRX | |
Class R6 | | NRMGX | |
SECTOR ALLOCATION
(as a % of Total Investments*) | |
Consumer Discretionary | | | 16.5 | % | |
Consumer Staples | | | 1.7 | | |
Energy | | | 1.4 | | |
Financials | | | 8.0 | | |
Health Care | | | 20.6 | | |
Industrials | | | 16.0 | | |
Information Technology | | | 29.4 | | |
Materials | | | 3.2 | | |
Short-Term Investment | | | 3.2 | | |
Total | | | 100.0 | % | |
* Derivatives (other than options purchased), if any, are excluded from this chart.
PERFORMANCE HIGHLIGHTS7
| | | | | Average Annual Total
Return Ended 08/31/2017 | |
| | | Inception
Date | | 1 Year | | 5 Years | | 10 Years | | Life of
Fund | |
At NAV | |
Investor Class | | 03/01/19792 | | | 15.80 | % | | | 11.83 | % | | | 7.13 | % | | | 11.70 | % | |
| Trust Class3 | | 08/30/1993 | | | 15.75 | % | | | 11.77 | % | | | 7.04 | % | | | 11.61 | % | |
| Advisor Class4 | | 09/03/1996 | | | 15.47 | % | | | 11.47 | % | | | 6.73 | % | | | 11.41 | % | |
| Institutional Class5 | | 04/19/2007 | | | 16.03 | % | | | 12.06 | % | | | 7.42 | % | | | 11.78 | % | |
| Class A19 | | 05/27/2009 | | | 15.58 | % | | | 11.64 | % | | | 7.02 | % | | | 11.67 | % | |
| Class C19 | | 05/27/2009 | | | 14.69 | % | | | 10.81 | % | | | 6.36 | % | | | 11.49 | % | |
| Class R316 | | 05/27/2009 | | | 15.30 | % | | | 11.37 | % | | | 6.80 | % | | | 11.61 | % | |
| Class R623 | | 03/15/2013 | | | 16.13 | % | | | 12.11 | % | | | 7.27 | % | | | 11.73 | % | |
With Sales Charge | |
| Class A19 | | | | | | | 8.92 | % | | | 10.33 | % | | | 6.39 | % | | | 11.50 | % | |
| Class C19 | | | | | | | 13.69 | % | | | 10.81 | % | | | 6.36 | % | | | 11.49 | % | |
Index | |
| Russell Midcap® Growth Index1,15 | | | | | | | 14.52 | % | | | 13.99 | % | | | 8.32 | % | | | N/A | | |
| Russell Midcap® Index1,15 | | | | | | | 12.44 | % | | | 14.11 | % | | | 8.14 | % | | | 13.26 | % | |
The performance data quoted represent past performance and do not indicate future results. Current performance may be lower or higher than the performance data quoted. For performance data current to the most recent month-end, please visit www.nb.com/performance.
The results shown in the table reflect the reinvestment of income dividends and other distributions, if any. The results do not reflect the effect of taxes a shareholder would pay on Fund distributions or on the redemption of Fund shares.
The investment return and principal value of an investment will fluctuate and shares, when redeemed, may be worth more or less than their original cost.
Returns would have been lower if Neuberger Berman Investment Advisers LLC ("Management") had not reimbursed certain expenses and/or waived a portion of the investment management fees during certain of the periods shown. Repayment by a class (of expenses previously reimbursed and/or fees previously waived by Management) will decrease the class's returns. Please see Note B in the Notes to Financial Statements for specific information regarding expense reimbursement and/or fee waiver arrangements.
As stated in the Fund's most recent prospectus, the total annual operating expense ratios for fiscal year 2016 were 0.96%, 0.99%, 1.25%, 0.76%, 1.12%, 1.88%, 1.39% and 0.67% for Investor Class, Trust Class, Advisor Class, Institutional Class, Class A, Class C, Class R3 and Class R6 shares, respectively (before expense reimbursements and/or fee waivers, if any). The expense ratios were 1.87% and 1.37% for Class C and Class R3 shares, respectively, after expense reimbursements and/or fee waivers. The total annual operating expense ratio for each of Institutional Class and Class A includes the class's repayment of expenses previously reimbursed and/or fees previously waived by Management. The expense ratios for the annual period ended August 31, 2017 can be found in the Financial Highlights section of this report.
Returns shown with a sales charge reflect the deduction of the current maximum initial sales charge of 5.75% for Class A shares and the contingent deferred sales charge (CDSC) for Class C shares. The CDSC for Class C shares is 1.00%, which is reduced to 0% after 1 year. The performance of the Fund's share classes will differ primarily due to different sales charge structures and class expenses. Please see the prospectus for more information about sales charge structures, if any, and class expenses for your share class.
49
Mid Cap Growth Fund (Unaudited)
COMPARISON OF A $10,000 INVESTMENT

This graph shows the change in value of a hypothetical $10,000 investment in the Fund over the past 10 fiscal years, or since the Fund's inception if it has not operated for 10 years. The graph is based on the Investor Class shares only; the performance of the Fund's share classes will differ primarily due to different sales charge structures and class expenses (see Performance Highlights chart on previous page). The result is compared with benchmarks, which include a broad-based market index and may include a more narrowly based index. Market indices have not been reduced to reflect any of the fees and costs of investing. The results shown in the graph reflect the reinvestment of income dividends and other distributions, if any. The results do not reflect the effect of taxes a shareholder would pay on Fund distributions or on the redemption of Fund shares. Results represent past performance and do not indicate future results.
50
Mid Cap Intrinsic Value Fund Commentary (Unaudited)
The Neuberger Berman Mid Cap Intrinsic Value Fund Investor Class generated a 17.19% total return for the fiscal year ended August 31, 2017, outperforming its benchmark, the Russell Midcap® Value Index (the "Index"), which returned 10.82% for the same period. (Performance for all share classes is provided in the table immediately following this letter.)
U.S. equity markets were up for the period. While the world economy continued to improve, investors became increasingly concerned with President Trump's ability to move his agenda through Congress. Larger cap and growth indices have outperformed the overall market so far this year—a reversal of 2016's market dynamics, which favored small value-oriented equities.
Fund performance benefitted most from Technology and Producer Durables on both an absolute and relative basis. In Technology, Western Digital, the top performer, reported another solid quarter raising its gross-margin and earnings-per-share guidance amid good execution and strong demand for the company's broad portfolio of storage products. ON Semiconductor reported a strong second quarter beating estimates. Macroeconomic data and reports from its customers point to increased demand for ON's products going forward. Other notable Technology winners were Skyworks Solutions and CheckPoint Software. Both companies have been executing well and reported several strong quarters. In Producer Durables, Spirit AeroSystems, Orbital ATK, General Dynamics, and Itron, all performed well. Spirit resolved its pricing dispute with Boeing, increasing long-term visibility and supporting an increase to their long-term free cash flow margin guidance. Orbital and General Dynamics continue to report solid results. Both companies announced dividend increases and expanded their share repurchase programs. Itron executed well on its cost savings initiative. Additionally, stock selection in Financial Services helped performance. Comerica's cost savings program improved fees and expense trends, loan growth rebounded and the company increased its dividend.
A healthy level of company specific events were announced during the period. Several of the companies the Fund invested in were acquired, disposed of significant assets, or made large acquisitions during the period. Of particular note since our last communication, Whole Foods Market agreed to be acquired by Amazon for $42 per share (we sold out of the position after the merger was announced but before it was completed), Starwood Waypoint announced an all stock merger with Invitation Homes, Lions Gate Entertainment sold its interest in EPIX to MGM, and Wyndham Worldwide announced plans to spin-off its hotel business.
On the negative side, the Fund's overweight and stock selection in the Health Care sector hurt performance. Teva Pharmaceutical's shares were trounced after the company reported an extremely disappointing earnings forecast due to price erosion from increased competition in the generic drug space. This outlook led the company to cut their dividend by 75%. Zimmer Biomet also exhibited underwhelming performance and reduced guidance due to lingering production delays and slower than expected sales recapture. Perrigo lowered its earnings forecast and the CEO unexpectedly retired. Several consumer holdings also had a negative impact on performance. Hertz materially missed expectations due in large part to improper fleet sizing and was subsequently sold by the Fund. Macy's lowered its earnings forecast due to a continued decrease in mall traffic. TreeHouse Foods decreased guidance as it continues to be impacted by pricing pressure from its retail partners. GNC and Deckers Outdoor materially missed earnings expectations and were eliminated from our portfolio as our investment thesis for both companies changed.
We believe near-term risks from conflicts in Washington, D.C. regarding the debt ceiling, the budget, Obamacare and tax reform, the potential for further interest rate hikes by the Federal Reserve, and geopolitical turmoil could pressure stocks through the remainder of the year. However, we anticipate ongoing economic growth, strong corporate earnings, and low inflation rates, which will support a continuing bull market as long as they remain in place.
Sincerely,
MICHAEL C. GREENE
PORTFOLIO MANAGER
Information about principal risks of investing in the Fund is set forth in the prospectus and statement of additional information.
The portfolio composition, industries and holdings of the Fund are subject to change without notice.
The opinions expressed are those of the Fund's portfolio manager. The opinions are as of the date of this report and are subject to change without notice.
51
Mid Cap Intrinsic Value Fund (Unaudited)
TICKER SYMBOLS
Investor Class | | NBRVX | |
Trust Class | | NBREX | |
Institutional Class | | NBRTX | |
Class A | | NBRAX | |
Class C | | NBRCX | |
Class R3 | | NBRRX | |
SECTOR ALLOCATION
(as a % of Total Investments*) | |
Consumer Discretionary | | | 13.7 | % | |
Consumer Staples | | | 1.7 | | |
Energy | | | 8.6 | | |
Financial Services | | | 15.1 | | |
Health Care | | | 10.5 | | |
Materials & Processing | | | 3.2 | | |
Producer Durables | | | 19.0 | | |
Technology | | | 19.2 | | |
Utilities | | | 5.4 | | |
Short-Term Investment | | | 3.6 | | |
Total | | | 100.0 | % | |
* Derivatives (other than options purchased), if any, are excluded from this chart.
PERFORMANCE HIGHLIGHTS7
| | | | | Average Annual Total
Return Ended 08/31/2017 | |
| | | Inception
Date | | 1 Year | | 5 Years | | 10 Years | | Life of
Fund | |
At NAV | |
Investor Class | | 06/01/1999 | | | 17.19 | % | | | 14.15 | % | | | 7.20 | % | | | 9.60 | % | |
| Trust Class3 | | 06/10/1999 | | | 16.85 | % | | | 13.93 | % | | | 7.08 | % | | | 9.51 | % | |
| Institutional Class5 | | 03/08/2010 | | | 17.40 | % | | | 14.40 | % | | | 7.41 | % | | | 9.72 | % | |
| Class A19 | | 06/21/2010 | | | 16.95 | % | | | 13.97 | % | | | 7.11 | % | | | 9.56 | % | |
| Class C19 | | 06/21/2010 | | | 16.09 | % | | | 13.13 | % | | | 6.54 | % | | | 9.24 | % | |
| Class R316 | | 06/21/2010 | | | 16.62 | % | | | 13.70 | % | | | 6.92 | % | | | 9.45 | % | |
With Sales Charge | |
| Class A19 | | | | | | | 10.22 | % | | | 12.64 | % | | | 6.48 | % | | | 9.20 | % | |
| Class C19 | | | | | | | 15.09 | % | | | 13.13 | % | | | 6.54 | % | | | 9.24 | % | |
Index | |
| Russell Midcap® Value Index1,15 | | | | | | | 10.82 | % | | | 14.22 | % | | | 7.82 | % | | | 9.44 | % | |
| Russell Midcap® Index1,15 | | | | | | | 12.44 | % | | | 14.11 | % | | | 8.14 | % | | | 8.98 | % | |
The performance data quoted represent past performance and do not indicate future results. Current performance may be lower or higher than the performance data quoted. For performance data current to the most recent month-end, please visit www.nb.com/performance.
The results shown in the table reflect the reinvestment of income dividends and other distributions, if any. The results do not reflect the effect of taxes a shareholder would pay on Fund distributions or on the redemption of Fund shares.
The investment return and principal value of an investment will fluctuate and shares, when redeemed, may be worth more or less than their original cost.
Returns would have been lower if Neuberger Berman Investment Advisers LLC ("Management") had not reimbursed certain expenses and/or waived a portion of the investment management fees during certain of the periods shown. Repayment by a class (of expenses previously reimbursed and/or fees previously waived by Management) will decrease the class's returns. Please see Note B in the Notes to Financial Statements for specific information regarding expense reimbursement and/or fee waiver arrangements.
As stated in the Fund's most recent prospectus, the total annual operating expense ratios for fiscal year 2016 were 1.31%, 1.48%, 1.09%, 1.50%, 2.24% and 1.76% for Investor Class, Trust Class, Institutional Class, Class A, Class C and Class R3 shares, respectively (before expense reimbursements and/or fee waivers, if any). The expense ratios were 1.26%, 0.86%, 1.22%, 1.97% and 1.47% for Trust Class, Institutional Class, Class A, Class C and Class R3 shares, respectively, after expense reimbursements and/or fee waivers. The expense ratios for the annual period ended August 31, 2017 can be found in the Financial Highlights section of this report.
Returns shown with a sales charge reflect the deduction of the current maximum initial sales charge of 5.75% for Class A shares and the contingent deferred sales charge (CDSC) for Class C shares. The CDSC for Class C shares is 1.00%, which is reduced to 0% after 1 year. The performance of the Fund's share classes will differ primarily due to different sales charge structures and class expenses. Please see the prospectus for more information about sales charge structures, if any, and class expenses for your share class.
52
Mid Cap Intrinsic Value Fund (Unaudited)
COMPARISON OF A $10,000 INVESTMENT

This graph shows the change in value of a hypothetical $10,000 investment in the Fund over the past 10 fiscal years, or since the Fund's inception if it has not operated for 10 years. The graph is based on the Investor Class shares only; the performance of the Fund's share classes will differ primarily due to different sales charge structures and class expenses (see Performance Highlights chart on previous page). The result is compared with benchmarks, which include a broad-based market index and may include a more narrowly based index. Market indices have not been reduced to reflect any of the fees and costs of investing. The results shown in the graph reflect the reinvestment of income dividends and other distributions, if any. The results do not reflect the effect of taxes a shareholder would pay on Fund distributions or on the redemption of Fund shares. Results represent past performance and do not indicate future results.
53
Multi-Cap Opportunities Fund Commentary (Unaudited)
Neuberger Berman Multi-Cap Opportunities Fund Institutional Class generated a 20.27% total return for the fiscal year ended August 31, 2017, versus a 16.23% total return for its benchmark, the S&P 500® Index (the "Index") for the same period. (Performance for all share classes is provided in the table immediately following this letter.)
Within the Index, positive performance was broad-based as nine of eleven sectors generated a positive return for the year. Financials, Industrials, and Information Technology (IT) outperformed relative to the overall Index. Consumer Discretionary, Consumer Staples, Energy, Health Care, Materials, Real Estate, Telecommunication Services, and Utilities all lagged the overall Index. We believe declining stock correlations over the course of the year contributed to the dispersion in performance across sectors.
Within the Fund, positioning benefited relative performance, driven primarily by an overweight to Financials and IT. Stock selection in Industrials and Energy also benefited relative performance. Stock selection in Health Care and IT detracted from relative performance during the year. The Fund ended the fiscal year with an overweight, relative to the Index, in the Financials, Industrials, IT, and Materials sectors. The Fund ended the fiscal year with an underweight, relative to the Index, in the Consumer Discretionary, Consumer Staples, Energy, and Health Care sectors, and had no exposure to the Real Estate, Telecommunication Services, and Utilities sectors.
Portfolio construction is an important component of our investment process and consists of three distinct investment categories: Special Situations, Opportunistic, and Classic. Special Situations have unique attributes (e.g., restructuring, spin-offs, post-bankruptcy equities) that require specific valuation methodologies and customized investment research. Opportunistic investments are companies that have become inexpensive for a tangible reason that we believe is temporary. Classic investments are those companies with long histories of shareholder friendly policies, high quality management teams and exceptional operating performance. We believe maintaining a balance of these three categories helps to mitigate risk within the portfolio. We continue to find investment opportunities across each investment category with attractive risk/return profiles.
We believe the current environment is attractive for free cash flow oriented investing. Many company balance sheets appear healthy and free cash flow generation has been strong. As a result, we believe management teams have a significant opportunity to create value for shareholders by allocating capital effectively. Dividend increases, share repurchase programs, cash accumulation, debt retirement, organic growth initiatives, and selective and highly accretive acquisitions—all can accrue to the benefit of equity holders. When company specific drivers are in focus, it is our view that high conviction active managers have the potential to add value for their clients through stock selection. We believe deep fundamental analysis centered on free cash flow and capital structure efficiency may be an important driver of performance going forward.
Our style of investing is based on rigorous fundamental research. The analysis centers on the business model and a company's ability to generate and effectively utilize free cash flow. As we evaluate both potential new positions and current portfolio holdings, we will continue to do so with a long-term investment perspective in mind. As always, our focus is to grow the Fund's assets through the disciplined application of our investment philosophy and process.
Sincerely,
RICHARD S. NACKENSON
PORTFOLIO MANAGER
Information about principal risks of investing in the Fund is set forth in the prospectus and statement of additional information.
The portfolio composition, industries and holdings of the Fund are subject to change without notice.
The opinions expressed are those of the Fund's portfolio manager. The opinions are as of the date of this report and are subject to change without notice.
54
Multi-Cap Opportunities Fund (Unaudited)
TICKER SYMBOLS
Institutional Class | | NMULX | |
Class A | | NMUAX | |
Class C | | NMUCX | |
SECTOR ALLOCATION
(as a % of Total Investments*) | |
Consumer Discretionary | | | 1.7 | % | |
Consumer Staples | | | 6.1 | | |
Energy | | | 4.7 | | |
Financials | | | 23.7 | | |
Health Care | | | 12.4 | | |
Industrials | | | 16.9 | | |
Information Technology | | | 27.7 | | |
Materials | | | 5.5 | | |
Short-Term Investment | | | 1.3 | | |
Total | | | 100.0 | % | |
* Derivatives (other than options purchased), if any, are excluded from this chart.
PERFORMANCE HIGHLIGHTS9
| | | | | Average Annual Total
Return Ended 08/31/2017 | |
| | | Inception
Date* | | 1 Year | | 5 Years | | 10 Years | | Life of
Fund | |
At NAV | |
| Institutional Class17 | | 12/21/2009 | | | 20.27 | % | | | 15.20 | % | | | 8.24 | % | | | 8.67 | % | |
| Class A17 | | 12/21/2009 | | | 19.85 | % | | | 14.80 | % | | | 7.94 | % | | | 8.39 | % | |
| Class C17 | | 12/21/2009 | | | 18.95 | % | | | 13.93 | % | | | 7.32 | % | | | 7.82 | % | |
With Sales Charge | |
| Class A17 | | | | | | | 12.98 | % | | | 13.45 | % | | | 7.30 | % | | | 7.80 | % | |
| Class C17 | | | | | | | 17.95 | % | | | 13.93 | % | | | 7.32 | % | | | 7.82 | % | |
Index | |
| S&P 500® Index1,15 | | | | | | | 16.23 | % | | | 14.34 | % | | | 7.61 | % | | | 7.90 | % | |
*Prior to December 14, 2009, the Fund had different investment goals, strategies, and portfolio management team. The performance data for each class includes the performance of the Fund's oldest share class, Trust Class, from November 2, 2006 through December 21, 2009. See endnote 17 for information about the effects of the different fees paid by each class.
The performance data quoted represent past performance and do not indicate future results. Current performance may be lower or higher than the performance data quoted. For performance data current to the most recent month-end, please visit www.nb.com/performance.
The results shown in the table reflect the reinvestment of income dividends and other distributions, if any. The results do not reflect the effect of taxes a shareholder would pay on Fund distributions or on the redemption of Fund shares.
The investment return and principal value of an investment will fluctuate and shares, when redeemed, may be worth more or less than their original cost.
Returns would have been lower if Neuberger Berman Investment Advisers LLC ("Management") had not reimbursed certain expenses and/or waived a portion of the investment management fees during certain of the periods shown. Repayment by a class (of expenses previously reimbursed and/or fees previously waived by Management) will decrease the class's returns. Please see Note B in the Notes to Financial Statements for specific information regarding expense reimbursement and/or fee waiver arrangements.
As stated in the Fund's most recent prospectus, the total annual operating expense ratios for fiscal year 2016 were 0.76%, 1.11% and 1.85% for Institutional Class, Class A and Class C shares, respectively (before expense reimbursements and/or fee waivers, if any). The expense ratios for the annual period ended August 31, 2017 can be found in the Financial Highlights section of this report.
Returns shown with a sales charge reflect the deduction of the current maximum initial sales charge of 5.75% for Class A shares and the contingent deferred sales charge (CDSC) for Class C shares. The CDSC for Class C shares is 1.00%, which is reduced to 0% after 1 year. The performance of the Fund's share classes will differ primarily due to different sales charge structures and class expenses. Please see the prospectus for more information about sales charge structures, if any, and class expenses for your share class.
55
Multi-Cap Opportunities Fund (Unaudited)
COMPARISON OF A $1,000,000 INVESTMENT17
(000's Omitted)
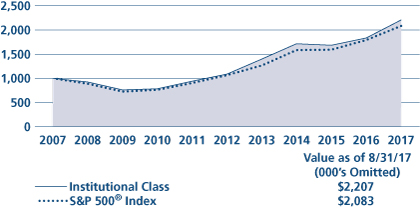
This graph shows the change in value of a hypothetical $1,000,000 investment in the Fund over the past 10 fiscal years, or since the Fund's inception if it has not operated for 10 years. The graph is based on the Institutional Class shares only; the performance of the Fund's share classes will differ primarily due to different sales charge structures and class expenses (see Performance Highlights chart on previous page). The result is compared with benchmarks, which include a broad-based market index and may include a more narrowly based index. Market indices have not been reduced to reflect any of the fees and costs of investing. The results shown in the graph reflect the reinvestment of income dividends and other distributions, if any. The results do not reflect the effect of taxes a shareholder would pay on Fund distributions or on the redemption of Fund shares. Results represent past performance and do not indicate future results.
56
Real Estate Fund Commentary (Unaudited)
Neuberger Berman Real Estate Fund Trust Class generated a 2.89% total return for the fiscal year ended August 31, 2017, outperforming its benchmark, the FTSE NAREIT All Equity REITs Index (the "Index"), which generated a 1.85% total return for the same period. (Performance for all share classes is provided in the table immediately following this letter.)
After a poor start, the U.S. stock market rallied sharply and reached several all-time highs during the reporting period. After relatively flat results in September 2016, stocks declined in October, as corporate profits were mixed and there were uncertainties surrounding the November elections. The market then moved sharply higher over the last ten months of the period. This turnaround was partially driven by corporate profits that were generally better-than-expected and hopes for improving growth and less regulations under the Trump administration. However, expectations for significant shifts in fiscal policy have been delayed, or the probability of success has been reduced. Nevertheless, the overall U.S. stock market, as measured by the S&P 500® Index, rose 16.23% for the 12-month period. Comparatively, real estate investment trusts (REITs) posted weaker results during the period.
The Fund outperformed its benchmark during the reporting period. Stock selection was the most beneficial for relative performance. Contributing the most to results were our holdings in the Lodging/Resorts, Data Centers and Infrastructure REITs sectors. American Tower, an Infrastructure REIT, Marriott International, Inc., a Lodging/Resorts company and Equinix, Inc., a Data Center REIT, were the largest contributors to performance. Sectors that detracted from the Fund's results from a stock selection perspective included Specialty, Regional Malls and Shopping Centers. Several individual holdings were also negative for results, including Simon Property Group, a leading commercial real estate company with both regional malls and discount outlet centers, Kimco Realty Corp., a Shopping Center REIT, and GGP, Inc., a Regional Mall REIT.
Sector positioning, overall, modestly contributed to the Fund's performance during the reporting period. On the upside, overweights to Real Estate Operating Companies (non-REIT real estate related securities), Data Centers, and Single Family Homes were the most beneficial for performance. Conversely, underweights to Specialty and Industrial REITs, along with an overweight to Regional Malls, were the largest negatives for results.
We anticipate seeing relatively modest economic growth for the year as a whole. The U.S. Federal Reserve (Fed), as expected, raised interest rates for a second time in calendar year 2017 at its meeting that concluded on June 14. Looking forward, we believe the Fed will likely take a measured approach in terms of further interest rate hikes. After moving higher following the U.S. presidential election, longer-term interest rates have declined thus far in 2017, balancing expectations for improved economic growth, with some level of political uncertainty. However, we believe real estate fundamentals, not interest rates, will be the long-term driver of performance in the REIT market. We think improved business and consumer confidence, potential fiscal stimulus, and modest inflation should be supportive for the U.S. commercial property market. We believe real estate companies with sustainable cash flow and dividend growth have the potential to perform well.
Sincerely,
STEVE SHIGEKAWA AND BRIAN C. JONES
PORTFOLIO CO-MANAGERS
Information about principal risks of investing in the Fund is set forth in the prospectus and statement of additional information.
The portfolio composition, industries and holdings of the Fund are subject to change without notice.
The opinions expressed are those of the Fund's portfolio managers. The opinions are as of the date of this report and are subject to change without notice.
57
Real Estate Fund (Unaudited)
TICKER SYMBOLS
Trust Class | | NBRFX | |
Institutional Class | | NBRIX | |
Class A | | NREAX | |
Class C | | NRECX | |
Class R3 | | NRERX | |
Class R6 | | NRREX | |
SECTOR ALLOCATION
(as a % of Total Investments*) | |
Apartments | | | 12.5 | % | |
Data Centers | | | 8.8 | | |
Diversified | | | 3.4 | | |
Free Standing | | | 1.0 | | |
Health Care | | | 9.0 | | |
Industrial | | | 7.9 | | |
Infrastructure | | | 13.8 | | |
Lodging/Resorts | | | 3.8 | | |
Manufactured Homes | | | 2.2 | | |
Office | | | 9.7 | | |
Real Estate Operating Companies | | | 2.2 | | |
Regional Malls | | | 8.5 | | |
Self Storage | | | 3.9 | | |
Shopping Centers | | | 4.0 | | |
Single Family Homes | | | 3.4 | | |
Specialty | | | 1.3 | | |
Timber | | | 3.7 | | |
Short-Term Investment | | | 0.9 | | |
Total | | | 100.0 | % | |
* Derivatives (other than options purchased), if any, are excluded from this chart.
PERFORMANCE HIGHLIGHTS7,21
| | | | | Average Annual Total
Return Ended 08/31/2017 | |
| | | Inception
Date | | 1 Year | | 5 Years | | 10 Years | | Life of
Fund | |
At NAV | |
Trust Class | | 05/01/2002 | | | 2.89 | % | | | 7.98 | % | | | 7.25 | % | | | 11.28 | % | |
| Institutional Class6 | | 06/04/2008 | | | 3.01 | % | | | 8.17 | % | | | 7.43 | % | | | 11.40 | % | |
| Class A14 | | 06/21/2010 | | | 2.63 | % | | | 7.78 | % | | | 7.10 | % | | | 11.18 | % | |
| Class C14 | | 06/21/2010 | | | 1.89 | % | | | 6.98 | % | | | 6.53 | % | | | 10.79 | % | |
| Class R314 | | 06/21/2010 | | | 2.45 | % | | | 7.52 | % | | | 6.91 | % | | | 11.05 | % | |
| Class R624 | | 03/15/2013 | | | 3.16 | % | | | 8.24 | % | | | 7.38 | % | | | 11.36 | % | |
With Sales Charge | |
| Class A14 | | | | | | | –3.26 | % | | | 6.52 | % | | | 6.47 | % | | | 10.75 | % | |
| Class C14 | | | | | | | 0.99 | % | | | 6.98 | % | | | 6.53 | % | | | 10.79 | % | |
Index | |
| FTSE NAREIT All Equity REITs Index1,15 | | | | | 1.85 | % | | | 9.87 | % | | | 6.60 | % | | | 10.38 | % | |
The performance data quoted represent past performance and do not indicate future results. Current performance may be lower or higher than the performance data quoted. For performance data current to the most recent month-end, please visit www.nb.com/performance.
The results shown in the table reflect the reinvestment of income dividends and other distributions, if any. The results do not reflect the effect of taxes a shareholder would pay on Fund distributions or on the redemption of Fund shares.
The investment return and principal value of an investment will fluctuate and shares, when redeemed, may be worth more or less than their original cost.
Returns would have been lower if Neuberger Berman Investment Advisers LLC ("Management") had not reimbursed certain expenses and/or waived a portion of the investment management fees during certain of the periods shown. Repayment by a class (of expenses previously reimbursed and/or fees previously waived by Management) will decrease the class's returns. Please see Note B in the Notes to Financial Statements for specific information regarding expense reimbursement and/or fee waiver arrangements.
As stated in the Fund's most recent prospectus, the total annual operating expense ratios for fiscal year 2016 were 1.41%, 1.05%, 1.42%, 2.18%, 1.68% and 0.98% for Trust Class, Institutional Class, Class A, Class C, Class R3 and Class R6 shares, respectively (before expense reimbursements and/or fee waivers, if any). The expense ratios were 0.85%, 1.21%, 1.96%, 1.46% and 0.78% for Institutional Class, Class A, Class C, Class R3 and Class R6 shares, respectively, after expense reimbursements and/or fee waivers. The expense ratios for the annual period ended August 31, 2017 can be found in the Financial Highlights section of this report.
Returns shown with a sales charge reflect the deduction of the current maximum initial sales charge of 5.75% for Class A shares and the contingent deferred sales charge (CDSC) for Class C shares. The CDSC for Class C shares is 1.00%, which is reduced to 0% after 1 year. The performance of the Fund's share classes will differ primarily due to different sales charge structures and class expenses. Please see the prospectus for more information about sales charge structures, if any, and class expenses for your share class.
58
Real Estate Fund (Unaudited)
COMPARISON OF A $10,000 INVESTMENT

This graph shows the change in value of a hypothetical $10,000 investment in the Fund over the past 10 fiscal years, or since the Fund's inception if it has not operated for 10 years. The graph is based on the Trust Class shares only; the performance of the Fund's share classes will differ primarily due to different sales charge structures and class expenses (see Performance Highlights chart on previous page). The result is compared with benchmarks, which include a broad-based market index and may include a more narrowly based index. Market indices have not been reduced to reflect any of the fees and costs of investing. The results shown in the graph reflect the reinvestment of income dividends and other distributions, if any. The results do not reflect the effect of taxes a shareholder would pay on Fund distributions or on the redemption of Fund shares. Results represent past performance and do not indicate future results.
59
Small Cap Growth Fund Commentary (Unaudited)
Neuberger Berman Small Cap Growth Fund Investor Class generated a 21.99% total return for the fiscal year ended August 31, 2017, outperforming its benchmark, the Russell 2000® Growth Index (the "Index"), which returned 16.39% for the same period. (Performance for all share classes is provided in the table immediately following this letter.)
Over the 12-month reporting period, the highly resilient U.S. market continued its upward trajectory, but not without challenges to that positive momentum. Whether it was the fluctuating volatility associated with oil prices, the U.S. dollar and economic news out of China, nuclear gamesmanship on the Korean peninsula, or the stunning outcome of a highly cynical and nationalistic campaign for the White House and subsequent legislative fits and starts of a governing party still trying to find its footing, it has been a wild ride. Fortunately, this bull market has largely turned a deaf ear to the macro noise and political gridlock and maintained the embedded optimism that has been a big part of this post-election surge. The good news, likely lost amid the headlines, is that economic trends remained broadly positive and companies generally continued to execute and deliver reasonably good earnings. With the markets boosted by a clearer and hawkish-leaning path to sustained monetary tightening by the Federal Reserve, we also saw signs of a shift away from the now 8+ year post-financial crisis trend favoring financial reallocations in the forms of share-repurchase and dividend programs. The move towards more strategic and forward-thinking capital reinvestment, along with a return to relevancy for fundamentals, proved beneficial to our style of investing. Lastly, there is no denying that valuations have become elevated, especially with growth handily outpacing value, but we believe that strong corporate earnings and compelling catalysts continue to provide the necessary counterbalance to prices.
During the fiscal year, the Fund was on average overweight versus the Index in Health Care, Information Technology (IT), Energy, Consumer Discretionary and Financials and underweight Industrials, Real Estate, Materials, Consumer Staples, Telecommunication Services and Utilities. Driven by strong stock selection across the sector, Health Care was the leading contributor to performance, while various business execution issues related to inventory, manufacturing and M&A negatively impacted our IT allocation. At the industry level, compelling underlying science and positive catalysts within our overweight to Biotechnology proved strongly additive to performance, while the aforementioned execution issues resulted in disappointing results and guidance for a number of our Semiconductors & Semiconductor Equipment names. Drilling down to our holdings, Exelixis, a biopharmaceutical company engaged in developing and commercializing therapies for the treatment of cancer, delivered strong execution and continued to develop an attractive product pipeline, while Paylocity, a cloud-based provider of payroll and human capital management software solutions, was pressured by post-election worries around the sustainability of Affordable Care Act enrollment and participation growth rates. We sold Paylocity.
We remain cautiously optimistic that this market will remain resilient and continue to be a conducive environment for active growth managers. Looking ahead, we believe a big unknown for the market remains the embedded optimism currently tied to anticipated pro-growth policies and what happens if that sentiment evaporates in the face of continued political missteps and policy delays. Since we don't hold much sway over Washington, D.C. or believe we can consistently predict market temperament swings, we will instead remain focused on identifying underappreciated catalysts and seeking higher qualitative growth companies that we believe are capable of consistently delivering compelling fundamentals, as top- and bottom-line results will be the highly visible and critical drivers of this current bull market that we can evaluate objectively.
Sincerely,
KENNETH J. TUREK
PORTFOLIO MANAGER
Information about principal risks of investing in the Fund is set forth in the prospectus and statement of additional information.
The portfolio composition, industries and holdings of the Fund are subject to change without notice.
The opinions expressed are those of the Fund's portfolio manager. The opinions are as of the date of this report and are subject to change without notice.
60
Small Cap Growth Fund (Unaudited)
TICKER SYMBOLS
Investor Class | | NBMIX | |
Trust Class | | NBMOX | |
Advisor Class | | NBMVX | |
Institutional Class | | NBSMX | |
Class A | | NSNAX | |
Class C | | NSNCX | |
Class R3 | | NSNRX | |
SECTOR ALLOCATION
(as a % of Total Investments*) | |
Consumer Discretionary | | | 13.6 | % | |
Consumer Staples | | | 1.7 | | |
Energy | | | 1.4 | | |
Financials | | | 4.9 | | |
Health Care | | | 29.8 | | |
Industrials | | | 17.4 | | |
Information Technology | | | 27.2 | | |
Materials | | | 2.1 | | |
Real Estate | | | 1.1 | | |
Short-Term Investment | | | 0.8 | | |
Total | | | 100.0 | % | |
* Derivatives (other than options purchased), if any, are excluded from this chart.
PERFORMANCE HIGHLIGHTS
| | | | | Average Annual Total
Return Ended 08/31/2017 | |
| | | Inception
Date | | 1 Year | | 5 Years | | 10 Years | | Life of
Fund | |
At NAV | |
Investor Class | | 10/20/1998 | | | 21.99 | % | | | 12.32 | % | | | 6.17 | % | | | 8.69 | % | |
| Trust Class3 | | 11/03/1998 | | | 21.74 | % | | | 12.13 | % | | | 5.96 | % | | | 8.54 | % | |
| Advisor Class4 | | 05/03/2002 | | | 21.58 | % | | | 11.98 | % | | | 5.78 | % | | | 8.44 | % | |
| Institutional Class5 | | 04/01/2008 | | | 22.31 | % | | | 12.67 | % | | | 6.45 | % | | | 8.84 | % | |
| Class A19 | | 05/27/2009 | | | 21.88 | % | | | 12.27 | % | | | 6.09 | % | | | 8.64 | % | |
| Class C19 | | 05/27/2009 | | | 21.00 | % | | | 11.43 | % | | | 5.43 | % | | | 8.29 | % | |
| Class R316 | | 05/27/2009 | | | 21.58 | % | | | 11.98 | % | | | 5.87 | % | | | 8.52 | % | |
With Sales Charge | |
| Class A19 | | | | | | | 14.87 | % | | | 10.94 | % | | | 5.46 | % | | | 8.30 | % | |
| Class C19 | | | | | | | 20.00 | % | | | 11.43 | % | | | 5.43 | % | | | 8.29 | % | |
Index | |
| Russell 2000® Growth Index1,15 | | | | | | | 16.39 | % | | | 13.75 | % | | | 8.21 | % | | | 7.91 | % | |
| Russell 2000® Index1,15 | | | | | | | 14.91 | % | | | 13.15 | % | | | 7.38 | % | | | 9.04 | % | |
The performance data quoted represent past performance and do not indicate future results. Current performance may be lower or higher than the performance data quoted. For performance data current to the most recent month-end, please visit www.nb.com/performance.
The results shown in the table reflect the reinvestment of income dividends and other distributions, if any. The results do not reflect the effect of taxes a shareholder would pay on Fund distributions or on the redemption of Fund shares.
The investment return and principal value of an investment will fluctuate and shares, when redeemed, may be worth more or less than their original cost.
Returns would have been lower if Neuberger Berman Investment Advisers LLC ("Management") had not reimbursed certain expenses and/or waived a portion of the investment management fees during certain of the periods shown. Repayment by a class (of expenses previously reimbursed and/or fees previously waived by Management) will decrease the class's returns. Please see Note B in the Notes to Financial Statements for specific information regarding expense reimbursement and/or fee waiver arrangements.
As stated in the Fund's most recent prospectus, the total annual operating expense ratios for fiscal year 2016 were 1.87%, 1.94%, 2.09%, 1.55%, 1.95%, 2.68% and 2.25% for Investor Class, Trust Class, Advisor Class, Institutional Class, Class A, Class C and Class R3 shares, respectively (before expense reimbursements and/or fee waivers, if any). The expense ratios were 1.30%, 1.41%, 1.61%, 0.90%, 1.26%, 2.01% and 1.52% for Investor Class, Trust Class, Advisor Class, Institutional Class, Class A, Class C and Class R3 shares, respectively, after expense reimbursements and/or fee waivers. The expense ratios for the annual period ended August 31, 2017 can be found in the Financial Highlights section of this report.
Returns shown with a sales charge reflect the deduction of the current maximum initial sales charge of 5.75% for Class A shares and the contingent deferred sales charge (CDSC) for Class C shares. The CDSC for Class C shares is 1.00%, which is reduced to 0% after 1 year. The performance of the Fund's share classes will differ primarily due to different sales charge structures and class expenses. Please see the prospectus for more information about sales charge structures, if any, and class expenses for your share class.
61
Small Cap Growth Fund (Unaudited)
COMPARISON OF A $10,000 INVESTMENT

This graph shows the change in value of a hypothetical $10,000 investment in the Fund over the past 10 fiscal years, or since the Fund's inception if it has not operated for 10 years. The graph is based on the Investor Class shares only; the performance of the Fund's share classes will differ primarily due to different sales charge structures and class expenses (see Performance Highlights chart on previous page). The result is compared with benchmarks, which include a broad-based market index and may include a more narrowly based index. Market indices have not been reduced to reflect any of the fees and costs of investing. The results shown in the graph reflect the reinvestment of income dividends and other distributions, if any. The results do not reflect the effect of taxes a shareholder would pay on Fund distributions or on the redemption of Fund shares. Results represent past performance and do not indicate future results.
62
Socially Responsive Fund Commentary (Unaudited)
Neuberger Berman Socially Responsive Fund Investor Class reported a total return of 13.54% for the fiscal year ended August 31, 2017, trailing the 16.23% return of its benchmark, the S&P 500® Index (the "Index"), during the same period. (Performance for all share classes is provided in the table immediately following this letter.)
As this period began, U.S. markets were volatile going into the November election, given policy and regulatory uncertainty. However, post the election, markets rebounded, reflecting incrementally positive expectations of potential tax reform, regulatory relief, and infrastructure spending.
The market continued its upward trajectory through this period's close and set new highs. However, returns have been narrow, with mega-capitalization technology stocks driving significant returns in the Index. Returns of established businesses have lagged, reflecting investors' concern around growth and profit implications of these incumbents. We believe this has resulted in some attractive opportunities, as the market has indiscriminately penalized stocks of established businesses without distinguishing between business models, industry structure, and quality of management.
Top individual detractors this period included W.W. Grainger, Kroger, and Advance Auto Parts. All three businesses saw stock valuations impacted on rising worries about Amazon's competitive threat. The Fund continues to own these names, as we believe these businesses will benefit as markets begin to shift towards a focus on fundamentals, including the opportunity of operating in a fragmented industry, as well as the benefits and competitive advantages of incumbent business models.
Top contributors included Progressive Corp., Ryanair, and Novozymes. Long-term holding Progressive Corp. continuing to demonstrate profitable growth in the auto insurance industry. Ryanair benefited as the company continued to report strong operating performance and investor fears around Brexit started to dissipate. Novozymes, an addition during the fiscal year, produces, distributes and sells enzymes to a broad range of end users globally. We believe the long-term opportunity to replace petro-chemicals via enzymes is a secular opportunity, as typically enzymes are a more cost-efficient and sustainable solution.
Consistent with our investment process, we took advantage of transitory market concerns to opportunistically buy well-positioned businesses while we exited positions based on valuation or where we found replacements that in our view offered a superior risk return profile.
Looking ahead, we anticipate the slow, positive growth trend in the U.S. to continue, based on ongoing strength in consumer spending and a lack of visible excesses in the economy. Actions by the Federal Reserve are likely to result in gradually rising interest rates, but, in our view, should remain in a range that is still supportive of growth.
Our primary concerns continue to be geopolitical. Domestically, we believe the new administration's ability to negotiate with Congress on the framework for trade, tax, healthcare and immigration policies continues to be a risk and a likely source of equity volatility.
Outside the U.S., geopolitical volatility, especially in the Middle East, ongoing tensions with Russia, an increasingly belligerent North Korea, and the continued uncertainty created by Brexit could likely be sources of market volatility. Further, in our opinion, China's continuing efforts to strike a balance between curbing excess speculation and sustainable long-term growth could create volatility in China's economic growth.
We believe the businesses we hold can translate top-line growth into stronger, advantaged bottom-line growth in a variety of economic environments, supported by competitive advantages, attractive return on capital profiles, and demonstrated leadership practices in environmental, social and governance practices.
We look forward to continuing to serve your investment needs.
63
Sincerely,
INGRID S. DYOTT AND SAJJAD S. LADIWALA
CO-PORTFOLIO MANAGERS
Information about principal risks of investing in the Fund is set forth in the prospectus and statement of additional information.
The portfolio composition, industries and holdings of the Fund are subject to change without notice.
The opinions expressed are those of the Fund's portfolio managers. The opinions are as of the date of this report and are subject to change without notice.
To read more on how we integrate sustainability issues into our investment process, please visit our SRI web site, Socially Responsive Investing, at http://www.nb.com/sri/.
64
Socially Responsive Fund (Unaudited)
TICKER SYMBOLS
Investor Class | | NBSRX | |
Trust Class | | NBSTX | |
Institutional Class | | NBSLX | |
Class A | | NRAAX | |
Class C | | NRACX | |
Class R3 | | NRARX | |
Class R6 | | NRSRX | |
SECTOR ALLOCATION
(as a % of Total Investments*) | |
Consumer Discretionary | | | 14.9 | % | |
Consumer Staples | | | 5.8 | | |
Energy | | | 7.2 | | |
Financials | | | 15.5 | | |
Health Care | | | 15.0 | | |
Industrials | | | 11.9 | | |
Information Technology | | | 21.4 | | |
Materials | | | 2.5 | | |
Real Estate | | | 2.6 | | |
Utilities | | | 1.5 | | |
Short-Term Investments | | | 1.7 | | |
Total | | | 100.0 | % | |
* Derivatives (other than options purchased), if any, are excluded from this chart.
PERFORMANCE HIGHLIGHTS7
| | | | | Average Annual Total
Return Ended 08/31/2017 | |
| | | Inception
Date | | 1 Year | | 5 Years | | 10 Years | | Life of
Fund | |
At NAV | |
Investor Class | | 03/16/1994 | | | 13.54 | % | | | 13.68 | % | | | 7.07 | % | | | 9.23 | % | |
| Trust Class3 | | 03/03/1997 | | | 13.41 | % | | | 13.50 | % | | | 6.88 | % | | | 9.06 | % | |
| Institutional Class5 | | 11/28/2007 | | | 13.78 | % | | | 13.90 | % | | | 7.25 | % | | | 9.31 | % | |
| Class A19 | | 05/27/2009 | | | 13.36 | % | | | 13.46 | % | | | 6.90 | % | | | 9.16 | % | |
| Class C19 | | 05/27/2009 | | | 12.53 | % | | | 12.62 | % | | | 6.24 | % | | | 8.87 | % | |
| Class R316 | | 05/27/2009 | | | 13.04 | % | | | 13.20 | % | | | 6.69 | % | | | 9.07 | % | |
| Class R623 | | 03/15/2013 | | | 13.84 | % | | | 13.94 | % | | | 7.18 | % | | | 9.28 | % | |
With Sales Charge | |
| Class A19 | | | | | | | 6.84 | % | | | 12.12 | % | | | 6.27 | % | | | 8.89 | % | |
| Class C19 | | | | | 11.53 | % | | | 12.62 | % | | | 6.24 | % | | | 8.87 | % | |
Index | |
| S&P 500® Index1,15 | | | | | | | 16.23 | % | | | 14.34 | % | | | 7.61 | % | | | 9.45 | % | |
The performance data quoted represent past performance and do not indicate future results. Current performance may be lower or higher than the performance data quoted. For performance data current to the most recent month-end, please visit www.nb.com/performance.
The results shown in the table reflect the reinvestment of income dividends and other distributions, if any. The results do not reflect the effect of taxes a shareholder would pay on Fund distributions or on the redemption of Fund shares.
The investment return and principal value of an investment will fluctuate and shares, when redeemed, may be worth more or less than their original cost.
Returns would have been lower if Neuberger Berman Investment Advisers LLC ("Management") had not reimbursed certain expenses and/or waived a portion of the investment management fees during certain of the periods shown. Repayment by a class (of expenses previously reimbursed and/or fees previously waived by Management) will decrease the class's returns. Please see Note B in the Notes to Financial Statements for specific information regarding expense reimbursement and/or fee waiver arrangements.
As stated in the Fund's most recent prospectus, the total annual operating expense ratios for fiscal year 2016 were 0.86%, 1.03%, 0.68%, 1.05%, 1.79%, 1.29% and 0.61% for Investor Class, Trust Class, Institutional Class, Class A, Class C, Class R3 and Class R6 shares, respectively (before expense reimbursements and/or fee waivers, if any). The expense ratios for the annual period ended August 31, 2017 can be found in the Financial Highlights section of this report.
Returns shown with a sales charge reflect the deduction of the current maximum initial sales charge of 5.75% for Class A shares and the contingent deferred sales charge (CDSC) for Class C shares. The CDSC for Class C shares is 1.00%, which is reduced to 0% after 1 year. The performance of the Fund's share classes will differ primarily due to different sales charge structures and class expenses. Please see the prospectus for more information about sales charge structures, if any, and class expenses for your share class.
65
Socially Responsive Fund (Unaudited)
COMPARISON OF A $10,000 INVESTMENT
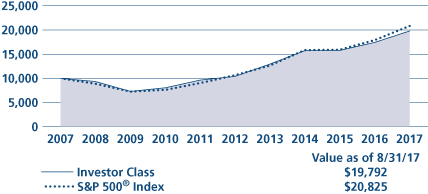
This graph shows the change in value of a hypothetical $10,000 investment in the Fund over the past 10 fiscal years, or since the Fund's inception if it has not operated for 10 years. The graph is based on the Investor Class shares only; the performance of the Fund's share classes will differ primarily due to different sales charge structures and class expenses (see Performance Highlights chart on previous page). The result is compared with benchmarks, which include a broad-based market index and may include a more narrowly based index. Market indices have not been reduced to reflect any of the fees and costs of investing. The results shown in the graph reflect the reinvestment of income dividends and other distributions, if any. The results do not reflect the effect of taxes a shareholder would pay on Fund distributions or on the redemption of Fund shares. Results represent past performance and do not indicate future results.
66
Value Fund Commentary (Unaudited)
Neuberger Berman Value Fund Institutional Class generated a 16.18% total return for the fiscal year ended August 31, 2017, outperforming its benchmark, the Russell 1000® Value Index (the "Index"), which returned 11.58% for the same period. (Performance for all share classes is provided in the table immediately following this letter.)
After a rather choppy start to the fiscal year, the U.S. stock market climbed sharply, propelled by optimism surrounding President Trump's election victory and his pro-business agenda of tax cuts, regulatory easing and increased infrastructure spending. Rising commodity prices and a steadily improving global economy further bolstered equities and enabled the U.S. Federal Reserve to continue on its path of increasing interest rates. Geopolitical risks caused occasional dips in the market, however, and the post-election tailwind abated as the current administration grappled with internal struggles, fueling skepticism that there would be any meaningful policy changes in the near future. Nonetheless, equity indexes continued to reach new heights as investors were enticed by strong corporate earnings against the backdrop of healthy employment levels, low inflation and moderately rising GDP, which fueled expectations for continued profit growth ahead.
Within the Index, sector performance was mixed, with Financials generating the strongest returns, owing to the anticipated easing of regulations, stable economy and rising interest rates. The favorable macro picture also drove outperformance relative to the overall Index in Materials and Information Technology. The Energy, Real Estate and Telecommunication Services sectors posted negative returns for the period. Energy faltered as oil prices fell and the latter two segments declined in large part due to sector rotation as investors favored other areas of the equity market.
Financials were the largest source of upside to Fund performance relative to the Index. Our heavier exposure to banks, including Citigroup, was especially beneficial as the industry continued to soar on expectations of less strict oversight under President Trump as well as the improving macro environment and interest rate increases. Favorable stress test results during the period also lifted these stocks in the latter part of the year. Consumer Staples was another area of relative strength, with the largest boost coming from retailer Wal-Mart, whose stock rose as the company made strategic moves to enhance its business and adapt to the proliferation of online shopping. On the downside, negative stock selection within Health Care hurt relative performance. One weak spot in this area was health care equipment stock Zimmer Biomet Holdings, which declined during the year on disappointing earnings and lowered guidance, as well as the departure of its CEO. Underperformance within Materials was also negative for the Fund on a relative basis, due in part to our underweight in the chemicals area, which was a strong component of the Index.
As the equity bull market enters another year, valuations are running high, yet we believe stocks seem poised to appreciate further as corporate earnings growth projections remain strong given the support of steady economic growth, tepid inflation, rising commodity prices and a weak U.S. dollar. Still, we remain cautious in light of the stock market's relentless ascent, which in our view could leave it vulnerable to sharp corrections if earnings expectations are not met or if tighter monetary policy begins to dampen the economy.
Therefore, we continue to explore all areas of the market for price dislocations that could turn into rewarding investment opportunities. Our portfolio construction strategy entails uncovering underappreciated stocks with hidden value that can be realized as specific catalysts play out over time, and we believe that this approach is fundamental to generating favorable returns over the long term.
Sincerely,
ELI M. SALZMANN
PORTFOLIO MANAGER
Information about principal risks of investing in the Fund is set forth in the prospectus and statement of additional information.
The portfolio composition, industries and holdings of the Fund are subject to change without notice.
The opinions expressed are those of the Fund's portfolio manager. The opinions are as of the date of this report and are subject to change without notice.
67
TICKER SYMBOLS
Institutional Class | | NLRLX | |
Class A | | NVAAX | |
Class C | | NVACX | |
SECTOR ALLOCATION
(as a % of Total Investments*) | |
Consumer Discretionary | | | 8.2 | % | |
Consumer Staples | | | 11.9 | | |
Energy | | | 9.9 | | |
Financials | | | 20.4 | | |
Health Care | | | 13.6 | | |
Industrials | | | 5.5 | | |
Information Technology | | | 2.0 | | |
Materials | | | 7.8 | | |
Real Estate | | | 0.5 | | |
Telecommunication Services | | | 1.0 | | |
Utilities | | | 5.2 | | |
Short-Term Investment | | | 14.0 | | |
Total | | | 100.0 | % | |
* Derivatives (other than options purchased), if any, are excluded from this chart.
PERFORMANCE HIGHLIGHTS9
| | | | | Average Annual Total
Return Ended 08/31/2017 | |
| | | Inception
Date* | | 1 Year | | 5 Years | | 10 Years | | Life of
Fund | |
At NAV | |
| Institutional Class20 | | 04/19/2010 | | | 16.18 | % | | | 13.04 | % | | | 7.71 | % | | | 8.12 | % | |
| Class A20 | | 03/02/2011 | | | 15.83 | % | | | 12.60 | % | | | 7.45 | % | | | 7.87 | % | |
| Class C20 | | 03/02/2011 | | | 14.92 | % | | | 11.77 | % | | | 6.92 | % | | | 7.39 | % | |
With Sales Charge | |
| Class A20 | | | | | | | 9.19 | % | | | 11.27 | % | | | 6.81 | % | | | 7.28 | % | |
| Class C20 | | | | | | | 13.92 | % | | | 11.77 | % | | | 6.92 | % | | | 7.39 | % | |
Index | |
| Russell 1000® Value Index1,15 | | | | | | | 11.58 | % | | | 13.25 | % | | | 5.96 | % | | | 6.22 | % | |
*The performance data for each class includes the performance of the Fund's oldest share class, Trust Class, from November 2, 2006 through April 19, 2010. The performance data for Class A and Class C also includes the performance of the Fund's Institutional Class from April 19, 2010 through March 2, 2011. See endnote 20 for information about the effects of the different fees paid by each class.
The performance data quoted represent past performance and do not indicate future results. Current performance may be lower or higher than the performance data quoted. For performance data current to the most recent month-end, please visit www.nb.com/performance.
The results shown in the table reflect the reinvestment of income dividends and other distributions, if any. The results do not reflect the effect of taxes a shareholder would pay on Fund distributions or on the redemption of Fund shares. The investment return and principal value of an investment will fluctuate and shares, when redeemed, may be worth more or less than their original cost.
Returns would have been lower if Neuberger Berman Investment Advisers LLC ("Management") had not reimbursed certain expenses and/or waived a portion of the investment management fees during certain of the periods shown. Repayment by a class (of expenses previously reimbursed and/or fees previously waived by Management) will decrease the class's returns. Please see Note B in the Notes to Financial Statements for specific information regarding expense reimbursement and/or fee waiver arrangements.
As stated in the Fund's most recent prospectus, the total annual operating expense ratios for fiscal year 2016 were 2.69%, 3.08% and 3.88% for Institutional Class, Class A and Class C shares, respectively (before expense reimbursements and/or fee waivers, if any). The expense ratios were 0.76%, 1.12% and 1.87% for Institutional Class, Class A and Class C shares, respectively, after expense reimbursements and/or fee waivers. The expense ratios for the annual period ended August 31, 2017 can be found in the Financial Highlights section of this report.
Returns shown with a sales charge reflect the deduction of the current maximum initial sales charge of 5.75% for Class A shares and the contingent deferred sales charge (CDSC) for Class C shares. The CDSC for Class C shares is 1.00%, which is reduced to 0% after 1 year. The performance of the Fund's share classes will differ primarily due to different sales charge structures and class expenses. Please see the prospectus for more information about sales charge structures, if any, and class expenses for your share class.
68
COMPARISON OF A $1,000,000 INVESTMENT20
(000's Omitted)

This graph shows the change in value of a hypothetical $1,000,000 investment in the Fund over the past 10 fiscal years, or since the Fund's inception if it has not operated for 10 years. The graph is based on the Institutional Class shares only; the performance of the Fund's share classes will differ primarily due to different sales charge structures and class expenses (see Performance Highlights chart on previous page). The result is compared with benchmarks, which include a broad-based market index and may include a more narrowly based index. Market indices have not been reduced to reflect any of the fees and costs of investing. The results shown in the graph reflect the reinvestment of income dividends and other distributions, if any. The results do not reflect the effect of taxes a shareholder would pay on Fund distributions or on the redemption of Fund shares. Results represent past performance and do not indicate future results.
69
1 Please see "Glossary of Indices" on page 74 for a description of indices. Please note that individuals cannot invest directly in any index. The indices described in this report do not take into account any fees, expenses or tax consequences of investing in the individual securities that they track. Data about the performance of an index are prepared or obtained by Neuberger Berman Investment Advisers LLC* ("Management") and reflect the reinvestment of income dividends and other distributions, if any. The Fund may invest in securities not included in a described index and generally does not invest in all securities included in a described index.
2 This date reflects when Management first became the investment manager to the Fund.
3 The performance information for the Trust Class prior to the class's inception date is that of the Fund's Investor Class. The performance information for the Investor Class has not been adjusted to take into account differences in class specific operating expenses. The Investor Class has lower expenses and typically higher returns than the Trust Class.
4 The performance information for the Advisor Class prior to the class's inception date is that of the Fund's Investor Class. The performance information for the Investor Class has not been adjusted to take into account differences in class specific operating expenses. The Investor Class has lower expenses and typically higher returns than the Advisor Class.
5 The performance information for the Institutional Class prior to the class's inception date is that of the Fund's Investor Class. The performance information for the Investor Class has not been adjusted to take into account differences in class specific operating expenses. The Investor Class has higher expenses and typically lower returns than the Institutional Class.
6 The performance information for the Institutional Class prior to the class's inception date is that of the Fund's Trust Class. The performance information for the Trust Class has not been adjusted to take into account differences in class specific operating expenses. The Trust Class has higher expenses and typically lower returns than the Institutional Class.
7 The investments for the Fund are managed by the same portfolio manager(s) who manage(s) one or more other registered funds that have names, investment objectives and investment styles that are similar to those of the Fund. You should be aware that the Fund is likely to differ from those other mutual fund(s) in size, cash flow pattern and tax matters. Accordingly, the holdings and performance of the Fund can be expected to vary from those of the other mutual fund(s).
8 The Fund had a policy of investing mainly in large-cap stocks prior to September 1998 and investing 90% of its assets in no more than six economic sectors prior to December 17, 2007. As of April 2, 2001, the Fund changed its investment policy to become "non-diversified" under the Investment Company Act of 1940 ("1940 Act"). Performance prior to these changes might have been different if current policies had been in effect. However, by operation of law under the 1940 Act, the Fund subsequently became, and currently operates as, a diversified fund. Please see the notes to the financial statements for information on a non-diversified fund becoming a diversified fund by operation of law.
9 Neuberger Berman Global Real Estate Fund and Neuberger Berman International Small Cap Fund are relatively small. Each of Neuberger Berman Emerging Markets Equity Fund, Neuberger Berman Equity Income Fund, Neuberger Berman Global Equity Fund, Neuberger Berman Multi-Cap Opportunities Fund and Neuberger Berman Value Fund were relatively small prior to September 2010, June 2008, August 2013, January 2010 and April 2013, respectively. The same techniques used to produce returns in a small fund may not work to produce similar returns in a larger fund and could have an impact on performance.
10 The performance information for Class R3 prior to the class's inception date is that of the Fund's Institutional Class. The performance information for the Institutional Class has not been adjusted to take into account
70
differences in class specific operating expenses (such as Rule 12b-1 fees). The Institutional Class has lower expenses and typically higher returns than Class R3.
11 The Fund had a policy of investing mainly in large-cap stocks prior to December 2002. Its performance prior to that date might have been different if current policies had been in effect.
12 The performance information for Class A, Class C, Investor Class, and Trust Class prior to the classes' inception date is that of the Fund's Institutional Class. The performance information for the Institutional Class has been adjusted to reflect the appropriate sales charges applicable to Class A and Class C shares, but has not been adjusted to take into account differences in class specific operating expenses (such as Rule 12b-1 fees). The Institutional Class has lower expenses and typically higher returns than Class A, Class C, Investor Class, and Trust Class.
13 The performance information for Institutional Class, Class A, Class C and Class R3 prior to June 9, 2008 is that of the Fund's Trust Class, which had an inception date of November 2, 2006, and converted into the Institutional Class on June 9, 2008. During the period from November 2, 2006 through June 9, 2008, the Trust Class had only one investor, which could have impacted Fund performance. The performance information for the Trust Class has been adjusted to reflect the appropriate sales charges applicable to Class A and Class C shares, but has not been adjusted to take into account differences in class specific operating expenses (such as Rule 12b-1 fees). The Trust Class had higher expenses and typically lower returns than the Institutional Class. The Trust Class had lower expenses and typically higher returns than Class A, Class C and Class R3. The performance information for Class R3 from June 9, 2008 to the class's inception date is that of the Fund's Institutional Class. The performance information for the Institutional Class has not been adjusted to take into account differences in class specific operating expenses (such as Rule 12b-1 fees). The Institutional Class has lower expenses and typically higher returns than Class R3.
14 The performance information for Class A, Class C and Class R3 prior to the classes' respective inception dates is that of the Fund's Trust Class. The performance information for the Trust Class has been adjusted to reflect the appropriate sales charges applicable to Class A and Class C shares, but has not been adjusted to take into account differences in class specific operating expenses (such as Rule 12b-1 fees). The Trust Class has lower expenses and typically higher returns than Class A, Class C and Class R3.
15 The date used to calculate Life of Fund performance for the index is the inception date of the oldest share class.
16 The performance information for Class R3 prior to the class's inception date is that of the Fund's Investor Class. The performance information for the Investor Class has not been adjusted to take into account differences in class specific operating expenses (such as Rule 12b-1 fees). The Investor Class has lower expenses and typically higher returns than Class R3.
17 Prior to December 14, 2009, the Fund had different investment goals, strategies and portfolio management team. The performance information for Institutional Class, Class A and Class C prior to December 21, 2009 is that of the Fund's Trust Class, which had an inception date of November 2, 2006, and converted into the Institutional Class on December 21, 2009. During the period from November 2, 2006 through December 21, 2009, the Trust Class had only one investor, which could have impacted Fund performance. The performance information for the Trust Class has been adjusted to reflect the appropriate sales charges applicable to Class A and Class C shares, but has not been adjusted to take into account differences in class specific operating expenses (such as Rule 12b-1 fees). Management had previously capped Trust Class expenses; absent this arrangement, the returns would have been lower. The Trust Class had lower capped expenses and typically higher returns than Class A and Class C. The Trust Class had equivalent capped expenses and typically similar returns to the Institutional Class.
18 The performance information for Institutional Class, Class A and Class C prior to the classes' inception date is that of the Fund's predecessor, the DJG Small Cap Value Fund L.P., an unregistered limited partnership ("DJG Fund");
71
DJG Fund was the successor to The DJG Small Cap Value Fund, an unregistered commingled investment account ("DJG Account"). The performance from July 8, 1997 (the commencement of operations) to September 11, 2008 is that of DJG Account, and the performance from September 12, 2008 to May 10, 2010 is that of DJG Fund. On May 10, 2010, the DJG Fund transferred its assets to the Fund in exchange for the Fund's Institutional Class shares. The investment policies, objectives, guidelines and restrictions of the Fund are in all material respects equivalent to those of DJG Fund and DJG Account (the "Predecessors"). As a mutual fund registered under the 1940 Act, the Fund is subject to certain restrictions under the 1940 Act and the Internal Revenue Code ("Code") to which the Predecessors were not subject. Had the Predecessors been registered under the 1940 Act and been subject to the provisions of the 1940 Act and the Code, their investment performance may have been adversely affected. The performance information reflects the actual expenses of the Predecessors, which were generally lower than those of the Fund.
19 The performance information for Class A and Class C prior to the classes' inception date is that of the Fund's Investor Class. The performance information for the Investor Class has been adjusted to reflect the appropriate sales charges applicable to Class A and Class C shares, but has not been adjusted to take into account differences in class specific operating expenses (such as Rule 12b-1 fees). The Investor Class has lower expenses and typically higher returns than Class A and Class C.
20 The performance information for Institutional Class, Class A and Class C prior to April 19, 2010 is that of the Fund's Trust Class, which had an inception date of November 2, 2006, and converted into the Institutional Class on April 19, 2010. During the period from November 2, 2006 through April 19, 2010, the Trust Class had only one investor, which could have impacted Fund performance. The performance information for Class A and Class C from April 19, 2010 to the classes' inception date is that of the Fund's Institutional Class. During the period from April 19, 2010 through March 2, 2011, the Institutional Class had only one investor, which could have impacted Fund performance. The performance information for the Trust Class and the Institutional Class has been adjusted to reflect the appropriate sales charges applicable to Class A and Class C shares, but has not been adjusted to take into account differences in class specific operating expenses (such as Rule 12b-1 fees). The Trust Class had higher expenses and typically lower returns than the Institutional Class. The Trust Class had lower expenses and typically higher returns than Class A and Class C. The Institutional Class has lower expenses and typically higher returns than Class A and Class C.
21 As of June 19, 2012, the Fund changed its investment policy to become "non-diversified" under the 1940 Act. A non-diversified fund is able to invest larger percentages of its assets in the securities of a single issuer, which could increase the fund's risk of loss. Performance prior to this change might have been different if current policies had been in effect.
22 The performance information for Class R6 prior to the class's inception date is that of the Fund's Institutional Class. The performance information for the Institutional Class has not been adjusted to take into account differences in class specific operating expenses. The Institutional Class has higher expenses and typically lower returns than Class R6.
23 The performance information for Class R6 prior to the class's inception date is that of the Fund's Investor Class. The performance information for the Investor Class has not been adjusted to take into account differences in class specific operating expenses. The Investor Class has higher expenses and typically lower returns than Class R6.
24 The performance information for Class R6 prior to the class's inception date is that of the Fund's Trust Class. The performance information for the Trust Class has not been adjusted to take into account differences in class specific operating expenses. The Trust Class has higher expenses and typically lower returns than Class R6.
25 As previously announced, on April 28, 2017, NBIA retained Green Court Capital Management Limited as the sub-adviser to Neuberger Berman Greater China Equity Fund, replacing Neuberger Berman Asia Limited. The nature
72
and level of the services provided under the New Sub-Advisory Agreement are the same as under the previous Sub-Advisory Agreement, and there will be no change in the fees incurred by the Fund. Neuberger Berman Group LLC ("NBG LLC") retains an ongoing passive minority ownership stake in Green Court. Other than NBG LLC, all equity in Green Court is owned by its professionals.
* On January 1, 2016, Neuberger Berman Management LLC ("NBM") and Neuberger Berman LLC ("Neuberger Berman") transferred to Neuberger Berman Fixed Income LLC ("NBFI") their rights and obligations pertaining to all services they provided to any Fund under any investment management, investment sub-advisory, and/or administration agreement, as applicable (the "Agreements"). Following such transfer, NBFI was renamed Neuberger Berman Investment Advisers LLC ("NBIA" or "Management"). Following the consolidation, the investment professionals of NBM who provided services to any Fund under the Agreements continue to provide the same services, except that they provide those services in their new capacities as investment professionals of NBIA. Further, the consolidation did not result in any change in the investment processes employed by any Fund, the nature or level of services provided to any Fund, or the fees any Fund pays under its Agreements.
On July 1, 2016, NBM was reorganized into Neuberger Berman (the "Reorganization"). Upon the completion of the Reorganization, Neuberger Berman assumed all rights and obligations pertaining to all services NBM provided to any Fund under any distribution agreement or distribution and services agreement (the "Agreements") or plan adopted pursuant to Rule 12b-1 under the Investment Company Act of 1940, as amended, (the "Plans"). Accordingly, after the Reorganization, Neuberger Berman became each Fund's distributor and the services previously provided by NBM under the Agreements and Plans are provided by Neuberger Berman.
Following the Reorganization, the employees of NBM provide the same services to each Fund under the Agreements and Plans, except that they provide those services in their capacities as employees of Neuberger Berman. Further, the Reorganization did not result in any change in the nature or level of services provided to each Fund, or the fees, if any, each Fund pays under the Agreements or the Plans.
On January 1, 2017, the Funds' distributor, Neuberger Berman, changed its name to Neuberger Berman BD LLC.
For more complete information on any of the Neuberger Berman Equity Funds, call us at (800) 877-9700, or visit our website at www.nb.com.
73
FTSE EPRA/NAREIT Developed Index: | | The index is a free float-adjusted market capitalization-weighted index that is designed to measure the performance of listed real estate companies and real estate investment trusts (REITs) in developed markets. Net total return indexes reinvest dividends after the deduction of withholding taxes, using (for international indexes) a tax rate applicable to non-resident institutional investors who do not benefit from double taxation treaties. Gross total return indexes reinvest as much as possible of a company's dividend distributions, regardless of withholding taxes that a non-resident may experience. | |
FTSE NAREIT All Equity REITs Index: | | The index is a free-float adjusted, market capitalization-weighted index of U.S. Equity REITs. Constituents of the Index include all tax-qualified REITs with more than 50 percent of total assets in qualifying real estate assets other than mortgages secured by real property. | |
MSCI All Country World Index: | | The index is a free float-adjusted market capitalization-weighted index that is designed to measure the equity market performance of developed and emerging markets. The index consists of 47 country indexes comprising 23 developed and 24 emerging market country indexes. The developed market country indexes included are: Australia, Austria, Belgium, Canada, Denmark, Finland, France, Germany, Hong Kong, Ireland, Israel, Italy, Japan, the Netherlands, New Zealand, Norway, Portugal, Singapore, Spain, Sweden, Switzerland, the United Kingdom and the United States. The emerging market country indexes included are: Brazil, Chile, China, Colombia, Czech Republic, Egypt, Greece, Hungary, India, Indonesia, Korea, Malaysia, Mexico, Pakistan, Peru, the Philippines, Poland, Qatar, Russia, South Africa, Taiwan, Thailand, Turkey, and the UAE. Net total return indexes reinvest dividends after the deduction of withholding taxes, using (for international indexes) a tax rate applicable to non-resident institutional investors who do not benefit from double taxation treaties. Gross total return indexes reinvest as much as possible of a company's dividend distributions, regardless of withholding taxes that a non-resident may experience. | |
MSCI China Index: | | The index is a free float-adjusted market capitalization-weighted index that is designed to measure the equity market performance of Chinese securities readily accessible to nondomestic investors. The index includes equity securities issued by companies incorporated in the People's Republic of China ("PRC"), and listed in the form of China B shares on the Shanghai Stock Exchange (in US$) or Shenzhen Stock Exchange (in HK$), or China H shares on the Hong Kong Stock Exchange (in HK$) and other foreign exchanges. It also includes Red-Chips and P-Chips, which are not incorporated in the PRC and are listed on the Hong Kong Stock Exchange. Red-Chips include companies that are directly or indirectly controlled by organizations or enterprises that are owned by the state, provinces, or municipalities of the PRC. P-Chips include non-state-owned Chinese companies incorporated outside the mainland and traded in Hong Kong. Starting December 1, 2015, MSCI began including U.S.-listed China stocks in the index. The index does not include China A-shares. (China A-shares are securities listed on the Shanghai or Shenzhen Stock Exchanges and traded in renminbi, with limited accessibility to foreign investors.) Net total return indexes reinvest dividends after the deduction of withholding taxes, using (for international indexes) a tax rate applicable to non-resident institutional investors who do not benefit from double taxation treaties. Gross total return indexes reinvest as much as possible of a company's dividend distributions, regardless of withholding taxes that a non-resident may experience. | |
74
Glossary of Indices (cont'd)
| MSCI EAFE® Index (Europe, Australasia, Far East): | | The index is a free float-adjusted market capitalization-weighted index that is designed to measure the equity market performance of developed markets, excluding the United States and Canada. The index consists of the following 21 developed market country indices: Australia, Austria, Belgium, Denmark, Finland, France, Germany, Hong Kong, Ireland, Israel, Italy, Japan, the Netherlands, New Zealand, Norway, Portugal, Singapore, Spain, Sweden, Switzerland, and the United Kingdom. Net total return indexes reinvest dividends after the deduction of withholding taxes, using (for international indexes) a tax rate applicable to non-resident institutional investors who do not benefit from double taxation treaties. Gross total return indexes reinvest as much as possible of a company's dividend distributions, regardless of withholding taxes that a non-resident may experience. | |
MSCI Emerging Markets Index: | | The index is a free float-adjusted market capitalization-weighted index that is designed to measure the equity market performance of emerging markets. The index consists of the following 24 emerging market country indexes: Brazil, Chile, China, Colombia, Czech Republic, Egypt, Greece, Hungary, India, Indonesia, Korea, Malaysia, Mexico, Pakistan, Peru, the Philippines, Poland, Qatar, Russia, South Africa, Taiwan, Thailand, Turkey, and the UAE. Net total return indexes reinvest dividends after the deduction of withholding taxes, using (for international indexes) a tax rate applicable to non-resident institutional investors who do not benefit from double taxation treaties. Gross total return indexes reinvest as much as possible of a company's dividend distributions, regardless of withholding taxes that a non-resident may experience. | |
| MSCI EAFE® Small Cap Index: | | The index is a free float-adjusted market capitalization-weighted index that is designed to measure the equity market performance of the small cap segment of developed markets, excluding the United States and Canada. The index consists of the following 21 developed market country indices: Australia, Austria, Belgium, Denmark, Finland, France, Germany, Hong Kong, Ireland, Israel, Italy, Japan, the Netherlands, New Zealand, Norway, Portugal, Singapore, Spain, Sweden, Switzerland, and the United Kingdom. Net total return indexes reinvest dividends after the deduction of withholding taxes, using (for international indexes) a tax rate applicable to non-resident institutional investors who do not benefit from double taxation treaties. | |
| Russell 1000® Index: | | The index is a float-adjusted market capitalization-weighted index that measures the performance of the large-cap segment of the U.S. equity market. It includes approximately 1,000 of the largest securities in the Russell 3000® Index (which measures the performance of the 3,000 largest U.S. public companies based on total market capitalization). The index is rebalanced annually in June. | |
| Russell 1000® Value Index: | | The index is a float-adjusted market capitalization-weighted index that measures the performance of the large-cap value segment of the U.S. equity market. It includes those Russell 1000 Index companies with lower price-to-book ratios and lower forecasted growth rates. The index is rebalanced annually in June. | |
| Russell 2000® Index: | | The index is a float-adjusted market capitalization-weighted index that measures the performance of the small-cap segment of the U.S. equity market. It includes approximately 2,000 of the smallest securities in the Russell 3000 Index (which measures the performance of the 3,000 largest U.S. public companies based on total market capitalization). The index is rebalanced annually in June. | |
75
Glossary of Indices (cont'd)
| Russell 2000® Growth Index: | | The index is a float-adjusted market capitalization-weighted index that measures the performance of the small-cap growth segment of the U.S. equity market. It includes those Russell 2000 Index companies with higher price-to-book ratios and higher forecasted growth rates. The index is rebalanced annually in June. | |
| Russell 2000® Value Index: | | The index is a float-adjusted market capitalization-weighted index that measures the performance of the small-cap value segment of the U.S. equity market. It includes those Russell 2000 Index companies with lower price-to-book ratios and lower forecasted growth rates. The index is rebalanced annually in June. | |
| Russell Midcap® Index: | | The index is a float-adjusted market capitalization-weighted index that measures the performance of the mid-cap segment of the U.S. equity market. It includes approximately 800 of the smallest securities in the Russell 1000 Index. The index is rebalanced annually in June. | |
| Russell Midcap® Growth Index: | | The index is a float-adjusted market capitalization-weighted index that measures the performance of the mid-cap growth segment of the U.S. equity market. It includes those Russell Midcap Index companies with higher price-to-book ratios and higher forecasted growth rates. The index is rebalanced annually in June. | |
| Russell Midcap® Value Index: | | The index is a float-adjusted market capitalization-weighted index that measures the performance of the mid-cap value segment of the U.S. equity market. It includes those Russell Midcap Index companies with lower price-to-book ratios and lower forecasted growth rates. The index is rebalanced annually in June. | |
| S&P 500® Index: | | The index is a float-adjusted market capitalization-weighted index that focuses on the large-cap segment of the U.S. equity market, and includes a significant portion of the total value of the market. | |
76
Information About Your Fund's Expenses (Unaudited)
As a Fund shareholder, you incur two types of costs: (1) transaction costs, including sales charges (loads) on purchase payments or redemption proceeds (if applicable); and (2) ongoing costs, including management fees, distribution and/or service (12b-1) fees (if applicable), and other Fund expenses. This example is intended to help you understand your ongoing costs (in U.S. dollars) of investing in a Fund and compare these costs with the ongoing costs of investing in other mutual funds.
This table is designed to provide information regarding costs related to your investments. The following examples are based on an investment of $1,000 made at the beginning of the six month period ended August 31, 2017 and held for the entire period. The table illustrates the Fund's costs in two ways:
Actual Expenses and Performance: | | The first section of the table provides information about actual account values and actual expenses in dollars, based on the Fund's actual performance during the period indicated. You may use the information in this line, together with the amount you invested, to estimate the expenses you paid over the period. Simply divide your account value by $1,000 (for example, an $8,600 account value divided by $1,000 = 8.6), then multiply the result by the number in the first section of the table under the heading entitled "Expenses Paid During the Period" to estimate the expenses you paid over the period. | |
Hypothetical Example for Comparison Purposes: | | The second section of the table provides information about hypothetical account values and hypothetical expenses based on the Fund's actual expense ratio and an assumed rate of return at 5% per year before expenses. This return is not the Fund's actual return. The hypothetical account values and expenses may not be used to estimate the actual ending account balance or expenses you paid for the period. You may use this information to compare the ongoing costs of investing in a Fund versus other funds. To do so, compare the expenses shown in this 5% hypothetical example with the 5% hypothetical examples that appear in the shareholder reports of other funds. | |
Please note that the expenses in the table are meant to highlight your ongoing costs only and do not include any transaction costs, such as sales charges (loads) (if applicable). Therefore, the information under the heading "Hypothetical (5% annual return before expenses)" is useful in comparing ongoing costs only, and will not help you determine the relative total costs of owning different funds. In addition, if these transaction costs were included, your costs would have been higher.
77
Expense Example (Unaudited)
Neuberger Berman Equity Funds | |
| | | ACTUAL | | HYPOTHETICAL (5% ANNUAL RETURN BEFORE EXPENSES) | |
| | | Beginning
Account
Value
3/1/17 | | Ending
Account
Value
8/31/17 | | Expenses Paid
During the
Period(1)
3/1/17 - 8/31/17 | | Expense
Ratio | | Beginning
Account
Value
3/1/17 | | Ending
Account
Value
8/31/17 | | Expenses Paid
During the
Period(2)
3/1/17 - 8/31/17 | | Expense
Ratio | |
Dividend Growth Fund | |
Institutional Class | | $ | 1,000.00 | | | $ | 1,051.20 | | | $ | 3.57 | | | | 0.69 | % | | $ | 1,000.00 | | | $ | 1,021.73 | | | $ | 3.52 | | | | 0.69 | % | |
Class A | | $ | 1,000.00 | | | $ | 1,049.50 | | | $ | 5.42 | | | | 1.05 | % | | $ | 1,000.00 | | | $ | 1,019.91 | | | $ | 5.35 | | | | 1.05 | % | |
Class C | | $ | 1,000.00 | | | $ | 1,045.50 | | | $ | 9.28 | | | | 1.80 | % | | $ | 1,000.00 | | | $ | 1,016.13 | | | $ | 9.15 | | | | 1.80 | % | |
Class R6 | | $ | 1,000.00 | | | $ | 1,050.40 | | | $ | 3.20 | | | | 0.62 | % | | $ | 1,000.00 | | | $ | 1,022.08 | | | $ | 3.16 | | | | 0.62 | % | |
Emerging Markets Equity Fund | |
Institutional Class | | $ | 1,000.00 | | | $ | 1,193.40 | | | $ | 6.91 | | | | 1.25 | % | | $ | 1,000.00 | | | $ | 1,018.90 | | | $ | 6.36 | | | | 1.25 | % | |
Class A | | $ | 1,000.00 | | | $ | 1,191.90 | | | $ | 8.29 | | | | 1.50 | % | | $ | 1,000.00 | | | $ | 1,017.64 | | | $ | 7.63 | | | | 1.50 | % | |
Class C | | $ | 1,000.00 | | | $ | 1,187.00 | | | $ | 12.40 | | | | 2.25 | % | | $ | 1,000.00 | | | $ | 1,013.86 | | | $ | 11.42 | | | | 2.25 | % | |
Class R3 | | $ | 1,000.00 | | | $ | 1,189.00 | | | $ | 10.54 | | | | 1.91 | % | | $ | 1,000.00 | | | $ | 1,015.58 | | | $ | 9.70 | | | | 1.91 | % | |
Class R6 | | $ | 1,000.00 | | | $ | 1,193.90 | | | $ | 6.53 | | | | 1.18 | % | | $ | 1,000.00 | | | $ | 1,019.26 | | | $ | 6.01 | | | | 1.18 | % | |
Equity Income Fund | |
Institutional Class | | $ | 1,000.00 | | | $ | 1,038.30 | | | $ | 3.49 | | | | 0.68 | % | | $ | 1,000.00 | | | $ | 1,021.78 | | | $ | 3.47 | | | | 0.68 | % | |
Class A | | $ | 1,000.00 | | | $ | 1,036.40 | | | $ | 5.34 | | | | 1.04 | % | | $ | 1,000.00 | | | $ | 1,019.96 | | | $ | 5.30 | | | | 1.04 | % | |
Class C | | $ | 1,000.00 | | | $ | 1,032.80 | | | $ | 9.17 | | | | 1.79 | % | | $ | 1,000.00 | | | $ | 1,016.18 | | | $ | 9.10 | | | | 1.79 | % | |
Class R3 | | $ | 1,000.00 | | | $ | 1,035.00 | | | $ | 6.82 | | | | 1.33 | % | | $ | 1,000.00 | | | $ | 1,018.50 | | | $ | 6.77 | | | | 1.33 | % | |
Focus Fund | |
Investor Class | | $ | 1,000.00 | | | $ | 1,078.40 | | | $ | 4.77 | | | | 0.91 | %(4) | | $ | 1,000.00 | | | $ | 1,020.62 | | | $ | 4.63 | | | | 0.91 | %(4) | |
Trust Class | | $ | 1,000.00 | | | $ | 1,077.40 | | | $ | 5.76 | | | | 1.10 | %(4) | | $ | 1,000.00 | | | $ | 1,019.66 | | | $ | 5.60 | | | | 1.10 | %(4) | |
Advisor Class | | $ | 1,000.00 | | | $ | 1,077.20 | | | $ | 6.60 | | | | 1.26 | %(4) | | $ | 1,000.00 | | | $ | 1,018.85 | | | $ | 6.41 | | | | 1.26 | %(4) | |
Institutional Class | | $ | 1,000.00 | | | $ | 1,079.50 | | | $ | 3.93 | | | | 0.75 | % | | $ | 1,000.00 | | | $ | 1,021.42 | | | $ | 3.82 | | | | 0.75 | % | |
Class A | | $ | 1,000.00 | | | $ | 1,077.80 | | | $ | 5.81 | | | | 1.11 | % | | $ | 1,000.00 | | | $ | 1,019.61 | | | $ | 5.65 | | | | 1.11 | % | |
Class C | | $ | 1,000.00 | | | $ | 1,073.60 | | | $ | 9.72 | | | | 1.86 | % | | $ | 1,000.00 | | | $ | 1,015.83 | | | $ | 9.45 | | | | 1.86 | % | |
Genesis Fund | |
Investor Class | | $ | 1,000.00 | | | $ | 998.50 | | | $ | 5.09 | | | | 1.01 | %(4) | | $ | 1,000.00 | | | $ | 1,020.11 | | | $ | 5.14 | | | | 1.01 | %(4) | |
Trust Class | | $ | 1,000.00 | | | $ | 998.20 | | | $ | 5.49 | | | | 1.09 | %(4) | | $ | 1,000.00 | | | $ | 1,019.71 | | | $ | 5.55 | | | | 1.09 | %(4) | |
Advisor Class | | $ | 1,000.00 | | | $ | 997.00 | | | $ | 6.74 | | | | 1.34 | %(4) | | $ | 1,000.00 | | | $ | 1,018.45 | | | $ | 6.82 | | | | 1.34 | %(4) | |
Institutional Class | | $ | 1,000.00 | | | $ | 999.50 | | | $ | 4.23 | | | | 0.84 | %(4) | | $ | 1,000.00 | | | $ | 1,020.97 | | | $ | 4.28 | | | | 0.84 | %(4) | |
Class R6 | | $ | 1,000.00 | | | $ | 999.80 | | | $ | 3.88 | | | | 0.77 | %(4) | | $ | 1,000.00 | | | $ | 1,021.32 | | | $ | 3.92 | | | | 0.77 | %(4) | |
Global Equity Fund | |
Institutional Class | | $ | 1,000.00 | | | $ | 1,110.10 | | | $ | 3.99 | | | | 0.75 | % | | $ | 1,000.00 | | | $ | 1,021.42 | | | $ | 3.82 | | | | 0.75 | % | |
Class A | | $ | 1,000.00 | | | $ | 1,109.80 | | | $ | 5.90 | | | | 1.11 | % | | $ | 1,000.00 | | | $ | 1,019.61 | | | $ | 5.65 | | | | 1.11 | % | |
Class C | | $ | 1,000.00 | | | $ | 1,104.00 | | | $ | 9.86 | | | | 1.86 | % | | $ | 1,000.00 | | | $ | 1,015.83 | | | $ | 9.45 | | | | 1.86 | % | |
Global Real Estate Fund | |
Institutional Class | | $ | 1,000.00 | | | $ | 1,060.20 | | | $ | 5.24 | | | | 1.01 | % | | $ | 1,000.00 | | | $ | 1,020.11 | | | $ | 5.14 | | | | 1.01 | % | |
Class A | | $ | 1,000.00 | | | $ | 1,058.70 | | | $ | 7.11 | | | | 1.37 | % | | $ | 1,000.00 | | | $ | 1,018.30 | | | $ | 6.97 | | | | 1.37 | % | |
Class C | | $ | 1,000.00 | | | $ | 1,054.50 | | | $ | 10.98 | | | | 2.12 | % | | $ | 1,000.00 | | | $ | 1,014.52 | | | $ | 10.76 | | | | 2.12 | % | |
Greater China Equity Fund | |
Institutional Class | | $ | 1,000.00 | | | $ | 1,336.40 | | | $ | 8.83 | | | | 1.50 | % | | $ | 1,000.00 | | | $ | 1,017.64 | | | $ | 7.63 | | | | 1.50 | % | |
Class A | | $ | 1,000.00 | | | $ | 1,333.90 | | | $ | 10.94 | | | | 1.86 | % | | $ | 1,000.00 | | | $ | 1,015.83 | | | $ | 9.45 | | | | 1.86 | % | |
Class C | | $ | 1,000.00 | | | $ | 1,329.00 | | | $ | 15.32 | | | | 2.61 | % | | $ | 1,000.00 | | | $ | 1,012.05 | | | $ | 13.24 | | | | 2.61 | % | |
Guardian Fund | |
Investor Class | | $ | 1,000.00 | | | $ | 1,077.40 | | | $ | 4.66 | | | | 0.89 | %(4) | | $ | 1,000.00 | | | $ | 1,020.72 | | | $ | 4.53 | | | | 0.89 | %(4) | |
Trust Class | | $ | 1,000.00 | | | $ | 1,075.80 | | | $ | 5.55 | | | | 1.06 | %(4) | | $ | 1,000.00 | | | $ | 1,019.86 | | | $ | 5.40 | | | | 1.06 | %(4) | |
Advisor Class | | $ | 1,000.00 | | | $ | 1,074.00 | | | $ | 7.16 | | | | 1.37 | %(4) | | $ | 1,000.00 | | | $ | 1,018.30 | | | $ | 6.97 | | | | 1.37 | %(4) | |
Institutional Class | | $ | 1,000.00 | | | $ | 1,077.90 | | | $ | 3.72 | | | | 0.71 | %(4) | | $ | 1,000.00 | | | $ | 1,021.63 | | | $ | 3.62 | | | | 0.71 | %(4) | |
Class A | | $ | 1,000.00 | | | $ | 1,076.00 | | | $ | 5.70 | | | | 1.09 | %(4) | | $ | 1,000.00 | | | $ | 1,019.71 | | | $ | 5.55 | | | | 1.09 | %(4) | |
Class C | | $ | 1,000.00 | | | $ | 1,072.20 | | | $ | 9.51 | | | | 1.82 | %(4) | | $ | 1,000.00 | | | $ | 1,016.03 | | | $ | 9.25 | | | | 1.82 | %(4) | |
Class R3 | | $ | 1,000.00 | | | $ | 1,074.50 | | | $ | 7.11 | | | | 1.36 | %(4) | | $ | 1,000.00 | | | $ | 1,018.35 | | | $ | 6.92 | | | | 1.36 | %(4) | |
78
Expense Example (Unaudited) (cont'd)
Neuberger Berman Equity Funds | |
| | | ACTUAL | | HYPOTHETICAL (5% ANNUAL RETURN BEFORE EXPENSES) | |
| | | Beginning
Account
Value
3/1/17 | | Ending
Account
Value
8/31/17 | | Expenses Paid
During the
Period(1)
3/1/17 - 8/31/17 | | Expense
Ratio | | Beginning
Account
Value
3/1/17 | | Ending
Account
Value
8/31/17 | | Expenses Paid
During the
Period(2)
3/1/17 - 8/31/17 | | Expense
Ratio | |
International Equity Fund | |
Investor Class | | $ | 1,000.00 | | | $ | 1,135.60 | | | $ | 5.65 | | | | 1.05 | %(4) | | $ | 1,000.00 | | | $ | 1,019.91 | | | $ | 5.35 | | | | 1.05 | %(4) | |
Trust Class | | $ | 1,000.00 | | | $ | 1,135.80 | | | $ | 5.87 | | | | 1.09 | %(4) | | $ | 1,000.00 | | | $ | 1,019.71 | | | $ | 5.55 | | | | 1.09 | %(4) | |
Institutional Class | | $ | 1,000.00 | | | $ | 1,137.50 | | | $ | 4.58 | | | | 0.85 | %(4) | | $ | 1,000.00 | | | $ | 1,020.92 | | | $ | 4.33 | | | | 0.85 | %(4) | |
Class A | | $ | 1,000.00 | | | $ | 1,134.60 | | | $ | 6.51 | | | | 1.21 | % | | $ | 1,000.00 | | | $ | 1,019.11 | | | $ | 6.16 | | | | 1.21 | % | |
Class C | | $ | 1,000.00 | | | $ | 1,130.20 | | | $ | 10.52 | | | | 1.96 | % | | $ | 1,000.00 | | | $ | 1,015.32 | | | $ | 9.96 | | | | 1.96 | % | |
Class R6 | | $ | 1,000.00 | | | $ | 1,138.00 | | | $ | 4.15 | | | | 0.77 | % | | $ | 1,000.00 | | | $ | 1,021.32 | | | $ | 3.92 | | | | 0.77 | % | |
International Select Fund | |
Trust Class | | $ | 1,000.00 | | | $ | 1,148.80 | | | $ | 6.23 | | | | 1.15 | % | | $ | 1,000.00 | | | $ | 1,019.41 | | | $ | 5.85 | | | | 1.15 | % | |
Institutional Class | | $ | 1,000.00 | | | $ | 1,151.10 | | | $ | 4.34 | | | | 0.80 | % | | $ | 1,000.00 | | | $ | 1,021.17 | | | $ | 4.08 | | | | 0.80 | % | |
Class A | | $ | 1,000.00 | | | $ | 1,149.00 | | | $ | 6.28 | | | | 1.16 | % | | $ | 1,000.00 | | | $ | 1,019.36 | | | $ | 5.90 | | | | 1.16 | % | |
Class C | | $ | 1,000.00 | | | $ | 1,143.90 | | | $ | 10.32 | | | | 1.91 | % | | $ | 1,000.00 | | | $ | 1,015.58 | | | $ | 9.70 | | | | 1.91 | % | |
Class R3 | | $ | 1,000.00 | | | $ | 1,146.30 | | | $ | 7.63 | | | | 1.41 | % | | $ | 1,000.00 | | | $ | 1,018.10 | | | $ | 7.17 | | | | 1.41 | % | |
Class R6 | | $ | 1,000.00 | | | $ | 1,116.90 | | | $ | 2.90 | (3) | | | 0.73 | % | | $ | 1,000.00 | | | $ | 1,021.53 | | | $ | 3.72 | | | | 0.73 | % | |
International Small Cap Fund | |
Institutional Class | | $ | 1,000.00 | | | $ | 1,164.50 | | | $ | 5.73 | | | | 1.05 | % | | $ | 1,000.00 | | | $ | 1,019.91 | | | $ | 5.35 | | | | 1.05 | % | |
Class A | | $ | 1,000.00 | | | $ | 1,161.90 | | | $ | 7.68 | | | | 1.41 | % | | $ | 1,000.00 | | | $ | 1,018.10 | | | $ | 7.17 | | | | 1.41 | % | |
Class C | | $ | 1,000.00 | | | $ | 1,156.60 | | | $ | 11.74 | | | | 2.16 | % | | $ | 1,000.00 | | | $ | 1,014.32 | | | $ | 10.97 | | | | 2.16 | % | |
Class R6 | | $ | 1,000.00 | | | $ | 1,163.50 | | | $ | 5.34 | | | | 0.98 | % | | $ | 1,000.00 | | | $ | 1,020.27 | | | $ | 4.99 | | | | 0.98 | % | |
Intrinsic Value Fund | |
Institutional Class | | $ | 1,000.00 | | | $ | 1,048.80 | | | $ | 5.16 | | | | 1.00 | % | | $ | 1,000.00 | | | $ | 1,020.16 | | | $ | 5.09 | | | | 1.00 | % | |
Class A | | $ | 1,000.00 | | | $ | 1,046.80 | | | $ | 7.02 | | | | 1.36 | % | | $ | 1,000.00 | | | $ | 1,018.35 | | | $ | 6.92 | | | | 1.36 | % | |
Class C | | $ | 1,000.00 | | | $ | 1,043.10 | | | $ | 10.87 | | | | 2.11 | % | | $ | 1,000.00 | | | $ | 1,014.57 | | | $ | 10.71 | | | | 2.11 | % | |
Large Cap Value Fund | |
Investor Class | | $ | 1,000.00 | | | $ | 1,028.60 | | | $ | 4.40 | | | | 0.86 | %(4) | | $ | 1,000.00 | | | $ | 1,020.87 | | | $ | 4.38 | | | | 0.86 | %(4) | |
Trust Class | | $ | 1,000.00 | | | $ | 1,028.00 | | | $ | 5.32 | | | | 1.04 | %(4) | | $ | 1,000.00 | | | $ | 1,019.96 | | | $ | 5.30 | | | | 1.04 | %(4) | |
Advisor Class | | $ | 1,000.00 | | | $ | 1,026.50 | | | $ | 6.08 | | | | 1.19 | %(4) | | $ | 1,000.00 | | | $ | 1,019.21 | | | $ | 6.06 | | | | 1.19 | %(4) | |
Institutional Class | | $ | 1,000.00 | | | $ | 1,029.40 | | | $ | 3.58 | | | | 0.70 | %(4) | | $ | 1,000.00 | | | $ | 1,021.68 | | | $ | 3.57 | | | | 0.70 | %(4) | |
Class A | | $ | 1,000.00 | | | $ | 1,027.60 | | | $ | 5.42 | | | | 1.06 | %(4) | | $ | 1,000.00 | | | $ | 1,019.86 | | | $ | 5.40 | | | | 1.06 | %(4) | |
Class C | | $ | 1,000.00 | | | $ | 1,023.60 | | | $ | 9.23 | | | | 1.81 | %(4) | | $ | 1,000.00 | | | $ | 1,016.08 | | | $ | 9.20 | | | | 1.81 | %(4) | |
Class R3 | | $ | 1,000.00 | | | $ | 1,025.40 | | | $ | 6.94 | | | | 1.36 | %(4) | | $ | 1,000.00 | | | $ | 1,018.35 | | | $ | 6.92 | | | | 1.36 | %(4) | |
Mid Cap Growth Fund | |
Investor Class | | $ | 1,000.00 | | | $ | 1,072.50 | | | $ | 4.75 | | | | 0.91 | %(4) | | $ | 1,000.00 | | | $ | 1,020.62 | | | $ | 4.63 | | | | 0.91 | %(4) | |
Trust Class | | $ | 1,000.00 | | | $ | 1,072.10 | | | $ | 5.01 | | | | 0.96 | %(4) | | $ | 1,000.00 | | | $ | 1,020.37 | | | $ | 4.89 | | | | 0.96 | %(4) | |
Advisor Class | | $ | 1,000.00 | | | $ | 1,070.70 | | | $ | 6.37 | | | | 1.22 | %(4) | | $ | 1,000.00 | | | $ | 1,019.06 | | | $ | 6.21 | | | | 1.22 | %(4) | |
Institutional Class | | $ | 1,000.00 | | | $ | 1,073.50 | | | $ | 3.71 | | | | 0.71 | %(4) | | $ | 1,000.00 | | | $ | 1,021.63 | | | $ | 3.62 | | | | 0.71 | %(4) | |
Class A | | $ | 1,000.00 | | | $ | 1,071.20 | | | $ | 5.79 | | | | 1.11 | %(4) | | $ | 1,000.00 | | | $ | 1,019.61 | | | $ | 5.65 | | | | 1.11 | %(4) | |
Class C | | $ | 1,000.00 | | | $ | 1,066.80 | | | $ | 9.69 | | | | 1.86 | % | | $ | 1,000.00 | | | $ | 1,015.83 | | | $ | 9.45 | | | | 1.86 | % | |
Class R3 | | $ | 1,000.00 | | | $ | 1,070.00 | | | $ | 7.10 | | | | 1.36 | % | | $ | 1,000.00 | | | $ | 1,018.35 | | | $ | 6.92 | | | | 1.36 | % | |
Class R6 | | $ | 1,000.00 | | | $ | 1,073.90 | | | $ | 3.35 | | | | 0.64 | %(4) | | $ | 1,000.00 | | | $ | 1,021.98 | | | $ | 3.26 | | | | 0.64 | %(4) | |
Mid Cap Intrinsic Value Fund | |
Investor Class | | $ | 1,000.00 | | | $ | 1,038.40 | | | $ | 5.29 | | | | 1.03 | %(4) | | $ | 1,000.00 | | | $ | 1,020.01 | | | $ | 5.24 | | | | 1.03 | %(4) | |
Trust Class | | $ | 1,000.00 | | | $ | 1,036.80 | | | $ | 6.42 | | | | 1.25 | %(4) | | $ | 1,000.00 | | | $ | 1,018.90 | | | $ | 6.36 | | | | 1.25 | %(4) | |
Institutional Class | | $ | 1,000.00 | | | $ | 1,039.30 | | | $ | 4.37 | | | | 0.85 | %(4) | | $ | 1,000.00 | | | $ | 1,020.92 | | | $ | 4.33 | | | | 0.85 | %(4) | |
Class A | | $ | 1,000.00 | | | $ | 1,037.40 | | | $ | 6.21 | | | | 1.21 | %(4) | | $ | 1,000.00 | | | $ | 1,019.11 | | | $ | 6.16 | | | | 1.21 | %(4) | |
Class C | | $ | 1,000.00 | | | $ | 1,033.80 | | | $ | 10.05 | | | | 1.96 | %(4) | | $ | 1,000.00 | | | $ | 1,015.32 | | | $ | 9.96 | | | | 1.96 | %(4) | |
Class R3 | | $ | 1,000.00 | | | $ | 1,035.90 | | | $ | 7.49 | | | | 1.46 | % | | $ | 1,000.00 | | | $ | 1,017.85 | | | $ | 7.43 | | | | 1.46 | % | |
79
Expense Example (Unaudited) (cont'd)
Neuberger Berman Equity Funds | |
| | | ACTUAL | | HYPOTHETICAL (5% ANNUAL RETURN BEFORE EXPENSES) | |
| | | Beginning
Account
Value
3/1/17 | | Ending
Account
Value
8/31/17 | | Expenses Paid
During the
Period(1)
3/1/17 - 8/31/17 | | Expense
Ratio | | Beginning
Account
Value
3/1/17 | | Ending
Account
Value
8/31/17 | | Expenses Paid
During the
Period(2)
3/1/17 - 8/31/17 | | Expense
Ratio | |
Multi-Cap Opportunities Fund | |
Institutional Class | | $ | 1,000.00 | | | $ | 1,054.80 | | | $ | 3.83 | | | | 0.74 | %(4) | | $ | 1,000.00 | | | $ | 1,021.48 | | | $ | 3.77 | | | | 0.74 | %(4) | |
Class A | | $ | 1,000.00 | | | $ | 1,052.80 | | | $ | 5.59 | | | | 1.08 | %(4) | | $ | 1,000.00 | | | $ | 1,019.76 | | | $ | 5.50 | | | | 1.08 | %(4) | |
Class C | | $ | 1,000.00 | | | $ | 1,049.40 | | | $ | 9.40 | | | | 1.82 | %(4) | | $ | 1,000.00 | | | $ | 1,016.03 | | | $ | 9.25 | | | | 1.82 | %(4) | |
Real Estate Fund | |
Trust Class | | $ | 1,000.00 | | | $ | 1,037.50 | | | $ | 5.34 | | | | 1.04 | % | | $ | 1,000.00 | | | $ | 1,019.96 | | | $ | 5.30 | | | | 1.04 | % | |
Institutional Class | | $ | 1,000.00 | | | $ | 1,038.40 | | | $ | 4.37 | | | | 0.85 | % | | $ | 1,000.00 | | | $ | 1,020.92 | | | $ | 4.33 | | | | 0.85 | % | |
Class A | | $ | 1,000.00 | | | $ | 1,035.70 | | | $ | 6.21 | | | | 1.21 | % | | $ | 1,000.00 | | | $ | 1,019.11 | | | $ | 6.16 | | | | 1.21 | % | |
Class C | | $ | 1,000.00 | | | $ | 1,031.80 | | | $ | 10.04 | | | | 1.96 | % | | $ | 1,000.00 | | | $ | 1,015.32 | | | $ | 9.96 | | | | 1.96 | % | |
Class R3 | | $ | 1,000.00 | | | $ | 1,035.30 | | | $ | 7.49 | | | | 1.46 | % | | $ | 1,000.00 | | | $ | 1,017.85 | | | $ | 7.43 | | | | 1.46 | % | |
Class R6 | | $ | 1,000.00 | | | $ | 1,038.70 | | | $ | 4.01 | | | | 0.78 | % | | $ | 1,000.00 | | | $ | 1,021.27 | | | $ | 3.97 | | | | 0.78 | % | |
Small Cap Growth Fund | |
Investor Class | | $ | 1,000.00 | | | $ | 1,092.30 | | | $ | 6.38 | | | | 1.21 | %(4) | | $ | 1,000.00 | | | $ | 1,019.11 | | | $ | 6.16 | | | | 1.21 | %(4) | |
Trust Class | | $ | 1,000.00 | | | $ | 1,091.30 | | | $ | 7.22 | | | | 1.37 | % | | $ | 1,000.00 | | | $ | 1,018.30 | | | $ | 6.97 | | | | 1.37 | % | |
Advisor Class | | $ | 1,000.00 | | | $ | 1,090.60 | | | $ | 7.96 | | | | 1.51 | %(4) | | $ | 1,000.00 | | | $ | 1,017.59 | | | $ | 7.68 | | | | 1.51 | %(4) | |
Institutional Class | | $ | 1,000.00 | | | $ | 1,093.80 | | | $ | 4.75 | | | | 0.90 | % | | $ | 1,000.00 | | | $ | 1,020.67 | | | $ | 4.58 | | | | 0.90 | % | |
Class A | | $ | 1,000.00 | | | $ | 1,091.90 | | | $ | 6.64 | | | | 1.26 | % | | $ | 1,000.00 | | | $ | 1,018.85 | | | $ | 6.41 | | | | 1.26 | % | |
Class C | | $ | 1,000.00 | | | $ | 1,088.20 | | | $ | 10.58 | | | | 2.01 | % | | $ | 1,000.00 | | | $ | 1,015.07 | | | $ | 10.21 | | | | 2.01 | % | |
Class R3 | | $ | 1,000.00 | | | $ | 1,090.30 | | | $ | 7.96 | | | | 1.51 | % | | $ | 1,000.00 | | | $ | 1,017.59 | | | $ | 7.68 | | | | 1.51 | % | |
Socially Responsive Fund | |
Investor Class | | $ | 1,000.00 | | | $ | 1,032.20 | | | $ | 4.35 | | | | 0.85 | %(4) | | $ | 1,000.00 | | | $ | 1,020.92 | | | $ | 4.33 | | | | 0.85 | %(4) | |
Trust Class | | $ | 1,000.00 | | | $ | 1,031.80 | | | $ | 5.17 | | | | 1.01 | %(4) | | $ | 1,000.00 | | | $ | 1,020.11 | | | $ | 5.14 | | | �� | 1.01 | %(4) | |
Institutional Class | | $ | 1,000.00 | | | $ | 1,033.30 | | | $ | 3.38 | | | | 0.66 | %(4) | | $ | 1,000.00 | | | $ | 1,021.88 | | | $ | 3.36 | | | | 0.66 | %(4) | |
Class A | | $ | 1,000.00 | | | $ | 1,031.20 | | | $ | 5.22 | | | | 1.02 | %(4) | | $ | 1,000.00 | | | $ | 1,020.06 | | | $ | 5.19 | | | | 1.02 | %(4) | |
Class C | | $ | 1,000.00 | | | $ | 1,027.60 | | | $ | 9.05 | | | | 1.77 | %(4) | | $ | 1,000.00 | | | $ | 1,016.28 | | | $ | 9.00 | | | | 1.77 | %(4) | |
Class R3 | | $ | 1,000.00 | | | $ | 1,030.10 | | | $ | 6.50 | | | | 1.27 | %(4) | | $ | 1,000.00 | | | $ | 1,018.80 | | | $ | 6.46 | | | | 1.27 | %(4) | |
Class R6 | | $ | 1,000.00 | | | $ | 1,033.60 | | | $ | 3.02 | | | | 0.59 | %(4) | | $ | 1,000.00 | | | $ | 1,022.23 | | | $ | 3.01 | | | | 0.59 | %(4) | |
Value Fund | |
Institutional Class | | $ | 1,000.00 | | | $ | 1,030.70 | | | $ | 3.63 | | | | 0.71 | % | | $ | 1,000.00 | | | $ | 1,021.63 | | | $ | 3.62 | | | | 0.71 | % | |
Class A | | $ | 1,000.00 | | | $ | 1,029.10 | | | $ | 5.52 | | | | 1.08 | % | | $ | 1,000.00 | | | $ | 1,019.76 | | | $ | 5.50 | | | | 1.08 | % | |
Class C | | $ | 1,000.00 | | | $ | 1,025.20 | | | $ | 9.34 | | | | 1.83 | % | | $ | 1,000.00 | | | $ | 1,015.98 | | | $ | 9.30 | | | | 1.83 | % | |
(1) For each class, expenses are equal to the annualized expense ratio for the class, multiplied by the average account value over the period, multiplied by 184/365 (to reflect the one-half year period shown), unless otherwise indicated.
(2) Hypothetical expenses are equal to the annualized expense ratios for each class, multiplied by the average account value over the period (assuming a 5% annual return), multiplied by 184/365 (to reflect the one-half year period shown).
(3) Expenses are equal to the annualized expense ratio for the class, multiplied by the average account value over the period, multiplied by 137/365 (to reflect the period shown of April 17, 2017 (Commencement of Operations) to August 31, 2017).
(4) Custodian Out-of-Pocket Expenses Refunded, as listed in Note G of the Notes to Financial Statements, is non-recurring. See Notes to Financial Highlights for the annualized ratio of net expenses to average daily net assets for the year ended August 31, 2107, had the Funds not received the refund as listed in Note G of the Notes to Financial Statements.
80
Schedule of Investments Dividend Growth Fund August 31, 2017
| | |
Number
of Shares | |
Value
(000's) | |
Common Stocks 87.7% | |
Aerospace & Defense 3.7% | |
General Dynamics
Corp. | | | 3,175 | | | $ | 639 | | |
Raytheon Co. | | | 4,050 | | | | 737 | | |
| | | | 1,376 | | |
Banks 9.8% | |
Citigroup, Inc. | | | 10,400 | | | | 708 | | |
Citizens Financial
Group, Inc. | | | 18,700 | | | | 620 | | |
Comerica, Inc. | | | 8,400 | | | | 573 | | |
FNB Corp. | | | 45,000 | | | | 571 | | |
JPMorgan
Chase & Co. | | | 7,550 | | | | 686 | | |
PNC Financial
Services Group,
Inc. | | | 4,100 | | | | 514 | | |
| | | | 3,672 | | |
Biotechnology 2.2% | |
Gilead Sciences,
Inc. | | | 9,700 | | | | 812 | | |
Communications Equipment 1.3% | |
Cisco Systems, Inc. | | | 14,950 | | | | 481 | | |
Consumer Finance 1.5% | |
Synchrony
Financial | | | 18,275 | | | | 563 | | |
Containers & Packaging 2.0% | |
Packaging Corp.
of America | | | 6,800 | | | | 764 | | |
Electric Utilities 1.4% | |
Exelon Corp. | | | 14,250 | | | | 540 | | |
Electrical Equipment 1.2% | |
Hubbell, Inc. | | | 4,000 | | | | 451 | | |
Electronic Equipment, Instruments & Components 3.2% | |
CDW Corp. | | | 7,750 | | | | 491 | | |
TE Connectivity Ltd. | | | 8,600 | | | | 685 | | |
| | | | 1,176 | | |
Energy Equipment & Services 2.0% | |
Schlumberger Ltd. | | | 11,700 | | | | 743 | | |
Equity Real Estate Investment
Trusts 1.6% | |
American Tower
Corp. | | | 4,000 | | | | 592 | | |
Food & Staples Retailing 1.9% | |
Wal-Mart Stores,
Inc. | | | 9,000 | | | | 703 | | |
Food Products 3.2% | |
Bunge Ltd. | | | 9,350 | | | | 698 | | |
Mondelez
International, Inc.
Class A | | | 12,350 | | | | 502 | | |
| | | | 1,200 | | |
| | |
Number
of Shares | |
Value
(000's) | |
Hotels, Restaurants & Leisure 3.8% | |
Carnival Corp. | | | 9,700 | | | $ | 674 | | |
MGM Resorts
International | | | 22,000 | | | | 725 | | |
| | | | 1,399 | | |
Industrial Conglomerates 2.0% | |
Honeywell
International,
Inc. | | | 5,400 | | | | 747 | | |
Insurance 3.4% | |
Aon PLC | | | 5,350 | | | | 744 | | |
Hartford Financial
Services Group,
Inc. | | | 10,000 | | | | 541 | | |
| | | | 1,285 | | |
IT Services 2.7% | |
Automatic Data
Processing, Inc. | | | 3,275 | | | | 349 | | |
Leidos Holdings,
Inc. | | | 11,100 | | | | 647 | | |
| | | | 996 | | |
Machinery 1.6% | |
Caterpillar, Inc. | | | 5,000 | | | | 587 | | |
Media 5.8% | |
CBS Corp.
Class B | | | 11,000 | | | | 705 | | |
Comcast
Corp. Class A | | | 17,750 | | | | 721 | | |
Interpublic
Group of Cos.,
Inc. | | | 36,400 | | | | 733 | | |
| | | | 2,159 | | |
Metals & Mining 6.6% | |
Lundin Mining
Corp. | | | 97,150 | | | | 734 | | |
Rio Tinto PLC
ADR | | | 17,200 | | | | 844 | | |
Royal Gold, Inc. | | | 9,400 | | | | 877 | | |
| | | | 2,455 | | |
Oil, Gas & Consumable Fuels 5.1% | |
Devon Energy
Corp. | | | 21,800 | | | | 685 | | |
EOG Resources,
Inc. | | | 6,750 | | | | 574 | | |
Suncor Energy, Inc. | | | 20,250 | | | | 634 | | |
| | | | 1,893 | | |
Pharmaceuticals 3.2% | |
Bristol-Myers
Squibb Co. | | | 11,100 | | | | 671 | | |
Eli Lilly & Co. | | | 6,500 | | | | 529 | | |
| | | | 1,200 | | |
| | |
Number
of Shares | |
Value
(000's) | |
Road & Rail 2.0% | |
CSX Corp. | | | 15,150 | | | $ | 760 | | |
Semiconductors & Semiconductor Equipment 4.0% | |
Applied Materials,
Inc. | | | 8,500 | | | | 383 | | |
Maxim Integrated
Products, Inc. | | | 14,950 | | | | 698 | | |
QUALCOMM, Inc. | | | 8,200 | | | | 429 | | |
| | | | 1,510 | | |
Software 3.8% | |
Microsoft Corp. | | | 9,150 | | | | 684 | | |
Oracle Corp. | | | 14,350 | | | | 722 | | |
| | | | 1,406 | | |
Specialty Retail 1.4% | |
Williams-Sonoma,
Inc. | | | 11,500 | | | | 529 | | |
Technology Hardware, Storage & Peripherals 3.9% | |
Apple, Inc. | | | 4,375 | | | | 718 | | |
Western Digital
Corp. | | | 8,350 | | | | 737 | | |
| | | | 1,455 | | |
Textiles, Apparel & Luxury Goods 1.8% | |
Coach, Inc. | | | 15,650 | | | | 653 | | |
Tobacco 1.6% | |
British American
Tobacco PLC | | | 9,600 | | | | 600 | | |
Total Common Stocks
(Cost $27,346) | | | | | 32,707 | | |
Preferred Stock 2.0% | |
Pharmaceuticals 2.0% | |
Allergan PLC,
Ser. A, 5.50%
(Cost $647) | | | 895 | | | | 733 | | |
Short-Term Investment 10.0% | |
Investment Company 10.0% | |
State Street
Institutional
Treasury Money
Market Fund
Premier Class,
0.90%(a)
(Cost $3,748) | | | 3,748,473 | | | | 3,748 | | |
Total Investments 99.7%
(Cost $31,741) | | | | | 37,188 | | |
Other Assets Less
Liabilities 0.3% | | | | | 117 | | |
Net Assets 100.0% | | | | $ | 37,305 | | |
See Notes to Financial Statements
81
Schedule of Investments Dividend Growth Fund (cont'd)
(a) Represents 7-day effective yield as of August 31, 2017.
The following is a summary, categorized by Level (see Note A of Notes to Financial Statements), of inputs used to value the Fund's investments as of August 31, 2017:
Asset Valuation Inputs | |
(000's omitted) | | Level 1 | | Level 2 | | Level 3 | | Total | |
Investments: | |
| Common Stocks(a) | | $ | 32,707 | | | $ | — | | | $ | — | | | $ | 32,707 | | |
| Preferred Stock(a) | | | 733 | | | | — | | | | — | | | | 733 | | |
Short-Term Investment | | | — | | | | 3,748 | | | | — | | | | 3,748 | | |
Total Investments | | $ | 33,440 | | | $ | 3,748 | | | $ | — | | | $ | 37,188 | | |
(a) The Schedule of Investments provides information on the industry categorization for the portfolio.
As of the year ended August 31, 2017, no securities were transferred from one level (as of August 31, 2016) to another.
See Notes to Financial Statements
82
Schedule of Investments Emerging Markets Equity Fund August 31, 2017
| | |
Number
of Shares | |
Value
(000's) | |
Common Stocks 94.3% | |
Brazil 6.7% | |
Atacadao
Distribuicao
Comercio
e Industria
Ltda* | | | 1,339,300 | | | $ | 6,722 | | |
B3 SA—Brasil
Bolsa Balcao | | | 1,635,100 | | | | 11,490 | | |
Cielo SA | | | 623,229 | | | | 4,441 | | |
Energisa SA | | | 1,087,717 | | | | 8,559 | | |
Hypermarcas SA | | | 717,600 | | | | 6,727 | | |
Itau Unibanco
Holding SA,
Preference
Shares | | | 1,083,967 | | | | 13,895 | | |
Kroton
Educacional SA | | | 1,257,900 | | | | 7,181 | | |
| | | | 59,015 | | |
Chile 1.1% | |
SACI Falabella | | | 919,355 | | | | 9,264 | | |
China 23.6% | |
Alibaba Group
Holding Ltd.
ADR* | | | 68,800 | | | | 11,816 | | |
Baidu, Inc. ADR* | | | 72,000 | | | | 16,420 | | |
Beijing
Enterprises
Holdings Ltd. | | | 1,158,900 | | | | 6,471 | | |
Changyou.com
Ltd. ADR* | | | 167,700 | | | | 6,711 | | |
China
Everbright
International
Ltd. | | | 8,896,900 | | | | 11,755 | | |
China Medical
System
Holdings Ltd. | | | 4,123,800 | | | | 7,588 | | |
China Mobile Ltd. | | | 1,242,500 | | | | 13,178 | | |
China State
Construction
International
Holdings Ltd. | | | 3,701,900 | | | | 5,364 | | |
China Vanke
Co. Ltd.,
H Shares | | | 429,309 | | | | 1,286 | | |
CNOOC Ltd. | | | 5,146,600 | | | | 6,156 | | |
Industrial &
Commercial
Bank of China
Ltd., H Shares | | | 22,075,400 | | | | 16,530 | | |
PICC Property &
Casualty Co.
Ltd., H Shares | | | 3,714,500 | | | | 6,977 | | |
Ping An
Insurance
Group Co. of
China Ltd.,
H Shares | | | 2,472,000 | | | | 19,632 | | |
| | |
Number
of Shares | |
Value
(000's) | |
Sunny Optical
Technology
Group Co. Ltd. | | | 1,479,400 | | | $ | 21,211 | | |
Tencent
Holdings Ltd. | | | 1,004,400 | | | | 42,226 | | |
Vipshop
Holdings Ltd.
ADR* | | | 674,818 | | | | 6,283 | | |
Zhuzhou CRRC
Times Electric
Co. Ltd.,
H Shares | | | 1,444,200 | | | | 7,557 | | |
| | | | 207,161 | | |
Czech Republic 0.8% | |
Komercni
Banka A/S | | | 166,755 | | | | 7,349 | | |
Hong Kong 2.9% | |
ASM Pacific
Technology Ltd. | | | 694,000 | | | | 8,585 | | |
Galaxy
Entertainment
Group Ltd. | | | 697,200 | | | | 4,374 | | |
Haier Electronics
Group Co. Ltd.* | | | 1,575,200 | | | | 4,187 | | |
Sino
Biopharmaceutical
Ltd. | | | 9,782,800 | | | | 8,588 | | |
| | | | 25,734 | | |
India 9.0% | |
Cummins India
Ltd. | | | 566,778 | | | | 8,114 | | |
Dabur India Ltd. | | | 1,444,969 | | | | 7,144 | | |
Dewan Housing
Finance
Corp. Ltd. | | | 952,266 | | | | 7,521 | | |
Glenmark
Pharmaceuticals
Ltd.* | | | 426,715 | | | | 4,065 | | |
HDFC Bank
Ltd. ADR | | | 87,200 | | | | 8,496 | | |
Housing
Development
Finance Corp.
Ltd. | | | 255,435 | | | | 7,112 | | |
ICICI Bank Ltd. | | | 1,410,322 | | | | 6,581 | | |
ITC Ltd. | | | 886,365 | | | | 3,917 | | |
Parag Milk
Foods Ltd.(a) | | | 630,579 | | | | 2,510 | | |
Power Grid
Corp. of
India Ltd. | | | 2,613,939 | | | | 8,936 | | |
Prestige Estates
Projects Ltd.* | | | 1,119,440 | | | | 4,781 | | |
SH Kelkar &
Co. Ltd.(a) | | | 706,370 | | | | 2,641 | | |
Vedanta Ltd. | | | 1,519,335 | | | | 7,339 | | |
| | | | 79,157 | | |
| | |
Number
of Shares | |
Value
(000's) | |
Indonesia 1.4% | |
PT Bank Negara
Indonesia
Persero Tbk | | | 9,249,600 | | | $ | 5,096 | | |
PT Gudang
Garam Tbk | | | 144,100 | | | | 747 | | |
PT Matahari
Department
Store Tbk | | | 4,325,900 | | | | 3,242 | | |
PT Sumber
Alfaria Trijaya
Tbk | | | 56,636,000 | | | | 2,887 | | |
| | | | 11,972 | | |
Jordan 0.2% | |
Hikma
Pharmaceuticals
PLC | | | 120,785 | | | | 1,955 | | |
Korea 15.4% | |
Amorepacific
Corp. | | | 6,275 | | | | 1,603 | | |
Com2uS Corp. | | | 57,436 | | | | 5,552 | | |
Coway Co. Ltd. | | | 149,135 | | | | 13,067 | | |
Hyundai
Motor Co. | | | 33,125 | | | | 4,127 | | |
Kangwon
Land, Inc. | | | 236,385 | | | | 7,233 | | |
Korea
Aerospace
Industries Ltd. | | | 175,086 | | | | 7,181 | | |
LG Chem Ltd. | | | 41,855 | | | | 14,068 | | |
Mando Corp. | | | 37,525 | | | | 7,970 | | |
NAVER Corp. | | | 7,755 | | | | 5,193 | | |
Orion Corp.* | | | 78,025 | | | | 6,041 | | |
Samsung
Electronics
Co. Ltd. | | | 18,535 | | | | 38,069 | | |
SFA Engineering
Corp. | | | 207,659 | | | | 6,971 | | |
SK Hynix, Inc. | | | 298,145 | | | | 18,138 | | |
| | | | 135,213 | | |
Malaysia 0.7% | |
Inari Amertron
Bhd | | | 10,565,650 | | | | 6,297 | | |
Mexico 4.8% | |
Fomento
Economico
Mexicano
SAB de CV | | | 919,400 | | | | 9,208 | | |
Grupo
Financiero
Banorte SAB
de CV,
O Shares | | | 1,351,200 | | | | 9,220 | | |
Grupo GICSA
SA de CV* | | | 5,012,200 | | | | 3,367 | | |
See Notes to Financial Statements
83
Schedule of Investments Emerging Markets Equity Fund (cont'd)
| | |
Number
of Shares | |
Value
(000's) | |
Grupo Mexico
SAB de CV
Series B | | | 2,516,100 | | | $ | 8,303 | | |
Infraestructura
Energetica
Nova SAB de CV | | | 1,304,100 | | | | 7,111 | | |
Unifin Financiera
SAPI de CV | | | 1,378,700 | | | | 4,742 | | |
| | | | 41,951 | | |
Peru 0.8% | |
Credicorp Ltd. | | | 34,600 | | | | 7,018 | | |
Philippines 1.9% | |
Ayala Corp. | | | 321,720 | | | | 5,784 | | |
GT Capital
Holdings, Inc. | | | 112,280 | | | | 2,453 | | |
Metropolitan
Bank &
Trust Co. | | | 2,980,020 | | | | 5,102 | | |
Pilipinas Shell
Petroleum
Corp. | | | 2,210,860 | | | | 2,850 | | |
Universal Robina
Corp. | | | 268,390 | | | | 766 | | |
| | | | 16,955 | | |
Poland 2.2% | |
Dino Polska
SA*(a) | | | 594,472 | | | | 9,828 | | |
PLAY
Communications
SA*(a) | | | 922,419 | | | | 9,309 | | |
| | | | 19,137 | | |
Russia 3.7% | |
Detsky Mir
PJSC(a)(b) | | | 2,345,390 | | | | 4,040 | | |
LUKOIL PJSC
ADR | | | 187,600 | | | | 9,427 | | |
| Magnit PJSC(b) | | | 37,705 | | | | 7,020 | | |
X5 Retail Group
NV GDR* | | | 302,280 | | | | 12,333 | | |
| | | | 32,820 | | |
| | |
Number
of Shares | |
Value
(000's) | |
South Africa 6.4% | |
Bid Corp. Ltd. | | | 346,424 | | | $ | 7,868 | | |
FirstRand Ltd. | | | 2,149,970 | | | | 9,178 | | |
JSE Ltd. | | | 627,170 | | | | 6,497 | | |
Life Healthcare
Group
Holdings Ltd. | | | 3,873,098 | | | | 7,851 | | |
Naspers Ltd.,
N Shares | | | 73,890 | | | | 16,705 | | |
Sasol Ltd. | | | 262,460 | | | | 7,906 | | |
| | | | 56,005 | | |
Taiwan, Province of China 9.8% | |
Accton
Technology
Corp. | | | 2,235,600 | | | | 5,852 | | |
Advanced
Ceramic X Corp. | | | 246,500 | | | | 3,512 | | |
Delta Electronics,
Inc. | | | 1,401,200 | | | | 7,684 | | |
Elite
Advanced
Laser Corp. | | | 1,322,880 | | | | 4,669 | | |
Elite Material
Co. Ltd. | | | 1,676,100 | | | | 8,442 | | |
eMemory
Technology,
Inc. | | | 315,400 | | | | 4,358 | | |
Hu Lane
Associate,
Inc. | | | 450,000 | | | | 2,505 | | |
Kingpak
Technology,
Inc. | | | 444,048 | | | | 3,112 | | |
MediaTek,
Inc. | | | 783,200 | | | | 7,020 | | |
Parade
Technologies
Ltd. | | | 670,400 | | | | 10,685 | | |
Taiwan
Semiconductor
Manufacturing
Co. Ltd. | | | 3,866,839 | | | | 27,740 | | |
| | | | 85,579 | | |
| | |
Number
of Shares | |
Value
(000's) | |
Thailand 0.7% | |
| CP ALL PCL | (b) | | | | 3,221,900 | | | $ | 6,016 | | |
Turkey 2.2% | |
Akbank TAS | | | 1,157,450 | | | | 3,465 | | |
Mavi Giyim
Sanayi Ve
Ticaret A/S
Class B*(a) | | | 320,440 | | | | 4,259 | | |
Tofas Turk
Otomobil
Fabrikasi A/S | | | 649,405 | | | | 5,942 | | |
Ulker
Biskuvi
Sanayi A/S | | | 912,095 | | | | 5,451 | | |
| | | | 19,117 | | |
Total Common Stocks
(Cost $648,951) | | | | | 827,715 | | |
Preferred Stock 0.1% | |
India 0.1% | |
Vedanta Ltd.,
7.50%
(Cost $725) | | | 60,773,400 | | | | 968 | | |
Short-Term Investment 5.4% | |
Investment Company 5.4% | |
State Street
Institutional
Treasury Money
Market Fund
Premier
Class, 0.90%(c)
(Cost $47,431) | | | 47,430,512 | | | | 47,431 | | |
Total Investments 99.8%
(Cost $697,107) | | | | | 876,114 | | |
Other Assets Less
Liabilities 0.2% | | | | | 1,335 | | |
Net Assets 100.0% | | | | $ | 877,449 | | |
* Non-income producing security.
(a) Securities were purchased under Rule 144A of the Securities Act of 1933, as amended (the "1933 Act"), or are otherwise restricted and, unless registered under the 1933 Act or exempted from registration, may only be sold to qualified institutional investors or may have other restrictions on resale. At August 31, 2017, these securities amounted to approximately $32,587,000, which represents 3.7% of net assets of the Fund. These securities have been deemed by the investment manager to be liquid.
(b) Security fair valued as of August 31, 2017 in accordance with procedures approved by the Board of Trustees (the "Board"). Total value of all such securities at August 31, 2017 amounted to approximately $17,076,000, which represents 1.9% of net assets of the Fund.
(c) Represents 7-day effective yield as of August 31, 2017.
See Notes to Financial Statements
84
Schedule of Investments Emerging Markets Equity Fund (cont'd)
POSITIONS BY INDUSTRY
Industry | | Investments at
Value
(000's omitted) | | Percentage of
Net Assets | |
Banks | | $ | 82,752 | | | | 9.4 | % | |
Semiconductors & Semiconductor Equipment | | | 81,195 | | | | 9.3 | % | |
Internet Software & Services | | | 75,655 | | | | 8.6 | % | |
Electronic Equipment, Instruments & Components | | | 53,717 | | | | 6.1 | % | |
Food & Staples Retailing | | | 52,674 | | | | 6.0 | % | |
Technology Hardware, Storage & Peripherals | | | 38,069 | | | | 4.3 | % | |
Pharmaceuticals | | | 28,923 | | | | 3.3 | % | |
Insurance | | | 26,609 | | | | 3.0 | % | |
Chemicals | | | 24,615 | | | | 2.8 | % | |
Wireless Telecommunication Services | | | 22,487 | | | | 2.6 | % | |
Oil, Gas & Consumable Fuels | | | 18,433 | | | | 2.1 | % | |
Capital Markets | | | 17,987 | | | | 2.1 | % | |
Electric Utilities | | | 17,495 | | | | 2.0 | % | |
Diversified Financial Services | | | 17,415 | | | | 2.0 | % | |
Household Durables | | | 17,254 | | | | 2.0 | % | |
Media | | | 16,705 | | | | 1.9 | % | |
Metals & Mining | | | 16,610 | | | | 1.9 | % | |
Food Products | | | 14,768 | | | | 1.7 | % | |
Thrifts & Mortgage Finance | | | 14,633 | | | | 1.7 | % | |
Multiline Retail | | | 12,506 | | | | 1.4 | % | |
Software | | | 12,263 | | | | 1.4 | % | |
Commercial Services & Supplies | | | 11,755 | | | | 1.3 | % | |
Hotels, Restaurants & Leisure | | | 11,607 | | | | 1.3 | % | |
Auto Components | | | 10,475 | | | | 1.2 | % | |
Automobiles | | | 10,069 | | | | 1.2 | % | |
Real Estate Management & Development | | | 9,434 | | | | 1.1 | % | |
Communications Equipment | | | 9,364 | | | | 1.1 | % | |
Beverages | | | 9,208 | | | | 1.1 | % | |
Personal Products | | | 8,747 | | | | 1.0 | % | |
Machinery | | | 8,114 | | | | 0.9 | % | |
Health Care Providers & Services | | | 7,851 | | | | 0.9 | % | |
Electrical Equipment | | | 7,557 | | | | 0.9 | % | |
Aerospace & Defense | | | 7,181 | | | | 0.8 | % | |
Diversified Consumer Services | | | 7,181 | | | | 0.8 | % | |
Gas Utilities | | | 7,111 | | | | 0.8 | % | |
Industrial Conglomerates | | | 6,471 | | | | 0.7 | % | |
Internet & Direct Marketing Retail | | | 6,283 | | | | 0.7 | % | |
Construction & Engineering | | | 5,364 | | | | 0.6 | % | |
Consumer Finance | | | 4,742 | | | | 0.5 | % | |
Tobacco | | | 4,664 | | | | 0.5 | % | |
IT Services | | | 4,441 | | | | 0.5 | % | |
Textiles, Apparel & Luxury Goods | | | 4,259 | | | | 0.5 | % | |
Specialty Retail | | | 4,040 | | | | 0.4 | % | |
Short-Term Investment and Other Assets—Net | | | 48,766 | | | | 5.6 | % | |
| | | $ | 877,449 | | | | 100.0 | % | |
See Notes to Financial Statements
85
Schedule of Investments Emerging Markets Equity Fund (cont'd)
The following is a summary, categorized by Level (see Note A of Notes to Financial Statements), of inputs used to value the Fund's investments as of August 31, 2017:
Asset Valuation Inputs | |
(000's omitted) | | Level 1 | | Level 2 | | Level 3 | | Total | |
Investments: | |
Common Stocks | |
Malaysia | | $ | — | | | $ | 6,297 | | | $ | — | | | $ | 6,297 | | |
Russia | | | 21,760 | | | | 11,060 | | | | — | | | | 32,820 | | |
Thailand | | | — | | | | 6,016 | | | | — | | | | 6,016 | | |
| Other Common Stocks(a) | | | 782,582 | | | | — | | | | — | | | | 782,582 | | |
Total Common Stocks | | | 804,342 | | | | 23,373 | | | | — | | | | 827,715 | | |
| Preferred Stock(a) | | | 968 | | | | — | | | | — | | | | 968 | | |
Short-Term Investment | | | — | | | | 47,431 | | | | — | | | | 47,431 | | |
Total Investments | | $ | 805,310 | | | $ | 70,804 | | | $ | — | | | $ | 876,114 | | |
(a) The Schedule of Investments provides a geographic categorization as well as a Positions by Industry summary.
As of the year ended August 31, 2017, no securities were transferred from one level (as of August 31, 2016) to another.
See Notes to Financial Statements
86
Schedule of Investments Equity Income Fund August 31, 2017
| | |
Number
of Shares | |
Value
(000's) | |
Common Stocks 87.1% | |
Aerospace & Defense 2.4% | |
Lockheed
Martin Corp. | | | 134,030 | | | $ | 40,931 | | |
Banks 7.7% | |
First
Hawaiian,
Inc. | | | 847,200 | | | | 22,951 | | |
FNB Corp. | | | 1,150,000 | | | | 14,593 | | |
JPMorgan
Chase & Co.(a) | | | 411,100 | | | | 37,365 | | |
PNC Financial
Services
Group, Inc. | | | 164,700 | | | | 20,655 | | |
Umpqua
Holdings
Corp. | | | 2,008,000 | | | | 35,140 | | |
| | | | 130,704 | | |
Biotechnology 2.3% | |
Gilead
Sciences,
Inc. | | | 459,100 | | | | 38,431 | | |
Capital Markets 1.0% | |
Virtu Financial,
Inc. Class A | | | 919,700 | | | | 16,509 | | |
Chemicals 1.0% | |
Agrium, Inc. | | | 177,400 | | | | 17,392 | | |
Communications Equipment 1.0% | |
Cisco Systems,
Inc.(a)(b) | | | 539,500 | | | | 17,377 | | |
Containers & Packaging 1.8% | |
International
Paper Co.(a) | | | 568,700 | | | | 30,636 | | |
Electric Utilities 4.8% | |
Exelon Corp. | | | 954,000 | | | | 36,128 | | |
NextEra
Energy, Inc. | | | 302,300 | | | | 45,499 | | |
| | | | 81,627 | | |
Energy Equipment & Services 1.4% | |
Helmerich &
Payne, Inc. | | | 563,600 | | | | 23,863 | | |
Equity Real Estate Investment
Trusts 17.0% | |
Alexandria
Real Estate
Equities, Inc. | | | 148,000 | | | | 17,954 | | |
Crown Castle
International
Corp. | | | 191,500 | | | | 20,766 | | |
DCT Industrial
Trust, Inc. | | | 549,200 | | | | 32,046 | | |
| | |
Number
of Shares | |
Value
(000's) | |
Douglas
Emmett, Inc. | | | 742,600 | | | $ | 28,932 | | |
Easterly
Government
Properties,
Inc. | | | 221,500 | | | | 4,443 | | |
| Equinix, Inc.(a) | | | 66,700 | | | | 31,243 | | |
Host Hotels &
Resorts, Inc. | | | 1,406,000 | | | | 25,477 | | |
Iron Mountain,
Inc. | | | 1,005,500 | | | | 39,637 | | |
Physicians
Realty Trust | | | 1,189,000 | | | | 22,270 | | |
Prologis, Inc. | | | 473,300 | | | | 29,988 | | |
Weyerhaeuser
Co. | | | 1,065,100 | | | | 34,733 | | |
| | | | 287,489 | | |
Food & Staples Retailing 2.1% | |
Wal-Mart
Stores, Inc. | | | 450,000 | | | | 35,131 | | |
Food Products 1.4% | |
Bunge Ltd. | | | 328,000 | | | | 24,479 | | |
Household Products 2.0% | |
Procter &
Gamble Co.(a) | | | 364,600 | | | | 33,642 | | |
Industrial Conglomerates 1.5% | |
Siemens AG | | | 198,000 | | | | 25,881 | | |
IT Services 1.4% | |
Paychex, Inc. | | | 424,400 | | | | 24,203 | | |
Media 1.5% | |
Interpublic
Group of
Cos., Inc. | | | 1,257,000 | | | | 25,316 | | |
Metals & Mining 2.9% | |
Rio Tinto
PLC ADR | | | 1,015,050 | | | | 49,819 | | |
Mortgage Real Estate Investment 2.4% | |
Blackstone
Mortgage
Trust, Inc.
Class A | | | 648,900 | | | | 20,343 | | |
Starwood
Property
Trust, Inc. | | | 892,300 | | | | 19,818 | | |
| | | | 40,161 | | |
Multi-Utilities 9.3% | |
Ameren Corp. | | | 670,300 | | | | 40,211 | | |
Black Hills Corp. | | | 297,300 | | | | 20,924 | | |
DTE Energy Co. | | | 360,100 | | | | 40,447 | | |
NiSource, Inc. | | | 1,415,400 | | | | 38,032 | | |
WEC Energy
Group, Inc. | | | 259,800 | | | | 16,944 | | |
| | | | 156,558 | | |
| | |
Number
of Shares | |
Value
(000's) | |
Oil, Gas & Consumable Fuels 5.0% | |
ONEOK, Inc. | | | 483,700 | | | $ | 26,197 | | |
Pembina
Pipeline
Corp. | | | 510,000 | | | | 16,438 | | |
Suncor
Energy, Inc. | | | 1,335,300 | | | | 41,835 | | |
| | | | 84,470 | | |
Pharmaceuticals 4.3% | |
Eli Lilly & Co. | | | 253,000 | | | | 20,566 | | |
GlaxoSmithKline
PLC ADR | | | 395,000 | | | | 15,891 | | |
Johnson &
Johnson | | | 269,100 | | | | 35,621 | | |
| | | | 72,078 | | |
Road & Rail 2.6% | |
CSX Corp. | | | 116,700 | | | | 5,858 | | |
Norfolk
Southern
Corp. | | | 128,900 | | | | 15,535 | | |
Union Pacific
Corp. | | | 216,700 | | | | 22,819 | | |
| | | | 44,212 | | |
Semiconductors & Semiconductor Equipment 4.4% | |
Maxim
Integrated
Products, Inc. | | | 655,700 | | | | 30,595 | | |
QUALCOMM,
Inc. | | | 305,300 | | | | 15,958 | | |
Taiwan
Semiconductor
Manufacturing
Co. Ltd. ADR | | | 740,000 | | | | 27,358 | | |
| | | | 73,911 | | |
Software 2.1% | |
Microsoft
Corp.(a) | | | 486,100 | | | | 36,346 | | |
Specialty Retail 1.1% | |
Best Buy Co.,
Inc. | | | 50,000 | | | | 2,713 | | |
Williams-
Sonoma, Inc. | | | 330,826 | | | | 15,218 | | |
| | | | 17,931 | | |
Technology Hardware, Storage & Peripherals 1.6% | |
Western Digital
Corp.(a) | | | 309,200 | | | | 27,293 | | |
See Notes to Financial Statements
87
Schedule of Investments Equity Income Fund (cont'd)
| | |
Number
of Shares | |
Value
(000's) | |
Transportation Infrastructure 1.1% | |
Sydney Airport | | | 3,179,137 | | | $ | 18,702 | | |
Total Common Stocks)
(Cost $1,206,434) | | | | | 1,475,092 | | |
Preferred Stocks 2.0% | |
Equity Real Estate Investment Trusts 0.3% | |
Farmland
Partners, Inc.,
Ser. B, 6.00%(c) | | | 218,000 | | | | 5,875 | | |
Oil, Gas & Consumable Fuel 0.2% | |
El Paso Energy
Capital
Trust I, 4.75% | | | 63,465 | | | | 3,110 | | |
Pharmaceuticals 1.5% | |
Allergan PLC,
Ser. A, 5.50% | | | 31,500 | | | | 25,806 | | |
Total Preferred Stocks
(Cost $33,666) | | | | | 34,791 | | |
| | | Principal
Amount | | | |
Convertible Bonds 6.6% | |
Communications Equipment 0.2% | |
Finisar Corp.,
0.50%, due
12/15/36(d) | | $ | 2,685,000 | | | | 2,581 | | |
Consumer Finance 0.6% | |
Encore Capital
Group, Inc.,
3.25%,
due 3/15/22(d) | | | 8,940,000 | | | | 9,739 | | |
| | |
Principal
Amount | |
Value
(000's) | |
Equity Real Estate Investment Trusts 2.3% | |
Colony Starwood
Homes, 3.50%,
due 1/15/22(d) | | $ | 2,600,000 | | | $ | 2,941 | | |
Extra Space
Storage
LP, 3.13%,
due 10/1/35(d) | | | 33,260,000 | | | | 35,983 | | |
| | | | 38,924 | | |
Health Care Providers & Services 0.1% | |
Teladoc, Inc.,
3.00%, due
12/15/22(d) | | | 1,800,000 | | | | 1,934 | | |
Internet & Direct Marketing Retail 1.1% | |
Liberty Expedia
Holdings, Inc.,
1.00%, due
6/30/47(d) | | | 3,615,000 | | | | 3,841 | | |
Priceline Group,
Inc., 0.90%,
due 9/15/21 | | | 12,900,000 | | | | 14,698 | | |
| | | | 18,539 | | |
Internet Software & Services 0.6% | |
LinkedIn Corp.,
0.50%,
due 11/1/19 | | | 8,600,000 | | | | 8,573 | | |
Zillow Group,
Inc., 2.00%,
due 12/1/21(d) | | | 1,740,000 | | | | 1,865 | | |
| | | | 10,438 | | |
Media 0.4% | |
Liberty Media
Corp-Liberty
Formula One,
1.00%, due
1/30/23(d) | | | 2,170,000 | | | | 2,620 | | |
| | |
Principal
Amount | |
Value
(000's) | |
World
Wrestling
Entertainment,
Inc., 3.38%,
due 12/15/23(d) | | $ | 4,340,000 | | | $ | 4,782 | | |
| | | | 7,402 | | |
Oil, Gas & Consumable Fuel 0.5% | |
Golar LNG Ltd.,
2.75%,
due 2/15/22(d) | | | 8,950,000 | | | | 8,335 | | |
Software 0.8% | |
Nice Systems, Inc.,
1.25%, due
1/15/24(d) | | | 4,331,000 | | | | 4,783 | | |
Verint Systems,
Inc., 1.50%,
due 6/1/21 | | | 8,700,000 | | | | 8,352 | | |
| | | | 13,135 | | |
Total Convertible Bonds
(Cost $103,156) | | | | | 111,027 | | |
| | | Number
of Shares | | | |
Short-Term Investment 3.9% | |
Investment Company 3.9% | |
State Street
Institutional
Treasury Money
Market Fund
Premier Class,
0.90%(b)(e)
(Cost $65,904) | | | 65,904,482 | | | | 65,904 | | |
Total Investments 99.6%
(Cost $1,409,160) | | | | | 1,686,814 | | |
Other Assets Less
Liabilities 0.4%(f) | | | | | 6,238 | | |
Net Assets 100.0% | | | | $ | 1,693,052 | | |
(a) All or a portion of the security is pledged as collateral for options written.
(b) All or a portion of this security is segregated in connection with obligations for options written with a total value of approximately $78,131,000.
(c) Step Bond. Coupon rate is a fixed rate for an initial period that either resets at a specific date or may reset in the future contingent upon a predetermined trigger. The interest rate shown was the current rate as of August 31, 2017.
(d) Securities were purchased under Rule 144A of the Securities Act of 1933, as amended (the "1933 Act"), or are otherwise restricted and, unless registered under the 1933 Act or exempted from registration, may only be sold to qualified institutional investors or may have other restrictions on resale. At August 31, 2017, these securities amounted to approximately $79,404,000, which represents 4.7% of net assets of the Fund. These securities have been deemed by the investment manager to be liquid.
(e) Represents 7-day effective yield as of August 31, 2017.
(f) Includes the impact of the Fund's open positions in derivatives at August 31, 2017.
See Notes to Financial Statements
88
Schedule of Investments Equity Income Fund (cont'd)
Derivative Instruments
Written option contracts ("options written")
At August 31, 2017, the Fund had outstanding options written as follows:
| Description | | Number of
Contracts | | Notional
Amount | | Exercise
Price | | Expiration
Date | | Value | |
Calls | |
Aerospace & Defense | |
Lockheed Martin Corp. | | | 100 | | | $ | (3,053,900 | ) | | $ | 305 | | | 12/15/2017 | | $ | (106,500 | ) | |
Lockheed Martin Corp. | | | 100 | | | | (3,053,900 | ) | | | 310 | | | 1/19/2018 | | | (95,500 | ) | |
Lockheed Martin Corp. | | | 100 | | | | (3,053,900 | ) | | | 320 | | | 1/19/2018 | | | (55,500 | ) | |
Lockheed Martin Corp. | | | 100 | | | | (3,053,900 | ) | | | 330 | | | 3/16/2018 | | | (51,500 | ) | |
| | | | | | | | | | | (309,000 | ) | |
| Banks | |
JPMorgan Chase & Co. | | | 250 | | | | (2,272,250 | ) | | | 105 | | | 3/16/2018 | | | (20,750 | ) | |
PNC Financial Services Group, Inc. | | | 150 | | | | (1,881,150 | ) | | | 145 | | | 1/19/2018 | | | (9,375 | ) | |
PNC Financial Services Group, Inc. | | | 150 | | | | (1,881,150 | ) | | | 150 | | | 2/16/2018 | | | (7,650 | ) | |
| | | | | | | | | | | (37,775 | ) | |
| Biotechnology | |
Gilead Sciences, Inc. | | | 150 | | | | (1,255,650 | ) | | | 90 | | | 12/15/2017 | | | (26,924 | ) | |
Gilead Sciences, Inc. | | | 150 | | | | (1,255,650 | ) | | | 92.5 | | | 1/19/2018 | | | (26,175 | ) | |
Gilead Sciences, Inc. | | | 150 | | | | (1,255,650 | ) | | | 95 | | | 2/16/2018 | | | (24,679 | ) | |
| | | | | | | | | | | (77,778 | ) | |
Electric Utilities | |
NextEra Energy, Inc. | | | 150 | | | | (2,257,650 | ) | | | 150 | | | 12/15/2017 | | | (70,500 | ) | |
Equity Real Estate Investment Trusts | |
Crown Castle International Corp. | | | 250 | | | | (2,711,000 | ) | | | 110 | | | 1/19/2018 | | | (76,250 | ) | |
Crown Castle International Corp. | | | 200 | | | | (2,168,800 | ) | | | 115 | | | 4/20/2018 | | | (46,500 | ) | |
DCT Industrial Trust, Inc. | | | 250 | | | | (1,458,750 | ) | | | 60 | | | 3/16/2018 | | | (41,875 | ) | |
Equinix, Inc. | | | 50 | | | | (2,342,050 | ) | | | 480 | | | 12/15/2017 | | | (78,000 | ) | |
Equinix, Inc. | | | 50 | | | | (2,342,050 | ) | | | 500 | | | 12/15/2017 | | | (42,750 | ) | |
Prologis, Inc. | | | 250 | | | | (1,584,000 | ) | | | 60 | | | 11/17/2017 | | | (101,250 | ) | |
Prologis, Inc. | | | 250 | | | | (1,584,000 | ) | | | 65 | | | 2/16/2018 | | | (50,000 | ) | |
| | | | | | | | | | | (436,625 | ) | |
Metals & Mining | |
Rio Tinto PLC | | | 250 | | | | (1,227,000 | ) | | | 57.5 | | | 4/20/2018 | | | (30,874 | ) | |
Rio Tinto PLC | | | 250 | | | | (1,227,000 | ) | | | 50 | | | 12/15/2017 | | | (61,875 | ) | |
Rio Tinto PLC | | | 250 | | | | (1,227,000 | ) | | | 52.5 | | | 1/19/2018 | | | (48,750 | ) | |
Rio Tinto PLC | | | 250 | | | | (1,227,000 | ) | | | 55 | | | 3/16/2018 | | | (42,500 | ) | |
| | | | | | | | | | | (183,999 | ) | |
Multi-Utilities | |
Ameren Corp. | | | 250 | | | | (1,499,750 | ) | | | 65 | | | 3/16/2018 | | | (13,750 | ) | |
Software | |
Microsoft Corp. | | | 250 | | | | (1,869,250 | ) | | | 72.5 | | | 9/15/2017 | | | (63,250 | ) | |
Microsoft Corp. | | | 250 | | | | (1,869,250 | ) | | | 75 | | | 10/20/2017 | | | (40,750 | ) | |
Microsoft Corp. | | | 250 | | | | (1,869,250 | ) | | | 80 | | | 1/19/2018 | | | (33,750 | ) | |
Microsoft Corp. | | | 250 | | | | (1,869,250 | ) | | | 82.5 | | | 2/16/2018 | | | (28,625 | ) | |
| | | | | | | | | | | (166,375 | ) | |
See Notes to Financial Statements
89
Schedule of Investments Equity Income Fund (cont'd)
| Description | | Number of
Contracts | | Notional
Amount | | Exercise
Price | | Expiration
Date | | Value | |
Specialty Retail | |
Best Buy Co., Inc. | | | 250 | | | $ | (1,356,500 | ) | | $ | 55 | | | 9/15/2017 | | $ | (22,000 | ) | |
Best Buy Co., Inc. | | | 250 | | | | (1,356,500 | ) | | | 65 | | | 12/15/2017 | | | (19,500 | ) | |
| | | | | | | | | | | (41,500 | ) | |
Total (premiums received: $770,792) | | | | | | | | | | $ | (1,337,302 | ) | |
Puts | |
Energy Equipment & Services | |
Helmerich & Payne, Inc. | | | 150 | | | $ | (635,100 | ) | | $ | 52.5 | | | 9/15/2017 | | $ | (152,250 | ) | |
Helmerich & Payne, Inc. | | | 150 | | | | (635,100 | ) | | | 45 | | | 12/15/2017 | | | (75,750 | ) | |
| | | | | | | | | | | (228,000 | ) | |
Food & Staples Retailing | |
CVS Health Corp. | | | 200 | | | | (1,546,800 | ) | | | 70 | | | 1/19/2018 | | | (27,400 | ) | |
Leisure Products | |
Mattel, Inc. | | | 500 | | | | (811,000 | ) | | | 17 | | | 1/19/2018 | | | (83,750 | ) | |
Specialty Retail | |
Home Depot, Inc. | | | 200 | | | | (2,997,400 | ) | | | 120 | | | 1/19/2018 | | | (15,200 | ) | |
Total (premiums received: $148,301) | | | | | | | | | | $ | (354,350 | ) | |
Total Options Written (premiums received: $919,093) | | | | | | | | | | $ | (1,691,652 | ) | |
For the year ended August 31, 2017, the Fund had an average market value of $(1,690,455) in options written. The Fund had securities pledged in the amount of $27,280,097 to cover collateral requirements for options written.
The following is a summary, categorized by Level (see Note A of Notes to Financial Statements), of inputs used to value the Fund's investments as of August 31, 2017:
Asset Valuation Inputs | |
(000's omitted) | | Level 1 | | Level 2 | | Level 3 | | Total | |
Investments: | |
| Common Stocks(a) | | $ | 1,475,092 | | | $ | — | | | $ | — | | | $ | 1,475,092 | | |
| Preferred Stocks(a) | | | 34,791 | | | | — | | | | — | | | | 34,791 | | |
| Convertible Bonds(a) | | | — | | | | 111,027 | | | | — | | | | 111,027 | | |
Short-Term Investment | | | — | | | | 65,904 | | | | — | | | | 65,904 | | |
Total Investments | | $ | 1,509,883 | | | $ | 176,931 | | | $ | — | | | $ | 1,686,814 | | |
(a) The Schedule of Investments provides information on the industry categorization for the portfolio.
As of the year ended August 31, 2017, no securities were transferred from one level (as of August 31, 2016) to another.
The following is a summary, categorized by Level (see Note A of Notes to Financial Statements), of inputs used to value the Fund's derivatives as of August 31, 2017:
Other Financial Instruments | |
(000's omitted) | | Level 1 | | Level 2 | | Level 3 | | Total | |
Options Written | |
Liabilities | | $ | (1,692 | ) | | $ | — | | | $ | — | | | $ | (1,692 | ) | |
Total | | $ | (1,692 | ) | | $ | — | | | $ | — | | | $ | (1,692 | ) | |
See Notes to Financial Statements
90
Schedule of Investments Focus Fund August 31, 2017
| | |
Number
of Shares | |
Value
(000's) | |
Common Stocks 99.0% | |
Aerospace & Defense 1.5% | |
General Dynamics
Corp. | | | 57,000 | | | $ | 11,477 | | |
Airlines 1.0% | |
Alaska Air
Group, Inc. | | | 98,000 | | | | 7,317 | | |
Banks 7.9% | |
Comerica, Inc. | | | 345,000 | | | | 23,546 | | |
JPMorgan
Chase & Co. | | | 390,000 | | | | 35,447 | | |
| | | | 58,993 | | |
Biotechnology 5.6% | |
BioMarin
Pharmaceutical,
Inc.* | | | 81,000 | | | | 7,305 | | |
Gilead
Sciences, Inc. | | | 409,000 | | | | 34,238 | | |
| | | | 41,543 | | |
Building Products 1.5% | |
Johnson Controls
International PLC | | | 280,000 | | | | 11,085 | | |
Capital Markets 3.0% | |
Intercontinental
Exchange, Inc. | | | 352,000 | | | | 22,764 | | |
Chemicals 1.2% | |
WR Grace & Co. | | | 127,000 | | | | 9,078 | | |
Communications Equipment 2.8% | |
Motorola
Solutions, Inc. | | | 235,000 | | | | 20,708 | | |
Containers & Packaging 1.1% | |
Crown Holdings,
Inc.* | | | 133,000 | | | | 7,851 | | |
Food & Staples Retailing 3.5% | |
Wal-Mart Stores,
Inc. | | | 335,000 | | | | 26,153 | | |
Food Products 2.9% | |
Blue Buffalo
Pet Products,
Inc.*(a) | | | 270,000 | | | | 6,955 | | |
Conagra
Brands, Inc. | | | 460,000 | | | | 14,932 | | |
| | | | 21,887 | | |
Health Care Equipment & Supplies 2.9% | |
Zimmer Biomet
Holdings, Inc. | | | 192,000 | | | | 21,940 | | |
Household Durables 4.9% | |
Newell Brands,
Inc. | | | 310,000 | | | | 14,967 | | |
Whirlpool Corp. | | | 128,000 | | | | 21,967 | | |
| | | | 36,934 | | |
| | |
Number
of Shares | |
Value
(000's) | |
Household Products 1.6% | |
Energizer
Holdings, Inc. | | | 265,000 | | | $ | 11,700 | | |
Independent Power and Renewable Electricity Producers 2.6% | |
Calpine Corp.* | | | 1,300,000 | | | | 19,110 | | |
Insurance 6.8% | |
American
International
Group, Inc. | | | 200,000 | | | | 12,096 | | |
Athene Holding
Ltd. Class A* | | | 449,880 | | | | 24,073 | | |
Chubb Ltd. | | | 101,000 | | | | 14,284 | | |
| | | | 50,453 | | |
Internet & Direct Marketing Retail 3.5% | |
Amazon.com,
Inc.*(a) | | | 10,000 | | | | 9,806 | | |
Expedia, Inc. | | | 110,000 | | | | 16,320 | | |
| | | | 26,126 | | |
Internet Software & Services 4.1% | |
Alphabet, Inc.
Class A* | | | 15,500 | | | | 14,806 | | |
Alphabet, Inc.
Class C* | | | 16,495 | | | | 15,494 | | |
| | | | 30,300 | | |
Life Sciences Tools & Services 3.1% | |
Quintiles IMS
Holdings, Inc.* | | | 243,000 | | | | 23,335 | | |
Media 3.9% | |
Charter
Communications,
Inc. Class A* | | | 50,000 | | | | 19,927 | | |
Twenty-First
Century Fox, Inc.
Class A | | | 334,000 | | | | 9,215 | | |
| | | | 29,142 | | |
Metals & Mining 1.2% | |
Alcoa Corp.* | | | 202,000 | | | | 8,864 | | |
Oil, Gas & Consumable Fuels 5.9% | |
Cabot Oil &
Gas Corp. | | | 835,000 | | | | 21,334 | | |
EOG Resources,
Inc. | | | 176,000 | | | | 14,958 | | |
Phillips 66 | | | 90,000 | | | | 7,543 | | |
| | | | 43,835 | | |
Pharmaceuticals 3.3% | |
| Allergan PLC(a) | | | 109,000 | | | | 25,013 | | |
Professional Services 1.6% | |
TransUnion* | | | 255,000 | | | | 12,204 | | |
| | |
Number
of Shares | |
Value
(000's) | |
Road & Rail 5.5% | |
Avis Budget
Group, Inc.*(a) | | | 604,500 | | | $ | 21,901 | | |
CSX Corp. | | | 380,000 | | | | 19,076 | | |
| | | | 40,977 | | |
Semiconductors & Semiconductor Equipment 2.3% | |
ASML
Holding NV | | | 111,500 | | | | 17,429 | | |
Software 6.1% | |
Activision
Blizzard, Inc. | | | 209,000 | | | | 13,702 | | |
Oracle Corp. | | | 303,000 | | | | 15,250 | | |
Symantec Corp. | | | 550,000 | | | | 16,489 | | |
| | | | 45,441 | | |
Specialty Retail 0.8% | |
Advance
Auto Parts,
Inc. | | | 64,000 | | | | 6,266 | | |
Technology Hardware, Storage & Peripherals 2.5% | |
Western Digital
Corp.(b) | | | 213,000 | | | | 18,802 | | |
Wireless Telecommunication Services 4.4% | |
T-Mobile US,
Inc.* | | | 510,000 | | | | 33,002 | | |
Total Common Stocks
(Cost $620,030) | | | | | 739,729 | | |
Short-Term Investment 1.1% | |
Investment Company 1.1% | |
State Street
Institutional
U.S. Government
Money Market
Fund Premier
Class, 0.93%(b)(c)
(Cost $7,888) | | | 7,888,323 | | | | 7,888 | | |
Total Purchased
Options 0.0%(d)(e)
(Cost $56) | | | | | 36 | | |
Total Investments 100.1%
(Cost $627,974) | | | | | 747,653 | | |
Liabilities Less
Other Assets (0.1)%(f) | | | | | (583 | ) | |
Net Assets 100.0% | | | | $ | 747,070 | | |
See Notes to Financial Statements
91
Schedule of Investments Focus Fund (cont'd)
* Non-income producing security.
(a) All or a portion of the security is pledged as collateral for options written.
(b) All or a portion of this security is segregated in connection with obligations for options written with a total value of approximately $24,483,000.
(c) Represents 7-day effective yield as of August 31, 2017.
(d) Represents less than 0.05% of net assets.
(e) See "Purchased option contracts" under Derivative Instruments.
(f) Includes the impact of the Fund's open positions in derivatives at August 31, 2017.
Derivative Instruments
Purchased option contracts ("options purchased")
At August 31, 2017, the Fund had outstanding options purchased as follows:
| Description | | Number of
Contracts | | Notional
Amount | | Exercise
Price | | Expiration
Date | | Value | |
Calls | |
Road & Rail | |
CSX Corp. | | | 400 | | | $ | 2,008,000 | | | $ | 55 | | | 11/17/2017 | | $ | 36,000 | | |
Total Options Purchased (cost: $56,484) | | | | | | | | | | $ | 36,000 | | |
Written option contracts ("options written")
At August 31, 2017, the Fund had outstanding options written as follows:
| Description | | Number of
Contracts | | Notional
Amount | | Exercise
Price | | Expiration
Date | | Value | |
Calls | |
Road & Rail | |
Avis Budget Group, Inc. | | | 200 | | | $ | (724,600 | ) | | $ | 36 | | | 10/20/2017 | | $ | (57,000 | ) | |
Avis Budget Group, Inc. | | | 100 | | | | (362,300 | ) | | | 38 | | | 10/20/2017 | | | (19,500 | ) | |
Total (premiums received: $42,649) | | | | | | | | | | $ | (76,500 | ) | |
Puts | |
Biotechnology | |
BioMarin Pharmaceutical, Inc. | | | 200 | | | | (1,803,800 | ) | | $ | 80 | | | 9/15/2017 | | $ | (3,500 | ) | |
Food Products | |
Blue Buffalo Pet Products, Inc. | | | 400 | | | | (1,030,400 | ) | | | 20 | | | 9/15/2017 | | | (0 | )(a) | |
Road & Rail | |
CSX Corp. | | | 400 | | | | (2,008,000 | ) | | | 50 | | | 11/17/2017 | | | (99,400 | ) | |
Specialty Retail | |
Advance Auto Parts, Inc. | | | 100 | | | | (979,000 | ) | | | 85 | | | 10/20/2017 | | | (8,750 | ) | |
Advance Auto Parts, Inc. | | | 300 | | | | (2,937,000 | ) | | | 90 | | | 10/20/2017 | | | (51,750 | ) | |
| | | | | | | | | | | (60,500 | ) | |
Total (premiums received: $259,450) | | | | | | | | | | $ | (163,400 | ) | |
Total Options Written (premiums received: $302,099) | | | | | | | | | | $ | (239,900 | ) | |
(a) Security fair valued as of August 31, 2017 in accordance with procedures approved by the Board of Trustees (the "Board").
See Notes to Financial Statements
92
Schedule of Investments Focus Fund (cont'd)
For the year ended August 31, 2017, the Fund had an average market value of $174,833 in options purchased and $(172,719) in options written, respectively. The Fund had securities pledged in the amount of $15,288,210 to cover collateral requirements for options written.
The following is a summary, categorized by Level (see Note A of Notes to Financial Statements), of inputs used to value the Fund's investments as of August 31, 2017:
Asset Valuation Inputs | |
(000's omitted) | | Level 1 | | Level 2 | | Level 3 | | Total | |
Investments: | |
| Common Stocks(a) | | $ | 739,729 | | | $ | — | | | $ | — | | | $ | 739,729 | | |
| Options Purchased(a) | | | 36 | | | | — | | | | — | | | | 36 | | |
Short-Term Investment | | | — | | | | 7,888 | | | | — | | | | 7,888 | | |
Total Investments | | $ | 739,765 | | | $ | 7,888 | | | $ | — | | | $ | 747,653 | | |
(a) The Schedule of Investments provides information on the industry categorization for the portfolio.
As of the year ended August 31, 2017, no securities were transferred from one level (as of August 31, 2016) to another.
The following is a summary, categorized by Level (see Note A of Notes to Financial Statements), of inputs used to value the Fund's derivatives as of August 31, 2017:
Other Financial Instruments | |
(000's omitted) | | Level 1 | | Level 2 | | Level 3(a) | | Total | |
Options Written | |
Liabilities | | $ | (240 | ) | | $ | — | | | $ | (0 | ) | | $ | (240 | ) | |
Total | | $ | (240 | ) | | $ | — | | | $ | (0 | ) | | $ | (240 | ) | |
(a) The following is a reconciliation between the beginning and ending balances of investments in which unobservable inputs (Level 3) were used in determining value:
| | | Beginning
balance, as
of 9/1/2016 | | Accrued
discounts/
(premiums) | | Realized
gain/
(loss) | | Change
in unrealized
appreciation/
(depreciation) | | Purchases | | Sales | | Transfers
into
Level 3 | | Transfers
out of
Level 3 | | Balance,
as of
8/31/2017 | | Net change in
unrealized
appreciation/
(depreciation)
from
investments
still held as
of 8/31/2017 | |
Other Financial Instruments:
(000's omitted) | |
Options
Written(b) | | $ | (0 | ) | | $ | — | | | $ | 30 | | | $ | (14 | ) | | $ | (0 | ) | | $ | (16 | ) | | $ | — | | | $ | — | | | $ | (0 | ) | | $ | 16 | | |
Total | | $ | (0 | ) | | $ | — | | | $ | 30 | | | $ | (14 | ) | | $ | (0 | ) | | $ | (16 | ) | | $ | — | | | $ | — | | | $ | (0 | ) | | $ | 16 | | |
(b) As of the year ended August 31, 2017, these investments were valued using methods the Board has approved in the good-faith belief that the resulting valuation will reflect the fair value of the security. As of the year ended August 31, 2017, these investments did not have a material impact on the Fund's net assets and, therefore, disclosure of unobservable inputs used in formulating valuations is not presented.
See Notes to Financial Statements
93
Schedule of Investments Genesis Fund August 31, 2017
| | |
Number
of Shares | |
Value
(000's) | |
Common Stocks 98.6% | |
Aerospace & Defense 0.3% | |
Astronics
Corp.*(a) | | | 1,138,109 | | | $ | 29,921 | | |
Air Freight & Logistics 0.6% | |
Forward Air
Corp. | | | 1,275,925 | | | | 66,310 | | |
Airlines 0.5% | |
Allegiant
Travel Co. | | | 456,613 | | | | 53,880 | | |
Auto Components 1.8% | |
Fox Factory
Holding
Corp.* | | | 777,210 | | | | 31,088 | | |
Gentex Corp. | | | 2,580,185 | | | | 47,140 | | |
LCI Industries | | | 1,222,875 | | | | 120,820 | | |
| | | | 199,048 | | |
Automobiles 0.5% | |
Thor Industries,
Inc. | | | 512,781 | | | | 55,709 | | |
Banks 12.4% | |
Bank of Hawaii
Corp.(a) | | | 2,181,636 | | | | 170,451 | | |
Bank of the
Ozarks | | | 3,020,046 | | | | 129,741 | | |
BankUnited, Inc. | | | 1,717,488 | | | | 57,158 | | |
BOK Financial
Corp. | | | 1,390,822 | | | | 111,933 | | |
Columbia
Banking
System, Inc. | | | 1,471,605 | | | | 54,700 | | |
Community
Bank System,
Inc. | | | 1,697,077 | | | | 87,332 | | |
Cullen/Frost
Bankers, Inc. | | | 1,757,166 | | | | 147,953 | | |
CVB Financial
Corp.(a) | | | 5,937,653 | | | | 122,909 | | |
First Financial
Bankshares, Inc. | | | 2,861,293 | | | | 114,595 | | |
First Hawaiian,
Inc. | | | 1,119,435 | | | | 30,325 | | |
FNB Corp. | | | 7,063,640 | | | | 89,638 | | |
Glacier Bancorp,
Inc. | | | 1,297,215 | | | | 43,081 | | |
Lakeland
Financial
Corp. | | | 484,105 | | | | 21,039 | | |
LegacyTexas
Financial
Group, Inc.(a) | | | 2,481,903 | | | | 89,324 | | |
PacWest
Bancorp | | | 1,561,379 | | | | 70,496 | | |
| | | | 1,340,675 | | |
| | |
Number
of Shares | |
Value
(000's) | |
Beverages 0.4% | |
MGP Ingredients,
Inc.(a) | | | 847,383 | | | $ | 47,648 | | |
Building Products 1.9% | |
AAON, Inc. | | | 2,590,286 | | | | 84,443 | | |
AO Smith Corp. | | | 1,683,940 | | | | 93,779 | | |
Patrick
Industries, Inc.* | | | 380,115 | | | | 28,129 | | |
| | | | 206,351 | | |
Capital Markets 3.0% | |
Artisan Partners
Asset
Management,
Inc. Class A | | | 1,660,813 | | | | 50,987 | | |
FactSet
Research
Systems, Inc. | | | 490,030 | | | | 77,023 | | |
Houlihan
Lokey, Inc. | | | 904,665 | | | | 32,613 | | |
MarketAxess
Holdings, Inc. | | | 717,192 | | | | 138,382 | | |
OM Asset
Management
PLC | | | 2,054,185 | | | | 29,026 | | |
| | | | 328,031 | | |
Chemicals 3.5% | |
Balchem Corp. | | | 1,267,781 | | | | 95,033 | | |
Chase Corp. | | | 153,787 | | | | 14,379 | | |
NewMarket Corp. | | | 63,525 | | | | 26,586 | | |
Quaker
Chemical Corp. | | | 453,249 | | | | 63,101 | | |
Sensient
Technologies
Corp.(a) | | | 2,485,181 | | | | 179,306 | | |
| | | | 378,405 | | |
Commercial Services & Supplies 4.2% | |
Healthcare
Services Group,
Inc. | | | 2,608,547 | | | | 133,558 | | |
MSA Safety,
Inc. | | | 423,635 | | | | 30,866 | | |
Ritchie Bros.
Auctioneers,
Inc. | | | 1,628,738 | | | | 48,439 | | |
Rollins, Inc. | | | 3,810,904 | | | | 169,242 | | |
UniFirst Corp. | | | 509,008 | | | | 73,093 | | |
| | | | 455,198 | | |
Communications Equipment 1.3% | |
NetScout
Systems, Inc.* | | | 4,272,673 | | | | 139,930 | | |
Construction & Engineering 0.9% | |
Valmont
Industries, Inc. | | | 680,683 | | | | 97,712 | | |
| | |
Number
of Shares | |
Value
(000's) | |
Construction Materials 1.5% | |
Eagle Materials,
Inc. | | | 1,663,982 | | | $ | 161,822 | | |
Containers & Packaging 1.2% | |
AptarGroup, Inc. | | | 1,603,125 | | | | 134,037 | | |
Distributors 1.8% | |
Pool Corp. | | | 1,958,235 | | | | 195,216 | | |
Diversified Consumer Services 0.5% | |
Bright Horizons
Family Solutions,
Inc.* | | | 699,485 | | | | 55,910 | | |
Electrical Equipment 0.7% | |
| AZZ, Inc.(a) | | | 1,499,039 | | | | 73,303 | | |
Electronic Equipment, Instruments & Components 5.2% | |
Cognex Corp. | | | 1,306,285 | | | | 142,346 | | |
Littelfuse, Inc. | | | 1,041,911 | | | | 193,962 | | |
| Rogers Corp.*(a) | | | 1,145,268 | | | | 135,771 | | |
Zebra
Technologies
Corp. Class A* | | | 889,908 | | | | 91,741 | | |
| | | | 563,820 | | |
Energy Equipment & Services 0.6% | |
Pason Systems,
Inc.(a) | | | 4,695,341 | | | | 67,613 | | |
Food Products 3.3% | |
Blue Buffalo Pet
Products, Inc.* | | | 3,127,353 | | | | 80,561 | | |
Cal-Maine
Foods, Inc.* | | | 1,252,095 | | | | 45,639 | | |
Calavo Growers,
Inc.(a) | | | 1,104,279 | | | | 74,152 | | |
J & J Snack
Foods Corp. | | | 586,281 | | | | 74,745 | | |
Lancaster
Colony Corp. | | | 656,126 | | | | 76,419 | | |
| | | | 351,516 | | |
Health Care Equipment & Supplies 6.4% | |
Abaxis, Inc. | | | 421,547 | | | | 19,484 | | |
Atrion Corp. | | | 63,388 | | | | 39,437 | | |
Cantel Medical
Corp. | | | 943,247 | | | | 76,639 | | |
Dentsply
Sirona, Inc. | | | 931,477 | | | | 52,693 | | |
Haemonetics
Corp.* | | | 1,047,143 | | | | 45,048 | | |
| Heska Corp.*(a) | | | 392,697 | | | | 39,945 | | |
IDEXX
Laboratories,
Inc.* | | | 1,036,080 | | | | 161,038 | | |
Neogen Corp.* | | | 379,200 | | | | 26,127 | | |
West
Pharmaceutical
Services, Inc. | | | 2,710,147 | | | | 235,891 | | |
| | | | 696,302 | | |
See Notes to Financial Statements
94
Schedule of Investments Genesis Fund (cont'd)
| | |
Number
of Shares | |
Value
(000's) | |
Health Care Providers & Services 3.2% | |
Chemed Corp. | | | 755,100 | | | $ | 148,974 | | |
Henry Schein,
Inc.* | | | 623,601 | | | | 108,307 | | |
Tivity Health,
Inc.* | | | 960,805 | | | | 37,663 | | |
U.S. Physical
Therapy, Inc.(a) | | | 792,415 | | | | 47,466 | | |
| | | | 342,410 | | |
Hotels, Restaurants & Leisure 2.6% | |
Cheesecake
Factory, Inc. | | | 1,314,947 | | | | 54,478 | | |
Cracker
Barrel Old
Country
Store, Inc. | | | 504,912 | | | | 75,060 | | |
Papa John's
International, Inc. | | | 811,673 | | | | 60,705 | | |
Texas Roadhouse,
Inc. | | | 1,793,140 | | | | 85,085 | | |
| | | | 275,328 | | |
Household Products 2.8% | |
Church & Dwight
Co., Inc. | | | 3,496,350 | | | | 175,412 | | |
Energizer
Holdings, Inc. | | | 1,557,829 | | | | 68,778 | | |
WD-40 Co. | | | 504,337 | | | | 54,948 | | |
| | | | 299,138 | | |
Industrial Conglomerates 0.4% | |
Raven Industries,
Inc. | | | 1,353,992 | | | | 37,912 | | |
Insurance 1.3% | |
AMERISAFE, Inc. | | | 908,220 | | | | 48,862 | | |
RLI Corp. | | | 1,792,022 | | | | 95,909 | | |
| | | | 144,771 | | |
IT Services 1.3% | |
Jack Henry &
Associates, Inc. | | | 1,329,614 | | | | 137,043 | | |
Life Sciences Tools & Services 2.8% | |
Bio-Techne Corp. | | | 1,359,335 | | | | 168,259 | | |
ICON PLC* | | | 1,150,864 | | | | 130,496 | | |
| | | | 298,755 | | |
Machinery 8.5% | |
Donaldson
Co., Inc. | | | 1,034,120 | | | | 48,862 | | |
Franklin Electric
Co., Inc. | | | 1,110,175 | | | | 42,797 | | |
Graco, Inc. | | | 635,695 | | | | 73,429 | | |
| Lindsay Corp.(a) | | | 594,944 | | | | 51,504 | | |
Middleby Corp.* | | | 996,898 | | | | 121,323 | | |
Nordson Corp. | | | 936,210 | | | | 102,328 | | |
RBC Bearings,
Inc.*(a) | | | 1,450,858 | | | | 159,986 | | |
Tennant Co. | | | 857,615 | | | | 52,272 | | |
| | |
Number
of Shares | |
Value
(000's) | |
Toro Co. | | | 2,558,105 | | | $ | 157,784 | | |
Wabtec Corp. | | | 1,580,373 | | | | 111,527 | | |
| | | | 921,812 | | |
Marine 0.4% | |
Kirby Corp.* | | | 753,703 | | | | 47,182 | | |
Media 2.4% | |
Cable One, Inc. | | | 54,615 | | | | 41,439 | | |
Gray Television,
Inc.*(a) | | | 4,247,791 | | | | 60,743 | | |
Nexstar Media
Group, Inc.
Class A(a) | | | 2,523,996 | | | | 151,945 | | |
| | | | 254,127 | | |
Oil, Gas & Consumable Fuels 1.5% | |
Centennial
Resource
Development,
Inc. Class A* | | | 2,241,431 | | | | 38,754 | | |
Matador
Resources Co.* | | | 3,655,443 | | | | 86,195 | | |
RSP Permian,
Inc.* | | | 1,275,924 | | | | 40,039 | | |
| | | | 164,988 | | |
Paper & Forest Products 1.0% | |
Stella-Jones, Inc. | | | 2,826,679 | | | | 107,954 | | |
Pharmaceuticals 0.5% | |
Prestige Brands
Holdings, Inc.* | | | 989,269 | | | | 50,166 | | |
Professional Services 1.1% | |
| Exponent, Inc.(a) | | | 1,723,752 | | | | 117,388 | | |
Real Estate Management & Development 0.4% | |
FirstService Corp. | | | 654,995 | | | | 45,679 | | |
Semiconductors & Semiconductor Equipment 2.5% | |
Cabot
Microelectronics
Corp. | | | 566,180 | | | | 40,550 | | |
MKS Instruments,
Inc. | | | 1,031,453 | | | | 84,940 | | |
Power
Integrations,
Inc.(a) | | | 2,029,349 | | | | 147,838 | | |
| | | | 273,328 | | |
Software 9.5% | |
Aspen
Technology,
Inc.* | | | 2,560,934 | | | | 161,979 | | |
Blackbaud, Inc. | | | 558,755 | | | | 47,165 | | |
Computer
Modelling
Group Ltd.(a)(b) | | | 4,240,438 | | | | 30,766 | | |
Constellation
Software, Inc. | | | 227,989 | | | | 127,068 | | |
| | |
Number
of Shares | |
Value
(000's) | |
Fair Isaac Corp. | | | 1,410,681 | | | $ | 198,567 | | |
Manhattan
Associates, Inc.* | | | 3,347,374 | | | | 140,757 | | |
Monotype
Imaging
Holdings, Inc.(a) | | | 2,722,100 | | | | 49,678 | | |
Qualys, Inc.* | | | 1,745,452 | | | | 82,909 | | |
Tyler
Technologies,
Inc.* | | | 1,104,024 | | | | 190,775 | | |
| | | | 1,029,664 | | |
Specialty Retail 2.4% | |
Asbury
Automotive
Group, Inc.* | | | 828,125 | | | | 44,594 | | |
Lithia Motors,
Inc. Class A | | | 1,043,962 | | | | 112,748 | | |
Monro, Inc. | | | 892,196 | | | | 42,558 | | |
Tractor
Supply Co. | | | 1,027,223 | | | | 61,130 | | |
| | | | 261,030 | | |
Trading Companies & Distributors 1.5% | |
Applied Industrial
Technologies, Inc. | | | 627,734 | | | | 35,781 | | |
Richelieu
Hardware
Ltd.(b) | | | 357,205 | | | | 8,776 | | |
Watsco, Inc. | | | 774,903 | | | | 114,190 | | |
| | | | 158,747 | | |
Total Common Stocks
(Cost $6,161,155) | | | | | 10,665,779 | | |
Short-Term Investments 1.0% | |
Investment Companies 1.0% | |
State Street
Institutional
Treasury
Money Market
Fund Premier
Class, 0.90%(c) | | | 57,009,405 | | | | 57,009 | | |
State Street
Institutional
Treasury Plus
Money Market
Fund Premier
Class, 0.93%(c) | | | 54,756,943 | | | | 54,757 | | |
Total Short-Term Investments
(Cost $111,766) | | | | | 111,766 | | |
Total Investments 99.6%
(Cost $6,272,921) | | | | | 10,777,545 | | |
Other Assets Less
Liabilities 0.4% | | | | | 42,300 | | |
Net Assets 100.0% | | | | $ | 10,819,845 | | |
See Notes to Financial Statements
95
Schedule of Investments Genesis Fund (cont'd)
* Non-income producing security.
(a) Affiliated company (see Note F of Notes to Financial Statements).
(b) Security fair valued as of August 31, 2017 in accordance with procedures approved by the Board of Trustees (the "Board"). Total value of all such securities at August 31, 2017 amounted to approximately $39,542,000, which represents approximately 0.4% of net assets of the Fund.
(c) Represents 7-day effective yield as of August 31, 2017.
The following is a summary, categorized by Level (see Note A of Notes to Financial Statements), of inputs used to value the Fund's investments as of August 31, 2017:
Asset Valuation Inputs | |
(000's omitted) | | Level 1 | | Level 2 | | Level 3 | | Total | |
Investments: | |
Common Stocks | |
Software | | $ | 998,898 | | | $ | 30,766 | | | $ | — | | | $ | 1,029,664 | | |
Trading Companies & Distributors | | | 149,971 | | | | 8,776 | | | | — | | | | 158,747 | | |
| Other Common Stocks(a) | | | 9,477,368 | | | | — | | | | — | | | | 9,477,368 | | |
Total Common Stocks | | | 10,626,237 | | | | 39,542 | | | | — | | | | 10,665,779 | | |
Short-Term Investments | | | — | | | | 111,766 | | | | — | | | | 111,766 | | |
Total Investments | | $ | 10,626,237 | | | $ | 151,308 | | | $ | — | | | $ | 10,777,545 | | |
(a) The Schedule of Investments provides information on the industry categorization for the portfolio.
As of the year ended August 31, 2017, certain securities were transferred from one level (as of August 31, 2016) to another. Based on beginning of period market values as of September 1, 2016, approximately $151,744,000 was transferred from Level 2 to Level 1 due to active market activity on recognized exchanges as of August 31, 2017. These securities had been categorized as Level 2 as of August 31, 2016, due to the use of methods the Board has approved in the good-faith belief that the resulting valuation will reflect the fair value of these securities.
See Notes to Financial Statements
96
Schedule of Investments Global Equity Fund August 31, 2017
| | |
Number
of Shares | |
Value
(000's) | |
Common Stocks 98.8% | |
Australia 1.3% | |
Insurance Australia
Group Ltd. | | | 11,830 | | | $ | 60 | | |
Belgium 0.4% | |
KBC Group NV | | | 232 | | | | 19 | | |
Canada 5.0% | |
Alimentation
Couche-Tard, Inc.
Class B | | | 1,480 | | | | 71 | | |
Kinaxis, Inc.* | | | 931 | | | | 55 | | |
Suncor Energy, Inc. | | | 1,259 | | | | 39 | | |
Waste
Connections, Inc. | | | 1,012 | | | | 67 | | |
| | | | 232 | | |
China 3.7% | |
Alibaba Group
Holding Ltd.
ADR* | | | 605 | | | | 104 | | |
Baidu, Inc. ADR* | | | 300 | | | | 68 | | |
| | | | 172 | | |
France 4.1% | |
Air Liquide SA | | | 291 | | | | 36 | | |
Sodexo SA | | | 535 | | | | 62 | | |
Valeo SA | | | 810 | | | | 54 | | |
Virbac SA* | | | 220 | | | | 37 | | |
| | | | 189 | | |
Germany 3.6% | |
Continental AG | | | 245 | | | | 55 | | |
Henkel AG & Co.
KGaA, Preference
Shares | | | 474 | | | | 64 | | |
SAP SE ADR | | | 468 | | | | 49 | | |
| | | | 168 | | |
Hong Kong 2.6% | |
AIA Group Ltd. | | | 6,800 | | | | 52 | | |
Haier Electronics
Group Co. Ltd.* | | | 14,350 | | | | 38 | | |
Techtronic
Industries Co. Ltd. | | | 5,500 | | | | 29 | | |
| | | | 119 | | |
Israel 2.1% | |
Check Point
Software
Technologies Ltd.* | | | 880 | | | | 99 | | |
Japan 4.4% | |
Bridgestone Corp. | | | 560 | | | | 24 | | |
Daikin Industries Ltd. | | | 450 | | | | 45 | | |
Hoya Corp. | | | 500 | | | | 29 | | |
Kao Corp. | | | 600 | | | | 38 | | |
Kose Corp. | | | 225 | | | | 28 | | |
Toyota Motor
Corp. | | | 750 | | | | 42 | | |
| | | | 206 | | |
| | |
Number
of Shares | |
Value
(000's) | |
Netherlands 4.6% | |
AerCap Holdings
NV* | | | 1,270 | | | $ | 64 | | |
| ASML Holding NV | | | 795 | | | | 123 | | |
| Intertrust NV(a) | | | 1,653 | | | | 27 | | |
| | | | 214 | | |
Norway 1.0% | |
Skandiabanken
ASA(a) | | | 4,342 | | | | 45 | | |
Spain 0.7% | |
Banco Bilbao
Vizcaya
Argentaria SA | | | 3,654 | | | | 32 | | |
Switzerland 7.4% | |
Cie Financiere
Richemont SA | | | 608 | | | | 54 | | |
Givaudan SA | | | 31 | | | | 63 | | |
Julius Baer
Group Ltd.* | | | 1,235 | | | | 69 | | |
Roche Holding AG | | | 226 | | | | 57 | | |
SGS SA | | | 24 | | | | 54 | | |
Sonova Holding
AG | | | 270 | | | | 46 | | |
| | | | 343 | | |
United Kingdom 10.0% | |
Aon PLC | | | 550 | | | | 77 | | |
Howden Joinery
Group PLC | | | 9,155 | | | | 50 | | |
Prudential PLC | | | 2,164 | | | | 51 | | |
RELX PLC | | | 1,845 | | | | 40 | | |
Spectris PLC | | | 1,605 | | | | 48 | | |
St. James's Place
PLC | | | 3,584 | | | | 53 | | |
Travis Perkins PLC | | | 2,366 | | | | 46 | | |
Virgin Money
Holdings UK PLC | | | 13,519 | | | | 47 | | |
Worldpay Group
PLC(a) | | | 9,755 | | | | 53 | | |
| | | | 465 | | |
United States 47.9% | |
Activision
Blizzard, Inc. | | | 935 | | | | 61 | | |
Alphabet, Inc.
Class A* | | | 45 | | | | 43 | | |
Alphabet, Inc.
Class C* | | | 45 | | | | 42 | | |
Amazon.com, Inc.* | | | 98 | | | | 96 | | |
Apple, Inc. | | | 718 | | | | 118 | | |
Biogen, Inc.* | | | 231 | | | | 73 | | |
BlackRock, Inc. | | | 145 | | | | 61 | | |
Blue Buffalo
Pet Products, Inc.* | | | 2,565 | | | | 66 | | |
Cabot Oil & Gas
Corp. | | | 2,570 | | | | 66 | | |
| | |
Number
of Shares | |
Value
(000's) | |
Cardinal Health,
Inc. | | | 645 | | | $ | 44 | | |
CDW Corp. | | | 1,055 | | | | 67 | | |
Centene Corp.* | | | 580 | | | | 52 | | |
Core
Laboratories NV | | | 342 | | | | 30 | | |
CVS Health
Corp. | | | 685 | | | | 53 | | |
Delphi
Automotive PLC | | | 400 | | | | 39 | | |
EOG Resources, Inc. | | | 668 | | | | 57 | | |
Estee Lauder Cos.,
Inc. Class A | | | 508 | | | | 54 | | |
Expedia, Inc. | | | 163 | | | | 24 | | |
Fidelity National
Information
Services, Inc. | | | 780 | | | | 72 | | |
First Republic Bank | | | 580 | | | | 56 | | |
Gilead Sciences,
Inc. | | | 395 | | | | 33 | | |
Graco, Inc. | | | 690 | | | | 80 | | |
Halliburton Co. | | | 790 | | | | 31 | | |
Henry Schein, Inc.* | | | 330 | | | | 57 | | |
Intercontinental
Exchange, Inc. | | | 1,055 | | | | 68 | | |
JPMorgan
Chase & Co. | | | 740 | | | | 67 | | |
Medtronic PLC | | | 652 | | | | 53 | | |
Milacron Holdings
Corp.* | | | 2,405 | | | | 38 | | |
Monsanto Co. | | | 370 | | | | 43 | | |
Nielsen Holdings
PLC | | | 1,270 | | | | 49 | | |
RPM International,
Inc. | | | 985 | | | | 48 | | |
Samsonite
International SA | | | 9,350 | | | | 38 | | |
Sealed Air Corp. | | | 1,300 | | | | 58 | | |
Sensata
Technologies
Holding NV* | | | 1,610 | | | | 72 | | |
Service Corp.
International | | | 1,005 | | | | 36 | | |
T-Mobile US, Inc.* | | | 1,025 | | | | 66 | | |
TE Connectivity
Ltd. | | | 615 | | | | 49 | | |
VF Corp. | | | 795 | | | | 50 | | |
Visa, Inc. Class A | | | 630 | | | | 65 | | |
Western Digital
Corp. | | | 550 | | | | 49 | | |
| | | | 2,224 | | |
Total Common Stocks
(Cost $3,642) | | | | | 4,587 | | |
See Notes to Financial Statements
97
Schedule of Investments Global Equity Fund (cont'd)
| | |
Number
of Shares | |
Value
(000's) | |
Short-Term Investment 1.9% | |
Investment Company 1.9% | |
State Street
Institutional
Treasury Money
Market Fund
Premier Class,
0.90%(b)
(Cost $89) | | | 89,085 | | | $ | 89 | | |
Total Investments 100.7%
(Cost $3,731) | | | | | 4,676 | | |
Liabilities Less Other
Assets (0.7)% | | | | | (32 | ) | |
Net Assets 100.0% | | | | $ | 4,644 | | |
* Non-income producing security.
(a) Securities were purchased under Rule 144A of the Securities Act of 1933, as amended (the "1933 Act"), or are otherwise restricted and, unless registered under the 1933 Act or exempted from registration, may only be sold to qualified institutional investors or may have other restrictions on resale. At August 31, 2017, these securities amounted to approximately $125,000, which represents 2.7% of net assets of the Fund. These securities have been deemed by the investment manager to be liquid.
(b) Represents 7-day effective yield as of August 31, 2017.
See Notes to Financial Statements
98
Schedule of Investments Global Equity Fund (cont'd)
POSITIONS BY INDUSTRY
Industry | | Investments at
Value
(000's omitted) | | Percentage of
Net Assets | |
Banks | | $ | 266 | | | | 5.7 | % | |
Software | | | 264 | | | | 5.7 | % | |
Internet Software & Services | | | 257 | | | | 5.5 | % | |
Capital Markets | | | 251 | | | | 5.4 | % | |
Insurance | | | 240 | | | | 5.2 | % | |
Chemicals | | | 190 | | | | 4.1 | % | |
IT Services | | | 190 | | | | 4.1 | % | |
Auto Components | | | 172 | | | | 3.7 | % | |
Professional Services | | | 170 | | | | 3.7 | % | |
Technology Hardware, Storage & Peripherals | | | 167 | | | | 3.6 | % | |
Electronic Equipment, Instruments & Components | | | 164 | | | | 3.5 | % | |
Oil, Gas & Consumable Fuels | | | 162 | | | | 3.5 | % | |
Trading Companies & Distributors | | | 160 | | | | 3.5 | % | |
Health Care Providers & Services | | | 153 | | | | 3.3 | % | |
Textiles, Apparel & Luxury Goods | | | 142 | | | | 3.1 | % | |
Health Care Equipment & Supplies | | | 128 | | | | 2.8 | % | |
Food & Staples Retailing | | | 124 | | | | 2.7 | % | |
Semiconductors & Semiconductor Equipment | | | 123 | | | | 2.6 | % | |
Internet & Direct Marketing Retail | | | 120 | | | | 2.6 | % | |
Personal Products | | | 120 | | | | 2.6 | % | |
Machinery | | | 118 | | | | 2.5 | % | |
Biotechnology | | | 106 | | | | 2.3 | % | |
Pharmaceuticals | | | 94 | | | | 2.0 | % | |
Electrical Equipment | | | 72 | | | | 1.6 | % | |
Commercial Services & Supplies | | | 67 | | | | 1.4 | % | |
Household Durables | | | 67 | | | | 1.4 | % | |
Food Products | | | 66 | | | | 1.4 | % | |
Wireless Telecommunication Services | | | 66 | | | | 1.4 | % | |
Household Products | | | 64 | | | | 1.4 | % | |
Hotels, Restaurants & Leisure | | | 62 | | | | 1.3 | % | |
Energy Equipment & Services | | | 61 | | | | 1.3 | % | |
Containers & Packaging | | | 58 | | | | 1.2 | % | |
Building Products | | | 45 | | | | 1.0 | % | |
Automobiles | | | 42 | | | | 0.9 | % | |
Diversified Consumer Services | | | 36 | | | | 0.8 | % | |
Short-Term Investment and Other Liabilities—Net | | | 57 | | | | 1.2 | % | |
| | | $ | 4,644 | | | | 100.0 | % | |
See Notes to Financial Statements
99
Schedule of Investments Global Equity Fund (cont'd)
The following is a summary, categorized by Level (see Note A of Notes to Financial Statements), of inputs used to value the Fund's investments as of August 31, 2017:
Asset Valuation Inputs | |
(000's omitted) | | Level 1 | | Level 2 | | Level 3 | | Total | |
Investments: | |
| Common Stocks(a) | | $ | 4,587 | | | $ | — | | | $ | — | | | $ | 4,587 | | |
Short-Term Investment | | | — | | | | 89 | | | | — | | | | 89 | | |
Total Investments | | $ | 4,587 | | | $ | 89 | | | $ | — | | | $ | 4,676 | | |
(a) The Schedule of Investments provides a geographic categorization as well as a Positions by Industry summary.
As of the year ended August 31, 2017, no securities were transferred from one level (as of August 31, 2016) to another.
See Notes to Financial Statements
100
Schedule of Investments Global Real Estate Fund August 31, 2017
| | |
Number
of Shares | |
Value
(000's) | |
Common Stocks 101.8% | |
Australia 6.8% | |
Goodman Group | | | 7,793 | | | $ | 51 | | |
Investa Office Fund | | | 10,963 | | | | 39 | | |
Mirvac Group | | | 23,681 | | | | 44 | | |
Scentre Group | | | 20,507 | | | | 63 | | |
| | | | 197 | | |
Canada 3.7% | |
Allied Properties
Real Estate
Investment Trust | | | 975 | | | | 30 | | |
Brookfield Asset
Management,
Inc. Class A | | | 1,022 | | | | 40 | | |
Canadian
Apartment
Properties REIT | | | 1,376 | | | | 38 | | |
| | | | 108 | | |
France 5.2% | |
ICADE | | | 758 | | | | 67 | | |
Unibail-Rodamco
SE | | | 328 | | | | 84 | | |
| | | | 151 | | |
Germany 4.2% | |
ADO Properties
SA(a) | | | 823 | | | | 40 | | |
Deutsche
Wohnen SE | | | 1,940 | | | | 83 | | |
| | | | 123 | | |
Hong Kong 8.6% | |
Cheung Kong
Property
Holdings Ltd. | | | 10,082 | | | | 88 | | |
Sun Hung Kai
Properties Ltd. | | | 9,740 | | | | 163 | | |
| | | | 251 | | |
Japan 10.2% | |
Activia Properties,
Inc. | | | 5 | | | | 22 | | |
Mitsubishi Estate
Co. Ltd. | | | 3,280 | | | | 57 | | |
Mitsui Fudosan
Co. Ltd. | | | 3,207 | | | | 69 | | |
Mitsui Fudosan
Logistics Park,
Inc. | | | 7 | | | | 20 | | |
Nippon
Accommodations
Fund, Inc. | | | 13 | | | | 53 | | |
Nippon Building
Fund, Inc. | | | 8 | | | | 43 | | |
| | |
Number
of Shares | |
Value
(000's) | |
Sumitomo
Realty &
Development
Co. Ltd. | | | 1,041 | | | $ | 31 | | |
| | | | 295 | | |
Singapore 2.2% | |
Ascendas Real
Estate
Investment Trust | | | 15,089 | | | | 30 | | |
CapitaLand Ltd. | | | 11,838 | | | | 33 | | |
| | | | 63 | | |
Spain 1.3% | |
Axiare Patrimonio
SOCIMI SA | | | 1,920 | | | | 37 | | |
Sweden 1.7% | |
Hufvudstaden AB,
A Shares | | | 2,813 | | | | 50 | | |
United Kingdom 3.7% | |
Safestore
Holdings PLC | | | 5,086 | | | | 27 | | |
SEGRO PLC | | | 6,730 | | | | 47 | | |
Shaftesbury PLC | | | 2,553 | | | | 33 | | |
| | | | 107 | | |
United States 54.2% | |
Alexandria Real
Estate Equities,
Inc. | | | 343 | | | | 42 | | |
American
Homes 4 Rent
Class A | | | 1,518 | | | | 34 | | |
American
Tower Corp. | | | 797 | | | | 118 | | |
Apartment
Investment &
Management Co.
Class A | | | 1,026 | | | | 46 | | |
Boston
Properties, Inc. | | | 423 | | | | 51 | | |
CyrusOne, Inc. | | | 1,048 | | | | 66 | | |
Douglas
Emmett, Inc. | | | 1,008 | | | | 39 | | |
Duke Realty
Corp. | | | 1,544 | | | | 46 | | |
EPR Properties | | | 362 | | | | 25 | | |
Equinix, Inc. | | | 197 | | | | 92 | | |
Equity Lifestyle
Properties, Inc. | | | 478 | | | | 43 | | |
Equity Residential | | | 945 | | | | 63 | | |
Essex Property
Trust, Inc. | | | 211 | | | | 56 | | |
Extra Space
Storage, Inc. | | | 407 | | | | 32 | | |
Federal Realty
Investment Trust | | | 223 | | | | 28 | | |
GGP, Inc. | | | 1,941 | | | | 40 | | |
| | |
Number
of Shares | |
Value
(000's) | |
Healthcare Trust
of America, Inc.
Class A | | | 1,069 | | | $ | 33 | | |
Highwoods
Properties, Inc. | | | 722 | | | | 38 | | |
Kimco Realty
Corp. | | | 2,342 | | | | 46 | | |
Marriott
International,
Inc. Class A | | | 694 | | | | 72 | | |
Mid-America
Apartment
Communities,
Inc. | | | 439 | | | | 47 | | |
National Retail
Properties, Inc. | | | 554 | | | | 23 | | |
Prologis, Inc. | | | 1,504 | | | | 95 | | |
Public Storage | | | 184 | | | | 38 | | |
Simon Property
Group, Inc. | | | 679 | | | | 106 | | |
Starwood
Waypoint Homes | | | 1,146 | | | | 43 | | |
Ventas, Inc. | | | 732 | | | | 50 | | |
Vornado Realty
Trust | | | 886 | | | | 66 | | |
Welltower, Inc. | | | 896 | | | | 66 | | |
Weyerhaeuser
Co. | | | 887 | | | | 29 | | |
| | | | 1,573 | | |
Total Common Stocks
(Cost $2,774) | | | | | 2,955 | | |
Short-Term Investment 1.2% | |
Investment Company 1.2% | |
State Street
Institutional
U.S. Government
Money Market
Fund Premier
Class, 0.93%(b)
(Cost $34) | | | 34,253 | | | | 34 | | |
Total Investments 103.0%
(Cost $2,808) | | | | | 2,989 | | |
Liabilities Less Other
Assets (3.0)% | | | | | (86 | ) | |
Net Assets 100.0% | | | | $ | 2,903 | | |
See Notes to Financial Statements
101
Schedule of Investments Global Real Estate Fund (cont'd)
(a) Securities were purchased under Rule 144A of the Securities Act of 1933, as amended (the "1933 Act"), or are otherwise restricted and, unless registered under the 1933 Act or exempted from registration, may only be sold to qualified institutional investors or may have other restrictions on resale. At August 31, 2017, these securities amounted to approximately $40,000, which represents 1.4% of net assets of the Fund. These securities have been deemed by the investment manager to be liquid.
(b) Represents 7-day effective yield as of August 31, 2017.
See Notes to Financial Statements
102
Schedule of Investments Global Real Estate Fund (cont'd)
POSITIONS BY SECTOR
Sector | | Investments at
Value
(000's omitted) | | Percentage of
Net Assets | |
Industrial & Office REITs | | $ | 841 | | | | 29.0 | % | |
Real Estate Holding & Development | | | 614 | | | | 21.2 | % | |
Residential REITs | | | 467 | | | | 16.1 | % | |
Retail REITs | | | 423 | | | | 14.5 | % | |
Specialty REITs | | | 400 | | | | 13.8 | % | |
Diversified REITs | | | 138 | | | | 4.8 | % | |
Hotel & Lodging REITs | | | 72 | | | | 2.4 | % | |
Short-Term Investment and Other Liabilities—Net | | | (52 | ) | | | (1.8 | )% | |
| | | $ | 2,903 | | | | 100.0 | % | |
See Notes to Financial Statements
103
Schedule of Investments Global Real Estate Fund (cont'd)
The following is a summary, categorized by Level (see Note A of Notes to Financial Statements), of inputs used to value the Fund's investments as of August 31, 2017:
Asset Valuation Inputs | |
(000's omitted) | | Level 1 | | Level 2 | | Level 3 | | Total | |
Investments: | |
| Common Stocks(a) | | $ | 2,955 | | | $ | — | | | $ | — | | | $ | 2,955 | | |
Short-Term Investment | | | — | | | | 34 | | | | — | | | | 34 | | |
Total Investments | | $ | 2,955 | | | $ | 34 | | | $ | — | | | $ | 2,989 | | |
(a) The Schedule of Investments provides a geographic categorization as well as a Positions by Sector summary.
As of the year ended August 31, 2017, no securities were transferred from one level (as of August 31, 2016) to another.
See Notes to Financial Statements
104
Schedule of Investments Greater China Equity Fund August 31, 2017
| | | Number
of Shares | | Value
(000's) | |
Common Stocks 91.0% | |
Air Freight & Logistics 2.7% | |
ZTO Express
Cayman, Inc.
ADR* | | | 261,441 | | | $ | 3,569 | | |
Automobiles 2.1% | |
Guangzhou
Automobile
Group Co. Ltd.,
H Shares | | | 1,388,000 | | | | 2,738 | | |
Banks 18.0% | |
Bank of China
Ltd., H Shares | | | 8,965,000 | | | | 4,720 | | |
China
Construction
Bank Corp.,
H Shares | | | 10,447,000 | | | | 9,158 | | |
Industrial &
Commercial
Bank of China
Ltd., H Shares | | | 13,011,911 | | | | 9,743 | | |
| | | | 23,621 | | |
Beverages 2.9% | |
Kweichow
Moutai Co. Ltd.
Class A | | | 50,946 | | | | 3,792 | | |
Commercial Services & Supplies 2.1% | |
China Everbright
International
Ltd. | | | 2,118,000 | | | | 2,798 | | |
Construction Materials 1.4% | |
Anhui Conch
Cement Co. Ltd.
Class A | | | 511,200 | | | | 1,819 | | |
Diversified Consumer Services 0.8% | |
New Oriental
Education &
Technology
Group, Inc.
ADR* | | | 13,366 | | | | 1,093 | | |
Electronic Equipment, Instruments & Components 2.0% | |
AAC Technologies
Holdings, Inc. | | | 18,000 | | | | 328 | | |
GoerTek, Inc.
Class A | | | 694,856 | | | | 2,275 | | |
| | | | 2,603 | | |
Health Care Providers & Services 1.4% | |
Huadong
Medicine Co. Ltd.
Class A | | | 251,700 | | | | 1,802 | | |
Huadong
Medicine Co. Ltd.
Class A | | | 4,000 | | | | 29 | | |
| | | | 1,831 | | |
| | | Number
of Shares | | Value
(000's) | |
Household Durables 5.6% | |
Gree Electric
Appliances, Inc.
of Zhuhai
Class A | | | 1,017,113 | | | $ | 5,959 | | |
Midea Group Co.
Ltd. Class A | | | 229,400 | | | | 1,426 | | |
| | | | 7,385 | | |
Independent Power and Renewable Electricity Producers 0.2% | |
China Everbright
Greentech
Ltd.*(a) | | | 376,469 | | | | 308 | | |
Insurance 11.0% | |
China Taiping
Insurance
Holdings
Co. Ltd. | | | 852,800 | | | | 2,588 | | |
New China
Life Insurance
Co. Ltd.,
H Shares | | | 577,800 | | | | 3,699 | | |
PICC Property &
Casualty
Co. Ltd.,
H Shares | | | 1,374,000 | | | | 2,581 | | |
Ping An
Insurance
Group Co.
of China Ltd.,
H Shares | | | 697,500 | | | | 5,539 | | |
| | | | 14,407 | | |
Internet & Direct Marketing Retail 1.8% | |
Ctrip.com
International Ltd.
ADR* | | | 44,778 | | | | 2,304 | | |
Internet Software & Services 24.6% | |
Alibaba Group
Holding Ltd.
ADR* | | | 66,894 | | | | 11,488 | | |
Baidu, Inc. ADR* | | | 13,816 | | | | 3,151 | | |
Baozun, Inc.
ADR* | | | 30,299 | | | | 824 | | |
NetEase, Inc.
ADR | | | 5,868 | | | | 1,619 | | |
SINA Corp.* | | | 33,599 | | | | 3,421 | | |
Tencent
Holdings Ltd. | | | 282,200 | | | | 11,864 | | |
| | | | 32,367 | | |
Pharmaceuticals 3.8% | |
China Medical
System
Holdings Ltd. | | | 971,000 | | | | 1,787 | | |
| | | Number
of Shares | | Value
(000's) | |
CSPC
Pharmaceutical
Group Ltd. | | | 2,024,000 | | | $ | 3,160 | | |
| | | | 4,947 | | |
Real Estate Management & Development 3.2% | |
CIFI Holdings
Group Co. Ltd. | | | 5,054,000 | | | | 2,842 | | |
Longfor
Properties
Co. Ltd. | | | 555,000 | | | | 1,333 | | |
| | | | 4,175 | | |
Transportation Infrastructure 3.2% | |
Guangzhou
Baiyun
International
Airport
Co. Ltd.
Class A | | | 2,096,093 | | | | 4,258 | | |
Water Utilities 2.2% | |
Beijing
Enterprises
Water
Group Ltd.* | | | 3,382,000 | | | | 2,874 | | |
Wireless Telecommunication
Services 2.0% | |
China Mobile Ltd. | | | 252,000 | | | | 2,673 | | |
Total Common Stocks
(Cost $97,301) | | | 119,562 | | |
Participatory Notes 4.5% | |
Beverages 0.6% | |
Kweichow
Moutai Co. Ltd.,
Class A (issuer
HSBC Bank PLC),
Expiration
Date 8/17/18(a) | | | 2,200 | | | | 164 | | |
Kweichow
Moutai Co. Ltd.,
Class A (issuer
Morgan Stanley
Asia Products),
Expiration
Date 11/9/17(a) | | | 7,600 | | | | 566 | | |
| | | | 730 | | |
Construction Materials 0.7% | |
Anhui Conch
Cement Co. Ltd.,
Class A (issuer
Morgan Stanley
Asia Products),
Expiration
Date 10/24/18(a) | | | 242,800 | | | | 864 | | |
See Notes to Financial Statements
105
Schedule of Investments Greater China Equity Fund (cont'd)
| | | Number
of Shares | | Value
(000's) | |
Health Care Providers & Services 0.6% | |
Huadong
Medicine Co.
Ltd., Class A
(issuer HSBC
Bank PLC),
Expiration
Date 6/19/23(a) | | | 87,882 | | | $ | 629 | | |
Huadong
Medicine Co.
Ltd., Class A
(issuer UBS AG),
Expiration
Date 1/10/18(a) | | | 29,604 | | | | 212 | | |
| | | | 841 | | |
Household Durables 2.6% | |
Midea Group
Co. Ltd.,
Class A (issuer
Morgan Stanley
Asia Products),
Expiration
Date 11/20/17(a) | | | 15,300 | | | | 95 | | |
| | | Number
of Shares | | Value
(000's) | |
Midea Group
Co. Ltd.,
Class A (issuer
BNP Paribas
Arbitrage),
Expiration
Date 12/20/17(a) | | | 360,185 | | | $ | 2,239 | | |
Midea Group
Co. Ltd.,
Class A (issuer
HSBC Bank PLC),
Expiration
Date 9/23/23(a) | | | 10,400 | | | | 65 | | |
Midea Group
Co. Ltd.,
Class A (issuer
UBS AG),
Expiration
Date 1/10/18(a) | | | 168,170 | | | | 1,045 | | |
| | | | 3,444 | | |
Total Participatory Notes
(Cost $3,854) | | | 5,879 | | |
| | | Number
of Shares | | Value
(000's) | |
Short-Term Investment 3.4% | |
Investment Company 3.4% | |
State Street
Institutional U.S.
Government
Money Market
Fund Premier
Class, 0.93%(b)
(Cost $4,548) | | | 4,548,207 | | | $ | 4,548 | | |
Total Investments 98.9%
(Cost $105,703) | | | 129,989 | | |
Other Assets
Less Liabilities 1.1% | | | | | 1,420 | | |
Net Assets 100.0% | | $ | 131,409 | | |
* Non-income producing security.
(a) Securities were purchased under Rule 144A of the Securities Act of 1933, as amended (the "1933 Act"), or are otherwise restricted and, unless registered under the 1933 Act or exempted from registration, may only be sold to qualified institutional investors or may have other restrictions on resale. At August 31, 2017, these securities amounted to approximately $6,187,000, which represents 4.7% of net assets of the Fund. These securities have been deemed by the investment manager to be liquid.
(b) Represents 7-day effective yield as of August 31, 2017.
The following is a summary, categorized by Level (see Note A of Notes to Financial Statements), of inputs used to value the Fund's investments as of August 31, 2017:
Asset Valuation Inputs | |
(000's omitted) | | Level 1 | | Level 2 | | Level 3 | | Total | |
Investments: | |
| Common Stocks(a) | | $ | 119,562 | | | $ | — | | | $ | — | | | $ | 119,562 | | |
| Participatory Notes(a) | | | 5,879 | | | | — | | | | — | | | | 5,879 | | |
Short-Term Investment | | | — | | | | 4,548 | | | | — | | | | 4,548 | | |
Total Investments | | $ | 125,441 | | | $ | 4,548 | | | $ | — | | | $ | 129,989 | | |
(a) The Schedule of Investments provides information on the industry categorization for the portfolio.
As of the year ended August 31, 2017, no securities were transferred from one level (as of August 31, 2016) to another.
See Notes to Financial Statements
106
Schedule of Investments Guardian Fund August 31, 2017
| | | Number
of Shares | | Value
(000's) | |
Common Stocks 98.4% | |
Aerospace & Defense 4.6% | |
General
Dynamics Corp. | | | 155,255 | | | $ | 31,261 | | |
Raytheon Co. | | | 129,000 | | | | 23,479 | | |
| | | | 54,740 | | |
Air Freight & Logistics 0.3% | |
Expeditors
International of
Washington,
Inc. | | | 55,000 | | | | 3,085 | | |
Airlines 1.8% | |
Delta Air Lines,
Inc.(a) | | | 459,000 | | | | 21,660 | | |
Banks 3.7% | |
JPMorgan
Chase & Co. | | | 294,505 | | | | 26,768 | | |
U.S. Bancorp | | | 326,325 | | | | 16,724 | | |
| | | | 43,492 | | |
Beverages 1.7% | |
PepsiCo, Inc. | | | 180,000 | | | | 20,831 | | |
Biotechnology 3.6% | |
Celgene Corp.* | | | 164,250 | | | | 22,819 | | |
Gilead
Sciences, Inc. | | | 234,910 | | | | 19,665 | | |
| | | | 42,484 | | |
Capital Markets 5.7% | |
BlackRock, Inc. | | | 38,500 | | | | 16,132 | | |
Brookfield Asset
Management,
Inc. Class A | | | 745,765 | | | | 29,495 | | |
CME Group, Inc. | | | 174,180 | | | | 21,912 | | |
| | | | 67,539 | | |
Chemicals 2.5% | |
Ashland Global
Holdings, Inc. | | | 218,625 | | | | 13,566 | | |
PPG Industries,
Inc. | | | 45,000 | | | | 4,694 | | |
Valvoline, Inc. | | | 526,000 | | | | 11,199 | | |
| | | | 29,459 | | |
Electric Utilities 3.2% | |
Brookfield
Infrastructure
Partners LP | | | 868,060 | | | | 38,307 | | |
Electronic Equipment, Instruments & Components 2.4% | |
CDW Corp. | | | 452,000 | | | | 28,666 | | |
Energy Equipment & Services 1.2% | |
Schlumberger
Ltd. | | | 220,000 | | | | 13,972 | | |
| | | Number
of Shares | | Value
(000's) | |
Equity Real Estate Investment
Trusts 1.8% | |
SBA
Communications
Corp.* | | | 84,555 | | | $ | 12,983 | | |
Weyerhaeuser
Co.(a) | | | 265,515 | | | | 8,659 | | |
| | | | 21,642 | | |
Food & Staples Retailing 3.4% | |
Costco
Wholesale
Corp.(b) | | | 120,100 | | | | 18,824 | | |
CVS Health
Corp.(b) | | | 278,000 | | | | 21,501 | | |
| | | | 40,325 | | |
Food Products 1.9% | |
Conagra
Brands, Inc.(a) | | | 700,000 | | | | 22,722 | | |
Health Care Equipment & Supplies 3.0% | |
Dentsply
Sirona, Inc. | | | 620,805 | | | | 35,119 | | |
Health Care Providers & Services 4.7% | |
DaVita, Inc.* | | | 497,000 | | | | 29,104 | | |
UnitedHealth
Group, Inc. | | | 133,710 | | | | 26,595 | | |
| | | | 55,699 | | |
Hotels, Restaurants & Leisure 2.7% | |
McDonald's
Corp. | | | 134,000 | | | | 21,436 | | |
Starbucks
Corp.(a) | | | 190,805 | | | | 10,467 | | |
| | | | 31,903 | | |
Industrial Conglomerates 1.5% | |
3M Co. | | | 87,215 | | | | 17,820 | | |
Internet & Direct Marketing Retail 6.5% | |
Amazon.com,
Inc.* | | | 27,195 | | | | 26,667 | | |
Expedia, Inc. | | | 214,725 | | | | 31,857 | | |
Priceline Group,
Inc.* | | | 5,795 | | | | 10,733 | | |
TripAdvisor, Inc.* | | | 192,520 | | | | 8,226 | | |
| | | | 77,483 | | |
Internet Software & Services 8.3% | |
Alphabet, Inc.
Class A* | | | 42,860 | | | | 40,941 | | |
eBay, Inc.* | | | 770,070 | | | | 27,823 | | |
Facebook, Inc.
Class A* | | | 174,180 | | | | 29,954 | | |
| | | | 98,718 | | |
| | | Number
of Shares | | Value
(000's) | |
IT Services 3.3% | |
PayPal Holdings,
Inc.* | | | 145,015 | | | $ | 8,945 | | |
Visa, Inc. Class A | | | 297,010 | | | | 30,746 | | |
| | | | 39,691 | | |
Machinery 1.6% | |
Allison
Transmission
Holdings, Inc. | | | 545,000 | | | | 18,928 | | |
Multi-Utilities 1.2% | |
WEC Energy
Group, Inc. | | | 218,000 | | | | 14,218 | | |
Oil, Gas & Consumable Fuels 4.4% | |
Cabot Oil & Gas
Corp. | | | 729,435 | | | | 18,637 | | |
Enbridge, Inc. | | | 834,700 | | | | 33,380 | | |
| | | | 52,017 | | |
Pharmaceuticals 0.7% | |
Bristol-Myers
Squibb Co. | | | 131,465 | | | | 7,951 | | |
Professional Services 4.7% | |
IHS Markit Ltd.* | | | 640,000 | | | | 29,978 | | |
Verisk
Analytics, Inc.* | | | 321,000 | | | | 26,017 | | |
| | | | 55,995 | | |
Road & Rail 1.3% | |
Norfolk
Southern Corp. | | | 128,000 | | | | 15,426 | | |
Software 5.1% | |
Microsoft Corp. | | | 540,000 | | | | 40,376 | | |
salesforce.com,
inc.* | | | 217,565 | | | | 20,775 | | |
| | | | 61,151 | | |
Specialty Retail 4.9% | |
Home Depot, Inc. | | | 200,000 | | | | 29,974 | | |
TJX Cos., Inc. | | | 123,000 | | | | 8,893 | | |
Tractor
Supply Co.(a) | | | 328,275 | | | | 19,535 | | |
| | | | 58,402 | | |
Technology Hardware, Storage & Peripherals 3.3% | |
Apple, Inc. | | | 237,500 | | | | 38,950 | | |
Textiles, Apparel & Luxury Goods 1.9% | |
| PVH Corp.(a) | | | 184,000 | | | | 23,164 | | |
Trading Companies & Distributors 1.5% | |
HD Supply
Holdings, Inc.* | | | 527,035 | | | | 17,550 | | |
Total Common Stocks
(Cost $958,887) | | | 1,169,109 | | |
See Notes to Financial Statements
107
Schedule of Investments Guardian Fund (cont'd)
| | | Number
of Shares | | Value
(000's) | |
Preferred Stock 0.7% | |
Health Care | |
Moderna
Therapeutics
Ser. F(c)(h)
(Cost $8,700) | | | 990,888 | | | $ | 8,700 | | |
Short-Term Investment 0.9% | |
Investment Company 0.9% | |
State Street
Institutional
Treasury Money
Market Fund
Premier Class,
0.90%(b)(f)
(Cost $10,760) | | | 10,759,681 | | | | 10,760 | | |
Total Purchased Options 0.0%(d)(e)
(Cost $430) | | | 143 | | |
Total Investments 100.0%
(Cost $978,777) | | | 1,188,712 | | |
Liabilities Less
Other Assets(g) (0.0)%(d) | | | | | (431 | ) | |
Net Assets 100.0% | | $ | 1,188,281 | | |
* Non-income producing security.
(a) All or a portion of the security is pledged as collateral for options written.
(b) All or a portion of this security is segregated in connection with obligations for options written with a total value of approximately $49,357,000.
(c) Security fair valued as of August 31, 2017 in accordance with procedures approved by the Board of Trustees (the "Board"). Total value of all such securities at August 31, 2017 amounted to approximately $8,700,000, which represents 0.7% of net assets of the Fund.
(d) Represents less than 0.05%.
(e) See "Purchased option contracts" under Derivative Instruments.
(f) Represents 7-day effective yield as of August 31, 2017.
(g) Includes the impact of the Fund's open positions in derivatives at August 31, 2017.
(h) This security has been deemed by the investment manager to be illiquid, and is subject to restrictions on resale.
At August 31, 2017, this security amounted to approximately $8,700,000, which represents 0.7% of net assets of the Fund.
(000's omitted)
Restricted Security | | Acquisition
Date | | Acquisition
Cost | | Acquisition
Cost
Percentage
of Net Assets | | Fair Value
Value as of
8/31/2017 | | Percentage
of Net Assets
as of
8/31/2017 | |
Moderna Therapeutics
(Series F Preferred Shares) | | 8/10/2016 | | $ | 8,700 | | | | 0.8 | % | | $ | 8,700 | | | | 0.7 | % | |
See Notes to Financial Statements
108
Schedule of Investments Guardian Fund (cont'd)
Derivative Instruments
Purchased option contracts ("options purchased")
At August 31, 2017, the Fund had outstanding options purchased as follows:
| Description | | Number of
Contracts | | Notional
Amount | | Exercise
Price | | Expiration
Date | | Value | |
Calls | |
| Food & Staples Retailing | |
Sprouts Farmers Market, Inc. | | | 2,850 | | | $ | 5,682,900 | | | $ | 25 | | | 12/15/2017 | | $ | 142,500 | | |
Total Options Purchased (cost: $430,407) | | | | | | | | | | $ | 142,500 | | |
Written option contracts ("options written")
At August 31, 2017, the Fund had outstanding options written as follows:
| Description | | Number of
Contracts | | Notional
Amount | | Exercise
Price | | Expiration
Date | | Value | |
Calls | |
| Chemicals | |
Ashland Global Holdings, Inc. | | | 455 | | | $ | (2,823,275 | ) | | $ | 70 | | | 10/20/2017 | | $ | (4,550 | ) | |
| Oil, Gas & Consumable Fuels | |
Cabot Oil & Gas Corp. | | | 1,550 | | | | (3,960,250 | ) | | | 27 | | | 10/20/2017 | | | (89,125 | ) | |
| Road & Rail | |
Norfolk Southern Corp. | | | 350 | | | | (4,218,200 | ) | | | 125 | | | 12/15/2017 | | | (147,000 | ) | |
Total (premiums received: $432,577) | | | | | | | | | | $ | (240,675 | ) | |
Puts | |
| Chemicals | |
Ashland Global Holdings, Inc. | | | 524 | | | | (3,251,420 | ) | | $ | 60 | | | 10/20/2017 | | $ | (48,470 | ) | |
| Food & Staples Retailing | |
Costco Wholesale Corp. | | | 200 | | | | (3,134,800 | ) | | | 150 | | | 10/20/2017 | | | (38,500 | ) | |
| IT Services | |
PayPal Holdings, Inc. | | | 690 | | | | (4,255,920 | ) | | | 55 | | | 10/20/2017 | | | (29,670 | ) | |
PayPal Holdings, Inc. | | | 1,030 | | | | (6,353,040 | ) | | | 50 | | | 6/15/2018 | | | (177,160 | ) | |
| | | | | | | | | | | (206,830 | ) | |
| Professional Services | |
Verisk Analytics, Inc. | | | 350 | | | | (2,836,750 | ) | | | 75 | | | 12/15/2017 | | | (33,250 | ) | |
Total (premiums received: $642,805) | | | | | | | | | | $ | (327,050 | ) | |
Total Options Written
(premiums received: $1,075,382) | | | | | | | | | | $ | (567,725 | ) | |
For the year ended August 31, 2017, the Fund had an average market value of $220,801 in options purchased and $(736,774) in options written, respectively. The Fund had securities pledged in the amount of $25,078,340 to cover collateral requirements for options written.
See Notes to Financial Statements
109
Schedule of Investments Guardian Fund (cont'd)
The following is a summary, categorized by Level (see Note A of Notes to Financial Statements), of inputs used to value the Fund's investments as of August 31, 2017:
Asset Valuation Inputs | |
(000's omitted) | | Level 1 | | Level 2 | | Level 3(b) | | Total | |
Investments: | |
| Common Stocks(a) | | $ | 1,169,109 | | | $ | — | | | $ | — | | | $ | 1,169,109 | | |
| Preferred Stock(a) | | | — | | | | — | | | | 8,700 | | | | 8,700 | | |
| Options Purchased(a) | | | 143 | | | | — | | | | — | | | | 143 | | |
Short-Term Investment | | | — | | | | 10,760 | | | | — | | | | 10,760 | | |
Total Investments | | $ | 1,169,252 | | | $ | 10,760 | | | $ | 8,700 | | | $ | 1,188,712 | | |
(a) The Schedule of Investments provides information on the industry categorization for the portfolio.
(b) The following is a reconciliation between the beginning and ending balances of investments in which unobservable inputs (Level 3) were used in determining value:
| | | Beginning
balance, as
of 9/1/2016 | | Accrued
discounts/
(premiums) | | Realized
gain/
(loss) | | Change
in unrealized
appreciation/
(depreciation) | | Purchases | | Sales | | Transfers
into
Level 3 | | Transfers
out of
Level 3 | | Balance
as of
8/31/2017 | | Net change in
unrealized
appreciation/
(depreciation)
from
investments
still held as
of 8/31/2017 | |
Investments in Securities:
(000's omitted) | |
Preferred
Stock | |
Health
Care | | $ | 8,700 | | | $ | — | | | $ | — | | | $ | — | | | $ | — | | | $ | — | | | $ | — | | | $ | — | | | $ | 8,700 | | | $ | — | | |
Total | | $ | 8,700 | | | $ | — | | | $ | — | | | $ | — | | | $ | — | | | $ | — | | | $ | — | | | $ | — | | | $ | 8,700 | | | $ | — | | |
The following table presents additional information about valuation techniques and inputs used for investments that are measured at fair value and categorized within Level 3 as of August 31, 2017.
Asset
class | | Fair value
at 8/31/2017 | | Valuation
techniques | | Unobservable
input | | Amount or
range
per unit | | Input value
per unit | | Impact to
valuation
from
decrease
in input(c) | |
Preferred
Stock | | $ | 8,699,997
| | | Market
Transaction Method | | Transaction
Price | | $ | 8.78
| | | $ | 8.78
| | | Decrease
| |
(c) Represents the expected directional change in the fair value of the Level 3 investments that would result from a decrease in the corresponding input. An increase to the unobservable input would have the opposite effect. Significant changes in these inputs could result in significantly higher or lower fair value measurements.
As of the year ended August 31, 2017, no securities were transferred from one level (as of August 31, 2016) to another.
See Notes to Financial Statements
110
Schedule of Investments Guardian Fund (cont'd)
The following is a summary, categorized by Level (see Note A of Notes to Financial Statements), of inputs used to value the Fund's derivatives as of August 31, 2017:
Other Financial Instruments | |
(000's omitted) | | Level 1 | | Level 2 | | Level 3(a) | | Total | |
Options Written | |
Liabilities | | $ | (568 | ) | | $ | — | | | $ | — | | | $ | (568 | ) | |
Total | | $ | (568 | ) | | $ | — | | | $ | — | | | $ | (568 | ) | |
(a) The following is a reconciliation between the beginning and ending balances of investments in which unobservable inputs (Level 3) were used in determining value:
| | | Beginning
balance, as
of 9/1/2016 | | Accrued
discounts/
(premiums) | | Realized
gain/
(loss) | | Change
in unrealized
appreciation/
(depreciation) | | Purchases | | Sales | | Transfers
into
Level 3 | | Transfers
out of
Level 3 | | Balance,
as of
8/31/2017 | | Net change in
unrealized
appreciation/
(depreciation)
from
investments
still held as
of 8/31/2017 | |
Other Financial Instruments:
(000's omitted) | |
Options
Written(c) | | $ | (0 | ) | | $ | — | | | $ | 43 | | | $ | (43 | ) | | $ | 0 | | | $ | — | | | $ | — | | | $ | — | | | $ | — | | | $ | — | | |
Total | | $ | (0 | ) | | $ | — | | | $ | 43 | | | $ | (43 | ) | | $ | 0 | | | $ | — | | | $ | — | | | $ | — | | | $ | — | | | $ | — | | |
(b) Amount less than one thousand.
(c) At the beginning of the year the Fund's Level 3 investments were valued based on using methods the Board has approved in the good-faith belief that the resulting valuation will reflect the fair value of the security. As of the year ended August 31, 2017, these investments did not have a material impact on the Fund's net assets and, therefore, disclosure of unobservable inputs used in formulating valuations is not presented.
See Notes to Financial Statements
111
Schedule of Investments International Equity Fund August 31, 2017
| | | Number
of Shares | | Value
(000's) | |
Common Stocks 96.2% | |
Australia 2.1% | |
Insurance
Australia
Group Ltd. | | | 5,522,416 | | | $ | 28,140 | | |
Reliance
Worldwide
Corp. Ltd. | | | 3,800,000 | | | | 10,996 | | |
| | | | 39,136 | | |
Austria 1.1% | |
Andritz AG | | | 360,510 | | | | 19,617 | | |
Belgium 1.3% | |
KBC Group NV | | | 84,731 | | | | 6,963 | | |
Ontex Group NV | | | 501,306 | | | | 17,104 | | |
| | | | 24,067 | | |
Canada 4.8% | |
Alimentation
Couche-Tard,
Inc. Class B | | | 544,241 | | | | 25,989 | | |
ATS Automation
Tooling
Systems, Inc.* | | | 1,132,600 | | | | 11,437 | | |
Kinaxis, Inc.* | | | 319,232 | | | | 18,733 | | |
MacDonald,
Dettwiler &
Associates Ltd. | | | 166,733 | | | | 9,174 | | |
Suncor
Energy, Inc. | | | 678,598 | | | | 21,264 | | |
| | | | 86,597 | | |
China 3.5% | |
Alibaba Group
Holding Ltd.
ADR* | | | 224,800 | | | | 38,607 | | |
Baidu, Inc. ADR* | | | 110,800 | | | | 25,268 | | |
| | | | 63,875 | | |
Denmark 1.9% | |
| Nets A/S*(a) | | | 787,072 | | | | 19,465 | | |
Sydbank A/S | | | 378,751 | | | | 14,774 | | |
| | | | 34,239 | | |
Finland 0.7% | |
Huhtamaki OYJ | | | 335,473 | | | | 13,051 | | |
France 10.1% | |
Air Liquide SA | | | 148,220 | | | | 18,095 | | |
Arkema SA | | | 210,561 | | | | 22,880 | | |
| Elior Group SA(a) | | | 447,625 | | | | 11,883 | | |
Pernod-Ricard SA | | | 176,140 | | | | 24,072 | | |
Sodexo SA | | | 188,318 | | | | 21,977 | | |
SPIE SA | | | 815,017 | | | | 23,087 | | |
TOTAL SA | | | 454,524 | | | | 23,507 | | |
Valeo SA | | | 377,060 | | | | 25,218 | | |
Virbac SA* | | | 83,738 | | | | 14,001 | | |
| | | | 184,720 | | |
| | | Number
of Shares | | Value
(000's) | |
Germany 7.5% | |
Brenntag AG | | | 282,000 | | | $ | 14,944 | | |
Continental AG | | | 78,700 | | | | 17,759 | | |
CTS Eventim
AG & Co.
KGaA | | | 430,589 | | | | 18,971 | | |
Deutsche
Boerse AG | | | 129,379 | | | | 13,829 | | |
Gerresheimer
AG | | | 199,993 | | | | 15,733 | | |
Henkel AG &
Co. KGaA,
Preference
Shares | | | 163,750 | | | | 21,940 | | |
SAP SE ADR | | | 325,900 | | | | 34,203 | | |
| | | | 137,379 | | |
Hong Kong 1.8% | |
HKBN Ltd. | | | 19,127,800 | | | | 18,331 | | |
Techtronic
Industries
Co. Ltd. | | | 2,815,300 | | | | 14,570 | | |
| | | | 32,901 | | |
Ireland 0.9% | |
Greencore
Group PLC | | | 6,282,818 | | | | 16,655 | | |
Israel 1.7% | |
Check Point
Software
Technologies
Ltd.* | | | 280,300 | | | | 31,357 | | |
Italy 1.0% | |
Azimut
Holding SpA | | | 836,650 | | | | 17,629 | | |
Japan 13.9% | |
Bridgestone
Corp. | | | 408,700 | | | | 17,544 | | |
Daikin
Industries Ltd. | | | 295,500 | | | | 29,554 | | |
Hoya Corp. | | | 259,600 | | | | 14,865 | | |
Ichigo, Inc. | | | 2,929,000 | | | | 9,458 | | |
Kansai Paint
Co. Ltd. | | | 943,300 | | | | 23,931 | | |
Kao Corp. | | | 223,900 | | | | 13,976 | | |
Keyence Corp. | | | 85,000 | | | | 44,273 | | |
Kose Corp. | | | 125,800 | | | | 15,791 | | |
Nabtesco Corp. | | | 352,850 | | | | 12,341 | | |
Santen
Pharmaceutical
Co. Ltd. | | | 1,012,500 | | | | 15,712 | | |
Shionogi &
Co. Ltd. | | | 339,500 | | | | 17,896 | | |
SMC Corp. | | | 70,300 | | | | 24,114 | | |
Toyota Motor
Corp. | | | 249,100 | | | | 14,010 | | |
| | | | 253,465 | | |
| | | Number
of Shares | | Value
(000's) | |
Netherlands 5.9% | |
AerCap
Holdings NV* | | | 553,350 | | | $ | 27,834 | | |
ASML
Holding NV | | | 292,321 | | | | 45,413 | | |
Heineken NV | | | 177,992 | | | | 18,674 | | |
| Intertrust NV(a) | | | 428,305 | | | | 6,883 | | |
Koninklijke
Ahold Delhaize
NV | | | 471,144 | | | | 8,469 | | |
| | | | 107,273 | | |
Norway 1.1% | |
Skandiabanken
ASA(a) | | | 1,943,223 | | | | 20,039 | | |
Spain 1.4% | |
Banco Bilbao
Vizcaya
Argentaria SA | | | 1,151,156 | | | | 10,171 | | |
| Euskaltel SA(a) | | | 1,423,304 | | | | 14,506 | | |
| | | | 24,677 | | |
Sweden 0.9% | |
Nordea Bank AB | | | 1,237,460 | | | | 16,649 | | |
Switzerland 13.0% | |
Bucher
Industries AG | | | 59,345 | | | | 20,871 | | |
Cie Financiere
Richemont SA | | | 172,840 | | | | 15,455 | | |
Givaudan SA | | | 12,830 | | | | 26,223 | | |
Julius Baer
Group Ltd.* | | | 453,240 | | | | 25,334 | | |
Novartis AG | | | 188,095 | | | | 15,868 | | |
Partners Group
Holding AG | | | 39,930 | | | | 25,900 | | |
Roche
Holding AG | | | 84,524 | | | | 21,463 | | |
SGS SA | | | 9,170 | | | | 20,493 | | |
Sonova
Holding AG | | | 95,495 | | | | 16,142 | | |
Tecan Group AG | | | 164,173 | | | | 32,819 | | |
UBS Group AG* | | | 1,005,855 | | | | 16,573 | | |
| | | | 237,141 | | |
United Kingdom 17.5% | |
Aon PLC | | | 201,900 | | | | 28,096 | | |
Barclays PLC | | | 6,268,883 | | | | 15,491 | | |
| Biffa PLC(a) | | | 3,582,087 | | | | 10,457 | | |
Bunzl PLC | | | 767,519 | | | | 22,926 | | |
Clinigen
Group PLC | | | 1,963,684 | | | | 28,312 | | |
Compass
Group PLC | | | 885,683 | | | | 18,920 | | |
DCC PLC | | | 180,503 | | | | 16,444 | | |
Howden
Joinery
Group PLC | | | 1,347,210 | | | | 7,421 | | |
See Notes to Financial Statements
112
Schedule of Investments International Equity Fund (cont'd)
| | | Number
of Shares | | Value
(000's) | |
Lloyds Banking
Group PLC | | | 28,050,374 | | | | $23,149 | | |
Prudential PLC | | | 1,136,197 | | | | 26,674 | | |
RELX PLC | | | 1,194,786 | | | | 26,126 | | |
| RPS Group PLC | | | 3,100,420 | | | | 11,576 | | |
Spectris PLC | | | 603,984 | | | | 18,073 | | |
St. James's
Place PLC | | | 1,325,333 | | | | 19,760 | | |
Travis
Perkins PLC | | | 854,623 | | | | 16,632 | | |
Unilever NV | | | 253,638 | | | | 15,100 | | |
Worldpay
Group PLC(a) | | | 2,768,407 | | | | 14,928 | | |
| | | | 320,085 | | |
| | | Number
of Shares | | Value
(000's) | |
United States 4.1% | |
Core
Laboratories NV | | | 71,604 | | | $ | 6,314 | | |
Nielsen
Holdings PLC | | | 431,302 | | | | 16,756 | | |
Samsonite
International SA | | | 5,071,900 | | | | 20,707 | | |
Sensata
Technologies
Holding NV* | | | 387,200 | | | | 17,292 | | |
TE Connectivity
Ltd. | | | 165,540 | | | | 13,177 | | |
| | | | 74,246 | | |
Total Common Stocks
(Cost $1,492,446) | | | | | 1,754,798 | | |
| | | Number
of Shares | | Value
(000's) | |
Short-Term Investment 3.6% | |
Investment Company 3.6% | |
State Street
Institutional
Treasury Money
Market Fund
Premier
Class, 0.90%(b)
(Cost $65,700) | | | 65,699,772 | | | $ | 65,700 | | |
Total Investments 99.8%
(Cost $1,558,146) | | | | | 1,820,498 | | |
Other Assets Less
Liabilities 0.2% | | | | | 4,323 | | |
Net Assets 100.0% | | | | $ | 1,824,821 | | |
* Non-income producing security.
(a) Securities were purchased under Rule 144A of the Securities Act of 1933, as amended (the "1933 Act"), or are otherwise restricted and, unless registered under the 1933 Act or exempted from registration, may only be sold to qualified institutional investors or may have other restrictions on resale. At August 31, 2017, these securities amounted to approximately $98,161,000, which represents 5.4% of net assets of the Fund. These securities have been deemed by the investment manager to be liquid.
(b) Represents 7-day effective yield as of August 31, 2017.
See Notes to Financial Statements
113
Schedule of Investments International Equity Fund (cont'd)
POSITIONS BY INDUSTRY
| Industry | | Investments at
Value
(000's omitted) | | Percentage of
Net Assets | |
Capital Markets | | $ | 119,025 | | | | 6.5 | % | |
Banks | | | 107,236 | | | | 5.9 | % | |
Chemicals | | | 91,129 | | | | 5.0 | % | |
Trading Companies & Distributors | | | 89,757 | | | | 4.9 | % | |
Machinery | | | 88,380 | | | | 4.8 | % | |
Pharmaceuticals | | | 84,940 | | | | 4.7 | % | |
Software | | | 84,293 | | | | 4.6 | % | |
Insurance | | | 82,910 | | | | 4.5 | % | |
Life Sciences Tools & Services | | | 76,864 | | | | 4.2 | % | |
Electronic Equipment, Instruments & Components | | | 75,523 | | | | 4.1 | % | |
Professional Services | | | 70,258 | | | | 3.9 | % | |
Internet Software & Services | | | 63,875 | | | | 3.5 | % | |
Personal Products | | | 61,971 | | | | 3.4 | % | |
Auto Components | | | 60,521 | | | | 3.3 | % | |
Hotels, Restaurants & Leisure | | | 52,780 | | | | 2.9 | % | |
Semiconductors & Semiconductor Equipment | | | 45,413 | | | | 2.5 | % | |
Commercial Services & Supplies | | | 45,120 | | | | 2.5 | % | |
Oil, Gas & Consumable Fuels | | | 44,771 | | | | 2.5 | % | |
Beverages | | | 42,746 | | | | 2.3 | % | |
Building Products | | | 40,550 | | | | 2.2 | % | |
Textiles, Apparel & Luxury Goods | | | 36,162 | | | | 2.0 | % | |
Food & Staples Retailing | | | 34,458 | | | | 1.9 | % | |
IT Services | | | 34,393 | | | | 1.9 | % | |
Diversified Telecommunication Services | | | 32,837 | | | | 1.8 | % | |
Health Care Equipment & Supplies | | | 31,007 | | | | 1.7 | % | |
Household Products | | | 21,940 | | | | 1.2 | % | |
Media | | | 18,971 | | | | 1.0 | % | |
Electrical Equipment | | | 17,292 | | | | 1.0 | % | |
Food Products | | | 16,655 | | | | 0.9 | % | |
Industrial Conglomerates | | | 16,444 | | | | 0.9 | % | |
Household Durables | | | 14,570 | | | | 0.8 | % | |
Automobiles | | | 14,010 | | | | 0.8 | % | |
Containers & Packaging | | | 13,051 | | | | 0.7 | % | |
Real Estate Management & Development | | | 9,458 | | | | 0.5 | % | |
Aerospace & Defense | | | 9,174 | | | | 0.5 | % | |
Energy Equipment & Services | | | 6,314 | | | | 0.4 | % | |
Short-Term Investment and Other Assets—Net | | | 70,023 | | | | 3.8 | % | |
| | | $ | 1,824,821 | | | | 100.0 | % | |
See Notes to Financial Statements
114
Schedule of Investments International Equity Fund (cont'd)
The following is a summary, categorized by Level (see Note A of Notes to Financial Statements), of inputs used to value the Fund's investments as of August 31, 2017:
Asset Valuation Inputs | |
(000's omitted) | | Level 1 | | Level 2 | | Level 3 | | Total | |
Investments: | |
| Common Stocks(a) | | $ | 1,754,798 | | | $ | — | | | $ | — | | | $ | 1,754,798 | | |
Short-Term Investment | | | — | | | | 65,700 | | | | — | | | | 65,700 | | |
Total Investments | | $ | 1,754,798 | | | $ | 65,700 | | | $ | — | | | $ | 1,820,498 | | |
(a) The Schedule of Investments provides a geographic categorization as well as a Positions by Industry summary.
As of the year ended August 31, 2017, no securities were transferred from one level (as of August 31, 2016) to another.
See Notes to Financial Statements
115
Schedule of Investments International Select Fund August 31, 2017
| | | Number
of Shares | | Value
(000's) | |
Common Stocks 97.3% | |
Australia 1.9% | |
Brambles Ltd. | | | 112,716 | | | $ | 834 | | |
Insurance Australia
Group Ltd. | | | 762,488 | | | | 3,886 | | |
| | | | 4,720 | | |
Austria 1.1% | |
Andritz AG | | | 49,265 | | | | 2,681 | | |
Belgium 0.4% | |
KBC Group NV | | | 12,368 | | | | 1,016 | | |
Canada 2.9% | |
Alimentation
Couche-Tard,
Inc. Class B | | | 86,411 | | | | 4,126 | | |
Suncor Energy, Inc. | | | 93,043 | | | | 2,916 | | |
| | | | 7,042 | | |
China 4.4% | |
Alibaba Group
Holding Ltd. ADR* | | | 40,600 | | | | 6,973 | | |
Baidu, Inc. ADR* | | | 16,700 | | | | 3,808 | | |
| | | | 10,781 | | |
Denmark 1.4% | |
| Nets A/S*(a) | | | 142,255 | | | | 3,518 | | |
France 12.2% | |
Air Liquide SA | | | 20,286 | | | | 2,477 | | |
Arkema SA | | | 28,870 | | | | 3,137 | | |
| Elior Group SA(a) | | | 77,780 | | | | 2,065 | | |
L'Oreal SA | | | 11,593 | | | | 2,448 | | |
Pernod-Ricard SA | | | 24,200 | | | | 3,307 | | |
Schneider
Electric SE* | | | 36,489 | | | | 2,942 | | |
Sodexo SA | | | 25,575 | | | | 2,985 | | |
SPIE SA | | | 109,695 | | | | 3,107 | | |
TOTAL SA | | | 62,356 | | | | 3,225 | | |
Valeo SA | | | 62,235 | | | | 4,162 | | |
| | | | 29,855 | | |
Germany 7.9% | |
Brenntag AG | | | 38,450 | | | | 2,038 | | |
Continental AG | | | 13,160 | | | | 2,969 | | |
CTS Eventim
AG & Co. KGaA | | | 57,910 | | | | 2,551 | | |
Deutsche
Boerse AG | | | 25,707 | | | | 2,748 | | |
Henkel AG & Co.
KGaA, Preference
Shares | | | 27,225 | | | | 3,648 | | |
SAP SE ADR | | | 51,185 | | | | 5,372 | | |
| | | | 19,326 | | |
Hong Kong 2.1% | |
AIA Group Ltd. | | | 326,900 | | | | 2,508 | | |
Techtronic
Industries Co. Ltd. | | | 510,100 | | | | 2,640 | | |
| | | | 5,148 | | |
| | | Number
of Shares | | Value
(000's) | |
Israel 2.6% | |
Check Point
Software
Technologies Ltd.* | | | 55,889 | | | $ | 6,252 | | |
Italy 1.0% | |
Azimut
Holding SpA | | | 114,940 | | | | 2,422 | | |
Japan 15.8% | |
Bridgestone Corp. | | | 54,600 | | | | 2,344 | | |
Daikin
Industries Ltd. | | | 35,000 | | | | 3,500 | | |
Hoya Corp. | | | 22,900 | | | | 1,311 | | |
Kansai Paint
Co. Ltd. | | | 161,500 | | | | 4,097 | | |
Kao Corp. | | | 40,600 | | | | 2,534 | | |
Keyence Corp. | | | 12,500 | | | | 6,511 | | |
Kose Corp. | | | 22,800 | | | | 2,862 | | |
Nabtesco Corp. | | | 48,400 | | | | 1,693 | | |
Omron Corp. | | | 27,200 | | | | 1,366 | | |
Santen
Pharmaceutical
Co. Ltd. | | | 187,400 | | | | 2,908 | | |
Shionogi & Co. Ltd. | | | 54,100 | | | | 2,852 | | |
SMC Corp. | | | 11,700 | | | | 4,013 | | |
Toyota Motor Corp. | | | 45,100 | | | | 2,537 | | |
| | | | 38,528 | | |
Netherlands 6.2% | |
AerCap
Holdings NV* | | | 75,400 | | | | 3,793 | | |
| ASML Holding NV | | | 45,150 | | | | 7,014 | | |
Heineken NV | | | 24,255 | | | | 2,545 | | |
Koninklijke
Ahold
Delhaize NV | | | 96,102 | | | | 1,727 | | |
| | | | 15,079 | | |
Spain 0.6% | |
Banco Bilbao
Vizcaya
Argentaria SA | | | 179,955 | | | | 1,590 | | |
Sweden 1.5% | |
Nordea Bank AB | | | 281,500 | | | | 3,787 | | |
Switzerland 12.5% | |
Cie Financiere
Richemont SA | | | 23,825 | | | | 2,130 | | |
Givaudan SA | | | 2,056 | | | | 4,202 | | |
Julius Baer
Group Ltd.* | | | 49,805 | | | | 2,784 | | |
Novartis AG | | | 43,731 | | | | 3,689 | | |
Partners Group
Holding AG | | | 5,420 | | | | 3,516 | | |
Roche Holding AG | | | 18,146 | | | | 4,608 | | |
SGS SA | | | 1,842 | | | | 4,116 | | |
Sonova Holding AG | | | 16,465 | | | | 2,783 | | |
UBS Group AG* | | | 165,360 | | | | 2,725 | | |
| | | | 30,553 | | |
| | | Number
of Shares | | Value
(000's) | |
United Kingdom 17.3% | |
Aon PLC | | | 36,300 | | | $ | 5,052 | | |
Barclays PLC | | | 1,025,496 | | | | 2,534 | | |
Bunzl PLC | | | 123,324 | | | | 3,684 | | |
Compass
Group PLC | | | 120,690 | | | | 2,578 | | |
DCC PLC | | | 20,970 | | | | 1,910 | | |
Howden Joinery
Group PLC | | | 463,580 | | | | 2,554 | | |
Lloyds Banking
Group PLC | | | 4,309,249 | | | | 3,556 | | |
Prudential PLC | | | 155,470 | | | | 3,650 | | |
RELX PLC | | | 197,448 | | | | 4,317 | | |
Spectris PLC | | | 82,532 | | | | 2,470 | | |
St. James's
Place PLC | | | 182,651 | | | | 2,723 | | |
Travis Perkins PLC | | | 130,254 | | | | 2,535 | | |
Unilever NV | | | 45,821 | | | | 2,728 | | |
Worldpay
Group PLC(a) | | | 377,171 | | | | 2,034 | | |
| | | | 42,325 | | |
United States 5.5% | |
Core
Laboratories NV | | | 9,300 | | | | 820 | | |
Delphi
Automotive PLC | | | 20,700 | | | | 1,995 | | |
Nielsen
Holdings PLC | | | 61,000 | | | | 2,370 | | |
Samsonite
International SA | | | 694,600 | | | | 2,836 | | |
Sensata
Technologies
Holding NV* | | | 66,300 | | | | 2,961 | | |
TE Connectivity
Ltd. | | | 30,177 | | | | 2,402 | | |
| | | | 13,384 | | |
Total Common Stocks
(Cost $188,838) | | | 238,007 | | |
Short-Term Investment 2.3% | |
Investment Company 2.3% | |
State Street
Institutional
Treasury Money
Market Fund
Premier Class,
0.90%(b)
(Cost $5,693) | | | 5,693,282 | | | | 5,693 | | |
Total Investments 99.6%
(Cost $194,531) | | | 243,700 | | |
Other Assets
Less Liabilities 0.4% | | | | | 874 | | |
Net Assets 100.0% | | $ | 244,574 | | |
See Notes to Financial Statements
116
Schedule of Investments International Select Fund (cont'd)
* Non-income producing security.
(a) Securities were purchased under Rule 144A of the Securities Act of 1933, as amended (the "1933 Act"), or are otherwise restricted and, unless registered under the 1933 Act or exempted from registration, may only be sold to qualified institutional investors or may have other restrictions on resale. At August 31, 2017, these securities amounted to approximately $7,617,000, which represents 3.1% of net assets of the Fund. These securities have been deemed by the investment manager to be liquid.
(b) Represents 7-day effective yield as of August 31, 2017.
See Notes to Financial Statements
117
Schedule of Investments International Select Fund (cont'd)
POSITIONS BY INDUSTRY
Industry | | Investments at
Value
(000's omitted) | | Percentage of
Net Assets | |
Capital Markets | | $ | 16,918 | | | | 6.9 | % | |
Insurance | | | 15,096 | | | | 6.2 | % | |
Trading Companies & Distributors | | | 14,604 | | | | 6.0 | % | |
Pharmaceuticals | | | 14,057 | | | | 5.8 | % | |
Chemicals | | | 13,913 | | | | 5.7 | % | |
Electronic Equipment, Instruments & Components | | | 12,749 | | | | 5.2 | % | |
Banks | | | 12,483 | | | | 5.1 | % | |
Software | | | 11,624 | | | | 4.8 | % | |
Auto Components | | | 11,470 | | | | 4.7 | % | |
Professional Services | | | 10,803 | | | | 4.4 | % | |
Internet Software & Services | | | 10,781 | | | | 4.4 | % | |
Personal Products | | | 10,572 | | | | 4.3 | % | |
Machinery | | | 8,387 | | | | 3.4 | % | |
Hotels, Restaurants & Leisure | | | 7,628 | | | | 3.1 | % | |
Semiconductors & Semiconductor Equipment | | | 7,014 | | | | 2.9 | % | |
Oil, Gas & Consumable Fuels | | | 6,141 | | | | 2.5 | % | |
Electrical Equipment | | | 5,903 | | | | 2.4 | % | |
Food & Staples Retailing | | | 5,853 | | | | 2.4 | % | |
Beverages | | | 5,852 | | | | 2.4 | % | |
IT Services | | | 5,552 | | | | 2.3 | % | |
Textiles, Apparel & Luxury Goods | | | 4,966 | | | | 2.0 | % | |
Health Care Equipment & Supplies | | | 4,094 | | | | 1.7 | % | |
Commercial Services & Supplies | | | 3,941 | | | | 1.6 | % | |
Household Products | | | 3,648 | | | | 1.5 | % | |
Building Products | | | 3,500 | | | | 1.4 | % | |
Household Durables | | | 2,640 | | | | 1.1 | % | |
Media | | | 2,551 | | | | 1.0 | % | |
Automobiles | | | 2,537 | | | | 1.0 | % | |
Industrial Conglomerates | | | 1,910 | | | | 0.8 | % | |
Energy Equipment & Services | | | 820 | | | | 0.3 | % | |
Short-Term Investment and Other Assets-Net | | | 6,567 | | | | 2.7 | % | |
| | | $ | 244,574 | | | | 100.0 | % | |
See Notes to Financial Statements
118
Schedule of Investments International Select Fund (cont'd)
The following is a summary, categorized by Level (see Note A of Notes to Financial Statements), of inputs used to value the Fund's investments as of August 31, 2017:
Asset Valuation Inputs | |
(000's omitted) | | Level 1 | | Level 2 | | Level 3 | | Total | |
Investments: | |
| Common Stocks(a) | | $ | 238,007 | | | $ | — | | | $ | — | | | $ | 238,007 | | |
Short-Term Investment | | | — | | | | 5,693 | | | | — | | | | 5,693 | | |
Total Investments | | $ | 238,007 | | | $ | 5,693 | | | $ | — | | | $ | 243,700 | | |
(a) The Schedule of Investments provides a geographic categorization as well as a Positions by Industry summary.
As of the year ended August 31, 2017, no securities were transferred from one level (as of August 31, 2016) to another.
See Notes to Financial Statements
119
Schedule of Investments International Small Cap Fund August 31, 2017
| | |
Number
of Shares | |
Value
(000's) | |
Common Stocks 100.5% | |
Australia 3.3% | |
nib holdings Ltd. | | | 3,780 | | | $ | 18 | | |
Reliance Worldwide
Corp. Ltd. | | | 5,845 | | | | 17 | | |
Steadfast Group Ltd. | | | 7,010 | | | | 15 | | |
| | | | 50 | | |
Austria 0.5% | |
Schoeller-Bleckmann
Oilfield
Equipment AG* | | | 110 | | | | 8 | | |
Belgium 2.9% | |
| Balta Group NV*(a) | | | 820 | | | | 12 | | |
Ion Beam
Applications | | | 425 | | | | 12 | | |
Ontex Group NV | | | 570 | | | | 19 | | |
| | | | 43 | | |
Canada 4.5% | |
Advantage Oil &
Gas Ltd.* | | | 1,300 | | | | 8 | | |
ATS Automation
Tooling Systems,
Inc.* | | | 1,890 | | | | 19 | | |
Colliers International
Group, Inc. | | | 360 | | | | 19 | | |
Kinaxis, Inc.* | | | 378 | | | | 22 | | |
| | | | 68 | | |
China 0.4% | |
Noah Holdings
Ltd. ADR* | | | 220 | | | | 6 | | |
Denmark 2.9% | |
Schouw & Co. AB | | | 220 | | | | 23 | | |
Sydbank A/S | | | 515 | | | | 20 | | |
| | | | 43 | | |
Finland 1.3% | |
Kemira OYJ | | | 1,565 | | | | 19 | | |
France 4.6% | |
Axway Software SA | | | 735 | | | | 20 | | |
Trigano SA | | | 205 | | | | 27 | | |
Virbac SA* | | | 130 | | | | 22 | | |
| | | | 69 | | |
Germany 6.1% | |
Jenoptik AG | | | 910 | | | | 27 | | |
SAF-Holland SA | | | 1,035 | | | | 19 | | |
Stabilus SA | | | 280 | | | | 24 | | |
Washtec AG | | | 280 | | | | 22 | | |
| | | | 92 | | |
Ireland 1.0% | |
Greencore
Group PLC | | | 5,795 | | | | 15 | | |
| | |
Number
of Shares | |
Value
(000's) | |
Italy 1.1% | |
Azimut
Holding SpA | | | 800 | | | $ | 17 | | |
Japan 25.6% | |
Aeon Delight
Co. Ltd. | | | 600 | | | | 21 | | |
Amano Corp. | | | 1,100 | | | | 26 | | |
Ariake Japan
Co. Ltd. | | | 300 | | | | 22 | | |
ASKUL Corp. | | | 400 | | | | 12 | | |
Azbil Corp. | | | 600 | | | | 25 | | |
Chugoku Marine
Paints Ltd. | | | 2,700 | | | | 22 | | |
Daifuku Co. Ltd. | | | 900 | | | | 39 | | |
Daikyonishikawa
Corp. | | | 1,000 | | | | 16 | | |
Ichigo, Inc. | | | 5,200 | | | | 17 | | |
Nihon Parkerizing
Co. Ltd. | | | 1,400 | | | | 20 | | |
Nohmi Bosai Ltd. | | | 1,100 | | | | 17 | | |
Okamoto
Industries, Inc. | | | 2,000 | | | | 21 | | |
Prestige
International, Inc. | | | 2,400 | | | | 26 | | |
Relo Group, Inc. | | | 1,300 | | | | 30 | | |
Sato Holdings Corp. | | | 800 | | | | 19 | | |
SHO-BOND
Holdings Co. Ltd. | | | 400 | | | | 22 | | |
Shoei Co. Ltd. | | | 500 | | | | 15 | | |
Sun Frontier
Fudousan Co. Ltd. | | | 1,500 | | | | 15 | | |
| | | | 385 | | |
Netherlands 3.9% | |
Corbion NV | | | 665 | | | | 20 | | |
| Intertrust NV(a) | | | 955 | | | | 15 | | |
Refresco
Group NV(a) | | | 1,151 | | | | 23 | | |
| | | | 58 | | |
Norway 2.9% | |
Borregaard ASA | | | 1,985 | | | | 23 | | |
Skandiabanken
ASA(a) | | | 1,975 | | | | 21 | | |
| | | | 44 | | |
Singapore 1.4% | |
Haw Par Corp. Ltd. | | | 2,500 | | | | 21 | | |
Spain 2.6% | |
Applus Services SA | | | 1,760 | | | | 23 | | |
| Euskaltel SA(a) | | | 1,605 | | | | 16 | | |
| | | | 39 | | |
Sweden 5.4% | |
Byggmax Group AB | | | 2,390 | | | | 20 | | |
Cloetta AB | | | 5,445 | | | | 20 | | |
Indutrade AB | | | 810 | | | | 20 | | |
| Thule Group AB(a) | | | 1,045 | | | | 20 | | |
| | | | 80 | | |
| | |
Number
of Shares | |
Value
(000's) | |
Switzerland 14.1% | |
Ascom Holding AG | | | 1,080 | | | $ | 21 | | |
Autoneum
Holding AG | | | 70 | | | | 18 | | |
Belimo Holding AG | | | 5 | | | | 20 | | |
Bossard Holding AG
Class A | | | 120 | | | | 26 | | |
Comet Holding AG* | | | 135 | | | | 19 | | |
Conzzeta AG | | | 20 | | | | 21 | | |
Interroll Holding AG | | | 15 | | | | 19 | | |
Komax Holding AG | | | 70 | | | | 19 | | |
Tecan Group AG | | | 110 | | | | 22 | | |
u-blox Holding AG* | | | 75 | | | | 13 | | |
VZ Holding AG | | | 45 | | | | 14 | | |
| | | | 212 | | |
United Kingdom 16.0% | |
| Biffa PLC(a) | | | 6,870 | | | | 20 | | |
Big Yellow
Group PLC | | | 1,095 | | | | 11 | | |
Clarkson PLC | | | 455 | | | | 17 | | |
Clinigen Group Plc | | | 1,685 | | | | 24 | | |
CVS Group PLC | | | 985 | | | | 17 | | |
Dechra
Pharmaceuticals
PLC | | | 845 | | | | 21 | | |
Diploma PLC | | | 1,525 | | | | 21 | | |
Essentra PLC | | | 2,925 | | | | 20 | | |
Johnson Service
Group PLC | | | 13,355 | | | | 23 | | |
Restore PLC | | | 3,921 | | | | 25 | | |
| RPS Group PLC | | | 6,290 | | | | 24 | | |
Volution
Group PLC | | | 6,700 | | | | 17 | | |
| | | | 240 | | |
Total Common Stocks
(Cost $1,268) | | | | | 1,509 | | |
Short-Term Investment 5.8% | |
Investment Company 5.8% | |
State Street
Institutional
Treasury Money
Market Fund
Premier Class,
0.90%(b)
(Cost $87) | | | 87,224 | | | | 87 | | |
Total Investments 106.3%
(Cost $1,355) | | | | | 1,596 | | |
Liabilities less
Other Assets (6.3)% | | | | | (94 | ) | |
Net Assets 100.0% | | | | $ | 1,502 | | |
See Notes to Financial Statements
120
Schedule of Investments International Small Cap Fund (cont'd)
* Non-income producing security.
(a) Securities were purchased under Rule 144A of the Securities Act of 1933, as amended (the "1933 Act"), or are otherwise restricted and, unless registered under the 1933 Act or exempted from registration, may only be sold to qualified institutional investors or may have other restrictions on resale. At August 31, 2017, these securities amounted to approximately $127,000, which represents 8.5% of net assets of the Fund. These securities have been deemed by the investment manager to be liquid.
(b) Represents 7-day effective yield as of August 31, 2017.
See Notes to Financial Statements
121
Schedule of Investments International Small Cap Fund (cont'd)
POSITIONS BY INDUSTRY
Industry | | Investments at
Value
(000's omitted) | | Percentage of
Net Assets | |
Machinery | | $ | 163 | | | | 10.9 | % | |
Commercial Services & Supplies | | | 158 | | | | 10.5 | % | |
Chemicals | | | 145 | | | | 9.7 | % | |
Electronic Equipment, Instruments & Components | | | 114 | | | | 7.6 | % | |
Real Estate Management & Development | | | 81 | | | | 5.4 | % | |
Food Products | | | 80 | | | | 5.3 | % | |
Auto Components | | | 68 | | | | 4.5 | % | |
Trading Companies & Distributors | | | 67 | | | | 4.5 | % | |
Pharmaceuticals | | | 64 | | | | 4.3 | % | |
Building Products | | | 54 | | | | 3.6 | % | |
Leisure Products | | | 47 | | | | 3.1 | % | |
Life Sciences Tools & Services | | | 46 | | | | 3.1 | % | |
Software | | | 42 | | | | 2.8 | % | |
Banks | | | 41 | | | | 2.7 | % | |
Professional Services | | | 38 | | | | 2.5 | % | |
Capital Markets | | | 37 | | | | 2.5 | % | |
Insurance | | | 33 | | | | 2.2 | % | |
Beverages | | | 23 | | | | 1.5 | % | |
Construction & Engineering | | | 22 | | | | 1.5 | % | |
Communications Equipment | | | 21 | | | | 1.4 | % | |
Specialty Retail | | | 20 | | | | 1.3 | % | |
Personal Products | | | 19 | | | | 1.3 | % | |
Marine | | | 17 | | | | 1.1 | % | |
Health Care Providers & Services | | | 17 | | | | 1.1 | % | |
Diversified Telecommunication Services | | | 16 | | | | 1.1 | % | |
Semiconductors & Semiconductor Equipment | | | 13 | | | | 0.9 | % | |
Internet & Direct Marketing Retail | | | 12 | | | | 0.8 | % | |
Health Care Equipment & Supplies | | | 12 | | | | 0.8 | % | |
Household Durables | | | 12 | | | | 0.8 | % | |
Equity Real Estate Investment Trusts | | | 11 | | | | 0.7 | % | |
Energy Equipment & Services | | | 8 | | | | 0.5 | % | |
Oil, Gas & Consumable Fuels | | | 8 | | | | 0.5 | % | |
Short-Term Investment and Other Liabilities—Net | | | (7 | ) | | | (0.5 | )% | |
| | | $ | 1,502 | | | | 100.0 | % | |
See Notes to Financial Statements
122
Schedule of Investments International Small Cap Fund (cont'd)
The following is a summary, categorized by Level (see Note A of Notes to Financial Statements), of inputs used to value the Fund's investments as of August 31, 2017:
Asset Valuation Inputs | |
(000's omitted) | | Level 1 | | Level 2 | | Level 3 | | Total | |
Investments: | |
| Common Stocks(a) | | $ | 1,509 | | | $ | — | | | $ | — | | | $ | 1,509 | | |
Short-Term Investment | | | — | | | | 87 | | | | — | | | | 87 | | |
Total Investments | | $ | 1,509 | | | $ | 87 | | | $ | — | | | $ | 1,596 | | |
(a) The Schedule of Investments provides a geographic categorization as well as a Positions by Industry summary.
As of the period ended August 31, 2017, no securities were transferred from one level (as of August 31, 2016) to another.
See Notes to Financial Statements
123
Schedule of Investments Intrinsic Value Fund August 31, 2017
| | |
Number
of Shares | |
Value
(000's) | |
Common Stocks 93.7% | |
Aerospace & Defense 9.2% | |
Aerovironment,
Inc.* | | | 320,559 | | | $ | 15,714 | | |
KEYW Holding
Corp.* | | | 1,214,006 | | | | 8,680 | | |
Mercury
Systems, Inc.* | | | 457,541 | | | | 22,076 | | |
Spirit
AeroSystems
Holdings, Inc.
Class A | | | 181,790 | | | | 13,544 | | |
Teledyne
Technologies,
Inc.* | | | 65,552 | | | | 9,837 | | |
Textron, Inc. | | | 238,239 | | | | 11,695 | | |
| | | | 81,546 | | |
Banks 5.0% | |
BankUnited,
Inc. | | | 237,204 | | | | 7,894 | | |
Comerica, Inc. | | | 133,074 | | | | 9,082 | | |
Huntington
Bancshares,
Inc. | | | 804,930 | | | | 10,134 | | |
TCF Financial
Corp. | | | 546,200 | | | | 8,483 | | |
Texas Capital
Bancshares,
Inc.* | | | 109,400 | | | | 8,123 | | |
| | | | 43,716 | | |
| Capital Markets 0.0%(a) | |
Alimco Financial
Corp.* | | | 8,337 | | | | 101 | | |
Commercial Services & Supplies 2.3% | |
Clean Harbors,
Inc.* | | | 215,514 | | | | 11,657 | | |
Covanta Holding
Corp. | | | 574,900 | | | | 8,250 | | |
| | | | 19,907 | | |
Communications Equipment 7.2% | |
ARRIS
International
PLC* | | | 640,369 | | | | 17,841 | | |
Ciena Corp.* | | | 795,183 | | | | 17,184 | | |
Infinera Corp.* | | | 1,521,100 | | | | 12,868 | | |
Mitel Networks
Corp.* | | | 383,000 | | | | 3,118 | | |
Sonus
Networks, Inc.* | | | 847,499 | | | | 5,856 | | |
Viavi Solutions,
Inc.* | | | 652,700 | | | | 6,553 | | |
| | | | 63,420 | | |
| | |
Number
of Shares | |
Value
(000's) | |
Construction & Engineering 2.0% | |
KBR, Inc. | | | 726,700 | | | $ | 11,823 | | |
Valmont
Industries, Inc. | | | 40,700 | | | | 5,843 | | |
| | | | 17,666 | | |
Containers & Packaging 4.3% | |
Avery Dennison
Corp. | | | 201,536 | | | | 18,997 | | |
Crown Holdings,
Inc.* | | | 323,500 | | | | 19,096 | | |
| | | | 38,093 | | |
Electronic Equipment, Instruments & Components 4.3% | |
II-VI, Inc.* | | | 127,130 | | | | 4,558 | | |
Itron, Inc.* | | | 144,531 | | | | 10,493 | | |
Maxwell
Technologies,
Inc.* | | | 706,000 | | | | 3,932 | | |
OSI Systems,
Inc.* | | | 111,700 | | | | 9,278 | | |
VeriFone
Systems, Inc.* | | | 509,790 | | | | 10,078 | | |
| | | | 38,339 | | |
Energy Equipment & Services 0.5% | |
ION Geophysical
Corp.* | | | 49,731 | | | | 365 | | |
McDermott
International,
Inc.* | | | 390,700 | | | | 2,399 | | |
TETRA
Technologies,
Inc.* | | | 927,092 | | | | 1,910 | | |
| | | | 4,674 | | |
Equity Real Estate Investment
Trusts 1.6% | |
InfraREIT, Inc. | | | 311,900 | | | | 7,014 | | |
Uniti Group, Inc. | | | 361,100 | | | | 6,955 | | |
| | | | 13,969 | | |
Food Products 1.2% | |
Hain Celestial
Group, Inc.* | | | 61,900 | | | | 2,490 | | |
TreeHouse
Foods, Inc.* | | | 120,500 | | | | 8,072 | | |
| | | | 10,562 | | |
Health Care Equipment &
Supplies 3.7% | |
Accuray, Inc.* | | | 1,750,139 | | | | 7,263 | | |
Analogic Corp. | | | 120,635 | | | | 8,632 | | |
AtriCure, Inc.* | | | 300,000 | | | | 6,729 | | |
Haemonetics
Corp.* | | | 224,900 | | | | 9,675 | | |
| | | | 32,299 | | |
| | |
Number
of Shares | |
Value
(000's) | |
Health Care Providers & Services 1.7% | |
Acadia
Healthcare
Co., Inc.* | | | 140,000 | | | $ | 6,572 | | |
Molina
Healthcare,
Inc.* | | | 125,161 | | | | 8,010 | | |
| | | | 14,582 | | |
Health Care Technology 1.7% | |
Allscripts
Healthcare
Solutions, Inc.* | | | 1,122,300 | | | | 14,747 | | |
Hotels, Restaurants & Leisure 0.7% | |
SeaWorld
Entertainment,
Inc. | | | 456,800 | | | | 5,929 | | |
Independent Power and Renewable Electricity Producers 3.8% | |
Atlantic Power
Corp.* | | | 1,733,958 | | | | 4,248 | | |
Dynegy, Inc.* | | | 729,700 | | | | 6,874 | | |
NRG Energy, Inc. | | | 484,200 | | | | 12,062 | | |
Ormat
Technologies,
Inc. | | | 178,241 | | | | 10,238 | | |
| | | | 33,422 | | |
IT Services 5.3% | |
Acxiom Corp.* | | | 560,500 | | | | 13,054 | | |
CoreLogic, Inc.* | | | 424,425 | | | | 19,935 | | |
DST Systems, Inc. | | | 193,138 | | | | 9,914 | | |
Unisys Corp.* | | | 497,900 | | | | 3,859 | | |
| | | | 46,762 | | |
Life Sciences Tools & Services 4.6% | |
Charles River
Laboratories
International,
Inc.* | | | 238,171 | | | | 25,913 | | |
Fluidigm
Corp.*(b) | | | 1,737,259 | | | | 7,939 | | |
Luminex Corp. | | | 333,400 | | | | 6,445 | | |
| | | | 40,297 | | |
Machinery 4.3% | |
Actuant Corp.
Class A | | | 208,475 | | | | 5,014 | | |
Harsco Corp.* | | | 529,400 | | | | 9,053 | | |
ITT, Inc. | | | 183,800 | | | | 7,418 | | |
Manitowoc
Co., Inc.* | | | 719,500 | | | | 5,921 | | |
Meritor, Inc.* | | | 380,250 | | | | 7,552 | | |
Twin Disc, Inc.* | | | 175,657 | | | | 3,049 | | |
| | | | 38,007 | | |
Marine 0.1% | |
Danaos Corp.* | | | 549,959 | | | | 907 | | |
See Notes to Financial Statements
124
Schedule of Investments Intrinsic Value Fund (cont'd)
| | |
Number
of Shares | |
Value
(000's) | |
Media 0.5% | |
MSG Networks,
Inc. Class A* | | | 208,153 | | | $ | 4,465 | | |
Metals & Mining 1.3% | |
Cleveland-Cliffs,
Inc.* | | | 1,331,500 | | | | 11,131 | | |
Pharmaceuticals 1.5% | |
Impax
Laboratories,
Inc.* | | | 266,800 | | | | 5,776 | | |
Intersect ENT,
Inc.* | | | 243,588 | | | | 7,527 | | |
| | | | 13,303 | | |
Road & Rail 4.6% | |
Avis Budget
Group, Inc.* | | | 622,500 | | | | 22,553 | | |
Hertz Global
Holdings, Inc.* | | | 352,100 | | | | 7,655 | | |
Ryder System,
Inc. | | | 139,604 | | | | 10,833 | | |
| | | | 41,041 | | |
Semiconductors & Semiconductor Equipment 8.9% | |
CEVA, Inc.* | | | 150,600 | | | | 6,107 | | |
Cypress
Semiconductor
Corp. | | | 819,135 | | | | 11,214 | | |
FormFactor, Inc.* | | | 427,803 | | | | 6,460 | | |
MACOM
Technology
Solutions
Holdings, Inc.* | | | 352,563 | | | | 16,056 | | |
Mellanox
Technologies
Ltd.* | | | 315,950 | | | | 14,834 | | |
Rambus, Inc.* | | | 1,268,644 | | | | 16,454 | | |
Veeco
Instruments, Inc.* | | | 408,900 | | | | 7,728 | | |
| | | | 78,853 | | |
| | |
Number
of Shares | |
Value
(000's) | |
Software 10.1% | |
FireEye, Inc.* | | | 905,400 | | | $ | 13,373 | | |
Nuance
Communications,
Inc.* | | | 1,119,300 | | | | 17,987 | | |
Seachange
International,
Inc.* | | | 798,867 | | | | 2,085 | | |
Silver Spring
Networks, Inc.* | | | 1,054,976 | | | | 13,356 | | |
TiVo Corp. | | | 877,130 | | | | 16,052 | | |
VASCO Data
Security
International, Inc.* | | | 281,500 | | | | 3,533 | | |
Verint Systems,
Inc.* | | | 576,961 | | | | 22,905 | | |
| | | | 89,291 | | |
Specialty Retail 0.9% | |
Express, Inc.* | | | 423,400 | | | | 2,697 | | |
New York &
Co., Inc.* | | | 299,700 | | | | 578 | | |
Office
Depot, Inc. | | | 1,113,167 | | | | 4,776 | | |
| | | | 8,051 | | |
Technology Hardware, Storage & Peripherals 0.6% | |
Diebold
Nixdorf, Inc. | | | 205,100 | | | | 4,194 | | |
Quantum Corp.* | | | 229,375 | | | | 1,264 | | |
| | | | 5,458 | | |
Textiles, Apparel & Luxury Goods 1.8% | |
Crocs, Inc.* | | | 481,700 | | | | 4,301 | | |
Deckers
Outdoor
Corp.* | | | 182,000 | | | | 11,630 | | |
| | | | 15,931 | | |
Total Common Stocks
(Cost $696,351) | | | | | 826,469 | | |
| | |
Number
of Shares | |
Value
(000's) | |
Convertible Preferred Stock 0.4% | |
Independent Power and Renewable Electricity Producers 0.4% | |
Dynegy, Inc.,
7.00%,
due 7/1/19
(Cost $5,627) | | | 57,900 | | | $ | 3,905 | | |
Short-Term Investment 6.4% | |
Investment Company 6.4% | |
State Street
Institutional
Treasury Money
Market Fund
Premier Class,
0.90%(c)
(Cost $56,423) | | | 56,422,974 | | | | 56,423 | | |
Total Investments 100.5%
(Cost $758,401) | | | | | 886,797 | | |
Liabilities Less
Other Assets (0.5)% | | | | | (4,344 | ) | |
Net Assets 100.0% | | | | $ | 882,453 | | |
* Non-income producing security.
(a) Represents less than 0.05% of net assets.
(b) Affiliated company (see Note F of Notes to Financial Statements).
(c) Represents 7-day effective yield as of August 31, 2017.
See Notes to Financial Statements
125
Schedule of Investments Intrinsic Value Fund (cont'd)
The following is a summary, categorized by Level (see Note A of Notes to Financial Statements), of inputs used to value the Fund's investments as of August 31, 2017:
Asset Valuation Inputs | |
(000's omitted) | | Level 1 | | Level 2 | | Level 3 | | Total | |
Investments: | |
| Common Stocks(a) | | $ | 826,469 | | | $ | — | | | $ | — | | | $ | 826,469 | | |
| Convertible Preferred Stock(a) | | | 3,905 | | | | — | | | | — | | | | 3,905 | | |
Short-Term Investment | | | — | | | | 56,423 | | | | — | | | | 56,423 | | |
Total Investments | | $ | 830,374 | | | $ | 56,423 | | | $ | — | | | $ | 886,797 | | |
(a) The Schedule of Investments provides information on the industry categorization for the portfolio.
As of the year ended August 31, 2017, no securities were transferred from one level (as of August 31, 2016) to another.
See Notes to Financial Statements
126
Schedule of Investments Large Cap Value Fund August 31, 2017
| | |
Number
of Shares | |
Value
(000's) | |
Common Stocks 84.0% | |
Airlines 0.4% | |
Delta Air Lines,
Inc. | | | 135,506 | | | $ | 6,395 | | |
Banks 15.0% | |
Bank of America
Corp. | | | 427,246 | | | | 10,207 | | |
Citigroup, Inc. | | | 782,273 | | | | 53,218 | | |
JPMorgan
Chase & Co.(a) | | | 786,715 | | | | 71,505 | | |
M&T Bank Corp. | | | 173,823 | | | | 25,701 | | |
PNC Financial
Services
Group, Inc. | | | 278,933 | | | | 34,981 | | |
U.S. Bancorp | | | 254,710 | | | | 13,054 | | |
Wells Fargo & Co. | | | 187,561 | | | | 9,579 | | |
| | | | 218,245 | | |
Beverages 1.0% | |
Coca-Cola Co. | | | 326,105 | | | | 14,854 | | |
Biotechnology 0.2% | |
Gilead Sciences,
Inc. | | | 42,184 | | | | 3,531 | | |
Building Products 0.6% | |
Johnson
Controls
International
PLC | | | 236,301 | | | | 9,355 | | |
Capital Markets 1.5% | |
CME Group, Inc. | | | 171,139 | | | | 21,529 | | |
Chemicals 0.8% | |
Potash Corp. of
Saskatchewan,
Inc. | | | 84,034 | | | | 1,462 | | |
Praxair, Inc. | | | 74,938 | | | | 9,857 | | |
| | | | 11,319 | | |
Containers & Packaging 1.0% | |
Crown
Holdings, Inc.* | | | 253,780 | | | | 14,981 | | |
| Distributors 0.0%(b) | |
LKQ Corp.* | | | 17,557 | | | | 608 | | |
Diversified Telecommunication Services 0.9% | |
AT&T, Inc. | | | 364,843 | | | | 13,667 | | |
Electric Utilities 4.1% | |
Alliant Energy
Corp. | | | 127,257 | | | | 5,439 | | |
American
Electric Power
Co., Inc. | | | 218,539 | | | | 16,091 | | |
Exelon Corp. | | | 989,753 | | | | 37,482 | | |
| | | | 59,012 | | |
| | |
Number
of Shares | |
Value
(000's) | |
Electrical Equipment 1.7% | |
Eaton Corp. PLC | | | 338,187 | | | $ | 24,268 | | |
Energy Equipment & Services 1.5% | |
McDermott
International,
Inc.* | | | 276,554 | | | | 1,698 | | |
Schlumberger
Ltd. | | | 323,637 | | | | 20,554 | | |
| | | | 22,252 | | |
Equity Real Estate Investment
Trusts 0.5% | |
American Homes
4 Rent Class A | | | 165,072 | | | | 3,658 | | |
Essex Property
Trust, Inc. | | | 13,666 | | | | 3,635 | | |
| | | | 7,293 | | |
Food & Staples Retailing 4.1% | |
Wal-Mart
Stores, Inc. | | | 756,866 | | | | 59,089 | | |
Food Products 2.1% | |
Mondelez
International,
Inc. Class A | | | 740,660 | | | | 30,115 | | |
Health Care Equipment &
Supplies 3.1% | |
Abbott
Laboratories(a) | | | 330,582 | | | | 16,840 | | |
Medtronic PLC | | | 134,874 | | | | 10,873 | | |
Zimmer Biomet
Holdings, Inc. | | | 152,726 | | | | 17,452 | | |
| | | | 45,165 | | |
Health Care Providers & Services 0.3% | |
HCA
Healthcare,
Inc.* | | | 55,335 | | | | 4,353 | | |
Hotels, Restaurants & Leisure 5.6% | |
Carnival Corp. | | | 963,964 | | | | 66,976 | | |
McDonald's Corp. | | | 88,340 | | | | 14,132 | | |
| | | | 81,108 | | |
Household Durables 0.5% | |
Whirlpool Corp. | | | 46,298 | | | | 7,946 | | |
Household Products 3.8% | |
Procter &
Gamble Co. | | | 606,005 | | | | 55,916 | | |
Industrial Conglomerates 1.2% | |
3M Co. | | | 83,557 | | | | 17,072 | | |
Insurance 3.5% | |
American
International
Group, Inc. | | | 254,480 | | | | 15,391 | | |
| | |
Number
of Shares | |
Value
(000's) | |
Athene
Holding Ltd.
Class A* | | | 368,433 | | | $ | 19,715 | | |
Chubb Ltd. | | | 30,139 | | | | 4,262 | | |
Lincoln
National
Corp. | | | 167,444 | | | | 11,363 | | |
| | | | 50,731 | | |
Machinery 1.5% | |
Caterpillar, Inc. | | | 84,812 | | | | 9,964 | | |
WABCO
Holdings, Inc.* | | | 80,181 | | | | 11,516 | | |
| | | | 21,480 | | |
Media 0.2% | |
CBS Corp. Class B | | | 22,003 | | | | 1,409 | | |
Viacom, Inc.
Class A | | | 23,862 | | | | 912 | | |
| | | | 2,321 | | |
Metals & Mining 5.9% | |
Alcoa Corp.* | | | 47,276 | | | | 2,075 | | |
Newmont
Mining Corp. | | | 2,014,746 | | | | 77,245 | | |
Southern
Copper Corp. | | | 157,692 | | | | 6,418 | | |
| | | | 85,738 | | |
Multi-Utilities 1.0% | |
NiSource, Inc. | | | 552,559 | | | | 14,847 | | |
Oil, Gas & Consumable Fuels 8.2% | |
Cabot Oil &
Gas Corp. | | | 1,757,193 | | | | 44,896 | | |
Devon Energy
Corp. | | | 91,370 | | | | 2,869 | | |
EOG
Resources, Inc. | | | 77,653 | | | | 6,600 | | |
Exxon Mobil
Corp. | | | 508,297 | | | | 38,798 | | |
Phillips 66 | | | 141,521 | | | | 11,861 | | |
Rice Energy, Inc.* | | | 498,108 | | | | 13,628 | | |
| | | | 118,652 | | |
Personal Products 0.7% | |
Estee Lauder
Cos., Inc.
Class A | | | 90,632 | | | | 9,697 | | |
Pharmaceuticals 9.7% | |
Bristol-Myers
Squibb Co. | | | 37,783 | | | | 2,285 | | |
Eli Lilly & Co. | | | 74,247 | | | | 6,036 | | |
Johnson &
Johnson | | | 399,017 | | | | 52,818 | | |
Merck &
Co., Inc. | | | 456,260 | | | | 29,137 | | |
Pfizer, Inc. | | | 1,502,283 | | | | 50,957 | | |
| | | | 141,233 | | |
See Notes to Financial Statements
127
Schedule of Investments Large Cap Value Fund (cont'd)
| | |
Number
of Shares | |
Value
(000's) | |
Semiconductors & Semiconductor Equipment 1.2% | |
NXP
Semiconductors
NV* | | | 154,064 | | | $ | 17,403 | | |
Specialty Retail 0.5% | |
Gap, Inc. | | | 343,109 | | | | 8,104 | | |
Technology Hardware, Storage & Peripherals 0.6% | |
Western
Digital Corp. | | | 92,512 | | | | 8,166 | | |
Textiles, Apparel & Luxury Goods 1.1% | |
Coach, Inc. | | | 109,700 | | | | 4,574 | | |
VF Corp. | | | 184,094 | | | | 11,574 | | |
| | | | 16,148 | | |
Total Common Stocks
(Cost $1,058,295) | | | | | 1,222,593 | | |
| | |
Number
of Shares | |
Value
(000's) | |
Short-Term Investment 16.8% | |
Investment Company 16.8% | |
State Street
Institutional
U.S. Government
Money Market
Fund Premier
Class, 0.93%(c)
(Cost $243,779) | | | 243,778,794 | | | $ | 243,779 | | |
Total Investments 100.8%
(Cost $1,302,074) | | | | | 1,466,372 | | |
Liabilities less
Other Assets(d) (0.8)% | | | | | (11,949) | | |
Net Assets 100.0% | | | | $ | 1,454,423 | | |
* Non-income producing security.
(a) All or a portion of the security is pledged as collateral for options written.
(b) Represents less than 0.05% of net assets.
(c) Represents 7-day effective yield as of August 31, 2017.
(d) Includes the impact of the Fund's open positions in derivatives at August 31, 2017.
Derivative Instruments
Written option contracts ("options written")
At August 31, 2017, the Fund had outstanding options written as follows:
| Description | | Number of
Contracts | | Notional
Amount | | Exercise
Price | | Expiration
Date | | Value | |
Calls | |
Machinery | |
Caterpillar, Inc. | | | 750 | | | $ | (8,811,750 | ) | | $ | 115 | | | 9/15/2017 | | $ | (262,500 | ) | |
Technology Hardware, Storage & Peripherals | |
Western Digital Corp. | | | 920 | | | | (8,120,840 | ) | | | 105 | | | 9/15/2017 | | | (0 | )(a) | |
Total Options Written (premiums received: $313,028) | | | | | | | | $(262,500 | ) | |
(a) Security fair valued as of August 31, 2017 in accordance with procedures approved by the Board of Trustees (the "Board").
See Notes to Financial Statements
128
Schedule of Investments Large Cap Value Fund (cont'd)
For the year ended August 31, 2017, the Fund had an average market value of $(290,550) in options written. The Fund had securities pledged in the amount of $9,803,350 to cover collateral requirements for options written.
The following is a summary, categorized by Level (see Note A of Notes to Financial Statements), of inputs used to value the Fund's investments as of August 31, 2017:
Asset Valuation Inputs | |
(000's omitted) | | Level 1 | | Level 2 | | Level 3 | | Total | |
Investments: | |
| Common Stocks(a) | | $ | 1,222,593 | | | $ | — | | | $ | — | | | $ | 1,222,593 | | |
Short-Term Investment | | | — | | | | 243,779 | | | | — | | | | 243,779 | | |
Total Investments | | $ | 1,222,593 | | | $ | 243,779 | | | $ | — | | | $ | 1,466,372 | | |
(a) The Schedule of Investments provides information on the industry categorization for the portfolio.
As of the year ended August 31, 2017, no securities were transferred from one level (as of August 31, 2016) to another.
The following is a summary, categorized by Level (see Note A of Notes to Financial Statements), of inputs used to value the Fund's derivatives as of August 31, 2017:
Other Financial Instruments | |
(000's omitted) | | Level 1 | | Level 2 | | Level 3(a) | | Total | |
Options Written | |
Liabilities | | $ | (262 | ) | | $ | — | | | $ | (0 | ) | | $ | (262 | ) | |
Total | | $ | (262 | ) | | $ | — | | | $ | (0 | ) | | $ | (262 | ) | |
(a) The following is a reconciliation between the beginning and ending balances of investments in which unobservable inputs (Level 3) were used in determining value:
| | | Beginning
balance, as
of 9/1/2016 | | Accrued
discounts/
(premiums) | | Realized
gain/
(loss) | | Change
in unrealized
appreciation/
(depreciation) | | Purchases | | Sales | | Transfers
into
Level 3 | | Transfers
out of
Level 3 | | Balance,
as of
8/31/2017 | | Net change in
unrealized
appreciation/
(depreciation)
from
investments
still held as
of 8/31/2017 | |
Other Financial Instruments:
(000's omitted) | |
Options
Written(b) | | $ | — | | | $ | — | | | $ | — | | | $ | 217 | | | $ | — | | | $ | (217 | ) | | $ | — | | | $ | — | | | $ | (0 | ) | | $ | 217 | | |
Total | | $ | — | | | $ | — | | | $ | — | | | $ | 217 | | | $ | — | | | $ | (217 | ) | | $ | — | | | $ | — | | | $ | (0 | ) | | $ | 217 | | |
(b) As of the year ended August 31, 2017, these investments were valued using methods the Board has approved in the good-faith belief that the resulting valuation will reflect the fair value of the security. As of the year ended August 31, 2017, these investments did not have a material impact on the Fund's net assets and, therefore, disclosure of unobservable inputs used in formulating valuations is not presented.
See Notes to Financial Statements
129
Schedule of Investments Mid Cap Growth Fund August 31, 2017
| | |
Number
of Shares | |
Value
(000's) | |
Common Stocks 96.9% | |
Aerospace & Defense 0.4% | |
KLX, Inc.* | | | 100,000 | | | $ | 4,794 | | |
Airlines 0.9% | |
Alaska Air
Group, Inc. | | | 135,000 | | | | 10,079 | | |
Auto Components 1.1% | |
Delphi
Automotive PLC | | | 130,000 | | | | 12,532 | | |
Automobiles 0.8% | |
Thor Industries,
Inc. | | | 91,000 | | | | 9,886 | | |
Banks 1.8% | |
East West
Bancorp, Inc. | | | 130,000 | | | | 7,198 | | |
SVB Financial
Group* | | | 80,000 | | | | 13,547 | | |
| | | | 20,745 | | |
Biotechnology 3.7% | |
Exact Sciences
Corp.* | | | 303,600 | | | | 12,718 | | |
Incyte Corp.* | | | 35,000 | | | | 4,809 | | |
Neurocrine
Biosciences,
Inc.* | | | 265,000 | | | | 14,999 | | |
TESARO, Inc.* | | | 85,000 | | | | 10,977 | | |
| | | | 43,503 | | |
Capital Markets 4.4% | |
Affiliated
Managers
Group, Inc. | | | 50,000 | | | | 8,835 | | |
CBOE
Holdings, Inc. | | | 182,500 | | | | 18,412 | | |
Northern
Trust Corp. | | | 85,000 | | | | 7,523 | | |
Raymond
James Financial,
Inc. | | | 210,000 | | | | 16,447 | | |
| | | | 51,217 | | |
Chemicals 3.2% | |
Chemours Co. | | | 125,000 | | | | 6,134 | | |
RPM
International,
Inc. | | | 130,000 | | | | 6,366 | | |
Scotts
Miracle-Gro
Co. | | | 133,500 | | | | 12,761 | | |
Sensient
Technologies
Corp. | | | 170,000 | | | | 12,266 | | |
| | | | 37,527 | | |
| | |
Number
of Shares | |
Value
(000's) | |
Commercial Services & Supplies 3.1% | |
Brink's Co. | | | 100,000 | | | $ | 7,845 | | |
Cintas Corp. | | | 100,000 | | | | 13,501 | | |
Waste
Connections,
Inc. | | | 225,000 | | | | 15,005 | | |
| | | | 36,351 | | |
Communications Equipment 2.4% | |
Harris Corp. | | | 77,500 | | | | 9,524 | | |
Lumentum
Holdings, Inc.* | | | 157,500 | | | | 8,954 | | |
Motorola
Solutions, Inc. | | | 115,000 | | | | 10,134 | | |
| | | | 28,612 | | |
Distributors 1.1% | |
LKQ Corp.* | | | 360,000 | | | | 12,474 | | |
Diversified Consumer Services 2.2% | |
Bright Horizons
Family
Solutions, Inc.* | | | 162,000 | | | | 12,949 | | |
Service Corp.
International | | | 350,000 | | | | 12,369 | | |
| | | | 25,318 | | |
Electrical Equipment 1.7% | |
AMETEK, Inc. | | | 175,000 | | | | 11,069 | | |
Rockwell
Automation, Inc. | | | 55,000 | | | | 9,023 | | |
| | | | 20,092 | | |
Electronic Equipment, Instruments & Components 4.7% | |
Amphenol Corp.
Class A | | | 209,500 | | | | 16,957 | | |
CDW Corp. | | | 282,500 | | | | 17,916 | | |
Cognex Corp. | | | 93,000 | | | | 10,134 | | |
Trimble, Inc.* | | | 265,000 | | | | 10,250 | | |
| | | | 55,257 | | |
Food Products 1.7% | |
Lamb Weston
Holdings, Inc. | | | 130,000 | | | | 5,912 | | |
Pinnacle
Foods, Inc. | | | 235,000 | | | | 13,938 | | |
| | | | 19,850 | | |
Health Care Equipment &
Supplies 8.5% | |
ABIOMED, Inc.* | | | 80,000 | | | | 12,064 | | |
Align
Technology,
Inc.* | | | 56,500 | | | | 9,986 | | |
Edwards
Lifesciences
Corp.* | | | 80,000 | | | | 9,093 | | |
Hill-Rom
Holdings, Inc. | | | 110,000 | | | | 8,466 | | |
Hologic, Inc.* | | | 220,000 | | | | 8,492 | | |
| | |
Number
of Shares | |
Value
(000's) | |
Merit Medical
Systems, Inc.* | | | 145,000 | | | $ | 5,988 | | |
Nevro Corp.* | | | 125,000 | | | | 10,772 | | |
NuVasive, Inc.* | | | 185,000 | | | | 11,559 | | |
Penumbra, Inc.* | | | 145,000 | | | | 12,470 | | |
Wright Medical
Group NV* | | | 380,000 | | | | 11,248 | | |
| | | | 100,138 | | |
Health Care Providers & Services 3.2% | |
Acadia
Healthcare
Co., Inc.* | | | 240,000 | | | | 11,266 | | |
Centene Corp.* | | | 87,500 | | | | 7,774 | | |
Envision
Healthcare
Corp.* | | | 170,000 | | | | 8,910 | | |
HealthSouth
Corp. | | | 200,000 | | | | 9,150 | | |
| | | | 37,100 | | |
Health Care Technology 0.5% | |
Veeva Systems,
Inc. Class A* | | | 100,000 | | | | 5,950 | | |
Hotels, Restaurants & Leisure 3.7% | |
Aramark | | | 300,000 | | | | 12,207 | | |
MGM Resorts
International | | | 400,000 | | | | 13,184 | | |
Red Rock
Resorts, Inc.
Class A | | | 275,000 | | | | 6,215 | | |
Vail Resorts, Inc. | | | 50,000 | | | | 11,398 | | |
| | | | 43,004 | | |
Household Durables 1.0% | |
Newell
Brands, Inc. | | | 235,000 | | | | 11,346 | | |
Industrial Conglomerates 1.6% | |
Roper
Technologies,
Inc. | | | 80,000 | | | | 18,453 | | |
Insurance 1.8% | |
Assurant, Inc. | | | 120,000 | | | | 11,363 | | |
Athene Holding
Ltd. Class A* | | | 185,000 | | | | 9,899 | | |
| | | | 21,262 | | |
Internet & Direct Marketing
Retail 1.2% | |
Expedia, Inc. | | | 97,500 | | | | 14,465 | | |
Internet Software & Services 4.3% | |
CoStar
Group, Inc.* | | | 82,500 | | | | 23,646 | | |
LogMeIn, Inc. | | | 135,000 | | | | 15,444 | | |
MercadoLibre,
Inc. | | | 45,000 | | | | 11,631 | | |
| | | | 50,721 | | |
See Notes to Financial Statements
130
Schedule of Investments Mid Cap Growth Fund (cont'd)
| | |
Number
of Shares | |
Value
(000's) | |
IT Services 5.3% | |
DXC
Technology
Co. | | | 90,000 | | | $ | 7,650 | | |
Euronet
Worldwide,
Inc.* | | | 150,000 | | | | 14,741 | | |
Fiserv, Inc.* | | | 116,500 | | | | 14,412 | | |
Global
Payments, Inc. | | | 190,000 | | | | 18,143 | | |
Total System
Services, Inc. | | | 100,000 | | | | 6,912 | | |
| | | | 61,858 | | |
Life Sciences Tools & Services 2.2% | |
Bio-Rad
Laboratories,
Inc. Class A* | | | 72,500 | | | | 15,792 | | |
PRA Health
Sciences, Inc.* | | | 130,000 | | | | 10,062 | | |
| | | | 25,854 | | |
Machinery 4.8% | |
Fortive Corp. | | | 195,000 | | | | 12,669 | | |
Gardner Denver
Holdings, Inc.* | | | 300,000 | | | | 7,047 | | |
IDEX Corp. | | | 130,000 | | | | 15,285 | | |
Milacron
Holdings
Corp.* | | | 449,700 | | | | 7,173 | | |
Stanley Black &
Decker, Inc. | | | 100,000 | | | | 14,400 | | |
| | | | 56,574 | | |
Media 1.1% | |
DISH Network
Corp. Class A* | | | 135,000 | | | | 7,734 | | |
WideOpenWest,
Inc.* | | | 300,000 | | | | 4,812 | | |
| | | | 12,546 | | |
Multiline Retail 0.7% | |
Dollar Tree, Inc.* | | | 100,000 | | | | 7,964 | | |
Oil, Gas & Consumable Fuels 1.4% | |
Concho
Resources,
Inc.* | | | 85,500 | | | | 9,488 | | |
Diamondback
Energy, Inc.* | | | 77,500 | | | | 7,036 | | |
| | | | 16,524 | | |
| | |
Number
of Shares | |
Value
(000's) | |
Pharmaceuticals 2.5% | |
Jazz
Pharmaceuticals
PLC* | | | 67,500 | | | $ | 10,082 | | |
Zoetis, Inc. | | | 300,000 | | | | 18,810 | | |
| | | | 28,892 | | |
Professional Services 1.2% | |
WageWorks,
Inc.* | | | 235,000 | | | | 13,853 | | |
Road & Rail 1.5% | |
J.B. Hunt
Transport
Services, Inc. | | | 100,000 | | | | 9,889 | | |
Old Dominion
Freight Line, Inc. | | | 80,000 | | | | 7,992 | | |
| | | | 17,881 | | |
Semiconductors & Semiconductor Equipment 4.8% | |
Cavium, Inc.* | | | 80,000 | | | | 5,065 | | |
Lam Research
Corp. | | | 105,000 | | | | 17,428 | | |
Microchip
Technology,
Inc. | | | 190,000 | | | | 16,492 | | |
Monolithic
Power
Systems, Inc. | | | 175,000 | | | | 17,731 | | |
| | | | 56,716 | | |
Software 7.8% | |
Autodesk, Inc.* | | | 82,500 | | | | 9,443 | | |
Electronic Arts,
Inc.* | | | 150,000 | | | | 18,225 | | |
Proofpoint, Inc.* | | | 162,500 | | | | 14,911 | | |
ServiceNow, Inc.* | | | 135,000 | | | | 15,686 | | |
Take-Two
Interactive
Software, Inc.* | | | 170,000 | | | | 16,624 | | |
Tyler
Technologies,
Inc.* | | | 40,000 | | | | 6,912 | | |
Ultimate
Software
Group, Inc.* | | | 47,500 | | | | 9,543 | | |
| | | | 91,344 | | |
| | |
Number
of Shares | |
Value
(000's) | |
Specialty Retail 3.8% | |
Burlington
Stores, Inc.* | | | 140,000 | | | $ | 12,198 | | |
Five Below, Inc.* | | | 200,000 | | | | 9,514 | | |
Ross Stores, Inc. | | | 230,000 | | | | 13,444 | | |
Ulta Beauty, Inc.* | | | 42,000 | | | | 9,282 | | |
| | | | 44,438 | | |
Trading Companies & Distributors 0.8% | |
United
Rentals, Inc. * | | | 80,000 | | | | 9,445 | | |
Total Common Stocks
(Cost $861,761) | | | | | 1,134,565 | | |
Short-Term Investment 3.2% | |
Investment Company 3.2% | |
State Street
Institutional U.S.
Government
Money Market
Fund Premier
Class, 0.93%(a)
(Cost $37,635) | | | 37,634,900 | | | | 37,635 | | |
Total Investments 100.1%
(Cost $899,396) | | | | | 1,172,200 | | |
Liabilities Less
Other Assets (0.1)% | | | | | (707) | | |
Net Assets 100.0% | | | | $ | 1,171,493 | | |
See Notes to Financial Statements
131
Schedule of Investments Mid Cap Growth Fund (cont'd)
* Non-income producing security.
(a) Represents 7-day effective yield as of August 31, 2017.
The following is a summary, categorized by Level (see Note A of Notes to Financial Statements), of inputs used to value the Fund's investments as of August 31, 2017:
Asset Valuation Inputs | |
(000's omitted) | | Level 1 | | Level 2 | | Level 3 | | Total | |
Investments: | |
| Common Stocks(a) | | $ | 1,134,565 | | | $ | — | | | $ | — | | | $ | 1,134,565 | | |
Short-Term Investment | | | — | | | | 37,635 | | | | — | | | | 37,635 | | |
Total | | $ | 1,134,565 | | | $ | 37,635 | | | $ | — | | | $ | 1,172,200 | | |
(a) The Schedule of Investments provides information on the industry categorization for the portfolio.
As of the year ended August 31, 2017, no securities were transferred from one level (as of August 31, 2016) to another.
See Notes to Financial Statements
132
Schedule of Investments Mid Cap Intrinsic Value Fund August 31, 2017
| | |
Number
of Shares | |
Value
(000's) | |
Common Stocks 96.7% | |
Aerospace & Defense 7.2% | |
General Dynamics
Corp. | | | 15,650 | | | $ | 3,151 | | |
Orbital ATK, Inc. | | | 22,900 | | | | 2,555 | | |
Spirit AeroSystems
Holdings, Inc.
Class A | | | 13,800 | | | | 1,028 | | |
| | | | 6,734 | | |
Airlines 2.1% | |
American Airlines
Group, Inc. | | | 44,300 | | | | 1,982 | | |
Banks 6.5% | |
BankUnited, Inc. | | | 81,300 | | | | 2,706 | | |
BB&T Corp. | | | 30,600 | | | | 1,410 | | |
Comerica, Inc. | | | 27,700 | | | | 1,891 | | |
| | | | 6,007 | | |
Building Products 2.6% | |
Johnson Controls
International PLC | | | 61,708 | | | | 2,443 | | |
Capital Markets 1.7% | |
State Street Corp. | | | 17,500 | | | | 1,619 | | |
Chemicals 4.2% | |
Ashland Global
Holdings, Inc. | | | 20,400 | | | | 1,266 | | |
Valvoline, Inc. | | | 124,504 | | | | 2,651 | | |
| | | | 3,917 | | |
Commercial Services & Supplies 2.1% | |
Covanta Holding
Corp. | | | 136,100 | | | | 1,953 | | |
Construction & Engineering 1.9% | |
Valmont
Industries, Inc. | | | 12,000 | | | | 1,723 | | |
Containers & Packaging 2.1% | |
Avery Dennison
Corp. | | | 20,700 | | | | 1,951 | | |
Electric Utilities 1.6% | |
Edison
International | | | 18,100 | | | | 1,451 | | |
Electronic Equipment, Instruments & Components 2.8% | |
Flex Ltd.* | | | 90,000 | | | | 1,464 | | |
Itron, Inc.* | | | 15,400 | | | | 1,118 | | |
| | | | 2,582 | | |
Equity Real Estate Investment Trusts 1.4% | |
Starwood
Waypoint Homes | | | 36,060 | | | | 1,343 | | |
Food Products 1.7% | |
TreeHouse Foods,
Inc.* | | | 22,900 | | | | 1,534 | | |
| | |
Number
of Shares | |
Value
(000's) | |
Health Care Equipment & Supplies 3.3% | |
Zimmer Biomet
Holdings, Inc. | | | 26,400 | | | $ | 3,017 | | |
Health Care Providers & Services 2.8% | |
Envision
Healthcare Corp.* | | | 30,000 | | | | 1,572 | | |
Molina
Healthcare, Inc.* | | | 15,800 | | | | 1,011 | | |
| | | | 2,583 | | |
Hotels, Restaurants & Leisure 1.7% | |
SeaWorld
Entertainment,
Inc. | | | 66,800 | | | | 867 | | |
Wyndham
Worldwide Corp. | | | 7,000 | | | | 698 | | |
| | | | 1,565 | | |
Household Durables 2.0% | |
Whirlpool Corp. | | | 10,800 | | | | 1,853 | | |
Independent Power and Renewable Electricity Producers 1.7% | |
AES Corp. | | | 141,200 | | | | 1,559 | | |
IT Services 4.6% | |
Amdocs Ltd. | | | 14,500 | | | | 940 | | |
Conduent, Inc.* | | | 89,900 | | | | 1,484 | | |
Teradata Corp.* | | | 58,400 | | | | 1,864 | | |
| | | | 4,288 | | |
Life Sciences Tools & Services 1.4% | |
Quintiles IMS
Holdings, Inc.* | | | 13,800 | | | | 1,325 | | |
Media 4.3% | |
CBS Corp. Class B | | | 20,900 | | | | 1,339 | | |
Lions Gate
Entertainment
Corp. Class A* | | | 21,600 | | | | 642 | | |
Lions Gate
Entertainment
Corp. Class B* | | | 21,600 | | | | 607 | | |
MSG Networks,
Inc. Class A* | | | 66,400 | | | | 1,424 | | |
| | | | 4,012 | | |
Mortgage Real Estate Investment 2.1% | |
Starwood Property
Trust, Inc. | | | 86,200 | | | | 1,914 | | |
Multi-Utilities 2.2% | |
CenterPoint
Energy, Inc. | | | 69,400 | | | | 2,056 | | |
Multiline Retail 1.3% | |
Macy's, Inc. | | | 59,800 | | | | 1,242 | | |
Oil, Gas & Consumable Fuels 5.8% | |
Cabot Oil & Gas
Corp. | | | 80,000 | | | | 2,044 | | |
ONEOK, Inc. | | | 35,600 | | | | 1,928 | | |
Williams Cos., Inc. | | | 48,200 | | | | 1,433 | | |
| | | | 5,405 | | |
| | |
Number
of Shares | |
Value
(000's) | |
Pharmaceuticals 3.1% | |
Perrigo Co. PLC | | | 26,400 | | | $ | 2,085 | | |
Teva
Pharmaceutical
Industries Ltd.
ADR | | | 50,900 | | | | 807 | | |
| | | | 2,892 | | |
Road & Rail 2.4% | |
Avis Budget
Group, Inc.* | | | 62,600 | | | | 2,268 | | |
Semiconductors & Semiconductor Equipment 6.6% | |
ON Semiconductor
Corp.* | | | 188,500 | | | | 3,220 | | |
Skyworks
Solutions, Inc. | | | 27,900 | | | | 2,939 | | |
| | | | 6,159 | | |
Software 5.1% | |
Check Point
Software
Technologies Ltd.* | | | 23,800 | | | | 2,663 | | |
Nuance
Communications,
Inc.* | | | 129,900 | | | | 2,087 | | |
| | | | 4,750 | | |
Specialty Retail 2.0% | |
Best Buy Co., Inc. | | | 24,600 | | | | 1,335 | | |
Office Depot, Inc. | | | 119,200 | | | | 511 | | |
| | | | 1,846 | | |
Technology Hardware, Storage & Peripherals 3.0% | |
Western Digital
Corp. | | | 31,136 | | | | 2,748 | | |
Trading Companies & Distributors 3.4% | |
AerCap Holdings
NV* | | | 63,400 | | | | 3,189 | | |
Total Common Stocks
(Cost $73,819) | | | | | 89,910 | | |
| Rights 0.0%(a) | |
| Food & Staples Retailing 0.0%(a) | |
Safeway, Inc.
(Casa Ley)*(b)(c) | | | 21,100 | | | | 11 | | |
Safeway, Inc.
(Property
Development
Centers)*(b)(c) | | | 21,100 | | | | 0 | | |
Total Rights
(Cost $22) | | | | | 11 | | |
See Notes to Financial Statements
133
Schedule of Investments Mid Cap Intrinsic Value Fund (cont'd)
| | |
Number
of Shares | |
Value
(000's) | |
Short-Term Investment 3.6% | |
Investment Company 3.6% | |
State Street
Institutional
U.S. Government
Money Market
Fund Premier
Class, 0.93%(d)
(Cost $3,323) | | | 3,323,189 | | | $ | 3,323 | | |
Total Investments 100.3%
(Cost $77,164) | | | | $ | 93,244 | | |
Liabilities Less Other
Assets (0.3)% | | | | | (259 | ) | |
Net Assets 100.0% | | | | $ | 92,985 | | |
* Non-income producing security.
(a) Represents less than 0.05% of net assets.
(b) Illiquid security.
(c) Security fair valued as of August 31, 2017 in accordance with procedures approved by the Board of Trustees. Total value of all such securities at August 31, 2017 amounted to approximately $11,000, which represents 0.0% of net assets of the Fund.
(d) Represents 7-day effective yield as of August 31, 2017.
The following is a summary, categorized by Level (see Note A of Notes to Financial Statements), of inputs used to value the Fund's investments as of August 31, 2017:
Asset Valuation Inputs | |
(000's omitted) | | Level 1 | | Level 2 | | Level 3(b) | | Total | |
Investments: | |
| Common Stocks(a) | | $ | 89,910 | | | $ | — | | | $ | — | | | $ | 89,910 | | |
| Rights(a) | | | — | | | | — | | | | 11 | | | | 11 | | |
Short-Term Investment | | | — | | | | 3,323 | | | | — | | | | 3,323 | | |
Total Investments | | $ | 89,910 | | | $ | 3,323 | | | $ | 11 | | | $ | 93,244 | | |
(a) The Schedule of Investments provides information on the industry categorization for the portfolio.
See Notes to Financial Statements
134
Schedule of Investments Mid Cap Intrinsic Value Fund (cont'd)
(b) The following is a reconciliation between the beginning and ending balances of investments in which unobservable inputs (Level 3) were used in determining value:
| | | Beginning
balance, as
of 9/1/2016 | | Accrued
discounts/
(premiums) | | Realized
gain/
(loss) | | Change
in unrealized
appreciation/
(depreciation) | | Purchases | | Sales | | Transfers
into
Level 3 | | Transfers
out of
Level 3 | | Balance
as of
8/31/2017 | | Net change in
unrealized
appreciation/
(depreciation)
from
investments
still held as
of 8/31/2017 | |
(000's omitted) | |
Investments in Securities: | |
| Rights(c) | |
Food & Staples
Retailing | | $ | 6 | | | $ | — | | | $ | — | | | $ | 5 | | | $ | — | | | $ | — | | | $ | — | | | $ | — | | | $ | 11 | | | $ | 5 | | |
Total | | $ | 6 | | | $ | — | | | $ | — | | | $ | 5 | | | $ | — | | | $ | — | | | $ | — | | | $ | — | | | $ | 11 | | | $ | 5 | | |
(c) As of the year ended August 31, 2017, these securities were valued based on a single quotation obtained from a dealer. The Fund does not have access to unobservable inputs and therefore cannot disclose such inputs used in formulating such quotation.
As of the year ended August 31, 2017, no securities were transferred from one level (as of August 31, 2016) to another.
See Notes to Financial Statements
135
Schedule of Investments Multi-Cap Opportunities Fund August 31, 2017
| | |
Number
of Shares | |
Value
(000's) | |
Common Stocks 98.9% | |
Aerospace & Defense 4.3% | |
Boeing Co. | | | 170,000 | | | $ | 40,742 | | |
Raytheon Co. | | | 235,000 | | | | 42,773 | | |
| | | | 83,515 | | |
Banks 5.2% | |
JPMorgan
Chase &
Co. | | | 1,100,000 | | | | 99,979 | | |
Building Products 1.1% | |
Masonite
International
Corp.* | | | 325,000 | | | | 20,572 | | |
Capital Markets 11.1% | |
Charles Schwab
Corp. | | | 1,275,000 | | | | 50,873 | | |
Goldman Sachs
Group, Inc. | | | 410,000 | | | | 91,733 | | |
Intercontinental
Exchange, Inc. | | | 1,100,000 | | | | 71,137 | | |
| | | | 213,743 | | |
Chemicals 3.1% | |
Methanex Corp. | | | 785,000 | | | | 40,113 | | |
Scotts
Miracle-Gro Co. | | | 200,000 | | | | 19,118 | | |
| | | | 59,231 | | |
Communications Equipment 7.3% | |
Cisco Systems,
Inc. | | | 1,750,000 | | | | 56,368 | | |
Motorola
Solutions, Inc. | | | 960,000 | | | | 84,595 | | |
| | | | 140,963 | | |
Construction Materials 0.3% | |
Martin Marietta
Materials, Inc. | | | 25,000 | | | | 5,282 | | |
Containers & Packaging 2.2% | |
Sealed Air Corp. | | | 940,000 | | | | 41,717 | | |
Diversified Financial Services 4.9% | |
Berkshire
Hathaway,
Inc. Class B* | | | 515,000 | | | | 93,297 | | |
Electrical Equipment 1.6% | |
Rockwell
Automation, Inc. | | | 190,000 | | | | 31,171 | | |
| | |
Number
of Shares | |
Value
(000's) | |
Energy Equipment & Services 1.3% | |
Schlumberger Ltd. | | | 390,000 | | | $ | 24,769 | | |
Food & Staples Retailing 3.0% | |
US Foods
Holding
Corp.* | | | 2,120,000 | | | | 58,194 | | |
Food Products 3.0% | |
Hain Celestial
Group, Inc.* | | | 620,000 | | | | 24,937 | | |
Mondelez
International,
Inc. Class A | | | 820,000 | | | | 33,341 | | |
| | | | 58,278 | | |
Health Care Equipment & Supplies 1.8% | |
Hill-Rom
Holdings, Inc. | | | 445,000 | | | | 34,247 | | |
Health Care Providers & Services 7.3% | |
Aetna, Inc. | | | 340,000 | | | | 53,618 | | |
HCA Healthcare,
Inc.* | | | 760,000 | | | | 59,782 | | |
Henry Schein,
Inc.* | | | 150,000 | | | | 26,052 | | |
| | | | 139,452 | | |
Hotels, Restaurants & Leisure 0.6% | |
Bloomin' Brands,
Inc. | | | 710,000 | | | | 12,077 | | |
Industrial Conglomerates 2.4% | |
3M Co. | | | 225,000 | | | | 45,972 | | |
Insurance 2.6% | |
Chubb Ltd. | | | 350,000 | | | | 49,497 | | |
Internet Software & Services 4.3% | |
Alphabet, Inc.
Class C* | | | 88,000 | | | | 82,661 | | |
IT Services 2.7% | |
PayPal Holdings,
Inc.* | | | 830,000 | | | | 51,194 | | |
Machinery 3.8% | |
Stanley Black &
Decker, Inc. | | | 510,000 | | | | 73,440 | | |
Oil, Gas & Consumable Fuels 3.4% | |
Cabot Oil & Gas
Corp. | | | 1,350,000 | | | | 34,493 | | |
EOG Resources,
Inc. | | | 375,000 | | | | 31,871 | | |
| | | | 66,364 | | |
| | |
Number
of Shares | |
Value
(000's) | |
Pharmaceuticals 3.4% | |
Allergan PLC | | | 75,000 | | | $ | 17,211 | | |
Pfizer, Inc. | | | 1,425,000 | | | | 48,336 | | |
| | | | 65,547 | | |
Professional Services 1.2% | |
Nielsen Holdings
PLC | | | 600,000 | | | | 23,310 | | |
Road & Rail 2.5% | |
CSX Corp. | | | 950,000 | | | | 47,690 | | |
Semiconductors & Semiconductor Equipment 2.1% | |
Analog Devices,
Inc. | | | 476,000 | | | | 39,827 | | |
Software 6.0% | |
Activision
Blizzard, Inc. | | | 680,000 | | | | 44,581 | | |
Symantec Corp. | | | 2,330,000 | | | | 69,853 | | |
| | | | 114,434 | | |
Technology Hardware, Storage & Peripherals 5.4% | |
Apple, Inc. | | | 358,000 | | | | 58,712 | | |
NCR Corp.* | | | 1,260,000 | | | | 46,028 | | |
| | | | 104,740 | | |
Textiles, Apparel & Luxury Goods 1.0% | |
NIKE, Inc. Class B | | | 370,000 | | | | 19,540 | | |
Total Common Stocks
(Cost $1,260,778) | | | 1,900,703 | | |
Short-Term Investment 1.3% | |
Investment Company 1.3% | |
State Street
Institutional
Treasury Money
Market Fund
Premier Class,
0.90%(a)
(Cost $25,115) | | | 25,114,635 | | | | 25,115 | | |
Total Investments 100.2%
(Cost $1,285,893) | | | 1,925,818 | | |
Liabilities Less
Other Assets (0.2)% | | | | | (3,501 | ) | |
Net Assets 100.0% | | $ | 1,922,317 | | |
See Notes to Financial Statements
136
Schedule of Investments Multi-Cap Opportunities Fund (cont'd)
* Non-income producing security.
(a) Represents 7-day effective yield as of August 31, 2017.
The following is a summary, categorized by Level (see Note A of Notes to Financial Statements), of inputs used to value the Fund's investments as of August 31, 2017:
Asset Valuation Inputs | |
(000's omitted) | | Level 1 | | Level 2 | | Level 3 | | Total | |
Investments: | |
| Common Stocks(a) | | $ | 1,900,703 | | | $ | — | | | $ | — | | | $ | 1,900,703 | | |
Short-Term Investment | | | — | | | | 25,115 | | | | — | | | | 25,115 | | |
Total Investments | | $ | 1,900,703 | | | $ | 25,115 | | | $ | — | | | $ | 1,925,818 | | |
(a) The Schedule of Investments provides information on the industry categorization for the portfolio.
As of the year ended August 31, 2017, no securities were transferred from one level (as of August 31, 2016) to another.
See Notes to Financial Statements
137
Schedule of Investments Real Estate Fund August 31, 2017
| | |
Number
of Shares | |
Value
(000's) | |
Common Stocks 98.8% | |
Apartments 12.4% | |
Apartment
Investment &
Management Co.
Class A | | | 245,900 | | | $ | 11,147 | | |
Equity Residential | | | 303,550 | | | | 20,383 | | |
Essex Property
Trust, Inc. | | | 66,725 | | | | 17,747 | | |
Mid-America
Apartment
Communities, Inc. | | | 137,747 | | | | 14,664 | | |
| | | | 63,941 | | |
Data Centers 8.8% | |
CoreSite Realty
Corp. | | | 92,475 | | | | 10,982 | | |
CyrusOne, Inc. | | | 166,300 | | | | 10,482 | | |
Equinix, Inc. | | | 50,284 | | | | 23,554 | | |
| | | | 45,018 | | |
Diversified 3.4% | |
Forest City Realty
Trust, Inc. Class A | | | 227,100 | | | | 5,441 | | |
Vornado Realty
Trust | | | 162,523 | | | | 12,107 | | |
| | | | 17,548 | | |
Free Standing 1.0% | |
National Retail
Properties, Inc. | | | 125,325 | | | | 5,242 | | |
Health Care 9.0% | |
Healthcare Trust
of America, Inc.
Class A | | | 336,975 | | | | 10,470 | | |
Ventas, Inc. | | | 253,980 | | | | 17,383 | | |
Welltower, Inc. | | | 248,515 | | | | 18,196 | | |
| | | | 46,049 | | |
Hotels, Restaurants & Leisure 3.8% | |
Marriott
International,
Inc. Class A | | | 185,890 | | | | 19,255 | | |
Industrial 7.9% | |
Duke Realty Corp. | | | 442,100 | | | | 13,139 | | |
Prologis, Inc. | | | 429,068 | | | | 27,186 | | |
| | | | 40,325 | | |
| | |
Number
of Shares | |
Value
(000's) | |
Infrastructure 13.8% | |
American Tower
Corp. | | | 259,875 | | | $ | 38,475 | | |
Crown Castle
International
Corp. | | | 174,105 | | | | 18,880 | | |
SBA
Communications
Corp.* | | | 88,730 | | | | 13,624 | | |
| | | | 70,979 | | |
Manufactured Homes 2.2% | |
Equity LifeStyle
Properties, Inc. | | | 127,785 | | | | 11,392 | | |
Office 9.6% | |
Alexandria Real
Estate Equities,
Inc. | | | 105,735 | | | | 12,827 | | |
Boston Properties,
Inc. | | | 108,784 | | | | 13,119 | | |
Douglas Emmett,
Inc. | | | 348,115 | | | | 13,562 | | |
Highwoods
Properties, Inc. | | | 192,700 | | | | 10,065 | | |
| | | | 49,573 | | |
Real Estate Management & Development 2.1% | |
Brookfield Asset
Management,
Inc. Class A | | | 277,465 | | | | 10,974 | | |
Regional Malls 8.5% | |
GGP, Inc. | | | 583,982 | | | | 12,118 | | |
Pennsylvania REIT | | | 129,700 | | | | 1,301 | | |
Simon Property
Group, Inc. | | | 193,098 | | | | 30,287 | | |
| | | | 43,706 | | |
Self Storage 3.9% | |
Extra Space
Storage, Inc. | | | 166,830 | | | | 12,951 | | |
Public Storage | | | 35,275 | | | | 7,243 | | |
| | | | 20,194 | | |
| | |
Number
of Shares | |
Value
(000's) | |
Shopping Centers 4.0% | |
Federal Realty
Investment Trust | | | 40,550 | | | $ | 5,147 | | |
Kimco Realty
Corp. | | | 453,570 | | | | 8,899 | | |
Regency Centers
Corp. | | | 103,207 | | | | 6,638 | | |
| | | | 20,684 | | |
Single Family Homes 3.4% | |
American Homes
4 Rent Class A | | | 345,525 | | | | 7,657 | | |
Starwood
Waypoint Homes | | | 267,650 | | | | 9,965 | | |
| | | | 17,622 | | |
Specialty 1.3% | |
EPR Properties | | | 95,800 | | | | 6,673 | | |
Timber 3.7% | |
Weyerhaeuser Co. | | | 583,599 | | | | 19,031 | | |
Total Common Stocks
(Cost $460,967) | | | 508,206 | | |
Short-Term Investment 0.9% | |
Investment Company 0.9% | |
State Street
Institutional U.S.
Government
Money Market
Fund Premier
Class, 0.93%(a)
(Cost $4,710) | | | 4,709,964 | | | | 4,710 | | |
Total Investments 99.7%
(Cost $465,677) | | | 512,916 | | |
Other Assets Less
Liabilities 0.3% | | | | | 1,606 | | |
Net Assets 100.0% | | $ | 514,522 | | |
See Notes to Financial Statements
138
Schedule of Investments Real Estate Fund (cont'd)
* Non-income producing security.
(a) Represents 7-day effective yield as of August 31, 2017.
The following is a summary, categorized by Level (see Note A of Notes to Financial Statements), of inputs used to value the Fund's investments as of August 31, 2017:
Asset Valuation Inputs | |
(000's omitted) | | Level 1 | | Level 2 | | Level 3 | | Total | |
Investments: | |
| Common Stocks(a) | | $ | 508,206 | | | $ | — | | | $ | — | | | $ | 508,206 | | |
Short-Term Investment | | | — | | | | 4,710 | | | | — | | | | 4,710 | | |
Total Investments | | $ | 508,206 | | | $ | 4,710 | | | $ | — | | | $ | 512,916 | | |
(a) The Schedule of Investments provides information on the sector categorization for the portfolio.
As of the year ended August 31, 2017, no securities were transferred from one level (as of August 31, 2016) to another.
See Notes to Financial Statements
139
Schedule of Investments Small Cap Growth Fund August 31, 2017
| | |
Number
of Shares | |
Value
(000's) | |
Common Stocks 98.7% | |
Aerospace & Defense 4.7% | |
HEICO Corp.
Class A | | | 15,000 | | | $ | 1,090 | | |
KLX, Inc.* | | | 13,000 | | | | 623 | | |
Mercury Systems,
Inc.* | | | 15,000 | | | | 724 | | |
Teledyne
Technologies, Inc.* | | | 7,000 | | | | 1,050 | | |
| | | | 3,487 | | |
Auto Components 1.4% | |
Dorman Products,
Inc.* | | | 5,500 | | | | 365 | | |
LCI Industries | | | 7,000 | | | | 692 | | |
| | | | 1,057 | | |
Banks 2.8% | |
Pinnacle Financial
Partners, Inc. | | | 15,181 | | | | 944 | | |
Seacoast Banking
Corp. of Florida* | | | 48,500 | | | | 1,109 | | |
| | | | 2,053 | | |
Beverages 0.9% | |
MGP Ingredients,
Inc. | | | 11,700 | | | | 658 | | |
Biotechnology 14.1% | |
Amarin Corp. PLC
ADR* | | | 100,000 | | | | 339 | | |
Amicus
Therapeutics, Inc.* | | | 39,000 | | | | 543 | | |
Bluebird Bio, Inc.* | | | 5,500 | | | | 687 | | |
Clovis Oncology,
Inc.* | | | 13,000 | | | | 989 | | |
Esperion
Therapeutics, Inc.* | | | 14,000 | | | | 692 | | |
Exact Sciences
Corp.* | | | 10,000 | | | | 419 | | |
Exelixis, Inc.* | | | 34,500 | | | | 1,009 | | |
Fate Therapeutics,
Inc.* | | | 133,000 | | | | 503 | | |
FibroGen, Inc.* | | | 18,500 | | | | 892 | | |
Neurocrine
Biosciences, Inc.* | | | 12,000 | | | | 679 | | |
Portola
Pharmaceuticals,
Inc.* | | | 6,000 | | | | 381 | | |
Puma
Biotechnology,
Inc.* | | | 4,600 | | | | 425 | | |
Sarepta
Therapeutics, Inc.* | | | 33,500 | | | | 1,350 | | |
Spark Therapeutics,
Inc.* | | | 7,500 | | | | 617 | | |
TESARO, Inc.* | | | 6,500 | | | | 839 | | |
| | | | 10,364 | | |
| | |
Number
of Shares | |
Value
(000's) | |
Capital Markets 1.1% | |
MarketAxess
Holdings, Inc. | | | 4,000 | | | $ | 772 | | |
Chemicals 1.2% | |
Sensient
Technologies Corp. | | | 12,000 | | | | 866 | | |
Commercial Services & Supplies 4.6% | |
Advanced Disposal
Services, Inc.* | | | 39,000 | | | | 930 | | |
Brink's Co. | | | 13,000 | | | | 1,020 | | |
Healthcare Services
Group, Inc. | | | 28,000 | | | | 1,433 | | |
| | | | 3,383 | | |
Communications Equipment 2.3% | |
Lumentum
Holdings, Inc.* | | | 30,300 | | | | 1,723 | | |
Containers & Packaging 0.9% | |
Greif, Inc. Class A | | | 11,000 | | | | 665 | | |
Diversified Consumer Services 3.1% | |
Bright Horizons
Family Solutions,
Inc.* | | | 10,000 | | | | 799 | | |
Chegg, Inc.* | | | 46,000 | | | | 653 | | |
Grand Canyon
Education, Inc.* | | | 10,000 | | | | 821 | | |
| | | | 2,273 | | |
Electronic Equipment, Instruments & Components 2.1% | |
Universal Display
Corp. | | | 12,200 | | | | 1,551 | | |
Equity Real Estate Investment Trusts 1.1% | |
CyrusOne, Inc. | | | 12,500 | | | | 788 | | |
Health Care Equipment & Supplies 9.6% | |
AxoGen, Inc.* | | | 62,000 | | | | 1,091 | | |
iRhythm
Technologies, Inc.* | | | 11,000 | | | | 525 | | |
Merit Medical
Systems, Inc.* | | | 42,000 | | | | 1,734 | | |
Nevro Corp.* | | | 9,500 | | | | 819 | | |
NuVasive, Inc.* | | | 13,000 | | | | 812 | | |
Oxford Immunotec
Global PLC* | | | 47,257 | | | | 748 | | |
Penumbra, Inc.* | | | 5,000 | | | | 430 | | |
Tactile Systems
Technology, Inc.* | | | 16,000 | | | | 526 | | |
Viveve Medical,
Inc.* | | | 70,000 | | | | 397 | | |
| | | | 7,082 | | |
Health Care Providers & Services 1.4% | |
Teladoc, Inc.* | | | 20,000 | | | | 671 | | |
Tivity Health, Inc.* | | | 10,000 | | | | 392 | | |
| | | | 1,063 | | |
| | |
Number
of Shares | |
Value
(000's) | |
Hotels, Restaurants & Leisure 3.3% | |
Hilton Grand
Vacations, Inc.* | | | 20,000 | | | $ | 725 | | |
Planet Fitness, Inc.
Class A | | | 22,000 | | | | 558 | | |
Texas Roadhouse,
Inc. | | | 12,000 | | | | 569 | | |
Vail Resorts, Inc. | | | 2,500 | | | | 570 | | |
| | | | 2,422 | | |
Household Durables 1.1% | |
Cavco Industries,
Inc.* | | | 6,000 | | | | 807 | | |
Insurance 1.0% | |
Primerica, Inc. | | | 10,000 | | | | 765 | | |
Internet Software & Services 6.6% | |
Five9, Inc.* | | | 45,500 | | | | 978 | | |
LogMeIn, Inc. | | | 10,400 | | | | 1,190 | | |
Q2 Holdings, Inc.* | | | 37,500 | | | | 1,522 | | |
Wix.com Ltd.* | | | 18,200 | | | | 1,185 | | |
| | | | 4,875 | | |
IT Services 1.7% | |
Euronet Worldwide,
Inc.* | | | 13,000 | | | | 1,278 | | |
Life Sciences Tools & Services 1.6% | |
Bio-Rad
Laboratories,
Inc. Class A* | | | 2,000 | | | | 436 | | |
PRA Health
Sciences, Inc.* | | | 10,000 | | | | 774 | | |
| | | | 1,210 | | |
Machinery 4.2% | |
Colfax Corp.* | | | 20,000 | | | | 798 | | |
Gardner Denver
Holdings, Inc.* | | | 25,000 | | | | 587 | | |
John Bean
Technologies Corp. | | | 12,500 | | | | 1,109 | | |
Milacron Holdings
Corp.* | | | 35,500 | | | | 566 | | |
| | | | 3,060 | | |
Media 2.5% | |
Cable One, Inc. | | | 1,250 | | | | 949 | | |
WideOpenWest,
Inc.* | | | 55,000 | | | | 882 | | |
| | | | 1,831 | | |
Multiline Retail 0.8% | |
Ollie's Bargain
Outlet Holdings,
Inc.* | | | 13,500 | | | | 565 | | |
Oil, Gas & Consumable Fuels 1.4% | |
Jagged Peak
Energy, Inc.* | | | 46,500 | | | | 596 | | |
Matador
Resources Co.* | | | 17,500 | | | | 412 | | |
| | | | 1,008 | | |
See Notes to Financial Statements
140
Schedule of Investments Small Cap Growth Fund (cont'd)
| | |
Number
of Shares | |
Value
(000's) | |
Pharmaceuticals 2.9% | |
Aerie
Pharmaceuticals,
Inc.* | | | 18,500 | | | $ | 1,061 | | |
Agile Therapeutics,
Inc.* | | | 137,500 | | | | 473 | | |
Supernus
Pharmaceuticals,
Inc.* | | | 12,500 | | | | 572 | | |
| | | | 2,106 | | |
Professional Services 1.4% | |
WageWorks, Inc.* | | | 17,500 | | | | 1,032 | | |
Road & Rail 1.0% | |
Genesee &
Wyoming, Inc.
Class A* | | | 11,000 | | | | 754 | | |
Semiconductors & Semiconductor Equipment 6.1% | |
Cavium, Inc.* | | | 5,500 | | | | 348 | | |
Impinj, Inc.* | | | 31,100 | | | | 1,189 | | |
MACOM
Technology
Solutions Holdings,
Inc.* | | | 25,700 | | | | 1,171 | | |
| | |
Number
of Shares | |
Value
(000's) | |
Monolithic Power
Systems, Inc. | | | 17,300 | | | | $1,753 | | |
| | | | 4,461 | | |
Software 8.2% | |
Callidus Software,
Inc.* | | | 38,000 | | | | 979 | | |
Descartes Systems
Group, Inc.* | | | 43,500 | | | | 1,220 | | |
HubSpot, Inc.* | | | 12,600 | | | | 924 | | |
Proofpoint, Inc.* | | | 15,600 | | | | 1,431 | | |
RingCentral, Inc.
Class A* | | | 35,300 | | | | 1,495 | | |
| | | | 6,049 | | |
Specialty Retail 1.4% | |
Burlington Stores,
Inc.* | | | 5,000 | | | | 435 | | |
Five Below, Inc.* | | | 12,000 | | | | 571 | | |
| | | | 1,006 | | |
Tobacco 0.8% | |
Turning Point
Brands, Inc.* | | | 33,000 | | | | 568 | | |
| | |
Number
of Shares | |
Value
(000's) | |
Trading Companies & Distributors 1.4% | |
Air Lease Corp. | | | 25,000 | | | $ | 1,016 | | |
Total Common Stocks
(Cost $63,978) | | | 72,598 | | |
Short-Term Investment 0.8% | |
Investment Company 0.8% | |
State Street
Institutional U.S.
Government
Money Market
Fund Premier
Class, 0.93%(a)
(Cost $605) | | | 604,531 | | | | 605 | | |
Total Investments 99.5%
(Cost $64,583) | | | 73,203 | | |
Other Assets Less
Liabilities 0.5% | | | | | 347 | | |
Net Assets 100.0% | | $ | 73,550 | | |
* Non-income producing security.
(a) Represents 7-day effective yield as of August 31, 2017.
The following is a summary, categorized by Level (see Note A of Notes to Financial Statements), of inputs used to value the Fund's investments as of August 31, 2017:
Asset Valuation Inputs | |
(000's omitted) | | Level 1 | | Level 2 | | Level 3 | | Total | |
Investments: | |
| Common Stocks(a) | | $ | 72,598 | | | $ | — | | �� | $ | — | | | $ | 72,598 | | |
Short-Term Investment | | | — | | | | 605 | | | | — | | | | 605 | | |
Total Investments | | $ | 72,598 | | | $ | 605 | | | $ | — | | | $ | 73,203 | | |
(a) The Schedule of Investments provides information on the industry categorization for the portfolio.
As of the year ended August 31, 2017, no securities were transferred from one level (as of August 31, 2016) to another.
See Notes to Financial Statements
141
Schedule of Investments Socially Responsive Fund August 31, 2017
| | |
Number
of Shares | |
Value
(000's) | |
Common Stocks 98.3% | |
Airlines 2.9% | |
Ryanair
Holdings
PLC ADR* | | | 608,711 | | | $ | 69,210 | | |
Auto Components 3.4% | |
Delphi
Automotive
PLC | | | 848,474 | | | | 81,793 | | |
Banks 5.0% | |
JPMorgan
Chase & Co. | | | 646,643 | | | | 58,773 | | |
U.S. Bancorp | | | 1,195,745 | | | | 61,282 | | |
| | | | 120,055 | | |
Capital Markets 3.2% | |
Intercontinental
Exchange, Inc. | | | 1,168,329 | | | | 75,556 | | |
Communications Equipment 3.3% | |
Motorola
Solutions, Inc. | | | 472,331 | | | | 41,622 | | |
NetScout
Systems, Inc.* | | | 1,146,939 | | | | 37,562 | | |
| | | | 79,184 | | |
Consumer Finance 2.6% | |
American
Express Co. | | | 731,212 | | | | 62,957 | | |
Electric Utilities 1.5% | |
Eversource
Energy | | | 586,363 | | | | 36,941 | | |
Energy Equipment & Services 2.0% | |
Schlumberger
Ltd. | | | 741,416 | | | | 47,087 | | |
Equity Real Estate Investment Trusts 2.6% | |
Weyerhaeuser
Co. | | | 1,894,745 | | | | 61,788 | | |
Food & Staples Retailing 2.3% | |
Kroger Co. | | | 2,517,209 | | | | 55,051 | | |
Health Care Equipment & Supplies 8.3% | |
Becton,
Dickinson &
Co. | | | 375,126 | | | | 74,815 | | |
Danaher Corp. | | | 810,980 | | | | 67,652 | | |
Medtronic PLC | | | 692,637 | | | | 55,840 | | |
| | | | 198,307 | | |
Health Care Providers & Services 4.6% | |
Amerisource
Bergen Corp. | | | 894,431 | | | | 71,778 | | |
Premier, Inc.
Class A* | | | 1,117,659 | | | | 37,442 | | |
| | | | 109,220 | | |
| | |
Number
of Shares | |
Value
(000's) | |
Household Durables 3.9% | |
Newell Brands,
Inc. | | | 1,955,490 | | | $ | 94,411 | | |
Industrial Conglomerates 1.9% | |
3M Co. | | | 227,030 | | | | 46,387 | | |
Insurance 4.7% | |
Progressive
Corp. | | | 2,406,061 | | | | 111,834 | | |
Internet Software & Services 6.0% | |
Alphabet, Inc.
Class A* | | | 70,359 | | | | 67,210 | | |
eBay, Inc.* | | | 2,102,701 | | | | 75,970 | | |
| | | | 143,180 | | |
IT Services 5.2% | |
Cognizant
Technology
Solutions
Corp. Class A | | | 1,003,127 | | | | 70,991 | | |
MasterCard,
Inc. Class A | | | 405,994 | | | | 54,119 | | |
| | | | 125,110 | | |
Media 3.7% | |
Comcast Corp.
Class A | | | 2,177,972 | | | | 88,447 | | |
Oil, Gas & Consumable Fuels 5.2% | |
Cimarex
Energy Co. | | | 186,001 | | | | 18,542 | | |
EQT Corp. | | | 1,007,502 | | | | 62,808 | | |
Noble Energy,
Inc. | | | 1,858,424 | | | | 44,175 | | |
| | | | 125,525 | | |
Personal Products 3.5% | |
Unilever NV | | | 1,393,523 | | | | 82,915 | | |
Pharmaceuticals 2.1% | |
Roche Holding
AG | | | 202,518 | | | | 51,424 | | |
Professional Services 1.6% | |
Manpower
Group, Inc. | | | 339,621 | | | | 37,871 | | |
Road & Rail 1.9% | |
J.B. Hunt
Transport
Services, Inc. | | | 466,444 | | | | 46,127 | | |
Semiconductors & Semiconductor Equipment 4.9% | |
Texas
Instruments,
Inc. | | | 1,407,343 | | | | 116,556 | | |
Software 2.1% | |
Intuit, Inc. | | | 347,471 | | | | 49,150 | | |
| | |
Number
of Shares | |
Value
(000's) | |
Specialty Chemicals 2.4% | |
Novozymes
A/S B Shares | | | 1,149,030 | | | $ | 58,451 | | |
Specialty Retail 2.4% | |
Advance
Auto Parts,
Inc. | | | 575,107 | | | | 56,303 | | |
Textiles, Apparel & Luxury Goods 1.5% | |
Gildan
Activewear,
Inc. | | | 1,150,759 | | | | 36,019 | | |
Trading Companies & Distributors 3.6% | |
Fastenal Co. | | | 561,464 | | | | 23,958 | | |
W.W.
Grainger,
Inc. | | | 377,281 | | | | 61,334 | | |
| | | | 85,292 | | |
Total Common Stocks
(Cost $1,705,780) | | | 2,352,151 | | |
| | | Principal
Amount | | | |
Short-Term Investments 1.7% | |
| Certificates of Deposit 0.0%(a) | |
Carver Federal
Savings Bank
Self Help Credit
Union, 0.10%,
due 9/23/17 | | $ | 100,000 | | | | 100 | | |
Self Help Credit
Union, 0.25%,
due 9/30/17 | | | 250,000 | | | | 250 | | |
Self Help Credit
Union, 0.25%,
due 11/16/17 | | | 250,000 | | | | 250 | | |
| | | | 600 | | |
| | | Number
of Shares | | | |
Investment Company 1.7% | |
State Street
Institutional
Treasury
Money
Market Fund
Premier Class,
0.90%(b) | | | 40,999,759 | | | | 41,000 | | |
Total Short-Term Investments
(Cost $41,600) | | | 41,600 | | |
Total Investments 100.0%
(Cost $1,747,380) | | | 2,393,751 | | |
Liabilities Less
Other Assets (0.0)%(a) | | | | | (727 | ) | |
Net Assets 100.0% | | $ | 2,393,024 | | |
See Notes to Financial Statements
142
Schedule of Investments Socially Responsive Fund (cont'd)
* Non-income producing security.
(a) Represents less than 0.05% of net assets.
(b) Represents 7-day effective yield as of August 31, 2017.
The following is a summary, categorized by Level (see Note A of Notes to Financial Statements), of inputs used to value the Fund's investments as of August 31, 2017:
Asset Valuation Inputs | |
(000's omitted) | | Level 1 | | Level 2 | | Level 3 | | Total | |
Investments: | |
| Common Stocks(a) | | $ | 2,352,151 | | | $ | — | | | $ | — | | | $ | 2,352,151 | | |
| Short-Term Investments(a) | | | — | | | | 41,600 | | | | — | | | | 41,600 | | |
Total Investments | | $ | 2,352,151 | | | $ | 41,600 | | | $ | — | | | $ | 2,393,751 | | |
(a) The Schedule of Investments provides information on the industry categorization for the portfolio.
As of the year ended August 31, 2017, no securities were transferred from one level (as of August 31, 2016) to another.
See Notes to Financial Statements
143
Schedule of Investments Value Fund August 31, 2017
| | |
Number
of Shares | |
Value
(000's) | |
Common Stocks 87.0% | |
Airlines 0.5% | |
Delta Air Lines, Inc. | | | 1,652 | | | $ | 78 | | |
Banks 15.5% | |
Bank of America
Corp. | | | 5,149 | | | | 123 | | |
Citigroup, Inc. | | | 9,190 | | | | 625 | | |
JPMorgan
Chase & Co.(a) | | | 9,542 | | | | 867 | | |
M&T Bank Corp. | | | 2,094 | | | | 310 | | |
PNC Financial
Services Group,
Inc. | | | 3,399 | | | | 426 | | |
U.S. Bancorp | | | 3,123 | | | | 160 | | |
Wells Fargo & Co. | | | 2,262 | | | | 116 | | |
| | | | 2,627 | | |
Beverages 1.1% | |
Coca-Cola Co. | | | 3,933 | | | | 179 | | |
Biotechnology 0.2% | |
Gilead Sciences,
Inc. | | | 509 | | | | 43 | | |
Building Products 0.7% | |
Johnson Controls
International PLC | | | 2,891 | | | | 114 | | |
Capital Markets 1.5% | |
CME Group, Inc. | | | 2,091 | | | | 263 | | |
Chemicals 0.8% | |
Potash Corp. of
Saskatchewan,
Inc. | | | 987 | | | | 17 | | |
Praxair, Inc. | | | 904 | | | | 119 | | |
| | | | 136 | | |
Containers & Packaging 1.0% | |
Crown Holdings,
Inc.* | | | 2,981 | | | | 176 | | |
Diversified Telecommunication
Services 1.0% | |
AT&T, Inc. | | | 4,402 | | | | 165 | | |
Electric Utilities 4.2% | |
Alliant Energy
Corp. | | | 1,566 | | | | 67 | | |
American Electric
Power Co., Inc. | | | 2,643 | | | | 195 | | |
Exelon Corp. | | | 12,057 | | | | 456 | | |
| | | | 718 | | |
Electrical Equipment 1.7% | |
Eaton Corp. PLC | | | 4,073 | | | | 292 | | |
Energy Equipment & Services 1.6% | |
McDermott
International, Inc.* | | | 3,342 | | | | 20 | | |
Schlumberger Ltd. | | | 3,903 | | | | 248 | | |
| | | | 268 | | |
| | |
Number
of Shares | |
Value
(000's) | |
Equity Real Estate Investment
Trusts 0.5% | |
American Homes
4 Rent Class A | | | 1,939 | | | $ | 43 | | |
Essex Property
Trust, Inc. | | | 161 | | | | 43 | | |
| | | | 86 | | |
Food & Staples Retailing 4.2% | |
Wal-Mart Stores,
Inc. | | | 9,236 | | | | 721 | | |
Food Products 2.1% | |
Mondelez
International, Inc.
Class A | | | 8,754 | | | | 356 | | |
Health Care Equipment &
Supplies 3.2% | |
Abbott
Laboratories(a) | | | 4,031 | | | | 205 | | |
Medtronic PLC | | | 1,668 | | | | 135 | | |
Zimmer Biomet
Holdings, Inc. | | | 1,862 | | | | 213 | | |
| | | | 553 | | |
Health Care Providers & Services 0.3% | |
HCA Healthcare,
Inc.* | | | 667 | | | | 52 | | |
Hotels, Restaurants & Leisure 5.8% | |
Carnival Corp. | | | 11,754 | | | | 817 | | |
McDonald's Corp. | | | 1,077 | | | | 172 | | |
| | | | 989 | | |
Household Durables 0.6% | |
Whirlpool Corp. | | | 561 | | | | 96 | | |
Household Products 4.0% | |
Procter & Gamble
Co. | | | 7,311 | | | | 675 | | |
Industrial Conglomerates 1.2% | |
3M Co. | | | 1,007 | | | | 206 | | |
Insurance 3.7% | |
American
International
Group, Inc. | | | 3,078 | | | | 186 | | |
Athene Holding
Ltd. Class A* | | | 4,496 | | | | 241 | | |
Chubb Ltd. | | | 395 | | | | 56 | | |
Lincoln National
Corp. | | | 2,040 | | | | 138 | | |
| | | | 621 | | |
Machinery 1.5% | |
Caterpillar, Inc. | | | 1,022 | | | | 120 | | |
WABCO Holdings,
Inc.* | | | 966 | | | | 139 | | |
| | | | 259 | | |
| | |
Number
of Shares | |
Value
(000's) | |
Media 0.2% | |
CBS Corp.
Class B | | | 262 | | | $ | 17 | | |
Viacom, Inc.
Class A | | | 284 | | | | 11 | | |
| | | | 28 | | |
Metals & Mining 6.1% | |
Alcoa Corp.* | | | 576 | | | | 25 | | |
Newmont Mining
Corp. | | | 24,279 | | | | 931 | | |
Southern Copper
Corp. | | | 1,849 | | | | 75 | | |
| | | | 1,031 | | |
Multi-Utilities 1.0% | |
NiSource, Inc. | | | 6,659 | | | | 179 | | |
Oil, Gas & Consumable Fuels 8.4% | |
Cabot Oil & Gas
Corp. | | | 21,191 | | | | 541 | | |
Devon Energy
Corp. | | | 1,089 | | | | 34 | | |
EOG Resources,
Inc. | | | 996 | | | | 85 | | |
Exxon Mobil Corp. | | | 6,047 | | | | 462 | | |
Phillips 66 | | | 1,684 | | | | 141 | | |
Rice Energy, Inc.* | | | 6,051 | | | | 165 | | |
| | | | 1,428 | | |
Personal Products 0.7% | |
Estee Lauder
Cos.,Inc. Class A | | | 1,092 | | | | 117 | | |
Pharmaceuticals 10.0% | |
Bristol-Myers
Squibb Co. | | | 444 | | | | 27 | | |
Eli Lilly & Co. | | | 872 | | | | 71 | | |
Johnson &
Johnson | | | 4,687 | | | | 620 | | |
Merck & Co., Inc. | | | 5,554 | | | | 354 | | |
Pfizer, Inc. | | | 18,300 | | | | 621 | | |
| | | | 1,693 | | |
Semiconductors & Semiconductor
Equipment 1.4% | |
NXP
Semiconductors
NV* | | | 2,088 | | | | 236 | | |
Specialty Retail 0.6% | |
Gap, Inc. | | | 4,183 | | | | 99 | | |
Technology Hardware, Storage &
Peripherals 0.6% | |
Western Digital Corp. | | | 1,223 | | | | 108 | | |
Textiles, Apparel & Luxury Goods 1.1% | |
Coach, Inc. | | | 1,320 | | | | 55 | | |
VF Corp. | | | 2,159 | | | | 136 | | |
| | | | 191 | | |
Total Common Stocks
(Cost $13,393) | | | 14,783 | | |
See Notes to Financial Statements
144
Schedule of Investments Value Fund (cont'd)
| | |
Number
of Shares | |
Value
(000's) | |
Short-Term Investment 14.1% | |
Investment Company 14.1% | |
State Street
Institutional
Treasury Money
Market Fund
Premier Class,
0.90%(b)
(Cost $2,399) | | | 2,398,509 | | | $ | 2,399 | | |
Total Investments 101.1%
(Cost $15,792) | | | 17,182 | | |
Liabilities Less
Other Assets(c) (1.1)% | | | | | (183 | ) | |
Net Assets 100.0% | | $ | 16,999 | | |
* Non-income producing security.
(a) All or a portion of the security is pledged as collateral for options written.
(b) Represents 7-day effective yield as of August 31, 2017.
(c) Includes the impact of the Fund's open positions in derivatives at August 31, 2017.
Derivative Instruments
Written option contracts ("options written")
At August 31, 2017, the Fund had outstanding options written as follows:
| Description | | Number of
Contracts | | Notional
Amount | | Exercise
Price | | Expiration
Date | | Value | |
Calls
Machinery | |
Caterpillar, Inc. | | | 10 | | | $ | (117,490 | ) | | $ | 115 | | | 9/15/2017 | | $ | (3,500 | ) | |
Technology Hardware, Storage & Peripherals | |
Western Digital Corp. | | | 12 | | | | (105,924 | ) | | | 105 | | | 9/15/2017 | | | (0 | )(a) | |
Total Options Written (premiums received: $4,110) | | | | | | | | | | $ | (3,500 | ) | |
(a) Security fair valued as of August 31, 2017 in accordance with procedures approved by the Board of Trustees (the "Board").
For the year ended August 31, 2017, the Fund had an average market value of $(3,848) in options written. The Fund had securities pledged in the amount of $147,325 to cover collateral requirements for options written.
See Notes to Financial Statements
145
Schedule of Investments Value Fund (cont'd)
The following is a summary, categorized by Level (see Note A of Notes to Financial Statements), of inputs used to value the Fund's investments as of August 31, 2017:
Asset Valuation Inputs | |
(000's omitted) | | Level 1 | | Level 2 | | Level 3 | | Total | |
Investments: | |
| Common Stocks(a) | | $ | 14,783 | | | $ | — | | | $ | — | | | $ | 14,783 | | |
Short-Term Investment | | | — | | | | 2,399 | | | | — | | | | 2,399 | | |
Total Investments | | $ | 14,783 | | | $ | 2,399 | | | $ | — | | | $ | 17,182 | | |
(a) The Schedule of Investments provides information on the industry categorization for the portfolio.
As of the year ended August 31, 2017, no securities were transferred from one level (as of August 31, 2016) to another.
The following is a summary, categorized by Level (see Note A of Notes to Financial Statements), of inputs used to value the Fund's derivatives as of August 31, 2017:
Other Financial Instruments | |
(000's omitted) | | Level 1 | | Level 2 | | Level 3(a) | | Total | |
Options Written | |
Liabilities | | $ | (3 | ) | | $ | — | | | $ | (0 | ) | | $ | (3 | ) | |
Total | | $ | (3 | ) | | $ | — | | | $ | (0 | ) | | $ | (3 | ) | |
(a) The following is a reconciliation between the beginning and ending balances of investments in which unobservable inputs (Level 3) were used in determining value:
| | | Beginning
balance, as
of 9/1/2016 | | Accrued
discounts/
(premiums) | | Realized
gain/
(loss) | | Change
in unrealized
appreciation/
(depreciation) | | Purchases | | Sales | | Transfers
into
Level 3 | | Transfers
out of
Level 3 | | Balance,
as of
8/31/2017 | | Net change in
unrealized
appreciation/
(depreciation)
from
investments
still held as
of 8/31/2017 | |
Other Financial Instruments:
(000's omitted) | |
Options
Written(b) | | $ | — | | | $ | — | | | $ | — | | | $ | 3 | | | $ | — | | | $ | (3 | ) | | $ | — | | | $ | — | | | $ | (0 | ) | | $ | 3 | | |
Total | | $ | — | | | $ | — | | | $ | — | | | $ | 3 | | | $ | — | | | $ | (3 | ) | | $ | — | | | $ | — | | | $ | (0 | ) | | $ | 3 | | |
(b) As of the year ended August 31, 2017, these investments were valued using methods the Board has approved in the good-faith belief that the resulting valuation will reflect the fair value of the security. As of the year ended August 31, 2017, these investments did not have a material impact on the Fund's net assets and, therefore, disclosure of unobservable inputs used in formulating valuations is not presented.
See Notes to Financial Statements
146
Statements of Assets and Liabilities
Neuberger Berman Equity Funds
(000's omitted except per share amounts)
| | | DIVIDEND
GROWTH FUND | | EMERGING
MARKETS
EQUITY FUND | | EQUITY
INCOME FUND | | FOCUS FUND | | GENESIS FUND | | GLOBAL EQUITY
FUND | | GLOBAL REAL
ESTATE FUND | | GREATER
CHINA EQUITY
FUND | | GUARDIAN
FUND | | INTERNATIONAL
EQUITY
FUND | |
| | | August 31,
2017 | | August 31,
2017 | | August 31,
2017 | | August 31,
2017 | | August 31,
2017 | | August 31,
2017 | | August 31,
2017 | | August 31,
2017 | | August 31,
2017 | | August 31,
2017 | |
Assets | |
Investments in securities, at value* (Notes A & F)—see Schedule of Investments: | |
Unaffiliated issuers | | $ | 37,188 | | | $ | 876,114 | | | $ | 1,686,814 | | | $ | 747,653 | | | $ | 8,929,888 | | | $ | 4,676 | | | $ | 2,989 | | | $ | 129,989 | | | $ | 1,188,712 | | | $ | 1,820,498 | | |
Affiliated issuers | | | — | | | | — | | | | — | | | | — | | | | 1,847,657 | | | | — | | | | — | | | | — | | | | — | | | | — | | |
| | | | 37,188 | | | | 876,114 | | | | 1,686,814 | | | | 747,653 | | | | 10,777,545 | | | | 4,676 | | | | 2,989 | | | | 129,989 | | | | 1,188,712 | | | | 1,820,498 | | |
Cash | | | — | | | | 159 | | | | — | | | | 13 | | | | — | | | | — | | | | — | | | | — | | | | — | | | | — | | |
Foreign currency* | | | — | | | | 92 | | | | — | | | | — | | | | — | | | | — | | | | 3 | | | | 1,308 | | | | — | | | | — | | |
Dividends and interest receivable | | | 107 | | | | 1,507 | | | | 8,379 | | | | 752 | | | | 12,594 | | | | 21 | | | | 4 | | | | 148 | | | | 2,897 | | | | 5,816 | | |
Receivable for securities sold | | | — | | | | 368 | | | | 3,317 | | | | — | | | | 38,948 | | | | 35 | | | | — | | | | 485 | | | | 993 | | | | — | | |
Receivable for Fund shares sold | | | 104 | | | | 1,214 | | | | 822 | | | | 2 | | | | 32,881 | | | | — | | | | — | | | | 746 | | | | 27 | | | | 2,300 | | |
Receivable from Management—net (Note B) | | | 7 | | | | 25 | | | | — | | | | — | | | | 3 | | | | 9 | | | | 8 | | | | — | | | | — | | | | 2 | | |
Prepaid expenses and other assets | | | 12 | | | | 80 | | | | 76 | | | | 70 | | | | 361 | | | | 24 | | | | 9 | | | | 32 | | | | 134 | | | | 143 | | |
Total Assets | | | 37,418 | | | | 879,559 | | | | 1,699,408 | | | | 748,490 | | | | 10,862,332 | | | | 4,765 | | | | 3,013 | | | | 132,708 | | | | 1,192,763 | | | | 1,828,759 | | |
Liabilities | |
Payable to investment manager—net (Note B) | | | 15 | | | | 695 | | | | 693 | | | | 329 | | | | 6,070 | | | | 2 | | | | 2 | | | | 117 | | | | 502 | | | | 965 | | |
Option contracts written, at value** (Note A) | | | — | | | | — | | | | 1,692 | | | | 240 | | | | — | | | | — | | | | — | | | | — | | | | 568 | | | | — | | |
Due to custodian | | | — | | | | — | | | | 1,855 | | | | — | | | | 228 | | | | — | | | | — | | | | — | | | | — | | | | — | | |
Payable for securities purchased | | | — | | | | 269 | | | | 14 | | | | — | | | | 19,228 | | | | 10 | | | | — | | | | 974 | | | | 1,177 | | | | 1,252 | | |
Payable for Fund shares redeemed | | | 4 | | | | 219 | | | | 1,314 | | | | 461 | | | | 14,160 | | | | 4 | | | | — | | | | 49 | | | | 1,660 | | | | 1,059 | | |
Payable to administrator—net (Note B) | | | — | | | | — | | | | 543 | | | | 179 | | | | 1,752 | | | | — | | | | — | | | | 6 | | | | 268 | | | | 324 | | |
Payable to trustees | | | 5 | | | | 5 | | | | 5 | | | | 5 | | | | 5 | | | | 5 | | | | 5 | | | | 5 | | | | 5 | | | | 5 | | |
Accrued capital gains taxes | | | — | | | | 386 | | | | — | | | | — | | | | — | | | | — | | | | — | | | | — | | | | — | | | | — | | |
Accrued expenses and other payables | | | 89 | | | | 536 | | | | 240 | | | | 206 | | | | 1,044 | | | | 100 | | | | 103 | | | | 148 | | | | 302 | | | | 333 | | |
Total Liabilities | | | 113 | | | | 2,110 | | | | 6,356 | | | | 1,420 | | | | 42,487 | | | | 121 | | | | 110 | | | | 1,299 | | | | 4,482 | | | | 3,938 | | |
Net Assets | | $ | 37,305 | | | $ | 877,449 | | | $ | 1,693,052 | | | $ | 747,070 | | | $ | 10,819,845 | | | $ | 4,644 | | | $ | 2,903 | | | $ | 131,409 | | | $ | 1,188,281 | | | $ | 1,824,821 | | |
Net Assets consist of: | |
Paid-in capital | | $ | 31,157 | | | $ | 747,912 | | | $ | 1,350,324 | | | $ | 570,614 | | | $ | 5,269,020 | | | $ | 3,765 | | | $ | 2,758 | | | $ | 106,888 | | | $ | 906,780 | | | $ | 1,624,775 | | |
Undistributed net investment income (loss) | | | 311 | | | | 4,510 | | | | 11,234 | | | | 1,337 | | | | 21,800 | | | | 24 | | | | — | | | | 850 | | | | 2,985 | | | | 12,844 | | |
Distributions in excess of net investment income | | | — | | | | — | | | | — | | | | — | | | | — | | | | — | | | | (35 | ) | | | — | | | | — | | | | — | | |
Accumulated net realized gains (losses) on investments | | | 390 | | | | (53,597 | ) | | | 54,602 | | | | 55,378 | | | | 1,024,399 | | | | (89 | ) | | | (1 | ) | | | (624 | ) | | | 68,086 | | | | (75,192 | ) | |
Net unrealized appreciation (depreciation) in value of investments | | | 5,447 | | | | 178,624 | | | | 276,892 | | | | 119,741 | | | | 4,504,626 | | | | 944 | | | | 181 | | | | 24,295 | | | | 210,430 | | | | 262,394 | | |
Net Assets | | $ | 37,305 | | | $ | 877,449 | | | $ | 1,693,052 | | | $ | 747,070 | | | $ | 10,819,845 | | | $ | 4,644 | | | $ | 2,903 | | | $ | 131,409 | | | $ | 1,188,281 | | | $ | 1,824,821 | | |
Net Assets | |
Investor Class | | $ | — | | | $ | — | | | $ | — | | | $ | 667,734 | | | $ | 1,785,984 | | | $ | — | | | $ | — | | | $ | — | | | $ | 1,052,401 | | | $ | 110,424 | | |
Trust Class | | | — | | | | — | | | | — | | | | 62,976 | | | | 1,576,174 | | | | — | | | | — | | | | — | | | | 57,816 | | | | 45,651 | | |
Advisor Class | | | — | | | | — | | | | — | | | | 3,503 | | | | 203,779 | | | | — | | | | — | | | | — | | | | 145 | | | | — | | |
Institutional Class | | | 32,528 | | | | 670,584 | | | | 1,208,673 | | | | 7,816 | | | | 3,650,285 | | | | 4,227 | | | | 2,150 | | | | 109,425 | | | | 70,176 | | | | 1,448,975 | | |
Class A | | | 1,646 | | | | 65,066 | | | | 200,273 | | | | 3,125 | | | | — | | | | 312 | | | | 486 | | | | 21,681 | | | | 5,643 | | | | 71,909 | | |
Class C | | | 3,104 | | | | 7,434 | | | | 282,322 | | | | 1,916 | | | | — | | | | 105 | | | | 267 | | | | 303 | | | | 1,630 | | | | 13,237 | | |
Class R3 | | | — | | | | 1,503 | | | | 1,784 | | | | — | | | | — | | | | — | | | | — | | | | — | | | | 470 | | | | — | | |
Class R6 | | | 27 | | | | 132,862 | | | | — | | | | — | | | | 3,603,623 | | | | — | | | | — | | | | — | | | | — | | | | 134,625 | | |
See Notes to Financial Statements
147
148
Statements of Assets and Liabilities (cont'd)
Neuberger Berman Equity Funds (cont'd)
(000's omitted except per share amounts)
| | | DIVIDEND
GROWTH FUND | | EMERGING
MARKETS
EQUITY FUND | | EQUITY
INCOME FUND | | FOCUS FUND | | GENESIS FUND | | GLOBAL EQUITY
FUND | | GLOBAL REAL
ESTATE FUND | | GREATER
CHINA EQUITY
FUND | | GUARDIAN
FUND | | INTERNATIONAL
EQUITY
FUND | |
| | | August 31,
2017 | | August 31,
2017 | | August 31,
2017 | | August 31,
2017 | | August 31,
2017 | | August 31,
2017 | | August 31,
2017 | | August 31,
2017 | | August 31,
2017 | | August 31,
2017 | |
Shares Outstanding ($.001 par value; unlimited shares authorized) | |
Investor Class | | | — | | | | — | | | | — | | | | 24,278 | | | | 52,796 | | | | — | | | | — | | | | — | | | | 61,483 | | | | 4,643 | | |
Trust Class | | | — | | | | — | | | | — | | | | 3,935 | | | | 25,467 | | | | — | | | | — | | | | — | | | | 5,427 | | | | 1,717 | | |
Advisor Class | | | — | | | | — | | | | — | | | | 546 | | | | 8,856 | | | | — | | | | — | | | | — | | | | 11 | | | | — | | |
Institutional Class | | | 2,515 | | | | 33,745 | | | | 92,333 | | | | 284 | | | | 62,178 | | | | 559 | | | | 202 | | | | 6,905 | | | | 4,088 | | | | 114,484 | | |
Class A | | | 127 | | | | 3,295 | | | | 15,355 | | | | 198 | | | | — | | | | 42 | | | | 46 | | | | 1,367 | | | | 538 | | | | 2,726 | | |
Class C | | | 241 | | | | 392 | | | | 21,802 | | | | 321 | | | | — | | | | 15 | | | | 25 | | | | 20 | | | | 125 | | | | 515 | | |
Class R3 | | | — | | | | 78 | | | | 137 | | | | — | | | | — | | | | — | | | | — | | | | — | | | | 35 | | | | — | | |
Class R6 | | | 2 | | | | 6,681 | | | | — | | | | — | | | | 61,371 | | | | — | | | | — | | | | — | | | | — | | | | 10,536 | | |
Net Asset Value, offering and redemption price per share | |
Investor Class | | $ | — | | | $ | — | | | $ | — | | | $ | 27.50 | | | $ | 33.83 | | | $ | — | | | $ | — | | | $ | — | | | $ | 17.12 | | | $ | 23.78 | | |
Trust Class | | | — | | | | — | | | | — | | | | 16.00 | | | | 61.89 | | | | — | | | | — | | | | — | | | | 10.65 | | | | 26.59 | | |
Advisor Class | | | — | | | | — | | | | — | | | | 6.42 | | | | 23.01 | | | | — | | | | — | | | | — | | | | 13.64 | | | | — | | |
Institutional Class | | | 12.93 | | | | 19.87 | | | | 13.09 | | | | 27.56 | | | | 58.71 | | | | 7.56 | | | | 10.64 | | | | 15.85 | | | | 17.16 | | | | 12.66 | | |
Class R3 | | | — | | | | 19.31 | | | | 13.01 | | | | — | | | | — | | | | — | | | | — | | | | — | | | | 13.55 | | | | — | | |
Class R6 | | | 12.93 | | | | 19.89 | | | | — | | | | — | | | | 58.72 | | | | — | | | | — | | | | — | | | | — | | | | 12.78 | | |
Net Asset Value and redemption price per share | |
Class A | | $ | 12.94 | | | $ | 19.75 | | | $ | 13.04 | | | $ | 15.80 | | | $ | — | | | $ | 7.48 | | | $ | 10.64 | | | $ | 15.86 | | | $ | 10.48 | | | $ | 26.38 | | |
Offering Price per share | |
Class A‡ | | $ | 13.73 | | | $ | 20.95 | | | $ | 13.84 | | | $ | 16.76 | | | $ | — | | | $ | 7.94 | | | $ | 11.29 | | | $ | 16.83 | | | $ | 11.12 | | | $ | 27.99 | | |
Net Asset Value and offering price per share | |
Class C^ | | $ | 12.87 | | | $ | 18.98 | | | $ | 12.95 | | | $ | 5.98 | | | $ | — | | | $ | 7.11 | | | $ | 10.62 | | | $ | 15.43 | | | $ | 13.06 | | | $ | 25.70 | | |
*Cost of Investments: | |
Unaffiliated issuers | | $ | 31,741 | | | $ | 697,107 | | | $ | 1,409,160 | | | $ | 627,974 | | | $ | 4,992,779 | | | $ | 3,731 | | | $ | 2,808 | | | $ | 105,703 | | | $ | 978,777 | | | $ | 1,558,146 | | |
Affiliated issuers | | | — | | | | — | | | | — | | | | — | | | | 1,280,142 | | | | — | | | | — | | | | — | | | | — | | | | — | | |
Total cost of investments | | $ | 31,741 | | | $ | 697,107 | | | $ | 1,409,160 | | | $ | 627,974 | | | $ | 6,272,921 | | | $ | 3,731 | | | $ | 2,808 | | | $ | 105,703 | | | $ | 978,777 | | | $ | 1,558,146 | | |
Total cost of foreign currency | | $ | — | | | $ | 92 | | | $ | — | | | $ | — | | | $ | — | | | $ | — | | | $ | 3 | | | $ | 1,299 | | | $ | — | | | $ | — | | |
**Premium received from option contracts written | | $ | — | | | $ | — | | | $ | 919 | | | $ | 302 | | | $ | — | | | $ | — | | | $ | — | | | $ | — | | | $ | 1,075 | | | $ | — | | |
‡ On single retail sales of less than $50,000. On sales of $50,000 or more or in certain other circumstances described in the Fund's prospectus, offering price is reduced.
^ Redemption price per share is equal to net asset value less any applicable contingent deferred sales charge.
See Notes to Financial Statements
149
150
Statements of Assets and Liabilities (cont'd)
Neuberger Berman Equity Funds
(000's omitted except per share amounts)
| | | INTERNATIONAL
SELECT FUND | | INTERNATIONAL
SMALL CAP
FUND | | INTRINSIC
VALUE FUND | | LARGE CAP
VALUE FUND | | MID CAP
GROWTH FUND | | MID CAP
INTRINSIC
VALUE FUND | | MULTI-CAP
OPPORTUNITIES
FUND | | REAL ESTATE
FUND | | SMALL CAP
GROWTH FUND | | SOCIALLY
RESPONSIVE
FUND | |
| | | August 31,
2017 | | August 31,
2017 | | August 31,
2017 | | August 31,
2017 | | August 31,
2017 | | August 31,
2017 | | August 31,
2017 | | August 31,
2017 | | August 31,
2017 | | August 31,
2017 | |
Assets | |
Investments in securities, at value* (Notes A & F)—see Schedule of Investments: | |
Unaffiliated issuers | | $ | 243,700 | | | $ | 1,596 | | | $ | 878,858 | | | $ | 1,466,372 | | | $ | 1,172,200 | | | $ | 93,244 | | | $ | 1,925,818 | | | $ | 512,916 | | | $ | 73,203 | | | $ | 2,393,751 | | |
Affiliated issuers | | | — | | | | — | | | | 7,939 | | | | — | | | | — | | | | — | | | | — | | | | — | | | | — | | | | — | | |
| | | | 243,700 | | | | 1,596 | | | | 886,797 | | | | 1,466,372 | | | | 1,172,200 | | | | 93,244 | | | | 1,925,818 | | | | 512,916 | | | | 73,203 | | | | 2,393,751 | | |
Cash | | | — | | | | — | | | | — | | | | — | | | | — | | | | — | | | | — | | | | — | | | | — | | | | — | | |
Foreign currency* | | | 11 | | | | — | | | | — | | | | — | | | | — | | | | — | | | | — | | | | — | | | | — | | | | — | | |
Dividends and interest receivable | | | 1,007 | | | | 2 | | | | 237 | | | | 3,511 | | | | 847 | | | | 67 | | | | 2,702 | | | | 377 | | | | 32 | | | | 4,059 | | |
Receivable for securities sold | | | — | | | | — | | | | — | | | | — | | | | — | | | | 198 | | | | — | | | | 1,499 | | | | 901 | | | | — | | |
Receivable for Fund shares sold | | | 113 | | | | — | | | | 1,807 | | | | 116 | | | | 419 | | | | 183 | | | | 1,164 | | | | 703 | | | | 33 | | | | 1,970 | | |
Receivable from Management—net (Note B) | | | — | | | | 6 | | | | — | | | | — | | | | — | | | | — | | | | — | | | | — | | | | — | | | | — | | |
Prepaid expenses and other assets | | | 70 | | | | 35 | | | | 59 | | | | 119 | | | | 84 | | | | 41 | | | | 77 | | | | 56 | | | | 46 | | | | 116 | | |
Total Assets | | | 244,901 | | | | 1,639 | | | | 888,900 | | | | 1,470,118 | | | | 1,173,550 | | | | 93,733 | | | | 1,929,761 | | | | 515,551 | | | | 74,215 | | | | 2,399,896 | | |
Liabilities | |
Payable to investment manager—net (Note B) | | | 116 | | | | 1 | | | | 576 | | | | 610 | | | | 495 | | | | 28 | | | | 853 | | | | 346 | | | | 52 | | | | 946 | | |
Option contracts written, at value** (Note A) | | | — | | | | — | | | | — | | | | 262 | | | | — | | | | — | | | | — | | | | — | | | | — | | | | — | | |
Due to custodian | | | — | | | | — | | | | — | | | | — | | | | — | | | | — | | | | — | | | | — | | | | — | | | | — | | |
Payable for securities purchased | | | — | | | | — | | | | 4,698 | | | | 12,860 | | | | — | | | | 540 | | | | 5,282 | | | | — | | | | 464 | | | | 2,841 | | |
Payable for Fund shares redeemed | | | 7 | | | | 18 | | | | 837 | | | | 1,273 | | | | 1,104 | | | | 60 | | | | 765 | | | | 409 | | | | 40 | | | | 2,172 | | |
Payable to administrator—net (Note B) | | | 58 | | | | — | | | | 195 | | | | 386 | | | | 231 | | | | 36 | | | | 297 | | | | 112 | | | | 11 | | | | 531 | | |
Payable to trustees | | | 5 | | | | 5 | | | | 5 | | | | 5 | | | | 5 | | | | 5 | | | | 5 | | | | 5 | | | | 5 | | | | 5 | | |
Accrued capital gains taxes | | | — | | | | — | | | | — | | | | — | | | | — | | | | — | | | | — | | | | — | | | | — | | | | — | | |
Accrued expenses and other payables | | | 141 | | | | 113 | | | | 136 | | | | 299 | | | | 222 | | | | 79 | | | | 242 | | | | 157 | | | | 93 | | | | 377 | | |
Total Liabilities | | | 327 | | | | 137 | | | | 6,447 | | | | 15,695 | | | | 2,057 | | | | 748 | | | | 7,444 | | | | 1,029 | | | | 665 | | | | 6,872 | | |
Net Assets | | $ | 244,574 | | | $ | 1,502 | | | $ | 882,453 | | | $ | 1,454,423 | | | $ | 1,171,493 | | | $ | 92,985 | | | $ | 1,922,317 | | | $ | 514,522 | | | $ | 73,550 | | | $ | 2,393,024 | | |
Net Assets consist of: | |
Paid-in capital | | $ | 218,368 | | | $ | 1,178 | | | $ | 725,781 | | | $ | 1,194,121 | | | $ | 812,725 | | | $ | 72,464 | | | $ | 1,150,685 | | | $ | 449,027 | | | $ | 64,231 | | | | 1,646,131 | | |
Undistributed net investment income (loss) | | | 1,624 | | | | 15 | | | | (100 | ) | | | 14,558 | | | | — | | | | 294 | | | | 7,156 | | | | — | | | | (405 | ) | | | 10,306 | | |
Distributions in excess of net investment income | | | — | | | | — | | | | — | | | | — | | | | — | | | | — | | | | — | | | | — | | | | — | | | | — | | |
Accumulated net realized gains (losses) on investments | | | (24,586 | ) | | | 68 | | | | 28,376 | | | | 81,395 | | | | 85,964 | | | | 4,147 | | | | 124,551 | | | | 18,256 | | | | 1,104 | | | | 90,210 | | |
Net unrealized appreciation (depreciation) in value of investments | | | 49,168 | | | | 241 | | | | 128,396 | | | | 164,349 | | | | 272,804 | | | | 16,080 | | | | 639,925 | | | | 47,239 | | | | 8,620 | | | | 646,377 | | |
Net Assets | | $ | 244,574 | | | $ | 1,502 | | | $ | 882,453 | | | $ | 1,454,423 | | | $ | 1,171,493 | | | $ | 92,985 | | | $ | 1,922,317 | | | $ | 514,522 | | | $ | 73,550 | | | $ | 2,393,024 | | |
Net Assets | |
Investor Class | | $ | — | | | $ | — | | | $ | — | | | $ | 1,148,512 | | | $ | 445,902 | | | $ | 40,310 | | | $ | — | | | $ | — | | | $ | 49,841 | | | $ | 732,581 | | |
Trust Class | | | 8,201 | | | | — | | | | — | | | | 74,981 | | | | 51,971 | | | | 10,924 | | | | — | | | | 156,601 | | | | 3,854 | | | | 234,577 | | |
Advisor Class | | | — | | | | — | | | | — | | | | 144,066 | | | | 12,386 | | | | — | | | | — | | | | — | | | | 1,712 | | | | — | | |
Institutional Class | | | 214,430 | | | | 815 | | | | 841,861 | | | | 80,638 | | | | 321,475 | | | | 29,124 | | | | 1,828,180 | | | | 191,332 | | | | 11,821 | | | | 848,765 | | |
Class A | | | 4,882 | | | | 306 | | | | 18,165 | | | | 3,762 | | | | 54,449 | | | | 8,625 | | | | 53,454 | | | | 83,498 | | | | 3,277 | | | | 117,955 | | |
Class C | | | 2,457 | | | | 126 | | | | 22,427 | | | | 2,259 | | | | 9,667 | | | | 2,548 | | | | 40,683 | | | | 18,904 | | | | 2,004 | | | | 56,618 | | |
Class R3 | | | 4,993 | | | | — | | | | — | | | | 205 | | | | 13,207 | | | | 1,454 | | | | — | | | | 19,005 | | | | 1,041 | | | | 41,257 | | |
Class R6 | | | 9,611 | | | | 255 | | | | — | | | | — | | | | 262,436 | | | | — | | | | — | | | | 45,182 | | | | — | | | | 361,271 | | |
See Notes to Financial Statements
151
152
Statements of Assets and Liabilities (cont'd)
Neuberger Berman Equity Funds (cont'd)
(000's omitted except per share amounts)
| | | INTERNATIONAL
SELECT FUND | | INTERNATIONAL
SMALL CAP
FUND | | INTRINSIC
VALUE FUND | | LARGE CAP
VALUE FUND | | MID CAP
GROWTH FUND | | MID CAP
INTRINSIC
VALUE FUND | | MULTI-CAP
OPPORTUNITIES
FUND | | REAL ESTATE
FUND | | SMALL CAP
GROWTH FUND | | SOCIALLY
RESPONSIVE
FUND | |
| | | August 31,
2017 | | August 31,
2017 | | August 31,
2017 | | August 31,
2017 | | August 31,
2017 | | August 31,
2017 | | August 31,
2017 | | August 31,
2017 | | August 31,
2017 | | August 31,
2017 | |
Shares Outstanding ($.001 par value; unlimited shares authorized) | |
Investor Class | | | — | | | | — | | | | — | | | | 36,337 | | | | 31,376 | | | | 1,755 | | | | — | | | | — | | | | 1,515 | | | | 19,540 | | |
Trust Class | | | 660 | | | | — | | | | — | | | | 3,720 | | | | 2,069 | | | | 579 | | | | — | | | | 11,587 | | | | 108 | | | | 10,953 | | |
Advisor Class | | | — | | | | — | | | | — | | | | 9,779 | | | | 487 | | | | — | | | | — | | | | — | | | | 75 | | | | — | | |
Institutional Class | | | 17,270 | | | | 64 | | | | 52,219 | | | | 2,532 | | | | 22,007 | | | | 1,266 | | | | 97,940 | | | | 14,109 | | | | 349 | | | | 22,606 | | |
Class A | | | 396 | | | | 24 | | | | 1,159 | | | | 187 | | | | 2,179 | | | | 458 | | | | 2,885 | | | | 6,179 | | | | 91 | | | | 5,575 | | |
Class C | | | 202 | | | | 10 | | | | 1,520 | | | | 163 | | | | 395 | | | | 139 | | | | 2,281 | | | | 1,398 | | | | 92 | | | | 2,764 | | |
Class R3 | | | 408 | | | | — | | | | — | | | | 14 | | | | 520 | | | | 77 | | | | — | | | | 1,409 | | | | 46 | | | | 1,976 | | |
Class R6 | | | 774 | | | | 20 | | | | — | | | | — | | | | 17,894 | | | | — | | | | — | | | | 3,333 | | | | — | | | | 9,616 | | |
Net Asset Value, offering and redemption price per share | |
Investor Class | | $ | — | | | $ | — | | | $ | — | | | $ | 31.61 | | | $ | 14.21 | | | $ | 22.98 | | | $ | — | | | $ | — | | | $ | 32.90 | | | $ | 37.49 | | |
Trust Class | | | 12.43 | | | | — | | | | — | | | | 20.16 | | | | 25.12 | | | | 18.86 | | | | — | | | | 13.52 | | | | 35.61 | | | | 21.42 | | |
Advisor Class | | | — | | | | — | | | | — | | | | 14.73 | | | | 25.45 | | | | — | | | | — | | | | — | | | | 22.76 | | | | — | | |
Institutional Class | | | 12.42 | | | | 12.74 | | | | 16.12 | | | | 31.85 | | | | 14.61 | | | | 23.00 | | | | 18.67 | | | | 13.56 | | | | 33.83 | | | | 37.55 | | |
Class R3 | | | 12.22 | | | | — | | | | — | | | | 14.96 | | | | 25.39 | | | | 18.78 | | | | — | | | | 13.49 | | | | 22.82 | | | | 20.88 | | |
Class R6 | | | 12.42 | | | | 12.74 | | | | — | | | | — | | | | 14.67 | | | | — | | | | — | | | | 13.56 | | | | — | | | | 37.57 | | |
Net Asset Value and redemption price per share | |
Class A | | $ | 12.34 | | | $ | 12.70 | | | $ | 15.67 | | | $ | 20.11 | | | $ | 24.99 | | | $ | 18.84 | | | $ | 18.53 | | | $ | 13.51 | | | $ | 35.99 | | | $ | 21.16 | | |
Offering Price per share | |
Class A‡ | | $ | 13.09 | | | $ | 13.47 | | | $ | 16.63 | | | $ | 21.34 | | | $ | 26.51 | | | $ | 19.99 | | | $ | 19.66 | | | $ | 14.33 | | | $ | 38.19 | | | $ | 22.45 | | |
Net Asset Value and offering price per share | |
Class C^ | | $ | 12.16 | | | $ | 12.63 | | | $ | 14.76 | | | $ | 13.87 | | | $ | 24.44 | | | $ | 18.37 | | | $ | 17.84 | | | $ | 13.52 | | | $ | 21.84 | | | $ | 20.49 | | |
*Cost of Investments: | |
Unaffiliated issuers | | $ | 194,531 | | | $ | 1,355 | | | $ | 749,834 | | | $ | 1,302,074 | | | $ | 899,396 | | | $ | 77,164 | | | $ | 1,285,893 | | | $ | 465,677 | | | $ | 64,583 | | | $ | 1,747,380 | | |
Affiliated issuers | | | — | | | | — | | | | 8,567 | | | | — | | | | — | | | | — | | | | — | | | | — | | | | — | | | | — | | |
Total cost of investments | | $ | 194,531 | | | $ | 1,355 | | | $ | 758,401 | | | $ | 1,302,074 | | | $ | 899,396 | | | $ | 77,164 | | | $ | 1,285,893 | | | $ | 465,677 | | | $ | 64,583 | | | $ | 1,747,380 | | |
Total cost of foreign currency | | $ | 11 | | | $ | — | | | $ | — | | | $ | — | | | $ | — | | | $ | — | | | $ | — | | | $ | — | | | $ | — | | | $ | — | | |
**Premium received from option contracts written | | $ | — | | | $ | — | | | $ | — | | | $ | 313 | | | $ | — | | | $ | — | | | $ | — | | | $ | — | | | $ | — | | | $ | — | | |
‡ On single retail sales of less than $50,000. On sales of $50,000 or more or in certain other circumstances described in the Fund's prospectus, offering price is reduced.
^ Redemption price per share is equal to net asset value less any applicable contingent deferred sales charge.
See Notes to Financial Statements
153
154
Statements of Assets and Liabilities (cont'd)
Neuberger Berman Equity Funds
(000's omitted except per share amounts)
| | | VALUE FUND | |
| | | August 31, 2017 | |
Assets | |
Investments in securities, at value* (Notes A & F)—see Schedule of Investments: | |
Unaffiliated issuers | | $ | 17,182 | | |
Affiliated issuers | | | — | | |
| | | 17,182 | | |
Cash | | | — | | |
Foreign currency* | | | — | | |
Dividends and interest receivable | | | 42 | | |
Receivable for securities sold | | | — | | |
Receivable for Fund shares sold | | | — | | |
Receivable from Management—net (Note B) | | | 16 | | |
Prepaid expenses and other assets | | | 16 | | |
Total Assets | | | 17,256 | | |
Liabilities | |
Payable to investment manager—net (Note B) | | | 8 | | |
Option contracts written, at value** (Note A) | | | 3 | | |
Due to custodian | | | — | | |
Payable for securities purchased | | | 145 | | |
Payable for Fund shares redeemed | | | 3 | | |
Payable to administrator—net (Note B) | | | — | | |
Payable to trustees | | | 5 | | |
Accrued capital gains taxes | | | — | | |
Accrued expenses and other payables | | | 93 | | |
Total Liabilities | | | 257 | | |
Net Assets | | $ | 16,999 | | |
Net Assets consist of: | |
Paid-in capital | | $ | 14,400 | | |
Undistributed net investment income (loss) | | | 210 | | |
Distributions in excess of net investment income | | | — | | |
Accumulated net realized gains (losses) on investments | | | 998 | | |
Net unrealized appreciation (depreciation) in value of investments | | | 1,391 | | |
Net Assets | | $ | 16,999 | | |
Net Assets | |
Investor Class | | $ | — | | |
Trust Class | | | — | | |
Advisor Class | | | — | | |
Institutional Class | | | 10,816 | | |
Class A | | | 2,696 | | |
Class C | | | 3,487 | | |
Class R3 | | | — | | |
Class R6 | | | — | | |
See Notes to Financial Statements
155
Statements of Assets and Liabilities (cont'd)
Neuberger Berman Equity Funds (cont'd)
(000's omitted except per share amounts)
| | | VALUE FUND | |
| | | August 31, 2017 | |
Shares Outstanding ($.001 par value; unlimited shares authorized) | |
Investor Class | | | — | | |
Trust Class | | | — | | |
Advisor Class | | | — | | |
Institutional Class | | | 596 | | |
Class A | | | 150 | | |
Class C | | | 199 | | |
Class R3 | | | — | | |
Class R6 | | | — | | |
Net Asset Value, offering and redemption price per share | |
Investor Class | | $ | — | | |
Trust Class | | | — | | |
Advisor Class | | | — | | |
Institutional Class | | | 18.14 | | |
Class R3 | | | — | | |
Class R6 | | | — | | |
Net Asset Value and redemption price per share | |
Class A | | $ | 18.02 | | |
Offering Price per share | |
Class A‡ | | $ | 19.12 | | |
Net Asset Value and offering price per share | |
Class C^ | | $ | 17.52 | | |
*Cost of Investments: | |
Unaffiliated issuers | | $ | 15,792 | | |
Affiliated issuers | | | — | | |
Total cost of investments | | $ | 15,792 | | |
Total cost of foreign currency | | $ | — | | |
**Premium received from option contracts written | | $ | 4 | | |
‡ On single retail sales of less than $50,000. On sales of $50,000 or more or in certain other circumstances described in the Fund's prospectus, offering price is reduced.
^ Redemption price per share is equal to net asset value less any applicable contingent deferred sales charge.
See Notes to Financial Statements
156
Neuberger Berman Equity Funds
(000's omitted)
| | | DIVIDEND
GROWTH FUND | | EMERGING
MARKETS
EQUITY FUND | | EQUITY
INCOME FUND | | FOCUS FUND | | GENESIS FUND | | GLOBAL EQUITY
FUND | | GLOBAL REAL
ESTATE FUND | | GREATER
CHINA EQUITY
FUND | | GUARDIAN
FUND | | INTERNATIONAL
EQUITY
FUND | |
| | | For the
Year Ended
August 31,
2017 | | For the
Year Ended
August 31,
2017 | | For the
Year Ended
August 31,
2017 | | For the
Year Ended
August 31,
2017 | | For the
Year Ended
August 31,
2017 | | For the
Year Ended
August 31,
2017 | | For the
Year Ended
August 31,
2017 | | For the
Year Ended
August 31,
2017 | | For the
Year Ended
August 31,
2017 | | For the
Year Ended
August 31,
2017 | |
Investment Income: | |
Income (Note A): | |
Dividend income—unaffiliated issuers | | $ | 702 | | | $ | 14,481 | | | $ | 58,894 | | | $ | 8,513 | | | $ | 108,310 | | | $ | 69 | | | $ | 76 | | | $ | 2,318 | | | $ | 19,300 | | | $ | 35,119 | | |
Dividend income—affiliated issuers (Note F) | | | — | | | | — | | | | — | | | | — | | | | 26,746 | | | | — | | | | — | | | | — | | | | — | | | | — | | |
Interest income—unaffiliated issuers | | | 14 | | | | 209 | | | | 3,374 | | | | 128 | | | | 739 | | | | 1 | | | | — | | | | 10 | | | | 98 | | | | 327 | | |
Foreign taxes withheld (Note A) | | | (3 | ) | | | (1,657 | ) | | | (640 | ) | | | (39 | ) | | | (1,196 | ) | | | (4 | ) | | | (4 | ) | | | (171 | ) | | | (361 | ) | | | (3,423 | ) | |
Total income | | $ | 713 | | | $ | 13,033 | | | $ | 61,628 | | | $ | 8,602 | | | $ | 134,599 | | | $ | 66 | | | $ | 72 | | | $ | 2,157 | | | $ | 19,037 | | | $ | 32,023 | | |
Expenses: | |
Investment management fees (Note B) | | | 144 | | | | 5,869 | | | | 8,158 | | | | 3,800 | | | | 72,904 | | | | 26 | | | | 21 | | | | 1,045 | | | | 5,799 | | | | 12,407 | | |
Administration fees (Note B) | | | 14 | | | | 276 | | | | 838 | | | | 358 | | | | 5,494 | | | | 2 | | | | 1 | | | | 45 | | | | 569 | | | | 764 | | |
Administration fees (Note B): | |
Investor Class | | | — | | | | — | | | | — | | | | 1,349 | | | | 3,832 | | | | — | | | | — | | | | — | | | | 2,128 | | | | 219 | | |
Trust Class | | | — | | | | — | | | | — | | | | 229 | | | | 5,837 | | | | — | | | | — | | | | — | | | | 228 | | | | 157 | | |
Advisor Class | | | — | | | | — | | | | — | | | | 13 | | | | 840 | | | | — | | | | — | | | | — | | | | 1 | | | | — | | |
Institutional Class | | | 27 | | | | 457 | | | | 1,159 | | | | 8 | | | | 3,637 | | | | 4 | | | | 2 | | | | 92 | | | | 66 | | | | 1,297 | | |
Class A | | | 2 | | | | 88 | | | | 463 | | | | 7 | | | | — | | | | 1 | | | | 1 | | | | 11 | | | | 12 | | | | 167 | | |
Class C | | | 4 | | | | 12 | | | | 649 | | | | 4 | | | | — | | | | — | | | | 1 | | | | — | | | | 4 | | | | 29 | | |
Class R3 | | | — | | | | 2 | | | | 4 | | | | — | | | | — | | | | — | | | | — | | | | — | | | | 1 | | | | — | | |
Class R6 | | | — | | | | 36 | | | | — | | | | — | | | | 1,106 | | | | — | | | | — | | | | — | | | | — | | | | 18 | | |
Distribution fees (Note B): | |
Trust Class | | | — | | | | — | | | | — | | | | 66 | | | | — | | | | — | | | | — | | | | — | | | | 65 | | | | — | | |
Advisor Class | | | — | | | | — | | | | — | | | | 9 | | | | 602 | | | | — | | | | — | | | | — | | | | — | | | | — | | |
Class A | | | 2 | | | | 102 | | | | 553 | | | | 8 | | | | — | | | | 1 | | | | 1 | | | | 11 | | | | 15 | | | | 199 | | |
Class C | | | 20 | | | | 57 | | | | 3,096 | | | | 20 | | | | — | | | | 1 | | | | 3 | | | | 2 | | | | 19 | | | | 136 | | |
Class R3 | | | — | | | | 6 | | | | 10 | | | | — | | | | — | | | | — | | | | — | | | | — | | | | 3 | | | | — | | |
Shareholder servicing agent fees: | |
Investor Class | | | — | | | | — | | | | — | | | | 396 | | | | 1,173 | | | | — | | | | — | | | | — | | | | 767 | | | | 114 | | |
Trust Class | | | — | | | | — | | | | — | | | | 1 | | | | 17 | | | | — | | | | — | | | | — | | | | 2 | | | | 5 | | |
Advisor Class | | | — | | | | — | | | | — | | | | 1 | | | | 39 | | | | — | | | | — | | | | — | | | | — | | | | — | | |
Institutional Class | | | 1 | | | | 128 | | | | 10 | | | | 1 | | | | 46 | | | | — | | | | — | | | | 32 | | | | 1 | | | | 18 | | |
Class A | | | 1 | | | | 15 | | | | 19 | | | | 1 | | | | — | | | | — | | | | — | | | | 2 | | | | 1 | | | | 8 | | |
Class C | | | — | | | | 1 | | | | 10 | | | | — | | | | — | | | | — | | | | — | | | | — | | | | — | | | | 2 | | |
Class R3 | | | — | | | | 1 | | | | 1 | | | | — | | | | — | | | | — | | | | — | | | | — | | | | — | | | | — | | |
Class R6 | | | — | | | | 2 | | | | — | | | | — | | | | 6 | | | | — | | | | — | | | | — | | | | — | | | | 2 | | |
Organization expense (Note A) | | | — | | | | — | | | | — | | | | — | | | | — | | | | — | | | | — | | | | — | | | | — | | | | — | | |
Audit fees | | | 40 | | | | 60 | | | | 68 | | | | 62 | | | | 72 | | | | 58 | | | | 56 | | | | 56 | | | | 63 | | | | 63 | | |
Custodian and accounting fees | | | 43 | | | | 771 | | | | 241 | | | | 135 | | | | 1,034 | | | | 48 | | | | 41 | | | | 108 | | | | 186 | | | | 417 | | |
Insurance expense | | | 1 | | | | 17 | | | | 77 | | | | 25 | | | | 369 | | | | — | | | | — | | | | 3 | | | | 40 | | | | 53 | | |
Legal fees | | | 67 | | | | 71 | | | | 71 | | | | 78 | | | | 74 | | | | 72 | | | | 75 | | | | 99 | | | | 74 | | | | 73 | | |
Registration and filing fees | | | 93 | | | | 125 | | | | 84 | | | | 93 | | | | 249 | | | | 44 | | | | 47 | | | | 50 | | | | 108 | | | | 174 | | |
Repayment to Management of expenses previously assumed by
Management (Note B) | | | — | | | | — | | | | — | | | | — | | | | 177 | | | | — | | | | — | | | | — | | | | — | | | | 220 | | |
Shareholder reports | | | 1 | | | | 27 | | | | 130 | | | | 49 | | | | 801 | | | | 3 | | | | — | | | | 6 | | | | 80 | | | | 97 | | |
Trustees' fees and expenses | | | 49 | | | | 51 | | | | 56 | | | | 52 | | | | 96 | | | | 49 | | | | 49 | | | | 49 | | | | 54 | | | | 55 | | |
Interest expense | | | — | | | | — | | | | 4 | | | | 3 | | | | 1 | | | | — | | | | — | | | | 3 | | | | 3 | | | | 1 | | |
Miscellaneous | | | 5 | | | | 71 | | | | 125 | | | | 44 | | | | 626 | | | | 4 | | | | — | | | | 9 | | | | 100 | | | | 136 | | |
Total expenses | | | 514 | | | | 8,245 | | | | 15,826 | | | | 6,812 | | | | 99,032 | | | | 313 | | | | 298 | | | | 1,623 | | | | 10,389 | | | | 16,831 | | |
See Notes to Financial Statements
157
158
Statements of Operations (cont'd)
Neuberger Berman Equity Funds (cont'd)
(000's omitted)
| | | DIVIDEND
GROWTH FUND | | EMERGING
MARKETS
EQUITY FUND | | EQUITY
INCOME FUND | | FOCUS FUND | | GENESIS FUND | | GLOBAL EQUITY
FUND | | GLOBAL REAL
ESTATE FUND | | GREATER
CHINA EQUITY
FUND | | GUARDIAN
FUND | | INTERNATIONAL
EQUITY
FUND | |
| | | For the
Year Ended
August 31,
2017 | | For the
Year Ended
August 31,
2017 | | For the
Year Ended
August 31,
2017 | | For the
Year Ended
August 31,
2017 | | For the
Year Ended
August 31,
2017 | | For the
Year Ended
August 31,
2017 | | For the
Year Ended
August 31,
2017 | | For the
Year Ended
August 31,
2017 | | For the
Year Ended
August 31,
2017 | | For the
Year Ended
August 31,
2017 | |
Expenses reimbursed by Management (Note B) | | | (288 | ) | | | (652 | ) | | | — | | | | (1 | ) | | | — | | | | (272 | ) | | | (267 | ) | | | (174 | ) | | | — | | | | — | | |
Investment management fees waived (Note B) | | | — | | | | — | | | | — | | | | — | | | | — | | | | — | | | | — | | | | — | | | | — | | | | (2,701 | ) | |
Custodian out-of-pocket expenses refunded (Note G) | | | — | | | | — | | | | (1 | ) | | | (73 | ) | | | (301 | ) | | | — | | | | — | | | | — | | | | (127 | ) | | | (494 | ) | |
Total net expenses | | | 226 | | | | 7,593 | | | | 15,825 | | | | 6,738 | | | | 98,731 | | | | 41 | | | | 31 | | | | 1,449 | | | | 10,262 | | | | 13,636 | | |
Net investment income (loss) | | $ | 487 | | | $ | 5,440 | | | $ | 45,803 | | | $ | 1,864 | | | $ | 35,868 | | | $ | 25 | | | $ | 41 | | | $ | 708 | | | $ | 8,775 | | | $ | 18,387 | | |
Realized and Unrealized Gain (Loss) on Investments (Note A): | |
Net realized gain (loss) on: | |
Sales of investment securities of unaffiliated issuers | | | 491 | | | | 16,813 | | | | 64,103 | | | | 67,496 | | | | 1,405,976 | | | | (68 | ) | | | 23 | | | | 13,352 | * | | | 83,409 | | | | 47,646 | | |
Sales of investment securities of affiliated issuers | | | — | | | | — | | | | — | | | | — | | | | 79,021 | | | | — | | | | — | | | | — | | | | — | | | | — | | |
Foreign currency | | | — | | | | (400 | ) | | | (21 | ) | | | — | | | | 7 | | | | (1 | ) | | | — | | | | 8 | | | | (14 | ) | | | (604 | ) | |
Option contracts written | | | — | | | | — | | | | 1,922 | | | | 1,046 | | | | — | | | | — | | | | — | | | | — | | | | 2,712 | | | | — | | |
Net increase from payments by affiliates (Note B) | | | — | | | | — | | | | 1 | | | | 1 | | | | — | | | | — | | | | — | | | | — | | | | — | | | | — | | |
Change in net unrealized appreciation (depreciation) in value of: | |
Unaffiliated investment securities | | | 3,658 | | | | 128,712 | ** | | | 68,315 | | | | 42,032 | | | | (589,498 | ) | | | 666 | | | | (4 | ) | | | 18,882 | | | | 91,430 | | | | 167,829 | | |
Affiliated investment securities | | | — | | | | — | | | | — | | | | — | | | | 151,662 | | | | — | | | | — | | | | — | | | | — | | | | — | | |
Foreign currency | | | — | | | | 5 | | | | 9 | | | | — | | | | 2 | | | | 1 | | | | — | | | | 11 | | | | 29 | | | | 207 | | |
Option contracts written | | | — | | | | — | | | | (426 | ) | | | (102 | ) | | | — | | | | — | | | | — | | | | — | | | | 127 | | | | — | | |
Net gain (loss) on investments | | | 4,149 | | | | 145,130 | | | | 133,903 | | | | 110,473 | | | | 1,047,170 | | | | 598 | | | | 19 | | | | 32,253 | | | | 177,693 | | | | 215,078 | | |
Net increase (decrease) in net assets resulting from operations | | $ | 4,636 | | | $ | 150,570 | | | $ | 179,706 | | | $ | 112,337 | | | $ | 1,083,038 | | | $ | 623 | | | $ | 60 | | | $ | 32,961 | | | $ | 186,468 | | | $ | 233,465 | | |
* Reversal of capital gains tax $6,061.
** Change in accrued foreign capital gains tax amounted to $(103,969).
See Notes to Financial Statements
159
160
Statements of Operations (cont'd)
Neuberger Berman Equity Funds
(000's omitted)
| | | INTERNATIONAL
SELECT FUND | | INTERNATIONAL
SMALL CAP
FUND | | INTRINSIC
VALUE FUND | | LARGE CAP
VALUE FUND | | MID CAP
GROWTH FUND | | MID CAP
INTRINSIC
VALUE FUND | | MULTI-CAP
OPPORTUNITIES
FUND | | REAL ESTATE
FUND | | SMALL CAP
GROWTH FUND | | SOCIALLY
RESPONSIVE
FUND | |
| | | For the
Year Ended
August 31,
2017 | | Period from
December 8, 2016
(Commencement
of Operations) to
August 31,
2017 | | For the
Year Ended
August 31,
2017 | | For the
Year Ended
August 31,
2017 | | For the
Year Ended
August 31,
2017 | | For the
Year Ended
August 31,
2017 | | For the
Year Ended
August 31,
2017 | | For the
Year Ended
August 31,
2017 | | For the
Year Ended
August 31,
2017 | | For the
Year Ended
August 31,
2017 | |
Investment Income: | |
Income (Note A): | |
Dividend income—unaffiliated issuers | | $ | 5,460 | | | $ | 23 | | | $ | 4,513 | | | $ | 30,278 | | | $ | 6,847 | | | $ | 1,901 | | | $ | 26,549 | | | $ | 14,202 | | | $ | 222 | | | $ | 35,661 | | |
Dividend income—affiliated issuers (Note F) | | | — | | | | — | | | | — | | | | — | | | | — | | | | — | | | | — | | | | — | | | | — | | | | — | | |
Interest income—unaffiliated issuers | | | 30 | | | | 1 | | | | 248 | | | | 962 | | | | 223 | | | | 10 | | | | 82 | | | | 30 | | | | 12 | | | | 175 | | |
Foreign taxes withheld (Note A) | | | (529 | ) | | | (3 | ) | | | — | | | | (1 | ) | | | (16 | ) | | | (8 | ) | | | (93 | ) | | | (25 | ) | | | — | | | | (844 | ) | |
Total income | | $ | 4,961 | | | $ | 21 | | | $ | 4,761 | | | $ | 31,239 | | | $ | 7,054 | | | $ | 1,903 | | | $ | 26,538 | | | $ | 14,207 | | | $ | 234 | | | $ | 34,992 | | |
Expenses: | |
Investment management fees (Note B) | | | 1,298 | | | | 9 | | | | 5,841 | | | | 7,102 | | | | 5,661 | | | | 505 | | | | 9,795 | | | | 4,551 | | | | 585 | | | | 10,881 | | |
Administration fees (Note B) | | | 116 | | | | — | | | | 351 | | | | 715 | | | | 553 | | | | 46 | | | | 916 | | | | 289 | | | | 34 | | | | 1,151 | | |
Administration fees (Note B): | |
Investor Class | | | — | | | | — | | | | — | | | | 2,378 | | | | 900 | | | | 83 | | | | — | | | | — | | | | 98 | | | | 1,533 | | |
Trust Class | | | 27 | | | | — | | | | — | | | | 276 | | | | 218 | | | | 38 | | | | — | | | | 604 | | | | 14 | | | | 876 | | |
Advisor Class | | | — | | | | — | | | | — | | | | 522 | | | | 41 | | | | — | | | | — | | | | — | | | | 6 | | | | — | | |
Institutional Class | | | 214 | | | | 1 | | | | 690 | | | | 76 | | | | 307 | | | | 26 | | | | 1,761 | | | | 212 | | | | 11 | | | | 805 | | |
Class A | | | 10 | | | | 1 | | | | 67 | | | | 7 | | | | 135 | | | | 24 | | | | 126 | | | | 199 | | | | 7 | | | | 255 | | |
Class C | | | 6 | | | | — | | | | 49 | | | | 5 | | | | 21 | | | | 6 | | | | 84 | | | | 47 | | | | 4 | | | | 116 | | |
Class R3 | | | 9 | | | | — | | | | — | | | | — | | | | 28 | | | | 3 | | | | — | | | | 45 | | | | 2 | | | | 78 | | |
Class R6 | | | 2 | | | | — | | | | — | | | | — | | | | 71 | | | | — | | | | — | | | | 13 | | | | — | | | | 103 | | |
Distribution fees (Note B): | |
Trust Class | | | 8 | | | | — | | | | — | | | | 79 | | | | — | | | | 11 | | | | — | | | | 173 | | | | 4 | | | | 251 | | |
Advisor Class | | | — | | | | — | | | | — | | | | 373 | | | | 29 | | | | — | | | | — | | | | — | | | | 5 | | | | — | | |
Class A | | | 11 | | | | 1 | | | | 82 | | | | 8 | | | | 162 | | | | 29 | | | | 151 | | | | 238 | | | | 8 | | | | 303 | | |
Class C | | | 30 | | | | 1 | | | | 236 | | | | 24 | | | | 100 | | | | 29 | | | | 400 | | | | 226 | | | | 18 | | | | 549 | | |
Class R3 | | | 22 | | | | — | | | | — | | | | — | | | | 68 | | | | 7 | | | | — | | | | 107 | | | | 5 | | | | 186 | | |
Shareholder servicing agent fees: | |
Investor Class | | | — | | | | — | | | | — | | | | 717 | | | | 424 | | | | 34 | | | | — | | | | — | | | | 80 | | | | 590 | | |
Trust Class | | | 8 | | | | — | | | | — | | | | 3 | | | | 2 | | | | 2 | | | | — | | | | 32 | | | | 1 | | | | 9 | | |
Advisor Class | | | — | | | | — | | | | — | | | | 4 | | | | 2 | | | | — | | | | — | | | | — | | | | 1 | | | | — | | |
Institutional Class | | | 1 | | | | — | | | | 9 | | | | 1 | | | | 10 | | | | 1 | | | | 584 | | | | 6 | | | | 1 | | | | 18 | | |
Class A | | | 1 | | | | — | | | | 12 | | | | 1 | | | | 10 | | | | 2 | | | | 14 | | | | 10 | | | | 1 | | | | 15 | | |
Class C | | | — | | | | — | | | | 2 | | | | — | | | | 3 | | | | 1 | | | | 4 | | | | 3 | | | | — | | | | 4 | | |
Class R3 | | | 1 | | | | — | | | | — | | | | — | | | | 5 | | | | — | | | | — | | | | 4 | | | | 1 | | | | 3 | | |
Class R6 | | | — | | | | — | | | | — | | | | — | | | | 5 | | | | — | | | | — | | | | 1 | | | | — | | | | 4 | | |
Organization expense (Note A) | | | — | | | | 70 | | | | — | | | | — | | | | — | | | | — | | | | — | | | | — | | | | — | | | | — | | |
Audit fees | | | 62 | | | | 29 | | | | 28 | | | | 62 | | | | 28 | | | | 28 | | | | 28 | | | | 61 | | | | 28 | | | | 28 | | |
Custodian and accounting fees | | | 131 | | | | 53 | | | | 112 | | | | 203 | | | | 182 | | | | 63 | | | | 209 | | | | 139 | | | | 72 | | | | 299 | | |
Insurance expense | | | 8 | | | | — | | | | 22 | | | | 48 | | | | 40 | | | | 3 | | | | 68 | | | | 23 | | | | 2 | | | | 80 | | |
Legal fees | | | 71 | | | | 60 | | | | 72 | | | | 86 | | | | 70 | | | | 69 | | | | 69 | | | | 70 | | | | 66 | | | | 71 | | |
Registration and filing fees | | | 102 | | | | 52 | | | | 96 | | | | 130 | | | | 141 | | | | 89 | | | | 73 | | | | 115 | | | | 105 | | | | 142 | | |
Repayment to Management of expenses previously assumed by
Management (Note B) | | | — | | | | — | | | | — | | | | 5 | | | | 14 | | | | 1 | | | | — | | | | — | | | | — | | | | — | | |
Shareholder reports | | | 10 | | | | 2 | | | | 180 | | | | 75 | | | | 95 | | | | 12 | | | | 57 | | | | 57 | | | | 12 | | | | 178 | | |
Trustees' fees and expenses | | | 50 | | | | 26 | | | | 52 | | | | 55 | | | | 54 | | | | 49 | | | | 57 | | | | 51 | | | | 49 | | | | 59 | | |
Interest expense | | | 2 | | | | — | | | | — | | | | — | | | | — | | | | — | | | | 21 | | | | 5 | | | | — | | | | — | | |
Miscellaneous | | | 25 | | | | 7 | | | | 42 | | | | 84 | | | | 66 | | | | 9 | | | | 106 | | | | 36 | | | | 10 | | | | 151 | | |
Total expenses | | | 2,225 | | | | 312 | | | | 7,943 | | | | 13,039 | | | | 9,445 | | | | 1,170 | | | | 14,523 | | | | 7,317 | | | | 1,230 | | | | 18,738 | | |
See Notes to Financial Statements
161
162
Statements of Operations (cont'd)
Neuberger Berman Equity Funds (cont'd)
(000's omitted)
| | | INTERNATIONAL
SELECT FUND | | INTERNATIONAL
SMALL CAP
FUND | | INTRINSIC
VALUE FUND | | LARGE CAP
VALUE FUND | | MID CAP
GROWTH FUND | | MID CAP
INTRINSIC
VALUE FUND | | MULTI-CAP
OPPORTUNITIES
FUND | | REAL ESTATE
FUND | | SMALL CAP
GROWTH FUND | | SOCIALLY
RESPONSIVE
FUND | |
| | | For the
Year Ended
August 31,
2017 | | Period from
December 8, 2016
(Commencement
of Operations) to
August 31,
2017 | | For the
Year Ended
August 31,
2017 | | For the
Year Ended
August 31,
2017 | | For the
Year Ended
August 31,
2017 | | For the
Year Ended
August 31,
2017 | | For the
Year Ended
August 31,
2017 | | For the
Year Ended
August 31,
2017 | | For the
Year Ended
August 31,
2017 | | For the
Year Ended
August 31,
2017 | |
Expenses reimbursed by Management (Note B) | | | (165 | ) | | | (300 | ) | | | (237 | ) | | | — | | | | — | | | | (12 | ) | | | — | | | | (1,434 | ) | | | (395 | ) | | | — | | |
Investment management fees waived (Note B) | | | — | | | | — | | | | — | | | | — | | | | — | | | | (164 | ) | | | — | | | | — | | | | — | | | | — | | |
Custodian out-of-pocket expenses refunded (Note G) | | | — | | | | — | | | | — | | | | (167 | ) | | | (79 | ) | | | (22 | ) | | | (1 | ) | | | — | | | | (4 | ) | | | (94 | ) | |
Total net expenses | | | 2,060 | | | | 12 | | | | 7,706 | | | | 12,872 | | | | 9,366 | | | | 972 | | | | 14,522 | | | | 5,883 | | | | 831 | | | | 18,644 | | |
Net investment income (loss) | | $ | 2,901 | | | $ | 9 | | | $ | (2,945 | ) | | $ | 18,367 | | | $ | (2,312 | ) | | $ | 931 | | | $ | 12,016 | | | $ | 8,324 | | | $ | (597 | ) | | $ | 16,348 | | |
Realized and Unrealized Gain (Loss) on Investments (Note A): | |
Net realized gain (loss) on: | |
Sales of investment securities of unaffiliated issuers | | | 6,839 | | | | 69 | | | | 39,725 | | | | 143,188 | | | | 110,017 | | | | 4,958 | | | | 137,938 | | | | 40,372 | | | | 14,135 | | | | 145,794 | | |
Sales of investment securities of affiliated issuers | | | — | | | | — | | | | — | | | | — | | | | — | | | | — | | | | — | | | | — | | | | — | | | | — | | |
Foreign currency | | | (74 | ) | | | 3 | | | | — | | | | — | | | | — | | | | — | | | | — | | | | — | | | | — | | | | 75 | | |
Option contracts written | | | — | | | | — | | | | — | | | | 142 | | | | — | | | | — | | | | — | | | | — | | | | — | | | | — | | |
Net increase from payments by affiliates (Note B) | | | — | | | | — | | | | — | | | | — | | | | — | | | | — | | | | — | | | | — | | | | — | | | | — | | |
Change in net unrealized appreciation (depreciation) in value of: | |
Unaffiliated investment securities | | | 26,795 | | | | 241 | | | | 73,200 | | | | 47,439 | | | | 57,664 | | | | 8,449 | | | | 187,940 | | | | (41,934 | ) | | | 104 | | | | 129,369 | | |
Affiliated investment securities | | | — | | | | — | | | | (628 | ) | | | — | | | | — | | | | — | | | | — | | | | — | | | | — | | | | — | | |
Foreign currency | | | 29 | | | | — | | | | — | | | | — | | | | — | | | | — | | | | — | | | | — | | | | — | | | | 71 | | |
Option contracts written | | | — | | | | — | | | | — | | | | 51 | | | | — | | | | — | | | | — | | | | — | | | | — | | | | — | | |
Net gain (loss) on investments | | | 33,589 | | | | 313 | | | | 112,297 | | | | 190,820 | | | | 167,681 | | | | 13,407 | | | | 325,878 | | | | (1,562 | ) | | | 14,239 | | | | 275,309 | | |
Net increase (decrease) in net assets resulting from operations | | $ | 36,490 | | | $ | 322 | | | $ | 109,352 | | | $ | 209,187 | | | $ | 165,369 | | | $ | 14,338 | | | $ | 337,894 | | | $ | 6,762 | | | $ | 13,642 | | | $ | 291,657 | | |
See Notes to Financial Statements
163
164
Statements of Operations (cont'd)
Neuberger Berman Equity Funds
(000's omitted)
| | | VALUE FUND | |
| | | For the
Year Ended
August 31,
2017 | |
Investment Income: | |
Income (Note A): | |
Dividend income—unaffiliated issuers | | $ | 397 | | |
Dividend income—affiliated issuers (Note F) | | | — | | |
Interest income—unaffiliated issuers | | | 11 | | |
Foreign taxes withheld (Note A) | | | — | | |
Total income | | $ | 408 | | |
Expenses: | |
Investment management fees (Note B) | | | 103 | | |
Administration fees (Note B) | | | 9 | | |
Administration fees (Note B): | |
Investor Class | | | — | | |
Trust Class | | | — | | |
Advisor Class | | | — | | |
Institutional Class | | | 12 | | |
Class A | | | 9 | | |
Class C | | | 6 | | |
Class R3 | | | — | | |
Class R6 | | | — | | |
Distribution fees (Note B): | |
Trust Class | | | — | | |
Advisor Class | | | — | | |
Class A | | | 11 | | |
Class C | | | 29 | | |
Class R3 | | | — | | |
Shareholder servicing agent fees: | |
Investor Class | | | — | | |
Trust Class | | | — | | |
Advisor Class | | | — | | |
Institutional Class | | | 1 | | |
Class A | | | 2 | | |
Class C | | | — | | |
Class R3 | | | — | | |
Class R6 | | | — | | |
Organization expense (Note A) | | | — | | |
Audit fees | | | 57 | | |
Custodian and accounting fees | | | 36 | | |
Insurance expense | | | 1 | | |
Legal fees | | | 85 | | |
Registration and filing fees | | | 47 | | |
Repayment to Management of expenses previously assumed by Management (Note B) | | | — | | |
Shareholder reports | | | 3 | | |
Trustees' fees and expenses | | | 49 | | |
Interest expense | | | — | | |
Miscellaneous | | | 3 | | |
Total expenses | | | 463 | | |
See Notes to Financial Statements
165
Statements of Operations (cont'd)
Neuberger Berman Equity Funds (cont'd)
(000's omitted)
| | | VALUE FUND | |
| | | For the
Year Ended
August 31,
2017 | |
Expenses reimbursed by Management (Note B) | | | (281 | ) | |
Investment management fees waived (Note B) | | | — | | |
Custodian out-of-pocket expenses refunded (Note G) | | | — | | |
Total net expenses | | | 182 | | |
Net investment income (loss) | | $ | 226 | | |
Realized and Unrealized Gain (Loss) on Investments (Note A): | |
Net realized gain (loss) on: | |
Sales of investment securities of unaffiliated issuers | | | 2,273 | | |
Sales of investment securities of affiliated issuers | | | — | | |
Foreign currency | | | — | | |
Option contracts written | | | 2 | | |
Net increase from payments by affiliates (Note B) | | | — | | |
Change in net unrealized appreciation (depreciation) in value of: | |
Unaffiliated investment securities | | | 240 | | |
Affiliated investment securities | | | — | | |
Foreign currency | | | — | | |
Option contracts written | | | 1 | | |
Net gain (loss) on investments | | | 2,516 | | |
Net increase (decrease) in net assets resulting from operations | | $ | 2,742 | | |
See Notes to Financial Statements
166
Statements of Changes in Net Assets
Neuberger Berman Equity Funds
(000's omitted)
| | | DIVIDEND GROWTH FUND | | EMERGING MARKETS
EQUITY FUND | | EQUITY INCOME FUND | | FOCUS FUND | | GENESIS FUND | | GLOBAL EQUITY FUND | |
| | | Year Ended
August 31,
2017 | | Period from
December 15, 2015
(Commencement
of Operations) to
August 31,
2016 | | Year Ended
August 31,
2017 | | Year Ended
August 31,
2016 | | Year Ended
August 31,
2017 | | Year Ended
August 31,
2016 | | Year Ended
August 31,
2017 | | Year Ended
August 31,
2016 | | Year Ended
August 31,
2017 | | Year Ended
August 31,
2016 | | Year Ended
August 31,
2017 | | Year Ended
August 31,
2016 | |
Increase (Decrease) in Net Assets: | |
From Operations: | |
Net investment income (loss) (Note A) | | $ | 487 | | | $ | 280 | | | $ | 5,440 | | | $ | 3,015 | | | $ | 45,803 | | | $ | 52,236 | | | $ | 1,864 | | | $ | 4,443 | | | $ | 35,868 | | | $ | 40,519 | | | $ | 25 | | | $ | 21 | | |
Net realized gain (loss) on investments (Note A) | | | 491 | | | | (120 | ) | | | 16,413 | | | | (32,525 | ) | | | 66,004 | | | | 63,571 | | | | 68,542 | | | | 76,979 | | | | 1,485,004 | | | | 955,524 | | | | (69 | ) | | | 37 | | |
Net increase from payments by affiliates (Note B) | | | — | | | | — | | | | — | | | | — | | | | 1 | | | | — | | | | 1 | | | | — | | | | — | | | | — | | | | — | | | | — | | |
Change in net unrealized appreciation (depreciation) of
investments (Note A) | | | 3,658 | | | | 1,789 | | | | 128,717 | | | | 92,414 | | | | 67,898 | | | | 88,146 | | | | 41,930 | | | | (36,876 | ) | | | (437,834 | ) | | | 133,370 | | | | 667 | | | | 161 | | |
Net increase (decrease) in net assets resulting from operations | | | 4,636 | | | | 1,949 | | | | 150,570 | | | | 62,904 | | | | 179,706 | | | | 203,953 | | | | 112,337 | | | | 44,546 | | | | 1,083,038 | | | | 1,129,413 | | | | 623 | | | | 219 | | |
Distributions to Shareholders From (Note A): | |
Net investment income: | |
Investor Class | | | — | | | | — | | | | — | | | | — | | | | — | | | | — | | | | (2,166 | ) | | | (4,272 | ) | | | (7,859 | ) | | | (7,480 | ) | | | — | | | | — | | |
Trust Class | | | — | | | | — | | | | — | | | | — | | | | — | | | | — | | | | (337 | ) | | | (798 | ) | | | (894 | ) | | | (1,035 | ) | | | — | | | | — | | |
Advisor Class | | | — | | | | — | | | | — | | | | — | | | | — | | | | — | | | | (53 | ) | | | (115 | ) | | | (765 | ) | | | (419 | ) | | | — | | | | — | | |
Institutional Class | | | (420 | ) | | | — | | | | (1,629 | ) | | | (1,980 | ) | | | (29,632 | ) | | | (33,197 | ) | | | (38 | ) | | | (221 | ) | | | (11,370 | ) | | | (13,363 | ) | | | (20 | ) | | | (6 | ) | |
Class A | | | (4 | ) | | | — | | | | (105 | ) | | | (70 | ) | | | (4,918 | ) | | | (6,196 | ) | | | (18 | ) | | | (45 | ) | | | — | | | | — | | | | (1 | ) | | | — | | |
Class C | | | (0 | ) | | | — | | | | — | | | | — | | | | (4,676 | ) | | | (5,844 | ) | | | (16 | ) | | | (53 | ) | | | — | | | | — | | | | — | | | | — | | |
Class R3 | | | — | | | | — | | | | (1 | ) | | | (2 | ) | | | (40 | ) | | | (65 | ) | | | — | | | | — | | | | — | | | | — | | | | — | | | | — | | |
Class R6 | | | (1 | ) | | | — | | | | (595 | ) | | | (673 | ) | | | — | | | | — | | | | — | | | | — | | | | (14,130 | ) | | | (13,260 | ) | | | — | | | | — | | |
Net realized gain on investments: | |
Investor Class | | | — | | | | — | | | | — | | | | — | | | | — | | | | — | | | | (52,641 | ) | | | (27,199 | ) | | | (179,026 | ) | | | (261,273 | ) | | | — | | | | — | | |
Trust Class | | | — | | | | — | | | | — | | | | — | | | | — | | | | — | | | | (9,025 | ) | | | (5,819 | ) | | | (96,426 | ) | | | (167,895 | ) | | | — | | | | — | | |
Advisor Class | | | — | | | | — | | | | — | | | | — | | | | — | | | | — | | | | (1,043 | ) | | | (710 | ) | | | (36,943 | ) | | | (69,131 | ) | | | — | | | | — | | |
Institutional Class | | | — | | | | — | | | | — | | | | — | | | | (36,549 | ) | | | (44,180 | ) | | | (608 | ) | | | (1,116 | ) | | | (209,556 | ) | | | (345,517 | ) | | | (25 | ) | | | — | | |
Class A | | | — | | | | — | | | | — | | | | — | | | | (7,824 | ) | | | (9,346 | ) | | | (446 | ) | | | (307 | ) | | | — | | | | — | | | | (3 | ) | | | — | | |
Class C | | | — | | | | — | | | | — | | | | — | | | | (10,759 | ) | | | (13,040 | ) | | | (591 | ) | | | (399 | ) | | | — | | | | — | | | | (1 | ) | | | — | | |
Class R3 | | | — | | | | — | | | | — | | | | — | | | | (78 | ) | | | (112 | ) | | | — | | | | — | | | | — | | | | — | | | | — | | | | — | | |
Class R6 | | | — | | | | — | | | | — | | | | — | | | | — | | | | — | | | | — | | | | — | | | | (214,988 | ) | | | (281,756 | ) | | | — | | | | — | | |
Total distributions to shareholders | | | (425 | ) | | | — | | | | (2,330 | ) | | | (2,725 | ) | | | (94,476 | ) | | | (111,980 | ) | | | (66,982 | ) | | | (41,054 | ) | | | (771,957 | ) | | | (1,161,129 | ) | | | (50 | ) | | | (6 | ) | |
From Fund Share Transactions (Note D): | |
Proceeds from shares sold: | |
Investor Class | | | — | | | | — | | | | — | | | | — | | | | — | | | | — | | | | 5,643 | | | | 5,207 | | | | 202,685 | | | | 166,774 | | | | — | | | | — | | |
Trust Class | | | — | | | | — | | | | — | | | | — | | | | — | | | | — | | | | 1,253 | | | | 1,694 | | | | 147,223 | | | | 131,035 | | | | — | | | | — | | |
Advisor Class | | | — | | | | — | | | | — | | | | — | | | | — | | | | — | | | | 415 | | | | 637 | | | | 48,532 | | | | 50,785 | | | | — | | | | — | | |
Institutional Class | | | 9,350 | | | | 20,184 | | | | 330,877 | | | | 113,068 | | | | 280,182 | | | | 179,243 | | | | 2,633 | | | | 2,431 | | | | 774,017 | | | | 868,352 | | | | 177 | | | | 615 | | |
Class A | | | 1,581 | | | | 716 | | | | 42,186 | | | | 15,370 | | | | 27,595 | | | | 30,839 | | | | 234 | | | | 463 | | | | — | | | | — | | | | 56 | | | | 202 | | |
Class C | | | 2,908 | | | | 601 | | | | 2,423 | | | | 567 | | | | 16,974 | | | | 25,033 | | | | 312 | | | | 522 | | | | — | | | | — | | | | 9 | | | | 19 | | |
Class R3 | | | — | | | | — | | | | 657 | | | | 476 | | | | 300 | | | | 566 | | | | — | | | | — | | | | — | | | | — | | | | — | | | | — | | |
Class R6 | | | — | | | | 1,000 | | | | 9,077 | | | | 11,499 | | | | — | | | | — | | | | — | | | | — | | | | 654,289 | | | | 656,719 | | | | — | | | | — | | |
See Notes to Financial Statements
167
168
Statements of Changes in Net Assets (cont'd)
Neuberger Berman Equity Funds (cont'd)
(000's omitted)
| | | DIVIDEND GROWTH FUND | | EMERGING MARKETS
EQUITY FUND | | EQUITY INCOME FUND | | FOCUS FUND | | GENESIS FUND | | GLOBAL EQUITY FUND | |
| | | Year Ended
August 31,
2017 | | Period from
December 15, 2015
(Commencement
of Operations) to
August 31,
2016 | | Year Ended
August 31,
2017 | | Year Ended
August 31,
2016 | | Year Ended
August 31,
2017 | | Year Ended
August 31,
2016 | | Year Ended
August 31,
2017 | | Year Ended
August 31,
2016 | | Year Ended
August 31,
2017 | | Year Ended
August 31,
2016 | | Year Ended
August 31,
2017 | | Year Ended
August 31,
2016 | |
Proceeds from reinvestment of dividends and distributions: | |
Investor Class | | | — | | | | — | | | | — | | | | — | | | | — | | | | — | | | | 49,229 | | | | 28,301 | | | | 180,857 | | | | 259,291 | | | | — | | | | — | | |
Trust Class | | | — | | | | — | | | | — | | | | — | | | | — | | | | — | | | | 9,313 | | | | 6,580 | | | | 96,408 | | | | 164,812 | | | | — | | | | — | | |
Advisor Class | | | — | | | | — | | | | — | | | | — | | | | — | | | | — | | | | 1,094 | | | | 825 | | | | 36,009 | | | | 64,441 | | | | — | | | | — | | |
Institutional Class | | | 419 | | | | — | | | | 845 | | | | 1,168 | | | | 55,466 | | | | 64,068 | | | | 510 | | | | 505 | | | | 202,793 | | | | 330,269 | | | | 45 | | | | 6 | | |
Class A | | | 4 | | | | — | | | | 87 | | | | 49 | | | | 11,330 | | | | 13,328 | | | | 451 | | | | 340 | | | | — | | | | — | | | | 3 | | | | — | | |
Class C | | | — | | | | — | | | | — | | | | — | | | | 10,921 | | | | 13,078 | | | | 542 | | | | 358 | | | | — | | | | — | | | | 1 | | | | — | | |
Class R3 | | | — | | | | — | | | | — | | | | 1 | | | | 71 | | | | 120 | | | | — | | | | — | | | | — | | | | — | | | | — | | | | — | | |
Class R6 | | | — | | | | — | | | | 595 | | | | 673 | | | | — | | | | — | | | | — | | | | — | | | | 229,031 | | | | 295,016 | | | | — | | | | — | | |
Payments for shares redeemed: | |
Investor Class | | | — | | | | — | | | | — | | | | — | | | | — | | | | — | | | | (58,894 | ) | | | (54,961 | ) | | | (340,454 | ) | | | (618,036 | ) | | | — | | | | — | | |
Trust Class | | | — | | | | — | | | | — | | | | — | | | | — | | | | — | | | | (18,668 | ) | | | (28,349 | ) | | | (494,926 | ) | | | (555,220 | ) | | | — | | | | — | | |
Advisor Class | | | — | | | | — | | | | — | | | | — | | | | — | | | | — | | | | (1,437 | ) | | | (3,048 | ) | | | (132,686 | ) | | | (267,459 | ) | | | — | | | | — | | |
Institutional Class | | | (1,414 | ) | | | (1,547 | ) | | | (90,148 | ) | | | (145,964 | ) | | | (262,887 | ) | | | (668,925 | ) | | | (2,687 | ) | | | (23,239 | ) | | | (944,849 | ) | | | (1,402,884 | ) | | | (153 | ) | | | (367 | ) | |
Class A | | | (263 | ) | | | (562 | ) | | | (11,389 | ) | | | (8,099 | ) | | | (92,482 | ) | | | (104,754 | ) | | | (792 | ) | | | (1,796 | ) | | | — | | | | — | | | | (286 | ) | | | (135 | ) | |
Class C | | | (70 | ) | | | (667 | ) | | | (1,437 | ) | | | (2,251 | ) | | | (94,582 | ) | | | (113,279 | ) | | | (813 | ) | | | (1,284 | ) | | | — | | | | — | | | | (71 | ) | | | (103 | ) | |
Class R3 | | | — | | | | — | | | | (627 | ) | | | (183 | ) | | | (1,330 | ) | | | (1,912 | ) | | | — | | | | — | | | | — | | | | — | | | | — | | | | — | | |
Class R6 | | | (38 | ) | | | (1,057 | ) | | | (10,117 | ) | | | (6,354 | ) | | | — | | | | — | | | | — | | | | — | | | | (794,413 | ) | | | (429,375 | ) | | | — | | | | — | | |
Net increase (decrease) from Fund share transactions | | | 12,477 | | | | 18,668 | | | | 273,029 | | | | (19,980 | ) | | | (48,442 | ) | | | (562,595 | ) | | | (11,662 | ) | | | (64,814 | ) | | | (135,484 | ) | | | (285,480 | ) | | | (219 | ) | | | 237 | | |
Net Increase (Decrease) in Net Assets | | | 16,688 | | | | 20,617 | | | | 421,269 | | | | 40,199 | | | | 36,788 | | | | (470,622 | ) | | | 33,693 | | | | (61,322 | ) | | | 175,597 | | | | (317,196 | ) | | | 354 | | | | 450 | | |
Net Assets: | |
Beginning of year | | | 20,617 | | | | — | | | | 456,180 | | | | 415,981 | | | | 1,656,264 | | | | 2,126,886 | | | | 713,377 | | | | 774,699 | | | | 10,644,248 | | | | 10,961,444 | | | | 4,290 | | | | 3,840 | | |
End of year | | $ | 37,305 | | | $ | 20,617 | | | $ | 877,449 | | | $ | 456,180 | | | $ | 1,693,052 | | | $ | 1,656,264 | | | $ | 747,070 | | | $ | 713,377 | | | $ | 10,819,845 | | | $ | 10,644,248 | | | $ | 4,644 | | | $ | 4,290 | | |
Undistributed net investment income (loss) at end of year | | $ | 311 | | | $ | 284 | | | $ | 4,510 | | | $ | 1,800 | | | $ | 11,234 | | | $ | 5,133 | | | $ | 1,337 | | | $ | 2,377 | | | $ | 21,800 | | | $ | 22,874 | | | $ | 24 | | | $ | 21 | | |
Distributions in excess of net investment income at
end of year | | $ | — | | | $ | — | | | $ | — | | | $ | — | | | $ | — | | | $ | — | | | $ | — | | | $ | — | | | $ | — | | | $ | — | | | $ | — | | | $ | — | | |
See Notes to Financial Statements
169
170
Statements of Changes in Net Assets (cont'd)
Neuberger Berman Equity Funds
(000's omitted)
| | | GLOBAL
REAL ESTATE FUND | | GREATER CHINA
EQUITY FUND | | GUARDIAN FUND | | INTERNATIONAL
EQUITY FUND | | INTERNATIONAL
SELECT FUND | | INTERNATIONAL
SMALL CAP FUND | |
| | | Year Ended
August 31,
2017 | | Year Ended
August 31,
2016 | | Year Ended
August 31,
2017 | | Year Ended
August 31,
2016 | | Year Ended
August 31,
2017 | | Year Ended
August 31,
2016 | | Year Ended
August 31,
2017 | | Year Ended
August 31,
2016 | | Year Ended
August 31,
2017 | | Year Ended
August 31,
2016 | | Period from
December 8, 2016
(Commencement
of Operations) to
August 31,
2017 | |
Increase (Decrease) in Net Assets: | |
From Operations: | |
Net investment income (loss) (Note A) | | $ | 41 | | | $ | 44 | | | $ | 708 | | | $ | 394 | | | $ | 8,775 | | | $ | 6,656 | | | $ | 18,387 | | | $ | 18,769 | | | $ | 2,901 | | | $ | 3,428 | | | $ | 9 | | |
Net realized gain (loss) on investments (Note A) | | | 23 | | | | 10 | | | | 13,360 | | | | (11,779 | ) | | | 86,107 | | | | 204,671 | | | | 47,042 | | | | 13,946 | | | | 6,765 | | | | 3,771 | | | | 72 | | |
Net increase from payments by affiliates (Note B) | | | — | | | | — | | | | — | | | | — | | | | — | | | | — | | | | — | | | | — | | | | — | | | | — | | | | — | | |
Change in net unrealized appreciation (depreciation) of
investments (Note A) | | | (4 | ) | | | 383 | | | | 18,893 | | | | 25,024 | | | | 91,586 | | | | (119,815 | ) | | | 168,036 | | | | 29,718 | | | | 26,824 | | | | 1,260 | | | | 241 | | |
Net increase (decrease) in net assets resulting from operations | | | 60 | | | | 437 | | | | 32,961 | | | | 13,639 | | | | 186,468 | | | | 91,512 | | | | 233,465 | | | | 62,433 | | | | 36,490 | | | | 8,459 | | | | 322 | | |
Distributions to Shareholders From (Note A): | |
Net investment income: | |
Investor Class | | | — | | | | — | | | | — | | | | — | | | | (6,263 | ) | | | (7,114 | ) | | | (449 | ) | | | (510 | ) | | | — | | | | — | | | | — | | |
Trust Class | | | — | | | | — | | | | — | | | | — | | | | (588 | ) | | | (694 | ) | | | (155 | ) | | | (126 | ) | | | (84 | ) | | | (91 | ) | | | — | | |
Advisor Class | | | — | | | | — | | | | — | | | | — | | | | (1 | ) | | | (0 | ) | | | — | | | | — | | | | — | | | | — | | | | — | | |
Institutional Class | | | (66 | ) | | | (44 | ) | | | (359 | ) | | | (857 | ) | | | (523 | ) | | | (699 | ) | | | (16,444 | ) | | | (12,200 | ) | | | (3,092 | ) | | | (2,723 | ) | | | — | | |
Class A | | | (11 | ) | | | (12 | ) | | | (1 | ) | | | (6 | ) | | | (49 | ) | | | (63 | ) | | | (159 | ) | | | (269 | ) | | | (48 | ) | | | (35 | ) | | | — | | |
Class C | | | (5 | ) | | | (3 | ) | | | — | | | | — | | | | (6 | ) | | | — | | | | — | | | | — | | | | (11 | ) | | | (7 | ) | | | — | | |
Class R3 | | | — | | | | — | | | | — | | | | — | | | | (2 | ) | | | (2 | ) | | | — | | | | — | | | | (42 | ) | | | (22 | ) | | | — | | |
Class R6 | | | — | | | | — | | | | — | | | | — | | | | — | | | | — | | | | (776 | ) | | | (499 | ) | | | — | | | | — | | | | — | | |
Net realized gain on investments: | |
Investor Class | | | — | | | | — | | | | — | | | | — | | | | (108,442 | ) | | | (109,463 | ) | | | — | | | | — | | | | — | | | | — | | | | — | | |
Trust Class | | | — | | | | — | | | | — | | | | — | | | | (10,943 | ) | | | (14,321 | ) | | | — | | | | — | | | | — | | | | — | | | | — | | |
Advisor Class | | | — | | | | — | | | | — | | | | — | | | | (29 | ) | | | (37 | ) | | | — | | | | — | | | | — | | | | — | | | | — | | |
Institutional Class | | | (9 | ) | | | (0 | ) | | | — | | | | (11,719 | ) | | | (6,846 | ) | | | (8,681 | ) | | | — | | | | — | | | | — | | | | — | | | | — | | |
Class A | | | (1 | ) | | | (0 | ) | | | — | | | | (270 | ) | | | (916 | ) | | | (1,333 | ) | | | — | | | | — | | | | — | | | | — | | | | — | | |
Class C | | | (1 | ) | | | (0 | ) | | | — | | | | (17 | ) | | | (330 | ) | | | (316 | ) | | | — | | | | — | | | | — | | | | — | | | | — | | |
Class R3 | | | — | | | | — | | | | — | | | | — | | | | (72 | ) | | | (68 | ) | | | — | | | | — | | | | — | | | | — | | | | — | | |
Class R6 | | | — | | | | — | | | | — | | | | — | | | | — | | | | — | | | | — | | | | — | | | | — | | | | — | | | | — | | |
Total distributions to shareholders | | | (93 | ) | | | (59 | ) | | | (360 | ) | | | (12,869 | ) | | | (135,010 | ) | | | (142,791 | ) | | | (17,983 | ) | | | (13,604 | ) | | | (3,277 | ) | | | (2,878 | ) | | | — | | |
From Fund Share Transactions (Note D): | |
Proceeds from shares sold: | |
Investor Class | | | — | | | | — | | | | — | | | | — | | | | 10,414 | | | | 9,981 | | | | 5,500 | | | | 8,007 | | | | — | | | | — | | | | — | | |
Trust Class | | | — | | | | — | | | | — | | | | — | | | | 4,820 | | | | 4,128 | | | | 6,540 | | | | 7,668 | | | | 276 | | | | 703 | | | | — | | |
Advisor Class | | | — | | | | — | | | | — | | | | — | | | | 22 | | | | 149 | | | | — | | | | — | | | | — | | | | — | | | | — | | |
Institutional Class | | | — | | | | 1 | | | | 22,865 | | | | 47,239 | | | | 17,432 | | | | 12,277 | | | | 464,902 | | | | 490,552 | | | | 48,560 | | | | 15,103 | | | | 643 | | |
Class A | | | 213 | | | | 4 | | | | 20,057 | | | | 8,257 | | | | 1,444 | | | | 4,814 | | | | 28,258 | | | | 50,530 | | | | 1,941 | | | | 2,006 | | | | 624 | | |
Class C | | | — | | | | 16 | | | | 283 | | | | — | | | | 376 | | | | 631 | | | | 2,776 | | | | 7,343 | | | | 481 | | | | 121 | | | | 111 | | |
Class R3 | | | — | | | | — | | | | — | | | | — | | | | 209 | | | | 127 | | | | — | | | | — | | | | 2,170 | | | | 1,396 | | | | — | | |
Class R6 | | | — | | | | — | | | | — | | | | — | | | | — | | | | — | | | | 94,389 | | | | 18,266 | | | | 9,237 | | | | — | | | | 200 | | |
See Notes to Financial Statements
171
172
Statements of Changes in Net Assets (cont'd)
Neuberger Berman Equity Funds (cont'd)
(000's omitted)
| | | GLOBAL
REAL ESTATE FUND | | GREATER CHINA
EQUITY FUND | | GUARDIAN FUND | | INTERNATIONAL
EQUITY FUND | | INTERNATIONAL
SELECT FUND | | INTERNATIONAL
SMALL CAP FUND | |
| | | Year Ended
August 31,
2017 | | Year Ended
August 31,
2016 | | Year Ended
August 31,
2017 | | Year Ended
August 31,
2016 | | Year Ended
August 31,
2017 | | Year Ended
August 31,
2016 | | Year Ended
August 31,
2017 | | Year Ended
August 31,
2016 | | Year Ended
August 31,
2017 | | Year Ended
August 31,
2016 | | Period from
December 8, 2016
(Commencement
of Operations) to
August 31,
2017 | |
Proceeds from reinvestment of dividends and distributions: | |
Investor Class | | | — | | | | — | | | | — | | | | — | | | | 108,145 | | | | 109,903 | | | | 432 | | | | 491 | | | | — | | | | — | | | | — | | |
Trust Class | | | — | | | | — | | | | — | | | | — | | | | 11,422 | | | | 14,782 | | | | 150 | | | | 122 | | | | 81 | | | | 88 | | | | — | | |
Advisor Class | | | — | | | | — | | | | — | | | | — | | | | 30 | | | | 34 | | | | — | | | | — | | | | — | | | | — | | | | — | | |
Institutional Class | | | 75 | | | | 12 | | | | 106 | | | | 4,363 | | | | 7,112 | | | | 8,851 | | | | 14,597 | | | | 10,984 | | | | 3,030 | | | | 2,673 | | | | — | | |
Class A | | | 4 | | | | 8 | | | | — | | | | 273 | | | | 906 | | | | 1,331 | | | | 92 | | | | 163 | | | | 43 | | | | 31 | | | | — | | |
Class C | | | 1 | | | | — | | | | — | | | | 16 | | | | 220 | | | | 212 | | | | — | | | | — | | | | 3 | | | | 2 | | | | — | | |
Class R3 | | | — | | | | — | | | | — | | | | — | | | | 43 | | | | 45 | | | | — | | | | — | | | | 35 | | | | 20 | | | | — | | |
Class R6 | | | — | | | | — | | | | — | | | | — | | | | — | | | | — | | | | 775 | | | | 498 | | | | — | | | | — | | | | — | | |
Payments for shares redeemed: | |
Investor Class | | | — | | | | — | | | | — | | | | — | | | | (108,871 | ) | | | (124,444 | ) | | | (14,532 | ) | | | (26,294 | ) | | | — | | | | — | | | | — | | |
Trust Class | | | — | | | | — | | | | — | | | | — | | | | (27,795 | ) | | | (43,451 | ) | | | (15,813 | ) | | | (16,752 | ) | | | (1,042 | ) | | | (3,237 | ) | | | — | | |
Advisor Class | | | — | | | | — | | | | — | | | | — | | | | (141 | ) | | | (232 | ) | | | — | | | | — | | | | — | | | | — | | | | — | | |
Institutional Class | | | (67 | ) | | | (12 | ) | | | (37,308 | ) | | | (62,736 | ) | | | (16,746 | ) | | | (50,412 | ) | | | (390,004 | ) | | | (240,561 | ) | | | (78,386 | ) | | | (27,684 | ) | | | — | | |
Class A | | | (387 | ) | | | (18 | ) | | | (2,503 | ) | | | (10,239 | ) | | | (3,205 | ) | | | (79,367 | ) | | | (70,145 | ) | | | (40,438 | ) | | | (2,306 | ) | | | (1,364 | ) | | | (387 | ) | |
Class C | | | (15 | ) | | | — | | | | (181 | ) | | | (31 | ) | | | (1,281 | ) | | | (714 | ) | | | (6,033 | ) | | | (4,269 | ) | | | (1,670 | ) | | | (657 | ) | | | (11 | ) | |
Class R3 | | | — | | | | — | | | | — | | | | — | | | | (365 | ) | | | (85 | ) | | | — | | | | — | | | | (1,666 | ) | | | (1,127 | ) | | | — | | |
Class R6 | | | — | | | | — | | | | — | | | | — | | | | — | | | | — | | | | (15,680 | ) | | | (6,388 | ) | | | (628 | ) | | | — | | | | — | | |
Net increase (decrease) from Fund share transactions | | | (176 | ) | | | 11 | | | | 3,319 | | | | (12,858 | ) | | | 4,191 | | | | (131,440 | ) | | | 106,204 | | | | 259,922 | | | | (19,841 | ) | | | (11,926 | ) | | | 1,180 | | |
Net Increase (Decrease) in Net Assets | | | (209 | ) | | | 389 | | | | 35,920 | | | | (12,088 | ) | | | 55,649 | | | | (182,719 | ) | | | 321,686 | | | | 308,751 | | | | 13,372 | | | | (6,345 | ) | | | 1,502 | | |
Net Assets: | |
Beginning of year | | | 3,112 | | | | 2,723 | | | | 95,489 | | | | 107,577 | | | | 1,132,632 | | | | 1,315,351 | | | | 1,503,135 | | | | 1,194,384 | | | | 231,202 | | | | 237,547 | | | | — | | |
End of year | | $ | 2,903 | | | $ | 3,112 | | | $ | 131,409 | | | $ | 95,489 | | | $ | 1,188,281 | | | $ | 1,132,632 | | | $ | 1,824,821 | | | $ | 1,503,135 | | | $ | 244,574 | | | $ | 231,202 | | | $ | 1,502 | | |
Undistributed net investment income (loss) at end of year | | $ | — | | | $ | 1 | | | $ | 850 | | | $ | 336 | | | $ | 2,985 | | | $ | 2,687 | | | $ | 12,844 | | | $ | 13,044 | | | $ | 1,624 | | | $ | 2,074 | | | $ | 15 | | |
Distributions in excess of net investment income at end of year | | $ | (35 | ) | | $ | — | | | $ | — | | | $ | — | | | $ | — | | | $ | — | | | $ | — | | | $ | — | | | $ | — | | | $ | — | | | $ | — | | |
See Notes to Financial Statements
173
174
Statements of Changes in Net Assets (cont'd)
Neuberger Berman Equity Funds
(000's omitted)
| | | INTRINSIC VALUE FUND | | LARGE CAP VALUE FUND | | MID CAP GROWTH FUND | | MID CAP
INTRINSIC VALUE FUND | | MULTI-CAP
OPPORTUNITIES FUND | | REAL ESTATE FUND | |
| | | Year Ended
August 31,
2017 | | Year Ended
August 31,
2016 | | Year Ended
August 31,
2017 | | Year Ended
August 31,
2016 | | Year Ended
August 31,
2017 | | Year Ended
August 31,
2016 | | Year Ended
August 31,
2017 | | Year Ended
August 31,
2016 | | Year Ended
August 31,
2017 | | Year Ended
August 31,
2016 | | Year Ended
August 31,
2017 | | Year Ended
August 31,
2016 | |
Increase (Decrease) in Net Assets: | |
From Operations: | |
Net investment income (loss) (Note A) | | $ | (2,945 | ) | | $ | (2,517 | ) | | $ | 18,367 | | | $ | 15,124 | | | $ | (2,312 | ) | | $ | (2,989 | ) | | $ | 931 | | | $ | 852 | | | $ | 12,016 | | | $ | 19,635 | | | $ | 8,324 | | | $ | 9,963 | | |
Net realized gain (loss) on investments (Note A) | | | 39,725 | | | | 13,887 | | | | 143,330 | | | | 2,357 | | | | 110,017 | | | | 46,790 | | | | 4,958 | | | | (701 | ) | | | 137,938 | | | | 71,256 | | | | 40,372 | | | | 90,375 | | |
Net increase from payments by affiliates (Note B) | | | — | | | | — | | | | — | | | | — | | | | — | | | | 1,007 | | | | — | | | | — | | | | — | | | | — | | | | — | | | | — | | |
Change in net unrealized appreciation (depreciation) of
investments (Note A) | | | 72,572 | | | | 18,804 | | | | 47,490 | | | | 137,870 | | | | 57,664 | | | | (68,458 | ) | | | 8,449 | | | | 4,256 | | | | 187,940 | | | | 69,607 | | | | (41,934 | ) | | | 48,034 | | |
Net increase (decrease) in net assets resulting from operations | | | 109,352 | | | | 30,174 | | | | 209,187 | | | | 155,351 | | | | 165,369 | | | | (23,650 | ) | | | 14,338 | | | | 4,407 | | | | 337,894 | | | | 160,498 | | | | 6,762 | | | | 148,372 | | |
Distributions to Shareholders From (Note A): | |
Net investment income: | |
Investor Class | | | — | | | | — | | | | (7,325 | ) | | | (11,530 | ) | | | — | | | | — | | | | (201 | ) | | | (190 | ) | | | — | | | | — | | | | — | | | | — | | |
Trust Class | | | — | | | | — | | | | (794 | ) | | | (1,539 | ) | | | — | | | | — | | | | (67 | ) | | | (59 | ) | | | — | | | | — | | | | (2,367 | ) | | | (3,347 | ) | |
Advisor Class | | | — | | | | — | | | | (1,953 | ) | | | (2,955 | ) | | | — | | | | — | | | | — | | | | — | | | | — | | | | — | | | | — | | | | — | | |
Institutional Class | | | — | | | | — | | | | (560 | ) | | | (711 | ) | | | — | | | | — | | | | (194 | ) | | | (235 | ) | | | (14,963 | ) | | | (19,825 | ) | | | (3,355 | ) | | | (5,052 | ) | |
Class A | | | — | | | | — | | | | (35 | ) | | | (53 | ) | | | — | | | | — | | | | (78 | ) | | | (82 | ) | | | (286 | ) | | | (486 | ) | | | (1,130 | ) | | | (1,575 | ) | |
Class C | | | — | | | | — | | | | (21 | ) | | | (27 | ) | | | — | | | | — | | | | (11 | ) | | | (13 | ) | | | (1 | ) | | | (26 | ) | | | (89 | ) | | | (146 | ) | |
Class R3 | | | — | | | | — | | | | (1 | ) | | | (1 | ) | | | — | | | | — | | | | (7 | ) | | | (7 | ) | | | — | | | | — | | | | (199 | ) | | | (232 | ) | |
Class R6 | | | — | | | | — | | | | — | | | | — | | | | — | | | | — | | | | — | | | | — | | | | — | | | | — | | | | (676 | ) | | | (569 | ) | |
Net realized gain on investments: | |
Investor Class | | | — | | | | — | | | | (32,301 | ) | | | (76,307 | ) | | | (19,685 | ) | | | (33,896 | ) | | | — | | | | (4,071 | ) | | | — | | | | — | | | | — | | | | — | | |
Trust Class | | | — | | | | — | | | | (3,644 | ) | | | (11,016 | ) | | | (1,759 | ) | | | (4,306 | ) | | | — | | | | (1,358 | ) | | | — | | | | — | | | | (21,699 | ) | | | (17,429 | ) | |
Advisor Class | | | — | | | | — | | | | (8,877 | ) | | | (21,422 | ) | | | (310 | ) | | | (570 | ) | | | — | | | | — | | | | — | | | | — | | | | — | | | | — | | |
Institutional Class | | | (8,811 | ) | | | (20,020 | ) | | | (1,923 | ) | | | (4,239 | ) | | | (13,469 | ) | | | (34,461 | ) | | | — | | | | (3,332 | ) | | | (45,915 | ) | | | (56,652 | ) | | | (26,621 | ) | | | (24,580 | ) | |
Class A | | | (609 | ) | | | (2,291 | ) | | | (158 | ) | | | (367 | ) | | | (2,041 | ) | | | (5,057 | ) | | | — | | | | (1,707 | ) | | | (1,735 | ) | | | (2,628 | ) | | | (12,376 | ) | | | (9,296 | ) | |
Class C | | | (365 | ) | | | (1,408 | ) | | | (141 | ) | | | (334 | ) | | | (276 | ) | | | (525 | ) | | | — | | | | (474 | ) | | | (1,065 | ) | | | (1,252 | ) | | | (2,889 | ) | | | (2,189 | ) | |
Class R3 | | | — | | | | — | | | | (4 | ) | | | (10 | ) | | | (370 | ) | | | (647 | ) | | | — | | | | (174 | ) | | | — | | | | — | | | | (2,659 | ) | | | (1,705 | ) | |
Class R6 | | | — | | | | — | | | | — | | | | — | | | | (9,481 | ) | | | (11,059 | ) | | | — | | | | — | | | | — | | | | — | | | | (4,843 | ) | | | (2,354 | ) | |
Total distributions to shareholders | | | (9,785 | ) | | | (23,719 | ) | | | (57,737 | ) | | | (130,511 | ) | | | (47,391 | ) | | | (90,521 | ) | | | (558 | ) | | | (11,702 | ) | | | (63,965 | ) | | | (80,869 | ) | | | (78,903 | ) | | | (68,474 | ) | |
From Fund Share Transactions (Note D): | |
Proceeds from shares sold: | |
Investor Class | | | — | | | | — | | | | 17,941 | | | | 15,530 | | | | 9,599 | | | | 30,726 | | | | 1,561 | | | | 2,183 | | | | — | | | | — | | | | — | | | | — | | |
Trust Class | | | — | | | | — | | | | 6,699 | | | | 4,646 | | | | 9,850 | | | | 13,829 | | | | 546 | | | | 434 | | | | — | | | | — | | | | 12,240 | | | | 22,476 | | |
Advisor Class | | | — | | | | — | | | | 13,478 | | | | 11,413 | | | | 3,126 | | | | 4,806 | | | | — | | | | — | | | | — | | | | — | | | | — | | | | — | | |
Institutional Class | | | 293,161 | | | | 334,188 | | | | 41,776 | | | | 7,155 | | | | 68,136 | | | | 135,219 | | | | 8,815 | | | | 7,328 | | | | 171,779 | | | | 93,383 | | | | 51,910 | | | | 87,082 | | |
Class A | | | 15,111 | | | | 30,062 | | | | 2,779 | | | | 1,185 | | | | 10,173 | | | | 34,869 | | | | 2,066 | | | | 4,006 | | | | 25,355 | | | | 13,768 | | | | 21,145 | | | | 37,989 | | |
Class C | | | 3,229 | | | | 6,203 | | | | 1,131 | | | | 776 | | | | 1,070 | | | | 5,176 | | | | 507 | | | | 1,122 | | | | 6,279 | | | | 5,123 | | | | 954 | | | | 2,210 | | |
Class R3 | | | — | | | | — | | | | 196 | | | | 3 | | | | 3,705 | | | | 6,637 | | | | 434 | | | | 604 | | | | — | | | | — | | | | 5,625 | | | | 8,186 | | |
Class R6 | | | — | | | | — | | | | — | | | | — | | | | 66,750 | | | | 135,445 | | | | — | | | | — | | | | — | | | | — | | | | 10,995 | | | | 17,098 | | |
See Notes to Financial Statements
175
176
Statements of Changes in Net Assets (cont'd)
Neuberger Berman Equity Funds (cont'd)
(000's omitted)
| | | INTRINSIC VALUE FUND | | LARGE CAP VALUE FUND | | MID CAP GROWTH FUND | | MID CAP
INTRINSIC VALUE FUND | | MULTI-CAP
OPPORTUNITIES FUND | | REAL ESTATE FUND | |
| | | Year Ended
August 31,
2017 | | Year Ended
August 31,
2016 | | Year Ended
August 31,
2017 | | Year Ended
August 31,
2016 | | Year Ended
August 31,
2017 | | Year Ended
August 31,
2016 | | Year Ended
August 31,
2017 | | Year Ended
August 31,
2016 | | Year Ended
August 31,
2017 | | Year Ended
August 31,
2016 | | Year Ended
August 31,
2017 | | Year Ended
August 31,
2016 | |
Proceeds from reinvestment of dividends and distributions: | |
Investor Class | | | — | | | | — | | | | 38,220 | | | | 84,421 | | | | 18,588 | | | | 31,963 | | | | 191 | | | | 4,057 | | | | — | | | | — | | | | — | | | | — | | |
Trust Class | | | — | | | | — | | | | 4,359 | | | | 12,472 | | | | 1,758 | | | | 4,301 | | | | 67 | | | | 1,391 | | | | — | | | | — | | | | 23,899 | | | | 20,576 | | |
Advisor Class | | | — | | | | — | | | | 10,811 | | | | 23,911 | | | | 249 | | | | 461 | | | | — | | | | — | | | | — | | | | — | | | | — | | | | — | | |
Institutional Class | | | 7,762 | | | | 17,259 | | | | 2,396 | | | | 4,727 | | | | 13,315 | | | | 34,137 | | | | 190 | | | | 3,513 | | | | 11,082 | | | | 12,661 | | | | 25,843 | | | | 23,584 | | |
Class A | | | 589 | | | | 2,112 | | | | 190 | | | | 402 | | | | 1,933 | | | | 4,971 | | | | 68 | | | | 1,394 | | | | 1,939 | | | | 2,761 | | | | 12,849 | | | | 10,136 | | |
Class C | | | 298 | | | | 1,094 | | | | 132 | | | | 246 | | | | 264 | | | | 500 | | | | 8 | | | | 254 | | | | 955 | | | | 1,106 | | | | 2,569 | | | | 1,968 | | |
Class R3 | | | — | | | | — | | | | — | | | | 8 | | | | 323 | | | | 591 | | | | 6 | | | | 171 | | | | — | | | | — | | | | 2,647 | | | | 1,808 | | |
Class R6 | | | — | | | | — | | | | — | | | | — | | | | 9,371 | | | | 10,862 | | | | — | | | | — | | | | — | | | | — | | | | 5,519 | | | | 2,922 | | |
Payments for shares redeemed: | |
Investor Class | | | — | | | | — | | | | (102,947 | ) | | | (112,554 | ) | | | (40,667 | ) | | | (46,371 | ) | | | (5,318 | ) | | | (8,233 | ) | | | — | | | | — | | | | — | | | | — | | |
Trust Class | | | — | | | | — | | | | (20,992 | ) | | | (43,086 | ) | | | (33,896 | ) | | | (36,422 | ) | | | (1,582 | ) | | | (2,571 | ) | | | — | | | | — | | | | (69,683 | ) | | | (105,898 | ) | |
Advisor Class | | | — | | | | — | | | | (36,688 | ) | | | (43,929 | ) | | | (3,916 | ) | | | (3,648 | ) | | | — | | | | — | | | | — | | | | — | | | | — | | | | — | | |
Institutional Class | | | (162,730 | ) | | | (168,231 | ) | | | (27,421 | ) | | | (42,832 | ) | | | (98,781 | ) | | | (237,894 | ) | | | (6,333 | ) | | | (19,558 | ) | | | (370,505 | ) | | | (615,578 | ) | | | (118,324 | ) | | | (220,377 | ) | |
Class A | | | (46,279 | ) | | | (31,554 | ) | | | (2,708 | ) | | | (1,221 | ) | | | (41,744 | ) | | | (53,600 | ) | | | (8,521 | ) | | | (5,823 | ) | | | (56,386 | ) | | | (48,887 | ) | | | (56,424 | ) | | | (80,084 | ) | |
Class C | | | (9,286 | ) | | | (7,010 | ) | | | (1,276 | ) | | | (1,365 | ) | | | (3,623 | ) | | | (2,505 | ) | | | (2,112 | ) | | | (842 | ) | | | (11,958 | ) | | | (14,416 | ) | | | (10,807 | ) | | | (7,907 | ) | |
Class R3 | | | — | | | | — | | | | (66 | ) | | | (13 | ) | | | (6,143 | ) | | | (5,380 | ) | | | (579 | ) | | | (449 | ) | | | — | | | | — | | | | (11,595 | ) | | | (9,775 | ) | |
Class R6 | | | — | | | | — | | | | — | | | | — | | | | (32,175 | ) | | | (33,454 | ) | | | — | | | | — | | | | — | | | | — | | | | (12,130 | ) | | | (8,819 | ) | |
Net increase (decrease) from Fund share transactions | | | 101,855 | | | | 184,123 | | | | (51,990 | ) | | | (78,105 | ) | | | (42,735 | ) | | | 35,219 | | | | (9,986 | ) | | | (11,019 | ) | | | (221,460 | ) | | | (550,079 | ) | | | (102,768 | ) | | | (196,825 | ) | |
Net Increase (Decrease) in Net Assets | | | 201,422 | | | | 190,578 | | | | 99,460 | | | | (53,265 | ) | | | 75,243 | | | | (78,952 | ) | | | 3,794 | | | | (18,314 | ) | | | 52,469 | | | | (470,450 | ) | | | (174,909 | ) | | | (116,927 | ) | |
Net Assets: | |
Beginning of year | | | 681,031 | | | | 490,453 | | | | 1,354,963 | | | | 1,408,228 | | | | 1,096,250 | | | | 1,175,202 | | | | 89,191 | | | | 107,505 | | | | 1,869,848 | | | | 2,340,298 | | | | 689,431 | | | | 806,358 | | |
End of year | | $ | 882,453 | | | $ | 681,031 | | | $ | 1,454,423 | | | $ | 1,354,963 | | | $ | 1,171,493 | | | $ | 1,096,250 | | | $ | 92,985 | | | $ | 89,191 | | | $ | 1,922,317 | | | $ | 1,869,848 | | | $ | 514,522 | | | $ | 689,431 | | |
Undistributed net investment income (loss) at end of year | | $ | (100 | ) | | $ | (113 | ) | | $ | 14,558 | | | $ | 10,386 | | | $ | — | | | $ | (1,654 | ) | | $ | 294 | | | $ | — | | | $ | 7,156 | | | $ | 10,815 | | | $ | — | | | $ | — | | |
Distributions in excess of net investment income at end of year | | $ | — | | | $ | — | | | $ | — | | | $ | — | | | $ | — | | | $ | — | | | $ | — | | | $ | — | | | $ | — | | | $ | — | | | $ | — | | | $ | — | | |
See Notes to Financial Statements
177
178
Statements of Changes in Net Assets (cont'd)
Neuberger Berman Equity Funds
(000's omitted)
| | | SMALL CAP
GROWTH FUND | | SOCIALLY
RESPONSIVE FUND | | VALUE FUND | |
| | | Year Ended
August 31,
2017 | | Year Ended
August 31,
2016 | | Year Ended
August 31,
2017 | | Year Ended
August 31,
2016 | | Year Ended
August 31,
2017 | | Year Ended
August 31,
2016 | |
Increase (Decrease) in Net Assets: | |
From Operations: | |
Net investment income (loss) (Note A) | | $ | (597 | ) | | $ | (582 | ) | | $ | 16,348 | | | $ | 17,184 | | | $ | 226 | | | $ | 173 | | |
Net realized gain (loss) on investments (Note A) | | | 14,135 | | | | (12,590 | ) | | | 145,869 | | | | 91,678 | | | | 2,275 | | | | (848 | ) | |
Net increase from payments by affiliates (Note B) | | | — | | | | — | | | | — | | | | — | | | | — | | | | — | | |
Change in net unrealized appreciation (depreciation) of
investments (Note A) | | | 104 | | | | 8,835 | | | | 129,440 | | | | 119,695 | | | | 241 | | | | 1,907 | | |
Net increase (decrease) in net assets resulting from operations | | | 13,642 | | | | (4,337 | ) | | | 291,657 | | | | 228,557 | | | | 2,742 | | | | 1,232 | | |
Distributions to Shareholders From (Note A): | |
Investor Class | | | — | | | | — | | | | (4,454 | ) | | | (4,849 | ) | | | — | | | | — | | |
Trust Class | | | — | | | | — | | | | (2,808 | ) | | | (3,097 | ) | | | — | | | | — | | |
Advisor Class | | | — | | | | — | | | | — | | | | — | | | | — | | | | — | | |
Institutional Class | | | — | | | | — | | | | (6,309 | ) | | | (6,167 | ) | | | (84 | ) | | | (141 | ) | |
Class A | | | — | | | | — | | | | (1,404 | ) | | | (1,475 | ) | | | (25 | ) | | | (53 | ) | |
Class C | | | — | | | | — | | | | (226 | ) | | | (188 | ) | | | (19 | ) | | | (3 | ) | |
Class R3 | | | — | | | | — | | | | (316 | ) | | | (265 | ) | | | — | | | | — | | |
Class R6 | | | — | | | | — | | | | (2,872 | ) | | | (2,260 | ) | | | — | | | | — | | |
Net realized gain on investments: | |
Investor Class | | | — | | | | (2,547 | ) | | | (26,356 | ) | | | (40,560 | ) | | | — | | | | — | | |
Trust Class | | | — | | | | (255 | ) | | | (16,367 | ) | | | (26,827 | ) | | | — | | | | — | | |
Advisor Class | | | — | | | | (199 | ) | | | — | | | | — | | | | — | | | | — | | |
Institutional Class | | | — | | | | (998 | ) | | | (28,362 | ) | | | (39,602 | ) | | | — | | | | (126 | ) | |
Class A | | | — | | | | (225 | ) | | | (8,167 | ) | | | (12,413 | ) | | | — | | | | (69 | ) | |
Class C | | | — | | | | (188 | ) | | | (3,469 | ) | | | (4,776 | ) | | | — | | | | (7 | ) | |
Class R3 | | | — | | | | (105 | ) | | | (2,219 | ) | | | (2,843 | ) | | | — | | | | — | | |
Class R6 | | | — | | | | — | | | | (11,964 | ) | | | (13,351 | ) | | | — | | | | — | | |
Total distributions to shareholders | | | — | | | | (4,517 | ) | | | (115,293 | ) | | | (158,673 | ) | | | (128 | ) | | | (399 | ) | |
From Fund Share Transactions (Note D): | |
Proceeds from shares sold: | |
Investor Class | | | 2,555 | | | | 968 | | | | 62,120 | | | | 75,553 | | | | — | | | | — | | |
Trust Class | | | 142 | | | | 312 | | | | 34,508 | | | | 35,105 | | | | — | | | | — | | |
Advisor Class | | | 187 | | | | 467 | | | | — | | | | — | | | | — | | | | — | | |
Institutional Class | | | 3,103 | | | | 2,475 | | | | 212,400 | | | | 212,232 | | | | 7,485 | | | | 2,513 | | |
Class A | | | 1,104 | | | | 1,084 | | | | 30,087 | | | | 27,754 | | | | 5,668 | | | | 406 | | |
Class C | | | 551 | | | | 451 | | | | 10,542 | | | | 9,208 | | | | 2,937 | | | | 126 | | |
Class R3 | | | 444 | | | | 1,026 | | | | 14,587 | | | | 9,985 | | | | — | | | | — | | |
Class R6 | | | — | | | | — | | | | 91,598 | | | | 167,892 | | | | — | | | | — | | |
See Notes to Financial Statements
179
180
Statements of Changes in Net Assets (cont'd)
Neuberger Berman Equity Funds (cont'd)
(000's omitted)
| | | SMALL CAP
GROWTH FUND | | SOCIALLY
RESPONSIVE FUND | | VALUE FUND | |
| | | Year Ended
August 31,
2017 | | Year Ended
August 31,
2016 | | Year Ended
August 31,
2017 | | Year Ended
August 31,
2016 | | Year Ended
August 31,
2017 | | Year Ended
August 31,
2016 | |
Proceeds from reinvestment of dividends and distributions: | |
Investor Class | | | — | | | | 2,498 | | | | 29,967 | | | | 43,969 | | | | — | | | | — | | |
Trust Class | | | — | | | | 249 | | | | 19,071 | | | | 29,722 | | | | — | | | | — | | |
Advisor Class | | | — | | | | 196 | | | | — | | | | — | | | | — | | | | — | | |
Institutional Class | | | — | | | | 680 | | | | 31,378 | | | | 41,836 | | | | 84 | | | | 267 | | |
Class A | | | — | | | | 222 | | | | 8,921 | | | | 12,834 | | | | 25 | | | | 105 | | |
Class C | | | — | | | | 170 | | | | 3,144 | | | | 4,114 | | | | 19 | | | | 10 | | |
Class R3 | | | — | | | | 84 | | | | 2,408 | | | | 3,009 | | | | — | | | | — | | |
Class R6 | | | — | | | | — | | | | 14,836 | | | | 15,611 | | | | — | | | | — | | |
Payments for shares redeemed: | |
Investor Class | | | (5,968 | ) | | | (4,410 | ) | | | (159,318 | ) | | | (167,651 | ) | | | — | | | | — | | |
Trust Class | | | (1,503 | ) | | | (925 | ) | | | (101,908 | ) | | | (110,618 | ) | | | — | | | | — | | |
Advisor Class | | | (937 | ) | | | (962 | ) | | | — | | | | — | | | | — | | | | — | | |
Institutional Class | | | (2,725 | ) | | | (11,757 | ) | | | (207,457 | ) | | | (251,018 | ) | | | (7,469 | ) | | | (7,301 | ) | |
Class A | | | (1,946 | ) | | | (2,448 | ) | | | (58,324 | ) | | | (48,836 | ) | | | (7,567 | ) | | | (4,190 | ) | |
Class C | | | (684 | ) | | | (756 | ) | | | (13,306 | ) | | | (11,809 | ) | | | (274 | ) | | | (161 | ) | |
Class R3 | | | (671 | ) | | | (925 | ) | | | (10,924 | ) | | | (9,928 | ) | | | — | | | | — | | |
Class R6 | | | — | | | | — | | | | (144,516 | ) | | | (49,013 | ) | | | — | | | | — | | |
Net increase (decrease) from Fund share transactions | | | (6,348 | ) | | | (11,301 | ) | | | (130,186 | ) | | | 39,951 | | | | 908 | | | | (8,225 | ) | |
Net Increase (Decrease) in Net Assets | | | 7,294 | | | | (20,155 | ) | | | 46,178 | | | | 109,835 | | | | 3,522 | | | | (7,392 | ) | |
Net Assets: | |
Beginning of year | | | 66,256 | | | | 86,411 | | | | 2,346,846 | | | | 2,237,011 | | | | 13,477 | | | | 20,869 | | |
End of year | | $ | 73,550 | | | $ | 66,256 | | | $ | 2,393,024 | | | $ | 2,346,846 | | | $ | 16,999 | | | $ | 13,477 | | |
Undistributed net investment income (loss) at end of year | | $ | (405 | ) | | $ | — | | | $ | 10,306 | | | $ | 12,472 | | | $ | 210 | | | $ | 150 | | |
Distributions in excess of net investment income at end of year | | $ | — | | | $ | (348 | ) | | $ | — | | | $ | — | | | $ | — | | | $ | — | | |
See Notes to Financial Statements
181
182
Notes to Financial Statements Equity Funds
Note A—Summary of Significant Accounting Policies:
1 General: Neuberger Berman Equity Funds (the "Trust") is a Delaware statutory trust organized pursuant to an Amended and Restated Trust Instrument dated March 27, 2014. The Trust is registered as an open-end management investment company under the Investment Company Act of 1940, as amended (the "1940 Act"), and its shares are registered under the Securities Act of 1933, as amended (the "1933 Act"). Neuberger Berman Dividend Growth Fund ("Dividend Growth"), Neuberger Berman Emerging Markets Equity Fund ("Emerging Markets Equity"), Neuberger Berman Equity Income Fund ("Equity Income"), Neuberger Berman Focus Fund ("Focus"), Neuberger Berman Genesis Fund ("Genesis"), Neuberger Berman Global Equity Fund ("Global Equity"), Neuberger Berman Global Real Estate Fund ("Global Real Estate"), Neuberger Berman Greater China Equity Fund ("Greater China Equity"), Neuberger Berman Guardian Fund ("Guardian"), Neuberger Berman International Equity Fund ("International Equity"), Neuberger Berman International Select Fund ("International Select"), Neuberger Berman International Small Cap Fund ("International Small Cap"), Neuberger Berman Intrinsic Value Fund ("Intrinsic Value"), Neuberger Berman Large Cap Value Fund ("Large Cap Value"), Neuberger Berman Mid Cap Growth Fund ("Mid Cap Growth"), Neuberger Berman Mid Cap Intrinsic Value Fund ("Mid Cap Intrinsic Value"), Neuberger Berman Multi-Cap Opportunities Fund ("Multi-Cap Opportunities"), Neuberger Berman Real Estate Fund ("Real Estate"), Neuberger Berman Small Cap Growth Fund ("Small Cap Growth"), Neuberger Berman Socially Responsive Fund ("Socially Responsive") and Neuberger Berman Value Fund ("Value") (each individually a "Fund," and collectively, the "Funds") are separate operating series of the Trust, each of which (except Global Real Estate, Greater China Equity and Real Estate) is diversified. Under the 1940 Act, the status of a Fund that was registered as non-diversified may, under certain circumstances, change to that of a diversified fund (Multi-Cap Opportunities became diversified in December 2012). Nine Funds offer Investor Class shares, eleven offer Trust Class shares, six offer Advisor Class shares, twenty-one offer Institutional Class shares, twenty offer Class A shares, twenty offer Class C shares, ten offer Class R3 shares and nine offer Class R6 shares. International Small Cap had no operations until December 8, 2016, other than matters relating to its organization and registration of shares under the 1933 Act. The Trust's Board of Trustees (the "Board") may establish additional series or classes of shares without the approval of shareholders.
A zero balance, if any, reflects an actual amount rounding to less than $1,000.
The assets of each Fund belong only to that Fund, and the liabilities of each Fund are borne solely by that Fund and no other.
Each Fund is an investment company and accordingly follows the investment company accounting and reporting guidance of the Financial Accounting Standards Board ("FASB") Accounting Standard Codification Topic 946 "Financial Services—Investment Companies."
The preparation of financial statements in accordance with U.S. generally accepted accounting principles ("GAAP") requires Neuberger Berman Investment Advisers LLC ("NBIA" or "Management") to make estimates and assumptions at the date of the financial statements. Actual results could differ from those estimates.
2 Portfolio valuation: In accordance with Accounting Standards Codification ("ASC") 820 "Fair Value Measurement" ("ASC 820"), all investments held by each of the Funds are carried at the value that Management believes a Fund would receive upon selling an investment in an orderly transaction to an independent buyer in the principal or most advantageous market for the investment under current market conditions. Various inputs, including the volume and level of activity for the asset or liability in the market, are considered in valuing the Funds' investments, some of which are discussed below. Significant Management judgment may be necessary to value investments in accordance with ASC 820.
183
ASC 820 established a three-tier hierarchy of inputs to create a classification of value measurements for disclosure purposes. The three-tier hierarchy of inputs is summarized in the three broad Levels listed below.
• Level 1 – quoted prices in active markets for identical investments
• Level 2 – other observable inputs (including quoted prices for similar investments, interest rates, prepayment speeds, credit risk, amortized cost, etc.)
• Level 3 – unobservable inputs (including a Fund's own assumptions in determining the fair value of investments)
The inputs or methodology used for valuing an investment are not necessarily an indication of the risk associated with investing in those securities.
The value of the Funds' investments in equity securities, preferred stocks, exchange-traded options purchased and options written, convertible preferred stocks and rights, for which market quotations are readily available, is generally determined by Management by obtaining valuations from independent pricing services based on the latest sale price quoted on a principal exchange or market for that security (Level 1 inputs).
Securities traded primarily on the NASDAQ Stock Market are normally valued at the NASDAQ Official Closing Price ("NOCP") provided by NASDAQ each business day. The NOCP is the most recently reported price as of 4:00:02 p.m., Eastern Time, unless that price is outside the range of the "inside" bid and asked prices (i.e., the bid and asked prices that dealers quote to each other when trading for their own accounts); in that case, NASDAQ will adjust the price to equal the inside bid or asked price, whichever is closer. Because of delays in reporting trades, the NOCP may not be based on the price of the last trade to occur before the market closes. If there is no sale of a security on a particular day, the independent pricing services may value the security based on market quotations.
The value of the Funds' investments in convertible bonds is determined by Management primarily by obtaining valuations from independent pricing services based on readily available bid quotations or, if quotations are not available, by methods which include various considerations such as underlying stock data, conversion premiums, listed bond and preferred stock prices and other market information that may include trade execution data and sensitivity analysis and adjustments (generally Level 2 inputs), when available.
The value of participatory notes is determined by Management by obtaining valuations from independent pricing services based on the underlying equity security and applicable exchange rate (Level 1 inputs).
Management has developed a process to periodically review information provided by independent pricing services for all types of securities.
Certificates of deposit are valued at amortized cost.
Investments in non-exchange traded investment companies are valued using the respective fund's daily calculated net asset value per share (Level 2 inputs).
If a valuation is not available from an independent pricing service, or if Management has reason to believe that the valuation received does not represent the amount a Fund might reasonably expect to receive on a current sale in an orderly transaction, Management seeks to obtain quotations from brokers or dealers (generally considered Level 2 or Level 3 inputs depending on the number of quotes available). If such quotations are not readily available, the security is valued using methods the Board has approved in the good-faith belief that the resulting valuation will reflect the fair value of the security. Numerous factors may be considered when determining the fair value of a security based on Level 2 or Level 3 inputs, including available analyst, media or other reports, securities within the same industry with recent highly correlated performance, trading in futures or American Depositary Receipts and whether the issuer of the security being fair valued has other securities outstanding.
The value of the Funds' investments in foreign securities is generally determined using the same valuation methods and inputs as other Fund investments, as discussed above. Foreign security prices expressed in local currency values are normally translated from the local currency into U.S. dollars using the exchange rates as of 4:00 p.m., Eastern Time on days the New York Stock Exchange ("NYSE") is open for business. The Board has
184
approved the use of Interactive Data Pricing and Reference Data LLC ("Interactive") to assist in determining the fair value of foreign equity securities when changes in the value of a certain index suggest that the closing prices on the foreign exchanges may no longer represent the amount that a Fund could expect to receive for those securities or on days when foreign markets are closed and U.S. markets are open. In each of these events, Interactive will provide adjusted prices for certain foreign equity securities using a statistical analysis of historical correlations of multiple factors (Level 2 inputs). The Board has also approved the use of Interactive to evaluate the prices of foreign debt securities as of the time as of which a Fund's share price is calculated. Interactive utilizes benchmark spread and yield curves and evaluates available market activity from the local close to the time as of which a Fund's share price is calculated (Level 2 inputs) to assist in determining prices for certain foreign debt securities. In the case of both foreign equity and foreign debt securities, in the absence of precise information about the market values of these foreign securities as of the time as of which a Fund's share price is calculated, the Board has determined on the basis of available data that prices adjusted or evaluated in this way are likely to be closer to the prices a Fund could realize on a current sale than are the prices of those securities established at the close of the foreign markets in which the securities primarily trade.
Fair value prices are necessarily estimates, and there is no assurance that such a price will be at or close to the price at which the security is next quoted or next trades.
3 Foreign currency translation: The accounting records of the Funds are maintained in U.S. dollars. Foreign currency amounts are normally translated into U.S. dollars using the exchange rate as of 4:00 p.m. Eastern Time, on days the NYSE is open for business to determine the value of investments, other assets and liabilities. Purchase and sale prices of securities, and income and expenses, are translated into U.S. dollars at the prevailing rate of exchange on the respective dates of such transactions. Net unrealized foreign currency gain/(loss), if any, arises from changes in the value of assets and liabilities, other than investments in securities, as a result of changes in exchange rates and is stated separately in the Statements of Operations.
4 Securities transactions and investment income: Securities transactions are recorded on trade date for financial reporting purposes. Dividend income is recorded on the ex-dividend date or, for certain foreign dividends, as soon as the Fund becomes aware of the dividends. Non-cash dividends included in dividend income, if any, are recorded at the fair market value of the securities received. Interest income, including accretion of discount on securities for Equity Income, accretion of original issue discount, where applicable, and accretion of discount on short-term investments, is recorded on the accrual basis. Realized gains and losses from securities transactions and foreign currency transactions, if any, are recorded on the basis of identified cost and stated separately in the Statements of Operations. Included in net realized gain/(loss) on investments are proceeds from the settlements of class action litigation in which the Funds participated as class members. The amounts of such proceeds for the year ended August 31, 2017 were $115, $66,229, $175,236, $55, $87,646, $12,300, $148,552, $15,115, $37,258, $1,059, $44,128, $146,119, and $674, for Equity Income, Focus, Genesis, Global Equity, Guardian, Intrinsic Value, Large Cap Value, Mid Cap Growth, Mid Cap Intrinsic Value, Multi-Cap Opportunities, Small Cap Growth, Socially Responsive and Value, respectively.
5 Income tax information: Each Fund is treated as a separate entity for U.S. federal income tax purposes. It is the policy of each Fund, except International Small Cap, to continue to, and the intention of International Small Cap, to qualify for treatment as a regulated investment company ("RIC") by complying with the requirements of the U.S. Internal Revenue Code applicable to RICs and to distribute substantially all of its net investment income and net realized capital gains to its shareholders. To the extent a Fund distributes substantially all of its net investment income and net realized capital gains to shareholders, no federal income or excise tax provision is required.
The Funds have adopted the provisions of ASC 740 "Income Taxes" ("ASC 740"). ASC 740 sets forth a minimum threshold for financial statement recognition of a tax position taken, or expected to be taken, in a tax return. The Funds recognize interest and penalties, if any, related to unrecognized tax positions as an income tax expense in the Statements of Operations. The Funds are subject to examination by U.S. federal and state tax authorities for returns filed for the tax years for which the applicable statutes of limitations have not yet expired. As of August 31, 2017, the Funds did not have any unrecognized tax positions.
185
At August 31, 2017, selected Fund information on a U.S. federal income tax basis was as follows:
(000's omitted) | | Cost | | Gross
Unrealized
Appreciation | | Gross
Unrealized
Depreciation | | Net Unrealized
Appreciation/
(Depreciation) | |
Dividend Growth | | $ | 31,745 | | | $ | 5,737 | | | $ | 294 | | | $ | 5,443 | | |
Emerging Markets Equity | | | 701,677 | | | | 192,080 | | | | 17,643 | | | | 174,437 | | |
Equity Income | | | 1,408,414 | | | | 289,174 | | | | 12,465 | | | | 276,709 | | |
Focus | | | 628,535 | | | | 127,570 | | | | 8,692 | | | | 118,878 | | |
Genesis | | | 6,286,098 | | | | 4,660,867 | | | | 169,420 | | | | 4,491,447 | | |
Global Equity | | | 3,744 | | | | 1,024 | | | | 92 | | | | 932 | | |
Global Real Estate | | | 2,842 | | | | 275 | | | | 128 | | | | 147 | | |
Greater China Equity | | | 107,443 | | | | 23,036 | | | | 490 | | | | 22,546 | | |
Guardian | | | 977,047 | | | | 233,683 | | | | 22,586 | | | | 211,097 | | |
International Equity | | | 1,559,322 | | | | 315,115 | | | | 53,939 | | | | 261,176 | | |
International Select | | | 195,134 | | | | 55,255 | | | | 6,689 | | | | 48,566 | | |
International Small Cap | | | 1,359 | | | | 254 | | | | 18 | | | | 236 | | |
Intrinsic Value | | | 758,922 | | | | 169,478 | | | | 41,603 | | | | 127,875 | | |
Large Cap Value | | | 1,304,676 | | | | 177,111 | | | | 15,678 | | | | 161,433 | | |
Mid Cap Growth | | | 899,472 | | | | 279,281 | | | | 6,553 | | | | 272,728 | | |
Mid Cap Intrinsic Value | | | 76,890 | | | | 21,176 | | | | 4,822 | | | | 16,354 | | |
Multi-Cap Opportunities | | | 1,286,249 | | | | 644,608 | | | | 5,039 | | | | 639,569 | | |
Real Estate | | | 466,117 | | | | 62,819 | | | | 16,020 | | | | 46,799 | | |
Small Cap Growth | | | 64,609 | | | | 9,871 | | | | 1,277 | | | | 8,594 | | |
Socially Responsive | | | 1,747,699 | | | | 740,679 | | | | 94,627 | | | | 646,052 | | |
Value | | | 15,842 | | | | 1,559 | | | | 223 | | | | 1,336 | | |
Income distributions and capital gain distributions are determined in accordance with income tax regulations, which may differ from GAAP. These differences are primarily due to differing treatments of income and gains on various investment securities held by each Fund, timing differences and differing characterization of distributions made by each Fund. The Funds may also utilize earnings and profits distributed to shareholders on redemption of their shares as a part of the dividends-paid deduction for income tax purposes.
As determined on August 31, 2017, permanent differences resulting primarily from different book and tax accounting were reclassified at year end. Such differences may be attributed to the tax treatment of one or more of the following: net operating loss netted against short term capital gains, distributions re-designated, partnership adjustments, net operating losses, prior year REIT/non REIT adjustments, non-taxable distributions from underlying investments, foreign currency gains and losses, gains and losses from passive foreign investment companies (PFICs), non-deductible stock issuance fees, deemed distributions on shareholder redemptions, amortization of bond premium, prior period adjustments, prior year partnership basis adjustments, expiration of capital loss carryforwards, return of capital distributions, tax adjustments related to REITs, redemptions in kind reversal, non-deductible foreign capital gain taxes, non-deductible excise tax and bond basis adjustments. For the year ended August 31, 2017, the Funds recorded the following permanent reclassifications:
| | | Paid-in Capital | | Undistributed
Net Investment
Income/(Loss) | | Accumulated
Net Realized
Gains/(Losses)
on Investments | |
Dividend Growth | | $ | 16,049 | | | $ | (35,205 | ) | | $ | 19,156 | | |
Emerging Markets Equity | | | — | | | | (400,296 | ) | | | 400,296 | | |
Equity Income | | | 10,609,392 | | | | (436,468 | ) | | | (10,172,924 | ) | |
186
| | Paid-in Capital | | Undistributed
Net Investment
Income/(Loss) | | Accumulated
Net Realized
Gains/(Losses)
on Investments | |
Focus | | $ | 5,585,927 | | | $ | (275,980 | ) | | $ | (5,309,947 | ) | |
Genesis | | | 296,894,581 | | | | (1,923,545 | ) | | | (294,971,036 | ) | |
Global Equity | | | — | | | | (776 | ) | | | 776 | | |
Global Real Estate | | | (1,153 | ) | | | 4,605 | | | | (3,452 | ) | |
Greater China Equity | | | 25,003 | | | | 165,641 | | | | (190,644 | ) | |
Guardian | | | 8,211,607 | | | | (1,045,113 | ) | | | (7,166,494 | ) | |
International Equity | | | (96,509,888 | ) | | | (603,796 | ) | | | 97,113,684 | | |
International Select | | | — | | | | (73,771 | ) | | | 73,771 | | |
International Small Cap | | | (2,160 | ) | | | 5,805 | | | | (3,645 | ) | |
Intrinsic Value | | | 5,734,744 | | | | 2,958,481 | | | | (8,693,225 | ) | |
Large Cap Value | | | 7,139,811 | | | | (3,505,987 | ) | | | (3,633,824 | ) | |
Mid Cap Growth | | | 4,591,046 | | | | 3,966,131 | | | | (8,557,177 | ) | |
Mid Cap Intrinsic Value | | | 258,355 | | | | (78,653 | ) | | | (179,702 | ) | |
Multi-Cap Opportunities | | | 12,483,520 | | | | (425,300 | ) | | | (12,058,220 | ) | |
Real Estate | | | 11,637,178 | | | | (508,092 | ) | | | (11,129,086 | ) | |
Small Cap Growth | | | (548,416 | ) | | | 539,486 | | | | 8,930 | | |
Socially Responsive | | | 17,805,126 | | | | (124,462 | ) | | | (17,680,664 | ) | |
Value | | | 357,551 | | | | (38,772 | ) | | | (318,779 | ) | |
The tax character of distributions paid during the years ended August 31, 2017 and August 31, 2016 was as follows:
| | Distributions Paid From: | |
| | Ordinary Income | | Long-Term Capital Gain | | Return of Capital | | Total | |
| | 2017 | | 2016 | | 2017 | | 2016 | | 2017 | | 2016 | | 2017 | | 2016 | |
Dividend
Growth | | $ | 424,723 | | | $ | — | (a) | | $ | — | | | $ | — | (a) | | $ | — | | | $ | — | (a) | | $ | 424,723 | | | $ | — | (a) | |
Emerging
Markets
Equity | | | 2,329,876 | | | | 2,725,387 | | | | — | | | | — | | | | — | | | | — | | | | 2,329,876 | | | | 2,725,387 | | |
Equity Income | | | 39,266,540 | | | | 45,301,642 | | | | 55,209,628 | | | | 66,678,398 | | | | — | | | | — | | | | 94,476,168 | | | | 111,980,040 | | |
Focus | | | 4,063,802 | | | | 5,504,703 | | | | 62,918,885 | | | | 35,550,318 | | | | — | | | | — | | | | 66,982,687 | | | | 41,055,021 | | |
Genesis | | | 43,971,041 | | | | 35,557,259 | | | | 727,986,249 | | | | 1,125,571,976 | | | | — | | | | — | | | | 771,957,290 | | | | 1,161,129,235 | | |
Global Equity | | | 20,547 | | | | 6,357 | | | | 29,438 | | | | — | | | | — | | | | — | | | | 49,985 | | | | 6,357 | | |
Global Real
Estate | | | 93,198 | | | | 58,229 | | | | — | | | | 341 | | | | — | | | | — | | | | 93,198 | | | | 58,570 | | |
Greater China
Equity | | | 359,921 | | | | 12,868,372 | | | | — | | | | — | | | | — | | | | — | | | | 359,921 | | | | 12,868,372 | | |
Guardian | | | 9,321,117 | | | | 8,572,126 | | | | 125,688,817 | | | | 134,218,623 | | | | — | | | | — | | | | 135,009,934 | | | | 142,790,749 | | |
International
Equity | | | 17,982,686 | | | | 13,604,543 | | | | — | | | | — | | | | — | | | | — | | | | 17,982,686 | | | | 13,604,543 | | |
International
Select | | | 3,276,565 | | | | 2,878,253 | | | | — | | | | — | | | | — | | | | — | | | | 3,276,565 | | | | 2,878,253 | | |
International
Small Cap | | | — | (b) | | | — | | | | — | (b) | | | — | | | | — | (b) | | | — | | | | — | (b) | | | — | | |
187
| | Distributions Paid From: | |
| | Ordinary Income | | Long-Term Capital Gain | | Return of Capital | | Total | |
| | 2017 | | 2016 | | 2017 | | 2016 | | 2017 | | 2016 | | 2017 | | 2016 | |
Intrinsic Value | | $ | 2,063,474 | | | $ | 733,120 | | | $ | 7,721,689 | | | $ | 22,985,868 | | | $ | — | | | $ | — | | | $ | 9,785,163 | | | $ | 23,718,988 | | |
Large Cap
Value | | | 35,514,012 | | | | 16,816,512 | | | | 22,223,369 | | | | 113,694,976 | | | | — | | | | — | | | | 57,737,381 | | | | 130,511,488 | | |
Mid Cap
Growth | | | 2,131,672 | | | | — | | | | 45,259,954 | | | | 90,521,333 | | | | — | | | | — | | | | 47,391,626 | | | | 90,521,333 | | |
Mid Cap
Intrinsic
Value | | | 558,393 | | | | 1,384,820 | | | | — | | | | 10,316,948 | | | | — | | | | — | | | | 558,393 | | | | 11,701,768 | | |
Multi-Cap
Opportunities | | | 15,250,634 | | | | 20,337,175 | | | | 48,714,824 | | | | 60,531,847 | | | | — | | | | — | | | | 63,965,458 | | | | 80,869,022 | | |
Real Estate | | | 17,350,353 | | | | 15,994,363 | | | | 61,552,296 | | | | 52,479,919 | | | | — | | | | — | | | | 78,902,649 | | | | 68,474,282 | | |
Small Cap
Growth | | | — | | | | 2,335,252 | | | | — | | | | 2,181,399 | | | | — | | | | — | | | | — | | | | 4,516,651 | | |
Socially
Responsive | | | 18,388,890 | | | | 20,668,806 | | | | 96,903,943 | | | | 138,003,445 | | | | — | | | | — | | | | 115,292,833 | | | | 158,672,251 | | |
Value | | | 128,375 | | | | 197,220 | | | | — | | | | 202,164 | | | | — | | | | — | | | | 128,375 | | | | 399,384 | | |
(a) Period from December 15, 2015 (Commencement of Operations) to August 31, 2016.
(b) Period from December 8, 2016 (Commencement of Operations) to August 31, 2017.
As of August 31, 2017, the components of distributable earnings (accumulated losses) on a U.S. federal income tax basis were as follows:
| | Undistributed
Ordinary
Income | | Undistributed
Long-Term
Capital Gain | | Unrealized
Appreciation/
(Depreciation) | | Loss
Carryforwards
and Deferrals | | Other
Temporary
Differences | | Total | |
Dividend Growth | | $ | 311,246 | | | $ | 393,456 | | | $ | 5,443,004 | | | $ | — | | | $ | — | | | $ | 6,147,706 | | |
Emerging Markets Equity | | | 6,837,225 | | | | — | | | | 174,054,496 | | | | (51,326,244 | ) | | | (29,192 | ) | | | 129,536,285 | | |
Equity Income | | | 11,594,731 | | | | 54,774,008 | | | | 276,720,357 | | | | — | | | | (361,574 | ) | | | 342,727,522 | | |
Focus | | | 33,183,179 | | | | 24,488,578 | | | | 118,877,960 | | | | — | | | | (93,053 | ) | | | 176,456,664 | | |
Genesis | | | 52,918,586 | | | | 1,006,454,962 | | | | 4,491,448,738 | | | | — | | | | (1 | ) | | | 5,550,822,285 | | |
Global Equity | | | 24,582 | | | | — | | | | 931,056 | | | | (77,199 | ) | | | 2 | | | | 878,441 | | |
Global Real Estate | | | — | | | | — | | | | 146,673 | | | | — | | | | (2,128 | ) | | | 144,545 | | |
Greater China Equity | | | 7,684,733 | | | | 3,958,343 | | | | 22,554,954 | | | | (9,655,400 | ) | | | (21,458 | ) | | | 24,521,172 | | |
Guardian | | | 15,563,995 | | | | 54,869,230 | | | | 211,084,499 | | | | — | | | | (16,950 | ) | | | 281,500,774 | | |
International Equity | | | 12,839,947 | | | | — | | | | 261,217,197 | | | | (74,012,423 | ) | | | (1,212 | ) | | | 200,043,509 | | |
International Select | | | 1,648,334 | | | | — | | | | 48,564,673 | | | | (23,982,792 | ) | | | (24,435 | ) | | | 26,205,780 | | |
International Small Cap | | | 87,622 | | | | | | | | 236,219 | | | | | | | | | | | | 323,841 | | |
Intrinsic Value | | | 5,528,025 | | | | 23,369,654 | | | | 127,874,511 | | | | — | | | | (100,386 | ) | | | 156,671,804 | | |
Large Cap Value | | | 51,481,947 | | | | 47,386,914 | | | | 161,433,333 | | | | — | | | | — | | | | 260,302,194 | | |
Mid Cap Growth | | | 9,030,581 | | | | 77,009,185 | | | | 272,727,656 | | | | — | | | | — | | | | 358,767,422 | | |
Mid Cap Intrinsic Value | | | 293,922 | | | | 3,873,515 | | | | 16,353,831 | | | | — | | | | (1 | ) | | | 20,521,267 | | |
Multi-Cap Opportunities | | | 7,156,056 | | | | 124,906,506 | | | | 639,569,086 | | | | — | | | | — | | | | 771,631,648 | | |
Real Estate | | | — | | | | 18,695,791 | | | | 46,798,903 | | | | — | | | | 2 | | | | 65,494,696 | | |
Small Cap Growth | | | — | | | | 1,129,307 | | | | 8,594,036 | | | | (405,162 | ) | | | — | | | | 9,318,181 | | |
Socially Responsive | | | 21,082,770 | | | | 79,751,995 | | | | 646,057,799 | | | | — | | | | — | | | | 746,892,564 | | |
Value | | | 888,588 | | | | 373,443 | | | | 1,336,186 | | | | — | | | | 2 | | | | 2,598,219 | | |
188
The temporary differences between book basis and tax basis distributable earnings are primarily due to: losses disallowed and recognized on wash sales and straddles, capital loss carryforwards, mark-to-market on spot contracts, post-October capital loss and late-year ordinary loss deferrals, unamortized organization expenses, partnership basis adjustments, non-REIT income adjustments, convertible bond income adjustments, non-REIT non-taxable adjustments, loss limitation due to ownership change and tax adjustments related to REITs, PFICs, partnerships and other investments.
To the extent each Fund's net realized capital gains, if any, can be offset by capital loss carryforwards, it is the policy of each Fund not to distribute such gains. The Regulated Investment Company Modernization Act of 2010 (the "Act") made changes to the capital loss carryforward rules allowing for RICs to carry forward capital losses indefinitely and to retain the character of capital loss carryforwards as short-term or long-term ("Post-Enactment"). Rules in effect previously limited the carryforward period to eight years and all carryforwards were considered short-term in character ("Pre-Enactment"). As determined at August 31, 2017, the following Funds had unused capital loss carryforwards available for federal income tax purposes to offset net realized capital gains, if any, as follows:
| | | Pre-Enactment | |
| | | Expiring in: | |
| | 2018 | |
International Equity | | $ | 74,012,423 | | |
International Select | | | 23,982,792 | | |
| | | Post-Enactment (No Expiration Date) | |
| | | Long-Term | | Short-Term | |
Emerging Markets Equity | | $ | 29,832,686 | | | $ | 21,493,558 | | |
Global Equity | | | 77,199 | | | | — | | |
Greater China Equity | | | 1,393,252 | * | | | 8,262,148 | * | |
* Future utilization is limited under current tax regulations.
Post-Enactment capital loss carryforwards must be fully used before Pre-Enactment capital loss carryforwards; therefore, under certain circumstances, Pre-Enactment capital loss carryforwards available as of the report date may expire unused.
During the year ended August 31, 2017, Dividend Growth, Emerging Markets Equity, Global Real Estate, Greater China Equity, International Equity, International Select, Small Cap Growth and Value utilized capital loss carryforwards of $96,027, $17,436,066, $6,724, $1,258,481, $47,147,816, $7,088,015, $12,782,825 and $408,265, respectively.
During the year ended August 31, 2017, International Equity had capital loss carryforwards expire of $96,509,888.
Under current tax regulations, capital losses realized on investment transactions after October 31 may be deferred and treated as occurring on the first day of the following fiscal year. Under the Act, the Funds may also defer any realized late-year ordinary losses as occurring on the first day of the following fiscal year. Late-year ordinary losses represent ordinary losses realized on investment transactions after December 31 and specified losses (ordinary losses from the sale, exchange, or other disposition of property, net foreign currency losses and net passive foreign investment company mark to market losses) realized on investment transactions after October 31. For the year ended August 31, 2017, the Funds elected to defer the following late-year ordinary losses and post October capital losses:
| | | Late-Year
Ordinary Loss | | Post October
Capital Loss
Deferral | |
| | Deferral | | Long-Term | | Short-Term | |
Small Cap Growth | | $ | 405,162 | | | $ | — | | | $ | — | | |
6 Foreign taxes: Foreign taxes withheld, if any, represent amounts withheld by foreign tax authorities, net of refunds recoverable.
189
Emerging Markets Equity accrues deferred capital gains tax on unrealized gains for certain securities of issuers domiciled in India. At August 31, 2017, Emerging Markets Equity had accrued capital gains taxes of $386,149 which is reflected in the Statements of Assets and Liabilities.
Effective November 17, 2014 ("Effective Date"), a change in the capital gains tax provision for Greater China Equity arose due to changes in the tax rules in the People's Republic of China ("PRC"). Capital gains derived from the trading of PRC equity investments after the Effective Date are temporarily exempt from PRC withholding tax. Prior to the Effective Date, Greater China Equity had accrued deferred capital gains tax on unrealized gains on participatory notes. During the year ended August 31, 2016, $43,359 of capital gains taxes on gains previously realized were reversed and are included as part of net realized gain (loss) on investments in the Statements of Changes in Net Assets. During the year ended August 31, 2017, $6,061 of capital gains taxes on gains previously realized were reversed and are included as part of net realized gain/(loss) on sales of investment securities of unaffiliated issuers in the Statements of Operations. The tax laws and regulations in the PRC are subject to change, possibly with retroactive effect.
7 Distributions to shareholders: Each Fund may earn income, net of expenses, daily on its investments.
Distributions from net investment income and net realized capital gains, if any, are generally distributed once a year (usually in December) and are recorded on the ex-date. However, Equity Income, Global Real Estate and Real Estate generally distribute net investment income, if any, at the end of each calendar quarter.
It is the policy of each of Equity Income, Global Real Estate, Mid Cap Intrinsic Value, Real Estate, Small Cap Growth and Socially Responsive to pass through to its shareholders substantially all REIT distributions and other income it receives, less operating expenses. The distributions received from REITs are generally composed of income, capital gains, and/or return of REIT capital, but the REITs do not report this information to these Funds until the following calendar year. At August 31, 2017, these Funds estimated these amounts for the period January 1, 2017 to August 31, 2017 within the financial statements because the 2017 information is not available from the REITs until after each Fund's fiscal period. All estimates are based upon REIT information sources available to these Funds together with actual IRS Forms 1099-DIV received to date. For the year ended August 31, 2017, the character of distributions, if any, paid to shareholders of these Funds disclosed within the Statements of Changes in Net Assets is based on estimates made at that time. Based on past experience it is possible that a portion of these Funds' distributions during the current fiscal year, if any, will be considered tax return of capital, but the actual amount of the tax return of capital, if any, is not determinable until after each Fund's fiscal year-end. After calendar year-end, when these Funds learn the nature of the distributions paid by REITs during that year, distributions previously identified as income are often recharacterized as return of capital and/or capital gain. After all applicable REITs have informed these Funds of the actual breakdown of distributions paid to these Funds during their fiscal year, estimates previously recorded are adjusted on the books of these Funds to reflect actual results. As a result, the composition of these Funds' distributions as reported herein may differ from the final composition determined after calendar year-end and reported to these Funds shareholders on IRS Form 1099-DIV.
8 Organization expenses: Costs incurred by International Small Cap in connection with its organization, which amounted to $70,462 and are reflected in Organization expense in the Statements of Operations, have been expensed as incurred.
9 Expense allocation: Certain expenses are applicable to multiple funds within the complex of related investment companies. Expenses directly attributable to a Fund are charged to that Fund. Expenses of the Trust that are not directly attributable to a particular series of the Trust (e.g., a Fund) are allocated among the series of the Trust, on the basis of relative net assets, except where a more appropriate allocation of expenses to each of the series can otherwise be made fairly. Expenses borne by the complex of related investment companies, which includes open-end and closed-end investment companies for which Management serves as investment manager, that are not directly attributable to a particular investment company in the complex (e.g., the Trust) or series thereof are allocated among the investment companies in the complex or series thereof on the basis of relative net assets, except where a more appropriate allocation of expenses to each of the investment companies in the complex or
190
series thereof can otherwise be made fairly. Each Fund's expenses (other than those specific to each class) are allocated proportionally each day among the classes based upon the relative net assets of each class.
10 Investments in foreign securities: Investing in foreign securities may involve sovereign and other risks, in addition to the credit and market risks normally associated with domestic securities. These additional risks include the possibility of adverse political and economic developments (including political instability, nationalization, expropriation, or confiscatory taxation) and the potentially adverse effects of unavailability of public information regarding issuers, less governmental supervision and regulation of financial markets, reduced liquidity of certain financial markets, and the lack of uniform accounting, auditing, and financial reporting standards or the application of standards that are different or less stringent than those applied in the United States. Foreign securities also may experience greater price volatility, higher rates of inflation, and delays in settlement.
11 Investment company securities and exchange-traded funds: The Funds may invest in shares of other registered investment companies, including exchange-traded funds ("ETFs"), within the limitations prescribed by the 1940 Act or pursuant to an exemptive order from the U.S. Securities and Exchange Commission ("SEC") that permits the Funds to invest in both affiliated and unaffiliated investment companies, including ETFs, in excess of the limits in Section 12(d)(1)(A) of the 1940 Act, as amended, subject to the terms and conditions of such order. Some ETFs seek to track the performance of a particular market index. These indices include both broad-based market indices and more narrowly-based indices, including those relating to particular sectors, markets, regions or industries. However, some ETFs have an actively-managed investment objective. ETF shares are traded like traditional equity securities on a national securities exchange or NASDAQ. A Fund will indirectly bear its proportionate share of any management fees and other expenses paid by such other investment companies, which will increase expenses and decrease returns.
12 Derivative instruments: Certain Funds' use of derivatives during the year ended August 31, 2017, is described below. Please see the Schedule of Investments for each Fund's open positions in derivatives, if any, at August 31, 2017. The Funds have adopted the provisions of ASC 815 "Derivatives and Hedging" ("ASC 815"). The disclosure requirements of ASC 815 distinguish between derivatives that qualify for hedge accounting and those that do not. Because investment companies value their derivatives at fair value and recognize changes in fair value through the Statements of Operations, they do not qualify for hedge accounting. Accordingly, even though a Fund's investments in derivatives may represent economic hedges, they are considered non-hedge transactions for purposes of this disclosure.
Options: For the year ended August 31, 2017, Equity Income, Focus, Guardian, Large Cap Value and Value used options written and Focus and Guardian used purchased option contracts ("options purchased"). Equity Income used options written to generate incremental returns. Focus used options written to enhance total return; written calls were used for hedging purposes and to manage the risk profile of the Fund, and written puts were used to enhance returns and to gain exposure to certain securities. Focus used options purchased for hedging purposes and as a risk management tool. Guardian used options written to enhance total return, to gain exposure more efficiently than through a direct purchase of the underlying security, to gain exposure to securities, markets, sectors or geographical areas and to manage or adjust the risk profile of the Fund or the risk of individual positions. Guardian used options purchased to gain exposure more efficiently than through a direct purchase of the underlying security, to gain exposure to securities, markets, sectors or geographical areas and to manage or adjust the risk profile of the Fund or the risk of individual positions. Large Cap Value and Value used options written to enhance total return and to efficiently manage risk exposures.
Premiums received by a Fund upon writing a call option or a put option are recorded in the liability section of the Fund's Statement of Assets and Liabilities and are subsequently adjusted to the current market value. When an option is exercised, closed, or expired, a Fund realizes a gain or loss and the liability is eliminated.
When a fund writes a call option on an underlying asset it does not own, its exposure on such an option is theoretically unlimited. When writing a covered call option, a Fund, in return for the premium, gives up the opportunity for profit from a price increase in the underlying security above the exercise price, but conversely
191
retains the risk of loss should the price of the security decline. When writing a put option, a Fund, in return for the premium, takes the risk that it must purchase the underlying security at a price that may be higher than the current market price of the security. If a call or put option that a Fund has written expires unexercised, a Fund will realize a gain in the amount of the premium. All securities covering outstanding written options are held in escrow by the custodian bank.
Premiums paid by a Fund upon purchasing a call or put option are recorded in the asset section of the Fund's Statement of Assets and Liabilities and are subsequently adjusted to the current market value. When an option is exercised, closed, or expired, a Fund realizes a gain or loss and the asset is eliminated.
For purchased call options, the Fund's loss is limited to the amount of the option premium paid.
At August 31, 2017, Equity Income, Focus, Guardian, Large Cap Value and Value had the following derivatives (which did not qualify as hedging instruments under ASC 815), grouped by primary risk, exposure.
Asset Derivatives
(000's omitted)
Derivative Type | | Statements of Assets and Liabilities Location | | Equity Risk | | Total | |
Focus | |
Options purchased | | Investments in securities, at value | | $ | 36 | | | $ | 36 | | |
Total Value—Assets | | | | $ | 36 | | | $ | 36 | | |
Guardian | |
Options purchased | | Investments in securities, at value | | $ | 143 | | | $ | 143 | | |
Total Value—Assets | | | | $ | 143 | | | $ | 143 | | |
Liability Derivatives
(000's omitted)
Derivative Type | | Statements of Assets and Liabilities Location | | Equity Risk | | Total | |
Equity Income | |
Options written | | Option contracts written, at value | | $ | (1,692 | ) | | $ | (1,692 | ) | |
Total Value—Liabilities | | | | $ | (1,692 | ) | | $ | (1,692 | ) | |
Focus | |
Options written | | Option contracts written, at value | | $ | (240 | ) | | $ | (240 | ) | |
Total Value—Liabilities | | | | $ | (240 | ) | | $ | (240 | ) | |
Guardian | |
Options written | | Option contracts written, at value | | $ | (568 | ) | | $ | (568 | ) | |
Total Value—Liabilities | | | | $ | (568 | ) | | $ | (568 | ) | |
Large Cap Value | |
Options written | | Option contracts written, at value | | $ | (262 | ) | | $ | (262 | ) | |
Total Value—Liabilities | | | | $ | (262 | ) | | $ | (262 | ) | |
Value | |
Options written | | Option contracts written, at value | | $ | (3 | ) | | $ | (3 | ) | |
Total Value—Liabilities | | | | $ | (3 | ) | | $ | (3 | ) | |
The impact of the use of these derivative instruments on the Statements of Operations during the year ended August 31, 2017, was as follows:
Realized Gain/(Loss)
(000's omitted)
Derivative Type | | Statements of Operations Location | | Equity Risk | | Total | |
Equity Income | |
Options written | | Net realized gain (loss) on: Option contracts written | | $ | 1,922 | | | $ | 1,922 | | |
Total Realized Gain/(Loss) | | | | $ | 1,922 | | | $ | 1,922 | | |
192
Realized Gain/(Loss)
(000's omitted)
Derivative Type | | Statements of Operations Location | | Equity Risk | | Total | |
Focus | |
| Options purchased | | Net realized gain (loss) on: sales of investment
securities of unaffiliated issuers | | $ | (106 | ) | | $ | (106 | ) | |
Options written | | Net realized gain (loss) on: Option contracts written | | | 1,046 | | | | 1,046 | | |
Total Realized Gain/(Loss) | | | | $ | 940 | | | $ | 940 | | |
Guardian | |
Options purchased | | Net realized gain (loss) on: sales of investment
securities of unaffiliated issuers | | $ | (387 | ) | | $ | (387 | ) | |
Options written | | Net realized gain (loss) on: Option contracts written | | | 2,712 | | | | 2,712 | | |
Total Realized Gain/(Loss) | | | | $ | 2,325 | | | $ | 2,325 | | |
Large Cap Value | |
Options written | | Net realized gain (loss) on: Option contracts written | | $ | 142 | | | $ | 142 | | |
Total Realized Gain/(Loss) | | | | $ | 142 | | | $ | 142 | | |
Value | |
Options written | | Net realized gain (loss) on: Option contracts written | | $ | 2 | | | $ | 2 | | |
Total Realized Gain/(Loss) | | | | $ | 2 | | | $ | 2 | | |
Change in Appreciation/(Depreciation)
(000's omitted)
Derivative Type | | Statements of Operations Location | | Equity Risk | | Total | |
Equity Income | |
Options written | | Change in net unrealized appreciation/(depreciation) in
value of: option contracts written | | $ | (426 | ) | | $ | (426 | ) | |
Total Change in Appreciation/(Depreciation) | | | | $ | (426 | ) | | $ | (426 | ) | |
Focus | |
Options purchased | | Change in net unrealized appreciation/(depreciation) in
value of: unaffiliated investment securities | | $ | (17 | ) | | $ | (17 | ) | |
Options written | | Change in net unrealized appreciation/(depreciation) in
value of: option contracts written | | | (102 | ) | | | (102 | ) | |
Total Change in Appreciation/(Depreciation) | | | | $ | (119 | ) | | $ | (119 | ) | |
Guardian | |
| Options purchased | | Change in net unrealized appreciation/(depreciation) in
value of: unaffiliated investment securities | | $ | (58 | ) | | $ | (58 | ) | |
| Options written | | Change in net unrealized appreciation/(depreciation) in
value of: option contracts written | | | 127 | | | | 127 | | |
Total Change in Appreciation/(Depreciation) | | | | $ | 69 | | | $ | 69 | | |
Large Cap Value | |
| Options written | | Change in net unrealized appreciation/(depreciation) in
value of: option contracts written | | $ | 51 | | | $ | 51 | | |
Total Change in Appreciation/(Depreciation) | | | | $ | 51 | | | $ | 51 | | |
Value | |
Options written | | Change in net unrealized appreciation/(depreciation) in
value of: option contracts written | | $ | 1 | | | $ | 1 | | |
Total Change in Appreciation/(Depreciation) | | | | $ | 1 | | | $ | 1 | | |
193
While the Funds may receive rights and warrants in connection with their investments in securities, these rights and warrants are not considered "derivative instruments" under ASC 815. Management has concluded that the Funds, except Equity Income, Focus, Guardian, Large Cap Value and Value did not hold any derivative instruments during the year ended August 31, 2017 that require additional disclosures pursuant to ASC 815.
13 Indemnifications: Like many other companies, the Trust's organizational documents provide that its officers ("Officers") and trustees ("Trustees") are indemnified against certain liabilities arising out of the performance of their duties to the Trust. In addition, both in some of its principal service contracts and in the normal course of its business, the Trust enters into contracts that provide indemnifications to other parties for certain types of losses or liabilities. The Trust's maximum exposure under these arrangements is unknown as this could involve future claims against the Trust.
14 In-kind redemptions: In accordance with guidelines described in a Fund's prospectus and in accordance with procedures adopted by the Board, a Fund may distribute portfolio securities rather than cash as payment for a redemption of Fund shares (in-kind redemption). For financial reporting purposes, the Fund recognizes a gain on in-kind redemptions to the extent the value of the distributed securities on the date of redemption exceeds the cost of those securities. Gains and losses realized on in-kind redemptions are not recognized for tax purposes and are reclassified from undistributed realized gain (loss) to paid-in capital. During the year ended August 31, 2017, Genesis realized $129,534,612 of net gain on $216,264,840 of in-kind redemptions.
15 Other: All net investment income and realized and unrealized capital gains and losses of each Fund are allocated, on the basis of relative net assets, pro rata among its respective classes.
Note B—Investment Management Fees, Administration Fees, Distribution Arrangements, and Other Transactions with Affiliates:
Each Fund retains Management as its investment manager under a Management Agreement. For such investment management services, each Fund pays Management a fee according to the following table:
Investment Management Fee as a Percentage of Average Daily Net Assets:
| | | First
$250
million | | Next
$250
million | | Next
$250
million | | Next
$250
million | | Next
$500
million | | Next
$500
million | | Next
$500
million | | Next
$1.5
billion | | Thereafter | |
| For Genesis(a), Intrinsic Value, and Small Cap Growth: | | | |
| | | | | | 0.85 | % | | | 0.80 | % | | | 0.75 | % | | | 0.70 | % | | | 0.65 | % | | | 0.65 | % | | | 0.65 | % | | | 0.65 | % | | | 0.65 | % | |
For Emerging Markets Equity: | | | |
| | | | | | 1.00 | % | | | 0.975 | % | | | 0.95 | % | | | 0.925 | % | | | 0.90 | % | | | 0.875 | % | | | 0.875 | % | | | 0.875 | % | | | 0.85 | % | |
For Global Real Estate and Real Estate: | | | |
| | | | | | 0.80 | % | | | 0.80 | % | | | 0.80 | % | | | 0.80 | % | | | 0.80 | % | | | 0.80 | % | | | 0.80 | % | | | 0.80 | % | | | 0.80 | % | |
| For International Equity(b): | | | |
| | | | | | 0.85 | % | | | 0.825 | % | | | 0.80 | % | | | 0.775 | % | | | 0.75 | % | | | 0.725 | % | | | 0.725 | % | | | 0.70 | % | | | 0.70 | % | |
For International Small Cap: | | | |
| | | | | | 0.85 | % | | | 0.825 | % | | | 0.80 | % | | | 0.775 | % | | | 0.75 | % | | | 0.725 | % | | | 0.725 | % | | | 0.725 | % | | | 0.70 | % | |
| For Equity Income, Focus, Guardian, International Select, Large Cap Value, Mid Cap Growth, Mid Cap Intrinsic Value(b), Socially Responsive and Value: | | | |
| | | | | | 0.55 | % | | | 0.525 | % | | | 0.50 | % | | | 0.475 | % | | | 0.45 | % | | | 0.425 | % | | | 0.425 | % | | | 0.425 | % | | | 0.40 | % | |
For Multi-Cap Opportunities: | | | |
| | | | | | 0.60 | % | | | 0.575 | % | | | 0.55 | % | | | 0.525 | % | | | 0.50 | % | | | 0.475 | % | | | 0.475 | % | | | 0.475 | % | | | 0.45 | % | |
194
| | First
$250
million | | Next
$250
million | | Next
$250
million | | Next
$250
million | | Next
$500
million | | Next
$500
million | | Next
$500
million | | Next
$1.5
billion | | Thereafter | |
| For Global Equity(c): | | | |
| | | | | | 0.55 | % | | | 0.55 | % | | | 0.55 | % | | | 0.55 | % | | | 0.55 | % | | | 0.55 | % | | | 0.55 | % | | | 0.55 | % | | | 0.55 | % | |
For Greater China Equity: | | | |
| | | | | | 1.10 | % | | | 1.10 | % | | | 1.10 | % | | | 1.10 | % | | | 0.95 | % | | | 0.95 | % | | | 0.95 | % | | | 0.95 | % | | | 0.95 | % | |
For Dividend Growth: | | | |
| | | | | | 0.50 | % | | | 0.50 | % | | | 0.50 | % | | | 0.50 | % | | | 0.50 | % | | | 0.475 | % | | | 0.475 | % | | | 0.475 | % | | | 0.45 | % | |
(a) Effective April 25, 2017, the investment management fee is 0.60% of average daily net assets in excess of $14 billion for Genesis.
(b) Effective June 1, 2017, Management has voluntarily agreed to waive its management fee in the amount of 0.15% of the average daily net assets of International Equity (0.18% effective May 1, 2015). Effective December 19, 2016, Management has voluntarily agreed to waive its management fee in the amount of 0.19% of the average daily net assets of Mid Cap Intrinsic Value (0.15% effective September 1, 2016, 2.89% effective August 31, 2016, 1.21% effective August 23, 2016, 0.11% effective November 1, 2015). Management may, at its sole discretion, modify or terminate these voluntary waivers without notice to International Equity or Mid Cap Intrinsic Value. For the year ended August 31, 2017, such waived fees amounted to $(2,700,998) and $(163,915) for International Equity and Mid Cap Intrinsic Value, respectively. These amounts are not subject to recovery by Management.
(c) Prior to December 8, 2016, Global Equity paid Management a fee at the annual rate of 0.750% of the first $250 million of the Fund's average daily net assets, 0.725% of the next $250 million, 0.700% of the next $250 million, 0.675% of the next $250 million, 0.650% of the next $500 million, 0.625% of the next $2.5 billion, and 0.600% of average daily net assets in excess of $4 billion.
Accordingly, for the year ended August 31, 2017, the investment management fee pursuant to the Management Agreement was equivalent to an annual effective rate of each Fund's average daily net assets, as follows:
| | | Effective
Rate | | | | Effective
Rate | |
Dividend Growth | | | 0.50 | % | | International Small Cap | | | 0.85 | % | |
Emerging Markets Equity | | | 0.98 | % | | Intrinsic Value | | | 0.80 | % | |
Equity Income | | | 0.48 | % | | Large Cap Value | | | 0.49 | % | |
Focus | | | 0.53 | % | | Mid Cap Growth | | | 0.51 | % | |
Genesis | | | 0.66 | % | | Mid Cap Intrinsic Value | | | 0.55 | %(b) | |
Global Equity | | | 0.60 | % | | Multi-Cap Opportunities | | | 0.53 | % | |
Global Real Estate | | | 0.80 | % | | Real Estate | | | 0.80 | % | |
Greater China Equity | | | 1.10 | % | | Small Cap Growth | | | 0.85 | % | |
Guardian | | | 0.50 | % | | Socially Responsive | | | 0.47 | % | |
International Equity | | | 0.79 | %(a) | | Value | | | 0.55 | % | |
International Select | | | 0.55 | % | | | | | |
(a) 0.62% annual effective net rate of the Fund's average daily net assets.
(b) 0.37% annual effective net rate of the Fund's average daily net assets.
Each Fund retains Management as its administrator under an Administration Agreement. Prior to July 1, 2017, each Fund paid Management an administration fee at the annual rate of 0.06% of its average daily net assets under this agreement in addition to an annual fee for certain class level services (specifically, 0.20% for each of Investor Class, Class A, Class C and Class R3; 0.34% for each of Trust Class and Advisor Class; 0.09% for Institutional
195
Class and 0.02% for Class R6, each as a percentage of its average daily net assets). Effective July 1, 2017, the administration fee is only assessed at the Class level and each share class of a Fund, as applicable, pays Management an annual administration fee equal to the following: 0.26% for each of Investor Class, Class A, Class C and Class R3; 0.40% for each of Trust Class and Advisor Class; 0.15% for Institutional Class; and 0.08% for Class R6, each as a percentage of its average daily net assets. This did not result in an increase in the administration fee for any share class. Additionally, Management retains State Street Bank and Trust Company ("State Street") as its sub-administrator under a Sub-Administration Agreement. Management pays State Street a fee for all services received under the agreement.
Management has contractually agreed to waive fees and/or reimburse certain expenses of the Investor Class of each of International Equity, Mid Cap Intrinsic Value and Small Cap Growth and the Trust Class, Advisor Class, Institutional Class, Class A, Class C, Class R3 and Class R6 of each Fund that offers those classes so that the total annual operating expenses of those classes do not exceed the expense limitations as detailed in the following table. These undertakings apply to a Fund's direct expenses and exclude interest, taxes, brokerage commissions, acquired fund fees and expenses, extraordinary expenses, and dividend and interest expenses relating to short sales, if any (commitment fees relating to borrowings are treated as interest for purposes of this exclusion); consequently, net expenses may exceed the contractual expense limitations. Each Fund has agreed that each of its respective classes will repay Management for fees and expenses waived or reimbursed for that class provided that repayment does not cause that class's annual operating expenses to exceed its contractual expense limitation in place at the time the fees and expenses were waived or reimbursed, or the expense limitation in place at the time the Fund repays Management, whichever is lower. Any such repayment must be made within three years after the year in which Management incurred the expense.
During the year ended August 31, 2017, the following classes repaid Management under their contractual expense limitation agreements as follows:
Class | | Expenses
Repaid to
Management | |
Genesis Institutional Class | | $ | 111,353 | | |
Genesis Class R6 | | | 65,989 | | |
International Equity Institutional Class | | | 211,730 | | |
International Equity Class A | | | 7,768 | | |
International Equity Class C | | | 774 | | |
Large Cap Value Institutional Class | | | 5,448 | | |
Mid Cap Growth Class A | | | 12,921 | | |
Mid Cap Growth Class C | | | 625 | | |
Mid Cap Intrinsic Value Trust Class | | | 1,431 | | |
| | | | | | | Expenses Reimbursed in
Year Ending August 31, | |
| | | | | | | 2015 | | 2016 | | 2017 | |
| | | | | | | Subject to Repayment until
August 31, | |
Class | | Contractual
Expense
Limitation(a) | | Expiration | | 2018 | | 2019 | | 2020 | |
Dividend Growth Institutional Class | | | 0.69 | % | | 8/31/20 | | $ | — | | | $ | 215,047 | (b) | | $ | 258,355 | | |
Dividend Growth Class A | | | 1.05 | % | | 8/31/20 | | | — | | | | 9,994 | (b) | | | 8,372 | | |
Dividend Growth Class C | | | 1.80 | % | | 8/31/20 | | | — | | | | 9,444 | (b) | | | 20,432 | | |
196
| | | | | | | Expenses Reimbursed in
Year Ending August 31, | |
| | | | | | | 2015 | | 2016 | | 2017 | |
| | | | | | | Subject to Repayment until
August 31, | |
Class | | Contractual
Expense
Limitation(a) | | Expiration | | 2018 | | 2019 | | 2020 | |
Dividend Growth Class R6 | | | 0.62 | % | | 8/31/20 | | $ | — | | | $ | 15,585 | (b) | | $ | 484 | | |
Emerging Markets Equity Institutional Class | | | 1.25 | % | | 8/31/20 | | | 744,668 | | | | 528,129 | | | | 460,088 | | |
Emerging Markets Equity Class A | | | 1.50 | % | | 8/31/20 | | | 48,822 | | | | 54,600 | | | | 91,792 | | |
Emerging Markets Equity Class C | | | 2.25 | % | | 8/31/20 | | | 19,353 | | | | 13,399 | | | | 11,097 | | |
Emerging Markets Equity Class R3 | | | 1.91 | % | | 8/31/20 | | | 1,334 | | | | 1,403 | | | | 1,161 | | |
Emerging Markets Equity Class R6 | | | 1.18 | % | | 8/31/20 | | | 135,893 | | | | 127,742 | | | | 88,158 | | |
Equity Income Institutional Class | | | 0.80 | % | | 8/31/20 | | | — | | | | — | | | | — | | |
Equity Income Class A | | | 1.16 | % | | 8/31/20 | | | — | | | | — | | | | — | | |
Equity Income Class C | | | 1.91 | % | | 8/31/20 | | | — | | | | — | | | | — | | |
Equity Income Class R3 | | | 1.41 | % | | 8/31/20 | | | — | | | | — | | | | — | | |
Focus Trust Class | | | 1.50 | % | | 8/31/20 | | | — | | | | — | | | | — | | |
Focus Advisor Class | | | 1.50 | % | | 8/31/22 | | | — | | | | — | | | | — | | |
Focus Institutional Class | | | 0.75 | % | | 8/31/20 | | | 1,518 | | | | 755 | | | | 209 | | |
Focus Class A | | | 1.11 | % | | 8/31/20 | | | 1,255 | | | | 1,451 | | | | 580 | | |
Focus Class C | | | 1.86 | % | | 8/31/20 | | | 708 | | | | 893 | | | | 336 | | |
Genesis Trust Class | | | 1.50 | % | | 8/31/20 | | | — | | | | — | | | | — | | |
Genesis Advisor Class | | | 1.50 | % | | 8/31/22 | | | — | | | | — | | | | — | | |
Genesis Institutional Class | | | 0.85 | % | | 8/31/22 | | | — | | | | — | | | | — | | |
Genesis Class R6 | | | 0.78 | %(c) | | 8/31/20 | | | — | | | | — | | | | — | | |
Global Equity Institutional Class | | | 0.75 | %(d) | | 8/31/20 | | | 249,720 | | | | 240,098 | | | | 239,590 | | |
Global Equity Class A | | | 1.11 | %(d) | | 8/31/20 | | | 14,226 | | | | 38,361 | | | | 24,676 | | |
Global Equity Class C | | | 1.86 | %(d) | | 8/31/20 | | | 5,783 | | | | 16,073 | | | | 8,112 | | |
Global Real Estate Institutional Class | | | 1.00 | % | | 8/31/20 | | | 185,406 | (e) | | | 197,159 | | | | 202,973 | | |
Global Real Estate Class A | | | 1.36 | % | | 8/31/20 | | | 58,526 | (e) | | | 64,529 | | | | 38,044 | | |
Global Real Estate Class C | | | 2.11 | % | | 8/31/20 | | | 24,504 | (e) | | | 25,169 | | | | 25,661 | | |
Greater China Equity Institutional Class | | | 1.50 | % | | 8/31/20 | | | 126,917 | | | | 229,329 | | | | 164,058 | | |
Greater China Equity Class A | | | 1.86 | % | | 8/31/20 | | | 5,487 | | | | 7,590 | | | | 9,343 | | |
Greater China Equity Class C | | | 2.61 | % | | 8/31/20 | | | 301 | | | | 320 | | | | 321 | | |
Guardian Trust Class | | | 1.50 | % | | 8/31/20 | | | — | | | | — | | | | — | | |
Guardian Advisor Class | | | 1.50 | % | | 8/31/22 | | | — | | | | — | | | | — | | |
Guardian Institutional Class | | | 0.75 | % | | 8/31/20 | | | — | | | | — | | | | — | | |
Guardian Class A | | | 1.11 | % | | 8/31/20 | | | — | | | | — | | | | — | | |
Guardian Class C | | | 1.86 | % | | 8/31/20 | | | — | | | | — | | | | — | | |
Guardian Class R3 | | | 1.36 | % | | 8/31/20 | | | 82 | | | | 148 | | | | 88 | | |
International Equity Investor Class | | | 1.40 | % | | 8/31/20 | | | — | | | | — | | | | — | | |
International Equity Trust Class | | | 2.00 | % | | 8/31/22 | | | — | | | | — | | | | — | | |
International Equity Institutional Class | | | 0.85 | % | | 8/31/22 | | | — | | | | — | | | | — | | |
197
| | | | | | | Expenses Reimbursed in
Year Ending August 31, | |
| | | | | | | 2015 | | 2016 | | 2017 | |
| | | | | | | Subject to Repayment until
August 31, | |
Class | | Contractual
Expense
Limitation(a) | | Expiration | | 2018 | | 2019 | | 2020 | |
International Equity Class A | | | 1.21 | % | | 8/31/20 | | $ | — | | | $ | 10,042 | | | $ | — | | |
International Equity Class C | | | 1.96 | % | | 8/31/20 | | | 280 | | | | 2,521 | | | | — | | |
International Equity Class R6 | | | 0.78 | % | | 8/31/20 | | | — | | | | — | | | | — | | |
International Select Trust Class | | | 1.15 | %(f) | | 8/31/20 | | | 9,396 | | | | 12,258 | | | | 12,594 | | |
International Select Institutional Class | | | 0.80 | %(f) | | 8/31/20 | | | 59,089 | | | | 91,989 | | | | 141,368 | | |
International Select Class A | | | 1.16 | %(f)(g) | | 8/31/20 | | | 526 | | | | 1,276 | | | | 3,083 | | |
International Select Class C | | | 1.91 | %(f) | | 8/31/20 | | | 1,857 | | | | 1,955 | | | | 2,278 | | |
International Select Class R3 | | | 1.41 | %(f) | | 8/31/20 | | | 1,371 | | | | 2,218 | | | | 3,513 | | |
International Select Class R6 | | | 0.73 | % | | 8/31/20 | | | — | | | | — | | | | 1,906 | (h) | |
International Small Cap Institutional Class | | | 1.05 | % | | 8/31/20 | | | — | | | | — | | | | 159,342 | (i) | |
International Small Cap Class A | | | 1.41 | % | | 8/31/20 | | | — | | | | — | | | | 65,158 | (i) | |
International Small Cap Class C | | | 2.16 | % | | 8/31/20 | | | — | | | | — | | | | 25,270 | (i) | |
International Small Cap Class R6 | | | 0.98 | % | | 8/31/20 | | | — | | | | — | | | | 50,711 | (i) | |
Intrinsic Value Institutional Class | | | 1.00 | % | | 8/31/20 | | | 339,659 | | | | 357,588 | | | | 205,715 | | |
Intrinsic Value Class A | | | 1.36 | % | | 8/31/20 | | | 36,399 | | | | 58,200 | | | | 21,955 | | |
Intrinsic Value Class C | | | 2.11 | % | | 8/31/20 | | | 20,071 | | | | 22,495 | | | | 9,376 | | |
Large Cap Value Trust Class | | | 1.50 | % | | 8/31/20 | | | — | | | | — | | | | — | | |
Large Cap Value Advisor Class | | | 1.50 | % | | 8/31/22 | | | — | | | | — | | | | — | | |
Large Cap Value Institutional Class | | | 0.70 | % | | 8/31/20 | | | — | | | | 983 | | | | — | | |
Large Cap Value Class A | | | 1.11 | % | | 8/31/20 | | | — | | | | — | | | | — | | |
Large Cap Value Class C | | | 1.86 | % | | 8/31/20 | | | — | | | | — | | | | — | | |
Large Cap Value Class R3 | | | 1.36 | % | | 8/31/20 | | | 150 | | | | 126 | | | | 70 | | |
Mid Cap Growth Trust Class | | | 1.50 | % | | 8/31/20 | | | — | | | | — | | | | — | | |
Mid Cap Growth Advisor Class | | | 1.50 | % | | 8/31/22 | | | — | | | | — | | | | — | | |
Mid Cap Growth Institutional Class | | | 0.75 | % | | 8/31/20 | | | — | | | | — | | | | — | | |
Mid Cap Growth Class A | | | 1.11 | % | | 8/31/20 | | | — | | | | — | | | | — | | |
Mid Cap Growth Class C | | | 1.86 | % | | 8/31/20 | | | 1,402 | | | | 1,762 | | | | — | | |
Mid Cap Growth Class R3 | | | 1.36 | % | | 8/31/20 | | | 1,071 | | | | 2,657 | | | | 80 | | |
Mid Cap Growth Class R6 | | | 0.68 | % | | 8/31/20 | | | — | | | | — | | | | — | | |
Mid Cap Intrinsic Value Investor Class | | | 1.50 | % | | 8/31/22 | | | — | | | | — | | | | — | | |
Mid Cap Intrinsic Value Trust Class | | | 1.25 | % | | 8/31/22 | | | 3,825 | | | | 8,167 | | | | — | | |
Mid Cap Intrinsic Value Institutional Class | | | 0.85 | % | | 8/31/20 | | | 9,129 | | | | 24,711 | | | | 5,015 | | |
Mid Cap Intrinsic Value Class A | | | 1.21 | % | | 8/31/20 | | | 6,396 | | | | 17,891 | | | | 4,690 | | |
Mid Cap Intrinsic Value Class C | | | 1.96 | % | | 8/31/20 | | | 1,380 | | | | 4,388 | | | | 1,218 | | |
Mid Cap Intrinsic Value Class R3 | | | 1.46 | % | | 8/31/20 | | | 508 | | | | 1,736 | | | | 629 | | |
Multi-Cap Opportunities Institutional Class | | | 1.00 | % | | 8/31/20 | | | — | | | | — | | | | — | | |
Multi-Cap Opportunities Class A | | | 1.36 | % | | 8/31/20 | | | — | | | | — | | | | — | | |
198
| | | | | | | Expenses Reimbursed in
Year Ending August 31, | |
| | | | | | | 2015 | | 2016 | | 2017 | |
| | | | | | | Subject to Repayment until
August 31, | |
Class | | Contractual
Expense
Limitation(a) | | Expiration | | 2018 | | 2019 | | 2020 | |
Multi-Cap Opportunities Class C | | | 2.11 | % | | 8/31/20 | | $ | — | | | $ | — | | | $ | — | | |
Real Estate Trust Class | | | 1.50 | %(g) | | 8/31/22 | | | — | | | | — | | | | — | | |
Real Estate Institutional Class | | | 0.85 | % | | 8/31/22 | | | 815,170 | | | | 588,136 | | | | 418,961 | | |
Real Estate Class A | | | 1.21 | % | | 8/31/20 | | | 344,493 | | | | 261,138 | | | | 193,727 | | |
Real Estate Class C | | | 1.96 | % | | 8/31/20 | | | 82,751 | | | | 62,906 | | | | 47,102 | | |
Real Estate Class R3 | | | 1.46 | % | | 8/31/20 | | | 50,187 | | | | 50,219 | | | | 46,018 | | |
Real Estate Class R6 | | | 0.78 | % | | 8/31/20 | | | 58,201 | | | | 70,754 | | | | 85,221 | | |
Small Cap Growth Investor Class | | | 1.30 | %(g) | | 8/31/22 | | | 192,273 | | | | 243,435 | | | | 221,840 | | |
Small Cap Growth Trust Class | | | 1.40 | %(g) | | 8/31/22 | | | 25,160 | | | | 24,155 | | | | 19,320 | | |
Small Cap Growth Advisor Class | | | 1.60 | %(g) | | 8/31/22 | | | 12,075 | | | | 10,968 | | | | 8,126 | | |
Small Cap Growth Institutional Class | | | 0.90 | % | | 8/31/20 | | | 110,976 | | | | 94,448 | | | | 61,816 | | |
Small Cap Growth Class A | | | 1.26 | % | | 8/31/20 | | | 26,864 | | | | 26,066 | | | | 20,750 | | |
Small Cap Growth Class C | | | 2.01 | % | | 8/31/20 | | | 10,703 | | | | 13,463 | | | | 11,214 | | |
Small Cap Growth Class R3 | | | 1.51 | % | | 8/31/20 | | | 4,955 | | | | 8,774 | | | | 6,935 | | |
Socially Responsive Trust Class | | | 1.50 | % | | 8/31/20 | | | — | | | | — | | | | — | | |
Socially Responsive Institutional Class | | | 0.75 | % | | 8/31/20 | | | — | | | | — | | | | — | | |
Socially Responsive Class A | | | 1.11 | % | | 8/31/20 | | | — | | | | — | | | | — | | |
Socially Responsive Class C | | | 1.86 | % | | 8/31/20 | | | — | | | | — | | | | — | | |
Socially Responsive Class R3 | | | 1.36 | % | | 8/31/20 | | | — | | | | — | | | | — | | |
Socially Responsive Class R6 | | | 0.68 | % | | 8/31/20 | | | — | | | | — | | | | — | | |
Value Institutional Class | | | 0.75 | %(g) | | 8/31/20 | | | 166,414 | | | | 172,294 | | | | 165,002 | | |
Value Class A | | | 1.11 | %(g) | | 8/31/20 | | | 98,718 | | | | 87,821 | | | | 66,962 | | |
Value Class C | | | 1.86 | %(g) | | 8/31/20 | | | 7,048 | | | | 9,526 | | | | 41,187 | | |
(a) Expense limitation per annum of the respective class's average daily net assets.
(b) Period from December 15, 2015 (Commencement of Operations) to August 31, 2016.
(c) From October 16, 2017, the contractual expense limitation is 0.75%.
(d) Prior to December 8, 2016, the contractual expense limitation was 1.15% for Institutional Class, 1.51% for Class A and 2.26% for Class C.
(e) Period from December 30, 2014 (Commencement of Operations) to August 31, 2015.
(f) Prior to December 8, 2016, the contractual expense limitation was 1.25% for Trust Class, 0.90% for Institutional Class, 1.30% for Class A, 2.00% for Class C and 1.51% for Class R3.
199
(g) In addition, Management has voluntarily undertaken to waive current payment of fees and/or reimburse certain expenses, so that their Operating Expenses, per annum of their respective average daily net assets, are limited to the percentages indicated below:
| Class | | Voluntary Expense
Limitation | | Expenses Voluntarily
Waived in Year
Ending August 31,
2017 Not Subject to
Repayment(j) | |
International Select Class A | | | 1.24 | %(k) | | $ | 733 | | |
Real Estate Trust Class | | | 1.04 | % | | | 643,395 | | |
Small Cap Growth Investor Class | | | 1.21 | % | | | 41,834 | | |
| | Effective September 1, 2015 | | | |
Small Cap Growth Trust Class | | | 1.37 | % | | | 1,215 | | |
Small Cap Growth Advisor Class | | | 1.51 | % | | | 1,652 | | |
| | Effective December 30, 2015 | | | |
| Value Institutional Class* | | | 0.70 | % | | | 5,703 | | |
| | | Effective March 15, 2017 | | | |
| Value Class A** | | | 1.07 | % | | | 1,487 | | |
| | Effective June 15, 2016 | | | |
| Value Class C*** | | | 1.82 | % | | | 1,139 | | |
* 0.71% from September 18, 2015 to December 29, 2015; 0.70% from June 22, 2015 to September 17, 2015; 0.69% from March 13, 2015 to June 21, 2015; 0.70% prior to March 13, 2015.
** 1.08% from June 15, 2016 to March 14, 2017; 1.09% from December 30, 2015 to June 14, 2016; 1.10% from September 18, 2015 to December 29, 2015; 1.07% from June 22, 2015 to September 17, 2015; 1.10% from March 13, 2015 to June 21, 2015; 1.08% from December 12, 2014 to March 12, 2015; 1.06% from September 12, 2014 to December 11, 2014; 1.08% from June 13, 2014 to September 11, 2014.
*** 1.83% from September 18, 2015 to June 14, 2016; 1.82% from March 13, 2015 to September 17, 2015; 1.83% from December 12, 2014 to March 12, 2015; 1.86% prior to December 12, 2014.
(h) Period from April 17, 2017 (Commencement of Operations) to August 31, 2017.
(i) Period from December 8, 2016 (Commencement of Operations) to August 31, 2017.
(j) Voluntary reimbursements are not subject to recovery by Management and are terminable by Management upon notice to International Select, Real Estate, Small Cap Growth and Value.
(k) Voluntary waiver terminated on December 7, 2016, due to the lower contractual expense limitation which went effective December 8, 2016.
As previously announced, on April 28, 2017, NBIA retained Green Court Capital Management Limited as the sub-adviser to Neuberger Berman Greater China Equity Fund, replacing Neuberger Berman Asia Limited. The nature and level of the services provided under the new Sub-Advisory Agreement are the same as under the previous Sub-Advisory Agreement, and there will be no change in the fees incurred by the Fund.
Neuberger Berman LLC ("Neuberger Berman"), as the sub-adviser to each Fund (except Greater China Equity), was retained by Management through December 31, 2015, to furnish it with investment recommendations, research information and related services without added cost to the Funds. Several individuals who are Officers and/or Trustees of the Trust are also employees of Neuberger Berman and/or Management. As a result of the entity consolidation described on page 73 of this Annual Report, the services previously provided by Neuberger Berman under the subadvisory agreements are being provided by NBIA as of January 1, 2016.
200
Each Fund also has a distribution agreement with Neuberger Berman BD LLC (the "Distributor") with respect to each class of shares. The Distributor acts as agent in arranging for the sale of class shares without sales commission or other compensation, except as described below, and bears the advertising and promotion expenses.
However, the Distributor receives fees from the Trust Class of each of Focus, Guardian, International Select, Large Cap Value, Mid Cap Intrinsic Value, Real Estate, Small Cap Growth and Socially Responsive, and from the Advisor Class, Class A, Class C and Class R3 of each Fund that offers those classes under their distribution plans (each a "Plan", collectively, the "Plans") pursuant to Rule 12b-1 under the 1940 Act. The Plans provide that, as compensation for administrative and other services provided to these classes, the Distributor's activities and expenses related to the sale and distribution of these classes, and ongoing services provided to investors in these classes, the Distributor receives from each of these respective classes a fee at the annual rate of 0.10% of such Trust Class's, 0.25% of such Advisor Class's, 0.25% of such Class A's, 1.00% of such Class C's and 0.50% of such Class R3's average daily net assets. The Distributor receives this amount to provide distribution and shareholder servicing for these classes and pays a portion of it to institutions that provide such services. Those institutions may use the payments for, among other purposes, compensating employees engaged in sales and/or shareholder servicing. The amount of fees paid by each class during any year may be more or less than the cost of distribution and other services provided to that class. FINRA rules limit the amount of annual distribution fees that may be paid by a mutual fund and impose a ceiling on the cumulative distribution fees paid. The Trust's Plans comply with those rules.
Class A shares of each Fund are generally sold with an initial sales charge of up to 5.75% and no contingent deferred sales charge ("CDSC"), except that a CDSC of 1.00% applies to certain redemptions made within 18 months following purchases of $1 million or more without an initial sales charge. Class C shares of each Fund are sold with no initial sales charge and a 1.00% CDSC if shares are sold within one year after purchase.
For the year ended August 31, 2017, Neuberger Berman, acting as underwriter and broker-dealer, received net initial sales charges from the purchase of Class A shares and CDSCs from the redemption of Class A and Class C shares as follows:
| | | Underwriter | | Broker-Dealer | |
| | | Net Initial Sales
Charge | | CDSC | | Net Initial Sales
Charge | | CDSC | |
Dividend Growth Class A | | $ | 1,158 | | | $ | — | | | $ | — | | | $ | — | | |
Dividend Growth Class C | | | — | | | | 5,376 | | | | — | | | | — | | |
Emerging Markets Equity Class A | | | 6,525 | | | | — | | | | — | | | | — | | |
Emerging Markets Equity Class C | | | — | | | | 429 | | | | — | | | | — | | |
Equity Income Class A | | | 23,386 | | | | — | | | | — | | | | — | | |
Equity Income Class C | | | — | | | | 15,079 | | | | — | | | | — | | |
Focus Class A | | | — | | | | — | | | | — | | | | — | | |
Focus Class C | | | — | | | | — | | | | — | | | | — | | |
Global Equity Class A | | | 1 | | | | — | | | | — | | | | — | | |
Global Equity Class C | | | — | | | | 2 | | | | — | | | | — | | |
Global Real Estate Class A | | | — | | | | — | | | | — | | | | — | | |
Global Real Estate Class C | | | — | | | | 32 | | | | — | | | | — | | |
Greater China Equity Class A | | | 1,002 | | | | — | | | | — | | | | — | | |
Greater China Equity Class C | | | — | | | | 448 | | | | — | | | | — | | |
Guardian Class A | | | 449 | | | | — | | | | — | | | | — | | |
Guardian Class C | | | — | | | | 7 | | | | — | | | | — | | |
International Equity Class A | | | 9,314 | | | | — | | | | — | | | | — | | |
International Equity Class C | | | — | | | | 2,942 | | | | — | | | | — | | |
201
| | | Underwriter | | Broker-Dealer | |
| | | Net Initial Sales
Charge | | CDSC | | Net Initial Sales
Charge | | CDSC | |
International Select Class A | | $ | 19 | | | $ | — | | | $ | — | | | $ | — | | |
International Select Class C | | | — | | | | 14 | | | | — | | | | — | | |
| International Small Cap Class A(a) | | | — | | | | — | | | | — | | | | — | | |
| International Small Cap Class C(a) | | | — | | | | 104 | | | | — | | | | — | | |
Intrinsic Value Class A | | | 5,260 | | | | — | | | | — | | | | — | | |
Intrinsic Value Class C | | | — | | | | 2,169 | | | | — | | | | — | | |
Large Cap Value Class A | | | 1,749 | | | | — | | | | — | | | | — | | |
Large Cap Value Class C | | | — | | | | 1,231 | | | | — | | | | — | | |
Mid Cap Growth Class A | | | 6,449 | | | | — | | | | — | | | | — | | |
Mid Cap Growth Class C | | | — | | | | 4,094 | | | | — | | | | — | | |
Mid Cap Intrinsic Value Class A | | | 896 | | | | — | | | | — | | | | — | | |
Mid Cap Intrinsic Value Class C | | | — | | | | 1,512 | | | | — | | | | — | | |
Multi-Cap Opportunities Class A | | | 23,704 | | | | — | | | | — | | | | — | | |
Multi-Cap Opportunities Class C | | | — | | | | 3,713 | | | | — | | | | — | | |
Real Estate Class A | | | 2,304 | | | | — | | | | — | | | | — | | |
Real Estate Class C | | | — | | | | 6,170 | | | | — | | | | — | | |
Small Cap Growth Class A | | | 790 | | | | — | | | | — | | | | — | | |
Small Cap Growth Class C | | | — | | | | 188 | | | | — | | | | — | | |
Socially Responsive Class A | | | 41,720 | | | | — | | | | — | | | | — | | |
Socially Responsive Class C | | | — | | | | 8,939 | | | | — | | | | — | | |
Value Class A | | | 4,215 | | | | — | | | | — | | | | — | | |
Value Class C | | | — | | | | 1,251 | | | | — | | | | — | | |
(a) Period from December 8, 2016 (Commencement of Operations) to August 31, 2017.
For the year ended August 31, 2017, Equity Income and Focus each recorded a capital contribution from Management in the amount of $1,250 and $1,145, respectively. These amounts were paid in connection with losses incurred in the execution of a trade for Equity Income and valuation of a corporate action for Focus.
For the year ended August 31, 2016, Mid Cap Growth recorded a capital contribution from Management in the amount of $1,006,679. This amount was paid in connection with losses incurred in the execution of a trade.
Note C—Securities Transactions:
During the year ended August 31, 2017, there were purchase and sale transactions of long-term securities (excluding option contracts) as follows:
(000's omitted) | | Purchases | | Sales | | (000's omitted) | | Purchases | | Sales | |
Dividend Growth | | $ | 22,411 | | | $ | 11,621 | | | International Small Cap(a) | | $ | 1,774 | | | $ | 576 | | |
Emerging Markets Equity | | | 395,291 | | | | 143,251 | | | Intrinsic Value | | | 258,737 | | | | 179,634 | | |
Equity Income | | | 871,269 | | | | 1,002,903 | | | Large Cap Value | | | 948,628 | | | | 1,140,328 | | |
Focus | | | 503,818 | | | | 552,949 | | | Mid Cap Growth | | | 508,405 | | | | 595,373 | | |
Genesis | | | 2,185,685 | | | | 2,855,300 | | | Mid Cap Intrinsic Value | | | 27,672 | | | | 37,527 | | |
Global Equity | | | 681 | | | | 999 | | | Multi-Cap Opportunities | | | 418,457 | | | | 695,914 | | |
Global Real Estate | | | 1,645 | | | | 1,802 | | | Real Estate | | | 255,990 | | | | 415,365 | | |
202
(000's omitted) | | Purchases | | Sales | | (000's omitted) | | Purchases | | Sales | |
Greater China Equity | | $ | 108,885 | | | $ | 106,803 | | | Small Cap Growth | | $ | 143,962 | | | $ | 150,244 | | |
Guardian | | | 414,937 | | | | 503,244 | | | Socially Responsive | | | 590,853 | | | | 830,565 | | |
International Equity | | | 530,309 | | | | 422,280 | | | Value | | | 19,142 | | | | 18,916 | | |
International Select | | | 61,425 | | | | 78,867 | | | | | | | | |
(a) Period from December 8, 2016 (Commencement of Operations) to August 31, 2017.
During the year ended August 31, 2017, no brokerage commissions on securities transactions were paid to affiliated brokers.
Note D—Fund Share Transactions:
Share activity for the years ended August 31, 2017 and August 31, 2016 was as follows:
| | | For the Year Ended August 31, 2017 | | For the Year Ended August 31, 2016 | |
(000's omitted) | | Shares
Sold | | Shares
Issued on
Reinvestment
of Dividends
and
Distributions | | Shares
Redeemed | | Total | | Shares
Sold | | Shares
Issued on
Reinvestment
of Dividends
and
Distributions | | Shares
Redeemed | | Total | |
Dividend Growth: | |
Institutional Class | | | 767 | | | | 36 | | | | (118 | ) | | | 685 | | | | 1,972 | | | | — | | | | (142 | ) | | | 1,830 | (a) | |
Class A | | | 128 | | | | 0 | z | | | (21 | ) | | | 107 | | | | 70 | | | | — | | | | (50 | ) | | | 20 | (a) | |
Class C | | | 246 | | | | 0 | z | | | (5 | ) | | | 241 | | | | 60 | | | | — | | | | (60 | ) | | | 0 | z(a) | |
Class R6 | | | — | | | | — | | | | (3 | ) | | | (3 | ) | | | 100 | | | | — | | | | (95 | ) | | | 5 | (a) | |
Emerging Markets Equity: | |
Institutional Class | | | 19,088 | | | | 56 | | | | (5,318 | ) | | | 13,826 | | | | 7,953 | | | | 83 | | | | (10,171 | ) | | | (2,135 | ) | |
Class A | | | 2,492 | | | | 6 | | | | (679 | ) | | | 1,819 | | | | 1,078 | | | | 3 | | | | (570 | ) | | | 511 | | |
Class C | | | 143 | | | | — | | | | (88 | ) | | | 55 | | | | 41 | | | | — | | | | (165 | ) | | | (124 | ) | |
Class R3 | | | 39 | | | | 0 | z | | | (38 | ) | | | 1 | | | | 34 | | | | 0 | z | | | (13 | ) | | | 21 | | |
Class R6 | | | 522 | | | | 39 | | | | (580 | ) | | | (19 | ) | | | 764 | | | | 48 | | | | (425 | ) | | | 387 | | |
Equity Income: | |
Institutional Class | | | 22,175 | | | | 4,444 | | | | (20,756 | ) | | | 5,863 | | | | 15,255 | | | | 5,579 | | | | (57,368 | ) | | | (36,534 | ) | |
Class A | | | 2,203 | | | | 912 | | | | (7,356 | ) | | | (4,241 | ) | | | 2,639 | | | | 1,164 | | | | (8,961 | ) | | | (5,158 | ) | |
Class C | | | 1,365 | | | | 885 | | | | (7,568 | ) | | | (5,318 | ) | | | 2,158 | | | | 1,150 | | | | (9,755 | ) | | | (6,447 | ) | |
Class R3 | | | 24 | | | | 6 | | | | (107 | ) | | | (77 | ) | | | 48 | | | | 11 | | | | (168 | ) | | | (109 | ) | |
Focus: | |
Investor Class | | | 217 | | | | 2,051 | | | | (2,278 | ) | | | (10 | ) | | | 209 | | | | 1,150 | | | | (2,214 | ) | | | (855 | ) | |
Trust Class | | | 81 | | | | 666 | | | | (1,220 | ) | | | (473 | ) | | | 111 | | | | 431 | | | | (1,843 | ) | | | (1,301 | ) | |
Advisor Class | | | 65 | | | | 195 | | | | (219 | ) | | | 41 | | | | 83 | | | | 111 | | | | (399 | ) | | | (205 | ) | |
Institutional Class | | | 103 | | | | 21 | | | | (104 | ) | | | 20 | | | | 97 | | | | 21 | | | | (980 | ) | | | (862 | ) | |
Class A | | | 15 | | | | 33 | | | | (53 | ) | | | (5 | ) | | | 31 | | | | 23 | | | | (124 | ) | | | (70 | ) | |
Class C | | | 55 | | | | 103 | | | | (134 | ) | | | 24 | | | | 69 | | | | 50 | | | | (178 | ) | | | (59 | ) | |
203
| | | For the Year Ended August 31, 2017 | | For the Year Ended August 31, 2016 | |
(000's omitted) | | Shares
Sold | | Shares
Issued on
Reinvestment
of Dividends
and
Distributions | | Shares
Redeemed | | Total | | Shares
Sold | | Shares
Issued on
Reinvestment
of Dividends
and
Distributions | | Shares
Redeemed | | Total | |
Genesis: | |
Investor Class | | | 5,975 | | | | 5,506 | | | | (10,049 | ) | | | 1,432 | | | | 5,103 | | | | 8,432 | | | | (17,909 | ) | | | (4,374 | ) | |
Trust Class | | | 2,413 | | | | 1,603 | | | | (8,136 | ) | | | (4,120 | ) | | | 2,360 | | | | 3,071 | | | | (9,793 | ) | | | (4,362 | ) | |
Advisor Class | | | 2,071 | | | | 1,608 | | | | (5,723 | ) | | | (2,044 | ) | | | 2,144 | | | | 2,934 | | | | (10,618 | ) | | | (5,540 | ) | |
Institutional Class | | | 13,326 | | | | 3,561 | | | | (16,214 | ) | | | 673 | | | | 16,116 | | | | 6,478 | | | | (26,335 | ) | | | (3,741 | ) | |
Class R6 | | | 11,215 | | | | 4,023 | | | | (13,556 | ) | | | 1,682 | | | | 12,364 | | | | 5,788 | | | | (7,989 | ) | | | 10,163 | | |
Global Equity: | |
Institutional Class | | | 25 | | | | 7 | | | | (21 | ) | | | 11 | | | | 96 | | | | 1 | | | | (58 | ) | | | 39 | | |
Class A | | | 8 | | | | 1 | | | | (43 | ) | | | (34 | ) | | | 32 | | | | — | | | | (22 | ) | | | 10 | | |
Class C | | | 1 | | | | 0 | z | | | (10 | ) | | | (9 | ) | | | 3 | | | | — | | | | (17 | ) | | | (14 | ) | |
Global Real Estate: | |
Institutional Class | | | — | | | | 8 | | | | (7 | ) | | | 1 | | | | 0 | z | | | 1 | | | | (1 | ) | | | 0 | z | |
Class A | | | 21 | | | | 0 | z | | | (40 | ) | | | (19 | ) | | | 0 | z | | | 1 | | | | (2 | ) | | | (1 | ) | |
Class C | | | — | | | | 0 | z | | | (2 | ) | | | (2 | ) | | | 2 | | | | 0 | z | | | — | | | | 2 | | |
Greater China Equity: | |
Institutional Class | | | 1,738 | | | | 10 | | | | (2,950 | ) | | | (1,202 | ) | | | 4,367 | | | | 389 | | | | (5,538 | ) | | | (782 | ) | |
Class A | | | 1,367 | | | | 0 | z | | | (182 | ) | | | 1,185 | | | | 690 | | | | 24 | | | | (877 | ) | | | (163 | ) | |
Class C | | | 21 | | | | — | | | | (14 | ) | | | 7 | | | | — | | | | 1 | | | | (2 | ) | | | (1 | ) | |
Guardian: | |
Investor Class | | | 644 | | | | 7,181 | | | | (6,730 | ) | | | 1,095 | | | | 620 | | | | 7,174 | | | | (7,829 | ) | | | (35 | ) | |
Trust Class | | | 466 | | | | 1,218 | | | | (2,696 | ) | | | (1,012 | ) | | | 386 | | | | 1,446 | | | | (4,008 | ) | | | (2,176 | ) | |
Advisor Class | | | 2 | | | | 2 | | | | (10 | ) | | | (6 | ) | | | 12 | | | | 3 | | | | (19 | ) | | | (4 | ) | |
Institutional Class | | | 1,074 | | | | 471 | | | | (1,035 | ) | | | 510 | | | | 767 | | | | 577 | | | | (3,250 | ) | | | (1,906 | ) | |
Class A | | | 147 | | | | 98 | | | | (313 | ) | | | (68 | ) | | | 416 | | | | 132 | | | | (6,594 | ) | | | (6,046 | ) | |
Class C | | | 31 | | | | 19 | | | | (107 | ) | | | (57 | ) | | | 51 | | | | 17 | | | | (59 | ) | | | 9 | | |
Class R3 | | | 16 | | | | 4 | | | | (28 | ) | | | (8 | ) | | | 10 | | | | 4 | | | | (7 | ) | | | 7 | | |
International Equity: | |
Investor Class | | | 260 | | | | 22 | | | | (687 | ) | | | (405 | ) | | | 402 | | | | 25 | | | | (1,331 | ) | | | (904 | ) | |
Trust Class | | | 273 | | | | 7 | | | | (668 | ) | | | (388 | ) | | | 346 | | | | 5 | | | | (752 | ) | | | (401 | ) | |
Institutional Class | | | 40,572 | | | | 1,388 | | | | (34,232 | ) | | | 7,728 | | | | 45,647 | | | | 1,013 | | | | (22,630 | ) | | | 24,030 | | |
Class A | | | 1,203 | | | | 4 | | | | (3,058 | ) | | | (1,851 | ) | | | 2,299 | | | | 7 | | | | (1,865 | ) | | | 441 | | |
Class C | | | 117 | | | | — | | | | (259 | ) | | | (142 | ) | | | 337 | | | | — | | | | (197 | ) | | | 140 | | |
Class R6 | | | 7,674 | | | | 73 | | | | (1,385 | ) | | | 6,362 | | | | 1,696 | | | | 45 | | | | (592 | ) | | | 1,149 | | |
204
| | | For the Year Ended August 31, 2017 | | For the Year Ended August 31, 2016 | |
(000's omitted) | | Shares
Sold | | Shares
Issued on
Reinvestment
of Dividends
and
Distributions | | Shares
Redeemed | | Total | | Shares
Sold | | Shares
Issued on
Reinvestment
of Dividends
and
Distributions | | Shares
Redeemed | | Total | |
International Select: | |
Trust Class | | | 26 | | | | 8 | | | | (95 | ) | | | (61 | ) | | | 66 | | | | 8 | | | | (317 | ) | | | (243 | ) | |
Institutional Class | | | 4,446 | | | | 295 | | | | (6,957 | ) | | | (2,216 | ) | | | 1,457 | | | | 252 | | | | (2,674 | ) | | | (965 | ) | |
Class A | | | 176 | | | | 4 | | | | (213 | ) | | | (33 | ) | | | 193 | | | | 3 | | | | (130 | ) | | | 66 | | |
Class C | | | 47 | | | | 0 | z | | | (150 | ) | | | (103 | ) | | | 12 | | | | 0 | z | | | (64 | ) | | | (52 | ) | |
Class R3 | | | 202 | | | | 3 | | | | (151 | ) | | | 54 | | | | 134 | | | | 2 | | | | (108 | ) | | | 28 | | |
| Class R6(b) | | | 825 | | | | — | | | | (51 | ) | | | 774 | | | | — | | | | — | | | | — | | | | — | | |
International Small Cap: | |
| Institutional Class(c) | | | 64 | | | | — | | | | — | | | | 64 | | | | — | | | | — | | | | — | | | | — | | |
| Class A(c) | | | 55 | | | | — | | | | (31 | ) | | | 24 | | | | — | | | | — | | | | — | | | | — | | |
| Class C(c) | | | 11 | | | | — | | | | (1 | ) | | | 10 | | | | — | | | | — | | | | — | | | | — | | |
| Class R6(c) | | | 20 | | | | — | | | | — | | | | 20 | | | | — | | | | — | | | | — | | | | — | | |
Intrinsic Value: | |
Institutional Class | | | 18,969 | | | | 521 | | | | (10,867 | ) | | | 8,623 | | | | 25,670 | | | | 1,318 | | | | (12,710 | ) | | | 14,278 | | |
Class A | | | 1,026 | | | | 40 | | | | (3,161 | ) | | | (2,095 | ) | | | 2,339 | | | | 165 | | | | (2,403 | ) | | | 101 | | |
Class C | | | 229 | | | | 22 | | | | (669 | ) | | | (418 | ) | | | 496 | | | | 89 | | | | (563 | ) | | | 22 | | |
Large Cap Value: | |
Investor Class | | | 593 | | | | 1,274 | | | | (3,403 | ) | | | (1,536 | ) | | | 605 | | | | 3,565 | | | | (4,378 | ) | | | (208 | ) | |
Trust Class | | | 347 | | | | 228 | | | | (1,078 | ) | | | (503 | ) | | | 275 | | | | 808 | | | | (2,634 | ) | | | (1,551 | ) | |
Advisor Class | | | 944 | | | | 772 | | | | (2,569 | ) | | | (853 | ) | | | 886 | | | | 2,074 | | | | (3,420 | ) | | | (460 | ) | |
Institutional Class | | | 1,373 | | | | 79 | | | | (895 | ) | | | 557 | | | | 271 | | | | 198 | | | | (1,621 | ) | | | (1,152 | ) | |
Class A | | | 141 | | | | 10 | | | | (139 | ) | | | 12 | | | | 66 | | | | 26 | | | | (73 | ) | | | 19 | | |
Class C | | | 84 | | | | 10 | | | | (94 | ) | | | 0 | z | | | 66 | | | | 22 | | | | (116 | ) | | | (28 | ) | |
Class R3 | | | 13 | | | | 0 | z | | | (4 | ) | | | 9 | | | | 0 | z | | | 1 | | | | (1 | ) | | | 0 | z | |
Mid Cap Growth: | |
Investor Class | | | 723 | | | | 1,481 | | | | (3,065 | ) | | | (861 | ) | | | 2,763 | | | | 2,578 | | | | (3,714 | ) | | | 1,627 | | |
Trust Class | | | 426 | | | | 79 | | | | (1,427 | ) | | | (922 | ) | | | 642 | | | | 201 | | | | (1,690 | ) | | | (847 | ) | |
Advisor Class | | | 132 | | | | 11 | | | | (165 | ) | | | (22 | ) | | | 215 | | | | 21 | | | | (166 | ) | | | 70 | | |
Institutional Class | | | 4,987 | | | | 1,034 | | | | (7,323 | ) | | | (1,302 | ) | | | 10,390 | | | | 2,690 | | | | (18,789 | ) | | | (5,709 | ) | |
Class A | | | 437 | | | | 87 | | | | (1,807 | ) | | | (1,283 | ) | | | 1,629 | | | | 232 | | | | (2,689 | ) | | | (828 | ) | |
Class C | | | 47 | | | | 12 | | | | (161 | ) | | | (102 | ) | | | 237 | | | | 23 | | | | (120 | ) | | | 140 | | |
Class R3 | | | 157 | | | | 14 | | | | (257 | ) | | | (86 | ) | | | 302 | | | | 27 | | | | (245 | ) | | | 84 | | |
Class R6 | | | 4,919 | | | | 725 | | | | (2,381 | ) | | | 3,263 | | | | 10,337 | | | | 854 | | | | (2,620 | ) | | | 8,571 | | |
205
| | | For the Year Ended August 31, 2017 | | For the Year Ended August 31, 2016 | |
(000's omitted) | | Shares
Sold | | Shares
Issued on
Reinvestment
of Dividends
and
Distributions | | Shares
Redeemed | | Total | | Shares
Sold | | Shares
Issued on
Reinvestment
of Dividends
and
Distributions | | Shares
Redeemed | | Total | |
Mid Cap Intrinsic Value: | |
Investor Class | | | 73 | | | | 9 | | | | (249 | ) | | | (167 | ) | | | 116 | | | | 231 | | | | (432 | ) | | | (85 | ) | |
Trust Class | | | 30 | | | | 4 | | | | (87 | ) | | | (53 | ) | | | 28 | | | | 96 | | | | (165 | ) | | | (41 | ) | |
Institutional Class | | | 405 | | | | 9 | | | | (297 | ) | | | 117 | | | | 378 | | | | 200 | | | | (1,045 | ) | | | (467 | ) | |
Class A | | | 119 | | | | 4 | | | | (483 | ) | | | (360 | ) | | | 264 | | | | 96 | | | | (379 | ) | | | (19 | ) | |
Class C | | | 29 | | | | 0 | z | | | (124 | ) | | | (95 | ) | | | 72 | | | | 18 | | | | (57 | ) | | | 33 | | |
Class R3 | | | 24 | | | | 0 | z | | | (32 | ) | | | (8 | ) | | | 37 | | | | 12 | | | | (31 | ) | | | 18 | | |
Multi-Cap Opportunities: | |
Institutional Class | | | 9,649 | | | | 669 | | | | (21,655 | ) | | | (11,337 | ) | | | 6,282 | | | | 844 | | | | (40,964 | ) | | | (33,838 | ) | |
Class A | | | 1,452 | | | | 118 | | | | (3,263 | ) | | | (1,693 | ) | | | 915 | | | | 185 | | | | (3,291 | ) | | | (2,191 | ) | |
Class C | | | 374 | | | | 60 | | | | (722 | ) | | | (288 | ) | | | 352 | | | | 76 | | | | (991 | ) | | | (563 | ) | |
Real Estate: | |
Trust Class | | | 916 | | | | 1,899 | | | | (5,271 | ) | | | (2,456 | ) | | | 1,581 | | | | 1,493 | | | | (7,466 | ) | | | (4,392 | ) | |
Institutional Class | | | 3,910 | | | | 2,045 | | | | (8,926 | ) | | | (2,971 | ) | | | 6,130 | | | | 1,707 | | | | (15,421 | ) | | | (7,584 | ) | |
Class A | | | 1,582 | | | | 1,022 | | | | (4,282 | ) | | | (1,678 | ) | | | 2,661 | | | | 736 | | | | (5,616 | ) | | | (2,219 | ) | |
Class C | | | 73 | | | | 204 | | | | (815 | ) | | | (538 | ) | | | 155 | | | | 143 | | | | (557 | ) | | | (259 | ) | |
Class R3 | | | 419 | | | | 211 | | | | (876 | ) | | | (246 | ) | | | 571 | | | | 131 | | | | (693 | ) | | | 9 | | |
Class R6 | | | 835 | | | | 437 | | | | (906 | ) | | | 366 | | | | 1,175 | | | | 211 | | | | (610 | ) | | | 776 | | |
Small Cap Growth: | |
Investor Class | | | 86 | | | | — | | | | (202 | ) | | | (116 | ) | | | 38 | | | | 95 | | | | (173 | ) | | | (40 | ) | |
Trust Class | | | 4 | | | | — | | | | (48 | ) | | | (44 | ) | | | 11 | | | | 9 | | | | (34 | ) | | | (14 | ) | |
Advisor Class | | | 9 | | | | — | | | | (46 | ) | | | (37 | ) | | | 25 | | | | 11 | | | | (55 | ) | | | (19 | ) | |
Institutional Class | | | 100 | | | | — | | | | (90 | ) | | | 10 | | | | 94 | | | | 25 | | | | (466 | ) | | | (347 | ) | |
Class A | | | 33 | | | | — | | | | (60 | ) | | | (27 | ) | | | 40 | | | | 8 | | | | (89 | ) | | | (41 | ) | |
Class C | | | 28 | | | | — | | | | (35 | ) | | | (7 | ) | | | 24 | | | | 10 | | | | (46 | ) | | | (12 | ) | |
Class R3 | | | 21 | | | | — | | | | (32 | ) | | | (11 | ) | | | 55 | | | | 5 | | | | (53 | ) | | | 7 | | |
Socially Responsive: | |
Investor Class | | | 1,723 | | | | 869 | | | | (4,473 | ) | | | (1,881 | ) | | | 2,321 | | | | 1,365 | | | | (5,077 | ) | | | (1,391 | ) | |
Trust Class | | | 1,668 | | | | 967 | | | | (4,962 | ) | | | (2,327 | ) | | | 1,800 | | | | 1,560 | | | | (5,630 | ) | | | (2,270 | ) | |
Institutional Class | | | 5,894 | | | | 910 | | | | (5,774 | ) | | | 1,030 | | | | 6,451 | | | | 1,298 | | | | (7,648 | ) | | | 101 | | |
Class A | | | 1,472 | | | | 458 | | | | (2,884 | ) | | | (954 | ) | | | 1,444 | | | | 681 | | | | (2,544 | ) | | | (419 | ) | |
Class C | | | 532 | | | | 166 | | | | (670 | ) | | | 28 | | | | 490 | | | | 224 | | | | (625 | ) | | | 89 | | |
Class R3 | | | 719 | | | | 125 | | | | (542 | ) | | | 302 | | | | 524 | | | | 161 | | | | (525 | ) | | | 160 | | |
Class R6 | | | 2,522 | | | | 430 | | | | (4,136 | ) | | | (1,184 | ) | | | 5,148 | | | | 484 | | | | (1,510 | ) | | | 4,122 | | |
206
| | | For the Year Ended August 31, 2017 | | For the Year Ended August 31, 2016 | |
| (000's omitted) | | Shares
Sold | | Shares
Issued on
Reinvestment
of Dividends
and
Distributions | | Shares
Redeemed | | Total | | Shares
Sold | | Shares
Issued on
Reinvestment
of Dividends
and
Distributions | | Shares
Redeemed | | Total | |
Value: | |
Institutional Class | | | 442 | | | | 5 | | | | (430 | ) | | | 17 | | | | 177 | | | | 20 | | | | (529 | ) | | | (332 | ) | |
Class A | | | 355 | | | | 1 | | | | (452 | ) | | | (96 | ) | | | 29 | | | | 8 | | | | (300 | ) | | | (263 | ) | |
Class C | | | 179 | | | | 1 | | | | (17 | ) | | | 163 | | | | 9 | | | | 1 | | | | (12 | ) | | | (2 | ) | |
(a) Period from December 15, 2015 (Commencement of Operations) to August 31, 2016.
(b) Period from April 17, 2017 (Commencement of Operations) to August 31, 2017.
(c) Period from December 8, 2016 (Commencement of Operations) to August 31, 2017.
z Amount less than one thousand.
Note E—Line of Credit:
At August 31, 2017, each Fund was a participant in a syndicated committed, unsecured $700,000,000 line of credit (the "Credit Facility"), to be used only for temporary or emergency purposes. Series of other investment companies managed by Management also participate in this line of credit on substantially the same terms except that some do not have access to the full amount of the Credit Facility. Interest is charged on borrowings under this Credit Facility at the highest of (a) a federal funds effective rate plus 1.00% per annum, (b) a Eurodollar rate for a one-month period plus 1.00% per annum, and (c) an overnight bank funding rate plus 1.00% per annum. The Credit Facility has an annual commitment fee of 0.15% per annum of the available line of credit, which is paid quarterly. Each Fund that is a participant has agreed to pay its pro rata share of the annual commitment fee, based on the ratio of its individual net assets to the net assets of all participants at the time the fee is due and payable and the level of its access to the Credit Facility, and interest charged on any borrowing made by such Fund and other costs incurred by such Fund. Because several mutual funds participate in the Credit Facility, there is no assurance that an individual Fund will have access to all or any part of the $700,000,000 at any particular time. There were no loans outstanding under the Credit Facility at August 31, 2017.
During the year ended August 31, 2017, the following Fund had borrowings under the Credit Facility:
Fund | | Number of
Days Borrowed | | Greatest
Amount Borrowed | | Average
Interest Rate | | Interest Paid(a) | |
Greater China Equity | | | 7 | | | $ | 11,020,000 | | | | 1.53 | % | | $ | 2,472 | | |
(a) Interest Paid is reflected in the Statements of Operations under the caption "Interest expense".
207
Note F—Investments in Affiliates(a):
| | | Balance of
Shares Held
August 31,
2016 | | Gross
Purchases
and
Additions | | Gross
Sales
and
Reductions | | Balance of
Shares Held
August 31,
2017 | | Value
August 31,
2017 | | Distributions
from
Investments
in Affiliated
Issuers | | Net Realized
Gain/(Loss)
from
Investments
in Affiliated
Issuers | | Change in
Net
Unrealized
Appreciation/
(Depreciation)
from
Investments
in Affiliated
Issuers | |
Genesis | |
Astronics
Corp. | | | 1,050,865 | | | | 190,529 | | | | 103,285 | | | | 1,138,109 | | | $ | 29,920,886 | | | $ | — | * | | $ | (1,515,931 | ) | | $ | (13,359,055 | ) | |
AZZ, Inc. | | | 454,900 | | | | 1,072,255 | | | | 28,116 | | | | 1,499,039 | | | | 73,303,007 | | | | 789,635 | | | | 14,072 | | | | (18,814,186 | ) | |
Bank of
Hawaii
Corp. | | | 2,218,312 | | | | 87,240 | | | | 123,916 | | | | 2,181,636 | | | | 170,451,221 | | | | 4,441,352 | | | | 3,390,734 | | | | 9,729,557 | | |
Calavo
Growers,
Inc. | | | 613,702 | | | | 580,900 | | | | 90,323 | | | | 1,104,279 | | | | 74,152,335 | | | | 536,312 | | | | 1,327,914 | | | | 8,366,288 | | |
Computer
Modelling
Group Ltd. | | | 4,651,700 | | | | — | | | | 411,262 | | | | 4,240,438 | | | | 30,765,459 | | | | 1,353,817 | | | | 180,112 | | | | 573,321 | | |
CVB Financial
Corp. | | | 5,731,072 | | | | 544,230 | | | | 337,649 | | | | 5,937,653 | | | | 122,909,417 | | | | 3,014,754 | | | | 1,716,831 | | | | 15,386,049 | | |
Exponent,
Inc. | | | 1,968,670 | | | | — | | | | 244,918 | | | | 1,723,752 | | | | 117,387,511 | | | | 1,467,143 | | | | 9,540,618 | | | | 23,116,568 | | |
Gray
Television,
Inc. | | | 4,097,350 | | | | 513,115 | | | | 362,674 | | | | 4,247,791 | | | | 60,743,411 | | | | — | * | | | (1,492,519 | ) | | | 14,469,217 | | |
Heska Corp. | | | — | | | | 408,717 | | | | 16,020 | | | | 392,697 | | | | 39,945,139 | | | | — | * | | | 223,415 | | | | 9,897,560 | | |
LegacyTexas
Financial
Group, Inc. | | | 1,878,818 | | | | 762,500 | | | | 159,415 | | | | 2,481,903 | | | | 89,323,689 | | | | 1,456,398 | | | | 1,802,686 | | | | 6,657,662 | | |
Lindsay Corp. | | | 668,350 | | | | — | | | | 73,406 | | | | 594,944 | | | | 51,504,302 | | | | 731,596 | | | | 566,178 | | | | 8,908,251 | | |
MGP
Ingredients,
Inc. | | | — | | | | 872,390 | | | | 25,007 | | | | 847,383 | | | | 47,648,346 | | | | 818,049 | | | | 181,370 | | | | 6,618,857 | | |
Monotype
Imaging
Holdings,
Inc. | | | 3,058,306 | | | | — | | | | 336,206 | | | | 2,722,100 | | | | 49,678,325 | | | | 1,292,886 | | | | (2,477,355 | ) | | | (5,713,882 | ) | |
Nexstar
Broadcasting
Group, Inc.
Class A(b) | | | 2,019,021 | | | | 619,925 | | | | 114,950 | | | | 2,523,996 | | | | 151,944,559 | | | | 2,699,625 | | | | 2,008,793 | | | | 10,970,903 | | |
Pason
Systems,
Inc. | | | 3,679,657 | | | | 1,208,740 | | | | 193,056 | | | | 4,695,341 | | | | 67,612,910 | | | | 2,137,881 | | | | (121,780 | ) | | | 296,964 | | |
208
| | Balance of
Shares Held
August 31,
2016 | | Gross
Purchases
and
Additions | | Gross
Sales
and
Reductions | | Balance of
Shares Held
August 31,
2017 | | Value
August 31,
2017 | | Distributions
from
Investments
in Affiliated
Issuers | | Net Realized
Gain/(Loss)
from
Investments
in Affiliated
Issuers | | Change in
Net
Unrealized
Appreciation/
(Depreciation)
from
Investments
in Affiliated
Issuers | |
Power
Integrations,
Inc. | | | 2,073,300 | | | | — | | | | 43,951 | | | | 2,029,349 | | | | 147,838,075 | | | | 1,133,137 | | | | 1,613,476 | | | | 28,118,335 | | |
RBC Bearings,
Inc. | | | 1,347,240 | | | | 201,200 | | | | 97,582 | | | | 1,450,858 | | | | 159,986,112 | | | | — | * | | | 3,255,847 | | | | 42,123,495 | | |
Rogers Corp. | | | 1,149,551 | | | | 99,105 | | | | 103,388 | | | | 1,145,268 | | | | 135,771,521 | | | | — | * | | | 1,081,847 | | | | 68,014,146 | | |
Sensient
Technologies
Corp. | | | 2,824,245 | | | | 27,865 | | | | 366,929 | | | | 2,485,181 | | | | 179,305,809 | | | | 3,115,130 | | | | 15,287,444 | | | | (15,861,987 | ) | |
U.S. Physical
Therapy, Inc. | | | 791,800 | | | | 70,500 | | | | 69,885 | | | | 792,415 | | | | 47,465,659 | | | | 634,575 | | | | 953,412 | | | | (3,010,582 | ) | |
Sub-total
for affiliates
as of
8/31/17(c) | | | | | | | | | | $ | 1,847,657,693 | | | $ | 25,622,290 | | | $ | 37,537,164 | | | $ | 196,487,481 | | |
Abaxis,
Inc.(d) | | | 1,161,900 | | | | — | | | | 740,353 | | | | 421,547 | | | | 19,483,902 | | | | 367,646 | | | | 13,085,842 | | | | (14,835,346 | ) | |
Hibbett
Sports,
Inc.(d) | | | 1,132,969 | | | | — | | | | 1,132,969 | | | | — | | | | — | | | | — | * | | | 27,301,824 | | | | (26,197,285 | ) | |
| Tennant Co.(d) | | | 963,802 | | | | — | | | | 106,187 | | | | 857,615 | | | | 52,271,634 | | | | 755,909 | | | | 1,096,549 | | | | (3,793,158 | ) | |
Sub-total
for affiliates
not held
as of
8/31/17 | | | | | | | | | | $ | 71,755,536 | | | $ | 1,123,555 | | | $ | 41,484,215 | | | $ | (44,825,789 | ) | |
Total | | | | | | | | | | $ | 1,919,413,229 | | | $ | 26,745,845 | | | $ | 79,021,379 | | | $ | 151,661,692 | | |
Intrinsic Value | |
Fluidigm Corp. | | | 382,600 | | | | 1,354,659 | | | | — | | | | 1,737,259 | | | $ | 7,939,274 | | | $ | — | * | | $ | — | | | $ | (628,108 | ) | |
| Total(e) | | | | | | | | | | $ | 7,939,274 | | | $ | — | | | $ | — | | | $ | (628,108 | ) | |
(a) Affiliated issuers, as defined in the 1940 Act.
(b) Effective January 17, 2017, this security underwent a name change from Nexstar Broadcasting Group, Inc. Class A.
(c) At August 31, 2017, these securities amounted to approximately 17.1% of net assets of the Fund.
(d) At August 31, 2017, the issuers of these companies were no longer affiliated with Genesis.
(e) At August 31, 2017, these securities amounted to approximately 0.9% of net assets of the Fund.
* Security did not produce income during the last twelve months.
209
Other: At August 31, 2017, Neuberger Berman Global Allocation Fund, which is also managed by Management, held 0.14%, 0.01% and 1.44%, of the outstanding shares of Emerging Markets Equity, Genesis and International Select, respectively.
In addition, at August 31, 2017, affiliated investors owned 0.07%, 0.00%, 0.02%, 65.79%, 92.36%, 0.05%, 0.00%, 0.01%, 84.72%, 0.00%, 0.00%, 0.03% and 0.35% of the outstanding shares of Dividend Growth, Emerging Markets Equity, Focus, Global Equity, Global Real Estate, Greater China Equity, International Equity, International Select, International Small Cap, Large Cap Value, Mid Cap Growth, Mid Cap Intrinsic Value and Value, respectively.
Note G—Custodian Out-of-Pocket Expenses Refunded:
In May 2016, the Funds' custodian, State Street, announced that it had identified inconsistencies in the way in which certain Funds were invoiced for categories of expenses, particularly those deemed "out-of-pocket" costs, from 1998 through November 2015. The amounts in the table below represent the refunded expenses and interest determined to be payable to certain Funds for the period in question. These amounts were refunded to those Funds by State Street during the year ended August 31, 2017.
| | | Expenses Refunded | | Interest Paid to the Funds | |
Equity Income | | $ | 1,268 | | | $ | 68 | | |
Focus | | | 73,297 | | | | 8,507 | | |
Genesis | | | 301,427 | | | | 22,289 | | |
Guardian | | | 127,308 | | | | 15,909 | | |
International Equity | | | 493,553 | | | | 60,646 | | |
Large Cap Value | | | 167,263 | | | | 14,872 | | |
Mid Cap Growth | | | 79,093 | | | | 8,282 | | |
Mid Cap Intrinsic Value | | | 21,954 | | | | 1,795 | | |
Multi-Cap Opportunities | | | 625 | | | | 5 | | |
Small Cap Growth | | | 4,397 | | | | 1,456 | | |
Socially Responsive | | | 94,334 | | | | 7,420 | | |
Note H—Recent Accounting Pronouncement:
In December 2016, FASB issued ASU No. 2016-19, "Technical Corrections and Improvements" ("ASU 2016-19"). The guidance includes an amendment to Topic 820, Fair Value Measurement, which clarifies the difference between a valuation approach and a valuation technique. The amendments also require an entity to disclose when it has changed either a valuation approach and/or a valuation technique. The guidance is effective for interim and annual reporting periods beginning after December 15, 2016. Management is currently evaluating the impact, if any, of applying this guidance.
210
The following tables include selected data for a share outstanding throughout each year and other performance information derived from the Financial Statements. Amounts that do not round to $0.01 or $(0.01) per share are presented as $0.00 or $(0.00), respectively. Ratios that do not round to 0.01% or (0.01)% per share are presented as 0.00% or (0.00)%, respectively. Net Asset amounts with a zero balance, if any, may reflect actual amounts rounding to less than $0.1 million. A "—" indicates that the line item was not applicable in the corresponding period.
| | | Net Asset
Value,
Beginning
of Year | | Net
Investment
Income (Loss)@ | | Net Gains or
Losses on
Securities
(both realized
and
unrealized) | | Total From
Investment
Operations | | Dividends
from Net
Investment
Income | | Distributions
from Net
Realized
Capital Gains | | Total
Distributions | | Voluntary
Contribution
from
Management | | Net Asset
Value, End of
Year | | Total Returnab | | Net Assets,
End of Year
(in millions) | | Ratio of Gross
Expenses to
Average Net
Assets# | | Ratio of Net
Expenses to
Average Net
Assets## | | Ratio of Net
Investment
Income/
(Loss) to
Average Net
Assets | | Portfolio
Turnover
Rate | |
Dividend Growth Fund | |
Institutional Class | |
8/31/2017 | | $ | 11.11 | | | $ | 0.22 | | | $ | 1.82 | | | $ | 2.04 | | | $ | (0.22 | ) | | $ | — | | | $ | (0.22 | ) | | $ | — | | | $ | 12.93 | | | | 18.54 | % | | $ | 32.5 | | | | 1.69 | % | | | 0.69 | % | | | 1.78 | % | | | 44 | % | |
Period from 12/15/2015^
to 8/31/2016 | | $ | 10.00 | | | $ | 0.18 | | | $ | 0.93 | | | $ | 1.11 | | | $ | — | | | $ | — | | | $ | — | | | $ | — | | | $ | 11.11 | | | | 11.10 | %* | | $ | 20.3 | | | | 2.61 | %**‡ | | | 0.69 | %**‡ | | | 2.44 | %**‡ | | | 23 | %* | |
Class A | |
8/31/2017 | | $ | 11.09 | | | $ | 0.18 | | | $ | 1.81 | | | $ | 1.99 | | | $ | (0.14 | ) | | $ | — | | | $ | (0.14 | ) | | $ | — | | | $ | 12.94 | | | | 18.10 | % | | $ | 1.6 | | | | 2.14 | % | | | 1.05 | % | | | 1.48 | % | | | 44 | % | |
Period from 12/15/2015^
to 8/31/2016 | | $ | 10.00 | | | $ | 0.16 | | | $ | 0.93 | | | $ | 1.09 | | | $ | — | | | $ | — | | | $ | — | | | $ | — | | | $ | 11.09 | | | | 10.90 | %* | | $ | 0.2 | | | | 3.36 | %**‡ | | | 1.05 | %**‡ | | | 2.14 | %**‡ | | | 23 | %* | |
Class C | |
8/31/2017 | | $ | 11.00 | | | $ | 0.07 | | | $ | 1.85 | | | $ | 1.92 | | | $ | (0.05 | ) | | $ | — | | | $ | (0.05 | ) | | $ | — | | | $ | 12.87 | | | | 17.47 | % | | $ | 3.1 | | | | 2.81 | % | | | 1.80 | % | | | 0.61 | % | | | 44 | % | |
Period from 12/15/2015^
to 8/31/2016 | | $ | 10.00 | | | $ | 0.08 | | | $ | 0.92 | | | $ | 1.00 | | | $ | — | | | $ | — | | | $ | — | | | $ | — | | | $ | 11.00 | | | | 10.00 | %* | | $ | 0.0 | | | | 4.11 | %**‡ | | | 1.80 | %**‡ | | | 1.17 | %**‡ | | | 23 | %* | |
Class R6 | |
8/31/2017 | | $ | 11.11 | | | $ | 0.23 | | | $ | 1.81 | | | $ | 2.04 | | | $ | (0.22 | ) | | $ | — | | | $ | (0.22 | ) | | $ | — | | | $ | 12.93 | | | | 18.60 | % | | $ | 0.0 | | | | 1.65 | % | | | 0.62 | % | | | 1.91 | % | | | 44 | % | |
Period from 12/15/2015^
to 8/31/2016 | | $ | 10.00 | | | $ | 0.15 | | | $ | 0.96 | | | $ | 1.11 | | | $ | — | | | $ | — | | | $ | — | | | $ | — | | | $ | 11.11 | | | | 11.10 | %* | | $ | 0.1 | | | | 2.75 | %**‡ | | | 0.62 | %**‡ | | | 2.06 | %**‡ | | | 23 | %* | |
Emerging Markets Equity Fund | |
Institutional Class | |
8/31/2017 | | $ | 16.01 | | | $ | 0.17 | | | $ | 3.77 | | | $ | 3.94 | | | $ | (0.08 | ) | | $ | — | | | $ | (0.08 | ) | | $ | — | | | $ | 19.87 | | | | 24.76 | % | | $ | 670.6 | | | | 1.36 | % | | | 1.25 | % | | | 0.95 | % | | | 25 | % | |
8/31/2016 | | $ | 13.94 | | | $ | 0.11 | | | $ | 2.06 | | | $ | 2.17 | | | $ | (0.10 | ) | | $ | — | | | $ | (0.10 | ) | | $ | — | | | $ | 16.01 | | | | 15.64 | % | | $ | 318.9 | | | | 1.43 | % | | | 1.25 | % | | | 0.74 | % | | | 43 | % | |
8/31/2015 | | $ | 17.89 | | | $ | 0.12 | | | $ | (3.90 | ) | | $ | (3.78 | ) | | $ | (0.17 | ) | | $ | — | | | $ | (0.17 | ) | | $ | — | | | $ | 13.94 | | | | (21.22 | )% | | $ | 307.5 | | | | 1.43 | % | | | 1.25 | % | | | 0.73 | % | | | 36 | % | |
8/31/2014 | | $ | 15.34 | | | $ | 0.16 | | | $ | 2.48 | | | $ | 2.64 | | | $ | (0.09 | ) | | $ | — | | | $ | (0.09 | ) | | $ | 0.00 | | | $ | 17.89 | | | | 17.24 | %c | | $ | 514.8 | | | | 1.45 | % | | | 1.25 | % | | | 0.96 | % | | | 36 | % | |
8/31/2013 | | $ | 14.99 | | | $ | 0.18 | | | $ | 0.24 | | | $ | 0.42 | | | $ | (0.07 | ) | | $ | — | | | $ | (0.07 | ) | | $ | — | | | $ | 15.34 | | | | 2.77 | % | | $ | 374.1 | | | | 1.60 | % | | | 1.25 | % | | | 1.10 | % | | | 36 | % | |
Class A | |
8/31/2017 | | $ | 15.92 | | | $ | 0.13 | | | $ | 3.75 | | | $ | 3.88 | | | $ | (0.05 | ) | | $ | — | | | $ | (0.05 | ) | | $ | — | | | $ | 19.75 | | | | 24.51 | % | | $ | 65.1 | | | | 1.73 | % | | | 1.50 | % | | | 0.74 | % | | | 25 | % | |
8/31/2016 | | $ | 13.87 | | | $ | 0.09 | | | $ | 2.02 | | | $ | 2.11 | | | $ | (0.06 | ) | | $ | — | | | $ | (0.06 | ) | | $ | — | | | $ | 15.92 | | | | 15.31 | % | | $ | 23.5 | | | | 1.82 | % | | | 1.50 | % | | | 0.60 | % | | | 43 | % | |
8/31/2015 | | $ | 17.80 | | | $ | 0.08 | | | $ | (3.88 | ) | | $ | (3.80 | ) | | $ | (0.13 | ) | | $ | — | | | $ | (0.13 | ) | | $ | — | | | $ | 13.87 | | | | (21.42 | )% | | $ | 13.4 | | | | 1.79 | % | | | 1.50 | % | | | 0.49 | % | | | 36 | % | |
8/31/2014 | | $ | 15.27 | | | $ | 0.15 | | | $ | 2.44 | | | $ | 2.59 | | | $ | (0.06 | ) | | $ | — | | | $ | (0.06 | ) | | $ | 0.00 | | | $ | 17.80 | | | | 16.99 | %c | | $ | 19.9 | | | | 1.82 | % | | | 1.50 | % | | | 0.88 | % | | | 36 | % | |
8/31/2013 | | $ | 14.92 | | | $ | 0.11 | | | $ | 0.27 | | | $ | 0.38 | | | $ | (0.03 | ) | | $ | — | | | $ | (0.03 | ) | | $ | — | | | $ | 15.27 | | | | 2.54 | % | | $ | 7.3 | | | | 2.00 | % | | | 1.50 | % | | | 0.69 | % | | | 36 | % | |
See Notes to Financial Highlights
211
212
Financial Highlights (cont'd)
| | | Net Asset
Value,
Beginning
of Year | | Net
Investment
Income (Loss)@ | | Net Gains or
Losses on
Securities
(both realized
and
unrealized) | | Total From
Investment
Operations | | Dividends
from Net
Investment
Income | | Distributions
from Net
Realized
Capital Gains | | Total
Distributions | | Voluntary
Contribution
from
Management | | Net Asset
Value, End of
Year | | Total Returnab | | Net Assets,
End of Year
(in millions) | | Ratio of Gross
Expenses to
Average Net
Assets# | | Ratio of Net
Expenses to
Average Net
Assets## | | Ratio of Net
Investment
Income/
(Loss) to
Average Net
Assets | | Portfolio
Turnover
Rate | |
Emerging Markets Equity Fund (cont'd) | |
Class C | |
8/31/2017 | | $ | 15.36 | | | $ | (0.03 | ) | | $ | 3.65 | | | $ | 3.62 | | | $ | — | | | $ | — | | | $ | — | | | $ | — | | | $ | 18.98 | | | | 23.57 | % | | $ | 7.4 | | | | 2.45 | % | | | 2.25 | % | | | (0.18 | )% | | | 25 | % | |
8/31/2016 | | $ | 13.42 | | | $ | (0.04 | ) | | $ | 1.98 | | | $ | 1.94 | | | $ | — | | | $ | — | | | $ | — | | | $ | — | | | $ | 15.36 | | | | 14.46 | % | | $ | 5.2 | | | | 2.51 | % | | | 2.25 | % | | | (0.30 | )% | | | 43 | % | |
8/31/2015 | | $ | 17.26 | | | $ | (0.03 | ) | | $ | (3.77 | ) | | $ | (3.80 | ) | | $ | (0.04 | ) | | $ | — | | | $ | (0.04 | ) | | $ | — | | | $ | 13.42 | | | | (22.02 | )% | | $ | 6.2 | | | | 2.53 | % | | | 2.25 | % | | | (0.20 | )% | | | 36 | % | |
8/31/2014 | | $ | 14.87 | | | $ | 0.00 | | | $ | 2.39 | | | $ | 2.39 | | | $ | — | | | $ | — | | | $ | — | | | $ | 0.00 | | | $ | 17.26 | | | | 16.07 | %c | | $ | 7.0 | | | | 2.56 | % | | | 2.25 | % | | | 0.01 | % | | | 36 | % | |
8/31/2013 | | $ | 14.61 | | | $ | 0.02 | | | $ | 0.24 | | | $ | 0.26 | | | $ | — | | | $ | — | | | $ | — | | | $ | — | | | $ | 14.87 | | | | 1.78 | % | | $ | 4.1 | | | | 2.73 | % | | | 2.25 | % | | | 0.13 | % | | | 36 | % | |
Class R3 | |
8/31/2017 | | $ | 15.59 | | | $ | 0.01 | | | $ | 3.72 | | | $ | 3.73 | | | $ | (0.01 | ) | | $ | — | | | $ | (0.01 | ) | | $ | — | | | $ | 19.31 | | | | 23.94 | % | | $ | 1.5 | | | | 2.01 | % | | | 1.91 | % | | | 0.08 | % | | | 25 | % | |
8/31/2016 | | $ | 13.60 | | | $ | 0.02 | | | $ | 2.00 | | | $ | 2.02 | | | $ | (0.03 | ) | | $ | — | | | $ | (0.03 | ) | | $ | — | | | $ | 15.59 | | | | 14.88 | % | | $ | 1.2 | | | | 2.06 | % | | | 1.91 | % | | | 0.16 | % | | | 43 | % | |
8/31/2015 | | $ | 17.47 | | | $ | 0.02 | | | $ | (3.80 | ) | | $ | (3.78 | ) | | $ | (0.09 | ) | | $ | — | | | $ | (0.09 | ) | | $ | — | | | $ | 13.60 | | | | (21.70 | )% | | $ | 0.8 | | | | 2.09 | % | | | 1.91 | % | | | 0.14 | % | | | 36 | % | |
8/31/2014 | | $ | 15.02 | | | $ | 0.07 | | | $ | 2.39 | | | $ | 2.46 | | | $ | (0.01 | ) | | $ | — | | | $ | (0.01 | ) | | $ | 0.00 | | | $ | 17.47 | | | | 16.42 | %c | | $ | 0.6 | | | | 2.13 | % | | | 1.91 | % | | | 0.45 | % | | | 36 | % | |
8/31/2013 | | $ | 14.71 | | | $ | 0.03 | | | $ | 0.28 | | | $ | 0.31 | | | $ | — | | | $ | — | | | $ | — | | | $ | — | | | $ | 15.02 | | | | 2.11 | % | | $ | 0.2 | | | | 2.31 | % | | | 1.91 | % | | | 0.22 | % | | | 36 | % | |
Class R6 | |
8/31/2017 | | $ | 16.02 | | | $ | 0.15 | | | $ | 3.81 | | | $ | 3.96 | | | $ | (0.09 | ) | | $ | — | | | $ | (0.09 | ) | | $ | — | | | $ | 19.89 | | | | 24.90 | % | | $ | 132.9 | | | | 1.26 | % | | | 1.18 | % | | | 0.86 | % | | | 25 | % | |
8/31/2016 | | $ | 13.96 | | | $ | 0.12 | | | $ | 2.05 | | | $ | 2.17 | | | $ | (0.11 | ) | | $ | — | | | $ | (0.11 | ) | | $ | — | | | $ | 16.02 | | | | 15.64 | % | | $ | 107.4 | | | | 1.32 | % | | | 1.18 | % | | | 0.83 | % | | | 43 | % | |
8/31/2015 | | $ | 17.91 | | | $ | 0.14 | | | $ | (3.91 | ) | | $ | (3.77 | ) | | $ | (0.18 | ) | | $ | — | | | $ | (0.18 | ) | | $ | — | | | $ | 13.96 | | | | (21.14 | )% | | $ | 88.1 | | | | 1.34 | % | | | 1.18 | % | | | 0.88 | % | | | 36 | % | |
8/31/2014 | | $ | 15.35 | | | $ | 0.18 | | | $ | 2.47 | | | $ | 2.65 | | | $ | (0.09 | ) | | $ | — | | | $ | (0.09 | ) | | $ | 0.00 | | | $ | 17.91 | | | | 17.35 | %c | | $ | 83.8 | | | | 1.37 | % | | | 1.18 | % | | | 1.08 | % | | | 36 | % | |
Period from 3/15/2013^
to 8/31/2013 | | $ | 16.85 | | | $ | 0.13 | | | $ | (1.63 | ) | | $ | (1.50 | ) | | $ | — | | | $ | — | | | $ | — | | | $ | — | | | $ | 15.35 | | | | (8.90 | )%* | | $ | 31.1 | | | | 1.57 | %** | | | 1.18 | %** | | | 1.80 | %** | | | 36 | %d | |
Equity Income Fund | |
Institutional Class | |
8/31/2017 | | $ | 12.45 | | | $ | 0.38 | | | $ | 1.01 | | | $ | 1.39 | | | $ | (0.33 | ) | | $ | (0.42 | ) | | $ | (0.75 | ) | | $ | 0.00 | | | $ | 13.09 | | | | 11.56 | %eh | | $ | 1,208.7 | | | | 0.69 | % | | | 0.69 | %f | | | 2.99 | %f | | | 53 | % | |
8/31/2016 | | $ | 11.74 | | | $ | 0.37 | | | $ | 1.08 | | | $ | 1.45 | | | $ | (0.32 | ) | | $ | (0.42 | ) | | $ | (0.74 | ) | | $ | — | | | $ | 12.45 | | | | 13.03 | % | | $ | 1,076.5 | | | | 0.69 | % | | | 0.69 | % | | | 3.18 | % | | | 49 | % | |
8/31/2015 | | $ | 13.19 | | | $ | 0.34 | | | $ | (0.92 | ) | | $ | (0.58 | ) | | $ | (0.30 | ) | | $ | (0.57 | ) | | $ | (0.87 | ) | | $ | — | | | $ | 11.74 | | | | (4.60 | )% | | $ | 1,443.7 | | | | 0.68 | % | | | 0.68 | % | | | 2.66 | % | | | 48 | % | |
8/31/2014 | | $ | 11.76 | | | $ | 0.33 | | | $ | 1.94 | | | $ | 2.27 | | | $ | (0.33 | ) | | $ | (0.51 | ) | | $ | (0.84 | ) | | $ | 0.00 | | | $ | 13.19 | | | | 20.11 | %c | | $ | 1,578.5 | | | | 0.68 | % | | | 0.68 | % | | | 2.66 | % | | | 41 | % | |
8/31/2013 | | $ | 11.74 | | | $ | 0.30 | | | $ | 0.25 | | | $ | 0.55 | | | $ | (0.42 | ) | | $ | (0.11 | ) | | $ | (0.53 | ) | | $ | — | | | $ | 11.76 | | | | 4.79 | % | | $ | 1,439.4 | | | | 0.68 | % | | | 0.68 | % | | | 2.45 | % | | | 70 | % | |
Class A | |
8/31/2017 | | $ | 12.40 | | | $ | 0.32 | | | $ | 1.02 | | | $ | 1.34 | | | $ | (0.28 | ) | | $ | (0.42 | ) | | $ | (0.70 | ) | | $ | 0.00 | | | $ | 13.04 | | | | 11.17 | %eh | | $ | 200.3 | | | | 1.05 | % | | | 1.05 | %f | | | 2.56 | %f | | | 53 | % | |
8/31/2016 | | $ | 11.69 | | | $ | 0.33 | | | $ | 1.08 | | | $ | 1.41 | | | $ | (0.28 | ) | | $ | (0.42 | ) | | $ | (0.70 | ) | | $ | — | | | $ | 12.40 | | | | 12.64 | % | | $ | 243.1 | | | | 1.07 | % | | | 1.07 | % | | | 2.81 | % | | | 49 | % | |
8/31/2015 | | $ | 13.14 | | | $ | 0.29 | | | $ | (0.93 | ) | | $ | (0.64 | ) | | $ | (0.24 | ) | | $ | (0.57 | ) | | $ | (0.81 | ) | | $ | — | | | $ | 11.69 | | | | (5.02 | )% | | $ | 289.5 | | | | 1.05 | % | | | 1.05 | % | | | 2.26 | % | | | 48 | % | |
8/31/2014 | | $ | 11.71 | | | $ | 0.27 | | | $ | 1.95 | | | $ | 2.22 | | | $ | (0.28 | ) | | $ | (0.51 | ) | | $ | (0.79 | ) | | $ | 0.00 | | | $ | 13.14 | | | | 19.72 | %c | | $ | 462.6 | | | | 1.05 | % | | | 1.05 | % | | | 2.21 | % | | | 41 | % | |
8/31/2013 | | $ | 11.70 | | | $ | 0.25 | | | $ | 0.25 | | | $ | 0.50 | | | $ | (0.38 | ) | | $ | (0.11 | ) | | $ | (0.49 | ) | | $ | — | | | $ | 11.71 | | | | 4.32 | % | | $ | 1,036.4 | | | | 1.05 | % | | | 1.05 | % | | | 2.09 | % | | | 70 | % | |
See Notes to Financial Highlights
213
214
Financial Highlights (cont'd)
| | | Net Asset
Value,
Beginning
of Year | | Net
Investment
Income (Loss)@ | | Net Gains or
Losses on
Securities
(both realized
and
unrealized) | | Total From
Investment
Operations | | Dividends
from Net
Investment
Income | | Distributions
from Net
Realized
Capital Gains | | Total
Distributions | | Voluntary
Contribution
from
Management | | Net Asset
Value, End of
Year | | Total Returnab | | Net Assets,
End of Year
(in millions) | | Ratio of Gross
Expenses to
Average Net
Assets# | | Ratio of Net
Expenses to
Average Net
Assets## | | Ratio of Net
Investment
Income/
(Loss) to
Average Net
Assets | | Portfolio
Turnover
Rate | |
Equity Income Fund (cont'd) | |
Class C | |
8/31/2017 | | $ | 12.32 | | | $ | 0.23 | | | $ | 1.01 | | | $ | 1.24 | | | $ | (0.19 | ) | | $ | (0.42 | ) | | $ | (0.61 | ) | | $ | 0.00 | | | $ | 12.95 | | | | 10.34 | %eh | | $ | 282.3 | | | | 1.80 | % | | | 1.80 | %f | | | 1.82 | %f | | | 53 | % | |
8/31/2016 | | $ | 11.62 | | | $ | 0.24 | | | $ | 1.07 | | | $ | 1.31 | | | $ | (0.19 | ) | | $ | (0.42 | ) | | $ | (0.61 | ) | | $ | — | | | $ | 12.32 | | | | 11.77 | % | | $ | 334.1 | | | | 1.81 | % | | | 1.81 | % | | | 2.07 | % | | | 49 | % | |
8/31/2015 | | $ | 13.06 | | | $ | 0.20 | | | $ | (0.92 | ) | | $ | (0.72 | ) | | $ | (0.15 | ) | | $ | (0.57 | ) | | $ | (0.72 | ) | | $ | — | | | $ | 11.62 | | | | (5.65 | )% | | $ | 390.0 | | | | 1.79 | % | | | 1.79 | % | | | 1.55 | % | | | 48 | % | |
8/31/2014 | | $ | 11.65 | | | $ | 0.19 | | | $ | 1.92 | | | $ | 2.11 | | | $ | (0.19 | ) | | $ | (0.51 | ) | | $ | (0.70 | ) | | $ | 0.00 | | | $ | 13.06 | | | | 18.77 | %c | | $ | 450.1 | | | | 1.79 | % | | | 1.79 | % | | | 1.54 | % | | | 41 | % | |
8/31/2013 | | $ | 11.64 | | | $ | 0.16 | | | $ | 0.25 | | | $ | 0.41 | | | $ | (0.29 | ) | | $ | (0.11 | ) | | $ | (0.40 | ) | | $ | — | | | $ | 11.65 | | | | 3.58 | % | | $ | 465.7 | | | | 1.80 | % | | | 1.80 | % | | | 1.34 | % | | | 70 | % | |
Class R3 | |
8/31/2017 | | $ | 12.37 | | | $ | 0.28 | | | $ | 1.02 | | | $ | 1.30 | | | $ | (0.24 | ) | | $ | (0.42 | ) | | $ | (0.66 | ) | | $ | 0.00 | | | $ | 13.01 | | | | 10.88 | %eh | | $ | 1.8 | | | | 1.34 | % | | | 1.34 | %f | | | 2.27 | %f | | | 53 | % | |
8/31/2016 | | $ | 11.67 | | | $ | 0.30 | | | $ | 1.07 | | | $ | 1.37 | | | $ | (0.25 | ) | | $ | (0.42 | ) | | $ | (0.67 | ) | | $ | — | | | $ | 12.37 | | | | 12.26 | % | | $ | 2.7 | | | | 1.33 | % | | | 1.33 | % | | | 2.53 | % | | | 49 | % | |
8/31/2015 | | $ | 13.12 | | | $ | 0.26 | | | $ | (0.92 | ) | | $ | (0.66 | ) | | $ | (0.22 | ) | | $ | (0.57 | ) | | $ | (0.79 | ) | | $ | — | | | $ | 11.67 | | | | (5.22 | )% | | $ | 3.8 | | | | 1.31 | % | | | 1.31 | % | | | 2.05 | % | | | 48 | % | |
8/31/2014 | | $ | 11.69 | | | $ | 0.25 | | | $ | 1.93 | | | $ | 2.18 | | | $ | (0.24 | ) | | $ | (0.51 | ) | | $ | (0.75 | ) | | $ | 0.00 | | | $ | 13.12 | | | | 19.42 | %c | | $ | 3.4 | | | | 1.34 | % | | | 1.34 | %§ | | | 2.04 | % | | | 41 | % | |
8/31/2013 | | $ | 11.69 | | | $ | 0.22 | | | $ | 0.23 | | | $ | 0.45 | | | $ | (0.34 | ) | | $ | (0.11 | ) | | $ | (0.45 | ) | | $ | — | | | $ | 11.69 | | | | 3.94 | % | | $ | 2.6 | | | | 1.41 | % | | | 1.41 | %§ | | | 1.78 | % | | | 70 | % | |
Focus Fund | |
Investor Class | |
8/31/2017 | | $ | 25.81 | | | $ | 0.07 | | | $ | 3.93 | | | $ | 4.00 | | | $ | (0.09 | ) | | $ | (2.22 | ) | | $ | (2.31 | ) | | $ | 0.00 | | | $ | 27.50 | | | | 16.81 | %eh | | $ | 667.7 | | | | 0.92 | % | | | 0.91 | %f | | | 0.28 | %f | | | 72 | % | |
8/31/2016 | | $ | 25.45 | | | $ | 0.16 | | | $ | 1.48 | | | $ | 1.64 | | | $ | (0.18 | ) | | $ | (1.10 | ) | | $ | (1.28 | ) | | $ | — | | | $ | 25.81 | | | | 6.68 | % | | $ | 626.8 | | | | 0.94 | % | | | 0.94 | % | | | 0.63 | % | | | 89 | % | |
8/31/2015 | | $ | 29.77 | | | $ | 0.21 | | | $ | (0.15 | ) | | $ | 0.06 | | | $ | (0.16 | ) | | $ | (4.22 | ) | | $ | (4.38 | ) | | $ | — | | | $ | 25.45 | | | | 0.49 | % | | $ | 639.8 | | | | 0.91 | % | | | 0.91 | % | | | 0.77 | % | | | 52 | % | |
8/31/2014 | | $ | 26.90 | | | $ | 0.18 | | | $ | 5.57 | | | $ | 5.75 | | | $ | (0.20 | ) | | $ | (2.68 | ) | | $ | (2.88 | ) | | $ | 0.00 | | | $ | 29.77 | | | | 22.65 | %c | | $ | 699.4 | | | | 0.91 | % | | | 0.91 | % | | | 0.64 | % | | | 84 | % | |
8/31/2013 | | $ | 21.71 | | | $ | 0.18 | | | $ | 5.15 | | | $ | 5.33 | | | $ | (0.14 | ) | | $ | — | | | $ | (0.14 | ) | | $ | — | | | $ | 26.90 | | | | 24.69 | % | | $ | 636.9 | | | | 0.94 | % | | | 0.94 | % | | | 0.72 | % | | | 79 | % | |
Trust Class | |
8/31/2017 | | $ | 15.98 | | | $ | 0.02 | | | $ | 2.30 | | | $ | 2.32 | | | $ | (0.08 | ) | | $ | (2.22 | ) | | $ | (2.30 | ) | | $ | 0.00 | | | $ | 16.00 | | | | 16.61 | %eh | | $ | 63.0 | | | | 1.10 | % | | | 1.09 | %f | | | 0.10 | %f | | | 72 | % | |
8/31/2016 | | $ | 16.24 | | | $ | 0.07 | | | $ | 0.93 | | | $ | 1.00 | | | $ | (0.16 | ) | | $ | (1.10 | ) | | $ | (1.26 | ) | | $ | — | | | $ | 15.98 | | | | 6.50 | % | | $ | 70.4 | | | | 1.11 | % | | | 1.11 | % | | | 0.47 | % | | | 89 | % | |
8/31/2015 | | $ | 20.64 | | | $ | 0.10 | | | $ | (0.13 | ) | | $ | (0.03 | ) | | $ | (0.15 | ) | | $ | (4.22 | ) | | $ | (4.37 | ) | | $ | — | | | $ | 16.24 | | | | 0.26 | % | | $ | 92.7 | | | | 1.10 | % | | | 1.10 | % | | | 0.57 | % | | | 52 | % | |
8/31/2014 | | $ | 19.50 | | | $ | 0.09 | | | $ | 3.94 | | | $ | 4.03 | | | $ | (0.21 | ) | | $ | (2.68 | ) | | $ | (2.89 | ) | | $ | 0.00 | | | $ | 20.64 | | | | 22.40 | %c | | $ | 125.7 | | | | 1.11 | % | | | 1.11 | % | | | 0.47 | % | | | 84 | % | |
8/31/2013 | | $ | 15.78 | | | $ | 0.10 | | | $ | 3.74 | | | $ | 3.84 | | | $ | (0.12 | ) | | $ | — | | | $ | (0.12 | ) | | $ | — | | | $ | 19.50 | | | | 24.48 | % | | $ | 56.3 | | | | 1.14 | % | | | 1.14 | % | | | 0.53 | % | | | 79 | % | |
Advisor Class | |
8/31/2017 | | $ | 7.80 | | | $ | (0.00 | ) | | $ | 0.95 | | | $ | 0.95 | | | $ | (0.11 | ) | | $ | (2.22 | ) | | $ | (2.33 | ) | | $ | 0.00 | | | $ | 6.42 | | | | 16.51 | %eh | | $ | 3.5 | | | | 1.26 | % | | | 1.23 | %f | | | (0.04 | )%f | | | 72 | % | |
8/31/2016 | | $ | 8.60 | | | $ | 0.03 | | | $ | 0.45 | | | $ | 0.48 | | | $ | (0.18 | ) | | $ | (1.10 | ) | | $ | (1.28 | ) | | $ | — | | | $ | 7.80 | | | | 6.33 | % | | $ | 3.9 | | | | 1.26 | % | | | 1.26 | % | | | 0.33 | % | | | 89 | % | |
8/31/2015 | | $ | 13.03 | | | $ | 0.04 | | | $ | (0.09 | ) | | $ | (0.05 | ) | | $ | (0.16 | ) | | $ | (4.22 | ) | | $ | (4.38 | ) | | $ | — | | | $ | 8.60 | | | | 0.15 | % | | $ | 6.1 | | | | 1.27 | % | | | 1.27 | % | | | 0.39 | % | | | 52 | % | |
8/31/2014 | | $ | 13.27 | | | $ | 0.04 | | | $ | 2.57 | | | $ | 2.61 | | | $ | (0.17 | ) | | $ | (2.68 | ) | | $ | (2.85 | ) | | $ | 0.00 | | | $ | 13.03 | | | | 22.21 | %c | | $ | 7.1 | | | | 1.27 | % | | | 1.27 | % | | | 0.28 | % | | | 84 | % | |
8/31/2013 | | $ | 10.79 | | | $ | 0.04 | | | $ | 2.55 | | | $ | 2.59 | | | $ | (0.11 | ) | | $ | — | | | $ | (0.11 | ) | | $ | — | | | $ | 13.27 | | | | 24.22 | % | | $ | 6.1 | | | | 1.29 | % | | | 1.29 | % | | | 0.37 | % | | | 79 | % | |
See Notes to Financial Highlights
215
216
Financial Highlights (cont'd)
| | | Net Asset
Value,
Beginning
of Year | | Net
Investment
Income (Loss)@ | | Net Gains or
Losses on
Securities
(both realized
and
unrealized) | | Total From
Investment
Operations | | Dividends
from Net
Investment
Income | | Distributions
from Net
Realized
Capital Gains | | Total
Distributions | | Voluntary
Contribution
from
Management | | Net Asset
Value, End of
Year | | Total Returnab | | Net Assets,
End of Year
(in millions) | | Ratio of Gross
Expenses to
Average Net
Assets# | | Ratio of Net
Expenses to
Average Net
Assets## | | Ratio of Net
Investment
Income/
(Loss) to
Average Net
Assets | | Portfolio
Turnover
Rate | |
Focus Fund (cont'd) | |
Institutional Class | |
8/31/2017 | | $ | 25.86 | | | $ | 0.11 | | | $ | 3.95 | | | $ | 4.06 | | | $ | (0.14 | ) | | $ | (2.22 | ) | | $ | (2.36 | ) | | $ | 0.00 | | | $ | 27.56 | | | | 17.04 | %e | | $ | 7.8 | | | | 0.76 | % | | | 0.75 | % | | | 0.44 | % | | | 72 | % | |
8/31/2016 | | $ | 25.50 | | | $ | 0.22 | | | $ | 1.46 | | | $ | 1.68 | | | $ | (0.22 | ) | | $ | (1.10 | ) | | $ | (1.32 | ) | | $ | — | | | $ | 25.86 | | | | 6.86 | % | | $ | 6.8 | | | | 0.76 | % | | | 0.75 | % | | | 0.89 | % | | | 89 | % | |
8/31/2015 | | $ | 29.83 | | | $ | 0.26 | | | $ | (0.16 | ) | | $ | 0.10 | | | $ | (0.21 | ) | | $ | (4.22 | ) | | $ | (4.43 | ) | | $ | — | | | $ | 25.50 | | | | 0.65 | % | | $ | 28.7 | | | | 0.76 | % | | | 0.75 | % | | | 0.96 | % | | | 52 | % | |
8/31/2014 | | $ | 26.95 | | | $ | 0.21 | | | $ | 5.60 | | | $ | 5.81 | | | $ | (0.25 | ) | | $ | (2.68 | ) | | $ | (2.93 | ) | | $ | 0.00 | | | $ | 29.83 | | | | 22.86 | %c | | $ | 9.4 | | | | 0.76 | % | | | 0.75 | % | | | 0.72 | % | | | 84 | % | |
8/31/2013 | | $ | 21.76 | | | $ | 0.24 | | | $ | 5.14 | | | $ | 5.38 | | | $ | (0.19 | ) | | $ | — | | | $ | (0.19 | ) | | $ | — | | | $ | 26.95 | | | | 24.89 | % | | $ | 22.6 | | | | 0.77 | % | | | 0.75 | % | | | 0.96 | % | | | 79 | % | |
Class A | |
8/31/2017 | | $ | 15.82 | | | $ | 0.01 | | | $ | 2.28 | | | $ | 2.29 | | | $ | (0.09 | ) | | $ | (2.22 | ) | | $ | (2.31 | ) | | $ | 0.00 | | | $ | 15.80 | | | | 16.58 | %e | | $ | 3.1 | | | | 1.13 | % | | | 1.11 | % | | | 0.07 | % | | | 72 | % | |
8/31/2016 | | $ | 16.10 | | | $ | 0.07 | | | $ | 0.92 | | | $ | 0.99 | | | $ | (0.17 | ) | | $ | (1.10 | ) | | $ | (1.27 | ) | | $ | — | | | $ | 15.82 | | | | 6.52 | % | | $ | 3.2 | | | | 1.15 | % | | | 1.11 | % | | | 0.48 | % | | | 89 | % | |
8/31/2015 | | $ | 20.50 | | | $ | 0.10 | | | $ | (0.13 | ) | | $ | (0.03 | ) | | $ | (0.15 | ) | | $ | (4.22 | ) | | $ | (4.37 | ) | | $ | — | | | $ | 16.10 | | | | 0.24 | % | | $ | 4.4 | | | | 1.14 | % | | | 1.11 | % | | | 0.58 | % | | | 52 | % | |
8/31/2014 | | $ | 19.38 | | | $ | 0.09 | | | $ | 3.91 | | | $ | 4.00 | | | $ | (0.20 | ) | | $ | (2.68 | ) | | $ | (2.88 | ) | | $ | 0.00 | | | $ | 20.50 | | | | 22.40 | %c | | $ | 3.9 | | | | 1.13 | % | | | 1.11 | % | | | 0.47 | % | | | 84 | % | |
8/31/2013 | | $ | 15.71 | | | $ | 0.10 | | | $ | 3.71 | | | $ | 3.81 | | | $ | (0.14 | ) | | $ | — | | | $ | (0.14 | ) | | $ | — | | | $ | 19.38 | | | | 24.47 | % | | $ | 1.9 | | | | 1.19 | % | | | 1.11 | % | | | 0.56 | % | | | 79 | % | |
Class C | |
8/31/2017 | | $ | 7.41 | | | $ | (0.04 | ) | | $ | 0.89 | | | $ | 0.85 | | | $ | (0.06 | ) | | $ | (2.22 | ) | | $ | (2.28 | ) | | $ | 0.00 | | | $ | 5.98 | | | | 15.76 | %e | | $ | 1.9 | | | | 1.88 | % | | | 1.86 | % | | | (0.67 | )% | | | 72 | % | |
8/31/2016 | | $ | 8.24 | | | $ | (0.02 | ) | | $ | 0.44 | | | $ | 0.42 | | | $ | (0.15 | ) | | $ | (1.10 | ) | | $ | (1.25 | ) | | $ | — | | | $ | 7.41 | | | | 5.75 | % | | $ | 2.2 | | | | 1.90 | % | | | 1.86 | % | | | (0.27 | )% | | | 89 | % | |
8/31/2015 | | $ | 12.70 | | | $ | (0.02 | ) | | $ | (0.10 | ) | | $ | (0.12 | ) | | $ | (0.12 | ) | | $ | (4.22 | ) | | $ | (4.34 | ) | | $ | — | | | $ | 8.24 | | | | (0.50 | )% | | $ | 2.9 | | | | 1.89 | % | | | 1.86 | % | | | (0.18 | )% | | | 52 | % | |
8/31/2014 | | $ | 13.03 | | | $ | (0.03 | ) | | $ | 2.52 | | | $ | 2.49 | | | $ | (0.14 | ) | | $ | (2.68 | ) | | $ | (2.82 | ) | | $ | 0.00 | | | $ | 12.70 | | | | 21.52 | %c | | $ | 1.5 | | | | 1.91 | % | | | 1.86 | % | | | (0.27 | )% | | | 84 | % | |
8/31/2013 | | $ | 10.62 | | | $ | (0.02 | ) | | $ | 2.51 | | | $ | 2.49 | | | $ | (0.08 | ) | | $ | — | | | $ | (0.08 | ) | | $ | — | | | $ | 13.03 | | | | 23.61 | % | | $ | 0.6 | | | | 1.94 | % | | | 1.86 | % | | | (0.20 | )% | | | 79 | % | |
Genesis Fund | |
Investor Class | |
8/31/2017 | | $ | 34.13 | | | $ | 0.07 | | | $ | 3.30 | | | $ | 3.37 | | | $ | (0.15 | ) | | $ | (3.52 | ) | | $ | (3.67 | ) | | $ | — | | | $ | 33.83 | | | | 10.19 | %h | | $ | 1,786.0 | | | | 1.02 | % | | | 1.01 | %f | | | 0.21 | %f | | | 20 | % | |
8/31/2016 | | $ | 36.31 | | | $ | 0.09 | | | $ | 3.43 | | | $ | 3.52 | | | $ | (0.15 | ) | | $ | (5.55 | ) | | $ | (5.70 | ) | | $ | — | | | $ | 34.13 | | | | 11.43 | % | | $ | 1,752.8 | | | | 1.03 | % | | | 1.03 | % | | | 0.28 | % | | | 16 | % | |
8/31/2015 | | $ | 40.89 | | | $ | 0.11 | | | $ | 0.36 | | | $ | 0.47 | | | $ | (0.14 | ) | | $ | (4.91 | ) | | $ | (5.05 | ) | | $ | — | | | $ | 36.31 | | | | 1.52 | % | | $ | 2,023.6 | | | | 1.01 | % | | | 1.01 | % | | | 0.29 | % | | | 13 | % | |
8/31/2014 | | $ | 40.18 | | | $ | 0.08 | | | $ | 5.37 | | | $ | 5.45 | | | $ | (0.24 | ) | | $ | (4.50 | ) | | $ | (4.74 | ) | | $ | 0.00 | | | $ | 40.89 | | | | 13.65 | %c | | $ | 2,437.6 | | | | 1.01 | % | | | 1.01 | % | | | 0.20 | % | | | 14 | % | |
8/31/2013 | | $ | 34.65 | | | $ | 0.26 | | | $ | 7.57 | | | $ | 7.83 | | | $ | (0.19 | ) | | $ | (2.11 | ) | | $ | (2.30 | ) | | $ | — | | | $ | 40.18 | | | | 23.91 | % | | $ | 2,458.7 | | | | 1.02 | % | | | 1.02 | % | | | 0.71 | % | | | 20 | % | |
Trust Class | |
8/31/2017 | | $ | 59.52 | | | $ | 0.08 | | | $ | 5.84 | | | $ | 5.92 | | | $ | (0.03 | ) | | $ | (3.52 | ) | | $ | (3.55 | ) | | $ | — | | | $ | 61.89 | | | | 10.11 | %h | | $ | 1,576.2 | | | | 1.09 | % | | | 1.08 | %f | | | 0.13 | %f | | | 20 | % | |
8/31/2016 | | $ | 59.01 | | | $ | 0.12 | | | $ | 5.97 | | | $ | 6.09 | | | $ | (0.03 | ) | | $ | (5.55 | ) | | $ | (5.58 | ) | | $ | — | | | $ | 59.52 | | | | 11.35 | % | | $ | 1,761.0 | | | | 1.10 | % | | | 1.10 | % | | | 0.21 | % | | | 16 | % | |
8/31/2015 | | $ | 63.21 | | | $ | 0.12 | | | $ | 0.63 | | | $ | 0.75 | | | $ | (0.04 | ) | | $ | (4.91 | ) | | $ | (4.95 | ) | | $ | — | | | $ | 59.01 | | | | 1.41 | % | | $ | 2,003.4 | | | | 1.10 | % | | | 1.10 | % | | | 0.19 | % | | | 13 | % | |
8/31/2014 | | $ | 59.83 | | | $ | 0.07 | | | $ | 8.00 | | | $ | 8.07 | | | $ | (0.19 | ) | | $ | (4.50 | ) | | $ | (4.69 | ) | | $ | 0.00 | | | $ | 63.21 | | | | 13.55 | %c | | $ | 2,935.3 | | | | 1.10 | % | | | 1.10 | % | | | 0.11 | % | | | 14 | % | |
8/31/2013 | | $ | 50.47 | | | $ | 0.35 | | | $ | 11.23 | | | $ | 11.58 | | | $ | (0.11 | ) | | $ | (2.11 | ) | | $ | (2.22 | ) | | $ | — | | | $ | 59.83 | | | | 23.81 | % | | $ | 3,192.4 | | | | 1.10 | % | | | 1.10 | % | | | 0.63 | % | | | 20 | % | |
See Notes to Financial Highlights
217
218
Financial Highlights (cont'd)
| | | Net Asset
Value,
Beginning
of Year | | Net
Investment
Income (Loss)@ | | Net Gains or
Losses on
Securities
(both realized
and
unrealized) | | Total From
Investment
Operations | | Dividends
from Net
Investment
Income | | Distributions
from Net
Realized
Capital Gains | | Total
Distributions | | Voluntary
Contribution
from
Management | | Net Asset
Value, End of
Year | | Total Returnab | | Net Assets,
End of Year
(in millions) | | Ratio of Gross
Expenses to
Average Net
Assets# | | Ratio of Net
Expenses to
Average Net
Assets## | | Ratio of Net
Investment
Income/
(Loss) to
Average Net
Assets | | Portfolio
Turnover
Rate | |
Genesis Fund (cont'd) | |
Advisor Class | |
8/31/2017 | | $ | 24.31 | | | $ | (0.03 | ) | | $ | 2.32 | | | $ | 2.29 | | | $ | (0.07 | ) | | $ | (3.52 | ) | | $ | (3.59 | ) | | $ | — | | | $ | 23.01 | | | | 9.81 | %h | | $ | 203.8 | | | | 1.36 | % | | | 1.35 | %f | | | (0.13 | )%f | | | 20 | % | |
8/31/2016 | | $ | 27.45 | | | $ | (0.02 | ) | | $ | 2.46 | | | $ | 2.44 | | | $ | (0.03 | ) | | $ | (5.55 | ) | | $ | (5.58 | ) | | $ | — | | | $ | 24.31 | | | | 11.06 | % | | $ | 264.9 | | | | 1.38 | % | | | 1.38 | % | | | (0.07 | )% | | | 16 | % | |
8/31/2015 | | $ | 32.18 | | | $ | (0.03 | ) | | $ | 0.25 | | | $ | 0.22 | | | $ | (0.04 | ) | | $ | (4.91 | ) | | $ | (4.95 | ) | | $ | — | | | $ | 27.45 | | | | 1.11 | % | | $ | 451.3 | | | | 1.39 | % | | | 1.39 | % | | | (0.09 | )% | | | 13 | % | |
8/31/2014 | | $ | 32.46 | | | $ | (0.05 | ) | | $ | 4.32 | | | $ | 4.27 | | | $ | (0.05 | ) | | $ | (4.50 | ) | | $ | (4.55 | ) | | $ | 0.00 | | | $ | 32.18 | | | | 13.24 | %c | | $ | 598.9 | | | | 1.37 | % | | | 1.37 | % | | | (0.16 | )% | | | 14 | % | |
8/31/2013 | | $ | 28.42 | | | $ | 0.11 | | | $ | 6.13 | | | $ | 6.24 | | | $ | (0.09 | ) | | $ | (2.11 | ) | | $ | (2.20 | ) | | $ | — | | | $ | 32.46 | | | | 23.46 | % | | $ | 626.0 | | | | 1.38 | % | | | 1.38 | % | | | 0.35 | % | | | 20 | % | |
Institutional Class | |
8/31/2017 | | $ | 56.64 | | | $ | 0.22 | | | $ | 5.56 | | | $ | 5.78 | | | $ | (0.19 | ) | | $ | (3.52 | ) | | $ | (3.71 | ) | | $ | — | | | $ | 58.71 | | | | 10.40 | %h | | $ | 3,650.3 | | | | 0.85 | % | | | 0.84 | %f§ | | | 0.38 | %f | | | 20 | % | |
8/31/2016 | | $ | 56.48 | | | $ | 0.25 | | | $ | 5.67 | | | $ | 5.92 | | | $ | (0.21 | ) | | $ | (5.55 | ) | | $ | (5.76 | ) | | $ | — | | | $ | 56.64 | | | | 11.62 | % | | $ | 3,483.9 | | | | 0.85 | % | | | 0.85 | %§ | | | 0.47 | % | | | 16 | % | |
8/31/2015 | | $ | 60.72 | | | $ | 0.26 | | | $ | 0.60 | | | $ | 0.86 | | | $ | (0.19 | ) | | $ | (4.91 | ) | | $ | (5.10 | ) | | $ | — | | | $ | 56.48 | | | | 1.68 | % | | $ | 3,685.0 | | | | 0.85 | % | | | 0.85 | % | | | 0.45 | % | | | 13 | % | |
8/31/2014 | | $ | 57.62 | | | $ | 0.22 | | | $ | 7.70 | | | $ | 7.92 | | | $ | (0.32 | ) | | $ | (4.50 | ) | | $ | (4.82 | ) | | $ | 0.00 | | | $ | 60.72 | | | | 13.82 | %c | | $ | 5,061.4 | | | | 0.85 | % | | | 0.85 | %§ | | | 0.36 | % | | | 14 | % | |
8/31/2013 | | $ | 48.71 | | | $ | 0.46 | | | $ | 10.81 | | | $ | 11.27 | | | $ | (0.25 | ) | | $ | (2.11 | ) | | $ | (2.36 | ) | | $ | — | | | $ | 57.62 | | | | 24.12 | % | | $ | 5,989.3 | | | | 0.85 | % | | | 0.85 | % | | | 0.87 | % | | | 20 | % | |
Class R6 | |
8/31/2017 | | $ | 56.65 | | | $ | 0.26 | | | $ | 5.56 | | | $ | 5.82 | | | $ | (0.23 | ) | | $ | (3.52 | ) | | $ | (3.75 | ) | | $ | — | | | $ | 58.72 | | | | 10.47 | %h | | $ | 3,603.6 | | | | 0.77 | % | | | 0.77 | %f§ | | | 0.45 | %f | | | 20 | % | |
8/31/2016 | | $ | 56.50 | | | $ | 0.29 | | | $ | 5.67 | | | $ | 5.96 | | | $ | (0.26 | ) | | $ | (5.55 | ) | | $ | (5.81 | ) | | $ | — | | | $ | 56.65 | | | | 11.69 | % | | $ | 3,381.6 | | | | 0.78 | % | | | 0.78 | %§ | | | 0.54 | % | | | 16 | % | |
8/31/2015 | | $ | 60.75 | | | $ | 0.30 | | | $ | 0.60 | | | $ | 0.90 | | | $ | (0.24 | ) | | $ | (4.91 | ) | | $ | (5.15 | ) | | $ | — | | | $ | 56.50 | | | | 1.75 | % | | $ | 2,798.0 | | | | 0.78 | % | | | 0.78 | % | | | 0.52 | % | | | 13 | % | |
8/31/2014 | | $ | 57.63 | | | $ | 0.28 | | | $ | 7.70 | | | $ | 7.98 | | | $ | (0.36 | ) | | $ | (4.50 | ) | | $ | (4.86 | ) | | $ | 0.00 | | | $ | 60.75 | | | | 13.92 | %c | | $ | 2,690.7 | | | | 0.78 | % | | | 0.78 | %§ | | | 0.45 | % | | | 14 | % | |
Period from 3/15/2013^
to 8/31/2013 | | $ | 53.91 | | | $ | 0.18 | | | $ | 3.54 | | | $ | 3.72 | | | $ | — | | | $ | — | | | $ | — | | | $ | — | | | $ | 57.63 | | | | 6.90 | %* | | $ | 975.9 | | | | 0.80 | %** | | | 0.78 | %** | | | 0.67 | %** | | | 20 | %d | |
Global Equity Fund | |
Institutional Class | |
8/31/2017 | | $ | 6.65 | | | $ | 0.05 | | | $ | 0.94 | | | $ | 0.99 | | | $ | (0.03 | ) | | $ | (0.05 | ) | | $ | (0.08 | ) | | $ | — | | | $ | 7.56 | | | | 15.13 | % | | $ | 4.2 | | | | 7.05 | % | | | 0.85 | % | | | 0.65 | % | | | 16 | % | |
8/31/2016 | | $ | 6.30 | | | $ | 0.04 | | | $ | 0.32 | | | $ | 0.36 | | | $ | (0.01 | ) | | $ | — | | | $ | (0.01 | ) | | $ | — | | | $ | 6.65 | | | | 5.76 | % | | $ | 3.6 | | | | 8.67 | % | | | 1.15 | % | | | 0.64 | % | | | 41 | % | |
8/31/2015 | | $ | 11.22 | | | $ | 0.03 | | | $ | (0.38 | ) | | $ | (0.35 | ) | | $ | (0.73 | ) | | $ | (3.84 | ) | | $ | (4.57 | ) | | $ | — | | | $ | 6.30 | | | | (3.16 | )% | | $ | 3.2 | | | | 4.76 | % | | | 1.15 | % | | | 0.35 | % | | | 18 | % | |
8/31/2014 | | $ | 9.49 | | | $ | 0.06 | | | $ | 1.80 | | | $ | 1.86 | | | $ | (0.04 | ) | | $ | (0.09 | ) | | $ | (0.13 | ) | | $ | — | | | $ | 11.22 | | | | 19.67 | % | | $ | 38.9 | | | | 1.72 | % | | | 1.15 | % | | | 0.54 | % | | | 39 | % | |
8/31/2013 | | $ | 8.50 | | | $ | 0.06 | | | $ | 0.93 | | | $ | 0.99 | | | $ | — | | | $ | — | | | $ | — | | | $ | — | | | $ | 9.49 | | | | 11.65 | % | | $ | 33.5 | | | | 5.16 | % | | | 1.15 | % | | | 0.63 | % | | | 43 | % | |
Class A | |
8/31/2017 | | $ | 6.57 | | | $ | 0.01 | | | $ | 0.96 | | | $ | 0.97 | | | $ | (0.01 | ) | | $ | (0.05 | ) | | $ | (0.06 | ) | | $ | — | | | $ | 7.48 | | | | 14.85 | % | | $ | 0.3 | | | | 7.74 | % | | | 1.25 | % | | | 0.19 | % | | | 16 | % | |
8/31/2016 | | $ | 6.23 | | | $ | 0.02 | | | $ | 0.32 | | | $ | 0.34 | | | $ | — | | | $ | — | | | $ | — | | | $ | — | | | $ | 6.57 | | | | 5.46 | % | | $ | 0.5 | | | | 9.12 | % | | | 1.51 | % | | | 0.31 | % | | | 41 | % | |
8/31/2015 | | $ | 11.14 | | | $ | 0.01 | | | $ | (0.38 | ) | | $ | (0.37 | ) | | $ | (0.70 | ) | | $ | (3.84 | ) | | $ | (4.54 | ) | | $ | — | | | $ | 6.23 | | | | (3.47 | )% | | $ | 0.4 | | | | 5.24 | % | | | 1.51 | % | | | 0.09 | % | | | 18 | % | |
8/31/2014 | | $ | 9.43 | | | $ | 0.03 | | | $ | 1.77 | | | $ | 1.80 | | | $ | (0.00 | ) | | $ | (0.09 | ) | | $ | (0.09 | ) | | $ | — | | | $ | 11.14 | | | | 19.18 | % | | $ | 0.4 | | | | 2.18 | % | | | 1.51 | % | | | 0.28 | % | | | 39 | % | |
8/31/2013 | | $ | 8.48 | | | $ | 0.03 | | | $ | 0.92 | | | $ | 0.95 | | | $ | — | | | $ | — | | | $ | — | | | $ | — | | | $ | 9.43 | | | | 11.20 | % | | $ | 0.1 | | | | 5.67 | % | | | 1.51 | % | | | 0.34 | % | | | 43 | % | |
See Notes to Financial Highlights
219
220
Financial Highlights (cont'd)
| | | Net Asset
Value,
Beginning
of Year | | Net
Investment
Income (Loss)@ | | Net Gains or
Losses on
Securities
(both realized
and
unrealized) | | Total From
Investment
Operations | | Dividends
from Net
Investment
Income | | Distributions
from Net
Realized
Capital Gains | | Total
Distributions | | Voluntary
Contribution
from
Management | | Net Asset
Value, End of
Year | | Total Returnab | | Net Assets,
End of Year
(in millions) | | Ratio of Gross
Expenses to
Average Net
Assets# | | Ratio of Net
Expenses to
Average Net
Assets## | | Ratio of Net
Investment
Income/
(Loss) to
Average Net
Assets | | Portfolio
Turnover
Rate | |
Global Equity Fund (cont'd) | |
Class C | |
8/31/2017 | | $ | 6.29 | | | $ | (0.03 | ) | | $ | 0.90 | | | $ | 0.87 | | | $ | — | | | $ | (0.05 | ) | | $ | (0.05 | ) | | $ | — | | | $ | 7.11 | | | | 13.89 | % | | $ | 0.1 | | | | 8.34 | % | | | 1.98 | % | | | (0.47 | )% | | | 16 | % | |
8/31/2016 | | $ | 6.01 | | | $ | (0.03 | ) | | $ | 0.31 | | | $ | 0.28 | | | $ | — | | | $ | — | | | $ | — | | | $ | — | | | $ | 6.29 | | | | 4.66 | % | | $ | 0.2 | | | | 9.80 | % | | | 2.26 | % | | | (0.45 | )% | | | 41 | % | |
8/31/2015 | | $ | 10.89 | | | $ | (0.05 | ) | | $ | (0.37 | ) | | $ | (0.42 | ) | | $ | (0.62 | ) | | $ | (3.84 | ) | | $ | (4.46 | ) | | $ | — | | | $ | 6.01 | | | | (4.21 | )% | | $ | 0.2 | | | | 6.00 | % | | | 2.26 | % | | | (0.68 | )% | | | 18 | % | |
8/31/2014 | | $ | 9.28 | | | $ | (0.06 | ) | | $ | 1.76 | | | $ | 1.70 | | | $ | — | | | $ | (0.09 | ) | | $ | (0.09 | ) | | $ | — | | | $ | 10.89 | | | | 18.39 | % | | $ | 0.2 | | | | 2.96 | % | | | 2.26 | % | | | (0.54 | )% | | | 39 | % | |
8/31/2013 | | $ | 8.41 | | | $ | (0.03 | ) | | $ | 0.90 | | | $ | 0.87 | | | $ | — | | | $ | — | | | $ | — | | | $ | — | | | $ | 9.28 | | | | 10.34 | % | | $ | 0.1 | | | | 6.50 | % | | | 2.26 | % | | | (0.36 | )% | | | 43 | % | |
Global Real Estate Fund | |
Institutional Class | |
8/31/2017 | | $ | 10.62 | | | $ | 0.17 | | | $ | 0.22 | | | $ | 0.39 | | | $ | (0.33 | ) | | $ | (0.04 | ) | | $ | (0.37 | ) | | $ | — | | | $ | 10.64 | | | | 4.01 | % | | $ | 2.2 | | | | 10.97 | % | | | 1.01 | % | | | 1.67 | % | | | 61 | % | |
8/31/2016 | | $ | 9.32 | | | $ | 0.17 | | | $ | 1.35 | | | $ | 1.52 | | | $ | (0.22 | ) | | $ | (0.00 | ) | | $ | (0.22 | ) | | $ | — | | | $ | 10.62 | | | | 16.49 | % | | $ | 2.1 | | | | 10.93 | % | | | 1.00 | % | | | 1.68 | % | | | 44 | % | |
Period from 12/30/2014^
to 8/31/2015 | | $ | 10.00 | | | $ | 0.08 | | | $ | (0.67 | ) | | $ | (0.59 | ) | | $ | (0.09 | ) | | $ | — | | | $ | (0.09 | ) | | $ | — | | | $ | 9.32 | | | | (5.92 | )%* | | $ | 1.9 | | | | 13.21 | %**‡ | | | 1.00 | %**‡ | | | 1.22 | %**‡ | | | 16 | %* | |
Class A | |
8/31/2017 | | $ | 10.61 | | | $ | 0.14 | | | $ | 0.22 | | | $ | 0.36 | | | $ | (0.29 | ) | | $ | (0.04 | ) | | $ | (0.33 | ) | | $ | — | | | $ | 10.64 | | | | 3.71 | % | | $ | 0.5 | | | | 11.23 | % | | | 1.37 | % | | | 1.41 | % | | | 61 | % | |
8/31/2016 | | $ | 9.31 | | | $ | 0.13 | | | $ | 1.35 | | | $ | 1.48 | | | $ | (0.18 | ) | | $ | (0.00 | ) | | $ | (0.18 | ) | | $ | — | | | $ | 10.61 | | | | 16.09 | % | | $ | 0.7 | | | | 11.31 | % | | | 1.36 | % | | | 1.32 | % | | | 44 | % | |
Period from 12/30/2014^
to 8/31/2015 | | $ | 10.00 | | | $ | 0.06 | | | $ | (0.67 | ) | | $ | (0.61 | ) | | $ | (0.08 | ) | | $ | — | | | $ | (0.08 | ) | | $ | — | | | $ | 9.31 | | | | (6.19 | )%* | | $ | 0.6 | | | | 13.62 | %**‡ | | | 1.36 | %**‡ | | | 0.94 | %**‡ | | | 16 | %* | |
Class C | |
8/31/2017 | | $ | 10.59 | | | $ | 0.06 | | | $ | 0.23 | | | $ | 0.29 | | | $ | (0.22 | ) | | $ | (0.04 | ) | | $ | (0.26 | ) | | $ | — | | | $ | 10.62 | | | | 2.96 | % | | $ | 0.3 | | | | 12.10 | % | | | 2.12 | % | | | 0.56 | % | | | 61 | % | |
8/31/2016 | | $ | 9.30 | | | $ | 0.06 | | | $ | 1.34 | | | $ | 1.40 | | | $ | (0.11 | ) | | $ | (0.00 | ) | | $ | (0.11 | ) | | $ | — | | | $ | 10.59 | | | | 15.15 | % | | $ | 0.3 | | | | 12.04 | % | | | 2.11 | % | | | 0.56 | % | | | 44 | % | |
Period from 12/30/2014^
to 8/31/2015 | | $ | 10.00 | | | $ | 0.01 | | | $ | (0.67 | ) | | $ | (0.66 | ) | | $ | (0.04 | ) | | $ | — | | | $ | (0.04 | ) | | $ | — | | | $ | 9.30 | | | | (6.64 | )%* | | $ | 0.2 | | | | 15.16 | %**‡ | | | 2.11 | %**‡ | | | 0.11 | %**‡ | | | 16 | %* | |
Greater China Equity Fund | |
Institutional Class | |
8/31/2017 | | $ | 11.50 | | | $ | 0.09 | | | $ | 4.31 | | | $ | 4.40 | | | $ | (0.05 | ) | | $ | — | | | $ | (0.05 | ) | | $ | — | | | $ | 15.85 | | | | 38.46 | % | | $ | 109.4 | | | | 1.69 | % | | | 1.51 | %^^ | | | 0.72 | % | | | 116 | % | |
8/31/2016 | | $ | 11.64 | | | $ | 0.05 | | | $ | 1.32 | | | $ | 1.37 | | | $ | (0.10 | ) | | $ | (1.41 | ) | | $ | (1.51 | ) | | $ | — | | | $ | 11.50 | | | | 12.09 | % | | $ | 93.3 | | | | 1.76 | % | | | 1.51 | %^^ | | | 0.44 | % | | | 120 | % | |
8/31/2015 | | $ | 12.17 | | | $ | 0.10 | | | $ | 0.17 | | | $ | 0.27 | | | $ | (0.09 | ) | | $ | (0.71 | ) | | $ | (0.80 | ) | | $ | — | | | $ | 11.64 | | | | 2.15 | % | | $ | 103.4 | | | | 1.61 | % | | | 1.50 | %^^ | | | 0.75 | % | | | 176 | % | |
8/31/2014 | | $ | 10.16 | | | $ | 0.10 | | | $ | 2.06 | | | $ | 2.16 | | | $ | — | | | $ | (0.15 | ) | | $ | (0.15 | ) | | $ | — | | | $ | 12.17 | | | | 21.37 | % | | $ | 72.1 | | | | 1.83 | % | | | 1.50 | % | | | 0.90 | % | | | 171 | % | |
Period from 7/17/2013^
to 8/31/2013 | | $ | 10.00 | | | $ | (0.02 | ) | | $ | 0.18 | | | $ | 0.16 | | | $ | — | | | $ | — | | | $ | — | | | $ | — | | | $ | 10.16 | | | | 1.60 | %* | | $ | 56.4 | | | | 2.80 | %**‡ | | | 1.50 | %**‡ | | | (1.25 | )%**‡ | | | 20 | %* | |
See Notes to Financial Highlights
221
222
Financial Highlights (cont'd)
| | | Net Asset
Value,
Beginning
of Year | | Net
Investment
Income (Loss)@ | | Net Gains or
Losses on
Securities
(both realized
and
unrealized) | | Total From
Investment
Operations | | Dividends
from Net
Investment
Income | | Distributions
from Net
Realized
Capital Gains | | Total
Distributions | | Voluntary
Contribution
from
Management | | Net Asset
Value, End of
Year | | Total Returnab | | Net Assets,
End of Year
(in millions) | | Ratio of Gross
Expenses to
Average Net
Assets# | | Ratio of Net
Expenses to
Average Net
Assets## | | Ratio of Net
Investment
Income/
(Loss) to
Average Net
Assets | | Portfolio
Turnover
Rate | |
Greater China Equity Fund (cont'd) | |
Class A | |
8/31/2017 | | $ | 11.50 | | | $ | 0.19 | | | $ | 4.17 | | | $ | 4.36 | | | $ | (0.00 | ) | | $ | — | | | $ | (0.00 | ) | | $ | — | | | $ | 15.86 | | | | 37.95 | % | | $ | 21.7 | | | | 2.07 | % | | | 1.86 | %^^ | | | 1.38 | % | | | 116 | % | |
8/31/2016 | | $ | 11.56 | | | $ | (0.01 | ) | | $ | 1.39 | | | $ | 1.38 | | | $ | (0.03 | ) | | $ | (1.41 | ) | | $ | (1.44 | ) | | $ | — | | | $ | 11.50 | | | | 12.19 | % | | $ | 2.1 | | | | 2.19 | % | | | 1.87 | %^^ | | | (0.08 | )% | | | 120 | % | |
8/31/2015 | | $ | 12.14 | | | $ | 0.05 | | | $ | 0.17 | | | $ | 0.22 | | | $ | (0.09 | ) | | $ | (0.71 | ) | | $ | (0.80 | ) | | $ | — | | | $ | 11.56 | | | | 1.68 | % | | $ | 4.0 | | | | 2.00 | % | | | 1.86 | %^^ | | | 0.34 | % | | | 176 | % | |
8/31/2014 | | $ | 10.16 | | | $ | 0.13 | | | $ | 2.00 | | | $ | 2.13 | | | $ | — | | | $ | (0.15 | ) | | $ | (0.15 | ) | | $ | — | | | $ | 12.14 | | | | 21.07 | % | | $ | 1.7 | | | | 2.30 | % | | | 1.86 | % | | | 1.19 | % | | | 171 | % | |
Period from 7/17/2013^
to 8/31/2013 | | $ | 10.00 | | | $ | (0.02 | ) | | $ | 0.18 | | | $ | 0.16 | | | $ | — | | | $ | — | | | $ | — | | | $ | — | | | $ | 10.16 | | | | 1.60 | %* | | $ | 0.1 | | | | 17.58 | %**‡ | | | 1.86 | %**‡ | | | (1.65 | )%**‡ | | | 20 | %* | |
Class C | |
8/31/2017 | | $ | 11.27 | | | $ | (0.14 | ) | | $ | 4.30 | | | $ | 4.16 | | | $ | — | | | $ | — | | | $ | — | | | $ | — | | | $ | 15.43 | | | | 36.91 | % | | $ | 0.3 | | | | 2.80 | % | | | 2.62 | %^^ | | | (1.18 | )% | | | 116 | % | |
8/31/2016 | | $ | 11.45 | | | $ | (0.07 | ) | | $ | 1.30 | | | $ | 1.23 | | | $ | — | | | $ | (1.41 | ) | | $ | (1.41 | ) | | $ | — | | | $ | 11.27 | | | | 10.93 | % | | $ | 0.1 | | | | 2.86 | % | | | 2.62 | %^^ | | | (0.65 | )% | | | 120 | % | |
8/31/2015 | | $ | 12.03 | | | $ | (0.07 | ) | | $ | 0.20 | | | $ | 0.13 | | | $ | — | | | $ | (0.71 | ) | | $ | (0.71 | ) | | $ | — | | | $ | 11.45 | | | | 0.93 | % | | $ | 0.2 | | | | 2.80 | % | | | 2.61 | %^^ | | | (0.52 | )% | | | 176 | % | |
8/31/2014 | | $ | 10.15 | | | $ | (0.02 | ) | | $ | 2.05 | | | $ | 2.03 | | | $ | — | | | $ | (0.15 | ) | | $ | (0.15 | ) | | $ | — | | | $ | 12.03 | | | | 20.09 | % | | $ | 0.1 | | | | 2.85 | % | | | 2.61 | % | | | (0.20 | )% | | | 171 | % | |
Period from 7/17/2013^
to 8/31/2013 | | $ | 10.00 | | | $ | (0.03 | ) | | $ | 0.18 | | | $ | 0.15 | | | $ | — | | | $ | — | | | $ | — | | | $ | — | | | $ | 10.15 | | | | 1.50 | %* | | $ | 0.1 | | | | 19.16 | %**‡ | | | 2.61 | %**‡ | | | (2.41 | )%**‡ | | | 20 | %* | |
Guardian Fund | |
Investor Class | |
8/31/2017 | | $ | 16.45 | | | $ | 0.12 | | | $ | 2.51 | | | $ | 2.63 | | | $ | (0.11 | ) | | $ | (1.85 | ) | | $ | (1.96 | ) | | $ | — | | | $ | 17.12 | | | | 17.60 | %h | | $ | 1,052.4 | | | | 0.90 | % | | | 0.89 | %f | | | 0.77 | %f | | | 37 | % | |
8/31/2016 | | $ | 17.13 | | | $ | 0.09 | | | $ | 1.21 | | | $ | 1.30 | | | $ | (0.12 | ) | | $ | (1.86 | ) | | $ | (1.98 | ) | | $ | — | | | $ | 16.45 | | | | 8.45 | % | | $ | 993.3 | | | | 0.93 | % | | | 0.93 | % | | | 0.58 | % | | | 99 | % | |
8/31/2015 | | $ | 20.43 | | | $ | 0.12 | | | $ | (0.64 | ) | | $ | (0.52 | ) | | $ | (0.15 | ) | | $ | (2.63 | ) | | $ | (2.78 | ) | | $ | — | | | $ | 17.13 | | | | (3.03 | )% | | $ | 1,034.9 | | | | 0.87 | % | | | 0.87 | % | | | 0.65 | % | | | 31 | % | |
8/31/2014 | | $ | 18.58 | | | $ | 0.16 | | | $ | 3.70 | | | $ | 3.86 | | | $ | (0.10 | ) | | $ | (1.91 | ) | | $ | (2.01 | ) | | $ | 0.00 | | | $ | 20.43 | | | | 21.87 | %c | | $ | 1,165.1 | | | | 0.88 | % | | | 0.88 | % | | | 0.83 | % | | | 37 | % | |
8/31/2013 | | $ | 15.80 | | | $ | 0.14 | | | $ | 3.28 | | | $ | 3.42 | | | $ | (0.20 | ) | | $ | (0.44 | ) | | $ | (0.64 | ) | | $ | — | | | $ | 18.58 | | | | 22.54 | % | | $ | 1,040.3 | | | | 0.90 | % | | | 0.90 | % | | | 0.85 | % | | | 36 | % | |
Trust Class | |
8/31/2017 | | $ | 10.96 | | | $ | 0.06 | | | $ | 1.58 | | | $ | 1.64 | | | $ | (0.10 | ) | | $ | (1.85 | ) | | $ | (1.95 | ) | | $ | — | | | $ | 10.65 | | | | 17.37 | %h | | $ | 57.8 | | | | 1.07 | % | | | 1.04 | %f | | | 0.60 | %f | | | 37 | % | |
8/31/2016 | | $ | 12.05 | | | $ | 0.04 | | | $ | 0.82 | | | $ | 0.86 | | | $ | (0.09 | ) | | $ | (1.86 | ) | | $ | (1.95 | ) | | $ | — | | | $ | 10.96 | | | | 8.31 | % | | $ | 70.6 | | | | 1.08 | % | | | 1.08 | % | | | 0.41 | % | | | 99 | % | |
8/31/2015 | | $ | 15.20 | | | $ | 0.06 | | | $ | (0.45 | ) | | $ | (0.39 | ) | | $ | (0.13 | ) | | $ | (2.63 | ) | | $ | (2.76 | ) | | $ | — | | | $ | 12.05 | | | | (3.22 | )% | | $ | 103.8 | | | | 1.06 | % | | | 1.06 | % | | | 0.46 | % | | | 31 | % | |
8/31/2014 | | $ | 14.30 | | | $ | 0.09 | | | $ | 2.81 | | | $ | 2.90 | | | $ | (0.09 | ) | | $ | (1.91 | ) | | $ | (2.00 | ) | | $ | 0.00 | | | $ | 15.20 | | | | 21.61 | %c | | $ | 136.6 | | | | 1.06 | % | | | 1.06 | % | | | 0.64 | % | | | 37 | % | |
8/31/2013 | | $ | 12.31 | | | $ | 0.09 | | | $ | 2.53 | | | $ | 2.62 | | | $ | (0.19 | ) | | $ | (0.44 | ) | | $ | (0.63 | ) | | $ | — | | | $ | 14.30 | | | | 22.36 | % | | $ | 129.4 | | | | 1.08 | % | | | 1.08 | % | | | 0.66 | % | | | 36 | % | |
Advisor Class | |
8/31/2017 | | $ | 13.47 | | | $ | 0.07 | | | $ | 2.00 | | | $ | 2.07 | | | $ | (0.05 | ) | | $ | (1.85 | ) | | $ | (1.90 | ) | | $ | — | | | $ | 13.64 | | | | 17.26 | %h | | $ | 0.1 | | | | 1.38 | % | | | 1.18 | %f | | | 0.51 | %f | | | 37 | % | |
8/31/2016 | | $ | 14.33 | | | $ | 0.03 | | | $ | 0.99 | | | $ | 1.02 | | | $ | (0.02 | ) | | $ | (1.86 | ) | | $ | (1.88 | ) | | $ | — | | | $ | 13.47 | | | | 8.03 | % | | $ | 0.2 | | | | 1.31 | % | | | 1.31 | %§ | | | 0.20 | % | | | 99 | % | |
8/31/2015 | | $ | 17.55 | | | $ | 0.00 | | | $ | (0.54 | ) | | $ | (0.54 | ) | | $ | (0.05 | ) | | $ | (2.63 | ) | | $ | (2.68 | ) | | $ | — | | | $ | 14.33 | | | | (3.66 | )% | | $ | 0.3 | | | | 1.54 | % | | | 1.50 | % | | | 0.03 | % | | | 31 | % | |
8/31/2014 | | $ | 16.27 | | | $ | 0.04 | | | $ | 3.24 | | | $ | 3.28 | | | $ | (0.09 | ) | | $ | (1.91 | ) | | $ | (2.00 | ) | | $ | 0.00 | | | $ | 17.55 | | | | 21.27 | %c | | $ | 0.4 | | | | 1.28 | % | | | 1.28 | % | | | 0.25 | % | | | 37 | % | |
8/31/2013 | | $ | 13.91 | | | $ | 0.04 | | | $ | 2.87 | | | $ | 2.91 | | | $ | (0.11 | ) | | $ | (0.44 | ) | | $ | (0.55 | ) | | $ | — | | | $ | 16.27 | | | | 21.81 | % | | $ | 0.6 | | | | 1.50 | % | | | 1.50 | %§ | | | 0.23 | % | | | 36 | % | |
See Notes to Financial Highlights
223
224
Financial Highlights (cont'd)
| | | Net Asset
Value,
Beginning
of Year | | Net
Investment
Income (Loss)@ | | Net Gains or
Losses on
Securities
(both realized
and
unrealized) | | Total From
Investment
Operations | | Dividends
from Net
Investment
Income | | Distributions
from Net
Realized
Capital Gains | | Total
Distributions | | Voluntary
Contribution
from
Management | | Net Asset
Value, End of
Year | | Total Returnab | | Net Assets,
End of Year
(in millions) | | Ratio of Gross
Expenses to
Average Net
Assets# | | Ratio of Net
Expenses to
Average Net
Assets## | | Ratio of Net
Investment
Income/
(Loss) to
Average Net
Assets | | Portfolio
Turnover
Rate | |
Guardian Fund (cont'd) | |
Institutional Class | |
8/31/2017 | | $ | 16.50 | | | $ | 0.15 | | | $ | 2.50 | | | $ | 2.65 | | | $ | (0.14 | ) | | $ | (1.85 | ) | | $ | (1.99 | ) | | $ | — | | | $ | 17.16 | | | | 17.72 | %h | | $ | 70.2 | | | | 0.72 | % | | | 0.71 | %f | | | 0.94 | %f | | | 37 | % | |
8/31/2016 | | $ | 17.17 | | | $ | 0.12 | | | $ | 1.22 | | | $ | 1.34 | | | $ | (0.15 | ) | | $ | (1.86 | ) | | $ | (2.01 | ) | | $ | — | | | $ | 16.50 | | | | 8.68 | % | | $ | 59.0 | | | | 0.72 | % | | | 0.72 | % | | | 0.73 | % | | | 99 | % | |
8/31/2015 | | $ | 20.47 | | | $ | 0.16 | | | $ | (0.65 | ) | | $ | (0.49 | ) | | $ | (0.18 | ) | | $ | (2.63 | ) | | $ | (2.81 | ) | | $ | — | | | $ | 17.17 | | | | (2.84 | )% | | $ | 94.1 | | | | 0.71 | % | | | 0.71 | % | | | 0.82 | % | | | 31 | % | |
8/31/2014 | | $ | 18.62 | | | $ | 0.20 | | | $ | 3.70 | | | $ | 3.90 | | | $ | (0.14 | ) | | $ | (1.91 | ) | | $ | (2.05 | ) | | $ | 0.00 | | | $ | 20.47 | | | | 22.03 | %c | | $ | 129.4 | | | | 0.71 | % | | | 0.71 | % | | | 1.01 | % | | | 37 | % | |
8/31/2013 | | $ | 15.83 | | | $ | 0.17 | | | $ | 3.29 | | | $ | 3.46 | | | $ | (0.23 | ) | | $ | (0.44 | ) | | $ | (0.67 | ) | | $ | — | | | $ | 18.62 | | | | 22.80 | % | | $ | 88.9 | | | | 0.73 | % | | | 0.73 | % | | | 1.00 | % | | | 36 | % | |
Class A | |
8/31/2017 | | $ | 10.82 | | | $ | 0.06 | | | $ | 1.55 | | | $ | 1.61 | | | $ | (0.10 | ) | | $ | (1.85 | ) | | $ | (1.95 | ) | | $ | — | | | $ | 10.48 | | | | 17.28 | %h | | $ | 5.6 | | | | 1.10 | % | | | 1.09 | %f | | | 0.56 | %f | | | 37 | % | |
8/31/2016 | | $ | 11.92 | | | $ | 0.03 | | | $ | 0.82 | | | $ | 0.85 | | | $ | (0.09 | ) | | $ | (1.86 | ) | | $ | (1.95 | ) | | $ | — | | | $ | 10.82 | | | | 8.32 | % | | $ | 6.6 | | | | 1.07 | % | | | 1.07 | % | | | 0.27 | % | | | 99 | % | |
8/31/2015 | | $ | 15.08 | | | $ | 0.06 | | | $ | (0.45 | ) | | $ | (0.39 | ) | | $ | (0.14 | ) | | $ | (2.63 | ) | | $ | (2.77 | ) | | $ | — | | | $ | 11.92 | | | | (3.23 | )% | | $ | 79.3 | | | | 1.07 | % | | | 1.07 | % | | | 0.46 | % | | | 31 | % | |
8/31/2014 | | $ | 14.21 | | | $ | 0.09 | | | $ | 2.79 | | | $ | 2.88 | | | $ | (0.10 | ) | | $ | (1.91 | ) | | $ | (2.01 | ) | | $ | 0.00 | | | $ | 15.08 | | | | 21.62 | %c | | $ | 73.8 | | | | 1.09 | % | | | 1.09 | %§ | | | 0.64 | % | | | 37 | % | |
8/31/2013 | | $ | 12.24 | | | $ | 0.08 | | | $ | 2.52 | | | $ | 2.60 | | | $ | (0.19 | ) | | $ | (0.44 | ) | | $ | (0.63 | ) | | $ | — | | | $ | 14.21 | | | | 22.38 | % | | $ | 34.6 | | | | 1.11 | % | | | 1.11 | %§ | | | 0.62 | % | | | 36 | % | |
Class C | |
8/31/2017 | | $ | 13.03 | | | $ | (0.02 | ) | | $ | 1.93 | | | $ | 1.91 | | | $ | (0.03 | ) | | $ | (1.85 | ) | | $ | (1.88 | ) | | $ | — | | | $ | 13.06 | | | | 16.53 | %h | | $ | 1.6 | | | | 1.84 | % | | | 1.84 | %f | | | (0.20 | )%f | | | 37 | % | |
8/31/2016 | | $ | 13.97 | | | $ | (0.04 | ) | | $ | 0.96 | | | $ | 0.92 | | | $ | — | | | $ | (1.86 | ) | | $ | (1.86 | ) | | $ | — | | | $ | 13.03 | | | | 7.47 | % | | $ | 2.4 | | | | 1.85 | % | | | 1.85 | % | | | (0.34 | )% | | | 99 | % | |
8/31/2015 | | $ | 17.18 | | | $ | (0.05 | ) | | $ | (0.53 | ) | | $ | (0.58 | ) | | $ | — | | | $ | (2.63 | ) | | $ | (2.63 | ) | | $ | — | | | $ | 13.97 | | | | (4.01 | )% | | $ | 2.4 | | | | 1.83 | % | | | 1.83 | % | | | (0.30 | )% | | | 31 | % | |
8/31/2014 | | $ | 15.96 | | | $ | (0.03 | ) | | $ | 3.16 | | | $ | 3.13 | | | $ | (0.00 | ) | | $ | (1.91 | ) | | $ | (1.91 | ) | | $ | 0.00 | | | $ | 17.18 | | | | 20.71 | %c | | $ | 2.9 | | | | 1.86 | % | | | 1.86 | %§ | | | (0.15 | )% | | | 37 | % | |
8/31/2013 | | $ | 13.66 | | | $ | (0.02 | ) | | $ | 2.84 | | | $ | 2.82 | | | $ | (0.08 | ) | | $ | (0.44 | ) | | $ | (0.52 | ) | | $ | — | | | $ | 15.96 | | | | 21.43 | % | | $ | 2.6 | | | | 1.86 | % | | | 1.86 | % | | | (0.15 | )% | | | 36 | % | |
Class R3 | |
8/31/2017 | | $ | 13.42 | | | $ | 0.04 | | | $ | 1.99 | | | $ | 2.03 | | | $ | (0.05 | ) | | $ | (1.85 | ) | | $ | (1.90 | ) | | $ | — | | | $ | 13.55 | | | | 17.02 | %h | | $ | 0.5 | | | | 1.38 | % | | | 1.36 | %f | | | 0.28 | %f | | | 37 | % | |
8/31/2016 | | $ | 14.31 | | | $ | 0.02 | | | $ | 0.99 | | | $ | 1.01 | | | $ | (0.04 | ) | | $ | (1.86 | ) | | $ | (1.90 | ) | | $ | — | | | $ | 13.42 | | | | 8.00 | % | | $ | 0.6 | | | | 1.39 | % | | | 1.36 | % | | | 0.15 | % | | | 99 | % | |
8/31/2015 | | $ | 17.54 | | | $ | 0.02 | | | $ | (0.54 | ) | | $ | (0.52 | ) | | $ | (0.08 | ) | | $ | (2.63 | ) | | $ | (2.71 | ) | | $ | — | | | $ | 14.31 | | | | (3.53 | )% | | $ | 0.5 | | | | 1.37 | % | | | 1.36 | % | | | 0.15 | % | | | 31 | % | |
8/31/2014 | | $ | 16.25 | | | $ | 0.06 | | | $ | 3.21 | | | $ | 3.27 | | | $ | (0.07 | ) | | $ | (1.91 | ) | | $ | (1.98 | ) | | $ | 0.00 | | | $ | 17.54 | | | | 21.29 | %c | | $ | 0.7 | | | | 1.38 | % | | | 1.36 | % | | | 0.37 | % | | | 37 | % | |
8/31/2013 | | $ | 13.79 | | | $ | 0.04 | | | $ | 2.89 | | | $ | 2.93 | | | $ | (0.03 | ) | | $ | (0.44 | ) | | $ | (0.47 | ) | | $ | — | | | $ | 16.25 | | | | 22.03 | % | | $ | 0.4 | | | | 1.41 | % | | | 1.36 | % | | | 0.24 | % | | | 36 | % | |
International Equity Fund | |
Investor Class | |
8/31/2017 | | $ | 20.60 | | | $ | 0.29 | | | $ | 2.98 | | | $ | 3.27 | | | $ | (0.09 | ) | | $ | — | | | $ | (0.09 | ) | | $ | — | | | $ | 23.78 | | | | 15.97 | %h | | $ | 110.4 | | | | 1.23 | % | | | 0.73 | %f | | | 1.34 | %f | | | 27 | % | |
8/31/2016 | | $ | 19.78 | | | $ | 0.24 | | | $ | 0.67 | | | $ | 0.91 | | | $ | (0.09 | ) | | $ | — | | | $ | (0.09 | ) | | $ | — | | | $ | 20.60 | | | | 4.60 | % | | $ | 104.0 | | | | 1.26 | % | | | 1.08 | % | | | 1.20 | % | | | 30 | % | |
8/31/2015 | | $ | 20.70 | | | $ | 0.19 | | | $ | (0.96 | ) | | $ | (0.77 | ) | | $ | (0.15 | ) | | $ | — | | | $ | (0.15 | ) | | $ | — | | | $ | 19.78 | | | | (3.71 | )% | | $ | 117.7 | | | | 1.25 | % | | | 1.02 | % | | | 0.93 | % | | | 25 | % | |
8/31/2014 | | $ | 18.62 | | | $ | 0.26 | | | $ | 1.99 | | | $ | 2.25 | | | $ | (0.17 | ) | | $ | — | | | $ | (0.17 | ) | | $ | 0.00 | | | $ | 20.70 | | | | 12.14 | %c | | $ | 124.4 | | | | 1.26 | % | | | 1.07 | % | | | 1.29 | % | | | 34 | % | |
Period from 1/28/2013^
to 8/31/2013 | | $ | 18.03 | | | $ | 0.21 | | | $ | 0.38 | | | $ | 0.59 | | | $ | — | | | $ | — | | | $ | — | | | $ | — | | | $ | 18.62 | | | | 3.27 | %* | | $ | 125.7 | | | | 1.32 | %** | | | 1.09 | %** | | | 1.87 | %** | | | 44 | %dg | |
See Notes to Financial Highlights
225
226
Financial Highlights (cont'd)
| | | Net Asset
Value,
Beginning
of Year | | Net
Investment
Income (Loss)@ | | Net Gains or
Losses on
Securities
(both realized
and
unrealized) | | Total From
Investment
Operations | | Dividends
from Net
Investment
Income | | Distributions
from Net
Realized
Capital Gains | | Total
Distributions | | Voluntary
Contribution
from
Management | | Net Asset
Value, End of
Year | | Total Returnab | | Net Assets,
End of Year
(in millions) | | Ratio of Gross
Expenses to
Average Net
Assets# | | Ratio of Net
Expenses to
Average Net
Assets## | | Ratio of Net
Investment
Income/
(Loss) to
Average Net
Assets | | Portfolio
Turnover
Rate | |
International Equity Fund (cont'd) | |
Trust Class | |
8/31/2017 | | $ | 23.02 | | | $ | 0.31 | | | $ | 3.34 | | | $ | 3.65 | | | $ | (0.08 | ) | | $ | — | | | $ | (0.08 | ) | | $ | — | | | $ | 26.59 | | | | 15.92 | %h | | $ | 45.7 | | | | 1.27 | % | | | 0.74 | %f | | | 1.29 | %f | | | 27 | % | |
8/31/2016 | | $ | 22.06 | | | $ | 0.26 | | | $ | 0.75 | | | $ | 1.01 | | | $ | (0.05 | ) | | $ | — | | | $ | (0.05 | ) | | $ | — | | | $ | 23.02 | | | | 4.59 | % | | $ | 48.4 | | | | 1.30 | % | | | 1.12 | % | | | 1.15 | % | | | 30 | % | |
8/31/2015 | | $ | 23.02 | | | $ | 0.19 | | | $ | (1.07 | ) | | $ | (0.88 | ) | | $ | (0.08 | ) | | $ | — | | | $ | (0.08 | ) | | $ | — | | | $ | 22.06 | | | | (3.82 | )% | | $ | 55.3 | | | | 1.36 | % | | | 1.13 | % | | | 0.81 | % | | | 25 | % | |
8/31/2014 | | $ | 20.70 | | | $ | 0.28 | | | $ | 2.20 | | | $ | 2.48 | | | $ | (0.16 | ) | | $ | — | | | $ | (0.16 | ) | | $ | 0.00 | | | $ | 23.02 | | | | 12.02 | %c | | $ | 67.7 | | | | 1.36 | % | | | 1.16 | % | | | 1.23 | % | | | 34 | % | |
Period from 1/28/2013^
to 8/31/2013 | | $ | 20.05 | | | $ | 0.21 | | | $ | 0.44 | | | $ | 0.65 | | | $ | — | | | $ | — | | | $ | — | | | $ | — | | | $ | 20.70 | | | | 3.24 | %* | | $ | 111.9 | | | | 1.42 | %** | | | 1.19 | %** | | | 1.73 | %** | | | 44 | %dg | |
Institutional Class | |
8/31/2017 | | $ | 11.09 | | | $ | 0.14 | | | $ | 1.58 | | | $ | 1.72 | | | $ | (0.15 | ) | | $ | — | | | $ | (0.15 | ) | | $ | — | | | $ | 12.66 | | | | 15.82 | %h | | $ | 1,449.0 | | | | 1.02 | % | | | 0.85 | %f§ | | | 1.19 | %f | | | 27 | % | |
8/31/2016 | | $ | 10.72 | | | $ | 0.16 | | | $ | 0.35 | | | $ | 0.51 | | | $ | (0.14 | ) | | $ | — | | | $ | (0.14 | ) | | $ | — | | | $ | 11.09 | | | | 4.78 | % | | $ | 1,184.3 | | | | 1.03 | % | | | 0.85 | %§ | | | 1.46 | % | | | 30 | % | |
8/31/2015 | | $ | 11.32 | | | $ | 0.13 | | | $ | (0.53 | ) | | $ | (0.40 | ) | | $ | (0.20 | ) | | $ | — | | | $ | (0.20 | ) | | $ | — | | | $ | 10.72 | | | | (3.51 | )% | | $ | 886.5 | | | | 1.07 | % | | | 0.85 | %§ | | | 1.11 | % | | | 25 | % | |
8/31/2014 | | $ | 10.26 | | | $ | 0.17 | | | $ | 1.09 | | | $ | 1.26 | | | $ | (0.20 | ) | | $ | — | | | $ | (0.20 | ) | | $ | 0.00 | | | $ | 11.32 | | | | 12.38 | %c | | $ | 887.3 | | | | 1.07 | % | | | 0.85 | % | | | 1.49 | % | | | 34 | % | |
8/31/2013 | | $ | 9.15 | | | $ | 0.15 | | | $ | 1.10 | | | $ | 1.25 | | | $ | (0.14 | ) | | $ | — | | | $ | (0.14 | ) | | $ | — | | | $ | 10.26 | | | | 13.82 | % | | $ | 770.3 | | | | 1.14 | % | | | 0.85 | % | | | 1.54 | % | | | 44 | %g | |
Class A | |
8/31/2017 | | $ | 22.92 | | | $ | 0.15 | | | $ | 3.35 | | | $ | 3.50 | | | $ | (0.04 | ) | | $ | — | | | $ | (0.04 | ) | | $ | — | | | $ | 26.38 | | | | 15.32 | % | | $ | 71.9 | | | | 1.39 | % | | | 1.21 | %§ | | | 0.65 | %f | | | 27 | % | |
8/31/2016 | | $ | 22.00 | | | $ | 0.23 | | | $ | 0.75 | | | $ | 0.98 | | | $ | (0.06 | ) | | $ | — | | | $ | (0.06 | ) | | $ | — | | | $ | 22.92 | | | | 4.48 | % | | $ | 104.9 | | | | 1.40 | % | | | 1.21 | % | | | 1.05 | % | | | 30 | % | |
8/31/2015 | | $ | 23.01 | | | $ | 0.25 | | | $ | (1.15 | ) | | $ | (0.90 | ) | | $ | (0.11 | ) | | $ | — | | | $ | (0.11 | ) | | $ | — | | | $ | 22.00 | | | | (3.90 | )% | | $ | 91.0 | | | | 1.43 | % | | | 1.21 | %§ | | | 1.09 | % | | | 25 | % | |
8/31/2014 | | $ | 20.69 | | | $ | 0.28 | | | $ | 2.19 | | | $ | 2.47 | | | $ | (0.15 | ) | | $ | — | | | $ | (0.15 | ) | | $ | 0.00 | | | $ | 23.01 | | | | 11.98 | %c | | $ | 26.2 | | | | 1.45 | % | | | 1.21 | % | | | 1.23 | % | | | 34 | % | |
Period from 1/28/2013^
to 8/31/2013 | | $ | 20.05 | | | $ | 0.19 | | | $ | 0.45 | | | $ | 0.64 | | | $ | — | | | $ | — | | | $ | — | | | $ | — | | | $ | 20.69 | | | | 3.19 | %* | | $ | 12.8 | | | | 1.55 | %** | | | 1.28 | %** | | | 1.57 | %** | | | 44 | %gd | |
Class C | |
8/31/2017 | | $ | 22.45 | | | $ | 0.01 | | | $ | 3.24 | | | $ | 3.25 | | | $ | — | | | $ | — | | | $ | — | | | $ | — | | | $ | 25.70 | | | | 14.48 | % | | $ | 13.2 | | | | 2.14 | % | | | 1.96 | %§ | | | 0.04 | %f | | | 27 | % | |
8/31/2016 | | $ | 21.65 | | | $ | 0.08 | | | $ | 0.72 | | | $ | 0.80 | | | $ | — | | | $ | — | | | $ | — | | | $ | — | | | $ | 22.45 | | | | 3.70 | % | | $ | 14.7 | | | | 2.16 | % | | | 1.96 | % | | | 0.37 | % | | | 30 | % | |
8/31/2015 | | $ | 22.72 | | | $ | 0.00 | | | $ | (1.05 | ) | | $ | (1.05 | ) | | $ | (0.02 | ) | | $ | — | | | $ | (0.02 | ) | | $ | — | | | $ | 21.65 | | | | (4.61 | )% | | $ | 11.2 | | | | 2.18 | % | | | 1.96 | % | | | 0.02 | % | | | 25 | % | |
8/31/2014 | | $ | 20.50 | | | $ | 0.13 | | | $ | 2.15 | | | $ | 2.28 | | | $ | (0.06 | ) | | $ | — | | | $ | (0.06 | ) | | $ | 0.00 | | | $ | 22.72 | | | | 11.16 | %c | | $ | 6.1 | | | | 2.21 | % | | | 1.96 | % | | | 0.59 | % | | | 34 | % | |
Period from 1/28/2013^
to 8/31/2013 | | $ | 19.97 | | | $ | 0.09 | | | $ | 0.44 | | | $ | 0.53 | | | $ | — | | | $ | — | | | $ | — | | | $ | — | | | $ | 20.50 | | | | 2.65 | %* | | $ | 1.9 | | | | 2.51 | %** | | | 2.08 | %** | | | 0.74 | %** | | | 44 | %gd | |
Class R6 | |
8/31/2017 | | $ | 11.20 | | | $ | 0.15 | | | $ | 1.59 | | | $ | 1.74 | | | $ | (0.16 | ) | | $ | — | | | $ | (0.16 | ) | | $ | — | | | $ | 12.78 | | | | 15.85 | % | | $ | 134.6 | | | | 0.94 | % | | | 0.77 | % | | | 1.31 | %f | | | 27 | % | |
8/31/2016 | | $ | 10.81 | | | $ | 0.16 | | | $ | 0.38 | | | $ | 0.54 | | | $ | (0.15 | ) | | $ | — | | | $ | (0.15 | ) | | $ | — | | | $ | 11.20 | | | | 5.02 | % | | $ | 46.7 | | | | 0.96 | % | | | 0.78 | % | | | 1.49 | % | | | 30 | % | |
8/31/2015 | | $ | 11.42 | | | $ | 0.14 | | | $ | (0.54 | ) | | $ | (0.40 | ) | | $ | (0.21 | ) | | $ | — | | | $ | (0.21 | ) | | $ | — | | | $ | 10.81 | | | | (3.49 | )% | | $ | 32.7 | | | | 0.99 | % | | | 0.77 | %§ | | | 1.24 | % | | | 25 | % | |
Period from 9/3/2013^
to 8/31/2014 | | $ | 10.26 | | | $ | 0.08 | | | $ | 1.19 | | | $ | 1.27 | | | $ | (0.11 | ) | | $ | — | | | $ | (0.11 | ) | | $ | 0.00 | | | $ | 11.42 | | | | 12.46 | %*c | | $ | 21.9 | | | | 1.12 | %** | | | 0.79 | %* | | | 0.73 | %** | | | 34 | %d | |
See Notes to Financial Highlights
227
228
Financial Highlights (cont'd)
| | | Net Asset
Value,
Beginning
of Year | | Net
Investment
Income (Loss)@ | | Net Gains or
Losses on
Securities
(both realized
and
unrealized) | | Total From
Investment
Operations | | Dividends
from Net
Investment
Income | | Distributions
from Net
Realized
Capital Gains | | Total
Distributions | | Voluntary
Contribution
from
Management | | Net Asset
Value, End of
Year | | Total Returnab | | Net Assets,
End of Year
(in millions) | | Ratio of Gross
Expenses to
Average Net
Assets# | | Ratio of Net
Expenses to
Average Net
Assets## | | Ratio of Net
Investment
Income/
(Loss) to
Average Net
Assets | | Portfolio
Turnover
Rate | |
International Select Fund | |
Trust Class | |
8/31/2017 | | $ | 10.88 | | | $ | 0.10 | | | $ | 1.57 | | | $ | 1.67 | | | $ | (0.12 | ) | | $ | — | | | $ | (0.12 | ) | | $ | — | | | $ | 12.43 | | | | 15.57 | % | | $ | 8.2 | | | | 1.34 | % | | | 1.18 | % | | | 0.90 | % | | | 27 | % | |
8/31/2016 | | $ | 10.59 | | | $ | 0.11 | | | $ | 0.27 | | | $ | 0.38 | | | $ | (0.09 | ) | | $ | — | | | $ | (0.09 | ) | | $ | — | | | $ | 10.88 | | | | 3.65 | % | | $ | 7.8 | | | | 1.39 | % | | | 1.25 | % | | | 1.06 | % | | | 22 | % | |
8/31/2015 | | $ | 11.21 | | | $ | 0.09 | | | $ | (0.59 | ) | | $ | (0.50 | ) | | $ | (0.12 | ) | | $ | — | | | $ | (0.12 | ) | | $ | — | | | $ | 10.59 | | | | (4.47 | )% | | $ | 10.2 | | | | 1.33 | % | | | 1.25 | % | | | 0.76 | % | | | 24 | % | |
8/31/2014 | | $ | 10.14 | | | $ | 0.13 | | | $ | 1.04 | | | $ | 1.17 | | | $ | (0.10 | ) | | $ | — | | | $ | (0.10 | ) | | $ | 0.00 | | | $ | 11.21 | | | | 11.56 | %c | | $ | 13.0 | | | | 1.33 | % | | | 1.25 | % | | | 1.19 | % | | | 27 | % | |
8/31/2013 | | $ | 9.14 | | | $ | 0.10 | | | $ | 1.01 | | | $ | 1.11 | | | $ | (0.11 | ) | | $ | — | | | $ | (0.11 | ) | | $ | — | | | $ | 10.14 | | | | 12.17 | % | | $ | 13.9 | | | | 1.37 | % | | | 1.25 | % | | | 1.05 | % | | | 50 | % | |
Institutional Class | |
8/31/2017 | | $ | 10.86 | | | $ | 0.14 | | | $ | 1.58 | | | $ | 1.72 | | | $ | (0.16 | ) | | $ | — | | | $ | (0.16 | ) | | $ | — | | | $ | 12.42 | | | | 16.13 | % | | $ | 214.4 | | | | 0.90 | % | | | 0.83 | % | | | 1.27 | % | | | 27 | % | |
8/31/2016 | | $ | 10.58 | | | $ | 0.16 | | | $ | 0.25 | | | $ | 0.41 | | | $ | (0.13 | ) | | $ | — | | | $ | (0.13 | ) | | $ | — | | | $ | 10.86 | | | | 3.94 | % | | $ | 211.7 | | | | 0.94 | % | | | 0.90 | % | | | 1.51 | % | | | 22 | % | |
8/31/2015 | | $ | 11.21 | | | $ | 0.13 | | | $ | (0.60 | ) | | $ | (0.47 | ) | | $ | (0.16 | ) | | $ | — | | | $ | (0.16 | ) | | $ | — | | | $ | 10.58 | | | | (4.18 | )% | | $ | 216.4 | | | | 0.93 | % | | | 0.90 | % | | | 1.16 | % | | | 24 | % | |
8/31/2014 | | $ | 10.14 | | | $ | 0.18 | | | $ | 1.03 | | | $ | 1.21 | | | $ | (0.14 | ) | | $ | — | | | $ | (0.14 | ) | | $ | 0.00 | | | $ | 11.21 | | | | 11.98 | %c | | $ | 211.6 | | | | 0.93 | % | | | 0.90 | % | | | 1.58 | % | | | 27 | % | |
8/31/2013 | | $ | 9.14 | | | $ | 0.14 | | | $ | 1.00 | | | $ | 1.14 | | | $ | (0.14 | ) | | $ | — | | | $ | (0.14 | ) | | $ | — | | | $ | 10.14 | | | | 12.56 | % | | $ | 200.6 | | | | 0.97 | % | | | 0.90 | % | | | 1.44 | % | | | 50 | % | |
Class A | |
8/31/2017 | | $ | 10.80 | | | $ | 0.10 | | | $ | 1.56 | | | $ | 1.66 | | | $ | (0.12 | ) | | $ | — | | | $ | (0.12 | ) | | $ | — | | | $ | 12.34 | | | | 15.60 | % | | $ | 4.9 | | | | 1.27 | % | | | 1.19 | % | | | 0.87 | % | | | 27 | % | |
8/31/2016 | | $ | 10.51 | | | $ | 0.13 | | | $ | 0.26 | | | $ | 0.39 | | | $ | (0.10 | ) | | $ | — | | | $ | (0.10 | ) | | $ | — | | | $ | 10.80 | | | | 3.69 | % | | $ | 4.6 | | | | 1.33 | % | | | 1.24 | % | | | 1.25 | % | | | 22 | % | |
8/31/2015 | | $ | 11.14 | | | $ | 0.08 | | | $ | (0.59 | ) | | $ | (0.51 | ) | | $ | (0.12 | ) | | $ | — | | | $ | (0.12 | ) | | $ | — | | | $ | 10.51 | | | | (4.62 | )% | | $ | 3.8 | | | | 1.31 | % | | | 1.24 | % | | | 0.71 | % | | | 24 | % | |
8/31/2014 | | $ | 10.07 | | | $ | 0.14 | | | $ | 1.03 | | | $ | 1.17 | | | $ | (0.10 | ) | | $ | — | | | $ | (0.10 | ) | | $ | 0.00 | | | $ | 11.14 | | | | 11.69 | %c | | $ | 9.3 | | | | 1.30 | % | | | 1.24 | % | | | 1.25 | % | | | 27 | % | |
8/31/2013 | | $ | 9.09 | | | $ | 0.11 | | | $ | 0.98 | | | $ | 1.09 | | | $ | (0.11 | ) | | $ | — | | | $ | (0.11 | ) | | $ | — | | | $ | 10.07 | | | | 12.08 | % | | $ | 9.3 | | | | 1.36 | % | | | 1.24 | % | | | 1.16 | % | | | 50 | % | |
Class C | |
8/31/2017 | | $ | 10.64 | | | $ | 0.02 | | | $ | 1.54 | | | $ | 1.56 | | | $ | (0.04 | ) | | $ | — | | | $ | (0.04 | ) | | $ | — | | | $ | 12.16 | | | | 14.70 | % | | $ | 2.5 | | | | 2.02 | % | | | 1.94 | % | | | 0.16 | % | | | 27 | % | |
8/31/2016 | | $ | 10.36 | | | $ | 0.04 | | | $ | 0.26 | | | $ | 0.30 | | | $ | (0.02 | ) | | $ | — | | | $ | (0.02 | ) | | $ | — | | | $ | 10.64 | | | | 2.89 | % | | $ | 3.2 | | | | 2.06 | % | | | 2.00 | % | | | 0.39 | % | | | 22 | % | |
8/31/2015 | | $ | 10.97 | | | $ | 0.01 | | | $ | (0.58 | ) | | $ | (0.57 | ) | | $ | (0.04 | ) | | $ | — | | | $ | (0.04 | ) | | $ | — | | | $ | 10.36 | | | | (5.23 | )% | | $ | 3.7 | | | | 2.04 | % | | | 2.00 | % | | | 0.06 | % | | | 24 | % | |
8/31/2014 | | $ | 9.93 | | | $ | 0.05 | | | $ | 1.02 | | | $ | 1.07 | | | $ | (0.03 | ) | | $ | — | | | $ | (0.03 | ) | | $ | 0.00 | | | $ | 10.97 | | | | 10.79 | %c | | $ | 4.6 | | | | 2.05 | % | | | 2.00 | % | | | 0.42 | % | | | 27 | % | |
8/31/2013 | | $ | 8.98 | | | $ | 0.04 | | | $ | 0.97 | | | $ | 1.01 | | | $ | (0.06 | ) | | $ | — | | | $ | (0.06 | ) | | $ | — | | | $ | 9.93 | | | | 11.23 | % | | $ | 4.0 | | | | 2.09 | % | | | 2.00 | % | | | 0.36 | % | | | 50 | % | |
Class R3 | |
8/31/2017 | | $ | 10.71 | | | $ | 0.08 | | | $ | 1.53 | | | $ | 1.61 | | | $ | (0.10 | ) | | $ | — | | | $ | (0.10 | ) | | $ | — | | | $ | 12.22 | | | | 15.26 | % | | $ | 5.0 | | | | 1.52 | % | | | 1.44 | % | | | 0.70 | % | | | 27 | % | |
8/31/2016 | | $ | 10.43 | | | $ | 0.10 | | | $ | 0.25 | | | $ | 0.35 | | | $ | (0.07 | ) | | $ | — | | | $ | (0.07 | ) | | $ | — | | | $ | 10.71 | | | | 3.33 | % | | $ | 3.8 | | | | 1.57 | % | | | 1.51 | % | | | 0.95 | % | | | 22 | % | |
8/31/2015 | | $ | 11.05 | | | $ | 0.06 | | | $ | (0.58 | ) | | $ | (0.52 | ) | | $ | (0.10 | ) | | $ | — | | | $ | (0.10 | ) | | $ | — | | | $ | 10.43 | | | | (4.71 | )% | | $ | 3.4 | | | | 1.55 | % | | | 1.51 | % | | | 0.56 | % | | | 24 | % | |
8/31/2014 | | $ | 10.01 | | | $ | 0.11 | | | $ | 1.02 | | | $ | 1.13 | | | $ | (0.09 | ) | | $ | — | | | $ | (0.09 | ) | | $ | 0.00 | | | $ | 11.05 | | | | 11.35 | %c | | $ | 2.2 | | | | 1.55 | % | | | 1.51 | % | | | 1.03 | % | | | 27 | % | |
8/31/2013 | | $ | 9.04 | | | $ | 0.07 | | | $ | 0.99 | | | $ | 1.06 | | | $ | (0.09 | ) | | $ | — | | | $ | (0.09 | ) | | $ | — | | | $ | 10.01 | | | | 11.83 | % | | $ | 2.6 | | | | 1.60 | % | | | 1.51 | % | | | 0.74 | % | | | 50 | % | |
Class R6 | |
Period from 4/17/2017^
to 8/31/2017 | | $ | 11.12 | | | $ | 0.08 | | | $ | 1.22 | | | $ | 1.30 | | | $ | — | | | $ | — | | | $ | — | | | $ | — | | | $ | 12.42 | | | | 11.69 | %* | | $ | 9.6 | | | | 0.79 | %** | | | 0.73 | %** | | | 1.70 | %** | | | 27 | %d | |
See Notes to Financial Highlights
229
230
Financial Highlights (cont'd)
| | | Net Asset
Value,
Beginning
of Year | | Net
Investment
Income (Loss)@ | | Net Gains or
Losses on
Securities
(both realized
and
unrealized) | | Total From
Investment
Operations | | Dividends
from Net
Investment
Income | | Distributions
from Net
Realized
Capital Gains | | Total
Distributions | | Voluntary
Contribution
from
Management | | Net Asset
Value, End of
Year | | Total Returnab | | Net Assets,
End of Year
(in millions) | | Ratio of Gross
Expenses to
Average Net
Assets# | | Ratio of Net
Expenses to
Average Net
Assets## | | Ratio of Net
Investment
Income/
(Loss) to
Average Net
Assets | | Portfolio
Turnover
Rate | |
International Small Cap Fund | |
Institutional Class | |
Period from 12/8/2016^
to 8/31/2017 | | $ | 10.00 | | | $ | 0.08 | | | $ | 2.66 | | | $ | 2.74 | | | $ | — | | | $ | — | | | $ | — | | | $ | — | | | $ | 12.74 | | | | 27.40 | %* | | $ | 0.8 | | | | 29.10 | %**‡ | | | 1.05 | %**‡ | | | 0.93 | %**‡ | | | 43 | %* | |
Class A | |
Period from 12/8/2016^
to 8/31/2017 | | $ | 10.00 | | | $ | 0.11 | | | $ | 2.59 | | | $ | 2.70 | | | $ | — | | | $ | — | | | $ | — | | | $ | — | | | $ | 12.70 | | | | 27.00 | %* | | $ | 0.3 | | | | 29.48 | %**‡ | | | 1.41 | %**‡ | | | 1.21 | %**‡ | | | 43 | %* | |
Class C | |
Period from 12/8/2016^
to 8/31/2017 | | $ | 10.00 | | | $ | (0.02 | ) | | $ | 2.65 | | | $ | 2.63 | | | $ | — | | | $ | — | | | $ | — | | | $ | — | | | $ | 12.63 | | | | 26.30 | %* | | $ | 0.1 | | | | 30.21 | %**‡ | | | 2.16 | %**‡ | | | (0.19 | )%**‡ | | | 43 | %* | |
Class R6 | |
Period from 12/8/2016^
to 8/31/2017 | | $ | 10.00 | | | $ | 0.08 | | | $ | 2.66 | | | $ | 2.74 | | | $ | — | | | $ | — | | | $ | — | | | $ | — | | | $ | 12.74 | | | | 27.40 | %* | | $ | 0.3 | | | | 29.02 | %**‡ | | | 0.98 | %**‡ | | | 0.99 | %**‡ | | | 43 | %* | |
Intrinsic Value Fund | |
Institutional Class | |
8/31/2017 | | $ | 14.02 | | | $ | (0.05 | ) | | $ | 2.36 | | | $ | 2.31 | | | $ | — | | | $ | (0.21 | ) | | $ | (0.21 | ) | | $ | — | | | $ | 16.12 | | | | 16.59 | % | | $ | 841.9 | | | | 1.03 | % | | | 1.00 | % | | | (0.35 | )% | | | 26 | % | |
8/31/2016 | | $ | 14.34 | | | $ | (0.05 | ) | | $ | 0.43 | | | $ | 0.38 | | | $ | — | | | $ | (0.70 | ) | | $ | (0.70 | ) | | $ | — | | | $ | 14.02 | | | | 2.96 | % | | $ | 611.3 | | | | 1.08 | % | | | 1.00 | % | | | (0.38 | )% | | | 17 | % | |
8/31/2015 | | $ | 14.98 | | | $ | (0.06 | ) | | $ | 0.21 | | | $ | 0.15 | | | $ | — | | | $ | (0.79 | ) | | $ | (0.79 | ) | | $ | — | | | $ | 14.34 | | | | 1.36 | % | | $ | 420.3 | | | | 1.10 | % | | | 1.00 | % | | | (0.41 | )% | | | 22 | % | |
8/31/2014 | | $ | 12.81 | | | $ | (0.06 | ) | | $ | 2.80 | | | $ | 2.74 | | | $ | (0.03 | ) | | $ | (0.54 | ) | | $ | (0.57 | ) | | $ | 0.00 | | | $ | 14.98 | | | | 21.74 | %c | | $ | 252.0 | | | | 1.13 | % | | | 1.00 | % | | | (0.40 | )% | | | 24 | % | |
8/31/2013 | | $ | 10.26 | | | $ | 0.05 | | | $ | 2.68 | | | $ | 2.73 | | | $ | — | | | $ | (0.18 | ) | | $ | (0.18 | ) | | $ | — | | | $ | 12.81 | | | | 26.94 | % | | $ | 182.6 | | | | 1.18 | % | | | 1.00 | % | | | 0.42 | % | | | 25 | % | |
Class A | |
8/31/2017 | | $ | 13.68 | | | $ | (0.10 | ) | | $ | 2.30 | | | $ | 2.20 | | | $ | — | | | $ | (0.21 | ) | | $ | (0.21 | ) | | $ | — | | | $ | 15.67 | | | | 16.20 | % | | $ | 18.2 | | | | 1.43 | % | | | 1.36 | % | | | (0.68 | )% | | | 26 | % | |
8/31/2016 | | $ | 14.06 | | | $ | (0.10 | ) | | $ | 0.42 | | | $ | 0.32 | | | $ | — | | | $ | (0.70 | ) | | $ | (0.70 | ) | | $ | — | | | $ | 13.68 | | | | 2.58 | % | | $ | 44.5 | | | | 1.48 | % | | | 1.36 | % | | | (0.72 | )% | | | 17 | % | |
8/31/2015 | | $ | 14.76 | | | $ | (0.11 | ) | | $ | 0.20 | | | $ | 0.09 | | | $ | — | | | $ | (0.79 | ) | | $ | (0.79 | ) | | $ | — | | | $ | 14.06 | | | | 0.96 | % | | $ | 44.3 | | | | 1.50 | % | | | 1.36 | % | | | (0.77 | )% | | | 22 | % | |
8/31/2014 | | $ | 12.65 | | | $ | (0.11 | ) | | $ | 2.76 | | | $ | 2.65 | | | $ | (0.00 | ) | | $ | (0.54 | ) | | $ | (0.54 | ) | | $ | 0.00 | | | $ | 14.76 | | | | 21.31 | %c | | $ | 13.5 | | | | 1.51 | % | | | 1.36 | % | | | (0.77 | )% | | | 24 | % | |
8/31/2013 | | $ | 10.16 | | | $ | 0.00 | | | $ | 2.67 | | | $ | 2.67 | | | $ | — | | | $ | (0.18 | ) | | $ | (0.18 | ) | | $ | — | | | $ | 12.65 | | | | 26.61 | % | | $ | 13.9 | | | | 1.58 | % | | | 1.36 | % | | | 0.01 | % | | | 25 | % | |
Class C | |
8/31/2017 | | $ | 12.99 | | | $ | (0.20 | ) | | $ | 2.18 | | | $ | 1.98 | | | $ | — | | | $ | (0.21 | ) | | $ | (0.21 | ) | | $ | — | | | $ | 14.76 | | | | 15.36 | % | | $ | 22.4 | | | | 2.15 | % | | | 2.11 | % | | | (1.45 | )% | | | 26 | % | |
8/31/2016 | | $ | 13.48 | | | $ | (0.18 | ) | | $ | 0.39 | | | $ | 0.21 | | | $ | — | | | $ | (0.70 | ) | | $ | (0.70 | ) | | $ | — | | | $ | 12.99 | | | | 1.85 | % | | $ | 25.2 | | | | 2.20 | % | | | 2.11 | % | | | (1.47 | )% | | | 17 | % | |
8/31/2015 | | $ | 14.29 | | | $ | (0.21 | ) | | $ | 0.19 | | | $ | (0.02 | ) | | $ | — | �� | | $ | (0.79 | ) | | $ | (0.79 | ) | | $ | — | | | $ | 13.48 | | | | 0.19 | % | | $ | 25.8 | | | | 2.22 | % | | | 2.11 | % | | | (1.52 | )% | | | 22 | % | |
8/31/2014 | | $ | 12.35 | | | $ | (0.21 | ) | | $ | 2.69 | | | $ | 2.48 | | | $ | — | | | $ | (0.54 | ) | | $ | (0.54 | ) | | $ | 0.00 | | | $ | 14.29 | | | | 20.40 | %c | | $ | 12.7 | | | | 2.26 | % | | | 2.11 | % | | | (1.51 | )% | | | 24 | % | |
8/31/2013 | | $ | 10.00 | | | $ | (0.08 | ) | | $ | 2.61 | | | $ | 2.53 | | | $ | — | | | $ | (0.18 | ) | | $ | (0.18 | ) | | $ | — | | | $ | 12.35 | | | | 25.62 | % | | $ | 10.3 | | | | 2.31 | % | | | 2.11 | % | | | (0.70 | )% | | | 25 | % | |
See Notes to Financial Highlights
231
232
Financial Highlights (cont'd)
| | | Net Asset
Value,
Beginning
of Year | | Net
Investment
Income (Loss)@ | | Net Gains or
Losses on
Securities
(both realized
and
unrealized) | | Total From
Investment
Operations | | Dividends
from Net
Investment
Income | | Distributions
from Net
Realized
Capital Gains | | Total
Distributions | | Voluntary
Contribution
from
Management | | Net Asset
Value, End of
Year | | Total Returnab | | Net Assets,
End of Year
(in millions) | | Ratio of Gross
Expenses to
Average Net
Assets# | | Ratio of Net
Expenses to
Average Net
Assets## | | Ratio of Net
Investment
Income/
(Loss) to
Average Net
Assets | | Portfolio
Turnover
Rate | |
Large Cap Value Fund | |
Investor Class | |
8/31/2017 | | $ | 28.25 | | | $ | 0.40 | | | $ | 4.03 | | | $ | 4.43 | | | $ | (0.20 | ) | | $ | (0.87 | ) | | $ | (1.07 | ) | | $ | — | | | $ | 31.61 | | | | 15.88 | %h | | $ | 1,148.5 | | | | 0.87 | % | | | 0.86 | %f | | | 1.31 | %f | | | 74 | % | |
8/31/2016 | | $ | 27.46 | | | $ | 0.31 | | | $ | 2.85 | | | $ | 3.16 | | | $ | (0.31 | ) | | $ | (2.06 | ) | | $ | (2.37 | ) | | $ | — | | | $ | 28.25 | | | | 13.16 | % | | $ | 1,069.8 | | | | 0.90 | % | | | 0.90 | % | | | 1.20 | % | | | 126 | % | |
8/31/2015 | | $ | 33.92 | | | $ | 0.33 | | | $ | (2.51 | ) | | $ | (2.18 | ) | | $ | (0.29 | ) | | $ | (3.99 | ) | | $ | (4.28 | ) | | $ | — | | | $ | 27.46 | | | | (7.19 | )% | | $ | 1,045.6 | | | | 0.86 | % | | | 0.86 | % | | | 1.08 | % | | | 153 | % | |
8/31/2014 | | $ | 32.40 | | | $ | 0.34 | | | $ | 6.62 | | | $ | 6.96 | | | $ | (0.42 | ) | | $ | (5.02 | ) | | $ | (5.44 | ) | | $ | 0.00 | | | $ | 33.92 | | | | 23.57 | %c | | $ | 1,238.3 | | | | 0.85 | % | | | 0.85 | % | | | 1.04 | % | | | 104 | % | |
8/31/2013 | | $ | 26.46 | | | $ | 0.36 | | | $ | 5.94 | | | $ | 6.30 | | | $ | (0.36 | ) | | $ | — | | | $ | (0.36 | ) | | $ | — | | | $ | 32.40 | | | | 24.05 | % | | $ | 1,149.7 | | | | 0.86 | % | | | 0.86 | % | | | 1.19 | % | | | 159 | % | |
Trust Class | |
8/31/2017 | | $ | 18.38 | | | $ | 0.23 | | | $ | 2.61 | | | $ | 2.84 | | | $ | (0.19 | ) | | $ | (0.87 | ) | | $ | (1.06 | ) | | $ | — | | | $ | 20.16 | | | | 15.77 | %h | | $ | 75.0 | | | | 1.05 | % | | | 1.01 | %f | | | 1.16 | %f | | | 74 | % | |
8/31/2016 | | $ | 18.74 | | | $ | 0.18 | | | $ | 1.80 | | | $ | 1.98 | | | $ | (0.28 | ) | | $ | (2.06 | ) | | $ | (2.34 | ) | | $ | — | | | $ | 18.38 | | | | 12.97 | % | | $ | 77.6 | | | | 1.07 | % | | | 1.07 | % | | | 1.03 | % | | | 126 | % | |
8/31/2015 | | $ | 24.54 | | | $ | 0.19 | | | $ | (1.74 | ) | | $ | (1.55 | ) | | $ | (0.26 | ) | | $ | (3.99 | ) | | $ | (4.25 | ) | | $ | — | | | $ | 18.74 | | | | (7.40 | )% | | $ | 108.2 | | | | 1.05 | % | | | 1.05 | % | | | 0.88 | % | | | 153 | % | |
8/31/2014 | | $ | 24.80 | | | $ | 0.20 | | | $ | 4.93 | | | $ | 5.13 | | | $ | (0.37 | ) | | $ | (5.02 | ) | | $ | (5.39 | ) | | $ | 0.00 | | | $ | 24.54 | | | | 23.36 | %c | | $ | 141.1 | | | | 1.05 | % | | | 1.05 | % | | | 0.83 | % | | | 104 | % | |
8/31/2013 | | $ | 20.30 | | | $ | 0.23 | | | $ | 4.54 | | | $ | 4.77 | | | $ | (0.27 | ) | | $ | — | | | $ | (0.27 | ) | | $ | — | | | $ | 24.80 | | | | 23.76 | % | | $ | 156.6 | | | | 1.06 | % | | | 1.06 | % | | | 1.01 | % | | | 159 | % | |
Advisor Class | |
8/31/2017 | | $ | 13.72 | | | $ | 0.14 | | | $ | 1.93 | | | $ | 2.07 | | | $ | (0.19 | ) | | $ | (0.87 | ) | | $ | (1.06 | ) | | $ | — | | | $ | 14.73 | | | | 15.51 | %h | | $ | 144.1 | | | | 1.20 | % | | | 1.19 | %f | | | 0.98 | %f | | | 74 | % | |
8/31/2016 | | $ | 14.63 | | | $ | 0.11 | | | $ | 1.32 | | | $ | 1.43 | | | $ | (0.28 | ) | | $ | (2.06 | ) | | $ | (2.34 | ) | | $ | — | | | $ | 13.72 | | | | 12.81 | % | | $ | 145.9 | | | | 1.22 | % | | | 1.22 | % | | | 0.88 | % | | | 126 | % | |
8/31/2015 | | $ | 20.12 | | | $ | 0.12 | | | $ | (1.37 | ) | | $ | (1.25 | ) | | $ | (0.25 | ) | | $ | (3.99 | ) | | $ | (4.24 | ) | | $ | — | | | $ | 14.63 | | | | (7.55 | )% | | $ | 162.3 | | | | 1.20 | % | | | 1.20 | % | | | 0.73 | % | | | 153 | % | |
8/31/2014 | | $ | 21.23 | | | $ | 0.14 | | | $ | 4.12 | | | $ | 4.26 | | | $ | (0.35 | ) | | $ | (5.02 | ) | | $ | (5.37 | ) | | $ | 0.00 | | | $ | 20.12 | | | | 23.17 | %c | | $ | 216.1 | | | | 1.20 | % | | | 1.20 | % | | | 0.69 | % | | | 104 | % | |
8/31/2013 | | $ | 17.46 | | | $ | 0.17 | | | $ | 3.89 | | | $ | 4.06 | | | $ | (0.29 | ) | | $ | — | | | $ | (0.29 | ) | | $ | — | | | $ | 21.23 | | | | 23.58 | % | | $ | 205.3 | | | | 1.21 | % | | | 1.21 | % | | | 0.86 | % | | | 159 | % | |
Institutional Class | |
8/31/2017 | | $ | 28.47 | | | $ | 0.46 | | | $ | 4.05 | | | $ | 4.51 | | | $ | (0.26 | ) | | $ | (0.87 | ) | | $ | (1.13 | ) | | $ | — | | | $ | 31.85 | | | | 16.04 | %h | | $ | 80.6 | | | | 0.70 | % | | | 0.69 | %f§ | | | 1.50 | %f | | | 74 | % | |
8/31/2016 | | $ | 27.64 | | | $ | 0.36 | | | $ | 2.87 | | | $ | 3.23 | | | $ | (0.34 | ) | | $ | (2.06 | ) | | $ | (2.40 | ) | | $ | — | | | $ | 28.47 | | | | 13.38 | % | | $ | 56.2 | | | | 0.71 | % | | | 0.70 | % | | | 1.38 | % | | | 126 | % | |
8/31/2015 | | $ | 34.11 | | | $ | 0.37 | | | $ | (2.51 | ) | | $ | (2.14 | ) | | $ | (0.34 | ) | | $ | (3.99 | ) | | $ | (4.33 | ) | | $ | — | | | $ | 27.64 | | | | (7.03 | )% | | $ | 86.4 | | | | 0.70 | % | | | 0.70 | %§ | | | 1.19 | % | | | 153 | % | |
8/31/2014 | | $ | 32.56 | | | $ | 0.39 | | | $ | 6.65 | | | $ | 7.04 | | | $ | (0.47 | ) | | $ | (5.02 | ) | | $ | (5.49 | ) | | $ | 0.00 | | | $ | 34.11 | | | | 23.74 | %c | | $ | 143.5 | | | | 0.70 | % | | | 0.70 | %§ | | | 1.18 | % | | | 104 | % | |
8/31/2013 | | $ | 26.59 | | | $ | 0.41 | | | $ | 5.97 | | | $ | 6.38 | | | $ | (0.41 | ) | | $ | — | | | $ | (0.41 | ) | | $ | — | | | $ | 32.56 | | | | 24.26 | % | | $ | 113.2 | | | | 0.70 | % | | | 0.70 | % | | | 1.36 | % | | | 159 | % | |
Class A | |
8/31/2017 | | $ | 18.36 | | | $ | 0.22 | | | $ | 2.60 | | | $ | 2.82 | | | $ | (0.20 | ) | | $ | (0.87 | ) | | $ | (1.07 | ) | | $ | — | | | $ | 20.11 | | | | 15.65 | %h | | $ | 3.8 | | | | 1.07 | % | | | 1.07 | %f | | | 1.11 | %f | | | 74 | % | |
8/31/2016 | | $ | 18.74 | | | $ | 0.17 | | | $ | 1.80 | | | $ | 1.97 | | | $ | (0.29 | ) | | $ | (2.06 | ) | | $ | (2.35 | ) | | $ | — | | | $ | 18.36 | | | | 12.94 | % | | $ | 3.2 | | | | 1.09 | % | | | 1.09 | % | | | 1.02 | % | | | 126 | % | |
8/31/2015 | | $ | 24.55 | | | $ | 0.20 | | | $ | (1.76 | ) | | $ | (1.56 | ) | | $ | (0.26 | ) | | $ | (3.99 | ) | | $ | (4.25 | ) | | $ | — | | | $ | 18.74 | | | | (7.44 | )% | | $ | 2.9 | | | | 1.09 | % | | | 1.09 | % | | | 0.96 | % | | | 153 | % | |
8/31/2014 | | $ | 24.83 | | | $ | 0.19 | | | $ | 4.94 | | | $ | 5.13 | | | $ | (0.39 | ) | | $ | (5.02 | ) | | $ | (5.41 | ) | | $ | 0.00 | | | $ | 24.55 | | | | 23.31 | %c | | $ | 2.7 | | | | 1.08 | % | | | 1.08 | %§ | | | 0.78 | % | | | 104 | % | |
8/31/2013 | | $ | 20.07 | | | $ | 0.22 | | | $ | 4.54 | | | $ | 4.76 | | | $ | — | | | $ | — | | | $ | — | | | $ | — | | | $ | 24.83 | | | | 23.72 | % | | $ | 1.6 | | | | 1.11 | % | | | 1.11 | % | | | 0.97 | % | | | 159 | % | |
See Notes to Financial Highlights
233
234
Financial Highlights (cont'd)
| | | Net Asset
Value,
Beginning
of Year | | Net
Investment
Income (Loss)@ | | Net Gains or
Losses on
Securities
(both realized
and
unrealized) | | Total From
Investment
Operations | | Dividends
from Net
Investment
Income | | Distributions
from Net
Realized
Capital Gains | | Total
Distributions | | Voluntary
Contribution
from
Management | | Net Asset
Value, End of
Year | | Total Returnab | | Net Assets,
End of Year
(in millions) | | Ratio of Gross
Expenses to
Average Net
Assets# | | Ratio of Net
Expenses to
Average Net
Assets## | | Ratio of Net
Investment
Income/
(Loss) to
Average Net
Assets | | Portfolio
Turnover
Rate | |
Large Cap Value Fund (cont'd) | |
Class C | |
8/31/2017 | | $ | 12.99 | | | $ | 0.05 | | | $ | 1.83 | | | $ | 1.88 | | | $ | (0.13 | ) | | $ | (0.87 | ) | | $ | (1.00 | ) | | $ | — | | | $ | 13.87 | | | | 14.84 | %h | | $ | 2.3 | | | | 1.81 | % | | | 1.81 | %f | | | 0.36 | %f | | | 74 | % | |
8/31/2016 | | $ | 13.94 | | | $ | 0.03 | | | $ | 1.24 | | | $ | 1.27 | | | $ | (0.16 | ) | | $ | (2.06 | ) | | $ | (2.22 | ) | | $ | — | | | $ | 12.99 | | | | 12.09 | % | | $ | 2.1 | | | | 1.83 | % | | | 1.83 | % | | | 0.26 | % | | | 126 | % | |
8/31/2015 | | $ | 19.40 | | | $ | 0.02 | | | $ | (1.32 | ) | | $ | (1.30 | ) | | $ | (0.17 | ) | | $ | (3.99 | ) | | $ | (4.16 | ) | | $ | — | | | $ | 13.94 | | | | (8.11 | )% | | $ | 2.7 | | | | 1.82 | % | | | 1.82 | %§ | | | 0.11 | % | | | 153 | % | |
8/31/2014 | | $ | 20.73 | | | $ | 0.00 | | | $ | 4.01 | | | $ | 4.01 | | | $ | (0.32 | ) | | $ | (5.02 | ) | | $ | (5.34 | ) | | $ | 0.00 | | | $ | 19.40 | | | | 22.37 | %c | | $ | 3.0 | | | | 1.86 | % | | | 1.86 | %§ | | | 0.03 | % | | | 104 | % | |
8/31/2013 | | $ | 17.19 | | | $ | 0.02 | | | $ | 3.85 | | | $ | 3.87 | | | $ | (0.33 | ) | | $ | — | | | $ | (0.33 | ) | | $ | — | | | $ | 20.73 | | | | 22.87 | % | | $ | 1.2 | | | | 1.86 | % | | | 1.86 | %§ | | | 0.10 | % | | | 159 | % | |
Class R3 | |
8/31/2017 | | $ | 13.93 | | | $ | 0.13 | | | $ | 1.95 | | | $ | 2.08 | | | $ | (0.18 | ) | | $ | (0.87 | ) | | $ | (1.05 | ) | | $ | — | | | $ | 14.96 | | | | 15.27 | %h | | $ | 0.2 | | | | 1.43 | % | | | 1.36 | %f | | | 0.90 | %f | | | 74 | % | |
8/31/2016 | | $ | 14.82 | | | $ | 0.10 | | | $ | 1.33 | | | $ | 1.43 | | | $ | (0.26 | ) | | $ | (2.06 | ) | | $ | (2.32 | ) | | $ | — | | | $ | 13.93 | | | | 12.58 | % | | $ | 0.1 | | | | 1.54 | % | | | 1.36 | % | | | 0.75 | % | | | 126 | % | |
8/31/2015 | | $ | 20.32 | | | $ | 0.09 | | | $ | (1.38 | ) | | $ | (1.29 | ) | | $ | (0.22 | ) | | $ | (3.99 | ) | | $ | (4.21 | ) | | $ | — | | | $ | 14.82 | | | | (7.64 | )% | | $ | 0.1 | | | | 1.51 | % | | | 1.36 | % | | | 0.53 | % | | | 153 | % | |
8/31/2014 | | $ | 21.41 | | | $ | 0.11 | | | $ | 4.16 | | | $ | 4.27 | | | $ | (0.34 | ) | | $ | (5.02 | ) | | $ | (5.36 | ) | | $ | 0.00 | | | $ | 20.32 | | | | 22.94 | %c | | $ | 0.1 | | | | 1.43 | % | | | 1.36 | % | | | 0.53 | % | | | 104 | % | |
8/31/2013 | | $ | 17.34 | | | $ | 0.09 | | | $ | 3.98 | | | $ | 4.07 | | | $ | — | | | $ | — | | | $ | — | | | $ | — | | | $ | 21.41 | | | | 23.47 | % | | $ | 0.1 | | | | 1.42 | % | | | 1.36 | % | | | 0.46 | % | | | 159 | % | |
Mid Cap Growth Fund | |
Investor Class | |
8/31/2017 | | $ | 12.88 | | | $ | (0.04 | ) | | $ | 1.99 | | | $ | 1.95 | | | $ | — | | | $ | (0.62 | ) | | $ | (0.62 | ) | | $ | — | | | $ | 14.21 | | | | 15.80 | %h | | $ | 445.9 | | | | 0.93 | % | | | 0.91 | %f | | | (0.28 | )%f | | | 47 | % | |
8/31/2016 | | $ | 14.29 | | | $ | (0.04 | ) | | $ | (0.26 | ) | | $ | (0.30 | ) | | $ | — | | | $ | (1.12 | ) | | $ | (1.12 | ) | | $ | 0.01 | | | $ | 12.88 | | | | (1.70 | )%e | | $ | 415.1 | | | | 0.95 | % | | | 0.95 | % | | | (0.34 | )% | | | 63 | % | |
8/31/2015 | | $ | 14.65 | | | $ | (0.07 | ) | | $ | 1.47 | | | $ | 1.40 | | | $ | — | | | $ | (1.76 | ) | | $ | (1.76 | ) | | $ | — | | | $ | 14.29 | | | | 10.74 | % | | $ | 437.5 | | | | 0.92 | % | | | 0.92 | % | | | (0.50 | )% | | | 50 | % | |
8/31/2014 | | $ | 13.35 | | | $ | (0.07 | ) | | $ | 2.34 | | | $ | 2.27 | | | $ | — | | | $ | (0.97 | ) | | $ | (0.97 | ) | | $ | 0.00 | | | $ | 14.65 | | | | 17.54 | %c | | $ | 415.6 | | | | 0.93 | % | | | 0.93 | % | | | (0.47 | )% | | | 63 | % | |
8/31/2013 | | $ | 11.98 | | | $ | (0.04 | ) | | $ | 2.08 | | | $ | 2.04 | | | $ | — | | | $ | (0.67 | ) | | $ | (0.67 | ) | | $ | — | | | $ | 13.35 | | | | 18.03 | % | | $ | 377.8 | | | | 0.98 | % | | | 0.98 | % | | | (0.30 | )% | | | 46 | % | |
Trust Class | |
8/31/2017 | | $ | 22.31 | | | $ | (0.08 | ) | | $ | 3.51 | | | $ | 3.43 | | | $ | — | | | $ | (0.62 | ) | | $ | (0.62 | ) | | $ | — | | | $ | 25.12 | | | | 15.75 | %h | | $ | 52.0 | | | | 0.97 | % | | | 0.97 | %f | | | (0.34 | )%f | | | 47 | % | |
8/31/2016 | | $ | 23.90 | | | $ | (0.08 | ) | | $ | (0.42 | ) | | $ | (0.50 | ) | | $ | — | | | $ | (1.12 | ) | | $ | (1.12 | ) | | $ | 0.03 | | | $ | 22.31 | | | | (1.77 | )%e | | $ | 66.7 | | | | 0.98 | % | | | 0.98 | % | | | (0.37 | )% | | | 63 | % | |
8/31/2015 | | $ | 23.33 | | | $ | (0.14 | ) | | $ | 2.47 | | | $ | 2.33 | | | $ | — | | | $ | (1.76 | ) | | $ | (1.76 | ) | | $ | — | | | $ | 23.90 | | | | 10.73 | % | | $ | 91.7 | | | | 0.99 | % | | | 0.99 | % | | | (0.58 | )% | | | 50 | % | |
8/31/2014 | | $ | 20.75 | | | $ | (0.12 | ) | | $ | 3.66 | | | $ | 3.54 | | | $ | — | | | $ | (0.96 | ) | | $ | (0.96 | ) | | $ | 0.00 | | | $ | 23.33 | | | | 17.40 | %c | | $ | 69.6 | | | | 1.00 | % | | | 1.00 | % | | | (0.54 | )% | | | 63 | % | |
8/31/2013 | | $ | 18.23 | | | $ | (0.07 | ) | | $ | 3.24 | | | $ | 3.17 | | | $ | — | | | $ | (0.65 | ) | | $ | (0.65 | ) | | $ | — | | | $ | 20.75 | | | | 18.02 | % | | $ | 54.9 | | | | 1.04 | % | | | 1.04 | % | | | (0.38 | )% | | | 46 | % | |
Advisor Class | |
8/31/2017 | | $ | 22.65 | | | $ | (0.14 | ) | | $ | 3.56 | | | $ | 3.42 | | | $ | — | | | $ | (0.62 | ) | | $ | (0.62 | ) | | $ | — | | | $ | 25.45 | | | | 15.47 | %h | | $ | 12.4 | | | | 1.23 | % | | | 1.23 | %f | | | (0.60 | )%f | | | 47 | % | |
8/31/2016 | | $ | 24.31 | | | $ | (0.14 | ) | | $ | (0.42 | ) | | $ | (0.56 | ) | | $ | — | | | $ | (1.12 | ) | | $ | (1.12 | ) | | $ | 0.02 | | | $ | 22.65 | | | | (2.04 | )%e | | $ | 11.5 | | | | 1.24 | % | | | 1.24 | % | | | (0.63 | )% | | | 63 | % | |
8/31/2015 | | $ | 23.77 | | | $ | (0.20 | ) | | $ | 2.50 | | | $ | 2.30 | | | $ | — | | | $ | (1.76 | ) | | $ | (1.76 | ) | | $ | — | | | $ | 24.31 | | | | 10.39 | % | | $ | 10.7 | | | | 1.25 | % | | | 1.25 | % | | | (0.84 | )% | | | 50 | % | |
8/31/2014 | | $ | 21.13 | | | $ | (0.18 | ) | | $ | 3.74 | | | $ | 3.56 | | | $ | — | | | $ | (0.92 | ) | | $ | (0.92 | ) | | $ | 0.00 | | | $ | 23.77 | | | | 17.16 | %c | | $ | 10.3 | | | | 1.26 | % | | | 1.26 | % | | | (0.81 | )% | | | 63 | % | |
8/31/2013 | | $ | 18.54 | | | $ | (0.12 | ) | | $ | 3.29 | | | $ | 3.17 | | | $ | — | | | $ | (0.58 | ) | | $ | (0.58 | ) | | $ | — | | | $ | 21.13 | | | | 17.64 | % | | $ | 11.7 | | | | 1.30 | % | | | 1.30 | % | | | (0.62 | )% | | | 46 | % | |
See Notes to Financial Highlights
235
236
Financial Highlights (cont'd)
| | | Net Asset
Value,
Beginning
of Year | | Net
Investment
Income (Loss)@ | | Net Gains or
Losses on
Securities
(both realized
and
unrealized) | | Total From
Investment
Operations | | Dividends
from Net
Investment
Income | | Distributions
from Net
Realized
Capital Gains | | Total
Distributions | | Voluntary
Contribution
from
Management | | Net Asset
Value, End of
Year | | Total Returnab | | Net Assets,
End of Year
(in millions) | | Ratio of Gross
Expenses to
Average Net
Assets# | | Ratio of Net
Expenses to
Average Net
Assets## | | Ratio of Net
Investment
Income/
(Loss) to
Average Net
Assets | | Portfolio
Turnover
Rate | |
Mid Cap Growth Fund (cont'd) | |
Institutional Class | |
8/31/2017 | | $ | 13.20 | | | $ | (0.01 | ) | | $ | 2.04 | | | $ | 2.03 | | | $ | — | | | $ | (0.62 | ) | | $ | (0.62 | ) | | $ | — | | | $ | 14.61 | | | | 16.03 | %h | | $ | 321.5 | | | | 0.72 | % | | | 0.72 | %f | | | (0.09 | )%f | | | 47 | % | |
8/31/2016 | | $ | 14.59 | | | $ | (0.02 | ) | | $ | (0.27 | ) | | $ | (0.29 | ) | | $ | — | | | $ | (1.12 | ) | | $ | (1.12 | ) | | $ | 0.02 | | | $ | 13.20 | | | | (1.52 | )%e | | $ | 307.6 | | | | 0.75 | % | | | 0.75 | %§ | | | (0.14 | )% | | | 63 | % | |
8/31/2015 | | $ | 14.89 | | | $ | (0.05 | ) | | $ | 1.51 | | | $ | 1.46 | | | $ | — | | | $ | (1.76 | ) | | $ | (1.76 | ) | | $ | — | | | $ | 14.59 | | | | 10.98 | % | | $ | 423.3 | | | | 0.75 | % | | | 0.75 | %§ | | | (0.34 | )% | | | 50 | % | |
8/31/2014 | | $ | 13.56 | | | $ | (0.04 | ) | | $ | 2.37 | | | $ | 2.33 | | | $ | — | | | $ | (1.00 | ) | | $ | (1.00 | ) | | $ | 0.00 | | | $ | 14.89 | | | | 17.74 | %c | | $ | 382.5 | | | | 0.75 | % | | | 0.75 | % | | | (0.29 | )% | | | 63 | % | |
8/31/2013 | | $ | 12.16 | | | $ | (0.01 | ) | | $ | 2.11 | | | $ | 2.10 | | | $ | — | | | $ | (0.70 | ) | | $ | (0.70 | ) | | $ | — | | | $ | 13.56 | | | | 18.32 | % | | $ | 258.6 | | | | 0.79 | % | | | 0.75 | % | | | (0.07 | )% | | | 46 | % | |
Class A | |
8/31/2017 | | $ | 22.23 | | | $ | (0.11 | ) | | $ | 3.49 | | | $ | 3.38 | | | $ | — | | | $ | (0.62 | ) | | $ | (0.62 | ) | | $ | — | | | $ | 24.99 | | | | 15.58 | %h | | $ | 54.4 | | | | 1.11 | % | | | 1.11 | %f§ | | | (0.49 | )%f | | | 47 | % | |
8/31/2016 | | $ | 23.85 | | | $ | (0.11 | ) | | $ | (0.42 | ) | | $ | (0.53 | ) | | $ | — | | | $ | (1.12 | ) | | $ | (1.12 | ) | | $ | 0.03 | | | $ | 22.23 | | | | (1.91 | )%e | | $ | 76.9 | | | | 1.11 | % | | | 1.11 | %§ | | | (0.51 | )% | | | 63 | % | |
8/31/2015 | | $ | 23.32 | | | $ | (0.16 | ) | | $ | 2.45 | | | $ | 2.29 | | | $ | — | | | $ | (1.76 | ) | | $ | (1.76 | ) | | $ | — | | | $ | 23.85 | | | | 10.55 | % | | $ | 102.3 | | | | 1.11 | % | | | 1.11 | %§ | | | (0.69 | )% | | | 50 | % | |
8/31/2014 | | $ | 20.74 | | | $ | (0.15 | ) | | $ | 3.67 | | | $ | 3.52 | | | $ | — | | | $ | (0.94 | ) | | $ | (0.94 | ) | | $ | 0.00 | | | $ | 23.32 | | | | 17.33 | %c | | $ | 100.7 | | | | 1.13 | % | | | 1.11 | % | | | (0.65 | )% | | | 63 | % | |
8/31/2013 | | $ | 18.23 | | | $ | (0.08 | ) | | $ | 3.23 | | | $ | 3.15 | | | $ | — | | | $ | (0.64 | ) | | $ | (0.64 | ) | | $ | — | | | $ | 20.74 | | | | 17.91 | % | | $ | 89.0 | | | | 1.18 | % | | | 1.11 | % | | | (0.44 | )% | | | 46 | % | |
Class C | |
8/31/2017 | | $ | 21.92 | | | $ | (0.28 | ) | | $ | 3.42 | | | $ | 3.14 | | | $ | — | | | $ | (0.62 | ) | | $ | (0.62 | ) | | $ | — | | | $ | 24.44 | | | | 14.69 | % | | $ | 9.7 | | | | 1.86 | % | | | 1.86 | %§ | | | (1.24 | )% | | | 47 | % | |
8/31/2016 | | $ | 23.70 | | | $ | (0.26 | ) | | $ | (0.41 | ) | | $ | (0.67 | ) | | $ | — | | | $ | (1.12 | ) | | $ | (1.12 | ) | | $ | 0.01 | | | $ | 21.92 | | | | (2.62 | )%e | | $ | 10.9 | | | | 1.88 | % | | | 1.86 | % | | | (1.24 | )% | | | 63 | % | |
8/31/2015 | | $ | 23.35 | | | $ | (0.34 | ) | | $ | 2.45 | | | $ | 2.11 | | | $ | — | | | $ | (1.76 | ) | | $ | (1.76 | ) | | $ | — | | | $ | 23.70 | | | | 9.72 | % | | $ | 8.4 | | | | 1.88 | % | | | 1.86 | % | | | (1.45 | )% | | | 50 | % | |
8/31/2014 | | $ | 20.81 | | | $ | (0.31 | ) | | $ | 3.68 | | | $ | 3.37 | | | $ | — | | | $ | (0.83 | ) | | $ | (0.83 | ) | | $ | 0.00 | | | $ | 23.35 | | | | 16.46 | %c | | $ | 6.0 | | | | 1.91 | % | | | 1.86 | % | | | (1.40 | )% | | | 63 | % | |
8/31/2013 | | $ | 18.31 | | | $ | (0.23 | ) | | $ | 3.26 | | | $ | 3.03 | | | $ | — | | | $ | (0.53 | ) | | $ | (0.53 | ) | | $ | — | | | $ | 20.81 | | | | 17.05 | % | | $ | 4.4 | | | | 1.95 | % | | | 1.86 | % | | | (1.20 | )% | | | 46 | % | |
Class R3 | |
8/31/2017 | | $ | 22.63 | | | $ | (0.17 | ) | | $ | 3.55 | | | $ | 3.38 | | | $ | — | | | $ | (0.62 | ) | | $ | (0.62 | ) | | $ | — | | | $ | 25.39 | | | | 15.30 | % | | $ | 13.2 | | | | 1.36 | % | | | 1.36 | % | | | (0.73 | )% | | | 47 | % | |
8/31/2016 | | $ | 24.31 | | | $ | (0.16 | ) | | $ | (0.42 | ) | | $ | (0.58 | ) | | $ | — | | | $ | (1.12 | ) | | $ | (1.12 | ) | | $ | 0.02 | | | $ | 22.63 | | | | (2.12 | )%e | | $ | 13.7 | | | | 1.38 | % | | | 1.36 | % | | | (0.74 | )% | | | 63 | % | |
8/31/2015 | | $ | 23.79 | | | $ | (0.23 | ) | | $ | 2.51 | | | $ | 2.28 | | | $ | — | | | $ | (1.76 | ) | | $ | (1.76 | ) | | $ | — | | | $ | 24.31 | | | | 10.29 | % | | $ | 12.7 | | | | 1.37 | % | | | 1.36 | % | | | (0.95 | )% | | | 50 | % | |
8/31/2014 | | $ | 21.16 | | | $ | (0.21 | ) | | $ | 3.75 | | | $ | 3.54 | | | $ | — | | | $ | (0.91 | ) | | $ | (0.91 | ) | | $ | 0.00 | | | $ | 23.79 | | | | 17.02 | %c | | $ | 8.3 | | | | 1.38 | % | | | 1.36 | % | | | (0.90 | )% | | | 63 | % | |
8/31/2013 | | $ | 18.61 | | | $ | (0.13 | ) | | $ | 3.30 | | | $ | 3.17 | | | $ | — | | | $ | (0.62 | ) | | $ | (0.62 | ) | | $ | — | | | $ | 21.16 | | | | 17.63 | % | | $ | 5.6 | | | | 1.43 | % | | | 1.36 | % | | | (0.68 | )% | | | 46 | % | |
Class R6 | |
8/31/2017 | | $ | 13.24 | | | $ | (0.00 | ) | | $ | 2.05 | | | $ | 2.05 | | | $ | — | | | $ | (0.62 | ) | | $ | (0.62 | ) | | $ | — | | | $ | 14.67 | | | | 16.13 | %h | | $ | 262.4 | | | | 0.65 | % | | | 0.65 | %f | | | (0.02 | )%f | | | 47 | % | |
8/31/2016 | | $ | 14.62 | | | $ | (0.00 | ) | | $ | (0.27 | ) | | $ | (0.27 | ) | | $ | — | | | $ | (1.12 | ) | | $ | (1.12 | ) | | $ | 0.01 | | | $ | 13.24 | | | | (1.44 | )%e | | $ | 193.7 | | | | 0.66 | % | | | 0.66 | % | | | (0.02 | )% | | | 63 | % | |
8/31/2015 | | $ | 14.91 | | | $ | (0.04 | ) | | $ | 1.51 | | | $ | 1.47 | | | $ | — | | | $ | (1.76 | ) | | $ | (1.76 | ) | | $ | — | | | $ | 14.62 | | | | 11.04 | % | | $ | 88.6 | | | | 0.67 | % | | | 0.67 | %§ | | | (0.26 | )% | | | 50 | % | |
8/31/2014 | | $ | 13.57 | | | $ | (0.03 | ) | | $ | 2.38 | | | $ | 2.35 | | | $ | — | | | $ | (1.01 | ) | | $ | (1.01 | ) | | $ | 0.00 | | | $ | 14.91 | | | | 17.89 | %c | | $ | 22.5 | | | | 0.68 | % | | | 0.68 | % | | | (0.21 | )% | | | 63 | % | |
Period from 3/15/2013^
to 8/31/2013 | | $ | 12.77 | | | $ | (0.01 | ) | | $ | 0.81 | | | $ | 0.80 | | | $ | — | | | $ | — | | | $ | — | | | $ | — | | | $ | 13.57 | | | | 6.26 | %* | | $ | 0.1 | | | | 7.22 | %** | | | 0.68 | %** | | | (0.13 | )%** | | | 46 | %d | |
See Notes to Financial Highlights
237
238
Financial Highlights (cont'd)
| | | Net Asset
Value,
Beginning
of Year | | Net
Investment
Income (Loss)@ | | Net Gains or
Losses on
Securities
(both realized
and
unrealized) | | Total From
Investment
Operations | | Dividends
from Net
Investment
Income | | Distributions
from Net
Realized
Capital Gains | | Total
Distributions | | Voluntary
Contribution
from
Management | | Net Asset
Value, End of
Year | | Total Returnab | | Net Assets,
End of Year
(in millions) | | Ratio of Gross
Expenses to
Average Net
Assets# | | Ratio of Net
Expenses to
Average Net
Assets## | | Ratio of Net
Investment
Income/
(Loss) to
Average Net
Assets | | Portfolio
Turnover
Rate | |
Mid Cap Intrinsic Value Fund | |
Investor Class | |
8/31/2017 | | $ | 19.71 | | | $ | 0.23 | | | $ | 3.15 | | | $ | 3.38 | | | $ | (0.11 | ) | | $ | — | | | $ | (0.11 | ) | | $ | — | | | $ | 22.98 | | | | 17.19 | %h | | $ | 40.3 | | | | 1.25 | % | | | 1.01 | %f | | | 1.06 | %f | | | 31 | % | |
8/31/2016 | | $ | 20.99 | | | $ | 0.16 | | | $ | 0.79 | | | $ | 0.95 | | | $ | (0.10 | ) | | $ | (2.13 | ) | | $ | (2.23 | ) | | $ | — | | | $ | 19.71 | | | | 5.85 | % | | $ | 37.9 | | | | 1.30 | % | | | 1.15 | % | | | 0.86 | % | | | 29 | % | |
8/31/2015 | | $ | 23.56 | | | $ | 0.08 | | | $ | (0.36 | ) | | $ | (0.28 | ) | | $ | (0.21 | ) | | $ | (2.08 | ) | | $ | (2.29 | ) | | $ | — | | | $ | 20.99 | | | | (1.09 | )% | | $ | 42.1 | | | | 1.24 | % | | | 1.05 | % | | | 0.37 | % | | | 50 | % | |
8/31/2014 | | $ | 20.29 | | | $ | 0.26 | | | $ | 4.20 | | | $ | 4.46 | | | $ | (0.32 | ) | | $ | (0.87 | ) | | $ | (1.19 | ) | | $ | 0.00 | | | $ | 23.56 | | | | 22.84 | %c | | $ | 43.4 | | | | 1.31 | % | | | 0.98 | % | | | 1.21 | % | | | 34 | % | |
8/31/2013 | | $ | 15.90 | | | $ | 0.26 | | | $ | 4.25 | | | $ | 4.51 | | | $ | (0.12 | ) | | $ | — | | | $ | (0.12 | ) | | $ | — | | | $ | 20.29 | | | | 28.58 | % | | $ | 45.9 | | | | 1.40 | % | | | 1.09 | % | | | 1.45 | % | | | 33 | % | |
Trust Class | |
8/31/2017 | | $ | 16.24 | | | $ | 0.15 | | | $ | 2.58 | | | $ | 2.73 | | | $ | (0.11 | ) | | $ | — | | | $ | (0.11 | ) | | $ | — | | | $ | 18.86 | | | | 16.85 | %h | | $ | 10.9 | | | | 1.43 | % | | | 1.25 | %f§ | | | 0.82 | %f | | | 31 | % | |
8/31/2016 | | $ | 17.71 | | | $ | 0.12 | | | $ | 0.64 | | | $ | 0.76 | | | $ | (0.10 | ) | | $ | (2.13 | ) | | $ | (2.23 | ) | | $ | — | | | $ | 16.24 | | | | 5.80 | % | | $ | 10.3 | | | | 1.48 | % | | | 1.25 | % | | | 0.77 | % | | | 29 | % | |
8/31/2015 | | $ | 20.24 | | | $ | 0.03 | | | $ | (0.32 | ) | | $ | (0.29 | ) | | $ | (0.16 | ) | | $ | (2.08 | ) | | $ | (2.24 | ) | | $ | — | | | $ | 17.71 | | | | (1.31 | )% | | $ | 11.9 | | | | 1.48 | % | | | 1.25 | % | | | 0.17 | % | | | 50 | % | |
8/31/2014 | | $ | 17.61 | | | $ | 0.18 | | | $ | 3.61 | | | $ | 3.79 | | | $ | (0.29 | ) | | $ | (0.87 | ) | | $ | (1.16 | ) | | $ | 0.00 | | | $ | 20.24 | | | | 22.47 | %c | | $ | 14.4 | | | | 1.57 | % | | | 1.25 | %§ | | | 0.97 | % | | | 34 | % | |
8/31/2013 | | $ | 13.82 | | | $ | 0.20 | | | $ | 3.70 | | | $ | 3.90 | | | $ | (0.11 | ) | | $ | — | | | $ | (0.11 | ) | | $ | — | | | $ | 17.61 | | | | 28.45 | % | | $ | 13.0 | | | | 1.66 | % | | | 1.25 | % | | | 1.26 | % | | | 33 | % | |
Institutional Class | |
8/31/2017 | | $ | 19.75 | | | $ | 0.26 | | | $ | 3.16 | | | $ | 3.42 | | | $ | (0.17 | ) | | $ | — | | | $ | (0.17 | ) | | $ | — | | | $ | 23.00 | | | | 17.40 | %h | | $ | 29.1 | | | | 1.05 | % | | | 0.85 | %f | | | 1.19 | %f | | | 31 | % | |
8/31/2016 | | $ | 21.02 | | | $ | 0.22 | | | $ | 0.79 | | | $ | 1.01 | | | $ | (0.15 | ) | | $ | (2.13 | ) | | $ | (2.28 | ) | | $ | — | | | $ | 19.75 | | | | 6.18 | % | | $ | 22.7 | | | | 1.09 | % | | | 0.85 | % | | | 1.18 | % | | | 29 | % | |
8/31/2015 | | $ | 23.59 | | | $ | 0.13 | | | $ | (0.37 | ) | | $ | (0.24 | ) | | $ | (0.25 | ) | | $ | (2.08 | ) | | $ | (2.33 | ) | | $ | — | | | $ | 21.02 | | | | (0.90 | )% | | $ | 34.0 | | | | 1.07 | % | | | 0.85 | % | | | 0.59 | % | | | 50 | % | |
8/31/2014 | | $ | 20.33 | | | $ | 0.33 | | | $ | 4.17 | | | $ | 4.50 | | | $ | (0.37 | ) | | $ | (0.87 | ) | | $ | (1.24 | ) | | $ | 0.00 | | | $ | 23.59 | | | | 22.99 | %c | | $ | 18.0 | | | | 1.17 | % | | | 0.85 | %§ | | | 1.48 | % | | | 34 | % | |
8/31/2013 | | $ | 15.93 | | | $ | 0.31 | | | $ | 4.26 | | | $ | 4.57 | | | $ | (0.17 | ) | | $ | — | | | $ | (0.17 | ) | | $ | — | | | $ | 20.33 | | | | 28.96 | % | | $ | 4.6 | | | | 1.23 | % | | | 0.85 | % | | | 1.73 | % | | | 33 | % | |
Class A | |
8/31/2017 | | $ | 16.21 | | | $ | 0.16 | | | $ | 2.58 | | | $ | 2.74 | | | $ | (0.11 | ) | | $ | — | | | $ | (0.11 | ) | | $ | — | | | $ | 18.84 | | | | 16.95 | %h | | $ | 8.6 | | | | 1.43 | % | | | 1.21 | %f | | | 0.89 | %f | | | 31 | % | |
8/31/2016 | | $ | 17.70 | | | $ | 0.13 | | | $ | 0.62 | | | $ | 0.75 | | | $ | (0.11 | ) | | $ | (2.13 | ) | | $ | (2.24 | ) | | $ | — | | | $ | 16.21 | | | | 5.76 | % | | $ | 13.3 | | | | 1.49 | % | | | 1.21 | % | | | 0.81 | % | | | 29 | % | |
8/31/2015 | | $ | 20.24 | | | $ | 0.04 | | | $ | (0.32 | ) | | $ | (0.28 | ) | | $ | (0.18 | ) | | $ | (2.08 | ) | | $ | (2.26 | ) | | $ | — | | | $ | 17.70 | | | | (1.25 | )% | | $ | 14.8 | | | | 1.47 | % | | | 1.21 | % | | | 0.20 | % | | | 50 | % | |
8/31/2014 | | $ | 17.60 | | | $ | 0.18 | | | $ | 3.63 | | | $ | 3.81 | | | $ | (0.30 | ) | | $ | (0.87 | ) | | $ | (1.17 | ) | | $ | 0.00 | | | $ | 20.24 | | | | 22.60 | %c | | $ | 5.2 | | | | 1.53 | % | | | 1.21 | %§ | | | 0.96 | % | | | 34 | % | |
8/31/2013 | | $ | 13.82 | | | $ | 0.23 | | | $ | 3.67 | | | $ | 3.90 | | | $ | (0.12 | ) | | $ | — | | | $ | (0.12 | ) | | $ | — | | | $ | 17.60 | | | | 28.43 | % | | $ | 2.7 | | | | 1.65 | % | | | 1.21 | % | | | 1.45 | % | | | 33 | % | |
Class C | |
8/31/2017 | | $ | 15.88 | | | $ | 0.03 | | | $ | 2.52 | | | $ | 2.55 | | | $ | (0.06 | ) | | $ | — | | | $ | (0.06 | ) | | $ | — | | | $ | 18.37 | | | | 16.09 | %h | | $ | 2.5 | | | | 2.18 | % | | | 1.96 | %f | | | 0.15 | %f | | | 31 | % | |
8/31/2016 | | $ | 17.45 | | | $ | 0.01 | | | $ | 0.61 | | | $ | 0.62 | | | $ | (0.06 | ) | | $ | (2.13 | ) | | $ | (2.19 | ) | | $ | — | | | $ | 15.88 | | | | 5.01 | % | | $ | 3.7 | | | | 2.23 | % | | | 1.96 | % | | | 0.05 | % | | | 29 | % | |
8/31/2015 | | $ | 20.00 | | | $ | (0.10 | ) | | $ | (0.31 | ) | | $ | (0.41 | ) | | $ | (0.06 | ) | | $ | (2.08 | ) | | $ | (2.14 | ) | | $ | — | | | $ | 17.45 | | | | (2.02 | )% | | $ | 3.5 | | | | 2.20 | % | | | 1.96 | % | | | (0.53 | )% | | | 50 | % | |
8/31/2014 | | $ | 17.44 | | | $ | 0.05 | | | $ | 3.58 | | | $ | 3.63 | | | $ | (0.20 | ) | | $ | (0.87 | ) | | $ | (1.07 | ) | | $ | 0.00 | | | $ | 20.00 | | | | 21.64 | %c | | $ | 1.9 | | | | 2.28 | % | | | 1.96 | %§ | | | 0.24 | % | | | 34 | % | |
8/31/2013 | | $ | 13.69 | | | $ | 0.09 | | | $ | 3.67 | | | $ | 3.76 | | | $ | (0.01 | ) | | $ | — | | | $ | (0.01 | ) | | $ | — | | | $ | 17.44 | | | | 27.51 | % | | $ | 1.3 | | | | 2.35 | % | | | 1.96 | % | | | 0.54 | % | | | 33 | % | |
See Notes to Financial Highlights
239
240
Financial Highlights (cont'd)
| | | Net Asset
Value,
Beginning
of Year | | Net
Investment
Income (Loss)@ | | Net Gains or
Losses on
Securities
(both realized
and
unrealized) | | Total From
Investment
Operations | | Dividends
from Net
Investment
Income | | Distributions
from Net
Realized
Capital Gains | | Total
Distributions | | Voluntary
Contribution
from
Management | | Net Asset
Value, End of
Year | | Total Returnab | | Net Assets,
End of Year
(in millions) | | Ratio of Gross
Expenses to
Average Net
Assets# | | Ratio of Net
Expenses to
Average Net
Assets## | | Ratio of Net
Investment
Income/
(Loss) to
Average Net
Assets | | Portfolio
Turnover
Rate | |
Mid Cap Intrinsic Value Fund (cont'd) | |
Class R3 | |
8/31/2017 | | $ | 16.19 | | | $ | 0.11 | | | $ | 2.57 | | | $ | 2.68 | | | $ | (0.09 | ) | | $ | — | | | $ | (0.09 | ) | | $ | — | | | $ | 18.78 | | | | 16.62 | % | | $ | 1.5 | | | | 1.69 | % | | | 1.46 | % | | | 0.63 | % | | | 31 | % | |
8/31/2016 | | $ | 17.70 | | | $ | 0.09 | | | $ | 0.62 | | | $ | 0.71 | | | $ | (0.09 | ) | | $ | (2.13 | ) | | $ | (2.22 | ) | | $ | — | | | $ | 16.19 | | | | 5.54 | % | | $ | 1.4 | | | | 1.75 | % | | | 1.46 | % | | | 0.56 | % | | | 29 | % | |
8/31/2015 | | $ | 20.23 | | | $ | 0.00 | | | $ | (0.32 | ) | | $ | (0.32 | ) | | $ | (0.13 | ) | | $ | (2.08 | ) | | $ | (2.21 | ) | | $ | — | | | $ | 17.70 | | | | (1.49 | )% | | $ | 1.2 | | | | 1.73 | % | | | 1.46 | % | | | 0.03 | % | | | 50 | % | |
8/31/2014 | | $ | 17.59 | | | $ | 0.15 | | | $ | 3.61 | | | $ | 3.76 | | | $ | (0.25 | ) | | $ | (0.87 | ) | | $ | (1.12 | ) | | $ | 0.00 | | | $ | 20.23 | | | | 22.23 | %c | | $ | 0.4 | | | | 1.80 | % | | | 1.46 | % | | | 0.80 | % | | | 34 | % | |
8/31/2013 | | $ | 13.80 | | | $ | 0.14 | | | $ | 3.73 | | | $ | 3.87 | | | $ | (0.08 | ) | | $ | — | | | $ | (0.08 | ) | | $ | — | | | $ | 17.59 | | | | 28.22 | % | | $ | 0.8 | | | | 1.86 | % | | | 1.46 | % | | | 0.85 | % | | | 33 | % | |
Multi-Cap Opportunities Fund | |
Institutional Class | |
8/31/2017 | | $ | 16.08 | | | $ | 0.12 | | | $ | 3.06 | | | $ | 3.18 | | | $ | (0.14 | ) | | $ | (0.45 | ) | | $ | (0.59 | ) | | $ | — | | | $ | 18.67 | | | | 20.27 | %h | | $ | 1,828.2 | | | | 0.75 | % | | | 0.75 | %f | | | 0.68 | %f | | | 23 | % | |
8/31/2016 | | $ | 15.31 | | | $ | 0.15 | | | $ | 1.18 | | | $ | 1.33 | | | $ | (0.15 | ) | | $ | (0.41 | ) | | $ | (0.56 | ) | | $ | — | | | $ | 16.08 | | | | 8.94 | % | | $ | 1,757.2 | | | | 0.76 | % | | | 0.76 | % | | | 0.99 | % | | | 18 | % | |
8/31/2015 | | $ | 16.27 | | | $ | 0.13 | | | $ | (0.43 | ) | | $ | (0.30 | ) | | $ | (0.15 | ) | | $ | (0.51 | ) | | $ | (0.66 | ) | | $ | — | | | $ | 15.31 | | | | (1.80 | )% | | $ | 2,191.4 | | | | 0.73 | % | | | 0.73 | % | | | 0.84 | % | | | 27 | % | |
8/31/2014 | | $ | 13.56 | | | $ | 0.16 | | | $ | 2.88 | | | $ | 3.04 | | | $ | (0.11 | ) | | $ | (0.22 | ) | | $ | (0.33 | ) | | $ | 0.00 | | | $ | 16.27 | | | | 22.65 | %c | | $ | 2,566.4 | | | | 0.74 | % | | | 0.74 | % | | | 1.06 | % | | | 17 | % | |
8/31/2013 | | $ | 10.76 | | | $ | 0.17 | | | $ | 2.86 | | | $ | 3.03 | | | $ | (0.14 | ) | | $ | (0.09 | ) | | $ | (0.23 | ) | | $ | — | | | $ | 13.56 | | | | 28.57 | % | | $ | 1,430.7 | | | | 0.85 | % | | | 0.85 | %§ | | | 1.38 | % | | | 11 | % | |
Class A | |
8/31/2017 | | $ | 15.95 | | | $ | 0.06 | | | $ | 3.04 | | | $ | 3.10 | | | $ | (0.07 | ) | | $ | (0.45 | ) | | $ | (0.52 | ) | | $ | — | | | $ | 18.53 | | | | 19.85 | %h | | $ | 53.5 | | | | 1.10 | % | | | 1.10 | %f | | | 0.32 | %f | | | 23 | % | |
8/31/2016 | | $ | 15.18 | | | $ | 0.09 | | | $ | 1.17 | | | $ | 1.26 | | | $ | (0.08 | ) | | $ | (0.41 | ) | | $ | (0.49 | ) | | $ | — | | | $ | 15.95 | | | | 8.53 | % | | $ | 73.0 | | | | 1.11 | % | | | 1.11 | % | | | 0.62 | % | | | 18 | % | |
8/31/2015 | | $ | 16.13 | | | $ | 0.07 | | | $ | (0.43 | ) | | $ | (0.36 | ) | | $ | (0.08 | ) | | $ | (0.51 | ) | | $ | (0.59 | ) | | $ | — | | | $ | 15.18 | | | | (2.16 | )% | | $ | 102.8 | | | | 1.10 | % | | | 1.10 | % | | | 0.47 | % | | | 27 | % | |
8/31/2014 | | $ | 13.48 | | | $ | 0.11 | | | $ | 2.85 | | | $ | 2.96 | | | $ | (0.09 | ) | | $ | (0.22 | ) | | $ | (0.31 | ) | | $ | 0.00 | | | $ | 16.13 | | | | 22.17 | %c | | $ | 143.1 | | | | 1.10 | % | | | 1.10 | % | | | 0.71 | % | | | 17 | % | |
8/31/2013 | | $ | 10.70 | | | $ | 0.12 | | | $ | 2.86 | | | $ | 2.98 | | | $ | (0.11 | ) | | $ | (0.09 | ) | | $ | (0.20 | ) | | $ | — | | | $ | 13.48 | | | | 28.22 | % | | $ | 51.6 | | | | 1.18 | % | | | 1.18 | %§ | | | 0.91 | % | | | 11 | % | |
Class C | |
8/31/2017 | | $ | 15.42 | | | $ | (0.07 | ) | | $ | 2.94 | | | $ | 2.87 | | | $ | (0.00 | ) | | $ | (0.45 | ) | | $ | (0.45 | ) | | $ | — | | | $ | 17.84 | | | | 18.95 | %h | | $ | 40.7 | | | | 1.84 | % | | | 1.84 | %f | | | (0.40 | )%f | | | 23 | % | |
8/31/2016 | | $ | 14.73 | | | $ | (0.02 | ) | | $ | 1.13 | | | $ | 1.11 | | | $ | (0.01 | ) | | $ | (0.41 | ) | | $ | (0.42 | ) | | $ | — | | | $ | 15.42 | | | | 7.73 | % | | $ | 39.6 | | | | 1.85 | % | | | 1.85 | % | | | (0.11 | )% | | | 18 | % | |
8/31/2015 | | $ | 15.71 | | | $ | (0.04 | ) | | $ | (0.41 | ) | | $ | (0.45 | ) | | $ | (0.02 | ) | | $ | (0.51 | ) | | $ | (0.53 | ) | | $ | — | | | $ | 14.73 | | | | (2.84 | )% | | $ | 46.1 | | | | 1.84 | % | | | 1.84 | % | | | (0.27 | )% | | | 27 | % | |
8/31/2014 | | $ | 13.20 | | | $ | (0.00 | ) | | $ | 2.79 | | | $ | 2.79 | | | $ | (0.06 | ) | | $ | (0.22 | ) | | $ | (0.28 | ) | | $ | 0.00 | | | $ | 15.71 | | | | 21.30 | %c | | $ | 50.5 | | | | 1.85 | % | | | 1.85 | % | | | (0.01 | )% | | | 17 | % | |
8/31/2013 | | $ | 10.52 | | | $ | 0.01 | | | $ | 2.81 | | | $ | 2.82 | | | $ | (0.05 | ) | | $ | (0.09 | ) | | $ | (0.14 | ) | | $ | — | | | $ | 13.20 | | | | 27.10 | % | | $ | 8.3 | | | | 2.05 | % | | | 2.05 | %§ | | | 0.04 | % | | | 11 | % | |
Real Estate Fund | |
Trust Class | |
8/31/2017 | | $ | 15.12 | | | $ | 0.20 | | | $ | 0.07 | | | $ | 0.27 | | | $ | (0.19 | ) | | $ | (1.68 | ) | | $ | (1.87 | ) | | $ | — | | | $ | 13.52 | | | | 2.89 | % | | $ | 156.6 | | | | 1.42 | % | | | 1.04 | % | | | 1.46 | % | | | 45 | % | |
8/31/2016 | | $ | 13.60 | | | $ | 0.19 | | | $ | 2.60 | | | $ | 2.79 | | | $ | (0.20 | ) | | $ | (1.07 | ) | | $ | (1.27 | ) | | $ | — | | | $ | 15.12 | | | | 21.59 | % | | $ | 212.4 | | | | 1.41 | % | | | 1.04 | % | | | 1.34 | % | | | 49 | % | |
8/31/2015 | | $ | 14.70 | | | $ | 0.18 | | | $ | (0.37 | ) | | $ | (0.19 | ) | | $ | (0.18 | ) | | $ | (0.73 | ) | | $ | (0.91 | ) | | $ | — | | | $ | 13.60 | | | | (1.54 | )% | | $ | 250.8 | | | | 1.39 | % | | | 1.04 | % | | | 1.24 | % | | | 33 | % | |
8/31/2014 | | $ | 12.96 | | | $ | 0.16 | | | $ | 2.56 | | | $ | 2.72 | | | $ | (0.17 | ) | | $ | (0.81 | ) | | $ | (0.98 | ) | | $ | 0.00 | | | $ | 14.70 | | | | 22.36 | %c | | $ | 314.3 | | | | 1.41 | % | | | 1.04 | % | | | 1.19 | % | | | 36 | % | |
8/31/2013 | | $ | 13.82 | | | $ | 0.15 | | | $ | (0.50 | ) | | $ | (0.35 | ) | | $ | (0.15 | ) | | $ | (0.36 | ) | | $ | (0.51 | ) | | $ | — | | | $ | 12.96 | | | | (2.60 | )% | | $ | 319.9 | | | | 1.43 | % | | | 1.04 | % | | | 1.09 | % | | | 33 | % | |
See Notes to Financial Highlights
241
242
Financial Highlights (cont'd)
| | | Net Asset
Value,
Beginning
of Year | | Net
Investment
Income (Loss)@ | | Net Gains or
Losses on
Securities
(both realized
and
unrealized) | | Total From
Investment
Operations | | Dividends
from Net
Investment
Income | | Distributions
from Net
Realized
Capital Gains | | Total
Distributions | | Voluntary
Contribution
from
Management | | Net Asset
Value, End of
Year | | Total Returnab | | Net Assets,
End of Year
(in millions) | | Ratio of Gross
Expenses to
Average Net
Assets# | | Ratio of Net
Expenses to
Average Net
Assets## | | Ratio of Net
Investment
Income/
(Loss) to
Average Net
Assets | | Portfolio
Turnover
Rate | |
Real Estate Fund (cont'd) | |
Institutional Class | |
8/31/2017 | | $ | 15.17 | | | $ | 0.22 | | | $ | 0.06 | | | $ | 0.28 | | | $ | (0.21 | ) | | $ | (1.68 | ) | | $ | (1.89 | ) | | $ | — | | | $ | 13.56 | | | | 3.01 | % | | $ | 191.3 | | | | 1.05 | % | | | 0.85 | % | | | 1.64 | % | | | 45 | % | |
8/31/2016 | | $ | 13.64 | | | $ | 0.22 | | | $ | 2.61 | | | $ | 2.83 | | | $ | (0.23 | ) | | $ | (1.07 | ) | | $ | (1.30 | ) | | $ | — | | | $ | 15.17 | | | | 21.84 | % | | $ | 259.1 | | | | 1.05 | % | | | 0.85 | % | | | 1.53 | % | | | 49 | % | |
8/31/2015 | | $ | 14.74 | | | $ | 0.21 | | | $ | (0.37 | ) | | $ | (0.16 | ) | | $ | (0.21 | ) | | $ | (0.73 | ) | | $ | (0.94 | ) | | $ | — | | | $ | 13.64 | | | | (1.34 | )% | | $ | 336.5 | | | | 1.03 | % | | | 0.85 | % | | | 1.42 | % | | | 33 | % | |
8/31/2014 | | $ | 12.99 | | | $ | 0.18 | | | $ | 2.57 | | | $ | 2.75 | | | $ | (0.19 | ) | | $ | (0.81 | ) | | $ | (1.00 | ) | | $ | 0.00 | | | $ | 14.74 | | | | 22.63 | %c | | $ | 463.5 | | | | 1.05 | % | | | 0.85 | % | | | 1.35 | % | | | 36 | % | |
8/31/2013 | | $ | 13.86 | | | $ | 0.17 | | | $ | (0.51 | ) | | $ | (0.34 | ) | | $ | (0.17 | ) | | $ | (0.36 | ) | | $ | (0.53 | ) | | $ | — | | | $ | 12.99 | | | | (2.48 | )% | | $ | 366.4 | | | | 1.07 | % | | | 0.85 | % | | | 1.23 | % | | | 33 | % | |
Class A | |
8/31/2017 | | $ | 15.12 | | | $ | 0.18 | | | $ | 0.05 | | | $ | 0.23 | | | $ | (0.16 | ) | | $ | (1.68 | ) | | $ | (1.84 | ) | | $ | — | | | $ | 13.51 | | | | 2.63 | % | | $ | 83.5 | | | | 1.42 | % | | | 1.21 | % | | | 1.32 | % | | | 45 | % | |
8/31/2016 | | $ | 13.60 | | | $ | 0.17 | | | $ | 2.60 | | | $ | 2.77 | | | $ | (0.18 | ) | | $ | (1.07 | ) | | $ | (1.25 | ) | | $ | — | | | $ | 15.12 | | | | 21.37 | % | | $ | 118.8 | | | | 1.42 | % | | | 1.21 | % | | | 1.16 | % | | | 49 | % | |
8/31/2015 | | $ | 14.69 | | | $ | 0.15 | | | $ | (0.35 | ) | | $ | (0.20 | ) | | $ | (0.16 | ) | | $ | (0.73 | ) | | $ | (0.89 | ) | | $ | — | | | $ | 13.60 | | | | (1.65 | )% | | $ | 137.0 | | | | 1.41 | % | | | 1.21 | % | | | 1.04 | % | | | 33 | % | |
8/31/2014 | | $ | 12.95 | | | $ | 0.14 | | | $ | 2.55 | | | $ | 2.69 | | | $ | (0.14 | ) | | $ | (0.81 | ) | | $ | (0.95 | ) | | $ | 0.00 | | | $ | 14.69 | | | | 22.17 | %c | | $ | 171.9 | | | | 1.43 | % | | | 1.21 | % | | | 1.02 | % | | | 36 | % | |
8/31/2013 | | $ | 13.82 | | | $ | 0.12 | | | $ | (0.51 | ) | | $ | (0.39 | ) | | $ | (0.12 | ) | | $ | (0.36 | ) | | $ | (0.48 | ) | | $ | — | | | $ | 12.95 | | | | (2.82 | )% | | $ | 164.5 | | | | 1.47 | % | | | 1.21 | % | | | 0.84 | % | | | 33 | % | |
Class C | |
8/31/2017 | | $ | 15.12 | | | $ | 0.08 | | | $ | 0.05 | | | $ | 0.13 | | | $ | (0.05 | ) | | $ | (1.68 | ) | | $ | (1.73 | ) | | $ | — | | | $ | 13.52 | | | | 1.89 | % | | $ | 18.9 | | | | 2.17 | % | | | 1.96 | % | | | 0.57 | % | | | 45 | % | |
8/31/2016 | | $ | 13.60 | | | $ | 0.06 | | | $ | 2.60 | | | $ | 2.66 | | | $ | (0.07 | ) | | $ | (1.07 | ) | | $ | (1.14 | ) | | $ | — | | | $ | 15.12 | | | | 20.45 | % | | $ | 29.3 | | | | 2.17 | % | | | 1.96 | % | | | 0.39 | % | | | 49 | % | |
8/31/2015 | | $ | 14.68 | | | $ | 0.04 | | | $ | (0.35 | ) | | $ | (0.31 | ) | | $ | (0.04 | ) | | $ | (0.73 | ) | | $ | (0.77 | ) | | $ | — | | | $ | 13.60 | | | | (2.38 | )% | | $ | 29.9 | | | | 2.17 | % | | | 1.96 | % | | | 0.30 | % | | | 33 | % | |
8/31/2014 | | $ | 12.94 | | | $ | 0.04 | | | $ | 2.55 | | | $ | 2.59 | | | $ | (0.04 | ) | | $ | (0.81 | ) | | $ | (0.85 | ) | | $ | 0.00 | | | $ | 14.68 | | | | 21.24 | %c | | $ | 40.4 | | | | 2.20 | % | | | 1.96 | % | | | 0.26 | % | | | 36 | % | |
8/31/2013 | | $ | 13.81 | | | $ | 0.02 | | | $ | (0.50 | ) | | $ | (0.48 | ) | | $ | (0.03 | ) | | $ | (0.36 | ) | | $ | (0.39 | ) | | $ | — | | | $ | 12.94 | | | | (3.52 | )% | | $ | 39.7 | | | | 2.24 | % | | | 1.96 | % | | | 0.11 | % | | | 33 | % | |
Class R3 | |
8/31/2017 | | $ | 15.09 | | | $ | 0.13 | | | $ | 0.08 | | | $ | 0.21 | | | $ | (0.13 | ) | | $ | (1.68 | ) | | $ | (1.81 | ) | | $ | — | | | $ | 13.49 | | | | 2.45 | % | | $ | 19.0 | | | | 1.68 | % | | | 1.46 | % | | | 1.01 | % | | | 45 | % | |
8/31/2016 | | $ | 13.58 | | | $ | 0.12 | | | $ | 2.60 | | | $ | 2.72 | | | $ | (0.14 | ) | | $ | (1.07 | ) | | $ | (1.21 | ) | | $ | — | | | $ | 15.09 | | | | 21.03 | % | | $ | 25.0 | | | | 1.68 | % | | | 1.46 | % | | | 0.87 | % | | | 49 | % | |
8/31/2015 | | $ | 14.68 | | | $ | 0.12 | | | $ | (0.37 | ) | | $ | (0.25 | ) | | $ | (0.12 | ) | | $ | (0.73 | ) | | $ | (0.85 | ) | | $ | — | | | $ | 13.58 | | | | (1.94 | )% | | $ | 22.4 | | | | 1.66 | % | | | 1.46 | % | | | 0.81 | % | | | 33 | % | |
8/31/2014 | | $ | 12.94 | | | $ | 0.10 | | | $ | 2.56 | | | $ | 2.66 | | | $ | (0.11 | ) | | $ | (0.81 | ) | | $ | (0.92 | ) | | $ | 0.00 | | | $ | 14.68 | | | | 21.89 | %c | | $ | 23.5 | | | | 1.67 | % | | | 1.46 | % | | | 0.71 | % | | | 36 | % | |
8/31/2013 | | $ | 13.81 | | | $ | 0.08 | | | $ | (0.50 | ) | | $ | (0.42 | ) | | $ | (0.09 | ) | | $ | (0.36 | ) | | $ | (0.45 | ) | | $ | — | | | $ | 12.94 | | | | (3.04 | )% | | $ | 15.2 | | | | 1.70 | % | | | 1.46 | % | | | 0.56 | % | | | 33 | % | |
Class R6 | |
8/31/2017 | | $ | 15.16 | | | $ | 0.22 | | | $ | 0.08 | | | $ | 0.30 | | | $ | (0.22 | ) | | $ | (1.68 | ) | | $ | (1.90 | ) | | $ | — | | | $ | 13.56 | | | | 3.16 | % | | $ | 45.2 | | | | 0.98 | % | | | 0.78 | % | | | 1.62 | % | | | 45 | % | |
8/31/2016 | | $ | 13.64 | | | $ | 0.21 | | | $ | 2.62 | | | $ | 2.83 | | | $ | (0.24 | ) | | $ | (1.07 | ) | | $ | (1.31 | ) | | $ | — | | | $ | 15.16 | | | | 21.85 | % | | $ | 45.0 | | | | 0.98 | % | | | 0.78 | % | | | 1.48 | % | | | 49 | % | |
8/31/2015 | | $ | 14.74 | | | $ | 0.21 | | | $ | (0.36 | ) | | $ | (0.15 | ) | | $ | (0.22 | ) | | $ | (0.73 | ) | | $ | (0.95 | ) | | $ | — | | | $ | 13.64 | | | | (1.26 | )% | | $ | 29.9 | | | | 0.97 | % | | | 0.78 | % | | | 1.40 | % | | | 33 | % | |
8/31/2014 | | $ | 12.99 | | | $ | 0.18 | | | $ | 2.59 | | | $ | 2.77 | | | $ | (0.21 | ) | | $ | (0.81 | ) | | $ | (1.02 | ) | | $ | 0.00 | | | $ | 14.74 | | | | 22.72 | %c | | $ | 26.3 | | | | 0.98 | % | | | 0.78 | % | | | 1.33 | % | | | 36 | % | |
Period from 3/15/2013^
to 8/31/2013 | | $ | 14.11 | | | $ | 0.06 | | | $ | (1.04 | ) | | $ | (0.98 | ) | | $ | (0.02 | ) | | $ | (0.12 | ) | | $ | (0.14 | ) | | $ | — | | | $ | 12.99 | | | | (6.96 | )%* | | $ | 8.3 | | | | 1.11 | %** | | | 0.78 | %** | | | 0.95 | %** | | | 33 | %d | |
See Notes to Financial Highlights
243
244
Financial Highlights (cont'd)
| | | Net Asset
Value,
Beginning
of Year | | Net
Investment
Income (Loss)@ | | Net Gains or
Losses on
Securities
(both realized
and
unrealized) | | Total From
Investment
Operations | | Dividends
from Net
Investment
Income | | Distributions
from Net
Realized
Capital Gains | | Total
Distributions | | Voluntary
Contribution
from
Management | | Net Asset
Value, End of
Year | | Total Returnab | | Net Assets,
End of Year
(in millions) | | Ratio of Gross
Expenses to
Average Net
Assets# | | Ratio of Net
Expenses to
Average Net
Assets## | | Ratio of Net
Investment
Income/
(Loss) to
Average Net
Assets | | Portfolio
Turnover
Rate | |
Small Cap Growth Fund | |
Investor Class | |
8/31/2017 | | $ | 26.97 | | | $ | (0.26 | ) | | $ | 6.19 | | | $ | 5.93 | | | $ | — | | | $ | — | | | $ | — | | | $ | — | | | $ | 32.90 | | | | 21.99 | %h | | $ | 49.8 | | | | 1.78 | % | | | 1.20 | %f | | | (0.86 | )%f | | | 215 | % | |
8/31/2016 | | $ | 29.50 | | | $ | (0.21 | ) | | $ | (0.77 | ) | | $ | (0.98 | ) | | $ | — | | | $ | (1.55 | ) | | $ | (1.55 | ) | | $ | — | | | $ | 26.97 | | | | (3.16 | )% | | $ | 44.0 | | | | 1.87 | % | | | 1.21 | % | | | (0.83 | )% | | | 164 | % | |
8/31/2015 | | $ | 27.44 | | | $ | (0.28 | ) | | $ | 2.34 | | | $ | 2.06 | | | $ | — | | | $ | — | | | $ | — | | | $ | — | | | $ | 29.50 | | | | 7.51 | % | | $ | 49.3 | | | | 1.67 | % | | | 1.21 | % | | | (0.96 | )% | | | 336 | % | |
8/31/2014 | | $ | 24.16 | | | $ | (0.23 | ) | | $ | 3.51 | | | $ | 3.28 | | | $ | — | | | $ | — | | | $ | — | | | $ | 0.00 | | | $ | 27.44 | | | | 13.58 | %c | | $ | 50.7 | | | | 1.67 | % | | | 1.21 | % | | | (0.85 | )% | | | 284 | % | |
8/31/2013 | | $ | 19.49 | | | $ | (0.15 | ) | | $ | 4.82 | | | $ | 4.67 | | | $ | — | | | $ | — | | | $ | — | | | $ | — | | | $ | 24.16 | | | | 23.96 | % | | $ | 48.8 | | | | 1.64 | % | | | 1.22 | % | | | (0.72 | )% | | | 249 | % | |
Trust Class | |
8/31/2017 | | $ | 29.25 | | | $ | (0.33 | ) | | $ | 6.69 | | | $ | 6.36 | | | $ | — | | | $ | — | | | $ | — | | | $ | — | | | $ | 35.61 | | | | 21.74 | % | | $ | 3.9 | | | | 1.88 | % | | | 1.37 | % | | | (1.04 | )% | | | 215 | % | |
8/31/2016 | | $ | 31.89 | | | $ | (0.27 | ) | | $ | (0.82 | ) | | $ | (1.09 | ) | | $ | — | | | $ | (1.55 | ) | | $ | (1.55 | ) | | $ | — | | | $ | 29.25 | | | | (3.27 | )% | | $ | 4.4 | | | | 1.93 | % | | | 1.37 | % | | | (0.99 | )% | | | 164 | % | |
8/31/2015 | | $ | 29.72 | | | $ | (0.37 | ) | | $ | 2.54 | | | $ | 2.17 | | | $ | — | | | $ | — | | | $ | — | | | $ | — | | | $ | 31.89 | | | | 7.30 | % | | $ | 5.3 | | | | 1.86 | % | | | 1.40 | % | | | (1.15 | )% | | | 336 | % | |
8/31/2014 | | $ | 26.22 | | | $ | (0.30 | ) | | $ | 3.80 | | | $ | 3.50 | | | $ | — | | | $ | — | | | $ | — | | | $ | 0.00 | | | $ | 29.72 | | | | 13.35 | %c | | $ | 5.5 | | | | 1.95 | % | | | 1.40 | % | | | (1.02 | )% | | | 284 | % | |
8/31/2013 | | $ | 21.19 | | | $ | (0.20 | ) | | $ | 5.23 | | | $ | 5.03 | | | $ | — | | | $ | — | | | $ | — | | | $ | — | | | $ | 26.22 | | | | 23.74 | % | | $ | 7.2 | | | | 1.83 | % | | | 1.40 | % | | | (0.91 | )% | | | 249 | % | |
Advisor Class | |
8/31/2017 | | $ | 18.72 | | | $ | (0.24 | ) | | $ | 4.28 | | | $ | 4.04 | | | $ | — | | | $ | — | | | $ | — | | | $ | — | | | $ | 22.76 | | | | 21.58 | %h | | $ | 1.7 | | | | 2.05 | % | | | 1.51 | %f | | | (1.18 | )%f | | | 215 | % | |
8/31/2016 | | $ | 21.03 | | | $ | (0.20 | ) | | $ | (0.56 | ) | | $ | (0.76 | ) | | $ | — | | | $ | (1.55 | ) | | $ | (1.55 | ) | | $ | — | | | $ | 18.72 | | | | (3.40 | )% | | $ | 2.1 | | | | 2.08 | % | | | 1.51 | % | | | (1.13 | )% | | | 164 | % | |
8/31/2015 | | $ | 19.63 | | | $ | (0.26 | ) | | $ | 1.66 | | | $ | 1.40 | | | $ | — | | | $ | — | | | $ | — | | | $ | — | | | $ | 21.03 | | | | 7.13 | % | | $ | 2.7 | | | | 2.00 | % | | | 1.51 | % | | | (1.26 | )% | | | 336 | % | |
8/31/2014 | | $ | 17.33 | | | $ | (0.22 | ) | | $ | 2.52 | | | $ | 2.30 | | | $ | — | | | $ | — | | | $ | — | | | $ | 0.00 | | | $ | 19.63 | | | | 13.27 | %c | | $ | 3.5 | | | | 1.96 | % | | | 1.51 | % | | | (1.15 | )% | | | 284 | % | |
8/31/2013 | | $ | 14.03 | | | $ | (0.15 | ) | | $ | 3.45 | | | $ | 3.30 | | | $ | — | | | $ | — | | | $ | — | | | $ | — | | | $ | 17.33 | | | | 23.52 | % | | $ | 3.6 | | | | 1.93 | % | | | 1.52 | % | | | (1.00 | )% | | | 249 | % | |
Institutional Class | |
8/31/2017 | | $ | 27.66 | | | $ | (0.17 | ) | | $ | 6.34 | | | $ | 6.17 | | | $ | — | | | $ | — | | | $ | — | | | $ | — | | | $ | 33.83 | | | | 22.31 | % | | $ | 11.8 | | | | 1.50 | % | | | 0.90 | % | | | (0.57 | )% | | | 215 | % | |
8/31/2016 | | $ | 30.11 | | | $ | (0.14 | ) | | $ | (0.76 | ) | | $ | (0.90 | ) | | $ | — | | | $ | (1.55 | ) | | $ | (1.55 | ) | | $ | — | | | $ | 27.66 | | | | (2.82 | )% | | $ | 9.4 | | | | 1.55 | % | | | 0.90 | % | | | (0.53 | )% | | | 164 | % | |
8/31/2015 | | $ | 27.92 | | | $ | (0.20 | ) | | $ | 2.39 | | | $ | 2.19 | | | $ | — | | | $ | — | | | $ | — | | | $ | — | | | $ | 30.11 | | | | 7.84 | % | | $ | 20.7 | | | | 1.44 | % | | | 0.90 | % | | | (0.65 | )% | | | 336 | % | |
8/31/2014 | | $ | 24.51 | | | $ | (0.15 | ) | | $ | 3.56 | | | $ | 3.41 | | | $ | — | | | $ | — | | | $ | — | | | $ | 0.00 | | | $ | 27.92 | | | | 13.91 | %c | | $ | 19.0 | | | | 1.48 | % | | | 0.90 | % | | | (0.54 | )% | | | 284 | % | |
8/31/2013 | | $ | 19.71 | | | $ | (0.09 | ) | | $ | 4.89 | | | $ | 4.80 | | | $ | — | | | $ | — | | | $ | — | | | $ | — | | | $ | 24.51 | | | | 24.35 | % | | $ | 14.9 | | | | 1.41 | % | | | 0.90 | % | | | (0.41 | )% | | | 249 | % | |
Class A | |
8/31/2017 | | $ | 29.53 | | | $ | (0.30 | ) | | $ | 6.76 | | | $ | 6.46 | | | $ | — | | | $ | — | | | $ | — | | | $ | — | | | $ | 35.99 | | | | 21.88 | % | | $ | 3.3 | | | | 1.90 | % | | | 1.26 | % | | | (0.93 | )% | | | 215 | % | |
8/31/2016 | | $ | 32.15 | | | $ | (0.25 | ) | | $ | (0.82 | ) | | $ | (1.07 | ) | | $ | — | | | $ | (1.55 | ) | | $ | (1.55 | ) | | $ | — | | | $ | 29.53 | | | | (3.18 | )% | | $ | 3.5 | | | | 1.95 | % | | | 1.26 | % | | | (0.88 | )% | | | 164 | % | |
8/31/2015 | | $ | 29.92 | | | $ | (0.33 | ) | | $ | 2.56 | | | $ | 2.23 | | | $ | — | | | $ | — | | | $ | — | | | $ | — | | | $ | 32.15 | | | | 7.45 | % | | $ | 5.1 | | | | 1.83 | % | | | 1.26 | % | | | (1.01 | )% | | | 336 | % | |
8/31/2014 | | $ | 26.36 | | | $ | (0.28 | ) | | $ | 3.84 | | | $ | 3.56 | | | $ | — | | | $ | — | | | $ | — | | | $ | 0.00 | | | $ | 29.92 | | | | 13.51 | %c | | $ | 4.4 | | | | 1.81 | % | | | 1.26 | % | | | (0.96 | )% | | | 284 | % | |
8/31/2013 | | $ | 21.27 | | | $ | (0.19 | ) | | $ | 5.28 | | | $ | 5.09 | | | $ | — | | | $ | — | | | $ | — | | | $ | — | | | $ | 26.36 | | | | 23.93 | % | | $ | 2.4 | | | | 1.83 | % | | | 1.26 | % | | | (0.81 | )% | | | 249 | % | |
See Notes to Financial Highlights
245
246
Financial Highlights (cont'd)
| | | Net Asset
Value,
Beginning
of Year | | Net
Investment
Income (Loss)@ | | Net Gains or
Losses on
Securities
(both realized
and
unrealized) | | Total From
Investment
Operations | | Dividends
from Net
Investment
Income | | Distributions
from Net
Realized
Capital Gains | | Total
Distributions | | Voluntary
Contribution
from
Management | | Net Asset
Value, End of
Year | | Total Returnab | | Net Assets,
End of Year
(in millions) | | Ratio of Gross
Expenses to
Average Net
Assets# | | Ratio of Net
Expenses to
Average Net
Assets## | | Ratio of Net
Investment
Income/
(Loss) to
Average Net
Assets | | Portfolio
Turnover
Rate | |
Small Cap Growth Fund (cont'd) | |
Class C | |
8/31/2017 | | $ | 18.05 | | | $ | (0.33 | ) | | $ | 4.12 | | | $ | 3.79 | | | $ | — | | | $ | — | | | $ | — | | | $ | — | | | $ | 21.84 | | | | 21.00 | % | | $ | 2.0 | | | | 2.63 | % | | | 2.01 | % | | | (1.68 | )% | | | 215 | % | |
8/31/2016 | | $ | 20.44 | | | $ | (0.28 | ) | | $ | (0.56 | ) | | $ | (0.84 | ) | | $ | — | | | $ | (1.55 | ) | | $ | (1.55 | ) | | $ | — | | | $ | 18.05 | | | | (3.92 | )% | | $ | 1.8 | | | | 2.68 | % | | | 2.01 | % | | | (1.63 | )% | | | 164 | % | |
8/31/2015 | | $ | 19.16 | | | $ | (0.36 | ) | | $ | 1.64 | | | $ | 1.28 | | | $ | — | | | $ | — | | | $ | — | | | $ | — | | | $ | 20.44 | | | | 6.68 | % | | $ | 2.3 | | | | 2.58 | % | | | 2.01 | % | | | (1.76 | )% | | | 336 | % | |
8/31/2014 | | $ | 17.01 | | | $ | (0.32 | ) | | $ | 2.47 | | | $ | 2.15 | | | $ | — | | | $ | — | | | $ | — | | | $ | 0.00 | | | $ | 19.16 | | | | 12.64 | %c | | $ | 1.8 | | | | 2.57 | % | | | 2.01 | % | | | (1.68 | )% | | | 284 | % | |
8/31/2013 | | $ | 13.83 | | | $ | (0.24 | ) | | $ | 3.42 | | | $ | 3.18 | | | $ | — | | | $ | — | | | $ | — | | | $ | — | | | $ | 17.01 | | | | 22.99 | % | | $ | 1.1 | | | | 2.56 | % | | | 2.01 | % | | | (1.58 | )% | | | 249 | % | |
Class R3 | |
8/31/2017 | | $ | 18.77 | | | $ | (0.24 | ) | | $ | 4.29 | | | $ | 4.05 | | | $ | — | | | $ | — | | | $ | — | | | $ | — | | | $ | 22.82 | | | | 21.58 | % | | $ | 1.0 | | | | 2.19 | % | | | 1.51 | % | | | (1.17 | )% | | | 215 | % | |
8/31/2016 | | $ | 21.09 | | | $ | (0.20 | ) | | $ | (0.57 | ) | | $ | (0.77 | ) | | $ | — | | | $ | (1.55 | ) | | $ | (1.55 | ) | | $ | — | | | $ | 18.77 | | | | (3.44 | )% | | $ | 1.1 | | | | 2.24 | % | | | 1.51 | % | | | (1.12 | )% | | | 164 | % | |
8/31/2015 | | $ | 19.67 | | | $ | (0.27 | ) | | $ | 1.69 | | | $ | 1.42 | | | $ | — | | | $ | — | | | $ | — | | | $ | — | | | $ | 21.09 | | | | 7.22 | % | | $ | 1.0 | | | | 2.15 | % | | | 1.51 | % | | | (1.25 | )% | | | 336 | % | |
8/31/2014 | | $ | 17.37 | | | $ | (0.22 | ) | | $ | 2.52 | | | $ | 2.30 | | | $ | — | | | $ | — | | | $ | — | | | $ | 0.00 | | | $ | 19.67 | | | | 13.24 | %c | | $ | 0.5 | | | | 2.16 | % | | | 1.51 | % | | | (1.15 | )% | | | 284 | % | |
8/31/2013 | | $ | 14.06 | | | $ | (0.16 | ) | | $ | 3.47 | | | $ | 3.31 | | | $ | — | | | $ | — | | | $ | — | | | $ | — | | | $ | 17.37 | | | | 23.54 | % | | $ | 0.4 | | | | 2.15 | % | | | 1.51 | % | | | (1.08 | )% | | | 249 | % | |
Socially Responsive Fund | |
Investor Class | |
8/31/2017 | | $ | 34.50 | | | $ | 0.24 | | | $ | 4.30 | | | $ | 4.54 | | | $ | (0.23 | ) | | $ | (1.32 | ) | | $ | (1.55 | ) | | $ | — | | | $ | 37.49 | | | | 13.54 | %h | | $ | 732.6 | | | | 0.85 | % | | | 0.84 | %f | | | 0.66 | %f | | | 26 | % | |
8/31/2016 | | $ | 33.23 | | | $ | 0.24 | | | $ | 3.10 | | | $ | 3.34 | | | $ | (0.22 | ) | | $ | (1.85 | ) | | $ | (2.07 | ) | | $ | — | | | $ | 34.50 | | | | 10.49 | % | | $ | 739.0 | | | | 0.86 | % | | | 0.86 | % | | | 0.74 | % | | | 25 | % | |
8/31/2015 | | $ | 36.94 | | | $ | 0.27 | | | $ | (0.12 | ) | | $ | 0.15 | | | $ | (0.26 | ) | | $ | (3.60 | ) | | $ | (3.86 | ) | | $ | — | | | $ | 33.23 | | | | 0.29 | % | | $ | 758.0 | | | | 0.85 | % | | | 0.85 | % | | | 0.76 | % | | | 28 | % | |
8/31/2014 | | $ | 32.66 | | | $ | 0.31 | | | $ | 6.48 | | | $ | 6.79 | | | $ | (0.30 | ) | | $ | (2.21 | ) | | $ | (2.51 | ) | | $ | 0.00 | | | $ | 36.94 | | | | 21.54 | %c | | $ | 821.1 | | | | 0.86 | % | | | 0.86 | % | | | 0.87 | % | | | 36 | % | |
8/31/2013 | | $ | 26.48 | | | $ | 0.27 | | | $ | 6.09 | | | $ | 6.36 | | | $ | (0.18 | ) | | $ | — | | | $ | (0.18 | ) | | $ | — | | | $ | 32.66 | | | | 24.18 | % | | $ | 825.2 | | | | 0.87 | % | | | 0.87 | % | | | 0.91 | % | | | 35 | % | |
Trust Class | |
8/31/2017 | | $ | 20.37 | | | $ | 0.10 | | | $ | 2.50 | | | $ | 2.60 | | | $ | (0.23 | ) | | $ | (1.32 | ) | | $ | (1.55 | ) | | $ | — | | | $ | 21.42 | | | | 13.41 | %h | | $ | 234.6 | | | | 1.02 | % | | | 1.01 | %f | | | 0.50 | %f | | | 26 | % | |
8/31/2016 | | $ | 20.47 | | | $ | 0.11 | | | $ | 1.85 | | | $ | 1.96 | | | $ | (0.21 | ) | | $ | (1.85 | ) | | $ | (2.06 | ) | | $ | — | | | $ | 20.37 | | | | 10.29 | % | | $ | 270.6 | | | | 1.03 | % | | | 1.03 | % | | | 0.58 | % | | | 25 | % | |
8/31/2015 | | $ | 24.24 | | | $ | 0.13 | | | $ | (0.06 | ) | | $ | 0.07 | | | $ | (0.24 | ) | | $ | (3.60 | ) | | $ | (3.84 | ) | | $ | — | | | $ | 20.47 | | | | 0.12 | % | | $ | 318.3 | | | | 1.03 | % | | | 1.03 | % | | | 0.58 | % | | | 28 | % | |
8/31/2014 | | $ | 22.20 | | | $ | 0.16 | | | $ | 4.34 | | | $ | 4.50 | | | $ | (0.25 | ) | | $ | (2.21 | ) | | $ | (2.46 | ) | | $ | 0.00 | | | $ | 24.24 | | | | 21.32 | %c | | $ | 418.4 | | | | 1.03 | % | | | 1.03 | % | | | 0.70 | % | | | 36 | % | |
8/31/2013 | | $ | 18.07 | | | $ | 0.15 | | | $ | 4.14 | | | $ | 4.29 | | | $ | (0.16 | ) | | $ | — | | | $ | (0.16 | ) | | $ | — | | | $ | 22.20 | | | | 23.95 | % | | $ | 431.3 | | | | 1.04 | % | | | 1.04 | % | | | 0.76 | % | | | 35 | % | |
Institutional Class | |
8/31/2017 | | $ | 34.55 | | | $ | 0.30 | | | $ | 4.32 | | | $ | 4.62 | | | $ | (0.30 | ) | | $ | (1.32 | ) | | $ | (1.62 | ) | | $ | — | | | $ | 37.55 | | | | 13.78 | %h | | $ | 848.8 | | | | 0.66 | % | | | 0.66 | %f | | | 0.84 | %f | | | 26 | % | |
8/31/2016 | | $ | 33.28 | | | $ | 0.30 | | | $ | 3.11 | | | $ | 3.41 | | | $ | (0.29 | ) | | $ | (1.85 | ) | | $ | (2.14 | ) | | $ | — | | | $ | 34.55 | | | | 10.70 | % | | $ | 745.5 | | | | 0.67 | % | | | 0.67 | % | | | 0.93 | % | | | 25 | % | |
8/31/2015 | | $ | 37.00 | | | $ | 0.33 | | | $ | (0.12 | ) | | $ | 0.21 | | | $ | (0.33 | ) | | $ | (3.60 | ) | | $ | (3.93 | ) | | $ | — | | | $ | 33.28 | | | | 0.46 | % | | $ | 714.8 | | | | 0.67 | % | | | 0.67 | % | | | 0.94 | % | | | 28 | % | |
8/31/2014 | | $ | 32.70 | | | $ | 0.37 | | | $ | 6.49 | | | $ | 6.86 | | | $ | (0.35 | ) | | $ | (2.21 | ) | | $ | (2.56 | ) | | $ | 0.00 | | | $ | 37.00 | | | | 21.76 | %c | | $ | 706.5 | | | | 0.68 | % | | | 0.68 | % | | | 1.06 | % | | | 36 | % | |
8/31/2013 | | $ | 26.51 | | | $ | 0.33 | | | $ | 6.09 | | | $ | 6.42 | | | $ | (0.23 | ) | | $ | — | | | $ | (0.23 | ) | | $ | — | | | $ | 32.70 | | | | 24.41 | % | | $ | 557.7 | | | | 0.69 | % | | | 0.69 | % | | | 1.10 | % | | | 35 | % | |
See Notes to Financial Highlights
247
248
Financial Highlights (cont'd)
| | | Net Asset
Value,
Beginning
of Year | | Net
Investment
Income (Loss)@ | | Net Gains or
Losses on
Securities
(both realized
and
unrealized) | | Total From
Investment
Operations | | Dividends
from Net
Investment
Income | | Distributions
from Net
Realized
Capital Gains | | Total
Distributions | | Voluntary
Contribution
from
Management | | Net Asset
Value, End of
Year | | Total Returnab | | Net Assets,
End of Year
(in millions) | | Ratio of Gross
Expenses to
Average Net
Assets# | | Ratio of Net
Expenses to
Average Net
Assets## | | Ratio of Net
Investment
Income/
(Loss) to
Average Net
Assets | | Portfolio
Turnover
Rate | |
Socially Responsive Fund (cont'd) | |
Class A | |
8/31/2017 | | $ | 20.15 | | | $ | 0.10 | | | $ | 2.46 | | | $ | 2.56 | | | $ | (0.23 | ) | | $ | (1.32 | ) | | $ | (1.55 | ) | | $ | — | | | $ | 21.16 | | | | 13.36 | %h | | $ | 118.0 | | | | 1.03 | % | | | 1.03 | %f | | | 0.48 | %f | | | 26 | % | |
8/31/2016 | | $ | 20.28 | | | $ | 0.11 | | | $ | 1.83 | | | $ | 1.94 | | | $ | (0.22 | ) | | $ | (1.85 | ) | | $ | (2.07 | ) | | $ | — | | | $ | 20.15 | | | | 10.27 | % | | $ | 131.6 | | | | 1.05 | % | | | 1.05 | % | | | 0.56 | % | | | 25 | % | |
8/31/2015 | | $ | 24.06 | | | $ | 0.13 | | | $ | (0.06 | ) | | $ | 0.07 | | | $ | (0.25 | ) | | $ | (3.60 | ) | | $ | (3.85 | ) | | $ | — | | | $ | 20.28 | | | | 0.11 | % | | $ | 140.9 | | | | 1.05 | % | | | 1.05 | % | | | 0.57 | % | | | 28 | % | |
8/31/2014 | | $ | 22.05 | | | $ | 0.16 | | | $ | 4.30 | | | $ | 4.46 | | | $ | (0.24 | ) | | $ | (2.21 | ) | | $ | (2.45 | ) | | $ | 0.00 | | | $ | 24.06 | | | | 21.28 | %c | | $ | 134.0 | | | | 1.05 | % | | | 1.05 | % | | | 0.68 | % | | | 36 | % | |
8/31/2013 | | $ | 17.95 | | | $ | 0.14 | | | $ | 4.12 | | | $ | 4.26 | | | $ | (0.16 | ) | | $ | — | | | $ | (0.16 | ) | | $ | — | | | $ | 22.05 | | | | 23.89 | % | | $ | 109.6 | | | | 1.09 | % | | | 1.09 | %§ | | | 0.67 | % | | | 35 | % | |
Class C | |
8/31/2017 | | $ | 19.56 | | | $ | (0.05 | ) | | $ | 2.39 | | | $ | 2.34 | | | $ | (0.09 | ) | | $ | (1.32 | ) | | $ | (1.41 | ) | | $ | — | | | $ | 20.49 | | | | 12.53 | %h | | $ | 56.6 | | | | 1.78 | % | | | 1.78 | %f | | | (0.27 | )%f | | | 26 | % | |
8/31/2016 | | $ | 19.74 | | | $ | (0.04 | ) | | $ | 1.78 | | | $ | 1.74 | | | $ | (0.07 | ) | | $ | (1.85 | ) | | $ | (1.92 | ) | | $ | — | | | $ | 19.56 | | | | 9.44 | % | | $ | 53.5 | | | | 1.79 | % | | | 1.79 | % | | | (0.19 | )% | | | 25 | % | |
8/31/2015 | | $ | 23.57 | | | $ | (0.04 | ) | | $ | (0.05 | ) | | $ | (0.09 | ) | | $ | (0.14 | ) | | $ | (3.60 | ) | | $ | (3.74 | ) | | $ | — | | | $ | 19.74 | | | | (0.67 | )% | | $ | 52.2 | | | | 1.79 | % | | | 1.79 | % | | | (0.18 | )% | | | 28 | % | |
8/31/2014 | | $ | 21.63 | | | $ | (0.01 | ) | | $ | 4.22 | | | $ | 4.21 | | | $ | (0.06 | ) | | $ | (2.21 | ) | | $ | (2.27 | ) | | $ | 0.00 | | | $ | 23.57 | | | | 20.42 | %c | | $ | 44.5 | | | | 1.80 | % | | | 1.80 | % | | | (0.05 | )% | | | 36 | % | |
8/31/2013 | | $ | 17.64 | | | $ | (0.02 | ) | | $ | 4.06 | | | $ | 4.04 | | | $ | (0.05 | ) | | $ | — | | | $ | (0.05 | ) | | $ | — | | | $ | 21.63 | | | | 22.98 | % | | $ | 27.5 | | | | 1.86 | % | | | 1.86 | %§ | | | (0.10 | )% | | | 35 | % | |
Class R3 | |
8/31/2017 | | $ | 19.92 | | | $ | 0.04 | | | $ | 2.43 | | | $ | 2.47 | | | $ | (0.19 | ) | | $ | (1.32 | ) | | $ | (1.51 | ) | | $ | — | | | $ | 20.88 | | | | 13.04 | %h | | $ | 41.3 | | | | 1.28 | % | | | 1.28 | %f | | | 0.21 | %f | | | 26 | % | |
8/31/2016 | | $ | 20.07 | | | $ | 0.06 | | | $ | 1.81 | | | $ | 1.87 | | | $ | (0.17 | ) | | $ | (1.85 | ) | | $ | (2.02 | ) | | $ | — | | | $ | 19.92 | | | | 10.01 | % | | $ | 33.3 | | | | 1.29 | % | | | 1.29 | % | | | 0.30 | % | | | 25 | % | |
8/31/2015 | | $ | 23.85 | | | $ | 0.07 | | | $ | (0.05 | ) | | $ | 0.02 | | | $ | (0.20 | ) | | $ | (3.60 | ) | | $ | (3.80 | ) | | $ | — | | | $ | 20.07 | | | | (0.12 | )% | | $ | 30.4 | | | | 1.29 | % | | | 1.29 | % | | | 0.31 | % | | | 28 | % | |
8/31/2014 | | $ | 21.86 | | | $ | 0.10 | | | $ | 4.27 | | | $ | 4.37 | | | $ | (0.17 | ) | | $ | (2.21 | ) | | $ | (2.38 | ) | | $ | 0.00 | | | $ | 23.85 | | | | 21.02 | %c | | $ | 32.2 | | | | 1.29 | % | | | 1.29 | % | | | 0.45 | % | | | 36 | % | |
8/31/2013 | | $ | 17.81 | | | $ | 0.09 | | | $ | 4.09 | | | $ | 4.18 | | | $ | (0.13 | ) | | $ | — | | | $ | (0.13 | ) | | $ | — | | | $ | 21.86 | | | | 23.64 | % | | $ | 25.3 | | | | 1.30 | % | | | 1.30 | % | | | 0.46 | % | | | 35 | % | |
Class R6 | |
8/31/2017 | | $ | 34.57 | | | $ | 0.33 | | | $ | 4.31 | | | $ | 4.64 | | | $ | (0.32 | ) | | $ | (1.32 | ) | | $ | (1.64 | ) | | $ | — | | | $ | 37.57 | | | | 13.84 | %h | | $ | 361.3 | | | | 0.59 | % | | | 0.59 | %f | | | 0.91 | %f | | | 26 | % | |
8/31/2016 | | $ | 33.30 | | | $ | 0.32 | | | $ | 3.11 | | | $ | 3.43 | | | $ | (0.31 | ) | | $ | (1.85 | ) | | $ | (2.16 | ) | | $ | — | | | $ | 34.57 | | | | 10.78 | % | | $ | 373.4 | | | | 0.60 | % | | | 0.60 | % | | | 0.96 | % | | | 25 | % | |
8/31/2015 | | $ | 37.03 | | | $ | 0.36 | | | $ | (0.14 | ) | | $ | 0.22 | | | $ | (0.35 | ) | | $ | (3.60 | ) | | $ | (3.95 | ) | | $ | — | | | $ | 33.30 | | | | 0.51 | % | | $ | 222.4 | | | | 0.60 | % | | | 0.60 | % | | | 1.02 | % | | | 28 | % | |
8/31/2014 | | $ | 32.71 | | | $ | 0.39 | | | $ | 6.51 | | | $ | 6.90 | | | $ | (0.37 | ) | | $ | (2.21 | ) | | $ | (2.58 | ) | | $ | 0.00 | | | $ | 37.03 | | | | 21.88 | %c | | $ | 279.6 | | | | 0.60 | % | | | 0.60 | % | | | 1.11 | % | | | 36 | % | |
Period from 3/15/2013^
to 8/31/2013 | | $ | 31.16 | | | $ | 0.14 | | | $ | 1.41 | | | $ | 1.55 | | | $ | — | | | $ | — | | | $ | — | | | $ | — | | | $ | 32.71 | | | | 4.97 | %* | | $ | 249.6 | | | | 0.62 | %** | | | 0.62 | %** | | | 0.94 | %** | | | 35 | %d | |
Value Fund | |
Institutional Class | |
8/31/2017 | | $ | 15.72 | | | $ | 0.25 | | | $ | 2.29 | | | $ | 2.54 | | | $ | (0.12 | ) | | $ | — | | | $ | (0.12 | ) | | $ | — | | | $ | 18.14 | | | | 16.18 | % | | $ | 10.8 | | | | 2.20 | % | | | 0.71 | % | | | 1.47 | % | | | 115 | % | |
8/31/2016 | | $ | 14.35 | | | $ | 0.20 | | | $ | 1.61 | | | $ | 1.81 | | | $ | (0.23 | ) | | $ | (0.21 | ) | | $ | (0.44 | ) | | $ | — | | | $ | 15.72 | | | | 13.23 | % | | $ | 9.1 | | | | 2.68 | % | | | 0.72 | %^^ | | | 1.40 | % | | | 118 | % | |
8/31/2015 | | $ | 16.51 | | | $ | 0.19 | | | $ | (1.35 | ) | | $ | (1.16 | ) | | $ | (0.15 | ) | | $ | (0.85 | ) | | $ | (1.00 | ) | | $ | — | | | $ | 14.35 | | | | (7.42 | )% | | $ | 13.1 | | | | 1.82 | % | | | 0.70 | % | | | 1.24 | % | | | 166 | % | |
8/31/2014 | | $ | 13.52 | | | $ | 0.17 | | | $ | 2.92 | | | $ | 3.09 | | | $ | (0.10 | ) | | $ | — | | | $ | (0.10 | ) | | $ | — | | | $ | 16.51 | | | | 22.98 | % | | $ | 12.6 | | | | 2.41 | % | | | 0.70 | % | | | 1.12 | % | | | 129 | % | |
8/31/2013 | | $ | 11.18 | | | $ | 0.16 | | | $ | 2.40 | | | $ | 2.56 | | | $ | (0.22 | ) | | $ | — | | | $ | (0.22 | ) | | $ | — | | | $ | 13.52 | | | | 23.23 | % | | $ | 6.9 | | | | 5.93 | % | | | 0.71 | % | | | 1.25 | % | | | 250 | % | |
See Notes to Financial Highlights
249
250
Financial Highlights (cont'd)
| | | Net Asset
Value,
Beginning
of Year | | Net
Investment
Income (Loss)@ | | Net Gains or
Losses on
Securities
(both realized
and
unrealized) | | Total From
Investment
Operations | | Dividends
from Net
Investment
Income | | Distributions
from Net
Realized
Capital Gains | | Total
Distributions | | Voluntary
Contribution
from
Management | | Net Asset
Value, End of
Year | | Total Returnab | | Net Assets,
End of Year
(in millions) | | Ratio of Gross
Expenses to
Average Net
Assets# | | Ratio of Net
Expenses to
Average Net
Assets## | | Ratio of Net
Investment
Income/
(Loss) to
Average Net
Assets | | Portfolio
Turnover
Rate | |
Value Fund (cont'd) | |
Class A | |
8/31/2017 | | $ | 15.62 | | | $ | 0.18 | | | $ | 2.29 | | | $ | 2.47 | | | $ | (0.07 | ) | | $ | — | | | $ | (0.07 | ) | | $ | — | | | $ | 18.02 | | | | 15.83 | % | | $ | 2.7 | | | | 2.60 | % | | | 1.08 | % | | | 1.08 | % | | | 115 | % | |
8/31/2016 | | $ | 14.25 | | | $ | 0.14 | | | $ | 1.60 | | | $ | 1.74 | | | $ | (0.16 | ) | | $ | (0.21 | ) | | $ | (0.37 | ) | | $ | — | | | $ | 15.62 | | | | 12.70 | % | | $ | 3.8 | | | | 3.08 | % | | | 1.10 | %^^ | | | 1.02 | % | | | 118 | % | |
8/31/2015 | | $ | 16.40 | | | $ | 0.13 | | | $ | (1.33 | ) | | $ | (1.20 | ) | | $ | (0.10 | ) | | $ | (0.85 | ) | | $ | (0.95 | ) | | $ | — | | | $ | 14.25 | | | | (7.71 | )% | | $ | 7.3 | | | | 2.21 | % | | | 1.08 | % | | | 0.84 | % | | | 166 | % | |
8/31/2014 | | $ | 13.44 | | | $ | 0.11 | | | $ | 2.90 | | | $ | 3.01 | | | $ | (0.05 | ) | | $ | — | | | $ | (0.05 | ) | | $ | — | | | $ | 16.40 | | | | 22.43 | % | | $ | 8.0 | | | | 2.80 | % | | | 1.10 | % | | | 0.74 | % | | | 129 | % | |
8/31/2013 | | $ | 11.13 | | | $ | 0.10 | | | $ | 2.40 | | | $ | 2.50 | | | $ | (0.19 | ) | | $ | — | | | $ | (0.19 | ) | | $ | — | | | $ | 13.44 | | | | 22.72 | % | | $ | 3.7 | | | | 6.81 | % | | | 1.11 | % | | | 0.82 | % | | | 250 | % | |
Class C | |
8/31/2017 | | $ | 15.33 | | | $ | 0.06 | | | $ | 2.22 | | | $ | 2.28 | | | $ | (0.09 | ) | | $ | — | | | $ | (0.09 | ) | | $ | — | | | $ | 17.52 | | | | 14.92 | % | | $ | 3.5 | | | | 3.31 | % | | | 1.83 | % | | | 0.37 | % | | | 115 | % | |
8/31/2016 | | $ | 14.02 | | | $ | 0.04 | | | $ | 1.57 | | | $ | 1.61 | | | $ | (0.09 | ) | | $ | (0.21 | ) | | $ | (0.30 | ) | | $ | — | | | $ | 15.33 | | | | 11.92 | % | | $ | 0.5 | | | | 3.87 | % | | | 1.84 | %^^ | | | 0.29 | % | | | 118 | % | |
8/31/2015 | | $ | 16.18 | | | $ | 0.01 | | | $ | (1.32 | ) | | $ | (1.31 | ) | | $ | (0.00 | ) | | $ | (0.85 | ) | | $ | (0.85 | ) | | $ | — | | | $ | 14.02 | | | | (8.44 | )% | | $ | 0.5 | | | | 2.98 | % | | | 1.83 | % | | | 0.07 | % | | | 166 | % | |
8/31/2014 | | $ | 13.31 | | | $ | (0.01 | ) | | $ | 2.88 | | | $ | 2.87 | | | $ | — | | | $ | — | | | $ | — | | | $ | — | | | $ | 16.18 | | | | 21.56 | % | | $ | 0.6 | | | | 3.57 | % | | | 1.86 | % | | | (0.05 | )% | | | 129 | % | |
8/31/2013 | | $ | 11.05 | | | $ | 0.00 | | | $ | 2.39 | | | $ | 2.39 | | | $ | (0.13 | ) | | $ | — | | | $ | (0.13 | ) | | $ | — | | | $ | 13.31 | | | | 21.82 | % | | $ | 0.3 | | | | 7.31 | % | | | 1.87 | % | | | 0.01 | % | | | 250 | % | |
See Notes to Financial Highlights
251
252
Notes to Financial Highlights
@ Calculated based on the average number of shares outstanding during each fiscal period.
# Represents the annualized ratios of net expenses to average daily net assets if Management had not reimbursed certain expenses and/or waived a portion of the investment management fee and/or if certain Funds did not receive the Custodian Out-of-Pocket Expenses Refunded, as listed in Note G of Notes to Financial Statements.
## Prior to January 1, 2013, the Fund had an expense offset arrangement in connection with its custodian contract. The impact of expense reductions related to expense offset arrangements, if any, was less than 0.01%.
^ The date investment operations commenced.
* Not annualized.
** Annualized.
‡ Organization expense, which is a non-recurring expense, is included in these ratios on a non-annualized basis.
§ After repayment of expenses previously reimbursed and/or fees previously waived by Management, as applicable. Had the Fund not made such repayments, the annualized ratios of net expenses to average net assets would have been:
| | | Year Ended August 31, | |
| | | 2017 | | 2016 | | 2015 | | 2014 | | 2013 | |
Equity Income Class R3 | | | — | | | | — | | | | — | | | | 1.32 | % | | | 1.31 | % | |
Genesis Institutional Class | | | 0.84 | % | | | 0.85 | % | | | — | | | | 0.85 | % | | | — | | |
Genesis Class R6 | | | 0.77 | % | | | 0.78 | % | | | — | | | | 0.78 | % | | | — | | |
Guardian Advisor Class | | | — | | | | 1.26 | % | | | — | | | | — | | | | 1.30 | % | |
Guardian Class A | | | — | | | | — | | | | — | | | | 1.08 | % | | | 1.10 | % | |
Guardian Class C | | | — | | | | — | | | | — | | | | 1.84 | % | | | — | | |
International Equity Institutional Class | | | 0.84 | % | | | 0.85 | % | | | 0.83 | % | | | — | | | | — | | |
International Equity Class A | | | 1.20 | % | | | — | | | | 1.20 | % | | | — | | | | — | | |
International Equity Class C | | | 1.96 | % | | | — | | | | — | | | | — | | | | — | | |
International Equity Class R6 | | | — | | | | — | | | | 0.76 | % | | | — | | | | — | | |
Large Cap Value Institutional Class | | | 0.69 | % | | | — | | | | 0.70 | % | | | 0.70 | % | | | — | | |
Large Cap Value Class A | | | — | | | | — | | | | — | | | | 1.08 | % | | | — | | |
Large Cap Value Class C | | | — | | | | — | | | | 1.82 | % | | | 1.82 | % | | | 1.86 | % | |
Mid Cap Growth Institutional Class | | | — | | | | 0.73 | % | | | 0.73 | % | | | — | | | | — | | |
Mid Cap Growth Class A | | | 1.09 | % | | | 1.10 | % | | | 1.10 | % | | | — | | | | — | | |
Mid Cap Growth Class C | | | 1.86 | % | | | — | | | | — | | | | — | | | | — | | |
Mid Cap Growth Class R6 | | | — | | | | — | | | | 0.67 | % | | | — | | | | — | | |
Mid Cap Intrinsic Value Trust Class | | | 1.24 | % | | | — | | | | — | | | | 1.23 | % | | | — | | |
Mid Cap Intrinsic Value Institutional Class | | | — | | | | — | | | | — | | | | 0.82 | % | | | — | | |
Mid Cap Intrinsic Value Class A | | | — | | | | — | | | | — | | | | 1.21 | % | | | — | | |
Mid Cap Intrinsic Value Class C | | | — | | | | — | | | | — | | | | 1.94 | % | | | — | | |
Multi-Cap Opportunities Institutional Class | | | — | | | | — | | | | — | | | | — | | | | 0.82 | % | |
Multi-Cap Opportunities Class A | | | — | | | | — | | | | — | | | | — | | | | 1.16 | % | |
Multi-Cap Opportunities Class C | | | — | | | | — | | | | — | | | | — | | | | 1.92 | % | |
Socially Responsive Class A | | | — | | | | — | | | | — | | | | — | | | | 1.08 | % | |
Socially Responsive Class C | | | — | | | | — | | | | — | | | | — | | | | 1.83 | % | |
^^ Represents the annualized ratio of net expenses to average daily net assets after utilization of the Line of Credit by Greater China Equity (2015, 2016 and 2017) and Value (2016) and/or reimbursement of expenses and/or waiver of
253
Notes to Financial Highlights (cont'd)
a portion of the investment management fee by Management. The Funds are required to calculate an expense ratio without taking into consideration any expense reductions related to expense offset arrangements. Had Greater China Equity and Value not utilized the Line of Credit, or had Management not undertaken such action, the annualized ratios of net expenses to average daily net assets would have been:
| | | Year Ended August 31, | |
| | | 2017 | | 2016 | | 2015 | |
Greater China Equity Institutional Class | | | 1.50 | % | | | 1.51 | % | | | 1.50 | % | |
Greater China Equity Class A | | | 1.86 | % | | | 1.87 | % | | | 1.86 | % | |
Greater China Equity Class C | | | 2.61 | % | | | 2.62 | % | | | 2.61 | % | |
Value Institutional Class | | | — | | | | 0.71 | % | | | — | | |
Value Class A | | | — | | | | 1.10 | % | | | — | | |
Value Class C | | | — | | | | 1.84 | % | | | — | | |
a Except for the Fund classes listed below, the class action proceeds listed in Note A of the Notes to Financial Statements, if any, had no impact on the Funds' total returns for the year ended August 31, 2017. Had the Fund classes listed below not received class action proceeds in 2017, total return based on per share NAV for the year ended August 31, 2017 would have been:
Mid Cap Intrinsic Value Class A | | | 16.89 | % | |
Small Cap Growth Investor Class | | | 21.91 | % | |
Small Cap Growth Trust Class | | | 21.68 | % | |
Small Cap Growth Advisor Class | | | 21.47 | % | |
Small Cap Growth Institutional Class | | | 22.23 | % | |
Small Cap Growth Class A | | | 21.81 | % | |
Small Cap Growth Class C | | | 20.94 | % | |
Small Cap Growth Class R3 | | | 21.47 | % | |
Except for the Fund classes listed below, the class action proceeds received in 2016, 2015, 2014 and 2013, if any, had no impact on the Funds' total returns for the years ended August 31, 2016, 2015, 2014 and/or 2013. Had the Fund classes listed below not received class action proceeds in 2016, 2015, 2014 and/or 2013, total return based on per share NAV for the years ended August 31, 2016, 2015, 2014 and/or 2013 would have been:
| | | Year Ended August 31, | |
| | 2016 | | 2015 | | 2014 | | 2013 | |
Genesis Investor Class | | | — | | | | — | | | | 13.62 | % | | | — | | |
Genesis Trust Class | | | — | | | | — | | | | 13.51 | % | | | — | | |
Genesis Advisor Class | | | — | | | | — | | | | 13.21 | % | | | — | | |
Genesis Institutional Class | | | — | | | | — | | | | 13.78 | % | | | — | | |
Genesis Class R6 | | | — | | | | — | | | | 13.90 | % | | | — | | |
Large Cap Value Investor Class | | | — | | | | (7.26 | )% | | | — | | | | 23.93 | % | |
Large Cap Value Trust Class | | | — | | | | (7.45 | )% | | | — | | | | 23.61 | % | |
Large Cap Value Advisor Class | | | — | | | | — | | | | — | | | | 23.46 | % | |
Large Cap Value Institutional Class | | | — | | | | (7.09 | )% | | | — | | | | 24.11 | % | |
Large Cap Value Class A | | | — | | | | (7.49 | )% | | | — | | | | 23.57 | % | |
Large Cap Value Class R3 | | | — | | | | (7.71 | )% | | | — | | | | 23.41 | % | |
Mid Cap Intrinsic Value Investor Class | | | — | | | | — | | | | 22.79 | % | | | — | | |
Mid Cap Intrinsic Value Trust Class | | | — | | | | — | | | | 22.41 | % | | | — | | |
Mid Cap Intrinsic Value Institutional Class | | | — | | | | — | | | | — | | | | — | | |
254
Notes to Financial Highlights (cont'd)
| | | Year Ended August 31, | |
| | | 2016 | | 2015 | | 2014 | | 2013 | |
Mid Cap Intrinsic Value Class R3 | | | — | | | | — | | | | 22.17 | % | | | — | | |
Small Cap Growth Investor Class | | | (3.27 | )% | | | 7.07 | % | | | — | | | | 23.81 | % | |
Small Cap Growth Trust Class | | | (3.40 | )% | | | 6.86 | % | | | — | | | | 23.45 | % | |
Small Cap Growth Advisor Class | | | (3.50 | )% | | | 6.72 | % | | | — | | | | 23.31 | % | |
Small Cap Growth Institutional Class | | | (2.99 | )% | | | 7.41 | % | | | — | | | | 24.05 | % | |
Small Cap Growth Class A | | | (3.31 | )% | | | 7.05 | % | | | — | | | | 23.84 | % | |
Small Cap Growth Class C | | | (4.02 | )% | | | 6.37 | % | | | — | | | | 22.92 | % | |
Small Cap Growth Class R3 | | | (3.54 | )% | | | 6.81 | % | | | — | | | | 23.47 | % | |
b Total return based on per share NAV reflects the effects of changes in NAV on the performance of each Fund during each fiscal period. Returns assume income dividends and other distributions, if any, were reinvested, but do not reflect the effect of sales charges. Results represent past performance and do not indicate future results. Current returns may be lower or higher than the performance data quoted. Investment returns and principal may fluctuate and shares when redeemed may be worth more or less than original cost. Total return would have been lower if Management had not reimbursed and/or waived certain expenses. Total return would have been higher if Management had not recouped previously reimbursed and/or waived expenses.
c The voluntary contributions received in 2014 had no impact on the Funds' total return for the year ended August 31, 2014.
d Portfolio turnover is calculated at the Fund level. Percentage indicated was calculated for the year ended August 31, 2013 for Emerging Markets Equity, Genesis, International Equity, Mid Cap Growth, Real Estate and Socially Responsive, for the year ended August 31, 2014 for International Equity and for the year ended August 31, 2017 for International Select.
e The voluntary contributions listed in Note B of the Notes to Financial Statements had no impact on the Funds' total returns for the year ended August 31, 2017. Had Mid Cap Growth not received the voluntary contribution listed in Note B of the Notes to Financial Statements, the total return based on per share NAV for the year ended August 31, 2016, would have been:
Mid Cap Growth Investor Class | | | (1.78 | )% | |
Mid Cap Growth Trust Class | | | (1.90 | )% | |
Mid Cap Growth Advisor Class | | | (2.13 | )% | |
Mid Cap Growth Institutional Class | | | (1.66 | )% | |
Mid Cap Growth Class A | | | (2.04 | )% | |
Mid Cap Growth Class C | | | (2.66 | )% | |
Mid Cap Growth Class R3 | | | (2.21 | )% | |
Mid Cap Growth Class R6 | | | (1.51 | )% | |
255
Notes to Financial Highlights (cont'd)
f Custodian Out-of-Pocket Expenses Refunded, as listed in Note G of the Notes to Financial Statements, is non-recurring, and is included in these ratios. Had the Funds not received the refund the annualized ratios of net expenses to average net assets and net investment income/(loss) to average net assets would have been:
| | | Ratio of Net
Expenses
to Average
Net Assets
Year Ended
August 31,
2017 | | Ratio of Net
Investment
Income/(Loss)
to Average
Net Assets
Year Ended
August 31,
2017 | |
Equity Income Institutional Class | | | 0.69 | % | | | 2.99 | % | |
Equity Income Class A | | | 1.05 | % | | | 2.56 | % | |
Equity Income Class C | | | 1.80 | % | | | 1.82 | % | |
Equity Income Class R3 | | | 1.34 | % | | | 2.27 | % | |
Focus Investor Class | | | 0.92 | % | | | 0.27 | % | |
Focus Trust Class | | | 1.10 | % | | | 0.09 | % | |
Focus Advisor Class | | | 1.26 | % | | | (0.08 | )% | |
Genesis Investor Class | | | 1.02 | % | | | 0.21 | % | |
Genesis Trust Class | | | 1.09 | % | | | 0.12 | % | |
Genesis Advisor Class | | | 1.36 | % | | | (0.14 | )% | |
Genesis Institutional Class | | | 0.85 | % | | | 0.38 | % | |
Genesis Class R6 | | | 0.77 | % | | | 0.45 | % | |
Guardian Investor Class | | | 0.90 | % | | | 0.75 | % | |
Guardian Trust Class | | | 1.07 | % | | | 0.57 | % | |
Guardian Advisor Class | | | 1.38 | % | | | 0.25 | % | |
Guardian Institutional Class | | | 0.72 | % | | | 0.94 | % | |
Guardian Class A | | | 1.10 | % | | | 0.55 | % | |
Guardian Class C | | | 1.84 | % | | | (0.20 | )% | |
Guardian Class R3 | | | 1.36 | % | | | 0.28 | % | |
International Equity Investor Class | | | 1.05 | % | | | 0.97 | % | |
International Equity Trust Class | | | 1.09 | % | | | 0.91 | % | |
International Equity Institutional Class | | | 0.85 | % | | | 1.19 | % | |
International Equity Class A | | | — | % | | | 0.65 | % | |
International Equity Class C | | | — | % | | | 0.04 | % | |
International Equity Class R6 | | | — | % | | | 1.31 | % | |
Large Cap Value Investor Class | | | 0.87 | % | | | 1.30 | % | |
Large Cap Value Trust Class | | | 1.05 | % | | | 1.11 | % | |
Large Cap Value Advisor Class | | | 1.20 | % | | | 0.97 | % | |
Large Cap Value Institutional Class | | | 0.70 | % | | | 1.49 | % | |
Large Cap Value Class A | | | 1.07 | % | | | 1.11 | % | |
Large Cap Value Class C | | | 1.81 | % | | | 0.36 | % | |
Large Cap Value Class R3 | | | 1.36 | % | | | 0.90 | % | |
Mid Cap Growth Investor Class | | | 0.93 | % | | | (0.30 | )% | |
256
Notes to Financial Highlights (cont'd)
| | | Ratio of Net
Expenses
to Average
Net Assets
Year Ended
August 31,
2017 | | Ratio of Net
Investment
Income/(Loss)
to Average
Net Assets
Year Ended
August 31,
2017 | |
Mid Cap Growth Trust Class | | | 0.97 | % | | | (0.34 | )% | |
Mid Cap Growth Advisor Class | | | 1.23 | % | | | (0.60 | )% | |
Mid Cap Growth Institutional Class | | | 0.72 | % | | | (0.09 | )% | |
Mid Cap Growth Class A | | | 1.11 | % | | | (0.49 | )% | |
Mid Cap Growth Class R6 | | | 0.65 | % | | | (0.02 | )% | |
Mid Cap Intrinsic Value Investor Class | | | 1.07 | % | | | 1.00 | % | |
Mid Cap Intrinsic Value Trust Class | | | 1.25 | % | | | 0.82 | % | |
Mid Cap Intrinsic Value Institutional Class | | | 0.85 | % | | | 1.19 | % | |
Mid Cap Intrinsic Value Class A | | | 1.21 | % | | | 0.89 | % | |
Mid Cap Intrinsic Value Class C | | | 1.96 | % | | | 0.15 | % | |
Multi-Cap Opportunities Institutional Class | | | 0.75 | % | | | 0.68 | % | |
Multi-Cap Opportunities Class A | | | 1.10 | % | | | 0.32 | % | |
Multi-Cap Opportunities Class C | | | 1.84 | % | | | (0.40 | )% | |
Small Cap Growth Investor Class | | | 1.21 | % | | | (0.87 | )% | |
Small Cap Growth Advisor Class | | | 1.51 | % | | | (1.18 | )% | |
Socially Responsive Investor Class | | | 0.85 | % | | | 0.66 | % | |
Socially Responsive Trust Class | | | 1.02 | % | | | 0.49 | % | |
Socially Responsive Institutional Class | | | 0.66 | % | | | 0.84 | % | |
Socially Responsive Class A | | | 1.03 | % | | | 0.48 | % | |
Socially Responsive Class C | | | 1.78 | % | | | (0.27 | )% | |
Socially Responsive Class R3 | | | 1.28 | % | | | 0.21 | % | |
Socially Responsive Class R6 | | | 0.59 | % | | | 0.91 | % | |
g On January 25, 2013, International Equity acquired all of the net assets of Neuberger Berman International Fund pursuant to a Plan of Reorganization and Dissolution. Portfolio turnover excludes purchases and sales of securities by International (acquired fund) prior to the merger date.
h Except for the Fund classes listed below, total return would have been the same for the year ended August 31, 2017, if the Funds had not received the refund listed in Note G of the Notes to Financial Statements. Had the Funds not received the refund listed in Note G of the Notes to Financial Statements, the total return would have been:
| | Year Ended August 31, 2017 | |
Guardian Advisor Class | | | 17.00 | % | |
International Equity Investor Class | | | 15.58 | % | |
International Equity Trust Class | | | 15.53 | % | |
Mid Cap Intrinsic Value Investor Class | | | 17.14 | % | |
257
Reports of Independent Registered Public Accounting Firms
To the Board of Trustees
Neuberger Berman Equity Funds and Shareholders of:
Neuberger Berman Dividend Growth Fund
Neuberger Berman Emerging Markets Equity Fund
Neuberger Berman Equity Income Fund
Neuberger Berman Focus Fund
Neuberger Berman Genesis Fund
Neuberger Berman Global Equity Fund
Neuberger Berman Global Real Estate Fund
Neuberger Berman Greater China Equity Fund
Neuberger Berman Guardian Fund
Neuberger Berman International Equity Fund
Neuberger Berman International Select Fund
Neuberger Berman International Small Cap Fund
Neuberger Berman Large Cap Value Fund
Neuberger Berman Real Estate Fund
Neuberger Berman Value Fund
We have audited the accompanying statements of assets and liabilities, including the schedules of investments, of Neuberger Berman Dividend Growth Fund, Neuberger Berman Emerging Markets Equity Fund, Neuberger Berman Equity Income Fund, Neuberger Berman Focus Fund, Neuberger Berman Genesis Fund, Neuberger Berman Global Equity Fund, Neuberger Berman Global Real Estate Fund, Neuberger Berman Greater China Equity Fund, Neuberger Berman Guardian Fund, Neuberger Berman International Equity Fund, Neuberger Berman International Select Fund, Neuberger Berman International Small Cap Fund, Neuberger Berman Large Cap Value Fund, Neuberger Berman Real Estate Fund, and Neuberger Berman Value Fund, fifteen of the series constituting Neuberger Berman Equity Funds (the "Trust") as of August 31, 2017, and the related statements of operations for the period then ended, and the statements of changes in net assets and the financial highlights for each of the periods indicated therein. These financial statements and financial highlights are the responsibility of the Trust's management. Our responsibility is to express an opinion on these financial statements and financial highlights based on our audits.
We conducted our audits in accordance with the standards of the Public Company Accounting Oversight Board (United States). Those standards require that we plan and perform the audit to obtain reasonable assurance about whether the financial statements and financial highlights are free of material misstatement. We were not engaged to perform an audit of the Trust's internal control over financial reporting. Our audits included consideration of internal control over financial reporting as a basis for designing audit procedures that are appropriate in the circumstances, but not for the purpose of expressing an opinion on the effectiveness of the Trust's internal control over financial reporting. Accordingly, we express no such opinion. An audit also includes examining, on a test basis, evidence supporting the amounts and disclosures in the financial statements and financial highlights, assessing the accounting principles used and significant estimates made by management, and evaluating the overall financial statement presentation. Our procedures included confirmation of securities owned as of August 31, 2017, by correspondence with the custodian and others or by other appropriate auditing procedures where replies from others were not received. We believe that our audits provide a reasonable basis for our opinion.
258
In our opinion, the financial statements and financial highlights referred to above present fairly, in all material respects, the financial position of the above-mentioned series of the Neuberger Berman Equity Funds, at August 31, 2017, the results of their operations for the period then ended, and the changes in their net assets and the financial highlights for each of the periods indicated therein, in conformity with U.S. generally accepted accounting principles.

Boston, Massachusetts
October 20, 2017
259
Reports of Independent Registered Public Accounting Firms
To the Board of Trustees and Shareholders
Neuberger Berman Equity Funds
We have audited the accompanying statements of assets and liabilities of the Neuberger Berman Intrinsic Value Fund, Neuberger Berman Mid Cap Growth Fund, Neuberger Berman Mid Cap Intrinsic Value Fund , Neuberger Berman Multi-Cap Opportunities Fund, Neuberger Berman Small Cap Growth Fund, and Neuberger Berman Socially Responsive Fund, each a series of Neuberger Berman Equity Funds (the "Trust"), including the schedules of investments, as of August 31, 2017, and the related statements of operations for the year then ended, the statements of changes in net assets and the financial highlights for the periods indicated therein. These financial statements and financial highlights are the responsibility of the Trust's management. Our responsibility is to express an opinion on these financial statements and financial highlights based on our audits.
We conducted our audits in accordance with the standards of the Public Company Accounting Oversight Board (United States). Those standards require that we plan and perform the audit to obtain reasonable assurance about whether the financial statements and financial highlights are free of material misstatement. The Trust is not required to have, nor were we engaged to perform, an audit of its internal control over financial reporting. Our audits included consideration of internal control over financial reporting as a basis for designing audit procedures that are appropriate in the circumstances, but not for the purpose of expressing an opinion on the effectiveness of the Trust's internal control over financial reporting. Accordingly, we express no such opinion. An audit also includes examining, on a test basis, evidence supporting the amounts and disclosures in the financial statements and financial highlights, assessing the accounting principles used and significant estimates made by management, as well as evaluating the overall financial statement presentation. Our procedures included confirmation of securities owned as of August 31, 2017, by correspondence with the custodian and brokers. We believe that our audits provide a reasonable basis for our opinion.
In our opinion, the financial statements and financial highlights referred to above present fairly, in all material respects, the financial position of the above mentioned series of the Trust, as of August 31, 2017, and the results of their operations, the changes in their net assets, and the financial highlights for the periods indicated therein, in conformity with accounting principles generally accepted in the United States of America.

Philadelphia, Pennsylvania
October 20, 2017
260
Investment Manager and Administrator
Neuberger Berman Investment Advisers LLC
1290 Avenue of the Americas
New York, NY 10104-0002
212.476.8800
Intermediary Client Services 800.366.6264
Distributor
Neuberger Berman BD LLC
1290 Avenue of the Americas
New York, NY 10104-0002
800.877.9700 or 212.476.8800
Intermediary Client Services
800.366.6264
Sub-Adviser
Green Court Capital Management Limited
Jardine House, 1 Connaught Place
Suites 2010-2020, 20th Floor
Central Hong Kong
Custodian and Shareholder Servicing Agent
State Street Bank and Trust Company
One Lincoln Street
Boston, MA 02111
For Investor Class Shareholders
Address correspondence to:
Neuberger Berman Funds
Boston Service Center
P.O. Box 8403
Boston, MA 02266-8403
800.877.9700 or 212.476.8800
For Class A, Class C, Class R3 and Class R6 Shareholders:
Please contact your investment provider
For Trust Class, Advisor Class and Institutional Class Shareholders
Address correspondence to:
Neuberger Berman Investment Advisers LLC
1290 Avenue of the Americas
New York, NY 10104-0002
Attn: Intermediary Client Services
800.366.6264
Legal Counsel
K&L Gates LLP
1601 K Street, NW
Washington, DC 20006-1600
Independent Registered Public Accounting Firms
Ernst & Young LLP
200 Clarendon Street
Boston, MA 02116
Tait, Weller & Baker LLP
1818 Market Street
Suite 2400
Philadelphia, PA 19103
261
Information about the Board of Trustees
Name, (Year of Birth),
and Address(1) | | Position(s)
and Length of
Time Served(2) | | Principal Occupation(s)(3) | | Number of
Funds in
Fund Complex | | Other Directorships Held
Outside Fund Complex by
Fund Trustee(3) Overseen
by Fund Trustee | |
Independent Fund Trustees | | | | | | | | | |
Michael J. Cosgrove (1949) | | Trustee since 2015 | | President, Carragh Consulting USA, since 2014; formerly, Executive, General Electric Company, 1970 to 2014, including President, Mutual Funds and Global Investment Programs, GE Asset Management, 2011 to 2014, President and Chief Executive Officer, Mutual Funds and Intermediary Business, GE Asset Management, 2007 to 2011, President, Institutional Sales and Marketing, GE Asset Management, 1998 to 2007, and Chief Financial Officer, GE Asset Management, and Deputy Treasurer, GE Company, 1988 to 1993. | | | 56 | | | Director, America Press, Inc. (not-for-profit Jesuit publisher), since 2015; Director, Fordham University, since 2001; formerly, Director, The Gabelli Go Anywhere Trust, June 2015 to June 2016; Director, Skin Cancer Foundation (not-for-profit), 2006 to 2015; Director, GE Investments Funds, Inc., 1997 to 2014; Trustee, GE Institutional Funds, 1997 to 2014; Director, GE Asset Management, 1988 to 2014; Director, Elfun Trusts, 1988 to 2014; Trustee, GE Pension & Benefit Plans, 1988 to 2014. | |
Marc Gary (1952) | | Trustee since 2015 | | Executive Vice Chancellor and Chief Operating Officer, Jewish Theological Seminary, since 2012; formerly, Executive Vice President and General Counsel, Fidelity Investments, 2007 to 2012; Executive Vice President and General Counsel, BellSouth Corporation, 2004 to 2007; Vice President and Associate General Counsel, BellSouth Corporation, 2000 to 2004; Associate, Partner, and National Litigation Practice Co-Chair, Mayer, Brown LLP, 1981 to 2000; Associate Independent Counsel, Office of Independent Counsel, 1990 to 1992. | | | 56 | | | Trustee, Jewish Theological Seminary, since 2015; Director, Counsel on Call (privately held for-profit company), since 2012; Director, Lawyers Committee for Civil Rights Under Law (not-for-profit), since 2005; formerly, Director, Equal Justice Works (not-for-profit), 2005 to 2014; Director, Corporate Counsel Institute, Georgetown University Law Center, 2007 to 2012; Director, Greater Boston Legal Services (not-for-profit), 2007 to 2012. | |
262
Name, (Year of Birth),
and Address(1) | | Position(s)
and Length of
Time Served(2) | | Principal Occupation(s)(3) | | Number of
Funds in
Fund Complex | | Other Directorships Held
Outside Fund Complex by
Fund Trustee(3) Overseen
by Fund Trustee | |
Martha C. Goss (1949) | | Trustee since 2007 | | President, Woodhill Enterprises Inc./Chase Hollow Associates LLC (personal investment vehicle), since 2006; formerly, Consultant, Resources Global Professionals (temporary staffing), 2002 to 2006. | | | 56 | | | Director, American Water (water utility), since 2003; Director, Allianz Life of New York (insurance), since 2005; Director, Berger Group Holdings, Inc. (engineering consulting firm), since 2013; Director, Financial Women's Association of New York (not-for-profit association), since 2003; Trustee Emerita, Brown University, since 1998; Director, Museum of American Finance (not-for-profit), since 2013; formerly, Non-Executive Chair and Director, Channel Reinsurance (financial guaranty reinsurance), 2006 to 2010; formerly, Director, Ocwen Financial Corporation (mortgage servicing), 2005 to 2010; formerly, Director, Claire's Stores, Inc. (retailer), 2005 to 2007; formerly, Director, Parsons Brinckerhoff Inc. (engineering consulting firm), 2007 to 2010; formerly, Director, Bank Leumi (commercial bank), 2005 to 2007; formerly, Advisory Board Member, Attensity (software developer), 2005 to 2007. | |
263
Name, (Year of Birth),
and Address(1) | | Position(s)
and Length of
Time Served(2) | | Principal Occupation(s)(3) | | Number of
Funds in
Fund Complex | | Other Directorships Held
Outside Fund Complex by
Fund Trustee(3) Overseen
by Fund Trustee | |
Michael M. Knetter (1960) | | Trustee since 2007 | | President and Chief Executive Officer, University of Wisconsin Foundation, since October 2010; formerly, Dean, School of Business, University of Wisconsin—Madison; formerly, Professor of International Economics and Associate Dean, Amos Tuck School of Business—Dartmouth College, 1998 to 2002. | | | 56 | | | Board Member, American Family Insurance (a mutual company, not publicly traded), since March 2009; formerly, Trustee, Northwestern Mutual Series Fund, Inc., 2007 to 2011; formerly, Director, Wausau Paper, 2005 to 2011; formerly, Director, Great Wolf Resorts, 2004 to 2009. | |
Deborah C. McLean (1954) | | Trustee since 2015 | | Member, Circle Financial Group (private wealth management membership practice), since 2011; Managing Director, Golden Seeds LLC (an angel investing group), since 2009; Adjunct Professor, Columbia University School of International and Public Affairs, since 2008; formerly, Visiting Assistant Professor, Fairfield University, Dolan School of Business, Fall 2007; formerly, Adjunct Associate Professor of Finance, Richmond, The American International University in London, 1999 to 2007. | | | 56 | | | Board member, Norwalk Community College Foundation, since 2014; Dean's Advisory Council, Radcliffe Institute for Advanced Study, since 2014; formerly, Director and Treasurer, At Home in Darien (not-for-profit), 2012 to 2014; Director, National Executive Service Corps (not-for-profit), 2012 to 2013; Trustee, Richmond, The American International University in London, 1999 to 2013. | |
264
Name, (Year of Birth),
and Address(1) | | Position(s)
and Length of
Time Served(2) | | Principal Occupation(s)(3) | | Number of
Funds in
Fund Complex | | Other Directorships Held
Outside Fund Complex by
Fund Trustee(3) Overseen
by Fund Trustee | |
George W. Morriss (1947) | | Trustee since 2007 | | Adjunct Professor, Columbia University School of International and Public Affairs, since October 2012; formerly, Executive Vice President and Chief Financial Officer, People's United Bank, Connecticut (a financial services company), 1991 to 2001. | | | 56 | | | Director, National Association of Corporate Directors, Connecticut Chapter, since 2011; Trustee, Steben Alternative Investment Funds, Steben Select Multi-Strategy Fund, and Steben Select Multi-Strategy Master Fund, since 2013; formerly, Treasurer, National Association of Corporate Directors, Connecticut Chapter, 2011 to 2015; formerly, Manager, Larch Lane Multi-Strategy Fund complex (which consisted of three funds), 2006 to 2011; formerly, Member, NASDAQ Issuers' Affairs Committee, 1995 to 2003. | |
Tom D. Seip (1950) | | Trustee since 2000; Chairman of the Board since 2008; formerly Lead Independent Trustee from 2006 to 2008 | | General Partner, Ridgefield Farm LLC (a private investment vehicle); formerly, President and CEO, Westaff, Inc. (temporary staffing), May 2001 to January 2002; formerly, Senior Executive, The Charles Schwab Corporation, 1983 to 1998, including Chief Executive Officer, Charles Schwab Investment Management, Inc.; Trustee, Schwab Family of Funds and Schwab Investments, 1997 to 1998; and Executive Vice President-Retail Brokerage, Charles Schwab & Co., Inc., 1994 to 1997. | | | 56 | | | Director, H&R Block, Inc. (financial services company), since May 2001; Chairman, Governance and Nominating Committee, H&R Block, Inc., since 2011; formerly, Chairman, Compensation Committee, H&R Block, Inc., 2006 to 2010; formerly, Director, Forward Management, Inc. (asset management company), 1999 to 2006. | |
265
Name, (Year of Birth),
and Address(1) | | Position(s)
and Length of
Time Served(2) | | Principal Occupation(s)(3) | | Number of
Funds in
Fund Complex | | Other Directorships Held
Outside Fund Complex by
Fund Trustee(3) Overseen
by Fund Trustee | |
James G. Stavridis (1955) | | Trustee since 2015 | | Dean, Fletcher School of Law and Diplomacy, Tufts University since 2013; formerly, Admiral, United States Navy, 2006 to 2013, including Supreme Allied Commander, NATO and Commander, European Command, 2009 to 2013, and Commander, United States Southern Command, 2006 to 2009. | | | 56 | | | Director, Utilidata Inc., since 2015; Director, BMC Software Federal, LLC, since 2014; Director, Vertical Knowledge, LLC, since 2013; formerly, Director, Navy Federal Credit Union, 2000-2002. | |
Candace L. Straight (1947) | | Trustee since 2000 | | Private investor and consultant specializing in the insurance industry; formerly, Advisory Director, Securitas Capital LLC (a global private equity investment firm dedicated to making investments in the insurance sector), 1998 to 2003. | | | 56 | | | Formerly, Public Member, Board of Governors and Board of Trustees, Rutgers University, 2011 to 2016; formerly, Director, Montpelier Re Holdings Ltd. (reinsurance company), 2006 to 2015; formerly, Director, National Atlantic Holdings Corporation (property and casualty insurance company), 2004 to 2008; formerly, Director, The Proformance Insurance Company (property and casualty insurance company), 2004 to 2008; formerly, Director, Providence Washington Insurance Company (property and casualty insurance company), 1998 to 2006; formerly, Director, Summit Global Partners (insurance brokerage firm), 2000 to 2005. | |
Peter P. Trapp (1944) | | Trustee since 2000 | | Retired; formerly, Regional Manager for Mid-Southern Region, Ford Motor Credit Company, September 1997 to 2007; formerly, President, Ford Life Insurance Company, April 1995 to August 1997. | | | 56 | | | None. | |
266
Name, (Year of Birth),
and Address(1) | | Position(s)
and Length of
Time Served(2) | | Principal Occupation(s)(3) | | Number of
Funds in
Fund Complex | | Other Directorships Held
Outside Fund Complex by
Fund Trustee(3) Overseen
by Fund Trustee | |
Fund Trustees who are "Interested Persons" | | | | | | | | | |
Joseph V. Amato* (1962) | | Trustee since 2009 | | President and Director, Neuberger Berman Group LLC, since 2009; President and Chief Executive Officer, Neuberger Berman BD LLC ("Neuberger Berman") and Neuberger Berman Holdings LLC (including its predecessor, Neuberger Berman Inc.), since 2007; Chief Investment Officer (Equities) and President (Equities), Neuberger Berman Investment Advisers LLC ("NBIA") (formerly, Neuberger Berman Fixed Income LLC ("NBFI") and including predecessor entities), since 2007, and Board Member of NBIA since 2006; formerly, Global Head of Asset Management of Lehman Brothers Holdings Inc.'s ("LBHI") Investment Management Division, 2006 to 2009; formerly, member of LBHI's Investment Management Division's Executive Management Committee, 2006 to 2009; formerly, Managing Director, Lehman Brothers Inc. ("LBI"), 2006 to 2008; formerly, Chief Recruiting and Development Officer, LBI, 2005 to 2006; formerly, Global Head of LBI's Equity Sales and a Member of its Equities Division Executive Committee, 2003 to 2005. | | | 56 | | | Member of Board of Advisors, McDonough School of Business, Georgetown University, since 2001; Member of New York City Board of Advisors, Teach for America, since 2005; Trustee, Montclair Kimberley Academy (private school), since 2007; Member of Board of Regents, Georgetown University, since 2013. | |
267
Name, (Year of Birth),
and Address(1) | | Position(s)
and Length of
Time Served(2) | | Principal Occupation(s)(3) | | Number of
Funds in
Fund Complex | | Other Directorships Held
Outside Fund Complex by
Fund Trustee(3) Overseen
by Fund Trustee | |
Robert Conti* (1956) | | Chief Executive Officer, President and Trustee since 2008; prior thereto, Executive Vice President in 2008 and Vice President from 2000 to 2008 | | Managing Director, Neuberger Berman, since 2007; President—Mutual Funds, NBIA, since 2008; formerly, Senior Vice President, Neuberger Berman, 2003 to 2006; formerly, Vice President, Neuberger Berman, 1999 to 2003; President and Chief Executive Officer, twenty-eight registered investment companies for which NBIA acts as investment manager and/or administrator. | | | 56 | | | Director, Staten Island Mental Health Society, since 1994; formerly, Chairman of the Board, Staten Island Mental Health Society, 2008 to 2011. | |
(1) The business address of each listed person is 1290 Avenue of the Americas, New York, NY 10104
(2) Pursuant to the Trust's Trust Instrument, each of these Trustees shall hold office for life or until his or her successor is elected or the Trust terminates; except that (a) any Trustee may resign by delivering a written resignation; (b) any Trustee may be removed with or without cause at any time by a written instrument signed by at least two-thirds of the other Trustees; (c) any Trustee who requests to be retired, or who has become unable to serve, may be retired by a written instrument signed by a majority of the other Trustees; and (d) any Trustee may be removed at any shareholder meeting by a vote of at least two-thirds of the outstanding shares.
(3) Except as otherwise indicated, each individual has held the positions shown during at least the last five years.
* Indicates a Trustee who is an "interested person" within the meaning of the 1940 Act. Mr. Amato and Mr. Conti are interested persons of the Trust by virtue of the fact that each is an officer of NBIA and/or its affiliates.
268
Information about the Officers of the Trust
Name, (Year of Birth),
and Address(1) | | Position(s)
and Length of
Time Served(2) | | Principal Occupation(s)(3) | |
Claudia A. Brandon (1956) | | Executive Vice President since 2008 and Secretary since 1985 | | Senior Vice President, Neuberger Berman, since 2007 and Employee since 1999; Senior Vice President, NBIA, since 2008 and Assistant Secretary since 2004; formerly, Vice President, Neuberger Berman, 2002 to 2006; formerly, Vice President—Mutual Fund Board Relations, NBIA, 2000 to 2008; formerly, Vice President, NBIA, 1986 to 1999 and Employee, 1984 to 1999; Executive Vice President, twenty-eight registered investment companies for which NBIA acts as investment manager and/or administrator; Secretary, fifteen registered investment companies for which NBIA acts as investment manager and/or administrator. | |
Agnes Diaz (1971) | | Vice President since 2013 | | Senior Vice President, Neuberger Berman, since 2012; Senior Vice President, NBIA, since 2012 and Employee since 1996; formerly, Vice President, Neuberger Berman, 2007 to 2012; Vice President, twenty-eight registered investment companies for which NBIA acts as investment manager and/or administrator. | |
Anthony DiBernardo (1979) | | Assistant Treasurer since 2011 | | Senior Vice President, Neuberger Berman, since 2014; Senior Vice President, NBIA, since 2014, and Employee since 2003; formerly, Vice President, Neuberger Berman, 2009 to 2014; Assistant Treasurer, ten registered investment companies for which NBIA acts as investment manager and/or administrator. | |
Corey A. Issing (1978) | | Chief Legal Officer since 2016 (only for purposes of sections 307 and 406 of the Sarbanes-Oxley Act of 2002) and Anti-Money Laundering Compliance Officer since 2016 | | General Counsel and Head of Compliance—Mutual Funds since 2016 and Senior Vice President, NBIA, since 2013, formerly, Associate General Counsel (2015 to 2016), Counsel (2007 to 2015), Vice President (2009-2013); Chief Legal Officer (only for purposes of sections 307 and 406 of the Sarbanes-Oxley Act of 2002), twenty-eight registered investment companies for which NBIA acts as investment manager and/or administrator; Anti-Money Laundering Compliance Officer, twenty-eight registered investment companies for which NBIA acts as investment manager and/or administrator. | |
Sheila R. James (1965) | | Assistant Secretary since 2002 | | Vice President, Neuberger Berman, since 2008 and Employee since 1999; Vice President, NBIA, since 2008; formerly, Assistant Vice President, Neuberger Berman, 2007; Employee, NBIA, 1991 to 1999; Assistant Secretary, twenty-eight registered investment companies for which NBIA acts as investment manager and/or administrator. | |
269
Name, (Year of Birth),
and Address(1) | | Position(s)
and Length of
Time Served(2) | | Principal Occupation(s)(3) | |
Brian Kerrane (1969) | | Chief Operating Officer since 2015 and Vice President since 2008 | | Managing Director, Neuberger Berman, since 2013; Chief Operating Officer—Mutual Funds and Managing Director, NBIA, since 2015; formerly, Senior Vice President, Neuberger Berman, 2006 to 2014; Vice President, NBIA, 2008 to 2015 and Employee since 1991; Chief Operating Officer, ten registered investment companies for which NBIA acts as investment manager and/or administrator; Vice President, twenty-eight registered investment companies for which NBIA acts as investment manager and/or administrator. | |
Josephine Marone (1963) | | Assistant Secretary since 2017 | | Senior Paralegal, Neuberger Berman, since 2007 and Employee since 2007; Assistant Secretary, twenty-four registered investment companies for which NBIA acts as investment manager and/or administrator. | |
Anthony Maltese (1959) | | Vice President since 2015 | | Senior Vice President, Neuberger Berman, since 2014 and Employee since 2000; Senior Vice President, NBIA, since 2014; Vice President, ten registered investment companies for which NBIA acts as investment manager and/or administrator. | |
Owen F. McEntee, Jr. (1961) | | Vice President since 2008 | | Vice President, Neuberger Berman, since 2006; Vice President, NBIA, since 2006 and Employee since 1992; Vice President, ten registered investment companies for which NBIA acts as investment manager and/or administrator. | |
John M. McGovern (1970) | | Treasurer and Principal Financial and Accounting Officer since 2005 | | Senior Vice President, Neuberger Berman, since 2007; Senior Vice President, NBIA, since 2007 and Employee since 1993; formerly, Vice President, Neuberger Berman, 2004 to 2006; formerly, Assistant Treasurer, 2002 to 2005; Treasurer and Principal Financial and Accounting Officer, twenty-eight registered investment companies for which NBIA acts as investment manager and/or administrator. | |
Frank Rosato (1971) | | Assistant Treasurer since 2005 | | Vice President, Neuberger Berman, since 2006; Vice President, NBIA, since 2006 and Employee since 1995; Assistant Treasurer, ten registered investment companies for which NBIA acts as investment manager and/or administrator. | |
Chamaine Williams (1971) | | Chief Compliance Officer since 2005 | | Chief Compliance Officer—Mutual Funds and Senior Vice President, NBIA, since 2006; formerly, Senior Vice President, LBI, 2007 to 2008; formerly, Vice President, LBI, 2003 to 2006; formerly, Chief Compliance Officer, Lehman Brothers Asset Management Inc., 2003 to 2007; formerly, Chief Compliance Officer, Lehman Brothers Alternative Investment Management LLC, 2003 to 2007; Chief Compliance Officer, fifteen registered investment companies for which NBIA acts as investment manager and/or administrator. | |
(1) The business address of each listed person is 1290 Avenue of the Americas, New York, NY 10104.
(2) Pursuant to the By-Laws of the Trust, each officer elected by the Trustees shall hold office until his or her successor shall have been elected and qualified or until his or her earlier death, inability to serve, or resignation. Officers serve at the pleasure of the Trustees and may be removed at any time with or without cause.
(3) Except as otherwise indicated, each individual has held the positions shown during at least the last five years.
270
Proxy Voting Policies and Procedures
A description of the policies and procedures that the Trust uses to determine how to vote proxies relating to portfolio securities is available, without charge, by calling 800-877-9700 (toll-free) and on the Securities and Exchange Commission's website, at www.sec.gov. Information regarding how the Trust voted proxies relating to portfolio securities during the most recent 12-month period ended June 30 is also available upon request, without charge, by calling 800-877-9700 (toll-free), on the Securities and Exchange Commission's website at www.sec.gov, and on Management's website at www.nb.com.
Quarterly Portfolio Schedule
The Trust files a complete schedule of portfolio holdings for each Fund with the Securities and Exchange Commission for the first and third quarters of each fiscal year on Form N-Q. The Trust's Forms N-Q are available on the Securities and Exchange Commission's website at www.sec.gov and may be reviewed and copied at the Securities and Exchange Commission's Public Reference Room in Washington, DC. Information on the operation of the Public Reference Room may be obtained by calling 800-SEC-0330. The information on Form N-Q is available upon request, without charge, by calling 800-877-9700 (toll-free).
271
Board Consideration of the Sub-Advisory Agreement
At a meeting held on March 29-30, 2017, the Board of Trustees (the "Board") of Neuberger Berman Equity Funds (the "Trust"), including the Trustees who are not "interested persons" of Neuberger Berman Investment Advisers LLC ("Management") (including its affiliates), Green Court Capital Management Limited ("Green Court") or the Trust ("Independent Fund Trustees"), evaluated and approved the Sub-Advisory Agreement between Management and Green Court (the "Sub-Advisory Agreement") with respect to Neuberger Berman Greater China Equity Fund (the "Fund"). Representatives of Management noted that, as previously announced, the Neuberger Berman Greater China Investment Team (the "GCI Team"), which includes the portfolio managers to the Fund, will establish an independent business, Green Court (the "Transaction"). Management informed the Board that, if approved by the Board, the Sub-Advisory Agreement would be effective with the closing of the Transaction. Throughout the process, the Independent Fund Trustees are advised by counsel that is experienced in Investment Company Act of 1940 (the "1940 Act") matters and that is independent of Management ("Independent Counsel").
The Board noted that Management and the Fund had obtained from the Securities and Exchange Commission an exemptive order that permitted Management to add or replace subadvisers to the Fund without a shareholder vote, provided the Independent Trustees approve the new subadviser and certain other steps are taken, and the Board was advised that those steps had been taken. The Board also noted that Management, pursuant to its agreement with the Fund and related subadviser oversight policies and procedures approved by the Board, is responsible for overseeing the new subadviser.
In evaluating the Sub-Advisory Agreement, the Board, including the Independent Fund Trustees, reviewed materials provided by Green Court in response to questions submitted by the Independent Fund Trustees, Independent Counsel, and Management, and met with senior representatives of Management regarding Green Court's personnel, operations and financial condition as they relate to the Fund.
The Board received and considered information regarding the nature, extent and quality of the services to be provided to the Fund by Green Court under the Sub-Advisory Agreement. The Board received information about the Transaction and noted that Management believed it would be in the Fund's best interest to retain Green Court as the subadviser to the Fund to ensure continuity of management for the Fund. The Board considered that the Transaction would not result in any change in the investment philosophy and process that had been used in managing the Fund. The Board considered the experience and staffing of the portfolio management and investment research personnel of Green Court who would perform services for the Fund, as well as the resources available to it, noting that the same portfolio management team would continue managing the Fund. The Board considered that, as compared to its peer group, the Fund's performance was higher than the median for the 3-year period but lower for the 1-year period. The Board also considered that, as compared to its benchmark, the Fund's performance was higher for the 3-year period but lower for the 1-year period. The Fund was launched in 2013 and therefore does not have 5 or 10-year performance. The Board reviewed the performance for accounts managed by the GCI Team that would be moving to Green Court that were substantially similar in strategy to the strategy Green Court will use for the Fund, noting that the accounts may not be subject to the same 1940 Act restrictions as the Fund. The Board considered the policies and practices regarding brokerage and allocation of portfolio transactions of Green Court and noted that Management would monitor the quality of the execution services provided by Green Court.
The Board also reviewed whether Green Court would use brokers to execute transactions for the Fund that provide research and other services to Green Court, and the types of benefits potentially derived from such services by Green Court, the Fund and other clients of Green Court. The Board also considered the compliance programs of Green Court and the compliance history of Green Court personnel when they were employed by GCI Team, including the Fund's Chief Compliance Officer's and Management's assessment of the compliance programs of Green Court. The Board also considered whether there were any pending lawsuits, enforcement proceedings or regulatory investigations involving Green Court, and reviewed information regarding its financial condition and any conflicts of interest in managing the Fund.
272
With respect to the overall fairness of the Sub-Advisory Agreement, the Board had previously considered the Fund's fee structure as compared to a peer group of comparable funds and any fall-out benefits likely to accrue to Management or its affiliates. The Board considered an estimate of the costs of the services to be provided and the estimated profit or loss that would be realized by Management as a result of utilizing Green Court as a subadviser to the Fund. The Board compared the fees to be charged by Green Court for another collective product managed in a similar style to the proposed subadvisory fees for Green Court at various asset levels. The Board considered the appropriateness and reasonableness of the subadvisory fees charged for the Fund and such other product and determined that the fees were appropriate in light of the management and other services provided. The Board noted that the subadvisory fee increases beyond a certain asset level, reportedly because of capacity constraints, but considered that Management, and not the Fund, pays the fee to Green Court and therefore the fees charged by Green Court will not change the overall expenses of the Fund. The Board also considered whether there are other business arrangements between Management and Green Court that could give rise to potential conflicts and noted that Neuberger Berman Group LLC ("Neuberger"), the parent company to Management, retains an ongoing passive minority ownership stake in Green Court. The Board further considered that other than Neuberger all equity in Green Court is owned by Green Court personnel. It considered whether the Sub-Advisory Agreement will or should provide for breakpoints in the fees and, as a general matter, the way in which any such breakpoints should factor into the fees paid by the Fund.
Conclusions
In approving the Sub-Advisory Agreement, the Board concluded that the terms of the Sub-Advisory Agreement are fair and reasonable and that approval of the Sub-Advisory Agreement is in the best interests of the Fund and its shareholders. In reaching this determination, the Board considered that Green Court could be expected to provide a high level of service to the Fund; that Green Court's fees appeared to the Board to be reasonable given the nature and quality of services expected to be provided and the markets in which Green Court operates; and that the expected benefits accruing to Green Court and its affiliates and Management and its affiliates by virtue of their relationship with the Fund were reasonable in light of the expected costs of providing the subadvisory services and the expected benefits accruing to the Fund. The Board's conclusions may be based in part on its consideration of materials prepared in connection with the approval of the previous subadvisory agreement in prior years and on the Board's ongoing regular review of Fund performance and operations throughout the year, in addition to material prepared specifically for the most recent review of the previous subadvisory agreement and the review of the Sub-Advisory Agreement.
273
Notice to Shareholders
Neuberger Berman Dividend Growth, Equity Income, Focus, Genesis, Global Equity, Greater China Equity, Guardian, Intrinsic Value, Large Cap Value, Mid Cap Growth, Mid Cap Intrinsic Value, Multi-Cap Opportunities, Real Estate, Small Cap Growth, Socially Responsive and Value hereby designate $16,049, $65,913,203, $68,504,812, $897,566,236, $29,438, $25,003, $133,900,424, $13,456,434, $29,389,925, $49,851,000, $252,967, $61,198,344, $73,181,536, $551, $114,709,069 and $357,551, respectively, as a capital gain distribution. Neuberger Berman Real Estate Fund hereby designates $2,865,059, as a Section 1250 gain distribution.
For the fiscal year ended August 31, 2017, each Fund makes the following designation, or up to the maximum amount of such dividends allowable pursuant to the Internal Revenue Code, as qualified dividend income eligible for reduced tax rates. These lower rates range from 5% to 15% depending upon an individual's tax bracket. Complete information regarding each Funds distributions during the calendar year 2017 will be reported in conjunction with Form 1099-DIV.
| Fund | | Qualified
Dividend Income | |
Dividend Growth | | $ | 701,896 | | |
Emerging Markets Equity | | | 14,481,309 | | |
Equity Income | | | 58,286,606 | | |
Focus | | | 8,512,625 | | |
Genesis | | | 134,535,923 | | |
Global Equity | | | 69,168 | | |
Global Real Estate | | | 74,923 | | |
Greater China Equity | | | 2,317,794 | | |
Guardian | | | 18,846,655 | | |
International Equity | | | 35,119,021 | | |
International Select | | | 5,459,648 | | |
International Small Cap | | | 23,422 | | |
Intrinsic Value | | | 4,420,197 | | |
Large Cap Value | | | 28,925,558 | | |
Mid Cap Growth | | | 6,846,977 | | |
Mid Cap Intrinsic Value | | | 1,904,455 | | |
Multi-Cap Opportunities | | | 26,400,532 | | |
Real Estate | | | 13,693,899 | | |
Small Cap Growth | | | 227,892 | | |
Socially Responsive | | | 36,695,649 | | |
Value | | | 380,095 | | |
274
This page has been left blank intentionally
275
This page has been left blank intentionally
276
This page has been left blank intentionally
277
Neuberger Berman Investment Advisers LLC
1290 Avenue of the Americas
New York, NY 10104–0002
Shareholder Services
800.877.9700
Intermediary Client Services
800.366.6264
www.nb.com
Statistics and projections in this report are derived from sources deemed to be reliable but cannot be regarded as a representation of future results of the Funds. This report is prepared for the general information of shareholders and is not an offer of shares of the Funds. Shares are sold only through the currently effective prospectus which you can obtain by calling 887.628.2583. An investor should consider carefully a Fund's investment objectives, risks and fees and expenses, which are described in its prospectus, before investing.
 H0599 10/17
Item 2. Code of Ethics.