
Neuberger Berman
Equity Funds
Investor Class Shares
Trust Class Shares
Advisor Class Shares
Institutional Class Shares
All Cap Core Fund
(Formerly Select Equities Fund)
Emerging Markets Equity Fund
Equity Income Fund
Focus Fund
Genesis Fund
Global Equity Fund
Global Thematic Opportunities Fund
Greater China Equity Fund
Guardian Fund
International Equity Fund
International Select Fund
(Formerly International Large Cap Fund)
Class A Shares
Class C Shares
Class R3 Shares
Class R6 Shares
Intrinsic Value Fund
Large Cap Disciplined Growth Fund
Large Cap Value Fund
Mid Cap Growth Fund
Mid Cap Intrinsic Value Fund
Multi-Cap Opportunities Fund
Real Estate Fund
Small Cap Growth Fund
Socially Responsive Fund
Value Fund
Annual Report
August 31, 2014
Contents
THE FUNDS
President's Letter | 1 | ||||||
PORTFOLIO COMMENTARY | |||||||
All Cap Core Fund (Formerly Select Equities Fund) | 2 | ||||||
Emerging Markets Equity Fund | 5 | ||||||
Equity Income Fund | 8 | ||||||
Focus Fund | 11 | ||||||
Genesis Fund | 14 | ||||||
Global Equity Fund | 17 | ||||||
Global Thematic Opportunities Fund | 20 | ||||||
Greater China Equity Fund | 23 | ||||||
Guardian Fund | 26 | ||||||
International Equity Fund | 29 | ||||||
International Select Fund (Formerly International Large Cap Fund) | 32 | ||||||
Intrinsic Value Fund | 35 | ||||||
Large Cap Disciplined Growth Fund | 38 | ||||||
Large Cap Value Fund | 41 | ||||||
Mid Cap Growth Fund | 44 | ||||||
Mid Cap Intrinsic Value Fund | 47 | ||||||
Multi-Cap Opportunities Fund | 50 | ||||||
Real Estate Fund | 53 | ||||||
Small Cap Growth Fund | 56 | ||||||
Socially Responsive Fund | 59 | ||||||
Value Fund | 62 | ||||||
FUND EXPENSE INFORMATION | 71 | ||||||
SCHEDULE OF INVESTMENTS/TOP TEN EQUITY HOLDINGS | |||||||
All Cap Core Fund (Formerly Select Equities Fund) | 75 | ||||||
Emerging Markets Equity Fund | 76 | ||||||
Equity Income Fund | 79 | ||||||
Focus Fund | 81 | ||||||
Genesis Fund | 82 | ||||||
Global Equity Fund | 85 | ||||||
Global Thematic Opportunities Fund | 88 | ||||||
Greater China Equity Fund | 91 | ||||||
Guardian Fund | 95 | ||||||
International Equity Fund | 96 | ||||||
International Select Fund (Formerly International Large Cap Fund) | 99 | ||||||
Intrinsic Value Fund | 102 | ||||||
Large Cap Disciplined Growth Fund | 104 | ||||||
Large Cap Value Fund | 106 | ||||||
Mid Cap Growth Fund | 108 | ||||||
Mid Cap Intrinsic Value Fund | 110 | ||||||
Multi-Cap Opportunities Fund | 112 | ||||||
Real Estate Fund | 113 | ||||||
Small Cap Growth Fund | 114 | ||||||
Socially Responsive Fund | 116 | ||||||
Value Fund | 117 | ||||||
FINANCIAL STATEMENTS | 129 | ||||||
FINANCIAL HIGHLIGHTS (ALL CLASSES)/PER SHARE DATA | |||||||
All Cap Core Fund (Formerly Select Equities Fund) | 193 | ||||||
Emerging Markets Equity Fund | 193 | ||||||
Equity Income Fund | 195 | ||||||
Focus Fund | 197 | ||||||
Genesis Fund | 199 | ||||||
Global Equity Fund | 201 | ||||||
Global Thematic Opportunities Fund | 203 | ||||||
Greater China Equity Fund | 203 | ||||||
Guardian Fund | 205 | ||||||
International Equity Fund | 207 | ||||||
International Select Fund (Formerly International Large Cap Fund) | 209 | ||||||
Intrinsic Value Fund | 211 | ||||||
Large Cap Disciplined Growth Fund | 213 | ||||||
Large Cap Value Fund | 215 | ||||||
Mid Cap Growth Fund | 217 | ||||||
Mid Cap Intrinsic Value Fund | 221 | ||||||
Multi-Cap Opportunities Fund | 223 | ||||||
Real Estate Fund | 225 | ||||||
Small Cap Growth Fund | 227 | ||||||
Socially Responsive Fund | 229 | ||||||
Value Fund | 233 | ||||||
Reports of Independent Registered Public Accounting Firms | 238 | ||||||
Directory | 241 | ||||||
Trustees and Officers | 242 | ||||||
Proxy Voting Policies and Procedures | 250 | ||||||
Quarterly Portfolio Schedule | 250 | ||||||
Notice to Shareholders | 251 | ||||||
The "Neuberger Berman" name and logo are registered service marks of Neuberger Berman Group LLC. "Neuberger Berman Management LLC" and the individual Fund names in this piece are either service marks or registered service marks of Neuberger Berman Management LLC. ©2014 Neuberger Berman Management LLC. All rights reserved.
President's Letter
Dear Shareholder,
This has been another positive year for the equity markets, with the S&P 500® Index advancing over 25% over the past 12 months and breaking 2000 for the first time in August 2014. Emerging markets rebounded, up 20% for the period, and while developed international equities trailed U.S. and emerging markets, they were still positive. Key drivers of returns this fiscal year have been two-fold—signs of growing economic momentum and constructive business activity.
On the economic side, after a positive 2013, data softened somewhat in the first quarter of 2014. By mid-year, however, improved statistics confirmed that the slippage had been temporary—caused by an unusually harsh winter. Stable growth in China and green shoots in the eurozone combined with generally positive trends in the U.S., where supports for improved consumer spending, by far the largest driver of U.S. GDP, remained apparent.
By August, unemployment declined to 6.1%, a post-crisis low. Wage inflation was beginning to appear, along with signs of a tightening skilled labor market. Auto sales in August peaked at pre-crisis rates, and the housing sector appeared healthy as well. Even with geopolitical tensions making headlines nightly, investor sentiment remained above long-term levels, and the Chicago Board Options Exchange Volatility Index (VIX) declined, touching 2007-era lows in July.
From a business management perspective, after years of caution and cash accumulation, we've seen companies deploying assets for future growth and to the benefit of shareholders, through capital investment, increased M&A activity, dividend increases and share buybacks. We believe the North American energy renaissance continues to have positive effects as well, and even as the U.S. Federal Reserve continues tapering, interest rates have fallen.
After marking a six-year rally in which the S&P 500 has gained more than 200% from its closing low in 2009, some would argue that valuations have climbed ahead of fundamentals, especially given subpar global economic growth and potential economic complications from Russian/Ukrainian tensions and conflict in the Middle East. As this bull market ages, we believe it's unlikely that we will continue to see outsized equity returns year over year. However, barring an unforeseen shock, we anticipate that markets will remain positive. From an investor's point of view, we've noted a falling correlation between stocks, suggesting individual fundamentals are again becoming paramount. We also see signs that the spread between top and bottom performers—fairly tight this year—may be widening.
As we move toward what we believe will be a more typical equity market—with more typical equity returns—we anticipate experienced active managers will have a clear opportunity to demonstrate their worth. We believe a fundamentally focused, differentiated market is a stock picker's market; one in which deep fundamental research and investment skill can add real value by uncovering opportunities outside the indices.
We thank you for your confidence in Neuberger Berman and look forward to continuing to serve your investment needs.
Sincerely,

ROBERT CONTI
PRESIDENT AND CEO
NEUBERGER BERMAN MUTUAL FUNDS
1
All Cap Core Fund Commentary* (Unaudited)
Neuberger Berman All Cap Core Fund (formerly Neuberger Berman Select Equities Fund) Institutional Class generated a 22.55% total return for the fiscal year ended August 31, 2014, but underperformed its benchmark, the S&P 500® Index, which generated a return of 25.25% for the period. (Performance for all share classes is provided in the table immediately following this letter.)
This past fiscal year, we decided to make a change to the management of the Fund in order to give ourselves more flexibility in overseeing your investment. Our team asked the Fund's Board of Trustees to allow us to invest in companies across the market capitalization spectrum rather than limiting our investments to companies over $7.5 billion in market cap. This modification was approved in June and implemented in September. We believe this change provides us with the added flexibility necessary to enhance our capabilities as we seek to provide our investors with attractive returns.
We are pleased with the performance of the Fund during the 12-month period, especially given our lower-than-market risk profile and a cash position that averaged roughly 7% throughout the period. Stock selection drove our significant outperformance within the Financials and Industrials sectors. Our lack of exposure to the weaker Consumer Staples and Telecommunication Services sectors was also a relative benefit. We underperformed on a relative basis versus the index in the Information Technology, Health Care and Energy sectors, and our cash position was a disadvantage against a rising market.
We continue to believe that the growth of the U.S. economy will continue to follow a Nike swoosh-like trajectory. We feel that this path will carry on for quite some time and it is our responsibility to identify trends or themes within the U.S. or global economies that we believe may have the wherewithal to grow at rates faster than the broader economic environment. We also think that the direction of interest rates over the next few years will be higher and, as such, have moved the portfolio in the direction of more cyclically oriented securities in an attempt to take advantage of that growth, and we have reduced our exposure to securities more closely correlated to interest rates.
We hope tensions in the Middle East and Ukraine will decline; barring any major shocks, however, we believe that stocks generally are positioned better than other investable asset classes. We are increasingly optimistic about the value of stock picking within the current environment and we are finding companies we believe are in strong financial health, and we anticipate profit growth could continue. We also believe companies will continue to allocate capital for the benefit of shareholders.
Over the past number of years, we've seen a rising tide that lifted all boats in a highly correlated market. In our view, much of that was due to the external stimulus of quantitative easing. Now that quantitative easing is coming to an end, we think the market will be driven more by the fundamentals of underlying securities. We believe owning a concentrated portfolio that has flexibility in terms of market capitalization as well as sector allocation, without a value or growth bias, gives us the opportunity to succeed in generating attractive risk-adjusted returns.
Sincerely,
MICHAEL KAMINSKY, RICHARD WERMAN, JAMES GARTLAND AND MINDY SCHWARTZAPFEL
PORTFOLIO CO-MANAGERS
* Effective September 2, 2014, Neuberger Berman Select Equities Fund changed its name to Neuberger Berman All Cap Core Fund.
Information about principal risks of investing in the Fund is set forth in the prospectus and statement of additional information.
The portfolio composition, industries and holdings of the Fund are subject to change.
The opinions expressed are those of the Fund's portfolio managers. The opinions are as of the date of this report and are subject to change without notice.
References to any third-party logos or service marks do not imply any endorsement by the Firm. The Nike name and logo are trademarks of Nike, Inc. All rights reserved.
2
All Cap Core Fund (Unaudited)
TICKER SYMBOLS
Institutional Class | NBEIX | ||||||
Class A | NBEAX | ||||||
Class C | NBECX | ||||||
SECTOR ALLOCATION
(as a % of Total Investments) | |||||
Consumer Discretionary | 17.5 | % | |||
Energy | 13.4 | ||||
Financials | 16.3 | ||||
Health Care | 4.2 | ||||
Industrials | 21.4 | ||||
Information Technology | 11.6 | ||||
Utilities | 5.3 | ||||
Short-Term Investments | 10.3 | ||||
Total | 100.0 | % | |||
PERFORMANCE HIGHLIGHTS27
| Average Annual Total Return Ended 08/31/2014 | |||||||||||||||||||
| Inception Date | 1 Year | 5 Year | Life of Fund | ||||||||||||||||
At NAV | |||||||||||||||||||
Institutional Class | 12/20/2007 | 22.55 | % | 14.09 | % | 6.90 | % | ||||||||||||
Class A | 12/20/2007 | 21.95 | % | 13.55 | % | 6.51 | % | ||||||||||||
Class C | 12/20/2007 | 21.13 | % | 12.73 | % | 5.71 | % | ||||||||||||
With Sales Charge | |||||||||||||||||||
Class A | 14.99 | % | 12.22 | % | 5.57 | % | |||||||||||||
Class C | 20.13 | % | 12.73 | % | 5.71 | % | |||||||||||||
Index | |||||||||||||||||||
| S&P 500® Index1,16 | 25.25 | % | 16.88 | % | 7.24 | % | |||||||||||||
The performance data quoted represent past performance and do not indicate future results. Current performance may be lower or higher than the performance data quoted. For more current performance data, please visit www.nb.com/performance.
The results shown in the table reflect the reinvestment of income dividends and other distributions, if any. The results do not reflect the effect of taxes a shareholder would pay on Fund distributions or on the redemption of Fund shares.
The investment return and principal value of an investment will fluctuate and shares, when redeemed, may be worth more or less than their original cost.
Returns would have been lower if Neuberger Berman Management LLC (Management) had not reimbursed certain expenses and/or waived a portion of the investment management fees during certain of the periods shown. Repayment by a class (of expenses previously reimbursed and/or fees previously waived by Management) will decrease the class's returns. Please see Note B in the Notes to Financial Statements for specific information regarding expense reimbursement and/or fee waiver arrangements.
As stated in the Fund's most recent prospectus, the total annual operating expense ratios for fiscal year 2013 were 1.11%, 1.49% and 2.24% for Institutional Class, Class A and Class C shares, respectively (before expense reimbursements and/or fee waivers, if any). The expense ratios were 0.76%, 1.21% and 1.96% for Institutional Class, Class A and Class C shares, respectively, after expense reimbursements and/or fee waivers.
Returns shown with a sales charge reflect the deduction of the current maximum initial sales charge of 5.75% for Class A shares and the contingent deferred sales charge (CDSC) for Class C shares. The CDSC for Class C shares is 1%, which is reduced to 0% after 1 year. The performance of the Fund's share classes will differ primarily due to different sales charge structures and class expenses. Please see the prospectus for more information about sales charge structures, if any, and class expenses for your share class.
3
All Cap Core Fund (Unaudited)
COMPARISON OF A $1,000,000 INVESTMENT
(000's Omitted)

This graph shows the change in value of a hypothetical $1,000,000 investment in the Fund over the past 10 fiscal years, or since the Fund's inception if it has not operated for 10 years. The graph is based on the Institutional Class shares only; the performance of the Fund's share classes will differ primarily due to different sales charge structures and class expenses (see Performance Highlights chart on previous page). The result is compared with benchmarks, which include a broad-based market index and may include a more narrowly based index. Market indices have not been reduced to reflect any of the fees and costs of investing. The results shown in the graph reflect the reinvestment of income dividends and other distributions, if any. The results do not reflect the effect of taxes a shareholder would pay on Fund distributions or on the redemption of Fund shares. Results represent past performance and do not indicate future results.
4
Emerging Markets Equity Fund Commentary (Unaudited)
Neuberger Berman Emerging Markets Equity Fund Institutional Class generated a 17.24% total return for the fiscal year ended August 31, 2014, but underperformed its benchmark, the MSCI Emerging Markets (EM) Index, which generated a 20.40% return during the period. (Performance for all share classes is provided in the table immediately following this letter.)
After weakness on relatively slow economic growth early in the reporting period, emerging markets have rebounded since early February. Markets were buoyed by a relative calming of the geopolitical tensions in Ukraine, on reform-minded Narendra Modi's landslide election victory in India, and on stabilizing economic data from China, along with generally improved sentiment.
All index sectors were positive this period, with Health Care, Information Technology and Utilities being the strongest performers. By country, Egypt, India and Brazil led the Index, while Hungary, United Arab Emirates and Qatar saw the worst negative returns.
Within the portfolio, excellent stock selection within the Consumer Discretionary sector—with consumer electronics/appliance names including China's Haier Electronics and Korea's Coway being among the top contributors—as well as stock selection and an overweight in Health Care had the most significant positive effects on relative performance from a sector perspective. By country, it was Indian and Chinese holdings, including India's Yes Bank, Chinese social networking company Tencent Holdings, and waste-to-energy plant builder China Everbright that had the most positive effect.
Stock selection within Energy, Financials and Materials was a relative detriment this period, and by country, holdings in Brazil and Korea underperformed. In Brazil, hopes for political change rather than fundamentals drove the market higher, while in Korea a large government stimulus package boosted the local stock market. We remain skeptical that this stimulus will be productive, and are not convinced these markets can continue their rallies without structural reforms. Individual detractors included China Child Care Corp., Brasil Insurance, China Vanke, as well as Lock & Lock (Korea), and Alamos Gold (Canada). Alamos Gold was sold during the reporting period and Lock & Lock was sold shortly afterward.
Our largest country overweights are currently India, China and the Philippines. Our greatest sector overweight is currently Industrials—where we own local infrastructure names, followed by Health Care and Consumer Staples. Considering slower global growth, we are currently underweighted in export markets, including Taiwan and Korea. We are also underweighted in Telecommunication Services stocks, Energy stocks, and Financials stocks.
As we look ahead, we acknowledge pockets of geopolitical risks, but several factors suggest the current rally may continue, in our opinion. First, current account deficits appear to us to have been tamed in certain countries. This has helped a subset of EM currencies to stabilize, if not rebound. Second, developed market economies have rebounded, but only to muted levels, creating a benign interest rate environment. Third, we believe EM equities offer attractive relative valuations versus developed markets. Fourth, reported earnings have generally stabilized after several years of downgrades; and finally, we see positive prospects for structural reforms in several countries, including India. Especially based on the last two drivers, we believe select EM markets could offer attractive growth going forward.
In both rallies and retrenchments, we believe stock picking skills, deep knowledge of local economies and companies, and a tested process can be important differentiators in EM equity investing. We believe we are well positioned for the future.
Sincerely,
CONRAD SALDANHA
PORTFOLIO MANAGER
Information about principal risks of investing in the Fund is set forth in the prospectus and statement of additional information.
The portfolio composition, industries and holdings of the Fund are subject to change.
The opinions expressed are those of the Fund's portfolio manager. The opinions are as of the date of this report and are subject to change without notice.
5
Emerging Markets Equity Fund (Unaudited)
TICKER SYMBOLS
Institutional Class | NEMIX | ||||||
Class A | NEMAX | ||||||
Class C | NEMCX | ||||||
Class R3 | NEMRX | ||||||
Class R6 | NREMX | ||||||
SECTOR ALLOCATION
(as a % of Total Investments) | |||||
Consumer Discretionary | 11.3 | % | |||
Consumer Staples | 12.3 | ||||
Energy | 5.2 | ||||
Financials | 22.7 | ||||
Health Care | 6.1 | ||||
Industrials | 13.6 | ||||
Information Technology | 18.8 | ||||
Materials | 4.1 | ||||
Telecommunication Services | 2.4 | ||||
Utilities | 1.0 | ||||
Short-Term Investments | 2.5 | ||||
Total | 100.0 | % | |||
PERFORMANCE HIGHLIGHTS9
| Average Annual Total Return Ended 08/31/2014 | |||||||||||||||||||
| Inception Date | 1 Year | 5 Years | Life of Fund | ||||||||||||||||
At NAV | |||||||||||||||||||
Institutional Class | 10/08/2008 | 17.24 | % | 7.19 | % | 12.88 | % | ||||||||||||
Class A | 10/08/2008 | 16.99 | % | 6.94 | % | 12.62 | % | ||||||||||||
Class C | 10/08/2008 | 16.07 | % | 6.13 | % | 11.77 | % | ||||||||||||
| Class R310 | 06/21/2010 | 16.42 | % | 6.58 | % | 12.33 | % | ||||||||||||
| Class R623 | 03/15/2013 | 17.35 | % | 7.22 | % | 12.91 | % | ||||||||||||
With Sales Charge | |||||||||||||||||||
Class A | 10.28 | % | 5.68 | % | 11.49 | % | |||||||||||||
Class C | 15.07 | % | 6.13 | % | 11.77 | % | |||||||||||||
Index | |||||||||||||||||||
| MSCI Emerging Markets Index1,16 | 20.40 | % | 8.24 | % | 11.90 | % | |||||||||||||
The performance data quoted represent past performance and do not indicate future results. Current performance may be lower or higher than the performance data quoted. For more current performance data, please visit www.nb.com/performance.
The results shown in the table reflect the reinvestment of income dividends and other distributions, if any. The results do not reflect the effect of taxes a shareholder would pay on Fund distributions or on the redemption of Fund shares.
The investment return and principal value of an investment will fluctuate and shares, when redeemed, may be worth more or less than their original cost.
Returns would have been lower if Neuberger Berman Management LLC (Management) had not reimbursed certain expenses and/or waived a portion of the investment management fees during certain of the periods shown. Repayment by a class (of expenses previously reimbursed and/or fees previously waived by Management) will decrease the class's returns. Please see Note B in the Notes to Financial Statements for specific information regarding expense reimbursement and/or fee waiver arrangements.
As stated in the Fund's most recent prospectus, the total annual operating expense ratios for fiscal year 2013 were 1.60%, 2.01%, 2.74%, 2.32% and 1.57% for Institutional Class, Class A, Class C, Class R3 and Class R6 shares, respectively (before expense reimbursements and/or fee waivers, if any). The expense ratios were 1.25%, 1.50%, 2.25%, 1.91% and 1.18% for Institutional Class, Class A, Class C, Class R3 and Class R6 shares, respectively, after expense reimbursements and/or fee waivers.
Returns shown with a sales charge reflect the deduction of the current maximum initial sales charge of 5.75% for Class A shares and the contingent deferred sales charge (CDSC) for Class C shares. The CDSC for Class C shares is 1%, which is reduced to 0% after 1 year. The performance of the Fund's share classes will differ primarily due to different sales charge structures and class expenses. Please see the prospectus for more information about sales charge structures, if any, and class expenses for your share class.
6
Emerging Markets Equity Fund (Unaudited)
COMPARISON OF A $1,000,000 INVESTMENT
(000's Omitted)
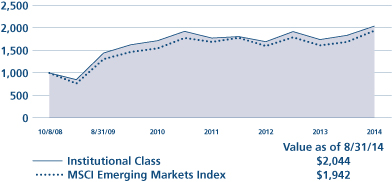
This graph shows the change in value of a hypothetical $1,000,000 investment in the Fund over the past 10 fiscal years, or since the Fund's inception if it has not operated for 10 years. The graph is based on the Institutional Class shares only; the performance of the Fund's share classes will differ primarily due to different sales charge structures and class expenses (see Performance Highlights chart on previous page). The result is compared with benchmarks, which include a broad-based market index and may include a more narrowly based index. Market indices have not been reduced to reflect any of the fees and costs of investing. The results shown in the graph reflect the reinvestment of income dividends and other distributions, if any. The results do not reflect the effect of taxes a shareholder would pay on Fund distributions or on the redemption of Fund shares. Results represent past performance and do not indicate future results.
7
Equity Income Fund Commentary (Unaudited)
Neuberger Berman Equity Income Fund Institutional Class generated a 20.11% total return for the fiscal year ended August 31, 2014, but underperformed its benchmark, the S&P 500® Index, which returned 25.25%. (Performance for all share classes is provided in the table immediately following this letter.)
The Fund's investment goal remains to provide total return from both dividend yield and capital appreciation. Given its defensive characteristics and its focus on both yield and growth, the Fund tends to lag somewhat during strong equity rallies while endeavoring to protect principal in more volatile markets. During this period, the top performing sectors of the S&P 500 were those that are synonymous with volatility and that provide little to no dividend income, namely the Information Technology (IT) sector and Health Care's Biotechnology industry, with both returning in excess of 30% and 50%, respectively.
The Fund has limited access to those sectors due to our income criteria—with the exception of some large IT names, including Microsoft, which was among our top contributors for the period, and Cisco Systems, which detracted. However, areas that we tend to overweight were fruitful, such as the Utilities sector, with top performing holdings including NextEra and Dominion Resources.
The portfolio also tends to be overweighted to Real Estate Investment Trusts (REITs). It was a tale of two cities as REITs shifted from dismal performance early on in the period (pulling back sharply on early signs of higher interest rates) to being among the top performers in the second half of the period. Over longer periods, REITs tend to be more closely tied to supply and demand for various types of real estate and less to interest rate movements or levels. Successful REITs are generally run by proven, experienced managers with histories of prudent capital allocation, and, in our experience, they tend to prevail during times of economic strength. This period, top contributors with these characteristics included Equity Residential and Extra Space Storage. Seeing economic improvement, we anticipate continuing to maintain our overweight in both U.S. and non-U.S. names, and would view any volatility as an opportunity to increase our allocations.
In addition to being underweighted in IT on lack of yield potential, the portfolio maintained an underweight to U.S. consumer stocks. Stock selection in this area was challenging with Lagardere, a media name, and General Motors, which encountered significant litigation coupled with weak sales in Europe and was sold, being among the detractors.
Early this period, we made several investments into names we anticipated could perform well during a rising rate environment, such as banks. Theoretically, as rates rise, we believed the net interest margin of certain banks would expand, thus improving earnings. Overall, this strategy benefited the portfolio, as did several of the private equity asset managers that we incrementally added over the period. We believe these asset managers are well positioned to see increased fee revenues from investments made since the global financial crisis.
The portfolio currently holds a selection of companies that, we believe, could outperform as the global economy accelerates, but could also offer some risk mitigation in the event of a slow-down, disappointment or shock. At this point, we think it makes sense to maintain some balance between offense and defense, given the uncertainty across the U.S. and global economies.
Sincerely,
RICHARD LEVINE, TONY GLEASON AND SANDY POMEROY
PORTFOLIO CO-MANAGERS
Information about principal risks of investing in the Fund is set forth in the prospectus and statement of additional information.
The portfolio composition, industries and holdings of the Fund are subject to change.
The opinions expressed are those of the Fund's portfolio managers. The opinions are as of the date of this report and are subject to change without notice.
8
Equity Income Fund (Unaudited)
TICKER SYMBOLS
Institutional Class | NBHIX | ||||||
Class A | NBHAX | ||||||
Class C | NBHCX | ||||||
Class R3 | NBHRX | ||||||
SECTOR ALLOCATION
(as a % of Total Investments) | |||||
Consumer Discretionary | 4.4 | % | |||
Consumer Staples | 1.9 | ||||
Energy | 12.7 | ||||
Financials | 36.3 | ||||
Health Care | 10.1 | ||||
Industrials | 6.5 | ||||
Information Technology | 2.2 | ||||
Materials | 3.3 | ||||
Telecommunication Services | 2.3 | ||||
Utilities | 16.6 | ||||
Other | 2.4 | ||||
Short-Term Investments | 1.3 | ||||
Total | 100.0 | % | |||
PERFORMANCE HIGHLIGHTS9
| Average Annual Total Return Ended 08/31/2014 | |||||||||||||||||||
| Inception Date* | 1 Year | 5 Years | Life of Fund | ||||||||||||||||
At NAV | |||||||||||||||||||
| Institutional Class14 | 06/09/2008 | 20.11 | % | 13.81 | % | 8.24 | % | ||||||||||||
| Class A14 | 06/09/2008 | 19.72 | % | 13.38 | % | 7.90 | % | ||||||||||||
| Class C14 | 06/09/2008 | 18.77 | % | 12.56 | % | 7.28 | % | ||||||||||||
| Class R314 | 06/21/2010 | 19.42 | % | 13.16 | % | 7.84 | % | ||||||||||||
With Sales Charge | |||||||||||||||||||
| Class A14 | 12.87 | % | 12.05 | % | 7.08 | % | |||||||||||||
| Class C14 | 17.77 | % | 12.56 | % | 7.28 | % | |||||||||||||
Index | |||||||||||||||||||
| S&P 500® Index1,16 | 25.25 | % | 16.88 | % | 7.28 | % | |||||||||||||
*The performance data for each class includes the performance of the Fund's oldest share class, Trust Class, from November 2, 2006 through June 9, 2008. The performance data for Class R3 also includes the performance of the Fund's Institutional Class from June 9, 2008 through June 21, 2010. See endnote 14 for information about the effects of the different fees paid by each class.
The performance data quoted represent past performance and do not indicate future results. Current performance may be lower or higher than the performance data quoted. For more current performance data, please visit www.nb.com/performance.
The results shown in the table reflect the reinvestment of income dividends and other distributions, if any. The results do not reflect the effect of taxes a shareholder would pay on Fund distributions or on the redemption of Fund shares.
The investment return and principal value of an investment will fluctuate and shares, when redeemed, may be worth more or less than their original cost.
Returns would have been lower if Neuberger Berman Management LLC (Management) had not reimbursed certain expenses and/or waived a portion of the investment management fees during certain of the periods shown. Repayment by a class (of expenses previously reimbursed and/or fees previously waived by Management) will decrease the class's returns. Please see Note B in the Notes to Financial Statements for specific information regarding expense reimbursement and/or fee waiver arrangements.
As stated in the Fund's most recent prospectus, the total annual operating expense ratios for fiscal year 2013 were 0.69%, 1.06%, 1.81%, and 1.42% for Institutional Class, Class A, Class C, and Class R3 shares, respectively (before expense reimbursements and/or fee waivers, if any). The total annual operating expense ratio for Class R3 includes the class's repayment of expenses previously reimbursed and/or fees previously waived by Management.
Returns shown with a sales charge reflect the deduction of the current maximum initial sales charge of 5.75% for Class A shares and the contingent deferred sales charge (CDSC) for Class C shares. The CDSC for Class C shares is 1%, which is reduced to 0% after 1 year. The performance of the Fund's share classes will differ primarily due to different sales charge structures and class expenses. Please see the prospectus for more information about sales charge structures, if any, and class expenses for your share class.
9
Equity Income Fund (Unaudited)
COMPARISON OF A $1,000,000 INVESTMENT14
(000's Omitted)

This graph shows the change in value of a hypothetical $1,000,000 investment in the Fund over the past 10 fiscal years, or since the Fund's inception if it has not operated for 10 years. The graph is based on the Institutional Class shares only; the performance of the Fund's share classes will differ primarily due to different sales charge structures and class expenses (see Performance Highlights chart on previous page). The result is compared with benchmarks, which include a broad-based market index and may include a more narrowly based index. Market indices have not been reduced to reflect any of the fees and costs of investing. The results shown in the graph reflect the reinvestment of income dividends and other distributions, if any. The results do not reflect the effect of taxes a shareholder would pay on Fund distributions or on the redemption of Fund shares. Results represent past performance and do not indicate future results.
10
Focus Fund Commentary (Unaudited)
Neuberger Berman Focus Fund Investor Class produced a 22.65% total return for the fiscal year ended August 31, 2014, but underperformed its benchmark, the S&P 500® Index, which posted a 25.25% total return. (Performance for all share classes is provided in the table immediately following this letter.) While the Fund's Investor Class underperformed during the one-year period, it outperformed for the three-year period with the Investor Class delivering a 21.09% return and the S&P 500 delivering a 20.61% return.1
The ongoing U.S. economic recovery and high levels of monetary liquidity produced another strong year for the U.S. stock market. The S&P 500 experienced a brief dip in January but generally the year was marked by new highs. Investors kept a watchful eye on the U.S. Federal Reserve (Fed), but the response to the Fed's tapering of its bond buying program was muted since the move was well communicated and has been implemented gradually and without unnecessary surprises. The market continued to be supported by low interest rates.
While every sector in the S&P 500 delivered strong, double-digit returns in this positive environment, Information Technology and Health Care led performance. Telecommunication Services and Consumer Staples trailed the index but still delivered solid returns. The improving economic picture as well as high levels of liquidity provided a constructive backdrop for the entire market.
Neuberger Berman Focus Fund is a high conviction portfolio, driven by individual stock selection rather than sector calls. SanDisk and WhiteWave Foods were the Fund's strongest individual stock performers on a relative basis. SanDisk moved higher as technology companies in general rallied, but SanDisk also benefited from good supply/demand dynamics, strong management, and a high-quality product that is in demand by consumers willing to pay a premium. We held a relatively heavy weighting in the company during the reporting period. WhiteWave Foods is a food product manufacturer that has benefited from consumers' focus on natural foods and organics. It was spun out as a stand-alone company over one year ago and has executed well, producing positive results for shareholders. We have sold the stock.
ARIAD Pharmaceuticals, Inc. and CIT Group Inc. had the greatest negative impacts on the Fund's relative return overall. ARIAD is a speculative pharmaceutical company that presented specific risks as well as some potential rewards. However, during the past year, the company had an issue with the FDA that caused its stock price to decline. CIT Group, a financial company, lagged as it lowered guidance earlier in the year on projected lower margins. We have sold both ARIAD and CIT.
While the steep run-up in the market over the past 12 months makes us cautious, we continue to find what we believe to be good value in individual stocks. While Fed moves, geo-political events, and profit taking may result in some additional market volatility over the coming year, we focus on choosing individual stocks that we believe provide solid fundamentals and attractive valuations with the potential to generate good returns over the long run. We continue to diversify the portfolio across all areas of the economy to drive our results from stock selection.
Sincerely,
TIMOTHY CREEDON AND DAVID LEVINE
PORTFOLIO CO-MANAGERS
1 The performance data quoted represent past performance and do not indicate future results. Current performance may be lower or higher than the performance data quoted. For more current performance data, please visit www.nb.com/performance.
Information about principal risks of investing in the Fund is set forth in the prospectus and statement of additional information.
The portfolio composition, industries and holdings of the Fund are subject to change.
The opinions expressed are those of the Fund's portfolio managers. The opinions are as of the date of this report and are subject to change without notice.
11
Focus Fund (Unaudited)
TICKER SYMBOLS
Investor Class | NBSSX | ||||||
Trust Class | NBFCX | ||||||
Advisor Class | NBFAX | ||||||
Institutional Class | NFALX | ||||||
Class A | NFAAX | ||||||
Class C | NFACX | ||||||
SECTOR ALLOCATION
(as a % of Total Investments) | |||||
Consumer Discretionary | 19.4 | % | |||
Consumer Staples | 6.8 | ||||
Energy | 9.9 | ||||
Financials | 15.0 | ||||
Health Care | 10.1 | ||||
Industrials | 9.2 | ||||
Information Technology | 19.2 | ||||
Materials | 4.0 | ||||
Utilities | 3.3 | ||||
Short-Term Investments | 3.1 | ||||
Total | 100.0 | % | |||
PERFORMANCE HIGHLIGHTS8
| Average Annual Total Return Ended 08/31/2014 | |||||||||||||||||||||||
| Inception Date | 1 Year | 5 Years | 10 Years | Life of Fund | |||||||||||||||||||
At NAV | |||||||||||||||||||||||
Investor Class | 10/19/1955 | 22.65 | % | 15.31 | % | 7.52 | % | 10.63 | % | ||||||||||||||
| Trust Class3 | 08/30/1993 | 22.40 | % | 15.07 | % | 7.30 | % | 10.62 | % | ||||||||||||||
| Advisor Class4 | 09/03/1996 | 22.21 | % | 14.87 | % | 7.09 | % | 10.56 | % | ||||||||||||||
| Institutional Class5 | 06/21/2010 | 22.86 | % | 15.50 | % | 7.62 | % | 10.64 | % | ||||||||||||||
| Class A20 | 06/21/2010 | 22.40 | % | 15.16 | % | 7.45 | % | 10.62 | % | ||||||||||||||
| Class C20 | 06/21/2010 | 21.52 | % | 14.45 | % | 7.12 | % | 10.56 | % | ||||||||||||||
With Sales Charge | |||||||||||||||||||||||
| Class A20 | 15.37 | % | 13.80 | % | 6.82 | % | 10.51 | % | |||||||||||||||
| Class C20 | 20.54 | % | 14.45 | % | 7.12 | % | 10.56 | % | |||||||||||||||
Index | |||||||||||||||||||||||
| S&P 500® Index1,16 | 25.25 | % | 16.88 | % | 8.38 | % | 10.21 | % | |||||||||||||||
The performance data quoted represent past performance and do not indicate future results. Current performance may be lower or higher than the performance data quoted. For more current performance data, please visit www.nb.com/performance.
The results shown in the table reflect the reinvestment of income dividends and other distributions, if any. The results do not reflect the effect of taxes a shareholder would pay on Fund distributions or on the redemption of Fund shares.
The investment return and principal value of an investment will fluctuate and shares, when redeemed, may be worth more or less than their original cost.
Returns would have been lower if Neuberger Berman Management LLC (Management) had not reimbursed certain expenses and/or waived a portion of the investment management fees during certain of the periods shown. Repayment by a class (of expenses previously reimbursed and/or fees previously waived by Management) will decrease the class's returns. Please see Note B in the Notes to Financial Statements for specific information regarding expense reimbursement and/or fee waiver arrangements.
As stated in the Fund's most recent prospectus, the total annual operating expense ratios for fiscal year 2013 were 0.94%, 1.14%, 1.29%, 0.78%, 1.20%, and 1.94% for Investor Class, Trust Class, Advisor Class, Institutional Class, Class A and Class C shares, respectively (before expense reimbursements and/or fee waivers, if any). The expense ratios were 0.75%, 1.11%, and 1.86% for Institutional Class, Class A and Class C shares, respectively, after expense reimbursements and/or fee waivers.
Returns shown with a sales charge reflect the deduction of the current maximum initial sales charge of 5.75% for Class A shares and the contingent deferred sales charge (CDSC) for Class C shares. The CDSC for Class C shares is 1%, which is reduced to 0% after 1 year. The performance of the Fund's share classes will differ primarily due to different sales charge structures and class expenses. Please see the prospectus for more information about sales charge structures, if any, and class expenses for your share class.
12
Focus Fund (Unaudited)
COMPARISON OF A $10,000 INVESTMENT

This graph shows the change in value of a hypothetical $10,000 investment in the Fund over the past 10 fiscal years, or since the Fund's inception if it has not operated for 10 years. The graph is based on the Investor Class shares only; the performance of the Fund's share classes will differ primarily due to different sales charge structures and class expenses (see Performance Highlights chart on previous page). The result is compared with benchmarks, which include a broad-based market index and may include a more narrowly based index. Market indices have not been reduced to reflect any of the fees and costs of investing. The results shown in the graph reflect the reinvestment of income dividends and other distributions, if any. The results do not reflect the effect of taxes a shareholder would pay on Fund distributions or on the redemption of Fund shares. Results represent past performance and do not indicate future results.
13
Genesis Fund Commentary (Unaudited)
Neuberger Berman Genesis Fund Investor Class posted a 13.65% total return for the fiscal year ended August 31, 2014, but underperformed its benchmark, the Russell 2000® Index, which provided a 17.68% return for the period. (Performance for all share classes is provided in the table immediately following this letter.)
The U.S. stock market rallied sharply during the reporting period. While the market experienced several periods of weakness, these proved to be only temporary setbacks as the S&P 500® Index repeatedly reached all-time highs during the period. Supporting the market were overall solid corporate profits and generally strong investor demand. While small-cap stocks posted strong results, they lagged the overall stock market as the S&P 500 Index gained 25.25% versus the 17.68% gain of the small-cap Russell 2000 Index during the 12-month period. Within the small-cap universe, value stocks outperformed their growth counterparts, as the Russell 2000 Value and Growth Indexes returned 18.10% and 17.30%, respectively.
While it produced a strong absolute return, the Fund's underperformance versus the benchmark was largely due to stock selection. This was partially driven by the outperformance of companies with a high degree of financial leverage as they benefited from the low interest rate environment. This was a headwind for the Fund as we emphasize less-leveraged, high-quality, profitable businesses. The sectors that detracted the most from performance were Financials and Health Care. Within Financials, mortgage servicing-related companies, including Ocwen Financial, were negative for performance. Following a period of significant growth, Ocwen Financial was impacted by the New York Department of Financial Services' request to halt its purchase of mortgage servicing rights from Wells Fargo. Within Health Care, a lack of exposure to outperforming pharmaceutical and biotechnology companies, many of which are more speculative in nature and have no earnings, detracted from results.
Contributing the most to performance was stock selection in the Information Technology sector, led by the Fund's position in Zebra Technologies Corp. The company manufactures and distributes thermal bar code printers, plastic card printers and products for use in data collection and automatic identification systems. It benefited the Fund's performance after announcing its intention to acquire Motorola Solutions' enterprise business. Other strong individual contributors to the Fund's results were Industrials company Westinghouse Air Brake Technologies Corp. and Consumer Discretionary firm Polaris Industries.
Sector positioning, overall, was a small drag on performance. In particular, while the portfolio's cash balance was modest and in line with historical levels, it detracted from results given the market's sharp rally and the low yields available from cash instruments. A lack of exposure to real estate investment trusts (REITs) was also negative for relative performance. On the upside, the Fund's overweights in the Materials and Energy sectors were beneficial for results.
Looking ahead, we believe the economy could continue to expand following the weather-induced slowdown earlier in the year. Turning to the small-cap market, in our view it appears to be fairly valued overall. That being said, we continue to find what we believe are pockets of opportunity. We also believe that investor demand may remain fairly strong if investors move out on the risk curve given the low interest rate environment and concerns for the negative impact rising rates can have on the bond market.
Sincerely,
JUDITH M. VALE AND ROBERT D'ALELIO
PORTFOLIO CO-MANAGERS
Information about principal risks of investing in the Fund is set forth in the prospectus and statement of additional information.
The portfolio composition, industries and holdings of the Fund are subject to change.
The opinions expressed are those of the Fund's portfolio managers. The opinions are as of the date of this report and are subject to change without notice.
14
Genesis Fund (Unaudited)
TICKER SYMBOLS
Investor Class | NBGNX | ||||||
Trust Class | NBGEX | ||||||
Advisor Class | NBGAX | ||||||
Institutional Class | NBGIX | ||||||
Class R6 | NRGSX | ||||||
SECTOR ALLOCATION
(as a % of Total Investments) | |||||
Consumer Discretionary | 11.5 | % | |||
Consumer Staples | 5.5 | ||||
Energy | 7.2 | ||||
Financials | 12.5 | ||||
Health Care | 11.7 | ||||
Industrials | 20.3 | ||||
Information Technology | 16.6 | ||||
Materials | 10.4 | ||||
Utilities | 0.7 | ||||
Short-Term Investments | 3.6 | ||||
Total | 100.0 | % | |||
PERFORMANCE HIGHLIGHTS
| Average Annual Total Return Ended 08/31/2014 | |||||||||||||||||||||||
| Inception Date | 1 Year | 5 Years | 10 Years | Life of Fund | |||||||||||||||||||
Investor Class | 09/27/1988 | 13.65 | % | 16.04 | % | 10.66 | % | 12.63 | % | ||||||||||||||
| Trust Class3 | 08/26/1993 | 13.55 | % | 15.95 | % | 10.59 | % | 12.62 | % | ||||||||||||||
| Advisor Class4 | 04/02/1997 | 13.24 | % | 15.65 | % | 10.30 | % | 12.41 | % | ||||||||||||||
| Institutional Class5 | 07/01/1999 | 13.82 | % | 16.26 | % | 10.87 | % | 12.78 | % | ||||||||||||||
| Class R624 | 03/15/2013 | 13.92 | % | 16.12 | % | 10.70 | % | 12.65 | % | ||||||||||||||
Index | |||||||||||||||||||||||
| Russell 2000® Index1,16 | 17.68 | % | 17.03 | % | 9.36 | % | 9.92 | % | |||||||||||||||
The performance data quoted represent past performance and do not indicate future results. Current performance may be lower or higher than the performance data quoted. For more current performance data, please visit www.nb.com/performance.
The results shown in the table reflect the reinvestment of income dividends and other distributions, if any. The results do not reflect the effect of taxes a shareholder would pay on Fund distributions or on the redemption of Fund shares.
The investment return and principal value of an investment will fluctuate and shares, when redeemed, may be worth more or less than their original cost.
Returns would have been lower if Neuberger Berman Management LLC (Management) had not reimbursed certain expenses and/or waived a portion of the investment management fees during certain of the periods shown. Repayment by a class (of expenses previously reimbursed and/or fees previously waived by Management) will decrease the class's returns. Please see Note B in the Notes to Financial Statements for specific information regarding expense reimbursement and/or fee waiver arrangements.
As stated in the Fund's most recent prospectus, the total annual operating expense ratios for fiscal year 2013 were 1.02%, 1.11%, 1.38%, 0.86% and 0.80% for Investor Class, Trust Class, Advisor Class, Institutional Class and Class R6 shares, respectively (before expense reimbursements and/or fee waivers, if any). The expense ratios were 0.85% and 0.78% for Institutional Class and Class R6 shares, respectively, after expense reimbursements and/or fee waivers.
15
Genesis Fund (Unaudited)
COMPARISON OF A $10,000 INVESTMENT
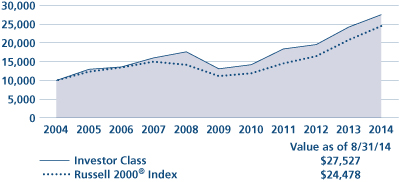
This graph shows the change in value of a hypothetical $10,000 investment in the Fund over the past 10 fiscal years, or since the Fund's inception if it has not operated for 10 years. The graph is based on the Investor Class shares only; the performance of the Fund's share classes will differ primarily due to different class expenses (see Performance Highlights chart on previous page). The result is compared with benchmarks, which include a broad-based market index and may include a more narrowly based index. Market indices have not been reduced to reflect any of the fees and costs of investing. The results shown in the graph reflect the reinvestment of income dividends and other distributions, if any. The results do not reflect the effect of taxes a shareholder would pay on Fund distributions or on the redemption of Fund shares. Results represent past performance and do not indicate future results.
16
Global Equity Fund Commentary (Unaudited)
Neuberger Berman Global Equity Fund Institutional Class generated a 19.67% total return for the fiscal year ended August 31, 2014, but trailed its benchmark, the MSCI All Country World Index, which advanced 21.61% during the period. (Performance for all share classes is provided in the table immediately following this letter.)
The MSCI All Country World Index performed well this period, driven by relatively improving global economic data and buoyant investor sentiment. After a brief pause in first quarter of 2014, markets continued their upward trajectory from 2013 through the end of this fiscal period. U.S. equities outperformed emerging markets, which in turn outperformed international developed markets, though each asset class saw double-digit returns.
While the U.S. market performed well, the index was led by smaller markets including Egypt, India and Finland. Hungary, United Arab Emirates and Qatar posted the most significant losses for the period. Amongst major developed markets, European periphery countries bested the core, and Japan was positive but lagged the index. By sector, Information Technology (IT) and Health Care strongly outperformed. Consumer Staples and Materials were weakest, although they, too, posted double-digit positive results.
Within the portfolio, stock selection within Consumer Staples and Consumer Discretionary benefited relative performance. Stock selection in IT put the largest strain on relative results, while Industrials holdings also underperformed. By country, U.S., Canada and Israel were our strongest performers, while relative underperformers included France, Sweden and Korea.
Looking at individual stocks, three of our top five contributors were U.S.-based companies—SanDisk, Apple and Cardinal Health, each benefiting from strong business drivers that were being recognized by the markets. Detractors included Softbank (Japan), which had a strong year last year, Sberbank (Russia), which we sold, and St. James's Place (UK).
While markets have recently been marching upward, discounting mixed economic data and a variety of results from global corporations as they've done recently, our focus remains on the fundamentals of the stocks we own, and those of the opportunities we are researching. We have spent much of our time recently working on existing names to ensure we have the highest conviction possible in those ideas, and in a number of cases increasing our positions in higher conviction holdings.
We have also reexamined our positioning toward European banks and other Financials, slightly reducing the scale of our largest sector underweight. Elsewhere, we have no exposure to the Utilities sector, and are overweighted to both Industrials and IT.
We continue to anticipate a weak economic cycle in the eurozone and Japan, solid growth in U.S. and UK, and just slightly faster growth in emerging markets. By geography, the portfolio remains modestly overweighted in the U.S. at the expense of Japan and emerging market-domiciled companies.
As part of our global search for quality growth companies, another recent development has been co-portfolio manager Benjamin Segal's relocation to Singapore. His focus is on deepening the team's comprehension of local and global companies' strategies and operations in the Asian region—home to two of the world's largest economies.
With a proven strategy, a deep fundamental research capability, and "feet on the ground" across the globe, we believe the team is well positioned to add value going forward.
Sincerely,
BENJAMIN SEGAL AND SAURIN D. SHAH
PORTFOLIO CO-MANAGERS
Information about principal risks of investing in the Fund is set forth in the prospectus and statement of additional information.
The portfolio composition, industries and holdings of the Fund are subject to change.
The opinions expressed are those of the Fund's portfolio managers. The opinions are as of the date of this report and are subject to change without notice.
17
Global Equity Fund (Unaudited)
TICKER SYMBOLS
Institutional Class | NGQIX | ||||||
Class A | NGQAX | ||||||
Class C | NGQCX | ||||||
SECTOR ALLOCATION
(as a % of Total Investments) | |||||
Consumer Discretionary | 10.0 | % | |||
Consumer Staples | 7.8 | ||||
Energy | 8.0 | ||||
Financials | 16.8 | ||||
Health Care | 10.3 | ||||
Industrials | 14.2 | ||||
Information Technology | 16.1 | ||||
Materials | 7.8 | ||||
Telecommunication Services | 3.4 | ||||
Short-Term Investments | 5.6 | ||||
Total | 100.0 | % | |||
PERFORMANCE HIGHLIGHTS9
| Average Annual Total Return Ended 08/31/2014 | |||||||||||||||
| Inception Date | 1 Year | Life of Fund | |||||||||||||
At NAV | |||||||||||||||
Institutional Class | 06/30/2011 | 19.67 | % | 7.28 | % | ||||||||||
Class A | 06/30/2011 | 19.18 | % | 6.87 | % | ||||||||||
Class C | 06/30/2011 | 18.39 | % | 6.11 | % | ||||||||||
With Sales Charge | |||||||||||||||
Class A | 12.28 | % | 4.90 | % | |||||||||||
Class C | 17.39 | % | 6.11 | % | |||||||||||
Index | |||||||||||||||
| MSCI All Country World Index1,16 | 21.61 | % | 11.03 | % | |||||||||||
| MSCI World Index1,16,26 | 21.74 | % | 12.40 | % | |||||||||||
The performance data quoted represent past performance and do not indicate future results. Current performance may be lower or higher than the performance data quoted. For more current performance data, please visit www.nb.com/performance.
The results shown in the table reflect the reinvestment of income dividends and other distributions, if any. The results do not reflect the effect of taxes a shareholder would pay on Fund distributions or on the redemption of Fund shares.
The investment return and principal value of an investment will fluctuate and shares, when redeemed, may be worth more or less than their original cost.
Returns would have been lower if Neuberger Berman Management LLC (Management) had not reimbursed certain expenses and/or waived a portion of the investment management fees during certain of the periods shown. Repayment by a class (of expenses previously reimbursed and/or fees previously waived by Management) will decrease the class's returns. Please see Note B in the Notes to Financial Statements for specific information regarding expense reimbursement and/or fee waiver arrangements.
As stated in the Fund's most recent prospectus, the total annual operating expense ratios for fiscal year 2013 were 5.16%, 5.67% and 6.51% for Institutional Class, Class A and Class C shares, respectively (before expense reimbursements and/or fee waivers, if any). The expense ratios were 1.15%, 1.51% and 2.26% for Institutional Class, Class A and Class C shares, respectively, after expense reimbursements and/or fee waivers.
Returns shown with a sales charge reflect the deduction of the current maximum initial sales charge of 5.75% for Class A shares and the contingent deferred sales charge (CDSC) for Class C shares. The CDSC for Class C shares is 1%, which is reduced to 0% after 1 year. The performance of the Fund's share classes will differ primarily due to different sales charge structures and class expenses. Please see the prospectus for more information about sales charge structures, if any, and class expenses for your share class.
18
Global Equity Fund (Unaudited)
COMPARISON OF A $1,000,000 INVESTMENT
(000's Omitted)

This graph shows the change in value of a hypothetical $1,000,000 investment in the Fund over the past 10 fiscal years, or since the Fund's inception if it has not operated for 10 years. The graph is based on the Institutional Class shares only; the performance of the Fund's share classes will differ primarily due to different sales charge structures and class expenses (see Performance Highlights chart on previous page). The result is compared with benchmarks, which include a broad-based market index and may include a more narrowly based index. Market indices have not been reduced to reflect any of the fees and costs of investing. The results shown in the graph reflect the reinvestment of income dividends and other distributions, if any. The results do not reflect the effect of taxes a shareholder would pay on Fund distributions or on the redemption of Fund shares. Results represent past performance and do not indicate future results.
19
Global Thematic Opportunities Fund Commentary (Unaudited)
Neuberger Berman Global Thematic Opportunities Fund Institutional Class generated a 12.92% total return for the fiscal year ended August 31, 2014, but underperformed the MSCI All Country World Index, which returned 21.61% for the period. (Performance for all share classes is provided in the table immediately following this letter).
Global markets broadly advanced as economic prospects were lifted by improving fundamentals in the U.S., Europe and, in some cases, developing markets. From a regional perspective, holdings within the U.S. provided the greatest source of index returns, while those in China and Japan were were relative laggards.
During the reporting period, the U.S. equity markets advanced to record highs, in part driven by a flurry of merger and acquisition activity coupled with strong buybacks and earnings growth. Improving employment figures and continued momentum in energy production were tailwinds for consumer confidence in the U.S. Despite increasing geopolitical tensions, the Chicago Board Options Exchange VIX Index, a widely followed barometer of volatility, neared its record low, reflecting relative stability in the markets. Outside the U.S., developed Europe posted healthy returns, while macro factors including the continued economic slowdown in China and currency weakness in the Japanese yen caused underperformance in those markets.
Thematically, our "Man vs. Machine" theme was supported by two strong contributors, SanDisk and Google. Reasonable valuations, coupled with improved revenues, stronger earnings and continued share buybacks attracted investors to the Information Technology sector, which rose over 30% during the period. Within our "Money in Motion" theme, KKR, American International Group and BlackRock were among our top contributors. While our Consumer Discretionary names underperformed overall, among the portfolio's largest positive contributors was hotel giant Wynn Resorts, where gaming revenues from Macau operations boosted profitability, prompting us to "cash out" for opportunities elsewhere.
Our "Emerging Market Consumer" theme was the largest hindrance to results, particularly names tied to China, such as Sa Sa International, New Oriental Education & Technology Group and Genting Hong Kong. These proved to be our biggest detractors, triggering a reevaluation of our initial investment theses, and ultimately resulting in the sale of these securities.
Within our "Self Help" theme, TRI Pointe Homes and General Motors lagged the broader Consumer Discretionary sector and were subsequently sold. By contrast, within Consumer Staples, Australia's Treasury Wine Estates surged over 40% following a takeout bid from private equity investors (we sold the position).
Looking ahead, we believe valuations within the equity markets will continue to appear reasonable. We have reduced our emerging market exposure and deployed proceeds among several companies in Europe, where we continue to find what we believe are opportunities in companies that should grow if the region continues its slow recovery from recession. We will continue to seek companies with resiliency in the face of geopolitical risk, but believe any corrections could create opportunities to add to certain names.
As always, we remain dedicated to finding opportunities in what we believe are excellent companies across a broad spectrum of countries and sectors with the goal of identifying persistent, structural and investable trends before they are recognized by the broader investment community. We believe that this opportunistic, disciplined and patient approach could be rewarded with attractive returns over time.
Sincerely,
TONY GLEASON, SANDY POMEROY, WILLIAM HUNTER AND RICHARD LEVINE
PORTFOLIO CO-MANAGERS
Information about principal risks of investing in the Fund is set forth in the prospectus and statement of additional information.
The portfolio composition, industries and holdings of the Fund are subject to change.
The opinions expressed are those of the Fund's portfolio managers. The opinions are as of the date of this report and are subject to change without notice.
20
Global Thematic Opportunities Fund (Unaudited)
TICKER SYMBOLS
Institutional Class | NGHIX | ||||||
Class A | NGHAX | ||||||
Class C | NGHCX | ||||||
SECTOR ALLOCATION
(as a % of Total Investments) | |||||
Consumer Discretionary | 16.1 | % | |||
Consumer Staples | 1.3 | ||||
Energy | 6.9 | ||||
Financials | 26.2 | ||||
Health Care | 9.0 | ||||
Industrials | 11.7 | ||||
Information Technology | 16.2 | ||||
Materials | 2.4 | ||||
Other | 2.2 | ||||
Short-Term Investments | 8.0 | ||||
Total | 100.0 | % | |||
PERFORMANCE HIGHLIGHTS
| Average Annual Total Return Ended 08/31/2014 | |||||||||||||||
| Inception Date | 1 Year | Life of Fund | |||||||||||||
At NAV | |||||||||||||||
Institutional Class | 06/30/2011 | 12.92 | % | 2.55 | % | ||||||||||
Class A | 06/30/2011 | 12.40 | % | 2.14 | % | ||||||||||
Class C | 06/30/2011 | 11.66 | % | 1.41 | % | ||||||||||
With Sales Charge | |||||||||||||||
Class A | 5.91 | % | 0.26 | % | |||||||||||
Class C | 10.66 | % | 1.41 | % | |||||||||||
Index | |||||||||||||||
| MSCI All Country World Index1,16 | 21.61 | % | 11.03 | % | |||||||||||
The performance data quoted represent past performance and do not indicate future results. Current performance may be lower or higher than the performance data quoted. For more current performance data, please visit www.nb.com/performance.
The results shown in the table reflect the reinvestment of income dividends and other distributions, if any. The results do not reflect the effect of taxes a shareholder would pay on Fund distributions or on the redemption of Fund shares.
The investment return and principal value of an investment will fluctuate and shares, when redeemed, may be worth more or less than their original cost.
Returns would have been lower if Neuberger Berman Management LLC (Management) had not reimbursed certain expenses and/or waived a portion of the investment management fees during certain of the periods shown. Repayment by a class (of expenses previously reimbursed and/or fees previously waived by Management) will decrease the class's returns. Please see Note B in the Notes to Financial Statements for specific information regarding expense reimbursement and/or fee waiver arrangements.
As stated in the Fund's most recent prospectus, the total annual operating expense ratios for fiscal year 2013 were 1.62%, 2.02% and 2.87% for Institutional Class, Class A and Class C shares, respectively (before expense reimbursements and/or fee waivers, if any). The expense ratios were 1.28%, 1.64% and 2.39% for Institutional Class, Class A and Class C shares, respectively, after expense reimbursements and/or fee waivers.
Returns shown with a sales charge reflect the deduction of the current maximum initial sales charge of 5.75% for Class A shares and the contingent deferred sales charge (CDSC) for Class C shares. The CDSC for Class C shares is 1%, which is reduced to 0% after 1 year. The performance of the Fund's share classes will differ primarily due to different sales charge structures and class expenses. Please see the prospectus for more information about sales charge structures, if any, and class expenses for your share class.
21
Global Thematic Opportunities Fund (Unaudited)
COMPARISON OF A $1,000,000 INVESTMENT
(000's Omitted)

This graph shows the change in value of a hypothetical $1,000,000 investment in the Fund over the past 10 fiscal years, or since the Fund's inception if it has not operated for 10 years. The graph is based on the Institutional Class shares only; the performance of the Fund's share classes will differ primarily due to different sales charge structures and class expenses (see Performance Highlights chart on previous page). The result is compared with benchmarks, which include a broad-based market index and may include a more narrowly based index. Market indices have not been reduced to reflect any of the fees and costs of investing. The results shown in the graph reflect the reinvestment of income dividends and other distributions, if any. The results do not reflect the effect of taxes a shareholder would pay on Fund distributions or on the redemption of Fund shares. Results represent past performance and do not indicate future results.
22
Greater China Equity Fund Commentary (Unaudited)
Neuberger Berman Greater China Equity Fund Institutional Class generated a 21.37% total return for the fiscal year ended August 31, 2014 and outperformed its benchmark, the MSCI China Index, which generated a 17.91% return over the same period. (Performance for all share classes is provided in the table immediately following this letter.)
For the 12-month period, the Fund's overweight positions in the Health Care and Utilities sectors contributed to performance relative to benchmark. On the contrary, the Fund's underweights in Energy and Information Technology detracted from performance relative to benchmark. Stock selection in Energy, Telecommunication Services and Utilities positively impacted performance, while stock selection in Financials and Industrials had a negative impact to performance relative to the benchmark.
Reviewing the market environment over the past year, improving fundamentals, the Third Plenary Session of the 18th CPC Central Committee and the release of the Third Plenum reform document boosted investor sentiment. As a result, the China equity markets displayed solid performance in September, October and November of 2013. In December, despite the China Securities Regulatory Commission (CSRC)'s announcement to end a 14-month freeze on IPOs, concerns over liquidity led the offshore China equity markets to decline. Going into the New Year, investor sentiment further dampened after the release of worse-than-expected macroeconomic indicators in January, but rebounded after the Chinese New Year holidays ahead of expectations from the Communist Party Central Committee (CPCC) and National People's Congress (NPC) meetings in March.
In March, China's first-ever corporate bond default and disappointing February macro data negatively impacted the China equity markets. In April, the CSRC and the Hong Kong Securities and Futures Commission (SFC) announced a pilot trading program called the Shanghai-Hong Kong Stock Connect, which, if implemented, would allow two-way investment between the Shanghai Stock Exchange and the Stock Exchange of Hong Kong for the first time. Chinese equities rebounded after the State Council unveiled the new national nine rules in May, which are designed to accelerate the further opening up of China's capital markets. Positive momentum extended into June in response to improved macroeconomic data and the State Council's announcements to ease policies. The markets continued to rally in July due to easing rules on bank's loan-to-deposit ratios, better-than-expected second quarter GDP growth and implementation of additional policies, such as relaxing home purchase curbs, implementation of fiscal measures, and state-owned enterprise (SOE) and other reforms. China equity markets weakened in August amid tepid macroeconomic data published for July and liquidity concerns raised by the resumption of China A-shares IPOs, although August still ended in slightly positive territory.
The Fund continues to focus on companies that we believe have sustainable top and bottom line growth as evidenced by operating cash flow from recurring core businesses. As of August 31, 2014, the Fund's largest sector overweight relative to the benchmark was Utilities and the largest sector underweight was Energy. The Fund also held overweight positions in Consumer Discretionary and Health Care, and underweight positions in Consumer Staples and Financials. The Fund's top 10 positions comprised more than 47% of total portfolio assets at the end of August.
Sincerely,
LIHUI TANG AND FRANK YAO
PORTFOLIO CO-MANAGERS
Information about principal risks of investing in the Fund is set forth in the prospectus and statement of additional information.
The portfolio composition, industries and holdings of the Fund are subject to change.
The opinions expressed are those of the Fund's portfolio managers. The opinions are as of the date of this report and are subject to change without notice.
23
Greater China Equity Fund (Unaudited)
TICKER SYMBOLS
Institutional Class | NCEIX | ||||||
Class A | NCEAX | ||||||
Class C | NCECX | ||||||
SECTOR ALLOCATION
(as a % of Total Investments) | |||||
Consumer Discretionary | 14.3 | % | |||
Consumer Staples | 1.1 | ||||
Energy | 0.5 | ||||
Financials | 33.4 | ||||
Health Care | 6.6 | ||||
Industrials | 6.8 | ||||
Information Technology | 14.7 | ||||
Materials | 0.7 | ||||
Telecommunication Services | 7.6 | ||||
Utilities | 13.1 | ||||
Short-Term Investments | 1.2 | ||||
Total | 100.0 | % | |||
EXCHANGE ALLOCATION
(as a % of Long Term Investments) | |||||
Mainland China | 25.0 | % | |||
Hong Kong | 65.7 | ||||
United States | 9.3 | ||||
Total | 100.0 | % | |||
PERFORMANCE HIGHLIGHTS
| Average Annual Total Return Ended 08/31/2014 | |||||||||||||||
| Inception Date | 1 Year | Life of Fund | |||||||||||||
At NAV | |||||||||||||||
Institutional Class | 07/17/2013 | 21.37 | % | 20.45 | % | ||||||||||
Class A | 07/17/2013 | 21.07 | % | 20.19 | % | ||||||||||
Class C | 07/17/2013 | 20.09 | % | 19.22 | % | ||||||||||
With Sales Charge | |||||||||||||||
Class A | 14.10 | % | 14.03 | % | |||||||||||
Class C | 19.09 | % | 19.22 | % | |||||||||||
Index | |||||||||||||||
| MSCI China Index1,16 | 17.91 | % | 20.67 | % | |||||||||||
The performance data quoted represent past performance and do not indicate future results. Current performance may be lower or higher than the performance data quoted. For more current performance data, please visit www.nb.com/performance.
The results shown in the table reflect the reinvestment of income dividends and other distributions, if any. The results do not reflect the effect of taxes a shareholder would pay on Fund distributions or on the redemption of Fund shares.
The investment return and principal value of an investment will fluctuate and shares, when redeemed, may be worth more or less than their original cost.
Returns would have been lower if Neuberger Berman Management LLC (Management) had not reimbursed certain expenses and/or waived a portion of the investment management fees during certain of the periods shown. Repayment by a class (of expenses previously reimbursed and/or fees previously waived by Management) will decrease the class's returns. Please see Note B in the Notes to Financial Statements for specific information regarding expense reimbursement and/or fee waiver arrangements.
As stated in the Fund's most recent prospectus, the estimated total annual operating expense ratios for fiscal year 2013 were 1.91%, 2.27% and 3.02% for Institutional Class, Class A and Class C shares, respectively (before expense reimbursements and/or fee waivers, if any). The estimated expense ratios were 1.51%, 1.87% and 2.62% for Institutional Class, Class A and Class C shares, respectively, after expense reimbursements and/or fee waivers.
Returns shown with a sales charge reflect the deduction of the current maximum initial sales charge of 5.75% for Class A shares and the contingent deferred sales charge (CDSC) for Class C shares. The CDSC for Class C shares is 1%, which is reduced to 0% after 1 year. The performance of the Fund's share classes will differ primarily due to different sales charge structures and class expenses. Please see the prospectus for more information about sales charge structures, if any, and class expenses for your share class.
24
Greater China Equity Fund (Unaudited)
COMPARISON OF A $1,000,000 INVESTMENT
(000's Omitted)

This graph shows the change in value of a hypothetical $1,000,000 investment in the Fund over the past 10 fiscal years, or since the Fund's inception if it has not operated for 10 years. The graph is based on the Institutional Class shares only; the performance of the Fund's share classes will differ primarily due to different sales charge structures and class expenses (see Performance Highlights chart on previous page). The result is compared with benchmarks, which include a broad-based market index and may include a more narrowly based index. Market indices have not been reduced to reflect any of the fees and costs of investing. The results shown in the graph reflect the reinvestment of income dividends and other distributions, if any. The results do not reflect the effect of taxes a shareholder would pay on Fund distributions or on the redemption of Fund shares. Results represent past performance and do not indicate future results.
25
Guardian Fund Commentary (Unaudited)
Neuberger Berman Guardian Fund Investor Class generated a 21.87% total return for the fiscal year ended August 31, 2014 but trailed the 25.25% return of its benchmark, the S&P 500® Index. (Performance for all share classes is provided in the table immediately following this letter.)
The absolute performance of our portfolio companies was solid for this reporting period, but our holdings faced a relative headwind for much of the period. With economic momentum building and the U.S. Federal Reserve's (Fed) tapering program underway, consensus (and this team's) opinion was that interest rates would begin trending higher. Instead, they have fallen year to date. As a result, higher-yielding sectors such as Utilities, REITs, and pipelines have outperformed. So far into 2014, our underrepresentation in these industry groups has been a headwind to relative performance.
With the general strength in equities and ample stock specific volatility, we took advantage of many opportunities to purchase the shares of high-quality companies at attractive valuations while realizing gains on many longer-term holdings as they became more fully valued. We also benefited from the surge in M&A activity as two of our companies are in the process of being acquired and as our holding M&A advisor Lazard enjoyed improved earnings prospects.
The portfolio outperformed the benchmark in Consumer Discretionary and Telecommunication Services. Newell Rubbermaid, Texas Instruments, and Covidien (which was sold after Medtronic offered a significant premium) made the largest individual contributions. Other recent sales of stocks with recent appreciation included Lazard and Scripps. We lagged in Information Technology (absence of Apple and underperformance by Altera, which was sold) and Consumer Staples. BG Group, another relative disappointment, was sold early in 2014.
Several recent purchases include NOW, a new distribution company formed from the consolidation of three large incumbents that serve energy related businesses. With what we consider an immaculate balance sheet, we believe NOW should benefit both from its strong position in a fragmented industry and from sustained spending to support the energy renaissance in North America.
We also purchased our first Utilities stock since the financial crisis. Wisconsin Energy recently announced the acquisition of Integrys. The combined company spans four states in the upper midwestern United States. We believe the infrastructure needs of the combined service territory should drive growth in Wisconsin Energy's rate base, one of the best organic growth prospects in the regulated utility sector, in our view. In our view, the company has a strong capital structure and should remain free cash flow-positive even as it grows.
Looking ahead, we see what we believe is economic momentum in the U.S., with signs of real strength in discrete segments—railroad volumes, skilled labor, consumer sentiment, housing, and auto sales, which in August touched the pre-crisis high. Balancing that, we believe sources of uncertainty include ongoing weakness in the European economy, which could be exacerbated by Russian/Ukrainian tensions, and potential market distortions from a divergence in central bank policy—with the Fed leaning toward tighter policy, but the European Central Bank and Bank of Japan still easing.
While we are always cognizant of external factors, our strategy remains unchanged—to focus on business fundamentals and to be an opportunistic buyer and seller around valuations. We feel constructive about our companies' businesses and look forward to continuing to serve your investment needs.
Sincerely,
ARTHUR MORETTI
PORTFOLIO MANAGER
Information about principal risks of investing in the Fund is set forth in the prospectus and statement of additional information.
The portfolio composition, industries and holdings of the Fund are subject to change.
The opinions expressed are those of the Fund's portfolio manager. The opinions are as of the date of this report and are subject to change without notice.
26
Guardian Fund (Unaudited)
TICKER SYMBOLS
Investor Class | NGUAX | ||||||
Trust Class | NBGTX | ||||||
Advisor Class | NBGUX | ||||||
Institutional Class | NGDLX | ||||||
Class A | NGDAX | ||||||
Class C | NGDCX | ||||||
Class R3 | NGDRX | ||||||
SECTOR ALLOCATION
(as a % of Total Investments) | |||||
Consumer Discretionary | 13.9 | % | |||
Consumer Staples | 11.0 | ||||
Energy | 6.0 | ||||
Financials | 20.2 | ||||
Health Care | 7.7 | ||||
Industrials | 15.1 | ||||
Information Technology | 17.9 | ||||
Materials | 3.9 | ||||
Telecommunication Services | 1.5 | ||||
Utilities | 1.0 | ||||
Short-Term Investments | 1.8 | ||||
Total | 100.0 | % | |||
PERFORMANCE HIGHLIGHTS7,12
| Average Annual Total Return Ended 08/31/2014 | |||||||||||||||||||||||
| Inception Date | 1 Year | 5 Years | 10 Years | Life of Fund | |||||||||||||||||||
At NAV | |||||||||||||||||||||||
Investor Class | 06/01/1950 | 21.87 | % | 16.54 | % | 8.89 | % | 11.24 | % | ||||||||||||||
| Trust Class3 | 08/03/1993 | 21.61 | % | 16.32 | % | 8.71 | % | 11.20 | % | ||||||||||||||
| Advisor Class4 | 09/03/1996 | 21.27 | % | 15.89 | % | 8.26 | % | 11.06 | % | ||||||||||||||
| Institutional Class5 | 05/27/2009 | 22.03 | % | 16.74 | % | 8.99 | % | 11.26 | % | ||||||||||||||
| Class A20 | 05/27/2009 | 21.62 | % | 16.30 | % | 8.79 | % | 11.22 | % | ||||||||||||||
| Class C20 | 05/27/2009 | 20.71 | % | 15.46 | % | 8.36 | % | 11.16 | % | ||||||||||||||
| Class R317 | 05/27/2009 | 21.29 | % | 16.03 | % | 8.65 | % | 11.20 | % | ||||||||||||||
With Sales Charge | |||||||||||||||||||||||
| Class A20 | 14.60 | % | 14.94 | % | 8.14 | % | 11.12 | % | |||||||||||||||
| Class C20 | 19.71 | % | 15.46 | % | 8.36 | % | 11.16 | % | |||||||||||||||
Index | |||||||||||||||||||||||
| S&P 500® Index1,16 | 25.25 | % | 16.88 | % | 8.38 | % | 11.21 | % | |||||||||||||||
The performance data quoted represent past performance and do not indicate future results. Current performance may be lower or higher than the performance data quoted. For more current performance data, please visit www.nb.com/performance.
The results shown in the table reflect the reinvestment of income dividends and other distributions, if any. The results do not reflect the effect of taxes a shareholder would pay on Fund distributions or on the redemption of Fund shares.
The investment return and principal value of an investment will fluctuate and shares, when redeemed, may be worth more or less than their original cost.
Returns would have been lower if Neuberger Berman Management LLC (Management) had not reimbursed certain expenses and/or waived a portion of the investment management fees during certain of the periods shown. Repayment by a class (of expenses previously reimbursed and/or fees previously waived by Management) will decrease the class's returns. Please see Note B in the Notes to Financial Statements for specific information regarding expense reimbursement and/or fee waiver arrangements.
As stated in the Fund's most recent prospectus, the total annual operating expense ratios for fiscal year 2013 were 0.91%, 1.08%, 1.50%, 0.73%, 1.11%, 1.87% and 1.41% for Investor Class, Trust Class, Advisor Class, Institutional Class, Class A, Class C and Class R3 shares, respectively (before expense reimbursements and/or fee waivers, if any). The expense ratios were 1.86% and 1.36% for Class C and Class R3 shares, respectively, after expense reimbursements and/or fee waivers. The total annual operating expense ratio for each of Advisor Class and Class A includes the class's repayment of expenses previously reimbursed and/or fees previously waived by Management.
Returns shown with a sales charge reflect the deduction of the current maximum initial sales charge of 5.75% for Class A shares and the contingent deferred sales charge (CDSC) for Class C shares. The CDSC for Class C shares is 1%, which is reduced to 0% after 1 year. The performance of the Fund's share classes will differ primarily due to different sales charge structures and class expenses. Please see the prospectus for more information about sales charge structures, if any, and class expenses for your share class.
27
Guardian Fund (Unaudited)
COMPARISON OF A $10,000 INVESTMENT
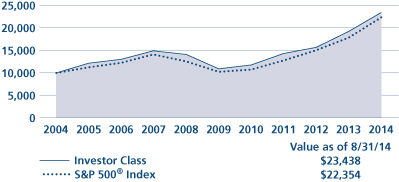
This graph shows the change in value of a hypothetical $10,000 investment in the Fund over the past 10 fiscal years, or since the Fund's inception if it has not operated for 10 years. The graph is based on the Investor Class shares only; the performance of the Fund's share classes will differ primarily due to different sales charge structures and class expenses (see Performance Highlights chart on previous page). The result is compared with benchmarks, which include a broad-based market index and may include a more narrowly based index. Market indices have not been reduced to reflect any of the fees and costs of investing. The results shown in the graph reflect the reinvestment of income dividends and other distributions, if any. The results do not reflect the effect of taxes a shareholder would pay on Fund distributions or on the redemption of Fund shares. Results represent past performance and do not indicate future results.
28
International Equity Fund Commentary (Unaudited)
Neuberger Berman International Equity Fund Institutional Class generated a 12.38% total return for the fiscal year ended August 31, 2014, trailing its benchmark, the MSCI EAFE® Index, which posted a 16.92% return. (Performance for all share classes is provided in the table immediately following this letter.)
International equity markets were volatile but generally positive during the 12-month period. Relative to other asset classes, however, the MSCI EAFE Index trailed both the S&P 500® Index and the MSCI Emerging Markets Index, as European economic data slowly improved but lagged the momentum seen in the U.S. Performance was also dampened amid concerns over the potential economic impact of tensions between Russia and Ukraine.
The developed international equity market rally that started in mid-2012 appears to have largely been driven by multiple expansion rather than earnings growth. In such an environment, our quality bias—with a specific focus on companies with strong balance sheets, sustainable organic earnings growth and high returns on invested capital—has been challenged, which has been a headwind for relative performance.
Within the portfolio, stock selection in the Financials sector had the greatest positive impact on relative performance this period, followed by Health Care. By country, holdings in the UK and Japan, along with our opportunistic allocation in the U.S., benefitted relative performance the most. Detractors relative to the benchmark included holdings within the Telecommunication Services and Consumer Staples sectors. By country, holdings in France and a lack of exposure to the strong Spanish market detracted the most.
Top contributors during the reporting period included Continental, the German auto parts maker, Sika, a Swiss global construction materials producer, and Nihon Kohden, the Japanese medical equipment manufacturer. Detractors included Sanrio, the Japanese owner of licenses for Hello Kitty and other characters, which we sold, as well as ProSafe, a Norwegian deepwater drilling accommodations firm, and Arkema, the French specialized chemicals producer—positions we maintain.
At the close of this period, the portfolio's largest overweights were in Industrials and Information Technology; the largest underweights were in Financials, Utilities (a zero allocation) and Energy.
One other recent development has been portfolio manager Benjamin Segal's relocation to Singapore. As a global investor, his focus is on deepening the team's understanding of local and global companies' strategies and operations in the Asian region—home to two of the three largest economies in the world.
Looking forward, we don't anticipate that the rising tide that has lifted all boats in the last 24 months will continue. As such, in addition to always being alert to new or better investment opportunities, we have spent much of our time in recent quarters working on existing names to ensure we have the highest conviction possible in those ideas. As a result of this work, we have identified a number of situations where we have focused assets in higher conviction holdings.
As we approach what appears to be an inflection point where fundamentals come back into focus and 'quality' matters again, we anticipate seeing more dispersion in individual stock returns—an environment that would be better suited to bottom-up, fundamentally focused stock-pickers such as ourselves. We believe having a focused portfolio of high-quality companies trading at reasonable valuations could be an appealing strategy if this rally continues to mature.
Sincerely,
BENJAMIN SEGAL
PORTFOLIO MANAGER
Information about principal risks of investing in the Fund is set forth in the prospectus and statement of additional information.
The portfolio composition, industries and holdings of the Fund are subject to change.
The opinions expressed are those of the Fund's portfolio manager. The opinions are as of the date of this report and are subject to change without notice.
29
International Equity Fund (Unaudited)
TICKER SYMBOLS
Investor Class | NIQVX | ||||||
Trust Class | NIQTX | ||||||
Institutional Class | NBIIX | ||||||
Class A | NIQAX | ||||||
Class C | NIQCX | ||||||
Class R6 | NRIQX | ||||||
SECTOR ALLOCATION
(as a % of Total Investments) | |||||
Consumer Discretionary | 9.8 | % | |||
Consumer Staples | 11.2 | ||||
Energy | 3.8 | ||||
Financials | 17.8 | ||||
Health Care | 10.6 | ||||
Industrials | 22.5 | ||||
Information Technology | 8.7 | ||||
Materials | 8.9 | ||||
Telecommunication Services | 3.8 | ||||
Short-Term Investments | 2.9 | ||||
Total | 100.0 | % | |||
PERFORMANCE HIGHLIGHTS7
| Average Annual Total Return Ended 08/31/2014 | |||||||||||||||||||
| Inception Date | 1 Year | 5 Years | Life of Fund | ||||||||||||||||
At NAV | |||||||||||||||||||
| Investor Class13 | 01/28/2013 | 12.14 | % | 10.12 | % | 5.41 | % | ||||||||||||
| Trust Class13 | 01/28/2013 | 12.02 | % | 10.09 | % | 5.39 | % | ||||||||||||
Institutional Class | 06/17/2005 | 12.38 | % | 10.20 | % | 5.45 | % | ||||||||||||
| Class A13 | 01/28/2013 | 11.98 | % | 10.07 | % | 5.38 | % | ||||||||||||
| Class C13 | 01/28/2013 | 11.16 | % | 9.79 | % | 5.24 | % | ||||||||||||
| Class R623 | 09/03/2013 | 12.46 | % | 10.22 | % | 5.46 | % | ||||||||||||
With Sales Charge | |||||||||||||||||||
| Class A13 | 5.55 | % | 8.78 | % | 4.71 | % | |||||||||||||
| Class C13 | 10.16 | % | 9.79 | % | 5.24 | % | |||||||||||||
Index | |||||||||||||||||||
| MSCI EAFE® Index1,16 | 16.92 | % | 8.69 | % | 6.33 | % | |||||||||||||
The performance data quoted represent past performance and do not indicate future results. Current performance may be lower or higher than the performance data quoted. For more current performance data, please visit www.nb.com/performance.
The results shown in the table reflect the reinvestment of income dividends and other distributions, if any. The results do not reflect the effect of taxes a shareholder would pay on Fund distributions or on the redemption of Fund shares.
The investment return and principal value of an investment will fluctuate and shares, when redeemed, may be worth more or less than their original cost.
Returns would have been lower if Neuberger Berman Management LLC (Management) had not reimbursed certain expenses and/or waived a portion of the investment management fees during certain of the periods shown. Repayment by a class (of expenses previously reimbursed and/or fees previously waived by Management) will decrease the class's returns. Please see Note B in the Notes to Financial Statements for specific information regarding expense reimbursement and/or fee waiver arrangements.
As stated in the Fund's most recent prospectus, the total annual operating expense ratios for fiscal year 2013 (estimated for Class R6) were 1.33%, 1.43%, 1.15%, 1.56%, 2.52% and 1.02 for Investor Class, Trust Class, Institutional Class, Class A, Class C and Class R6 shares, respectively (before expense reimbursements and/or fee waivers, if any). The expense ratios were 0.86%, 1.29%, 2.09% and 0.78% for Institutional Class, Class A, Class C and Class R6, respectively, after expense reimbursements and/or fee waivers.
Returns shown with a sales charge reflect the deduction of the current maximum initial sales charge of 5.75% for Class A shares and the contingent deferred sales charge (CDSC) for Class C shares. The CDSC for Class C shares is 1%, which is reduced to 0% after 1 year. The performance of the Fund's share classes will differ primarily due to different sales charge structures and class expenses. Please see the prospectus for more information about sales charge structures, if any, and class expenses for your share class.
30
International Equity Fund (Unaudited)
COMPARISON OF A $1,000,000 INVESTMENT
(000's Omitted)
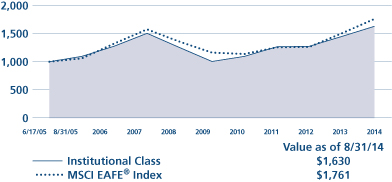
This graph shows the change in value of a hypothetical $1,000,000 investment in the Fund over the past 10 fiscal years, or since the Fund's inception if it has not operated for 10 years. The graph is based on the Institutional Class shares only; the performance of the Fund's share classes will differ primarily due to different sales charge structures and class expenses (see Performance Highlights chart on previous page). The result is compared with benchmarks, which include a broad-based market index and may include a more narrowly based index. Market indices have not been reduced to reflect any of the fees and costs of investing. The results shown in the graph reflect the reinvestment of income dividends and other distributions, if any. The results do not reflect the effect of taxes a shareholder would pay on Fund distributions or on the redemption of Fund shares. Results represent past performance and do not indicate future results.
31
International Select Fund Commentary* (Unaudited)
Neuberger Berman International Select Fund (formerly Neuberger Berman International Large Cap Fund) Trust Class generated a 11.56% total return for the fiscal year ended August 31, 2014, trailing its benchmark, the MSCI EAFE® Index, which provided a 16.92% return. (Performance for all share classes is provided in the table immediately following this letter.)
International equity markets were volatile but generally positive this past fiscal year. Relative to other asset classes, however, the MSCI EAFE Index trailed both the U.S. S&P 500® Index and the MSCI Emerging Markets Index, as European economic data slowly improved but lagged the momentum seen in the U.S. Performance was also dampened amid concerns over the potential economic impact of tensions between Russia and Ukraine.
The developed international equity market rally that started in mid-2012 appears to have largely been driven by multiple expansion rather than earnings growth. In such an environment, our quality bias—with a specific focus on companies with strong balance sheets, sustainable organic earnings growth and high returns on invested capital—has been challenged, which has been a headwind for relative performance.
Within the portfolio, stock selection in the Energy sector had the greatest positive impact on relative performance this period. By country, holdings in the UK and Japan, along with our opportunistic allocation in the U.S., benefitted relative performance the most. Stock selection (along with an overweight) in Industrials was the largest detractor from relative returns by sector. By country, holdings in France and a lack of exposure to the strong Spanish market detracted the most.
Top contributors included Continental, the German auto parts maker, Sika, a Swiss global construction materials producer, and Givaudan, the Swiss-based flavor and fragrances provider. Detractors included Japan's Sanrio, owner of Hello Kitty and other licensed characters, Arkema, the French specialized chemicals producer, and New Gold, a Canadian mining firm. Sanrio and New Gold were sold.
At the close of the reporting period, the portfolio's largest overweights were in Industrials and Information Technology, while the largest underweights were in Financials, Utilities (a zero allocation) and Energy.
One other recent development has been portfolio manager Benjamin Segal's relocation to Singapore. As a global investor, his focus is on deepening the team's understanding of local and global companies' strategies and operations in the Asian region—home to two of the three largest economies in the world.
Looking forward, we don't anticipate the rising tide that has lifted all boats in the last 24 months will continue. As such, in addition to always being alert to new or better investment opportunities, we have spent much of our time in recent quarters working on existing names to ensure we have the highest conviction possible in those ideas. As a result of this work, we have identified a number of situations where we have focused assets in higher conviction holdings.
As we approach what appears to be an inflection point where fundamentals come back into focus and 'quality' matters again, we anticipate seeing more dispersion in individual stock returns—an environment that would be better suited to bottom-up, fundamentally focused stock-pickers such as ourselves. We believe having a focused portfolio of high-quality companies trading at reasonable valuations could be an appealing strategy if this rally continues to mature.
Sincerely,
BENJAMIN SEGAL
PORTFOLIO MANAGER
* Effective June 2, 2014, Neuberger Berman International Large Cap Fund changed its name to Neuberger Berman International Select Fund.
Information about principal risks of investing in the Fund is set forth in the prospectus and statement of additional information.
The portfolio composition, industries and holdings of the Fund are subject to change.
The opinions expressed are those of the Fund's portfolio manager. The opinions are as of the date of this report and are subject to change without notice.
32
International Select Fund (Unaudited)
TICKER SYMBOLS
Trust Class | NILTX | ||||||
Institutional Class | NILIX | ||||||
Class A | NBNAX | ||||||
Class C | NBNCX | ||||||
Class R3 | NBNRX | ||||||
SECTOR ALLOCATION
(as a % of Total Investments) | |||||
Consumer Discretionary | 10.5 | % | |||
Consumer Staples | 8.6 | ||||
Energy | 3.1 | ||||
Financials | 19.9 | ||||
Health Care | 11.6 | ||||
Industrials | 18.6 | ||||
Information Technology | 10.0 | ||||
Materials | 11.2 | ||||
Telecommunication Services | 4.4 | ||||
Short-Term Investments | 2.1 | ||||
Total | 100.0 | % | |||
PERFORMANCE HIGHLIGHTS7,28
| Average Annual Total Return Ended 08/31/2014 | |||||||||||||||||||
| Inception Date | 1 Year | 5 Years | Life of Fund | ||||||||||||||||
At NAV | |||||||||||||||||||
Trust Class | 08/01/2006 | 11.56 | % | 8.19 | % | 3.17 | % | ||||||||||||
| Institutional Class6 | 10/06/2006 | 11.98 | % | 8.58 | % | 3.53 | % | ||||||||||||
| Class A15 | 12/20/2007 | 11.69 | % | 8.22 | % | 3.19 | % | ||||||||||||
| Class C15 | 12/20/2007 | 10.79 | % | 7.39 | % | 2.54 | % | ||||||||||||
| Class R315 | 05/27/2009 | 11.35 | % | 7.91 | % | 2.99 | % | ||||||||||||
With Sales Charge | |||||||||||||||||||
| Class A15 | 5.32 | % | 6.95 | % | 2.43 | % | |||||||||||||
| Class C15 | 9.79 | % | 7.39 | % | 2.54 | % | |||||||||||||
Index | |||||||||||||||||||
| MSCI EAFE® Index1,16 | 16.92 | % | 8.69 | % | 3.95 | % | |||||||||||||
The performance data quoted represent past performance and do not indicate future results. Current performance may be lower or higher than the performance data quoted. For more current performance data, please visit www.nb.com/performance.
The results shown in the table reflect the reinvestment of income dividends and other distributions, if any. The results do not reflect the effect of taxes a shareholder would pay on Fund distributions or on the redemption of Fund shares.
The investment return and principal value of an investment will fluctuate and shares, when redeemed, may be worth more or less than their original cost.
Returns would have been lower if Neuberger Berman Management LLC (Management) had not reimbursed certain expenses and/or waived a portion of the investment management fees during certain of the periods shown. Repayment by a class (of expenses previously reimbursed and/or fees previously waived by Management) will decrease the class's returns. Please see Note B in the Notes to Financial Statements for specific information regarding expense reimbursement and/or fee waiver arrangements.
As stated in the Fund's most recent prospectus, the total annual operating expense ratios for fiscal year 2013 were 1.38%, 0.98%, 1.38%, 2.10% and 1.61% for Trust Class, Institutional Class, Class A, Class C and Class R3 shares, respectively (before expense reimbursements and/or fee waivers, if any). The expense ratios were 1.26%, 0.91%, 1.31%, 2.01% and 1.52% for Trust Class, Institutional Class, Class A, Class C and Class R3 shares, respectively, after expense reimbursements and/or fee waivers.
Returns shown with a sales charge reflect the deduction of the current maximum initial sales charge of 5.75% for Class A shares and the contingent deferred sales charge (CDSC) for Class C shares. The CDSC for Class C shares is 1%, which is reduced to 0% after 1 year. The performance of the Fund's share classes will differ primarily due to different sales charge structures and class expenses. Please see the prospectus for more information about sales charge structures, if any, and class expenses for your share class.
33
International Select Fund (Unaudited)
COMPARISON OF A $10,000 INVESTMENT

This graph shows the change in value of a hypothetical $10,000 investment in the Fund over the past 10 fiscal years, or since the Fund's inception if it has not operated for 10 years. The graph is based on the Trust Class shares only; the performance of the Fund's share classes will differ primarily due to different sales charge structures and class expenses (see Performance Highlights chart on previous page). The result is compared with benchmarks, which include a broad-based market index and may include a more narrowly based index. Market indices have not been reduced to reflect any of the fees and costs of investing. The results shown in the graph reflect the reinvestment of income dividends and other distributions, if any. The results do not reflect the effect of taxes a shareholder would pay on Fund distributions or on the redemption of Fund shares. Results represent past performance and do not indicate future results.
34
Intrinsic Value Fund Commentary (Unaudited)
Neuberger Berman Intrinsic Value Fund Institutional Class posted a 21.74% total return for the fiscal year ended August 31, 2014, and outperformed the 18.10% return of its benchmark, the Russell 2000® Value Index. (Performance for all share classes is provided in the table immediately following this letter.)
During the 12-month period, improvement in the U.S. economy bolstered the outlook for corporate profits. We believe investors took note and pushed aside concerns that international economies weren't faring as well and that the Federal Reserve's stimulative interest rate and bond buying policies were drawing to an end.
Since 2009, the Fund has been positioned to profit from an upturn in the economy by focusing on the more cyclical sectors of the small cap market, such as Technology, Producer Durables (think capital goods) and Materials & Processing. Almost two-thirds of the Fund's investments fell into these sectors and a similar percentage of our return, about 16% for the fiscal year, was realized from these groups. By way of comparison, the Russell 2000 Value Index has less than 30% of its constituent companies in these same sectors. The analyst team selected attractively valued companies that outperformed similar companies (same sectors) in the index, and had done so by nearly 10 percentage points.
Companies of noteworthy individual performance were Arris, a leading provider of cable equipment to companies such as Comcast, Spirit Aerosystems, a major sub-contractor to Boeing and Airbus, and Sierra Wireless, a vendor of microwave communications modules that enable machine-to-machine communications. The Fund's analysts continue to believe that Arris and Spirit sell at attractive discounts to what the team believes are their long term intrinsic values,1 whereas Sierra Wireless is closer to fair value and the position has been reduced.
The Energy sector presented a challenge for the team during the fiscal year. Investments in KBR, an engineering firm focused on several aspects of energy production, and ION Geophysical, a provider of seismic software and services, suffered from issues that we believe were largely of their own making. The team believes that both companies are undervalued and that patience could ultimately be rewarded. In the consumer area, performance was mixed. The takeover of Safeway was a positive event, but RadioShack (which was sold) and Elizabeth Arden each detracted from the year's results. We would note that Rhone Capital, an investment firm closely linked to the success of Coty, the beauty products company, has recently purchased $50 million of preferred stock in Elizabeth Arden and has tendered to purchase seven million common shares. Since we made our investment in Elizabeth Arden, the financial performance of the company has been poor but the emergence of what we believe is a well-informed, financially strong, long-term investor is encouraging.
The presence of activist shareholders who can influence the strategic direction of a company is a trend that accelerated throughout the year. At last count, over ten investments in the Fund were subject to activism. It remains unclear how much shareholder value these groups can unlock, but we believe it makes the management teams of these companies more accountable.
Historically, we believe a period of improving economic trends together with an increase in company-specific events has been favorable for our style of investing. The challenge in a rising market has always been finding an attractive set of new investments. The Fund made several new investments and eliminated others during the period. Through these changes as well as rebalancing existing positions, we believe we have enhanced the portfolio's discount to intrinsic value.
Sincerely,
BENJAMIN H. NAHUM, JAMES F. MCAREE AND AMIT SOLOMON
PORTFOLIO CO-MANAGERS
1 Intrinsic value reflects the portfolio management team's analysis and estimates of a company's value. There is no guarantee that any intrinsic values will be realized; security prices may decrease regardless of intrinsic values.
Information about principal risks of investing in the Fund is set forth in the prospectus and statement of additional information.
The portfolio composition, industries and holdings of the Fund are subject to change.
The opinions expressed are those of the Fund's portfolio managers. The opinions are as of the date of this report and are subject to change without notice.
35
Intrinsic Value Fund (Unaudited)
TICKER SYMBOLS
Institutional Class | NINLX | ||||||
Class A | NINAX | ||||||
Class C | NINCX | ||||||
SECTOR ALLOCATION
(as a % of Total Investments) | |||||
Consumer Discretionary | 6.4 | % | |||
Consumer Staples | 0.4 | ||||
Energy | 2.6 | ||||
Financial Services | 12.9 | ||||
Health Care | 5.7 | ||||
Materials & Processing | 7.7 | ||||
Producer Durables | 21.5 | ||||
Technology | 34.2 | ||||
Utilities | 4.7 | ||||
Short-Term Investments | 3.9 | ||||
Total | 100.0 | % | |||
PERFORMANCE HIGHLIGHTS
| Average Annual Total Return Ended 08/31/2014 | |||||||||||||||||||||||
| Inception Date* | 1 Year | 5 Years | 10 Years | Life of Fund | |||||||||||||||||||
At NAV | |||||||||||||||||||||||
| Institutional Class19 | 05/10/2010 | 21.74 | % | 15.90 | % | 10.99 | % | 12.03 | % | ||||||||||||||
| Class A19 | 05/10/2010 | 21.31 | % | 15.55 | % | 10.82 | % | 11.92 | % | ||||||||||||||
| Class C19 | 05/10/2010 | 20.40 | % | 14.82 | % | 10.47 | % | 11.72 | % | ||||||||||||||
With Sales Charge | |||||||||||||||||||||||
| Class A19 | 14.35 | % | 14.19 | % | 10.17 | % | 11.54 | % | |||||||||||||||
| Class C19 | 19.40 | % | 14.82 | % | 10.47 | % | 11.72 | % | |||||||||||||||
Index | |||||||||||||||||||||||
| Russell 2000® Value Index1,16 | 18.10 | % | 15.74 | % | 8.43 | % | 9.10 | % | |||||||||||||||
| Russell 2000® Index1,16 | 17.68 | % | 17.03 | % | 9.36 | % | 7.93 | % | |||||||||||||||
*The inception date for Neuberger Berman Intrinsic Value Fund Institutional Class, Class A, and Class C shares is May 10, 2010. Performance prior to that date is that of the Fund's predecessor, the DJG Small Cap Value Fund L.P., an unregistered limited partnership ("DJG Fund"); DJG Fund was the successor to The DJG Small Cap Value Fund, an unregistered commingled investment account ("DJG Account"), which had similar investment goals, strategies, and portfolio management team. See endnote 19 for more information.
The performance data quoted represent past performance and do not indicate future results. Current performance may be lower or higher than the performance data quoted. For more current performance data, please visit www.nb.com/performance.
The results shown in the table reflect the reinvestment of income dividends and other distributions, if any. The results do not reflect the effect of taxes a shareholder would pay on Fund distributions or on the redemption of Fund shares.
The investment return and principal value of an investment will fluctuate and shares, when redeemed, may be worth more or less than their original cost.
Returns would have been lower if Neuberger Berman Management LLC (Management) had not reimbursed certain expenses and/or waived a portion of the investment management fees during certain of the periods shown. Repayment by a class (of expenses previously reimbursed and/or fees previously waived by Management) will decrease the class's returns. Please see Note B in the Notes to Financial Statements for specific information regarding expense reimbursement and/or fee waiver arrangements.
As stated in the Fund's most recent prospectus, the total annual operating expense ratios for fiscal year 2013 were 1.19%, 1.58% and 2.32% for Institutional Class, Class A and Class C shares, respectively (before expense reimbursements and/or fee waivers, if any). The expense ratios were 1.01%, 1.37% and 2.12% for Institutional Class, Class A and Class C shares, respectively, after expense reimbursements and/or fee waivers.
Returns shown with a sales charge reflect the deduction of the current maximum initial sales charge of 5.75% for Class A shares and the contingent deferred sales charge (CDSC) for Class C shares. The CDSC for Class C shares is 1%, which is reduced to 0% after 1 year. The performance of the Fund's share classes will differ primarily due to different sales charge structures and class expenses. Please see the prospectus for more information about sales charge structures, if any, and class expenses for your share class.
36
Intrinsic Value Fund (Unaudited)
COMPARISON OF A $1,000,000 INVESTMENT19
(000's Omitted)

This graph shows the change in value of a hypothetical $1,000,000 investment in the Fund over the past 10 fiscal years, or since the Fund's inception if it has not operated for 10 years. The graph is based on the Institutional Class shares only; the performance of the Fund's share classes will differ primarily due to different sales charge structures and class expenses (see Performance Highlights chart on previous page). The result is compared with benchmarks, which include a broad-based market index and may include a more narrowly based index. Market indices have not been reduced to reflect any of the fees and costs of investing. The results shown in the graph reflect the reinvestment of income dividends and other distributions, if any. The results do not reflect the effect of taxes a shareholder would pay on Fund distributions or on the redemption of Fund shares. Results represent past performance and do not indicate future results.
37
Large Cap Disciplined Growth Fund Commentary (Unaudited)
Neuberger Berman Large Cap Disciplined Growth Fund Investor Class generated a 19.09% total return for the fiscal year ended August 31, 2014, but trailed its benchmark, the Russell 1000® Growth Index, which provided a return of 26.29%. (Performance for all share classes is provided in the table immediately following this letter.)
We wish to first communicate that after nearly 25 years at Neuberger Berman, Dan Rosenblatt, Portfolio Co-Manager for the Fund, has retired. John Barker, who joined the firm in 1994 to work with Dan and co-managed the Fund, became its sole Portfolio Manager, effective August 15, 2014.
We started this fiscal year with a slight defensive bent to the portfolio, similar to our positioning in the previous fiscal year. We believed this stance was justified given that, economically, not much had changed at that time. U.S. GDP growth was volatile and slightly below average, growth in Asia had been slowing, and Europe remained relatively weak. Earnings growth also had not changed significantly. Meanwhile, stocks had run up considerably, with the net result being meaningfully higher valuations against a similar fundamental backdrop. Our characteristic relative defensiveness was something of a drag during a very strong year. We sought to balance that headwind with increased active share and stock specific bets—something we plan to continue doing going forward.
From a sector perspective, our greatest areas of strength this 12-month period included Information Technology (IT), Industrials and Materials. Our top three contributors for the period were IT names—Apple, Google and Alliance Data Systems (ADS).
Apple saw strong performance during the period due to a reacceleration in both top- and bottom-line growth and as positive sentiment grew around the expected release of a larger format iPhone, a watch, and a mobile payments platform. We remain positive on Apple, as we believe there is pent-up demand for the larger iPhone and significant revenue stream potential from mobile payments.
Google outperformed as concerns about its ability to dominate and profit from search functionality on mobile devices just as it had in desktop computers were laid to rest. While other players, such as Facebook, may compete for display ads, we believe Google remains well positioned.
ADS continued to expand into the lucrative private-label credit card market. To retailers, the benefit of store cards is SKU-level purchase data, allowing for more targeted marketing. For such accounts, interest rates and fees are generally very high and typically there are few write-offs against what are generally smaller balances. A large contract with eBay could be a further benefit going forward.
The largest drags on performance came from Health Care, Energy and cash equivalents. GM was our single largest detractor. We continue to own the stock based on our positive outlook for its new truck cycle and coming changes to its global platform; however, recalls created very negative sentiment this period.
Looking ahead, we see a positive market for bottom-up stock pickers such as ourselves. We've seen correlations between stocks decline over the past several years, something we anticipate could continue. We also suspect that the narrow spread between the top and bottom decile of performance we saw this year will widen. Both of these trends, if they continue, could benefit us, as should our high active share, lower-than-market beta, and increasing number of stock-specific bets within the portfolio.
Sincerely,
JOHN J. BARKER
PORTFOLIO MANAGER
Information about principal risks of investing in the Fund is set forth in the prospectus and statement of additional information.
The portfolio composition, industries and holdings of the Fund are subject to change.
The opinions expressed are those of the Fund's portfolio manager. The opinions are as of the date of this report and are subject to change without notice.
38
Large Cap Disciplined Growth Fund (Unaudited)
TICKER SYMBOLS
Investor Class | NBCIX | ||||||
Institutional Class | NLDLX | ||||||
Class A | NLDAX | ||||||
Class C | NLDCX | ||||||
Class R3 | NLDRX | ||||||
SECTOR ALLOCATION
(as a % of Total Investments) | |||||
Consumer Discretionary | 14.7 | % | |||
Consumer Staples | 8.1 | ||||
Energy | 5.7 | ||||
Financials | 4.9 | ||||
Health Care | 12.3 | ||||
Industrials | 9.7 | ||||
Information Technology | 29.1 | ||||
Materials | 8.4 | ||||
Telecommunication Services | 1.7 | ||||
Utilities | 3.1 | ||||
Short-Term Investments | 2.3 | ||||
Total | 100.0 | % | |||
PERFORMANCE HIGHLIGHTS11
| Average Annual Total Return Ended 08/31/2014 | |||||||||||||||||||||||
| Inception Date | 1 Year | 5 Years | 10 Years | Life of Fund | |||||||||||||||||||
At NAV | |||||||||||||||||||||||
Investor Class | 12/06/1999 | 19.09 | % | 12.37 | % | 6.94 | % | 0.54 | % | ||||||||||||||
| Institutional Class5 | 04/06/2009 | 19.41 | % | 12.75 | % | 7.13 | % | 0.67 | % | ||||||||||||||
| Class A20 | 04/06/2009 | 19.05 | % | 12.33 | % | 6.92 | % | 0.53 | % | ||||||||||||||
| Class C20 | 04/06/2009 | 18.29 | % | 11.54 | % | 6.51 | % | 0.27 | % | ||||||||||||||
| Class R317 | 05/27/2009 | 18.82 | % | 12.09 | % | 6.80 | % | 0.46 | % | ||||||||||||||
With Sales Charge | |||||||||||||||||||||||
| Class A20 | 12.18 | % | 11.01 | % | 6.29 | % | 0.13 | % | |||||||||||||||
| Class C20 | 17.29 | % | 11.54 | % | 6.51 | % | 0.27 | % | |||||||||||||||
Index | |||||||||||||||||||||||
| Russell 1000® Growth Index1,16 | 26.29 | % | 17.82 | % | 9.20 | % | 2.42 | % | |||||||||||||||
The performance data quoted represent past performance and do not indicate future results. Current performance may be lower or higher than the performance data quoted. For more current performance data, please visit www.nb.com/performance.
The results shown in the table reflect the reinvestment of income dividends and other distributions, if any. The results do not reflect the effect of taxes a shareholder would pay on Fund distributions or on the redemption of Fund shares.
The investment return and principal value of an investment will fluctuate and shares, when redeemed, may be worth more or less than their original cost.
Returns would have been lower if Neuberger Berman Management LLC (Management) had not reimbursed certain expenses and/or waived a portion of the investment management fees during certain of the periods shown. Repayment by a class (of expenses previously reimbursed and/or fees previously waived by Management) will decrease the class's returns. Please see Note B in the Notes to Financial Statements for specific information regarding expense reimbursement and/or fee waiver arrangements.
As stated in the Fund's most recent prospectus, the total annual operating expense ratios for fiscal year 2013 were 1.11%, 0.80%, 1.16%, 1.92% and 1.46% for Investor Class, Institutional Class, Class A, Class C and Class R3 shares, respectively (before expense reimbursements and/or fee waivers, if any). The expense ratios were 0.75%, 1.11%, 1.86% and 1.36% for Institutional Class, Class A, Class C and Class R3 shares, respectively, after expense reimbursements and/or fee waivers. The total annual operating expense ratio for Investor Class includes the class's repayment of expenses previously reimbursed and/or fees previously waived by Management.
Returns shown with a sales charge reflect the deduction of the current maximum initial sales charge of 5.75% for Class A shares and the contingent deferred sales charge (CDSC) for Class C shares. The CDSC for Class C shares is 1%, which is reduced to 0% after 1 year. The performance of the Fund's share classes will differ primarily due to different sales charge structures and class expenses. Please see the prospectus for more information about sales charge structures, if any, and class expenses for your share class.
39
Large Cap Disciplined Growth Fund (Unaudited)
COMPARISON OF A $10,000 INVESTMENT

This graph shows the change in value of a hypothetical $10,000 investment in the Fund over the past 10 fiscal years, or since the Fund's inception if it has not operated for 10 years. The graph is based on the Investor Class shares only; the performance of the Fund's share classes will differ primarily due to different sales charge structures and class expenses (see Performance Highlights chart on previous page). The result is compared with benchmarks, which include a broad-based market index and may include a more narrowly based index. Market indices have not been reduced to reflect any of the fees and costs of investing. The results shown in the graph reflect the reinvestment of income dividends and other distributions, if any. The results do not reflect the effect of taxes a shareholder would pay on Fund distributions or on the redemption of Fund shares. Results represent past performance and do not indicate future results.
40
Large Cap Value Fund Commentary (Unaudited)
Neuberger Berman Large Cap Value Fund Investor Class produced a 23.57% total return for the fiscal year ended August 31, 2014, but underperformed its benchmark, the Russell 1000® Value Index, which generated a 24.43% total return. (Performance for all share classes is provided in the table immediately following this letter.)
The stock market continued to rally over the past fiscal year, driven, in our view, by the ongoing economic recovery, improving demand from businesses for material and labor, relatively strong consumer confidence, and ongoing easy monetary policy from the U.S. Federal Reserve (Fed). The Fed began to taper its bond buying program last December. Despite this slowdown, a high level of liquidity remained in the market and interest rates were historically low. Valuations continued to be attractive overall, which we think helped lead to the strong performance of the market over the 12-month period.
The top-performing sectors for the Russell 1000 Value Index during the reporting period were Information Technology (IT) and Materials. Telecommunication Services and Consumer Staples lagged other index sectors but still produced strong double-digit returns. The improving economic picture as well as high levels of liquidity provided an excellent backdrop for every sector in the index.
The strongest performing sectors for the Fund on a relative basis were Industrials and Materials. Within Industrials, the Fund's performance was driven by airline stocks, which delivered excellent results over the past year. Airlines, in general, and particularly those we held in the portfolio, have been able to increase revenues while controlling costs and have benefited from favorable industry trends. Within Materials, we were overweighted versus the benchmark in chemical companies, which were strong performers overall, and the stocks we chose in this area outperformed those in the index. The companies benefited from high demand for existing capacity, as well as stable to lower input costs.
Energy and IT were the weakest performing sectors in terms of relative performance. However, both sectors delivered positive returns on an absolute basis. Within Energy, an underweighting and stock picking were both negatives, and our exposure to coal hurt during a time of falling natural gas prices. IT was a strong absolute performer for the Fund. However, despite strong double-digit returns, our holdings lagged the index. Semiconductors & Semiconductor Equipment, and Technology Hardware Storage & Peripherals were among the top performing industries for the Fund on an absolute basis.
We continue to be cautiously optimistic about the economy and the U.S. stock market. The strong run-up we have seen over the past year makes us suspect that we will see some profit taking in the future. It is uncertain what may trigger these dips but we will consider pull-backs as buying opportunities. The Fed's process of tapering is now well underway and we believe it could be completed by the end of this calendar year. We continue to see value in industrial stocks, such as airlines, as well as chemical and technology companies. We are currently attracted to stocks that we believe are undervalued based on normalized earnings whose value could be recognized by the market over time. In our view, this strategy may produce favorable risk-adjusted returns as we continue to monitor the correlation among holdings in seeking to achieve a positive risk/reward balance.
Sincerely,
ELI SALZMANN
PORTFOLIO MANAGER
Information about principal risks of investing in the Fund is set forth in the prospectus and statement of additional information.
The portfolio composition, industries and holdings of the Fund are subject to change.
The opinions expressed are those of the Fund's portfolio manager. The opinions are as of the date of this report and are subject to change without notice.
41
Large Cap Value Fund (Unaudited)
TICKER SYMBOLS
Investor Class | NPRTX | ||||||
Trust Class | NBPTX | ||||||
Advisor Class | NBPBX | ||||||
Institutional Class | NBPIX | ||||||
Class A | NPNAX | ||||||
Class C | NPNCX | ||||||
Class R3 | NPNRX | ||||||
SECTOR ALLOCATION
(as a % of Total Investments) | |||||
Consumer Discretionary | 7.3 | % | |||
Consumer Staples | 1.1 | ||||
Energy | 7.3 | ||||
Financials | 28.8 | ||||
Health Care | 11.6 | ||||
Industrials | 20.8 | ||||
Information Technology | 10.4 | ||||
Materials | 8.4 | ||||
Utilities | 1.0 | ||||
Other | 1.2 | ||||
Short-Term Investments | 2.1 | ||||
Total | 100.0 | % | |||
PERFORMANCE HIGHLIGHTS7
| Average Annual Total Return Ended 08/31/2014 | |||||||||||||||||||||||
| Inception Date | 1 Year | 5 Years | 10 Years | Life of Fund | |||||||||||||||||||
At NAV | |||||||||||||||||||||||
Investor Class | 01/20/19752 | 23.57 | % | 13.61 | % | 8.30 | % | 13.00 | % | ||||||||||||||
| Trust Class3 | 08/30/1993 | 23.36 | % | 13.40 | % | 8.10 | % | 12.91 | % | ||||||||||||||
| Advisor Class4 | 08/16/1996 | 23.17 | % | 13.22 | % | 7.92 | % | 12.79 | % | ||||||||||||||
| Institutional Class5 | 06/07/2006 | 23.74 | % | 13.79 | % | 8.44 | % | 13.03 | % | ||||||||||||||
| Class A20 | 06/21/2010 | 23.31 | % | 13.39 | % | 8.19 | % | 12.97 | % | ||||||||||||||
| Class C20 | 06/21/2010 | 22.37 | % | 12.67 | % | 7.85 | % | 12.88 | % | ||||||||||||||
| Class R317 | 06/21/2010 | 22.94 | % | 13.14 | % | 8.07 | % | 12.94 | % | ||||||||||||||
With Sales Charge | |||||||||||||||||||||||
| Class A20 | 16.24 | % | 12.05 | % | 7.55 | % | 12.80 | % | |||||||||||||||
| Class C20 | 21.44 | % | 12.67 | % | 7.85 | % | 12.88 | % | |||||||||||||||
Index | |||||||||||||||||||||||
| Russell 1000® Value Index1,16 | 24.43 | % | 16.62 | % | 8.23 | % | N/A | ||||||||||||||||
The performance data quoted represent past performance and do not indicate future results. Current performance may be lower or higher than the performance data quoted. For more current performance data, please visit www.nb.com/performance.
The results shown in the table reflect the reinvestment of income dividends and other distributions, if any. The results do not reflect the effect of taxes a shareholder would pay on Fund distributions or on the redemption of Fund shares.
The investment return and principal value of an investment will fluctuate and shares, when redeemed, may be worth more or less than their original cost.
Returns would have been lower if Neuberger Berman Management LLC (Management) had not reimbursed certain expenses and/or waived a portion of the investment management fees during certain of the periods shown. Repayment by a class (of expenses previously reimbursed and/or fees previously waived by Management) will decrease the class's returns. Please see Note B in the Notes to Financial Statements for specific information regarding expense reimbursement and/or fee waiver arrangements.
As stated in the Fund's most recent prospectus, the total annual operating expense ratios for fiscal year 2013 were 0.87%, 1.07%, 1.22%, 0.72%, 1.12%, 1.87% and 1.44% for Investor Class, Trust Class, Advisor Class, Institutional Class, Class A, Class C and Class R3 shares, respectively (before expense reimbursements and/or fee waivers, if any). The expense ratios were 0.71 and 1.37% for Institutional Class and Class R3 shares, respectively, after expense reimbursements and/or fee waivers.
Returns shown with a sales charge reflect the deduction of the current maximum initial sales charge of 5.75% for Class A shares and the contingent deferred sales charge (CDSC) for Class C shares. The CDSC for Class C shares is 1%, which is reduced to 0% after 1 year. The performance of the Fund's share classes will differ primarily due to different sales charge structures and class expenses. Please see the prospectus for more information about sales charge structures, if any, and class expenses for your share class.
42
Large Cap Value Fund (Unaudited)
COMPARISON OF A $10,000 INVESTMENT
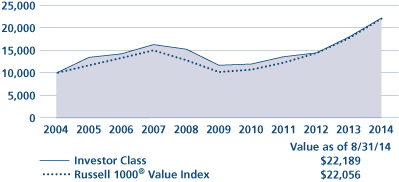
This graph shows the change in value of a hypothetical $10,000 investment in the Fund over the past 10 fiscal years, or since the Fund's inception if it has not operated for 10 years. The graph is based on the Investor Class shares only; the performance of the Fund's share classes will differ primarily due to different sales charge structures and class expenses (see Performance Highlights chart on previous page). The result is compared with benchmarks, which include a broad-based market index and may include a more narrowly based index. Market indices have not been reduced to reflect any of the fees and costs of investing. The results shown in the graph reflect the reinvestment of income dividends and other distributions, if any. The results do not reflect the effect of taxes a shareholder would pay on Fund distributions or on the redemption of Fund shares. Results represent past performance and do not indicate future results.
43
Mid Cap Growth Fund Commentary (Unaudited)
Neuberger Berman Mid Cap Growth Fund Investor Class generated a 17.54% total return for the fiscal year ended August 31, 2014, but lagged its benchmark, the Russell Midcap® Growth Index, which returned 23.67% for the period. (Performance for all share classes is provided in the table immediately following this letter.)
The 12-month period proved to be a roller coaster ride, highlighted by weakness in high-expectation growth stocks, amid interest rate hike and valuation concerns. The period also offered unexpected macro twists and turns courtesy of instability in the Ukraine and Iraq, a reemergence of political acrimony and handwringing generated by inarticulate rate and valuation comments from the U.S. Federal Reserve.
In our minds, the case for "stomaching the ride" centered on what we believe are compelling corporate fundamentals and the return of capital investment. What we consider generally strong earnings and reasonable guidance didn't validate the market's rotation away from higher growth and higher-expectation companies, while merger activity, from headline grabbing bidding wars to quiet, small strategic acquisitions, potentially signaled, in our view, that companies appear to finally be ready to shift the focus back towards growth and expanding their franchises through capital reinvestment.
Looking broadly at the Fund's positioning, relative performance was negatively impacted by stock selection across the majority of relevant growth sectors, particularly within Industrials. However, any discussion of industry- or security-level attribution ultimately leads back to the aforementioned sharp rotation away from higher beta stocks, which resulted in meaningful gains being surrendered across key growth segments, most notably within Information Technology and Health Care. Given that the rotation away from higher growth and higher-expectation stocks, and the resulting performance headwind, was, in our opinion, primarily stylistic in nature and not driven by underlying fundamentals or the overall prospects for those segments, we remain constructive on those industry groups and names, despite the shorter-term volatility.
During the reporting period, Illumina was the top contributor to performance, while ARIAD Pharmaceuticals was the leading detractor. Illumina, a developer and manufacturer of life science tools and integrated systems for the analysis of genetic variation and function, continued to consistently deliver strong results and positive guidance as both its science and results have been well received by the market. ARIAD Pharmaceuticals, which is focused on treatment options for patients with late-stage cancer, had a trial suspended by the FDA. The market reacted negatively to this development, and we sold the stock.
We still believe that U.S. equities remain an attractive investment. Our cautious optimism is rooted in our belief that corporate fundamentals should remain constructive throughout the balance of 2014 and into 2015. In addition to our perspective on the bottom-lines of higher qualitative mid cap companies, we also believe that the incremental positives of an accommodative rate environment, minimal inflation, generally reasonable valuations, apparently pent-up corporate and consumer demand and the absence of either extreme investor pessimism or euphoria, if they continue, are indicators that, despite the debatable advanced "age" of this current cycle, this is a market that could continue to demonstrate resiliency and which may still have the potential for upward momentum into the foreseeable future.
Sincerely,
KENNETH J. TUREK
PORTFOLIO MANAGER
Information about principal risks of investing in the Fund is set forth in the prospectus and statement of additional information.
The portfolio composition, industries and holdings of the Fund are subject to change.
The opinions expressed are those of the Fund's portfolio manager. The opinions are as of the date of this report and are subject to change without notice.
44
Mid Cap Growth Fund (Unaudited)
TICKER SYMBOLS
Investor Class | NMANX | ||||||
Trust Class | NBMTX | ||||||
Advisor Class | NBMBX | ||||||
Institutional Class | NBMLX | ||||||
Class A | NMGAX | ||||||
Class C | NMGCX | ||||||
Class R3 | NMGRX | ||||||
Class R6 | NRMGX | ||||||
SECTOR ALLOCATION
(as a % of Total Investments) | |||||
Consumer Discretionary | 20.5 | % | |||
Consumer Staples | 2.8 | ||||
Energy | 4.5 | ||||
Financials | 6.3 | ||||
Health Care | 18.4 | ||||
Industrials | 15.6 | ||||
Information Technology | 24.5 | ||||
Materials | 1.9 | ||||
Telecommunication Services | 2.1 | ||||
Short-Term Investments | 3.4 | ||||
Total | 100.0 | % | |||
PERFORMANCE HIGHLIGHTS7
| Average Annual Total Return Ended 08/31/2014 | |||||||||||||||||||||||
| Inception Date | 1 Year | 5 Years | 10 Years | Life of Fund | |||||||||||||||||||
At NAV | |||||||||||||||||||||||
Investor Class | 03/01/19792 | 17.54 | % | 17.52 | % | 11.01 | % | 12.01 | % | ||||||||||||||
| Trust Class3 | 08/30/1993 | 17.40 | % | 17.44 | % | 10.82 | % | 11.92 | % | ||||||||||||||
| Advisor Class4 | 09/03/1996 | 17.16 | % | 17.05 | % | 10.52 | % | 11.73 | % | ||||||||||||||
| Institutional Class5 | 04/19/2007 | 17.74 | % | 17.81 | % | 11.25 | % | 12.08 | % | ||||||||||||||
| Class A20 | 05/27/2009 | 17.33 | % | 17.41 | % | 10.95 | % | 12.00 | % | ||||||||||||||
| Class C20 | 05/27/2009 | 16.46 | % | 16.52 | % | 10.52 | % | 11.87 | % | ||||||||||||||
| Class R317 | 05/27/2009 | 17.02 | % | 17.11 | % | 10.80 | % | 11.96 | % | ||||||||||||||
| Class R624 | 03/15/2013 | 17.89 | % | 17.62 | % | 11.06 | % | 12.03 | % | ||||||||||||||
With Sales Charge | |||||||||||||||||||||||
| Class A20 | 10.56 | % | 16.03 | % | 10.30 | % | 11.81 | % | |||||||||||||||
| Class C20 | 15.46 | % | 16.52 | % | 10.52 | % | 11.87 | % | |||||||||||||||
Index | |||||||||||||||||||||||
| Russell Midcap® Growth Index1,16 | 23.67 | % | 19.14 | % | 10.97 | % | N/A | ||||||||||||||||
| Russell Midcap® Index1,16 | 25.32 | % | 19.29 | % | 11.07 | % | 13.78 | % | |||||||||||||||
The performance data quoted represent past performance and do not indicate future results. Current performance may be lower or higher than the performance data quoted. For more current performance data, please visit www.nb.com/performance.
The results shown in the table reflect the reinvestment of income dividends and other distributions, if any. The results do not reflect the effect of taxes a shareholder would pay on Fund distributions or on the redemption of Fund shares.
The investment return and principal value of an investment will fluctuate and shares, when redeemed, may be worth more or less than their original cost.
Returns would have been lower if Neuberger Berman Management LLC (Management) had not reimbursed certain expenses and/or waived a portion of the investment management fees during certain of the periods shown. Repayment by a class (of expenses previously reimbursed and/or fees previously waived by Management) will decrease the class's returns. Please see Note B in the Notes to Financial Statements for specific information regarding expense reimbursement and/or fee waiver arrangements.
As stated in the Fund's most recent prospectus, the total annual operating expense ratios for fiscal year 2013 were 0.98%, 1.04%, 1.30%, 0.79%, 1.18%, 1.96%, 1.43% and 7.22% for Investor Class, Trust Class, Advisor Class, Institutional Class, Class A, Class C, Class R3 and Class R6 shares, respectively (before expense reimbursements and/or fee waivers, if any). The expense ratios were 0.76%, 1.12%, 1.87%, 1.37% and 0.69% for Institutional Class, Class A, Class C, Class R3 and Class R6 shares, respectively, after expense reimbursements and/or fee waivers.
Returns shown with a sales charge reflect the deduction of the current maximum initial sales charge of 5.75% for Class A shares and the contingent deferred sales charge (CDSC) for Class C shares. The CDSC for Class C shares is 1%, which is reduced to 0% after 1 year. The performance of the Fund's share classes will differ primarily due to different sales charge structures and class expenses. Please see the prospectus for more information about sales charge structures, if any, and class expenses for your share class.
45
Mid Cap Growth Fund (Unaudited)
COMPARISON OF A $10,000 INVESTMENT

This graph shows the change in value of a hypothetical $10,000 investment in the Fund over the past 10 fiscal years, or since the Fund's inception if it has not operated for 10 years. The graph is based on the Investor Class shares only; the performance of the Fund's share classes will differ primarily due to different sales charge structures and class expenses (see Performance Highlights chart on previous page). The result is compared with benchmarks, which include a broad-based market index and may include a more narrowly based index. Market indices have not been reduced to reflect any of the fees and costs of investing. The results shown in the graph reflect the reinvestment of income dividends and other distributions, if any. The results do not reflect the effect of taxes a shareholder would pay on Fund distributions or on the redemption of Fund shares. Results represent past performance and do not indicate future results.
46
Mid Cap Intrinsic Value Fund Commentary (Unaudited)
Neuberger Berman Mid Cap Intrinsic Value Fund Investor Class generated a 22.84% total return for the fiscal year ended August 31, 2014, but underperformed its benchmark, the Russell Midcap® Value Index, which generated a 27.20% return for the period. (Performance for all share classes is provided in the table immediately following this letter.)
While economic growth remains sluggish, it seems to be accelerating. Many key economic indicators have shown improvement. Most central banks including the U.S. Federal Reserve (Fed) continue to be accommodative. We believe this easy money policy has been the primary driver of stock and bond rallies and will hopefully translate into a self-sustaining recovery. We believe it could also allow corporate earnings to further expand, albeit at a slower rate than past expansions. We believe that continued progress in earnings is essential to stock market gains, particularly given the multi-year expansion in price/earnings (P/E) ratios. The market P/E ratio has recently been trading above long-term averages.
During the reporting period, the Fund's overweight and stock selection in the Consumer Staples sector helped performance. Safeway outperformed on the takeover proposal by Cerbus Capital. Also adding to performance were several companies whose earnings continued to exceed analysts' estimates, including Skyworks, CVS, Spirit AeroSystems, Avis Budget and Cardinal Health. Both Textron and General Dynamics continued to benefit from a strengthening business jet market. Both Avis Budget and Textron were sold.
Stock selection in the cyclically sensitive Producer Durables, Technology and Consumer Discretionary sectors detracted from performance. Elizabeth Arden's licensed perfume business fared poorly and KBR continued to struggle with poorly priced contracts. Negative earnings announcements by several companies including Nuance, Express, Darden and Symantec hurt performance. We viewed the weakness in most of these companies as buying opportunities as we believed the investment cases were still intact despite short-term disappointments. However, we eliminated our positions in Elizabeth Arden and Symantec as the investment cases changed. Holdings in Financial Services and Utilities benefited as interest rates fell.
Despite the multi-year bull market that has boosted equities to above average valuations, we believe that stocks can move even higher. Notwithstanding some signs of a pick-up in inflation, the Fed remains very accommodative and given this backdrop investors may continue to favor equities. While our portfolio of stocks is not nearly as cheap as it was in 2009, we are still identifying companies that, in our opinion, are selling at meaningful discounts to our estimates of intrinsic value1 and generating strong free cash flow. At this time, given increased merger and acquisition deals and activist activity, we anticipate seeing more of our portfolio companies engage in value creating events as we move through 2014. Despite our somewhat bullish position, we are cognizant of the huge amount of liquidity created by the worldwide monetary authorities over the last five plus years and its positive impact on equity markets. At some point (if inflation accelerates), we believe this may need to be reversed, which could put pressure on stocks.
Sincerely,
MICHAEL C. GREENE
PORTFOLIO MANAGER
1 Intrinsic value reflects the team's analysis and estimates of a company's value. There is no guarantee that any intrinsic values will be realized; security prices may decrease regardless of intrinsic values.
Information about principal risks of investing in the Fund is set forth in the prospectus and statement of additional information.
The portfolio composition, industries and holdings of the Fund are subject to change.
The opinions expressed are those of the Fund's portfolio manager. The opinions are as of the date of this report and are subject to change without notice.
47
Mid Cap Intrinsic Value Fund (Unaudited)
TICKER SYMBOLS
Investor Class | NBRVX | ||||||
Trust Class | NBREX | ||||||
Institutional Class | NBRTX | ||||||
Class A | NBRAX | ||||||
Class C | NBRCX | ||||||
Class R3 | NBRRX | ||||||
SECTOR ALLOCATION
(as a % of Total Investments) | |||||
Consumer Discretionary | 15.8 | % | |||
Consumer Staples | 3.0 | ||||
Energy | 8.1 | ||||
Financial Services | 17.3 | ||||
Health Care | 5.2 | ||||
Materials & Processing | 5.3 | ||||
Producer Durables | 16.8 | ||||
Technology | 15.5 | ||||
Utilities | 8.5 | ||||
Short-Term Investments | 4.5 | ||||
Total | 100.0 | % | |||
PERFORMANCE HIGHLIGHTS7
| Average Annual Total Return Ended 08/31/2014 | |||||||||||||||||||||||
| Inception Date | 1 Year | 5 Years | 10 Years | Life of Fund | |||||||||||||||||||
At NAV | |||||||||||||||||||||||
Investor Class | 06/01/1999 | 22.84 | % | 18.09 | % | 9.51 | % | 10.11 | % | ||||||||||||||
| Trust Class3 | 06/10/1999 | 22.47 | % | 17.95 | % | 9.39 | % | 10.04 | % | ||||||||||||||
| Institutional Class5 | 03/08/2010 | 22.99 | % | 18.39 | % | 9.65 | % | 10.21 | % | ||||||||||||||
| Class A20 | 06/21/2010 | 22.60 | % | 18.01 | % | 9.47 | % | 10.09 | % | ||||||||||||||
| Class C20 | 06/21/2010 | 21.64 | % | 17.28 | % | 9.13 | % | 9.87 | % | ||||||||||||||
| Class R317 | 06/21/2010 | 22.23 | % | 17.76 | % | 9.35 | % | 10.01 | % | ||||||||||||||
With Sales Charge | |||||||||||||||||||||||
| Class A20 | 15.57 | % | 16.62 | % | 8.82 | % | 9.66 | % | |||||||||||||||
| Class C20 | 20.64 | % | 17.28 | % | 9.13 | % | 9.87 | % | |||||||||||||||
Index | |||||||||||||||||||||||
| Russell Midcap® Value Index1,16 | 27.20 | % | 19.45 | % | 10.92 | % | 9.96 | % | |||||||||||||||
| Russell Midcap® Index1,16 | 25.32 | % | 19.29 | % | 11.07 | % | 9.31 | % | |||||||||||||||
The performance data quoted represent past performance and do not indicate future results. Current performance may be lower or higher than the performance data quoted. For more current performance data, please visit www.nb.com/performance.
The results shown in the table reflect the reinvestment of income dividends and other distributions, if any. The results do not reflect the effect of taxes a shareholder would pay on Fund distributions or on the redemption of Fund shares.
The investment return and principal value of an investment will fluctuate and shares, when redeemed, may be worth more or less than their original cost.
Returns would have been lower if Neuberger Berman Management LLC (Management) had not reimbursed certain expenses and/or waived a portion of the investment management fees during certain of the periods shown. Repayment by a class (of expenses previously reimbursed and/or fees previously waived by Management) will decrease the class's returns. Please see Note B in the Notes to Financial Statements for specific information regarding expense reimbursement and/or fee waiver arrangements.
As stated in the Fund's most recent prospectus, the total annual operating expense ratios for fiscal year 2013 were 1.41%, 1.66%, 1.24%, 1.66%, 2.35% and 1.86% for Investor Class, Trust Class, Institutional Class, Class A, Class C and Class R3 shares, respectively (before expense reimbursements and/or fee waivers, if any). The expense ratios were 1.26%, 0.86%, 1.22%, 1.97% and 1.47% for Trust Class, Institutional Class, Class A, Class C and Class R3 shares, respectively, after expense reimbursements and/or fee waivers.
Returns shown with a sales charge reflect the deduction of the current maximum initial sales charge of 5.75% for Class A shares and the contingent deferred sales charge (CDSC) for Class C shares. The CDSC for Class C shares is 1%, which is reduced to 0% after 1 year. The performance of the Fund's share classes will differ primarily due to different sales charge structures and class expenses. Please see the prospectus for more information about sales charge structures, if any, and class expenses for your share class.
48
Mid Cap Intrinsic Value Fund (Unaudited)
COMPARISON OF A $10,000 INVESTMENT
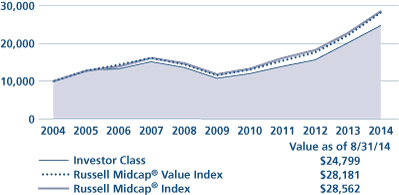
This graph shows the change in value of a hypothetical $10,000 investment in the Fund over the past 10 fiscal years, or since the Fund's inception if it has not operated for 10 years. The graph is based on the Investor Class shares only; the performance of the Fund's share classes will differ primarily due to different sales charge structures and class expenses (see Performance Highlights chart on previous page). The result is compared with benchmarks, which include a broad-based market index and may include a more narrowly based index. Market indices have not been reduced to reflect any of the fees and costs of investing. The results shown in the graph reflect the reinvestment of income dividends and other distributions, if any. The results do not reflect the effect of taxes a shareholder would pay on Fund distributions or on the redemption of Fund shares. Results represent past performance and do not indicate future results.
49
Multi-Cap Opportunities Fund Commentary (Unaudited)
Neuberger Berman Multi-Cap Opportunities Fund Institutional Class generated a 22.65% total return for the fiscal year ended August 31, 2014 versus the 25.25% return of its benchmark, the S&P 500® Index. (Performance for all share classes is provided in the table immediately following this letter.)
During the reporting period, stocks were supported by strong corporate profits and increased economic activity. Within the S&P 500 Index, all sectors generated positive returns for the period. Health Care, Information Technology and Materials outperformed relative to the overall benchmark. Consumer Discretionary, Consumer Staples, Energy, Financials, Industrials, Telecommunication Services and Utilities lagged the overall benchmark. We believe declining stock correlations over the course of the year contributed to the dispersion in performance across sectors.
Within the portfolio, stock selection in Health Care and Information Technology was the most beneficial to relative performance during the period, whereas stock selection in Consumer Discretionary and Consumer Staples was the largest detractor from relative performance. The Fund ended the fiscal year with an overweight, relative to the benchmark, in the Consumer Discretionary, Health Care, Industrials and Materials sectors. The Fund ended the 12-month period with an underweight, relative to the benchmark, in the Consumer Staples, Energy, Financials, Information Technology, Telecommunication Services (a zero allocation) and Utilities sectors.
Portfolio construction is an important component of our investment process and consists of three distinct investment categories: Special Situations, Opportunistic and Classic. Special Situations have unique attributes (e.g., restructuring, spin-offs, post-bankruptcy equities) that require specific valuation methodologies and customized investment research. Opportunistic investments are companies that have become inexpensive for a tangible reason that we believe is temporary. Classic investments are those companies with long histories of shareholder-friendly policies, high-quality management teams and exceptional operating performance. We believe maintaining a balance of these three categories helps to mitigate risk within the portfolio. We continue to find investment opportunities across each investment category with what we consider attractive risk/return profiles.
We believe the current environment remains attractive for free cash flow-oriented investing as free cash flow yields for equities relative to fixed income yields remain near historic highs. Companies with high free cash flow and prudent management teams can potentially do very well in a moderate growth environment. Dividend increases, share repurchase programs, cash accumulation, debt retirement, organic growth initiatives and selective acquisitions all accrue to the benefit of equity holders. We believe these positive developments are taking place at many of the companies owned by the Fund.
Our style of investing is based on rigorous fundamental research. Our analysis centers on a company's business model and its ability to generate and effectively utilize free cash flow. As we evaluate both potential new positions and current portfolio holdings, we will continue to do so with a long-term investment perspective in mind. As always, our focus is to grow our clients' assets through the disciplined application of our investment philosophy and process.
Sincerely,
RICHARD S. NACKENSON
PORTFOLIO MANAGER
Information about principal risks of investing in the Fund is set forth in the prospectus and statement of additional information.
The portfolio composition, industries and holdings of the Fund are subject to change.
The opinions expressed are those of the Fund's portfolio manager. The opinions are as of the date of this report and are subject to change without notice.
50
Multi-Cap Opportunities Fund (Unaudited)
TICKER SYMBOLS
Institutional Class | NMULX | ||||||
Class A | NMUAX | ||||||
Class C | NMUCX | ||||||
SECTOR ALLOCATION
(as a % of Total Investments) | |||||
Consumer Discretionary | 12.2 | % | |||
Consumer Staples | 5.6 | ||||
Energy | 10.0 | ||||
Financials | 15.8 | ||||
Health Care | 16.0 | ||||
Industrials | 20.4 | ||||
Information Technology | 10.0 | ||||
Materials | 6.2 | ||||
Utilities | 1.7 | ||||
Short-Term Investments | 2.1 | ||||
Total | 100.0 | % | |||
PERFORMANCE HIGHLIGHTS9
| Average Annual Total Return Ended 08/31/2014 | |||||||||||||||||||
| Inception Date* | 1 Year | 5 Years | Life of Fund | ||||||||||||||||
At NAV | |||||||||||||||||||
| Institutional Class18 | 12/21/2009 | 22.65 | % | 17.66 | % | 8.64 | % | ||||||||||||
| Class A18 | 12/21/2009 | 22.17 | % | 17.26 | % | 8.40 | % | ||||||||||||
| Class C18 | 12/21/2009 | 21.30 | % | 16.43 | % | 7.91 | % | ||||||||||||
With Sales Charge | |||||||||||||||||||
| Class A18 | 15.17 | % | 15.88 | % | 7.59 | % | |||||||||||||
| Class C18 | 20.30 | % | 16.43 | % | 7.91 | % | |||||||||||||
Index | |||||||||||||||||||
| S&P 500® Index1,16 | 25.25 | % | 16.88 | % | 7.28 | % | |||||||||||||
*Prior to December 14, 2009, the Fund had different investment goals, strategies, and portfolio management team. The performance data for each class includes the performance of the Fund's oldest share class, Trust Class, from November 2, 2006 through December 21, 2009. See endnote 18 for information about the effects of the different fees paid by each class.
The performance data quoted represent past performance and do not indicate future results. Current performance may be lower or higher than the performance data quoted. For more current performance data, please visit www.nb.com/performance.
The results shown in the table reflect the reinvestment of income dividends and other distributions, if any. The results do not reflect the effect of taxes a shareholder would pay on Fund distributions or on the redemption of Fund shares.
The investment return and principal value of an investment will fluctuate and shares, when redeemed, may be worth more or less than their original cost.
Returns would have been lower if Neuberger Berman Management LLC (Management) had not reimbursed certain expenses and/or waived a portion of the investment management fees during certain of the periods shown. Repayment by a class (of expenses previously reimbursed and/or fees previously waived by Management) will decrease the class's returns. Please see Note B in the Notes to Financial Statements for specific information regarding expense reimbursement and/or fee waiver arrangements.
As stated in the Fund's most recent prospectus, the total annual operating expense ratios for fiscal year 2013 were 0.86%, 1.18% and 2.06% for Institutional Class, Class A and Class C shares, respectively (before expense reimbursements and/or fee waivers, if any). The total annual operating expense ratio for each of Institutional Class, Class A and Class C includes the class's repayment of expenses previously reimbursed and/or fees previously waived by Management.
Returns shown with a sales charge reflect the deduction of the current maximum initial sales charge of 5.75% for Class A shares and the contingent deferred sales charge (CDSC) for Class C shares. The CDSC for Class C shares is 1%, which is reduced to 0% after 1 year. The performance of the Fund's share classes will differ primarily due to different sales charge structures and class expenses. Please see the prospectus for more information about sales charge structures, if any, and class expenses for your share class.
51
Multi-Cap Opportunities Fund (Unaudited)
COMPARISON OF A $1,000,000 INVESTMENT18
(000's Omitted)

This graph shows the change in value of a hypothetical $1,000,000 investment in the Fund over the past 10 fiscal years, or since the Fund's inception if it has not operated for 10 years. The graph is based on the Institutional Class shares only; the performance of the Fund's share classes will differ primarily due to different sales charge structures and class expenses (see Performance Highlights chart on previous page). The result is compared with benchmarks, which include a broad-based market index and may include a more narrowly based index. Market indices have not been reduced to reflect any of the fees and costs of investing. The results shown in the graph reflect the reinvestment of income dividends and other distributions, if any. The results do not reflect the effect of taxes a shareholder would pay on Fund distributions or on the redemption of Fund shares. Results represent past performance and do not indicate future results.
52
Real Estate Fund Commentary (Unaudited)
Neuberger Berman Real Estate Fund Trust Class generated a 22.36% total return for the fiscal year ended August 31, 2014, underperforming its benchmark, the FTSE NAREIT All Equity REITs Index, which generated a 24.01% return for the period. (Performance for all share classes is provided in the table immediately following this letter.)
The U.S. stock market rallied sharply during the 12-month period. While the market experienced several periods of weakness, these proved to be only temporary setbacks as the S&P 500® Index reached numerous all-time highs, and ended the period with a 25.25% return. Supporting the market were overall solid corporate profits and generally strong investor demand. As was the case for the overall stock market, real estate investment trusts (REITs) posted strong results during the reporting period.
While it produced a strong absolute return, the Fund's underperformance versus the benchmark was due to sector positioning. The portfolio's small cash balance detracted from results given the REIT market's strong returns and the low yields available from cash instruments. On the upside, an underweight to the Health Care sector contributed to results.
Stock selection, overall, was a modest positive for performance. Contributing the most to results was stock selection in the Infrastructure REITs and Free Standing sectors. Within the Infrastructure sector, American Tower Corp. was a standout performer. The company is the leading owner and operator of wireless and broadcast communication sites. From an individual holding perspective, our position in Simon Property Group, a leading commercial real estate company with both regional malls and discount outlet centers, was rewarded.
From a selection perspective, the sectors that detracted the most from the Fund's relative performance were Lodging/Resorts and Health Care. Several individual holdings were also negative for results, including Rayonier, Inc. and Digital Realty Trust. After several years of strong results, investors were disappointed as timber REIT Rayonier expected to see lower prices from its specialty pulp business in 2014 and we sold the position. Digital Realty Trust is the world's largest data center company. It performed poorly in 2013 given investor concerns regarding oversupply in the data center industry, as well as management missteps that led to the departure of its CEO. Against this backdrop, we eliminated the position in January.
Looking ahead, it is our view that a number of factors could be supportive for REITs as the year progresses. REIT cash flow and dividend growth have steadily strengthened and, given our expectations for continued economic growth in the U.S., REIT occupancy and rental rates could improve further. While investor demand for REITs has been robust, overall supply remains near a multi-decade low. Furthermore, we anticipate an increase in merger and acquisition activity from well-positioned REITs given their access to capital. REIT prices have benefited from the surprising decline in U.S. Treasury yields thus far in 2014. We believe a reversal in rates could negatively impact investor sentiment at first. However, we believe the headwind that would be associated with rising rates could potentially be more than offset by further improving REIT fundamentals.
Sincerely,
STEVE S. SHIGEKAWA AND BRIAN JONES
PORTFOLIO CO-MANAGERS
Information about principal risks of investing in the Fund is set forth in the prospectus and statement of additional information.
The portfolio composition, industries and holdings of the Fund are subject to change.
The opinions expressed are those of the Fund's portfolio managers. The opinions are as of the date of this report and are subject to change without notice.
53
Real Estate Fund (Unaudited)
TICKER SYMBOLS
Trust Class | NBRFX | ||||||
Institutional Class | NBRIX | ||||||
Class A | NREAX | ||||||
Class C | NRECX | ||||||
Class R3 | NRERX | ||||||
Class R6 | NRREX | ||||||
SECTOR ALLOCATION
(as a % of Total Investments) | |||||
Apartments | 11.8 | % | |||
Diversified | 7.2 | ||||
Free Standing | 1.3 | ||||
Health Care | 8.7 | ||||
Homebuilders | 1.3 | ||||
Industrial | 5.3 | ||||
Infrastructure | 9.3 | ||||
Lodging/Resorts | 7.2 | ||||
Mortgage Home Financing | 12.6 | ||||
Office | 4.4 | ||||
Real Estate Operating Companies | 14.2 | ||||
Regional Malls | 3.6 | ||||
Self Storage | 7.3 | ||||
Shopping Centers | 4.1 | ||||
Timber | 1.5 | ||||
Short-Term Investments | 0.2 | ||||
Total | 100.0 | % | |||
PERFORMANCE HIGHLIGHTS7,22
| Average Annual Total Return Ended 08/31/2014 | |||||||||||||||||||||||
| Inception Date | 1 Year | 5 Years | 10 Years | Life of Fund | |||||||||||||||||||
At NAV | |||||||||||||||||||||||
Trust Class | 05/01/2002 | 22.36 | % | 17.73 | % | 10.26 | % | 12.29 | % | ||||||||||||||
| Institutional Class6 | 06/04/2008 | 22.63 | % | 17.92 | % | 10.40 | % | 12.40 | % | ||||||||||||||
| Class A15 | 06/21/2010 | 22.17 | % | 17.55 | % | 10.18 | % | 12.22 | % | ||||||||||||||
| Class C15 | 06/21/2010 | 21.24 | % | 16.81 | % | 9.83 | % | 11.94 | % | ||||||||||||||
| Class R315 | 06/21/2010 | 21.89 | % | 17.31 | % | 10.07 | % | 12.13 | % | ||||||||||||||
| Class R625 | 03/15/2013 | 22.72 | % | 17.84 | % | 10.31 | % | 12.33 | % | ||||||||||||||
With Sales Charge | |||||||||||||||||||||||
| Class A15 | 15.15 | % | 16.16 | % | 9.53 | % | 11.69 | % | |||||||||||||||
| Class C15 | 20.24 | % | 16.81 | % | 9.83 | % | 11.94 | % | |||||||||||||||
Index | |||||||||||||||||||||||
| FTSE NAREIT All Equity REITs Index1,16 | 24.01 | % | 18.98 | % | 9.16 | % | 10.88 | % | |||||||||||||||
The performance data quoted represent past performance and do not indicate future results. Current performance may be lower or higher than the performance data quoted. For more current performance data, please visit www.nb.com/performance.
The results shown in the table reflect the reinvestment of income dividends and other distributions, if any. The results do not reflect the effect of taxes a shareholder would pay on Fund distributions or on the redemption of Fund shares.
The investment return and principal value of an investment will fluctuate and shares, when redeemed, may be worth more or less than their original cost.
Returns would have been lower if Neuberger Berman Management LLC (Management) had not reimbursed certain expenses and/or waived a portion of the investment management fees during certain of the periods shown. Repayment by a class (of expenses previously reimbursed and/or fees previously waived by Management) will decrease the class's returns. Please see Note B in the Notes to Financial Statements for specific information regarding expense reimbursement and/or fee waiver arrangements.
As stated in the Fund's most recent prospectus, the total annual operating expense ratios for fiscal year 2013 were 1.43%, 1.07%, 1.47%, 2.24%, 1.70% and 1.11% for Trust Class, Institutional Class, Class A, Class C, Class R3 and Class R6 shares, respectively (before expense reimbursements and/or fee waivers, if any). The expense ratios were 0.85%, 1.21%, 1.96%, 1.46% and 0.78% for Institutional Class, Class A, Class C, Class R3 and Class R6 shares, respectively, after expense reimbursements and/or fee waivers.
Returns shown with a sales charge reflect the deduction of the current maximum initial sales charge of 5.75% for Class A shares and the contingent deferred sales charge (CDSC) for Class C shares. The CDSC for Class C shares is 1%, which is reduced to 0% after 1 year. The performance of the Fund's share classes will differ primarily due to different sales charge structures and class expenses. Please see the prospectus for more information about sales charge structures, if any, and class expenses for your share class.
54
Real Estate Fund (Unaudited)
COMPARISON OF A $10,000 INVESTMENT

This graph shows the change in value of a hypothetical $10,000 investment in the Fund over the past 10 fiscal years, or since the Fund's inception if it has not operated for 10 years. The graph is based on the Trust Class shares only; the performance of the Fund's share classes will differ primarily due to different sales charge structures and class expenses (see Performance Highlights chart on previous page). The result is compared with benchmarks, which include a broad-based market index and may include a more narrowly based index. Market indices have not been reduced to reflect any of the fees and costs of investing. The results shown in the graph reflect the reinvestment of income dividends and other distributions, if any. The results do not reflect the effect of taxes a shareholder would pay on Fund distributions or on the redemption of Fund shares. Results represent past performance and do not indicate future results.
55
Small Cap Growth Fund Commentary (Unaudited)
Neuberger Berman Small Cap Growth Fund Investor Class generated a 13.58% total return for the fiscal year ended August 31, 2014, but lagged its benchmark, the Russell 2000® Growth Index, which returned 17.30% for the period. (Performance for all share classes is provided in the table immediately following this letter.)
The 12-month period proved to be a roller coaster ride, highlighted by weakness in high-expectation growth stocks, amid interest rate hike and valuation concerns. The period also offered unexpected macro twists and turns courtesy of instability in the Ukraine and Iraq, a reemergence of political acrimony and handwringing generated by inarticulate rate and valuation comments from the U.S. Federal Reserve.
In our minds, the case for "stomaching the ride" centered on what we believe are compelling corporate fundamentals and the return of capital investment. What we consider generally strong earnings and reasonable guidance didn't validate the market's rotation away from higher growth and higher-expectation companies, while merger activity, from headline grabbing bidding wars to quiet, small strategic acquisitions, potentially signaled, in our view, that companies appear to finally be ready to shift the focus back towards growth and expanding their franchises through capital reinvestment.
Relative performance was primarily impacted by our allocation and stock selection decisions within Information Technology (IT). The aforementioned sharp rotation away from higher beta stocks resulted in meaningful gains being surrendered across key growth segments of IT, as well as within Health Care. Given that the rotation away from higher growth and higher-expectation stocks, and the resulting performance headwind, was, in our opinion, primarily stylistic in nature and not driven by underlying fundamentals or the overall prospects for those segments, we remain constructive on those industry groups and names, despite the shorter-term volatility.
During the reporting period, Gentherm was the top contributor to performance, while Horizon Pharma was the leading detractor. Gentherm, a developer and manufacturer of automotive thermal management technologies, benefitted from new product introductions and a robust global automotive market. Horizon Pharma, which is focused on the treatment of arthritis, pain and inflammatory diseases, had two drugs removed from the formularies, or reimbursable lists, of the two largest pharmacy benefit managers. The market reacted negatively to this development. We have exited the position.
We still believe that U.S. equities remain an attractive investment. Our cautious optimism is rooted in our belief that corporate fundamentals should remain constructive throughout the balance of 2014 and into 2015. In addition to our perspective on the bottom-lines of higher qualitative small cap companies, we also believe the incremental positives of an accommodative rate environment, minimal inflation, generally reasonable valuations, apparently pent-up corporate and consumer demand and the absence of either extreme investor pessimism or euphoria, if they continue, are indicators that, despite the debatable advanced "age" of this current cycle, this is a market that could continue to demonstrate resiliency and may still have the potential for upward momentum into the foreseeable future.
Sincerely,
DAVID H. BURSHTAN
PORTFOLIO MANAGER
Information about principal risks of investing in the Fund is set forth in the prospectus and statement of additional information.
The portfolio composition, industries and holdings of the Fund are subject to change.
The opinions expressed are those of the Fund's portfolio manager. The opinions are as of the date of this report and are subject to change without notice.
56
Small Cap Growth Fund (Unaudited)
TICKER SYMBOLS
Investor Class | NBMIX | ||||||
Trust Class | NBMOX | ||||||
Advisor Class | NBMVX | ||||||
Institutional Class | NBSMX | ||||||
Class A | NSNAX | ||||||
Class C | NSNCX | ||||||
Class R3 | NSNRX | ||||||
SECTOR ALLOCATION
(as a % of Total Investments) | |||||
Consumer Discretionary | 16.9 | % | |||
Consumer Staples | 4.9 | ||||
Energy | 7.2 | ||||
Financials | 4.7 | ||||
Health Care | 23.3 | ||||
Industrials | 12.8 | ||||
Information Technology | 24.5 | ||||
Materials | 5.0 | ||||
Short-Term Investments | 0.7 | ||||
Total | 100.0 | % | |||
PERFORMANCE HIGHLIGHTS7
| Average Annual Total Return Ended 08/31/2014 | |||||||||||||||||||||||
| Inception Date | 1 Year | 5 Years | 10 Years | Life of Fund | |||||||||||||||||||
At NAV | |||||||||||||||||||||||
Investor Class | 10/20/1998 | 13.58 | % | 15.85 | % | 9.87 | % | 8.76 | % | ||||||||||||||
| Trust Class3 | 11/03/1998 | 13.35 | % | 15.55 | % | 9.69 | % | 8.62 | % | ||||||||||||||
| Advisor Class4 | 05/03/2002 | 13.27 | % | 15.36 | % | 9.50 | % | 8.54 | % | ||||||||||||||
| Institutional Class5 | 04/01/2008 | 13.91 | % | 16.11 | % | 10.06 | % | 8.88 | % | ||||||||||||||
| Class A20 | 05/27/2009 | 13.51 | % | 15.70 | % | 9.80 | % | 8.72 | % | ||||||||||||||
| Class C20 | 05/27/2009 | 12.64 | % | 14.82 | % | 9.36 | % | 8.45 | % | ||||||||||||||
| Class R317 | 05/27/2009 | 13.24 | % | 15.40 | % | 9.65 | % | 8.63 | % | ||||||||||||||
With Sales Charge | |||||||||||||||||||||||
| Class A20 | 6.97 | % | 14.34 | % | 9.15 | % | 8.32 | % | |||||||||||||||
| Class C20 | 11.64 | % | 14.82 | % | 9.36 | % | 8.45 | % | |||||||||||||||
Index | |||||||||||||||||||||||
| Russell 2000® Growth Index1,16 | 17.30 | % | 18.29 | % | 10.22 | % | 7.85 | % | |||||||||||||||
| Russell 2000® Index1,16 | 17.68 | % | 17.03 | % | 9.36 | % | 9.30 | % | |||||||||||||||
The performance data quoted represent past performance and do not indicate future results. Current performance may be lower or higher than the performance data quoted. For more current performance data, please visit www.nb.com/performance.
The results shown in the table reflect the reinvestment of income dividends and other distributions, if any. The results do not reflect the effect of taxes a shareholder would pay on Fund distributions or on the redemption of Fund shares.
The investment return and principal value of an investment will fluctuate and shares, when redeemed, may be worth more or less than their original cost.
Returns would have been lower if Neuberger Berman Management LLC (Management) had not reimbursed certain expenses and/or waived a portion of the investment management fees during certain of the periods shown. Repayment by a class (of expenses previously reimbursed and/or fees previously waived by Management) will decrease the class's returns. Please see Note B in the Notes to Financial Statements for specific information regarding expense reimbursement and/or fee waiver arrangements.
As stated in the Fund's most recent prospectus, the total annual operating expense ratios for fiscal year 2013 were 1.64%, 1.84%, 1.93%, 1.41%, 1.83%, 2.56% and 2.15% for Investor Class, Trust Class, Advisor Class, Institutional Class, Class A, Class C and Class R3 shares, respectively (before expense reimbursements and/or fee waivers, if any). The expense ratios were 1.30%, 1.40%, 1.60%, 0.90%, 1.26%, 2.01% and 1.51% for Investor Class, Trust Class, Advisor Class, Institutional Class, Class A, Class C and Class R3 shares, respectively, after expense reimbursements and/or fee waivers.
Returns shown with a sales charge reflect the deduction of the current maximum initial sales charge of 5.75% for Class A shares and the contingent deferred sales charge (CDSC) for Class C shares. The CDSC for Class C shares is 1%, which is reduced to 0% after 1 year. The performance of the Fund's share classes will differ primarily due to different sales charge structures and class expenses. Please see the prospectus for more information about sales charge structures, if any, and class expenses for your share class.
57
Small Cap Growth Fund (Unaudited)
COMPARISON OF A $10,000 INVESTMENT

This graph shows the change in value of a hypothetical $10,000 investment in the Fund over the past 10 fiscal years, or since the Fund's inception if it has not operated for 10 years. The graph is based on the Investor Class shares only; the performance of the Fund's share classes will differ primarily due to different sales charge structures and class expenses (see Performance Highlights chart on previous page). The result is compared with benchmarks, which include a broad-based market index and may include a more narrowly based index. Market indices have not been reduced to reflect any of the fees and costs of investing. The results shown in the graph reflect the reinvestment of income dividends and other distributions, if any. The results do not reflect the effect of taxes a shareholder would pay on Fund distributions or on the redemption of Fund shares. Results represent past performance and do not indicate future results.
58
Socially Responsive Fund Commentary (Unaudited)
Neuberger Berman Socially Responsive Fund Investor Class generated a 21.54% total return for the fiscal year ended August 31, 2014 but trailed the 25.25% return of its benchmark, the S&P 500® Index. (Performance for all share classes is provided in the table immediately following this letter.)
The absolute performance of our portfolio companies was solid for this reporting period, but our holdings faced a relative headwind for much of the period. With economic momentum building and the U.S. Federal Reserve's (Fed) tapering program underway, consensus (and this team's) opinion was that interest rates would begin trending higher. Instead, they have fallen year to date. As a result, higher-yielding sectors such as Utilities, REITs, and pipelines have outperformed. So far into 2014, our underrepresentation in these industry groups has been a headwind to relative performance.
With the general strength in equities and ample stock specific volatility, we took advantage of many opportunities to purchase the shares of high-quality companies at attractive valuations while realizing gains on many longer-term holdings as they became more fully valued. We also benefited from the surge in M&A activity as two of our companies are in the process of being acquired and as our holding M&A advisor Lazard enjoyed improved earnings prospects.
The portfolio outperformed the benchmark in Consumer Discretionary and Telecommunication Services. Newell Rubbermaid, Texas Instruments and Covidien (sold after Medtronic offered a significant premium) made the largest individual contributions. Other recent sales of stocks with recent appreciation included Lazard and Scripps. We lagged in Information Technology (absence of Apple and underperformance by Altera, which was sold) and Consumer Staples. BG Group, another relative disappointment, was sold early in 2014.
Several recent purchases include NOW, a new distribution company formed from the consolidation of three large incumbents that serve energy related businesses. With what we consider an immaculate balance sheet, we believe NOW should benefit both from its strong position in a fragmented industry and from sustained spending to support the energy renaissance in North America.
We also purchased our first Utilities stock since the financial crisis. Northeast Utilities, New England's largest utility system, is a transmission and distribution company with a 3.3% dividend yield, a strong balance sheet, and planned investments to address the aging transmission and distribution infrastructure in the U.S. From an environmental perspective, the New England electrical grid managed by Northeast Utilities is already among the least carbon intensive in the country. Furthermore, prospective growth in the company's electric and gas transmission networks could promote more renewable power within the company's service territory.
Looking ahead, we see what we believe is economic momentum in the U.S., with signs of real strength in discrete segments—railroad volumes, skilled labor, consumer sentiment, housing, and auto sales, which in August touched the pre-crisis high. Balancing that, we believe sources of uncertainty include ongoing weakness in the European economy, which could be exacerbated by Russian/Ukrainian tensions, and potential market distortions from a divergence in central bank policy—with the Fed leaning toward tighter policy, but the European Central Bank and Bank of Japan still easing.
While we are always cognizant of external factors, our strategy remains unchanged—to focus on business fundamentals and to be an opportunistic buyer and seller around valuations. We feel constructive about our companies' businesses and look forward to continuing to serve your investment needs.
Sincerely,
ARTHUR MORETTI AND INGRID S. DYOTT
PORTFOLIO CO-MANAGERS
Information about principal risks of investing in the Fund is set forth in the prospectus and statement of additional information.
The portfolio composition, industries and holdings of the Fund are subject to change.
The opinions expressed are those of the Fund's portfolio managers. The opinions are as of the date of this report and are subject to change without notice.
59
Socially Responsive Fund (Unaudited)
TICKER SYMBOLS
Investor Class | NBSRX | ||||||
Trust Class | NBSTX | ||||||
Institutional Class | NBSLX | ||||||
Class A | NRAAX | ||||||
Class C | NRACX | ||||||
Class R3 | NRARX | ||||||
Class R6 | NRSRX | ||||||
SECTOR ALLOCATION
(as a % of Total Investments) | |||||
Consumer Discretionary | 12.6 | % | |||
Consumer Staples | 10.9 | ||||
Energy | 6.9 | ||||
Financials | 15.0 | ||||
Health Care | 10.6 | ||||
Industrials | 18.9 | ||||
Information Technology | 15.5 | ||||
Materials | 4.7 | ||||
Telecommunication Services | 1.5 | ||||
Utilities | 1.0 | ||||
Short-Term Investments | 2.4 | ||||
Total | 100.0 | % | |||
PERFORMANCE HIGHLIGHTS7
| Average Annual Total Return Ended 08/31/2014 | |||||||||||||||||||||||
| Inception Date | 1 Year | 5 Years | 10 Years | Life of Fund | |||||||||||||||||||
At NAV | |||||||||||||||||||||||
Investor Class | 03/16/1994 | 21.54 | % | 16.57 | % | 8.97 | % | 9.42 | % | ||||||||||||||
| Trust Class3 | 03/03/1997 | 21.32 | % | 16.37 | % | 8.78 | % | 9.24 | % | ||||||||||||||
| Institutional Class5 | 11/28/2007 | 21.76 | % | 16.77 | % | 9.10 | % | 9.48 | % | ||||||||||||||
| Class A20 | 05/27/2009 | 21.28 | % | 16.35 | % | 8.86 | % | 9.37 | % | ||||||||||||||
| Class C20 | 05/27/2009 | 20.42 | % | 15.47 | % | 8.43 | % | 9.16 | % | ||||||||||||||
| Class R317 | 05/27/2009 | 21.02 | % | 16.08 | % | 8.72 | % | 9.30 | % | ||||||||||||||
| Class R624 | 03/15/2013 | 21.88 | % | 16.65 | % | 9.01 | % | 9.44 | % | ||||||||||||||
With Sales Charge | |||||||||||||||||||||||
| Class A20 | 14.28 | % | 14.97 | % | 8.22 | % | 9.05 | % | |||||||||||||||
| Class C20 | 19.42 | % | 15.47 | % | 8.43 | % | 9.16 | % | |||||||||||||||
Index | |||||||||||||||||||||||
| S&P 500® Index1,16 | 25.25 | % | 16.88 | % | 8.38 | % | 9.46 | % | |||||||||||||||
The performance data quoted represent past performance and do not indicate future results. Current performance may be lower or higher than the performance data quoted. For more current performance data, please visit www.nb.com/performance.
The results shown in the table reflect the reinvestment of income dividends and other distributions, if any. The results do not reflect the effect of taxes a shareholder would pay on Fund distributions or on the redemption of Fund shares.
The investment return and principal value of an investment will fluctuate and shares, when redeemed, may be worth more or less than their original cost.
Returns would have been lower if Neuberger Berman Management LLC (Management) had not reimbursed certain expenses and/or waived a portion of the investment management fees during certain of the periods shown. Repayment by a class (of expenses previously reimbursed and/or fees previously waived by Management) will decrease the class's returns. Please see Note B in the Notes to Financial Statements for specific information regarding expense reimbursement and/or fee waiver arrangements.
As stated in the Fund's most recent prospectus, the total annual operating expense ratios for fiscal year 2013 were 0.87%, 1.05%, 0.69%, 1.10%, 1.86%, 1.30% and 0.62% for Investor Class, Trust Class, Institutional Class, Class A, Class C, Class R3 and Class R6 shares, respectively (before expense reimbursements and/or fee waivers, if any). The total annual operating expense ratio for each of Class A and Class C includes the class's repayment of expenses previously reimbursed and/or fees previously waived by Management.
Returns shown with a sales charge reflect the deduction of the current maximum initial sales charge of 5.75% for Class A shares and the contingent deferred sales charge (CDSC) for Class C shares. The CDSC for Class C shares is 1%, which is reduced to 0% after 1 year. The performance of the Fund's share classes will differ primarily due to different sales charge structures and class expenses. Please see the prospectus for more information about sales charge structures, if any, and class expenses for your share class.
60
Socially Responsive Fund (Unaudited)
COMPARISON OF A $10,000 INVESTMENT

This graph shows the change in value of a hypothetical $10,000 investment in the Fund over the past 10 fiscal years, or since the Fund's inception if it has not operated for 10 years. The graph is based on the Investor Class shares only; the performance of the Fund's share classes will differ primarily due to different sales charge structures and class expenses (see Performance Highlights chart on previous page). The result is compared with benchmarks, which include a broad-based market index and may include a more narrowly based index. Market indices have not been reduced to reflect any of the fees and costs of investing. The results shown in the graph reflect the reinvestment of income dividends and other distributions, if any. The results do not reflect the effect of taxes a shareholder would pay on Fund distributions or on the redemption of Fund shares. Results represent past performance and do not indicate future results.
61
Value Fund Commentary (Unaudited)
Neuberger Berman Value Fund Institutional Class produced a 22.98% total return for the fiscal year ended August 31, 2014, but underperformed its benchmark, the Russell 1000® Value Index, which generated a 24.43% total return. (Performance for all share classes is provided in the table immediately following this letter.)
The stock market continued to rally over the past fiscal year, driven, in our view, by the ongoing economic recovery, improving demand from businesses for material and labor, relatively strong consumer confidence, and ongoing easy monetary policy from the U.S. Federal Reserve (Fed). The Fed began to taper its bond buying program last December. Despite this slowdown, a high level of liquidity remained in the market and interest rates were historically low. Valuations continued to be attractive overall, which we think helped lead to the strong performance of the market over the 12-month period.
The top-performing sectors for the Russell 1000 Value Index during the reporting period were Information Technology (IT) and Materials. Telecommunication Services and Consumer Staples lagged other index sectors but still produced strong double-digit returns. The improving economic picture as well as high levels of liquidity provided an excellent backdrop for every sector in the index.
The strongest performing sectors for the Fund on a relative basis were Industrials and Materials. Within Industrials, the Fund's performance was driven by airline stocks, which delivered excellent results over the past year. Airlines, in general, and particularly those we held in the portfolio, have been able to increase revenues while controlling costs and have benefited from favorable industry trends. Within Materials, we were overweighted versus the benchmark in chemical companies, which were strong performers overall, and the stocks we chose in this area outperformed those in the index. The companies benefited from high demand for existing capacity, along with stable to lower commodity input costs.
Energy and IT were the weakest performing sectors in terms of relative performance. However, both sectors delivered positive returns on an absolute basis. Within Energy, an underweighting and stock picking were both negatives, and our exposure to coal hurt during a time of falling natural gas prices. IT was a strong absolute performer for the Fund. However, despite strong double-digit returns, our holdings lagged the index. Semiconductors & Semiconductor Equipment, and Technology Hardware Storage & Peripherals were among the top performing industries for the Fund on an absolute basis.
We continue to be cautiously optimistic about the economy and the U.S. stock market. The strong run-up we have seen over the past year makes us suspect that we will see some profit taking in the future. It is uncertain what may trigger these dips but we will consider pull-backs as buying opportunities. The Fed's process of tapering is now well underway and we believe it could be completed by the end of this calendar year. We continue to see value in industrial stocks, such as airlines, as well as chemical and technology companies. We are currently attracted to stocks that we believe are undervalued based on normalized earnings whose value could be recognized by the market over time. In our view, this strategy may produce favorable risk-adjusted returns as we continue to monitor the correlation among holdings in seeking to achieve a positive risk/reward balance.
Sincerely,
ELI M. SALZMANN
PORTFOLIO MANAGER
Information about principal risks of investing in the Fund is set forth in the prospectus and statement of additional information.
The portfolio composition, industries and holdings of the Fund are subject to change.
The opinions expressed are those of the Fund's portfolio manager. The opinions are as of the date of this report and are subject to change without notice.
62
Value Fund (Unaudited)
TICKER SYMBOLS
Institutional Class | NLRLX | ||||||
Class A | NVAAX | ||||||
Class C | NVACX | ||||||
SECTOR ALLOCATION
(as a % of Total Investments) | |||||
Consumer Discretionary | 7.1 | % | |||
Consumer Staples | 1.1 | ||||
Energy | 6.8 | ||||
Financials | 27.9 | ||||
Health Care | 11.1 | ||||
Industrials | 20.1 | ||||
Information Technology | 10.1 | ||||
Materials | 8.1 | ||||
Utilities | 0.9 | ||||
Other | 1.2 | ||||
Short-Term Investments | 5.6 | ||||
Total | 100.0 | % | |||
PERFORMANCE HIGHLIGHTS9
| Average Annual Total Return Ended 08/31/2014 | |||||||||||||||||||
| Inception Date* | 1 Year | 5 Years | Life of Fund | ||||||||||||||||
At NAV | |||||||||||||||||||
| Institutional Class21 | 04/19/2010 | 22.98 | % | 15.55 | % | 8.63 | % | ||||||||||||
| Class A21 | 03/02/2011 | 22.43 | % | 15.23 | % | 8.44 | % | ||||||||||||
| Class C21 | 03/02/2011 | 21.56 | % | 14.64 | % | 8.09 | % | ||||||||||||
With Sales Charge | |||||||||||||||||||
| Class A21 | 15.39 | % | 13.87 | % | 7.63 | % | |||||||||||||
| Class C21 | 20.56 | % | 14.64 | % | 8.09 | % | |||||||||||||
Index | |||||||||||||||||||
| Russell 1000® Value Index1,16 | 24.43 | % | 16.62 | % | 6.03 | % | |||||||||||||
*The performance data for each class includes the performance of the Fund's oldest share class, Trust Class, from November 2, 2006 through April 19, 2010. The performance data for Class A and Class C also includes the performance of the Fund's Institutional Class from April 19, 2010 through March 2, 2011. See endnote 21 for information about the effects of the different fees paid by each class.
The performance data quoted represent past performance and do not indicate future results. Current performance may be lower or higher than the performance data quoted. For more current performance data, please visit www.nb.com/performance.
The results shown in the table reflect the reinvestment of income dividends and other distributions, if any. The results do not reflect the effect of taxes a shareholder would pay on Fund distributions or on the redemption of Fund shares.
The investment return and principal value of an investment will fluctuate and shares, when redeemed, may be worth more or less than their original cost.
Returns would have been lower if Neuberger Berman Management LLC (Management) had not reimbursed certain expenses and/or waived a portion of the investment management fees during certain of the periods shown. Repayment by a class (of expenses previously reimbursed and/or fees previously waived by Management) will decrease the class's returns. Please see Note B in the Notes to Financial Statements for specific information regarding expense reimbursement and/or fee waiver arrangements.
As stated in the Fund's most recent prospectus, the total annual operating expense ratios for fiscal year 2013 were 5.95%, 6.83% and 7.33% for Institutional Class, Class A and Class C shares, respectively (before expense reimbursements and/or fee waivers, if any). These expense ratios were 0.77%, 1.13% and 1.88% for Institutional Class, Class A and Class C shares, respectively, after expense reimbursements and/or fee waivers.
Returns shown with a sales charge reflect the deduction of the current maximum initial sales charge of 5.75% for Class A shares and the contingent deferred sales charge (CDSC) for Class C shares. The CDSC for Class C shares is 1%, which is reduced to 0% after 1 year. The performance of the Fund's share classes will differ primarily due to different sales charge structures and class expenses. Please see the prospectus for more information about sales charge structures, if any, and class expenses for your share class.
63
Value Fund (Unaudited)
COMPARISON OF A $1,000,000 INVESTMENT21
(000's Omitted)

This graph shows the change in value of a hypothetical $1,000,000 investment in the Fund over the past 10 fiscal years, or since the Fund's inception if it has not operated for 10 years. The graph is based on the Institutional Class shares only; the performance of the Fund's share classes will differ primarily due to different sales charge structures and class expenses (see Performance Highlights chart on previous page). The result is compared with benchmarks, which include a broad-based market index and may include a more narrowly based index. Market indices have not been reduced to reflect any of the fees and costs of investing. The results shown in the graph reflect the reinvestment of income dividends and other distributions, if any. The results do not reflect the effect of taxes a shareholder would pay on Fund distributions or on the redemption of Fund shares. Results represent past performance and do not indicate future results.
64
Endnotes
1 Please see "Glossary of Indices" on page 69 for a description of indices. Please note that individuals cannot invest directly in any index. The indices described in this report do not take into account any fees, expenses or tax consequences of investing in the individual securities that they track. Data about the performance of an index are prepared or obtained by Neuberger Berman Management LLC ("Management") and reflect the reinvestment of income dividends and other distributions, if any. The Fund may invest in securities not included in a described index and generally does not invest in all securities included in a described index.
2 This date reflects when Management first became the investment manager to the Fund.
3 The performance information for the Trust Class prior to the class's inception date is that of the Fund's Investor Class. The performance information for the Investor Class has not been adjusted to take into account differences in class specific operating expenses. The Investor Class has lower expenses and typically higher returns than the Trust Class.
4 The performance information for the Advisor Class prior to the class's inception date is that of the Fund's Investor Class. The performance information for the Investor Class has not been adjusted to take into account differences in class specific operating expenses. The Investor Class has lower expenses and typically higher returns than the Advisor Class.
5 The performance information for the Institutional Class prior to the class's inception date is that of the Fund's Investor Class. The performance information for the Investor Class has not been adjusted to take into account differences in class specific operating expenses. The Investor Class has higher expenses and typically lower returns than the Institutional Class.
6 The performance information for the Institutional Class prior to the class's inception date is that of the Fund's Trust Class. The performance information for the Trust Class has not been adjusted to take into account differences in class specific operating expenses. The Trust Class has higher expenses and typically lower returns than the Institutional Class.
7 The investments for the Fund are managed by the same portfolio manager(s) who manage(s) one or more other registered funds that have names, investment objectives and investment styles that are similar to those of the Fund. You should be aware that the Fund is likely to differ from the other mutual fund(s) in size, cash flow pattern and tax matters. Accordingly, the holdings and performance of the Fund can be expected to vary from those of the other mutual fund(s).
8 The Fund had a policy of investing mainly in large-cap stocks prior to September 1998 and investing 90% of its assets in no more than six economic sectors prior to December 17, 2007. As of April 2, 2001, the Fund changed its investment policy to become "non-diversified" under the Investment Company Act of 1940 ("1940 Act"). Performance prior to these changes might have been different if current policies had been in effect. However, by operation of law under the 1940 Act, the Fund subsequently became, and currently operates as, a diversified fund. Please see the notes to the financial statements for information on a non-diversified fund becoming a diversified fund by operation of law.
9 Each of Neuberger Berman Emerging Markets Equity Fund, Neuberger Berman Equity Income Fund, Neuberger Berman Global Equity Fund, Neuberger Berman Multi-Cap Opportunities Fund and Neuberger Berman Value Fund was relatively small prior to September 2010, June 2008, August 2013, January 2010 and April 2013, respectively. The same techniques used to produce returns in a small fund may not work to produce similar returns in a larger fund.
10 The performance information for Class R3 prior to the class's inception date is that of the Fund's Institutional Class. The performance information for the Institutional Class has not been adjusted to take into account differences in
65
Endnotes (cont'd)
class specific operating expenses (such as Rule 12b-1 fees). The Institutional Class has lower expenses and typically higher returns than Class R3.
11 As of December 17, 2007, the Fund changed its investment policy to become "non-diversified" under the 1940 Act. A non-diversified fund is able to invest larger percentages of its assets in the securities of a single issuer, which could increase the fund's risk of loss. Performance prior to this change might have been different if current policies had been in effect. Although the Fund has a policy that allows it to operate as a non-diversified fund, on December 5, 2008, the Board adopted a policy, which cannot be changed without a shareholder vote, that the Fund will invest its portfolio so as to meet the standards of a diversified fund.
12 The Fund had a policy of investing mainly in large-cap stocks prior to December 2002. Its performance prior to that date might have been different if current policies had been in effect.
13 The performance information for Class A, Class C, Investor Class, and Trust Class prior to the classes' inception date is that of the Fund's Institutional Class. The performance information for the Institutional Class has been adjusted to reflect the appropriate sales charges applicable to Class A and Class C shares, but has not been adjusted to take into account differences in class specific operating expenses (such as Rule 12b-1 fees). The Institutional Class has lower expenses and typically higher returns than Class A, Class C, Investor Class, and Trust Class.
14 The performance information for Institutional Class, Class A, Class C and Class R3 prior to June 9, 2008 is that of the Fund's Trust Class, which had an inception date of November 2, 2006, and converted into the Institutional Class on June 9, 2008. During the period from November 2, 2006 through June 9, 2008, the Trust Class had only one investor, which could have impacted Fund performance. The performance information for the Trust Class has been adjusted to reflect the appropriate sales charges applicable to Class A and Class C shares, but has not been adjusted to take into account differences in class specific operating expenses (such as Rule 12b-1 fees). The Trust Class had higher expenses and typically lower returns than the Institutional Class. The Trust Class had lower expenses and typically higher returns than Class A, Class C and Class R3. The performance information for Class R3 from June 9, 2008 to the class's inception date is that of the Fund's Institutional Class. The performance information for the Institutional Class has not been adjusted to take into account differences in class specific operating expenses (such as Rule 12b-1 fees). The Institutional Class has lower expenses and typically higher returns than Class R3.
15 The performance information for Class A, Class C and Class R3 prior to the classes' respective inception dates is that of the Fund's Trust Class. The performance information for the Trust Class has been adjusted to reflect the appropriate sales charges applicable to Class A and Class C shares, but has not been adjusted to take into account differences in class specific operating expenses (such as Rule 12b-1 fees). The Trust Class has lower expenses and typically higher returns than Class A, Class C and Class R3.
16 The date used to calculate Life of Fund performance for the index is the inception date of the oldest share class.
17 The performance information for Class R3 prior to the class's inception date is that of the Fund's Investor Class. The performance information for the Investor Class has not been adjusted to take into account differences in class specific operating expenses (such as Rule 12b-1 fees). The Investor Class has lower expenses and typically higher returns than Class R3.
18 Prior to December 14, 2009, the Fund had different investment goals, strategies and portfolio management team. The performance information for Institutional Class, Class A and Class C prior to December 21, 2009 is that of the Fund's Trust Class, which had an inception date of November 2, 2006, and converted into the Institutional Class on December 21, 2009. During the period from November 2, 2006 through December 21, 2009, the Trust Class had only one investor, which could have impacted Fund performance. The performance information for the Trust Class has been adjusted to reflect the appropriate sales charges applicable to Class A and Class C shares, but has not
66
Endnotes (cont'd)
been adjusted to take into account differences in class specific operating expenses (such as Rule 12b-1 fees). Management had previously capped Trust Class expenses; absent this arrangement, the returns would have been lower. The Trust Class had lower capped expenses and typically higher returns than Class A and Class C. The Trust Class had equivalent capped expenses and typically similar returns to the Institutional Class.
19 The performance information for Institutional Class, Class A and Class C prior to the classes' inception date is that of the Fund's predecessor, the DJG Small Cap Value Fund L.P., an unregistered limited partnership ("DJG Fund"); DJG Fund was the successor to The DJG Small Cap Value Fund, an unregistered commingled investment account ("DJG Account"). The performance from July 8, 1997 (the commencement of operations) to September 11, 2008 is that of DJG Account, and the performance from September 12, 2008 to May 10, 2010 is that of DJG Fund. On May 10, 2010, the DJG Fund transferred its assets to the Fund in exchange for the Fund's Institutional Class shares. The investment policies, objectives, guidelines and restrictions of the Fund are in all material respects equivalent to those of DJG Fund and DJG Account (the "Predecessors"). As a mutual fund registered under the 1940 Act, the Fund is subject to certain restrictions under the 1940 Act and the Internal Revenue Code ("Code") to which the Predecessors were not subject. Had the Predecessors been registered under the 1940 Act and been subject to the provisions of the 1940 Act and the Code, their investment performance may have been adversely affected. The performance information reflects the actual expenses of the Predecessors, which were generally lower than those of the Fund.
20 The performance information for Class A and Class C prior to the classes' inception date is that of the Fund's Investor Class. The performance information for the Investor Class has been adjusted to reflect the appropriate sales charges applicable to Class A and Class C shares, but has not been adjusted to take into account differences in class specific operating expenses (such as Rule 12b-1 fees). The Investor Class has lower expenses and typically higher returns than Class A and Class C.
21 The performance information for Institutional Class, Class A and Class C prior to April 19, 2010 is that of the Fund's Trust Class, which had an inception date of November 2, 2006, and converted into the Institutional Class on April 19, 2010. During the period from November 2, 2006 through April 19, 2010, the Trust Class had only one investor, which could have impacted Fund performance. The performance information for Class A and Class C from April 19, 2010 to the classes' inception date is that of the Fund's Institutional Class. During the period from April 19, 2010 through March 2, 2011, the Institutional Class had only one investor, which could have impacted Fund performance. The performance information for the Trust Class and the Institutional Class has been adjusted to reflect the appropriate sales charges applicable to Class A and Class C shares, but has not been adjusted to take into account differences in class specific operating expenses (such as Rule 12b-1 fees). The Trust Class had higher expenses and typically lower returns than the Institutional Class. The Trust Class had lower expenses and typically higher returns than Class A and Class C. The Institutional Class has lower expenses and typically higher returns than Class A and Class C.
22 As of June 19, 2012, the Fund changed its investment policy to become "non-diversified" under the 1940 Act. A non-diversified fund is able to invest larger percentages of its assets in the securities of a single issuer, which could increase the fund's risk of loss. Performance prior to this change might have been different if current policies had been in effect.
23 The performance information for Class R6 prior to the class's inception date is that of the Fund's Institutional Class. The performance information for the Institutional Class has not been adjusted to take into account differences in class specific operating expenses. The Institutional Class has higher expenses and typically lower returns than Class R6.
24 The performance information for Class R6 prior to the class's inception date is that of the Fund's Investor Class. The performance information for the Investor Class has not been adjusted to take into account differences in class specific operating expenses. The Investor Class has higher expenses and typically lower returns than Class R6.
67
Endnotes (cont'd)
25 The performance information for Class R6 prior to the class's inception date is that of the Fund's Trust Class. The performance information for the Trust Class has not been adjusted to take into account differences in class specific operating expenses. The Trust Class has higher expenses and typically lower returns than Class R6.
26 On December 16, 2013, the Fund began comparing its performance to the MSCI All Country World Index rather than the MSCI World Index because the MSCI All Country World Index is a fairer representation of the Fund's investment universe.
27 Prior to September 2, 2014, Neuberger Berman All Cap Core Fund was known as Neuberger Berman Select Equities Fund.
28 Prior to June 2, 2014, Neuberger Berman International Select Fund was known as Neuberger Berman International Large Cap Fund.
For more complete information on any of the Neuberger Berman Equity Funds, call Neuberger Berman Management LLC at (800) 877-9700, or visit our website at www.nb.com.
68
Glossary of Indices
| S&P 500® Index: | The index is a float-adjusted market capitalization-weighted index that focuses on the large-cap segment of the U.S. equity market, and includes a significant portion of the total value of the market. | ||||||
| Russell 1000® Index: | The index is a float-adjusted market capitalization-weighted index that measures the performance of the large-cap segment of the U.S. equity market. It includes approximately 1,000 of the largest securities in the Russell 3000® Index (which measures the performance of the 3,000 largest U.S. public companies based on total market capitalization). The index is rebalanced annually in June. | ||||||
| Russell 1000® Growth Index: | The index is a float-adjusted market capitalization-weighted index that measures the performance of the large-cap growth segment of the U.S. equity market. It includes those Russell 1000 Index companies with higher price-to-book ratios and higher forecasted growth rates. The index is rebalanced annually in June. | ||||||
| Russell 1000® Value Index: | The index is a float-adjusted market capitalization-weighted index that measures the performance of the large-cap value segment of the U.S. equity market. It includes those Russell 1000 Index companies with lower price-to-book ratios and lower forecasted growth rates. The index is rebalanced annually in June. | ||||||
| Russell 2000® Index: | The index is a float-adjusted market capitalization-weighted index that measures the performance of the small-cap segment of the U.S. equity market. It includes approximately 2,000 of the smallest securities in the Russell 3000 Index. The index is rebalanced annually in June. | ||||||
| Russell 2000® Growth Index: | The index is a float-adjusted market capitalization-weighted index that measures the performance of the small-cap growth segment of the U.S. equity market. It includes those Russell 2000 Index companies with higher price-to-book ratios and higher forecasted growth rates. The index is rebalanced annually in June. | ||||||
| Russell 2000® Value Index: | The index is a float-adjusted market capitalization-weighted index that measures the performance of the small-cap value segment of the U.S. equity market. It includes those Russell 2000 Index companies with lower price-to-book ratios and lower forecasted growth rates. The index is rebalanced annually in June. | ||||||
| Russell Midcap® Index: | The index is a float-adjusted market capitalization-weighted index that measures the performance of the mid-cap segment of the U.S. equity market. It includes approximately 800 of the smallest securities in the Russell 1000 Index. The index is rebalanced annually in June. | ||||||
| Russell Midcap® Growth Index: | The index is a float-adjusted market capitalization-weighted index that measures the performance of the mid-cap growth segment of the U.S. equity market. It includes those Russell Midcap Index companies with higher price-to-book ratios and higher forecasted growth rates. The index is rebalanced annually in June. | ||||||
| Russell Midcap® Value Index: | The index is a float-adjusted market capitalization-weighted index that measures the performance of the mid-cap value segment of the U.S. equity market. It includes those Russell Midcap Index companies with lower price-to-book ratios and lower forecasted growth rates. The index is rebalanced annually in June. | ||||||
FTSE NAREIT All Equity REITs Index: | The index is a free float-adjusted market capitalization-weighted index that tracks the performance of all equity real estate investment trusts (REITs) that are listed on the New York Stock Exchange, the NYSE Arca or the NASDAQ National Market List. Equity REITs include all tax-qualified REITs with more than 50 percent of total assets in qualifying real estate assets other than mortgages secured by real property. | ||||||
69
Glossary of Indices (cont'd)
| MSCI EAFE® Index (Europe, Australasia, Far East): | The index is a free float-adjusted market capitalization-weighted index that is designed to measure the equity market performance of developed markets, excluding the United States and Canada. The index consists of the following 21 developed market country indexes: Australia, Austria, Belgium, Denmark, Finland, France, Germany, Hong Kong, Ireland, Israel, Italy, Japan, the Netherlands, New Zealand, Norway, Portugal, Singapore, Spain, Sweden, Switzerland, and the United Kingdom. | ||||||
MSCI Emerging Markets Index: | The index is a free float-adjusted market capitalization-weighted index that is designed to measure the equity market performance of emerging markets. The index consists of the following 23 emerging market country indexes: Brazil, Chile, China, Colombia, Czech Republic, Egypt, Greece, Hungary, India, Indonesia, Korea, Malaysia, Mexico, Peru, the Philippines, Poland, Qatar, Russia, South Africa, Taiwan, Thailand, Turkey, and the UAE. | ||||||
MSCI World Index: | The index is a free float-adjusted market capitalization-weighted index that is designed to measure the equity market performance of developed markets. The index consists of the following 23 developed market country indexes: Australia, Austria, Belgium, Canada, Denmark, Finland, France, Germany, Hong Kong, Ireland, Israel, Italy, Japan, the Netherlands, New Zealand, Norway, Portugal, Singapore, Spain, Sweden, Switzerland, the United Kingdom, and the United States. | ||||||
MSCI All Country World Index: | The index is a free float-adjusted market capitalization-weighted index that is designed to measure the equity market performance of developed and emerging markets. The index consists of 46 country indexes comprising 23 developed and 23 emerging market country indexes. The developed market country indexes included are: Australia, Austria, Belgium, Canada, Denmark, Finland, France, Germany, Hong Kong, Ireland, Israel, Italy, Japan, the Netherlands, New Zealand, Norway, Portugal, Singapore, Spain, Sweden, Switzerland, the United Kingdom, and the United States. The emerging market country indexes included are: Brazil, Chile, China, Colombia, Czech Republic, Egypt, Greece, Hungary, India, Indonesia, Korea, Malaysia, Mexico, Peru, the Philippines, Poland, Qatar, Russia, South Africa, Taiwan, Thailand, Turkey, and the UAE. | ||||||
MSCI China Index: | The index is a free float-adjusted market capitalization-weighted index that is designed to measure the equity market performance of Chinese securities accessible to non-domestic investors. The index includes equity securities issued by companies incorporated in the People's Republic of China ("PRC"), and listed in the form of China B shares on the Shanghai Stock Exchange (in US$) or Shenzhen Stock Exchange (in HK$), or China H shares on the Hong Kong Stock Exchange (in HK$) and other foreign exchanges. It also includes Red-Chips and P-Chips, which are not incorporated in the PRC and listed on the Hong Kong Stock Exchange. Red-Chips include companies that are directly or indirectly controlled by organizations or enterprises that are owned by the state, provinces, or municipalities of the PRC. P-Chips include non-state-owned Chinese companies incorporated outside the mainland and traded in Hong Kong. The index does not include China A-shares or securities of US and Singapore-listed overseas companies. (China A-shares are securities listed on the Shanghai or Shenzhen Stock Exchanges and traded in Renminbi, with limited accessibility to foreign investors.) | ||||||
70
Information About Your Fund's Expenses (Unaudited)
As a Fund shareholder, you incur two types of costs: (1) transaction costs, including sales charges (loads) on purchase payments or redemption proceeds (if applicable); and (2) ongoing costs, including management fees, distribution and/or service (12b-1) fees (if applicable), and other Fund expenses. This example is intended to help you understand your ongoing costs (in U.S. dollars) of investing in a Fund and compare these costs with the ongoing costs of investing in other mutual funds.
This table is designed to provide information regarding costs related to your investments. The following examples are based on an investment of $1,000 made at the beginning of the six month period ended August 31, 2014 and held for the entire period. The table illustrates each Fund's costs in two ways:
Actual Expenses and Performance: | The first section of the table provides information about actual account values and actual expenses in dollars, based on the Fund's actual performance during the period. You may use the information in this line, together with the amount you invested, to estimate the expenses you paid over the period. Simply divide your account value by $1,000 (for example, an $8,600 account value divided by $1,000 = 8.6), then multiply the result by the number in the first section of the table under the heading entitled "Expenses Paid During the Period" to estimate the expenses you paid over the period. | ||||||
| Hypothetical Example for Comparison Purposes: | The second section of the table provides information about hypothetical account values and hypothetical expenses based on the Fund's actual expense ratio and an assumed rate of return at 5% per year before expenses. This return is not the Fund's actual return. The hypothetical account values and expenses may not be used to estimate the actual ending account balance or expenses you paid for the period. You may use this information to compare the ongoing costs of investing in a Fund versus other funds. To do so, compare the expenses shown in this 5% hypothetical example with the 5% hypothetical examples that appear in the shareholder reports of other funds. | ||||||
Please note that the expenses in the table are meant to highlight your ongoing costs only and do not include any transaction costs, such as sales charges (loads) (if applicable). Therefore, the information under the heading "Hypothetical (5% annual return before expenses)" is useful in comparing ongoing costs only, and will not help you determine the relative total costs of owning different funds. In addition, if these transaction costs were included, your costs would have been higher.
71
Expense Information as of 8/31/14 (Unaudited)
Neuberger Berman Equity Funds | |||||||||||||||||||||||||||||||||
ACTUAL | HYPOTHETICAL (5% ANNUAL RETURN BEFORE EXPENSES)(4) | ||||||||||||||||||||||||||||||||
| Beginning Account Value 3/1/14 | Ending Account Value 8/31/14 | Expenses Paid During the Period(1) 3/1/14 - 8/31/14 | Expense Ratio | Beginning Account Value 3/1/14 | Ending Account Value 8/31/14 | Expenses Paid During the Period(1) 3/1/14 - 8/31/14 | Expense Ratio | ||||||||||||||||||||||||||
| All Cap Core Fund(3) | |||||||||||||||||||||||||||||||||
Institutional Class | $ | 1,000.00 | $ | 1,070.30 | $ | 3.91 | .75 | % | $ | 1,000.00 | $ | 1,021.42 | $ | 3.82 | .75 | % | |||||||||||||||||
Class A | $ | 1,000.00 | $ | 1,067.40 | $ | 6.25 | 1.20 | % | $ | 1,000.00 | $ | 1,019.16 | $ | 6.11 | 1.20 | % | |||||||||||||||||
Class C | $ | 1,000.00 | $ | 1,064.00 | $ | 10.14 | 1.95 | % | $ | 1,000.00 | $ | 1,015.38 | $ | 9.91 | 1.95 | % | |||||||||||||||||
Emerging Markets Equity Fund | |||||||||||||||||||||||||||||||||
Institutional Class | $ | 1,000.00 | $ | 1,111.90 | $ | 6.65 | 1.25 | % | $ | 1,000.00 | $ | 1,018.90 | $ | 6.36 | 1.25 | % | |||||||||||||||||
Class A | $ | 1,000.00 | $ | 1,111.10 | $ | 7.98 | 1.50 | % | $ | 1,000.00 | $ | 1,017.64 | $ | 7.63 | 1.50 | % | |||||||||||||||||
Class C | $ | 1,000.00 | $ | 1,107.10 | $ | 11.95 | 2.25 | % | $ | 1,000.00 | $ | 1,013.86 | $ | 11.42 | 2.25 | % | |||||||||||||||||
Class R3 | $ | 1,000.00 | $ | 1,107.80 | $ | 10.15 | 1.91 | % | $ | 1,000.00 | $ | 1,015.58 | $ | 9.70 | 1.91 | % | |||||||||||||||||
Class R6 | $ | 1,000.00 | $ | 1,112.40 | $ | 6.28 | 1.18 | % | $ | 1,000.00 | $ | 1,019.26 | $ | 6.01 | 1.18 | % | |||||||||||||||||
Equity Income Fund | |||||||||||||||||||||||||||||||||
Institutional Class | $ | 1,000.00 | $ | 1,079.20 | $ | 3.56 | .68 | % | $ | 1,000.00 | $ | 1,021.78 | $ | 3.47 | .68 | % | |||||||||||||||||
Class A | $ | 1,000.00 | $ | 1,077.50 | $ | 5.50 | 1.05 | % | $ | 1,000.00 | $ | 1,019.91 | $ | 5.35 | 1.05 | % | |||||||||||||||||
Class C | $ | 1,000.00 | $ | 1,073.20 | $ | 9.35 | 1.79 | % | $ | 1,000.00 | $ | 1,016.18 | $ | 9.10 | 1.79 | % | |||||||||||||||||
Class R3 | $ | 1,000.00 | $ | 1,075.40 | $ | 6.85 | 1.31 | % | $ | 1,000.00 | $ | 1,018.60 | $ | 6.67 | 1.31 | % | |||||||||||||||||
Focus Fund | |||||||||||||||||||||||||||||||||
Investor Class | $ | 1,000.00 | $ | 1,060.60 | $ | 4.73 | .91 | % | $ | 1,000.00 | $ | 1,020.62 | $ | 4.63 | .91 | % | |||||||||||||||||
Trust Class | $ | 1,000.00 | $ | 1,059.50 | $ | 5.76 | 1.11 | % | $ | 1,000.00 | $ | 1,019.61 | $ | 5.65 | 1.11 | % | |||||||||||||||||
Advisor Class | $ | 1,000.00 | $ | 1,058.50 | $ | 6.59 | 1.27 | % | $ | 1,000.00 | $ | 1,018.80 | $ | 6.46 | 1.27 | % | |||||||||||||||||
Institutional Class | $ | 1,000.00 | $ | 1,061.60 | $ | 3.90 | .75 | % | $ | 1,000.00 | $ | 1,021.42 | $ | 3.82 | .75 | % | |||||||||||||||||
Class A | $ | 1,000.00 | $ | 1,060.00 | $ | 5.76 | 1.11 | % | $ | 1,000.00 | $ | 1,019.61 | $ | 5.65 | 1.11 | % | |||||||||||||||||
Class C | $ | 1,000.00 | $ | 1,055.70 | $ | 9.64 | 1.86 | % | $ | 1,000.00 | $ | 1,015.83 | $ | 9.45 | 1.86 | % | |||||||||||||||||
Genesis Fund | |||||||||||||||||||||||||||||||||
Investor Class | $ | 1,000.00 | $ | 1,001.00 | $ | 5.09 | 1.01 | % | $ | 1,000.00 | $ | 1,020.11 | $ | 5.14 | 1.01 | % | |||||||||||||||||
Trust Class | $ | 1,000.00 | $ | 1,000.50 | $ | 5.55 | 1.10 | % | $ | 1,000.00 | $ | 1,019.66 | $ | 5.60 | 1.10 | % | |||||||||||||||||
Advisor Class | $ | 1,000.00 | $ | 999.10 | $ | 6.90 | 1.37 | % | $ | 1,000.00 | $ | 1,018.30 | $ | 6.97 | 1.37 | % | |||||||||||||||||
Institutional Class | $ | 1,000.00 | $ | 1,001.80 | $ | 4.29 | .85 | % | $ | 1,000.00 | $ | 1,020.92 | $ | 4.33 | .85 | % | |||||||||||||||||
Class R6 | $ | 1,000.00 | $ | 1,002.10 | $ | 3.94 | .78 | % | $ | 1,000.00 | $ | 1,021.27 | $ | 3.97 | .78 | % | |||||||||||||||||
Global Equity Fund | |||||||||||||||||||||||||||||||||
Institutional Class | $ | 1,000.00 | $ | 1,043.70 | $ | 5.92 | 1.15 | % | $ | 1,000.00 | $ | 1,019.41 | $ | 5.85 | 1.15 | % | |||||||||||||||||
Class A | $ | 1,000.00 | $ | 1,041.10 | $ | 7.77 | 1.51 | % | $ | 1,000.00 | $ | 1,017.59 | $ | 7.68 | 1.51 | % | |||||||||||||||||
Class C | $ | 1,000.00 | $ | 1,038.10 | $ | 11.61 | 2.26 | % | $ | 1,000.00 | $ | 1,013.81 | $ | 11.47 | 2.26 | % | |||||||||||||||||
Global Thematic Opportunities Fund | |||||||||||||||||||||||||||||||||
Institutional Class | $ | 1,000.00 | $ | 980.80 | $ | 6.24 | 1.25 | % | $ | 1,000.00 | $ | 1,018.90 | $ | 6.36 | 1.25 | % | |||||||||||||||||
Class A | $ | 1,000.00 | $ | 977.90 | $ | 8.03 | 1.61 | % | $ | 1,000.00 | $ | 1,017.09 | $ | 8.19 | 1.61 | % | |||||||||||||||||
Class C | $ | 1,000.00 | $ | 975.70 | $ | 11.75 | 2.36 | % | $ | 1,000.00 | $ | 1,013.31 | $ | 11.98 | 2.36 | % | |||||||||||||||||
Greater China Equity Fund | |||||||||||||||||||||||||||||||||
Institutional Class | $ | 1,000.00 | $ | 1,131.00 | $ | 8.11 | 1.51 | % | $ | 1,000.00 | $ | 1,017.59 | $ | 7.68 | 1.51 | % | |||||||||||||||||
Class A | $ | 1,000.00 | $ | 1,130.40 | $ | 9.99 | 1.86 | % | $ | 1,000.00 | $ | 1,015.83 | $ | 9.45 | 1.86 | % | |||||||||||||||||
Class C | $ | 1,000.00 | $ | 1,125.40 | $ | 14.04 | 2.62 | % | $ | 1,000.00 | $ | 1,012.00 | $ | 13.29 | 2.62 | % | |||||||||||||||||
Guardian Fund | |||||||||||||||||||||||||||||||||
Investor Class | $ | 1,000.00 | $ | 1,061.30 | $ | 4.57 | .88 | % | $ | 1,000.00 | $ | 1,020.77 | $ | 4.48 | .88 | % | |||||||||||||||||
Trust Class | $ | 1,000.00 | $ | 1,060.00 | $ | 5.50 | 1.06 | % | $ | 1,000.00 | $ | 1,019.86 | $ | 5.40 | 1.06 | % | |||||||||||||||||
Advisor Class | $ | 1,000.00 | $ | 1,058.50 | $ | 7.00 | 1.35 | % | $ | 1,000.00 | $ | 1,018.40 | $ | 6.87 | 1.35 | % | |||||||||||||||||
Institutional Class | $ | 1,000.00 | $ | 1,061.70 | $ | 3.69 | .71 | % | $ | 1,000.00 | $ | 1,021.63 | $ | 3.62 | .71 | % | |||||||||||||||||
Class A | $ | 1,000.00 | $ | 1,060.50 | $ | 5.61 | 1.08 | % | $ | 1,000.00 | $ | 1,019.76 | $ | 5.50 | 1.08 | % | |||||||||||||||||
Class C | $ | 1,000.00 | $ | 1,055.90 | $ | 9.64 | 1.86 | % | $ | 1,000.00 | $ | 1,015.83 | $ | 9.45 | 1.86 | % | |||||||||||||||||
Class R3 | $ | 1,000.00 | $ | 1,058.50 | $ | 7.06 | 1.36 | % | $ | 1,000.00 | $ | 1,018.35 | $ | 6.92 | 1.36 | % | |||||||||||||||||
72
Expense Information as of 8/31/14 (Unaudited) (cont'd)
ACTUAL | HYPOTHETICAL (5% ANNUAL RETURN BEFORE EXPENSES)(4) | ||||||||||||||||||||||||||||||||
| Beginning Account Value 3/1/14 | Ending Account Value 8/31/14 | Expenses Paid During the Period(1) 3/1/14 - 8/31/14 | Expense Ratio | Beginning Account Value 3/1/14 | Ending Account Value 8/31/14 | Expenses Paid During the Period(1) 3/1/14 - 8/31/14 | Expense Ratio | ||||||||||||||||||||||||||
International Equity Fund | |||||||||||||||||||||||||||||||||
Investor Class | $ | 1,000.00 | $ | 999.50 | $ | 5.34 | 1.06 | % | $ | 1,000.00 | $ | 1,019.86 | $ | 5.40 | 1.06 | % | |||||||||||||||||
Trust Class | $ | 1,000.00 | $ | 999.10 | $ | 5.74 | 1.14 | % | $ | 1,000.00 | $ | 1,019.46 | $ | 5.80 | 1.14 | % | |||||||||||||||||
Institutional Class | $ | 1,000.00 | $ | 1,000.90 | $ | 4.29 | .85 | % | $ | 1,000.00 | $ | 1,020.92 | $ | 4.33 | .85 | % | |||||||||||||||||
Class A | $ | 1,000.00 | $ | 998.70 | $ | 6.10 | 1.21 | % | $ | 1,000.00 | $ | 1,019.11 | $ | 6.16 | 1.21 | % | |||||||||||||||||
Class C | $ | 1,000.00 | $ | 994.70 | $ | 9.85 | 1.96 | % | $ | 1,000.00 | $ | 1,015.32 | $ | 9.96 | 1.96 | % | |||||||||||||||||
Class R6 | $ | 1,000.00 | $ | 1,000.90 | $ | 3.98 | .79 | % | $ | 1,000.00 | $ | 1,021.22 | $ | 4.02 | .79 | % | |||||||||||||||||
| International Select Fund(2) | |||||||||||||||||||||||||||||||||
Trust Class | $ | 1,000.00 | $ | 992.00 | $ | 6.28 | 1.25 | % | $ | 1,000.00 | $ | 1,018.90 | $ | 6.36 | 1.25 | % | |||||||||||||||||
Institutional Class | $ | 1,000.00 | $ | 993.80 | $ | 4.52 | .90 | % | $ | 1,000.00 | $ | 1,020.67 | $ | 4.58 | .90 | % | |||||||||||||||||
Class A | $ | 1,000.00 | $ | 992.90 | $ | 6.23 | 1.24 | % | $ | 1,000.00 | $ | 1,018.95 | $ | 6.31 | 1.24 | % | |||||||||||||||||
Class C | $ | 1,000.00 | $ | 988.30 | $ | 10.02 | 2.00 | % | $ | 1,000.00 | $ | 1,015.12 | $ | 10.16 | 2.00 | % | |||||||||||||||||
Class R3 | $ | 1,000.00 | $ | 991.00 | $ | 7.58 | 1.51 | % | $ | 1,000.00 | $ | 1,017.59 | $ | 7.68 | 1.51 | % | |||||||||||||||||
Intrinsic Value Fund | |||||||||||||||||||||||||||||||||
Institutional Class | $ | 1,000.00 | $ | 1,017.70 | $ | 5.09 | 1.00 | % | $ | 1,000.00 | $ | 1,020.16 | $ | 5.09 | 1.00 | % | |||||||||||||||||
Class A | $ | 1,000.00 | $ | 1,015.80 | $ | 6.91 | 1.36 | % | $ | 1,000.00 | $ | 1,018.35 | $ | 6.92 | 1.36 | % | |||||||||||||||||
Class C | $ | 1,000.00 | $ | 1,012.00 | $ | 10.70 | 2.11 | % | $ | 1,000.00 | $ | 1,014.57 | $ | 10.71 | 2.11 | % | |||||||||||||||||
Large Cap Disciplined Growth Fund | |||||||||||||||||||||||||||||||||
Investor Class | $ | 1,000.00 | $ | 1,051.80 | $ | 5.64 | 1.09 | % | $ | 1,000.00 | $ | 1,019.71 | $ | 5.55 | 1.09 | % | |||||||||||||||||
Institutional Class | $ | 1,000.00 | $ | 1,054.10 | $ | 3.88 | .75 | % | $ | 1,000.00 | $ | 1,021.42 | $ | 3.82 | .75 | % | |||||||||||||||||
Class A | $ | 1,000.00 | $ | 1,053.10 | $ | 5.74 | 1.11 | % | $ | 1,000.00 | $ | 1,019.61 | $ | 5.65 | 1.11 | % | |||||||||||||||||
Class C | $ | 1,000.00 | $ | 1,048.30 | $ | 9.60 | 1.86 | % | $ | 1,000.00 | $ | 1,015.83 | $ | 9.45 | 1.86 | % | |||||||||||||||||
Class R3 | $ | 1,000.00 | $ | 1,050.80 | $ | 7.03 | 1.36 | % | $ | 1,000.00 | $ | 1,018.35 | $ | 6.92 | 1.36 | % | |||||||||||||||||
Large Cap Value Fund | |||||||||||||||||||||||||||||||||
Investor Class | $ | 1,000.00 | $ | 1,075.10 | $ | 4.45 | .85 | % | $ | 1,000.00 | $ | 1,020.92 | $ | 4.33 | .85 | % | |||||||||||||||||
Trust Class | $ | 1,000.00 | $ | 1,074.00 | $ | 5.49 | 1.05 | % | $ | 1,000.00 | $ | 1,019.91 | $ | 5.35 | 1.05 | % | |||||||||||||||||
Advisor Class | $ | 1,000.00 | $ | 1,073.10 | $ | 6.22 | 1.19 | % | $ | 1,000.00 | $ | 1,019.21 | $ | 6.06 | 1.19 | % | |||||||||||||||||
Institutional Class | $ | 1,000.00 | $ | 1,075.70 | $ | 3.66 | .70 | % | $ | 1,000.00 | $ | 1,021.68 | $ | 3.57 | .70 | % | |||||||||||||||||
Class A | $ | 1,000.00 | $ | 1,073.90 | $ | 5.59 | 1.07 | % | $ | 1,000.00 | $ | 1,019.81 | $ | 5.45 | 1.07 | % | |||||||||||||||||
Class C | $ | 1,000.00 | $ | 1,070.00 | $ | 9.70 | 1.86 | % | $ | 1,000.00 | $ | 1,015.83 | $ | 9.45 | 1.86 | % | |||||||||||||||||
Class R3 | $ | 1,000.00 | $ | 1,072.30 | $ | 7.10 | 1.36 | % | $ | 1,000.00 | $ | 1,018.35 | $ | 6.92 | 1.36 | % | |||||||||||||||||
Mid Cap Growth Fund | |||||||||||||||||||||||||||||||||
Investor Class | $ | 1,000.00 | $ | 1,000.00 | $ | 4.69 | .93 | % | $ | 1,000.00 | $ | 1,020.52 | $ | 4.74 | .93 | % | |||||||||||||||||
Trust Class | $ | 1,000.00 | $ | 999.60 | $ | 5.04 | 1.00 | % | $ | 1,000.00 | $ | 1,020.16 | $ | 5.09 | 1.00 | % | |||||||||||||||||
Advisor Class | $ | 1,000.00 | $ | 998.30 | $ | 6.35 | 1.26 | % | $ | 1,000.00 | $ | 1,018.85 | $ | 6.41 | 1.26 | % | |||||||||||||||||
Institutional Class | $ | 1,000.00 | $ | 1,000.70 | $ | 3.78 | .75 | % | $ | 1,000.00 | $ | 1,021.42 | $ | 3.82 | .75 | % | |||||||||||||||||
Class A | $ | 1,000.00 | $ | 999.10 | $ | 5.59 | 1.11 | % | $ | 1,000.00 | $ | 1,019.61 | $ | 5.65 | 1.11 | % | |||||||||||||||||
Class C | $ | 1,000.00 | $ | 995.30 | $ | 9.35 | 1.86 | % | $ | 1,000.00 | $ | 1,015.83 | $ | 9.45 | 1.86 | % | |||||||||||||||||
Class R3 | $ | 1,000.00 | $ | 997.50 | $ | 6.85 | 1.36 | % | $ | 1,000.00 | $ | 1,018.35 | $ | 6.92 | 1.36 | % | |||||||||||||||||
Class R6 | $ | 1,000.00 | $ | 1,001.30 | $ | 3.43 | .68 | % | $ | 1,000.00 | $ | 1,021.78 | $ | 3.47 | .68 | % | |||||||||||||||||
Mid Cap Intrinsic Value Fund | |||||||||||||||||||||||||||||||||
Investor Class | $ | 1,000.00 | $ | 1,081.70 | $ | 5.19 | .99 | % | $ | 1,000.00 | $ | 1,020.21 | $ | 5.04 | .99 | % | |||||||||||||||||
Trust Class | $ | 1,000.00 | $ | 1,079.50 | $ | 6.55 | 1.25 | % | $ | 1,000.00 | $ | 1,018.90 | $ | 6.36 | 1.25 | % | |||||||||||||||||
Institutional Class | $ | 1,000.00 | $ | 1,082.10 | $ | 4.46 | .85 | % | $ | 1,000.00 | $ | 1,020.92 | $ | 4.33 | .85 | % | |||||||||||||||||
Class A | $ | 1,000.00 | $ | 1,080.60 | $ | 6.35 | 1.21 | % | $ | 1,000.00 | $ | 1,019.11 | $ | 6.16 | 1.21 | % | |||||||||||||||||
Class C | $ | 1,000.00 | $ | 1,076.40 | $ | 10.26 | 1.96 | % | $ | 1,000.00 | $ | 1,015.32 | $ | 9.96 | 1.96 | % | |||||||||||||||||
Class R3 | $ | 1,000.00 | $ | 1,078.90 | $ | 7.65 | 1.46 | % | $ | 1,000.00 | $ | 1,017.85 | $ | 7.43 | 1.46 | % | |||||||||||||||||
Multi-Cap Opportunities Fund | |||||||||||||||||||||||||||||||||
Institutional Class | $ | 1,000.00 | $ | 1,064.10 | $ | 3.80 | .73 | % | $ | 1,000.00 | $ | 1,021.53 | $ | 3.72 | .73 | % | |||||||||||||||||
Class A | $ | 1,000.00 | $ | 1,061.90 | $ | 5.72 | 1.10 | % | $ | 1,000.00 | $ | 1,019.66 | $ | 5.60 | 1.10 | % | |||||||||||||||||
Class C | $ | 1,000.00 | $ | 1,057.90 | $ | 9.60 | 1.85 | % | $ | 1,000.00 | $ | 1,015.88 | $ | 9.40 | 1.85 | % | |||||||||||||||||
73
Expense Information as of 8/31/14 (Unaudited) (cont'd)
ACTUAL | HYPOTHETICAL (5% ANNUAL RETURN BEFORE EXPENSES)(4) | ||||||||||||||||||||||||||||||||
| Beginning Account Value 3/1/14 | Ending Account Value 8/31/14 | Expenses Paid During the Period(1) 3/1/14 - 8/31/14 | Expense Ratio | Beginning Account Value 3/1/14 | Ending Account Value 8/31/14 | Expenses Paid During the Period(1) 3/1/14 - 8/31/14 | Expense Ratio | ||||||||||||||||||||||||||
Real Estate Fund | |||||||||||||||||||||||||||||||||
Trust Class | $ | 1,000.00 | $ | 1,106.00 | $ | 5.52 | 1.04 | % | $ | 1,000.00 | $ | 1,019.96 | $ | 5.30 | 1.04 | % | |||||||||||||||||
Institutional Class | $ | 1,000.00 | $ | 1,106.70 | $ | 4.51 | .85 | % | $ | 1,000.00 | $ | 1,020.92 | $ | 4.33 | .85 | % | |||||||||||||||||
Class A | $ | 1,000.00 | $ | 1,104.30 | $ | 6.42 | 1.21 | % | $ | 1,000.00 | $ | 1,019.11 | $ | 6.16 | 1.21 | % | |||||||||||||||||
Class C | $ | 1,000.00 | $ | 1,100.20 | $ | 10.38 | 1.96 | % | $ | 1,000.00 | $ | 1,015.32 | $ | 9.96 | 1.96 | % | |||||||||||||||||
Class R3 | $ | 1,000.00 | $ | 1,103.90 | $ | 7.74 | 1.46 | % | $ | 1,000.00 | $ | 1,017.85 | $ | 7.43 | 1.46 | % | |||||||||||||||||
Class R6 | $ | 1,000.00 | $ | 1,107.10 | $ | 4.14 | .78 | % | $ | 1,000.00 | $ | 1,021.27 | $ | 3.97 | .78 | % | |||||||||||||||||
Small Cap Growth Fund | |||||||||||||||||||||||||||||||||
Investor Class | $ | 1,000.00 | $ | 922.40 | $ | 5.86 | 1.21 | % | $ | 1,000.00 | $ | 1,019.11 | $ | 6.16 | 1.21 | % | |||||||||||||||||
Trust Class | $ | 1,000.00 | $ | 921.60 | $ | 6.78 | 1.40 | % | $ | 1,000.00 | $ | 1,018.15 | $ | 7.12 | 1.40 | % | |||||||||||||||||
Advisor Class | $ | 1,000.00 | $ | 921.20 | $ | 7.31 | 1.51 | % | $ | 1,000.00 | $ | 1,017.59 | $ | 7.68 | 1.51 | % | |||||||||||||||||
Institutional Class | $ | 1,000.00 | $ | 923.60 | $ | 4.36 | .90 | % | $ | 1,000.00 | $ | 1,020.67 | $ | 4.58 | .90 | % | |||||||||||||||||
Class A | $ | 1,000.00 | $ | 922.00 | $ | 6.10 | 1.26 | % | $ | 1,000.00 | $ | 1,018.85 | $ | 6.41 | 1.26 | % | |||||||||||||||||
Class C | $ | 1,000.00 | $ | 918.50 | $ | 9.72 | 2.01 | % | $ | 1,000.00 | $ | 1,015.07 | $ | 10.21 | 2.01 | % | |||||||||||||||||
Class R3 | $ | 1,000.00 | $ | 920.90 | $ | 7.31 | 1.51 | % | $ | 1,000.00 | $ | 1,017.59 | $ | 7.68 | 1.51 | % | |||||||||||||||||
Socially Responsive Fund | |||||||||||||||||||||||||||||||||
Investor Class | $ | 1,000.00 | $ | 1,056.00 | $ | 4.46 | .86 | % | $ | 1,000.00 | $ | 1,020.87 | $ | 4.38 | .86 | % | |||||||||||||||||
Trust Class | $ | 1,000.00 | $ | 1,054.80 | $ | 5.33 | 1.03 | % | $ | 1,000.00 | $ | 1,020.01 | $ | 5.24 | 1.03 | % | |||||||||||||||||
Institutional Class | $ | 1,000.00 | $ | 1,056.80 | $ | 3.53 | .68 | % | $ | 1,000.00 | $ | 1,021.78 | $ | 3.47 | .68 | % | |||||||||||||||||
Class A | $ | 1,000.00 | $ | 1,054.80 | $ | 5.44 | 1.05 | % | $ | 1,000.00 | $ | 1,019.91 | $ | 5.35 | 1.05 | % | |||||||||||||||||
Class C | $ | 1,000.00 | $ | 1,051.30 | $ | 9.31 | 1.80 | % | $ | 1,000.00 | $ | 1,016.13 | $ | 9.15 | 1.80 | % | |||||||||||||||||
Class R3 | $ | 1,000.00 | $ | 1,053.90 | $ | 6.68 | 1.29 | % | $ | 1,000.00 | $ | 1,018.70 | $ | 6.56 | 1.29 | % | |||||||||||||||||
Class R6 | $ | 1,000.00 | $ | 1,057.70 | $ | 3.11 | .60 | % | $ | 1,000.00 | $ | 1,022.18 | $ | 3.06 | .60 | % | |||||||||||||||||
Value Fund | |||||||||||||||||||||||||||||||||
Institutional Class | $ | 1,000.00 | $ | 1,070.70 | $ | 3.65 | .70 | % | $ | 1,000.00 | $ | 1,021.68 | $ | 3.57 | .70 | % | |||||||||||||||||
Class A | $ | 1,000.00 | $ | 1,067.70 | $ | 5.68 | 1.09 | % | $ | 1,000.00 | $ | 1,019.71 | $ | 5.55 | 1.09 | % | |||||||||||||||||
Class C | $ | 1,000.00 | $ | 1,064.50 | $ | 9.68 | 1.86 | % | $ | 1,000.00 | $ | 1,015.83 | $ | 9.45 | 1.86 | % | |||||||||||||||||
(1) For each class, expenses are equal to the annualized expense ratio for the class, multiplied by the average account value over the period, multiplied by 184/365 (to reflect the one-half year period shown), unless otherwise indicated.
(2) Effective June 2, 2014. Formerly, International Large Cap Fund through June 1, 2014.
(3) Effective September 2, 2014. Formerly, Select Equities Fund through September 1, 2014.
(4) Hypothetical 5% annual return before expenses is calculated by multiplying the number of days in the most recent period divided by 365.
74
Schedule of Investments All Cap Core Fundb
TOP TEN EQUITY HOLDINGS
1 | American Tower Corp. | 6.7 | % | ||||||||
2 | Invesco Ltd. | 5.4 | % | ||||||||
3 | Calpine Corp. | 5.3 | % | ||||||||
4 | Intuit, Inc. | 5.1 | % | ||||||||
5 | Nielsen NV | 5.0 | % | ||||||||
6 | Cooper Cos., Inc. | 4.2 | % | ||||||||
7 | BlackRock, Inc. | 4.2 | % | ||||||||
8 | IHS, Inc. Class A | 4.1 | % | ||||||||
9 | Delphi Automotive PLC | 4.0 | % | ||||||||
10 | Enbridge Energy Management LLC | 4.0 | % | ||||||||
Number of Shares | Value† (000's)z | ||||||||||
Common Stocks (89.7%) | |||||||||||
Aerospace & Defense (3.4%) | |||||||||||
Boeing Co. | 26,703 | $ | 3,386 | ||||||||
Auto Components (6.8%) | |||||||||||
BorgWarner, Inc. | 44,906 | 2,793 | |||||||||
| Delphi Automotive PLC | 58,505 | 4,071 | |||||||||
6,864 | |||||||||||
Automobiles (2.7%) | |||||||||||
| General Motors Co. | 79,445 | 2,765 | |||||||||
Capital Markets (9.7%) | |||||||||||
BlackRock, Inc. | 12,797 | 4,230 | |||||||||
Invesco Ltd. | 134,024 | 5,473 | |||||||||
9,703 | |||||||||||
Health Care Equipment & Supplies (4.2%) | |||||||||||
Cooper Cos., Inc. | 26,095 | 4,254 | |||||||||
Independent Power and Renewable Electricity Producers (5.3%) | |||||||||||
Calpine Corp.* | 222,814 | 5,296 | |||||||||
Internet & Catalog Retail (3.6%) | |||||||||||
| Amazon.com, Inc.* | 10,815 | 3,667 | |||||||||
Internet Software & Services (3.1%) | |||||||||||
eBay, Inc.* | 55,461 | 3,078 | |||||||||
IT Services (3.5%) | |||||||||||
Visa, Inc. Class A | 16,442 | 3,494 | |||||||||
Media (4.2%) | |||||||||||
| Tribune Media Co. Class A* | 52,224 | 3,985 | |||||||||
| Tribune Publishing Co.* | 13,056 | 250 | |||||||||
4,235 | |||||||||||
Oil, Gas & Consumable Fuels (13.4%) | |||||||||||
| Antero Resources Corp.* | 49,421 | 2,859 | |||||||||
| Enbridge Energy Management LLC* | 112,381 | 4,026 | |||||||||
| Pioneer Natural Resources Co. | 14,641 | 3,055 | |||||||||
| Range Resources Corp. | 45,312 | 3,561 | |||||||||
13,501 | |||||||||||
Number of Shares | Value† (000's)z | ||||||||||
Professional Services (12.8%) | |||||||||||
IHS, Inc. Class A* | 29,241 | $ | 4,166 | ||||||||
Nielsen NV | 106,414 | 5,000 | |||||||||
| Verisk Analytics, Inc. Class A* | 57,527 | 3,693 | |||||||||
12,859 | |||||||||||
Real Estate Investment Trusts (6.7%) | |||||||||||
| American Tower Corp. | 68,158 | 6,721 | |||||||||
Road & Rail (2.3%) | |||||||||||
| Kansas City Southern | 20,217 | 2,332 | |||||||||
Software (5.1%) | |||||||||||
Intuit, Inc. | 61,088 | 5,081 | |||||||||
Trading Companies & Distributors (2.9%) | |||||||||||
| United Rentals, Inc.* | 25,101 | 2,953 | |||||||||
| Total Common Stocks (Cost $73,269) | 90,189 | ||||||||||
Short-Term Investments (10.3%) | |||||||||||
| State Street Institutional Treasury Money Market Fund Premier Class (Cost $10,350) | 10,350,409 | 10,350 | |||||||||
| Total Investments## (100.0%) (Cost $83,619) | 100,539 | ||||||||||
| Liabilities, less cash, receivables and other assets [(0.0%)] | (6 | ) | |||||||||
Total Net Assets (100.0%) | $ | 100,533 | |||||||||
See Notes to Schedule of Investments
75
Schedule of Investments Emerging Markets Equity Fund
TOP TEN EQUITY HOLDINGS
Country | Industry | ||||||||||||||||||
1 | Samsung Electronics Co. Ltd. | Korea | Semiconductors & Semiconductor Equipment | 3.2 | % | ||||||||||||||
2 | Tencent Holdings Ltd. | China | Internet Software & Services | 2.6 | % | ||||||||||||||
3 | Hyundai Motor Co. | Korea | Automobiles | 2.3 | % | ||||||||||||||
4 | Coway Co. Ltd. | Korea | Household Durables | 1.9 | % | ||||||||||||||
5 | Taiwan Semiconductor Manufacturing Co. Ltd. | Taiwan, Province of China | Semiconductors & Semiconductor Equipment | 1.9 | % | ||||||||||||||
6 | China Everbright International Ltd. | China | Commercial Services & Supplies | 1.7 | % | ||||||||||||||
7 | Haier Electronics Group Co. Ltd. | China | Household Durables | 1.7 | % | ||||||||||||||
8 | Vale SA ADR, Preference Shares | Brazil | Metals & Mining | 1.6 | % | ||||||||||||||
9 | Industries Qatar QSC | Qatar | Industrial Conglomerates | 1.6 | % | ||||||||||||||
10 | AMBEV SA ADR | Brazil | Beverages | 1.5 | % | ||||||||||||||
Number of Shares | Value† (000's)z | ||||||||||
Common Stocks (97.0%) | |||||||||||
Brazil (10.7%) | |||||||||||
AMBEV SA ADR | 1,307,800 | $ | 9,534 | ||||||||
| Banco do Estado do Rio Grande do Sul SA Class B, Preference Shares | 558,600 | 3,855 | |||||||||
| BB Seguridade Participacoes SA | 492,800 | 7,868 | |||||||||
| BM&FBOVESPA SA | 1,391,900 | 8,394 | |||||||||
| BR Malls Participacoes SA | 679,100 | 7,060 | |||||||||
| Brasil Insurance Participacoes E Administracao SA | 579,500 | 2,068 | |||||||||
CCR SA | 72,700 | 670 | |||||||||
Cielo SA | 166,100 | 3,114 | |||||||||
| Itau Unibanco Holding SA, Preference Shares | 279,300 | 5,036 | |||||||||
Qualicorp SA* | 460,100 | 5,755 | |||||||||
Totvs SA | 198,525 | 3,624 | |||||||||
| Vale SA ADR, Preference Shares | 869,225 | 10,126 | |||||||||
67,104 | |||||||||||
Chile (0.4%) | |||||||||||
SACI Falabella | 317,490 | 2,392 | |||||||||
China (21.8%) | |||||||||||
| AAC Technologies Holdings, Inc. | 814,800 | 5,309 | |||||||||
| Agricultural Bank of China Ltd., H Shares | 19,254,600 | 8,919 | |||||||||
Baidu, Inc. ADR* | 27,300 | 5,856 | |||||||||
| Bolina Holding Co. Ltd. | 6,096,700 | 2,368 | |||||||||
| Changyou.com Ltd. ADR* | 175,800 | 4,230 | |||||||||
Number of Shares | Value† (000's)z | ||||||||||
| China Child Care Corp. Ltd. | 7,623,300 | $ | 2,076 | ||||||||
| China Everbright International Ltd. | 7,912,200 | 10,842 | |||||||||
| China Lesso Group Holdings Ltd. | 1,071,600 | 614 | |||||||||
| China Medical System Holdings Ltd. | 3,878,200 | 5,615 | |||||||||
| China Mengniu Dairy Co. Ltd. | 1,485,140 | 6,880 | |||||||||
| China State Construction International Holdings Ltd. | 3,256,400 | 5,252 | |||||||||
| China Vanke Co. Ltd., H Shares* | 4,339,023 | 8,129 | |||||||||
CNOOC Ltd. | 4,576,000 | 9,187 | |||||||||
| Haier Electronics Group Co. Ltd. | 3,653,800 | 10,490 | |||||||||
| Industrial & Commercial Bank of China Ltd., H Shares | 12,946,900 | 8,587 | |||||||||
| New Oriental Education & Technology Group, Inc. ADR | 195,900 | 4,468 | |||||||||
| PICC Property & Casualty Co. Ltd., H Shares | 2,999,200 | 4,969 | |||||||||
| Sinopec Engineering Group Co. Ltd., H Shares | 4,872,800 | 5,533 | |||||||||
| Sunny Optical Technology Group Co. Ltd. | 6,007,400 | 8,139 | |||||||||
| Tencent Holdings Ltd. | 985,100 | 16,079 | |||||||||
| Zhuzhou CSR Times Electric Co. Ltd., H Shares | 914,900 | 3,164 | |||||||||
136,706 | |||||||||||
Number of Shares | Value† (000's)z | ||||||||||
Czech Republic (0.8%) | |||||||||||
| Komercni Banka A/S | 21,400 | $ | 4,968 | ||||||||
India (11.1%) | |||||||||||
Bank of Baroda | 413,200 | 5,960 | |||||||||
| Cummins India Ltd. | 653,645 | 7,499 | |||||||||
Dabur India Ltd. | 1,531,554 | 5,848 | |||||||||
| Glenmark Pharmaceuticals Ltd. | 400,370 | 4,735 | |||||||||
ITC Ltd. | 657,505 | 3,858 | |||||||||
| Jubilant Foodworks Ltd.* | 190,266 | 4,040 | |||||||||
| Larsen & Toubro Ltd. | 263,427 | 6,671 | |||||||||
| Mahindra & Mahindra Ltd. | 263,215 | 6,114 | |||||||||
| Power Grid Corp. of India Ltd. | 2,873,079 | 6,111 | |||||||||
| Prestige Estates Projects Ltd.* | 1,083,500 | 3,993 | |||||||||
| Reliance Industries Ltd. | 177,515 | 2,932 | |||||||||
| Tata Global Beverages Ltd. | 1,835,105 | 4,576 | |||||||||
Yes Bank Ltd. | 730,153 | 6,878 | |||||||||
69,215 | |||||||||||
Indonesia (3.6%) | |||||||||||
| PT AKR Corporindo Tbk | 13,043,600 | 5,854 | |||||||||
| PT Gudang Garam Tbk | 978,900 | 4,519 | |||||||||
| PT Matahari Department Store Tbk | 3,725,700 | 5,184 | |||||||||
| PT Semen Indonesia (Persero) Tbk | 4,628,800 | 6,420 | |||||||||
| PT Wijaya Karya (Persero) Tbk | 3,454,700 | 848 | |||||||||
22,825 | |||||||||||
See Notes to Schedule of Investments
76
Number of Shares | Value† (000's)z | ||||||||||
Korea (10.9%) | |||||||||||
Coway Co. Ltd. | 142,820 | $ | 11,987 | ||||||||
| Hankook Tire Co. Ltd. | 16,090 | 835 | |||||||||
| Hyundai Motor Co. | 63,375 | 14,563 | |||||||||
| Lock & Lock Co. Ltd. | 49,949 | 593 | |||||||||
NCSoft Corp. | 42,985 | 6,147 | |||||||||
| Samsung Electronics Co. Ltd. | 16,398 | 19,957 | |||||||||
| Samsung Engineering Co. Ltd.* | 101,158 | 6,375 | |||||||||
| SFA Engineering Corp. | 111,837 | 4,853 | |||||||||
| Sung Kwang Bend Co. Ltd. | 183,762 | 3,181 | |||||||||
68,491 | |||||||||||
Luxembourg (0.5%) | |||||||||||
Tenaris SA ADR | 68,400 | 3,030 | |||||||||
Malaysia (2.8%) | |||||||||||
| Axiata Group Berhad | 3,524,700 | 7,749 | |||||||||
| Malayan Banking Berhad | 1,585,000 | 5,079 | |||||||||
| Top Glove Corp. Berhad | 2,881,500 | 4,379 | |||||||||
17,207 | |||||||||||
Mexico (5.4%) | |||||||||||
| Arca Continental SAB de CV | 809,700 | 5,944 | |||||||||
| Corp. Inmobiliaria Vesta SAB de CV | 2,355,500 | 5,121 | |||||||||
| Fibra Uno Administracion SA de CV | 1,584,300 | 5,708 | |||||||||
| Grupo Financiero Banorte SAB de CV, O Shares | 953,800 | 6,724 | |||||||||
| Grupo Mexico SAB de CV Series B | 1,320,600 | 4,812 | |||||||||
| Kimberly-Clark de Mexico SAB de CV Class A | 2,010,400 | 5,398 | |||||||||
33,707 | |||||||||||
Nigeria (0.5%) | |||||||||||
Afren PLC* | 1,979,330 | 3,204 | |||||||||
Peru (1.3%) | |||||||||||
Credicorp Ltd. | 54,100 | 8,389 | |||||||||
Philippines (2.8%) | |||||||||||
Ayala Corp. | 336,250 | 5,402 | |||||||||
| International Container Terminal Services, Inc. | 2,255,880 | 5,841 | |||||||||
Number of Shares | Value† (000's)z | ||||||||||
RFM Corp. | 16,007,300 | $ | 1,799 | ||||||||
| SM Investments Corp. | 240,290 | 4,255 | |||||||||
17,297 | |||||||||||
Qatar (1.6%) | |||||||||||
Industries Qatar | 182,133 | 9,703 QSC | |||||||||
Russia (4.0%) | |||||||||||
| Eurasia Drilling Co. Ltd. GDR | 116,300 | 3,359 | |||||||||
| Magnit OJSC^^ | 33,400 | 8,212 | |||||||||
QIWI PLC ADR | 115,400 | 4,303 | |||||||||
| Sberbank of Russia^^ | 2,435,835 | 4,818 | |||||||||
| Yandex NV Class A* | 146,800 | 4,173 | |||||||||
24,865 | |||||||||||
Singapore (1.0%) | |||||||||||
| Asian Pay Television Trust | 8,714,702 | 6,244 | |||||||||
South Africa (5.7%) | |||||||||||
| Alexander Forbes Group Holdings Ltd.* | 4,695,100 | 3,997 | |||||||||
| Alexander Forbes Ltd., Preference Shares* | 2,088,100 | 1,938 | |||||||||
| Bidvest Group Ltd. | 229,113 | 6,043 | |||||||||
| Life Healthcare Group Holdings Ltd. | 1,729,045 | 7,259 | |||||||||
MTN Group Ltd. | 305,689 | 6,908 | |||||||||
Sasol Ltd. | 78,900 | 4,574 | |||||||||
| Shoprite Holdings Ltd. | 357,960 | 4,948 | |||||||||
35,667 | |||||||||||
Taiwan, Province of China (5.5%) | |||||||||||
| China Steel Chemical Corp. | 579,400 | 3,644 | |||||||||
| eMemory Technology, Inc. | 471,000 | 4,491 | |||||||||
| Hermes Microvision, Inc. | 140,440 | 6,038 | |||||||||
MediaTek, Inc. | 518,100 | 8,658 | |||||||||
| Taiwan Semiconductor Manufacturing Co. Ltd. | 2,848,739 | 11,818 | |||||||||
34,649 | |||||||||||
Thailand (1.5%) | |||||||||||
| Bangkok Dusit Medical Services PCL^^ | 6,922,800 | 4,226 | |||||||||
| CP ALL PCL | ^^ | 3,348,600 | 4,980 | ||||||||
9,206 | |||||||||||
Number of Shares | Value† (000's)z | ||||||||||
Turkey (1.9%) | |||||||||||
Arcelik A/S | 732,840 | $ | 4,391 | ||||||||
| Emlak Konut Gayrimenkul Yatirim Ortakligi A/S | 4,015,065 | 5,052 | |||||||||
| Turkiye Garanti Bankasi A/S | 686,365 | 2,690 | |||||||||
12,133 | |||||||||||
United Arab Emirates (1.0%) | |||||||||||
Dragon Oil PLC | 629,325 | 6,269 | |||||||||
United Kingdom (2.2%) | |||||||||||
| Hikma Pharmaceuticals PLC | 207,490 | 5,949 | |||||||||
SABMiller PLC | 142,395 | 7,794 | |||||||||
13,743 | |||||||||||
| Total Common Stocks (Cost $538,663) | 607,014 | ||||||||||
Short-Term Investments (2.5%) | |||||||||||
| State Street Institutional Treasury Money Market Fund Premier Class (Cost $15,786) | 15,786,492 | 15,786 | |||||||||
| Total Investments## (99.5%) (Cost $554,449) | 622,800 | ||||||||||
| Cash, receivables and other assets, less liabilities (0.5%) | 3,416 | ||||||||||
Total Net Assets (100.0%) | $ | 626,216 | |||||||||
See Notes to Schedule of Investments
77
SUMMARY SCHEDULE OF INVESTMENTS BY INDUSTRY EMERGING MARKETS EQUITY FUND
Industry | Investments at Value† (000's omitted) | Percentage of Net Assets | |||||||||
Banks | $ | 71,903 | 11.5 | % | |||||||
Semiconductors & Semiconductor Equipment | 50,962 | 8.1 | % | ||||||||
Household Durables | 26,868 | 4.3 | % | ||||||||
Oil, Gas & Consumable Fuels | 26,166 | 4.2 | % | ||||||||
Internet Software & Services | 26,108 | 4.2 | % | ||||||||
Construction & Engineering | 24,679 | 4.0 | % | ||||||||
Real Estate Management & Development | 24,303 | 3.9 | % | ||||||||
Beverages | 23,272 | 3.7 | % | ||||||||
Automobiles | 20,677 | 3.3 | % | ||||||||
Industrial Conglomerates | 20,001 | 3.2 | % | ||||||||
Diversified Financial Services | 19,731 | 3.2 | % | ||||||||
Electronic Equipment, Instruments & Components | 18,301 | 2.9 | % | ||||||||
Food & Staples Retailing | 18,140 | 2.9 | % | ||||||||
Health Care Providers & Services | 17,240 | 2.8 | % | ||||||||
Pharmaceuticals | 16,299 | 2.6 | % | ||||||||
Metals & Mining | 14,938 | 2.4 | % | ||||||||
Insurance | 14,905 | 2.4 | % | ||||||||
Wireless Telecommunication Services | 14,657 | 2.3 | % | ||||||||
Software | 14,001 | 2.2 | % | ||||||||
Food Products | 13,255 | 2.1 | % | ||||||||
Commercial Services & Supplies | 10,842 | 1.7 | % | ||||||||
Real Estate Investment Trusts | 10,760 | 1.7 | % | ||||||||
Tobacco | 8,377 | 1.3 | % | ||||||||
Personal Products | 7,924 | 1.3 | % | ||||||||
Multiline Retail | 7,576 | 1.2 | % | ||||||||
Machinery | 7,499 | 1.2 | % | ||||||||
IT Services | 7,417 | 1.2 | % | ||||||||
Transportation Infrastructure | 6,511 | 1.0 | % | ||||||||
Construction Materials | 6,420 | 1.0 | % | ||||||||
Energy Equipment & Services | 6,389 | 1.0 | % | ||||||||
Media | 6,244 | 1.0 | % | ||||||||
Building Products | 6,163 | 1.0 | % | ||||||||
Electric Utilities | 6,111 | 1.0 | % | ||||||||
Trading Companies & Distributors | 5,854 | 0.9 | % | ||||||||
Household Products | 5,398 | 0.9 | % | ||||||||
Diversified Consumer Services | 4,468 | 0.7 | % | ||||||||
Health Care Equipment & Supplies | 4,379 | 0.7 | % | ||||||||
Hotels, Restaurants & Leisure | 4,040 | 0.7 | % | ||||||||
Chemicals | 3,644 | 0.6 | % | ||||||||
Electrical Equipment | 3,164 | 0.5 | % | ||||||||
Auto Components | 835 | 0.1 | % | ||||||||
Containers & Packaging | 593 | 0.1 | % | ||||||||
Short-Term Investments and Other Assets—Net | 19,202 | 3.0 | % | ||||||||
$ | 626,216 | 100.0 | % | ||||||||
See Notes to Schedule of Investments
78
Schedule of Investments Equity Income Fund
TOP TEN EQUITY HOLDINGS
1 | NextEra Energy, Inc. | 2.6 | % | ||||||||
2 | Prologis, Inc. | 2.6 | % | ||||||||
3 | Wells Fargo & Co. | 2.5 | % | ||||||||
4 | Novartis AG ADR | 2.3 | % | ||||||||
5 | Equity Residential | 2.3 | % | ||||||||
6 | Singapore Telecommunications Ltd. | 2.3 | % | ||||||||
7 | Ventas, Inc. | 2.3 | % | ||||||||
8 | Dominion Resources, Inc. | 2.2 | % | ||||||||
9 | Johnson & Johnson | 2.2 | % | ||||||||
10 | Microsoft Corp. | 2.1 | % | ||||||||
Number of Shares | Value† (000's)z | ||||||||||
Common Stocks (95.5%) | |||||||||||
Aerospace & Defense (2.7%) | |||||||||||
| General Dynamics Corp.@ | 325,000 | $ | 40,057 | ||||||||
| Honeywell International, Inc. | 275,000 | 26,188 | |||||||||
66,245 | |||||||||||
Banks (7.8%) | |||||||||||
| JPMorgan Chase & Co.@ | 800,000 | 47,560 | |||||||||
M&T Bank Corp. | 314,000 | 38,820 | |||||||||
| PNC Financial Services Group, Inc. | 545,000 | 46,189 | |||||||||
| Wells Fargo & Co. | 1,200,000 | 61,728 | |||||||||
194,297 | |||||||||||
Capital Markets (3.7%) | |||||||||||
BlackRock, Inc. | 52,000 | 17,187 | |||||||||
| Blackstone Group LP | 817,000 | 27,394 | |||||||||
| FS Investment Corp. | 905,681 | 9,510 | |||||||||
KKR & Co. LP | 1,610,000 | 37,819 | |||||||||
91,910 | |||||||||||
Chemicals (1.7%) | |||||||||||
| E.I. du Pont de Nemours & Co. | 634,000 | 41,914 | |||||||||
Diversified Financial Services (1.6%) | |||||||||||
CME Group, Inc. | 514,000 | 39,347 | |||||||||
Diversified Telecommunication Services (2.3%) | |||||||||||
| Singapore Telecommunications Ltd. | 18,500,000 | 57,616 | |||||||||
Electric Utilities (4.1%) | |||||||||||
| Great Plains Energy, Inc. | 470,000 | 12,065 | |||||||||
| NextEra Energy, Inc. | 660,000 | 64,977 | |||||||||
OGE Energy Corp. | 651,000 | 24,425 | |||||||||
101,467 | |||||||||||
Food & Staples Retailing (0.5%) | |||||||||||
Wesfarmers Ltd. | 317,000 | 12,822 | |||||||||
Number of Shares | Value† (000's)z | ||||||||||
Gas Utilities (0.5%) | |||||||||||
| Infraestructura Energetica Nova SAB de CV | 2,151,900 | $ | 12,954 | ||||||||
Household Products (1.3%) | |||||||||||
| Kimberly-Clark Corp. | 310,000 | 33,480 | |||||||||
Independent Power and Renewable Electricity Producers (1.4%) | |||||||||||
| Abengoa Yield PLC* | 659,000 | 26,432 | |||||||||
| NextEra Energy Partners LP* | 46,400 | 1,629 | |||||||||
| TerraForm Power, Inc. Class A* | 262,800 | 8,210 | |||||||||
36,271 | |||||||||||
Industrial Conglomerates (2.6%) | |||||||||||
3M Co. | 95,000 | 13,680 | |||||||||
| Koninklijke Philips NV | 1,644,500 | 50,109 | |||||||||
63,789 | |||||||||||
Insurance (0.5%) | |||||||||||
MetLife, Inc. | 233,000 | 12,754 | |||||||||
Leisure Products (1.9%) | |||||||||||
Hasbro, Inc. | 920,000 | 48,443 | |||||||||
Media (1.3%) | |||||||||||
Lagardere SCA | 1,144,714 | 31,518 | |||||||||
Metals & Mining (1.6%) | |||||||||||
| BHP Billiton Ltd. ADR | 581,000 | 39,874 | |||||||||
Multi-Utilities (11.0%) | |||||||||||
| Alliant Energy Corp. | 909,000 | 53,167 | |||||||||
Ameren Corp. | 1,169,000 | 46,748 | |||||||||
| CenterPoint Energy, Inc. | 1,492,000 | 37,061 | |||||||||
| Dominion Resources, Inc. | 795,000 | 55,825 | |||||||||
NiSource, Inc. | 825,000 | 32,728 | |||||||||
Sempra Energy | 285,200 | 30,223 | |||||||||
| Wisconsin Energy Corp. | 400,000 | 18,132 | |||||||||
273,884 | |||||||||||
Oil, Gas & Consumable Fuels (12.1%) | |||||||||||
| Cenovus Energy, Inc. | 1,183,000 | 37,726 | |||||||||
Number of Shares | Value† (000's)z | ||||||||||
| Chevron Corp.@ | 287,200 | $ | 37,178 | ||||||||
ConocoPhillips | 300,000 | 24,366 | |||||||||
Enbridge, Inc. | 941,700 | 46,944 | |||||||||
Exxon Mobil Corp. | 260,000 | 25,860 | |||||||||
| Golar LNG Ltd.@ | 678,000 | 42,714 | |||||||||
| ONEOK, Inc.@ | 607,000 | 42,611 | |||||||||
| Spectra Energy Corp.@ | 1,082,500 | 45,097 | |||||||||
302,496 | |||||||||||
Pharmaceuticals (10.1%) | |||||||||||
| Bristol-Myers Squibb Co. | 475,100 | 24,064 | |||||||||
| Eli Lilly & Co.@ | 815,000 | 51,801 | |||||||||
| GlaxoSmithKline PLC ADR | 260,000 | 12,766 | |||||||||
| Johnson & Johnson | 525,000 | 54,458 | |||||||||
| Novartis AG ADR | 645,000 | 57,947 | |||||||||
| Roche Holding AG ADR | 1,366,000 | 49,873 | |||||||||
250,909 | |||||||||||
Real Estate Investment Trusts (22.4%) | |||||||||||
| Blackstone Mortgage Trust, Inc. Class A | 438,000 | 12,724 | |||||||||
| Capita Commercial Trust | 9,448,000 | 12,859 | |||||||||
| Equity Residential@ | 870,000 | 57,829 | |||||||||
| Extra Space Storage, Inc. | 700,000 | 36,890 | |||||||||
| Fibra Uno Administracion SA de CV | 10,962,000 | 39,492 | |||||||||
Goodman Group | 3,089,000 | 16,098 | |||||||||
| Host Hotels & Resorts, Inc. | 1,317,000 | 30,054 | |||||||||
| Keppel REIT Management Ltd. | 12,422,000 | 12,431 | |||||||||
| Mapletree Logistics Trust | 12,280,000 | 11,552 | |||||||||
| Parkway Life Real Estate Investment Trust | 5,973,000 | 11,238 | |||||||||
Prologis, Inc. | 1,578,000 | 64,603 | |||||||||
Public Storage | 116,000 | 20,321 | |||||||||
See Notes to Schedule of Investments
79
Number of Shares | Value† (000's)z | ||||||||||
| Realty Income Corp. | 849,000 | $ | 37,967 | ||||||||
| Simon Property Group, Inc. | 239,000 | 40,637 | |||||||||
| Starwood Property Trust, Inc. | 2,063,000 | 49,203 | |||||||||
| TF Administradora Industrial S de RL de CV* | 6,200,000 | 14,214 | |||||||||
Ventas, Inc. | 854,000 | 56,176 | |||||||||
| Weyerhaeuser Co. | 1,000,000 | 33,950 | |||||||||
558,238 | |||||||||||
Road & Rail (1.2%) | |||||||||||
| Norfolk Southern Corp.@ | 275,000 | 29,425 | |||||||||
Software (2.1%) | |||||||||||
| Microsoft Corp.@ | 1,180,000 | 53,607 | |||||||||
Specialty Retail (1.1%) | |||||||||||
| Home Depot, Inc.@ | 305,000 | 28,518 | |||||||||
| Total Common Stocks (Cost $2,010,583) | 2,381,778 | ||||||||||
| Principal Amount | |||||||||||
Convertible Bonds (2.3%) | |||||||||||
| Emulex Corp., Senior Unsecured Notes, 1.75%, due 11/15/18ñ | $ | 2,100,000 | 1,896 | ||||||||
| Live Nation Entertainment, Inc., Senior Unsecured Notes, 2.50%, due 5/15/19ñ | 3,260,000 | 3,276 | |||||||||
| RTI International Metals, Inc., Senior Unsecured Notes, 1.63%, due 10/15/19 | 5,000,000 | 5,119 | |||||||||
| SINA Corp., Senior Unsecured Notes, 1.00%, due 12/1/18ñ | 25,100,000 | 23,202 | |||||||||
| WebMD Health Corp., Senior Unsecured Notes, 2.25%, due 3/31/16 | 10,000,000 | 10,244 | |||||||||
Principal Amount | Value† (000's)z | ||||||||||
| WebMD Health Corp., Senior Unsecured Notes, 2.50%, due 1/31/18 | $ | 13,965,000 | $ | 14,794 | |||||||
| Total Convertible Bonds (Cost $56,018) | 58,531 | ||||||||||
| Number of Shares | |||||||||||
Short-Term Investments (1.3%) | |||||||||||
| State Street Institutional Treasury Money Market Fund Premier Class (Cost $32,319) | 32,318,578 | 32,319 | |||||||||
| Total Investments## (99.1%) (Cost $2,098,920) | 2,472,628 | ||||||||||
| Cash, receivables and other assets, less liabilities‡‡± (0.9%) | 21,975 | ||||||||||
Total Net Assets (100.0%) | $ | 2,494,603 | |||||||||
| |||
See Notes to Schedule of Investments
80
Schedule of Investments Focus Fund
TOP TEN EQUITY HOLDINGS
1 | JPMorgan Chase & Co. | 4.7 | % | ||||||||
2 | Invesco Ltd. | 4.4 | % | ||||||||
3 | Eli Lilly & Co. | 4.4 | % | ||||||||
4 | Comcast Corp. Class A Special | 4.0 | % | ||||||||
5 | Cisco Systems, Inc. | 3.7 | % | ||||||||
6 | Eaton Corp. PLC | 3.7 | % | ||||||||
7 | eBay, Inc. | 3.6 | % | ||||||||
8 | Teva Pharmaceutical Industries Ltd. ADR | 3.6 | % | ||||||||
9 | Antero Resources Corp. | 3.5 | % | ||||||||
10 | NiSource, Inc. | 3.3 | % | ||||||||
Number of Shares | Value† (000's)z | ||||||||||
Common Stocks (97.0%) | |||||||||||
Airlines (2.9%) | |||||||||||
| Delta Air Lines, Inc. | 612,000 | $ | 24,223 | ||||||||
Automobiles (0.9%) | |||||||||||
| General Motors Co. | 225,000 | 7,830 | |||||||||
Banks (7.1%) | |||||||||||
| JPMorgan Chase & Co. | 665,000 | 39,534 | |||||||||
| PNC Financial Services Group, Inc. | 243,000 | 20,594 | |||||||||
60,128 | |||||||||||
Capital Markets (4.4%) | |||||||||||
Invesco Ltd. | 910,000 | 37,164 | |||||||||
Chemicals (2.2%) | |||||||||||
| RPM International, Inc. | 386,500 | 18,216 | |||||||||
Communications Equipment (3.7%) | |||||||||||
| Cisco Systems, Inc. | 1,265,000 | 31,612 | |||||||||
Diversified Consumer Services (2.2%) | |||||||||||
| Service Corp. International | 820,000 | 18,179 | |||||||||
Diversified Financial Services (2.7%) | |||||||||||
| Intercontinental Exchange, Inc. | 122,500 | 23,153 | |||||||||
Electrical Equipment (3.7%) | |||||||||||
Eaton Corp. PLC | 445,000 | 31,065 | |||||||||
Electronic Equipment, Instruments & Components (2.1%) | |||||||||||
Corning, Inc. | 870,000 | 18,148 | |||||||||
Food Products (2.8%) | |||||||||||
| Mondelez International, Inc. Class A | 645,000 | 23,343 | |||||||||
| Health Care Providers & Services (2.2%) | |||||||||||
| DaVita HealthCare Partners, Inc.* | 245,000 | 18,297 | |||||||||
Hotels, Restaurants & Leisure (2.1%) | |||||||||||
| Starwood Hotels & Resorts Worldwide, Inc. | 214,000 | 18,092 | |||||||||
Number of Shares | Value† (000's)z | ||||||||||
Household Durables (2.5%) | |||||||||||
| Newell Rubbermaid, Inc. | 643,000 | $ | 21,553 | ||||||||
Household Products (1.9%) | |||||||||||
| Energizer Holdings, Inc. | 133,000 | 16,162 | |||||||||
Internet Software & Services (6.2%) | |||||||||||
eBay, Inc.* | 550,000 | 30,525 | |||||||||
| Google, Inc. Class A* | 19,000 | 11,065 | |||||||||
| Google, Inc. Class C* | 19,000 | 10,860 | |||||||||
52,450 | |||||||||||
Machinery (2.7%) | |||||||||||
| Stanley Black & Decker, Inc. | 251,000 | 22,967 | |||||||||
Media (6.8%) | |||||||||||
| Comcast Corp. Class A Special | 620,000 | 33,852 | |||||||||
Time Warner, Inc. | 305,000 | 23,494 | |||||||||
57,346 | |||||||||||
Metals & Mining (0.6%) | |||||||||||
| BHP Billiton PLC ADR | 85,000 | 5,396 | |||||||||
Multi-Utilities (3.3%) | |||||||||||
NiSource, Inc. | 707,490 | 28,066 | |||||||||
Oil, Gas & Consumable Fuels (9.9%) | |||||||||||
| Antero Resources Corp.* | 506,100 | 29,278 | |||||||||
Apache Corp. | 222,000 | 22,606 | |||||||||
| Pioneer Natural Resources Co. | 94,000 | 19,613 | |||||||||
| Range Resources Corp. | 160,000 | 12,575 | |||||||||
84,072 | |||||||||||
Paper & Forest Products (1.2%) | |||||||||||
| International Paper Co. | 207,000 | 10,029 | |||||||||
Personal Products (2.1%) | |||||||||||
| Estee Lauder Cos., Inc. Class A | 230,000 | 17,671 | |||||||||
Pharmaceuticals (8.0%) | |||||||||||
Eli Lilly & Co. | 584,000 | 37,119 | |||||||||
Number of Shares | Value† (000's)z | ||||||||||
| Teva Pharmaceutical Industries Ltd. ADR | 580,000 | $ | 30,462 | ||||||||
67,581 | |||||||||||
Real Estate Management & Development (0.8%) | |||||||||||
| Brookfield Property Partners LP | 325,000 | 6,939 | |||||||||
Semiconductors & Semiconductor Equipment (2.0%) | |||||||||||
Altera Corp. | 480,000 | 16,963 | |||||||||
Software (2.0%) | |||||||||||
| Activision Blizzard, Inc. | 720,000 | 16,949 | |||||||||
Specialty Retail (2.9%) | |||||||||||
| Bed Bath & Beyond, Inc.* | 375,000 | 24,097 | |||||||||
Technology Hardware, Storage & Peripherals (3.1%) | |||||||||||
SanDisk Corp. | 270,000 | 26,449 | |||||||||
Textiles, Apparel & Luxury Goods (2.0%) | |||||||||||
| Ralph Lauren Corp. | 101,000 | 17,089 | |||||||||
| Total Common Stocks (Cost $675,523) | 821,229 | ||||||||||
Short-Term Investments (3.1%) | |||||||||||
| State Street Institutional Treasury Money Market Fund Premier Class (Cost $26,642) | 26,641,954 | 26,642 | |||||||||
| Total Investments## (100.1%) (Cost $702,165) | 847,871 | ||||||||||
| Liabilities, less cash, receivables and other assets [(0.1%)] | (906 | ) | |||||||||
Total Net Assets (100.0%) | $ | 846,965 | |||||||||
See Notes to Schedule of Investments
81
Schedule of Investments Genesis Fund
TOP TEN EQUITY HOLDINGS
1 | Wabtec Corp. | 2.5 | % | ||||||||
2 | Church & Dwight Co., Inc. | 2.1 | % | ||||||||
3 | AptarGroup, Inc. | 1.9 | % | ||||||||
4 | Polaris Industries, Inc. | 1.8 | % | ||||||||
5 | Compass Minerals International, Inc. | 1.8 | % | ||||||||
6 | Sensient Technologies Corp. | 1.6 | % | ||||||||
7 | CLARCOR, Inc. | 1.6 | % | ||||||||
8 | ICON PLC | 1.5 | % | ||||||||
9 | Oceaneering International, Inc. | 1.4 | % | ||||||||
10 | Zebra Technologies Corp. Class A | 1.3 | % | ||||||||
Number of Shares | Value† (000's)z | ||||||||||
Common Stocks (96.2%) | |||||||||||
Aerospace & Defense (0.1%) | |||||||||||
Cubic Corp. | 185,600 | $ | 8,285 | ||||||||
Air Freight & Logistics (0.6%) | |||||||||||
| Forward Air Corp.^ | 1,737,200 | 80,415 | |||||||||
Airlines (0.0%) | |||||||||||
| Allegiant Travel Co. | 23,300 | 2,863 | |||||||||
Auto Components (0.4%) | |||||||||||
Gentex Corp. | 1,673,949 | 49,465 | |||||||||
Banks (7.6%) | |||||||||||
| Bank of Hawaii Corp.^ | 2,393,212 | 138,926 | |||||||||
| Bank of the Ozarks, Inc. | 2,773,000 | 88,597 | |||||||||
| BankUnited, Inc. | 2,994,130 | 94,465 | |||||||||
| BOK Financial Corp. | 1,580,976 | 106,526 | |||||||||
| Community Bank System, Inc. | 1,211,023 | 42,798 | |||||||||
| Cullen/Frost Bankers, Inc. | 1,888,325 | 148,422 | |||||||||
| CVB Financial Corp. | 3,100,172 | 48,177 | |||||||||
| First Financial Bankshares, Inc.^ | 3,628,036 | 106,628 | |||||||||
FNB Corp. | 4,304,746 | 53,207 | |||||||||
| PacWest Bancorp | 2,301,451 | 96,523 | |||||||||
| ViewPoint Financial Group, Inc. | 1,957,668 | 50,997 | |||||||||
| Westamerica Bancorporation^ | 1,566,743 | 75,783 | |||||||||
1,051,049 | |||||||||||
Beverages (0.8%) | |||||||||||
| Boston Beer Co., Inc. Class A* | 513,219 | 113,411 | |||||||||
Building Products (0.7%) | |||||||||||
AAON, Inc. | 1,196,681 | 22,330 | |||||||||
| AO Smith Corp. | 1,455,648 | 71,443 | |||||||||
93,773 | |||||||||||
Number of Shares | Value† (000's)z | ||||||||||
Chemicals (4.6%) | |||||||||||
| Balchem Corp.^ | 1,643,735 | $ | 84,554 | ||||||||
Hawkins, Inc. | 233,273 | 8,585 | |||||||||
| Innophos Holdings, Inc.^ | 1,586,542 | 92,258 | |||||||||
| NewMarket Corp. | 214,012 | 87,079 | |||||||||
| RPM International, Inc. | 2,142,444 | 100,973 | |||||||||
| Sensient Technologies Corp.^ | 3,975,245 | 223,051 | |||||||||
Stepan Co. | 628,896 | 30,369 | |||||||||
626,869 | |||||||||||
Commercial Services & Supplies (3.5%) | |||||||||||
Copart, Inc.* | 4,062 | 140 | |||||||||
| Healthcare Services Group, Inc.^ | 4,687,081 | 128,098 | |||||||||
Rollins, Inc. | 5,269,520 | 156,768 | |||||||||
Team, Inc.* | 848,206 | 33,852 | |||||||||
UniFirst Corp. | 473,250 | 45,882 | |||||||||
| United Stationers, Inc.^ | 2,780,741 | 113,037 | |||||||||
477,777 | |||||||||||
Communications Equipment (0.7%) | |||||||||||
| NETGEAR, Inc.*^ | 2,893,300 | 96,115 | |||||||||
Construction & Engineering (0.2%) | |||||||||||
| Primoris Services Corp. | 904,100 | 26,255 | |||||||||
Construction Materials (0.6%) | |||||||||||
| Eagle Materials, Inc. | 782,900 | 79,785 | |||||||||
Containers & Packaging (2.5%) | |||||||||||
| AptarGroup, Inc.^ | 3,977,400 | 255,150 | |||||||||
| Silgan Holdings, Inc. | 1,764,383 | 88,837 | |||||||||
343,987 | |||||||||||
Distributors (1.3%) | |||||||||||
| Pool Corp.^ | 3,049,798 | 172,802 | |||||||||
Number of Shares | Value† (000's)z | ||||||||||
Diversified Financial Services (0.2%) | |||||||||||
| MarketAxess Holdings, Inc. | 454,249 | $ | 26,764 | ||||||||
Electrical Equipment (0.5%) | |||||||||||
| Franklin Electric Co., Inc. | 1,096,172 | 41,611 | |||||||||
| Thermon Group Holdings, Inc.* | 808,931 | 21,962 | |||||||||
63,573 | |||||||||||
Electronic Equipment, Instruments & Components (4.1%) | |||||||||||
| Badger Meter, Inc.^ | 727,301 | 37,878 | |||||||||
Cognex Corp.* | 513,700 | 21,565 | |||||||||
Coherent, Inc.* | 313,200 | 20,192 | |||||||||
| FARO Technologies, Inc.* | 369,400 | 21,429 | |||||||||
FEI Co. | 1,935,542 | 162,663 | |||||||||
Littelfuse, Inc. | 682,253 | 62,706 | |||||||||
| MTS Systems Corp. | 132,087 | 9,389 | |||||||||
Rogers Corp.* | 856,551 | 51,547 | |||||||||
| Zebra Technologies Corp. Class A* | 2,310,924 | 180,321 | |||||||||
567,690 | |||||||||||
Energy Equipment & Services (4.6%) | |||||||||||
| Canadian Energy Services & Technology Corp. | 1,855,000 | 18,596 | �� | ||||||||
| CARBO Ceramics, Inc.^ | 1,362,257 | 146,565 | |||||||||
| Matrix Service Co.* | 766,100 | 21,612 | |||||||||
| Natural Gas Services Group, Inc.*^ | 713,700 | 21,182 | |||||||||
| Oceaneering International, Inc. | 2,675,528 | 186,110 | |||||||||
| Pason Systems, Inc.^ | 4,710,557 | 150,116 | |||||||||
See Notes to Schedule of Investments
82
Number of Shares | Value† (000's)z | ||||||||||
ShawCor Ltd. | 1,640,300 | $ | 88,902 | ||||||||
633,083 | |||||||||||
Food & Staples Retailing (0.2%) | |||||||||||
| North West Co., Inc. | 1,242,400 | 28,155 | |||||||||
Food Products (2.3%) | |||||||||||
| B&G Foods, Inc. | 2,053,600 | 62,019 | |||||||||
| Flowers Foods, Inc. | 3,560,100 | 69,707 | |||||||||
| J & J Snack Foods Corp.^ | 997,646 | 94,487 | |||||||||
| Lancaster Colony Corp. | 1,033,956 | 91,412 | |||||||||
317,625 | |||||||||||
Gas Utilities (0.4%) | |||||||||||
| South Jersey Industries, Inc. | 873,148 | 50,599 | |||||||||
| Health Care Equipment & Supplies (5.8%) | |||||||||||
| Abaxis, Inc.^ | 1,162,400 | 55,505 | |||||||||
| Cyberonics, Inc.* | 757,595 | 43,478 | |||||||||
| Haemonetics Corp.*^ | 4,260,500 | 152,057 | |||||||||
| IDEXX Laboratories, Inc.* | 1,356,062 | 168,111 | |||||||||
| Meridian Bioscience, Inc.^ | 2,537,797 | 49,665 | |||||||||
| Sirona Dental Systems, Inc.* | 1,951,026 | 159,028 | |||||||||
| West Pharmaceutical Services, Inc.^ | 4,051,158 | 175,942 | |||||||||
803,786 | |||||||||||
| Health Care Providers & Services (3.4%) | |||||||||||
| AmSurg Corp.* | 1,324,150 | 71,226 | |||||||||
| Chemed Corp. | 470,900 | 49,732 | |||||||||
| Henry Schein, Inc.* | 1,408,340 | 168,564 | |||||||||
| MWI Veterinary Supply, Inc.*^ | 1,213,705 | 172,407 | |||||||||
461,929 | |||||||||||
Hotels, Restaurants & Leisure (3.7%) | |||||||||||
| Bally Technologies, Inc.* | 1,057,686 | 83,864 | |||||||||
| Brinker International, Inc. | 2,717,500 | 132,886 | |||||||||
| Cheesecake Factory, Inc. | 1,465,800 | 65,888 | |||||||||
Number of Shares | Value† (000's)z | ||||||||||
| Cracker Barrel Old Country Store, Inc. | 829,727 | $ | 83,313 | ||||||||
| Papa John's International, Inc. | 1,728,445 | 68,446 | |||||||||
| Texas Roadhouse, Inc. | 2,707,000 | 71,979 | |||||||||
506,376 | |||||||||||
Household Products (2.1%) | |||||||||||
| Church & Dwight Co., Inc. | 4,300,456 | 293,463 | |||||||||
Industrial Conglomerates (0.6%) | |||||||||||
| Raven Industries, Inc.^ | 3,087,352 | 82,309 | |||||||||
Insurance (1.2%) | |||||||||||
| RLI Corp.^ | 2,522,414 | 112,752 | |||||||||
| Safety Insurance Group, Inc.^ | 950,949 | 52,492 | |||||||||
165,244 | |||||||||||
Internet Software & Services (0.3%) | |||||||||||
j2 Global, Inc. | 881,701 | 47,127 | |||||||||
IT Services (1.3%) | |||||||||||
| Jack Henry & Associates, Inc. | 1,855,003 | 107,238 | |||||||||
Sapient Corp.* | 5,308,127 | 77,021 | |||||||||
184,259 | |||||||||||
Leisure Products (1.8%) | |||||||||||
| Polaris Industries, Inc. | 1,659,220 | 241,217 | |||||||||
Life Sciences Tools & Services (2.5%) | |||||||||||
| ICON PLC*^ | 4,109,500 | 203,584 | |||||||||
| PAREXEL International Corp.* | 1,397,655 | 78,884 | |||||||||
Techne Corp. | 585,900 | 55,965 | |||||||||
338,433 | |||||||||||
Machinery (11.2%) | |||||||||||
| Chart Industries, Inc.* | 683,000 | 45,686 | |||||||||
| CIRCOR International, Inc. | 492,250 | 35,043 | |||||||||
| CLARCOR, Inc.^ | 3,492,088 | 220,735 | |||||||||
| Donaldson Co., Inc. | 2,544,600 | 106,517 | |||||||||
Graco, Inc. | 756,617 | 58,154 | |||||||||
Number of Shares | Value† (000's)z | ||||||||||
| Lincoln Electric Holdings, Inc. | 546,382 | $ | 38,848 | ||||||||
| Lindsay Corp.^ | 872,250 | 67,844 | |||||||||
| Middleby Corp.* | 1,504,318 | 129,717 | |||||||||
Nordson Corp. | 2,071,608 | 167,925 | |||||||||
| RBC Bearings, Inc. | 637,240 | 39,394 | |||||||||
| Tennant Co.^ | 948,802 | 66,122 | |||||||||
Toro Co. | 1,582,788 | 97,389 | |||||||||
| Valmont Industries, Inc. | 941,104 | 132,460 | |||||||||
Wabtec Corp. | 4,054,600 | 337,991 | |||||||||
1,543,825 | |||||||||||
Media (1.3%) | |||||||||||
| LIN Media LLC Class A* | 1,472,930 | 34,349 | |||||||||
| Media General, Inc.* | 1,626,509 | 25,064 | |||||||||
| Nexstar Broadcasting Group, Inc. Class A^ | 2,748,021 | 125,420 | |||||||||
184,833 | |||||||||||
Metals & Mining (2.1%) | |||||||||||
| Alamos Gold, Inc. | 5,821,800 | 53,619 | |||||||||
| Compass Minerals International, Inc.^ | 2,697,873 | 240,299 | |||||||||
293,918 | |||||||||||
Multi-Utilities (0.3%) | |||||||||||
| NorthWestern Corp. | 852,500 | 41,159 | |||||||||
Oil, Gas & Consumable Fuels (2.6%) | |||||||||||
| Evolution Petroleum Corp. | 1,044,450 | 10,476 | |||||||||
| Gulfport Energy Corp.* | 2,225,500 | 130,192 | |||||||||
| Kodiak Oil & Gas Corp.* | 1,844,237 | 30,006 | |||||||||
| Laredo Petroleum, Inc.* | 1,703,200 | 40,263 | |||||||||
| Oasis Petroleum, Inc.* | 1,628,080 | 80,085 | |||||||||
| Painted Pony Petroleum Ltd.* | 2,530,950 | 33,611 | |||||||||
| Synergy Resources Corp.* | 1,982,751 | 26,688 | |||||||||
351,321 | |||||||||||
See Notes to Schedule of Investments
83
Number of Shares | Value† (000's)z | ||||||||||
Paper & Forest Products (0.6%) | |||||||||||
| Stella-Jones, Inc. | 2,293,300 | $ | 62,938 | ||||||||
| Stella-Jones, Incc | 621,200 | 17,048 | |||||||||
79,986 | |||||||||||
Professional Services (0.6%) | |||||||||||
| Exponent, Inc.^ | 1,122,035 | 81,976 | |||||||||
Real Estate Management & Development (2.0%) | |||||||||||
| Altisource Asset Management Corp.*^ | 155,717 | 115,921 | |||||||||
| Altisource Portfolio Solutions SA*^ | 1,595,670 | 159,455 | |||||||||
275,376 | |||||||||||
Road & Rail (0.2%) | |||||||||||
| Genesee & Wyoming, Inc. Class A* | 245,600 | 24,150 | |||||||||
Semiconductors & Semiconductor Equipment (1.1%) | |||||||||||
| Power Integrations, Inc.^ | 2,530,900 | 151,297 | |||||||||
Software (8.5%) | |||||||||||
| Advent Software, Inc. | 2,471,438 | 79,852 | |||||||||
| Computer Modelling Group Ltd.^ | 5,948,400 | 69,643 | |||||||||
| Constellation Software, Inc. | 690,142 | 171,500 | |||||||||
| Descartes Systems Group, Inc.* | 2,452,550 | 34,409 | |||||||||
| Enghouse Systems Ltd. | 1,060,700 | 34,085 | |||||||||
| FactSet Research Systems, Inc. | 754,900 | 96,174 | |||||||||
Fair Isaac Corp. | 639,858 | 37,221 | |||||||||
| Manhattan Associates, Inc.*^ | 5,217,228 | 150,674 | |||||||||
| MICROS Systems, Inc.* | 931,342 | 63,303 | |||||||||
| Monotype Imaging Holdings, Inc.^ | 2,986,745 | 87,781 | |||||||||
| NetScout Systems, Inc.* | 766,884 | 35,330 | |||||||||
| Solera Holdings, Inc. | 2,645,753 | 161,285 | |||||||||
Number of Shares | Value† (000's)z | ||||||||||
| Tyler Technologies, Inc.*^ | 1,718,232 | $ | 153,026 | ||||||||
1,174,283 | |||||||||||
Specialty Retail (2.6%) | |||||||||||
| Hibbett Sports, Inc.*^ | 1,778,969 | 80,818 | |||||||||
| Sally Beauty Holdings, Inc.* | 4,441,293 | 123,823 | |||||||||
| Tractor Supply Co. | 2,190,182 | 146,633 | |||||||||
351,274 | |||||||||||
Technology Hardware, Storage & Peripherals (0.4%) | |||||||||||
| Electronics For Imaging, Inc.* | 1,214,700 | 53,495 | |||||||||
| Textiles, Apparel & Luxury Goods (0.5%) | |||||||||||
| Wolverine World Wide, Inc. | 2,549,670 | 67,719 | |||||||||
Thrifts & Mortgage Finance (1.4%) | |||||||||||
| Home Loan Servicing Solutions Ltd.^ | 5,407,600 | 118,427 | |||||||||
| Ocwen Financial Corp.* | 2,724,529 | 76,123 | |||||||||
194,550 | |||||||||||
| Trading Companies & Distributors (2.2%) | |||||||||||
| Applied Industrial Technologies, Inc.^ | 2,403,244 | 117,062 | |||||||||
| Beacon Roofing Supply, Inc.* | 1,791,100 | 51,082 | |||||||||
| MSC Industrial Direct Co., Inc. Class A | 684,700 | 61,719 | |||||||||
Watsco, Inc. | 754,304 | 69,766 | |||||||||
299,629 | |||||||||||
| Total Common Stocks (Cost $7,253,191) | 13,203,274 | ||||||||||
Short-Term Investments (3.6%) | |||||||||||
| State Street Institutional Treasury Money Market Fund Premier Class | 233,965,859 | 233,966 | |||||||||
Number of Shares | Value† (000's)z | ||||||||||
| State Street Institutional Treasury Plus Fund Premier Class*^ | 255,161,152 | $ | 255,161 | ||||||||
| Total Short-Term Investments (Cost $489,127) | 489,127 | ||||||||||
| Total Investments## (99.8%) (Cost $7,742,318) | 13,692,401 | ||||||||||
| Cash, receivables and other assets, less liabilities (0.2%) | 31,406 | ||||||||||
Total Net Assets (100.0%) | $ | 13,723,807 | |||||||||
See Notes to Schedule of Investments
84
Schedule of Investments Global Equity Fund
TOP TEN EQUITY HOLDINGS
Country | Industry | ||||||||||||||||||
1 | SanDisk Corp. | United States | Technology Hardware, Storage & Peripherals | 2.9 | % | ||||||||||||||
2 | Apple, Inc. | United States | Technology Hardware, Storage & Peripherals | 2.3 | % | ||||||||||||||
3 | ASML Holding NV | Netherlands | Semiconductors & Semiconductor Equipment | 1.7 | % | ||||||||||||||
4 | Cardinal Health, Inc. | United States | Health Care Providers & Services | 1.7 | % | ||||||||||||||
5 | Check Point Software Technologies Ltd. | Israel | Software | 1.7 | % | ||||||||||||||
6 | RPM International, Inc. | United States | Chemicals | 1.6 | % | ||||||||||||||
7 | Wabtec Corp. | United States | Machinery | 1.6 | % | ||||||||||||||
8 | BlackRock, Inc. | United States | Capital Markets | 1.6 | % | ||||||||||||||
9 | Sealed Air Corp. | United States | Containers & Packaging | 1.6 | % | ||||||||||||||
10 | JPMorgan Chase & Co. | United States | Banks | 1.6 | % | ||||||||||||||
Number of Shares | Value† (000's)z | ||||||||||
Common Stocks (95.3%) | |||||||||||
Brazil (0.8%) | |||||||||||
SLC Agricola SA | 40,100 | $ | 310 | ||||||||
Canada (4.6%) | |||||||||||
| Alimentation Couche-Tard, Inc. Class B | 16,880 | 506 | |||||||||
| Home Capital Group, Inc. | 3,400 | 170 | |||||||||
ShawCor Ltd. | 11,300 | 612 | |||||||||
| Suncor Energy, Inc. | 12,900 | 530 | |||||||||
1,818 | |||||||||||
China (1.2%) | |||||||||||
| PICC Property & Casualty Co. Ltd., H Shares | 290,100 | 481 | |||||||||
France (5.0%) | |||||||||||
BNP Paribas SA | 6,400 | 432 | |||||||||
Rexel SA | 22,700 | 452 | |||||||||
Sanofi | 5,300 | 582 | |||||||||
Sodexo | 5,300 | 522 | |||||||||
1,988 | |||||||||||
Germany (4.6%) | |||||||||||
Continental AG | 2,435 | 520 | |||||||||
| Henkel AG & Co. KGaA | 4,670 | 489 | |||||||||
Linde AG | 2,222 | 440 | |||||||||
| Volkswagen AG, Preference Shares | 1,620 | 364 | |||||||||
1,813 | |||||||||||
Hong Kong (1.0%) | |||||||||||
| Haier Electronics Group Co. Ltd. | 143,000 | 411 | |||||||||
Israel (2.9%) | |||||||||||
| Bezeq Israeli Telecommunication Corp. Ltd. | 260,140 | 491 | |||||||||
Number of Shares | Value† (000's)z | ||||||||||
| Check Point Software Technologies Ltd.* | 9,190 | $ | 653 | ||||||||
1,144 | |||||||||||
Japan (4.2%) | |||||||||||
FANUC Corp. | 2,800 | 468 | |||||||||
SOFTBANK Corp. | 5,100 | 368 | |||||||||
| SUGI HOLDINGS Co. Ltd. | 6,900 | 287 | |||||||||
| TOYOTA MOTOR Corp. | 9,250 | 527 | |||||||||
1,650 | |||||||||||
Korea (1.3%) | |||||||||||
| Samsung Electronics Co. Ltd. | 438 | 533 | |||||||||
Netherlands (2.8%) | |||||||||||
| ASML Holding NV | 6,985 | 668 | |||||||||
| Sensata Technologies Holding NV* | 8,885 | 437 | |||||||||
1,105 | |||||||||||
Norway (1.5%) | |||||||||||
DNB ASA | 32,530 | 607 | |||||||||
Sweden (1.5%) | |||||||||||
Elekta AB, B Shares | 18,505 | 211 | |||||||||
| Telefonaktiebolaget LM Ericsson, B Shares | 29,135 | 363 | |||||||||
574 | |||||||||||
Switzerland (8.5%) | |||||||||||
Givaudan SA* | 368 | 611 | |||||||||
| Julius Baer Group Ltd.* | 12,300 | 559 | |||||||||
Roche Holding AG | 1,966 | 573 | |||||||||
SGS SA | 236 | 524 | |||||||||
Sika AG | 141 | 533 | |||||||||
Number of Shares | Value† (000's)z | ||||||||||
Sonova Holding AG | 3,410 | $ | 545 | ||||||||
3,345 | |||||||||||
United Kingdom (8.2%) | |||||||||||
Aon PLC | 5,435 | 474 | |||||||||
Barclays PLC | 79,600 | 297 | |||||||||
| Howden Joinery Group PLC | 69,100 | 405 | |||||||||
Prudential PLC | 24,700 | 594 | |||||||||
SABMiller PLC | 8,995 | 496 | |||||||||
| St. James's Place PLC | 38,400 | 457 | |||||||||
| TalkTalk Telecom Group PLC | 98,600 | 495 | |||||||||
3,218 | |||||||||||
United States (47.2%) | |||||||||||
| Actuant Corp. Class A | 14,050 | 474 | |||||||||
| Amazon.com, Inc.* | 1,210 | 410 | |||||||||
| American Tower Corp. | 4,045 | 399 | |||||||||
AMETEK, Inc. | 9,595 | 508 | |||||||||
Apple, Inc. | 9,023 | 925 | |||||||||
BlackRock, Inc. | 1,863 | 616 | |||||||||
BorgWarner, Inc. | 6,380 | 397 | |||||||||
| Cardinal Health, Inc. | 8,905 | 656 | |||||||||
Covidien PLC | 6,245 | 542 | |||||||||
| CVS Caremark Corp. | 6,705 | 533 | |||||||||
eBay, Inc.* | 7,155 | 397 | |||||||||
| EOG Resources, Inc. | 5,084 | 559 | |||||||||
| Estee Lauder Cos., Inc. Class A | 6,400 | 492 | |||||||||
First Republic Bank | 11,300 | 553 | |||||||||
| Google, Inc. Class A* | 460 | 268 | |||||||||
| Google, Inc. Class C* | 460 | 263 | |||||||||
Graco, Inc. | 6,850 | 526 | |||||||||
See Notes to Schedule of Investments
85
Number of Shares | Value† (000's)z | ||||||||||
| Henry Schein, Inc.* | 4,330 | $ | 518 | ||||||||
| Intercontinental Exchange, Inc. | 2,450 | 463 | |||||||||
| JPMorgan Chase & Co. | 10,305 | 613 | |||||||||
| Motorola Solutions, Inc. | 7,680 | 456 | |||||||||
Nielsen NV | 10,140 | 476 | |||||||||
Nordstrom, Inc. | 6,235 | 432 | |||||||||
Pall Corp. | 6,890 | 581 | |||||||||
| Pioneer Natural Resources Co. | 2,535 | 529 | |||||||||
| Range Resources Corp. | 5,605 | 440 | |||||||||
| RPM International, Inc. | 13,500 | 636 | |||||||||
SanDisk Corp. | 11,745 | 1,151 | |||||||||
Schlumberger Ltd. | 4,715 | 517 | |||||||||
Sealed Air Corp. | 16,995 | 613 | |||||||||
| Sirona Dental Systems, Inc.* | 6,010 | 490 | |||||||||
Taminco Corp.* | 11,395 | 273 | |||||||||
Teradata Corp.* | 8,100 | 370 | |||||||||
Visa, Inc. Class A | 1,870 | 397 | |||||||||
Wabtec Corp. | 7,630 | 636 | |||||||||
| Waste Connections, Inc. | 11,100 | 545 | |||||||||
18,654 | |||||||||||
| Total Common Stocks (Cost $32,874) | 37,651 | ||||||||||
Short-Term Investments (5.7%) | |||||||||||
| State Street Institutional Treasury Money Market Fund Premier Class (Cost $2,248) | 2,248,189 | 2,248 | |||||||||
| Total Investments## (101.0%) (Cost $35,122) | 39,899 | ||||||||||
| Liabilities, less cash, receivables and other assets [(1.0%)] | (415 | ) | |||||||||
Total Net Assets (100.0%) | $ | 39,484 | |||||||||
| |||
| |||
See Notes to Schedule of Investments
86
SUMMARY SCHEDULE OF INVESTMENTS BY INDUSTRY GLOBAL EQUITY FUND
Industry | Investments at Value† (000's omitted) | Percentage of Net Assets | |||||||||
Machinery | $ | 2,685 | 6.8 | % | |||||||
Banks | 2,502 | 6.3 | % | ||||||||
Chemicals | 2,493 | 6.3 | % | ||||||||
Technology Hardware, Storage & Peripherals | 2,076 | 5.3 | % | ||||||||
Oil, Gas & Consumable Fuels | 2,058 | 5.2 | % | ||||||||
Insurance | 2,006 | 5.1 | % | ||||||||
Health Care Equipment & Supplies | 1,788 | 4.5 | % | ||||||||
Food & Staples Retailing | 1,326 | 3.4 | % | ||||||||
Semiconductors & Semiconductor Equipment | 1,201 | 3.0 | % | ||||||||
Capital Markets | 1,175 | 3.0 | % | ||||||||
Health Care Providers & Services | 1,174 | 3.0 | % | ||||||||
Pharmaceuticals | 1,155 | 2.9 | % | ||||||||
Energy Equipment & Services | 1,129 | 2.9 | % | ||||||||
Professional Services | 1,000 | 2.5 | % | ||||||||
Diversified Telecommunication Services | 986 | 2.5 | % | ||||||||
Electrical Equipment | 945 | 2.4 | % | ||||||||
Internet Software & Services | 928 | 2.4 | % | ||||||||
Auto Components | 917 | 2.3 | % | ||||||||
Automobiles | 891 | 2.3 | % | ||||||||
Communications Equipment | 819 | 2.1 | % | ||||||||
IT Services | 767 | 1.9 | % | ||||||||
Software | 653 | 1.7 | % | ||||||||
Containers & Packaging | 613 | 1.6 | % | ||||||||
Commercial Services & Supplies | 545 | 1.4 | % | ||||||||
Hotels, Restaurants & Leisure | 522 | 1.3 | % | ||||||||
Beverages | 496 | 1.3 | % | ||||||||
Personal Products | 492 | 1.2 | % | ||||||||
Household Products | 489 | 1.2 | % | ||||||||
Diversified Financial Services | 463 | 1.2 | % | ||||||||
Trading Companies & Distributors | 452 | 1.1 | % | ||||||||
Multiline Retail | 432 | 1.1 | % | ||||||||
Household Durables | 411 | 1.0 | % | ||||||||
Internet & Catalog Retail | 410 | 1.0 | % | ||||||||
Specialty Retail | 405 | 1.0 | % | ||||||||
Real Estate Investment Trusts | 399 | 1.0 | % | ||||||||
Wireless Telecommunication Services | 368 | 0.9 | % | ||||||||
Food Products | 310 | 0.8 | % | ||||||||
Thrifts & Mortgage Finance | 170 | 0.4 | % | ||||||||
Short-Term Investments and Other Assets—Net | 1,833 | 4.7 | % | ||||||||
$ | 39,484 | 100.0 | % | ||||||||
See Notes to Schedule of Investments
87
Schedule of Investments Global Thematic Opportunities Fund
TOP TEN EQUITY HOLDINGS
Country | Industry | ||||||||||||||||||
1 | SanDisk Corp. | United States | Technology Hardware, Storage & Peripherals | 4.1 | % | ||||||||||||||
2 | Check Point Software Technologies Ltd. | Israel | Software | 3.4 | % | ||||||||||||||
3 | Belle International Holdings Ltd. | Hong Kong | Specialty Retail | 3.3 | % | ||||||||||||||
4 | American International Group, Inc. | United States | Insurance | 3.2 | % | ||||||||||||||
5 | KKR & Co. LP | United States | Capital Markets | 3.0 | % | ||||||||||||||
6 | Mediaset Espana Comunicacion SA | Spain | Media | 3.0 | % | ||||||||||||||
7 | Range Resources Corp. | United States | Oil, Gas & Consumable Fuels | 2.9 | % | ||||||||||||||
8 | BlackRock, Inc. | United States | Capital Markets | 2.6 | % | ||||||||||||||
9 | Honeywell International, Inc. | United States | Aerospace & Defense | 2.6 | % | ||||||||||||||
10 | Blackstone Group LP | United States | Capital Markets | 2.6 | % | ||||||||||||||
Number of Shares | Value† (000's)z | ||||||||||
Common Stocks (88.9%) | |||||||||||
Australia (1.9%) | |||||||||||
| BHP Billiton Ltd. ADR | 22,600 | $ | 1,551 | ||||||||
Canada (1.0%) | |||||||||||
| Cenovus Energy, Inc. | 27,000 | 861 | |||||||||
China (0.7%) | |||||||||||
| Bitauto Holdings Ltd. ADR* | 7,000 | 615 | |||||||||
France (2.6%) | |||||||||||
Accor SA | 18,800 | 914 | |||||||||
Lagardere SCA | 44,000 | 1,211 | |||||||||
2,125 | |||||||||||
Hong Kong (5.0%) | |||||||||||
| Belle International Holdings Ltd. | 2,171,000 | 2,776 | |||||||||
| Chow Tai Fook Jewellery Group Ltd. | 959,400 | 1,387 | |||||||||
4,163 | |||||||||||
Israel (3.4%) | |||||||||||
| Check Point Software Technologies Ltd.* | 39,500 | 2,805 | |||||||||
Japan (6.5%) | |||||||||||
LAWSON, Inc. | 15,500 | 1,113 | |||||||||
| Mitsubishi UFJ Financial Group, Inc. | 373,700 | 2,148 | |||||||||
| TOYOTA MOTOR Corp. | 37,000 | 2,108 | |||||||||
5,369 | |||||||||||
Korea (1.9%) | |||||||||||
| Samsung Electronics Co. Ltd. GDR | 2,655 | 1,617 | |||||||||
Number of Shares | Value† (000's)z | ||||||||||
Netherlands (1.9%) | |||||||||||
| Koninklijke Philips NV | 51,000 | $ | 1,554 | ||||||||
Norway (1.0%) | |||||||||||
Golar LNG Ltd. | 13,400 | 844 | |||||||||
Spain (3.0%) | |||||||||||
| Mediaset Espana Comunicacion SA* | 217,000 | 2,485 | |||||||||
Switzerland (4.8%) | |||||||||||
Novartis AG ADR | 20,900 | 1,877 | |||||||||
| Roche Holding AG ADR | 56,800 | 2,074 | |||||||||
3,951 | |||||||||||
United Kingdom (6.5%) | |||||||||||
| Aberdeen Asset Management PLC | 292,000 | 2,106 | |||||||||
Aon PLC | 22,650 | 1,974 | |||||||||
| Derwent London PLC | 10,000 | 463 | |||||||||
| GlaxoSmithKline PLC | 35,400 | 867 | |||||||||
5,410 | |||||||||||
United States (48.7%) | |||||||||||
| American International Group, Inc. | 46,900 | 2,629 | |||||||||
| Antero Resources Corp.* | 28,300 | 1,637 | |||||||||
| Bed Bath & Beyond, Inc.* | 26,200 | 1,684 | |||||||||
BlackRock, Inc. | 6,600 | 2,181 | |||||||||
| Blackstone Group LP | 65,000 | 2,179 | |||||||||
Boeing Co. | 6,500 | 824 | |||||||||
CME Group, Inc. | 12,000 | 919 | |||||||||
Corning, Inc. | 88,900 | 1,854 | |||||||||
Deere & Co. | 18,000 | 1,514 | |||||||||
Eli Lilly & Co. | 13,400 | 852 | |||||||||
| Express Scripts Holding Co.* | 24,700 | 1,826 | |||||||||
Number of Shares | Value† (000's)z | ||||||||||
| Franklin Resources, Inc. | 31,900 | $ | 1,803 | ||||||||
| General Dynamics Corp. | 9,000 | 1,109 | |||||||||
| Google, Inc. Class A* | 2,775 | 1,616 | |||||||||
| Google, Inc. Class C* | 2,775 | 1,586 | |||||||||
| Honeywell International, Inc. | 22,900 | 2,181 | |||||||||
Invesco Ltd. | 48,600 | 1,985 | |||||||||
KKR & Co. LP | 107,600 | 2,528 | |||||||||
MetLife, Inc. | 16,000 | 876 | |||||||||
| Navistar International Corp.* | 23,600 | 890 | |||||||||
| Range Resources Corp. | 30,300 | 2,381 | |||||||||
SanDisk Corp. | 35,000 | 3,429 | |||||||||
| Southern Copper Corp. | 12,600 | 413 | |||||||||
| Valmont Industries, Inc. | 11,600 | 1,633 | |||||||||
40,529 | |||||||||||
| Total Common Stocks (Cost $61,082) | 73,879 | ||||||||||
Exchange Traded Funds (2.2%) | |||||||||||
United States (2.2%) | |||||||||||
| WisdomTree India Earnings Fund (Cost $1,775) | 80,000 | 1,822 | |||||||||
| Principal Amount | |||||||||||
Convertible Bonds (0.9%) | |||||||||||
China (0.9%) | |||||||||||
| Home Inns & Hotels Management, Inc., Senior Unsecured Notes, 2.00%, due 12/15/15 (Cost $790) | $ | 800,000 | 779 | ||||||||
See Notes to Schedule of Investments
88
Number of Shares | Value† (000's)z | ||||||||||
Short-Term Investments (8.0%) | |||||||||||
| State Street Institutional Treasury Money Market Fund Premier Class (Cost $6,649) | 6,648,691 | $ | 6,649 | ||||||||
| Total Investments## (100.0%) (Cost $70,296) | 83,129 | ||||||||||
| Cash, receivables and other assets, less liabilities (0.0%) | 15 | ||||||||||
Total Net Assets (100.0%) | $ | 83,144 | |||||||||
| |||
| |||
See Notes to Schedule of Investments
89
SUMMARY SCHEDULE OF INVESTMENTS BY INDUSTRY GLOBAL THEMATIC OPPORTUNITIES FUND
Industry | Investments at Value† (000's omitted) | Percentage of Net Assets | |||||||||
Capital Markets | $ | 12,782 | 15.3 | % | |||||||
Specialty Retail | 5,847 | 7.0 | % | ||||||||
Oil, Gas & Consumable Fuels | 5,723 | 6.9 | % | ||||||||
Pharmaceuticals | 5,670 | 6.8 | % | ||||||||
Insurance | 5,479 | 6.7 | % | ||||||||
Aerospace & Defense | 4,114 | 4.9 | % | ||||||||
Machinery | 4,037 | 4.9 | % | ||||||||
Internet Software & Services | 3,817 | 4.5 | % | ||||||||
Media | 3,696 | 4.5 | % | ||||||||
Technology Hardware, Storage & Peripherals | 3,429 | 4.1 | % | ||||||||
Software | 2,805 | 3.4 | % | ||||||||
Banks | 2,148 | 2.6 | % | ||||||||
Automobiles | 2,108 | 2.5 | % | ||||||||
Metals & Mining | 1,964 | 2.4 | % | ||||||||
Electronic Equipment, Instruments & Components | 1,854 | 2.2 | % | ||||||||
Health Care Providers & Services | 1,826 | 2.2 | % | ||||||||
Exchange Traded Funds | 1,822 | 2.2 | % | ||||||||
Hotels, Restaurants & Leisure | 1,693 | 2.0 | % | ||||||||
Semiconductors & Semiconductor Equipment | 1,617 | 1.9 | % | ||||||||
Industrial Conglomerates | 1,554 | 1.9 | % | ||||||||
Food & Staples Retailing | 1,113 | 1.4 | % | ||||||||
Diversified Financial Services | 919 | 1.1 | % | ||||||||
Real Estate Investment Trusts | 463 | 0.6 | % | ||||||||
Short-Term Investments and Other Assets—Net | 6,664 | 8.0 | % | ||||||||
$ | 83,144 | 100.0 | % | ||||||||
See Notes to Schedule of Investments
90
Schedule of Investments Greater China Equity Fund
TOP TEN EQUITY HOLDINGS
1 | Ping An Insurance Group Co. of China Ltd., H Shares | 6.4 | % | ||||||||
2 | SDIC Power Holdings Co. Ltd., Class A | 5.6 | % | ||||||||
3 | Industrial & Commercial Bank of China Ltd., H Shares | 5.1 | % | ||||||||
4 | Dongfeng Motor Group Co. Ltd., H Shares | 5.1 | % | ||||||||
5 | Baidu, Inc. ADR | 4.9 | % | ||||||||
6 | SAIC Motor Corp. Ltd., Class A | 4.6 | % | ||||||||
7 | Tencent Holdings Ltd. | 4.4 | % | ||||||||
8 | China Unicom Hong Kong Ltd. | 4.0 | % | ||||||||
9 | Sunac China Holdings Ltd. | 3.8 | % | ||||||||
10 | Qihoo 360 Technology Co. Ltd. ADR | 3.6 | % | ||||||||
Number of Shares | Value† (000's)z | ||||||||||
Common Stocks (74.2%) | |||||||||||
Auto Components (0.6%) | |||||||||||
| Weifu High-Technology Group Co. Ltd. Class B | 127,812 | $ | 444 | ||||||||
Automobiles (8.2%) | |||||||||||
| Brilliance China Automotive Holdings Ltd. | 1,252,000 | 2,310 | |||||||||
| Dongfeng Motor Group Co. Ltd., H Shares | 2,024,000 | 3,756 | |||||||||
6,066 | |||||||||||
Banks (8.6%) | |||||||||||
| China Construction Bank Corp., H Shares | 3,505,000 | 2,601 | |||||||||
| Industrial & Commercial Bank of China Ltd., H Shares | 5,703,000 | 3,782 | |||||||||
6,383 | |||||||||||
Commercial Services & Supplies (0.4%) | |||||||||||
| Dongjiang Environmental Co. Ltd., H Shares | 77,400 | 306 | |||||||||
Construction Materials (0.7%) | |||||||||||
| BBMG Corp., H Shares | 692,000 | 513 | |||||||||
Diversified Telecommunication Services (4.0%) | |||||||||||
| China Unicom Hong Kong Ltd. | 1,642,000 | 2,928 | |||||||||
Food Products (1.1%) | |||||||||||
| WH Group Ltd.*ñ | 55,500 | 46 | |||||||||
| WH Group Ltd.*c | 916,500 | 753 | |||||||||
799 | |||||||||||
Gas Utilities (1.0%) | |||||||||||
| ENN Energy Holdings Ltd. | 106,000 | 749 | |||||||||
Health Care Providers & Services (1.0%) | |||||||||||
| Sinopharm Group Co. Ltd., H Shares | 219,200 | 766 | |||||||||
Number of Shares | Value† (000's)z | ||||||||||
Independent Power and Renewable Electricity Producers (6.3%) | |||||||||||
| China Power International Development Ltd. | 5,282,000 | $ | 2,413 | ||||||||
| Huadian Fuxin Energy Corp. Ltd., H Shares | 1,542,000 | 915 | |||||||||
| Huadian Power International Corp. Ltd., H Shares | 1,104,000 | 778 | |||||||||
| Huaneng Renewables Corp. Ltd., H Shares | 1,488,000 | 547 | |||||||||
4,653 | |||||||||||
Insurance (12.2%) | |||||||||||
| China Life Insurance Co. Ltd., H Shares | 658,000 | 1,893 | |||||||||
| China Pacific Insurance Group Co. Ltd., H Shares | 634,600 | 2,379 | |||||||||
| Ping An Insurance Group Co. of China Ltd., H Shares | 585,500 | 4,767 | |||||||||
9,039 | |||||||||||
Internet & Catalog Retail (0.5%) | |||||||||||
| Jumei International Holding Ltd. ADR* | 12,992 | 397 | |||||||||
Internet Software & Services (12.9%) | |||||||||||
Baidu, Inc. ADR* | 16,816 | 3,607 | |||||||||
| Qihoo 360 Technology Co. Ltd. ADR* | 30,040 | 2,639 | |||||||||
| Tencent Holdings Ltd. | 200,900 | 3,279 | |||||||||
9,525 | |||||||||||
Machinery (1.2%) | |||||||||||
| Sany Heavy Equipment International Holdings Co. Ltd.* | 1,005,000 | 219 | |||||||||
Number of Shares | Value† (000's)z | ||||||||||
| Shanghai Mechanical and Electrical Industry Co. Ltd. Class B | 317,714 | $ | 670 | ||||||||
889 | |||||||||||
Oil, Gas & Consumable Fuels (0.4%) | |||||||||||
CNOOC Ltd. | 165,000 | 331 | |||||||||
Pharmaceuticals (3.3%) | |||||||||||
| CSPC Pharmaceutical Group Ltd. | 716,000 | 599 | |||||||||
| Luye Pharma Group Ltd.* | 951,500 | 1,050 | |||||||||
| Sino Biopharmaceutical Ltd. | 820,000 | 755 | |||||||||
2,404 | |||||||||||
Real Estate Management & Development (6.1%) | |||||||||||
| China Resources Land Ltd. | 468,000 | 1,070 | |||||||||
| China Vanke Co. Ltd., H Shares* | 330,300 | 619 | |||||||||
| Sunac China Holdings Ltd. | 3,587,000 | 2,786 | |||||||||
4,475 | |||||||||||
Transportation Infrastructure (1.5%) | |||||||||||
| Shenzhen Internationl Holdings Ltd. | 821,000 | 1,102 | |||||||||
Water Utilities (0.7%) | |||||||||||
| Kangda International Environmental Co. Ltd.*c | 102,000 | 42 | |||||||||
| Kangda International Environmental Co. Ltd.*ñ | 1,106,000 | 461 | |||||||||
503 | |||||||||||
| Wireless Telecommunication Services (3.5%) | |||||||||||
| China Mobile Ltd. | 210,000 | 2,608 | |||||||||
| Total Common Stocks (Cost $49,104) | 54,880 | ||||||||||
See Notes to Schedule of Investments
91
Number of Shares | Value† (000's)z | ||||||||||
Participatory Notes (22.8%) | |||||||||||
Automobiles (4.6%) | |||||||||||
| SAIC Motor Corp. Ltd., Class A (issuer Goldman Sachs Int'l), Expiration Date 6/4/2015 | 45,442 | $ | 125 | ||||||||
| SAIC Motor Corp. Ltd., Class A (issuer Citigroup Global Markets Holdings, Inc.), Expiration Date 1/20/2015c | 37,000 | 101 | |||||||||
| SAIC Motor Corp. Ltd., Class A (issuer Citigroup Global Markets Holdings, Inc.), Expiration Date 1/20/2015ñ | 211,761 | 580 | |||||||||
| SAIC Motor Corp. Ltd., Class A (issuer UBS AG), Expiration Date 2/9/2015 | 161,755 | 446 | |||||||||
| SAIC Motor Corp. Ltd., Class A (issuer HSBC Bank PLC), Expiration Date 8/14/2023 | 21,600 | 60 | |||||||||
| SAIC Motor Corp. Ltd., Class A (issuer Merrill Lynch Int'l & Co.), Expiration Date 8/29/2018 | 540,937 | 1,483 | |||||||||
| SAIC Motor Corp. Ltd., Class A (issuer Morgan Stanley Asia Products), Expiration Date 8/29/2018 | 226,200 | 623 | |||||||||
3,418 | |||||||||||
Electrical Equipment (3.2%) | |||||||||||
| XJ Electric Co. Ltd., Class A (issuer HSBC Bank PLC), Expiration Date 7/3/2024 | 138,932 | 468 | |||||||||
| XJ Electric Co. Ltd., Class A (issuer UBS AG), Expiration Date 1/2/2015 | 143,777 | 484 | |||||||||
Number of Shares | Value† (000's)z | ||||||||||
| XJ Electric Co. Ltd., Class A (issuer Morgan Stanley Asia Products), Expiration Date 7/30/2015 | 5,900 | $ | 20 | ||||||||
| XJ Electric Co. Ltd., Class A (issuer Citigroup Global Markets Holdings, Inc.), Expiration Date 1/16/2015c | 63,000 | 212 | |||||||||
| Zhejiang Dahua Technology Co. Ltd., Class A (issuer HSBC Bank PLC), Expiration Date 12/19/2022 | 10,751 | 41 | |||||||||
| Zhejiang Dahua Technology Co. Ltd., Class A (issuer UBS AG), Expiration Date 3/19/2015 | 25,662 | 98 | |||||||||
| Zhejiang Dahua Technology Co. Ltd., Class A (issuer Morgan Stanley Asia Products), Expiration Date 3/18/2015 | 60,355 | 230 | |||||||||
| Zhejiang Dahua Technology Co. Ltd., Class A (issuer Citigroup Global Markets Holdings, Inc.), Expiration Date 1/20/2015c | 8,000 | 30 | |||||||||
| Zhejiang Dahua Technology Co. Ltd., Class A (issuer Merrill Lynch Int'l & Co.), Expiration Date 4/1/2019 | 35,092 | 134 | |||||||||
| Zhejiang Dahua Technology Co. Ltd., Class A (issuer Goldman Sachs Int'l), Expiration Date 4/1/2015 | 158,904 | 605 | |||||||||
2,322 | |||||||||||
Number of Shares | Value† (000's)z | ||||||||||
Independent Power and Renewable Electricity Producers (5.6%) | |||||||||||
| SDIC Power Holdings Co. Ltd., Class A (issuer Citigroup Global Markets Holdings, Inc.), Expiration Date 1/16/2015c | 131,000 | $ | 125 | ||||||||
| SDIC Power Holdings Co. Ltd., Class A (issuer Citigroup Global Markets Holdings, Inc.), Expiration Date 1/16/2015ñ | 614,500 | 587 | |||||||||
| SDIC Power Holdings Co. Ltd., Class A (issuer HSBC Bank PLC), Expiration Date 11/4/2019 | 333,232 | 319 | |||||||||
| SDIC Power Holdings Co. Ltd., Class A (issuer Morgan Stanley Asia Products), Expiration Date 7/23/2018 | 964,755 | 922 | |||||||||
| SDIC Power Holdings Co. Ltd., Class A (issuer Merrill Lynch Int'l & Co.), Expiration Date 1/17/2019 | 626,449 | 599 | |||||||||
| SDIC Power Holdings Co. Ltd., Class A (issuer UBS AG), Expiration Date 1/19/2015 | 531,984 | 508 | |||||||||
| SDIC Power Holdings Co. Ltd., Class A (issuer Goldman Sachs Int'l), Expiration Date 1/21/2015 | 1,134,482 | 1,084 | |||||||||
4,144 | |||||||||||
Insurance (1.4%) | |||||||||||
| Ping An Insurance Group Co. of China Ltd., Class A (issuer Citigroup Global Markets Holdings, Inc.), Expiration Date 1/16/2015c | 9,600 | 66 | |||||||||
See Notes to Schedule of Investments
92
Number of Shares | Value† (000's)z | ||||||||||
| Ping An Insurance Group Co. of China Ltd., Class A (issuer Citigroup Global Markets Holdings, Inc.), Expiration Date 1/16/2015ñ | 7,400 | $ | 51 | ||||||||
| Ping An Insurance Group Co. of China Ltd., Class A (issuer UBS AG), Expiration Date 5/27/2015 | 50,900 | 352 | |||||||||
| Ping An Insurance Group Co. of China Ltd., Class A (issuer Morgan Stanley Asia Products), Expiration Date 9/5/2018 | 67,900 | 470 | |||||||||
| Ping An Insurance Group Co. of China Ltd., Class A (issuer Merrill Lynch Int'l & Co.), Expiration Date 3/13/2019 | 16,600 | 115 | |||||||||
| Ping An Insurance Group Co. of China Ltd., Class A (issuer HSBC Bank PLC), Expiration Date 6/23/2024 | 1,200 | 8 | |||||||||
1,062 | |||||||||||
Pharmaceuticals (2.2%) | |||||||||||
| Beijing SL Pharmaceutical Co. Ltd., Class A (issuer Citigroup Global Markets Holdings, Inc.), Expiration Date 1/16/2015c | 52,357 | 364 | |||||||||
| Beijing SL Pharmaceutical Co. Ltd., Class A (issuer Citigroup Global Markets Holdings, Inc.), Expiration Date 1/16/2015ñ | 35,208 | 245 | |||||||||
| Beijing SL Pharmaceutical Co. Ltd., Class A (issuer Goldman Sachs Int'l), Expiration Date 1/23/2015 | 60,938 | 424 | |||||||||
Number of Shares | Value† (000's)z | ||||||||||
| Beijing SL Pharmaceutical Co. Ltd., Class A (issuer UBS AG), Expiration Date 11/7/2014 | 8,300 | $ | 58 | ||||||||
| Beijing SL Pharmaceutical Co. Ltd., Class A (issuer Morgan Stanley Asia Products), Expiration Date 10/22/2018 | 17,559 | 122 | |||||||||
| Beijing SL Pharmaceutical Co. Ltd., Class A (issuer HSBC Bank PLC), Expiration Date 1/3/2024 | 59,000 | 410 | |||||||||
1,623 | |||||||||||
Real Estate Management & Development (4.5%) | |||||||||||
| China Vanke Co. Ltd., Class A (issuer Citigroup Global Markets Holdings, Inc.), Expiration Date 1/20/2015ñ | 300,841 | 444 | |||||||||
| China Vanke Co. Ltd., Class A (issuer Goldman Sachs Int'l), Expiration Date 6/30/2015 | 338,947 | 503 | |||||||||
| China Vanke Co. Ltd., Class A (issuer Merrill Lynch Int'l & Co.), Expiration Date 1/7/2019 | 41,500 | 62 | |||||||||
| China Vanke Co. Ltd., Class A (issuer UBS AG), Expiration Date 9/26/2014 | 283,984 | 421 | |||||||||
| Poly Real Estate Group Co. Ltd., Class A (issuer UBS AG), Expiration Date 8/4/2015 | 521,000 | 481 | |||||||||
| Poly Real Estate Group Co. Ltd., Class A (issuer HSBC Bank PLC), Expiration Date 9/25/2023 | 1,056,300 | 975 | |||||||||
Number of Shares | Value† (000's)z | ||||||||||
| Poly Real Estate Group Co. Ltd., Class A (issuer Citigroup Global Markets Holdings, Inc.), Expiration Date 1/20/2015c | 467,700 | $ | 432 | ||||||||
3,318 | |||||||||||
Road & Rail (1.3%) | |||||||||||
| Daqin Railway Co. Ltd., Class A (issuer Citigroup Global Markets Holdings, Inc.), Expiration Date 1/20/2015c | 34,600 | 42 | |||||||||
| Daqin Railway Co. Ltd., Class A (issuer Citigroup Global Markets Holdings, Inc.), Expiration Date 1/20/2015ñ | 136,716 | 165 | |||||||||
| Daqin Railway Co. Ltd., Class A (issuer Merrill Lynch Int'l & Co.), Expiration Date 7/6/2018 | 290,339 | 350 | |||||||||
| Daqin Railway Co. Ltd., Class A (issuer HSBC Bank PLC), Expiration Date 10/28/2020 | 106,800 | 128 | |||||||||
| Daqin Railway Co. Ltd., Class A (issuer Morgan Stanley Asia Products), Expiration Date 7/18/2018 | 191,390 | 230 | |||||||||
| Daqin Railway Co. Ltd., Class A (issuer Goldman Sachs Int'l), Expiration Date 9/18/2014 | 27,500 | 33 | |||||||||
| Daqin Railway Co. Ltd., Class A (issuer UBS AG), Expiration Date 12/19/2014 | 21,668 | 26 | |||||||||
974 | |||||||||||
| Total Participatory Notes (Cost $15,676) | 16,861 | ||||||||||
See Notes to Schedule of Investments
93
Number of Shares | Value† (000's)z | ||||||||||
Short-Term Investments (1.2%) | |||||||||||
| State Street Institutional Government Money Market Fund Premier Class (Cost $877) | 876,728 | $ | 877 | ||||||||
| Total Investments## (98.2%) (Cost $65,657) | 72,618 | ||||||||||
| Cash, receivables and other assets, less liabilities (1.8%) | 1,341 | ||||||||||
Total Net Assets (100.0%) | $ | 73,959 | |||||||||
See Notes to Schedule of Investments
94
Schedule of Investments Guardian Fund
TOP TEN EQUITY HOLDINGS
1 | Berkshire Hathaway, Inc. Class B | 5.4 | % | ||||||||
2 | Newell Rubbermaid, Inc. | 5.1 | % | ||||||||
3 | Texas Instruments, Inc. | 5.0 | % | ||||||||
4 | American Express Co. | 4.5 | % | ||||||||
5 | TJX Cos., Inc. | 4.5 | % | ||||||||
6 | Anheuser-Busch InBev NV ADR | 4.2 | % | ||||||||
7 | Danaher Corp. | 4.2 | % | ||||||||
8 | Progressive Corp. | 4.1 | % | ||||||||
9 | 3M Co. | 3.4 | % | ||||||||
10 | eBay, Inc. | 3.4 | % | ||||||||
Number of Shares | Value† (000's)z | ||||||||||
Common Stocks (98.1%) | |||||||||||
Auto Components (1.4%) | |||||||||||
BorgWarner, Inc. | 338,111 | $ | 21,027 | ||||||||
Banks (3.0%) | |||||||||||
U.S. Bancorp | 1,089,004 | 46,043 | |||||||||
Beverages (6.1%) | |||||||||||
| Anheuser-Busch InBev NV ADR | 573,496 | 64,105 | |||||||||
Coca-Cola Co. | 684,890 | 28,574 | |||||||||
92,679 | |||||||||||
Consumer Finance (4.5%) | |||||||||||
| American Express Co. | 760,057 | 68,063 | |||||||||
Diversified Financial Services (8.5%) | |||||||||||
| Berkshire Hathaway, Inc. Class B* | 597,878 | 82,059 | |||||||||
| Intercontinental Exchange, Inc. | 243,076 | 45,941 | |||||||||
128,000 | |||||||||||
Diversified Telecommunication Services (1.5%) | |||||||||||
tw telecom, inc.* | 556,894 | 22,852 | |||||||||
Energy Equipment & Services (2.9%) | |||||||||||
Schlumberger Ltd. | 396,980 | 43,525 | |||||||||
Food & Staples Retailing (2.6%) | |||||||||||
| Costco Wholesale Corp. | 320,818 | 38,845 | |||||||||
| Health Care Equipment & Supplies (2.3%) | |||||||||||
| Abbott Laboratories | 819,266 | 34,606 | |||||||||
Household Durables (5.1%) | |||||||||||
| Newell Rubbermaid, Inc. | 2,291,402 | 76,808 | |||||||||
Household Products (2.3%) | |||||||||||
| Procter & Gamble Co. | 414,050 | 34,412 | |||||||||
Industrial Conglomerates (7.6%) | |||||||||||
3M Co. | 358,650 | 51,646 | |||||||||
Danaher Corp. | 818,027 | 62,669 | |||||||||
114,315 | |||||||||||
Number of Shares | Value† (000's)z | ||||||||||
Industrial Gases (1.9%) | |||||||||||
Praxair, Inc. | 219,419 | $ | 28,865 | ||||||||
Insurance (4.1%) | |||||||||||
Progressive Corp. | 2,466,769 | 61,719 | |||||||||
Internet Software & Services (3.4%) | |||||||||||
eBay, Inc.* | 915,365 | 50,803 | |||||||||
IT Services (4.0%) | |||||||||||
| Computer Sciences Corp. | 695,455 | 41,581 | |||||||||
| MasterCard, Inc. Class A | 257,618 | 19,530 | |||||||||
61,111 | |||||||||||
Leisure Products (2.9%) | |||||||||||
| Polaris Industries, Inc. | 298,136 | 43,343 | |||||||||
Machinery (2.6%) | |||||||||||
| Lincoln Electric Holdings, Inc. | 556,858 | 39,593 | |||||||||
Metals & Mining (2.0%) | |||||||||||
Nucor Corp. | 550,772 | 29,918 | |||||||||
Multi-Utilities (1.0%) | |||||||||||
| Wisconsin Energy Corp. | 328,821 | 14,905 | |||||||||
Oil, Gas & Consumable Fuels (3.1%) | |||||||||||
Noble Energy, Inc. | 654,042 | 47,182 | |||||||||
Pharmaceuticals (5.4%) | |||||||||||
Roche Holding AG | 142,357 | 41,511 | |||||||||
Sanofi ADR | 724,965 | 39,655 | |||||||||
81,166 | |||||||||||
Road & Rail (1.9%) | |||||||||||
| J.B. Hunt Transport Services, Inc. | 374,051 | 28,259 | |||||||||
Semiconductors & Semiconductor Equipment (7.5%) | |||||||||||
| Microchip Technology, Inc. | 796,991 | 38,917 | |||||||||
| Texas Instruments, Inc. | 1,555,069 | 74,923 | |||||||||
113,840 | |||||||||||
Software (3.0%) | |||||||||||
Intuit, Inc. | 537,333 | 44,695 | |||||||||
Specialty Retail (4.5%) | |||||||||||
TJX Cos., Inc. | 1,138,236 | 67,850 | |||||||||
Number of Shares | Value† (000's)z | ||||||||||
| Trading Companies & Distributors (3.0%) | |||||||||||
NOW, Inc.* | 448,377 | $ | 14,810 | ||||||||
W.W. Grainger, Inc. | 124,774 | 30,719 | |||||||||
45,529 | |||||||||||
| Total Common Stocks (Cost $1,086,159) | 1,479,953 | ||||||||||
Short-Term Investments (1.8%) | |||||||||||
| State Street Institutional Treasury Money Market Fund Premier Class (Cost $27,356) | 27,355,618 | 27,356 | |||||||||
| Total Investments## (99.9%) (Cost $1,113,515) | 1,507,309 | ||||||||||
| Cash, receivables and other assets, less liabilities (0.1%) | 1,571 | ||||||||||
Total Net Assets (100.0%) | $ | 1,508,880 | |||||||||
See Notes to Schedule of Investments
95
Schedule of Investments International Equity Fund
TOP TEN EQUITY HOLDINGS
Country | Industry | ||||||||||||||||||
1 | Check Point Software Technologies Ltd. | Israel | Software | 2.0 | % | ||||||||||||||
2 | Givaudan SA | Switzerland | Chemicals | 1.7 | % | ||||||||||||||
3 | Sodexo | France | Hotels, Restaurants & Leisure | 1.7 | % | ||||||||||||||
4 | Sika AG | Switzerland | Chemicals | 1.7 | % | ||||||||||||||
5 | Reed Elsevier PLC | United Kingdom | Media | 1.6 | % | ||||||||||||||
6 | TOYOTA MOTOR Corp. | Japan | Automobiles | 1.6 | % | ||||||||||||||
7 | Bunzl PLC | United Kingdom | Trading Companies & Distributors | 1.6 | % | ||||||||||||||
8 | DNB ASA | Norway | Banks | 1.6 | % | ||||||||||||||
9 | Sanofi | France | Pharmaceuticals | 1.5 | % | ||||||||||||||
10 | Roche Holding AG | Switzerland | Pharmaceuticals | 1.5 | % | ||||||||||||||
Number of Shares | Value† (000's)z | ||||||||||
Common Stocks (97.0%) | |||||||||||
Australia (1.6%) | |||||||||||
Brambles Ltd. | 1,299,275 | $ | 11,528 | ||||||||
| Spotless Group Holdings Ltd.* | 3,612,555 | 6,545 | |||||||||
18,073 | |||||||||||
Austria (1.1%) | |||||||||||
Andritz AG | 229,515 | 12,280 | |||||||||
Belgium (0.8%) | |||||||||||
Colruyt SA | 201,635 | 9,617 | |||||||||
Brazil (1.0%) | |||||||||||
SLC Agricola SA | 1,403,000 | 10,849 | |||||||||
Canada (8.1%) | |||||||||||
| Alimentation Couche-Tard, Inc. Class B | 402,000 | 12,057 | |||||||||
| ATS Automation Tooling Systems, Inc.* | 870,100 | 10,667 | |||||||||
| Cenovus Energy, Inc. | 297,652 | 9,494 | |||||||||
| Corus Entertainment, Inc., B Shares | 637,301 | 14,331 | |||||||||
| Home Capital Group, Inc. | 99,000 | 4,937 | |||||||||
| MacDonald, Dettwiler & Associates Ltd. | 181,833 | 13,884 | |||||||||
ShawCor Ltd. | 258,000 | 13,983 | |||||||||
| Suncor Energy, Inc. | 295,600 | 12,133 | |||||||||
91,486 | |||||||||||
China (1.3%) | |||||||||||
| PICC Property & Casualty Co. Ltd., H Shares | 8,647,300 | 14,326 | |||||||||
Denmark (1.4%) | |||||||||||
Sydbank A/S* | 526,581 | 16,191 | |||||||||
Number of Shares | Value† (000's)z | ||||||||||
France (8.2%) | |||||||||||
Arkema SA | 121,435 | $ | 9,112 | ||||||||
BNP Paribas SA | 151,710 | 10,242 | |||||||||
Pernod-Ricard SA | 88,940 | 10,487 | |||||||||
Publicis Groupe SA | 170,515 | 12,704 | |||||||||
Rexel SA | 705,227 | 14,039 | |||||||||
Sanofi | 154,760 | 16,979 | |||||||||
Sodexo | 196,730 | 19,379 | |||||||||
92,942 | |||||||||||
Germany (11.0%) | |||||||||||
Bayer AG | 102,440 | 13,736 | |||||||||
Brenntag AG | 274,965 | 14,551 | |||||||||
Continental AG | 60,750 | 12,971 | |||||||||
| Deutsche Boerse AG | 182,494 | 12,975 | |||||||||
Gerresheimer AG | 210,073 | 15,181 | |||||||||
| Henkel AG & Co. KGaA | 125,780 | 13,189 | |||||||||
Linde AG | 81,896 | 16,211 | |||||||||
SAP SE ADR | 155,600 | 12,126 | |||||||||
| Volkswagen AG, Preference Shares | 61,176 | 13,733 | |||||||||
124,673 | |||||||||||
Ireland (0.7%) | |||||||||||
DCC PLC | 126,713 | 7,522 | |||||||||
Israel (3.3%) | |||||||||||
| Bezeq Israeli Telecommunication Corp. Ltd. | 7,925,314 | 14,956 | |||||||||
| Check Point Software Technologies Ltd.* | 317,700 | 22,563 | |||||||||
37,519 | |||||||||||
Italy (1.0%) | |||||||||||
| Azimut Holding SpA | 434,665 | 11,314 | |||||||||
Japan (13.2%) | |||||||||||
FANUC Corp. | 94,700 | 15,837 | |||||||||
| KANSAI PAINT Co. Ltd. | 912,600 | 14,490 | |||||||||
KEYENCE Corp. | 38,700 | 16,561 | |||||||||
Number of Shares | Value† (000's)z | ||||||||||
| Nihon Kohden Corp. | 302,100 | $ | 16,725 | ||||||||
PIGEON Corp. | 204,900 | 12,112 | |||||||||
| Pola Orbis Holdings, Inc. | 25,200 | 993 | |||||||||
SMC Corp. | 58,400 | 15,264 | |||||||||
SOFTBANK Corp. | 188,000 | 13,563 | |||||||||
| SUGI HOLDINGS Co. Ltd. | 229,500 | 9,551 | |||||||||
Sundrug Co. Ltd. | 376,000 | 16,696 | |||||||||
| TOYOTA MOTOR Corp. | 324,200 | 18,471 | |||||||||
150,263 | |||||||||||
Korea (1.4%) | |||||||||||
| Samsung Electronics Co. Ltd. | 13,136 | 15,987 | |||||||||
Netherlands (5.0%) | |||||||||||
Akzo Nobel NV | 177,527 | 12,547 | |||||||||
| ASML Holding NV | 172,460 | 16,499 | |||||||||
| Euronext NVñ* | 308,610 | 7,875 | |||||||||
| Koninklijke Ahold NV | 590,924 | 10,094 | |||||||||
Nutreco NV | 259,873 | 9,996 | |||||||||
57,011 | |||||||||||
Norway (2.8%) | |||||||||||
DNB ASA | 969,479 | 18,082 | |||||||||
| Norwegian Property ASA* | 3,578,842 | 5,716 | |||||||||
ProSafe SE | 1,298,820 | 7,909 | |||||||||
31,707 | |||||||||||
Singapore (2.1%) | |||||||||||
| Jardine Matheson Holdings Ltd. | 195,930 | 11,807 | |||||||||
| United Overseas Bank Ltd. | 657,200 | 12,065 | |||||||||
23,872 | |||||||||||
Sweden (1.6%) | |||||||||||
| Elekta AB, B Shares | 309,908 | 3,532 | |||||||||
See Notes to Schedule of Investments
96
Number of Shares | Value† (000's)z | ||||||||||
| Telefonaktiebolaget LM Ericsson, B Shares | 1,183,480 | $ | 14,757 | ||||||||
18,289 | |||||||||||
Switzerland (12.0%) | |||||||||||
| Bucher Industries AG | 34,325 | 10,207 | |||||||||
Givaudan SA* | 11,695 | 19,414 | |||||||||
| Julius Baer Group Ltd.* | 304,720 | 13,851 | |||||||||
| Partners Group Holding AG | 41,495 | 10,947 | |||||||||
Roche Holding AG | 57,729 | 16,834 | |||||||||
SGS SA | 7,055 | 15,654 | |||||||||
Sika AG | 5,055 | 19,107 | |||||||||
Sonova Holding AG | 79,100 | 12,649 | |||||||||
Sulzer AG | 71,576 | 9,496 | |||||||||
Tecan Group AG | 68,723 | 7,710 | |||||||||
135,869 | |||||||||||
United Kingdom (17.2%) | |||||||||||
Amlin PLC | 2,001,427 | 14,949 | |||||||||
Aon PLC | 156,900 | 13,675 | |||||||||
Barclays PLC | 2,256,900 | 8,410 | |||||||||
Bunzl PLC | 665,001 | 18,172 | |||||||||
Diploma PLC | 1,012,450 | 11,547 | |||||||||
Mitie Group PLC | 3,176,712 | 16,655 | |||||||||
Prudential PLC | 644,450 | 15,513 | |||||||||
Reed Elsevier PLC | 1,146,096 | 18,694 | |||||||||
| RPS Group PLC | 2,832,456 | 13,077 | |||||||||
SABMiller PLC | 207,330 | 11,438 | |||||||||
| St. James's Place PLC | 871,370 | 10,372 | |||||||||
| Synergy Health PLC | 651,374 | 16,221 | |||||||||
| TalkTalk Telecom Group PLC | 2,926,610 | 14,687 | |||||||||
Travis Perkins PLC | 386,283 | 11,178 | |||||||||
194,588 | |||||||||||
United States (2.2%) | |||||||||||
Nielsen NV | 322,900 | 15,173 | |||||||||
Taminco Corp.* | 420,150 | 10,062 | |||||||||
25,235 | |||||||||||
| Total Common Stocks (Cost $926,163) | 1,099,613 | ||||||||||
Short-Term Investments (2.9%) | |||||||||||
| State Street Institutional Treasury Money Market Fund Premier Class (Cost $32,332) | 32,331,632 | 32,332 | |||||||||
| Total Investments## (99.9%) (Cost $958,495) | 1,131,945 | ||||||||||
| Cash, receivables and other assets, less liabilities (0.1%) | 1,578 | ||||||||||
Total Net Assets (100.0%) | $ | 1,133,523 | |||||||||
| |||
| |||
See Notes to Schedule of Investments
97
SUMMARY SCHEDULE OF INVESTMENTS BY INDUSTRY INTERNATIONAL EQUITY FUND
Industry | Investments at Value† (000's omitted) | Percentage of Net Assets | |||||||||
Chemicals | $ | 100,943 | 8.9 | % | |||||||
Machinery | 73,751 | 6.5 | % | ||||||||
Trading Companies & Distributors | 69,487 | 6.2 | % | ||||||||
Insurance | 68,835 | 6.1 | % | ||||||||
Banks | 64,990 | 5.7 | % | ||||||||
Food & Staples Retailing | 58,015 | 5.1 | % | ||||||||
Commercial Services & Supplies | 47,805 | 4.3 | % | ||||||||
Pharmaceuticals | 47,549 | 4.2 | % | ||||||||
Media | 45,729 | 4.0 | % | ||||||||
Capital Markets | 36,112 | 3.2 | % | ||||||||
Software | 34,689 | 3.1 | % | ||||||||
Health Care Equipment & Supplies | 32,906 | 2.9 | % | ||||||||
Semiconductors & Semiconductor Equipment | 32,486 | 2.9 | % | ||||||||
Automobiles | 32,204 | 2.8 | % | ||||||||
Professional Services | 30,827 | 2.7 | % | ||||||||
Diversified Telecommunication Services | 29,643 | 2.6 | % | ||||||||
Household Products | 25,301 | 2.2 | % | ||||||||
Life Sciences Tools & Services | 22,891 | 2.0 | % | ||||||||
Beverages | 21,925 | 1.9 | % | ||||||||
Energy Equipment & Services | 21,892 | 1.9 | % | ||||||||
Oil, Gas & Consumable Fuels | 21,627 | 1.9 | % | ||||||||
Diversified Financial Services | 20,850 | 1.9 | % | ||||||||
Food Products | 20,845 | 1.9 | % | ||||||||
Hotels, Restaurants & Leisure | 19,379 | 1.7 | % | ||||||||
Industrial Conglomerates | 19,329 | 1.7 | % | ||||||||
Electronic Equipment, Instruments & Components | 16,561 | 1.5 | % | ||||||||
Health Care Providers & Services | 16,221 | 1.4 | % | ||||||||
Communications Equipment | 14,757 | 1.3 | % | ||||||||
Aerospace & Defense | 13,884 | 1.2 | % | ||||||||
Wireless Telecommunication Services | 13,563 | 1.2 | % | ||||||||
Auto Components | 12,971 | 1.1 | % | ||||||||
Real Estate Management & Development | 5,716 | 0.5 | % | ||||||||
Thrifts & Mortgage Finance | 4,937 | 0.4 | % | ||||||||
Personal Products | 993 | 0.1 | % | ||||||||
Short-Term Investments and Other Assets—Net | 33,910 | 3.0 | % | ||||||||
$ | 1,133,523 | 100.0 | % | ||||||||
See Notes to Schedule of Investments
98
Schedule of Investments International Select Funda
TOP TEN EQUITY HOLDINGS
Country | Industry | ||||||||||||||||||
1 | Roche Holding AG | Switzerland | Pharmaceuticals | 2.6 | % | ||||||||||||||
2 | Givaudan SA | Switzerland | Chemicals | 2.5 | % | ||||||||||||||
3 | Check Point Software Technologies Ltd. | Israel | Software | 2.3 | % | ||||||||||||||
4 | SMC Corp. | Japan | Machinery | 2.1 | % | ||||||||||||||
5 | KANSAI PAINT Co. Ltd. | Japan | Chemicals | 2.0 | % | ||||||||||||||
6 | Sika AG | Switzerland | Chemicals | 2.0 | % | ||||||||||||||
7 | SGS SA | Switzerland | Professional Services | 2.0 | % | ||||||||||||||
8 | Reed Elsevier PLC | United Kingdom | Media | 1.9 | % | ||||||||||||||
9 | Bunzl PLC | United Kingdom | Trading Companies & Distributors | 1.9 | % | ||||||||||||||
10 | Novartis AG | Switzerland | Pharmaceuticals | 1.9 | % | ||||||||||||||
Number of Shares | Value† (000's)z | ||||||||||
Common Stocks (98.0%) | |||||||||||
Australia (1.1%) | |||||||||||
Brambles Ltd. | 298,470 | $ | 2,648 | ||||||||
Austria (1.1%) | |||||||||||
Andritz AG | 49,120 | 2,628 | |||||||||
Belgium (0.8%) | |||||||||||
Colruyt SA | 40,400 | 1,927 | |||||||||
Canada (6.9%) | |||||||||||
Agrium, Inc. | 25,500 | 2,413 | |||||||||
| Alimentation Couche-Tard, Inc. Class B | 107,800 | 3,233 | |||||||||
| Bank of Nova Scotia | 50,486 | 3,345 | |||||||||
| Cenovus Energy, Inc. | 63,329 | 2,020 | |||||||||
ShawCor Ltd. | 55,400 | 3,002 | |||||||||
| Suncor Energy, Inc. | 62,900 | 2,582 | |||||||||
16,595 | |||||||||||
China (1.3%) | |||||||||||
| PICC Property & Casualty Co. Ltd., H Shares | 1,849,400 | 3,064 | |||||||||
Denmark (1.3%) | |||||||||||
Jyske Bank A/S* | 55,410 | 3,020 | |||||||||
France (10.8%) | |||||||||||
Arkema SA | 26,095 | 1,958 | |||||||||
BNP Paribas SA | 40,435 | 2,730 | |||||||||
Pernod-Ricard SA | 18,890 | 2,227 | |||||||||
Publicis Groupe SA | 43,873 | 3,269 | |||||||||
Rexel SA | 174,038 | 3,464 | |||||||||
Sanofi | 41,335 | 4,535 | |||||||||
| Schneider Electric SE | 42,869 | 3,623 | |||||||||
Sodexo | 41,965 | 4,134 | |||||||||
25,940 | |||||||||||
Germany (10.6%) | |||||||||||
Bayer AG | 22,240 | 2,982 | |||||||||
Brenntag AG | 60,315 | 3,192 | |||||||||
Continental AG | 15,465 | 3,302 | |||||||||
Number of Shares | Value† (000's)z | ||||||||||
| Deutsche Boerse AG | 53,077 | $ | 3,774 | ||||||||
| Henkel AG & Co. KGaA | 31,975 | 3,353 | |||||||||
Linde AG | 17,185 | 3,402 | |||||||||
SAP SE ADR | 33,685 | 2,625 | |||||||||
| Volkswagen AG, Preference Shares | 13,014 | 2,921 | |||||||||
25,551 | |||||||||||
Israel (3.9%) | |||||||||||
| Bezeq Israeli Telecommunication Corp. Ltd. | 2,103,675 | 3,970 | |||||||||
| Check Point Software Technologies Ltd.* | 77,900 | 5,532 | |||||||||
9,502 | |||||||||||
Italy (1.0%) | |||||||||||
| Azimut Holding SpA | 92,085 | 2,397 | |||||||||
Japan (14.8%) | |||||||||||
FANUC Corp. | 24,000 | 4,014 | |||||||||
| KANSAI PAINT Co. Ltd. | 309,800 | 4,919 | |||||||||
KEYENCE Corp. | 8,200 | 3,509 | |||||||||
LAWSON, Inc. | 35,200 | 2,527 | |||||||||
| MIRACA HOLDINGS, Inc. | 55,400 | 2,577 | |||||||||
| SANTEN PHARMACEUTICAL Co. Ltd. | 53,900 | 3,108 | |||||||||
SMC Corp. | 19,500 | 5,097 | |||||||||
SOFTBANK Corp. | 48,700 | 3,513 | |||||||||
| SUGI HOLDINGS Co. Ltd. | 43,400 | 1,806 | |||||||||
| TOYOTA MOTOR Corp. | 77,900 | 4,439 | |||||||||
35,509 | |||||||||||
Number of Shares | Value† (000's)z | ||||||||||
Korea (1.8%) | |||||||||||
| Samsung Electronics Co. Ltd. | 3,626 | $ | 4,413 | ||||||||
Netherlands (4.3%) | |||||||||||
Akzo Nobel NV | 49,265 | 3,482 | |||||||||
| ASML Holding NV | 44,515 | 4,259 | |||||||||
| Koninklijke Ahold NV | 158,095 | 2,700 | |||||||||
10,441 | |||||||||||
Norway (1.3%) | |||||||||||
DNB ASA | 171,828 | 3,205 | |||||||||
Singapore (1.8%) | |||||||||||
| Jardine Matheson Holdings Ltd. | 41,391 | 2,494 | |||||||||
| United Overseas Bank Ltd. | 97,800 | 1,796 | |||||||||
4,290 | |||||||||||
Sweden (3.2%) | |||||||||||
Elekta AB, B Shares | 98,955 | 1,128 | |||||||||
Nordea Bank AB | 211,160 | 2,752 | |||||||||
| Telefonaktiebolaget LM Ericsson, B Shares | 303,750 | 3,788 | |||||||||
7,668 | |||||||||||
Switzerland (16.0%) | |||||||||||
Givaudan SA* | 3,596 | 5,970 | |||||||||
| Julius Baer Group Ltd.* | 52,115 | 2,369 | |||||||||
Novartis AG | 51,376 | 4,608 | |||||||||
| Partners Group Holding AG | 9,210 | 2,430 | |||||||||
Roche Holding AG | 21,316 | 6,216 | |||||||||
SGS SA | 2,162 | 4,797 | |||||||||
Sika AG | 1,293 | 4,887 | |||||||||
Sonova Holding AG | 16,850 | 2,694 | |||||||||
Sulzer AG | 18,871 | 2,504 | |||||||||
UBS AG* | 118,125 | 2,118 | |||||||||
38,593 | |||||||||||
See Notes to Schedule of Investments
99
Number of Shares | Value† (000's)z | ||||||||||
United Kingdom (14.7%) | |||||||||||
Amlin PLC | 523,934 | $ | 3,913 | ||||||||
Aon PLC | 42,700 | 3,722 | |||||||||
Barclays PLC | 477,600 | 1,780 | |||||||||
Bunzl PLC | 170,824 | 4,668 | |||||||||
| Howden Joinery Group PLC | 440,070 | 2,582 | |||||||||
Prudential PLC | 136,880 | 3,295 | |||||||||
Reed Elsevier PLC | 286,664 | 4,676 | |||||||||
SABMiller PLC | 52,230 | 2,881 | |||||||||
| St. James's Place PLC | 186,450 | 2,219 | |||||||||
| TalkTalk Telecom Group PLC | 625,660 | 3,140 | |||||||||
Travis Perkins PLC | 82,674 | 2,392 | |||||||||
35,268 | |||||||||||
United States (1.3%) | |||||||||||
Nielsen NV | 68,900 | 3,238 | |||||||||
| Total Common Stocks (Cost $194,491) | 235,897 | ||||||||||
Short-Term Investments (2.1%) | |||||||||||
| State Street Institutional Treasury Money Market Fund Premier Class (Cost $5,137) | 5,137,188 | 5,137 | |||||||||
| Total Investments## (100.1%) (Cost $199,628) | 241,034 | ||||||||||
| Liabilities, less cash, receivables and other assets [(0.1%)] | (335 | ) | |||||||||
Total Net Assets (100.0%) | $ | 240,699 | |||||||||
| |||
| |||
See Notes to Schedule of Investments
100
SUMMARY SCHEDULE OF INVESTMENTS BY INDUSTRY INTERNATIONAL SELECT FUNDa
Industry | Investments at Value† (000's omitted) | Percentage of Net Assets | |||||||||
Chemicals | $ | 27,031 | 11.2 | % | |||||||
Pharmaceuticals | 21,449 | 8.9 | % | ||||||||
Banks | 18,628 | 7.7 | % | ||||||||
Insurance | 16,213 | 6.7 | % | ||||||||
Machinery | 14,243 | 5.9 | % | ||||||||
Trading Companies & Distributors | 13,716 | 5.7 | % | ||||||||
Food & Staples Retailing | 12,193 | 5.1 | % | ||||||||
Capital Markets | 9,314 | 3.9 | % | ||||||||
Semiconductors & Semiconductor Equipment | 8,672 | 3.6 | % | ||||||||
Software | 8,157 | 3.4 | % | ||||||||
Professional Services | 8,035 | 3.3 | % | ||||||||
Media | 7,945 | 3.3 | % | ||||||||
Automobiles | 7,360 | 3.1 | % | ||||||||
Diversified Telecommunication Services | 7,110 | 2.9 | % | ||||||||
Beverages | 5,108 | 2.1 | % | ||||||||
Oil, Gas & Consumable Fuels | 4,602 | 1.9 | % | ||||||||
Hotels, Restaurants & Leisure | 4,134 | 1.7 | % | ||||||||
Health Care Equipment & Supplies | 3,822 | 1.6 | % | ||||||||
Communications Equipment | 3,788 | 1.6 | % | ||||||||
Diversified Financial Services | 3,774 | 1.6 | % | ||||||||
Electrical Equipment | 3,623 | 1.5 | % | ||||||||
Wireless Telecommunication Services | 3,513 | 1.5 | % | ||||||||
Electronic Equipment, Instruments & Components | 3,509 | 1.5 | % | ||||||||
Household Products | 3,353 | 1.4 | % | ||||||||
Auto Components | 3,302 | 1.4 | % | ||||||||
Energy Equipment & Services | 3,002 | 1.2 | % | ||||||||
Commercial Services & Supplies | 2,648 | 1.1 | % | ||||||||
Specialty Retail | 2,582 | 1.1 | % | ||||||||
Health Care Providers & Services | 2,577 | 1.1 | % | ||||||||
Industrial Conglomerates | 2,494 | 1.0 | % | ||||||||
Short-Term Investments and Other Assets—Net | 4,802 | 2.0 | % | ||||||||
$ | 240,699 | 100.0 | % | ||||||||
See Notes to Schedule of Investments
101
Schedule of Investments Intrinsic Value Fund
TOP TEN EQUITY HOLDINGS
1 | Verint Systems, Inc. | 2.5 | % | ||||||||
2 | Spirit AeroSystems Holdings, Inc. Class A | 2.4 | % | ||||||||
3 | Rovi Corp. | 2.4 | % | ||||||||
4 | Charles River Laboratories International, Inc. | 2.3 | % | ||||||||
5 | ARRIS Group, Inc. | 2.2 | % | ||||||||
6 | CoreLogic, Inc. | 2.1 | % | ||||||||
7 | Crown Holdings, Inc. | 2.1 | % | ||||||||
8 | Textron, Inc. | 1.9 | % | ||||||||
9 | Avery Dennison Corp. | 1.9 | % | ||||||||
10 | Chemtura Corp. | 1.8 | % | ||||||||
Number of Shares | Value† (000's)z | ||||||||||
Common Stocks (95.7%) | |||||||||||
Aerospace & Defense (6.6%) | |||||||||||
Aerovironment, Inc.* | 28,359 | $ | 894 | ||||||||
| KEYW Holding Corp.* | 122,700 | 1,452 | |||||||||
| Spirit AeroSystems Holdings, Inc. Class A* | 173,490 | 6,653 | |||||||||
| Teledyne Technologies, Inc.* | 41,852 | 4,063 | |||||||||
Textron, Inc. | 138,439 | 5,261 | |||||||||
18,323 | |||||||||||
Auto Components (1.4%) | |||||||||||
| Dana Holding Corp. | 143,200 | 3,326 | |||||||||
| Remy International, Inc. | 27,006 | 597 | |||||||||
3,923 | |||||||||||
Banks (9.9%) | |||||||||||
BankUnited, Inc. | 93,504 | 2,950 | |||||||||
City National Corp. | 34,700 | 2,633 | |||||||||
Comerica, Inc. | 67,274 | 3,387 | |||||||||
| First Niagara Financial Group, Inc. | 366,800 | 3,191 | |||||||||
| Huntington Bancshares, Inc. | 471,030 | 4,637 | |||||||||
| TCF Financial Corp. | 253,000 | 3,997 | |||||||||
| Texas Capital Bancshares, Inc.* | 56,900 | 3,072 | |||||||||
| Umpqua Holdings Corp. | 209,800 | 3,665 | |||||||||
27,532 | |||||||||||
Beverages (0.4%) | |||||||||||
Cott Corp. | 159,300 | 1,195 | |||||||||
Building Products (0.8%) | |||||||||||
| Owens Corning, Inc. | 57,800 | 2,081 | |||||||||
Chemicals (3.1%) | |||||||||||
Chemtura Corp.* | 199,700 | 4,931 | |||||||||
| Cytec Industries, Inc. | 35,900 | 3,699 | |||||||||
8,630 | |||||||||||
Number of Shares | Value† (000's)z | ||||||||||
Commercial Services & Supplies (3.1%) | |||||||||||
| Clean Harbors, Inc.* | 63,414 | $ | 3,839 | ||||||||
| Covanta Holding Corp. | 230,000 | 4,828 | |||||||||
8,667 | |||||||||||
Communications Equipment (8.1%) | |||||||||||
| ARRIS Group, Inc.* | 204,469 | 6,259 | |||||||||
| Aviat Networks, Inc.* | 230,699 | 362 | |||||||||
| Brocade Communications Systems, Inc. | 264,959 | 2,795 | |||||||||
| Ceragon Networks Ltd.* | 294,888 | 723 | |||||||||
Ciena Corp.* | 182,183 | 3,769 | |||||||||
Infinera Corp.* | 421,200 | 4,456 | |||||||||
| JDS Uniphase Corp.* | 178,700 | 2,064 | |||||||||
| Sierra Wireless, Inc.* | 73,674 | 2,064 | |||||||||
22,492 | |||||||||||
Construction & Engineering (1.4%) | |||||||||||
KBR, Inc. | 179,300 | 3,948 | |||||||||
Containers & Packaging (5.2%) | |||||||||||
| Avery Dennison Corp. | 108,836 | 5,238 | |||||||||
| Crown Holdings, Inc.* | 120,800 | 5,831 | |||||||||
Sealed Air Corp. | 96,008 | 3,466 | |||||||||
14,535 | |||||||||||
Electrical Equipment (0.7%) | |||||||||||
Regal-Beloit Corp. | 26,500 | 1,883 | |||||||||
Electronic Equipment, Instruments & Components (4.5%) | |||||||||||
| Dolby Laboratories, Inc. Class A* | 61,700 | 2,874 | |||||||||
II-VI, Inc.* | 172,330 | 2,406 | |||||||||
Itron, Inc.* | 53,133 | 2,243 | |||||||||
Jabil Circuit, Inc. | 77,700 | 1,677 | |||||||||
| Mercury Systems, Inc.* | 144,960 | 1,619 | |||||||||
OSI Systems, Inc.* | 24,200 | 1,688 | |||||||||
12,507 | |||||||||||
Number of Shares | Value† (000's)z | ||||||||||
Energy Equipment & Services (2.6%) | |||||||||||
| ION Geophysical Corp.* | 476,117 | $ | 1,643 | ||||||||
| McDermott International, Inc.* | 198,100 | 1,426 | |||||||||
| TETRA Technologies, Inc.* | 350,492 | 4,136 | |||||||||
7,205 | |||||||||||
| Health Care Equipment & Supplies (0.8%) | |||||||||||
Accuray, Inc.* | 125,470 | 1,021 | |||||||||
| Symmetry Medical, Inc.* | 140,010 | 1,291 | |||||||||
2,312 | |||||||||||
Health Care Technology (1.3%) | |||||||||||
| Allscripts Healthcare Solutions, Inc.* | 249,700 | 3,689 | |||||||||
Hotels, Restaurants & Leisure (0.5%) | |||||||||||
Wendy's Co. | 161,600 | 1,317 | |||||||||
Independent Power and Renewable Electricity Producers (3.7%) | |||||||||||
Dynegy, Inc.* | 139,700 | 4,565 | |||||||||
NRG Energy, Inc. | 82,665 | 2,545 | |||||||||
| Ormat Technologies, Inc. | 115,756 | 3,187 | |||||||||
10,297 | |||||||||||
Internet Software & Services (2.0%) | |||||||||||
Bankrate, Inc.* | 146,500 | 2,057 | |||||||||
Digital River, Inc.* | 228,263 | 3,486 | |||||||||
5,543 | |||||||||||
IT Services (5.5%) | |||||||||||
Convergys Corp. | 96,900 | 1,861 | |||||||||
CoreLogic, Inc.* | 208,125 | 5,884 | |||||||||
DST Systems, Inc. | 28,619 | 2,656 | |||||||||
| MoneyGram International, Inc.* | 165,800 | 2,331 | |||||||||
| VeriFone Systems, Inc.* | 76,090 | 2,657 | |||||||||
15,389 | |||||||||||
Life Sciences Tools & Services (3.5%) | |||||||||||
Affymetrix, Inc.* | 229,600 | 1,991 | |||||||||
Cambrex Corp.* | 64,638 | 1,417 | |||||||||
See Notes to Schedule of Investments
102
Number of Shares | Value† (000's)z | ||||||||||
| Charles River Laboratories International, Inc.* | 107,771 | $ | 6,369 | ||||||||
9,777 | |||||||||||
Machinery (4.1%) | |||||||||||
ITT Corp. | 62,800 | 3,006 | |||||||||
| Manitowoc Co., Inc. | 123,900 | 3,645 | |||||||||
Meritor, Inc.* | 203,050 | 2,767 | |||||||||
Twin Disc, Inc. | 64,693 | 2,093 | |||||||||
11,511 | |||||||||||
Marine (0.6%) | |||||||||||
Danaos Corp.* | 285,191 | 1,648 | |||||||||
Metals & Mining (0.5%) | |||||||||||
| Cliffs Natural Resources, Inc. | 90,900 | 1,370 | |||||||||
Personal Products (0.4%) | |||||||||||
| Elizabeth Arden, Inc.* | 63,120 | 1,079 | |||||||||
Professional Services (0.8%) | |||||||||||
| FTI Consulting, Inc.* | 57,906 | 2,148 | |||||||||
Road & Rail (1.7%) | |||||||||||
Ryder System, Inc. | 51,304 | 4,635 | |||||||||
Semiconductors & Semiconductor Equipment (8.1%) | |||||||||||
| Alliance Semiconductor Corp.* | 82,370 | 66 | |||||||||
CEVA, Inc.* | 72,900 | 1,105 | |||||||||
FormFactor, Inc.* | 269,900 | 1,900 | |||||||||
| Freescale Semiconductor Ltd.* | 154,390 | 3,250 | |||||||||
| Mellanox Technologies Ltd.* | 62,650 | 2,618 | |||||||||
Rambus, Inc.* | 381,872 | 4,739 | |||||||||
| Spansion, Inc. Class A* | 128,340 | 2,862 | |||||||||
Ultratech, Inc.* | 175,494 | 4,538 | |||||||||
| Veeco Instruments, Inc.* | 42,700 | 1,511 | |||||||||
22,589 | |||||||||||
Software (10.1%) | |||||||||||
| Cadence Design Systems, Inc.* | 158,907 | 2,803 | |||||||||
Comverse, Inc.* | 110,635 | 2,731 | |||||||||
Covisint Corp.* | 170,999 | 823 | |||||||||
Gigamon, Inc.* | 97,600 | 1,062 | |||||||||
| Nuance Communications, Inc.* | 125,500 | 2,135 | |||||||||
Rovi Corp.* | 284,030 | 6,570 | |||||||||
Number of Shares | Value† (000's)z | ||||||||||
| Seachange International, Inc.* | 267,067 | $ | 2,027 | ||||||||
| TIBCO Software, Inc.* | 142,200 | 2,963 | |||||||||
| Verint Systems, Inc.* | 140,161 | 7,026 | |||||||||
28,140 | |||||||||||
Specialty Retail (2.8%) | |||||||||||
Express, Inc.* | 169,500 | 2,939 | |||||||||
| New York & Co., Inc.* | 154,100 | 524 | |||||||||
| Office Depot, Inc.* | 517,767 | 2,651 | |||||||||
| Select Comfort Corp.* | 75,200 | 1,682 | |||||||||
7,796 | |||||||||||
Technology Hardware, Storage & Peripherals (0.2%) | |||||||||||
Quantum Corp.* | 473,800 | 592 | |||||||||
| Textiles, Apparel & Luxury Goods (0.3%) | |||||||||||
Crocs, Inc.* | 47,600 | 735 | |||||||||
Wireless Telecommunication Services (1.0%) | |||||||||||
| Telephone & Data Systems, Inc. | 52,900 | 1,393 | |||||||||
| United States Cellular Corp.* | 34,200 | 1,290 | |||||||||
2,683 | |||||||||||
| Total Common Stocks (Cost $197,686) | 266,171 | ||||||||||
Short-Term Investments (3.9%) | |||||||||||
| State Street Institutional Treasury Money Market Fund Premier Class (Cost $10,852) | 10,851,558 | 10,852 | |||||||||
| Total Investments## (99.6%) (Cost $208,538) | 277,023 | ||||||||||
| Cash, receivables and other assets, less liabilities (0.4%) | 1,191 | ||||||||||
Total Net Assets (100.0%) | $ | 278,214 | |||||||||
| |||
See Notes to Schedule of Investments
103
Schedule of Investments Large Cap Disciplined Growth Fund
TOP TEN EQUITY HOLDINGS
1 | Apple, Inc. | 7.2 | % | ||||||||
2 | Union Pacific Corp. | 2.8 | % | ||||||||
3 | Oracle Corp. | 2.8 | % | ||||||||
4 | Johnson & Johnson | 2.5 | % | ||||||||
5 | Google, Inc. Class A | 2.4 | % | ||||||||
6 | Precision Castparts Corp. | 2.3 | % | ||||||||
7 | FleetCor Technologies, Inc. | 2.3 | % | ||||||||
8 | Alliance Data Systems Corp. | 2.2 | % | ||||||||
9 | Range Resources Corp. | 2.2 | % | ||||||||
10 | Comcast Corp. Class A | 2.1 | % | ||||||||
Number of Shares | Value† (000's)z | ||||||||||
Common Stocks (97.3%) | |||||||||||
Aerospace & Defense (3.8%) | |||||||||||
| General Dynamics Corp. | 28,571 | $ | 3,521 | ||||||||
| Precision Castparts Corp. | 21,711 | 5,299 | |||||||||
8,820 | |||||||||||
Auto Components (0.7%) | |||||||||||
| Delphi Automotive PLC | 24,907 | 1,733 | |||||||||
Automobiles (1.0%) | |||||||||||
| General Motors Co. | 67,014 | 2,332 | |||||||||
Banks (3.3%) | |||||||||||
CIT Group, Inc. | 65,890 | 3,160 | |||||||||
Comerica, Inc. | 89,910 | 4,526 | |||||||||
7,686 | |||||||||||
Beverages (1.0%) | |||||||||||
PepsiCo, Inc. | 25,050 | 2,317 | |||||||||
Biotechnology (2.5%) | |||||||||||
| BioMarin Pharmaceutical, Inc.* | 35,637 | 2,538 | |||||||||
Celgene Corp.* | 34,182 | 3,248 | |||||||||
5,786 | |||||||||||
Chemicals (5.9%) | |||||||||||
| LyondellBasell Industries NV Class A | 37,441 | 4,281 | |||||||||
Monsanto Co. | 21,854 | 2,528 | |||||||||
| PPG Industries, Inc. | 11,032 | 2,271 | |||||||||
| Sherwin-Williams Co. | 21,534 | 4,697 | |||||||||
13,777 | |||||||||||
Construction Materials (0.5%) | |||||||||||
| Martin Marietta Materials, Inc. | 9,010 | 1,180 | |||||||||
Diversified Telecommunication Services (1.7%) | |||||||||||
| Verizon Communications, Inc. | 78,189 | 3,895 | |||||||||
Electric Utilities (1.0%) | |||||||||||
| NextEra Energy, Inc. | 23,530 | 2,317 | |||||||||
Number of Shares | Value† (000's)z | ||||||||||
Energy Equipment & Services (1.0%) | |||||||||||
Halliburton Co. | 33,641 | $ | 2,274 | ||||||||
Food & Staples Retailing (3.3%) | |||||||||||
| Costco Wholesale Corp. | 29,226 | 3,539 | |||||||||
| CVS Caremark Corp. | 50,734 | 4,031 | |||||||||
7,570 | |||||||||||
Food Products (2.4%) | |||||||||||
| Kraft Foods Group, Inc. | 46,986 | 2,767 | |||||||||
Unilever NV | 68,372 | 2,847 | |||||||||
5,614 | |||||||||||
| Health Care Equipment & Supplies (1.3%) | |||||||||||
| Abbott Laboratories | 70,884 | 2,994 | |||||||||
| Health Care Providers & Services (1.0%) | |||||||||||
| Laboratory Corporation of America Holdings* | 21,556 | 2,311 | |||||||||
Hotels, Restaurants & Leisure (2.6%) | |||||||||||
Starbucks Corp. | 45,178 | 3,515 | |||||||||
| Starwood Hotels & Resorts Worldwide, Inc. | 29,027 | 2,454 | |||||||||
5,969 | |||||||||||
Household Products (1.4%) | |||||||||||
| Procter & Gamble Co. | 39,636 | 3,294 | |||||||||
Industrial Conglomerates (1.8%) | |||||||||||
Danaher Corp. | 53,404 | 4,091 | |||||||||
Internet Software & Services (5.5%) | |||||||||||
| Facebook, Inc. Class A* | 31,104 | 2,327 | |||||||||
| Google, Inc. Class A* | 9,644 | 5,616 | |||||||||
Yelp, Inc.* | 59,049 | 4,867 | |||||||||
12,810 | |||||||||||
IT Services (6.4%) | |||||||||||
| Alliance Data Systems Corp.* | 19,313 | 5,111 | |||||||||
| FleetCor Technologies, Inc.* | 36,395 | 5,230 | |||||||||
Visa, Inc. Class A | 21,471 | 4,563 | |||||||||
14,904 | |||||||||||
Number of Shares | Value† (000's)z | ||||||||||
Media (3.1%) | |||||||||||
| Comcast Corp. Class A | 89,652 | $ | 4,907 | ||||||||
| Twenty-First Century Fox, Inc. Class A | 65,986 | 2,337 | |||||||||
7,244 | |||||||||||
Metals & Mining (2.0%) | |||||||||||
Alcoa, Inc. | 277,904 | 4,616 | |||||||||
Multi-Utilities (2.0%) | |||||||||||
| Dominion Resources, Inc. | 67,978 | 4,773 | |||||||||
Multiline Retail (2.0%) | |||||||||||
Target Corp. | 77,486 | 4,655 | |||||||||
Oil, Gas & Consumable Fuels (4.7%) | |||||||||||
Apache Corp. | 34,149 | 3,477 | |||||||||
Noble Energy, Inc. | 32,503 | 2,345 | |||||||||
| Range Resources Corp. | 63,740 | 5,009 | |||||||||
10,831 | |||||||||||
Pharmaceuticals (7.5%) | |||||||||||
| Bristol-Myers Squibb Co. | 90,775 | 4,598 | |||||||||
Johnson & Johnson | 55,068 | 5,712 | |||||||||
Perrigo Co. PLC | 16,835 | 2,504 | |||||||||
Pfizer, Inc. | 74,765 | 2,197 | |||||||||
| Teva Pharmaceutical Industries Ltd. ADR | 43,863 | 2,304 | |||||||||
17,315 | |||||||||||
Professional Services (1.3%) | |||||||||||
Nielsen NV | 62,834 | 2,953 | |||||||||
Real Estate Investment Trusts (1.5%) | |||||||||||
| Crown Castle International Corp. | 45,446 | 3,613 | |||||||||
Road & Rail (2.8%) | |||||||||||
| Union Pacific Corp. | 61,980 | 6,525 | |||||||||
Semiconductors & Semiconductor Equipment (1.6%) | |||||||||||
| ASML Holding NV | 38,032 | 3,656 | |||||||||
See Notes to Schedule of Investments
104
Number of Shares | Value† (000's)z | ||||||||||
Software (8.3%) | |||||||||||
| Check Point Software Technologies Ltd.* | 43,749 | $ | 3,107 | ||||||||
Intuit, Inc. | 30,213 | 2,513 | |||||||||
Microsoft Corp. | 83,149 | 3,778 | |||||||||
Oracle Corp. | 156,938 | 6,518 | |||||||||
| VMware, Inc. Class A* | 34,341 | 3,385 | |||||||||
19,301 | |||||||||||
Specialty Retail (3.1%) | |||||||||||
Home Depot, Inc. | 51,202 | 4,788 | |||||||||
| O'Reilly Automotive, Inc.* | 14,876 | 2,320 | |||||||||
7,108 | |||||||||||
Technology Hardware, Storage & Peripherals (7.2%) | |||||||||||
Apple, Inc. | 162,141 | 16,619 | |||||||||
Textiles, Apparel & Luxury Goods (2.1%) | |||||||||||
| Ralph Lauren Corp. | 28,420 | 4,809 | |||||||||
| Total Common Stocks (Cost $183,047) | 225,692 | ||||||||||
Short-Term Investments (2.2%) | |||||||||||
| State Street Institutional Liquid Reserves Fund Premier Class (Cost $5,207) | 5,206,820 | 5,207 | |||||||||
| Total Investments## (99.5%) (Cost $188,254) | 230,899 | ||||||||||
| Cash, receivables and other assets, less liabilities (0.5%) | 1,118 | ||||||||||
Total Net Assets (100.0%) | $ | 232,017 | |||||||||
See Notes to Schedule of Investments
105
Schedule of Investments Large Cap Value Fund
TOP TEN EQUITY HOLDINGS
1 | Bank of New York Mellon Corp. | 3.7 | % | ||||||||
2 | Cisco Systems, Inc. | 3.6 | % | ||||||||
3 | Eaton Corp. PLC | 3.2 | % | ||||||||
4 | JPMorgan Chase & Co. | 3.1 | % | ||||||||
5 | Lincoln National Corp. | 2.9 | % | ||||||||
6 | Goldman Sachs Group, Inc. | 2.7 | % | ||||||||
7 | American Airlines Group, Inc. | 2.7 | % | ||||||||
8 | Intel Corp. | 2.5 | % | ||||||||
9 | MetLife, Inc. | 2.5 | % | ||||||||
10 | CME Group, Inc. | 2.5 | % | ||||||||
Number of Shares | Value† (000's)z | ||||||||||
Common Stocks (92.7%) | |||||||||||
Airlines (5.4%) | |||||||||||
| American Airlines Group, Inc. | 1,188,480 | $ | 46,244 | ||||||||
| Delta Air Lines, Inc. | 273,818 | 10,837 | |||||||||
| United Continental Holdings, Inc.* | 768,008 | 36,565 | |||||||||
93,646 | |||||||||||
Automobiles (1.0%) | |||||||||||
Ford Motor Co. | 990,958 | 17,253 | |||||||||
Banks (11.4%) | |||||||||||
Citigroup, Inc. | 578,492 | 29,879 | |||||||||
Comerica, Inc. | 520,152 | 26,185 | |||||||||
| JPMorgan Chase & Co. | 901,248 | 53,579 | |||||||||
M&T Bank Corp. | 228,651 | 28,268 | |||||||||
| PNC Financial Services Group, Inc. | 337,585 | 28,610 | |||||||||
| Regions Financial Corp. | 1,129,913 | 11,469 | |||||||||
Wells Fargo & Co. | 411,043 | 21,144 | |||||||||
199,134 | |||||||||||
Capital Markets (8.4%) | |||||||||||
| Bank of New York Mellon Corp. | 1,655,714 | 64,871 | |||||||||
| Goldman Sachs Group, Inc. | 260,695 | 46,693 | |||||||||
Invesco Ltd. | 673,154 | 27,492 | |||||||||
Morgan Stanley | 220,360 | 7,560 | |||||||||
146,616 | |||||||||||
Chemicals (4.4%) | |||||||||||
| Dow Chemical Co. | 430,276 | 23,042 | |||||||||
| LyondellBasell Industries NV Class A | 323,989 | 37,048 | |||||||||
Monsanto Co. | 143,175 | 16,558 | |||||||||
76,648 | |||||||||||
Communications Equipment (3.6%) | |||||||||||
| Cisco Systems, Inc. | 2,493,426 | 62,311 | |||||||||
Number of Shares | Value† (000's)z | ||||||||||
Diversified Financial Services (2.5%) | |||||||||||
CME Group, Inc. | 558,844 | $ | 42,779 | ||||||||
Electrical Equipment (3.2%) | |||||||||||
Eaton Corp. PLC | 798,117 | 55,716 | |||||||||
Electronic Equipment, Instruments & Components (0.8%) | |||||||||||
Corning, Inc. | 704,919 | 14,705 | |||||||||
Energy Equipment & Services (2.3%) | |||||||||||
Halliburton Co. | 199,791 | 13,508 | |||||||||
| McDermott International, Inc.* | 3,672,103 | 26,439 | |||||||||
39,947 | |||||||||||
Food Products (1.1%) | |||||||||||
| WhiteWave Foods Co.* | 539,629 | 18,898 | |||||||||
Health Care Equipment & Supplies (3.7%) | |||||||||||
| Baxter International, Inc. | 91,011 | 6,824 | |||||||||
| Boston Scientific Corp.* | 1,329,409 | 16,857 | |||||||||
Covidien PLC | 363,589 | 31,571 | |||||||||
Hologic, Inc.* | 342,676 | 8,522 | |||||||||
63,774 | |||||||||||
Health Care Providers & Services (1.9%) | |||||||||||
| Tenet Healthcare Corp.* | 65,062 | 3,981 | |||||||||
| UnitedHealth Group, Inc. | 333,068 | 28,870 | |||||||||
32,851 | |||||||||||
Hotels, Restaurants & Leisure (2.3%) | |||||||||||
Carnival Corp. | 1,059,065 | 40,117 | |||||||||
Independent Power and Renewable Electricity Producers (0.9%) | |||||||||||
Calpine Corp.* | 676,831 | 16,088 | |||||||||
Industrial Conglomerates (2.0%) | |||||||||||
| General Electric Co. | 1,326,622 | 34,466 | |||||||||
Insurance (5.4%) | |||||||||||
| Lincoln National Corp. | 920,911 | 50,687 | |||||||||
MetLife, Inc. | 794,550 | 43,494 | |||||||||
94,181 | |||||||||||
Number of Shares | Value† (000's)z | ||||||||||
Machinery (9.4%) | |||||||||||
Caterpillar, Inc. | 145,124 | $ | 15,829 | ||||||||
Cummins, Inc. | 219,792 | 31,894 | |||||||||
Joy Global, Inc. | 611,440 | 38,612 | |||||||||
| Kubota Corp. ADR | 350,472 | 25,094 | |||||||||
Pall Corp. | 167,433 | 14,126 | |||||||||
Terex Corp. | 1,042,728 | 39,009 | |||||||||
164,564 | |||||||||||
Media (0.1%) | |||||||||||
| News Corp. Class A* | 102,053 | 1,799 | |||||||||
Metals & Mining (3.7%) | |||||||||||
| Newmont Mining Corp. | 1,260,770 | 34,154 | |||||||||
| United States Steel Corp. | 769,726 | 29,750 | |||||||||
63,904 | |||||||||||
Multiline Retail (2.9%) | |||||||||||
| JC Penney Co., Inc.* | 1,059,216 | 11,440 | |||||||||
Kohl's Corp. | 281,330 | 16,539 | |||||||||
Target Corp. | 388,467 | 23,335 | |||||||||
51,314 | |||||||||||
Oil, Gas & Consumable Fuels (4.7%) | |||||||||||
| Antero Resources Corp.* | 344,825 | 19,948 | |||||||||
Apache Corp. | 47,319 | 4,818 | |||||||||
| Devon Energy Corp. | 167,723 | 12,650 | |||||||||
| Noble Energy, Inc. | 118,909 | 8,578 | |||||||||
| Occidental Petroleum Corp. | 217,782 | 22,590 | |||||||||
| Range Resources Corp. | 175,271 | 13,775 | |||||||||
82,359 | |||||||||||
Pharmaceuticals (5.5%) | |||||||||||
Eli Lilly & Co. | 269,264 | 17,114 | |||||||||
Johnson & Johnson | 312,736 | 32,440 | |||||||||
| Merck & Co., Inc. | 498,589 | 29,970 | |||||||||
See Notes to Schedule of Investments
106
Number of Shares | Value† (000's)z | ||||||||||
| Teva Pharmaceutical Industries Ltd. ADR | 328,443 | $ | 17,250 | ||||||||
96,774 | |||||||||||
Semiconductors & Semiconductor Equipment (2.5%) | |||||||||||
Intel Corp. | 1,270,097 | 44,352 | |||||||||
Software (1.9%) | |||||||||||
Microsoft Corp. | 746,831 | 33,928 | |||||||||
Specialty Retail (0.2%) | |||||||||||
| American Eagle Outfitters, Inc. | 296,184 | 4,170 | |||||||||
Technology Hardware, Storage & Peripherals (1.1%) | |||||||||||
SanDisk Corp. | 187,044 | 18,323 | |||||||||
Textiles, Apparel & Luxury Goods (0.4%) | |||||||||||
| Ralph Lauren Corp. | 42,276 | 7,153 | |||||||||
| Total Common Stocks (Cost $1,352,650) | 1,617,770 | ||||||||||
Exchange Traded Funds (1.2%) | |||||||||||
| SPDR Gold Shares* (Cost $20,532) | 162,109 | 20,079 | |||||||||
Short-Term Investments (2.0%) | |||||||||||
| State Street Institutional Liquid Reserves Fund Premier Class (Cost $34,844) | 34,844,011 | 34,844 | |||||||||
| Total Investments## (95.9%) (Cost $1,408,026) | 1,672,693 | ||||||||||
| Cash, receivables and other assets, less liabilities (4.1%) | 72,082 | ||||||||||
Total Net Assets (100.0%) | $ | 1,744,775 | |||||||||
See Notes to Schedule of Investments
107
Schedule of Investments Mid Cap Growth Fund
TOP TEN EQUITY HOLDINGS
1 | Avago Technologies Ltd. | 2.2 | % | ||||||||
2 | SBA Communications Corp. Class A | 2.1 | % | ||||||||
3 | Alliance Data Systems Corp. | 1.8 | % | ||||||||
4 | Affiliated Managers Group, Inc. | 1.7 | % | ||||||||
5 | AMETEK, Inc. | 1.5 | % | ||||||||
6 | Cerner Corp. | 1.5 | % | ||||||||
7 | Stericycle, Inc. | 1.5 | % | ||||||||
8 | Hanesbrands, Inc. | 1.5 | % | ||||||||
9 | Acadia Healthcare Co., Inc. | 1.4 | % | ||||||||
10 | Verisk Analytics, Inc. Class A | 1.4 | % | ||||||||
Number of Shares | Value† (000's)z | ||||||||||
Common Stocks (95.9%) | |||||||||||
Aerospace & Defense (0.9%) | |||||||||||
| BE Aerospace, Inc.* | 110,000 | $ | 9,321 | ||||||||
Airlines (1.0%) | |||||||||||
| Alaska Air Group, Inc. | 220,000 | 10,195 | |||||||||
Auto Components (0.8%) | |||||||||||
BorgWarner, Inc. | 127,500 | 7,929 | |||||||||
Banks (0.9%) | |||||||||||
| SVB Financial Group* | 80,000 | 8,906 | |||||||||
Biotechnology (3.2%) | |||||||||||
Alkermes PLC* | 100,000 | 4,473 | |||||||||
| BioMarin Pharmaceutical, Inc.* | 185,000 | 13,176 | |||||||||
| Cubist Pharmaceuticals, Inc.* | 137,500 | 9,492 | |||||||||
| Puma Biotechnology, Inc.* | 20,000 | 5,210 | |||||||||
32,351 | |||||||||||
Building Products (1.0%) | |||||||||||
| Fortune Brands Home & Security, Inc. | 244,000 | 10,543 | |||||||||
Capital Markets (2.7%) | |||||||||||
| Affiliated Managers Group, Inc.* | 81,000 | 17,103 | |||||||||
| Raymond James Financial, Inc. | 195,000 | 10,655 | |||||||||
27,758 | |||||||||||
Chemicals (0.8%) | |||||||||||
PolyOne Corp. | 200,000 | 7,844 | |||||||||
Commercial Services & Supplies (1.5%) | |||||||||||
Stericycle, Inc.* | 130,000 | 15,450 | |||||||||
Communications Equipment (2.4%) | |||||||||||
| ARRIS Group, Inc.* | 270,000 | 8,265 | |||||||||
| F5 Networks, Inc.* | 80,000 | 9,935 | |||||||||
| Palo Alto Networks, Inc.* | 77,500 | 6,587 | |||||||||
24,787 | |||||||||||
Number of Shares | Value† (000's)z | ||||||||||
Consumer Finance (1.0%) | |||||||||||
| Portfolio Recovery Associates, Inc.* | 175,000 | $ | 9,945 | ||||||||
Containers & Packaging (1.1%) | |||||||||||
| Packaging Corp. of America | 163,000 | 11,082 | |||||||||
Distributors (1.1%) | |||||||||||
LKQ Corp.* | 400,000 | 11,360 | |||||||||
Diversified Financial Services (0.7%) | |||||||||||
| CBOE Holdings, Inc. | 125,000 | 6,628 | |||||||||
Electrical Equipment (1.5%) | |||||||||||
AMETEK, Inc. | 294,000 | 15,564 | |||||||||
Electronic Equipment, Instruments & Components (2.7%) | |||||||||||
| Amphenol Corp. Class A | 100,000 | 10,301 | |||||||||
CDW Corp. | 300,000 | 9,912 | |||||||||
| Zebra Technologies Corp. Class A* | 95,000 | 7,413 | |||||||||
27,626 | |||||||||||
Energy Equipment & Services (1.2%) | |||||||||||
Dril-Quip, Inc.* | 60,000 | 6,088 | |||||||||
| Oceaneering International, Inc. | 86,500 | 6,017 | |||||||||
12,105 | |||||||||||
Food & Staples Retailing (0.9%) | |||||||||||
PriceSmart, Inc. | 100,000 | 8,962 | |||||||||
Food Products (1.9%) | |||||||||||
| TreeHouse Foods, Inc.* | 97,500 | 8,046 | |||||||||
| WhiteWave Foods Co.* | 325,000 | 11,381 | |||||||||
19,427 | |||||||||||
Health Care Equipment & Supplies (1.7%) | |||||||||||
Cooper Cos., Inc. | 52,000 | 8,477 | |||||||||
| Wright Medical Group, Inc.* | 295,000 | 8,803 | |||||||||
17,280 | |||||||||||
Number of Shares | Value† (000's)z | ||||||||||
Health Care Providers & Services (6.5%) | |||||||||||
| Acadia Healthcare Co., Inc.* | 277,500 | $ | 14,211 | ||||||||
| Envision Healthcare Holdings, Inc.* | 300,000 | 10,968 | |||||||||
| HealthSouth Corp. | 260,000 | 10,241 | |||||||||
| IPC The Hospitalist Co., Inc.* | 60,000 | 2,900 | |||||||||
Omnicare, Inc. | 120,000 | 7,652 | |||||||||
| Universal Health Services, Inc. Class B | 110,000 | 12,589 | |||||||||
| WellCare Health Plans, Inc.* | 117,500 | 7,739 | |||||||||
66,300 | |||||||||||
Health Care Technology (1.5%) | |||||||||||
Cerner Corp.* | 268,500 | 15,482 | |||||||||
Hotels, Restaurants & Leisure (2.0%) | |||||||||||
| Buffalo Wild Wings, Inc.* | 65,500 | 9,677 | |||||||||
| MGM Resorts International* | 425,000 | 10,400 | |||||||||
20,077 | |||||||||||
Household Durables (0.8%) | |||||||||||
| Newell Rubbermaid, Inc. | 246,200 | 8,253 | |||||||||
Industrial Conglomerates (1.3%) | |||||||||||
| Roper Industries, Inc. | 90,500 | 13,626 | |||||||||
Internet & Catalog Retail (0.6%) | |||||||||||
HomeAway, Inc.* | 170,000 | 5,644 | |||||||||
Internet Software & Services (1.9%) | |||||||||||
| Akamai Technologies, Inc.* | 115,000 | 6,948 | |||||||||
| Demandware, Inc.* | 125,000 | 6,644 | |||||||||
| Pandora Media, Inc.* | 225,000 | 6,084 | |||||||||
19,676 | |||||||||||
See Notes to Schedule of Investments
108
Number of Shares | Value† (000's)z | ||||||||||
IT Services (3.3%) | |||||||||||
| Alliance Data Systems Corp.* | 70,000 | $ | 18,525 | ||||||||
Fiserv, Inc.* | 75,000 | 4,835 | |||||||||
| FleetCor Technologies, Inc.* | 70,000 | 10,058 | |||||||||
33,418 | |||||||||||
Leisure Products (1.1%) | |||||||||||
| Polaris Industries, Inc. | 75,000 | 10,904 | |||||||||
Life Sciences Tools & Services (1.8%) | |||||||||||
ICON PLC* | 100,000 | 4,954 | |||||||||
Illumina, Inc.* | 72,500 | 13,004 | |||||||||
17,958 | |||||||||||
Machinery (2.5%) | |||||||||||
Dover Corp. | 110,000 | 9,666 | |||||||||
Pall Corp. | 119,000 | 10,040 | |||||||||
Wabtec Corp. | 62,500 | 5,210 | |||||||||
24,916 | |||||||||||
Multiline Retail (1.3%) | |||||||||||
Dollar Tree, Inc.* | 172,000 | 9,223 | |||||||||
| Tuesday Morning Corp.* | 250,000 | 4,395 | |||||||||
13,618 | |||||||||||
Oil, Gas & Consumable Fuels (3.3%) | |||||||||||
| Antero Resources Corp.* | 135,000 | 7,810 | |||||||||
| Cabot Oil & Gas Corp. | 190,000 | 6,373 | |||||||||
| Concho Resources, Inc.* | 90,000 | 12,783 | |||||||||
| Oasis Petroleum, Inc.* | 125,000 | 6,149 | |||||||||
33,115 | |||||||||||
Pharmaceuticals (3.5%) | |||||||||||
Akorn, Inc.* | 285,000 | 11,121 | |||||||||
| Endo International PLC* | 125,000 | 7,964 | |||||||||
Mylan, Inc.* | 180,000 | 8,748 | |||||||||
| Salix Pharmaceuticals Ltd.* | 50,000 | 7,955 | |||||||||
35,788 | |||||||||||
Professional Services (2.4%) | |||||||||||
| Advisory Board Co.* | 120,000 | 5,952 | |||||||||
| Verisk Analytics, Inc. Class A* | 220,000 | 14,122 | |||||||||
| WageWorks, Inc.* | 100,000 | 4,126 | |||||||||
24,200 | |||||||||||
Number of Shares | Value† (000's)z | ||||||||||
Real Estate Management & Development (1.0%) | |||||||||||
| Jones Lang LaSalle, Inc. | 80,000 | $ | 10,689 | ||||||||
Road & Rail (2.0%) | |||||||||||
| J.B. Hunt Transport Services, Inc. | 132,500 | 10,010 | |||||||||
| Old Dominion Freight Line, Inc.* | 150,000 | 10,001 | |||||||||
20,011 | |||||||||||
Semiconductors & Semiconductor Equipment (6.9%) | |||||||||||
| Avago Technologies Ltd. | 275,000 | 22,575 | |||||||||
Cavium, Inc.* | 150,000 | 8,427 | |||||||||
| Lam Research Corp. | 100,000 | 7,191 | |||||||||
| Microchip Technology, Inc. | 200,000 | 9,766 | |||||||||
| Monolithic Power Systems, Inc. | 175,000 | 8,362 | |||||||||
| NXP Semiconductors NV* | 195,000 | 13,361 | |||||||||
69,682 | |||||||||||
Software (6.3%) | |||||||||||
| Activision Blizzard, Inc. | 460,000 | 10,828 | |||||||||
| Aspen Technology, Inc.* | 200,000 | 8,218 | |||||||||
Autodesk, Inc.* | 100,000 | 5,364 | |||||||||
| Electronic Arts, Inc.* | 212,000 | 8,022 | |||||||||
| ServiceNow, Inc.* | 120,000 | 7,336 | |||||||||
Splunk, Inc.* | 87,600 | 4,726 | |||||||||
| Synchronoss Technologies, Inc.* | 175,000 | 7,730 | |||||||||
| Ultimate Software Group, Inc.* | 42,500 | 6,247 | |||||||||
| Workday, Inc. Class A* | 65,000 | 5,919 | |||||||||
64,390 | |||||||||||
Specialty Retail (7.4%) | |||||||||||
| Advance Auto Parts, Inc. | 72,500 | 9,890 | |||||||||
Cabela's, Inc.* | 112,500 | 6,865 | |||||||||
| Lithia Motors, Inc. Class A | 75,000 | 6,557 | |||||||||
| O'Reilly Automotive, Inc.* | 89,500 | 13,960 | |||||||||
Ross Stores, Inc. | 129,000 | 9,729 | |||||||||
Number of Shares | Value† (000's)z | ||||||||||
| Signet Jewelers Ltd. | 60,000 | $ | 7,072 | ||||||||
| Tractor Supply Co. | 170,000 | 11,381 | |||||||||
| Williams-Sonoma, Inc. | 149,500 | 9,833 | |||||||||
75,287 | |||||||||||
Technology Hardware, Storage & Peripherals (0.8%) | |||||||||||
SanDisk Corp. | 80,000 | 7,837 | |||||||||
Textiles, Apparel & Luxury Goods (5.3%) | |||||||||||
Carter's, Inc. | 107,500 | 8,899 | |||||||||
| Hanesbrands, Inc. | 148,500 | 15,248 | |||||||||
| Kate Spade & Co.* | 290,000 | 9,379 | |||||||||
| Michael Kors Holdings Ltd.* | 79,500 | 6,369 | |||||||||
| Under Armour, Inc. Class A* | 200,000 | 13,672 | |||||||||
53,567 | |||||||||||
Trading Companies & Distributors (1.3%) | |||||||||||
| United Rentals, Inc.* | 114,000 | 13,412 | |||||||||
Wireless Telecommunication Services (2.1%) | |||||||||||
| SBA Communications Corp. Class A* | 190,000 | 20,955 | |||||||||
| Total Common Stocks (Cost $703,396) | 973,868 | ||||||||||
Short-Term Investments (3.4%) | |||||||||||
| State Street Institutional Liquid Reserves Fund Premier Class (Cost $34,299) | 34,299,059 | 34,299 | |||||||||
| Total Investments## (99.3%) (Cost $737,695) | 1,008,167 | ||||||||||
| Cash, receivables and other assets, less liabilities (0.7%) | 7,367 | ||||||||||
Total Net Assets (100.0%) | $ | 1,015,534 | |||||||||
See Notes to Schedule of Investments
109
Schedule of Investments Mid Cap Intrinsic Value Fund
TOP TEN EQUITY HOLDINGS
1 | ADT Corp. | 3.6 | % | ||||||||
2 | Skyworks Solutions, Inc. | 3.0 | % | ||||||||
3 | General Dynamics Corp. | 2.9 | % | ||||||||
4 | Corrections Corporation of America | 2.6 | % | ||||||||
5 | Devon Energy Corp. | 2.6 | % | ||||||||
6 | Ashland, Inc. | 2.6 | % | ||||||||
7 | Hertz Global Holdings, Inc. | 2.4 | % | ||||||||
8 | AES Corp. | 2.3 | % | ||||||||
9 | Nuance Communications, Inc. | 2.3 | % | ||||||||
10 | Best Buy Co., Inc. | 2.2 | % | ||||||||
Number of Shares | Value† (000's)z | ||||||||||
Common Stocks (95.5%) | |||||||||||
Aerospace & Defense (5.1%) | |||||||||||
| General Dynamics Corp. | 19,850 | $ | 2,447 | ||||||||
| Spirit AeroSystems Holdings, Inc. Class A* | 46,400 | 1,779 | |||||||||
4,226 | |||||||||||
Auto Components (1.5%) | |||||||||||
Lear Corp. | 8,800 | 890 | |||||||||
| TRW Automotive Holdings Corp.* | 3,900 | 375 | |||||||||
1,265 | |||||||||||
Banks (7.1%) | |||||||||||
BankUnited, Inc. | 37,800 | 1,192 | |||||||||
BB&T Corp. | 25,800 | 963 | |||||||||
Comerica, Inc. | 26,200 | 1,319 | |||||||||
| Huntington Bancshares, Inc. | 118,700 | 1,169 | |||||||||
M&T Bank Corp. | 10,200 | 1,261 | |||||||||
5,904 | |||||||||||
Building Products (1.0%) | |||||||||||
Owens Corning | 22,700 | 817 | |||||||||
Capital Markets (1.8%) | |||||||||||
State Street Corp. | 20,800 | 1,498 | |||||||||
Chemicals (2.6%) | |||||||||||
Ashland, Inc. | 19,800 | 2,123 | |||||||||
| Commercial Services & Supplies (8.5%) | |||||||||||
ADT Corp. | 81,200 | 2,993 | |||||||||
| Covanta Holding Corp. | 85,800 | 1,801 | |||||||||
| Republic Services, Inc. | 25,900 | 1,019 | |||||||||
| Tyco International Ltd. | 28,800 | 1,285 | |||||||||
7,098 | |||||||||||
Construction & Engineering (1.3%) | |||||||||||
KBR, Inc. | 49,200 | 1,083 | |||||||||
Containers & Packaging (1.0%) | |||||||||||
| Avery Dennison Corp. | 17,100 | 823 | |||||||||
Electric Utilities (3.3%) | |||||||||||
| Edison International | 28,700 | 1,697 | |||||||||
Number of Shares | Value† (000's)z | ||||||||||
| Pinnacle West Capital Corp. | 18,700 | $ | 1,065 | ||||||||
2,762 | |||||||||||
Electrical Equipment (0.9%) | |||||||||||
Regal-Beloit Corp. | 10,500 | 746 | |||||||||
Electronic Equipment, Instruments & Components (3.0%) | |||||||||||
| Dolby Laboratories, Inc. Class A* | 18,500 | 862 | |||||||||
| Flextronics International Ltd.* | 144,100 | 1,591 | |||||||||
2,453 | |||||||||||
Energy Equipment & Services (2.1%) | |||||||||||
| Cameron International Corp.* | 24,000 | 1,784 | |||||||||
Food & Staples Retailing (3.0%) | |||||||||||
| CVS Caremark Corp. | 22,400 | 1,780 | |||||||||
Safeway, Inc. | 21,100 | 734 | |||||||||
2,514 | |||||||||||
Health Care Equipment & Supplies (2.9%) | |||||||||||
Covidien PLC | 11,100 | 964 | |||||||||
| Zimmer Holdings, Inc. | 14,300 | 1,420 | |||||||||
2,384 | |||||||||||
Health Care Providers & Services (2.4%) | |||||||||||
Cardinal Health, Inc. | 11,300 | 833 | |||||||||
Omnicare, Inc. | 17,700 | 1,129 | |||||||||
1,962 | |||||||||||
Hotels, Restaurants & Leisure (1.8%) | |||||||||||
| Darden Restaurants, Inc. | 31,900 | 1,510 | |||||||||
Independent Power and Renewable Electricity Producers (2.3%) | |||||||||||
AES Corp. | 127,800 | 1,940 | |||||||||
IT Services (5.9%) | |||||||||||
Amdocs Ltd. | 39,300 | 1,851 | |||||||||
Teradata Corp.* | 36,300 | 1,658 | |||||||||
Western Union Co. | 82,100 | 1,434 | |||||||||
4,943 | |||||||||||
Number of Shares | Value† (000's)z | ||||||||||
Machinery (1.8%) | |||||||||||
| Valmont Industries, Inc. | 10,800 | $ | 1,520 | ||||||||
Multi-Utilities (1.8%) | |||||||||||
| CenterPoint Energy, Inc. | 59,400 | 1,476 | |||||||||
Multiline Retail (1.8%) | |||||||||||
Kohl's Corp. | 25,000 | 1,470 | |||||||||
Oil, Gas & Consumable Fuels (6.0%) | |||||||||||
| Cabot Oil & Gas Corp. | 48,100 | 1,613 | |||||||||
| Devon Energy Corp. | 29,000 | 2,187 | |||||||||
| Energy Transfer Partners L.P. | 8,325 | 478 | |||||||||
| Southwestern Energy Co.* | 16,400 | 676 | |||||||||
4,954 | |||||||||||
Real Estate Investment Trusts (5.7%) | |||||||||||
| Corrections Corporation of America | 61,804 | 2,203 | |||||||||
| Starwood Property Trust, Inc. | 73,800 | 1,760 | |||||||||
| Starwood Waypoint Residential Trust* | 28,260 | 782 | |||||||||
4,745 | |||||||||||
Road & Rail (2.4%) | |||||||||||
| Hertz Global Holdings, Inc.* | 68,200 | 2,015 | |||||||||
Semiconductors & Semiconductor Equipment (3.0%) | |||||||||||
| Skyworks Solutions, Inc. | 44,500 | 2,521 | |||||||||
Software (5.3%) | |||||||||||
| Cadence Design Systems, Inc.* | 56,100 | 990 | |||||||||
| Check Point Software Technologies Ltd.* | 21,500 | 1,527 | |||||||||
| Nuance Communications, Inc.* | 110,600 | 1,881 | |||||||||
4,398 | |||||||||||
See Notes to Schedule of Investments
110
Number of Shares | Value† (000's)z | ||||||||||
Specialty Retail (8.3%) | |||||||||||
| Bed Bath & Beyond, Inc.* | 17,100 | $ | 1,099 | ||||||||
Best Buy Co., Inc. | 58,500 | 1,866 | |||||||||
Express, Inc.* | 79,200 | 1,373 | |||||||||
| Office Depot, Inc.* | 318,000 | 1,628 | |||||||||
| Select Comfort Corp.* | 40,600 | 908 | |||||||||
6,874 | |||||||||||
Thrifts & Mortgage Finance (0.9%) | |||||||||||
| People's United Financial, Inc. | 51,300 | 767 | |||||||||
| Wireless Telecommunication Services (1.0%) | |||||||||||
| Telephone & Data Systems, Inc. | 33,100 | 872 | |||||||||
| Total Common Stocks (Cost $60,677) | 79,447 | ||||||||||
Short-Term Investments (4.5%) | |||||||||||
| State Street Institutional Liquid Reserves Fund Premier Class (Cost $3,719) | 3,719,138 | 3,719 | |||||||||
| Total Investments## (100.0%) (Cost $64,396) | 83,166 | ||||||||||
| Liabilities, less cash, receivables and other assets [(0.0%)] | (8 | ) | |||||||||
Total Net Assets (100.0%) | $ | 83,158 | |||||||||
See Notes to Schedule of Investments
111
Schedule of Investments Multi-Cap Opportunities Fund
TOP TEN EQUITY HOLDINGS
1 | HCA Holdings, Inc. | 3.9 | % | ||||||||
2 | eBay, Inc. | 3.9 | % | ||||||||
3 | JPMorgan Chase & Co. | 3.5 | % | ||||||||
4 | Berkshire Hathaway, Inc. Class B | 3.4 | % | ||||||||
5 | Schlumberger Ltd. | 3.3 | % | ||||||||
6 | Boeing Co. | 3.3 | % | ||||||||
7 | Cardinal Health, Inc. | 3.3 | % | ||||||||
8 | Goldman Sachs Group, Inc. | 3.2 | % | ||||||||
9 | Intercontinental Exchange, Inc. | 3.2 | % | ||||||||
10 | Hertz Global Holdings, Inc. | 3.1 | % | ||||||||
Number of Shares | Value† (000's)z | ||||||||||
Common Stocks (97.7%) | |||||||||||
Aerospace & Defense (4.6%) | |||||||||||
Boeing Co. | 715,000 | $ | 90,662 | ||||||||
Raytheon Co. | 370,000 | 35,646 | |||||||||
126,308 | |||||||||||
Banks (6.0%) | |||||||||||
| JPMorgan Chase & Co. | 1,645,000 | 97,795 | |||||||||
Wells Fargo & Co. | 1,325,000 | 68,158 | |||||||||
165,953 | |||||||||||
Capital Markets (3.2%) | |||||||||||
| Goldman Sachs Group, Inc. | 495,000 | 88,659 | |||||||||
Chemicals (1.2%) | |||||||||||
| Scotts Miracle-Gro Co. Class A | 575,000 | 33,195 | |||||||||
Commercial Services & Supplies (1.1%) | |||||||||||
| Covanta Holding Corp. | 1,400,000 | 29,386 | |||||||||
Containers & Packaging (2.3%) | |||||||||||
Sealed Air Corp. | 1,740,000 | 62,814 | |||||||||
Diversified Financial Services (6.5%) | |||||||||||
| Berkshire Hathaway, Inc. Class B* | 680,000 | 93,330 | |||||||||
| Intercontinental Exchange, Inc. | 460,000 | 86,940 | |||||||||
180,270 | |||||||||||
Electrical Equipment (2.2%) | |||||||||||
ABB Ltd. ADR* | 1,725,000 | 39,278 | |||||||||
| Rockwell Automation, Inc. | 180,000 | 20,990 | |||||||||
60,268 | |||||||||||
Energy Equipment & Services (3.3%) | |||||||||||
Schlumberger Ltd. | 840,000 | 92,098 | |||||||||
Food Products (3.7%) | |||||||||||
| ConAgra Foods, Inc. | 1,275,000 | 41,055 | |||||||||
| Kraft Foods Group, Inc. | 290,000 | 17,081 | |||||||||
| Mondelez International, Inc. Class A | 1,180,000 | 42,704 | |||||||||
100,840 | |||||||||||
Number of Shares | Value† (000's)z | ||||||||||
Gas Utilities (1.7%) | |||||||||||
| National Fuel Gas Co. | 615,000 | $ | 47,011 | ||||||||
Health Care Equipment & Supplies (1.6%) | |||||||||||
| Hill-Rom Holdings, Inc. | 1,000,000 | 43,810 | |||||||||
Health Care Providers & Services (11.4%) | |||||||||||
Aetna, Inc. | 1,000,000 | 82,130 | |||||||||
| Cardinal Health, Inc. | 1,225,000 | 90,283 | |||||||||
| HCA Holdings, Inc.* | 1,555,000 | 108,570 | |||||||||
| Henry Schein, Inc.* | 280,000 | 33,513 | |||||||||
314,496 | |||||||||||
Hotels, Restaurants & Leisure (2.4%) | |||||||||||
| Hyatt Hotels Corp. Class A* | 1,085,000 | 66,283 | |||||||||
Household Products (2.0%) | |||||||||||
| Procter & Gamble Co. | 650,000 | 54,022 | |||||||||
Industrial Conglomerates (2.7%) | |||||||||||
3M Co. | 510,000 | 73,440 | |||||||||
Internet Software & Services (3.9%) | |||||||||||
eBay, Inc.* | 1,925,000 | 106,838 | |||||||||
Leisure Products (1.7%) | |||||||||||
Mattel, Inc. | 1,380,000 | 47,596 | |||||||||
Machinery (2.4%) | |||||||||||
| Stanley Black & Decker, Inc. | 725,000 | 66,337 | |||||||||
Media (5.1%) | |||||||||||
| Omnicom Group, Inc. | 1,020,000 | 73,450 | |||||||||
| Twenty-First Century Fox, Inc. Class A | 1,910,000 | 67,652 | |||||||||
141,102 | |||||||||||
Metals & Mining (2.7%) | |||||||||||
| Carpenter Technology Corp. | 1,355,000 | 74,159 | |||||||||
Oil, Gas & Consumable Fuels (6.6%) | |||||||||||
Apache Corp. | 465,000 | 47,351 | |||||||||
Number of Shares | Value† (000's)z | ||||||||||
| Cenovus Energy, Inc. | 2,000,000 | $ | 63,780 | ||||||||
| Range Resources Corp. | 905,000 | 71,124 | |||||||||
182,255 | |||||||||||
Pharmaceuticals (3.0%) | |||||||||||
Pfizer, Inc. | 2,825,000 | 83,027 | |||||||||
Professional Services (1.7%) | |||||||||||
Nielsen NV | 1,015,000 | 47,695 | |||||||||
Road & Rail (5.7%) | |||||||||||
CSX Corp. | 2,340,000 | 72,329 | |||||||||
| Hertz Global Holdings, Inc.* | 2,900,000 | 85,695 | |||||||||
158,024 | |||||||||||
Software (4.2%) | |||||||||||
| Activision Blizzard, Inc. | 2,375,000 | 55,907 | |||||||||
Microsoft Corp. | 1,320,000 | 59,968 | |||||||||
115,875 | |||||||||||
Specialty Retail (2.0%) | |||||||||||
| Bed Bath & Beyond, Inc.* | 875,000 | 56,227 | |||||||||
Technology Hardware, Storage & Peripherals (1.9%) | |||||||||||
Apple, Inc. | 525,000 | 53,813 | |||||||||
Textiles, Apparel & Luxury Goods (0.9%) | |||||||||||
Hanesbrands, Inc. | 235,000 | 24,130 | |||||||||
| Total Common Stocks (Cost $2,182,786) | 2,695,931 | ||||||||||
Short-Term Investments (2.0%) | |||||||||||
| State Street Institutional Liquid Reserves Fund Premier Class (Cost $57,144) | 57,144,461 | 57,144 | |||||||||
| Total Investments## (99.7%) (Cost $2,239,930) | 2,753,075 | ||||||||||
| Cash, receivables and other assets, less liabilities (0.3%) | 6,909 | ||||||||||
Total Net Assets (100.0%) | $ | 2,759,984 | |||||||||
See Notes to Schedule of Investments
112
Schedule of Investments Real Estate Fund
TOP TEN EQUITY HOLDINGS
1 | Simon Property Group, Inc. | 9.3 | % | ||||||||
2 | American Tower Corp. | 7.3 | % | ||||||||
3 | Equity Residential | 5.1 | % | ||||||||
4 | Boston Properties, Inc. | 4.9 | % | ||||||||
5 | AvalonBay Communities, Inc. | 4.8 | % | ||||||||
6 | Ventas, Inc. | 4.0 | % | ||||||||
7 | Public Storage | 3.6 | % | ||||||||
8 | Prologis, Inc. | 3.5 | % | ||||||||
9 | Vornado Realty Trust | 3.4 | % | ||||||||
10 | Host Hotels & Resorts, Inc. | 3.0 | % | ||||||||
Number of Shares | Value† (000's)z | ||||||||||
Common Stocks (99.5%) | |||||||||||
Apartments (11.7%) | |||||||||||
| AvalonBay Communities, Inc. | 322,592 | $ | 49,712 | ||||||||
| Camden Property Trust | 260,798 | 19,518 | |||||||||
Equity Residential | 792,600 | 52,684 | |||||||||
121,914 | |||||||||||
Diversified (7.2%) | |||||||||||
| American Homes 4 Rent Class A | 1,308,300 | 23,392 | |||||||||
| American Residential Properties, Inc.ñ* | 595,350 | 11,300 | |||||||||
| American Residential Properties, Inc.* | 249,000 | 4,726 | |||||||||
| Vornado Realty Trust | 336,823 | 35,659 | |||||||||
75,077 | |||||||||||
Freestanding (1.3%) | |||||||||||
| National Retail Properties, Inc. | 356,700 | 13,248 | |||||||||
Health Care (8.6%) | |||||||||||
HCP, Inc. | 433,100 | 18,766 | |||||||||
| Health Care REIT, Inc. | 274,740 | 18,567 | |||||||||
| OMEGA Healthcare Investors, Inc. | 276,500 | 10,416 | |||||||||
Ventas, Inc. | 640,030 | 42,101 | |||||||||
89,850 | |||||||||||
Home Financing (1.6%) | |||||||||||
| Altisource Residential Corp. | 656,349 | 16,107 | |||||||||
Hotels, Restaurants & Leisure (1.0%) | |||||||||||
| Starwood Hotels & Resorts Worldwide, Inc. | 125,300 | 10,593 | |||||||||
Household Durables (1.3%) | |||||||||||
| TRI Pointe Homes, Inc.* | 939,980 | 13,912 | |||||||||
Industrial (5.3%) | |||||||||||
| EastGroup Properties, Inc. | 278,600 | 18,064 | |||||||||
Prologis, Inc. | 892,038 | 36,520 | |||||||||
54,584 | |||||||||||
Number of Shares | Value† (000's)z | ||||||||||
Infrastructure (9.3%) | |||||||||||
| American Tower Corp. | 774,700 | $ | 76,385 | ||||||||
| Crown Castle International Corp. | 255,700 | 20,331 | |||||||||
96,716 | |||||||||||
Lodging/Resorts (6.2%) | |||||||||||
| Host Hotels & Resorts, Inc. | 1,355,643 | 30,936 | |||||||||
| LaSalle Hotel Properties | 426,600 | 15,592 | |||||||||
| Sunstone Hotel Investors, Inc. | 1,232,400 | 17,956 | |||||||||
64,484 | |||||||||||
Office (12.6%) | |||||||||||
| Alexandria Real Estate Equities, Inc. | 196,200 | 15,512 | |||||||||
| Boston Properties, Inc. | 417,584 | 50,703 | |||||||||
| Douglas Emmett, Inc. | 776,525 | 22,185 | |||||||||
| Parkway Properties, Inc. | 736,600 | 15,284 | |||||||||
| SL Green Realty Corp. | 245,915 | 26,891 | |||||||||
130,575 | |||||||||||
Real Estate Management & Development (4.3%) | |||||||||||
| Brookfield Asset Management, Inc. Class A | 500,777 | 23,912 | |||||||||
| Forest City Enterprises, Inc. Class A* | 1,023,779 | 21,295 | |||||||||
45,207 | |||||||||||
Regional Malls (14.1%) | |||||||||||
| CBL & Associates Properties, Inc. | 1,009,997 | 19,190 | |||||||||
| General Growth Properties, Inc. | 848,732 | 20,853 | |||||||||
| Simon Property Group, Inc. | 569,248 | 96,789 | |||||||||
| Washington Prime Group, Inc. | 522,674 | 10,203 | |||||||||
147,035 | |||||||||||
Number of Shares | Value† (000's)z | ||||||||||
Self Storage (3.6%) | |||||||||||
Public Storage | 211,100 | $ | 36,980 | ||||||||
Shopping Centers (7.3%) | |||||||||||
DDR Corp. | 1,186,750 | 21,623 | |||||||||
| Federal Realty Investment Trust | 179,600 | 22,410 | |||||||||
| Regency Centers Corp. | 337,357 | 19,277 | |||||||||
| Urstadt Biddle Properties, Inc. Class A | 583,169 | 12,433 | |||||||||
75,743 | |||||||||||
Timber (4.1%) | |||||||||||
| Plum Creek Timber Co., Inc. | 332,900 | 13,526 | |||||||||
Weyerhaeuser Co. | 869,496 | 29,519 | |||||||||
43,045 | |||||||||||
| Total Common Stocks (Cost $894,826) | 1,035,070 | ||||||||||
Short-Term Investments (0.2%) | |||||||||||
| State Street Institutional Liquid Reserves Fund Premier Class (Cost $1,636) | 1,635,806 | 1,636 | |||||||||
| Total Investments## (99.7%) (Cost $896,462) | 1,036,706 | ||||||||||
| Cash, receivables and other assets, less liabilities (0.3%) | 3,169 | ||||||||||
Total Net Assets (100.0%) | $ | 1,039,875 | |||||||||
See Notes to Schedule of Investments
113
Schedule of Investments Small Cap Growth Fund
TOP TEN EQUITY HOLDINGS
1 | Cavium, Inc. | 3.1 | % | ||||||||
2 | Tuesday Morning Corp. | 2.3 | % | ||||||||
3 | Acadia Healthcare Co., Inc. | 2.3 | % | ||||||||
4 | Monolithic Power Systems, Inc. | 2.1 | % | ||||||||
5 | Sanchez Energy Corp. | 2.0 | % | ||||||||
6 | Ultimate Software Group, Inc. | 1.9 | % | ||||||||
7 | PolyOne Corp. | 1.9 | % | ||||||||
8 | IGI Laboratories, Inc. | 1.9 | % | ||||||||
9 | Synergy Resources Corp. | 1.9 | % | ||||||||
10 | Spectranetics Corp. | 1.8 | % | ||||||||
Number of Shares | Value† (000's)z | ||||||||||
Common Stocks (99.0%) | |||||||||||
Aerospace & Defense (5.3%) | |||||||||||
Astronics Corp.* | 20,100 | $ | 1,261 | ||||||||
| Curtiss-Wright Corp. | 17,100 | 1,228 | |||||||||
HEICO Corp. | 15,737 | 815 | |||||||||
| Kratos Defense & Security Solutions, Inc.* | 158,500 | 1,194 | |||||||||
4,498 | |||||||||||
Auto Components (2.6%) | |||||||||||
Gentherm, Inc.* | 23,300 | 1,138 | |||||||||
| Motorcar Parts of America, Inc.* | 35,100 | 1,064 | |||||||||
2,202 | |||||||||||
Banks (1.4%) | |||||||||||
| Bank of the Ozarks, Inc. | 36,300 | 1,160 | |||||||||
Biotechnology (4.3%) | |||||||||||
Dyax Corp.* | 42,400 | 433 | |||||||||
Novavax, Inc.* | 189,600 | 889 | |||||||||
Ophthotech Corp.* | 11,000 | 429 | |||||||||
| Portola Pharmaceuticals, Inc.* | 15,900 | 443 | |||||||||
| PTC Therapeutics, Inc.* | 13,300 | 421 | |||||||||
| Puma Biotechnology, Inc.* | 4,000 | 1,042 | |||||||||
3,657 | |||||||||||
Capital Markets (2.2%) | |||||||||||
| Evercore Partners, Inc. Class A | 23,700 | 1,214 | |||||||||
| Stifel Financial Corp.* | 13,200 | 632 | |||||||||
1,846 | |||||||||||
Chemicals (1.9%) | |||||||||||
PolyOne Corp. | 41,300 | 1,620 | |||||||||
Communications Equipment (1.1%) | |||||||||||
| Arista Networks, Inc.* | 11,300 | 948 | |||||||||
Consumer Finance (1.2%) | |||||||||||
| Portfolio Recovery Associates, Inc.* | 17,800 | 1,012 | |||||||||
Number of Shares | Value† (000's)z | ||||||||||
Containers & Packaging (1.7%) | |||||||||||
| Graphic Packaging Holding Co.* | 117,100 | $ | 1,498 | ||||||||
Diversified Consumer Services (1.2%) | |||||||||||
| Bright Horizons Family Solutions, Inc.* | 25,400 | 1,033 | |||||||||
Food Products (3.0%) | |||||||||||
| Hain Celestial Group, Inc.* | 14,400 | 1,416 | |||||||||
| TreeHouse Foods, Inc.* | 14,300 | 1,180 | |||||||||
2,596 | |||||||||||
Health Care Equipment & Supplies (6.2%) | |||||||||||
| LDR Holding Corp.* | 47,100 | 1,275 | |||||||||
| Spectranetics Corp.* | 53,800 | 1,527 | |||||||||
Tornier NV* | 63,400 | 1,371 | |||||||||
| Wright Medical Group, Inc.* | 37,300 | 1,113 | |||||||||
5,286 | |||||||||||
Health Care Providers & Services (6.8%) | |||||||||||
| Acadia Healthcare Co., Inc.* | 37,895 | 1,941 | |||||||||
| Air Methods Corp.* | 21,000 | 1,232 | |||||||||
HealthSouth Corp. | 22,600 | 890 | |||||||||
| LifePoint Hospitals, Inc.* | 12,100 | 905 | |||||||||
| Surgical Care Affiliates, Inc.* | 28,500 | 848 | |||||||||
5,816 | |||||||||||
Hotels, Restaurants & Leisure (3.4%) | |||||||||||
| Buffalo Wild Wings, Inc.* | 5,900 | 871 | |||||||||
| La Quinta Holdings, Inc.* | 40,800 | 806 | |||||||||
Vail Resorts, Inc. | 16,000 | 1,272 | |||||||||
2,949 | |||||||||||
Internet Software & Services (4.8%) | |||||||||||
comScore, Inc.* | 16,700 | 640 | |||||||||
| Constant Contact, Inc.* | 36,100 | 1,125 | |||||||||
Number of Shares | Value† (000's)z | ||||||||||
| Cornerstone OnDemand, Inc.* | 30,200 | $ | 1,131 | ||||||||
| Demandware, Inc.* | 23,200 | 1,233 | |||||||||
4,129 | |||||||||||
IT Services (3.8%) | |||||||||||
| Blackhawk Network Holdings, Inc.* | 30,200 | 833 | |||||||||
iGATE Corp.* | 39,200 | 1,467 | |||||||||
WEX, Inc.* | 8,200 | 932 | |||||||||
3,232 | |||||||||||
Leisure Products (1.5%) | |||||||||||
Brunswick Corp. | 29,800 | 1,281 | |||||||||
Life Sciences Tools & Services (1.3%) | |||||||||||
Techne Corp. | 11,300 | 1,079 | |||||||||
Machinery (1.3%) | |||||||||||
CLARCOR, Inc. | 17,500 | 1,106 | |||||||||
Media (1.3%) | |||||||||||
Rentrak Corp.* | 21,100 | 1,077 | |||||||||
Metals & Mining (1.3%) | |||||||||||
| Stillwater Mining Co.* | 60,100 | 1,116 | |||||||||
Multiline Retail (2.3%) | |||||||||||
| Tuesday Morning Corp.* | 111,100 | 1,953 | |||||||||
Oil, Gas & Consumable Fuels (7.2%) | |||||||||||
| Abraxas Petroleum Corp.* | 232,100 | 1,372 | |||||||||
| Carrizo Oil & Gas, Inc.* | 22,500 | 1,411 | |||||||||
| Sanchez Energy Corp.* | 52,000 | 1,726 | |||||||||
| Synergy Resources Corp.* | 119,200 | 1,604 | |||||||||
6,113 | |||||||||||
Personal Products (1.9%) | |||||||||||
| IGI Laboratories, Inc.* | 233,800 | 1,611 | |||||||||
Pharmaceuticals (4.6%) | |||||||||||
Akorn, Inc.* | 28,400 | 1,108 | |||||||||
Depomed, Inc.* | 72,800 | 1,118 | |||||||||
| Flamel Technologies SA ADR* | 53,200 | 798 | |||||||||
See Notes to Schedule of Investments
114
Number of Shares | Value† (000's)z | ||||||||||
| Pacira Pharmaceuticals, Inc.* | 8,500 | $ |
| 920 | |||||||
3,944 | |||||||||||
Professional Services (1.3%) | |||||||||||
| Paylocity Holding Corp.* | 48,100 | 1,093 | |||||||||
Road & Rail (2.5%) | |||||||||||
| Old Dominion Freight Line, Inc.* | 18,071 | 1,205 | |||||||||
Saia, Inc.* | 19,900 | 944 | |||||||||
2,149 | |||||||||||
Semiconductors & Semiconductor Equipment (7.8%) | |||||||||||
Cavium, Inc.* | 47,000 | 2,640 | |||||||||
Microsemi Corp.* | 42,700 | 1,138 | |||||||||
| Monolithic Power Systems, Inc. | 37,800 | 1,806 | |||||||||
Synaptics, Inc.* | 13,300 | 1,092 | |||||||||
6,676 | |||||||||||
Software (7.8%) | |||||||||||
MobileIron, Inc.* | 84,000 | 973 | |||||||||
| NetScout Systems, Inc.* | 33,100 | 1,525 | |||||||||
Proofpoint, Inc.* | 36,500 | 1,456 | |||||||||
PTC, Inc.* | 28,300 | 1,095 | |||||||||
| Ultimate Software Group, Inc.* | 11,100 | 1,632 | |||||||||
6,681 | |||||||||||
Specialty Retail (1.8%) | |||||||||||
| Lithia Motors, Inc. Class A | 10,700 | 935 | |||||||||
| Sportsman's Warehouse Holdings, Inc.* | 105,400 | 634 | |||||||||
1,569 | |||||||||||
Textiles, Apparel & Luxury Goods (2.7%) | |||||||||||
| G-III Apparel Group Ltd.* | 13,500 | 1,114 | |||||||||
| Oxford Industries, Inc. | 19,800 | 1,215 | |||||||||
2,329 | |||||||||||
Trading Companies & Distributors (1.5%) | |||||||||||
Air Lease Corp. | 32,900 | 1,247 | |||||||||
| Total Common Stocks (Cost $78,455) | 84,506 | ||||||||||
Number of Shares | Value† (000's)z | ||||||||||
Short-Term Investments (0.7%) | |||||||||||
| State Street Institutional Liquid Reserves Fund Premier Class (Cost $570) | 570,260 | $ | 570 | ||||||||
| Total Investments## (99.7%) (Cost $79,025) | 85,076 | ||||||||||
| Cash, receivables and other assets, less liabilities (0.3%) | 261 | ||||||||||
Total Net Assets (100.0%) | $ | 85,337 | |||||||||
See Notes to Schedule of Investments
115
Schedule of Investments Socially Responsive Fund
TOP TEN EQUITY HOLDINGS
1 | Newell Rubbermaid, Inc. | 5.1 | % | ||||||||
2 | Texas Instruments, Inc. | 5.0 | % | ||||||||
3 | American Express Co. | 4.7 | % | ||||||||
4 | TJX Cos., Inc. | 4.5 | % | ||||||||
5 | Danaher Corp. | 4.2 | % | ||||||||
6 | Progressive Corp. | 4.1 | % | ||||||||
7 | 3M Co. | 3.5 | % | ||||||||
8 | eBay, Inc. | 3.4 | % | ||||||||
9 | Unilever NV | 3.4 | % | ||||||||
10 | Noble Energy, Inc. | 3.3 | % | ||||||||
Number of Shares | Value† (000's)z | ||||||||||
Common Stocks (97.4%) | |||||||||||
Airlines (1.8%) | |||||||||||
| Ryanair Holdings PLC ADR* | 788,614 | $ | 43,295 | ||||||||
Auto Components (1.4%) | |||||||||||
BorgWarner, Inc. | 560,683 | 34,869 | |||||||||
Banks (3.1%) | |||||||||||
U.S. Bancorp | 1,789,232 | 75,649 | |||||||||
Commercial Services & Supplies (1.1%) | |||||||||||
Herman Miller, Inc. | 899,678 | 26,739 | |||||||||
Consumer Finance (4.7%) | |||||||||||
| American Express Co. | 1,263,048 | 113,106 | |||||||||
Diversified Financial Services (3.1%) | |||||||||||
| Intercontinental Exchange, Inc. | 398,022 | 75,226 | |||||||||
Diversified Telecommunication Services (1.5%) | |||||||||||
tw telecom, inc.* | 914,635 | 37,532 | |||||||||
Electric Utilities (1.0%) | |||||||||||
Northeast Utilities | 534,884 | 24,546 | |||||||||
Energy Equipment & Services (2.4%) | |||||||||||
Schlumberger Ltd. | 538,552 | 59,047 | |||||||||
Food & Staples Retailing (2.6%) | |||||||||||
| Costco Wholesale Corp. | 523,405 | 63,374 | |||||||||
Food Products (5.9%) | |||||||||||
J.M. Smucker Co. | 599,420 | 61,501 | |||||||||
Unilever NV | 1,996,572 | 83,137 | |||||||||
144,638 | |||||||||||
Health Care Equipment & Supplies (5.1%) | |||||||||||
| Abbott Laboratories | 1,324,342 | 55,940 | |||||||||
| Becton, Dickinson & Co. | 590,118 | 69,144 | |||||||||
125,084 | |||||||||||
Household Durables (5.1%) | |||||||||||
| Newell Rubbermaid, Inc. | 3,725,366 | 124,874 | |||||||||
Household Products (2.4%) | |||||||||||
| Procter & Gamble Co. | 696,849 | 57,915 | |||||||||
Number of Shares | Value† (000's)z | ||||||||||
Industrial Conglomerates (7.7%) | |||||||||||
3M Co. | 592,970 | $ | 85,388 | ||||||||
Danaher Corp. | 1,327,887 | 101,729 | |||||||||
187,117 | |||||||||||
Industrial Gases (1.9%) | |||||||||||
Praxair, Inc. | 352,975 | 46,434 | |||||||||
Insurance (4.1%) | |||||||||||
Progressive Corp. | 4,020,864 | 100,602 | |||||||||
Internet Software & Services (3.4%) | |||||||||||
eBay, Inc.* | 1,503,842 | 83,463 | |||||||||
IT Services (1.3%) | |||||||||||
| MasterCard, Inc. Class A | 419,289 | 31,786 | |||||||||
Metals & Mining (2.0%) | |||||||||||
Nucor Corp. | 889,937 | 48,341 | |||||||||
Oil, Gas & Consumable Fuels (4.4%) | |||||||||||
| Cimarex Energy Co. | 181,882 | 26,402 | |||||||||
Noble Energy, Inc. | 1,125,243 | 81,175 | |||||||||
107,577 | |||||||||||
Pharmaceuticals (5.5%) | |||||||||||
Roche Holding AG | 235,230 | 68,592 | |||||||||
Sanofi ADR | 1,187,087 | 64,934 | |||||||||
133,526 | |||||||||||
Professional Services (3.3%) | |||||||||||
| Robert Half International, Inc. | 1,596,699 | 80,170 | |||||||||
Road & Rail (2.0%) | |||||||||||
| J.B. Hunt Transport Services, Inc. | 634,771 | 47,957 | |||||||||
Semiconductors & Semiconductor Equipment (7.6%) | |||||||||||
| Microchip Technology, Inc. | 1,304,456 | 63,696 | |||||||||
| Texas Instruments, Inc. | 2,512,632 | 121,059 | |||||||||
184,755 | |||||||||||
Software (3.1%) | |||||||||||
Intuit, Inc. | 909,126 | 75,621 | |||||||||
Specialty Chemicals (0.9%) | |||||||||||
| Novozymes A/S B Shares | 442,723 | 20,555 | |||||||||
Number of Shares | Value† (000's)z | ||||||||||
Specialty Retail (6.0%) | |||||||||||
| O'Reilly Automotive, Inc.* | 231,721 | $ | 36,144 | ||||||||
TJX Cos., Inc. | 1,840,293 | 109,700 | |||||||||
145,844 | |||||||||||
Trading Companies & Distributors (3.0%) | |||||||||||
NOW, Inc.* | 729,934 | 24,110 | |||||||||
W.W. Grainger, Inc. | 203,089 | 50,000 | |||||||||
74,110 | |||||||||||
| Total Common Stocks (Cost $1,791,635) | 2,373,752 | ||||||||||
| Principal Amount | |||||||||||
Short-Term Investments (2.4%) | |||||||||||
Certificates of Deposit (0.0%) | |||||||||||
| Carver Federal Savings Bank Self Help Credit Union, 0.25%, due 9/24/14 | $ | 100,000 | 100 | ||||||||
| Self Help Credit Union, 0.25%, due 10/16/14 | 250,000 | 250 | |||||||||
| Self Help Credit Union, 0.25%, due 11/16/14 | 250,000 | 250 | |||||||||
600 | # | ||||||||||
| Number of Shares | |||||||||||
Money Market Fund (2.4%) | |||||||||||
| State Street Institutional Treasury Money Market Fund Premier Class | 57,296,591 | 57,297 | |||||||||
| Total Short-Term Investments (Cost $57,897) | 57,897 | ||||||||||
| Total Investments## (99.8%) (Cost $1,849,532) | 2,431,649 | ||||||||||
| Cash, receivables and other assets, less liabilities (0.2%) | 4,519 | ||||||||||
Total Net Assets (100.0%) | $ | 2,436,168 | |||||||||
See Notes to Schedule of Investments
116
Schedule of Investments Value Fund
TOP TEN EQUITY HOLDINGS
1 | Bank of New York Mellon Corp. | 3.7 | % | ||||||||
2 | Cisco Systems, Inc. | 3.5 | % | ||||||||
3 | Eaton Corp. PLC | 3.2 | % | ||||||||
4 | JPMorgan Chase & Co. | 3.0 | % | ||||||||
5 | Lincoln National Corp. | 2.9 | % | ||||||||
6 | Goldman Sachs Group, Inc. | 2.6 | % | ||||||||
7 | American Airlines Group, Inc. | 2.6 | % | ||||||||
8 | Intel Corp. | 2.5 | % | ||||||||
9 | MetLife, Inc. | 2.5 | % | ||||||||
10 | CME Group, Inc. | 2.4 | % | ||||||||
Number of Shares | Value† (000's)z | ||||||||||
Common Stocks (91.3%) | |||||||||||
Airlines (5.3%) | |||||||||||
| American Airlines Group, Inc. | 14,258 | $ | 555 | ||||||||
Delta Air Lines, Inc. | 3,294 | 130 | |||||||||
| United Continental Holdings, Inc.* | 9,126 | 435 | |||||||||
1,120 | |||||||||||
Automobiles (1.0%) | |||||||||||
Ford Motor Co. | 11,991 | 209 | |||||||||
Banks (11.3%) | |||||||||||
Citigroup, Inc. | 6,945 | 359 | |||||||||
Comerica, Inc. | 6,224 | 313 | |||||||||
| JPMorgan Chase & Co. | 10,807 | 643 | |||||||||
M&T Bank Corp. | 2,765 | 342 | |||||||||
| PNC Financial Services Group, Inc. | 4,047 | 343 | |||||||||
| Regions Financial Corp. | 13,607 | 138 | |||||||||
Wells Fargo & Co. | 4,922 | 253 | |||||||||
2,391 | |||||||||||
Capital Markets (8.3%) | |||||||||||
| Bank of New York Mellon Corp. | 19,830 | 777 | |||||||||
| Goldman Sachs Group, Inc. | 3,109 | 557 | |||||||||
Invesco Ltd. | 8,061 | 329 | |||||||||
Morgan Stanley | 2,382 | 82 | |||||||||
1,745 | |||||||||||
Chemicals (4.4%) | |||||||||||
Dow Chemical Co. | 5,150 | 276 | |||||||||
| LyondellBasell Industries NV Class A | 3,883 | 444 | |||||||||
Monsanto Co. | 1,715 | 198 | |||||||||
918 | |||||||||||
Communications Equipment (3.5%) | |||||||||||
Cisco Systems, Inc. | 29,758 | 744 | |||||||||
Diversified Financial Services (2.4%) | |||||||||||
CME Group, Inc. | 6,709 | 514 | |||||||||
Electrical Equipment (3.2%) | |||||||||||
Eaton Corp. PLC | 9,531 | 665 | |||||||||
Number of Shares | Value† (000's)z | ||||||||||
Electronic Equipment, Instruments & Components (0.8%) | |||||||||||
Corning, Inc. | 8,487 | $ | 177 | ||||||||
Energy Equipment & Services (2.3%) | |||||||||||
Halliburton Co. | 2,381 | 161 | |||||||||
| McDermott International, Inc.* | 44,523 | 320 | |||||||||
481 | |||||||||||
Food Products (1.1%) | |||||||||||
| WhiteWave Foods Co.* | 6,469 | 226 | |||||||||
Health Care Equipment & Supplies (3.6%) | |||||||||||
| Baxter International, Inc. | 1,101 | 83 | |||||||||
| Boston Scientific Corp.* | 15,986 | 203 | |||||||||
Covidien PLC | 4,359 | 378 | |||||||||
Hologic, Inc.* | 4,223 | 105 | |||||||||
769 | |||||||||||
Health Care Providers & Services (1.8%) | |||||||||||
| Tenet Healthcare Corp.* | 703 | 43 | |||||||||
| UnitedHealth Group, Inc. | 3,985 | 345 | |||||||||
388 | |||||||||||
Hotels, Restaurants & Leisure (2.3%) | |||||||||||
Carnival Corp. | 12,816 | 485 | |||||||||
Independent Power and Renewable Electricity Producers (0.9%) | |||||||||||
Calpine Corp.* | 8,110 | 193 | |||||||||
Industrial Conglomerates (1.9%) | |||||||||||
General Electric Co. | 15,788 | 410 | |||||||||
Insurance (5.3%) | |||||||||||
| Lincoln National Corp. | 11,047 | 608 | |||||||||
MetLife, Inc. | 9,515 | 521 | |||||||||
1,129 | |||||||||||
Machinery (9.3%) | |||||||||||
Caterpillar, Inc. | 1,739 | 190 | |||||||||
Cummins, Inc. | 2,640 | 383 | |||||||||
Joy Global, Inc. | 7,328 | 463 | |||||||||
Kubota Corp. ADR | 4,164 | 298 | |||||||||
Number of Shares | Value† (000's)z | ||||||||||
Pall Corp. | 2,009 | $ | 169 | ||||||||
Terex Corp. | 12,515 | 468 | |||||||||
1,971 | |||||||||||
Media (0.1%) | |||||||||||
News Corp. Class A* | 1,158 | 20 | |||||||||
Metals & Mining (3.6%) | |||||||||||
| Newmont Mining Corp. | 15,133 | 410 | |||||||||
| United States Steel Corp. | 9,234 | 357 | |||||||||
767 | |||||||||||
Multiline Retail (2.9%) | |||||||||||
| JC Penney Co., Inc.* | 12,843 | 139 | |||||||||
Kohl's Corp. | 3,411 | 200 | |||||||||
Target Corp. | 4,612 | 277 | |||||||||
616 | |||||||||||
Oil, Gas & Consumable Fuels (4.4%) | |||||||||||
| Antero Resources Corp.* | 3,720 | 215 | |||||||||
Apache Corp. | 557 | 57 | |||||||||
Devon Energy Corp. | 2,006 | 151 | |||||||||
Noble Energy, Inc. | 1,428 | 103 | |||||||||
| Occidental Petroleum Corp. | 2,611 | 271 | |||||||||
| Range Resources Corp. | 1,709 | 134 | |||||||||
931 | |||||||||||
Pharmaceuticals (5.4%) | |||||||||||
Eli Lilly & Co. | 3,229 | 205 | |||||||||
Johnson & Johnson | 3,745 | 389 | |||||||||
Merck & Co., Inc. | 5,850 | 352 | |||||||||
| Teva Pharmaceutical Industries Ltd. ADR | 3,892 | 204 | |||||||||
1,150 | |||||||||||
Semiconductors & Semiconductor Equipment (2.5%) | |||||||||||
Intel Corp. | 15,136 | 528 | |||||||||
Software (2.0%) | |||||||||||
Microsoft Corp. | 9,043 | 411 | |||||||||
Specialty Retail (0.3%) | |||||||||||
| American Eagle Outfitters, Inc. | 3,591 | 51 | |||||||||
See Notes to Schedule of Investments
117
Number of Shares | Value† (000's)z | ||||||||||
Technology Hardware, Storage & Peripherals (1.0%) | |||||||||||
SanDisk Corp. | 2,243 | $ | 220 | ||||||||
Textiles, Apparel & Luxury Goods (0.4%) | |||||||||||
Ralph Lauren Corp. | 512 | 87 | |||||||||
| Total Common Stocks (Cost $17,680) | 19,316 | ||||||||||
Exchange Traded Funds (1.1%) | |||||||||||
| SPDR Gold Shares* (Cost $244) | 1,936 | 240 | |||||||||
Short-Term Investments (5.5%) | |||||||||||
| State Street Institutional Treasury Money Market Fund Premier Class (Cost $1,158) | 1,157,583 | 1,158 | |||||||||
| Total Investments## (97.9%) (Cost $19,082) | 20,714 | ||||||||||
| Cash, receivables and other assets, less liabilities (2.1%) | 445 | ||||||||||
Total Net Assets (100.0%) | $ | 21,159 | |||||||||
See Notes to Schedule of Investments
118
Notes to Schedule of Investments
† In accordance with Accounting Standards Codification ("ASC") 820 "Fair Value Measurement" ("ASC 820"), all investments held by each of Neuberger Berman All Cap Core Fund ("All Cap Core") (formerly, Neuberger Berman Select Equities Fund), Neuberger Berman Emerging Markets Equity Fund ("Emerging Markets Equity"), Neuberger Berman Equity Income Fund ("Equity Income"), Neuberger Berman Focus Fund ("Focus"), Neuberger Berman Genesis Fund ("Genesis"), Neuberger Berman Global Equity Fund ("Global Equity"), Neuberger Berman Global Thematic Opportunities Fund ("Global Thematic Opportunities"), Neuberger Berman Greater China Equity Fund ("Greater China Equity"), Neuberger Berman Guardian Fund ("Guardian"), Neuberger Berman International Equity Fund ("International Equity"), Neuberger Berman International Select Fund ("International Select") (formerly, Neuberger Berman International Large Cap Fund), Neuberger Berman Intrinsic Value Fund ("Intrinsic Value"), Neuberger Berman Large Cap Disciplined Growth Fund ("Large Cap Disciplined Growth"), Neuberger Berman Large Cap Value Fund ("Large Cap Value"), Neuberger Berman Mid Cap Growth Fund ("Mid Cap Growth"), Neuberger Berman Mid Cap Intrinsic Value Fund ("Mid Cap Intrinsic Value"), Neuberger Berman Multi-Cap Opportunities Fund ("Multi-Cap Opportunities"), Neuberger Berman Real Estate Fund ("Real Estate"), Neuberger Berman Small Cap Growth Fund ("Small Cap Growth"), Neuberger Berman Socially Responsive Fund ("Socially Responsive") and Neuberger Berman Value Fund ("Value") (each individually a "Fund," and collectively, the "Funds") are carried at the value that Neuberger Berman Management LLC ("Management") believes a Fund would receive upon selling an investment in an orderly transaction to an independent buyer in the principal or most advantageous market for the investment under current market conditions. Various inputs, including the volume and level of activity for the asset or liability in the market, are considered in valuing the Funds' investments, some of which are discussed below. Significant management judgment may be necessary to value investments in accordance with ASC 820.
ASC 820 established a three-tier hierarchy of inputs to create a classification of value measurements for disclosure purposes. The three-tier hierarchy of inputs is summarized in the three broad Levels listed below.
• Level 1 – quoted prices in active markets for identical investments
• Level 2 – other observable inputs (including quoted prices for similar investments, interest rates, prepayment speeds, credit risk, amortized cost, etc.)
• Level 3 – unobservable inputs (including a Fund's own assumptions in determining the fair value of investments)
The inputs or methodology used for valuing an investment are not necessarily an indication of the risk associated with investing in those securities.
The value of the Funds' investments in equity securities, exchange traded funds, convertible preferred stocks and written option contracts, for which market quotations are readily available, is generally determined by Management by obtaining valuations from an independent pricing service based on the latest sale price quoted on a principal exchange or market for that security (Level 1 inputs). Securities traded primarily on the NASDAQ Stock Market are normally valued at the NASDAQ Official Closing Price ("NOCP") provided by NASDAQ each business day. The NOCP is the most recently reported price as of 4:00:02 p.m., Eastern time, unless that price is outside the range of the "inside" bid and asked prices (i.e., the bid and asked prices that dealers quote to each other when trading for their own accounts); in that case, NASDAQ will adjust the price to equal the inside bid or asked price, whichever is closer. Because of delays in reporting trades, the NOCP may not be based on the price of the last trade to occur before the market closes. If there is no reported sale of a security on a particular day, the independent pricing service may value the security based on reported market quotations.
The value of the Funds' investments in convertible bonds is determined by Management primarily by obtaining valuations from independent pricing services based on readily available bid quotations or, if quotations are not available, by methods which include various considerations such as yields or prices of securities of comparable
See Notes to Financial Statements
119
Notes to Schedule of Investments (cont'd)
quality, coupon, maturity and type; indications as to values from dealers; and general market conditions (generally Level 2 inputs).
Other Level 2 inputs used by an independent pricing service to value convertible bonds generally include underlying stock data, dealer quotes, conversion premiums, listed bond and preferred stock prices and other market information which may include benchmark curves, trade execution data, and sensitivity analysis, when available.
The value of participatory notes is determined by Management by obtaining valuations from an independent pricing service based on the underlying equity security and applicable exchange rate.
Management has developed a process to periodically review information provided by independent pricing services for all types of securities.
Certificates of deposit are valued at amortized cost.
Investments in investment companies are valued using the respective fund's daily calculated net asset value per share (Level 2 inputs).
If a valuation is not available from an independent pricing service, or if Management has reason to believe that the valuation received does not represent the amount a Fund might reasonably expect to receive on a current sale in an orderly transaction, the applicable Fund seeks to obtain quotations from brokers or dealers (generally considered Level 2 or Level 3 inputs depending on the number of quotes available). If such quotations are not readily available, the security is valued using methods the Neuberger Berman Equity Funds' Board of Trustees (the "Board") has approved in the good-faith belief that the resulting valuation will reflect the fair value of the security. Numerous factors may be considered when determining the fair value of a security based on Level 2 or Level 3 inputs, including available analyst, media or other reports, trading in futures or American Depositary Receipts ("ADRs") and whether the issuer of the security being fair valued has other securities outstanding.
The value of the Funds' investments in foreign securities is generally determined using the same valuation methods and inputs as other Fund investments, as discussed above. Foreign security prices expressed in local currency values are translated from the local currency into U.S. dollars using the exchange rates as of the end of regular trading on the New York Stock Exchange ("NYSE") on business days, usually 4:00 p.m., Eastern time. The Board has approved the use of Interactive Data Pricing and Reference Data, Inc. ("Interactive") to assist in determining the fair value of foreign equity securities when changes in the value of a certain index suggest that the closing prices on the foreign exchanges may no longer represent the amount that a Fund could expect to receive for those securities or on days when foreign markets are closed and U.S. markets are open. In each of these events, Interactive will provide adjusted prices for certain foreign equity securities using a statistical analysis of historical correlations of multiple factors (Level 2 inputs). In the absence of precise information about the market values of these foreign securities as of the close of the NYSE, the Board has determined on the basis of available data that prices adjusted in this way are likely to be closer to the prices a Fund could realize on a current sale than are the prices of those securities established at the close of the foreign markets in which the securities primarily trade.
Fair value prices are necessarily estimates, and there is no assurance that such a price will be at or close to the price at which the security is next quoted or next trades.
See Notes to Financial Statements
120
Notes to Schedule of Investments (cont'd)
The following is a summary, categorized by Level, of inputs used to value the Funds' investments as of August 31, 2014:
Asset Valuation Inputs
(000's omitted) | Level 1 | Level 2 | Level 3 | Total | |||||||||||||||
All Cap Core | |||||||||||||||||||
Investments: | |||||||||||||||||||
Common Stocks§ | $ | 90,189 | $ | — | $ | — | $ | 90,189 | |||||||||||
Short-Term Investments | — | 10,350 | — | 10,350 | |||||||||||||||
Total Investments | 90,189 | 10,350 | — | 100,539 | |||||||||||||||
Emerging Markets Equity | |||||||||||||||||||
Investments: | |||||||||||||||||||
Common Stocks§ | |||||||||||||||||||
India | — | 69,215 | — | 69,215 | |||||||||||||||
Qatar | — | 9,703 | — | 9,703 | |||||||||||||||
Russia | 11,835 | 13,030 | — | 24,865 | |||||||||||||||
Thailand | — | 9,206 | — | 9,206 | |||||||||||||||
Other Common Stocksß | 494,025 | — | — | 494,025 | |||||||||||||||
Total Common Stocks | 505,860 | 101,154 | — | 607,014 | |||||||||||||||
Short-Term Investments | — | 15,786 | — | 15,786 | |||||||||||||||
Total Investments | 505,860 | 116,940 | — | 622,800 | |||||||||||||||
Equity Income | |||||||||||||||||||
Investments: | |||||||||||||||||||
Common Stocks§ | 2,381,778 | — | — | 2,381,778 | |||||||||||||||
Convertible Bonds | — | 58,531 | — | 58,531 | |||||||||||||||
Short-Term Investments | — | 32,319 | — | 32,319 | |||||||||||||||
Total Investments | 2,381,778 | 90,850 | — | 2,472,628 | |||||||||||||||
Focus | |||||||||||||||||||
Investments: | |||||||||||||||||||
Common Stocks§ | 821,229 | — | — | 821,229 | |||||||||||||||
Short-Term Investments | — | 26,642 | — | 26,642 | |||||||||||||||
Total Investments | 821,229 | 26,642 | — | 847,871 | |||||||||||||||
Genesis | |||||||||||||||||||
Investments: | |||||||||||||||||||
Common Stocks§ | 13,203,274 | — | — | 13,203,274 | |||||||||||||||
Short-Term Investments | — | 489,127 | — | 489,127 | |||||||||||||||
Total Investments | 13,203,274 | 489,127 | — | 13,692,401 | |||||||||||||||
See Notes to Financial Statements
121
Notes to Schedule of Investments (cont'd)
(000's omitted) | Level 1 | Level 2 | Level 3 | Total | |||||||||||||||
Global Equity | |||||||||||||||||||
Investments: | |||||||||||||||||||
Common Stocks§ | |||||||||||||||||||
Israel | $ | 653 | $ | 491 | $ | — | $ | 1,144 | |||||||||||
Other Common Stocksß | 36,507 | — | — | 36,507 | |||||||||||||||
Total Common Stocks | 37,160 | 491 | — | 37,651 | |||||||||||||||
Short-Term Investments | — | 2,248 | — | 2,248 | |||||||||||||||
Total Investments | 37,160 | 2,739 | — | 39,899 | |||||||||||||||
Global Thematic Opportunities | |||||||||||||||||||
Investments: | |||||||||||||||||||
Common Stocks§ | 73,879 | — | — | 73,879 | |||||||||||||||
Exchange Traded Funds | 1,822 | — | — | 1,822 | |||||||||||||||
Convertible Bonds | — | 779 | — | 779 | |||||||||||||||
Short-Term Investments | — | 6,649 | — | 6,649 | |||||||||||||||
Total Investments | 75,701 | 7,428 | — | 83,129 | |||||||||||||||
Greater China Equity | |||||||||||||||||||
Investments: | |||||||||||||||||||
Common Stocks§ | 54,880 | — | — | 54,880 | |||||||||||||||
Participatory Notes§ | 16,861 | — | — | 16,861 | |||||||||||||||
Short-Term Investments | — | 877 | — | 877 | |||||||||||||||
Total Investments | 71,741 | 877 | — | 72,618 | |||||||||||||||
Guardian | |||||||||||||||||||
Investments: | |||||||||||||||||||
Common Stocks§ | 1,479,953 | — | — | 1,479,953 | |||||||||||||||
Short-Term Investments | — | 27,356 | — | 27,356 | |||||||||||||||
Total Investments | 1,479,953 | 27,356 | — | 1,507,309 | |||||||||||||||
International Equity | |||||||||||||||||||
Investments: | |||||||||||||||||||
Common Stocks§ | |||||||||||||||||||
Israel | 22,563 | 14,956 | — | 37,519 | |||||||||||||||
Other Common Stocksß | 1,062,094 | — | — | 1,062,094 | |||||||||||||||
Total Common Stocks | 1,084,657 | 14,956 | — | 1,099,613 | |||||||||||||||
Short-Term Investments | — | 32,332 | — | 32,332 | |||||||||||||||
Total Investments | 1,084,657 | 47,288 | — | 1,131,945 | |||||||||||||||
See Notes to Financial Statements
122
Notes to Schedule of Investments (cont'd)
(000's omitted) | Level 1 | Level 2 | Level 3 | Total | |||||||||||||||
International Select | |||||||||||||||||||
Investments: | |||||||||||||||||||
Common Stocks§ | |||||||||||||||||||
Israel | $ | 5,532 | $ | 3,970 | $ | — | $ | 9,502 | |||||||||||
Other Common Stocksß | 226,395 | — | — | 226,395 | |||||||||||||||
Total Common Stocks | 231,927 | 3,970 | — | 235,897 | |||||||||||||||
Short-Term Investments | — | 5,137 | — | 5,137 | |||||||||||||||
Total Investments | 231,927 | 9,107 | — | 241,034 | |||||||||||||||
Intrinsic Value | |||||||||||||||||||
Investments: | |||||||||||||||||||
Common Stocks§ | 266,171 | — | — | 266,171 | |||||||||||||||
Short-Term Investments | — | 10,852 | — | 10,852 | |||||||||||||||
Total Investments | 266,171 | 10,852 | — | 277,023 | |||||||||||||||
Large Cap Disciplined Growth | |||||||||||||||||||
Investments: | |||||||||||||||||||
Common Stocks§ | 225,692 | — | — | 225,692 | |||||||||||||||
Short-Term Investments | — | 5,207 | — | 5,207 | |||||||||||||||
Total Investments | 225,692 | 5,207 | — | 230,899 | |||||||||||||||
Large Cap Value | |||||||||||||||||||
Investments: | |||||||||||||||||||
Common Stocks§ | 1,617,770 | — | — | 1,617,770 | |||||||||||||||
Exchange Traded Funds | 20,079 | — | — | 20,079 | |||||||||||||||
Short-Term Investments | — | 34,844 | — | 34,844 | |||||||||||||||
Total Investments | 1,637,849 | 34,844 | — | 1,672,693 | |||||||||||||||
Mid Cap Growth | |||||||||||||||||||
Investments: | |||||||||||||||||||
Common Stocks§ | 973,868 | — | — | 973,868 | |||||||||||||||
Short-Term Investments | — | 34,299 | — | 34,299 | |||||||||||||||
Total Investments | 973,868 | 34,299 | — | 1,008,167 | |||||||||||||||
Mid Cap Intrinsic Value | |||||||||||||||||||
Investments: | |||||||||||||||||||
Common Stocks§ | 79,447 | — | — | 79,447 | |||||||||||||||
Short-Term Investments | — | 3,719 | — | 3,719 | |||||||||||||||
Total Investments | 79,447 | 3,719 | — | 83,166 | |||||||||||||||
Multi-Cap Opportunities | |||||||||||||||||||
Investments: | |||||||||||||||||||
Common Stocks§ | 2,695,931 | — | — | 2,695,931 | |||||||||||||||
Short-Term Investments | — | 57,144 | — | 57,144 | |||||||||||||||
Total Investments | 2,695,931 | 57,144 | — | 2,753,075 | |||||||||||||||
See Notes to Financial Statements
123
Notes to Schedule of Investments (cont'd)
(000's omitted) | Level 1 | Level 2 | Level 3 | Total | |||||||||||||||
Real Estate | |||||||||||||||||||
Investments: | |||||||||||||||||||
Common Stocks§ | $ | 1,035,070 | $ | — | $ | — | $ | 1,035,070 | |||||||||||
Short-Term Investments | — | 1,636 | — | 1,636 | |||||||||||||||
Total Investments | 1,035,070 | 1,636 | — | 1,036,706 | |||||||||||||||
Small Cap Growth | |||||||||||||||||||
Investments: | |||||||||||||||||||
Common Stocks§ | 84,506 | — | — | 84,506 | |||||||||||||||
Short-Term Investments | — | 570 | — | 570 | |||||||||||||||
Total Investments | 84,506 | 570 | — | 85,076 | |||||||||||||||
Socially Responsive | |||||||||||||||||||
Investments: | |||||||||||||||||||
Common Stocks§ | 2,373,752 | — | — | 2,373,752 | |||||||||||||||
Short-Term Investments§ | — | 57,897 | — | 57,897 | |||||||||||||||
Total Investments | 2,373,752 | 57,897 | — | 2,431,649 | |||||||||||||||
Value | |||||||||||||||||||
Investments: | |||||||||||||||||||
Common Stocks§ | 19,316 | — | — | 19,316 | |||||||||||||||
Exchange Traded Funds | 240 | — | — | 240 | |||||||||||||||
Short-Term Investments | — | 1,158 | — | 1,158 | |||||||||||||||
Total Investments | 19,556 | 1,158 | — | 20,714 | |||||||||||||||
§ The Schedule of Investments (or Summary Schedule of Investments by Industry for the global/international funds) provides information on the industry for the portfolio.
ß Represents a geographic location and/or industry where all securities were Level 1 securities. Please refer to the Schedule of Investments for additional information.
As of the year ending August 31, 2014, certain securities were transferred from one level to another based on beginning of period market values as of August 31, 2013. Approximately $19,532,000 was transferred from Level 1 to Level 2 for Emerging Markets Equity. Interactive provided adjusted prices for these securities as of August 31, 2014, as stated in the description of the valuation methods of foreign equity securities in footnote † above. Also, approximately $137,287,000, $117,283,000, $1,978,000, $6,549,000, $21,528,000, $176,982,000 and $41,534,000 were transferred from Level 2 to Level 1 for Emerging Markets Equity, Equity Income, Global Equity, Global Thematic Opportunities, Greater China Equity, International Equity and International Select due to active market activity on recognized exchanges as of August 31, 2014. These securities had been categorized as Level 2 as of August 31, 2013, due to foreign exchanges having been closed and, therefore, no prices having been readily available for the securities as of that date. In addition, approximately $10,157,000 was transferred from Level 2 to Level 1 for Real Estate due to market quotations being readily available as of August 31, 2014. A security had been categorized as Level 2 as of August 31, 2013, due to a management appraised fair valuation as of that date.
See Notes to Financial Statements
124
Notes to Schedule of Investments (cont'd)
The following is a summary, categorized by Level, of inputs used to value the Fund's derivatives as of August 31, 2014:
Liability Valuation Inputs
(000's omitted) | Level 1 | Level 2 | Level 3 | Total | |||||||||||||||
Equity Income | |||||||||||||||||||
Option Contracts | $ | (2,064 | ) | $ | — | $ | — | $ | (2,064 | ) | |||||||||
# At cost, which approximates market value.
## At August 31, 2014, selected fund information on a U.S. federal income tax basis was as follows:
(000's omitted) | Cost | Gross Unrealized Appreciation | Gross Unrealized Depreciation | Net Unrealized Appreciation (Depreciation) | |||||||||||||||
All Cap Core | $ | 83,625 | $ | 17,196 | $ | 282 | $ | 16,914 | |||||||||||
Emerging Markets Equity | 555,906 | 89,764 | 22,870 | 66,894 | |||||||||||||||
Equity Income | 2,103,886 | 378,681 | 9,939 | 368,742 | |||||||||||||||
Focus | 703,466 | 148,231 | 3,826 | 144,405 | |||||||||||||||
Genesis | 7,757,243 | 6,023,846 | 88,688 | 5,935,158 | |||||||||||||||
Global Equity | 35,154 | 5,280 | 535 | 4,745 | |||||||||||||||
Global Thematic Opportunities | 70,093 | 13,639 | 603 | 13,036 | |||||||||||||||
Greater China Equity | 66,172 | 7,117 | 671 | 6,446 | |||||||||||||||
Guardian | 1,113,729 | 393,611 | 31 | 393,580 | |||||||||||||||
International Equity | 960,748 | 188,003 | 16,806 | 171,197 | |||||||||||||||
International Select | 199,711 | 43,901 | 2,578 | 41,323 | |||||||||||||||
Intrinsic Value | 209,881 | 75,097 | 7,955 | 67,142 | |||||||||||||||
Large Cap Disciplined Growth | 189,133 | 42,548 | 782 | 41,766 | |||||||||||||||
Large Cap Value | 1,409,240 | 268,708 | 5,255 | 263,453 | |||||||||||||||
Mid Cap Growth | 737,641 | 273,813 | 3,287 | 270,526 | |||||||||||||||
Mid Cap Intrinsic Value | 64,314 | 19,601 | 749 | 18,852 | |||||||||||||||
Multi-Cap Opportunities | 2,241,495 | 521,065 | 9,485 | 511,580 | |||||||||||||||
Real Estate | 896,861 | 147,530 | 7,685 | 139,845 | |||||||||||||||
Small Cap Growth | 79,553 | 6,807 | 1,284 | 5,523 | |||||||||||||||
Socially Responsive | 1,849,298 | 582,521 | 170 | 582,351 | |||||||||||||||
Value | 19,118 | 1,662 | 66 | 1,596 | |||||||||||||||
* Security did not produce income during the last twelve months.
‡‡ At August 31, 2014, Equity Income had outstanding call and put options written as follows:
Name of Issuer | Contracts | Exercise Price | Expiration Date | Market Value of Optionsµ | |||||||||||||||
Chevron Corp., Call | 300 | 140 | January 2015 | $ | (26,000 | ) | |||||||||||||
Deere & Co., Put | 500 | 75 | January 2015 | (45,000 | ) | ||||||||||||||
Deere & Co., Put | 500 | 77.5 | January 2015 | (74,000 | ) | ||||||||||||||
Eli Lilly & Co., Call | 295 | 70 | January 2015 | (12,000 | ) | ||||||||||||||
See Notes to Financial Statements
125
Notes to Schedule of Investments (cont'd)
Name of Issuer | Contracts | Exercise Price | Expiration Date | Market Value of Optionsµ | |||||||||||||||
Equity Residential, Call | 34 | 65 | October 2014 | $ | (7,000 | ) | |||||||||||||
Equity Residential, Call | 500 | 65 | January 2015 | (142,000 | ) | ||||||||||||||
Equity Residential, Call | 149 | 67.5 | January 2015 | (19,000 | ) | ||||||||||||||
General Dynamics Corp., Call | 500 | 125 | November 2014 | (130,000 | ) | ||||||||||||||
Golar LNG Ltd., Call | 300 | 75 | January 2015 | (58,000 | ) | ||||||||||||||
Golar LNG Ltd., Call | 600 | 80 | January 2015 | (90,000 | ) | ||||||||||||||
Home Depot, Inc., Call | 500 | 90 | January 2015 | (260,000 | ) | ||||||||||||||
Home Depot, Inc., Call | 500 | 90 | February 2015 | (267,000 | ) | ||||||||||||||
JPMorgan Chase & Co., Call | 500 | 65 | March 2015 | (45,000 | ) | ||||||||||||||
JPMorgan Chase & Co., Call | 500 | 67.5 | June 2015 | (49,000 | ) | ||||||||||||||
MetLife, Inc., Put | 467 | 47 | January 2015 | (33,000 | ) | ||||||||||||||
MetLife, Inc., Put | 500 | 50 | January 2015 | (64,000 | ) | ||||||||||||||
Microsoft Corp., Call | 500 | 45 | January 2015 | (108,000 | ) | ||||||||||||||
Microsoft Corp., Call | 500 | 46 | January 2015 | (78,000 | ) | ||||||||||||||
Microsoft Corp., Call | 500 | 50 | April 2015 | (46,000 | ) | ||||||||||||||
Norfolk Southern Corp., Call | 500 | 110 | December 2014 | (112,000 | ) | ||||||||||||||
Norfolk Southern Corp., Call | 272 | 115 | December 2014 | (23,000 | ) | ||||||||||||||
Norfolk Southern Corp., Call | 500 | 110 | January 2015 | (138,000 | ) | ||||||||||||||
Norfolk Southern Corp., Call | 400 | 115 | January 2015 | (49,000 | ) | ||||||||||||||
Occidental Petroleum Corp., Put | 400 | 85 | January 2015 | (23,000 | ) | ||||||||||||||
ONEOK, Inc., Call | 500 | 72.5 | January 2015 | (85,000 | ) | ||||||||||||||
Southern Copper Corp., Put | 50 | 28 | March 2015 | (4,000 | ) | ||||||||||||||
Southern Copper Corp., Put | 500 | 29 | March 2015 | (50,000 | ) | ||||||||||||||
Spectra Energy Corp., Call | 500 | 44 | January 2015 | (27,000 | ) | ||||||||||||||
Total | $ | (2,064,000 | ) | ||||||||||||||||
µ Rounded to the nearest thousand.
At August 31, 2014, Equity Income had deposited $18,175,395 in a segregated account to cover requirements on put options written.
@ All or a portion of this security is pledged in connection with outstanding call options written.
ñ Securities were purchased under Rule 144A of the Securities Act of 1933, as amended (the "1933 Act"), or are private placements and, unless registered under the 1933 Act or exempted from registration, may only be sold to qualified institutional investors. These securities have been deemed by the investment manager to be liquid. At August 31, 2014, these securities amounted to approximately $28,374,000 or 1.1% of net assets for Equity Income, approximately $2,579,000 or 3.5% of net assets for Greater China Equity, approximately $7,875,000 or 0.7% of net assets for International Equity and approximately $11,300,000 or 1.1% of net assets for Real Estate.
a Effective June 2, 2014. Formerly, Neuberger Berman International Large Cap Fund through June 1, 2014.
b Effective September 2, 2014. Formerly, Neuberger Berman Select Equities Fund through September 1, 2014.
c These securities have been deemed by the investment manager to be illiquid. Restricted securities subject to restrictions on resale. Securities were purchased under Rule 144A of the 1933 Act or are private placements and, unless registered under the 1933 Act or exempted from registration, may only be sold to qualified institutional investors.
See Notes to Financial Statements
126
Notes to Schedule of Investments (cont'd)
At August 31, 2014, these securities amounted to approximately $17,048,000 or 0.1% of net assets for Genesis and approximately $2,167,000 or 2.9% of net assets for Greater China Equity, respectively.
(000's omitted) | Restricted Security | Acquisition Date | Acquisition Cost | Acquisition Cost Percentage of Net Assets as of Acquisition Date | Value as of August 31, 2014 | Fair Value Percentage of Net Assets as of August 31, 2014 | |||||||||||||||||||||
Genesis | Stella-Jones, Inc. | 11/20/2012 | $ | 10,579 | 0.1 | % | $ | 17,048 | 0.1 | % | |||||||||||||||||
| Greater China Equity | Beijing SL Pharmaceutical Co. Ltd., Class A | 8/22/2014 | 354 | 0.5 | % | 364 | 0.5 | % | |||||||||||||||||||
| Daqin Railway Co. Ltd., Class A | 8/14/2014 | 41 | 0.1% | 42 | 0.1% | ||||||||||||||||||||||
| Kangda International Environmental Co. Ltd. | 8/7/2014 | 35 | 0.1% | 42 | 0.1% | ||||||||||||||||||||||
| Ping An Insurance Group Co. of China Ltd., Class A | 8/14/2014 | 68 | 0.1% | 66 | 0.1% | ||||||||||||||||||||||
| Poly Real Estate Group Co. Ltd., Class A | 8/14/2014 | 68 | 0.1% | 67 | 0.1% | ||||||||||||||||||||||
| Poly Real Estate Group Co. Ltd., Class A | 8/22/2014 | 366 | 0.5% | 365 | 0.5% | ||||||||||||||||||||||
| SAIC Motor Corp. Ltd., Class A | 8/22/2014 | 103 | 0.1% | 101 | 0.1% | ||||||||||||||||||||||
| SDIC Power Holdings Co. Ltd., Class A | 8/22/2014 | 120 | 0.2% | 125 | 0.1% | ||||||||||||||||||||||
WH Group Ltd. | 7/30/2014 | 741 | 1.1 | % | 753 | 1.0 | % | ||||||||||||||||||||
| XJ Electric Co. Ltd., Class A | 8/22/2014 | 217 | 0.3% | 212 | 0.3% | ||||||||||||||||||||||
| Zhejiang Dahua Technology Co. Ltd., Class A | 8/22/2014 | 34 | 0.0% | 30 | 0.0% | ||||||||||||||||||||||
z A zero balance, if any, may reflect actual amounts rounding to less than $1,000.
^ Affiliated issuer (see Note F of Notes to Financial Statements).
^^ Value of the security was determined using methods the Board has approved in the good-faith belief the resulting valuation will reflect the fair value of the security.
± See Note A-10 in the Notes to Financial Statements for the Fund's open positions in derivatives at August 31, 2014.
See Notes to Financial Statements
127
This page has been left blank intentionally
128
Statements of Assets and Liabilities
Neuberger Berman Equity Funds
(000's omitted except per share amounts)
| ALL CAP CORE FUNDa | EMERGING MARKETS EQUITY FUND | EQUITY INCOME FUND | FOCUS FUND | GENESIS FUND | GLOBAL EQUITY FUND | GLOBAL THEMATIC OPPORTUNITIES FUND | GREATER CHINA EQUITY FUND | GUARDIAN FUND | INTERNATIONAL EQUITY FUND | ||||||||||||||||||||||||||||||||||
| August 31, 2014 | August 31, 2014 | August 31, 2014 | August 31, 2014 | August 31, 2014 | August 31, 2014 | August 31, 2014 | August 31, 2014 | August 31, 2014 | August 31, 2014 | ||||||||||||||||||||||||||||||||||
Assets | |||||||||||||||||||||||||||||||||||||||||||
Investments in securities, at value* (Notes A & F)—see Schedule of Investments: | |||||||||||||||||||||||||||||||||||||||||||
Unaffiliated issuers | $ | 100,539 | $ | 622,800 | $ | 2,472,628 | $ | 847,871 | $ | 8,356,983 | $ | 39,899 | $ | 83,129 | $ | 72,618 | $ | 1,507,309 | $ | 1,131,945 | |||||||||||||||||||||||
Affiliated issuers | — | — | — | — | 5,335,418 | — | — | — | — | — | |||||||||||||||||||||||||||||||||
100,539 | 622,800 | 2,472,628 | 847,871 | 13,692,401 | 39,899 | 83,129 | 72,618 | 1,507,309 | 1,131,945 | ||||||||||||||||||||||||||||||||||
Cash | — | — | 1,115 | — | — | — | — | — | — | — | |||||||||||||||||||||||||||||||||
Foreign currency* | — | 2,469 | 145 | — | 356 | 2 | — | 1,527 | — | 668 | |||||||||||||||||||||||||||||||||
Deposits with brokers for open option contracts | — | — | 18,175 | — | — | — | — | — | — | — | |||||||||||||||||||||||||||||||||
Dividends and interest receivable | 113 | 552 | 8,580 | 1,339 | 15,596 | 47 | 105 | 6 | 2,737 | 3,799 | |||||||||||||||||||||||||||||||||
Receivable for securities sold | — | 4,327 | — | 889 | 83,555 | 230 | — | 2,271 | — | 2,559 | |||||||||||||||||||||||||||||||||
Receivable for Fund shares sold | 100 | 183 | 2,286 | 322 | 7,666 | — | 39 | 7 | 603 | 804 | |||||||||||||||||||||||||||||||||
Receivable from Management—net (Note B) | — | 23 | — | — | — | 23 | 3 | 30 | — | — | |||||||||||||||||||||||||||||||||
Prepaid expenses and other assets | 13 | 50 | 87 | 63 | 395 | 20 | 21 | 23 | 128 | 64 | |||||||||||||||||||||||||||||||||
Total Assets | 100,765 | 630,404 | 2,503,016 | 850,484 | 13,799,969 | 40,221 | 83,297 | 76,482 | 1,510,777 | 1,139,839 | |||||||||||||||||||||||||||||||||
Liabilities | |||||||||||||||||||||||||||||||||||||||||||
Option contracts written, at value** (Note A) | — | — | 2,064 | — | — | — | — | — | — | — | |||||||||||||||||||||||||||||||||
Due to custodian | — | — | — | — | 1,777 | — | — | — | — | — | |||||||||||||||||||||||||||||||||
Payable for securities purchased | — | 2,865 | 2,707 | 2,519 | 10,719 | 622 | — | 2,185 | — | 4,593 | |||||||||||||||||||||||||||||||||
Payable for Fund shares redeemed | 85 | 399 | 1,433 | 205 | 51,720 | — | 2 | 1 | 530 | 674 | |||||||||||||||||||||||||||||||||
Payable to investment manager—net (Note B) | 46 | 512 | 966 | 366 | 7,665 | 25 | 60 | 67 | 620 | 570 | |||||||||||||||||||||||||||||||||
Payable to administrator—net (Note B) | 4 | — | 878 | 211 | 2,704 | — | — | — | 361 | 202 | |||||||||||||||||||||||||||||||||
Payable to trustees | 4 | 4 | 4 | 4 | 4 | 4 | 4 | 4 | 4 | 4 | |||||||||||||||||||||||||||||||||
Accrued expenses and other payables | 93 | 408 | 361 | 214 | 1,573 | 86 | 87 | 266 | 382 | 273 | |||||||||||||||||||||||||||||||||
Total Liabilities | 232 | 4,188 | 8,413 | 3,519 | 76,162 | 737 | 153 | 2,523 | 1,897 | 6,316 | |||||||||||||||||||||||||||||||||
Net Assets | $ | 100,533 | $ | 626,216 | $ | 2,494,603 | $ | 846,965 | $ | 13,723,807 | $ | 39,484 | $ | 83,144 | $ | 73,959 | $ | 1,508,880 | $ | 1,133,523 | |||||||||||||||||||||||
Net Assets consist of: | |||||||||||||||||||||||||||||||||||||||||||
Paid-in capital | $ | 71,567 | $ | 579,058 | $ | 2,019,519 | $ | 573,169 | $ | 6,800,799 | $ | 33,742 | $ | 73,547 | $ | 62,643 | $ | 933,950 | $ | 1,224,934 | |||||||||||||||||||||||
Undistributed net investment income (loss) | — | 4,627 | — | 3,504 | 12,211 | 226 | 113 | 627 | 8,457 | 12,034 | |||||||||||||||||||||||||||||||||
Distributions in excess of net investment income | (8 | ) | — | (2,844 | ) | — | — | — | — | — | — | — | |||||||||||||||||||||||||||||||
Accumulated net realized gains (losses) on investments | 12,054 | (25,717 | ) | 104,756 | 124,586 | 960,714 | 739 | (3,349 | ) | 3,883 | 172,685 | (276,840 | ) | ||||||||||||||||||||||||||||||
Net unrealized appreciation (depreciation) in value of investments | 16,920 | 68,248 | 373,172 | 145,706 | 5,950,083 | 4,777 | 12,833 | 6,806 | 393,788 | 173,395 | |||||||||||||||||||||||||||||||||
Net Assets | $ | 100,533 | $ | 626,216 | $ | 2,494,603 | $ | 846,965 | $ | 13,723,807 | $ | 39,484 | $ | 83,144 | $ | 73,959 | $ | 1,508,880 | $ | 1,133,523 | |||||||||||||||||||||||
Net Assets | |||||||||||||||||||||||||||||||||||||||||||
Investor Class | $ | — | $ | — | $ | — | $ | 699,412 | $ | 2,437,592 | $ | — | $ | — | $ | — | $ | 1,165,081 | $ | 124,385 | |||||||||||||||||||||||
Trust Class | — | — | — | 125,667 | 2,935,267 | — | — | — | 136,607 | 67,719 | |||||||||||||||||||||||||||||||||
Advisor Class | — | — | — | 7,061 | 598,909 | — | — | — | 372 | — | |||||||||||||||||||||||||||||||||
Institutional Class | 59,298 | 514,830 | 1,578,479 | 9,433 | 5,061,356 | 38,930 | 82,799 | 72,143 | 129,380 | 887,284 | |||||||||||||||||||||||||||||||||
Class A | 25,675 | 19,948 | 462,611 | 3,921 | — | 387 | 215 | 1,694 | 73,843 | 26,181 | |||||||||||||||||||||||||||||||||
Class C | 15,560 | 6,967 | 450,099 | 1,471 | — | 167 | 130 | 122 | 2,902 | 6,097 | |||||||||||||||||||||||||||||||||
Class R3 | — | 640 | 3,414 | — | — | — | — | — | 695 | — | |||||||||||||||||||||||||||||||||
Class R6 | — | 83,831 | — | — | 2,690,683 | — | — | — | — | 21,857 | |||||||||||||||||||||||||||||||||
See Notes to Financial Statements
129
130
Statements of Assets and Liabilities (cont'd)
Neuberger Berman Equity Funds (cont'd)
(000's omitted except per share amounts)
| ALL CAP CORE FUNDa | EMERGING MARKETS EQUITY FUND | EQUITY INCOME FUND | FOCUS FUND | GENESIS FUND | GLOBAL EQUITY FUND | GLOBAL THEMATIC OPPORTUNITIES FUND | GREATER CHINA EQUITY FUND | GUARDIAN FUND | INTERNATIONAL EQUITY FUND | ||||||||||||||||||||||||||||||||||
| August 31, 2014 | August 31, 2014 | August 31, 2014 | August 31, 2014 | August 31, 2014 | August 31, 2014 | August 31, 2014 | August 31, 2014 | August 31, 2014 | August 31, 2014 | ||||||||||||||||||||||||||||||||||
Shares Outstanding ($.001 par value; unlimited shares authorized) | |||||||||||||||||||||||||||||||||||||||||||
Investor Class | — | — | — | 23,491 | 59,616 | — | — | — | 57,033 | 6,009 | |||||||||||||||||||||||||||||||||
Trust Class | — | — | — | 6,088 | 46,439 | — | — | — | 8,987 | 2,942 | |||||||||||||||||||||||||||||||||
Advisor Class | — | — | — | 542 | 18,613 | — | — | — | 21 | — | |||||||||||||||||||||||||||||||||
Institutional Class | 5,192 | 28,774 | 119,672 | 316 | 83,356 | 3,471 | 7,740 | 5,926 | 6,319 | 78,384 | |||||||||||||||||||||||||||||||||
Class A | 2,281 | 1,121 | 35,208 | 191 | — | 35 | 20 | 139 | 4,897 | 1,138 | |||||||||||||||||||||||||||||||||
Class C | 1,463 | 404 | 34,461 | 116 | — | 15 | 12 | 10 | 169 | 268 | |||||||||||||||||||||||||||||||||
Class R3 | — | 37 | 260 | — | — | — | — | — | 40 | — | |||||||||||||||||||||||||||||||||
Class R6 | — | 4,681 | — | — | 44,293 | — | — | — | — | 1,914 | |||||||||||||||||||||||||||||||||
Net Asset Value, offering and redemption price per share | |||||||||||||||||||||||||||||||||||||||||||
Investor Class | $ | — | $ | — | $ | — | $ | 29.77 | $ | 40.89 | $ | — | $ | — | $ | — | $ | 20.43 | $ | 20.70 | |||||||||||||||||||||||
Trust Class | — | — | — | 20.64 | 63.21 | — | — | — | 15.20 | 23.02 | |||||||||||||||||||||||||||||||||
Advisor Class | — | — | — | 13.03 | 32.18 | — | — | — | 17.55 | — | |||||||||||||||||||||||||||||||||
Institutional Class | 11.42 | 17.89 | 13.19 | 29.83 | 60.72 | 11.22 | 10.70 | 12.17 | 20.47 | 11.32 | |||||||||||||||||||||||||||||||||
Class R3 | — | 17.47 | 13.12 | — | — | — | — | — | 17.54 | — | |||||||||||||||||||||||||||||||||
Class R6 | — | 17.91 | — | — | 60.75 | — | — | — | — | 11.42 | |||||||||||||||||||||||||||||||||
Net Asset Value and redemption price per share | |||||||||||||||||||||||||||||||||||||||||||
Class A | $ | 11.25 | $ | 17.80 | $ | 13.14 | $ | 20.50 | $ | — | $ | 11.14 | $ | 10.62 | $ | 12.14 | $ | 15.08 | $ | 23.01 | |||||||||||||||||||||||
Offering Price per share | |||||||||||||||||||||||||||||||||||||||||||
Class A‡ | $ | 11.94 | $ | 18.89 | $ | 13.94 | $ | 21.75 | $ | — | $ | 11.82 | $ | 11.27 | $ | 12.88 | $ | 16.00 | $ | 24.41 | |||||||||||||||||||||||
Net Asset Value and offering price per share | |||||||||||||||||||||||||||||||||||||||||||
Class C^ | $ | 10.64 | $ | 17.26 | $ | 13.06 | $ | 12.70 | $ | — | $ | 10.89 | $ | 10.44 | $ | 12.03 | $ | 17.18 | $ | 22.72 | |||||||||||||||||||||||
*Cost of Investments: | |||||||||||||||||||||||||||||||||||||||||||
Unaffiliated issuers | $ | 83,619 | $ | 554,449 | $ | 2,098,920 | $ | 702,165 | $ | 4,609,137 | $ | 35,122 | $ | 70,296 | $ | 65,657 | $ | 1,113,515 | $ | 958,495 | |||||||||||||||||||||||
Affiliated issuers | — | — | — | — | 3,133,181 | — | — | — | — | — | |||||||||||||||||||||||||||||||||
Total cost of investments | $ | 83,619 | $ | 554,449 | $ | 2,098,920 | $ | 702,165 | $ | 7,742,318 | $ | 35,122 | $ | 70,296 | $ | 65,657 | $ | 1,113,515 | $ | 958,495 | |||||||||||||||||||||||
Total cost of foreign currency | $ | — | $ | 2,470 | $ | 145 | $ | — | $ | 356 | $ | 2 | $ | — | $ | 1,527 | $ | — | $ | 670 | |||||||||||||||||||||||
**Premium received from option contracts written | $ | — | $ | — | $ | 1,527 | $ | — | $ | — | $ | — | $ | — | $ | — | $ | — | $ | — | |||||||||||||||||||||||
‡ On single retail sales of less than $50,000. On sales of $50,000 or more or in certain other circumstances described in the Fund's prospectus, offering price is reduced.
^ Redemption price per share is equal to net asset value less any applicable contingent deferred sales charge.
a Formerly Select Equities Fund. See Note A of Notes to Financial Statements.
See Notes to Financial Statements
131
132
Statements of Assets and Liabilities (cont'd)
Neuberger Berman Equity Funds
(000's omitted except per share amounts)
| INTERNATIONAL SELECT FUNDb | INTRINSIC VALUE FUND | LARGE CAP DISCIPLINED GROWTH FUND | LARGE CAP VALUE FUND | MID CAP GROWTH FUND | MID CAP INTRINSIC VALUE FUND | MULTI-CAP OPPORTUNITIES FUND | REAL ESTATE FUND | SMALL CAP GROWTH FUND | SOCIALLY RESPONSIVE FUND | ||||||||||||||||||||||||||||||||||
| August 31, 2014 | August 31, 2014 | August 31, 2014 | August 31, 2014 | August 31, 2014 | August 31, 2014 | August 31, 2014 | August 31, 2014 | August 31, 2014 | August 31, 2014 | ||||||||||||||||||||||||||||||||||
Assets | |||||||||||||||||||||||||||||||||||||||||||
Investments in securities, at value* (Notes A & F)—see Schedule of Investments: | |||||||||||||||||||||||||||||||||||||||||||
Unaffiliated issuers | $ | 241,034 | $ | 277,023 | $ | 230,899 | $ | 1,672,693 | $ | 1,008,167 | $ | 83,166 | $ | 2,753,075 | $ | 1,036,706 | $ | 85,076 | $ | 2,431,649 | |||||||||||||||||||||||
Affiliated issuers | — | — | — | — | — | — | — | — | — | — | |||||||||||||||||||||||||||||||||
241,034 | 277,023 | 230,899 | 1,672,693 | 1,008,167 | 83,166 | 2,753,075 | 1,036,706 | 85,076 | 2,431,649 | ||||||||||||||||||||||||||||||||||
Cash | — | — | — | — | — | — | — | — | — | — | |||||||||||||||||||||||||||||||||
Foreign currency* | 126 | — | — | — | — | — | — | — | — | — | |||||||||||||||||||||||||||||||||
Deposits with brokers for open option contracts | — | — | — | — | — | — | — | — | — | — | |||||||||||||||||||||||||||||||||
Dividends and interest receivable | 694 | 127 | 285 | 3,027 | 428 | 51 | 5,970 | 615 | 10 | 5,209 | |||||||||||||||||||||||||||||||||
Receivable for securities sold | — | 1,028 | 5,318 | 99,810 | 9,225 | — | — | 4,992 | 3,323 | — | |||||||||||||||||||||||||||||||||
Receivable for Fund shares sold | 29 | 335 | 53 | 237 | 649 | 56 | 4,022 | 769 | 48 | 4,554 | |||||||||||||||||||||||||||||||||
Receivable from Management—net (Note B) | — | — | — | — | — | — | — | — | 12 | — | |||||||||||||||||||||||||||||||||
Prepaid expenses and other assets | 44 | 24 | 23 | 107 | 67 | 33 | 66 | 70 | 37 | 100 | |||||||||||||||||||||||||||||||||
Total Assets | 241,927 | 278,537 | 236,578 | 1,775,874 | 1,018,536 | 83,306 | 2,763,133 | 1,043,152 | 88,506 | 2,441,512 | |||||||||||||||||||||||||||||||||
Liabilities | |||||||||||||||||||||||||||||||||||||||||||
Option contracts written, at value** (Note A) | — | — | — | — | — | — | — | — | — | — | |||||||||||||||||||||||||||||||||
Due to custodian | — | — | — | — | — | — | — | — | — | — | |||||||||||||||||||||||||||||||||
Payable for securities purchased | 952 | — | 3,004 | 28,843 | 1,320 | — | — | — | 2,748 | — | |||||||||||||||||||||||||||||||||
Payable for Fund shares redeemed | 9 | 44 | 1,289 | 740 | 818 | 39 | 1,269 | 2,240 | 272 | 3,372 | |||||||||||||||||||||||||||||||||
Payable to investment manager—net (Note B) | 111 | 195 | 111 | 704 | 430 | 17 | 1,174 | 704 | 60 | 949 | |||||||||||||||||||||||||||||||||
Payable to administrator—net (Note B) | 16 | 12 | 51 | 469 | 220 | 21 | 433 | 113 | — | 586 | |||||||||||||||||||||||||||||||||
Payable to trustees | 4 | 4 | 4 | 4 | 4 | 4 | 4 | 4 | 4 | 4 | |||||||||||||||||||||||||||||||||
Accrued expenses and other payables | 136 | 68 | 102 | 339 | 210 | 67 | 269 | 216 | 85 | 433 | |||||||||||||||||||||||||||||||||
Total Liabilities | 1,228 | 323 | 4,561 | 31,099 | 3,002 | 148 | 3,149 | 3,277 | 3,169 | 5,344 | |||||||||||||||||||||||||||||||||
Net Assets | $ | 240,699 | $ | 278,214 | $ | 232,017 | $ | 1,744,775 | $ | 1,015,534 | $ | 83,158 | $ | 2,759,984 | $ | 1,039,875 | $ | 85,337 | $ | 2,436,168 | |||||||||||||||||||||||
Net Assets consist of: | |||||||||||||||||||||||||||||||||||||||||||
Paid-in capital | $ | 239,926 | $ | 195,960 | $ | 127,469 | $ | 1,275,236 | $ | 657,720 | $ | 56,141 | $ | 2,153,638 | $ | 871,491 | $ | 87,291 | $ | 1,600,789 | |||||||||||||||||||||||
Undistributed net investment income (loss) | 2,273 | — | — | 13,641 | (2,889 | ) | 593 | 16,877 | — | (445 | ) | 17,453 | |||||||||||||||||||||||||||||||
Distributions in excess of net investment income | — | (124 | ) | (13 | ) | — | — | — | — | — | — | — | |||||||||||||||||||||||||||||||
Accumulated net realized gains (losses) on investments | (42,899 | ) | 13,893 | 61,916 | 191,231 | 90,231 | 7,654 | 76,324 | 28,140 | (7,560 | ) | 235,819 | |||||||||||||||||||||||||||||||
Net unrealized appreciation (depreciation) in value of investments | 41,399 | 68,485 | 42,645 | 264,667 | 270,472 | 18,770 | 513,145 | 140,244 | 6,051 | 582,107 | |||||||||||||||||||||||||||||||||
Net Assets | $ | 240,699 | $ | 278,214 | $ | 232,017 | $ | 1,744,775 | $ | 1,015,534 | $ | 83,158 | $ | 2,759,984 | $ | 1,039,875 | $ | 85,337 | $ | 2,436,168 | |||||||||||||||||||||||
Net Assets | |||||||||||||||||||||||||||||||||||||||||||
Investor Class | $ | — | $ | — | $ | 11,201 | $ | 1,238,326 | $ | 415,603 | $ | 43,360 | $ | — | $ | — | $ | 50,702 | $ | 821,077 | |||||||||||||||||||||||
Trust Class | 12,958 | — | — | 141,066 | 69,567 | 14,389 | — | 314,270 | 5,471 | 418,369 | |||||||||||||||||||||||||||||||||
Advisor Class | — | — | — | 216,114 | 10,316 | — | — | — | 3,472 | — | |||||||||||||||||||||||||||||||||
Institutional Class | 211,647 | 251,995 | 185,049 | 143,450 | 382,521 | 17,966 | 2,566,391 | 463,483 | 18,978 | 706,475 | |||||||||||||||||||||||||||||||||
Class A | 9,299 | 13,545 | 12,712 | 2,717 | 100,739 | 5,196 | 143,086 | 171,912 | 4,389 | 133,991 | |||||||||||||||||||||||||||||||||
Class C | 4,620 | 12,674 | 22,901 | 2,969 | 6,039 | 1,875 | 50,507 | 40,398 | 1,826 | 44,465 | |||||||||||||||||||||||||||||||||
Class R3 | 2,175 | — | 154 | 133 | 8,281 | 372 | — | 23,470 | 499 | 32,211 | |||||||||||||||||||||||||||||||||
Class R6 | — | — | — | — | 22,468 | — | — | 26,342 | — | 279,580 | |||||||||||||||||||||||||||||||||
See Notes to Financial Statements
133
134
Statements of Assets and Liabilities (cont'd)
Neuberger Berman Equity Funds (cont'd)
(000's omitted except per share amounts)
| INTERNATIONAL SELECT FUNDb | INTRINSIC VALUE FUND | LARGE CAP DISCIPLINED GROWTH FUND | LARGE CAP VALUE FUND | MID CAP GROWTH FUND | MID CAP INTRINSIC VALUE FUND | MULTI-CAP OPPORTUNITIES FUND | REAL ESTATE FUND | SMALL CAP GROWTH FUND | SOCIALLY RESPONSIVE FUND | ||||||||||||||||||||||||||||||||||
| August 31, 2014 | August 31, 2014 | August 31, 2014 | August 31, 2014 | August 31, 2014 | August 31, 2014 | August 31, 2014 | August 31, 2014 | August 31, 2014 | August 31, 2014 | ||||||||||||||||||||||||||||||||||
Shares Outstanding ($.001 par value; unlimited shares authorized) | |||||||||||||||||||||||||||||||||||||||||||
Investor Class | — | — | 1,344 | 36,509 | 28,370 | 1,840 | — | — | 1,848 | 22,226 | |||||||||||||||||||||||||||||||||
Trust Class | 1,156 | — | — | 5,749 | 2,981 | 711 | — | 21,380 | 184 | 17,257 | |||||||||||||||||||||||||||||||||
Advisor Class | — | — | — | 10,742 | 434 | — | — | — | 177 | — | |||||||||||||||||||||||||||||||||
Institutional Class | 18,880 | 16,819 | 22,074 | 4,205 | 25,688 | 761 | 157,780 | 31,446 | 680 | 19,091 | |||||||||||||||||||||||||||||||||
Class A | 835 | 918 | 1,527 | 111 | 4,321 | 257 | 8,872 | 11,701 | 147 | 5,568 | |||||||||||||||||||||||||||||||||
Class C | 421 | 887 | 2,853 | 153 | 259 | 94 | 3,216 | 2,751 | 95 | 1,887 | |||||||||||||||||||||||||||||||||
Class R3 | 197 | — | 19 | 7 | 348 | 18 | — | 1,599 | 25 | 1,350 | |||||||||||||||||||||||||||||||||
Class R6 | — | — | — | — | 1,507 | — | — | 1,788 | — | 7,551 | |||||||||||||||||||||||||||||||||
Net Asset Value, offering and redemption price per share | |||||||||||||||||||||||||||||||||||||||||||
Investor Class | $ | — | $ | — | $ | 8.33 | $ | 33.92 | $ | 14.65 | $ | 23.56 | $ | — | $ | — | $ | 27.44 | $ | 36.94 | |||||||||||||||||||||||
Trust Class | 11.21 | — | — | 24.54 | 23.33 | 20.24 | — | 14.70 | 29.72 | 24.24 | |||||||||||||||||||||||||||||||||
Advisor Class | — | — | — | 20.12 | 23.77 | — | — | — | 19.63 | — | |||||||||||||||||||||||||||||||||
Institutional Class | 11.21 | 14.98 | 8.38 | 34.11 | 14.89 | 23.59 | 16.27 | 14.74 | 27.92 | 37.00 | |||||||||||||||||||||||||||||||||
Class R3 | 11.05 | — | 8.27 | 20.32 | 23.79 | 20.23 | — | 14.68 | 19.67 | 23.85 | |||||||||||||||||||||||||||||||||
Class R6 | — | — | — | — | 14.91 | — | — | 14.74 | — | 37.03 | |||||||||||||||||||||||||||||||||
Net Asset Value and redemption price per share | |||||||||||||||||||||||||||||||||||||||||||
Class A | $ | 11.14 | $ | 14.76 | $ | 8.33 | $ | 24.55 | $ | 23.32 | $ | 20.24 | $ | 16.13 | $ | 14.69 | $ | 29.92 | $ | 24.06 | |||||||||||||||||||||||
Offering Price per share | |||||||||||||||||||||||||||||||||||||||||||
Class A‡ | $ | 11.82 | $ | 15.66 | $ | 8.84 | $ | 26.05 | $ | 24.74 | $ | 21.47 | $ | 17.11 | $ | 15.59 | $ | 31.75 | $ | 25.53 | |||||||||||||||||||||||
Net Asset Value and offering price per share | |||||||||||||||||||||||||||||||||||||||||||
Class C^ | $ | 10.97 | $ | 14.29 | $ | 8.03 | $ | 19.40 | $ | 23.35 | $ | 20.00 | $ | 15.71 | $ | 14.68 | $ | 19.16 | $ | 23.57 | |||||||||||||||||||||||
*Cost of Investments: | |||||||||||||||||||||||||||||||||||||||||||
Unaffiliated issuers | $ | 199,628 | $ | 208,538 | $ | 188,254 | $ | 1,408,026 | $ | 737,695 | $ | 64,396 | $ | 2,239,930 | $ | 896,462 | $ | 79,025 | $ | 1,849,532 | |||||||||||||||||||||||
Affiliated issuers | — | — | — | — | — | — | — | — | — | — | |||||||||||||||||||||||||||||||||
Total cost of investments | $ | 199,628 | $ | 208,538 | $ | 188,254 | $ | 1,408,026 | $ | 737,695 | $ | 64,396 | $ | 2,239,930 | $ | 896,462 | $ | 79,025 | $ | 1,849,532 | |||||||||||||||||||||||
Total cost of foreign currency | $ | 127 | $ | — | $ | — | $ | — | $ | — | $ | — | $ | — | $ | — | $ | — | $ | — | |||||||||||||||||||||||
**Premium received from option contracts written | $ | — | $ | — | $ | — | $ | — | $ | — | $ | — | $ | — | $ | — | $ | — | $ | — | |||||||||||||||||||||||
‡ On single retail sales of less than $50,000. On sales of $50,000 or more or in certain other circumstances described in the Fund's prospectus, offering price is reduced.
^ Redemption price per share is equal to net asset value less any applicable contingent deferred sales charge.
b Formerly International Large Cap Fund. See Note A of Notes to Financial Statements.
See Notes to Financial Statements
135
136
Statements of Assets and Liabilities (cont'd)
Neuberger Berman Equity Funds
(000's omitted except per share amounts)
VALUE FUND | |||||||
| August 31, 2014 | |||||||
Assets | |||||||
Investments in securities, at value* (Notes A & F)—see Schedule of Investments: | |||||||
Unaffiliated issuers | $ | 20,714 | |||||
Affiliated issuers | — | ||||||
20,714 | |||||||
Cash | — | ||||||
Foreign currency* | — | ||||||
Deposits with brokers for open option contracts | — | ||||||
Dividends and interest receivable | 32 | ||||||
Receivable for securities sold | 825 | ||||||
Receivable for Fund shares sold | 47 | ||||||
Receivable from Management—net (Note B) | 22 | ||||||
Prepaid expenses and other assets | 12 | ||||||
Total Assets | 21,652 | ||||||
Liabilities | |||||||
Option contracts written, at value** (Note A) | — | ||||||
Due to custodian | — | ||||||
Payable for securities purchased | 389 | ||||||
Payable for Fund shares redeemed | 8 | ||||||
Payable to investment manager—net (Note B) | 9 | ||||||
Payable to administrator—net (Note B) | — | ||||||
Payable to trustees | 4 | ||||||
Accrued expenses and other payables | 83 | ||||||
Total Liabilities | 493 | ||||||
Net Assets | $ | 21,159 | |||||
Net Assets consist of: | |||||||
Paid-in capital | $ | 18,229 | |||||
Undistributed net investment income (loss) | 121 | ||||||
Distributions in excess of net investment income | — | ||||||
Accumulated net realized gains (losses) on investments | 1,177 | ||||||
Net unrealized appreciation (depreciation) in value of investments | 1,632 | ||||||
Net Assets | $ | 21,159 | |||||
Net Assets | |||||||
Investor Class | $ | — | |||||
Trust Class | — | ||||||
Advisor Class | — | ||||||
Institutional Class | 12,592 | ||||||
Class A | 8,006 | ||||||
Class C | 561 | ||||||
Class R3 | — | ||||||
Class R6 | — | ||||||
See Notes to Financial Statements
137
Statements of Assets and Liabilities (cont'd)
Neuberger Berman Equity Funds (cont'd)
(000's omitted except per share amounts)
VALUE FUND | |||||||
| August 31, 2014 | |||||||
Shares Outstanding ($.001 par value; unlimited shares authorized) | |||||||
Investor Class | — | ||||||
Trust Class | — | ||||||
Advisor Class | — | ||||||
Institutional Class | 763 | ||||||
Class A | 488 | ||||||
Class C | 35 | ||||||
Class R3 | — | ||||||
Class R6 | — | ||||||
Net Asset Value, offering and redemption price per share | |||||||
Investor Class | $ | — | |||||
Trust Class | — | ||||||
Advisor Class | — | ||||||
Institutional Class | 16.51 | ||||||
Class R3 | — | ||||||
Class R6 | — | ||||||
Net Asset Value and redemption price per share | |||||||
Class A | $ | 16.40 | |||||
Offering Price per share | |||||||
Class A‡ | $ | 17.40 | |||||
Net Asset Value and offering price per share | |||||||
Class C^ | $ | 16.18 | |||||
*Cost of Investments: | |||||||
Unaffiliated issuers | $ | 19,082 | |||||
Affiliated issuers | — | ||||||
Total cost of investments | $ | 19,082 | |||||
Total cost of foreign currency | $ | — | |||||
**Premium received from option contracts written | $ | — | |||||
‡ On single retail sales of less than $50,000. On sales of $50,000 or more or in certain other circumstances described in the Fund's prospectus, offering price is reduced.
^ Redemption price per share is equal to net asset value less any applicable contingent deferred sales charge.
See Notes to Financial Statements
138
Statements of Operations
Neuberger Berman Equity Funds
(000's omitted)
| ALL CAP CORE FUNDa | EMERGING MARKETS EQUITY FUND | EQUITY INCOME FUND | FOCUS FUND | GENESIS FUND | GLOBAL EQUITY FUND | GLOBAL THEMATIC OPPORTUNITIES FUND | GREATER CHINA EQUITY FUND | GUARDIAN FUND | INTERNATIONAL EQUITY FUND | ||||||||||||||||||||||||||||||||||
| For the Year Ended August 31, 2014 | For the Year Ended August 31, 2014 | For the Year Ended August 31, 2014 | For the Year Ended August 31, 2014 | For the Year Ended August 31, 2014 | For the Year Ended August 31, 2014 | For the Year Ended August 31, 2014 | For the Year Ended August 31, 2014 | For the Year Ended August 31, 2014 | For the Year Ended August 31, 2014 | ||||||||||||||||||||||||||||||||||
Investment Income: | |||||||||||||||||||||||||||||||||||||||||||
Income (Note A): | |||||||||||||||||||||||||||||||||||||||||||
Dividend income—unaffiliated issuers | $ | 864 | $ | 12,937 | $ | 85,595 | $ | 12,310 | $ | 90,995 | $ | 690 | $ | 1,736 | $ | 1,515 | $ | 25,229 | $ | 29,660 | |||||||||||||||||||||||
Dividend income—affiliated issuers (Note F) | — | — | — | — | 85,374 | — | — | — | — | — | |||||||||||||||||||||||||||||||||
Interest income—unaffiliated issuers | — | — | 2,050 | — | — | — | 1 | — | — | — | |||||||||||||||||||||||||||||||||
Foreign taxes withheld (Note A) | (15 | ) | (1,073 | ) | (2,611 | ) | (75 | ) | (1,833 | ) | (57 | ) | (76 | ) | (84 | ) | (629 | ) | (2,944 | ) | |||||||||||||||||||||||
Total income | $ | 849 | $ | 11,864 | $ | 85,034 | $ | 12,235 | $ | 174,536 | $ | 633 | $ | 1,661 | $ | 1,431 | $ | 24,600 | $ | 26,716 | |||||||||||||||||||||||
Expenses: | |||||||||||||||||||||||||||||||||||||||||||
Investment management fees (Note B) | 540 | 5,254 | 11,903 | 4,126 | 94,541 | 280 | 704 | 654 | 7,110 | 9,142 | |||||||||||||||||||||||||||||||||
Administration fees (Note B) | 59 | 320 | 1,540 | 474 | 8,611 | 23 | 50 | 36 | 865 | 682 | |||||||||||||||||||||||||||||||||
Administration fees (Note B): | |||||||||||||||||||||||||||||||||||||||||||
Investor Class | — | — | — | 1,352 | 5,228 | — | — | — | 2,262 | 258 | |||||||||||||||||||||||||||||||||
Trust Class | — | — | — | 319 | 11,068 | — | — | — | 467 | 378 | |||||||||||||||||||||||||||||||||
Advisor Class | — | — | — | 23 | 2,231 | — | — | — | 2 | — | |||||||||||||||||||||||||||||||||
Institutional Class | 45 | 401 | 1,208 | 9 | 5,030 | 33 | 74 | 53 | 101 | 779 | |||||||||||||||||||||||||||||||||
Class A | 64 | 32 | 1,527 | 6 | — | 1 | 1 | 1 | 111 | 49 | |||||||||||||||||||||||||||||||||
Class C | 31 | 11 | 913 | 2 | — | — | — | — | 6 | 8 | |||||||||||||||||||||||||||||||||
Class R3 | — | 1 | 6 | — | — | — | — | — | 1 | — | |||||||||||||||||||||||||||||||||
Class R6 | — | 13 | — | — | 448 | — | — | — | — | — | |||||||||||||||||||||||||||||||||
Distribution fees (Note B): | |||||||||||||||||||||||||||||||||||||||||||
Trust Class | — | — | — | 94 | — | — | — | — | 137 | — | |||||||||||||||||||||||||||||||||
Advisor Class | — | — | — | 17 | 1,640 | — | — | — | 2 | — | |||||||||||||||||||||||||||||||||
Class A | 80 | 39 | 1,909 | 7 | — | 1 | 1 | 1 | 139 | 62 | |||||||||||||||||||||||||||||||||
Class C | 155 | 56 | 4,564 | 10 | — | 1 | 2 | 1 | 31 | 41 | |||||||||||||||||||||||||||||||||
Class R3 | — | 2 | 15 | — | — | — | — | — | 3 | — | |||||||||||||||||||||||||||||||||
Shareholder servicing agent fees: | |||||||||||||||||||||||||||||||||||||||||||
Investor Class | — | — | — | 348 | 1,629 | — | — | — | 750 | 114 | |||||||||||||||||||||||||||||||||
Trust Class | — | — | — | 9 | 321 | — | — | — | 13 | 46 | |||||||||||||||||||||||||||||||||
Advisor Class | — | — | — | 1 | 221 | — | — | — | 1 | — | |||||||||||||||||||||||||||||||||
Institutional Class | 6 | 91 | 131 | 1 | 539 | 3 | 6 | 17 | 10 | 65 | |||||||||||||||||||||||||||||||||
Class A | 8 | 5 | 166 | 1 | — | — | 1 | — | 8 | 6 | |||||||||||||||||||||||||||||||||
Class C | 3 | 1 | 70 | — | — | — | — | — | 1 | 1 | |||||||||||||||||||||||||||||||||
Class R3 | — | — | 1 | — | — | — | — | — | — | — | |||||||||||||||||||||||||||||||||
Class R6 | — | 5 | — | — | 159 | — | — | — | — | 1 | |||||||||||||||||||||||||||||||||
Audit fees | 60 | 60 | 62 | 62 | 62 | 57 | 57 | 38 | 62 | 72 | |||||||||||||||||||||||||||||||||
Custodian and accounting fees | 55 | 1,192 | 568 | 212 | 1,827 | 72 | 74 | 86 | 332 | 654 | |||||||||||||||||||||||||||||||||
Insurance expense | 3 | 16 | 109 | 25 | 473 | 1 | 2 | 1 | 48 | 37 | |||||||||||||||||||||||||||||||||
Legal fees (Note H for International Equity Fund) | 75 | 70 | 70 | 71 | 72 | 70 | 70 | 69 | 72 | 106 | |||||||||||||||||||||||||||||||||
Registration and filing fees | 53 | 121 | 142 | 95 | 261 | 46 | 46 | 83 | 110 | 152 | |||||||||||||||||||||||||||||||||
| Repayment to Management of expenses previously assumed by Management (Note B) | — | — | 1 | — | 157 | — | — | — | 4 | — | |||||||||||||||||||||||||||||||||
Shareholder reports | 22 | 34 | 275 | 67 | 1,084 | 10 | 14 | 5 | 147 | 120 | |||||||||||||||||||||||||||||||||
Trustees' fees and expenses | 38 | 38 | 38 | 38 | 38 | 38 | 38 | 36 | 38 | 38 | |||||||||||||||||||||||||||||||||
Miscellaneous | 7 | 35 | 148 | 31 | 496 | 10 | 13 | 12 | 54 | 70 | |||||||||||||||||||||||||||||||||
Total expenses | 1,304 | 7,797 | 25,366 | 7,400 | 136,136 | 646 | 1,153 | 1,093 | 12,887 | 12,881 | |||||||||||||||||||||||||||||||||
See Notes to Financial Statements
139
140
Statements of Operations (cont'd)
Neuberger Berman Equity Funds (cont'd)
(000's omitted)
| ALL CAP CORE FUNDa | EMERGING MARKETS EQUITY FUND | EQUITY INCOME FUND | FOCUS FUND | GENESIS FUND | GLOBAL EQUITY FUND | GLOBAL THEMATIC OPPORTUNITIES FUND | GREATER CHINA EQUITY FUND | GUARDIAN FUND | INTERNATIONAL EQUITY FUND | ||||||||||||||||||||||||||||||||||
| For the Year Ended August 31, 2014 | For the Year Ended August 31, 2014 | For the Year Ended August 31, 2014 | For the Year Ended August 31, 2014 | For the Year Ended August 31, 2014 | For the Year Ended August 31, 2014 | For the Year Ended August 31, 2014 | For the Year Ended August 31, 2014 | For the Year Ended August 31, 2014 | For the Year Ended August 31, 2014 | ||||||||||||||||||||||||||||||||||
Expenses reimbursed by Management (Note B) | (237 | ) | (1,075 | ) | — | (2 | ) | — | (214 | ) | (113 | ) | (196 | ) | — | (227 | ) | ||||||||||||||||||||||||||
Investment management fees waived (Note B) | — | — | — | — | — | — | — | — | — | (2,242 | ) | ||||||||||||||||||||||||||||||||
Total net expenses | 1,067 | 6,722 | 25,366 | 7,398 | 136,136 | 432 | 1,040 | 897 | 12,887 | 10,412 | |||||||||||||||||||||||||||||||||
Net investment income (loss) | $ | (218 | ) | $ | 5,142 | $ | 59,668 | $ | 4,837 | $ | 38,400 | $ | 201 | $ | 621 | $ | 534 | $ | 11,713 | $ | 16,304 | ||||||||||||||||||||||
Realized and Unrealized Gain (Loss) on Investments: | |||||||||||||||||||||||||||||||||||||||||||
Net realized gain (loss) on: | |||||||||||||||||||||||||||||||||||||||||||
Sales of investment securities of unaffiliated issuers (Note A) | 15,486 | 186 | 166,141 | 139,112 | 925,583 | 1,118 | 1,106 | 4,597 | * | 205,035 | 58,130 | ||||||||||||||||||||||||||||||||
Sales of investment securities of affiliated issuers (Note A) | — | — | — | — | 444,869 | — | — | — | — | — | |||||||||||||||||||||||||||||||||
Redemption in-kind (Note A) | — | — | — | — | — | — | — | — | — | — | |||||||||||||||||||||||||||||||||
Foreign currency (Note A) | — | (464 | ) | (245 | ) | — | 13 | (6 | ) | (19 | ) | (1 | ) | (19 | ) | (322 | ) | ||||||||||||||||||||||||||
Option contracts written (Note A) | — | — | 2,839 | — | — | — | — | — | — | — | |||||||||||||||||||||||||||||||||
Net increase from payments by affiliates (Note B) | 12 | 8 | 72 | 15 | 619 | — | 2 | — | 31 | 24 | |||||||||||||||||||||||||||||||||
| Change in net unrealized appreciation (depreciation) in value of (Note A): | |||||||||||||||||||||||||||||||||||||||||||
Unaffiliated investment securities | 4,262 | 76,488 | ** | 245,363 | 14,347 | 336,545 | 5,186 | 7,572 | 6,762 | ** | 61,939 | 53,117 | |||||||||||||||||||||||||||||||
Affiliated investment securities | — | — | — | — | 50,782 | — | — | — | — | — | |||||||||||||||||||||||||||||||||
Foreign currency | — | 4 | 13 | — | — | — | — | — | (3 | ) | (35 | ) | |||||||||||||||||||||||||||||||
Option contracts written | — | — | (363 | ) | — | — | — | — | — | — | — | ||||||||||||||||||||||||||||||||
Net gain (loss) on investments | 19,760 | 76,222 | 413,820 | 153,474 | 1,758,411 | 6,298 | 8,661 | 11,358 | 266,983 | 110,914 | |||||||||||||||||||||||||||||||||
Net increase (decrease) in net assets resulting from operations | $ | 19,542 | $ | 81,364 | $ | 473,488 | $ | 158,311 | $ | 1,796,811 | $ | 6,499 | $ | 9,282 | $ | 11,892 | $ | 278,696 | $ | 127,218 | |||||||||||||||||||||||
a Formerly Select Equities Fund. See Note A of Notes to Financial Statements.
* Net of foreign capital gains tax $(30,417).
** Change in accrued foreign capital gains tax amounted to $(92,069) for Emerging Markets Equity and $(132,467) for Greater China Equity.
See Notes to Financial Statements
141
142
Statements of Operations (cont'd)
Neuberger Berman Equity Funds
(000's omitted)
| INTERNATIONAL SELECT FUNDb | INTRINSIC VALUE FUND | LARGE CAP DISCIPLINED GROWTH FUND | LARGE CAP VALUE FUND | MID CAP GROWTH FUND | MID CAP INTRINSIC VALUE FUND | MULTI-CAP OPPORTUNITIES FUND | REAL ESTATE FUND | SMALL CAP GROWTH FUND | SOCIALLY RESPONSIVE FUND | ||||||||||||||||||||||||||||||||||
| For the Year Ended August 31, 2014 | For the Year Ended August 31, 2014 | For the Year Ended August 31, 2014 | For the Year Ended August 31, 2014 | For the Year Ended August 31, 2014 | For the Year Ended August 31, 2014 | For the Year Ended August 31, 2014 | For the Year Ended August 31, 2014 | For the Year Ended August 31, 2014 | For the Year Ended August 31, 2014 | ||||||||||||||||||||||||||||||||||
Investment Income: | |||||||||||||||||||||||||||||||||||||||||||
Income (Note A): | |||||||||||||||||||||||||||||||||||||||||||
Dividend income—unaffiliated issuers | $ | 7,048 | $ | 1,534 | $ | 5,311 | $ | 32,151 | $ | 4,355 | $ | 1,701 | $ | 39,884 | $ | 21,461 | $ | 308 | $ | 42,028 | |||||||||||||||||||||||
Dividend income—affiliated issuers (Note F) | — | — | — | — | — | — | — | — | — | — | |||||||||||||||||||||||||||||||||
Interest income—unaffiliated issuers | — | — | 10 | 42 | 25 | 2 | 38 | 8 | 1 | 2 | |||||||||||||||||||||||||||||||||
Foreign taxes withheld (Note A) | (760 | ) | (1 | ) | (63 | ) | (194 | ) | (8 | ) | — | (476 | ) | (45 | ) | — | (1,067 | ) | |||||||||||||||||||||||||
Total income | $ | 6,288 | $ | 1,533 | $ | 5,258 | $ | 31,999 | $ | 4,372 | $ | 1,703 | $ | 39,446 | $ | 21,424 | $ | 309 | $ | 40,963 | |||||||||||||||||||||||
Expenses: | |||||||||||||||||||||||||||||||||||||||||||
Investment management fees (Note B) | 1,395 | 2,177 | 1,935 | 8,217 | 4,894 | 422 | 11,422 | 7,739 | 738 | 11,061 | |||||||||||||||||||||||||||||||||
Administration fees (Note B) | 152 | 154 | 214 | 1,019 | 571 | 46 | 1,316 | 580 | 52 | 1,420 | |||||||||||||||||||||||||||||||||
Administration fees (Note B): | |||||||||||||||||||||||||||||||||||||||||||
Investor Class | — | — | 32 | 2,404 | 815 | 86 | — | — | 105 | 1,627 | |||||||||||||||||||||||||||||||||
Trust Class | 48 | — | — | 510 | 216 | 46 | — | 1,046 | 21 | 1,513 | |||||||||||||||||||||||||||||||||
Advisor Class | — | — | — | 735 | 36 | — | — | — | 14 | — | |||||||||||||||||||||||||||||||||
Institutional Class | 200 | 204 | 255 | 113 | 313 | 13 | 1,841 | 376 | 15 | 579 | |||||||||||||||||||||||||||||||||
Class A | 22 | 37 | 65 | 5 | 197 | 8 | 233 | 336 | 10 | 269 | |||||||||||||||||||||||||||||||||
Class C | 9 | 24 | 50 | 5 | 11 | 3 | 64 | 80 | 4 | 73 | |||||||||||||||||||||||||||||||||
Class R3 | 5 | — | — | — | 15 | 1 | — | 39 | 1 | 58 | |||||||||||||||||||||||||||||||||
Class R6 | — | — | — | — | 2 | — | — | 3 | — | 53 | |||||||||||||||||||||||||||||||||
Distribution fees (Note B): | |||||||||||||||||||||||||||||||||||||||||||
Trust Class | 14 | — | — | 150 | — | 14 | — | 308 | 6 | 445 | |||||||||||||||||||||||||||||||||
Advisor Class | — | — | — | 541 | 27 | — | — | — | 10 | — | |||||||||||||||||||||||||||||||||
Class A | 27 | 46 | 81 | 6 | 246 | 10 | 291 | 419 | 13 | 336 | |||||||||||||||||||||||||||||||||
Class C | 44 | 120 | 247 | 23 | 55 | 16 | 318 | 402 | 17 | 366 | |||||||||||||||||||||||||||||||||
Class R3 | 14 | — | 1 | 1 | 38 | 2 | — | 98 | 2 | 146 | |||||||||||||||||||||||||||||||||
Shareholder servicing agent fees: | |||||||||||||||||||||||||||||||||||||||||||
Investor Class | — | — | 21 | 629 | 337 | 29 | — | — | 71 | 663 | |||||||||||||||||||||||||||||||||
Trust Class | 8 | — | — | 21 | 8 | 10 | — | 66 | 11 | 55 | |||||||||||||||||||||||||||||||||
Advisor Class | — | — | — | 25 | 2 | — | — | — | 1 | — | |||||||||||||||||||||||||||||||||
Institutional Class | 16 | 21 | 52 | 14 | 40 | 1 | 609 | 46 | 9 | 60 | |||||||||||||||||||||||||||||||||
Class A | 3 | 6 | 7 | 1 | 30 | 2 | 37 | 63 | 2 | 37 | |||||||||||||||||||||||||||||||||
Class C | 1 | 3 | 4 | 1 | 3 | — | 10 | 21 | 1 | 9 | |||||||||||||||||||||||||||||||||
Class R3 | 1 | — | — | — | 3 | — | — | 5 | 1 | 4 | |||||||||||||||||||||||||||||||||
Class R6 | — | — | — | — | 1 | — | — | 1 | — | 19 | |||||||||||||||||||||||||||||||||
Audit fees | 62 | 26 | 26 | 62 | 26 | 26 | 25 | 64 | 26 | 26 | |||||||||||||||||||||||||||||||||
Custodian and accounting fees | 239 | 102 | 140 | 347 | 259 | 81 | 352 | 240 | 99 | 490 | |||||||||||||||||||||||||||||||||
Insurance expense | 9 | 7 | 17 | 60 | 29 | 3 | 54 | 37 | 4 | 79 | |||||||||||||||||||||||||||||||||
Legal fees (Note H for International Equity Fund) | 75 | 70 | 73 | 71 | 73 | 71 | 73 | 70 | 71 | 71 | |||||||||||||||||||||||||||||||||
Registration and filing fees | 89 | 49 | 85 | 113 | 141 | 87 | 119 | 174 | 100 | 152 | |||||||||||||||||||||||||||||||||
| Repayment to Management of expenses previously assumed by Management (Note B) | — | — | — | 5 | — | 7 | — | — | — | — | |||||||||||||||||||||||||||||||||
Shareholder reports | 21 | 24 | 55 | 128 | 120 | 19 | 107 | 159 | 20 | 232 | |||||||||||||||||||||||||||||||||
Trustees' fees and expenses | 38 | 37 | 38 | 38 | 38 | 38 | 38 | 38 | 38 | 38 | |||||||||||||||||||||||||||||||||
Miscellaneous | 26 | 9 | 19 | 62 | 36 | 6 | 72 | 40 | 7 | 92 | |||||||||||||||||||||||||||||||||
Total expenses | 2,518 | 3,116 | 3,417 | 15,306 | 8,582 | 1,047 | 16,981 | 12,450 | 1,469 | 19,973 | |||||||||||||||||||||||||||||||||
See Notes to Financial Statements
143
144
Statements of Operations (cont'd)
Neuberger Berman Equity Funds (cont'd)
(000's omitted)
| INTERNATIONAL SELECT FUNDb | INTRINSIC VALUE FUND | LARGE CAP DISCIPLINED GROWTH FUND | LARGE CAP VALUE FUND | MID CAP GROWTH FUND | MID CAP INTRINSIC VALUE FUND | MULTI-CAP OPPORTUNITIES FUND | REAL ESTATE FUND | SMALL CAP GROWTH FUND | SOCIALLY RESPONSIVE FUND | ||||||||||||||||||||||||||||||||||
| For the Year Ended August 31, 2014 | For the Year Ended August 31, 2014 | For the Year Ended August 31, 2014 | For the Year Ended August 31, 2014 | For the Year Ended August 31, 2014 | For the Year Ended August 31, 2014 | For the Year Ended August 31, 2014 | For the Year Ended August 31, 2014 | For the Year Ended August 31, 2014 | For the Year Ended August 31, 2014 | ||||||||||||||||||||||||||||||||||
Expenses reimbursed by Management (Note B) | (79 | ) | (348 | ) | (296 | ) | — | (31 | ) | — | — | (2,482 | ) | (429 | ) | — | |||||||||||||||||||||||||||
Investment management fees waived (Note B) | — | — | — | — | — | (249 | ) | — | — | — | — | ||||||||||||||||||||||||||||||||
Total net expenses | 2,439 | 2,768 | 3,121 | 15,306 | 8,551 | 798 | 16,981 | 9,968 | 1,040 | 19,973 | |||||||||||||||||||||||||||||||||
Net investment income (loss) | $ | 3,849 | $ | (1,235 | ) | $ | 2,137 | $ | 16,693 | $ | (4,179 | ) | $ | 905 | $ | 22,465 | $ | 11,456 | $ | (731 | ) | $ | 20,990 | ||||||||||||||||||||
Realized and Unrealized Gain (Loss) on Investments: | |||||||||||||||||||||||||||||||||||||||||||
Net realized gain (loss) on: | |||||||||||||||||||||||||||||||||||||||||||
Sales of investment securities of unaffiliated issuers (Note A) | 11,683 | 18,710 | 101,237 | 252,527 | 115,249 | 8,719 | 87,639 | 50,573 | 14,211 | 316,781 | |||||||||||||||||||||||||||||||||
Sales of investment securities of affiliated issuers (Note A) | — | — | — | — | — | — | — | — | — | — | |||||||||||||||||||||||||||||||||
Redemption in-kind (Note A) | — | — | — | — | — | — | — | — | — | 22,727 | |||||||||||||||||||||||||||||||||
Foreign currency (Note A) | (71 | ) | — | — | 2 | — | — | 3 | — | — | 51 | ||||||||||||||||||||||||||||||||
Option contracts written (Note A) | — | — | — | — | — | — | — | — | — | — | |||||||||||||||||||||||||||||||||
Net increase from payments by affiliates (Note B) | 8 | 5 | 26 | 101 | 39 | 6 | 19 | 16 | 4 | 52 | |||||||||||||||||||||||||||||||||
| Change in net unrealized appreciation (depreciation) in value of (Note A): | |||||||||||||||||||||||||||||||||||||||||||
Unaffiliated investment securities | 12,591 | 29,545 | (34,548 | ) | 87,513 | 35,520 | 5,887 | 300,270 | 132,321 | (3,502 | ) | 95,317 | |||||||||||||||||||||||||||||||
Affiliated investment securities | — | — | — | — | — | — | — | — | — | — | |||||||||||||||||||||||||||||||||
Foreign currency | (4 | ) | — | — | — | — | — | — | — | — | (5 | ) | |||||||||||||||||||||||||||||||
Option contracts written | — | — | — | — | — | — | — | — | — | — | |||||||||||||||||||||||||||||||||
Net gain (loss) on investments | 24,207 | 48,260 | 66,715 | 340,143 | 150,808 | 14,612 | 387,931 | 182,910 | 10,713 | 434,923 | |||||||||||||||||||||||||||||||||
Net increase (decrease) in net assets resulting from operations | $ | 28,056 | $ | 47,025 | $ | 68,852 | $ | 356,836 | $ | 146,629 | $ | 15,517 | $ | 410,396 | $ | 194,366 | $ | 9,982 | $ | 455,913 | |||||||||||||||||||||||
b Formerly International Large Cap Fund. See Note A of Notes to Financial Statements.
See Notes to Financial Statements
145
146
Statements of Operations (cont'd)
Neuberger Berman Equity Funds
(000's omitted)
VALUE FUND | |||||||
| For the Year Ended August 31, 2014 | |||||||
Investment Income: | |||||||
Income (Note A): | |||||||
Dividend income—unaffiliated issuers | $ | 285 | |||||
Dividend income—affiliated issuers (Note F) | — | ||||||
Interest income—unaffiliated issuers | — | ||||||
Foreign taxes withheld (Note A) | (2 | ) | |||||
Total income | $ | 283 | |||||
Expenses: | |||||||
Investment management fees (Note B) | 85 | ||||||
Administration fees (Note B) | 9 | ||||||
Administration fees (Note B): | |||||||
Investor Class | — | ||||||
Trust Class | — | ||||||
Advisor Class | — | ||||||
Institutional Class | 9 | ||||||
Class A | 11 | ||||||
Class C | 1 | ||||||
Class R3 | — | ||||||
Class R6 | — | ||||||
Distribution fees (Note B): | |||||||
Trust Class | — | ||||||
Advisor Class | — | ||||||
Class A | 14 | ||||||
Class C | 4 | ||||||
Class R3 | — | ||||||
Shareholder servicing agent fees: | |||||||
Investor Class | — | ||||||
Trust Class | — | ||||||
Advisor Class | — | ||||||
Institutional Class | 1 | ||||||
Class A | 3 | ||||||
Class C | — | ||||||
Class R3 | — | ||||||
Class R6 | — | ||||||
Audit fees | 62 | ||||||
Custodian and accounting fees | 37 | ||||||
Insurance expense | — | ||||||
Legal fees (Note H for International Equity Fund) | 70 | ||||||
Registration and filing fees | 44 | ||||||
Repayment to Management of expenses previously assumed by Management (Note B) | — | ||||||
Shareholder reports | 9 | ||||||
Trustees' fees and expenses | 38 | ||||||
Miscellaneous | 3 | ||||||
Total expenses | 400 | ||||||
See Notes to Financial Statements
147
Statements of Operations (cont'd)
Neuberger Berman Equity Funds (cont'd)
(000's omitted)
VALUE FUND | |||||||
| For the Year Ended August 31, 2014 | |||||||
Expenses reimbursed by Management (Note B) | (264 | ) | |||||
Investment management fees waived (Note B) | — | ||||||
Total net expenses | 136 | ||||||
Net investment income (loss) | $ | 147 | |||||
Realized and Unrealized Gain (Loss) on Investments: | |||||||
Net realized gain (loss) on: | |||||||
Sales of investment securities of unaffiliated issuers (Note A) | 1,387 | ||||||
Sales of investment securities of affiliated issuers (Note A) | — | ||||||
Redemption in-kind (Note A) | — | ||||||
Foreign currency (Note A) | — | ||||||
Option contracts written (Note A) | — | ||||||
Net increase from payments by affiliates (Note B) | — | ||||||
Change in net unrealized appreciation (depreciation) in value of (Note A): | |||||||
Unaffiliated investment securities | 1,452 | ||||||
Affiliated investment securities | — | ||||||
Foreign currency | — | ||||||
Option contracts written | — | ||||||
Net gain (loss) on investments | 2,839 | ||||||
Net increase (decrease) in net assets resulting from operations | $ | 2,986 | |||||
See Notes to Financial Statements
148
Statements of Changes in Net Assets
Neuberger Berman Equity Funds
(000's omitted)
ALL CAP CORE FUNDa | EMERGING MARKETS EQUITY FUND | EQUITY INCOME FUND | FOCUS FUND | GENESIS FUND | |||||||||||||||||||||||||||||||||||||||
| Year Ended August 31, 2014 | Year Ended August 31, 2013 | Year Ended August 31, 2014 | Year Ended August 31, 2013 | Year Ended August 31, 2014 | Year Ended August 31, 2013 | Year Ended August 31, 2014 | Year Ended August 31, 2013 | Year Ended August 31, 2014 | Year Ended August 31, 2013 | ||||||||||||||||||||||||||||||||||
Increase (Decrease) in Net Assets: | |||||||||||||||||||||||||||||||||||||||||||
From Operations: | |||||||||||||||||||||||||||||||||||||||||||
Net investment income (loss) (Note A) | $ | (218 | ) | $ | 45 | $ | 5,142 | $ | 3,365 | $ | 59,668 | $ | 63,142 | $ | 4,837 | $ | 4,610 | $ | 38,400 | $ | 92,811 | ||||||||||||||||||||||
Net realized gain (loss) on investments (Note A) | 15,486 | 7,509 | (278 | ) | (3,466 | ) | 168,735 | 98,655 | 139,112 | 68,341 | 1,370,465 | 1,213,928 | |||||||||||||||||||||||||||||||
Net increase from payments by affiliates (Note B) | 12 | — | 8 | — | 72 | — | 15 | — | 619 | — | |||||||||||||||||||||||||||||||||
| Change in net unrealized appreciation (depreciation) of investments (Note A) | 4,262 | 4,375 | 76,492 | (13,569 | ) | 245,013 | (52,438 | ) | 14,347 | 66,874 | 387,327 | 1,318,251 | |||||||||||||||||||||||||||||||
Net increase (decrease) in net assets resulting from operations | 19,542 | 11,929 | 81,364 | (13,670 | ) | 473,488 | 109,359 | 158,311 | 139,825 | 1,796,811 | 2,624,990 | ||||||||||||||||||||||||||||||||
Distributions to Shareholders From (Note A): | |||||||||||||||||||||||||||||||||||||||||||
Net investment income: | |||||||||||||||||||||||||||||||||||||||||||
Investor Class | — | — | — | — | — | — | (4,481 | ) | (3,453 | ) | (14,369 | ) | (12,713 | ) | |||||||||||||||||||||||||||||
Trust Class | — | — | — | — | — | — | (788 | ) | (117 | ) | (9,946 | ) | (6,707 | ) | |||||||||||||||||||||||||||||
Advisor Class | — | — | — | — | — | — | (78 | ) | (55 | ) | (1,169 | ) | (1,895 | ) | |||||||||||||||||||||||||||||
Institutional Class | (37 | ) | — | (2,211 | ) | (875 | ) | (34,499 | ) | (47,127 | ) | (63 | ) | (185 | ) | (29,067 | ) | (29,115 | ) | ||||||||||||||||||||||||
Class A | — | — | (44 | ) | (10 | ) | (17,649 | ) | (33,492 | ) | (26 | ) | (7 | ) | — | — | |||||||||||||||||||||||||||
Class C | — | — | — | — | (6,745 | ) | (10,272 | ) | (8 | ) | (3 | ) | — | — | |||||||||||||||||||||||||||||
Class R3 | — | — | (0 | ) | — | (58 | ) | (49 | ) | — | — | — | — | ||||||||||||||||||||||||||||||
Class R6 | — | — | (322 | ) | — | — | — | — | — | (11,801 | ) | — | |||||||||||||||||||||||||||||||
Net realized gain on investments: | |||||||||||||||||||||||||||||||||||||||||||
Investor Class | — | — | — | — | — | — | (60,554 | ) | — | (268,282 | ) | (134,977 | ) | ||||||||||||||||||||||||||||||
Trust Class | — | — | — | — | — | — | (10,218 | ) | — | (230,081 | ) | (120,167 | ) | ||||||||||||||||||||||||||||||
Advisor Class | — | — | — | — | — | — | (1,196 | ) | — | (85,753 | ) | (41,050 | ) | ||||||||||||||||||||||||||||||
Institutional Class | (4,589 | ) | (2,157 | ) | — | — | (54,106 | ) | (12,237 | ) | (687 | ) | — | (405,133 | ) | (233,502 | ) | ||||||||||||||||||||||||||
Class A | (2,810 | ) | (2,114 | ) | — | — | (32,919 | ) | (9,976 | ) | (346 | ) | — | — | — | ||||||||||||||||||||||||||||
Class C | (1,393 | ) | (878 | ) | — | — | (19,266 | ) | (3,952 | ) | (156 | ) | — | — | — | ||||||||||||||||||||||||||||
Class R3 | — | — | — | — | (121 | ) | (16 | ) | — | — | — | — | |||||||||||||||||||||||||||||||
Class R6 | — | — | — | — | — | — | — | — | (148,025 | ) | — | ||||||||||||||||||||||||||||||||
Total distributions to shareholders | (8,829 | ) | (5,149 | ) | (2,577 | ) | (885 | ) | (165,363 | ) | (117,121 | ) | (78,601 | ) | (3,820 | ) | (1,203,626 | ) | (580,126 | ) | |||||||||||||||||||||||
From Fund Share Transactions (Note D): | |||||||||||||||||||||||||||||||||||||||||||
Proceeds from shares sold: | |||||||||||||||||||||||||||||||||||||||||||
Investor Class | — | — | — | — | — | — | 7,131 | 28,847 | 326,973 | 346,454 | |||||||||||||||||||||||||||||||||
Trust Class | — | — | — | — | — | — | 80,497 | 42,596 | 326,902 | 329,155 | |||||||||||||||||||||||||||||||||
Advisor Class | — | — | — | — | — | — | 2,124 | 1,421 | 152,697 | 150,460 | |||||||||||||||||||||||||||||||||
Institutional Class | 24,829 | 28,723 | 187,999 | 296,114 | 532,610 | 582,068 | 2,677 | 15,650 | 1,138,280 | 1,247,941 | |||||||||||||||||||||||||||||||||
Class A | 5,449 | 14,466 | 16,283 | 7,538 | 124,552 | 477,410 | 2,686 | 1,659 | — | — | |||||||||||||||||||||||||||||||||
Class C | 2,667 | 3,421 | 3,307 | 3,593 | 44,793 | 149,578 | 699 | 225 | — | — | |||||||||||||||||||||||||||||||||
Class R3 | — | — | 591 | 987 | 1,334 | 4,525 | — | — | — | — | |||||||||||||||||||||||||||||||||
Class R6 | — | — | 45,242 | 34,597 | — | — | — | — | 1,881,331 | 988,848 | |||||||||||||||||||||||||||||||||
See Notes to Financial Statements
149
150
Statements of Changes in Net Assets (cont'd)
Neuberger Berman Equity Funds (cont'd)
(000's omitted)
ALL CAP CORE FUNDa | EMERGING MARKETS EQUITY FUND | EQUITY INCOME FUND | FOCUS FUND | GENESIS FUND | |||||||||||||||||||||||||||||||||||||||
| Year Ended August 31, 2014 | Year Ended August 31, 2013 | Year Ended August 31, 2014 | Year Ended August 31, 2013 | Year Ended August 31, 2014 | Year Ended August 31, 2013 | Year Ended August 31, 2014 | Year Ended August 31, 2013 | Year Ended August 31, 2014 | Year Ended August 31, 2013 | ||||||||||||||||||||||||||||||||||
Proceeds from reinvestment of dividends and distributions: | |||||||||||||||||||||||||||||||||||||||||||
Investor Class | — | — | — | — | — | — | 57,841 | 3,037 | 273,964 | 143,080 | |||||||||||||||||||||||||||||||||
Trust Class | — | — | — | — | — | — | 10,913 | 113 | 233,324 | 122,344 | |||||||||||||||||||||||||||||||||
Advisor Class | — | — | — | — | — | — | 1,253 | 54 | 75,501 | 38,492 | |||||||||||||||||||||||||||||||||
Institutional Class | 3,966 | 1,847 | 1,376 | 580 | 65,965 | 42,019 | 686 | 166 | 417,802 | 256,618 | |||||||||||||||||||||||||||||||||
Class A | 2,561 | 1,956 | 24 | 8 | 46,131 | 39,711 | 337 | 5 | — | — | |||||||||||||||||||||||||||||||||
Class C | 1,139 | 690 | — | — | 17,727 | 9,152 | 143 | 2 | — | — | |||||||||||||||||||||||||||||||||
Class R3 | — | — | — | — | 116 | 34 | — | — | — | — | |||||||||||||||||||||||||||||||||
Class R6 | — | — | 322 | — | — | — | — | — | 159,826 | — | |||||||||||||||||||||||||||||||||
| Proceeds from shares issued in connection with the acquisition of International Fund (Note G): | |||||||||||||||||||||||||||||||||||||||||||
Investor Class | — | — | — | — | — | — | — | — | — | — | |||||||||||||||||||||||||||||||||
Trust Class | — | — | — | — | — | — | — | — | — | — | |||||||||||||||||||||||||||||||||
Class A | — | — | — | — | — | — | — | — | — | — | |||||||||||||||||||||||||||||||||
Class C | — | — | — | — | — | — | — | — | — | — | |||||||||||||||||||||||||||||||||
Payments for shares redeemed: | |||||||||||||||||||||||||||||||||||||||||||
Investor Class | — | — | — | — | — | — | (74,233 | ) | (55,470 | ) | (671,817 | ) | (657,617 | ) | |||||||||||||||||||||||||||||
Trust Class | — | — | — | — | — | — | (28,246 | ) | (5,279 | ) | (997,456 | ) | (828,383 | ) | |||||||||||||||||||||||||||||
Advisor Class | — | — | — | — | — | — | (2,419 | ) | (2,393 | ) | (251,670 | ) | (225,969 | ) | |||||||||||||||||||||||||||||
Institutional Class | (23,483 | ) | (12,695 | ) | (115,052 | ) | (73,488 | ) | (618,006 | ) | (391,773 | ) | (17,988 | ) | (4,586 | ) | (2,820,340 | ) | (2,259,163 | ) | |||||||||||||||||||||||
Class A | (16,557 | ) | (17,450 | ) | (6,143 | ) | (4,314 | ) | (840,833 | ) | (494,504 | ) | (1,132 | ) | (777 | ) | — | — | |||||||||||||||||||||||||
Class C | (3,385 | ) | (3,025 | ) | (1,261 | ) | (694 | ) | (131,062 | ) | (70,816 | ) | (6 | ) | (9 | ) | — | — | |||||||||||||||||||||||||
Class R3 | — | — | (197 | ) | (1,073 | ) | (969 | ) | (2,924 | ) | — | — | — | — | |||||||||||||||||||||||||||||
Class R6 | — | — | (1,841 | ) | — | — | — | — | — | (357,000 | ) | (35,308 | ) | ||||||||||||||||||||||||||||||
Net increase (decrease) from Fund share transactions | (2,814 | ) | 17,933 | 130,650 | 263,848 | (757,642 | ) | 344,480 | 42,963 | 25,261 | (111,683 | ) | (383,048 | ) | |||||||||||||||||||||||||||||
Net Increase (Decrease) in Net Assets | 7,899 | 24,713 | 209,437 | 249,293 | (449,517 | ) | 336,718 | 122,673 | 161,266 | 481,502 | 1,661,816 | ||||||||||||||||||||||||||||||||
Net Assets: | |||||||||||||||||||||||||||||||||||||||||||
Beginning of year | 92,634 | 67,921 | 416,779 | 167,486 | 2,944,120 | 2,607,402 | 724,292 | 563,026 | 13,242,305 | 11,580,489 | |||||||||||||||||||||||||||||||||
End of year | $ | 100,533 | $ | 92,634 | $ | 626,216 | $ | 416,779 | $ | 2,494,603 | $ | 2,944,120 | $ | 846,965 | $ | 724,292 | $ | 13,723,807 | $ | 13,242,305 | |||||||||||||||||||||||
Undistributed net investment income (loss) at end of year | $ | — | $ | 34 | $ | 4,627 | $ | 2,526 | $ | — | $ | — | $ | 3,504 | $ | 4,608 | $ | 12,211 | $ | 40,414 | |||||||||||||||||||||||
Distributions in excess of net investment income at end of year | $ | (8 | ) | $ | — | $ | — | $ | — | $ | (2,844 | ) | $ | (9,661 | ) | $ | — | $ | — | $ | — | $ | — | ||||||||||||||||||||
a Formerly Select Equities Fund. See Note A of Notes to Financial Statements.
See Notes to Financial Statements
151
152
Statements of Changes in Net Assets (cont'd)
Neuberger Berman Equity Funds
(000's omitted)
GLOBAL EQUITY FUND | GLOBAL THEMATIC OPPORTUNITIES FUND | GREATER CHINA EQUITY FUND | GUARDIAN FUND | INTERNATIONAL EQUITY FUND | |||||||||||||||||||||||||||||||||||||||
| Year Ended August 31, 2014 | Year Ended August 31, 2013 | Year Ended August 31, 2014 | Year Ended August 31, 2013 | Year Ended August 31, 2014 | Period from July 17, 2013 (Commencement of Operation) to August 31, 2013 | Year Ended August 31, 2014 | Year Ended August 31, 2013 | Year Ended August 31, 2014 | Year Ended August 31, 2013 | ||||||||||||||||||||||||||||||||||
Increase (Decrease) in Net Assets: | |||||||||||||||||||||||||||||||||||||||||||
From Operations: | |||||||||||||||||||||||||||||||||||||||||||
Net investment income (loss) (Note A) | $ | 201 | $ | 41 | $ | 621 | $ | 295 | $ | 534 | $ | (65 | ) | $ | 11,713 | $ | 10,049 | $ | 16,304 | $ | 12,302 | ||||||||||||||||||||||
Net realized gain (loss) on investments (Note A) | 1,112 | 192 | 1,087 | (1,109 | ) | 4,596 | 248 | 205,016 | 125,045 | 57,808 | 21,830 | ||||||||||||||||||||||||||||||||
Net increase from payments by affiliates (Note B) | — | — | 2 | — | — | — | 31 | — | 24 | — | |||||||||||||||||||||||||||||||||
| Change in net unrealized appreciation (depreciation) of investments (Note A) | 5,186 | (507 | ) | 7,572 | 4,947 | 6,762 | 44 | 61,936 | 107,577 | 53,082 | 44,586 | ||||||||||||||||||||||||||||||||
Net increase (decrease) in net assets resulting from operations | 6,499 | (274 | ) | 9,282 | 4,133 | 11,892 | 227 | 278,696 | 242,671 | 127,218 | 78,718 | ||||||||||||||||||||||||||||||||
Distributions to Shareholders From (Note A): | |||||||||||||||||||||||||||||||||||||||||||
Net investment income: | |||||||||||||||||||||||||||||||||||||||||||
Investor Class | — | — | — | — | — | — | (5,725 | ) | (11,549 | ) | (1,141 | ) | — | ||||||||||||||||||||||||||||||
Trust Class | — | — | — | — | — | — | (769 | ) | (1,615 | ) | (881 | ) | — | ||||||||||||||||||||||||||||||
Advisor Class | — | — | — | — | — | — | (8 | ) | (4 | ) | — | — | |||||||||||||||||||||||||||||||
Institutional Class | (124 | ) | — | (374 | ) | (276 | ) | — | — | (704 | ) | (850 | ) | (15,790 | ) | (7,601 | ) | ||||||||||||||||||||||||||
Class A | (0 | ) | — | (1 | ) | (4 | ) | — | — | (297 | ) | (286 | ) | (155 | ) | — | |||||||||||||||||||||||||||
Class C | — | — | — | — | — | — | (0 | ) | (7 | ) | (8 | ) | — | ||||||||||||||||||||||||||||||
Class R3 | — | — | — | — | — | — | (2 | ) | (0 | ) | — | — | |||||||||||||||||||||||||||||||
Class R6 | — | — | — | — | — | — | — | — | (1 | ) | — | ||||||||||||||||||||||||||||||||
Net realized gain on investments: | |||||||||||||||||||||||||||||||||||||||||||
Investor Class | — | — | — | — | — | — | (104,953 | ) | (25,562 | ) | — | — | |||||||||||||||||||||||||||||||
Trust Class | — | — | — | — | — | — | (17,108 | ) | (3,874 | ) | — | — | |||||||||||||||||||||||||||||||
Advisor Class | — | — | — | — | — | — | (197 | ) | (17 | ) | — | — | |||||||||||||||||||||||||||||||
Institutional Class | (308 | ) | — | — | — | (798 | ) | — | (9,818 | ) | (1,633 | ) | — | — | |||||||||||||||||||||||||||||
Class A | (2 | ) | — | — | — | (4 | ) | — | (5,882 | ) | (664 | ) | — | — | |||||||||||||||||||||||||||||
Class C | (1 | ) | — | — | — | (1 | ) | — | (363 | ) | (41 | ) | — | — | |||||||||||||||||||||||||||||
Class R3 | — | — | — | — | — | — | (58 | ) | (5 | ) | — | — | |||||||||||||||||||||||||||||||
Class R6 | — | — | — | ��� | — | — | — | — | — | — | |||||||||||||||||||||||||||||||||
Total distributions to shareholders | (435 | ) | — | (375 | ) | (280 | ) | (803 | ) | — | (145,884 | ) | (46,107 | ) | (17,976 | ) | (7,601 | ) | |||||||||||||||||||||||||
From Fund Share Transactions (Note D): | |||||||||||||||||||||||||||||||||||||||||||
Proceeds from shares sold: | |||||||||||||||||||||||||||||||||||||||||||
Investor Class | — | — | — | — | — | — | 20,340 | 16,860 | 6,504 | 2,966 | |||||||||||||||||||||||||||||||||
Trust Class | — | — | — | — | — | — | 11,693 | 19,315 | 15,396 | 13,895 | |||||||||||||||||||||||||||||||||
Advisor Class | — | — | — | — | — | — | 1,420 | 247 | — | — | |||||||||||||||||||||||||||||||||
Institutional Class | 51 | 30,851 | 12,930 | 33,157 | 21,058 | 56,198 | 44,468 | 31,571 | 283,123 | 305,607 | |||||||||||||||||||||||||||||||||
Class A | 281 | 64 | 34 | 1,783 | 1,495 | 116 | 40,412 | 17,756 | 23,348 | 6,138 | |||||||||||||||||||||||||||||||||
Class C | 88 | 17 | 18 | 21 | — | 100 | 1,032 | 1,286 | 4,449 | 1,247 | |||||||||||||||||||||||||||||||||
Class R3 | — | — | — | — | — | — | 298 | 273 | — | — | |||||||||||||||||||||||||||||||||
Class R6 | — | — | — | — | — | — | — | — | 21,390 | — | |||||||||||||||||||||||||||||||||
See Notes to Financial Statements
153
154
Statements of Changes in Net Assets (cont'd)
Neuberger Berman Equity Funds (cont'd)
(000's omitted)
GLOBAL EQUITY FUND | GLOBAL THEMATIC OPPORTUNITIES FUND | GREATER CHINA EQUITY FUND | GUARDIAN FUND | INTERNATIONAL EQUITY FUND | |||||||||||||||||||||||||||||||||||||||
| Year Ended August 31, 2014 | Year Ended August 31, 2013 | Year Ended August 31, 2014 | Year Ended August 31, 2013 | Year Ended August 31, 2014 | Period from July 17, 2013 (Commencement of Operation) to August 31, 2013 | Year Ended August 31, 2014 | Year Ended August 31, 2013 | Year Ended August 31, 2014 | Year Ended August 31, 2013 | ||||||||||||||||||||||||||||||||||
Proceeds from reinvestment of dividends and distributions: | |||||||||||||||||||||||||||||||||||||||||||
Investor Class | — | — | — | — | — | — | 104,346 | 34,993 | 1,057 | — | |||||||||||||||||||||||||||||||||
Trust Class | — | — | — | — | — | — | 17,409 | 5,345 | 851 | — | |||||||||||||||||||||||||||||||||
Advisor Class | — | — | — | — | — | — | 195 | 17 | — | — | |||||||||||||||||||||||||||||||||
Institutional Class | 431 | — | 372 | 276 | 70 | — | 9,698 | 2,290 | 14,839 | 7,492 | |||||||||||||||||||||||||||||||||
Class A | 2 | — | 1 | 4 | 4 | — | 6,099 | 929 | 142 | — | |||||||||||||||||||||||||||||||||
Class C | 1 | — | — | — | 1 | — | 219 | 29 | 5 | — | |||||||||||||||||||||||||||||||||
Class R3 | — | — | — | — | — | — | 37 | 1 | — | — | |||||||||||||||||||||||||||||||||
Class R6 | — | — | — | — | — | — | — | — | 1 | — | |||||||||||||||||||||||||||||||||
| Proceeds from shares issued in connection with the acquisition of International Fund (Note G): | |||||||||||||||||||||||||||||||||||||||||||
Investor Class | — | — | — | — | — | — | — | — | — | 147,787 | |||||||||||||||||||||||||||||||||
Trust Class | — | — | — | — | — | — | — | — | — | 117,674 | |||||||||||||||||||||||||||||||||
Class A | — | — | — | — | — | — | — | — | — | 6,829 | |||||||||||||||||||||||||||||||||
Class C | — | — | — | — | — | — | — | — | — | 658 | |||||||||||||||||||||||||||||||||
Payments for shares redeemed: | |||||||||||||||||||||||||||||||||||||||||||
Investor Class | — | — | — | — | — | — | (109,604 | ) | (113,780 | ) | (22,722 | ) | (29,620 | ) | |||||||||||||||||||||||||||||
Trust Class | — | — | — | — | — | — | (30,736 | ) | (27,072 | ) | (73,369 | ) | (23,377 | ) | |||||||||||||||||||||||||||||
Advisor Class | — | — | — | — | — | — | (1,803 | ) | (298 | ) | — | — | |||||||||||||||||||||||||||||||
Institutional Class | (1,015 | ) | (1,429 | ) | (12,391 | ) | (13,854 | ) | (16,343 | ) | (35 | ) | (24,298 | ) | (16,535 | ) | (260,918 | ) | (96,929 | ) | |||||||||||||||||||||||
Class A | (89 | ) | (28 | ) | (500 | ) | (1,925 | ) | (21 | ) | — | (10,790 | ) | (5,298 | ) | (11,803 | ) | (425 | ) | ||||||||||||||||||||||||
Class C | (8 | ) | — | (41 | ) | (40 | ) | — | — | (1,116 | ) | (265 | ) | (530 | ) | (10 | ) | ||||||||||||||||||||||||||
Class R3 | — | — | — | — | — | — | (89 | ) | (418 | ) | — | — | |||||||||||||||||||||||||||||||
Class R6 | — | — | — | — | — | — | — | — | (97 | ) | — | ||||||||||||||||||||||||||||||||
Net increase (decrease) from Fund share transactions | (258 | ) | 29,475 | 423 | 19,422 | 6,264 | 56,379 | 79,230 | (32,754 | ) | 1,666 | 459,932 | |||||||||||||||||||||||||||||||
Net Increase (Decrease) in Net Assets | 5,806 | 29,201 | 9,330 | 23,275 | 17,353 | 56,606 | 212,042 | 163,810 | 110,908 | 531,049 | |||||||||||||||||||||||||||||||||
Net Assets: | |||||||||||||||||||||||||||||||||||||||||||
Beginning of year | 33,678 | 4,477 | 73,814 | 50,539 | 56,606 | — | 1,296,838 | 1,133,028 | 1,022,615 | 491,566 | |||||||||||||||||||||||||||||||||
End of year | $ | 39,484 | $ | 33,678 | $ | 83,144 | $ | 73,814 | $ | 73,959 | $ | 56,606 | $ | 1,508,880 | $ | 1,296,838 | $ | 1,133,523 | $ | 1,022,615 | |||||||||||||||||||||||
Undistributed net investment income (loss) at end of year | $ | 226 | $ | (15 | ) | $ | 113 | $ | 80 | $ | 627 | $ | (29 | ) | $ | 8,457 | $ | 4,053 | $ | 12,034 | $ | 5,335 | |||||||||||||||||||||
Distributions in excess of net investment income at end of year | $ | — | $ | — | $ | — | $ | — | $ | — | $ | — | $ | — | $ | — | $ | — | $ | — | |||||||||||||||||||||||
See Notes to Financial Statements
155
156
Statements of Changes in Net Assets (cont'd)
Neuberger Berman Equity Funds
(000's omitted)
| INTERNATIONAL SELECT FUNDb | INTRINSIC VALUE FUND | LARGE CAP DISCIPLINED GROWTH FUND | LARGE CAP VALUE FUND | MID CAP GROWTH FUND | |||||||||||||||||||||||||||||||||||||||
| Year Ended August 31, 2014 | Year Ended August 31, 2013 | Year Ended August 31, 2014 | Year Ended August 31, 2013 | Year Ended August 31, 2014 | Year Ended August 31, 2013 | Year Ended August 31, 2014 | Year Ended August 31, 2013 | Year Ended August 31, 2014 | Year Ended August 31, 2013 | ||||||||||||||||||||||||||||||||||
Increase (Decrease) in Net Assets: | |||||||||||||||||||||||||||||||||||||||||||
From Operations: | |||||||||||||||||||||||||||||||||||||||||||
Net investment income (loss) (Note A) | $ | 3,849 | $ | 3,023 | $ | (1,235 | ) | $ | 599 | $ | 2,137 | $ | 4,047 | $ | 16,693 | $ | 18,516 | $ | (4,179 | ) | $ | (1,871 | ) | ||||||||||||||||||||
Net realized gain (loss) on investments (Note A) | 11,612 | 8,658 | 18,710 | 8,483 | 101,237 | 85,033 | 252,529 | 251,101 | 115,249 | 63,525 | |||||||||||||||||||||||||||||||||
Net increase from payments by affiliates (Note B) | 8 | — | 5 | — | 26 | — | 101 | — | 39 | — | |||||||||||||||||||||||||||||||||
| Change in net unrealized appreciation (depreciation) of investments (Note A) | 12,587 | 13,257 | 29,545 | 31,300 | (34,548 | ) | (13,128 | ) | 87,513 | 77,930 | 35,520 | 57,235 | |||||||||||||||||||||||||||||||
Net increase (decrease) in net assets resulting from operations | 28,056 | 24,938 | 47,025 | 40,382 | 68,852 | 75,952 | 356,836 | 347,547 | 146,629 | 118,889 | |||||||||||||||||||||||||||||||||
Distributions to Shareholders From (Note A): | |||||||||||||||||||||||||||||||||||||||||||
Net investment income: | |||||||||||||||||||||||||||||||||||||||||||
Investor Class | — | — | — | — | (27 | ) | (111 | ) | (14,083 | ) | (13,482 | ) | — | — | |||||||||||||||||||||||||||||
Trust Class | (129 | ) | (171 | ) | — | — | — | — | (2,047 | ) | (2,264 | ) | — | — | |||||||||||||||||||||||||||||
Advisor Class | — | — | — | — | — | — | (3,265 | ) | (3,397 | ) | — | — | |||||||||||||||||||||||||||||||
Institutional Class | (2,764 | ) | (2,605 | ) | (425 | ) | — | (2,087 | ) | (5,687 | ) | (1,523 | ) | (1,728 | ) | — | — | ||||||||||||||||||||||||||
Class A | (101 | ) | (104 | ) | (4 | ) | — | — | (462 | ) | (30 | ) | — | — | — | ||||||||||||||||||||||||||||
Class C | (13 | ) | (22 | ) | — | — | — | (91 | ) | (22 | ) | (5 | ) | — | — | ||||||||||||||||||||||||||||
Class R3 | (23 | ) | (5 | ) | — | — | — | (2 | ) | (2 | ) | — | — | — | |||||||||||||||||||||||||||||
Class R6 | — | — | — | — | — | — | — | — | — | — | |||||||||||||||||||||||||||||||||
Net realized gain on investments: | |||||||||||||||||||||||||||||||||||||||||||
Investor Class | — | — | — | — | (2,434 | ) | (777 | ) | (168,785 | ) | — | (27,005 | ) | (18,920 | ) | ||||||||||||||||||||||||||||
Trust Class | — | — | — | — | — | — | (27,921 | ) | — | (2,672 | ) | (1,443 | ) | ||||||||||||||||||||||||||||||
Advisor Class | — | — | — | — | — | — | (46,194 | ) | — | (469 | ) | (301 | ) | ||||||||||||||||||||||||||||||
Institutional Class | — | — | (8,209 | ) | (2,306 | ) | (60,585 | ) | (25,427 | ) | (16,225 | ) | — | (23,431 | ) | (10,717 | ) | ||||||||||||||||||||||||||
Class A | — | — | (723 | ) | (123 | ) | (5,333 | ) | (3,134 | ) | (394 | ) | — | (3,978 | ) | (2,328 | ) | ||||||||||||||||||||||||||
Class C | — | — | (448 | ) | (113 | ) | (3,776 | ) | (1,516 | ) | (350 | ) | — | (195 | ) | (73 | ) | ||||||||||||||||||||||||||
Class R3 | — | — | — | — | (20 | ) | (16 | ) | (25 | ) | — | (289 | ) | (134 | ) | ||||||||||||||||||||||||||||
Class R6 | — | — | — | — | — | — | — | — | (391 | ) | — | ||||||||||||||||||||||||||||||||
Total distributions to shareholders | (3,030 | ) | (2,907 | ) | (9,809 | ) | (2,542 | ) | (74,262 | ) | (37,223 | ) | (280,866 | ) | (20,876 | ) | (58,430 | ) | (33,916 | ) | |||||||||||||||||||||||
From Fund Share Transactions (Note D): | |||||||||||||||||||||||||||||||||||||||||||
Proceeds from shares sold: | |||||||||||||||||||||||||||||||||||||||||||
Investor Class | — | — | — | — | 1,319 | 1,849 | 15,524 | 25,522 | 7,315 | 7,085 | |||||||||||||||||||||||||||||||||
Trust Class | 797 | 3,235 | — | — | — | — | 7,321 | 9,218 | 17,099 | 17,145 | |||||||||||||||||||||||||||||||||
Advisor Class | — | — | — | — | — | — | 16,068 | 17,573 | 3,095 | 3,116 | |||||||||||||||||||||||||||||||||
Institutional Class | 26,904 | 29,228 | 60,529 | 49,202 | 71,898 | 132,077 | 28,473 | 27,922 | 156,573 | 91,661 | |||||||||||||||||||||||||||||||||
Class A | 2,698 | 3,916 | 10,596 | 8,162 | 4,517 | 25,150 | 2,414 | 639 | 27,567 | 34,927 | |||||||||||||||||||||||||||||||||
Class C | 1,133 | 890 | 3,170 | 4,310 | 3,648 | 2,633 | 2,187 | 1,058 | 1,931 | 1,873 | |||||||||||||||||||||||||||||||||
Class R3 | 814 | 2,273 | — | — | 21 | 64 | 20 | 61 | 3,691 | 3,150 | |||||||||||||||||||||||||||||||||
Class R6 | — | — | — | — | — | — | — | — | 23,439 | 50 | |||||||||||||||||||||||||||||||||
See Notes to Financial Statements
157
158
Statements of Changes in Net Assets (cont'd)
Neuberger Berman Equity Funds (cont'd)
(000's omitted)
| INTERNATIONAL SELECT FUNDb | INTRINSIC VALUE FUND | LARGE CAP DISCIPLINED GROWTH FUND | LARGE CAP VALUE FUND | MID CAP GROWTH FUND | |||||||||||||||||||||||||||||||||||||||
| Year Ended August 31, 2014 | Year Ended August 31, 2013 | Year Ended August 31, 2014 | Year Ended August 31, 2013 | Year Ended August 31, 2014 | Year Ended August 31, 2013 | Year Ended August 31, 2014 | Year Ended August 31, 2013 | Year Ended August 31, 2014 | Year Ended August 31, 2013 | ||||||||||||||||||||||||||||||||||
Proceeds from reinvestment of dividends and distributions: | |||||||||||||||||||||||||||||||||||||||||||
Investor Class | — | — | — | — | 2,438 | 882 | 174,745 | 12,838 | 25,390 | 17,577 | |||||||||||||||||||||||||||||||||
Trust Class | 124 | 157 | — | — | — | — | 29,591 | 2,176 | 2,663 | 1,438 | |||||||||||||||||||||||||||||||||
Advisor Class | — | — | — | — | — | — | 48,458 | 3,330 | 419 | 269 | |||||||||||||||||||||||||||||||||
Institutional Class | 2,645 | 2,489 | 7,037 | 1,970 | 50,883 | 26,541 | 17,308 | 1,702 | 23,283 | 10,514 | |||||||||||||||||||||||||||||||||
Class A | 94 | 100 | 702 | 102 | 4,387 | 3,136 | 360 | — | 3,886 | 2,281 | |||||||||||||||||||||||||||||||||
Class C | 2 | 3 | 236 | 48 | 1,066 | 569 | 201 | 2 | 182 | 67 | |||||||||||||||||||||||||||||||||
Class R3 | 23 | 5 | — | — | 10 | 3 | 10 | — | 276 | 126 | |||||||||||||||||||||||||||||||||
Class R6 | — | — | — | — | — | — | — | — | 291 | — | |||||||||||||||||||||||||||||||||
| Proceeds from shares issued in connection with the acquisition of International Fund (Note G): | |||||||||||||||||||||||||||||||||||||||||||
Investor Class | — | — | — | — | — | — | — | — | — | — | |||||||||||||||||||||||||||||||||
Trust Class | — | — | — | — | — | — | — | — | — | — | |||||||||||||||||||||||||||||||||
Class A | — | — | — | — | — | — | — | — | — | — | |||||||||||||||||||||||||||||||||
Class C | — | — | — | — | — | — | — | — | — | — | |||||||||||||||||||||||||||||||||
Payments for shares redeemed: | |||||||||||||||||||||||||||||||||||||||||||
Investor Class | — | — | — | — | (8,922 | ) | (5,585 | ) | (172,279 | ) | (169,639 | ) | (32,660 | ) | (35,471 | ) | |||||||||||||||||||||||||||
Trust Class | (3,347 | ) | (5,361 | ) | — | — | — | — | (54,387 | ) | (100,816 | ) | (12,340 | ) | (10,416 | ) | |||||||||||||||||||||||||||
Advisor Class | — | — | — | — | — | — | (48,961 | ) | (78,135 | ) | (6,226 | ) | (3,279 | ) | |||||||||||||||||||||||||||||
Institutional Class | (40,351 | ) | (22,065 | ) | (31,282 | ) | (37,104 | ) | (340,441 | ) | (382,507 | ) | (23,652 | ) | (42,604 | ) | (84,259 | ) | (42,619 | ) | |||||||||||||||||||||||
Class A | (3,809 | ) | (3,944 | ) | (14,163 | ) | (4,515 | ) | (34,983 | ) | (61,415 | ) | (1,706 | ) | (1,477 | ) | (30,915 | ) | (21,507 | ) | |||||||||||||||||||||||
Class C | (927 | ) | (956 | ) | (2,667 | ) | (2,662 | ) | (6,948 | ) | (13,472 | ) | (600 | ) | (134 | ) | (1,026 | ) | (424 | ) | |||||||||||||||||||||||
Class R3 | (1,555 | ) | (179 | ) | — | — | (269 | ) | (47 | ) | — | (611 | ) | (2,052 | ) | (1,315 | ) | ||||||||||||||||||||||||||
Class R6 | — | — | — | — | — | — | — | — | (2,288 | ) | — | ||||||||||||||||||||||||||||||||
Net increase (decrease) from Fund share transactions | (14,755 | ) | 9,791 | 34,158 | 19,513 | (251,376 | ) | (270,122 | ) | 41,095 | (291,375 | ) | 125,334 | 76,248 | |||||||||||||||||||||||||||||
Net Increase (Decrease) in Net Assets | 10,271 | 31,822 | 71,374 | 57,353 | (256,786 | ) | (231,393 | ) | 117,065 | 35,296 | 213,533 | 161,221 | |||||||||||||||||||||||||||||||
Net Assets: | |||||||||||||||||||||||||||||||||||||||||||
Beginning of year | 230,428 | 198,606 | 206,840 | 149,487 | 488,803 | 720,196 | 1,627,710 | 1,592,414 | 802,001 | 640,780 | |||||||||||||||||||||||||||||||||
End of year | $ | 240,699 | $ | 230,428 | $ | 278,214 | $ | 206,840 | $ | 232,017 | $ | 488,803 | $ | 1,744,775 | $ | 1,627,710 | $ | 1,015,534 | $ | 802,001 | |||||||||||||||||||||||
Undistributed net investment income (loss) at end of year | $ | 2,273 | $ | 1,535 | $ | — | $ | 275 | $ | — | $ | — | $ | 13,641 | $ | 18,034 | $ | (2,889 | ) | $ | (2,198 | ) | |||||||||||||||||||||
Distributions in excess of net investment income at end of year | $ | — | $ | — | $ | (124 | ) | $ | — | $ | (13 | ) | $ | (14 | ) | $ | — | $ | — | $ | — | $ | — | ||||||||||||||||||||
b Formerly International Large Cap Fund. See Note A of Notes to Financial Statements.
See Notes to Financial Statements
159
160
Statements of Changes in Net Assets (cont'd)
Neuberger Berman Equity Funds
(000's omitted)
| MID CAP INTRINSIC VALUE FUND | MULTI-CAP OPPORTUNITIES FUND | REAL ESTATE FUND | SMALL CAP GROWTH FUND | SOCIALLY RESPONSIVE FUND | |||||||||||||||||||||||||||||||||||||||
| Year Ended August 31, 2014 | Year Ended August 31, 2013 | Year Ended August 31, 2014 | Year Ended August 31, 2013 | Year Ended August 31, 2014 | Year Ended August 31, 2013 | Year Ended August 31, 2014 | Year Ended August 31, 2013 | Year Ended August 31, 2014 | Year Ended August 31, 2013 | ||||||||||||||||||||||||||||||||||
Increase (Decrease) in Net Assets: | |||||||||||||||||||||||||||||||||||||||||||
From Operations: | |||||||||||||||||||||||||||||||||||||||||||
Net investment income (loss) (Note A) | $ | 905 | $ | 956 | $ | 22,465 | $ | 12,559 | $ | 11,456 | $ | 8,895 | $ | (731 | ) | $ | (709 | ) | $ | 20,990 | $ | 18,102 | |||||||||||||||||||||
Net realized gain (loss) on investments (Note A) | 8,719 | 7,516 | 87,642 | 18,491 | 50,573 | 45,175 | 14,211 | 24,040 | 339,559 | 154,610 | |||||||||||||||||||||||||||||||||
Net increase from payments by affiliates (Note B) | 6 | — | 19 | — | 16 | — | 4 | — | 52 | — | |||||||||||||||||||||||||||||||||
| Change in net unrealized appreciation (depreciation) of investments (Note A) | 5,887 | 7,966 | 300,270 | 187,685 | 132,321 | (91,260 | ) | (3,502 | ) | (2,206 | ) | 95,312 | 244,494 | ||||||||||||||||||||||||||||||
Net increase (decrease) in net assets resulting from operations | 15,517 | 16,438 | 410,396 | 218,735 | 194,366 | (37,190 | ) | 9,982 | 21,125 | 455,913 | 417,206 | ||||||||||||||||||||||||||||||||
Distributions to Shareholders From (Note A): | |||||||||||||||||||||||||||||||||||||||||||
Net investment income: | |||||||||||||||||||||||||||||||||||||||||||
Investor Class | (578 | ) | (294 | ) | — | — | — | — | — | — | (6,812 | ) | (4,747 | ) | |||||||||||||||||||||||||||||
Trust Class | (208 | ) | (89 | ) | — | — | (3,764 | ) | (3,639 | ) | — | — | (4,600 | ) | (4,131 | ) | |||||||||||||||||||||||||||
Advisor Class | — | — | — | — | — | — | — | — | — | — | |||||||||||||||||||||||||||||||||
Institutional Class | (266 | ) | (49 | ) | (12,809 | ) | (7,627 | ) | (5,763 | ) | (3,810 | ) | — | — | (6,382 | ) | (4,520 | ) | |||||||||||||||||||||||||
Class A | (67 | ) | (30 | ) | (571 | ) | (37 | ) | (1,768 | ) | (1,097 | ) | — | — | (1,231 | ) | (666 | ) | |||||||||||||||||||||||||
Class C | (16 | ) | (1 | ) | (80 | ) | (3 | ) | (117 | ) | (67 | ) | — | — | (86 | ) | (50 | ) | |||||||||||||||||||||||||
Class R3 | (5 | ) | (1 | ) | — | — | (153 | ) | (66 | ) | — | — | (204 | ) | (119 | ) | |||||||||||||||||||||||||||
Class R6 | — | — | — | — | (194 | ) | (4 | ) | — | — | (2,006 | ) | — | ||||||||||||||||||||||||||||||
Net realized gain on investments: | |||||||||||||||||||||||||||||||||||||||||||
Investor Class | (1,556 | ) | — | — | — | — | — | — | — | (50,122 | ) | — | |||||||||||||||||||||||||||||||
Trust Class | (618 | ) | — | — | — | (18,399 | ) | (8,564 | ) | — | — | (40,943 | ) | — | |||||||||||||||||||||||||||||
Advisor Class | — | — | — | — | — | — | — | — | — | — | |||||||||||||||||||||||||||||||||
Institutional Class | (633 | ) | — | (26,066 | ) | (4,824 | ) | (23,729 | ) | (7,205 | ) | — | — | (40,032 | ) | — | |||||||||||||||||||||||||||
Class A | (195 | ) | — | (1,431 | ) | (29 | ) | (9,795 | ) | (2,687 | ) | — | — | (11,439 | ) | — | |||||||||||||||||||||||||||
Class C | (69 | ) | — | (322 | ) | (5 | ) | (2,421 | ) | (715 | ) | — | — | (3,098 | ) | — | |||||||||||||||||||||||||||
Class R3 | (18 | ) | — | — | — | (1,051 | ) | (195 | ) | — | — | (2,602 | ) | — | |||||||||||||||||||||||||||||
Class R6 | — | — | — | — | (564 | ) | (13 | ) | — | — | (11,964 | ) | — | ||||||||||||||||||||||||||||||
Total distributions to shareholders | (4,229 | ) | (464 | ) | (41,279 | ) | (12,525 | ) | (67,718 | ) | (28,062 | ) | — | — | (181,521 | ) | (14,233 | ) | |||||||||||||||||||||||||
From Fund Share Transactions (Note D): | |||||||||||||||||||||||||||||||||||||||||||
Proceeds from shares sold: | |||||||||||||||||||||||||||||||||||||||||||
Investor Class | 3,859 | 7,498 | — | — | — | — | 2,997 | 5,046 | 71,171 | 108,703 | |||||||||||||||||||||||||||||||||
Trust Class | 1,326 | 1,848 | — | — | 71,310 | 201,267 | 542 | 3,324 | 71,994 | 86,220 | |||||||||||||||||||||||||||||||||
Advisor Class | — | — | — | — | — | — | 914 | 797 | — | — | |||||||||||||||||||||||||||||||||
Institutional Class | 14,710 | 1,385 | 1,018,161 | 874,449 | 181,199 | 267,914 | 4,881 | 18,132 | 224,677 | 275,576 | |||||||||||||||||||||||||||||||||
Class A | 3,992 | 3,392 | 129,361 | 51,803 | 72,692 | 138,662 | 7,810 | 1,548 | 52,427 | 37,427 | |||||||||||||||||||||||||||||||||
Class C | 449 | 691 | 40,707 | 7,784 | 5,321 | 26,224 | 1,059 | 327 | 15,201 | 9,421 | |||||||||||||||||||||||||||||||||
Class R3 | 50 | 533 | — | — | 11,166 | 15,875 | 261 | 161 | 8,898 | 8,874 | |||||||||||||||||||||||||||||||||
Class R6 | — | — | — | — | 17,458 | 9,341 | — | — | 193,825 | 251,259 | |||||||||||||||||||||||||||||||||
See Notes to Financial Statements
161
162
Statements of Changes in Net Assets (cont'd)
Neuberger Berman Equity Funds (cont'd)
(000's omitted)
| MID CAP INTRINSIC VALUE FUND | MULTI-CAP OPPORTUNITIES FUND | REAL ESTATE FUND | SMALL CAP GROWTH FUND | SOCIALLY RESPONSIVE FUND | |||||||||||||||||||||||||||||||||||||||
| Year Ended August 31, 2014 | Year Ended August 31, 2013 | Year Ended August 31, 2014 | Year Ended August 31, 2013 | Year Ended August 31, 2014 | Year Ended August 31, 2013 | Year Ended August 31, 2014 | Year Ended August 31, 2013 | Year Ended August 31, 2014 | Year Ended August 31, 2013 | ||||||||||||||||||||||||||||||||||
Proceeds from reinvestment of dividends and distributions: | |||||||||||||||||||||||||||||||||||||||||||
Investor Class | 2,010 | 276 | — | — | — | — | — | — | 54,086 | 4,505 | |||||||||||||||||||||||||||||||||
Trust Class | 780 | 84 | — | — | 21,915 | 12,062 | — | — | 45,143 | 4,081 | |||||||||||||||||||||||||||||||||
Advisor Class | — | — | — | — | — | — | — | — | — | — | |||||||||||||||||||||||||||||||||
Institutional Class | 872 | 45 | 3,824 | 659 | 21,360 | 7,711 | — | — | 42,684 | 4,112 | |||||||||||||||||||||||||||||||||
Class A | 236 | 27 | 1,823 | 60 | 10,171 | 3,308 | — | — | 11,025 | 571 | |||||||||||||||||||||||||||||||||
Class C | 15 | — | 344 | 4 | 2,086 | 644 | — | — | 2,585 | 38 | |||||||||||||||||||||||||||||||||
Class R3 | 23 | — | — | — | 1,041 | 194 | — | — | 2,739 | 116 | |||||||||||||||||||||||||||||||||
Class R6 | — | — | — | — | 758 | 16 | — | — | 13,970 | — | |||||||||||||||||||||||||||||||||
| Proceeds from shares issued in connection with the acquisition of International Fund (Note G): | |||||||||||||||||||||||||||||||||||||||||||
Investor Class | — | — | — | — | — | — | — | — | — | — | |||||||||||||||||||||||||||||||||
Trust Class | — | — | — | — | — | — | — | — | — | — | |||||||||||||||||||||||||||||||||
Class A | — | — | — | — | — | — | — | — | — | — | |||||||||||||||||||||||||||||||||
Class C | — | — | — | — | — | — | — | — | — | — | |||||||||||||||||||||||||||||||||
Payments for shares redeemed: | |||||||||||||||||||||||||||||||||||||||||||
Investor Class | (15,323 | ) | (18,403 | ) | — | — | — | — | (7,503 | ) | (27,520 | ) | (231,387 | ) | (172,173 | ) | |||||||||||||||||||||||||||
Trust Class | (2,676 | ) | (10,133 | ) | — | — | (138,623 | ) | (160,092 | ) | (3,068 | ) | (14,751 | ) | (170,160 | ) | (233,763 | ) | |||||||||||||||||||||||||
Advisor Class | — | — | — | — | — | — | (1,497 | ) | (3,932 | ) | — | — | |||||||||||||||||||||||||||||||
Institutional Class | (3,821 | ) | (2,386 | ) | (233,691 | ) | (113,403 | ) | (160,265 | ) | (112,080 | ) | (2,873 | ) | (42,243 | ) | (196,402 | ) | (362,695 | ) | |||||||||||||||||||||||
Class A | (2,174 | ) | (5,672 | ) | (57,088 | ) | (5,544 | ) | (97,375 | ) | (43,472 | ) | (5,795 | ) | (620 | ) | (50,967 | ) | (29,966 | ) | |||||||||||||||||||||||
Class C | (132 | ) | (5 | ) | (3,127 | ) | (134 | ) | (11,829 | ) | (4,960 | ) | (482 | ) | (73 | ) | (3,965 | ) | (2,765 | ) | |||||||||||||||||||||||
Class R3 | (567 | ) | — | — | — | (6,639 | ) | (4,379 | ) | (223 | ) | (61 | ) | (7,268 | ) | (5,531 | ) | ||||||||||||||||||||||||||
Class R6 | — | — | — | — | (2,582 | ) | (285 | ) | — | — | (214,722 | ) | (3,663 | ) | |||||||||||||||||||||||||||||
Net increase (decrease) from Fund share transactions | 3,629 | (20,820 | ) | 900,314 | 815,678 | (836 | ) | 357,950 | (2,977 | ) | (59,865 | ) | (64,446 | ) | (19,653 | ) | |||||||||||||||||||||||||||
Net Increase (Decrease) in Net Assets | 14,917 | (4,846 | ) | 1,269,431 | 1,021,888 | 125,812 | 292,698 | 7,005 | (38,740 | ) | 209,946 | 383,320 | |||||||||||||||||||||||||||||||
Net Assets: | |||||||||||||||||||||||||||||||||||||||||||
Beginning of year | 68,241 | 73,087 | 1,490,553 | 468,665 | 914,063 | 621,365 | 78,332 | 117,072 | 2,226,222 | 1,842,902 | |||||||||||||||||||||||||||||||||
End of year | $ | 83,158 | $ | 68,241 | $ | 2,759,984 | $ | 1,490,553 | $ | 1,039,875 | $ | 914,063 | $ | 85,337 | $ | 78,332 | $ | 2,436,168 | $ | 2,226,222 | |||||||||||||||||||||||
Undistributed net investment income (loss) at end of year | $ | 593 | $ | 882 | $ | 16,877 | $ | 7,949 | $ | — | $ | — | $ | (445 | ) | $ | (671 | ) | $ | 17,453 | $ | 17,367 | |||||||||||||||||||||
Distributions in excess of net investment income at end of year | $ | — | $ | — | $ | — | $ | — | $ | — | $ | — | $ | — | $ | — | $ | — | $ | — | |||||||||||||||||||||||
See Notes to Financial Statements
163
164
Statements of Changes in Net Assets (cont'd)
Neuberger Berman Equity Funds
(000's omitted)
VALUE FUND | |||||||||||
| Year Ended August 31, 2014 | Year Ended August 31, 2013 | ||||||||||
Increase (Decrease) in Net Assets: | |||||||||||
From Operations: | |||||||||||
Net investment income (loss) (Note A) | $ | 147 | $ | 50 | |||||||
Net realized gain (loss) on investments (Note A) | 1,387 | 530 | |||||||||
Net increase from payments by affiliates (Note B) | — | — | |||||||||
Change in net unrealized appreciation (depreciation) of investments (Note A) | 1,452 | 38 | |||||||||
Net increase (decrease) in net assets resulting from operations | 2,986 | 618 | |||||||||
Distributions to Shareholders From (Note A): | |||||||||||
Net investment income: | |||||||||||
Investor Class | — | — | |||||||||
Trust Class | — | — | |||||||||
Advisor Class | — | — | |||||||||
Institutional Class | (57 | ) | (23 | ) | |||||||
Class A | (17 | ) | (23 | ) | |||||||
Class C | — | (1 | ) | ||||||||
Class R3 | — | — | |||||||||
Class R6 | — | — | |||||||||
Net realized gain on investments: | |||||||||||
Investor Class | — | — | |||||||||
Trust Class | — | — | |||||||||
Advisor Class | — | — | |||||||||
Institutional Class | — | — | |||||||||
Class A | — | — | |||||||||
Class C | — | — | |||||||||
Class R3 | — | — | |||||||||
Class R6 | — | — | |||||||||
Total distributions to shareholders | (74 | ) | (47 | ) | |||||||
From Fund Share Transactions (Note D): | |||||||||||
Proceeds from shares sold: | |||||||||||
Investor Class | — | — | |||||||||
Trust Class | — | — | |||||||||
Advisor Class | — | — | |||||||||
Institutional Class | 8,780 | 5,916 | |||||||||
Class A | 4,764 | 2,547 | |||||||||
Class C | 230 | 244 | |||||||||
Class R3 | — | — | |||||||||
Class R6 | — | — | |||||||||
See Notes to Financial Statements
165
Statements of Changes in Net Assets (cont'd)
Neuberger Berman Equity Funds (cont'd)
(000's omitted)
VALUE FUND | |||||||||||
| Year Ended August 31, 2014 | Year Ended August 31, 2013 | ||||||||||
Proceeds from reinvestment of dividends and distributions: | |||||||||||
Investor Class | — | — | |||||||||
Trust Class | — | — | |||||||||
Advisor Class | — | — | |||||||||
Institutional Class | 29 | 23 | |||||||||
Class A | 15 | 22 | |||||||||
Class C | — | 1 | |||||||||
Class R3 | — | — | |||||||||
Class R6 | — | — | |||||||||
Proceeds from shares issued in connection with the acquisition of International Fund (Note G): | |||||||||||
Investor Class | — | — | |||||||||
Trust Class | — | — | |||||||||
Class A | — | — | |||||||||
Class C | — | — | |||||||||
Payments for shares redeemed: | |||||||||||
Investor Class | — | — | |||||||||
Trust Class | — | — | |||||||||
Advisor Class | — | — | |||||||||
Institutional Class | (4,951 | ) | (1,863 | ) | |||||||
Class A | (1,463 | ) | (862 | ) | |||||||
Class C | (55 | ) | (15 | ) | |||||||
Class R3 | — | — | |||||||||
Class R6 | — | — | |||||||||
Net increase (decrease) from Fund share transactions | 7,349 | 6,013 | |||||||||
Net Increase (Decrease) in Net Assets | 10,261 | 6,584 | |||||||||
Net Assets: | |||||||||||
Beginning of year | 10,898 | 4,314 | |||||||||
End of year | $ | 21,159 | $ | 10,898 | |||||||
Undistributed net investment income (loss) at end of year | $ | 121 | $ | 49 | |||||||
Distributions in excess of net investment income at end of year | $ | — | $ | — | |||||||
See Notes to Financial Statements
166
Notes to Financial Statements Equity Funds
Note A—Summary of Significant Accounting Policies:
1 General: Neuberger Berman Equity Funds (the "Trust") is a Delaware statutory trust organized pursuant to an Amended and Restated Trust Instrument dated March 27, 2014. The Trust is registered as an open-end management investment company under the Investment Company Act of 1940, as amended (the "1940 Act"), and its shares are registered under the 1933 Act. The Funds are separate operating series of the Trust, each of which (except All Cap Core, Greater China Equity and Real Estate) is diversified. Under the 1940 Act, the status of a Fund that was registered as non-diversified may, under certain circumstances, change to that of a diversified fund (Multi-Cap Opportunities became diversified in December 2012). Ten Funds offer Investor Class shares, eleven offer Trust Class shares, six offer Advisor Class shares, twenty-one offer Institutional Class shares, twenty offer Class A shares, twenty offer Class C shares, eleven offer Class R3 shares and six offer Class R6 shares. Greater China Equity had no operations until July 17, 2013 other than matters relating to its organization and registration of shares under the 1933 Act. The Board may establish additional series or classes of shares without the approval of shareholders. Effective June 2, 2014, Neuberger Berman International Large Cap Fund changed its name to Neuberger Berman International Select Fund. Effective September 2, 2014, Neuberger Berman Select Equities Fund changed its name to Neuberger Berman All Cap Core Fund.
A zero balance, if any, reflects an actual amount rounding to less than $1,000.
The assets of each Fund belong only to that Fund, and the liabilities of each Fund are borne solely by that Fund and no other.
Each Fund is an investment company and accordingly follows the investment company accounting and reporting guidance of the Financial Accounting Standards Board (FASB) Accounting Standard Codification Topic 946 Financial Services—Investment Companies.
The preparation of financial statements in accordance with U.S. generally accepted accounting principles ("GAAP") requires Management to make estimates and assumptions at the date of the financial statements. Actual results could differ from those estimates.
2 Portfolio valuation: Investment securities are valued as indicated in the notes following the Funds' Schedule of Investments.
3 Foreign currency translation: The accounting records of the Funds are maintained in U.S. dollars. Foreign currency amounts are translated into U.S. dollars using the exchange rate as of the end of regular trading on the NYSE on business days, usually 4:00 p.m., Eastern time, to determine the value of investments, other assets and liabilities. Purchase and sale prices of securities, and income and expenses, are translated into U.S. dollars at the prevailing rate of exchange on the respective dates of such transactions. Net unrealized foreign currency gain (loss), if any, arises from changes in the value of assets and liabilities, other than investments in securities, as a result of changes in exchange rates and is stated separately in the Statements of Operations.
4 Securities transactions and investment income: Securities transactions are recorded on trade date for financial reporting purposes. Dividend income is recorded on the ex-dividend date or, for certain foreign dividends, as soon as the Fund becomes aware of the dividends. Non-cash dividends included in dividend income, if any, are recorded at the fair market value of the securities received. Interest income, including accretion of discount on securities for Equity Income, accretion of original issue discount, where applicable, and accretion of discount on short-term investments, is recorded on the accrual basis. Realized gains and losses from securities transactions and foreign currency transactions, if any, are recorded on the basis of identified cost and stated separately in the Statements of Operations. Included in net realized gain (loss) on investments are proceeds from the settlements of class action litigation in which the Funds participated as class members. The amounts of such proceeds for the year ended August 31, 2014 were $5,325, $125, $2,435, $4,777,697, $229,203, $45,363, $4,921, $25,560, $5,833, $45,668, $2,328,
167
$193,537 and $29 for All Cap Core, Equity Income, Focus, Genesis, Guardian, Intrinsic Value, Large Cap Disciplined Growth, Large Cap Value, Mid Cap Growth, Mid Cap Intrinsic Value, Small Cap Growth, Socially Responsive and Value, respectively.
5 Income tax information: Each Fund is treated as a separate entity for U.S. federal income tax purposes. It is the policy of each Fund to continue to qualify for treatment as a regulated investment company ("RIC") by complying with the requirements of the U.S. Internal Revenue Code applicable to RICs and to distribute substantially all of its net investment income and net realized capital gains to its shareholders. To the extent a Fund distributes substantially all of its net investment income and net realized capital gains to shareholders, no federal income or excise tax provision is required.
The Funds have adopted the provisions of ASC 740 "Income Taxes" ("ASC 740"). ASC 740 sets forth a minimum threshold for financial statement recognition of a tax position taken, or expected to be taken, in a tax return. The Funds recognize interest and penalties, if any, related to unrecognized tax positions as an income tax expense in the Statements of Operations. The Funds are subject to examination by U.S. federal and state tax authorities for returns filed for the tax years for which the applicable statutes of limitations have not yet expired. As of August 31, 2014, the Funds did not have any unrecognized tax positions.
Income distributions and capital gain distributions are determined in accordance with income tax regulations, which may differ from GAAP. These differences are primarily due to differing treatments of income and gains on various investment securities held by each Fund, timing differences and differing characterization of distributions made by each Fund. The Funds may also utilize earnings and profits distributed to shareholders on redemption of their shares as a part of the dividends-paid deduction for income tax purposes.
As determined on August 31, 2014, permanent differences resulting primarily from different book and tax accounting were reclassified at year end. Such differences may be attributed to the tax treatment of one or more of the following: net operating losses, foreign currency gains/losses, amortization of premium on debt instruments, partnership and grantor trust adjustments, passive foreign investment company ("PFIC") adjustments, non-taxable distributions from real estate investment trusts ("REITs") and other underlying investments, capital gain distributions from REITs and deemed distributions on shareholder redemptions. For the year ended August 31, 2014, the Funds recorded the following permanent reclassifications:
Paid-in Capital | Undistributed Net Investment Income (Loss) | Accumulated Net Realized Gains (Losses) on Investments | |||||||||||||
All Cap Core | $ | 1 | $ | 212,637 | $ | (212,638 | ) | ||||||||
Emerging Markets Equity | (1 | ) | (464,383 | ) | 464,384 | ||||||||||
Equity Income | 19,762,630 | 6,099,968 | (25,862,598 | ) | |||||||||||
Focus | — | (497,159 | ) | 497,159 | |||||||||||
Genesis | 275,992,022 | (251,189 | ) | (275,740,833 | ) | ||||||||||
Global Equity | 1 | 164,131 | (164,132 | ) | |||||||||||
Global Thematic Opportunities | (2 | ) | (213,195 | ) | 213,197 | ||||||||||
Greater China Equity | 1 | 121,665 | (121,666 | ) | |||||||||||
Guardian | — | 195,639 | (195,639 | ) | |||||||||||
International Equity | 11,063 | 8,370,939 | (8,382,002 | ) | |||||||||||
International Select | 1 | (80,941 | ) | 80,940 | |||||||||||
Intrinsic Value | 1 | 1,265,093 | (1,265,094 | ) | |||||||||||
Large Cap Disciplined Growth | 28,024,262 | (21,688 | ) | (28,002,574 | ) | ||||||||||
Large Cap Value | 1 | (114,364 | ) | 114,363 | |||||||||||
168
Paid-in Capital | Undistributed Net Investment Income (Loss) | Accumulated Net Realized Gains (Losses) on Investments | |||||||||||||
Mid Cap Growth | $ | (3,684,683 | ) | $ | 3,487,938 | $ | 196,745 | ||||||||
Mid Cap Intrinsic Value | (1 | ) | (54,377 | ) | 54,378 | ||||||||||
Multi-Cap Opportunities | 1 | (77,193 | ) | 77,192 | |||||||||||
Real Estate | (1 | ) | 303,074 | (303,073 | ) | ||||||||||
Small Cap Growth | (961,131 | ) | 956,741 | 4,390 | |||||||||||
Socially Responsive | 59,773,446 | 416,901 | (60,190,347 | ) | |||||||||||
Value | — | (787 | ) | 787 | |||||||||||
For tax purposes, distributions of short-term capital gains are taxable to shareholders as ordinary income.
The tax character of distributions paid during the years ended August 31, 2014 and August 31, 2013 were as follows:
Distributions Paid From: | |||||||||||||||||||||||||||||||||||
Ordinary Income | Long-Term Capital Gain | Return of Capital | Total | ||||||||||||||||||||||||||||||||
2014 | 2013 | 2014 | 2013 | 2014 | 2013 | 2014 | 2013 | ||||||||||||||||||||||||||||
All Cap Core | $ | 392,027 | $ | 543,533 | $ | 8,437,994 | $ | 4,605,363 | $ | — | $ | — | $ | 8,830,021 | $ | 5,148,896 | |||||||||||||||||||
| Emerging Markets Equity | 2,577,895 | 884,719 | — | — | — | — | 2,577,895 | 884,719 | |||||||||||||||||||||||||||
Equity Income | 62,522,140 | 90,941,035 | 102,840,935 | 26,180,631 | — | — | 165,363,075 | 117,121,666 | |||||||||||||||||||||||||||
Focus | 14,850,876 | 3,819,785 | 63,750,537 | — | — | — | 78,601,413 | 3,819,785 | |||||||||||||||||||||||||||
Genesis | 66,351,341 | 50,429,244 | 1,137,274,077 | 529,696,292 | — | — | 1,203,625,418 | 580,125,536 | |||||||||||||||||||||||||||
Global Equity | 191,068 | — | 243,211 | — | — | — | 434,279 | — | |||||||||||||||||||||||||||
| Global Thematic Opportunities | 375,166 | 280,038 | — | — | — | — | 375,166 | 280,038 | |||||||||||||||||||||||||||
| Greater China Equity | 803,283 | — | (1) | — | — | (1) | — | — | (1) | 803,283 | — | (1) | |||||||||||||||||||||||
Guardian | 33,366,130 | 15,542,473 | 112,517,878 | 30,564,740 | — | — | 145,884,008 | 46,107,213 | |||||||||||||||||||||||||||
International Equity | 17,975,975 | 7,600,707 | — | — | — | — | 17,975,975 | 7,600,707 | |||||||||||||||||||||||||||
International Select | 3,029,765 | 2,907,325 | — | — | — | — | 3,029,765 | 2,907,325 | |||||||||||||||||||||||||||
Intrinsic Value | 1,071,106 | — | 8,738,393 | 2,542,565 | — | — | 9,809,499 | 2,542,565 | |||||||||||||||||||||||||||
| Large Cap Disciplined Growth | 21,926,193 | 6,805,182 | 52,335,028 | 30,418,426 | — | — | 74,261,221 | 37,223,608 | |||||||||||||||||||||||||||
Large Cap Value | 145,323,607 | 20,876,494 | 135,542,504 | — | — | — | 280,866,111 | 20,876,494 | |||||||||||||||||||||||||||
Mid Cap Growth | — | — | 58,429,501 | 33,916,496 | — | — | 58,429,501 | 33,916,496 | |||||||||||||||||||||||||||
| Mid Cap Intrinsic Value | 1,173,749 | 464,057 | 3,055,247 | — | — | — | 4,228,996 | 464,057 | |||||||||||||||||||||||||||
| Multi-Cap Opportunities | 13,459,794 | 9,989,299 | 27,819,682 | 2,536,247 | — | — | 41,279,476 | 12,525,546 | |||||||||||||||||||||||||||
Real Estate | 16,336,584 | 12,032,586 | 51,381,659 | 16,029,835 | — | — | 67,718,243 | 28,062,421 | |||||||||||||||||||||||||||
Small Cap Growth | — | — | — | — | — | — | — | — | |||||||||||||||||||||||||||
Socially Responsive | 31,881,495 | 14,233,383 | 149,639,493 | — | — | — | 181,520,988 | 14,233,383 | |||||||||||||||||||||||||||
Value | 73,519 | 47,274 | — | — | — | — | 73,519 | 47,274 | |||||||||||||||||||||||||||
(1) Period from July 17, 2013 (Commencement of Operations) to August 31, 2013.
169
As of August 31, 2014, the components of distributable earnings (accumulated losses) on a U.S. federal income tax basis were as follows:
| Undistributed Ordinary Income | Undistributed Long-Term Capital Gain | Unrealized Appreciation (Depreciation) | Loss Carryforwards and Deferrals | Other Temporary Differences | Total | ||||||||||||||||||||||
All Cap Core | $ | 2,189,581 | $ | 9,870,268 | $ | 16,913,948 | $ | — | $ | (8,583 | ) | $ | 28,965,214 | ||||||||||||||
| Emerging Markets Equity | 4,670,278 | — | 66,790,316 | (24,259,481 | ) | (43,592 | ) | 47,157,521 | |||||||||||||||||||
Equity Income | 19,196,347 | 87,682,028 | 368,205,976 | — | — | 475,084,351 | |||||||||||||||||||||
Focus | 18,257,040 | 111,133,381 | 144,405,582 | — | — | 273,796,003 | |||||||||||||||||||||
Genesis | 17,101,275 | 970,748,570 | 5,935,157,949 | — | — | 6,923,007,794 | |||||||||||||||||||||
Global Equity | 827,681 | 169,801 | 4,744,184 | — | — | 5,741,666 | |||||||||||||||||||||
| Global Thematic Opportunities | 118,524 | — | 13,035,326 | (3,551,376 | ) | (5,980 | ) | 9,596,494 | |||||||||||||||||||
Greater China Equity | 4,722,446 | 418,107 | 6,290,292 | — | (114,781 | ) | 11,316,064 | ||||||||||||||||||||
Guardian | 15,565,003 | 165,791,615 | 393,573,387 | — | — | 574,930,005 | |||||||||||||||||||||
International Equity | 13,221,714 | — | 171,141,496 | (275,771,861 | ) | (2,536 | ) | (91,411,187 | ) | ||||||||||||||||||
International Select | 2,316,566 | — | 41,315,639 | (42,816,601 | ) | (43,145 | ) | 772,459 | |||||||||||||||||||
Intrinsic Value | 3,270,946 | 11,979,614 | 67,142,155 | — | (139,668 | ) | 82,253,047 | ||||||||||||||||||||
| Large Cap Disciplined Growth | 8,818,352 | 53,975,269 | 41,766,697 | — | (12,997 | ) | 104,547,321 | ||||||||||||||||||||
Large Cap Value | 104,653,272 | 101,432,852 | 263,453,185 | — | — | 469,539,309 | |||||||||||||||||||||
Mid Cap Growth | — | 90,177,231 | 270,525,945 | (2,888,953 | ) | — | 357,814,223 | ||||||||||||||||||||
| Mid Cap Intrinsic Value | 1,250,016 | 6,914,691 | 18,851,957 | — | — | 27,016,664 | |||||||||||||||||||||
| Multi-Cap Opportunities | 16,876,331 | 77,889,794 | 511,579,310 | — | — | 606,345,435 | |||||||||||||||||||||
Real Estate | — | 28,538,542 | 139,845,380 | — | — | 168,383,922 | |||||||||||||||||||||
Small Cap Growth | — | — | 5,523,509 | (7,476,974 | ) | — | (1,953,465 | ) | |||||||||||||||||||
Socially Responsive | 26,367,377 | 226,669,999 | 582,340,745 | — | — | 835,378,121 | |||||||||||||||||||||
Value | 1,174,201 | 160,006 | 1,595,786 | — | — | 2,929,993 | |||||||||||||||||||||
The differences between book basis and tax basis distributable earnings are primarily due to: wash sale loss deferrals, capital loss carry forwards, post-October capital loss and late-year ordinary loss deferrals, unamortized organization expenses, foreign capital gain taxes on unrealized gains, amortization of premium on debt instruments and basis adjustments related to REITs, PFICs, partnerships, grantor trusts and other investments.
To the extent each Fund's net realized capital gains, if any, can be offset by capital loss carryforwards, it is the policy of each Fund not to distribute such gains. The Regulated Investment Company ("RIC") Modernization Act of 2010 (the "Act") became effective for the Funds on September 1, 2011 (July 17, 2013 (Commencement of Operations) for Greater China Equity). The Act modernizes several of the federal income and excise tax provisions related to RICs. Among the changes made are changes to the capital loss carryforward rules allowing for RICs to carry forward capital losses indefinitely and to retain the character of capital loss carryforwards as short-term or long-term ("Post-Enactment"). Rules in effect previously limited the carryforward period to eight years and all carryforwards were considered short-term in character ("Pre-Enactment"). As determined at August 31, 2014, the following
170
Funds had unused capital loss carryforwards available for federal income tax purposes to offset net realized capital gains, if any, as follows:
Pre-Enactment | |||||||||||||||
Expiring in: | |||||||||||||||
2016 | 2017 | 2018 | |||||||||||||
| International Equity(1) | $ | 17,546,220 | $ | 180,082,720 | $ | 78,142,921 | |||||||||
International Select | — | 6,656,149 | 36,160,452 | ||||||||||||
Small Cap Growth | — | — | 7,031,490 | ||||||||||||
Post-Enactment (No Expiration Date) | |||||||||||
Long-Term | Short-Term | ||||||||||
Emerging Markets Equity | $ | — | $ | 24,259,481 | |||||||
Global Thematic Opportunities | — | 3,551,376 | |||||||||
(1) The capital loss carryforwards shown above for International Equity include $17,546,220 expiring in 2016 and $114,232,268 expiring in 2017, which were acquired on January 25, 2013 in the merger with Neuberger Berman International Fund. Future utilization of these losses may be limited under current tax rules.
Post-Enactment capital loss carryforwards must be fully used before Pre-Enactment capital loss carryforwards; therefore, under certain circumstances, Pre-Enactment capital loss carryforwards available as of the report date may expire unused.
During the year ended August 31, 2014, International Equity, International Select, Small Cap Growth and Value utilized capital loss carryforwards of $48,469,014, $11,609,019, $14,613,672 and $200,078, respectively.
Under current tax regulations, capital losses realized on investment transactions after October 31 may be deferred and treated as occurring on the first day of the following fiscal year. Under the Act, the Funds may also defer any realized late-year ordinary losses as occurring on the first day of the following fiscal year. Late-year ordinary losses represent ordinary losses realized on investment transactions after December 31 and specified losses (ordinary losses from the sale, exchange, or other disposition of property, net foreign currency losses and net passive foreign investment company mark to market losses) realized on investment transactions after October 31. For the year ended August 31, 2014, the Funds elected to defer the following late-year ordinary losses and post October capital losses:
| Late-Year Ordinary Loss | Post October Capital Loss Deferral | ||||||||||||||
Deferral | Long-Term | Short-Term | |||||||||||||
Mid Cap Growth | $ | 2,888,953 | $ | — | $ | — | |||||||||
Small Cap Growth | 445,484 | — | — | ||||||||||||
6 Foreign taxes: Foreign taxes withheld, if any, represent amounts withheld by foreign tax authorities, net of refunds recoverable.
Emerging Markets Equity accrues deferred capital gains tax on unrealized gains for certain securities domiciled in India. Greater China Equity accrues deferred capital gains tax on unrealized gains for participatory notes domiciled in China. At August 31, 2014, this amounted to $92,069 and $132,467 for Emerging Markets Equity and Greater China Equity, respectively, which is reflected as part of accrued expenses and other payables with a corresponding decrease in unrealized gain or loss in the Statements of Assets and Liabilities.
7 Distributions to shareholders: Each Fund may earn income, net of expenses, daily on its investments.
171
Distributions from net investment income and net realized capital gains, if any, generally are distributed once a year (usually in December) and are recorded on the ex-date. However, Equity Income and Real Estate generally distribute substantially all of their net investment income, if any, at the end of each calendar quarter.
It is the policy of each of Equity Income, Mid Cap Intrinsic Value and Real Estate to pass through to its shareholders substantially all REIT distributions and other income it receives, less operating expenses. The distributions received from REITs held by Equity Income, Mid Cap Intrinsic Value and Real Estate are generally composed of income, capital gains, and/or return of REIT capital, but the REITs do not report this information to Equity Income, Mid Cap Intrinsic Value and Real Estate until the following calendar year. At August 31, 2014, Equity Income, Mid Cap Intrinsic Value and Real Estate estimated these amounts for the period January 1, 2014 to August 31, 2014 within the financial statements since the information is not available from the REITs until after each Fund's fiscal year-end. For the year ended August 31, 2014, the character of distributions paid to shareholders of Equity Income, Mid Cap Intrinsic Value and Real Estate disclosed within the Statements of Changes in Net Assets is based on estimates made at that time. All estimates are based upon REIT information sources available to Equity Income, Mid Cap Intrinsic Value and Real Estate together with actual IRS Forms 1099-DIV received to date. Based on past experience it is possible that a portion of Equity Income's, Mid Cap Intrinsic Value's and Real Estate's distributions during the current fiscal year will be considered tax return of capital, but the actual amount of the tax return of capital, if any, is not determinable until after each Fund's fiscal year-end. After calendar year-end, when Equity Income, Mid Cap Intrinsic Value and Real Estate learn the nature of the distributions paid by REITs during that year, distributions previously identified as income are often re-characterized as return of capital and/or capital gain. After all applicable REITs have informed Equity Income, Mid Cap Intrinsic Value and Real Estate of the actual breakdown of distributions paid to Equity Income, Mid Cap Intrinsic Value and Real Estate during its fiscal year, estimates previously recorded are adjusted on the books of Equity Income, Mid Cap Intrinsic Value and Real Estate to reflect actual results. As a result, the composition of Equity Income's, Mid Cap Intrinsic Value's and Real Estate's distributions as reported herein may differ from the final composition determined after calendar year-end and reported to Equity Income, Mid Cap Intrinsic Value and Real Estate shareholders on IRS Form 1099-DIV.
8 Expense allocation: Certain expenses are applicable to multiple funds. Expenses directly attributable to a Fund are charged to that Fund. Expenses of the Trust that are not directly attributable to a particular series of the Trust (e.g., a Fund) are allocated among the series of the Trust, on the basis of relative net assets, except where a more appropriate allocation of expenses to each of the series can otherwise be made fairly. Expenses borne by the complex of related investment companies, which includes open-end and closed-end investment companies for which Management serves as investment manager, that are not directly attributable to a particular investment company in the complex (e.g., the Trust) or series thereof are allocated among the investment companies in the complex or series thereof, on the basis of relative net assets, except where a more appropriate allocation of expenses to each of the investment companies in the complex or series thereof can otherwise be made fairly. Each Fund's expenses (other than those specific to each class) are allocated proportionally each day among the classes based upon the relative net assets of each class.
9 Investments in foreign securities: Investing in foreign securities may involve certain sovereign and other risks, in addition to the credit and market risks normally associated with domestic securities. These additional risks include the possibility of adverse political and economic developments (including political instability, nationalization, expropriation, or confiscatory taxation) and the potentially adverse effects of unavailability of public information regarding issuers, less governmental supervision and regulation of financial markets, reduced liquidity of certain financial markets, and the lack of uniform accounting, auditing, and financial reporting standards or the application of standards that are different or less stringent than those applied in the United States. Foreign securities also may experience greater price volatility, higher rates of inflation, and delays in settlement.
10 Derivative instruments: During the year ended August 31, 2014, certain of the Funds' use of derivatives, as described below, was limited to written option transactions. The Funds have adopted the provisions of ASC 815 "Derivatives and Hedging" ("ASC 815"). The disclosure requirements of ASC 815 distinguish between derivatives that qualify for hedge accounting and those that do not. Because investment companies value their derivatives at
172
fair value and recognize changes in fair value through the Statements of Operations, they do not qualify for hedge accounting. Accordingly, even though a Fund's investments in derivatives may represent economic hedges, they are considered non-hedge transactions for purposes of this disclosure.
Options: Premiums received by a Fund upon writing a covered call option or a put option are recorded in the liability section of the Fund's Statement of Assets and Liabilities and are subsequently adjusted to the current market value. When an option is exercised, closed, or expired, the Fund realizes a gain or loss and the liability is eliminated.
When writing a covered call option, a Fund, in return for the premium, gives up the opportunity for profit from a price increase in the underlying security above the exercise price, but conversely retains the risk of loss should the price of the security decline. When writing a put option, the Fund, in return for the premium, takes the risk that it must purchase the underlying security at a price that may be higher than the current market price of the security. If a covered call or a put option that the Fund has written expires unexercised, the Fund will realize a gain in the amount of the premium. All securities covering outstanding written options are held in escrow by the custodian bank.
Premiums paid by a Fund upon purchasing a call or put option are recorded in the asset section of the Fund's Statement of Assets and Liabilities and are subsequently adjusted to the current market value. When an option is exercised, closed, or expired, the Fund realizes a gain or loss and the asset is eliminated.
Written option transactions were used in an attempt to generate incremental returns for Equity Income for the year ended August 31, 2014. Written option transactions for Equity Income for the year ended August 31, 2014 were:
Equity Income
Number | Value When Written | ||||||||||
Contracts outstanding 8/31/2013 | 7,995 | $ | 1,064,000 | ||||||||
Contracts written | 62,562 | 7,395,000 | |||||||||
Contracts expired | (790 | ) | (62,000 | ) | |||||||
Contracts exercised | (4,611 | ) | (590,000 | ) | |||||||
Contracts closed | (53,389 | ) | (6,280,000 | ) | |||||||
Contracts outstanding 8/31/2014 | 11,767 | $ | 1,527,000 | ||||||||
At August 31, 2014, Equity Income had the following derivatives (which did not qualify for hedge accounting under ASC 815), grouped by primary risk exposure:
Liability Derivatives
Equity Risk | Statements of Assets and Liabilities Location | ||||||||||
Option Contracts Written | $ | (2,064,000 | ) | Option contracts | |||||||
Total Value | $ | (2,064,000 | ) | written, at value | |||||||
The impact of the use of these derivative instruments on the Statements of Operations during the year ended August 31, 2014 was as follows:
Realized Gain (Loss)
Equity Income | Equity Risk | Statements of Operations Location | |||||||||
Option Contracts Written | $ | 2,839,000 | Net realized gain | ||||||||
| Total Realized Gain (Loss) | $ | 2,839,000 | (loss) on: option contracts written | ||||||||
173
Change in Appreciation (Depreciation)
Equity Income | Equity Risk | Statements of Operations Location | |||||||||
Option Contracts Written | $(363,000) | Change in net unrealized appreciation | |||||||||
Total Change in Appreciation (Depreciation) | $(363,000) | (depreciation) in value of: option contracts written | |||||||||
For the year ended August 31, 2014, Equity Income had an average market value of $(1,431,000) in written options.
While the Funds may receive rights and warrants in connection with their investments in securities, these rights and warrants are not considered "derivative instruments" under ASC 815. Management has concluded that the Funds, except Equity Income, did not hold any derivative instruments during the year ended August 31, 2014 that require additional disclosures pursuant to ASC 815.
11 In-kind subscriptions: Under certain circumstances, and when considered to be in the best interest of a Fund, the Fund may accept portfolio securities rather than cash as payment for the purchase of Fund shares (in-kind subscription). For financial reporting and tax purposes, the cost basis of contributed securities is equal to the market value of the securities, less any applicable foreign security taxes, on the date of contribution. In-kind subscriptions result in no gain or loss and no tax consequences for a Fund. During the year ended August 31, 2014, Socially Responsive accepted $8,240,922 of in-kind subscriptions. During the year ended August 31, 2013, International Equity accepted $48,182,440 of in-kind subscriptions.
12 In-kind redemptions: In accordance with guidelines described in a Fund's prospectus, a Fund may distribute portfolio securities rather than cash as payment for a redemption of Fund shares (in-kind redemption). For financial reporting purposes, the Fund recognizes a gain on in-kind redemptions to the extent the value of the distributed securities on the date of redemption exceeds the cost of those securities. Gains and losses realized on in-kind redemptions are not recognized for tax purposes and are reclassified from undistributed realized gain (loss) to paid-in capital. During the year ended August 31, 2014, Socially Responsive realized $22,727,127 of net gain on $68,411,909 of in-kind redemptions.
13 Indemnifications: Like many other companies, the Trust's organizational documents provide that its officers and trustees are indemnified against certain liabilities arising out of the performance of their duties to the Trust. In addition, both in some of its principal service contracts and in the normal course of its business, the Trust enters into contracts that provide indemnifications to other parties for certain types of losses or liabilities. The Trust's maximum exposure under these arrangements is unknown as this could involve future claims against the Trust.
14 Other: All net investment income and realized and unrealized capital gains and losses of each Fund are allocated, on the basis of relative net assets, pro rata among its respective classes.
Note B—Management Fees, Administration Fees, Distribution Arrangements, and Other Transactions with Affiliates:
Each Fund retains Management as its investment manager under a Management Agreement. For such investment management services, each Fund pays Management a fee according to the following table:
Investment Management Fee as a Percentage of Average Daily Net Assets:
| First $250 million | Next $250 million | Next $250 million | Next $250 million | Next $500 million | Next $500 million | Next $500 million | Next $1.5 billion | Thereafter | |||||||||||||||||||||||||||||||
For Genesis, Intrinsic Value, and Small Cap Growth: | |||||||||||||||||||||||||||||||||||||||
0.85 | % | 0.80 | % | 0.75 | % | 0.70 | % | 0.65 | % | 0.65 | % | 0.65 | % | 0.65 | % | 0.65 | % | ||||||||||||||||||||||
174
| First $250 million | Next $250 million | Next $250 million | Next $250 million | Next $500 million | Next $500 million | Next $500 million | Next $1.5 billion | Thereafter | |||||||||||||||||||||||||||||||
For Emerging Markets Equity: | |||||||||||||||||||||||||||||||||||||||
1.00 | % | 0.975 | % | 0.95 | % | 0.925 | % | 0.90 | % | 0.875 | % | 0.875 | % | 0.875 | % | 0.85 | % | ||||||||||||||||||||||
For Real Estate: | |||||||||||||||||||||||||||||||||||||||
0.80 | % | 0.80 | % | 0.80 | % | 0.80 | % | 0.80 | % | 0.80 | % | 0.80 | % | 0.80 | % | 0.80 | % | ||||||||||||||||||||||
| For International Equity(1): | |||||||||||||||||||||||||||||||||||||||
0.85 | % | 0.825 | % | 0.80 | % | 0.775 | % | 0.75 | % | 0.725 | % | 0.725 | % | 0.70 | % | 0.70 | % | ||||||||||||||||||||||
| For All Cap Core, Equity Income, Focus, Guardian, International Select, Large Cap Disciplined Growth, Large Cap Value, Mid Cap Growth, Mid Cap Intrinsic Value(1), Socially Responsive and Value: | |||||||||||||||||||||||||||||||||||||||
0.55 | % | 0.525 | % | 0.50 | % | 0.475 | % | 0.45 | % | 0.425 | % | 0.425 | % | 0.425 | % | 0.40 | % | ||||||||||||||||||||||
For Multi-Cap Opportunities: | |||||||||||||||||||||||||||||||||||||||
0.60 | % | 0.575 | % | 0.55 | % | 0.525 | % | 0.50 | % | 0.475 | % | 0.475 | % | 0.475 | % | 0.45 | % | ||||||||||||||||||||||
For Global Equity: | |||||||||||||||||||||||||||||||||||||||
0.75 | % | 0.725 | % | 0.70 | % | 0.675 | % | 0.65 | % | 0.625 | % | 0.625 | % | 0.625 | % | 0.60 | % | ||||||||||||||||||||||
For Global Thematic Opportunities: | |||||||||||||||||||||||||||||||||||||||
0.85 | % | 0.825 | % | 0.80 | % | 0.775 | % | 0.75 | % | 0.725 | % | 0.725 | % | 0.725 | % | 0.70 | % | ||||||||||||||||||||||
For Greater China Equity: | |||||||||||||||||||||||||||||||||||||||
1.10 | % | 1.10 | % | 1.10 | % | 1.10 | % | 0.95 | % | 0.95 | % | 0.95 | % | 0.95 | % | 0.95 | % | ||||||||||||||||||||||
(1) Effective February 1, 2014, Management has voluntarily agreed to waive its management fee in the amount of 0.21% of the average daily net assets of International Equity (0.18% effective January 28, 2013). Effective February 1, 2014, Management has voluntarily agreed to waive its management fee in the amount of 0.30% of the average daily net assets of Mid Cap Intrinsic Value (0.36% effective May 1, 2013, 0.33% effective February 1, 2013, 0.28% effective December 1, 2012 and 0.25% effective February 1, 2012). Management may, at its sole discretion, modify or terminate these voluntary waivers without notice to International Equity or Mid Cap Intrinsic Value. For the year ended August 31, 2014, such waived fees amounted to $2,242,192 and $248,731 for International Equity and Mid Cap Intrinsic Value, respectively. These amounts are not subject to recovery by Management.
Accordingly, for the year ended August 31, 2014, the management fee pursuant to the Management Agreement was equivalent to an annual effective rate of each Fund's average daily net assets, as follows:
| Effective Rate | Effective Rate | ||||||||||||||
All Cap Core | 0.55 | % | Intrinsic Value | 0.85 | % | ||||||||||
Emerging Markets Equity | 0.98 | % | Large Cap Disciplined Growth | 0.54 | % | ||||||||||
Equity Income | 0.46 | % | Large Cap Value | 0.48 | % | ||||||||||
Focus | 0.52 | % | Mid Cap Growth | 0.51 | % | ||||||||||
Genesis | 0.66 | % | Mid Cap Intrinsic Value | 0.23 | % | ||||||||||
Global Equity | 0.75 | % | Multi-Cap Opportunities | 0.52 | % | ||||||||||
Global Thematic Opportunities | 0.85 | % | Real Estate | 0.80 | % | ||||||||||
Greater China Equity | 1.10 | % | Small Cap Growth | 0.85 | % | ||||||||||
Guardian | 0.49 | % | Socially Responsive | 0.47 | % | ||||||||||
International Equity | 0.61 | % | Value | 0.55 | % | ||||||||||
International Select | 0.55 | % | |||||||||||||
175
Each Fund retains Management as its administrator under an Administration Agreement. Each Fund pays Management an administration fee at the annual rate of 0.06% of its average daily net assets under this agreement. In addition, Investor Class, Class A, Class C and Class R3 of each Fund that offers those classes pays Management an administration fee at the annual rate of 0.20% of its average daily net assets, Trust Class and Advisor Class of each Fund that offers those classes pays Management an administration fee at the annual rate of 0.34% of its average daily net assets, Institutional Class of each Fund pays Management an administration fee at the annual rate of 0.09% of its average daily net assets, and Class R6 of each Fund that offers that class pays Management an administration fee of 0.02% of its average daily net assets, under this agreement. Additionally, Management retains State Street Bank and Trust Company ("State Street") as its sub-administrator under a Sub-Administration Agreement. Management pays State Street a fee for all services received under the agreement.
For the Trust Class of Focus, Guardian, International Select, Large Cap Value, Mid Cap Intrinsic Value, Real Estate, Small Cap Growth and Socially Responsive, the Advisor Class of each Fund that offers that class, and Class A, Class C and Class R3 of each Fund that offers those classes, Management acts as agent in arranging for the sale of class shares without commission and bears advertising and promotion expenses. The Board has adopted distribution plans (each a "Plan", collectively, the "Plans") with respect to these classes, pursuant to Rule 12b-1 under the 1940 Act. The Plans provide that, as compensation for administrative and other services provided to these classes, Management's activities and expenses related to the sale and distribution of these classes, and ongoing services provided to investors in these classes, Management receives from each of these classes a fee at the annual rate of 0.10% of such Trust Class's, 0.25% of such Advisor Class's, 0.25% of such Class A's, 1.00% of such Class C's and 0.50% of such Class R3's average daily net assets. Management receives this amount to provide distribution and shareholder servicing for those classes and pays a portion of it to institutions that provide such services. Those institutions may use the payments for, among other purposes, compensating employees engaged in sales and/or shareholder servicing. The amount of fees paid by each class during any year could have been more or less than the cost of distribution and other services provided to that class. FINRA rules limit the amount of annual distribution fees that may be paid by a mutual fund and impose a ceiling on the cumulative distribution fees paid. The Trust's Plans comply with those rules.
Management has contractually agreed to waive current payment of fees and/or reimburse certain expenses of the Investor Class of each of International Equity, Large Cap Disciplined Growth, Mid Cap Intrinsic Value and Small Cap Growth and the Trust Class, Advisor Class, Institutional Class, Class A, Class C, Class R3 and Class R6 of each Fund that offers those classes so that the total annual operating expenses of those classes do not exceed the expense limitations as detailed in the following table. These undertakings apply to a Fund's direct expenses and exclude interest, taxes, brokerage commissions, acquired fund fees and expenses, extraordinary expenses and dividend expenses on short sales, if any (as well as interest expenses on short sales in the case of Greater China Equity); consequently, net expenses may exceed the contractual expense limitations. Each Fund has agreed that each of its respective classes will repay Management for fees and expenses waived or reimbursed for that class provided that repayment does not cause that class's annual operating expenses to exceed its contractual expense limitation in place at the time the fees and expenses were waived or reimbursed. Any such repayment must be made within three years after the year in which Management incurred the expense. During the year ended August 31, 2014, the following classes repaid Management under their contractual expense limitation agreements as follows:
Class | Expenses Repaid to Management | ||||||
Equity Income Fund Class R3 | $ | 843 | |||||
Genesis Fund Institutional Class | 119,861 | ||||||
Genesis Fund Class R6 | 37,050 | ||||||
Guardian Fund Class A | 3,620 | ||||||
Guardian Fund Class C | 641 | ||||||
Large Cap Value Fund Institutional Class | 3,597 | ||||||
176
| Class | Expenses Repaid to Management | ||||||
Large Cap Value Fund Class A | $ | 45 | |||||
Large Cap Value Fund Class C | 950 | ||||||
Mid Cap Intrinsic Value Fund Trust Class | 3,199 | ||||||
Mid Cap Intrinsic Value Fund Institutional Class | 4,018 | ||||||
Mid Cap Intrinsic Value Fund Class A | 52 | ||||||
Mid Cap Intrinsic Value Fund Class C | 288 | ||||||
At August 31, 2014, contingent liabilities to Management under the agreements were as follows:
| Expenses Reimbursed in Fiscal Period Ending August 31, | |||||||||||||||||||||||
2012 | 2013 | 2014 | |||||||||||||||||||||
| Subject to Repayment until August 31, | |||||||||||||||||||||||
Class | Contractual Expense Limitation(1) | Expiration | 2015 | 2016 | 2017 | ||||||||||||||||||
All Cap Core Fund Institutional Class | 0.75 | % | 8/31/17 | $ | 109,640 | $ | 125,967 | $ | 142,102 | ||||||||||||||
All Cap Core Fund Class A | 1.20 | % | 8/31/17 | 98,482 | 84,083 | 64,707 | |||||||||||||||||
All Cap Core Fund Class C | 1.95 | % | 8/31/17 | 39,600 | 33,146 | 30,603 | |||||||||||||||||
Emerging Markets Equity Fund Institutional Class | 1.25 | % | 8/31/17 | 680,473 | 993,712 | 883,793 | |||||||||||||||||
Emerging Markets Equity Fund Class A | 1.50 | % | 8/31/17 | 30,719 | 30,312 | 50,749 | |||||||||||||||||
Emerging Markets Equity Fund Class C | 2.25 | % | 8/31/17 | 8,678 | 13,600 | 17,601 | |||||||||||||||||
Emerging Markets Equity Fund Class R3 | 1.91 | % | 8/31/17 | 470 | 689 | 937 | |||||||||||||||||
Emerging Markets Equity Fund Class R6 | 1.18 | % | 8/31/17 | — | 38,968 | (4) | 122,359 | ||||||||||||||||
Equity Income Fund Institutional Class | 0.80 | % | 8/31/17 | — | — | — | |||||||||||||||||
Equity Income Fund Class A | 1.16 | % | 8/31/17 | — | — | — | |||||||||||||||||
Equity Income Fund Class C | 1.91 | % | 8/31/17 | — | — | — | |||||||||||||||||
Equity Income Fund Class R3 | 1.41 | % | 8/31/17 | — | — | — | |||||||||||||||||
Focus Fund Trust Class | 1.50 | % | 8/31/17 | — | — | — | |||||||||||||||||
Focus Fund Advisor Class | 1.50 | % | 8/31/22 | — | — | — | |||||||||||||||||
Focus Fund Institutional Class | 0.75 | % | 8/31/17 | 2,815 | 4,649 | 521 | |||||||||||||||||
Focus Fund Class A | 1.11 | % | 8/31/17 | 570 | 977 | 726 | |||||||||||||||||
Focus Fund Class C | 1.86 | % | 8/31/17 | 322 | 342 | 435 | |||||||||||||||||
Genesis Fund Trust Class | 1.50 | % | 8/31/17 | — | — | — | |||||||||||||||||
Genesis Fund Advisor Class | 1.50 | % | 8/31/22 | — | — | — | |||||||||||||||||
Genesis Fund Institutional Class | 0.85 | % | 8/31/22 | 526,949 | 117,849 | — | |||||||||||||||||
Genesis Fund Class R6 | 0.78 | % | 8/31/17 | — | — | (4) | — | ||||||||||||||||
Global Equity Fund Institutional Class | 1.15 | % | 8/31/17 | 268,266 | 261,844 | 210,511 | |||||||||||||||||
Global Equity Fund Class A | 1.51 | % | 8/31/17 | 7,900 | 6,060 | 2,179 | |||||||||||||||||
Global Equity Fund Class C | 2.26 | % | 8/31/17 | 4,712 | 2,623 | 967 | |||||||||||||||||
Global Thematic Opportunities Fund Institutional Class | 1.25 | % | 8/31/17 | 229,703 | 188,890 | 111,225 | |||||||||||||||||
Global Thematic Opportunities Fund Class A | 1.61 | % | 8/31/17 | 3,105 | 4,219 | 1,094 | |||||||||||||||||
Global Thematic Opportunities Fund Class C | 2.36 | % | 8/31/17 | 885 | 695 | 379 | |||||||||||||||||
177
| Expenses Reimbursed in Fiscal Period Ending August 31, | |||||||||||||||||||||||
2012 | 2013 | 2014 | |||||||||||||||||||||
| Subject to Repayment until August 31, | |||||||||||||||||||||||
| Class | Contractual Expense Limitation(1) | Expiration | 2015 | 2016 | 2017 | ||||||||||||||||||
Greater China Equity Fund Institutional Class | 1.50 | % | 8/31/17 | $ | — | $ | 160,702 | (5) | $ | 193,960 | |||||||||||||
Greater China Equity Fund Class A | 1.86 | % | 8/31/17 | — | 2,385 | (5) | 1,756 | ||||||||||||||||
Greater China Equity Fund Class C | 2.61 | % | 8/31/17 | — | 2,350 | (5) | 264 | ||||||||||||||||
Guardian Fund Trust Class | 1.50 | % | 8/31/17 | — | — | — | |||||||||||||||||
Guardian Fund Advisor Class | 1.50 | % | 8/31/22 | — | — | — | |||||||||||||||||
Guardian Fund Institutional Class | 0.75 | % | 8/31/17 | — | — | — | |||||||||||||||||
Guardian Fund Class A | 1.11 | % | 8/31/17 | — | — | — | |||||||||||||||||
Guardian Fund Class C | 1.86 | % | 8/31/17 | — | — | — | |||||||||||||||||
Guardian Fund Class R3 | 1.36 | % | 8/31/17 | 146 | 134 | 114 | |||||||||||||||||
International Equity Fund Investor Class | 1.40 | % | 8/31/17 | — | — | (3) | — | ||||||||||||||||
International Equity Fund Trust Class | 2.00 | % | 8/31/22 | — | — | (3) | — | ||||||||||||||||
International Equity Fund Institutional Class | 0.85 | % | 8/31/22 | 1,211,689 | 784,945 | 213,333 | |||||||||||||||||
International Equity Fund Class A | 1.21 | %(6) | 8/31/17 | — | 2,253 | (3) | 10,567 | ||||||||||||||||
International Equity Fund Class C | 1.96 | %(6) | 8/31/17 | — | 1,409 | (3) | 1,864 | ||||||||||||||||
International Equity Fund Class R6 | 0.78 | % | 8/31/17 | — | — | 1,490 | (7) | ||||||||||||||||
International Select Fund Trust Class | 1.25 | % | 8/31/17 | 23,177 | 17,980 | 10,697 | |||||||||||||||||
International Select Fund Institutional Class | 0.90 | % | 8/31/17 | 151,893 | 126,756 | 58,414 | |||||||||||||||||
International Select Fund Class A | 1.30 | %(2) | 8/31/17 | 6,199 | 6,163 | 430 | |||||||||||||||||
International Select Fund Class C | 2.00 | % | 8/31/17 | 3,016 | 3,613 | 2,151 | |||||||||||||||||
International Select Fund Class R3 | 1.51 | % | 8/31/17 | 438 | 1,103 | 1,076 | |||||||||||||||||
Intrinsic Value Fund Institutional Class | 1.00 | % | 8/31/17 | 271,075 | 289,297 | 302,070 | |||||||||||||||||
Intrinsic Value Fund Class A | 1.36 | % | 8/31/17 | 22,387 | 20,599 | 28,539 | |||||||||||||||||
Intrinsic Value Fund Class C | 2.11 | % | 8/31/17 | 16,110 | 16,477 | 17,391 | |||||||||||||||||
Large Cap Disciplined Growth Fund Investor Class | 1.11 | % | 8/31/17 | — | — | — | |||||||||||||||||
Large Cap Disciplined Growth Fund Institutional Class | 0.75 | % | 8/31/17 | 162,865 | 219,810 | 239,882 | |||||||||||||||||
Large Cap Disciplined Growth Fund Class A | 1.11 | % | 8/31/17 | 28,718 | 29,500 | 32,217 | |||||||||||||||||
Large Cap Disciplined Growth Fund Class C | 1.86 | % | 8/31/17 | 14,075 | 15,074 | 23,600 | |||||||||||||||||
Large Cap Disciplined Growth Fund Class R3 | 1.36 | % | 8/31/17 | 260 | 327 | 375 | |||||||||||||||||
Large Cap Value Fund Trust Class | 1.50 | % | 8/31/17 | — | — | — | |||||||||||||||||
Large Cap Value Fund Advisor Class | 1.50 | % | 8/31/22 | — | — | — | |||||||||||||||||
Large Cap Value Fund Institutional Class | 0.70 | % | 8/31/17 | — | 1,631 | — | |||||||||||||||||
Large Cap Value Fund Class A | 1.11 | % | 8/31/17 | — | — | — | |||||||||||||||||
Large Cap Value Fund Class C | 1.86 | % | 8/31/17 | 168 | — | — | |||||||||||||||||
Large Cap Value Fund Class R3 | 1.36 | % | 8/31/17 | 67 | 83 | 82 | |||||||||||||||||
Mid Cap Growth Fund Trust Class | 1.50 | % | 8/31/17 | — | — | — | |||||||||||||||||
Mid Cap Growth Fund Advisor Class | 1.50 | % | 8/31/22 | — | — | — | |||||||||||||||||
Mid Cap Growth Fund Institutional Class | 0.75 | % | 8/31/17 | 57,778 | 74,654 | 6,497 | |||||||||||||||||
178
| Expenses Reimbursed in Fiscal Period Ending August 31, | |||||||||||||||||||||||
2012 | 2013 | 2014 | |||||||||||||||||||||
| Subject to Repayment until August 31, | |||||||||||||||||||||||
| Class | Contractual Expense Limitation(1) | Expiration | 2015 | 2016 | 2017 | ||||||||||||||||||
Mid Cap Growth Fund Class A | 1.11 | % | 8/31/17 | $ | 32,163 | $ | 51,584 | $ | 19,819 | ||||||||||||||
Mid Cap Growth Fund Class C | 1.86 | % | 8/31/17 | 1,973 | 2,985 | 2,522 | |||||||||||||||||
Mid Cap Growth Fund Class R3 | 1.36 | % | 8/31/17 | 1,733 | 3,079 | 1,821 | |||||||||||||||||
Mid Cap Growth Fund Class R6 | 0.68 | % | 8/31/17 | — | 1,565 | (4) | 250 | ||||||||||||||||
Mid Cap Intrinsic Value Fund Investor Class | 1.50 | % | 8/31/22 | — | — | — | |||||||||||||||||
Mid Cap Intrinsic Value Fund Trust Class | 1.25 | % | 8/31/22 | 29,878 | 13,066 | — | |||||||||||||||||
Mid Cap Intrinsic Value Fund Institutional Class | 0.85 | % | 8/31/17 | 5,012 | 3,203 | — | |||||||||||||||||
Mid Cap Intrinsic Value Fund Class A | 1.21 | % | 8/31/17 | 5,552 | 5,190 | — | |||||||||||||||||
Mid Cap Intrinsic Value Fund Class C | 1.96 | % | 8/31/17 | 524 | 494 | — | |||||||||||||||||
Mid Cap Intrinsic Value Fund Class R3 | 1.46 | % | 8/31/17 | 383 | 203 | 60 | |||||||||||||||||
Multi-Cap Opportunities Fund Institutional Class | 1.00 | % | 8/31/17 | — | — | — | |||||||||||||||||
Multi-Cap Opportunities Fund Class A | 1.36 | % | 8/31/17 | — | — | — | |||||||||||||||||
Multi-Cap Opportunities Fund Class C | 2.11 | % | 8/31/17 | — | — | — | |||||||||||||||||
Real Estate Fund Trust Class | 1.50 | %(2) | 8/31/22 | — | — | — | |||||||||||||||||
Real Estate Fund Institutional Class | 0.85 | % | 8/31/22 | 401,382 | 707,517 | 817,481 | |||||||||||||||||
Real Estate Fund Class A | 1.21 | % | 8/31/17 | 160,543 | 336,286 | 372,528 | |||||||||||||||||
Real Estate Fund Class C | 1.96 | % | 8/31/17 | 40,775 | 90,654 | 95,712 | |||||||||||||||||
Real Estate Fund Class R3 | 1.46 | % | 8/31/17 | 6,246 | 24,426 | 40,953 | |||||||||||||||||
Real Estate Fund Class R6 | 0.78 | % | 8/31/17 | — | 5,033 | (4) | 29,668 | ||||||||||||||||
Small Cap Growth Fund Investor Class | 1.30 | %(2) | 8/31/22 | 169,034 | 177,688 | 192,480 | |||||||||||||||||
Small Cap Growth Fund Trust Class | 1.40 | % | 8/31/22 | 63,093 | 60,615 | 34,116 | |||||||||||||||||
Small Cap Growth Fund Advisor Class | 1.60 | %(2) | 8/31/22 | 17,513 | 14,942 | 14,620 | |||||||||||||||||
Small Cap Growth Fund Institutional Class | 0.90 | % | 8/31/17 | 203,174 | 147,976 | 95,710 | |||||||||||||||||
Small Cap Growth Fund Class A | 1.26 | % | 8/31/17 | 5,555 | 9,439 | 28,007 | |||||||||||||||||
Small Cap Growth Fund Class C | 2.01 | % | 8/31/17 | 2,744 | 4,742 | 9,549 | |||||||||||||||||
Small Cap Growth Fund Class R3 | 1.51 | % | 8/31/17 | 1,022 | 1,908 | 3,116 | |||||||||||||||||
Socially Responsive Fund Trust Class | 1.50 | % | 8/31/17 | — | — | — | |||||||||||||||||
Socially Responsive Fund Institutional Class | 0.75 | % | 8/31/17 | — | — | — | |||||||||||||||||
Socially Responsive Fund Class A | 1.11 | % | 8/31/17 | — | — | — | |||||||||||||||||
Socially Responsive Fund Class C | 1.86 | % | 8/31/17 | — | — | — | |||||||||||||||||
Socially Responsive Fund Class R3 | 1.36 | % | 8/31/17 | — | — | — | |||||||||||||||||
Socially Responsive Fund Class R6 | 0.68 | % | 8/31/17 | — | — | (4) | — | ||||||||||||||||
Value Fund Institutional Class | 0.75 | %(2) | 8/31/17 | 217,250 | 122,469 | 156,332 | |||||||||||||||||
Value Fund Class A | 1.11 | %(2) | 8/31/17 | 81,085 | 141,386 | 94,806 | |||||||||||||||||
Value Fund Class C | 1.86 | % | 8/31/17 | 3,750 | 8,538 | 7,238 | |||||||||||||||||
(1) Expense limitation per annum of the respective class's average daily net assets.
179
(2) In addition, Management has voluntarily undertaken to waive current payment of fees and/or reimburse certain expenses of Class A of International Select, the Trust Class of Real Estate, the Investor Class of Small Cap Growth, the Advisor Class of Small Cap Growth, the Institutional Class of Value and Class A of Value, so that their Operating Expenses are limited to 1.24%, 1.04%, 1.21% (1.25% prior to December 1, 2012), 1.51% (1.55% prior to December 1, 2012), 0.70% and 1.08% (effective June 13, 2014; 1.09% from March 14, 2014 to June 12, 2014; and 1.04% prior to October 12, 2012), respectively, per annum of their average daily net assets. For the year ended August 31, 2014, voluntary reimbursements for Class A of International Select, the Trust Class of Real Estate, the Investor Class of Small Cap Growth, the Advisor Class of Small Cap Growth, the Institutional Class of Value and Class A of Value amounted to $6,486, $1,125,843, $47,424, $3,606, $4,728 and $754, respectively. These amounts are not subject to recovery by Management. These undertakings, which are terminable by Management upon notice to International Select, Real Estate, Small Cap Growth and Value, are in addition to the contractual undertakings as stated above.
(3) Period from January 28, 2013 (Commencement of Operations) to August 31, 2013.
(4) Period from March 15, 2013 (Commencement of Operations) to August 31, 2013.
(5) Period from July 17, 2013 (Commencement of Operations) to August 31, 2013.
(6) From January 28, 2013 to June 27, 2013, the contractual expense limitation was 1.51% for Class A and 2.26% for Class C.
(7) Period from September 3, 2013 (Commencement of Operations) to August 31, 2014.
Neuberger Berman LLC ("Neuberger"), as the sub-adviser to each Fund (except Greater China Equity), is retained by Management to furnish it with investment recommendations, research information and related services without added cost to the Funds. Neuberger Berman Asia Limited ("Neuberger Asia"), as the sub-adviser to Greater China Equity, is retained by Management to choose the Fund's investments and handle its day-to-day business. Several individuals who are officers and/or Trustees of the Trust are also employees of Neuberger and/or Management.
Each class of shares has a distribution agreement with Management. Class A shares of each Fund are generally sold with an initial sales charge of up to 5.75% and no contingent deferred sales charge ("CDSC"), except that a CDSC of 1.00% applies to certain redemptions made within 18 months following purchases of $1 million or more without an initial sales charge. Class C shares of each Fund are sold with no initial sales charge and a 1.00% CDSC if shares are sold within one year after purchase.
For the year ended August 31, 2014, Management, acting as underwriter and broker-dealer, received net initial sales charges from the purchase of Class A shares and CDSCs from the redemptions of Class A and Class C shares as follows:
Underwriter | Broker-Dealer | ||||||||||||||||||
| Net Initial Sales Charge | CDSC | Net Initial Sales Charge | CDSC | ||||||||||||||||
All Cap Core Fund Class A | $ | 3,699 | $ | — | $ | — | $ | — | |||||||||||
All Cap Core Fund Class C | — | 3,146 | — | — | |||||||||||||||
Emerging Markets Equity Fund Class A | 8,457 | 588 | — | — | |||||||||||||||
Emerging Markets Equity Fund Class C | — | 1,944 | — | — | |||||||||||||||
Equity Income Fund Class A | 81,770 | 20,886 | — | — | |||||||||||||||
Equity Income Fund Class C | — | 75,347 | — | — | |||||||||||||||
Focus Fund Class A | 2,735 | — | — | — | |||||||||||||||
Focus Fund Class C | — | — | — | — | |||||||||||||||
Global Equity Fund Class A | 110 | — | — | — | |||||||||||||||
Global Equity Fund Class C | — | 45 | — | — | |||||||||||||||
Global Thematic Opportunities Fund Class A | — | — | — | — | |||||||||||||||
180
Underwriter | Broker-Dealer | ||||||||||||||||||
| Net Initial Sales Charge | CDSC | Net Initial Sales Charge | CDSC | ||||||||||||||||
Global Thematic Opportunities Fund Class C | $ | — | $ | — | $ | — | $ | — | |||||||||||
Greater China Equity Fund Class A | — | — | — | — | |||||||||||||||
Greater China Equity Fund Class C | — | — | — | — | |||||||||||||||
Guardian Fund Class A | 1,632 | — | — | — | |||||||||||||||
Guardian Fund Class C | — | 218 | — | — | |||||||||||||||
International Equity Fund Class A | 10,457 | — | — | — | |||||||||||||||
International Equity Fund Class C | — | 1,780 | — | — | |||||||||||||||
International Select Fund Class A | 1,324 | — | — | — | |||||||||||||||
International Select Fund Class C | — | 427 | — | — | |||||||||||||||
Intrinsic Value Fund Class A | 8,799 | — | — | — | |||||||||||||||
Intrinsic Value Fund Class C | — | 1,271 | — | — | |||||||||||||||
Large Cap Disciplined Growth Fund Class A | 2,907 | — | — | — | |||||||||||||||
Large Cap Disciplined Growth Fund Class C | — | 636 | — | — | |||||||||||||||
Large Cap Value Fund Class A | 2,371 | 176 | — | — | |||||||||||||||
Large Cap Value Fund Class C | — | 585 | — | — | |||||||||||||||
Mid Cap Growth Fund Class A | 8,487 | — | — | — | |||||||||||||||
Mid Cap Growth Fund Class C | — | 613 | — | — | |||||||||||||||
Mid Cap Intrinsic Value Fund Class A | 1,195 | — | — | — | |||||||||||||||
Mid Cap Intrinsic Value Fund Class C | — | 285 | — | — | |||||||||||||||
Multi-Cap Opportunities Fund Class A | 87,736 | 2,502 | — | — | |||||||||||||||
Multi-Cap Opportunities Fund Class C | — | 11,732 | — | — | |||||||||||||||
Real Estate Fund Class A | 9,569 | 8,834 | — | — | |||||||||||||||
Real Estate Fund Class C | — | 15,431 | — | — | |||||||||||||||
Small Cap Growth Fund Class A | 2,933 | 1,324 | — | — | |||||||||||||||
Small Cap Growth Fund Class C | — | 81 | — | — | |||||||||||||||
Socially Responsive Fund Class A | 47,766 | — | — | — | |||||||||||||||
Socially Responsive Fund Class C | — | 6,869 | — | — | |||||||||||||||
Value Fund Class A | 3,377 | — | — | — | |||||||||||||||
Value Fund Class C | — | 222 | — | — | |||||||||||||||
On June 3, 2014, Management made a voluntary contribution to certain of the Funds in connection with a payment matter related to the Funds' investment in a State Street money market fund as follows:
| Contribution Amount | Contribution Amount | ||||||||||||||
All Cap Core | $ | 11,607 | Intrinsic Value | $ | 4,946 | ||||||||||
Emerging Markets Equity | 8,197 | Large Cap Disciplined Growth | 25,583 | ||||||||||||
Equity Income | 72,008 | Large Cap Value | 101,072 | ||||||||||||
Focus | 14,932 | Mid Cap Growth | 39,098 | ||||||||||||
Genesis | 619,373 | Mid Cap Intrinsic Value | 5,917 | ||||||||||||
Global Thematic Opportunities | 1,536 | Multi-Cap Opportunities | 18,804 | ||||||||||||
Guardian | 30,585 | Real Estate | 15,705 | ||||||||||||
International Equity | 24,281 | Small Cap Growth | 3,827 | ||||||||||||
International Select | 8,356 | Socially Responsive | 52,169 | ||||||||||||
181
Note C—Securities Transactions:
During the year ended August 31, 2014, there were purchase and sale transactions of long-term securities (excluding option contracts) as follows:
(000's omitted) | Purchases | Sales | (000's omitted) | Purchases | Sales | ||||||||||||||||||
All Cap Core | $ | 56,621 | $ | 65,620 | Intrinsic Value | $ | 84,515 | $ | 58,727 | ||||||||||||||
Emerging Markets Equity | 325,164 | 184,515 | Large Cap Disciplined Growth | 205,085 | 511,002 | ||||||||||||||||||
Equity Income | 1,045,974 | 1,893,192 | Large Cap Value | 1,697,900 | 1,959,551 | ||||||||||||||||||
Focus | 640,415 | 667,465 | Mid Cap Growth | 629,260 | 575,584 | ||||||||||||||||||
Genesis | 1,889,221 | 3,115,416 | Mid Cap Intrinsic Value | 24,875 | 25,299 | ||||||||||||||||||
Global Equity | 14,244 | 15,975 | Multi-Cap Opportunities | 1,239,826 | 375,705 | ||||||||||||||||||
Global Thematic Opportunities | 62,940 | 64,513 | Real Estate | 340,722 | 381,015 | ||||||||||||||||||
Greater China Equity | 109,523 | 98,139 | Small Cap Growth | 241,987 | 245,335 | ||||||||||||||||||
Guardian | 519,542 | 580,719 | Socially Responsive | 838,100 | 997,762 | ||||||||||||||||||
International Equity | 375,358 | 368,675 | Value | 26,195 | 18,722 | ||||||||||||||||||
International Select | 66,994 | 74,231 | |||||||||||||||||||||
During the year ended August 31, 2014, no brokerage commissions on securities transactions were paid to affiliated brokers.
Note D—Fund Share Transactions:
Share activity for the years ended August 31, 2014 and August 31, 2013 was as follows:
For the Year Ended August 31, 2014 | For the Year Ended August 31, 2013 | ||||||||||||||||||||||||||||||||||||||
| (000's omitted) | Shares Sold | Shares Issued on Reinvestment of Dividends and Distributions | Shares Redeemed | Total | Shares Sold | Shares Issued on Reinvestment of Dividends and Distributions | Shares Issued in Connection with the Acquisition of International Fund (Note G) | Shares Redeemed | Total | ||||||||||||||||||||||||||||||
All Cap Core: | |||||||||||||||||||||||||||||||||||||||
Institutional Class | 2,268 | 385 | (2,201 | ) | 452 | 2,915 | 206 | — | (1,281 | ) | 1,840 | ||||||||||||||||||||||||||||
Class A | 514 | 252 | (1,533 | ) | (767 | ) | 1,500 | 220 | — | (1,810 | ) | (90 | ) | ||||||||||||||||||||||||||
Class C | 264 | 118 | (332 | ) | 50 | 362 | 80 | — | (330 | ) | 112 | ||||||||||||||||||||||||||||
| Emerging Markets Equity: | |||||||||||||||||||||||||||||||||||||||
Institutional Class | 11,289 | 84 | (6,980 | ) | 4,393 | 18,009 | 36 | — | (4,452 | ) | 13,593 | ||||||||||||||||||||||||||||
Class A | 1,008 | 1 | (366 | ) | 643 | 466 | 0 | z | — | (265 | ) | 201 | |||||||||||||||||||||||||||
Class C | 205 | — | (79 | ) | 126 | 225 | — | — | (43 | ) | 182 | ||||||||||||||||||||||||||||
Class R3 | 36 | 0 | z | (11 | ) | 25 | 62 | — | — | (68 | ) | (6 | ) | ||||||||||||||||||||||||||
Class R6 | 2,745 | 20 | (108 | ) | 2,657 | 2,024 | — | — | — | 2,024 | (2) | ||||||||||||||||||||||||||||
182
For the Year Ended August 31, 2014 | For the Year Ended August 31, 2013 | ||||||||||||||||||||||||||||||||||||||
| (000's omitted) | Shares Sold | Shares Issued on Reinvestment of Dividends and Distributions | Shares Redeemed | Total | Shares Sold | Shares Issued on Reinvestment of Dividends and Distributions | Shares Issued in Connection with the Acquisition of International Fund (Note G) | Shares Redeemed | Total | ||||||||||||||||||||||||||||||
Equity Income: | |||||||||||||||||||||||||||||||||||||||
Institutional Class | 42,043 | 5,515 | (50,330 | ) | (2,772 | ) | 47,914 | 3,568 | — | (32,381 | ) | 19,101 | |||||||||||||||||||||||||||
Class A | 10,109 | 3,876 | (67,276 | ) | (53,291 | ) | 39,536 | 3,387 | — | (40,945 | ) | 1,978 | |||||||||||||||||||||||||||
Class C | 3,640 | 1,500 | (10,670 | ) | (5,530 | ) | 12,451 | 785 | — | (5,924 | ) | 7,312 | |||||||||||||||||||||||||||
Class R3 | 107 | 10 | (78 | ) | 39 | 371 | 3 | — | (243 | ) | 131 | ||||||||||||||||||||||||||||
Focus: | |||||||||||||||||||||||||||||||||||||||
Investor Class | 252 | 2,175 | (2,610 | ) | (183 | ) | 1,230 | 137 | — | (2,298 | ) | (931 | ) | ||||||||||||||||||||||||||
Trust Class | 4,036 | 591 | (1,426 | ) | 3,201 | 2,228 | 7 | — | (297 | ) | 1,938 | ||||||||||||||||||||||||||||
Advisor Class | 165 | 107 | (188 | ) | 84 | 116 | 5 | — | (200 | ) | (79 | ) | |||||||||||||||||||||||||||
Institutional Class | 94 | 26 | (641 | ) | (521 | ) | 697 | 7 | — | (186 | ) | 518 | |||||||||||||||||||||||||||
Class A | 135 | 18 | (58 | ) | 95 | 90 | 0 | z | — | (42 | ) | 48 | |||||||||||||||||||||||||||
Class C | 56 | 13 | (1 | ) | 68 | 19 | 0 | z | — | (1 | ) | 18 | |||||||||||||||||||||||||||
Genesis: | |||||||||||||||||||||||||||||||||||||||
Investor Class | 7,896 | 6,750 | (16,221 | ) | (1,575 | ) | 9,350 | 4,261 | — | (17,524 | ) | (3,913 | ) | ||||||||||||||||||||||||||
Trust Class | 5,132 | 3,716 | (15,767 | ) | (6,919 | ) | 6,000 | 2,446 | — | (15,270 | ) | (6,824 | ) | ||||||||||||||||||||||||||
Advisor Class | 4,636 | 2,357 | (7,666 | ) | (673 | ) | 5,008 | 1,415 | — | (7,538 | ) | (1,115 | ) | ||||||||||||||||||||||||||
Institutional Class | 18,630 | 6,939 | (46,165 | ) | (20,596 | ) | 23,263 | 5,335 | — | (41,819 | ) | (13,221 | ) | ||||||||||||||||||||||||||
Class R6 | 30,589 | 2,654 | (5,884 | ) | 27,359 | 17,541 | — | — | (607 | ) | 16,934 | (2) | |||||||||||||||||||||||||||
Global Equity: | |||||||||||||||||||||||||||||||||||||||
Institutional Class | 5 | 42 | (103 | ) | (56 | ) | 3,170 | — | — | (153 | ) | 3,017 | |||||||||||||||||||||||||||
Class A | 27 | 0 | z | (8 | ) | 19 | 7 | — | — | (2 | ) | 5 | |||||||||||||||||||||||||||
Class C | 9 | 0 | z | (1 | ) | 8 | 2 | — | — | — | 2 | ||||||||||||||||||||||||||||
| Global Thematic Opportunities: | |||||||||||||||||||||||||||||||||||||||
Institutional Class | 1,211 | 35 | (1,179 | ) | 67 | 3,423 | 30 | — | (1,475 | ) | 1,978 | ||||||||||||||||||||||||||||
Class A | 3 | 0 | z | (47 | ) | (44 | ) | 191 | 0 | z | — | (200 | ) | (9 | ) | ||||||||||||||||||||||||
Class C | 1 | — | (4 | ) | (3 | ) | 2 | — | — | (4 | ) | (2 | ) | ||||||||||||||||||||||||||
| Greater China Equity: | |||||||||||||||||||||||||||||||||||||||
Institutional Class | 1,890 | 6 | (1,521 | ) | 375 | 5,554 | — | — | (3 | ) | 5,551 | (3) | |||||||||||||||||||||||||||
Class A | 129 | 0 | z | (2 | ) | 127 | 12 | — | — | — | 12 | (3) | |||||||||||||||||||||||||||
Class C | — | 0 | z | — | 0 | z | 10 | — | — | — | 10 | (3) | |||||||||||||||||||||||||||
183
For the Year Ended August 31, 2014 | For the Year Ended August 31, 2013 | ||||||||||||||||||||||||||||||||||||||
(000's omitted) | Shares Sold | Shares Issued on Reinvestment of Dividends and Distributions | Shares Redeemed | Total | Shares Sold | Shares Issued on Reinvestment of Dividends and Distributions | Shares Issued in Connection with the Acquisition of International Fund (Note G) | Shares Redeemed | Total | ||||||||||||||||||||||||||||||
Guardian: | |||||||||||||||||||||||||||||||||||||||
Investor Class | 1,051 | 5,601 | (5,605 | ) | 1,047 | 986 | 2,284 | — | (6,763 | ) | (3,493 | ) | |||||||||||||||||||||||||||
Trust Class | 794 | 1,254 | (2,110 | ) | (62 | ) | 1,432 | 453 | — | (2,056 | ) | (171 | ) | ||||||||||||||||||||||||||
Advisor Class | 81 | 12 | (110 | ) | (17 | ) | 16 | 1 | — | (19 | ) | (2 | ) | ||||||||||||||||||||||||||
Institutional Class | 2,275 | 520 | (1,251 | ) | 1,544 | 1,798 | 149 | — | (961 | ) | 986 | ||||||||||||||||||||||||||||
Class A | 2,764 | 443 | (743 | ) | 2,464 | 1,313 | 79 | — | (399 | ) | 993 | ||||||||||||||||||||||||||||
Class C | 62 | 14 | (68 | ) | 8 | 83 | 2 | — | (18 | ) | 67 | ||||||||||||||||||||||||||||
Class R3 | 18 | 2 | (5 | ) | 15 | 17 | 0 | z | — | (30 | ) | (13 | ) | ||||||||||||||||||||||||||
| International Equity: | |||||||||||||||||||||||||||||||||||||||
Investor Class | 316 | 54 | (1,112 | ) | (742 | ) | 161 | — | 8,196 | (1,606 | ) | 6,751 | (1) | ||||||||||||||||||||||||||
Trust Class | 688 | 39 | (3,189 | ) | (2,462 | ) | 676 | — | 5,868 | (1,140 | ) | 5,404 | (1) | ||||||||||||||||||||||||||
Institutional Class | 25,238 | 1,373 | (23,305 | ) | 3,306 | 30,515 | 784 | — | (9,961 | ) | 21,338 | ||||||||||||||||||||||||||||
Class A | 1,030 | 7 | (518 | ) | 519 | 299 | — | 341 | (21 | ) | 619 | (1) | |||||||||||||||||||||||||||
Class C | 198 | 0 | z | (23 | ) | 175 | 61 | — | 33 | (1 | ) | 93 | (1) | ||||||||||||||||||||||||||
| Class R6(4) | 1,922 | 0 | z | (8 | ) | 1,914 | — | — | — | — | — | ||||||||||||||||||||||||||||
| International Select: | |||||||||||||||||||||||||||||||||||||||
Trust Class | 72 | 11 | (298 | ) | (215 | ) | 327 | 16 | — | (529 | ) | (186 | ) | ||||||||||||||||||||||||||
Institutional Class | 2,428 | 245 | (3,581 | ) | (908 | ) | 2,978 | 260 | — | (2,261 | ) | 977 | |||||||||||||||||||||||||||
Class A | 246 | 8 | (341 | ) | (87 | ) | 397 | 10 | — | (394 | ) | 13 | |||||||||||||||||||||||||||
Class C | 105 | 0 | z | (86 | ) | 19 | 92 | 0 | z | — | (100 | ) | (8 | ) | |||||||||||||||||||||||||
Class R3 | 74 | 2 | (138 | ) | (62 | ) | 228 | 1 | — | (18 | ) | 211 | |||||||||||||||||||||||||||
Intrinsic Value: | |||||||||||||||||||||||||||||||||||||||
Institutional Class | 4,235 | 510 | (2,180 | ) | 2,565 | 4,210 | 187 | — | (3,231 | ) | 1,166 | ||||||||||||||||||||||||||||
Class A | 750 | 52 | (984 | ) | (182 | ) | 671 | 10 | — | (405 | ) | 276 | |||||||||||||||||||||||||||
Class C | 229 | 17 | (192 | ) | 54 | 379 | 5 | — | (241 | ) | 143 | ||||||||||||||||||||||||||||
| Large Cap Disciplined Growth: | |||||||||||||||||||||||||||||||||||||||
Investor Class | 161 | 317 | (1,100 | ) | (622 | ) | 243 | 124 | — | (720 | ) | (353 | ) | ||||||||||||||||||||||||||
Institutional Class | 8,757 | 6,591 | (43,021 | ) | (27,673 | ) | 16,907 | 3,712 | — | (48,805 | ) | (28,186 | ) | ||||||||||||||||||||||||||
Class A | 561 | 570 | (4,306 | ) | (3,175 | ) | 3,235 | 441 | — | (7,724 | ) | (4,048 | ) | ||||||||||||||||||||||||||
Class C | 480 | 143 | (893 | ) | (270 | ) | 358 | 82 | — | (1,778 | ) | (1,338 | ) | ||||||||||||||||||||||||||
Class R3 | 3 | 1 | (31 | ) | (27 | ) | 8 | 1 | — | (6 | ) | 3 | |||||||||||||||||||||||||||
184
For the Year Ended August 31, 2014 | For the Year Ended August 31, 2013 | ||||||||||||||||||||||||||||||||||||||
(000's omitted) | Shares Sold | Shares Issued on Reinvestment of Dividends and Distributions | Shares Redeemed | Total | Shares Sold | Shares Issued on Reinvestment of Dividends and Distributions | Shares Issued in Connection with the Acquisition of International Fund (Note G) | Shares Redeemed | Total | ||||||||||||||||||||||||||||||
Large Cap Value: | |||||||||||||||||||||||||||||||||||||||
Investor Class | 479 | 5,792 | (5,253 | ) | 1,018 | 850 | 468 | — | (5,783 | ) | (4,465 | ) | |||||||||||||||||||||||||||
Trust Class | 306 | 1,354 | (2,224 | ) | (564 | ) | 400 | 103 | — | (4,516 | ) | (4,013 | ) | ||||||||||||||||||||||||||
Advisor Class | 821 | 2,701 | (2,451 | ) | 1,071 | 886 | 185 | — | (4,002 | ) | (2,931 | ) | |||||||||||||||||||||||||||
Institutional Class | 872 | 571 | (715 | ) | 728 | 967 | 62 | — | (1,424 | ) | (395 | ) | |||||||||||||||||||||||||||
Class A | 102 | 16 | (71 | ) | 47 | 28 | — | — | (66 | ) | (38 | ) | |||||||||||||||||||||||||||
Class C | 114 | 11 | (28 | ) | 97 | 53 | 0 | z | — | (7 | ) | 46 | |||||||||||||||||||||||||||
Class R3 | 2 | 0 | z | — | 2 | 3 | — | — | (34 | ) | (31 | ) | |||||||||||||||||||||||||||
Mid Cap Growth: | |||||||||||||||||||||||||||||||||||||||
Investor Class | 515 | 1,861 | (2,307 | ) | 69 | 571 | 1,560 | — | (2,877 | ) | (746 | ) | |||||||||||||||||||||||||||
Trust Class | 766 | 122 | (552 | ) | 336 | 910 | 82 | — | (538 | ) | 454 | ||||||||||||||||||||||||||||
Advisor Class | 135 | 19 | (274 | ) | (120 | ) | 160 | 15 | — | (170 | ) | 5 | |||||||||||||||||||||||||||
Institutional Class | 10,799 | 1,681 | (5,863 | ) | 6,617 | 7,225 | 920 | — | (3,395 | ) | 4,750 | ||||||||||||||||||||||||||||
Class A | 1,231 | 179 | (1,382 | ) | 28 | 1,823 | 130 | — | (1,125 | ) | 828 | ||||||||||||||||||||||||||||
Class C | 86 | 8 | (45 | ) | 49 | 96 | 4 | — | (22 | ) | 78 | ||||||||||||||||||||||||||||
Class R3 | 163 | 12 | (89 | ) | 86 | 165 | 7 | — | (69 | ) | 103 | ||||||||||||||||||||||||||||
Class R6 | 1,642 | 21 | (160 | ) | 1,503 | 4 | — | — | — | 4 | (2) | ||||||||||||||||||||||||||||
| Mid Cap Intrinsic Value: | |||||||||||||||||||||||||||||||||||||||
Investor Class | 176 | 97 | (696 | ) | (423 | ) | 408 | 17 | — | (1,055 | ) | (630 | ) | ||||||||||||||||||||||||||
Trust Class | 70 | 44 | (142 | ) | (28 | ) | 117 | 6 | — | (712 | ) | (589 | ) | ||||||||||||||||||||||||||
Institutional Class | 667 | 42 | (172 | ) | 537 | 74 | 3 | — | (127 | ) | (50 | ) | |||||||||||||||||||||||||||
Class A | 210 | 13 | (117 | ) | 106 | 208 | 2 | — | (331 | ) | (121 | ) | |||||||||||||||||||||||||||
Class C | 24 | 1 | (7 | ) | 18 | 45 | 0 | z | — | (0 | )z | 45 | |||||||||||||||||||||||||||
Class R3 | 3 | 1 | (31 | ) | (27 | ) | 31 | 0 | z | — | — | 31 | |||||||||||||||||||||||||||
| Multi-Cap Opportunities: | |||||||||||||||||||||||||||||||||||||||
Institutional Class | 67,275 | 258 | (15,271 | ) | 52,262 | 71,566 | 60 | — | (9,385 | ) | 62,241 | ||||||||||||||||||||||||||||
Class A | 8,625 | 124 | (3,704 | ) | 5,045 | 4,015 | 6 | — | (457 | ) | 3,564 | ||||||||||||||||||||||||||||
Class C | 2,771 | 24 | (207 | ) | 2,588 | 604 | 1 | — | (11 | ) | 594 | ||||||||||||||||||||||||||||
Real Estate: | |||||||||||||||||||||||||||||||||||||||
Trust Class | 5,241 | 1,742 | (10,294 | ) | (3,311 | ) | 14,497 | 906 | — | (11,609 | ) | 3,794 | |||||||||||||||||||||||||||
Institutional Class | 13,294 | 1,691 | (11,747 | ) | 3,238 | 19,215 | 578 | — | (8,078 | ) | 11,715 | ||||||||||||||||||||||||||||
Class A | 5,346 | 809 | (7,154 | ) | (999 | ) | 9,924 | 248 | — | (3,140 | ) | 7,032 | |||||||||||||||||||||||||||
Class C | 395 | 167 | (878 | ) | (316 | ) | 1,877 | 49 | — | (360 | ) | 1,566 | |||||||||||||||||||||||||||
Class R3 | 830 | 83 | (492 | ) | 421 | 1,130 | 14 | — | (315 | ) | 829 | ||||||||||||||||||||||||||||
Class R6 | 1,282 | 59 | (189 | ) | 1,152 | 655 | 1 | — | (20 | ) | 636 | (2) | |||||||||||||||||||||||||||
185
For the Year Ended August 31, 2014 | For the Year Ended August 31, 2013 | ||||||||||||||||||||||||||||||||||||||
(000's omitted) | Shares Sold | Shares Issued on Reinvestment of Dividends and Distributions | Shares Redeemed | Total | Shares Sold | Shares Issued on Reinvestment of Dividends and Distributions | Shares Issued in Connection with the Acquisition of International Fund (Note G) | Shares Redeemed | Total | ||||||||||||||||||||||||||||||
| Small Cap Growth: | |||||||||||||||||||||||||||||||||||||||
Investor Class | 108 | — | (279 | ) | (171 | ) | 243 | — | — | (1,307 | ) | (1,064 | ) | ||||||||||||||||||||||||||
Trust Class | 18 | — | (107 | ) | (89 | ) | 147 | — | — | (621 | ) | (474 | ) | ||||||||||||||||||||||||||
Advisor Class | 48 | — | (78 | ) | (30 | ) | 53 | — | — | (265 | ) | (212 | ) | ||||||||||||||||||||||||||
Institutional Class | 178 | — | (106 | ) | 72 | 840 | — | — | (1,922 | ) | (1,082 | ) | |||||||||||||||||||||||||||
Class A | 256 | — | (199 | ) | 57 | 67 | — | — | (27 | ) | 40 | ||||||||||||||||||||||||||||
Class C | 55 | — | (25 | ) | 30 | 22 | — | — | (5 | ) | 17 | ||||||||||||||||||||||||||||
Class R3 | 13 | — | (12 | ) | 1 | 11 | — | — | (4 | ) | 7 | ||||||||||||||||||||||||||||
| Socially Responsive: | |||||||||||||||||||||||||||||||||||||||
Investor Class | 2,027 | 1,608 | (6,674 | ) | (3,039 | ) | 3,549 | 168 | — | (5,811 | ) | (2,094 | ) | ||||||||||||||||||||||||||
Trust Class | 3,087 | 2,042 | (7,296 | ) | (2,167 | ) | 4,183 | 224 | — | (12,021 | ) | (7,614 | ) | ||||||||||||||||||||||||||
Institutional Class | 6,348 | 1,268 | (5,577 | ) | 2,039 | 9,100 | 153 | — | (11,532 | ) | (2,279 | ) | |||||||||||||||||||||||||||
Class A | 2,274 | 502 | (2,180 | ) | 596 | 1,822 | 31 | — | (1,510 | ) | 343 | ||||||||||||||||||||||||||||
Class C | 671 | 119 | (174 | ) | 616 | 463 | 2 | — | (141 | ) | 324 | ||||||||||||||||||||||||||||
Class R3 | 387 | 126 | (320 | ) | 193 | 432 | 7 | — | (288 | ) | 151 | ||||||||||||||||||||||||||||
Class R6 | 5,548 | 415 | (6,043 | ) | (80 | ) | 7,742 | — | — | (111 | ) | 7,631 | (2) | ||||||||||||||||||||||||||
Value: | |||||||||||||||||||||||||||||||||||||||
Institutional Class | 560 | 2 | (310 | ) | 252 | 432 | 2 | — | (164 | ) | 270 | ||||||||||||||||||||||||||||
Class A | 308 | 1 | (95 | ) | 214 | 202 | 2 | — | (70 | ) | 134 | ||||||||||||||||||||||||||||
Class C | 15 | — | (3 | ) | 12 | 19 | 0 | z | — | (1 | ) | 18 | |||||||||||||||||||||||||||
(1) Period from January 28, 2013 (Commencement of Operations) to August 31, 2013.
(2) Period from March 15, 2013 (Commencement of Operations) to August 31, 2013.
(3) Period from July 17, 2013 (Commencement of Operations) to August 31, 2013.
(4) Period from September 3, 2013 (Commencement of Operations) to August 31, 2014.
z A zero balance may reflect actual amounts rounding to less than 1,000.
Note E—Lines of Credit:
At August 31, 2014, each Fund was a participant in a single committed, unsecured $300,000,000 line of credit with State Street, to be used only for temporary or emergency purposes. Other investment companies managed by Management also participate in this line of credit on the same terms. Interest is charged on borrowings under this line of credit at the higher of (a) the Federal Funds Rate plus 1.25% per annum or (b) the overnight LIBOR Rate plus 1.25% per annum. A commitment fee of 0.10% per annum of the available line of credit is charged, of which each participating Fund has agreed to pay its pro rata share, based on the ratio of its individual net assets to the net assets of all participants at the time the fee is due and payable. The fee is paid quarterly in arrears. Because several
186
mutual funds participate, there is no assurance that an individual Fund will have access to all or any part of the $300,000,000 at any particular time. There were no loans outstanding pursuant to this line of credit at August 31, 2014. During the year ended August 31, 2014, none of the Funds utilized this line of credit.
At August 31, 2014, each Fund was a participant in a single uncommitted, unsecured $100,000,000 line of credit with State Street to be used only for temporary or emergency purposes. Other investment companies managed by Management also participate in this line of credit on the same terms. Interest is charged on borrowings under this line of credit at a variable rate per annum as determined and quoted by State Street at the time a Fund requests a loan. Because several mutual funds participate, there is no assurance that an individual Fund will have access to all or any part of the $100,000,000 at any particular time. There were no loans outstanding pursuant to this line of credit at August 31, 2014. During the year ended August 31, 2014, none of the Funds utilized this line of credit.
Note F—Investments In Affiliates(1):
| Balance of Shares Held August 31, 2013 | Gross Purchases and Additions | Gross Sales and Reductions | Balance of Shares Held August 31, 2014 | Value August 31, 2014 | Distributions from Investments in Affiliated Issuers | Net Realized Gain (Loss) from Investments in Affiliated Issuers | |||||||||||||||||||||||||
Genesis | |||||||||||||||||||||||||||||||
Abaxis, Inc. | 1,125,200 | 103,700 | 66,500 | 1,162,400 | $ | 55,504,600 | $ | 223,390 | $ | 821,639 | |||||||||||||||||||||
| Altisource Asset Management Corp. | 143,317 | 12,700 | 300 | 155,717 | 115,920,406 | — | * | 202,973 | |||||||||||||||||||||||
| Altisource Portfolio Solutions SA | 1,631,270 | 42,700 | 78,300 | 1,595,670 | 159,455,303 | — | * | 464,390 | |||||||||||||||||||||||
| AmSurg Corp.(2) | 1,682,828 | 140,100 | 498,778 | 1,324,150 | 71,226,029 | — | * | 11,272,839 | |||||||||||||||||||||||
| Applied Industrial Technologies, Inc. | 2,493,344 | 129,100 | 219,200 | 2,403,244 | 117,062,015 | 2,465,481 | 1,118,169 | ||||||||||||||||||||||||
AptarGroup, Inc. | 4,538,700 | — | 561,300 | 3,977,400 | 255,150,210 | 4,577,864 | 28,130,539 | ||||||||||||||||||||||||
Badger Meter, Inc. | 793,501 | — | 66,200 | 727,301 | 37,877,836 | 558,963 | 538,033 | ||||||||||||||||||||||||
Balchem Corp. | 1,501,935 | 211,200 | 69,400 | 1,643,735 | 84,553,728 | 416,503 | 1,112,963 | ||||||||||||||||||||||||
| Bally Technologies, Inc.(2) | 2,447,392 | 496,100 | 1,885,806 | 1,057,686 | 83,863,923 | — | * | 56,467,975 | |||||||||||||||||||||||
Bank of Hawaii Corp. | 2,609,212 | — | 216,000 | 2,393,212 | 138,925,957 | 4,536,472 | 1,785,640 | ||||||||||||||||||||||||
| Boston Beer Co., Inc.(2) | 702,719 | — | 189,500 | 513,219 | 113,411,135 | — | * | 36,535,798 | |||||||||||||||||||||||
| Brookline Bancorp, Inc.(2) | 3,866,590 | — | 3,866,590 | — | — | 314,390 | (6,526,432 | ) | |||||||||||||||||||||||
CARBO Ceramics, Inc. | 1,565,657 | — | 203,400 | 1,362,257 | 146,565,231 | 1,842,994 | 12,713,349 | ||||||||||||||||||||||||
CLARCOR, Inc. | 4,212,822 | — | 720,734 | 3,492,088 | 220,734,882 | 2,703,355 | 23,418,987 | ||||||||||||||||||||||||
| Compass Minerals International, Inc. | 3,193,700 | — | 495,827 | 2,697,873 | 240,299,548 | 6,812,298 | 30,310,755 | ||||||||||||||||||||||||
| Computer Modelling Group Ltd. | 3,101,000 | 3,119,900 | 272,500 | 5,948,400 | 69,643,272 | 2,118,204 | 2,015,544 | ||||||||||||||||||||||||
Exponent, Inc. | 1,202,035 | — | 80,000 | 1,122,035 | 81,975,877 | 943,228 | 2,189,135 | ||||||||||||||||||||||||
| FEI Co.(2) | 2,096,342 | 48,500 | 209,300 | 1,935,542 | 162,662,950 | 1,219,201 | 4,922,125 | ||||||||||||||||||||||||
187
| Balance of Shares Held August 31, 2013 | Gross Purchases and Additions | Gross Sales and Reductions | Balance of Shares Held August 31, 2014 | Value August 31, 2014 | Distributions from Investments in Affiliated Issuers | Net Realized Gain (Loss) from Investments in Affiliated Issuers | |||||||||||||||||||||||||
| First Financial Bankshares, Inc. | 1,908,468 | 1,962,968 | 243,400 | 3,628,036 | $ | 106,627,978 | $ | 2,047,148 | $ | 1,711,920 | |||||||||||||||||||||
Forward Air Corp. | 1,658,000 | 161,000 | 81,800 | 1,737,200 | 80,414,988 | 789,602 | 943,771 | ||||||||||||||||||||||||
Haemonetics Corp. | 4,787,500 | — | 527,000 | 4,260,500 | 152,057,245 | — | * | 4,823,615 | |||||||||||||||||||||||
| Harris Teeter Supermarkets, Inc.(2) | 3,369,203 | — | 3,369,203 | — | — | 505,380 | 62,066,131 | ||||||||||||||||||||||||
| Healthcare Services Group, Inc. | 5,114,481 | — | 427,400 | 4,687,081 | 128,097,924 | 3,406,288 | 6,021,801 | ||||||||||||||||||||||||
Hibbett Sports, Inc. | 1,719,469 | 151,800 | 92,300 | 1,778,969 | 80,818,562 | — | * | 2,739,771 | |||||||||||||||||||||||
| Hittite Microwave Corp.(2) | 2,312,765 | 48,900 | 2,361,665 | — | — | 686,885 | 49,412,285 | ||||||||||||||||||||||||
| Home Loan Servicing Solutions Ltd. | 5,181,100 | 719,800 | 493,300 | 5,407,600 | 118,426,440 | 10,566,100 | (361,827 | ) | |||||||||||||||||||||||
ICON PLC | 4,363,500 | 77,900 | 331,900 | 4,109,500 | 203,584,630 | — | * | 4,008,336 | |||||||||||||||||||||||
| Innophos Holdings, Inc. | 1,816,700 | — | 230,158 | 1,586,542 | 92,257,417 | 2,861,844 | 283,522 | ||||||||||||||||||||||||
| J & J Snack Foods Corp. | 1,088,746 | — | 91,100 | 997,646 | 94,487,053 | 1,194,916 | 5,851,864 | ||||||||||||||||||||||||
Lindsay Corp. | 932,550 | 19,200 | 79,500 | 872,250 | 67,843,605 | 844,756 | (1,197,184 | ) | |||||||||||||||||||||||
| Manhattan Associates, Inc. | 1,302,807 | 4,182,821 | 268,400 | 5,217,228 | 150,673,545 | — | * | 3,377,678 | |||||||||||||||||||||||
| Meridian Bioscience, Inc. | 3,208,597 | 17,400 | 688,200 | 2,537,797 | 49,664,687 | 2,413,912 | (80,024 | ) | |||||||||||||||||||||||
| Monotype Imaging Holdings, Inc. | 2,093,103 | 1,076,242 | 182,600 | 2,986,745 | 87,780,436 | 735,579 | 406,517 | ||||||||||||||||||||||||
| MWI Veterinary Supply, Inc. | 1,083,429 | 190,276 | 60,000 | 1,213,705 | 172,406,795 | — | * | 4,361,554 | |||||||||||||||||||||||
| Natural Gas Services Group, Inc. | 778,600 | — | 64,900 | 713,700 | 21,182,616 | — | * | 754,387 | |||||||||||||||||||||||
NETGEAR, Inc. | 2,673,900 | 479,100 | 259,700 | 2,893,300 | 96,115,426 | — | * | (1,161,613 | ) | ||||||||||||||||||||||
| Nexstar Broadcasting Group, Inc. Class A | 1,940,269 | 938,052 | 130,300 | 2,748,021 | 125,419,678 | 1,522,782 | 498,360 | ||||||||||||||||||||||||
Pason Systems, Inc. | 4,283,657 | 708,400 | 281,500 | 4,710,557 | 150,115,701 | 2,436,545 | 2,176,235 | ||||||||||||||||||||||||
Pool Corp. | 3,117,923 | 283,500 | 351,625 | 3,049,798 | 172,801,555 | 2,659,980 | 3,669,932 | ||||||||||||||||||||||||
| Power Integrations, Inc. | 1,974,600 | 739,500 | 183,200 | 2,530,900 | 151,297,202 | 874,108 | 2,844,248 | ||||||||||||||||||||||||
Raven Industries, Inc. | 3,369,152 | — | 281,800 | 3,087,352 | 82,308,804 | 1,581,781 | 3,329,747 | ||||||||||||||||||||||||
RLI Corp. | 1,420,407 | 1,355,507 | 253,500 | 2,522,414 | 112,751,906 | 6,135,162 | 4,733,662 | ||||||||||||||||||||||||
| Safety Insurance Group, Inc. | 1,039,049 | — | 88,100 | 950,949 | 52,492,385 | 2,499,683 | 349,396 | ||||||||||||||||||||||||
188
| Balance of Shares Held August 31, 2013 | Gross Purchases and Additions | Gross Sales and Reductions | Balance of Shares Held August 31, 2014 | Value August 31, 2014 | Distributions from Investments in Affiliated Issuers | Net Realized Gain (Loss) from Investments in Affiliated Issuers | |||||||||||||||||||||||||
| Sensient Technologies Corp. | 3,672,617 | 573,328 | 270,700 | 3,975,245 | $ | 223,050,997 | $ | 3,755,450 | $ | 4,167,886 | |||||||||||||||||||||
| Solera Holdings, Inc.(2) | 3,699,553 | — | 1,053,800 | 2,645,753 | 161,285,103 | 2,212,739 | 43,221,532 | ||||||||||||||||||||||||
| State Street Institutional Treasury Plus Fund Premier Class | 199,091,299 | 1,428,893,917 | 1,372,824,064 | 255,161,152 | 255,161,152 | — | * | — | |||||||||||||||||||||||
Tennant Co. | 749,502 | 244,700 | 45,400 | 948,802 | 66,122,011 | 668,456 | 851,285 | ||||||||||||||||||||||||
| Thermon Group Holdings, Inc.(2) | 2,068,131 | — | 1,259,200 | 808,931 | 21,962,477 | — | * | 1,773,004 | |||||||||||||||||||||||
| Tyler Technologies, Inc. | 1,315,832 | 499,600 | 97,200 | 1,718,232 | 153,025,742 | — | * | 1,653,887 | |||||||||||||||||||||||
United Stationers, Inc. | 3,755,341 | — | 974,600 | 2,780,741 | 113,037,122 | 1,807,605 | 8,129,769 | ||||||||||||||||||||||||
| West Pharmaceutical Services, Inc. | 1,971,229 | 2,310,729 | 230,800 | 4,051,158 | 175,941,792 | 1,633,803 | 3,523,864 | ||||||||||||||||||||||||
| Westamerica Bancorporation | 1,894,243 | — | 327,500 | 1,566,743 | 75,783,359 | 2,801,577 | (250,186 | ) | |||||||||||||||||||||||
| Zebra Technologies Corp.(2) | 2,637,824 | — | 326,900 | 2,310,924 | 180,321,400 | — | * | 12,739,390 | |||||||||||||||||||||||
Total | $ | 6,130,150,635 | $ | 85,374,424 | $ | 444,868,936 | |||||||||||||||||||||||||
(1) Affiliated issuers, as defined in the 1940 Act.
(2) At August 31, 2014, the issuers of these securities were no longer affiliated with Genesis.
* Security did not produce income during the last twelve months.
Note G—Reorganization:
On January 25, 2013, International Equity acquired all of the net assets of Neuberger Berman International Fund ("International") pursuant to a plan of reorganization and termination approved by the Board. The purpose of the transaction was to combine two funds managed by Management with comparable investment objectives and strategies. The merger was accomplished by a tax-free exchange of: 8,195,935 shares of the Investor Class of International Equity (valued at $147,786,970) for the 8,195,935 shares of the Investor Class of International outstanding on January 25, 2013; 5,867,925 shares of the Trust Class of International Equity (valued at $117,673,918) for the 5,867,925 shares of the Trust Class of International outstanding on January 25, 2013; 340,582 shares of Class A of International Equity (valued at $6,829,665) for the 340,582 shares of Class A of International outstanding on January 25, 2013; and 32,947 shares of Class C of International Equity (valued at $657,940) for the 32,947 shares of Class C of International outstanding on January 25, 2013. International's aggregate net assets at that date ($272,948,493, including investments with a cost of $204,366,702 and $52,807,215 of net unrealized appreciation) were combined with those of International Equity ($541,261,827). The combined net assets of International Equity immediately after the merger were $814,210,320. For financial reporting purposes, assets
189
received and shares issued by International Equity were recorded at fair value; however, the cost basis of the investments received from International was carried forward to align ongoing reporting of International Equity's realized and unrealized gains and losses with amounts distributable to shareholders for tax purposes.
Assuming the reorganization had been completed on September 1, 2012, the beginning of the annual reporting period of International Equity, International Equity's pro forma results of operations for the fiscal year ended August 31, 2013, are as follows:
Net investment income (loss) | $ | 12,547,737 | |||||
Net realized gain (loss) on investments | 27,137,575 | ||||||
Net unrealized gain (loss) on investments | 64,086,832 | ||||||
Net increase (decrease) in net assets resulting from operations | $ | 103,772,144 | |||||
Because the combined investment portfolios had been managed as a single integrated portfolio since the reorganization was completed, it is not practicable to separate the amounts of revenue and earnings of International that had been included in International Equity's Statement of Changes in Net Assets as of August 31, 2013.
Note H—Legal Matters:
In January 2013, International merged into International Equity and International Equity was the surviving Fund (See Note G above for additional disclosure).
Prior to the merger, in July 2010, Benjamin J. Gamoran filed a purported "Verified Derivative Complaint" in the Supreme Court of the State of New York naming, along with other defendants, the Trust as a nominal defendant. The suit alleged that the defendants are liable for losses related to International's investments in shares of certain companies that are alleged to have illegally offered or facilitated online gambling by individuals located in the United States and asserted purported state law derivative claims for breach of fiduciary duty, negligence, and waste. In August 2010, defendants removed the action to the United States District Court for the Southern District of New York. On May 11, 2011, the District Court dismissed the action without prejudice upon plaintiff's mid-suit demand on the Board. The Board named a committee of independent, non-involved Trustees to review the plaintiff's demand and to make a recommendation to the Board regarding how to appropriately respond. The committee retained independent counsel and conducted an investigation.
On August 24, 2011, plaintiff Gamoran filed another complaint, this time in Delaware federal court ("Gamoran III"). The case was later transferred to the Southern District of New York. The substantive underlying claims alleged in the Gamoran III complaint were similar to those that appeared in the July 2010 case discussed above and an earlier voluntarily dismissed action. The Gamoran III complaint also alleged some purported class claims. It sought relief including compensatory damages for the Trust representing the loss in value of the Trust's investments resulting from the allegedly illegal conduct, compensatory damages for individual shareholders for the investment losses, forfeiture and disgorgement of fees and commissions, treble and punitive damages, attorney's fees, and other items. While earlier complaints contended that demand was futile, the Gamoran III complaint alleged that plaintiff Gamoran had made demand but that filing the latest lawsuit was necessary to prevent the claims from being barred by the statute of limitations. The Gamoran III complaint named the Trust as a nominal defendant. Although none of the complaints to date appear to have sought a judgment against International, there might have been circumstances in which International could have been called upon to indemnify certain defendants. A full statement of plaintiff's claims and the relief sought are set forth in the Gamoran III complaint.
Defendants moved to dismiss the Gamoran III complaint. In his brief opposing defendants' motion to dismiss, plaintiff indicated that he does not intend to pursue his putative class claims. The committee named by the Trust's Board to evaluate the claims in plaintiff's May 2011 demand letter recommended that the Board decline to pursue those claims, and the Board adopted that recommendation. On March 16, 2012, counsel to the committee transmitted a letter to Mr. Gamoran's counsel notifying Mr. Gamoran of the Board's decision.
190
On June 12, 2012, the Court entered an order dismissing the initial Gamoran III complaint. Among other things, the Court rejected Mr. Gamoran's arguments that his claims under 18 U.S.C. §§ 1955(a) and 1962(c)-(d) were exempt from the demand requirement and that the Board took too long to respond to his demand. The Court further held that, in light of the Board's refusal of Mr. Gamoran's demand, the Gamoran III complaint addressed outdated circumstances in that it was predicated on the assumption that the Board had not responded to Mr. Gamoran's demand. The Court permitted Mr. Gamoran to file an amended complaint alleging that the Board's refusal of his demand was not protected by the business judgment rule.
On July 16, 2012, plaintiff Gamoran filed an amended derivative complaint repeating many of his earlier allegations and including allegations that the Board had wrongfully refused his demand. On August 24, 2012, defendants moved to dismiss.
On March 29, 2013 and April 1, 2013, respectively, the District Court entered an opinion and judgment dismissing Gamoran's amended derivative complaint in its entirety without prejudice. Among other things, the Court concluded that plaintiff's "predicate theory"—"that 18 U.S.C. § 1955['s] use of the term 'owns' includes purchasing or owning publicly traded stock in a foreign market"—is "without merit" and accordingly "dismisse[d] plaintiff's RICO claims." The Court also found that "none of plaintiff's allegations rise to the level of specificity required to overcome the strong deference owed to a board under the business judgment rule."
Plaintiff appealed the Court's decision on April 23, 2013, and defendants cross-appealed on May 3, 2013. On October 28, 2013, the Court of Appeals entered a summary order affirming the dismissal of plaintiff's amended derivative complaint on the basis of plaintiff's failure to allege wrongful refusal and directing the District Court to enter a judgment of dismissal with prejudice. After the issuance of the mandate, on or about November 28, 2013, the District Court entered a judgment dismissing the action with prejudice.
For the period ended August 31, 2014, the litigation, demand investigation and related fees recorded in the Statements of Operations were $31,179. The Trust has filed a claim under its insurance policy for reimbursement of certain litigation expenses. During the period ended August 31, 2014, the Trust did not receive insurance proceeds. Although there is no assurance as to whether or to what extent the insurance carrier will continue to pay on this claim, the Trust is hopeful that insurance proceeds may continue to offset a portion of its defensive litigation expenses. Costs of the demand investigation are not currently anticipated to be covered by the Trust's insurance policy.
Note I—Subsequent Events:
Management has evaluated the possibility of subsequent events affecting the Funds' financial statements through the date the financial statements were issued. On October 6, 2014, an investor holding 90% of Global Equity advised Management of its intention to redeem its holding. Management has no current intention to propose the liquidation of Global Equity and does not expect the redemption to affect Global Equity's operations. Management is not aware of any additional subsequent events that would require disclosure in the Funds' financial statements through the date the financial statements were issued.
191
This page has been left blank intentionally
192
Financial Highlights
The following tables include selected data for a share outstanding throughout each period and other performance information derived from the Financial Statements. Per share amounts that round to less than $0.01 or $(0.01) per share are presented as $0.00 or $(0.00), respectively. Ratios that round to less than 0.00% or (0.00%) per share are presented as 0.00% or (0.00%), respectively. Net Asset amounts with a zero balance may reflect actual amounts rounding to less than $0.1 million. A "—" indicates that the line item was not applicable in the corresponding period.
| Net Asset Value, Beginning of Year | Net Investment Income (Loss)@ | Net Gains or Losses on Securities (both realized and unrealized) | Total From Investment Operations | Dividends from Net Investment Income | Distributions from Net Realized Capital Gains | Tax Return of Capital | Total Distributions | Voluntary Contribution from Management | Redemption Feesøø | Net Asset Value, End of Year | Total Return†† | Net Assets, End of Year (in millions) | Ratio of Gross Expenses to Average Net Assets# | Ratio of Net Expenses to Average Net Assets‡ | Ratio of Net Investment Income/ (Loss) to Average Net Assets | Portfolio Turnover Rate | |||||||||||||||||||||||||||||||||||||||||||||||||||||||
| All Cap Core Fund§§§ | |||||||||||||||||||||||||||||||||||||||||||||||||||||||||||||||||||||||
Institutional Class | |||||||||||||||||||||||||||||||||||||||||||||||||||||||||||||||||||||||
8/31/2014 | $ | 10.18 | $ | 0.01 | $ | 2.18 | $ | 2.19 | $ | (0.01 | ) | $ | (0.94 | ) | $ | — | $ | (0.95 | ) | $ | 0.00 | $ | — | $ | 11.42 | 22.55 | % | $ | 59.3 | 1.03 | % | .75 | % | .12 | % | 62 | % | ||||||||||||||||||||||||||||||||||
8/31/2013 | $ | 9.34 | $ | 0.04 | $ | 1.54 | $ | 1.58 | $ | — | $ | (0.74 | ) | $ | — | $ | (0.74 | ) | $ | — | $ | — | $ | 10.18 | 17.97 | % | $ | 48.3 | 1.10 | % | .75 | % | .40 | % | 70 | % | |||||||||||||||||||||||||||||||||||
8/31/2012 | $ | 9.05 | $ | 0.02 | $ | 0.98 | $ | 1.00 | $ | (0.02 | ) | $ | (0.69 | ) | $ | — | $ | (0.71 | ) | $ | — | $ | — | $ | 9.34 | 12.21 | % | $ | 27.1 | 1.15 | % | .75 | % | .26 | % | 93 | % | ||||||||||||||||||||||||||||||||||
8/31/2011 | $ | 7.91 | $ | 0.06 | $ | 1.41 | $ | 1.47 | $ | (0.07 | ) | $ | (0.26 | ) | $ | — | $ | (0.33 | ) | $ | — | $ | — | $ | 9.05 | 18.62 | % | $ | 27.3 | 1.17 | % | .75 | % | .67 | % | 150 | % | ||||||||||||||||||||||||||||||||||
8/31/2010 | $ | 8.06 | $ | 0.06 | $ | (0.01 | ) | $ | 0.05 | $ | (0.05 | ) | $ | (0.15 | ) | $ | — | $ | (0.20 | ) | $ | — | $ | — | $ | 7.91 | .44 | % | $ | 17.6 | 1.22 | % | .75 | % | .78 | % | 129 | % | |||||||||||||||||||||||||||||||||
Class A | |||||||||||||||||||||||||||||||||||||||||||||||||||||||||||||||||||||||
8/31/2014 | $ | 10.08 | $ | (0.04 | ) | $ | 2.15 | $ | 2.11 | $ | — | $ | (0.94 | ) | $ | — | $ | (0.94 | ) | $ | 0.00 | $ | — | $ | 11.25 | 21.95 | % | $ | 25.7 | 1.40 | % | 1.20 | % | (.34 | %) | 62 | % | ||||||||||||||||||||||||||||||||||
8/31/2013 | $ | 9.29 | $ | (0.00 | ) | $ | 1.53 | $ | 1.53 | $ | — | $ | (0.74 | ) | $ | — | $ | (0.74 | ) | $ | — | $ | — | $ | 10.08 | 17.50 | % | $ | 30.7 | 1.48 | % | 1.20 | % | (.02 | %) | 70 | % | ||||||||||||||||||||||||||||||||||
8/31/2012 | $ | 9.03 | $ | (0.02 | ) | $ | 0.97 | $ | 0.95 | $ | — | $ | (0.69 | ) | $ | — | $ | (0.69 | ) | $ | — | $ | — | $ | 9.29 | 11.62 | % | $ | 29.2 | 1.53 | % | 1.20 | % | (.20 | %) | 93 | % | ||||||||||||||||||||||||||||||||||
8/31/2011 | $ | 7.88 | $ | 0.02 | $ | 1.41 | $ | 1.43 | $ | (0.02 | ) | $ | (0.26 | ) | $ | — | $ | (0.28 | ) | $ | — | $ | — | $ | 9.03 | 18.15 | % | $ | 30.9 | 1.58 | % | 1.20 | % | .23 | % | 150 | % | ||||||||||||||||||||||||||||||||||
8/31/2010 | $ | 8.05 | $ | 0.03 | $ | (0.03 | ) | $ | 0.00 | $ | (0.02 | ) | $ | (0.15 | ) | $ | — | $ | (0.17 | ) | $ | — | $ | — | $ | 7.88 | (.11 | %) | $ | 38.0 | 1.60 | % | 1.20 | % | .36 | % | 129 | % | |||||||||||||||||||||||||||||||||
Class C | |||||||||||||||||||||||||||||||||||||||||||||||||||||||||||||||||||||||
8/31/2014 | $ | 9.64 | $ | (0.11 | ) | $ | 2.05 | $ | 1.94 | $ | — | $ | (0.94 | ) | $ | — | $ | (0.94 | ) | $ | 0.00 | $ | — | $ | 10.64 | 21.13 | % | $ | 15.6 | 2.15 | % | 1.95 | % | (1.08 | %) | 62 | % | ||||||||||||||||||||||||||||||||||
8/31/2013 | $ | 8.98 | $ | (0.07 | ) | $ | 1.47 | $ | 1.40 | $ | — | $ | (0.74 | ) | $ | — | $ | (0.74 | ) | $ | — | $ | — | $ | 9.64 | 16.60 | % | $ | 13.6 | 2.23 | % | 1.95 | % | (.78 | %) | 70 | % | ||||||||||||||||||||||||||||||||||
8/31/2012 | $ | 8.82 | $ | (0.08 | ) | $ | 0.93 | $ | 0.85 | $ | — | $ | (0.69 | ) | $ | — | $ | (0.69 | ) | $ | — | $ | — | $ | 8.98 | 10.71 | % | $ | 11.7 | 2.28 | % | 1.95 | % | (.96 | %) | 93 | % | ||||||||||||||||||||||||||||||||||
8/31/2011 | $ | 7.74 | $ | (0.05 | ) | $ | 1.39 | $ | 1.34 | $ | — | $ | (0.26 | ) | $ | — | $ | (0.26 | ) | $ | — | $ | — | $ | 8.82 | 17.29 | % | $ | 13.2 | 2.30 | % | 1.95 | % | (.53 | %) | 150 | % | ||||||||||||||||||||||||||||||||||
8/31/2010 | $ | 7.94 | $ | (0.03 | ) | $ | (0.02 | ) | $ | (0.05 | ) | $ | — | $ | (0.15 | ) | $ | — | $ | (0.15 | ) | $ | — | $ | — | $ | 7.74 | (.75 | %) | $ | 11.6 | 2.35 | % | 1.95 | % | (.41 | %) | 129 | % | ||||||||||||||||||||||||||||||||
Emerging Markets Equity Fund | |||||||||||||||||||||||||||||||||||||||||||||||||||||||||||||||||||||||
Institutional Class | |||||||||||||||||||||||||||||||||||||||||||||||||||||||||||||||||||||||
8/31/2014 | $ | 15.34 | $ | 0.16 | $ | 2.48 | $ | 2.64 | $ | (0.09 | ) | $ | — | $ | — | $ | (0.09 | ) | $ | 0.00 | $ | — | $ | 17.89 | 17.24 | % | $ | 514.8 | 1.45 | % | 1.25 | % | .96 | % | 36 | % | |||||||||||||||||||||||||||||||||||
8/31/2013 | $ | 14.99 | $ | 0.18 | $ | 0.24 | $ | 0.42 | $ | (0.07 | ) | $ | — | $ | — | $ | (0.07 | ) | $ | — | $ | — | $ | 15.34 | 2.77 | % | $ | 374.1 | 1.60 | % | 1.25 | % | 1.10 | % | 36 | % | |||||||||||||||||||||||||||||||||||
8/31/2012 | $ | 15.80 | $ | 0.13 | $ | (0.86 | ) | $ | (0.73 | ) | $ | (0.08 | ) | $ | — | $ | — | $ | (0.08 | ) | $ | — | $ | — | $ | 14.99 | (4.53 | %) | $ | 161.7 | 1.77 | % | 1.25 | % | .89 | % | 78 | % | |||||||||||||||||||||||||||||||||
8/31/2011 | $ | 15.61 | $ | 0.18 | $ | 0.40 | $ | 0.58 | $ | (0.03 | ) | $ | (0.36 | ) | $ | — | $ | (0.39 | ) | $ | — | $ | 0.00 | $ | 15.80 | 3.44 | % | $ | 107.7 | 2.56 | % | 1.26 | % | 1.05 | % | 71 | % | ||||||||||||||||||||||||||||||||||
8/31/2010 | $ | 14.05 | $ | 0.11 | $ | 2.51 | $ | 2.62 | $ | (0.06 | ) | $ | (1.00 | ) | $ | — | $ | (1.06 | ) | $ | — | $ | 0.00 | $ | 15.61 | 18.76 | % | $ | 9.0 | 6.65 | % | 1.26 | % | .72 | % | 81 | % | ||||||||||||||||||||||||||||||||||
See Notes to Financial Highlights
193
194
Financial Highlights (cont'd)
| Net Asset Value, Beginning of Year | Net Investment Income (Loss)@ | Net Gains or Losses on Securities (both realized and unrealized) | Total From Investment Operations | Dividends from Net Investment Income | Distributions from Net Realized Capital Gains | Tax Return of Capital | Total Distributions | Voluntary Contribution from Management | Redemption Feesøø | Net Asset Value, End of Year | Total Return†† | Net Assets, End of Year (in millions) | Ratio of Gross Expenses to Average Net Assets# | Ratio of Net Expenses to Average Net Assets‡ | Ratio of Net Investment Income/ (Loss) to Average Net Assets | Portfolio Turnover Rate | |||||||||||||||||||||||||||||||||||||||||||||||||||||||
Emerging Markets Equity Fund (cont'd) | |||||||||||||||||||||||||||||||||||||||||||||||||||||||||||||||||||||||
Class A | |||||||||||||||||||||||||||||||||||||||||||||||||||||||||||||||||||||||
8/31/2014 | $ | 15.27 | $ | 0.15 | $ | 2.44 | $ | 2.59 | $ | (0.06 | ) | $ | — | $ | — | $ | (0.06 | ) | $ | 0.00 | $ | — | $ | 17.80 | 16.99 | % | $ | 19.9 | 1.82 | % | 1.50 | % | .88 | % | 36 | % | |||||||||||||||||||||||||||||||||||
8/31/2013 | $ | 14.92 | $ | 0.11 | $ | 0.27 | $ | 0.38 | $ | (0.03 | ) | $ | — | $ | — | $ | (0.03 | ) | $ | — | $ | — | $ | 15.27 | 2.54 | % | $ | 7.3 | 2.00 | % | 1.50 | % | .69 | % | 36 | % | |||||||||||||||||||||||||||||||||||
8/31/2012 | $ | 15.74 | $ | 0.08 | $ | (0.85 | ) | $ | (0.77 | ) | $ | (0.05 | ) | $ | — | $ | — | $ | (0.05 | ) | $ | — | $ | — | $ | 14.92 | (4.84 | %) | $ | 4.1 | 2.23 | % | 1.50 | % | .53 | % | 78 | % | |||||||||||||||||||||||||||||||||
8/31/2011 | $ | 15.57 | $ | 0.03 | $ | 0.50 | $ | 0.53 | $ | — | $ | (0.36 | ) | $ | — | $ | (0.36 | ) | $ | — | $ | 0.00 | $ | 15.74 | 3.16 | % | $ | 4.9 | 3.22 | % | 1.50 | % | .19 | % | 71 | % | |||||||||||||||||||||||||||||||||||
8/31/2010 | $ | 14.02 | $ | 0.09 | $ | 2.50 | $ | 2.59 | $ | (0.04 | ) | $ | (1.00 | ) | $ | — | $ | (1.04 | ) | $ | — | $ | 0.00 | $ | 15.57 | 18.58 | % | $ | 5.5 | 6.71 | % | 1.51 | % | .61 | % | 81 | % | ||||||||||||||||||||||||||||||||||
Class C | |||||||||||||||||||||||||||||||||||||||||||||||||||||||||||||||||||||||
8/31/2014 | $ | 14.87 | $ | 0.00 | $ | 2.39 | $ | 2.39 | $ | — | $ | — | $ | — | $ | — | $ | 0.00 | $ | — | $ | 17.26 | 16.07 | % | $ | 7.0 | 2.56 | % | 2.25 | % | .01 | % | 36 | % | |||||||||||||||||||||||||||||||||||||
8/31/2013 | $ | 14.61 | $ | 0.02 | $ | 0.24 | $ | 0.26 | $ | — | $ | — | $ | — | $ | — | $ | — | $ | — | $ | 14.87 | 1.78 | % | $ | 4.1 | 2.73 | % | 2.25 | % | .13 | % | 36 | % | |||||||||||||||||||||||||||||||||||||
8/31/2012 | $ | 15.46 | $ | (0.02 | ) | $ | (0.83 | ) | $ | (0.85 | ) | $ | — | $ | — | $ | — | $ | — | $ | — | $ | — | $ | 14.61 | (5.50 | %) | $ | 1.4 | 2.93 | % | 2.25 | % | (.17 | %) | 78 | % | ||||||||||||||||||||||||||||||||||
8/31/2011 | $ | 15.41 | $ | (0.02 | ) | $ | 0.43 | $ | 0.41 | $ | — | $ | (0.36 | ) | $ | — | $ | (0.36 | ) | $ | — | $ | 0.00 | $ | 15.46 | 2.41 | % | $ | 1.1 | 3.80 | % | 2.26 | % | (.12 | %) | 71 | % | ||||||||||||||||||||||||||||||||||
8/31/2010 | $ | 13.96 | $ | (0.10 | ) | $ | 2.55 | $ | 2.45 | $ | — | $ | (1.00 | ) | $ | — | $ | (1.00 | ) | $ | — | $ | 0.00 | $ | 15.41 | 17.62 | % | $ | 0.2 | 7.05 | % | 2.26 | % | (.63 | %) | 81 | % | ||||||||||||||||||||||||||||||||||
Class R3 | |||||||||||||||||||||||||||||||||||||||||||||||||||||||||||||||||||||||
8/31/2014 | $ | 15.02 | $ | 0.07 | $ | 2.39 | $ | 2.46 | $ | (0.01 | ) | $ | — | $ | — | $ | (0.01 | ) | $ | 0.00 | $ | — | $ | 17.47 | 16.42 | % | $ | 0.6 | 2.13 | % | 1.91 | % | .45 | % | 36 | % | |||||||||||||||||||||||||||||||||||
8/31/2013 | $ | 14.71 | $ | 0.03 | $ | 0.28 | $ | 0.31 | $ | — | $ | — | $ | — | $ | — | $ | — | $ | — | $ | 15.02 | 2.11 | % | $ | 0.2 | 2.31 | % | 1.91 | % | .22 | % | 36 | % | |||||||||||||||||||||||||||||||||||||
8/31/2012 | $ | 15.52 | $ | 0.04 | $ | (0.85 | ) | $ | (0.81 | ) | $ | — | $ | — | $ | — | $ | — | $ | — | $ | — | $ | 14.71 | (5.22 | %) | $ | 0.3 | 2.49 | % | 1.92 | % | .28 | % | 78 | % | |||||||||||||||||||||||||||||||||||
8/31/2011 | $ | 15.42 | $ | (0.01 | ) | $ | 0.47 | $ | 0.46 | $ | — | $ | (0.36 | ) | $ | — | $ | (0.36 | ) | $ | — | $ | 0.00 | $ | 15.52 | 2.73 | % | $ | 0.0 | 8.02 | % | 1.91 | % | (.04 | %) | 71 | % | ||||||||||||||||||||||||||||||||||
| Period from 6/21/2010^ to 8/31/2010 | $ | 15.10 | $ | (0.00 | ) | $ | 0.32 | $ | 0.32 | $ | — | $ | — | $ | — | $ | — | $ | — | $ | 0.00 | $ | 15.42 | 2.12 | %** | $ | 0.0 | 39.77 | %* | 1.93 | %* | (.09 | %)* | 81 | %Ø | ||||||||||||||||||||||||||||||||||||
Class R6 | |||||||||||||||||||||||||||||||||||||||||||||||||||||||||||||||||||||||
8/31/2014 | $ | 15.35 | $ | 0.18 | $ | 2.47 | $ | 2.65 | $ | (0.09 | ) | $ | — | $ | — | $ | (0.09 | ) | $ | 0.00 | $ | — | $ | 17.91 | 17.35 | % | $ | 83.8 | 1.37 | % | 1.18 | % | 1.08 | % | 36 | % | |||||||||||||||||||||||||||||||||||
| Period from 3/15/2013^ to 8/31/2013 | $ | 16.85 | $ | 0.13 | $ | (1.63 | ) | $ | (1.50 | ) | $ | — | $ | — | $ | — | $ | — | $ | — | $ | — | $ | 15.35 | (8.90 | %)** | $ | 31.1 | 1.57 | %* | 1.18 | %* | 1.80 | %* | 36 | %Ø | |||||||||||||||||||||||||||||||||||
Equity Income Fund | |||||||||||||||||||||||||||||||||||||||||||||||||||||||||||||||||||||||
Institutional Class | |||||||||||||||||||||||||||||||||||||||||||||||||||||||||||||||||||||||
8/31/2014 | $ | 11.76 | $ | 0.33 | $ | 1.94 | $ | 2.27 | $ | (0.33 | ) | $ | (0.51 | ) | $ | — | $ | (0.84 | ) | $ | 0.00 | $ | — | $ | 13.19 | 20.11 | % | $ | 1,578.5 | .68 | % | .68 | % | 2.66 | % | 41 | % | ||||||||||||||||||||||||||||||||||
8/31/2013 | $ | 11.74 | $ | 0.30 | $ | 0.25 | $ | 0.55 | $ | (0.42 | ) | $ | (0.11 | ) | $ | — | $ | (0.53 | ) | $ | — | $ | — | $ | 11.76 | 4.79 | % | $ | 1,439.4 | .68 | % | .68 | % | 2.45 | % | 70 | % | ||||||||||||||||||||||||||||||||||
8/31/2012 | $ | 11.28 | $ | 0.35 | $ | 0.57 | $ | 0.92 | $ | (0.38 | ) | $ | (0.08 | ) | $ | — | $ | (0.46 | ) | $ | — | $ | — | $ | 11.74 | 8.49 | % | $ | 1,213.6 | .71 | % | .71 | %§ | 3.10 | % | 42 | % | ||||||||||||||||||||||||||||||||||
8/31/2011 | $ | 10.02 | $ | 0.33 | $ | 1.41 | $ | 1.74 | $ | (0.48 | ) | $ | — | $ | — | $ | (0.48 | ) | $ | — | $ | — | $ | 11.28 | 17.70 | % | $ | 701.7 | .80 | % | .80 | %§ | 2.93 | % | 22 | % | |||||||||||||||||||||||||||||||||||
8/31/2010 | $ | 8.74 | $ | 0.40 | $ | 1.22 | $ | 1.62 | $ | (0.34 | ) | $ | — | $ | — | $ | (0.34 | ) | $ | — | $ | — | $ | 10.02 | 18.81 | % | $ | 100.9 | 1.01 | % | .80 | % | 4.09 | % | 29 | % | |||||||||||||||||||||||||||||||||||
See Notes to Financial Highlights
195
196
Financial Highlights (cont'd)
| Net Asset Value, Beginning of Year | Net Investment Income (Loss)@ | Net Gains or Losses on Securities (both realized and unrealized) | Total From Investment Operations | Dividends from Net Investment Income | Distributions from Net Realized Capital Gains | Tax Return of Capital | Total Distributions | Voluntary Contribution from Management | Redemption Feesøø | Net Asset Value, End of Year | Total Return†† | Net Assets, End of Year (in millions) | Ratio of Gross Expenses to Average Net Assets# | Ratio of Net Expenses to Average Net Assets‡ | Ratio of Net Investment Income/ (Loss) to Average Net Assets | Portfolio Turnover Rate | |||||||||||||||||||||||||||||||||||||||||||||||||||||||
Equity Income Fund (cont'd) | |||||||||||||||||||||||||||||||||||||||||||||||||||||||||||||||||||||||
Class A | |||||||||||||||||||||||||||||||||||||||||||||||||||||||||||||||||||||||
8/31/2014 | $ | 11.71 | $ | 0.27 | $ | 1.95 | $ | 2.22 | $ | (0.28 | ) | $ | (0.51 | ) | $ | — | $ | (0.79 | ) | $ | 0.00 | $ | — | $ | 13.14 | 19.72 | % | $ | 462.6 | 1.05 | % | 1.05 | % | 2.21 | % | 41 | % | ||||||||||||||||||||||||||||||||||
8/31/2013 | $ | 11.70 | $ | 0.25 | $ | 0.25 | $ | 0.50 | $ | (0.38 | ) | $ | (0.11 | ) | $ | — | $ | (0.49 | ) | $ | — | $ | — | $ | 11.71 | 4.32 | % | $ | 1,036.4 | 1.05 | % | 1.05 | % | 2.09 | % | 70 | % | ||||||||||||||||||||||||||||||||||
8/31/2012 | $ | 11.24 | $ | 0.30 | $ | 0.57 | $ | 0.87 | $ | (0.33 | ) | $ | (0.08 | ) | $ | — | $ | (0.41 | ) | $ | — | $ | — | $ | 11.70 | 8.09 | % | $ | 1,012.3 | 1.13 | % | 1.13 | %§ | 2.70 | % | 42 | % | ||||||||||||||||||||||||||||||||||
8/31/2011 | $ | 9.99 | $ | 0.28 | $ | 1.41 | $ | 1.69 | $ | (0.44 | ) | $ | — | $ | — | $ | (0.44 | ) | $ | — | $ | — | $ | 11.24 | 17.27 | % | $ | 567.0 | 1.16 | % | 1.16 | %§ | 2.50 | % | 22 | % | |||||||||||||||||||||||||||||||||||
8/31/2010 | $ | 8.72 | $ | 0.36 | $ | 1.22 | $ | 1.58 | $ | (0.31 | ) | $ | — | $ | — | $ | (0.31 | ) | $ | — | $ | — | $ | 9.99 | 18.36 | % | $ | 176.6 | 1.36 | % | 1.16 | % | 3.70 | % | 29 | % | |||||||||||||||||||||||||||||||||||
Class C | |||||||||||||||||||||||||||||||||||||||||||||||||||||||||||||||||||||||
8/31/2014 | $ | 11.65 | $ | 0.19 | $ | 1.92 | $ | 2.11 | $ | (0.19 | ) | $ | (0.51 | ) | $ | — | $ | (0.70 | ) | $ | 0.00 | $ | — | $ | 13.06 | 18.77 | % | $ | 450.1 | 1.79 | % | 1.79 | % | 1.54 | % | 41 | % | ||||||||||||||||||||||||||||||||||
8/31/2013 | $ | 11.64 | $ | 0.16 | $ | 0.25 | $ | 0.41 | $ | (0.29 | ) | $ | (0.11 | ) | $ | — | $ | (0.40 | ) | $ | — | $ | — | $ | 11.65 | 3.58 | % | $ | 465.7 | 1.80 | % | 1.80 | % | 1.34 | % | 70 | % | ||||||||||||||||||||||||||||||||||
8/31/2012 | $ | 11.18 | $ | 0.22 | $ | 0.58 | $ | 0.80 | $ | (0.26 | ) | $ | (0.08 | ) | $ | — | $ | (0.34 | ) | $ | — | $ | — | $ | 11.64 | 7.40 | % | $ | 380.4 | 1.84 | % | 1.84 | %§ | 1.98 | % | 42 | % | ||||||||||||||||||||||||||||||||||
8/31/2011 | $ | 9.96 | $ | 0.20 | $ | 1.40 | $ | 1.60 | $ | (0.38 | ) | $ | — | $ | — | $ | (0.38 | ) | $ | — | $ | — | $ | 11.18 | 16.31 | % | $ | 233.2 | 1.91 | % | 1.91 | %§ | 1.81 | % | 22 | % | |||||||||||||||||||||||||||||||||||
8/31/2010 | $ | 8.70 | $ | 0.31 | $ | 1.20 | $ | 1.51 | $ | (0.25 | ) | $ | — | $ | — | $ | (0.25 | ) | $ | — | $ | — | $ | 9.96 | 17.59 | % | $ | 44.0 | 2.12 | % | 1.91 | % | 3.15 | % | 29 | % | |||||||||||||||||||||||||||||||||||
Class R3 | |||||||||||||||||||||||||||||||||||||||||||||||||||||||||||||||||||||||
8/31/2014 | $ | 11.69 | $ | 0.25 | $ | 1.93 | $ | 2.18 | $ | (0.24 | ) | $ | (0.51 | ) | $ | — | $ | (0.75 | ) | $ | 0.00 | $ | — | $ | 13.12 | 19.42 | % | $ | 3.4 | 1.34 | % | 1.34 | %§ | 2.04 | % | 41 | % | ||||||||||||||||||||||||||||||||||
8/31/2013 | $ | 11.69 | $ | 0.22 | $ | 0.23 | $ | 0.45 | $ | (0.34 | ) | $ | (0.11 | ) | $ | — | $ | (0.45 | ) | $ | — | $ | — | $ | 11.69 | 3.94 | % | $ | 2.6 | 1.41 | % | 1.41 | %§ | 1.78 | % | 70 | % | ||||||||||||||||||||||||||||||||||
8/31/2012 | $ | 11.24 | $ | 0.29 | $ | 0.55 | $ | 0.84 | $ | (0.31 | ) | $ | (0.08 | ) | $ | — | $ | (0.39 | ) | $ | — | $ | — | $ | 11.69 | 7.78 | % | $ | 1.1 | 1.41 | % | 1.41 | %§ | 2.59 | % | 42 | % | ||||||||||||||||||||||||||||||||||
8/31/2011 | $ | 9.99 | $ | 0.27 | $ | 1.39 | $ | 1.66 | $ | (0.41 | ) | $ | — | $ | — | $ | (0.41 | ) | $ | — | $ | — | $ | 11.24 | 16.92 | % | $ | 0.2 | 4.32 | % | 1.41 | % | 2.44 | % | 22 | % | |||||||||||||||||||||||||||||||||||
| Period from 6/21/2010^ to 8/31/2010 | $ | 10.06 | $ | 0.11 | $ | (0.12 | ) | $ | (0.01 | ) | $ | (0.06 | ) | $ | — | $ | — | $ | (0.06 | ) | $ | — | $ | — | $ | 9.99 | (.04 | %)** | $ | 0.0 | 36.17 | %* | 1.41 | %* | 5.53 | %* | 29 | %Ø | |||||||||||||||||||||||||||||||||
Focus Fund | |||||||||||||||||||||||||||||||||||||||||||||||||||||||||||||||||||||||
Investor Class | |||||||||||||||||||||||||||||||||||||||||||||||||||||||||||||||||||||||
8/31/2014 | $ | 26.90 | $ | 0.18 | $ | 5.57 | $ | 5.75 | $ | (0.20 | ) | $ | (2.68 | ) | $ | — | $ | (2.88 | ) | $ | 0.00 | $ | — | $ | 29.77 | 22.65 | % | $ | 699.4 | .91 | % | .91 | % | .64 | % | 84 | % | ||||||||||||||||||||||||||||||||||
8/31/2013 | $ | 21.71 | $ | 0.18 | $ | 5.15 | $ | 5.33 | $ | (0.14 | ) | $ | — | $ | — | $ | (0.14 | ) | $ | — | $ | — | $ | 26.90 | 24.69 | % | $ | 636.9 | .94 | % | .94 | % | .72 | % | 79 | % | |||||||||||||||||||||||||||||||||||
8/31/2012 | $ | 18.80 | $ | 0.14 | $ | 2.87 | $ | 3.01 | $ | (0.10 | ) | $ | — | $ | — | $ | (0.10 | ) | $ | — | $ | — | $ | 21.71 | 16.10 | % | $ | 534.3 | .97 | % | .97 | % | .72 | % | 96 | % | |||||||||||||||||||||||||||||||||||
8/31/2011 | $ | 16.07 | $ | 0.13 | $ | 2.70 | $ | 2.83 | $ | (0.10 | ) | $ | — | $ | — | $ | (0.10 | ) | $ | — | $ | — | $ | 18.80 | 17.61 | % | $ | 503.8 | .97 | % | .97 | % | .65 | % | 113 | % | |||||||||||||||||||||||||||||||||||
8/31/2010 | $ | 16.59 | $ | 0.11 | $ | (0.50 | ) | $ | (0.39 | ) | $ | (0.13 | ) | $ | — | $ | — | $ | (0.13 | ) | $ | — | $ | — | $ | 16.07 | (2.39 | %) | $ | 478.8 | .97 | % | .97 | % | .61 | % | 89 | % | |||||||||||||||||||||||||||||||||
Trust Class | |||||||||||||||||||||||||||||||||||||||||||||||||||||||||||||||||||||||
8/31/2014 | $ | 19.50 | $ | 0.09 | $ | 3.94 | $ | 4.03 | $ | (0.21 | ) | $ | (2.68 | ) | $ | — | $ | (2.89 | ) | $ | 0.00 | $ | — | $ | 20.64 | 22.40 | % | $ | 125.7 | 1.11 | % | 1.11 | % | .47 | % | 84 | % | ||||||||||||||||||||||||||||||||||
8/31/2013 | $ | 15.78 | $ | 0.10 | $ | 3.74 | $ | 3.84 | $ | (0.12 | ) | $ | — | $ | — | $ | (0.12 | ) | $ | — | $ | — | $ | 19.50 | 24.48 | % | $ | 56.3 | 1.14 | % | 1.14 | % | .53 | % | 79 | % | |||||||||||||||||||||||||||||||||||
8/31/2012 | $ | 13.70 | $ | 0.07 | $ | 2.08 | $ | 2.15 | $ | (0.07 | ) | $ | — | $ | — | $ | (0.07 | ) | $ | — | $ | — | $ | 15.78 | 15.82 | % | $ | 15.0 | 1.16 | % | 1.16 | % | .52 | % | 96 | % | |||||||||||||||||||||||||||||||||||
8/31/2011 | $ | 11.73 | $ | 0.06 | $ | 1.98 | $ | 2.04 | $ | (0.07 | ) | $ | — | $ | — | $ | (0.07 | ) | $ | — | $ | — | $ | 13.70 | 17.39 | % | $ | 17.9 | 1.16 | % | 1.16 | % | .45 | % | 113 | % | |||||||||||||||||||||||||||||||||||
8/31/2010 | $ | 12.14 | $ | 0.05 | $ | (0.36 | ) | $ | (0.31 | ) | $ | (0.10 | ) | $ | — | $ | — | $ | (0.10 | ) | $ | — | $ | — | $ | 11.73 | (2.61 | %) | $ | 18.9 | 1.19 | % | 1.19 | % | .38 | % | 89 | % | |||||||||||||||||||||||||||||||||
See Notes to Financial Highlights
197
198
Financial Highlights (cont'd)
| Net Asset Value, Beginning of Year | Net Investment Income (Loss)@ | Net Gains or Losses on Securities (both realized and unrealized) | Total From Investment Operations | Dividends from Net Investment Income | Distributions from Net Realized Capital Gains | Tax Return of Capital | Total Distributions | Voluntary Contribution from Management | Redemption Feesøø | Net Asset Value, End of Year | Total Return†† | Net Assets, End of Year (in millions) | Ratio of Gross Expenses to Average Net Assets# | Ratio of Net Expenses to Average Net Assets‡ | Ratio of Net Investment Income/ (Loss) to Average Net Assets | Portfolio Turnover Rate | |||||||||||||||||||||||||||||||||||||||||||||||||||||||
Focus Fund (cont'd) | |||||||||||||||||||||||||||||||||||||||||||||||||||||||||||||||||||||||
Advisor Class | |||||||||||||||||||||||||||||||||||||||||||||||||||||||||||||||||||||||
8/31/2014 | $ | 13.27 | $ | 0.04 | $ | 2.57 | $ | 2.61 | $ | (0.17 | ) | $ | (2.68 | ) | $ | — | $ | (2.85 | ) | $ | 0.00 | $ | — | $ | 13.03 | 22.21 | % | $ | 7.1 | 1.27 | % | 1.27 | % | .28 | % | 84 | % | ||||||||||||||||||||||||||||||||||
8/31/2013 | $ | 10.79 | $ | 0.04 | $ | 2.55 | $ | 2.59 | $ | (0.11 | ) | $ | — | $ | — | $ | (0.11 | ) | $ | — | $ | — | $ | 13.27 | 24.22 | % | $ | 6.1 | 1.29 | % | 1.29 | % | .37 | % | 79 | % | |||||||||||||||||||||||||||||||||||
8/31/2012 | $ | 9.41 | $ | 0.04 | $ | 1.42 | $ | 1.46 | $ | (0.08 | ) | $ | — | $ | — | $ | (0.08 | ) | $ | — | $ | — | $ | 10.79 | 15.68 | % | $ | 5.8 | 1.31 | % | 1.31 | % | .37 | % | 96 | % | |||||||||||||||||||||||||||||||||||
8/31/2011 | $ | 8.08 | $ | 0.03 | $ | 1.36 | $ | 1.39 | $ | (0.06 | ) | $ | — | $ | — | $ | (0.06 | ) | $ | — | $ | — | $ | 9.41 | 17.20 | % | $ | 7.8 | 1.32 | % | 1.32 | % | .30 | % | 113 | % | |||||||||||||||||||||||||||||||||||
8/31/2010 | $ | 8.40 | $ | 0.01 | $ | (0.24 | ) | $ | (0.23 | ) | $ | (0.09 | ) | $ | — | $ | — | $ | (0.09 | ) | $ | — | $ | — | $ | 8.08 | (2.83 | %) | $ | 7.7 | 1.42 | % | 1.42 | %§ | .15 | % | 89 | % | |||||||||||||||||||||||||||||||||
Institutional Class | |||||||||||||||||||||||||||||||||||||||||||||||||||||||||||||||||||||||
8/31/2014 | $ | 26.95 | $ | 0.21 | $ | 5.60 | $ | 5.81 | $ | (0.25 | ) | $ | (2.68 | ) | $ | — | $ | (2.93 | ) | $ | 0.00 | $ | — | $ | 29.83 | 22.86 | % | $ | 9.4 | .76 | % | .75 | % | .72 | % | 84 | % | ||||||||||||||||||||||||||||||||||
8/31/2013 | $ | 21.76 | $ | 0.24 | $ | 5.14 | $ | 5.38 | $ | (0.19 | ) | $ | — | $ | — | $ | (0.19 | ) | $ | — | $ | — | $ | 26.95 | 24.89 | % | $ | 22.6 | .77 | % | .75 | % | .96 | % | 79 | % | |||||||||||||||||||||||||||||||||||
8/31/2012 | $ | 18.84 | $ | 0.19 | $ | 2.87 | $ | 3.06 | $ | (0.14 | ) | $ | — | $ | — | $ | (0.14 | ) | $ | — | $ | — | $ | 21.76 | 16.39 | % | $ | 6.9 | .80 | % | .75 | % | .97 | % | 96 | % | |||||||||||||||||||||||||||||||||||
8/31/2011 | $ | 16.08 | $ | 0.21 | $ | 2.66 | $ | 2.87 | $ | (0.11 | ) | $ | — | $ | — | $ | (0.11 | ) | $ | — | $ | — | $ | 18.84 | 17.85 | % | $ | 4.9 | .85 | % | .75 | % | 1.03 | % | 113 | % | |||||||||||||||||||||||||||||||||||
| Period from 6/21/2010^ to 8/31/2010 | $ | 17.77 | $ | 0.06 | $ | (1.75 | ) | $ | (1.69 | ) | $ | — | $ | — | $ | — | $ | — | $ | — | $ | — | $ | 16.08 | (9.51 | %)** | $ | 0.0 | 36.90 | %* | .75 | %* | 1.80 | %* | 89 | %Ø | |||||||||||||||||||||||||||||||||||
Class A | |||||||||||||||||||||||||||||||||||||||||||||||||||||||||||||||||||||||
8/31/2014 | $ | 19.38 | $ | 0.09 | $ | 3.91 | $ | 4.00 | $ | (0.20 | ) | $ | (2.68 | ) | $ | — | $ | (2.88 | ) | $ | 0.00 | $ | — | $ | 20.50 | 22.40 | % | $ | 3.9 | 1.13 | % | 1.11 | % | .47 | % | 84 | % | ||||||||||||||||||||||||||||||||||
8/31/2013 | $ | 15.71 | $ | 0.10 | $ | 3.71 | $ | 3.81 | $ | (0.14 | ) | $ | — | $ | — | $ | (0.14 | ) | $ | — | $ | — | $ | 19.38 | 24.47 | % | $ | 1.9 | 1.19 | % | 1.11 | % | .56 | % | 79 | % | |||||||||||||||||||||||||||||||||||
8/31/2012 | $ | 13.67 | $ | 0.09 | $ | 2.07 | $ | 2.16 | $ | (0.12 | ) | $ | — | $ | — | $ | (0.12 | ) | $ | — | $ | — | $ | 15.71 | 15.96 | % | $ | 0.7 | 1.22 | % | 1.11 | % | .61 | % | 96 | % | |||||||||||||||||||||||||||||||||||
8/31/2011 | $ | 11.73 | $ | 0.10 | $ | 1.95 | $ | 2.05 | $ | (0.11 | ) | $ | — | $ | — | $ | (0.11 | ) | $ | — | $ | — | $ | 13.67 | 17.43 | % | $ | 0.4 | 2.20 | % | 1.11 | % | .66 | % | 113 | % | |||||||||||||||||||||||||||||||||||
| Period from 6/21/2010^ to 8/31/2010 | $ | 12.97 | $ | 0.03 | $ | (1.27 | ) | $ | (1.24 | ) | $ | — | $ | — | $ | — | $ | — | $ | — | $ | — | $ | 11.73 | (9.56 | %)** | $ | 0.0 | 37.28 | %* | 1.11 | %* | 1.44 | %* | 89 | %Ø | |||||||||||||||||||||||||||||||||||
Class C | |||||||||||||||||||||||||||||||||||||||||||||||||||||||||||||||||||||||
8/31/2014 | $ | 13.03 | $ | (0.03 | ) | $ | 2.52 | $ | 2.49 | $ | (0.14 | ) | $ | (2.68 | ) | $ | — | $ | (2.82 | ) | $ | 0.00 | $ | — | $ | 12.70 | 21.52 | % | $ | 1.5 | 1.91 | % | 1.86 | % | (.27 | %) | 84 | % | |||||||||||||||||||||||||||||||||
8/31/2013 | $ | 10.62 | $ | (0.02 | ) | $ | 2.51 | $ | 2.49 | $ | (0.08 | ) | $ | — | $ | — | $ | (0.08 | ) | $ | — | $ | — | $ | 13.03 | 23.61 | % | $ | 0.6 | 1.94 | % | 1.86 | % | (.20 | %) | 79 | % | ||||||||||||||||||||||||||||||||||
8/31/2012 | $ | 9.32 | $ | (0.02 | ) | $ | 1.41 | $ | 1.39 | $ | (0.09 | ) | $ | — | $ | — | $ | (0.09 | ) | $ | — | $ | — | $ | 10.62 | 15.04 | % | $ | 0.3 | 1.97 | % | 1.86 | % | (.17 | %) | 96 | % | ||||||||||||||||||||||||||||||||||
8/31/2011 | $ | 8.07 | $ | (0.02 | ) | $ | 1.36 | $ | 1.34 | $ | (0.09 | ) | $ | — | $ | — | $ | (0.09 | ) | $ | — | $ | — | $ | 9.32 | 16.62 | % | $ | 0.3 | 2.92 | % | 1.86 | % | (.16 | %) | 113 | % | ||||||||||||||||||||||||||||||||||
| Period from 6/21/2010^ to 8/31/2010 | $ | 8.94 | $ | 0.01 | $ | (0.88 | ) | $ | (0.87 | ) | $ | — | $ | — | $ | — | $ | — | $ | — | $ | — | $ | 8.07 | (9.73 | %)** | $ | 0.0 | 38.06 | %* | 1.86 | %* | .69 | %* | 89 | %Ø | |||||||||||||||||||||||||||||||||||
Genesis Fund | |||||||||||||||||||||||||||||||||||||||||||||||||||||||||||||||||||||||
Investor Class | |||||||||||||||||||||||||||||||||||||||||||||||||||||||||||||||||||||||
8/31/2014 | $ | 40.18 | $ | 0.08 | $ | 5.37 | $ | 5.45 | $ | (0.24 | ) | $ | (4.50 | ) | $ | — | $ | (4.74 | ) | $ | 0.00 | $ | — | $ | 40.89 | 13.65 | %@@ | $ | 2,437.6 | 1.01 | % | 1.01 | % | .20 | % | 14 | % | ||||||||||||||||||||||||||||||||||
8/31/2013 | $ | 34.65 | $ | 0.26 | $ | 7.57 | $ | 7.83 | $ | (0.19 | ) | $ | (2.11 | ) | $ | — | $ | (2.30 | ) | $ | — | $ | — | $ | 40.18 | 23.91 | % | $ | 2,458.7 | 1.02 | % | 1.02 | % | .71 | % | 20 | % | ||||||||||||||||||||||||||||||||||
8/31/2012 | $ | 34.28 | $ | 0.11 | $ | 1.94 | $ | 2.05 | $ | (0.53 | ) | $ | (1.15 | ) | $ | — | $ | (1.68 | ) | $ | — | $ | — | $ | 34.65 | 6.31 | % | $ | 2,256.0 | 1.03 | % | 1.03 | % | .31 | % | 15 | % | ||||||||||||||||||||||||||||||||||
8/31/2011 | $ | 26.44 | $ | 0.27 | $ | 7.57 | $ | 7.84 | $ | — | $ | — | $ | — | $ | — | $ | — | $ | — | $ | 34.28 | 29.65 | % | $ | 2,157.7 | 1.05 | % | 1.05 | % | .81 | % | 18 | % | |||||||||||||||||||||||||||||||||||||
8/31/2010 | $ | 24.39 | $ | (0.03 | ) | $ | 2.08 | $ | 2.05 | $ | — | $ | — | $ | — | $ | — | $ | — | $ | — | $ | 26.44 | 8.41 | % | $ | 1,773.6 | 1.06 | % | 1.06 | % | (.11 | %) | 16 | % | ||||||||||||||||||||||||||||||||||||
See Notes to Financial Highlights
199
200
Financial Highlights (cont'd)
| Net Asset Value, Beginning of Year | Net Investment Income (Loss)@ | Net Gains or Losses on Securities (both realized and unrealized) | Total From Investment Operations | Dividends from Net Investment Income | Distributions from Net Realized Capital Gains | Tax Return of Capital | Total Distributions | Voluntary Contribution from Management | Redemption Feesøø | Net Asset Value, End of Year | Total Return†† | Net Assets, End of Year (in millions) | Ratio of Gross Expenses to Average Net Assets# | Ratio of Net Expenses to Average Net Assets‡ | Ratio of Net Investment Income/ (Loss) to Average Net Assets | Portfolio Turnover Rate | |||||||||||||||||||||||||||||||||||||||||||||||||||||||
Genesis Fund (cont'd) | |||||||||||||||||||||||||||||||||||||||||||||||||||||||||||||||||||||||
Trust Class | |||||||||||||||||||||||||||||||||||||||||||||||||||||||||||||||||||||||
8/31/2014 | $ | 59.83 | $ | 0.07 | $ | 8.00 | $ | 8.07 | $ | (0.19 | ) | $ | (4.50 | ) | $ | — | $ | (4.69 | ) | $ | 0.00 | $ | — | $ | 63.21 | 13.55 | %@@ | $ | 2,935.3 | 1.10 | % | 1.10 | % | .11 | % | 14 | % | ||||||||||||||||||||||||||||||||||
8/31/2013 | $ | 50.47 | $ | 0.35 | $ | 11.23 | $ | 11.58 | $ | (0.11 | ) | $ | (2.11 | ) | $ | — | $ | (2.22 | ) | $ | — | $ | — | $ | 59.83 | 23.81 | % | $ | 3,192.4 | 1.10 | % | 1.10 | % | .63 | % | 20 | % | ||||||||||||||||||||||||||||||||||
8/31/2012 | $ | 49.13 | $ | 0.11 | $ | 2.83 | $ | 2.94 | $ | (0.45 | ) | $ | (1.15 | ) | $ | — | $ | (1.60 | ) | $ | — | $ | — | $ | 50.47 | 6.21 | % | $ | 3,037.6 | 1.11 | % | 1.11 | % | .23 | % | 15 | % | ||||||||||||||||||||||||||||||||||
8/31/2011 | $ | 37.92 | $ | 0.35 | $ | 10.86 | $ | 11.21 | $ | — | $ | — | $ | — | $ | — | $ | — | $ | — | $ | 49.13 | 29.56 | % | $ | 3,436.5 | 1.13 | % | 1.13 | % | .74 | % | 18 | % | |||||||||||||||||||||||||||||||||||||
8/31/2010 | $ | 35.00 | $ | (0.07 | ) | $ | 2.99 | $ | 2.92 | $ | — | $ | — | $ | — | $ | — | $ | — | $ | — | $ | 37.92 | 8.34 | % | $ | 3,057.6 | 1.12 | % | 1.12 | % | (.17 | %) | 16 | % | ||||||||||||||||||||||||||||||||||||
Advisor Class | |||||||||||||||||||||||||||||||||||||||||||||||||||||||||||||||||||||||
8/31/2014 | $ | 32.46 | $ | (0.05 | ) | $ | 4.32 | $ | 4.27 | $ | (0.05 | ) | $ | (4.50 | ) | $ | — | $ | (4.55 | ) | $ | 0.00 | $ | — | $ | 32.18 | 13.24 | %@@ | $ | 598.9 | 1.37 | % | 1.37 | % | (.16 | %) | 14 | % | |||||||||||||||||||||||||||||||||
8/31/2013 | $ | 28.42 | $ | 0.11 | $ | 6.13 | $ | 6.24 | $ | (0.09 | ) | $ | (2.11 | ) | $ | — | $ | (2.20 | ) | $ | — | $ | — | $ | 32.46 | 23.46 | % | $ | 626.0 | 1.38 | % | 1.38 | % | .35 | % | 20 | % | ||||||||||||||||||||||||||||||||||
8/31/2012 | $ | 28.43 | $ | (0.01 | ) | $ | 1.58 | $ | 1.57 | $ | (0.43 | ) | $ | (1.15 | ) | $ | — | $ | (1.58 | ) | $ | — | $ | — | $ | 28.42 | 5.91 | % | $ | 579.8 | 1.38 | % | 1.38 | % | (.04 | %) | 15 | % | |||||||||||||||||||||||||||||||||
8/31/2011 | $ | 22.00 | $ | 0.12 | $ | 6.31 | $ | 6.43 | $ | — | $ | — | $ | — | $ | — | $ | — | $ | — | $ | 28.43 | 29.23 | % | $ | 601.3 | 1.40 | % | 1.40 | % | .43 | % | 18 | % | |||||||||||||||||||||||||||||||||||||
8/31/2010 | $ | 20.35 | $ | (0.10 | ) | $ | 1.75 | $ | 1.65 | $ | — | $ | — | $ | — | $ | — | $ | — | $ | — | $ | 22.00 | 8.11 | % | $ | 440.2 | 1.38 | % | 1.38 | % | (.42 | %) | 16 | % | ||||||||||||||||||||||||||||||||||||
Institutional Class | |||||||||||||||||||||||||||||||||||||||||||||||||||||||||||||||||||||||
8/31/2014 | $ | 57.62 | $ | 0.22 | $ | 7.70 | $ | 7.92 | $ | (0.32 | ) | $ | (4.50 | ) | $ | — | $ | (4.82 | ) | $ | 0.00 | $ | — | $ | 60.72 | 13.82 | %@@ | $ | 5,061.4 | .85 | % | .85 | %§ | .36 | % | 14 | % | ||||||||||||||||||||||||||||||||||
8/31/2013 | $ | 48.71 | $ | 0.46 | $ | 10.81 | $ | 11.27 | $ | (0.25 | ) | $ | (2.11 | ) | $ | — | $ | (2.36 | ) | $ | — | $ | — | $ | 57.62 | 24.12 | % | $ | 5,989.3 | .85 | % | .85 | % | .87 | % | 20 | % | ||||||||||||||||||||||||||||||||||
8/31/2012 | $ | 47.48 | $ | 0.24 | $ | 2.73 | $ | 2.97 | $ | (0.59 | ) | $ | (1.15 | ) | $ | — | $ | (1.74 | ) | $ | — | $ | — | $ | 48.71 | 6.51 | % | $ | 5,707.1 | .86 | % | .85 | % | .49 | % | 15 | % | ||||||||||||||||||||||||||||||||||
8/31/2011 | $ | 36.56 | $ | 0.45 | $ | 10.47 | $ | 10.92 | $ | — | $ | — | $ | — | $ | — | $ | — | $ | — | $ | 47.48 | 29.87 | % | $ | 4,975.0 | .89 | % | .87 | % | .97 | % | 18 | % | |||||||||||||||||||||||||||||||||||||
8/31/2010 | $ | 33.64 | $ | 0.04 | $ | 2.88 | $ | 2.92 | $ | — | $ | — | $ | — | $ | — | $ | — | $ | — | $ | 36.56 | 8.68 | % | $ | 3,571.8 | .87 | % | .85 | % | .11 | % | 16 | % | |||||||||||||||||||||||||||||||||||||
Class R6 | |||||||||||||||||||||||||||||||||||||||||||||||||||||||||||||||||||||||
8/31/2014 | $ | 57.63 | $ | 0.28 | $ | 7.70 | $ | 7.98 | $ | (0.36 | ) | $ | (4.50 | ) | $ | — | $ | (4.86 | ) | $ | 0.00 | $ | — | $ | 60.75 | 13.92 | %@@ | $ | 2,690.7 | .78 | % | .78 | %§ | .45 | % | 14 | % | ||||||||||||||||||||||||||||||||||
| Period from 3/15/2013^ to 8/31/2013 | $ | 53.91 | $ | 0.18 | $ | 3.54 | $ | 3.72 | $ | — | $ | — | $ | — | $ | — | $ | — | $ | — | $ | 57.63 | 6.90 | %** | $ | 975.9 | .80 | %* | .78 | %* | .67 | %* | 20 | %Ø | |||||||||||||||||||||||||||||||||||||
Global Equity Fund | |||||||||||||||||||||||||||||||||||||||||||||||||||||||||||||||||||||||
Institutional Class | |||||||||||||||||||||||||||||||||||||||||||||||||||||||||||||||||||||||
8/31/2014 | $ | 9.49 | $ | 0.06 | $ | 1.80 | $ | 1.86 | $ | (0.04 | ) | $ | (0.09 | ) | $ | — | $ | (0.13 | ) | $ | — | $ | — | $ | 11.22 | 19.67 | % | $ | 38.9 | 1.72 | % | 1.15 | % | .54 | % | 39 | % | ||||||||||||||||||||||||||||||||||
8/31/2013 | $ | 8.50 | $ | 0.06 | $ | 0.93 | $ | 0.99 | $ | — | $ | — | $ | — | $ | — | $ | — | $ | — | $ | 9.49 | 11.65 | % | $ | 33.5 | 5.16 | % | 1.15 | % | .63 | % | 43 | % | |||||||||||||||||||||||||||||||||||||
8/31/2012 | $ | 9.10 | $ | 0.09 | $ | 0.09 | $ | 0.18 | $ | (0.32 | ) | $ | — | $ | (0.46 | ) | $ | (0.78 | ) | $ | — | $ | — | $ | 8.50 | 2.82 | % | $ | 4.3 | 10.85 | % | 1.15 | % | 1.12 | % | 62 | % | ||||||||||||||||||||||||||||||||||
| Period from 6/30/2011^ to 8/31/2011 | $ | 10.00 | $ | (0.00 | ) | $ | (0.90 | ) | $ | (0.90 | ) | $ | — | $ | — | $ | — | $ | — | $ | — | $ | — | $ | 9.10 | (9.00 | %)** | $ | 0.8 | 55.68 | %* | 1.15 | %* | (.20 | %)* | 8 | %** | ||||||||||||||||||||||||||||||||||
Class A | |||||||||||||||||||||||||||||||||||||||||||||||||||||||||||||||||||||||
8/31/2014 | $ | 9.43 | $ | 0.03 | $ | 1.77 | $ | 1.80 | $ | (0.00 | ) | $ | (0.09 | ) | $ | — | $ | (0.09 | ) | $ | — | $ | — | $ | 11.14 | 19.18 | % | $ | 0.4 | 2.18 | % | 1.51 | % | .28 | % | 39 | % | ||||||||||||||||||||||||||||||||||
8/31/2013 | $ | 8.48 | $ | 0.03 | $ | 0.92 | $ | 0.95 | $ | — | $ | — | $ | — | $ | — | $ | — | $ | — | $ | 9.43 | 11.20 | % | $ | 0.1 | 5.67 | % | 1.51 | % | .34 | % | 43 | % | |||||||||||||||||||||||||||||||||||||
8/31/2012 | $ | 9.09 | $ | 0.04 | $ | 0.11 | $ | 0.15 | $ | (0.30 | ) | $ | — | $ | (0.46 | ) | $ | (0.76 | ) | $ | — | $ | — | $ | 8.48 | 2.51 | % | $ | 0.1 | 11.83 | % | 1.51 | % | .54 | % | 62 | % | ||||||||||||||||||||||||||||||||||
| Period from 6/30/2011^ to 8/31/2011 | $ | 10.00 | $ | (0.01 | ) | $ | (0.90 | ) | $ | (0.91 | ) | $ | — | $ | — | $ | — | $ | — | $ | — | $ | — | $ | 9.09 | (9.10 | %)** | $ | 0.1 | 69.65 | %* | 1.51 | %* | (.53 | %)* | 8 | %** | ||||||||||||||||||||||||||||||||||
See Notes to Financial Highlights
201
202
Financial Highlights (cont'd)
| Net Asset Value, Beginning of Year | Net Investment Income (Loss)@ | Net Gains or Losses on Securities (both realized and unrealized) | Total From Investment Operations | Dividends from Net Investment Income | Distributions from Net Realized Capital Gains | Tax Return of Capital | Total Distributions | Voluntary Contribution from Management | Redemption Feesøø | Net Asset Value, End of Year | Total Return†† | Net Assets, End of Year (in millions) | Ratio of Gross Expenses to Average Net Assets# | Ratio of Net Expenses to Average Net Assets‡ | Ratio of Net Investment Income/ (Loss) to Average Net Assets | Portfolio Turnover Rate | |||||||||||||||||||||||||||||||||||||||||||||||||||||||
Global Equity Fund (cont'd) | |||||||||||||||||||||||||||||||||||||||||||||||||||||||||||||||||||||||
Class C | |||||||||||||||||||||||||||||||||||||||||||||||||||||||||||||||||||||||
8/31/2014 | $ | 9.28 | $ | (0.06 | ) | $ | 1.76 | $ | 1.70 | $ | — | $ | (0.09 | ) | $ | — | $ | (0.09 | ) | $ | — | $ | — | $ | 10.89 | 18.39 | % | $ | 0.2 | 2.96 | % | 2.26 | % | (.54 | %) | 39 | % | ||||||||||||||||||||||||||||||||||
8/31/2013 | $ | 8.41 | $ | (0.03 | ) | $ | 0.90 | $ | 0.87 | $ | — | $ | — | $ | — | $ | — | $ | — | $ | — | $ | 9.28 | 10.34 | % | $ | 0.1 | 6.50 | % | 2.26 | % | (.36 | %) | 43 | % | ||||||||||||||||||||||||||||||||||||
8/31/2012 | $ | 9.08 | $ | (0.02 | ) | $ | 0.11 | $ | 0.09 | $ | (0.30 | ) | $ | — | $ | (0.46 | ) | $ | (0.76 | ) | $ | — | $ | — | $ | 8.41 | 1.77 | % | $ | 0.0 | 12.88 | % | 2.26 | % | (.30 | %) | 62 | % | |||||||||||||||||||||||||||||||||
| Period from 6/30/2011^ to 8/31/2011 | $ | 10.00 | $ | (0.02 | ) | $ | (0.90 | ) | $ | (0.92 | ) | $ | — | $ | — | $ | — | $ | — | $ | — | $ | — | $ | 9.08 | (9.20 | %)** | $ | 0.0 | 74.49 | %* | 2.26 | %* | (1.31 | %)* | 8 | %** | ||||||||||||||||||||||||||||||||||
Global Thematic Opportunities Fund | |||||||||||||||||||||||||||||||||||||||||||||||||||||||||||||||||||||||
Institutional Class | |||||||||||||||||||||||||||||||||||||||||||||||||||||||||||||||||||||||
8/31/2014 | $ | 9.52 | $ | 0.08 | $ | 1.15 | $ | 1.23 | $ | (0.05 | ) | $ | — | $ | — | $ | (0.05 | ) | $ | 0.00 | $ | — | $ | 10.70 | 12.92 | % | $ | 82.8 | 1.39 | % | 1.25 | % | .75 | % | 80 | % | |||||||||||||||||||||||||||||||||||
8/31/2013 | $ | 8.74 | $ | 0.05 | $ | 0.78 | $ | 0.83 | $ | (0.05 | ) | $ | — | $ | — | $ | (0.05 | ) | $ | — | $ | — | $ | 9.52 | 9.53 | % | $ | 73.1 | 1.59 | % | 1.25 | % | .53 | % | 98 | % | |||||||||||||||||||||||||||||||||||
8/31/2012 | $ | 9.44 | $ | 0.05 | $ | (0.73 | ) | $ | (0.68 | ) | $ | (0.02 | ) | $ | — | $ | — | $ | (0.02 | ) | $ | — | $ | — | $ | 8.74 | (7.22 | %) | $ | 49.8 | 1.84 | % | 1.25 | % | .56 | % | 57 | % | |||||||||||||||||||||||||||||||||
| Period from 6/30/2011^ to 8/31/2011 | $ | 10.00 | $ | (0.00 | ) | $ | (0.56 | ) | $ | (0.56 | ) | $ | — | $ | — | $ | — | $ | — | $ | — | $ | — | $ | 9.44 | (5.60 | %)** | $ | 27.4 | 4.83 | %* | 1.25 | %* | (.14 | %)* | 11 | %** | ||||||||||||||||||||||||||||||||||
Class A | |||||||||||||||||||||||||||||||||||||||||||||||||||||||||||||||||||||||
8/31/2014 | $ | 9.47 | $ | 0.04 | $ | 1.13 | $ | 1.17 | $ | (0.02 | ) | $ | — | $ | — | $ | (0.02 | ) | $ | 0.00 | $ | — | $ | 10.62 | 12.40 | % | $ | 0.2 | 1.85 | % | 1.61 | % | .36 | % | 80 | % | |||||||||||||||||||||||||||||||||||
8/31/2013 | $ | 8.70 | $ | 0.02 | $ | 0.78 | $ | 0.80 | $ | (0.03 | ) | $ | — | $ | — | $ | (0.03 | ) | $ | — | $ | — | $ | 9.47 | 9.20 | % | $ | 0.6 | 2.00 | % | 1.61 | % | .23 | % | 98 | % | |||||||||||||||||||||||||||||||||||
8/31/2012 | $ | 9.44 | $ | 0.02 | $ | (0.75 | ) | $ | (0.73 | ) | $ | (0.01 | ) | $ | — | $ | — | $ | (0.01 | ) | $ | — | $ | — | $ | 8.70 | (7.68 | %) | $ | 0.6 | 2.25 | % | 1.61 | % | .27 | % | 57 | % | |||||||||||||||||||||||||||||||||
| Period from 6/30/2011^ to 8/31/2011 | $ | 10.00 | $ | (0.01 | ) | $ | (0.55 | ) | $ | (0.56 | ) | $ | — | $ | — | $ | — | $ | — | $ | — | $ | — | $ | 9.44 | (5.60 | %)** | $ | 0.2 | 13.72 | %* | 1.61 | %* | (.50 | %)* | 11 | %** | ||||||||||||||||||||||||||||||||||
Class C | |||||||||||||||||||||||||||||||||||||||||||||||||||||||||||||||||||||||
8/31/2014 | $ | 9.35 | $ | (0.04 | ) | $ | 1.13 | $ | 1.09 | $ | — | $ | — | $ | — | $ | — | $ | 0.00 | $ | — | $ | 10.44 | 11.66 | % | $ | 0.1 | 2.64 | % | 2.36 | % | (.37 | %) | 80 | % | ||||||||||||||||||||||||||||||||||||
8/31/2013 | $ | 8.63 | $ | (0.05 | ) | $ | 0.77 | $ | 0.72 | $ | — | $ | — | $ | — | $ | — | $ | — | $ | — | $ | 9.35 | 8.34 | % | $ | 0.1 | 2.84 | % | 2.36 | % | (.59 | %) | 98 | % | ||||||||||||||||||||||||||||||||||||
8/31/2012 | $ | 9.42 | $ | (0.05 | ) | $ | (0.73 | ) | $ | (0.78 | ) | $ | (0.01 | ) | $ | — | $ | — | $ | (0.01 | ) | $ | — | $ | — | $ | 8.63 | (8.25 | %) | $ | 0.1 | 3.11 | % | 2.36 | % | (.57 | %) | 57 | % | ||||||||||||||||||||||||||||||||
| Period from 6/30/2011^ to 8/31/2011 | $ | 10.00 | $ | (0.02 | ) | $ | (0.56 | ) | $ | (0.58 | ) | $ | — | $ | — | $ | — | $ | — | $ | — | $ | — | $ | 9.42 | (5.80 | %)** | $ | 0.1 | 21.31 | %* | 2.36 | %* | (1.32 | %)* | 11 | %** | ||||||||||||||||||||||||||||||||||
Greater China Equity Fund | |||||||||||||||||||||||||||||||||||||||||||||||||||||||||||||||||||||||
Institutional Class | |||||||||||||||||||||||||||||||||||||||||||||||||||||||||||||||||||||||
8/31/2014 | $ | 10.16 | $ | 0.10 | $ | 2.06 | $ | 2.16 | $ | — | $ | (0.15 | ) | $ | — | $ | (0.15 | ) | $ | — | $ | — | $ | 12.17 | 21.37 | % | $ | 72.1 | 1.83 | % | 1.50 | % | .90 | % | 171 | % | |||||||||||||||||||||||||||||||||||
| Period from 7/17/2013^ to 8/31/2013 | $ | 10.00 | $ | (0.02 | ) | $ | 0.18 | $ | 0.16 | $ | — | $ | — | $ | — | $ | — | $ | — | $ | — | $ | 10.16 | 1.60 | %** | $ | 56.4 | 2.80 | %b* | 1.50 | %b* | (1.25 | %)b* | 20 | %** | ||||||||||||||||||||||||||||||||||||
See Notes to Financial Highlights
203
204
Financial Highlights (cont'd)
| Net Asset Value, Beginning of Year | Net Investment Income (Loss)@ | Net Gains or Losses on Securities (both realized and unrealized) | Total From Investment Operations | Dividends from Net Investment Income | Distributions from Net Realized Capital Gains | Tax Return of Capital | Total Distributions | Voluntary Contribution from Management | Redemption Feesøø | Net Asset Value, End of Year | Total Return†† | Net Assets, End of Year (in millions) | Ratio of Gross Expenses to Average Net Assets# | Ratio of Net Expenses to Average Net Assets‡ | Ratio of Net Investment Income/ (Loss) to Average Net Assets | Portfolio Turnover Rate | |||||||||||||||||||||||||||||||||||||||||||||||||||||||
Greater China Equity Fund (cont'd) | |||||||||||||||||||||||||||||||||||||||||||||||||||||||||||||||||||||||
Class A | |||||||||||||||||||||||||||||||||||||||||||||||||||||||||||||||||||||||
8/31/2014 | $ | 10.16 | $ | 0.13 | $ | 2.00 | $ | 2.13 | $ | — | $ | (0.15 | ) | $ | — | $ | (0.15 | ) | $ | — | $ | — | $ | 12.14 | 21.07 | % | $ | 1.7 | 2.30 | % | 1.86 | % | 1.19 | % | 171 | % | |||||||||||||||||||||||||||||||||||
| Period from 7/17/2013^ to 8/31/2013 | $ | 10.00 | $ | (0.02 | ) | $ | 0.18 | $ | 0.16 | $ | — | $ | — | $ | — | $ | — | $ | — | $ | — | $ | 10.16 | 1.60 | %** | $ | 0.1 | 17.58 | %b* | 1.86 | %b* | (1.65 | %)b* | 20 | %** | ||||||||||||||||||||||||||||||||||||
Class C | |||||||||||||||||||||||||||||||||||||||||||||||||||||||||||||||||||||||
8/31/2014 | $ | 10.15 | $ | (0.02 | ) | $ | 2.05 | $ | 2.03 | $ | — | $ | (0.15 | ) | $ | — | $ | (0.15 | ) | $ | — | $ | — | $ | 12.03 | 20.09 | % | $ | 0.1 | 2.85 | % | 2.61 | % | (.20 | %) | 171 | % | ||||||||||||||||||||||||||||||||||
| Period from 7/17/2013^ to 8/31/2013 | $ | 10.00 | $ | (0.03 | ) | $ | 0.18 | $ | 0.15 | $ | — | $ | — | $ | — | $ | — | $ | — | $ | — | $ | 10.15 | 1.50 | %** | $ | 0.1 | 19.16 | %b* | 2.61 | %b* | (2.41 | %)b* | 20 | %** | ||||||||||||||||||||||||||||||||||||
Guardian Fund | |||||||||||||||||||||||||||||||||||||||||||||||||||||||||||||||||||||||
Investor Class | |||||||||||||||||||||||||||||||||||||||||||||||||||||||||||||||||||||||
8/31/2014 | $ | 18.58 | $ | 0.16 | $ | 3.70 | $ | 3.86 | $ | (0.10 | ) | $ | (1.91 | ) | $ | — | $ | (2.01 | ) | $ | 0.00 | $ | — | $ | 20.43 | 21.87 | % | $ | 1,165.1 | .88 | % | .88 | % | .83 | % | 37 | % | ||||||||||||||||||||||||||||||||||
8/31/2013 | $ | 15.80 | $ | 0.14 | $ | 3.28 | $ | 3.42 | $ | (0.20 | ) | $ | (0.44 | ) | $ | — | $ | (0.64 | ) | $ | — | $ | — | $ | 18.58 | 22.54 | % | $ | 1,040.3 | .90 | % | .90 | % | .85 | % | 36 | % | ||||||||||||||||||||||||||||||||||
8/31/2012 | $ | 14.49 | $ | 0.12 | $ | 1.29 | $ | 1.41 | $ | (0.10 | ) | $ | — | $ | — | $ | (0.10 | ) | $ | — | $ | — | $ | 15.80 | 9.84 | % | $ | 939.6 | .92 | % | .92 | % | .79 | % | 26 | % | |||||||||||||||||||||||||||||||||||
8/31/2011 | $ | 11.98 | $ | 0.11 | $ | 2.45 | $ | 2.56 | $ | (0.05 | ) | $ | — | $ | — | $ | (0.05 | ) | $ | — | $ | — | $ | 14.49 | 21.35 | % | $ | 962.6 | .92 | % | .92 | % | .74 | % | 32 | % | |||||||||||||||||||||||||||||||||||
8/31/2010 | $ | 11.15 | $ | 0.05 | $ | 0.84 | $ | 0.89 | $ | (0.06 | ) | $ | — | $ | — | $ | (0.06 | ) | $ | — | $ | — | $ | 11.98 | 7.99 | % | $ | 869.2 | .95 | % | .95 | % | .40 | % | 36 | % | |||||||||||||||||||||||||||||||||||
Trust Class | |||||||||||||||||||||||||||||||||||||||||||||||||||||||||||||||||||||||
8/31/2014 | $ | 14.30 | $ | 0.09 | $ | 2.81 | $ | 2.90 | $ | (0.09 | ) | $ | (1.91 | ) | $ | — | $ | (2.00 | ) | $ | 0.00 | $ | — | $ | 15.20 | 21.61 | % | $ | 136.6 | 1.06 | % | 1.06 | % | .64 | % | 37 | % | ||||||||||||||||||||||||||||||||||
8/31/2013 | $ | 12.31 | $ | 0.09 | $ | 2.53 | $ | 2.62 | $ | (0.19 | ) | $ | (0.44 | ) | $ | — | $ | (0.63 | ) | $ | — | $ | — | $ | 14.30 | 22.36 | % | $ | 129.4 | 1.08 | % | 1.08 | % | .66 | % | 36 | % | ||||||||||||||||||||||||||||||||||
8/31/2012 | $ | 11.32 | $ | 0.07 | $ | 1.01 | $ | 1.08 | $ | (0.09 | ) | $ | — | $ | — | $ | (0.09 | ) | $ | — | $ | — | $ | 12.31 | 9.68 | % | $ | 113.5 | 1.09 | % | 1.09 | % | .64 | % | 26 | % | |||||||||||||||||||||||||||||||||||
8/31/2011 | $ | 9.38 | $ | 0.06 | $ | 1.92 | $ | 1.98 | $ | (0.04 | ) | $ | — | $ | — | $ | (0.04 | ) | $ | — | $ | — | $ | 11.32 | 21.08 | % | $ | 102.6 | 1.09 | % | 1.09 | % | .55 | % | 32 | % | |||||||||||||||||||||||||||||||||||
8/31/2010 | $ | 8.75 | $ | 0.02 | $ | 0.66 | $ | 0.68 | $ | (0.05 | ) | $ | — | $ | — | $ | (0.05 | ) | $ | — | $ | — | $ | 9.38 | 7.75 | % | $ | 79.0 | 1.12 | % | 1.12 | % | .23 | % | 36 | % | |||||||||||||||||||||||||||||||||||
Advisor Class | |||||||||||||||||||||||||||||||||||||||||||||||||||||||||||||||||||||||
8/31/2014 | $ | 16.27 | $ | 0.04 | $ | 3.24 | $ | 3.28 | $ | (0.09 | ) | $ | (1.91 | ) | $ | — | $ | (2.00 | ) | $ | 0.00 | $ | — | $ | 17.55 | 21.27 | % | $ | 0.4 | 1.28 | % | 1.28 | % | .25 | % | 37 | % | ||||||||||||||||||||||||||||||||||
8/31/2013 | $ | 13.91 | $ | 0.04 | $ | 2.87 | $ | 2.91 | $ | (0.11 | ) | $ | (0.44 | ) | $ | — | $ | (0.55 | ) | $ | — | $ | — | $ | 16.27 | 21.81 | % | $ | 0.6 | 1.50 | % | 1.50 | %§ | .23 | % | 36 | % | ||||||||||||||||||||||||||||||||||
8/31/2012 | $ | 12.77 | $ | 0.02 | $ | 1.16 | $ | 1.18 | $ | (0.04 | ) | $ | — | $ | — | $ | (0.04 | ) | $ | — | $ | — | $ | 13.91 | 9.27 | % | $ | 0.6 | 1.50 | % | 1.50 | %§ | .19 | % | 26 | % | |||||||||||||||||||||||||||||||||||
8/31/2011 | $ | 10.59 | $ | 0.02 | $ | 2.16 | $ | 2.18 | $ | — | $ | — | $ | — | $ | — | $ | — | $ | — | $ | 12.77 | 20.59 | % | $ | 0.6 | 1.50 | % | 1.50 | %§ | .15 | % | 32 | % | |||||||||||||||||||||||||||||||||||||
8/31/2010 | $ | 9.87 | $ | (0.02 | ) | $ | 0.75 | $ | 0.73 | $ | (0.01 | ) | $ | — | $ | — | $ | (0.01 | ) | $ | — | $ | — | $ | 10.59 | 7.38 | % | $ | 0.5 | 2.59 | % | 1.50 | % | (.16 | %) | 36 | % | ||||||||||||||||||||||||||||||||||
Institutional Class | |||||||||||||||||||||||||||||||||||||||||||||||||||||||||||||||||||||||
8/31/2014 | $ | 18.62 | $ | 0.20 | $ | 3.70 | $ | 3.90 | $ | (0.14 | ) | $ | (1.91 | ) | $ | — | $ | (2.05 | ) | $ | 0.00 | $ | — | $ | 20.47 | 22.03 | % | $ | 129.4 | .71 | % | .71 | % | 1.01 | % | 37 | % | ||||||||||||||||||||||||||||||||||
8/31/2013 | $ | 15.83 | $ | 0.17 | $ | 3.29 | $ | 3.46 | $ | (0.23 | ) | $ | (0.44 | ) | $ | — | $ | (0.67 | ) | $ | — | $ | — | $ | 18.62 | 22.80 | % | $ | 88.9 | .73 | % | .73 | % | 1.00 | % | 36 | % | ||||||||||||||||||||||||||||||||||
8/31/2012 | $ | 14.52 | $ | 0.15 | $ | 1.29 | $ | 1.44 | $ | (0.13 | ) | $ | — | $ | — | $ | (0.13 | ) | $ | — | $ | — | $ | 15.83 | 10.03 | % | $ | 60.0 | .74 | % | .74 | %§ | 1.01 | % | 26 | % | |||||||||||||||||||||||||||||||||||
8/31/2011 | $ | 12.01 | $ | 0.12 | $ | 2.47 | $ | 2.59 | $ | (0.08 | ) | $ | — | $ | — | $ | (0.08 | ) | $ | — | $ | — | $ | 14.52 | 21.51 | % | $ | 33.5 | .75 | % | .75 | %§ | .77 | % | 32 | % | |||||||||||||||||||||||||||||||||||
8/31/2010 | $ | 11.16 | $ | 0.08 | $ | 0.84 | $ | 0.92 | $ | (0.07 | ) | $ | — | $ | — | $ | (0.07 | ) | $ | — | $ | — | $ | 12.01 | 8.22 | % | $ | 4.3 | .81 | % | .75 | % | .65 | % | 36 | % | |||||||||||||||||||||||||||||||||||
See Notes to Financial Highlights
205
206
Financial Highlights (cont'd)
| Net Asset Value, Beginning of Year | Net Investment Income (Loss)@ | Net Gains or Losses on Securities (both realized and unrealized) | Total From Investment Operations | Dividends from Net Investment Income | Distributions from Net Realized Capital Gains | Tax Return of Capital | Total Distributions | Voluntary Contribution from Management | Redemption Feesøø | Net Asset Value, End of Year | Total Return†† | Net Assets, End of Year (in millions) | Ratio of Gross Expenses to Average Net Assets# | Ratio of Net Expenses to Average Net Assets‡ | Ratio of Net Investment Income/ (Loss) to Average Net Assets | Portfolio Turnover Rate | |||||||||||||||||||||||||||||||||||||||||||||||||||||||
Guardian Fund (cont'd) | |||||||||||||||||||||||||||||||||||||||||||||||||||||||||||||||||||||||
Class A | |||||||||||||||||||||||||||||||||||||||||||||||||||||||||||||||||||||||
8/31/2014 | $ | 14.21 | $ | 0.09 | $ | 2.79 | $ | 2.88 | $ | (0.10 | ) | $ | (1.91 | ) | $ | — | $ | (2.01 | ) | $ | 0.00 | $ | — | $ | 15.08 | 21.62 | % | $ | 73.8 | 1.09 | % | 1.09 | %§ | .64 | % | 37 | % | ||||||||||||||||||||||||||||||||||
8/31/2013 | $ | 12.24 | $ | 0.08 | $ | 2.52 | $ | 2.60 | $ | (0.19 | ) | $ | (0.44 | ) | $ | — | $ | (0.63 | ) | $ | — | $ | — | $ | 14.21 | 22.38 | % | $ | 34.6 | 1.11 | % | 1.11 | %§ | .62 | % | 36 | % | ||||||||||||||||||||||||||||||||||
8/31/2012 | $ | 11.28 | $ | 0.07 | $ | 1.00 | $ | 1.07 | $ | (0.11 | ) | $ | — | $ | — | $ | (0.11 | ) | $ | — | $ | — | $ | 12.24 | 9.63 | % | $ | 17.6 | 1.12 | % | 1.11 | % | .64 | % | 26 | % | |||||||||||||||||||||||||||||||||||
8/31/2011 | $ | 9.36 | $ | 0.06 | $ | 1.91 | $ | 1.97 | $ | (0.05 | ) | $ | — | $ | — | $ | (0.05 | ) | $ | — | $ | — | $ | 11.28 | 21.06 | % | $ | 10.8 | 1.15 | % | 1.11 | % | .51 | % | 32 | % | |||||||||||||||||||||||||||||||||||
8/31/2010 | $ | 8.75 | $ | 0.02 | $ | 0.66 | $ | 0.68 | $ | (0.07 | ) | $ | — | $ | — | $ | (0.07 | ) | $ | — | $ | — | $ | 9.36 | 7.72 | % | $ | 3.5 | 1.22 | % | 1.11 | % | .23 | % | 36 | % | |||||||||||||||||||||||||||||||||||
Class C | |||||||||||||||||||||||||||||||||||||||||||||||||||||||||||||||||||||||
8/31/2014 | $ | 15.96 | $ | (0.03 | ) | $ | 3.16 | $ | 3.13 | $ | (0.00 | ) | $ | (1.91 | ) | $ | — | $ | (1.91 | ) | $ | 0.00 | $ | — | $ | 17.18 | 20.71 | % | $ | 2.9 | 1.86 | % | 1.86 | %§ | (.15 | %) | 37 | % | |||||||||||||||||||||||||||||||||
8/31/2013 | $ | 13.66 | $ | (0.02 | ) | $ | 2.84 | $ | 2.82 | $ | (0.08 | ) | $ | (0.44 | ) | $ | — | $ | (0.52 | ) | $ | — | $ | — | $ | 15.96 | 21.43 | % | $ | 2.6 | 1.86 | % | 1.86 | % | (.15 | %) | 36 | % | |||||||||||||||||||||||||||||||||
8/31/2012 | $ | 12.60 | $ | (0.02 | ) | $ | 1.13 | $ | 1.11 | $ | (0.05 | ) | $ | — | $ | — | $ | (0.05 | ) | $ | — | $ | — | $ | 13.66 | 8.83 | % | $ | 1.3 | 1.88 | % | 1.86 | % | (.13 | %) | 26 | % | ||||||||||||||||||||||||||||||||||
8/31/2011 | $ | 10.51 | $ | (0.04 | ) | $ | 2.15 | $ | 2.11 | $ | (0.02 | ) | $ | — | $ | — | $ | (0.02 | ) | $ | — | $ | — | $ | 12.60 | 20.11 | % | $ | 1.1 | 1.90 | % | 1.86 | % | (.28 | %) | 32 | % | ||||||||||||||||||||||||||||||||||
8/31/2010 | $ | 9.86 | $ | (0.06 | ) | $ | 0.76 | $ | 0.70 | $ | (0.05 | ) | $ | — | $ | — | $ | (0.05 | ) | $ | — | $ | — | $ | 10.51 | 7.08 | % | $ | 0.4 | 2.46 | % | 1.86 | % | (.51 | %) | 36 | % | ||||||||||||||||||||||||||||||||||
Class R3 | |||||||||||||||||||||||||||||||||||||||||||||||||||||||||||||||||||||||
8/31/2014 | $ | 16.25 | $ | 0.06 | $ | 3.21 | $ | 3.27 | $ | (0.07 | ) | $ | (1.91 | ) | $ | — | $ | (1.98 | ) | $ | 0.00 | $ | — | $ | 17.54 | 21.29 | % | $ | 0.7 | 1.38 | % | 1.36 | % | .37 | % | 37 | % | ||||||||||||||||||||||||||||||||||
8/31/2013 | $ | 13.79 | $ | 0.04 | $ | 2.89 | $ | 2.93 | $ | (0.03 | ) | $ | (0.44 | ) | $ | — | $ | (0.47 | ) | $ | — | $ | — | $ | 16.25 | 22.03 | % | $ | 0.4 | 1.41 | % | 1.36 | % | .24 | % | 36 | % | ||||||||||||||||||||||||||||||||||
8/31/2012 | $ | 12.72 | $ | 0.05 | $ | 1.13 | $ | 1.18 | $ | (0.11 | ) | $ | — | $ | — | $ | (0.11 | ) | $ | — | $ | — | $ | 13.79 | 9.40 | % | $ | 0.5 | 1.39 | % | 1.36 | % | .36 | % | 26 | % | |||||||||||||||||||||||||||||||||||
8/31/2011 | $ | 10.57 | $ | 0.04 | $ | 2.16 | $ | 2.20 | $ | (0.05 | ) | $ | — | $ | — | $ | (0.05 | ) | $ | — | $ | — | $ | 12.72 | 20.79 | % | $ | 0.4 | 1.44 | % | 1.36 | % | .28 | % | 32 | % | |||||||||||||||||||||||||||||||||||
8/31/2010 | $ | 9.88 | $ | (0.00 | ) | $ | 0.74 | $ | 0.74 | $ | (0.05 | ) | $ | — | $ | — | $ | (0.05 | ) | $ | — | $ | — | $ | 10.57 | 7.51 | % | $ | 0.1 | 3.12 | % | 1.36 | % | (.02 | %) | 36 | % | ||||||||||||||||||||||||||||||||||
International Equity Fund | |||||||||||||||||||||||||||||||||||||||||||||||||||||||||||||||||||||||
Investor Class | |||||||||||||||||||||||||||||||||||||||||||||||||||||||||||||||||||||||
8/31/2014 | $ | 18.62 | $ | 0.26 | $ | 1.99 | $ | 2.25 | $ | (0.17 | ) | $ | — | $ | — | $ | (0.17 | ) | $ | 0.00 | $ | — | $ | 20.70 | 12.14 | % | $ | 124.4 | 1.26 | % | 1.07 | % | 1.29 | % | 34 | % | |||||||||||||||||||||||||||||||||||
| Period from 1/28/2013^ to 8/31/2013 | $ | 18.03 | $ | 0.21 | $ | 0.38 | $ | 0.59 | $ | — | $ | — | $ | — | $ | — | $ | — | $ | — | $ | 18.62 | 3.27 | %** | $ | 125.7 | 1.32 | %* | 1.09 | %* | 1.87 | %* | 44 | %Øa | |||||||||||||||||||||||||||||||||||||
Trust Class | |||||||||||||||||||||||||||||||||||||||||||||||||||||||||||||||||||||||
8/31/2014 | $ | 20.70 | $ | 0.28 | $ | 2.20 | $ | 2.48 | $ | (0.16 | ) | $ | — | $ | — | $ | (0.16 | ) | $ | 0.00 | $ | — | $ | 23.02 | 12.02 | % | $ | 67.7 | 1.36 | % | 1.16 | % | 1.23 | % | 34 | % | |||||||||||||||||||||||||||||||||||
| Period from 1/28/2013^ to 8/31/2013 | $ | 20.05 | $ | 0.21 | $ | 0.44 | $ | 0.65 | $ | — | $ | — | $ | — | $ | — | $ | — | $ | — | $ | 20.70 | 3.24 | %** | $ | 111.9 | 1.42 | %* | 1.19 | %* | 1.73 | %* | 44 | %Øa | |||||||||||||||||||||||||||||||||||||
Institutional Class | |||||||||||||||||||||||||||||||||||||||||||||||||||||||||||||||||||||||
8/31/2014 | $ | 10.26 | $ | 0.17 | $ | 1.09 | $ | 1.26 | $ | (0.20 | ) | $ | — | $ | — | $ | (0.20 | ) | $ | 0.00 | $ | — | $ | 11.32 | 12.38 | % | $ | 887.3 | 1.07 | % | .85 | % | 1.49 | % | 34 | % | |||||||||||||||||||||||||||||||||||
8/31/2013 | $ | 9.15 | $ | 0.15 | $ | 1.10 | $ | 1.25 | $ | (0.14 | ) | $ | — | $ | — | $ | (0.14 | ) | $ | — | $ | — | $ | 10.26 | 13.82 | % | $ | 770.3 | 1.14 | % | .85 | % | 1.54 | % | 44 | %a | |||||||||||||||||||||||||||||||||||
8/31/2012 | $ | 9.20 | $ | 0.16 | $ | (0.10 | ) | $ | 0.06 | $ | (0.11 | ) | $ | — | $ | — | $ | (0.11 | ) | $ | — | $ | — | $ | 9.15 | .78 | % | $ | 491.6 | 1.16 | % | .84 | % | 1.88 | % | 33 | % | ||||||||||||||||||||||||||||||||||
8/31/2011 | $ | 8.10 | $ | 0.16 | $ | 1.11 | $ | 1.27 | $ | (0.17 | ) | $ | — | $ | — | $ | (0.17 | ) | $ | — | $ | — | $ | 9.20 | 15.62 | % | $ | 342.6 | 1.23 | % | .80 | % | 1.67 | % | 46 | % | |||||||||||||||||||||||||||||||||||
8/31/2010 | $ | 7.53 | $ | 0.12 | $ | 0.56 | $ | 0.68 | $ | (0.11 | ) | $ | — | $ | — | $ | (0.11 | ) | $ | — | $ | 0.00 | $ | 8.10 | 9.05 | % | $ | 168.1 | 1.24 | % | .80 | % | 1.53 | % | 50 | % | |||||||||||||||||||||||||||||||||||
See Notes to Financial Highlights
207
208
Financial Highlights (cont'd)
| Net Asset Value, Beginning of Year | Net Investment Income (Loss)@ | Net Gains or Losses on Securities (both realized and unrealized) | Total From Investment Operations | Dividends from Net Investment Income | Distributions from Net Realized Capital Gains | Tax Return of Capital | Total Distributions | Voluntary Contribution from Management | Redemption Feesøø | Net Asset Value, End of Year | Total Return†† | Net Assets, End of Year (in millions) | Ratio of Gross Expenses to Average Net Assets# | Ratio of Net Expenses to Average Net Assets‡ | Ratio of Net Investment Income/ (Loss) to Average Net Assets | Portfolio Turnover Rate | |||||||||||||||||||||||||||||||||||||||||||||||||||||||
International Equity Fund (cont'd) | |||||||||||||||||||||||||||||||||||||||||||||||||||||||||||||||||||||||
Class A | |||||||||||||||||||||||||||||||||||||||||||||||||||||||||||||||||||||||
8/31/2014 | $ | 20.69 | $ | 0.28 | $ | 2.19 | $ | 2.47 | $ | (0.15 | ) | $ | — | $ | — | $ | (0.15 | ) | $ | 0.00 | $ | — | $ | 23.01 | 11.98 | % | $ | 26.2 | 1.45 | % | 1.21 | % | 1.23 | % | 34 | % | |||||||||||||||||||||||||||||||||||
| Period from 1/28/2013^ to 8/31/2013 | $ | 20.05 | $ | 0.19 | $ | 0.45 | $ | 0.64 | $ | — | $ | — | $ | — | $ | — | $ | — | $ | — | $ | 20.69 | 3.19 | %** | $ | 12.8 | 1.55 | %* | 1.28 | %* | 1.57 | %* | 44 | %Øa | |||||||||||||||||||||||||||||||||||||
Class C | |||||||||||||||||||||||||||||||||||||||||||||||||||||||||||||||||||||||
8/31/2014 | $ | 20.50 | $ | 0.13 | $ | 2.15 | $ | 2.28 | $ | (0.06 | ) | $ | — | $ | — | $ | (0.06 | ) | $ | 0.00 | $ | — | $ | 22.72 | 11.16 | % | $ | 6.1 | 2.21 | % | 1.96 | % | .59 | % | 34 | % | |||||||||||||||||||||||||||||||||||
| Period from 1/28/2013^ to 8/31/2013 | $ | 19.97 | $ | 0.09 | $ | 0.44 | $ | 0.53 | $ | — | $ | — | $ | — | $ | — | $ | — | $ | — | $ | 20.50 | 2.65 | %** | $ | 1.9 | 2.51 | %* | 2.08 | %* | .74 | %* | 44 | %Øa | |||||||||||||||||||||||||||||||||||||
Class R6 | |||||||||||||||||||||||||||||||||||||||||||||||||||||||||||||||||||||||
| Period from 9/3/2013^ to 8/31/2014 | $ | 10.26 | $ | 0.08 | $ | 1.19 | $ | 1.27 | $ | (0.11 | ) | $ | — | $ | — | $ | (0.11 | ) | $ | 0.00 | $ | — | $ | 11.42 | 12.46 | %** | $ | 21.9 | 1.12 | %* | .79 | %* | .73 | %* | 34 | %Ø | |||||||||||||||||||||||||||||||||||
| International Select Fund§§ | |||||||||||||||||||||||||||||||||||||||||||||||||||||||||||||||||||||||
Trust Class | |||||||||||||||||||||||||||||||||||||||||||||||||||||||||||||||||||||||
8/31/2014 | $ | 10.14 | $ | 0.13 | $ | 1.04 | $ | 1.17 | $ | (0.10 | ) | $ | — | $ | — | $ | (0.10 | ) | $ | 0.00 | $ | — | $ | 11.21 | 11.56 | % | $ | 13.0 | 1.33 | % | 1.25 | % | 1.19 | % | 27 | % | |||||||||||||||||||||||||||||||||||
8/31/2013 | $ | 9.14 | $ | 0.10 | $ | 1.01 | $ | 1.11 | $ | (0.11 | ) | $ | — | $ | — | $ | (0.11 | ) | $ | — | $ | — | $ | 10.14 | 12.17 | % | $ | 13.9 | 1.37 | % | 1.25 | % | 1.05 | % | 50 | % | |||||||||||||||||||||||||||||||||||
8/31/2012 | $ | 9.35 | $ | 0.13 | $ | (0.24 | ) | $ | (0.11 | ) | $ | (0.10 | ) | $ | — | $ | — | $ | (0.10 | ) | $ | — | $ | — | $ | 9.14 | (1.05 | %) | $ | 14.2 | 1.40 | % | 1.25 | % | 1.47 | % | 29 | % | |||||||||||||||||||||||||||||||||
8/31/2011 | $ | 8.31 | $ | 0.09 | $ | 1.00 | $ | 1.09 | $ | (0.05 | ) | $ | — | $ | — | $ | (0.05 | ) | $ | — | $ | 0.00 | $ | 9.35 | 13.09 | % | $ | 18.6 | 1.39 | % | 1.25 | % | .97 | % | 54 | % | |||||||||||||||||||||||||||||||||||
8/31/2010 | $ | 7.93 | $ | 0.09 | $ | 0.38 | $ | 0.47 | $ | (0.09 | ) | $ | — | $ | — | $ | (0.09 | ) | $ | — | $ | 0.00 | $ | 8.31 | 5.87 | % | $ | 27.7 | 1.53 | % | 1.25 | % | 1.10 | % | 45 | % | |||||||||||||||||||||||||||||||||||
Institutional Class | |||||||||||||||||||||||||||||||||||||||||||||||||||||||||||||||||||||||
8/31/2014 | $ | 10.14 | $ | 0.18 | $ | 1.03 | $ | 1.21 | $ | (0.14 | ) | $ | — | $ | — | $ | (0.14 | ) | $ | 0.00 | $ | — | $ | 11.21 | 11.98 | % | $ | 211.6 | .93 | % | .90 | % | 1.58 | % | 27 | % | |||||||||||||||||||||||||||||||||||
8/31/2013 | $ | 9.14 | $ | 0.14 | $ | 1.00 | $ | 1.14 | $ | (0.14 | ) | $ | — | $ | — | $ | (0.14 | ) | $ | — | $ | — | $ | 10.14 | 12.56 | % | $ | 200.6 | .97 | % | .90 | % | 1.44 | % | 50 | % | |||||||||||||||||||||||||||||||||||
8/31/2012 | $ | 9.36 | $ | 0.15 | $ | (0.23 | ) | $ | (0.08 | ) | $ | (0.14 | ) | $ | — | $ | — | $ | (0.14 | ) | $ | — | $ | — | $ | 9.14 | (.65 | %) | $ | 172.0 | .99 | % | .90 | % | 1.76 | % | 29 | % | |||||||||||||||||||||||||||||||||
8/31/2011 | $ | 8.32 | $ | 0.16 | $ | 0.96 | $ | 1.12 | $ | (0.08 | ) | $ | — | $ | — | $ | (0.08 | ) | $ | — | $ | 0.00 | $ | 9.36 | 13.39 | % | $ | 161.5 | 1.01 | % | .90 | % | 1.60 | % | 54 | % | |||||||||||||||||||||||||||||||||||
8/31/2010 | $ | 7.93 | $ | 0.12 | $ | 0.38 | $ | 0.50 | $ | (0.11 | ) | $ | — | $ | — | $ | (0.11 | ) | $ | — | $ | 0.00 | $ | 8.32 | 6.29 | % | $ | 129.5 | 1.12 | % | .90 | % | 1.45 | % | 45 | % | |||||||||||||||||||||||||||||||||||
Class A | |||||||||||||||||||||||||||||||||||||||||||||||||||||||||||||||||||||||
8/31/2014 | $ | 10.07 | $ | 0.14 | $ | 1.03 | $ | 1.17 | $ | (0.10 | ) | $ | — | $ | — | $ | (0.10 | ) | $ | 0.00 | $ | — | $ | 11.14 | 11.69 | % | $ | 9.3 | 1.30 | % | 1.24 | % | 1.25 | % | 27 | % | |||||||||||||||||||||||||||||||||||
8/31/2013 | $ | 9.09 | $ | 0.11 | $ | 0.98 | $ | 1.09 | $ | (0.11 | ) | $ | — | $ | — | $ | (0.11 | ) | $ | — | $ | — | $ | 10.07 | 12.08 | % | $ | 9.3 | 1.36 | % | 1.24 | % | 1.16 | % | 50 | % | |||||||||||||||||||||||||||||||||||
8/31/2012 | $ | 9.30 | $ | 0.14 | $ | (0.24 | ) | $ | (0.10 | ) | $ | (0.11 | ) | $ | — | $ | — | $ | (0.11 | ) | $ | — | $ | — | $ | 9.09 | (.96 | %) | $ | 8.3 | 1.39 | % | 1.24 | % | 1.56 | % | 29 | % | |||||||||||||||||||||||||||||||||
8/31/2011 | $ | 8.27 | $ | 0.08 | $ | 1.00 | $ | 1.08 | $ | (0.05 | ) | $ | — | $ | — | $ | (0.05 | ) | $ | — | $ | 0.00 | $ | 9.30 | 13.06 | % | $ | 5.2 | 1.39 | % | 1.24 | % | .81 | % | 54 | % | |||||||||||||||||||||||||||||||||||
8/31/2010 | $ | 7.90 | $ | 0.10 | $ | 0.37 | $ | 0.47 | $ | (0.10 | ) | $ | — | $ | — | $ | (0.10 | ) | $ | — | $ | 0.00 | $ | 8.27 | 5.87 | % | $ | 9.3 | 1.52 | % | 1.24 | % | 1.24 | % | 45 | % | |||||||||||||||||||||||||||||||||||
See Notes to Financial Highlights
209
210
Financial Highlights (cont'd)
| Net Asset Value, Beginning of Year | Net Investment Income (Loss)@ | Net Gains or Losses on Securities (both realized and unrealized) | Total From Investment Operations | Dividends from Net Investment Income | Distributions from Net Realized Capital Gains | Tax Return of Capital | Total Distributions | Voluntary Contribution from Management | Redemption Feesøø | Net Asset Value, End of Year | Total Return†† | Net Assets, End of Year (in millions) | Ratio of Gross Expenses to Average Net Assets# | Ratio of Net Expenses to Average Net Assets‡ | Ratio of Net Investment Income/ (Loss) to Average Net Assets | Portfolio Turnover Rate | |||||||||||||||||||||||||||||||||||||||||||||||||||||||
| International Select Fund§§ (cont'd) | |||||||||||||||||||||||||||||||||||||||||||||||||||||||||||||||||||||||
Class C | |||||||||||||||||||||||||||||||||||||||||||||||||||||||||||||||||||||||
8/31/2014 | $ | 9.93 | $ | 0.05 | $ | 1.02 | $ | 1.07 | $ | (0.03 | ) | $ | — | $ | — | $ | (0.03 | ) | $ | 0.00 | $ | — | $ | 10.97 | 10.79 | % | $ | 4.6 | 2.05 | % | 2.00 | % | .42 | % | 27 | % | |||||||||||||||||||||||||||||||||||
8/31/2013 | $ | 8.98 | $ | 0.04 | $ | 0.97 | $ | 1.01 | $ | (0.06 | ) | $ | — | $ | — | $ | (0.06 | ) | $ | — | $ | — | $ | 9.93 | 11.23 | % | $ | 4.0 | 2.09 | % | 2.00 | % | .36 | % | 50 | % | |||||||||||||||||||||||||||||||||||
8/31/2012 | $ | 9.17 | $ | 0.06 | $ | (0.21 | ) | $ | (0.15 | ) | $ | (0.04 | ) | $ | — | $ | — | $ | (0.04 | ) | $ | — | $ | — | $ | 8.98 | (1.64 | %) | $ | 3.7 | 2.13 | % | 2.00 | % | .65 | % | 29 | % | |||||||||||||||||||||||||||||||||
8/31/2011 | $ | 8.20 | $ | 0.05 | $ | 0.95 | $ | 1.00 | $ | (0.03 | ) | $ | — | $ | — | $ | (0.03 | ) | $ | — | $ | 0.00 | $ | 9.17 | 12.19 | % | $ | 2.1 | 2.14 | % | 2.00 | % | .57 | % | 54 | % | |||||||||||||||||||||||||||||||||||
8/31/2010 | $ | 7.87 | $ | 0.04 | $ | 0.36 | $ | 0.40 | $ | (0.07 | ) | $ | — | $ | — | $ | (0.07 | ) | $ | — | $ | 0.00 | $ | 8.20 | 5.02 | % | $ | 1.5 | 2.29 | % | 2.01 | % | .45 | % | 45 | % | |||||||||||||||||||||||||||||||||||
Class R3 | |||||||||||||||||||||||||||||||||||||||||||||||||||||||||||||||||||||||
8/31/2014 | $ | 10.01 | $ | 0.11 | $ | 1.02 | $ | 1.13 | $ | (0.09 | ) | $ | — | $ | — | $ | (0.09 | ) | $ | 0.00 | $ | — | $ | 11.05 | 11.35 | % | $ | 2.2 | 1.55 | % | 1.51 | % | 1.03 | % | 27 | % | |||||||||||||||||||||||||||||||||||
8/31/2013 | $ | 9.04 | $ | 0.07 | $ | 0.99 | $ | 1.06 | $ | (0.09 | ) | $ | — | $ | — | $ | (0.09 | ) | $ | — | $ | — | $ | 10.01 | 11.83 | % | $ | 2.6 | 1.60 | % | 1.51 | % | .74 | % | 50 | % | |||||||||||||||||||||||||||||||||||
8/31/2012 | $ | 9.27 | $ | 0.12 | $ | (0.25 | ) | $ | (0.13 | ) | $ | (0.10 | ) | $ | — | $ | — | $ | (0.10 | ) | $ | — | $ | — | $ | 9.04 | (1.24 | %) | $ | 0.4 | 1.67 | % | 1.51 | % | 1.35 | % | 29 | % | |||||||||||||||||||||||||||||||||
8/31/2011 | $ | 8.26 | $ | 0.11 | $ | 0.94 | $ | 1.05 | $ | (0.04 | ) | $ | — | $ | — | $ | (0.04 | ) | $ | — | $ | 0.00 | $ | 9.27 | 12.71 | % | $ | 0.1 | 1.87 | % | 1.51 | % | 1.15 | % | 54 | % | |||||||||||||||||||||||||||||||||||
8/31/2010 | $ | 7.90 | $ | 0.07 | $ | 0.37 | $ | 0.44 | $ | (0.08 | ) | $ | — | $ | — | $ | (0.08 | ) | $ | — | $ | 0.00 | $ | 8.26 | 5.57 | % | $ | 0.1 | 3.50 | % | 1.51 | % | .87 | % | 45 | % | |||||||||||||||||||||||||||||||||||
Intrinsic Value Fund | |||||||||||||||||||||||||||||||||||||||||||||||||||||||||||||||||||||||
Institutional Class | |||||||||||||||||||||||||||||||||||||||||||||||||||||||||||||||||||||||
8/31/2014 | $ | 12.81 | $ | (0.06 | ) | $ | 2.80 | $ | 2.74 | $ | (0.03 | ) | $ | (0.54 | ) | $ | — | $ | (0.57 | ) | $ | 0.00 | $ | — | $ | 14.98 | 21.74 | % | $ | 252.0 | 1.13 | % | 1.00 | % | (.40 | %) | 24 | % | |||||||||||||||||||||||||||||||||
8/31/2013 | $ | 10.26 | $ | 0.05 | $ | 2.68 | $ | 2.73 | $ | — | $ | (0.18 | ) | $ | — | $ | (0.18 | ) | $ | — | $ | — | $ | 12.81 | 26.94 | % | $ | 182.6 | 1.18 | % | 1.00 | % | .42 | % | 25 | % | |||||||||||||||||||||||||||||||||||
8/31/2012 | $ | 10.26 | $ | (0.01 | ) | $ | 1.09 | $ | 1.08 | $ | — | $ | (1.08 | ) | $ | — | $ | (1.08 | ) | $ | — | $ | — | $ | 10.26 | 12.21 | % | $ | 134.2 | 1.22 | % | 1.00 | % | (.14 | %) | 30 | % | ||||||||||||||||||||||||||||||||||
8/31/2011 | $ | 9.41 | $ | (0.04 | ) | $ | 1.32 | $ | 1.28 | $ | (0.03 | ) | $ | (0.40 | ) | $ | — | $ | (0.43 | ) | $ | — | $ | — | $ | 10.26 | 13.08 | % | $ | 114.7 | 1.26 | % | 1.00 | % | (.35 | %) | 44 | % | |||||||||||||||||||||||||||||||||
| Period from 5/10/2010^ to 8/31/2010 | $ | 10.00 | $ | 0.01 | $ | (0.60 | ) | $ | (0.59 | ) | $ | — | $ | — | $ | — | $ | — | $ | — | $ | — | $ | 9.41 | (5.90 | %)** | $ | 80.9 | 1.70 | %* | 1.00 | %* | .33 | %* | 19 | %** | |||||||||||||||||||||||||||||||||||
Class A | |||||||||||||||||||||||||||||||||||||||||||||||||||||||||||||||||||||||
8/31/2014 | $ | 12.65 | $ | (0.11 | ) | $ | 2.76 | $ | 2.65 | $ | (0.00 | ) | $ | (0.54 | ) | $ | — | $ | (0.54 | ) | $ | 0.00 | $ | — | $ | 14.76 | 21.31 | % | $ | 13.5 | 1.51 | % | 1.36 | % | (.77 | %) | 24 | % | |||||||||||||||||||||||||||||||||
8/31/2013 | $ | 10.16 | $ | 0.00 | $ | 2.67 | $ | 2.67 | $ | — | $ | (0.18 | ) | $ | — | $ | (0.18 | ) | $ | — | $ | — | $ | 12.65 | 26.61 | % | $ | 13.9 | 1.58 | % | 1.36 | % | .01 | % | 25 | % | |||||||||||||||||||||||||||||||||||
8/31/2012 | $ | 10.22 | $ | (0.05 | ) | $ | 1.07 | $ | 1.02 | $ | — | $ | (1.08 | ) | $ | — | $ | (1.08 | ) | $ | — | $ | — | $ | 10.16 | 11.62 | % | $ | 8.4 | 1.61 | % | 1.36 | % | (.51 | %) | 30 | % | ||||||||||||||||||||||||||||||||||
8/31/2011 | $ | 9.40 | $ | (0.09 | ) | $ | 1.34 | $ | 1.25 | $ | (0.03 | ) | $ | (0.40 | ) | $ | — | $ | (0.43 | ) | $ | — | $ | — | $ | 10.22 | 12.74 | % | $ | 8.6 | 1.65 | % | 1.36 | % | (.73 | %) | 44 | % | |||||||||||||||||||||||||||||||||
| Period from 5/10/2010^ to 8/31/2010 | $ | 10.00 | $ | (0.00 | ) | $ | (0.60 | ) | $ | (0.60 | ) | $ | — | $ | — | $ | — | $ | — | $ | — | $ | — | $ | 9.40 | (6.00 | %)** | $ | 0.6 | 2.11 | %* | 1.36 | %* | (.02 | %)* | 19 | %** | ||||||||||||||||||||||||||||||||||
See Notes to Financial Highlights
211
212
Financial Highlights (cont'd)
| Net Asset Value, Beginning of Year | Net Investment Income (Loss)@ | Net Gains or Losses on Securities (both realized and unrealized) | Total From Investment Operations | Dividends from Net Investment Income | Distributions from Net Realized Capital Gains | Tax Return of Capital | Total Distributions | Voluntary Contribution from Management | Redemption Feesøø | Net Asset Value, End of Year | Total Return†† | Net Assets, End of Year (in millions) | Ratio of Gross Expenses to Average Net Assets# | Ratio of Net Expenses to Average Net Assets‡ | Ratio of Net Investment Income/ (Loss) to Average Net Assets | Portfolio Turnover Rate | |||||||||||||||||||||||||||||||||||||||||||||||||||||||
Intrinsic Value Fund (cont'd) | |||||||||||||||||||||||||||||||||||||||||||||||||||||||||||||||||||||||
Class C | |||||||||||||||||||||||||||||||||||||||||||||||||||||||||||||||||||||||
8/31/2014 | $ | 12.35 | $ | (0.21 | ) | $ | 2.69 | $ | 2.48 | $ | — | $ | (0.54 | ) | $ | — | $ | (0.54 | ) | $ | 0.00 | $ | — | $ | 14.29 | 20.40 | % | $ | 12.7 | 2.26 | % | 2.11 | % | (1.51 | %) | 24 | % | ||||||||||||||||||||||||||||||||||
8/31/2013 | $ | 10.00 | $ | (0.08 | ) | $ | 2.61 | $ | 2.53 | $ | — | $ | (0.18 | ) | $ | — | $ | (0.18 | ) | $ | — | $ | — | $ | 12.35 | 25.62 | % | $ | 10.3 | 2.31 | % | 2.11 | % | (.70 | %) | 25 | % | ||||||||||||||||||||||||||||||||||
8/31/2012 | $ | 10.14 | $ | (0.12 | ) | $ | 1.06 | $ | 0.94 | $ | — | $ | (1.08 | ) | $ | — | $ | (1.08 | ) | $ | — | $ | — | $ | 10.00 | 10.87 | % | $ | 6.9 | 2.35 | % | 2.11 | % | (1.25 | %) | 30 | % | ||||||||||||||||||||||||||||||||||
8/31/2011 | $ | 9.38 | $ | (0.17 | ) | $ | 1.34 | $ | 1.17 | $ | (0.01 | ) | $ | (0.40 | ) | $ | — | $ | (0.41 | ) | $ | — | $ | — | $ | 10.14 | 11.91 | % | $ | 5.5 | 2.34 | % | 2.11 | % | (1.48 | %) | 44 | % | |||||||||||||||||||||||||||||||||
| Period from 5/10/2010^ to 8/31/2010 | $ | 10.00 | $ | (0.02 | ) | $ | (0.60 | ) | $ | (0.62 | ) | $ | — | $ | — | $ | — | $ | — | $ | — | $ | — | $ | 9.38 | (6.20 | %)** | $ | 0.0 | 3.09 | %* | 2.11 | %* | (.79 | %)* | 19 | %** | ||||||||||||||||||||||||||||||||||
Large Cap Disciplined Growth Fund | |||||||||||||||||||||||||||||||||||||||||||||||||||||||||||||||||||||||
Investor Class | |||||||||||||||||||||||||||||||||||||||||||||||||||||||||||||||||||||||
8/31/2014 | $ | 8.18 | $ | 0.04 | $ | 1.41 | $ | 1.45 | $ | (0.01 | ) | $ | (1.29 | ) | $ | — | $ | (1.30 | ) | $ | 0.00 | $ | — | $ | 8.33 | 19.09 | % | $ | 11.2 | 1.07 | % | 1.07 | % | .44 | % | 61 | % | ||||||||||||||||||||||||||||||||||
8/31/2013 | $ | 7.68 | $ | 0.03 | $ | 0.89 | $ | 0.92 | $ | (0.05 | ) | $ | (0.37 | ) | $ | — | $ | (0.42 | ) | $ | — | $ | — | $ | 8.18 | 12.76 | % | $ | 16.1 | 1.11 | % | 1.11 | %§ | .42 | % | 66 | % | ||||||||||||||||||||||||||||||||||
8/31/2012 | $ | 7.38 | $ | 0.01 | $ | 0.62 | $ | 0.63 | $ | — | $ | (0.33 | ) | $ | — | $ | (0.33 | ) | $ | — | $ | — | $ | 7.68 | 9.12 | % | $ | 17.8 | 1.11 | % | 1.11 | %§ | .08 | % | 116 | % | |||||||||||||||||||||||||||||||||||
8/31/2011 | $ | 6.18 | $ | (0.01 | ) | $ | 1.21 | $ | 1.20 | $ | (0.00 | ) | $ | — | $ | — | $ | (0.00 | ) | $ | — | $ | — | $ | 7.38 | 19.44 | % | $ | 15.5 | 1.11 | % | 1.11 | %§ | (.08 | %) | 101 | % | ||||||||||||||||||||||||||||||||||
8/31/2010 | $ | 6.04 | $ | 0.02 | $ | 0.12 | $ | 0.14 | $ | (0.00 | ) | $ | — | $ | — | $ | (0.00 | ) | $ | — | $ | — | $ | 6.18 | 2.37 | % | $ | 11.4 | 1.23 | % | 1.11 | % | .29 | % | 104 | % | |||||||||||||||||||||||||||||||||||
Institutional Class | |||||||||||||||||||||||||||||||||||||||||||||||||||||||||||||||||||||||
8/31/2014 | $ | 8.23 | $ | 0.06 | $ | 1.42 | $ | 1.48 | $ | (0.04 | ) | $ | (1.29 | ) | $ | — | $ | (1.33 | ) | $ | 0.00 | $ | — | $ | 8.38 | 19.41 | % | $ | 185.0 | .83 | % | .75 | % | .71 | % | 61 | % | ||||||||||||||||||||||||||||||||||
8/31/2013 | $ | 7.72 | $ | 0.06 | $ | 0.90 | $ | 0.96 | $ | (0.08 | ) | $ | (0.37 | ) | $ | — | $ | (0.45 | ) | $ | — | $ | — | $ | 8.23 | 13.28 | % | $ | 409.2 | .79 | % | .75 | % | .77 | % | 66 | % | ||||||||||||||||||||||||||||||||||
8/31/2012 | $ | 7.41 | $ | 0.03 | $ | 0.62 | $ | 0.65 | $ | (0.01 | ) | $ | (0.33 | ) | $ | — | $ | (0.34 | ) | $ | — | $ | — | $ | 7.72 | 9.43 | % | $ | 601.6 | .78 | % | .75 | % | .44 | % | 116 | % | ||||||||||||||||||||||||||||||||||
8/31/2011 | $ | 6.20 | $ | 0.02 | $ | 1.21 | $ | 1.23 | $ | (0.02 | ) | $ | — | $ | — | $ | (0.02 | ) | $ | — | $ | — | $ | 7.41 | 19.79 | % | $ | 565.4 | .80 | % | .75 | % | .29 | % | 101 | % | |||||||||||||||||||||||||||||||||||
8/31/2010 | $ | 6.05 | $ | 0.04 | $ | 0.13 | $ | 0.17 | $ | (0.02 | ) | $ | — | $ | — | $ | (0.02 | ) | $ | — | $ | — | $ | 6.20 | 2.76 | % | $ | 346.6 | .87 | % | .75 | % | .61 | % | 104 | % | |||||||||||||||||||||||||||||||||||
Class A | |||||||||||||||||||||||||||||||||||||||||||||||||||||||||||||||||||||||
8/31/2014 | $ | 8.17 | $ | 0.03 | $ | 1.42 | $ | 1.45 | �� | $ | — | $ | (1.29 | ) | $ | — | $ | (1.29 | ) | $ | 0.00 | $ | — | $ | 8.33 | 19.05 | % | $ | 12.7 | 1.21 | % | 1.11 | % | .38 | % | 61 | % | ||||||||||||||||||||||||||||||||||
8/31/2013 | $ | 7.67 | $ | 0.03 | $ | 0.89 | $ | 0.92 | $ | (0.05 | ) | $ | (0.37 | ) | $ | — | $ | (0.42 | ) | $ | — | $ | — | $ | 8.17 | 12.80 | % | $ | 38.4 | 1.16 | % | 1.11 | % | .42 | % | 66 | % | ||||||||||||||||||||||||||||||||||
8/31/2012 | $ | 7.37 | $ | 0.00 | $ | 0.63 | $ | 0.63 | $ | — | $ | (0.33 | ) | $ | — | $ | (0.33 | ) | $ | — | $ | — | $ | 7.67 | 9.13 | % | $ | 67.1 | 1.16 | % | 1.11 | % | .06 | % | 116 | % | |||||||||||||||||||||||||||||||||||
8/31/2011 | $ | 6.18 | $ | (0.01 | ) | $ | 1.20 | $ | 1.19 | $ | (0.00 | ) | $ | — | $ | — | $ | (0.00 | ) | $ | — | $ | — | $ | 7.37 | 19.30 | % | $ | 40.2 | 1.19 | % | 1.11 | % | (.09 | %) | 101 | % | ||||||||||||||||||||||||||||||||||
8/31/2010 | $ | 6.04 | $ | 0.02 | $ | 0.12 | $ | 0.14 | $ | — | $ | — | $ | — | $ | — | $ | — | $ | — | $ | 6.18 | 2.32 | % | $ | 33.0 | 1.30 | % | 1.11 | % | .35 | % | 104 | % | |||||||||||||||||||||||||||||||||||||
Class C | |||||||||||||||||||||||||||||||||||||||||||||||||||||||||||||||||||||||
8/31/2014 | $ | 7.93 | $ | (0.03 | ) | $ | 1.38 | $ | 1.35 | $ | — | $ | (1.25 | ) | $ | — | $ | (1.25 | ) | $ | 0.00 | $ | — | $ | 8.03 | 18.29 | % | $ | 22.9 | 1.96 | % | 1.86 | % | (.34 | %) | 61 | % | ||||||||||||||||||||||||||||||||||
8/31/2013 | $ | 7.48 | $ | (0.03 | ) | $ | 0.87 | $ | 0.84 | $ | (0.02 | ) | $ | (0.37 | ) | $ | — | $ | (0.39 | ) | $ | — | $ | — | $ | 7.93 | 11.93 | % | $ | 24.8 | 1.91 | % | 1.86 | % | (.34 | %) | 66 | % | |||||||||||||||||||||||||||||||||
8/31/2012 | $ | 7.26 | $ | (0.05 | ) | $ | 0.60 | $ | 0.55 | $ | — | $ | (0.33 | ) | $ | — | $ | (0.33 | ) | $ | — | $ | — | $ | 7.48 | 8.14 | % | $ | 33.4 | 1.90 | % | 1.86 | % | (.67 | %) | 116 | % | ||||||||||||||||||||||||||||||||||
8/31/2011 | $ | 6.12 | $ | (0.06 | ) | $ | 1.20 | $ | 1.14 | $ | — | $ | — | $ | — | $ | — | $ | — | $ | — | $ | 7.26 | 18.63 | % | $ | 37.0 | 1.92 | % | 1.86 | % | (.83 | %) | 101 | % | ||||||||||||||||||||||||||||||||||||
8/31/2010 | $ | 6.02 | $ | (0.03 | ) | $ | 0.13 | $ | 0.10 | $ | — | $ | — | $ | — | $ | — | $ | — | $ | — | $ | 6.12 | 1.66 | % | $ | 31.0 | 2.01 | % | 1.86 | % | (.46 | %) | 104 | % | ||||||||||||||||||||||||||||||||||||
See Notes to Financial Highlights
213
214
Financial Highlights (cont'd)
| Net Asset Value, Beginning of Year | Net Investment Income (Loss)@ | Net Gains or Losses on Securities (both realized and unrealized) | Total From Investment Operations | Dividends from Net Investment Income | Distributions from Net Realized Capital Gains | Tax Return of Capital | Total Distributions | Voluntary Contribution from Management | Redemption Feesøø | Net Asset Value, End of Year | Total Return†† | Net Assets, End of Year (in millions) | Ratio of Gross Expenses to Average Net Assets# | Ratio of Net Expenses to Average Net Assets‡ | Ratio of Net Investment Income/ (Loss) to Average Net Assets | Portfolio Turnover Rate | |||||||||||||||||||||||||||||||||||||||||||||||||||||||
Large Cap Disciplined Growth Fund (cont'd) | |||||||||||||||||||||||||||||||||||||||||||||||||||||||||||||||||||||||
Class R3 | |||||||||||||||||||||||||||||||||||||||||||||||||||||||||||||||||||||||
8/31/2014 | $ | 8.10 | $ | 0.01 | $ | 1.41 | $ | 1.42 | $ | — | $ | (1.25 | ) | $ | — | $ | (1.25 | ) | $ | 0.00 | $ | — | $ | 8.27 | 18.82 | % | $ | 0.2 | 1.60 | % | 1.36 | % | .12 | % | 61 | % | |||||||||||||||||||||||||||||||||||
8/31/2013 | $ | 7.61 | $ | 0.01 | $ | 0.88 | $ | 0.89 | $ | (0.03 | ) | $ | (0.37 | ) | $ | — | $ | (0.40 | ) | $ | — | $ | — | $ | 8.10 | 12.48 | % | $ | 0.4 | 1.45 | % | 1.36 | % | .17 | % | 66 | % | ||||||||||||||||||||||||||||||||||
8/31/2012 | $ | 7.34 | $ | (0.01 | ) | $ | 0.61 | $ | 0.60 | $ | — | $ | (0.33 | ) | $ | — | $ | (0.33 | ) | $ | — | $ | — | $ | 7.61 | 8.75 | % | $ | 0.3 | 1.44 | % | 1.36 | % | (.18 | %) | 116 | % | ||||||||||||||||||||||||||||||||||
8/31/2011 | $ | 6.16 | $ | (0.02 | ) | $ | 1.20 | $ | 1.18 | $ | — | $ | — | $ | — | $ | — | $ | — | $ | — | $ | 7.34 | 19.16 | % | $ | 0.3 | 1.48 | % | 1.36 | % | (.29 | %) | 101 | % | ||||||||||||||||||||||||||||||||||||
8/31/2010 | $ | 6.03 | $ | 0.00 | $ | 0.13 | $ | 0.13 | $ | — | $ | — | $ | — | $ | — | $ | — | $ | — | $ | 6.16 | 2.16 | % | $ | 0.1 | 3.23 | % | 1.36 | % | .04 | % | 104 | % | |||||||||||||||||||||||||||||||||||||
Large Cap Value Fund | |||||||||||||||||||||||||||||||||||||||||||||||||||||||||||||||||||||||
Investor Class | |||||||||||||||||||||||||||||||||||||||||||||||||||||||||||||||||||||||
8/31/2014 | $ | 32.40 | $ | 0.34 | $ | 6.62 | $ | 6.96 | $ | (0.42 | ) | $ | (5.02 | ) | $ | — | $ | (5.44 | ) | $ | 0.00 | $ | — | $ | 33.92 | 23.57 | % | $ | 1,238.3 | .85 | % | .85 | % | 1.04 | % | 104 | % | ||||||||||||||||||||||||||||||||||
8/31/2013 | $ | 26.46 | $ | 0.36 | $ | 5.94 | $ | 6.30 | $ | (0.36 | ) | $ | — | $ | — | $ | (0.36 | ) | $ | — | $ | — | $ | 32.40 | 24.05 | %@@ | $ | 1,149.7 | .86 | % | .86 | % | 1.19 | % | 159 | % | |||||||||||||||||||||||||||||||||||
8/31/2012 | $ | 24.97 | $ | 0.30 | $ | 1.30 | $ | 1.60 | $ | (0.11 | ) | $ | — | $ | — | $ | (0.11 | ) | $ | — | $ | — | $ | 26.46 | 6.47 | % | $ | 1,057.1 | .87 | % | .87 | % | 1.20 | % | 171 | % | |||||||||||||||||||||||||||||||||||
8/31/2011 | $ | 22.03 | $ | 0.11 | $ | 2.86 | $ | 2.97 | $ | (0.03 | ) | $ | — | $ | — | $ | (0.03 | ) | $ | — | $ | — | $ | 24.97 | 13.48 | % | $ | 1,171.4 | .85 | % | .85 | % | .42 | % | 41 | % | |||||||||||||||||||||||||||||||||||
8/31/2010 | $ | 21.67 | $ | 0.04 | $ | 0.45 | $ | 0.49 | $ | (0.13 | ) | $ | — | $ | — | $ | (0.13 | ) | $ | — | $ | — | $ | 22.03 | 2.21 | % | $ | 1,189.1 | .85 | % | .85 | % | .19 | % | 42 | % | |||||||||||||||||||||||||||||||||||
Trust Class | |||||||||||||||||||||||||||||||||||||||||||||||||||||||||||||||||||||||
8/31/2014 | $ | 24.80 | $ | 0.20 | $ | 4.93 | $ | 5.13 | $ | (0.37 | ) | $ | (5.02 | ) | $ | — | $ | (5.39 | ) | $ | 0.00 | $ | — | $ | 24.54 | 23.36 | % | $ | 141.1 | 1.05 | % | 1.05 | % | .83 | % | 104 | % | ||||||||||||||||||||||||||||||||||
8/31/2013 | $ | 20.30 | $ | 0.23 | $ | 4.54 | $ | 4.77 | $ | (0.27 | ) | $ | — | $ | — | $ | (0.27 | ) | $ | — | $ | — | $ | 24.80 | 23.76 | %@@ | $ | 156.6 | 1.06 | % | 1.06 | % | 1.01 | % | 159 | % | |||||||||||||||||||||||||||||||||||
8/31/2012 | $ | 19.15 | $ | 0.19 | $ | 1.00 | $ | 1.19 | $ | (0.04 | ) | $ | — | $ | — | $ | (0.04 | ) | $ | — | $ | — | $ | 20.30 | 6.26 | % | $ | 209.6 | 1.05 | % | 1.05 | % | .97 | % | 171 | % | |||||||||||||||||||||||||||||||||||
8/31/2011 | $ | 16.90 | $ | 0.04 | $ | 2.21 | $ | 2.25 | $ | (0.00 | ) | $ | — | $ | — | $ | (0.00 | ) | $ | — | $ | — | $ | 19.15 | 13.32 | % | $ | 424.9 | 1.04 | % | 1.04 | % | .22 | % | 41 | % | |||||||||||||||||||||||||||||||||||
8/31/2010 | $ | 16.67 | $ | 0.00 | $ | 0.34 | $ | 0.34 | $ | (0.11 | ) | $ | — | $ | — | $ | (0.11 | ) | $ | — | $ | — | $ | 16.90 | 2.01 | % | $ | 547.6 | 1.03 | % | 1.03 | % | .01 | % | 42 | % | |||||||||||||||||||||||||||||||||||
Advisor Class | |||||||||||||||||||||||||||||||||||||||||||||||||||||||||||||||||||||||
8/31/2014 | $ | 21.23 | $ | 0.14 | $ | 4.12 | $ | 4.26 | $ | (0.35 | ) | $ | (5.02 | ) | $ | — | $ | (5.37 | ) | $ | 0.00 | $ | — | $ | 20.12 | 23.17 | % | $ | 216.1 | 1.20 | % | 1.20 | % | .69 | % | 104 | % | ||||||||||||||||||||||||||||||||||
8/31/2013 | $ | 17.46 | $ | 0.17 | $ | 3.89 | $ | 4.06 | $ | (0.29 | ) | $ | — | $ | — | $ | (0.29 | ) | $ | — | $ | — | $ | 21.23 | 23.58 | %@@ | $ | 205.3 | 1.21 | % | 1.21 | % | .86 | % | 159 | % | |||||||||||||||||||||||||||||||||||
8/31/2012 | $ | 16.50 | $ | 0.14 | $ | 0.87 | $ | 1.01 | $ | (0.05 | ) | $ | — | $ | — | $ | (0.05 | ) | $ | — | $ | — | $ | 17.46 | 6.13 | % | $ | 220.0 | 1.20 | % | 1.20 | % | .84 | % | 171 | % | |||||||||||||||||||||||||||||||||||
8/31/2011 | $ | 14.59 | $ | 0.01 | $ | 1.90 | $ | 1.91 | $ | — | $ | — | $ | — | $ | — | $ | — | $ | — | $ | 16.50 | 13.09 | % | $ | 308.9 | 1.19 | % | 1.19 | % | .07 | % | 41 | % | |||||||||||||||||||||||||||||||||||||
8/31/2010 | $ | 14.42 | $ | (0.02 | ) | $ | 0.29 | $ | 0.27 | $ | (0.10 | ) | $ | — | $ | — | $ | (0.10 | ) | $ | — | $ | — | $ | 14.59 | 1.83 | % | $ | 341.5 | 1.18 | % | 1.18 | % | (.14 | %) | 42 | % | ||||||||||||||||||||||||||||||||||
Institutional Class | |||||||||||||||||||||||||||||||||||||||||||||||||||||||||||||||||||||||
8/31/2014 | $ | 32.56 | $ | 0.39 | $ | 6.65 | $ | 7.04 | $ | (0.47 | ) | $ | (5.02 | ) | $ | — | $ | (5.49 | ) | $ | 0.00 | $ | — | $ | 34.11 | 23.74 | % | $ | 143.5 | .70 | % | .70 | %§ | 1.18 | % | 104 | % | ||||||||||||||||||||||||||||||||||
8/31/2013 | $ | 26.59 | $ | 0.41 | $ | 5.97 | $ | 6.38 | $ | (0.41 | ) | $ | — | $ | — | $ | (0.41 | ) | $ | — | $ | — | $ | 32.56 | 24.26 | %@@ | $ | 113.2 | .70 | % | .70 | % | 1.36 | % | 159 | % | |||||||||||||||||||||||||||||||||||
8/31/2012 | $ | 25.11 | $ | 0.34 | $ | 1.30 | $ | 1.64 | $ | (0.16 | ) | $ | — | $ | — | $ | (0.16 | ) | $ | — | $ | — | $ | 26.59 | 6.61 | % | $ | 103.0 | .70 | % | .70 | % | 1.35 | % | 171 | % | |||||||||||||||||||||||||||||||||||
8/31/2011 | $ | 22.15 | $ | 0.17 | $ | 2.87 | $ | 3.04 | $ | (0.08 | ) | $ | — | $ | — | $ | (0.08 | ) | $ | — | $ | — | $ | 25.11 | 13.69 | % | $ | 200.6 | .69 | % | .69 | % | .61 | % | 41 | % | |||||||||||||||||||||||||||||||||||
8/31/2010 | $ | 21.79 | $ | 0.08 | $ | 0.45 | $ | 0.53 | $ | (0.17 | ) | $ | — | $ | — | $ | (0.17 | ) | $ | — | $ | — | $ | 22.15 | 2.35 | % | $ | 148.7 | .69 | % | .69 | %§ | .35 | % | 42 | % | |||||||||||||||||||||||||||||||||||
See Notes to Financial Highlights
215
216
Financial Highlights (cont'd)
| Net Asset Value, Beginning of Year | Net Investment Income (Loss)@ | Net Gains or Losses on Securities (both realized and unrealized) | Total From Investment Operations | Dividends from Net Investment Income | Distributions from Net Realized Capital Gains | Tax Return of Capital | Total Distributions | Voluntary Contribution from Management | Redemption Feesøø | Net Asset Value, End of Year | Total Return†† | Net Assets, End of Year (in millions) | Ratio of Gross Expenses to Average Net Assets# | Ratio of Net Expenses to Average Net Assets‡ | Ratio of Net Investment Income/ (Loss) to Average Net Assets | Portfolio Turnover Rate | |||||||||||||||||||||||||||||||||||||||||||||||||||||||
Large Cap Value Fund (cont'd) | |||||||||||||||||||||||||||||||||||||||||||||||||||||||||||||||||||||||
Class A | |||||||||||||||||||||||||||||||||||||||||||||||||||||||||||||||||||||||
8/31/2014 | $ | 24.83 | $ | 0.19 | $ | 4.94 | $ | 5.13 | $ | (0.39 | ) | $ | (5.02 | ) | $ | — | $ | (5.41 | ) | $ | 0.00 | $ | — | $ | 24.55 | 23.31 | % | $ | 2.7 | 1.08 | % | 1.08 | %§ | .78 | % | 104 | % | ||||||||||||||||||||||||||||||||||
8/31/2013 | $ | 20.07 | $ | 0.22 | $ | 4.54 | $ | 4.76 | $ | — | $ | — | $ | — | $ | — | $ | — | $ | — | $ | 24.83 | 23.72 | %@@ | $ | 1.6 | 1.11 | % | 1.11 | % | .97 | % | 159 | % | |||||||||||||||||||||||||||||||||||||
8/31/2012 | $ | 19.06 | $ | 0.20 | $ | 0.97 | $ | 1.17 | $ | (0.16 | ) | $ | — | $ | — | $ | (0.16 | ) | $ | — | $ | — | $ | 20.07 | 6.24 | % | $ | 2.0 | 1.07 | % | 1.07 | %§ | 1.03 | % | 171 | % | |||||||||||||||||||||||||||||||||||
8/31/2011 | $ | 16.90 | $ | 0.06 | $ | 2.18 | $ | 2.24 | $ | (0.08 | ) | $ | — | $ | — | $ | (0.08 | ) | $ | — | $ | — | $ | 19.06 | 13.20 | % | $ | 1.4 | 1.29 | % | 1.11 | % | .30 | % | 41 | % | |||||||||||||||||||||||||||||||||||
| Period from 6/21/2010^ to 8/31/2010 | $ | 18.36 | $ | 0.01 | $ | (1.47 | ) | $ | (1.46 | ) | $ | — | $ | — | $ | — | $ | — | $ | — | $ | — | $ | 16.90 | (7.95 | %)** | $ | 0.0 | 35.72 | %* | 1.11 | %* | .16 | %* | 42 | %Ø | |||||||||||||||||||||||||||||||||||
Class C | |||||||||||||||||||||||||||||||||||||||||||||||||||||||||||||||||||||||
8/31/2014 | $ | 20.73 | $ | 0.00 | $ | 4.01 | $ | 4.01 | $ | (0.32 | ) | $ | (5.02 | ) | $ | — | $ | (5.34 | ) | $ | 0.00 | $ | — | $ | 19.40 | 22.37 | % | $ | 3.0 | 1.86 | % | 1.86 | %§ | .03 | % | 104 | % | ||||||||||||||||||||||||||||||||||
8/31/2013 | $ | 17.19 | $ | 0.02 | $ | 3.85 | $ | 3.87 | $ | (0.33 | ) | $ | — | $ | — | $ | (0.33 | ) | $ | — | $ | — | $ | 20.73 | 22.87 | % | $ | 1.2 | 1.86 | % | 1.86 | %§ | .10 | % | 159 | % | |||||||||||||||||||||||||||||||||||
8/31/2012 | $ | 16.31 | $ | 0.05 | $ | 0.83 | $ | 0.88 | $ | — | $ | — | $ | — | $ | — | $ | — | $ | — | $ | 17.19 | 5.40 | % | $ | 0.2 | 2.04 | % | 1.86 | % | .27 | % | 171 | % | |||||||||||||||||||||||||||||||||||||
8/31/2011 | $ | 14.57 | $ | (0.10 | ) | $ | 1.90 | $ | 1.80 | $ | (0.06 | ) | $ | — | $ | — | $ | (0.06 | ) | $ | — | $ | — | $ | 16.31 | 12.32 | % | $ | 0.1 | 4.61 | % | 1.86 | % | (.56 | %) | 41 | % | ||||||||||||||||||||||||||||||||||
| Period from 6/21/2010^ to 8/31/2010 | $ | 15.85 | $ | (0.02 | ) | $ | (1.26 | ) | $ | (1.28 | ) | $ | — | $ | — | $ | — | $ | — | $ | — | $ | — | $ | 14.57 | (8.08 | %)** | $ | 0.0 | 37.45 | %* | 1.86 | %* | (.60 | %)* | 42 | %Ø | ||||||||||||||||||||||||||||||||||
Class R3 | |||||||||||||||||||||||||||||||||||||||||||||||||||||||||||||||||||||||
8/31/2014 | $ | 21.41 | $ | 0.11 | $ | 4.16 | $ | 4.27 | $ | (0.34 | ) | $ | (5.02 | ) | $ | — | $ | (5.36 | ) | $ | 0.00 | $ | — | $ | 20.32 | 22.94 | % | $ | 0.1 | 1.43 | % | 1.36 | % | .53 | % | 104 | % | ||||||||||||||||||||||||||||||||||
8/31/2013 | $ | 17.34 | $ | 0.09 | $ | 3.98 | $ | 4.07 | $ | — | $ | — | $ | — | $ | — | $ | — | $ | — | $ | 21.41 | 23.47 | %@@ | $ | 0.1 | 1.42 | % | 1.36 | % | .46 | % | 159 | % | |||||||||||||||||||||||||||||||||||||
8/31/2012 | $ | 16.41 | $ | 0.15 | $ | 0.82 | $ | 0.97 | $ | (0.04 | ) | $ | — | $ | — | $ | (0.04 | ) | $ | — | $ | — | $ | 17.34 | 5.95 | % | $ | 0.6 | 1.39 | % | 1.36 | % | .93 | % | 171 | % | |||||||||||||||||||||||||||||||||||
8/31/2011 | $ | 14.58 | $ | (0.01 | ) | $ | 1.90 | $ | 1.89 | $ | (0.06 | ) | $ | — | $ | — | $ | (0.06 | ) | $ | — | $ | — | $ | 16.41 | 12.93 | % | $ | 0.0 | 6.07 | % | 1.36 | % | (.08 | %) | 41 | % | ||||||||||||||||||||||||||||||||||
| Period from 6/21/2010^ to 8/31/2010 | $ | 15.85 | $ | (0.00 | ) | $ | (1.27 | ) | $ | (1.27 | ) | $ | — | $ | — | $ | — | $ | — | $ | — | $ | — | $ | 14.58 | (8.01 | %)** | $ | 0.0 | 36.96 | %* | 1.36 | %* | (.09 | %)* | 42 | %Ø | ||||||||||||||||||||||||||||||||||
Mid Cap Growth Fund | |||||||||||||||||||||||||||||||||||||||||||||||||||||||||||||||||||||||
Investor Class | |||||||||||||||||||||||||||||||||||||||||||||||||||||||||||||||||||||||
8/31/2014 | $ | 13.35 | $ | (0.07 | ) | $ | 2.34 | $ | 2.27 | $ | — | $ | (0.97 | ) | $ | — | $ | (0.97 | ) | $ | 0.00 | $ | — | $ | 14.65 | 17.54 | % | $ | 415.6 | .93 | % | .93 | % | (.47 | %) | 63 | % | ||||||||||||||||||||||||||||||||||
8/31/2013 | $ | 11.98 | $ | (0.04 | ) | $ | 2.08 | $ | 2.04 | $ | — | $ | (0.67 | ) | $ | — | $ | (0.67 | ) | $ | — | $ | — | $ | 13.35 | 18.03 | % | $ | 377.8 | .98 | % | .98 | % | (.30 | %) | 46 | % | ||||||||||||||||||||||||||||||||||
8/31/2012 | $ | 10.84 | $ | (0.06 | ) | $ | 1.22 | $ | 1.16 | $ | — | $ | (0.02 | ) | $ | — | $ | (0.02 | ) | $ | — | $ | — | $ | 11.98 | 10.73 | % | $ | 347.9 | 1.01 | % | 1.01 | % | (.51 | %) | 40 | % | ||||||||||||||||||||||||||||||||||
8/31/2011 | $ | 8.43 | $ | (0.05 | ) | $ | 2.46 | $ | 2.41 | $ | — | $ | — | $ | — | $ | — | $ | — | $ | — | $ | 10.84 | 28.59 | % | $ | 335.5 | 1.02 | % | 1.02 | % | (.45 | %) | 49 | % | ||||||||||||||||||||||||||||||||||||
8/31/2010 | $ | 7.43 | $ | (0.05 | ) | $ | 1.05 | $ | 1.00 | $ | — | $ | — | $ | — | $ | — | $ | — | $ | — | $ | 8.43 | 13.46 | % | $ | 288.0 | 1.07 | % | 1.07 | % | (.55 | %) | 70 | % | ||||||||||||||||||||||||||||||||||||
Trust Class | |||||||||||||||||||||||||||||||||||||||||||||||||||||||||||||||||||||||
8/31/2014 | $ | 20.75 | $ | (0.12 | ) | $ | 3.66 | $ | 3.54 | $ | — | $ | (0.96 | ) | $ | — | $ | (0.96 | ) | $ | 0.00 | $ | — | $ | 23.33 | 17.40 | % | $ | 69.6 | 1.00 | % | 1.00 | % | (.54 | %) | 63 | % | ||||||||||||||||||||||||||||||||||
8/31/2013 | $ | 18.23 | $ | (0.07 | ) | $ | 3.24 | $ | 3.17 | $ | — | $ | (0.65 | ) | $ | — | $ | (0.65 | ) | $ | — | $ | — | $ | 20.75 | 18.02 | % | $ | 54.9 | 1.04 | % | 1.04 | % | (.38 | %) | 46 | % | ||||||||||||||||||||||||||||||||||
8/31/2012 | $ | 16.48 | $ | (0.10 | ) | $ | 1.85 | $ | 1.75 | $ | — | $ | (0.00 | ) | $ | — | $ | (0.00 | ) | $ | — | $ | — | $ | 18.23 | 10.65 | % | $ | 39.9 | 1.05 | % | 1.05 | % | (.55 | %) | 40 | % | ||||||||||||||||||||||||||||||||||
8/31/2011 | $ | 12.83 | $ | (0.08 | ) | $ | 3.73 | $ | 3.65 | $ | — | $ | — | $ | — | $ | — | $ | — | $ | — | $ | 16.48 | 28.45 | % | $ | 28.1 | 1.07 | % | 1.07 | % | (.52 | %) | 49 | % | ||||||||||||||||||||||||||||||||||||
8/31/2010 | $ | 11.31 | $ | (0.08 | ) | $ | 1.60 | $ | 1.52 | $ | — | $ | — | $ | — | $ | — | $ | — | $ | — | $ | 12.83 | 13.44 | % | $ | 21.8 | 1.14 | % | 1.14 | % | (.61 | %) | 70 | % | ||||||||||||||||||||||||||||||||||||
See Notes to Financial Highlights
217
218
Financial Highlights (cont'd)
| Net Asset Value, Beginning of Year | Net Investment Income (Loss)@ | Net Gains or Losses on Securities (both realized and unrealized) | Total From Investment Operations | Dividends from Net Investment Income | Distributions from Net Realized Capital Gains | Tax Return of Capital | Total Distributions | Voluntary Contribution from Management | Redemption Feesøø | Net Asset Value, End of Year | Total Return†† | Net Assets, End of Year (in millions) | Ratio of Gross Expenses to Average Net Assets# | Ratio of Net Expenses to Average Net Assets‡ | Ratio of Net Investment Income/ (Loss) to Average Net Assets | Portfolio Turnover Rate | |||||||||||||||||||||||||||||||||||||||||||||||||||||||
Mid Cap Growth Fund (cont'd) | |||||||||||||||||||||||||||||||||||||||||||||||||||||||||||||||||||||||
Advisor Class | |||||||||||||||||||||||||||||||||||||||||||||||||||||||||||||||||||||||
8/31/2014 | $ | 21.13 | $ | (0.18 | ) | $ | 3.74 | $ | 3.56 | $ | — | $ | (0.92 | ) | $ | — | $ | (0.92 | ) | $ | 0.00 | $ | — | $ | 23.77 | 17.16 | % | $ | 10.3 | 1.26 | % | 1.26 | % | (.81 | %) | 63 | % | ||||||||||||||||||||||||||||||||||
8/31/2013 | $ | 18.54 | $ | (0.12 | ) | $ | 3.29 | $ | 3.17 | $ | — | $ | (0.58 | ) | $ | — | $ | (0.58 | ) | $ | — | $ | — | $ | 21.13 | 17.64 | % | $ | 11.7 | 1.30 | % | 1.30 | % | (.62 | %) | 46 | % | ||||||||||||||||||||||||||||||||||
8/31/2012 | $ | 16.82 | $ | (0.17 | ) | $ | 1.89 | $ | 1.72 | $ | — | $ | — | $ | — | $ | — | $ | — | $ | — | $ | 18.54 | 10.23 | % | $ | 10.2 | 1.44 | % | 1.44 | %§ | (.95 | %) | 40 | % | ||||||||||||||||||||||||||||||||||||
8/31/2011 | $ | 13.14 | $ | (0.16 | ) | $ | 3.84 | $ | 3.68 | $ | — | $ | — | $ | — | $ | — | $ | — | $ | — | $ | 16.82 | 28.01 | % | $ | 9.0 | 1.50 | % | 1.50 | %§ | (.95 | %) | 49 | % | ||||||||||||||||||||||||||||||||||||
8/31/2010 | $ | 11.63 | $ | (0.13 | ) | $ | 1.64 | $ | 1.51 | $ | — | $ | — | $ | — | $ | — | $ | — | $ | — | $ | 13.14 | 12.98 | % | $ | 5.4 | 1.50 | % | 1.50 | %§ | (.98 | %) | 70 | % | ||||||||||||||||||||||||||||||||||||
Institutional Class | |||||||||||||||||||||||||||||||||||||||||||||||||||||||||||||||||||||||
8/31/2014 | $ | 13.56 | $ | (0.04 | ) | $ | 2.37 | $ | 2.33 | $ | — | $ | (1.00 | ) | $ | — | $ | (1.00 | ) | $ | 0.00 | $ | — | $ | 14.89 | 17.74 | % | $ | 382.5 | .75 | % | .75 | % | (.29 | %) | 63 | % | ||||||||||||||||||||||||||||||||||
8/31/2013 | $ | 12.16 | $ | (0.01 | ) | $ | 2.11 | $ | 2.10 | $ | — | $ | (0.70 | ) | $ | — | $ | (0.70 | ) | $ | — | $ | — | $ | 13.56 | 18.32 | % | $ | 258.6 | .79 | % | .75 | % | (.07 | %) | 46 | % | ||||||||||||||||||||||||||||||||||
8/31/2012 | $ | 11.01 | $ | (0.03 | ) | $ | 1.23 | $ | 1.20 | $ | — | $ | (0.05 | ) | $ | — | $ | (0.05 | ) | $ | — | $ | — | $ | 12.16 | 10.96 | % | $ | 174.2 | .79 | % | .75 | % | (.26 | %) | 40 | % | ||||||||||||||||||||||||||||||||||
8/31/2011 | $ | 8.54 | $ | (0.02 | ) | $ | 2.49 | $ | 2.47 | $ | — | $ | — | $ | — | $ | — | $ | — | $ | — | $ | 11.01 | 28.92 | % | $ | 113.8 | .81 | % | .75 | % | (.21 | %) | 49 | % | ||||||||||||||||||||||||||||||||||||
8/31/2010 | $ | 7.50 | $ | (0.02 | ) | $ | 1.06 | $ | 1.04 | $ | — | $ | — | $ | — | $ | — | $ | — | $ | — | $ | 8.54 | 13.87 | % | $ | 121.1 | .83 | % | .75 | % | (.22 | %) | 70 | % | ||||||||||||||||||||||||||||||||||||
Class A | |||||||||||||||||||||||||||||||||||||||||||||||||||||||||||||||||||||||
8/31/2014 | $ | 20.74 | $ | (0.15 | ) | $ | 3.67 | $ | 3.52 | $ | — | $ | (0.94 | ) | $ | — | $ | (0.94 | ) | $ | 0.00 | $ | — | $ | 23.32 | 17.33 | % | $ | 100.7 | 1.13 | % | 1.11 | % | (.65 | %) | 63 | % | ||||||||||||||||||||||||||||||||||
8/31/2013 | $ | 18.23 | $ | (0.08 | ) | $ | 3.23 | $ | 3.15 | $ | — | $ | (0.64 | ) | $ | — | $ | (0.64 | ) | $ | — | $ | — | $ | 20.74 | 17.91 | % | $ | 89.0 | 1.18 | % | 1.11 | % | (.44 | %) | 46 | % | ||||||||||||||||||||||||||||||||||
8/31/2012 | $ | 16.49 | $ | (0.11 | ) | $ | 1.86 | $ | 1.75 | $ | — | $ | (0.01 | ) | $ | — | $ | (0.01 | ) | $ | — | $ | — | $ | 18.23 | 10.61 | % | $ | 63.2 | 1.17 | % | 1.11 | % | (.62 | %) | 40 | % | ||||||||||||||||||||||||||||||||||
8/31/2011 | $ | 12.84 | $ | (0.09 | ) | $ | 3.74 | $ | 3.65 | $ | — | $ | — | $ | — | $ | — | $ | — | $ | — | $ | 16.49 | 28.43 | % | $ | 25.2 | 1.19 | % | 1.11 | % | (.56 | %) | 49 | % | ||||||||||||||||||||||||||||||||||||
8/31/2010 | $ | 11.31 | $ | (0.07 | ) | $ | 1.60 | $ | 1.53 | $ | — | $ | — | $ | — | $ | — | $ | — | $ | — | $ | 12.84 | 13.53 | % | $ | 13.6 | 1.28 | % | 1.11 | % | (.51 | %) | 70 | % | ||||||||||||||||||||||||||||||||||||
Class C | |||||||||||||||||||||||||||||||||||||||||||||||||||||||||||||||||||||||
8/31/2014 | $ | 20.81 | $ | (0.31 | ) | $ | 3.68 | $ | 3.37 | $ | — | $ | (0.83 | ) | $ | — | $ | (0.83 | ) | $ | 0.00 | $ | — | $ | 23.35 | 16.46 | % | $ | 6.0 | 1.91 | % | 1.86 | % | (1.40 | %) | 63 | % | ||||||||||||||||||||||||||||||||||
8/31/2013 | $ | 18.31 | $ | (0.23 | ) | $ | 3.26 | $ | 3.03 | $ | — | $ | (0.53 | ) | $ | — | $ | (0.53 | ) | $ | — | $ | — | $ | 20.81 | 17.05 | % | $ | 4.4 | 1.95 | % | 1.86 | % | (1.20 | %) | 46 | % | ||||||||||||||||||||||||||||||||||
8/31/2012 | $ | 16.68 | $ | (0.24 | ) | $ | 1.87 | $ | 1.63 | $ | — | $ | — | $ | — | $ | — | $ | — | $ | — | $ | 18.31 | 9.77 | % | $ | 2.4 | 1.98 | % | 1.86 | % | (1.36 | %) | 40 | % | ||||||||||||||||||||||||||||||||||||
8/31/2011 | $ | 13.09 | $ | (0.23 | ) | $ | 3.82 | $ | 3.59 | $ | — | $ | — | $ | — | $ | — | $ | — | $ | — | $ | 16.68 | 27.43 | % | $ | 0.6 | 2.04 | % | 1.86 | % | (1.36 | %) | 49 | % | ||||||||||||||||||||||||||||||||||||
8/31/2010 | $ | 11.62 | $ | (0.18 | ) | $ | 1.65 | $ | 1.47 | $ | — | $ | — | $ | — | $ | — | $ | — | $ | — | $ | 13.09 | 12.65 | % | $ | 0.2 | 2.64 | % | 1.86 | % | (1.32 | %) | 70 | % | ||||||||||||||||||||||||||||||||||||
Class R3 | |||||||||||||||||||||||||||||||||||||||||||||||||||||||||||||||||||||||
8/31/2014 | $ | 21.16 | $ | (0.21 | ) | $ | 3.75 | $ | 3.54 | $ | — | $ | (0.91 | ) | $ | — | $ | (0.91 | ) | $ | 0.00 | $ | — | $ | 23.79 | 17.02 | % | $ | 8.3 | 1.38 | % | 1.36 | % | (.90 | %) | 63 | % | ||||||||||||||||||||||||||||||||||
8/31/2013 | $ | 18.61 | $ | (0.13 | ) | $ | 3.30 | $ | 3.17 | $ | — | $ | (0.62 | ) | $ | — | $ | (0.62 | ) | $ | — | $ | — | $ | 21.16 | 17.63 | % | $ | 5.6 | 1.43 | % | 1.36 | % | (.68 | %) | 46 | % | ||||||||||||||||||||||||||||||||||
8/31/2012 | $ | 16.87 | $ | (0.16 | ) | $ | 1.90 | $ | 1.74 | $ | — | $ | — | $ | — | $ | — | $ | — | $ | — | $ | 18.61 | 10.31 | % | $ | 3.0 | 1.45 | % | 1.36 | % | (.89 | %) | 40 | % | ||||||||||||||||||||||||||||||||||||
8/31/2011 | $ | 13.17 | $ | (0.16 | ) | $ | 3.86 | $ | 3.70 | $ | — | $ | — | $ | — | $ | — | $ | — | $ | — | $ | 16.87 | 28.09 | % | $ | 0.5 | 1.50 | % | 1.36 | % | (.91 | %) | 49 | % | ||||||||||||||||||||||||||||||||||||
8/31/2010 | $ | 11.63 | $ | (0.11 | ) | $ | 1.65 | $ | 1.54 | $ | — | $ | — | $ | — | $ | — | $ | — | $ | — | $ | 13.17 | 13.24 | % | $ | 0.1 | 3.15 | % | 1.36 | % | (.84 | %) | 70 | % | ||||||||||||||||||||||||||||||||||||
Class R6 | |||||||||||||||||||||||||||||||||||||||||||||||||||||||||||||||||||||||
8/31/2014 | $ | 13.57 | $ | (0.03 | ) | $ | 2.38 | $ | 2.35 | $ | — | $ | (1.01 | ) | $ | — | $ | (1.01 | ) | $ | 0.00 | $ | — | $ | 14.91 | 17.89 | % | $ | 22.5 | .68 | % | .68 | % | (.21 | %) | 63 | % | ||||||||||||||||||||||||||||||||||
| Period from 3/15/2013^ to 8/31/2013 | $ | 12.77 | $ | (0.01 | ) | $ | 0.81 | $ | 0.80 | $ | — | $ | — | $ | — | $ | — | $ | — | $ | — | $ | 13.57 | 6.26 | %** | $ | 0.1 | 7.22 | %* | .68 | %* | (.13 | %)* | 46 | %Ø | ||||||||||||||||||||||||||||||||||||
See Notes to Financial Highlights
219
220
Financial Highlights (cont'd)
| Net Asset Value, Beginning of Year | Net Investment Income (Loss)@ | Net Gains or Losses on Securities (both realized and unrealized) | Total From Investment Operations | Dividends from Net Investment Income | Distributions from Net Realized Capital Gains | Tax Return of Capital | Total Distributions | Voluntary Contribution from Management | Redemption Feesøø | Net Asset Value, End of Year | Total Return†† | Net Assets, End of Year (in millions) | Ratio of Gross Expenses to Average Net Assets# | Ratio of Net Expenses to Average Net Assets‡ | Ratio of Net Investment Income/ (Loss) to Average Net Assets | Portfolio Turnover Rate | |||||||||||||||||||||||||||||||||||||||||||||||||||||||
Mid Cap Intrinsic Value Fund | |||||||||||||||||||||||||||||||||||||||||||||||||||||||||||||||||||||||
Investor Class | |||||||||||||||||||||||||||||||||||||||||||||||||||||||||||||||||||||||
8/31/2014 | $ | 20.29 | $ | 0.26 | $ | 4.20 | $ | 4.46 | $ | (0.32 | ) | $ | (0.87 | ) | $ | — | $ | (1.19 | ) | $ | 0.00 | $ | — | $ | 23.56 | 22.84 | %@@ | $ | 43.4 | 1.31 | % | .98 | % | 1.21 | % | 34 | % | ||||||||||||||||||||||||||||||||||
8/31/2013 | $ | 15.90 | $ | 0.26 | $ | 4.25 | $ | 4.51 | $ | (0.12 | ) | $ | — | $ | — | $ | (0.12 | ) | $ | — | $ | — | $ | 20.29 | 28.58 | % | $ | 45.9 | 1.40 | % | 1.09 | % | 1.45 | % | 33 | % | |||||||||||||||||||||||||||||||||||
8/31/2012 | $ | 14.18 | $ | 0.10 | $ | 1.68 | $ | 1.78 | $ | (0.06 | ) | $ | — | $ | — | $ | (0.06 | ) | $ | — | $ | — | $ | 15.90 | 12.62 | %@@ | $ | 46.0 | 1.39 | % | 1.18 | % | .69 | % | 118 | % | |||||||||||||||||||||||||||||||||||
8/31/2011 | $ | 12.26 | $ | 0.06 | $ | 1.88 | $ | 1.94 | $ | (0.02 | ) | $ | — | $ | — | $ | (0.02 | ) | $ | — | $ | — | $ | 14.18 | 15.79 | % | $ | 46.5 | 1.33 | % | 1.22 | % | .38 | % | 27 | % | |||||||||||||||||||||||||||||||||||
8/31/2010 | $ | 11.07 | $ | 0.01 | $ | 1.26 | $ | 1.27 | $ | (0.08 | ) | $ | — | $ | — | $ | (0.08 | ) | $ | — | $ | — | $ | 12.26 | 11.51 | % | $ | 55.9 | 1.24 | % | 1.22 | % | .10 | % | 51 | % | |||||||||||||||||||||||||||||||||||
Trust Class | |||||||||||||||||||||||||||||||||||||||||||||||||||||||||||||||||||||||
8/31/2014 | $ | 17.61 | $ | 0.18 | $ | 3.61 | $ | 3.79 | $ | (0.29 | ) | $ | (0.87 | ) | $ | — | $ | (1.16 | ) | $ | 0.00 | $ | — | $ | 20.24 | 22.47 | %@@ | $ | 14.4 | 1.57 | % | 1.25 | %§ | .97 | % | 34 | % | ||||||||||||||||||||||||||||||||||
8/31/2013 | $ | 13.82 | $ | 0.20 | $ | 3.70 | $ | 3.90 | $ | (0.11 | ) | $ | — | $ | — | $ | (0.11 | ) | $ | — | $ | — | $ | 17.61 | 28.45 | % | $ | 13.0 | 1.66 | % | 1.25 | % | 1.26 | % | 33 | % | |||||||||||||||||||||||||||||||||||
8/31/2012 | $ | 12.34 | $ | 0.08 | $ | 1.46 | $ | 1.54 | $ | (0.06 | ) | $ | — | $ | — | $ | (0.06 | ) | $ | — | $ | — | $ | 13.82 | 12.51 | %@@ | $ | 18.4 | 1.60 | % | 1.25 | % | .61 | % | 118 | % | |||||||||||||||||||||||||||||||||||
8/31/2011 | $ | 10.68 | $ | 0.04 | $ | 1.63 | $ | 1.67 | $ | (0.01 | ) | $ | — | $ | — | $ | (0.01 | ) | $ | — | $ | — | $ | 12.34 | 15.66 | % | $ | 24.1 | 1.54 | % | 1.26 | % | .33 | % | 27 | % | |||||||||||||||||||||||||||||||||||
8/31/2010 | $ | 9.66 | $ | 0.01 | $ | 1.11 | $ | 1.12 | $ | (0.10 | ) | $ | — | $ | — | $ | (0.10 | ) | $ | — | $ | — | $ | 10.68 | 11.55 | % | $ | 80.5 | 1.42 | % | 1.25 | % | .07 | % | 51 | % | |||||||||||||||||||||||||||||||||||
Institutional Class | |||||||||||||||||||||||||||||||||||||||||||||||||||||||||||||||||||||||
8/31/2014 | $ | 20.33 | $ | 0.33 | $ | 4.17 | $ | 4.50 | $ | (0.37 | ) | $ | (0.87 | ) | $ | — | $ | (1.24 | ) | $ | 0.00 | $ | — | $ | 23.59 | 22.99 | % | $ | 18.0 | 1.17 | % | .85 | %§ | 1.48 | % | 34 | % | ||||||||||||||||||||||||||||||||||
8/31/2013 | $ | 15.93 | $ | 0.31 | $ | 4.26 | $ | 4.57 | $ | (0.17 | ) | $ | — | $ | — | $ | (0.17 | ) | $ | — | $ | — | $ | 20.33 | 28.96 | % | $ | 4.6 | 1.23 | % | .85 | % | 1.73 | % | 33 | % | |||||||||||||||||||||||||||||||||||
8/31/2012 | $ | 14.22 | $ | 0.15 | $ | 1.67 | $ | 1.82 | $ | (0.11 | ) | $ | — | $ | — | $ | (0.11 | ) | $ | — | $ | — | $ | 15.93 | 12.94 | %@@ | $ | 4.4 | 1.19 | % | .85 | % | 1.01 | % | 118 | % | |||||||||||||||||||||||||||||||||||
8/31/2011 | $ | 12.28 | $ | 0.11 | $ | 1.89 | $ | 2.00 | $ | (0.06 | ) | $ | — | $ | — | $ | (0.06 | ) | $ | — | $ | — | $ | 14.22 | 16.26 | % | $ | 3.5 | 1.16 | % | .86 | % | .67 | % | 27 | % | |||||||||||||||||||||||||||||||||||
| Period from 3/8/2010^ to 8/31/2010 | $ | 13.12 | $ | 0.03 | $ | (0.87 | ) | $ | (0.84 | ) | $ | — | $ | — | $ | — | $ | — | $ | — | $ | — | $ | 12.28 | (6.40 | %)** | $ | 0.7 | 1.03 | %* | .85 | %* | .48 | %* | 51 | %Ø | |||||||||||||||||||||||||||||||||||
Class A | |||||||||||||||||||||||||||||||||||||||||||||||||||||||||||||||||||||||
8/31/2014 | $ | 17.60 | $ | 0.18 | $ | 3.63 | $ | 3.81 | $ | (0.30 | ) | $ | (0.87 | ) | $ | — | $ | (1.17 | ) | $ | 0.00 | $ | — | $ | 20.24 | 22.60 | % | $ | 5.2 | 1.53 | % | 1.21 | %§ | .96 | % | 34 | % | ||||||||||||||||||||||||||||||||||
8/31/2013 | $ | 13.82 | $ | 0.23 | $ | 3.67 | $ | 3.90 | $ | (0.12 | ) | $ | — | $ | — | $ | (0.12 | ) | $ | — | $ | — | $ | 17.60 | 28.43 | % | $ | 2.7 | 1.65 | % | 1.21 | % | 1.45 | % | 33 | % | |||||||||||||||||||||||||||||||||||
8/31/2012 | $ | 12.34 | $ | 0.08 | $ | 1.46 | $ | 1.54 | $ | (0.06 | ) | $ | — | $ | — | $ | (0.06 | ) | $ | — | $ | — | $ | 13.82 | 12.56 | % | $ | 3.8 | 1.61 | % | 1.21 | % | .63 | % | 118 | % | |||||||||||||||||||||||||||||||||||
8/31/2011 | $ | 10.68 | $ | 0.05 | $ | 1.63 | $ | 1.68 | $ | (0.02 | ) | $ | — | $ | — | $ | (0.02 | ) | $ | — | $ | — | $ | 12.34 | 15.70 | % | $ | 1.2 | 1.91 | % | 1.22 | % | .37 | % | 27 | % | |||||||||||||||||||||||||||||||||||
| Period from 6/21/2010^ to 8/31/2010 | $ | 11.41 | $ | 0.00 | $ | (0.73 | ) | $ | (0.73 | ) | $ | — | $ | — | $ | — | $ | — | $ | — | $ | — | $ | 10.68 | (6.40 | %)** | $ | 0.0 | 37.23 | %* | 1.21 | %* | .04 | %* | 51 | %Ø | |||||||||||||||||||||||||||||||||||
Class C | |||||||||||||||||||||||||||||||||||||||||||||||||||||||||||||||||||||||
8/31/2014 | $ | 17.44 | $ | 0.05 | $ | 3.58 | $ | 3.63 | $ | (0.20 | ) | $ | (0.87 | ) | $ | — | $ | (1.07 | ) | $ | 0.00 | $ | — | $ | 20.00 | 21.64 | % | $ | 1.9 | 2.28 | % | 1.96 | %§ | .24 | % | 34 | % | ||||||||||||||||||||||||||||||||||
8/31/2013 | $ | 13.69 | $ | 0.09 | $ | 3.67 | $ | 3.76 | $ | (0.01 | ) | $ | — | $ | — | $ | (0.01 | ) | $ | — | $ | — | $ | 17.44 | 27.51 | % | $ | 1.3 | 2.35 | % | 1.96 | % | .54 | % | 33 | % | |||||||||||||||||||||||||||||||||||
8/31/2012 | $ | 12.25 | $ | (0.01 | ) | $ | 1.45 | $ | 1.44 | $ | — | $ | — | $ | — | $ | — | $ | — | $ | — | $ | 13.69 | 11.76 | % | $ | 0.4 | 2.43 | % | 1.96 | % | (.09 | %) | 118 | % | ||||||||||||||||||||||||||||||||||||
8/31/2011 | $ | 10.66 | $ | (0.04 | ) | $ | 1.63 | $ | 1.59 | $ | — | $ | — | $ | — | $ | — | $ | — | $ | — | $ | 12.25 | 14.92 | % | $ | 0.1 | 3.97 | % | 1.97 | % | (.31 | %) | 27 | % | ||||||||||||||||||||||||||||||||||||
| Period from 6/21/2010^ to 8/31/2010 | $ | 11.41 | $ | (0.01 | ) | $ | (0.74 | ) | $ | (0.75 | ) | $ | — | $ | — | $ | — | $ | — | $ | — | $ | — | $ | 10.66 | (6.57 | %)** | $ | 0.0 | 35.88 | %* | 1.96 | %* | (.64 | %)* | 51 | %Ø | ||||||||||||||||||||||||||||||||||
See Notes to Financial Highlights
221
222
Financial Highlights (cont'd)
| Net Asset Value, Beginning of Year | Net Investment Income (Loss)@ | Net Gains or Losses on Securities (both realized and unrealized) | Total From Investment Operations | Dividends from Net Investment Income | Distributions from Net Realized Capital Gains | Tax Return of Capital | Total Distributions | Voluntary Contribution from Management | Redemption Feesøø | Net Asset Value, End of Year | Total Return†† | Net Assets, End of Year (in millions) | Ratio of Gross Expenses to Average Net Assets# | Ratio of Net Expenses to Average Net Assets‡ | Ratio of Net Investment Income/ (Loss) to Average Net Assets | Portfolio Turnover Rate | |||||||||||||||||||||||||||||||||||||||||||||||||||||||
Mid Cap Intrinsic Value Fund (cont'd) | |||||||||||||||||||||||||||||||||||||||||||||||||||||||||||||||||||||||
Class R3 | |||||||||||||||||||||||||||||||||||||||||||||||||||||||||||||||||||||||
8/31/2014 | $ | 17.59 | $ | 0.15 | $ | 3.61 | $ | 3.76 | $ | (0.25 | ) | $ | (0.87 | ) | $ | — | $ | (1.12 | ) | $ | 0.00 | $ | — | $ | 20.23 | 22.23 | %@@ | $ | 0.4 | 1.80 | % | 1.46 | % | .80 | % | 34 | % | ||||||||||||||||||||||||||||||||||
8/31/2013 | $ | 13.80 | $ | 0.14 | $ | 3.73 | $ | 3.87 | $ | (0.08 | ) | $ | — | $ | — | $ | (0.08 | ) | $ | — | $ | — | $ | 17.59 | 28.22 | % | $ | 0.8 | 1.86 | % | 1.46 | % | .85 | % | 33 | % | |||||||||||||||||||||||||||||||||||
8/31/2012 | $ | 12.32 | $ | 0.05 | $ | 1.46 | $ | 1.51 | $ | (0.03 | ) | $ | — | $ | — | $ | (0.03 | ) | $ | — | $ | — | $ | 13.80 | 12.25 | %@@ | $ | 0.2 | 1.88 | % | 1.46 | % | .41 | % | 118 | % | |||||||||||||||||||||||||||||||||||
8/31/2011 | $ | 10.67 | $ | 0.04 | $ | 1.61 | $ | 1.65 | $ | — | $ | — | $ | — | $ | — | $ | — | $ | — | $ | 12.32 | 15.46 | % | $ | 0.2 | 6.06 | % | 1.47 | % | .32 | % | 27 | % | |||||||||||||||||||||||||||||||||||||
| Period from 6/21/2010^ to 8/31/2010 | $ | 11.41 | $ | (0.00 | ) | $ | (0.74 | ) | $ | (0.74 | ) | $ | — | $ | — | $ | — | $ | — | $ | — | $ | — | $ | 10.67 | (6.49 | %)** | $ | 0.0 | 37.59 | %* | 1.46 | %* | (.22 | %)* | 51 | %Ø | ||||||||||||||||||||||||||||||||||
Multi-Cap Opportunities Fund | |||||||||||||||||||||||||||||||||||||||||||||||||||||||||||||||||||||||
Institutional Class | |||||||||||||||||||||||||||||||||||||||||||||||||||||||||||||||||||||||
8/31/2014 | $ | 13.56 | $ | 0.16 | $ | 2.88 | $ | 3.04 | $ | (0.11 | ) | $ | (0.22 | ) | $ | — | $ | (0.33 | ) | $ | 0.00 | $ | — | $ | 16.27 | 22.65 | % | $ | 2,566.4 | .74 | % | .74 | % | 1.06 | % | 17 | % | ||||||||||||||||||||||||||||||||||
8/31/2013 | $ | 10.76 | $ | 0.17 | $ | 2.86 | $ | 3.03 | $ | (0.14 | ) | $ | (0.09 | ) | $ | — | $ | (0.23 | ) | $ | — | $ | — | $ | 13.56 | 28.57 | % | $ | 1,430.7 | .85 | % | .85 | %§ | 1.38 | % | 11 | % | ||||||||||||||||||||||||||||||||||
8/31/2012 | $ | 9.59 | $ | 0.17 | $ | 1.27 | $ | 1.44 | $ | (0.02 | ) | $ | (0.25 | ) | $ | — | $ | (0.27 | ) | $ | — | $ | — | $ | 10.76 | 15.56 | % | $ | 465.5 | 1.00 | % | 1.00 | %§ | 1.70 | % | 29 | % | ||||||||||||||||||||||||||||||||||
8/31/2011 | $ | 8.03 | $ | 0.06 | $ | 1.55 | $ | 1.61 | $ | (0.05 | ) | $ | — | $ | — | $ | (0.05 | ) | $ | — | $ | — | $ | 9.59 | 20.09 | % | $ | 91.0 | 1.21 | % | 1.01 | %^^ | .64 | % | 105 | % | |||||||||||||||||||||||||||||||||||
| 8/31/2010‡‡ | $ | 7.93 | $ | 0.09 | $ | 0.16 | $ | 0.25 | $ | (0.15 | ) | $ | — | $ | — | $ | (0.15 | ) | $ | — | $ | — | $ | 8.03 | 3.02 | %††† | $ | 47.2 | 1.95 | % | 1.00 | % | 1.10 | % | 62 | % | |||||||||||||||||||||||||||||||||||
Class A | |||||||||||||||||||||||||||||||||||||||||||||||||||||||||||||||||||||||
8/31/2014 | $ | 13.48 | $ | 0.11 | $ | 2.85 | $ | 2.96 | $ | (0.09 | ) | $ | (0.22 | ) | $ | — | $ | (0.31 | ) | $ | 0.00 | $ | — | $ | 16.13 | 22.17 | % | $ | 143.1 | 1.10 | % | 1.10 | % | .71 | % | 17 | % | ||||||||||||||||||||||||||||||||||
8/31/2013 | $ | 10.70 | $ | 0.12 | $ | 2.86 | $ | 2.98 | $ | (0.11 | ) | $ | (0.09 | ) | $ | — | $ | (0.20 | ) | $ | — | $ | — | $ | 13.48 | 28.22 | % | $ | 51.6 | 1.18 | % | 1.18 | %§ | .91 | % | 11 | % | ||||||||||||||||||||||||||||||||||
8/31/2012 | $ | 9.56 | $ | 0.13 | $ | 1.27 | $ | 1.40 | $ | (0.01 | ) | $ | (0.25 | ) | $ | — | $ | (0.26 | ) | $ | — | $ | — | $ | 10.70 | 15.13 | % | $ | 2.8 | 1.36 | % | 1.36 | %§ | 1.29 | % | 29 | % | ||||||||||||||||||||||||||||||||||
8/31/2011 | $ | 8.02 | $ | 0.03 | $ | 1.53 | $ | 1.56 | $ | (0.02 | ) | $ | — | $ | — | $ | (0.02 | ) | $ | — | $ | — | $ | 9.56 | 19.48 | % | $ | 0.2 | 1.69 | % | 1.37 | %^^ | .28 | % | 105 | % | |||||||||||||||||||||||||||||||||||
| Period from 12/21/2009^ to 8/31/2010 | $ | 8.38 | $ | 0.03 | $ | (0.39 | ) | $ | (0.36 | ) | $ | — | $ | — | $ | — | $ | — | $ | — | $ | — | $ | 8.02 | (4.30 | %)** | $ | 0.3 | 3.18 | %* | 1.36 | %* | .58 | %* | 62 | %Ø | |||||||||||||||||||||||||||||||||||
Class C | |||||||||||||||||||||||||||||||||||||||||||||||||||||||||||||||||||||||
8/31/2014 | $ | 13.20 | $ | (0.00 | ) | $ | 2.79 | $ | 2.79 | $ | (0.06 | ) | $ | (0.22 | ) | $ | — | $ | (0.28 | ) | $ | 0.00 | $ | — | $ | 15.71 | 21.30 | % | $ | 50.5 | 1.85 | % | 1.85 | % | (.01 | %) | 17 | % | |||||||||||||||||||||||||||||||||
8/31/2013 | $ | 10.52 | $ | 0.01 | $ | 2.81 | $ | 2.82 | $ | (0.05 | ) | $ | (0.09 | ) | $ | — | $ | (0.14 | ) | $ | — | $ | — | $ | 13.20 | 27.10 | % | $ | 8.3 | 2.05 | % | 2.05 | %§ | .04 | % | 11 | % | ||||||||||||||||||||||||||||||||||
8/31/2012 | $ | 9.47 | $ | 0.07 | $ | 1.23 | $ | 1.30 | $ | — | $ | (0.25 | ) | $ | — | $ | (0.25 | ) | $ | — | $ | — | $ | 10.52 | 14.22 | % | $ | 0.4 | 2.14 | % | 2.11 | % | .70 | % | 29 | % | |||||||||||||||||||||||||||||||||||
8/31/2011 | $ | 7.97 | $ | (0.05 | ) | $ | 1.55 | $ | 1.50 | $ | — | $ | — | $ | — | $ | — | $ | — | $ | — | $ | 9.47 | 18.82 | % | $ | 0.2 | 2.43 | % | 2.12 | %^^ | (.50 | %) | 105 | % | ||||||||||||||||||||||||||||||||||||
| Period from 12/21/2009^ to 8/31/2010 | $ | 8.38 | $ | (0.01 | ) | $ | (0.40 | ) | $ | (0.41 | ) | $ | — | $ | — | $ | — | $ | — | $ | — | $ | — | $ | 7.97 | (4.89 | %)** | $ | 0.1 | 6.43 | %* | 2.12 | %* | (.18 | %)* | 62 | %Ø | ||||||||||||||||||||||||||||||||||
See Notes to Financial Highlights
223
224
Financial Highlights (cont'd)
| Net Asset Value, Beginning of Year | Net Investment Income (Loss)@ | Net Gains or Losses on Securities (both realized and unrealized) | Total From Investment Operations | Dividends from Net Investment Income | Distributions from Net Realized Capital Gains | Tax Return of Capital | Total Distributions | Voluntary Contribution from Management | Redemption Feesøø | Net Asset Value, End of Year | Total Return†† | Net Assets, End of Year (in millions) | Ratio of Gross Expenses to Average Net Assets# | Ratio of Net Expenses to Average Net Assets‡ | Ratio of Net Investment Income/ (Loss) to Average Net Assets | Portfolio Turnover Rate | |||||||||||||||||||||||||||||||||||||||||||||||||||||||
Real Estate Fund | |||||||||||||||||||||||||||||||||||||||||||||||||||||||||||||||||||||||
Trust Class | |||||||||||||||||||||||||||||||||||||||||||||||||||||||||||||||||||||||
8/31/2014 | $ | 12.96 | $ | 0.16 | $ | 2.56 | $ | 2.72 | $ | (0.17 | ) | $ | (0.81 | ) | $ | — | $ | (0.98 | ) | $ | 0.00 | $ | — | $ | 14.70 | 22.36 | % | $ | 314.3 | 1.41 | % | 1.04 | % | 1.19 | % | 36 | % | ||||||||||||||||||||||||||||||||||
8/31/2013 | $ | 13.82 | $ | 0.15 | $ | (0.50 | ) | $ | (0.35 | ) | $ | (0.15 | ) | $ | (0.36 | ) | $ | — | $ | (0.51 | ) | $ | — | $ | — | $ | 12.96 | (2.60 | %) | $ | 319.9 | 1.43 | % | 1.04 | % | 1.09 | % | 33 | % | ||||||||||||||||||||||||||||||||
8/31/2012 | $ | 11.80 | $ | 0.14 | $ | 2.12 | $ | 2.26 | $ | (0.19 | ) | $ | (0.05 | ) | $ | — | $ | (0.24 | ) | $ | — | $ | — | $ | 13.82 | 19.53 | % | $ | 288.9 | 1.47 | % | 1.03 | % | 1.10 | % | 29 | % | ||||||||||||||||||||||||||||||||||
8/31/2011 | $ | 10.23 | $ | 0.09 | $ | 1.68 | $ | 1.77 | $ | (0.21 | ) | $ | — | $ | — | $ | (0.21 | ) | $ | — | $ | 0.01 | $ | 11.80 | 17.53 | % | $ | 216.3 | 1.55 | % | .99 | % | .75 | % | 28 | % | |||||||||||||||||||||||||||||||||||
8/31/2010 | $ | 7.74 | $ | 0.16 | $ | 2.53 | $ | 2.69 | $ | (0.16 | ) | $ | — | $ | (0.04 | ) | $ | (0.20 | ) | $ | — | $ | 0.00 | $ | 10.23 | 35.09 | % | $ | 126.7 | 1.75 | % | .99 | % | 1.73 | % | 70 | % | ||||||||||||||||||||||||||||||||||
Institutional Class | |||||||||||||||||||||||||||||||||||||||||||||||||||||||||||||||||||||||
8/31/2014 | $ | 12.99 | $ | 0.18 | $ | 2.57 | $ | 2.75 | $ | (0.19 | ) | $ | (0.81 | ) | $ | — | $ | (1.00 | ) | $ | 0.00 | $ | — | $ | 14.74 | 22.63 | % | $ | 463.5 | 1.05 | % | .85 | % | 1.35 | % | 36 | % | ||||||||||||||||||||||||||||||||||
8/31/2013 | $ | 13.86 | $ | 0.17 | $ | (0.51 | ) | $ | (0.34 | ) | $ | (0.17 | ) | $ | (0.36 | ) | $ | — | $ | (0.53 | ) | $ | — | $ | — | $ | 12.99 | (2.48 | %) | $ | 366.4 | 1.07 | % | .85 | % | 1.23 | % | 33 | % | ||||||||||||||||||||||||||||||||
8/31/2012 | $ | 11.83 | $ | 0.15 | $ | 2.14 | $ | 2.29 | $ | (0.21 | ) | $ | (0.05 | ) | $ | — | $ | (0.26 | ) | $ | — | $ | — | $ | 13.86 | 19.77 | % | $ | 228.6 | 1.10 | % | .85 | % | 1.21 | % | 29 | % | ||||||||||||||||||||||||||||||||||
8/31/2011 | $ | 10.25 | $ | 0.10 | $ | 1.71 | $ | 1.81 | $ | (0.23 | ) | $ | — | $ | — | $ | (0.23 | ) | $ | — | $ | 0.00 | $ | 11.83 | 17.77 | % | $ | 117.1 | 1.16 | % | .85 | % | .81 | % | 28 | % | |||||||||||||||||||||||||||||||||||
8/31/2010 | $ | 7.76 | $ | 0.17 | $ | 2.53 | $ | 2.70 | $ | (0.16 | ) | $ | — | $ | (0.05 | ) | $ | (0.21 | ) | $ | — | $ | 0.00 | $ | 10.25 | 35.18 | % | $ | 22.6 | 1.39 | % | .85 | % | 1.77 | % | 70 | % | ||||||||||||||||||||||||||||||||||
Class A | |||||||||||||||||||||||||||||||||||||||||||||||||||||||||||||||||||||||
8/31/2014 | $ | 12.95 | $ | 0.14 | $ | 2.55 | $ | 2.69 | $ | (0.14 | ) | $ | (0.81 | ) | $ | — | $ | (0.95 | ) | $ | 0.00 | $ | — | $ | 14.69 | 22.17 | % | $ | 171.9 | 1.43 | % | 1.21 | % | 1.02 | % | 36 | % | ||||||||||||||||||||||||||||||||||
8/31/2013 | $ | 13.82 | $ | 0.12 | $ | (0.51 | ) | $ | (0.39 | ) | $ | (0.12 | ) | $ | (0.36 | ) | $ | — | $ | (0.48 | ) | $ | — | $ | — | $ | 12.95 | (2.82 | %) | $ | 164.5 | 1.47 | % | 1.21 | % | .84 | % | 33 | % | ||||||||||||||||||||||||||||||||
8/31/2012 | $ | 11.80 | $ | 0.11 | $ | 2.13 | $ | 2.24 | $ | (0.17 | ) | $ | (0.05 | ) | $ | — | $ | (0.22 | ) | $ | — | $ | — | $ | 13.82 | 19.33 | % | $ | 78.3 | 1.51 | % | 1.21 | % | .86 | % | 29 | % | ||||||||||||||||||||||||||||||||||
8/31/2011 | $ | 10.23 | $ | 0.04 | $ | 1.72 | $ | 1.76 | $ | (0.19 | ) | $ | — | $ | — | $ | (0.19 | ) | $ | — | $ | 0.00 | $ | 11.80 | 17.33 | % | $ | 36.3 | 1.60 | % | 1.21 | % | .33 | % | 28 | % | |||||||||||||||||||||||||||||||||||
| Period from 6/21/2010^ to 8/31/2010 | $ | 10.38 | $ | 0.01 | $ | (0.11 | ) | $ | (0.10 | ) | $ | (0.02 | ) | $ | — | $ | (0.03 | ) | $ | (0.05 | ) | $ | — | $ | 0.00 | $ | 10.23 | (.98 | %)** | $ | 0.5 | 12.56 | %* | 1.21 | %* | .68 | %* | 70 | %Ø | ||||||||||||||||||||||||||||||||
Class C | |||||||||||||||||||||||||||||||||||||||||||||||||||||||||||||||||||||||
8/31/2014 | $ | 12.94 | $ | 0.04 | $ | 2.55 | $ | 2.59 | $ | (0.04 | ) | $ | (0.81 | ) | $ | — | $ | (0.85 | ) | $ | 0.00 | $ | — | $ | 14.68 | 21.24 | % | $ | 40.4 | 2.20 | % | 1.96 | % | .26 | % | 36 | % | ||||||||||||||||||||||||||||||||||
8/31/2013 | $ | 13.81 | $ | 0.02 | $ | (0.50 | ) | $ | (0.48 | ) | $ | (0.03 | ) | $ | (0.36 | ) | $ | — | $ | (0.39 | ) | $ | — | $ | — | $ | 12.94 | (3.52 | %) | $ | 39.7 | 2.24 | % | 1.96 | % | .11 | % | 33 | % | ||||||||||||||||||||||||||||||||
8/31/2012 | $ | 11.80 | $ | 0.01 | $ | 2.14 | $ | 2.15 | $ | (0.09 | ) | $ | (0.05 | ) | $ | — | $ | (0.14 | ) | $ | — | $ | — | $ | 13.81 | 18.40 | % | $ | 20.7 | 2.28 | % | 1.96 | % | .09 | % | 29 | % | ||||||||||||||||||||||||||||||||||
8/31/2011 | $ | 10.24 | $ | (0.05 | ) | $ | 1.73 | $ | 1.68 | $ | (0.12 | ) | $ | — | $ | — | $ | (0.12 | ) | $ | — | $ | 0.00 | $ | 11.80 | 16.44 | % | $ | 8.3 | 2.37 | % | 1.96 | % | (.46 | %) | 28 | % | ||||||||||||||||||||||||||||||||||
| Period from 6/21/2010^ to 8/31/2010 | $ | 10.38 | $ | 0.01 | $ | (0.12 | ) | $ | (0.11 | ) | $ | (0.01 | ) | $ | — | $ | (0.02 | ) | $ | (0.03 | ) | $ | — | $ | 0.00 | $ | 10.24 | (1.08 | %)** | $ | 0.1 | 20.75 | %* | 1.96 | %* | .66 | %* | 70 | %Ø | ||||||||||||||||||||||||||||||||
Class R3 | |||||||||||||||||||||||||||||||||||||||||||||||||||||||||||||||||||||||
8/31/2014 | $ | 12.94 | $ | 0.10 | $ | 2.56 | $ | 2.66 | $ | (0.11 | ) | $ | (0.81 | ) | $ | — | $ | (0.92 | ) | $ | 0.00 | $ | — | $ | 14.68 | 21.89 | % | $ | 23.5 | 1.67 | % | 1.46 | % | .71 | % | 36 | % | ||||||||||||||||||||||||||||||||||
8/31/2013 | $ | 13.81 | $ | 0.08 | $ | (0.50 | ) | $ | (0.42 | ) | $ | (0.09 | ) | $ | (0.36 | ) | $ | — | $ | (0.45 | ) | $ | — | $ | — | $ | 12.94 | (3.04 | %) | $ | 15.2 | 1.70 | % | 1.46 | % | .56 | % | 33 | % | ||||||||||||||||||||||||||||||||
8/31/2012 | $ | 11.80 | $ | 0.05 | $ | 2.17 | $ | 2.22 | $ | (0.16 | ) | $ | (0.05 | ) | $ | — | $ | (0.21 | ) | $ | — | $ | — | $ | 13.81 | 19.07 | % | $ | 4.8 | 1.74 | % | 1.46 | % | .41 | % | 29 | % | ||||||||||||||||||||||||||||||||||
8/31/2011 | $ | 10.23 | $ | (0.01 | ) | $ | 1.74 | $ | 1.73 | $ | (0.16 | ) | $ | — | $ | — | $ | (0.16 | ) | $ | — | $ | 0.00 | $ | 11.80 | 17.00 | % | $ | 0.3 | 2.81 | % | 1.46 | % | (.06 | %) | 28 | % | ||||||||||||||||||||||||||||||||||
| Period from 6/21/2010^ to 8/31/2010 | $ | 10.38 | $ | 0.02 | $ | (0.13 | ) | $ | (0.11 | ) | $ | (0.03 | ) | $ | — | $ | (0.01 | ) | $ | (0.04 | ) | $ | — | $ | 0.00 | $ | 10.23 | (1.04 | %)** | $ | 0.0 | 37.36 | %* | 1.46 | %* | .93 | %* | 70 | %Ø | ||||||||||||||||||||||||||||||||
See Notes to Financial Highlights
225
226
Financial Highlights (cont'd)
| Net Asset Value, Beginning of Year | Net Investment Income (Loss)@ | Net Gains or Losses on Securities (both realized and unrealized) | Total From Investment Operations | Dividends from Net Investment Income | Distributions from Net Realized Capital Gains | Tax Return of Capital | Total Distributions | Voluntary Contribution from Management | Redemption Feesøø | Net Asset Value, End of Year | Total Return†† | Net Assets, End of Year (in millions) | Ratio of Gross Expenses to Average Net Assets# | Ratio of Net Expenses to Average Net Assets‡ | Ratio of Net Investment Income/ (Loss) to Average Net Assets | Portfolio Turnover Rate | |||||||||||||||||||||||||||||||||||||||||||||||||||||||
Real Estate Fund (cont'd) | |||||||||||||||||||||||||||||||||||||||||||||||||||||||||||||||||||||||
Class R6 | |||||||||||||||||||||||||||||||||||||||||||||||||||||||||||||||||||||||
8/31/2014 | $ | 12.99 | $ | 0.18 | $ | 2.59 | $ | 2.77 | $ | (0.21 | ) | $ | (0.81 | ) | $ | — | $ | (1.02 | ) | $ | 0.00 | $ | — | $ | 14.74 | 22.72 | % | $ | 26.3 | .98 | % | .78 | % | 1.33 | % | 36 | % | ||||||||||||||||||||||||||||||||||
| Period from 3/15/2013^ to 8/31/2013 | $ | 14.11 | $ | 0.06 | $ | (1.04 | ) | $ | (0.98 | ) | $ | (0.02 | ) | $ | (0.12 | ) | $ | — | $ | (0.14 | ) | $ | — | $ | — | $ | 12.99 | (6.96 | %)** | $ | 8.3 | 1.11 | %* | .78 | %* | .95 | %* | 33 | %Ø | ||||||||||||||||||||||||||||||||
Small Cap Growth Fund | |||||||||||||||||||||||||||||||||||||||||||||||||||||||||||||||||||||||
Investor Class | |||||||||||||||||||||||||||||||||||||||||||||||||||||||||||||||||||||||
8/31/2014 | $ | 24.16 | $ | (0.23 | ) | $ | 3.51 | $ | 3.28 | $ | — | $ | — | $ | — | $ | — | $ | 0.00 | $ | — | $ | 27.44 | 13.58 | % | $ | 50.7 | 1.67 | % | 1.21 | % | (.85 | %) | 284 | % | ||||||||||||||||||||||||||||||||||||
8/31/2013 | $ | 19.49 | $ | (0.15 | ) | $ | 4.82 | $ | 4.67 | $ | — | $ | — | $ | — | $ | — | $ | — | $ | — | $ | 24.16 | 23.96 | %@@ | $ | 48.8 | 1.64 | % | 1.22 | % | (.72 | %) | 249 | % | ||||||||||||||||||||||||||||||||||||
8/31/2012 | $ | 17.74 | $ | (0.17 | ) | $ | 1.92 | $ | 1.75 | $ | — | $ | — | $ | — | $ | — | $ | — | $ | — | $ | 19.49 | 9.86 | % | $ | 60.1 | 1.58 | % | 1.21 | % | (.92 | %) | 294 | % | ||||||||||||||||||||||||||||||||||||
8/31/2011 | $ | 13.68 | $ | (0.16 | ) | $ | 4.22 | $ | 4.06 | $ | — | $ | — | $ | — | $ | — | $ | — | $ | — | $ | 17.74 | 29.68 | % | $ | 63.6 | 1.49 | % | 1.15 | % | (.88 | %) | 185 | % | ||||||||||||||||||||||||||||||||||||
8/31/2010 | $ | 13.15 | $ | (0.13 | ) | $ | 0.66 | $ | 0.53 | $ | — | $ | — | $ | — | $ | — | $ | — | $ | — | $ | 13.68 | 4.03 | % | $ | 75.4 | 1.50 | % | 1.15 | % | (.89 | %) | 235 | % | ||||||||||||||||||||||||||||||||||||
Trust Class | |||||||||||||||||||||||||||||||||||||||||||||||||||||||||||||||||||||||
8/31/2014 | $ | 26.22 | $ | (0.30 | ) | $ | 3.80 | $ | 3.50 | $ | — | $ | — | $ | — | $ | — | $ | 0.00 | $ | — | $ | 29.72 | 13.35 | % | $ | 5.5 | 1.95 | % | 1.40 | % | (1.02 | %) | 284 | % | ||||||||||||||||||||||||||||||||||||
8/31/2013 | $ | 21.19 | $ | (0.20 | ) | $ | 5.23 | $ | 5.03 | $ | — | $ | — | $ | — | $ | — | $ | — | $ | — | $ | 26.22 | 23.74 | %@@ | $ | 7.2 | 1.83 | % | 1.40 | % | (.91 | %) | 249 | % | ||||||||||||||||||||||||||||||||||||
8/31/2012 | $ | 19.32 | $ | (0.22 | ) | $ | 2.09 | $ | 1.87 | $ | — | $ | — | $ | — | $ | — | $ | — | $ | — | $ | 21.19 | 9.68 | % | $ | 15.8 | 1.77 | % | 1.39 | % | (1.10 | %) | 294 | % | ||||||||||||||||||||||||||||||||||||
8/31/2011 | $ | 14.93 | $ | (0.21 | ) | $ | 4.60 | $ | 4.39 | $ | — | $ | — | $ | — | $ | — | $ | — | $ | — | $ | 19.32 | 29.40 | % | $ | 19.3 | 1.67 | % | 1.37 | % | (1.10 | %) | 185 | % | ||||||||||||||||||||||||||||||||||||
8/31/2010 | $ | 14.43 | $ | (0.18 | ) | $ | 0.68 | $ | 0.50 | $ | — | $ | — | $ | — | $ | — | $ | — | $ | — | $ | 14.93 | 3.47 | % | $ | 22.0 | 1.70 | % | 1.37 | % | (1.11 | %) | 235 | % | ||||||||||||||||||||||||||||||||||||
Advisor Class | |||||||||||||||||||||||||||||||||||||||||||||||||||||||||||||||||||||||
8/31/2014 | $ | 17.33 | $ | (0.22 | ) | $ | 2.52 | $ | 2.30 | $ | — | $ | — | $ | — | $ | — | $ | 0.00 | $ | — | $ | 19.63 | 13.27 | % | $ | 3.5 | 1.96 | % | 1.51 | % | (1.15 | %) | 284 | % | ||||||||||||||||||||||||||||||||||||
8/31/2013 | $ | 14.03 | $ | (0.15 | ) | $ | 3.45 | $ | 3.30 | $ | — | $ | — | $ | — | $ | — | $ | — | $ | — | $ | 17.33 | 23.52 | %@@ | $ | 3.6 | 1.93 | % | 1.52 | % | (1.00 | %) | 249 | % | ||||||||||||||||||||||||||||||||||||
8/31/2012 | $ | 12.81 | $ | (0.17 | ) | $ | 1.39 | $ | 1.22 | $ | — | $ | — | $ | — | $ | — | $ | — | $ | — | $ | 14.03 | 9.52 | % | $ | 5.9 | 1.87 | % | 1.58 | % | (1.28 | %) | 294 | % | ||||||||||||||||||||||||||||||||||||
8/31/2011 | $ | 9.92 | $ | (0.17 | ) | $ | 3.06 | $ | 2.89 | $ | — | $ | — | $ | — | $ | — | $ | — | $ | — | $ | 12.81 | 29.13 | % | $ | 7.9 | 1.80 | % | 1.60 | % | (1.33 | %) | 185 | % | ||||||||||||||||||||||||||||||||||||
8/31/2010 | $ | 9.61 | $ | (0.14 | ) | $ | 0.45 | $ | 0.31 | $ | — | $ | — | $ | — | $ | — | $ | — | $ | — | $ | 9.92 | 3.23 | % | $ | 9.7 | 1.90 | % | 1.60 | % | (1.34 | %) | 235 | % | ||||||||||||||||||||||||||||||||||||
Institutional Class | |||||||||||||||||||||||||||||||||||||||||||||||||||||||||||||||||||||||
8/31/2014 | $ | 24.51 | $ | (0.15 | ) | $ | 3.56 | $ | 3.41 | $ | — | $ | — | $ | — | $ | — | $ | 0.00 | $ | — | $ | 27.92 | 13.91 | % | $ | 19.0 | 1.48 | % | .90 | % | (.54 | %) | 284 | % | ||||||||||||||||||||||||||||||||||||
8/31/2013 | $ | 19.71 | $ | (0.09 | ) | $ | 4.89 | $ | 4.80 | $ | — | $ | — | $ | — | $ | — | $ | — | $ | — | $ | 24.51 | 24.35 | %@@ | $ | 14.9 | 1.41 | % | .90 | % | (.41 | %) | 249 | % | ||||||||||||||||||||||||||||||||||||
8/31/2012 | $ | 17.88 | $ | (0.11 | ) | $ | 1.94 | $ | 1.83 | $ | — | $ | — | $ | — | $ | — | $ | — | $ | — | $ | 19.71 | 10.23 | % | $ | 33.3 | 1.33 | % | .90 | % | (.58 | %) | 294 | % | ||||||||||||||||||||||||||||||||||||
8/31/2011 | $ | 13.75 | $ | (0.11 | ) | $ | 4.24 | $ | 4.13 | $ | — | $ | — | $ | — | $ | — | $ | — | $ | — | $ | 17.88 | 30.04 | % | $ | 103.0 | 1.26 | % | .90 | % | (.63 | %) | 185 | % | ||||||||||||||||||||||||||||||||||||
8/31/2010 | $ | 13.23 | $ | (0.09 | ) | $ | 0.61 | $ | 0.52 | $ | — | $ | — | $ | — | $ | — | $ | — | $ | — | $ | 13.75 | 3.93 | % | $ | 82.6 | 1.28 | % | .91 | % | (.63 | %) | 235 | % | ||||||||||||||||||||||||||||||||||||
See Notes to Financial Highlights
227
228
Financial Highlights (cont'd)
| Net Asset Value, Beginning of Year | Net Investment Income (Loss)@ | Net Gains or Losses on Securities (both realized and unrealized) | Total From Investment Operations | Dividends from Net Investment Income | Distributions from Net Realized Capital Gains | Tax Return of Capital | Total Distributions | Voluntary Contribution from Management | Redemption Feesøø | Net Asset Value, End of Year | Total Return†† | Net Assets, End of Year (in millions) | Ratio of Gross Expenses to Average Net Assets# | Ratio of Net Expenses to Average Net Assets‡ | Ratio of Net Investment Income/ (Loss) to Average Net Assets | Portfolio Turnover Rate | |||||||||||||||||||||||||||||||||||||||||||||||||||||||
Small Cap Growth Fund (cont'd) | |||||||||||||||||||||||||||||||||||||||||||||||||||||||||||||||||||||||
Class A | |||||||||||||||||||||||||||||||||||||||||||||||||||||||||||||||||||||||
8/31/2014 | $ | 26.36 | $ | (0.28 | ) | $ | 3.84 | $ | 3.56 | $ | — | $ | — | $ | — | $ | — | $ | 0.00 | $ | — | $ | 29.92 | 13.51 | % | $ | 4.4 | 1.81 | % | 1.26 | % | (.96 | %) | 284 | % | ||||||||||||||||||||||||||||||||||||
8/31/2013 | $ | 21.27 | $ | (0.19 | ) | $ | 5.28 | $ | 5.09 | $ | — | $ | — | $ | — | $ | — | $ | — | $ | — | $ | 26.36 | 23.93 | %@@ | $ | 2.4 | 1.83 | % | 1.26 | % | (.81 | %) | 249 | % | ||||||||||||||||||||||||||||||||||||
8/31/2012 | $ | 19.36 | $ | (0.19 | ) | $ | 2.10 | $ | 1.91 | $ | — | $ | — | $ | — | $ | — | $ | — | $ | — | $ | 21.27 | 9.87 | % | $ | 1.1 | 1.79 | % | 1.26 | % | (.98 | %) | 294 | % | ||||||||||||||||||||||||||||||||||||
8/31/2011 | $ | 14.95 | $ | (0.20 | ) | $ | 4.61 | $ | 4.41 | $ | — | $ | — | $ | — | $ | — | $ | — | $ | — | $ | 19.36 | 29.50 | % | $ | 1.2 | 1.78 | % | 1.26 | % | (1.01 | %) | 185 | % | ||||||||||||||||||||||||||||||||||||
8/31/2010 | $ | 14.43 | $ | (0.16 | ) | $ | 0.68 | $ | 0.52 | $ | — | $ | — | $ | — | $ | — | $ | — | $ | — | $ | 14.95 | 3.60 | % | $ | 0.5 | 2.05 | % | 1.26 | % | (1.01 | %) | 235 | % | ||||||||||||||||||||||||||||||||||||
Class C | |||||||||||||||||||||||||||||||||||||||||||||||||||||||||||||||||||||||
8/31/2014 | $ | 17.01 | $ | (0.32 | ) | $ | 2.47 | $ | 2.15 | $ | — | $ | — | $ | — | $ | — | $ | 0.00 | $ | — | $ | 19.16 | 12.64 | % | $ | 1.8 | 2.57 | % | 2.01 | % | (1.68 | %) | 284 | % | ||||||||||||||||||||||||||||||||||||
8/31/2013 | $ | 13.83 | $ | (0.24 | ) | $ | 3.42 | $ | 3.18 | $ | — | $ | — | $ | — | $ | — | $ | — | $ | — | $ | 17.01 | 22.99 | %@@ | $ | 1.1 | 2.56 | % | 2.01 | % | (1.58 | %) | 249 | % | ||||||||||||||||||||||||||||||||||||
8/31/2012 | $ | 12.69 | $ | (0.23 | ) | $ | 1.37 | $ | 1.14 | $ | — | $ | — | $ | — | $ | — | $ | — | $ | — | $ | 13.83 | 8.98 | % | $ | 0.7 | 2.57 | % | 2.01 | % | (1.73 | %) | 294 | % | ||||||||||||||||||||||||||||||||||||
8/31/2011 | $ | 9.87 | $ | (0.22 | ) | $ | 3.04 | $ | 2.82 | $ | — | $ | — | $ | — | $ | — | $ | — | $ | — | $ | 12.69 | 28.57 | % | $ | 0.3 | 2.52 | % | 2.01 | % | (1.72 | %) | 185 | % | ||||||||||||||||||||||||||||||||||||
8/31/2010 | $ | 9.60 | $ | (0.19 | ) | $ | 0.46 | $ | 0.27 | $ | — | $ | — | $ | — | $ | — | $ | — | $ | — | $ | 9.87 | 2.81 | % | $ | 0.1 | 3.43 | % | 2.01 | % | (1.76 | %) | 235 | % | ||||||||||||||||||||||||||||||||||||
Class R3 | |||||||||||||||||||||||||||||||||||||||||||||||||||||||||||||||||||||||
8/31/2014 | $ | 17.37 | $ | (0.22 | ) | $ | 2.52 | $ | 2.30 | $ | — | $ | — | $ | — | $ | — | $ | 0.00 | $ | — | $ | 19.67 | 13.24 | % | $ | 0.5 | 2.16 | % | 1.51 | % | (1.15 | %) | 284 | % | ||||||||||||||||||||||||||||||||||||
8/31/2013 | $ | 14.06 | $ | (0.16 | ) | $ | 3.47 | $ | 3.31 | $ | — | $ | — | $ | — | $ | — | $ | — | $ | — | $ | 17.37 | 23.54 | %@@ | $ | 0.4 | 2.15 | % | 1.51 | % | (1.08 | %) | 249 | % | ||||||||||||||||||||||||||||||||||||
8/31/2012 | $ | 12.83 | $ | (0.17 | ) | $ | 1.40 | $ | 1.23 | $ | — | $ | — | $ | — | $ | — | $ | — | $ | — | $ | 14.06 | 9.59 | % | $ | 0.2 | 2.12 | % | 1.51 | % | (1.23 | %) | 294 | % | ||||||||||||||||||||||||||||||||||||
8/31/2011 | $ | 9.93 | $ | (0.16 | ) | $ | 3.06 | $ | 2.90 | $ | — | $ | — | $ | — | $ | — | $ | — | $ | — | $ | 12.83 | 29.20 | % | $ | 0.1 | 2.05 | % | 1.51 | % | (1.24 | %) | 185 | % | ||||||||||||||||||||||||||||||||||||
8/31/2010 | $ | 9.61 | $ | (0.13 | ) | $ | 0.45 | $ | 0.32 | $ | — | $ | — | $ | — | $ | — | $ | — | $ | — | $ | 9.93 | 3.33 | % | $ | 0.1 | 4.16 | % | 1.51 | % | (1.25 | %) | 235 | % | ||||||||||||||||||||||||||||||||||||
Socially Responsive Fund | |||||||||||||||||||||||||||||||||||||||||||||||||||||||||||||||||||||||
Investor Class | |||||||||||||||||||||||||||||||||||||||||||||||||||||||||||||||||||||||
8/31/2014 | $ | 32.66 | $ | 0.31 | $ | 6.48 | $ | 6.79 | $ | (0.30 | ) | $ | (2.21 | ) | $ | — | $ | (2.51 | ) | $ | 0.00 | $ | — | $ | 36.94 | 21.54 | % | $ | 821.1 | .86 | % | .86 | % | .87 | % | 36 | % | ||||||||||||||||||||||||||||||||||
8/31/2013 | $ | 26.48 | $ | 0.27 | $ | 6.09 | $ | 6.36 | $ | (0.18 | ) | $ | — | $ | — | $ | (0.18 | ) | $ | — | $ | — | $ | 32.66 | 24.18 | % | $ | 825.2 | .87 | % | .87 | % | .91 | % | 35 | % | |||||||||||||||||||||||||||||||||||
8/31/2012 | $ | 24.61 | $ | 0.22 | $ | 1.77 | $ | 1.99 | $ | (0.12 | ) | $ | — | $ | — | $ | (0.12 | ) | $ | — | $ | — | $ | 26.48 | 8.13 | % | $ | 724.3 | .89 | % | .89 | % | .86 | % | 28 | % | |||||||||||||||||||||||||||||||||||
8/31/2011 | $ | 20.58 | $ | 0.18 | $ | 3.88 | $ | 4.06 | $ | (0.03 | ) | $ | — | $ | — | $ | (0.03 | ) | $ | — | $ | — | $ | 24.61 | 19.74 | % | $ | 648.1 | .90 | % | .90 | % | .69 | % | 20 | % | |||||||||||||||||||||||||||||||||||
8/31/2010 | $ | 18.74 | $ | 0.06 | $ | 1.84 | $ | 1.90 | $ | (0.06 | ) | $ | — | $ | — | $ | (0.06 | ) | $ | — | $ | — | $ | 20.58 | 10.14 | % | $ | 582.5 | .94 | % | .94 | % | .27 | % | 41 | % | |||||||||||||||||||||||||||||||||||
Trust Class | |||||||||||||||||||||||||||||||||||||||||||||||||||||||||||||||||||||||
8/31/2014 | $ | 22.20 | $ | 0.16 | $ | 4.34 | $ | 4.50 | $ | (0.25 | ) | $ | (2.21 | ) | $ | — | $ | (2.46 | ) | $ | 0.00 | $ | — | $ | 24.24 | 21.32 | % | $ | 418.4 | 1.03 | % | 1.03 | % | .70 | % | 36 | % | ||||||||||||||||||||||||||||||||||
8/31/2013 | $ | 18.07 | $ | 0.15 | $ | 4.14 | $ | 4.29 | $ | (0.16 | ) | $ | — | $ | — | $ | (0.16 | ) | $ | — | $ | — | $ | 22.20 | 23.95 | % | $ | 431.3 | 1.04 | % | 1.04 | % | .76 | % | 35 | % | |||||||||||||||||||||||||||||||||||
8/31/2012 | $ | 16.85 | $ | 0.11 | $ | 1.21 | $ | 1.32 | $ | (0.10 | ) | $ | — | $ | — | $ | (0.10 | ) | $ | — | $ | — | $ | 18.07 | 7.93 | % | $ | 488.5 | 1.06 | % | 1.06 | % | .66 | % | 28 | % | |||||||||||||||||||||||||||||||||||
8/31/2011 | $ | 14.11 | $ | 0.09 | $ | 2.68 | $ | 2.77 | $ | (0.03 | ) | $ | — | $ | — | $ | (0.03 | ) | $ | — | $ | — | $ | 16.85 | 19.60 | % | $ | 484.7 | 1.08 | % | 1.08 | % | .50 | % | 20 | % | |||||||||||||||||||||||||||||||||||
8/31/2010 | $ | 12.88 | $ | 0.01 | $ | 1.27 | $ | 1.28 | $ | (0.05 | ) | $ | — | $ | — | $ | (0.05 | ) | $ | — | $ | — | $ | 14.11 | 9.94 | % | $ | 356.1 | 1.12 | % | 1.12 | % | .10 | % | 41 | % | |||||||||||||||||||||||||||||||||||
See Notes to Financial Highlights
229
230
Financial Highlights (cont'd)
| Net Asset Value, Beginning of Year | Net Investment Income (Loss)@ | Net Gains or Losses on Securities (both realized and unrealized) | Total From Investment Operations | Dividends from Net Investment Income | Distributions from Net Realized Capital Gains | Tax Return of Capital | Total Distributions | Voluntary Contribution from Management | Redemption Feesøø | Net Asset Value, End of Year | Total Return†† | Net Assets, End of Year (in millions) | Ratio of Gross Expenses to Average Net Assets# | Ratio of Net Expenses to Average Net Assets‡ | Ratio of Net Investment Income/ (Loss) to Average Net Assets | Portfolio Turnover Rate | |||||||||||||||||||||||||||||||||||||||||||||||||||||||
Socially Responsive Fund (cont'd) | |||||||||||||||||||||||||||||||||||||||||||||||||||||||||||||||||||||||
Institutional Class | |||||||||||||||||||||||||||||||||||||||||||||||||||||||||||||||||||||||
8/31/2014 | $ | 32.70 | $ | 0.37 | $ | 6.49 | $ | 6.86 | $ | (0.35 | ) | $ | (2.21 | ) | $ | — | $ | (2.56 | ) | $ | 0.00 | $ | — | $ | 37.00 | 21.76 | % | $ | 706.5 | .68 | % | .68 | % | 1.06 | % | 36 | % | ||||||||||||||||||||||||||||||||||
8/31/2013 | $ | 26.51 | $ | 0.33 | $ | 6.09 | $ | 6.42 | $ | (0.23 | ) | $ | — | $ | — | $ | (0.23 | ) | $ | — | $ | — | $ | 32.70 | 24.41 | % | $ | 557.7 | .69 | % | .69 | % | 1.10 | % | 35 | % | |||||||||||||||||||||||||||||||||||
8/31/2012 | $ | 24.64 | $ | 0.26 | $ | 1.77 | $ | 2.03 | $ | (0.16 | ) | $ | — | $ | — | $ | (0.16 | ) | $ | — | $ | — | $ | 26.51 | 8.32 | % | $ | 512.4 | .71 | % | .71 | % | 1.02 | % | 28 | % | |||||||||||||||||||||||||||||||||||
8/31/2011 | $ | 20.60 | $ | 0.21 | $ | 3.91 | $ | 4.12 | $ | (0.08 | ) | $ | — | $ | — | $ | (0.08 | ) | $ | — | $ | — | $ | 24.64 | 19.98 | % | $ | 417.7 | .74 | % | .74 | %§ | .82 | % | 20 | % | |||||||||||||||||||||||||||||||||||
8/31/2010 | $ | 18.75 | $ | 0.10 | $ | 1.84 | $ | 1.94 | $ | (0.09 | ) | $ | — | $ | — | $ | (0.09 | ) | $ | — | $ | — | $ | 20.60 | 10.36 | % | $ | 166.9 | .77 | % | .75 | % | .49 | % | 41 | % | |||||||||||||||||||||||||||||||||||
Class A | |||||||||||||||||||||||||||||||||||||||||||||||||||||||||||||||||||||||
8/31/2014 | $ | 22.05 | $ | 0.16 | $ | 4.30 | $ | 4.46 | $ | (0.24 | ) | $ | (2.21 | ) | $ | — | $ | (2.45 | ) | $ | 0.00 | $ | — | $ | 24.06 | 21.28 | % | $ | 134.0 | 1.05 | % | 1.05 | % | .68 | % | 36 | % | ||||||||||||||||||||||||||||||||||
8/31/2013 | $ | 17.95 | $ | 0.14 | $ | 4.12 | $ | 4.26 | $ | (0.16 | ) | $ | — | $ | — | $ | (0.16 | ) | $ | — | $ | — | $ | 22.05 | 23.89 | % | $ | 109.6 | 1.09 | % | 1.09 | %§ | .67 | % | 35 | % | |||||||||||||||||||||||||||||||||||
8/31/2012 | $ | 16.77 | $ | 0.10 | $ | 1.21 | $ | 1.31 | $ | (0.13 | ) | $ | — | $ | — | $ | (0.13 | ) | $ | — | $ | — | $ | 17.95 | 7.89 | % | $ | 83.1 | 1.11 | % | 1.11 | %§ | .61 | % | 28 | % | |||||||||||||||||||||||||||||||||||
8/31/2011 | $ | 14.08 | $ | 0.07 | $ | 2.68 | $ | 2.75 | $ | (0.06 | ) | $ | — | $ | — | $ | (0.06 | ) | $ | — | $ | — | $ | 16.77 | 19.54 | % | $ | 75.9 | 1.14 | % | 1.11 | % | .42 | % | 20 | % | |||||||||||||||||||||||||||||||||||
8/31/2010 | $ | 12.88 | $ | 0.03 | $ | 1.26 | $ | 1.29 | $ | (0.09 | ) | $ | — | $ | — | $ | (0.09 | ) | $ | — | $ | — | $ | 14.08 | 10.03 | % | $ | 12.4 | 1.21 | % | 1.11 | % | .18 | % | 41 | % | |||||||||||||||||||||||||||||||||||
Class C | |||||||||||||||||||||||||||||||||||||||||||||||||||||||||||||||||||||||
8/31/2014 | $ | 21.63 | $ | (0.01 | ) | $ | 4.22 | $ | 4.21 | $ | (0.06 | ) | $ | (2.21 | ) | $ | — | $ | (2.27 | ) | $ | 0.00 | $ | — | $ | 23.57 | 20.42 | % | $ | 44.5 | 1.80 | % | 1.80 | % | (.05 | %) | 36 | % | |||||||||||||||||||||||||||||||||
8/31/2013 | $ | 17.64 | $ | (0.02 | ) | $ | 4.06 | $ | 4.04 | $ | (0.05 | ) | $ | — | $ | — | $ | (0.05 | ) | $ | — | $ | — | $ | 21.63 | 22.98 | % | $ | 27.5 | 1.86 | % | 1.86 | %§ | (.10 | %) | 35 | % | ||||||||||||||||||||||||||||||||||
8/31/2012 | $ | 16.52 | $ | (0.02 | ) | $ | 1.19 | $ | 1.17 | $ | (0.05 | ) | $ | — | $ | — | $ | (0.05 | ) | $ | — | $ | — | $ | 17.64 | 7.08 | % | $ | 16.7 | 1.87 | % | 1.86 | % | (.12 | %) | 28 | % | ||||||||||||||||||||||||||||||||||
8/31/2011 | $ | 13.94 | $ | (0.06 | ) | $ | 2.66 | $ | 2.60 | $ | (0.02 | ) | $ | — | $ | — | $ | (0.02 | ) | $ | — | $ | — | $ | 16.52 | 18.63 | % | $ | 12.9 | 1.89 | % | 1.86 | % | (.35 | %) | 20 | % | ||||||||||||||||||||||||||||||||||
8/31/2010 | $ | 12.86 | $ | (0.08 | ) | $ | 1.25 | $ | 1.17 | $ | (0.09 | ) | $ | — | $ | — | $ | (0.09 | ) | $ | — | $ | — | $ | 13.94 | 9.10 | % | $ | 3.3 | 1.99 | % | 1.86 | % | (.57 | %) | 41 | % | ||||||||||||||||||||||||||||||||||
Class R3 | |||||||||||||||||||||||||||||||||||||||||||||||||||||||||||||||||||||||
8/31/2014 | $ | 21.86 | $ | 0.10 | $ | 4.27 | $ | 4.37 | $ | (0.17 | ) | $ | (2.21 | ) | $ | — | $ | (2.38 | ) | $ | 0.00 | $ | — | $ | 23.85 | 21.02 | % | $ | 32.2 | 1.29 | % | 1.29 | % | .45 | % | 36 | % | ||||||||||||||||||||||||||||||||||
8/31/2013 | $ | 17.81 | $ | 0.09 | $ | 4.09 | $ | 4.18 | $ | (0.13 | ) | $ | — | $ | — | $ | (0.13 | ) | $ | — | $ | — | $ | 21.86 | 23.64 | % | $ | 25.3 | 1.30 | % | 1.30 | % | .46 | % | 35 | % | |||||||||||||||||||||||||||||||||||
8/31/2012 | $ | 16.68 | $ | 0.07 | $ | 1.19 | $ | 1.26 | $ | (0.13 | ) | $ | — | $ | — | $ | (0.13 | ) | $ | — | $ | — | $ | 17.81 | 7.65 | % | $ | 17.9 | 1.33 | % | 1.33 | %§ | .43 | % | 28 | % | |||||||||||||||||||||||||||||||||||
8/31/2011 | $ | 14.05 | $ | 0.01 | $ | 2.69 | $ | 2.70 | $ | (0.07 | ) | $ | — | $ | — | $ | (0.07 | ) | $ | — | $ | — | $ | 16.68 | 19.20 | % | $ | 9.7 | 1.36 | % | 1.36 | %§ | .08 | % | 20 | % | |||||||||||||||||||||||||||||||||||
8/31/2010 | $ | 12.87 | $ | (0.02 | ) | $ | 1.27 | $ | 1.25 | $ | (0.07 | ) | $ | — | $ | — | $ | (0.07 | ) | $ | — | $ | — | $ | 14.05 | 9.74 | % | $ | 0.2 | 2.95 | % | 1.36 | % | (.11 | %) | 41 | % | ||||||||||||||||||||||||||||||||||
Class R6 | |||||||||||||||||||||||||||||||||||||||||||||||||||||||||||||||||||||||
8/31/2014 | $ | 32.71 | $ | 0.39 | $ | 6.51 | $ | 6.90 | $ | (0.37 | ) | $ | (2.21 | ) | $ | — | $ | (2.58 | ) | $ | 0.00 | $ | — | $ | 37.03 | 21.88 | % | $ | 279.6 | .60 | % | .60 | % | 1.11 | % | 36 | % | ||||||||||||||||||||||||||||||||||
| Period from 3/15/2013^ to 8/31/2013 | $ | 31.16 | $ | 0.14 | $ | 1.41 | $ | 1.55 | $ | — | $ | — | $ | — | $ | — | $ | — | $ | — | $ | 32.71 | 4.97 | %** | $ | 249.6 | .62 | %* | .62 | %* | .94 | %* | 35 | %Ø | |||||||||||||||||||||||||||||||||||||
See Notes to Financial Highlights
231
232
Financial Highlights (cont'd)
| Net Asset Value, Beginning of Year | Net Investment Income (Loss)@ | Net Gains or Losses on Securities (both realized and unrealized) | Total From Investment Operations | Dividends from Net Investment Income | Distributions from Net Realized Capital Gains | Tax Return of Capital | Total Distributions | Voluntary Contribution from Management | Redemption Feesøø | Net Asset Value, End of Year | Total Return†† | Net Assets, End of Year (in millions) | Ratio of Gross Expenses to Average Net Assets# | Ratio of Net Expenses to Average Net Assets‡ | Ratio of Net Investment Income/ (Loss) to Average Net Assets | Portfolio Turnover Rate | |||||||||||||||||||||||||||||||||||||||||||||||||||||||
Value Fund | |||||||||||||||||||||||||||||||||||||||||||||||||||||||||||||||||||||||
Institutional Class | |||||||||||||||||||||||||||||||||||||||||||||||||||||||||||||||||||||||
8/31/2014 | $ | 13.52 | $ | 0.17 | $ | 2.92 | $ | 3.09 | $ | (0.10 | ) | $ | — | $ | — | $ | (0.10 | ) | $ | — | $ | — | $ | 16.51 | 22.98 | % | $ | 12.6 | 2.41 | % | .70 | % | 1.12 | % | 129 | % | |||||||||||||||||||||||||||||||||||
8/31/2013 | $ | 11.18 | $ | 0.16 | $ | 2.40 | $ | 2.56 | $ | (0.22 | ) | $ | — | $ | — | $ | (0.22 | ) | $ | — | $ | — | $ | 13.52 | 23.23 | % | $ | 6.9 | 5.93 | % | .71 | % | 1.25 | % | 250 | % | |||||||||||||||||||||||||||||||||||
8/31/2012 | $ | 9.95 | $ | 0.15 | $ | 1.16 | $ | 1.31 | $ | (0.08 | ) | $ | — | $ | — | $ | (0.08 | ) | $ | — | $ | — | $ | 11.18 | 13.25 | % | $ | 2.7 | 9.42 | % | .73 | % | 1.46 | % | 200 | % | |||||||||||||||||||||||||||||||||||
8/31/2011 | $ | 8.30 | $ | 0.13 | $ | 1.60 | $ | 1.73 | $ | (0.08 | ) | $ | — | $ | — | $ | (0.08 | ) | $ | — | $ | — | $ | 9.95 | 20.87 | % | $ | 2.6 | 18.35 | % | .75 | %c | 1.28 | % | 191 | % | |||||||||||||||||||||||||||||||||||
| 8/31/2010‡‡‡ | $ | 8.57 | $ | 0.08 | $ | (0.13 | ) | $ | (0.05 | ) | $ | (0.22 | ) | $ | — | $ | — | $ | (0.22 | ) | $ | — | $ | — | $ | 8.30 | (.71 | %)†††† | $ | 1.2 | 15.47 | % | .92 | %c | .93 | % | 52 | % | |||||||||||||||||||||||||||||||||
Class A | |||||||||||||||||||||||||||||||||||||||||||||||||||||||||||||||||||||||
8/31/2014 | $ | 13.44 | $ | 0.11 | $ | 2.90 | $ | 3.01 | $ | (0.05 | ) | $ | — | $ | — | $ | (0.05 | ) | $ | — | $ | — | $ | 16.40 | 22.43 | % | $ | 8.0 | 2.80 | % | 1.10 | % | .74 | % | 129 | % | |||||||||||||||||||||||||||||||||||
8/31/2013 | $ | 11.13 | $ | 0.10 | $ | 2.40 | $ | 2.50 | $ | (0.19 | ) | $ | — | $ | — | $ | (0.19 | ) | $ | — | $ | — | $ | 13.44 | 22.72 | % | $ | 3.7 | 6.81 | % | 1.11 | % | .82 | % | 250 | % | |||||||||||||||||||||||||||||||||||
8/31/2012 | $ | 9.93 | $ | 0.12 | $ | 1.15 | $ | 1.27 | $ | (0.07 | ) | $ | — | $ | — | $ | (0.07 | ) | $ | — | $ | — | $ | 11.13 | 12.89 | % | $ | 1.6 | 9.88 | % | 1.08 | % | 1.08 | % | 200 | % | |||||||||||||||||||||||||||||||||||
| Period from 3/2/2011^ to 8/31/2011 | $ | 10.28 | $ | 0.06 | $ | (0.41 | ) | $ | (0.35 | ) | $ | — | $ | — | $ | — | $ | — | $ | — | $ | — | $ | 9.93 | (3.40 | %)** | $ | 0.3 | 17.08 | %* | 1.12 | %* | 1.22 | %* | 191 | %Ø | |||||||||||||||||||||||||||||||||||
Class C | |||||||||||||||||||||||||||||||||||||||||||||||||||||||||||||||||||||||
8/31/2014 | $ | 13.31 | $ | (0.01 | ) | $ | 2.88 | $ | 2.87 | $ | — | $ | — | $ | — | $ | — | $ | — | $ | — | $ | 16.18 | 21.56 | % | $ | 0.6 | 3.57 | % | 1.86 | % | (.05 | %) | 129 | % | ||||||||||||||||||||||||||||||||||||
8/31/2013 | $ | 11.05 | $ | 0.00 | $ | 2.39 | $ | 2.39 | $ | (0.13 | ) | $ | — | $ | — | $ | (0.13 | ) | $ | — | $ | — | $ | 13.31 | 21.82 | % | $ | 0.3 | 7.31 | % | 1.87 | % | .01 | % | 250 | % | |||||||||||||||||||||||||||||||||||
8/31/2012 | $ | 9.89 | $ | 0.03 | $ | 1.16 | $ | 1.19 | $ | (0.03 | ) | $ | — | $ | — | $ | (0.03 | ) | $ | — | $ | — | $ | 11.05 | 12.07 | % | $ | 0.1 | 10.74 | % | 1.87 | % | .30 | % | 200 | % | |||||||||||||||||||||||||||||||||||
| Period from 3/2/2011^ to 8/31/2011 | $ | 10.28 | $ | 0.01 | $ | (0.40 | ) | $ | (0.39 | ) | $ | — | $ | — | $ | — | $ | — | $ | — | $ | — | $ | 9.89 | (3.79 | %)** | $ | 0.0 | 26.31 | %* | 1.86 | %* | .26 | %* | 191 | %Ø | |||||||||||||||||||||||||||||||||||
See Notes to Financial Highlights
233
234
Notes to Financial Highlights Equity Funds
†† Total return based on per share NAV reflects the effects of changes in NAV on the performance of each Fund during each fiscal period. Returns assume income dividends and other distributions, if any, were reinvested but do not reflect the effect of sales charges. Results represent past performance and do not indicate future results. Current returns may be lower or higher than the performance data quoted. Investment returns and principal may fluctuate and shares when redeemed may be worth more or less than original cost. Total return would have been lower if Management had not reimbursed and/or waived certain expenses. Total return would have been higher if Management had not recouped previously reimbursed and/or waived expenses. The voluntary contribution listed in Note B of the Notes to Financial Statements had no impact on the Funds' total returns for the year ended August 31, 2014.
@@ Except for the Funds listed below, the class action proceeds listed in Note A-4 of the Notes to Financial Statements had no impact on the Funds' total returns for the year ended August 31, 2014. Had Genesis not received class action proceeds in 2014, total return based on per share NAV for the year ended August 31, 2014 would have been 13.62%, 13.51%, 13.21%, 13.78% and 13.90% for Investor Class, Trust Class, Advisor Class, Institutional Class and Class R6, respectively. Had Mid Cap Intrinsic Value not received class action proceeds in 2014, total return based on per share NAV for the year ended August 31, 2014 would have been 22.79%, 22.41% and 22.17% for Investor Class, Trust Class and Class R3, respectively. Had Large Cap Value not received class action proceeds in 2013, total return based on per share NAV for the year ended August 31, 2013 would have been 23.93%, 23.61%, 23.46%, 24.11%, 23.57% and 23.41% for Investor Class, Trust Class, Advisor Class, Institutional Class, Class A and Class R3, respectively. Had Small Cap Growth not received class action proceeds in 2013, total return based on per share NAV for the year ended August 31, 2013 would have been 23.81%, 23.45%, 23.31%, 24.05%, 23.84%, 22.92% and 23.47% for Investor Class, Trust Class, Advisor Class, Institutional Class, Class A, Class C and Class R3, respectively. Had Mid Cap Intrinsic Value not received class action proceeds in 2012, total return based on per share NAV for the year ended August 31, 2012 would have been 12.48%, 12.34%, 12.86% and 12.16% for Investor Class, Trust Class, Institutional Class and Class R3, respectively.
‡‡ On December 21, 2009, Multi-Cap Opportunities' Trust Class was converted into the Fund's Institutional Class. The financial information of the Fund's Institutional Class includes the financial information of Trust Class shares. The Trust Class had equivalent capped expenses and, therefore, typically similar returns to the Institutional Class.
‡‡‡ On April 19, 2010, Value's Trust Class was converted into the Fund's Institutional Class. The financial information of the Fund's Institutional Class includes the financial information of Trust Class shares. Because the Trust Class had moderately higher expenses, its performance typically would have been slightly lower than the Institutional Class.
††† During the period from November 2, 2006 through December 21, 2009, Multi-Cap Opportunities' Trust Class had only one investor, which could have impacted Fund performance. On December 21, 2009, the Fund's Trust Class was converted into the Fund's Institutional Class and the Institutional Class was opened to the public. The total return of the Fund's Institutional Class includes the performance of the former Trust Class.
†††† During the period from November 2, 2006 through April 19, 2010, Value's Trust Class had only one investor, which could have impacted Fund performance. On April 19, 2010, the Fund's Trust Class was converted into the Fund's Institutional Class and the Fund had only one Institutional Class investor, which could have impacted performance. The total return of the Fund's Institutional Class includes the performance of the former Trust Class.
# Represents the annualized ratios of net expenses to average daily net assets if Management had not reimbursed certain expenses and/or waived a portion of the investment management fee.
‡ Prior to January 1, 2013, each Fund had an expense offset arrangement in connection with its custodian contract. The impact of expense reductions related to expense offset arrangements, if any, was less than 0.01%.
^^ After utilization of the Line of Credit by Multi-Cap Opportunities (2011) and/or reimbursement of expenses and/or waiver of a portion of the investment management fee by Management. The Fund is required to calculate an
235
Notes to Financial Highlights Equity Funds (cont'd)
expense ratio without taking into consideration any expense reductions related to expense offset arrangements. Had the Fund not received expense reductions related to expense offset arrangements, and had the Fund not utilized the Line of Credit or had Management not undertaken such action, the annualized ratios of net expenses to average daily net assets would have been:
Year Ended August 31, | |||||||
2011 | |||||||
| Multi-Cap Opportunities Fund Institutional Class | 1.01 | % | |||||
Multi-Cap Opportunities Fund Class A | 1.37 | % | |||||
Multi-Cap Opportunities Fund Class C | 2.12 | % | |||||
§ After repayment of expenses previously reimbursed and/or fees previously waived by Management, as applicable. Had the Fund not made such repayments, the annualized ratios of net expenses to average daily net assets would have been:
Year Ended August 31, | |||||||||||||||||||||||
2014 | 2013 | 2012 | 2011 | 2010 | |||||||||||||||||||
Equity Income Fund Institutional Class | — | — | .70 | % | .76 | % | — | ||||||||||||||||
Equity Income Fund Class A | — | — | 1.07 | % | 1.16 | % | — | ||||||||||||||||
Equity Income Fund Class C | — | — | 1.82 | % | 1.90 | % | — | ||||||||||||||||
Equity Income Fund Class R3 | 1.32 | % | 1.31 | % | 1.35 | % | — | — | |||||||||||||||
Focus Fund Advisor Class | — | — | — | — | 1.39 | % | |||||||||||||||||
Genesis Fund Institutional Class | .85 | % | — | — | — | — | |||||||||||||||||
Genesis Fund Class R6 | .78 | % | — | — | — | — | |||||||||||||||||
Guardian Fund Advisor Class | — | 1.30 | % | 1.33 | % | 1.35 | % | — | |||||||||||||||
Guardian Fund Institutional Class | — | — | .74 | % | .74 | % | — | ||||||||||||||||
Guardian Fund Class A | 1.08 | % | 1.10 | % | — | — | — | ||||||||||||||||
Guardian Fund Class C | 1.84 | % | — | — | — | — | |||||||||||||||||
Large Cap Disciplined Growth Fund Investor Class | — | 1.05 | % | 1.03 | % | 1.08 | % | — | |||||||||||||||
Large Cap Value Fund Institutional Class | .70 | % | — | — | — | .68 | % | ||||||||||||||||
Large Cap Value Fund Class A | 1.08 | % | — | 1.05 | % | — | — | ||||||||||||||||
Large Cap Value Fund Class C | 1.82 | % | 1.86 | % | — | — | — | ||||||||||||||||
Mid Cap Growth Fund Advisor Class | — | — | 1.31 | % | 1.34 | % | 1.48 | % | |||||||||||||||
Mid Cap Intrinsic Value Fund Trust Class | 1.23 | % | — | — | — | — | |||||||||||||||||
Mid Cap Intrinsic Value Fund Institutional Class | .82 | % | — | — | — | — | |||||||||||||||||
Mid Cap Intrinsic Value Fund Class A | 1.21 | % | — | — | — | — | |||||||||||||||||
Mid Cap Intrinsic Value Fund Class C | 1.94 | % | — | — | — | — | |||||||||||||||||
Multi-Cap Opportunities Fund Institutional Class | — | .82 | % | .93 | % | — | — | ||||||||||||||||
Multi-Cap Opportunities Fund Class A | — | 1.16 | % | 1.30 | % | — | — | ||||||||||||||||
Multi-Cap Opportunities Fund Class C | — | 1.92 | % | — | — | — | |||||||||||||||||
Socially Responsive Fund Institutional Class | — | — | — | .72 | % | — | |||||||||||||||||
Socially Responsive Fund Class A | — | 1.08 | % | 1.11 | % | — | — | ||||||||||||||||
Socially Responsive Fund Class C | — | 1.83 | % | — | — | — | |||||||||||||||||
Socially Responsive Fund Class R3 | — | — | 1.32 | % | 1.35 | % | — | ||||||||||||||||
236
Notes to Financial Highlights Equity Funds (cont'd)
^ The date investment operations commenced.
@ Calculated based on the average number of shares outstanding during each fiscal period.
ØØ Prior to June 1, 2011, redemption fees were charged on Emerging Markets Equity, International Equity, International Select, and Real Estate. Calculated based on the average number of shares outstanding during each fiscal period.
* Annualized.
** Not annualized.
Ø Portfolio turnover is calculated at the Fund level. Percentage indicated was calculated for the year ended August 31, 2010 for Emerging Markets Equity, Equity Income, Focus, Large Cap Value, Mid Cap Intrinsic Value, Multi-Cap Opportunities and Real Estate, for the year ended August 31, 2011 for Value, for the year ended August 31, 2013 for Emerging Markets Equity, Genesis, International Equity, Mid Cap Growth, Real Estate and Socially Responsive and for the year ended August 31, 2014 for International Equity.
a On January 25, 2013, International Equity acquired all of the net assets of Neuberger Berman International Fund pursuant to a Plan of Reorganization and Dissolution. Portfolio turnover excludes purchases and sales of securities by International (acquired fund) prior to the merger date.
b Organization expense, which is a non-recurring expense, is included in these ratios on a non-annualized basis.
c These ratios reflect a reduced fee schedule for certain expenses. If these ratios had not been reduced, the ratios would have been higher.
§§ Effective June 2, 2014, Neuberger Berman International Large Cap Fund changed its name to Neuberger Berman International Select Fund.
§§§ Effective September 2, 2014, Neuberger Berman Select Equities Fund changed its name to Neuberger Berman All Cap Core Fund.
237
Report of Independent Registered Public Accounting Firm
To the Board of Trustees
Neuberger Berman Equity Funds and
Shareholders of:
Neuberger Berman All Cap Core Fund,
Neuberger Berman Emerging Markets Equity Fund,
Neuberger Berman Equity Income Fund,
Neuberger Berman Focus Fund,
Neuberger Berman Genesis Fund,
Neuberger Berman Global Equity Fund,
Neuberger Berman Global Thematic Opportunities Fund,
Neuberger Berman Greater China Equity Fund,
Neuberger Berman Guardian Fund,
Neuberger Berman International Equity Fund,
Neuberger Berman International Select Fund,
Neuberger Berman Large Cap Value Fund,
Neuberger Berman Real Estate Fund,
Neuberger Berman Value Fund
We have audited the accompanying statements of assets and liabilities of Neuberger Berman All Cap Core Fund (formerly, Neuberger Berman Select Equities Fund), Neuberger Berman Emerging Markets Equity Fund, Neuberger Berman Equity Income Fund, Neuberger Berman Focus Fund, Neuberger Berman Genesis Fund, Neuberger Berman Global Equity Fund, Neuberger Berman Global Thematic Opportunities Fund, Neuberger Berman Greater China Equity Fund, Neuberger Berman Guardian Fund, Neuberger Berman International Equity Fund, Neuberger Berman International Select Fund (formerly, Neuberger Berman International Large Cap Fund), Neuberger Berman Large Cap Value Fund, Neuberger Berman Real Estate Fund and Neuberger Berman Value Fund, fourteen of the series constituting Neuberger Berman Equity Funds (the "Trust"), including the schedules of investments, as of August 31, 2014, and the related statements of operations for the year then ended , the statements of changes in net assets for each of the periods indicated therein, and the financial highlights for each of the periods indicated therein. These financial statements and financial highlights are the responsibility of the Trust's management. Our responsibility is to express an opinion on these financial statements and financial highlights based on our audits.
We conducted our audits in accordance with the standards of the Public Company Accounting Oversight Board (United States). Those standards require that we plan and perform the audit to obtain reasonable assurance about whether the financial statements and financial highlights are free of material misstatement. We were not engaged to perform an audit of the Trust's internal control over financial reporting. Our audits included consideration of internal control over financial reporting as a basis for designing audit procedures that are appropriate in the circumstances, but not for the purpose of expressing an opinion on the effectiveness of the Trust's internal control over financial reporting. Accordingly, we express no such opinion. An audit also includes examining, on a test basis, evidence supporting the amounts and disclosures in the financial statements and financial highlights, assessing the accounting principles used and significant estimates made by management, and evaluating the overall financial statement presentation. Our procedures included confirmation of securities owned as of August 31, 2014, by correspondence with the custodian and others or by other appropriate auditing procedures where replies from others were not received. We believe that our audits provide a reasonable basis for our opinion.
238
In our opinion, the financial statements and financial highlights referred to above present fairly, in all material respects, the financial position of the above-mentioned series of the Neuberger Berman Equity Funds, at August 31, 2014, the results of their operations for the year then ended, the changes in their net assets for each of the periods indicated therein, and the financial highlights for each of the periods indicated therein, in conformity with U.S. generally accepted accounting principles.

Boston, Massachusetts
October 15, 2014
239
Report of Independent Registered Public Accounting Firm
To the Board of Trustees and Shareholders
Neuberger Berman Equity Funds
We have audited the accompanying statements of assets and liabilities of the Neuberger Berman Intrinsic Value Fund, Neuberger Berman Large Cap Disciplined Growth Fund, Neuberger Berman Mid Cap Growth Fund, Neuberger Berman Mid Cap Intrinsic Value Fund, Neuberger Berman Multi-Cap Opportunities Fund, Neuberger Berman Small Cap Growth Fund, and Neuberger Berman Socially Responsive Fund, each a series of Neuberger Berman Equity Funds (the "Trust"), including the schedules of investments, as of August 31, 2014, and the related statements of operations for the year then ended, the statements of changes in net assets and the financial highlights for the periods indicated therein. These financial statements and financial highlights are the responsibility of the Trust's management. Our responsibility is to express an opinion on these financial statements and financial highlights based on our audits.
We conducted our audits in accordance with the standards of the Public Company Accounting Oversight Board (United States). Those standards require that we plan and perform the audit to obtain reasonable assurance about whether the financial statements and financial highlights are free of material misstatement. The Trust is not required to have, nor were we engaged to perform, an audit of its internal control over financial reporting. Our audits included consideration of internal control over financial reporting as a basis for designing audit procedures that are appropriate in the circumstances, but not for the purpose of expressing an opinion on the effectiveness of the Trust's internal control over financial reporting. Accordingly, we express no such opinion. An audit also includes examining, on a test basis, evidence supporting the amounts and disclosures in the financial statements and financial highlights, assessing the accounting principles used and significant estimates made by management, as well as evaluating the overall financial statement presentation. Our procedures included confirmation of securities owned as of August 31, 2014, by correspondence with the custodian and brokers or by other appropriate auditing procedures where replies from brokers were not received. We believe that our audits provide a reasonable basis for our opinion.
In our opinion, the financial statements and financial highlights referred to above present fairly, in all material respects, the financial position of the above mentioned series of the Trust, as of August 31, 2014, and the results of their operations, the changes in their net assets, and the financial highlights for the periods indicated therein, in conformity with accounting principles generally accepted in the United States of America.

Philadelphia, Pennsylvania
October 15, 2014
240
Directory
Investment Manager, Administrator and Distributor
Neuberger Berman Management LLC
605 Third Avenue, 2nd Floor
New York, NY 10158-0180
800.877.9700 or 212.476.8800
Intermediary Client Services 800.366.6264
Sub-Advisers
Neuberger Berman LLC
605 Third Avenue
New York, NY 10158-3698
Neuberger Berman Asia Limited
Jardine House, 1 Connaught Place
Suites 2010-2020, 20th Floor
Central Hong Kong
Custodian and Shareholder Servicing Agent
State Street Bank and Trust Company
One Lincoln Street
Boston, MA 02111
For Investor Class Shareholders
Address correspondence to:
Neuberger Berman Funds
Boston Service Center
P.O. Box 8403
Boston, MA 02266-8403
800.877.9700 or 212.476.8800
For Class A, Class C, Class R3 and Class R6 Shareholders:
Please contact your investment provider
For Trust Class, Advisor Class and Institutional Class Shareholders
Address correspondence to:
Neuberger Berman Management LLC
605 Third Avenue, Mail Drop 2-7
New York, NY 10158-0180
Attn: Intermediary Client Services
800.366.6264
Legal Counsel
K&L Gates LLP
1601 K Street, NW
Washington, DC 20006-1600
Independent Registered Public Accounting Firms
Ernst & Young LLP
200 Clarendon Street
Boston, MA 02116
Tait, Weller & Baker LLP
1818 Market Street
Suite 2400
Philadelphia, PA 19103
241
Trustees and Officers
The following tables set forth information concerning the trustees ("Trustees") and officers ("Officers") of each of the Funds. All persons named as Trustees and Officers also serve in similar capacities for other funds administered or managed by Management and Neuberger. Each Fund's Statement of Additional Information includes additional information about the Trustees as of the time of the Fund's most recent public offering and is available upon request, without charge, by calling (800) 877-9700.
Information about the Board of Trustees
| Name, (Year of Birth), and Address(1) | Position(s) and Length of Time Served(2) | Principal Occupation(s)(3) | Number of Funds in Fund Complex Overseen by Fund Trustee | Other Directorships Held Outside Fund Complex by Fund Trustee(3) | |||||||||||||||
Independent Trustees | |||||||||||||||||||
Faith Colish (1935) | Trustee since 1982 | Counsel, Carter Ledyard & Milburn LLP (law firm) since October 2002; formerly, Attorney-at-Law and President, Faith Colish, A Professional Corporation, 1980 to 2002. | 58 | Formerly, Director, 1997 to 2003, and Advisory Director, 2003 to 2006, ABA Retirement Funds (formerly, American Bar Retirement Association) (not-for-profit membership corporation). | |||||||||||||||
242
| Name, (Year of Birth), and Address(1) | Position(s) and Length of Time Served(2) | Principal Occupation(s)(3) | Number of Funds in Fund Complex Overseen by Fund Trustee | Other Directorships Held Outside Fund Complex by Fund Trustee(3) | |||||||||||||||
Martha C. Goss (1949) | Trustee since 2007 | President, Woodhill Enterprises Inc./Chase Hollow Associates LLC (personal investment vehicle), since 2006; formerly, Consultant, Resources Global Professionals (temporary staffing), 2002 to 2006. | 58 | Director, American Water (water utility), since 2003; Director, Allianz Life of New York (insurance), since 2005; Director, Berger Group Holdings, Inc. (engineering consulting firm), since 2013; Director, Financial Women's Association of New York (not-for-profit association), since 2003; Trustee Emerita, Brown University, since 1998; Director, Museum of American Finance (not-for-profit), since 2013; formerly, Non-Executive Chair and Director, Channel Reinsurance (financial guaranty reinsurance), 2006 to 2010; formerly, Director, Ocwen Financial Corporation (mortgage servicing), 2005 to 2010; formerly, Director, Claire's Stores, Inc. (retailer), 2005 to 2007; formerly, Director, Parsons Brinckerhoff Inc. (engineering consulting firm), 2007 to 2010; formerly, Director, Bank Leumi (commercial bank), 2005 to 2007; formerly, Advisory Board Member, Attensity (software developer), 2005 to 2007. | |||||||||||||||
243
| Name, (Year of Birth), and Address(1) | Position(s) and Length of Time Served(2) | Principal Occupation(s)(3) | Number of Funds in Fund Complex Overseen by Fund Trustee | Other Directorships Held Outside Fund Complex by Fund Trustee(3) | |||||||||||||||
Michael M. Knetter (1960) | Trustee since 2007 | President and Chief Executive Officer, University of Wisconsin Foundation, since October 2010; formerly, Dean, School of Business, University of Wisconsin—Madison; formerly, Professor of International Economics and Associate Dean, Amos Tuck School of Business—Dartmouth College, 1998 to 2002. | 58 | Director, American Family Insurance (a mutual company, not publicly traded), since March 2009; formerly, Trustee, Northwestern Mutual Series Fund, Inc., 2007 to 2010; formerly, Director, Wausau Paper, 2005 to 2011; formerly, Director, Great Wolf Resorts, 2004 to 2009. | |||||||||||||||
Howard A. Mileaf (1937) | Trustee since 1984 | Retired; formerly, Vice President and General Counsel, WHX Corporation (holding company), 1993 to 2001. | 58 | Formerly, Director, Webfinancial Corporation (holding company), 2002 to 2008; formerly, Director, WHX Corporation (holding company), 2002 to 2005; formerly, Director, State Theatre of New Jersey (not-for-profit theatre), 2000 to 2005. | |||||||||||||||
George W. Morriss (1947) | Trustee since 2007 | Adjunct Professor, Columbia University School of International and Public Affairs, since October 2012; formerly, Executive Vice President and Chief Financial Officer, People's Bank, Connecticut (a financial services company), 1991 to 2001. | 58 | Director and Treasurer, National Association of Corporate Directors, Connecticut Chapter, since 2013; Trustee, Steben Alternative Investment Funds, Steben Select Multi-Strategy Fund and Steben Select Multi-Strategy Master Fund, since 2013; formerly, Manager, Larch Lane Multi-Strategy Fund complex (which consisted of three funds), 2006 to 2011; formerly, Member, NASDAQ Issuers' Affairs Committee, 1995 to 2003. | |||||||||||||||
244
| Name, (Year of Birth), and Address(1) | Position(s) and Length of Time Served(2) | Principal Occupation(s)(3) | Number of Funds in Fund Complex Overseen by Fund Trustee | Other Directorships Held Outside Fund Complex by Fund Trustee(3) | |||||||||||||||
Tom D. Seip (1950) | Trustee since 2000; Chairman of the Board since 2008; Lead Independent Trustee from 2006 to 2008 | General Partner, Ridgefield Farm LLC (a private investment vehicle); formerly, President and CEO, Westaff, Inc. (temporary staffing), May 2001 to January 2002; formerly, Senior Executive, The Charles Schwab Corporation, 1983 to 1998, including Chief Executive Officer, Charles Schwab Investment Management, Inc.; Trustee, Schwab Family of Funds and Schwab Investments, 1997 to 1998; and Executive Vice President-Retail Brokerage, Charles Schwab & Co., Inc., 1994 to 1997. | 58 | Director, H&R Block, Inc. (financial services company), since May 2001; Chairman, Governance and Nominating Committee, H&R Block, Inc., since 2011; formerly, Chairman, Compensation Committee, H&R Block, Inc., 2006 to 2010; formerly, Director, Forward Management, Inc. (asset management company), 1999 to 2006. | |||||||||||||||
Candace L. Straight (1947) | Trustee since 2000 | Private investor and consultant specializing in the insurance industry; formerly, Advisory Director, Securitas Capital LLC (a global private equity investment firm dedicated to making investments in the insurance sector), 1998 to December 2003. | 58 | Public Member, Board of Governors and Board of Trustees, Rutgers University, since 2011; Director, Montpelier Re Holdings Ltd. (reinsurance company), since 2006; formerly, Director, National Atlantic Holdings Corporation (property and casualty insurance company), 2004 to 2008; formerly, Director, The Proformance Insurance Company (property and casualty insurance company), 2004 to 2008; formerly, Director, Providence Washington Insurance Company (property and casualty insurance company), 1998 to 2006; formerly, Director, Summit Global Partners (insurance brokerage firm), 2000 to 2005. | |||||||||||||||
245
| Name, (Year of Birth), and Address(1) | Position(s) and Length of Time Served(2) | Principal Occupation(s)(3) | Number of Funds in Fund Complex Overseen by Fund Trustee | Other Directorships Held Outside Fund Complex by Fund Trustee(3) | |||||||||||||||
Peter P. Trapp (1944) | Trustee since 2000 | Retired; formerly, Regional Manager for Mid-Southern Region, Ford Motor Credit Company, September 1997 to 2007; formerly, President, Ford Life Insurance Company, April 1995 to August 1997. | 58 | None. | |||||||||||||||
Trustees who are "Interested Persons" | |||||||||||||||||||
Joseph V. Amato* (1962) | Trustee since 2009 | President and Director, Neuberger Berman Group LLC, since 2009; President and Chief Executive Officer, Neuberger and Neuberger Berman Holdings LLC (including its predecessor, Neuberger Berman Inc.), since 2007; Chief Investment Officer (Equities) and Managing Director, Management, since 2009; Managing Director, Neuberger Berman Fixed Income LLC ("NBFI"), since 2007; Board member of NBFI since 2006; formerly, Global Head of Asset Management of Lehman Brothers Holdings Inc.'s ("LBHI") Investment Management Division, 2006 to 2009; formerly, member of LBHI's Investment Management Division's Executive Management Committee, 2006 to 2009; formerly, Managing Director, Lehman Brothers Inc. ("LBI"), 2006 to 2008; formerly, Chief Recruiting and Development Officer, LBI, 2005 to 2006; formerly, Global Head of LBI's Equity Sales and a Member of its Equities Division Executive Committee, 2003 to 2005. | 58 | Member of Board of Advisors, McDonough School of Business, Georgetown University, since 2001; Member of New York City Board of Advisors, Teach for America, since 2005; Trustee, Montclair Kimberley Academy (private school), since 2007; Member of Board of Regents, Georgetown University, since 2013. | |||||||||||||||
246
| Name, (Year of Birth), and Address(1) | Position(s) and Length of Time Served(2) | Principal Occupation(s)(3) | Number of Funds in Fund Complex Overseen by Fund Trustee | Other Directorships Held Outside Fund Complex by Fund Trustee(3) | |||||||||||||||
Robert Conti* (1956) | Chief Executive Officer, President and Trustee since 2008; prior thereto, Executive Vice President in 2008 and Vice President from 2000 to 2008 | Managing Director, Neuberger, since 2007; Managing Director, NBFI, since 2009; formerly, Senior Vice President, Neuberger, 2003 to 2006; formerly, Vice President, Neuberger, 1999 to 2003; President and Chief Executive Officer, Management, since 2008; formerly, Senior Vice President, Management, 2000 to 2008. | 58 | Director, Staten Island Mental Health Society, since 1994; formerly, Chairman of the Board, Staten Island Mental Health Society, 2008 to 2011. | |||||||||||||||
(1) The business address of each listed person is 605 Third Avenue, New York, New York 10158.
(2) Pursuant to the Trust's Trust Instrument, each of these Trustees shall hold office for life or until his or her successor is elected or the Trust terminates; except that (a) any Trustee may resign by delivering a written resignation; (b) any Trustee may be removed with or without cause at any time by a written instrument signed by at least two-thirds of the other Trustees; (c) any Trustee who requests to be retired, or who has become unable to serve, may be retired by a written instrument signed by a majority of the other Trustees; and (d) any Trustee may be removed at any shareholder meeting by a vote of at least two-thirds of the outstanding shares.
(3) Except as otherwise indicated, each individual has held the positions shown for at least the last five years.
* Indicates a Trustee who is an "interested person" within the meaning of the 1940 Act. Mr. Amato and Mr. Conti are interested persons of the Trust by virtue of the fact that each is an officer of Management, Neuberger and/or their affiliates.
247
Information about the Officers of the Trust
| Name, (Year of Birth), and Address(1) | Position(s) and Length of Time Served(2) | Principal Occupation(s)(3) | |||||||||
Andrew B. Allard (1961) | Chief Legal Officer since 2013 (only for purposes of sections 307 and 406 of the Sarbanes-Oxley Act of 2002) and Anti-Money Laundering Compliance Officer since 2002 | General Counsel and Senior Vice President, Management since 2013; Senior Vice President, Neuberger, since 2006 and Employee since 1999; Deputy General Counsel, Neuberger, since 2004; formerly, Vice President, Neuberger, 2000 to 2005; formerly, Employee, Management, 1994 to 1999; Chief Legal Officer since 2013 (only for purposes of sections 307 and 406 of the Sarbanes-Oxley Act of 2002), ten registered investment companies for which Management acts as investment manager and administrator (ten since 2013); Anti-Money Laundering Compliance Officer, ten registered investment companies for which Management acts as investment manager and administrator (six since 2002, one since 2003, one since 2005, one since 2006 and one since 2013). | |||||||||
Claudia A. Brandon (1956) | Executive Vice President since 2008 and Secretary since 1985 | Senior Vice President, Neuberger, since 2007 and Employee since 1999; Senior Vice President, Management, since 2008 and Assistant Secretary since 2004; formerly, Vice President, Neuberger, 2002 to 2006; formerly, Vice President-Mutual Fund Board Relations, Management, 2000 to 2008; formerly, Vice President, Management, 1986 to 1999 and Employee 1984 to 1999; Executive Vice President, ten registered investment companies for which Management acts as investment manager and administrator (nine since 2008 and one since 2013); Secretary, ten registered investment companies for which Management acts as investment manager and administrator (three since 1985, three since 2002, one since 2003, one since 2005, one since 2006 and one since 2013). | |||||||||
Agnes Diaz (1971) | Vice President since 2013 | Senior Vice President, Neuberger, since 2012; Employee, NB Management, since 1996; formerly, Vice President, Neuberger, 2007 to 2012; Vice President, ten registered investment companies for which Management acts as investment manager and administrator (ten since 2013). | |||||||||
Anthony DiBernardo (1979) | Assistant Treasurer since 2011 | Senior Vice President, Neuberger, since 2014; Employee, Management, since 2003; formerly, Vice President, Neuberger, 2009 to 2014; Assistant Treasurer, ten registered investment companies for which Management acts as investment manager and administrator (nine since 2011 and one since 2013). | |||||||||
Sheila R. James (1965) | Assistant Secretary since 2002 | Vice President, Neuberger, since 2008 and Employee since 1999; formerly, Assistant Vice President, Neuberger, 2007; formerly, Employee, Management, 1991 to 1999; Assistant Secretary, ten registered investment companies for which Management acts as investment manager and administrator (six since 2002, one since 2003, one since 2005, one since 2006 and one since 2013). | |||||||||
248
| Name, (Year of Birth), and Address(1) | Position(s) and Length of Time Served(2) | Principal Occupation(s)(3) | |||||||||
Brian Kerrane (1969) | Vice President since 2008 | Managing Director, Neuberger, since 2014; Vice President, Management, since 2008 and Employee since 1991; formerly, Senior Vice President, Neuberger, 2006 to 2014; Vice President, ten registered investment companies for which Management acts as investment manager and administrator (nine since 2008 and one since 2013). | |||||||||
Kevin Lyons (1955) | Assistant Secretary since 2003 | Assistant Vice President, Neuberger, since 2008 and Employee since 1999; formerly, Employee, Management, 1993 to 1999; Assistant Secretary, ten registered investment companies for which Management acts as investment manager and administrator (seven since 2003, one since 2005, one since 2006 and one since 2013). | |||||||||
Owen F. McEntee, Jr. (1961) | Vice President since 2008 | Vice President, Neuberger, since 2006; Employee, Management, since 1992; Vice President, ten registered investment companies for which Management acts as investment manager and administrator (nine since 2008 and one since 2013). | |||||||||
John M. McGovern (1970) | Treasurer and Principal Financial and Accounting Officer since 2005 | Senior Vice President, Neuberger, since 2007; formerly, Vice President, Neuberger, 2004 to 2006; Employee, Management, since 1993; Treasurer and Principal Financial and Accounting Officer, ten registered investment companies for which Management acts as investment manager and administrator (eight since 2005, one since 2006 and one since 2013); formerly, Assistant Treasurer, eight registered investment companies for which Management acts as investment manager and administrator, 2002 to 2005. | |||||||||
Frank Rosato (1971) | Assistant Treasurer since 2005 | Vice President, Neuberger, since 2006; Employee, Management, since 1995; Assistant Treasurer, ten registered investment companies for which Management acts as investment manager and administrator (eight since 2005, one since 2006 and one since 2013). | |||||||||
Neil S. Siegel (1967) | Vice President since 2008 | Managing Director, Management, since 2008; Managing Director, Neuberger, since 2006; Managing Director, NBFI, since 2011; formerly, Senior Vice President, Neuberger, 2004 to 2006; Vice President, ten registered investment companies for which Management acts as investment manager and administrator (nine since 2008 and one since 2013). | |||||||||
Chamaine Williams (1971) | Chief Compliance Officer since 2005 | Senior Vice President, Neuberger, since 2007; Chief Compliance Officer, Management, since 2006; Chief Compliance Officer, ten registered investment companies for which Management acts as investment manager and administrator (eight since 2005, one since 2006 and one since 2013); formerly, Senior Vice President, LBI, 2007 to 2008; formerly, Vice President, LBI, 2003 to 2006; formerly, Chief Compliance Officer, Lehman Brothers Asset Management Inc., 2003 to 2007; formerly, Chief Compliance Officer, Lehman Brothers Alternative Investment Management LLC, 2003 to 2007. | |||||||||
(1) The business address of each listed person is 605 Third Avenue, New York, New York 10158.
(2) Pursuant to the By-Laws of the Trust, each officer elected by the Trustees shall hold office until his or her successor shall have been elected and qualified or until his or her earlier death, inability to serve, or resignation. Officers serve at the pleasure of the Trustees and may be removed at any time with or without cause.
(3) Except as otherwise indicated, each individual has held the positions shown for at least the last five years.
249
Proxy Voting Policies and Procedures
A description of the policies and procedures that the Trust uses to determine how to vote proxies relating to portfolio securities is available, without charge, by calling 800-877-9700 (toll-free) and on the Securities and Exchange Commission's website, at www.sec.gov. Information regarding how the Trust voted proxies relating to portfolio securities during the most recent 12-month period ended June 30 is also available upon request, without charge, by calling 800-877-9700 (toll-free), on the Securities and Exchange Commission's website at www.sec.gov, and on Management's website at www.nb.com.
Quarterly Portfolio Schedule
The Trust files a complete schedule of portfolio holdings for each Fund with the Securities and Exchange Commission for the first and third quarters of each fiscal year on Form N-Q. The Trust's Forms N-Q are available on the Securities and Exchange Commission's website at www.sec.gov and may be reviewed and copied at the Securities and Exchange Commission's Public Reference Room in Washington, DC. Information on the operation of the Public Reference Room may be obtained by calling 800-SEC-0330. The information on Form N-Q is available upon request, without charge, by calling 800-877-9700 (toll-free).
250
Notice to Shareholders
Neuberger Berman All Cap Core Fund, Equity Income Fund, Focus Fund, Genesis Fund, Guardian Fund, Intrinsic Value Fund, Large Cap Disciplined Growth Fund, Large Cap Value Fund, Mid Cap Growth Fund, Mid Cap Intrinsic Value Fund, Multi-Cap Opportunities Fund, Real Estate Fund and Socially Responsive Fund hereby designate $8,437,994, $102,840,935, $63,750,537, $1,137,274,077, $112,517,878, $8,738,393, $52,335,028, $135,542,504, $58,429,501, $3,055,247, $27,819,682, $51,381,659 and $149,639,493, respectively, as a capital gain distribution.
For the fiscal year ended August 31, 2014, each Fund makes the following designation, or up to the maximum amount of such dividends allowable pursuant to the Internal Revenue Code, as qualified dividend income eligible for reduced tax rates. These lower rates range from 5% to 15% depending upon an individual's tax bracket. Complete information regarding each Fund's distributions during the calendar year 2014 will be reported in conjunction with Form 1099-DIV.
Fund | Qualified Dividend Income | ||||||
All Cap Core | $ | 864,385 | |||||
Emerging Markets Equity | 12,937,899 | ||||||
Equity Income | 85,595,741 | ||||||
Focus | 12,097,592 | ||||||
Genesis | 175,969,376 | ||||||
Global Equity | 687,044 | ||||||
Global Thematic Opportunities | 1,736,377 | ||||||
Greater China Equity | 1,515,201 | ||||||
Guardian | 25,053,332 | ||||||
International Equity | 29,660,244 | ||||||
International Select | 7,048,494 | ||||||
Intrinsic Value | 1,500,781 | ||||||
Large Cap Disciplined Growth | 5,289,249 | ||||||
Large Cap Value | 32,151,097 | ||||||
Mid Cap Growth | 4,293,528 | ||||||
Mid Cap Intrinsic Value | 1,706,723 | ||||||
Multi-Cap Opportunities | 39,913,271 | ||||||
Real Estate | 21,460,966 | ||||||
Small Cap Growth | 307,663 | ||||||
Socially Responsive | 42,027,634 | ||||||
Value | 284,844 | ||||||
251
This page has been left blank intentionally
252
This page has been left blank intentionally
253
Neuberger Berman Management LLC
605 Third Avenue 2nd Floor
New York, NY 10158–0180
Shareholder Services
800.877.9700
Intermediary Client Services
800.366.6264
www.nb.com
Statistics and projections in this report are derived from sources deemed to be reliable but cannot be regarded as a representation of future results of the Funds. This report is prepared for the general information of shareholders and is not an offer of shares of the Funds. Shares are sold only through the currently effective prospectus, which must precede or accompany this report.
 H0599 10/14
| (a) | Based on an evaluation of the disclosure controls and procedures (as defined in Rule 30a-3(c) under the Investment Company Act of 1940, as amended (the “Act”)) as of a date within 90 days of the filing date of this document, the Chief Executive Officer and President and the Treasurer and Principal Financial and Accounting Officer of the Registrant have concluded that such disclosure controls and procedures are effectively designed to ensure that information required to be disclosed by the Registrant on Form N-CSR and Form N-Q is accumulated and communicated to the Registrant’s management to allow timely decisions regarding required disclosure. |
| (b) | There were no significant changes in the Registrant’s internal controls over financial reporting (as defined in Rule 30a-3(d) under the Act) that occurred during the Registrant’s second fiscal quarter of the period covered by this report that have materially affected, or are reasonably likely to materially affect, the Registrant’s internal control over financial reporting. |
| (a)(1) | A copy of the Code of Ethics is incorporated by reference to the Registrant’s Form N-CSR, Investment Company Act file number 811-00582 (filed May 6, 2013). |
| (a)(2) | The certifications required by Rule 30a-2(a) under the Act and Section 302 of the Sarbanes-Oxley Act of 2002 (“Sarbanes-Oxley Act”) are filed herewith. |
| (a)(3) | Not applicable to the Registrant. |
| (b) | The certifications required by Rule 30a-2(b) under the Act and Section 906 of the Sarbanes-Oxley Act are filed herewith. |
| By: | /s/ Robert Conti | |||||||||||||||
Robert Conti Chief Executive Officer and President |
| By: | /s/ Robert Conti | |||||||||||||||
Robert Conti Chief Executive Officer and President |
| By: | /s/ John M. McGovern | |||||||||||||||
John M. McGovern Treasurer and Principal Financial and Accounting Officer |