These gains belie the fact that this reporting period contained two very different markets. As the period began, the markets, which had been threatened by the possibility of a double-dip recession through summer 2010, rallied. The Federal Reserve's second quantitative easing effort ("QE2") was a tremendous stimulus that, along with unexpectedly strong corporate earnings, returned the market to its feet. Economically sensitive areas led as risk appetites increased, and the S&P 500 advanced by over 27% through February 2011.
Market volatility began to increase in March in the wake of the disaster in Japan and worsening global economic news. The U.S. economy grew only 0.8% through the first half of 2011, bringing investor sentiment full circle to recessionary fears. In addition, the ending of QE2, alarming headlines from the European debt crisis, engineered slowdowns in China and India, and a once unthinkable downgrade of U.S. government debt aggravated fears. Risk aversion increased, with investors pulling over $30 billion from equity mutual funds in July alone. In August, the CBOE Volatility (VIX) Index spiked to 48, a level not seen since March 2009, and consumer confidence hit a two-year low.
While the period closed in uncertain territory, our portfolio managers generally remain guardedly optimistic, expecting continued slow growth ahead rather than recession. In August, total industrial production was 3.4% above its level a year ago. Inventory restocking, M&A activity, and slow, steady increases in capital expenditures could also support growth for the remainder of the year. In addition, corporate balance sheets remain healthy, and in many cases, flush with cash; and earnings continue to show resilience.
With headlines continuing to influence investor sentiment and behavior, however, ongoing concerns bear watching. Paramount among these is what course of action the U.S. government and EU leaders will take in addressing their serious deficit situations. The Fed has suggested that policymakers will consider further steps to help stimulate the U.S. economy and has initiated an effort to reduce longer term interest rates dubbed "Operation Twist." However, with interest rates extremely low, and after two rounds of quantitative easing, it is uncertain what more the Fed can do. At the time of this writing, EU leaders continue working toward a solution to address Greece's potential default.
Regarding the U.S., our hope is that the deeply divided government will move past partisanship to reach lasting solutions to fiscal challenges. Meanwhile, we are closely watching economic indicators such as industrial and service business data, and consumer spending.
We have seen three sharp market declines during the last three years. During each, correlations among equities rose and stocks declined indiscriminately. As the market recovered from the first two downturns, fundamentals-driven active managers were able to add value, as the stocks of companies best positioned for the ensuing economic backdrop outperformed. Although it's too early to know this time, we think our strengths as hands-on active managers are on our side. We continue to believe that managers employing tested strategies and in-depth research to build differentiated, advantaged portfolios will outperform over the long term.
Along these lines, we are pleased to have introduced two new mutual funds—Neuberger Berman Global Equity Fund and Neuberger Berman Global Thematic Opportunities Fund, which you can learn more about in this report. Along with our other relatively new fund, Neuberger Berman Global Allocation Fund, they reinforce our commitment to providing shareholders with global investment opportunities, through experienced management teams and disciplined investment approaches.
Thank you for your confidence in Neuberger Berman. We look forward to continuing to serve your investment needs.
Neuberger Berman Emerging Markets Equity Fund Institutional Class generated a 3.44% total return for the fiscal year ended August 31, 2011, and underperformed its benchmark, the MSCI Emerging Markets (EM) Index, which provided a 9.40% return for the period. (Performance for all share classes is provided in the table immediately following this letter.)
From late summer through calendar year-end 2010, emerging markets continued their strong run, benefiting from expectations for improving global growth and ongoing local demographic and economic strength. Several factors converged, as the fiscal year progressed, however, that pulled back performance. As economic growth in developed markets came into question, with serious debt and political headwinds in both the U.S. and eurozone, markets weighted toward exports (global sectors) came under pressure. Additionally, concerns over inflation prompted investor outflows, particularly from local, smaller cap sectors. Central banks in several high growth economies, including China and India, began raising interest rates in an effort to control inflation and manage growth. Food inflation is a particular concern across emerging markets as it can make up almost half of the consumer price index (CPI) in certain countries.
Taking the fiscal year as a whole, emerging markets turned in high single-digit returns, underperforming both international developed markets and the S&P 500 Index. Although markets generally slowed down somewhat after their strong run, results remained positive for all sectors except Utilities. Consumer Discretionary and Staples stocks showed significant strength for the period, followed by Telecommunication Services. In addition to Utilities, Financials and Industrials stocks were areas of weakness.
By country, Thailand, Indonesia and Mexico were among the strongest markets, while Egypt, Turkey and India were the weakest. With the exception of a relatively robust Russian market, the powerful BRIC economies—Brazil, Russia, India and China—underperformed significantly this period.
Relative to the benchmark, the portfolio benefited most from underweights in the two weakest sectors, Utilities and Financials, and from our overweight in Consumer Discretionary holdings. Stock selection within Consumer Staples was also additive to performance. An overweight to the relatively weak Industrials and Health Care sectors and an underweight in Energy, relative to the benchmark, were detrimental to peformance.
Among individual holdings, Korean auto parts manufacturer Hyundai Mobis was the Fund's top contributor to performance. Hyundai/Kia Motors benefited from a loss of production from Japanese automakers. Longer term, we believe the company will benefit as Japanese automakers diversify their supplier base. Indonesia's PT Global Mediacom, an integrated pay TV and broadcasting company, benefited from favorable analyst reports highlighting the company's value. International Container Terminal, a Philippines based terminal port operator, performed well on strong fundamentals and new terminal concession wins.
Disappointments included Indian cable TV company DEN Networks. In our view, DEN is positioned to benefit from the migration to digital cable, but regulatory hurdles delayed the shutdown of the analog spectrum. Boer Power, a Chinese industrial company, underperformed as competition eroded the profitability of their Electronic Distribution Systems business. Xingda International, a leading Chinese wire manufacturer, detracted as margins dropped in both its auto and solar businesses. We believe these businesses' margins will recover over time. Supply disruptions impacted Melfas, a capacitive touch-sensor chip company. The possibility that Samsung, their biggest customer, may be developing their own chips raises significant risks for the company, and we sold the stock late in the reporting period.
We continue to see secular growth opportunities in the domestic sectors of the emerging markets. Fundamentals have remained solid and have been supported by a rising middle class, urbanization and governments with healthy balance sheets. While we acknowledge structural inflation will likely remain elevated, on average, wages have been rising faster than inflation, which combined with high savings rates bodes well for consumption over the long term.
From a sector perspective, Health Care continues to be our largest overweight, offering good consumer exposure, with a record of high returns and good cash flow generation at reasonable valuations. We are also constructive on domestically
driven Industrials, due to their potential role in resolving large infrastructure bottlenecks, capacity constraints and rising labor input costs—a recurring theme across many countries, including Brazil, India, China and the Philippines. We are underweighted in Financials compared to the benchmark, where we find valuations expensive. We are also slightly overweighted in Consumer Staples.
At the country level, we see growth and value in Thailand (where we think the decisive parliamentary victory of the Puea Thai party bodes well for stability), Turkey and the Philippines. We believe India offers interesting mid-cap opportunities, as does Brazil on a selective basis. We are more cautious on component-oriented export markets such as Korea and Taiwan, but are finding select opportunities. We also continue to see opportunities in the domestic sectors in China, although considerable government policy noise (to address rapidly rising property prices and wage increases) has put downward pressure on the market. While we see potential for a property bubble in China's largest cities, we continue to think that risks on a national level are largely overstated. We also believe that local government debt is manageable considering the significant reserves of the national government.We feel the biggest risk will likely be in Chinese financials, where we are underweight compared to the benchmark.
We believe that our bottom-up fundamental analysis within a macro perspective will help us continue to capture the longer-term opportunity these markets hold.
The risks involved in seeking capital appreciation from investments primarily in companies based outside the United States are set forth in the prospectus and statement of additional information.
Investing in foreign securities involves greater risks than investing in securities of U.S. issuers, including currency fluctuations, changes in local economic and political conditions, and the need to operate in less regulated financial markets. These risks are typically heightened for investments in emerging markets.
To the extent that the Fund emphasizes small-, mid- or large-cap stocks, it takes on the associated risks. At times, large-cap stocks may lag other types of stocks in performance, which could cause a fund holding those stocks to perform worse than certain other funds. Small- and mid-capitalization stocks are more vulnerable to financial risks and other risks than stocks of larger companies. They also trade less frequently and in lower volume than larger company stocks, so their market prices tend to be more volatile.
The composition, industries and holdings of the Fund are subject to change.
Emerging Markets Equity Fund (Unaudited)
| Institutional Class | | NEMIX | |
| Class A | | NEMAX | |
| Class C | | NEMCX | |
| Class R3 | | NEMRX | |
| (as a % of Total Investments) | |
| Consumer Discretionary | | | 12.7 | % | |
| Consumer Staples | | | 7.5 | | |
| Energy | | | 9.4 | | |
| Financials | | | 14.5 | | |
| Health Care | | | 5.6 | | |
| Industrials | | | 10.0 | | |
| Information Technology | | | 11.6 | | |
| Materials | | | 14.2 | | |
| Telecommunication Services | | | 7.2 | | |
| Utilities | | | 1.6 | | |
| Short-Term Investments | | | 5.7 | | |
| Total | | | 100.0 | % | |
PERFORMANCE HIGHLIGHTS2,9,12 |
| | | | | Average Annual Total Return Ended 08/31/2011 | |
| | | Inception Date | | 1 Year | | Life of Fund | |
| At NAV | |
| Institutional Class | | 10/08/2008 | | | 3.44 | % | | | 21.94 | % | |
| Class A | | 10/08/2008 | | | 3.16 | % | | | 21.68 | % | |
| Class C | | 10/08/2008 | | | 2.41 | % | | | 20.76 | % | |
Class R312 | | 06/21/2010 | | | 2.73 | % | | | 21.61 | % | |
| With Sales Charge | |
| Class A | | | | | –2.77 | % | | | 19.22 | % | |
| Class C | | | | | 1.41 | % | | | 20.76 | % | |
| Index | |
MSCI Emerging Markets Index1,18 | | | | | 9.40 | % | | | 19.88 | % | |
Performance data quoted represent past performance and do not indicate future results. The investment return and principal value of an investment will fluctuate so that an investor's shares, when redeemed, may be worth more or less than their original cost. Results are shown on a "total return" basis and include reinvestment of all income dividends and distributions.
Current performance may be lower or higher than the performance data quoted. For performance data current to the most recent month end, visit www.nb.com/performance.
As stated in the Fund's most recent prospectus, the total annual operating expense ratios for fiscal year 2010 were 6.65%, 6.72%, 7.06% and 2.76% for Institutional Class, Class A, Class C and Class R3 shares, respectively (prior to any fee waivers and/or expense reimbursements, if any). The expense ratios net of waivers and/or reimbursements were 1.27%, 1.52%, 2.27% and 1.92% for Institutional Class, Class A, Class C and Class R3 shares, respectively. Neuberger Berman Management LLC has contractually agreed to limit certain expenses of the Fund through August 31, 2014 for Institutional Class, Class A, Class C and Class R3 shares.
Total Returns shown with a sales charge reflect the deduction of the current maximum initial sales charge of 5.75% for Class A shares and the applicable contingent deferred sales charges (CDSC) for Class C shares. The maximum CDSC for Class C shares is 1%, which is reduced to 0% after 1 year. The performance of the Fund's share classes will differ primarily due to different sales charge structures and class expenses. Please see the prospectus for more information about sales charge structures, if any, and class expenses for your share class.
The results shown in the table do not reflect the effect of taxes an investor would pay on Fund distributions or on the redemption of Fund shares.
Emerging Markets Equity Fund (Unaudited)
| COMPARISON OF A $1,000,000 INVESTMENT |
(000's Omitted)
 |
| |
| This graph shows the change in value of a hypothetical $1,000,000 investment in the Fund over the past 10 fiscal years, or since the Fund's inception if it has not operated for 10 years. The graph is based on the Institutional Class shares only; the performance of the Fund's share classes will differ primarily due to different sales charge structures and class expenses (see Performance Highlights chart on previous page). The result is compared with benchmarks, which include a broad-based market index and may include a more narrowly based index. Market indices have not been reduced to reflect any of the fees and costs of investing. All results include the reinvestment of income dividends and distributions. The results shown in the graph do not reflect the effect of taxes an investor would pay on Fund distributions or on the redemption of Fund shares. Results represent past performance and do not indicate future results. |
Equity Income Fund Commentary (Unaudited)
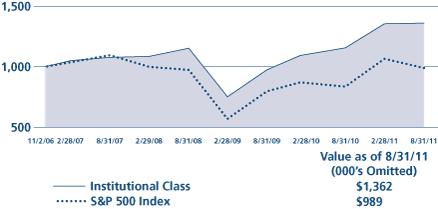
Neuberger Berman Equity Income Fund Institutional Class generated a 17.70% total return for the fiscal year ended August 31, 2011. As is typical during a strong rally in the equity market, the portfolio underperformed its benchmark, the S&P 500 Index, which generated an 18.50% return. (Performance for all share classes is provided in the table immediately following this letter.) Because of the portfolio's defensive positioning, however, it made headway relative to the index during the final quarter of the fiscal year, when the rally abated and volatility intensified.
The market's strength for much of the fiscal year was largely based on relatively strong economic expectations. Going into calendar year 2011, the consensus among analysts had been for U.S. GDP growth to be in the range of 3%-4%. In the final months of the reporting period, however, fears of a double-dip recession were reignited by renewed concern over the serious debt issues facing Greece and Europe in general, and what broader effects might be felt.
Against this shifting backdrop, the Fund performed well for a number of reasons. Real Estate Investment Trusts (REITs) were among the top performing asset classes for much of this period relative to the S&P 500 Index, even though they pulled back sharply during July and August. Representing approximately 20% of the portfolio's assets, our position in REITs—namely those focused on specialty and international areas—benefited performance. American Campus Communities, a student housing specialist, was among the top contributors, while RLJ Lodging and Suntec were detractors. We did not own RLJ the entire fiscal year, so the portfolio saw less of the benefit from the sector's positive run. We consider the company undervalued, and expect that its niche—longer-term lodging for consultant type clientele—may be a benefit given that the trend toward hiring consultants instead of full-time employees tends to be increasing. Suntec, a Singapore-based office and retail REIT, underperformed as investors questioned the sustainability of the strong growth in the Asian markets.
The portfolio also benefited from investments with exposure to emerging markets consumers, a theme within the portfolio for over two years now. In this category, names including Philip Morris International and Unilever benefited as wages in some emerging markets continued to increase, leading to a higher quality of living standards, particularly in Asia. Both were among top contributors this period.
Precious metals commodity-related stocks—gold in particular—also outperformed relative to the benchmark. Royal Gold was our strongest contributor this fiscal year, and Franco-Nevada also performed well. Gold prices increased as investors sought a safe haven against a weaker U.S. dollar, fears about U.S. debt, and market volatility. Both names also offer a modest dividend yield. Within the convertibles portion of the portfolio, NovaGold appreciated significantly as well, and we sold it for a gain.
Despite the fact that oil and gas prices declined somewhat during the fiscal year, several of our diversified Canadian oil sands holdings, including Crescent Point, Cenovus, and Arc Resources, performed extremely well. CNOOC, the Chinese oil and gas conglomerate, was also beneficial to results. That position was sold for a gain and we replaced it with PetroChina, which we believed had more significant upside potential. Despite the recent price movement, we remain positive on oil. From our point of view, prices over $75 per barrel are still quite profitable for our portfolio holdings, even the higher-cost producers.
The portfolio's Utilities investments, at just over 16% of assets, added value over the fiscal year as well. The sector appeared relatively attractive in recent months as investors sought yield in a volatile market. We witnessed several of our Utilities holdings raise their dividends this period. Among our holdings, CenterPoint Energy was a standout performer, with both a dividend increase and a big win in a Texas rate case, enabling the company to begin to recoup costs.
Our convertible bond holdings were a relative detriment this period. While absolute performance was positive, they lagged the market, as they tend to do during equity rallies. Still, they are an excellent source of income and generally help dampen volatility within the portfolio, in our view. Our focus continues to be on bonds with maturity or put dates of less than seven years.
Within convertibles and elsewhere, commodities including coal, timber and uranium fell somewhat out of favor as emerging markets economies began raising interest rates to help contain inflation. This, along with the slowdown in developed markets, took a toll on holdings including James River and Paladin, both convertible bonds, and Potlatch, one of our timber REITs.
While we thought earlier analyst estimates of 3% to 4% GDP growth were overly optimistic, we also believe fears of a double-dip recession are overblown and anticipate the U.S. will muddle through with a growth rate near 1% through 2012, barring unforeseen issues in Europe. In the current environment, however, we think fear has overtaken greed, and the markets have been weak and extremely volatile as investors may react nervously to headlines and analyze each economic data release for meaning and direction.
We consider the portfolio to be well positioned against the volatility that we expect will continue. With its defensive characteristics and yield component, the portfolio typically outperforms when markets are difficult. Additionally, with the strength in our companies' balance sheets and the benefit of rising dividends, we think the Fund may be a good alternative to the bond market for investors seeking income.
Sincerely,
Richard S. Levine, Tony Gleason and Sandy Pomeroy
Portfolio Co-Managers
The risks involved in seeking capital appreciation from investments in a wide array of stocks are set forth in the prospectus and statement of additional information.
To the extent that the Fund emphasizes small-, mid- or large-cap stocks, it takes on the associated risks. At times, large-cap stocks may lag other types of stocks in performance, which could cause a fund holding those stocks to perform worse than certain other funds. Small- and mid-capitalization stocks are more vulnerable to financial risks and other risks than stocks of larger companies. They also trade less frequently and in lower volume than larger company stocks, so their market prices tend to be more volatile.
Investing in foreign securities involves greater risks than investing in securities of U.S. issuers, including currency fluctuations, changes in local economic and political conditions, and the need to operate in less regulated financial markets. These risks are typically heightened for investments in emerging markets.
The composition, industries and holdings of the Fund are subject to change.
Equity Income Fund (Unaudited)
| Institutional Class | | NBHIX | |
| Class A | | NBHAX | |
| Class C | | NBHCX | |
| Class R3 | | NBHRX | |
| (as a % of Total Investments) | |
| Consumer Discretionary | | | 2.1 | % | |
| Consumer Staples | | | 7.6 | | |
| Energy | | | 12.0 | | |
| Financials | | | 23.4 | | |
| Health Care | | | 3.8 | | |
| Industrials | | | 7.5 | | |
| Information Technology | | | 1.2 | | |
| Materials | | | 5.3 | | |
| Telecommunication Services | | | 5.2 | | |
| Utilities | | | 16.1 | | |
| Other | | | 10.6 | | |
| Short-Term Investments | | | 5.2 | | |
| Total | | | 100.0 | % | |
PERFORMANCE HIGHLIGHTS2,9 |
| | | | | Average Annual Total Return Ended 08/31/2011 | |
| | | Inception Date | | 1 Year | | Life of Fund | |
| At NAV | |
Institutional Class16 | | 06/09/2008 | | | 17.70 | % | | | 6.60 | % | |
Class A16 | | 06/09/2008 | | | 17.27 | % | | | 6.31 | % | |
Class C16 | | 06/09/2008 | | | 16.31 | % | | | 5.79 | % | |
Class R316 | | 06/21/2010 | | | 16.92 | % | | | 6.42 | % | |
| With Sales Charge | |
Class A16 | | | | | | | 10.52 | % | | | 5.01 | % | |
Class C16 | | | | | | | 15.31 | % | | | 5.79 | % | |
| Index | |
S&P 500 Index1,18 | | | | | | | 18.50 | % | | | –0.23 | % | |
The performance data for each class includes the performance of the Fund's oldest share class, Trust Class, from November 2, 2006 through June 9, 2008. The performance data for Class R3 also includes the performance of the Fund's Institutional Class from June 9, 2008 through June 21, 2010. See footnote 16 for information about the effects of the different fees paid by each class.
Performance data quoted represent past performance and do not indicate future results. The investment return and principal value of an investment will fluctuate so that an investor's shares, when redeemed, may be worth more or less than their original cost. Results are shown on a "total return" basis and include reinvestment of all income dividends and distributions.
Current performance may be lower or higher than the performance data quoted. For performance data current to the most recent month end, visit www.nb.com/performance.
As stated in the Fund's most recent prospectus, the total annual operating expense ratios for fiscal year 2010 were 1.02%, 1.37%, 2.13% and 1.44% for Institutional Class, Class A, Class C and Class R3 shares, respectively (prior to any fee waivers and/or expense reimbursements, if any). The expense ratios net of waivers and/or reimbursements were 0.81%, 1.17%, 1.92% and 1.42% for Institutional Class, Class A, Class C and Class R3 shares, respectively. Neuberger Berman Management LLC has contractually agreed to limit certain expenses of the Fund through August 31, 2014 for Institutional Class, Class A, Class C and Class R3 shares.
Total Returns shown with a sales charge reflect the deduction of the current maximum initial sales charge of 5.75% for Class A shares and the applicable contingent deferred sales charges (CDSC) for Class C shares. The maximum CDSC for Class C shares is 1%, which is reduced to 0% after 1 year. The performance of the Fund's share classes will differ primarily due to different sales charge structures and class expenses. Please see the prospectus for more information about sales charge structures, if any, and class expenses for your share class.
The results shown in the table do not reflect the effect of taxes an investor would pay on Fund distributions or on the redemption of Fund shares.
Equity Income Fund (Unaudited)
COMPARISON OF A $1,000,000 INVESTMENT16 |
(000's Omitted)
 |
| |
| This graph shows the change in value of a hypothetical $1,000,000 investment in the Fund over the past 10 fiscal years, or since the Fund's inception if it has not operated for 10 years. The graph is based on the Institutional Class shares only; the performance of the Fund's share classes will differ primarily due to different sales charge structures and class expenses (see Performance Highlights chart on previous page). The result is compared with benchmarks, which include a broad-based market index and may include a more narrowly based index. Market indices have not been reduced to reflect any of the fees and costs of investing. All results include the reinvestment of income dividends and distributions. The results shown in the graph do not reflect the effect of taxes an investor would pay on Fund distributions or on the redemption of Fund shares. Results represent past performance and do not indicate future results. |
Focus Fund Commentary (Unaudited)
Neuberger Berman Focus Fund Investor Class generated a 17.61% total return for the fiscal year ended August 31, 2011 and trailed its benchmark, the S&P 500 Index, which provided an 18.50% return for the period. (Performance for all share classes is provided in the table immediately following this letter.)
The fiscal year was an extremely volatile time for the markets. From a strong start in the fall of 2010 through the first calendar quarter of 2011, investors appeared optimistic that the economic recovery was progressing well, and that the GDP growth rate would accelerate as the year progressed. In late spring, the markets experienced a setback as investors struggled with the potential impact of a second round of serious sovereign debt issues in Europe, signs of slowing growth combined with contentious debt ceiling negotiations in the U.S., and the possibility of decelerating growth in emerging markets. Equities declined in response and volatility rose for the remainder of the fiscal period.
Although the Fund held its ground fairly well during the decline, market conditions were something of a headwind. Nonetheless, because the Fund is a concentrated portfolio of our analysts' best ideas, we believe our shareholders will benefit if headline risk declines and investors once again evaluate opportunities in a way that more clearly plays to the strengths of bottom-up active managers—on business prospects, valuations and fundamentals.
For the fiscal year as a whole, cyclical sectors led the market as investor optimism reigned for roughly two-thirds of the reporting period. All sectors in the S&P 500 Index except for Financials were positive for the fiscal year, with the best returns coming from the Energy and Consumer Discretionary sectors. The more defensive Telecommunication Services and Utilities sectors underperformed the index slightly over the period.
Within the portfolio, Information Technology holdings detracted the most from performance relative to the benchmark, although Energy holdings also underperformed. Within Information Technology, Apple was a top contributor, but poor performance from Hewlett-Packard and NXP Semiconductors counteracted any positive effect. Hewlett-Packard had been performing well under the direction of CEO Mark Hurd, who was ousted in August 2010. As new management took the helm, we continued to believe there was value in the company, but as earnings weakened and the company's new strategic direction became less clear, we sold our position, finding what we consider better opportunities elsewhere.
NXP is a supplier of high performance and standard semiconductor devices with a dominant market share in the vast majority of its product segments. One of the key growth drivers for NXP is an emerging technology that enables payments to be made via smart phones. Because this is a new technology, however, integration into mobile phones has been choppy and concerns about the ramp-up of this product, combined with overall economic weakness, have been weighing heavily on the stock. We see a great deal of value in its shares at current levels, however, and expect sales to pick up when the economy improves and even more so if the company's differentiated payment technology takes root and becomes widespread within the mobile phone industry.
On the positive side, our Consumer Discretionary holdings outperformed relative to the benchmark, on both strong stock selection and overweight positions. Brinker International, the operator of Chili's Restaurants, Discovery Communications, and Comcast performed well. We sold Brinker during the period, but continue to have meaningful positions in both Discovery and Comcast.
Discovery Communications is, in our view, a very well run pure-play cable network with a strong international presence. The company owns a number of cable TV channels including Discovery Channel, TLC and Animal Planet. We continue to see value in the stock and expect further upside as the company benefits from increased adoption of paid television internationally and makes strides in improving its network ratings and monetization domestically.
Comcast closed the NBC Universal deal this period, which should be self-funding from a cash flow perspective going forward. The rest of the business also continues to perform well, generating significant free cash flow which the company is redeploying to shareholders via dividends and buybacks.
Beyond our Consumer Discretionary holdings, strong stock selection led to outperformance in the Consumer Staples, Financials and Health Care sectors as well. Although we underperformed the index, we were able to add value in seven of 10 sectors.
As we enter the remainder of the year, equities appear attractive to us, although we expect the market may continue to be extremely volatile as long as macroeconomic news continues to drive investor behavior. We believe our valuation discipline allows us to use volatility to our advantage, however, as we work to purchase sound companies with strong growth prospects at depressed levels.
While we choose each holding based on its individual fundamentals, we are also mindful of how the Fund comes together as a whole. We therefore pay close attention to how holdings correlate with each other in order to create a portfolio of stocks with what we consider an optimal risk/reward balance. At this time, we believe we have a well-diversified portfolio with both cyclical and counter-cyclical exposure and believe that our rigorous bottom-up stock selection process should work in favor of our shareholders over time.
Sincerely,
Tim Creedon and David Levine
Portfolio Co-Managers
Because the Fund is concentrated in a small number of stocks, it may be substantially overweighted or underweighted in certain economic sectors at any given time. Therefore its performance is likely to be disproportionately affected by the factors influencing those sectors and may suffer if certain economic sectors it emphasizes do not perform as expected. The risks associated with these investments are set forth in the prospectus and statement of additional information.
Small- and mid-capitalization stocks are more vulnerable to financial risks and other risks than stocks of larger companies. They also trade less frequently and in lower volume than larger company stocks, so their market prices tend to be more volatile. Large-cap stocks are subject to all the risks of stock market investing, including the risk that they may lose value.
The composition, industries and holdings of the Fund are subject to change.
Focus Fund (Unaudited)
| Investor Class | | NBSSX | |
| Trust Class | | NBFCX | |
| Advisor Class | | NBFAX | |
| Institutional Class | | NFALX | |
| Class A | | NFAAX | |
| Class C | | NFACX | |
| (as a % of Total Investments) | |
| Consumer Discretionary | | | 17.2 | % | |
| Consumer Staples | | | 7.8 | | |
| Energy | | | 12.1 | | |
| Financials | | | 14.0 | | |
| Health Care | | | 12.1 | | |
| Industrials | | | 9.8 | | |
| Information Technology | | | 16.1 | | |
| Materials | | | 4.5 | | |
| Utilities | | | 3.8 | | |
| Short-Term Investments | | | 2.6 | | |
| Total | | | 100.0 | % | |
PERFORMANCE HIGHLIGHTS2,8 |
| | | | | Average Annual Total Return Ended 08/31/2011 | |
| | | Inception Date | | 1 Year | | 5 Years | | 10 Years | | Life of Fund | |
| At NAV | |
| Investor Class | | 10/19/1955 | | | 17.61 | % | | | –1.40 | % | | | 1.01 | % | | | 10.09 | % | |
Trust Class4 | | 08/30/1993 | | | 17.39 | % | | | –1.61 | % | | | 0.81 | % | | | 10.10 | % | |
Advisor Class4 | | 09/03/1996 | | | 17.20 | % | | | –1.83 | % | | | 0.60 | % | | | 10.05 | % | |
Institutional Class21 | | 06/21/2010 | | | 17.85 | % | | | –1.35 | % | | | 1.03 | % | | | 10.10 | % | |
Class A24 | | 06/21/2010 | | | 17.43 | % | | | –1.43 | % | | | 0.99 | % | | | 10.09 | % | |
Class C24 | | 06/21/2010 | | | 16.62 | % | | | –1.61 | % | | | 0.90 | % | | | 10.07 | % | |
| With Sales Charge | |
Class A24 | | | | | | | 10.64 | % | | | –2.59 | % | | | 0.40 | % | | | 9.98 | % | |
Class C24 | | | | | | | 15.62 | % | | | –1.61 | % | | | 0.90 | % | | | 10.07 | % | |
| Index | |
S&P 500 Index1,18 | | | | | | | 18.50 | % | | | 0.78 | % | | | 2.70 | % | | | 9.67 | % | |
Performance data quoted represent past performance and do not indicate future results. The investment return and principal value of an investment will fluctuate so that an investor's shares, when redeemed, may be worth more or less than their original cost. Results are shown on a "total return" basis and include reinvestment of all income dividends and distributions.
Current performance may be lower or higher than the performance data quoted. For performance data current to the most recent month end, visit www.nb.com/performance.
As stated in the Fund's most recent prospectus, the total annual operating expense ratios for fiscal year 2010 were 0.98%, 1.19%, 1.43%, 0.80%, 1.16% and 1.91% for Investor Class, Trust Class, Advisor Class, Institutional Class, Class A and Class C shares, respectively (prior to any fee waivers and/or expense reimbursements, if any). The expense ratios net of waivers and/or reimbursements were 0.75%, 1.11% and 1.86% for Institutional Class, Class A and Class C shares, respectively. Neuberger Berman Management LLC has contractually agreed to limit certain expenses of the Fund through August 31, 2021 for Advisor Class shares and August 31, 2014 for Institutional Class, Class A and Class C shares.
Total Returns shown with a sales charge reflect the deduction of the current maximum initial sales charge of 5.75% for Class A shares and the applicable contingent deferred sales charges (CDSC) for Class C shares. The maximum CDSC for Class C shares is 1%, which is reduced to 0% after 1 year. The performance of the Fund's share classes will differ primarily due to different sales charge structures and class expenses. Please see the prospectus for more information about sales charge structures, if any, and class expenses for your share class.
The results shown in the table do not reflect the effect of taxes an investor would pay on Fund distributions or on the redemption of Fund shares.
Focus Fund (Unaudited)
| COMPARISON OF A $10,000 INVESTMENT |
 |
| |
| This graph shows the change in value of a hypothetical $10,000 investment in the Fund over the past 10 fiscal years, or since the Fund's inception if it has not operated for 10 years. The graph is based on the Investor Class shares only; the performance of the Fund's share classes will differ primarily due to different sales charge structures and class expenses (see Performance Highlights chart on previous page). The result is compared with benchmarks, which include a broad-based market index and may include a more narrowly based index. Market indices have not been reduced to reflect any of the fees and costs of investing. All results include the reinvestment of income dividends and distributions. The results shown in the graph do not reflect the effect of taxes an investor would pay on Fund distributions or on the redemption of Fund shares. Results represent past performance and do not indicate future results. |
Genesis Fund Commentary (Unaudited)
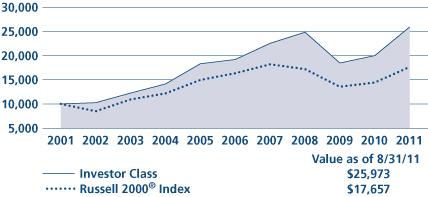
Neuberger Berman Genesis Fund Investor Class posted a 29.65% total return for the fiscal year ended August 31, 2011, outperforming its benchmark, the Russell 2000® Index, which provided a 22.19% return for the period. (Performance for all share classes is provided in the table immediately following this letter.)
There was a dramatic shift in terms of the stock market's performance during the fiscal year. Over the first eight months of the reporting period, the market rose sharply and more volatile/high beta stocks (whose performance is closely tied to overall market results) typically outperformed higher quality/less speculative issues (companies with higher than average profitability, less financial leverage and which are less cyclical). However, we saw a nearly complete reversal of this trend during the last four months of the period, as investor risk appetite was largely replaced with risk aversion. Against this backdrop, higher quality companies generally performed better than their higher beta counterparts.
This changing environment demonstrated what we feel has been a key attribute for the Fund. While the Fund lagged its benchmark during the market's sharp ascent, it outperformed its benchmark when the market faltered. This is consistent with what we've seen in the past, and it resulted in the Fund's strong absolute and relative performance during the fiscal year.
Stock selection was the main driver of the Fund's outperformance. Sector positioning was also beneficial, albeit to a lesser extent. The Fund's holdings and longtime overweight in the Energy sector added significant value during the period. In particular, CARBO Ceramics, Cabot Oil & Gas and Oceaneering International posted very strong results. These three companies, as well as other Energy companies held within the portfolio, benefited from rising oil prices and/or increased drilling activity.
Other notable standouts were Consumer Staples company Church & Dwight and Health Care firm Dionex. Church & Dwight markets a diverse array of household and personal care items, including its Arm & Hammer brand products. The company's stock rose sharply as its earnings surpassed expectations and it continued to generate strong free cash flow. Dionex manufactures liquid chromatography systems that are used to analyze the composition and quality of substances for biopharmaceutical, environmental and industrial customers. During the reporting period, Dionex agreed to be acquired by Thermo Fisher Scientific at a significant premium and we sold the position.
The two largest detractors from performance were for-profit education companies Capella Education and Strayer Education. These Consumer Discretionary stocks saw their stock prices fall sharply given ongoing concerns that enrollment rates would decline and that expenses would rise. While we feel these are the best-in-class companies within the for-profit education industry, we pared our exposures given the uncertainties about future revenue growth, and eliminated the Capella position after the reporting period.
Several holdings within the Financial sector, including Greenhill & Co. and Westamerica Bancorp, were also detrimental to Fund performance. Greenhill & Co.'s stock fell as its earnings declined given the tepid merger and acquisition environment. We pared the position during the period and sold out entirely in September 2011. Westamerica faltered along with the overall banking industry during the reporting period. However, we remain positive on Westamerica given its strong capital position and its historically solid track record. We also feel that the company could be a beneficiary of anticipated consolidation in the banking industry as weaker competitors get absorbed by best-in-class operators like Westamerica.
In our last report to shareholders, we stated our belief that "a number of factors could result in below average gross domestic product (GDP) growth in the coming years." Recent developments have been consistent with our view, as economic growth has moderated in recent months. Another issue that could impact the markets and investor sentiment is the escalating European debt crisis and its potential impact on the U.S. financial system. We feel the portfolio is well-positioned given the uncertainties that exist today. We continue to manage a diversified portfolio of what we consider high quality companies with proven track records of generating strong results in various economic and market environments. The portfolio is also balanced—including relatively defensive companies that we believe could hold up relatively well should the market continue
to falter, as well as certain cyclical companies, such as those in the energy and agriculture industries, that could benefit should global growth strengthen more than is currently anticipated.
Sincerely,
Judith M. Vale and Robert D'Alelio
Portfolio Co-Managers
The risks involved in seeking capital appreciation from investments primarily in companies with small market capitalization are set forth in the prospectus and statement of additional information.
Small- and mid-capitalization stocks are more vulnerable to financial risks and other risks than stocks of larger companies. They also trade less frequently and in lower volume than larger company stocks, so their market prices tend to be more volatile.
The composition, industries and holdings of the Fund are subject to change.
Genesis Fund (Unaudited)
| Investor Class | | NBGNX | |
| Trust Class | | NBGEX | |
| Advisor Class | | NBGAX | |
| Institutional Class | | NBGIX | |
| (as a % of Total Investments) | |
| Consumer Discretionary | | | 6.4 | % | |
| Consumer Staples | | | 7.1 | | |
| Energy | | | 15.4 | | |
| Financials | | | 7.7 | | |
| Health Care | | | 12.7 | | |
| Industrials | | | 18.5 | | |
| Information Technology | | | 10.9 | | |
| Materials | | | 11.9 | | |
| Utilities | | | 3.2 | | |
| Short-Term Investments | | | 6.2 | | |
| Total | | | 100.0 | % | |
| | | | | Average Annual Total Return Ended 08/31/2011 | |
| | | Inception Date | | 1 Year | | 5 Years | | 10 Years | | Life of Fund | |
| Investor Class | | 09/27/1988 | | | 29.65 | % | | | 6.21 | % | | | 10.01 | % | | | 12.41 | % | |
Trust Class4 | | 08/26/1993 | | | 29.56 | % | | | 6.17 | % | | | 9.97 | % | | | 12.40 | % | |
Advisor Class4 | | 04/02/1997 | | | 29.23 | % | | | 5.90 | % | | | 9.69 | % | | | 12.21 | % | |
Institutional Class6 | | 07/01/1999 | | | 29.87 | % | | | 6.45 | % | | | 10.25 | % | | | 12.55 | % | |
Russell 2000® Index1,18 | | | | | | | 22.19 | % | | | 1.53 | % | | | 5.85 | % | | | 8.79 | % | |
Performance data quoted represent past performance and do not indicate future results. The investment return and principal value of an investment will fluctuate so that an investor's shares, when redeemed, may be worth more or less than their original cost. Results are shown on a "total return" basis and include reinvestment of all income dividends and distributions.
Current performance may be lower or higher than the performance data quoted. For performance data current to the most recent month end, visit www.nb.com/performance.
As stated in the Fund's most recent prospectus, the total annual operating expense ratios for fiscal year 2010 were 1.06%, 1.12%, 1.38% and 0.87% for Investor Class, Trust Class, Advisor Class and Institutional Class shares, respectively (prior to any fee waivers and/or expense reimbursements, if any). The expense ratio net of waivers and reimbursements was 0.85% for Institutional Class shares. Neuberger Berman Management LLC has contractually agreed to limit certain expenses of the Fund through August 31, 2021 for Institutional Class and Advisor Class shares and through August 31, 2014 for Trust Class shares.
| COMPARISON OF A $10,000 INVESTMENT |
 |
| |
This graph shows the change in value of a hypothetical $10,000 investment in the Fund over the past 10 fiscal years, or since the Fund's inception if it has not operated for 10 years. The graph is based on the Investor Class shares only; the performance of the Fund's share classes will differ primarily due to different sales charge structures and class expenses (see Performance Highlights chart above). The result is compared with benchmarks, which include a broad-based market index and may include a more narrowly based index. Market indices have not been reduced to reflect any of the fees and costs of investing. All results include the reinvestment of income dividends and distributions. The results shown in the table and the graph do not reflect the effect of taxes an investor would pay on Fund distributions or on the redemption of Fund shares. Results represent past performance and do not indicate future results. |
Global Equity Fund Commentary (Unaudited)
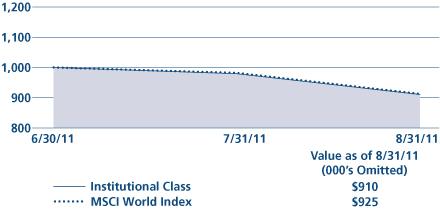
During the two-month period from its inception on June 30, 2011 through August 31, 2011, Neuberger Berman Global Equity Fund Institutional Class posted a –9.00% return, underperforming its benchmark, the MSCI World Index, which provided a –7.47% return for the same period. (Performance for all share classes is provided in the table immediately following this letter.)
In this, our first annual report letter, we would like to take the opportunity to explain our approach to portfolio management. The Global Equity Fund follows an investment discipline, Quality at a Reasonable Price (QuaRP), designed by our team, which includes a four-step process that applies initial screening, fundamental and strategic analysis, and financial analysis to help identify investment opportunities that others may miss. With the flexibility to invest across styles and market capitalization ranges, as well as outside the benchmark, we believe our approach enables us to build a differentiated portfolio with the potential to benefit our shareholders.
Looking more closely at our process, we first perform an initial screening of securities to ensure they have "quality" characteristics such as historically high return on invested capital and earnings per share, as well as low debt ratios.
Companies that pass the initial screening undergo intensive hands-on strategic analysis for a thorough understanding of both the companies and their business environments. We assess each company's strategy, management team quality, and commitment to driving shareholder value. As part of this assessment, we generally meet with company management, as well as numerous industry competitors, suppliers and customers.
Finally, using a proprietary discounted cash flow model and valuation criteria including price to cash flow and price to earnings metrics, we are able to identify the explicit price levels at which we would become a buyer—or seller—of a particular stock. In the end, we are able to build a diversified portfolio of between approximately 60 to 100 names that we believe will outperform the market over the long term.
During this abbreviated reporting period, representing tremendously negative investor sentiment and high market volatility, every sector of the MSCI World Index reported negative results. Worst hit were Financials, Industrials and Consumer Discretionary stocks. Performance of Consumer Staples, Utilities, and Information Technology stocks was relatively better. By country, Greece, Italy and Germany were the worst performing markets during a period in which all markets in the index, except New Zealand, lost value.
Within the portfolio, stock selection in the Materials, Telecommunication Services and Consumer Discretionary sectors was beneficial to performance on a relative basis, while Information Technology, Financials and Consumer Staples holdings disappointed. In terms of performance by country, holdings in Canada had the most positive effect on portfolio performance this period, followed by Germany. A zero allocation to Italy was also beneficial relative to the index. Our weaker markets this period included Korea, the U.S., and Japan.
Three of our top contributors to performance were New Gold, Silver Wheaton and Goldcorp—Canadian precious metals companies that benefited from strong operations and upward commodity price movement, especially as investors sought safe heavens from the equity market. Four U.S.-based companies—Apple, Cabot Oil & Gas, Waste Connections and McDonald's—were also top contributors.
Disappointments during the two-month period included Lincoln National, a U.S.-based financial services company. Lincoln is quite sensitive to movement in the capital markets, and has been adversely affected by prospects for continued low interest rates, poor equity returns, and higher hedging costs. Other underperformers included Alcatel-Lucent, Credit Suisse, Hyundai Mobis, Nippon Electric Glass, and Deutsche Boerse. Lincoln National, Credit Suisse and Nippon Electric Glass have been sold, but, generally speaking, we continue to believe in our longer-term value assessments of the companies we continue to own.
The current negative market sentiment has been driven by the European policy makers' delayed response to the EU sovereign debt crisis and signs of a potential U.S. economic slowdown. This has focused investor concerns on large
structural issues that developed markets' governments are struggling to address effectively. We believe that, sooner or later, fiscal deficits will be reduced—either via higher taxes or via lower spending—which we believe will act as a drag to economic growth in the U.S., Europe and Japan in particular. At the same time, emerging markets are currently experiencing higher levels of inflation, which could result in higher interest rates and/or slower economic growth. As a consequence, the portfolio remains underweighted relative to the benchmark in Japan, where public debt is high, and also in the weaker European economies which we believe will suffer the most fiscal retrenchment.
However, we believe that, following improvements to their balance sheets since the financial crisis of 2008, many companies with no apparent exposure exposed to these risks are in good shape. Operating profit margins are high, and since spending on fixed assets and working capital has been restrained, cash flow is strong. As a result, valuation levels appear compelling to us. Although risks remain, we have identified a few themes that we anticipate will drive stock selection in the portfolio going forward: 1) an end to increases in the costs of raw materials, which could help Materials and Consumer Staples companies; 2) growing demand in emerging markets as the middle class grows, which could benefit global multinational Consumer Staples and Consumer Discretionary firms; and 3) consumers and companies spending more on maintenance and ongoing expenses rather than new purchases, which may benefit Consumer Discretionary sub-sectors like Cable TV, or corporate software IT firms.
With the discipline of our QuaRP strategy and the benefit of insight into these secular themes, we believe we can deliver value for our shareholders over the longer term.
Sincerely,
Benjamin Segal and Saurin Shah
Portfolio Co-Managers
The risks involved in seeking capital appreciation from investments primarily in issuers who are based or who operate outside the United States are set forth in the prospectus and statement of additional information.
Investing in foreign securities involves greater risks than investing in securities of U.S. issuers, including currency fluctuations, changes in local economic and political conditions, and the need to operate in less regulated financial markets. These risks are typically heightened for investments in emerging markets.
Investing in the stocks of even the largest companies involves all the risks of stock market investing, including the risk that they may lose value due to overall market or economic conditions.
The composition, industries and holdings of the Fund are subject to change.
Global Equity Fund (Unaudited)
| Institutional Class | | NGQIX | |
| Class A | | NGQAX | |
| Class C | | NVACX | |
| (as a % of Total Investments) | |
| Consumer Discretionary | | | 10.5 | % | |
| Consumer Staples | | | 8.0 | | |
| Energy | | | 11.1 | | |
| Financials | | | 10.6 | | |
| Health Care | | | 11.2 | | |
| Industrials | | | 11.9 | | |
| Information Technology | | | 13.7 | | |
| Materials | | | 14.8 | | |
| Telecommunication Services | | | 6.1 | | |
| Short-Term Investments | | | 2.1 | | |
| Total | | | 100.0 | % | |
PERFORMANCE HIGHLIGHTS2,9 |
| | | Inception Date | | Cumulative Total Return Ended 08/31/2011 Life of Fund | |
| At NAV | |
| Institutional Class | | 06/30/2011 | | | –9.00 | % | |
| Class A | | 06/30/2011 | | | –9.10 | % | |
| Class C | | 06/30/2011 | | | –9.20 | % | |
| With Sales Charge | |
| Class A | | | | | | | –14.33 | % | |
| Class C | | | | | | | –10.11 | % | |
| Index | |
MSCI World Index1,18 | | | | | | | –7.47 | % | |
Performance data quoted represent past performance and do not indicate future results. The investment return and principal value of an investment will fluctuate so that an investor's shares, when redeemed, may be worth more or less than their original cost. Results are shown on a "total return" basis and include reinvestment of all income dividends and distributions.
Current performance may be lower or higher than the performance data quoted. For performance data current to the most recent month end, visit www.nb.com/performance.
As stated in the Fund's most recent prospectus, the estimated total annual operating expense ratios for fiscal year 2011 were 1.42%, 1.78% and 2.53% for Institutional Class, Class A and Class C shares, respectively (prior to any fee waivers and/or expense reimbursements, if any). The estimated expense ratios net of waivers and/or reimbursements were 1.15%, 1.51% and 2.26% for Institutional Class, Class A and Class C shares, respectively. Neuberger Berman Management LLC has contractually agreed to limit certain expenses of the Fund through August 31, 2014 for Institutional Class, Class A and Class C shares.
Total Returns shown with a sales charge reflect the deduction of the current maximum initial sales charge of 5.75% for Class A shares and the applicable contingent deferred sales charges (CDSC) for Class C shares. The maximum CDSC for Class C shares is 1%, which is reduced to 0% after 1 year. The performance of the Fund's share classes will differ primarily due to different sales charge structures and class expenses. Please see the prospectus for more information about sales charge structures, if any, and class expenses for your share class.
The results shown in the table do not reflect the effect of taxes an investor would pay on Fund distributions or on the redemption of Fund shares.
Global Equity Fund (Unaudited)
| COMPARISON OF A $1,000,000 INVESTMENT |
(000's Omitted)
 |
| |
| This graph shows the change in value of a hypothetical $1,000,000 investment in the Fund over the past 10 fiscal years, or since the Fund's inception if it has not operated for 10 years. The graph is based on the Institutional Class shares only; the performance of the Fund's share classes will differ primarily due to different sales charge structures and class expenses (see Performance Highlights chart on previous page). The result is compared with benchmarks, which include a broad-based market index and may include a more narrowly based index. Market indices have not been reduced to reflect any of the fees and costs of investing. All results include the reinvestment of income dividends and distributions. The results shown in the graph do not reflect the effect of taxes an investor would pay on Fund distributions or on the redemption of Fund shares. Results represent past performance and do not indicate future results. |
Global Thematic Opportunities Fund Commentary (Unaudited)
During the period from its inception on June 30, 2011 through August 31, 2011, Neuberger Berman Global Thematic Opportunities Fund Institutional Class provided a –5.60% return, outperforming its benchmark, the MSCI All Country World Index (ACWI), which delivered a –7.56% return during the period. (Performance for all share classes is provided in the table immediately following this letter.)
Coming off of a nine-month rally during the full fiscal year, global equity markets stumbled in summer 2011 as fears of a double-dip recession were reignited. A weakened economic outlook for the U.S. was combined with heightened concerns over the serious debt issues facing Greece and Europe and their broader potential consequences. Interest rate increases in China, India and other several emerging markets nations aimed at controlling inflation implied that rapid growth in those markets could come to an abrupt end as well. As headwinds to the global economy appeared to increase, we saw investors grow more conservative, moving down the risk spectrum, out of emerging markets, and from equities to bonds.
The Fund is designed to invest along longer-term themes in which we expect above-average growth driven by structural changes in the global economy. This period, themes included being "long what China is short," the strong emerging markets consumer, being on the right side of inflation worldwide, and demand for ever-increasing agricultural yields, among others. Our managers travel extensively, going to where the investments are for a deep, hands-on understanding of the companies, economies, and industries in which we invest. Compared with the MSCI ACWI Index, we are currently underweighted in the U.S., Europe and Japan, and overweighted in emerging markets and Canada, based on our view of where the best opportunities exist.
During the abbreviated reporting period, even though investors generally shied away from emerging markets equities, a number of our top contributors came from our emerging markets consumer theme. Companies like Ace Hardware Indonesia, which serves as a combination of a Bed, Bath and Beyond and Home Depot for Indonesian consumers, and Philip Morris International saw consistent demand. Las Vegas Sands, whose operations in Macao and Singapore are quite profitable, was another top contributor, as were two auto-related names. Hong Kong's Dah Chong Hong Holdings has benefited from stellar auto sales in China. The company is the exclusive distributor of Bentleys and also has a large contract with Isuzu. India's Mahindra & Mahindra, a distributor of sport utility vehicles and tractors, was also strong, benefiting from demand stemming from generally poor road conditions.
As part of our inflation theme, we have a higher tilt toward gold than the index. Stocks closely tied to gold and other precious metals commodities holdings were a big positive for the portfolio this period, as investors sought a safe haven against a weaker dollar, fears about U.S. debt, and market volatility. Agnico-Eagle Mines and Goldcorp benefited as gold prices increased, and Silver Wheaton was also a top contributor.
Stocks within our agriculture theme underperformed over the past two months. For example, China's First Tractor was our largest detractor this period. However, we remain bullish about the sector for the longer term and are willing to be patient. As wages and quality of life improve in the emerging markets, and particularly in China, the increased demand for dietary proteins is driving a greater need for grain for feed.
All America Latina Logistica also disappointed as risk-averse investors avoided emerging markets. We continue to like this Brazilian infrastructure company, viewing it as part of the solution to helping increase Brazil's ability to export goods to Asia and other regions.
The Energy sector contained several detractors for the period. Energy names are part of our "long what China is short" theme. Coal holdings including Indonesia's PT Adaro Energy and Alpha Natural Resources, a U.S. holding, disappointed as emerging markets governments increased interest rates to manage growth and relieve inflationary pressures. Investors worried that this activity could cool the growing recent demand for products such as coal. We remain bullish for the long term on both thermal and metallurgical coal and anticipate using any temporary price declines as a buying opportunity.
One other disappointment this period was the asset manager Invesco, part of our "money in motion" theme. Investors moved money from equities to bonds during this period's market volatility, which are lower margin products for Invesco.
Longer term, however, we anticipate that investors who want to keep up with inflation to re-enter the equity market, particularly in high dividend areas, out of frustration for the current low yields of bonds.
Looking ahead, we believe that U.S. economic growth will be relatively slow in the coming months, but that we will see much more attractive economic growth in other parts of the world. Our goal is to find companies, either U.S.-based or foreign, that we believe are best positioned to take advantage of that global growth. We plan to apply a rigorous investment discipline as we seek investment candidates with what we would view as great growth stories, trading at reasonable valuations. We believe we can to identify "under the radar" local companies, multinationals, and strong niche players positioned to benefit from structural global themes that will serve our shareholders well over time.
Sincerely,
Anthony Gleason, Sandy Pomeroy, William Hunter and Richard Levine
Portfolio Co-Managers
The risks involved in seeking capital appreciation from investments primarily in issuers who are based or who operate outside the United States are set forth in the prospectus and statement of additional information.
Investing in foreign securities involves greater risks than investing in securities of U.S. issuers, including currency fluctuations, changes in local economic and political conditions, and the need to operate in less regulated financial markets. These risks are typically heightened for investments in emerging markets.
To the extent that the Fund emphasizes small-, mid- or large-cap stocks, it takes on the associated risks. At times, large-cap stocks may lag other types of stocks in performance, which could cause a fund holding those stocks to perform worse than certain other funds. Small- and mid-capitalization stocks are more vulnerable to financial risks and other risks than stocks of larger companies. They also trade less frequently and in lower volume than larger company stocks, so their market prices tend to be more volatile.
The composition, industries and holdings of the Fund are subject to change.
Global Thematic Opportunities Fund (Unaudited)
| Institutional Class | | NGHIX | |
| Class A | | NGHAX | |
| Class C | | NGHCX | |
| (as a % of Total Investments) | |
| Consumer Discretionary | | | 13.3 | % | |
| Consumer Staples | | | 8.2 | | |
| Energy | | | 17.3 | | |
| Financials | | | 8.3 | | |
| Health Care | | | 1.8 | | |
| Industrials | | | 15.6 | | |
| Information Technology | | | 4.1 | | |
| Materials | | | 12.4 | | |
| Telecommunication Services | | | 1.7 | | |
| Utilities | | | 3.4 | | |
| Short-Term Investments | | | 13.9 | | |
| Total | | | 100.0 | % | |
| | | Inception Date | | Cumulative Total Return Ended 08/31/2011 Life of Fund | |
| At NAV | |
| Institutional Class | | 06/30/2011 | | | –5.60 | % | |
| Class A | | 06/30/2011 | | | –5.60 | % | |
| Class C | | 06/30/2011 | | | –5.80 | % | |
| With Sales Charge | |
| Class A | | | | | | | –11.03 | % | |
| Class C | | | | | | | –6.74 | % | |
| Index | |
MSCI All Country World Index1,18 | | | | | | | –7.56 | % | |
Performance data quoted represent past performance and do not indicate future results. The investment return and principal value of an investment will fluctuate so that an investor's shares, when redeemed, may be worth more or less than their original cost. Results are shown on a "total return" basis and include reinvestment of all income dividends and distributions.
Current performance may be lower or higher than the performance data quoted. For performance data current to the most recent month end, visit www.nb.com/performance.
As stated in the Fund's most recent prospectus, the estimated total annual operating expense ratios for fiscal year 2011 were 1.56%, 1.92% and 2.67% for Institutional Class, Class A and Class C shares, respectively (prior to any fee waivers and/or expense reimbursements, if any). The estimated expense ratios net of waivers and/or reimbursements were 1.25%, 1.61% and 2.36% for Institutional Class, Class A and Class C shares, respectively. Neuberger Berman Management LLC has contractually agreed to limit certain expenses of the Fund through August 31, 2014 for Institutional Class, Class A and Class C shares.
Total Returns shown with a sales charge reflect the deduction of the current maximum initial sales charge of 5.75% for Class A shares and the applicable contingent deferred sales charges (CDSC) for Class C shares. The maximum CDSC for Class C shares is 1%, which is reduced to 0% after 1 year. The performance of the Fund's share classes will differ primarily due to different sales charge structures and class expenses. Please see the prospectus for more information about sales charge structures, if any, and class expenses for your share class.
The results shown in the table do not reflect the effect of taxes an investor would pay on Fund distributions or on the redemption of Fund shares.
Global Thematic Opportunities Fund (Unaudited)
| COMPARISON OF A $1,000,000 INVESTMENT |
(000's Omitted)
 |
| |
| This graph shows the change in value of a hypothetical $1,000,000 investment in the Fund over the past 10 fiscal years, or since the Fund's inception if it has not operated for 10 years. The graph is based on the Institutional Class shares only; the performance of the Fund's share classes will differ primarily due to different sales charge structures and class expenses (see Performance Highlights chart on previous page). The result is compared with benchmarks, which include a broad-based market index and may include a more narrowly based index. Market indices have not been reduced to reflect any of the fees and costs of investing. All results include the reinvestment of income dividends and distributions. The results shown in the graph do not reflect the effect of taxes an investor would pay on Fund distributions or on the redemption of Fund shares. Results represent past performance and do not indicate future results. |
Guardian Fund Commentary (Unaudited)
Neuberger Berman Guardian Fund Investor Class generated a 21.35% total return for the fiscal year ended August 31, 2011, outperforming its benchmark, the S&P 500 Index, which provided an 18.50% return for the period. (Performance for all share classes is provided in the table immediately following this letter.)
The fiscal year started on the heels of a difficult spring and summer, when fears of a double-dip recession ran high. As economic data improved, the stock market enjoyed a strong three-quarter run. As we moved into summer 2011, however, the same set of fears seen last spring were replayed. With a second version of the Greek debt crisis, followed by a contentious U.S. debt ceiling debate, investors went from being encouraged by what seemed a healthy economy to experiencing worries over a potential recession.
Near the beginning of the fiscal year, we began adding to some of our favorite portfolio holdings, increasing weightings at what we believe were excellent valuations. The stock market rallied strongly, and, through the first half of fiscal year 2011, many of the names we had purchased at depressed levels last summer contributed positively to performance. Our performance is typically advantaged during slow-growth environments, as our quality focus identifies businesses that, in our opinion, can grow by gaining share in challenging economic times. For the first three quarters of this reporting period, high-quality businesses outperformed, and their stocks were revalued accordingly. As a result, the Fund enjoyed a performance advantage over the market index.
Ironically, the environment at the end the reporting period is similar to a year ago. Investor anxiety is high and many high-quality businesses are again priced for recession. Following the early summer's Greek debt negotiations, investors sold indiscriminately, and our holdings declined with the market regardless of the advantages we believe they offer. Although the Fund lost some of its "lead," it closed the fiscal year ahead of the benchmark.
In our opinion, when the market does not discriminate, this creates opportunity. We have now seen the good thrown out with the bad three times in three years. During the first two periods of weakness, we actively bought businesses that, in our opinion had previously been too richly valued as stocks. This time, we felt very well positioned already, and yet we also were able to buy two names that had been on our prospect list for years.
Google's disappointing earnings, driven by a decision to invest toward future growth, allowed us to introduce a position in the stock, and a merger deal that Wall Street did not like created an opening for us in Ecolab. Ecolab, which provides sanitizing and pest control products as well as food service equipment and food safety services to various industries, has, in our view, the predictability, strong free cash flow, and great secular growth opportunities associated with consumer staples companies, with the added advantage of controlling distribution.
Within the portfolio, several of our top contributors, including Altera, Schlumberger, and BG Group, performed well in the first three quarters of the period, but gave up some ground more recently. MasterCard was a benefit to the portfolio throughout. We bought MasterCard during last summer's weakness and amid concerns about prospective rules on debit processing fees. A year later, we believe the business remains very strong under a new CEO, and the stock performed well through the downturn. W.W. Grainger is another stock that held up well. Grainger reports sales numbers on a monthly basis, and as fears of recession have increased, stable, frequent revenue reports are helpful.
On the negative side, Hospira, a leading specialty injectable drug company, was our weakest performer. We view Hospira as part of the solution to controlling health care costs and consider it an attractive business for the longer term. The stock declined this period as the company's response to FDA-cited manufacturing issues has been slow and costly. The insurer Progressive was another disappointment. A defensive business, the stock was largely overlooked during the rally, even though it is managed well, growing, and taking market share. We like the company, and think its innovative new usage-based auto insurance product called Snapshot could prove to be disruptive to its competition. We bought SAIC for its fast-growing cyber security business, but as the balance of its government contract business faces a headwind on concerns about the budget, we sold the position before the end of the period.
There has been fear that market volatility and negative sentiment will spill into the economy, weakening spending. So far that hasn't happened. High frequency statistics—like credit card processing volumes, same store sales, and industrial distributors' revenues—remain relatively positive. However, statistics with more long-term significance reflect more uncertainty. In August, business and consumer sentiment and intentions surveys fell dramatically, and hints of companies delaying business decisions are evident in reduced goods orders for fall and holiday delivery, lower transportation utilization rates, and softening in electronic components orders.
Our view is that, as long as Europe doesn't deteriorate into a full crisis situation, the factors that could cause a recession are not present. While the debt problem creates uncertainty and is likely to lead to continued slow growth, we anticipate high-quality companies like those in the Fund to continue to be advantaged, and, barring a broader problem out of Europe, we are optimistic for the intermediate to long term.
Sincerely,
Arthur Moretti
Portfolio Manager
The risks involved in seeking capital appreciation from investments primarily in mid- to large-cap stocks are set forth in the prospectus and statement of additional information.
Mid-capitalization stocks are more vulnerable to financial risks and other risks than larger stocks. They also trade less frequently and in lower volume than larger company stocks, so their market prices tend to be more volatile. Large-cap stocks are subject to all the risks of stock market investing, including the risk that they may lose value due to overall market or economic conditions.
The composition, industries and holdings of the Fund are subject to change.
Guardian Fund (Unaudited)
| Investor Class | | NGUAX | |
| Trust Class | | NBGTX | |
| Advisor Class | | NBGUX | |
| Institutional Class | | NGDLX | |
| Class A | | NGDAX | |
| Class C | | NGDCX | |
| Class R3 | | NGDRX | |
| (as a % of Total Investments) | |
| Consumer Discretionary | | | 9.0 | % | |
| Consumer Staples | | | 8.9 | | |
| Energy | | | 14.9 | | |
| Financials | | | 11.4 | | |
| Health Care | | | 13.7 | | |
| Industrials | | | 14.1 | | |
| Information Technology | | | 21.4 | | |
| Materials | | | 5.5 | | |
| Short-Term Investments | | | 1.1 | | |
| Total | | | 100.0 | % | |
PERFORMANCE HIGHLIGHTS2,7,14 |
| | | | | Average Annual Total Return Ended 08/31/2011 | |
| | | Inception Date | | 1 Year | | 5 Years | | 10 Years | | Life of Fund | |
| At NAV | |
| Investor Class | | 06/01/1950 | | | 21.35 | % | | | 1.89 | % | | | 3.93 | % | | | 10.92 | % | |
Trust Class4 | | 08/03/1993 | | | 21.08 | % | | | 1.71 | % | | | 3.77 | % | | | 10.89 | % | |
Advisor Class4 | | 09/03/1996 | | | 20.59 | % | | | 1.30 | % | | | 3.37 | % | | | 10.77 | % | |
Institutional Class21 | | 05/27/2009 | | | 21.51 | % | | | 1.98 | % | | | 3.98 | % | | | 10.93 | % | |
Class A20 | | 05/27/2009 | | | 21.06 | % | | | 1.80 | % | | | 3.89 | % | | | 10.92 | % | |
Class C20 | | 05/27/2009 | | | 20.11 | % | | | 1.46 | % | | | 3.71 | % | | | 10.89 | % | |
Class R320 | | 05/27/2009 | | | 20.79 | % | | | 1.69 | % | | | 3.83 | % | | | 10.91 | % | |
| With Sales Charge | |
Class A20 | | | | | | | 14.11 | % | | | 0.60 | % | | | 3.27 | % | | | 10.81 | % | |
Class C20 | | | | | | | 19.11 | % | | | 1.46 | % | | | 3.71 | % | | | 10.89 | % | |
| Index | |
S&P 500 Index1,18 | | | | | | | 18.50 | % | | | 0.78 | % | | | 2.70 | % | | | 10.77 | % | |
Performance data quoted represent past performance and do not indicate future results. The investment return and principal value of an investment will fluctuate so that an investor's shares, when redeemed, may be worth more or less than their original cost. Results are shown on a "total return" basis and include reinvestment of all income dividends and distributions.
Current performance may be lower or higher than the performance data quoted. For performance data current to the most recent month end, visit www.nb.com/performance.
As stated in the Fund's most recent prospectus, the total annual operating expense ratios for fiscal year 2010 were 0.95%, 1.12%, 2.59%, 0.81%, 1.23%, 2.47% and 3.13% for Investor Class, Trust Class, Advisor Class, Institutional Class, Class A, Class C and Class R3 shares, respectively (prior to any fee waivers and/or expense reimbursements, if any). The expense ratios net of waivers and/or reimbursements were 1.50%, 0.75%, 1.11%, 1.86% and 1.36% for Advisor Class, Institutional Class, Class A, Class C and Class R3 shares, respectively. Neuberger Berman Management LLC has contractually agreed to limit certain expenses of the Fund through August 31, 2021 for Advisor Class shares and through August 31, 2014 for Trust Class, Institutional Class, Class A, Class C and Class R3 shares.
Total Returns shown with a sales charge reflect the deduction of the current maximum initial sales charge of 5.75% for Class A shares and the applicable contingent deferred sales charges (CDSC) for Class C shares. The maximum CDSC for Class C shares is 1%, which is reduced to 0% after 1 year. The performance of the Fund's share classes will differ primarily due to different sales charge structures and class expenses. Please see the prospectus for more information about sales charge structures, if any, and class expenses for your share class.
The results shown in the table do not reflect the effect of taxes an investor would pay on Fund distributions or on the redemption of Fund shares.
Guardian Fund (Unaudited)
| COMPARISON OF A $10,000 INVESTMENT |
 |
| |
| This graph shows the change in value of a hypothetical $10,000 investment in the Fund over the past 10 fiscal years, or since the Fund's inception if it has not operated for 10 years. The graph is based on the Investor Class shares only; the performance of the Fund's share classes will differ primarily due to different sales charge structures and class expenses (see Performance Highlights chart on previous page). The result is compared with benchmarks, which include a broad-based market index and may include a more narrowly based index. Market indices have not been reduced to reflect any of the fees and costs of investing. All results include the reinvestment of income dividends and distributions. The results shown in the graph do not reflect the effect of taxes an investor would pay on Fund distributions or on the redemption of Fund shares. Results represent past performance and do not indicate future results. |
International Fund Commentary (Unaudited)
Neuberger Berman International Fund Investor Class generated a 16.28% return for the fiscal year ended August 31, 2011, outperforming its benchmark, the MSCI EAFE® Index, which provided a 10.50% return. (Performance for all share classes is provided in the table immediately following this letter.)
Taken as a whole, the past fiscal year was positive but highly volatile for international developed market equities. While the MSCI EAFE Index closed the period in positive territory, it had been up by over 28% between September 2010 and April 2011.
Early in the reporting period, markets generally rebounded sharply off of mid-calendar-year 2010 lows as economic and company data surpassed expectations. Volatility increased after March 2011, as the near- and longer-term toll of the tsunami and nuclear disaster in Japan was evaluated by the market. From May through the August fiscal-year end, markets stumbled, as fears intensified around the scope of the European debt crisis and its potential broader effects. At the same time, global economic data appeared to weaken, driving investors away from riskier assets. From a regional perspective, the S&P 500 outperformed international markets for the fiscal year, with returns of over 18%. The MSCI Emerging Markets Index trailed the other two indexes noted above with a return of 9.4% during the period.
Cyclical sectors led index returns for most of the fiscal year, as the Materials, Energy and Consumer Discretionary sectors outperformed. The more traditionally defensive Health Care sector also outperformed. Weak-performing sectors included Utilities and Financials, and, to a lesser extent, Information Technology. From a country perspective, New Zealand, Norway, Australia and Ireland were among the strongest markets in the index. Greece, Italy, Israel and Spain were among the weakest.
The portfolio's outperformance versus the benchmark for the fiscal year was primarily the result of strong stock selection. Industrials, Materials and Telecommunication Services holdings contributed most to relative performance, and stock selection was additive in six of nine sectors. Within Energy, exploration and production companies—the majority of our exposure—were relatively weak. By country, the portfolio benefited most from an underweight relative to the MSCI EAFE Index in Japan, investments in a strong Canadian market, and stock selection in France. An underweight in Australia and overweights in Brazil and India were relative underperformers for the period.
In terms of individual holdings, Korean auto parts manufacturer Hyundai Mobis was the Fund's top contributor to performance for the fiscal year. Hyundai/Kia Motors benefited from reduced production by Japanese automakers. Conjecture that Japanese automakers might begin to diversify supply chains also boosted the stock. Daimler and Rolls Royce made a successful joint offer for another strong performer, Tognum, a manufacturer of off-highway high-speed engines for marine, industrial, power generation, and defense applications. Silver Wheaton, a Canadian silver streaming company, benefited from both operational successes and continued strength in silver prices, and Arkema, a specialty chemical company, did well on continued strong demand from Asia and new applications. We sold both Tognum and Arkema.
Detractors for the period included Heidelberg Cement, a global cement producer, which declined on general industry weakness and was eliminated from the portfolio. Credit Suisse, the leading Swiss investment and private bank, underperformed on weakness in its fixed income, currency and commodities trading business, a trend felt industry wide. Germany's Deutsche Boerse's performance was hurt by continued low interest rates, which negatively impacted custody businesses, and by lower securities trading volumes. Additionally, Eldorado Gold, a global gold miner, declined because of production delays and was sold.
Continued debt issues in Europe and associated government spending cuts, contractionary monetary policies in most emerging markets, and price increases in raw materials indicate a period of slowing economic growth, in our view. While a continued accommodative monetary policy in the U.S. may help to offset this, we have positioned the portfolio relatively defensively, focusing on companies that we believe are able to perform in tougher economic times.
In Europe, we think having a focus on global multinational companies exposed to the emerging markets will be beneficial as these companies should benefit from those markets' growing consumer base and rising disposable incomes. The Fund's
European weighting is roughly neutral compared to the benchmark although we have extremely limited exposure to the economies we consider among the weakest (i.e., Greece, Italy, Portugal and Spain). We remain underweighted in Japan, where we struggle to identify high-quality companies, and Australia, where we find valuations unattractive. Despite recent underperformance, we retain our exposure to emerging markets, with holdings in Brazil, Chile, China, India, Korea, South Africa and Turkey.
From a sector perspective, the Fund is modestly overweighted in Telecommunication Services. With data traffic doubling every 12-18 months and spectrum a finite resource, we expect telecom carriers to regain pricing power. We are also modestly overweighted in Materials, where we have exposure to agriculture-related and specialty chemical companies that we think have pricing power and relatively stable end markets. We also have holdings in precious metal miners, an industry where prices have risen due to economic uncertainty. One of our largest underweights continues to be in Financials. Valuations of financial stocks in developed markets are at historically inexpensive levels on the basis of price to net assets, but the outlook remains challenging. We continue to see a risk to profits from increasing regulation, and credit demand is generally sluggish across developed markets. Lastly, we continue to have a zero weighting in Utilities—which we classify as generally low growth, capital-intensive and regulated businesses.
Sincerely,
Benjamin Segal
Portfolio Manager
The risks involved in seeking capital appreciation from investments primarily in companies based outside the United States are set forth in the prospectus and statement of additional information.
Investing in foreign securities involves greater risks than investing in securities of U.S. issuers, including currency fluctuations, changes in local economic and political conditions, and the need to operate in less regulated financial markets. These risks are typically heightened for investments in emerging markets.
The composition, industries and holdings of the Fund are subject to change.
International Fund (Unaudited)
| Investor Class | | NBISX | |
| Trust Class | | NBITX | |
| Class A | | NIRAX | |
| Class C | | NIRCX | |
| (as a % of Total Investments) | |
| Consumer Discretionary | | | 12.3 | % | |
| Consumer Staples | | | 9.8 | | |
| Energy | | | 7.7 | | |
| Financials | | | 14.2 | | |
| Health Care | | | 9.7 | | |
| Industrials | | | 14.4 | | |
| Information Technology | | | 6.4 | | |
| Materials | | | 15.1 | | |
| Telecommunication Services | | | 7.6 | | |
| Short-Term Investments | | | 2.8 | | |
| Total | | | 100.0 | % | |
PERFORMANCE HIGHLIGHTS7,2,15 |
| | | | | Average Annual Total Return Ended 08/31/2011 | |
| | | Inception Date | | 1 Year | | 5 Years | | 10 Years | | Life of Fund | |
| At NAV | |
| Investor Class | | 06/15/1994 | | | 16.28 | % | | | –0.50 | % | | | 7.90 | % | | | 7.37 | % | |
Trust Class4 | | 06/29/1998 | | | 15.91 | % | | | –0.63 | % | | | 7.96 | % | | | 7.55 | % | |
Class A26 | | 12/20/2010 | | | 16.26 | % | | | –0.50 | % | | | 7.90 | % | | | 7.37 | % | |
Class C26 | | 12/20/2010 | | | 15.63 | % | | | –0.61 | % | | | 7.84 | % | | | 7.33 | % | |
| With Sales Charge | |
Class A26 | | | | | | | 9.57 | % | | | –1.67 | % | | | 7.26 | % | | | 7.00 | % | |
Class C26 | | | | | | | 14.63 | % | | | –0.61 | % | | | 7.84 | % | | | 7.33 | % | |
| Index | |
MSCI EAFE® Index1,18 | | | | | | | 10.50 | % | | | –1.01 | % | | | 5.41 | % | | | 4.76 | % | |
Performance data quoted represent past performance and do not indicate future results. The investment return and principal value of an investment will fluctuate so that an investor's shares, when redeemed, may be worth more or less than their original cost. Results are shown on a "total return" basis and include reinvestment of all income dividends and distributions.
Current performance may be lower or higher than the performance data quoted. For performance data current to the most recent month end, visit www.nb.com/performance.
As stated in the Fund's most recent prospectus, the total annual operating expense ratios for fiscal year 2010 were 1.43%, 1.53%,1.59% and 2.34% for Investor Class, Trust Class, Class A and Class C shares, respectively (prior to any fee waivers and/or expense reimbursements, if any).The expense ratios net of waivers and/or reimbursements were 1.42%, 1.53% and 2.28% for Investor Class, Class A and Class C shares, respectively. Neuberger Berman Management LLC has contractually agreed to limit certain expenses of the Fund through August 31, 2021 for Trust Class shares and through August 31, 2014 for Investor Class, Class A and Class C shares.
Total Returns shown with a sales charge reflect the deduction of the current maximum initial sales charge of 5.75% for Class A shares and the applicable contingent deferred sales charges (CDSC) for Class C shares. The maximum CDSC for Class C shares is 1%, which is reduced to 0% after 1 year. The performance of the Fund's share classes will differ primarily due to different sales charge structures and class expenses. Please see the prospectus for more information about sales charge structures, if any, and class expenses for your share class.
The results shown in the table do not reflect the effect of taxes an investor would pay on Fund distributions or on the redemption of Fund shares.
International Fund (Unaudited)
| COMPARISON OF A $10,000 INVESTMENT |
 |
| |
| This graph shows the change in value of a hypothetical $10,000 investment in the Fund over the past 10 fiscal years, or since the Fund's inception if it has not operated for 10 years. The graph is based on the Investor Class shares only; the performance of the Fund's share classes will differ primarily due to different sales charge structures and class expenses (see Performance Highlights chart on previous page). The result is compared with benchmarks, which include a broad-based market index and may include a more narrowly based index. Market indices have not been reduced to reflect any of the fees and costs of investing. All results include the reinvestment of income dividends and distributions. The results shown in the graph do not reflect the effect of taxes an investor would pay on Fund distributions or on the redemption of Fund shares. Results represent past performance and do not indicate future results. |
International Institutional Fund Commentary (Unaudited)
Neuberger Berman International Institutional Fund generated a 15.62% return for the fiscal year ended August 31, 2011, outperforming its benchmark, the MSCI EAFE® Index, which provided a 10.50% return.
Taken as a whole, the past fiscal year was positive but highly volatile for international developed market equities. While the MSCI EAFE Index closed the period in positive territory, it had been up by over 28% between September 2010 and April 2011.
Early in the reporting period, markets rebounded sharply off of mid-calendar-year 2010 lows as economic and company data surpassed expectations. Volatility increased after March 2011, as the near- and longer-term toll of the tsunami and nuclear disaster in Japan was evaluated by the market. From May through the August fiscal-year end, markets stumbled, as fears intensified around the scope of the European debt crisis and its potential broader effects. At the same time, global economic data appeared to weaken, driving investors away from riskier assets. From a regional perspective, the S&P 500 outperformed international markets for the fiscal year, with returns of over 18%. The MSCI Emerging Markets Index trailed the other two indexes noted above with a return of 9.4% during the period.
Cyclical sectors led index returns for most of the fiscal year, as the Materials, Energy and Consumer Discretionary sectors outperformed. The more traditionally defensive Health Care sector also outperformed. Weak-performing sectors included Utilities and Financials, and, to a lesser extent, Information Technology. From a country perspective, New Zealand, Norway, Australia and Ireland were among the strongest markets in the index. Greece, Italy, Israel and Spain were among the weakest.
The portfolio's outperformance versus the benchmark for the fiscal year was primarily the result of strong stock selection. Industrials, Materials and Telecommunication Services holdings contributed most to relative performance, and stock selection was additive in every sector except Energy. Within Energy, exploration and production companies—the majority of our exposure—were relatively weak. By country, the portfolio benefited most from an underweight relative to the MSCI EAFE Index in Japan, investments in a strong Canadian market, and stock selection in France. An underweight in Australia and overweights in Brazil and India hurt performance for the period.
In terms of individual holdings, Korean auto parts manufacturer Hyundai Mobis was the Fund's top contributor to performance for the fiscal year. Hyundai/Kia Motors benefited from reduced production by Japanese automakers. Conjecture that Japanese automakers might begin to diversify supply chains also boosted the stock. Daimler and Rolls Royce made a successful joint offer for another strong performer, Tognum, a manufacturer of off-highway high-speed engines for marine, industrial, power generation, and defense applications. Silver Wheaton, a Canadian silver streaming company, benefited from both operational successes and continued strength in silver prices, and Arkema, a specialty chemical company, did well on continued strong demand from Asia and new applications. We sold both Tognum and Arkema.
Detractors for the period included Heidelberg Cement, a global cement producer, which declined on general industry weakness and was eliminated from the portfolio. Credit Suisse, the leading Swiss investment and private bank, underperformed on weakness in its fixed income, currency and commodities trading business, a trend felt industry wide. Germany's Deutsche Boerse's performance was hurt by continued low interest rates, which negatively impacted custody businesses, and by lower securities trading volumes. Additionally, Eldorado Gold, a global gold miner, declined because of production delays and was sold.
Continued debt issues in Europe and associated government spending cuts, contractionary monetary policies in most emerging markets, and price increases in raw materials indicate, in our view, a period of slowing economic growth. While a continued accommodative monetary policy in the U.S. may help to offset this, we have positioned the portfolio relatively defensively, focusing on companies that we believe are able to perform in tougher economic times.
In Europe, we think having a focus on global multinational companies exposed to the emerging markets will be beneficial, as these companies should benefit from those markets' growing consumer base and rising disposable incomes. The Fund's European weighting is roughly neutral compared to the benchmark although we have extremely limited exposure to the
economies we consider among the weakest (i.e., Greece, Italy, Portugal, and Spain). We remain underweighted in Japan, where we struggle to identify high-quality companies, and Australia, where we find valuations unattractive. Despite recent underperformance, we retain our exposure to emerging markets, with holdings in Brazil, Chile, China, India, Korea, South Africa and Turkey.
From a sector perspective, the Fund is modestly overweighted in Telecommunication Services. With data traffic doubling every 12-18 months and spectrum a finite resource, we expect telecom carriers to regain pricing power. We are also modestly overweighted in Materials, where we have exposure to agriculture-related and specialty chemical companies that we think have pricing power and relatively stable end markets. We also have holdings in precious metal miners, an industry where prices have risen due to economic uncertainty. One of our largest underweights continues to be in Financials. Valuations of financial stocks in developed markets are at historically inexpensive levels on the basis of price to net assets, but the outlook remains challenging. We continue to see a risk to profits from increasing regulation, and credit demand is generally sluggish across developed markets. Lastly, we continue to have a zero weighting in Utilities—which we classify as generally low growth, capital-intensive and regulated businesses.
Sincerely,
Benjamin Segal
Portfolio Manager
The risks involved in seeking capital appreciation from investments primarily in companies based outside the United States are set forth in the prospectus and statement of additional information.
Investing in foreign securities involves greater risks than investing in securities of U.S. issuers, including currency fluctuations, changes in local economic and political conditions, and the need to operate in less regulated financial markets. These risks are typically heightened for investments in emerging markets.
The composition, industries and holdings of the Fund are subject to change.
International Institutional Fund (Unaudited)
| Institutional Class | | NBIIX | |
| (as a % of Total Investments) | |
| Consumer Discretionary | | | 12.2 | % | |
| Consumer Staples | | | 9.8 | | |
| Energy | | | 7.7 | | |
| Financials | | | 13.9 | | |
| Health Care | | | 9.7 | | |
| Industrials | | | 14.3 | | |
| Information Technology | | | 6.4 | | |
| Materials | | | 14.7 | | |
| Telecommunication Services | | | 7.6 | | |
| Short-Term Investments | | | 3.7 | | |
| Total | | | 100.0 | % | |
PERFORMANCE HIGHLIGHTS2,7 |
| | | | | Average Annual Total Return Ended 08/31/2011 | |
| | | Inception Date | | 1 Year | | 5 Years | | Life of Fund | |
| Institutional Class | | 06/17/2005 | | | 15.62 | % | | | –0.20 | % | | | 3.85 | % | |
MSCI EAFE® Index1,18 | | | | | | | 10.50 | % | | | –1.01 | % | | | 3.76 | % | |
Performance data quoted represent past performance and do not indicate future results. The investment return and principal value of an investment will fluctuate so that an investor's shares, when redeemed, may be worth more or less than their original cost. Results are shown on a "total return" basis and include reinvestment of all income dividends and distributions.
Current performance may be lower or higher than the performance data quoted. For performance data current to the most recent month end, visit www.nb.com/performance.
As stated in the Fund's most recent prospectus, the total annual operating expense ratio for fiscal year 2010 was 1.26% for Institutional Class shares (prior to any fee waivers and/or expense reimbursements, if any). The expense ratio net of waivers and/or reimbursements was 0.82% for Institutional Class shares. Neuberger Berman Management LLC has contractually agreed to limit certain expenses of the Fund through August 31, 2021 for Institutional Class shares.
| COMPARISON OF A $1,000,000 INVESTMENT |
(000's Omitted)
 |
| |
| This graph shows the change in value of a hypothetical $1,000,000 investment in the Fund over the past 10 fiscal years, or since the Fund's inception if it has not operated for 10 years. The result is compared with benchmarks, which include a broad-based market index and may include a more narrowly based index. Market indices have not been reduced to reflect any of the fees and costs of investing. All results include the reinvestment of income dividends and distributions. The results shown in the table and the graph do not reflect the effect of taxes an investor would pay on Fund distributions or on the redemption of Fund shares. Results represent past performance and do not indicate future results. |
International Large Cap Fund Commentary (Unaudited)
Neuberger Berman International Large Cap Fund Trust Class generated a 13.09% total return for the fiscal year ended August 31, 2011, outperforming its benchmark, the MSCI EAFE® Index, which provided a 10.50% return for the period. (Performance for all share classes is provided in the table immediately following this letter.)
Taken as a whole, the past fiscal year was positive but highly volatile for international developed market equities. While the MSCI EAFE Index closed the period in positive territory, it had been up by over 28% between September 2010 and April 2011.
Early in the reporting period, markets rebounded sharply off of mid-calendar-year 2010 lows as economic and company data surpassed expectations. Volatility increased after March 2011, as the near- and longer-term toll of the tsunami and nuclear disaster in Japan was evaluated. From May through the August fiscal-year end, markets stumbled, as fears intensified around the scope of the European debt crisis and its potential broader effects. At the same time, global economic data appeared to weaken, driving investors away from riskier assets. From a regional perspective, the S&P 500 outperformed international markets for the fiscal year, with returns of over 18%. The MSCI Emerging Markets Index trailed the other two indexes noted above with a return of 9.4% during the period.
Cyclical sectors led index returns for most of the fiscal year, as the Materials, Energy and Consumer Discretionary sectors outperformed. The more traditionally defensive Health Care sector also outperformed. Weak-performing sectors included Utilities and Financials, and, to a lesser extent, Information Technology. From a country perspective, New Zealand, Norway, Australia and Ireland were among the strongest markets in the index. Greece, Italy, Israel and Spain were among the weakest.
Strong stock selection within Industrials and Consumer Discretionary, along with a lack of exposure to Utilities, contributed most to outperformance versus the benchmark during the reporting period. Within Energy, exploration and production companies—the majority of our exposure—were relatively weak. That, along with an underweight in Consumer Staples, negatively impacted the Fund.
By country, the portfolio benefited most from an underweight in Japan and by exposure to Canada and stock selection in Germany. An overweight exposure to Brazil and the Netherlands and an underweight to Australia were detrimental to performance.
Among individual holdings, Korean auto parts manufacturer Hyundai Mobis was the Fund's top contributor to performance for the fiscal year. Hyundai/Kia Motors benefited from reduced production by Japanese automakers. Conjecture that Japanese automakers might begin to diversify supply chains also boosted the stock. Silver Wheaton, a Canadian silver streaming company, benefited from both operational successes and continued strength in silver prices. Daimler and Rolls Royce made a successful joint offer for another outperformer, Tognum, a manufacturer of off-highway high-speed engines for marine, industrial, power generation, and defense applications, which was sold. Sulzer, a Swiss diversified industrial company, was also a top contributor, when viewed in U.S. dollar terms, due to the strength of the Swiss franc.
Detractors for the period included Credit Suisse, the leading Swiss investment and private bank, which underperformed on weakness in its fixed income, currency and commodities trading business, a trend felt industry-wide. Heidelberg Cement, a global cement producer, declined on general industry weakness and was eliminated from the portfolio. HRT Participacoes em Petroleo, a Brazilian energy producer, was impacted by weakness in upstream energy companies as well as the Brazilian market, and Germany's Deutsche Boerse's performance was hurt by continued low interest rates, which negatively impacted custody businesses, and by lower securities trading volumes.
Continued debt issues in Europe and associated government spending cuts, contractionary monetary policies in most emerging markets, and price increases in raw materials indicate, in our view, a period of slowing economic growth. While a continued accommodative monetary policy in the U.S. may help to offset this, we have positioned the portfolio relatively defensively, focusing on companies that we believe are able to perform in tougher economic times.
In Europe, we think having a focus on global multinational companies exposed to the emerging markets will be beneficial as these companies should benefit from those markets' growing consumer base and rising disposable incomes. The Fund's European weighting is roughly neutral compared to the benchmark although we have extremely limited exposure to the economies we consider weakest (i.e., Greece, Ireland, Portugal and Spain). We remain underweighted in Japan, where we struggle to identify high-quality companies, and Australia, where we find valuations unattractive. Despite recent underperformance, we retain our exposure to emerging markets, with holdings in Brazil, Chile, China, Korea, South Africa and Malaysia.
From a sector perspective, the Fund is modestly overweighted in Telecommunication Services. With data traffic doubling every 12-18 months and spectrum a finite resource, we expect telecom carriers to regain pricing power. We are also modestly overweighted in Materials, where we have exposure to agriculture-related and specialty chemical companies that we think have pricing power and relatively stable end markets. We also have holdings in precious metal miners, an industry where prices have risen due to economic uncertainty. One of our largest underweights continues to be in Financials. Valuations of financial stocks in developed markets are at historically inexpensive levels on the basis of price to net assets, but the outlook remains challenging. We continue to see a risk to profits from increasing regulation, and credit demand is generally sluggish across developed markets. Lastly, we continue to have no exposure to Utilities—which we classify as generally low growth, capital-intensive and regulated businesses.
Sincerely,
Benjamin Segal
Portfolio Manager
The risks involved in seeking capital appreciation from investments primarily in companies based outside the United States are set forth in the prospectus and statement of additional information.
Investing in foreign securities involves greater risks than investing in securities of U.S. issuers, including currency fluctuations, changes in local economic and political conditions, and the need to operate in less regulated financial markets. These risks are typically heightened for investments in emerging markets.
Investing in the stocks of even the largest companies involves all the risks of stock market investing, including the risk that they may lose value due to overall market or economic conditions.
The composition, industries and holdings of the Fund are subject to change.
International Large Cap Fund (Unaudited)
| Trust Class | | NILTX | |
| Institutional Class | | NILIX | |
| Class A | | NBNAX | |
| Class C | | NBNCX | |
| Class R3 | | NBNRX | |
| (as a % of Total Investments) | |
| Consumer Discretionary | | | 11.8 | % | |
| Consumer Staples | | | 8.3 | | |
| Energy | | | 9.4 | | |
| Financials | | | 14.6 | | |
| Health Care | | | 8.6 | | |
| Industrials | | | 12.7 | | |
| Information Technology | | | 6.4 | | |
| Materials | | | 15.7 | | |
| Telecommunication Services | | | 9.6 | | |
| Short-Term Investments | | | 2.9 | | |
| Total | | | 100.0 | % | |
PERFORMANCE HIGHLIGHTS2,7 |
| | | | | Average Annual Total Return Ended 08/31/2011 | |
| | | Inception Date | | 1 Year | | 5 Years | | Life of Fund | |
| At NAV | |
| Trust Class | | 08/01/2006 | | | 13.09 | % | | | 0.40 | % | | | 0.77 | % | |
Institutional Class6 | | 10/06/2006 | | | 13.39 | % | | | 0.73 | % | | | 1.10 | % | |
Class A17 | | 12/20/2007 | | | 13.06 | % | | | 0.40 | % | | | 0.76 | % | |
Class C17 | | 12/20/2007 | | | 12.19 | % | | | –0.16 | % | | | 0.21 | % | |
Class R317 | | 05/27/2009 | | | 12.71 | % | | | 0.26 | % | | | 0.63 | % | |
| With Sales Charge | |
Class A17 | | | | | | | 6.61 | % | | | –0.78 | % | | | –0.40 | % | |
Class C17 | | | | | | | 11.19 | % | | | –0.16 | % | | | 0.21 | % | |
| Index | |
MSCI EAFE® Index1,18 | | | | | | | 10.50 | % | | | –1.01 | % | | | –0.46 | % | |
Performance data quoted represent past performance and do not indicate future results. The investment return and principal value of an investment will fluctuate so that an investor's shares, when redeemed, may be worth more or less than their original cost. Results are shown on a "total return" basis and include reinvestment of all income dividends and distributions.
Current performance may be lower or higher than the performance data quoted. For performance data current to the most recent month end, visit www.nb.com/performance.
As stated in the Fund's most recent prospectus, the total annual operating expense ratios for fiscal year 2010 were 1.55%, 1.14%, 1.54%, 2.31% and 3.52% for Trust Class, Institutional Class, Class A, Class C and Class R3 shares, respectively (prior to any fee waivers and/or expense reimbursements, if any). The expense ratios net of waivers and/or reimbursements were 1.27%, 0.92%, 1.32%, 2.02% and 1.53% for Trust Class, Institutional Class, Class A, Class C and Class R3 shares, respectively. Neuberger Berman Management LLC has contractually agreed to limit certain expenses of the Fund through August 31, 2014 for Trust Class, Institutional Class, Class A, Class C and Class R3 shares.
Total Returns shown with a sales charge reflect the deduction of the current maximum initial sales charge of 5.75% for Class A shares and the applicable contingent deferred sales charges (CDSC) for Class C shares. The maximum CDSC for Class C shares is 1%, which is reduced to 0% after 1 year. The performance of the Fund's share classes will differ primarily due to different sales charge structures and class expenses. Please see the prospectus for more information about sales charge structures, if any, and class expenses for your share class.
The results shown in the table do not reflect the effect of taxes an investor would pay on Fund distributions or on the redemption of Fund shares.
International Large Cap Fund (Unaudited)
| COMPARISON OF A $10,000 INVESTMENT |
 |
| |
| This graph shows the change in value of a hypothetical $10,000 investment in the Fund over the past 10 fiscal years, or since the Fund's inception if it has not operated for 10 years. The graph is based on the Trust Class shares only; the performance of the Fund's share classes will differ primarily due to different sales charge structures and class expenses (see Performance Highlights chart on previous page). The result is compared with benchmarks, which include a broad-based market index and may include a more narrowly based index. Market indices have not been reduced to reflect any of the fees and costs of investing. All results include the reinvestment of income dividends and distributions. The results shown in the graph do not reflect the effect of taxes an investor would pay on Fund distributions or on the redemption of Fund shares. Results represent past performance and do not indicate future results. |
Intrinsic Value Fund Commentary (Unaudited)
Neuberger Berman Intrinsic Value Fund Institutional Class generated a 13.08% total return for the fiscal year ended August 31, 2011, underperforming its benchmark, the Russell 2000® Value Index, which provided a 16.86% return for the period. (Performance for all share classes is provided in the table immediately following this letter.)
Equity markets advanced during the majority of the reporting period. A rally that started in the fall of 2010 on improving economic conditions continued through the first quarter of 2011. Driven by solid sales and earnings growth, small caps continued their advance into April, surpassing their previous high in July 2007, as measured by the Russell 2000 Index.
Beginning in May, disappointing economic data triggered a sell-off in equities, with softness seen in growth, manufacturing, and employment figures. The downturn continued as sovereign debt concerns in Europe and delayed government action to raise the debt ceiling, along with the resulting downgrade in the credit rating of the U.S. government, took their toll on the economy. The dismal performance of Congress during the deficit debate combined with disappointing economic news significantly undermined investor confidence. Anxious investors reassessed their view of "riskier assets" like small caps and retreated to the perceived safer havens of defensive larger companies and fixed income investments.
Small caps are particularly sensitive to changes in economic outlooks as their revenues and profits are more levered to economic growth or contraction, and cyclical stocks have historically been more vulnerable than broader market indices in the start of a slowdown. The portfolio, which is overweighted in economically sensitive companies, was negatively impacted during the downturn. Against this backdrop of renewed concern for the health of the economic recovery, the portfolio's valuation, as measured by its discount to intrinsic value*, has become more attractive.
Stock selection and our overweight in Producer Durables companies contributed most to performance. Aerospace company Ladish, our top performer, was purchased at a 50% premium to its market price (and at our intrinsic value estimate) by Allegheny Technologies in late 2010.
The Health Care sector was also beneficial to performance. In first quarter of 2011, Cooper Companies was sold as it approached our intrinsic value estimate, and Beckman Coulter was acquired by Danaher at a price close to our intrinsic value estimate. We redeployed the proceeds into new and existing ideas.
Stock selection among Financial Services stocks were the biggest detractors from performance during the period. Lender Processing Services (LPS), the worst performer, is the leading provider of mortgage processing services. Shares suffered as regulatory uncertainty slowed foreclosure processing. Despite current challenges, LPS generates strong earnings and its customer base has grown. If, as we anticipate, regulatory certainty returns, we believe LPS should resume revenue and EPS growth. Corelogic, which provides property and mortgage information for most real estate transactions, also hurt performance as loan origination and real estate activity remain low, depressing margins. With a more normalized environment, the company's earnings power should increase in our estimation. Importantly, Corelogic recently retained an investment bank to explore strategic options that could enhance shareholder value.
Materials & Processing and Technology stocks also hurt performance. Chemtura, a specialty chemical company, underperformed. We remain positive about the firm due to its attractive niche businesses and well-respected CEO. Technology detractors include Intermec, which we sold in August, and Powerwave, a leading provider of antennas and base station equipment. Powerwave should benefit as Verizon and AT&T upgrade their networks to 4G capabilities.
During the final two months of the fiscal year, we exited a number of companies where we felt the risk/reward equation or franchise quality was no longer sufficiently compelling. Merger and acquisition activity continued to be a bright spot. We have suggested that our approach of "private equity" style analysis is well suited for small cap investing, and all the activity we witnessed during most of the fiscal year underscores our conviction. Despite daunting macroeconomic issues, there has recently been a meaningful acceleration of insider purchases and corporate share repurchase programs within our portfolio companies, demonstrating that executives have conviction in their shares.
Although the near-term economic outlook is uncertain, we believe the more pressing challenges to longer-term prosperity and market performance are the structural imbalances in our global economy. In our opinion, the U.S. needs meaningful progress on the Federal budget deficit. Overseas, we think authorities must engineer a transition to consumption-driven economies. In an environment with high levels of global indebtedness, we believe stock markets will likely experience volatile periods as the cost of policy mistakes or inaction will make debt loads appear unmanageable. Economic recoveries can happen against a backdrop of financial leverage; however, they take time and frustrate many who want a quick resolution to problems decades in the making.
These issues are not lost on investors and, we believe, account for the modest valuations of many large companies. In contrast, small companies trade like call options on the pace of the economic recovery. In the past, as the mood has darkened, valuations have quickly compressed; when optimism has returned, they have generally recovered in an equally dramatic fashion. The small cap asset class is not for the faint of heart and, more importantly, it is hard to effectively predict entry or exit points for investing in the asset class. Thus, we believe that clients should stay invested to the extent they can tolerate the swings in small-cap stocks. Remember that small cap investing brings both historically strong returns and, inevitably, volatility.
Sincerely,
Benjamin H. Nahum, James F. McAree and Amit Solomon
Portfolio Co-Managers
* Intrinsic value reflects the group's estimate of a company's value. There is no guarantee that any intrinsic values will be realized; security prices may decrease regardless of intrinsic values.
The risks involved in seeking capital appreciation from investments primarily in companies with small- and mid-cap stocks are set forth in the prospectus and statement of additional information.
Small- and mid-capitalization stocks are more vulnerable to financial risks and other risks than stocks of larger companies. They also trade less frequently and in lower volume than larger company stocks, so their market prices tend to be more volatile.
The composition, industries and holdings of the Fund are subject to change.
Intrinsic Value Fund (Unaudited)
| Institutional Class | | NINLX | |
| Class A | | NINAX | |
| Class C | | NINCX | |
| (as a % of Total Investments) | |
| Consumer Discretionary | | | 10.6 | % | |
| Consumer Staples | | | 2.0 | | |
| Energy | | | 5.4 | | |
| Financial Services | | | 11.3 | | |
| Health Care | | | 5.9 | | |
| Materials & Processing | | | 6.3 | | |
| Producer Durables | | | 25.4 | | |
| Technology | | | 26.7 | | |
| Utilities | | | 2.4 | | |
| Short-Term Investments | | | 4.0 | | |
| Total | | | 100.0 | % | |
| | | | | Average Annual Total Return Ended 08/31/2011 | |
| | | Inception Date | | 1 Year | | 5 Year | | 10 Year | | Life of Fund | |
| At NAV | |
Institutional Class23 | | 05/10/2010 | | | 13.08 | % | | | 4.37 | % | | | 7.47 | % | | | 10.38 | % | |
Class A23 | | 05/10/2010 | | | 12.74 | % | | | 4.28 | % | | | 7.43 | % | | | 10.35 | % | |
Class C23 | | 05/10/2010 | | | 11.91 | % | | | 4.08 | % | | | 7.32 | % | | | 10.27 | % | |
| With Sales Charge | |
Class A23 | | | | | 6.29 | % | | | 3.05 | % | | | 6.79 | % | | | 9.89 | % | |
Class C23 | | | | | 10.91 | % | | | 4.08 | % | | | 7.32 | % | | | 10.27 | % | |
| Index | |
Russell 2000® Value Index1,18 | | | | | 16.86 | % | | | –0.62 | % | | | 6.46 | % | | | 7.15 | % | |
Russell 2000® Index1,18 | | | | | 22.19 | % | | | 1.53 | % | | | 5.85 | % | | | 5.72 | % | |
The inception date for Neuberger Berman Intrinsic Value Fund Class A, Class C and Institutional Class shares is May 10, 2010. Performance prior to that date is that of the Fund's predecessor, the DJG Small Cap Value Fund L.P., an unregistered limited partnership ("DJG Fund"); DJG Fund was the successor to The DJG Small Cap Value Fund, an unregistered commingled investment account ("DJG Account"), which had similar investment goals, strategies, and portfolio management team. See footnote 23 for information about the effects of the different fees paid by each class.
Performance data quoted represent past performance and do not indicate future results. The investment return and principal value of an investment will fluctuate so that an investor's shares, when redeemed, may be worth more or less than their original cost. Results are shown on a "total return" basis and include reinvestment of all income dividends and distributions.
Current performance may be lower or higher than the performance data quoted. For performance data current to the most recent month end, visit www.nb.com/performance.
As stated in the Fund's most recent prospectus, the total annual operating expense ratios for fiscal year 2010 were 1.24%, 1.60% and 2.35% for Institutional Class, Class A and Class C shares, respectively (prior to any fee waivers and/or expense reimbursements, if any). The expense ratios net of waivers and/or reimbursements were 1.00%, 1.36% and 2.11% Institutional Class, Class A and Class C shares, respectively. Neuberger Berman Management LLC has contractually agreed to limit certain expenses of the Fund through August 31, 2014 for Institutional Class, Class A and Class C shares.
Total Returns shown with a sales charge reflect the deduction of the current maximum initial sales charge of 5.75% for Class A shares and the applicable contingent deferred sales charges (CDSC) for Class C shares. The maximum CDSC for Class C shares is 1%, which is reduced to 0% after 1 year. The performance of the Fund's share classes will differ primarily due to different sales charge structures and class expenses. Please see the prospectus for more information about sales charge structures, if any, and class expenses for your share class.
The results shown in the table do not reflect the effect of taxes an investor would pay on Fund distributions or on the redemption of Fund shares.
Intrinsic Value Fund (Unaudited)
COMPARISON OF A $1,000,000 INVESTMENT27 |
(000's Omitted)
 |
| |
| This graph shows the change in value of a hypothetical $1,000,000 investment in the Fund over the past 10 fiscal years, or since the Fund's inception if it has not operated for 10 years. The graph is based on the Institutional Class shares only; the performance of the Fund's share classes will differ primarily due to different sales charge structures and class expenses (see Performance Highlights chart on previous page). The result is compared with benchmarks, which include a broad-based market index and may include a more narrowly based index. Market indices have not been reduced to reflect any of the fees and costs of investing. All results include the reinvestment of income dividends and distributions. The results shown in the graph do not reflect the effect of taxes an investor would pay on Fund distributions or on the redemption of Fund shares. Results represent past performance and do not indicate future results. |
Large Cap Disciplined Growth Fund Commentary (Unaudited)
Neuberger Berman Large Cap Disciplined Growth Fund Investor Class generated a 19.44% total return for the fiscal year ended August 31, 2011, but underperformed its benchmark, the Russell 1000® Growth Index, which provided a 23.96% return for the period. (Performance for all share classes is provided in the table immediately following this letter.)
Through the second half of the fiscal year, both market and economic conditions deteriorated significantly. At the end of calendar year 2010, GDP growth estimates for the first half of 2011 were around 2%, and growth was expected to accelerate to closer to 4% by the second half of the year. In recent months, however, actual growth has been significantly below expectations and estimates for the remainder of the year have been lowered considerably.
Recent employment data suggest a worsening in an already low job growth recovery. The Federal Reserve's experimental, second round of quantitative easing, or QE2, aimed at stimulating growth did not work as well as expected. The government's stimulus plan, which is now effectively rolling off, did not have the expected impact on jobs, and the lack of cooperation between the U.S. Congress and the Obama administration has been a significant drag on investor sentiment. The impasse and disturbing rhetoric surrounding debt-ceiling negotiations not only damaged sentiment but also materially impacted growth by pushing off hiring, spending, and business expansion decisions.
The European debt situation has clearly worsened as well, and while austerity measures are necessary, economic growth is also important to overcoming deficits. Without government spending, such growth may be constrained. Given that the European economy is about 10% larger than the U.S. economy, and, with roughly 50% of U.S. companies' revenues generated outside the U.S., weakness in Europe is both a global and a local concern. China raised interest rates this period in an effort to contain inflation, which also heightened concerns about global growth. With slowing growth and a number of conceivable risks of the situation in Europe—with possible consequences ranging from a split in the European Union to a very large bailout—investors have plenty of reasons to be concerned, which is something the market has clearly demonstrated in recent months.
Over the course of the full fiscal year, the portfolio benefited most from strong stock selection in the Consumer Discretionary sector, with Amazon and Starbucks among the standout performers. An overweight in the sector versus the benchmark was also additive on a relative basis, as the sector was among the strongest within the Russell 1000 Growth Index.
Amazon continues to expand its retail operations and gain market share. Because of its comprehensive offering and competitive pricing, consumers often shop with Amazon first. This very positive trend limits the company's online advertising expenses and increases the likelihood of a sale. Amazon continues to reinvest in distribution facilities and international expansion. The company is also investing in its cloud computing business, a huge growth driver that they expect will become as significant as their retail business.
Starbucks is something of a turnaround story. The company dialed back from an overly aggressive domestic expansion strategy to focus instead on new products, like Via (a ready-brew coffee), cold beverages, and breakfast sandwiches, in addition to a continued emphasis on high growth international markets like Japan and China.
The portfolio underperformed the index in Energy due to an underweight and several individual disappointments, and also underperformed the index in Information Technology (IT) and Health Care. In IT, Juniper Networks disappointed as its telecommunications customers focused spending on 4G data networks and as a new product, QFabric, launched more slowly than expected. We continue to own the stock. Hewlett-Packard, another detractor, declined as the company faced uncertainty in the wake of the departure of its CEO, Mark Hurd. We have exited the stock.
Within Health Care, Illumina, a maker of genetic sequencing equipment, declined on fears over cuts to the National Institutes of Health budget. We continue to own the stock, having stress-tested it under a variety of scenarios, and on the potential of a new diagnostic product called MiSeq. In our view Stryker, a manufacturer of orthopedics, faces more difficulties, and was sold.
In early May, we began shifting the portfolio from a slightly pro-cyclical position to a more defensive posture, expecting global headwinds to extend a period of subpar economic growth. We've reduced our exposure to Energy, Materials, IT and Industrials, and added to Consumer Staples and Health Care, using our bottom-up approach to replace holdings that rely on economic activity for growth with companies that we believe have the ability to grow through any environment. We're now at a point where we feel the portfolio is much better positioned for a market that could continue to be difficult. Still, we are contemplating further moves as we watch the global economic and market environment evolve.
Sincerely,
Daniel S. Rosenblatt, John J. Barker, Daniel J. Fletcher and Lawrence K. Fisher
Portfolio Co-Managers
The risks involved in seeking capital appreciation from investments primarily in companies with large capitalizations are set forth in the prospectus and statement of additional information.
Investing in the stocks of even the largest companies involves all the risks of stock market investing, including the risk that they may lose value due to overall market or economic conditions.
The composition, industries and holdings of the Fund are subject to change.
Large Cap Disciplined Growth Fund (Unaudited)
| Investor Class | | NBCIX | |
| Institutional Class | | NLDLX | |
| Class A | | NLDAX | |
| Class C | | NLDCX | |
| Class R3 | | NLDRX | |
| (as a % of Total Investments) | |
| Consumer Discretionary | | | 17.9 | % | |
| Consumer Staples | | | 15.4 | | |
| Energy | | | 8.2 | | |
| Financials | | | 1.6 | | |
| Health Care | | | 12.6 | | |
| Industrials | | | 9.9 | | |
| Information Technology | | | 23.8 | | |
| Materials | | | 5.5 | | |
| Utilities | | | 1.0 | | |
| Short-Term Investments | | | 4.0 | | |
| Total | | | 100.0 | % | |
PERFORMANCE HIGHLIGHTS2,13 |
| | | | | Average Annual Total Return Ended 08/31/2011 | |
| | | Inception Date | | 1 Year | | 5 Years | | 10 Years | | Life of Fund | |
| At NAV | |
| Investor Class | | 12/06/1999 | | | 19.44 | % | | | 2.52 | % | | | 1.29 | % | | | –2.54 | % | |
Institutional Class19 | | 04/06/2009 | | | 19.79 | % | | | 2.70 | % | | | 1.38 | % | | | –2.47 | % | |
Class A19 | | 04/06/2009 | | | 19.30 | % | | | 2.49 | % | | | 1.28 | % | | | –2.55 | % | |
Class C19 | | 04/06/2009 | | | 18.63 | % | | | 2.17 | % | | | 1.12 | % | | | –2.68 | % | |
Class R319 | | 05/27/2009 | | | 19.16 | % | | | 2.43 | % | | | 1.25 | % | | | –2.58 | % | |
| With Sales Charge | |
Class A19 | | | | | 12.39 | % | | | 1.28 | % | | | 0.68 | % | | | –3.04 | % | |
Class C19 | | | | | 17.63 | % | | | 2.17 | % | | | 1.12 | % | | | –2.68 | % | |
| Index | |
Russell 1000® Growth Index1,18 | | | | | 23.96 | % | | | 3.75 | % | | | 2.71 | % | | | –1.63 | % | |
Performance data quoted represent past performance and do not indicate future results. The investment return and principal value of an investment will fluctuate so that an investor's shares, when redeemed, may be worth more or less than their original cost. Results are shown on a "total return" basis and include reinvestment of all income dividends and distributions.
Current performance may be lower or higher than the performance data quoted. For performance data current to the most recent month end, visit www.nb.com/performance.
As stated in the Fund's most recent prospectus, the total annual operating expense ratios for fiscal year 2010 were 1.24%, 0.87%, 1.31%, 2.01% and 3.24% for Investor Class, Institutional Class, Class A, Class C and Class R3 shares, respectively (prior to any fee waivers and/or expense reimbursements, if any). The expense ratios net of waivers and/or reimbursements were 1.11%, 0.75%, 1.11%, 1.86% and 1.36% for Investor Class, Institutional Class, Class A, Class C and Class R3 shares, respectively. Neuberger Berman Management LLC has contractually agreed to limit certain expenses of the Fund through August 31, 2015 for Investor Class shares and through August 31, 2014 for Institutional Class, Class A, Class C and Class R3 shares.
Total Returns shown with a sales charge reflect the deduction of the current maximum initial sales charge of 5.75% for Class A shares and the applicable contingent deferred sales charges (CDSC) for Class C shares. The maximum CDSC for Class C shares is 1%, which is reduced to 0% after 1 year. The performance of the Fund's share classes will differ primarily due to different sales charge structures and class expenses. Please see the prospectus for more information about sales charge structures, if any, and class expenses for your share class.
The results shown in the table do not reflect the effect of taxes an investor would pay on Fund distributions or on the redemption of Fund shares.
Large Cap Disciplined Growth Fund (Unaudited)
| COMPARISON OF A $10,000 INVESTMENT |
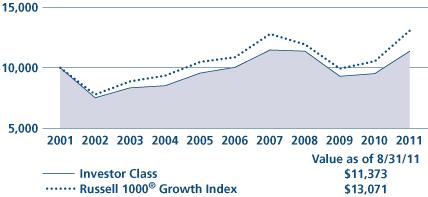 |
| |
| This graph shows the change in value of a hypothetical $10,000 investment in the Fund over the past 10 fiscal years, or since the Fund's inception if it has not operated for 10 years. The graph is based on the Investor Class shares only; the performance of the Fund's share classes will differ primarily due to different sales charge structures and class expenses (see Performance Highlights chart on previous page). The result is compared with benchmarks, which include a broad-based market index and may include a more narrowly based index. Market indices have not been reduced to reflect any of the fees and costs of investing. All results include the reinvestment of income dividends and distributions. The results shown in the graph do not reflect the effect of taxes an investor would pay on Fund distributions or on the redemption of Fund shares. Results represent past performance and do not indicate future results. |
Large Cap Value Fund Commentary (Unaudited)
Neuberger Berman Large Cap Value Fund Institutional Class posted a 20.87% total return for the fiscal year ended August 31, 2011, outperforming its benchmark, the Russell 1000® Value Index, which provided a 14.37% return. (Performance for all share classes is provided in the table immediately following this letter.)
The equity market rose and fell over the fiscal year amidst a myriad of macro events. In the first half of the period, stocks appreciated steadily alongside positive headlines that included improving retail sales and consumer spending in the U.S. and rising manufacturing and industrial production in the U.S., China and Europe. Also during this time, regulatory actions such as the release of the Basel III rules (which impact banking capital requirements) and the extension of the Bush tax cuts provided a tailwind as we believe they removed some elements of uncertainty in the market. Still, concerns about the sovereign debt crisis in Europe and monetary tightening in China lingered in the background, and in the weeks that followed escalating geopolitical tensions in the Middle East and North Africa as well as the catastrophic earthquake/tsunami in Japan threw the market off its course.
Equities moved in fits and starts over the first few months and into the second half of the reporting period. M&A activity picked-up and companies in general continued to beat expectations for both earnings and revenues. Sovereign debt issues in Europe and the U.S. returned to the forefront and economic data, particularly manufacturing, began to deteriorate on a global level. At the very end of the period, conditions across Europe became increasingly dire and it became apparent that the U.S. Government was too polarized to pass a viable long-term solution for the domestic economy—leading Standard & Poor's to downgrade the U.S. credit rating from its AAA status. The market gave back some of its gains during this time but remained in positive territory for the fiscal year.
Within the portfolio, Energy was the most beneficial sector to relative performance over the period due to strong stock selection. Five of the Fund's top 10 contributors came from this sector, including Range Resources and Cabot Oil & Gas. Both of these companies are natural gas plays in the Marcellus Shale region, and the market came to realize their value in force this period, in our observation. Range Resources advanced by over 90% for the year and Cabot was up 173%.
An underweight in the Financials sector also contributed to our relative performance. Financials was the only sector within the index to generate a negative return for the year, with companies under pressure for both political and fundamental reasons. Among the financial stocks we did own, Citigroup, Goldman Sachs, Bank of America and Morgan Stanley detracted from results.
Consumer Staples was another strong sector for the portfolio. As economic worries increased in recent months, investors who had previously preferred economically sensitive stocks were drawn to companies whose businesses have that potential to grow without the benefit of U.S. economic growth. As a result, Consumer Staples companies—and the holdings we own in the sector—began to outperform early in the second quarter of 2011. In Consumer Discretionary, the portfolio benefited from Comcast and Brinker International, which was sold. Comcast had been, in our opinion, a misunderstood story with regard to the NBC Universal acquisition, and the stock was undervalued as a result. We recognized the value of the revenue potential and cost synergies of the deal early on and were rewarded as performance improved.
The Information Technology sector was the largest detriment to portfolio performance relative to the index, due mainly to Hewlett-Packard. The company had been performing well under the direction of CEO Mark Hurd, who was ousted in August 2010. We believed there was a valuation case to be made after his departure, but as earnings weakened and company strategy became less clear with the announcement of a plan to divest Hewlett-Packard of its personal computer business and buy an expensive software company, we sold the stock in August 2011.
We closed the period underweighted in Financials, Consumer Discretionary and Health Care compared to the benchmark, and overweighted in Materials (primarily gold and agriculture), and to a lesser extent, Consumer Staples. Looking ahead, we are seeing a tempering of earnings expectations for companies over the next few quarters as the domestic economy continues on a path of sluggish growth. However, market movements are being increasingly driven by
events around the world, so we anticipate volatility may remain high as investors react to macroeconomic and geopolitical developments. At the same time, we believe such market volatility can uncover favorable buying opportunities. As bottom-up, value driven managers, we intend to use this to our advantage by remaining focused on our core strategy: finding attractively valued companies that have solid fundamentals and identifiable catalysts that can help them reach their true value over time. In addition, we continue to pay close attention to how individual portfolio holdings correlate with each other in order to create a portfolio with an optimal risk-return balance. We believe that staying true to our bottom-up stock selection process while remaining nimble to new opportunities can produce favorable portfolio outperformance over an economic cycle.
Sincerely,
Eli M. Salzmann
Portfolio Manager
The risks involved in seeking capital appreciation from investments primarily in companies with large capitalization are set forth in the prospectus and statement of additional information.
Investing in the stocks of even the largest companies involves all the risks of stock market investing, including the risk that they may lose value due to overall market or economic conditions.
The composition, industries and holdings of the Fund are subject to change.
Large Cap Value Fund (Unaudited)
| Institutional Class | | NLRLX | |
| Class A | | NVAAX | |
| Class C | | NVACX | |
| (as a % of Total Investments) | |
| Consumer Discretionary | | | 6.1 | % | |
| Consumer Staples | | | 9.3 | | |
| Energy | | | 10.2 | | |
| Financials | | | 23.1 | | |
| Health Care | | | 10.4 | | |
| Industrials | | | 9.6 | | |
| Information Technology | | | 7.8 | | |
| Materials | | | 4.9 | | |
| Telecommunication Services | | | 5.3 | | |
| Utilities | | | 7.4 | | |
| Short-Term Investments | | | 5.9 | | |
| Total | | | 100.0 | % | |
PERFORMANCE HIGHLIGHTS2,9 |
| | | | | Average Annual Total Return Ended 08/31/2011 | |
| | | Inception Date | | 1 Year | | Life of Fund | |
| At NAV | |
Institutional Class27 | | 04/19/2010 | | | 20.87 | % | | | 2.27 | % | |
Class A27 | | 03/02/2011 | | | 20.63 | % | | | 2.23 | % | |
Class C27 | | 03/02/2011 | | | 20.14 | % | | | 2.15 | % | |
| With Sales Charge | |
Class A27 | | | | | 13.69 | % | | | 0.99 | % | |
Class C27 | | | | | 19.14 | % | | | 2.15 | % | |
| Index | |
Russell 1000® Value Index1,18 | | | | | 14.37 | % | | | –2.60 | % | |
The performance data for each class includes the performance of the Fund's oldest share class, Trust Class, from November 2, 2006 through April 19, 2010. The performance data for Class A and Class C also includes the performance of the Fund's Institutional Class from April 19, 2010 through March 2, 2011. See note 27 for information about the effects of the different fees paid by each class.
Performance data quoted represent past performance and do not indicate future results. The investment return and principal value of an investment will fluctuate so that an investor's shares, when redeemed, may be worth more or less than their original cost. Results are shown on a "total return" basis and include reinvestment of all income dividends and distributions.
Current performance may be lower or higher than the performance data quoted. For performance data current to the most recent month end, visit www.nb.com/performance.
As stated in the Fund's most recent prospectus, the total annual operating expense ratios for fiscal year 2010 were 15.26%, 1.51% and 2.26% for Institutional Class, Class A and Class C shares, respectively (prior to any fee waivers and/or expense reimbursements, if any). The expense ratios net of waivers and/or reimbursements were 0.76%, 1.12% and 1.87% for Institutional Class, Class A and Class C shares, respectively. Neuberger Berman Management LLC has contractually agreed to limit certain expenses of the Fund through August 31, 2014 for Institutional Class, Class A and Class C shares.
Total Returns shown with a sales charge reflect the deduction of the current maximum initial sales charge of 5.75% for Class A shares and the applicable contingent deferred sales charges (CDSC) for Class C shares. The maximum CDSC for Class C shares is 1%, which is reduced to 0% after 1 year. The performance of the Fund's share classes will differ primarily due to different sales charge structures and class expenses. Please see the prospectus for more information about sales charge structures, if any, and class expenses for your share class.
The results shown in the table do not reflect the effect of taxes an investor would pay on Fund distributions or on the redemption of Fund shares.
Large Cap Value Fund (Unaudited)
COMPARISON OF A $1,000,000 INVESTMENT27 |
(000's Omitted)
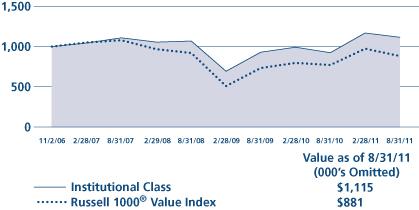 |
| |
| This graph shows the change in value of a hypothetical $1,000,000 investment in the Fund over the past 10 fiscal years, or since the Fund's inception if it has not operated for 10 years. The graph is based on the Institutional Class shares only; the performance of the Fund's share classes will differ primarily due to different sales charge structures and class expenses (see Performance Highlights chart on previous page). The result is compared with benchmarks, which include a broad-based market index and may include a more narrowly based index. Market indices have not been reduced to reflect any of the fees and costs of investing. All results include the reinvestment of income dividends and distributions. The results shown in the graph do not reflect the effect of taxes an investor would pay on Fund distributions or on the redemption of Fund shares. Results represent past performance and do not indicate future results. |
Mid Cap Growth Fund Commentary (Unaudited)
Neuberger Berman Mid Cap Growth Fund Investor Class generated a 28.59% total return for the fiscal year ended August 31, 2011, outperforming its benchmark, the Russell Midcap® Growth Index, which provided a 25.61% return for the period. (Performance for all share classes is provided in the table immediately following this letter.)
The past fiscal year has been a roller coaster of market activity, emotions and "risk on/risk off" sentiments. We saw the implementation and winding down of the Federal Reserve's second quantitative easing effort, or QE2, a debt ceiling political skirmish and U.S. credit downgrade, and a continued cycle of optimism and regression around Europe's debt contagion. More recently, economic indicators and sentiment have turned negative, creating an aura of pessimism around the global economy and the pace of the U.S. recovery.
Despite the current backdrop, over the last 12 months every sector delivered positive returns, with the Health Care, Industrials and Energy sectors being the top contributors to the Fund's relative performance. Health Care was led by Alexion Pharmaceuticals, a company specializing in therapies for rare and life threatening diseases, which benefited from the continuing international rollout of Solaris, and Cerner Corporation, a health care information technology company, which benefited from an industry-wide focus on cost cutting and organization through software applications.
Within Industrials, significant contributors to performance were Fastenal, a wholesale and retail distributor of industrials and construction supplies, and Sensata Technologies, a manufacturer of controls and sensors for use in automobiles and aerospace. Fastenal benefited from new product introductions and Sensata from the trend of higher sensor content per automobile.
Energy, with a focus on on-shore exploration and production, also delivered one of the strongest absolute sector return for the period. Carbo Ceramics, a manufacturer of proppants used in oil and natural gas extraction, benefited from top- and bottom-line growth, and Concho Resources, an exploration company, outperformed on the strength of oil prices, production growth and excellent cost control.
Underperforming sectors included Consumer Discretionary, Telecommunication Services and Financials. Consumer Discretionary, despite strong returns from several of our largest positions, underperformed due in part to our underweight position relative to the benchmark. Conversely, our overweight in Telecommunications and an emphasis on tower companies such as SBA Communications resulted in relative underperformance. Stifel Financial, a retail and institutional brokerage and investment banking firm, was the primary detractor from the Fund's Financials sector performance, as the firm experienced a decline in trading volume and weakness in investment banking. We subsequently sold our position in Stifel.
The Fund's overall top detractor was WESCO International, a wholesale and retail industrial distributor with products more closely tied to housing. With no concrete rebound in housing on the horizon, we sold the stock.
Based on our current expectations for the balance of 2011 and into 2012, we remain overweighted in Industrials, Health Care and Information Technology and underweighted in Materials, Consumer Discretionary and Consumer Staples. We believe innovation and unique products and services can be catalysts for outperformance in a tough environment and our sector overweights reflect that belief. Inconsistent earnings and high cyclicality lead us to be underweighted in Materials and the stubbornly sluggish recoveries in employment and housing have us underweighted in the consumer sectors.
As we look forward, we believe analyst expectations of the markets are likely to moderate, which, in our view, should be a positive as we believe that they were too high and predicated on an overly optimistic view of the economy's recovery. While we expect strategic capital investment and M&A activity to continue, we believe that corporations are clearly looking for greater clarity on the economy, as well as on regulatory and tax issues out of Washington, before they substantially start allocating cash to expanding headcount. As a result, we think unemployment may remain stubbornly high for at least the near term. While commodity input costs have risen and we have seen food and gas price inflation impact a weakened consumer, we are not seeing broad inflation in our companies' financial reporting numbers and we
believe it is likely that a weaker market will serve to further correct those inflated commodity prices. With respect to monetary policy, we don't expect a third iteration of quantitative easing to be immediately implemented, however, continued weak economic indicators may force the Federal Reserve into further monetary action. Regardless, we anticipate that we will see interest rates remaining low for the foreseeable future.
Despite a tougher-than-expected environment, we remain cautiously optimistic. Growth is still evident and we think mid-cap valuations are now once again attractive. We continue to focus, as we always have, on identifying higher quality growth companies with innovative, new product cycles, exceptional top-line growth, and the management teams, operating models, and balance sheet strength needed to continue to succeed in a competitive global economy. Quality has historically shined when investors have been discriminating and mindful of risk. Given the current sentiment in the market and the potential for a scarcity of strong growth, we remain confident that now is the time to embrace higher quality.
Sincerely,
Kenneth J. Turek
Portfolio Manager
The risks involved in seeking capital appreciation from investments primarily in companies with mid-market capitalization are set forth in the prospectus and statement of additional information.
Mid-capitalization stocks are more vulnerable to financial risks and other risks than stocks of larger companies. They also trade less frequently and in lower volume than larger company stocks, so their market prices tend to be more volatile.
The composition, industries and holdings of the Fund are subject to change.
Mid Cap Growth Fund (Unaudited)
| Investor Class | | NMANX | |
| Trust Class | | NBMTX | |
| Advisor Class | | NBMBX | |
| Institutional Class | | NBMLX | |
| Class A | | NMGAX | |
| Class C | | NMGCX | |
| Class R3 | | NMGRX | |
| (as a % of Total Investments) | |
| Consumer Discretionary | | | 16.9 | % | |
| Consumer Staples | | | 3.3 | | |
| Energy | | | 9.9 | | |
| Financials | | | 4.0 | | |
| Health Care | | | 16.3 | | |
| Industrials | | | 19.0 | | |
| Information Technology | | | 23.5 | | |
| Materials | | | 2.3 | | |
| Telecommunication Services | | | 3.5 | | |
| Short-Term Investments | | | 1.3 | | |
| Total | | | 100.0 | % | |
PERFORMANCE HIGHLIGHT2,7,10 |
| | | | | Average Annual Total Return Ended 08/31/2011 | |
| | | Inception Date | | 1 Year | | 5 Years | | 10 Years | | Life of Fund | |
| At NAV | |
| Investor Class | | 03/01/19793 | | | 28.59 | % | | | 5.82 | % | | | 5.12 | % | | | 11.71 | % | |
Trust Class4 | | 08/30/1993 | | | 28.45 | % | | | 5.63 | % | | | 4.96 | % | | | 11.62 | % | |
Advisor Class4 | | 09/03/1996 | | | 28.01 | % | | | 5.35 | % | | | 4.64 | % | | | 11.43 | % | |
Institutional Class6 | | 04/19/2007 | | | 28.92 | % | | | 6.15 | % | | | 5.28 | % | | | 11.76 | % | |
Class A20 | | 05/27/2009 | | | 28.43 | % | | | 5.80 | % | | | 5.11 | % | | | 11.71 | % | |
Class C20 | | 05/27/2009 | | | 27.43 | % | | | 5.43 | % | | | 4.93 | % | | | 11.65 | % | |
Class R320 | | 05/27/2009 | | | 28.09 | % | | | 5.67 | % | | | 5.05 | % | | | 11.69 | % | |
| With Sales Charge | |
Class A20 | | | | | 21.07 | % | | | 4.55 | % | | | 4.49 | % | | | 11.50 | % | |
Class C20 | | | | | 26.43 | % | | | 5.43 | % | | | 4.93 | % | | | 11.65 | % | |
| Index | |
Russell Midcap® Growth Index1,18 | | | | | 25.61 | % | | | 4.28 | % | | | 5.90 | % | | | N/A | | |
Russell Midcap® Index1,18 | | | | | 21.28 | % | | | 2.99 | % | | | 7.16 | % | | | 13.13 | % | |
Performance data quoted represent past performance and do not indicate future results. The investment return and principal value of an investment will fluctuate so that an investor's shares, when redeemed, may be worth more or less than their original cost. Results are shown on a "total return" basis and include reinvestment of all income dividends and distributions.
Current performance may be lower or higher than the performance data quoted. For performance data current to the most recent month end, visit www.nb.com/performance.
As stated in the Fund's most recent prospectus, the total annual operating expense ratios for fiscal year 2010 were 1.09%, 1.15%, 1.52%, 0.85%, 1.30%, 2.66% and 3.17% for Investor Class, Trust Class, Advisor Class, Institutional Class, Class A, Class C and Class R3 shares, respectively (prior to any fee waivers and/or expense reimbursements, if any). The expense ratios net of waivers and/or reimbursements were 0.77%, 1.13%, 1.88%, and 1.38% for Institutional Class, Class A, Class C and Class R3 shares, respectively. Neuberger Berman Management LLC has contractually agreed to limit certain expenses of the Fund through August 31, 2021 for Advisor Class shares and through August 31, 2014 for Institutional Class, Class A, Class C and Class R3 shares.
Total Returns shown with a sales charge reflect the deduction of the current maximum initial sales charge of 5.75% for Class A shares and the applicable contingent deferred sales charges (CDSC) for Class C shares. The maximum CDSC for Class C shares is 1%, which is reduced to 0% after 1 year. The performance of the Fund's share classes will differ primarily due to different sales charge structures and class expenses. Please see the prospectus for more information about sales charge structures, if any, and class expenses for your share class.
The results shown in the table do not reflect the effect of taxes an investor would pay on Fund distributions or on the redemption of Fund shares.
Mid Cap Growth Fund (Unaudited)
| COMPARISON OF A $10,000 INVESTMENT |
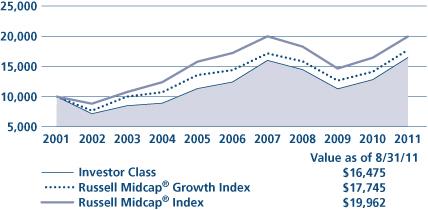 |
| |
| This graph shows the change in value of a hypothetical $10,000 investment in the Fund over the past 10 fiscal years, or since the Fund's inception if it has not operated for 10 years. The graph is based on the Investor Class shares only; the performance of the Fund's share classes will differ primarily due to different sales charge structures and class expenses (see Performance Highlights chart on previous page). The result is compared with benchmarks, which include a broad-based market index and may include a more narrowly based index. Market indices have not been reduced to reflect any of the fees and costs of investing. All results include the reinvestment of income dividends and distributions. The results shown in the graph do not reflect the effect of taxes an investor would pay on Fund distributions or on the redemption of Fund shares. Results represent past performance and do not indicate future results. |
Multi-Cap Opportunities Fund Commentary (Unaudited)
Neuberger Berman Multi-Cap Opportunities Fund Institutional Class generated a 20.09% total return for the fiscal year ended August 31, 2011, outperforming its benchmark the S&P 500 Index, which provided an 18.50% return for the period. (Performance for all share classes is provided in the table immediately following this letter.)
The equity markets posted double-digit returns for the reporting period. For much of the fiscal year, equities were supported by accommodative monetary policy, attractive relative valuations, and strong corporate profits. Investor confidence, however, shifted over the last four months of the period as weak economic data raised concerns of a slowdown in the recovery. Additionally, uncertainty regarding European debt restructuring and global fiscal policy continued to weigh on the market. Volatility increased and equities pulled back sharply to close the year.
Portfolio construction is an important component of our investment process and consists of three distinct investment categories: Classic, Opportunistic, and Special Situations investments. We define Classic investments as stocks of financially stable, recognizable companies, with consistent free cash flow from diverse sources and high returns on invested capital. Opportunistic investments are stocks of undervalued, underfollowed, or inherently misunderstood companies with high free cash flow yields and improving returns on invested capital. Finally, Special Situations are companies in which we see potential benefits from under-recognized recovery prospects, new management teams, restructuring, spin-offs or other special situations, including post-bankruptcy recapitalizations.
The Fund's balanced approach across our three investment categories helped mitigate risk in a volatile equity environment with broad based alpha generation (added value) coming through stock picking. Special Situations and Opportunistic companies were key drivers of performance during the strong market conditions over the first part of the fiscal year. As market trends reversed, the larger Classic companies dampened volatility and were a source of alpha generation through stock selection. During the period, we have been increasing the Fund's exposure to Special Situations and Opportunistic companies while selectively trimming Classic companies that have done well. In our opinion, the increase in balance sheet restructuring opportunities provided an attractive environment for Special Situations investing. Additionally, price volatility enabled us to take advantage of disconnects between company fundamentals and stock valuations, resulting in an increase in Opportunistic investments.
Within the S&P 500 Index, cyclical sectors such as Consumer Discretionary and Energy were the strongest performers, while Financials underperformed. The Fund's overweight position relative to the benchmark in the Consumer Discretionary sector and underweight in Financials were two significant contributors to performance relative to the benchmark. Additionally, the Fund owned companies across various industries that meaningfully outperformed the overall market and their respective sectors. Stock selection within the Consumer Discretionary and Energy sectors was the largest contributor to relative performance, while investments in the Information Technology (IT) sector hindered relative performance. The Fund finished the fiscal year with an overweight position in the Consumer Discretionary and Industrials sectors and a relative underweight in Financials, IT and Consumer Staples.
We added several new positions to the portfolio this year, providing exposure to such themes as international growth, U.S. consumer strength versus low expectations, companies with pricing power that we believe can offset rising input costs, and increased energy demand. We think we have been able to find high-quality franchises with strong free cash flow generation trading at attractive relative valuations.
Looking forward, we continue to believe that U.S. economic growth will be slow, while global growth will be somewhat more robust, particularly in developing economies. Regarding the equity markets, the combination of strong company fundamentals and attractive relative valuations gives us confidence in the opportunities available to investors with a reasonable time horizon. Broadly speaking, corporate profitability and free cash flow generation remain strong and balance sheets are healthy. We consider stock valuations to be attractive, both in absolute terms and relative to other asset classes, particularly given the low yields on cash and high-quality fixed income investments. We believe there is potential for attractive returns in the equity markets, albeit with heightened volatility from macro headwinds. We will continue to maintain a balanced approach across our three investment categories in an effort to help mitigate risk and dampen volatility.
Our investment process is based on deep fundamental research and valuation analysis. As we evaluate both potential new positions and current portfolio holdings, we continue to do so with a long-term investment perspective in mind. As always, our focus is to grow our investor's assets through the disciplined application of our investment process.
Sincerely,
Richard S. Nackenson
Portfolio Manager
The risks involved in seeking capital appreciation from investments in a wide array of stocks are set forth in the prospectus and statement of additional information.
To the extent that the Fund emphasizes small-, mid- or large-cap stocks, it takes on the associated risks. At times, large-cap stocks may lag other types of stocks in performance, which could cause a fund holding those stocks to perform worse than certain other funds. Small- and mid-capitalization stocks are more vulnerable to financial risks and other risks than stocks of larger companies. They also trade less frequently and in lower volume than larger company stocks, so their market prices tend to be more volatile.
Companies that are considered "special situations" include, among other things: companies that have unrecognized recovery prospects or new management teams; companies involved in restructurings or spin-offs; companies emerging from bankruptcy; initial public offerings that trade below their initial offering prices; and companies with a break-up value above their market price. The principal risk associated with special situations is that certain of such situations may not develop as expected or the market may react differently than expected to such situations, in which case the Fund may realize losses.
The composition, industries and holdings of the Fund are subject to change.
Multi-Cap Opportunities Fund (Unaudited)
| Institutional Class | | NMULX | |
| Class A | | NMUAX | |
| Class C | | NMUCX | |
| (as a % of Total Investments) | |
| Consumer Discretionary | | | 22.7 | % | |
| Consumer Staples | | | 7.3 | | |
| Energy | | | 11.0 | | |
| Financials | | | 6.3 | | |
| Health Care | | | 12.3 | | |
| Industrials | | | 17.1 | | |
| Information Technology | | | 13.1 | | |
| Materials | | | 4.4 | | |
| Utilities | | | 2.4 | | |
| Short-Term Investments | | | 3.4 | | |
| Total | | | 100.0 | % | |
PERFORMANCE HIGHLIGHTS2,9 |
| | | | | Average Annual Total Return Ended 08/31/2011 | |
| | | Inception Date | | 1 Year | | Life of Fund | |
| At NAV | |
Institutional Class22 | | 12/21/2009 | | | 20.09 | % | | | 1.02 | % | |
Class A22 | | 12/21/2009 | | | 19.48 | % | | | 0.88 | % | |
Class C22 | | 12/21/2009 | | | 18.82 | % | | | 0.64 | % | |
| With Sales Charge | |
Class A22 | | | | | 12.60 | % | | | –0.35 | % | |
Class C22 | | | | | 17.82 | % | | | 0.64 | % | |
| Index | |
S&P 500 Index1,18 | | | | | 18.50 | % | | | –0.23 | % | |
Prior to December 14, 2009, Neuberger Berman Multi-Cap Opportunities Fund was known as Neuberger Berman Research Opportunities Fund, which had different investment goals, strategies, and portfolio management team. The performance data for each class includes the performance of the Fund's oldest share class, Trust Class, from November 2, 2006 through December 21, 2009. See footnote 22 for information about the effects of the different fees paid by each class.
Performance data quoted represent past performance and do not indicate future results. The investment return and principal value of an investment will fluctuate so that an investor's shares, when redeemed, may be worth more or less than their original cost. Results are shown on a "total return" basis and include reinvestment of all income dividends and distributions.
Current performance may be lower or higher than the performance data quoted. For performance data current to the most recent month end, visit www.nb.com/performance.
As stated in the Fund's most recent prospectus, the total annual operating expense ratios for fiscal year 2010 were 1.95%, 3.19% and 6.44% for Institutional Class, Class A and Class C shares, respectively (prior to any fee waivers and/or expense reimbursements, if any). The expense ratios net of waivers and/or reimbursements were1.01%, 1.37% and 2.13% for Institutional Class, Class A and Class C shares, respectively. Neuberger Berman Management LLC has contractually agreed to limit certain expenses of the Fund through August 31, 2014 for Institutional Class, Class A and Class C shares.
Total Returns shown with a sales charge reflect the deduction of the current maximum initial sales charge of 5.75% for Class A shares and the applicable contingent deferred sales charges (CDSC) for Class C shares. The maximum CDSC for Class C shares is 1%, which is reduced to 0% after 1 year. The performance of the Fund's share classes will differ primarily due to different sales charge structures and class expenses. Please see the prospectus for more information about sales charge structures, if any, and class expenses for your share class.
The results shown in the table do not reflect the effect of taxes an investor would pay on Fund distributions or on the redemption of Fund shares.
Multi-Cap Opportunities Fund (Unaudited)
COMPARISON OF A $1,000,000 INVESTMENT22 |
(000's Omitted)
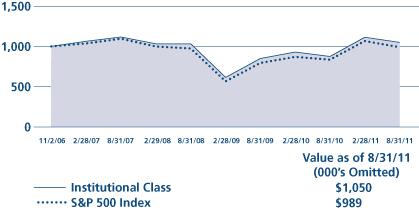 |
| |
| This graph shows the change in value of a hypothetical $1,000,000 investment in the Fund over the past 10 fiscal years, or since the Fund's inception if it has not operated for 10 years. The graph is based on the Institutional Class shares only; the performance of the Fund's share classes will differ primarily due to different sales charge structures and class expenses (see Performance Highlights chart on previous page). The result is compared with benchmarks, which include a broad-based market index and may include a more narrowly based index. Market indices have not been reduced to reflect any of the fees and costs of investing. All results include the reinvestment of income dividends and distributions. The results shown in the graph do not reflect the effect of taxes an investor would pay on Fund distributions or on the redemption of Fund shares. Results represent past performance and do not indicate future results. |
Partners Fund Commentary (Unaudited)
Neuberger Berman Partners Fund Investor Class generated a 13.48% return for the fiscal year ended August 31, 2011, trailing the Russell 1000® Value Index, which provided a 14.37% return, as well as the S&P 500 Index, which advanced by 18.50%. (Performance for all share classes is provided in the table immediately following this letter.) These positive absolute returns came despite market turmoil in last few months of the period. The Fund's relative underperformance was primarily due to disappointing results in several Information Technology holdings.
In many ways, the economy and the stock market have come full circle over the last year. Prior to the reporting period, the Greek debt crisis and the potential for it to spread to other leveraged European economies, combined with a sluggish economic recovery in the U.S., had triggered investor concern about a global economic slowdown and the potential for a double-dip recession in the U.S. Following the second quantitative easing by the Fed, some progress in resolving European debt issues, and increasing evidence that the U.S. economic recovery was sustainable, stocks, especially more economically sensitive stocks, rallied. Today, European debt woes are once again front page news and the lack of job growth and weakening investor sentiment have undermined investor confidence in the U.S. and global economic recoveries. Stocks, particularly more economically sensitive issues, have sold off sharply. We continue to believe that the U.S. and global economies can avoid slipping back into recession and that economically sensitive stocks are especially attractive based on valuation in relation to longer-term earnings power.
Health Care sector investments had the most positive impact on portfolio returns relative to the Russell 1000 Value Index this year. Ongoing strength in Shire's core franchise related to ADHD treatment along with the introduction of several new biotechnology products resulted in a substantial gain for the stock, the portfolio's single biggest performance contributor. HMOs WellPoint and Aetna also performed well. HMOs benefited from reduced medical procedures due in large part to the weak economy. We think this trend will continue as economic growth remains muted. Covidien, a medical devices supplier to hospitals, made substantial progress with improved execution on its internal business plan. Due in large part to the strong performance of Teck Resources, which benefited from the shortage of metallurgical coal caused by this year's Australian floods, our Materials sector holdings buoyed relative returns. Led by leading bond rating agency Moody's, whose results were bolstered by a substantial increase in corporate bond issuance, Financials sector investments also outperformed.
Stock selection in the Information Technology sector penalized returns. Lender Processing Services, a company that provides software for large mortgage providers (the major banks), became embroiled in legal actions relating to flaws in the foreclosure process. We believe that the mortgage processors are the primary culprits in this controversy and that Lender Processing Services will ultimately be vindicated. Consequently, we have maintained a position in this beaten-down security. The poor performance of Hewlett-Packard resulted, in our opinion, from its ill-advised acquisition of Autonomy, a software company. However, what we consider Hewlett-Packard's low stock valuation has prompted us to maintain a position in the company.
Although our Energy sector investments delivered a mid 20% return, they lagged the corresponding benchmark component. The poor performance of Petrobras, which issued a massive and highly dilutive secondary equity offering, deserves much of the blame. We are discomforted by the Brazilian government's increasingly active role in the management of the company and have therefore exited the stock. Lagging performance of oil services companies Weatherford International and McDermott International also restrained relative returns in the Energy sector.
Looking ahead, while the macroeconomic outlook remains somewhat clouded and the European sovereign debt issues bear close watching, we believe the global economy will remain on a slow growth path. Although the U.S. economy has slowed and sentiment indicators have turned negative, we believe that strong corporate balance sheets and modest valuations, especially relative to Treasury securities, present a positive case for equities. We remain comfortable with our sector exposures, which (aside from underweights in Financials and Utilities) are generally in line with the benchmark Russell 1000 Value Index weightings, and with our individual holdings, many of which now appear to us significantly undervalued based on their long-term earnings potential and balance sheet strength. In general, we are still seeing greater
value in cyclical rather than in defensive names, which in our view appear more expensive relative to long-term growth potential.
In closing, we can never be sure what the economy and stock market have in store, especially in the short term. However, we can and will remain dedicated to identifying conservatively financed, high quality companies trading at attractive discounts to normalized earnings power—a strategy we believe will continue to benefit Fund shareholders.
Sincerely,
S. Basu Mullick
Portfolio Manager
The risks involved in seeking capital appreciation from investments primarily in mid- to large-cap stocks are set forth in the prospectus and statement of additional information.
Mid-capitalization stocks are more vulnerable to financial risks and other risks than larger stocks. They also trade less frequently and in lower volume than larger company stocks, so their market prices tend to be more volatile. Large-cap stocks are subject to all the risks of stock market investing, including the risk that they may lose value due to overall market or economic conditions.
The composition, industries and holdings of the Fund are subject to change.
Partners Fund (Unaudited)
| Investor Class | | NPRTX | |
| Trust Class | | NBPTX | |
| Advisor Class | | NBPBX | |
| Institutional Class | | NBPIX | |
| Class A | | NPNAX | |
| Class C | | NPNCX | |
| Class R3 | | NPNRX | |
| (as a % of Total Investments) | |
| Consumer Discretionary | | | 10.8 | % | |
| Consumer Staples | | | 5.0 | | |
| Energy | | | 15.5 | | |
| Financials | | | 22.6 | | |
| Health Care | | | 13.3 | | |
| Industrials | | | 11.4 | | |
| Information Technology | | | 9.0 | | |
| Materials | | | 3.7 | | |
| Telecommunication Services | | | 2.6 | | |
| Utilities | | | 3.4 | | |
| Short-Term Investments | | | 2.7 | | |
| Total | | | 100.0 | % | |
PERFORMANCE HIGHLIGHTS2,7 |
| | | | | Average Annual Total Return Ended 08/31/2011 | |
| | | Inception Date | | 1 Year | | 5 Years | | 10 Years | | Life of Fund | |
| At NAV | |
| Investor Class | | 01/20/19753 | | | 13.48 | % | | | –0.93 | % | | | 3.81 | % | | | 12.62 | % | |
Trust Class4 | | 08/30/1993 | | | 13.32 | % | | | –1.11 | % | | | 3.63 | % | | | 12.55 | % | |
Advisor Class4 | | 08/16/1996 | | | 13.09 | % | | | –1.26 | % | | | 3.44 | % | | | 12.42 | % | |
Institutional Class6 | | 06/07/2006 | | | 13.69 | % | | | –0.77 | % | | | 3.90 | % | | | 12.64 | % | |
Class A24 | | 06/21/2010 | | | 13.20 | % | | | –0.99 | % | | | 3.78 | % | | | 12.61 | % | |
Class C24 | | 06/21/2010 | | | 12.32 | % | | | –1.17 | % | | | 3.68 | % | | | 12.58 | % | |
Class R324 | | 06/21/2010 | | | 12.93 | % | | | –1.05 | % | | | 3.74 | % | | | 12.60 | % | |
| With Sales Charge | |
Class A24 | | | | | 6.70 | % | | | –2.16 | % | | | 3.16 | % | | | 12.43 | % | |
Class C24 | | | | | 11.32 | % | | | –1.17 | % | | | 3.68 | % | | | 12.58 | % | |
| Index | |
Russell 1000® Value Index1,18 | | | | | 14.37 | % | | | –1.62 | % | | | 3.41 | % | | | N/A | | |
S&P 500 Index1,18 | | | | | 18.50 | % | | | 0.78 | % | | | 2.70 | % | | | 11.45 | % | |
Performance data quoted represent past performance and do not indicate future results. The investment return and principal value of an investment will fluctuate so that an investor's shares, when redeemed, may be worth more or less than their original cost. Results are shown on a "total return" basis and include reinvestment of all income dividends and distributions.
Current performance may be lower or higher than the performance data quoted. For performance data current to the most recent month end, visit www.nb.com/performance.
As stated in the Fund's most recent prospectus, the total annual operating expense ratios for fiscal year 2010 were 0.85%, 1.03%, 1.18%, 0.69%, 1.04%, 1.79% and 1.29% for Investor Class, Trust Class, Advisor Class, Institutional Class, Class A, Class C and Class R3 shares, respectively (prior to any fee waivers and/or expense reimbursements, if any). Neuberger Berman Management LLC has contractually agreed to limit certain expenses of the Fund through August 31, 2021 for Advisor Class shares and through August 31, 2014 for Trust Class, Institutional Class, Class A, Class C and Class R3 shares.
Total Returns shown with a sales charge reflect the deduction of the current maximum initial sales charge of 5.75% for Class A shares and the applicable contingent deferred sales charges (CDSC) for Class C shares. The maximum CDSC for Class C shares is 1%, which is reduced to 0% after 1 year. The performance of the Fund's share classes will differ primarily due to different sales charge structures and class expenses. Please see the prospectus for more information about sales charge structures, if any, and class expenses for your share class.
The results shown in the table do not reflect the effect of taxes an investor would pay on Fund distributions or on the redemption of Fund shares.
Partners Fund (Unaudited)
| COMPARISON OF A $10,000 INVESTMENT |
 |
| |
| This graph shows the change in value of a hypothetical $10,000 investment in the Fund over the past 10 fiscal years, or since the Fund's inception if it has not operated for 10 years. The graph is based on the Investor Class shares only; the performance of the Fund's share classes will differ primarily due to different sales charge structures and class expenses (see Performance Highlights chart on previous page). The result is compared with benchmarks, which include a broad-based market index and may include a more narrowly based index. Market indices have not been reduced to reflect any of the fees and costs of investing. All results include the reinvestment of income dividends and distributions. The results shown in the graph do not reflect the effect of taxes an investor would pay on Fund distributions or on the redemption of Fund shares. Results represent past performance and do not indicate future results. |
Real Estate Fund Commentary (Unaudited)
Neuberger Berman Real Estate Fund Trust Class generated a 17.53% total return for the fiscal year ended August 31, 2011, and lagged its benchmark, the FTSE NAREIT All Equity REITs Index, which provided an 18.44% return. (Performance for all share classes is provided in the table immediately following this letter.)
Despite weakness toward the end of the reporting period, the real estate investment trust (REIT) market produced strong results for the fiscal year. Signs that REIT business fundamentals were beginning to improve, including better cash flows and REITs' continued ability to access the capital markets, supported the market. In addition, demand for REITs was generally strong as investors sought to generate relatively attractive yields in the low interest rate environment. However, as was the case with the overall stock market, REITs took a step backward late in the reporting period. During this time, investor risk aversion increased, given fears of a double-dip recession, the downgrade of the U.S. credit rating and concerns regarding the escalating European sovereign debt crisis.
Several adjustments were made to the portfolio during the period. While we continued to have an underweight in the Apartments sector versus the benchmark, we did increase exposure during the period. The underweight detracted from results as the sector was among the best performers during the fiscal year. The Fund's allocation to the Lodging/Resorts sector was pared, but we maintained an overweight versus the benchmark. This was not rewarded, as the sector performed poorly given fears of a global economic slowdown. In contrast, the Fund benefited from increasing its exposure to the Office sector. We were drawn to this sector by its favorable valuations following the lengthy economic downturn. We also saw fundamentals improve in a number of major markets, including New York City, Boston and certain West Coast cities. While the Fund was rewarded for its overweight to the Industrial sector—namely distribution warehouse REITs—we pared this allocation given concerns about the economic impact from the European sovereign debt crisis.
Overall, our stock selection benefited performance. Regional mall operator Simon Property Group was the Fund's top performing holding. The company has what we consider a compelling mix of high quality properties, as well as price-conscious outlet centers. In addition, we believe it has a strong management team and is well positioned to pursue acquisition opportunities. The Fund's position in the company Public Storage was also beneficial. Fundamentals in the Self Storage sector improved and the company was rewarded for generating strong cash flow and having low debt. Office REIT Boston Properties was another solid contributor to results. The company owns a high quality portfolio of office properties in New York City, Washington D.C., Boston and San Francisco. In addition, it has a strong balance sheet and, in our view, good access to capital.
Lodging and resort company Marriott International was the largest detractor from performance. The thesis behind this investment was our expectation for strengthening fundamentals as the economy expanded. However, the company's stock fell sharply due to signs of moderating economic growth and disappointing revenues. Another lodging and resort company, Strategic Hotels and Resorts, was hurt for having a somewhat risky balance sheet. There were also concerns that its upscale properties would be especially susceptible to a slower economy. A position in Timber REIT Weyerhaeuser Co. was also detrimental to portfolio performance. Its shares declined given decreased demand for lumber from ongoing weakness in the housing market.
Looking ahead, we maintain a positive long-term outlook for REITs due to favorable supply/demand trends and what we consider increasingly attractive stock valuations. We also anticipate seeing REIT cash flows improve over time. This could result in stronger balance sheets and dividend increases from many REITs. That said, our shorter-term outlook is somewhat cautious given several potential headwinds that could impact valuations. First, while we do not think the U.S. will slip back into recession, the economy has clearly lost some momentum. As such, REIT cash flow growth may weaken. Second, borrowing costs for REITs have remained relatively stable due to low Treasury yields. However, we continue to closely monitor the debt capital markets, as disruptions can influence both REIT borrowing costs and asset values. Third, geopolitical risks related to both European sovereign debt issues and U.S. deficit reduction efforts may influence economic activity and capital costs.
Given these near-term uncertainties, we have placed a greater emphasis on companies with lower financial leverage and those that have, in our opinion, sustainable cash flows. We have been paring our exposure to certain REITs that are more cyclical and which we think could feel the brunt of continued economic weakness.
Sincerely,
Steve S. Shigekawa and Brian Jones
Portfolio Co-Managers
The risks involved in seeking capital appreciation and income from investments primarily in companies, in particular REITs, with small- and mid-market capitalization are set forth in the prospectus and statement of additional information.
Small- and mid-capitalization stocks are more vulnerable to financial risks and other risks than stocks of larger companies. They also trade less frequently and in lower volume than larger company stocks, so their market prices tend to be more volatile.
The portfolio's concentration in real estate investments makes it subject to greater potential risks and volatility than a more diversified portfolio, and the value of its shares may decline due to events affecting the real estate industry.
The composition, industries and holdings of the Fund are subject to change.
Real Estate Fund (Unaudited)
| Trust Class | | NBRFX | |
| Institutional Class | | NBRIX | |
| Class A | | NREAX | |
| Class C | | NRECX | |
| Class R3 | | NRERX | |
| (as a % of Total Investments) | |
| Apartments | | | 15.6 | % | |
| Diversified | | | 9.9 | | |
| Health Care | | | 10.5 | | |
| Industrial | | | 4.8 | | |
| Lodging/Resorts | | | 6.6 | | |
| Mixed | | | 1.0 | | |
| Office | | | 14.7 | | |
| Regional Malls | | | 14.0 | | |
| Self Storage | | | 6.1 | | |
| Shopping Centers | | | 10.4 | | |
| Timber | | | 3.5 | | |
| Short-Term Investments | | | 2.9 | | |
| Total | | | 100.0 | % | |
PERFORMANCE HIGHLIGHTS2,7 |
| | | | | Average Annual Total Return Ended 08/31/2011 | |
| | | Inception Date | | 1 Year | | 5 Years | | Life of Fund | |
| At NAV | |
| Trust Class | | 05/01/2002 | | | 17.53 | % | | | 2.69 | % | | | 12.23 | % | |
Institutional Class6 | | 06/04/2008 | | | 17.77 | % | | | 2.83 | % | | | 12.31 | % | |
Class A17 | | 06/21/2010 | | | 17.33 | % | | | 2.65 | % | | | 12.20 | % | |
Class C17 | | 06/21/2010 | | | 16.44 | % | | | 2.47 | % | | | 12.09 | % | |
Class R317 | | 06/21/2010 | | | 17.00 | % | | | 2.58 | % | | | 12.16 | % | |
| With Sales Charge | |
Class A17 | | | | | 10.62 | % | | | 1.44 | % | | | 11.49 | % | |
Class C17 | | | | | 15.44 | % | | | 2.47 | % | | | 12.09 | % | |
| Index | |
FTSE NAREIT All Equity REITs Index1,18 | | | | | 18.44 | % | | | 0.23 | % | | | 9.62 | % | |
Performance data quoted represent past performance and do not indicate future results. The investment return and principal value of an investment will fluctuate so that an investor's shares, when redeemed, may be worth more or less than their original cost. Results are shown on a "total return" basis and include reinvestment of all income dividends and distributions.
Current performance may be lower or higher than the performance data quoted. For performance data current to the most recent month end, visit www.nb.com/performance.
As stated in the Fund's most recent prospectus, the total annual operating expense ratios for fiscal year 2010 were 1.76%, 1.40%, 1.52%, 2.27% and 1.77% for Trust Class, Institutional Class, Class A, Class C and Class R3 shares, respectively (prior to any fee waivers and/or expense reimbursements, if any). The expense ratios net of waivers and/or reimbursements were 1.51%, 0.86%, 1.22%, 1.97% and 1.47% for Trust Class, Institutional Class, Class A, Class C and Class R3 shares, respectively. Neuberger Berman Management LLC has contractually agreed to limit certain expenses of the Fund through August 31, 2021 for Trust Class and Institutional Class shares and through August 31, 2014 for Class A, Class C and Class R3 shares.
Total Returns shown with a sales charge reflect the deduction of the current maximum initial sales charge of 5.75% for Class A shares and the applicable contingent deferred sales charges (CDSC) for Class C shares. The maximum CDSC for Class C shares is 1%, which is reduced to 0% after 1 year. The performance of the Fund's share classes will differ primarily due to different sales charge structures and class expenses. Please see the prospectus for more information about sales charge structures, if any, and class expenses for your share class.
The results shown in the table do not reflect the effect of taxes an investor would pay on Fund distributions or on the redemption of Fund shares.
Real Estate Fund (Unaudited)
| COMPARISON OF A $10,000 INVESTMENT |
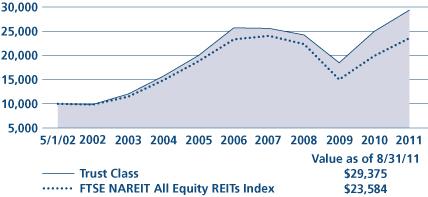 |
| |
| This graph shows the change in value of a hypothetical $10,000 investment in the Fund over the past 10 fiscal years, or since the Fund's inception if it has not operated for 10 years. The graph is based on the Trust Class shares only; the performance of the Fund's share classes will differ primarily due to different sales charge structures and class expenses (see Performance Highlights chart on previous page). The result is compared with benchmarks, which include a broad-based market index and may include a more narrowly based index. Market indices have not been reduced to reflect any of the fees and costs of investing. All results include the reinvestment of income dividends and distributions. The results shown in the graph do not reflect the effect of taxes an investor would pay on Fund distributions or on the redemption of Fund shares. Results represent past performance and do not indicate future results. |
Regency Fund Commentary (Unaudited)
Neuberger Berman Regency Fund Investor Class generated a 15.79% return for the fiscal year ended August 31, 2011, lagging its Russell Midcap® Value Index benchmark, which provided a 17.51% return for the period. (Performance for all share classes is provided in the table immediately following this letter.) The advance came despite substantial market volatility over the past few months.
Last year at about this time, investors were focused on an evolving European debt crisis and the lackluster U.S. economic recovery. Today, European sovereign debt problems are once again front page news and U.S. budget woes combined with a still soft labor market and weakening investor sentiment have investors questioning whether global and domestic economic growth is sustainable. We believe the global and U.S. economies can maintain a slow growth path and that economically sensitive stocks can rebound from their recent sell-off.
Health Care sector investments had the most positive impact this fiscal year on portfolio returns relative to the Russell Midcap Value Index. Leading drug distributor and pharmacy benefits manager AmerisourceBergen was the Fund's most significant performance contributor in the Health Care sector. Like most HMOs, Coventry continued to benefit from a reduction in health care procedures caused in large part by the weak economy. We believe this trend will continue as economic growth remains muted. The strong performance of Teck Resources, due in part to a temporary shortage in metallurgical coal resulting from major flooding in Australia, buoyed relative returns in the Materials sector. Consumer Discretionary sector investments also contributed to relative returns, with department store chain J.C. Penney, publisher McGraw-Hill, and retailer Limited among the best performers in the portfolio.
Other portfolio standouts this fiscal year include mining equipment manufacturer Bucyrus International, which was acquired at an attractive premium by Caterpillar (and sold from the portfolio), energy infrastructure design and engineering company Chicago Bridge & Iron, and motorcycle manufacturer Harley-Davidson.
Information Technology investments were the largest detractors to relative returns. Lender Processing Services, a company that provides software for large mortgage providers, became embroiled in legal actions relating to technical flaws in the foreclosure process. We believe that the mortgage processors are the primary culprits in this controversy and that Lender Processing Services will ultimately be vindicated. Consequently, we have maintained a position in this beaten-down security. NXP Semiconductors was also a drag on returns. NXP's debt level hurt was as leverage became a major negative in the market sell-off toward the end of the 12-month reporting period. Financial sector holdings also underperformed, most notably regional banks Regions Financial and Huntington Bancshares. We think the sell-off in regional banks is overdone and anticipate that those stocks could rebound. Although the Fund's Energy sector holdings delivered a mid-20% return, they lagged the corresponding benchmark sector component. Exploration and production companies Whiting Petroleum and Denbury Resources were among the laggards. We remain positive on the long-term outlook for energy prices and select energy securities.
Other performance laggards this fiscal year include retailer Aeropostale, a teen clothing retailer that experienced a major fashion "miss" causing it to discount inventory and lose customers to competitors such as Abercrombie & Fitch. We have not given up hope that this company can get back on the right track, but have eliminated our position and do not intend to establish a new one until we see evidence of some progress. U.S. Steel slid as steel prices weakened due to fears of a slowing global recovery. We sold the stock in favor of what we believe are better positioned Materials companies.
Looking ahead, while the macroeconomic outlook remains somewhat clouded and European sovereign debt issues bear close watching, we believe the global economy will remain on a slow growth path. Although the U.S. economy has slowed and sentiment indicators have turned negative, strong corporate balance sheets and modest valuations, especially relative to Treasury securities, present a positive case for equities. We remain comfortable with our sector exposures, and with our stocks, many of which now appear significantly undervalued based on our estimation of their long-term earnings potential and balance sheet strength. In general, we are still finding deeper value in cyclical rather than in defensive names, which appear more expensive relative to long-term growth potential.
In closing, we can never be sure what the economy and stock market have in store in the short run. However, we can and will remain dedicated to identifying conservatively financed, high quality companies trading at attractive discounts to normalized earnings power—a strategy we believe will continue to benefit Fund shareholders.
Sincerely,
S. Basu Mullick
Portfolio Manager
The risks involved in seeking capital appreciation from investments primarily in mid-cap stocks are set forth in the prospectus and statement of additional information.
Mid-capitalization stocks are more vulnerable to financial risks and other risks than stocks of larger companies. They also trade less frequently and in lower volume than larger company stocks, so their market prices tend to be more volatile.
The composition, industries and holdings of the Fund are subject to change.
Regency Fund (Unaudited)
| Investor Class | | NBRVX | |
| Trust Class | | NBREX | |
| Institutional Class | | NBRTX | |
| Class A | | NBRAX | |
| Class C | | NBRCX | |
| Class R3 | | NBRRX | |
| (as a % of Total Investments) | |
| Consumer Discretionary | | | 13.9 | % | |
| Consumer Staples | | | 2.9 | | |
| Energy | | | 9.4 | | |
| Financials | | | 26.2 | | |
| Health Care | | | 10.4 | | |
| Industrials | | | 10.5 | | |
| Information Technology | | | 8.1 | | |
| Materials | | | 4.3 | | |
| Utilities | | | 10.7 | | |
| Short-Term Investments | | | 3.6 | | |
| Total | | | 100.0 | % | |
PERFORMANCE HIGHLIGHTS2,7 |
| | | | | Average Annual Total Return Ended 08/31/2011 | |
| | | Inception Date | | 1 Year | | 5 Years | | 10 Years | | Life of Fund | |
| At NAV | |
| Investor Class | | 06/01/1999 | | | 15.79 | % | | | 0.94 | % | | | 5.82 | % | | | 7.57 | % | |
Trust Class4 | | 06/10/1999 | | | 15.66 | % | | | 0.87 | % | | | 5.76 | % | | | 7.52 | % | |
Institutional Class25 | | 03/08/2010 | | | 16.26 | % | | | 1.05 | % | | | 5.88 | % | | | 7.62 | % | |
Class A24 | | 06/21/2010 | | | 15.70 | % | | | 0.94 | % | | | 5.83 | % | | | 7.57 | % | |
Class C24 | | 06/21/2010 | | | 14.92 | % | | | 0.76 | % | | | 5.73 | % | | | 7.50 | % | |
Class R324 | | 06/21/2010 | | | 15.46 | % | | | 0.88 | % | | | 5.79 | % | | | 7.54 | % | |
| With Sales Charge | |
Class A24 | | | | | 9.06 | % | | | –0.25 | % | | | 5.20 | % | | | 7.05 | % | |
Class C24 | | | | | 13.92 | % | | | 0.76 | % | | | 5.73 | % | | | 7.50 | % | |
| Index | |
Russell Midcap® Value Index1,18 | | | | | 17.51 | % | | | 1.36 | % | | | 7.50 | % | | | 7.13 | % | |
Russell Midcap® Index1,18 | | | | | 21.28 | % | | | 2.99 | % | | | 7.16 | % | | | 6.62 | % | |
Performance data quoted represent past performance and do not indicate future results. The investment return and principal value of an investment will fluctuate so that an investor's shares, when redeemed, may be worth more or less than their original cost. Results are shown on a "total return" basis and include reinvestment of all income dividends and distributions.
Current performance may be lower or higher than the performance data quoted. For performance data current to the most recent month end, visit www.nb.com/performance.
As stated in the Fund's most recent prospectus, the total annual operating expense ratios for fiscal year 2010 were 1.25%, 1.43%, 1.04%, 1.32%, 2.07% and 1.57% for Investor Class, Trust Class, Institutional Class, Class A, Class C and Class R3 shares, respectively (prior to any fee waivers and/or expense reimbursements, if any). The expense ratios net of waivers and/or reimbursements were 1.26%, 0.86%, 1.22%, 1.97% and 1.47% for Trust Class, Institutional Class, Class A, Class C and Class R3 shares, respectively. Neuberger Berman Management LLC has contractually agreed to limit certain expenses of the Fund through August 31, 2021 for Investor Class and Trust Class shares and through August 31, 2014 for Institutional Class, Class A, Class C and Class R3 shares.
Total Returns shown with a sales charge reflect the deduction of the current maximum initial sales charge of 5.75% for Class A shares and the applicable contingent deferred sales charges (CDSC) for Class C shares. The maximum CDSC for Class C shares is 1%, which is reduced to 0% after 1 year. The performance of the Fund's share classes will differ primarily due to different sales charge structures and class expenses. Please see the prospectus for more information about sales charge structures, if any, and class expenses for your share class.
The results shown in the table do not reflect the effect of taxes an investor would pay on Fund distributions or on the redemption of Fund shares.
Regency Fund (Unaudited)
| COMPARISON OF A $10,000 INVESTMENT |
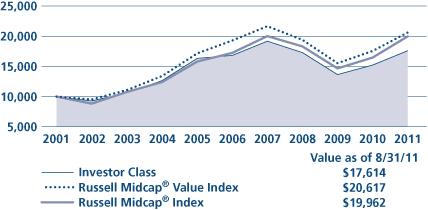 |
| |
| This graph shows the change in value of a hypothetical $10,000 investment in the Fund over the past 10 fiscal years, or since the Fund's inception if it has not operated for 10 years. The graph is based on the Investor Class shares only; the performance of the Fund's share classes will differ primarily due to different sales charge structures and class expenses (see Performance Highlights chart on previous page). The result is compared with benchmarks, which include a broad-based market index and may include a more narrowly based index. Market indices have not been reduced to reflect any of the fees and costs of investing. All results include the reinvestment of income dividends and distributions. The results shown in the graph do not reflect the effect of taxes an investor would pay on Fund distributions or on the redemption of Fund shares. Results represent past performance and do not indicate future results. |
Select Equities Fund Commentary (Unaudited)
Neuberger Berman Select Equities Fund Class A generated an 18.15% total return at NAV for the fiscal year ended August 31, 2011, compared with its benchmark, the S&P 500 Index, which provided an 18.50% return for the period. (Performance for all share classes is provided in the table immediately following this letter.) In a fiscal year marked by extraordinary volatility and economic uncertainty, we are pleased to have been able to deliver market-like returns with less volatility than the broader market.
When this reporting period began last fall, Federal Reserve Chairman Bernanke's announcement of a second round of quantitative easing (QE2) aimed at stimulating economic growth had triggered a strong rally of risk assets, particularly in the more cyclical areas of the equity market. This rally, while volatile, essentially continued through late spring 2011. However, by June, economic data shifted dramatically downward, highlighting a deceleration of U.S. economic growth.
For more than two years, we have stated our belief that the shape of the economic recovery would resemble the image of the Nike "swoosh" symbol, and that description has been accurate thus far. From our perspective, at the beginning calendar-year 2011, economic growth rates were more positive than the trend line we had been forecasting. At that time most economists were predicting a strong year in terms of GDP growth. Statistics now suggest to us that the trend line could be even weaker than the "swoosh" trajectory would indicate.
From a portfolio positioning perspective, beginning around June 2010 through the calendar year-end, the portfolio was invested heavily in both global franchise names and cyclical securities, which allowed us to participate in the market's upward movement during that time period. As QE2 was initiated during the fall of 2010 and early 2011, its implementation drove cyclical and industrial stocks significantly higher. The Fund's exposure to cyclicals peaked by March 2011.
From late April 2011 through the end of this reporting period, the market declined as investors reacted to 1) worsening economic data from both the U.S. and the eurozone, 2) political issues including the prolonged U.S. debt ceiling debate and 3) uncertainty over the direction European leaders would take to confront and contain their serious debt problems, as well as other issues.
During this time, we began reducing our exposure to the more cyclical Industrials, Materials and Energy sectors. As a result of our analysis of predictive economic data, first hand company meetings and market research, we reallocated assets toward more defensive areas and cash-equivalent securities. Generally speaking, in our move away from cyclical exposure, we did not significantly increase our allocations to more equity income securities as we had done in the past, but instead added to the cash portion of the portfolio given our concerns about valuations in some segments of the market.
At the beginning of this period, approximately 7% of portfolio assets were in cash. At its peak, the cash position was above 30%, and, as we close this period, our cash position is around 20%. Despite our concerns, however, we continue to look for companies that meet our investment criteria and that we believe can thrive given our economic outlook, and, as such, we added carefully selected securities during the period. For example, we increased our exposure to Consumer Discretionary stocks, but with specialized opportunities in areas including automotive components and media rather than directly cyclical areas such as retail or travel. We believe these specific investments have long-term secular trends that will benefit their growth and are somewhat masked by the cyclical nature of the industries in which they operate.
In managing a focused strategy that is not tied to the benchmark, we are able to avoid areas we consider particularly difficult. Compared with the benchmark, the Fund ended the period underweighted in Financials, Information Technology and Health Care stocks. We currently remain overweighted in Materials, and, to a smaller extent, are overweighted in Telecommunication Services.
Portfolio turnover this period was relatively high as a result of raising cash at times and changing the underlying mix of the stocks in the portfolio. With the rapid changes in the economic environment, we sold several of our top-performing holdings as well as some disappointments as part of our move to a more conservative positioning.
We continue to maintain a defensive posture, holding significant cash within the portfolio because of the ongoing uncertainty we foresee. As far as economic growth is concerned, while we are not seeing signs that necessarily point toward another recession, we do believe growth will be moderate. This is consistent with the conservative viewpoint we have had since the Fund's inception in 2008. While corporate earnings for the most part have remained resilient, we believe that without underlying economic growth, earnings estimates may have to be reviewed due to the deceleration in the economy. This could cause a major headwind for the market over the next year.
Sincerely,
Gerald Kaminsky, Michael Kaminsky and Richard Werman
Portfolio Co-Managers
The risks involved in seeking capital appreciation from investments primarily in companies of mid- and large capitalization are set forth in the prospectus and statement of additional information.
To the extent that the Fund emphasizes mid- or large-cap stocks, it takes on the associated risks. Mid-cap stocks tend to be more volatile than large-cap stocks and are usually more sensitive to economic, political, regulatory and market factors. At any given time, one or both groups of stocks may be out of favor with investors.
The composition, industries and holdings of the Fund are subject to change.
Select Equities Fund (Unaudited)
| Institutional Class | | NBEIX | |
| Class A | | NBEAX | |
| Class C | | NBECX | |
| (as a % of Total Investments) | |
| Consumer Discretionary | | | 12.0 | % | |
| Energy | | | 12.2 | | |
| Financials | | | 4.4 | | |
| Health Care | | | 2.7 | | |
| Industrials | | | 14.4 | | |
| Information Technology | | | 9.9 | | |
| Materials | | | 12.7 | | |
| Telecommunication Services | | | 6.8 | | |
| Utilities | | | 4.9 | | |
| Short-Term Investments | | �� | 20.0 | | |
| Total | | | 100.0 | % | |
| | | | | Average Annual Total Return Ended 08/31/2011 | |
| | | Inception Date | | 1 Year | | Life of Fund | |
| At NAV | |
| Institutional Class | | 12/20/2007 | | | 18.62 | % | | | –0.98 | % | |
| Class A | | 12/20/2007 | | | 18.15 | % | | | –1.26 | % | |
| Class C | | 12/20/2007 | | | 17.29 | % | | | –1.99 | % | |
| With Sales Charge | |
| Class A | | | | | 11.37 | % | | | –2.83 | % | |
| Class C | | | | | 16.29 | % | | | –1.99 | % | |
| Index | |
S&P 500 Index1,18 | | | | | 18.50 | % | | | –2.50 | % | |
Performance data quoted represent past performance and do not indicate future results. The investment return and principal value of an investment will fluctuate so that an investor's shares, when redeemed, may be worth more or less than their original cost. Results are shown on a "total return" basis and include reinvestment of all income dividends and distributions.
Current performance may be lower or higher than the performance data quoted. For performance data current to the most recent month end, visit www.nb.com/performance.
As stated in the Fund's most recent prospectus, the total annual operating expense ratios for fiscal year 2010 were 1.24%, 1.62% and 2.37% for Institutional Class, Class A and Class C shares, respectively (prior to any fee waivers and/or expense reimbursements, if any). The expense ratios net of waivers and/or reimbursements were 0.77%, 1.22% and 1.97% for Institutional Class, Class A and Class C shares, respectively. Neuberger Berman Management LLC has contractually agreed to limit certain expenses of the Fund through August 31, 2014 for Institutional Class, Class A and Class C shares.
Total Returns shown with a sales charge reflect the deduction of the current maximum initial sales charge of 5.75% for Class A shares and the applicable contingent deferred sales charges (CDSC) for Class C shares. The maximum CDSC for Class C shares is 1%, which is reduced to 0% after 1 year. The performance of the Fund's share classes will differ primarily due to different sales charge structures and class expenses. Please see the prospectus for more information about sales charge structures, if any, and class expenses for your share class.
The results shown in the table do not reflect the effect of taxes an investor would pay on Fund distributions or on the redemption of Fund shares.
Select Equities Fund (Unaudited)
| COMPARISON OF A $10,000 INVESTMENT (WITH SALES CHARGE) |
 |
| |
| This graph shows the change in value of a hypothetical $10,000 investment in the Fund over the past 10 fiscal years, or since the Fund's inception if it has not operated for 10 years. The graph is based on the Class A shares only; the performance of the Fund's share classes will differ primarily due to different sales charge structures and class expenses (see Performance Highlights chart on previous page). The result is compared with benchmarks, which include a broad-based market index and may include a more narrowly based index. Market indices have not been reduced to reflect any of the fees and costs of investing. All results include the reinvestment of income dividends and distributions. The results shown in the graph do not reflect the effect of taxes an investor would pay on Fund distributions or on the redemption of Fund shares. Results represent past performance and do not indicate future results. |
Small Cap Growth Fund Commentary (Unaudited)
Neuberger Berman Small Cap Growth Fund Investor Class generated a 29.68% total return for the fiscal year ended August 31, 2011, outperforming its benchmark, the Russell 2000® Growth Index, which provided a 27.54% return. (Performance for all share classes is provided in the table immediately following this letter.)
The past fiscal year has been a roller coaster of market activity, emotions and "risk on/risk off" sentiments. We saw the implementation and winding down of the Federal Reserve's second round of quantitative easing, or QE2, the debt-ceiling political skirmish and the U.S. credit downgrade and a continued cycle of optimism and regression around Europe's debt contagion. More recently, economic indicators and sentiment have turned negative creating an aura of pessimism around the global economy and the pace of the U.S. recovery.
On a positive note, the stylistic headwinds we encountered in 2009 and 2010 have abated. Higher beta (performance tied to overall market results) and a disregard for risk have been replaced with a focus on fundamentals and consistency, more in tune with our investment approach.
Over the last 12 months every industry sector within the portfolio delivered positive returns, with the Industrials, Health Care and Energy sectors being the top contributors to the Fund's relative performance. Within Industrials, significant contributors to performance were Heico and Polypore. Heico, a manufacturer of FAA-approved engine and component replacement parts, continues to benefit from a recovery in aviation. Polypore, a manufacturer of specialized membranes used in lithium batteries, has benefited from the continued growth in the demand of smart phones and tablets.
Positive stock selection in Health Care was lead by Alexion Pharmaceuticals, a company specializing in therapies for rare and life threatening diseases. Alexion continued to benefit from the international rollout of Solaris. We fully realized our valuation target for the stock and sold the position as a result.
Within Energy, Rosetta Resources and Brigham Exploration, on-shore oil and natural gas exploration and production companies, were the top contributors to performance. Both benefited from the strength of oil prices and production growth.
Underperforming sectors within the portfolio included Information Technology (IT) and Consumer Discretionary. The top detractors within IT were Velti PLC and Sonic Solutions. Velti, a global provider of mobile marketing and advertising solutions, was negatively impacted by code compatibility issues with leading smart phone and tablet manufacturers, while Sonic Solutions, a digital media company, failed to gain critical mass in a very competitive space. We eliminated both holdings.
Detractors within Consumer Discretionary were Brunswick Corporation and MakeMyTrip. Brunswick, a designer, manufacturer and marketer of recreation products was weighed down by concerns over consumer spending. MakeMyTrip, an Indian online travel company, disappointed on a slower-than-expected expansion of online booking in India and we sold the position.
Based on our expectations for the remainder of 2011 and into 2012, we remain overweighted relative to the benchmark in Consumer Discretionary, Consumer Staples and IT and underweighted in Materials and Financials. We believe unique products and services can be catalysts for outperformance in a tough environment and our sector overweights reflect that belief. Inconsistent earnings in Materials and a lack of strong growth metrics in Financials have led us to an underweight in both these sectors.
As we look forward, we believe analyst expectations of the markets are likely to moderate, which should be a positive as we believe that they were too high and predicated on an overly optimistic view of the economy's recovery. While we expect strategic capital investment and M&A activity to continue, we believe that corporations are clearly looking for greater clarity on the economy, as well as on regulatory and tax issues out of Washington, before they substantially start allocating cash to expanding headcount. As a result, we think unemployment may remain stubbornly high for at least the near term. While commodity input costs have risen and we have seen food and gas price inflation impact a weakened consumer, we are not seeing broad inflation in our companies' financial reporting numbers and it is likely that a weaker market will serve to further correct those inflated commodity prices. With respect to monetary policy, we don't expect a third iteration of quantitative easing to be immediately implemented, however, continued weak economic indicators may force
the Federal Reserve into further monetary action. Regardless, we anticipate that we will see interest rates remaining low for the foreseeable future.
Despite a tougher-than-expected environment, we remain cautiously optimistic. Growth is still evident and small-cap valuations are now once again attractive. We continue to focus, as we always have, on identifying higher quality growth companies with innovative, new product cycles, exceptional top-line growth, and the management teams, operating models, and balance sheet strength needed to continue to succeed in a competitive global economy. Quality has historically shined when investors have been discriminating and mindful of risk. Given the current sentiment in the market and the potential for a scarcity of strong growth, we remain confident that now is the time to embrace higher quality.
Sincerely,
David H. Burstan
Portfolio Manager
The risks involved in seeking capital appreciation from investments primarily in companies with small-market capitalization are set forth in the prospectus and statement of additional information.
Small-capitalization stocks are more vulnerable to financial risks and other risks than larger stocks. They are generally less liquid than larger stocks, so their market prices tend to be more volatile.
The composition, industries and holdings of the Fund are subject to change.
Small Cap Growth Fund (Unaudited)
| Investor Class | | NBMIX | |
| Trust Class | | NBMOX | |
| Advisor Class | | NBMVX | |
| Institutional Class | | NBSMX | |
| Class A | | NSNAX | |
| Class C | | NSNCX | |
| Class R3 | | NSNRX | |
| (as a % of Total Investments) | |
| Consumer Discretionary | | | 19.4 | % | |
| Consumer Staples | | | 6.4 | | |
| Energy | | | 8.0 | | |
| Financials | | | 6.1 | | |
| Health Care | | | 18.8 | | |
| Industrials | | | 15.8 | | |
| Information Technology | | | 24.5 | | |
| Short-Term Investments | | | 1.0 | | |
| Total | | | 100.0 | % | |
PERFORMANCE HIGHLIGHTS2,7,11 |
| | | | | Average Annual Total Return Ended 08/31/2011 | |
| | | Inception Date | | 1 Year | | 5 Years | | 10 Years | | Life of Fund | |
| At NAV | |
| Investor Class | | 10/20/1998 | | | 29.68 | % | | | 3.40 | % | | | 2.16 | % | | | 7.22 | % | |
Trust Class4 | | 11/03/1998 | | | 29.40 | % | | | 3.18 | % | | | 2.03 | % | | | 7.09 | % | |
Advisor Class5 | | 05/03/2002 | | | 29.13 | % | | | 2.96 | % | | | 1.91 | % | | | 7.02 | % | |
Institutional Class6 | | 04/01/2008 | | | 30.04 | % | | | 3.56 | % | | | 2.24 | % | | | 7.29 | % | |
Class A20 | | 05/27/2009 | | | 29.50 | % | | | 3.29 | % | | | 2.10 | % | | | 7.18 | % | |
Class C20 | | 05/27/2009 | | | 28.57 | % | | | 2.95 | % | | | 1.93 | % | | | 7.04 | % | |
Class R320 | | 05/27/2009 | | | 29.20 | % | | | 3.17 | % | | | 2.05 | % | | | 7.13 | % | |
| With Sales Charge | |
Class A20 | | | | | 22.07 | % | | | 2.07 | % | | | 1.50 | % | | | 6.68 | % | |
Class C20 | | | | | 27.57 | % | | | 2.95 | % | | | 1.93 | % | | | 7.04 | % | |
| Index | |
Russell 2000® Growth Index1,18 | | | | | 27.54 | % | | | 3.59 | % | | | 4.89 | % | | | 5.37 | % | |
Russell 2000® Index1,18 | | | | | 22.19 | % | | | 1.53 | % | | | 5.85 | % | | | 7.16 | % | |
Performance data quoted represent past performance and do not indicate future results. The investment return and principal value of an investment will fluctuate so that an investor's shares, when redeemed, may be worth more or less than their original cost. Results are shown on a "total return" basis and include reinvestment of all income dividends and distributions.
Current performance may be lower or higher than the performance data quoted. For performance data current to the most recent month end, visit www.nb.com/performance.
As stated in the Fund's most recent prospectus, the total annual operating expense ratios for fiscal year 2010 were 1.51%, 1.71%, 1.91%, 1.28%, 2.06%, 3.44% and 4.17% for Investor Class, Trust Class, Advisor Class, Institutional Class, Class A, Class C and Class R3 shares, respectively (prior to any fee waivers and/or expense reimbursements, if any). The expense ratios net of waivers and/or reimbursements were 1.31%, 1.41%, 1.61%, 0.91%, 1.27%, 2.02% and 1.52% for Investor Class, Trust Class, Advisor Class, Institutional Class, Class A, Class C and Class R3 shares, respectively. Neuberger Berman Management LLC has contractually agreed to limit certain expenses of the Fund through August 31, 2021 for Investor Class, Trust Class and Advisor Class shares and through August 31, 2014 for Institutional Class, Class A, Class C and Class R3 shares.
Total Returns shown with a sales charge reflect the deduction of the current maximum initial sales charge of 5.75% for Class A shares and the applicable contingent deferred sales charges (CDSC) for Class C shares. The maximum CDSC for Class C shares is 1%, which is reduced to 0% after 1 year. The performance of the Fund's share classes will differ primarily due to different sales charge structures and class expenses. Please see the prospectus for more information about sales charge structures, if any, and class expenses for your share class.
The results shown in the table do not reflect the effect of taxes an investor would pay on Fund distributions or on the redemption of Fund shares.
Small Cap Growth Fund (Unaudited)
| COMPARISON OF A $10,000 INVESTMENT |
 |
| |
| This graph shows the change in value of a hypothetical $10,000 investment in the Fund over the past 10 fiscal years, or since the Fund's inception if it has not operated for 10 years. The graph is based on the Investor Class shares only; the performance of the Fund's share classes will differ primarily due to different sales charge structures and class expenses (see Performance Highlights chart on previous page). The result is compared with benchmarks, which include a broad-based market index and may include a more narrowly based index. Market indices have not been reduced to reflect any of the fees and costs of investing. All results include the reinvestment of income dividends and distributions. The results shown in the graph do not reflect the effect of taxes an investor would pay on Fund distributions or on the redemption of Fund shares. Results represent past performance and do not indicate future results. |
Socially Responsive Fund Commentary (Unaudited)
Neuberger Berman Socially Responsive Fund Investor Class generated a 19.74% total return for the fiscal year ended August 31, 2011, outperforming its benchmark, the S&P 500 Index, which provided an 18.50% return. (Performance for all share classes is provided in the table immediately following this letter.)
The past fiscal year started on the heels of a difficult spring and summer, when fears of a double-dip recession ran high. As economic data improved, the market enjoyed a strong three-quarter run. As we moved into summer 2011, however, the same set of fears seen last spring were replayed. With a second version of the Greek debt crisis, followed by a contentious U.S. debt ceiling debate, investors went from being encouraged by what seemed a healthy economy to experiencing worries over a potential recession.
Near the beginning of the fiscal year, we began adding to some of our favorite portfolio holdings, increasing weightings at what we believe were excellent valuations. The stock market rallied strongly, and, through the first half of fiscal year 2011, many of the names we had purchased at depressed levels last summer contributed positively to performance. Our performance is typically advantaged during slow-growth environments, as our quality focus identifies businesses that, in our opinion, can grow by gaining share in challenging economic times. For the first three-quarters of this reporting period, high-quality businesses outperformed, and their stocks were revalued accordingly. As a result, the Fund enjoyed a performance advantage over the market index.
Ironically, the environment at the end of the reporting period is similar to a year ago. Investor anxiety is high and many high-quality businesses are again priced for a recession. Following the early summer's Greek debt negotiations, investors sold indiscriminately and our holdings declined with the market regardless of the advantages we believe they offer. Although the Fund lost some of its "lead," we closed the year ahead of the benchmark.
In our opinion, when the market does not discriminate, this creates opportunity. We have now seen the good thrown out with the bad three times in three years. During the first two periods, we actively bought businesses that, in our opinion, had previously been too richly valued as stocks. This time, we felt very well positioned already, and yet we also were able to buy two names that had been on our prospect list for years.
Google's disappointing earnings, driven by a decision to invest toward future growth, allowed us to introduce a position in the company, which is known for exceptional workplace practices and employee satisfaction. In fact, Google consistently ranks near the top of Fortune's "100 Best Companies to Work For" list.
As a result of a merger deal that Wall Street did not like, we were able to initiate a position in Ecolab. Ecolab, which provides sanitizing and pest control products, as well as food service equipment and food safety services to various industries, has, in our view, predictability, strong free cash flow, and great secular growth opportunities associated with consumer staples companies, with the added advantage of controlling distribution. Ecolab helps customers maximize environmental, health and safety performance and has appeared on Newsweek's "Greenest Companies in America" list for its leadership in pollution prevention.
Within the portfolio, several of our top contributors, including Altera, BG Group and Covidien, performed well in the first three quarters of the reporting period, but gave up some ground more recently. MasterCard benefited performance throughout the period. We bought MasterCard during last summer's weakness and amid concerns about prospective rules on debit processing fees. A year later, we believe the business remains very strong under a new CEO, and the stock performed well through the downturn. W.W. Grainger is another stock that held up well. W.W. Grainger reports sales numbers on a monthly basis, and as fears of recession have increased, stable, frequent revenue reports are helpful.
On the negative side, Hospira, a leading specialty injectable drug company, was our weakest performer. We view Hospira as part of the solution to controlling health care costs and consider it an attractive business for the longer term. The stock declined this period as the company's response to FDA-cited manufacturing issues has been slow and costly. The insurer Progressive was another disappointment. A defensive business, the stock was largely overlooked during the rally, even
though it is managed well, growing, and taking market share. We like the company, and think an innovative new usage-based auto insurance product called Snapshot could prove to be disruptive to its competition.
There has been enormous fear that market volatility and negative sentiment will spill into the economy, weakening spending. So far that hasn't happened. High frequency statistics—like credit card processing volumes, same store sales, and industrial distributors' revenues—remain relatively positive. However, statistics with more long-term significance reflect more uncertainty. In August, business and consumer sentiment and intentions surveys fell dramatically, and hints of companies delaying decisions are evident in reduced goods orders for fall and holiday delivery, lower transportation utilization rates, and softening in electronic components orders.
Our view is that, as long as Europe doesn't deteriorate into a full crisis situation, the factors that could cause a recession are not present. While the debt problem creates uncertainty and is likely to lead to continued slow growth, we anticipate high-quality companies like those in the Fund to continue to be advantaged, and, barring a broader problem out of Europe, we are optimistic for the intermediate to long term.
Sincerely,
Arthur Moretti and Ingrid S. Dyott
Portfolio Co-Managers
The risks involved in seeking capital appreciation from investments in mid- to large-cap stocks that meet the Fund's financial criteria and social policy are set forth in the prospectus and statement of additional information.
Mid-capitalization stocks are more vulnerable to financial risks and other risks than larger stocks. They are generally less liquid than larger stocks, so their market prices tend to be more volatile. Large-cap stocks are subject to all the risks of stock market investing, including the risk that they may lose value.
The Fund's social policy could cause it to underperform similar funds that do not have a social policy. The composition, industries and holdings of the Fund are subject to change.
Socially Responsive Fund (Unaudited)
| Investor Class | | NBSRX | |
| Trust Class | | NBSTX | |
| Institutional Class | | NBSLX | |
| Class A | | NRAAX | |
| Class C | | NRACX | |
| Class R3 | | NRARX | |
| (as a % of Total Investments) | |
| Consumer Discretionary | | | 9.0 | % | |
| Consumer Staples | | | 8.6 | | |
| Energy | | | 13.1 | | |
| Financials | | | 11.3 | | |
| Health Care | | | 14.2 | | |
| Industrials | | | 14.1 | | |
| Information Technology | | | 21.0 | | |
| Materials | | | 6.2 | | |
| Short-Term Investments | | | 2.5 | | |
| Total | | | 100.0 | % | |
PERFORMANCE HIGHLIGHTS2,7 |
| | | | | Average Annual Total Return Ended 08/31/2011 | |
| | | Inception Date | | 1 Year | | 5 Years | | 10 Years | | Life of Fund | |
| At NAV | |
| Investor Class | | 03/16/1994 | | | 19.74 | % | | | 2.11 | % | | | 5.57 | % | | | 8.06 | % | |
Trust Class4 | | 03/03/1997 | | | 19.60 | % | | | 1.92 | % | | | 5.36 | % | | | 7.88 | % | |
Institutional Class6 | | 11/28/2007 | | | 19.98 | % | | | 2.24 | % | | | 5.63 | % | | | 8.10 | % | |
Class A20 | | 05/27/2009 | | | 19.54 | % | | | 2.04 | % | | | 5.53 | % | | | 8.04 | % | |
Class C20 | | 05/27/2009 | | | 18.63 | % | | | 1.68 | % | | | 5.35 | % | | | 7.93 | % | |
Class R320 | | 05/27/2009 | | | 19.20 | % | | | 1.91 | % | | | 5.47 | % | | | 8.00 | % | |
| With Sales Charge | |
Class A20 | | | | | 12.66 | % | | | 0.84 | % | | | 4.91 | % | | | 7.67 | % | |
Class C20 | | | | | 17.63 | % | | | 1.68 | % | | | 5.35 | % | | | 7.93 | % | |
| Index | |
S&P 500 Index1,18 | | | | | 18.50 | % | | | 0.78 | % | | | 2.70 | % | | | 7.66 | % | |
Performance data quoted represent past performance and do not indicate future results. The investment return and principal value of an investment will fluctuate so that an investor's shares, when redeemed, may be worth more or less than their original cost. Results are shown on a "total return" basis and include reinvestment of all income dividends and distributions.
Current performance may be lower or higher than the performance data quoted. For performance data current to the most recent month end, visit www.nb.com/performance.
As stated in the Fund's most recent prospectus, the total annual operating expense ratios for fiscal year 2010 were 0.95%, 1.13%, 0.77%, 1.21%, 1.99% and 2.96% for Investor Class, Trust Class, Institutional Class, Class A, Class C and Class R3 shares, respectively (prior to any fee waivers and/or expense reimbursements, if any). The expense ratios net of waivers and/or reimbursements were 0.75%, 1.11%, 1.86% and 1.36% for Institutional Class, Class A, Class C and Class R3 shares, respectively. Neuberger Berman Management LLC has contractually agreed to limit certain expenses of the Fund through August 31, 2014 for Institutional Class, Class A, Class C and Class R3 shares.
Total Returns shown with a sales charge reflect the deduction of the current maximum initial sales charge of 5.75% for Class A shares and the applicable contingent deferred sales charges (CDSC) for Class C shares. The maximum CDSC for Class C shares is 1%, which is reduced to 0% after 1 year. The performance of the Fund's share classes will differ primarily due to different sales charge structures and class expenses. Please see the prospectus for more information about sales charge structures, if any, and class expenses for your share class.
The results shown in the table do not reflect the effect of taxes an investor would pay on Fund distributions or on the redemption of Fund shares.
Socially Responsive Fund (Unaudited)
| COMPARISON OF A $10,000 INVESTMENT |
 |
| |
| This graph shows the change in value of a hypothetical $10,000 investment in the Fund over the past 10 fiscal years, or since the Fund's inception if it has not operated for 10 years. The graph is based on the Investor Class shares only; the performance of the Fund's share classes will differ primarily due to different sales charge structures and class expenses (see Performance Highlights chart on previous page). The result is compared with benchmarks, which include a broad-based market index and may include a more narrowly based index. Market indices have not been reduced to reflect any of the fees and costs of investing. All results include the reinvestment of income dividends and distributions. The results shown in the graph do not reflect the effect of taxes an investor would pay on Fund distributions or on the redemption of Fund shares. Results represent past performance and do not indicate future results. |
| Endnotes (Unaudited) |
| |
| 1 | Please see "Glossary of Indices" starting on page 88 for a description of indices. Please note that indices do not take into account any fees and expenses or tax consequences of investing in the individual securities that they track, and that individuals cannot invest directly in any index. Data about the performance of these indices are prepared or obtained by Neuberger Berman Management LLC ("Management") and include reinvestment of all income dividends and distributions. The Fund may invest in securities not included in the described indices and may not invest in all securities included in the described indices. |
| | |
| 2 | Expense Caps or Waivers: These arrangements are subject to change. The total returns for these periods may have been less if Management had not reimbursed and/or waived certain operating expenses. Please see the notes to the financial statements for specific information regarding which Funds and which classes currently have a portion of their operating expenses reimbursed and/or waived by Management. |
| | |
| 3 | This date reflects when Management first became investment advisor to the Fund. |
| | |
| 4 | For each of Focus Fund, Genesis Fund, Guardian Fund, Mid Cap Growth Fund and Partners Fund, Life of Fund performance shown for the Advisor Class and the Trust Class is that of the respective Fund's Investor Class from the inception date of the Investor Class to the inception date of the Advisor Class or the Trust Class. For each of International Fund, Regency Fund, Small Cap Growth Fund and Socially Responsive Fund, Life of Fund performance shown for the Trust Class is that of the respective Fund's Investor Class from the inception date of the Investor Class to the inception date of the Trust Class. The Investor Class of a Fund has lower expenses and typically higher returns than the Advisor Class, as applicable, and the Trust Class of that Fund. |
| | |
| 5 | Performance shown prior to May 2002 for the Advisor Class of Small Cap Growth Fund is that of the Fund's Investor Class. The Investor Class has lower expenses and typically higher returns than the Advisor Class. |
| | |
| 6 | Performance shown prior to July 1999 for the Institutional Class of Genesis Fund, prior to June 2006 for the Institutional Class of Partners Fund, prior to April 2007 for the Institutional Class of Mid Cap Growth Fund, prior to November 2007 for the Institutional Class of Socially Responsive Fund and prior to April 2008 for the Institutional Class of Small Cap Growth Fund is that of the respective Fund's Investor Class. Performance shown prior to October 2006 for the Institutional Class of International Large Cap Fund and prior to June 2008 for the Institutional Class of Real Estate Fund is that of the respective Fund's Trust Class. The Investor Class or Trust Class of a Fund, as applicable, has higher expenses and typically lower returns than the Institutional Class of that Fund. |
| | |
| 7 | The investments for the Fund are managed by the same portfolio manager(s) who manage(s) one or more other registered funds that have similar names, investment objectives, and investment styles as the Fund. You should be aware that the Fund is likely to differ from the other mutual funds in size, cash flow pattern and tax matters. Accordingly, the holdings and performance can be expected to vary from those of the other mutual funds. |
| | |
| 8 | The Fund had a policy of investing mainly in large-cap stocks prior to September 1998 and investing 90% of its assets in no more than six economic sectors prior to December 17, 2007. As of April 2, 2001, the Fund changed its investment policy to become "non-diversified" under the Investment Company Act of 1940. Performance prior to these changes might have been different if current policies had been in effect. As a result of becoming "non-diversified," the Fund can invest a greater percentage of assets in any single security. This practice could increase the risk of investing in the Fund because it may own fewer securities. While the Fund's value-oriented approach is intended to limit risks, the Fund, with its concentration in a limited number of securities, may be more affected by any single economic, political or regulatory development than a more diversified mutual fund. |
| | |
| 9 | Each of Emerging Markets Equity Fund, Equity Income Fund, Global Equity Fund, Large Cap Value Fund and Multi-Cap Opportunities Fund was relatively small prior to September 2010, June 2008, August 2011, August 2011 and January 2010, respectively. The same techniques used to produce returns in a small fund may not work to produce similar returns in a larger fund. |
Endnotes (Unaudited) (cont'd) |
| |
| |
| 10 | Prior to December 17, 2007, Mid Cap Growth Fund was known as the Manhattan Fund. |
| | |
| 11 | Prior to December 17, 2007, Small Cap Growth Fund was known as the Millennium Fund. |
| | |
| 12 | Performance shown prior to June 21, 2010 for Emerging Markets Equity Fund's Class R3 is that of Emerging Markets Equity Fund's Institutional Class. The performance information of Class R3 has not been adjusted to take into account differences in class specific operating expenses. The Institutional Class has lower expenses and typically higher returns than Class R3. |
| | |
| 13 | As of December 17, 2007, the Fund changed its investment policy to become "non-diversified" under the Investment Company Act of 1940. Performance prior to this change might have been different if current policies had been in effect. As a result of becoming "non-diversified," the Fund can invest a greater percentage of assets in any single security. This practice could increase the risk of investing in the Fund because it may own fewer securities. Although the Fund has a policy that allows it to operate as a non-diversified investment company, on December 5, 2008, the Board adopted a policy, which cannot be changed without a shareholder vote, that the Fund will invest its portfolio so as to meet the standards of a diversified investment company. |
| | |
| 14 | Because the Fund had a policy of investing mainly in large-cap stocks prior to December 2002, its performance during that time might have been different if current policies had been in effect. |
| | |
| 15 | Because the Fund had a policy of investing primarily in mid- and large-cap stocks prior to September 1998, its performance during that time might have been different if current policies had been in effect. |
| | |
| 16 | During the period from November 2, 2006 through June 9, 2008, the Fund's Trust Class had only one investor, which could have impacted Fund performance. The inception date for the Fund's Institutional Class, Class A and Class C shares was June 9, 2008 and the inception date for the Fund's Class R3 shares was June 21, 2010. Performance shown for Institutional Class, Class A, Class C and Class R3 prior to those dates is that of the Trust Class, which had an inception date of November 2, 2006, and converted into the Institutional Class and ceased operations on June 9, 2008. The performance of Class R3 also includes that of Institutional Class from June 9, 2008 to June 21, 2010. The performance information of the Trust Class has been adjusted to reflect the appropriate sales charges applicable to Class A and Class C shares, but has not been adjusted to take into account differences in class specific operating expenses (such as Rule 12b-1 fees). The Trust Class had lower expenses and typically higher returns than Class A, Class C and Class R3. The Trust Class had moderately higher expenses and typically slightly lower returns than Institutional Class. The Institutional Class has lower expenses and typically higher returns than Class R3. |
| | |
| 17 | Performance shown prior to December 20, 2007 for Class A and Class C and prior to May 27, 2009 for Class R3 of International Large Cap Fund, and prior to June 21, 2010 for Class A, Class C and Class R3 of Real Estate Fund is that of the respective Fund's Trust Class. The performance information of the Trust Class has been adjusted to reflect the appropriate sales charges applicable to Class A and Class C shares, but has not been adjusted to take into account differences in class specific operating expenses (such as Rule 12b-1 fees). The Trust Class of a Fund has lower expenses and typically higher returns than Class A, Class C or Class R3 of that Fund. |
| | |
| 18 | The date used to calculate Life of Fund performance for the index is the inception date of the oldest share class. |
| | |
| 19 | Prior to April 9, 2009, Large Cap Disciplined Growth Fund was known as Century Fund. The inception dates are April 6, 2009 for the Fund’s Class A, Class C and Institutional Class and May 27, 2009 for the Fund’s Class R3. Performance shown prior to May 27, 2009 for Class R3, and prior to April 6, 2009 for Institutional Class, Class A and Class C, of is that of the Investor Class. The performance information of the Investor Class has been adjusted to reflect the appropriate sales charges applicable to Class A and Class C shares, but has not been adjusted to take into account differences in class specific operating expenses (such as Rule 12b-1 fees). The Investor Class has lower |
Endnotes (Unaudited) (cont'd) |
| |
| | expenses and typically higher returns than Class A, Class C or Class R3. The Investor Class has higher expenses and typically lower returns than Institutional Class. |
| | |
| 20 | Performance shown prior to May 27, 2009 for Class A, Class C and Class R3 of Guardian Fund, Mid Cap Growth Fund, Small Cap Growth Fund and Socially Responsive Fund is that of the respective Fund's Investor Class. The performance information of the Investor Class has been adjusted to reflect the appropriate sales charges applicable to Class A and Class C shares, but has not been adjusted to take into account differences in class specific operating expenses (such as Rule 12b-1 fees). The Investor Class of a Fund has lower expenses and typically higher returns than Class A, Class C or Class R3 of that Fund. |
| | |
| 21 | Performance shown prior to May 27, 2009 for Institutional Class of Guardian Fund, and prior to June 21, 2010 for Institutional Class of Focus Fund is that of the respective Fund's Investor Class. The performance information of Investor Class has not been adjusted to take into account differences in class specific operating expenses. The Investor Class of a Fund has higher expenses and typically lower returns than the Institutional Class of that Fund. |
| | |
| 22 | During the period from November 2, 2006 through December 21, 2009, the Fund's Trust Class had only one investor, which could have impacted fund performance. The inception date for the Fund's Class A, Class C and Institutional Class shares was December 21, 2009. Performance shown for Class A, Class C and Institutional Class prior to that date is that of the Trust Class, which had an inception date of November 2, 2006, and converted into the Institutional Class and ceased operations on December 21, 2009. Management had previously capped Trust Class expenses; absent this arrangement, the returns would have been lower. The Trust Class had lower capped expenses and typically higher returns than Class A and Class C shares. The Trust Class had equivalent capped expenses and, therefore, typically similar returns to the Institutional Class. The performance information of the Trust Class has been adjusted to reflect the appropriate sales charges applicable to Class A and Class C shares, but has not been adjusted to take into account differences in class specific operating expenses (such as Rule 12b-1 fees). |
| | |
| 23 | The inception date for Intrinsic Value Fund Class A, Class C and Institutional Class shares is May 10, 2010. Performance shown prior to that date is that of the Fund's predecessor, the DJG Small Cap Value Fund L.P., an unregistered limited partnership ("DJG Fund"); DJG Fund was the successor to The DJG Small Cap Value Fund, an unregistered commingled investment account ("DJG Account"). The performance from September 12, 2008 is that of DJG Fund and the performance from July 8, 1997 (the Fund's commencement of operations) to September 11, 2008 is that of DJG Account. On May 10, 2010, the DJG Fund transferred its assets to the Fund in exchange for the Fund's Institutional Class shares. The investment policies, objectives, guidelines and restrictions of the Fund are in all material respects equivalent to those of DJG Fund and DJG Account (the "Predecessors"). As a mutual fund registered under the Investment Company Act of 1940, the Fund is subject to certain restrictions under the 1940 Act and the Internal Revenue Code to which the Predecessors were not subject. Had the Predecessors been registered under the 1940 Act and been subject to the provisions of the 1940 Act and the Code, its investment performance may have been adversely affected. The performance information reflects the actual expenses of the Predecessors. |
| | |
| 24 | Performance shown prior to June 21, 2010 for Class A and Class C of Focus Fund and Class A, Class C and Class R3 of Partners Fund and Regency Fund is that of the respective Fund's Investor Class. The performance information of the Investor Class has been adjusted to reflect the appropriate sales charges applicable to Class A and Class C shares, but has not been adjusted to take into account differences in class specific operating expenses (such as Rule 12b-1 fees). The Investor Class of a Fund has lower expenses and typically higher returns than Class A, Class C or Class R3 of that Fund. |
| | |
| 25 | Performance shown prior to March 8, 2010 for Institutional Class of Regency Fund is that of the Fund's Investor Class. The performance information of the Investor Class has not been adjusted to take into account differences in class specific operating expenses. The Investor Class has higher expenses and typically lower returns than the Institutional Class. |
Endnotes (Unaudited) (cont'd) |
| |
| 26 | Performance shown prior to December 20, 2010 for Class A and Class C of International Fund is that of the Fund's Investor Class. The performance information of the Investor Class has been adjusted to reflect the appropriate sales charges applicable to Class A and Class C shares, but has not been adjusted to take into account differences in class specific operating expenses (such as Rule 12b-1 fees). The Investor Class has lower expenses and typically higher returns than Class A or Class C. |
| | |
| 27 | During the period from November 2, 2006 through April 19, 2010, the Fund's Trust Class had only one investor, which could have impacted Fund performance. The inception date for the Fund's Institutional Class was April 19, 2010, and the Fund had only one Institutional Class investor, which could have impacted performance. The inception date for the Fund's Class A and Class C was March 2, 2011. Performance shown for Institutional Class, Class A and Class C prior to those dates is that of the Trust Class, which had an inception date of November 2, 2006, and the Trust Class converted into the Institutional Class and ceased operations on April 19, 2010. The performance of Class A and Class C also includes that of Institutional Class from April 19, 2010 to March 2, 2011. The performance information of the Trust Class and the Institutional Class has been adjusted to reflect the appropriate sales charges applicable to Class A and Class C shares, but has not been adjusted to take into account differences in class specific operating expenses (such as Rule 12b-1 fees). The Trust Class had moderately higher expenses and therefore typically slightly lower returns than Institutional Class, Class A and Class C. The Institutional Class has lower expenses and typically higher returns than Class A and Class C. |
| | |
| For more complete information on any of the Neuberger Berman Equity Funds, call Neuberger Berman Management LLC at (800) 877-9700, or visit our website at www.nb.com. |
| | |
Glossary of Indices (Unaudited)
| S&P 500 Index: | | The S&P 500 Index is widely regarded as the standard for measuring the performance of large-cap stocks traded on U.S. markets and includes a representative sample of leading companies in leading industries. | |
| |
Russell 1000® Index: | | Measures the performance of the 1,000 largest companies in the Russell 3000® Index (which measures the performance of the 3,000 largest U.S. companies based on total market capitalization and current index membership). The Russell 1000 Index represents approximately 92% of the U.S. market. | |
| |
Russell 1000® Value Index: | | Measures the performance of those Russell 1000® Index companies with lower price-to-book ratios and lower expected growth rates. | |
| |
Russell 1000® Growth Index: | | Measures the performance of those Russell 1000® Index companies with higher price-to-book ratios and higher forecasted growth rates. | |
| |
Russell 2000® Index: | | An unmanaged index consisting of securities of the 2,000 issuers having the smallest capitalization in the Russell 3000® Index, representing approximately 10% of the Russell 3000 Index total market capitalization. As of the latest reconstitution, the smallest company's market capitalization was approximately $130 million. | |
| |
Russell 2000® Growth Index: | | Measures the performance of those Russell 2000® Index companies with higher price-to-book ratios and higher forecasted growth rates. | |
| |
Russell 2000® Value Index: | | Measures the performance of those Russell 2000® Index companies with lower price-to-book ratios and lower forecasted growth rates. | |
| |
Russell Midcap® Index: | | Measures the performance of the approximately 800 smallest companies in the Russell 1000® Index. The Russell Midcap Index represents approximately 31% of the Russell 1000® Index total market capitalization. | |
| |
Russell Midcap® Growth Index: | | An unmanaged index that measures the performance of those Russell Midcap® Index companies (the approximately 800 smallest companies in the Russell 1000® Index) with higher price-to-book ratios and higher forecasted Index growth rates. | |
| |
Russell Midcap® Value Index: | | An unmanaged index that measures the performance of those Russell Midcap® Index companies (the approximately 800 smallest companies in the Russell 1000® Index) with lower price-to-book ratios and lower forecasted Index growth rates. | |
| |
FTSE NAREIT All Equity REITs Index: (formerly, FTSE NAREIT Equity REITs Index) | | An unmanaged free float-adjusted market capitalization weighted index that tracks the performance of all Equity REITs currently listed on the New York Stock Exchange, the NASDAQ National Market System and the NYSE Amex. REITs are classified as Equity REITs if 75% or more of their gross invested book assets are invested directly or indirectly in real property. | |
| |
MSCI EAFE® Index: | | Also known as the Morgan Stanley Capital International Europe, Australasia, Far East Index. A free float-adjusted market capitalization index that is designed to measure the equity market performance of developed markets, excluding the US & Canada. As of May 27, 2010 the MSCI EAFE Index consisted of the following 22 developed market country indices: Australia, Austria, Belgium, Denmark, Finland, France, Germany, Greece, Hong Kong, Ireland, Israel, Italy, Japan, the Netherlands, New Zealand, Norway, Portugal, Singapore, Spain, Sweden, Switzerland, and the United Kingdom. | |
| |
Glossary of Indices (Unaudited) (cont'd)
| MSCI Emerging Markets Index: | | A free float-adjusted market capitalization index that is designed to measure equity market performance of emerging markets. As of May 27, 2010 the MSCI Emerging Markets Index consisted of the following 21 emerging market country indices: Brazil, Chile, China, Colombia, Czech Republic, Egypt, Hungary, India, Indonesia, Korea, Malaysia, Mexico, Morocco, Peru, Philippines, Poland, Russia, South Africa, Taiwan,Thailand, and Turkey. | |
| |
| MSCI World Index: | | A free float-adjusted market capitalization weighted index that is designed to measure the equity market performance of developed markets. As of May 27, 2010 the MSCI World Index consisted of the following 24 developed market country indices: Australia, Austria, Belgium, Canada, Denmark, Finland, France, Germany, Greece, Hong Kong, Ireland, Israel, Italy, Japan, Netherlands, New Zealand, Norway, Portugal, Singapore, Spain, Sweden, Switzerland, the United Kingdom, and the United States. | |
| |
MSCI All Country World Index (ACWI): | | A free float-adjusted market capitalization weighted index that is designed to measure the equity market performance of developed and emerging markets. As of May 27, 2010, the MSCI ACWI consists of 45 country indices comprising 24 developed and 21 emerging market country indices. The developed market country indices included are: Australia, Austria, Belgium, Canada, Denmark, Finland, France, Germany, Greece, Hong Kong, Ireland, Israel, Italy, Japan, Netherlands, New Zealand, Norway, Portugal, Singapore, Spain, Sweden, Switzerland, the United Kingdom and the United States. The emerging market country indices included are: Brazil, Chile, China, Colombia, Czech Republic, Egypt, Hungary, India, Indonesia, Korea, Malaysia, Mexico, Morocco, Peru, Philippines, Poland, Russia, South Africa, Taiwan, Thailand, and Turkey. | |
| |
Information About Your Fund's Expenses (Unaudited)
These tables are designed to provide information regarding costs related to your investments. All mutual funds incur operating expenses, which include management fees, fees for administrative services and costs of shareholder reports, among others. The following examples are based on an investment of $1,000 made at the beginning of the six month period ended August 31, 2011 and held for the entire period. The table illustrates the fund's costs in two ways:
| Actual Expenses and Performance: | | The first section of the table provides information about actual account values and actual expenses in dollars, based on the fund's actual performance during the period. You may use the information in this line, together with the amount you invested, to estimate the expenses you paid over the period. Simply divide your account value by $1,000 (for example, an $8,600 account value divided by $1,000 = 8.6), then multiply the result by the number in the first section of the table under the heading entitled "Expenses Paid During the Period" to estimate the expenses you paid over the period. | |
| |
Hypothetical Example for Comparison Purposes: | | The second section of the table provides information about hypothetical account values and hypothetical expenses based on the fund's actual expense ratio and an assumed rate of return at 5% per year before expenses. This return is not the fund's actual return. The hypothetical account values and expenses may not be used to estimate the actual ending account balance or expenses you paid for the period. You may use this information to compare the ongoing costs of investing in these funds versus other funds. To do so, compare the expenses shown in this 5% hypothetical example with the 5% hypothetical examples that appear in the shareholder reports of other funds. | |
| |
Please note that the expenses in the tables are meant to highlight your ongoing costs only and do not reflect any transaction costs, such as sales charges (loads) or redemption fees. Therefore, the information under the heading "Hypothetical (5% annual return before expenses)" is useful in comparing ongoing costs only, and will not help you determine the relative total costs of owning different funds. In addition, if these transaction costs were included, your costs would have been higher.
Expense Information as of 8/31/11 (Unaudited)
| Neuberger Berman Equity Funds | |
| | | ACTUAL | | HYPOTHETICAL (5% ANNUAL RETURN BEFORE EXPENSES)(4) | |
| | | Beginning Account Value 3/1/11 | | Ending Account Value 8/31/11 | | Expenses Paid During the Period(1) 3/1/11 - 8/31/11 | | Expense Ratio | | Beginning Account Value 3/1/11 | | Ending Account Value 8/31/11 | | Expenses Paid During the Period(1) 3/1/11 - 8/31/11 | | Expense Ratio | |
| Emerging Markets Equity Fund | |
| Institutional Class | | $ | 1,000.00 | | | $ | 921.80 | | | $ | 6.10 | | | | 1.26 | % | | $ | 1,000.00 | | | $ | 1,018.85 | | | $ | 6.41 | | | | 1.26 | % | |
| Class A | | $ | 1,000.00 | | | $ | 921.00 | | | $ | 7.31 | | | | 1.51 | % | | $ | 1,000.00 | | | $ | 1,017.59 | | | $ | 7.68 | | | | 1.51 | % | |
| Class C | | $ | 1,000.00 | | | $ | 917.50 | | | $ | 10.92 | | | | 2.26 | % | | $ | 1,000.00 | | | $ | 1,013.81 | | | $ | 11.47 | | | | 2.26 | % | |
| Class R3 | | $ | 1,000.00 | | | $ | 918.90 | | | $ | 9.29 | | | | 1.92 | % | | $ | 1,000.00 | | | $ | 1,015.53 | | | $ | 9.75 | | | | 1.92 | % | |
| | | | | | | | | | | | | | | | | | | | | | | | | | | | | | | | | | |
| Equity Income Fund | |
| Institutional Class | | $ | 1,000.00 | | | $ | 1,003.70 | | | $ | 4.04 | | | | .80 | % | | $ | 1,000.00 | | | $ | 1,021.17 | | | $ | 4.08 | | | | .80 | % | |
| Class A | | $ | 1,000.00 | | | $ | 1,002.00 | | | $ | 5.85 | | | | 1.16 | % | | $ | 1,000.00 | | | $ | 1,019.36 | | | $ | 5.90 | | | | 1.16 | % | |
| Class C | | $ | 1,000.00 | | | $ | 997.10 | | | $ | 9.61 | | | | 1.91 | % | | $ | 1,000.00 | | | $ | 1,015.58 | | | $ | 9.70 | | | | 1.91 | % | |
| Class R3 | | $ | 1,000.00 | | | $ | 1,000.60 | | | $ | 7.11 | | | | 1.41 | % | | $ | 1,000.00 | | | $ | 1,018.10 | | | $ | 7.17 | | | | 1.41 | % | |
| | | | | | | | | | | | | | | | | | | | | | | | | | | | | | | | | | |
| Focus Fund | |
| Investor Class | | $ | 1,000.00 | | | $ | 898.70 | | | $ | 4.55 | | | | .95 | % | | $ | 1,000.00 | | | $ | 1,020.42 | | | $ | 4.84 | | | | .95 | % | |
| Trust Class | | $ | 1,000.00 | | | $ | 897.80 | | | $ | 5.45 | | | | 1.14 | % | | $ | 1,000.00 | | | $ | 1,019.46 | | | $ | 5.80 | | | | 1.14 | % | |
| Advisor Class | | $ | 1,000.00 | | | $ | 897.00 | | | $ | 6.22 | | | | 1.30 | % | | $ | 1,000.00 | | | $ | 1,018.65 | | | $ | 6.61 | | | | 1.30 | % | |
| Institutional Class | | $ | 1,000.00 | | | $ | 899.30 | | | $ | 3.59 | | | | .75 | % | | $ | 1,000.00 | | | $ | 1,021.42 | | | $ | 3.82 | | | | .75 | % | |
| Class A | | $ | 1,000.00 | | | $ | 897.60 | | | $ | 5.31 | | | | 1.11 | % | | $ | 1,000.00 | | | $ | 1,019.61 | | | $ | 5.65 | | | | 1.11 | % | |
| Class C | | $ | 1,000.00 | | | $ | 894.40 | | | $ | 8.88 | | | | 1.86 | % | | $ | 1,000.00 | | | $ | 1,015.83 | | | $ | 9.45 | | | | 1.86 | % | |
| | | | | | | | | | | | | | | | | | | | | | | | | | | | | | | | | | |
| Genesis Fund | |
| Investor Class | | $ | 1,000.00 | | | $ | 974.70 | | | $ | 5.18 | | | | 1.04 | % | | $ | 1,000.00 | | | $ | 1,019.96 | | | $ | 5.30 | | | | 1.04 | % | |
| Trust Class | | $ | 1,000.00 | | | $ | 974.40 | | | $ | 5.57 | | | | 1.12 | % | | $ | 1,000.00 | | | $ | 1,019.56 | | | $ | 5.70 | | | | 1.12 | % | |
| Advisor Class | | $ | 1,000.00 | | | $ | 973.30 | | | $ | 6.91 | | | | 1.39 | % | | $ | 1,000.00 | | | $ | 1,018.20 | | | $ | 7.07 | | | | 1.39 | % | |
| Institutional Class | | $ | 1,000.00 | | | $ | 975.80 | | | $ | 4.28 | | | | .86 | % | | $ | 1,000.00 | | | $ | 1,020.87 | | | $ | 4.38 | | | | .86 | % | |
| | | | | | | | | | | | | | | | | | | | | | | | | | | | | | | | | | |
| Global Equity Fund | |
| Institutional Class | | $ | 1,000.00 | | | $ | 910.00 | | | $ | 1.90 | (2) | | | 1.15 | % | | $ | 1,000.00 | | | $ | 1,019.41 | | | $ | 5.85 | | | | 1.15 | % | |
| Class A | | $ | 1,000.00 | | | $ | 909.00 | | | $ | 2.49 | (2) | | | 1.51 | % | | $ | 1,000.00 | | | $ | 1,017.59 | | | $ | 7.68 | | | | 1.51 | % | |
| Class C | | $ | 1,000.00 | | | $ | 908.00 | | | $ | 3.72 | (2) | | | 2.26 | % | | $ | 1,000.00 | | | $ | 1,013.81 | | | $ | 11.47 | | | | 2.26 | % | |
| | | | | | | | | | | | | | | | | | | | | | | | | | | | | | | | | | |
| Global Thematic Opportunities Fund | |
| Institutional Class | | $ | 1,000.00 | | | $ | 944.00 | | | $ | 2.10 | (2) | | | 1.25 | % | | $ | 1,000.00 | | | $ | 1,018.90 | | | $ | 6.36 | | | | 1.25 | % | |
| Class A | | $ | 1,000.00 | | | $ | 944.00 | | | $ | 2.70 | (2) | | | 1.61 | % | | $ | 1,000.00 | | | $ | 1,017.09 | | | $ | 8.19 | | | | 1.61 | % | |
| Class C | | $ | 1,000.00 | | | $ | 942.00 | | | $ | 3.96 | (2) | | | 2.36 | % | | $ | 1,000.00 | | | $ | 1,013.31 | | | $ | 11.98 | | | | 2.36 | % | |
| | | | | | | | | | | | | | | | | | | | | | | | | | | | | | | | | | |
| Guardian Fund | |
| Investor Class | | $ | 1,000.00 | | | $ | 914.80 | | | $ | 4.39 | | | | .91 | % | | $ | 1,000.00 | | | $ | 1,020.62 | | | $ | 4.63 | | | | .91 | % | |
| Trust Class | | $ | 1,000.00 | | | $ | 913.60 | | | $ | 5.21 | | | | 1.08 | % | | $ | 1,000.00 | | | $ | 1,019.76 | | | $ | 5.50 | | �� | | 1.08 | % | |
| Advisor Class | | $ | 1,000.00 | | | $ | 912.10 | | | $ | 7.23 | | | | 1.50 | % | | $ | 1,000.00 | | | $ | 1,017.64 | | | $ | 7.63 | | | | 1.50 | % | |
| Institutional Class | | $ | 1,000.00 | | | $ | 915.50 | | | $ | 3.62 | | | | .75 | % | | $ | 1,000.00 | | | $ | 1,021.42 | | | $ | 3.82 | | | | .75 | % | |
| Class A | | $ | 1,000.00 | | | $ | 913.40 | | | $ | 5.35 | | | | 1.11 | % | | $ | 1,000.00 | | | $ | 1,019.61 | | | $ | 5.65 | | | | 1.11 | % | |
| Class C | | $ | 1,000.00 | | | $ | 909.70 | | | $ | 8.95 | | | | 1.86 | % | | $ | 1,000.00 | | | $ | 1,015.83 | | | $ | 9.45 | | | | 1.86 | % | |
| Class R3 | | $ | 1,000.00 | | | $ | 912.50 | | | $ | 6.56 | | | | 1.36 | % | | $ | 1,000.00 | | | $ | 1,018.35 | | | $ | 6.92 | | | | 1.36 | % | |
| | | | | | | | | | | | | | | | | | | | | | | | | | | | | | | | | | |
| International Fund | |
| Investor Class | | $ | 1,000.00 | | | $ | 946.10 | | | $ | 7.11 | | | | 1.45 | % | | $ | 1,000.00 | | | $ | 1,017.90 | | | $ | 7.37 | | | | 1.45 | % | |
| Trust Class | | $ | 1,000.00 | | | $ | 944.30 | | | $ | 8.58 | | | | 1.75 | % | | $ | 1,000.00 | | | $ | 1,016.38 | | | $ | 8.89 | | | | 1.75 | % | |
| Class A | | $ | 1,000.00 | | | $ | 945.80 | | | $ | 8.04 | | | | 1.64 | % | | $ | 1,000.00 | | | $ | 1,016.94 | | | $ | 8.34 | | | | 1.64 | % | |
| Class C | | $ | 1,000.00 | | | $ | 942.20 | | | $ | 11.36 | | | | 2.32 | % | | $ | 1,000.00 | | | $ | 1,013.51 | | | $ | 11.77 | | | | 2.32 | % | |
| | | | | | | | | | | | | | | | | | | | | | | | | | | | | | | | | | |
| International Institutional Fund | |
| Institutional Class | | $ | 1,000.00 | | | $ | 937.80 | | | $ | 3.91 | | | | .80 | % | | $ | 1,000.00 | | | $ | 1,021.17 | | | $ | 4.08 | | | | .80 | % | |
Expense Information as of 8/31/11 (Unaudited) cont'd
| | | ACTUAL | | HYPOTHETICAL (5% ANNUAL RETURN BEFORE EXPENSES)(4) | |
| | | Beginning Account Value 3/1/11 | | Ending Account Value 8/31/11 | | Expenses Paid During the Period(1) 3/1/11 - 8/31/11 | | Expense Ratio | | Beginning Account Value 3/1/11 | | Ending Account Value 8/31/11 | | Expenses Paid During the Period(1) 3/1/11 - 8/31/11 | | Expense Ratio | |
| International Large Cap Fund | |
| Trust Class | | $ | 1,000.00 | | | $ | 927.60 | | | $ | 6.07 | | | | 1.25 | % | | $ | 1,000.00 | | | $ | 1,018.90 | | | $ | 6.36 | | | | 1.25 | % | |
| Institutional Class | | $ | 1,000.00 | | | $ | 928.60 | | | $ | 4.38 | | | | .90 | % | | $ | 1,000.00 | | | $ | 1,020.67 | | | $ | 4.58 | | | | .90 | % | |
| Class A | | $ | 1,000.00 | | | $ | 927.20 | | | $ | 6.02 | | | | 1.24 | % | | $ | 1,000.00 | | | $ | 1,018.95 | | | $ | 6.31 | | | | 1.24 | % | |
| Class C | | $ | 1,000.00 | | | $ | 923.50 | | | $ | 9.70 | | | | 2.00 | % | | $ | 1,000.00 | | | $ | 1,015.12 | | | $ | 10.16 | | | | 2.00 | % | |
| Class R3 | | $ | 1,000.00 | | | $ | 925.10 | | | $ | 7.33 | | | | 1.51 | % | | $ | 1,000.00 | | | $ | 1,017.59 | | | $ | 7.68 | | | | 1.51 | % | |
| | | | | | | | | | | | | | | | | | | | | | | | | | | | | | | | | | |
| Intrinsic Value Fund | |
| Institutional Class | | $ | 1,000.00 | | | $ | 813.60 | | | $ | 4.57 | | | | 1.00 | % | | $ | 1,000.00 | | | $ | 1,020.16 | | | $ | 5.09 | | | | 1.00 | % | |
| Class A | | $ | 1,000.00 | | | $ | 813.00 | | | $ | 6.21 | | | | 1.36 | % | | $ | 1,000.00 | | | $ | 1,018.35 | | | $ | 6.92 | | | | 1.36 | % | |
| Class C | | $ | 1,000.00 | | | $ | 809.90 | | | $ | 9.63 | | | | 2.11 | % | | $ | 1,000.00 | | | $ | 1,014.57 | | | $ | 10.71 | | | | 2.11 | % | |
| | | | | | | | | | | | | | | | | | | | | | | | | | | | | | | | | | |
| Large Cap Disciplined Growth Fund | |
| Investor Class | | $ | 1,000.00 | | | $ | 923.70 | | | $ | 5.38 | | | | 1.11 | % | | $ | 1,000.00 | | | $ | 1,019.61 | | | $ | 5.65 | | | | 1.11 | % | |
| Institutional Class | | $ | 1,000.00 | | | $ | 925.10 | | | $ | 3.64 | | | | .75 | % | | $ | 1,000.00 | | | $ | 1,021.42 | | | $ | 3.82 | | | | .75 | % | |
| Class A | | $ | 1,000.00 | | | $ | 923.60 | | | $ | 5.38 | | | | 1.11 | % | | $ | 1,000.00 | | | $ | 1,019.61 | | | $ | 5.65 | | | | 1.11 | % | |
| Class C | | $ | 1,000.00 | | | $ | 921.30 | | | $ | 9.01 | | | | 1.86 | % | | $ | 1,000.00 | | | $ | 1,015.83 | | | $ | 9.45 | | | | 1.86 | % | |
| Class R3 | | $ | 1,000.00 | | | $ | 923.30 | | | $ | 6.59 | | | | 1.36 | % | | $ | 1,000.00 | | | $ | 1,018.35 | | | $ | 6.92 | | | | 1.36 | % | |
| | | | | | | | | | | | | | | | | | | | | | | | | | | | | | | | | | |
| Large Cap Value Fund | |
| Institutional Class | | $ | 1,000.00 | | | $ | 954.00 | | | $ | 3.74 | | | | .76 | % | | $ | 1,000.00 | | | $ | 1,021.37 | | | $ | 3.87 | | | | .76 | % | |
| Class A | | $ | 1,000.00 | | | $ | 966.00 | | | $ | 5.52 | (3) | | | 1.12 | % | | $ | 1,000.00 | | | $ | 1,019.56 | | | $ | 5.70 | | | | 1.12 | % | |
| Class C | | $ | 1,000.00 | | | $ | 962.10 | | | $ | 9.20 | (3) | | | 1.87 | % | | $ | 1,000.00 | | | $ | 1,015.78 | | | $ | 9.50 | | | | 1.87 | % | |
| | | | | | | | | | | | | | | | | | | | | | | | | | | | | | | | | | |
| Mid Cap Growth Fund | |
| Investor Class | | $ | 1,000.00 | | | $ | 972.20 | | | $ | 4.92 | | | | .99 | % | | $ | 1,000.00 | | | $ | 1,020.21 | | | $ | 5.04 | | | | .99 | % | |
| Trust Class | | $ | 1,000.00 | | | $ | 972.30 | | | $ | 5.22 | | | | 1.05 | % | | $ | 1,000.00 | | | $ | 1,019.91 | | | $ | 5.35 | | | | 1.05 | % | |
| Advisor Class | | $ | 1,000.00 | | | $ | 970.00 | | | $ | 7.35 | | | | 1.48 | % | | $ | 1,000.00 | | | $ | 1,017.74 | | | $ | 7.53 | | | | 1.48 | % | |
| Institutional Class | | $ | 1,000.00 | | | $ | 973.50 | | | $ | 3.73 | | | | .75 | % | | $ | 1,000.00 | | | $ | 1,021.42 | | | $ | 3.82 | | | | .75 | % | |
| Class A | | $ | 1,000.00 | | | $ | 971.70 | | | $ | 5.52 | | | | 1.11 | % | | $ | 1,000.00 | | | $ | 1,019.61 | | | $ | 5.65 | | | | 1.11 | % | |
| Class C | | $ | 1,000.00 | | | $ | 968.10 | | | $ | 9.23 | | | | 1.86 | % | | $ | 1,000.00 | | | $ | 1,015.83 | | | $ | 9.45 | | | | 1.86 | % | |
| Class R3 | | $ | 1,000.00 | | | $ | 970.70 | | | $ | 6.76 | | | | 1.36 | % | | $ | 1,000.00 | | | $ | 1,018.35 | | | $ | 6.92 | | | | 1.36 | % | |
| | | | | | | | | | | | | | | | | | | | | | | | | | | | | | | | | | |
| Multi-Cap Opportunities Fund | |
| Institutional Class | | $ | 1,000.00 | | | $ | 943.00 | | | $ | 4.90 | | | | 1.00 | % | | $ | 1,000.00 | | | $ | 1,020.16 | | | $ | 5.09 | | | | 1.00 | % | |
| Class A | | $ | 1,000.00 | | | $ | 940.90 | | | $ | 6.65 | | | | 1.36 | % | | $ | 1,000.00 | | | $ | 1,018.35 | | | $ | 6.92 | | | | 1.36 | % | |
| Class C | | $ | 1,000.00 | | | $ | 938.60 | | | $ | 10.31 | | | | 2.11 | % | | $ | 1,000.00 | | | $ | 1,014.57 | | | $ | 10.71 | | | | 2.11 | % | |
| | | | | | | | | | | | | | | | | | | | | | | | | | | | | | | | | | |
| Partners Fund | |
| Investor Class | | $ | 1,000.00 | | | $ | 849.90 | | | $ | 3.92 | | | | .84 | % | | $ | 1,000.00 | | | $ | 1,020.97 | | | $ | 4.28 | | | | .84 | % | |
| Trust Class | | $ | 1,000.00 | | | $ | 849.20 | | | $ | 4.80 | | | | 1.03 | % | | $ | 1,000.00 | | | $ | 1,020.01 | | | $ | 5.24 | | | | 1.03 | % | |
| Advisor Class | | $ | 1,000.00 | | | $ | 848.30 | | | $ | 5.50 | | | | 1.18 | % | | $ | 1,000.00 | | | $ | 1,019.26 | | | $ | 6.01 | | | | 1.18 | % | |
| Institutional Class | | $ | 1,000.00 | | | $ | 850.60 | | | $ | 3.17 | | | | .68 | % | | $ | 1,000.00 | | | $ | 1,021.78 | | | $ | 3.47 | | | | .68 | % | |
| Class A | | $ | 1,000.00 | | | $ | 848.60 | | | $ | 5.17 | | | | 1.11 | % | | $ | 1,000.00 | | | $ | 1,019.61 | | | $ | 5.65 | | | | 1.11 | % | |
| Class C | | $ | 1,000.00 | | | $ | 845.50 | | | $ | 8.65 | | | | 1.86 | % | | $ | 1,000.00 | | | $ | 1,015.83 | | | $ | 9.45 | | | | 1.86 | % | |
| Class R3 | | $ | 1,000.00 | | | $ | 847.60 | | | $ | 6.33 | | | | 1.36 | % | | $ | 1,000.00 | | | $ | 1,018.35 | | | $ | 6.92 | | | | 1.36 | % | |
| | | | | | | | | | | | | | | | | | | | | | | | | | | | | | | | | | |
| Real Estate Fund | |
| Trust Class | | $ | 1,000.00 | | | $ | 974.90 | | | $ | 4.93 | | | | .99 | % | | $ | 1,000.00 | | | $ | 1,020.21 | | | $ | 5.04 | | | | .99 | % | |
| Institutional Class | | $ | 1,000.00 | | | $ | 976.50 | | | $ | 4.23 | | | | .85 | % | | $ | 1,000.00 | | | $ | 1,020.92 | | | $ | 4.33 | | | | .85 | % | |
| Class A | | $ | 1,000.00 | | | $ | 973.90 | | | $ | 6.02 | | | | 1.21 | % | | $ | 1,000.00 | | | $ | 1,019.11 | | | $ | 6.16 | | | | 1.21 | % | |
| Class C | | $ | 1,000.00 | | | $ | 970.70 | | | $ | 9.74 | | | | 1.96 | % | | $ | 1,000.00 | | | $ | 1,015.32 | | | $ | 9.96 | | | | 1.96 | % | |
| Class R3 | | $ | 1,000.00 | | | $ | 972.70 | | | $ | 7.26 | | | | 1.46 | % | | $ | 1,000.00 | | | $ | 1,017.85 | | | $ | 7.43 | | | | 1.46 | % | |
Expense Information as of 8/31/11 (Unaudited) cont'd
| | | ACTUAL | | HYPOTHETICAL (5% ANNUAL RETURN BEFORE EXPENSES)(4) | |
| | | Beginning Account Value 3/1/11 | | Ending Account Value 8/31/11 | | Expenses Paid During the Period(1) 3/1/11 - 8/31/11 | | Expense Ratio | | Beginning Account Value 3/1/11 | | Ending Account Value 8/31/11 | | Expenses Paid During the Period(1) 3/1/11 - 8/31/11 | | Expense Ratio | |
| Regency Fund | |
| Investor Class | | $ | 1,000.00 | | | $ | 855.20 | | | $ | 5.33 | | | | 1.14 | % | | $ | 1,000.00 | | | $ | 1,019.46 | | | $ | 5.80 | | | | 1.14 | % | |
| Trust Class | | $ | 1,000.00 | | | $ | 854.00 | | | $ | 5.84 | | | | 1.25 | % | | $ | 1,000.00 | | | $ | 1,018.90 | | | $ | 6.36 | | | | 1.25 | % | |
| Institutional Class | | $ | 1,000.00 | | | $ | 856.10 | | | $ | 3.98 | | | | .85 | % | | $ | 1,000.00 | | | $ | 1,020.92 | | | $ | 4.33 | | | | .85 | % | |
| Class A | | $ | 1,000.00 | | | $ | 854.60 | | | $ | 5.66 | | | | 1.21 | % | | $ | 1,000.00 | | | $ | 1,019.11 | | | $ | 6.16 | | | | 1.21 | % | |
| Class C | | $ | 1,000.00 | | | $ | 851.30 | | | $ | 9.15 | | | | 1.96 | % | | $ | 1,000.00 | | | $ | 1,015.32 | | | $ | 9.96 | | | | 1.96 | % | |
| Class R3 | | $ | 1,000.00 | | | $ | 853.20 | | | $ | 6.82 | | | | 1.46 | % | | $ | 1,000.00 | | | $ | 1,017.85 | | | $ | 7.43 | | | | 1.46 | % | |
| | | | | | | | | | | | | | | | | | | | | | | | | | | | | | | | | | |
| Select Equities Fund | |
| Institutional Class | | $ | 1,000.00 | | | $ | 942.70 | | | $ | 3.67 | | | | .75 | % | | $ | 1,000.00 | | | $ | 1,021.42 | | | $ | 3.82 | | | | .75 | % | |
| Class A | | $ | 1,000.00 | | | $ | 941.60 | | | $ | 5.87 | | | | 1.20 | % | | $ | 1,000.00 | | | $ | 1,019.16 | | | $ | 6.11 | | | | 1.20 | % | |
| Class C | | $ | 1,000.00 | | | $ | 938.30 | | | $ | 9.53 | | | | 1.95 | % | | $ | 1,000.00 | | | $ | 1,015.38 | | | $ | 9.91 | | | | 1.95 | % | |
| | | | | | | | | | | | | | | | | | | | | | | | | | | | | | | | | | |
| Small Cap Growth Fund | |
| Investor Class | | $ | 1,000.00 | | | $ | 945.60 | | | $ | 5.64 | | | | 1.15 | % | | $ | 1,000.00 | | | $ | 1,019.41 | | | $ | 5.85 | | | | 1.15 | % | |
| Trust Class | | $ | 1,000.00 | | | $ | 944.30 | | | $ | 6.71 | | | | 1.37 | % | | $ | 1,000.00 | | | $ | 1,018.30 | | | $ | 6.97 | | | | 1.37 | % | |
| Advisor Class | | $ | 1,000.00 | | | $ | 943.30 | | | $ | 7.84 | | | | 1.60 | % | | $ | 1,000.00 | | | $ | 1,017.14 | | | $ | 8.13 | | | | 1.60 | % | |
| Institutional Class | | $ | 1,000.00 | | | $ | 946.50 | | | $ | 4.42 | | | | .90 | % | | $ | 1,000.00 | | | $ | 1,020.67 | | | $ | 4.58 | | | | .90 | % | |
| Class A | | $ | 1,000.00 | | | $ | 944.40 | | | $ | 6.18 | | | | 1.26 | % | | $ | 1,000.00 | | | $ | 1,018.85 | | | $ | 6.41 | | | | 1.26 | % | |
| Class C | | $ | 1,000.00 | | | $ | 941.40 | | | $ | 9.84 | | | | 2.01 | % | | $ | 1,000.00 | | | $ | 1,015.07 | | | $ | 10.21 | | | | 2.01 | % | |
| Class R3 | | $ | 1,000.00 | | | $ | 943.40 | | | $ | 7.40 | | | | 1.51 | % | | $ | 1,000.00 | | | $ | 1,017.59 | | | $ | 7.68 | | | | 1.51 | % | |
| | | | | | | | | | | | | | | | | | | | | | | | | | | | | | | | | | |
| Socially Responsive Fund | |
| Investor Class | | $ | 1,000.00 | | | $ | 907.80 | | | $ | 4.23 | | | | .88 | % | | $ | 1,000.00 | | | $ | 1,020.77 | | | $ | 4.48 | | | | .88 | % | |
| Trust Class | | $ | 1,000.00 | | | $ | 906.90 | | | $ | 5.09 | | | | 1.06 | % | | $ | 1,000.00 | | | $ | 1,019.86 | | | $ | 5.40 | | | | 1.06 | % | |
| Institutional Class | | $ | 1,000.00 | | | $ | 908.20 | | | $ | 3.51 | | | | .73 | % | | $ | 1,000.00 | | | $ | 1,021.53 | | | $ | 3.72 | | | | .73 | % | |
| Class A | | $ | 1,000.00 | | | $ | 907.00 | | | $ | 5.34 | | | | 1.11 | % | | $ | 1,000.00 | | | $ | 1,019.61 | | | $ | 5.65 | | | | 1.11 | % | |
| Class C | | $ | 1,000.00 | | | $ | 903.20 | | | $ | 8.92 | | | | 1.86 | % | | $ | 1,000.00 | | | $ | 1,015.83 | | | $ | 9.45 | | | | 1.86 | % | |
| Class R3 | | $ | 1,000.00 | | | $ | 905.50 | | | $ | 6.53 | | | | 1.36 | % | | $ | 1,000.00 | | | $ | 1,018.35 | | | $ | 6.92 | | | | 1.36 | % | |
| (1) | For each class, expenses are equal to the annualized expense ratio for the class, multiplied by the average account value over the period, multiplied by 184/365 (to reflect the one-half year period shown), unless otherwise indicated. |
| | |
| (2) | For each class, expenses are equal to the annualized expense ratio for the class, multiplied by the average account value over the period, multiplied by 63/365 (to reflect the period shown of June 30, 2011 (Commencement of Operations) to August 31, 2011). |
| | |
| (3) | For each class, expenses are equal to the annualized expense ratio for the class, multiplied by the average account value over the period, multiplied by 183/365 (to reflect the period shown of March 2, 2011 to August 31, 2011). |
| | |
| (4) | Hypothetical 5% annual return before expenses is calculated by multiplying the number of days in the most recent period divided by 365. |
Schedule of Investments Emerging Markets Equity Fund
| | | | | Country | | Industry | | | |
| | | | | | | | | | |
| | 1 | | | Vale SA ADR | | Brazil | | Metals & Mining | | | 2.2 | % | |
| | 2 | | | China Mobile | | China | | Wireless Telecommunication Services | | | 2.0 | % | |
| | 3 | | | Hyundai Mobis | | Korea | | Auto Components | | | 2.0 | % | |
| | 4 | | | MTN Group | | South Africa | | Wireless Telecommunication Services | | | 2.0 | % | |
| | 5 | | | Samsung Electronics | | Korea | | Semiconductors & Semiconductor Equipment | | | 1.9 | % | |
| | 6 | | | Sberbank of Russia | | Russia | | Commercial Banks | | | 1.6 | % | |
| | 7 | | | Sociedad Quimica y Minera de Chile ADR, B Shares | | Chile | | Chemicals | | | 1.6 | % | |
| | 8 | | | LUKOIL OAO ADR | | Russia | | Oil, Gas & Consumable Fuels | | | 1.5 | % | |
| | 9 | | | International Container Terminal Services | | Philippines | | Transportation Infrastructure | | | 1.5 | % | |
| | 10 | | | QGEP Participacoes | | Brazil | | Oil, Gas & Consumable Fuels | | | 1.4 | % | |


 H0599 10/11