As filed with the Securities and Exchange Commission on November 5, 2009
UNITED STATES
SECURITIES AND EXCHANGE COMMISSION
Washington, D.C. 20549
FORM N-CSR
CERTIFIED SHAREHOLDER REPORT OF
REGISTERED MANAGEMENT INVESTMENT COMPANIES
Investment Company Act file number: 811-00582
NEUBERGER BERMAN EQUITY FUNDS
(Exact Name of the Registrant as Specified in Charter)
605 Third Avenue, 2nd Floor
New York, New York 10158-0180
(Address of Principal Executive Offices – Zip Code)
Registrant's telephone number, including area code: (212) 476-8800
Robert Conti
Chief Executive Officer and President
Neuberger Berman Equity Funds
605 Third Avenue, 2nd Floor
New York, New York 10158-0180
Arthur Delibert, Esq.
K&L Gates LLP
1601 K Street, N.W.
Washington, D.C. 20006-1600
(Names and Addresses of agents for service)
Date of fiscal year end: August 31, 2009
Date of reporting period: August 31, 2009
Form N-CSR is to be used by management investment companies to file reports with the Commission not later than 10 days after the transmission to stockholders of any report that is required to be transmitted to stockholders under Rule 30e-1 under the Investment Company Act of 1940 (17 CFR 270.30e-1). The Commission may use the information provided on Form N-CSR in its regulatory, disclosure review, inspection, and policymaking roles.
A registrant is required to disclose the information specified by Form N-CSR, and the Commission will make this information public. A registrant is not required to respond to the collection of information contained in Form N-CSR unless the Form displays a currently valid Office of Management and Budget ("OMB") control number. Please direct comments concerning the accuracy of the information collection burden estimate and any suggestions for reducing the burden to Secretary, Securities and Exchange Commission, 100 F Street, NE, Washington, DC 20549-0609. The OMB has reviewed this collection of information under the clearance requirements of 44 U.S.C. § 3507.
Item 1. Reports to Shareholders.

Neuberger Berman
Equity Funds
Investor Class Shares
Trust Class Shares
Advisor Class Shares
Institutional Class Shares
Class A Shares
Class C Shares
Class R3 Shares
Climate Change Fund
Emerging Markets Equity Fund
Equity Income Fund
Focus Fund
Genesis Fund
Guardian Fund
International Fund
International Institutional Fund
International Large Cap Fund
Large Cap Disciplined Growth Fund
Mid Cap Growth Fund
Partners Fund
Real Estate Fund
Regency Fund
Select Equities Fund
Small and Mid Cap Growth Fund
Small Cap Growth Fund
Socially Responsive Fund
Annual Report
August 31, 2009
Contents
THE FUNDS
| President's Letter | | | 1 | | |
|
| PORTFOLIO COMMENTARY | |
|
| Climate Change Fund | | | 2 | | |
|
| Emerging Markets Equity Fund | | | 6 | | |
|
| Equity Income Fund | | | 10 | | |
|
| Focus Fund | | | 14 | | |
|
| Genesis Fund | | | 17 | | |
|
| Guardian Fund | | | 20 | | |
|
| International Fund | | | 24 | | |
|
| International Institutional Fund | | | 27 | | |
|
| International Large Cap Fund | | | 30 | | |
|
| Large Cap Disciplined Growth Fund | | | 34 | | |
|
| Mid Cap Growth Fund | | | 38 | | |
|
| Partners Fund | | | 42 | | |
|
| Real Estate Fund | | | 45 | | |
|
| Regency Fund | | | 48 | | |
|
| Select Equities Fund | | | 51 | | |
|
| Small and Mid Cap Growth Fund | | | 55 | | |
|
| Small Cap Growth Fund | | | 58 | | |
|
| Socially Responsive Fund | | | 62 | | |
|
| FUND EXPENSE INFORMATION | | | 70 | | |
|
| SCHEDULE OF INVESTMENTS/TOP TEN EQUITY HOLDINGS | |
|
| Climate Change Fund | | | 73 | | |
|
| Emerging Markets Equity Fund | | | 75 | | |
|
| Equity Income Fund | | | 78 | | |
|
| Focus Fund | | | 80 | | |
|
| Genesis Fund | | | 81 | | |
|
| Guardian Fund | | | 83 | | |
|
| International Fund | | | 84 | | |
|
| International Institutional Fund | | | 87 | | |
| International Large Cap Fund | | | 90 | | |
|
| Large Cap Disciplined Growth Fund | | | 93 | | |
|
| Mid Cap Growth Fund | | | 95 | | |
|
| Partners Fund | | | 97 | | |
|
| Real Estate Fund | | | 99 | | |
|
| Regency Fund | | | 100 | | |
|
| Select Equities Fund | | | 102 | | |
|
| Small and Mid Cap Growth Fund | | | 103 | | |
|
| Small Cap Growth Fund | | | 105 | | |
|
| Socially Responsive Fund | | | 107 | | |
|
| FINANCIAL STATEMENTS | | | 117 | | |
|
| FINANCIAL HIGHLIGHTS (ALL CLASSES) PER SHARE DATA | |
|
| Climate Change Fund | | | 173 | | |
|
| Emerging Markets Equity Fund | | | 173 | | |
|
| Equity Income Fund | | | 173 | | |
|
| Focus Fund | | | 175 | | |
|
| Genesis Fund | | | 175 | | |
|
| Guardian Fund | | | 177 | | |
|
| International Fund | | | 179 | | |
|
| International Institutional Fund | | | 181 | | |
|
| International Large Cap Fund | | | 181 | | |
|
| Large Cap Disciplined Growth Fund | | | 183 | | |
|
| Mid Cap Growth Fund | | | 183 | | |
|
| Partners Fund | | | 185 | | |
|
| Real Estate Fund | | | 187 | | |
|
| Regency Fund | | | 187 | | |
|
| Select Equities Fund | | | 189 | | |
|
| Small and Mid Cap Growth Fund | | | 189 | | |
|
| Small Cap Growth Fund | | | 189 | | |
|
| Socially Responsive Fund | | | 191 | | |
|
| Reports of Independent Registered Public Accounting Firms | | | 199 | | |
|
| Directory | | | 202 | | |
|
| Trustees and Officers | | | 203 | | |
|
| Proxy Voting Policies and Procedures | | | 213 | | |
|
| Quarterly Portfolio Schedule | | | 213 | | |
|
| Notice to Shareholders | | | 214 | | |
|
| Report of Votes of Shareholders | | | 215 | | |
|
"Neuberger Berman" and the Neuberger Berman logo are service marks of Neuberger Berman LLC. "Neuberger Berman Management LLC" and the individual fund names in this shareholder report are either service marks or registered service marks of Neuberger Berman Management LLC, formerly Neuberger Berman Management Inc. ©2009 Neuberger Berman Management LLC. All rights reserved.
President's Letter
Dear Fellow Shareholder,
The fiscal year ended August 31, 2009 was one of remarkable extremes, involving a series of unprecedented events affecting the financial markets and global economy as well as drastic shifts in the performance patterns of the capital markets. During the period, the S&P 500 Index closed down by roughly 18%, which included both the worst six-month market decline and the strongest six-month rally for the index since the early 1930s.
The equity market was under pressure even before the start of the reporting period, as the damaged housing market, rising unemployment, constrained consumer spending and difficult credit conditions helped undermine the economy and investor confidence. With September 2008's financial crisis, however, the situation became markedly worse. Credit markets virtually froze, stocks dropped precipitously across the globe, and investors became increasingly concerned not just about recession, but the possibility of a 1930s-style depression.
In the midst of these problems, governments worldwide took unprecedented measures to shore up liquidity and stimulate their economies, providing massive bailouts to individual financial institutions and seeking ways to support balance sheets and reduce the impact of toxic debt on the credit markets. Despite these efforts, economic news continued to be dismal for months. However, by March, signs of marginal improvement in housing and the banking sector, as well as moderating declines in other areas triggered new optimism that worst-case economic scenarios could be avoided, and led to a sharp rebound in stocks that continued, with some breaks, through the end of the reporting period.
Looking forward, we believe there continue to be risks. Although the economy appears to be improving, its long-term strength is in question: domestic consumers face many challenges including high unemployment and a relatively conservative credit environment, and corporations may become less eager to spend once depleted inventory levels are restored. Still, governments worldwide remain very serious about economic stimulus, and prospects for consumers in the emerging markets are currently considerably brighter than for their U.S. counterparts, potentially providing some support for well positioned globally oriented companies.
Even with recent gains, the past fiscal year has been enormously painful for investors. For portfolio managers who focus on fundamentals, this period has carried some unique challenges, as a largely indiscriminate equity sell-off has been followed by a period in which many low-quality stocks, which had declined precipitously, enjoyed some of the market's best returns on the upside. Still, for practitioners of long-term investing, one benefit of the steep correction was to depress the stock prices of many good companies—allowing such investors viable entry points in what they believe could be exceptional opportunities.
As always, the portfolio managers at Neuberger Berman are approaching this environment thoughtfully and with great precision. Although they do not profess to be market prognosticators, they remain highly attentive to current macroeconomic trends, as well as the development of new regulation in this era of heightened government activism. Most importantly, they remain true to their investment disciplines, looking at individual company fundamentals as well as key measures of quality, value and risk to create portfolios that they believe will serve their shareholders well over the long term. This expertise and focus on individual stock selection, I believe, will be highly valuable in the current market and economic environment.
Thank you for your continued confidence in Neuberger Berman. We look forward to serving your investment needs in the year to come.
Sincerely,

Robert Conti
President and CEO
Neuberger Berman Mutual Funds
1
Climate Change Fund Commentary
For the fiscal year ended August 31, 2009, Neuberger Berman Climate Change Fund trailed its benchmark, the MSCI World Index, as both the Fund and the index declined as a result of an unprecedented equity market environment. While the Fund was outdistanced by the more comparable HSBC Global Climate Change Index during the period, the Fund outperformed many "pure play" alternative and clean energy investment vehicles. Although extreme market volatility created a challenging environment at times during the 12-month reporting period, we are greatly encouraged by the Fund's strong performance in calendar year 2009 and are more energized than ever about the Fund's investment approach, especially given the many positive climate-change related government, industry and company-specific policies and initiatives that are developing on an ongoing basis.
Government policy momentum has been extraordinary this calendar year, with the Obama Administration and Congress introducing numerous climate-related initiatives. The American Reinvestment and Recovery Act, passed in February, provides for more than $100 billion in spending on low-carbon growth initiatives. Recently, federal agencies have begun deploying these funds in myriad ways—for example, through clean energy cash grants and loan guarantees, advanced battery/electric vehicle grants, renewable energy manufacturing tax credits, smart grid grants and cleaner transportation programs (such as "cash-for-clunkers" and natural gas vehicle incentives). On a global basis, governments are targeting "green" stimulus initiatives in the hope, not only to improve energy security and environmental benefits, but also to drive job creation; we estimate that hundreds of billions of dollars have been directed worldwide to address these issues so far. We believe that an upcoming global climate change summit in Copenhagen could stimulate even more interest in climate change issues—and by extension support opportunities in climate change-related investing.
The Climate Change Fund invests within three broad market segments—Cleaner Energy, Energy Efficiency and Climate Adaptation—carving out investment sub-themes within these areas. During the fiscal year, a number of factors supported Fund results, including relatively defensive holdings (e.g., natural gas utilities, water metering companies) with strong management teams and stocks within our alternative energy and energy storage sub-themes (within our Cleaner Energy and Energy Efficiency categories). We believe the energy storage/battery industry is poised to enter a significant expansion phase driven by higher energy costs, technological breakthroughs and domestic and international policy support; for example, the global lithium ion battery market for automotive applications alone is expected to grow exponentially over the coming decade. In alternative energy, the geothermal industry appears promising to us. Not only is it a clean, dependable and cost-effective energy solution, but it appears to have strong regulatory support (in the form of renewable electricity standards) and a seemingly abundant, although largely untapped, source of supply.
Several factors impeded Fund performance during the fiscal year, including lingering questions about commodity prices and economy-wide concerns over the availability of capital. For instance, even with continued progress toward grid parity, our solar sub-theme underperformed as the fragile credit market and softening demand gave rise to oversupply, pricing pressures, and short-term profitability concerns. The wind industry also succumbed to the weak credit market as marginal wind farms struggled to access project finance and some utilities pared back capital expenditures, which triggered concerns about turbine overcapacity. Importantly, these sectors have rebounded strongly in calendar year 2009 and we continue to believe that the long-term investment appeal of both wind and solar remains intact, with the two industries likely, in our view, to be among the top beneficiaries of government stimulus in 2010.
Although economic and credit-related fears appear to be tapering off, we believe that the Fund's diversification—by segment, geography, market capitalization and sector—remains a key advantage. The Fund continues to be overweighted in U.S. securities—largely due to policy catalysts and signs of economic stabilization—but our international exposure has continued to rise in recent months. At the close of the fiscal year, our allocation among the three investment components was as follows: 40% Cleaner Energy, 34% Energy Efficiency and 22% Climate Adaptation. Our holdings currently span market capitalizations and represent eight of 10 industrial sectors, with our largest overweights in smart grid, water service, natural gas and wind power. Cash levels are currently low as we continue to find what we consider exceptional opportunities with attractive long-term reward/risk profiles.
2
In closing, we believe that climate change-related companies could benefit from the economic recovery, especially given the potential impact of climate-related stimulus next year and ongoing political support for policy initiatives. In our view, the Fund is well positioned to capitalize on these potential short-term developments and the ongoing, long-term evolution of the world to a new "carbon constrained" reality.
Sincerely,

Ronald B. Silvestri
Portfolio Manager
Climate change-related companies may be particularly susceptible to such factors as environmental protection regulatory actions, changes in government standards and subsidy levels, changes in taxation, and other domestic and international, political, regulatory and economic developments. Such companies may also be significantly affected by the level or pace of technological change in industries focusing on energy, pollution and environmental control. Because society's focus on climate change issues is relatively new, there could be significant changes of emphasis and direction, and rapid technological change, rendering even new approaches and products obsolete. The risks associated with these investments are set forth in the prospectus and statement of additional information.
Investing in foreign securities involves greater risks than investing in securities of U.S. issuers, including currency fluctuations, changes in local economic and political conditions, and the need to operate in less regulated financial markets.
To the extent that the Fund emphasizes small-, mid- or large-cap stocks, it takes on the associated risks. At times, large-cap stocks may lag other types of stocks in performance, which could cause a fund holding those stocks to perform worse than certain other funds. Small- or mid-cap stocks may fluctuate more widely in price than the market as a whole; underperform other types of stocks or be difficult to sell when the economy is not robust or during market downturns; be more affected than other types of stocks by the underperformance of a sector emphasized by the Fund. In addition, smaller companies in which the Fund may invest are often more volatile and less liquid than the stocks of larger companies; and these companies: may have a shorter history of operations than larger companies; may not have as great an ability to raise additional capital; and may have a less diversified product line, making them more susceptible to market pressure.
The composition, industries and holdings of the Fund are subject to change. Climate Change Fund is invested in a wide array of stocks and no single holding makes up a significant portion of the Fund's total assets.
3
Climate Change Fund
TICKER SYMBOLS
| Institutional Class | | NBCLX | |
| Class A | | NBCAX | |
| Class C | | NBCCX | |
SECTOR ALLOCATION
| (% of Equity Market Value) | |
| Consumer Discretionary | | | 4.1 | % | |
| Consumer Staples | | | 0.5 | | |
| Energy | | | 9.1 | | |
| Financials | | | 2.2 | | |
| Industrials | | | 37.7 | | |
| Information Technology | | | 10.2 | | |
| Materials | | | 6.8 | | |
| Utilities | | | 28.5 | | |
| Other | | | 0.9 | | |
| Total | | | 100.0 | % | |
AVERAGE ANNUAL TOTAL RETURN1,3,10
| | | Inception
Date | | 1 Year | | Life of
Fund | |
| At NAV | |
| Institutional Class | | 05/01/2008 | | | (26.55 | %) | | | (27.05 | %) | |
| Class A | | 05/01/2008 | | | (26.77 | %) | | | (27.22 | %) | |
| Class C | | 05/01/2008 | | | (27.22 | %) | | | (27.73 | %) | |
| With Sales Charge | |
| Class A | | | | | (30.95 | %) | | | (30.37 | %) | |
| Class C | | | | | (27.92 | %) | | | (27.73 | %) | |
| Index | |
| MSCI World Index2,19 | | | | | (16.64 | %) | | | (19.29 | %) | |
Performance data quoted represent past performance, which is no guarantee of future results. The investment return and principal value of an investment will fluctuate so that an investor's shares, when redeemed, may be worth more or less than their original cost. Results are shown on a "total return" basis and include reinvestment of all dividends and capital gain distributions.
Current performance may be lower or higher than the performance data quoted. For performance data current to the most recent month end, visit www.nb.com/performance.
Neuberger Berman Management LLC has contractually agreed to limit certain expenses of the Fund through August 31, 2012 for Institutional Class, Class A and Class C shares. The net expense ratios were 1.03%, 1.28% and 2.03% for Institutional Class, Class A and C shares, respectively. As stated in the Fund's most recent prospectus, the total annual fund operating expense ratios for fiscal year 2008 were 25.07%, 16.86% and 28.63% for Institutional Class, Class A and Class C shares, respectively (prior to any fee waivers or expense reimbursements).
Total Returns shown with a sales charge reflect the deduction of the current maximum initial sales charge of 5.75% for Class A shares and the applicable contingent deferred sales charge (CDSC) for Class C shares. The maximum CDSC for Class C shares is 1% which is reduced to 0% after 1 year. The performance of the Fund's share classes will differ primarily due to different sales charge structures and class expenses. Please see the prospectus for more information about sales charge structures, if any, and class expenses for your share class.
4
Climate Change Fund
COMPARISON OF A $10,000 INVESTMENT

This chart shows the value of a hypothetical $10,000 investment in the Fund over the past 10 fiscal years, or since the Fund's inception if it has not operated for 10 years. The graph is based on the Institutional Class shares only; performance of other classes will vary due to differences in fee structures and any applicable sales charges (see Average Annual Total Return chart on previous page). The result is compared with benchmarks, which may include a broad-based market index and/or a narrower index. Please note that market indexes have not been reduced to reflect any of the fees and costs of investing. All results include the reinvestment of dividends and capital gain distributions. Neither the Fund's returns nor the market indexes shown in the graph and table reflect the effect of taxes an investor would pay on Fund distributions or on the redemption of Fund shares. Results represent past performance and do not indicate future results.
5
Emerging Markets Equity Fund Commentary
We are pleased to report that, for the period from its October 8, 2008 inception through fiscal year-end on August 31, 2009, Neuberger Berman Emerging Markets Equity Fund posted a strong positive return and outperformed its benchmark, the MSCI Emerging Markets (MSCI EM) Index.
The emerging markets, as measured by the MSCI EM Index, bottomed in October. They were extremely volatile from that point until early March, when the U.S. and developed international markets began to see improvement on the back of government stimulus plans and early indications of economic improvement. From March through the end of this reporting period, the index was up substantially, with numerous underlying countries posting high double-digit or low triple-digit returns.
During the October-August reporting period, all sectors of the index were positive, with Materials stocks performing best, up over 70%. The weakest index sector was Telecommunications, but even that closed up by 26%. China, Brazil and India contributed strongly to the index on a country basis, while Eastern European nations were relatively weak.
Beginning as it did in the midst of a tremendous worldwide equity market correction, the portfolio was well positioned from the start to employ some of the key tenets of its strategy—seeking opportunities from mispricings, and identifying quality companies selling at a discount to their underlying values.
Within the portfolio, stock selection in the Information Technology sector was excellent, and made a significant contribution to our outperformance. Wasion, a Chinese power meter firm, was a top performer for the period. Having completed an extensive build-out in generating capacity, China is now focusing spending on its electricity grid, benefiting companies like Wasion. ZTE, a Chinese telecom equipment manufacturer, was another positive contributor, on news that the company is gaining market share overseas and is likely to be a major beneficiary of increased mobile capital expenditures in China.
Stock selection in Energy also contributed to results. The Brazilian oil and gas firm Petrobras saw shares rise as prospects in Brazil's offshore oil segment improved. Addax Petroleum, a Canadian energy company with assets in West Africa and Kurdistan, was another strong performer. Addax was purchased by Chinese energy company Sinopec at a premium.
An overweight in Consumer Staples, along with solid stock selection, was also additive. Hengan International, a Chinese disposable paper hygiene products company, performed very well, although Central European Distribution, the largest producer and distributor of vodka in Poland and Russia, was among our weakest holdings, declining on concerns about Eastern European exposure and euro- and dollar-denominated debt.
Materials holdings were the largest detriment on a relative basis. Being underweight in the benchmark's top-performing sector, along with several individual disappointments, hurt relative results. Uralkali, a CIS-based potash producer, declined steeply. Potash prices had risen significantly in the first half of 2008, and fertilizer stocks throughout the world rallied. However, in what appeared to be punishment for charging market prices, the Russian government levied a large fine on the firm, damaging its prospects. Evraz was another disappointment. The Russian steel maker had become highly leveraged after several acquisitions, so when credit conditions became largely frozen early in the reporting period, the stock fell to near-bankruptcy levels. We purchased the stock well into its correction, but the severity of the economic downturn took a further toll on the share price. We recovered part of our losses before selling, but Evraz was still one of our poorest performers. Cash holdings within the portfolio, while not significant, were another slight negative in a sharply rallying market.
Looking ahead, we remain fairly cautious on the global economy. However, we expect better growth from the emerging markets than from developed nations. While there are rather large disparities among developing countries, the economic fundamentals of many emerging markets appear, in our opinion, to be strong, and, in many cases, more attractive than their developed counterparts. We think countries like China, India and Indonesia, with low public and private debt-to-GDP levels, banking systems with lower loan-to-deposit ratios, and strong potential from domestic
6
demand growth driven by large populations, offer attractive opportunities. Conversely, the indebted, export-driven economies of Taiwan, Korea and Eastern Europe are, in our opinion, less appealing.
In terms of individual stocks, the portfolio remains overweight in smaller domestic-market driven names, which we believe will continue to show secular growth despite global economic weakness. Sector overweights include Consumer Staples, Health Care, Information Technology and Industrials, and underweights include Energy and Financials.
In the face of a market that has rallied sharply since the Fund's inception, we continue to seek companies with strong fundamentals and attractive valuations across markets, using bottom-up stock selection to identify the opportunities we believe are best positioned for the longer term.
Sincerely,

Conrad Saldanha
Portfolio Manager
The risks involved in seeking capital appreciation from investments primarily in companies based outside the United States are set forth in the prospectus and statement of additional information.
Investing in foreign securities involves greater risks than investing in securities of U.S. issuers, including currency fluctuations, changes in local economic and political conditions, and the need to operate in less regulated financial markets. These risks are typically heightened for investments in emerging markets.
Investing in the stocks of even the largest companies involves all the risks of stock market investing, including the risk that they may lose value due to overall market or economic conditions.
The composition, industries and holdings of the Fund are subject to change. In an attempt to reduce overall volatility, Emerging Markets Equity Fund diversifies the portfolio holdings over a wide array of countries and individual stocks.
7
Emerging Markets Equity Fund
TICKER SYMBOLS
| Institutional Class | | NEMIX | |
| Class A | | NEMAX | |
| Class C | | NEMCX | |
SECTOR ALLOCATION
| (% of Equity Market Value) | |
| Consumer Discretionary | | | 5.6 | % | |
| Consumer Staples | | | 7.4 | | |
| Energy | | | 12.6 | | |
| Financials | | | 19.7 | | |
| Health Care | | | 3.7 | | |
| Industrials | | | 13.5 | | |
| Information Technology | | | 16.0 | | |
| Materials | | | 11.6 | | |
| Telecommunication Services | | | 8.9 | | |
| Utilities | | | 1.0 | | |
| Total | | | 100.0 | % | |
CUMULATIVE TOTAL RETURN1,3,10
| | | Inception
Date | | Cumulative Total
Return Ended 8/31/09
Life of Fund | |
| At NAV | |
| Institutional Class | | 10/08/2008 | | | 44.66 | % | |
| Class A | | 10/08/2008 | | | 44.38 | % | |
| Class C | | 10/08/2008 | | | 43.42 | % | |
| With Sales Charge | |
| Class A | | | | | 36.08 | % | |
| Class C | | | | | 42.42 | % | |
| Index | |
| MSCI Emerging Markets Index2,19 | | | | | 30.66 | % | |
Performance data quoted represent past performance, which is no guarantee of future results. The investment return and principal value of an investment will fluctuate so that an investor's shares, when redeemed, may be worth more or less than their original cost. Results are shown on a "total return" basis and include reinvestment of all dividends and capital gain distributions.
Current performance may be lower or higher than the performance data quoted. For performance data current to the most recent month end, visit www.nb.com/performance.
Neuberger Berman Management LLC has contractually agreed to limit certain expenses of the Fund through August 31, 2012 for Institutional Class, Class A and Class C shares. The net expense ratios were 1.25%, 1.50% and 2.25% for Institutional Class, Class A and Class C shares, respectively. As stated in the Fund's most recent prospectus, the total annual fund operating expense ratios for fiscal year 2008 were 2.09%, 2.45% and 3.20% for Institutional Class, Class A and Class C shares, respectively (prior to any fee waivers or expense reimbursements).
Total Returns shown with a sales charge reflect the deduction of current maximum initial sales charge of 5.75% for Class A shares and the applicable contingent deferred sales charges (CDSC) for Class C shares. The maximum CDSC for Class C shares is 1%, which is reduced to 0% after 1 year. The performance of the Fund's share classes will differ primarily due to different sales charge structures and class expenses. Please see the prospectus for more information about sales charge structures, if any, and class expenses for your share class.
8
Emerging Markets Equity Fund
COMPARISON OF A $10,000 INVESTMENT

This chart shows the value of a hypothetical $10,000 investment in the Fund over the past 10 fiscal years, or since the Fund's inception if it has not operated for 10 years. The graph is based on the Institutional Class shares only; performance of other classes will vary due to differences in fee structures and any applicable sales charges (see Cumulative Total Return chart on previous page). The result is compared with benchmarks, which may include a broad-based market index and/or a narrower index. Please note that market indexes have not been reduced to reflect any of the fees and costs of investing. All results include the reinvestment of dividends and capital gain distributions. Neither the Fund's returns nor the market indexes shown in the graph and table reflect the effect of taxes an investor would pay on Fund distributions or on the redemption of Fund shares. Results represent past performance and do not indicate future results.
9
Equity Income Fund Commentary
We are pleased to report that for the fiscal year ended August 31, 2009, Neuberger Berman Equity Income Fund outperformed its benchmark, the S&P 500 Index. In light of the investment environment, however, returns for both the Fund and the index were negative.
The past 12 months encompassed some of the most difficult economic and market conditions in memory. The S&P 500 closed down over 18% for the fiscal year, but that figure belies the quarter-by-quarter turbulence beneath it. Beginning with the Lehman bankruptcy and economic crisis that ensued, we saw enormous upheaval in financial markets. By March 2009, the market had bottomed. A bank bailout proposal and other mildly positive news supported equities in a rally that continued through August. For the full fiscal year, however, every sector of the S&P 500 closed down.
Equity Income Fund has defensive features that seek to provide value in difficult environments. The sectors we emphasize—Real Estate Investment Trusts (REITs), Utilities, Convertible Bonds and higher yielding stocks—contribute to a portfolio designed for high income and capital appreciation potential, with less volatility than the market. This strategy, along with an opportunistic cash position and successful option writing strategies, led to our outperformance for the fiscal year.
Heading into this period, we had taken profits in Energy holdings, resulting in a significant cash position. With concerns about the slowdown already underway and the potential for damage to come, we kept approximately 20% of assets in cash and cash equivalents, which helped limit the impact of ongoing upheaval. We also purchased floating rate notes, which are cash equivalents whose income advantage helped us meet yield goals.
At an average of 14%, the portfolio's Utilities holdings were at a significant overweight versus the index. This sector has defensive characteristics and attractive, often growing dividends. Although Utilities underperformed the broader index, our stock selection enhanced relative performance.
In REITs, approximately 15% of assets, we sought companies with ample cash, attractive dividends and the potential to grow their businesses and withstand economic setbacks. We generally avoided traditional commercial and industrial REITs, finding what we consider compelling opportunities elsewhere. Digital Realty, a digital storage REIT, was a top performer. The aptly named Health Care REIT, as well as GZI, a Chinese REIT, and American Campus Communities, an off-campus housing firm, were beneficial to results. Timber REIT holdings also helped relative returns. Among traditional REITs, Weingarten Realty Investors and Equity Residential disappointed.
In Convertible Bonds, the portfolio's weighting was as high as 30% recently, up from around 18% last year. From September through November, the sector came under pressure as hedge funds began deleveraging quickly, dumping securities inventory at what we consider an exceptional discount to par. In December, we sifted through the carnage and built exposure as price declines drove yields to 10-15%. Even after the market improved, we believe the yield-to-maturity and yield-to-puts of our portfolio holdings remain impressive relative to the five-year U.S. Treasury. By August, we sold certain convertible bonds after dramatic appreciation and redeployed proceeds into other bonds with, in our opinion, attractive yields, strong balance sheets and good cash flows. The portfolio's allocation was approximately 22% by the period's close.
The Fund also benefited from option writing throughout the year. We sold call options as stocks in the portfolio approached our target sell prices, allowing us the potential to enhance the income from stocks as they neared our exit prices. When possible, we also sold puts on companies we wished to own at a particular price. This also served to increase income.
The most negative impact on the portfolio this period came from an overweight in Energy, where many holdings underperformed as oil prices declined from approximately $140 per barrel to $40 within seven months. We also owned energy-related Canadian Income Trusts. Holdings such as Hugoton Royalty Trust, Canadian Oil Sands Trust and Cathedral Energy suffered doubly as the Canadian dollar weakened toward year-end.
10
The Fund was significantly underweighted in Consumer Discretionary and Staples stocks versus the S&P 500, on concerns about high unemployment, declining home prices, limited access to credit, and a slowdown in U.S. consumer spending. Although REITs fall under the category of Financials, the portfolio was underweighted in traditional bank stocks versus the index. This hurt relative performance during the rally, but benefited the portfolio for the full year. For a brief time, the Fund owned JPMorgan Chase and Bank of America but sold these positions when we became uncertain about earnings as government intervention continued.
Going forward, our approach is optimistic but relatively cautious. We believe the Fund is well positioned to take advantage of improvements in the broader market, while limiting exposure to volatility and providing a competitive yield. The portfolio's cash position is down. In Energy, we expect benefits as oil prices rise on diminished production and increasing demand. The portfolio is overweighted in Materials, with holdings including Freeport-McMoRan Copper & Gold and Royal Gold serving as a hedge against a potentially weaker U.S. dollar. We expect to continue to find opportunity in Convertibles and select non-traditional REITs. Finally, the Fund remains underweighted in companies dependent on the U.S. consumer, instead looking to overweight those we believe have great assets, sustainable business models and an ability to continuously grow in a capital-constrained world.
Sincerely,


Richard S. Levine, Tony Gleason and Sandy Pomeroy
Portfolio Co-Managers
The risks involved in seeking capital appreciation from investments in a wide array of stocks are set forth in the prospectus and statement of additional information.
Small- and mid-capitalization stocks are more vulnerable to financial risks and other risks than stocks of larger companies. They also trade less frequently and in lower volume than larger company stocks, so their market prices tend to be more volatile.
Investing in the stocks of even the largest companies involves all the risks of stock market investing, including the risk that they may lose value due to overall market or economic conditions.
The composition, industries and holdings of the Fund are subject to change. Equity Income Fund is invested in a wide array of stocks and no single holding makes up a significant portion of the Fund's total assets.
11
Equity Income Fund
TICKER SYMBOLS
| Institutional Class | | NBHIX | |
| Class A | | NBHAX | |
| Class C | | NBHCX | |
SECTOR ALLOCATION
| (% of Equity Market Value) | |
| Consumer Discretionary | | | 2.0 | % | |
| Consumer Staples | | | 6.8 | | |
| Energy | | | 14.5 | | |
| Financials | | | 22.5 | | |
| Health Care | | | 1.7 | | |
| Industrials | | | 2.1 | | |
| Information Technology | | | 1.8 | | |
| Materials | | | 3.7 | | |
| Telecommunication Services | | | 1.7 | | |
| Utilities | | | 14.1 | | |
| Other | | | 29.1 | | |
| Total | | | 100.0 | % | |
AVERAGE ANNUAL TOTAL RETURN1,3
| | | Inception
Date | | 1 Year | | Life of
Fund | |
| At NAV | |
| Institutional Class | | 06/09/2008 | | | (15.54 | %) | | | (0.94 | %) | |
| Class A17 | | 06/09/2008 | | | (16.01 | %) | | | (1.13 | %) | |
| Class C17 | | 06/09/2008 | | | (16.60 | %) | | | (1.44 | %) | |
| With Sales Charge | |
| Class A17 | | | | | (20.81 | %) | | | (3.18 | %) | |
| Class C17 | | | | | (17.42 | %) | | | (1.44 | %) | |
| Index | |
| S&P 500 Index2,19 | | | | | (18.25 | %) | | | (7.76 | %) | |
Performance data quoted represent past performance, which is no guarantee of future results. The investment return and principal value of an investment will fluctuate so that an investor's shares, when redeemed, may be worth more or less than their original cost. Results are shown on a "total return" basis and include reinvestment of all dividends and capital gain distributions.
Current performance may be lower or higher than the performance data quoted. For performance data current to the most recent month end, visit www.nb.com/performance.
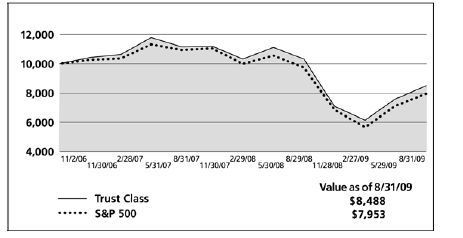
During the period from November 2, 2006 through June 9, 2008, the Fund's Trust Class had only one investor, which could have impacted Fund performance. The inception date for the Fund's Institutional Class, Class A and Class C shares was June 9, 2008. Performance shown for the Institutional Class, Class A and Class C shares prior to that date is that of the Trust Class, which had an inception date of November 2, 2006 and converted into Institutional Class shares and ceased operations on June 9, 2008.
Neuberger Berman Management LLC has contractually agreed to limit certain expenses of the Fund through August 31, 2012 for Institutional Class, Class A and Class C shares. The net expense ratios were 0.85%, 1.23% and 1.98% for Institutional Class, Class A and Class C shares, respectively. As stated in the Fund's most recent prospectus, the total annual fund operating expense ratios for fiscal year 2008 were 3.41%, 5.73% and 7.00% for Institutional Class, Class A and Class C shares, respectively (prior to any fee waivers or expense reimbursements).
Total Returns shown with a sales charge reflect the deduction of current maximum initial sales charge of 5.75% for Class A shares and the applicable contingent deferred sales charges (CDSC) for Class C shares. The maximum CDSC for Class C shares is 1%, which is reduced to 0% after 1 year. The performance of the Fund's share classes will differ primarily due to different sales charge structures and class expenses. Please see the prospectus for more information about sales charge structures, if any, and class expenses for your share class.
12
Equity Income Fund
COMPARISON OF A $10,000 INVESTMENT (WITH SALES CHARGE)

This chart shows the value of a hypothetical $10,000 investment in the Fund over the past 10 fiscal years, or since the Fund's inception if it has not operated for 10 years. The graph is based on the Class A shares only; performance of other classes will vary due to differences in fee structures and any applicable sales charges (see Average Annual Total Return chart on previous page). The result is compared with benchmarks, which may include a broad-based market index and/or a narrower index. Please note that market indexes have not been reduced to reflect any of the fees and costs of investing. All results include the reinvestment of dividends and capital gain distributions. Neither the Fund's returns nor the market indexes shown in the graph and table reflect the effect of taxes an investor would pay on Fund distributions or on the redemption of Fund shares. Results represent past performance and do not indicate future results.
13
Focus Fund Commentary
The fiscal year ended August 31, 2009 was a period of unprecedented market volatility as fallout from the credit crisis triggered a substantial decline, which was followed by a rally as governments responded worldwide. Although Neuberger Berman Focus Fund was able to regain a substantial amount of lost ground and roughly match the performance of its S&P 500 benchmark in the second half of the fiscal year, it recorded a loss and trailed the index for the full period.
Health Care investments had the most negative effect on performance relative to the benchmark. Two disappointing holdings in this sector were joint replacement manufacturer Zimmer Holdings and biotechnology company Genzyme. In the case of Zimmer, management's failure to quickly and effectively address issues regarding payments to doctors resulted in a loss of business momentum in a highly competitive market. We eliminated the position, but not before sustaining a substantial loss. Genzyme shares fell when one of its major plants failed an FDA inspection and then encountered manufacturing issues at the plant, causing an extended shut-down. We expect the plant to be fully functional by late November, which we consider a big first step in Genzyme's potential road to recovery.
Financials sector investments also underperformed, with Bank of America and Citigroup detracting from results. Citigroup had been a long-standing portfolio holding. We held onto the position throughout much of the credit crisis with the belief that the company would be able to weather the turmoil and ultimately emerge as a stronger entity. However, as the economy grew increasingly dire in the fourth quarter of calendar year 2008 and the stock market experienced a precipitous decline, in our view it became a real possibility that Citigroup might not survive. So, we gradually sold the position and took steep losses, albeit at much higher price levels than where Citigroup bottomed a few months later. We purchased Bank of America after the stock dropped 30% off its recent high because we felt that the risk/reward looked compelling. Yet when the federal government stepped in a few months later to inject capital into the company, we believed the risk to common shareholders became too severe. We therefore exited the position, again at a sharp loss, but several weeks before the stock reached its bottom. The Fund maintains exposure to the higher quality, better capitalized Financials that have and, we believe, should continue to benefit as the market stabilizes.
Consumer Discretionary sector investments posted a solid gain versus a loss for the corresponding S&P 500 sector component. Helped by particularly strong sales in its Olive Garden division, casual dining company Darden Restaurants enjoyed a gain for the period (although we then sold the position at an overall loss). Off-price retailer TJX was one of the few retailers to record sales growth over the last 12 months. The company's ability to access better brands (a result of the weak sales for full-price retailers) helped boost sales.
Although our Energy sector investments recorded a substantial loss, they outperformed the benchmark sector component by a sizable margin. Our focus on exploration and production companies with the lowest finding and development costs, which make them less leveraged to energy prices, helped limit the damage in this, the S&P 500's second worst performing sector. Range Resources, was the Fund's best Energy sector performer.
Reluctantly putting on our economic forecasting hat, we remain cautiously optimistic. We think the doomsday "Great Depression II" scenario is now highly unlikely. However, we question whether the V-shaped recovery equities investors appear to be anticipating will materialize. The economy has come a long way in the last six months, but this may be more a function of the replenishment of severely depleted inventories and government programs temporarily stimulating consumer spending than an indication of more normalized demand-driven growth.
Over the last six months, we believe investor confidence in a strong economic recovery and appetite for risk have increased significantly as evidenced by the superior performance of economically sensitive sectors such as Financials, Industrials, Materials and Energy and big moves in what we consider lower quality, more speculative issues. If economic growth fails to meet what may be optimistic expectations, we believe that today's market leaders are probably vulnerable. We think that focusing on undervalued companies that can sustain respectable cash flow and earnings growth even in a less vibrant economy could be a relatively satisfactory approach in the year ahead.
14
Sincerely,

David Levine
Portfolio Manager
Because the Fund is concentrated in a small number of stocks, it will be substantially overweighted or underweighted in certain economic sectors at any given time. Therefore its performance is likely to be disproportionately affected by the factors influencing those sectors and may suffer if certain economic sectors it emphasizes do not perform as expected. The risks associated with these investments are set forth in the prospectus and statement of additional information.
Small- and mid-capitalization stocks are more vulnerable to financial risks and other risks than stocks of larger companies. They also trade less frequently and in lower volume than larger company stocks, so their market prices tend to be more volatile. Large-cap stocks are subject to all the risks of stock market investing, including the risk that they may lose value.
The composition, industries and holdings of the Fund are subject to change.
15
Focus Fund
TICKER SYMBOLS
| Investor Class | | NBSSX | |
| Trust Class | | NBFCX | |
| Advisor Class | | NBFAX | |
SECTOR ALLOCATION
| (% of Equity Market Value) | |
| Consumer Discretionary | | | 8.7 | % | |
| Consumer Staples | | | 12.6 | | |
| Energy | | | 14.4 | | |
| Financials | | | 12.7 | | |
| Health Care | | | 16.6 | | |
| Industrials | | | 11.1 | | |
| Information Technology | | | 20.5 | | |
| Utilities | | | 3.4 | | |
| Total | | | 100.0 | % | |
AVERAGE ANNUAL TOTAL RETURN1,3,9
| | | Inception
Date | | 1 Year | | 5 Years | | 10 Years | | Life of
Fund | |
| Investor Class | | 10/19/1955 | | | (21.06 | %) | | | 0.27 | % | | | 2.02 | % | | | 10.21 | % | |
| Trust Class | | 08/30/1993 | | | (21.21 | %) | | | 0.06 | % | | | 1.82 | % | | | 10.22 | % | |
| Advisor Class | | 09/03/1996 | | | (21.45 | %) | | | (0.17 | %) | | | 1.58 | % | | | 10.17 | % | |
| S&P 500 Index2,19 | | | | | (18.25 | %) | | | 0.49 | % | | | (0.79 | %) | | | 9.61 | % | |
Performance data quoted represent past performance, which is no guarantee of future results. The investment return and principal value of an investment will fluctuate so that an investor's shares, when redeemed, may be worth more or less than their original cost. Results are shown on a "total return" basis and include reinvestment of all dividends and capital gain distributions.
Current performance may be lower or higher than the performance data quoted. For performance data current to the most recent month end, visit www.nb.com/performance.
As stated in the Fund's most recent prospectus, the total annual fund operating expense ratios for fiscal year 2008 were 0.90%, 1.12% and 1.35% for Investor Class, Trust Class and Advisor Class shares, respectively.
COMPARISON OF A $10,000 INVESTMENT
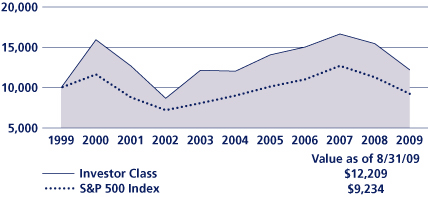
This chart shows the value of a hypothetical $10,000 investment in the Fund over the past 10 fiscal years, or since the Fund's inception if it has not operated for 10 years. The graph is based on the Investor Class shares only; performance of other classes will vary due to differences in fee structures and any applicable sales charges (see Average Annual Total Return chart above). The result is compared with benchmarks, which may include a broad-based market index and/or a narrower index. Please note that market indexes have not been reduced to reflect any of the fees and costs of investing. All results include the reinvestment of dividends and capital gain distributions. Neither the Fund's returns nor the market indexes shown in the graph and table reflect the effect of taxes an investor would pay on Fund distributions or on the redemption of Fund shares. Results represent past performance and do not indicate future results.
16
Genesis Fund Commentary
U.S. stocks mounted a sustained rally following the early March market bottom. However, this advance failed to compensate for the sharp sell-off during the first half of the fiscal year ended August 31, 2009. For the full 12-month period, all 10 Russell 2000® Index sectors declined, with four finishing down 20% or more. Neuberger Berman Genesis Fund recorded strongly positive returns in the second half of the period but finished in negative territory, lagging its Russell 2000 benchmark.
The disappointing relative returns of Health Care and Consumer Discretionary sector investments were largely responsible for the Fund's underperformance versus the benchmark. We made some mistakes, most notably ArthroCare and K-V Pharmaceutical Company, both of which suffered company-specific problems and were eliminated from the portfolio. Contract research companies Pharmaceutical Product Development and ICON PLC also performed poorly as large pharmaceuticals responded to potential changes in the health care system by reducing research and development spending. We believe this is a temporary phenomenon and that once "big pharma" increases R&D spending, these two well-positioned companies will rebound. Radio rating services company Arbitron and casket and headstone manufacturer Matthews International were the poorest performing Consumer Discretionary investments. Arbitron's struggles are tied to the pressures facing its primary customers—radio operators which have been experiencing a severe advertising slump. We have meaningfully reduced our position in Arbitron. As for Matthews, this is a classic "Steady Eddie" company with strong competitive positions in stable end markets. Due largely to the severe recession and a decline in the nation's death rate for 2009, Matthews is on track to have modestly down earnings for the year—a disappointing performance for investors who had become accustomed to consistently increasing earnings during the past several years. As a result, the stock was not able to keep pace with the overall Consumer Discretionary segment during the fiscal year.
Although the portfolio was overweighted in Energy—the Russell 2000's worst performing sector—and our holdings declined sharply, they outpaced sector counterparts and made a positive contribution to relative performance. Our bias toward exploration and production companies such as Southwestern Energy and Concho Resources, which have solid balance sheets and have been steadily increasing production and reserves on an economic basis, was the primary reason our holdings outperformed the corresponding benchmark component by a wide margin. Financials holdings also outperformed. The portfolio was significantly underweighted in Financials and our avoidance of the most credit-sensitive financial businesses helped us escape much of the damage in this hard-hit sector.
Over the last six months we have witnessed a sea change in investor sentiment. Investors have gone from asking, "How bad will it get?" to "How good is it going to be?" We believe that investor confidence in a strong global economic recovery is reflected in their renewed appetite for risk. To wit, from the Russell 2000 bottom on March 9, 2009 through August 31, 2009, lower quality, more speculative stocks—as measured by return on equity, price/projected earnings, market capitalization range and stock price (stocks trading under $5 per share)—have outperformed by a wide margin. Historically, Genesis has lagged its benchmark during such periods due to our focus on owning high quality businesses.
Moreover, we are not so confident that the current economic rebound is sustainable. We believe that recent improvement in the U.S. economy is primarily the result of rebuilding inventories that were decimated when the "economic sky was falling." In addition, government programs may have temporarily reinvigorated consumer spending. Once inventories are brought in line with still relatively weak domestic demand and government incentives for consumer spending are reduced or eliminated, we believe the economy may lose momentum.
Our long-held approach of seeking a diversified portfolio of high quality, financially strong companies selling at average to below-average prices remains intact. We have overlaid this approach with several macroeconomic themes. Consequently, we continue to underweight sectors such as Consumer Discretionary and Financials (specifically, credit-sensitive businesses such as banking, consumer credit companies and real estate investment trusts) that are highly dependent on the still overleveraged American consumer. Also, we continue to overweight sectors such as Energy, select Materials and agriculture-related Industrials, which we believe should continue to benefit from increasing emerging market demand. We also remain committed to less economically sensitive businesses, such as "Steady Eddies" and Health Care. We believe
17
these strategies could lead to superior relative performance if our reservations regarding the durability of a vibrant economic recovery prove justified. If economic growth exceeds our expectations, we believe the portfolio's overweights in Energy, Materials and select Industrials should help Genesis participate in any extended stock-market advance.
Sincerely,


Judith M. Vale and Robert D'Alelio
Portfolio Co-Managers
The risks involved in seeking capital appreciation from investments primarily in companies with small market capitalization are set forth in the prospectus and statement of additional information.
Small- and mid-capitalization stocks are more vulnerable to financial risks and other risks than stocks of larger companies. They also trade less frequently and in lower volume than larger company stocks, so their market prices tend to be more volatile.
The composition, industries and holdings of the Fund are subject to change. Genesis Fund is invested in a wide array of stocks and no single holding makes up a significant portion of the Fund's total assets.
18
Genesis Fund
TICKER SYMBOLS
| Investor Class | | NBGNX | |
| Trust Class | | NBGEX | |
| Advisor Class | | NBGAX | |
| Institutional Class | | NBGIX | |
SECTOR ALLOCATION
| (% of Equity Market Value) | |
| Consumer Discretionary | | | 4.9 | % | |
| Consumer Staples | | | 8.1 | | |
| Energy | | | 14.6 | | |
| Financials | | | 10.3 | | |
| Health Care | | | 18.7 | | |
| Industrials | | | 25.0 | | |
| Information Technology | | | 10.5 | | |
| Materials | | | 6.7 | | |
| Utilities | | | 1.2 | | |
| Total | | | 100.0 | % | |
AVERAGE ANNUAL TOTAL RETURN1,3
| | | Inception
Date | | 1 Year | | 5 Years | | 10 Years | | Life of
Fund | |
| Investor Class | | 09/27/1988 | | | (25.72 | %) | | | 5.52 | % | | | 10.48 | % | | | 11.84 | % | |
| Trust Class | | 08/26/1993 | | | (25.73 | %) | | | 5.48 | % | | | 10.44 | % | | | 11.84 | % | |
| Advisor Class | | 04/02/1997 | | | (25.95 | %) | | | 5.20 | % | | | 10.15 | % | | | 11.65 | % | |
| Institutional Class7 | | 07/01/1999 | | | (25.55 | %) | | | 5.74 | % | | | 10.74 | % | | | 11.97 | % | |
| Russell 2000® Index2,19 | | | | | (21.29 | %) | | | 2.21 | % | | | 4.30 | % | | | 8.29 | % | |
Performance data quoted represent past performance, which is no guarantee of future results. The investment return and principal value of an investment will fluctuate so that an investor's shares, when redeemed, may be worth more or less than their original cost. Results are shown on a "total return" basis and include reinvestment of all dividends and capital gain distributions.
Current performance may be lower or higher than the performance data quoted. For performance data current to the most recent month end, visit www.nb.com/performance.
As stated in the Fund's most recent prospectus, the total annual fund operating expense ratios for fiscal year 2008 were 1.04%, 1.11%, 1.37% and 0.86% for Investor Class, Trust Class, Advisor Class and Institutional Class shares, respectively. Neuberger Berman Management LLC has contractually agreed to limit certain expenses of the Fund through August 31, 2019 for Institutional Class shares.
COMPARISON OF A $10,000 INVESTMENT
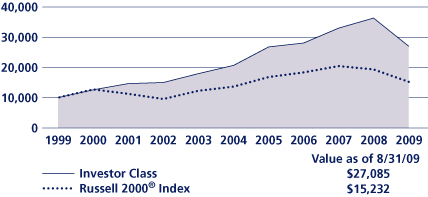
This chart shows the value of a hypothetical $10,000 investment in the Fund over the past 10 fiscal years, or since the Fund's inception if it has not operated for 10 years. The graph is based on the Investor Class shares only; performance of other classes will vary due to differences in fee structures and any applicable sales charges (see Average Annual Total Return chart above). The result is compared with benchmarks, which may include a broad-based market index and/or a narrower index. Please note that market indexes have not been reduced to reflect any of the fees and costs of investing. All results include the reinvestment of dividends and capital gain distributions. Neither the Fund's returns nor the market indexes shown in the graph and table reflect the effect of taxes an investor would pay on Fund distributions or on the redemption of Fund shares. Results represent past performance and do not indicate future results.
19
Guardian Fund Commentary
For the fiscal year ended August 31, 2009, Neuberger Berman Guardian Fund underperformed its benchmark, the S&P 500 Index. Within an overwhelmingly down market, performance for both the Fund and the index was negative.
In September 2008, the macroeconomic environment appeared dire, and markets sold off indiscriminately. Credit was constrained, business and consumer spending collapsed, and capacity utilization plummeted as businesses aggressively liquidated inventory. By early calendar year 2009, evidence suggested to us that this unprecedented global inventory destocking was ending, shifting toward a replenishment cycle.
Subsequent to the March equity market low, we have seen a significant rebound in global industrial production as businesses position to restock inventory. Over this period, the global economy has also benefited from various stimulus packages, reopened credit markets, low interest rates, and generally healthy corporate balance sheets. Together these factors added to optimism, and the markets rallied strongly. While the economy is clearly enjoying a vigorous near-term bounce, we believe consumers need to deleverage, and that the government's serious fiscal problems must also be addressed to remove long-term headwinds for economic growth. We are also concerned about pockets of excess industrial capacity in light of lower demand, and are cautious about growth rates and fundamentals when the inventory boost ends.
As long-term investors, we made few changes to the types of companies we own, except for selective repositioning for the "post-Lehman bankruptcy" environment. Turnover remains relatively low, and our adjustments have been thoughtful, careful and aligned with our longer-term strategy. We continue focusing on businesses whose growth, we believe, is less dependent on a vibrant global economy. In our opinion, most holdings either have recession-resistant businesses, or some strategic advantage that should allow them to gain market share to offset cyclical pressure presented by a weak economy.
We used last year's volatility to add to and introduce such names at attractive valuations. For example, while the newspaper business is weak, we own Washington Post Company for its high-growth Kaplan education business—Kaplan is enjoying extraordinary growth as American workers return to school to add credentials and improve their employment prospects.
Intuit, a top performer, is another example. Intuit provides individual and business productivity software and services including TurboTax, Quicken and QuickBooks. Through marketing initiatives, Intuit has grown its business and acquired new small- and medium-sized business customers during a period of economic weakness. For instance, the company has introduced a free version of the QuickBooks general ledger accounting system. This version demonstrates the software's value proposition—low cost and compelling benefits—and from there, Intuit can offer a full suite of paid services, such as payroll and payment systems, and web hosting.
We are currently limiting exposure to credit-sensitive Financials, as credit losses are rising, and the business models and earnings potential of the post-2008 world are still unclear. Within the Consumer Discretionary sector, we are avoiding retailers, expecting that consumer spending will be more measured. Finally, we are avoiding deep cyclicals; these include many Materials-related businesses and Industrial sector companies that depend on high capacity utilization rates for growth. All of these areas have enjoyed strong rallies off of the March lows.
Within a wildly divergent market—down following the Lehman bankruptcy then sharply higher—individual stock performance over this reporting period had more to do with the timing of specific purchases and sales. For instance, our top performer was IntercontinentalExchange, whose volume growth, we believe, should continue with increased regulation of securities markets. We added Praxair, a resilient, well-run business, during the valuation opportunity in 2008. Yahoo is in a turnaround, with a solid balance sheet, no debt, a low price-to-cash flow ratio and strong positioning for an ad-spending recovery, and Markel is one of the largest participants in the fragmented specialty insurance sector. We bought it at a meaningful discount, and believe it is positioned to grow. All of these holdings were new to the portfolio and were initially purchased prior to the rally from the March lows.
Among poor performers, we continue to own cable and component distributor Anixter. While disappointing for the August reporting period, it has been a strong performer in calendar year 2009. We eliminated Weingarten Realty Investors
20
and American Express last fall on concerns about credit markets. We sold Liberty Global but held Comcast, a resilient business that has enjoyed improved share price performance recently. We also sold Petroleo Brasiliero and added to our position in BG Group. While Petroleo Brasiliero needed additional leverage to finance growth, BG Group has an immaculate balance sheet, and has been an opportunistic buyer of energy properties.
True to our successful long-term strategy, we continue to manage the portfolio with a three- to five-year view, looking for businesses with advantaged growth. After performing better than the index during much of calendar year 2009, we lost ground in August as investors favored the "cyclical bounce" stocks we consider risky. We are encouraged by the prospects for our companies and think the portfolio is well positioned for growth within the more challenging environment we foresee. As always, we look forward to continuing to serve your investment needs.
Sincerely,

Arthur Moretti
Portfolio Manager
The risks involved in seeking capital appreciation from investments primarily in mid- to large-cap stocks are set forth in the prospectus and statement of additional information.
Mid-capitalization stocks are more vulnerable to financial risks and other risks than larger stocks. They are generally less liquid than larger stocks, so their market prices tend to be more volatile. Large-cap stocks are subject to all the risks of stock market investing, including the risk that they may lose value.
The composition, industries and holdings of the Fund are subject to change. Guardian Fund is invested in a wide array of stocks and no single holding makes up a significant portion of the Fund's total assets.
21
Guardian Fund
TICKER SYMBOLS
| Investor Class | | NGUAX | |
| Trust Class | | NBGTX | |
| Advisor Class | | NBGUX | |
| Institutional Class | | NGDLX | |
| Class A | | NGDAX | |
| Class C | | NGDCX | |
| Class R3 | | NGDRX | |
SECTOR ALLOCATION
| (% of Equity Market Value) | |
| Consumer Discretionary | | | 16.6 | % | |
| Energy | | | 12.9 | | |
| Financials | | | 14.1 | | |
| Health Care | | | 7.8 | | |
| Industrials | | | 18.8 | | |
| Information Technology | | | 23.9 | | |
| Materials | | | 3.2 | | |
| Utilities | | | 2.7 | | |
| Total | | | 100.0 | % | |
AVERAGE ANNUAL TOTAL RETURN1,3,8,15
| | | Inception
Date | | 1 Year | | 5 Years | | 10 Years | | Life of
Fund | |
| At NAV | |
| Investor Class | | 06/01/1950 | | | (22.65 | %) | | | 1.74 | % | | | 1.28 | % | | | 10.81 | % | |
| Trust Class | | 08/03/1993 | | | (22.74 | %) | | | 1.59 | % | | | 1.15 | % | | | 10.78 | % | |
| Advisor Class | | 09/03/1996 | | | (23.05 | %) | | | 1.13 | % | | | 0.74 | % | | | 10.67 | % | |
| Institutional Class22 | | 05/27/2009 | | | (22.58 | %) | | | 1.76 | % | | | 1.29 | % | | | 10.81 | % | |
| Class A21 | | 05/27/2009 | | | (22.61 | %) | | | 1.75 | % | | | 1.29 | % | | | 10.81 | % | |
| Class C21 | | 05/27/2009 | | | (22.83 | %) | | | 1.70 | % | | | 1.26 | % | | | 10.80 | % | |
| Class R321 | | 05/27/2009 | | | (22.68 | %) | | | 1.74 | % | | | 1.28 | % | | | 10.80 | % | |
| With Sales Charge | |
| Class A21 | | | | | (27.06 | %) | | | 0.56 | % | | | 0.69 | % | | | 10.70 | % | |
| Class C21 | | | | | (23.50 | %) | | | 1.70 | % | | | 1.26 | % | | | 10.80 | % | |
| Index | |
| S&P 500 Index2,19 | | | | | (18.25 | %) | | | 0.49 | % | | | (0.79 | %) | | | 10.75 | % | |
Performance data quoted represent past performance, which is no guarantee of future results. The investment return and principal value of an investment will fluctuate so that an investor's shares, when redeemed, may be worth more or less than their original cost. Results are shown on a "total return" basis and include reinvestment of all dividends and capital gain distributions.
Current performance may be lower or higher than the performance data quoted. For performance data current to the most recent month end, visit www.nb.com/performance.
Neuberger Berman Management LLC has contractually agreed to limit certain expenses of the Fund through August 31, 2019 for Advisor Class shares, through August 31, 2012 for Institutional Class shares and through August 31, 2013 for Class A, Class C and Class R3 shares. The net expense ratios were 1.51%, 0.76%, 1.11%, 1.86% and 1.36% for Advisor Class, Institutional Class, Class A, Class C and Class R3 shares, respectively. As stated in the Fund's most recent prospectus, the total annual fund operating expense ratios for fiscal year 2008 were 0.90%, 1.07%, 3.44%, 0.78%, 1.21%, 1.96% and 1.41% for Investor Class, Trust Class, Advisor Class, Institutional Class, Class A, Class C and Class R3 shares, respectively (prior to any fee waivers or expense reimbursements).
Total Returns shown with a sales charge reflect the deduction of current maximum initial sales charge of 5.75% for Class A shares and the applicable contingent deferred sales charges (CDSC) for Class C shares. The maximum CDSC for Class C shares is 1%, which is reduced to 0% after 1 year. The performance of the Fund's share classes will differ primarily due to different sales charge structures and class expenses. Please see the prospectus for more information about sales charge structures, if any, and class expenses for your share class.
22
Guardian Fund
COMPARISON OF A $10,000 INVESTMENT

This chart shows the value of a hypothetical $10,000 investment in the Fund over the past 10 fiscal years, or since the Fund's inception if it has not operated for 10 years. The graph is based on the Investor Class shares only; performance of other classes will vary due to differences in fee structures and any applicable sales charges (see Average Annual Total Return chart on previous page). The result is compared with benchmarks, which may include a broad-based market index and/or a narrower index. Please note that market indexes have not been reduced to reflect any of the fees and costs of investing. All results include the reinvestment of dividends and capital gain distributions. Neither the Fund's returns nor the market indexes shown in the graph and table reflect the effect of taxes an investor would pay on Fund distributions or on the redemption of Fund shares. Results represent past performance and do not indicate future results.
23
International Fund Commentary
For the fiscal year ended August 31, 2009, Neuberger Berman International Fund underperformed its benchmark, the MSCI EAFE® Index. While both the Fund and the index posted double-digit positive returns in calendar year 2009, returns for the full period were negative.
This was a tremendously difficult time for world's economies and equity markets, with steep declines in the EAFE Index from the beginning of the reporting period through early March 2009. Although markets rallied subsequently, the extremely bearish environment that endured through much of the period overwhelmed more recent improvements. For the full fiscal year, all sectors within the EAFE were down, with Consumer Staples performing best on a relative basis, and Materials declining most. Every country in the index declined except Spain, which was up less than 1%.
Because this report covers two distinctly different market environments—one in which defensive positioning was beneficial, and one in which cyclical companies outperformed—overall themes are not readily apparent. Taking the period as a whole, the market sectors that fared best included Consumer Staples, Telecommunications, Health Care and Consumer Discretionary. Materials, Information Technology, Financials, Utilities, Industrials and Energy were relatively weak. Throughout the period, our holdings reflected our commitment to our QuaRP (quality at a reasonable price) philosophy.
During the fiscal year, the Fund benefited on a relative basis from a lack of exposure to the weak Utilities sector, which, although usually defensive, underperformed. Given that we are QuaRP investors, Utilities companies rarely meet our requirements, tending to be lower growth, highly capital intensive, and highly regulated businesses. Stock selection within Telecommunications was also additive, and stock selection was beneficial within Materials as well. Initiated at a favorable time, our position in French chemical company Arkema was among the portfolio's top performers. However, Wacker Chemie, a German chemical company, lagged and was eliminated from the portfolio. While its solar business remains strong, Wacker's more cyclical chemical business has recently hampered company results. Finally, in a decidedly negative market, the Fund's somewhat higher-than-average level of cash and cash equivalents was another benefit.
In terms of detractors, the performance of some of the portfolio's Industrial holdings was disappointing. Vallourec, a French maker of seamless steel tubing and connectors used in deepwater drilling for natural gas, was our poorest performer. The stock was hurt by a soft U.S. gas market, and was sold. Health Care was another area of weakness. Within Energy, Addax Petroleum, a Canadian company with assets in West Africa and Kurdistan, was the Fund's top contributor. The company was taken over by Chinese energy company Sinopec during the period and was sold. Cameco, a Canadian uranium company, was also among our strongest performers. As governments worldwide look for ways to increase energy production with a lower carbon footprint, Cameco has benefited. However, Fund holdings underperformed the benchmark sector component, with disappointments including Paladin, a smaller-cap, lower-production Australian uranium company which has been eliminated from the portfolio. Canadian Natural Resources, a higher cost oil producer that was disproportionately impacted as commodity prices declined, also underperformed. We sold the stock early in the period. In Information Technology, an overweight and stock selection worked against us. While Canadian data specialist MacDonald Dettwiler was one of our best holdings, British electronics firm Laird PLC was one of the weakest and was sold. Our slight underweight and stock selection in Consumer Discretionary stocks were a headwind in this environment.
Within the troubled Financials sector, portfolio holdings had mixed results. On the positive side, Deutsche Boerse, operator of the Frankfurt stock exchange and an electronic and derivatives exchange, saw earnings exceed expectations, and performed very well. We believe the company should benefit further as new regulations move over-the-counter financial instruments to exchanges. Norwegian commercial bank DnB NOR returned to favor, as investors appeared to have considered its risks and opportunities more rationally. However, Swiss Re, an insurer of primary insurance companies, was sold from the portfolio after experiencing losses greater than we had anticipated. Piraeus, a Greek bank, declined on economic concerns and was eliminated from the portfolio. And French insurance company, Euler Hermes, was another significant disappointment that was sold. Overall, Fund holdings underperformed the benchmark in the sector.
24
Looking ahead, we continue to be fairly cautious on the global economy, expecting a protracted and muted recovery. While remaining somewhat defensive, we are adding cyclical names on a stock-by-stock basis where we find valuations compelling after lowered assumptions for revenue growth and margin expansion. In these markets, we continue to remain focused on our QuaRP discipline, seeking high quality, financially strong companies with good organic growth opportunities—an approach that we believe can deliver superior returns over the long run.
Sincerely,

Benjamin Segal
Portfolio Manager
The Fund is currently closed to new investors.
The risks involved in seeking capital appreciation from investments primarily in companies based outside the United States are set forth in the prospectus and statement of additional information.
Investing in foreign securities involves greater risks than investing in securities of U.S. issuers, including currency fluctuations, changes in local economic and political conditions, and the need to operate in less regulated financial markets. These risks are typically heightened for investments in emerging markets.
The composition, industries and holdings of the Fund are subject to change. In an attempt to reduce overall volatility, International Fund diversifies the portfolio holdings over a wide array of countries and individual stocks.
25
International Fund
TICKER SYMBOLS
| Investor Class | | NBISX | |
| Trust Class | | NBITX | |
SECTOR ALLOCATION
| (% of Equity Market Value) | |
| Consumer Discretionary | | | 8.9 | % | |
| Consumer Staples | | | 14.0 | | |
| Energy | | | 9.4 | | |
| Financials | | | 18.3 | | |
| Health Care | | | 10.6 | | |
| Industrials | | | 13.9 | | |
| Information Technology | | | 7.7 | | |
| Materials | | | 9.3 | | |
| Telecommunication Services | | | 7.9 | | |
| Total | | | 100.0 | % | |
AVERAGE ANNUAL TOTAL RETURN1,3,8,16
| | | Inception
Date | | 1 Year | | 5 Years | | 10 Years | | Life of
Fund | |
| Investor Class | | 06/15/1994 | | | (20.42 | %) | | | 4.98 | % | | | 4.70 | % | | | 6.75 | % | |
| Trust Class5 | | 06/29/1998 | | | (20.48 | %) | | | 4.88 | % | | | 4.95 | % | | | 6.98 | % | |
| MSCI EAFE® Index2,19 | | | | | (14.47 | %) | | | 6.32 | % | | | 2.68 | % | | | 4.85 | % | |
Performance data quoted represent past performance, which is no guarantee of future results. The investment return and principal value of an investment will fluctuate so that an investor's shares, when redeemed, may be worth more or less than their original cost. Results are shown on a "total return" basis and include reinvestment of all dividends and capital gain distributions.
Current performance may be lower or higher than the performance data quoted. For performance data current to the most recent month end, visit www.nb.com/performance.
As stated in the Fund's most recent prospectus, the total annual fund operating expense ratios for fiscal year 2008 were 1.28% and 1.38% for Investor Class and Trust Class shares, respectively.Neuberger Berman Management LLC has contractually agreed to limit certain expenses of the Fund through August 31, 2012 for Investor Class shares and August 31, 2019 for Trust Class shares.
COMPARISON OF A $10,000 INVESTMENT
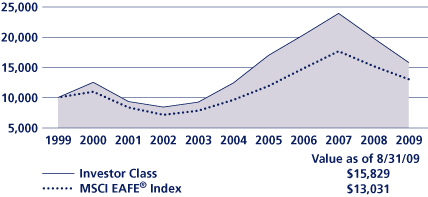
This chart shows the value of a hypothetical $10,000 investment in the Fund over the past 10 fiscal years, or since the Fund's inception if it has not operated for 10 years. The graph is based on the Investor Class shares only; performance of other classes will vary due to differences in fee structures and any applicable sales charges (see Average Annual Total Return chart above). The result is compared with benchmarks, which may include a broad-based market index and/or a narrower index. Please note that market indexes have not been reduced to reflect any of the fees and costs of investing. All results include the reinvestment of dividends and capital gain distributions. Neither the Fund's returns nor the market indexes shown in the graph and table reflect the effect of taxes an investor would pay on Fund distributions or on the redemption of Fund shares. Results represent past performance and do not indicate future results.
26
International Institutional Fund Commentary
For the fiscal year ended August 31, 2009, Neuberger Berman International Institutional Fund underperformed its benchmark, the MSCI EAFE® Index. While both the Fund and the index posted double-digit positive returns in calendar year 2009, returns for the full period were negative.
This was a tremendously difficult time for world's economies and equity markets, with steep declines in the EAFE Index from the beginning of the reporting period through early March 2009. Although markets rallied subsequently, the extremely bearish environment that endured through much of the period overwhelmed more recent improvements. For the full fiscal year, all sectors within the EAFE were down, with Consumer Staples performing best on a relative basis, and Materials declining most. Every country in the index declined except Spain, which was up less than 1%.
Because this report covers two distinctly different market environments—one in which defensive positioning was beneficial, and one in which cyclical companies outperformed—overall themes are not readily apparent. Taking the period as a whole, the market sectors that fared best included Consumer Staples, Telecommunications, Health Care and Consumer Discretionary. Materials, Information Technology, Financials, Utilities, Industrials and Energy were relatively weak. Throughout the period, our holdings reflected our commitment to our QuaRP (quality at a reasonable price) philosophy.
During the fiscal year, the Fund benefited on a relative basis from a lack of exposure to the weak Utilities sector, which, although usually defensive, underperformed. Given that we are QuaRP investors, Utilities companies rarely meet our requirements, tending to be lower growth, highly capital intensive, and highly regulated businesses. Stock selection within Telecommunications was also additive, and stock selection was beneficial within Materials as well. Initiated at a favorable time, our position in French chemical company Arkema was among the portfolio's top performers. However, Wacker Chemie, a German chemical company, lagged and was eliminated from the portfolio. While its solar business remains strong, Wacker's more cyclical chemical business has recently hampered company results. Finally, in a decidedly negative market, the Fund's somewhat higher-than-average level of cash and cash equivalents was another benefit.
In terms of detractors, the performance of some of the portfolio's Industrial holdings was disappointing. Vallourec, a French maker of seamless steel tubing and connectors used in deepwater drilling for natural gas, was our poorest performer. The stock was hurt by a soft U.S. gas market, and was sold. Health Care was another area of weakness. Within Energy, Addax Petroleum, a Canadian company with assets in West Africa and Kurdistan, was the Fund's top contributor. The company was taken over by Chinese energy company Sinopec during the period and was sold. Cameco, a Canadian uranium company, was also among our strongest performers. As governments worldwide look for ways to increase energy production with a lower carbon footprint, Cameco has benefited. However, Fund holdings underperformed the benchmark sector component, with disappointments including Paladin, a smaller-cap, lower-production Australian uranium company which has been eliminated from the portfolio. Canadian Natural Resources, a higher cost oil producer that was disproportionately impacted as commodity prices declined, also underperformed. We sold the stock early in the period. In Information Technology, an overweight and stock selection worked against us. While Canadian data specialist MacDonald Dettwiler was one of our best holdings, British electronics firm Laird PLC was one of the weakest and was sold. Our slight underweight and stock selection in Consumer Discretionary stocks were a headwind in this environment.
Within the troubled Financials sector, portfolio holdings had mixed results. On the positive side, Deutsche Boerse, operator of the Frankfurt stock exchange and an electronic and derivatives exchange, saw earnings exceed expectations, and performed very well. We believe the company should benefit further as new regulations move over-the-counter financial instruments to exchanges. Norwegian commercial bank DnB NOR returned to favor, as investors appeared to have considered its risks and opportunities more rationally. However, Swiss Re, an insurer of primary insurance companies, was sold from the portfolio after experiencing losses greater than we had anticipated. Piraeus, a Greek bank, declined on economic concerns and was eliminated from the portfolio. And French insurance company, Euler Hermes, was another significant disappointment that was sold. Overall, Fund holdings underperformed the benchmark in the sector.
27
Looking ahead, we continue to be fairly cautious on the global economy, expecting a protracted and muted recovery. While remaining somewhat defensive, we are adding cyclical names on a stock-by-stock basis where we find valuations compelling after lowered assumptions for revenue growth and margin expansion. In these markets, we continue to remain focused on our QuaRP discipline, seeking high quality, financially strong companies with good organic growth opportunities—an approach that we believe can deliver superior returns over the long run.
Sincerely,

Benjamin Segal
Portfolio Manager
The Fund is currently closed to new investors.
The risks involved in seeking capital appreciation from investments primarily in companies based outside the United States are set forth in the prospectus and statement of additional information.
Investing in foreign securities involves greater risks than investing in securities of U.S. issuers, including currency fluctuations, changes in local economic and political conditions, and the need to operate in less regulated financial markets. These risks are typically heightened for investments in emerging markets.
The composition, industries and holdings of the Fund are subject to change. In an attempt to reduce overall volatility, International Institutional Fund diversifies the portfolio holdings over a wide array of countries and individual stocks.
28
International Institutional Fund
TICKER SYMBOLS
| Institutional Class | | NBIIX | |
SECTOR ALLOCATION
| (% of Equity Market Value) | |
| Consumer Discretionary | | | 9.0 | % | |
| Consumer Staples | | | 14.1 | | |
| Energy | | | 9.4 | | |
| Financials | | | 18.1 | | |
| Health Care | | | 10.6 | | |
| Industrials | | | 13.9 | | |
| Information Technology | | | 7.7 | | |
| Materials | | | 9.4 | | |
| Telecommunication Services | | | 7.8 | | |
| Total | | | 100.0 | % | |
AVERAGE ANNUAL TOTAL RETURN1,3,8
| | | Inception
Date | | 1 Year | | Life of
Fund | |
| Institutional Class | | | 06/17/2005 | | | | (19.92 | %) | | | 0.07 | % | |
| MSCI EAFE® Index2,19 | | | | | | | (14.47 | %) | | | 3.60 | % | |
Performance data quoted represent past performance, which is no guarantee of future results. The investment return and principal value of an investment will fluctuate so that an investor's shares, when redeemed, may be worth more or less than their original cost. Results are shown on a "total return" basis and include reinvestment of all dividends and capital gain distributions.
Current performance may be lower or higher than the performance data quoted. For performance data current to the most recent month end, visit www.nb.com/performance.
As stated in the Fund's most recent prospectus, the total annual fund operating expense ratio for fiscal year 2008 was 1.13% for Institutional Class shares (prior to any fee waivers or expense reimbursements). The net expense ratio was 0.87%. Neuberger Berman Management LLC has contractually agreed to limit certain expenses of the Fund through August 31, 2019 for Institutional Class shares.
COMPARISON OF A $10,000 INVESTMENT
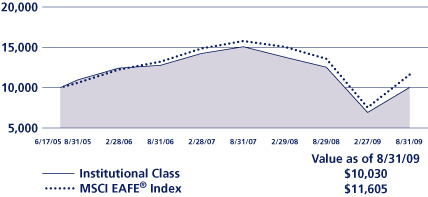
This chart shows the value of a hypothetical $10,000 investment in the Fund over the past 10 fiscal years, or since the Fund's inception if it has not operated for 10 years. The graph is based on the Institutional Class shares only; performance of other classes will vary due to differences in fee structures and any applicable sales charges (see Average Annual Total Return chart above). The result is compared with benchmarks, which may include a broad-based market index and/or a narrower index. Please note that market indexes have not been reduced to reflect any of the fees and costs of investing. All results include the reinvestment of dividends and capital gain distributions. Neither the Fund's returns nor the market indexes shown in the graph and table reflect the effect of taxes an investor would pay on Fund distributions or on the redemption of Fund shares. Results represent past performance and do not indicate future results.
29
International Large Cap Fund Commentary
For the fiscal year ended August 31, 2009, Neuberger Berman International Large Cap Fund underperformed its benchmark, the MSCI EAFE® Index. While both the portfolio and the index posted double-digit positive returns in calendar 2009, returns for the full reporting period were negative.
This was a tremendously difficult time for the world's economies and equity markets, with steep declines in the EAFE Index from the beginning of the reporting period through early March 2009. Although markets rallied subsequently, the extremely bearish first half overwhelmed more recent improvements. For the full fiscal year, all sectors within the EAFE were down, with Consumer Staples performing best on a relative basis, and Materials declining most. Every country in the index declined except Spain, which was up less than 1%.
Because this report covers two distinctly different market phases—one in which defensive positioning was beneficial, and one in which cyclical companies outperformed—overall themes are not readily apparent. Taking the period as a whole, the sectors that fared best included Consumer Staples, Telecommunications, Health Care and Consumer Discretionary stocks. Materials, Information Technology, Financials, Utilities, Industrials and Energy were weaker. Throughout the period, our holdings reflected our commitment to our QuaRP (quality at a reasonable price) philosophy.
During the fiscal year, the Fund benefited on a relative basis from Consumer Staples, with both an overweight and strong stock selection, including a gain by Hengan International, a Chinese disposable paper hygiene company which was sold during the period. Another positive was our lack of exposure to the Utilities sector, which, while typically defensive, underperformed during the period. Given that we are QuaRP investors, Utilities companies rarely meet our requirements, tending to be lower growth, highly capital intensive, and highly regulated businesses. Stock selection within Telecommunications was additive as well. Finally, in a decidedly negative market, a somewhat higher-than-average level of cash was another benefit.
The performance of some of the Fund's Industrials holdings was disappointing. Vallourec, a French maker of seamless steel tubing and connectors used in deepwater drilling for natural gas, was our poorest performer. The stock was hurt by a weak U.S. gas market, and was sold. Health Care was another negative, where although Novo Nordisk was a benefit, stock performance in the sector was weaker than expected. In Energy, though our holdings underperformed overall, stock selection was beneficial. Canadian firm Addax Petroleum was our top performer, benefiting from a takeover by Chinese energy company Sinopec during the period. Canadian Natural Resources, a higher cost oil producer that was disproportionately impacted as commodity prices declined, underperformed. We sold the stock early in the period. Australian firms Paladin, a uranium producer, and Woodside Petroleum also disappointed and were sold.
Within the troubled Financials sector, Fund holdings had mixed performance. On the positive side, Deutsche Boerse, operator of the Frankfurt stock exchange and an electronic and derivatives exchange, saw earnings exceed expectations, and performed very well. We believe the company should benefit further as new regulations move over-the-counter financial instruments to exchanges. Bank of China remained strong and UBS performed well (both were sold), and Norwegian commercial bank DnB NOR returned to favor. However, Swiss Re, an insurer of primary insurance companies, was sold after experiencing losses greater than we had anticipated. Piraeus, a Greek bank, declined on economic concerns and was eliminated from the portfolio. And French insurance company Euler Hermes was another significant disappointment that was sold. Overall, our holdings underperformed the benchmark sector component.
In Information Technology, an overweight and stock performance worked against the Fund, as did the performance of some Materials holdings. Three of the best portfolio performers are in the Materials sector—Sociedad Quimica y Minera de Chile, a leader in specialty plant nutrition, iodine and lithium, BHP Billiton, a Australian metals and mining firm, and Linde, a German industrial gas manufacturer. However, Wacker Chemie, a German chemical company we sold as its chemical business suffered, and Vale (also sold), a Brazilian metals and mining firm, both posted large declines.
Looking ahead, we continue to be fairly cautious on the global economy, expecting a protracted and muted recovery. While remaining somewhat defensive, we are adding cyclical names on a stock-by-stock basis, where we find valuations
30
compelling after lowered assumptions for revenue growth and margin expansion. In these markets, we continue to remain focused on our QuaRP discipline, seeking high quality, financially strong companies with good organic growth opportunities—an approach that we believe can deliver superior returns over the long run.
Sincerely,

Benjamin Segal
Portfolio Manager
The risks involved in seeking capital appreciation from investments primarily in companies based outside the United States and from investments in large-cap stocks are set forth in the prospectus and statement of additional information.
Investing in foreign securities involves greater risks than investing in securities of U.S. issuers, including currency fluctuations, changes in local economic and political conditions, and the need to operate in less regulated financial markets. These risks are typically heightened for investments in emerging markets.
Investing in the stocks of even the largest companies involves all the risks of stock market investing, including the risk that they may lose value due to overall market or economic conditions.
The composition, industries and holdings of the Fund are subject to change. In an attempt to reduce overall volatility, International Large Cap Fund diversifies the portfolio holdings over a wide array of countries and individual stocks.
31
International Large Cap Fund
TICKER SYMBOLS
| Trust Class | | NILTX | |
| Institutional Class | | NILIX | |
| Class A | | NBNAX | |
| Class C | | NBNCX | |
| Class R3 | | NBNRX | |
SECTOR ALLOCATION
| (% of Equity Market Value) | |
| Consumer Discretionary | | | 10.3 | % | |
| Consumer Staples | | | 11.3 | | |
| Energy | | | 9.2 | | |
| Financials | | | 21.5 | | |
| Health Care | | | 11.3 | | |
| Industrials | | | 10.7 | | |
| Information Technology | | | 6.8 | | |
| Materials | | | 10.1 | | |
| Telecommunication Services | | | 8.8 | | |
| Total | | | 100.0 | % | |
AVERAGE ANNUAL TOTAL RETURN1,3,8
| | | Inception
Date | | 1 Year | | Life of
Fund | |
| At NAV | |
| Trust Class | | 08/01/2006 | | | (18.84 | %) | | | (4.47 | %) | |
| Institutional Class7 | | 10/06/2006 | | | (18.57 | %) | | | (4.16 | %) | |
| Class A18 | | 12/20/2007 | | | (18.83 | %) | | | (4.47 | %) | |
| Class C18 | | 12/20/2007 | | | (19.34 | %) | | | (4.84 | %) | |
| Class R318 | | 05/27/2009 | | | (18.92 | %) | | | (4.50 | %) | |
| With Sales Charge | |
| Class A18 | | | | | (23.52 | %) | | | (6.28 | %) | |
| Class C18 | | | | | (20.12 | %) | | | (4.84 | %) | |
| Index | |
| MSCI EAFE® Index2,19 | | | | | (14.47 | %) | | | (3.30 | %) | |
Performance data quoted represent past performance, which is no guarantee of future results. The investment return and principal value of an investment will fluctuate so that an investor's shares, when redeemed, may be worth more or less than their original cost. Results are shown on a "total return" basis and include reinvestment of all dividends and capital gain distributions.
Current performance may be lower or higher than the performance data quoted. For performance data current to the most recent month end, visit www.nb.com/performance.
Neuberger Berman Management LLC has contractually agreed to limit certain expenses of the Fund through August 31, 2012 for Trust Class, Institutional Class, Class A and Class C shares and through August 31, 2013 for Class R3 shares. The net expense ratios were 1.30%, 0.95%, 1.37%, 2.07% and 1.53% for Trust Class, Institutional Class, Class A, Class C and Class R3 shares, respectively. As stated in the Fund's most recent prospectus, the total annual fund operating expense ratios for fiscal year 2008 were 1.39%, 1.00%, 1.72%, 4.12% and 2.00% for Trust Class, Institutional Class, Class A, Class C and Class R3 shares, respectively (prior to any fee waivers or expense reimbursements).
Total Returns shown with a sales charge reflect the deduction of current maximum initial sales charge of 5.75% for Class A shares and the applicable contingent deferred sales charges (CDSC) for Class C shares. The maximum CDSC for Class C shares is 1%, which is reduced to 0% after 1 year. The performance of the Fund's share classes will differ primarily due to different sales charge structures and class expenses. Please see the prospectus for more information about sales charge structures, if any, and class expenses for your share class.
32
International Large Cap Fund
COMPARISON OF A $10,000 INVESTMENT
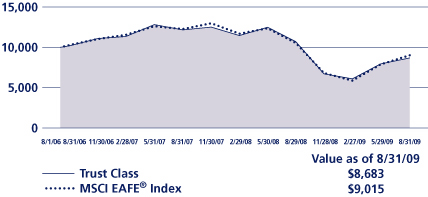
This chart shows the value of a hypothetical $10,000 investment in the Fund over the past 10 fiscal years, or since the Fund's inception if it has not operated for 10 years. The graph is based on the Trust Class shares only; performance of other classes will vary due to differences in fee structures and any applicable sales charges (see Average Annual Total Return chart on previous page). The result is compared with benchmarks, which may include a broad-based market index and/or a narrower index. Please note that market indexes have not been reduced to reflect any of the fees and costs of investing. All results include the reinvestment of dividends and capital gain distributions. Neither the Fund's returns nor the market indexes shown in the graph and table reflect the effect of taxes an investor would pay on Fund distributions or on the redemption of Fund shares. Results represent past performance and do not indicate future results.
33
Large Cap Disciplined Growth Fund Commentary
For the fiscal year ended August 31, 2009, Neuberger Berman Large Cap Disciplined Growth Fund underperformed its benchmark, the Russell 1000® Growth Index. During an extremely difficult year for equity investors, returns for both the Fund and the index were negative.
Fifteen days into this reporting period, Lehman Brothers declared bankruptcy. While the economy was already in a downturn cycle, this triggered a tailspin as credit evaporated. The fourth quarter of calendar year 2008 saw a tremendous drop in retail activity, and signs of improvement would not be apparent until late in the first quarter of calendar year 2009, as the first of various economic stimulus programs began to have an influence.
By March, we saw two catalysts for improvement. First, Citigroup announced strong earnings and the apparent likelihood that they could earn their way through their capital issues had widespread implications. At the same time, analysts began to understand the impact that a stimulus package by the Chinese government—a very targeted package focused on infrastructure spending—could have on various economic sectors.
Since March, the market has rallied in fits and starts, with early leadership coming from lower quality names—those with weaker balance sheets, smaller market caps, low liquidity and share price, and higher economic sensitivity. From April through August, the rally became more broadly based.
During this fiscal year, stock selection within areas including Industrials, Health Care, Information Technology and Financials hurt the portfolio versus the index, since our high quality bias kept us out of the stocks that performed best. For example, within Financials, the Fund owned quality holdings such as JP Morgan Chase and Goldman Sachs, and both stocks performed well. They did not, however, see the bounce that weaker players we avoided—like Citigroup and AIG—enjoyed. Being underweighted in Information Technology as it rebounded also limited relative performance.
Decisions that benefited the portfolio on a relative basis included excellent stock selection within Consumer Discretionary stocks. However, our underweight in the sector offset some of the benefit. Very strong stock selection in Materials, Telecommunications and Utilities also helped.
One of the top holdings in the portfolio for the year was Apple. Strong results from the iPhone within a difficult environment surprised the marketplace when expectations were relatively low. We felt more positive and, in fact, Apple has sold 30 million units to date. Apple has also begun to profit from iPhone applications, continues to release newer generations of other high-demand devices, and has expanded globally, most notably in China and Israel.
With demand for copper increasing tremendously as a result of the Chinese stimulus package, Freeport-McMoRan Copper & Gold was another strong performer. The firm benefited from Chinese infrastructure projects like railroads, bridges, airports, and power generation and transmission. Located in Asia, Freeport's biggest mine is well positioned to serve China.
Amazon was another huge contributor. Amazon revamped its distribution network prior to the economic downturn, which reduced delivery costs, and in turn improved price competitiveness on both goods and shipping. Amazon also gained significant share from eBay, which was having operating difficulties, especially in sales of new items.
Disappointments included Lockheed Martin, which we sold after the close of the fiscal year. Lockheed was a defensive holding in calendar year 2008, but in calendar year 2009, a change in administration caused budget and defense spending questions to loom, and later in the year, the market rotated into more volatile, economically sensitive stocks.
Research in Motion (RIMM) was another disappointment. We bought RIMM in calendar year 2008 believing the firm would gain new consumer share alongside its business and enterprise domination. With the collapse of U.S. consumer demand, it became obvious that this thesis was not going to play out, and we eliminated the stock from the portfolio.
We also sold Schlumberger, another negative performer for the portfolio. New oil production often comes from costly, technologically complicated procedures, such as underwater, shale or horizontal drilling. This is Schlumberger's specialty.
34
However, as the price of crude declined dramatically, such projects were the first to be shuttered, and Schlumberger traded down in sympathy.
Within the past six months, we shifted from a very defensive posture to a much more economically sensitive stance, decreasing Health Care, Consumer Staples, Utilities and Telecom in favor of Materials, Industrials, Financials and Technology. We think the work required to close the huge gap between low inventories and increasing demand will continue to benefit these types of firms, as well as to potentially re-start a "virtuous" cycle—in which demand drives manufacturing and employment increases, which promotes confidence and spending, and eventually, economic improvement. We are focused on companies that have cut expenses and beaten earnings estimates. If revenues increase for lean companies like these, we believe it should impact the bottom line quickly. Within this outlook, while we are conservatively positioned for recovery, we have room to become more aggressive if our thesis becomes evident even faster.
Sincerely,


Daniel D. Rosenblatt, John J. Barker, Daniel J. Fletcher and Lawrence K. Fisher
Portfolio Co-Managers
The risks involved in seeking capital appreciation from investments primarily in companies with large capitalizations are set forth in the prospectus and statement of additional information.
Investing in the stocks of even the largest companies involves all the risks of stock market investing, including the risk that they may lose value due to overall market or economic conditions.
The composition, industries and holdings of the Fund are subject to change. Large Cap Disciplined Growth Fund is invested in a wide array of stocks and no single holding makes up a significant portion of the Fund's total assets.
35
Large Cap Disciplined Growth Fund
TICKER SYMBOLS
| Investor Class | | NBCIX | |
| Institutional Class | | NLDLX | |
| Class A | | NLDAX | |
| Class C | | NLDCX | |
| Class R3 | | NLDRX | |
SECTOR ALLOCATION
| (% of Equity Market Value) | |
| Consumer Discretionary | | | 9.1 | % | |
| Consumer Staples | | | 11.5 | | |
| Energy | | | 8.0 | | |
| Financials | | | 5.4 | | |
| Health Care | | | 12.1 | | |
| Industrials | | | 10.1 | | |
| Information Technology | | | 35.3 | | |
| Materials | | | 7.3 | | |
| Telecommunication Services | | | 1.2 | | |
| Total | | | 100.0 | % | |
AVERAGE ANNUAL TOTAL RETURN1,3,14
| | | Inception
Date | | 1 Year | | 5 Years | | Life of
Fund | |
| At NAV | |
| Investor Class | | 12/06/1999 | | | (18.27 | %) | | | 1.76 | % | | | (5.03 | %) | |
| Institutional Class20 | | 04/06/2009 | | | (18.13 | %) | | | 1.80 | % | | | (5.02 | %) | |
| Class A20 | | 04/06/2009 | | | (18.27 | %) | | | 1.76 | % | | | (5.03 | %) | |
| Class C20 | | 04/06/2009 | | | (18.54 | %) | | | 1.70 | % | | | (5.06 | %) | |
| Class R320 | | 05/27/2009 | | | (18.25 | %) | | | 1.77 | % | | | (5.03 | %) | |
| With Sales Charge | |
| Class A20 | | | | | (22.97 | %) | | | 0.56 | % | | | (5.61 | %) | |
| Class C20 | | | | | (19.35 | %) | | | 1.70 | % | | | (5.06 | %) | |
| Index | |
| Russell 1000® Growth Index2,19 | | | | | (16.76 | %) | | | 1.21 | % | | | (4.68 | %) | |
Performance data quoted represent past performance, which is no guarantee of future results. The investment return and principal value of an investment will fluctuate so that an investor's shares, when redeemed, may be worth more or less than their original cost. Results are shown on a "total return" basis and include reinvestment of all dividends and capital gain distributions.
Current performance may be lower or higher than the performance data quoted. For performance data current to the most recent month end, visit www.nb.com/performance.
Neuberger Berman Management LLC has contractually agreed to limit certain expenses of the Fund through August 31, 2019 for Investor Class and through August 31, 2013 for Institutional Class, Class A and Class C and Class R3 shares. The net expense ratios were 1.52%, 0.76%, 1.12%, 1.87% and 1.37% for Investor Class, Institutional Class, Class A and Class C and Class R3 shares, respectively. As stated in the Fund's most recent prospectus, the total annual fund operating expense ratios for fiscal year 2008 were 2.55%, 2.80%, 1.90%, 2.75% and 1.78% for Investor Class, Institutional Class, Class A and Class C and Class R3 shares, respectively (prior to any fee waivers or expense reimbursements).
Total Returns shown with a sales charge reflect the deduction of current maximum initial sales charge of 5.75% for Class A shares and the applicable contingent deferred sales charges (CDSC) for Class C shares. The maximum CDSC for Class C shares is 1%, which is reduced to 0% after 1 year. The performance of the Fund's share classes will differ primarily due to different sales charge structures and class expenses. Please see the prospectus for more information about sales charge structures, if any, and class expenses for your share class.
36
Large Cap Disciplined Growth Fund
COMPARISON OF A $10,000 INVESTMENT

This chart shows the value of a hypothetical $10,000 investment in the Fund over the past 10 fiscal years, or since the Fund's inception if it has not operated for 10 years. The graph is based on the Investor Class shares only; performance of other classes will vary due to differences in fee structures and any applicable sales charges (see Average Annual Total Return chart on previous page). The result is compared with benchmarks, which may include a broad-based market index and/or a narrower index. Please note that market indexes have not been reduced to reflect any of the fees and costs of investing. All results include the reinvestment of dividends and capital gain distributions. Neither the Fund's returns nor the market indexes shown in the graph and table reflect the effect of taxes an investor would pay on Fund distributions or on the redemption of Fund shares. Results represent past performance and do not indicate future results.
37
Mid Cap Growth Fund Commentary
For the fiscal year ended August 31, 2009—a turbulent period for equities—both Neuberger Berman Mid Cap Growth Fund and its benchmark, the Russell Midcap® Growth Index, posted negative returns. Fund performance trailed that of the index.
All sectors of the index finished the fiscal year in double-digit negative territory. Within the benchmark, Telecommunications was the weakest sector, off by nearly 40%. Energy was next, down roughly 37%. Consumer Discretionary stocks performed best, declining approximately 10%. The large Information Technology (IT) sector was whipsawed over the year, initially showing extreme weakness, but turning in middling results overall due to strong performance in recent months.
Early in the fiscal year, more defensive, lower growth stocks outperformed on a relative basis while the markets were declining dramatically. After the March low, nearly the opposite was true—with lower quality (e.g., little or no earnings, low return on equity), smallest and least expensive stocks in the lead. This shift is not surprising to us—in markets following a period of sustained weakness, such as in 2003, lower quality stocks have often led early on. The Fund trailed the benchmark during the market recovery, given that such stocks do not meet our fundamental requirements. We believe the "junk rally" may be waning now, however, and that the Fund can benefit when the market pauses to weigh price appreciation against the underlying fundamental value of securities.
Within the Fund, Energy holdings outperformed in the difficult Energy sector due to excellent security selection. An overweight position (versus the benchmark) in oil and gas firm Concho Resources was a benefit, as were Range Resources and Noble. The Fund remains overweighted in the weak Telecommunications sector, where we enjoyed good stock selection. Millicom International, an emerging markets prepaid cellular company, and SBA Communications, a tower company, were beneficial. NII Holdings was sold on earnings disappointments, as its Latin American business declined. In Materials, Freeport-McMoRan Copper & Gold, the large copper supplier, was among our best performers. The company benefited from rising prices and increasing demand, especially in China.
Areas that were most detrimental to relative Fund performance this fiscal year were IT and Health Care. In IT, Fund holdings did not keep pace with rebounding lower quality stocks. Silicon Laboratories and Marvell Technology Group were among our top performers but our higher quality semiconductor and equipment holdings underperformed. Software holdings also lagged, with Trimble Navigation and Activision Blizzard disappointing. VistaPrint, a lower cost business stationery provider, was a bright spot, particularly in the latter half of the period.
In Health Care, the Fund's services and equipment holdings disappointed. Services companies, which we have reduced as a proportion of the portfolio, were held back by "political" risk—the unknowns surrounding health care reform—and equipment firms underperformed on lower hospital spending. We sold disappointments including Intuitive Surgical, Psychiatric Solutions, Perrigo and Myriad Genetics. Our biotech holdings were stronger, as this area proved to be more resilient in the face of political risk.
Consumer Discretionary holdings were slightly negative on a relative basis. In retrospect, we held our education theme too long after last year's strong performance. We have since consolidated the overall position and are less defensive in the sector, reflected in our building a longer-term position in retail, including positive contributors Ross Stores and Nordstrom. Gaming companies WMS and Penn National were also very strong.
The Fund underperformed in Financials. We think the sector remains somewhat risky, so the Fund remains slightly underweighted relative to the index. We continue to favor asset management firms, and capital-sensitive names. In Industrials, our prison outsourcing theme is on hold, as states are unable to outsource prison services in light of worsening deficits. Corrections Corp. of America declined, and was sold. We continue to emphasize higher quality, good earnings visibility Industrials, such as Precision Castparts, Stericycle and Jacobs Engineering.
38
Looking ahead, while not expecting a rapid recovery, we are becoming more constructive on the market and find mid-cap valuations very attractive. As the market begins to price in 2010 results, we expect to add to areas including Health Care (pending reform details), Consumer Discretionary and IT. Across sectors, the companies that meet our fundamental criteria generally have strong balance sheets, good cash flow characteristics and low leverage, which should benefit them on a competitive basis as we move through this economic downturn and what we consider a transitional market.
As experienced at inflection points in the past, we believe the recent strong performance of lower-quality stocks is not sustainable. Instead, we continue to believe that, longer term, fundamental stock selection is the key to performance, and that, over time, the market will reward companies that possess the strong fundamentals and quality growth characteristics that we seek.
Sincerely,

Kenneth J. Turek
Portfolio Manager
The risks involved in seeking capital appreciation from investments primarily in companies with mid-market capitalization are set forth in the prospectus and statement of additional information.
Mid-capitalization stocks are more vulnerable to financial risks and other risks than stocks of larger companies. They also trade less frequently and in lower volume than larger company stocks, so their market prices tend to be more volatile.
The composition, industries and holdings of the Fund are subject to change. Mid Cap Growth Fund is invested in a wide array of stocks and no single holding makes up a significant portion of the Fund's total assets.
39
Mid Cap Growth Fund
TICKER SYMBOLS
| Investor Class | | NMANX | |
| Trust Class | | NBMTX | |
| Advisor Class | | NBMBX | |
| Institutional Class | | NBMLX | |
| Class A | | NMGAX | |
| Class C | | NMGCX | |
| Class R3 | | NMGRX | |
SECTOR ALLOCATION
| (% of Equity Market Value) | |
| Consumer Discretionary | | | 20.9 | % | |
| Consumer Staples | | | 5.2 | | |
| Energy | | | 7.5 | | |
| Financials | | | 8.1 | | |
| Health Care | | | 12.0 | | |
| Industrials | | | 15.4 | | |
| Information Technology | | | 23.0 | | |
| Materials | | | 3.8 | | |
| Telecommunication Services | | | 4.1 | | |
| Total | | | 100.0 | % | |
AVERAGE ANNUAL TOTAL RETURN1,3,8,11
| | | Inception
Date | | 1 Year | | 5 Years | | 10 Years | | Life of
Fund | |
| At NAV | |
| Investor Class | | 03/01/19794 | | | (22.04 | %) | | | 4.86 | % | | | 0.37 | % | | | 11.14 | % | |
| Trust Class | | 08/30/1993 | | | (22.21 | %) | | | 4.58 | % | | | 0.22 | % | | | 11.05 | % | |
| Advisor Class | | 09/03/1996 | | | (22.36 | %) | | | 4.35 | % | | | (0.17 | %) | | | 10.88 | % | |
| Institutional Class 7 | | 04/19/2007 | | | (21.63 | %) | | | 5.06 | % | | | 0.46 | % | | | 11.17 | % | |
| Class A21 | | 05/27/2009 | | | (22.07 | %) | | | 4.85 | % | | | 0.37 | % | | | 11.14 | % | |
| Class C21 | | 05/27/2009 | | | (22.19 | %) | | | 4.82 | % | | | 0.35 | % | | | 11.13 | % | |
| Class R321 | | 05/27/2009 | | | (22.12 | %) | | | 4.84 | % | | | 0.36 | % | | | 11.14 | % | |
| With Sales Charge | |
| Class A21 | | | | | (26.55 | %) | | | 3.62 | % | | | (0.23 | %) | | | 10.92 | % | |
| Class C21 | | | | | (22.97 | %) | | | 4.82 | % | | | 0.35 | % | | | 11.13 | % | |
| Index | |
| Russell Midcap® Growth Index2,19 | | | | | (20.21 | %) | | | 3.35 | % | | | 1.52 | % | | | N/A | | |
| Russell Midcap® Index2,19 | | | | | (19.92 | %) | | | 3.40 | % | | | 5.09 | % | | | 12.90 | % | |
Performance data quoted represent past performance, which is no guarantee of future results. The investment return and principal value of an investment will fluctuate so that an investor's shares, when redeemed, may be worth more or less than their original cost. Results are shown on a "total return" basis and include reinvestment of all dividends and capital gain distributions.
Current performance may be lower or higher than the performance data quoted. For performance data current to the most recent month end, visit www.nb.com/performance.
Neuberger Berman Management LLC has contractually agreed to limit certain expenses of the Fund through August 31, 2019 for Advisor Class shares, through August 31, 2012 for Institutional Class shares and through August 31, 2013 for Class A, Class C and Class R3 shares. The net expense ratios were 1.52%, 0.77%, 1.12%, 1.87% and 1.37% for Advisor Class, Institutional Class, Class A, Class C and Class R3 shares, respectively. As stated in the Fund's most recent prospectus, the total annual fund operating expense ratios for fiscal year 2008 were 1.03%, 1.27%, 2.40%, 0.80%, 1.27%, 2.02% and 1.52% for Investor Class, Trust Class, Advisor Class, Institutional Class, Class A, Class C and Class R3 shares, respectively (prior to any fee waivers or expense reimbursements).
Total Returns shown with a sales charge reflect the deduction of current maximum initial sales charge of 5.75% for Class A shares and the applicable contingent deferred sales charges (CDSC) for Class C shares. The maximum CDSC for Class C shares is 1%, which is reduced to 0% after 1 year. The performance of the Fund's share classes will differ primarily due to different sales charge structures and class expenses. Please see the prospectus for more information about sales charge structures, if any, and class expenses for your share class.
40
Mid Cap Growth Fund
COMPARISON OF A $10,000 INVESTMENT

This chart shows the value of a hypothetical $10,000 investment in the Fund over the past 10 fiscal years, or since the Fund's inception if it has not operated for 10 years. The graph is based on the Investor Class shares only; performance of other classes will vary due to differences in fee structures and any applicable sales charges (see Average Annual Total Return chart on previous page). The result is compared with benchmarks, which may include a broad-based market index and/or a narrower index. Please note that market indexes have not been reduced to reflect any of the fees and costs of investing. All results include the reinvestment of dividends and capital gain distributions. Neither the Fund's returns nor the market indexes shown in the graph and table reflect the effect of taxes an investor would pay on Fund distributions or on the redemption of Fund shares. Results represent past performance and do not indicate future results.
41
Partners Fund Commentary
Despite the strong performance of stocks following the early March market lows, all 10 sectors in the Russell 1000® Value Index and the S&P 500 Index posted declines in the fiscal year ended August 31, 2009. Neuberger Berman Partners Fund regained lost ground and materially outperformed these benchmarks in the second half of the period. However, due to the severity of its first-half market decline, the Fund posted a negative return and trailed the Russell 1000 Value Index and S&P 500 Index for the full fiscal year.
The Fund's cyclical bias, which penalized performance relative to the Russell benchmark as the market plunged during the first half of the reporting period, benefited relative performance in the second half as stocks in many economically sensitive sectors led the market rebound.
Investments in the Health Care sector had the most negative impact on relative performance this fiscal year. The portfolio was underweighted in Health Care, the Russell benchmark's second best performing sector, but due in part to the disappointing performance of HMOs such as Aetna (affected by concern regarding health care reform), our holdings lagged the Russell benchmark sector component. Utilities sector investors penalized relative returns, primarily due to the disappointing performance of merchant power producers such as NRG, which suffered from depressed demand and power prices, as well as a leveraged balance sheet. An underweight in Consumer Staples, the Russell's best performing sector, and a sizable decline in beverage distributor Constellation Brands (which was sold) were a drag on relative returns.
Although recording a negative return, Financials sector investments had the most favorable impact on relative performance. The portfolio was underweighted in Financials, the Russell's second worst performing sector, and the strong second half gains recorded by JP Morgan Chase, Wells Fargo, and State Street helped our holdings outperform by a substantial margin. Collectively, Information Technology sector holdings posted a modest decline compared to a double-digit percentage loss for the benchmark sector component. Gains in banking back-office software company Fidelity National Information Services and mortgage processing and settlement services provider Lender Processing Services buoyed returns. The strong performance of motorcycle manufacturer Harley-Davidson helped the Fund's Consumer Discretionary holdings post favorable relative returns.
We (along with most everyone in the money management business) did not anticipate that issues in the U.S. residential mortgage market would result in a near collapse of the U.S. and global financial system, systemic risk aversion, and subsequently, a sharp and swift exodus from equities. However, what we consider the largely indiscriminate sell-off in stocks made valuations of many excellent companies even more compelling. We took the opportunity to upgrade the quality of the portfolio by adding to positions in what we view as "best of breed" companies and reducing or eliminating positions in companies that we did not think were as financially strong or as well positioned in their businesses. We believed that once investors began looking past the recession, the highest quality companies in their respective businesses would excel. We took particular advantage of evolving opportunities in the beaten down Financials sector, where we believed investors had failed to adequately acknowledge improving outlooks. As evidenced by the Fund's outperformance versus the benchmark in the second half of the fiscal year, these strategies appear to be working.
Looking ahead, the economic outlook remains cloudy, with some economists forecasting a slow U-shaped recovery and others expecting a more rapid V-shaped rebound. Regardless of which of these scenarios unfolds, our focus remains on identifying companies that are selling at a significant discount to normalized earnings power. We believe that when the economy does fully regain its footing, these stocks are likely to excel.
In closing, in recent years, investor patience and courage have been tested by one of the most severe bear markets in history. We believe the worst is over and are pleased with the Partners Fund's strong absolute and relative performance in the second half of fiscal 2009. We believe that the Partners Fund is well positioned to reward our shareholders over the next several years.
42
Sincerely,

S. Basu Mullick
Portfolio Manager
The risks involved in seeking capital appreciation from investments primarily in mid- to large-cap stocks are set forth in the prospectus and statement of additional information.
Mid-capitalization stocks are more vulnerable to financial risks and other risks than larger stocks. They are generally less liquid than larger stocks, so their market prices tend to be more volatile. Large-cap stocks are subject to all the risks of stock market investing, including the risk that they may lose value.
The composition, industries and holdings of the Fund are subject to change. Partners Fund is invested in a wide array of stocks and no single holding makes up a significant portion of the Fund's total assets.
43
Partners Fund
TICKER SYMBOLS
| Investor Class | | NPRTX | |
| Trust Class | | NBPTX | |
| Advisor Class | | NBPBX | |
| Institutional Class | | NBPIX | |
SECTOR ALLOCATION
| (% of Equity Market Value) | |
| Consumer Discretionary | | | 9.7 | % | |
| Consumer Staples | | | 7.1 | | |
| Energy | | | 16.4 | | |
| Financials | | | 23.8 | | |
| Health Care | | | 8.3 | | |
| Industrials | | | 14.5 | | |
| Information Technology | | | 9.8 | | |
| Materials | | | 7.3 | | |
| Telecommunication Services | | | 1.4 | | |
| Utilities | | | 1.7 | | |
| Total | | | 100.0 | % | |
AVERAGE ANNUAL TOTAL RETURN1,3,8
| | | Inception
Date | | 1 Year | | 5 Years | | 10 Years | | Life of
Fund | |
| Investor Class | | 01/20/19754 | | | (23.27 | %) | | | 3.23 | % | | | 2.07 | % | | | 12.91 | % | |
| Trust Class | | 08/30/1993 | | | (23.38 | %) | | | 3.04 | % | | | 1.91 | % | | | 12.85 | % | |
| Advisor Class | | 08/16/1996 | | | (23.47 | %) | | | 2.88 | % | | | 1.68 | % | | | 12.73 | % | |
| Institutional Class7 | | 06/07/2006 | | | (23.10 | %) | | | 3.34 | % | | | 2.13 | % | | | 12.93 | % | |
| Russell 1000® Value Index2,19 | | | | | (20.27 | %) | | | 0.45 | % | | | 1.84 | % | | | N/A | | |
| S&P 500 Index2,19 | | | | | (18.25 | %) | | | 0.49 | % | | | (0.79 | %) | | | 11.45 | % | |
Performance data quoted represent past performance, which is no guarantee of future results. The investment return and principal value of an investment will fluctuate so that an investor's shares, when redeemed, may be worth more or less than their original cost. Results are shown on a "total return" basis and include reinvestment of all dividends and capital gain distributions.
Current performance may be lower or higher than the performance data quoted. For performance data current to the most recent month end, visit www.nb.com/performance.
As stated in the Fund's most recent prospectus, the total annual fund operating expense ratios for fiscal year 2008 were 0.81%, 1.00%, 1.15% and 0.66% for Investor Class, Trust Class, Advisor Class and Institutional Class shares, respectively.
COMPARISON OF A $10,000 INVESTMENT

This chart shows the value of a hypothetical $10,000 investment in the Fund over the past 10 fiscal years, or since the Fund's inception if it has not operated for 10 years. The graph is based on the Investor Class shares only; performance of other classes will vary due to differences in fee structures and any applicable sales charges (see Average Annual Total Return chart above). The result is compared with benchmarks, which may include a broad-based market index and/or a narrower index. Please note that market indexes have not been reduced to reflect any of the fees and costs of investing. All results include the reinvestment of dividends and capital gain distributions. Neither the Fund's returns nor the market indexes shown in the graph and table reflect the effect of taxes an investor would pay on Fund distributions or on the redemption of Fund shares. Results represent past performance and do not indicate future results.
44
Real Estate Fund Commentary
The real estate investment trust (REIT) market was extremely volatile during the 12 months ended August 31, 2009, falling sharply in the first half of the period and then rallying during the second half. Neuberger Berman Real Estate Fund suffered a steep decline but significantly outperformed its benchmark, the FTSE NAREIT Equity REITs Index.
Looking back, the REIT index fell 60% in the first six months of the fiscal year. The severe credit crunch, a weakening global economy, turmoil in the financial markets and extreme risk aversion conspired to drag down the equity market, and REITs were hit particularly hard. REITs typically use leverage to fund their operation and the largely frozen credit and capital markets led to fears of markedly higher bankruptcies in the sector.
The same factors that caused REITs to perform poorly during the first half of the reporting period were instrumental in their subsequent rally. During the second half, massive government intervention improved credit conditions and helped to restore order to the financial markets. There were also signs that the economy was bottoming and that investor risk aversion was abating. In addition, various REITs proved successful in accessing the capital markets, as they raised more than $16 billion in equity capital during the first eight months of calendar year 2009 alone. In addition, with improving credit markets, REITs were able to better access the unsecured bond market. This lifted the dark cloud that had hung over the REIT market, helping the benchmark index gain 68% during the final six months of the reporting period.
Over the course of the fiscal year, we made various adjustments to the portfolio that contributed to outperformance. At the start of the period, the Fund was defensively positioned, given signs that the economy might experience a more severe recession than had previously been expected. In particular, we emphasized REIT sectors such as Heath Care, Self Storage and Specialty REITs (including data storage center and timber REITs), that historically have held up relatively well during economic contractions. We also favored those less defensive REITs with relatively strong balance sheets. This positioning was rewarded during the first half of the fiscal year.
Toward the end of calendar year 2008, we began to opportunistically adjust the portfolio to be somewhat less defensive. This shift was driven by less dire economic news and in anticipation of improving conditions in the REIT market. As time passed, we reduced some of our defensive sector overweights, turning our attention to the roughly 50 REITs that had successfully issued equity capital. Using our extensive research capabilities, we selectively purchased REITs that had been severely punished by investors during the first half of the fiscal year and whose balance sheets had improved through the infusion of new capital. We also identified several REITs that previously had relatively solid balance sheets, believing that, with new capital in their coffers, they now had the potential to acquire assets from weaker, overleveraged counterparts. Overall, these adjustments were rewarded during the second half of the fiscal year.
On the downside, in addition to the negative impact of the overall decline of the REIT market, several of our strategies detracted from Fund performance during the fiscal year. For example, reducing our overweight in the defensive Health Care sector at the end of calendar year 2008 proved to be premature, as REIT prices fell sharply in January and February of 2009. In addition, the Fund's modest cash position was a drag on performance when the REIT market rallied during the second half of the period.
Looking ahead, we remain positive on the long-term prospects for REITs. We believe their ability to, once again, access capital has removed a major roadblock for the sector. In addition, while challenges remain, it appears to us that the overall economy may have bottomed. A return to positive economic growth would be favorable for commercial real estate occupancy and rental rates.
In conclusion, we would like to address the outlook for REIT dividends. During the credit crisis, REIT dividends were often affected by the sale of stock. We believe this cycle has largely ended and we expect to see a return to more stable income levels for REITs going forward, with a shift back to all-cash dividends. Additionally, we believe there is the potential for rising dividend levels down the road should we see further improvements on the economic front.
45
Sincerely,


Steve S. Shigekawa and Brian Jones
Portfolio Co-Managers
The risks involved in seeking capital appreciation and income from investments primarily in companies with small- and mid-market capitalization are set forth in the prospectus and statement of additional information.
Small- and mid-capitalization stocks are more vulnerable to financial risks and other risks than stocks of larger companies. They also trade less frequently and in lower volume than larger company stocks, so their market prices tend to be more volatile.
The portfolio's concentration in real estate investments makes it subject to greater potential risks and volatility than a more diversified portfolio, and the value of its shares may decline due to events affecting the real estate industry.
The composition, industries and holdings of the Fund are subject to change. Real Estate Fund is invested in a wide array of stocks and no single holding makes up a significant portion of the Fund's total assets.
46
Real Estate Fund
TICKER SYMBOLS
| Trust Class | | NBRFX | |
| Institutional Class | | NBRIX | |
SECTOR ALLOCATION
| (% of Equity Market Value) | |
| Office | | | 15.8 | % | |
| Apartments | | | 14.0 | | |
| Health Care | | | 12.5 | | |
| Regional Malls | | | 10.3 | | |
| Shopping Centers | | | 10.2 | | |
| Specialty | | | 10.0 | | |
| Self Storage | | | 7.2 | | |
| Industrial | | | 6.0 | | |
| Lodging/Resorts | | | 5.4 | | |
| Diversified | | | 3.9 | | |
| Mixed | | | 2.8 | | |
| Mortgage Home Financing | | | 1.9 | | |
| Total | | | 100.0 | % | |
AVERAGE ANNUAL TOTAL RETURN1,3,8
| | | Inception
Date | | 1 Year | | 5 Years | | Life of
Fund | |
| Trust Class | | 05/01/2002 | | | (23.69 | %) | | | 3.27 | % | | | 8.74 | % | |
| Institutional Class7 | | 06/04/2008 | | | (23.46 | %) | | | 3.35 | % | | | 8.80 | % | |
| FTSE NAREIT Equity REITs Index2,19 | | | | | (32.83 | %) | | | 0.14 | % | | | 5.68 | % | |
Performance data quoted represent past performance, which is no guarantee of future results. The investment return and principal value of an investment will fluctuate so that an investor's shares, when redeemed, may be worth more or less than their original cost. Results are shown on a "total return" basis and include reinvestment of all dividends and capital gain distributions.
Current performance may be lower or higher than the performance data quoted. For performance data current to the most recent month end, visit www.nb.com/performance.
As stated in the Fund's most recent prospectus, the total annual fund operating expense ratio for fiscal year 2008 were 1.86% and 1.79% for Trust Class and Institutional Class shares, respectively (prior to any fee waivers or expense reimbursements). The net expense ratios were 1.51% and 0.88% for Trust Class and Institutional Class shares, respectively. Neuberger Berman Management LLC has contractually agreed to limit certain expenses of the Fund through August 31, 2019 for Trust Class and Institutional Class shares.
COMPARISON OF A $10,000 INVESTMENT
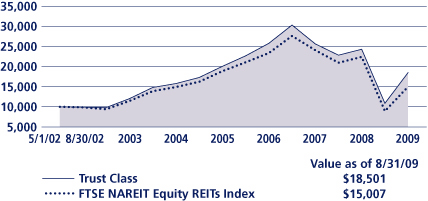
This chart shows the value of a hypothetical $10,000 investment in the Fund over the past 10 fiscal years, or since the Fund's inception if it has not operated for 10 years. The graph is based on the Trust Class shares only; performance of other classes will vary due to differences in fee structures and any applicable sales charges (see Average Annual Total Return chart above). The result is compared with benchmarks, which may include a broad-based market index and/or a narrower index. Please note that market indexes have not been reduced to reflect any of the fees and costs of investing. All results include the reinvestment of dividends and capital gain distributions. Neither the Fund's returns nor the market indexes shown in the graph and table reflect the effect of taxes an investor would pay on Fund distributions or on the redemption of Fund shares. Results represent past performance and do not indicate future results.
47
Regency Fund Commentary
The stock market's strong performance coming off early-March lows was not enough to compensate for its steep decline in the first half of the fiscal year ended August 31, 2009. For the full 12-month period, all 10 sectors in the Russell Midcap® Value Index were in negative territory, with four of 10 dropping by 20% or more. Although Neuberger Berman Regency Fund posted strongly positive returns and materially outperformed its benchmark in the second half, it had a negative return and trailed its benchmark for the fiscal year overall.
Our bias toward leading companies in more economically sensitive sectors, which penalized relative performance in the first half, enhanced relative returns in the second half of the reporting period as data, indicating that the global economy was stabilizing, prompted investors to move into the shares of quality cyclical companies.
During the reporting period, Industrial sector investments had the most negative effect on performance relative to the Russell benchmark. The portfolio was overweighted in Industrials, the index's second worst performing sector, and the disappointing performance of holdings such as Eagle Bulk Shipping (which was sold) and heavy equipment manufacturer Terex weighed on returns. Health Care investments lagged the benchmark sector component by a wide margin, primarily due to the poor performance of HMOs such as Aetna, CIGNA, and Conventry, which declined in response to uncertainty caused by potential changes in the health care system. Due in part to a big decline in merchant power producer Dynegy, which suffered from excess leverage and reduced industrial demand for power (and was sold), our Utilities holdings also underperformed.
Our investments in the hard-hit Financials sector held up relatively well, posting a negative return but materially outperforming the benchmark sector component. Gains in real estate investment trusts Macerich Company and Annaly Capital Management, and regional bank First Horizon National contributed substantially to performance. Although posting a significant decline, Energy sector holdings, primarily oil-oriented exploration and production companies, held up relatively well compared to the poorly performing benchmark sector overall. Helped by a big gain in Cablevision Systems, Consumer Discretionary sector investments also enhanced relative returns.
Last year's largely indiscriminate stock market plunge allowed us to further improve the quality of the portfolio by adding to positions in what we believed were the financially strongest and best positioned companies in their respective businesses and by reducing or eliminating positions in companies whose long-term prospects we believed were not quite as bright. We believed that the severely beaten down but still "best of breed" companies would excel once the market began anticipating an economic recovery. In addition, we began increasing our allocation to Financials, most notably well-capitalized regional banks, where we saw incredible bargains based on longer-term earnings power. As evidenced by the Fund's favorable relative performance in the second half of 2009, these strategies appear to be paying off.
Looking ahead, the economic outlook remains somewhat murky, with some forecasters expecting a more gradual U-shaped recovery and others anticipating a rapid V-shaped rebound. We can't be sure which of these economic scenarios will unfold. We do note that the economy appears to have improved considerably in the second quarter of calendar year 2009 and we believe we could see better-than-generally-expected GDP growth in the third quarter. Regardless of how long it takes the economy to fully regain its footing, however, our focus remains on identifying companies that are selling at a significant discount to normalized earnings power. We believe that, when the economy is solidly back on a growth path, these stocks will excel.
In closing, in recent years, investors have suffered through one of the most severe bear markets in history. Their patience and fortitude have been sorely tested. We believe the worst is over and are beginning to see some light at the end of the tunnel. We are pleased with the Regency Fund's strong absolute and relative performance in the second half of the fiscal year and believe we are well positioned to serve our shareholders in the years to come.
48
Sincerely,

S. Basu Mullick
Portfolio Manager
The risks involved in seeking capital appreciation from investments primarily in mid-cap stocks are set forth in the prospectus and statement of additional information.
Mid-capitalization stocks are more vulnerable to financial risks and other risks than stocks of larger companies. They also trade less frequently and in lower volume than larger company stocks, so their market prices tend to be more volatile.
The composition, industries and holdings of the Fund are subject to change. Regency Fund is invested in a wide array of stocks and no single holding makes up a significant portion of the Fund's total assets.
49
Regency Fund
TICKER SYMBOLS
| Investor Class | | NBRVX | |
| Trust Class | | NBREX | |
SECTOR ALLOCATION
| (% of Equity Market Value) | |
| Consumer Discretionary | | | 13.9 | % | |
| Consumer Staples | | | 7.6 | | |
| Energy | | | 11.9 | | |
| Financials | | | 25.3 | | |
| Health Care | | | 8.7 | | |
| Industrials | | | 11.8 | | |
| Information Technology | | | 6.9 | | |
| Materials | | | 5.5 | | |
| Utilities | | | 8.4 | | |
| Total | | | 100.0 | % | |
AVERAGE ANNUAL TOTAL RETURN1,3,8
| | | Inception
Date | | 1 Year | | 5 Years | | 10 Years | | Life of
Fund | |
| Investor Class | | 06/01/1999 | | | (21.04 | %) | | | 1.55 | % | | | 6.79 | % | | | 6.43 | % | |
| Trust Class5 | | 06/10/1999 | | | (20.96 | %) | | | 1.45 | % | | | 6.73 | % | | | 6.38 | % | |
| Russell Midcap® Value Index2,19 | | | | | (20.00 | %) | | | 3.00 | % | | | 6.29 | % | | | 5.62 | % | |
| Russell Midcap® Index2,19 | | | | | (19.92 | %) | | | 3.40 | % | | | 5.09 | % | | | 4.76 | % | |
Performance data quoted represent past performance, which is no guarantee of future results. The investment return and principal value of an investment will fluctuate so that an investor's shares, when redeemed, may be worth more or less than their original cost. Results are shown on a "total return" basis and include reinvestment of all dividends and capital gain distributions.
Current performance may be lower or higher than the performance data quoted. For performance data current to the most recent month end, visit www.nb.com/performance.
As stated in the Fund's most recent prospectus, the total annual fund operating expense ratios for fiscal year 2008 were 1.13% and 1.38% for Investor Class and Trust Class shares, respectively (prior to any fee waivers or expense reimbursements). The net expense ratio was 1.26% for Trust Class shares. Neuberger Berman Management LLC has contractually agreed to limit certain expenses of the Fund through August 31, 2019 for Trust Class shares.
COMPARISON OF A $10,000 INVESTMENT
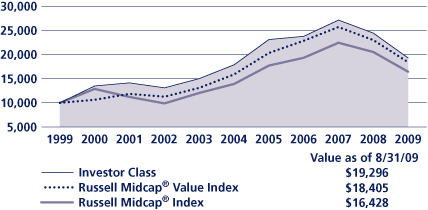
This chart shows the value of a hypothetical $10,000 investment in the Fund over the past 10 fiscal years, or since the Fund's inception if it has not operated for 10 years. The graph is based on the Investor Class shares only; performance of other classes will vary due to differences in fee structures and any applicable sales charges (see Average Annual Total Return chart above). The result is compared with benchmarks, which may include a broad-based market index and/or a narrower index. Please note that market indexes have not been reduced to reflect any of the fees and costs of investing. All results include the reinvestment of dividends and capital gain distributions. Neither the Fund's returns nor the market indexes shown in the graph and table reflect the effect of taxes an investor would pay on Fund distributions or on the redemption of Fund shares. Results represent past performance and do not indicate future results.
50
Select Equities Fund Commentary
For the fiscal year ended August 31, 2009, Neuberger Berman Select Equities Fund materially outperformed its benchmark, the S&P 500 Index. During a period of extreme distress and volatility for the equity markets, absolute returns for both the Fund and the index were negative.
As the fiscal year began, we had significant concerns about the condition of the economy and prospects for the markets. As a result, our portfolio was positioned in what we thought was a conservative fashion, with an historically high cash balance and overweightings in traditionally defensive areas such as Utilities. During the 12-month period, our worst fears were borne out—the economy suffered dramatically due to such factors as soft consumer spending, the weak housing market and rising unemployment. The credit crisis locked consumers and businesses out of financing options, and then, following the bankruptcy of Lehman Brothers on September 15, 2008, significant financial turmoil began in earnest. Given this extraordinary confluence of events, our main goal during the period was to preserve capital.
Positioning that started out as conservative and evolved to become extremely conservative was a significant benefit, with the most notable contributor to the Fund's relative outperformance this period being a large cash and cash equivalent position from September 2008 through February 2009. As noted above, the portfolio had been holding cash going into this period (about 20%), and as the dramatic downturn in the financial markets began to unfold, we raised and held very large amounts of cash. By October 2008, in fact, our cash position averaged roughly 60%, the highest it has ever been.
Stock selection and positioning helped as well. While every sector within the S&P 500 was down for the reporting period, some fared worse than others. The portfolio benefited on a relative basis from having underweighted (relative to the benchmark) some of the sectors that were weakest—especially in the fall—such as Financials and Industrials. In areas such as these, the portfolio's commitments (if any) declined far less than those of the market. In addition to cash, Health Care investments, such as Alcon, were beneficial on an absolute basis. Although the portfolio was underweighted versus the index in Health Care, with strong stock selection, our holdings closed the period up 15%, well ahead of the Health Care segment of the index, which was down 11%.
Timing of purchases and sales was another strength for the Select Equities Fund during this fiscal year—a period that contained both an extreme downturn and a subsequent rally from early March through August. From roughly September to the end of April, when the market was weakest, we created a "shopping list" of the companies we hoped to buy when we thought valuations and timing were right. By March, as we saw valuations come down to levels that were attractive to us from a risk perspective, and then signs from leading economic indicators that business was stabilizing and possibly improving, we became more positive on equities. During the spring, we were ready to reallocate to equities and were already focused on our targets.
Thus, we began building positions in a number of what we consider world-class companies, many of which exhibited the same characteristics as the few companies we kept throughout the fall—companies that we believed had the ability to grow organically regardless of the economic environment, with fortress-like balance sheets, that did not need access to the capital markets to grow their businesses. Our research led us to a number of the larger capitalized companies that have done very well for the portfolio this period, including Hewlett-Packard, BHP Billiton and Goldman Sachs.
The companies that had the most detrimental effect on performance over the period include some that we sold into the weak 2008 market as we were raising cash. We eliminated those holdings that we thought were least likely to weather the financial and economic crisis—either from a financing needs or business perspective. During the period, companies including Crown Castle and Brookfield Asset Management were sold from the portfolio at a loss to raise cash.
Looking ahead, we believe the financial crisis ended this past spring, but that the economy, while clearly improving, has a long way to go before full recovery. In our opinion, the economic recovery will unfold more slowly and less sharply than many prognosticators expect. With consumer spending likely to be weak for some time, and with banks now more
51
stringent in their consumer and business lending policies, we see far more moderate growth going forward. We are positioning the portfolio accordingly. We believe that if we are too conservative in our outlook, and the markets and economy are stronger than we anticipate, then the companies we are investing in will exceed our expectations.
We thank you for your support during what has been a most challenging period in the financial markets and world. We are excited about the year ahead.
Sincerely,


Gerald Kaminsky, Michael Kaminsky and Richard Werman
Portfolio Co-Managers
The risks involved in seeking capital appreciation from investments primarily in companies of large capitalization are set forth in the prospectus and statement of additional information.
Investing in the stocks of even the largest companies involves all the risks of stock market investing, including the risk that they may lose value due to overall market or economic conditions.
The composition, industries and holdings of the Fund are subject to change. Select Equities Fund is invested in a wide array of stocks and no single holding makes up a significant portion of the Fund's total assets.
52
Select Equities Fund
TICKER SYMBOLS
| Institutional Class | | NBEIX | |
| Class A | | NBEAX | |
| Class C | | NBECX | |
SECTOR ALLOCATION
| (% of Equity Market Value) | |
| Consumer Staples | | | 10.3 | % | |
| Energy | | | 15.3 | | |
| Financials | | | 17.5 | | |
| Health Care | | | 9.2 | | |
| Industrials | | | 11.5 | | |
| Information Technology | | | 15.8 | | |
| Materials | | | 9.0 | | |
| Telecommunication Services | | | 5.4 | | |
| Utilities | | | 6.0 | | |
| Total | | | 100.0 | % | |
AVERAGE ANNUAL TOTAL RETURN1,3
| | | Inception
Date | | 1 Year | | Life of
Fund | |
| At NAV | |
| Institutional Class | | 12/20/2007 | | | (12.03 | %) | | | (11.69 | %) | |
| Class A | | 12/20/2007 | | | (11.95 | %) | | | (11.76 | %) | |
| Class C | | 12/20/2007 | | | (12.58 | %) | | | (12.47 | %) | |
| With Sales Charge | |
| Class A | | | | | (17.01 | %) | | | (14.78 | %) | |
| Class C | | | | | (13.45 | %) | | | (12.47 | %) | |
| Index | |
| S&P 500 Index2,19 | | | | | (18.25 | %) | | | (16.72 | %) | |
Performance data quoted represent past performance, which is no guarantee of future results. The investment return and principal value of an investment will fluctuate so that an investor's shares, when redeemed, may be worth more or less than their original cost. Results are shown on a "total return" basis and include reinvestment of all dividends and capital gain distributions.
Current performance may be lower or higher than the performance data quoted. For performance data current to the most recent month end, visit www.nb.com/performance.
As stated in the Fund's most recent prospectus, the total annual fund operating expense ratios for fiscal year 2008 were 13.98%, 4.06% and 7.28% for Institutional Class, Class A and Class C shares, respectively (prior to any fee waivers or expense reimbursements). The net expense ratios were 0.85%, 1.33% and 2.07% for Institutional Class, Class A and Class C shares, respectively. Neuberger Berman Management LLC has contractually agreed to limit certain expenses of the Fund through August 31, 2012 for Class A, Class C and Institutional Class shares.
Total Returns shown with a sales charge reflect the deduction of current maximum initial sales charge of 5.75% for Class A shares and the applicable contingent deferred sales charges (CDSC) for Class C shares. The maximum CDSC for Class C shares is 1%, which is reduced to 0% after 1 year. The performance of the Fund's share classes will differ primarily due to different sales charge structures and class expenses. Please see the prospectus for more information about sales charge structures, if any, and class expenses for your share class.
53
Select Equities Fund
COMPARISON OF A $10,000 INVESTMENT (WITH SALES CHARGE)

This chart shows the value of a hypothetical $10,000 investment in the Fund over the past 10 fiscal years, or since the Fund's inception if it has not operated for 10 years. The graph is based on the Class A shares only; performance of other classes will vary due to differences in fee structures and any applicable sales charges (see Average Annual Total Return chart on previous page). The result is compared with benchmarks, which may include a broad-based market index and/or a narrower index. Please note that market indexes have not been reduced to reflect any of the fees and costs of investing. All results include the reinvestment of dividends and capital gain distributions. Neither the Fund's returns nor the market indexes shown in the graph and table reflect the effect of taxes an investor would pay on Fund distributions or on the redemption of Fund shares. Results represent past performance and do not indicate future results.
54
Small and Mid Cap Growth Fund Commentary
For the fiscal year ended August 31, 2009—a turbulent period for equities—Neuberger Berman Small and Mid Cap Growth Fund and its benchmark, the Russell 2500TM Growth Index, posted negative returns. Fund performance was behind that of the index.
Nearly every sector of the index finished this period in double-digit negative territory. Within the benchmark, Energy was the weakest sector, off by roughly 50%. Industrials were down more than 30%. Consumer Staples turned in the least negative results, declining approximately 10%. The largest index sectors—Information Technology and Health Care stocks—were whipsawed over the course of the fiscal year, initially performing very poorly but turning in middling results overall due to strong performance in the latter six months of the period.
Early in the fiscal year, more defensive and lower growth stocks outperformed on a relative basis while the markets were declining dramatically. After the March low, nearly the opposite was true—with lower quality (e.g., little or no earnings, low return on equity), smallest and least expensive stocks in the lead. This shift is not surprising—historically, in a transitional market following a period of sustained weakness, such as in 2003, lower quality stocks often have led early on. The Fund trailed the benchmark slightly through August, given that the low quality stocks leading the rally did not meet our quality growth and fundamental requirements. We believe the "junk rally" is waning now, however, and that the Fund can benefit when the market pauses to weigh price appreciation against the underlying fundamental value of securities.
Within the Fund, holdings in the difficult Energy sector markedly outperformed benchmark counterparts due to excellent security selection. An overweight position (versus the index) in Concho Resources, a high quality oil and gas company with good earnings visibility, was a benefit, as was Southwestern Energy.
Industrials holdings were also positive for the Fund versus the benchmark. Stocks that contributed to relative outperformance included shipping and logistics firms Old Dominion Freight and C.H. Robinson Worldwide, and Allegiant Travel, a low cost air-travel firm that has been gaining share in smaller travel markets.
The Fund slightly underperformed the index in Consumer Discretionary stocks, although stock selection within the sector was strong. After benefiting from our defensive secondary education theme in calendar year 2008, and to a lesser extent so far in calendar year 2009, we reduced the theme somewhat in favor of less defensive gaming and leisure firms. Ameristar Casinos, restaurant operator Brinker International and luxury hotel chain Orient Express were among our top performers for the period. Specialty retailer Bed Bath and Beyond was another strong performer within the sector.
The areas that were most detrimental to the Fund for the fiscal year were Information Technology (IT) and Health Care. In the key IT sector, Fund holdings did not keep pace with rebounding lower quality stocks. While the Fund outperformed the benchmark in the semiconductor and equipment area, with companies including Silicon Laboratories, Varian, Marvell and NetLogic among the top performers, the Fund strongly underperformed in Software. Trimble Navigation, a high quality software company, is a good example. Activision was among our weakest performers, and Advent also underperformed.
In Health Care, the Fund was underweighted relative to the benchmark and underperformed, as our services and equipment companies disappointed. Services companies were held back by "political" risk—the unknowns surrounding health care reform—and equipment firms lagged as hospitals reduced capital expenditures. Performance within Health Care was hampered by companies such as Intuitive Surgical and Illumina, both of which were sold.
Within Consumer Staples, we sold the Fund's weakest performer for the period, Central European Distribution. The liquor company's stock suffered due to changes in exchange rates and exposure to weakened emerging markets such as Russia and Poland.
We are approaching the coming year with positioning that is for the most part sector-neutral. The Fund is slightly overweighted in the Energy, Consumer Discretionary and Telecommunications sectors, and significantly underweighted in Health Care, but roughly market-weighted in Financials, Industrials, Technology, Materials and Consumer Staples.
55
As always, the companies that meet our fundamental criteria generally have strong balance sheets, good cash flow characteristics and low leverage, which should benefit them on a competitive basis as we move through this economic downturn and what we believe is a transitional market. Despite the strong performance of lower quality stocks, we continue to believe that, longer term, fundamental stock selection is the key to long-term performance, and that, over time, the market will reward companies that possess the strong fundamentals and quality growth characteristics that we seek.
Sincerely,


David H. Burshtan, Kenneth J. Turek and Kristina Kalebcih
Portfolio Co-Managers
The risks involved in seeking capital appreciation from investments primarily in companies with small- to mid-cap capitalization are set forth in the prospectus and statement of additional information.
Mid-capitalization stocks are more vulnerable to financial risks and other risks than larger stocks. They are generally less liquid than larger stocks, so their market prices tend to be more volatile.
The composition, industries and holdings of the Fund are subject to change. Small and Mid Cap Growth Fund is invested in a wide array of stocks and no single holding makes up a significant portion of the Fund's total assets.
56
Small and Mid Cap Growth Fund
TICKER SYMBOL
SECTOR ALLOCATION
| (% of Equity Market Value) | |
| Consumer Discretionary | | | 19.5 | % | |
| Consumer Staples | | | 5.2 | | |
| Energy | | | 7.0 | | |
| Financials | | | 9.1 | | |
| Health Care | | | 11.0 | | |
| Industrials | | | 17.5 | | |
| Information Technology | | | 26.6 | | |
| Materials | | | 1.8 | | |
| Telecommunication Services | | | 2.3 | | |
| Total | | | 100.0 | % | |
AVERAGE ANNUAL TOTAL RETURN1,3,10,13
| | | Inception
Date | | 1 Year | | Life of
Fund | |
| Trust Class | | | 09/05/2006 | | | | (23.21 | %) | | | (4.37 | %) | |
| Russell 2500TM Growth Index2,19 | | | | | | | (21.08 | %) | | | (4.05 | %) | |
Performance data quoted represent past performance, which is no guarantee of future results. The investment return and principal value of an investment will fluctuate so that an investor's shares, when redeemed, may be worth more or less than their original cost. Results are shown on a "total return" basis and include reinvestment of all dividends and capital gain distributions.
Current performance may be lower or higher than the performance data quoted. For performance data current to the most recent month end, visit www.nb.com/performance.
As stated in the Fund's most recent prospectus, the total annual fund operating expense ratio for fiscal year 2008 was 2.96% for Trust Class shares (prior to any fee waivers or expense reimbursements). The net expense ratio was 1.13%. Neuberger Berman Management LLC has contractually agreed to limit certain expenses of the Fund through August 31, 2012 for Trust Class shares.
COMPARISON OF A $10,000 INVESTMENT

This chart shows the value of a hypothetical $10,000 investment in the Fund over the past 10 fiscal years, or since the Fund's inception if it has not operated for 10 years. The graph is based on the Trust Class shares only; performance of other classes will vary due to differences in fee structures and any applicable sales charges (see Average Annual Total Return chart above). The result is compared with benchmarks, which may include a broad-based market index and/or a narrower index. Please note that market indexes have not been reduced to reflect any of the fees and costs of investing. All results include the reinvestment of dividends and capital gain distributions. Neither the Fund's returns nor the market indexes shown in the graph and table reflect the effect of taxes an investor would pay on Fund distributions or on the redemption of Fund shares. Results represent past performance and do not indicate future results.
57
Small Cap Growth Fund Commentary
For the fiscal year ended August 31, 2009—a turbulent period for equities—both Neuberger Berman Small Cap Growth Fund and its benchmark, the Russell 2000® Growth Index, posted negative returns. Fund performance was behind that of the index.
Nearly every sector of the Russell 2000 Growth Index finished this period in double-digit negative territory. Within the benchmark, Energy was the weakest sector, off by more than 50%. Industrials were down roughly 36%. At negative 1.7%, the tiny Consumer Staples sector turned in the strongest results.
Early in the fiscal year, more defensive and lower growth stocks outperformed on a relative basis while the markets were declining dramatically. After the March low and into the current rally, nearly the opposite was true—with the lower quality (e.g., little or no earnings, low return on equity), smallest, and least expensive stocks in the lead. In our view, this shift is not surprising—in a transitional market following a period of sustained weakness, such as in 2003, lower quality stocks have, in the past, often led early on. Such stocks do not meet our quality growth and fundamental requirements, accounting for the Fund's modest underperformance. However, we believe the "junk rally" may be waning now, and that our portfolio can benefit each time the market pauses to weigh price appreciation against underlying fundamental value.
The largest index sectors—Information Technology (IT), Health Care and Consumer Discretionary—were whipsawed during the fiscal year, initially performing very poorly, but turning in middling results overall due to strong performance in the second half. Within the Fund, holdings in the difficult Energy sector outperformed index counterparts thanks to excellent security selection. An overweight position (versus the benchmark) in Concho Resources, a high quality oil and gas firm with good earnings visibility, was a significant benefit.
Industrials holdings were also positive for the Fund versus the benchmark. Stocks that contributed to relative outperformance include Allegiant Travel, the Fund's top performer this period. Allegiant is a cost-effective secondary markets travel company that is gaining share from traditional carriers. Textron was another positive. Textron provides cost-efficient aircraft, industrial and financial solutions to the military and industry.
Our Consumer Discretionary holdings were also slightly positive on a relative basis. Our defensive secondary education theme performed very well on a relative basis through the end of calendar year 2008, although this trend has reversed so far in calendar year 2009. For the full fiscal year, the theme was a benefit, with the majority of our holdings contributing to returns.
The areas that were most detrimental to the Fund over the year were IT and Health Care. In IT, our holdings did not keep pace with rebounding lower quality stocks. While Silicon Laboratories and Varian Semiconductor Equipment were among our top performers, we tend not to invest heavily in semiconductor and equipment stocks, which led this market. Software, which we emphasized, underperformed the sector. Trimble Navigation, a high quality software company, is a good example. VistaPrint, a niche technology holding that sells lower cost business stationery, was a standout performer, particularly in the latter half of the fiscal year.
In Health Care, our services and equipment holdings underperformed. Services companies were hurt by "political risk"—the unknowns surrounding health care reform—and equipment firms underperformed as hospitals reduced spending. Disappointments included Kensey Nash, Wright Medical and Masimo, all of which were sold. Less susceptible to political risk, our biotech holdings performed relatively well this period. We added select exposure where we believe product pipelines are fairly predictable.
Last fall, the Fund was overweighted in Consumer Staples, a defensive move. As of fiscal year-end, the sector is at less than half the benchmark's weighting. We sold our weakest performer, Central European Distribution, this year. The liquor stock suffered on currency exposure and exposure to weakened Eastern European markets. On a positive note, we also sold Whole Foods, our second best performer.
We are approaching the coming year with roughly sector-neutral positioning. The Fund is overweighted in Consumer Discretionary, and is now less defensive in the sector, as we have reduced secondary education in favor of leisure and gaming companies such as Orient Express, Royal Caribbean Cruises and WMS Industries. We have eliminated our Telecommunications exposure.
58
As always, the companies that meet our fundamental criteria generally have strong balance sheets, good cash flow characteristics and low leverage, which should benefit them on a competitive basis as we move through this economic downturn and what we consider a transitional market. Despite the runs in performance that we have seen in lower quality stocks, we continue to believe that, longer term, fundamental stock selection is the key to long-term performance, and that the market will reward companies that possess the strong fundamentals and quality growth characteristics we seek over time.
Sincerely,

David H. Burshtan
Portfolio Manager
The risks involved in seeking capital appreciation from investments primarily in companies with small-market capitalization are set forth in the prospectus and statement of additional information.
Small-capitalization stocks are more vulnerable to financial risks and other risks than larger stocks. They are generally less liquid than larger stocks, so their market prices tend to be more volatile.
The composition, industries and holdings of the Fund are subject to change. Small Cap Growth Fund is invested in a wide array of stocks and no single holding makes up a significant portion of the Fund's total assets.
59
Small Cap Growth Fund
TICKER SYMBOLS
| Investor Class | | NBMIX | |
| Trust Class | | NBMOX | |
| Advisor Class | | NBMVX | |
| Institutional Class | | NBSMX | |
| Class A | | NSNAX | |
| Class C | | NSNCX | |
| Class R3 | | NSNRX | |
SECTOR ALLOCATION
| (% of Equity Market Value) | |
| Consumer Discretionary | | | 18.5 | % | |
| Consumer Staples | | | 1.5 | | |
| Energy | | | 3.1 | | |
| Financials | | | 5.8 | | |
| Health Care | | | 25.7 | | |
| Industrials | | | 15.1 | | |
| Information Technology | | | 27.7 | | |
| Materials | | | 2.6 | | |
| Total | | | 100.0 | % | |
AVERAGE ANNUAL TOTAL RETURN1,3,8,12
| | | Inception
Date | | 1 Year | | 5 Years | | 10 Years | | Life of
Fund | |
| At NAV | |
| Investor Class | | 10/20/1998 | | | (26.62 | %) | | | 4.19 | % | | | (0.68 | %) | | | 5.66 | % | |
| Trust Class5 | | 11/03/1998 | | | (26.64 | %) | | | 4.12 | % | | | (0.77 | %) | | | 5.58 | % | |
| Advisor Class6 | | 05/03/2002 | | | (26.81 | %) | | | 3.94 | % | | | (0.80 | %) | | | 5.54 | % | |
| Institutional Class7 | | 04/01/2008 | | | (26.30 | %) | | | 4.32 | % | | | (0.62 | %) | | | 5.71 | % | |
| Class A21 | | 05/27/2009 | | | (26.61 | %) | | | 4.19 | % | | | (0.68 | %) | | | 5.66 | % | |
| Class C21 | | 05/27/2009 | | | (26.73 | %) | | | 4.16 | % | | | (0.70 | %) | | | 5.64 | % | |
| Class R321 | | 05/27/2009 | | | (26.66 | %) | | | 4.18 | % | | | (0.69 | %) | | | 5.65 | % | |
| With Sales Charge | |
| Class A21 | | | | | (30.83 | %) | | | 2.97 | % | | | (1.27 | %) | | | 5.08 | % | |
| Class C21 | | | | | (27.47 | %) | | | 4.16 | % | | | (0.70 | %) | | | 5.64 | % | |
| Index | |
| Russell 2000® Growth Index2,19 | | | | | (22.02 | %) | | | 2.71 | % | | | 0.65 | % | | | 3.37 | % | |
| Russell 2000® Index2,19 | | | | | (21.29 | %) | | | 2.21 | % | | | 4.30 | % | | | 5.92 | % | |
Performance data quoted represent past performance, which is no guarantee of future results. The investment return and principal value of an investment will fluctuate so that an investor's shares, when redeemed, may be worth more or less than their original cost. Results are shown on a "total return" basis and include reinvestment of all dividends and capital gain distributions.
Current performance may be lower or higher than the performance data quoted. For performance data current to the most recent month end, visit www.nb.com/performance.
Neuberger Berman Management LLC has contractually agreed to limit certain expenses of the Fund through August 31, 2019 for Investor Class, Trust Class and Advisor Class shares, through August 31, 2012 for Institutional Class shares and through August 31, 2013 for Class A, Class C and Class R3 shares. The net expense ratios were 1.32%, 1.42%, 1.62%, 0.91%, 1.26%, 2.01% and 1.51% for Investor Class, Trust Class, Advisor Class, Institutional Class, Class A, Class C and Class R3 shares, respectively. As stated in the Fund's most recent prospectus, the total annual fund operating expense ratios for fiscal year 2008 were 1.45%, 1.67%, 1.99%, 1.11%, 1.60%, 2.35% and 1.85% for Investor Class, Trust Class, Advisor Class, Institutional Class, Class A, Class C and Class R3 shares, respectively (prior to any fee waivers or expense reimbursements).
Total Returns shown with a sales charge reflect the deduction of current maximum initial sales charge of 5.75% for Class A shares and the applicable contingent deferred sales charges (CDSC) for Class C shares. The maximum CDSC for Class C shares is 1%, which is reduced to 0% after 1 year. The performance of the Fund's share classes will differ primarily due to different sales charge structures and class expenses. Please see the prospectus for more information about sales charge structures, if any, and class expenses for your share class.
60
Small Cap Growth Fund
COMPARISON OF A $10,000 INVESTMENT

This chart shows the value of a hypothetical $10,000 investment in the Fund over the past 10 fiscal years, or since the Fund's inception if it has not operated for 10 years. The graph is based on the Investor Class shares only; performance of other classes will vary due to differences in fee structures and any applicable sales charges (see Average Annual Total Return chart on previous page). The result is compared with benchmarks, which may include a broad-based market index and/or a narrower index. Please note that market indexes have not been reduced to reflect any of the fees and costs of investing. All results include the reinvestment of dividends and capital gain distributions. Neither the Fund's returns nor the market indexes shown in the graph and table reflect the effect of taxes an investor would pay on Fund distributions or on the redemption of Fund shares. Results represent past performance and do not indicate future results.
61
Socially Responsive Fund Commentary
For the fiscal year ended August 31, 2009, Neuberger Berman Socially Responsive Fund underperformed its benchmark, the S&P 500 Index. In an overwhelmingly down market, performance for both the Fund and the index was negative.
In September 2008, the macroeconomic environment appeared dire, and markets sold off indiscriminately. Credit was constrained, business and consumer spending collapsed, and capacity utilization plummeted as businesses aggressively liquidated inventory. By early calendar year 2009, evidence suggested to us that this unprecedented global inventory destocking was ending, shifting toward a replenishment cycle.
Following the March 2009 equity market low, we have seen a significant rebound in global industrial production as businesses position to restock inventory. Over the same period, the global economy has also benefited from various stimulus packages, reopened credit markets, low interest rates, and generally healthy corporate balance sheets. Together theses factors added to optimism, and the markets rallied strongly. While the economy is clearly enjoying a vigorous near-term bounce, we believe the indebtedness of consumers and imbalances in government finances represent a long-term headwind for economic growth. We are also concerned about pockets of excess industrial capacity in light of lower demand, and are cautious about growth rates and fundamentals when the inventory boost ends.
As long-term investors, we made few changes to the types of companies we own, except for selective repositioning for the "post-Lehman bankruptcy" environment. Turnover remains relatively low, and our adjustments have been thoughtful, careful, and aligned with our longer-term strategy. We continue to focus on companies with strong, sustainable business models that are managed responsibly for the benefit of all stakeholders. The prospective growth in such businesses, we believe, is less dependent on a vibrant global economy. We believe most holdings have recession-resistant businesses and/or strategic advantages that should allow them to gain share to offset cyclical pressure presented by a weak economy.
We used last year's volatility to add to and introduce such names at attractive valuations. For example, while the newspaper business is weak, we own Washington Post for its high growth Kaplan education business—Kaplan is a beneficiary as American workers pursue higher education for a more secure future within a difficult labor market. The company has been recognized for its commitment to workplace diversity and recycling initiatives.
A top performer, Intuit is another example. One of Fortune's 100 Best Companies to Work For, Intuit sells software including TurboTax, Quicken and QuickBooks. Intuit has grown its business and acquired new small- and medium-sized business customers in a period of economic weakness, through a free version of the QuickBooks general ledger accounting system. This version demonstrates the software's value proposition—low cost and compelling benefits—and from there, Intuit can offer a full suite of paid services, such as payroll and payment systems, and web hosting.
We are currently avoiding credit-sensitive Financials, as we believe credit losses are rising, and the business models and earnings potential of the post-2008 world are still unclear. Within the Consumer Discretionary sector, we are avoiding retailers and consumer non-durables names, expecting that consumer spending will be more measured. Finally, we are avoiding deep cyclicals—these include many Materials-related businesses and Industrial sector companies that depend on high capacity utilization rates for growth. All of these areas have enjoyed strong rallies off of the March lows.
Within a wildly divergent market—down following the Lehman failure then sharply higher—individual stock performance was as much about the timing of purchases and sales as a commentary on its value. Our top performer was IntercontinentalExchange, whose volume growth we believe should continue with increased regulation of securities markets. We added Praxair, a resilient, well-run business, during the valuation opportunity in calendar year 2008. Many of Praxair's products are aimed at improving efficiency and reducing potential pollutants. Long-term holding Novo Nordisk, a leader in treatment of the growing global diabetes epidemic, and on social and environmental issues, also performed well. Yahoo is in a turnaround, with a solid balance sheet, no debt, a low price-to-cash flow ratio, and strong positioning for an ad spending recovery. Markel is one of the largest participants in a fragmented specialty insurance sector. We bought it at a meaningful discount, and believe it is positioned to grow.
62
Among the poor performers, we continue to own cable and component distributor Anixter. While disappointing for the reporting period, it has been a top performer in calendar year 2009. We eliminated Weingarten Realty Investors and American Express last fall on concerns about credit markets. We sold Liberty Global but held Comcast, a resilient business that has enjoyed improved share price performance recently.
True to our successful long-term strategy, we continue to manage the portfolio with a three- to five-year view, looking for socially responsive businesses with advantaged growth. After performing better than the index during much of calendar year 2009 so far, we lost ground in August as investors favored the "cyclical bounce" stocks we consider risky. We are encouraged by the prospects for our companies and think the portfolio is well positioned for growth within the more challenging environment we foresee. As always, we look forward to continuing to serve your investment needs.
Sincerely,


Arthur Moretti and Ingrid S. Dyott
Portfolio Co-Managers
The risks involved in seeking capital appreciation from investments in mid- to large-cap stocks that meet the Fund's financial criteria and social policy are set forth in the prospectus and statement of additional information.
Mid-capitalization stocks are more vulnerable to financial risks and other risks than larger stocks. They are generally less liquid than larger stocks, so their market prices tend to be more volatile. Large-cap stocks are subject to all the risks of stock market investing, including the risk that they may lose value.
The Fund's social policy could cause it to underperform similar funds that do not have a social policy. The composition, industries and holdings of the Fund are subject to change. Socially Responsive Fund is invested in a wide array of stocks and no single holding makes up a significant portion of the Fund's total assets.
63
Socially Responsive Fund
TICKER SYMBOLS
| Investor Class | | NBSRX | |
| Trust Class | | NBSTX | |
| Institutional Class | | NBSLX | |
| Class A | | NRAAX | |
| Class C | | NRACX | |
| Class R3 | | NRARX | |
SECTOR ALLOCATION
| (% of Equity Market Value) | |
| Consumer Discretionary | | | 16.4 | % | |
| Energy | | | 12.9 | | |
| Financials | | | 14.1 | | |
| Health Care | | | 12.0 | | |
| Industrials | | | 13.8 | | |
| Information Technology | | | 23.7 | | |
| Materials | | | 4.4 | | |
| Utilities | | | 2.7 | | |
| Total | | | 100.0 | % | |
AVERAGE ANNUAL TOTAL RETURN1,3,8
| | | Inception
Date | | 1 Year | | 5 Years | | 10 Years | | Life of
Fund | |
| At NAV | |
| Investor Class | | 03/16/1994 | | | (21.83 | %) | | | 1.86 | % | | | 1.93 | % | | | 7.21 | % | |
| Trust Class | | 03/03/1997 | | | (22.01 | %) | | | 1.67 | % | | | 1.71 | % | | | 7.04 | % | |
| Institutional Class7 | | 11/28/2007 | | | (21.71 | %) | | | 1.91 | % | | | 1.96 | % | | | 7.23 | % | |
| Class A21 | | 05/27/2009 | | | (21.87 | %) | | | 1.85 | % | | | 1.93 | % | | | 7.20 | % | |
| Class C21 | | 05/27/2009 | | | (22.00 | %) | | | 1.82 | % | | | 1.91 | % | | | 7.19 | % | |
| Class R321 | | 05/27/2009 | | | (21.93 | %) | | | 1.84 | % | | | 1.92 | % | | | 7.20 | % | |
| With Sales Charge | |
| Class A21 | | | | | (26.37 | %) | | | 0.65 | % | | | 1.33 | % | | | 6.79 | % | |
| Class C21 | | | | | (22.76 | %) | | | 1.82 | % | | | 1.91 | % | | | 7.19 | % | |
| Index | |
| S&P 500 Index2,19 | | | | | (18.25 | %) | | | 0.49 | % | | | (0.79 | %) | | | 7.17 | % | |
Performance data quoted represent past performance, which is no guarantee of future results. The investment return and principal value of an investment will fluctuate so that an investor's shares, when redeemed, may be worth more or less than their original cost. Results are shown on a "total return" basis and include reinvestment of all dividends and capital gain distributions.
Current performance may be lower or higher than the performance data quoted. For performance data current to the most recent month end, visit www.nb.com/performance.
Neuberger Berman Management LLC has contractually agreed to limit certain expenses of the Fund through August 31, 2012 for Institutional Class shares and through August 31, 2013 for Class A, Class C and Class R3 shares. The net expense ratios were 0.75%, 1.11%, 1.86% and 1.36% for Institutional Class, Class A, Class C and Class R3 shares. As stated in the Fund's most recent prospectus, the total annual fund operating expense ratios for fiscal year 2008 were 0.90%, 1.09%, 0.77%, 1.21%, 1.96% and 1.41% for Investor Class, Trust Class, Institutional Class, Class A, Class C and Class R3 shares, respectively (prior to any fee waivers or expense reimbursements).
Total Returns shown with a sales charge reflect the deduction of current maximum initial sales charge of 5.75% for Class A shares and the applicable contingent deferred sales charges (CDSC) for Class C shares. The maximum CDSC for Class C shares is 1%, which is reduced to 0% after 1 year. The performance of the Fund's share classes will differ primarily due to different sales charge structures and class expenses. Please see the prospectus for more information about sales charge structures, if any, and class expenses for your share class.
64
Socially Responsive Fund
COMPARISON OF A $10,000 INVESTMENT
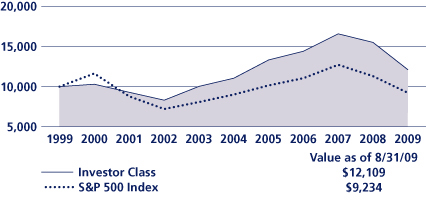
This chart shows the value of a hypothetical $10,000 investment in the Fund over the past 10 fiscal years, or since the Fund's inception if it has not operated for 10 years. The graph is based on the Investor Class shares only; performance of other classes will vary due to differences in fee structures and any applicable sales charges (see Average Annual Total Return chart on previous page). The result is compared with benchmarks, which may include a broad-based market index and/or a narrower index. Please note that market indexes have not been reduced to reflect any of the fees and costs of investing. All results include the reinvestment of dividends and capital gain distributions. Neither the Fund's returns nor the market indexes shown in the graph and table reflect the effect of taxes an investor would pay on Fund distributions or on the redemption of Fund shares. Results represent past performance and do not indicate future results.
65
Endnotes
1 "Total Return" includes reinvestment of all income dividends and capital gain distributions. Results represent past performance and do not indicate future results. The value of an investment in the Fund and the return on the investment both will fluctuate, and redemption proceeds may be higher or lower than an investor's original cost.
2 Please see "Glossary of Indices" starting on page 68 for a description of indices. Please note that indices do not take into account any fees and expenses or tax consequences of investing in the individual securities that they track, and that individuals cannot invest directly in any index. Data about the performance of these indices are prepared or obtained by Neuberger Berman Management LLC ("Management") and include reinvestment of all dividends and capital gain distributions. The Fund may invest in securities not included in the described indices or may not invest in all securities included in the described indices.
3 Expense Caps or Waivers: Absent these arrangements, which are subject to change, the total returns for these periods may have been less due to Management reimbursing and/or waiving certain operating expenses. Please see the notes to the financial statements for specific information regarding which funds and which classes currently have a portion of their operating expenses reimbursed and/or waived by Management.
4 This date reflects when Management first became investment advisor to the Fund.
5 Performance shown for the Trust Class prior to June 1998 for International Fund, November 1998 for Small Cap Growth Fund, and June 1999 for Regency Fund is that of the Investor Class, which has lower expenses and typically higher returns than the Trust Class.
6 Performance shown for the Advisor Class prior to May 2002 for Small Cap Growth Fund is that of the Investor Class, which has lower expenses and typically higher returns than the Advisor Class.
7 Performance shown prior to July 1999 for the Institutional Class of Genesis Fund, prior to June 2006 for the Institutional Class of Partners Fund, prior to April 2007 for the Institutional Class of Mid Cap Growth Fund, prior to November 2007 for the Institutional Class of Socially Responsive Fund and prior to April 2008 for the Institutional Class of Small Cap Growth Fund is that of the Investor Class. Performance shown prior to October 2006 for the Institutional Class of International Large Cap Fund and prior to June 2008 for the Institutional Class of Real Estate Fund is that of the Trust Class. The Investor Class and Trust Class have higher expenses and typically lower returns than the Institutional Class.
8 The investments for the Fund are managed by the same portfolio manager(s) who manage one or more other mutual funds that have similar names, investment objectives, and investment styles as the Fund. You should be aware that the Fund is likely to differ from the other mutual funds in size, cash flow pattern and tax matters. Accordingly, the holdings and performance can be expected to vary from those of the other mutual funds.
9 The Fund had a policy of investing mainly in large-cap stocks prior to September 1998 and investing 90% of its assets in no more than six economic sectors prior to December 17, 2007. As of April 2, 2001, the Fund changed its investment policy to become "non-diversified" under the Investment Company Act of 1940. Performance prior to these changes might have been different if current policies had been in effect. As a result of becoming "nondiversified", the Fund can invest a greater percentage of assets in any single security. This practice could increase the risk of investing in the Fund because it may own fewer securities. While the Fund's value-oriented approach is intended to limit risks, the Fund, with its concentration in a limited number of securities, may be more affected by any single economic, political or regulatory development than a more diversified mutual fund.
10 The Fund was relatively small during the period shown. The same techniques used to produce returns in a small fund may not work to produce similar returns in a larger fund.
11 Prior to December 17, 2007 Mid Cap Growth Fund was known as the Manhattan Fund.
12 Prior to December 17, 2007 Small Cap Growth Fund was known as the Millennium Fund.
13 Prior to December 17, 2007 Small and Mid Cap Growth Fund was known as All Cap Growth Fund and invested a significant portion of its assets in large cap securities. Performance after that date reflects the current small- and mid-cap strategy.
66
Endnotes (cont'd)
14 As of December 17, 2007, the Fund changed its investment policy to become "non-diversified" under the Investment Company Act of 1940. Performance prior to this change might have been different if current policies had been in effect. As a result of becoming "non-diversified," the Fund can invest a greater percentage of assets in any single security. This practice could increase the risk of investing in the Fund because it may own fewer securities. Although the Fund has a policy that allows it to operate as a non-diversified investment company, on December 5, 2008, the Board adopted a policy, which cannot be changed without a shareholder vote, that the Fund will invest its portfolio so as to meet the standards of a diversified investment company.
15 Because the Fund had a policy of investing mainly in large-cap stocks prior to December 2002, its performance during that time might have been different if current policies had been in effect.
16 Because the Fund had a policy of investing primarily in mid- and large-cap stocks prior to September 1998, its performance during that time might have been different if current policies had been in effect.
17 Performance from the beginning of the measurement period to June 9, 2008 for Class A and Class C of Neuberger Berman Equity Income Fund is that of the Trust Class. The performance information of the Trust Class has been adjusted to reflect the appropriate sales charge applicable to Class A and Class C shares, but has not been adjusted to take into account differences in class specific operating expenses (such as Rule 12b-1 fees). The Trust Class had lower expenses and typically higher returns than Class A or Class C.
18 Performance shown prior to December 20, 2007 for Class A and Class C, and prior to May 27, 2009 for Class R3, of Neuberger Berman International Large Cap Fund is that of the Trust Class. The performance information of the Trust Class has been adjusted to reflect the appropriate sales charge applicable to Class A and Class C shares, but has not been adjusted to take into account differences in class specific operating expenses (such as Rule 12b-1 fees). The Trust Class has lower expenses and typically higher returns than Class A, Class C or Class R3.
19 The date used to calculate Life of Fund performance for the index is the inception date of the oldest share class.
20 Prior to April 9, 2009, Neuberger Berman Large Cap Disciplined Growth Fund was known as Neuberger Berman Century Fund. From April 6, 2009 through April 8, 2009, Large Cap Disciplined Growth Fund Class A, Class C and Institutional Class were known as Century Fund Class A, Class C and Institutional Class. The inception dates for Large Cap Disciplined Growth Fund Class A, Class C and Institutional Class are April 6, 2009 and May 27, 2009 for Class R3. Performance shown prior to May 27, 2009 for Class R3, and prior to April 6, 2009 for Institutional Class, Class A and Class C of Neuberger Berman Large Cap Disciplined Growth Fund is that of Neuberger Berman Century Fund Investor Class. The performance information of the Investor Class has been adjusted to reflect the appropriate sales charge applicable to Class A and Class C shares, but has not been adjusted to take into account differences in class specific operating expenses (such as Rule 12b-1 fees). The Investor Class has lower expenses and typically higher returns than Class A, Class C or Class R3. The Institutional Class has lower expenses and typically higher returns than Investor Class.
21 Performance shown prior to May 27, 2009 for Class A, Class C and Class R3 of Neuberger Berman Guardian Fund, Neuberger Berman Mid Cap Growth Fund, Neuberger Berman Small Cap Growth Fund and Neuberger Berman Socially Responsive Fund is that of the Investor Class. The performance information of the Investor Class has been adjusted to reflect the appropriate sales charge applicable to Class A and Class C shares, but has not been adjusted to take into account differences in class specific operating expenses (such as Rule 12b-1 fees). The Investor Class has lower expenses and typically higher returns than Class A, Class C or Class R3
22 Performance shown prior to May 27, 2009 for Institutional Class of Neuberger Berman Guardian Fund is that of the Investor Class. The performance information of Institutional Class has not been adjusted to take into account differences in class specific operating expenses (such as Rule 12b-1 fees). Institutional Class has lower expenses and typically higher returns than Investor Class.
For more complete information on any of the Neuberger Berman Equity Funds, call Neuberger Berman Management LLC at (800) 877-9700, or visit our website at www.nb.com.
67
Glossary of Indices
| S&P 500 Index: | | The S&P 500 Index is widely regarded as the standard for measuring the performance of large-cap stocks traded on U.S. markets and includes a representative sample of leading companies in leading industries. | |
|
| Russell 1000®Index: | | Measures the performance of the 1,000 largest companies in the Russell 3000® Index (which measures the performance of the 3,000 largest U.S. companies based on total market capitalization). The Russell 1000 Index represents approximately 92% of the U.S. market. | |
|
| Russell 1000®Value Index: | | Measures the performance of those Russell 1000® Index companies with lower price-to-book ratios and lower forecasted growth rates. | |
|
| Russell 1000®Growth Index: | | Measures the performance of those Russell 1000® Index companies with higher price-to-book ratios and higher forecasted growth rates. | |
|
| Russell 2000®Index: | | An unmanaged index consisting of securities of the 2,000 issuers having the smallest capitalization in the Russell 3000® Index, representing approximately 8% of the Russell 3000 Index total market capitalization. As of the latest reconstitution, the smallest company's market capitalization was approximately $78 million. | |
|
| Russell 2000®Growth Index: | | Measures the performance of those Russell 2000® Index companies with higher price-to-book ratios and higher forecasted growth rates. | |
|
| Russell 2500TMGrowth Index: | | Measures the performance of those Russell 2500TM Index companies with higher price-to-book ratios and higher forecasted growth values. The Russell 2500 Index measures the performance of the 2,500 smallest companies in the Russell 3000®, which represents approximately 18% of the total market capitalization of the Russell 3000 Index. As of the latest reconstitution, the weighted average market capitalization was approximately $1.7 billion; the median market capitalization was approximately $425 million. The largest company in the index had an approximate market capitalization of $3.9 billion. | |
|
| Russell Midcap®Index: | | Measures the performance of the 800 smallest companies in the Russell 1000® Index. | |
|
| Russell Midcap®Growth Index: | | An unmanaged index that measures the performance of those Russell Midcap® Index companies (the 800 smallest companies in the Russell 1000® Index) with higher price-to-book ratios and higher forecasted growth rates. | |
|
| Russell Midcap®Value Index: | | An unmanaged index that measures the performance of those Russell Midcap® Index companies (the 800 smallest companies in the Russell 1000® Index) with lower price-to-book ratios and lower forecasted growth rates. | |
|
| FTSE NAREIT Equity REITs Index: | | The FTSE NAREIT Equity REITs Index tracks the performance of all Equity REITs currently listed on the New York Stock Exchange, the NASDAQ National Market System and the American Stock Exchange. REITs are classified as Equity if 75% or more or their gross invested Book assets are invested directly or indirectly in equity of commercial properties. | |
|
| MSCI EAFE®Index: | | Also known as the Morgan Stanley Capital International Europe, Australasia, Far East Index. An unmanaged index of over 1,000 foreign stock prices. The index is translated into U.S. dollars. | |
|
| MSCI Emerging Markets Index: | | A free float-adjusted market capitalization index that is designed to measure equity market performance in the global emerging markets. As of June 2009 the MSCI Emerging Markets Index consisted of the following 22 emerging market country indices: Brazil, Chile, China, Colombia, Czech Republic, Egypt, Hungary, India, Indonesia, Israel, Korea, Malaysia, Mexico, Morocco, Peru, Philippines,Poland, Russia, South Africa, Taiwan, Thailand, and Turkey. | |
|
68
Glossary of Indices (cont'd)
| MSCI World Index: | | A free float-adjusted market capitalization index that is designed to measure global developed market equity performance. As of June 2006 the MSCI World Index consisted of the following 23 developed market country indices: Australia, Austria, Belgium, Canada, Denmark, Finland, France, Germany, Greece, Hong Kong, Ireland, Italy, Japan, Netherlands, New Zealand, Norway, Portugal, Singapore, Spain, Sweden, Switzerland, the United Kingdom and the United States. | |
|
| HSBC Global Climate Change Index: | | The index is rule-based and uses a modified market capitalization approach that takes into account free float and revenues associated with climate change-related businesses. Recognizing that there is also a growing number of integrated players exposed to this theme, individual companies are weighted in the index according to their exposure to climate change. Exposure is defined as the percentage of overall revenues that are attributable to reducing emissions, reacting to the effects of climate change or adapting to climate change. The revenue data are based on HSBC's analysis of publicly available information and data from an external consultant specializing in renewable energy, low carbon technology and the carbon markets. Once a company has been ascribed an exposure factor and it forms part of the selection universe, HSBC monitors and modifies its climate change-related revenues, if necessary, on an annual basis. | |
|
Please note that indices do not take into account any fees and expenses or any tax consequences of investing in the individual securities that they track and that individuals cannot invest directly in any index. Data about the performance of these indices are prepared or obtained by Neuberger Berman Management LLC and include reinvestment of all dividends and capital gain distributions. The Funds may invest in securities not included in the above-described indices.
69
Information About Your Fund's Expenses
These tables are designed to provide information regarding costs related to your investments. All mutual funds incur operating expenses, which include management fees, fees for administrative services and costs of shareholder reports, among others. The following examples are based on an investment of $1,000 made at the beginning of the six month period ended August 31, 2009 and held for the entire period. The tables illustrate the fund's costs in two ways:
| Actual Expenses and Performance: | | The first section of the table provides information about actual account values and actual expenses in dollars, based on the fund's actual performance during the period. You may use the information in this line, together with the amount you invested, to estimate the expenses you paid over the period. Simply divide your account value by $1,000 (for example, an $8,600 account value divided by $1,000 = 8.6), then multiply the result by the number in the first section of the table under the heading entitled "Expenses Paid During the Period" to estimate the expenses you paid over the period. | |
|
Hypothetical Example for
Comparison Purposes: | | The second section of the table provides information about hypothetical account values and hypothetical expenses based on the fund's actual expense ratio and an assumed rate of return at 5% per year before expenses. This return is not the fund's actual return. The hypothetical account values and expenses may not be used to estimate the actual ending account balance or expenses you paid for the period. You may use this information to compare the ongoing costs of investing in these funds versus other funds. To do so, compare the expenses shown in this 5% hypothetical example with the 5% hypothetical examples that appear in the shareholder reports of other funds. | |
|
Please note that the expenses in the tables are meant to highlight your ongoing costs only and do not reflect any transactional costs, such as sales charges (loads) or redemption fees. Therefore, the information under the heading "Hypothetical (5% annual return before expenses)" is useful in comparing ongoing costs only, and will not help you determine the relative total costs of owning different funds. In addition, if these transactional costs were included, your costs would have been higher.
70
Expense Information as of 8/31/09 (Unaudited)
| Neuberger Berman Equity Funds | |
| | | ACTUAL | | HYPOTHETICAL (5% ANNUAL RETURN BEFORE EXPENSES)(4) | |
| | | Beginning
Account
Value
3/1/09 | | Ending
Account
Value
8/31/09 | | Expenses Paid
During the
Period(1)
3/1/09 - 8/31/09 | | Expense
Ratio | | Beginning
Account
Value
3/1/09 | | Ending
Account
Value
8/31/09 | | Expenses Paid
During the
Period(1)
3/1/09 - 8/31/09 | | Expense
Ratio | |
| Climate Change Fund | |
| Institutional Class | | $ | 1,000.00 | | | $ | 1,361.50 | | | $ | 5.83 | | | | .98 | % | | $ | 1,000.00 | | | $ | 1,020.27 | | | $ | 4.99 | | | | .98 | % | |
| Class A | | $ | 1,000.00 | | | $ | 1,360.10 | | | $ | 7.32 | | | | 1.23 | % | | $ | 1,000.00 | | | $ | 1,019.00 | | | $ | 6.26 | | | | 1.23 | % | |
| Class C | | $ | 1,000.00 | | | $ | 1,355.90 | | | $ | 11.76 | | | | 1.98 | % | | $ | 1,000.00 | | | $ | 1,015.22 | | | $ | 10.06 | | | | 1.98 | % | |
| Emerging Markets Equity Fund | |
| Institutional Class | | $ | 1,000.00 | | | $ | 1,703.00 | | | $ | 8.72 | | | | 1.28 | % | | $ | 1,000.00 | | | $ | 1,018.75 | | | $ | 6.51 | | | | 1.28 | % | |
| Class A | | $ | 1,000.00 | | | $ | 1,701.50 | | | $ | 10.42 | | | | 1.53 | % | | $ | 1,000.00 | | | $ | 1,017.49 | | | $ | 7.78 | | | | 1.53 | % | |
| Class C | | $ | 1,000.00 | | | $ | 1,696.20 | | | $ | 15.49 | | | | 2.28 | % | | $ | 1,000.00 | | | $ | 1,013.71 | | | $ | 11.57 | | | | 2.28 | % | |
| Equity Income Fund | |
| Institutional Class | | $ | 1,000.00 | | | $ | 1,298.00 | | | $ | 4.63 | | | | .80 | % | | $ | 1,000.00 | | | $ | 1,021.17 | | | $ | 4.08 | | | | .80 | % | |
| Class A | | $ | 1,000.00 | | | $ | 1,296.70 | | | $ | 6.72 | | | | 1.16 | % | | $ | 1,000.00 | | | $ | 1,019.36 | | | $ | 5.90 | | | | 1.16 | % | |
| Class C | | $ | 1,000.00 | | | $ | 1,292.30 | | | $ | 11.04 | | | | 1.91 | % | | $ | 1,000.00 | | | $ | 1,015.58 | | | $ | 9.70 | | | | 1.91 | % | |
| Focus Fund | |
| Investor Class | | $ | 1,000.00 | | | $ | 1,413.10 | | | $ | 6.14 | | | | 1.01 | % | | $ | 1,000.00 | | | $ | 1,020.11 | | | $ | 5.14 | | | | 1.01 | % | |
| Trust Class | | $ | 1,000.00 | | | $ | 1,411.60 | | | $ | 7.60 | | | | 1.25 | % | | $ | 1,000.00 | | | $ | 1,018.90 | | | $ | 6.36 | | | | 1.25 | % | |
| Advisor Class | | $ | 1,000.00 | | | $ | 1,409.40 | | | $ | 9.11 | | | | 1.50 | % | | $ | 1,000.00 | | | $ | 1,017.64 | | | $ | 7.63 | | | | 1.50 | % | |
| Genesis Fund | |
| Investor Class | | $ | 1,000.00 | | | $ | 1,324.80 | | | $ | 6.33 | | | | 1.08 | % | | $ | 1,000.00 | | | $ | 1,019.76 | | | $ | 5.50 | | | | 1.08 | % | |
| Trust Class | | $ | 1,000.00 | | | $ | 1,324.30 | | | $ | 6.56 | | | | 1.12 | % | | $ | 1,000.00 | | | $ | 1,019.56 | | | $ | 5.70 | | | | 1.12 | % | |
| Advisor Class | | $ | 1,000.00 | | | $ | 1,322.30 | | | $ | 8.08 | | | | 1.38 | % | | $ | 1,000.00 | | | $ | 1,018.25 | | | $ | 7.02 | | | | 1.38 | % | |
| Institutional Class | | $ | 1,000.00 | | | $ | 1,326.00 | | | $ | 4.98 | | | | .85 | % | | $ | 1,000.00 | | | $ | 1,020.92 | | | $ | 4.33 | | | | .85 | % | |
| Guardian Fund | |
| Investor Class | | $ | 1,000.00 | | | $ | 1,338.50 | | | $ | 5.78 | | | | .98 | % | | $ | 1,000.00 | | | $ | 1,020.27 | | | $ | 4.99 | | | | .98 | % | |
| Trust Class | | $ | 1,000.00 | | | $ | 1,337.90 | | | $ | 6.78 | | | | 1.15 | % | | $ | 1,000.00 | | | $ | 1,019.41 | | | $ | 5.85 | | | | 1.15 | % | |
| Advisor Class | | $ | 1,000.00 | | | $ | 1,335.60 | | | $ | 8.83 | | | | 1.50 | % | | $ | 1,000.00 | | | $ | 1,017.64 | | | $ | 7.63 | | | | 1.50 | % | |
| Institutional Class(3) | | $ | 1,000.00 | | | $ | 1,074.10 | | | $ | 2.07 | | | | .75 | % | | $ | 1,000.00 | | | $ | 1,011.29 | | | $ | 2.00 | | | | .75 | % | |
| Class A(3) | | $ | 1,000.00 | | | $ | 1,073.60 | | | $ | 3.06 | | | | 1.11 | % | | $ | 1,000.00 | | | $ | 1,010.34 | | | $ | 2.97 | | | | 1.11 | % | |
| Class C(3) | | $ | 1,000.00 | | | $ | 1,070.60 | | | $ | 5.12 | | | | 1.86 | % | | $ | 1,000.00 | | | $ | 1,008.34 | | | $ | 4.96 | | | | 1.86 | % | |
| Class R3(3) | | $ | 1,000.00 | | | $ | 1,072.70 | | | $ | 3.75 | | | | 1.36 | % | | $ | 1,000.00 | | | $ | 1,009.67 | | | $ | 3.63 | | | | 1.36 | % | |
| International Fund | |
| Investor Class | | $ | 1,000.00 | | | $ | 1,432.50 | | | $ | 8.58 | | | | 1.40 | % | | $ | 1,000.00 | | | $ | 1,018.15 | | | $ | 7.12 | | | | 1.40 | % | |
| Trust Class | | $ | 1,000.00 | | | $ | 1,431.40 | | | $ | 9.25 | | | | 1.51 | % | | $ | 1,000.00 | | | $ | 1,017.59 | | | $ | 7.68 | | | | 1.51 | % | |
| International Institutional Fund | |
| Institutional Class | | $ | 1,000.00 | | | $ | 1,450.90 | | | $ | 4.94 | | | | .80 | % | | $ | 1,000.00 | | | $ | 1,021.17 | | | $ | 4.08 | | | | .80 | % | |
| International Large Cap Fund | |
| Trust Class | | $ | 1,000.00 | | | $ | 1,426.30 | | | $ | 7.71 | | | | 1.26 | % | | $ | 1,000.00 | | | $ | 1,018.85 | | | $ | 6.41 | | | | 1.26 | % | |
| Institutional Class | | $ | 1,000.00 | | | $ | 1,426.30 | | | $ | 5.57 | | | | .91 | % | | $ | 1,000.00 | | | $ | 1,020.62 | | | $ | 4.63 | | | | .91 | % | |
| Class A | | $ | 1,000.00 | | | $ | 1,426.00 | | | $ | 7.77 | | | | 1.27 | % | | $ | 1,000.00 | | | $ | 1,018.80 | | | $ | 6.46 | | | | 1.27 | % | |
| Class C | | $ | 1,000.00 | | | $ | 1,420.60 | | | $ | 12.26 | | | | 2.01 | % | | $ | 1,000.00 | | | $ | 1,015.07 | | | $ | 10.21 | | | | 2.01 | % | |
| Class R3(3) | | $ | 1,000.00 | | | $ | 1,112.70 | | | $ | 4.27 | | | | 1.52 | % | | $ | 1,000.00 | | | $ | 1,009.25 | | | $ | 4.06 | | | | 1.52 | % | |
| Large Cap Disciplined Growth Fund | |
| Investor Class | | $ | 1,000.00 | | | $ | 1,296.10 | | | $ | 6.89 | | | | 1.19 | % | | $ | 1,000.00 | | | $ | 1,019.21 | | | $ | 6.06 | | | | 1.19 | % | |
| Institutional Class(2) | | $ | 1,000.00 | | | $ | 1,145.80 | | | $ | 3.26 | | | | .75 | % | | $ | 1,000.00 | | | $ | 1,017.23 | | | $ | 3.07 | | | | .75 | % | |
| Class A(2) | | $ | 1,000.00 | | | $ | 1,143.90 | | | $ | 4.82 | | | | 1.11 | % | | $ | 1,000.00 | | | $ | 1,015.77 | | | $ | 4.54 | | | | 1.11 | % | |
| Class C(2) | | $ | 1,000.00 | | | $ | 1,140.20 | | | $ | 8.07 | | | | 1.86 | % | | $ | 1,000.00 | | | $ | 1,012.73 | | | $ | 7.59 | | | | 1.86 | % | |
| Class R3(3) | | $ | 1,000.00 | | | $ | 1,102.40 | | | $ | 3.80 | | | | 1.36 | % | | $ | 1,000.00 | | | $ | 1,009.67 | | | $ | 3.63 | | | | 1.36 | % | |
71
Expense Information as of 8/31/09 cont'd (Unaudited)
| | | ACTUAL | | HYPOTHETICAL (5% ANNUAL RETURN BEFORE EXPENSES)(4) | |
| | | Beginning
Account
Value
3/1/09 | | Ending
Account
Value
8/31/09 | | Expenses Paid
During the
Period(1)
3/1/09 - 8/31/09 | | Expense
Ratio | | Beginning
Account
Value
3/1/09 | | Ending
Account
Value
8/31/09 | | Expenses Paid
During the
Period(1)
3/1/09 - 8/31/09 | | Expense
Ratio | |
| Mid Cap Growth Fund | |
| Investor Class | | $ | 1,000.00 | | | $ | 1,296.70 | | | $ | 6.60 | | | | 1.14 | % | | $ | 1,000.00 | | | $ | 1,019.46 | | | $ | 5.80 | | | | 1.14 | % | |
| Trust Class | | $ | 1,000.00 | | | $ | 1,295.50 | | | $ | 7.06 | | | | 1.22 | % | | $ | 1,000.00 | | | $ | 1,019.06 | | | $ | 6.21 | | | | 1.22 | % | |
| Advisor Class | | $ | 1,000.00 | | | $ | 1,293.70 | | | $ | 8.67 | | | | 1.50 | % | | $ | 1,000.00 | | | $ | 1,017.64 | | | $ | 7.63 | | | | 1.50 | % | |
| Institutional Class | | $ | 1,000.00 | | | $ | 1,299.80 | | | $ | 4.35 | | | | .75 | % | | $ | 1,000.00 | | | $ | 1,021.42 | | | $ | 3.82 | | | | .75 | % | |
| Class A(3) | | $ | 1,000.00 | | | $ | 1,093.80 | | | $ | 3.09 | | | | 1.11 | % | | $ | 1,000.00 | | | $ | 1,010.34 | | | $ | 2.97 | | | | 1.11 | % | |
| Class C(3) | | $ | 1,000.00 | | | $ | 1,092.10 | | | $ | 5.17 | | | | 1.86 | % | | $ | 1,000.00 | | | $ | 1,008.34 | | | $ | 4.96 | | | | 1.86 | % | |
| Class R3(3) | | $ | 1,000.00 | | | $ | 1,093.00 | | | $ | 3.78 | | | | 1.36 | % | | $ | 1,000.00 | | | $ | 1,009.67 | | | $ | 3.63 | | | | 1.36 | % | |
| Partners Fund | |
| Investor Class | | $ | 1,000.00 | | | $ | 1,647.90 | | | $ | 5.87 | | | | .88 | % | | $ | 1,000.00 | | | $ | 1,020.77 | | | $ | 4.48 | | | | .88 | % | |
| Trust Class | | $ | 1,000.00 | | | $ | 1,645.60 | | | $ | 6.94 | | | | 1.04 | % | | $ | 1,000.00 | | | $ | 1,019.96 | | | $ | 5.30 | | | | 1.04 | % | |
| Advisor Class | | $ | 1,000.00 | | | $ | 1,646.10 | | | $ | 7.94 | | | | 1.19 | % | | $ | 1,000.00 | | | $ | 1,019.21 | | | $ | 6.06 | | | | 1.19 | % | |
| Institutional Class | | $ | 1,000.00 | | | $ | 1,649.50 | | | $ | 4.67 | | | | .70 | % | | $ | 1,000.00 | | | $ | 1,021.68 | | | $ | 3.57 | | | | .70 | % | |
| Real Estate Fund | |
| Trust Class | | $ | 1,000.00 | | | $ | 1,704.70 | | | $ | 6.75 | | | | .99 | % | | $ | 1,000.00 | | | $ | 1,020.21 | | | $ | 5.04 | | | | .99 | % | |
| Institutional Class | | $ | 1,000.00 | | | $ | 1,706.50 | | | $ | 5.80 | | | | .85 | % | | $ | 1,000.00 | | | $ | 1,020.92 | | | $ | 4.33 | | | | .85 | % | |
| Regency Fund | |
| Investor Class | | $ | 1,000.00 | | | $ | 1,623.20 | | | $ | 8.73 | | | | 1.32 | % | | $ | 1,000.00 | | | $ | 1,018.55 | | | $ | 6.72 | | | | 1.32 | % | |
| Trust Class | | $ | 1,000.00 | | | $ | 1,623.50 | | | $ | 8.33 | | | | 1.26 | % | | $ | 1,000.00 | | | $ | 1,018.85 | | | $ | 6.41 | | | | 1.26 | % | |
| Select Equities Fund | |
| Institutional Class | | $ | 1,000.00 | | | $ | 1,215.70 | | | $ | 4.19 | | | | .75 | % | | $ | 1,000.00 | | | $ | 1,021.42 | | | $ | 3.82 | | | | .75 | % | |
| Class A | | $ | 1,000.00 | | | $ | 1,212.30 | | | $ | 6.69 | | | | 1.20 | % | | $ | 1,000.00 | | | $ | 1,019.16 | | | $ | 6.11 | | | | 1.20 | % | |
| Class C | | $ | 1,000.00 | | | $ | 1,206.70 | | | $ | 10.85 | | | | 1.95 | % | | $ | 1,000.00 | | | $ | 1,015.38 | | | $ | 9.91 | | | | 1.95 | % | |
| Small and Mid Cap Growth Fund | |
| Trust Class | | $ | 1,000.00 | | | $ | 1,287.10 | | | $ | 6.40 | | | | 1.11 | % | | $ | 1,000.00 | | | $ | 1,019.61 | | | $ | 5.65 | | | | 1.11 | % | |
| Small Cap Growth Fund | |
| Investor Class | | $ | 1,000.00 | | | $ | 1,350.10 | | | $ | 7.70 | | | | 1.30 | % | | $ | 1,000.00 | | | $ | 1,018.65 | | | $ | 6.61 | | | | 1.30 | % | |
| Trust Class | | $ | 1,000.00 | | | $ | 1,349.90 | | | $ | 8.29 | | | | 1.40 | % | | $ | 1,000.00 | | | $ | 1,018.15 | | | $ | 7.12 | | | | 1.40 | % | |
| Advisor Class | | $ | 1,000.00 | | | $ | 1,347.80 | | | $ | 9.47 | | | | 1.60 | % | | $ | 1,000.00 | | | $ | 1,017.14 | | | $ | 8.13 | | | | 1.60 | % | |
| Institutional Class | | $ | 1,000.00 | | | $ | 1,352.80 | | | $ | 5.34 | | | | .90 | % | | $ | 1,000.00 | | | $ | 1,020.67 | | | $ | 4.58 | | | | .90 | % | |
| Class A(3) | | $ | 1,000.00 | | | $ | 1,111.70 | | | $ | 3.54 | | | | 1.26 | % | | $ | 1,000.00 | | | $ | 1,009.94 | | | $ | 3.37 | | | | 1.26 | % | |
| Class C(3) | | $ | 1,000.00 | | | $ | 1,109.80 | | | $ | 5.63 | | | | 2.01 | % | | $ | 1,000.00 | | | $ | 1,007.95 | | | $ | 5.36 | | | | 2.01 | % | |
| Class R3(3) | | $ | 1,000.00 | | | $ | 1,111.00 | | | $ | 4.26 | | | | 1.52 | % | | $ | 1,000.00 | | | $ | 1,009.25 | | | $ | 4.06 | | | | 1.52 | % | |
| Socially Responsive Fund | |
| Investor Class | | $ | 1,000.00 | | | $ | 1,347.20 | | | $ | 5.50 | | | | .93 | % | | $ | 1,000.00 | | | $ | 1,020.52 | | | $ | 4.74 | | | | .93 | % | |
| Trust Class | | $ | 1,000.00 | | | $ | 1,345.90 | | | $ | 6.62 | | | | 1.12 | % | | $ | 1,000.00 | | | $ | 1,019.56 | | | $ | 5.70 | | | | 1.12 | % | |
| Institutional Class | | $ | 1,000.00 | | | $ | 1,348.00 | | | $ | 4.44 | | | | .75 | % | | $ | 1,000.00 | | | $ | 1,021.42 | | | $ | 3.82 | | | | .75 | % | |
| Class A(3) | | $ | 1,000.00 | | | $ | 1,073.30 | | | $ | 3.06 | | | | 1.11 | % | | $ | 1,000.00 | | | $ | 1,010.34 | | | $ | 2.97 | | | | 1.11 | % | |
| Class C(3) | | $ | 1,000.00 | | | $ | 1,071.70 | | | $ | 5.12 | | | | 1.86 | % | | $ | 1,000.00 | | | $ | 1,008.34 | | | $ | 4.96 | | | | 1.86 | % | |
| Class R3(3) | | $ | 1,000.00 | | | $ | 1,072.50 | | | $ | 3.75 | | | | 1.36 | % | | $ | 1,000.00 | | | $ | 1,009.67 | | | $ | 3.63 | | | | 1.36 | % | |
(1) For each class of the fund, expenses are equal to the annualized expense ratio for the class, multiplied by the average account value over the period, multiplied by 184/365 (to reflect the one-half year period shown), unless otherwise indicated.
(2) For each class of the fund, expenses are equal to the annualized expense ratio for the class, multiplied by the average account value over the period, multiplied by 148/365 (to reflect the period shown of April 6, 2009 to August 31, 2009).
(3) For each class of the fund, expenses are equal to the annualized expense ratio for the class, multiplied by the average account value over the period, multiplied by 97/365 (to reflect the period shown of May 27, 2009 to August 31, 2009).
(4) Hypothetical 5% annual return before expenses is calculated by multiplying the number of days in the most recent period divided by 365.
72
Schedule of Investments Climate Change Fund
TOP TEN EQUITY HOLDINGS
| | | | | Country | | Industry | | | |
| | 1 | | | Itron, Inc. | | United States | | Electronic Equipment & Instruments | | | 3.1 | % | |
| | 2 | | | ITC Holdings | | United States | | Electric Utilities | | | 2.6 | % | |
| | 3 | | | FPL Group | | United States | | Electric Utilities | | | 2.4 | % | |
| | 4 | | | The Williams Companies | | United States | | Oil & Gas Storage & Transportation | | | 2.4 | % | |
| | 5 | | | MYR Group | | United States | | Construction & Engineering | | | 2.2 | % | |
| | 6 | | | Northeast Utilities | | United States | | Electric Utilities | | | 2.1 | % | |
| | 7 | | | Gamesa Corporacion Tecnologica | | Spain | | Heavy Electrical Equipment | | | 2.0 | % | |
| | 8 | | | First Solar | | United States | | Electrical Components & Equipment | | | 2.0 | % | |
| | 9 | | | Covanta Holding | | United States | | Environmental & Facilities Services | | | 1.8 | % | |
| | 10 | | | Shaw Group | | United States | | Construction & Engineering | | | 1.7 | % | |
| | | Number
of Shares | | Value†
(000's) | |
| Common Stocks (99.0%) | |
| Application Software (0.5%) | |
| SAP AG | | | 300 | | | $ | 15 | | |
| Auto Parts & Equipment (4.0%) | |
| BorgWarner, Inc. | | | 415 | | | | 12 | | |
Fuel Systems
Solutions* | | | 1,100 | | | | 37 | | |
| Johnson Controls | | | 900 | | | | 22 | | |
Westport
Innovations* | | | 5,000 | | | | 50 | | |
| | | | 121 | | |
| Coal & Consumable Fuels (0.5%) | |
| Cameco Corp. | | | 600 | | | | 16 | | |
| Commodity Chemicals (1.1%) | |
| Calgon Carbon* | | | 2,300 | | | | 33 | | |
| Communications Equipment (1.7%) | |
| Tandberg ASA | | | 2,400 | | | | 50 | | |
| Computer Hardware (0.8%) | |
| IBM | | | 200 | | | | 24 | | |
| Construction & Engineering (6.8%) | |
| Foster Wheeler* | | | 600 | | | | 17 | | |
Jacobs Engineering
Group* | | | 300 | | | | 13 | | |
| Layne Christensen* | | | 700 | | | | 18 | | |
| MYR Group* | | | 3,200 | | | | 66 | | |
| Quanta Services* | | | 1,800 | | | | 40 | | |
| Shaw Group* | | | 1,800 | | | | 53 | | |
| | | | 207 | | |
| Construction & Farm Machinery (0.6%) | |
| Deere & Co. | | | 400 | | | | 17 | | |
| Diversified Support Services (1.5%) | |
| EnerNOC, Inc.* | | | 1,700 | | | | 46 | | |
| Electric Utilities (10.4%) | |
| Entergy Corp. | | | 515 | | | | 40 | | |
| Exelon Corp. | | | 575 | | | | 29 | | |
| FirstEnergy Corp. | | | 706 | | | | 32 | | |
| FPL Group | | | 1,295 | | | | 73 | | |
| ITC Holdings | | | 1,670 | | | | 78 | | |
| Northeast Utilities | | | 2,700 | | | | 64 | | |
| | | | 316 | | |
| | | Number
of Shares | | Value†
(000's) | |
| Electrical Components & Equipment (12.1%) | |
American
Superconductor* | | | 500 | | | $ | 16 | | |
Cooper Industries
Class A | | | 404 | | | | 13 | | |
| Emerson Electric | | | 400 | | | | 15 | | |
| Ener1, Inc.* | | | 4,700 | | | | 30 | | |
| EnerSys* | | | 2,000 | | | | 40 | | |
| First Solar* | | | 500 | | | | 61 | | |
| FuelCell Energy* | | | 3,600 | | | | 13 | | |
| General Cable* | | | 400 | | | | 14 | | |
| Q Cells* | | | 1,135 | | | | 17 | | |
| Roper Industries | | | 605 | | | | 29 | | |
Sunpower Corp
Class A* | | | 1,200 | | | | 30 | | |
Suntech Power
Holdings* | | | 2,400 | | | | 34 | | |
| Trina Solar* | | | 600 | | | | 16 | | |
| Yingli Green Energy* | | | 3,600 | | | | 39 | | |
| | | | 367 | | |
| Electronic Equipment & Instruments (3.9%) | |
| Itron, Inc.* | | | 1,718 | | | | 94 | | |
Wasion Group
Holdings | | | 25,000 | | | | 23 | | |
| | | | 117 | | |
| Electronic Manufacturing Services (1.1%) | |
| Echelon Corp.* | | | 1,000 | | | | 11 | | |
Maxwell
Technologies* | | | 1,600 | | | | 22 | | |
| | | | 33 | | |
| Environmental & Facilities Services (4.8%) | |
China Everbright
International | | | 90,000 | | | | 33 | | |
| Covanta Holding* | | | 3,075 | | | | 55 | | |
| EnergySolutions Inc. | | | 1,600 | | | | 14 | | |
| Tetra Tech* | | | 1,500 | | | | 45 | | |
| | | | 147 | | |
| | | Number
of Shares | | Value†
(000's) | |
| Fertilizers & Agricultural Chemicals (1.5%) | |
| Monsanto Co. | | | 189 | | | $ | 16 | | |
| Syngenta AG ADR | | | 600 | | | | 28 | | |
| | | | 44 | | |
| Forest Products (0.5%) | |
| Weyerhaeuser Co. | | | 400 | | | | 15 | | |
| Gas Utilities (3.7%) | |
| EQT Corp. | | | 700 | | | | 28 | | |
| New Jersey Resources | | | 400 | | | | 15 | | |
| ONEOK, Inc. | | | 1,100 | | | | 37 | | |
| Questar Corp. | | | 413 | | | | 14 | | |
South Jersey
Industries | | | 500 | | | | 17 | | |
| | | | 111 | | |
| Heavy Electrical Equipment (4.4%) | |
| ABB Ltd. | | | 838 | | | | 16 | | |
| Alstom S.A. | | | 400 | | | | 28 | | |
Gamesa Corporacion
Tecnologica | | | 2,800 | | | | 61 | | |
| Vestas Wind Systems* | | | 400 | | | | 29 | | |
| | | | 134 | | |
| Hypermarkets & Super Centers (0.5%) | |
| Wal-Mart Stores | | | 300 | | | | 15 | | |
| Independent Power Producers & Energy Traders (7.5%) | |
| AES Corp.* | | | 1,100 | | | | 15 | | |
| Calpine Corp.* | | | 2,988 | | | | 35 | | |
Constellation Energy
Group | | | 800 | | | | 25 | | |
| EDP Renovaveis* | | | 3,400 | | | | 34 | | |
| Iberdrola Renovables | | | 9,700 | | | | 44 | | |
| Magma Energy* | | | 16,000 | | | | 28 | | |
| Ormat Technologies | | | 1,300 | | | | 47 | | |
| | | | 228 | | |
| Industrial Conglomerates (1.1%) | |
McDermott
International* | | | 650 | | | | 16 | | |
| Siemens AG | | | 200 | | | | 17 | | |
| | | | 33 | | |
See Notes to Schedule of Investments
73
| | | Number
of Shares | | Value†
(000's) | |
| Industrial Gases (0.5%) | |
| Praxair, Inc. | | | 200 | | | $ | 15 | | |
| Industrial Machinery (5.5%) | |
| Badger Meter | | | 800 | | | | 29 | | |
| Danaher Corp. | | | 300 | | | | 18 | | |
| Energy Recovery* | | | 5,000 | | | | 26 | | |
| ESCO Technologies* | | | 800 | | | | 30 | | |
| Kaydon Corp. | | | 395 | | | | 13 | | |
| SPX Corp. | | | 600 | | | | 33 | | |
| Valmont Industries | | | 200 | | | | 17 | | |
| | | | 166 | | |
| IT Consulting & Other Services (0.6%) | |
| Telvent GIT | | | 700 | | | | 19 | | |
| Multi-Utilities (4.5%) | |
| Gdf Suez | | | 700 | | | | 30 | | |
| National Grid ADR | | | 370 | | | | 18 | | |
| PG&E Corp. | | | 400 | | | | 16 | | |
Suez Environnement
SA ADR | | | 1,900 | | | | 19 | | |
Veolia Environnement
ADR | | | 1,500 | | | | 52 | | |
| | | | 135 | | |
| Oil & Gas Exploration & Production (4.0%) | |
| Denbury Resources* | | | 1,400 | | | | 21 | | |
| EOG Resources | | | 200 | | | | 15 | | |
| Range Resources | | | 850 | | | | 41 | | |
| Southwestern Energy* | | | 700 | | | | 26 | | |
| XTO Energy | | | 500 | | | | 19 | | |
| | | | 122 | | |
| Oil & Gas Refining & Marketing (1.1%) | |
| Clean Energy Fuels* | | | 2,600 | | | | 33 | | |
| Oil & Gas Storage & Transportation (3.4%) | |
| Enbridge Inc. | | | 400 | | | | 15 | | |
| Spectra Energy | | | 800 | | | | 15 | | |
The Williams
Companies | | | 4,400 | | | | 72 | | |
| | | | 102 | | |
| Railroads (0.5%) | |
| Norfolk Southern | | | 300 | | | | 14 | | |
| Semiconductor Equipment (0.4%) | |
MEMC Electronic
Materials* | | | 800 | | | | 13 | | |
| Semiconductors (0.6%) | |
| Cree, Inc.* | | | 500 | | | | 19 | | |
| Specialized Finance (1.7%) | |
| Climate Exchange* | | | 2,200 | | | | 33 | | |
IntercontinentalExchange
Inc.* | | | 200 | | | | 19 | | |
| | | | 52 | | |
| | | Number
of Shares | | Value†
(000's) | |
| Specialized REITS (0.5%) | |
Plum Creek Timber
Company | | | 500 | | | $ | 15 | | |
| Specialty Chemicals (2.1%) | |
| Nalco Holding | | | 1,000 | | | | 18 | | |
| Rockwood Holdings* | | | 2,331 | | | | 47 | | |
| | | | 65 | | |
| Steel (1.0%) | |
Allegheny
Technologies | | | 1,000 | | | | 30 | | |
| Systems Software (0.6%) | |
| VMware Inc.* | | | 500 | | | | 18 | | |
| Water Utilities (3.0%) | |
American Water
Works | | | 1,800 | | | | 36 | | |
| Aqua America | | | 1,700 | | | | 29 | | |
Companhia de Saneamento
Basico do Estado de Sao
Paulo | | | 700 | | | | 25 | | |
| | | | 90 | | |
Total Common Stocks
(Cost $2,588) | | | | | | | 2,997 | | |
| Short-Term Investments (2.0%) | |
State Street
Institutional
Liquid Reserves
Fund Institutional
Class
(Cost $62) | | | 62,467 | | | | 62 | | |
Total Investments##(101.0%)
(Cost $2,650) | | | | | | | 3,059 | | |
Liabilities, less cash,
receivables and
other assets [(1.0%)] | | | | | | | (30 | ) | |
| Total Net Assets (100.0%) | | | | | | $ | 3,029 | | |
See Notes to Schedule of Investments
74
Schedule of Investments Emerging Markets Equity Fund
TOP TEN EQUITY HOLDINGS
| | | | | Country | | Industry | | | |
| | 1 | | | Petroleo Brasileiro ADR | | Brazil | | Oil, Gas & Consumable Fuels | | | 3.5 | % | |
| | 2 | | | China Mobile | | China | | Wireless Telecommunication Services | | | 2.4 | % | |
| | 3 | | | Samsung Electronics | |
Korea | | Equipment | | | 2.0 | % | |
| | 4 | | | Vale SA ADR | | Brazil | | Metals & Mining | | | 2.0 | % | |
| | 5 | | | America Movil ADR | | Mexico | | Wireless Telecommunication Services | | | 1.8 | % | |
| | | | | | | | | Semiconductors & Semiconductor | | | | | |
| | 6 | | | Taiwan Semiconductor Manufacturing ADR | | Taiwan, Province Of China | | Equipment | | | 1.8 | % | |
| | 7 | | | Bank of China, H Shares | | China | | Commercial Banks | | | 1.7 | % | |
| | 8 | | | MTN Group | | South Africa | | Wireless Telecommunication Services | | | 1.6 | % | |
| | 9 | | | Industrial & Commercial Bank of
China, H Shares | |
China | |
Commercial Banks | | | 1.6 | % | |
| | 10 | | | Elbit Systems | | Israel | | Aerospace & Defense | | | 1.6 | % | |
| | | Number
of Shares | | Value†
(000's) | |
| Common Stocks (79.6%) | |
| Brazil (3.9%) | |
Cia Brasileira de Meios de
Pagamento | | | 4,830 | | | $ | 42 | | |
Diagnosticos da
America* | | | 2,675 | | | | 60 | | |
Multiplan Empreendimentos
Imobiliarios | | | 5,500 | | | | 75 | | |
PDG Realty
Empreendimentos
E Participacoes | | | 4,305 | | | | 63 | | |
| | | | 240 | | |
| Chile (1.1%) | |
Sociedad Quimica
y Minera de Chile
ADR, B Shares | | | 1,870 | | | | 65 | | |
| China (16.5%) | |
Bank of China,
H Shares | | | 214,400 | | | | 104 | | |
| China Mobile | | | 14,750 | | | | 143 | | |
China Oilfield Services,
H Shares | | | 68,000 | | | | 59 | | |
China South Locomotive &
Rolling Stock,
H Shares | | | 78,600 | | | | 47 | | |
China Vanke,
B Shares | | | 39,800 | | | | 46 | | |
Chongqing Machinery &
Electric, H Shares* | | | 244,600 | | | | 45 | | |
| CNOOC Ltd. | | | 35,000 | | | | 46 | | |
GOME Electrical Appliances
Holdings* | | | 123,654 | | | | 33 | | |
Industrial & Commercial
Bank of China,
H Shares | | | 142,400 | | | | 97 | | |
| Inspur International | | | 272,900 | | | | 41 | | |
Maanshan Iron & Steel,
H Shares* | | | 108,900 | | | | 67 | | |
NetEase.com, Inc.
ADR* | | | 700 | | | | 29 | | |
| | | Number
of Shares | | Value†
(000's) | |
Travelsky Technology,
H Shares | | | 61,200 | | | $ | 40 | | |
Want Want China
Holdings | | | 72,300 | | | | 38 | | |
Wasion Group
Holdings | | | 68,200 | | | | 62 | | |
Zhaojin Mining
Industry, H Shares | | | 21,000 | | | | 30 | | |
Zijin Mining Group,
H Shares | | | 48,400 | | | | 41 | | |
| ZTE Corp., H Shares | | | 8,600 | | | | 40 | | |
| | | | 1,008 | | |
| Czech Republic (0.5%) | |
Telefonica O2 Czech
Republic | | | 1,090 | | | | 30 | | |
| Egypt (0.5%) | |
| Eastern Tobacco | | | 1,350 | | | | 33 | | |
| India (2.6%) | |
State Bank of India
GDR | | | 960 | | | | 71 | | |
Sterlite Industries (India)
ADR* | | | 6,400 | | | | 86 | | |
| | | | 157 | | |
| Indonesia (2.0%) | |
PT Astra Agro Lestari
Tbk | | | 16,500 | | | | 35 | | |
PT United Tractors
Tbk | | | 65,235 | | | | 87 | | |
| | | | 122 | | |
| Israel (5.3%) | |
| Elbit Systems | | | 1,460 | | | | 95 | | |
| Israel Chemicals | | | 5,320 | | | | 59 | | |
Makhteshim-Agan
Industries | | | 6,390 | | | | 29 | | |
Mizrahi Tefahot
Bank* | | | 7,060 | | | | 54 | | |
Teva Pharmaceutical
Industries ADR | | | 1,650 | | | | 85 | | |
| | | | 322 | | |
| | | Number
of Shares | | Value†
(000's) | |
| Korea (10.7%) | |
| Dongbu Insurance | | | 1,490 | | | $ | 45 | | |
Doosan Heavy Industries &
Construction | | | 1,285 | | | | 65 | | |
| HNK Machine Tool* | | | 1,065 | | | | 40 | | |
| Hyundai Mobis | | | 715 | | | | 76 | | |
| KB Financial Group* | | | 1,485 | | | | 61 | | |
| LG Electronics | | | 330 | | | | 38 | | |
| NHN Corp.* | | | 285 | | | | 39 | | |
| Samsung Electronics | | | 200 | | | | 124 | | |
| Samsung SDI | | | 365 | | | | 43 | | |
| Taewoong Co. | | | 830 | | | | 54 | | |
| Woongjin Thinkbig | | | 4,170 | | | | 67 | | |
| | | | 652 | | |
| Malaysia (1.1%) | |
| Top Glove | | | 34,400 | | | | 68 | | |
| Mexico (3.7%) | |
| America Movil ADR | | | 2,450 | | | | 111 | | |
Empresas ICA SAB
de C.V.* | | | 31,400 | | | | 66 | | |
Fomento Economico
Mexicano ADR,
B Shares | | | 1,340 | | | | 49 | | |
| | | | 226 | | |
| Nigeria (1.0%) | |
Guaranty Trust
Bank | | | 166,595 | | | | 15 | | |
Guaranty Trust Bank
GDR | | | 9,280 | | | | 46 | | |
| | | | 61 | | |
| Philippines (2.1%) | |
Energy
Development | | | 651,200 | | | | 60 | | |
International Container
Terminal Services | | | 158,000 | | | | 70 | | |
| | | | 130 | | |
| Poland (1.0%) | |
| PBG SA* | | | 755 | | | | 59 | | |
See Notes to Schedule of Investments
75
| | | Number
of Shares | | Value†
(000's) | |
| Russia (4.0%) | |
| Gazprom ADR | | | 4,265 | | | $ | 91 | | |
| Magnit GDR | | | 4,310 | | | | 49 | | |
Mobile TeleSystems
ADR | | | 980 | | | | 43 | | |
| Rosneft Oil GDR* | | | 9,035 | | | | 58 | | |
| | | | 241 | | |
| South Africa (6.2%) | |
| ABSA Group | | | 2,895 | | | | 47 | | |
| AngloGold Ashanti | | | 980 | | | | 37 | | |
| BHP Billiton | | | 3,010 | | | | 77 | | |
| Discovery Holdings | | | 9,810 | | | | 35 | | |
| MTN Group | | | 5,960 | | | | 98 | | |
| Raubex Group | | | 12,425 | | | | 41 | | |
| Tiger Brands | | | 2,230 | | | | 45 | | |
| | | | 380 | | |
| Sweden (1.0%) | |
Oriflame Cosmetics
SDR | | | 1,245 | | | | 60 | | |
| Taiwan, Province Of China (10.0%) | |
| Chroma Ate | | | 33,358 | | | | 45 | | |
Chunghwa Telecom
ADR | | | 2,300 | | | | 39 | | |
Hung Poo Real Estate
Development | | | 58,100 | | | | 67 | | |
Powertech
Technology | | | 26,764 | | | | 73 | | |
| Simplo Technology | | | 9,620 | | | | 44 | | |
Taiwan Semiconductor
Manufacturing
ADR | | | 60,238 | | | | 108 | | |
| TXC Corp. | | | 42,945 | | | | 52 | | |
| Wistron Corp. | | | 28,599 | | | | 56 | | |
| WPG Holdings | | | 58,360 | | | | 75 | | |
Yuanta Financial
Holding | | | 87,015 | | | | 54 | | |
| | | | 613 | | |
| Thailand (3.0%) | |
| Banpu Public | | | 4,500 | | | | 53 | | |
| Kasikornbank PCL | | | 31,300 | | | | 68 | | |
Thanachart Capital
PCL | | | 138,700 | | | | 60 | | |
| | | | 181 | | |
| Turkey (2.5%) | |
BIM Birlesik
Magazalar | | | 1,570 | | | | 59 | | |
Turkcell Iletisim Hizmetleri
ADR | | | 2,700 | | | | 43 | | |
Turkiye Garanti
Bankasi* | | | 14,410 | | | | 53 | | |
| | | | 155 | | |
| United Kingdom (0.9%) | |
| Tullow Oil | | | 3,060 | | | | 54 | | |
Total Common Stocks
(Cost $3,724) | | | | | | | 4,857 | | |
| | | Number
of Shares | | Value†
(000's) | |
| Preferred Stocks (9.2%) | |
| Brazil (9.2%) | |
Banco Do Estado do Rio
Grande do Sul | | | 16,900 | | | $ | 93 | | |
Companhia de Bebidas
das Americas ADR | | | 710 | | | | 53 | | |
Petroleo Brasileiro
ADR | | | 6,340 | | | | 211 | | |
Refinaria de Petroleo
Ipiranga*^^ | | | 173 | | | | 0 | | |
Ultrapar Participacoes
ADR | | | 2,070 | | | | 76 | | |
| Vale SA ADR | | | 7,125 | | | | 123 | | |
Total Preferred Stocks
(Cost $409) | | | | | | | 556 | | |
| Participatory Notes (5.2%) | |
| India (5.2%) | |
Bharat Heavy Electricals
(issuer JP Morgan Int'l
Derivatives), Expiration
Date 4/29/2013*µµ | | | 1,005 | | | | 48 | | |
Cairn India (issuer
JP Morgan Int'l
Derivatives), Expiration
Date 1/15/2013*µµ | | | 14,495 | | | | 78 | | |
Grasim Industry (issuer
JP Morgan Int'l
Derivatives), Expiration
Date 3/10/2014*µµ | | | 905 | | | | 50 | | |
Hero Honda Motors
(issuer JP Morgan Int'l
Derivatives), Expiration
Date 11/13/2014*µµ | | | 1,340 | | | | 41 | | |
Punjab National Bank
(issuer JP Morgan Chase
Int'l Derivatives),
Expiration Date
10/17/2013*µµ | | | 3,156 | | | | 44 | | |
Unitech Ltd. (issuer
JP Morgan Int'l
Derivatives), Expiration
Date 9/9/2018*µµ | | | 28,525 | | | | 58 | | |
Total Participatory Notes
(Cost $234) | | | | | | | 319 | | |
| | | Principal
Amount | | | |
| Convertible Bonds (0.1%) | |
| Brazil (0.1%) | |
PDG Realty
Empreendimentos
E Participacoes,
Floating Rate
Guaranteed Notes,
1.00% due
10/15/09µ^^
(Cost $5) | | $ | 10,000 | | | | 8 | | |
| | | Number
of Shares | | Value†
(000's) | |
| Short-Term Investments (2.6%) | |
State Street
Institutional
Liquid Reserves
Fund Institutional
Class
(Cost $161) | | | 161,305 | | | $ | 161 | | |
Total Investments##(96.7%)
(Cost $4,533) | | | | | 5,901 | | |
Cash, receivables
and other assets,
less liabilities (3.3%) | | | | | 204 | | |
| Total Net Assets (100.0%) | | | | $ | 6,105 | | |
See Notes to Schedule of Investments
76
SUMMARY SCHEDULE OF INVESTMENTS BY INDUSTRY EMERGING MARKETS EQUITY FUND
| Industry | | Investments at
Value†
(000's omitted) | | Percentage of
Net Assets | |
| Commercial Banks | | $ | 709 | | | | 11.6 | % | |
| Oil, Gas & Consumable Fuels | | | 535 | | | | 8.8 | % | |
| Metals & Mining | | | 461 | | | | 7.6 | % | |
| Wireless Telecommunication Services | | | 438 | | | | 7.2 | % | |
| Diversified Financial Services | | | 373 | | | | 6.1 | % | |
| Electronic Equipment, Instruments & Components | | | 318 | | | | 5.2 | % | |
| Semiconductors & Semiconductor Equipment | | | 305 | | | | 5.0 | % | |
| Construction & Engineering | | | 231 | | | | 3.8 | % | |
| Machinery | | | 228 | | | | 3.7 | % | |
| Real Estate Management & Development | | | 188 | | | | 3.1 | % | |
| Chemicals | | | 153 | | | | 2.5 | % | |
| Food Products | | | 118 | | | | 1.9 | % | |
| Household Durables | | | 109 | | | | 1.8 | % | |
| Food & Staples Retailing | | | 108 | | | | 1.8 | % | |
| Beverages | | | 102 | | | | 1.7 | % | |
| Computers & Peripherals | | | 100 | | | | 1.6 | % | |
| Aerospace & Defense | | | 95 | | | | 1.6 | % | |
| Pharmaceuticals | | | 85 | | | | 1.4 | % | |
| IT Services | | | 82 | | | | 1.3 | % | |
| Insurance | | | 80 | | | | 1.3 | % | |
| Auto Components | | | 76 | | | | 1.2 | % | |
| Transportation Infrastructure | | | 70 | | | | 1.1 | % | |
| Diversified Telecommunication Services | | | 69 | | | | 1.1 | % | |
| Internet Software & Services | | | 68 | | | | 1.1 | % | |
| Health Care Equipment & Supplies | | | 68 | | | | 1.1 | % | |
| Media | | | 67 | | | | 1.1 | % | |
| Personal Products | | | 60 | | | | 1.0 | % | |
| Health Care Providers & Services | | | 60 | | | | 1.0 | % | |
| Independent Power Producers & Energy Traders | | | 60 | | | | 1.0 | % | |
| Consumer Finance | | | 60 | | | | 1.0 | % | |
| Energy Equipment & Services | | | 59 | | | | 1.0 | % | |
| Integrated Oil & Gas | | | 54 | | | | 0.9 | % | |
| Industrial Conglomerates | | | 45 | | | | 0.7 | % | |
| Communications Equipment | | | 40 | | | | 0.7 | % | |
| Specialty Retail | | | 33 | | | | 0.5 | % | |
| Tobacco | | | 33 | | | | 0.5 | % | |
| Other Assets—Net | | | 365 | | | | 6.0 | % | |
| | | $ | 6,105 | | | | 100.0 | % | |
See Notes to Schedule of Investments
77
Schedule of Investments Equity Income Fund
TOP TEN EQUITY HOLDINGS
| | 1 | | | Marsh & McLennan | | | 2.2 | % | |
| | 2 | | | Diageo PLC ADR | | | 2.1 | % | |
| | 3 | | | AvalonBay Communities | | | 2.0 | % | |
| | 4 | | | Total SA ADR | | | 1.9 | % | |
| | 5 | | | Potlatch Corp. | | | 1.9 | % | |
| | 6 | | | AMB Property | | | 1.9 | % | |
| | 7 | | | Norfolk Southern | | | 1.9 | % | |
| | 8 | | | FPL Group | | | 1.9 | % | |
| | 9 | | | Penn West Energy Trust | | | 1.9 | % | |
| | 10 | | | TECO Energy | | | 1.9 | % | |
| | | Number
of Shares | | Value†
(000's) | |
| Common Stocks (62.7%) | |
| Beverages (2.1%) | |
| Diageo PLC ADR‡‡ | | | 22,200 | | | $ | 1,377 | | |
| Capital Markets (1.3%) | |
| Apollo Investment | | | 90,000 | | | | 833 | | |
| Electric Utilities (7.4%) | |
| Duke EnergyØØ | | | 19,800 | | | | 307 | | |
| Exelon Corp.‡‡ØØ | | | 24,000 | | | | 1,200 | | |
| FPL Group‡‡ | | | 22,000 | | | | 1,236 | | |
| Northeast Utilities | | | 46,600 | | | | 1,109 | | |
| Progress Energy | | | 27,000 | | | | 1,067 | | |
| | | | 4,919 | | |
| Energy Equipment & Services (1.0%) | |
Cathedral Energy Services
Income Trust | | | 231,200 | | | | 691 | | |
| Food & Staples Retailing (1.0%) | |
| Safeway Inc.‡‡ | | | 33,400 | | | | 636 | | |
| Food Products (1.1%) | |
| Unilever NV | | | 26,400 | | | | 737 | | |
| Insurance (2.2%) | |
Marsh &
McLennan‡‡ | | | 60,600 | | | | 1,427 | | |
| Media (1.8%) | |
World Wrestling
Entertainment | | | 82,200 | | | | 1,172 | | |
| Metals & Mining (2.3%) | |
Franco-Nevada
Corp. | | | 25,800 | | | | 664 | | |
| Royal Gold, Inc.‡‡ | | | 22,500 | | | | 893 | | |
| | | | 1,557 | | |
| Multi-Utilities (4.7%) | |
| NSTAR | | | 34,000 | | | | 1,076 | | |
| TECO Energy | | | 92,000 | | | | 1,225 | | |
| Xcel EnergyØØ | | | 42,000 | | | | 830 | | |
| | | | 3,131 | | |
| Mutual Funds (1.2%) | |
iShares iBoxx High
Yield Corporate
Bond Fund | | | 9,850 | | | | 811 | | |
| Oil, Gas & Consumable Fuels (11.6%) | |
| ARC Energy Trust | | | 75,000 | | | | 1,183 | | |
| Canadian Oil Sands | | | 2,000 | | | | 50 | | |
Canadian Oil Sands
Trust | | | 46,000 | | | | 1,157 | | |
| | | Number
of Shares | | Value†
(000's) | |
Enbridge Energy
Management* | | | 24,713 | | | $ | 1,041 | | |
Kinder Morgan
Management* | | | 13,500 | | | | 639 | | |
Penn West Energy
Trust | | | 96,100 | | | | 1,233 | | |
| Spectra Energy‡‡ØØ | | | 58,100 | | | | 1,093 | | |
| Total SA ADR | | | 22,400 | | | | 1,283 | | |
| | | | 7,679 | | |
| Pharmaceuticals (1.5%) | |
Johnson &
Johnson‡‡ | | | 16,000 | | | | 967 | | |
| Real Estate Investment Trusts (15.2%) | |
| AMB Property | | | 55,000 | | | | 1,256 | | |
American Campus
Communities‡‡ | | | 45,800 | | | | 1,191 | | |
AvalonBay
Communities‡‡ | | | 20,400 | | | | 1,314 | | |
Digital Realty
Trust‡‡ | | | 17,000 | | | | 741 | | |
| GZI REIT | | | 2,862,000 | | | | 1,015 | | |
| Health Care REIT‡‡ | | | 13,500 | | | | 577 | | |
| Potlatch Corp. | | | 44,000 | | | | 1,280 | | |
| Rayonier Inc. | | | 14,500 | | | | 623 | | |
| Realty Income‡‡ | | | 42,900 | | | | 1,096 | | |
| Ventas, Inc.‡‡ | | | 25,500 | | | | 1,000 | | |
| | | | 10,093 | | |
| Road & Rail (1.9%) | |
| Norfolk Southern‡‡ | | | 27,000 | | | | 1,239 | | |
Semiconductors & Semiconductor
Equipment (1.6%) | |
Microchip
Technology | | | 40,000 | | | | 1,062 | | |
| Thrifts & Mortgage Finance (1.2%) | |
New York Community
Bancorp | | | 75,100 | | | | 799 | | |
| Tobacco (1.8%) | |
Philip Morris
International‡‡ | | | 26,400 | | | | 1,207 | | |
| Water Utilities (0.2%) | |
California Water Service
Group | | | 3,000 | | | | 112 | | |
Wireless Telecommunication Services
(1.6%) | |
| China Mobile ADR | | | 21,000 | | | | 1,034 | | |
Total Common Stocks
(Cost $40,077) | | | | | | | 41,483 | | |
| | | Number
of Shares | | Value†
(000's) | |
| Convertible Preferred Stocks (4.3%) | |
| Bunge Ltd. | | | 13,200 | | | $ | 1,181 | | |
Freeport-McMoRan
Copper & Gold | | | 6,300 | | | | 602 | | |
| Vale Capital II | | | 18,000 | | | | 1,071 | | |
Total Convertible Preferred Stocks
(Cost $2,685) | | | | | | | 2,854 | | |
| | | Principal
Amount | | | |
| Convertible Bonds (21.7%) | |
Allied Waste
Industries, Inc.,
Senior
Subordinated
Debentures,
4.25%, due
4/15/34 | | $ | 1,405,000 | | | | 1,405 | | |
Bill Barrett Corp.,
Senior
Unsecured
Notes, 5.00%,
due 3/15/28 | | | 850,000 | | | | 785 | | |
Carnival Corp.,
Guaranteed
Notes, 0.50%,
due 10/29/09 | | | 1,000,000 | | | | 658 | | |
Covanta Holding
Corp., Senior
Unsecured
Notes, 1.00%,
due 2/1/27 | | | 1,000,000 | | | | 895 | | |
Goldcorp, Inc.,
Senior Notes,
2.00%, due
8/1/14ñ | | | 500,000 | | | | 523 | | |
Iconix Brand
Group, Inc.,
Senior
Subordinated
Notes, 1.88%,
due 6/30/12 | | | 1,000,000 | | | | 915 | | |
Integra
Lifesciences
Holdings Corp.,
Guaranteed
Notes,
2.38%, due
6/1/12ñ | | | 500,000 | | | | 441 | | |
See Notes to Schedule of Investments
78
| | |
Principal
Amount | | Value†
(000's) | |
International
Game
Technology,
Senior
Unsecured
Notes, 2.60%,
due 12/15/36 | | $ | 825,000 | | | $ | 825 | | |
Kinross Gold
Corp., Senior
Unsecured
Notes, 1.75%,
due 3/15/28 | | | 750,000 | | | | 756 | | |
Pacific Rubiales
Energy Corp.,
Subordinated
Debentures,
8.00%, due
8/29/13 | | | 600,000 | | | | 660 | | |
Patriot Coal
Corp., Senior
Unsecured
Notes, 3.25%,
due 5/31/13ñ | | | 1,000,000 | | | | 755 | | |
Rayonier TRS
Holdings, Inc.,
Guaranteed
Notes, 3.75%,
due 10/15/12 | | | 500,000 | | | | 524 | | |
Rayonier TRS
Holdings, Inc.,
Guaranteed
Notes, 4.50%,
due 8/15/15ñ | | | 250,000 | | | | 271 | | |
Sino-Forest Corp.,
Guaranteed
Notes, 5.00%,
due 8/1/13ñ | | | 750,000 | | | | 731 | | |
St. Mary Land &
Exploration Co.,
Senior
Unsecured
Notes, 3.50%,
due 4/1/27 | | | 1,095,000 | | | | 1,024 | | |
SunPower Corp.,
Senior
Unsecured
Debentures,
0.75%, due
8/1/27 | | | 700,000 | | | | 658 | | |
Trinidad Energy
Services Income
Trust, Unsecured
Subordinated
Debentures,
7.75%, due
7/31/12 | | | 650,000 | | | | 572 | | |
Verisign, Inc.,
Junior
Subordinated
Debentures,
3.25%, due
8/15/37 | | | 1,150,000 | | | | 949 | | |
| | |
Principal
Amount | | Value†
(000's) | |
Vornado Realty
Trust,
Guaranteed
Notes, 3.63%,
due 11/15/26 | | $ | 1,100,000 | | | $ | 1,046 | | |
Total Convertible Bonds
(Cost $13,669) | | | | | | | 14,393 | | |
| Corporate Debt Securities (0.4%) | |
Martin Marietta
Materials, Inc.,
Floating Rate
Senior
Unsecured
Notes, 0.64%
due 10/30/09µ
(Cost $242) | | | 250,000 | | | | 248 | | |
| | | Number
of Shares | | | |
| Short-Term Investments (8.7%) | |
State Street
Institutional
Liquid Reserves
Fund Institutional
Class
(Cost $5,780) | | | 5,780,444 | | | | 5,780 | | |
Total Investments##(97.8%)
(Cost $62,453) | | | | | | | 64,758 | | |
Cash, receivables
and other assets,
less liabilities‡‡(2.2%) | | | | | | | 1,414 | | |
| Total Net Assets (100.0%) | | | | | | $ | 66,172 | | |
See Notes to Schedule of Investments
79
Schedule of Investments Focus Fund
TOP TEN EQUITY HOLDINGS
| | 1 | | | J.P. Morgan Chase | | | 5.5 | % | |
| | 2 | | | Occidental Petroleum | | | 5.2 | % | |
| | 3 | | | XTO Energy | | | 5.0 | % | |
| | 4 | | | The Bank of New York Mellon | | | 4.7 | % | |
| | 5 | | | Covidien PLC | | | 4.4 | % | |
| | 6 | | | Rockwell Automation | | | 4.1 | % | |
| | 7 | | | Intel Corp. | | | 3.9 | % | |
| | 8 | | | Microsoft Corp. | | | 3.8 | % | |
| | 9 | | | Ingersoll-Rand PLC | | | 3.8 | % | |
| | 10 | | | Hewlett-Packard | | | 3.7 | % | |
| | | Number
of Shares | | Value†
(000's) | |
| Common Stocks (96.6%) | |
| Beverages (3.0%) | |
| PepsiCo, Inc. | | | 300,000 | | | $ | 17,001 | | |
| Biotechnology (5.3%) | |
| Amgen Inc.* | | | 185,000 | | | | 11,052 | | |
| Genzyme Corp.*È | | | 350,000 | | | | 19,498 | | |
| | | | 30,550 | | |
| Capital Markets (4.7%) | |
The Bank of
New York MellonÈ | | | 910,000 | | | | 26,945 | | |
| Communications Equipment (5.0%) | |
| Cisco Systems* | | | 715,000 | | | | 15,444 | | |
| QUALCOMM Inc. | | | 285,000 | | | | 13,230 | | |
| | | | 28,674 | | |
| Computers & Peripherals (5.5%) | |
| Hewlett-Packard | | | 480,000 | | | | 21,547 | | |
| IBM | | | 85,000 | | | | 10,034 | | |
| | | | 31,581 | | |
| Diversified Financial Services (5.5%) | |
| J.P. Morgan Chase | | | 725,000 | | | | 31,508 | | |
| Electric Utilities (3.3%) | |
| Exelon Corp. | | | 380,000 | | | | 19,008 | | |
| Electrical Equipment (6.9%) | |
| ABB Ltd.È | | | 850,000 | | | | 16,295 | | |
Rockwell
Automation | | | 565,000 | | | | 23,645 | | |
| | | | 39,940 | | |
| Food & Staples Retailing (5.9%) | |
| CVS Corp. | | | 560,000 | | | | 21,011 | | |
| Wal-Mart Stores | | | 250,000 | | | | 12,718 | | |
| | | | 33,729 | | |
| Food Products (0.8%) | |
| Unilever NV | | | 165,000 | | | | 4,608 | | |
Health Care Equipment & Supplies
(4.4%) | |
| Covidien PLC | | | 640,000 | | | | 25,325 | | |
| Hotels, Restaurants & Leisure (1.4%) | |
Brinker
International | | | 565,000 | | | | 8,226 | | |
| Household Products (2.6%) | |
Energizer
Holdings* | | | 225,000 | | | | 14,722 | | |
| Insurance (2.1%) | |
Willis Group
Holdings | | | 465,000 | | | | 11,992 | | |
| | | Number
of Shares | | Value†
(000's) | |
| IT Services (1.7%) | |
| Accenture Ltd. | | | 290,000 | | | $ | 9,570 | | |
| Life Science Tools & Services (3.6%) | |
Thermo Fisher
Scientific* | | | 460,000 | | | | 20,797 | | |
| Machinery (3.8%) | |
| Ingersoll-Rand PLC | | | 700,000 | | | | 21,623 | | |
| Oil, Gas & Consumable Fuels (13.9%) | |
| Cabot Oil & Gas | | | 190,000 | | | | 6,697 | | |
Occidental
Petroleum | | | 410,000 | | | | 29,971 | | |
| Range ResourcesÈ | | | 305,000 | | | | 14,753 | | |
| XTO Energy | | | 745,000 | | | | 28,757 | | |
| | | | 80,178 | | |
| Pharmaceuticals (2.6%) | |
| Merck & Co.È | | | 455,000 | | | | 14,756 | | |
Semiconductors & Semiconductor
Equipment (3.8%) | |
| Intel Corp. | | | 1,090,000 | | | | 22,149 | | |
| Software (3.8%) | |
| Microsoft Corp. | | | 890,000 | | | | 21,939 | | |
| Specialty Retail (7.0%) | |
| PETsMART, Inc.È | | | 500,000 | | | | 10,455 | | |
| Tiffany & Co.È | | | 480,000 | | | | 17,462 | | |
| TJX Cos.È | | | 345,000 | | | | 12,403 | | |
| | | | 40,320 | | |
Total Common Stocks
(Cost $513,417) | | | | | | | 555,141 | | |
| Short-Term Investments (11.5%) | |
Neuberger Berman
Securities Lending
Quality Fund,
LLC‡ | | | 46,141,223 | | | | 46,603 | | |
State Street
Institutional
Liquid Reserves
Fund Institutional
Class | | | 19,597,443 | | | | 19,597 | | |
Total Short-Term Investments
(Cost $66,200) | | | | | | | 66,200 | | |
Total Investments##(108.1%)
(Cost $579,617) | | | | | | | 621,341 | | |
Liabilities, less cash,
receivables and
other assets [(8.1%)] | | | | | | | (46,446 | ) | |
| Total Net Assets (100.0%) | | | | | | $ | 574,895 | | |
See Notes to Schedule of Investments
80
Schedule of Investments Genesis Fund
TOP TEN EQUITY HOLDINGS
| | 1 | | | Church & Dwight | | | 2.7 | % | |
| | 2 | | | AptarGroup Inc. | | | 2.6 | % | |
| | 3 | | | Compass Minerals International | | | 2.4 | % | |
| | 4 | | | CLARCOR Inc. | | | 2.0 | % | |
| | 5 | | | Alberto-Culver Co. | | | 1.8 | % | |
| | 6 | | | MICROS Systems | | | 1.7 | % | |
| | 7 | | | Henry Schein | | | 1.7 | % | |
| | 8 | | | IDEXX Laboratories | | | 1.7 | % | |
| | 9 | | | Haemonetics Corp. | | | 1.6 | % | |
| | 10 | | | Southwestern Energy | | | 1.6 | % | |
| | | Number
of Shares | | Value†
(000's) | |
| Common Stocks (96.1%) | |
| Aerospace & Defense (2.0%) | |
Alliant
Techsystems*^ | | | 1,746,962 | | | $ | 135,005 | | |
| Argon ST* | | | 173,300 | | | | 3,463 | | |
Teledyne
Technologies* | | | 851,400 | | | | 28,743 | | |
| | | | 167,211 | | |
| Air Freight & Logistics (1.0%) | |
| Forward Air^ | | | 2,043,600 | | | | 47,166 | | |
Hub Group
Class A* | | | 1,862,500 | | | | 40,845 | | |
| | | | 88,011 | | |
| Auto Components (0.7%) | |
| Gentex Corp. | | | 3,948,014 | | | | 57,602 | | |
| Beverages (0.5%) | |
Boston Beer
Company*^ | | | 1,019,019 | | | | 40,506 | | |
| Building Products (0.4%) | |
Simpson
Manufacturing | | | 1,302,900 | | | | 33,485 | | |
| Capital Markets (0.9%) | |
| Eaton Vance | | | 1,070,300 | | | | 30,578 | | |
| Greenhill & Co. | | | 585,200 | | | | 46,348 | | |
| | | | 76,926 | | |
| Chemicals (0.5%) | |
| Intrepid Potash* | | | 1,728,120 | | | | 40,594 | | |
| Commercial Banks (3.6%) | |
| Bank of Hawaii | | | 1,485,900 | | | | 58,619 | | |
| BOK Financial | | | 1,089,894 | | | | 49,307 | | |
Cullen/Frost
Bankers | | | 1,473,600 | | | | 72,619 | | |
| Glacier Bancorp | | | 1,401,908 | | | | 20,902 | | |
Westamerica
Bancorp^ | | | 2,121,843 | | | | 109,126 | | |
| | | | 310,573 | | |
| Commercial Services & Supplies (5.0%) | |
| Copart, Inc.* | | | 3,163,531 | | | | 111,799 | | |
| Healthcare Services Group^ | | | 3,606,154 | | | | 63,757 | | |
| Knoll, Inc. | | | 1,701,300 | | | | 16,384 | | |
Ritchie Bros.
Auctioneers^ | | | 5,338,160 | | | | 133,774 | | |
| Rollins, Inc. | | | 3,482,372 | | | | 62,160 | | |
| United Stationers* | | | 923,375 | | | | 42,189 | | |
| | | | 430,063 | | |
| | | Number
of Shares | | Value†
(000's) | |
| Construction & Engineering (0.7%) | |
Layne
Christensen*^ | | | 2,240,321 | | | $ | 57,800 | | |
| Containers & Packaging (2.6%) | |
| AptarGroup Inc.^ | | | 6,555,400 | | | | 225,375 | | |
| Diversified Consumer Services (2.3%) | |
Matthews
International^ | | | 3,518,900 | | | | 122,599 | | |
| Strayer Education | | | 346,111 | | | | 73,064 | | |
| | | | 195,663 | | |
| Diversified Financial Services (0.3%) | |
| Pico Holdings* | | | 838,772 | | | | 27,789 | | |
| Electrical Equipment (0.5%) | |
| Brady Corp. | | | 1,420,289 | | | | 42,083 | | |
Electronic Equipment, Instruments &
Components (1.9%) | |
Rofin-Sinar
Technologies*^ | | | 3,423,150 | | | | 77,843 | | |
Trimble
Navigation* | | | 3,409,242 | | | | 86,799 | | |
| | | | 164,642 | | |
| Energy Equipment & Services (3.3%) | |
CARBO
Ceramics^ | | | 2,217,200 | | | | 95,450 | | |
| NATCO Group*^ | | | 1,974,328 | | | | 82,132 | | |
National Oilwell
Varco* | | | 808,078 | | | | 29,374 | | |
Natural Gas Services
Group* | | | 150,000 | | | | 2,143 | | |
Oceaneering
International* | | | 1,237,700 | | | | 64,571 | | |
| Pason Systems | | | 1,287,365 | | | | 12,078 | | |
| | | | 285,748 | | |
| Food & Staples Retailing (1.2%) | |
| Ruddick Corp.^ | | | 3,956,002 | | | | 105,071 | | |
| Food Products (1.0%) | |
| Flowers Foods | | | 1,323,500 | | | | 31,460 | | |
| J&J Snack Foods^ | | | 1,270,946 | | | | 55,540 | | |
| | | | 87,000 | | |
| Gas Utilities (1.0%) | |
New Jersey
Resources | | | 1,366,400 | | | | 50,215 | | |
Northwest Natural
Gas | | | 477,300 | | | | 20,094 | | |
South Jersey
Industries | | | 432,200 | | | | 14,976 | | |
| | | | 85,285 | | |
| | | Number
of Shares | | Value†
(000's) | |
Health Care Equipment & Supplies
(8.5%) | |
| Abaxis, Inc.* | | | 1,090,300 | | | $ | 29,002 | | |
American Medical
Systems
Holdings*^ | | | 7,874,765 | | | | 120,012 | | |
DENTSPLY
International | | | 2,059,900 | | | | 69,439 | | |
Haemonetics
Corp.*^ | | | 2,660,600 | | | | 140,054 | | |
IDEXX
Laboratories* | | | 2,796,662 | | | | 141,959 | | |
| Immucor Inc.* | | | 3,307,491 | | | | 59,833 | | |
Integra LifeSciences
Holdings* | | | 114,392 | | | | 3,865 | | |
Meridian
Bioscience | | | 624,800 | | | | 15,058 | | |
Sirona Dental
Systems*^ | | | 2,805,726 | | | | 74,183 | | |
Surmodics,
Inc.*^ | | | 2,032,430 | | | | 46,522 | | |
Wright Medical
Group* | | | 1,850,194 | | | | 30,047 | | |
| | | | 729,974 | | |
Health Care Providers & Services
(5.1%) | |
| AmSurg Corp.*^ | | | 1,930,734 | | | | 39,194 | | |
| Henry Schein* | | | 2,717,540 | | | | 143,975 | | |
| Landauer, Inc.^ | | | 542,800 | | | | 29,876 | | |
MWI Veterinary
Supply*^ | | | 1,168,629 | | | | 43,485 | | |
Patterson
Companies* | | | 3,457,400 | | | | 94,145 | | |
| VCA Antech* | | | 3,620,705 | | | | 89,612 | | |
| | | | 440,287 | | |
| Household Products (2.7%) | |
Church &
Dwight^ | | | 4,050,055 | | | | 231,380 | | |
| Industrial Conglomerates (0.6%) | |
| Raven Industries^ | | | 1,872,976 | | | | 54,129 | | |
| Insurance (4.6%) | |
| Brown & Brown | | | 4,269,355 | | | | 84,832 | | |
Hanover Insurance
Group | | | 1,214,100 | | | | 49,645 | | |
| Harleysville Group | | | 435,980 | | | | 14,130 | | |
HCC Insurance
Holdings | | | 1,291,300 | | | | 34,142 | | |
Infinity Property &
Casualty | | | 99,400 | | | | 4,371 | | |
See Notes to Schedule of Investments
81
| | | Number
of Shares | | Value†
(000's) | |
RenaissanceRe
Holdings | | | 1,480,553 | | | $ | 80,616 | | |
| RLI Corp. | | | 984,407 | | | | 52,183 | | |
| Validus Holdings | | | 1,402,100 | | | | 35,978 | | |
Zenith National
Insurance | | | 1,410,700 | | | | 38,032 | | |
| | | | 393,929 | | |
| IT Services (1.6%) | |
ManTech
International*^ | | | 2,426,100 | | | | 128,195 | | |
| NCI, Inc. Class A* | | | 353,099 | | | | 10,364 | | |
| | | | 138,559 | | |
| Life Science Tools & Services (4.3%) | |
Charles River Laboratories
International* | | | 1,474,900 | | | | 50,869 | | |
| Dionex Corp.*^ | | | 2,041,532 | | | | 122,778 | | |
| ICON PLC*^ | | | 3,798,400 | | | | 82,121 | | |
Pharmaceutical Product
Development | | | 4,292,900 | | | | 86,330 | | |
| Techne Corp. | | | 352,500 | | | | 21,739 | | |
| | | | 363,837 | | |
| Machinery (13.0%) | |
Astec
Industries*^ | | | 1,949,622 | | | | 49,384 | | |
Bucyrus
International^ | | | 4,385,700 | | | | 130,913 | | |
Chart
Industries*^ | | | 2,188,928 | | | | 40,845 | | |
| CLARCOR Inc.^ | | | 5,421,622 | | | | 173,817 | | |
| Donaldson Co. | | | 2,632,100 | | | | 98,888 | | |
| Graco Inc. | | | 1,629,417 | | | | 40,915 | | |
| Joy Global | | | 1,890,200 | | | | 73,434 | | |
Lincoln Electric
Holdings | | | 88,347 | | | | 4,021 | | |
| Lindsay Corp.^ | | | 1,342,250 | | | | 55,717 | | |
| Nordson Corp.^ | | | 2,405,430 | | | | 128,883 | | |
Robbins &
Myers^ | | | 1,787,500 | | | | 41,506 | | |
Titan
International^ | | | 2,200,047 | | | | 18,282 | | |
| Toro Co. | | | 1,296,994 | | | | 49,195 | | |
Valmont
Industries | | | 1,102,304 | | | | 90,753 | | |
| Wabtec Corp.^ | | | 3,002,100 | | | | 112,429 | | |
| | | | 1,108,982 | | |
| Media (1.0%) | |
| Arbitron Inc. | | | 1,300,567 | | | | 23,826 | | |
| Interactive Data | | | 2,678,700 | | | | 62,173 | | |
| | | | 85,999 | | |
| Metals & Mining (2.4%) | |
Compass Minerals
International^ | | | 3,802,000 | | | | 202,190 | | |
| Mutual Funds (1.0%) | |
| SPDR Gold Trust* | | | 900,000 | | | | 84,060 | | |
| Office Electronics (1.1%) | |
Zebra
Technologies*^ | | | 3,874,247 | | | | 96,817 | | |
| | | Number
of Shares | | Value†
(000's) | |
| Oil, Gas & Consumable Fuels (10.7%) | |
Alpha Natural
Resources* | | | 3,331,674 | | | $ | 107,646 | | |
Arena
Resources*^ | | | 3,283,628 | | | | 100,413 | | |
| Cabot Oil & Gas | | | 2,981,700 | | | | 105,105 | | |
Carrizo Oil &
Gas*^ | | | 1,681,227 | | | | 32,498 | | |
Concho
Resources* | | | 1,225,600 | | | | 39,942 | | |
Denbury
Resources* | | | 6,346,277 | | | | 96,590 | | |
Encore
Acquisition* | | | 1,615,200 | | | | 60,877 | | |
Petrobank Energy
and Resources* | | | 3,197,000 | | | | 118,992 | | |
Petrohawk
Energy* | | | 2,585,830 | | | | 55,673 | | |
Southwestern
Energy* | | | 3,681,700 | | | | 135,708 | | |
St. Mary Land &
Exploration | | | 1,237,600 | | | | 32,549 | | |
| XTO Energy | | | 828,225 | | | | 31,970 | | |
| | | | 917,963 | | |
| Personal Products (2.4%) | |
Alberto-Culver
Co.^ | | | 5,742,450 | | | | 151,543 | | |
| Chattem, Inc.* | | | 823,995 | | | | 50,462 | | |
| | | | 202,005 | | |
| Professional Services (0.4%) | |
| Exponent, Inc.*^ | | | 1,164,735 | | | | 32,939 | | |
| Road & Rail (0.1%) | |
| Landstar System | | | 120,400 | | | | 4,198 | | |
| Software (5.4%) | |
| ANSYS, Inc.* | | | 503,200 | | | | 17,683 | | |
| Blackbaud, Inc.^ | | | 4,369,503 | | | | 84,157 | | |
FactSet Research
Systems | | | 1,304,600 | | | | 71,805 | | |
Jack Henry &
Associates | | | 1,119,600 | | | | 26,098 | | |
MICROS
Systems*^ | | | 5,249,242 | | | | 146,296 | | |
Solera
Holdings*^ | | | 4,480,005 | | | | 118,003 | | |
| | | | 464,042 | | |
| Specialty Retail (0.8%) | |
| Hibbett Sports*^ | | | 1,864,063 | | | | 32,752 | | |
Sally Beauty
Holdings* | | | 620,208 | | | | 4,410 | | |
| Tractor Supply* | | | 631,800 | | | | 29,732 | | |
| | | | 66,894 | | |
| Thrifts & Mortgage Finance (0.5%) | |
Brookline
Bancorp | | | 2,426,354 | | | | 25,331 | | |
| Oritani Financial | | | 1,170,000 | | | | 15,608 | | |
| | | | 40,939 | | |
| | | Number
of Shares | | Value†
(000's) | |
Trading Companies & Distributors
(0.4%) | |
MSC Industrial
Direct | | | 810,900 | | | $ | 32,039 | | |
| Water Utilities (0.1%) | |
American States
Water | | | 149,500 | | | | 4,936 | | |
Total Common Stocks
(Cost $6,432,709) | | | | | | | 8,217,525 | | |
| Short-Term Investments (3.9%) | |
State Street
Institutional
Liquid Reserves
Fund Institutional
Class
(Cost
$335,213) | | | 335,212,934 | | | | 335,213 | | |
Total Investments##(100.0%)
(Cost $6,767,922) | | | | | | | 8,552,738 | | |
Liabilities, less cash,
receivables and
other assets [(0.0%)] | | | | | | | (876 | ) | |
| Total Net Assets (100.0%) | | | | | | $ | 8,551,862 | | |
See Notes to Schedule of Investments
82
Schedule of Investments Guardian Fund
TOP TEN EQUITY HOLDINGS
| | 1 | | | Scripps Networks Interactive | | | 5.2 | % | |
| | 2 | | | Altera Corp. | | | 5.0 | % | |
| | 3 | | | Washington Post | | | 5.0 | % | |
| | 4 | | | Intuit Inc. | | | 4.9 | % | |
| | 5 | | | Danaher Corp. | | | 4.7 | % | |
| | 6 | | | National Instruments | | | 4.5 | % | |
| | 7 | | | 3M Co. | | | 4.2 | % | |
| | 8 | | | Newfield Exploration | | | 4.0 | % | |
| | 9 | | | Charles Schwab | | | 3.9 | % | |
| | 10 | | | Comcast Corp. Class A Special | | | 3.9 | % | |
| | | Number
of Shares | | Value†
(000's) | |
| Common Stocks (96.5%) | |
| Automobiles (2.0%) | |
| Toyota Motor ADRÈ | | | 225,860 | | | $ | 19,241 | | |
| Biotechnology (3.6%) | |
| Genzyme Corp.* | | | 606,540 | | | | 33,790 | | |
| Capital Markets (6.4%) | |
| Charles Schwab | | | 2,043,255 | | | | 36,901 | | |
The Bank of
New York Mellon | | | 786,913 | | | | 23,301 | | |
| | | | 60,202 | | |
Commercial Services & Supplies
(6.2%) | |
| Republic Services | | | 1,031,050 | | | | 26,405 | | |
Waste
Management | | | 1,072,725 | | | | 32,107 | | |
| | | | 58,512 | | |
| Diversified Financial Services (1.6%) | |
IntercontinentalExchange
Inc.* | | | 157,754 | | | | 14,797 | | |
Electronic Equipment, Instruments &
Components (8.1%) | |
Anixter
International* | | | 978,955 | | | | 34,342 | | |
National
Instruments | | | 1,664,254 | | | | 42,655 | | |
| | | | 76,997 | | |
| Energy Equipment & Services (3.7%) | |
| Schlumberger Ltd. | | | 615,600 | | | | 34,597 | | |
| Health Care Providers & Services (1.8%) | |
UnitedHealth
Group | | | 624,675 | | | | 17,491 | | |
| Industrial Conglomerates (4.2%) | |
| 3M Co. | | | 547,300 | | | | 39,460 | | |
| Industrial Gases (3.1%) | |
| Praxair, Inc. | | | 384,896 | | | | 29,491 | | |
| Insurance (5.3%) | |
| Markel Corp.* | | | 63,550 | | | | 20,899 | | |
Progressive
Corp.* | | | 1,762,550 | | | | 29,117 | | |
| | | | 50,016 | | |
| Internet Software & Services (3.1%) | |
| Yahoo! Inc.* | | | 2,009,500 | | | | 29,359 | | |
| Life Science Tools & Services (2.1%) | |
| Millipore Corp.* | | | 303,290 | | | | 20,087 | | |
| | | Number
of Shares | | Value†
(000's) | |
| Machinery (4.7%) | |
| Danaher Corp. | | | 734,240 | | | $ | 44,576 | | |
| Media (14.0%) | |
Comcast Corp.
Class A Special | | | 2,511,125 | | | | 36,637 | | |
Scripps Networks
Interactive | | | 1,521,735 | | | | 49,411 | | |
| Washington Post | | | 108,128 | | | | 46,966 | | |
| | | | 133,014 | | |
| Multi-Utilities (2.6%) | |
| National Grid | | | 2,234,232 | | | | 21,551 | | |
| National Grid ADR | | | 67,218 | | | | 3,232 | | |
| | | | 24,783 | | |
| Oil, Gas & Consumable Fuels (8.9%) | |
| BG Group PLC | | | 1,934,950 | | | | 32,035 | | |
| Cimarex Energy | | | 368,175 | | | | 14,374 | | |
Newfield
Exploration* | | | 978,800 | | | | 37,870 | | |
| | | | 84,279 | | |
| Road & Rail (3.2%) | |
Canadian National
Railway | | | 629,565 | | | | 30,389 | | |
Semiconductors & Semiconductor
Equipment (7.0%) | |
| Altera Corp. | | | 2,462,669 | | | | 47,308 | | |
| Texas Instruments | | | 787,800 | | | | 19,372 | | |
| | | | 66,680 | | |
| Software (4.9%) | |
| Intuit Inc.* | | | 1,674,752 | | | | 46,508 | | |
Total Common Stocks
(Cost $912,709) | | | | | | | 914,269 | | |
| Short-Term Investments (3.4%) | |
Neuberger Berman
Securities Lending
Quality Fund,
LLC‡ | | | 3,129,168 | | | | 3,160 | | |
State Street
Institutional
Liquid Reserves
Fund Institutional
ClassØØ | | | 28,878,874 | | | | 28,879 | | |
Total Short-Term Investments
(Cost $32,039) | | | | | | | 32,039 | | |
Total Investments##(99.9%)
(Cost $944,748) | | | | | | | 946,308 | | |
Cash, receivables
and other assets,
less liabilities (0.1%) | | | | | | | 1,410 | | |
| Total Net Assets (100.0%) | | | | | | $ | 947,718 | | |
See Notes to Schedule of Investments
83
Schedule of Investments International Fund
TOP TEN EQUITY HOLDINGS
| | | | | Country | | Industry | | | |
| | 1 | | | Vodafone Group | | United Kingdom | | Wireless Telecommunication Services | | | 2.8 | % | |
| | 2 | | | Unilever NV | | Netherlands | | Food Products | | | 2.0 | % | |
| | 3 | | | MacDonald, Dettwiler | | Canada | | Software | | | 2.0 | % | |
| | 4 | | | HSBC Holdings | | United Kingdom | | Commercial Banks | | | 1.9 | % | |
| | 5 | | | Deutsche Boerse | | Germany | | Diversified Financial Services | | | 1.7 | % | |
| | 6 | | | Banco Santander | | Spain | | Commercial Banks | | | 1.6 | % | |
| | 7 | | | Nihon Kohden | | Japan | | Health Care Equipment & Supplies | | | 1.6 | % | |
| | 8 | | | Chemring Group | | United Kingdom | | Aerospace & Defense | | | 1.5 | % | |
| | 9 | | | Ipsen SA | | France | | Pharmaceuticals | | | 1.5 | % | |
| | 10 | | | Amlin PLC | | United Kingdom | | Insurance | | | 1.5 | % | |
| | | Number
of Shares | | Value†
(000's) | |
| Common Stocks (92.1%) | |
| Australia (0.8%) | |
| BHP Billiton ADRÈ | | | 54,100 | | | $ | 3,370 | | |
| Austria (0.6%) | |
Schoeller-Bleckmann
Oilfield Equipment | | | 55,300 | | | | 2,258 | | |
| Belgium (2.8%) | |
Anheuser-Busch
InBev | | | 75,888 | | | | 3,276 | | |
| Colruyt SA | | | 15,630 | | | | 3,585 | | |
| Fortis* | | | 192,640 | | | | 824 | | |
Telenet Group
Holding | | | 162,840 | | | | 3,877 | | |
| | | | 11,562 | | |
| Brazil (0.5%) | |
Vivo
Participacoes ADR | | | 91,500 | | | | 2,083 | | |
| Canada (4.4%) | |
| Barrick Gold | | | 72,100 | | | | 2,488 | | |
| Cameco Corp. | | | 134,520 | | | | 3,580 | | |
MacDonald,
Dettwiler* | | | 289,990 | | | | 8,079 | | |
| Talisman Energy | | | 243,820 | | | | 3,920 | | |
| | | | 18,067 | | |
| Chile (0.8%) | |
Sociedad Quimica
y Minera de Chile
ADR, B Shares | | | 97,480 | | | | 3,395 | | |
| Czech Republic (0.5%) | |
Telefonica O2 Czech
Republic | | | 74,300 | | | | 2,062 | | |
| Denmark (1.3%) | |
Novo Nordisk
Class B | | | 83,490 | | | | 5,089 | | |
| France (7.1%) | |
| Arkema | | | 102,192 | | | | 3,333 | | |
| France TelecomÈ | | | 119,560 | | | | 3,041 | | |
| Ipsen SA | | | 124,704 | | | | 6,168 | | |
| IpsosÑ | | | 181,723 | | | | 5,060 | | |
| Sodexo | | | 54,805 | | | | 3,157 | | |
| | | Number
of Shares | | Value†
(000's) | |
| Teleperformance | | | 138,930 | | | $ | 4,773 | | |
| Thales SA | | | 79,485 | | | | 3,646 | | |
| | | | 29,178 | | |
| Germany (9.6%) | |
| Deutsche Boerse | | | 89,365 | | | | 6,822 | | |
Fresenius Medical
Care | | | 76,910 | | | | 3,456 | | |
| GEA Group | | | 202,280 | | | | 3,584 | | |
| Gerresheimer AG | | | 181,277 | | | | 5,109 | | |
| Linde AG | | | 54,770 | | | | 5,504 | | |
| SAP AG | | | 86,875 | | | | 4,236 | | |
SMA Solar
TechnologyÈ | | | 24,715 | | | | 1,831 | | |
| Tognum AG | | | 243,226 | | | | 3,707 | | |
| Wincor Nixdorf | | | 89,952 | | | | 5,099 | | |
| | | | 39,348 | | |
| Greece (0.0%) | |
| Titan Cement | | | 4,878 | | | | 141 | | |
| Hong Kong (1.1%) | |
| China Mobile ADR | | | 93,465 | | | | 4,600 | | |
| India (0.8%) | |
State Bank of India
GDR | | | 45,586 | | | | 3,373 | | |
| Ireland (1.0%) | |
| DCC PLC | | | 173,225 | | | | 4,248 | | |
| Israel (0.9%) | |
Makhteshim-Agan
Industries | | | 827,930 | | | | 3,794 | | |
| Italy (2.4%) | |
| Lottomatica SPA | | | 128,375 | | | | 2,888 | | |
Milano
Assicurazioni | | | 462,346 | | | | 1,521 | | |
| UBI Banca | | | 348,395 | | | | 5,264 | | |
| | | | 9,673 | | |
| Japan (12.1%) | |
| Circle K Sunkus | | | 254,900 | | | | 4,145 | | |
Hisamitsu
Pharmaceutical | | | 118,200 | | | | 4,560 | | |
Jupiter
Telecommunications | | | 5,296 | | | | 4,610 | | |
| KDDI Corp. | | | 534 | | | | 3,036 | | |
| | | Number
of Shares | | Value†
(000's) | |
Kenedix Realty
Investment | | | 635 | | | $ | 2,382 | | |
| Nihon Kohden | | | 398,800 | | | | 6,536 | | |
| Nintendo Co. ADR | | | 131,630 | | | | 4,416 | | |
| NSD Co. | | | 118,400 | | | | 1,256 | | |
| Sankyo Co. | | | 79,500 | | | | 5,006 | | |
| Seven Bank | | | 1,809 | | | | 4,590 | | |
| Sundrug Co. | | | 167,400 | | | | 4,300 | | |
| Toyota Motor ADR | | | 33,420 | | | | 2,847 | | |
| Unicharm PetcareÈ | | | 56,700 | | | | 2,035 | | |
| | | | 49,719 | | |
| Korea (1.7%) | |
| Hyundai Mobis | | | 40,905 | | | | 4,340 | | |
| Samsung SDI | | | 23,375 | | | | 2,770 | | |
| | | | 7,110 | | |
| Netherlands (9.7%) | |
| ArcelorMittal | | | 87,500 | | | | 3,132 | | |
| Fugro NV | | | 86,537 | | | | 4,658 | | |
| Koninklijke Ahold | | | 454,370 | | | | 5,323 | | |
| Koninklijke DSM | | | 81,379 | | | | 2,966 | | |
| Nutreco Holding | | | 105,400 | | | | 4,744 | | |
| Sligro Food GroupÑ | | | 171,181 | | | | 4,810 | | |
| TNT NV | | | 238,036 | | | | 5,873 | | |
| Unilever NVÈ | | | 296,237 | | | | 8,279 | | |
| | | | 39,785 | | |
| Norway (1.8%) | |
| DnB NOR* | | | 413,280 | | | | 4,224 | | |
| Prosafe ASA | | | 636,435 | | | | 3,092 | | |
| | | | 7,316 | | |
| Singapore (0.7%) | |
United
Overseas Bank | | | 247,000 | | | | 2,863 | | |
| Spain (1.6%) | |
| Banco Santander | | | 427,350 | | | | 6,577 | | |
| Sweden (1.5%) | |
Svenska
Handelsbanken,
A Shares | | | 151,620 | | | | 3,972 | | |
Swedbank AB,
A Shares* | | | 192,000 | | | | 2,010 | | |
| | | | 5,982 | | |
See Notes to Schedule of Investments
84
| | | Number
of Shares | | Value†
(000's) | |
| Switzerland (7.3%) | |
| Barry Callebaut | | | 6,411 | | | $ | 3,475 | | |
| Bucher Industries | | | 16,428 | | | | 1,921 | | |
| Credit Suisse Group | | | 61,945 | | | | 3,156 | | |
| Givaudan SA | | | 4,475 | | | | 3,216 | | |
| Nestle SA | | | 123,155 | | | | 5,115 | | |
Nobel Biocare
Holding | | | 79,485 | | | | 2,428 | | |
| Roche Holding | | | 21,810 | | | | 3,466 | | |
| SGS SA | | | 2,442 | | | | 3,019 | | |
| Sulzer AG | | | 52,449 | | | | 4,057 | | |
| | | | 29,853 | | |
| United Kingdom (21.1%) | |
| Amdocs Ltd.* | | | 90,800 | | | | 2,208 | | |
| Amlin PLC | | | 1,016,625 | | | | 6,110 | | |
| Antofagasta PLC | | | 164,900 | | | | 2,058 | | |
| Balfour Beatty | | | 438,830 | | | | 2,405 | | |
| Barclays PLC* | | | 859,655 | | | | 5,322 | | |
| BP PLC | | | 353,100 | | | | 3,058 | | |
| Cairn Energy* | | | 92,172 | | | | 3,762 | | |
| Chemring Group | | | 185,238 | | | | 6,300 | | |
| Croda International | | | 272,515 | | | | 2,786 | | |
| Diageo PLC | | | 306,465 | | | | 4,760 | | |
| Experian Group | | | 677,267 | | | | 5,706 | | |
| HSBC HoldingsÈ | | | 750,800 | | | | 7,948 | | |
| Informa PLC | | | 1,049,676 | | | | 4,860 | | |
| Reed Elsevier | | | 235,880 | | | | 1,716 | | |
| RPS Group | | | 1,397,851 | | | | 4,551 | | |
| Smith & Nephew | | | 464,292 | | | | 3,961 | | |
| Tullow Oil | | | 194,801 | | | | 3,415 | | |
| Vodafone Group | | | 5,401,649 | | | | 11,678 | | |
Willis Group
Holdings | | | 153,600 | | | | 3,961 | | |
| | | | 86,565 | | |
Total Common Stocks
(Cost $353,064) | | | | | | | 378,011 | | |
| Preferred Stocks (2.1%) | |
| Brazil (2.1%) | |
Petroleo
Brasileiro ADR | | | 132,625 | | | | 4,403 | | |
Refinaria de Petroleo
Ipiranga*^^ | | | 19,056 | | | | 10 | | |
Ultrapar
Participacoes | | | 109,290 | | | | 3,998 | | |
Total Preferred Stocks
(Cost $5,603) | | | | | | | 8,411 | | |
| Rights (0.0%) | |
| Belgium (0.0%) | |
Anheuser-Busch InBev
VVPR Strip* | | | 177,256 | | | | 1 | | |
| Fortis* | | | 192,640 | | | | 0 | | |
| Fortis VVPR Strip* | | | 192,640 | | | | 0 | | |
Total Rights
(Cost $0) | | | | | | | 1 | | |
| | | Number
of Shares | | Value†
(000's) | |
| Warrants (0.0%) | |
| Italy (0.0%) | |
UBI Banca*
(Cost $0) | | | 165,350 | | | $ | 17 | | |
| Short-Term Investments (7.8%) | |
Neuberger Berman
Securities Lending
Quality Fund,
LLC‡ | | | 15,429,775 | | | | 15,584 | | |
State Street
Institutional
Liquid Reserves
Fund Institutional
Class | | | 16,420,160 | | | | 16,420 | | |
Total Short-Term Investments
(Cost $32,004) | | | | | | | 32,004 | | |
Total Investments##(102.0%)
(Cost $390,671) | | | | | | | 418,444 | | |
Liabilities, less cash,
receivables and
other assets [(2.0%)] | | | | | | | (8,186 | ) | |
| Total Net Assets (100.0%) | | | | | | $ | 410,258 | | |
See Notes to Schedule of Investments
85
SUMMARY SCHEDULE OF INVESTMENTS BY INDUSTRY INTERNATIONAL FUND
| Industry | | Investments at
Value†
(000's omitted) | | Percentage of
Net Assets | |
| Commercial Banks | | $ | 42,188 | | | | 10.3 | % | |
| Chemicals | | | 24,994 | | | | 6.1 | % | |
| Food Products | | | 23,648 | | | | 5.8 | % | |
| Food & Staples Retailing | | | 22,163 | | | | 5.4 | % | |
| Oil, Gas & Consumable Fuels | | | 22,138 | | | | 5.4 | % | |
| Wireless Telecommunication Services | | | 21,397 | | | | 5.2 | % | |
| Software | | | 20,195 | | | | 4.9 | % | |
| Pharmaceuticals | | | 19,283 | | | | 4.7 | % | |
| Media | | | 16,246 | | | | 4.0 | % | |
| Professional Services | | | 13,498 | | | | 3.3 | % | |
| Health Care Equipment & Supplies | | | 12,925 | | | | 3.2 | % | |
| Insurance | | | 11,592 | | | | 2.8 | % | |
| Metals & Mining | | | 11,048 | | | | 2.7 | % | |
| Energy Equipment & Services | | | 10,008 | | | | 2.4 | % | |
| Aerospace & Defense | | | 9,946 | | | | 2.4 | % | |
| Machinery | | | 9,562 | | | | 2.3 | % | |
| Diversified Telecommunication Services | | | 8,980 | | | | 2.2 | % | |
| Beverages | | | 8,037 | | | | 2.0 | % | |
| Diversified Financial Services | | | 7,646 | | | | 1.9 | % | |
| Hotels, Restaurants & Leisure | | | 6,045 | | | | 1.5 | % | |
| Air Freight & Logistics | | | 5,873 | | | | 1.4 | % | |
| Electrical Equipment | | | 5,538 | | | | 1.3 | % | |
| Life Science Tools & Services | | | 5,109 | | | | 1.2 | % | |
| Computers & Peripherals | | | 5,099 | | | | 1.2 | % | |
| Leisure Equipment & Products | | | 5,006 | | | | 1.2 | % | |
| Commercial Services & Supplies | | | 4,551 | | | | 1.1 | % | |
| Auto Components | | | 4,340 | | | | 1.1 | % | |
| Industrial Conglomerates | | | 4,248 | | | | 1.0 | % | |
| Specialty Retail | | | 3,998 | | | | 1.0 | % | |
| Banking | | | 3,972 | | | | 1.0 | % | |
| Health Care Providers & Services | | | 3,456 | | | | 0.8 | % | |
| Capital Markets | | | 3,156 | | | | 0.8 | % | |
| Automobiles | | | 2,847 | | | | 0.7 | % | |
| Electronic Equipment, Instruments & Components | | | 2,770 | | | | 0.7 | % | |
| Construction & Engineering | | | 2,405 | | | | 0.6 | % | |
| Real Estate Investment Trusts | | | 2,382 | | | | 0.6 | % | |
| Construction Materials | | | 141 | | | | 0.0 | % | |
| Consumer Discretionary | | | 10 | | | | 0.0 | % | |
| Other Assets-Net | | | 23,818 | | | | 5.8 | % | |
| | | $ | 410,258 | | | | 100.0 | % | |
See Notes to Schedule of Investments
86
Schedule of Investments International Institutional Fund
TOP TEN EQUITY HOLDINGS
| | | | | Country | | Industry | | | |
| | 1 | | | Vodafone Group | | United Kingdom | | Wireless Telecommunication Services | | | 2.8 | % | |
| | 2 | | | Unilever NV | | Netherlands | | Food Products | | | 2.0 | % | |
| | 3 | | | MacDonald, Dettwiler | | Canada | | Software | | | 2.0 | % | |
| | 4 | | | HSBC Holdings | | United Kingdom | | Commercial Banks | | | 2.0 | % | |
| | 5 | | | Deutsche Boerse | | Germany | | Diversified Financial Services | | | 1.7 | % | |
| | 6 | | | Banco Santander | | Spain | | Commercial Banks | | | 1.6 | % | |
| | 7 | | | Nihon Kohden | | Japan | | Health Care Equipment & Supplies | | | 1.6 | % | |
| | 8 | | | Chemring Group | | United Kingdom | | Aerospace & Defense | | | 1.6 | % | |
| | 9 | | | Ipsen SA | | France | | Pharmaceuticals | | | 1.5 | % | |
| | 10 | | | Amlin PLC | | United Kingdom | | Insurance | | | 1.5 | % | |
| | | Number
of Shares | | Value†
(000's) | |
| Common Stocks (93.4%) | |
| Australia (0.8%) | |
| BHP Billiton ADRÈ | | | 29,900 | | | $ | 1,863 | | |
| Austria (0.6%) | |
Schoeller-Bleckmann
Oilfield Equipment | | | 31,300 | | | | 1,278 | | |
| Belgium (2.7%) | |
Anheuser-Busch
InBev | | | 42,003 | | | | 1,813 | | |
| Colruyt SA | | | 8,650 | | | | 1,984 | | |
Telenet Group
Holding | | | 90,125 | | | | 2,146 | | |
| | | | 5,943 | | |
| Brazil (0.5%) | |
Vivo
Participacoes ADR | | | 50,600 | | | | 1,152 | | |
| Canada (4.5%) | |
| Barrick Gold | | | 39,900 | | | | 1,377 | | |
| Cameco Corp. | | | 74,410 | | | | 1,980 | | |
MacDonald,
Dettwiler* | | | 160,509 | | | | 4,472 | | |
| Talisman Energy | | | 134,940 | | | | 2,169 | | |
| | | | 9,998 | | |
| Chile (0.9%) | |
Sociedad Quimica
y Minera de Chile
ADR, B Shares | | | 54,005 | | | | 1,881 | | |
| Czech Republic (0.5%) | |
Telefonica O2 Czech
Republic | | | 41,400 | | | | 1,149 | | |
| Denmark (1.3%) | |
Novo Nordisk
Class B | | | 46,210 | | | | 2,817 | | |
| France (7.2%) | |
| Arkema | | | 56,560 | | | | 1,845 | | |
| France TelecomÈ | | | 66,170 | | | | 1,683 | | |
| Ipsen SA | | | 69,015 | | | | 3,413 | | |
| Ipsos | | | 100,575 | | | | 2,801 | | |
| Sodexo | | | 30,330 | | | | 1,747 | | |
| Teleperformance | | | 76,890 | | | | 2,641 | | |
| Thales SA | | | 43,990 | | | | 2,018 | | |
| | | | 16,148 | | |
| | | Number
of Shares | | Value†
(000's) | |
| Germany (9.7%) | |
| Deutsche Boerse | | | 48,425 | | | $ | 3,697 | | |
Fresenius Medical
Care | | | 42,565 | | | | 1,912 | | |
| GEA Group | | | 111,950 | | | | 1,984 | | |
| Gerresheimer AG | | | 100,325 | | | | 2,828 | | |
| Linde AG | | | 30,310 | | | | 3,046 | | |
| SAP AG | | | 48,105 | | | | 2,345 | | |
SMA Solar
Technology | | | 13,680 | | | | 1,014 | | |
| Tognum AG | | | 134,615 | | | | 2,051 | | |
| Wincor Nixdorf | | | 49,785 | | | | 2,822 | | |
| | | | 21,699 | | |
| Greece (0.0%) | |
| Titan Cement | | | 2,760 | | | | 80 | | |
| Hong Kong (1.1%) | |
| China Mobile ADR | | | 51,770 | | | | 2,548 | | |
| India (0.8%) | |
State Bank of India
GDR | | | 25,230 | | | | 1,867 | | |
| Ireland (1.1%) | |
| DCC PLC | | | 95,870 | | | | 2,351 | | |
| Israel (0.9%) | |
Makhteshim-Agan
Industries | | | 458,215 | | | | 2,099 | | |
| Italy (2.4%) | |
| Lottomatica SPAÈ | | | 71,050 | | | | 1,598 | | |
Milano
Assicurazioni | | | 260,505 | | | | 857 | | |
| UBI Banca | | | 195,295 | | | | 2,951 | | |
| | | | 5,406 | | |
| Japan (12.4%) | |
| Circle K Sunkus | | | 144,800 | | | | 2,354 | | |
Hisamitsu
Pharmaceutical | | | 65,400 | | | | 2,523 | | |
Jupiter
Telecommunications | | | 2,933 | | | | 2,553 | | |
| KDDI Corp. | | | 295 | | | | 1,677 | | |
Kenedix Realty
Investment | | | 350 | | | | 1,313 | | |
| Nihon Kohden | | | 220,700 | | | | 3,617 | | |
| Nintendo Co. ADR | | | 72,775 | | | | 2,442 | | |
| NSD Co. | | | 67,100 | | | | 712 | | |
| | | Number
of Shares | | Value†
(000's) | |
| Sankyo Co. | | | 44,000 | | | $ | 2,771 | | |
| Seven Bank | | | 1,001 | | | | 2,540 | | |
| Sundrug Co. | | | 95,300 | | | | 2,448 | | |
| Takuma Co.* | | | 15,000 | | | | 40 | | |
| Toyota Motor ADR | | | 18,470 | | | | 1,574 | | |
| Unicharm Petcare | | | 32,600 | | | | 1,170 | | |
| | | | 27,734 | | |
| Korea (1.8%) | |
| Hyundai Mobis | | | 22,639 | | | | 2,402 | | |
| Samsung SDI | | | 12,940 | | | | 1,533 | | |
| | | | 3,935 | | |
| Netherlands (9.9%) | |
| ArcelorMittal | | | 48,425 | | | | 1,734 | | |
| Fugro NV | | | 47,895 | | | | 2,578 | | |
| Koninklijke Ahold | | | 254,346 | | | | 2,979 | | |
| Koninklijke DSM | | | 45,042 | | | | 1,642 | | |
| Nutreco Holding | | | 58,336 | | | | 2,626 | | |
| Sligro Food Group | | | 94,741 | | | | 2,662 | | |
| TNT NV | | | 131,767 | | | | 3,251 | | |
| Unilever NVÈ | | | 163,952 | | | | 4,582 | | |
| | | | 22,054 | | |
| Norway (1.8%) | |
| DnB NOR* | | | 228,715 | | | | 2,337 | | |
| Prosafe ASA | | | 352,285 | | | | 1,712 | | |
| | | | 4,049 | | |
| Singapore (0.7%) | |
United
Overseas Bank | | | 137,000 | | | | 1,588 | | |
| Spain (1.6%) | |
| Banco Santander | | | 235,325 | | | | 3,622 | | |
| Sweden (1.5%) | |
Svenska Handelsbanken,
A Shares | | | 83,915 | | | | 2,198 | | |
Swedbank AB,
A Shares* | | | 109,110 | | | | 1,142 | | |
| | | | 3,340 | | |
| Switzerland (7.4%) | |
| Barry Callebaut | | | 3,550 | | | | 1,924 | | |
| Bucher Industries | | | 9,197 | | | | 1,075 | | |
| Credit Suisse Group | | | 34,120 | | | | 1,738 | |
| Givaudan SA | | | 2,475 | | | | 1,779 | | |
See Notes to Schedule of Investments
87
| | | Number
of Shares | | Value†
(000's) | |
| Nestle SA | | | 69,985 | | | $ | 2,907 | | |
Nobel Biocare
Holding | | | 43,990 | | | | 1,344 | | |
| Roche Holding | | | 12,070 | | | | 1,918 | | |
| SGS SA | | | 1,361 | | | | 1,683 | | |
| Sulzer AG | | | 29,165 | | | | 2,256 | | |
| | | | 16,624 | | |
| United Kingdom (21.3%) | |
| Amdocs Ltd.* | | | 50,300 | | | | 1,223 | | |
| Amlin PLC | | | 562,649 | | | | 3,382 | | |
| Antofagasta PLC | | | 93,400 | | | | 1,166 | | |
| Balfour Beatty | | | 244,980 | | | | 1,343 | | |
| Barclays PLC* | | | 475,775 | | | | 2,945 | | |
| BP PLC | | | 200,000 | | | | 1,732 | | |
| Cairn Energy* | | | 51,015 | | | | 2,082 | | |
| Chemring Group | | | 102,518 | | | | 3,486 | | |
| Croda International | | | 150,820 | | | | 1,542 | | |
| Diageo PLC | | | 171,107 | | | | 2,657 | | |
| Experian Group | | | 374,836 | | | | 3,158 | | |
GlaxoSmithKline
PLC | | | 1,016 | | | | 20 | | |
| HSBC Holdings | | | 414,000 | | | | 4,383 | | |
| Informa PLC | | | 580,938 | | | | 2,690 | | |
| Reed Elsevier | | | 134,700 | | | | 980 | | |
| RPS Group | | | 773,639 | | | | 2,519 | | |
| Smith & Nephew | | | 256,962 | | | | 2,192 | | |
| Tullow Oil | | | 107,814 | | | | 1,890 | | |
| Vodafone Group | | | 2,871,496 | | | | 6,208 | | |
Willis Group
Holdings | | | 85,000 | | | | 2,192 | | |
| | | | 47,790 | | |
Total Common Stocks
(Cost $205,058) | | | | | | | 209,015 | | |
| Preferred Stocks (2.1%) | |
| Brazil (2.1%) | |
Petroleo
Brasileiro ADR | | | 73,400 | | | | 2,437 | | |
Ultrapar
Participacoes ADR | | | 61,030 | | | | 2,213 | | |
Total Preferred Stocks
(Cost $3,636) | | | | | | | 4,650 | | |
| Rights (0.0%) | |
| Belgium (0.0%) | |
Anheuser-Busch InBev
VVPR Strip* | | | 101,696 | | | | 1 | | |
| Fortis VVPR Strip* | | | 77,074 | | | | 0 | | |
Total Rights
(Cost $0) | | | | | | | 1 | | |
| Warrants (0.0%) | |
| Italy (0.0%) | |
UBI Banca*
(Cost $0) | | | 89,730 | | | | 9 | | |
| | | Number
of Shares | | Value†
(000's) | |
| Short-Term Investments (6.5%) | |
Neuberger Berman
Securities Lending
Quality Fund,
LLC‡ | | | 4,502,766 | | | $ | 4,548 | | |
State Street
Institutional
Liquid Reserves
Fund Institutional
Class | | | 10,154,371 | | | | 10,154 | | |
Total Short-Term Investments
(Cost $14,702) | | | | | 14,702 | | |
Total Investments##(102.0%)
(Cost $223,396) | | | | | 228,377 | | |
Liabilities, less cash,
receivables and
other assets [(2.0%)] | | | | | (4,583 | ) | |
| Total Net Assets (100.0%) | | | | $ | 223,794 | | |
See Notes to Schedule of Investments
88
SUMMARY SCHEDULE OF INVESTMENTS BY INDUSTRY INTERNATIONAL INSTITUTIONAL FUND
| Industry | | Investments at
Value†
(000's omitted) | | Percentage of
Net Assets | |
| Commercial Banks | | $ | 25,582 | | | | 11.4 | % | |
| Oil, Gas & Consumable Fuels | | | 14,503 | | | | 6.5 | % | |
| Chemicals | | | 13,834 | | | | 6.2 | % | |
| Food Products | | | 13,209 | | | | 5.9 | % | |
| Food & Staples Retailing | | | 12,427 | | | | 5.6 | % | |
| Wireless Telecommunication Services | | | 11,585 | | | | 5.2 | % | |
| Software | | | 11,194 | | | | 5.0 | % | |
| Pharmaceuticals | | | 10,691 | | | | 4.8 | % | |
| Media | | | 9,024 | | | | 4.0 | % | |
| Professional Services | | | 7,482 | | | | 3.3 | % | |
| Health Care Equipment & Supplies | | | 7,153 | | | | 3.2 | % | |
| Insurance | | | 6,431 | | | | 2.9 | % | |
| Metals & Mining | | | 6,140 | | | | 2.7 | % | |
| Energy Equipment & Services | | | 5,568 | | | | 2.5 | % | |
| Aerospace & Defense | | | 5,504 | | | | 2.5 | % | |
| Machinery | | | 5,355 | | | | 2.4 | % | |
| Diversified Telecommunication Services | | | 4,978 | | | | 2.2 | % | |
| Beverages | | | 4,471 | | | | 2.0 | % | |
| Diversified Financial Services | | | 3,697 | | | | 1.6 | % | |
| Hotels, Restaurants & Leisure | | | 3,345 | | | | 1.5 | % | |
| Air Freight & Logistics | | | 3,251 | | | | 1.4 | % | |
| Electrical Equipment | | | 3,065 | | | | 1.4 | % | |
| Life Science Tools & Services | | | 2,828 | | | | 1.3 | % | |
| Computers & Peripherals | | | 2,822 | | | | 1.3 | % | |
| Leisure Equipment & Products | | | 2,771 | | | | 1.2 | % | |
| Commercial Services & Supplies | | | 2,519 | | | | 1.1 | % | |
| Auto Components | | | 2,402 | | | | 1.1 | % | |
| Industrial Conglomerates | | | 2,351 | | | | 1.0 | % | |
| Health Care Providers & Services | | | 1,912 | | | | 0.9 | % | |
| Capital Markets | | | 1,738 | | | | 0.8 | % | |
| Automobiles | | | 1,574 | | | | 0.7 | % | |
| Electronic Equipment, Instruments & Components | | | 1,533 | | | | 0.7 | % | |
| Construction & Engineering | | | 1,343 | | | | 0.6 | % | |
| Real Estate Investment Trusts | | | 1,313 | | | | 0.6 | % | |
| Construction Materials | | | 80 | | | | 0.0 | % | |
| Other Assets-Net | | | 10,119 | | | | 4.5 | % | |
| | | $ | 223,794 | | | | 100.0 | % | |
See Notes to Schedule of Investments
89
Schedule of Investments International Large Cap Fund
TOP TEN EQUITY HOLDINGS
| | | | | Country | | Industry | | | |
| | 1 | | | Vodafone Group | | United Kingdom | | Wireless Telecommunication Services | | | 3.3 | % | |
| | 2 | | | HSBC Holdings | | United Kingdom | | Commercial Banks | | | 2.4 | % | |
| | 3 | | | Unilever NV | | Netherlands | | Food Products | | | 2.3 | % | |
| | 4 | | | Deutsche Boerse | | Germany | | Diversified Financial Services | | | 2.0 | % | |
| | 5 | | | Banco Santander | | Spain | | Commercial Banks | | | 1.8 | % | |
| | 6 | | | Ipsen SA | | France | | Pharmaceuticals | | | 1.7 | % | |
| | 7 | | | Informa PLC | | United Kingdom | | Media | | | 1.7 | % | |
| | 8 | | | Novo Nordisk Class B | | Denmark | | Pharmaceuticals | | | 1.7 | % | |
| | 9 | | | Amlin PLC | | United Kingdom | | Insurance | | | 1.7 | % | |
| | 10 | | | Barclays PLC | | United Kingdom | | Commercial Banks | | | 1.6 | % | |
| | | Number
of Shares | | Value†
(000's) | |
| Common Stocks (90.7%) | |
| Australia (1.1%) | |
| BHP Billiton ADRÈ | | | 17,800 | | | $ | 1,109 | | |
| Belgium (2.4%) | |
Anheuser-Busch
InBev | | | 24,586 | | | | 1,061 | | |
| Colruyt SA | | | 5,735 | | | | 1,316 | | |
| | | | 2,377 | | |
| Brazil (0.8%) | |
Vivo
Participacoes ADR | | | 33,600 | | | | 765 | | |
| Canada (2.9%) | |
| Barrick Gold | | | 17,600 | | | | 607 | | |
| Cameco Corp. | | | 42,820 | | | | 1,139 | | |
| Talisman Energy | | | 71,985 | | | | 1,157 | | |
| | | | 2,903 | | |
| Chile (1.2%) | |
Sociedad Quimica
y Minera de Chile
ADR, B Shares | | | 35,645 | | | | 1,242 | | |
| Czech Republic (0.8%) | |
Telefonica O2 Czech
Republic | | | 27,480 | | | | 763 | | |
| Denmark (1.7%) | |
Novo Nordisk
Class B | | | 28,550 | | | | 1,740 | | |
| France (4.8%) | |
| France TelecomÈ | | | 39,020 | | | | 992 | | |
| Ipsen SA | | | 35,715 | | | | 1,766 | | |
| Sodexo | | | 17,285 | | | | 996 | | |
| Thales SA | | | 22,865 | | | | 1,049 | | |
| | | | 4,803 | | |
| Germany (10.2%) | |
| Deutsche Boerse | | | 25,980 | | | | 1,983 | | |
Fresenius Medical
Care | | | 23,160 | | | | 1,041 | | |
| GEA Group | | | 60,365 | | | | 1,070 | | |
| Linde AG | | | 16,155 | | | | 1,623 | | |
| SAP AG | | | 26,885 | | | | 1,311 | | |
| Siemens AG | | | 8,620 | | | | 747 | | |
| | | Number
of Shares | | Value†
(000's) | |
| Tognum AG | | | 71,525 | | | $ | 1,090 | | |
| Wincor Nixdorf | | | 25,930 | | | | 1,470 | | |
| | | | 10,335 | | |
| Hong Kong (1.3%) | |
| China Mobile ADR | | | 27,515 | | | | 1,354 | | |
| India (1.1%) | |
State Bank of India
GDR | | | 15,085 | | | | 1,116 | | |
| Israel (1.3%) | |
Makhteshim-Agan
Industries | | | 281,135 | | | | 1,288 | | |
| Italy (2.9%) | |
| Lottomatica SPA | | | 42,220 | | | | 950 | | |
Milano
Assicurazioni | | | 136,860 | | | | 450 | | |
| UBI Banca | | | 100,270 | | | | 1,515 | | |
| | | | 2,915 | | |
| Japan (9.5%) | |
Hisamitsu
Pharmaceutical | | | 36,100 | | | | 1,393 | | |
Hitachi Construction
Machinery | | | 42,600 | | | | 865 | | |
Jupiter
Telecommunications | | | 1,668 | | | | 1,452 | | |
| KDDI Corp. | | | 175 | | | | 995 | | |
| Nintendo Co. | | | 4,800 | | | | 1,298 | | |
| Sankyo Co. | | | 24,720 | | | | 1,557 | | |
| Seven Bank | | | 442 | | | | 1,121 | | |
| Toyota Motor ADR | | | 11,095 | | | | 945 | | |
| | | | 9,626 | | |
| Korea (2.0%) | |
| Hyundai Mobis | | | 12,470 | | | | 1,323 | | |
| Samsung SDI | | | 5,665 | | | | 671 | | |
| | | | 1,994 | | |
| Netherlands (7.5%) | |
| Fugro NV | | | 26,521 | | | | 1,428 | | |
| Koninklijke Ahold | | | 133,170 | | | | 1,560 | | |
| Koninklijke DSM | | | 19,831 | | | | 723 | | |
| TNT NV | | | 65,238 | | | | 1,610 | | |
| Unilever NVÈ | | | 82,709 | | | | 2,311 | | |
| | | | 7,632 | | |
| | | Number
of Shares | | Value†
(000's) | |
| Norway (1.0%) | |
| DnB NOR* | | | 99,950 | | | $ | 1,022 | | |
| Singapore (0.9%) | |
United
Overseas Bank | | | 82,000 | | | | 951 | | |
| Spain (1.9%) | |
| Banco Santander | | | 121,500 | | | | 1,870 | | |
| Sweden (2.0%) | |
Svenska Handelsbanken,
A Shares | | | 49,510 | | | | 1,297 | | |
Swedbank AB,
A Shares* | | | 70,640 | | | | 739 | | |
| | | | 2,036 | | |
| Switzerland (7.8%) | |
| Credit Suisse Group | | | 20,130 | | | | 1,026 | | |
| Givaudan SA | | | 1,435 | | | | 1,031 | | |
| Nestle SA | | | 36,245 | | | | 1,505 | | |
Nobel Biocare
Holding | | | 29,100 | | | | 889 | | |
| Novartis AG | | | 24,549 | | | | 1,138 | | |
| Roche Holding | | | 8,035 | | | | 1,277 | | |
| SGS SA | | | 820 | | | | 1,014 | | |
| | | | 7,880 | | |
| Taiwan, Province Of China (0.7%) | |
Taiwan Semiconductor
Manufacturing ADR | | | 68,334 | | | | 731 | | |
| United Kingdom (24.9%) | |
| Amdocs Ltd.* | | | 33,600 | | | | 817 | | |
| Amlin PLC | | | 283,560 | | | | 1,704 | | |
| Antofagasta PLC | | | 60,400 | | | | 754 | | |
| ArcelorMittal | | | 28,740 | | | | 1,029 | | |
| BAE Systems | | | 194,966 | | | | 991 | | |
| Barclays PLC* | | | 262,370 | | | | 1,624 | | |
| BP PLC | | | 172,600 | | | | 1,495 | | |
| Cairn Energy* | | | 23,285 | | | | 950 | | |
| Diageo PLC | | | 87,650 | | | | 1,361 | | |
| Experian Group | | | 181,369 | | | | 1,528 | | |
| HSBC Holdings | | | 228,800 | | | | 2,422 | | |
| Informa PLC | | | 380,953 | | | | 1,764 | | |
| Reed Elsevier | | | 85,800 | | | | 624 | | |
| Smith & Nephew | | | 143,273 | | | | 1,222 | | |
| Tesco PLC | | | 229,053 | | | | 1,402 | | |
| Tullow Oil | | | 59,389 | | | | 1,041 | | |
See Notes to Schedule of Investments
90
| | | Number
of Shares | | Value†
(000's) | |
| Vodafone Group | | | 1,537,787 | | | $ | 3,325 | | |
Willis Group
Holdings | | | 44,900 | | | | 1,158 | | |
| | | | 25,211 | | |
Total Common Stocks
(Cost $86,221) | | | | | | | 91,663 | | |
| Preferred Stocks (1.3%) | |
| Brazil (1.3%) | |
Petroleo
Brasileiro ADR
(Cost $1,260) | | | 40,861 | | | | 1,357 | | |
| Rights (0.0%) | |
| Belgium (0.0%) | |
Anheuser-Busch InBev
VVPR Strip* | | | 58,520 | | | | 0 | | |
| Fortis VVPR Strip* | | | 23,964 | | | | 0 | | |
Total Rights
(Cost $0) | | | | | | | 0 | | |
| Warrants (0.0%) | |
| Italy (0.0%) | |
UBI Banca*
(Cost $0) | | | 48,665 | | | | 5 | | |
| Short-Term Investments (10.3%) | |
Neuberger Berman
Securities Lending
Quality Fund,
LLC‡ | | | 2,310,165 | | | | 2,333 | | |
State Street
Institutional
Liquid Reserves
Fund Institutional
Class | | | 8,121,357 | | | | 8,121 | | |
Total Short-Term Investments
(Cost $10,454) | | | | | | | 10,454 | | |
Total Investments##(102.3%)
(Cost $97,935) | | | | | | | 103,479 | | |
Liabilities, less cash,
receivables and
other assets [(2.3%)] | | | | | | | (2,366 | ) | |
| Total Net Assets (100.0%) | | | | | | $ | 101,113 | | |
See Notes to Schedule of Investments
91
SUMMARY SCHEDULE OF INVESTMENTS BY INDUSTRY INTERNATIONAL LARGE CAP FUND
| Industry | | Investments at
Value†
(000's omitted) | | Percentage of
Net Assets | |
| Commercial Banks | | $ | 12,943 | | | | 12.8 | % | |
| Pharmaceuticals | | | 7,314 | | | | 7.2 | % | |
| Oil, Gas & Consumable Fuels | | | 7,138 | | | | 7.1 | % | |
| Wireless Telecommunication Services | | | 6,439 | | | | 6.4 | % | |
| Chemicals | | | 5,907 | | | | 5.9 | % | |
| Food & Staples Retailing | | | 4,278 | | | | 4.2 | % | |
| Media | | | 3,840 | | | | 3.8 | % | |
| Food Products | | | 3,816 | | | | 3.8 | % | |
| Metals & Mining | | | 3,499 | | | | 3.5 | % | |
| Software | | | 3,426 | | | | 3.4 | % | |
| Insurance | | | 3,312 | | | | 3.3 | % | |
| Professional Services | | | 2,542 | | | | 2.5 | % | |
| Beverages | | | 2,422 | | | | 2.4 | % | |
| Health Care Equipment & Supplies | | | 2,111 | | | | 2.1 | % | |
| Aerospace & Defense | | | 2,040 | | | | 2.0 | % | |
| Diversified Financial Services | | | 1,983 | | | | 2.0 | % | |
| Hotels, Restaurants & Leisure | | | 1,946 | | | | 1.9 | % | |
| Machinery | | | 1,935 | | | | 1.9 | % | |
| Diversified Telecommunication Services | | | 1,755 | | | | 1.7 | % | |
| Air Freight & Logistics | | | 1,610 | | | | 1.6 | % | |
| Leisure Equipment & Products | | | 1,557 | | | | 1.5 | % | |
| Computers & Peripherals | | | 1,470 | | | | 1.5 | % | |
| Energy Equipment & Services | | | 1,428 | | | | 1.4 | % | |
| Auto Components | | | 1,323 | | | | 1.3 | % | |
| Electrical Equipment | | | 1,090 | | | | 1.1 | % | |
| Health Care Providers & Services | | | 1,041 | | | | 1.0 | % | |
| Capital Markets | | | 1,026 | | | | 1.0 | % | |
| Automobiles | | | 945 | | | | 0.9 | % | |
| Industrial Conglomerates | | | 747 | | | | 0.7 | % | |
| Diversified Banks | | | 740 | | | | 0.7 | % | |
| Semiconductors & Semiconductor Equipment | | | 731 | | | | 0.7 | % | |
| Electronic Equipment, Instruments & Components | | | 671 | | | | 0.7 | % | |
| Other Assets-Net | | | 8,088 | | | | 8.0 | % | |
| | | $ | 101,113 | | | | 100.0 | % | |
See Notes to Schedule of Investments
92
Schedule of Investments Large Cap Disciplined Growth Fund
TOP TEN EQUITY HOLDINGS
| | 1 | | | Microsoft Corp. | | | 4.5 | % | |
| | 2 | | | Apple, Inc. | | | 3.9 | % | |
| | 3 | | | IBM | | | 3.2 | % | |
| | 4 | | | Procter & Gamble | | | 3.0 | % | |
| | 5 | | | Hewlett-Packard | | | 2.6 | % | |
| | 6 | | | Cisco Systems | | | 2.4 | % | |
| | 7 | | | Wal-Mart Stores | | | 2.1 | % | |
| | 8 | | | United Technologies | | | 2.1 | % | |
| | 9 | | | Adobe Systems | | | 2.0 | % | |
| | 10 | | | Google Inc. Class A | | | 2.0 | % | |
| | | Number
of Shares | | Value†
(000's) | |
| Common Stocks (97.2%) | |
| Aerospace & Defense (2.8%) | |
| Lockheed Martin | | | 11,784 | | | $ | 884 | | |
| United Technologies | | | 43,673 | | | | 2,592 | | |
| | | | 3,476 | | |
| Air Freight & Logistics (1.0%) | |
| United Parcel Service | | | 22,660 | | | | 1,211 | | |
| Auto Components (1.0%) | |
| Johnson Controls | | | 51,749 | | | | 1,282 | | |
| Beverages (1.8%) | |
| PepsiCo, Inc. | | | 40,047 | | | | 2,269 | | |
| Biotechnology (4.1%) | |
| Amgen Inc.* | | | 32,960 | | | | 1,969 | | |
| Celgene Corp.* | | | 14,997 | | | | 782 | | |
| Gilead Sciences* | | | 52,819 | | | | 2,380 | | |
| | | | 5,131 | | |
| Capital Markets (2.3%) | |
Goldman Sachs
Group | | | 11,867 | | | | 1,964 | | |
| Northern Trust | | | 16,439 | | | | 961 | | |
| | | | 2,925 | | |
| Chemicals (2.0%) | |
| Monsanto Co. | | | 13,142 | | | | 1,102 | | |
Potash Corp. of
Saskatchewan | | | 16,151 | | | | 1,430 | | |
| | | | 2,532 | | |
| Communications Equipment (4.2%) | |
| Cisco Systems* | | | 138,662 | | | | 2,995 | | |
| QUALCOMM Inc. | | | 48,452 | | | | 2,249 | | |
| | | | 5,244 | | |
| Computers & Peripherals (11.3%) | |
| Apple, Inc.* | | | 29,006 | | | | 4,879 | | |
| EMC Corp.* | | | 127,064 | | | | 2,020 | | |
| Hewlett-Packard | | | 71,278 | | | | 3,200 | | |
| IBM | | | 33,640 | | | | 3,971 | | |
| | | | 14,070 | | |
| Consumer Finance (1.1%) | |
| American Express | | | 41,695 | | | | 1,410 | | |
| Diversified Financial Services (1.7%) | |
| J.P. Morgan Chase | | | 49,689 | | | | 2,160 | | |
| Electrical Equipment (0.5%) | |
| Emerson Electric | | | 16,727 | | | | 617 | | |
| | | Number
of Shares | | Value†
(000's) | |
| Energy Equipment & Services (2.6%) | |
National Oilwell
Varco* | | | 53,972 | | | $ | 1,962 | | |
| TransOcean* | | | 17,139 | | | | 1,300 | | |
| | | | 3,262 | | |
| Food & Staples Retailing (5.1%) | |
| CVS Corp. | | | 52,326 | | | | 1,963 | | |
| Wal-Mart Stores | | | 52,242 | | | | 2,658 | | |
| Walgreen Co. | | | 52,902 | | | | 1,792 | | |
| | | | 6,413 | | |
| Health Care Equipment & Supplies (3.5%) | |
| Baxter International | | | 29,974 | | | | 1,706 | | |
Becton,
Dickinson & Co. | | | 15,224 | | | | 1,060 | | |
| St. Jude Medical* | | | 42,767 | | | | 1,648 | | |
| | | | 4,414 | | |
| Household Products (3.0%) | |
| Procter & Gamble | | | 68,064 | | | | 3,683 | | |
| Industrial Gases (1.0%) | |
| Praxair, Inc. | | | 15,574 | | | | 1,193 | | |
| Internet & Catalog Retail (2.0%) | |
| Amazon.com* | | | 30,406 | | | | 2,469 | | |
| Internet Software & Services (3.5%) | |
| Google Inc. Class A* | | | 5,356 | | | | 2,473 | | |
| Yahoo! Inc.* | | | 126,817 | | | | 1,853 | | |
| | | | 4,326 | | |
| IT Services (2.2%) | |
Accenture PLC
Class A | | | 35,845 | | | | 1,183 | | |
| Visa Inc. | | | 21,425 | | | | 1,523 | | |
| | | | 2,706 | | |
| Machinery (3.9%) | |
| Caterpillar Inc. | | | 30,900 | | | | 1,400 | | |
| Cummins Inc. | | | 50,511 | | | | 2,289 | | |
| Danaher Corp. | | | 18,932 | | | | 1,150 | | |
| | | | 4,839 | | |
| Media (1.5%) | |
| Time Warner | | | 67,982 | | | | 1,897 | | |
| Metals & Mining (4.1%) | |
| BHP Billiton ADR | | | 19,117 | | | | 1,191 | | |
Freeport-McMoRan
Copper & Gold | | | 31,561 | | | | 1,988 | | |
| United States Steel | | | 45,238 | | | | 1,980 | | |
| | | | 5,159 | | |
| | | Number
of Shares | | Value†
(000's) | |
| Oil, Gas & Consumable Fuels (5.1%) | |
Canadian Natural
Resources | | | 34,440 | | | $ | 1,971 | | |
Occidental
Petroleum | | | 29,747 | | | | 2,174 | | |
Petroleo Brasileiro
ADR | | | 28,552 | | | | 1,132 | | |
| Range Resources | | | 22,908 | | | | 1,108 | | |
| | | | 6,385 | | |
| Pharmaceuticals (4.1%) | |
| Abbott Laboratories | | | 46,619 | | | | 2,108 | | |
| Johnson & Johnson | | | 29,088 | | | | 1,758 | | |
Teva Pharmaceutical
Industries ADR | | | 23,566 | | | | 1,214 | | |
| | | | 5,080 | | |
| Restaurants (0.9%) | |
| Yum! Brands | | | 32,301 | | | | 1,106 | | |
| Road & Rail (1.7%) | |
| Union Pacific | | | 34,361 | | | | 2,055 | | |
| Semiconductors & Semiconductor Equipment (5.2%) | |
| Analog Devices | | | 44,002 | | | | 1,243 | | |
| ASML Holding ADR | | | 48,535 | | | | 1,333 | | |
| Broadcom Corp.* | | | 48,781 | | | | 1,388 | | |
| Intel Corp. | | | 120,966 | | | | 2,458 | | |
| | | | 6,422 | | |
| Software (8.1%) | |
| Adobe Systems* | | | 80,177 | | | | 2,519 | | |
| Microsoft Corp. | | | 229,325 | | | | 5,653 | | |
| Oracle Corp. | | | 85,451 | | | | 1,869 | | |
| | | | 10,041 | | |
| Specialty Retail (3.4%) | |
| Best Buy | | | 33,125 | | | | 1,202 | | |
| Lowe's Cos. | | | 83,143 | | | | 1,788 | | |
| Staples, Inc. | | | 58,506 | | | | 1,264 | | |
| | | | 4,254 | | |
| Tobacco (1.3%) | |
Philip Morris
International | | | 34,031 | | | | 1,556 | | |
| Wireless Telecommunication Services (1.2%) | |
| American Tower* | | | 47,505 | | | | 1,504 | | |
Total Common Stocks
(Cost $107,511) | | | | | | | 121,091 | | |
See Notes to Schedule of Investments
93
| | | Number
of Shares | | Value†
(000's) | |
| Short-Term Investments (3.8%) | |
State Street
Institutional
Liquid Reserves
Fund Institutional
Class
(Cost $4,732) | | | 4,732,295 | | | $ | 4,732 | | |
Total Investments##(101.0%)
(Cost $112,243) | | | | | 125,823 | | |
Liabilities, less cash,
receivables and
other assets [(1.0%)] | | | | | (1,223 | ) | |
| Total Net Assets (100.0%) | | | | $ | 124,600 | | |
See Notes to Schedule of Investments
94
Schedule of Investments Mid Cap Growth Fund
TOP TEN EQUITY HOLDINGS
| | 1 | | | WMS Industries | | | 2.0 | % | |
| | 2 | | | SBA Communications | | | 1.8 | % | |
| | 3 | | | Urban Outfitters | | | 1.8 | % | |
| | 4 | | | Ross Stores | | | 1.6 | % | |
| | 5 | | | Lazard Ltd. | | | 1.6 | % | |
| | 6 | | | Airgas, Inc. | | | 1.5 | % | |
| | 7 | | | Stericycle, Inc. | | | 1.5 | % | |
| | 8 | | | Ecolab Inc. | | | 1.5 | % | |
| | 9 | | | Dolby Laboratories | | | 1.4 | % | |
| | 10 | | | Express Scripts | | | 1.4 | % | |
| | | Number
of Shares | | Value†
(000's) | |
| Common Stocks (94.4%) | |
| Aerospace & Defense (1.2%) | |
| Precision Castparts | | | 61,300 | | | $ | 5,595 | | |
| Air Freight & Logistics (2.0%) | |
C.H. Robinson
Worldwide | | | 105,800 | | | | 5,952 | | |
Expeditors
International | | | 94,900 | | | | 3,100 | | |
| | | | 9,052 | | |
| Biotechnology (3.2%) | |
Alexion
Pharmaceuticals* | | | 76,400 | | | | 3,449 | | |
| Dendreon Corp.* | | | 60,400 | | | | 1,412 | | |
Human Genome
Sciences*È | | | 130,000 | | | | 2,571 | | |
United
Therapeutics* | | | 24,500 | | | | 2,242 | | |
Vertex
Pharmaceuticals*È | | | 125,000 | | | | 4,676 | | |
| | | | 14,350 | | |
| Capital Markets (4.9%) | |
Affiliated Managers
Group* | | | 71,900 | | | | 4,697 | | |
| Invesco Ltd. | | | 205,300 | | | | 4,260 | | |
| Lazard Ltd. | | | 185,100 | | | | 7,195 | | |
| Northern Trust | | | 101,900 | | | | 5,957 | | |
| | | | 22,109 | | |
| Chemicals (3.0%) | |
| Airgas, Inc. | | | 150,300 | | | | 6,989 | | |
| Ecolab Inc.È | | | 155,100 | | | | 6,559 | | |
| | | | 13,548 | | |
| Commercial Banks (0.8%) | |
| Signature Bank* | | | 111,900 | | | | 3,397 | | |
Commercial Services & Supplies
(3.1%) | |
| Copart, Inc.*È | | | 65,600 | | | | 2,318 | | |
| Iron Mountain*È | | | 78,000 | | | | 2,285 | | |
| Stericycle, Inc.* | | | 140,900 | | | | 6,978 | | |
| Waste Connections* | | | 81,000 | | | | 2,215 | | |
| | | | 13,796 | | |
| Communications Equipment (1.4%) | |
Brocade
Communications* | | | 278,200 | | | | 2,011 | | |
| Juniper Networks* | | | 181,900 | | | | 4,197 | | |
| | | | 6,208 | | |
| | | Number
of Shares | | Value†
(000's) | |
| Computers & Peripherals (1.0%) | |
| NetApp, Inc.* | | | 95,700 | | | $ | 2,177 | | |
| Western Digital* | | | 72,400 | | | | 2,482 | | |
| | | | 4,659 | | |
| Construction & Engineering (1.0%) | |
Jacobs Engineering
Group* | | | 102,800 | | | | 4,521 | | |
| Diversified Consumer Services (2.3%) | |
| DeVry, Inc. | | | 91,000 | | | | 4,650 | | |
| Strayer EducationÈ | | | 27,900 | | | | 5,890 | | |
| | | | 10,540 | | |
| Diversified Financial Services (2.0%) | |
IntercontinentalExchange
Inc.* | | | 43,600 | | | | 4,090 | | |
| MSCI Inc.* | | | 159,400 | | | | 4,689 | | |
| | | | 8,779 | | |
| Electrical Equipment (1.6%) | |
| AMETEK, Inc. | | | 135,500 | | | | 4,265 | | |
| Roper Industries | | | 65,400 | | | | 3,099 | | |
| | | | 7,364 | | |
| Electronic Equipment, Instruments & Components (3.8%) | |
| Amphenol Corp. | | | 99,200 | | | | 3,468 | | |
| Dolby Laboratories* | | | 159,300 | | | | 6,214 | | |
National
Instruments | | | 131,900 | | | | 3,381 | | |
| Trimble Navigation* | | | 154,100 | | | | 3,923 | | |
| | | | 16,986 | | |
| Energy Equipment & Services (2.6%) | |
| CARBO CeramicsÈ | | | 97,500 | | | | 4,197 | | |
Core
Laboratories N.V.È | | | 43,600 | | | | 4,041 | | |
| Noble Corp. | | | 96,900 | | | | 3,394 | | |
| | | | 11,632 | | |
| Food & Staples Retailing (1.2%) | |
Shoppers Drug
MartÈ | | | 132,500 | | | | 5,204 | | |
| Food Products (1.2%) | |
| Ralcorp Holdings* | | | 83,100 | | | | 5,213 | | |
| Health Care Equipment & Supplies (2.2%) | |
| C.R. BardÈ | | | 34,800 | | | | 2,804 | | |
| NuVasive, Inc.*È | | | 66,400 | | | | 2,661 | | |
| | | Number
of Shares | | Value†
(000's) | |
| ResMed Inc.* | | | 51,300 | | | $ | 2,355 | | |
Wright Medical
Group* | | | 122,600 | | | | 1,991 | | |
| | | | 9,811 | | |
| Health Care Providers & Services (2.8%) | |
| Express Scripts* | | | 85,300 | | | | 6,161 | | |
| HMS Holdings* | | | 66,800 | | | | 2,512 | | |
| VCA Antech* | | | 158,100 | | | | 3,913 | | |
| | | | 12,586 | | |
| Health Care Technology (1.0%) | |
Allscripts Healthcare
SolutionsÈ | | | 147,400 | | | | 2,189 | | |
| MedAssets Inc.* | | | 111,500 | | | | 2,490 | | |
| | | | 4,679 | | |
| Hotels, Restaurants & Leisure (4.7%) | |
| Ameristar CasinosÈ | | | 149,500 | | | | 2,483 | | |
International Game
Technology | | | 84,600 | | | | 1,770 | | |
Marriott
International | | | 82,698 | | | | 1,977 | | |
Penn National
Gaming* | | | 203,800 | | | | 5,953 | | |
| WMS Industries* | | | 213,800 | | | | 9,050 | | |
| | | | 21,233 | | |
| Household Products (1.0%) | |
| Church & Dwight | | | 76,700 | | | | 4,382 | | |
| Internet & Catalog Retail (0.7%) | |
| Priceline.com Inc.*È | | | 21,300 | | | | 3,280 | | |
| Internet Software & Services (2.3%) | |
| Equinix, Inc.*È | | | 55,300 | | | | 4,659 | | |
| VistaPrint Ltd.*È | | | 139,300 | | | | 5,773 | | |
| | | | 10,432 | | |
| IT Services (0.9%) | |
Cognizant Technology
Solutions* | | | 116,000 | | | | 4,046 | | |
| Life Science Tools & Services (1.5%) | |
AMAG
Pharmaceuticals* | | | 58,700 | | | | 2,409 | | |
| Illumina, Inc.*È | | | 124,500 | | | | 4,391 | | |
| | | | 6,800 | | |
| Machinery (1.5%) | |
| Danaher Corp. | | | 82,800 | | | | 5,027 | | |
| Flowserve Corp. | | | 21,500 | | | | 1,854 | | |
| | | | 6,881 | | |
See Notes to Schedule of Investments
95
| | | Number
of Shares | | Value†
(000's) | |
| Media (1.4%) | |
DreamWorks
Animation SKG* | | | 88,900 | | | $ | 3,001 | | |
| McGraw-Hill Cos. | | | 95,700 | | | | 3,217 | | |
| | | | 6,218 | | |
| Metals & Mining (0.6%) | |
Freeport-McMoRan
Copper & Gold | | | 41,900 | | | | 2,639 | | |
| Multiline Retail (2.5%) | |
| Dollar Tree* | | | 71,800 | | | | 3,586 | | |
| Kohl's Corp.*È | | | 73,400 | | | | 3,787 | | |
| Nordstrom, Inc.È | | | 140,000 | | | | 3,925 | | |
| | | | 11,298 | | |
| Oil, Gas & Consumable Fuels (4.5%) | |
Alpha Natural
Resources* | | | 45,000 | | | | 1,454 | | |
| Cabot Oil & Gas | | | 63,100 | | | | 2,224 | | |
| Concho Resources* | | | 183,800 | | | | 5,990 | | |
| Range Resources | | | 122,500 | | | | 5,926 | | |
Southwestern
Energy* | | | 132,500 | | | | 4,884 | | |
| | | | 20,478 | | |
| Personal Products (1.6%) | |
| Avon Products | | | 74,700 | | | | 2,381 | | |
Mead Johnson
Nutrition | | | 126,600 | | | | 5,021 | | |
| | | | 7,402 | | |
| Pharmaceuticals (0.6%) | |
Mylan
Laboratories*È | | | 191,900 | | | | 2,815 | | |
| Professional Services (1.6%) | |
| CoStar Group*È | | | 65,300 | | | | 2,478 | | |
| IHS Inc.* | | | 98,800 | | | | 4,782 | | |
| | | | 7,260 | | |
| Road & Rail (0.9%) | |
J.B. Hunt Transport
ServicesÈ | | | 139,400 | | | | 3,907 | | |
| Semiconductors & Semiconductor Equipment (7.0%) | |
| Altera Corp. | | | 90,400 | | | | 1,737 | | |
| Analog Devices | | | 144,300 | | | | 4,076 | | |
Avago
Technologies* | | | 125,000 | | | | 2,275 | | |
| Broadcom Corp.* | | | 109,000 | | | | 3,101 | | |
| Lam Research* | | | 79,700 | | | | 2,447 | | |
Marvell Technology
Group* | | | 263,600 | | | | 4,020 | | |
Microchip
TechnologyÈ | | | 208,400 | | | | 5,533 | | |
Silicon
Laboratories* | | | 111,800 | | | | 5,035 | | |
Varian Semiconductor
Equipment*È | | | 107,900 | | | | 3,299 | | |
| | | | 31,523 | | |
| | | Number
of Shares | | Value†
(000's) | |
| Software (5.3%) | |
| Activision Blizzard* | | | 485,800 | | | $ | 5,640 | | |
| ANSYS, Inc.* | | | 159,100 | | | | 5,591 | | |
| Citrix Systems*È | | | 63,500 | | | | 2,266 | | |
| McAfee Inc.*È | | | 69,200 | | | | 2,753 | | |
| MICROS Systems* | | | 74,800 | | | | 2,085 | | |
| Rovi Corp.* | | | 107,100 | | | | 3,260 | | |
| Sybase, Inc.*È | | | 70,000 | | | | 2,439 | | |
| | | | 24,034 | | |
| Specialty Retail (7.6%) | |
Bed Bath &
Beyond* | | | 137,400 | | | | 5,012 | | |
| CarMax, Inc.* | | | 135,600 | | | | 2,347 | | |
| Gap Inc. | | | 63,700 | | �� | | 1,252 | | |
O' Reilly
Automotive*È | | | 84,600 | | | | 3,238 | | |
| Ross Stores | | | 158,200 | | | | 7,378 | | |
| TJX Cos. | | | 119,100 | | | | 4,282 | | |
| Urban Outfitters* | | | 283,600 | | | | 8,063 | | |
| Williams-Sonoma | | | 143,100 | | | | 2,738 | | |
| | | | 34,310 | | |
| Textiles, Apparel & Luxury Goods (0.5%) | |
| Coach, Inc. | | | 77,000 | | | | 2,178 | | |
| Trading Companies & Distributors (1.6%) | |
| Fastenal Co.È | | | 125,600 | | | | 4,547 | | |
| W.W. Grainger | | | 31,800 | | | | 2,781 | | |
| | | | 7,328 | | |
| Wireless Telecommunication Services (3.8%) | |
| American Tower* | | | 194,300 | | | | 6,150 | | |
Millicom International
Cellular*È | | | 41,300 | | | | 2,914 | | |
SBA
Communications* | | | 338,400 | | | | 8,159 | | |
| | | | 17,223 | | |
Total Common Stocks
(Cost $367,935) | | | | | | | 425,696 | | |
| Short-Term Investments (20.9%) | |
Neuberger Berman
Securities Lending
Quality Fund,
LLC‡ | | | 68,669,144 | | | | 69,356 | | |
State Street
Institutional
Liquid Reserves
Fund Institutional
Class | | | 25,018,476 | | | | 25,018 | | |
Total Short-Term Investments
(Cost $94,374) | | | | | | | 94,374 | | |
Total Investments##(115.3%)
(Cost $462,309) | | | | | | | 520,070 | | |
Liabilities, less cash,
receivables and
other assets [(15.3%)] | | | | | | | (69,081 | ) | |
| Total Net Assets (100.0%) | | | | | | $ | 450,989 | | |
See Notes to Schedule of Investments
96
Schedule of Investments Partners Fund
TOP TEN EQUITY HOLDINGS
| | 1 | | | Bank of America | | | 3.4 | % | |
| | 2 | | | NBTY, Inc. | | | 2.6 | % | |
| | 3 | | | Petroleo Brasileiro ADR | | | 2.3 | % | |
| | 4 | | | Canadian Natural Resources | | | 2.2 | % | |
| | 5 | | | Berkshire Hathaway Class B | | | 2.2 | % | |
| | 6 | | | Moody's Corp. | | | 2.2 | % | |
| | 7 | | | Shire Limited ADR | | | 2.1 | % | |
| | 8 | | | Teck Cominco Class B | | | 2.1 | % | |
| | 9 | | | Harley-Davidson | | | 1.9 | % | |
| | 10 | | | J.P. Morgan Chase | | | 1.9 | % | |
| | | Number
of Shares | | Value†
(000's) | |
| Common Stocks (96.9%) | |
| Aerospace & Defense (2.3%) | |
| Boeing Co.È | | | 435,100 | | | $ | 21,612 | | |
L-3 Communications
HoldingsÈ | | | 476,200 | | | | 35,429 | | |
| | | | 57,041 | | |
| Automobiles (1.9%) | |
| Harley-Davidson | | | 2,033,066 | | | | 48,753 | | |
| Beverages (1.6%) | |
Dr. Pepper Snapple
Group* | | | 1,559,800 | | | | 41,241 | | |
| Building Products (1.0%) | |
| Owens Corning*È | | | 1,168,000 | | | | 26,093 | | |
| Capital Markets (5.3%) | |
Goldman Sachs
Group | | | 153,100 | | | | 25,332 | | |
| Invesco Ltd. | | | 1,877,500 | | | | 38,958 | | |
| Morgan StanleyÈ | | | 1,115,782 | | | | 32,313 | | |
| State Street | | | 661,500 | | | | 34,716 | | |
| | | | 131,319 | | |
| Commercial Banks (2.8%) | |
| Comerica Inc.È | | | 255,400 | | | | 6,811 | | |
Fifth Third
Bancorp | | | 1,151,400 | | | | 12,596 | | |
| SunTrust BanksÈ | | | 305,500 | | | | 7,140 | | |
| Wells Fargo | | | 1,564,300 | | | | 43,050 | | |
| | | | 69,597 | | |
| Computers & Peripherals (1.8%) | |
| Hewlett-Packard | | | 979,200 | | | | 43,956 | | |
| Construction & Engineering (2.6%) | |
Chicago Bridge &
Iron | | | 2,434,600 | | | | 38,320 | | |
| KBR, Inc. | | | 1,164,532 | | | | 26,377 | | |
| | | | 64,697 | | |
| Consumer Finance (1.6%) | |
| American Express | | | 1,187,900 | | | | 40,175 | | |
| Diversified Financial Services (9.3%) | |
| Bank of America | | | 4,780,400 | | | | 84,087 | | |
| Citigroup Inc. | | | 9,303,037 | | | | 46,515 | | |
J.P. Morgan
Chase | | | 1,088,900 | | | | 47,324 | | |
| Moody's Corp. | | | 1,981,994 | | | | 53,990 | | |
| | | | 231,916 | | |
| Electric Utilities (0.2%) | |
| FirstEnergy Corp. | | | 83,600 | | | | 3,773 | | |
| | | Number
of Shares | | Value†
(000's) | |
| Electrical Equipment (1.5%) | |
| ABB Ltd. | | | 1,977,500 | | | $ | 37,909 | | |
| Energy Equipment & Services (3.0%) | |
National Oilwell
Varco* | | | 966,700 | | | | 35,139 | | |
| Noble Corp. | | | 1,136,900 | | | | 39,826 | | |
| | | | 74,965 | | |
| Health Care Equipment & Supplies (2.1%) | |
| Covidien PLC | | | 688,000 | | | | 27,224 | | |
| Zimmer Holdings* | | | 550,700 | | | | 26,076 | | |
| | | | 53,300 | | |
| Health Care Providers & Services (3.0%) | |
| Aetna Inc. | | | 1,031,700 | | | | 29,403 | | |
| WellPoint Inc.* | | | 851,800 | | | | 45,018 | | |
| | | | 74,421 | | |
| Health Care Technology (0.8%) | |
| IMS HealthÈ | | | 1,482,100 | | | | 20,542 | | |
| Household Durables (0.7%) | |
| NVR, Inc.* | | | 5,400 | | | | 3,646 | | |
| Whirlpool Corp.È | | | 199,900 | | | | 12,836 | | |
| | | | 16,482 | | |
| Household Products (1.9%) | |
| Energizer Holdings* | | | 714,500 | | | | 46,750 | | |
| Independent Power Producers & Energy Traders (1.5%) | |
| NRG Energy*È | | | 1,375,868 | | | | 36,942 | | |
| Industrial Conglomerates (1.7%) | |
McDermott
International* | | | 1,790,700 | | | | 42,547 | | |
| Insurance (4.2%) | |
| Assurant, Inc. | | | 674,500 | | | | 20,202 | | |
Berkshire Hathaway
Class B* | | | 16,700 | | | | 54,876 | | |
| MetLife, Inc. | | | 814,542 | | | | 30,757 | | |
| | | | 105,835 | | |
| IT Services (4.6%) | |
Affiliated Computer
Services* | | | 686,200 | | | | 30,742 | | |
Fidelity National
Information
ServicesÈ | | | 1,738,530 | | | | 42,698 | | |
Lender Processing
Services | | | 1,230,915 | | | | 42,196 | | |
| | | | 115,636 | | |
| | | Number
of Shares | | Value†
(000's) | |
| Machinery (4.1%) | |
Ingersoll-Rand
PLC | | | 1,050,174 | | | $ | 32,440 | | |
| Joy GlobalÈ | | | 721,458 | | | | 28,028 | | |
| Terex Corp.* | | | 2,475,900 | | | | 40,803 | | |
| | | | 101,271 | | |
| Marine (0.5%) | |
Genco Shipping &
TradingÈ | | | 606,400 | | | | 11,746 | | |
| Media (3.1%) | |
Cablevision
Systems | | | 1,474,313 | | | | 32,936 | | |
| McGraw-Hill Cos. | | | 1,362,800 | | | | 45,804 | | |
| | | | 78,740 | | |
| Metals & Mining (6.2%) | |
Cliffs Natural
Resources | | | 563,200 | | | | 14,255 | | |
Freeport-McMoRan
Copper & GoldÈ | | | 669,400 | | | | 42,159 | | |
Sterlite Industries
(India) ADR* | | | 961,900 | | | | 12,880 | | |
Teck Cominco
Class B*È | | | 2,185,900 | | | | 52,593 | | |
| Xstrata PLC | | | 2,427,000 | | | | 32,655 | | |
| | | | 154,542 | | |
| Multiline Retail (2.5%) | |
| J.C. PenneyÈ | | | 1,270,900 | | | | 38,178 | | |
| Macy's Inc. | | | 1,572,400 | | | | 24,403 | | |
| | | | 62,581 | | |
| Oil, Gas & Consumable Fuels (13.7%) | |
Canadian Natural
ResourcesÈ | | | 964,400 | | | | 55,193 | | |
Denbury
Resources* | | | 1,423,760 | | | | 21,670 | | |
| EOG Resources | | | 422,200 | | | | 30,398 | | |
| Exxon Mobil | | | 28,200 | | | | 1,950 | | |
| Peabody Energy | | | 861,400 | | | | 28,151 | | |
Petroleo Brasileiro
ADRÈ | | | 1,439,500 | | | | 57,062 | | |
Ship Finance
InternationalÈ | | | 1,290,203 | | | | 16,334 | | |
Southwestern
Energy* | | | 1,084,225 | | | | 39,964 | | |
| Suncor Energy | | | 822,305 | | | | 25,195 | | |
| Talisman EnergyÈ | | | 1,403,940 | | | | 22,547 | | |
| Walter Industries | | | 358,100 | | | | 18,589 | | |
| XTO Energy | | | 634,457 | | | | 24,490 | | |
| | | | 341,543 | | |
See Notes to Schedule of Investments
97
| | | Number
of Shares | | Value†
(000's) | |
| Personal Products (3.3%) | |
| Avon Products | | | 620,457 | | | $ | 19,774 | | |
| NBTY, Inc.* | | | 1,724,774 | | | | 63,920 | | |
| | | | 83,694 | | |
| Pharmaceuticals (2.1%) | |
Shire Limited
ADRÈ | | | 1,065,659 | | | | 52,814 | | |
| Road & Rail (0.3%) | |
| Norfolk SouthernÈ | | | 183,900 | | | | 8,435 | | |
| Software (3.1%) | |
Check Point Software
Technologies*È | | | 806,573 | | | | 22,479 | | |
| Microsoft Corp. | | | 957,400 | | | | 23,600 | | |
| Oracle Corp.È | | | 1,468,500 | | | | 32,116 | | |
| | | | 78,195 | | |
| Specialty Retail (1.2%) | |
| Best BuyÈ | | | 829,975 | | | | 30,111 | | |
| Wireless Telecommunication Services (1.4%) | |
China Mobile
ADRÈ | | | 712,600 | | | | 35,074 | | |
Total Common Stocks
(Cost $2,295,212) | | | | | | | 2,422,636 | | |
| Short-Term Investments (7.6%) | |
Neuberger Berman
Securities Lending
Quality Fund,
LLC‡ | | | 120,980,475 | | | | 122,190 | | |
State Street
Institutional
Liquid Reserves
Fund Institutional
Class | | | 67,955,372 | | | | 67,955 | | |
Total Short-Term Investments
(Cost $190,145) | | | | | | | 190,145 | | |
Total Investments##(104.5%)
(Cost $2,485,357) | | | | | | | 2,612,781 | | |
Liabilities, less cash,
receivables and
other assets [(4.5%)] | | | | | | | (111,964 | ) | |
| Total Net Assets (100.0%) | | | | | | $ | 2,500,817 | | |
See Notes to Schedule of Investments
98
Schedule of Investments Real Estate Fund
TOP TEN EQUITY HOLDINGS
| | 1 | | | Simon Property Group | | | 9.0 | % | |
| | 2 | | | Boston Properties | | | 5.6 | % | |
| | 3 | | | Public Storage | | | 5.6 | % | |
| | 4 | | | Digital Realty Trust | | | 4.8 | % | |
| | 5 | | | HCP, Inc. | | | 4.6 | % | |
| | 6 | | | Equity Residential | | | 4.0 | % | |
| | 7 | | | Vornado Realty Trust | | | 3.8 | % | |
| | 8 | | | Ventas, Inc. | | | 3.6 | % | |
| | 9 | | | Federal Realty Investment Trust | | | 2.8 | % | |
| | 10 | | | Essex Property Trust | | | 2.8 | % | |
| | | Number
of Shares | | Value†
(000's) | |
| Common Stocks (96.7%) | |
| Apartments (13.5%) | |
American Campus
Communities | | | 39,451 | | | $ | 1,026 | | |
AvalonBay
Communities | | | 28,032 | | | | 1,806 | | |
Camden Property
Trust | | | 43,500 | | | | 1,597 | | |
| Equity Residential | | | 97,700 | | | | 2,668 | | |
Essex Property
TrustÈ | | | 24,900 | | | | 1,858 | | |
| | | | 8,955 | | |
| Diversified (3.8%) | |
Vornado Realty
Trust | | | 43,442 | | | | 2,499 | | |
| Health Care (12.1%) | |
| HCP, Inc. | | | 106,800 | | | | 3,042 | | |
Nationwide Health
Properties | | | 57,600 | | | | 1,836 | | |
OMEGA Healthcare
Investors | | | 47,600 | | | | 805 | | |
| Ventas, Inc. | | | 60,300 | | | | 2,364 | | |
| | | | 8,047 | | |
| Home Financing (1.8%) | |
Starwood Property
Trust* | | | 61,600 | | | | 1,219 | | |
| Industrial (5.8%) | |
| AMB Property | | | 66,100 | | | | 1,509 | | |
DCT Industrial
Trust | | | 131,500 | | | | 694 | | |
EastGroup
Properties | | | 24,900 | | | | 937 | | |
| ProLogis | | | 61,100 | | | | 680 | | |
| | | | 3,820 | | |
| Lodging (5.2%) | |
Host Hotels &
Resorts | | | 121,500 | | | | 1,211 | | |
LaSalle Hotel
Properties | | | 36,300 | | | | 601 | | |
Starwood
Hotels & Resorts
WorldwideÈ | | | 56,000 | | | | 1,668 | | |
| | | | 3,480 | | |
| Mixed (2.8%) | |
| Duke Realty | | | 78,100 | | | | 900 | | |
| PS Business Parks | | | 17,500 | | | | 926 | | |
| | | | 1,826 | | |
| | | Number
of Shares | | Value†
(000's) | |
| Office (15.3%) | |
Alexandria Real
Estate EquitiesÈ | | | 29,350 | | | $ | 1,635 | | |
| Boston Properties | | | 61,600 | | | | 3,732 | | |
Brandywine
Realty Trust | | | 88,900 | | | | 943 | | |
Brookfield
Properties | | | 149,400 | | | | 1,639 | | |
Corporate Office
Properties Trust | | | 29,370 | | | | 1,082 | | |
Highwoods
Properties | | | 38,200 | | | | 1,122 | | |
| | | | 10,153 | | |
| Regional Malls (10.0%) | |
Simon Property
GroupÈ | | | 93,679 | | | | 5,960 | | |
| Taubman Centers | | | 21,400 | | | | 677 | | |
| | | | 6,637 | | |
| Self Storage (6.9%) | |
| Public Storage | | | 52,300 | | | | 3,690 | | |
| Sovran Self Storage | | | 31,100 | | | | 914 | | |
| | | | 4,604 | | |
| Shopping Centers (9.8%) | |
Acadia Realty
TrustÈ | | | 40,722 | | | | 624 | | |
Federal Realty
Investment Trust | | | 29,900 | | | | 1,865 | | |
| Kimco Realty | | | 115,000 | | | | 1,443 | | |
| Regency Centers | | | 28,000 | | | | 939 | | |
Tanger Factory
Outlet Centers | | | 44,200 | | | | 1,663 | | |
| | | | 6,534 | | |
| Specialty (9.7%) | |
| Digital Realty Trust | | | 73,500 | | | | 3,203 | | |
Dupont Fabros
Technology | | | 54,500 | | | | 713 | | |
Plum Creek Timber
Company | | | 36,000 | | | | 1,091 | | |
| Rayonier Inc. | | | 32,600 | | | | 1,400 | | |
| | | | 6,407 | | |
Total Common Stocks
(Cost $50,864) | | | | | | | 64,181 | | |
| | | Number
of Shares | | Value†
(000's) | |
| Short-Term Investments (17.2%) | |
Neuberger Berman
Securities Lending
Quality Fund,
LLC‡ | | | 9,144,630 | | | $ | 9,236 | | |
State Street
Institutional
Liquid Reserves
Fund Institutional
Class | | | 2,226,248 | | | | 2,226 | | |
Total Short-Term Investments
(Cost $11,462) | | | | | 11,462 | | |
Total Investments##(113.9%)
(Cost $62,326) | | | | | 75,643 | | |
Liabilities, less cash,
receivables and
other assets [(13.9%)] | | | | | (9,257 | ) | |
| Total Net Assets (100.0%) | | | | $ | 66,386 | | |
See Notes to Schedule of Investments
99
Schedule of Investments Regency Fund
TOP TEN EQUITY HOLDINGS
| | 1 | | | NBTY, Inc. | | | 2.6 | % | |
| | 2 | | | Teck Cominco Class B | | | 2.5 | % | |
| | 3 | | | Whirlpool Corp. | | | 2.3 | % | |
| | 4 | | | Whiting Petroleum | | | 1.9 | % | |
| | 5 | | | Harley-Davidson | | | 1.9 | % | |
| | 6 | | | Dr. Pepper Snapple Group | | | 1.8 | % | |
| | 7 | | | McGraw-Hill Cos. | | | 1.7 | % | |
| | 8 | | | Moody's Corp. | | | 1.7 | % | |
| | 9 | | | Lender Processing Services | | | 1.7 | % | |
| | 10 | | | NRG Energy | | | 1.7 | % | |
| | | Number
of Shares | | Value†
(000's) | |
| Common Stocks (96.4%) | |
| Aerospace & Defense (2.3%) | |
Embraer-Empresa
Brasileira de
Aeronautica ADRÈ | | | 38,700 | | | $ | 822 | | |
L-3 Communications
Holdings | | | 10,700 | | | | 796 | | |
| | | | 1,618 | | |
| Auto Components (1.7%) | |
| Johnson Controls | | | 20,400 | | | | 506 | | |
| WABCO Holdings | | | 36,300 | | | | 692 | | |
| | | | 1,198 | | |
| Automobiles (1.9%) | |
| Harley-Davidson | | | 55,200 | | | | 1,324 | | |
| Beverages (1.8%) | |
Dr. Pepper Snapple
Group* | | | 47,100 | | | | 1,245 | | |
| Building Products (1.2%) | |
| Owens Corning* | | | 38,500 | | | | 860 | | |
| Capital Markets (4.1%) | |
| Invesco Ltd. | | | 56,600 | | | | 1,174 | | |
| Jefferies Group* | | | 28,500 | | | | 674 | | |
| Morgan Stanley | | | 35,000 | | | | 1,014 | | |
| | | | 2,862 | | |
| Commercial Banks (6.0%) | |
| Comerica Inc. | | | 29,700 | | | | 792 | | |
Fifth Third
Bancorp | | | 56,400 | | | | 617 | | |
First Horizon
National* | | | 42,405 | | | | 567 | | |
| KeyCorp | | | 99,800 | | | | 665 | | |
| Regions FinancialÈ | | | 95,900 | | | | 562 | | |
| SunTrust Banks | | | 21,200 | | | | 495 | | |
| Zions BancorpÈ | | | 29,400 | | | | 520 | | |
| | | | 4,218 | | |
| Construction & Engineering (1.4%) | |
Chicago Bridge &
Iron | | | 63,000 | | | | 992 | | |
| Diversified Financial Services (1.7%) | |
| Moody's Corp. | | | 43,700 | | | | 1,190 | | |
| Electric Utilities (5.0%) | |
| DPL Inc. | | | 37,800 | | | | 936 | | |
| Entergy Corp. | | | 7,100 | | | | 561 | | |
| FirstEnergy Corp. | | | 17,100 | | | | 772 | | |
| | | Number
of Shares | | Value†
(000's) | |
| NV Energy | | | 69,000 | | | $ | 832 | | |
| PPL Corp. | | | 15,900 | | | | 468 | | |
| | | | 3,569 | | |
| Electronic Equipment, Instruments & Components (2.3%) | |
Anixter
International* | | | 24,900 | | | | 873 | | |
| Avnet, Inc.* | | | 28,800 | | | | 768 | | |
| | | | 1,641 | | |
| Energy Equipment & Services (3.0%) | |
National Oilwell
Varco* | | | 27,600 | | | | 1,003 | | |
| Noble Corp. | | | 20,400 | | | | 715 | | |
Oceaneering
International* | | | 7,400 | | | | 386 | | |
| | | | 2,104 | | |
| Food Products (1.4%) | |
| ConAgra, Inc. | | | 24,300 | | | | 499 | | |
| J.M. Smucker | | | 9,600 | | | | 502 | | |
| | | | 1,001 | | |
| Health Care Equipment & Supplies (0.6%) | |
| Covidien PLC | | | 10,900 | | | | 431 | | |
| Health Care Providers & Services (5.0%) | |
| Aetna Inc. | | | 26,800 | | | | 764 | | |
AmerisourceBergen
Corp. | | | 30,900 | | | | 658 | | |
| CIGNA Corp. | | | 19,800 | | | | 583 | | |
Coventry Health
Care* | | | 19,300 | | | | 421 | | |
| Mednax, Inc.* | | | 21,500 | | | | 1,120 | | |
| | | | 3,546 | | |
| Health Care Technology (0.7%) | |
| IMS Health | | | 33,600 | | | | 466 | | |
| Household Durables (3.4%) | |
| NVR, Inc.* | | | 1,150 | | | | 776 | | |
| Whirlpool Corp. | | | 25,600 | | | | 1,644 | | |
| | | | 2,420 | | |
| Household Products (1.6%) | |
Energizer
Holdings* | | | 17,300 | | | | 1,132 | | |
| Independent Power Producers & Energy Traders (1.7%) | |
| NRG Energy* | | | 44,100 | | | | 1,184 | | |
| | | Number
of Shares | | Value†
(000's) | |
| Industrial Conglomerates (0.8%) | |
McDermott
International* | | | 25,100 | | | $ | 596 | | |
| Insurance (6.7%) | |
| Assurant, Inc. | | | 29,800 | | | | 893 | | |
Fidelity National
Financial Class A | | | 17,000 | | | | 255 | | |
| PartnerRe Ltd. | | | 10,200 | | | | 754 | | |
Principal Financial
Group | | | 32,600 | | | | 926 | | |
StanCorp
Financial Group | | | 30,300 | | | | 1,147 | | |
| W.R. Berkley | | | 31,000 | | | | 792 | | |
| | | | 4,767 | | |
| IT Services (3.9%) | |
Affiliated Computer
Services* | | | 15,900 | | | | 712 | | |
Fidelity National
Information
Services | | | 36,100 | | | | 887 | | |
Lender Processing
Services | | | 34,700 | | | | 1,189 | | |
| | | | 2,788 | | |
| Life Science Tools & Services (0.6%) | |
Charles River
Laboratories
International* | | | 11,600 | | | | 400 | | |
| Machinery (5.2%) | |
Bucyrus
International | | | 20,700 | | | | 618 | | |
| Ingersoll-Rand PLC | | | 35,000 | | | | 1,081 | | |
Navistar
International* | | | 12,100 | | | | 523 | | |
| SPX Corp. | | | 7,400 | | | | 412 | | |
| Terex Corp.* | | | 62,700 | | | | 1,034 | | |
| | | | 3,668 | | |
| Marine (0.5%) | |
Genco Shipping &
TradingÈ | | | 17,000 | | | | 329 | | |
| Media (3.2%) | |
| Cablevision Systems | | | 46,500 | | | | 1,039 | | |
| McGraw-Hill Cos. | | | 35,700 | | | | 1,200 | | |
| | | | 2,239 | | |
See Notes to Schedule of Investments
100
| | | Number
of Shares | | Value†
(000's) | |
| Metals & Mining (5.3%) | |
Cliffs Natural
Resources | | | 23,800 | | | $ | 603 | | |
Freeport-McMoRan
Copper & Gold | | | 16,200 | | | | 1,020 | | |
Sterlite Industries
(India) ADR* | | | 31,300 | | | | 419 | | |
Teck Cominco
Class B* | | | 72,100 | | | | 1,735 | | |
| | | | 3,777 | | |
| Multi-Utilities (1.3%) | |
| CMS Energy | | | 66,500 | | | | 892 | | |
| Multiline Retail (2.6%) | |
| J.C. Penney | | | 37,700 | | | | 1,133 | | |
| Macy's Inc. | | | 47,500 | | | | 737 | | |
| | | | 1,870 | | |
| Oil, Gas & Consumable Fuels (8.5%) | |
| Apache Corp.È | | | 8,700 | | | | 739 | | |
Denbury
Resources* | | | 32,200 | | | | 490 | | |
| Noble Energy | | | 17,300 | | | | 1,046 | | |
Ship Finance
InternationalÈ | | | 28,279 | | | | 358 | | |
Southwestern
Energy* | | | 23,100 | | | | 851 | | |
| Talisman Energy | | | 71,585 | | | | 1,150 | | |
Whiting
Petroleum* | | | 28,100 | | | | 1,364 | | |
| | | | 5,998 | | |
| Personal Products (2.6%) | |
| NBTY, Inc.* | | | 49,300 | | | | 1,827 | | |
| Pharmaceuticals (1.5%) | |
| Shire Limited ADR | | | 22,100 | | | | 1,095 | | |
| Real Estate Investment Trusts (6.0%) | |
Alexandria Real
Estate EquitiesÈ | | | 12,200 | | | | 680 | | |
Annaly Capital
Management | | | 35,800 | | | | 621 | | |
| Boston Properties | | | 17,900 | | | | 1,084 | | |
| Macerich Co.È | | | 30,003 | | | | 860 | | |
Vornado Realty
Trust | | | 16,954 | | | | 975 | | |
| | | | 4,220 | | |
| Semiconductors & Semiconductor Equipment (0.4%) | |
International
Rectifier* | | | 16,100 | | | | 302 | | |
| Specialty Retail (0.5%) | |
GameStop Corp.
Class A* | | | 13,800 | | | | 328 | | |
Total Common Stocks
(Cost $68,039) | | | | | | | 68,097 | | |
| | | Number
of Shares | | Value†
(000's) | |
| Short-Term Investments (8.1%) | |
Neuberger Berman
Securities Lending
Quality Fund,
LLC‡ | | | 3,651,833 | | | $ | 3,688 | | |
State Street
Institutional
Liquid Reserves
Fund Institutional
ClassØØ | | | 2,047,443 | | | | 2,047 | | |
Total Short-Term Investments
(Cost $5,735) | | | | | 5,735 | | |
Total Investments##(104.5%)
(Cost $73,774) | | | | | 73,832 | | |
Liabilities, less cash,
receivables and
other assets [(4.5%)] | | | | | (3,188 | ) | |
| Total Net Assets (100.0%) | | | | $ | 70,644 | | |
See Notes to Schedule of Investments
101
Schedule of Investments Select Equities Fund
TOP TEN EQUITY HOLDINGS
| | 1 | | | FPL Group | | | 4.9 | % | |
| | 2 | | | American Tower | | | 4.5 | % | |
| | 3 | | | Hewlett-Packard | | | 4.0 | % | |
| | 4 | | | J.P. Morgan Chase | | | 3.9 | % | |
| | 5 | | | Expeditors International | | | 3.8 | % | |
| | 6 | | | Lockheed Martin | | | 3.4 | % | |
| | 7 | | | QUALCOMM Inc. | | | 3.3 | % | |
| | 8 | | | Canadian Natural Resources | | | 3.2 | % | |
| | 9 | | | Visa Inc. | | | 3.0 | % | |
| | 10 | | | Baxter International | | | 2.9 | % | |
| | | Number
of Shares | | Value†
(000's) | |
| Common Stocks (83.3%) | |
| Aerospace & Defense (3.5%) | |
| Lockheed Martin | | | 24,002 | | | $ | 1,800 | | |
| Air Freight & Logistics (6.1%) | |
C.H. Robinson
Worldwide | | | 21,922 | | | | 1,233 | | |
Expeditors
International | | | 60,442 | | | | 1,974 | | |
| | | | 3,207 | | |
| Capital Markets (2.5%) | |
Goldman Sachs
Group | | | 7,821 | | | | 1,294 | | |
| Chemicals (2.3%) | |
| Monsanto Co. | | | 14,229 | | | | 1,193 | | |
| Commercial Banks (5.7%) | |
Banco Santander
ADR | | | 97,360 | | | | 1,502 | | |
HSBC Holdings PLC
ADR | | | 27,252 | | | | 1,470 | | |
| | | | 2,972 | | |
| Communications Equipment (3.3%) | |
| QUALCOMM Inc. | | | 37,507 | | | | 1,741 | | |
| Computers & Peripherals (4.0%) | |
| Hewlett-Packard | | | 45,965 | | | | 2,063 | | |
| Diversified Financial Services (3.9%) | |
| J.P. Morgan Chase | | | 46,917 | | | | 2,039 | | |
| Electric Utilities (4.9%) | |
| FPL Group | | | 45,331 | | | | 2,547 | | |
| Food & Staples Retailing (2.9%) | |
| Wal-Mart Stores | | | 29,567 | | | | 1,504 | | |
| Health Care Equipment & Supplies (4.8%) | |
| Alcon, Inc. | | | 7,587 | | | | 982 | | |
| Baxter International | | | 26,940 | | | | 1,534 | | |
| | | | 2,516 | | |
| Household Products (2.9%) | |
| Procter & Gamble | | | 28,305 | | | | 1,531 | | |
| Industrial Gases (2.9%) | |
| Praxair, Inc. | | | 19,874 | | | | 1,523 | | |
| IT Services (3.0%) | |
| Visa Inc. | | | 22,136 | | | | 1,574 | | |
| | | Number
of Shares | | Value†
(000's) | |
| Metals & Mining (2.3%) | |
| BHP Billiton ADR | | | 19,500 | | | $ | 1,215 | | |
| Oil, Gas & Consumable Fuels (12.8%) | |
Canadian Natural
Resources | | | 28,752 | | | | 1,645 | | |
| Enbridge Inc. | | | 33,990 | | | | 1,265 | | |
Petroleo Brasileiro
ADR | | | 28,327 | | | | 1,123 | | |
| Range Resources | | | 25,883 | | | | 1,252 | | |
| Suncor Energy | | | 45,480 | | | | 1,394 | | |
| | | | 6,679 | | |
| Pharmaceuticals (2.9%) | |
| Johnson & Johnson | | | 24,918 | | | | 1,506 | | |
| Real Estate Investment Trusts (2.5%) | |
Vornado Realty
Trust | | | 22,563 | | | | 1,298 | | |
| Software (2.8%) | |
| Oracle Corp. | | | 67,816 | | | | 1,483 | | |
| Tobacco (2.8%) | |
Philip Morris
International | | | 32,142 | | | | 1,469 | | |
| Wireless Telecommunication Services (4.5%) | |
| American Tower* | | | 74,948 | | | | 2,372 | | |
Total Common Stocks
(Cost $39,591) | | | | | | | 43,526 | | |
| Short-Term Investments (14.9%) | |
State Street
Institutional
Liquid Reserves
Fund Institutional
Class
(Cost $7,805) | | | 7,805,144 | | | | 7,805 | | |
Total Investments##(98.2%)
(Cost $47,396) | | | | | | | 51,331 | | |
Cash, receivables
and other assets,
less liabilities (1.8%) | | | | | | | 936 | | |
| Total Net Assets (100.0%) | | | | | | $ | 52,267 | | |
See Notes to Schedule of Investments
102
Schedule of Investments Small and Mid Cap Growth Fund
TOP TEN EQUITY HOLDINGS
| | 1 | | | Urban Outfitters | | | 2.8 | % | |
| | 2 | | | Royal Caribbean Cruises | | | 2.5 | % | |
| | 3 | | | Ross Stores | | | 2.4 | % | |
| | 4 | | | Stericycle, Inc. | | | 2.4 | % | |
| | 5 | | | Lazard Ltd. | | | 2.3 | % | |
| | 6 | | | SBA Communications | | | 2.2 | % | |
| | 7 | | | Equinix, Inc. | | | 2.2 | % | |
| | 8 | | | Southwestern Energy | | | 2.2 | % | |
| | 9 | | | Marvell Technology Group | | | 2.1 | % | |
| | 10 | | | Shoppers Drug Mart | | | 2.1 | % | |
| | | Number
of Shares | | Value†
(000's) | |
| Common Stocks (98.0%) | |
| Aerospace & Defense (3.0%) | |
| HEICO Corp. | | | 1,700 | | | $ | 63 | | |
| Precision Castparts | | | 1,300 | | | | 119 | | |
| | | | 182 | | |
| Air Freight & Logistics (1.9%) | |
C.H. Robinson
Worldwide | | | 2,100 | | | | 118 | | |
| Biotechnology (1.6%) | |
Vertex
Pharmaceuticals* | | | 2,600 | | | | 97 | | |
| Building Products (0.9%) | |
| Ameron International | | | 700 | | | | 57 | | |
| Capital Markets (5.4%) | |
| Lazard Ltd. | | | 3,600 | | | | 140 | | |
| Northern Trust | | | 1,800 | | | | 105 | | |
Waddell & Reed
Financial | | | 3,200 | | | | 85 | | |
| | | | 330 | | |
| Chemicals (1.8%) | |
| Airgas, Inc. | | | 2,300 | | | | 107 | | |
| Commercial Services & Supplies (2.4%) | |
| Stericycle, Inc.* | | | 2,900 | | | | 144 | | |
| Construction & Engineering (1.2%) | |
Jacobs Engineering
Group* | | | 1,600 | | | | 70 | | |
| Diversified Consumer Services (2.7%) | |
| DeVry, Inc. | | | 1,550 | | | | 79 | | |
Lincoln Educational
Services* | | | 3,900 | | | | 87 | | |
| | | | 166 | | |
| Diversified Financial Services (3.5%) | |
IntercontinentalExchange
Inc.* | | | 1,100 | | | | 103 | | |
| MSCI Inc.* | | | 3,700 | | | | 109 | | |
| | | | 212 | | |
| Electrical Equipment (1.2%) | |
| AMETEK, Inc. | | | 2,300 | | | | 72 | | |
| Electronic Equipment, Instruments & Components (1.7%) | |
| Dolby Laboratories* | | | 2,600 | | | | 101 | | |
| | | Number
of Shares | | Value†
(000's) | |
| Food & Staples Retailing (2.1%) | |
| Shoppers Drug Mart | | | 3,200 | | | $ | 126 | | |
| Food Products (1.7%) | |
| Ralcorp Holdings* | | | 1,600 | | | | 100 | | |
| Health Care Equipment & Supplies (4.7%) | |
Emergency Medical
Services* | | | 2,200 | | | | 100 | | |
| NuVasive, Inc.* | | | 2,300 | | | | 92 | | |
| ResMed Inc.* | | | 2,100 | | | | 96 | | |
| | | | 288 | | |
| Health Care Providers & Services (4.4%) | |
| Air Methods* | | | 2,200 | | | | 75 | | |
| Express Scripts* | | | 1,400 | | | | 101 | | |
| Mednax, Inc.* | | | 1,800 | | | | 94 | | |
| | | | 270 | | |
| Hotels, Restaurants & Leisure (6.9%) | |
| Orient-Express Hotel | | | 8,300 | | | | 82 | | |
Penn National
Gaming* | | | 2,600 | | | | 76 | | |
Royal Caribbean
Cruises | | | 7,900 | | | | 151 | | |
| WMS Industries* | | | 2,600 | | | | 110 | | |
| | | | 419 | | |
| Internet Software & Services (3.3%) | |
| Equinix, Inc.* | | | 1,600 | | | | 135 | | |
| VistaPrint Ltd.* | | | 1,600 | | | | 66 | | |
| | | | 201 | | |
| IT Services (1.6%) | |
RightNow
Technologies* | | | 7,800 | | | | 98 | | |
| Marine (1.5%) | |
| Kirby Corp.* | | | 2,500 | | | | 93 | | |
| Media (1.2%) | |
| McGraw-Hill Cos. | | | 2,100 | | | | 71 | | |
| Oil, Gas & Consumable Fuels (6.9%) | |
| Arena Resources* | | | 2,300 | | | | 70 | | |
| Concho Resources* | | | 3,500 | | | | 114 | | |
| Range Resources | | | 2,100 | | | | 102 | | |
Southwestern
Energy* | | | 3,600 | | | | 133 | | |
| | | | 419 | | |
| | | Number
of Shares | | Value†
(000's) | |
| Personal Products (1.4%) | |
Mead Johnson
Nutrition | | | 2,100 | | | $ | 83 | | |
| Professional Services (3.2%) | |
| IHS Inc.* | | | 2,100 | | | | 102 | | |
| TrueBlue, Inc.* | | | 6,700 | | | | 91 | | |
| | | | 193 | | |
| Road & Rail (1.9%) | |
Old Dominion
Freight Line* | | | 3,200 | | | | 115 | | |
| Semiconductors & Semiconductor Equipment (14.6%) | |
| Analog Devices | | | 3,200 | | | | 90 | | |
| Hittite Microwave* | | | 1,500 | | | | 52 | | |
| Lam Research* | | | 2,600 | | | | 80 | | |
Marvell Technology
Group* | | | 8,500 | | | | 130 | | |
Microchip
Technology | | | 4,200 | | | | 112 | | |
Netlogic
Microsystems* | | | 2,100 | | | | 92 | | |
| Semtech Corp.* | | | 3,900 | | | | 71 | | |
Silicon
Laboratories* | | | 2,200 | | | | 99 | | |
Varian Semiconductor
Equipment* | | | 3,300 | | | | 101 | | |
| Veeco Instruments* | | | 3,000 | | | | 64 | | |
| | | | 891 | | |
| Software (4.8%) | |
| Activision Blizzard* | | | 7,400 | | | | 86 | | |
| Informatica Corp.* | | | 5,400 | | | | 97 | | |
Ultimate Software
Group* | | | 4,200 | | | | 110 | | |
| | | | 293 | | |
| Specialty Retail (8.3%) | |
| Bed Bath & Beyond* | | | 2,600 | | | | 95 | | |
| Ross Stores | | | 3,200 | | | | 149 | | |
| Tractor Supply* | | | 2,000 | | | | 94 | | |
| Urban Outfitters* | | | 5,900 | | | | 168 | | |
| | | | 506 | | |
| Wireless Telecommunication Services (2.2%) | |
SBA
Communications* | | | 5,600 | | | | 135 | | |
Total Common Stocks
(Cost $5,420) | | | | | | | 5,957 | | |
See Notes to Schedule of Investments
103
| | | Number
of Shares | | Value†
(000's) | |
| Short-Term Investments (2.8%) | |
State Street
Institutional
Liquid Reserves
Fund Institutional
Class
(Cost $173) | | | 172,701 | | | $ | 173 | | |
Total Investments##(100.8%)
(Cost $5,593) | | | | | 6,130 | | |
Liabilities, less cash,
receivables and
other assets [(0.8%)] | | | | | (48 | ) | |
| Total Net Assets (100.0%) | | | | $ | 6,082 | | |
See Notes to Schedule of Investments
104
Schedule of Investments Small Cap Growth Fund
TOP TEN EQUITY HOLDINGS
| | 1 | | | Royal Caribbean Cruises | | | 2.4 | % | |
| | 2 | | | Ultimate Software Group | | | 2.1 | % | |
| | 3 | | | Old Dominion Freight Line | | | 2.0 | % | |
| | 4 | | | Taleo Corp. Class A | | | 2.0 | % | |
| | 5 | | | Concho Resources | | | 2.0 | % | |
| | 6 | | | Informatica Corp. | | | 1.9 | % | |
| | 7 | | | Lincoln Educational Services | | | 1.9 | % | |
| | 8 | | | RightNow Technologies | | | 1.8 | % | |
| | 9 | | | IPC The Hospitalist | | | 1.8 | % | |
| | 10 | | | Orient-Express Hotel | | | 1.8 | % | |
| | | Number
of Shares | | Value†
(000's) | |
| Common Stocks (97.7%) | |
| Aerospace & Defense (0.8%) | |
| HEICO Corp.È | | | 44,900 | | | $ | 1,664 | | |
| Biotechnology (7.3%) | |
Alexion
Pharmaceuticals* | | | 56,100 | | | | 2,532 | | |
Human Genome
Sciences*È | | | 148,600 | | | | 2,939 | | |
Isis
Pharmaceuticals* | | | 129,000 | | | | 2,082 | | |
Onyx
Pharmaceuticals*È | | | 71,900 | | | | 2,306 | | |
Regeneron
Pharmaceuticals*È | | | 110,100 | | | | 2,503 | | |
| Seattle Genetics* | | | 182,500 | | | | 2,236 | | |
| | | | 14,598 | | |
| Building Products (1.0%) | |
Ameron
International | | | 23,300 | | | | 1,887 | | |
| Capital Markets (4.4%) | |
| GFI Group | | | 330,300 | | | | 2,365 | | |
Janus Capital
GroupÈ | | | 254,800 | | | | 3,241 | | |
Waddell & Reed
Financial | | | 117,500 | | | | 3,117 | | |
| | | | 8,723 | | |
| Chemicals (1.2%) | |
| NewMarket Corp | | | 29,800 | | | | 2,477 | | |
| Commercial Services & Supplies (4.8%) | |
Cornell
Companies* | | | 125,500 | | | | 2,521 | | |
| Geo Group* | | | 114,900 | | | | 2,105 | | |
Healthcare Services
GroupÈ | | | 141,300 | | | | 2,498 | | |
| Tetra Tech* | | | 78,400 | | | | 2,316 | | |
| | | | 9,440 | | |
| Consumer Finance (1.3%) | |
| Dollar Financial* | | | 150,400 | | | | 2,622 | | |
| Containers & Packaging (1.3%) | |
| Rock-Tenn | | | 48,900 | | | | 2,508 | | |
| Diversified Consumer Services (3.5%) | |
Capella
Education*È | | | 50,100 | | | | 3,174 | | |
Lincoln Educational
Services* | | | 165,800 | | | | 3,677 | | |
| | | | 6,851 | | |
| | | Number
of Shares | | Value†
(000's) | |
| Electrical Equipment (2.1%) | |
| Harbin Electric* | | | 163,400 | | | $ | 2,028 | | |
Polypore
International*È | | | 183,700 | | | | 2,088 | | |
| | | | 4,116 | | |
| Food & Staples Retailing (1.5%) | |
United Natural
Foods* | | | 110,700 | | | | 2,991 | | |
| Health Care Equipment & Supplies (5.1%) | |
| ICU Medical* | | | 61,300 | | | | 2,280 | | |
Inverness Medical
Innovations* | | | 56,600 | | | | 2,015 | | |
| NuVasive, Inc.*È | | | 62,100 | | | | 2,488 | | |
Sirona Dental
Systems*È | | | 126,800 | | | | 3,353 | | |
| | | | 10,136 | | |
| Health Care Providers & Services (9.8%) | |
| Air Methods* | | | 77,100 | | | | 2,632 | | |
Emergency Medical
Services* | | | 64,000 | | | | 2,902 | | |
| HMS Holdings* | | | 61,200 | | | | 2,302 | | |
IPC The
Hospitalist* | | | 119,400 | | | | 3,527 | | |
| Mednax, Inc.* | | | 60,300 | | | | 3,140 | | |
PSS World
Medical* | | | 114,400 | | | | 2,338 | | |
Psychiatric
Solutions*È | | | 101,500 | | | | 2,719 | | |
| | | | 19,560 | | |
| Health Care Technology (2.6%) | |
| MedAssets Inc.* | | | 115,300 | | | | 2,575 | | |
SXC Health
Solutions* | | | 62,300 | | | | 2,536 | | |
| | | | 5,111 | | |
| Hotels, Restaurants & Leisure (6.7%) | |
| BJ Restaurants*È | | | 133,900 | | | | 2,296 | | |
Orient-Express
HotelÈ | | | 351,500 | | | | 3,501 | | |
Royal Caribbean
CruisesÈ | | | 253,900 | | | | 4,844 | | |
| WMS Industries* | | | 62,500 | | | | 2,646 | | |
| | | | 13,287 | | |
| Household Durables (1.3%) | |
| Jarden Corp.*È | | | 103,100 | | | | 2,511 | | |
| | | Number
of Shares | | Value†
(000's) | |
| Internet Software & Services (3.5%) | |
Constant
Contact*È | | | 114,600 | | | $ | 2,387 | | |
| LivePerson, Inc.* | | | 544,500 | | | | 2,243 | | |
| VistaPrint Ltd.*È | | | 57,300 | | | | 2,375 | | |
| | | | 7,005 | | |
| IT Services (2.7%) | |
Global Cash Access
Holdings*È | | | 258,000 | | | | 1,870 | | |
RightNow
Technologies*È | | | 281,700 | | | | 3,544 | | |
| | | | 5,414 | | |
| Marine (1.5%) | |
| Kirby Corp.* | | | 82,000 | | | | 3,038 | | |
| Oil, Gas & Consumable Fuels (3.1%) | |
| Arena Resources* | | | 73,100 | | | | 2,236 | | |
Concho
Resources* | | | 120,600 | | | | 3,930 | | |
| | | | 6,166 | | |
| Professional Services (2.8%) | |
| ICF International* | | | 96,400 | | | | 2,637 | | |
| TrueBlue, Inc.*È | | | 217,800 | | | | 2,962 | | |
| | | | 5,599 | | |
| Road & Rail (2.0%) | |
Old Dominion
Freight Line*È | | | 113,000 | | | | 4,043 | | |
| Semiconductors & Semiconductor Equipment (8.2%) | |
| Hittite Microwave* | | | 58,400 | | | | 2,010 | | |
Netlogic
Microsystems*È | | | 71,300 | | | | 3,131 | | |
| Semtech Corp.*È | | | 137,531 | | | | 2,513 | | |
Silicon
Laboratories* | | | 72,500 | | | | 3,265 | | |
Varian Semiconductor
Equipment*È | | | 105,600 | | | | 3,228 | | |
Veeco
Instruments* | | | 95,600 | | | | 2,054 | | |
| | | | 16,201 | | |
| Software (12.4%) | |
| Informatica Corp.* | | | 214,800 | | | | 3,851 | | |
Jack Henry &
Associates | | | 89,200 | | | | 2,079 | | |
Nuance
Communications* | | | 172,900 | | | | 2,132 | | |
| Perfect World*È | | | 73,300 | | | | 2,797 | | |
See Notes to Schedule of Investments
105
| | | Number
of Shares | | Value†
(000's) | |
| Rovi Corp.* | | | 94,900 | | | $ | 2,889 | | |
| Solera Holdings* | | | 86,800 | | | | 2,286 | | |
SuccessFactors,
Inc.* | | | 47,800 | | | | 567 | | |
Taleo Corp.
Class A* | | | 223,100 | | | | 4,036 | | |
Ultimate Software
Group*È | | | 154,500 | | | | 4,074 | | |
| | | | 24,711 | | |
| Specialty Retail (2.5%) | |
| hhgregg, Inc.*È | | | 147,000 | | | | 2,540 | | |
| Tractor Supply*È | | | 53,200 | | | | 2,504 | | |
| | | | 5,044 | | |
| Textiles, Apparel & Luxury Goods (4.3%) | |
| Carter's, Inc.* | | | 83,700 | | | | 2,106 | | |
Fuqi
International*È | | | 80,400 | | | | 2,085 | | |
Lululemon
Athetica*È | | | 107,300 | | | | 2,152 | | |
Warnaco
Group*È | | | 57,300 | | | | 2,180 | | |
| | | | 8,523 | | |
Total Common Stocks
(Cost $159,647) | | | | | | | 194,226 | | |
| Short-Term Investments (19.5%) | |
Neuberger Berman
Securities Lending
Quality Fund,
LLC‡ | | | 31,671,128 | | | | 31,988 | | |
State Street
Institutional
Liquid Reserves
Fund Institutional
ClassØØ | | | 6,686,278 | | | | 6,686 | | |
Total Short-Term Investments
(Cost $38,674) | | | | | | | 38,674 | | |
Total Investments##(117.2%)
(Cost $198,321) | | | | | | | 232,900 | | |
Liabilities, less cash,
receivables and
other assets [(17.2%)] | | | | | | | (34,190 | ) | |
| Total Net Assets (100.0%) | | | | | | $ | 198,710 | | |
See Notes to Schedule of Investments
106
Schedule of Investments Socially Responsive Fund
TOP TEN EQUITY HOLDINGS
| | 1 | | | Scripps Networks Interactive | | | 5.1 | % | |
| | 2 | | | Altera Corp. | | | 5.0 | % | |
| | 3 | | | Intuit Inc. | | | 4.9 | % | |
| | 4 | | | Washington Post | | | 4.8 | % | |
| | 5 | | | Danaher Corp. | | | 4.7 | % | |
| | 6 | | | National Instruments | | | 4.1 | % | |
| | 7 | | | Newfield Exploration | | | 4.1 | % | |
| | 8 | | | 3M Co. | | | 4.0 | % | |
| | 9 | | | Novo Nordisk A/S Class B | | | 4.0 | % | |
| | 10 | | | Charles Schwab | | | 3.9 | % | |
| | | Number
of Shares | | Value†
(000's) | |
| Common Stocks (95.0%) | |
| Automobiles (2.0%) | |
Toyota Motor
ADRÈ | | | 230,425 | | | $ | 19,630 | | |
| Biotechnology (3.4%) | |
| Genzyme Corp.* | | | 601,595 | | | | 33,515 | | |
| Capital Markets (6.3%) | |
| Charles Schwab | | | 2,116,589 | | | | 38,225 | | |
The Bank of
New York Mellon | | | 806,617 | | | | 23,884 | | |
| | | | 62,109 | | |
| Commercial Services & Supplies (1.0%) | |
| Herman Miller | | | 642,500 | | | | 10,421 | | |
| Diversified Financial Services (1.5%) | |
IntercontinentalExchange
Inc.* | | | 162,965 | | | | 15,286 | | |
| Electronic Equipment, Instruments & Components (7.7%) | |
Anixter
International* | | | 1,009,460 | | | | 35,412 | | |
National
Instruments | | | 1,571,218 | | | | 40,270 | | |
| | | | 75,682 | | |
| Energy Equipment & Services (2.3%) | |
Smith
International | | | 810,615 | | | | 22,349 | | |
| Health Care Providers & Services (2.0%) | |
UnitedHealth
Group | | | 696,465 | | | | 19,501 | | |
| Industrial Conglomerates (4.0%) | |
| 3M Co. | | | 551,090 | | | | 39,734 | | |
| Industrial Gases (3.2%) | |
| Praxair, Inc. | | | 406,825 | | | | 31,171 | | |
| Insurance (5.2%) | |
| Markel Corp.* | | | 63,215 | | | | 20,789 | | |
Progressive
Corp. | | | 1,821,165 | | | | 30,086 | | |
| | | | 50,875 | | |
| Internet Software & Services (3.0%) | |
| Yahoo! Inc.* | | | 2,054,800 | | | | 30,021 | | |
| | | Number
of Shares | | Value†
(000's) | |
| Life Science Tools & Services (2.1%) | |
| Millipore Corp.* | | | 314,500 | | | $ | 20,829 | | |
| Machinery (4.7%) | |
| Danaher Corp. | | | 758,845 | | | | 46,069 | | |
| Media (13.6%) | |
Comcast Corp.
Class A Special | | | 2,474,225 | | | | 36,099 | | |
Scripps Networks
Interactive | | | 1,550,265 | | | | 50,337 | | |
| Washington Post | | | 110,143 | | | | 47,842 | | |
| | | | 134,278 | | |
| Multi-Utilities (2.6%) | |
| National Grid | | | 1,942,488 | | | | 18,737 | | |
| National Grid ADR | | | 134,438 | | | | 6,465 | | |
| | | | 25,202 | | |
| Oil, Gas & Consumable Fuels (10.1%) | |
| BG Group PLC | | | 2,056,900 | | | | 34,055 | | |
| Cimarex Energy | | | 636,744 | | | | 24,858 | | |
Newfield
Exploration* | | | 1,040,730 | | | | 40,266 | | |
| | | | 99,179 | | |
| Pharmaceuticals (4.0%) | |
Novo Nordisk A/S
Class B | | | 639,950 | | | | 39,010 | | |
| Road & Rail (3.4%) | |
Canadian National
Railway | | | 690,835 | | | | 33,347 | | |
| Semiconductors & Semiconductor Equipment (7.0%) | |
| Altera Corp. | | | 2,552,680 | | | | 49,037 | | |
| Texas Instruments | | | 797,430 | | | | 19,609 | | |
| | | | 68,646 | | |
| Software (4.9%) | |
| Intuit Inc.* | | | 1,735,125 | | | | 48,184 | | |
| Specialty Chemicals (1.0%) | |
| Novozymes A/S | | | 115,100 | | | | 9,876 | | |
Total Common Stocks
(Cost $986,950) | | | | | | | 934,914 | | |
| Short-Term Investments (0.4%) | |
Neuberger Berman
Securities Lending
Quality Fund,
LLC‡
(Cost $4,332) | | | 4,289,134 | | | | 4,332 | | |
| | | Principal
Amount | | Value†
(000's) | |
| Repurchase Agreements (4.6%) | |
Repurchase
Agreement
with Fixed Income
Clearing Corp.,
0.09%, due 9/1/09,
dated 8/31/09,
Maturity Value
$45,172,113,
Collateralized by
$45,840,000,
Federal Home
Loan Bank,
1.62%, due
12/30/09 (Collateral
Value $46,532,184)#
(Cost $45,172)
| | $ | 45,172,000 | | | $ | 45,172 | | |
| Certificates of Deposit (0.1%) | |
Carver Federal
Savings, 0.50%,
due 9/26/09 | | | 100,000 | | | | 100 | | |
Self Help Credit
Union, 0.46%,
due 11/16/09 | | | 100,000 | | | | 100 | | |
Shorebank Chicago,
0.75%, due
10/26/09 | | | 100,000 | | | | 100 | | |
Shorebank Pacific,
0.75%, due
11/2/09 | | | 100,000 | | | | 100 | | |
Total Certificates of Deposit#
(Cost $400) | | | | | | | 400 | | |
Total Investments##(100.1%)
(Cost $1,036,854) | | | | | | | 984,818 | | |
Liabilities, less cash,
receivables and
other assets [(0.1%)] | | | | | | | (641 | ) | |
| Total Net Assets (100.0%) | | | | | | $ | 984,177 | | |
See Notes to Schedule of Investments
107
Notes to Schedule of Investments
† The value of investments in equity securities by each fund and written options by Equity Income are determined by Neuberger Berman Management LLC ("Management") primarily by obtaining valuations from an independent pricing service based on the latest sale price when that price is readily available. Securities traded primarily on the NASDAQ Stock Market are normally valued by the funds at the NASDAQ Official Closing Price ("NOCP") provided by NASDAQ each business day. The NOCP is the most recently reported price as of 4:00:02 p.m., Eastern time, unless that price is outside the range of the "inside" bid and asked prices (i.e., the bid and asked prices that dealers quote to each other when trading for their own accounts); in that case, NASDAQ will adjust the price to equal the inside bid or asked price, whichever is closer. Because of delays in reporting trades, the NOCP may not be based on the price of the last trade to occur before the market closes. If there is no reported sale of a security on a particular day, the independent pricing service may value the security based on reported market quotations. If a valuation is not available from an independent pricing service, each fund seeks to obtain quotations from principal market makers. The value of investments in debt securities are determined by Management primarily by obtaining valuations from independent pricing services based on readily available bid quotations, or if quotations are not available, by methods which include considerations such as: yields or prices of securities of comparable quality, coupon, maturity and type; indications as to values from dealers; and general market conditions. Management has developed a process to periodically review information provided by independent pricing services. For both debt and equity securities, if such quotations are not readily available, securities are valued using methods the Board of Trustees of Neuberger Berman Equity Funds (the "Board") has approved on the belief that they reflect fair value. Numerous factors may be considered when determining the fair value of a security, including available analyst, media or other reports, trading in futures or ADRs and whether the issuer of the security being fair valued has other securities outstanding. Foreign security prices are furnished by independent quotation services and expressed in local currency values. Foreign security prices are currently translated from the local currency into U.S. dollars using the exchange rate as of 4:00 p.m., Eastern time. The Board has approved the use of Interactive Data Pricing and Reference Data, Inc. ("Interactive") to assist in determining the fair value of the funds' foreign equity securities when changes in the value of a certain index suggest that the closing prices on the foreign exchanges may no longer represent the amount that a fund could expect to receive for those securities. In this event, Interactive will provide adjusted prices for certain foreign equity securities using a statistical analysis of historical correlations of multiple factors. In the absence of precise information about the market values of these foreign securities as of the close of the New York Stock Exchange, the Board has determined on the basis of available data that prices adjusted in this way are likely to be closer to the prices the funds could realize on a current sale than are the prices of those securities established at the close of the foreign markets in which the securities primarily trade. Fair value prices are necessarily estimates, and there is no assurance that such a price will be at or close to the price at which the security next trades. Short-term debt securities with less than 60 days until maturity may be valued at cost which, when combined with interest earned, approximates market value.
In accordance with Financial Accounting Standards Board ("FASB") Statement of Financial Accounting Standards No. 157, Fair Value Measurements ("FAS 157"), investments held by a fund are carried at "fair value" on a recurring basis. Fair value is defined as the price that a fund would receive upon selling an investment in an orderly transaction to an independent buyer in the principal or most advantageous market for the investment under current market conditions. Various inputs are used in determining the value of the funds' investments some of which are discussed above.
In addition, effective August 31, 2009, the funds adopted FASB Staff position ("FSP") No. 157-4, "Determining Fair Value When the Volume and Level of Activity for the Asset or Liability Have Significantly Decreased and Identifying Transactions That Are Not Orderly" ("FSP No. 157-4"). FSP No. 157-4 emphasizes that the objective of fair value measurement described in FAS 157 remains unchanged and provides additional guidance for estimating fair value in accordance with FAS 157 when the volume and level of activity for the asset or liability have significantly decreased, as well as identifying circumstances that indicate that transactions are not orderly. FSP No. 157-4
See Notes to Financial Statements
108
Notes to Schedule of Investments (cont'd)
identifies factors to be considered when determining whether or not a market is inactive and indicates that if a market is determined to be inactive and/or current market prices are reflective of "distressed sales" significant management judgment may be necessary to estimate fair value in accordance with FAS 157.
In addition to defining fair value, FAS 157 established a three-tier hierarchy of inputs to establish a classification of fair value measurements for disclosure purposes. The three-tier hierarchy of inputs is summarized in the three broad Levels listed below.
• Level 1 – quoted prices in active markets for identical investments
• Level 2 – other significant observable inputs (including quoted prices for similar investments, interest rates, prepayment speeds, credit risk, amortized cost, etc.)
• Level 3 – significant unobservable inputs (including the funds' own assumptions in determining the fair value of investments)
The inputs or methodology used for valuing an investment are not necessarily an indication of the risk associated with investing in those securities.
The following is a summary, by category of Level, of inputs used to value the funds' investments as of August 31, 2009:
| Asset Valuation Inputs | |
Neuberger Berman
(000's omitted) | | Level 1 | | Level 2 | | Level 3§§ | | Total | |
| Climate Change Fund | |
| Investments: | |
| Common Stocks§ | | $ | 2,997 | | | $ | — | | | $ | — | | | $ | 2,997 | | |
| Short-Term Investments | | | — | | | | 62 | | | | — | | | | 62 | | |
| Total Investments | | | 2,997 | | | | 62 | | | | — | | | | 3,059 | | |
| Emerging Markets Equity Fund | |
| Investments: | |
| Common Stocks§ | | | 4,797 | | | | 60 | | | | — | | | | 4,857 | | |
| Preferred Stocks§ | | | 556 | | | | — | | | | 0 | | | | 556 | | |
| Participatory Notes§ | | | 319 | | | | — | | | | — | | | | 319 | | |
| Convertible Bonds | | | — | | | | — | | | | 8 | | | | 8 | | |
| Short-Term Investments | | | — | | | | 161 | | | | — | | | | 161 | | |
| Total Investments | | | 5,672 | | | | 221 | | | | 8 | | | | 5,901 | | |
| Equity Income Fund | |
| Investments: | |
| Common Stocks§ | | | 41,483 | | | | — | | | | — | | | | 41,483 | | |
| Convertible Preferred Stocks | | | 2,854 | | | | — | | | | — | | | | 2,854 | | |
| Convertible Bonds | | | — | | | | 14,393 | | | | — | | | | 14,393 | | |
| Corporate Debt Securities | | | — | | | | 248 | | | | — | | | | 248 | | |
| Short-Term Investments | | | — | | | | 5,780 | | | | — | | | | 5,780 | | |
| Total Investments | | | 44,337 | | | | 20,421 | | | | — | | | | 64,758 | | |
See Notes to Financial Statements
109
Notes to Schedule of Investments (cont'd)
Neuberger Berman
(000's omitted) | | Level 1 | | Level 2 | | Level 3§§ | | Total | |
| Focus Fund | |
| Investments: | |
| Common Stocks§ | | $ | 555,141 | | | $ | — | | | $ | — | | | $ | 555,141 | | |
| Short-Term Investments | | | — | | | | 66,200 | | | | — | | | | 66,200 | | |
| Total Investments | | | 555,141 | | | | 66,200 | | | | — | | | | 621,341 | | |
| Genesis Fund | |
| Investments: | |
| Common Stocks§ | | | 8,217,525 | | | | — | | | | — | | | | 8,217,525 | | |
| Short-Term Investments | | | — | | | | 335,213 | | | | — | | | | 335,213 | | |
| Total Investments | | | 8,217,525 | | | | 335,213 | | | | — | | | | 8,552,738 | | |
| Guardian Fund | |
| Investments: | |
| Common Stocks§ | | | 914,269 | | | | — | | | | — | | | | 914,269 | | |
| Short-Term Investments | | | — | | | | 32,039 | | | | — | | | | 32,039 | | |
| Total Investments | | | 914,269 | | | | 32,039 | | | | — | | | | 946,308 | | |
| International Fund | |
| Investments: | |
| Common Stocks§ | | | 378,011 | | | | — | | | | — | | | | 378,011 | | |
| Preferred Stocks§ | | | 8,401 | | | | — | | | | 10 | | | | 8,411 | | |
| Rights§ | | | 1 | | | | — | | | | — | | | | 1 | | |
| Warrants§ | | | 17 | | | | — | | | | — | | | | 17 | | |
| Short-Term Investments | | | — | | | | 32,004 | | | | — | | | | 32,004 | | |
| Total Investments | | | 386,430 | | | | 32,004 | | | | 10 | | | | 418,444 | | |
| International Institutional Fund | |
| Investments: | |
| Common Stocks§ | | | 209,015 | | | | — | | | | — | | | | 209,015 | | |
| Preferred Stocks§ | | | 4,650 | | | | — | | | | — | | | | 4,650 | | |
| Rights§ | | | 1 | | | | — | | | | — | | | | 1 | | |
| Warrants§ | | | 9 | | | | — | | | | — | | | | 9 | | |
| Short-Term Investments | | | — | | | | 14,702 | | | | — | | | | 14,702 | | |
| Total Investments | | | 213,675 | | | | 14,702 | | | | — | | | | 228,377 | | |
| International Large Cap Fund | |
| Investments: | |
| Common Stocks§ | | | 91,663 | | | | — | | | | — | | | | 91,663 | | |
| Preferred Stocks§ | | | 1,357 | | | | — | | | | — | | | | 1,357 | | |
| Rights§ | | | 0 | | | | — | | | | — | | | | 0 | | |
| Warrants§ | | | 5 | | | | — | | | | — | | | | 5 | | |
| Short-Term Investments | | | — | | | | 10,454 | | | | — | | | | 10,454 | | |
| Total Investments | | | 93,025 | | | | 10,454 | | | | — | | | | 103,479 | | |
See Notes to Financial Statements
110
Notes to Schedule of Investments (cont'd)
Neuberger Berman
(000's omitted) | | Level 1 | | Level 2 | | Level 3§§ | | Total | |
| Large Cap Disciplined Growth Fund | |
| Investments: | |
| Common Stocks§ | | $ | 121,091 | | | $ | — | | | $ | — | | | $ | 121,091 | | |
| Short-Term Investments | | | — | | | | 4,732 | | | | — | | | | 4,732 | | |
| Total Investments | | | 121,091 | | | | 4,732 | | | | — | | | | 125,823 | | |
| Mid Cap Growth Fund | |
| Investments: | |
| Common Stocks§ | | | 425,696 | | | | — | | | | — | | | | 425,696 | | |
| Short-Term Investments | | | — | | | | 94,374 | | | | — | | | | 94,374 | | |
| Total Investments | | | 425,696 | | | | 94,374 | | | | — | | | | 520,070 | | |
| Partners Fund | |
| Investments: | |
| Common Stocks§ | | | 2,422,636 | | | | — | | | | — | | | | 2,422,636 | | |
| Short-Term Investments | | | — | | | | 190,145 | | | | — | | | | 190,145 | | |
| Total Investments | | | 2,422,636 | | | | 190,145 | | | | — | | | | 2,612,781 | | |
| Real Estate Fund | |
| Investments: | |
| Common Stocks§ | | | 64,181 | | | | — | | | | — | | | | 64,181 | | |
| Short-Term Investments | | | — | | | | 11,462 | | | | — | | | | 11,462 | | |
| Total Investments | | | 64,181 | | | | 11,462 | | | | — | | | | 75,643 | | |
| Regency Fund | |
| Investments: | |
| Common Stocks§ | | | 68,097 | | | | — | | | | — | | | | 68,097 | | |
| Short-Term Investments | | | — | | | | 5,735 | | | | — | | | | 5,735 | | |
| Total Investments | | | 68,097 | | | | 5,735 | | | | — | | | | 73,832 | | |
| Select Equities Fund | |
| Investments: | |
| Common Stocks§ | | | 43,526 | | | | — | | | | — | | | | 43,526 | | |
| Short-Term Investments | | | — | | | | 7,805 | | | | — | | | | 7,805 | | |
| Total Investments | | | 43,526 | | | | 7,805 | | | | — | | | | 51,331 | | |
| Small and Mid Cap Growth Fund | |
| Investments: | |
| Common Stocks§ | | | 5,957 | | | | — | | | | — | | | | 5,957 | | |
| Short-Term Investments | | | — | | | | 173 | | | | — | | | | 173 | | |
| Total Investments | | | 5,957 | | | | 173 | | | | — | | | | 6,130 | | |
| Small Cap Growth Fund | |
| Investments: | |
| Common Stocks§ | | | 194,226 | | | | — | | | | — | | | | 194,226 | | |
| Short-Term Investments | | | — | | | | 38,674 | | | | — | | | | 38,674 | | |
| Total Investments | | | 194,226 | | | | 38,674 | | | | — | | | | 232,900 | | |
See Notes to Financial Statements
111
Notes to Schedule of Investments (cont'd)
Neuberger Berman
(000's omitted) | | Level 1 | | Level 2 | | Level 3§§ | | Total | |
| Socially Responsive Fund | |
| Investments: | |
| Common Stocks§ | | $ | 934,914 | | | $ | — | | | $ | — | | | $ | 934,914 | | |
| Short-Term Investments | | | — | | | | 4,332 | | | | — | | | | 4,332 | | |
| Repurchase Agreements | | | — | | | | 45,172 | | | | — | | | | 45,172 | | |
| Certificates of Deposit | | | — | | | | 400 | | | | — | | | | 400 | | |
| Total Investments | | | 934,914 | | | | 49,904 | | | | — | | | | 984,818 | | |
| § The Schedule of Investments provides information on the industry or country categorization for the portfolio. |
| |
§§ The following is a reconciliation between the beginning and ending balances of investments in which significant unobservable inputs (Level 3) were used in determining value: |
Neuberger Berman
(000's omitted) | | Beginning
balance, as
of 9/1/08 | | Accrued
discounts/
(premiums) | | Realized
gain/loss
and change
in unrealized
appreciation/
(depreciation) | | Net
purchases/
(sales) | | Net
transfers in
and/or out
of Level 3 | | Balance, as
of 8/31/09 | | Net change in
unrealized
appreciation/
(depreciation)
from
investments
still held
as of 8/31/09 | |
| Investments in Securities: | |
Emerging Markets
Equity Fund | |
| Preferred Stocks Brazil | | $ | — | | | $ | — | | | $ | 0 | | | $ | 0 | | | $ | — | | | $ | 0 | | | $ | 0 | | |
| Convertible Bonds Brazil | | | — | | | | — | | | | 3 | | | | 5 | | | | — | | | | 8 | | | | 3 | | |
| Total | | | — | | | | — | | | | 3 | | | | 5 | | | | — | | | | 8 | | | | 3 | | |
| International Fund | | | | | | | | | | | | | | | | | | | | | | | | | | | | | |
| Preferred Stocks Brazil | | | — | | | | — | | | | 2 | | | | 8 | | | | — | | | | 10 | | | | 2 | | |
| Total | | | — | | | | — | | | | 2 | | | | 8 | | | | — | | | | 10 | | | | 2 | | |
Liability Valuation Inputs
The following is a summary, by category of Level, of inputs used to value the Fund's derivatives as of August 31, 2009:
Neuberger Berman
(000's omitted) | | Level 1 | | Level 2 | | Level 3 | | Total | |
| Equity Income Fund | |
| Option Contracts | | $ | (265 | ) | | $ | — | | | $ | — | | | $ | (265 | ) | |
# At cost, which approximates market value.
^^ Value of the security was determined using methods the Board has approved on the belief they reflect fair value.
See Notes to Financial Statements
112
Notes to Schedule of Investments (cont'd)
## At August 31, 2009, selected fund information on a U.S. federal income tax basis was as follows:
Neuberger Berman
(000's omitted) | | Cost | | Gross
Unrealized
Appreciation | | Gross
Unrealized
Depreciation | | Net Unrealized
Appreciation
(Depreciation) | |
| Climate Change Fund | | $ | 2,882 | | | $ | 211 | | | $ | 34 | | | $ | 177 | | |
| Emerging Markets Equity Fund | | | 4,555 | | | | 1,379 | | | | 33 | | | | 1,346 | | |
| Equity Income Fund | | | 62,672 | | | | 3,586 | | | | 1,500 | | | | 2,086 | | |
| Focus Fund | | | 587,068 | | | | 65,310 | | | | 31,037 | | | | 34,273 | | |
| Genesis Fund | | | 6,781,944 | | | | 2,338,204 | | | | 567,410 | | | | 1,770,794 | | |
| Guardian Fund | | | 950,225 | | | | 94,408 | | | | 98,325 | | | | (3,917 | ) | |
| International Fund | | | 402,933 | | | | 42,275 | | | | 26,764 | | | | 15,511 | | |
| International Institutional Fund | | | 228,520 | | | | 18,618 | | | | 18,761 | | | | (143 | ) | |
| International Large Cap Fund | | | 100,155 | | | | 9,030 | | | | 5,706 | | | | 3,324 | | |
| Large Cap Disciplined Growth Fund | | | 115,463 | | | | 10,637 | | | | 277 | | | | 10,360 | | |
| Mid Cap Growth Fund | | | 464,329 | | | | 66,172 | | | | 10,431 | | | | 55,741 | | |
| Partners Fund | | | 2,489,577 | | | | 477,638 | | | | 354,434 | | | | 123,204 | | |
| Real Estate Fund | | | 69,377 | | | | 6,659 | | | | 393 | | | | 6,266 | | |
| Regency Fund | | | 75,047 | | | | 8,858 | | | | 10,073 | | | | (1,215 | ) | |
| Select Equities Fund | | | 47,575 | | | | 3,881 | | | | 125 | | | | 3,756 | | |
| Small and Mid Cap Growth Fund | | | 5,644 | | | | 676 | | | | 190 | | | | 486 | | |
| Small Cap Growth Fund | | | 202,667 | | | | 31,567 | | | | 1,334 | | | | 30,233 | | |
| Socially Responsive Fund | | | 1,044,093 | | | | 61,812 | | | | 121,087 | | | | (59,275 | ) | |
* Security did not produce income during the last twelve months.
È All or a portion of this security is on loan (see Note A of Notes to Financial Statements).
^ Affiliated issuer (see Note F of Notes to Financial Statements).
‡ Managed by an affiliate of Management and could be deemed an affiliate of the fund and is segregated in connection with obligations for security lending (see Notes A & F of Notes to Financial Statements).
See Notes to Financial Statements
113
Notes to Schedule of Investments (cont'd)
‡‡ At August 31, 2009, Neuberger Berman Equity Income Fund had outstanding call and put options written as follows:
| Shares | | Securities and Options | | Market Value of Options | |
| | 23,000 | | | American Campus Communities, Call
December 2009 @ 30 | | $ | 20,000 | | |
| | 10,000 | | | AvalonBay Communities, Call
October 2009 @ 75 | | | 8,000 | | |
| | 10,000 | | | Diageo PLC ADR, Call
October 2009 @ 60 | | | 25,000 | | |
| | 12,500 | | | Digital Realty Trust, Call
October 2009 @ 45 | | | 19,000 | | |
| | 6,500 | | | Exelon Corp., Call
October 2009 @ 55 | | | 2,000 | | |
| | 3,500 | | | FPL Group, Call
September 2009 @ 60 | | | 0 | | |
| | 13,500 | | | Health Care REIT, Call
December 2009 @ 45 | | | 23,000 | | |
| | 6,500 | | | Johnson & Johnson, Call
October 2009 @ 60 | | | 10,000 | | |
| | 2,000 | | | Marsh & McLennan, Call
January 2010 @ 25 | | | 2,000 | | |
| | 4,500 | | | Norfolk Southern, Call
December 2009 @ 55 | | | 4,000 | | |
| | 9,000 | | | Norfolk Southern, Call
September 2009 @ 45 | | | 18,000 | | |
| | 10,000 | | | Phillip Morris International, Call
September 2009 @ 48 | | | 1,000 | | |
| | 5,000 | | | Potash Corp. of Saskatchewan, Call
December 2009 @ 75 | | | 19,000 | | |
| | 5,000 | | | Potash Corp. of Saskatchewan, Put
September 2009 @ 80 | | | 5,000 | | |
| | 21,500 | | | Realty Income, Call
December 2009 @ 30 | | | 11,000 | | |
| | 15,000 | | | Royal Gold, Inc., Put
October 2009 @ 35 | | | 10,000 | | |
| | 15,000 | | | Safeway Inc., Put
December 2009 @ 17.5 | | | 10,000 | | |
| | 5,000 | | | Schlumberger Ltd., Put
November 2009 @ 45 | | | 5,000 | | |
| | 20,000 | | | Spectra Energy, Call
December 2009 @ 20 | | | 12,000 | | |
| | 25,500 | | | Ventas, Inc., Call
November 2009 @ 40 | | | 61,000 | | |
| | | | | Total | | $ | 265,000 | | |
ñ Restricted security subject to restrictions on resale under federal securities laws. These securities may be resold in transactions exempt from registration, normally to qualified institutional buyers under Rule 144A under the Securities Act of 1933, as amended, and have been deemed by the investment manager to be liquid. At August 31, 2009, these securities amounted to $2,721,000 or 4.1% of net assets for Equity Income Fund.
Ñ These securities have been deemed by the investment manager to be illiquid. At August 31, 2009, these securities amounted to $9,870,000 or 2.4% of net assets for International Fund.
µµ Restricted security subject to restrictions on resale under federal securities laws. These securities may be resold in transactions exempt from registration, normally to qualified institutional buyers under Rule 144A under the Securities Act of 1933, as amended, and have been deemed by the investment manager to be illiquid and restricted. At August 31, 2009, these securities amounted to approximately $319,000 or 5.2% of net assets for Emerging Markets Equity Fund.
See Notes to Financial Statements
114
Notes to Schedule of Investments (cont'd)
(000's omitted)
Restricted Security | |
Acquisition
Date | |
Acquisition
Cost | |
Acquisition
Cost
Percentage
of Net Assets
as of
Acquisition
Date | |
Value as of
August 31, 2009 | |
Fair Value
Percentage of
Net Assets as of
August 31, 2009 | |
| Bharat Heavy Electricals | | 2/18/2009 – 8/10/2009 | | $ | 32 | | | | 1.2 | % | | $ | 48 | | | | 0.8 | % | |
| Cairn India | | 2/20/2009 – 7/29/2009 | | | 50 | | | | 1.6 | % | | | 78 | | | | 1.3 | % | |
| Grasim Industry | | 5/12/2009 – 7/29/2009 | | | 35 | | | | 0.8 | % | | | 50 | | | | 0.8 | % | |
| Hero Honda Motors | | 6/8/2009 & 7/29/2009 | | | 42 | | | | 0.8 | % | | | 41 | | | | 0.7 | % | |
| Punjab National Bank | | 2/18/2009 & 7/29/2009 | | | 26 | | | | 0.9 | % | | | 44 | | | | 0.7 | % | |
| Unitech Ltd. | | 6/30/2009 – 7/29/2009 | | | 49 | | | | 1.1 | % | | | 58 | | | | 0.9 | % | |
µ Floating rate securities are securities whose yields vary with a designated market index or market rate. These securities are shown at their current rates as of August 31, 2009.
ØØ All or a portion of this security is segregated in connection with written options and/or obligations for security lending.
See Notes to Financial Statements
115
This page has been left blank intentionally
116
Statements of Assets and Liabilities
Neuberger Berman Equity Funds
(000's omitted except per share amounts)
| | | CLIMATE
CHANGE FUND | | EMERGING
MARKETS
EQUITY FUND | | EQUITY
INCOME FUND | | FOCUS FUND | | GENESIS FUND | |
| | | August 31,
2009 | | August 31,
2009 | | August 31,
2009 | | August 31,
2009 | | August 31,
2009 | |
| Assets | |
| Investments in securities, at value*† (Notes A & F)—see Schedule of Investments: | |
| Unaffiliated issuers | | $ | 3,059 | | | $ | 5,901 | | | $ | 64,758 | | | $ | 574,738 | | | $ | 4,340,279 | | |
| Affiliated issuers | | | — | | | | — | | | | — | | | | 46,603 | | | | 4,212,459 | | |
| | | | 3,059 | | | | 5,901 | | | | 64,758 | | | | 621,341 | | | | 8,552,738 | | |
| Cash | | | — | | | | — | | | | 240 | | | | — | | | | — | | |
| Foreign currency | | | — | | | | 135 | | | | — | | | | — | | | | — | | |
| Deposits with brokers for open option contracts | | | — | | | | — | | | | 1,877 | | | | — | | | | — | | |
| Dividends and interest receivable | | | 5 | | | | 15 | | | | 279 | | | | 773 | | | | 6,335 | | |
| Receivable for securities sold | | | 113 | | | | — | | | | 962 | | | | 3,292 | | | | 3,098 | | |
| Receivable for Fund shares sold | | | 2 | | | | 5 | | | | 555 | | | | 98 | | | | 13,757 | | |
| Receivable from administrator—net (Note B) | | | — | | | | 140 | | | | — | | | | — | | | | — | | |
| Receivable for securities lending income—net (Note A) | | | — | | | | — | | | | — | | | | 16 | | | | — | | |
| Prepaid expenses and other assets | | | — | | | | — | | | | 2 | | | | 40 | | | | 431 | | |
| Total Assets | | | 3,179 | | | | 6,196 | | | | 68,673 | | | | 625,560 | | | | 8,576,359 | | |
| Liabilities | |
| Options contracts written, at value (Note A) | | | — | | | | — | | | | 265 | | | | — | | | | — | | |
| Due to custodian | | | — | | | | 8 | | | | — | | | | — | | | | — | | |
| Payable for collateral on securities loaned (Note A) | | | — | | | | — | | | | — | | | | 46,099 | | | | — | | |
| Payable for securities purchased | | | 62 | | | | 1 | | | | 1,986 | | | | 3,613 | | | | 5,411 | | |
| Payable for Fund shares redeemed | | | 1 | | | | — | | | | 108 | | | | 286 | | | | 11,411 | | |
| Payable to investment manager—net (Notes A & B) | | | 2 | | | | 5 | | | | 29 | | | | 257 | | | | 4,832 | | |
| Payable to administrator—net (Note B) | | | 15 | | | | — | | | | 2 | | | | 133 | | | | 1,966 | | |
| Accrued expenses and other payables | | | 70 | | | | 77 | | | | 111 | | | | 277 | | | | 877 | | |
| Total Liabilities | | | 150 | | | | 91 | | | | 2,501 | | | | 50,665 | | | | 24,497 | | |
| Net Assets at value | | $ | 3,029 | | | $ | 6,105 | | | $ | 66,172 | | | $ | 574,895 | | | $ | 8,551,862 | | |
| Net Assets consist of: | |
| Paid-in capital | | $ | 4,708 | | | $ | 4,730 | | | $ | 68,291 | | | $ | 669,368 | | | $ | 7,602,049 | | |
| Undistributed net investment income (loss) | | | — | | | | — | | | | 365 | | | | 4,523 | | | | (3 | ) | |
| Distributions in excess of net investment income | | | (62 | ) | | | (45 | ) | | | — | | | | — | | | | — | | |
| Accumulated net realized gains (losses) on investments | | | (2,026 | ) | | | 52 | | | | (4,795 | ) | | | (140,720 | ) | | | (835,000 | ) | |
| Net unrealized appreciation (depreciation) in value of investments | | | 409 | | | | 1,368 | | | | 2,311 | | | | 41,724 | | | | 1,784,816 | | |
| Net Assets at value | | $ | 3,029 | | | $ | 6,105 | | | $ | 66,172 | | | $ | 574,895 | | | $ | 8,551,862 | | |
| Net Assets | |
| Investor Class | | $ | — | | | $ | — | | | $ | — | | | $ | 540,912 | | | $ | 1,626,817 | | |
| Trust Class | | | — | | | | — | | | | — | | | | 23,747 | | | | 3,244,145 | | |
| Advisor Class | | | — | | | | — | | | | — | | | | 10,236 | | | | 397,851 | | |
| Institutional Class | | | 1,510 | | | | 4,054 | | | | 18,883 | | | | — | | | | 3,283,049 | | |
| Class A | | | 1,332 | | | | 1,821 | | | | 43,023 | | | | — | | | | — | | |
| Class C | | | 187 | | | | 230 | | | | 4,266 | | | | — | | | | — | | |
| Class R3 | | | — | | | | — | | | | — | | | | — | | | | — | | |
See Notes to Financial Statements
117
| | | GUARDIAN
FUND | | INTERNATIONAL
FUND | | INTERNATIONAL
INSTITUTIONAL
FUND | | INTERNATIONAL
LARGE CAP
FUND | | LARGE CAP
DISCIPLINED
GROWTH FUND | |
| | | August 31,
2009 | | August 31,
2009 | | August 31,
2009 | | August 31,
2009 | | August 31,
2009 | |
| Assets | |
| Investments in securities, at value*† (Notes A & F)—see Schedule of Investments: | |
| Unaffiliated issuers | | $ | 943,148 | | | $ | 402,860 | | | $ | 223,829 | | | $ | 101,146 | | | $ | 125,823 | | |
| Affiliated issuers | | | 3,160 | | | | 15,584 | | | | 4,548 | | | | 2,333 | | | | — | | |
| | | | 946,308 | | | | 418,444 | | | | 228,377 | | | | 103,479 | | | | 125,823 | | |
| Cash | | | — | | | | — | | | | — | | | | — | | | | — | | |
| Foreign currency | | | — | | | | 9,915 | | | | 734 | | | | 186 | | | | — | | |
| Deposits with brokers for open option contracts | | | — | | | | — | | | | — | | | | — | | | | — | | |
| Dividends and interest receivable | | | 848 | | | | 642 | | | | 411 | | | | 212 | | | | 201 | | |
| Receivable for securities sold | | | 6,971 | | | | 1,841 | | | | 1,026 | | | | 44 | | | | — | | |
| Receivable for Fund shares sold | | | 305 | | | | 91 | | | | 8 | | | | 56 | | | | 1,655 | | |
| Receivable from administrator—net (Note B) | | | — | | | | — | | | | 67 | | | | 6 | | | | 46 | | |
| Receivable for securities lending income—net (Note A) | | | 4 | | | | 8 | | | | 5 | | | | 1 | | | | — | | |
| Prepaid expenses and other assets | | | 114 | | | | 15 | | | | 10 | | | | 4 | | | | 4 | | |
| Total Assets | | | 954,550 | | | | 430,956 | | | | 230,638 | | | | 103,988 | | | | 127,729 | | |
| Liabilities | |
| Options contracts written, at value (Note A) | | | — | | | | — | | | | — | | | | — | | | | — | | |
| Due to custodian | | | — | | | | — | | | | — | | | | — | | | | — | | |
| Payable for collateral on securities loaned (Note A) | | | 3,212 | | | | 15,301 | | | | 4,414 | | | | 2,248 | | | | — | | |
| Payable for securities purchased | | | 1,581 | | | | 3,367 | | | | 2,090 | | | | 481 | | | | 2,150 | | |
| Payable for Fund shares redeemed | | | 1,021 | | | | 1,359 | | | | 52 | | | | 1 | | | | 739 | | |
| Payable to investment manager—net (Notes A & B) | | | 417 | | | | 290 | | | | 161 | | | | 46 | | | | 56 | | |
| Payable to administrator—net (Note B) | | | 223 | | | | 125 | | | | — | | | | — | | | | — | | |
| Accrued expenses and other payables | | | 378 | | | | 256 | | | | 127 | | | | 99 | | | | 184 | | |
| Total Liabilities | | | 6,832 | | | | 20,698 | | | | 6,844 | | | | 2,875 | | | | 3,129 | | |
| Net Assets at value | | $ | 947,718 | | | $ | 410,258 | | | $ | 223,794 | | | $ | 101,113 | | | $ | 124,600 | | |
| Net Assets consist of: | |
| Paid-in capital | | $ | 1,071,855 | | | $ | 639,985 | | | $ | 401,041 | | | $ | 167,562 | | | $ | 121,895 | | |
| Undistributed net investment income (loss) | | | 5,195 | | | | — | | | | — | | | | 226 | | | | 120 | | |
| Distributions in excess of net investment income | | | — | | | | (464 | ) | | | (293 | ) | | | — | | | | — | | |
| Accumulated net realized gains (losses) on investments | | | (130,884 | ) | | | (257,046 | ) | | | (181,935 | ) | | | (72,226 | ) | | | (10,995 | ) | |
| Net unrealized appreciation (depreciation) in value of investments | | | 1,552 | | | | 27,783 | | | | 4,981 | | | | 5,551 | | | | 13,580 | | |
| Net Assets at value | | $ | 947,718 | | | $ | 410,258 | | | $ | 223,794 | | | $ | 101,113 | | | $ | 124,600 | | |
| Net Assets | |
| Investor Class | | $ | 875,486 | | | $ | 208,808 | | | $ | — | | | $ | — | | | $ | 11,709 | | |
| Trust Class | | | 71,017 | | | | 201,450 | | | | — | | | | 28,904 | | | | — | | |
| Advisor Class | | | 543 | | | | — | | | | — | | | | — | | | | — | | |
| Institutional Class | | | 54 | | | | — | | | | 223,794 | | | | 67,725 | | | | 23,336 | | |
| Class A | | | 510 | | | | — | | | | — | | | | 4,033 | | | | 63,650 | | |
| Class C | | | 54 | | | | — | | | | — | | | | 396 | | | | 25,850 | | |
| Class R3 | | | 54 | | | | — | | | | — | | | | 55 | | | | 55 | | |
118
Statements of Assets and Liabilities (cont'd)
Neuberger Berman Equity Funds (cont'd)
(000's omitted except per share amounts)
| | | CLIMATE
CHANGE FUND | | EMERGING
MARKETS
EQUITY FUND | | EQUITY
INCOME FUND | | FOCUS FUND | | GENESIS FUND | |
| | | August 31,
2009 | | August 31,
2009 | | August 31,
2009 | | August 31,
2009 | | August 31,
2009 | |
| Shares Outstanding ($.001 par value; unlimited shares authorized) | |
| Investor Class | | | — | | | | — | | | | — | | | | 32,597 | | | | 66,706 | | |
| Trust Class | | | — | | | | — | | | | — | | | | 1,956 | | | | 92,701 | | |
| Advisor Class | | | — | | | | — | | | | — | | | | 1,219 | | | | 19,546 | | |
| Institutional Class | | | 240 | | | | 288 | | | | 2,161 | | | | — | | | | 97,586 | | |
| Class A | | | 212 | | | | 130 | | | | 4,935 | | | | — | | | | — | | |
| Class C | | | 30 | | | | 16 | | | | 490 | | | | — | | | | — | | |
| Class R3 | | | — | | | | — | | | | — | | | | — | | | | — | | |
| Net Asset Value, offering and redemption price per share | |
| Investor Class | | $ | — | | | $ | — | | | $ | — | | | $ | 16.59 | | | $ | 24.39 | | |
| Trust Class | | | — | | | | — | | | | — | | | | 12.14 | | | | 35.00 | | |
| Advisor Class | | | — | | | | — | | | | — | | | | 8.40 | | | | 20.35 | | |
| Institutional Class | | | 6.29 | | | | 14.05 | | | | 8.74 | | | | — | | | | 33.64 | | |
| Class R3 | | | — | | | | — | | | | — | | | | — | | | | — | | |
| Net Asset Value and redemption price per share | |
| Class A | | $ | 6.27 | | | $ | 14.02 | | | $ | 8.72 | | | $ | — | | | $ | — | | |
| Offering Price per share | |
| Class A‡ | | $ | 6.65 | | | $ | 14.88 | | | $ | 9.25 | | | $ | — | | | $ | — | | |
| Net Asset Value and offering price per share | |
| Class C^ | | $ | 6.21 | | | $ | 13.96 | | | $ | 8.70 | | | $ | — | | | $ | — | | |
| †Securities on loan, at value: | |
| Unaffiliated issuers | | $ | — | | | $ | — | | | $ | — | | | $ | 45,136 | | | $ | — | | |
| *Cost of Investments: | |
| Unaffiliated issuers | | $ | 2,650 | | | $ | 4,533 | | | $ | 62,453 | | | $ | 533,014 | | | $ | 3,226,646 | | |
| Affiliated issuers | | | — | | | | — | | | | — | | | | 46,603 | | | | 3,541,276 | | |
| Total cost of investments | | $ | 2,650 | | | $ | 4,533 | | | $ | 62,453 | | | $ | 579,617 | | | $ | 6,767,922 | | |
| Total cost of foreign currency | | $ | — | | | $ | 135 | | | $ | — | | | $ | — | | | $ | — | | |
‡ On single retail sales of less than $50,000. On sales of $50,000 or more or in certain other circumstances described in the fund's prospectus, offering price is reduced.
^ Redemption price per share is equal to net asset value less any applicable contingent deferred sales charge.
See Notes to Financial Statements
119
| | | GUARDIAN
FUND | | INTERNATIONAL
FUND | | INTERNATIONAL
INSTITUTIONAL
FUND | | INTERNATIONAL
LARGE CAP
FUND | | LARGE CAP
DISCIPLINED
GROWTH FUND | |
| | | August 31,
2009 | | August 31,
2009 | | August 31,
2009 | | August 31,
2009 | | August 31,
2009 | |
| Shares Outstanding ($.001 par value; unlimited shares authorized) | |
| Investor Class | | | 78,509 | | | | 15,375 | | | | — | | | | — | | | | 1,939 | | |
| Trust Class | | | 8,120 | | | | 13,403 | | | | — | | | | 3,644 | | | | — | | |
| Advisor Class | | | 55 | | | | — | | | | — | | | | — | | | | — | | |
| Institutional Class | | | 5 | | | | — | | | | 29,737 | | | | 8,537 | | | | 3,859 | | |
| Class A | | | 58 | | | | — | | | | — | | | | 511 | | | | 10,542 | | |
| Class C | | | 5 | | | | — | | | | — | | | | 50 | | | | 4,293 | | |
| Class R3 | | | 5 | | | | — | | | | — | | | | 7 | | | | 9 | | |
| Net Asset Value, offering and redemption price per share | |
| Investor Class | | $ | 11.15 | | | $ | 13.58 | | | $ | — | | | $ | — | | | $ | 6.04 | | |
| Trust Class | | | 8.75 | | | | 15.03 | | | | — | | | | 7.93 | | | | — | | |
| Advisor Class | | | 9.87 | | | | — | | | | — | | | | — | | | | — | | |
| Institutional Class | | | 11.16 | | | | — | | | | 7.53 | | | | 7.93 | | | | 6.05 | | |
| Class R3 | | | 9.88 | | | | — | | | | — | | | | 7.90 | | | | 6.03 | | |
| Net Asset Value and redemption price per share | |
| Class A | | $ | 8.75 | | | $ | — | | | $ | — | | | $ | 7.90 | | | $ | 6.04 | | |
| Offering Price per share | |
| Class A‡ | | $ | 9.28 | | | $ | — | | | $ | — | | | $ | 8.38 | | | $ | 6.41 | | |
| Net Asset Value and offering price per share | |
| Class C^ | | $ | 9.86 | | | $ | — | | | $ | — | | | $ | 7.87 | | | $ | 6.02 | | |
| †Securities on loan, at value: | |
| Unaffiliated issuers | | $ | 3,148 | | | $ | 14,664 | | | $ | 4,255 | | | $ | 2,172 | | | $ | — | | |
| *Cost of Investments: | |
| Unaffiliated issuers | | $ | 941,588 | | | $ | 375,087 | | | $ | 218,848 | | | $ | 95,602 | | | $ | 112,243 | | |
| Affiliated issuers | | | 3,160 | | | | 15,584 | | | | 4,548 | | | | 2,333 | | | | — | | |
| Total cost of investments | | $ | 944,748 | | | $ | 390,671 | | | $ | 223,396 | | | $ | 97,935 | | | $ | 112,243 | | |
| Total cost of foreign currency | | $ | — | | | $ | 9,898 | | | $ | 734 | | | $ | 186 | | | $ | — | | |
120
Statements of Assets and Liabilities (cont'd)
Neuberger Berman Equity Funds
(000's omitted except per share amounts)
| | |
MID CAP
GROWTH FUND | |
PARTNERS
FUND | |
REAL ESTATE
FUND | |
REGENCY
FUND | |
| | | August 31,
2009 | | August 31,
2009 | | August 31,
2009 | | August 31,
2009 | |
| Assets | |
| Investments in securities, at value*† (Notes A & F)—see Schedule of Investments: | |
| Unaffiliated issuers | | $ | 450,714 | | | $ | 2,490,591 | | | $ | 66,407 | | | $ | 70,144 | | |
| Affiliated issuers | | | 69,356 | | | | 122,190 | | | | 9,236 | | | | 3,688 | | |
| | | | 520,070 | | | | 2,612,781 | | | | 75,643 | | | | 73,832 | | |
| Cash | | | — | | | | — | | | | — | | | | — | | |
| Foreign currency | | | — | | | | — | | | | — | | | | — | | |
| Deposits with brokers for open option contracts | | | — | | | | — | | | | — | | | | — | | |
| Dividends and interest receivable | | | 249 | | | | 3,284 | | | | 182 | | | | 144 | | |
| Receivable for securities sold | | | 1,923 | | | | 25,503 | | | | 423 | | | | 390 | | |
| Receivable for Fund shares sold | | | 2,060 | | | | 1,546 | | | | 188 | | | | 475 | | |
| Receivable from administrator—net (Note B) | | | — | | | | — | | | | 28 | | | | — | | |
| Receivable for securities lending income—net (Note A) | | | 12 | | | | 71 | | | | 1 | | | | 2 | | |
| Prepaid expenses and other assets | | | 34 | | | | 138 | | | | 3 | | | | 4 | | |
| Total Assets | | | 524,348 | | | | 2,643,323 | | | | 76,468 | | | | 74,847 | | |
| Liabilities | |
| Options contracts written, at value (Note A) | | | — | | | | — | | | | — | | | | — | | |
| Due to custodian | | | — | | | | — | | | | — | | | | 152 | | |
| Payable for collateral on securities loaned (Note A) | | | 68,957 | | | | 120,963 | | | | 9,075 | | | | 3,812 | | |
| Payable for securities purchased | | | 3,783 | | | | 15,579 | | | | 658 | | | | 36 | | |
| Payable for Fund shares redeemed | | | 151 | | | | 3,646 | | | | 214 | | | | 72 | | |
| Payable to investment manager—net (Notes A & B) | | | 202 | | | | 984 | | | | 43 | | | | 33 | | |
| Payable to administrator—net (Note B) | | | 65 | | | | 790 | | | | — | | | | 15 | | |
| Accrued expenses and other payables | | | 201 | | | | 544 | | | | 92 | | | | 83 | | |
| Total Liabilities | | | 73,359 | | | | 142,506 | | | | 10,082 | | | | 4,203 | | |
| Net Assets at value | | $ | 450,989 | | | $ | 2,500,817 | | | $ | 66,386 | | | $ | 70,644 | | |
| Net Assets consist of: | |
| Paid-in capital | | $ | 718,754 | | | $ | 2,929,578 | | | $ | 85,745 | | | $ | 101,372 | | |
| Undistributed net investment income (loss) | | | (1 | ) | | | 16,033 | | | | — | | | | 593 | | |
| Distributions in excess of net investment income | | | — | | | | — | | | | — | | | | — | | |
| Accumulated net realized gains (losses) on investments | | | (325,525 | ) | | | (572,218 | ) | | | (32,676 | ) | | | (31,379 | ) | |
| Net unrealized appreciation (depreciation) in value of investments | | | 57,761 | | | | 127,424 | | | | 13,317 | | | | 58 | | |
| Net Assets at value | | $ | 450,989 | | | $ | 2,500,817 | | | $ | 66,386 | | | $ | 70,644 | | |
| Net Assets | |
| Investor Class | | $ | 280,880 | | | $ | 1,337,246 | | | $ | — | | | $ | 43,785 | | |
| Trust Class | | | 16,350 | | | | 622,588 | | | | 63,045 | | | | 26,859 | | |
| Advisor Class | | | 6,881 | | | | 379,688 | | | | — | | | | — | | |
| Institutional Class | | | 146,645 | | | | 161,295 | | | | 3,341 | | | | — | | |
| Class A | | | 122 | | | | — | | | | — | | | | — | | |
| Class C | | | 56 | | | | — | | | | — | | | | — | | |
| Class R3 | | | 55 | | | | — | | | | — | | | | — | | |
See Notes to Financial Statements
121
| | | SELECT
EQUITIES
FUND | | SMALL AND
MID CAP
GROWTH FUND | |
SMALL CAP
GROWTH FUND | | SOCIALLY
RESPONSIVE
FUND | |
| | | August 31,
2009 | | August 31,
2009 | | August 31,
2009 | | August 31,
2009 | |
| Assets | |
| Investments in securities, at value*† (Notes A & F)—see Schedule of Investments: | |
| Unaffiliated issuers | | $ | 51,331 | | | $ | 6,130 | | | $ | 200,912 | | | $ | 980,486 | | |
| Affiliated issuers | | | — | | | | — | | | | 31,988 | | | | 4,332 | | |
| | | | 51,331 | | | | 6,130 | | | | 232,900 | | | | 984,818 | | |
| Cash | | | — | | | | — | | | | — | | | | — | | |
| Foreign currency | | | — | | | | — | | | | — | | | | — | | |
| Deposits with brokers for open option contracts | | | — | | | | — | | | | — | | | | — | | |
| Dividends and interest receivable | | | 116 | | | | 2 | | | | 1 | | | | 753 | | |
| Receivable for securities sold | | | 393 | | | | 171 | | | | 3,449 | | | | 7,218 | | |
| Receivable for Fund shares sold | | | 535 | | | | — | | | | 381 | | | | 1,229 | | |
| Receivable from administrator—net (Note B) | | | — | | | | 18 | | | | 60 | | | | — | | |
| Receivable for securities lending income—net (Note A) | | | — | | | | — | | | | 6 | | | | 5 | | |
| Prepaid expenses and other assets | | | 3 | | | | — | | | | 13 | | | | 49 | | |
| Total Assets | | | 52,378 | | | | 6,321 | | | | 236,810 | | | | 994,072 | | |
| Liabilities | |
| Options contracts written, at value (Note A) | | | — | | | | — | | | | — | | | | — | | |
| Due to custodian | | | — | | | | — | | | | — | | | | — | | |
| Payable for collateral on securities loaned (Note A) | | | — | | | | — | | | | 32,178 | | | | 4,268 | | |
| Payable for securities purchased | | | — | | | | 175 | | | | 4,976 | | | | 3,786 | | |
| Payable for Fund shares redeemed | | | 4 | | | | 4 | | | | 670 | | | | 992 | | |
| Payable to investment manager—net (Notes A & B) | | | 23 | | | | 3 | | | | 155 | | | | 430 | | |
| Payable to administrator—net (Note B) | | | 1 | | | | — | | | | — | | | | 270 | | |
| Accrued expenses and other payables | | | 83 | | | | 57 | | | | 121 | | | | 149 | | |
| Total Liabilities | | | 111 | | | | 239 | | | | 38,100 | | | | 9,895 | | |
| Net Assets at value | | $ | 52,267 | | | $ | 6,082 | | | 198,710 | | | $ | 984,177 | | |
| Net Assets consist of: | |
| Paid-in capital | | $ | 49,606 | | | $ | 7,963 | | | $ | 385,108 | | | $ | 1,188,392 | | |
| Undistributed net investment income (loss) | | | 90 | | | | (29 | ) | | | — | | | | 3,543 | | |
| Distributions in excess of net investment income | | | — | | | | — | | | | — | | | | — | | |
| Accumulated net realized gains (losses) on investments | | | (1,364 | ) | | | (2,389 | ) | | | (220,977 | ) | | | (155,714 | ) | |
| Net unrealized appreciation (depreciation) in value of investments | | | 3,935 | | | | 537 | | | | 34,579 | | | | (52,044 | ) | |
| Net Assets at value | | $ | 52,267 | | | $ | 6,082 | | | $ | 198,710 | | | $ | 984,177 | | |
| Net Assets | |
| Investor Class | | $ | — | | | $ | — | | | $ | 144,118 | | | $ | 597,052 | | |
| Trust Class | | | — | | | | 6,082 | | | | 35,187 | | | | 308,241 | | |
| Advisor Class | | | — | | | | — | | | | 11,711 | | | | — | | |
| Institutional Class | | | 6,517 | | | | — | | | | 7,484 | | | | 77,644 | | |
| Class A | | | 38,318 | | | | — | | | | 85 | | | | 1,091 | | |
| Class C | | | 7,432 | | | | — | | | | 69 | | | | 95 | | |
| Class R3 | | | — | | | | — | | | | 56 | | | | 54 | | |
122
Statements of Assets and Liabilities (cont'd)
Neuberger Berman Equity Funds (cont'd)
(000's omitted except per share amounts)
| | | MID CAP
GROWTH FUND | | PARTNERS
FUND | | REAL ESTATE
FUND | | REGENCY
FUND | |
| | | August 31,
2009 | | August 31,
2009 | | August 31,
2009 | | August 31,
2009 | |
| Shares Outstanding ($.001 par value; unlimited shares authorized) | |
| Investor Class | | | 37,806 | | | | 61,700 | | | | — | | | | 3,955 | | |
| Trust Class | | | 1,446 | | | | 37,340 | | | | 8,146 | | | | 2,779 | | |
| Advisor Class | | | 592 | | | | 26,336 | | | | — | | | | — | | |
| Institutional Class | | | 19,556 | | | | 7,402 | | | | 431 | | | | — | | |
| Class A | | | 11 | | | | — | | | | — | | | | — | | |
| Class C | | | 5 | | | | — | | | | — | | | | — | | |
| Class R3 | | | 5 | | | | — | | | | — | | | | — | | |
| Net Asset Value, offering and redemption price per share | |
| Investor Class | | $ | 7.43 | | | $ | 21.67 | | | $ | — | | | $ | 11.07 | | |
| Trust Class | | | 11.31 | | | | 16.67 | | | | 7.74 | | | | 9.66 | | |
| Advisor Class | | | 11.63 | | | | 14.42 | | | | — | | | | — | | |
| Institutional Class | | | 7.50 | | | | 21.79 | | | | 7.76 | | | | — | | |
| Class R3 | | | 11.63 | | | | — | | | | — | | | | — | | |
| Net Asset Value and redemption price per share | |
| Class A | | $ | 11.31 | | | $ | — | | | $ | — | | | $ | — | | |
| Offering Price per share | |
| Class A‡ | | $ | 12.00 | | | $ | — | | | $ | — | | | $ | — | | |
| Net Asset Value and offering price per share | |
| Class C^ | | $ | 11.62 | | | $ | — | | | $ | — | | | $ | — | | |
| †Securities on loan, at value: | |
| Unaffiliated issuers | | $ | 67,391 | | | $ | 118,395 | | | $ | 8,890 | | | $ | 3,732 | | |
| *Cost of Investments: | |
| Unaffiliated issuers | | $ | 392,953 | | | $ | 2,363,167 | | | $ | 53,090 | | | $ | 70,086 | | |
| Affiliated issuers | | | 69,356 | | | | 122,190 | | | | 9,236 | | | | 3,688 | | |
| Total cost of investments | | $ | 462,309 | | | $ | 2,485,357 | | | $ | 62,326 | | | $ | 73,774 | | |
| Total cost of foreign currency | | $ | — | | | $ | — | | | $ | — | | | $ | — | | |
‡ On single retail sales of less than $50,000. On sales of $50,000 or more or in certain other circumstances described in the fund's prospectus, offering price is reduced.
^ Redemption price per share is equal to net asset value less any applicable contingent deferred sales charge.
See Notes to Financial Statements
123
| | | SELECT
EQUITIES
FUND | | SMALL AND
MID CAP
GROWTH FUND | | SMALL CAP
GROWTH FUND | | SOCIALLY
RESPONSIVE
FUND | |
| | | August 31,
2009 | | August 31,
2009 | | August 31,
2009 | | August 31,
2009 | |
| Shares Outstanding ($.001 par value; unlimited shares authorized) | |
| Investor Class | | | — | | | | — | | | | 10,956 | | | | 31,864 | | |
| Trust Class | | | — | | | | 753 | | | | 2,438 | | | | 23,925 | | |
| Advisor Class | | | — | | | | — | | | | 1,218 | | | | — | | |
| Institutional Class | | | 808 | | | | — | | | | 566 | | | | 4,140 | | |
| Class A | | | 4,763 | | | | — | | | | 6 | | | | 85 | | |
| Class C | | | 936 | | | | — | | | | 7 | | | | 7 | | |
| Class R3 | | | — | | | | — | | | | 6 | | | | 4 | | |
| Net Asset Value, offering and redemption price per share | |
| Investor Class | | $ | — | | | $ | — | | | $ | 13.15 | | | $ | 18.74 | | |
| Trust Class | | | — | | | | 8.07 | | | | 14.43 | | | | 12.88 | | |
| Advisor Class | | | — | | | | — | | | | 9.61 | | | | — | | |
| Institutional Class | | | 8.06 | | | | — | | | | 13.23 | | | | 18.75 | | |
| Class R3 | | | — | | | | — | | | | 9.61 | | | | 12.87 | | |
| Net Asset Value and redemption price per share | |
| Class A | | $ | 8.05 | | | $ | — | | | $ | 14.43 | | | $ | 12.88 | | |
| Offering Price per share | |
| Class A‡ | | $ | 8.54 | | | $ | — | | | $ | 15.31 | | | $ | 13.67 | | |
| Net Asset Value and offering price per share | |
| Class C^ | | $ | 7.94 | | | $ | — | | | $ | 9.60 | | | $ | 12.86 | | |
| †Securities on loan, at value: | |
| Unaffiliated issuers | | $ | — | | | $ | — | | | $ | 31,486 | | | $ | 4,184 | | |
| *Cost of Investments: | |
| Unaffiliated issuers | | $ | 47,396 | | | $ | 5,593 | | | $ | 166,333 | | | $ | 1,032,522 | | |
| Affiliated issuers | | | — | | | | — | | | | 31,988 | | | | 4,332 | | |
| Total cost of investments | | $ | 47,396 | | | $ | 5,593 | | | $ | 198,321 | | | $ | 1,036,854 | | |
| Total cost of foreign currency | | $ | — | | | $ | — | | | $ | — | | | $ | — | | |
124
Statements of Operations
Neuberger Berman Equity Funds
(000's omitted)
| | | CLIMATE
CHANGE
FUND | |
EMERGING
MARKETS
EQUITY FUND | |
EQUITY
INCOME FUND | | FOCUS FUND | | GENESIS FUND | |
| | | For the
Year Ended
August 31,
2009 | | For the
Period from
October 8, 2008
(Commencement
of Operations) to
August 31,
2009 | | For the
Year Ended
August 31,
2009 | | For the
Year Ended
August 31,
2009 | |
For the
Year Ended
August 31,
2009 | |
| Investment Income: | |
| Income (Note A): | |
| Dividend income—unaffiliated issuers | | $ | 47 | | | $ | 98 | | | $ | 1,074 | | | $ | 9,588 | | | $ | 36,178 | | |
| Dividend income—affiliated issuers (Note F) | | | — | | | | — | | | | — | | | | — | | | | 41,612 | | |
| Interest income—unaffiliated issuers | | | — | | | | — | | | | 353 | | | | 4 | | | | 268 | | |
| Income from securities loaned—net (Note F) | | | — | | | | — | | | | — | | | | 587 | | | | — | | |
| Income from investments in affiliated issuers (Note F) | | | 2 | | | | 4 | | | | 25 | | | | 189 | | | | 4,922 | | |
| Foreign taxes withheld | | | (1 | ) | | | (12 | ) | | | (35 | ) | | | (97 | ) | | | (340 | ) | |
| Total income | | $ | 48 | | | $ | 90 | | | $ | 1,417 | | | $ | 10,271 | | | $ | 82,640 | | |
| Expenses: | |
| Investment management fees (Notes A & B) | | | 23 | | | | 32 | | | | 178 | | | | 2,873 | | | | 53,314 | | |
| Administration fees (Note B) | | | 2 | | | | 2 | | | | 19 | | | | 323 | | | | 4,806 | | |
| Administration fees (Note B): | |
| Investor Class | | | — | | | | — | | | | — | | | | 1,007 | | | | 2,955 | | |
| Trust Class | | | — | | | | — | | | | — | | | | 84 | | | | 10,540 | | |
| Advisor Class | | | — | | | | — | | | | — | | | | 33 | | | | 1,251 | | |
| Institutional Class | | | 1 | | | | 2 | | | | 3 | | | | — | | | | 2,758 | | |
| Class A | | | 2 | | | | 1 | | | | 54 | | | | — | | | | — | | |
| Class C | | | — | | | | — | | | | 4 | | | | — | | | | — | | |
| Class R3 | | | — | | | | — | | | | — | | | | — | | | | — | | |
| Distribution fees (Note B): | |
| Trust Class | | | — | | | | — | | | | — | | | | 25 | | | | — | | |
| Advisor Class | | | — | | | | — | | | | — | | | | 24 | | | | 920 | | |
| Class A | | | 3 | | | | 1 | | | | 67 | | | | — | | | | — | | |
| Class C | | | 1 | | | | 1 | | | | 19 | | | | — | | | | — | | |
| Shareholder servicing agent fees: | |
| Investor Class | | | — | | | | — | | | | — | | | | 428 | | | | 1,487 | | |
| Trust Class | | | — | | | | — | | | | — | | | | 24 | | | | 63 | | |
| Advisor Class | | | — | | | | — | | | | — | | | | 23 | | | | 35 | | |
| Institutional Class | | | 13 | | | | 4 | | | | 3 | | | | — | | | | 23 | | |
| Class A | | | 9 | | | | 3 | | | | 89 | | | | — | | | | — | | |
| Class C | | | 2 | | | | 3 | | | | 3 | | | | — | | | | — | | |
| Class R3 | | | — | | | | — | | | | — | | | | — | | | | — | | |
| Organization expense (Note A) | | | — | | | | 72 | | | | — | | | | — | | | | — | | |
| Audit fees | | | 31 | | | | 25 | | | | 57 | | | | 57 | | | | 57 | | |
| Custodian fees (Note B) | | | 40 | | | | 86 | | | | 38 | | | | 170 | | | | 1,102 | | |
| Insurance expense | | | — | | | | — | | | | 1 | | | | 34 | | | | 416 | | |
| Legal fees | | | 48 | | | | 157 | | | | 71 | | | | 56 | | | | 74 | | |
| Registration and filing fees | | | 50 | | | | 39 | | | | 57 | | | | 49 | | | | 273 | | |
| Shareholder reports | | | — | | | | 10 | | | | 11 | | | | 142 | | | | 1,901 | | |
| Trustees' fees and expenses | | | 40 | | | | 40 | | | | 45 | | | | 45 | | | | 42 | | |
| Miscellaneous | | | — | | | | 12 | | | | 4 | | | | 48 | | | | 557 | | |
| Total expenses | | | 265 | | | | 490 | | | | 723 | | | | 5,445 | | | | 82,574 | | |
See Notes to Financial Statements
125
| | | GUARDIAN
FUND | | INTERNATIONAL
FUND | |
INTERNATIONAL
INSTITUTIONAL
FUND | |
INTERNATIONAL
LARGE CAP
FUND | | LARGE CAP
DISCIPLINED
GROWTH
FUND | |
| | | For the
Year Ended
August 31,
2009 | |
For the
Year Ended
August 31,
2009 | | For the
Year Ended
August 31,
2009 | | For the
Year Ended
August 31,
2009 | | For the
Year Ended
August 31,
2009 | |
| Investment Income: | |
| Income (Note A): | |
| Dividend income—unaffiliated issuers | | $ | 14,569 | | | $ | 11,710 | | | $ | 6,476 | | | $ | 2,838 | | | $ | 659 | | |
| Dividend income—affiliated issuers (Note F) | | | — | | | | — | | | | — | | | | — | | | | — | | |
| Interest income—unaffiliated issuers | | | 5 | | | | 36 | | | | 3 | | | | 1 | | | | 1 | | |
| Income from securities loaned—net (Note F) | | | 161 | | | | 603 | | | | 318 | | | | 152 | | | | — | | |
| Income from investments in affiliated issuers (Note F) | | | 129 | | | | 259 | | | | 147 | | | | 67 | | | | 4 | | |
| Foreign taxes withheld | | | (135 | ) | | | (963 | ) | | | (535 | ) | | | (260 | ) | | | (3 | ) | |
| Total income | | $ | 14,729 | | | $ | 11,645 | | | $ | 6,409 | | | $ | 2,798 | | | $ | 661 | | |
| Expenses: | |
| Investment management fees (Notes A & B) | | | 4,646 | | | | 3,516 | | | | 1,926 | | | | 529 | | | | 224 | | |
| Administration fees (Note B) | | | 540 | | | | 252 | | | | 136 | | | | 58 | | | | 24 | | |
| Administration fees (Note B): | |
| Investor Class | | | 1,663 | | | | 406 | | | | — | | | | — | | | | 19 | | |
| Trust Class | | | 233 | | | | 734 | | | | — | | | | 88 | | | | — | | |
| Advisor Class | | | 2 | | | | — | | | | — | | | | — | | | | — | | |
| Institutional Class | | | — | | | | — | | | | 204 | | | | 61 | | | | 4 | | |
| Class A | | | — | | | | — | | | | — | | | | 4 | | | | 36 | | |
| Class C | | | — | | | | — | | | | — | | | | — | | | | 17 | | |
| Class R3 | | | — | | | | — | | | | — | | | | — | | | | — | | |
| Distribution fees (Note B): | |
| Trust Class | | | 68 | | | | — | | | | — | | | | 26 | | | | — | | |
| Advisor Class | | | 1 | | | | — | | | | — | | | | — | | | | — | | |
| Class A | | | — | | | | — | | | | — | | | | 5 | | | | 45 | | |
| Class C | | | — | | | | — | | | | — | | | | 2 | | | | 83 | | |
| Shareholder servicing agent fees: | |
| Investor Class | | | 870 | | | | 223 | | | | — | | | | — | | | | 37 | | |
| Trust Class | | | 25 | | | | 128 | | | | — | | | | 34 | | | | — | | |
| Advisor Class | | | 22 | | | | — | | | | — | | | | — | | | | — | | |
| Institutional Class | | | 1 | | | | — | | | | 24 | | | | 31 | | | | 13 | | |
| Class A | | | 1 | | | | — | | | | — | | | | 10 | | | | 32 | | |
| Class C | | | 1 | | | | — | | | | — | | | | 3 | | | | 18 | | |
| Class R3 | | | 1 | | | | — | | | | — | | | | 1 | | | | 1 | | |
| Organization expense (Note A) | | | — | | | | — | | | | — | | | | — | | | | — | | |
| Audit fees | | | 57 | | | | 59 | | | | 59 | | | | 60 | | | | 21 | | |
| Custodian fees (Note B) | | | 215 | | | | 409 | | | | 263 | | | | 174 | | | | 60 | | |
| Insurance expense | | | 52 | | | | 30 | | | | 16 | | | | 7 | | | | 2 | | |
| Legal fees | | | 65 | | | | 49 | | | | 49 | | | | 59 | | | | 99 | | |
| Registration and filing fees | | | 113 | | | | 46 | | | | 44 | | | | 127 | | | | 40 | | |
| Shareholder reports | | | 154 | | | | 116 | | | | 42 | | | | 34 | | | | 26 | | |
| Trustees' fees and expenses | | | 45 | | | | 45 | | | | 45 | | | | 45 | | | | 45 | | |
| Miscellaneous | | | 79 | | | | 67 | | | | 52 | | | | 27 | | | | 4 | | |
| Total expenses | | | 8,854 | | | | 6,080 | | | | 2,860 | | | | 1,385 | | | | 850 | | |
126
Statements of Operations (cont'd)
Neuberger Berman Equity Funds (cont'd)
(000's omitted)
| | | CLIMATE
CHANGE
FUND | |
EMERGING
MARKETS
EQUITY FUND | |
EQUITY
INCOME FUND | | FOCUS FUND | | GENESIS FUND | |
| | | For the
Year Ended
August 31,
2009 | | For the
Period from
October 8, 2008
(Commencement
of Operations) to
August 31,
2009 | | For the
Year Ended
August 31,
2009 | | For the
Year Ended
August 31,
2009 | | For the
Year Ended
August 31,
2009 | |
| Expenses reimbursed by administrator (Note B) | | | (235 | ) | | | (448 | ) | | | (342 | ) | | | (3 | ) | | | (510 | ) | |
| Investment management fees waived (Note A) | | | — | | | | — | | | | (3 | ) | | | (15 | ) | | | (389 | ) | |
| Expenses reduced by custodian fee expense offset arrangement (Note B) | | | — | | | | — | | | | — | | | | — | | | | (1 | ) | |
| Total net expenses | | | 30 | | | | 42 | | | | 378 | | | | 5,427 | | | | 81,674 | | |
| Net investment income (loss) | | $ | 18 | | | $ | 48 | | | $ | 1,039 | | | $ | 4,844 | | | $ | 966 | | |
| Realized and Unrealized Gain (Loss) on Investments (Note A): | |
| Net realized gain (loss) on: | |
| Sales of investment securities of unaffiliated issuers | | | (1,753 | ) | | | 51 | | | | (4,994 | ) | | | (140,118 | ) | | | (297,543 | ) | |
| Sales of investment securities of affiliated issuers | | | — | | | | — | | | | — | | | | (85 | ) | | | (535,194 | ) | |
| Foreign currency | | | — | | | | (15 | ) | | | (7 | ) | | | — | | | | (3 | ) | |
| Net increase from payments by affiliates (Note B) | | | — | | | | 1 | | | | — | | | | — | | | | — | | |
| Options written | | | — | | | | — | | | | 184 | | | | — | | | | — | | |
| Change in net unrealized appreciation (depreciation) in value of: | |
| Unaffiliated investment securities | | | 631 | | | | 1,368 | | | | 2,046 | | | | (58,876 | ) | | | (710,128 | ) | |
| Affiliated investment securities | | | — | | | | — | | | | — | | | | (505 | ) | | | (1,713,558 | ) | |
| Foreign currency | | | — | | | | — | | | | — | | | | — | | | | — | | |
| Options written | | | — | | | | — | | | | 1 | | | | — | | | | — | | |
| Net gain (loss) on investments | | | (1,122 | ) | | | 1,405 | | | | (2,770 | ) | | | (199,584 | ) | | | (3,256,426 | ) | |
| Net increase (decrease) in net assets resulting from operations | | $ | (1,104 | ) | | $ | 1,453 | | | $ | (1,731 | ) | | $ | (194,740 | ) | | $ | (3,255,460 | ) | |
See Notes to Financial Statements
127
| | | GUARDIAN
FUND | | INTERNATIONAL
FUND | |
INTERNATIONAL
INSTITUTIONAL
FUND | |
INTERNATIONAL
LARGE CAP
FUND | | LARGE CAP
DISCIPLINED
GROWTH
FUND | |
| | | For the
Year Ended
August 31,
2009 | | For the
Year Ended
August 31,
2009 | | For the
Year Ended
August 31,
2009 | | For the
Year Ended
August 31,
2009 | | For the
Year Ended
August 31,
2009 | |
| Expenses reimbursed by administrator (Note B) | | | (23 | ) | | | — | | | | (1,006 | ) | | | (398 | ) | | | (330 | ) | |
| Investment management fees waived (Note A) | | | (15 | ) | | | (16 | ) | | | (9 | ) | | | (5 | ) | | | (1 | ) | |
| Expenses reduced by custodian fee expense offset arrangement (Note B) | | | — | | | | (1 | ) | | | — | | | | — | | | | — | | |
| Total net expenses | | | 8,816 | | | | 6,063 | | | | 1,845 | | | | 982 | | | | 519 | | |
| Net investment income (loss) | | $ | 5,913 | | | $ | 5,582 | | | $ | 4,564 | | | $ | 1,816 | | | $ | 142 | | |
| Realized and Unrealized Gain (Loss) on Investments (Note A): | |
| Net realized gain (loss) on: | |
| Sales of investment securities of unaffiliated issuers | | | (124,413 | ) | | | (230,634 | ) | | | (147,350 | ) | | | (61,803 | ) | | | (3,314 | ) | |
| Sales of investment securities of affiliated issuers | | | (1,262 | ) | | | (214 | ) | | | (124 | ) | | | 21 | | | | — | | |
| Foreign currency | | | (371 | ) | | | (1,658 | ) | | | (966 | ) | | | (373 | ) | | | — | | |
| Net increase from payments by affiliates (Note B) | | | — | | | | — | | | | — | | | | — | | | | — | | |
| Options written | | | — | | | | — | | | | — | | | | — | | | | — | | |
| Change in net unrealized appreciation (depreciation) in value of: | |
| Unaffiliated investment securities | | | (197,850 | ) | | | 31,603 | | | | 29,327 | | | | 21,541 | | | | 12,067 | | |
| Affiliated investment securities | | | — | | | | — | | | | — | | | | — | | | | — | | |
| Foreign currency | | | 42 | | | | 186 | | | | 30 | | | | 25 | | | | — | | |
| Options written | | | — | | | | — | | | | — | | | | — | | | | — | | |
| Net gain (loss) on investments | | | (323,854 | ) | | | (200,717 | ) | | | (119,083 | ) | | | (40,589 | ) | | | 8,753 | | |
| Net increase (decrease) in net assets resulting from operations | | $ | (317,941 | ) | | $ | (195,135 | ) | | $ | (114,519 | ) | | $ | (38,773 | ) | | $ | 8,895 | | |
128
Statements of Operations (cont'd)
Neuberger Berman Equity Funds
(000's omitted)
| | | MID CAP
GROWTH
FUND | | PARTNERS
FUND | | REAL ESTATE
FUND | | REGENCY
FUND | |
| | | For the
Year Ended
August 31,
2009 | | For the
Year Ended
August 31,
2009 | | For the
Year Ended
August 31,
2009 | | For the
Year Ended
August 31,
2009 | |
| Investment Income: | |
| Income (Note A): | |
| Dividend income—unaffiliated issuers | | $ | 2,080 | | | $ | 35,078 | | | $ | 1,933 | | | $ | 1,488 | | |
| Dividend income—affiliated issuers (Note F) | | | — | | | | — | | | | — | | | | — | | |
| Interest income—unaffiliated issuers | | | 6 | | | | 49 | | | | — | | | | 1 | | |
| Income from securities loaned—net (Note F) | | | 719 | | | | 2,467 | | | | 94 | | | | 75 | | |
| Income from investments in affiliated issuers (Note F) | | | 221 | | | | 180 | | | | 11 | | | | 37 | | |
| Foreign taxes withheld | | | (23 | ) | | | (292 | ) | | | (5 | ) | | | (6 | ) | |
| Total income | | $ | 3,003 | | | $ | 37,482 | | | $ | 2,033 | | | $ | 1,595 | | |
| Expenses: | |
| Investment management fees (Notes A & B) | | | 1,945 | | | | 10,158 | | | | 354 | | | | 409 | | |
| Administration fees (Note B) | | | 215 | | | | 1,293 | | | | 27 | | | | 45 | | |
| Administration fees (Note B): | |
| Investor Class | | | 538 | | | | 2,336 | | | | — | | | | 82 | | |
| Trust Class | | | 38 | | | | 1,837 | | | | 147 | | | | 113 | | |
| Advisor Class | | | 12 | | | | 1,107 | | | | — | | | | — | | |
| Institutional Class | | | 67 | | | | 109 | | | | 1 | | | | — | | |
| Class A | | | — | | | | — | | | | — | | | | — | | |
| Class C | | | — | | | | — | | | | — | | | | — | | |
| Class R3 | | | — | | | | — | | | | — | | | | — | | |
| Distribution fees (Note B): | |
| Trust Class | | | — | | | | 540 | | | | 43 | | | | 33 | | |
| Advisor Class | | | 9 | | | | 814 | | | | — | | | | — | | |
| Class A | | | — | | | | — | | | | — | | | | — | | |
| Class C | | | — | | | | — | | | | — | | | | — | | |
| Shareholder servicing agent fees: | |
| Investor Class | | | 461 | | | | 1,031 | | | | — | | | | 70 | | |
| Trust Class | | | 20 | | | | 32 | | | | 45 | | | | 49 | | |
| Advisor Class | | | 19 | | | | 31 | | | | — | | | | — | | |
| Institutional Class | | | 23 | | | | 23 | | | | 14 | | | | — | | |
| Class A | | | 1 | | | | — | | | | — | | | | — | | |
| Class C | | | 1 | | | | — | | | | — | | | | — | | |
| Class R3 | | | 1 | | | | — | | | | — | | | | — | | |
| Organization expense (Note A) | | | — | | | | — | | | | — | | | | — | | |
| Audit fees | | | 21 | | | | 57 | | | | 59 | | | | 21 | | |
| Custodian fees (Note B) | | | 148 | | | | 468 | | | | 31 | | | | 66 | | |
| Insurance expense | | | 19 | | | | 136 | | | | 2 | | | | 5 | | |
| Legal fees | | | 62 | | | | 52 | | | | 44 | | | | 43 | | |
| Registration and filing fees | | | 111 | | | | 85 | | | | 69 | | | | 68 | | |
| Shareholder reports | | | 73 | | | | 460 | | | | 16 | | | | 28 | | |
| Trustees' fees and expenses | | | 45 | | | | 45 | | | | 45 | | | | 45 | | |
| Miscellaneous | | | 33 | | | | 173 | | | | 5 | | | | 14 | | |
| Total expenses | | | 3,862 | | | | 20,787 | | | | 902 | | | | 1,091 | | |
See Notes to Financial Statements
129
| | | SELECT
EQUITIES
FUND | | SMALL AND
MID CAP
GROWTH FUND | | SMALL CAP
GROWTH
FUND | | SOCIALLY
RESPONSIVE
FUND | |
| | | For the
Year Ended
August 31,
2009 | | For the
Year Ended
August 31,
2009 | | For the
Year Ended
August 31,
2009 | | For the
Year Ended
August 31,
2009 | |
| Investment Income: | |
| Income (Note A): | |
| Dividend income—unaffiliated issuers | | $ | 409 | | | $ | 23 | | | $ | 507 | | | $ | 12,515 | | |
| Dividend income—affiliated issuers (Note F) | | | — | | | | — | | | | — | | | | — | | |
| Interest income—unaffiliated issuers | | | 2 | | | | — | | | | 2 | | | | 101 | | |
| Income from securities loaned—net (Note F) | | | — | | | | — | | | | 295 | | | | 131 | | |
| Income from investments in affiliated issuers (Note F) | | | 35 | | | | 4 | | | | 81 | | | | — | | |
| Foreign taxes withheld | | | (12 | ) | | | — | | | | — | | | | (208 | ) | |
| Total income | | $ | 434 | | | $ | 27 | | | $ | 885 | | | $ | 12,539 | | |
| Expenses: | |
| Investment management fees (Notes A & B) | | | 138 | | | | 30 | | | | 1,834 | | | | 4,497 | | |
| Administration fees (Note B) | | | 15 | | | | 3 | | | | 130 | | | | 521 | | |
| Administration fees (Note B): | |
| Investor Class | | | — | | | | — | | | | 346 | | | | 1,087 | | |
| Trust Class | | | — | | | | 19 | | | | 95 | | | | 902 | | |
| Advisor Class | | | — | | | | — | | | | 35 | | | | — | | |
| Institutional Class | | | 2 | | | | — | | | | 4 | | | | 54 | | |
| Class A | | | 40 | | | | — | | | | — | | | | — | | |
| Class C | | | 6 | | | | — | | | | — | | | | — | | |
| Class R3 | | | — | | | | — | | | | — | | | | — | | |
| Distribution fees (Note B): | |
| Trust Class | | | — | | | | 6 | | | | 28 | | | | 265 | | |
| Advisor Class | | | — | | | | — | | | | 26 | | | | — | | |
| Class A | | | 50 | | | | — | | | | — | | | | — | | |
| Class C | | | 31 | | | | — | | | | — | | | | — | | |
| Shareholder servicing agent fees: | |
| Investor Class | | | — | | | | — | | | | 161 | | | | 357 | | |
| Trust Class | | | — | | | | 28 | | | | 22 | | | | 58 | | |
| Advisor Class | | | — | | | | — | | | | 20 | | | | — | | |
| Institutional Class | | | 22 | | | | — | | | | 18 | | | | 14 | | |
| Class A | | | 71 | | | | — | | | | 1 | | | | 1 | | |
| Class C | | | 11 | | | | — | | | | 1 | | | | 1 | | |
| Class R3 | | | — | | | | — | | | | 1 | | | | 1 | | |
| Organization expense (Note A) | | | — | | | | — | | | | — | | | | — | | |
| Audit fees | | | 40 | | | | 21 | | | | 21 | | | | 21 | | |
| Custodian fees (Note B) | | | 34 | | | | 11 | | | | 127 | | | | 240 | | |
| Insurance expense | | | 1 | | | | — | | | | 7 | | | | 45 | | |
| Legal fees | | | 28 | | | | 43 | | | | 74 | | | | 37 | | |
| Registration and filing fees | | | 46 | | | | 49 | | | | 138 | | | | 103 | | |
| Shareholder reports | | | — | | | | 9 | | | | 181 | | | | 212 | | |
| Trustees' fees and expenses | | | 45 | | | | 45 | | | | 45 | | | | 45 | | |
| Miscellaneous | | | — | | | | 2 | | | | 22 | | | | 67 | | |
| Total expenses | | | 580 | | | | 266 | | | | 3,337 | | | | 8,528 | | |
130
Statements of Operations (cont'd)
Neuberger Berman Equity Funds (cont'd)
(000's omitted)
| | | MID CAP
GROWTH
FUND | | PARTNERS
FUND | | REAL ESTATE
FUND | | REGENCY
FUND | |
| | | For the
Year Ended
August 31,
2009 | | For the
Year Ended
August 31,
2009 | | For the
Year Ended
August 31,
2009 | | For the
Year Ended
August 31,
2009 | |
| Expenses reimbursed by administrator (Note B) | | | (103 | ) | | | (10 | ) | | | (463 | ) | | | (111 | ) | |
| Investment management fees waived (Note A) | | | (19 | ) | | | (20 | ) | | | (1 | ) | | | (2 | ) | |
| Expenses reduced by custodian fee expense offset arrangement (Note B) | | | (1 | ) | | | (1 | ) | | | — | | | | — | | |
| Total net expenses | | | 3,739 | | | | 20,756 | | | | 438 | | | | 978 | | |
| Net investment income (loss) | | $ | (736 | ) | | $ | 16,726 | | | $ | 1,595 | | | $ | 617 | | |
| Realized and Unrealized Gain (Loss) on Investments (Note A): | |
| Net realized gain (loss) on: | |
| Sales of investment securities of unaffiliated issuers | | | (67,393 | ) | | | (573,688 | ) | | | (21,990 | ) | | | (30,862 | ) | |
| Sales of investment securities of affiliated issuers | | | 526 | | | | 1,909 | | | | 173 | | | | (84 | ) | |
| Foreign currency | | | (1 | ) | | | (675 | ) | | | — | | | | — | | |
| Net increase from payments by affiliates (Note B) | | | — | | | | — | | | | — | | | | — | | |
| Options written | | | — | | | | — | | | | — | | | | — | | |
| Change in net unrealized appreciation (depreciation) in value of: | |
| Unaffiliated investment securities | | | (28,480 | ) | | | (472,844 | ) | | | 12,292 | | | | (4,490 | ) | |
| Affiliated investment securities | | | — | | | | — | | | | — | | | | — | | |
| Foreign currency | | | 1 | | | | 55 | | | | — | | | | — | | |
| Options written | | | — | | | | — | | | | — | | | | — | | |
| Net gain (loss) on investments | | | (95,347 | ) | | | (1,045,243 | ) | | | (9,525 | ) | | | (35,436 | ) | |
| Net increase (decrease) in net assets resulting from operations | | $ | (96,083 | ) | | $ | (1,028,517 | ) | | $ | (7,930 | ) | | $ | (34,819 | ) | |
See Notes to Financial Statements
131
| | | SELECT
EQUITIES
FUND | | SMALL AND
MID CAP
GROWTH FUND | | SMALL CAP
GROWTH
FUND | | SOCIALLY
RESPONSIVE
FUND | |
| | | For the
Year Ended
August 31,
2009 | | For the
Year Ended
August 31,
2009 | | For the
Year Ended
August 31,
2009 | | For the
Year Ended
August 31,
2009 | |
| Expenses reimbursed by administrator (Note B) | | | (258 | ) | | | (204 | ) | | | (477 | ) | | | (20 | ) | |
| Investment management fees waived (Note A) | | | (6 | ) | | | — | | | | (5 | ) | | | — | | |
| Expenses reduced by custodian fee expense offset arrangement (Note B) | | | — | | | | — | | | | — | | | | (3 | ) | |
| Total net expenses | | | 316 | | | | 62 | | | | 2,855 | | | | 8,505 | | |
| Net investment income (loss) | | $ | 118 | | | $ | (35 | ) | | $ | (1,970 | ) | | $ | 4,034 | | |
| Realized and Unrealized Gain (Loss) on Investments (Note A): | |
| Net realized gain (loss) on: | |
| Sales of investment securities of unaffiliated issuers | | | (1,082 | ) | | | (1,618 | ) | | | (90,281 | ) | | | (148,654 | ) | |
| Sales of investment securities of affiliated issuers | | | — | | | | — | | | | (349 | ) | | | (182 | ) | |
| Foreign currency | | | — | | | | — | | | | — | | | | (191 | ) | |
| Net increase from payments by affiliates (Note B) | | | — | | | | — | | | | — | | | | — | | |
| Options written | | | — | | | | — | | | | — | | | | — | | |
| Change in net unrealized appreciation (depreciation) in value of: | |
| Unaffiliated investment securities | | | 4,057 | | | | (137 | ) | | | 10,318 | | | | (126,684 | ) | |
| Affiliated investment securities | | | — | | | | — | | | | — | | | | — | | |
| Foreign currency | | | — | | | | — | | | | — | | | | 31 | | |
| Options written | | | — | | | | — | | | | — | | | | — | | |
| Net gain (loss) on investments | | | 2,975 | | | | (1,755 | ) | | | (80,312 | ) | | | (275,680 | ) | |
| Net increase (decrease) in net assets resulting from operations | | $ | 3,093 | | | $ | (1,790 | ) | | $ | (82,282 | ) | | $ | (271,646 | ) | |
132
Statements of Changes in Net Assets
Neuberger Berman Equity Funds
(000's omitted)
| | |
CLIMATE CHANGE FUND | | EMERGING
MARKETS
EQUITY FUND | | EQUITY INCOME FUND | |
| | | Year Ended
August 31, | | Period from
May 1, 2008
(Commencement
of Operations) to
August 31, | | Period from
October 8, 2008
(Commencement
of Operations) to
August 31, | | Year Ended
August 31, | | Year Ended
August 31, | |
| | | 2009 | | 2008 | | 2009 | | 2009 | | 2008 | |
| Increase (Decrease) in Net Assets: | |
| From Operations (Note A): | |
| Net investment income (loss) | | $ | 18 | | | $ | 20 | | | $ | 48 | | | $ | 1,039 | | | $ | 228 | | |
| Net realized gain (loss) on investments | | | (1,753 | ) | | | (276 | ) | | | 36 | | | | (4,817 | ) | | | 206 | | |
| Net increase from payments by affiliates | | | — | | | | — | | | | 1 | | | | — | | | | — | | |
| Change in net unrealized appreciation (depreciation) of investments | | | 631 | | | | (222 | ) | | | 1,368 | | | | 2,047 | | | | 136 | | |
| Net increase (decrease) in net assets resulting from operations | | | (1,104 | ) | | | (478 | ) | | | 1,453 | | | | (1,731 | ) | | | 570 | | |
| Distributions to Shareholders From (Note A): | |
| Net investment income: | |
| Investor Class | | | — | | | | — | | | | — | | | | — | | | | — | | |
| Trust Class | | | — | | | | — | | | | — | | | | — | | | | (110 | ) | |
| Advisor Class | | | — | | | | — | | | | — | | | | — | | | | — | | |
| Institutional Class | | | (51 | ) | | | — | | | | (73 | ) | | | (83 | ) | | | (30 | ) | |
| Class A | | | (44 | ) | | | — | | | | (3 | ) | | | (593 | ) | | | (34 | ) | |
| Class C | | | (3 | ) | | | — | | | | (2 | ) | | | (33 | ) | | | — | | |
| Net realized gain on investments: | |
| Investor Class | | | — | | | | — | | | | — | | | | — | | | | — | | |
| Trust Class | | | — | | | | — | | | | — | | | | — | | | | (122 | ) | |
| Advisor Class | | | — | | | | — | | | | — | | | | — | | | | — | | |
| Institutional Class | | | — | | | | — | | | | — | | | | (8 | ) | | | — | | |
| Class A | | | — | | | | — | | | | — | | | | (195 | ) | | | — | | |
| Class C | | | — | | | | — | | | | — | | | | (11 | ) | | | — | | |
| Tax Return of Capital: | |
| Investor Class | | | — | | | | — | | | | — | | | | — | | | | — | | |
| Trust Class | | | — | | | | — | | | | — | | | | — | | | | — | | |
| Advisor Class | | | — | | | | — | | | | — | | | | — | | | | — | | |
| Institutional Class | | | — | | | | — | | | | — | | | | — | | | | — | | |
| Total distributions to shareholders | | | (98 | ) | | | — | | | | (78 | ) | | | (923 | ) | | | (296 | ) | |
| From Fund Share Transactions (Note D): | |
| Proceeds from shares sold: | |
| Investor Class | | | — | | | | — | | | | — | | | | — | | | | — | | |
| Trust Class | | | — | | | | — | | | | — | | | | — | | | | — | | |
| Advisor Class | | | — | | | | — | | | | — | | | | — | | | | — | | |
| Institutional Class | | | — | | | | 2,300 | | | | 2,803 | | | | 17,793 | | | | — | | |
| Class A | | | 766 | | | | 2,062 | | | | 1,839 | | | | 34,665 | | | | 23,659 | | |
| Class C | | | 131 | | | | 103 | | | | 230 | | | | 3,843 | | | | 1,362 | | |
| Class R3 | | | — | | | | — | | | | — | | | | — | | | | — | | |
| Proceeds from reinvestment of dividends and distributions: | |
| Investor Class | | | — | | | | — | | | | — | | | | — | | | | — | | |
| Trust Class | | | — | | | | — | | | | — | | | | — | | | | 232 | | |
| Advisor Class | | | — | | | | — | | | | — | | | | — | | | | — | | |
| Institutional Class | | | 51 | | | | — | | | | 73 | | | | 67 | | | | 30 | | |
| Class A | | | 39 | | | | — | | | | 3 | | | | 645 | | | | 34 | | |
| Class C | | | 3 | | | | — | | | | 2 | | | | 19 | | | | — | | |
See Notes to Financial Statements
133
| | | FOCUS FUND | | GENESIS FUND | |
| | | Year Ended
August 31, | | Year Ended
August 31, | | Year Ended
August 31, | | Year Ended
August 31, | |
| | | 2009 | | 2008 | | 2009 | | 2008 | |
| Increase (Decrease) in Net Assets: | |
| From Operations (Note A): | |
| Net investment income (loss) | | $ | 4,844 | | | $ | 5,189 | | | $ | 966 | | | $ | (21,135 | ) | |
| Net realized gain (loss) on investments | | | (140,203 | ) | | | 89,847 | | | | (832,740 | ) | | | 656,988 | | |
| Net increase from payments by affiliates | | | — | | | | — | | | | — | | | | — | | |
| Change in net unrealized appreciation (depreciation) of investments | | | (59,381 | ) | | | (161,335 | ) | | | (2,423,686 | ) | | | 518,219 | | |
| Net increase (decrease) in net assets resulting from operations | | | (194,740 | ) | | | (66,299 | ) | | | (3,255,460 | ) | | | 1,154,072 | | |
| Distributions to Shareholders From (Note A): | |
| Net investment income: | |
| Investor Class | | | (4,182 | ) | | | (4,520 | ) | | | — | | | | (8,679 | ) | |
| Trust Class | | | (216 | ) | | | (251 | ) | | | — | | | | (6,795 | ) | |
| Advisor Class | | | (101 | ) | | | (93 | ) | | | — | | | | (1,175 | ) | |
| Institutional Class | | | — | | | | — | | | | — | | | | (16,557 | ) | |
| Class A | | | — | | | | — | | | | — | | | | — | | |
| Class C | | | — | | | | — | | | | — | | | | — | | |
| Net realized gain on investments: | |
| Investor Class | | | (67,093 | ) | | | (170,665 | ) | | | (80,456 | ) | | | (311,099 | ) | |
| Trust Class | | | (3,422 | ) | | | (12,027 | ) | | | (173,777 | ) | | | (714,962 | ) | |
| Advisor Class | | | (1,281 | ) | | | (3,835 | ) | | | (19,689 | ) | | | (85,542 | ) | |
| Institutional Class | | | — | | | | — | | | | (168,141 | ) | | | (580,084 | ) | |
| Class A | | | — | | | | — | | | | — | | | | — | | |
| Class C | | | — | | | | — | | | | — | | | | — | | |
| Tax Return of Capital: | |
| Investor Class | | | — | | | | — | | | | (4 | ) | | | — | | |
| Trust Class | | | — | | | | — | | | | (6 | ) | | | — | | |
| Advisor Class | | | — | | | | — | | | | (1 | ) | | | — | | |
| Institutional Class | | | — | | | | — | | | | (6 | ) | | | — | | |
| Total distributions to shareholders | | | (76,295 | ) | | | (191,391 | ) | | | (442,080 | ) | | | (1,724,893 | ) | |
| From Fund Share Transactions (Note D): | |
| Proceeds from shares sold: | |
| Investor Class | | | 7,825 | | | | 11,833 | | | | 329,375 | | | | 326,391 | | |
| Trust Class | | | 6,788 | | | | 7,677 | | | | 732,619 | | | | 1,117,558 | | |
| Advisor Class | | | 1,361 | | | | 2,397 | | | | 127,612 | | | | 168,479 | | |
| Institutional Class | | | — | | | | — | | | | 707,914 | | | | 1,544,706 | | |
| Class A | | | — | | | | — | | | | — | | | | — | | |
| Class C | | | — | | | | — | | | | — | | | | — | | |
| Class R3 | | | — | | | | — | | | | — | | | | — | | |
| Proceeds from reinvestment of dividends and distributions: | |
| Investor Class | | | 62,415 | | | | 151,938 | | | | 77,477 | | | | 308,158 | | |
| Trust Class | | | 3,550 | | | | 12,094 | | | | 161,758 | | | | 700,429 | | |
| Advisor Class | | | 1,369 | | | | 3,890 | | | | 19,082 | | | | 84,454 | | |
| Institutional Class | | | — | | | | — | | | | 167,662 | | | | 593,818 | | |
| Class A | | | — | | | | — | | | | — | | | | — | | |
| Class C | | | — | | | | — | | | | — | | | | — | | |
134
Statements of Changes in Net Assets (cont'd)
Neuberger Berman Equity Funds (cont'd)
(000's omitted)
| | |
CLIMATE CHANGE FUND | | EMERGING
MARKETS
EQUITY FUND | | EQUITY INCOME FUND | |
| | | Year Ended
August 31, | | Period from
May 1, 2008
(Commencement
of Operations) to
August 31, | | Period from
October 8, 2008
(Commencement
of Operations) to
August 31, | | Year Ended
August 31, | | Year Ended
August 31, | |
| | | 2009 | | 2008 | | 2009 | | 2009 | | 2008 | |
| Proceeds from shares issued in connection with mergers (Note H) | |
| Investor Class | | | — | | | | — | | | | — | | | | — | | | | — | | |
| Advisor Class | | | — | | | | — | | | | — | | | | — | | | | — | | |
| Institutional Class | | | — | | | | — | | | | — | | | | — | | | | — | | |
| Class A | | | — | | | | — | | | | — | | | | — | | | | — | | |
| Class C | | | — | | | | — | | | | — | | | | — | | | | — | | |
| Proceeds from conversion of Trust Class or Class A shares (Note H): | |
| Investor Class | | | — | | | | — | | | | — | | | | — | | | | — | | |
| Trust Class | | | — | | | | — | | | | — | | | | — | | | | (5,654 | ) | |
| Institutional Class | | | — | | | | — | | | | — | | | | — | | | | 5,654 | | |
| Class A | | | — | | | | — | | | | — | | | | | | | | | | |
| Payments for shares redeemed: | |
| Investor Class | | | — | | | | — | | | | — | | | | — | | | | — | | |
| Trust Class | | | — | | | | — | | | | — | | | | — | | | | (200 | ) | |
| Advisor Class | | | — | | | | — | | | | — | | | | — | | | | — | | |
| Institutional Class | | | — | | | | — | | | | — | | | | (4,176 | ) | | | — | | |
| Class A | | | (740 | ) | | | — | | | | (158 | ) | | | (13,462 | ) | | | (187 | ) | |
| Class C | | | (6 | ) | | | — | | | | (62 | ) | | | (978 | ) | | | (179 | ) | |
| Redemption fees retained: | |
| Investor Class | | | — | | | | — | | | | — | | | | — | | | | — | | |
| Trust Class | | | — | | | | — | | | | — | | | | — | | | | — | | |
| Institutional Class | | | — | | | | — | | | | — | | | | — | | | | — | | |
| Net increase (decrease) from Fund share transactions | | | 244 | | | | 4,465 | | | | 4,730 | | | | 38,416 | | | | 24,751 | | |
| Net Increase (Decrease) in Net Assets | | | (958 | ) | | | 3,987 | | | | 6,105 | | | | 35,762 | | | | 25,025 | | |
| Net Assets: | |
| Beginning of year | | | 3,987 | | | | — | | | | — | | | | 30,410 | | | | 5,385 | | |
| End of year | | $ | 3,029 | | | $ | 3,987 | | | $ | 6,105 | | | $ | 66,172 | | | $ | 30,410 | | |
| Undistributed net investment income (loss) at end of year | | $ | — | | | $ | 18 | | | $ | — | | | $ | 365 | | | $ | 58 | | |
| Distributions in excess of net investment income at end of year | | $ | (62 | ) | | $ | — | | | $ | (45 | ) | | $ | — | | | $ | — | | |
See Notes to Financial Statements
135
| | | FOCUS FUND | | GENESIS FUND | |
| | | Year Ended
August 31, | | Year Ended
August 31, | | Year Ended
August 31, | | Year Ended
August 31, | |
| | | 2009 | | 2008 | | 2009 | | 2008 | |
| Proceeds from shares issued in connection with mergers (Note H) | |
| Investor Class | | | — | | | | — | | | | — | | | | 205,864 | | |
| Advisor Class | | | — | | | | — | | | | — | | | | 11,848 | | |
| Institutional Class | | | — | | | | — | | | | — | | | | — | | |
| Class A | | | — | | | | — | | | | — | | | | — | | |
| Class C | | | — | | | | — | | | | — | | | | — | | |
| Proceeds from conversion of Trust Class or Class A shares (Note H): | |
| Investor Class | | | — | | | | — | | | | — | | | | — | | |
| Trust Class | | | — | | | | — | | | | — | | | | — | | |
| Institutional Class | | | — | | | | — | | | | — | | | | — | | |
| Class A | | | | | | | | | | | | | | | | | |
| Payments for shares redeemed: | |
| Investor Class | | | (73,700 | ) | | | (150,638 | ) | | | (475,531 | ) | | | (389,364 | ) | |
| Trust Class | | | (13,371 | ) | | | (34,425 | ) | | | (1,020,015 | ) | | | (1,749,307 | ) | |
| Advisor Class | | | (4,156 | ) | | | (7,419 | ) | | | (167,155 | ) | | | (182,141 | ) | |
| Institutional Class | | | — | | | | — | | | | (976,050 | ) | | | (442,834 | ) | |
| Class A | | | — | | | | — | | | | — | | | | — | | |
| Class C | | | — | | | | — | | | | — | | | | — | | |
| Redemption fees retained: | |
| Investor Class | | | — | | | | — | | | | — | | | | — | | |
| Trust Class | | | — | | | | — | | | | — | | | | — | | |
| Institutional Class | | | — | | | | — | | | | — | | | | — | | |
| Net increase (decrease) from Fund share transactions | | | (7,919 | ) | | | (2,653 | ) | | | (315,252 | ) | | | 2,298,059 | | |
| Net Increase (Decrease) in Net Assets | | | (278,954 | ) | | | (260,343 | ) | | | (4,012,792 | ) | | | 1,727,238 | | |
| Net Assets: | |
| Beginning of year | | | 853,849 | | | | 1,114,192 | | | | 12,564,654 | | | | 10,837,416 | | |
| End of year | | $ | 574,895 | | | $ | 853,849 | | | $ | 8,551,862 | | | $ | 12,564,654 | | |
| Undistributed net investment income (loss) at end of year | | $ | 4,523 | | | $ | 4,780 | | | $ | (3 | ) | | $ | — | | |
| Distributions in excess of net investment income at end of year | | $ | — | | | $ | — | | | $ | — | | | $ | (36,478 | ) | |
136
Statements of Changes in Net Assets (cont'd)
Neuberger Berman Equity Funds
(000's omitted)
| | | GUARDIAN FUND | | INTERNATIONAL FUND | | INTERNATIONAL
INSTITUTIONAL FUND | |
| | | Year Ended
August 31,
2009 | | Year Ended
August 31,
2008 | | Year Ended
August 31,
2009 | | Year Ended
August 31,
2008 | | Year Ended
August 31,
2009 | | Year Ended
August 31,
2008 | |
| Increase (Decrease) in Net Assets: | |
| From Operations (Note A): | |
| Net investment income (loss) | | $ | 5,913 | | | $ | 8,526 | | | $ | 5,582 | | | $ | 19,675 | | | $ | 4,564 | | | $ | 11,671 | | |
| Net realized gain (loss) on investments | | | (126,046 | ) | | | 144,289 | | | | (232,506 | ) | | | 18,355 | | | | (148,440 | ) | | | (23,075 | ) | |
| Net increase from payments by affiliates | | | — | | | | — | | | | — | | | | — | | | | — | | | | — | | |
| Change in net unrealized appreciation (depreciation) of investments | | | (197,808 | ) | | | (234,042 | ) | | | 31,789 | | | | (234,868 | ) | | | 29,357 | | | | (78,980 | ) | |
| Net increase (decrease) in net assets resulting from operations | | | (317,941 | ) | | | (81,227 | ) | | | (195,135 | ) | | | (196,838 | ) | | | (114,519 | ) | | | (90,384 | ) | |
| Distributions to Shareholders From (Note A): | |
| Net investment income: | |
| Investor Class | | | (3,980 | ) | | | (9,563 | ) | | | (6,506 | ) | | | (19,410 | ) | | | — | | | | — | | |
| Trust Class | | | (295 | ) | | | (768 | ) | | | (5,862 | ) | | | (19,811 | ) | | | — | | | | — | | |
| Advisor Class | | | — | | | | — | | | | — | | | | — | | | | — | | | | — | | |
| Institutional Class | | | — | | | | — | | | | — | | | | — | | | | (9,897 | ) | | | (19,663 | ) | |
| Class A | | | — | | | | — | | | | — | | | | — | | | | — | | | | — | | |
| Class C | | | — | | | | — | | | | — | | | | — | | | | — | | | | — | | |
| Net realized gain on investments: | |
| Investor Class | | | (94,513 | ) | | | (161,566 | ) | | | — | | | | (80,957 | ) | | | — | | | | — | | |
| Trust Class | | | (7,812 | ) | | | (13,458 | ) | | | — | | | | (94,488 | ) | | | — | | | | — | | |
| Advisor Class | | | (62 | ) | | | (113 | ) | | | — | | | | — | | | | — | | | | — | | |
| Institutional Class | | | — | | | | — | | | | — | | | | — | | | | — | | | | (76,882 | ) | |
| Class A | | | — | | | | — | | | | — | | | | — | | | | — | | | | — | | |
| Class C | | | — | | | | — | | | | — | | | | — | | | | — | | | | — | | |
| Tax Return of Capital: | |
| Investor Class | | | — | | | | — | | | | — | | | | — | | | | — | | | | — | | |
| Trust Class | | | — | | | | — | | | | — | | | | — | | | | — | | | | — | | |
| Advisor Class | | | — | | | | — | | | | — | | | | — | | | | — | | | | — | | |
| Institutional Class | | | — | | | | — | | | | — | | | | — | | | | — | | | | — | | |
| Total distributions to shareholders | | | (106,662 | ) | | | (185,468 | ) | | | (12,368 | ) | | | (214,666 | ) | | | (9,897 | ) | | | (96,545 | ) | |
| From Fund Share Transactions (Note D): | |
| Proceeds from shares sold: | |
| Investor Class | | | 42,010 | | | | 72,374 | | | | 19,420 | | | | 41,919 | | | | — | | | | — | | |
| Trust Class | | | 12,413 | | | | 16,804 | | | | 30,446 | | | | 87,306 | | | | — | | | | — | | |
| Advisor Class | | | 204 | | | | 279 | | | | — | | | | — | | | | — | | | | — | | |
| Institutional Class | | | 50 | | | | — | | | | — | | | | — | | | | 49,948 | | | | 20,706 | | |
| Class A | | | 487 | | | | — | | | | — | | | | — | | | | — | | | | — | | |
| Class C | | | 50 | | | | — | | | | — | | | | — | | | | — | | | | — | | |
| Class R3 | | | 50 | | | | — | | | | — | | | | — | | | | — | | | | — | | |
| Proceeds from reinvestment of dividends and distributions: | |
| Investor Class | | | 92,722 | | | | 160,182 | | | | 5,498 | | | | 87,842 | | | | — | | | | — | | |
| Trust Class | | | 8,083 | | | | 14,004 | | | | 5,247 | | | | 105,180 | | | | — | | | | — | | |
| Advisor Class | | | 56 | | | | 102 | | | | — | | | | — | | | | — | | | | — | | |
| Institutional Class | | | — | | | | — | | | | — | | | | — | | | | 9,873 | | | | 93,575 | | |
| Class A | | | — | | | | — | | | | — | | | | — | | | | — | | | | — | | |
| Class C | | | — | | | | — | | | | — | | | | — | | | | — | | | | — | | |
See Notes to Financial Statements
137
| | | INTERNATIONAL
LARGE CAP FUND | | LARGE CAP DISCIPLINED
GROWTH FUND | |
| | | Year Ended
August 31,
2009 | | Year Ended
August 31,
2008 | | Year Ended
August 31,
2009 | | Year Ended
August 31,
2008 | |
| Increase (Decrease) in Net Assets: | |
| From Operations (Note A): | |
| Net investment income (loss) | | $ | 1,816 | | | $ | 4,683 | | | $ | 142 | | | $ | (0 | ) | |
| Net realized gain (loss) on investments | | | (62,155 | ) | | | (8,218 | ) | | | (3,314 | ) | | | 905 | | |
| Net increase from payments by affiliates | | | — | | | | — | | | | — | | | | — | | |
| Change in net unrealized appreciation (depreciation) of investments | | | 21,566 | | | | (21,882 | ) | | | 12,067 | | | | (1,097 | ) | |
| Net increase (decrease) in net assets resulting from operations | | | (38,773 | ) | | | (25,417 | ) | | | 8,895 | | | | (192 | ) | |
| Distributions to Shareholders From (Note A): | |
| Net investment income: | |
| Investor Class | | | — | | | | — | | | | — | | | | — | | |
| Trust Class | | | (848 | ) | | | (907 | ) | | | — | | | | — | | |
| Advisor Class | | | — | | | | — | | | | — | | | | — | | |
| Institutional Class | | | (2,903 | ) | | | (2,068 | ) | | | — | | | | — | | |
| Class A | | | (52 | ) | | | — | | | | — | | | | — | | |
| Class C | | | (3 | ) | | | — | | | | — | | | | — | | |
| Net realized gain on investments: | |
| Investor Class | | | — | | | | — | | | | — | | | | — | | |
| Trust Class | | | — | | | | (1,984 | ) | | | — | | | | — | | |
| Advisor Class | | | — | | | | — | | | | — | | | | — | | |
| Institutional Class | | | — | | | | (3,862 | ) | | | — | | | | — | | |
| Class A | | | — | | | | — | | | | — | | | | — | | |
| Class C | | | — | | | | — | | | | — | | | | — | | |
| Tax Return of Capital: | |
| Investor Class | | | — | | | | — | | | | — | | | | — | | |
| Trust Class | | | — | | | | — | | | | — | | | | — | | |
| Advisor Class | | | — | | | | — | | | | — | | | | — | | |
| Institutional Class | | | — | | | | — | | | | — | | | | — | | |
| Total distributions to shareholders | | | (3,806 | ) | | | (8,821 | ) | | | — | | | | — | | |
| From Fund Share Transactions (Note D): | |
| Proceeds from shares sold: | |
| Investor Class | | | — | | | | — | | | | 4,737 | | | | 4,231 | | |
| Trust Class | | | 11,048 | | | | 25,593 | | | | — | | | | — | | |
| Advisor Class | | | — | | | | — | | | | — | | | | — | | |
| Institutional Class | | | 3,498 | | | | 102,215 | | | | 20,375 | | | | — | | |
| Class A | | | 2,160 | | | | 2,460 | | | | 29,464 | | | | — | | |
| Class C | | | 278 | | | | 120 | | | | 7,677 | | | | — | | |
| Class R3 | | | 50 | | | | — | | | | 50 | | | | — | | |
| Proceeds from reinvestment of dividends and distributions: | |
| Investor Class | | | — | | | | — | | | | — | | | | — | | |
| Trust Class | | | 823 | | | | 2,674 | | | | — | | | | — | | |
| Advisor Class | | | — | | | | — | | | | — | | | | — | | |
| Institutional Class | | | 2,264 | | | | 5,429 | | | | — | | | | — | | |
| Class A | | | 48 | | | | — | | | | — | | | | — | | |
| Class C | | | 2 | | | | — | | | | — | | | | — | | |
138
Statements of Changes in Net Assets (cont'd)
Neuberger Berman Equity Funds (cont'd)
(000's omitted)
| | | GUARDIAN FUND | | INTERNATIONAL FUND | | INTERNATIONAL
INSTITUTIONAL FUND | |
| | | Year Ended
August 31,
2009 | | Year Ended
August 31,
2008 | | Year Ended
August 31,
2009 | | Year Ended
August 31,
2008 | | Year Ended
August 31,
2009 | | Year Ended
August 31,
2008 | |
| Proceeds from shares issued in connection with mergers (Note H) | |
| Investor Class | | | — | | | | — | | | | — | | | | — | | | | — | | | | — | | |
| Advisor Class | | | — | | | | — | | | | — | | | | — | | | | — | | | | — | | |
| Institutional Class | | | — | | | | — | | | | — | | | | — | | | | — | | | | — | | |
| Class A | | | — | | | | — | | | | — | | | | — | | | | — | | | | — | | |
| Class C | | | — | | | | — | | | | — | | | | — | | | | — | | | | — | | |
| Proceeds from conversion of Trust Class or Class A shares (Note H): | |
| Investor Class | | | — | | | | — | | | | — | | | | — | | | | — | | | | — | | |
| Trust Class | | | — | | | | — | | | | — | | | | — | | | | — | | | | — | | |
| Institutional Class | | | — | | | | — | | | | — | | | | — | | | | — | | | | — | | |
| Class A | | | — | | | | — | | | | — | | | | — | | | | — | | | | — | | |
| Payments for shares redeemed: | |
| Investor Class | | | (120,403 | ) | | | (175,230 | ) | | | (121,991 | ) | | | (221,511 | ) | | | — | | | | — | | |
| Trust Class | | | (20,513 | ) | | | (29,358 | ) | | | (143,841 | ) | | | (381,348 | ) | | | — | | | | — | | |
| Advisor Class | | | (307 | ) | | | (509 | ) | | | — | | | | — | | | | — | | | | — | | |
| Institutional Class | | | — | | | | — | | | | — | | | | — | | | | (123,109 | ) | | | (90,131 | ) | |
| Class A | | | — | | | | — | | | | — | | | | — | | | | — | | | | — | | |
| Class C | | | — | | | | — | | | | — | | | | — | | | | — | | | | — | | |
| Redemption fees retained: | |
| Investor Class | | | — | | | | — | | | | 34 | | | | 42 | | | | — | | | | — | | |
| Trust Class | | | — | | | | — | | | | 37 | | | | 48 | | | | — | | | | — | | |
| Institutional Class | | | — | | | | — | | | | — | | | | — | | | | 3 | | | | — | | |
| Net increase (decrease) from Fund share transactions | | | 14,902 | | | | 58,648 | | | | (205,150 | ) | | | (280,522 | ) | | | (63,285 | ) | | | 24,150 | | |
| Net Increase (Decrease) in Net Assets | | | (409,701 | ) | | | (208,047 | ) | | | (412,653 | ) | | | (692,026 | ) | | | (187,701 | ) | | | (162,779 | ) | |
| Net Assets: | |
| Beginning of year | | | 1,357,419 | | | | 1,565,466 | | | | 822,911 | | | | 1,514,937 | | | | 411,495 | | | | 574,274 | | |
| End of year | | $ | 947,718 | | | $ | 1,357,419 | | | $ | 410,258 | | | $ | 822,911 | | | $ | 223,794 | | | $ | 411,495 | | |
| Undistributed net investment income (loss) at end of year | | $ | 5,195 | | | $ | 5,086 | | | $ | — | | | $ | 5,616 | | | $ | — | | | $ | 5,069 | | |
| Distributions in excess of net investment income at end of year | | $ | — | | | $ | — | | | $ | (464 | ) | | $ | — | | | $ | (293 | ) | | $ | — | | |
See Notes to Financial Statements
139
| | | INTERNATIONAL
LARGE CAP FUND | | LARGE CAP DISCIPLINED
GROWTH FUND | |
| | | Year Ended
August 31,
2009 | | Year Ended
August 31,
2008 | | Year Ended
August 31,
2009 | | Year Ended
August 31,
2008 | |
| Proceeds from shares issued in connection with mergers (Note H) | |
| Investor Class | | | — | | | | — | | | | — | | | | — | | |
| Advisor Class | | | — | | | | — | | | | — | | | | — | | |
| Institutional Class | | | — | | | | — | | | | 3,227 | | | | — | | |
| Class A | | | — | | | | — | | | | 31,234 | | | | — | | |
| Class C | | | — | | | | — | | | | 16,456 | | | | — | | |
| Proceeds from conversion of Trust Class or Class A shares (Note H): | |
| Investor Class | | | — | | | | — | | | | 213 | | | | — | | |
| Trust Class | | | — | | | | — | | | | — | | | | — | | |
| Institutional Class | | | — | | | | — | | | | — | | | | — | | |
| Class A | | | — | | | | — | | | | (213 | ) | | | — | | |
| Payments for shares redeemed: | |
| Investor Class | | | — | | | | — | | | | (3,387 | ) | | | (2,136 | ) | |
| Trust Class | | | (21,671 | ) | | | (20,604 | ) | | | — | | | | — | | |
| Advisor Class | | | — | | | | — | | | | — | | | | — | | |
| Institutional Class | | | (22,926 | ) | | | (80,631 | ) | | | (2,026 | ) | | | — | | |
| Class A | | | (125 | ) | | | (24 | ) | | | (2,964 | ) | | | — | | |
| Class C | | | — | | | | — | | | | (1,014 | ) | | | — | | |
| Redemption fees retained: | |
| Investor Class | | | — | | | | — | | | | — | | | | — | | |
| Trust Class | | | — | | | | 1 | | | | — | | | | — | | |
| Institutional Class | | | 1 | | | | 2 | | | | — | | | | — | | |
| Net increase (decrease) from Fund share transactions | | | (24,550 | ) | | | 37,235 | | | | 103,829 | | | | 2,095 | | |
| Net Increase (Decrease) in Net Assets | | | (67,129 | ) | | | 2,997 | | | | 112,724 | | | | 1,903 | | |
| Net Assets: | |
| Beginning of year | | | 168,242 | | | | 165,245 | | | | 11,876 | | | | 9,973 | | |
| End of year | | $ | 101,113 | | | $ | 168,242 | | | $ | 124,600 | | | $ | 11,876 | | |
| Undistributed net investment income (loss) at end of year | | $ | 226 | | | $ | 2,589 | | | $ | 120 | | | $ | — | | |
| Distributions in excess of net investment income at end of year | | $ | — | | | $ | — | | | $ | — | | | $ | — | | |
140
Statements of Changes in Net Assets (cont'd)
Neuberger Berman Equity Funds
(000's omitted)
| | | MID CAP GROWTH FUND | | PARTNERS FUND | | REAL ESTATE FUND | |
| | | Year Ended
August 31,
2009 | | Year Ended
August 31,
2008 | | Year Ended
August 31,
2009 | | Year Ended
August 31,
2008 | | Year Ended
August 31,
2009 | | Year Ended
August 31,
2008 | |
| Increase (Decrease) in Net Assets: | |
| From Operations (Note A): | |
| Net investment income (loss) | | $ | (736 | ) | | $ | (2,291 | ) | | $ | 16,726 | | | $ | 13,749 | | | $ | 1,595 | | | $ | 1,133 | | |
| Net realized gain (loss) on investments | | | (66,868 | ) | | | 29,669 | | | | (572,454 | ) | | | 34,281 | | | | (21,817 | ) | | | (10,401 | ) | |
| Net increase from payments by affiliates | | | — | | | | — | | | | — | | | | — | | | | — | | | | — | | |
| Change in net unrealized appreciation (depreciation) of investments | | | (28,479 | ) | | | (75,581 | ) | | | (472,789 | ) | | | (325,745 | ) | | | 12,292 | | | | 5,445 | | |
| Net increase (decrease) in net assets resulting from operations | | | (96,083 | ) | | | (48,203 | ) | | | (1,028,517 | ) | | | (277,715 | ) | | | (7,930 | ) | | | (3,823 | ) | |
| Distributions to Shareholders From (Note A): | |
| Net investment income: | |
| Investor Class | | | — | | | | — | | | | (5,768 | ) | | | (8,169 | ) | | | — | | | | — | | |
| Trust Class | | | — | | | | — | | | | (2,401 | ) | | | (3,427 | ) | | | (1,544 | ) | | | (904 | ) | |
| Advisor Class | | | — | | | | — | | | | (1,463 | ) | | | (1,299 | ) | | | — | | | | — | | |
| Institutional Class | | | — | | | | — | | | | (748 | ) | | | (697 | ) | | | (29 | ) | | | (1 | ) | |
| Class A | | | — | | | | — | | | | — | | | | — | | | | — | | | | — | | |
| Class C | | | — | | | | — | | | | — | | | | — | | | | — | | | | — | | |
| Net realized gain on investments: | |
| Investor Class | | | — | | | | — | | | | (17,026 | ) | | | (83,956 | ) | | | — | | | | — | | |
| Trust Class | | | — | | | | — | | | | (7,858 | ) | | | (40,592 | ) | | | — | | | | (10,592 | ) | |
| Advisor Class | | | — | | | | — | | | | (4,741 | ) | | | (21,932 | ) | | | — | | | | — | | |
| Institutional Class | | | — | | | | — | | | | (1,593 | ) | | | (5,002 | ) | | | — | | | | — | | |
| Class A | | | — | | | | — | | | | — | | | | — | | | | — | | | | — | | |
| Class C | | | — | | | | — | | | | — | | | | — | | | | — | | | | — | | |
| Tax Return of Capital: | |
| Investor Class | | | — | | | | — | | | | — | | | | — | | | | — | | | | — | | |
| Trust Class | | | — | | | | — | | | | — | | | | — | | | | (466 | ) | | | (755 | ) | |
| Advisor Class | | | — | | | | — | | | | — | | | | — | | | | — | | | | — | | |
| Institutional Class | | | — | | | | — | | | | — | | | | — | | | | (11 | ) | | | (0 | ) | |
| Total distributions to shareholders | | | — | | | | — | | | | (41,598 | ) | | | (165,074 | ) | | | (2,050 | ) | | | (12,252 | ) | |
| From Fund Share Transactions (Note D): | |
| Proceeds from shares sold: | |
| Investor Class | | | 17,412 | | | | 52,198 | | | | 124,679 | | | | 441,209 | | | | — | | | | — | | |
| Trust Class | | | 14,486 | | | | 6,833 | | | | 105,676 | | | | 316,286 | | | | 43,725 | | | | 28,095 | | |
| Advisor Class | | | 5,117 | | | | 2,615 | | | | 114,148 | | | | 147,161 | | | | — | | | | — | | |
| Institutional Class | | | 116,820 | | | | 43,188 | | | | 96,082 | | | | 61,308 | | | | 2,486 | | | | 1,665 | | |
| Class A | | | 116 | | | | — | | | | — | | | | — | | | | — | | | | — | | |
| Class C | | | 51 | | | | — | | | | — | | | | — | | | | — | | | | — | | |
| Class R3 | | | 50 | | | | — | | | | — | | | | — | | | | — | | | | — | | |
| Proceeds from reinvestment of dividends and distributions: | |
| Investor Class | | | — | | | | — | | | | 21,824 | | | | 89,010 | | | | — | | | | — | | |
| Trust Class | | | — | | | | — | | | | 9,724 | | | | 40,444 | | | | 1,942 | | | | 11,214 | | |
| Advisor Class | | | — | | | | — | | | | 5,823 | | | | 21,877 | | | | — | | | | — | | |
| Institutional Class | | | — | | | | — | | | | 2,341 | | | | 5,699 | | | | 3 | | | | 1 | | |
| Class A | | | — | | | | — | | | | — | | | | — | | | | — | | | | — | | |
| Class C | | | — | | | | — | | | | — | | | | — | | | | — | | | | — | | |
See Notes to Financial Statements
141
| | | REGENCY FUND | | SELECT EQUITIES FUND | |
| | | Year Ended
August 31,
2009 | | Year Ended
August 31,
2008 | | Year Ended
August 31,
2009 | | Period from
December 20, 2007
(Commencement
of Operations) to
August 31,
2008 | |
| Increase (Decrease) in Net Assets: | |
| From Operations (Note A): | |
| Net investment income (loss) | | $ | 617 | | | $ | 523 | | | $ | 118 | | | $ | 27 | | |
| Net realized gain (loss) on investments | | | (30,946 | ) | | | 4,528 | | | | (1,082 | ) | | | (282 | ) | |
| Net increase from payments by affiliates | | | — | | | | — | | | | — | | | | — | | |
| Change in net unrealized appreciation (depreciation) of investments | | | (4,490 | ) | | | (18,066 | ) | | | 4,057 | | | | (122 | ) | |
| Net increase (decrease) in net assets resulting from operations | | | (34,819 | ) | | | (13,015 | ) | | | 3,093 | | | | (377 | ) | |
| Distributions to Shareholders From (Note A): | |
| Net investment income: | |
| Investor Class | | | (6 | ) | | | (606 | ) | | | — | | | | — | | |
| Trust Class | | | (5 | ) | | | (358 | ) | | | — | | | | — | | |
| Advisor Class | | | — | | | | — | | | | — | | | | — | | |
| Institutional Class | | | — | | | | — | | | | (1 | ) | | | — | | |
| Class A | | | — | | | | — | | | | (48 | ) | | | — | | |
| Class C | | | — | | | | — | | | | (7 | ) | | | — | | |
| Net realized gain on investments: | |
| Investor Class | | | (2,509 | ) | | | (7,952 | ) | | | — | | | | — | | |
| Trust Class | | | (1,917 | ) | | | (5,303 | ) | | | — | | | | — | | |
| Advisor Class | | | — | | | | — | | | | — | | | | — | | |
| Institutional Class | | | — | | | | — | | | | — | | | | — | | |
| Class A | | | — | | | | — | | | | — | | | | — | | |
| Class C | | | — | | | | — | | | | — | | | | — | | |
| Tax Return of Capital: | |
| Investor Class | | | — | | | | — | | | | — | | | | — | | |
| Trust Class | | | — | | | | — | | | | — | | | | — | | |
| Advisor Class | | | — | | | | — | | | | — | | | | — | | |
| Institutional Class | | | — | | | | — | | | | — | | | | — | | |
| Total distributions to shareholders | | | (4,437 | ) | | | (14,219 | ) | | | (56 | ) | | | — | | |
| From Fund Share Transactions (Note D): | |
| Proceeds from shares sold: | |
| Investor Class | | | 9,424 | | | | 21,941 | | | | — | | | | — | | |
| Trust Class | | | 15,090 | | | | 19,507 | | | | — | | | | — | | |
| Advisor Class | | | — | | | | — | | | | — | | | | — | | |
| Institutional Class | | | — | | | | — | | | | 6,127 | | | | 2,501 | | |
| Class A | | | — | | | | — | | | | 41,400 | | | | 5,107 | | |
| Class C | | | — | | | | — | | | | 6,414 | | | | 810 | | |
| Class R3 | | | — | | | | — | | | | — | | | | — | | |
| Proceeds from reinvestment of dividends and distributions: | |
| Investor Class | | | 2,406 | | | | 8,203 | | | | — | | | | — | | |
| Trust Class | | | 1,628 | | | | 5,321 | | | | — | | | | — | | |
| Advisor Class | | | — | | | | — | | | | — | | | | — | | |
| Institutional Class | | | — | | | | — | | | | 1 | | | | — | | |
| Class A | | | — | | | | — | | | | 25 | | | | — | | |
| Class C | | | — | | | | — | | | | 7 | | | | — | | |
142
Statements of Changes in Net Assets (cont'd)
Neuberger Berman Equity Funds (cont'd)
(000's omitted)
| | | MID CAP GROWTH FUND | | PARTNERS FUND | | REAL ESTATE FUND | |
| | | Year Ended
August 31,
2009 | | Year Ended
August 31,
2008 | | Year Ended
August 31,
2009 | | Year Ended
August 31,
2008 | | Year Ended
August 31,
2009 | | Year Ended
August 31,
2008 | |
| Proceeds from shares issued in connection with mergers (Note H) | |
| Investor Class | | | — | | | | — | | | | — | | | | — | | | | — | | | | — | | |
| Advisor Class | | | — | | | | — | | | | — | | | | — | | | | — | | | | — | | |
| Institutional Class | | | — | | | | — | | | | — | | | | — | | | | — | | | | — | | |
| Class A | | | — | | | | — | | | | — | | | | — | | | | — | | | | — | | |
| Class C | | | — | | | | — | | | | — | | | | — | | | | — | | | | — | | |
| Proceeds from conversion of Trust Class or Class A shares (Note H): | |
| Investor Class | | | — | | | | — | | | | — | | | | — | | | | — | | | | — | | |
| Trust Class | | | — | | | | — | | | | — | | | | — | | | | — | | | | — | | |
| Institutional Class | | | — | | | | — | | | | — | | | | — | | | | — | | | | — | | |
| Class A | | | — | | | | — | | | | — | | | | — | | | | — | | | | — | | |
| Payments for shares redeemed: | |
| Investor Class | | | (43,190 | ) | | | (58,010 | ) | | | (406,927 | ) | | | (357,051 | ) | | | — | | | | — | | |
| Trust Class | | | (8,369 | ) | | | (7,188 | ) | | | (221,949 | ) | | | (409,795 | ) | | | (25,838 | ) | | | (80,552 | ) | |
| Advisor Class | | | (1,295 | ) | | | (564 | ) | | | (149,975 | ) | | | (146,593 | ) | | | — | | | | — | | |
| Institutional Class | | | (16,789 | ) | | | (7,490 | ) | | | (54,780 | ) | | | (14,120 | ) | | | (759 | ) | | | — | | |
| Class A | | | (2 | ) | | | — | | | | — | | | | — | | | | — | | | | — | | |
| Class C | | | — | | | | — | | | | — | | | | — | | | | — | | | | — | | |
| Redemption fees retained: | |
| Investor Class | | | — | | | | — | | | | — | | | | — | | | | — | | | | — | | |
| Trust Class | | | — | | | | — | | | | — | | | | — | | | | 29 | | | | 18 | | |
| Institutional Class | | | — | | | | — | | | | — | | | | — | | | | 1 | | | | — | | |
| Net increase (decrease) from Fund share transactions | | | 84,407 | | | | 31,582 | | | | (353,334 | ) | | | 195,435 | | | | 21,589 | | | | (39,559 | ) | |
| Net Increase (Decrease) in Net Assets | | | (11,676 | ) | | | (16,621 | ) | | | (1,423,449 | ) | | | (247,354 | ) | | | 11,609 | | | | (55,634 | ) | |
| Net Assets: | |
| Beginning of year | | | 462,665 | | | | 479,286 | | | | 3,924,266 | | | | 4,171,620 | | | | 54,777 | | | | 110,411 | | |
| End of year | | $ | 450,989 | | | $ | 462,665 | | | $ | 2,500,817 | | | $ | 3,924,266 | | | $ | 66,386 | | | $ | 54,777 | | |
| Undistributed net investment income (loss) at end of year | | $ | (1 | ) | | $ | — | | | $ | 16,033 | | | $ | 11,319 | | | $ | — | | | $ | — | | |
| Distributions in excess of net investment income at end of year | | $ | — | | | $ | — | | | $ | — | | | $ | — | | | $ | — | | | $ | — | | |
See Notes to Financial Statements
143
| | | REGENCY FUND | | SELECT EQUITIES FUND | |
| | | Year Ended
August 31,
2009 | | Year Ended
August 31,
2008 | | Year Ended
August 31,
2009 | | Period from
December 20, 2007
(Commencement
of Operations) to
August 31,
2008 | |
| Proceeds from shares issued in connection with mergers (Note H) | |
| Investor Class | | | — | | | | — | | | | — | | | | — | | |
| Advisor Class | | | — | | | | — | | | | — | | | | — | | |
| Institutional Class | | | — | | | | — | | | | — | | | | — | | |
| Class A | | | — | | | | — | | | | — | | | | — | | |
| Class C | | | — | | | | — | | | | — | | | | — | | |
| Proceeds from conversion of Trust Class or Class A shares (Note H): | |
| Investor Class | | | — | | | | — | | | | — | | | | — | | |
| Trust Class | | | — | | | | — | | | | — | | | | — | | |
| Institutional Class | | | — | | | | — | | | | — | | | | — | | |
| Class A | | | — | | | | — | | | | — | | | | — | | |
| Payments for shares redeemed: | |
| Investor Class | | | (23,262 | ) | | | (35,031 | ) | | | — | | | | — | | |
| Trust Class | | | (27,286 | ) | | | (16,258 | ) | | | — | | | | — | | |
| Advisor Class | | | — | | | | — | | | | — | | | | — | | |
| Institutional Class | | | — | | | | — | | | | (2,039 | ) | | | — | | |
| Class A | | | — | | | | — | | | | (10,454 | ) | | | (56 | ) | |
| Class C | | | — | | | | — | | | | (236 | ) | | | — | | |
| Redemption fees retained: | |
| Investor Class | | | — | | | | — | | | | — | | | | — | | |
| Trust Class | | | — | | | | — | | | | — | | | | — | | |
| Institutional Class | | | — | | | | — | | | | — | | | | — | | |
| Net increase (decrease) from Fund share transactions | | | (22,000 | ) | | | 3,683 | | | | 41,245 | | | | 8,362 | | |
| Net Increase (Decrease) in Net Assets | | | (61,256 | ) | | | (23,551 | ) | | | 44,282 | | | | 7,985 | | |
| Net Assets: | |
| Beginning of year | | | 131,900 | | | | 155,451 | | | | 7,985 | | | | — | | |
| End of year | | $ | 70,644 | | | $ | 131,900 | | | $ | 52,267 | | | $ | 7,985 | | |
| Undistributed net investment income (loss) at end of year | | $ | 593 | | | $ | — | | | $ | 90 | | | $ | 28 | | |
| Distributions in excess of net investment income at end of year | | $ | — | | | $ | — | | | $ | — | | | $ | — | | |
144
Statements of Changes in Net Assets (cont'd)
Neuberger Berman Equity Funds
(000's omitted)
| | | SMALL AND MID CAP
GROWTH FUND | | SMALL CAP GROWTH FUND | |
| | | Year Ended
August 31,
2009 | | Year Ended
August 31,
2008 | | Year Ended
August 31,
2009 | | Year Ended
August 31,
2008 | |
| Increase (Decrease) in Net Assets: | |
| From Operations (Note A): | |
| Net investment income (loss) | | $ | (35 | ) | | $ | (57 | ) | | $ | (1,970 | ) | | $ | (1,647 | ) | |
| Net realized gain (loss) on investments | | | (1,618 | ) | | | (431 | ) | | | (90,630 | ) | | | (26,919 | ) | |
| Net increase from payments by affiliates | | | — | | | | — | | | | — | | | | — | | |
| Change in net unrealized appreciation (depreciation) of investments | | | (137 | ) | | | (475 | ) | | | 10,318 | | | | 11,643 | | |
| Net increase (decrease) in net assets resulting from operations | | | (1,790 | ) | | | (963 | ) | | | (82,282 | ) | | | (16,923 | ) | |
| Distributions to Shareholders From (Note A): | |
| Net investment income: | |
| Investor Class | | | — | | | | — | | | | — | | | | — | | |
| Trust Class | | | — | | | | — | | | | — | | | | — | | |
| Advisor Class | | | — | | | | — | | | | — | | | | — | | |
| Institutional Class | | | — | | | | — | | | | — | | | | — | | |
| Class A | | | — | | | | — | | | | — | | | | — | | |
| Class C | | | — | | | | — | | | | — | | | | — | | |
| Net realized gain on investments: | |
| Investor Class | | | — | | | | — | | | | — | | | | — | | |
| Trust Class | | | — | | | | (626 | ) | | | — | | | | — | | |
| Advisor Class | | | — | | | | — | | | | — | | | | — | | |
| Institutional Class | | | — | | | | — | | | | — | | | | — | | |
| Class A | | | — | | | | — | | | | — | | | | — | | |
| Class C | | | — | | | | — | | | | — | | | | — | | |
| Tax Return of Capital: | |
| Investor Class | | | — | | | | — | | | | — | | | | — | | |
| Trust Class | | | (19 | ) | | | — | | | | — | | | | — | | |
| Advisor Class | | | — | | | | — | | | | — | | | | — | | |
| Institutional Class | | | — | | | | — | | | | — | | | | — | | |
| Total distributions to shareholders | | | (19 | ) | | | (626 | ) | | | — | | | | — | | |
| From Fund Share Transactions (Note D): | |
| Proceeds from shares sold: | |
| Investor Class | | | — | | | | — | | | | 82,569 | | | | 248,900 | | |
| Trust Class | | | 800 | | | | 1,591 | | | | 27,772 | | | | 44,971 | | |
| Advisor Class | | | — | | | | — | | | | 7,571 | | | | 14,811 | | |
| Institutional Class | | | — | | | | — | | | | 5,217 | | | | 4,217 | | |
| Class A | | | — | | | | — | | | | 79 | | | | — | | |
| Class C | | | — | | | | — | | | | 63 | | | | — | | |
| Class R3 | | | — | | | | — | | | | 50 | | | | — | | |
| Proceeds from reinvestment of dividends and distributions: | |
| Investor Class | | | — | | | | — | | | | — | | | | — | | |
| Trust Class | | | 19 | | | | 621 | | | | — | | | | — | | |
| Advisor Class | | | — | | | | — | | | | — | | | | — | | |
| Institutional Class | | | — | | | | — | | | | — | | | | — | | |
| Class A | | | — | | | | — | | | | — | | | | — | | |
| Class C | | | — | | | | — | | | | — | | | | — | | |
See Notes to Financial Statements
145
| | | SOCIALLY RESPONSIVE FUND | |
| | | Year Ended
August 31,
2009 | | Year Ended
August 31,
2008 | |
| Increase (Decrease) in Net Assets: | |
| From Operations (Note A): | |
| Net investment income (loss) | | $ | 4,034 | | | $ | 6,242 | | |
| Net realized gain (loss) on investments | | | (149,027 | ) | | | 19,436 | | |
| Net increase from payments by affiliates | | | — | | | | — | | |
| Change in net unrealized appreciation (depreciation) of investments | | | (126,653 | ) | | | (109,089 | ) | |
| Net increase (decrease) in net assets resulting from operations | | | (271,646 | ) | | | (83,411 | ) | |
| Distributions to Shareholders From (Note A): | |
| Net investment income: | |
| Investor Class | | | (2,456 | ) | | | (3,919 | ) | |
| Trust Class | | | (1,472 | ) | | | (1,946 | ) | |
| Advisor Class | | | — | | | | — | | |
| Institutional Class | | | (334 | ) | | | (67 | ) | |
| Class A | | | — | | | | — | | |
| Class C | | | — | | | | — | | |
| Net realized gain on investments: | |
| Investor Class | | | (8,128 | ) | | | (25,723 | ) | |
| Trust Class | | | (3,896 | ) | | | (11,806 | ) | |
| Advisor Class | | | — | | | | — | | |
| Institutional Class | | | (850 | ) | | | (428 | ) | |
| Class A | | | — | | | | — | | |
| Class C | | | — | | | | — | | |
| Tax Return of Capital: | |
| Investor Class | | | — | | | | — | | |
| Trust Class | | | — | | | | — | | |
| Advisor Class | | | — | | | | — | | |
| Institutional Class | | | — | | | | — | | |
| Total distributions to shareholders | | | (17,136 | ) | | | (43,889 | ) | |
| From Fund Share Transactions (Note D): | |
| Proceeds from shares sold: | |
| Investor Class | | | 123,093 | | | | 248,757 | | |
| Trust Class | | | 82,486 | | | | 118,138 | | |
| Advisor Class | | | — | | | | — | | |
| Institutional Class | | | 31,056 | | | | 91,009 | | |
| Class A | | | 1,109 | | | | — | | |
| Class C | | | 92 | | | | — | | |
| Class R3 | | | 50 | | | | — | | |
| Proceeds from reinvestment of dividends and distributions: | |
| Investor Class | | | 9,888 | | | | 27,680 | | |
| Trust Class | | | 5,197 | | | | 13,197 | | |
| Advisor Class | | | — | | | | — | | |
| Institutional Class | | | 1,184 | | | | 495 | | |
| Class A | | | — | | | | — | | |
| Class C | | | — | | | | — | | |
146
Statements of Changes in Net Assets (cont'd)
Neuberger Berman Equity Funds (cont'd)
(000's omitted)
| | | SMALL AND MID CAP
GROWTH FUND | | SMALL CAP GROWTH FUND | |
| | | Year Ended
August 31,
2009 | | Year Ended
August 31,
2008 | | Year Ended
August 31,
2009 | | Year Ended
August 31,
2008 | |
| Proceeds from shares issued in connection with mergers (Note H) | |
| Investor Class | | | — | | | | — | | | | — | | | | — | | |
| Advisor Class | | | — | | | | — | | | | — | | | | — | | |
| Institutional Class | | | — | | | | — | | | | — | | | | — | | |
| Class A | | | — | | | | — | | | | — | | | | — | | |
| Class C | | | — | | | | — | | | | — | | | | — | | |
| Proceeds from conversion of Trust Class or Class A shares (Note H): | |
| Investor Class | | | — | | | | — | | | | — | | | | — | | |
| Trust Class | | | — | | | | — | | | | — | | | | — | | |
| Institutional Class | | | — | | | | — | | | | — | | | | — | | |
| Class A | | | — | | | | — | | | | — | | | | — | | |
| Payments for shares redeemed: | |
| Investor Class | | | — | | | | — | | | | (112,924 | ) | | | (53,266 | ) | |
| Trust Class | | | (661 | ) | | | (1,426 | ) | | | (22,460 | ) | | | (9,264 | ) | |
| Advisor Class | | | — | | | | — | | | | (5,917 | ) | | | (4,228 | ) | |
| Institutional Class | | | — | | | | — | | | | (1,114 | ) | | | — | | |
| Class A | | | — | | | | — | | | | — | | | | — | | |
| Class C | | | — | | | | — | | | | — | | | | — | | |
| Redemption fees retained: | |
| Investor Class | | | — | | | | — | | | | — | | | | — | | |
| Trust Class | | | — | | | | — | | | | — | | | | — | | |
| Institutional Class | | | — | | | | — | | | | — | | | | — | | |
| Net increase (decrease) from Fund share transactions | | | 158 | | | | 786 | | | | (19,094 | ) | | | 246,141 | | |
| Net Increase (Decrease) in Net Assets | | | (1,651 | ) | | | (803 | ) | | | (101,376 | ) | | | 229,218 | | |
| Net Assets: | |
| Beginning of year | | | 7,733 | | | | 8,536 | | | | 300,086 | | | | 70,868 | | |
| End of year | | $ | 6,082 | | | $ | 7,733 | | | $ | 198,710 | | | $ | 300,086 | | |
| Undistributed net investment income (loss) at end of year | | $ | (29 | ) | | $ | (31 | ) | | $ | — | | | $ | — | | |
| Distributions in excess of net investment income at end of year | | $ | — | | | $ | — | | | $ | — | | | $ | — | | |
See Notes to Financial Statements
147
| | | SOCIALLY RESPONSIVE FUND | |
| | | Year Ended
August 31,
2009 | | Year Ended
August 31,
2008 | |
| Proceeds from shares issued in connection with mergers (Note H) | |
| Investor Class | | | — | | | | — | | |
| Advisor Class | | | — | | | | — | | |
| Institutional Class | | | — | | | | — | | |
| Class A | | | — | | | | — | | |
| Class C | | | — | | | | — | | |
| Proceeds from conversion of Trust Class or Class A shares (Note H): | |
| Investor Class | | | — | | | | — | | |
| Trust Class | | | — | | | | — | | |
| Institutional Class | | | — | | | | — | | |
| Class A | | | — | | | | — | | |
| Payments for shares redeemed: | |
| Investor Class | | | (149,312 | ) | | | (176,994 | ) | |
| Trust Class | | | (59,029 | ) | | | (85,846 | ) | |
| Advisor Class | | | — | | | | — | | |
| Institutional Class | | | (10,100 | ) | | | (13,479 | ) | |
| Class A | | | (63 | ) | | | — | | |
| Class C | | | — | | | | — | | |
| Redemption fees retained: | |
| Investor Class | | | — | | | | — | | |
| Trust Class | | | — | | | | — | | |
| Institutional Class | | | — | | | | — | | |
| Net increase (decrease) from Fund share transactions | | | 35,651 | | | | 222,957 | | |
| Net Increase (Decrease) in Net Assets | | | (253,131 | ) | | | 95,657 | | |
| Net Assets: | |
| Beginning of year | | | 1,237,308 | | | | 1,141,651 | | |
| End of year | | $ | 984,177 | | | $ | 1,237,308 | | |
| Undistributed net investment income (loss) at end of year | | $ | 3,543 | | | $ | 5,011 | | |
| Distributions in excess of net investment income at end of year | | $ | — | | | $ | — | | |
148
Notes to Financial Statements Equity Funds
Note A—Summary of Significant Accounting Policies:
1 General: Neuberger Berman Equity Funds (the "Trust") is a Delaware statutory trust organized pursuant to an Amended and Restated Trust Instrument dated June 24, 2009. The Trust is registered as an open-end management investment company under the Investment Company Act of 1940, as amended (the "1940 Act"), and its shares are registered under the Securities Act of 1933, as amended (the "1933 Act"). Neuberger Berman Climate Change Fund ("Climate Change"), Neuberger Berman Emerging Markets Equity Fund ("Emerging Markets Equity"), Neuberger Berman Equity Income Fund ("Equity Income"), Neuberger Berman Focus Fund ("Focus"), Neuberger Berman Genesis Fund ("Genesis"), Neuberger Berman Guardian Fund ("Guardian"), Neuberger Berman International Fund ("International"), Neuberger Berman International Institutional Fund ("International Institutional"), Neuberger Berman International Large Cap Fund ("International Large Cap"), Neuberger Berman Large Cap Disciplined Growth Fund ("Large Cap Disciplined Growth") (formerly, Neuberger Berman Century Fund), Neuberger Berman Mid Cap Growth Fund ("Mid Cap Growth"), Neuberger Berman Partners Fund ("Partners"), Neuberger Berman Real Estate Fund ("Real Estate"), Neuberger Berman Regency Fund ("Regency"), Neuberger Berman Select Equities Fund ("Select Equities"), Neuberger Berman Small and Mid Cap Growth Fund ("Small and Mid Cap Growth"), Neuberger Berman Small Cap Growth Fund ("Small Cap Growth"), and Neuberger Berman Socially Responsive Fund ("Socially Responsive") (individually a "Fund," collectively, the "Funds") are separate operating series of the Trust, each of which (except Focus, Large Cap Disciplined Growth, Real Estate, and Select Equities) is diversified. Under the 1940 Act, the status of a Fund that was registered as non-diversified may, under certain circumstances, change to that of a diversified fund. Ten Funds offer Investor Class shares, twelve offer Trust Class shares, six offer Advisor Class shares, fourteen offer Institutional Class shares, ten offer Class A shares, ten offer Class C shares, and six offer Class R3 shares. Emerging Markets Equity had no operations until October 8, 2008 other than matters relating to its organization and registration of shares under the 1933 Act. The Board of Trustees of the Trust (the "Board") may establish additional series or classes of shares without the approval of shareholders.
The assets of each Fund belong only to that Fund, and the liabilities of each Fund are borne solely by that Fund and no other.
The preparation of financial statements in accordance with U.S. generally accepted accounting principles requires Neuberger Berman Management LLC ("Management") to make estimates and assumptions at the date of the financial statements. Actual results could differ from those estimates.
2 Portfolio valuation: Investment securities are valued as indicated in the notes following the Funds' Schedule of Investments.
3 Foreign currency translation: The accounting records of the Funds are maintained in U.S. dollars. Foreign currency amounts are currently translated into U.S. dollars using the exchange rate as of 4:00 p.m., Eastern time, to determine the value of investments, other assets and liabilities. Purchase and sale prices of securities, and income and expenses, are translated into U.S. dollars at the prevailing rate of exchange on the respective dates of such transactions. Net unrealized foreign currency gain (loss), if any, arises from changes in the value of assets and liabilities, other than investments in securities, as a result of changes in exchange rates and is stated separately in the Statements of Operations.
4 Securities transactions and investment income: Securities transactions are recorded on trade date for financial reporting purposes. Dividend income is recorded on the ex-dividend date or, for certain foreign dividends, as soon as the Fund becomes aware of the dividends. Non-cash dividends included in dividend income, if any, are recorded at the fair market value of the securities received. Interest income, including accretion of discount on securities for Equity Income, accretion of original issue discount, where applicable, and accretion of discount on short-term investments, is recorded on the accrual basis. Realized gains and losses from securities transactions and foreign currency transactions, if any, are recorded on the basis of identified cost and stated separately in the Statements of
149
Operations. Included in net realized gain (loss) on investments are proceeds from the settlements of class action litigation in which the Funds participated as class members. The amounts of such proceeds for the year ended August 31, 2009 were $45,160 $110,868, $1,695,273, $171,210, $14,139, $4,311, $1,294,337, $7,057, $162,740 and $375,332 for Focus, Genesis, Guardian, International, Large Cap Disciplined Growth, Mid Cap Growth, Partners, Regency, Small Cap Growth, and Socially Responsive, respectively.
5 Income tax information: The Funds are treated as separate entities for U.S. federal income tax purposes. It is the policy of each Fund, except Emerging Markets Equity, to continue to, and the intention of Emerging Markets Equity to qualify as regulated investment companies by complying with the requirements of Subchapter M of the Internal Revenue Code applicable to regulated investment companies and to distribute substantially all of its earnings to its shareholders. Therefore, no federal income or excise tax provision is required.
The Funds have adopted the provisions of Financial Accounting Standards Board ("FASB") Interpretation No. 48 ("FIN 48") "Accounting for Uncertainty in Income Taxes—an interpretation of FASB Statement No. 109". FIN 48 sets forth a minimum threshold for financial statement recognition of the benefit of a tax position taken, or expected to be taken, in a tax return. The Funds recognize interest and penalties, if any, related to unrecognized tax benefits as an income tax expense in the Statements of Operations. The Funds are subject to examination by U.S. federal and state tax authorities for returns filed for the prior three fiscal years 2006-2008. As of August 31, 2009, the Funds did not have any unrecognized tax benefits.
Income distributions and capital gain distributions are determined in accordance with income tax regulations, which may differ from U.S. generally accepted accounting principles. These differences are primarily due to differing treatments of income and gains on various investment securities held by each Fund, timing differences and differing characterization of distributions made by each Fund as a whole. The Funds may also utilize earnings and profits distributed to shareholders on redemption of shares as a part of the dividends paid deduction for income tax purposes.
As determined on August 31, 2009, permanent differences resulting primarily from different book and tax accounting for net operating losses, convertible preferred stock income adjustments, equalization, premium amortization adjustments, partnership income adjustments, depletion income adjustments, foreign currency gains and losses, non-deductible 12b-1 fees, non-taxable dividend adjustments, passive foreign investment companies gains and losses, return of capital distributions and characterization of distributions from real estate investment trusts ("REITs") were reclassified at fiscal year-end. These reclassifications had no effect on net income, net asset value or net asset value per share of each Fund.
The tax character of distributions paid during the years ended August 31, 2009 and August 31, 2008 were as follows:
| | | Distributions Paid From: | |
| | | Ordinary Income | | Long-Term Capital Gain | | Return of Capital | | Total | |
| | | 2009 | | 2008 | | 2009 | | 2008 | | 2009 | | 2008 | | 2009 | | 2008 | |
| Climate Change | | $ | 98,215 | | | $ | — | (2) | | $ | — | | | $ | — | (2) | | $ | — | | | $ | — | (2) | | $ | 98,215 | | | $ | — | (2) | |
Emerging
Markets Equity(3) | | | 77,563 | | | | — | | | | — | | | | — | | | | — | | | | — | | | | 77,563 | | | | — | | |
| Equity Income | | | 723,146 | | | | 276,696 | | | | 199,719 | | | | 19,877 | | | | — | | | | — | | | | 922,865 | | | | 296,573 | | |
| Focus | | | 4,498,471 | | | | 7,176,327 | | | | 71,795,704 | | | | 184,214,412 | | | | — | | | | — | | | | 76,294,175 | | | | 191,390,739 | | |
| Genesis | | | — | | | | — | | | | 442,063,981 | | | | 1,724,892,718 | | | | 16,648 | | | | — | | | | 442,080,629 | | | | 1,724,892,718 | | |
| Guardian | | | 9,781,084 | | | | 15,840,323 | | | | 96,880,945 | | | | 169,628,176 | | | | — | | | | — | | | | 106,662,029 | | | | 185,468,499 | | |
| International | | | 12,367,880 | | | | 75,652,027 | | | | — | | | | 139,013,741 | | | | — | | | | — | | | | 12,367,880 | | | | 214,665,768 | | |
International
Institutional | | | 9,896,743 | | | | 41,813,215 | | | | — | | | | 54,732,059 | | | | — | | | | — | | | | 9,896,743 | | | | 96,545,274 | | |
International
Large Cap | | | 3,805,457 | | | | 6,810,627 | | | | — | | | | 2,010,927 | | | | — | | | | — | | | | 3,805,457 | | | | 8,821,554 | | |
150
| | | Distributions Paid From: | |
| | | Ordinary Income | | Long-Term Capital Gain | | Return of Capital | | Total | |
| | | 2009 | | 2008 | | 2009 | | 2008 | | 2009 | | 2008 | | 2009 | | 2008 | |
Large Cap
Disciplined Growth | | $ | — | | | $ | — | | | $ | — | | | $ | — | | | $ | — | | | $ | — | | | $ | — | | | $ | — | | |
| Mid Cap Growth | | | — | | | | — | | | | — | | | | — | | | | — | | | | — | | | | — | | | | — | | |
| Partners | | | 10,379,749 | | | | 13,592,516 | | | | 31,218,246 | | | | 151,482,195 | | | | — | | | | — | | | | 41,597,995 | | | | 165,074,711 | | |
| Real Estate | | | 1,572,919 | | | | 917,173 | | | | — | | | | 10,578,900 | | | | 477,253 | | | | 754,957 | | | | 2,050,172 | | | | 12,251,030 | | |
| Regency | | | 10,898 | | | | 755,029 | | | | 4,426,635 | | | | 13,464,501 | | | | — | | | | — | | | | 4,437,533 | | | | 14,219,530 | | |
| Select Equities | | | 56,266 | | | | — | (1) | | | — | | | | — | (1) | | | — | | | | — | (1) | | | 56,266 | | | | — | (1) | |
Small and Mid Cap
Growth | | | — | | | | 407,481 | | | | — | | | | 218,139 | | | | 19,074 | | | | — | | | | 19,074 | | | | 625,620 | | |
| Small Cap Growth | | | — | | | | — | | | | — | | | | — | | | | — | | | | — | | | | — | | | | — | | |
| Socially Responsive | | | 4,262,072 | | | | 6,921,880 | | | | 12,873,755 | | | | 36,967,425 | | | | — | | | | — | | | | 17,135,827 | | | | 43,889,305 | | |
(1) Period from December 20, 2007 (Commencement of Operations) to August 31, 2008.
(2) Period from May 1, 2008 (Commencement of Operations) to August 31, 2008.
(3) Period from October 8, 2008 (Commencement of Operations) to August 31, 2009.
As of August 31, 2009, the components of distributable earnings (accumlated losses) on a U.S. federal income tax basis were as follows:
| | | Undistributed
Ordinary
Income | | Undistributed
Long-Term
Gain | | Unrealized
Appreciation
(Depreciation) | | Loss
Carryforwards
and Deferrals | | Total | |
| Climate Change | | $ | 7,836 | | | $ | — | | | $ | 176,574 | | | ($ | 1,793,583 | ) | | ($ | 1,609,173 | ) | |
| Emerging Markets Equity | | | 95,872 | | | | — | | | | 1,346,456 | | | | — | | | | 1,442,328 | | |
| Equity Income | | | 581,294 | | | | — | | | | 2,092,370 | | | | (4,793,089 | ) | | | (2,119,425 | ) | |
| Focus | | | 4,523,162 | | | | — | | | | 34,273,159 | | | | (133,269,669 | ) | | | (94,473,348 | ) | |
| Genesis | | | — | | | | — | | | | 1,770,793,796 | | | | (820,981,122 | ) | | | 949,812,674 | | |
| Guardian | | | 5,195,284 | | | | — | | | | (3,924,592 | ) | | | (125,408,333 | ) | | | (124,137,641 | ) | |
| International | | | 202,171 | | | | — | | | | 15,531,549 | | | | (245,460,885 | ) | | | (229,727,165 | ) | |
| International Institutional | | | 77,245 | | | | — | | | | (137,247 | ) | | | (177,181,994 | ) | | | (177,241,996 | ) | |
| International Large Cap | | | 326,866 | | | | — | | | | 3,331,581 | | | | (70,032,617 | ) | | | (66,374,170 | ) | |
| Large Cap Disciplined Growth(1) | | | 141,417 | | | | — | | | | 10,360,357 | | | | (7,775,053 | ) | | | 2,726,721 | | |
| Mid Cap Growth | | | — | | | | — | | | | 55,740,658 | | | | (323,506,043 | ) | | | (267,765,385 | ) | |
| Partners | | | 16,033,417 | | | | — | | | | 123,204,416 | | | | (567,998,849 | ) | | | (428,761,016 | ) | |
| Real Estate | | | — | | | | — | | | | 6,266,471 | | | | (25,625,403 | ) | | | (19,358,932 | ) | |
| Regency | | | 592,855 | | | | — | | | | (1,214,564 | ) | | | (30,106,616 | ) | | | (30,728,325 | ) | |
| Select Equities | | | 103,643 | | | | — | | | | 3,756,688 | | | | (1,184,680 | ) | | | 2,675,651 | | |
| Small and Mid Cap Growth | | | — | | | | — | | | | 485,842 | | | | (2,337,410 | ) | | | (1,851,568 | ) | |
| Small Cap Growth | | | — | | | | — | | | | 30,232,592 | | | | (216,630,940 | ) | | | (186,398,348 | ) | |
| Socially Responsive | | | 3,542,439 | | | | — | | | | (59,282,382 | ) | | | (148,475,052 | ) | | | (204,214,995 | ) | |
The differences between book basis and tax basis distributable earnings are primarily due to: wash sales, partnership basis adjustments, capital loss carryforwards, post October loss deferrals, REIT basis adjustments, organization expenses, passive foreign investment companies, contingent payment debt instrument basis adjustments, premium amortization accruals, forward contracts mark to market, non-taxable dividend adjustments, convertible preferred stock basis adjustments, securities lending FAS 140 adjustment and depletion basis adjustments.
151
To the extent each Fund's net realized capital gains, if any, can be offset by capital loss carryforwards, it is the policy of each Fund not to distribute such gains. As determined at August 31, 2009, the following Funds had unused capital loss carryforwards available for federal income tax purposes to offset net realized capital gains, if any, as follows:
| | | Expiring In | |
| | | 2010 | | 2011 | | 2012 | | 2013 | | 2014 | | 2015 | | 2016 | | 2017 | |
| Climate Change | | $ | — | | | $ | — | | | $ | — | | | $ | — | | | $ | — | | | $ | — | | | $ | 206,442 | | | $ | 488,619 | | |
| Equity Income(2) | | | — | | | | — | | | | — | | | | — | | | | — | | | | — | | | | — | | | | 1,390,528 | | |
| Focus | | | — | | | | — | | | | — | | | | — | | | | — | | | | — | | | | — | | | | 35,105,393 | | |
| Genesis | | | — | | | | — | | | | — | | | | — | | | | — | | | | — | | | | — | | | | 56,608,624 | | |
| Guardian | | | — | | | | — | | | | — | | | | — | | | | — | | | | — | | | | — | | | | 58,796,523 | | |
| International | | | — | | | | — | | | | — | | | | — | | | | — | | | | — | | | | — | | | | 109,492,631 | | |
International
Institutional | | | — | | | | — | | | | — | | | | — | | | | — | | | | — | | | | — | | | | 93,661,292 | | |
International
Large Cap | | | — | | | | — | | | | — | | | | — | | | | — | | | | — | | | | — | | | | 32,589,988 | | |
Large Cap
Disciplined Growth(1) | | | — | | | | 1,676,598 | | | | — | | | | — | | | | — | | | | 317,954 | | | | 1,325,771 | | | | 3,672,386 | | |
| Mid Cap Growth | | | 155,307,949 | | | | 102,695,626 | | | | — | | | | — | | | | — | | | | — | | | | — | | | | 21,093,068 | | |
| Partners | | | — | | | | — | | | | — | | | | — | | | | — | | | | — | | | | — | | | | 81,556,791 | | |
| Real Estate | | | — | | | | — | | | | — | | | | — | | | | — | | | | — | | | | 1,844,454 | | | | 9,262,430 | | |
| Regency | | | — | | | | — | | | | — | | | | — | | | | — | | | | — | | | | — | | | | 3,350,748 | | |
| Select Equities(2) | | | — | | | | — | | | | — | | | | — | | | | — | | | | — | | | | 274,349 | | | | 536,920 | | |
Small and Mid Cap
Growth | | | — | | | | — | | | | — | | | | — | | | | — | | | | — | | | | — | | | | 1,362,603 | | |
| Small Cap Growth(2) | | | 70,414,892 | | | | 33,014,006 | | | | — | | | | — | | | | — | | | | — | | | | 25,763,569 | | | | 32,917,417 | | |
| Socially Responsive | | | — | | | | — | | | | — | | | | — | | | | — | | | | — | | | | — | | | | 65,700,906 | | |
(1) The capital loss carryforwards shown above for Large Cap Disciplined Growth (formerly, Century) include $1,643,725 expiring in 2015 and 2016, which were acquired on April 9, 2009 in the merger with Neuberger Berman Large Cap Disciplined Growth Fund. The use of the losses expiring in 2011 to offset future gains may be limited. Large Cap Disciplined Growth lost capital loss carryforwards of $30,961,476 due to the merger.
(2) Under current law, the use of these losses to offset future gains may be limited.
Under current tax law, certain net capital, net foreign currency losses and net passive foreign investment company mark to market losses realized after October 31 within the taxable year may be deferred and treated as occurring on the first day of the following tax year. For the year ended August 31, 2009, the Funds elected to defer the following:
| | | Post October
Capital Loss
Deferral | | Post October
Currency Loss
Deferral | |
| Climate Change | | $ | 1,098,522 | | | $ | — | | |
| Equity Income | | | 3,402,561 | | | | — | | |
| Focus | | | 98,164,276 | | | | — | | |
| Genesis | | | 764,369,930 | | | | 2,568 | | |
| Guardian | | | 66,611,810 | | | | — | | |
| International | | | 135,968,254 | | | | — | | |
| International Institutional | | | 83,520,702 | | | | — | | |
| International Large Cap | | | 37,442,629 | | | | — | | |
| Large Cap Disciplined Growth | | | 782,344 | | | | — | | |
152
| | | Post October
Capital Loss
Deferral | | Post October
Currency Loss
Deferral | |
| Mid Cap Growth | | $ | 44,408,320 | | | $ | 1,080 | | |
| Partners | | | 486,442,058 | | | | — | | |
| Real Estate | | | 14,518,519 | | | | — | | |
| Regency | | | 26,755,868 | | | | — | | |
| Select Equities | | | 373,411 | | | | — | | |
| Small and Mid Cap Growth | | | 974,807 | | | | — | | |
| Small Cap Growth | | | 54,521,056 | | | | — | | |
| Socially Responsive | | | 82,774,146 | | | | — | | |
6 Foreign taxes: Foreign taxes withheld represent amounts withheld by foreign tax authorities, net of refunds recoverable.
7 Distributions to shareholders: Each Fund may earn income, net of expenses, daily on its investments. Distributions from net investment income and net realized capital gains, if any, generally are distributed in December and are recorded on the ex-date. However, Equity Income and Real Estate generally distribute substantially all of their net investment income, if any, at the end of each calendar quarter.
It is the policy of each of Equity Income and Real Estate to pass through to its shareholders substantially all REIT distributions and other income it receives, less operating expenses. The distributions received from REITs held by Equity Income and Real Estate are generally comprised of income, capital gains, and return of REIT capital, but the REITs do not report this information to Equity Income and Real Estate until the following calendar year. At August 31, 2009, Equity Income and Real Estate estimated these amounts within the financial statements since the information is not available from the REITs until after Equity Income's and Real Estate's fiscal year-end. For the year ended August 31, 2009, the character of distributions paid to shareholders for Equity Income and Real Estate disclosed within the Statements of Changes in Net Assets is based on estimates made at that time. All estimates are based upon REIT information sources available to Equity Income and Real Estate together with actual IRS Forms 1099DIV received to date. Based on past experience it is probable that a portion of Equity Income's and Real Estate's distributions during the current fiscal year will be considered tax return of capital but the actual amount of the tax return of capital, if any, is not determinable until after Equity Income's and Real Estate's fiscal year-end. After calendar year-end, when Equity Income and Real Estate learn the nature of the distributions paid by REITs during that year, distributions previously identified as income are often recharacterized as return of capital and/or capital gain. After all applicable REITs have informed Equity Income and Real Estate of the actual breakdown of distributions paid to Equity Income and Real Estate during its fiscal year, estimates previously recorded are adjusted on the books of Equity Income and Real Estate to reflect actual results. As a result, the composition of Equity Income's and Real Estate's distributions as reported herein may differ from the final composition determined after calendar year-end and reported to Equity Income and Real Estate shareholders on IRS Form 1099DIV.
8 Organization expenses: Costs incurred by Emerging Markets Equity in connection with its organization, which amounted to $71,992 have been expensed as incurred.
9 Expense allocation: Certain expenses are applicable to multiple funds. Expenses directly attributable to a Fund are charged to that Fund. Expenses of the Trust that are not directly attributed to a Fund are allocated among the Funds, on the basis of relative net assets, except where a more appropriate allocation of expenses to each of the Funds can otherwise be made fairly. Expenses borne by the complex of related investment companies, which includes open-end and closed-end investment companies for which Management serves as investment manager, that are not directly attributed to a Fund or the Trust are allocated among the Funds and the other investment companies in the complex or series thereof on the basis of relative net assets, except where a more appropriate allocation of expenses to each investment company in the complex or series thereof can otherwise be made fairly. Each Fund's expenses (other than those specific to each class) are allocated proportionally each day between the classes based upon the relative net assets of each class.
10 Security lending: A third party, eSecLending, has assisted Focus, Guardian, International, International Institutional, International Large Cap, Mid Cap Growth, Partners, Real Estate, Regency, Small Cap Growth and
153
Socially Responsive in conducting a bidding process to try to identify a principal that would pay a guaranteed amount to each Fund in consideration of that Fund entering into an exclusive securities lending arrangement. eSecLending currently serves as exclusive lending agent for each of these Funds. Each Fund, except for International, International Institutional and International Large Cap, is currently guaranteed a particular level of income. These arrangements will change so that no Fund will be guaranteed a particular level of income.
For part of the fiscal period, Neuberger Berman LLC, (formerly known as Neuberger Berman, LLC) ("Neuberger"), an affiliate of each Fund, served as exclusive lending agent for International, International Institutional and International Large Cap. Each Fund selected Neuberger through the bidding process in accordance with an Exemptive Order issued by the Securities and Exchange Commission.
Under the securities lending arrangements, each Fund receives cash collateral at the beginning of each transaction equal to at least 102% of the prior day's market value of the loaned securities (105% in the case of international securities). Each Fund may invest all the cash collateral in Neuberger Berman Securities Lending Quality Fund, LLC ("Quality Fund"), a fund managed by Neuberger Berman Fixed Income LLC (formerly known as Lehman Brothers Asset Management LLC) ("NBFI"), an affiliate of Management. Effective July 1, 2009, Dwight Asset Management Company LLC became the Sub-Adviser to the Quality Fund. The Quality Fund is not a money market fund that is registered under the 1940 Act and does not operate in accordance with all requirements of Rule 2a-7 under the 1940 Act. There is no assurance that the Quality Fund will maintain a $1.00 share price.
On various days during the period from September 1, 2008 to November 3, 2008, the Quality Fund's NAV was $0.99 per share, which could have affected the NAV of the Funds with securities loans outstanding on those days. For the period from November 4, 2008 to August 31, 2009, the Quality Fund's price per share was at least $1.00. The market value of each Fund's investments in the Quality Fund as of the fiscal year ended August 31, 2009, if any, is reflected in the Fund's Schedule of Investments. If it were necessary to liquidate assets in the Quality Fund to meet returns on outstanding securities loans at a time when the Quality Fund's price per share was less than $1.00, a Fund may not receive an amount from the Quality Fund that is equal in amount to the collateral the Fund would be required to return to the borrower of the securities and the Fund would be required to make up for this shortfall. In addition, as a result of recent reduced liquidity in the credit and fixed income markets, it may be difficult to dispose quickly of some securities in the Quality Fund at the price at which the Quality Fund is carrying them.
Net income from the applicable lending program represents the guaranteed amount received from a principal, if applicable, plus income earned on the cash collateral invested in Quality Fund or in other investments, if applicable, less cash collateral fees and other expenses associated with the loans. For the fiscal year ended August 31, 2009, the approximate amount of income earned on cash collateral, which includes approximate amounts of interest income earned from the Quality Fund and guaranteed amounts; the approximate amount of fees and expenses paid on securities loaned; the approximate amount of net income received under the securities lending arrangements, which is reflected in the Statements of Operations under the caption "Income from securities loaned—net"; the amount of interest income that was earned from the Quality Fund; the guaranteed amounts received from Neuberger; and the fees and expenses that were retained by Neuberger are as follows:
| | | Total Interest
Income Earned
From the
Quality Fund
and Guaranteed
Amounts | | Fees and
Expenses
Paid on
Securities
Loaned | | Net Income
Received
Under the
Securities
Lending
Arrangements | | Interest
Income
Earned From
the Quality
Fund | | Guaranteed
Amounts
Received
From
Neuberger | | Fees and
Expenses Paid
that were
Retained by
Neuberger | |
| Focus | | $ | 1,706,387 | | | $ | 1,119,406 | | | $ | 586,981 | | | $ | 1,393,971 | | | $ | — | | | $ | — | | |
| Guardian | | | 606,395 | | | | 444,892 | | | | 161,503 | | | | 534,546 | | | | — | | | | — | | |
| International | | | 824,945 | | | | 222,398 | | | | 602,547 | | | | 404,741 | | | | 124,517 | | | | — | | |
| International Institutional | | | 431,392 | | | | 113,671 | | | | 317,721 | | | | 213,385 | | | | 70,717 | | | | — | | |
| International Large Cap | | | 202,450 | | | | 50,528 | | | | 151,922 | | | | 106,666 | | | | 16,112 | | | | — | | |
| Mid Cap Growth | | | 1,482,724 | | | | 763,647 | | | | 719,077 | | | | 1,281,503 | | | | — | | | | — | | |
154
| | | Total Interest
Income Earned
From the
Quality Fund
and Guaranteed
Amounts | | Fees and
Expenses
Paid on
Securities
Loaned | | Net Income
Received
Under the
Securities
Lending
Arrangements | | Interest
Income
Earned From
the Quality
Fund | | Guaranteed
Amounts
Received
From
Neuberger | | Fees and
Expenses Paid
that were
Retained by
Neuberger | |
| Partners | | $ | 6,423,186 | | | $ | 3,956,167 | | | $ | 2,467,019 | | | $ | 5,371,988 | | | $ | — | | | $ | — | | |
| Real Estate | | | 191,883 | | | | 98,192 | | | | 93,691 | | | | 166,081 | | | | — | | | | — | | |
| Regency | | | 191,278 | | | | 116,223 | | | | 75,055 | | | | 157,431 | | | | — | | | | — | | |
| Small Cap Growth | | | 781,409 | | | | 486,866 | | | | 294,543 | | | | 656,910 | | | | — | | | | — | | |
| Socially Responsive | | | 271,297 | | | | 140,768 | | | | 130,529 | | | | 201,224 | | | | — | | | | — | | |
11 Repurchase agreements: Each Fund may enter into repurchase agreements with institutions that Management has determined are creditworthy. Each repurchase agreement is recorded at cost. Each Fund requires that the securities purchased in a repurchase agreement be transferred to the custodian in a manner sufficient to enable the Fund to assert a perfected security interest in those securities in the event of a default under the repurchase agreement. Each Fund monitors, on a daily basis, the value of the securities transferred to ensure that their value, including accrued interest, is greater than amounts owed to the Fund under each such repurchase agreement.
12 Redemption of fund shares: Each class of Emerging Markets Equity, International, International Institutional, and International Large Cap, charges a redemption fee of 2%, and Real Estate charges a redemption fee of 1%, respectively, on shares redeemed or exchanged for shares of another fund within 60 days or less of the purchase date. All redemption fees are paid to and recorded by each Fund as Paid-in capital. For the year ended August 31, 2009, Emerging Markets Equity, International, International Institutional, International Large Cap, and Real Estate received $243, $70,315, $2,985, $1,360 and $29,953, respectively, in redemption fees.
13 Transactions with other funds managed by Neuberger Berman Management LLC: Pursuant to an Exemptive Order issued by the Securities and Exchange Commission, the Funds may invest in a money market fund managed by Management or an affiliate. Through August 10, 2009, the Funds invested in Neuberger Berman Prime Money Fund ("Prime Money") or Neuberger Berman Government Money Fund ("Government Money"), as approved by the Board. Prime Money and Government Money each sought to provide the highest available current income consistent with safety and liquidity. For any cash that the Funds invested in Prime Money or Government Money, Management waived a portion of its management fee equal to the management fee it received from Prime Money or Government Money on those assets (the "Arrangement"). For the year ended August 31, 2009, management fees waived under this Arrangement are reflected in the Statements of Operations under the caption "Investment management fees waived." For the year ended August 31, 2009, income earned under this Arrangement is reflected in the Statements of Operations under the caption "Income from investments in affiliated issuers." For the year ended August 31, 2009, management fees waived and income earned under this Arrangement on Prime Money were as follows:
| (000's omitted) | | Management
Fees Waived | | Income
Earned | | (000's omitted) | | Management
Fees Waived | | Income
Earned | |
| Climate Change | | $ | — | | | $ | 2 | | | Large Cap Disciplined Growth | | $ | 1 | | | $ | 4 | | |
| Emerging Markets Equity(1) | | | — | | | | 4 | | | Mid Cap Growth | | | 19 | | | | 221 | | |
| Equity Income(2) | | | 3 | | | | 23 | | | Partners | | | 20 | | | | 180 | | |
| Focus | | | 15 | | | | 189 | | | Real Estate | | | 1 | | | | 11 | | |
| Genesis | | | 389 | | | | 4,922 | | | Regency | | | 2 | | | | 37 | | |
| Guardian | | | 15 | | | | 129 | | | Select Equities | | | 6 | | | | 35 | | |
| International | | | 16 | | | | 259 | | | Small and Mid Cap Growth | | | — | | | | 4 | | |
| International Institutional | | | 9 | | | | 147 | | | Small Cap Growth | | | 5 | | | | 81 | | |
| International Large Cap | | | 5 | | | | 67 | | | Socially Responsive | | | — | | | | — | | |
(1) Period from October 8, 2008 (Commencement of Operations) to August 31, 2009.
155
(2) All Funds invested in Prime Money during the year ended August 31, 2009. Equity Income also invested in Government Money. Equity Income had the following: approximately $0 in management fees waived and approximately $2,000 in income earned under this Arrangement on Government Money.
On August 10, 2009, the Funds ceased investing in Prime Money or Government Money. On this date, the Funds' shares of Prime Money or Government Money were redeemed in exchange for portfolio holdings of Prime Money or Government Money, which were used to purchase Institutional Class shares of State Street Institutional Liquid Reserves Fund.
14 Investments in foreign securities: Investing in foreign securities may involve certain sovereign and other risks, in addition to the credit and market risks normally associated with domestic securities. These additional risks include the possibility of adverse political and economic developments (including political instability, nationalization, expropriation, or confiscatory taxation) and the potentially adverse effects of unavailability of public information regarding issuers, less governmental supervision and regulation of financial markets, reduced liquidity of certain financial markets, and the lack of uniform accounting, auditing, and financial reporting standards or the application of standards that are different or less stringent than those applied in the United States. Foreign securities also may experience greater price volatility, higher rates of inflation, and delays in settlement.
15 Derivative instruments: During the period ending August 31, 2009, the Funds' use of derivatives was limited to written option transactions. The Funds adopted FASB Statement of Financial Accounting Standards No. 161 "Disclosures about Derivative Instruments and Hedging Activities" ("SFAS 161"), effective December 1, 2008. The Funds have disclosed derivative transactions for the year ending August 31, 2009, although SFAS 161 only requires disclosure for the six months ending August 31, 2009.
Options: Each Fund may write covered call options, and certain Funds may write put options.
Premiums received by a Fund upon writing a covered call option or a put option are recorded in the liability section of each Fund's Statement of Assets and Liabilities and are subsequently adjusted to the current market value. When an option is exercised, closed, or expired, the Fund realizes a gain or loss and the liability is eliminated.
In general, written covered call and put options may serve as a partial hedge against decreases or increases in value in the underlying securities. For written call options, a Fund bears the risk of a decline in the price of the underlying security during the period, although any potential loss during the period would be reduced by the amount of the option premium received. For written put options, a Fund bears the risk of an increase in the price of the underlying security during the period, although if a put option a Fund has written expires unexercised, the Fund would realize a gain in the amount of the premium received. All securities covering outstanding options are held in escrow by the custodian bank.
Summary of written option transactions for the year ended August 31, 2009 for Equity Income were:
| | | Put Options | | Call Options | |
| | | Number | | Value When
Written | | Number | | Value When
Written | |
| Contracts outstanding 8/31/2008 | | | — | | | $ | — | | | | 5,600 | | | $ | 6,000 | | |
| Contracts written | | | 96,500 | | | | 153,000 | | | | 271,400 | | | | 358,000 | | |
| Contracts expired | | | (18,000 | ) | | | (30,000 | ) | | | (19,000 | ) | | | (26,000 | ) | |
| Contracts exercised | | | (9,000 | ) | | | (30,000 | ) | | | (28,500 | ) | | | (29,000 | ) | |
| Contracts closed | | | (29,500 | ) | | | (46,000 | ) | | | (46,500 | ) | | | (85,000 | ) | |
| Contracts outstanding 8/31/2009 | | | 40,000 | | | $ | 47,000 | | | | 183,000 | | | $ | 224,000 | | |
The option transactions in the summary above are indicative of the volume throughout the period.
156
At August 31, 2009, Equity Income had the following derivatives (not designated as hedging instruments under SFAS No.133), grouped by primary risk exposure:
Liability Derivatives
| | | Equity
Contracts
Risk | | Total | |
| Option Contracts Written:(1) | | $ | 265,000 | | | $ | 265,000 | | |
| Total Value | | $ | 265,000 | | | $ | 265,000 | | |
(1) Statements of Assets and Liabilities location: Options contracts written, at value.
The impact of the use of derivative instruments on the Statement of Operations during the year ended August 31, 2009, was as follows:
Realized Gain (Loss)(1)
| | | Equity
Contracts
Risk | | Total | |
| Option Contracts Written | | $ | 184,000 | | | $ | 184,000 | | |
| Total Realized Gain (Loss) | | $ | 184,000 | | | $ | 184,000 | | |
Change in Appreciation (Depreciation)(2)
| | | Equity
Contracts
Risk | | Total | |
| Option Contracts Written | | $ | 1,000 | | | $ | 1,000 | | |
| Total Change in Appreciation (Depreciation) | | $ | 1,000 | | | $ | 1,000 | | |
(1) Statements of Operations location: Net realized gain (loss) on options written.
(2) Statements of Operations location: Change in net unrealized appreciation (depreciation) in value of options written.
While the Funds may receive rights and warrants in connection with their investments in securities, these rights and warrants are not considered "derivative instruments" under FASB Statement of Financial Accounting Standards No. 133. Management has concluded that the Funds, except Equity Income, did not hold any derivative instruments during the year ended August 31, 2009 that require additional disclosures pursuant to SFAS 161.
16 Indemnifications: Like many other companies, the Trust's organizational documents provide that its officers and trustees are indemnified against certain liabilities arising out of the performance of their duties to the Trust. In addition, both in some of its principal service contracts and in the normal course of its business, the Trust enters into contracts that provide indemnifications to other parties for certain types of losses or liabilities. The Trust's maximum exposure under these arrangements is unknown as this could involve future claims against the Trust.
17 Other: All net investment income and realized and unrealized capital gains and losses of each Fund are allocated, on the basis of relative net assets, pro rata among its respective classes.
157
Note B—Management Fees, Administration Fees, Distribution Arrangements, and Other Transactions With Affiliates:
Each Fund retains Management as its investment manager under a Management Agreement. For such investment management services, each Fund pays Management a fee according to the following table:
Investment Management Fee as a Percentage of Average Daily Net Assets:
| | | First
$250
million | | Next
$250
million | | Next
$250
million | | Next
$250
million | | Next
$500
million | | Next
$500
million | | Next
$500
million | | Next
$1.5
billion | | Thereafter | |
| For Climate Change, Genesis and Small Cap Growth: | |
| | | 0.85 | % | | | 0.80 | % | | | 0.75 | % | | | 0.70 | % | | | 0.65 | % | | | 0.65 | % | | | 0.65 | % | | | 0.65 | % | | | 0.65 | % | |
| For Emerging Markets Equity: | |
| | | 1.00 | % | | | 0.975 | % | | | 0.95 | % | | | 0.925 | % | | | 0.90 | % | | | 0.875 | % | | | 0.875 | % | | | 0.875 | % | | | 0.85 | % | |
| For Real Estate: | |
| | | 0.80 | % | | | 0.80 | % | | | 0.80 | % | | | 0.80 | % | | | 0.80 | % | | | 0.80 | % | | | 0.80 | % | | | 0.80 | % | | | 0.80 | % | |
| For International and International Institutional: | |
| | | 0.85 | % | | | 0.825 | % | | | 0.80 | % | | | 0.775 | % | | | 0.75 | % | | | 0.725 | % | | | 0.725 | % | | | 0.70 | % | | | 0.70 | % | |
| For Equity Income, Focus, Guardian, International Large Cap, Large Cap Disciplined Growth, Mid Cap Growth, Partners, Regency, Select Equities, Small and Mid Cap Growth, and Socially Responsive: | |
| | | 0.55 | % | | | 0.525 | % | | | 0.50 | % | | | 0.475 | % | | | 0.45 | % | | | 0.425 | % | | | 0.425 | % | | | 0.425 | % | | | 0.40 | % | |
Each Fund retains Management as its administrator under an Administration Agreement. Each Fund pays Management an administration fee at the annual rate of 0.06% of its average daily net assets under this Agreement. In addition, each Fund's Investor Class, Class A, Class C and Class R3 pays Management an administration fee at the annual rate of 0.20% of its average daily net assets, each Fund's Trust Class and Advisor Class pays Management an administration fee at the annual rate of 0.34% of its average daily net assets, and each Fund's Institutional Class pays Management an administration fee at the annual rate of 0.09% of its average daily net assets. Additionally, Management retains State Street Bank and Trust Company ("State Street") as its sub-administrator under a Sub-Administration Agreement. Management pays State Street a fee for all services received under the agreement.
For the Trust Class of Focus, Guardian, International Large Cap, Partners, Real Estate, Regency, Small and Mid Cap Growth, Small Cap Growth and Socially Responsive (and for Equity Income prior to June 9, 2008), the Advisor Class of each Fund, and Class A, Class C and Class R3 of each Fund, Management acts as agent in arranging for the sale of class shares without commission and bears advertising and promotion expenses. The Board has adopted distribution plans (each a "Plan", collectively, the "Plans") with respect to these classes, pursuant to Rule 12b-1 under the 1940 Act. The Plans provide that, as compensation for administrative and other services provided to these classes, Management's activities and expenses related to the sale and distribution of these classes of shares, and ongoing services provided to investors in these classes, Management receives from each of these classes a fee at the annual rate of 0.10% of such Trust Class, 0.25% of such Advisor Class, 0.25% of such Class A's, 1.00% of such Class C's and 0.50% of such Class R3's average daily net assets. Management receives this amount to provide distribution and shareholder servicing for those classes and pays a portion of it to institutions that provide such services. Those institutions may use the payments for, among other purposes, compensating employees engaged in sales and/or shareholder servicing. The amount of fees paid by each class during any year may be more or less than the cost of distribution and other services provided to that class. FINRA rules limit the amount of annual distribution fees that may be paid by a mutual fund and impose a ceiling on the cumulative distribution fees paid. The Trust's Plans comply with those rules.
Management has contractually undertaken to forgo current payment of fees and/or reimburse operating expenses (including the fees payable to Management but excluding interest, taxes, brokerage commissions and extraordinary
158
expenses) ("Operating Expenses") which exceed the expense limitation as detailed in the following table. The Investor Classes of International, Large Cap Disciplined Growth, Regency, and Small Cap Growth and the Trust Class, Advisor Class, Institutional Class, Class A, Class C and Class R3 of each Fund have agreed to repay Management for fees and expenses forgone and/or its excess Operating Expenses previously reimbursed by Management, pursuant to a contractual expense limitation, so long as their annual Operating Expenses during that period do not exceed their Expense Limitations, and the repayments are made within three years after the year in which Management issued the reimbursement. During the year ended August 31, 2009, there were no reimbursements to Management under this agreement. At August 31, 2009, contingent liabilities to Management under the agreement were as follows:
| | | | | | | Expenses Deferred In
Fiscal Period Ending August 31, | |
| | | | | | | 2007 | | 2008 | | 2009 | |
| | | | | | | Subject to Repayment until
August 31, | |
| Class | | Contractual
Expense
Limitation(1) | | Expiration | | 2010 | | 2011 | | 2012 | |
| Climate Change Fund Institutional Class | | | 0.95 | % | | 8/31/12 | | $ | — | | | $ | 179,923 | (6) | | $ | 120,170 | | |
| Climate Change Fund Class A | | | 1.20 | % | | 8/31/12 | | | — | | | | 75,053 | (6) | | | 102,914 | | |
| Climate Change Fund Class C | | | 1.95 | % | | 8/31/12 | | | — | | | | 8,633 | (6) | | | 11,617 | | |
| Emerging Markets Equity Fund Institutional Class | | | 1.25 | % | | 8/31/12 | | | — | | | | — | | | | 371,874 | (9) | |
| Emerging Markets Equity Fund Class A | | | 1.50 | % | | 8/31/12 | | | — | | | | — | | | | 56,747 | (9) | |
| Emerging Markets Equity Fund Class C | | | 2.25 | % | | 8/31/12 | | | — | | | | — | | | | 19,340 | (9) | |
| Equity Income Fund Institutional Class | | | 0.80 | % | | 8/31/12 | | | 84,036 | | | | 155,052 | (8) | | | 18,095 | | |
| Equity Income Fund Class A | | | 1.16 | % | | 8/31/12 | | | — | | | | 108,121 | (8) | | | 307,047 | | |
| Equity Income Fund Class C | | | 1.91 | % | | 8/31/12 | | | — | | | | 4,441 | (8) | | | 16,896 | | |
| Focus Fund Trust Class | | | 1.50 | % | | 8/31/12 | | | — | | | | — | | | | — | | |
| Focus Fund Advisor Class | | | 1.50 | % | | 8/31/19 | | | — | | | | — | | | | 2,550 | | |
| Genesis Fund Trust Class | | | 1.50 | % | | 8/31/12 | | | — | | | | — | | | | — | | |
| Genesis Fund Advisor Class | | | 1.50 | % | | 8/31/19 | | | — | | | | — | | | | — | | |
| Genesis Fund Institutional Class | | | 0.85 | % | | 8/31/19 | | | — | | | | — | | | | 510,447 | | |
| Guardian Fund Trust Class | | | 1.50 | % | | 8/31/12 | | | — | | | | — | | | | — | | |
| Guardian Fund Advisor Class | | | 1.50 | % | | 8/31/19 | | | 16,816 | | | | 18,491 | | | | 20,599 | | |
| Guardian Fund Institutional Class | | | 0.75 | % | | 8/13/12 | | | — | | | | — | | | | 603 | (11) | |
| Guardian Fund Class A | | | 1.11 | % | | 8/31/13 | | | — | | | | — | | | | 633 | (11) | |
| Guardian Fund Class C | | | 1.86 | % | | 8/31/13 | | | — | | | | — | | | | 603 | (11) | |
| Guardian Fund Class R3 | | | 1.36 | % | | 8/31/13 | | | — | | | | — | | | | 603 | (11) | |
| International Fund Investor Class | | | 1.40 | % | | 8/31/12 | | | — | | | | — | | | | — | | |
| International Fund Trust Class | | | 2.00 | % | | 8/31/19 | | | — | | | | — | | | | — | | |
| International Institutional Fund Institutional Class | | | 0.85 | %(2) | | 8/31/19 | | | 1,588,898 | | | | 1,304,181 | | | | 892,834 | | |
| International Large Cap Fund Trust Class | | | 1.25 | % | | 8/31/12 | | | 63,756 | | | | 51,118 | | | | 118,494 | | |
| International Large Cap Fund Institutional Class | | | 0.90 | % | | 8/31/12 | | | 64,891 | | | | 63,922 | | | | 259,193 | | |
| International Large Cap Fund Class A | | | 1.30 | %(2) | | 8/31/12 | | | — | | | | 1,930 | (3) | | | 15,881 | | |
| International Large Cap Fund Class C | | | 2.00 | % | | 8/31/12 | | | — | | | | 1,475 | (3) | | | 3,157 | | |
| International Large Cap Fund Class R3 | | | 1.51 | % | | 8/31/13 | | | — | | | | — | | | | 642 | (11) | |
| Large Cap Disciplined Growth Fund Investor Class | | | 1.11 | %(12) | | 8/31/15 | | | 98,946 | | | | 114,962 | | | | 110,752 | | |
159
| | | | | | | Expenses Deferred In
Fiscal Period Ending August 31, | |
| | | | | | | 2007 | | 2008 | | 2009 | |
| | | | | | | Subject to Repayment until
August 31, | |
| Class | | Contractual
Expense
Limitation(1) | | Expiration | | 2010 | | 2011 | | 2012 | |
| Large Cap Disciplined Growth Fund Institutional Class | | | 0.75 | % | | 8/31/13 | | $ | — | | | $ | — | | | $ | 40,802 | (10) | |
| Large Cap Disciplined Growth Fund Class A | | | 1.11 | % | | 8/31/13 | | | — | | | | — | | | | 120,878 | (10) | |
| Large Cap Disciplined Growth Fund Class C | | | 1.86 | % | | 8/31/13 | | | — | | | | — | | | | 57,300 | (10) | |
| Large Cap Disciplined Growth Fund Class R3 | | | 1.36 | % | | 8/31/13 | | | — | | | | — | | | | 679 | (11) | |
| Mid Cap Growth Fund Trust Class | | | 1.50 | % | | 8/31/12 | | | — | | | | — | | | | — | | |
| Mid Cap Growth Fund Advisor Class | | | 1.50 | % | | 8/31/19 | | | 18,886 | | | | 21,479 | | | | 12,953 | | |
| Mid Cap Growth Fund Institutional Class | | | 0.75 | % | | 8/31/12 | | | 18,664 | | | | 5,692 | | | | 87,923 | | |
| Mid Cap Growth Fund Class A | | | 1.11 | % | | 8/31/13 | | | — | | | | — | | | | 625 | (11) | |
| Mid Cap Growth Fund Class C | | | 1.86 | % | | 8/31/13 | | | — | | | | — | | | | 613 | (11) | |
| Mid Cap Growth Fund Class R3 | | | 1.36 | % | | 8/31/13 | | | — | | | | — | | | | 613 | (11) | |
| Partners Fund Trust Class | | | 1.50 | % | | 8/31/12 | | | — | | | | — | | | | — | | |
| Partners Fund Advisor Class | | | 1.50 | % | | 8/31/19 | | | — | | | | — | | | | — | | |
| Partners Fund Institutional Class | | | 0.70 | % | | 8/31/12 | | | — | | | | — | | | | 10,118 | | |
| Real Estate Fund Trust Class | | | 1.50 | %(2) | | 8/31/19 | | | 126,728 | | | | 202,213 | | | | 221,579 | | |
| Real Estate Fund Institutional Class | | | 0.85 | % | | 8/31/19 | | | — | | | | 1,565 | (7) | | | 21,094 | | |
| Regency Fund Investor Class | | | 1.50 | % | | 8/31/19 | | | — | | | | — | | | | — | | |
| Regency Fund Trust Class | | | 1.25 | % | | 8/31/19 | | | 45,898 | | | | 64,085 | | | | 110,510 | | |
| Select Equities Fund Institutional Class | | | 0.75 | % | | 8/31/12 | | | — | | | | 204,528 | (3) | | | 37,421 | | |
| Select Equities Fund Class A | | | 1.20 | % | | 8/31/12 | | | — | | | | 36,737 | (3) | | | 191,995 | | |
| Select Equities Fund Class C | | | 1.95 | % | | 8/31/12 | | | — | | | | 10,276 | (3) | | | 28,856 | | |
| Small and Mid Cap Growth Fund Trust Class | | | 1.10 | % | | 8/31/12 | | | 167,603 | | | | 156,067 | | | | 203,996 | | |
| Small Cap Growth Fund Investor Class | | | 1.30 | % | | 8/31/19 | | | 242,097 | | | | 167,399 | | | | 307,973 | | |
| Small Cap Growth Fund Trust Class | | | 1.40 | % | | 8/31/19 | | | 34,251 | | | | 61,978 | | | | 89,143 | | |
| Small Cap Growth Fund Advisor Class | | | 1.60 | % | | 8/31/19 | | | 28,271 | | | | 36,185 | | | | 39,339 | | |
| Small Cap Growth Fund Institutional Class | | | 0.90 | % | | 8/31/12 | | | — | | | | 3,615 | (5) | | | 38,496 | | |
| Small Cap Growth Fund Class A | | | 1.26 | % | | 8/31/13 | | | — | | | | — | | | | 702 | (11) | |
| Small Cap Growth Fund Class C | | | 2.01 | % | | 8/31/13 | | | — | | | | — | | | | 685 | (11) | |
| Small Cap Growth Fund Class R3 | | | 1.51 | % | | 8/31/13 | | | — | | | | — | | | | 678 | (11) | |
| Socially Responsive Fund Trust Class | | | 1.50 | % | | 8/31/12 | | | — | | | | — | | | | — | | |
| Socially Responsive Fund Institutional Class | | | 0.75 | % | | 8/31/12 | | | — | | | | 8,868 | (4) | | | 18,282 | | |
| Socially Responsive Fund Class A | | | 1.11 | % | | 8/31/13 | | | — | | | | — | | | | 628 | (11) | |
| Socially Responsive Fund Class C | | | 1.86 | % | | 8/31/13 | | | — | | | | — | | | | 603 | (11) | |
| Socially Responsive Fund Class R3 | | | 1.36 | % | | 8/31/13 | | | — | | | | — | | | | 601 | (11) | |
(1) Expense limitation per annum of the respective class' average daily net assets.
(2) In addition, Management has voluntarily undertaken to forgo current payment of fees and/or reimburse the Institutional Class of International Institutional, Class A of International Large Cap and the Trust Class of Real Estate, so that their Operating Expenses are limited to 0.80%, 1.24% and 0.99%, respectively, per annum of their
160
average daily net assets. For the year ended August 31, 2009, voluntary reimbursements for the Institutional Class of International Institutional, Class A of International Large Cap and the Trust Class of Real Estate amounted to $113,489, $461 and $220,118, respectively. This undertaking, which is terminable by Management upon notice to International Institutional, International Large Cap and Real Estate, is in addition to the contractual undertaking as stated above.
(3) Period from December 20, 2007 (Commencement of Operations) to August 31, 2008.
(4) Period from November 28, 2007 (Commencement of Operations) to August 31, 2008.
(5) Period from April 1, 2008 (Commencement of Operations) to August 31, 2008.
(6) Period from May 1, 2008 (Commencement of Operations) to August 31, 2008.
(7) Period from June 4, 2008 (Commencement of Operations) to August 31, 2008.
(8) Period from June 9, 2008 (Commencement of Operations) to August 31, 2008. On June 9, 2008, Equity Income's Trust Class was converted into the Fund's Institutional Class. The financial information of the Fund's Institutional Class includes the financial information of Trust Class shares.
(9) Period from October 8, 2008 (Commencement of Operations) to August 31, 2009.
(10) Period from April 6, 2009 (Commencement of Operations) to August 31, 2009.
(11) Period from May 27, 2009 (Commencement of Operations) to August 31, 2009.
(12) Expense limitation was 1.50% until April 13, 2009.
During the reporting period, the predecessor of Management, the investment manager of the Funds, and Neuberger, the sub-adviser of the Funds, were wholly owned subsidiaries of Lehman Brothers Holdings Inc. ("Lehman Brothers"), a publicly owned holding company. On September 15, 2008, Lehman Brothers filed a voluntary petition under Chapter 11 of the U.S. Bankruptcy Code. On December 3, 2008, NBSH Acquisition, LLC ("NBSH"), an entity organized by key members of Neuberger Berman's senior management, was selected as the successful bidder in the public auction to acquire a majority interest in Neuberger Berman's business and the fixed income and certain alternative asset management businesses of Lehman Brothers' Investment Management Division (together with Neuberger Berman, the "Acquired Businesses") (the "Acquisition"). On December 22, 2008, the bankruptcy court having jurisdiction over the Lehman Brothers matter approved the sale of the Acquired Businesses to NBSH (or its successor or assign), as the successful bidder.
The Acquisition closed on May 4, 2009. The Acquired Businesses are now indirectly owned by, among others, portfolio managers, Neuberger Berman's management team, and certain key members and senior professionals who are employed in various parts of the Neuberger Berman complex of companies, with a minority interest retained by Lehman Brothers and certain affiliates of Lehman Brothers.
The closing of the Acquisition resulted in an "assignment" of the Funds' Management Agreements and Sub-Advisory Agreements. Such an assignment, by law, automatically terminated those agreements. Accordingly, prior to the closing the Board, including the Trustees who are not "interested persons" of the Funds' investment manager and its affiliates or the Funds, considered and approved new Management Agreements and Sub-Advisory Agreements for the Funds. The new agreements, which are virtually identical to those previously in effect, were also approved by a vote of the Funds' shareholders.
These events have not had a material impact on the Funds or their operations. Management and Neuberger continue to operate in the ordinary course of business as the investment manager and sub-adviser of the Funds.
Neuberger is retained by Management to furnish it with investment recommendations and research information without added cost to the Funds. Several individuals who are officers and/or Trustees of the Trust are also employees of Neuberger and/or Management.
161
Each class of shares has a distribution agreement with Management. Class A shares of each Fund are generally sold with an initial sales charge of up to 5.75% and no contingent deferred sales charge, except that a charge of 1.00% applies to certain redemptions made within 18 months following purchases of $1 million or more without an initial sales charge. Class C shares are sold with no initial sales charge and a 1.00% contingent deferred sales charge ("CDSC") if shares are sold within one year after purchase.
For the year ended August 31, 2009, Emerging Markets Equity and Socially Responsive each recorded capital contributions from Management in the amounts of $1,418 and $422, respectively. These amounts were paid in connection with losses outside each Fund's direct control incurred in the execution of a trade. Management does not normally make payments for losses incurred from a trade error.
For the year ended August 31, 2009, Management, acting as underwriter and broker-dealer, received net commissions from the sale of Class A and Class C shares and CDSCs from the redemptions of Class A and Class C shares as follows:
| | | Underwriter
Net Commissions | | CDSC | | Broker-Dealer
Net Commissions | | CDSC | |
| Climate Change Fund Class A | | $ | 115 | | | $ | — | | | $ | — | | | $ | — | | |
| Climate Change Fund Class C | | | — | | | | 1 | | | | — | | | | — | | |
| Emerging Markets Equity Fund Class A | | | 337 | | | | — | | | | — | | | | — | | |
| Emerging Markets Equity Fund Class C | | | — | | | | 500 | | | | — | | | | — | | |
| Equity Income Fund Class A | | | 15,069 | | | | — | | | | — | | | | — | | |
| Equity Income Fund Class C | | | — | | | | 7,647 | | | | — | | | | — | | |
| Guardian Fund Class A | | | — | | | | — | | | | — | | | | — | | |
| Guardian Fund Class C | | | — | | | | — | | | | — | | | | — | | |
| International Large Cap Fund Class A | | | 126 | | | | — | | | | — | | | | — | | |
| International Large Cap Fund Class C | | | — | | | | — | | | | — | | | | — | | |
| Large Cap Disciplined Growth Fund Class A | | | 3,668 | | | | — | | | | — | | | | — | | |
| Large Cap Disciplined Growth Fund Class C | | | — | | | | 830 | | | | — | | | | — | | |
| Mid Cap Growth Fund Class A | | | — | | | | — | | | | — | | | | — | | |
| Mid Cap Growth Fund Class C | | | — | | | | — | | | | — | | | | — | | |
| Select Equities Fund Class A | | | 10,853 | | | | — | | | | — | | | | — | | |
| Select Equities Fund Class C | | | — | | | | 1,735 | | | | — | | | | — | | |
| Small Cap Growth Fund Class A | | | — | | | | — | | | | — | | | | — | | |
| Small Cap Growth Fund Class C | | | — | | | | — | | | | — | | | | — | | |
| Socially Responsive Fund Class A | | | — | | | | — | | | | — | | | | — | | |
| Socially Responsive Fund Class C | | | — | | | | — | | | | — | | | | — | | |
Each Fund has an expense offset arrangement in connection with its custodian contract. For the year ended August 31, 2009, the impact of this arrangement was a reduction of expenses of $1, $0, $268, $355, $546, $156, $1,043, $53, $62, $2, $1,310, $564, $14, $130, $4, $3, $366, and $3,076 for Climate Change, Emerging Markets Equity, Equity Income, Focus, Genesis, Guardian, International, International Institutional, International Large Cap, Large Cap Disciplined Growth, Mid Cap Growth, Partners, Real Estate, Regency, Select Equities, Small and Mid Cap Growth, Small Cap Growth, and Socially Responsive, respectively.
162
Note C—Securities Transactions:
During the year ended August 31, 2009, there were purchase and sale transactions (excluding short-term securities and option contracts) as follows:
| (000's omitted) | | Purchases | | Sales | | (000's omitted) | | Purchases | | Sales | |
| Climate Change | | $ | 10,423 | | | $ | 9,917 | | | Large Cap Disciplined Growth | | $ | 106,020 | | | $ | 54,631 | | |
| Emerging Markets Equity(1) | | | 7,186 | | | | 2,794 | | | Mid Cap Growth | | | 327,216 | | | | 238,679 | | |
| Equity Income | | | 53,545 | | | | 17,570 | | | Partners | | | 776,881 | | | | 1,161,100 | | |
| Focus | | | 476,906 | | | | 554,916 | | | Real Estate | | | 101,616 | | | | 80,858 | | |
| Genesis | | | 927,243 | | | | 1,246,003 | | | Regency | | | 37,759 | | | | 57,838 | | |
| Guardian | | | 268,970 | | | | 360,625 | | | Select Equities | | | 51,034 | | | | 16,785 | | |
| International | | | 323,486 | | | | 499,624 | | | Small and Mid Cap Growth | | | 9,588 | | | | 9,086 | | |
| International Institutional | | | 218,532 | | | | 276,805 | | | Small Cap Growth | | | 630,139 | | | | 632,204 | | |
| International Large Cap | | | 83,668 | | | | 108,733 | | | Socially Responsive | | | 329,573 | | | | 310,330 | | |
(1) Period from October 8, 2008 (Commencement of Operations) to August 31, 2009.
During the year ended August 31, 2009, there were brokerage commissions on securities transactions paid to affiliated brokers as follows:
| (000's omitted) | | Neuberger | | Lehman
Brothers Inc. | | (000's omitted) | | Neuberger | | Lehman
Brothers Inc. | |
| Climate Change | | $ | — | | | $ | — | | | Large Cap Disciplined Growth | | $ | — | | | $ | — | | |
| Emerging Markets Equity(1) | | | — | | | | — | | | Mid Cap Growth | | | — | | | | 1 | | |
| Equity Income | | | — | | | | — | | | Partners | | | — | | | | 10 | | |
| Focus | | | 1 | | | | 7 | | | Real Estate | | | — | | | | 1 | | |
| Genesis | | | — | | | | — | | | Regency | | | — | | | | — | | |
| Guardian | | | — | | | | 3 | | | Select Equities | | | 1 | | | | — | | |
| International | | | — | | | | — | | | Small and Mid Cap Growth | | | — | | | | — | | |
| International Institutional | | | — | | | | — | | | Small Cap Growth | | | — | | | | 8 | | |
| International Large Cap | | | — | | | | — | | | Socially Responsive | | | — | | | | 4 | | |
(1) Period from October 8, 2008 (Commencement of Operations) to August 31, 2009.
Note D—Fund Share Transactions:
Share activity for the years ended August 31, 2009 and August 31, 2008 was as follows:
| | | For the Year Ended August 31, 2009 | | For the Year Ended August 31, 2008 | |
| (000's omitted) | | Shares
Sold | | Shares
Issued on
Reinvestment
of Dividends
and
Distributions
and
Conversions/
Acquisitions | | Shares
Redeemed | | Total | | Shares
Sold | | Shares
Issued on
Reinvestment
of Dividends
and
Distributions
and
Conversions/
Acquisitions | | Shares
Redeemed | | Total | |
| Climate Change: | |
| Institutional Class | | | — | | | | 10 | | | | — | | | | 10 | | | | 230 | | | | — | | | | — | | | | 230 | (4) | |
| Class A | | | 139 | | | | 8 | | | | (141 | ) | | | 6 | | | | 206 | | | | — | | | | — | | | | 206 | (4) | |
| Class C | | | 20 | | | | 1 | | | | (1 | ) | | | 20 | | | | 10 | | | | — | | | | — | | | | 10 | (4) | |
163
| | | For the Year Ended August 31, 2009 | | For the Year Ended August 31, 2008 | |
| (000's omitted) | | Shares
Sold | | Shares
Issued on
Reinvestment
of Dividends
and
Distributions
and
Conversions/
Acquisitions | | Shares
Redeemed | | Total | | Shares
Sold | | Shares
Issued on
Reinvestment
of Dividends
and
Distributions
and
Conversions/
Acquisitions | | Shares
Redeemed | | Total | |
Emerging Markets
Equity:(7) | |
| Institutional Class | | | 280 | | | | 8 | | | | — | | | | 288 | | | | — | | | | — | | | | — | | | | — | | |
| Class A | | | 141 | | | | — | | | | (11 | ) | | | 130 | | | | — | | | | — | | | | — | | | | — | | |
| Class C | | | 21 | | | | — | | | | (5 | ) | | | 16 | | | | — | | | | — | | | | — | | | | — | | |
| Equity Income: | |
| Trust Class | | | — | | | | — | | | | — | | | | — | | | | — | | | | (494 | )(10) | | | (18 | ) | | | (512 | ) | |
| Institutional Class | | | 2,171 | | | | 8 | | | | (537 | ) | | | 1,642 | | | | — | | | | 519 | (10) | | | — | | | | 519 | (6) | |
| Class A | | | 4,424 | | | | 82 | | | | (1,777 | ) | | | 2,729 | | | | 2,221 | | | | 3 | | | | (18 | ) | | | 2,206 | (6) | |
| Class C | | | 488 | | | | 2 | | | | (112 | ) | | | 378 | | | | 129 | | | | — | | | | (17 | ) | | | 112 | (6) | |
| Focus: | |
| Investor Class | | | 516 | | | | 4,798 | | | | (4,831 | ) | | | 483 | | | | 439 | | | | 5,733 | | | | (5,122 | ) | | | 1,050 | | |
| Trust Class | | | 516 | | | | 372 | | | | (1,213 | ) | | | (325 | ) | | | 384 | | | | 621 | | | | (1,727 | ) | | | (722 | ) | |
| Advisor Class | | | 179 | | | | 207 | | | | (491 | ) | | | (105 | ) | | | 170 | | | | 287 | | | | (520 | ) | | | (63 | ) | |
| Genesis: | |
| Investor Class | | | 14,600 | | | | 3,788 | | | | (19,983 | ) | | | (1,595 | ) | | | 9,275 | | | | 17,039 | (11) | | | (11,202 | ) | | | 15,112 | | |
| Trust Class | | | 22,236 | | | | 5,511 | | | | (30,734 | ) | | | (2,987 | ) | | | 22,066 | | | | 14,796 | | | | (34,022 | ) | | | 2,840 | | |
| Advisor Class | | | 6,679 | | | | 1,116 | | | | (8,651 | ) | | | (856 | ) | | | 5,731 | | | | 3,516 | (11) | | | (6,257 | ) | | | 2,990 | | |
| Institutional Class | | | 21,974 | | | | 5,954 | | | | (29,770 | ) | | | (1,842 | ) | | | 31,370 | | | | 13,106 | | | | (9,245 | ) | | | 35,231 | | |
| Guardian | |
| Investor Class | | | 4,085 | | | | 10,268 | | | | (11,403 | ) | | | 2,950 | | | | 3,834 | | | | 9,112 | | | | (9,864 | ) | | | 3,082 | | |
| Trust Class | | | 1,529 | | | | 1,140 | | | | (2,509 | ) | | | 160 | | | | 1,206 | | | | 1,013 | | | | (2,103 | ) | | | 116 | | |
| Advisor Class | | | 22 | | | | 7 | | | | (32 | ) | | | (3 | ) | | | 17 | | | | 7 | | | | (31 | ) | | | (7 | ) | |
| Institutional Class(9) | | | 5 | | | | — | | | | — | | | | 5 | | | | — | | | | — | | | | — | | | | — | | |
| Class A(9) | | | 58 | | | | — | | | | — | | | | 58 | | | | — | | | | — | | | | — | | | | — | | |
| Class C(9) | | | 5 | | | | — | | | | — | | | | 5 | | | | — | | | | — | | | | — | | | | — | | |
| Class R3(9) | | | 5 | | | | — | | | | — | | | | 5 | | | | — | | | | — | | | | — | | | | — | | |
| International: | |
| Investor Class | | | 1,634 | | | | 516 | | | | (9,747 | ) | | | (7,597 | ) | | | 1,973 | | | | 4,364 | | | | (10,260 | ) | | | (3,923 | ) | |
| Trust Class | | | 2,448 | | | | 445 | | | | (10,990 | ) | | | (8,097 | ) | | | 3,875 | | | | 4,740 | | | | (16,371 | ) | | | (7,756 | ) | |
International
Institutional: | |
| Institutional Class | | | 6,536 | | | | 1,685 | | | | (20,306 | ) | | | (12,085 | ) | | | 1,740 | | | | 8,347 | | | | (8,022 | ) | | | 2,065 | | |
International
Large Cap: | |
| Trust Class | | | 1,543 | | | | 131 | | | | (3,123 | ) | | | (1,449 | ) | | | 2,267 | | | | 237 | | | | (1,896 | ) | | | 608 | | |
| Institutional Class | | | 478 | | | | 361 | | | | (3,577 | ) | | | (2,738 | ) | | | 8,624 | | | | 481 | | | | (6,995 | ) | | | 2,110 | | |
| Class A | | | 306 | | | | 8 | | | | (20 | ) | | | 294 | | | | 219 | | | | — | | | | (2 | ) | | | 217 | (1) | |
| Class C | | | 39 | | | | — | | | | — | | | | 39 | | | | 11 | | | | — | | | | — | | | | 11 | (1) | |
| Class R3(9) | | | 7 | | | | — | | | | — | | | | 7 | | | | — | | | | — | | | | — | | | | — | | |
164
| | | For the Year Ended August 31, 2009 | | For the Year Ended August 31, 2008 | |
| (000's omitted) | | Shares
Sold | | Shares
Issued on
Reinvestment
of Dividends
and
Distributions
and
Conversions/
Acquisitions | | Shares
Redeemed | | Total | | Shares
Sold | | Shares
Issued on
Reinvestment
of Dividends
and
Distributions
and
Conversions/
Acquisitions | | Shares
Redeemed | | Total | |
Large Cap
Disciplined
Growth: | |
| Investor Class | | | 884 | | | | 40 | (12) | | | (592 | ) | | | 332 | | | | 545 | | | | — | | | | (276 | ) | | | 269 | | |
| Institutional Class(8) | | | 3,604 | | | | 606 | (13) | | | (351 | ) | | | 3,859 | | | | — | | | | — | | | | — | | | | — | | |
| Class A(8) | | | 5,234 | | | | 5,829 | (12)(13) | | | (521 | ) | | | 10,542 | | | | — | | | | — | | | | — | | | | — | | |
| Class C(8) | | | 1,377 | | | | 3,092 | (13) | | | (176 | ) | | | 4,293 | | | | — | | | | — | | | | — | | | | — | | |
| Class R3(9) | | | 9 | | | | — | | | | — | | | | 9 | | | | — | | | | — | | | | — | | | | — | | |
| Mid Cap Growth: | |
| Investor Class | | | 2,627 | | | | — | | | | (6,426 | ) | | | (3,799 | ) | | | 5,035 | | | | — | | | | (5,776 | ) | | | (741 | ) | |
| Trust Class | | | 1,431 | | | | — | | | | (791 | ) | | | 640 | | | | 434 | | | | — | | | | (461 | ) | | | (27 | ) | |
| Advisor Class | | | 493 | | | | — | | | | (117 | ) | | | 376 | | | | 163 | | | | — | | | | (36 | ) | | | 127 | | |
| Institutional Class | | | 16,738 | | | | — | | | | (2,515 | ) | | | 14,223 | | | | 4,345 | | | | — | | | | (727 | ) | | | 3,618 | | |
| Class A(9) | | | 11 | | | | — | | | | — | | | | 11 | | | | — | | | | — | | | | — | | | | — | | |
| Class C(9) | | | 5 | | | | — | | | | — | | | | 5 | | | | — | | | | — | | | | — | | | | — | | |
| Class R3(9) | | | 5 | | | | — | | | | — | | | | 5 | | | | — | | | | — | | | | — | | | | — | | |
| Partners: | |
| Investor Class | | | 7,189 | | | | 1,509 | | | | (22,895 | ) | | | (14,197 | ) | | | 13,919 | | | | 2,820 | | | | (11,492 | ) | | | 5,247 | | |
| Trust Class | | | 7,840 | | | | 873 | | | | (16,496 | ) | | | (7,783 | ) | | | 13,231 | | | | 1,662 | | | | (17,105 | ) | | | (2,212 | ) | |
| Advisor Class | | | 9,828 | | | | 604 | | | | (13,107 | ) | | | (2,675 | ) | | | 7,028 | | | | 1,037 | | | | (6,982 | ) | | | 1,083 | | |
| Institutional Class | | | 4,445 | | | | 161 | | | | (2,989 | ) | | | 1,617 | | | | 1,911 | | | | 180 | | | | (443 | ) | | | 1,648 | | |
| Real Estate: | |
| Trust Class | | | 6,708 | | | | 317 | | | | (3,859 | ) | | | 3,166 | | | | 2,421 | | | | 1,053 | | | | (6,263 | ) | | | (2,789 | ) | |
| Institutional Class | | | 382 | | | | 1 | | | | (115 | ) | | | 268 | | | | 163 | | | | — | | | | — | | | | 163 | (5) | |
| Regency: | |
| Investor Class | | | 1,039 | | | | 313 | | | | (2,662 | ) | | | (1,310 | ) | | | 1,380 | | | | 499 | | | | (1,969 | ) | | | (90 | ) | |
| Trust Class | | | 1,927 | | | | 243 | | | | (3,425 | ) | | | (1,255 | ) | | | 1,352 | | | | 371 | | | | (1,107 | ) | | | 616 | | |
| Select Equities: | |
| Institutional Class | | | 828 | | | | — | | | | (271 | ) | | | 557 | | | | 251 | | | | — | | | | — | | | | 251 | (1) | |
| Class A | | | 5,673 | | | | 4 | | | | (1,448 | ) | | | 4,229 | | | | 540 | | | | — | | | | (6 | ) | | | 534 | (1) | |
| Class C | | | 883 | | | | 1 | | | | (33 | ) | | | 851 | | | | 85 | | | | — | | | | — | | | | 85 | (1) | |
Small and Mid Cap
Growth: | |
| Trust Class | | | 107 | | | | 3 | | | | (90 | ) | | | 20 | | | | 127 | | | | 54 | | | | (125 | ) | | | 56 | | |
165
| | | For the Year Ended August 31, 2009 | | For the Year Ended August 31, 2008 | |
| (000's omitted) | | Shares
Sold | | Shares
Issued on
Reinvestment
of Dividends
and
Distributions
and
Conversions/
Acquisitions | | Shares
Redeemed | | Total | | Shares
Sold | | Shares
Issued on
Reinvestment
of Dividends
and
Distributions
and
Conversions/
Acquisitions | | Shares
Redeemed | | Total | |
| Small Cap Growth: | |
| Investor Class | | | 6,629 | | | | — | | | | (9,065 | ) | | | (2,436 | ) | | | 13,216 | | | | — | | | | (2,858 | ) | | | 10,358 | | |
| Trust Class | | | 1,985 | | | | — | | | | (1,695 | ) | | | 290 | | | | 2,193 | | | | — | | | | (450 | ) | | | 1,743 | | |
| Advisor Class | | | 842 | | | | — | | | | (658 | ) | | | 184 | | | | 1,043 | | | | — | | | | (311 | ) | | | 732 | | |
| Institutional Class | | | 420 | | | | — | | | | (93 | ) | | | 327 | | | | 239 | | | | — | | | | — | | | | 239 | (3) | |
| Class A(9) | | | 6 | | | | — | | | | — | | | | 6 | | | | — | | | | — | | | | — | | | | — | | |
| Class C(9) | | | 7 | | | | — | | | | — | | | | 7 | | | | — | | | | — | | | | — | | | | — | | |
| Class R3(9) | | | 6 | | | | — | | | | — | | | | 6 | | | | — | | | | — | | | | — | | | | — | | |
| Socially Responsive: | |
| Investor Class | | | 7,280 | | | | 655 | | | | (8,878 | ) | | | (943 | ) | | | 9,640 | | | | 1,057 | | | | (6,795 | ) | | | 3,902 | | |
| Trust Class | | | 7,075 | | | | 500 | | | | (5,031 | ) | | | 2,544 | | | | 6,599 | | | | 730 | | | | (4,846 | ) | | | 2,483 | | |
| Institutional Class | | | 1,742 | | | | 78 | | | | (609 | ) | | | 1,211 | | | | 3,448 | | | | 19 | | | | (538 | ) | | | 2,929 | (2) | |
| Class A(9) | | | 90 | | | | — | | | | (5 | ) | | | 85 | | | | — | | | | — | | | | — | | | | — | | |
| Class C(9) | | | 7 | | | | — | | | | — | | | | 7 | | | | — | | | | — | | | | — | | | | — | | |
| Class R3(9) | | | 4 | | | | — | | | | — | | | | 4 | | | | — | | | | — | | | | — | | | | — | | |
(1) Period from December 20, 2007 (Commencement of Operations) to August 31, 2008.
(2) Period from November 28, 2007 (Commencement of Operations) to August 31, 2008.
(3) Period from April 1, 2008 (Commencement of Operations) to August 31, 2008.
(4) Period from May 1, 2008 (Commencement of Operations) to August 31, 2008.
(5) Period from June 4, 2008 (Commencement of Operations) to August 31, 2008.
(6) Period from June 9, 2008 (Commencement of Operations) to August 31, 2008. On June 9, 2008, Equity Income's Trust Class was converted into the Fund's Institutional Class.
(7) Period from October 8, 2008 (Commencement of Operations) to August 31, 2009.
(8) Period from April 6, 2009 (Commencement of Operations) to August 31, 2009.
(9) Period from May 27, 2009 (Commencement of Operations) to August 31, 2009.
(10) Approximately 516,000 Institutional Class shares were issued in connection with conversion of approximately 516,000 Trust Class shares (see Note H).
(11) Approximately 7,701,000 Investor Class shares and 463,000 Advisor Class shares were issued in connection with the acquisition of Fasciano Fund (see Note H).
(12) Approximately 40,000 Investor Class shares were issued in connection with conversion of approximately 40,000 Class A shares (see Note H).
(13) Approximately 606,000 of Institutional Class shares, 5,869,000 of Class A shares, and 3,092,000 of Class C shares were issued in connection with the acquisition of Large Cap Disciplined Growth Fund for approximately 488,000 of Acquired Fund's Institutional Class shares, 4,752,000 of Acquired Fund's Class A shares, and 2,524,000 of Acquired Fund's Class C shares (see Note H).
166
Note E—Lines of Credit:
At August 31, 2009, each Fund was a participant in a single committed, unsecured $150,000,000 line of credit with State Street, to be used only for temporary or emergency purposes. Other investment companies managed by Management also participate in this line of credit on the same terms. Interest is charged on borrowings under this line of credit at the Federal Funds Rate plus 0.50% per annum. (As of September 18, 2009, at the higher of the overnight LIBOR or Federal Funds Rate plus 1.25% per annum). A facility fee of 0.09% (as of September 18, 2009, 0.15%) per annum of the available line of credit is charged, of which each Fund has agreed to pay its pro rata share, based on the ratio of its individual net assets to the net assets of all participants at the time the fee is due and payable. The fee is paid quarterly in arrears. Because several investment companies participate, there is no assurance that an individual Fund will have access to all or any part of the $150,000,000 at any particular time. There were no loans outstanding pursuant to this line of credit at August 31, 2009. During the year ended August 31, 2009, none of the Funds utilized this line of credit.
At August 31, 2009, International, International Institutional and International Large Cap were three of five holders of a single $100,000,000 uncommitted, secured line of credit with State Street to be used only for temporary or emergency purposes or for leverage. Another investment company managed by Management also participates in this line of credit on the same terms. Interest is charged at LIBOR, or the overnight Federal Funds Rate, plus a spread to be determined at the time of borrowing. Because two investment companies participate, there is no assurance that a Fund will have access to all or any part of the $100,000,000 at any particular time. International, International Institutional and International Large Cap had no loans outstanding pursuant to this line of credit at August 31, 2009. During the year ended August 31, 2009, International, International Institutional, and International Large Cap did not utilize this line of credit.
Note F—Investments In Affiliates*:
| | | Balance of
Shares Held
August 31,
2008 | | Gross
Purchases
and
Additions | | Gross
Sales
and
Reductions | | Balance of
Shares Held
August 31,
2009 | | Value
August 31,
2009 | | Income from
Investments
in Affiliated
Issuers Included
in Total Income | |
| Climate Change | |
Neuberger Berman Prime
Money Fund Trust Class*** | | | 292,388 | | | | 3,765,557 | | | | 4,057,945 | | | | — | | | $ | — | | | $ | 2,331 | | |
| Emerging Markets Equity | |
Neuberger Berman Prime
Money Fund Trust Class*** | | | — | | | | 5,657,803 | | | | 5,657,803 | | | | — | | | $ | — | | | $ | 3,792 | | |
| Equity Income | |
Neuberger Berman
Government Money Fund
Investor Class*** | | | — | | | | 19,092,079 | | | | 19,092,079 | | | | — | | | $ | — | | | $ | 2,344 | | |
Neuberger Berman Prime
Money Fund Trust Class*** | | | 5,379,579 | | | | 16,676,863 | | | | 22,056,442 | | | | — | | | | — | | | | 22,733 | | |
| Total | | | | | | | | | | | | | | | | | | $ | — | | | $ | 25,077 | | |
| Focus | |
Neuberger Berman Prime
Money Fund Trust Class*** | | | 27,145,869 | | | | 124,035,003 | | | | 151,180,872 | | | | — | | | $ | — | | | $ | 189,478 | | |
Neuberger Berman
Securities Lending
Quality Fund, LLC**** | | | 179,283,932 | | | | 1,176,252,409 | | | | 1,309,395,118 | | | | 46,141,223 | | | | 46,602,635 | | | | 1,393,971 | | |
| Total | | | | | | | | | | | | | | | | | | $ | 46,602,635 | | | $ | 1,583,449 | | |
167
| | | Balance of
Shares Held
August 31,
2008 | | Gross
Purchases
and
Additions | | Gross
Sales
and
Reductions | | Balance of
Shares Held
August 31,
2009 | | Value
August 31,
2009 | | Income from
Investments
in Affiliated
Issuers Included
in Total Income | |
| Genesis | |
| Abaxis, Inc.** | | | 1,103,500 | | | | 51,000 | | | | 64,200 | | | | 1,090,300 | | | $ | 29,001,980 | | | $ | — | | |
| Alberto-Culver Co. | | | 5,868,450 | | | | 218,000 | | | | 344,000 | | | | 5,742,450 | | | | 151,543,256 | | | | 1,633,151 | | |
| Alliant Techsystems | | | 1,890,262 | | | | — | | | | 143,300 | | | | 1,746,962 | | | | 135,005,223 | | | | — | | |
American Medical
Systems Holdings | | | 8,642,065 | | | | — | | | | 767,300 | | | | 7,874,765 | | | | 120,011,419 | | | | — | | |
| AmSurg Corp. | | | 2,050,634 | | | | — | | | | 119,900 | | | | 1,930,734 | | | | 39,193,900 | | | | — | | |
| AptarGroup Inc. | | | 6,963,600 | | | | — | | | | 408,200 | | | | 6,555,400 | | | | 225,374,652 | | | | 3,964,890 | | |
| Arbitron Inc.** | | | 1,980,467 | | | | — | | | | 679,900 | | | | 1,300,567 | | | | 23,826,387 | | | | 605,557 | | |
| Arena Resources | | | 3,481,128 | | | | — | | | | 197,500 | | | | 3,283,628 | | | | 100,413,344 | | | | — | | |
| ArthroCare Corp.** | | | 2,963,662 | | | | — | | | | 2,963,662 | | | | — | | | | — | | | | — | | |
| Astec Industries | | | 2,120,622 | | | | — | | | | 171,000 | | | | 1,949,622 | | | | 49,383,925 | | | | — | | |
| Blackbaud, Inc. | | | 4,581,603 | | | | 50,000 | | | | 262,100 | | | | 4,369,503 | | | | 84,156,628 | | | | 1,761,061 | | |
| Boston Beer Company | | | 1,059,319 | | | | 20,000 | | | | 60,300 | | | | 1,019,019 | | | | 40,506,005 | | | | — | | |
| Brady Corp.** | | | 3,749,200 | | | | — | | | | 2,328,911 | | | | 1,420,289 | | | | 42,083,163 | | | | 1,692,174 | | |
| Bucyrus International | | | 4,369,600 | | | | 272,100 | | | | 256,000 | | | | 4,385,700 | | | | 130,913,145 | | | | 426,433 | | |
| CARBO Ceramics | | | 2,140,500 | | | | 202,400 | | | | 125,700 | | | | 2,217,200 | | | | 95,450,460 | | | | 1,437,694 | | |
| Carrizo Oil & Gas | | | 1,784,327 | | | | 1,800 | | | | 104,900 | | | | 1,681,227 | | | | 32,498,118 | | | | — | | |
| Chart Industries | | | 2,320,828 | | | | — | | | | 131,900 | | | | 2,188,928 | | | | 40,845,396 | | | | — | | |
| Church & Dwight | | | 5,671,018 | | | | — | | | | 1,620,963 | | | | 4,050,055 | | | | 231,379,642 | | | | 1,793,296 | | |
| CLARCOR Inc. | | | 5,796,322 | | | | — | | | | 374,700 | | | | 5,421,622 | | | | 173,817,201 | | | | 1,990,826 | | |
Compass Minerals
International | | | 3,607,800 | | | | 400,800 | | | | 206,600 | | | | 3,802,000 | | | | 202,190,360 | | | | 5,011,352 | | |
| Dionex Corp. | | | 2,168,532 | | | | — | | | | 127,000 | | | | 2,041,532 | | | | 122,777,734 | | | | — | | |
| Drew Industries** | | | 2,375,900 | | | | — | | | | 2,375,900 | | | | — | | | | — | | | | — | | |
| Exponent, Inc. | | | 1,225,235 | | | | — | | | | 60,500 | | | | 1,164,735 | | | | 32,938,706 | | | | — | | |
| Flotek Industries** | | | 1,491,600 | | | | — | | | | 1,491,600 | | | | — | | | | — | | | | — | | |
| Forward Air | | | 2,271,700 | | | | 35,000 | | | | 263,100 | | | | 2,043,600 | | | | 47,166,288 | | | | 589,582 | | |
| Foundation Coal Holdings** | | | 2,981,200 | | | | 315,000 | | | | 3,296,200 | | | | — | | | | — | | | | 589,310 | | |
| Haemonetics Corp. | | | 2,597,300 | | | | 216,000 | | | | 152,700 | | | | 2,660,600 | | | | 140,053,984 | | | | — | | |
| Healthcare Services Group | | | 4,022,654 | | | | — | | | | 416,500 | | | | 3,606,154 | | | | 63,756,803 | | | | 2,604,036 | | |
| Hibbett Sports | | | 1,892,463 | | | | 77,300 | | | | 105,700 | | | | 1,864,063 | | | | 32,751,587 | | | | — | | |
| Hub Group Class A** | | | 2,930,200 | | | | 23,700 | | | | 1,091,400 | | | | 1,862,500 | | | | 40,844,625 | | | | — | | |
| ICON PLC | | | 3,431,000 | | | | 566,600 | | | | 199,200 | | | | 3,798,400 | | | | 82,121,408 | | | | — | | |
| Immucor Inc.** | | | 3,513,491 | | | | — | | | | 206,000 | | | | 3,307,491 | | | | 59,832,512 | | | | — | | |
Integra LifeSciences
Holdings** | | | 2,452,202 | | | | — | | | | 2,337,810 | | | | 114,392 | | | | 3,865,306 | | | | — | | |
| ION Geophysical** | | | 5,510,900 | | | | — | | | | 5,510,900 | | | | — | | | | — | | | | — | | |
| J & J Snack Foods | | | 1,518,416 | | | | — | | | | 247,470 | | | | 1,270,946 | | | | 55,540,340 | | | | 550,176 | | |
| K-V Pharmaceutical** | | | 3,696,247 | | | | — | | | | 3,696,247 | | | | — | | | | — | | | | — | | |
168
| | | Balance of
Shares Held
August 31,
2008 | | Gross
Purchases
and
Additions | | Gross
Sales
and
Reductions | | Balance of
Shares Held
August 31,
2009 | | Value
August 31,
2009 | | Income from
Investments
in Affiliated
Issuers Included
in Total Income | |
| Landauer, Inc. | | | 81,300 | | | | 489,400 | | | | 27,900 | | | | 542,800 | | | $ | 29,875,712 | | | $ | 376,739 | | |
| Layne Christensen | | | 2,059,065 | | | | 301,656 | | | | 120,400 | | | | 2,240,321 | | | | 57,800,282 | | | | — | | |
| Lindsay Corp. | | | 961,350 | | | | 441,600 | | | | 60,700 | | | | 1,342,250 | | | | 55,716,798 | | | | 353,796 | | |
| ManTech International | | | 2,248,000 | | | | 321,400 | | | | 143,300 | | | | 2,426,100 | | | | 128,195,124 | | | | — | | |
| Matthews International | | | 3,737,800 | | | | — | | | | 218,900 | | | | 3,518,900 | | | | 122,598,476 | | | | 922,246 | | |
| MICROS Systems | | | 5,392,542 | | | | 178,200 | | | | 321,500 | | | | 5,249,242 | | | | 146,296,375 | | | | — | | |
| MWI Veterinary Supply | | | 1,241,529 | | | | — | | | | 72,900 | | | | 1,168,629 | | | | 43,484,685 | | | | — | | |
| NATCO Group | | | 2,097,228 | | | | — | | | | 122,900 | | | | 1,974,328 | | | | 82,132,045 | | | | — | | |
Neuberger Berman Prime
Money Fund Trust Class*** | | | 823,917,513 | | | | 953,313,212 | | | | 1,777,230,725 | | | | — | | | | — | | | | 4,921,502 | | |
| Nordson Corp. | | | 2,623,230 | | | | — | | | | 217,800 | | | | 2,405,430 | | | | 128,882,939 | | | | 1,798,460 | | |
| Parallel Petroleum** | | | 3,551,541 | | | | — | | | | 3,551,541 | | | | — | | | | — | | | | — | | |
| Raven Industries | | | 1,989,876 | | | | — | | | | 116,900 | | | | 1,872,976 | | | | 54,129,006 | | | | 3,389,348 | | |
| Ritchie Bros. Auctioneers | | | 5,736,060 | | | | — | | | 397,900 | | | | 5,338,160 | | | | 133,774,290 | | | | 2,003,010 | | |
| Robbins & Myers | | | 1,639,300 | | | | 244,600 | | | | 96,400 | | | | 1,787,500 | | | | 41,505,750 | | | | 256,788 | | |
| Rofin-Sinar Technologies | | | 3,636,350 | | | | — | | | | 213,200 | | | | 3,423,150 | | | | 77,842,431 | | | | — | | |
| Ruddick Corp. | | | 3,483,702 | | | | 681,000 | | | | 208,700 | | | | 3,956,002 | | | | 105,071,413 | | | | 1,770,049 | | |
| Simpson Manufacturing** | | | 3,494,800 | | | | — | | | | 2,191,900 | | | | 1,302,900 | | | | 33,484,530 | | | | 1,066,829 | | |
| Sirona Dental Systems | | | 2,975,226 | | | | — | | | | 169,500 | | | | 2,805,726 | | | | 74,183,395 | | | | — | | |
| Solera Holdings | | | 2,424,116 | | | | 2,189,589 | | | | 133,700 | | | | 4,480,005 | | | | 118,003,332 | | | | | | |
| Surmodics, Inc. | | | 2,159,130 | | | | — | | | | 126,700 | | | | 2,032,430 | | | | 46,522,323 | | | | — | | |
| Tennant Co.** | | | 1,044,800 | | | | — | | | | 1,044,800 | | | | — | | | | — | | | | 190,567 | | |
| Titan International | | | 2,137,147 | | | | 326,400 | | | | 263,500 | | | | 2,200,047 | | | | 18,282,391 | | | | 45,952 | | |
| Toro Co.** | | | 3,284,604 | | | | — | | | | 1,987,610 | | | | 1,296,994 | | | | 49,194,982 | | | | 1,664,942 | | |
| United Stationers** | | | 2,376,728 | | | | — | | | | 1,453,353 | | | | 923,375 | | | | 42,189,004 | | | | — | | |
| Wabtec Corp. | | | 2,826,100 | | | | 341,400 | | | | 165,400 | | | | 3,002,100 | | | | 112,428,645 | | | | 114,574 | | |
| Westamerica Bancorp | | | 2,243,243 | | | | — | | | | 121,400 | | | | 2,121,843 | | | | 109,126,385 | | | | 3,008,839 | | |
| Wright Medical Group** | | | 1,891,994 | | | | 69,200 | | | | 111,000 | | | | 1,850,194 | | | | 30,047,151 | | | | — | | |
| Zebra Technologies | | | 4,115,847 | | | | — | | | | 241,600 | | | | 3,874,247 | | | | 96,817,433 | | | | — | | |
| Total | | | | | | | | | | | | | | | | | | $ | 4,566,828,394 | | | $ | 46,533,179 | | |
| Guardian | |
Neuberger Berman Prime
Money Fund Trust Class*** | | | 13,486,818 | | | | 208,148,076 | | | | 221,634,894 | | | | — | | | $ | — | | | $ | 128,800 | | |
Neuberger Berman
Securities Lending
Quality Fund, LLC**** | | | 72,711,362 | | | | 721,083,660 | | | | 790,665,854 | | | | 3,129,168 | | | | 3,160,460 | | | | 534,546 | | |
| Total | | | | | | | | | | | | | | | | | | $ | 3,160,460 | | | $ | 663,346 | | |
169
August 31,
2009| | | Balance of
Shares Held
August 31,
2008 | | Gross
Purchases
and
Additions | | Gross
Sales
and
Reductions | | Balance of
| | | Value
August 31,
2009 | | Income from
Investments
in Affiliated
Issuers Included
in Total Income | |
| International | |
Neuberger Berman Prime
Money Fund Trust Class*** | | | 47,734,447 | | | | 242,052,618 | | | | 289,787,065 | | | | — | | | $ | — | | | $ | 259,293 | | |
Neuberger Berman
Securities Lending
Quality Fund, LLC**** | | | 44,490,214 | | | | 203,488,769 | | | | 232,549,208 | | | | 15,429,775 | | | | 15,584,073 | | | | 404,741 | | |
| Total | | | | | | | | | | | | | | | | | | $ | 15,584,073 | | | $ | 664,034 | | |
| International Institutional | |
Neuberger Berman Prime
Money Fund Trust Class*** | | | 22,533,581 | | | | 160,814,296 | | | | 183,347,877 | | | | — | | | $ | — | | | $ | 146,674 | | |
Neuberger Berman
Securities Lending
Quality Fund, LLC**** | | | 25,033,565 | | | | 84,650,917 | | | | 105,181,716 | | | | 4,502,766 | | | | 4,547,794 | | | | 213,385 | | |
| Total | | | | | | | | | | | | | | | | | | $ | 4,547,794 | | | $ | 360,059 | | |
| International Large Cap | |
Neuberger Berman Prime
Money Fund Trust Class*** | | | 7,184,775 | | | | 56,083,703 | | | | 63,268,478 | | | | — | | | $ | — | | | $ | 67,217 | | |
Neuberger Berman
Securities Lending
Quality Fund, LLC**** | | | 9,389,597 | | | | 42,190,486 | | | | 49,269,918 | | | | 2,310,165 | | | | 2,333,267 | | | | 106,666 | | |
| Total | | | | | | | | | | | | | | | | | | $ | 2,333,267 | | | $ | 173,883 | | |
| Large Cap Disciplined Growth | |
Neuberger Berman Prime
Money Fund Trust Class*** | | | 314,130 | | | | 29,674,922 | | | | 29,989,052 | | | | — | | | $ | — | | | $ | 3,518 | | |
| Mid Cap Growth | |
Neuberger Berman Prime
Money Fund Trust Class*** | | | 33,930,331 | | | | 133,464,966 | | | | 167,395,297 | | | | — | | | $ | — | | | $ | 220,787 | | |
Neuberger Berman
Securities Lending
Quality Fund, LLC**** | | | 62,574,628 | | | | 466,466,266 | | | | 460,371,750 | | | | 68,669,144 | | | | 69,355,835 | | | | 1,281,503 | | |
| Total | | | | | | | | | | | | | | | | | | $ | 69,355,835 | | | $ | 1,502,290 | | |
| Partners | |
Neuberger Berman Prime
Money Fund Trust Class*** | | | 39,861,472 | | | | 498,787,072 | | | | 538,648,544 | | | | — | | | $ | — | | | $ | 179,675 | | |
Neuberger Berman
Securities Lending
Quality Fund, LLC**** | | | 349,883,850 | | | | 2,974,864,316 | | | | 3,203,767,691 | | | | 120,980,475 | | | | 122,190,280 | | | | 5,371,988 | | |
| Total | | | | | | | | | | | | | | | | | | $ | 122,190,280 | | | $ | 5,551,663 | | |
170
| | | Balance of
Shares Held
August 31,
2008 | | Gross
Purchases
and
Additions | | Gross
Sales
and
Reductions | | Balance of
Shares Held
August 31,
2009 | | Value
August 31,
2009 | | Income from
Investments
in Affiliated
Issuers Included
in Total Income | |
| Real Estate | |
Neuberger Berman Prime
Money Fund Trust Class*** | | | 1,729,191 | | | | 35,479,567 | | | | 37,208,758 | | | | — | | | $ | — | | | $ | 11,183 | | |
Neuberger Berman
Securities Lending
Quality Fund, LLC**** | | | 9,693,032 | | | | 137,202,409 | | | | 137,750,811 | | | | 9,144,630 | | | | 9,236,077 | | | | 166,081 | | |
| Total | | | | | | | | | | | | | | | | | | $ | 9,236,077 | | | $ | 177,264 | | |
| Regency | |
Neuberger Berman Prime
Money Fund Trust Class*** | | | 12,548,922 | | | | 25,910,080 | | | | 38,459,002 | | | | — | | | $ | — | | | $ | 37,426 | | |
Neuberger Berman
Securities Lending
Quality Fund, LLC**** | | | 10,776,449 | | | | 110,226,397 | | | | 117,351,013 | | | | 3,651,833 | | | | 3,688,351 | | | | 157,431 | | |
| Total | | | | | | | | | | | | | | | | | | $ | 3,688,351 | | | $ | 194,857 | | |
| Select Equities | |
Neuberger Berman Prime
Money Fund Trust Class*** | | | 2,295,880 | | | | 44,188,345 | | | | 46,484,225 | | | | — | | | $ | — | | | $ | 35,495 | | |
| Small and Mid Cap Growth | |
Neuberger Berman Prime
Money Fund Trust Class*** | | | 544,508 | | | | 5,157,585 | | | | 5,702,093 | | | | — | | | $ | — | | | $ | 4,035 | | |
| Small Cap Growth | |
Neuberger Berman Prime
Money Fund Trust Class*** | | | 24,408,951 | | | | 167,917,397 | | | | 192,326,348 | | | | — | | | $ | — | | | $ | 80,683 | | |
Neuberger Berman
Securities Lending
Quality Fund, LLC**** | | | 55,736,558 | | | | 333,592,794 | | | | 357,658,224 | | | | 31,671,128 | | | | 31,987,839 | | | | 656,910 | | |
| Total | | | | | | | | | | | | | | | | | | $ | 31,987,839 | | | $ | 737,593 | | |
| Socially Responsive | |
Neuberger Berman
Securities Lending
Quality Fund, LLC**** | | | — | | | | 377,114,773 | | | | 372,825,639 | | | | 4,289,134 | | | $ | 4,332,025 | | | $ | 201,224 | | |
* Affiliated issuers, as defined in the 1940 Act.
** At August 31, 2009, the issuers of these securities were no longer affiliated with the Fund.
*** Prime Money and Government Money were also managed by Management and may have been considered affiliates since they had the same officers, Board members, and investment manager as the Fund and because, at times, the Fund may have owned 5% or more of the outstanding voting securities of Prime Money or Government Money, respectively.
**** Quality Fund, a fund managed by NBFI, an affiliate of Management, is used to invest cash the Funds receive as collateral for securities loaned as approved by the Board. Because all shares of Quality Fund are held by funds in the related investment management complex, Quality Fund may be considered an affiliate of the Funds.
171
Note G—Recent Accounting Pronouncement:
In accordance with the provision set forth in FASB Statement of Financial Accounting Standards No. 165 ("FAS 165"), "Subsequent Events," Management has evaluated the possibility of subsequent events existing in the Funds' financial statements through October 16, 2009. Management has determined that there are no subsequent events that, in accordance with FAS 165, would need to be disclosed in the Funds' financial statements through this date.
Note H—Reorganizations and Share Class Conversions:
On June 9, 2008, Trust Class shares of Equity Income converted into Institutional Class shares of Equity Income pursuant to a share class conversion ("Institutional Class Conversion"). The Institutional Class Conversion was accomplished by a tax-free conversion of 516,483 Trust Class shares of Equity Income (valued at $5,653,933) into 516,483 Institutional Class shares of Equity Income. The number of Institutional Class shares of Equity Income outstanding immediately after the Institutional Class Conversion was 516,483. The net assets of Institutional Class shares of Equity Income immediately after the Institutional Class Conversion were $5,653,933.
On August 15, 2008, Genesis acquired all of the net assets of Neuberger Berman Fasciano Fund ("Fasciano") pursuant to a Plan of Reorganization and Dissolution approved by Fasciano shareholders. The merger was accomplished by a tax-free exchange of: 7,700,868 shares of the Investor Class of Genesis (valued at $270,161,608) for the 7,608,283 shares of the Investor Class of Fasciano outstanding on August 15, 2008 and the 462,573 shares of the Advisor Class of Genesis (valued at $13,574,657) for the 1,451,583 shares of the Advisor Class of Fasciano outstanding on August 15, 2008. Fasciano's aggregate net assets at that date ($283,736,265, including $66,024,106 of net unrealized appreciation) were combined with those of Genesis. The combined net assets of Genesis immediately after the merger were $12,591,585,945.
On April 9, 2009, Neuberger Berman Century Fund ("Acquiring Fund") acquired all of the net assets of Neuberger Berman Large Cap Disciplined Growth Fund ("Acquired Fund") and changed its name to Neuberger Berman Large Cap Disciplined Growth Fund pursuant to a Plan of Reorganization and Dissolution approved by the Board. The reorganization was accomplished by a tax-free exchange of 5,869,273 shares of Class A of Acquiring Fund (valued at $31,234,312) for 4,752,086 shares of Class A of Acquired Fund outstanding on April 9, 2009, 3,091,731 shares of Class C of Acquiring Fund (valued at $16,455,988) for 2,524,011 shares of Class C of Acquired Fund outstanding on April 9, 2009, and 606,318 shares of Institutional Class of Acquiring Fund (valued at $3,226,698) for 488,494 shares of Institutional Class of Acquired Fund outstanding on April 9, 2009. Acquired Fund's aggregate net assets at that date ($50,916,998, including $864,207 of net unrealized appreciation) were combined with those of Acquiring Fund. The combined net assets of Acquiring Fund immediately after the reorganization were $61,540,126. In addition, immediately after the reorganization, Class A shares of Acquiring Fund held by Grandfathered Investors (as defined below) were converted into Investor Class shares of Acquiring Fund pursuant to a share class conversion ("Investor Class Conversion"). The Investor Class Conversion was accomplished by a tax-free conversion of 40,012 Class A shares of Acquiring Fund (valued at $212,934) into 39,996 Investor Class shares of Acquiring Fund. The number of Investor Class shares of Acquiring Fund outstanding immediately after the Investor Class Conversion was 1,847,397. The net assets of Investor Class shares of Acquiring Fund immediately after the Investor Class Conversion were $9,835,309. "Grandfathered Investors" are investors who established accounts in Investor Class or Trust Class shares of a Neuberger Berman Fund prior to March 1, 2008, and who have continuously maintained an account in Investor or Trust Class shares since that date.
172
Financial Highlights
The following tables include selected data for a share outstanding throughout each period and other performance information derived from the Financial Statements.
| | |
Net Asset
Value,
Beginning
of Year | |
Net
Investment
Income (Loss)@ | | Net Gains or
Losses on
Securities
(both realized
and
| | |
Total From
Investment
Operations | |
Dividends
from Net
Investment
Income | |
Distributions
from Net
Realized
Capital Gains | |
Tax
Return of
Capital | |
Total
Distributions | |
| Climate Change Fund | |
| Institutional Class | |
| 8/31/2009 | | $ | 8.93 | | | $ | 0.05 | | | $ | (2.47 | ) | | $ | (2.42 | ) | | $ | (0.22 | ) | | $ | — | | | $ | — | | | $ | (0.22 | ) | |
Period from 5/1/2008^
to 8/31/2008 | | $ | 10.00 | | | $ | 0.06 | | | $ | (1.13 | ) | | $ | (1.07 | ) | | $ | — | | | $ | — | | | $ | — | | | $ | — | | |
| Class A | |
| 8/31/2009 | | $ | 8.93 | | | $ | 0.03 | | | $ | (2.47 | ) | | $ | (2.44 | ) | | $ | (0.22 | ) | | $ | — | | | $ | — | | | $ | (0.22 | ) | |
Period from 5/1/2008^
to 8/31/2008 | | $ | 10.00 | | | $ | 0.05 | | | $ | (1.12 | ) | | $ | (1.07 | ) | | $ | — | | | $ | — | | | $ | — | | | $ | — | | |
| Class C | |
| 8/31/2009 | | $ | 8.90 | | | $ | (0.01 | ) | | $ | (2.46 | ) | | $ | (2.47 | ) | | $ | (0.22 | ) | | $ | — | | | $ | — | | | $ | (0.22 | ) | |
Period from 5/1/2008^
to 8/31/2008 | | $ | 10.00 | | | $ | 0.02 | | | $ | (1.12 | ) | | $ | (1.10 | ) | | $ | — | | | $ | — | | | $ | — | | | $ | — | | |
| Emerging Markets Equity Fund | |
| Institutional Class | |
Period from 10/8/2008^
to 8/31/2009 | | $ | 10.00 | | | $ | 0.15 | | | $ | 4.16 | | | $ | 4.31 | | | $ | (0.26 | ) | | $ | — | | | $ | — | | | $ | (0.26 | ) | |
| Class A | |
Period from 10/8/2008^
to 8/31/2009 | | $ | 10.00 | | | $ | 0.15 | | | $ | 4.13 | | | $ | 4.28 | | | $ | (0.26 | ) | | $ | — | | | $ | — | | | $ | (0.26 | ) | |
| Class C | |
Period from 10/8/2008^
to 8/31/2009 | | $ | 10.00 | | | $ | 0.08 | | | $ | 4.12 | | | $ | 4.20 | | | $ | (0.24 | ) | | $ | — | | | $ | — | | | $ | (0.24 | ) | |
| Equity Income Fund | |
| Institutional Class | |
| 8/31/2009 | | $ | 10.72 | | | $ | 0.34 | | | $ | (2.04 | ) | | $ | (1.70 | ) | | $ | (0.21 | ) | | $ | (0.07 | ) | | $ | — | | | $ | (0.28 | ) | |
| 8/31/2008‡‡ | | $ | 10.52 | | | $ | 0.31 | | | $ | 0.40 | | | $ | 0.71 | | | $ | (0.27 | ) | | $ | (0.24 | ) | | $ | — | | | $ | (0.51 | ) | |
Period from 11/2/2006^
to 8/31/2007‡‡ | | $ | 10.00 | | | $ | 0.25 | | | $ | 0.52 | | | $ | 0.77 | | | $ | (0.25 | ) | | $ | (0.00 | ) | | $ | — | | | $ | (0.25 | ) | |
See Notes to Financial Highlights
173
| | |
Redemption
Feesøø | |
Net Asset
Value, End of
Year | |
Total Return†† | |
Net Assets,
End of Year
(in millions) | |
Ratio of Gross
Expenses to
Average Net
Assets# | |
Ratio of Net
Expenses to
Average Net
Assets | | Ratio of Net
Investment
Income/
(Loss) to
Average Net
Assets | |
Portfolio
Turnover
Rate | |
| Climate Change Fund | |
| Institutional Class | |
| 8/31/2009 | | $ | — | | | $ | 6.29 | | | | (26.55 | %) | | $ | 1.5 | | | | .97 | % | | | .97 | %‡ | | | .85 | % | | | 374 | % | |
Period from 5/1/2008^
to 8/31/2008 | | $ | — | | | $ | 8.93 | | | | (10.70 | %)** | | $ | 2.1 | | | | .95 | %* | | | .95 | %‡* | | | 1.72 | %* | | | 71 | %** | |
| Class A | |
| 8/31/2009 | | $ | — | | | $ | 6.27 | | | | (26.77 | %) | | $ | 1.3 | | | | 1.22 | % | | | 1.22 | %‡ | | | .58 | % | | | 374 | % | |
Period from 5/1/2008^
to 8/31/2008 | | $ | — | | | $ | 8.93 | | | | (10.70 | %)** | | $ | 1.8 | | | | 1.20 | %* | | | 1.20 | %‡* | | | 1.42 | %* | | | 71 | %** | |
| Class C | |
| 8/31/2009 | | $ | — | | | $ | 6.21 | | | | (27.22 | %) | | $ | 0.2 | | | | 1.97 | % | | | 1.97 | %‡ | | | (.12 | %) | | | 374 | % | |
Period from 5/1/2008^
to 8/31/2008 | | $ | — | | | $ | 8.90 | | | | (11.00 | %)** | | $ | 0.1 | | | | 1.95 | %* | | | 1.95 | %‡* | | | .72 | %* | | | 71 | %** | |
| Emerging Markets Equity Fund | |
| Institutional Class | |
Period from 10/8/2008^
to 8/31/2009 | | $ | 0.00 | | | $ | 14.05 | | | | 44.66 | %** | | $ | 4.0 | | | | 1.28 | %* | | | 1.28 | %‡* | | | 1.55 | %* | | | 84 | %** | |
| Class A | |
Period from 10/8/2008^
to 8/31/2009 | | $ | 0.00 | | | $ | 14.02 | | | | 44.38 | %** | | $ | 1.8 | | | | 1.53 | %* | | | 1.53 | %‡* | | | 1.31 | %* | | | 84 | %** | |
| Class C | |
Period from 10/8/2008^
to 8/31/2009 | | $ | 0.00 | | | $ | 13.96 | | | | 43.42 | %** | | $ | 0.2 | | | | 2.28 | %* | | | 2.28 | %‡* | | | .77 | %* | | | 84 | %** | |
| Equity Income Fund | |
| Institutional Class | |
| 8/31/2009 | | $ | — | | | $ | 8.74 | | | | (15.54 | %) | | $ | 18.9 | | | | .80 | % | | | .80 | %‡ | | | 3.97 | % | | | 61 | % | |
| 8/31/2008‡‡ | | $ | — | | | $ | 10.72 | | | | 7.01 | %††† | | $ | 5.6 | | | | .97 | % | | | .96 | %‡ | | | 2.94 | % | | | 48 | % | |
Period from 11/2/2006^
to 8/31/2007‡‡ | | $ | — | | | $ | 10.52 | | | | 7.73 | %** | | $ | 5.4 | | | | 1.00 | %* | | | 1.00 | %‡* | | | 2.81 | %* | | | 26 | %** | |
174
Financial Highlights (cont'd)
to 8/31/2008| | |
Net Asset
Value,
Beginning
of Year | |
Net
Investment
Income (Loss)@ | | Net Gains or
Losses on
Securities
(both realized
and
unrealized) | |
Total From
Investment
Operations | |
Dividends
from Net
Investment
Income | |
Distributions
from Net
Realized
Capital Gains | |
Tax
Return of
Capital | |
Total
Distributions | |
| Class A | |
| 8/31/2009 | | $ | 10.72 | | | $ | 0.25 | | | $ | (1.99 | ) | | $ | (1.74 | ) | | $ | (0.19 | ) | | $ | (0.07 | ) | | $ | — | | | $ | (0.26 | ) | |
| Period from 6/9/2008 | $ | | $ | 10.95 | | | $ | 0.07 | | | $ | (0.24 | ) | | $ | (0.17 | ) | | $ | (0.06 | ) | | $ | — | | | $ | — | | | $ | (0.06 | ) | |
| Class C | |
| 8/31/2009 | | $ | 10.71 | | | $ | 0.20 | | | $ | (2.00 | ) | | $ | (1.80 | ) | | $ | (0.14 | ) | | $ | (0.07 | ) | | $ | — | | | $ | (0.21 | ) | |
Period from 6/9/2008^
to 8/31/2008 | | $ | 10.95 | | | $ | 0.05 | | | $ | (0.24 | ) | | $ | (0.19 | ) | | $ | (0.05 | ) | | $ | — | | | $ | — | | | $ | (0.05 | ) | |
| Focus Fund | |
| Investor Class | |
| 8/31/2009 | | $ | 24.78 | | | $ | 0.14 | | | $ | (6.00 | ) | | $ | (5.86 | ) | | $ | (0.14 | ) | | $ | (2.19 | ) | | $ | — | | | $ | (2.33 | ) | |
| 8/31/2008 | | $ | 32.79 | | | $ | 0.15 | | | $ | (2.09 | ) | | $ | (1.94 | ) | | $ | (0.16 | ) | | $ | (5.91 | ) | | $ | — | | | $ | (6.07 | ) | |
| 8/31/2007 | | $ | 34.30 | | | $ | 0.15 | | | $ | 3.33 | | | $ | 3.48 | | | $ | (0.15 | ) | | $ | (4.84 | ) | | $ | — | | | $ | (4.99 | ) | |
| 8/31/2006 | | $ | 37.21 | | | $ | 0.13 | | | $ | 2.24 | | | $ | 2.37 | | | $ | (0.24 | ) | | $ | (5.04 | ) | | $ | — | | | $ | (5.28 | ) | |
| 8/31/2005 | | $ | 31.96 | | | $ | 0.21 | | | $ | 5.12 | | | $ | 5.33 | | | $ | (0.08 | ) | | $ | — | | | $ | — | | | $ | (0.08 | ) | |
| Trust Class | |
| 8/31/2009 | | $ | 18.18 | | | $ | 0.07 | | | $ | (4.40 | ) | | $ | (4.33 | ) | | $ | (0.10 | ) | | $ | (1.61 | ) | | $ | — | | | $ | (1.71 | ) | |
| 8/31/2008 | | $ | 24.09 | | | $ | 0.06 | | | $ | (1.54 | ) | | $ | (1.48 | ) | | $ | (0.09 | ) | | $ | (4.34 | ) | | $ | — | | | $ | (4.43 | ) | |
| 8/31/2007 | | $ | 25.19 | | | $ | 0.05 | | | $ | 2.46 | | | $ | 2.51 | | | $ | (0.04 | ) | | $ | (3.57 | ) | | $ | — | | | $ | (3.61 | ) | |
| 8/31/2006 | | $ | 27.36 | | | $ | 0.04 | | | $ | 1.65 | | | $ | 1.69 | | | $ | (0.16 | ) | | $ | (3.70 | ) | | $ | — | | | $ | (3.86 | ) | |
| 8/31/2005 | | $ | 23.51 | | | $ | 0.10 | | | $ | 3.76 | | | $ | 3.86 | | | $ | (0.01 | ) | | $ | — | | | $ | — | | | $ | (0.01 | ) | |
| Advisor Class | |
| 8/31/2009 | | $ | 12.64 | | | $ | 0.03 | | | $ | (3.07 | ) | | $ | (3.04 | ) | | $ | (0.09 | ) | | $ | (1.11 | ) | | $ | — | | | $ | (1.20 | ) | |
| 8/31/2008 | | $ | 16.80 | | | $ | 0.02 | | | $ | (1.08 | ) | | $ | (1.06 | ) | | $ | (0.07 | ) | | $ | (3.03 | ) | | $ | — | | | $ | (3.10 | ) | |
| 8/31/2007 | | $ | 17.57 | | | $ | 0.00 | | | $ | 1.71 | | | $ | 1.71 | | | $ | — | | | $ | (2.48 | ) | | $ | — | | | $ | (2.48 | ) | |
| 8/31/2006 | | $ | 19.00 | | | $ | (0.00 | ) | | $ | 1.15 | | | $ | 1.15 | | | $ | — | | | $ | (2.58 | ) | | $ | — | | | $ | (2.58 | ) | |
| 8/31/2005 | | $ | 16.35 | | | $ | 0.04 | | | $ | 2.61 | | | $ | 2.65 | | | $ | — | | | $ | — | | | $ | — | | | $ | — | | |
| Genesis Fund | |
| Investor Class | |
| 8/31/2009 | | $ | 34.95 | | | $ | (0.01 | ) | | $ | (9.23 | ) | | $ | (9.24 | ) | | $ | — | | | $ | (1.32 | ) | | $ | (0.00 | ) | | $ | (1.32 | ) | |
| 8/31/2008 | | $ | 37.55 | | | $ | (0.07 | ) | | $ | 3.53 | | | $ | 3.46 | | | $ | (0.16 | ) | | $ | (5.90 | ) | | $ | — | | | $ | (6.06 | ) | |
| 8/31/2007 | | $ | 34.92 | | | $ | 0.18 | @@ | | $ | 5.58 | @@ | | $ | 5.76 | | | $ | (0.46 | ) | | $ | (2.67 | ) | | $ | — | | | $ | (3.13 | ) | |
| 8/31/2006 | | $ | 34.03 | | | $ | (0.05 | ) | | $ | 1.71 | | | $ | 1.66 | | | $ | — | | | $ | (0.77 | ) | | $ | — | | | $ | (0.77 | ) | |
| 8/31/2005 | | $ | 27.03 | | | $ | (0.08 | ) | | $ | 7.97 | | | $ | 7.89 | | | $ | — | | | $ | (0.89 | ) | | $ | — | | | $ | (0.89 | ) | |
See Notes to Financial Highlights
175
| | |
Redemption
Feesøø | |
Net Asset
Value, End of
Year | |
Total Return†† | |
Net Assets,
End of Year
(in millions) | |
Ratio of Gross
Expenses to
Average Net
Assets# | |
Ratio of Net
Expenses to
Average Net
Assets | | Ratio of Net
Investment
Income/
(Loss) to
Average Net
Assets | |
Portfolio
Turnover
Rate | |
| Class A | |
| 8/31/2009 | | $ | — | | | $ | 8.72 | | | | (16.01 | %) | | $ | 43.0 | | | | 1.16 | % | | | 1.16 | %‡ | | | 3.15 | % | | | 61 | % | |
Period from 6/9/2008^
to 8/31/2008 | | $ | — | | | $ | 10.72 | | | | (1.57 | %)** | | $ | 23.6 | | | | 1.17 | %* | | | 1.16 | %‡* | | | 2.72 | %* | | | 48 | %Ø | |
| Class C | |
| 8/31/2009 | | $ | — | | | $ | 8.70 | | | | (16.60 | %) | | $ | 4.3 | | | | 1.91 | % | | | 1.91 | %‡ | | | 2.46 | % | | | 61 | % | |
Period from 6/9/2008^
to 8/31/2008 | | $ | — | | | $ | 10.71 | | | | (1.72 | %)** | | $ | 1.2 | | | | 1.92 | %* | | | 1.90 | %‡* | | | 2.22 | %* | | | 48 | %Ø | |
| Focus Fund | |
| Investor Class | |
| 8/31/2009 | | $ | — | | | $ | 16.59 | | | | (21.06 | %) | | $ | 540.9 | | | | .99 | % | | | .99 | %‡ | | | .92 | % | | | 89 | % | |
| 8/31/2008 | | $ | — | | | $ | 24.78 | | | | (7.12 | %) | | $ | 795.6 | | | | .89 | % | | | .88 | %‡ | | | .56 | % | | | 90 | % | |
| 8/31/2007 | | $ | — | | | $ | 32.79 | | | | 10.71 | % | | $ | 1,018.6 | | | | .88 | % | | | .87 | %‡ | | | .44 | % | | | 53 | % | |
| 8/31/2006 | | $ | — | | | $ | 34.30 | | | | 7.00 | % | | $ | 1,093.1 | | | | .88 | % | | | .87 | %‡ | | | .37 | % | | | 41 | % | |
| 8/31/2005 | | $ | — | | | $ | 37.21 | | | | 16.69 | % | | $ | 1,185.4 | | | | .87 | % | | | .87 | %‡ | | | .57 | % | | | 19 | % | |
| Trust Class | |
| 8/31/2009 | | $ | — | | | $ | 12.14 | | | | (21.21 | %) | | $ | 23.7 | | | | 1.24 | % | | | 1.24 | %‡ | | | .65 | % | | | 89 | % | |
| 8/31/2008 | | $ | — | | | $ | 18.18 | | | | (7.37 | %) | | $ | 41.5 | | | | 1.11 | % | | | 1.10 | %‡ | | | .31 | % | | | 90 | % | |
| 8/31/2007 | | $ | — | | | $ | 24.09 | | | | 10.49 | % | | $ | 72.3 | | | | 1.08 | % | | | 1.07 | %‡ | | | .21 | % | | | 53 | % | |
| 8/31/2006 | | $ | — | | | $ | 25.19 | | | | 6.81 | % | | $ | 112.8 | | | | 1.06 | % | | | 1.06 | %‡ | | | .14 | % | | | 41 | % | |
| 8/31/2005 | | $ | — | | | $ | 27.36 | | | | 16.44 | % | | $ | 189.4 | | | | 1.05 | % | | | 1.04 | %‡ | | | .38 | % | | | 19 | % | |
| Advisor Class | |
| 8/31/2009 | | $ | — | | | $ | 8.40 | | | | (21.45 | %) | | $ | 10.2 | | | | 1.50 | % | | | 1.50 | %‡ | | | .40 | % | | | 89 | % | |
| 8/31/2008 | | $ | — | | | $ | 12.64 | | | | (7.55 | %) | | $ | 16.7 | | | | 1.34 | % | | | 1.33 | %‡ | | | .12 | % | | | 90 | % | |
| 8/31/2007 | | $ | — | | | $ | 16.80 | | | | 10.23 | % | | $ | 23.3 | | | | 1.29 | % | | | 1.28 | %‡ | | | .02 | % | | | 53 | % | |
| 8/31/2006 | | $ | — | | | $ | 17.57 | | | | 6.62 | % | | $ | 28.1 | | | | 1.27 | % | | | 1.26 | %‡ | | | (.03 | %) | | | 41 | % | |
| 8/31/2005 | | $ | — | | | $ | 19.00 | | | | 16.21 | % | | $ | 35.3 | | | | 1.24 | % | | | 1.23 | %‡ | | | .20 | % | | | 19 | % | |
| Genesis Fund | |
| Investor Class | |
| 8/31/2009 | | $ | — | | | $ | 24.39 | | | | (25.72 | %) | | $ | 1,626.8 | | | | 1.08 | % | | | 1.08 | %‡ | | | (.04 | %) | | | 12 | % | |
| 8/31/2008 | | $ | — | | | $ | 34.95 | | | | 10.18 | % | | $ | 2,386.8 | | | | 1.03 | % | | | 1.02 | %‡ | | | (.20 | %) | | | 18 | %## | |
| 8/31/2007 | | $ | — | | | $ | 37.55 | | | | 17.51 | % | | $ | 1,997.2 | | | | 1.03 | % | | | 1.02 | %‡ | | | .51 | %@@ | | | 25 | % | |
| 8/31/2006 | | $ | — | | | $ | 34.92 | | | | 4.89 | % | | $ | 1,901.1 | | | | 1.02 | % | | | 1.02 | %‡ | | | (.15 | %) | | | 19 | % | |
| 8/31/2005 | | $ | — | | | $ | 34.03 | | | | 29.68 | % | | $ | 1,823.2 | | | | 1.04 | % | | | 1.04 | %‡ | | | (.25 | %) | | | 11 | % | |
176
Financial Highlights (cont'd)
| | |
Net Asset
Value,
Beginning
of Year | |
Net
Investment
Income (Loss)@ | | Net Gains or
Losses on
Securities
(both realized
and
unrealized) | |
Total From
Investment
Operations | |
Dividends
from Net
Investment
Income | |
Distributions
from Net
Realized
Capital Gains | |
Tax
Return of
Capital | |
Total
Distributions | |
| Trust Class | |
| 8/31/2009 | | $ | 50.16 | | | $ | (0.03 | ) | | $ | (13.24 | ) | | $ | (13.27 | ) | | $ | — | | | $ | (1.89 | ) | | $ | (0.00 | ) | | $ | (1.89 | ) | |
| 8/31/2008 | | $ | 53.69 | | | $ | (0.14 | ) | | $ | 5.12 | | | $ | 4.98 | | | $ | (0.08 | ) | | $ | (8.43 | ) | | $ | — | | | $ | (8.51 | ) | |
| 8/31/2007 | | $ | 49.89 | | | $ | 0.24 | @@ | | $ | 7.96 | @@ | | $ | 8.20 | | | $ | (0.60 | ) | | $ | (3.80 | ) | | $ | — | | | $ | (4.40 | ) | |
| 8/31/2006 | | $ | 48.66 | | | $ | (0.11 | ) | | $ | 2.44 | | | $ | 2.33 | | | $ | — | | | $ | (1.10 | ) | | $ | — | | | $ | (1.10 | ) | |
| 8/31/2005 | | $ | 38.66 | | | $ | (0.13 | ) | | $ | 11.39 | | | $ | 11.26 | | | $ | — | | | $ | (1.26 | ) | | $ | — | | | $ | (1.26 | ) | |
| Advisor Class | |
| 8/31/2009 | | $ | 29.25 | | | $ | (0.07 | ) | | $ | (7.73 | ) | | $ | (7.80 | ) | | $ | — | | | $ | (1.10 | ) | | $ | (0.00 | ) | | $ | (1.10 | ) | |
| 8/31/2008 | | $ | 31.43 | | | $ | (0.16 | ) | | $ | 2.98 | | | $ | 2.82 | | | $ | (0.07 | ) | | $ | (4.93 | ) | | $ | — | | | $ | (5.00 | ) | |
| 8/31/2007 | | $ | 29.10 | | | $ | 0.06 | @@ | | $ | 4.67 | @@ | | $ | 4.73 | | | $ | (0.18 | ) | | $ | (2.22 | ) | | $ | — | | | $ | (2.40 | ) | |
| 8/31/2006 | | $ | 28.46 | | | $ | (0.14 | ) | | $ | 1.42 | | | $ | 1.28 | | | $ | — | | | $ | (0.64 | ) | | $ | — | | | $ | (0.64 | ) | |
| 8/31/2005 | | $ | 22.66 | | | $ | (0.14 | ) | | $ | 6.67 | | | $ | 6.53 | | | $ | — | | | $ | (0.73 | ) | | $ | — | | | $ | (0.73 | ) | |
| Institutional Class | |
| 8/31/2009 | | $ | 48.09 | | | $ | 0.06 | | | $ | (12.70 | ) | | $ | (12.64 | ) | | $ | — | | | $ | (1.81 | ) | | $ | (0.00 | ) | | $ | (1.81 | ) | |
| 8/31/2008 | | $ | 51.52 | | | $ | (0.01 | ) | | $ | 4.90 | | | $ | 4.89 | | | $ | (0.23 | ) | | $ | (8.09 | ) | | $ | — | | | $ | (8.32 | ) | |
| 8/31/2007 | | $ | 47.95 | | | $ | 0.32 | @@ | | $ | 7.68 | @@ | | $ | 8.00 | | | $ | (0.78 | ) | | $ | (3.65 | ) | | $ | — | | | $ | (4.43 | ) | |
| 8/31/2006 | | $ | 46.66 | | | $ | 0.01 | | | $ | 2.34 | | | $ | 2.35 | | | $ | — | | | $ | (1.06 | ) | | $ | — | | | $ | (1.06 | ) | |
| 8/31/2005 | | $ | 36.98 | | | $ | (0.02 | ) | | $ | 10.91 | | | $ | 10.89 | | | $ | — | | | $ | (1.21 | ) | | $ | — | | | $ | (1.21 | ) | |
| Guardian Fund | |
| Investor Class | |
| 8/31/2009 | | $ | 16.58 | | | $ | 0.07 | | | $ | (4.15 | ) | | $ | (4.08 | ) | | $ | (0.05 | ) | | $ | (1.30 | ) | | $ | — | | | $ | (1.35 | ) | |
| 8/31/2008 | | $ | 19.89 | | | $ | 0.11 | | | $ | (1.05 | ) | | $ | (0.94 | ) | | $ | (0.13 | ) | | $ | (2.24 | ) | | $ | — | | | $ | (2.37 | ) | |
| 8/31/2007 | | $ | 18.64 | | | $ | 0.14 | | | $ | 2.49 | | | $ | 2.63 | | | $ | (0.07 | ) | | $ | (1.31 | ) | | $ | — | | | $ | (1.38 | ) | |
| 8/31/2006 | | $ | 17.52 | | | $ | 0.08 | | | $ | 1.16 | | | $ | 1.24 | | | $ | (0.12 | ) | | $ | — | | | $ | — | | | $ | (0.12 | ) | |
| 8/31/2005 | | $ | 14.46 | | | $ | 0.13 | | | $ | 2.98 | | | $ | 3.11 | | | $ | (0.05 | ) | | $ | — | | | $ | — | | | $ | (0.05 | ) | |
| Trust Class | |
| 8/31/2009 | | $ | 13.02 | | | $ | 0.04 | | | $ | (3.25 | ) | | $ | (3.21 | ) | | $ | (0.04 | ) | | $ | (1.02 | ) | | $ | — | | | $ | (1.06 | ) | |
| 8/31/2008 | | $ | 15.64 | | | $ | 0.06 | | | $ | (0.82 | ) | | $ | (0.76 | ) | | $ | (0.10 | ) | | $ | (1.76 | ) | | $ | — | | | $ | (1.86 | ) | |
| 8/31/2007 | | $ | 14.66 | | | $ | 0.07 | | | $ | 1.98 | | | $ | 2.05 | | | $ | (0.04 | ) | | $ | (1.03 | ) | | $ | — | | | $ | (1.07 | ) | |
| 8/31/2006 | | $ | 13.79 | | | $ | 0.04 | | | $ | 0.91 | | | $ | 0.95 | | | $ | (0.08 | ) | | $ | — | | | $ | — | | | $ | (0.08 | ) | |
| 8/31/2005 | | $ | 11.39 | | | $ | 0.08 | | | $ | 2.35 | | | $ | 2.43 | | | $ | (0.03 | ) | | $ | — | | | $ | — | | | $ | (0.03 | ) | |
See Notes to Financial Highlights
177
| | |
Redemption
Feesøø | |
Net Asset
Value, End of
Year | |
Total Return†† | |
Net Assets,
End of Year
(in millions) | |
Ratio of Gross
Expenses to
Average Net
Assets# | |
Ratio of Net
Expenses to
Average Net
Assets | | Ratio of Net
Investment
Income/
(Loss) to
Average Net
Assets | |
Portfolio
Turnover
Rate | |
| Trust Class | |
| 8/31/2009 | | $ | — | | | $ | 35.00 | | | | (25.73 | %) | | $ | 3,244.1 | | | | 1.12 | % | | | 1.12 | %‡ | | | (.09 | %) | | | 12 | % | |
| 8/31/2008 | | $ | — | | | $ | 50.16 | | | | 10.22 | % | | $ | 4,799.6 | | | | 1.09 | % | | | 1.09 | %‡ | | | (.27 | %) | | | 18 | %## | |
| 8/31/2007 | | $ | — | | | $ | 53.69 | | | | 17.41 | % | | $ | 4,985.5 | | | | 1.10 | % | | | 1.09 | %‡ | | | .48 | %@@ | | | 25 | % | |
| 8/31/2006 | | $ | — | | | $ | 49.89 | | | | 4.82 | % | | $ | 5,970.9 | | | | 1.09 | % | | | 1.09 | %‡ | | | (.22 | %) | | | 19 | % | |
| 8/31/2005 | | $ | — | | | $ | 48.66 | | | | 29.63 | % | | $ | 6,348.2 | | | | 1.10 | % | | | 1.09 | %‡ | | | (.31 | %) | | | 11 | % | |
| Advisor Class | |
| 8/31/2009 | | $ | — | | | $ | 20.35 | | | | (25.95 | %) | | $ | 397.9 | | | | 1.38 | % | | | 1.38 | %‡ | | | (.34 | %) | | | 12 | % | |
| 8/31/2008 | | $ | — | | | $ | 29.25 | | | | 9.89 | % | | $ | 596.8 | | | | 1.35 | % | | | 1.34 | %‡ | | | (.53 | %) | | | 18 | %## | |
| 8/31/2007 | | $ | — | | | $ | 31.43 | | | | 17.14 | % | | $ | 547.2 | | | | 1.35 | % | | | 1.35 | %‡ | | | .20 | %@@ | | | 25 | % | |
| 8/31/2006 | | $ | — | | | $ | 29.10 | | | | 4.52 | % | | $ | 617.4 | | | | 1.35 | % | | | 1.34 | %‡ | | | (.47 | %) | | | 19 | % | |
| 8/31/2005 | | $ | — | | | $ | 28.46 | | | | 29.31 | % | | $ | 661.0 | | | | 1.35 | % | | | 1.35 | %‡ | | | (.56 | %) | | | 11 | % | |
| Institutional Class | |
| 8/31/2009 | | $ | — | | | $ | 33.64 | | | | (25.55 | %) | | $ | 3,283.0 | | | | .85 | % | | | .85 | %‡ | | | .18 | % | | | 12 | % | |
| 8/31/2008 | | $ | — | | | $ | 48.09 | | | | 10.48 | % | | $ | 4,781.4 | | | | .84 | % | | | .84 | %‡ | | | (.03 | %) | | | 18 | %## | |
| 8/31/2007 | | $ | — | | | $ | 51.52 | | | | 17.73 | % | | $ | 3,307.5 | | | | .85 | % | | | .84 | %‡ | | | .65 | %@@ | | | 25 | % | |
| 8/31/2006 | | $ | — | | | $ | 47.95 | | | | 5.05 | % | | $ | 2,625.7 | | | | .85 | % | | | .85 | %‡§ | | | .03 | % | | | 19 | % | |
| 8/31/2005 | | $ | — | | | $ | 46.66 | | | | 29.95 | % | | $ | 1,788.7 | | | | .85 | % | | | .85 | %‡§ | | | (.06 | %) | | | 11 | % | |
| Guardian Fund | |
| Investor Class | |
| 8/31/2009 | | $ | — | | | $ | 11.15 | | | | (22.65 | %) | | $ | 875.5 | | | | .97 | % | | | .97 | %‡ | | | .67 | % | | | 29 | % | |
| 8/31/2008 | | $ | — | | | $ | 16.58 | | | | (5.38 | %) | | $ | 1,252.9 | | | | .89 | % | | | .88 | %‡ | | | .59 | % | | | 42 | % | |
| 8/31/2007 | | $ | — | | | $ | 19.89 | | | | 14.48 | % | | $ | 1,441.6 | | | | .88 | % | | | .87 | %‡ | | | .69 | % | | | 20 | % | |
| 8/31/2006 | | $ | — | | | $ | 18.64 | | | | 7.09 | % | | $ | 1,417.0 | | | | .89 | % | | | .88 | %‡ | | | .47 | % | | | 34 | % | |
| 8/31/2005 | | $ | — | | | $ | 17.52 | | | | 21.52 | % | | $ | 1,415.2 | | | | .90 | % | | | .90 | %‡ | | | .83 | % | | | 20 | % | |
| Trust Class | |
| 8/31/2009 | | $ | — | | | $ | 8.75 | | | | (22.74 | %) | | $ | 71.0 | | | | 1.14 | % | | | 1.14 | %‡ | | | .50 | % | | | 29 | % | |
| 8/31/2008 | | $ | — | | | $ | 13.02 | | | | (5.52 | %) | | $ | 103.6 | | | | 1.07 | % | | | 1.06 | %‡ | | | .41 | % | | | 42 | % | |
| 8/31/2007 | | $ | — | | | $ | 15.64 | | | | 14.30 | % | | $ | 122.7 | | | | 1.05 | % | | | 1.05 | %‡ | | | .47 | % | | | 20 | % | |
| 8/31/2006 | | $ | — | | | $ | 14.66 | | | | 6.90 | % | | $ | 160.5 | | | | 1.05 | % | | | 1.04 | %‡ | | | .31 | % | | | 34 | % | |
| 8/31/2005 | | $ | — | | | $ | 13.79 | | | | 21.33 | % | | $ | 180.0 | | | | 1.05 | % | | | 1.04 | %‡ | | | .64 | % | | | 20 | % | |
178
Financial Highlights (cont'd)
| | |
Net Asset
Value,
Beginning
of Year | |
Net
Investment
Income (Loss)@ | | Net Gains or
Losses on
Securities
(both realized
and
unrealized) | |
Total From
Investment
Operations | |
Dividends
from Net
Investment
Income | |
Distributions
from Net
Realized
Capital Gains | |
Tax
Return of
Capital | |
Total
Distributions | |
| Advisor Class | |
| 8/31/2009 | | $ | 14.65 | | | $ | 0.01 | | | $ | (3.65 | ) | | $ | (3.64 | ) | | $ | (0.00 | ) | | $ | (1.14 | ) | | $ | — | | | $ | (1.14 | ) | |
| 8/31/2008 | | $ | 17.55 | | | $ | (0.01 | ) | | $ | (0.92 | ) | | $ | (0.93 | ) | | $ | — | | | $ | (1.97 | ) | | $ | — | | | $ | (1.97 | ) | |
| 8/31/2007 | | $ | 16.48 | | | $ | 0.01 | | | $ | 2.22 | | | $ | 2.23 | | | $ | — | | | $ | (1.16 | ) | | $ | — | | | $ | (1.16 | ) | |
| 8/31/2006 | | $ | 15.49 | | | $ | (0.02 | ) | | $ | 1.01 | | | $ | 0.99 | | | $ | — | | | $ | — | | | $ | — | | | $ | — | | |
| 8/31/2005 | | $ | 12.83 | | | $ | (0.04 | ) | | $ | 2.70 | | | $ | 2.66 | | | $ | — | | | $ | — | | | $ | — | | | $ | — | | |
| Institutional Class | |
Period from 5/27/2009^
to 8/31/2009 | | $ | 10.39 | | | $ | 0.03 | | | $ | 0.74 | | | $ | 0.77 | | | $ | — | | | $ | — | | | $ | — | | | $ | — | | |
| Class A | |
Period from 5/27/2009^
to 8/31/2009 | | $ | 8.15 | | | $ | 0.01 | | | $ | 0.59 | | | $ | 0.60 | | | $ | — | | | $ | — | | | $ | — | | | $ | — | | |
| Class C | |
Period from 5/27/2009^
to 8/31/2009 | | $ | 9.21 | | | $ | 0.00 | | | $ | 0.65 | | | $ | 0.65 | | | $ | — | | | $ | — | | | $ | — | | | $ | — | | |
| Class R3 | |
Period from 5/27/2009^
to 8/31/2009 | | $ | 9.21 | | | $ | 0.01 | | | $ | 0.66 | | | $ | 0.67 | | | $ | — | | | $ | — | | | $ | — | | | $ | — | | |
| International Fund | |
| Investor Class | |
| 8/31/2009 | | $ | 17.64 | | | $ | 0.16 | | | $ | (3.86 | ) | | $ | (3.70 | ) | | $ | (0.36 | ) | | $ | — | | | $ | — | | | $ | (0.36 | ) | |
| 8/31/2008 | | $ | 25.68 | | | $ | 0.38 | | | $ | (4.26 | ) | | $ | (3.88 | ) | | $ | (0.80 | ) | | $ | (3.36 | ) | | $ | — | | | $ | (4.16 | ) | |
| 8/31/2007 | | $ | 24.23 | | | $ | 0.26 | | | $ | 3.81 | | | $ | 4.07 | | | $ | (0.29 | ) | | $ | (2.33 | ) | | $ | — | | | $ | (2.62 | ) | |
| 8/31/2006 | | $ | 21.01 | | | $ | 0.28 | | | $ | 3.81 | | | $ | 4.09 | | | $ | (0.13 | ) | | $ | (0.75 | ) | | $ | — | | | $ | (0.88 | ) | |
| 8/31/2005 | | $ | 15.42 | | | $ | 0.15 | | | $ | 5.54 | | | $ | 5.69 | | | $ | (0.11 | ) | | $ | — | | | $ | — | | | $ | (0.11 | ) | |
| Trust Class | |
| 8/31/2009 | | $ | 19.43 | | | $ | 0.17 | | | $ | (4.24 | ) | | $ | (4.07 | ) | | $ | (0.33 | ) | | $ | — | | | $ | — | | | $ | (0.33 | ) | |
| 8/31/2008 | | $ | 28.18 | | | $ | 0.39 | | | $ | (4.69 | ) | | $ | (4.30 | ) | | $ | (0.77 | ) | | $ | (3.68 | ) | | $ | — | | | $ | (4.45 | ) | |
| 8/31/2007 | | $ | 26.52 | | | $ | 0.27 | | | $ | 4.16 | | | $ | 4.43 | | | $ | (0.24 | ) | | $ | (2.53 | ) | | $ | — | | | $ | (2.77 | ) | |
| 8/31/2006 | | $ | 22.93 | | | $ | 0.31 | | | $ | 4.16 | | | $ | 4.47 | | | $ | (0.08 | ) | | $ | (0.81 | ) | | $ | — | | | $ | (0.89 | ) | |
| 8/31/2005 | | $ | 16.80 | | | $ | 0.14 | | | $ | 6.04 | | | $ | 6.18 | | | $ | (0.06 | ) | | $ | — | | | $ | — | | | $ | (0.06 | ) | |
See Notes to Financial Highlights
179
| | |
Redemption
Feesøø | |
Net Asset
Value, End of
Year | |
Total Return†† | |
Net Assets,
End of Year
(in millions) | |
Ratio of Gross
Expenses to
Average Net
Assets# | |
Ratio of Net
Expenses to
Average Net
Assets | | Ratio of Net
Investment
Income/
(Loss) to
Average Net
Assets | |
Portfolio
Turnover
Rate | |
| Advisor Class | |
| 8/31/2009 | | $ | — | | | $ | 9.87 | | | | (23.05 | %) | | $ | 0.5 | | | | 1.50 | % | | | 1.50 | %‡ | | | .13 | % | | | 29 | % | |
| 8/31/2008 | | $ | — | | | $ | 14.65 | | | | (5.96 | %) | | $ | 0.9 | | | | 1.50 | % | | | 1.50 | %‡ | | | (.04 | %) | | | 42 | % | |
| 8/31/2007 | | $ | — | | | $ | 17.55 | | | | 13.82 | % | | $ | 1.1 | | | | 1.50 | % | | | 1.50 | %‡ | | | .04 | % | | | 20 | % | |
| 8/31/2006 | | $ | — | | | $ | 16.48 | | | | 6.39 | % | | $ | 1.3 | | | | 1.50 | % | | | 1.49 | %‡ | | | (.12 | %) | | | 34 | % | |
| 8/31/2005 | | $ | — | | | $ | 15.49 | | | | 20.73 | % | | $ | 0.6 | | | | 1.50 | % | | | 1.50 | %‡ | | | (.28 | %) | | | 20 | % | |
| Institutional Class | |
Period from 5/27/2009^
to 8/31/2009 | | $ | — | | | $ | 11.16 | | | | 7.41 | %** | | $ | 0.1 | | | | .75 | %* | | | .75 | %‡* | | | 1.12 | %* | | | 29 | %Ø | |
| Class A | |
Period from 5/27/2009^
to 8/31/2009 | | $ | — | | | $ | 8.75 | | | | 7.36 | %** | | $ | 0.5 | | | | 1.11 | %* | | | 1.11 | %‡* | | | .41 | %* | | | 29 | %Ø | |
| Class C | |
Period from 5/27/2009^
to 8/31/2009 | | $ | — | | | $ | 9.86 | | | | 7.06 | %** | | $ | 0.1 | | | | 1.86 | %* | | | 1.86 | %‡* | | | .01 | %* | | | 29 | %Ø | |
| Class R3 | |
Period from 5/27/2009^
to 8/31/2009 | | $ | — | | | $ | 9.88 | | | | 7.27 | %** | | $ | 0.1 | | | | 1.36 | %* | | | 1.36 | %‡* | | | .51 | %* | | | 29 | %Ø | |
| International Fund | |
| Investor Class | |
| 8/31/2009 | | $ | 0.00 | | | $ | 13.58 | | | | (20.42 | %) | | $ | 208.8 | | | | 1.40 | % | | | 1.40 | %‡ | | | 1.38 | % | | | 81 | % | |
| 8/31/2008 | | $ | 0.00 | | | $ | 17.64 | | | | (17.11 | %) | | $ | 405.2 | | | | 1.26 | % | | | 1.25 | %‡ | | | 1.80 | % | | | 53 | % | |
| 8/31/2007 | | $ | 0.00 | | | $ | 25.68 | | | | 17.44 | % | | $ | 690.6 | | | | 1.25 | % | | | 1.23 | %‡ | | | 1.02 | % | | | 42 | % | |
| 8/31/2006 | | $ | 0.01 | | | $ | 24.23 | | | | 20.07 | % | | $ | 921.4 | | | | 1.26 | % | | | 1.25 | %ठ| | | 1.19 | % | | | 48 | % | |
| 8/31/2005 | | $ | 0.01 | | | $ | 21.01 | | | | 37.08 | % | | $ | 455.5 | | | | 1.40 | % | | | 1.39 | %‡ | | | .82 | % | | | 38 | % | |
| Trust Class | |
| 8/31/2009 | | $ | 0.00 | | | $ | 15.03 | | | | (20.48 | %) | | $ | 201.5 | | | | 1.49 | % | | | 1.49 | %‡ | | | 1.29 | % | | | 81 | % | |
| 8/31/2008 | | $ | 0.00 | | | $ | 19.43 | | | | (17.21 | %) | | $ | 417.7 | | | | 1.36 | % | | | 1.35 | %‡ | | | 1.64 | % | | | 53 | % | |
| 8/31/2007 | | $ | 0.00 | | | $ | 28.18 | | | | 17.34 | % | | $ | 824.3 | | | | 1.34 | % | | | 1.33 | %‡ | | | | % | | | 42 | % | |
| 8/31/2006 | | $ | 0.01 | | | $ | 26.52 | | | | 20.02 | % | | $ | 870.9 | | | | 1.33 | % | | | 1.32 | %ठ| | | 1.21 | % | | | 48 | % | |
| 8/31/2005 | | $ | 0.01 | | | $ | 22.93 | | | | 36.89 | % | | $ | 233.2 | | | | 1.50 | % | | | 1.48 | %‡ | | | .70 | % | | | 38 | % | |
180
Financial Highlights (cont'd)
| | |
Net Asset
Value,
Beginning
of Year | |
Net
Investment
Income (Loss)@ | | Net Gains or
Losses on
Securities
(both realized
and
unrealized) | |
Total From
Investment
Operations | |
Dividends
from Net
Investment
Income | |
Distributions
from Net
Realized
Capital Gains | |
Tax
Return of
Capital | |
Total
Distributions | |
| International Institutional Fund | |
| Institutional Class | |
| 8/31/2009 | | $ | 9.84 | | | $ | 0.13 | | | $ | (2.17 | ) | | $ | (2.04 | ) | | $ | (0.27 | ) | | $ | — | | | $ | — | | | $ | (0.27 | ) | |
| 8/31/2008 | | $ | 14.44 | | | $ | 0.28 | | | $ | (2.42 | ) | | $ | (2.14 | ) | | $ | (0.50 | ) | | $ | (1.96 | ) | | $ | — | | | $ | (2.46 | ) | |
| 8/31/2007 | | $ | 12.69 | | | $ | 0.20 | | | $ | 2.04 | | | $ | 2.24 | | | $ | (0.18 | ) | | $ | (0.31 | ) | | $ | — | | | $ | (0.49 | ) | |
| 8/31/2006 | | $ | 10.95 | | | $ | 0.22 | | | $ | 1.60 | | | $ | 1.82 | | | $ | (0.03 | ) | | $ | (0.05 | ) | | $ | — | | | $ | (0.08 | ) | |
Period from 6/17/2005^
to 8/31/2005 | | $ | 10.00 | | | $ | 0.00 | | | $ | 0.95 | | | $ | 0.95 | | | $ | — | | | $ | — | | | $ | — | | | $ | — | | |
| International Large Cap Fund | |
| Trust Class | |
| 8/31/2009 | | $ | 10.12 | | | $ | 0.11 | | | $ | (2.08 | ) | | $ | (1.97 | ) | | $ | (0.22 | ) | | $ | — | | | $ | — | | | $ | (0.22 | ) | |
| 8/31/2008 | | $ | 12.09 | | | $ | 0.24 | | | $ | (1.63 | ) | | $ | (1.39 | ) | | $ | (0.18 | ) | | $ | (0.40 | ) | | $ | — | | | $ | (0.58 | ) | |
| 8/31/2007 | | $ | 10.19 | | | $ | 0.17 | | | $ | 1.79 | | | $ | 1.96 | | | $ | (0.05 | ) | | $ | (0.01 | ) | | $ | — | | | $ | (0.06 | ) | |
Period from 8/1/2006^
t0 8/31/2006 | | $ | 10.00 | | | $ | 0.01 | | | $ | 0.18 | | | $ | 0.19 | | | $ | — | | | $ | — | | | $ | — | | | $ | — | | |
| Institutional Class | |
| 8/31/2009 | | $ | 10.15 | | | $ | 0.14 | | | $ | (2.09 | ) | | $ | (1.95 | ) | | $ | (0.27 | ) | | $ | — | | | $ | — | | | $ | (0.27 | ) | |
| 8/31/2008 | | $ | 12.11 | | | $ | 0.29 | | | $ | (1.63 | ) | | $ | (1.34 | ) | | $ | (0.22 | ) | | $ | (0.40 | ) | | $ | — | | | $ | (0.62 | ) | |
Period from 10/6/2006^
to 8/31/2007 | | $ | 10.19 | | | $ | 0.19 | | | $ | 1.80 | | | $ | 1.99 | | | $ | (0.06 | ) | | $ | (0.01 | ) | | $ | — | | | $ | (0.07 | ) | |
| Class A | |
| 8/31/2009 | | $ | 10.12 | | | $ | 0.11 | | | $ | (2.08 | ) | | $ | (1.97 | ) | | $ | (0.25 | ) | | $ | — | | | $ | — | | | $ | (0.25 | ) | |
Period from 12/20/2007^
to 8/31/2008 | | $ | 11.30 | | | $ | 0.08 | | | $ | (1.26 | ) | | $ | (1.18 | ) | | $ | — | | | $ | — | | | $ | — | | | $ | — | | |
| Class C | |
| 8/31/2009 | | $ | 10.06 | | | $ | 0.08 | | | $ | (2.08 | ) | | $ | (2.00 | ) | | $ | (0.19 | ) | | $ | — | | | $ | — | | | $ | (0.19 | ) | |
Period from 12/20/2007^
to 8/31/2008 | | $ | 11.30 | | | $ | 0.16 | | | $ | (1.40 | ) | | $ | (1.24 | ) | | $ | — | | | $ | — | | | $ | — | | | $ | — | | |
| Class R3 | |
Period from 5/27/2009^
to 8/31/2009 | | $ | 7.10 | | | $ | 0.03 | | | $ | 0.77 | | | $ | 0.80 | | | $ | — | | | $ | — | | | $ | — | | | $ | — | | |
See Notes to Financial Highlights
181
| | |
Redemption
Feesøø | |
Net Asset
Value, End of
Year | |
Total Return†† | |
Net Assets,
End of Year
(in millions) | |
Ratio of Gross
Expenses to
Average Net
Assets# | |
Ratio of Net
Expenses to
Average Net
Assets | | Ratio of Net
Investment
Income/
(Loss) to
Average Net
Assets | |
Portfolio
Turnover
Rate | |
| International Institutional Fund | |
| Institutional Class | |
| 8/31/2009 | | $ | 0.00 | | | $ | 7.53 | | | | (19.92 | %) | | $ | 223.8 | | | | .81 | % | | | .81 | %^^ | | | 2.01 | % | | | 98 | % | |
| 8/31/2008 | | $ | 0.00 | | | $ | 9.84 | | | | (16.90 | %) | | $ | 411.5 | | | | .81 | % | | | .80 | %^^ | | | 2.32 | % | | | 58 | % | |
| 8/31/2007 | | $ | 0.00 | | | $ | 14.44 | | | | 17.97 | % | | $ | 574.3 | | | | .83 | % | | | .83 | %^^ | | | 1.44 | % | | | 59 | % | |
| 8/31/2006 | | $ | 0.00 | | | $ | 12.69 | | | | 16.68 | % | | $ | 627.6 | | | | .85 | % | | | .85 | %^^ | | | 1.78 | % | | | 45 | % | |
Period from 6/17/2005^
to 8/31/2005 | | $ | — | | | $ | 10.95 | | | | 9.50 | %** | | $ | 42.2 | | | | .85 | %* | | | .85 | %^^* | | | .14 | %* | | | 14 | %** | |
| International Large Cap Fund | |
| Trust Class | |
| 8/31/2009 | | $ | 0.00 | | | $ | 7.93 | | | | (18.84 | %) | | $ | 28.9 | | | | 1.27 | % | | | 1.27 | %‡ | | | 1.62 | % | | | 90 | % | |
| 8/31/2008 | | $ | 0.00 | | | $ | 10.12 | | | | (11.95 | %) | | $ | 51.5 | | | | 1.28 | % | | | 1.27 | %‡ | | | 2.07 | % | | | 97 | % | |
| 8/31/2007 | | $ | 0.00 | | | $ | 12.09 | | | | 19.24 | % | | $ | 54.2 | | | | 1.25 | % | | | 1.24 | %‡ | | | 1.42 | % | | | 23 | % | |
Period from 8/1/2006^
t0 8/31/2006 | | $ | — | | | $ | 10.19 | | | | 1.90 | %** | | $ | 6.2 | | | | 1.25 | %* | | | 1.25 | %‡* | | | 1.32 | %* | | | 6 | %** | |
| Institutional Class | |
| 8/31/2009 | | $ | 0.00 | | | $ | 7.93 | | | | (18.57 | %) | | $ | 67.7 | | | | .92 | % | | | .92 | %‡ | | | 2.00 | % | | | 90 | % | |
| 8/31/2008 | | $ | 0.00 | | | $ | 10.15 | | | | (11.60 | %) | | $ | 114.4 | | | | .93 | % | | | .92 | %‡ | | | 2.59 | % | | | 97 | % | |
Period from 10/6/2006^
to 8/31/2007 | | $ | 0.00 | | | $ | 12.11 | | | | 19.56 | %** | | $ | 111.0 | | | | .90 | %* | | | .89 | %‡* | | | 1.80 | %* | | | 23 | %Ø | |
| Class A | |
| 8/31/2009 | | $ | 0.00 | | | $ | 7.90 | | | | (18.83 | %) | | $ | 4.0 | | | | 1.29 | % | | | 1.29 | %‡ | | | 1.63 | % | | | 90 | % | |
Period from 12/20/2007^
to 8/31/2008 | | $ | 0.00 | | | $ | 10.12 | | | | (10.44 | %)** | | $ | 2.2 | | | | 1.34 | %* | | | 1.34 | %‡* | | | 1.15 | %* | | | 97 | %Ø | |
| Class C | |
| 8/31/2009 | | $ | 0.00 | | | $ | 7.87 | | | | (19.34 | %) | | $ | 0.4 | | | | 2.01 | % | | | 2.01 | %‡ | | | 1.23 | % | | | 90 | % | |
Period from 12/20/2007^
to 8/31/2008 | | $ | 0.00 | | | $ | 10.06 | | | | (10.97 | %)** | | $ | 0.1 | | | | 2.04 | %* | | | 2.03 | %‡* | | | 2.05 | %* | | | 97 | %Ø | |
| Class R3 | |
Period from 5/27/2009^
to 8/31/2009 | | $ | 0.00 | | | $ | 7.90 | | | | 11.27 | %** | | $ | 0.1 | | | | 1.52 | %* | | | 1.52 | %‡* | | | 1.31 | %* | | | 90 | %Ø | |
182
Financial Highlights (cont'd)
| | |
Net Asset
Value,
Beginning
of Year | |
Net
Investment
Income (Loss)@ | | Net Gains or
Losses on
Securities
(both realized
and
unrealized) | |
Total From
Investment
Operations | |
Dividends
from Net
Investment
Income | |
Distributions
from Net
Realized
Capital Gains | |
Tax
Return of
Capital | |
Total
Distributions | |
| Large Cap Disciplined Growth Fund | |
| Investor Class | |
| 8/31/2009 | | $ | 7.39 | | | $ | 0.02 | | | $ | (1.37 | ) | | $ | (1.35 | ) | | $ | — | | | $ | — | | | $ | — | | | $ | — | | |
| 8/31/2008 | | $ | 7.45 | | | $ | (0.00 | ) | | $ | (0.06 | ) | | $ | (0.06 | ) | | $ | — | | | $ | — | | | $ | — | | | $ | — | | |
| 8/31/2007 | | $ | 6.52 | | | $ | (0.00 | ) | | $ | 0.93 | | | $ | 0.93 | | | $ | — | | | $ | — | | | $ | — | | | $ | — | | |
| 8/31/2006 | | $ | 6.22 | | | $ | (0.02 | ) | | $ | 0.33 | | | $ | 0.31 | | | $ | (0.01 | ) | | $ | — | | | $ | — | | | $ | (0.01 | ) | |
| 8/31/2005 | | $ | 5.54 | | | $ | 0.01 | | | $ | 0.67 | | | $ | 0.68 | | | $ | — | | | $ | — | | | $ | — | | | $ | — | | |
| Institutional Class | |
Period from 4/6/2009^
to 8/31/2009 | | $ | 5.28 | | | $ | 0.02 | | | $ | 0.75 | | | $ | 0.77 | | | $ | — | | | $ | — | | | $ | — | | | $ | — | | |
| Class A | |
Period from 4/6/2009^
to 8/31/2009 | | $ | 5.28 | | | $ | 0.01 | | | $ | 0.75 | | | $ | 0.76 | | | $ | — | | | $ | — | | | $ | — | | | $ | — | | |
| Class C | |
Period from 4/6/2009^
to 8/31/2009 | | $ | 5.28 | | | $ | (0.01 | ) | | $ | 0.75 | | | $ | 0.74 | | | $ | — | | | $ | — | | | $ | — | | | $ | — | | |
| Class R3 | |
Period from 5/27/2009^
to 8/31/2009 | | $ | 5.47 | | | $ | 0.00 | | | $ | 0.56 | | | $ | 0.56 | | | $ | — | | | $ | — | | | $ | — | | | $ | — | | |
| Mid Cap Growth Fund | |
| Investor Class | |
| 8/31/2009 | | $ | 9.53 | | | $ | (0.02 | ) | | $ | (2.08 | ) | | $ | (2.10 | ) | | $ | — | | | $ | — | | | $ | — | | | $ | — | | |
| 8/31/2008 | | $ | 10.54 | | | $ | (0.05 | ) | | $ | (0.96 | ) | | $ | (1.01 | ) | | $ | — | | | $ | — | | | $ | — | | | $ | — | | |
| 8/31/2007 | | $ | 8.17 | | | $ | (0.03 | ) | | $ | 2.40 | | | $ | 2.37 | | | $ | — | | | $ | — | | | $ | — | | | $ | — | | |
| 8/31/2006 | | $ | 7.45 | | | $ | (0.03 | ) | | $ | 0.75 | | | $ | 0.72 | | | $ | — | | | $ | — | | | $ | — | | | $ | — | | |
| 8/31/2005 | | $ | 5.86 | | | $ | (0.04 | ) | | $ | 1.63 | | | $ | 1.59 | | | $ | — | | | $ | — | | | $ | — | | | $ | — | | |
| Trust Class | |
| 8/31/2009 | | $ | 14.54 | | | $ | (0.04 | ) | | $ | (3.19 | ) | | $ | (3.23 | ) | | $ | — | | | $ | — | | | $ | — | | | $ | — | | |
| 8/31/2008 | | $ | 16.11 | | | $ | (0.11 | ) | | $ | (1.46 | ) | | $ | (1.57 | ) | | $ | — | | | $ | — | | | $ | — | | | $ | — | | |
| 8/31/2007 | | $ | 12.53 | | | $ | (0.09 | ) | | $ | 3.67 | | | $ | 3.58 | | | $ | — | | | $ | — | | | $ | — | | | $ | — | | |
| 8/31/2006 | | $ | 11.46 | | | $ | (0.08 | ) | | $ | 1.15 | | | $ | 1.07 | | | $ | — | | | $ | — | | | $ | — | | | $ | — | | |
| 8/31/2005 | | $ | 9.04 | | | $ | (0.09 | ) | | $ | 2.51 | | | $ | 2.42 | | | $ | — | | | $ | — | | | $ | — | | | $ | — | | |
See Notes to Financial Highlights
183
| | |
Redemption
Feesøø | |
Net Asset
Value, End of
Year | |
Total Return†† | |
Net Assets,
End of Year
(in millions) | |
Ratio of Gross
Expenses to
Average Net
Assets# | |
Ratio of Net
Expenses to
Average Net
Assets | | Ratio of Net
Investment
Income/
(Loss) to
Average Net
Assets | |
Portfolio
Turnover
Rate | |
| Large Cap Disciplined Growth Fund | |
| Investor Class | |
| 8/31/2009 | | $ | — | | | $ | 6.04 | | | | (18.27 | %) | | $ | 11.7 | | | | 1.34 | % | | | 1.34 | %‡ | | | .40 | % | | | 132 | %### | |
| 8/31/2008 | | $ | — | | | $ | 7.39 | | | | (.81 | %) | | $ | 11.9 | | | | 1.51 | % | | | 1.50 | %‡ | | | (.00 | %) | | | 167 | % | |
| 8/31/2007 | | $ | — | | | $ | 7.45 | | | | 14.26 | % | | $ | 10.0 | | | | 1.51 | % | | | 1.50 | %‡ | | | (.02 | %) | | | 46 | % | |
| 8/31/2006 | | $ | — | | | $ | 6.52 | | | | 4.92 | % | | $ | 10.4 | | | | 1.51 | % | | | 1.49 | %‡ | | | (.27 | %) | | | 64 | % | |
| 8/31/2005 | | $ | — | | | $ | 6.22 | | | | 12.27 | % | | $ | 11.2 | | | | 1.50 | % | | | 1.47 | %‡ | | | .09 | % | | | 107 | % | |
| Institutional Class | |
Period from 4/6/2009^
to 8/31/2009 | | $ | — | | | $ | 6.05 | | | | 14.58 | %** | | $ | 23.3 | | | | .75 | %* | | | .75 | %‡* | | | .86 | %* | | | 132 | %Ø### | |
| Class A | |
Period from 4/6/2009^
to 8/31/2009 | | $ | — | | | $ | 6.04 | | | | 14.39 | %** | | $ | 63.7 | | | | 1.11 | %* | | | 1.11 | %‡* | | | .47 | %* | | | 132 | %Ø### | |
| Class C | |
Period from 4/6/2009^
to 8/31/2009 | | $ | — | | | $ | 6.02 | | | | 14.02 | %** | | $ | 25.9 | | | | 1.86 | %* | | | 1.86 | %‡* | | | (.28 | %)* | | | 132 | %Ø### | |
| Class R3 | |
Period from 5/27/2009^
to 8/31/2009 | | $ | — | | | $ | 6.03 | | | | 10.24 | %** | | $ | 0.1 | | | | 1.36 | %* | | | 1.36 | %‡* | | | .20 | %* | | | 132 | %Ø### | |
| Mid Cap Growth Fund | |
| Investor Class | |
| 8/31/2009 | | $ | — | | | $ | 7.43 | | | | (22.04 | %) | | $ | 280.9 | | | | 1.11 | % | | | 1.11 | %‡ | | | (.28 | %) | | | 69 | % | |
| 8/31/2008 | | $ | — | | | $ | 9.53 | | | | (9.58 | %) | | $ | 396.7 | | | | 1.01 | % | | | 1.01 | %‡ | | | (.49 | %) | | | 70 | % | |
| 8/31/2007 | | $ | — | | | $ | 10.54 | | | | 29.01 | % | | $ | 446.3 | | | | 1.03 | % | | | 1.02 | %‡ | | | (.33 | %) | | | 49 | % | |
| 8/31/2006 | | $ | — | | | $ | 8.17 | | | | 9.66 | % | | $ | 356.7 | | | | 1.05 | % | | | 1.04 | %‡ | | | (.36 | %) | | | 45 | % | |
| 8/31/2005 | | $ | — | | | $ | 7.45 | | | | 27.13 | % | | $ | 342.2 | | | | 1.07 | % | | | 1.06 | %‡ | | | (.65 | %) | | | 65 | % | |
| Trust Class | |
| 8/31/2009 | | $ | — | | | $ | 11.31 | | | | (22.21 | %) | | $ | 16.4 | | | | 1.26 | % | | | 1.26 | %‡ | | | (.37 | %) | | | 69 | % | |
| 8/31/2008 | | $ | — | | | $ | 14.54 | | | | (9.75 | %) | | $ | 11.7 | | | | 1.25 | % | | | 1.25 | %‡ | | | (.73 | %) | | | 70 | % | |
| 8/31/2007 | | $ | — | | | $ | 16.11 | | | | 28.57 | % | | $ | 13.4 | | | | 1.31 | % | | | 1.30 | %‡ | | | (.63 | %) | | | 49 | % | |
| 8/31/2006 | | $ | — | | | $ | 12.53 | | | | 9.34 | % | | $ | 6.6 | | | | 1.33 | % | | | 1.32 | %‡ | | | (.65 | %) | | | 45 | % | |
| 8/31/2005 | | $ | — | | | $ | 11.46 | | | | 26.77 | % | | $ | 7.6 | | | | 1.27 | % | | | 1.26 | %‡ | | | (.85 | %) | | | 65 | % | |
184
Financial Highlights (cont'd)
| | |
Net Asset
Value,
Beginning
of Year | |
Net
Investment
Income (Loss)@ | | Net Gains or
Losses on
Securities
(both realized
and
unrealized) | |
Total From
Investment
Operations | |
Dividends
from Net
Investment
Income | |
Distributions
from Net
Realized
Capital Gains | |
Tax
Return of
Capital | |
Total
Distributions | |
| Advisor Class | |
| 8/31/2009 | | $ | 14.98 | | | $ | (0.06 | ) | | $ | (3.29 | ) | | $ | (3.35 | ) | | $ | — | | | $ | — | | | $ | — | | | $ | — | | |
| 8/31/2008 | | $ | 16.64 | | | $ | (0.16 | ) | | $ | (1.50 | ) | | $ | (1.66 | ) | | $ | — | | | $ | — | | | $ | — | | | $ | — | | |
| 8/31/2007 | | $ | 12.96 | | | $ | (0.12 | ) | | $ | 3.80 | | | $ | 3.68 | | | $ | — | | | $ | — | | | $ | — | | | $ | — | | |
| 8/31/2006 | | $ | 11.88 | | | $ | (0.10 | ) | | $ | 1.18 | | | $ | 1.08 | | | $ | — | | | $ | — | | | $ | — | | | $ | — | | |
| 8/31/2005 | | $ | 9.40 | | | $ | (0.11 | ) | | $ | 2.59 | | | $ | 2.48 | | | $ | — | | | $ | — | | | $ | — | | | $ | — | | |
| Institutional Class | |
| 8/31/2009 | | $ | 9.57 | | | $ | 0.01 | | | $ | (2.08 | ) | | $ | (2.07 | ) | | $ | — | | | $ | — | | | $ | — | | | $ | — | | |
| 8/31/2008 | | $ | 10.55 | | | $ | (0.02 | ) | | $ | (0.96 | ) | | $ | (0.98 | ) | | $ | — | | | $ | — | | | $ | — | | | $ | — | | |
Period from 4/29/2007^
to 8/31/2007 | | $ | 9.97 | | | $ | (0.01 | ) | | $ | 0.59 | | | $ | 0.58 | | | $ | — | | | $ | — | | | $ | — | | | $ | — | | |
| Class A | |
Period from 5/27/2009^
to 8/31/2009 | | $ | 10.34 | | | $ | (0.00 | ) | | $ | 0.97 | | | $ | 0.97 | | | $ | — | | | $ | — | | | $ | — | | | $ | — | | |
| Class C | |
Period from 5/27/2009^
to 8/31/2009 | | $ | 10.64 | | | $ | (0.02 | ) | | $ | 1.00 | | | $ | 0.98 | | | $ | — | | | $ | — | | | $ | — | | | $ | — | | |
| Class R3 | |
Period from 5/27/2009^
to 8/31/2009 | | $ | 10.64 | | | $ | (0.00 | ) | | $ | 0.99 | | | $ | 0.99 | | | $ | — | | | $ | — | | | $ | — | | | $ | — | | |
| Partners Fund | |
| Investor Class | |
| 8/31/2009 | | $ | 28.90 | | | $ | 0.15 | | | $ | (7.04 | ) | | $ | (6.89 | ) | | $ | (0.09 | ) | | $ | (0.25 | ) | | $ | — | | | $ | (0.34 | ) | |
| 8/31/2008 | | $ | 32.10 | | | $ | 0.13 | | | $ | (2.01 | ) | | $ | (1.88 | ) | | $ | (0.12 | ) | | $ | (1.20 | ) | | $ | — | | | $ | (1.32 | ) | |
| 8/31/2007 | | $ | 28.71 | | | $ | 0.14 | | | $ | 3.96 | | | $ | 4.10 | | | $ | (0.20 | ) | | $ | (0.51 | ) | | $ | — | | | $ | (0.71 | ) | |
| 8/31/2006 | | $ | 28.62 | | | $ | 0.24 | | | $ | 1.43 | | | $ | 1.67 | | | $ | (0.27 | ) | | $ | (1.31 | ) | | $ | — | | | $ | (1.58 | ) | |
| 8/31/2005 | | $ | 21.41 | | | $ | 0.21 | | | $ | 7.17 | | | $ | 7.38 | | | $ | (0.17 | ) | | $ | — | | | $ | — | | | $ | (0.17 | ) | |
| Trust Class | |
| 8/31/2009 | | $ | 22.25 | | | $ | 0.09 | | | $ | (5.42 | ) | | $ | (5.33 | ) | | $ | (0.06 | ) | | $ | (0.19 | ) | | $ | — | | | $ | (0.25 | ) | |
| 8/31/2008 | | $ | 24.75 | | | $ | 0.06 | | | $ | (1.56 | ) | | $ | (1.50 | ) | | $ | (0.08 | ) | | $ | (0.92 | ) | | $ | — | | | $ | (1.00 | ) | |
| 8/31/2007 | | $ | 22.14 | | | $ | 0.06 | | | $ | 3.05 | | | $ | 3.11 | | | $ | (0.11 | ) | | $ | (0.39 | ) | | $ | — | | | $ | (0.50 | ) | |
| 8/31/2006 | | $ | 22.02 | | | $ | 0.15 | | | $ | 1.11 | | | $ | 1.26 | | | $ | (0.13 | ) | | $ | (1.01 | ) | | $ | — | | | $ | (1.14 | ) | |
| 8/31/2005 | | $ | 16.48 | | | $ | 0.13 | | | $ | 5.51 | | | $ | 5.64 | | | $ | (0.10 | ) | | $ | — | | | $ | — | | | $ | (0.10 | ) | |
See Notes to Financial Highlights
185
| | |
Redemption
Feesøø | |
Net Asset
Value, End of
Year | |
Total Return†† | |
Net Assets,
End of Year
(in millions) | |
Ratio of Gross
Expenses to
Average Net
Assets# | |
Ratio of Net
Expenses to
Average Net
Assets | | Ratio of Net
Investment
Income/
(Loss) to
Average Net
Assets | |
Portfolio
Turnover
Rate | |
| Advisor Class | |
| 8/31/2009 | | $ | — | | | $ | 11.63 | | | | (22.36 | %) | | $ | 6.9 | | | | 1.50 | % | | | 1.50 | %‡ | | | (.57 | %) | | | 69 | % | |
| 8/31/2008 | | $ | — | | | $ | 14.98 | | | | (9.98 | %) | | $ | 3.2 | | | | 1.50 | % | | | 1.49 | %‡ | | | (.98 | %) | | | 70 | % | |
| 8/31/2007 | | $ | — | | | $ | 16.64 | | | | 28.40 | % | | $ | 1.5 | | | | 1.50 | % | | | 1.49 | %‡ | | | (.80 | %) | | | 49 | % | |
| 8/31/2006 | | $ | — | | | $ | 12.96 | | | | 9.09 | % | | $ | 0.8 | | | | 1.50 | % | | | 1.49 | %‡ | | | (.80 | %) | | | 45 | % | |
| 8/31/2005 | | $ | — | | | $ | 11.88 | | | | 26.38 | % | | $ | 1.1 | | | | 1.50 | % | | | 1.49 | %‡ | | | (1.08 | %) | | | 65 | % | |
| Institutional Class | |
| 8/31/2009 | | $ | — | | | $ | 7.50 | | | | (21.63 | %) | | $ | 146.6 | | | | .75 | % | | | .75 | %‡ | | | .12 | % | | | 69 | % | |
| 8/31/2008 | | $ | — | | | $ | 9.57 | | | | (9.29 | %) | | $ | 51.1 | | | | .75 | % | | | .75 | %‡ | | | (.22 | %) | | | 70 | % | |
Period from 4/29/2007^
to 8/31/2007 | | $ | — | | | $ | 10.55 | | | | 5.82 | %** | | $ | 18.1 | | | | .75 | %* | | | .74 | %‡* | | | (.25 | %)* | | | 49 | %Ø | |
| Class A | |
Period from 5/27/2009^
to 8/31/2009 | | $ | — | | | $ | 11.31 | | | | 9.38 | %** | | $ | 0.1 | | | | 1.11 | %* | | | 1.11 | %‡* | | | (.01 | %)* | | | 69 | %Ø | |
| Class C | |
Period from 5/27/2009^
to 8/31/2009 | | $ | — | | | $ | 11.62 | | | | 9.21 | %** | | $ | 0.1 | | | | 1.86 | %* | | | 1.86 | %‡* | | | (.64 | %)* | | | 69 | %Ø | |
| Class R3 | |
Period from 5/27/2009^
to 8/31/2009 | | $ | — | | | $ | 11.63 | | | | 9.30 | %** | | $ | 0.1 | | | | 1.36 | %* | | | 1.36 | %‡* | | | (.14 | %)* | | | 69 | %Ø | |
| Partners Fund | |
| Investor Class | |
| 8/31/2009 | | $ | — | | | $ | 21.67 | | | | (23.27 | %) | | $ | 1,337.2 | | | | .89 | % | | | .89 | %‡ | | | .85 | % | | | 35 | % | |
| 8/31/2008 | | $ | — | | | $ | 28.90 | | | | (6.22 | %) | | $ | 2,193.1 | | | | .81 | % | | | .80 | %‡ | | | .42 | % | | | 41 | % | |
| 8/31/2007 | | $ | — | | | $ | 32.10 | | | | 14.33 | % | | $ | 2,267.6 | | | | .81 | % | | | .80 | %‡ | | | .44 | % | | | 47 | % | |
| 8/31/2006 | | $ | — | | | $ | 28.71 | | | | 5.87 | % | | $ | 2,106.7 | | | | .82 | % | | | .82 | %‡ | | | .84 | % | | | 33 | % | |
| 8/31/2005 | | $ | — | | | $ | 28.62 | | | | 34.59 | % | | $ | 1,826.9 | | | | .86 | % | | | .85 | %‡ | | | .83 | % | | | 61 | % | |
| Trust Class | |
| 8/31/2009 | | $ | — | | | $ | 16.67 | | | | (23.38 | %) | | $ | 622.6 | | | | 1.04 | % | | | 1.04 | %‡ | | | .70 | % | | | 35 | % | |
| 8/31/2008 | | $ | — | | | $ | 22.25 | | | | (6.40 | %) | | $ | 1,004.0 | | | | .99 | % | | | .99 | %‡ | | | .23 | % | | | 41 | % | |
| 8/31/2007 | | $ | — | | | $ | 24.75 | | | | 14.09 | % | | $ | 1,171.5 | | | | 1.00 | % | | | .99 | %‡ | | | .26 | % | | | 47 | % | |
| 8/31/2006 | | $ | — | | | $ | 22.14 | | | | 5.70 | % | | $ | 970.5 | | | | 1.00 | % | | | .99 | %‡ | | | .66 | % | | | 33 | % | |
| 8/31/2005 | | $ | — | | | $ | 22.02 | | | | 34.34 | % | | $ | 532.8 | | | | 1.03 | % | | | 1.02 | %‡ | | | .66 | % | | | 61 | % | |
186
Financial Highlights (cont'd)
| | |
Net Asset
Value,
Beginning
of Year | |
Net
Investment
Income (Loss)@ | | Net Gains or
Losses on
Securities
(both realized
and
unrealized) | |
Total From
Investment
Operations | |
Dividends
from Net
Investment
Income | |
Distributions
from Net
Realized
Capital Gains | |
.96Return of
Capital | |
Total
Distributions | |
| Advisor Class | |
| 8/31/2009 | | $ | 19.27 | | | $ | 0.06 | | | $ | (4.69 | ) | | $ | (4.63 | ) | | $ | (0.05 | ) | | $ | (0.17 | ) | | $ | — | | | $ | (0.22 | ) | |
| 8/31/2008 | | $ | 21.45 | | | $ | 0.02 | | | $ | (1.35 | ) | | $ | (1.33 | ) | | $ | (0.05 | ) | | $ | (0.80 | ) | | $ | — | | | $ | (0.85 | ) | |
| 8/31/2007 | | $ | 19.18 | | | $ | 0.02 | | | $ | 2.65 | | | $ | 2.67 | | | $ | (0.06 | ) | | $ | (0.34 | ) | | $ | — | | | $ | (0.40 | ) | |
| 8/31/2006 | | $ | 19.01 | | | $ | 0.10 | | | $ | 0.94 | | | $ | 1.04 | | | $ | (0.01 | ) | | $ | (0.86 | ) | | $ | — | | | $ | (0.87 | ) | |
| 8/31/2005 | | $ | 14.23 | | | $ | 0.07 | | | $ | 4.77 | | | $ | 4.84 | | | $ | (0.06 | ) | | $ | — | | | $ | — | | | $ | (0.06 | ) | |
| Institutional Class | |
| 8/31/2009 | | $ | 29.06 | | | $ | 0.18 | | | $ | (7.08 | ) | | $ | (6.90 | ) | | $ | (0.12 | ) | | $ | (0.25 | ) | | $ | — | | | $ | (0.37 | ) | |
| 8/31/2008 | | $ | 32.28 | | | $ | 0.19 | | | $ | (2.04 | ) | | $ | (1.85 | ) | | $ | (0.17 | ) | | $ | (1.20 | ) | | $ | — | | | $ | (1.37 | ) | |
| 8/31/2007 | | $ | 28.72 | | | $ | 0.19 | | | $ | 3.96 | | | $ | 4.15 | | | $ | (0.08 | ) | | $ | (0.51 | ) | | $ | — | | | $ | (0.59 | ) | |
Period from 6/7/2006^
to 8/31/2006 | | $ | 28.12 | | | $ | 0.19 | | | $ | 0.41 | | | $ | 0.60 | | | $ | — | | | $ | — | | | $ | — | | | $ | — | | |
| Real Estate Fund | |
| Trust Class | |
| 8/31/2009 | | $ | 10.65 | | | $ | 0.24 | | | $ | (2.84 | ) | | $ | (2.60 | ) | | $ | (0.24 | ) | | $ | — | | | $ | (0.07 | ) | | $ | (0.31 | ) | |
| 8/31/2008 | | $ | 14.21 | | | $ | 0.22 | | | $ | (1.04 | ) | | $ | (0.82 | ) | | $ | (0.19 | ) | | $ | (2.39 | ) | | $ | (0.16 | ) | | $ | (2.74 | ) | |
| 8/31/2007 | | $ | 15.69 | | | $ | 0.17 | | | $ | (0.09 | ) | | $ | 0.08 | | | $ | (0.19 | ) | | $ | (1.37 | ) | | $ | — | | | $ | (1.56 | ) | |
| 8/31/2006 | | $ | 14.73 | | | $ | 0.20 | | | $ | 3.39 | | | $ | 3.59 | | | $ | (0.27 | ) | | $ | (2.36 | ) | | $ | — | | | $ | (2.63 | ) | |
| 8/31/2005 | | $ | 14.13 | | | $ | 0.19 | | | $ | 3.28 | | | $ | 3.47 | | | $ | (0.23 | ) | | $ | (2.64 | ) | | $ | — | | | $ | (2.87 | ) | |
| Institutional Class | |
| 8/31/2009 | | $ | 10.66 | | | $ | 0.24 | | | $ | (2.82 | ) | | $ | (2.58 | ) | | $ | (0.23 | ) | | $ | — | | | $ | (0.09 | ) | | $ | (0.32 | ) | |
Period from 6/4/2008^
to 8/31/2008 | | $ | 10.88 | | | $ | 0.07 | | | $ | (0.22 | ) | | $ | (0.15 | ) | | $ | (0.04 | ) | | $ | — | | | $ | (0.03 | ) | | $ | (0.07 | ) | |
| Regency Fund | |
| Investor Class | |
| 8/31/2009 | | $ | 15.02 | | | $ | 0.07 | | | $ | (3.47 | ) | | $ | (3.40 | ) | | $ | (0.00 | ) | | $ | (0.55 | ) | | $ | — | | | $ | (0.55 | ) | |
| 8/31/2008 | | $ | 18.65 | | | $ | 0.07 | | | $ | (1.75 | ) | | $ | (1.68 | ) | | $ | (0.14 | ) | | $ | (1.81 | ) | | $ | — | | | $ | (1.95 | ) | |
| 8/31/2007 | | $ | 16.52 | | | $ | 0.13 | | | $ | 2.19 | | | $ | 2.32 | | | $ | (0.10 | ) | | $ | (0.09 | ) | | $ | — | | | $ | (0.19 | ) | |
| 8/31/2006 | | $ | 17.37 | | | $ | 0.13 | | | $ | 0.39 | | | $ | 0.52 | | | $ | (0.06 | ) | | $ | (1.31 | ) | | $ | — | | | $ | (1.37 | ) | |
| 8/31/2005 | | $ | 14.44 | | | $ | 0.01 | | | $ | 4.08 | §§ | | $ | 4.09 | | | $ | — | | | $ | (1.16 | ) | | $ | — | | | $ | (1.16 | ) | |
See Notes to Financial Highlights
187
| | |
Redemption
Feesøø | |
Net Asset
Value, End of
Year | |
Total Return†† | |
Net Assets,
End of Year
(in millions) | |
Ratio of Gross
Expenses to
Average Net
Assets# | |
Ratio of Net
Expenses to
Average Net
Assets | | Ratio of Net
Investment
Income/
(Loss) to
Average Net
Assets | |
Portfolio
Turnover
Rate | |
| Advisor Class | |
| 8/31/2009 | | $ | — | | | $ | 14.42 | | | | (23.47 | %) | | $ | 379.7 | | | | 1.20 | % | | | 1.20 | %‡ | | | .54 | % | | | 35 | % | |
| 8/31/2008 | | $ | — | | | $ | 19.27 | | | | (6.56 | %) | | $ | 559.0 | | | | 1.15 | % | | | 1.14 | %‡ | | | .08 | % | | | 41 | % | |
| 8/31/2007 | | $ | — | | | $ | 21.45 | | | | 13.94 | % | | $ | 599.0 | | | | 1.15 | % | | | 1.14 | %‡ | | | .11 | % | | | 47 | % | |
| 8/31/2006 | | $ | — | | | $ | 19.18 | | | | 5.56 | % | | $ | 605.0 | | | | 1.15 | % | | | 1.14 | %‡ | | | .52 | % | | | 33 | % | |
| 8/31/2005 | | $ | — | | | $ | 19.01 | | | | 34.04 | % | | $ | 85.6 | | | | 1.25 | % | | | 1.23 | %‡ | | | .40 | % | | | 61 | % | |
| Institutional Class | |
| 8/31/2009 | | $ | — | | | $ | 21.79 | | | | (23.10 | %) | | $ | 161.3 | | | | .70 | % | | | .70 | %‡ | | | 1.01 | % | | | 35 | % | |
| 8/31/2008 | | $ | — | | | $ | 29.06 | | | | (6.08 | %) | | $ | 168.1 | | | | .66 | % | | | .65 | %‡ | | | .59 | % | | | 41 | % | |
| 8/31/2007 | | $ | — | | | $ | 32.28 | | | | 14.49 | % | | $ | 133.5 | | | | .66 | % | | | .65 | %‡§ | | | .59 | % | | | 47 | % | |
Period from 6/7/2006^
to 8/31/2006 | | $ | — | | | $ | 28.72 | | | | 2.13 | %** | | $ | 130.5 | | | | .70 | %* | | | .69 | %‡* | | | 2.85 | %* | | | 33 | %Ø | |
| Real Estate Fund | |
| Trust Class | |
| 8/31/2009 | | $ | 0.00 | | | $ | 7.74 | | | | (23.69 | %) | | $ | 63.0 | | | | .99 | % | | | .99 | %‡ | | | 3.61 | % | | | 181 | % | |
| 8/31/2008 | | $ | 0.00 | | | $ | 10.65 | | | | (5.32 | %) | | $ | 53.0 | | | | 1.00 | % | | | .97 | %‡ | | | 1.93 | % | | | 187 | % | |
| 8/31/2007 | | $ | 0.00 | | | $ | 14.21 | | | | (.43 | %) | | $ | 110.4 | | | | .99 | % | | | .97 | %‡ | | | 1.06 | % | | | 99 | % | |
| 8/31/2006 | | $ | 0.00 | | | $ | 15.69 | | | | 28.50 | % | | $ | 86.7 | | | | 1.11 | % | | | 1.09 | %‡ | | | 1.39 | % | | | 97 | % | |
| 8/31/2005 | | $ | 0.00 | | | $ | 14.73 | | | | 27.06 | % | | $ | 46.8 | | | | 1.50 | % | | | 1.48 | %‡ | | | 1.40 | % | | | 129 | % | |
| Institutional Class | |
| 8/31/2009 | | $ | 0.00 | | | $ | 7.76 | | | | (23.46 | %) | | $ | 3.3 | | | | .85 | % | | | .85 | %‡ | | | 3.47 | % | | | 181 | % | |
Period from 6/4/2008^
to 8/31/2008 | | $ | 0.00 | | | $ | 10.66 | | | | (1.31 | %)** | | $ | 1.7 | | | | .87 | %* | | | .86 | %‡* | | | 2.76 | %* | | | 187 | %Ø | |
| Regency Fund | |
| Investor Class | |
| 8/31/2009 | | $ | — | | | $ | 11.07 | | | | (21.04 | %) | | $ | 43.8 | | | | 1.36 | % | | | 1.36 | %‡ | | | .78 | % | | | 51 | % | |
| 8/31/2008 | | $ | — | | | $ | 15.02 | | | | (9.93 | %) | | $ | 79.1 | | | | 1.13 | % | | | 1.11 | %‡ | | | .43 | % | | | 60 | % | |
| 8/31/2007 | | $ | — | | | $ | 18.65 | | | | 14.10 | % | | $ | 99.9 | | | | 1.09 | % | | | 1.08 | %‡ | | | .72 | % | | | 80 | % | |
| 8/31/2006 | | $ | — | | | $ | 16.52 | | | | 2.94 | % | | $ | 111.1 | | | | 1.12 | % | | | 1.11 | %‡ | | | .75 | % | | | 52 | % | |
| 8/31/2005 | | $ | — | | | $ | 17.37 | | | | 29.26 | % | | $ | 107.9 | | | | 1.21 | % | | | 1.20 | %‡§ | | | .09 | % | | | 91 | % | |
188
Financial Highlights (cont'd)
| | |
Net Asset
Value,
Beginning
of Year | |
Net
Investment
Income (Loss)@ | | Net Gains or
Losses on
Securities
(both realized
and
unrealized) | |
Total From
Investment
Operations | |
Dividends
from Net
Investment
Income | |
Distributions
from Net
Realized
Capital Gains | |
Tax
Return of
Capital | |
Total
Distributions | |
| Trust Class | |
| 8/31/2009 | | $ | 13.09 | | | $ | 0.07 | | | $ | (3.02 | ) | | $ | (2.95 | ) | | $ | (0.00 | ) | | $ | (0.48 | ) | | $ | — | | | $ | (0.48 | ) | |
| 8/31/2008 | | $ | 16.26 | | | $ | 0.04 | | | $ | (1.52 | ) | | $ | (1.48 | ) | | $ | (0.11 | ) | | $ | (1.58 | ) | | $ | — | | | $ | (1.69 | ) | |
| 8/31/2007 | | $ | 14.41 | | | $ | 0.08 | | | $ | 1.91 | | | $ | 1.99 | | | $ | (0.06 | ) | | $ | (0.08 | ) | | $ | — | | | $ | (0.14 | ) | |
| 8/31/2006 | | $ | 15.13 | | | $ | 0.09 | | | $ | 0.34 | | | $ | 0.43 | | | $ | (0.02 | ) | | $ | (1.13 | ) | | $ | — | | | $ | (1.15 | ) | |
| 8/31/2005 | | $ | 12.61 | | | $ | (0.01 | ) | | $ | 3.56 | §§ | | $ | 3.55 | | | $ | — | | | $ | (1.03 | ) | | $ | — | | | $ | (1.03 | ) | |
| Select Equities Fund | |
| Institutional Class | |
| 8/31/2009 | | $ | 9.20 | | | $ | 0.08 | | | $ | (1.19 | ) | | $ | (1.11 | ) | | $ | (0.03 | ) | | $ | — | | | $ | — | | | $ | (0.03 | ) | |
Period from 12/20/2007^
to 8/31/2008 | | $ | 10.00 | | | $ | 0.08 | | | $ | (0.88 | ) | | $ | (0.80 | ) | | $ | — | | | $ | — | | | $ | — | | | $ | — | | |
| Class A | |
| 8/31/2009 | | $ | 9.18 | | | $ | 0.04 | | | $ | (1.14 | ) | | $ | (1.10 | ) | | $ | (0.03 | ) | | $ | — | | | $ | — | | | $ | (0.03 | ) | |
Period from 12/20/2007^
to 8/31/2008 | | $ | 10.00 | | | $ | 0.04 | | | $ | (0.86 | ) | | $ | (0.82 | ) | | $ | — | | | $ | — | | | $ | — | | | $ | — | | |
| Class C | |
| 8/31/2009 | | $ | 9.12 | | | $ | (0.02 | ) | | $ | (1.13 | ) | | $ | (1.15 | ) | | $ | (0.03 | ) | | $ | — | | | $ | — | | | $ | (0.03 | ) | |
Period from 12/20/2007^
to 8/31/2008 | | $ | 10.00 | | | $ | (0.01 | ) | | $ | (0.87 | ) | | $ | (0.88 | ) | | $ | — | | | $ | — | | | $ | — | | | $ | — | | |
| Small and Mid Cap Growth Fund | |
| Trust Class | |
| 8/31/2009 | | $ | 10.55 | | | $ | (0.05 | ) | | $ | (2.40 | ) | | $ | (2.45 | ) | | $ | — | | | $ | — | | | $ | (0.03 | ) | | $ | (0.03 | ) | |
| 8/31/2008 | | $ | 12.60 | | | $ | (0.08 | ) | | $ | (1.11 | ) | | $ | (1.19 | ) | | $ | — | | | $ | (0.86 | ) | | $ | — | | | $ | (0.86 | ) | |
Period from 9/5/2006^
to 8/31/2007 | | $ | 10.00 | | | $ | (0.04 | ) | | $ | 2.70 | | | $ | 2.66 | | | $ | (0.06 | ) | | $ | — | | | $ | — | | | $ | (0.06 | ) | |
| Small Cap Growth Fund | |
| Investor Class | |
| 8/31/2009 | | $ | 17.92 | | | $ | (0.11 | ) | | $ | (4.66 | ) | | $ | (4.77 | ) | | $ | — | | | $ | — | | | $ | — | | | $ | — | | |
| 8/31/2008 | | $ | 19.15 | | | $ | (0.18 | ) | | $ | (1.05 | ) | | $ | (1.23 | ) | | $ | — | | | $ | — | | | $ | — | | | $ | — | | |
| 8/31/2007 | | $ | 15.01 | | | $ | (0.18 | ) | | $ | 4.32 | | | $ | 4.14 | | | $ | — | | | $ | — | | | $ | — | | | $ | — | | |
| 8/31/2006 | | $ | 14.19 | | | $ | (0.19 | ) | | $ | 1.01 | | | $ | 0.82 | | | $ | — | | | $ | — | | | $ | — | | | $ | — | | |
| 8/31/2005 | | $ | 10.71 | | | $ | (0.19 | ) | | $ | 3.67 | | | $ | 3.48 | | | $ | — | | | $ | — | | | $ | — | | | $ | — | | |
��
See Notes to Financial Highlights
189
| | |
Redemption
Feesøø | |
Net Asset
Value, End of
Year | |
Total Return†† | |
Net Assets,
End of Year
(in millions) | |
Ratio of Gross
Expenses to
Average Net
Assets# | |
Ratio of Net
Expenses to
Average Net
Assets | | Ratio of Net
Investment
Income/
(Loss) to
Average Net
Assets | |
Portfolio
Turnover
Rate | |
| Trust Class | |
| 8/31/2009 | | $ | — | | | $ | 9.66 | | | | (20.96 | %) | | $ | 26.9 | | | | 1.25 | % | | | 1.25 | %‡ | | | .89 | % | | | 51 | % | |
| 8/31/2008 | | $ | — | | | $ | 13.09 | | | | (10.03 | %) | | $ | 52.8 | | | | 1.26 | % | | | 1.24 | %‡ | | | .30 | % | | | 60 | % | |
| 8/31/2007 | | $ | — | | | $ | 16.26 | | | | 13.84 | % | | $ | 55.6 | | | | 1.25 | % | | | 1.24 | %‡ | | | .51 | % | | | 80 | % | |
| 8/31/2006 | | $ | — | | | $ | 14.41 | | | | 2.81 | % | | $ | 64.2 | | | | 1.25 | % | | | 1.24 | %‡ | | | .61 | % | | | 52 | % | |
| 8/31/2005 | | $ | — | | | $ | 15.13 | | | | 29.13 | % | | $ | 36.1 | | | | 1.38 | % | | | 1.37 | %‡ | | | (.10 | %) | | | 91 | % | |
| Select Equities Fund | |
| Institutional Class | |
| 8/31/2009 | | $ | — | | | $ | 8.06 | | | | (12.03 | %) | | $ | 6.5 | | | | .75 | % | | | .75 | %‡ | | | 1.04 | % | | | 93 | % | |
Period from 12/20/2007^
to 8/31/2008 | | $ | — | | | $ | 9.20 | | | | (8.00 | %)** | | $ | 2.3 | | | | .76 | %* | | | .76 | %‡* | | | 1.17 | %* | | | 53 | %** | |
| Class A | |
| 8/31/2009 | | $ | — | | | $ | 8.05 | | | | (11.95 | %) | | $ | 38.3 | | | | 1.20 | % | | | 1.20 | %‡ | | | .52 | % | | | 93 | % | |
Period from 12/20/2007^
to 8/31/2008 | | $ | — | | | $ | 9.18 | | | | (8.20 | %)** | | $ | 4.9 | | | | 1.24 | %* | | | 1.24 | %‡* | | | .63 | %* | | | 53 | %** | |
| Class C | |
| 8/31/2009 | | $ | — | | | $ | 7.94 | | | | (12.58 | %) | | $ | 7.4 | | | | 1.95 | % | | | 1.95 | %‡ | | | (.22 | %) | | | 93 | % | |
Period from 12/20/2007^
to 8/31/2008 | | $ | — | | | $ | 9.12 | | | | (8.80 | %)** | | $ | 0.8 | | | | 1.99 | %* | | | 1.98 | %‡* | | | (.08 | %)* | | | 53 | %** | |
| Small and Mid Cap Growth Fund | |
| Trust Class | |
| 8/31/2009 | | $ | — | | | $ | 8.07 | | | | (23.21 | %) | | $ | 6.1 | | | | 1.11 | % | | | 1.11 | %‡ | | | (.62 | %) | | | 173 | % | |
| 8/31/2008 | | $ | — | | | $ | 10.55 | | | | (10.05 | %) | | $ | 7.7 | | | | 1.11 | % | | | 1.09 | %‡ | | | (.67 | %) | | | 135 | % | |
Period from 9/5/2006^
to 8/31/2007 | | $ | — | | | $ | 12.60 | | | | 26.65 | %** | | $ | 8.5 | | | | 1.10 | %* | | | 1.08 | %‡* | | | (.34 | %)* | | | 110 | %** | |
| Small Cap Growth Fund | |
| Investor Class | |
| 8/31/2009 | | $ | — | | | $ | 13.15 | | | | (26.62 | %) | | $ | 144.1 | | | | 1.30 | % | | | 1.30 | %‡ | | | (.89 | %) | | | 292 | % | |
| 8/31/2008 | | $ | — | | | $ | 17.92 | | | | (6.42 | %) | | $ | 239.9 | | | | 1.31 | % | | | 1.29 | %‡ | | | (.93 | %) | | | 185 | % | |
| 8/31/2007 | | $ | — | | | $ | 19.15 | | | | 27.58 | % | | $ | 58.1 | | | | 1.30 | % | | | 1.27 | %‡ | | | (1.01 | %) | | | 153 | % | |
| 8/31/2006 | | $ | — | | | $ | 15.01 | | | | 5.78 | % | | $ | 46.9 | | | | 1.60 | % | | | 1.57 | %‡ | | | (1.21 | %) | | | 142 | % | |
| 8/31/2005 | | $ | — | | | $ | 14.19 | | | | 32.49 | % | | $ | 45.0 | | | | 1.75 | % | | | 1.71 | %‡ | | | (1.47 | %) | | | 204 | % | |
190
Financial Highlights (cont'd)
| | |
Net Asset
Value,
Beginning
of Year | |
Net
Investment
Income (Loss)@ | | Net Gains or
Losses on
Securities
(both realized
and
unrealized) | |
Total From
Investment
Operations | |
Dividends
from Net
Investment
Income | |
Distributions
from Net
Realized
Capital Gains | |
Tax
Return of
Capital | |
Total
Distributions | |
| Trust Class | |
| 8/31/2009 | | $ | 19.67 | | | $ | (0.14 | ) | | $ | (5.10 | ) | | $ | (5.24 | ) | | $ | — | | | $ | — | | | $ | — | | | $ | — | | |
| 8/31/2008 | | $ | 21.05 | | | $ | (0.21 | ) | | $ | (1.17 | ) | | $ | (1.38 | ) | | $ | — | | | $ | — | | | $ | — | | | $ | — | | |
| 8/31/2007 | | $ | 16.52 | | | $ | (0.21 | ) | | $ | 4.74 | | | $ | 4.53 | | | $ | — | | | $ | — | | | $ | — | | | $ | — | | |
| 8/31/2006 | | $ | 15.62 | | | $ | (0.22 | ) | | $ | 1.12 | | | $ | 0.90 | | | $ | — | | | $ | — | | | $ | — | | | $ | — | | |
| 8/31/2005 | | $ | 11.78 | | | $ | (0.21 | ) | | $ | 4.05 | | | $ | 3.84 | | | $ | — | | | $ | — | | | $ | — | | | $ | — | | |
| Advisor Class | |
| 8/31/2009 | | $ | 13.13 | | | $ | (0.11 | ) | | $ | (3.41 | ) | | $ | (3.52 | ) | | $ | — | | | $ | — | | | $ | — | | | $ | — | | |
| 8/31/2008 | | $ | 14.08 | | | $ | (0.17 | ) | | $ | (0.78 | ) | | $ | (0.95 | ) | | $ | — | | | $ | — | | | $ | — | | | $ | — | | |
| 8/31/2007 | | $ | 11.07 | | | $ | (0.17 | ) | | $ | 3.18 | | | $ | 3.01 | | | $ | — | | | $ | — | | | $ | — | | | $ | — | | |
| 8/31/2006 | | $ | 10.49 | | | $ | (0.16 | ) | | $ | 0.74 | | | $ | 0.58 | | | $ | — | | | $ | — | | | $ | — | | | $ | — | | |
| 8/31/2005 | | $ | 7.92 | | | $ | (0.15 | ) | | $ | 2.72 | | | $ | 2.57 | | | $ | — | | | $ | — | | | $ | — | | | $ | — | | |
| Institutional Class | |
| 8/31/2009 | | $ | 17.95 | | | $ | (0.06 | ) | | $ | (4.66 | ) | | $ | (4.72 | ) | | $ | — | | | $ | — | | | $ | — | | | $ | — | | |
Period from 4/1/2008^
to 8/31/2008 | | $ | 17.64 | | | $ | (0.04 | ) | | $ | 0.35 | | | $ | 0.31 | | | $ | — | | | $ | — | | | $ | — | | | $ | — | | |
| Class A | |
Period from 5/27/2009^
to 8/31/2009 | | $ | 12.98 | | | $ | (0.03 | ) | | $ | 1.48 | | | $ | 1.45 | | | $ | — | | | $ | — | | | $ | — | | | $ | — | | |
| Class C | |
Period from 5/27/2009^
to 8/31/2009 | | $ | 8.65 | | | $ | (0.04 | ) | | $ | 0.99 | | | $ | 0.95 | | | $ | — | | | $ | — | | | $ | — | | | $ | — | | |
| Class R3 | |
Period from 5/27/2009^
to 8/31/2009 | | $ | 8.65 | | | $ | (0.02 | ) | | $ | 0.98 | | | $ | 0.96 | | | $ | — | | | $ | — | | | $ | — | | | $ | — | | |
| Socially Responsive Fund | |
| Investor Class | |
| 8/31/2009 | | $ | 24.51 | | | $ | 0.09 | | | $ | (5.52 | ) | | $ | (5.43 | ) | | $ | (0.08 | ) | | $ | (0.26 | ) | | $ | — | | | $ | (0.34 | ) | |
| 8/31/2008 | | $ | 27.20 | | | $ | 0.15 | | | $ | (1.85 | ) | | $ | (1.70 | ) | | $ | (0.13 | ) | | $ | (0.86 | ) | | $ | — | | | $ | (0.99 | ) | |
| 8/31/2007 | | $ | 23.88 | | | $ | 0.18 | | | $ | 3.42 | | | $ | 3.60 | | | $ | (0.04 | ) | | $ | (0.24 | ) | | $ | — | | | $ | (0.28 | ) | |
| 8/31/2006 | | $ | 22.91 | | | $ | 0.09 | | | $ | 1.73 | | | $ | 1.82 | | | $ | (0.14 | ) | | $ | (0.71 | ) | | $ | — | | | $ | (0.85 | ) | |
| 8/31/2005 | | $ | 19.48 | | | $ | 0.18 | | | $ | 3.79 | | | $ | 3.97 | | | $ | (0.03 | ) | | $ | (0.51 | ) | | $ | — | | | $ | (0.54 | ) | |
See Notes to Financial Highlights
191
| | |
Redemption
Feesøø | |
Net Asset
Value, End of
Year | |
Total Return†† | |
Net Assets,
End of Year
(in millions) | |
Ratio of Gross
Expenses to
Average Net
Assets# | |
Ratio of Net
Expenses to
Average Net
Assets | | Ratio of Net
Investment
Income/
(Loss) to
Average Net
Assets | |
Portfolio
Turnover
Rate | |
| Trust Class | |
| 8/31/2009 | | $ | — | | | $ | 14.43 | | | | (26.64 | %) | | $ | 35.2 | | | | 1.40 | % | | | 1.40 | %‡ | | | (1.00 | %) | | | 292 | % | |
| 8/31/2008 | | $ | — | | | $ | 19.67 | | | | (6.56 | %) | | $ | 42.3 | | | | 1.41 | % | | | 1.39 | %‡ | | | (1.04 | %) | | | 185 | % | |
| 8/31/2007 | | $ | — | | | $ | 21.05 | | | | 27.42 | % | | $ | 8.5 | | | | 1.40 | % | | | 1.38 | %‡ | | | (1.08 | %) | | | 153 | % | |
| 8/31/2006 | | $ | — | | | $ | 16.52 | | | | 5.76 | % | | $ | 2.5 | | | | 1.66 | % | | | 1.63 | %‡ | | | (1.26 | %) | | | 142 | % | |
| 8/31/2005 | | $ | — | | | $ | 15.62 | | | | 32.60 | % | | $ | 2.7 | | | | 1.75 | % | | | 1.71 | %‡ | | | (1.48 | %) | | | 204 | % | |
| Advisor Class | |
| 8/31/2009 | | $ | — | | | $ | 9.61 | | | | (26.81 | %) | | $ | 11.7 | | | | 1.60 | % | | | 1.60 | %‡ | | | (1.19 | %) | | | 292 | % | |
| 8/31/2008 | | $ | — | | | $ | 13.13 | | | | (6.75 | %) | | $ | 13.6 | | | | 1.61 | % | | | 1.59 | %‡ | | | (1.23 | %) | | | 185 | % | |
| 8/31/2007 | | $ | — | | | $ | 14.08 | | | | 27.19 | % | | $ | 4.3 | | | | 1.60 | % | | | 1.57 | %‡ | | | (1.30 | %) | | | 153 | % | |
| 8/31/2006 | | $ | — | | | $ | 11.07 | | | | 5.53 | % | | $ | 2.2 | | | | 1.77 | % | | | 1.74 | %‡ | | | (1.36 | %) | | | 142 | % | |
| 8/31/2005 | | $ | — | | | $ | 10.49 | | | | 32.45 | % | | $ | 1.0 | | | | 1.90 | % | | | 1.86 | %‡ | | | (1.62 | %) | | | 204 | % | |
| Institutional Class | |
| 8/31/2009 | | $ | — | | | $ | 13.23 | | | | (26.30 | %) | | $ | 7.5 | | | | .90 | % | | | .90 | %‡ | | | (.48 | %) | | | 292 | % | |
Period from 4/1/2008^
to 8/31/2008 | | $ | — | | | $ | 17.95 | | | | 1.76 | %** | | $ | 4.3 | | | | .91 | %* | | | .90 | %‡* | | | (.55 | %)* | | | 185 | %Ø | |
| Class A | |
Period from 5/27/2009^
to 8/31/2009 | | $ | — | | | $ | 14.43 | | | | 11.17 | %** | | $ | 0.1 | | | | 1.26 | %* | | | 1.26 | %‡* | | | (.76 | %)* | | | 292 | %Ø | |
| Class C | |
Period from 5/27/2009^
to 8/31/2009 | | $ | — | | | $ | 9.60 | | | | 10.98 | %** | | $ | 0.1 | | | | 2.01 | %* | | | 2.01 | %‡* | | | (1.47 | %)* | | | 292 | %Ø | |
| Class R3 | |
Period from 5/27/2009^
to 8/31/2009 | | $ | — | | | $ | 9.61 | | | | 11.10 | %** | | $ | 0.1 | | | | 1.52 | %* | | | 1.52 | %‡* | | | (.97 | %)* | | | 292 | %Ø | |
| Socially Responsive Fund | |
| Investor Class | |
| 8/31/2009 | | $ | — | | | $ | 18.74 | | | | (21.83 | %) | | $ | 597.1 | | | | .93 | % | | | .93 | % | | | .51 | % | | | 36 | % | |
| 8/31/2008 | | $ | — | | | $ | 24.51 | | | | (6.49 | %) | | $ | 804.0 | | | | .90 | % | | | .89 | % | | | .57 | % | | | 35 | % | |
| 8/31/2007 | | $ | — | | | $ | 27.20 | | | | 15.15 | % | | $ | 786.2 | | | | .91 | % | | | .90 | % | | | .66 | % | | | 16 | % | |
| 8/31/2006 | | $ | — | | | $ | 23.88 | | | | 8.08 | % | | $ | 487.5 | | | | .95 | % | | | .95 | % | | | .39 | % | | | 23 | % | |
| 8/31/2005 | | $ | — | | | $ | 22.91 | | | | 20.57 | % | | $ | 330.0 | | | | 1.02 | % | | | 1.01 | % | | | .83 | % | | | 21 | % | |
192
Financial Highlights (cont'd)
| | |
Net Asset
Value,
Beginning
of Year | |
Net
Investment
Income (Loss)@ | | Net Gains or
Losses on
Securities
(both realized
and
unrealized) | |
Total From
Investment
Operations | |
Dividends
from Net
Investment
Income | |
Distributions
from Net
Realized
Capital Gains | |
Tax
Return of
Capital | |
Total
Distributions | |
| Trust Class | |
| 8/31/2009 | | $ | 16.91 | | | $ | 0.04 | | | $ | (3.82 | ) | | $ | (3.78 | ) | | $ | (0.07 | ) | | $ | (0.18 | ) | | $ | — | | | $ | (0.25 | ) | |
| 8/31/2008 | | $ | 18.81 | | | $ | 0.07 | | | $ | (1.28 | ) | | $ | (1.21 | ) | | $ | (0.10 | ) | | $ | (0.59 | ) | | $ | — | | | $ | (0.69 | ) | |
| 8/31/2007 | | $ | 16.53 | | | $ | 0.08 | | | $ | 2.38 | | | $ | 2.46 | | | $ | (0.01 | ) | | $ | (0.17 | ) | | $ | — | | | $ | (0.18 | ) | |
| 8/31/2006 | | $ | 15.84 | | | $ | 0.03 | | | $ | 1.20 | | | $ | 1.23 | | | $ | (0.06 | ) | | $ | (0.48 | ) | | $ | — | | | $ | (0.54 | ) | |
| 8/31/2005 | | $ | 13.47 | | | $ | 0.12 | | | $ | 2.60 | | | $ | 2.72 | | | $ | (0.00 | ) | | $ | (0.35 | ) | | $ | — | | | $ | (0.35 | ) | |
| Institutional Class | |
| 8/31/2009 | | $ | 24.53 | | | $ | 0.12 | | | $ | (5.53 | ) | | $ | (5.41 | ) | | $ | (0.11 | ) | | $ | (0.26 | ) | | $ | — | | | $ | (0.37 | ) | |
Period from 11/28/2007^
to 8/31/2008 | | $ | 26.93 | | | $ | 0.16 | | | $ | (1.57 | ) | | $ | (1.41 | ) | | $ | (0.13 | ) | | $ | (0.86 | ) | | $ | — | | | $ | (0.99 | ) | |
| Class A | |
Period from 5/27/2009^
to 8/31/2009 | | $ | 12.00 | | | $ | 0.00 | | | $ | 0.88 | | | $ | 0.88 | | | $ | — | | | $ | — | | | $ | — | | | $ | — | | |
| Class C | |
Period from 5/27/2009^
to 8/31/2009 | | $ | 12.00 | | | $ | (0.01 | ) | | $ | 0.87 | | | $ | 0.86 | | | $ | — | | | $ | — | | | $ | — | | | $ | — | | |
| Class R3 | |
Period from 5/27/2009^
to 8/31/2009 | | $ | 12.00 | | | $ | 0.00 | | | $ | 0.87 | | | $ | 0.87 | | | $ | — | | | $ | — | | | $ | — | | | $ | — | | |
See Notes to Financial Highlights
193
| | |
Redemption
Feesøø | |
Net Asset
Value, End of
Year | |
Total Return†† | |
Net Assets,
End of Year
(in millions) | |
Ratio of Gross
Expenses to
Average Net
Assets# | |
Ratio of Net
Expenses to
Average Net
Assets | | Ratio of Net
Investment
Income/
(Loss) to
Average Net
Assets | |
Portfolio
Turnover
Rate | |
| Trust Class | |
| 8/31/2009 | | $ | — | | | $ | 12.88 | | | | (22.01 | %) | | $ | 308.2 | | | | 1.13 | % | | | 1.13 | % | | | .32 | % | | | 36 | % | |
| 8/31/2008 | | $ | — | | | $ | 16.91 | | | | (6.67 | %) | | $ | 361.5 | | | | 1.09 | % | | | 1.08 | % | | | .38 | % | | | 35 | % | |
| 8/31/2007 | | $ | — | | | $ | 18.81 | | | | 14.93 | % | | $ | 355.5 | | | | 1.10 | % | | | 1.09 | % | | | .45 | % | | | 16 | % | |
| 8/31/2006 | | $ | — | | | $ | 16.53 | | | | 7.93 | % | | $ | 239.2 | | | | 1.13 | % | | | 1.12 | % | | | .21 | % | | | 23 | % | |
| 8/31/2005 | | $ | — | | | $ | 15.84 | | | | 20.36 | % | | $ | 140.1 | | | | 1.17 | % | | | 1.17 | % | | | .78 | % | | | 21 | % | |
| Institutional Class | |
| 8/31/2009 | | $ | — | | | $ | 18.75 | | | | (21.71 | %) | | $ | 77.6 | | | | .75 | % | | | .75 | %‡ | | | .70 | % | | | 36 | % | |
Period from 11/28/2007^
to 8/31/2008 | | $ | — | | | $ | 24.53 | | | | (5.47 | %)** | | $ | 71.8 | | | | .75 | %* | | | .74 | %‡* | | | .83 | %* | | | 35 | %Ø | |
| Class A | |
Period from 5/27/2009^
to 8/31/2009 | | $ | — | | | $ | 12.88 | | | | 7.33 | %** | | $ | 1.1 | | | | 1.11 | %* | | | 1.11 | %‡* | | | .11 | %* | | | 36 | %Ø | |
| Class C | |
Period from 5/27/2009^
to 8/31/2009 | | $ | — | | | $ | 12.86 | | | | 7.17 | %** | | $ | 0.1 | | | | 1.86 | %* | | | 1.86 | %‡* | | | (.40 | %)* | | | 36 | %Ø | |
| Class R3 | |
Period from 5/27/2009^
to 8/31/2009 | | $ | — | | | $ | 12.87 | | | | 7.25 | %** | | $ | 0.1 | | | | 1.36 | %* | | | 1.36 | %‡* | | | .12 | %* | | | 36 | %Ø | |
194
Notes to Financial Highlights
†† Total return based on per share net asset value reflects the effects of changes in net asset value on the performance of each Fund during each fiscal period. Returns assume dividends and other distributions, if any, were reinvested and do not reflect the effect of sales charges. Results represent past performance and do not guarantee future results. Current returns may be lower or higher than the performance data quoted. Investment returns and principal may fluctuate and shares when redeemed may be worth more or less than original cost. For each Fund, total return would have been lower if Management had not reimbursed and/or waived certain expenses. Total return would have been higher if Management had not recouped previously reimbursed expenses. For the year ended August 31, 2005, Management reimbursed Partners for losses incurred in connection with the disposition of foreign forward currency contracts, which had no impact on total return. For the year ended August 31, 2009, Management reimbursed Emerging Markets Equity and Socially Responsive for losses incurred in connection with a trade error, which had no impact on total return.
‡‡ On June 9, 2008, Equity Income's Trust Class was converted into the Fund's Institutional Class. The financial information of the Fund's Institutional Class includes the financial information of Trust Class shares. Because the Trust Class had moderately higher expenses, its performance typically would have been slightly lower than the Institutional Class.
††† During the period from November 2, 2006 through June 9, 2008, Equity Income's Trust Class had only one investor, which could have impacted Fund performance. On June 9, 2008, the Fund's Trust Class was converted into the Fund's Institutional Class and the Institutional Class was opened to the public. The total return of the Fund's Institutional Class includes the performance of the former Trust Class.
# The Fund is required to calculate an expense ratio without taking into consideration any expense reductions related to expense offset arrangements.
‡ After reimbursement of expenses and/or waiver of a portion of the investment management fee by Management. Had Management not undertaken such actions, the annualized ratios of net expenses to average daily net assets would have been:
| | | Year Ended August 31, | |
| | | 2009 | | 2008 | | 2007 | | 2006 | | 2005 | |
| Climate Change Fund Institutional Class | | | 9.85 | % | | | 25.07 | %(10) | | | — | | | | — | | | | — | | |
| Climate Change Fund Class A | | | 9.92 | % | | | 16.79 | %(10) | | | — | | | | — | | | | — | | |
| Climate Change Fund Class C | | | 10.94 | % | | | 28.56 | %(10) | | | — | | | | — | | | | — | | |
| Emerging Markets Equity Fund Institutional Class(13) | | | 14.78 | % | | | — | | | | — | | | | — | | | | — | | |
| Emerging Markets Equity Fund Class A(13) | | | 18.97 | % | | | — | | | | — | | | | — | | | | — | | |
| Emerging Markets Equity Fund Class C(13) | | | 17.56 | % | | | — | | | | — | | | | — | | | | — | | |
| Equity Income Fund Institutional Class | | | 1.32 | % | | | 3.63 | %(12) | | | 2.91 | %(6) | | | — | | | | — | | |
| Equity Income Fund Class A | | | 2.31 | % | | | 5.67 | %(12) | | | — | | | | — | | | | — | | |
| Equity Income Fund Class C | | | 2.80 | % | | | 6.94 | %(12) | | | — | | | | — | | | | — | | |
| Focus Fund Investor Class | | | .99 | % | | | .89 | % | | | .87 | % | | | .87 | % | | | .87 | % | |
| Focus Fund Trust Class | | | 1.24 | % | | | 1.10 | % | | | 1.07 | % | | | 1.06 | % | | | 1.04 | % | |
| Focus Fund Advisor Class | | | 1.53 | % | | | 1.33 | % | | | 1.28 | % | | | 1.26 | % | | | 1.23 | % | |
| Genesis Fund Investor Class | | | 1.08 | % | | | 1.03 | % | | | 1.03 | % | | | 1.02 | % | | | 1.04 | % | |
| Genesis Fund Trust Class | | | 1.12 | % | | | 1.09 | % | | | 1.10 | % | | | 1.09 | % | | | 1.10 | % | |
| Genesis Fund Advisor Class | | | 1.38 | % | | | 1.35 | % | | | 1.35 | % | | | 1.35 | % | | | 1.35 | % | |
| Genesis Fund Institutional Class | | | .87 | % | | | .85 | % | | | .85 | % | | | .85 | % | | | .85 | % | |
| Guardian Fund Investor Class | | | .97 | % | | | .89 | % | | | .87 | % | | | .88 | % | | | .90 | % | |
| Guardian Fund Trust Class | | | 1.14 | % | | | 1.06 | % | | | 1.05 | % | | | 1.04 | % | | | 1.05 | % | |
195
Notes to Financial Highlights (cont'd)
| | | Year Ended August 31, | |
| | | 2009 | | 2008 | | 2007 | | 2006 | | 2005 | |
| Guardian Fund Advisor Class | | | 5.33 | % | | | 3.44 | % | | | 2.85 | % | | | 3.13 | % | | | 1.68 | % | |
| Guardian Fund Institutional Class(15) | | | 5.16 | % | | | — | | | | — | | | | — | | | | — | | |
| Guardian Fund Class A(15) | | | 2.24 | % | | | — | | | | — | | | | — | | | | — | | |
| Guardian Fund Class C(15) | | | 6.27 | % | | | — | | | | — | | | | — | | | | — | | |
| Guardian Fund Class R3(15) | | | 5.77 | % | | | — | | | | — | | | | — | | | | — | | |
| International Fund Investor Class | | | 1.40 | % | | | 1.26 | % | | | 1.24 | % | | | 1.25 | % | | | 1.42 | % | |
| International Fund Trust Class | | | 1.49 | % | | | 1.35 | % | | | 1.33 | % | | | 1.32 | % | | | 1.50 | % | |
| International Large Cap Fund Trust Class | | | 1.73 | % | | | 1.37 | % | | | 1.48 | % | | | 37.46 | %(1) | | | — | | |
| International Large Cap Fund Institutional Class | | | 1.30 | % | | | .97 | % | | | .99 | %(4) | | | — | | | | — | | |
| International Large Cap Fund Class A | | | 2.17 | % | | | 1.70 | %(7) | | | — | | | | — | | | | — | | |
| International Large Cap Fund Class C | | | 3.94 | % | | | 4.08 | %(7) | | | — | | | | — | | | | — | | |
| International Large Cap Fund Class R3(15) | | | 6.18 | % | | | — | | | | — | | | | — | | | | — | | |
| Large Cap Disciplined Growth Fund Investor Class | | | 2.50 | % | | | 2.53 | % | | | 2.44 | % | | | 2.51 | % | | | 2.35 | % | |
| Large Cap Disciplined Growth Fund Institutional Class(14) | | | 1.57 | % | | | — | | | | — | | | | — | | | | — | | |
| Large Cap Disciplined Growth Fund Class A(14) | | | 1.79 | % | | | — | | | | — | | | | — | | | | — | | |
| Large Cap Disciplined Growth Fund Class C(14) | | | 2.56 | % | | | — | | | | — | | | | — | | | | — | | |
| Large Cap Disciplined Growth Fund Class R3(15) | | | 6.21 | % | | | — | | | | — | | | | — | | | | — | | |
| Mid Cap Growth Fund Investor Class | | | 1.11 | % | | | 1.01 | % | | | 1.02 | % | | | 1.04 | % | | | 1.06 | % | |
| Mid Cap Growth Fund Trust Class | | | 1.26 | % | | | 1.25 | % | | | 1.30 | % | | | 1.32 | % | | | 1.26 | % | |
| Mid Cap Growth Fund Advisor Class | | | 1.86 | % | | | 2.38 | % | | | 3.39 | % | | | 2.85 | % | | | 2.87 | % | |
| Mid Cap Growth Fund Institutional Class | | | .87 | % | | | .78 | % | | | 1.03 | %(5) | | | — | | | | — | | |
| Mid Cap Growth Fund Class A(15) | | | 4.05 | % | | | — | | | | — | | | | — | | | | — | | |
| Mid Cap Growth Fund Class C(15) | | | 6.29 | % | | | — | | | | — | | | | — | | | | — | | |
| Mid Cap Growth Fund Class R3(15) | | | 5.78 | % | | | — | | | | — | | | | — | | | | — | | |
| Partners Fund Investor Class | | | .89 | % | | | .80 | % | | | .80 | % | | | .82 | % | | | .85 | % | |
| Partners Fund Trust Class | | | 1.05 | % | | | .99 | % | | | .99 | % | | | .99 | % | | | 1.02 | % | |
| Partners Fund Advisor Class | | | 1.20 | % | | | 1.14 | % | | | 1.14 | % | | | 1.15 | % | | | 1.23 | % | |
| Partners Fund Institutional Class | | | .71 | % | | | .65 | % | | | .65 | % | | | .96 | %(2) | | | — | | |
| Real Estate Fund Trust Class | | | 2.02 | % | | | 1.83 | % | | | 1.59 | % | | | 1.90 | % | | | 1.86 | % | |
| Real Estate Fund Institutional Class | | | 2.80 | % | | | 1.77 | %(11) | | | — | | | | — | | | | — | | |
| Regency Fund Investor Class | | | 1.37 | % | | | 1.12 | % | | | 1.08 | % | | | 1.12 | % | | | 1.20 | % | |
| Regency Fund Trust Class | | | 1.59 | % | | | 1.36 | % | | | 1.31 | % | | | 1.32 | % | | | 1.39 | % | |
| Select Equities Fund Institutional Class | | | 2.57 | % | | | 13.92 | %(7) | | | — | | | | — | | | | — | | |
| Select Equities Fund Class A | | | 2.19 | % | | | 3.99 | %(7) | | | — | | | | — | | | | — | | |
| Select Equities Fund Class C | | | 2.91 | % | | | 7.21 | %(7) | | | — | | | | — | | | | — | | |
| Small and Mid Growth Fund Trust Class | | | 4.80 | % | | | 2.92 | % | | | 3.66 | %(3) | | | — | | | | — | | |
| Small Cap Growth Fund Investor Class | | | 1.48 | % | | | 1.42 | % | | | 1.76 | % | | | 1.86 | % | | | 1.90 | % | |
| Small Cap Growth Fund Trust Class | | | 1.73 | % | | | 1.64 | % | | | 2.22 | % | | | 2.47 | % | | | 2.50 | % | |
| Small Cap Growth Fund Advisor Class | | | 1.99 | % | | | 1.96 | % | | | 2.58 | % | | | 3.24 | % | | | 4.58 | % | |
| Small Cap Growth Fund Institutional Class | | | 1.69 | % | | | 1.10 | %(9) | | | — | | | | — | | | | — | | |
196
Notes to Financial Highlights (cont'd)
| | | Year Ended August 31, | |
| | | 2009 | | 2008 | | 2007 | | 2006 | | 2005 | |
| Small Cap Growth Fund Class A(15) | | | 5.34 | % | | | — | | | | — | | | | — | | | | — | | |
| Small Cap Growth Fund Class C(15) | | | 6.65 | % | | | — | | | | — | | | | — | | | | — | | |
| Small Cap Growth Fund Class R3(15) | | | 6.29 | % | | | — | | | | — | | | | — | | | | — | | |
| Socially Responsive Fund Institutional Class | | | .78 | % | | | .76 | %(8) | | | — | | | | — | | | | — | | |
| Socially Responsive Fund Class A(15) | | | 1.70 | %(15) | | | — | | | | — | | | | — | | | | — | | |
| Socially Responsive Fund Class C(15) | | | 6.17 | %(15) | | | — | | | | — | | | | — | | | | — | | |
| Socially Responsive Fund Class R3(15) | | | 5.76 | %(15) | | | — | | | | — | | | | — | | | | — | | |
(1) Period from August 1, 2006 to August 31, 2006.
(2) Period from June 7, 2006 to August 31, 2006.
(3) Period from September 5, 2006 to August 31, 2007.
(4) Period from October 6, 2006 to August 31, 2007.
(5) Period from April 19, 2007 to August 31, 2007.
(6) Period from November 2, 2006 to August 31, 2007.
(7) Period from December 20, 2007 to August 31, 2008.
(8) Period from November 28, 2007 to August 31, 2008.
(9) Period from April 1, 2008 to August 31, 2008.
(10) Period from May 1, 2008 to August 31, 2008.
(11) Period from June 4, 2008 to August 31, 2008.
(12) Period from June 9, 2008 to August 31, 2008. On June 9, 2008, Equity Income's Trust Class was converted into the Fund's Institutional Class. The financial information of the Fund's Institutional Class includes the financial information of Trust Class shares.
(13) Period from October 8, 2008 to August 31, 2009. Organization expense, which is an extraordinary non-recurring expense, is included in ratios on a non-annualized basis.
(14) Period from April 6, 2009 to August 31, 2009.
(15) Period from May 27, 2009 to August 31, 2009.
^^ After utilization of the Line of Credit by International Institutional and/or reimbursement of expenses and/or waiver of a portion of the investment management fee by Management. Had Management not undertaken such actions, or had the Fund not utilized the Line of Credit, the annualized ratio of net expenses to average daily net assets would have been:
| | | Year Ended August 31, | |
| | | 2009 | | 2008 | | 2007 | | 2006 | | 2005 | |
| International Institutional Fund Institutional Class | | | 1.26 | % | | | 1.11 | % | | | 1.12 | % | | | 1.20 | % | | | 2.90 | %(1) | |
(1) Period from June 17, 2005 to August 31, 2005
197
Notes to Financial Highlights (cont'd)
§ After reimbursement of expenses previously paid by Management and/or waiver of a portion of the investment management fee by Management. Had each Fund not made such reimbursements or Management not undertaken such actions, the annualized ratios of net expenses to average daily net assets would have been:
| | | Year Ended August 31, | |
| | | 2007 | | 2006 | | 2005 | |
| Genesis Fund Institutional Class | | | — | | | | .84 | % | | | .85 | % | |
| International Fund Investor Class | | | — | | | | 1.24 | % | | | — | | |
| International Fund Trust Class | | | — | | | | 1.32 | % | | | — | | |
| Partners Fund Institutional Class | | | .64 | % | | | — | | | | — | | |
| Regency Fund Investor Class | | | — | | | | — | | | | 1.18 | % | |
^ The date investment operations commenced.
@ Calculated based on the average number of shares outstanding during each fiscal period.
ØØ Redemption fees are charged on Emerging Markets Equity, International, International Institutional, International Large Cap, and Real Estate. Calculated based on the average number of shares outstanding during each fiscal period.
§§ Included in this gain is a voluntary reimbursement from Management for all brokerage commissions from June 6, 2005 to July 20, 2005 to facilitate a restructuring of the portfolio following a change in the Fund's portfolio manager.
* Annualized.
** Not annualized.
Ø Portfolio turnover is calculated at the Fund level. Percentage indicated was calculated for the year ended August 31, 2006 for Partners, for the year ended August 31, 2007 for International Large Cap and Mid Cap Growth, for the period ended August 31, 2008 for Equity Income, International Large Cap, Real Estate, Small Cap Growth, and Socially Responsive, and for the year ended August 31, 2009 for Guardian, International Large Cap, Large Cap Disciplined Growth, Mid Cap Growth, Small Cap Growth, and Socially Responsive.
## Portfolio turnover excludes purchases and sales of securities by Fasciano prior to the merger date (see Note H of Notes to Financial Statements).
### Portfolio turnover excludes purchases and sales of securities by Large Cap Disciplined Growth (acquired fund) prior to the merger date (see Note H of Notes to Financial Statements).
@@ Subsequent to August 31, 2007, Genesis received notification that a substantial portion of a special cash dividend received from one of its investments, which was recorded as dividend income in the 2007 financial statements, represented a non-taxable return of capital to Genesis. The reclassification had no impact on the total or per share net assets of Genesis, but resulted in a decrease of $62,516,000 in net investment income (loss), an increase of $2,354,000 in net realized gain (loss) on investments and an increase of $60,162,000 in change in unrealized appreciation (depreciation) of investments, for that year. The financial highlights for each class of shares for the year ended August 31, 2007, have been updated to reflect the revised recharacterization. The impact on the financial highlights for each class was a reclassification of $0.21, $0.32, $0.18 and $0.26 per share for the Investor Class, Trust Class, Advisor Class and Institutional Class, respectively, and a decrease in the Ratio of Net Investment Income (Loss) to Average Net Assets of 0.57%, 0.61%, 0.59% and 0.54% for the Investor Class, Trust Class, Advisor Class and Institutional Class, respectively.
198
Report of Independent Registered Public Accounting Firm
To the Board of Trustees
Neuberger Berman Equity Funds and
Shareholders of:
Neuberger Berman Climate Change Fund
Neuberger Berman Emerging Markets Equity Fund
Neuberger Berman Equity Income Fund
Neuberger Berman Focus Fund
Neuberger Berman Genesis Fund
Neuberger Berman Guardian Fund
Neuberger Berman International Fund
Neuberger Berman International Institutional Fund
Neuberger Berman International Large Cap Fund
Neuberger Berman Partners Fund
Neuberger Berman Real Estate Fund
Neuberger Berman Select Equities Fund
We have audited the accompanying statements of assets and liabilities, including the schedules of investments, of Neuberger Berman Climate Change Fund (Climate Change), Neuberger Berman Emerging Markets Equity Fund (Emerging Markets Equity), Neuberger Berman Equity Income Fund (Equity Income), Neuberger Berman Focus Fund (Focus), Neuberger Berman Genesis Fund (Genesis), Neuberger Berman Guardian Fund (Guardian), Neuberger Berman International Fund (International), Neuberger Berman International Institutional Fund (International Institutional), Neuberger Berman International Large Cap Fund (International Large Cap), Neuberger Berman Partners Fund (Partners), Neuberger Berman Real Estate Fund (Real Estate), and Neuberger Berman Select Equities Fund (Select Equities), twelve of the series constituting Neuberger Berman Equity Funds (the "Trust"), as of August 31, 2009, and the related statements of operations for the year then ended for Climate Change, Equity Income, Focus, Genesis, Guardian, International, International Institutional, International Large Cap, Partners, Real Estate, and Select Equities and the period from October 8, 2008 (commencement of operations) to August 31, 2009 for Emerging Markets Equity, the statements of changes in net assets and the financial highlights for each of the periods indicated therein. These financial statements and financial highlights are the responsibility of the Trust's management. Our responsibility is to express an opinion on these financial statements and financial highlights based on our audits.
We conducted our audits in accordance with the standards of the Public Company Accounting Oversight Board (United States). Those standards require that we plan and perform the audits to obtain reasonable assurance about whether the financial statements and financial highlights are free of material misstatement. We were not engaged to perform an audit of the Trust's internal control over financial reporting. Our audits included consideration of internal control over financial reporting as a basis for designing audit procedures that are appropriate in the circumstances, but not for the purpose of expressing an opinion on the effectiveness of the Trust's internal control over financial reporting. Accordingly, we express no such opinion. An audit also includes examining, on a test basis, evidence supporting the amounts and disclosures in the financial statements and financial highlights, assessing the accounting principles used and significant estimates made by management, and evaluating the overall financial statement presentation. Our procedures included confirmation of securities owned as of August 31, 2009, by correspondence with the custodian and brokers or by other appropriate auditing procedures where replies from brokers were not received. We believe that our audits provide a reasonable basis for our opinion.
In our opinion, the financial statements and financial highlights referred to above present fairly, in all material respects, the financial position of each of the above-mentioned series of Neuberger Berman Equity Funds as of August 31, 2009, the results of their operations for the year then ended for Climate Change, Equity Income, Focus, Genesis, Guardian, International, International Institutional, International Large Cap, Partners, Real Estate and Select Equities and the period from October 8, 2008 (commencement of operations) to August 31, 2009 for Emerging Markets Equity, the changes in
199
their net assets and the financial highlights for each of the periods indicated therein, in conformity with U.S. generally accepted accounting principles.

Boston, Massachusetts
October 16, 2009
200
Report of Independent Registered Public Accounting Firm
To the Board of Trustees and Shareholders
Neuberger Berman Equity Funds
We have audited the accompanying statements of assets and liabilities of the Neuberger Berman Large Cap Disciplined Growth Fund, Neuberger Berman Mid Cap Growth Fund, Neuberger Berman Regency Fund, Neuberger Berman Small Cap Growth Fund, Neuberger Berman Small and Mid Cap Growth Fund, and Neuberger Berman Socially Responsive Fund, each a series of the Neuberger Berman Equity Funds (the "Trust"), including the schedules of investments, as of August 31, 2009, and the related statements of operations for the year then ended (with respect to Neuberger Berman Large Cap Disciplined Growth Fund, the period December 20, 2007 to August 31, 2009), the statements of changes in net assets for each of the two years in the period then ended (with respect to Neuberger Berman Large Cap Disciplined Growth Fund, the period December 20, 2007 to August 31, 2009), and the financial highlights for each of the five years in the period then ended (with respect to Neuberger Berman Large Cap Disciplined Growth Fund, the period December 20, 2007 to August 31, 2009, and with respect to Neuberger Berman Small and Mid Cap Growth Fund, the three years in the period then ended). These financial statements and financial highlights are the responsibility of the Trust's management. Our responsibility is to express an opinion on these financial statements and financial highlights based on our audits.
We conducted our audits in accordance with the standards of the Public Company Accounting Oversight Board (United States). Those standards require that we plan and perform the audit to obtain reasonable assurance about whether the financial statements and financial highlights are free of material misstatement. The Trust is not required to have, nor were we engaged to perform, an audit of its internal control over financial reporting. Our audits included consideration of internal control over financial reporting as a basis for designing audit procedures that are appropriate in the circumstances, but not for the purpose of expressing an opinion on the effectiveness of the Trust's internal control over financial reporting. Accordingly, we express no such opinion. An audit also includes examining, on a test basis, evidence supporting the amounts and disclosures in the financial statements, assessing the accounting principles used and significant estimates made by management, as well as evaluating the overall financial statement presentation. Our procedures included confirmation of securities owned as of August 31, 2009, by correspondence with the custodian and brokers or by other appropriate auditing procedures where replies from brokers were not received. We believe that our audits provide a reasonable basis for our opinion.
In our opinion, the financial statements and financial highlights referred to above present fairly, in all material respects, the financial position of the above mentioned series of the Neuberger Berman Equity Funds, as of August 31, 2009, and the results of their operations, the changes in their net assets, and the financial highlights for the periods indicated above, in conformity with accounting principles generally accepted in the United States of America.

Philadelphia, Pennsylvania
October 16, 2009
201
Directory
Investment Manager, Administrator and Distributor
Neuberger Berman Management LLC
605 Third Avenue, 2nd Floor
New York, NY 10158-0180
800.877.9700 or 212.476.8800
Institutional Services 800.366.6264
Sub-Adviser
Neuberger Berman LLC
605 Third Avenue
New York, NY 10158-3698
Custodian and Shareholder Servicing Agent
State Street Bank and Trust Company
2 Avenue de Lafayette
Boston, MA 02111
For Investor Class Shareholders
Address correspondence to:
Neuberger Berman Funds
Boston Service Center
P.O. Box 8403
Boston, MA 02266-8403
800.877.9700 or 212.476.8800
For Class A, Class C and Class R3 Shareholders:
Please contact your investment provider
For Trust Class, Advisor Class, and Institutional Class Shareholders
Address correspondence to:
Neuberger Berman Management LLC
605 Third Avenue, Mail Drop 2-7
New York, NY 10158-0180
Attn: Intermediary Support Services
800.366.6264
Legal Counsel
K&L Gates LLP
1601 K Street, NW
Washington, DC 20006
Independent Registered Public Accounting Firms
Ernst & Young LLP
200 Clarendon Street
Boston, MA 02116
Tait, Weller & Baker LLP
1818 Market Street
Suite 2400
Philadelphia, PA 19103
202
Trustee and Officer Information
The following tables set forth information concerning the trustees and officers of the Trust. All persons named as trustees and officers also serve in similar capacities for other funds administered or managed by Management and Neuberger. The Statement of Additional Information includes additional information about trustees and is available upon request, without charge, by calling (800) 877-9700.
Information about the Board of Trustees
Name, (Year of Birth),
and Address(1) | | Position and
Length of
Time Served(2) | | Principal Occupation(s)(3) | | Number of
Funds in
Fund Complex
Fund Trustee | | Other Directorships Held
Outside Fund Complex by
Fund Trustee
Overseen by | |
| Independent Fund Trustees | |
|
| John Cannon (1930) | | Trustee since 2000 | | Consultant; formerly, Chairman, CDC Investment Advisers (registered investment adviser), 1993 to January 1999; formerly, President and Chief Executive Officer, AMA Investment Advisors, an affiliate of the American Medical Association. | | | 47 | | | Formerly, Independent Trustee or Director of three series of Oppenheimer Funds: Oppenheimer Limited Term New York Municipal Fund, Rochester Fund Municipals, and Oppenheimer Convertible Securities Fund (1992 to 2009). | |
|
| Faith Colish (1935) | | Trustee since 1982 | | Counsel, Carter Ledyard & Milburn LLP (law firm) since October 2002; formerly, Attorney-at-Law and President, Faith Colish, A Professional Corporation, 1980 to 2002. | | | 47 | | | Formerly, Director (1997 to 2003) and Advisory Director (2003 to 2006), ABA Retirement Funds (formerly, American Bar Retirement Association) (not-for-profit membership corporation). | |
|
203
Name, (Year of Birth),
and Address(1) | | Position and
Length of
Time Served(2) | | Principal Occupation(s)(3) | | Number of
Funds in
Fund Complex
Fund Trustee | | Other Directorships Held
Outside Fund Complex by
Fund Trustee
Overseen by | |
| Martha C. Goss (1949) | | Trustee since 2007 | | President, Woodhill Enterprises Inc./Chase Hollow Associates LLC (personal investment vehicle), since 2006; Chief Operating and Financial Officer, Hopewell Holdings LLC/Amwell Holdings, LLC (a holding company for a healthcare reinsurance company start-up), since 2003; formerly, Consultant, Resources Connection (temporary staffing), 2002 to 2006. | | | 47 | | | Director, Ocwen Financial Corporation (mortgage servicing), since 2005; Director, American Water (water utility), since 2003; Director, Channel Reinsurance (financial guaranty reinsurance), since 2006; Advisory Board Member, Attensity (software developer), since 2005; Director, Allianz Life of New York (insurance), since 2005; Director, Financial Women's Association of New York (not for profit association), since 2003; Trustee Emerita, Brown University, since 1998. | |
|
| C. Anne Harvey (1937) | | Trustee since 2000 | | President, C.A. Harvey Associates, since October 2001; formerly, Director, AARP, 1978 to December 2001. | | | 47 | | | Formerly, President, Board of Associates to The National Rehabilitation Hospital's Board of Directors, 2001 to 2002; formerly, Member, Individual Investors Advisory Committee to the New York Stock Exchange Board of Directors, 1998 to June 2002. | |
|
| Robert A. Kavesh (1927) | | Trustee since 1986 | | Retired; Marcus Nadler Professor Emeritus of Finance and Economics, New York University Stern School of Business; formerly, Executive Secretary-Treasurer, American Finance Association, 1961 to 1979. | | | 47 | | | Formerly, Director, The Caring Community (not-for-profit), 1997 to 2006; formerly, Director, DEL Laboratories, Inc. (cosmetics and pharmaceuticals), 1978 to 2004; formerly, Director, Apple Bank for Savings, 1979 to 1990; formerly, Director, Western Pacific Industries, Inc., 1972 to 1986 (public company). | |
|
204
Name, (Year of Birth),
and Address(1) | | Position and
Length of
Time Served(2) | | Principal Occupation(s)(3) | | Number of
Funds in
Fund Complex
Fund Trustee | | Other Directorships Held
Outside Fund Complex by
Fund Trustee
Overseen by | |
| Michael M. Knetter (1960) | | Trustee since 2007 | | Dean, School of Business, University of Wisconsin— Madison; formerly, Professor of International Economics and Associate Dean, Amos Tuck School of Business— Dartmouth College, 1998 to 2002. | | | 47 | | | Trustee, Northwestern Mutual Series Fund, Inc., since February 2007; Director, Wausau Paper, since 2005; Director, Great Wolf Resorts, since 2004. | |
|
| Howard A. Mileaf (1937) | | Trustee since 1984 | | Retired; formerly, Vice President and General Counsel, WHX Corporation (holding company), 1993 to 2001. | | | 47 | | | Formerly, Director, Webfinancial Corporation (holding company), 2002 to 2008; formerly, Director WHX Corporation (holding company), January 2002 to June 2005; formerly, Director, State Theatre of New Jersey (not-for-profit theater), 2000 to 2005. | |
|
| George W. Morriss (1947) | | Trustee since 2007 | | Retired; formerly, Executive Vice President and Chief Financial Officer, People's Bank, Connecticut (a financial services company), 1991 to 2001. | | | 47 | | | Manager, Old Mutual 2100 fund complex (consisting of six funds) since October 2006 for four funds and since February 2007 for two funds; formerly, Member NASDAQ Issuers' Affairs Committee, 1995 to 2003. | |
|
| Edward I. O'Brien (1928) | | Trustee since 1993 | | Retired; formerly, Member, Investment Policy Committee, Edward Jones, 1993 to 2001; President, Securities Industry Association ("SIA") (securities industry's representative in government relations and regulatory matters at the federal and state levels), 1974 to 1992; Adviser to SIA, November 1992 to November 1993. | | | 47 | | | Formerly, Director, Legg Mason, Inc. (financial services holding company), 1993 to July 2008; formerly, Director, Boston Financial Group (real estate and tax shelters), 1993 to 1999. | |
|
205
Name, (Year of Birth),
and Address(1) | | Position and
Length of
Time Served(2) | | Principal Occupation(s)(3) | | Number of
Funds in
Fund Complex
Fund Trustee | | Other Directorships Held
Outside Fund Complex by
Fund Trustee
Overseen by | |
| Cornelius T. Ryan (1931) | | Trustee since 1982 | | Founding General Partner, Oxford Partners and Oxford Bioscience Partners (venture capital investing) and President, Oxford Venture Corporation, since 1981. | | | 47 | | | None. | |
|
| Tom D. Seip (1950) | | Trustee since 2000; Chairman of the Board since 2008; Lead Independent Trustee from 2006 to 2008 | | General Partner, Seip Investments LP (a private investment partnership); formerly, President and CEO, Westaff, Inc. (temporary staffing), May 2001 to January 2002; formerly, Senior Executive at the Charles Schwab Corporation, 1983 to 1998, including Chief Executive Officer, Charles Schwab Investment Management, Inc., and Trustee, Schwab Family of Funds and Schwab Investments, 1997 to 1998, and Executive Vice President-Retail Brokerage, Charles Schwab & Co., Inc., 1994 to 1997. | | | 47 | | | Director, H&R Block, Inc. (financial services company), since May 2001; Chairman, Compensation Committee, H&R Block, Inc., since 2006; formerly, Director, Forward Management, Inc. (asset management company), 1999 to 2006. | |
|
206
Name, (Year of Birth),
and Address(1) | | Position and
Length of
Time Served(2) | | Principal Occupation(s)(3) | | Number of
Funds in
Fund Complex
Fund Trustee | | Other Directorships Held
Outside Fund Complex by
Fund Trustee
Overseen by | |
| Candace L. Straight (1947) | | Trustee since 2000 | | Private investor and consultant specializing in the insurance industry; formerly, Advisory Director, Securitas Capital LLC (a global private equity investment firm dedicated to making investments in the insurance sector), 1998 to December 2003. | | | 47 | | | Director, Montpelier Re (reinsurance company), since 2006; formerly, Director, National Atlantic Holdings Corporation (property and casualty insurance company), 2004 to 2008; formerly, Director, The Proformance Insurance Company (property and casualty insurance company), 2004 to 2008; formerly, Director, Providence Washington Insurance Company (property and casualty insurance company), December 1998 to March 2006; formerly, Director, Summit Global Partners (insurance brokerage firm), 2000 to 2005. | |
|
| Peter P. Trapp (1944) | | Trustee since 2000 | | Retired; formerly, Regional Manager for Mid-Southern Region, Ford Motor Credit Company, September 1997 to 2007; formerly, President, Ford Life Insurance Company, April 1995 to August 1997. | | | 47 | | | None. | |
|
207
Name, (Year of Birth),
and Address(1) | | Position and
Length of
Time Served(2) | | Principal Occupation(s)(3) | | Number of
Funds in
Fund Complex
Fund Trustee | | Other Directorships Held
Outside Fund Complex by
Fund Trustee
Overseen by | |
| Fund Trustees who are "Interested Persons" | |
|
| Joseph V. Amato* (1962) | | Trustee since 2009 | | President and Director, Neuberger Berman Group LLC, since 2009; President and Chief Executive Officer, Neuberger and Neuberger Berman Holdings LLC (including its predecessor, Neuberger Berman Inc.), since 2007; Chief Investment Officer, Neuberger, since 2009; Chief Investment Officer (Equities) and Managing Director, Management, since 2009; Managing Director, Neuberger Berman Fixed Income LLC (formerly known as Lehman Brothers Asset Management LLC) ("NBFI"), since 2007; Board member of NBFI since 2006; formerly, Global Head of Asset Management of Lehman Brothers Holdings Inc.'s ("LBHI") Investment Management Division, 2006 to 2009; formerly, member of LBHI's Investment Management Division's Executive Management Committee, 2006 to 2009; formerly, Managing Director, Lehman Brothers Inc. ("LBI"), 2006 to 2008; formerly, Chief Recruiting and Development Officer, LBI, 2005 to 2006; formerly, Global Head of LBI's Equity Sales and a Member of its Equities Division Executive Committee, 2003 to 2005. | | | 47 | | | Member of Board of Advisors, McDonough School of Business, Georgetown University, since 2001; Member of New York City Board of Advisors, Teach for America, since 2005; Trustee, Montclair Kimberley Academy (private school), since 2007. | |
|
208
Name, (Year of Birth),
and Address(1) | | Position and
Length of
Time Served(2) | | Principal Occupation(s)(3) | | Number of
Funds in
Fund Complex
Fund Trustee | | Other Directorships Held
Outside Fund Complex by
Fund Trustee
Overseen by | |
| Robert Conti* (1956) | | Chief Executive Officer, President and Trustee since 2008; prior thereto, Executive Vice President in 2008 and Vice President 2000 to 2008 | | Managing Director, Neuberger, since 2007; formerly, Senior Vice President, Neuberger, 2003 to 2006; formerly, Vice President, Neuberger, 1999 to 2003; President and Chief Executive Officer, Management, since 2008; formerly, Senior Vice President, Management, 2000 to 2008. | | | 47 | | | Chairman of the Board, Staten Island Mental Health Society since 2008. | |
|
| Jack L. Rivkin* (1940) | | Trustee since 2002; President from 2002 to 2008 | | Formerly, Executive Vice President and Chief Investment Officer, Neuberger Berman Holdings LLC (holding company), 2002 to August 2008 and 2003 to August 2008, respectively; formerly, Managing Director and Chief Investment Officer, Neuberger, December 2005 to August 2008 and 2003 to August 2008, respectively; formerly, Executive Vice President, Neuberger, December 2002 to 2005; formerly, Director and Chairman, Management, December 2002 to August 2008; formerly, Executive Vice President, Citigroup Investments, Inc., September 1995 to February 2002; formerly, Executive Vice President, Citigroup Inc., September 1995 to February 2002. | | | 47 | | | Director, Idealab (private company), since 2009; Director, Distributed World Power (private company), since 2009; Director, Dale Carnegie and Associates, Inc. (private company), since 1998; Director, Solbright, Inc. (private company), since 1997; formerly, Director, New York Society of Security Analysts (2006 to 2008). | |
|
(1) The business address of each listed person is 605 Third Avenue, New York, New York 10158.
(2) Pursuant to the Trust's Trust Instrument, each of these Fund Trustees shall hold office for life or until his or her successor is elected or the Trust terminates; except that (a) any Fund Trustee may resign by delivering a written resignation; (b) any Fund Trustee may be removed with or without cause at any time by a written instrument signed by at least two-thirds of the other Fund Trustees; (c) any Fund Trustee who requests to be retired, or who
209
has become unable to serve, may be retired by a written instrument signed by a majority of the other Fund Trustees; and (d) any Fund Trustee may be removed at any shareholder meeting by a vote of at least two-thirds of the outstanding shares.
(3) Except as otherwise indicated, each individual has held the positions shown for at least the last five years.
* Indicates a Fund Trustee who is an "interested person" within the meaning of the 1940 Act. Mr. Amato and Mr. Conti are interested persons of the Trust by virtue of the fact that each is an officer of Management, Neuberger and/or their affiliates. Mr. Rivkin may be deemed an interested person of the Trust by virtue of the fact that, until August 2008, he was a director of Management and an officer of Neuberger.
210
Information about the Officers of the Trust
Name, (Year of Birth),
and Address(1) | | Position and
Length of
Time Served(2) | | Principal Occupation(s)(3) | |
| Andrew B. Allard (1961) | | Anti-Money Laundering Compliance Officer since 2002 | | Senior Vice President, Neuberger, since 2006; Deputy General Counsel, Neuberger, since 2004; formerly, Vice President, Neuberger, 2000 to 2005; formerly, Associate General Counsel, Neuberger, 1999 to 2004; Anti-Money Laundering Compliance Officer, ten registered investment companies for which Management acts as investment manager and administrator (six since 2002, two since 2003, one since 2005 and one since 2006). | |
|
| Claudia A. Brandon (1956) | | Executive Vice President since 2008 and Secretary since 1985 | | Senior Vice President, Neuberger, since 2007 and Employee since 1999; formerly, Vice President, Neuberger, 2002 to 2006; Senior Vice President, Management, since 2008 and Assistant Secretary since 2004; formerly, Vice President-Mutual Fund Board Relations, Management, 2000 to 2008; Executive Vice President, ten registered investment companies for which Management acts as investment manager and administrator (ten since 2008); Secretary, ten registered investment companies for which Management acts as investment manager and administrator (three since 1985, three since 2002, two since 2003, one since 2005 and one since 2006). | |
|
| Maxine L. Gerson (1950) | | Executive Vice President since 2008 and Chief Legal Officer since 2005 (only for purposes of sections 307 and 406 of the Sarbanes-Oxley Act of 2002) | | Senior Vice President, Neuberger, since 2002; Deputy General Counsel and Assistant Secretary, Neuberger, since 2001; Senior Vice President, Management, since 2006; Secretary and General Counsel, Management, since 2004; Executive Vice President, ten registered investment companies for which Management acts as investment manager and administrator (ten since 2008); Chief Legal Officer (only for purposes of sections 307 and 406 of the Sarbanes-Oxley Act of 2002), ten registered investment companies for which Management acts as investment manager and administrator (nine since 2005 and one since 2006). | |
|
| Sheila R. James (1965) | | Assistant Secretary since 2002 | | Vice President, Neuberger, since 2008 and Employee since 1999; formerly, Assistant Vice President, Neuberger, 2007; Assistant Secretary, ten registered investment companies for which Management acts as investment manager and administrator (six since 2002, two since 2003, one since 2005 and one since 2006). | |
|
| Brian Kerrane (1969) | | Vice President since 2008 | | Senior Vice President, Neuberger, since 2006; formerly, Vice President, Neuberger, 2002 to 2006; Vice President, Management, since 2008 and Employee since 1991; Vice President, ten registered investment companies for which Management acts as investment manager and administrator (ten since 2008). | |
|
| Kevin Lyons (1955) | | Assistant Secretary since 2003 | | Assistant Vice President, Neuberger, since 2008 and Employee since 1999; Assistant Secretary, ten registered investment companies for which Management acts as investment manager and administrator (eight since 2003, one since 2005 and one since 2006). | |
|
211
Name, (Year of Birth),
and Address(1) | | Position and
Length of
Time Served(2) | | Principal Occupation(s)(3) | |
| Owen F. McEntee, Jr. (1961) | | Vice President since 2008 | | Vice President, Neuberger, since 2006; Employee, Management, since 1992; Vice President, ten registered investment companies for which Management acts as investment manager and administrator (ten since 2008). | |
|
| John M. McGovern (1970) | | Treasurer and Principal Financial and Accounting Officer since 2005; prior thereto, Assistant Treasurer since 2002 | | Senior Vice President, Neuberger, since 2007; formerly, Vice President, Neuberger, 2004 to 2006; Employee, Management, since 1993; Treasurer and Principal Financial and Accounting Officer, ten registered investment companies for which Management acts as investment manager and administrator (nine since 2005 and one since 2006); formerly, Assistant Treasurer, ten registered investment companies for which Management acts as investment manager and administrator, 2002 to 2005. | |
|
| Andrew Provencher (1965) | | Vice President since 2008 | | Managing Director, Management, since 2008; Managing Director, Neuberger, since 2005; formerly, Senior Vice President, Neuberger, 2003 to 2005; formerly, Vice President, Neuberger, 1999 to 2003; Vice President, ten registered investment companies for which Management acts as investment manager and administrator (ten since 2008). | |
|
| Frank Rosato (1971) | | Assistant Treasurer since 2005 | | Vice President, Neuberger, since 2006; Employee, Management, since 1995; Assistant Treasurer, ten registered investment companies for which Management acts as investment manager and administrator (nine since 2005 and one since 2006). | |
|
| Neil S. Siegel (1967) | | Vice President since 2008 | | Managing Director, Management, since 2008; Managing Director, Neuberger, since 2006; formerly, Senior Vice President, Neuberger, 2004 to 2006; Vice President, ten registered investment companies for which Management acts as investment manager and administrator (ten since 2008); formerly, Head of Institutional Marketing, Morgan Stanley Investment Management, 1993 to 2004. | |
|
| Chamaine Williams (1971) | | Chief Compliance Officer since 2005 | | Senior Vice President, Neuberger, since 2007; Chief Compliance Officer, Management, since 2006; Chief Compliance Officer, ten registered investment companies for which Management acts as investment manager and administrator (nine since 2005 and one since 2006); formerly, Senior Vice President, Lehman Brothers Inc., 2007 to 2008; formerly, Vice President, Lehman Brothers Inc., 2003 to 2006; formerly, Chief Compliance Officer, Lehman Brothers Asset Management Inc., 2003 to 2007; formerly, Chief Compliance Officer, Lehman Brothers Alternative Investment Management LLC, 2003 to 2007; formerly, Vice President, UBS Global Asset Management (US) Inc. (formerly, Mitchell Hutchins Asset Management, a wholly-owned subsidiary of PaineWebber Inc.), 1997 to 2003. | |
|
(1) The business address of each listed person is 605 Third Avenue, New York, New York 10158.
(2) Pursuant to the By-Laws of the Trust, each officer elected by the Fund Trustees shall hold office until his or her successor shall have been elected and qualified or until his or her earlier death, inability to serve, or resignation. Officers serve at the pleasure of the Fund Trustees and may be removed at any time with or without cause.
(3) Except as otherwise indicated, each individual has held the positions shown for at least the last five years.
212
Proxy Voting Policies and Procedures
A description of the policies and procedures that the Trust uses to determine how to vote proxies relating to portfolio securities is available, without charge, by calling 1-800-877-9700 (toll-free) and on the website of the Securities and Exchange Commission, at www.sec.gov. Information regarding how the Trust voted proxies relating to portfolio securities during the most recent 12-month period ended June 30 is also available, without charge, by calling 1-800-877-9700 (toll-free), on the website of the Securities and Exchange Commission at www.sec.gov, and on Management's website at www.nb.com.
Quarterly Portfolio Schedule
The Trust files a complete schedule of portfolio holdings for each Fund with the Securities and Exchange Commission for the first and third quarters of each fiscal year on Form N-Q. The Trust's Forms N-Q are available on the Securities and Exchange Commission's website at www.sec.gov and may be reviewed and copied at the Securities and Exchange Commission's Public Reference Room in Washington, DC. Information on the operation of the Public Reference Room may be obtained by calling 1-800-SEC-0330. The information on Form N-Q is available upon request, without charge, by calling 1-800-877-9700 (toll-free).
213
Notice to Shareholders (Unaudited)
Neuberger Berman Equity Income Fund, Neuberger Berman Focus Fund, Neuberger Berman Genesis Fund, Neuberger Berman Guardian Fund, Neuberger Berman Partners Fund, Neuberger Berman Regency Fund, and Neuberger Berman Socially Responsive Fund hereby designate $199,719, $71,795,704, $442,063,981, $96,880,945, $31,218,246, $4,426,635, and $12,873,755, respectively, as a capital gain distribution.
For the fiscal year ended August 31, 2009, each fund makes the following designation, or up to the maximum amount of such dividends allowable pursuant to the Internal Revenue Code, as qualified dividend income eligible for reduced tax rates. These lower rates range from 5% to 15% depending upon an individual's tax bracket. Complete information regarding each funds distributions during the calendar year 2009 will be reported in conjunction with Form 1099-DIV.
| Fund | | Qualified
Dividend Income | |
| Climate Change Fund | | $ | 47,327 | | |
| Emerging Markets Equity Fund | | | 97,909 | | |
| Equity Income Fund | | | 1,189,388 | | |
| Focus Fund | | | 9,588,233 | | |
| Genesis Fund | | | 77,789,580 | | |
| Guardian Fund | | | 14,569,299 | | |
| International Fund | | | 11,709,601 | | |
| International Institutional Fund | | | 6,475,553 | | |
| International Large Cap Fund | | | 2,837,877 | | |
| Large Cap Disciplined Growth Fund | | | 659,659 | | |
| Mid Cap Growth Fund | | | 2,080,046 | | |
| Partners Fund | | | 35,078,654 | | |
| Real Estate Fund | | | 2,392,263 | | |
| Regency Fund | | | 1,488,021 | | |
| Select Equities Fund | | | 409,001 | | |
| Small and Mid Cap Growth Fund | | | 23,442 | | |
| Small Cap Growth Fund | | | 507,732 | | |
| Socially Responsive Fund | | | 12,514,943 | | |
214
Report of Votes of Shareholders
A special meeting of shareholders of Neuberger Berman Climate Change Fund, Neuberger Berman Emerging Markets Equity Fund, Neuberger Berman Equity Income Fund, Neuberger Berman Focus Fund, Neuberger Berman Genesis Fund, Neuberger Berman Guardian Fund, Neuberger Berman International Fund, Neuberger Berman International Institutional Fund, Neuberger Berman International Large Cap Fund, Neuberger Berman Large Cap Disciplined Growth Fund, Neuberger Berman Mid Cap Growth Fund, Neuberger Berman Partners Fund, Neuberger Berman Real Estate Fund, Neuberger Berman Regency Fund, Neuberger Berman Select Equities Fund, Neuberger Berman Small and Mid Cap Growth Fund, Neuberger Berman Small Cap Growth Fund and Neuberger Berman Socially Responsive Fund (each a "Fund" and collectively the "Funds"), each a series of Neuberger Berman Equity Funds (the "Trust"), was held on April 6, 2009 for each Fund except Neuberger Berman Small Cap Growth Fund, which was held on April 20, 2009. Upon completion of the acquisition of Neuberger Berman Management LLC ("Management") and Neuberger Berman, LLC ("Neuberger") by NBSH Acquisition, LLC, an entity organized by key members of Neuberger Berman's senior management (the "Acquisition"), the Trust's management and sub-advisory agreements, on behalf of each Fund, with Management and Neuberger, respectively, automatically terminated. To provide for continuity of management, the shareholders of each Fund voted on the following matters, which became effective upon completion of the Acquisition on May 4, 2009.
PROPOSAL 1—TO APPROVE A NEW MANAGEMENT AGREEMENT BETWEEN THE TRUST, ON BEHALF OF EACH FUND, AND A NEWLY-FORMED SUCCESSOR ENTITY TO NB MANAGEMENT ("NEW NB MANAGEMENT")
Neuberger Berman
Equity Funds | | Votes For | | Votes Against | | Abstentions | | Broker Non-Votes | |
| Climate Change Fund | | | 427,362 | | | | — | | | | 2994 | | | | 36,243 | | |
| Emerging Markets Equity Fund | | | 308,444 | | | | — | | | | — | | | | — | | |
| Equity Income Fund | | | 1,891,391 | | | | 4,667 | | | | 11,795 | | | | 743,332 | | |
| Focus Fund | | | 19,451,008 | | | | 837,462 | | | | 1,483,395 | | | | 3,846,696 | | |
| Genesis Fund | | | 120,376,050 | | | | 2,384,250 | | | | 3,634,517 | | | | 21,165,113 | | |
| Guardian Fund | | | 40,238,909 | | | | 1,447,460 | | | | 1,583,243 | | | | 5,372,705 | | |
| International Fund | | | 13,787,213 | | | | 326,889 | | | | 348,058 | | | | 5,331,933 | | |
| International Institutional Fund | | | 18,096,092 | | | | 11,126 | | | | 16,418 | | | | 623,328 | | |
| International Large Cap Fund | | | 7,721,689 | | | | 18,965 | | | | 39,266 | | | | 1,823,995 | | |
| Large Cap Disciplined Growth Fund | | | 2,909,829 | | | | 128,014 | | | | 114,830 | | | | 532,346 | | |
| Mid Cap Growth Fund | | | 26,277,124 | | | | 1,077,997 | | | | 1,277,367 | | | | 7,002,587 | | |
| Partners Fund | | | 57,022,505 | | | | 2,610,521 | | | | 6,451,898 | | | | 9,152,745 | | |
| Real Estate Fund | | | 2,907,593 | | | | 41,600 | | | | 99,058 | | | | 1,182,593 | | |
| Regency Fund | | | 4,678,677 | | | | 120,737 | | | | 166,737 | | | | 1,989,123 | | |
| Select Equities Fund | | | 1,312,972 | | | | 34,665 | | | | 35,140. | | | | 538,703 | | |
| Small and Mid Cap Growth Fund | | | 661,381 | | | | 270 | | | | 209 | | | | 12,815 | | |
| Small Cap Growth Fund | | | 9,391,657 | | | | 249,992 | | | | 277,318 | | | | 4,697,568 | | |
| Socially Responsive Fund | | | 22,910,526 | | | | 804,318 | | | | 993,666 | | | | 8,568,793 | | |
215
PROPOSAL 2—TO APPROVE A NEW SUB-ADVISORY AGREEMENT WITH RESPECT TO THE TRUST AND EACH FUND, BETWEEN NEW NB MANAGEMENT AND NEUBERGER
Neuberger Berman
Equity Funds | | Votes For | | Votes Against | | Abstentions | | Broker Non-Votes | |
| Climate Change Fund | | | 427,361 | | | | — | | | | 2,994 | | | | 36,243 | | |
| Emerging Markets Equity Fund | | | 308,444 | | | | — | | | | — | | | | — | | |
| Equity Income Fund | | | 1,891,391 | | | | 4,667 | | | | 11,795 | | | | 743,332 | | |
| Focus Fund | | | 19,419,293 | | | | 863,917 | | | | 1,488,655 | | | | 3,846,696 | | |
| Genesis Fund | | | 120,350,934 | | | | 2,410,083 | | | | 3,633,802 | | | | 21,165,111 | | |
| Guardian Fund | | | 40,307,192 | | | | 1,452,324 | | | | 1,510,096 | | | | 5,372,705 | | |
| International Fund | | | 13,779,591 | | | | 325,661 | | | | 356,909 | | | | 5,331,932 | | |
| International Institutional Fund | | | 18,085,899 | | | | 21,514 | | | | 16,223 | | | | 623,328 | | |
| International Large Cap Fund | | | 7,721,878 | | | | 18,965 | | | | 39,077 | | | | 1,823,995 | | |
| Large Cap Disciplined Growth Fund | | | 2,900,497 | | | | 136,834 | | | | 115,342 | | | | 532,346 | | |
| Mid Cap Growth Fund | | | 26,251,154 | | | | 1,104,744 | | | | 1,276,589 | | | | 7,002,588 | | |
| Partners Fund | | | 56,914,357 | | | | 2,662,961 | | | | 6,507,605 | | | | 9,152,746 | | |
| Real Estate Fund | | | 2,895,328 | | | | 38,964 | | | | 113,959 | | | | 1,182,593 | | |
| Regency Fund | | | 4,678,874 | | | | 119,281 | | | | 167,996 | | | | 1,989,123 | | |
| Select Equities Fund | | | 1,295,324 | | | | 45,788 | | | | 41,665 | | | | 538,703 | | |
| Small and Mid Cap Growth Fund | | | 661,586 | | | | 270 | | | | 4 | | | | 12,815 | | |
| Small Cap Growth Fund | | | 9,383,231 | | | | 254,843 | | | | 280,893 | | | | 4,697,568 | | |
| Socially Responsive Fund | | | 22,917,776 | | | | 806,745 | | | | 983,989 | | | | 8,568,793 | | |
PROPOSAL 3—TO APPROVE THE ELECTION OF THE FOLLOWING TRUSTEES TO THE BOARD OF TRUSTEES OF THE TRUST:*
Neuberger Berman
Equity Funds | | Votes For | | Votes Withheld | | Abstentions | | Broker Non-Votes | |
| Joseph V. Amato | | | 375,800,496 | | | | 25,057,691 | | | | — | | | | — | | |
| John Cannon | | | 376,042,283 | | | | 24,815,904 | | | | — | | | | — | | |
| Faith Colish | | | 376,397,707 | | | | 24,460,480 | | | | — | | | | — | | |
| Robert Conti | | | 376,557,077 | | | | 24,301,110 | | | | — | | | | — | | |
| Martha C. Goss | | | 376,415,188 | | | | 24,442,999 | | | | — | | | | — | | |
| C. Anne Harvey | | | 376,525,613 | | | | 24,332,574 | | | | — | | | | — | | |
| Robert A. Kavesh | | | 375,957,185 | | | | 24,901,002 | | | | — | | | | — | | |
| Michael M. Knetter | | | 376,709,573 | | | | 24,148,614 | | | | — | | | | — | | |
| Howard A. Mileaf | | | 376,302,991 | | | | 24,555,196 | | | | — | | | | — | | |
| George W. Morriss | | | 376,915,464 | | | | 23,942,723 | | | | — | | | | — | | |
| Edward I. O'Brien | | | 376,310,888 | | | | 24,547,299 | | | | — | | | | — | | |
| Jack L. Rivkin | | | 376,029,844 | | | | 24,828,343 | | | | — | | | | — | | |
| Cornelius T. Ryan | | | 375,904,396 | | | | 24,953,791 | | | | — | | | | — | | |
| Tom D. Seip | | | 376,671,096 | | | | 24,187,091 | | | | — | | | | — | | |
| Candace L. Straight | | | 376,954,598 | | | | 23,903,589 | | | | — | | | | — | | |
| Peter P. Trapp | | | 361,387,672 | | | | 39,470,515 | | | | — | | | | — | | |
*Denotes trust-wide proposal and voting results.
216
This page has been left blank intentionally
217

Neuberger Berman Management LLC
605 Third Avenue 2nd Floor
New York, NY 10158–0180
Shareholder Services
800.877.9700
Institutional Services
800.366.6264
www.nb.com
Statistics and projections in this report are derived from sources deemed to be reliable but cannot be regarded as a representation of future results of the Funds. This report is prepared for the general information of shareholders and is not an offer of shares of the Funds. Shares are sold only through the currently effective prospectus, which must precede or accompany this report.
 H0599 10/09
Large Cap Value Fund Commentary
Neuberger Berman Large Cap Value Fund, formerly Neuberger Berman Dividend Fund, posted a decline for the fiscal year ended August 31, 2009 but outperformed the Russell 1000® Value Index and S&P 500 Index for the period.
On June 12, 2009, the Fund was renamed and its investment team and management approach were changed. Previously, the Fund invested in high yielding securities and stocks with “buy” ratings from Neuberger Berman’s in-house Research Department. Currently, the Fund still leverages the research strengths of our firm, but invests exclusively in large capitalization value stocks.
The fiscal year was a period of unprecedented market volatility as fallout from the credit crisis triggered a substantial decline in stocks, which was followed by a rally as governments responded worldwide. The rally did not completely offset earlier losses, however, and the Russell 1000 Value and S&P 500 indexes both finished down substantially for the full period. Losses were widespread with considerable declines in all sectors of the indices.
For the time period prior to the transition, the Fund outperformed its previous benchmark, the S&P 500 Index. A large allocation to cash and cash equivalents, which at times reached 25%, was highly beneficial on a relative basis, due to market declines early in the fiscal year. Stock selection in Industrials and Consumer Discretionary also aided returns during that period. Given concerns about economic deceleration, the Fund established a defensive position, in part, by underweighting the Consumer Discretionary sector. This underweighting, unfortunately, offset some of the benefits of strong stock selection.
Stock selection in Energy and Information Technology was disappointing. In Energy, holdings including Canadian oil sands companies were hurt by falling energy prices while Information Technology holdings suffered due to weakness in one stock. An overweight of the Utilities sector (designed to capture its relatively high yields) also harmed performance, as the sector underperformed.
After the June 12, 2009 management transition, the Fund performed well on an absolute return basis, slightly surpassing results for the Russell 1000 Value Index, its new benchmark.
Stock selection and an underweight in the Energy sector, in aggregate, had the largest beneficial impact on relative performance. Holdings emphasized exploration and development companies and outperformed large, integrated conglomerates that represent a significant portion of the index sector. Upon assuming management of the Fund, we acquired companies with low fmding and development costs. These stocks typically benefit from increasing energy prices, while their efficient access to new energy resources makes them less sensitive to commodity price declines. As such, we continue to believe that the sector is well positioned.
A Utilities sector underweighting also proved beneficial as the sector constituents, in aggregate, trailed the performance of the overall index. This underweight resulted, in large part, from our belief that the sector lacked compelling opportunities.
A defensive underweighting of the troubled Financials sector was a negative during the second part of the period, when the sector posted strong gains. We generally avoided companies with substantial exposure to consumer financing as well as real estate investment trusts (which tend to have substantial leverage). As investors took on more risk, these industries performed well, hurting relative performance.
A Health Care overweight was another considerable drag on relative performance from June 12, 2009 onward. We had established this overweight for defensive purposes and to capitalize on what we consider the sector’s potential for long-term growth, even with current regulatory uncertainty.
Looking forward, we remain concerned about the sustainability of the current market rally, which has been led by lower quality companies, or those with high levels of leverage and low earnings. Over the last six months, investor confidence in a strong economic recovery and appetite for risk have increased significantly, as evidenced by the superior performance of economically sensitive sectors such as Financials, Industrials, Materials and Energy and big moves in more speculative issues. If economic growth fails to meet what may be optimistic expectations, we believe that today’s market leaders are probably vulnerable. We think that focusing on undervalued companies that we believe can sustain respectable cash flow and earnings growth even in a less vibrant economy could be a relatively satisfactory approach in the year ahead.
Sincerely,
David Levine
Portfolio Manager
The risks involved in seeking capital appreciation from investments in companies with large-market capitalization are set forth in the prospectus and statement of additional information.
Large-cap stocks are subject to all the risks of stock market investing, including the risk that they may lose value.
The composition, industries and holdings of the Fund are subject to change Large Cap Value Fund is invested in a wide array of stocks, and no single holding makes up a significant portion of the Fund’s total assets.
| SECTOR ALLOCATION | | |
| (% of Equity Market Value) | | |
| Consumer Discretionary | 7.7 | % |
| Consumer Staples | 7.6 | |
| Energy | 18.6 | |
| Financials | 23.2 | |
| Health Care | 13.5 | |
| Industrials | 8.3 | |
| Information Technology | 6.9 | |
| Materials | 2.9 | |
| Telecommunication Services | 5.1 | |
| Utilities | 6.2 | |
| Total | 100 | % |
AVERAGE ANNUAL TOTAL RETURN1,4 | |
| | |
| | Inception Date | | 1 Year | | | Life of Fund | |
| | | | | | | | |
Trust Class3 | 11/02/2006 | | -13.01 | % | | | -2.57 | % | |
Russell 1000® Value Index 2,5 | | | -20.27 | % | | | -10.36 | % | |
S&P 500 Index2,5,6 | | | -18.25 | % | | | -7.76 | % | |
Performance data quoted represent past performance, which is no guarantee of future results. The investment return and principal value of an investment will fluctuate so that an investor’s shares, when redeemed, may be worth more or less than their original cost. Results are shown on a “total return” basis and assume reinvestment of all dividends and capital gain distributions.
Current performance may be lower or higher than the performance data quoted. For performance data current to the most recent month end, phone 800.877.9700.
As stated in the Fund’s most recent prospectus, the total annual fund operating expense ratio for fiscal year 2008 was 2.71% for Trust Class shares (prior to any fee waivers or expense reimbursements). The net expense ratio was 1.04%. Neuberger Berman Management LLC has contractually agreed to limit certain expenses of the Fund through August 31, 2012.
COMPARISON OF A $10,000 INVESTMENT
This chart shows the value of a hypothetical $10,000 investment in the Fund over the past 10 fiscal years, or since the Fund’s inception if it has not operated for 10 years. The result is compared with benchmarks, which may include a broad-based market index and/or a narrower index. Please note that market indexes have not been reduced to reflect any of the fees and costs of investing. All results include the reinvestment of dividends and capital gain distributions. Neither the Fund’s returns nor the market indexes shown in the graph and table reflect the effect of taxes an investor would pay on Fund distributions or on the redemption of Fund shares. Results represent past performance and do not indicate future results.
Research Opportunities Fund Commentary
Neuberger Berman Research Opportunities Fund posted a decline for the fiscal year ended August 31, 2009, but outperformed its benchmark, the S&P 500 Index.
The Fund seeks to capitalize on the “best ideas” of Neuberger Berman’s in-house research department by investing exclusively in stocks that Neuberger Berman analysts rate as “buys.” If an analyst downgrades a stock, it is sold. The Fund maintains a neutral weighting of industry sectors relative to its benchmark.
The fiscal year was a period of unprecedented market volatility as fallout from the credit crisis triggered a substantial decline in equities, which was followed by a rally as governments responded worldwide. The rally was unable to completely offset earlier losses, however, and the S&P 500 finished down more than 18%. All sectors within the S&P 500 declined, with Financials, Energy and Industrials dropping the most. In contrast, Consumer Staples and Information Technology fared the best.
During the reporting period, stock selection within Energy and Industrials enhanced Fund performance relative to the index considerably. Among Energy stocks, exposure to companies with low finding and development costs proved beneficial as their efficient access to new energy resources made them less sensitive to commodity price declines.
In Industrials, the Fund avoided a small number of large sector constituents that had substantial declines. Furthermore, the Fund held no railroad companies early in the period, which proved beneficial as the companies declined substantially. The Fund later purchased these stocks at what we believe were attractive valuations and the holdings subsequently appreciated in value, further enhancing relative performance.
Health Care and Telecommunications Services holdings, by contrast, disappointed. In Health Care, we avoided large pharmaceutical companies with expiring patents because of concerns that they would face increased competition from generic products. This was a drag on relative performance as the companies, some of which are index constituents, performed well. In the Telecom sector, we believe the credit crisis harmed some of our holdings of leveraged companies that lease antenna tower space for wireless transmissions. We had purchased the companies because we believed their strong cash flows made them attractive.
Looking forward, we remain concerned about the sustainability of the current market rally, which has been led by lower quality companies, or those with high levels of leverage and low earnings. Over the last six months, investor confidence in a strong economic recovery and appetite for risk have increased significantly, as evidenced by the superior performance of economically sensitive sectors such as Financials, Industrials, Materials and Energy and big moves in more speculative issues. If economic growth fails to meet what may be optimistic expectations, we believe that today’s market leaders are probably vulnerable. We think that focusing on undervalued companies that we believe can sustain respectable cash flow and earnings growth even in a less vibrant economy could be a relatively satisfactory approach in the year ahead.
Sincerely,
David Levine
Portfolio Manager
The risks involved in seeking capital appreciation from investments in companies with small-, mid-, and large-market capitalization are set forth in the prospectus and statement of additional information.
Small- and mid-capitalization stocks are more vulnerable to financial risks and other risks than stocks of larger companies. They also trade less frequently and in lower volume than larger company stocks, so their market prices tend to be more volatile. Large-cap stocks are subject to all the risks of stock market investing, including the risk that they may lose value.
The composition, industries and holdings of the Fund are subject to change. Neuberger Berman Research Opportunities Fund is invested in a wide array of stocks, and no single holding makes up a significant portion of the Fund’s total assets.
| SECTOR ALLOCATION | | |
| (% of Equity Market Value) | | |
| Consumer Discretionary | 9.0 | % |
| Consumer Staples | 11.4 | |
| Energy | 11.4 | |
| Financials | 14.5 | |
| Health Care | 13.4 | |
| Industrials | 10.1 | |
| Information Technology | 18.3 | |
| Materials | 3.4 | |
| Telecommunication Services | 3.1 | |
| Utilities | 3.7 | |
| Other | 1.7 | |
| Total | 100 | % |
AVERAGE ANNUAL TOTAL RETURN1,4 |
| |
| | Inception Date | 1 Year | Life of Fund |
| | | | |
Trust Class3 | 11/02/2006 | -17.74% | -5.62% |
S&P 500 Index 2,5 | | -18.25% | -7.76% |
| | | | |
Performance data quoted represent past performance, which is no guarantee of future results. The investment return and principal value of an investment will fluctuate so that an investor’s shares, when redeemed, may be worth more or less than their original cost. Results are shown on a “total return” basis and assume reinvestment of all dividends and capital gain distributions.
Current performance may be lower or higher than the performance data quoted. For performance data current to the most recent month end, phone 800.877.9700.
As stated in the Fund’s most recent prospectus, the total annual fund operating expense ratio for fiscal year 2009 was 2.43% for Trust Class shares (prior to any fee waivers or expense reimbursements). The net expense ratio was 1.01%. Neuberger Berman Management LLC has contractually agreed to limit certain expenses of the Fund through 8/31/2012 for Trust Class.
COMPARISON OF A $10,000 INVESTMENT
This chart shows the value of a hypothetical $10,000 investment in the Fund over the past 10 fiscal years, or since the Fund’s inception if it has not operated for 10 years. The result is compared with benchmarks, which may include a broad-based market index and/or a narrower index. Please note that market indexes have not been reduced to reflect any of the fees and costs of investing. All results include the reinvestment of dividends and capital gain distributions. Neither the Fund’s returns nor the market indexes shown in the graph and table reflect the effect of taxes an investor would pay on Fund distributions or on the redemption of Fund shares. Results represent past performance and do not indicate future results.
Endnotes
| 1 | “Total Return” includes reinvestment of all income dividends and capital gain distributions. Results represent past performance and do not indicate future results. The value of an investment in the Fund and the return on the investment both will fluctuate, and redemption proceeds may be higher or lower than an investor’s original cost. |
| | |
| 2 | Please see “Glossary of Indices” on the following page for a description of the indices. Please note that the indices do not take into account any fees and expenses or tax consequences of investing in the individual securities that they track, and that individuals cannot invest directly in any index. Data about the performance of these indices are prepared or obtained by Neuberger Berman Management LLC (“Management”) and include reinvestment of all dividends and capital gain distributions. The Fund may invest in securities not included in the described indices. |
| | |
| 3 | Management has contractually agreed to forgo current payment of fees and/or reimburse certain expenses of the Trust Class of the Fund through August 31, 2012, so that the total annual operating expenses of the Trust Class of the Fund are limited to 1.00% of average net assets. Absent such reimbursements, the performance of the Fund during the fiscal year ended August 31, 2009 would have been less. The Fund has contractually undertaken to reimburse Management for the excess expenses of the Trust Class paid by Management, provided the reimbursements do not cause operating expenses (exclusive of taxes, interest, brokerage commissions, and extraordinary expenses) to exceed the above-stated expense limitation and the reimbursements are made within three years after the year that Management incurred the expense. |
| | |
| 4 | The Fund was relatively small during the period shown. Certain techniques that may be used to produce returns in a small fund may not work to produce similar returns in a larger fund. |
| | |
| 5 | Index returns are for the period beginning November 2, 2006, the inception of the Trust Class. |
| | |
| 6 | The Fund’s broad-based index used for comparison purposes has been changed from the S&P 500 Index to the Russell 1000® Value Index because the new index more closely resembles the characteristics of the Fund’s investment following the change in its management approach. |
For more complete information on any of the Neuberger Berman Equity Funds, call Neuberger Berman Management LLC at (800) 877-9700, or visit our website at www.nb.com.
Glossary of Indices
Russell 1000® Value Index: | Measures the performance of those Russell 1000® Index companies with lower price-to-book ratios and lower forecasted growth rates. |
| |
Russell 1000® Index: | Measures the performance of the 1,000 largest companies in the Russell 3000® Index (which measures the performance of the 3,000 largest U.S. companies based on total market capitalization). The Russell 1000 Index represents approximately 92% of the U.S. market. |
| |
| S&P 500 Index: | The S&P 500 Index is widely regarded as the standard for measuring the performance of large-cap stocks traded on U.S. markets and includes a representative sample of leading companies in leading industries. |
Please note that indices do not take into account any fees and expenses or any tax consequences of investing in the individual securities that they track and that individuals cannot invest directly in any index. Data about the performance of these indices are prepared or obtained by Neuberger Berman Management LLC and include reinvestment of all dividends and capital gain distributions. The Funds may invest in securities not included in the above-described indices.
Information About Your Fund’s Expenses
This table is designed to provide information regarding costs related to your investments. All mutual funds incur operating expenses, which include management fees, fees for administrative services and costs of shareholder reports, among others. The following examples are based on an investment of $1,000 made at the beginning of the six month period ended August 31, 2009 and held for the entire period. The table illustrates the fund’s costs in two ways:
Actual Expenses and Performance: | | The first section of the table provides information about actual account values and actual expenses in dollars, based on the fund’s actual performance during the period. You may use the information in this line, together with the amount you invested, to estimate the expenses you paid over the period. Simply divide your account value by $1,000 (for example, an $8,600 account value divided by $1,000 = 8.6), then multiply the result by the number in the first section of the table under the heading entitled “Expenses Paid During the Period” to estimate the expenses you paid over the period. |
| Hypothetical Example for Comparison Purposes: | | The second section of the table provides information about hypothetical account values and hypothetical expenses based on the fund’s actual expense ratio and an assumed rate of return at 5% per year before expenses. This return is not the fund’s actual return. The hypothetical account values and expenses may not be used to estimate the actual ending account balance or expenses you paid for the period. You may use this information to compare the ongoing costs of investing in these funds versus other funds. To do so, compare the expenses shown in this 5% hypothetical example with the 5% hypothetical examples that appear in the shareholder reports of other funds. |
Please note that the expenses in the table are meant to highlight your ongoing costs only. The table and the expense example do not include any transactional costs, such as fees and expenses that are, or may be, imposed under your variable contract or qualified pension plan. Therefore, the information under the heading “Hypothetical (5% annual return before expenses)” is useful in comparing ongoing costs only, and will not help you determine the relative total costs of owning different funds. In addition, if these transactional costs were included, your cost would have been higher.
Expense Information As of 8/31/09 (Unaudited)
Neuberger Berman Equity Funds
| | | Actual | | Hypothetical (5% annual return before expenses) ** | |
| | | | | | | Expenses Paid | | | | | | | | Expenses Paid | | | |
| | | Beginning | | Ending Account | | During the | | | | Beginning | | Ending Account | | During the | | | |
| | | Account Value | | Value | | Period* 3/1/09 - | | Expense | | Account Value | | Value | | Period* 3/1/09 - | | Expense | |
| | | 3/1/09 | | 8/31/09 | | 8/31/09 | | Ratio | | 3/1/09 | | 8/31/09 | | 8/31/09 | | Ratio | |
| Large Cap Value Fund | | | | | | | | | | | | | | | | | |
| Trust Class | | | $1,000.00 | | | $1,340.50 | | | $6.37 | | | 1.08 | % | | $1,000.00 | | | $1,019.76 | | | $5.50 | | | 1.08 | % |
| Research Opportunities Fund | | | | | | | | | | | | | | | | | | | | | | | | | |
| Trust Class | | | $1,000.00 | | | $1,381.50 | | | $6.24 | | | 1.04 | % | | $1,000.00 | | | $1,019.96 | | | $5.30 | | | 1.04 | % |
* For each class of the fund, expenses are equal to the annualized expense ratio for the class, multiplied by the average account value over the period, multiplied by 184/365 (to reflect the one-half year period shown).
** Hypothetical 5% annual return before expenses is calculated by multiplying the number of days in the most recent half year divided by 365.
Schedule of Investments Large Cap Value
| Top Ten Equity Holdings | | | | |
1 J.P. Morgan Chase | | | 5.4 | % | | | |
2 Occidental Petroleum | | | 4.3 | % | | | |
3 Exxon Mobil | | | 4.1 | % | | | |
4 Bank of America | | | 3.7 | % | | | |
5 AT&T Inc. | | | 3.2 | % | | | |
6 CVS Corp. | | | 3.1 | % | | | |
7 The Bank of New York Mellon | | | 2.7 | % | | | |
8 Pfizer Inc. | | | 2.4 | % | | | |
9 XTO Energy | | | 2.3 | % | | | |
10 Merck & Co. | | | 2.2 | % | | | |
| | | | | | | |
| | | Number of | | | Value† | |
| | | Shares | | | (000’s) | |
| | | | | | | | |
| Common Stocks (98.4%) | | | | | | | |
| Aerospace & Defense (1.1%) | | | | | | | |
| Lockheed Martin | | | 170 | | | | $13 | |
| Beverages (0.5%) | | | | | | | | |
| PepsiCo, Inc. | | | 100 | | | | 6 | |
| Biotechnology (1.7%) | | | | | | | | |
| Amgen Inc. * | | | 265 | | | | 16 | |
| Genzyme Corp. * | | | 100 | | | | 5 | |
| | | | | | | | 21 | |
| | | | | | | | | |
| Capital Markets (4.2%) | | | | | | | | |
| State Street | | | 350 | | | | 18 | |
The Bank of New York Mellon | | | 1,100 | | | | 33 | |
| | | | | | | | 51 | |
| | | | | | | | | |
| Commercial Banks (3.8%) | | | | | | | | |
| PNC Financial Services | | | | | | | | |
| Group | | | 276 | | | | 12 | |
| U.S. Bancorp | | | 655 | | | | 15 | |
| Wells Fargo | | | 715 | | | | 19 | |
| | | | | | | | 46 | |
| | | | | | | | | |
| Communications Equipment (0.7%) | | | | | | | | |
| Cisco Systems * | | | 405 | | | | 9 | |
| Computers & Peripherals (3.0%) | | | | | | | | |
| Hewlett-Packard | | | 450 | | | | 20 | |
| IBM | | | 135 | | | | 16 | |
| | | | | | | | 36 | |
| | | | | | | | | |
| Containers & Packaging (1.2%) | | | | | | | | |
| Pactiv Corp. * | | | 560 | | | | 14 | |
| Diversified Financial Services (9.1%) | | | | | | | | |
| Bank of America | | | 2,570 | | | | 45 | |
| J.P. Morgan Chase | | | 1,520 | | | | 66 | |
| | | | | | | | 111 | |
| | | | | | | | | |
| Diversified Telecommunication | | | | | | | | |
| Services (5.0%) | | | | | | | | |
| AT&T Inc. | | | 1,520 | | | | 39 | |
| Verizon Communications | | | 700 | | | | 22 | |
| | | | | | | | 61 | |
| | | | | | | | |
| | | Number of | | | | Value† | |
| | | Shares | | | | (000's) | |
| Electric Utilities (3.7%) | | | | | | | | |
| Entergy Corp. | | | 150 | | | | $12 | |
| Exelon Corp. | | | 240 | | | | 12 | |
| FirstEnergy Corp. | | | 210 | | | | 9 | |
| FPL Group | | | 210 | | | | 12 | |
| | | | | | | | 45 | |
| Electrical Equipment (1.6%) | | | | | | | | |
| Rockwell Automation | | | 455 | | | | 19 | |
| | | | | | | | | |
| Food & Staples Retailing (5.0%) | | | | | | | | |
| CVS Corp. | | | 1,005 | | | | 38 | |
| Wal-Mart Stores | | | 450 | | | | 23 | |
| | | | | | | | 61 | |
| | | | | | | | | |
| Food Products (1.1%) | | | | | | | | |
| Kraft Foods | | | 460 | | | | 13 | |
| | | | | | | | | |
| Health Care Equipment & Supplies (3.0%) | | | | | | | | |
| Baxter International | | | 260 | | | | 15 | |
| Covidien PLC | | | 535 | | | | 21 | |
| | | | | | | | 36 | |
| Health Care Providers & Services (1.0%) | | | | | | | | |
| UnitedHealth Group | | | 420 | | | | 12 | |
| | | | | | | | | |
| Hotels, Restaurants & Leisure (1.2%) | | | | | | | | |
| Brinker International | | | 620 | | | | 9 | |
| McDonald's Corp. | | | 103 | | | | 6 | |
| | | | | | | | 15 | |
| | | | | | | | | |
| Household Products (1.0%) | | | | | | | | |
| Energizer Holdings * | | | 90 | | | | 6 | |
| Procter & Gamble | | | 105 | | | | 6 | |
| | | | | | | | 12 | |
| | | | | | | | | |
| Independent Power Producers & | | | | | | | | |
| Energy Traders (1.6%) | | | | | | | | |
| NRG Energy * | | | 700 | | | | 19 | |
| | | | | | | | | |
| Industrial Conglomerates (0.9%) | | | | | | | | |
| General Electric | | | 775 | | | | 11 | |
| | | | | | | | | |
| Insurance (5.7%) | | | | | | | | |
| Lincoln National | | | 550 | | | | 14 | |
| Marsh & McLennan | | | 275 | | | | 6 | |
| MetLife, Inc. | | | 595 | | | | 22 | |
| Reinsurance Group of | | | | | | | | |
| America | | | 290 | | | | 13 | |
| Willis Group Holdings | | | 525 | | | | 14 | |
| | | | | | | | 69 | |
| IT Services (0.6%) | | | | | | | | |
| Accenture Ltd. | | | 210 | | | | 7 | |
| | | | | | | | | |
| Life Science Tools & Services (1.1%) | | | | | | | | |
| Thermo Fisher Scientific * | | | 300 | | | | 14 | |
| | | | | | | | | |
| Machinery (2.5%) | | | | | | | | |
| Deere & Co. | | | 480 | | | | 21 | |
| Parker-Hannifin | | | 190 | | | | 9 | |
| | | | | | | | 30 | |
| | | | | | | | | |
| | | Number of | | | | Value† | |
| Media (2.9%) | | | Shares | | | | (000's) | |
| Comcast Corp. Class A | | | | | | | | |
| Special | | | 1,205 | | | | $18 | |
| Time Warner | | | 620 | | | | 17 | |
| | | | | | | | 35 | |
| Metals & Mining (1.6%) | | | | | | | | |
| Freeport-McMoRan Copper | | | | | | | | |
| & Gold | | | 325 | | | | 20 | |
| | | | | | | | | |
| Multi-Utilities (0.8%) | | | | | | | | |
| PG&E Corp. | | | 250 | | | | 10 | |
| | | | | | | | | |
| Multiline Retail (1.7%) | | | | | | | | |
| J.C. Penney | | | 300 | | | | 9 | |
| Macy's Inc. | | | 790 | | | | 12 | |
| | | | | | | | 21 | |
| Office Electronics (1.6%) | | | | | | | | |
| Xerox Corp. | | | 2,170 | | | | 19 | |
| | | | | | | | | |
| Oil, Gas & Consumable Fuels (18.3%) | | | | | | | | |
| Anadarko Petroleum | | | 395 | | | | 21 | |
| Apache Corp. | | | 270 | | | | 23 | |
| ConocoPhillips | | | 330 | | | | 15 | |
| EOG Resources | | | 255 | | | | 18 | |
| Exxon Mobil | | | 720 | | | | 50 | |
| Occidental Petroleum | | | 710 | | | | 52 | |
| Range Resources | | | 130 | | | | 6 | |
| Southwestern Energy * | | | 275 | | | | 10 | |
| XTO Energy | | | 725 | | | | 28 | |
| | | | | | | | 223 | |
| Pharmaceuticals (6.4%) | | | | | | | | |
| Johnson & Johnson | | | 360 | | | | 22 | |
| Merck & Co. | | | 850 | | | | 27 | |
| Pfizer Inc. | | | 1,720 | | | | 29 | |
| | | | | | | | 78 | |
| Road & Rail (2.1%) | | | | | | | | |
| Norfolk Southern | | | 565 | | | | 26 | |
| | | | | | | | | |
| Semiconductors & Semiconductor | | | | | | | | |
| Equipment (1.0%) | | | | | | | | |
| Intel Corp. | | | 600 | | | | 12 | |
| | | | | | | | | |
| Specialty Retail (1.7%) | | | | | | | | |
| PETsMART, Inc. | | | 505 | | | | 10 | |
| Tiffany & Co. | | | 300 | | | | 11 | |
| | | | | | | | 21 | |
| Total Common Stocks | | | | | | | | |
| (Cost $1,072) | | | | | | | 1,196 | |
| | | | | | | | | |
| Short-Term Investments (4.5%) | | | | | | | | |
| State Street Institutional | | | | | | | | |
| Liquid Reserves Fund | | | | | | | | |
| Institutional Class | | | | | | | | |
| (Cost $55) | | | 54,521 | | | | 55 | |
Schedule of Investments Large Cap Value Fund cont’d
Value† (000's) |
| Total Investments## | | |
| (102.9%) | | |
| (Cost $1,127) | | $ 1,251 |
| Liabilities, less cash, | | |
| receivables and other | | |
| assets [(2.9%)] | | (35) |
| | | |
| Total Net Assets (100.0%) | | $ 1,216 |
See Notes to Schedule of Investments
Schedule of Investments Research Opportunities Fund
| Top Ten Equity Holdings | | | | | | |
1 Exxon Mobil | | | 3.9 | % | | | |
2 Microsoft Corp. | | | 3.8 | % | | | |
3 Hewlett-Packard | | | 3.7 | % | | | |
4 J.P. Morgan Chase | | | 3.2 | % | | | |
5 IBM | | | 2.8 | % | | | |
6 Wal-Mart Stores | | | 2.7 | % | | | |
7 PepsiCo, Inc. | | | 2.7 | % | | | |
8 AT&T Inc. | | | 2.4 | % | | | |
9 Johnson & Johnson | | | 2.4 | % | | | |
10 Wells Fargo | | | 2.2 | % | | | |
| | | | | | | |
| | | Number of | | | Value† | |
| | | Shares | | | (000's) | |
| Common Stocks (100.4%) | | | | | | | |
| Aerospace & Defense (1.3%) | | | | | | | |
| Lockheed Martin | | | 207 | | | | $15 | |
| United Technologies | | | 422 | | | | 25 | |
| | | | | | | | 40 | |
| Air Freight & Logistics (0.8%) | | | | | | | | |
| United Parcel Service | | | 443 | | | | 24 | |
| | | | | | | | | |
| Auto Components (0.1%) | | | | | | | | |
| WABCO Holdings | | | 200 | | | | 4 | |
| | | | | | | | | |
| Beverages (2.7%) | | | | | | | | |
| PepsiCo, Inc. | | | 1,459 | | | | 83 | |
| | | | | | | | | |
| Biotechnology (4.5%) | | | | | | | | |
| Amgen Inc. * | | | 790 | | | | 47 | |
| Genzyme Corp. * | | | 690 | | | | 39 | |
| Gilead Sciences * | | | 1,198 | | | | 54 | |
| | | | | | | | 140 | |
| Capital Markets (2.3%) | | | | | | | | |
| State Street | | | 628 | | | | 33 | |
| The Bank of New York | | | | | | | | |
| Mellon | | | 1,294 | | | | 38 | |
| | | | | | | | 71 | |
| Chemicals (1.0%) | | | | | | | | |
| Airgas, Inc. | | | 229 | | | | 11 | |
| Ecolab Inc. | | | 320 | | | | 13 | |
| Nalco Holding | | | 420 | | | | 7 | |
| | | | | | | | 31 | |
| Commercial Banks (3.4%) | | | | | | | | |
| First Citizens BancShares | | | | | | | | |
| Class A | | | 116 | | | | 16 | |
| PNC Financial Services | | | | | | | | |
| Group | | | 389 | | | | 17 | |
| Univest Corp. | | | 160 | | | | 3 | |
| Wells Fargo | | | 2,524 | | | | 69 | |
| | | | | | | | 105 | |
| Commercial Services & Supplies (0.2%) | | | | | | | | |
| Covanta Holding * | | | 328 | | | | 6 | |
| | | | | | | | | |
| Communications Equipment (1.6%) | | | | | | | | |
| Motorola, Inc. | | | 1,126 | | | | 8 | |
| | | | | | | | | |
| | | | Number of | | | | Value† | |
| | | | Shares | | | | (000's) | |
| QUALCOMM Inc. | | | 934 | | | | $43 | |
| | | | | | | | 51 | |
| Computers & Peripherals (6.5%) | | | | | | | | |
| Hewlett-Packard | | | 2,592 | | | | 116 | |
| IBM | | | 724 | | | | 86 | |
| | | | | | | | 202 | |
| Construction & Engineering (0.2%) | | | | | | | | |
| Foster Wheeler * | | | 228 | | | | 7 | |
| | | | | | | | | |
| Containers & Packaging (0.2%) | | | | | | | | |
| Pactiv Corp. * | | | 277 | | | | 7 | |
| | | | | | | | | |
| Diversified Financial Services (3.2%) | | | | | | | | |
| J.P. Morgan Chase | | | 2,315 | | | | 101 | |
| | | | | | | | | |
| Diversified Telecommunication | | | | | | | | |
| Services (2.4%) | | | | | | | | |
| AT&T Inc. | | | 2,935 | | | | 76 | |
| | | | | | | | | |
| Electric Utilities (2.3%) | | | | | | | | |
| Allegheny Energy | | | 344 | | | | 9 | |
| Entergy Corp. | | | 160 | | | | 13 | |
| Exelon Corp. | | | 311 | | | | 15 | |
| FirstEnergy Corp. | | | 239 | | | | 11 | |
| FPL Group | | | 317 | | | | 18 | |
| ITC Holdings | | | 123 | | | | 6 | |
| | | | | | | | 72 | |
| Electrical Equipment (2.1%) | | | | | | | | |
| ABB Ltd. | | | 2,123 | | | | 40 | |
| Rockwell Automation | | | 591 | | | | 25 | |
| | | | | | | | 65 | |
| Food & Staples Retailing (4.4%) | | | | | | | | |
| CVS Corp. | | | 1,414 | | | | 53 | |
| Wal-Mart Stores | | | 1,658 | | | | 84 | |
| | | | | | | | 137 | |
| Food Products (3.1%) | | | | | | | | |
| Kraft Foods | | | 1,438 | | | | 41 | |
| Nestle SA ADR | | | 1,371 | | | | 57 | |
| | | | | | | | 98 | |
| Health Care Equipment & Supplies (1.0%) | | | | | | | | |
| Covidien PLC | | | 761 | | | | 30 | |
| | | | | | | | | |
| Health Care Providers & Services (1.7%) | | | | | | | | |
| Aetna Inc. | | | 756 | | | | 22 | |
| Express Scripts * | | | 132 | | | | 9 | |
| UnitedHealth Group | | | 755 | | | | 21 | |
| | | | | | | | 52 | |
| Hotels, Restaurants & Leisure (3.2%) | | | | | | | | |
| Brinker International | | | 2,740 | | | | 40 | |
| Buffalo Wild Wings * | | | 339 | | | | 14 | |
| McDonald's Corp. | | | 808 | | | | 45 | |
| | | | | | | | 99 | |
| Household Products (1.2%) | | | | | | | | |
| Energizer Holdings * | | | 576 | | | | 38 | |
| | | | | | | | |
| | | Number of | | | | Value† | |
| | | Shares | | | | (000's) | |
| Independent Power Producers & | | | | | | | | |
| Energy Traders (0.4%) | | | | | | | | |
| NRG Energy * | | | 440 | | | | $12 | |
| | | | | | | | | |
| Industrial Conglomerates (1.2%) | | | | | | | | |
| 3M Co. | | | 512 | | | | 37 | |
| | | | | | | | | |
| Industrial Gases (0.7%) | | | | | | | | |
| Praxair, Inc. | | | 268 | | | | 21 | |
| | | | | | | | | |
| Insurance (6.0%) | | | | | | | | |
| Endurance Specialty | | | | | | | | |
| Holdings | | | 246 | | | | 9 | |
| Everest Re Group | | | 140 | | | | 12 | |
| Lincoln National | | | 1,561 | | | | 39 | |
| MetLife, Inc. | | | 833 | | | | 32 | |
| Prudential Financial | | | 404 | | | | 20 | |
| Reinsurance Group of | | | | | | | | |
| America | | | 862 | | | | 37 | |
| Willis Group Holdings | | | 1,513 | | | | 39 | |
| | | | | | | | 188 | |
| IT Services (0.9%) | | | | | | | | |
| Accenture Ltd. | | | 815 | | | | 27 | |
| | | | | | | | | |
| Life Science Tools & Services (0.7%) | | | | | | | | |
| Thermo Fisher Scientific * | | | 460 | | | | 21 | |
| | | | | | | | | |
| Machinery (2.8%) | | | | | | | | |
| AGCO Corp. * | | | 195 | | | | 6 | |
| Danaher Corp. | | | 406 | | | | 25 | |
| Deere & Co. | | | 349 | | | | 15 | |
| Ingersoll-Rand PLC | | | 1,041 | | | | 32 | |
| Parker-Hannifin | | | 194 | | | | 9 | |
| | | | | | | | 87 | |
| Media (2.6%) | | | | | | | | |
| Comcast Corp. Class A | | | | | | | | |
| Special | | | 2,270 | | | | 33 | |
| Omnicom Group | | | 250 | | | | 9 | |
| Scripps Networks | | | | | | | | |
| Interactive | | | 178 | | | | 6 | |
| Time Warner | | | 1,134 | | | | 32 | |
| | | | | | | | 80 | |
| Metals & Mining (1.6%) | | | | | | | | |
| Allegheny Technologies | | | 300 | | | | 9 | |
| Freeport-McMoRan Copper | | | | | | | | |
| & Gold | | | 329 | | | | 21 | |
| Teck Cominco Class B * | | | 785 | | | | 19 | |
| | | | | | | | 49 | |
| Multi-Utilities (0.9%) | | | | | | | | |
| PG&E Corp. | | | 431 | | | | 17 | |
| Wisconsin Energy | | | 262 | | | | 12 | |
| | | | | | | | 29 | |
| Mutual Funds (1.4%) | | | | | | | | |
| S&P 500 Depositary | | | | | | | | |
| Receipts | | | 417 | | | | 43 | |
| | | | | | | | | |
| Office Electronics (1.1%) | | | | | | | | |
| Xerox Corp. | | | 3,997 | | | | 34 | |
Schedule of Investments Research Opportunities Fund cont’d
| | Number of | | | Value† | |
| | | Shares | | | (000's) | |
| Oil, Gas & Consumable Fuels (11.4%) | | | | | | |
| Cabot Oil & Gas | | | 539 | | | | $19 | |
| Canadian Natural | | | | | | | | |
| Resources | | | 259 | | | | 15 | |
| Concho Resources * | | | 816 | | | | 26 | |
| Denbury Resources * | | | 1,563 | | | | 24 | |
| EOG Resources | | | 289 | | | | 21 | |
| Exxon Mobil | | | 1,772 | | | | 122 | |
| Occidental Petroleum | | | 547 | | | | 40 | |
| Range Resources | | | 538 | | | | 26 | |
| Southwestern Energy * | | | 859 | | | | 32 | |
| The Williams Companies | | | 421 | | | | 7 | |
| XTO Energy | | | 632 | | | | 24 | |
| | | | | | | | 356 | |
| Pharmaceuticals (5.7%) | | | | | | | | |
| Abbott Laboratories | | | 893 | | | | 41 | |
| Johnson & Johnson | | | 1,262 | | | | 76 | |
| Merck & Co. | | | 1,886 | | | | 61 | |
| | | | | | | | 178 | |
| Road & Rail (1.3%) | | | | | | | | |
| Norfolk Southern | | | 428 | | | | 20 | |
| Union Pacific | | | 355 | | | | 21 | |
| | | | | | | | 41 | |
| Semiconductors & Semiconductor | | | | | | | | |
| Equipment (2.0%) | | | | | | | | |
| Intel Corp. | | | 3,101 | | | | 63 | |
| | | | | | | | | |
| Software (6.2%) | | | | | | | | |
| Activision Blizzard * | | | 225 | | | | 3 | |
| Intuit Inc. * | | | 293 | | | | 8 | |
| Microsoft Corp. | | | 4,725 | | | | 117 | |
| Oracle Corp. | | | 2,763 | | | | 60 | |
| Symantec Corp. * | | | 461 | | | | 7 | |
| | | | | | | | 195 | |
| Specialty Retail (2.6%) | | | | | | | | |
| PETsMART, Inc. | | | 1,593 | | | | 33 | |
| Tiffany & Co. | | | 1,151 | | | | 42 | |
| TJX Cos. | | | 161 | | | | 6 | |
| | | | | | | | 81 | |
| Textiles, Apparel & Luxury Goods (0.5%) | | | | | | | | |
| Iconix Brand Group * | | | 984 | | | | 17 | |
| | | | | | | | | |
| Trading Companies & Distributors (0.3%) | | | | | | | | |
| WESCO International * | | | 386 | | | | 9 | |
| | | | | | | | | |
| Water Utilities (0.1%) | | | | | | | | |
| Aqua America | | | 233 | | | | 4 | |
| | | | | | | | |
| Wireless Telecommunication Services (0.6%) | | | | | | | | |
| American Tower * | | | 476 | | | | 15 | |
| NII Holdings * | | | 205 | | | | 5 | |
| | | | | | | | 20 | |
| Total Common Stocks | | | | | | | | |
| (Cost $2,973) | | | | | | | 3,131 | |
| | | | | | | | | |
| Short-Term Investments (0.0%) | | | | | | | | |
| State Street Institutional | | | | | | | | |
| Liquid Reserves Fund | | | | | | | | |
| Institutional Class | | | | | | | | |
| (Cost $1) | | | 885 | | | | 1 | |
| | | | | | | | | |
| | | | | | | | Value† (000's) | |
| Total Investments## | | | | | | | | |
| (100.4%) | | | | | | | | |
| (Cost $2,974) | | | | | | $ | 3,132 | |
| | | | | | | | | |
| Liabilities, less cash, | | | | | | | | |
| receivables and other | | | | | | | | |
| assets [(0.4%)] | | | | | | | (13 | ) |
| | | | | | | | | |
| Total Net Assets (100.0%) | | | | | | $ | 3,119 | |
See Notes to Schedule of Investments
Notes to Schedule of Investments
| † | The value of investments in equity securities by each fund is determined by Neuberger Berman Management LLC (“Management”) primarily by obtaining valuations from an independent pricing service based on the latest sale price when that price is readily available. Securities traded primarily on the NASDAQ Stock Market are normally valued by the funds at the NASDAQ Official Closing Price (“NOCP”) provided by NASDAQ each business day. The NOCP is the most recently reported price as of 4:00:02 p.m., Eastern time, unless that price is outside the range of the “inside” bid and asked prices (i.e., the bid and asked prices that dealers quote to each other when trading for their own accounts); in that case, NASDAQ will adjust the price to equal the inside bid or asked price, whichever is closer. Because of delays in reporting trades, the NOCP may not be based on the price of the last trade to occur before the market closes. If there is no reported sale of a security on a particular day, the independent pricing service may value the security based on reported market quotations. Management has developed a process to periodically review information provided by independent pricing services. If a valuation is not available from an independent pricing service, each fund seeks to obtain quotations from principal market makers. If such quotations are not readily available, securities are valued using methods the Board of Trustees of Neuberger Berman Equity Funds (the “Board”) has approved on the belief that they reflect fair value. Numerous factors may be considered when determining the fair value of a security, including available analyst, media or other reports, trading in futures or ADRs and whether the issuer of the security being fair valued has other securities outstanding. Foreign security prices are furnished by independent quotation services and expressed in local currency values. Foreign security prices are currently translated from the local currency into U.S. dollars using the exchange rate as of 4:00 p.m., Eastern time. The Board has approved the use of Interactive Data Pricing and Reference Data, Inc. (“Interactive”) to assist in determining the fair value of the funds’ foreign equity securities when changes in the value of a certain index suggest that the closing prices on the foreign exchanges may no longer represent the amount that a fund could expect to receive for those securities. In this event, Interactive will provide adjusted prices for certain foreign equity securities using a statistical analysis of historical correlations of multiple factors. In the absence of precise information about the market values of these foreign securities as of the close of the New York Stock Exchange, the Board has determined on the basis of available data that prices adjusted in this way are likely to be closer to the prices the funds could realize on a current sale than are the prices of those securities established at the close of the foreign markets in which the securities primarily trade. Fair value prices are necessarily estimates, and there is no assurance that such a price will be at or close to the price at which the security next trades. Short-term debt securities with less than 60 days until maturity may be valued at cost which, when combined with interest earned, approximates market value. |
| | |
| | In accordance with Financial Accounting Standards Board (“FASB”) Statement of Financial Accounting Standards No. 157, Fair Value Measurements (“FAS 157”), investments held by a fund are carried at “fair value” on a recurring basis. Fair value is defined as the price that a fund would receive upon selling an investment in an orderly transaction to an independent buyer in the principal or most advantageous market for the investment under current market conditions. Various inputs are used in determining the value of the funds’ investments some of which are discussed above. |
| | |
| | In addition, effective August 31, 2009, the funds adopted FASB Staff position (“FSP”) No. 157-4, “Determining Fair Value When the Volume and Level of Activity for the Asset or Liability Have Significantly Decreased and Identifying Transactions That Are Not Orderly” (“FSP No. 157-4”). FSP No. 157-4 emphasizes that the objective of fair value measurement described in FAS 157 remains unchanged and provides additional guidance for estimating fair value in accordance with FAS 157 when the volume and level of activity for the asset or liability have significantly decreased, as well as identifying circumstances that indicate that transactions are not orderly. FSP No. 157-4 identifies factors to be considered when determining whether or not a market is inactive and indicates that if a market is determined to be inactive and/or current market prices are reflective of “distressed sales” significant management judgment may be necessary to estimate fair value in accordance with FAS 157. |
| | |
| | In addition to defining fair value, FAS 157 established a three-tier hierarchy of inputs to establish a classification of fair value measurements for disclosure purposes. The three-tier hierarchy of inputs is summarized in the three broad Levels listed below. |
| | — | Level 1 – quoted prices in active markets for identical investments |
| | — | Level 2 – other significant observable inputs (including quoted prices for similar investments, interest rates, prepayment speeds, credit risk, amortized cost, etc.) |
| | — | Level 3 – significant unobservable inputs (including the funds’ own assumptions in determining the fair value of investments) |
See Notes to Financial Statements
The inputs or methodology used for valuing an investment are not necessarily an indication of the risk associated with investing in those securities.
The following is a summary, by category of Level, of inputs used to value the funds’ investments as of August 31, 2009:
Neuberger Berman (000’s omitted) | | Level 1 | | | Level 2 | | | Level 3 | | | Total | |
| Large Cap Value Fund | | | | | | | | | | | | |
| Common Stock^ | | | $1,196 | | | | $— | | | | $— | | | | $1,196 | |
| Short-Tenn Investments | | | — | | | | 55 | | | | — | | | | 55 | |
| Total Investments | | | 1,196 | | | | 55 | | | | — | | | | 1,251 | |
| Research Opportunities Fund | | | | | | | | | | | | | | | | |
| Common Stock^ | | | 3,131 | | | | — | | | | — | | | | 3,131 | |
| Short-Tenn Investments | | | — | | | | 1 | | | | — | | | | 1 | |
| Total Investments | | | 3,131 | | | | 1 | | | | — | | | | 3,132 | |
| ^ | The Schedule of Investments provides information on the industry categorization for the portfolio. |
| | |
| ## | At August 31, 2009, selected fund information on a U.S. federal income tax basis was as follows: |
| | | | | | | | | | | | Net | |
| | | | | | Gross | | | Gross | | | Unrealized | |
| Neuberger Berman | | | | | Unrealized | | | Unrealized | | | Appreciation | |
| (000’s omitted) | | Cost | | | Appreciation | | | Depreciation | | | (Depreciation) | |
| Large Cap Value Fund | | | $1,138 | | | | $129 | | | | $16 | | | | $113 | |
| Research Opportunities Fund | | | 3,090 | | | | 228 | | | | 186 | | | | 42 | |
| * | Security did not produce income during the last twelve months. |
See Notes to Financial Statements
Statements of Assets and Liabilities Neuberger Berman Equity Funds (000’s omitted except per share amounts) | | | | | | |
| | | LARGE CAP VALUE FUND | | | RESEARCH OPPORTUNITIES FUND | |
| | | | | | | |
| Assets | | August 31, 2009 | | | August 31, 2009 | |
| | | | | | | |
| Investments in securities, at value *(Note A)-see Schedule of Investments: | | | $1,251 | | | | $3,132 | |
| Unaffiliated insurers | | | 1 | | | | — | |
| Dividends and interest receivable | | | 2 | | | | 6 | |
| Receivable for securities sold | | | 9 | | | | 20 | |
| Receivable from administrator-net (Note B) | | | 103 | | | | 13 | |
| Total Assets | | | 1,366 | | | | 3,171 | |
| | | | | | | | | |
| Liabilities | | | | | | | | |
| | | | | | | | | |
| Payable for securities purchased | | | 10 | | | | 19 | |
| Payable to investment manager-net (Notes A & B) | | | 1 | | | | 1 | |
| Accrued expenses and other payables | | | 139 | | | | 32 | |
| | | | | | | | | |
| Total Liabilities | | | 150 | | | | 52 | |
| | | | | | | | | |
| Net Assets at value | | | $1,216 | | | | $3,119 | |
| | | | | | | | | |
| Net Assets consist of: | | | | | | | | |
| | | | | | | | | |
| Paid-in capital | | | $2,285 | | | | $4,210 | |
| Undistributed net investment income (loss) | | | 31 | | | | 31 | |
| Accumulated net realized gains (losses) on investments | | | (1,224 | ) | | | (1,280 | ) |
| Net unrealized appreciation depreciation) in value of investments | | | 124 | | | | 158 | |
| | | | | | | | | |
| Net Assets at value | | | $1216 | | | | $3,119 | |
| | | | | | | | | |
| Net Assets | | | | | | | | |
| Trust Class | | $ | 1,216 | | | $ | 3,119 | |
| Shares Outstanding ($.001 per value; unlimited shares authorized) | | | | | | | | |
| Trust Class | | | 142 | | | | 393 | |
| Net Asset Value, offering and redemption price per share | | | | | | | | |
| Trust Class | | $ | 8.57 | | | $ | 7.93 | |
| *Cost of Investments: | | | | | | | | |
| | | | | | | | | |
| Unaffiliated issuers | | $ | 1,127 | | | $ | 2,974 | |
| | | | | | | | | |
| Total cost of foreign currency | | $ | 1 | | | $ | — | |
See Notes to Financial Statements
Statements of Operations
Neuberger Berman Equity Funds
(000’s omitted)
| | | LARGE CAP VALUE FUND | | | RESEARCH OPPORTUNITIES FUND | |
| | | For the Year Ended August 31, 2009 | | | For the Year Ended August 31, 2009 | |
| Investment Income: | | | | | | |
| Income (Note A): | | | | | | |
| Dividend income-unaffiliated issuers | | $ | 61 | | | $ | 65 | |
| Income from investments in affiliated issuers (Note E) | | | 4 | | | | — | |
| Foreign taxes withheld | | | (2 | ) | | | (1 | ) |
Total income | | $ | 63 | | | $ | 64 | |
| Expenses: | | | | | | | | |
| Investment management fees (Notes A & B) | | | 9 | | | | 15 | |
| Administration fees (Note B) | | | 1 | | | | 2 | |
| Administration fees (Note B): | | | | | | | | |
| Trust Class | | | 6 | | | | 11 | |
| Distribution fees (Note B): | | | | | | | | |
| Trust Class | | | 2 | | | | 3 | |
| Shareholder servicing agent fees: | | | | | | | | |
| Trust Class | | | 21 | | | | 21 | |
| Audit fees | | | 49 | | | | 12 | |
| Custodian fees (Note B) | | | 8 | | | | 15 | |
| Legal fees | | | 129 | | | | 47 | |
| Shareholder reports | | | 7 | | | | 6 | |
| Trustees’ fees and expenses | | | 45 | | | | 45 | |
| Miscellaneous | | | 1 | | | | 1 | |
| Total expenses | | | 278 | | | | 178 | |
| Expenses reimbursed by administrator (Note B) | | | (259 | ) | | | (146 | ) |
| Investment management fees waived (Note A) | | | — | | | | — | |
| Expenses reduced by custodian fee expense offset arrangement | | | | | | | | |
| (Note B) | | | — | | | | — | |
| Total net expenses | | | 19 | | | | 32 | |
| Net investment income (loss) | | $ | 44 | | | $ | 32 | |
| Realized and Unrealized Gain (Loss) on | | | | | | | | |
| Investments (Note A) | | | | | | | | |
| Net realized gain (loss) on: | | | | | | | | |
| Sales of investment securities of unaffiliated issuers | | | (1,074 | ) | | | (1,231 | ) |
| Foreign currency | | | (1 | ) | | | — | |
Change in net unrealized appreciation (depreciation) in value of: | | | | | | | | |
| Unaffiliated investment securities | | | (93 | ) | | | 139 | |
| Foreign currency | | | — | | | | — | |
| Net gain (loss) on investments | | | (1,168 | ) | | | (1,092 | ) |
| Net increase (decrease) in net assets resulting from operations | | $ | (1,124 | ) | | $ | (1,060 | ) |
See Notes to Financial Statements
Statements of Changes in Net Assets
Neuberger Berman Equity Funds
(000’s omitted)
| | | LARGE CAP VALUE FUND | | | RESEARCH OPPORTUNITIES FUND | |
| | | Year Ended August 31, 2009 | | | Year Ended August 31, 2008 | | | Year Ended August 31, 2009 | | | Year Ended August 31, 2008 | |
| Increase (Decrease) in Net Assets: | | | | | | | | | | | | |
| | | | | | | | | | | | | |
From Operations (Note A): | | | | | | | | | | | | |
| Net investment income (loss) | | | $44 | | | | $142 | | | | $32 | | | | $33 | |
| Net realized gain (loss) on investments | | | (1,075 | ) | | | (31 | ) | | | (1,231 | ) | | | 22 | |
| Change in net unrealized appreciation (depreciation) of investments | | | (93 | ) | | | (294 | ) | | | 139 | | | | (647 | ) |
| | | | | | | | | | | | | | | | | |
| Net increase (decrease) in net assets resulting from operations | | | (1,124 | ) | | | (183 | ) | | | (1,060 | ) | | | (592 | ) |
| | | | | | | | | | | | | | | | | |
Distributions to Shareholders From (Note A): | | | | | | | | | | | | | | | | |
| Net investment income: | | | | | | | | | | | | | | | | |
| Trust Class | | | (42 | ) | | | (147 | ) | | | (23 | ) | | | (51 | ) |
| Net realized gain on investments: | | | | | | | | | | | | | | | | |
| Trust Class | | | — | | | | (177 | ) | | | (43 | ) | | | (328 | ) |
| Total distributions to shareholders | | | (42 | ) | | | (324 | ) | | | (66 | ) | | | (379 | ) |
| | | | | | | | | | | | | | | | | |
| From Fund Share Transactions (Note D): | | | | | | | | | | | | | | | | |
| Proceeds from reinvestment of dividends and distributions: | | | | | | | | | | | | | | | | |
| Trust Class | | | 42 | | | | 324 | | | | 66 | | | | 379 | |
| Payments for shares redeemed: | | | | | | | | | | | | | | | | |
| Trust Class | | | (2,500 | ) | | | (2,100 | ) | | | (800 | ) | | | (3,000 | ) |
| | | | | | | | | | | | | | | | | |
| Net increase (decrease) from Fund share transactions | | | (2,458 | ) | | | (1,776 | ) | | | (734 | ) | | | (2,621 | ) |
| | | | | | | | | | | | | | | | | |
| Net Increase (Decrease) in Net Assets | | | (3,624 | ) | | | (2,283 | ) | | | (1,860 | ) | | | (3,592 | ) |
| | | | | | | | | | | | | | | | | |
| Net Assets: | | | | | | | | | | | | | | | | |
| Beginning of year | | | 4,840 | | | | 7,123 | | | | 4,979 | | | | 8,571 | |
| End of year | | | $1,216 | | | | $4,840 | | | | $3,119 | | | | $4,979 | |
Undistributed net investment income (loss) at end of year | | | $31 | | | | $22 | | | | $31 | | | | $23 | |
See Notes to Financial Statements
Notes to Financial Statements Equity Funds
Note A — Summary of Significant Accounting Policies:
| 1 | General: Neuberger Berman Equity Funds (the “Trust”) is a Delaware statutory trust organized pursuant to an Amended and Restated Trust Instrument dated as of June 24, 2009. The Trust is registered as an open-end management investment company under the Investment Company Act of 1940, as amended (the “1940 Act”), and its shares are registered under the Securities Act of 1933, as amended (the “1933 Act”). Neuberger Berman Large Cap Value Fund (“Large Cap Value”) (formerly, Neuberger Berman Dividend Fund) and Neuberger Berman Research Opportunities Fund (“Research Opportunities”) (each individually a “Fund” and collectively, the “Funds”) are separate operating series of the Trust, each of which is diversified. Both of the Funds offer Trust Class shares. The Board of Trustees of the Trust (the “Board”) may establish additional series or classes of shares without the approval of shareholders. |
| | |
| | The assets of each Fund belong only to that Fund, and the liabilities of each Fund are borne solely by that Fund and no other. |
| | |
| | The preparation of financial statements in accordance with U.S. generally accepted accounting principles requires Neuberger Berman Management LLC (“Management”) to make estimates and assumptions at the date of the financial statements. Actual results could differ from those estimates. |
| | |
| 2 | Portfolio valuation: Investment securities are valued as indicated in the notes following the Funds’ Schedule of Investments. |
| | |
| 3 | Foreign currency translation: The accounting records of the Funds are maintained in U.S. dollars. Foreign currency amounts are currently translated into U.S. dollars using the exchange rate as of 4:00 p.m., Eastern time, to determine the value of investments, other assets and liabilities. Purchase and sale prices of securities, and income and expenses, are translated into U.S. dollars at the prevailing rate of exchange on the respective dates of such transactions. Net unrealized foreign currency gain (loss), if any, arises from changes in the value of assets and liabilities, other than investments in securities, as a result of changes in exchange rates and is stated separately in the Statements of Operations. |
| | |
| 4 | Securities transactions and investment income: Securities transactions are recorded on trade date for financial reporting purposes. Dividend income is recorded on the ex-dividend date or, for certain foreign dividends, as soon as the Fund becomes aware of the dividends. Non-cash dividends included in dividend income, if any, are recorded at the fair market value of the securities received. Interest income, including accretion of original issue discount, where applicable, and accretion of discount on short-term investments, is recorded on the accrual basis. Realized gains and losses from securities transactions and foreign currency transactions, if any, are recorded on the basis of identified cost and stated separately in the Statements of Operations. Included in net realized gain (loss) on investments are proceeds from the settlements of class action litigation in which the Fund participated as a class member. The amounts of such proceeds for the year ended August 31, 2009 was $210 for Research Opportunities. |
| | |
| 5 | Income tax information: The Funds are treated as separate entities for U.S. federal income tax purposes. It is the policy of each Fund to continue to qualify as a regulated investment company by complying with the requirements of Subchapter M of the Internal Revenue Code applicable to regulated investment companies and to distribute substantially all of its earnings to its shareholders. Therefore, no federal income or excise tax provision is required. |
| | |
| | The Funds have adopted the provisions of Financial Accounting Standards Board (“FASB”) Interpretation No. 48 (“FIN 48”) “Accounting for Uncertainty in Income Taxes - an interpretation of FASB Statement No. 109”. FIN 48 sets forth a minimum threshold for financial statement recognition of the benefit of a tax position taken, or expected to be taken, in a tax return. The Funds recognize interest and penalties, if any, related to unrecognized tax benefits as an income tax expense in the Statements of Operations. The Funds are subject to examination by U.S. federal and state tax authorities for returns filed for the prior three fiscal years 2006 - 2008. As of August 31, 2009, the Funds did not have any unrecognized tax benefits. |
| | |
| | Income distributions and capital gain distributions are determined in accordance with income tax regulations, which may differ from U.S. generally accepted accounting principles. These differences are primarily due to differing treatments of income and gains on various investment securities held by each Fund, timing differences and differing characterization of distributions |
Notes to Financial Statements Equity Funds cont’d
| | made by each Fund as a whole. The Funds may also utilize earnings and profits distributed to shareholders on redemption of shares as a part of the dividends paid deduction for income tax purposes. |
| | |
| | As determined on August 31, 2009, permanent differences resulting primarily from different book and tax accounting for foreign currency gains and losses, convertible preferred stock basis adjustments and non-taxable dividend adjustments were reclassified at fiscal year-end. These reclassifications had no effect on net income, net asset value or net asset value per share of each Fund. |
| | |
| | The tax character of distributions paid during the years ended August 31, 2009 and August 31, 2008 were as follows: |
| | | Distributions Paid From: Long –Term Capital |
| | | Ordinary Income | Gain | Total |
| | | 2009 | 2008 | 2009 | 2008 | 2009 | 2008 |
| | Large Cap Value | $41,696 | $237,180 | $ — | $ 87,284 | $41,696 | $324,464 |
| | Research Opportunities | 29,440 | 247,745 | 37,033 | 131,303 | 66,473 | 379,048 |
| | | | | | | | |
| | As of August 31, 2009, the components of distributable earnings (accumulated losses) on a U.S. federal income tax basis were as follows: |
| | | Undistributed Ordinary Income | Undistributed Long-Term Gain | Unrealized Appreciation (Depreciation) | Loss Carryforwards and Deferrals | Total |
| | Large Cap Value | $31,585 | $— | $112,598 | $(1,213,389) | $(1,069,206) |
| | Research Opportunities | 30,749 | — | 41,953 | (1,164,310) | (1,091,608) |
| | The differences between book basis and tax basis distributable earnings are primarily due to: wash sales, non-taxable dividend adjustments, capital loss carryforwards and post October loss deferrals. |
| | |
| | To the extent each Fund’s net realized capital gains, if any, can be offset by capital loss carryforwards, it is the policy of each Fund not to distribute such gains. As determined at August 31, 2009, the following Fund had unused capital loss carryforwards available for federal income tax purposes to offset net realized capital gains, if any, as follows: |
| | Expiring in | |
| | 2016 | 2017 | |
| Large Cap Value | $16,897 | $298,580 | |
| Research Opportunities | — | 413,299 | |
| | Under current tax law, certain net capital losses realized after October 31 within the taxable year may be deferred and treated as occurring on the first day of the following tax year. For the year ended August 31, 2009, the Funds elected to defer the following: |
| | | |
| | Post October Capital Loss Deferral | |
| Large Cap Value | $897,912 | |
| Research Opportunities | 751,011 | |
6 | Foreign taxes: Foreign taxes withheld represent amounts withheld by foreign tax authorities, net of refunds recoverable. |
| | |
| 7 | Distributions to shareholders: Each Fund may earn income, net of expenses, daily on its investments. Distributions from net investment income and net realized capital gains for both Funds, if any, generally are distributed in December and are recorded on the ex-date. Prior to June 12, 2009, Large Cap Value generally distributed substantially all of its net investment income, if any, at the end of each calendar quarter. |
| | |
| 8 | Expense allocation: Certain expenses are applicable to multiple funds. Expenses directly attributable to a Fund are charged to that Fund. Expenses of the Trust that are not directly attributed to a series of the Trust are allocated among the series, on the |
Notes to Financial Statements Equity Funds cont’d
| | basis of relative net assets, except where a more appropriate allocation of expenses to each of the series can otherwise be made fairly. Expenses borne by the complex of related investment companies, which includes open-end and closed-end investment companies for which Management serves as investment manager, that are not directly attributed to a Fund or the Trust are allocated among the Funds and the other investment companies in the complex or series thereof on the basis of relative net assets, except where a more appropriate allocation of expenses to each investment company in the complex or series thereof can otherwise be made fairly. |
| | |
| 9 | Repurchase agreements: Each Fund may enter into repurchase agreements with institutions that Management has determined are creditworthy. Each repurchase agreement is recorded at cost. Each Fund requires that the securities purchased in a repurchase agreement be transferred to the custodian in a manner sufficient to enable the Fund to assert a perfected security interest in those securities in the event of a default under the repurchase agreement. Each Fund monitors, on a daily basis, the value of the securities transferred to ensure that their value, including accrued interest, is greater than amounts owed to the Fund under each such repurchase agreement. |
| | |
| 10 | Transactions with other funds managed by Neuberger Berman Management LLC: Pursuant to an Exemptive Order issued by the Securities and Exchange Commission, the Funds may invest in a money market fund managed by Management or an affiliate. Through August 10, 2009, the Funds invested in Neuberger Berman Prime Money Fund (“Prime Money”), as approved by the Board. Prime Money sought to provide the highest available current income consistent with safety and liquidity. For any cash that the Funds invested in Prime Money, Management waived a portion of its management fee equal to the management fee it received from Prime Money on those assets (the “Arrangement”). For the year ended August 31, 2009, management fees waived under this Arrangement are reflected in the Statements of Operations under the caption “Investment management fees waived.” For the year ended August 31, 2009, income earned under this Arrangement is reflected in the Statements of Operations under the caption “Income from investments in affiliated issuers.” For the year ended August 31, 2009, management fees waived and income earned under this Arrangement were as follows: |
| | |
| | Management Fees Waived | Income Earned |
| Large Cap Value | $248 | $4,484 |
| Research Opportunities | 9 | 86 |
| | On August 10, 2009, the Funds ceased investing in Prime Money. On this date, the Funds’ shares of Prime Money were redeemed in exchange for portfolio holdings of Prime Money, which were used to purchase Institutional Class shares of State Street Institutional Liquid Reserves Fund. |
| | |
| 11 | Indemnifications: Like many other companies, the Trust’s organizational documents provide that its officers and trustees are indemnified against certain liabilities arising out of the performance of their duties to the Trust. In addition, both in some of its principal service contracts and in the normal course of its business, the Trust enters into contracts that provide indemnifications to other parties for certain types of losses or liabilities. The Trust’s maximum exposure under these arrangements is unknown as this could involve future claims against the Trust. |
| | |
| 12 | Investments in foreign securities: Investing in foreign securities may involve certain sovereign and other risks, in addition to the credit and market risks normally associated with domestic securities. These additional risks include the possibility of adverse political and economic developments (including political instability, nationalization, expropriation, or confiscatory taxation) and the potentially adverse effects of unavailability of public information regarding issuers, less governmental supervision and regulation of financial markets, reduced liquidity of certain fmancial markets, and the lack of uniform accounting, auditing, and fmancial reporting standards or the application of standards that are different or less stringent than those applied in the United States. Foreign securities also may experience greater price volatility, higher rates of inflation, and delays in settlement. |
Notes to Financial Statements Equity Funds cont’d
| 13 | Derivative instruments: Management has evaluated the requirements of FASB Statement of Financial Accounting Standards No. 161, Disclosures about Derivative Instruments and Hedging Activities (“FAS 161”), which are effective for fmancial statements issued for fiscal years and interim periods beginning after November 15, 2008. FAS 161 requires enhanced disclosures about a fund’s derivative and hedging activities. Management has concluded that, since the Fund did not hold any derivative instruments during the year ended August 31, 2009, no additional disclosures pursuant to FAS 161 are required at this time. |
| | |
| | Note B — Management Fees, Administration Fees, Distribution Arrangements, and Other Transactions With Affiliates: |
| | |
| | Each Fund retains Management as its investment manager under a Management Agreement. For such investment management services (prior to June 12, 2009 for Large Cap Value and April 1, 2009 for Research Opportunities), each Fund paid Management a fee at the annual rate of 0.45% of that Fund’s average daily net assets. Effective June 12, 2009 for Large Cap Value and April 1, 2009 for Research Opportunities, each Fund pays Management a fee at the annual rate of 0.55% of the first $250 million of that Fund’s average daily net assets, 0.525% of the next $250 million, 0.50% of the next $250 million, 0.475% of the next $250 million, 0.45% of the next $500 million, 0.425% of the next $2.5 billion and 0.40% of average daily net assets in excess of $4 billion. |
| | |
| | Each Fund retains Management as its administrator under an Administration Agreement. Each Fund pays Management an administration fee at the annual rate of 0.06% of its average daily net assets under this agreement. In addition, each Fund’s Trust Class pays Management an administration fee at the annual rate of 0.34% of its average daily net assets under this agreement. Additionally, Management retains State Street Bank and Trust Company (“State Street”) as its sub-administrator under a Sub-Administration Agreement. Management pays State Street a fee for all services received under the agreement. |
| | |
| | For each Fund’s Trust Class, Management acts as agent in arranging for the sale of class shares without commission and bears advertising and promotion expenses. The Board has adopted a distribution plan (the “Plan”) with respect to this class, pursuant to Rule 12b-1 under the 1940 Act. The Plan provides that, as compensation for administrative and other services provided to this class, Management’s activities and expenses related to the sale and distribution of this class of shares, and ongoing services provided to investors in this class, Management receives from this class a fee at the annual rate of 0.10% of the Trust Class’ average daily net assets. Management receives this amount to provide distribution and shareholder servicing for this class and pays a portion of it to institutions that provide such services. Those institutions may use the payments for, among other purposes, compensating employees engaged in sales and/or shareholder servicing. The amount of fees paid by this class during any year may be more or less than the cost of distribution and other services provided to that class. FINRA rules limit the amount of annual distribution fees that may be paid by a mutual fund and impose a ceiling on the cumulative distribution fees paid. The Trust’s Plan complies with those rules. |
| | |
| | Management has contractually undertaken to forgo current payment of fees and/or reimburse operating expenses (including the fees payable to Management but excluding interest, taxes, brokerage commissions and extraordinary expenses) (“Operating Expenses”) which exceed the expense limitation as detailed in the following table. The Trust Class of each Fund has agreed to repay Management for fees and expenses forgone and/or their excess Operating Expenses previously reimbursed by Management, pursuant to a contractual expense limitation, so long as their annual Operating Expenses during that period do not exceed their expense limitations, and the repayments are made within three years after the year in which Management issued the reimbursement. During the year ended August 31, 2009, there was no reimbursement to Management under this agreement. At August 31, 2009, contingent liabilities to Management under the agreement were as follows: |
| | | | Expenses Deferred In Fiscal Period Ending August 31, |
| | | | 2007(2) | 2008 | 2009 |
| | | | Subject to Repayment until August 31, |
| | | | 2010 | 2011 | 2012 |
| | | | | |
| Large Cap Value Trust Class | 1.00% | 8/31/12 | $77,844 | $110,529 | $258,534 |
| | | | | | |
| Research Opportunities Trust Class | 1.00% | 8/31/12 | 74,769 | 94,587 | 146,100 |
Notes to Financial Statements Equity Funds cont’d
| | (1) | Expense limitation per annum of the respective class’ average daily net assets. |
| | (2) | Period from November 2, 2006 (Commencement of Operations) to August 31, 2007. |
| | During the reporting period, the predecessor of Management, the investment manager of the Funds, and Neuberger, the sub-adviser of the Funds, were wholly owned subsidiaries of Lehman Brothers Holdings Inc. (“Lehman Brothers”), a publicly owned holding company. On September 15, 2008, Lehman Brothers filed a voluntary petition under Chapter 11 of the U.S. Bankruptcy Code. On December 3, 2008, NBSH Acquisition, LLC (“NBSH”), an entity organized by key members of Neuberger Berman’s senior management, was selected as the successful bidder in the public auction to acquire a majority interest in Neuberger Berman’s business and the fixed income and certain alternative asset management businesses of Lehman Brothers’ Investment Management Division (together with Neuberger Berman, the “Acquired Businesses”) (the “Acquisition”). On December 22, 2008, the bankruptcy court having jurisdiction over the Lehman Brothers matter approved the sale of the Acquired Businesses to NBSH (or its successor or assign), as the successful bidder. |
| | |
| | The Acquisition closed on May 4, 2009. The Acquired Businesses are now indirectly owned by, among others, portfolio managers, Neuberger Berman’s management team, and certain key members and senior professionals who are employed in various parts of the Neuberger Berman complex of companies, with a minority interest retained by Lehman Brothers and certain affiliates of Lehman Brothers. |
| | |
| | The closing of the Acquisition resulted in an “assignment” of the Funds’ Management Agreements and Sub-Advisory Agreements. Such an assignment, by law, automatically terminated those agreements. Accordingly, prior to the closing the Board, including the Trustees who are not “interested persons” of the Funds’ investment manager and its affiliates or the Funds, considered and approved new Management Agreements and Sub-Advisory Agreements for the Funds. The new agreements, which are virtually identical to those previously in effect, were also approved by a vote of the Funds’ shareholders. |
| | |
| | These events have not had a material impact on the Funds or their operations. Management and Neuberger continue to operate in the ordinary course of business as the investment manager and sub-adviser of the Funds. |
| | |
| | Neuberger is retained by Management to furnish it with investment recommendations and research information without added cost to the Fund. Several individuals who are officers and/or Trustees of the Trust are also employees of Neuberger and/or Management. |
| | |
| | Each Fund’s Trust Class has a distribution agreement with Management. Management receives no commissions for sales or redemptions of shares of beneficial interest of each share class, but receives fees from the Trust Class under the Trust Class’ Plan, as described above. |
| | |
| | Each Fund has an expense offset arrangement in connection with its custodian contract. For the year ended August 31, 2009, the impact of this arrangement was a reduction of expenses of $0 and $0 for Large Cap Value and Research Opportunities, respectively. |
| | |
| | Note C — Securities Transactions: |
| | |
| | During the year ended August 31, 2009, there were purchase and sale transactions (excluding short-term securities) as follows: |
| | |
| (000’s omitted) | | Purchases | | | Sales | |
| Large Cap Value | | | $1,576 | | | | $3,485 | |
| Research Opportunities | | | 4,049 | | | | 4,801 | |
| | During the year ended August 31, 2009, there were brokerage commissions on securities transactions paid to affiliated brokers |
| (000’s omitted) | | Neuberger | | | Lehman Brothers, Inc. | |
| Large Cap Value | | | $— | | | | $— | |
| Research Opportunities | | | — | | | | — | |
Notes to Financial Statements Equity Funds cont’d
| | Note D - Fund Share Transactions: |
| | |
| | Share activity for the years ended August 31, 2009 and August 31, 2008 was as follows: |
| | | | | | | | | |
| (000’s omitted) | Shares Sold | Shares Issued on Reinvestment of Dividends and Distributions | Shares Redeemed | Total | Shares Sold | Shares Issued on Reinvestment of Dividends and Distributions | Shares Redeemed | Total |
| Large Cap Value: | | | | | | | | |
| Trust Class | — | 5 | (345) | (340) | — | 31 | (200) | (169) |
| Research Opportunities: | | | | | | | | |
| Trust Class | — | 10 | (123) | (113) | — | 36 | (299) | (263) |
| | Note 3 – Investments In Affiliates: |
| | | | | | | |
| | Balance of Shares Held August 31, 2008 | Gross Purchases and Additions | Gross Sales and Reductions | Balance of Shares Held August 31, 2009 | Value August 31, 2009 | Income from Investments in Affiliates Issuers Included in Total Income |
| Large Cap Value | | | | | | |
| Neuberger Berman Prime | | | | | | |
| Money Fund Trust Class* | 569,960 | 2,076,604 | 2,646,564 | — | $— | $4,484 |
| | | | | | | |
| Research Opportunities | | | | | | |
| Neuberger Berman Prime | | | | | | |
| Money Fund Trust Class* | 15,148 | 331,929 | 347,077 | — | $— | $86 |
| * | Prime Money was also managed by Management and may have been considered an affiliate since it had the same officers, Board members, and investment manager as the Fund and because, at times, the Fund may have owned 5% or more of the outstanding voting securities of Prime Money. |
| | Note F – Recent Accounting Pronouncement: |
| | |
| | In accordance with the provision set forth in FASB Statement of Financial Accounting Standards No. 165 (“FAS 165”), “Subsequent Events,” Management has evaluated the possibility of subsequent events existing in the Fund’s financial statements through October 16, 2009. Management has determined that there are no subsequent events that, in accordance with FAS 165, would need to be disclosed in the Funds’ fmancial statements through this date. |
Financial Highlights
LARGE CAP VALUE FUND
The following table includes selected data for a share outstanding throughout each period and other performance information derived from the Financial Statements.
Trust Class
| | Year Ended August 31, | Period from November 2, 2006^ to August 31, | |
| | 2009 | 2008 | 2007 | |
| Net Asset Value, Beginning of Period | $10.04 | $10.93 | $10.00 | |
| | | | | |
| Income From Investment Operations: | | | | |
Net Investment Income (Loss)@ | .19 | .24 | .21 | |
Net Gains or Losses on Securities (both realized and unrealized) | (1.52) | (.62) | .88 | |
| | | | | |
| Total From Investment Operations | (1.33) | (.38) | 1.09 | |
| | | | | |
| Less Distributions From: | | | | |
| Net Investment Income | (.14) | (.24) | (.16) | |
| Net Capital Gains | | (.27) | | |
| | | | | |
| Total Distributions | (.14) | (.51) | (.16) | |
| | | | | |
| Net Asset Value, End of Period | $8.57 | $10.04 | $10.93 | |
| | | | | |
Total Return†† | (13.01%) | (3.68%) | 10.87% | ** |
| | | | | |
| Ratios/Supplemental Data | | | | |
| Net Assets, End of Period (in millions) | $1.2 | $4.8 | $7.1 | |
Ratio of Gross Expenses to Average Net Assets# | 1.03% | 1.01% | 1.00% | * |
Ratio of Net Expenses to Average Net Assets‡ | 1.03% | 1.01% | 1.00% | * |
Ratio of Net Investment Income (Loss) to Average Net Assets | 2.39% | 2.24% | 2.37% | * |
| Portfolio Turnover Rate | 94% | 53% | 42% | ** |
Financial Highlights
RESEARCH OPPORTUNITIES FUND
The following table includes selected data for a share outstanding throughout each period and other performance information derived from the Financial Statements.
| | | Year Ended August 31, | | | Period from November 2, 2006^ to August 31, | |
| | | 2009 | | | 2008 | | | 2007 | |
| | | | | | | | | | |
| Net Asset Value, Beginning of Period | | $ | 9.84 | | | $ | 11.14 | | | $ | 10.00 | |
| | | | | | | | | | | | | |
| Income From Investment Operations: | | | | | | | | | | | | |
Net Investment Income (Loss)@ | | | .07 | | | | .05 | | | | .04 | |
Net Gains or Losses on Securities (both realized and unrealized) | | | (1.84 | ) | | | (.86 | ) | | | 1.12 | |
| | | | | | | | | | | | | |
| Total From Investment Operations | | | (1.77 | ) | | | (.81 | ) | | | 1.16 | |
| | | | | | | | | | | | | |
| Less Distributions From: | | | | | | | | | | | | |
| Net Investment Income | | | (.05 | ) | | | (.07 | ) | | | (.02 | ) |
| Net Capital Gains | | | (.09 | ) | | | (.42 | ) | | | — | |
| | | | | | | | | | | | | |
| Total Distributions | | | (.14 | ) | | | (.49 | ) | | | (.02 | ) |
| | | | | | | | | | | | | |
| Net Asset Value, End of Period | | $ | 7.93 | | | $ | 9.84 | | | $ | 11.14 | |
| | | | | | | | | | | | | |
Total Return†† | | | (17.74 | %) | | | (7.53 | %) | | | 11.58 | % ** |
| | | | | | | | | | | | | |
| Ratios/Supplemental Data | | | | | | | | | | | | |
| Net Assets, End of Period (in millions) | | $ | 3.1 | | | $ | 5.0 | | | $ | 8.6 | |
Ratio of Gross Expenses to Average Net Assets# | | | 1.02 | % | | | 1.01 | % | | | 1.00 | % * |
Ratio of Net Expenses to Average Net Assets‡ | | | 1.02 | % | | | 1.01 | % | | | 1.00 | % * |
Ratio of Net Investment Income (Loss) to Average Net Assets | | | 1.02 | % | | | .46 | % | | | .44 | % * |
| Portfolio Turnover Rate | | | 124 | % | | | 129 | % | | | 88 | % ** |
Notes to Financial Highlights Equity Funds
| †† | Total return based on per share net asset value reflects the effects of changes in net asset value on the performance of each Fund during each fiscal period and assumes dividends and other distributions, if any, were reinvested. Results represent past performance and do not guarantee future results. Current returns may be lower or higher than the performance data quoted. Investment returns and principal may fluctuate and shares when redeemed may be worth more or less than original cost. For each Fund, total return would have been lower if Management had not reimbursed and/or waived certain expenses. |
| | |
| # | The Fund is required to calculate an expense ratio without taking into consideration any expense reductions related to expense offset arrangements. |
| | |
| ‡ | After reimbursement of expenses and/or waiver of the investment management fees by Management. Had Management not undertaken such actions, the annualized ratios of net expenses to average daily net assets would have been: |
| | Year Ended August 31, | Period Ended August 31, |
| | 2009(2) | 2008(2) | 2007(2) |
| Large Cap Value Fund Trust Class | 15.05% | 2.58% | 2.54%(1) |
| Research Opportunities Fund Trust Class | 5.67% | 2.33% | 2.31%(1) |
| | | | (1) | Period from November 2, 2006 to August 31, 2007. |
| | | | | |
| | | | (2) | These ratios reflect a reduced fee schedule for certain expenses. If these expenses had not been reduced, the ratios would have been higher. |
| ^ | The date investment operations commenced. |
| | |
| @ | Calculated based on the average number of shares outstanding during each fiscal period. |
| | |
| * | Annualized. |
| | |
| ** | Not annualized. |
Report of Independent Registered Public Accounting Firm
To the Board of Trustees
Neuberger Berman Equity Funds and
Shareholders of Neuberger Berman Large Cap Value Fund
We have audited the accompanying statement of assets and liabilities, including the schedule of investments, of Neuberger Berman Large Cap Value Fund (formerly the Neuberger Berman Dividend Fund), a series of Neuberger Berman Equity Funds (the “Trust”), as of August 31, 2009, and the related statement of operations for the year then ended, the statements of changes in net assets for the two years in the period then ended and the financial highlights for each of the periods indicated therein. These financial statements and financial highlights are the responsibility of the Trust’s management. Our responsibility is to express an opinion on these financial statements and fmancial highlights based on our audits.
We conducted our audits in accordance with the standards of the Public Company Accounting Oversight Board (United States). Those standards require that we plan and perform the audit to obtain reasonable assurance about whether the fmancial statements and financial highlights are free of material misstatement. We were not engaged to perform an audit of the Trust’s internal control over financial reporting. Our audit included consideration of internal control over fmancial reporting as a basis for designing audit procedures that are appropriate in the circumstances, but not for the purpose of expressing an opinion on the effectiveness of the Trust’s internal control over fmancial reporting. Accordingly, we express no such opinion. An audit also includes examining, on a test basis, evidence supporting the amounts and disclosures in the financial statements and financial highlights, assessing the accounting principles used and significant estimates made by management, and evaluating the overall financial statement presentation. Our procedures included confirmation of securities owned as of August 31, 2009, by correspondence with the custodian and brokers or by other appropriate auditing procedures where replies from brokers were not received. We believe that our audits provide a reasonable basis for our opinion.
In our opinion, the financial statements and fmancial highlights referred to above present fairly, in all material respects, the fmancial position of Neuberger Berman Large Cap Value Fund as of August 31, 2009, the results of its operations for the year then ended, the changes in its net assets for the two years in the period then ended and the financial highlights for each of the periods indicated therein, in conformity with U.S. generally accepted accounting principles.
Boston, Massachusetts
October 16, 2009
REPORT OF INDEPENDENT REGISTERED PUBLIC ACCOUNTING FIRM
To the Board of Trustees and Shareholders
Neuberger Berman Equity Funds
We have audited the accompanying statement of assets and liabilities of the Neuberger Berman Research Opportunities Fund, a fund of the Neuberger Berman Equity Funds (the “Trust”), including the schedule of investments, as of August 31, 2009, and the related statement of operations for the year then ended, the statement of changes in net assets for each of the two years in the period then ended, and the financial highlights for each of the two years in the period ended August 31, 2009 and the period November 2, 2006 (commencement of operations) to August 31, 2007. The financial statements and financial highlights are the responsibility of the Trust’s management. Our responsibility is to express an opinion on these financial statements and financial highlights based on our audit.
We conducted our audit in accordance with the standards of the Public Company Accounting Oversight Board (United States). Those standards require that we plan and perform the audit to obtain reasonable assurance about whether the financial statements and financial highlights are free of material misstatement. The Trust is not required to have, nor were we engaged to perform, an audit of its internal control over financial reporting. Our audit included consideration of internal control over financial reporting as a basis for designing audit procedures that are appropriate in the circumstances, but not for the purpose of expressing an opinion on the effectiveness of the Trust’s internal control over financial reporting. Accordingly, we express no such opinion. An audit also includes examining, on a test basis, evidence supporting the amounts and disclosures in the financial statements, assessing the accounting principles used and significant estimates made by management, as well as evaluating the overall financial statement presentation. Our procedures included confirmation of securities owned as of August 31, 2009, by correspondence with the custodian and brokers or by other appropriate auditing procedures where replies from brokers were not received. We believe that our audit provides a reasonable basis for our opinion.
In our opinion, the financial statements and financial highlights of the Neuberger Berman Research Opportunities Fund present fairly, in all material respects, the financial position of the Neuberger Berman Research Opportunities Fund as of August 31, 2009, and the results of its operations for the year then ended, the changes in its net assets for each of the two years in the period then ended and its financial highlights for each of the two years in the period ended August 31, 2009 and the period November 2, 2006 (commencement of operations) to August 31, 2007, in conformity with accounting principles generally accepted in the United States of America.
Philadelphia, Pennsylvania
October 16, 2009
Directory
Investment Manager, Administrator and Distributor Neuberger Berman Management LLC 605 Third Avenue, 2nd Floor New York, NY 10158-0180 800.461.1899 or 212.476.9000 Institutional Services 800.366.6264 Sub-Adviser Neuberger Berman LLC 605 Third Avenue New York, NY 10158-3698 Custodian and Shareholder Servicing Agent State Street Bank and Trust Company 2 Avenue de Lafayette Boston, MA 02111 For Trust Class Shareholders Address correspondence to: Neuberger Berman Management LLC 605 Third Avenue, Mail Drop 2-7 New York, NY 10158-0180 Attn: Intermediary Support Services 800.366.6264 | | Legal Counsel K&L Gates LLP 1601 K Street, NW Washington, DC 20006-1600 Independent Registered Public Accounting Firms Ernst & Young LLP 200 Clarendon Street Boston, MA 02116 Tait, Weller & Baker LLP 1818 Market Street Suite 2400 Philadelphia, PA 19103 |
Trustee and Officer Information
The following tables set forth information concerning the trustees and officers of the Trust. All persons named as trustees and officers also serve in similar capacities for other funds administered or managed by Management and Neuberger. The Statement of Additional Information includes additional information about trustees and is available upon request, without charge, by calling (800) 877-9700.
Information about the Board of Trustees
Name, (Year of Birth), and Address(1) | Position and Length of Time Served (2) | Principal Occupation(s) (3) | Number of Funds in Fund Complex Overseen by Fund Trustee | Other Directorships Held Outside Fund Complex by Fund Trustee |
| Independent Fund Trustees |
| John Cannon (1930) | Trustee since 2000 | Consultant; formerly, Chairman, CDC Investment Advisers (registered investment adviser), 1993 to January 1999; formerly, President and Chief Executive Officer, AMA Investment Advisors, an affiliate of the American Medical Association. | 47 | Formerly, Independent Trustee or Director of three series of Oppenheimer Funds: Oppenheimer Limited Term New York Municipal Fund, Rochester Fund Municipals, and Oppenheimer Convertible Securities Fund (1992 to 2009). |
| Faith Colish (1935) | Trustee since 1982 | Counsel, Carter Ledyard & Milburn LLP (law firm) since October 2002; formerly, Attorney-at-Law and President, Faith Colish, A Professional Corporation, 1980 to 2002. | 47 | Formerly, Director (1997 to 2003) and Advisory Director (2003 to 2006), ABA Retirement Funds (formerly, American Bar Retirement Association) (not-for-profit membership corporation). |
| Martha C. Goss (1949) | Trustee since 2007 | President, Woodhill Enterprises Inc./Chase Hollow Associates LLC (personal investment vehicle), since 2006; Chief Operating and Financial Officer, Hopewell Holdings LLC/ Amwell Holdings, LLC (a holding company for a healthcare reinsurance company start-up), since 2003; formerly, Consultant, Resources Connection (temporary staffmg), 2002 to 2006. | 47 | Director, Ocwen Financial Corporation (mortgage servicing), since 2005; Director, American Water (water utility), since 2003; Director, Channel Reinsurance (financial guaranty reinsurance), since 2006; Advisory Board Member, Attensity (software developer), since 2005; Director, Allianz Life of New York (insurance), since 2005; Director, Financial Women’s Association of New York (not for profit association), since 2003; Trustee Emerita, Brown University, since 1998. |
Name, (Year of Birth), and Address(1) | Position and Length of Time Served (2) | Principal Occupation(s) (3) | Number of Funds in Fund Complex Overseen by Fund Trustee | Other Directorships Held Outside Fund Complex by Fund Trustee |
| C. Anne Harvey (1937) | Trustee since 2000 | President, C.A. Harvey Associates, since October 2001; formerly, Director, AARP, 1978 to December 2001. | 47 | Formerly, President, Board of Associates to The National Rehabilitation Hospital’s Board of Directors, 2001 to 2002; formerly, Member, Individual Investors Advisory Committee to the New York Stock Exchange Board of Directors, 1998 to June 2002. |
| Robert A. Kavesh (1927) | Trustee since 1986 | Retired; Marcus Nadler Professor Emeritus of Finance and Economics, New York University Stern School of Business; formerly, Executive Secretary-Treasurer, American Finance Association, 1961 to 1979. | 47 | Formerly, Director, The Caring Community (not-for-profit), 1997 to 2006; formerly, Director, DEL Laboratories, Inc. (cosmetics and pharmaceuticals), 1978 to 2004; formerly, Director, Apple Bank for Savings, 1979 to 1990; formerly, Director, Western Pacific Industries, Inc., 1972 to 1986 (public company). |
| Michael M. Knetter (1960) | Trustee since 2007 | Dean, School of Business, University of Wisconsin - Madison; formerly, Professor of International Economics and Associate Dean, Amos Tuck School of Business - Dartmouth College, 1998 to 2002. | 47 | Trustee, Northwestern Mutual Series Fund, Inc., since February 2007; Director, Wausau Paper, since 2005; Director, Great Wolf Resorts, since 2004. |
| Howard A. Mileaf (1937) | Trustee since 1984 | Retired; formerly, Vice President and General Counsel, WHX Corporation (holding company), 1993 to 2001. | 47 | Formerly, Director, Webfinancial Corporation (holding company), 2002 to 2008; formerly, Director WHX Corporation (holding company), January 2002 to June 2005; formerly, Director, State Theatre of New Jersey (not-for-profit theater), 2000 to 2005. |
| George W. Morriss (1947) | Trustee since 2007 | Retired; formerly, Executive Vice President and Chief Financial Officer, People’s Bank, Connecticut (a fmancial services company), 1991 to 2001. | 47 | Manager, Old Mutual 2100 fund complex (consisting of six funds) since October 2006 for four funds and since February 2007 for two funds; formerly, Member NASDAQ Issuers’ Affairs Committee, 1995 to 2003. |
Name, (Year of Birth), and Address(1) | Position and Length of Time Served (2) | Principal Occupation(s) (3) | Number of Funds in Fund Complex Overseen by Fund Trustee | Other Directorships Held Outside Fund Complex by Fund Trustee |
| Edward I. O’Brien (1928) | Trustee since 1993 | Retired; formerly, Member, Investment Policy Committee, Edward Jones, 1993 to 2001; President, Securities Industry Association (“SIA”) (securities industry’s representative in government relations and regulatory matters at the federal and state levels), 1974 to 1992; Adviser to SIA, November 1992 to November 1993. | 47 | Formerly, Director, Legg Mason, Inc. (fmancial services holding company), 1993 to July 2008; formerly, Director, Boston Financial Group (real estate and tax shelters), 1993 to 1999. |
| Cornelius T. Ryan (1931) | Trustee since 1982 | Founding General Partner, Oxford Partners and Oxford Bioscience Partners (venture capital investing) and President, Oxford Venture Corporation, since 1981. | 47 | None. |
| Tom D. Seip (1950) | Trustee since 2000; Chairman of the Board since 2008; Lead Independent Trustee from 2006 to 2008 | General Partner, Seip Investments LP (a private investment partnership); formerly, President and CEO, Westaff, Inc. (temporary staffing), May 2001 to January 2002; formerly, Senior Executive at the Charles Schwab Corporation, 1983 to 1998, including Chief Executive Officer, Charles Schwab Investment Management, Inc., and Trustee, Schwab Family of Funds and Schwab Investments, 1997 to 1998, and Executive Vice President-Retail Brokerage, Charles Schwab & Co., Inc., 1994 to 1997. | 47 | Director, H&R Block, Inc. (financial services company), since May 2001; Chairman, Compensation Committee, H&R Block, Inc., since 2006; formerly, Director, Forward Management, Inc. (asset management company), 1999 to 2006. |
Name, (Year of Birth), and Address(1) | Position and Length of Time Served (2) | Principal Occupation(s) (3) | Number of Funds in Fund Complex Overseen by Fund Trustee | Other Directorships Held Outside Fund Complex by Fund Trustee |
| Candace L. Straight (1947) | Trustee since 2000 | Private investor and consultant specializing in the insurance industry; formerly, Advisory Director, Securitas Capital LLC (a global private equity investment firm dedicated to making investments in the insurance sector), 1998 to December 2003. | 47 | Director, Montpelier Re (reinsurance company), since 2006; formerly, Director, National Atlantic Holdings Corporation (property and casualty insurance company), 2004 to 2008; formerly, Director, The Proformance Insurance Company (property and casualty insurance company), 2004 to 2008; formerly, Director, Providence Washington Insurance Company (property and casualty insurance company), December 1998 to March 2006; formerly, Director, Summit Global Partners (insurance brokerage firm), 2000 to 2005. |
| Peter P. Trapp (1944) | Trustee since 2000 | Retired; formerly, Regional Manager for Mid-Southern Region, Ford Motor Credit Company, September 1997 to 2007; formerly, President, Ford Life Insurance Company, April 1995 to August 1997. | 47 | None. |
Name, (Year of Birth), and Address(1) | Position and Length of Time Served (2) | Principal Occupation(s) (3) | Number of Funds in Fund Complex Overseen by Fund Trustee | Other Directorships Held Outside Fund Complex by Fund Trustee |
| Fund Trustees who are “Interested Persons” |
| Joseph V. Amato* (1962) | Trustee since 2009 | President and Director, Neuberger Berman Group LLC, since 2009; President and Chief Executive Officer, Neuberger and Neuberger Berman Holdings LLC (including its predecessor, Neuberger Berman Inc.), since 2007; Chief Investment Officer, Neuberger, since 2009; Chief Investment Officer (Equities) and Managing Director, Management, since 2009; Managing Director, Neuberger Berman Fixed Income LLC (formerly known as Lehman Brothers Asset Management LLC) (“NBFI”), since 2007; Board member of NBFI since 2006; formerly, Global Head of Asset Management of Lehman Brothers Holdings Inc.’s (“LBHI”) Investment Management Division, 2006 to 2009; formerly, member of LBHI’s Investment Management Division’s Executive Management Committee, 2006 to 2009; formerly, Managing Director, Lehman Brothers Inc. (“LBI”), 2006 to 2008; formerly, Chief Recruiting and Development Officer, LBI, 2005 to 2006; formerly, Global Head of LBI’s Equity Sales and a Member of its Equities Division Executive Committee, 2003 to 2005. | 47 | Member of Board of Advisors, McDonough School of Business, Georgetown University, since 2001; Member of New York City Board of Advisors, Teach for America, since 2005; Trustee, Montclair Kimberley Academy (private school), since 2007. |
Name, (Year of Birth), and Address(1) | Position and Length of Time Served (2) | Principal Occupation(s) (3) | Number of Funds in Fund Complex Overseen by Fund Trustee | Other Directorships Held Outside Fund Complex by Fund Trustee |
Robert Conti* (1956) | Chief Executive Officer, President and Trustee since 2008; prior thereto, Executive Vice President in 2008 and Vice President 2000 to 2008 | Managing Director, Neuberger, since 2007; formerly, Senior Vice President, Neuberger, 2003 to 2006; formerly, Vice President, Neuberger, 1999 to 2003; President and Chief Executive Officer, Management, since 2008; formerly, Senior Vice President, Management, 2000 to 2008. | 47 | Chairman of the Board, Staten Island Mental Health Society since 2008. |
Jack L. Rivkin* (1940) | Trustee since 2002; President from 2002 to 2008 | Formerly, Executive Vice President and Chief Investment Officer, Neuberger Berman Holdings LLC (holding company), 2002 to August 2008 and 2003 to August 2008, respectively; formerly, Managing Director and Chief Investment Officer, Neuberger, December 2005 to August 2008 and 2003 to August 2008, respectively; formerly, Executive Vice President, Neuberger, December 2002 to 2005; formerly, Director and Chairman, Management, December 2002 to August 2008; formerly, Executive Vice President, Citigroup Investments, Inc., September 1995 to February 2002; formerly, Executive Vice President, Citigroup Inc., September 1995 to February 2002. | 47 | Director, Idealab (private company), since 2009; Director, Distributed World Power (private company), since 2009; Director, Dale Carnegie and Associates, Inc. (private company), since 1998; Director, Solbright, Inc. (private company), since 1997; formerly, Director, New York Society of Security Analysts (2006 to 2008). |
| (1) | The business address of each listed person is 605 Third Avenue, New York, New York 10158. |
| | |
| (2) | Pursuant to the Trust’s Trust Instrument, each of these Fund Trustees shall hold office for life or until his or her successor is elected or the Trust terminates; except that (a) any Fund Trustee may resign by delivering a written resignation; (b) any Fund Trustee may be removed with or without cause at any time by a written instrument signed by at least two-thirds of the other Fund Trustees; (c) any Fund Trustee who requests to be retired, or who has become unable to serve, may be retired by a written instrument signed by a majority of the other Fund Trustees; and (d) any Fund Trustee may be removed at any shareholder meeting by a vote of at least two-thirds of the outstanding shares. |
| | |
| (3) | Except as otherwise indicated, each individual has held the positions shown for at least the last five years. |
| | |
| * | Indicates a Fund Trustee who is an “interested person” within the meaning of the 1940 Act. Mr. Amato and Mr. Conti are interested persons of the Trust by virtue of the fact that each is an officer of Management, Neuberger and/or their affiliates. Mr. Rivkin may be deemed an interested person of the Trust by virtue of the fact that, until August 2008, he was a director of Management and an officer of Neuberger. |
Information about the Officers of the Trust
| | | |
Name, (Year of Birth), and Address (1) | Position and Length of
Time Served (2) | Principal Occupation(s) (3)
|
| | | |
Andrew B. Allard (1961) | Anti-Money Laundering
Compliance Officer since 2002 | Senior Vice President, Neuberger, since 2006; Deputy General Counsel, Neuberger, since 2004; formerly, Vice President, Neuberger, 2000 to 2005; formerly, Associate General Counsel, Neuberger, 1999 to 2004; Anti-Money Laundering Compliance Officer, ten registered investment companies for which Management acts as investment manager and administrator (six since 2002, two since 2003, one since 2005 and one since 2006). |
| | | |
Claudia A. Brandon (1956) | Executive Vice President since 2008 and Secretary since 1985 | Senior Vice President, Neuberger, since 2007 and Employee since 1999; formerly, Vice President, Neuberger, 2002 to 2006; Senior Vice President, Management, since 2008 and Assistant Secretary since 2004; formerly, Vice President-Mutual Fund Board Relations, Management, 2000 to 2008; Executive Vice President, ten registered investment companies for which Management acts as investment manager and administrator (ten since 2008); Secretary, ten registered investment companies for which Management acts as investment manager and administrator (three since 1985, three since 2002, two since 2003, one since 2005 and one since 2006). |
| | | |
Maxine L. Gerson (1950) | Executive Vice President since 2008 and Chief Legal Officer since 2005 (only for purposes of sections 307 and 406 of the Sarbanes-Oxley Act of 2002) | Senior Vice President, Neuberger, since 2002; Deputy General Counsel and Assistant Secretary, Neuberger, since 2001; Senior Vice President, Management, since 2006; Secretary and General Counsel, Management, since 2004; Executive Vice President, ten registered investment companies for which Management acts as investment manager and administrator (ten since 2008); Chief Legal Officer (only for purposes of sections 307 and 406 of the Sarbanes-Oxley Act of 2002), ten registered investment companies for which Management acts as investment manager and administrator (nine since 2005 and one since 2006). |
| | | |
Sheila R. James (1965) | Assistant Secretary since 2002 | Vice President, Neuberger, since 2008 and Employee since 1999; formerly, Assistant Vice President, Neuberger, 2007; Assistant Secretary, ten registered investment companies for which Management acts as investment manager and administrator (six since 2002, two since 2003, one since 2005 and one since 2006). |
- 7 -
Name, (Year of Birth), and Address(1) | Position and Length of
Time Served (2) | Principal Occupation(s) (3)
|
| | | |
Brian Kerrane (1969) | Vice President since 2008 | Senior Vice President, Neuberger, since 2006; formerly, Vice President, Neuberger, 2002 to 2006; Vice President, Management, since 2008 and Employee since 1991; Vice President, ten registered investment companies for which Management acts as investment manager and administrator (ten since 2008). |
| | | |
Kevin Lyons (1955) | Assistant Secretary since 2003
| Assistant Vice President, Neuberger, since 2008 and Employee since 1999; Assistant Secretary, ten registered investment companies for which Management acts as investment manager and administrator (eight since 2003, one since 2005 and one since 2006). |
| | | |
Owen F. McEntee, Jr. (1961) | Vice President since 2008 | Vice President, Neuberger, since 2006; Employee, Management, since 1992; Vice President, ten registered investment companies for which Management acts as investment manager and administrator (ten since 2008). |
| | | |
John M. McGovern (1970) | Treasurer and Principal Financial and Accounting Officer since 2005; prior thereto, Assistant Treasurer since
2002 | Senior Vice President, Neuberger, since 2007; formerly, Vice President, Neuberger, 2004 to 2006; Employee, Management, since 1993; Treasurer and Principal Financial and Accounting Officer, ten registered investment companies for which Management acts as investment manager and administrator (nine since 2005 and one since 2006); formerly, Assistant Treasurer, ten registered investment companies for which Management acts as investment manager and administrator, 2002 to 2005. |
| | | |
Andrew Provencher (1965) | Vice President since 2008 | Managing Director, Management, since 2008; Managing Director, Neuberger, since 2005; formerly, Senior Vice President, Neuberger, 2003 to 2005; formerly, Vice President, Neuberger, 1999 to 2003; Vice President, ten registered investment companies for which Management acts as investment manager and administrator (ten since 2008). |
| | | |
Frank Rosato (1971) | Assistant Treasurer since 2005 | Vice President, Neuberger, since 2006; Employee, Management, since 1995; Assistant Treasurer, ten registered investment companies for which Management acts as investment manager and administrator (nine since 2005 and one since 2006). |
- 8 -
Name, (Year of Birth), and Address(1) | Position and Length of
Time Served (2) | Principal Occupation(s) (3)
|
| | | |
Neil S. Siegel (1967) | Vice President since 2008 | Managing Director, Management, since 2008; Managing Director, Neuberger, since 2006; formerly, Senior Vice President, Neuberger, 2004 to 2006; Vice President, ten registered investment companies for which Management acts as investment manager and administrator (ten since 2008); formerly, Head of Institutional Marketing, Morgan Stanley Investment Management, 1993 to 2004. |
| | | |
Chamaine Williams (1971) | Chief Compliance Officer since 2005 | Senior Vice President, Neuberger, since 2007; Chief Compliance Officer, Management, since 2006; Chief Compliance Officer, ten registered investment companies for which Management acts as investment manager and administrator (nine since 2005 and one since 2006); formerly, Senior Vice President, Lehman Brothers Inc., 2007 to 2008; formerly, Vice President, Lehman Brothers Inc., 2003 to 2006; formerly, Chief Compliance Officer, Lehman Brothers Asset Management Inc., 2003 to 2007; formerly, Chief Compliance Officer, Lehman Brothers Alternative Investment Management LLC, 2003 to 2007; formerly, Vice President, UBS Global Asset Management (US) Inc. (formerly, Mitchell Hutchins Asset Management, a wholly-owned subsidiary of PaineWebber Inc.), 1997 to 2003. |
(1) | The business address of each listed person is 605 Third Avenue, New York, New York 10158. |
| | |
(2) | Pursuant to the By-Laws of the Trust, each officer elected by the Fund Trustees shall hold office until his or her successor shall have been elected and qualified or until his or her earlier death, inability to serve, or resignation. Officers serve at the pleasure of the Fund Trustees and may be removed at any time with or without cause. |
| | |
(3) | Except as otherwise indicated, each individual has held the positions shown for at least the last five years. |
- 9 -
Proxy Voting Policies and Procedures
A description of the policies and procedures that the Trust uses to determine how to vote proxies relating to portfolio securities is available, without charge, by calling 1-800-877-9700 (toll-free) and on the website of the Securities and Exchange Commission, at www.sec.gov. Information regarding how the Trust voted proxies relating to portfolio securities during the most recent 12-month period ended June 30 is also available, without charge, by calling 1-800-877-9700 (toll-free), on the website of the Securities and Exchange Commission at www.sec.gov, and on Management’s website at www.nb.com.
Quarterly Portfolio Schedule
The Trust files a complete schedule of portfolio holdings for each Fund with the Securities and Exchange Commission for the first and third quarters of each fiscal year on Form N-Q. The Trust’s Forms N-Q are available on the Securities and Exchange Commission’s website at www.sec.gov and may be reviewed and copied at the Securities and Exchange Commission’s Public Reference Room in Washington, DC. Information on the operation of the Public Reference Room may be obtained by calling 1-800SEC-0330. The information on Form N-Q is available upon request, without charge, by calling 1-800-877-9700 (toll-free).
Notice to Shareholders (Unaudited)
Neuberger Berman Research Opportunities Fund hereby designates $37,033 as a capital gain distribution.
For the fiscal year ended August 31, 2009, each Fund makes the following designation, or up to the maximum amount of such dividends allowable pursuant to the Internal Revenue Code, as qualified dividend income eligible for reduced tax rates. These lower rates range from 5% to 15% depending upon an individual’s tax bracket. Complete information regarding each Fund’s distributions during the calendar year 2009 will be reported in conjunction with Form 1099DIV.
| | |
Fund | Qualified Dividend Income |
| Large Cap Value Fund | $60,669 |
| Research Opportunities | 65,137 |
Written Consents of Sole Shareholder
The sole shareholder of Neuberger Berman Large Cap Value Fund and Neuberger Berman Research Opportunities Fund (each a “Fund” and collectively the “Funds”), each a series of Neuberger Berman Equity Funds (the “Trust”), signed written consents on January 23, 2009 approving certain agreements with respect to each Fund enumerated below. Upon completion of the acquisition of Neuberger Berman Management LLC (“Management”) and Neuberger Berman, LLC (“Neuberger”) by NBSH Acquisition, LLC, an entity organized by key members of Neuberger Berman’s senior management (the “Acquisition”), the Trust’s management and sub-advisory agreements, on behalf of each Fund, with Management and Neuberger, respectively, automatically terminated. To provide for continuity of management, the sole shareholder of each Fund signed written consents approving the following matters, which became effective upon completion of the Acquisition on May 4, 2009: 1) A new management agreement between the Trust, on behalf of each Fund, and a newly-formed successor entity to Management (“New Management”); 2) A new sub-advisory agreement with respect to the Trust and each Fund, between New Management and Neuberger; and 3) The election of the following Trustees to the Board of Trustees of the Trust: Joseph V. Amato, John Cannon, Faith Colish, Robert Conti, Martha C. Goss, C. Anne Harvey, Robert A. Kavesh, Michael M. Knetter, Howard A. Mileaf, George W. Morriss, Edward I. O’Brien, Jack L. Rivkin, Cornelius T. Ryan, Tom D. Seip, Candace L. Straight and Peter P. Trapp. Neuberger, as the sole shareholder, was the owner of 244,167.26 shares or 100% of Neuberger Berman Large Cap Value Fund and 516,365.68 shares or 100% of Neuberger Berman Research Opportunities Fund on January 23, 2009.
The sole shareholder of Neuberger Berman Large Cap Value Fund and Neuberger Berman Research Opportunities Fund also signed written consents on June 12, 2009 and April 1, 2009, respectively, amending the Management Agreement dated November 3, 2003 between the Trust and Management with respect to each Fund changing the management fee paid by each Fund to an annual rate of 0.550% of the first $250 million of the Fund’s average daily net assets, 0.525% of the next $250 million, 0.500% of the next $250 million, 0.475% of the next $250 million, 0.450% of the next $500 million, 0.425% of the next $2.5 billion and 0.400% of average daily net assets in excess of $4 billion. Prior to June 12, 2009 for Neuberger Berman Large Cap Value Fund and April 1, 2009 for Neuberger Berman Research Opportunities Fund, each Fund paid NB Management a fee at the annual rate of 0.45% of the Fund’s average daily net assets. On June 12, 2009, Neuberger held 141,932.13 shares or 100% of Neuberger Berman Large Cap Value Fund and on April 1, 2009, Neuberger held 393,322.22 shares or 100% of Neuberger Berman Research Opportunities Fund.
Item 2. Code of Ethics.
The Board of Trustees (“Board”) of Neuberger Berman Equity Funds (“Registrant”) adopted a code of ethics that applies to the Registrant’s principal executive officer, principal financial officer, principal accounting officer or controller, or persons performing similar functions (“Code of Ethics”). For the period covered by this Form N-CSR, there were no amendments to the Code of Ethics and there were no waivers from the Code of Ethics granted to the Registrant’s principal executive officer, principal financial officer, principal accounting officer or controller, or persons performing similar functions.
A copy of the Code of Ethics is incorporated by reference to the Registrant’s Form N-CSR, Investment Company Act file number 811-00582 (filed May 8, 2006). The Code of Ethics is also available, without charge, by calling 1-800-877-9700 (toll-free).
Item 3. Audit Committee Financial Expert.
The Board has determined that the Registrant has three audit committee financial experts serving on its audit committee. The Registrant’s audit committee financial experts are Martha Goss and George Morriss. Ms. Goss and Mr. Morriss are independent trustees as defined by Form N-CSR.
Item 4. Principal Accountant Fees and Services.
Ernst & Young, LLP (“E&Y”) serves as independent registered public accounting firm to the Neuberger Berman Climate Change, Emerging Markets Equity, Equity Income, Focus, Genesis, Guardian, International, International Institutional, International Large Cap, Large Cap Value, Partners, Real Estate Funds and Select Equities.
Tait, Weller & Baker LLP (“Tait Weller”) serves as independent registered public accounting firm to the Neuberger Berman Large Cap Disciplined Growth, Mid Cap Growth, Regency, Research Opportunities, Small Cap Growth, Small and Mid Cap Growth and Socially Responsive Funds.
(a) Audit Fees
The aggregate fees billed for professional services rendered by E&Y for the audit of the annual financial statements or services that are normally provided by E&Y in connection with statutory and regulatory filings or engagements were $451,167 and $527,000 for the fiscal years ended 2008 and 2009, respectively.
The aggregate fees billed for professional services rendered by Tait Weller for the audit of the annual financial statements or services that are normally provided by Tait Weller in connection with statutory and regulatory filings or engagements were $147,200 and $119,000 for the fiscal years ended 2008 and 2009, respectively.
(b) Audit-Related Fees
The aggregate fees billed to the Registrant for assurance and related services by E&Y that are reasonably related to the performance of the audit of the Registrant’s financial statements and are not reported above in Audit Fees were $0 and $0 for the fiscal years ended 2008 and 2009, respectively.
The fees billed to other entities in the investment company complex for assurance and related services by E&Y that are reasonably related to the performance of the audit that the Audit Committee was required to approve because the engagement related directly to the operations and financial reporting of the Registrant were $0 and $0 for the fiscal years ended 2008 and 2009, respectively.
The aggregate fees billed to the Registrant for assurance and related services by Tait Weller that are reasonably related to the performance of the audit of the Registrant’s financial statements and are not reported above in Audit Fees were $0 and $0 for the fiscal years ended 2008 and 2009, respectively.
The fees billed to other entities in the investment company complex for assurance and related services by Tait Weller that are reasonably related to the performance of the audit that the Audit Committee was required to approve because the engagement related directly to the operations and financial reporting of the Registrant were $0 and $0 for the fiscal years ended 2008 and 2009, respectively.
(c) Tax Fees
The aggregate fees billed to the Registrant for professional services rendered by E&Y for tax compliance, tax advice, and tax planning were $124,800 and $124,800 for the fiscal years ended 2008 and 2009, respectively. The nature of the services provided were tax compliance, tax advice, and tax planning. The Audit Committee approved 0% and 0% of these services provided by E&Y for the fiscal years ended 2008 and 2009, respectively, pursuant to the waiver provisions of Rule 2-01(c)(7)(i)(C) of Regulation S-X.
The fees billed to other entities in the investment company complex for professional services rendered by E&Y for tax compliance, tax advice, and tax planning that the Audit Committee was required to approve because the engagement related directly to the operations and financial reporting of the Registrant were $0 and $0 for the fiscal years ended 2008 and 2009, respectively.
The aggregate fees billed to the Registrant for professional services rendered by Tait Weller for tax compliance, tax advice, and tax planning were $27,800 and $20,500 for the fiscal years ended 2008 and 2009, respectively. The nature of the services provided were tax compliance, tax advice, and tax planning. The Audit Committee approved 0% and 0% of these services provided by Tait Weller for the fiscal years ended 2008 and 2009, respectively, pursuant to the waiver provisions of Rule 2-01(c)(7)(i)(C) of Regulation S-X.
The fees billed to other entities in the investment company complex for professional services rendered by Tait Weller for tax compliance, tax advice, and tax planning that the Audit Committee was required to approve because the engagement related directly to the operations and financial reporting of the Registrant were $0 and $0 for the fiscal years ended 2008 and 2009, respectively.
(d) All Other Fees
The aggregate fees billed to the Registrant for products and services provided by E&Y, other than services reported in Audit Fees, Audit-Related Fees, and Tax Fees were $0 and $0 for the fiscal years ended 2008 and 2009, respectively.
The fees billed to other entities in the investment company complex for products and services provided by E&Y, other than services reported in Audit Fees, Audit-Related Fees, and Tax Fees that the Audit Committee was required to approve because the engagement related directly to the operations and financial reporting of the Registrant were $0 and $0 for the fiscal years ended 2008 and 2009, respectively.
The aggregate fees billed to the Registrant for products and services provided by Tait Weller, other than services reported in Audit Fees, Audit-Related Fees, and Tax Fees were $0 and $0 for the fiscal years ended 2008 and 2009, respectively.
The fees billed to other entities in the investment company complex for products and services provided by Tait Weller, other than services reported in Audit Fees, Audit-Related Fees, and Tax Fees that the Audit Committee was required to approve because the engagement related directly to the operations and financial reporting of the Registrant were $0 and $0 for the fiscal years ended 2008 and 2009, respectively.
(e) Audit Committee’s Pre-Approval Policies and Procedures
(1) The Audit Committee’s pre-approval policies and procedures for the Registrant to engage an accountant to render audit and non-audit services delegate to each member of the Committee the power to pre-approve services between meetings of the Committee.
(2) None of the services described in paragraphs (b) through (d) above were approved by the Audit Committee pursuant to paragraph (c)(7)(i)(C) of Rule 2-01 of Regulation S-X.
(f) Hours Attributed to Other Persons
Not applicable.
(g) Non-Audit Fees
Non-audit fees billed by E&Y for services rendered to the Registrant were $124,800 and $124,800 for the fiscal years ended 2008 and 2009, respectively.
Non-audit fees billed by E&Y for services rendered to the Registrant’s investment adviser and any entity controlling, controlled by, or under common control with the adviser that provides ongoing services to the Registrant were $400,000 and $334,450 for the fiscal years ended 2008 and 2009, respectively.
Non-audit fees billed by Tait Weller for services rendered to the Registrant were $27,800 and $20,500 for the fiscal years ended 2008 and 2009, respectively.
Non-audit fees billed by Tait Weller for services rendered to the Registrant’s investment adviser and any entity controlling, controlled by, or under common control with the adviser that provides ongoing services to the Registrant were $0 and $0 for the fiscal years ended 2008 and 2009, respectively.
(h) The Audit Committee of the Board considered whether the provision of non-audit services rendered to the Registrant’s investment adviser and any entity controlling, controlled by, or under common control with the adviser that provides ongoing services to the Registrant that were not pre-approved by the Audit Committee because the engagement did not relate directly to the operations and financial reporting of the Registrant is compatible with maintaining E&Y’s and Tait Weller’s independence.
Item 5. Audit Committee of Listed Registrants.
Not applicable to the Registrant.
Item 6. Schedule of Investments.
The complete schedule of investments for each series is disclosed in the Registrant’s Annual Report, which is included as Item 1 of this Form N-CSR.
Item 7. Disclosure of Proxy Voting Policies and Procedures for Closed-End Management Investment Companies.
Not applicable to the Registrant.
Item 8. Portfolio Managers of Closed-End Management Investment Companies.
Not applicable to the Registrant.
Item 9. Purchases of Equity Securities by Closed-End Management Investment Company and Affiliated Purchasers.
Not applicable to the Registrant.
Item 10. Submission of Matters to a Vote of Security Holders.
There were no changes to the procedures by which shareholders may recommend nominees to the Board.
Item 11. Controls and Procedures.
(a) | Based on an evaluation of the disclosure controls and procedures (as defined in Rule 30a-3(c) under the Investment Company Act of 1940, as amended (the “Act”)) as of a date within 90 days of the filing date of this document, the Chief Executive Officer and Treasurer and Principal Financial and Accounting Officer of the Registrant have concluded that such disclosure controls and procedures are effectively designed to ensure that information required to be disclosed by the Registrant on Form N-CSR and Form N-Q is accumulated and |
| communicated to the Registrant’s management to allow timely decisions regarding required disclosure. |
| |
(b) | There were no significant changes in the Registrant’s internal controls over financial reporting (as defined in Rule 30a-3(d) under the Act) that occurred during the Registrant’s second fiscal quarter of the period covered by this report that have materially affected, or are reasonably likely to materially affect, the Registrant’s internal control over financial reporting. |
Item 12. Exhibits
(a)(1) | A copy of the Code of Ethics is incorporated by reference to the Registrant’s Form N-CSR, Investment Company Act file number 811-00582 (filed May 8, 2006). |
| | |
(a)(2) | The certifications required by Rule 30a-2(a) of the Act and Section 302 of the Sarbanes-Oxley Act of 2002 (“Sarbanes-Oxley Act”) are filed herewith. |
| | |
(a)(3) | Not applicable to the Registrant. |
| | |
| | The certifications required by Rule 30a-2(b) of the Act and Section 906 of the Sarbanes-Oxley Act are filed herewith. |
The certifications provided pursuant to Rule 30a-2(b) of the Act and Section 906 of the Sarbanes-Oxley Act are not deemed “filed” for purposes of Section 18 of the Securities Exchange Act of 1934, as amended (“Exchange Act”), or otherwise subject to the liability of that section. Such certifications will not be deemed to be incorporated by reference into any filing under the Securities Act of 1933 or the Exchange Act, except to the extent that the Registrant specifically incorporates them by reference.
SIGNATURES
Pursuant to the requirements of the Securities Exchange Act of 1934 and the Investment Company Act of 1940, the Registrant has duly caused this report to be signed on its behalf by the undersigned, thereunto duly authorized.
Neuberger Berman Equity Funds
By: | /s/ Robert Conti |
| | Robert Conti |
| | Chief Executive Officer |
Date: November 5, 2009
Pursuant to the requirements of the Securities Exchange Act of 1934 and the Investment Company Act of 1940, this report has been signed below by the following persons on behalf of the Registrant and in the capacities and on the dates indicated.
By: | /s/ Robert Conti |
| | Robert Conti |
| | Chief Executive Officer |
Date: November 5, 2009
By: | /s/ John M. McGovern |
| | John M. McGovern
Treasurer and Principal Financial and Accounting Officer |
Date: November 5, 2009