As filed with the Securities and Exchange Commission on November 5, 2010
UNITED STATES
SECURITIES AND EXCHANGE COMMISSION
Washington, D.C. 20549
FORM N-CSR
CERTIFIED SHAREHOLDER REPORT OF
REGISTERED MANAGEMENT INVESTMENT COMPANIES
Investment Company Act file number: 811-00582
NEUBERGER BERMAN EQUITY FUNDS
(Exact Name of the Registrant as Specified in Charter)
c/o Neuberger Berman Management LLC
605 Third Avenue, 2nd Floor
New York, New York 10158-0180
(Address of Principal Executive Offices – Zip Code)
Registrant's telephone number, including area code: (212) 476-8800
Robert Conti
Chief Executive Officer and President
c/o Neuberger Berman Management LLC
Neuberger Berman Equity Funds
605 Third Avenue, 2nd Floor
New York, New York 10158-0180
Arthur C. Delibert, Esq.
K&L Gates LLP
1601 K Street, N.W.
Washington, D.C. 20006-1600
(Names and Addresses of agents for service)
Date of fiscal year end: August 31, 2010
Date of reporting period: August 31, 2010
Form N-CSR is to be used by management investment companies to file reports with the Commission not later than 10 days after the transmission to stockholders of any report that is required to be transmitted to stockholders under Rule 30e-1 under the Investment Company Act of 1940 (17 CFR 270.30e-1). The Commission may use the information provided on Form N-CSR in its regulatory, disclosure review, inspection, and policymaking roles.
A registrant is required to disclose the information specified by Form N-CSR, and the Commission will make this information public. A registrant is not required to respond to the collection of information contained in Form N-CSR unless the Form displays a currently valid Office of Management and Budget ("OMB") control number. Please direct comments concerning the accuracy of the information collection burden estimate and any suggestions for reducing the burden to the Secretary, Securities and Exchange Commission, 100 F Street, NE, Washington, DC 20549-0609. The OMB has reviewed this collection of information under the clearance requirements of 44 U.S.C. § 3507.
Item 1. Reports to Shareholders.

| | | | | Neuberger Berman Equity Funds |
| | | | | | |
| | | | | Investor Class Shares Trust Class Shares Advisor Class Shares Institutional Class Shares | Class A Shares Class C Shares Class R3 Shares |
| | | | | | |
| | | | | Climate Change Fund Emerging Markets Equity Fund Equity Income Fund Focus Fund Genesis Fund Guardian Fund International Fund International Institutional Fund International Large Cap Fund Intrinsic Value Fund | Large Cap Disciplined Growth Fund Mid Cap Growth Fund Multi-Cap Opportunities Fund Partners Fund Real Estate Fund Regency Fund Select Equities Fund Small Cap Growth Fund Socially Responsive Fund |
| | | | | | |
| | | | | | |
| | | | | |
| | | | | | |
| | | | | | |
| | | | | Annual Report | |
| | | | | August 31, 2010 | |
| | | | | THE FUNDS | |
| | | | | President's Letter | 1 |
| | | | | | |
| | | | | PORTFOLIO COMMENTARY (UNAUDITED) | |
| | | | | | |
| | | | | Climate Change Fund | 2 |
| | | | | | |
| | | | | Emerging Markets Equity Fund | 6 |
| | | | | | |
| | | | | Equity Income Fund | 10 |
| | | | | | |
| | | | | Focus Fund | 14 |
| | | | | | |
| | | | | Genesis Fund | 18 |
| | | | | | |
| | | | | Guardian Fund | 22 |
| | | | | | |
| | | | | International Fund | 26 |
| | | | | | |
| | | | | International Institutional Fund | 29 |
| | | | | | |
| | | | | International Large Cap Fund | 32 |
| | | | | | |
| | | | | Intrinsic Value Fund | 36 |
| | | | | | |
| | | | | Large Cap Disciplined Growth Fund | 40 |
| | | | | | |
| | | | | Mid Cap Growth Fund | 44 |
| | | | | | |
| | | | | Multi-Cap Opportunities Fund | 48 |
| | | | | | |
| | | | | Partners Fund | 52 |
| | | | | | |
| | | | | Real Estate Fund | 56 |
| | | | | | |
| | | | | Regency Fund | 60 |
| | | | | | |
| | | | | Select Equities Fund | 64 |
| | | | | | |
| | | | | Small Cap Growth Fund | 68 |
| | | | | | |
| | | | | Socially Responsive Fund | 72 |
| | | | | | |
| | | | | FUND EXPENSE INFORMATION | 81 |
| | | | | | |
| | | | | SCHEDULE OF INVESTMENTS/TOP TEN EQUITY HOLDINGS | |
| | | | | | |
| | | | | Climate Change Fund | 85 |
| | | | | | |
| | | | | Emerging Markets Equity Fund | 87 |
| | | | | | |
| | | | | Equity Income Fund | 90 |
| | | | | | |
| | | | | Focus Fund | 92 |
| | | | | | |
| | | | | Genesis Fund | 93 |
| | | | | | |
| | | | | Guardian Fund | 95 |
| | | | | | |
| | | | | International Fund | 96 |
| | | | | International Institutional Fund | 99 |
| | | | | | |
| | | | | International Large Cap Fund | 102 |
| | | | | | |
| | | | | Intrinsic Value Fund | 105 |
| | | | | | |
| | | | | Large Cap Disciplined Growth Fund | 107 |
| | | | | | |
| | | | | Mid Cap Growth Fund | 109 |
| | | | | | |
| | | | | Multi-Cap Opportunities Fund | 111 |
| | | | | | |
| | | | | Partners Fund | 112 |
| | | | | | |
| | | | | Real Estate Fund | 114 |
| | | | | | |
| | | | | Regency Fund | 115 |
| | | | | | |
| | | | | Select Equities Fund | 117 |
| | | | | | |
| | | | | Small Cap Growth Fund | 118 |
| | | | | | |
| | | | | Socially Responsive Fund | 120 |
| | | | | | |
| | | | | FINANCIAL STATEMENTS | 131 |
| | | | | | |
| | | | | FINANCIAL HIGHLIGHTS (ALL CLASSES) PER SHARE DATA | |
| | | | | | |
| | | | | Climate Change Fund | 185 |
| | | | | | |
| | | | | Emerging Markets Equity Fund | 185 |
| | | | | | |
| | | | | Equity Income Fund | 187 |
| | | | | | |
| | | | | Focus Fund | 187 |
| | | | | | |
| | | | | Genesis Fund | 189 |
| | | | | | |
| | | | | Guardian Fund | 191 |
| | | | | | |
| | | | | International Fund | 193 |
| | | | | | |
| | | | | International Institutional Fund | 193 |
| | | | | | |
| | | | | International Large Cap Fund | 195 |
| | | | | | |
| | | | | Intrinsic Value Fund | 195 |
| | | | | | |
| | | | | Large Cap Disciplined Growth Fund | 197 |
| | | | | | |
| | | | | Mid Cap Growth Fund | 199 |
| | | | | | |
| | | | | Multi-Cap Opportunities Fund | 201 |
| | | | | | |
| | | | | Partners Fund | 201 |
| | | | | | |
| | | | | Real Estate Fund | 203 |
| | | | | | |
| | | | | Regency Fund | 205 |
| | | | | | |
| | | | | Select Equities Fund | 207 |
| | | | | | |
| | | | | Small Cap Growth Fund | 207 |
| | | | | | |
| | | | | Socially Responsive Fund | 211 |
| | | | | Reports of Independent Registered Public Accounting Firms | 218 |
| | | | | | |
| | | | | Directory | 220 |
| | | | | | |
| | | | | Trustees and Officers | 221 |
| | | | | | |
| | | | | Proxy Voting Policies and Procedures | 231 |
| | | | | | |
| | | | | Quarterly Portfolio Schedule | 231 |
| | | | | | |
| | | | | Notice to Shareholders | 232 |
| | | | | | |
The "Neuberger Berman" name and logo are registered service marks of Neuberger Berman Group LLC. "Neuberger Berman Management LLC" and the individual Fund names in this piece are either service marks or registered service marks of Neuberger Berman Management LLC. ©2010 Neuberger Berman Management LLC. All rights reserved.
President's Letter
Dear Fellow Shareholder,
The fiscal year ended August 31, 2010 was a time marked by significant volatility, as unsteady markets adjusted in real time to changing economic news. Over the course of the period, the U.S. stock market moved from a low-quality, speculative rally coming out of the financial crisis to a market more focused on concerns about slower-than-anticipated economic growth.
Major headlines about Chinese efforts to contain growth and possible contagion from European sovereign debt issues joined slowing economic data from the U.S. in cooling sentiment. Regionally, performance was led by the emerging markets, where economic growth rates were higher and fears related to developed markets' issues were less severe. U.S. stocks generally closed in mildly positive territory, but international developed markets, working through debt concerns and the austerity measures necessary to counteract them, declined.
Despite fears reported in the headlines, economic data over the period were mixed. Just as the market may have overreacted on the upside during the rally, we think the later selloff may have been overstated as well. Also, we believe the possibility of a double-dip recession, a topic that resurfaced this summer, remains unlikely. While the temporary increase from the inventory replacement cycle was shorter-lived and less steep than generally expected, more current data are somewhat more optimistic. In July, business inventories saw the largest increase in two years, a positive for U.S. GDP growth. August's capacity utilization number also increased, although it remains below the longer-term average. Retail sales, an indicator of consumer spending, declined in August, but that too remains well above levels a year ago.
While the U.S. government's $814 billion stimulus package, which helped the economy in the short term, is ending, inflation and interest rates remain low, and corporate America appears to be healthy. Between sharp cost-cutting measures during the downturn and conservative spending coming out of it, company balance sheets are showing abundant cash—which can be deployed to increase shareholder value, toward future growth, or for mergers and acquisitions, which have already begun to accelerate.
Consumer spending is the counterpoint. Private wage and salary disbursements increased by $25.7 billion in July, but serious pressure on consumers continues. At 9.6%, the unemployment rate is still far too high. The savings rate increased during the second quarter, credit remains somewhat constrained, and the housing sector is weak. While the total number of jobs increased over the fiscal year, more hiring is clearly needed.
GDP growth was revised down to 1.7% for the second quarter and, all told, we expect below-trend economic growth for at least the near term. Without strong economic growth, we expect investors will begin to focus more on fundamentals. In such an environment, we believe the market should offer a premium for companies that are truly exceptional, and that can execute under a variety of economic conditions.
That would be a quintessential stock-picker's scenario—where the variation in performance between individual securities is meaningful, and where investors are rewarded for thoughtful, detailed fundamental analysis—and that speaks to our strengths. Moving forward, we think the quality of our investment teams, our thorough and independent research, and our investment disciplines will be advantages.
Thank you for your continued confidence in Neuberger Berman. We look forward to continuing to serve your investment needs.
Sincerely,
Robert Conti
President and CEO
Neuberger Berman Mutual Funds
Climate Change Fund Commentary
For the fiscal year ended August 31, 2010, Neuberger Berman Climate Change Fund posted a slightly negative return, underperforming its benchmark, the MSCI World Index. The Fund outperformed the more comparable HSBC Global Climate Change Index and many of its peers for the period.
To some degree, performance of the MSCI World Index was driven by defensive areas this period, such as Telecommunications and Consumer Staples—sectors that are less relevant to the portfolio's investment theme. Defensive stocks led within markets that were extremely volatile, shaken by global macroeconomic concerns. While we acknowledge the difficulties of the past year's uncertain macro environment, key defensive decisions helped us temper volatility and outperform our peers and what we consider the more appropriate indexes.
We remain constructive from a thematic perspective. We continue to believe the Fund is advantageously positioned as a long-term, global portfolio that invests in a diverse universe of companies poised to benefit from efforts to address the impacts of climate change worldwide. We continue to allocate assets across three main themes—Cleaner Energy including wind, solar, nuclear and natural gas; Energy Efficiency including smart grid technology, energy efficient buildings and transportation; and Climate Adaptation including water services, carbon trading and agriculture.
Given the market backdrop over the past year, we were very balanced in our management approach, aware that some of our investment areas entailed higher volatility. A significant part of the portfolio is allocated to renewable energy and other higher-beta, growth-oriented areas. While some of these holdings posted lackluster performance, we had prudently bar-belled our exposure with more defensive holdings. Broad diversification remained a strategic priority for the Fund as we focused on key areas such as nuclear power, natural gas, water and smart grid. Defensive investments this period included a healthy weighting to Utilities and other dividend-paying companies. In power and utility companies, we continued to see attractive dividends, solid earnings visibility and exposure to clean energy growth opportunities. Both ou r diversification and the inclusion of Utilities tempered portfolio volatility and helped us outperform many "pure play" alternative and clean energy investment vehicles during the period.
While we manage a global portfolio, another defensive decision involved maintaining a significant allocation—approximately 65-70% of assets—to the U.S. market. As we witnessed economic deterioration in Europe and parts of Asia, an overweight to the U.S., which we believed was showing signs of recovery, seemed prudent. The case for an overweight U.S. allocation extends beyond macroeconomic considerations as well. We continue to believe the U.S. has much more room to advance in climate change efforts than regions such as Europe. We believe as more stringent environmental regulations begin to take hold in the U.S., and companies become more aggressive in their pursuit of cleaner energy, it will open up a great deal of opportunity for many American companies to benefit, and some foreign companies as well. Additi onally, from our perspective, the valuations of the U.S. stocks that we participate in do not reflect the long-term potential in many of these areas.
From a climate-policy perspective, movement over the period was disappointing, from the Copenhagen Global Climate Change Conference to the lack of progress from the U.S. Senate on a comprehensive energy bill. Policy uncertainty has created a short-term cloud and overhang over many companies levered to cleaner energy and climate change in particular.
Even so, with a much more active Environmental Protection Agency under the Obama administration, regulations have been and, we believe, will continue to be drafted that should benefit our portfolio holdings longer-term regardless of the lack of national energy legislation. These regulations are what we believe will be the first wave of the administration's strategy to economically burden more carbon intensive forms of energy. Although political uncertainty exists, we believe the new regulations pave the way for a bright future for cleaner energy, the largest component of the portfolio. We, therefore, believe the environmental policy direction is certainly very favorable for the companies in this Fund.
Looking forward, we believe regulatory forces driving the desire for an increasingly diversified, clean and secure energy mix could provide a myriad of investment opportunities across the Fund's Cleaner Energy, Energy Efficiency and Climate Adaptation segments—most of which still have billions of dollars in "stimulus tailwind" and could benefit from favorable incentives and rising demand for years to come.
Sincerely,

Ronald B. Silvestri
Portfolio Manager
Climate change-related companies may be particularly susceptible to such factors as environmental protection regulatory actions, changes in government standards and subsidy levels, changes in taxation, and other domestic and international, political, regulatory and economic developments. Such companies may also be significantly affected by the level or pace of technological change in industries focusing on energy, pollution and environmental control. Because society's focus on climate change issues is relatively new, there could be significant changes of emphasis and direction, and rapid technological change, rendering even new approaches and products obsolete. The risks associated with these investments are set forth in the prospectus and statement of additional information.
Investing in foreign securities involves greater risks than investing in securities of U.S. issuers, including currency fluctuations, changes in local economic and political conditions, and the need to operate in less regulated financial markets.
To the extent that the Fund emphasizes small-, mid- or large-cap stocks, it takes on the associated risks. At times, large-cap stocks may lag other types of stocks in performance, which could cause a fund holding those stocks to perform worse than certain other funds. Small- and mid-capitalization stocks are more vulnerable to financial risks and other risks than stocks of larger companies. They also trade less frequently and in lower volume than larger company stocks, so their market prices tend to be more volatile.
The composition, industries and holdings of the Fund are subject to change. Climate Change Fund is invested in a wide array of stocks and no single holding makes up a significant portion of the Fund's total assets.
Climate Change Fund
| TICKER SYMBOLS |
| Institutional Class | | NBCLX |
| Class A | | NBCAX |
| Class C | | NBCCX |
| SECTOR ALLOCATION |
| (% of Total Investments) |
| Consumer Discretionary | | | 1.8 | % |
| Consumer Staples | | | 0.5 | |
| Energy | | | 10.6 | |
| Financials | | | 0.4 | |
| Industrials | | | 28.3 | |
| Information Technology | | | 13.5 | |
| Materials | | | 1.5 | |
| Utilities | | | 40.4 | |
| Short-Term | | | 3.0 | |
| Total | | | 100.0 | % |
| PERFORMANCE HIGHLIGHTS1,3,10 |
| | | | | Average Annual Total Return Ended 08/31/2010 | |
| | | Inception Date | | 1 Year | | Life of Fund | |
| At NAV | |
| Institutional Class | | 05/01/2008 | | | –0.17 | % | | –16.57 | % | |
| Class A | | 05/01/2008 | | | –0.22 | % | | –16.70 | % | |
| Class C | | 05/01/2008 | | | –0.97 | % | | –17.30 | % | |
| With Sales Charge | |
| Class A | | | | | –5.92 | % | | –18.78 | % | |
| Class C | | | | | –1.96 | % | | –17.30 | % | |
| Index | |
MSCI World Index2,19 | | | | | 2.07 | % | | –10.76 | % | |
Performance data quoted represent past performance, which is no guarantee of future results. The investment return and principal value of an investment will fluctuate so that an investor's shares, when redeemed, may be worth more or less than their original cost. Results are shown on a "total return" basis and include reinvestment of all income dividends and distributions.
Current performance may be lower or higher than the performance data quoted. For performance data current to the most recent month end, visit www.nb.com/performance.
As stated in the Fund's most recent prospectus, the total annual operating expense ratios for fiscal year 2009 were 9.87%, 9.94% and 10.96% for Institutional Class, Class A and Class C shares, respectively (prior to any fee waivers or expense reimbursements). The expense ratios net of waivers and reimbursements were 1.00%, 1.25% and 2.00% for Institutional Class, Class A and Class C shares, respectively. Neuberger Berman Management LLC has contractually agreed to limit certain expenses of the Fund through August 31, 2013 for Institutional Class, Class A and Class C shares.
Total Returns shown with a sales charge reflect the deduction of the current maximum initial sales charge of 5.75% for Class A shares and the applicable contingent deferred sales charge (CDSC) for Class C shares. The maximum CDSC for Class C shares is 1% which is reduced to 0% after 1 year. The performance of the Fund's share classes will differ primarily due to different sales charge structures and class expenses. Please see the prospectus for more information about sales charge structures, if any, and class expenses for your share class.
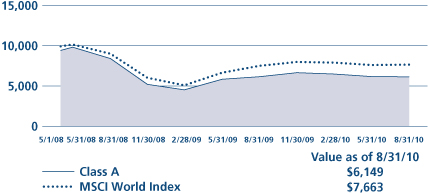
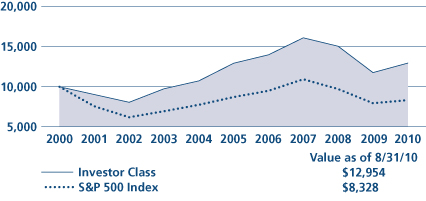
Climate Change Fund
COMPARISON OF A $10,000 INVESTMENT (WITH SALES CHARGE) |
|
| |
This chart shows the value of a hypothetical $10,000 investment in the Fund over the past 10 fiscal years, or since the Fund's inception if it has not operated for 10 years. The graph is based on the Class A shares only; performance of other classes will vary due to differences in fee structures and any applicable sales charges (see Performance Highlights chart on previous page). The result is compared with benchmarks, which may include a broad-based market index and/or a narrower index. Please note that market indexes have not been reduced to reflect any of the fees and costs of investing. All results include the reinvestment of income dividends and distributions. Neither the Fund's returns nor the market indexes shown in the graph and table reflect the effect of taxes an investor would pay on Fund distributions or on the redemption of Fund shares. Results represent past performance and do not indicate future results.
Emerging Markets Equity Fund Commentary
We are pleased to report that, for the fiscal year ended August 31, 2010, Neuberger Berman Emerging Markets Equity Fund Institutional Class generated a positive return and roughly matched its benchmark, the MSCI Emerging Markets (EM) Index. (See page 8 for performance of other share classes.)
While emerging markets turned in double-digit positive results for the fiscal year, the period was volatile. The markets dramatically outperformed from September through the end of calendar-year 2009, rising more than 18% versus 6% for developed overseas markets (represented by the MSCI EAFE® Index). Emerging markets weakened early in calendar-year 2010, as investors reacted to concerns about the Chinese government's plans to constrain growth. In the calendar second quarter, they declined but less than either the EAFE or S&P 500. With emerging markets economies in relatively better shape than their developed counterparts, the emerging markets were somewhat insulated from the sovereign debt issues in Europe and weakening economic data from the U.S. that worried investors. Emerging markets advanced again in July but were down slightly in August.
Within the MSCI EM Index, Consumer Staples was the best performing sector, followed by Consumer Discretionary and Materials. While every sector in the index posted gains, Telecommunications and Energy were weakest. Geographically, stronger markets included Colombia, Chile and Thailand. The Czech Republic, Morocco and Hungary were negative. Within the Fund, the Financials, Energy and Health Care sectors were the largest contributors to outperformance, primarily because of strong stock selection. Consumer Staples, Information Technology and our small cash and cash equivalents position detracted. Geographically, Brazil, Thailand and China were additive on a relative basis, while investments in Israel, Chile and South Africa detracted from Fund results.
In terms of individual holdings, Brazilian iron ore company Vale was our top contributor this period. As Vale outperformed, our relatively large position was a benefit. Thailand's auto lender Thanachart was another top contributor. Both Thanachart and Top Glove, the Malaysian rubber glove manufacturer, turned in outstanding results for the year. Thanachart benefited from a recent acquisition, while Top Glove expanded as latex costs declined and sales of medical gloves increased. Banco Do Estado do Rio Grande do Sul, a leading Brazilian bank, outperformed as well. The bank's loan growth remained strong and asset quality remained solid.
Disappointments included Inspur, a Chinese enterprise resource planning software vendor. Inspur declined on weaker-than-expected second quarter results. We believe that Inspur's fundamentals remain strong, and have added to the position on weakness. Taewoong, a leading Korean engineering forged-component supplier, focused on the wind energy and ship-building industries, also detracted, on weak order flow and the strengthening Korean currency. Unitech, a residential real estate developer in India, declined on concerns about inflation and its potential effect on real estate demand. Ausnutria, a Chinese baby formula and infant nutrition company, was sold from the portfolio as competition from multinational players intensified.
Looking ahead, in our view, the secular growth opportunity in emerging markets continues to be in the domestic sectors—which will also have less earnings volatility in an uncertain global backdrop. From a sector perspective, we think the consumer sectors are already pricing in much of the upside. In our view, the Health Care sector offers good consumer type exposure, with high returns and good cash flow generation at reasonable multiples. The other domestic sector where we are positive is Industrials, due to large infrastructure bottlenecks. This is a recurring theme across a great number of countries, including Brazil and the Philippines. Across the board, the Fund is currently underweighted versus the benchmark in Financials, Utilities, Telecommunications and Energy and overweighted in Health Care and Informatio n Technology.
On the country front, we believe there is growth and value in countries including Thailand, Turkey and the Philippines, and believe India and Brazil still have interesting mid-cap opportunities. We believe Brazil could start to perform once the approximately $72 billion deal from Petrobras and the October presidential elections—where the expected outcome should signal the continuation of favorable trends—get out of the way. In Korea and Taiwan, which continue to be export-driven
markets (especially for technology products), we are more cautious, looking for select opportunities. We think China is a contrarian market where we see select opportunities in the domestic space. There has been considerable policy noise locally in China to address the rapidly rising property prices and wage increases. The mounting U.S. pressure on the Chinese to revalue its currency, the renminbi, could lead to increased tensions over trade and, in our view, is a genuine risk.
While emerging markets equities outperformed their U.S. and developed international peers this year, we continue to see the markets overall as reasonably valued, especially considering their 5-6% incremental growth versus developed markets. We believe that our strict bottom-up fundamental analysis within a macro perspective will help us continue to capture the opportunity these markets represent.
Sincerely,
Conrad Saldanha
Portfolio Manager
The risks involved in seeking capital appreciation from investments primarily in companies based outside the United States are set forth in the prospectus and statement of additional information.
Investing in foreign securities involves greater risks than investing in securities of U.S. issuers, including currency fluctuations, changes in local economic and political conditions, and the need to operate in less regulated financial markets. These risks are typically heightened for investments in emerging markets.
To the extent that the Fund emphasizes small-, mid- or large-cap stocks, it takes on the associated risks. At times, large-cap stocks may lag other types of stocks in performance, which could cause a fund holding those stocks to perform worse than certain other funds. Small- and mid-capitalization stocks are more vulnerable to financial risks and other risks than stocks of larger companies. They also trade less frequently and in lower volume than larger company stocks, so their market prices tend to be more volatile.
The composition, industries and holdings of the Fund are subject to change. In an attempt to reduce overall volatility, Emerging Markets Equity Fund diversifies the portfolio holdings over a wide array of countries and individual stocks.
Emerging Markets Equity Fund
| TICKER SYMBOLS |
| Institutional Class | | NEMIX | |
| Class A | | NEMAX | |
| Class C | | NEMCX | |
| Class R3 | | NEMRX | |
| SECTOR ALLOCATION |
| (% of Total Investments) | |
| Consumer Discretionary | | | 8.6 | % | |
| Consumer Staples | | | 5.8 | | |
| Energy | | | 11.9 | | |
| Financials | | | 18.4 | | |
| Health Care | | | 7.3 | | |
| Industrials | | | 9.1 | | |
| Information Technology | | | 16.5 | | |
| Materials | | | 12.7 | | |
| Telecommunication Services | | | 5.7 | | |
| Utilities | | | 0.7 | | |
| Short-Term | | | 3.3 | | |
| Total | | | 100.0 | % | |
| PERFORMANCE HIGHLIGHTS1,3,10 |
| | | | | Average Annual Total Return Ended 08/31/2010 | |
| | | Inception Date | | 1 Year | | Life of Fund | |
| At NAV | |
| Institutional Class | | 10/08/2008 | | | 18.76 | % | | | 32.98 | % | |
| Class A | | 10/08/2008 | | | 18.58 | % | | | 32.73 | % | |
| Class C | | 10/08/2008 | | | 17.62 | % | | | 31.71 | % | |
Class R313 | | 06/21/2010 | | | 18.64 | % | | | 32.90 | % | |
| With Sales Charge | |
| Class A | | | | | 11.72 | % | | | 28.66 | % | |
| Class C | | | | | 16.62 | % | | | 31.71 | % | |
| Index | |
MSCI Emerging Markets Index2,19 | | | | | 18.34 | % | | | 25.80 | % | |
Performance data quoted represent past performance, which is no guarantee of future results. The investment return and principal value of an investment will fluctuate so that an investor's shares, when redeemed, may be worth more or less than their original cost. Results are shown on a "total return" basis and include reinvestment of all income dividends and distributions.
Current performance may be lower or higher than the performance data quoted. For performance data current to the most recent month end, visit www.nb.com/performance.
As stated in the Fund's most recent prospectus, the total annual operating expense ratios for fiscal year 2009 were 14.80%, 19.00%, 17.58% and 3.05% for Institutional Class, Class A, Class C and Class R3 shares, respectively (prior to any fee waivers or expense reimbursements). The expense ratios net of waivers and reimbursements were 1.30%, 1.56%, 2.30% and 1.93% for Institutional Class, Class A, Class C and Class R3 shares, respectively. Neuberger Berman Management LLC has contractually agreed to limit certain expenses of the Fund through August 31, 2013 for Institutional Class, Class A, Class C and Class R3 shares.
Total Returns shown with a sales charge reflect the deduction of the current maximum initial sales charge of 5.75% for Class A shares and the applicable contingent deferred sales charges (CDSC) for Class C shares. The maximum CDSC for Class C shares is 1%, which is reduced to 0% after 1 year. The performance of the Fund's share classes will differ primarily due to different sales charge structures and class expenses. Please see the prospectus for more information about sales charge structures, if any, and class expenses for your share class.
Emerging Markets Equity Fund
COMPARISON OF A $10,000 INVESTMENT |
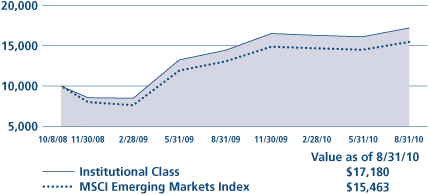 |
This chart shows the value of a hypothetical $10,000 investment in the Fund over the past 10 fiscal years, or since the Fund's inception if it has not operated for 10 years. The graph is based on the Institutional Class shares only; performance of other classes will vary due to differences in fee structures and any applicable sales charges (see Performance Highlights chart on previous page). The result is compared with benchmarks, which may include a broad-based market index and/or a narrower index. Please note that market indexes have not been reduced to reflect any of the fees and costs of investing. All results include the reinvestment of income dividends and distributions. Neither the Fund's returns nor the market indexes shown in the graph and table reflect the effect of taxes an investor would pay on Fund distribu tions or on the redemption of Fund shares. Results represent past performance and do not indicate future results.
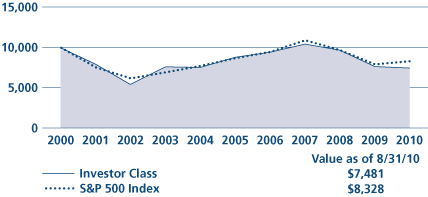
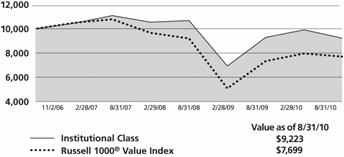
Equity Income Fund Commentary
We are pleased to report that for the fiscal year ended August 31, 2010, Neuberger Berman Equity Income Fund generated a strongly positive return and significantly outperformed its benchmark, the S&P 500 Index.
By the second half of calendar-year 2009 it seemed apparent that the U.S. was pulling out of the recession that had followed the financial crisis. Stocks had already begun discounting that move, starting their advance in March 2009, and the positive trend in both the markets and the economy continued through the remainder of the year.
In the beginning of calendar-year 2010, however, investors paused, and in our opinion questioned, whether stocks had climbed too far too fast, expanding beyond what appeared warranted by economic data considering the many uncertainties that remained. When early 2010 economic data continued to appear positive, investors found renewed optimism and drove the markets higher until the end of April. In May, the European sovereign debt crisis deepened, damaging investor confidence fairly significantly. From that point through the Fund's fiscal year-end, the market maintained a very volatile, wide trading range.
Taking the fiscal year as a whole, the first half was characterized by investor enthusiasm, while the second half was marked by concern, loss of confidence, and risk aversion. Given the Equity Income investment philosophy and process, we were able to use the volatility we saw to our advantage. We used our strict investment discipline to reposition the portfolio, selling strong performers in up markets, and buying attractive stocks at discounted prices when the market was weaker.
Within the portfolio, certain sectors performed particularly well, contributing significantly to our outperformance for the period. The largest single benefit came from our Energy holdings. We continue to believe that oil is in a structural bull market, and that, as the global economy recovers, demand for oil and oil products will continue to drive prices higher. Within the sector, Penn West, Cathedral Energy, CNOOC, Enbridge and Arc Energy Trust were among the top contributors.
The second key area for us this period was real estate investment trusts (REITs), always a significant part of our strategy. Our exposure to REITs, and in particular to unconventional REITs and international names, was highly beneficial, with standout investments within the sector including AvalonBay, Ascendas (a Singapore REIT) and Digital Realty Trust.
Our avoidance of certain equity sectors also contributed to the Fund's outperformance this period. For example, our underweight, versus the benchmark, to the relatively weak Health Care sector was beneficial relative to the S&P 500. Information Technology holdings were also positive, as strong stock selection, in terms of both sub-sector and the specific companies within them, provided contributions to returns. Materials was a similar story this period, with the portfolio exposed to the right sectors and companies, and in particular, owning the gold royalty companies. As with REITs, with concern about the U.S. consumer, we have been seeking companies with international exposure across our equity position.
After lagging during the first half of the fiscal period, Utilities, another important portion of our strategy, began to show some improvement in the second half. Taking the period as a whole, they too contributed to our outperformance. There were individual disappointments including Exelon and NextEra, but their negative effect was more than compensated for by strong performers within the sector.
Finally, a combination of our option writing and exposure to convertible securities was additive. One highlight within this group was a convertible preferred issued by Vale, a Brazilian mining company, which contributed strongly to the Fund's performance.
Looking ahead, we think the near-term market outlook remains choppy, as many of the issues that impacted the second half of this fiscal period are still with us—important among them, uncertainty about sovereign debt and uncertainty surrounding the U.S. economy's ability to grow in a meaningful way.
We expect to see global economic growth, but at slower than typical levels. As a result, while we remain cautious, we also believe that stocks are quite reasonably priced in the current market. We continue to find what we consider some phenomenal companies with great balance sheets, that appear to us well positioned to grow their earnings and their free cash flow, which in our view should eventually enable them to raise their dividends as well.
We view the current environment, complicated though it may be, as something of a sweet spot for the Equity Income strategy. We think the companies we own will continue to generate good profit growth, that will manifest itself in good dividend growth going forward. At the same time, we remain confident that our strategy's yield and other defensive characteristics may help insulate the portfolio should the outlook temporarily weaken.
Sincerely,


Richard S. Levine, Tony Gleason and Sandy Pomeroy
Portfolio Co-Managers
The risks involved in seeking capital appreciation from investments in a wide array of stocks are set forth in the prospectus and statement of additional information.
To the extent that the Fund emphasizes small-, mid- or large-cap stocks, it takes on the associated risks. At times, large-cap stocks may lag other types of stocks in performance, which could cause a fund holding those stocks to perform worse than certain other funds. Small- and mid-capitalization stocks are more vulnerable to financial risks and other risks than stocks of larger companies. They also trade less frequently and in lower volume than larger company stocks, so their market prices tend to be more volatile.
The composition, industries and holdings of the Fund are subject to change. Equity Income Fund is invested in a wide array of stocks and no single holding makes up a significant portion of the Fund's total assets.
Equity Income Fund
| TICKER SYMBOLS |
| Institutional Class | | NBHIX |
| Class A | | NBHAX |
| Class C | | NBHCX |
| Class R3 | | NBHRX |
| SECTOR ALLOCATION |
| (% of Total Investments) |
| Consumer Discretionary | | | 1.4 | % |
| Consumer Staples | | | 4.5 | |
| Energy | | | 14.1 | |
| Financials | | | 15.9 | |
| Health Care | | | 4.3 | |
| Industrials | | | 3.8 | |
| Information Technology | | | 2.7 | |
| Materials | | | 2.9 | |
| Telecommunication Services | | | 5.1 | |
| Utilities | | | 15.0 | |
| Other | | | 23.5 | |
| Short-Term | | | 6.8 | |
| Total | | | 100.0 | % |
| PERFORMANCE HIGHLIGHTS1,3 |
| | | | | Average Annual Total Return Ended 08/31/2010 |
| | | Inception Date | | 1 Year | | Life of Fund |
| At NAV | |
| Institutional Class | | 06/09/2008 | | | 18.81 | % | | 3.87 | % |
Class A17 | | 06/09/2008 | | | 18.36 | % | | 3.62 | % |
Class C17 | | 06/09/2008 | | | 17.59 | % | | 3.21 | % |
Class R317 | | 06/21/2010 | | | 18.62 | % | | 3.83 | % |
| With Sales Charge | |
Class A17 | | | | | 11.58 | % | | 2.03 | % |
Class C17 | | | | | 16.59 | % | | 3.21 | % |
| Index | |
S&P 500 Index2,19 | | | | | 4.91 | % | | –4.61 | % |
The performance data for each class includes the performance of the Fund's oldest share class, Trust Class, from November 2, 2006 through June 9, 2008. The performance data of Class R3 also includes the performance of Institutional Class from June 9, 2008 through June 21, 2010. See footnote 17 for information about the effects of the different fees paid by each class.
Performance data quoted represent past performance, which is no guarantee of future results. The investment return and principal value of an investment will fluctuate so that an investor's shares, when redeemed, may be worth more or less than their original cost. Results are shown on a "total return" basis and include reinvestment of all income dividends and distributions.
Current performance may be lower or higher than the performance data quoted. For performance data current to the most recent month end, visit www.nb.com/performance.
As stated in the Fund's most recent prospectus, the total annual operating expense ratios for fiscal year 2009 were 1.36%, 2.35%, 2.84% and 1.56% for Institutional Class, Class A, Class C and Class R3 shares, respectively (prior to any fee waivers or expense reimbursements). The expense ratios net of waivers and reimbursements were 0.84%, 1.20%, 1.95% and 1.45% for Institutional Class, Class A, Class C and Class R3 shares, respectively. Neuberger Berman Management LLC has contractually agreed to limit certain expenses of the Fund through August 31, 2013 for Institutional Class, Class A, Class C and Class R3 shares.
Total Returns shown with a sales charge reflect the deduction of the current maximum initial sales charge of 5.75% for Class A shares and the applicable contingent deferred sales charges (CDSC) for Class C shares. The maximum CDSC for Class C shares is 1%, which is reduced to 0% after 1 year. The performance of the Fund's share classes will differ primarily due to different sales charge structures and class expenses. Please see the prospectus for more information about sales charge structures, if any, and class expenses for your share class.
Equity Income Fund
| COMPARISON OF A $10,000 INVESTMENT17 |
|
This chart shows the value of a hypothetical $10,000 investment in the Fund over the past 10 fiscal years, or since the Fund's inception if it has not operated for 10 years. The graph is based on the Institutional Class shares only; performance of other classes will vary due to differences in fee structures and any applicable sales charges (see Performance Highlights chart on previous page). The result is compared with benchmarks, which may include a broad-based market index and/or a narrower index. Please note that market indexes have not been reduced to reflect any of the fees and costs of investing. All results include the reinvestment of income dividends and distributions. Neither the Fund's returns nor the market indexes shown in the graph and table reflect the effect of taxes an investor would pay on Fund distribu tions or on the redemption of Fund shares. Results represent past performance and do not indicate future results.
Focus Fund Commentary
During the volatile fiscal year ended August 31, 2010, Neuberger Berman Focus Fund posted a marginally negative return, underperforming its benchmark, the S&P 500 Index. While this is disappointing to us, we believe the Fund represents a portfolio of shares in businesses that have strong competitive positions in their industries and which are trading at distinct discounts to what we consider the underlying value of their assets and operations.
Within the index, the best-performing sectors included Consumer Discretionary, Industrials and Telecommunications. Financials, Information Technology and Health Care underperformed. We had entered the reporting period somewhat defensively positioned, seeking opportunities in Health Care and Information Technology. This defensive positioning was a key reason for the Fund's underperformance.
The Fund was invested in what we consider quality names during the period. For a variety of reasons, the share prices of large-capitalization, high-quality companies have generally underperformed in recent years. One source of this underperformance is that investors have been reducing exposure to U.S. common stocks. As money has moved into bonds and foreign stocks, these flows have hurt the prices of the Fund's holdings. We think this has created an interesting value opportunity. The U.S. stock market is trading at roughly the same level now as it was back in 1998. Over the past 12-plus years, our economy has expanded and U.S. companies have increased their exposure to developing markets. These companies have grown revenues and profits and increased the value of their businesses. While the timing is unclear, and the U.S . still faces challenges, we believe these dynamics have created a very interesting valuation opportunity in many high-quality stocks. We think patient investors will be rewarded for holding these high-quality businesses at today's reasonable valuations.
The top positive contributor to performance for the fiscal year was Rockwell Automation. This industrial company benefited from an improving economy over the course of the reporting period. We have since sold the position as it reached what we considered full valuation. Another positive contributor was XTO Energy, which was taken over by ExxonMobil during the period. The Fund also benefited from holding Brinker International, the owner of Chili's and other restaurants. Their management really focused the company during the fiscal year, managed it for cash flow, started a share repurchase program and increased the dividend significantly.
The single largest detractor from performance for the fiscal year was Range Resources, a natural gas producer. In our view, the company is a best-in-class operator within a best-in-class geography, owning assets in the core of the Marcellus shale region. The stock declined on investors' concerns about the long-term outlook for gas at the intersection of low gas prices and what appears to be undisciplined drilling activity. We think drilling activity will decline in the coming months as obligations expire, that prices ultimately will rise, and that the net asset value of Range Resources, which far exceeds its current share price, will be realized. Other areas of underperformance came from Information Technology, where we owned Hewlett-Packard and Yahoo!. Within Health Care, our ownership of Gilead Sciences hurt relative performance.
Looking ahead, we expect continued volatility, but within mildly positive markets. The recovery seems to have stalled somewhat, but we see healthy corporate balance sheets with significant cash, as well as stock buybacks, increased dividends, and increasing merger and acquisition activity, all of which, in our opinion, should be positive for the markets. After a dramatic cutback in capital expenditures, we have started to see a small pickup in capital spending, which is a good sign for the economy and markets. Furthermore, as the new Basel III banking rules get ironed out, some of the uncertainty that these widely anticipated proposals have created will be eliminated.
We think valuations are positive for stocks on a longer-term basis, and that as volatility continues, it will create buying opportunities along the way. As always, we think about decisions from an overall portfolio perspective. We remain highly attuned to the interaction among holdings in an attempt to minimize risk and enhance the prospects for healthy returns.
In our opinion, the Fund is positioned to take advantage of a return to U.S. high quality equities which, given the valuations currently present in the market, seems very likely.
Sincerely,
Gregory Francfort and David Levine
Portfolio Co-Managers
Because the Fund is concentrated in a small number of stocks, it will be substantially overweighted or underweighted in certain economic sectors at any given time. Therefore its performance is likely to be disproportionately affected by the factors influencing those sectors and may suffer if certain economic sectors it emphasizes do not perform as expected. The risks associated with these investments are set forth in the prospectus and statement of additional information.
Small- and mid-capitalization stocks are more vulnerable to financial risks and other risks than stocks of larger companies. They also trade less frequently and in lower volume than larger company stocks, so their market prices tend to be more volatile. Large-cap stocks are subject to all the risks of stock market investing, including the risk that they may lose value.
The composition, industries and holdings of the Fund are subject to change.
Focus Fund
| TICKER SYMBOLS |
| Investor Class | | NBSSX |
| Trust Class | | NBFCX |
| Advisor Class | | NBFAX |
| Institutional Class | | NFALX |
| Class A | | NFAAX |
| Class C | | NFACX |
| SECTOR ALLOCATION |
| (% of Total Investments) | |
| Consumer Discretionary | | | 12.1 | % |
| Consumer Staples | | | 6.2 | |
| Energy | | | 11.9 | |
| Financials | | | 16.0 | |
| Health Care | | | 18.0 | |
| Industrials | | | 10.9 | |
| Information Technology | | | 19.2 | |
| Materials | | | 2.2 | |
| Utilities | | | 1.5 | |
| Short-Term | | | 2.0 | |
| Total | | | 100.0 | % |
| PERFORMANCE HIGHLIGHTS1,3,9 |
| | | | | Average Annual Total Return Ended 08/31/2010 |
| | | Inception Date | | 1 Year | | 5 Years | | 10 Years | | Life of Fund |
| At NAV | |
| Investor Class | | 10/19/1955 | | | –2.39 | % | | | –3.25 | % | | | –2.86 | % | | | 9.96 | % |
Trust Class5 | | 08/30/1993 | | | –2.61 | % | | | –3.46 | % | | | –3.06 | % | | | 9.97 | % |
Advisor Class5 | | 09/03/1996 | | | –2.83 | % | | | –3.67 | % | | | –3.28 | % | | | 9.92 | % |
Institutional Class22 | | 06/21/2010 | | | –2.33 | % | | | –3.24 | % | | | –2.85 | % | | | 9.96 | % |
Class A25 | | 06/21/2010 | | | –2.38 | % | | | –3.25 | % | | | –2.86 | % | | | 9.96 | % |
Class C25 | | 06/21/2010 | | | –2.57 | % | | | –3.29 | % | | | –2.88 | % | | | 9.96 | % |
| With Sales Charge | |
Class A25 | | | | | –8.00 | % | | | –4.39 | % | | | –3.43 | % | | | 9.84 | % |
Class C25 | | | | | –3.53 | % | | | –3.29 | % | | | –2.88 | % | | | 9.96 | % |
| Index | |
S&P 500 Index2,19 | | | | | 4.91 | % | | | –0.91 | % | | | –1.81 | % | | | 9.52 | % |
Performance data quoted represent past performance, which is no guarantee of future results. The investment return and principal value of an investment will fluctuate so that an investor's shares, when redeemed, may be worth more or less than their original cost. Results are shown on a "total return" basis and include reinvestment of all income dividends and distributions.
Current performance may be lower or higher than the performance data quoted. For performance data current to the most recent month end, visit www.nb.com/performance.
As stated in the Fund's most recent prospectus, the total annual operating expense ratios for fiscal year 2009 were 1.01%, 1.26% and 1.54%, 0.80%, 1.16% and 1.91% for Investor Class, Trust Class, Advisor Class, Institutional Class, Class A and Class C shares, respectively (prior to any fee waivers or expense reimbursements). The expense ratios net of waivers and reimbursements were 1.52%, 0.77%, 1.13% and 1.88% for Advisor Class, Institutional Class, Class A and Class C shares, respectively. Neuberger Berman Management LLC has contractually agreed to limit certain expenses of the Fund through August 31, 2020 for Advisor Class shares and through August 31, 2013 for Institutional Class, Class A and Class C shares.
Total Returns shown with a sales charge reflect the deduction of the current maximum initial sales charge of 5.75% for Class A shares and the applicable contingent deferred sales charges (CDSC) for Class C shares. The maximum CDSC for Class C shares is 1%, which is reduced to 0% after 1 year. The performance of the Fund's share classes will differ primarily due to different sales charge structures and class expenses. Please see the prospectus for more information about sales charge structures, if any, and class expenses for your share class.
Focus Fund
| COMPARISON OF A $10,000 INVESTMENT |
|
This chart shows the value of a hypothetical $10,000 investment in the Fund over the past 10 fiscal years, or since the Fund's inception if it has not operated for 10 years. The graph is based on the Investor Class shares only; performance of other classes will vary due to differences in fee structures and any applicable sales charges (see Performance Highlights chart on previous page). The result is compared with benchmarks, which may include a broad-based market index and/or a narrower index. Please note that market indexes have not been reduced to reflect any of the fees and costs of investing. All results include the reinvestment of income dividends and distributions. Neither the Fund's returns nor the market indexes shown in the graph and table reflect the effect of taxes an investor would pay on Fund distributi ons or on the redemption of Fund shares. Results represent past performance and do not indicate future results.
Genesis Fund Commentary
We witnessed oscillation in investor risk preference during the fiscal year ended August 31, 2010. From September 2009 until the mid-April market high, investors' confidence in the economic recovery translated into a willingness to take on risk in the form of more speculative and economically sensitive stocks. However, as weak economic data called into question the strength and sustainability of the recovery, investors hit the "risk-off" button and rotated into bonds and higher quality companies in less economically sensitive sectors.
Not surprisingly considering our affection for high quality, consistently-profitable companies and our aversion to risk, Neuberger Berman Genesis Fund lagged its Russell 2000® Index benchmark while investors were taking more risk and outperformed when their appetite for risk diminished. We are pleased to report that, for the full 12-month period, the Fund generated a positive return and outperformed its benchmark.
Investments in the Materials sector had the most positive impact on performance relative to the benchmark, with salt and specialty-fertilizer company Compass Minerals and dispenser and closure producer AptarGroup making major contributions. Industrial sector holdings also excelled, led by strong gains from coal mining equipment manufacturers Bucyrus International and Joy Global. Superior relative performance in the Energy sector was driven by solid gains from hydraulic fracturing proppant leader CARBO Ceramics, metallurgical coal producer Alpha Natural Resources, and domestic oil and gas exploration company Concho Resources. We believe most of the aforementioned companies still have attractive upside potential. However, we have pared back our positions in Bucyrus International, Joy Global and Alpha Natural Resources bec ause we believe that Chinese demand for coal may soften as the Chinese government takes actions to cool its economy.
Collectively, our Consumer Discretionary sector investments detracted from relative performance. Two of the biggest disappointments were for-profit education companies Strayer Education and Capella Education. In general, for-profit education companies came under pressure due to new Department of Education (DOE) regulations that threaten to reduce the availability of student loans for for-profit schools. The DOE has set two new criteria, at least one of which must be satisfied for a school to retain full eligibility. While Strayer and Capella have thus far failed to meet one of the criteria, both assert that they should easily satisfy the second. If they make good on this assertion, we believe both stocks can rebound.
Information Technology sector holdings also underperformed. ManTech International, which produces security systems for the Departments of Defense, Homeland Security and State, and foreign government agencies, we believe is really a defense company. We suspect that the stock came under pressure largely due to investor concern over potential cuts in U.S. government defense spending. We believe the stock is currently very cheap and offers an attractive risk/reward profile.
Health Care sector holdings lagged, with veterinary hospital, clinic and lab company VCA Antech among the Fund's poorest performers. VCA earnings were pressured by reduced consumer spending on pet care. However, we think earnings will recover as pet owners resume spending needed to take care of their pets.
The dramatic slowdown in Gross Domestic Product (GDP) growth in the second quarter of 2010 did not surprise us. We had anticipated that, once severely depleted inventories were replenished and government stimulus programs wound down, economic growth would moderate significantly. Now, in our view, the business community and equity investors are beginning to discount uncertainty regarding the near and intermediate term outlook for the economy. Is inflation or deflation the biggest threat? What is the ultimate economic impact of major regulatory overhauls of the health care and financial industries? What is the outlook for taxes? Currently, no one (including us) has answers to these questions. In addition, due to deficit concerns, we believe more financial stimulus from the federal government appears politically unpalatabl e. Most importantly, in our opinion, the American consumer is still overleveraged. Until consumers get their personal balance sheets in better shape, we expect consumer spending and therefore end-demand will remain soft and economic growth will remain uninspiring. We think this is not an encouraging scenario for the broad stock market.
One encouraging note is that stocks are quite cheap relative to fixed income alternatives. At some point, even if the economy remains sluggish, investors may tire of extremely low bond yields and move back into equities. One thing we believe could be quite constructive for the stock market would be for cash-rich corporate America to increase equity dividends, thereby enhancing the attractiveness of stocks relative to bonds.
How are we responding to the aforementioned economic and market uncertainty? By doing the same thing we have always done—searching for high-quality, financially strong small companies capable of consistently growing earnings over the economic cycle. Over the long term, we believe this will continue to be productive.
Sincerely,
Judith M. Vale and Robert D'Alelio
Portfolio Co-Managers
The risks involved in seeking capital appreciation from investments primarily in companies with small market capitalization are set forth in the prospectus and statement of additional information.
Small- and mid-capitalization stocks are more vulnerable to financial risks and other risks than stocks of larger companies. They also trade less frequently and in lower volume than larger company stocks, so their market prices tend to be more volatile.
The composition, industries and holdings of the Fund are subject to change. Genesis Fund is invested in a wide array of stocks and no single holding makes up a significant portion of the Fund's total assets.
Genesis Fund
| TICKER SYMBOLS |
| Investor Class | | NBGNX |
| Trust Class | | NBGEX |
| Advisor Class | | NBGAX |
| Institutional Class | | NBGIX |
| SECTOR ALLOCATION |
| (% of Total Investments) | |
| Consumer Discretionary | | | 5.3 | % |
| Consumer Staples | | | 8.3 | |
| Energy | | | 12.8 | |
| Financials | | | 9.2 | |
| Health Care | | | 18.4 | |
| Industrials | | | 18.8 | |
| Information Technology | | | 10.0 | |
| Materials | | | 9.3 | |
| Utilities | | | 2.9 | |
| Short-Term | | | 5.0 | |
| Total | | | 100.0 | % |
| PERFORMANCE HIGHLIGHTS1,3 |
| | | | | Average Annual Total Return Ended 08/31/2010 |
| | | Inception Date | | 1 Year | | 5 Years | | 10 Years | | Life of Fund |
| Investor Class | | 09/27/1988 | | | 8.41 | % | | | 1.81 | % | | | 8.85 | % | | | 11.68 | % |
Trust Class5 | | 08/26/1993 | | | 8.34 | % | | | 1.76 | % | | | 8.81 | % | | | 11.68 | % |
Advisor Class5 | | 04/02/1997 | | | 8.11 | % | | | 1.50 | % | | | 8.53 | % | | | 11.49 | % |
Institutional Class7 | | 07/01/1999 | | | 8.68 | % | | | 2.03 | % | | | 9.09 | % | | | 11.81 | % |
Russell 2000® Index2,19 | | | | | 6.60 | % | | | –0.69 | % | | | 2.48 | % | | | 8.21 | % |
Performance data quoted represent past performance, which is no guarantee of future results. The investment return and principal value of an investment will fluctuate so that an investor's shares, when redeemed, may be worth more or less than their original cost. Results are shown on a "total return" basis and include reinvestment of all income dividends and distributions.
Current performance may be lower or higher than the performance data quoted. For performance data current to the most recent month end, visit www.nb.com/performance.
As stated in the Fund's most recent prospectus, the total annual operating expense ratios for fiscal year 2009 were 1.10%, 1.14%, 1.40% and 0.89% for Investor Class, Trust Class, Advisor Class and Institutional Class shares, respectively (prior to any fee waivers or expense reimbursement for Institutional Class shares). The expense ratio net of waivers and reimbursements was 0.87% for Institutional Class shares. Neuberger Berman Management LLC has contractually agreed to limit certain expenses of the Fund through August 31, 2020 for Institutional Class and Advisor Class shares and through August 31, 2013 for Trust Class shares.
Genesis Fund
| COMPARISON OF A $10,000 INVESTMENT |
|
This chart shows the value of a hypothetical $10,000 investment in the Fund over the past 10 fiscal years, or since the Fund's inception if it has not operated for 10 years. The graph is based on the Investor Class shares only; performance of other classes will vary due to differences in fee structures and any applicable sales charges (see Performance Highlights chart on previous page). The result is compared with benchmarks, which may include a broad-based market index and/or a narrower index. Please note that market indexes have not been reduced to reflect any of the fees and costs of investing. All results include the reinvestment of income dividends and distributions. Neither the Fund's returns nor the market indexes shown in the graph and table reflect the effect of taxes an investor would pay on Fund distributions or on the redemption of Fund shares. Results represent past performance and do not indicate future results.
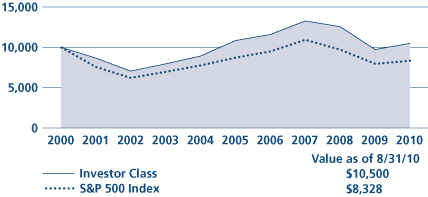
Guardian Fund Commentary
We are pleased to report that, for the fiscal year ended August 31, 2010, Neuberger Berman Guardian Fund generated a positive return and outperformed its benchmark, the S&P 500 Index.
We saw a sharp shift in market sentiment over this fiscal year. For the first two-thirds of the period, the economy was expanding at an above-trend rate—coming off the bottom of the recession, with an inventory cycle underway, and, through April 2010, with active discussion about how the Federal Reserve might begin to exit its quantitative easing program. Against that backdrop, equities performed very well, led by shares of businesses that would be the greatest beneficiaries of a cyclical recovery, including Consumer Discretionary, Industrials, credit-sensitive Financials and Materials.
In late April and early May, as worries about sovereign debt issues in Europe increased, credit markets grew nervous and many equity investors sold their shares. This was the lead-in to the seasonally soft summer months, and throughout the summer, economic statistics—industrial production, employment, spending—weakened. Against this backdrop, some of the sectors that had outperformed came under the most pressure.
Within the Fund, our focus for several years has been on identifying businesses positioned to perform in a slower growth environment on the strength of their products and value to customers. Earlier this period, the shares of many traditional growth sectors performed poorly as investors favored cyclical exposure. As multiples between growth and value converged, we were able to buy high-quality growth companies at what we believe were very attractive prices. That is where we have been adding holdings—in strong businesses, with good secular growth, whose stocks have underperformed. We now have a meaningful Consumer Staples allocation, a different mix in Health Care, and a number of one-off names across the portfolio that share these characteristics.
Examples include Coca-Cola, W.W. Grainger, the industrial distributor, and MasterCard, the debit/credit card payment processing firm. These businesses proved defensive during the downturn, but also demonstrated that they can maintain and protect earnings in an inflationary environment. We believe, given the current environment, that such extremes are not off the table.
For the fiscal year, despite the fact that we were largely underexposed to the best performing sectors early on, we were able to deliver very good relative returns by executing our strategy. The largest contributors to our outperformance this period included three long-term core holdings: Intuit, Altera and Millipore.
We bought Intuit years ago, believing that the business could grow in a tough environment, and in our opinion they have done a remarkable job—through 2008, 2009 and today at a double-digit pace. Altera also outperformed. While it's late in the semiconductor cycle, the secular outlook for Altera, based on what we consider superior technology, has become more apparent. Biosciences firm Millipore was put into play by a hostile acquisition bid from a competitor, and then acquired by a white knight at a premium. During the first quarter of calendar-year 2010, we began to see increased merger and acquisition activity. We expect to see more going forward given the growing strength of corporate balance sheets.
Disappointments included Charles Schwab, a core long-term holding whose business is growing, and that stands to benefit when interest rates eventually rise. The stock underperformed as European debt and U.S. recovery concerns pushed out the likely timeline for rate increases and the related upside earnings potential. We continue to own Schwab, encouraged by management's execution of its business.
Covidien, a Health Care name we added over the winter on the opportunity to buy good secular growth at an attractive value, performed well through early spring. The stock weakened over concerns about slowing utilization of medical services, likely triggered by the coming expiration of extended COBRA benefits. We remain positive about the stock and sector, and continue to own both Covidien and C.R. Bard.
Washington Post, which we owned for its Kaplan education business, was frustrating. While we got the fundamentals right—Kaplan met our expectations for dramatic and contra-cyclical growth—the regulatory environment changed dramatically. As proposed regulations threatened Kaplan's business model, we eliminated our position.
From our perspective, investor expectations seem to have overshot early in the fiscal year, as inventory rebuilding drove GDP growth at a rate that we think is likely to prove greater than the long-term trend. As the fiscal year progressed, credit market volatility in Europe and fears of a double-dip recession appear to have caused sentiment to overshoot on the downside. While we expect there will be challenges ahead, we think odds are that the economy will remain on course for a slow recovery.
In an uncertain world, we remain confident that the high quality businesses represented in the Guardian Fund are financially strong, and positioned to deliver reasonable growth over a wide range of economic outcomes.
As always, we look forward to continuing to serve your investment needs.
Sincerely,

Arthur Moretti
Portfolio Manager
The risks involved in seeking capital appreciation from investments primarily in mid- to large-cap stocks are set forth in the prospectus and statement of additional information.
Mid-capitalization stocks are more vulnerable to financial risks and other risks than larger stocks. They also trade less frequently and in lower volume than larger company stocks, so their market prices tend to be more volatile. Large-cap stocks are subject to all the risks of stock market investing, including the risk that they may lose value due to overall market or economic conditions.
The composition, industries and holdings of the Fund are subject to change. Guardian Fund is invested in a wide array of stocks and no single holding makes up a significant portion of the Fund's total assets.
Guardian Fund
| TICKER SYMBOLS |
| Investor Class | | NGUAX |
| Trust Class | | NBGTX |
| Advisor Class | | NBGUX |
| Institutional Class | | NGDLX |
| Class A | | NGDAX |
| Class C | | NGDCX |
| Class R3 | | NGDRX |
| SECTOR ALLOCATION |
| (% of Total Investments) | |
| Consumer Discretionary | | | 5.4 | % |
| Consumer Staples | | | 8.9 | |
| Energy | | | 13.6 | |
| Financials | | | 11.6 | |
| Health Care | | | 9.3 | |
| Industrials | | | 18.1 | |
| Information Technology | | | 26.6 | |
| Materials | | | 2.6 | |
| Short-Term | | | 3.9 | |
| Total | | | 100.0 | % |
| PERFORMANCE HIGHLIGHTS1,3,8,15 |
| | | | | Average Annual Total Return Ended 08/31/2010 |
| | | Inception Date | | 1 Year | | 5 Years | | 10 Years | | Life of Fund |
| At NAV |
| Investor Class | | 06/01/1950 | | | 7.99 | % | | –0.63 | % | | | 0.49 | % | | | 10.76 | % |
Trust Class5 | | 08/03/1993 | | | 7.75 | % | | –0.79 | % | | | 0.34 | % | | | 10.72 | % |
Advisor Class5 | | 09/03/1996 | | | 7.38 | % | | –1.21 | % | | | –0.04 | % | | | 10.61 | % |
Institutional Class22 | | 05/27/2009 | | | 8.22 | % | | –0.57 | % | | | 0.52 | % | | | 10.76 | % |
Class A21 | | 05/27/2009 | | | 7.72 | % | | –0.67 | % | | | 0.47 | % | | | 10.75 | % |
Class C21 | | 05/27/2009 | | | 7.08 | % | | –0.85 | % | | | 0.38 | % | | | 10.74 | % |
Class R321 | | 05/27/2009 | | | 7.51 | % | | –0.72 | % | | | 0.44 | % | | | 10.75 | % |
| With Sales Charge |
Class A21 | | | | | 1.57 | % | | –1.84 | % | | | –0.12 | % | | | 10.65 | % |
Class C21 | | | | | 6.08 | % | | –0.85 | % | | | 0.38 | % | | | 10.74 | % |
| Index |
S&P 500 Index2,19 | | | | | 4.91 | % | | –0.91 | % | | | –1.81 | % | | | 10.65 | % |
Performance data quoted represent past performance, which is no guarantee of future results. The investment return and principal value of an investment will fluctuate so that an investor's shares, when redeemed, may be worth more or less than their original cost. Results are shown on a "total return" basis and include reinvestment of all income dividends and distributions.
Current performance may be lower or higher than the performance data quoted. For performance data current to the most recent month end, visit www.nb.com/performance.
As stated in the Fund's most recent prospectus, the total annual operating expense ratios for fiscal year 2009 were 0.97%, 1.15%, 5.33%, 0.81%, 1.17%, 1.92% and 1.42% for Investor Class, Trust Class, Advisor Class, Institutional Class, Class A, Class C and Class R3 shares, respectively (prior to any fee waivers or expense reimbursements). The expense ratios net of waivers and reimbursements were 1.51%, 0.75%, 1.11%, 1.86% and 1.36% for Advisor Class, Institutional Class, Class A, Class C and Class R3 shares, respectively. Neuberger Berman Management LLC has contractually agreed to limit certain expenses of the Fund through August 31, 2020 for Advisor Class shares, through August 31, 2013 for Institutional Class, Class A, Class C and Class R3 shares.
Total Returns shown with a sales charge reflect the deduction of the current maximum initial sales charge of 5.75% for Class A shares and the applicable contingent deferred sales charges (CDSC) for Class C shares. The maximum CDSC for Class C shares is 1%, which is reduced to 0% after 1 year. The performance of the Fund's share classes will differ primarily due to different sales charge structures and class expenses. Please see the prospectus for more information about sales charge structures, if any, and class expenses for your share class.
Guardian Fund
| COMPARISON OF A $10,000 INVESTMENT |
|
This chart shows the value of a hypothetical $10,000 investment in the Fund over the past 10 fiscal years, or since the Fund's inception if it has not operated for 10 years. The graph is based on the Investor Class shares only; performance of other classes will vary due to differences in fee structures and any applicable sales charges (see Performance Highlights chart on previous page). The result is compared with benchmarks, which may include a broad-based market index and/or a narrower index. Please note that market indexes have not been reduced to reflect any of the fees and costs of investing. All results include the reinvestment of income dividends and distributions. Neither the Fund's returns nor the market indexes shown in the graph and table reflect the effect of taxes an investor would pay on Fund distributi ons or on the redemption of Fund shares. Results represent past performance and do not indicate future results.
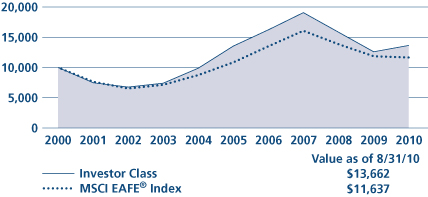
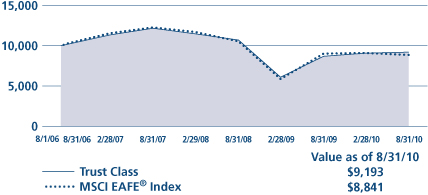
International Fund Commentary
We are pleased to report that, for the fiscal year ended August 31, 2010, Neuberger Berman International Fund posted a positive return and significantly outperformed its benchmark, the MSCI EAFE® Index.
The MSCI EAFE Index was down slightly for the 12-month reporting period. The rally that had taken place in calendar-year 2009 began to peter out at the end of the first quarter of calendar-year 2010, with the markets turning dramatically negative in the second quarter, as the index declined by nearly 14% when concerns about European sovereign debt worsened. While markets recovered somewhat by fiscal year-end, the volatility continued as investors appeared to remain undecided on the state of the global economic recovery.
The MSCI EAFE Index underperformed both the S&P 500 Index and the MSCI Emerging Markets Index this fiscal period. Within the EAFE index, Consumer Staples was the best performing sector, with Telecommunications and Industrials adding incrementally to performance. In contrast, Financials were quite negative, followed by Energy and Utilities. On a country basis, the U.K., Switzerland and Sweden contributed significantly to index performance, while Japan, France and Spain were most detrimental to performance.
The Fund's substantial outperformance relative to its benchmark was driven primarily by stock selection, although sector allocation was also positive. The Fund added value in eight of 10 sectors, with significant outperformance in Energy, Materials and Financials. Our two disappointments this period were Health Care and Consumer Staples. In terms of countries, Canada, the U.K. and Germany were most positive for the Fund, while Australia, Hong Kong and Greece were weakest.
Within Energy, top contributors included Cairn, a U.K.-based oil company, which rose on news that it had secured contracts to sell oil at better-than-expected prices, Pacific Rubiales, a Canadian-listed oil and natural gas producer with assets in South America, up due to production growth and continued exploration success in its Quifa field, and Ultrapar, an oil and gas distributor, which benefited from the strength of the Brazilian economic recovery. In Materials, Croda, a U.K.-based global specialty chemical company, outperformed, as did Eldorado Gold, releasing strong results and raising guidance provided regarding their earnings due to better-than-expected production. In Financials, we had some disappointments—including National Bank of Greece (sold in the fourth quarter of calendar-year 2009), as well as CNP Assurances, a French insurer, and Deutsche Boerse, a transaction-services provider for the securities industry, both of which we continue to hold. Overall, however, our holdings in the sector outperformed. In Health Care, where we underperformed, iSOFT, an Australia-based health care software company, Ipsen, a French specialty pharmaceuticals firm, and Nobel Biocare, a Swiss dental implants manufacturer, disappointed. We sold our position in Nobel.
Given the uncertain environment, the Fund remains somewhat defensively positioned. In Europe, the Fund has limited exposure to the economies we consider weakest, notably Greece. European holdings are concentrated in companies that operate globally, and are likely beneficiaries of a weaker euro (as German businesses have been). Relative to the benchmark, the Fund remains underweighted in Japan, where we struggle to identify high-quality companies, and Australia, where we find valuations unattractive. The Fund is overweighted in emerging markets, notably Brazil, where we think the upcoming presidential election is unlikely to affect pro-growth economic policies. We continue to be less concerned about China's tightening measures, believing the country will still generate strong GDP growth; and while wage hikes in China hav e made news this year, we believe they pose little threat to the profitability of the companies we hold (which include Chinese companies and developed market companies with operations there).
From a sector perspective, the Fund's largest underweight is Financials, where we find little valuation support for less profitable business models under new regulations. Although the recently announced Basel III banking regulations appear less onerous than many expected, uncertainty remains around many key details. We are avoiding Utilities—generally low growth, highly capital-intensive businesses. The Fund is modestly overweighted in Materials, with exposure to agriculture-related and specialty chemical companies with pricing power and relatively stable end markets. Lastly, the
Fund is overweighted in Information Technology; despite corporations' reluctance to invest in new projects, we continue to see strong demand for replacement products.
In our opinion, macro issues—such as elections, regulatory changes, and government debt concerns—will likely continue to affect markets through the remainder of the year. European sovereign debt issues have yet to be resolved, so while certain bright spots like Germany exist, growth overall is likely to be constrained as European, and many other developed countries' governments, have shifted from stimulus spending toward greater fiscal restraint. Considering this, and the fact that U.S. economic data remain mixed (with a stubbornly high unemployment rate), we believe the global growth story, or at least market sentiment, will be reliant on emerging markets. We anticipate investors will be sensitive to news flow in these markets until a recovery in the developed world firmly takes hold.
While we expect markets to remain focused on macro issues, our holdings are geared to longer-term structured opportunities in areas like raw materials, emerging markets, technology and telecommunications. We believe these high-quality firms will to continue to execute despite uncertainty.
Sincerely,
Benjamin Segal
Portfolio Manager
The risks involved in seeking capital appreciation from investments primarily in companies based outside the United States are set forth in the prospectus and statement of additional information.
Investing in foreign securities involves greater risks than investing in securities of U.S. issuers, including currency fluctuations, changes in local economic and political conditions, and the need to operate in less regulated financial markets. These risks are typically heightened for investments in emerging markets.
The composition, industries and holdings of the Fund are subject to change. In an attempt to reduce overall volatility, International Fund diversifies the portfolio holdings over a wide array of countries and individual stocks.
International Fund
| TICKER SYMBOLS |
| Investor Class | | NBISX |
| Trust Class | | NBITX |
| SECTOR ALLOCATION |
| (% of Total Investments) |
| Consumer Discretionary | | | 11.1 | % |
| Consumer Staples | | | 10.2 | |
| Energy | | | 8.2 | |
| Financials | | | 16.4 | |
| Health Care | | | 7.1 | |
| Industrials | | | 14.4 | |
| Information Technology | | | 9.3 | |
| Materials | | | 12.1 | |
| Telecommunication Services | | | 8.2 | |
| Short-Term | | | 3.0 | |
| Total | | | 100.0 | % |
| PERFORMANCE HIGHLIGHTS1,3,8,16 |
| | | | | Average Annual Total Return Ended 08/31/2010 |
| | | Inception Date | | 1 Year | | 5 Years | | 10 Years | | Life of Fund |
| Investor Class | | 06/15/1994 | | | 8.26 | % | | | 0.14 | % | | | 3.17 | % | | | 6.84 | % |
Trust Class5 | | 06/29/1998 | | | 8.18 | % | | | 0.06 | % | | | 3.31 | % | | | 7.06 | % |
MSCI EAFE® Index2,19 | | | | | –1.93 | % | | | 1.43 | % | | | 1.53 | % | | | 4.42 | % |
Performance data quoted represent past performance, which is no guarantee of future results. The investment return and principal value of an investment will fluctuate so that an investor's shares, when redeemed, may be worth more or less than their original cost. Results are shown on a "total return" basis and include reinvestment of all income dividends and distributions.
Current performance may be lower or higher than the performance data quoted. For performance data current to the most recent month end, visit www.nb.com/performance.
As stated in the Fund's most recent prospectus, the total annual operating expense ratios for fiscal year 2009 were 1.42% and 1.51% for Investor Class and Trust Class shares, respectively.Neuberger Berman Management LLC has contractually agreed to limit certain expenses of the Fund through August 31, 2013 for Investor Class shares and August 31, 2020 for Trust Class shares.
| COMPARISON OF A $10,000 INVESTMENT |
|
This chart shows the value of a hypothetical $10,000 investment in the Fund over the past 10 fiscal years, or since the Fund's inception if it has not operated for 10 years. The graph is based on the Investor Class shares only; performance of other classes will vary due to differences in fee structures and any applicable sales charges (see Performance Highlights chart above). The result is compared with benchmarks, which may include a broad-based market index and/or a narrower index. Please note that market indexes have not been reduced to reflect any of the fees and costs of investing. All results include the reinvestment of income dividends and distributions. Neither the Fund's returns nor the market indexes shown in the graph and table reflect the effect of taxes an investor would pay on Fund distributions or on the redemption of Fund shares. Results represent past performance and do not indicate future results.
International Institutional Fund Commentary
We are pleased to report that, for the fiscal year ended August 31, 2010, Neuberger Berman International Institutional Fund posted a positive return and significantly outperformed its benchmark, the MSCI EAFE® Index.
The MSCI EAFE Index was down slightly for the 12-month reporting period. The rally that had taken place in calendar-year 2009 began to peter out at the end of the first quarter of calendar-year 2010, with the markets turning dramatically negative in the second quarter, as the index declined by nearly 14% when concerns about European sovereign debt worsened. While markets recovered somewhat by fiscal year-end, the volatility continued as investors appeared to remain undecided on the state of the global economic recovery.
The MSCI EAFE Index underperformed both the S&P 500 Index and the MSCI Emerging Markets Index this fiscal period. Within the EAFE index, Consumer Staples was the best performing sector, with Telecommunications and Industrials adding incrementally to performance. In contrast, Financials were quite negative, followed by Energy and Utilities. On a country basis, the U.K., Switzerland and Sweden contributed significantly to index performance, while Japan, France and Spain were most detrimental to performance.
The Fund's substantial outperformance relative to its benchmark was driven primarily by stock selection, although sector allocation was also positive. The Fund added value in eight of 10 sectors, with significant outperformance in Energy, Materials and Financials. Our two disappointments this period were Health Care and Consumer Staples. In terms of countries, Canada, the U.K. and Germany were most positive for the Fund, while Australia, Hong Kong and Greece were weakest.
Within Energy, top contributors included Cairn, a U.K.-based oil company, which rose on news that it had secured contracts to sell oil at better-than-expected prices, Pacific Rubiales, a Canadian-listed oil and natural gas producer with assets in South America, up due to production growth and continued exploration success in its Quifa field, and Ultrapar, an oil and gas distributor, which benefited from the strength of the Brazilian economic recovery. In Materials, Croda, a U.K.-based global specialty chemical company, outperformed, as did Eldorado Gold, releasing strong results and raising guidance provided regarding their earnings due to better-than-expected production. In Financials, we had some disappointments—including National Bank of Greece (sold in the fourth quarter of calendar-year 2009), as well as CNP Assurances, a French insurer, and Deutsche Boerse, a transaction-services provider for the securities industry, both of which we continue to hold. Overall, however, our holdings in the sector outperformed. In Health Care, where we underperformed, iSOFT, an Australia-based health care software company, Ipsen, a French specialty pharmaceuticals firm, and Nobel Biocare, a Swiss dental implants manufacturer, disappointed. We sold our position in Nobel.
Given the uncertain environment, the Fund remains somewhat defensively positioned. In Europe, the Fund has limited exposure to the economies we consider weakest, notably Greece. European holdings are concentrated in companies that operate globally, and are likely beneficiaries of a weaker euro (as German businesses have been). Relative to the benchmark, the Fund remains underweighted in Japan, where we struggle to identify high-quality companies, and Australia, where we find valuations unattractive. The Fund is overweighted in emerging markets, notably Brazil, where we think the upcoming presidential election is unlikely to affect pro-growth economic policies. We continue to be less concerned about China's tightening measures, believing the country will still generate strong GDP growth; and while wage hikes in China hav e made news this year, we believe they pose little threat to the profitability of the companies we hold (which include Chinese companies and developed market companies with operations there).
From a sector perspective, the Fund's largest underweight is Financials, where we find little valuation support for less profitable business models under new regulations. Although the recently announced Basel III banking regulations appear less onerous than many expected, uncertainty remains around many key details. We are avoiding Utilities—generally low growth, highly capital-intensive businesses. The Fund is modestly overweighted in Materials, with exposure to agriculture-related and specialty chemical companies with pricing power and relatively stable end markets. Lastly, the
Fund is overweighted in Information Technology; despite corporations' reluctance to invest in new projects, we continue to see strong demand for replacement products.
In our opinion, macro issues—such as elections, regulatory changes, and government debt concerns—will likely continue to affect markets through the remainder of the year. European sovereign debt issues have yet to be resolved, so while certain bright spots like Germany exist, growth overall is likely to be constrained as European, and many other developed countries' governments, have shifted from stimulus spending toward greater fiscal restraint. Considering this, and the fact that U.S. economic data remain mixed (with a stubbornly high unemployment rate), we believe the global growth story, or at least market sentiment, will be reliant on emerging markets. We anticipate investors will be sensitive to news flow in these markets until a recovery in the developed world firmly takes hold.
While we expect markets to remain focused on macro issues, our holdings are geared to longer-term structured opportunities in areas like raw materials, emerging markets, technology and telecommunications. We believe these high-quality firms will to continue to execute despite uncertainty.
Sincerely,
Benjamin Segal
Portfolio Manager
The risks involved in seeking capital appreciation from investments primarily in companies based outside the United States are set forth in the prospectus and statement of additional information.
Investing in foreign securities involves greater risks than investing in securities of U.S. issuers, including currency fluctuations, changes in local economic and political conditions, and the need to operate in less regulated financial markets. These risks are typically heightened for investments in emerging markets.
The composition, industries and holdings of the Fund are subject to change. In an attempt to reduce overall volatility, International Institutional Fund diversifies the portfolio holdings over a wide array of countries and individual stocks.
International Institutional Fund
| TICKER SYMBOLS |
| Institutional Class | | NBIIX |
| SECTOR ALLOCATION |
| (% of Total Investments) | |
| Consumer Discretionary | | | 11.1 | % |
| Consumer Staples | | | 10.3 | |
| Energy | | | 8.3 | |
| Financials | | | 16.5 | |
| Health Care | | | 7.2 | |
| Industrials | | | 14.5 | |
| Information Technology | | | 9.4 | |
| Materials | | | 12.2 | |
| Telecommunication Services | | | 8.3 | |
| Short-Term | | | 2.2 | |
| Total | | | 100.0 | % |
| PERFORMANCE HIGHLIGHTS1,3,8 |
| | | | | Average Annual Total Return Ended 08/31/2010 |
| | | Inception Date | | 1 Year | | 5 Years | | Life of Fund |
| Institutional Class | | 06/17/2005 | | | 9.05 | % | | | –0.02 | % | | | 1.74 | % |
MSCI EAFE® Index2,19 | | | | | –1.93 | % | | | 1.43 | % | | | 2.51 | % |
Performance data quoted represent past performance, which is no guarantee of future results. The investment return and principal value of an investment will fluctuate so that an investor's shares, when redeemed, may be worth more or less than their original cost. Results are shown on a "total return" basis and include reinvestment of all income dividends and distributions.
Current performance may be lower or higher than the performance data quoted. For performance data current to the most recent month end, visit www.nb.com/performance.
As stated in the Fund's most recent prospectus, the total annual operating expense ratio for fiscal year 2009 was 1.28% for Institutional Class shares (prior to any fee waivers or expense reimbursements). The expense ratio net of waivers and reimbursements was 0.83% for Institutional Class shares. Neuberger Berman Management LLC has contractually agreed to limit certain expenses of the Fund through August 31, 2020 for Institutional Class shares.
| COMPARISON OF A $10,000 INVESTMENT |
|
This chart shows the value of a hypothetical $10,000 investment in the Fund over the past 10 fiscal years, or since the Fund's inception if it has not operated for 10 years. The graph is based on the Institutional Class shares only; performance of other classes will vary due to differences in fee structures and any applicable sales charges (see Performance Highlights chart above). The result is compared with benchmarks, which may include a broad-based market index and/or a narrower index. Please note that market indexes have not been reduced to reflect any of the fees and costs of investing. All results include the reinvestment of income dividends and distributions. Neither the Fund's returns nor the market indexes shown in the graph and table reflect the effect of taxes an investor would pay on Fund distributions or on the redemption of Fund shares. Results represent past performance and do not indicate future results.
International Large Cap Fund Commentary
We are pleased to report that, for the fiscal year ended August 31, 2010, Neuberger Berman International Large Cap Fund posted a positive return and significantly outperformed its benchmark, the MSCI EAFE® Index.
The MSCI EAFE Index was down slightly for the 12-month reporting period. The rally that had taken place in calendar-year 2009 began to peter out at the end of the first quarter of calendar-year 2010, with the markets turning dramatically negative in the second quarter, as the index declined by nearly 14% when concerns about European sovereign debt worsened. While markets recovered somewhat by fiscal year-end, the volatility continued as investors appeared to remain undecided on the state of the global economic recovery.
The MSCI EAFE Index underperformed both the S&P 500 Index and the MSCI Emerging Markets Index this fiscal period. Within the EAFE index, Consumer Staples was far and away the best performing sector, with Telecommunications and Industrials adding incrementally to performance. In contrast, Financials were quite negative, followed by Energy and Utilities. On a country basis, the U.K., Switzerland and Sweden contributed significantly, while Japan, France and Spain were most detrimental to performance.
The Fund's substantial outperformance this period relative to the benchmark was driven primarily by stock selection, although sector allocation was also positive. The Fund added value in eight of 10 sectors, with significant outperformance in Financials, Materials and Energy. Our two disappointments this period were Health Care and Consumer Staples. In terms of countries, India, Canada and the U.K. were most positive for the Fund, while Australia, Hong Kong and France were weakest.
Within Financials, State Bank of India was a top contributor, as the bank reported numbers far ahead of consensus. While stock selection across the sector was strong, the sector also included some of our largest disappointments—National Bank of Greece, and, U.K. bank Barclays (both of which we sold), as well as Deutsche Boerse, a transaction services provider for the securities industry. In Materials, Eldorado Gold outperformed, releasing strong results and raising guidance due to better-than-expected production, as did the Swiss specialty chemicals company Givaudan. In Energy, top contributors included Cairn, a U.K.-based oil company, which secured contracts to sell oil at better-than-expected prices, and Pacific Rubiales, a Canadian-listed oil and gas firm with South American assets, which rose dramatically due to production growth and continued exploration success in its Quifa field. Bankers Petroleum, a Canadian oil and gas exploration and production company with assets in Albania, was a detractor. The stock declined on concerns over Europe. In Health Care, where we underperformed, Ipsen, a French specialty pharmaceuticals firm, and Nobel Biocare, a Swiss dental implants manufacturer, each disappointed. We sold our position in Nobel.
Given the uncertain environment, the Fund remains somewhat defensively positioned. In Europe, we have limited exposure to the economies we consider weakest, notably Greece. European holdings are concentrated in companies that operate globally, and are likely beneficiaries of a weaker Euro, as Germany has been. Relative to the benchmark, the Fund remains underweighted in Japan, where we struggle to identify high-quality companies, and Australia, where we find valuations unattractive. The Fund is overweighted in emerging markets, notably Brazil, where we think the upcoming presidential election is unlikely to affect pro-growth economic policies. We continue to be less concerned about China's tightening measures, believing the country will still generate strong GDP growth; and while wage hikes in China have made news this year, we believe they pose little threat to the profitability of the companies we hold (including Chinese companies and developed-market companies with operations there).
From a sector perspective, the Fund's largest underweight is Financials, where we find little valuation support for less profitable business models under new regulations. Although the recently announced Basel III banking regulations appear less onerous than many expected, uncertainty remains regarding many key details. We continue to avoid Utilities—generally low-growth, highly capital-intensive businesses. The Fund is modestly overweighted in Materials, with exposure to agriculture-related and specialty chemical companies with pricing power and relatively stable end markets. Lastly, the
Fund is overweighted in Information Technology; despite corporations' reluctance to invest in new projects, we continue to see strong demand for replacement products.
In our opinion, macro issues—such as elections, regulatory changes and government debt concerns—will likely continue to affect markets through the remainder of the year. European sovereign debt issues have yet to be resolved, so while certain bright spots like Germany exist, overall growth is likely to be constrained as European, and many other governments in developed countries, have shifted from stimulus spending toward greater fiscal restraint. Considering this, and the fact that U.S. economic data remain mixed (with a stubbornly high unemployment rate), we expect the global growth story, or at least market sentiment, to be reliant on emerging markets. We anticipate investors will be sensitive to news flow in these markets until a recovery in the developed world firmly takes hold.
While we expect markets to remain focused on macro issues, our holdings are geared to longer-term structured opportunities in areas like raw materials, emerging markets, technology and telecommunications. We believe these high-quality firms in the portfolio will to continue to execute despite uncertainty.
Sincerely,

Benjamin Segal
Portfolio Manager
The risks involved in seeking capital appreciation from investments primarily in companies based outside the United States and from investments in large-cap stocks are set forth in the prospectus and statement of additional information.
Investing in foreign securities involves greater risks than investing in securities of U.S. issuers, including currency fluctuations, changes in local economic and political conditions, and the need to operate in less regulated financial markets. These risks are typically heightened for investments in emerging markets.
Investing in the stocks of even the largest companies involves all the risks of stock market investing, including the risk that they may lose value due to overall market or economic conditions.
The composition, industries and holdings of the Fund are subject to change. In an attempt to reduce overall volatility, International Large Cap Fund diversifies the portfolio holdings over a wide array of countries and individual stocks.
International Large Cap Fund
| TICKER SYMBOLS |
| Trust Class | | NILTX |
| Institutional Class | | NILIX |
| Class A | | NBNAX |
| Class C | | NBNCX |
| Class R3 | | NBNRX |
| SECTOR ALLOCATION |
| (% of Total Investments) | |
| Consumer Discretionary | | | 11.0 | % |
| Consumer Staples | | | 8.7 | |
| Energy | | | 9.3 | |
| Financials | | | 18.2 | |
| Health Care | | | 8.4 | |
| Industrials | | | 14.5 | |
| Information Technology | | | 7.6 | |
| Materials | | | 12.8 | |
| Telecommunication Services | | | 6.9 | |
| Short-Term | | | 2.6 | |
| Total | | | 100.0 | % |
| PERFORMANCE HIGHLIGHTS1,3,8 |
| | | | | Average Annual Total Return Ended 08/31/2010 |
| | | Inception Date | | 1 Year | | Life of Fund |
| At NAV |
| Trust Class | | 08/01/2006 | | | 5.87 | % | | | –2.04 | % |
Institutional Class7 | | 10/06/2006 | | | 6.29 | % | | | –1.70 | % |
Class A18 | | 12/20/2007 | | | 5.87 | % | | | –2.03 | % |
Class C18 | | 12/20/2007 | | | 5.02 | % | | | –2.52 | % |
Class R318 | | 05/27/2009 | | | 5.57 | % | | | –2.13 | % |
| With Sales Charge |
Class A18 | | | | | –0.19 | % | | | –3.44 | % |
Class C18 | | | | | 4.02 | % | | | –2.52 | % |
| Index |
MSCI EAFE® Index2,19 | | | | | –1.93 | % | | | –2.97 | % |
Performance data quoted represent past performance, which is no guarantee of future results. The investment return and principal value of an investment will fluctuate so that an investor's shares, when redeemed, may be worth more or less than their original cost. Results are shown on a "total return" basis and include reinvestment of all income dividends and distributions.
Current performance may be lower or higher than the performance data quoted. For performance data current to the most recent month end, visit www.nb.com/performance.
As stated in the Fund's most recent prospectus, the total annual operating expense ratios for fiscal year 2009 were 1.75%, 1.32%, 2.19%, 3.96% and 1.90% for Trust Class, Institutional Class, Class A, Class C and Class R3 shares, respectively (prior to any fee waivers or expense reimbursements). The expense ratios net of waivers and reimbursements were 1.29%, 0.94%, 1.33%, 2.03% and 1.53% for Trust Class, Institutional Class, Class A, Class C and Class R3 shares, respectively. Neuberger Berman Management LLC has contractually agreed to limit certain expenses of the Fund through August 31, 2013 for Trust Class, Institutional Class, Class A and Class C shares and Class R3 shares.
Total Returns shown with a sales charge reflect the deduction of the current maximum initial sales charge of 5.75% for Class A shares and the applicable contingent deferred sales charges (CDSC) for Class C shares. The maximum CDSC for Class C shares is 1%, which is reduced to 0% after 1 year. The performance of the Fund's share classes will differ primarily due to different sales charge structures and class expenses. Please see the prospectus for more information about sales charge structures, if any, and class expenses for your share class.
International Large Cap Fund
| COMPARISON OF A $10,000 INVESTMENT |
|
This chart shows the value of a hypothetical $10,000 investment in the Fund over the past 10 fiscal years, or since the Fund's inception if it has not operated for 10 years. The graph is based on the Trust Class shares only; performance of other classes will vary due to differences in fee structures and any applicable sales charges (see Performance Highlights chart on previous page). The result is compared with benchmarks, which may include a broad-based market index and/or a narrower index. Please note that market indexes have not been reduced to reflect any of the fees and costs of investing. All results include the reinvestment of income dividends and distributions. Neither the Fund's returns nor the market indexes shown in the graph and table reflect the effect of taxes an investor would pay on Fund distributions or on the redemption of Fund shares. Results represent past performance and do not indicate future results.
Intrinsic Value Fund Commentary
Neuberger Berman Intrinsic Value Fund performed well this reporting period, exceeding the returns of its benchmark, the Russell 2000® Value Index, for the fiscal year ended August 31, 2010.
While Neuberger Berman Intrinsic Value Fund is relatively new, the strategy is not. The Fund represents the continuation of a time-tested philosophy that started in 1997 and has continued under consistent leadership for the past 13 years. Our team—portfolio managers supported by a highly seasoned analyst team with long tenures in the small-cap space—is focused on identifying stocks of small-cap companies that we believe are trading at a significant discount to their "intrinsic value," or our estimate of the companies' true long-term worth.
The portfolio is managed from an "intelligent contrarian" point of view. Since stock valuations represent the aggregated judgment of individuals, sentiments can run to extremes about companies, sectors and the market as a whole. Our objective is to intelligently and rationally invest in those areas where we think emotions have run too high, and sentiment has become too negative. We take a long-term, thoughtful, value approach, believing we can drive meaningful shareholder appreciation by thinking differently about out-of-favor companies. This approach has been tested across several major market and economic cycles during the strategy's lifetime.
We see the strategy's key advantages deriving from three characteristics: our disciplined value approach, our long-term perspective versus market players driven by short-term factors and momentum considerations, and our requirement for an identified catalyst that can unlock the value that we see in candidate companies.
In calculating the intrinsic valuations of the stocks we take under consideration, we evaluate companies the same way private equity firms do—as though we were going to buy the company in its entirety today. We consider factors including underappreciated assets, the quality of a company's customer base, and whether the balance sheet is strong enough to get the company through difficult times.
Through our work, we have found that market inefficiencies which create undervalued companies follow patterns. As such, our companies typically fall into three categories. They may be complicated and trading in a market that values simplicity; they may be cyclical businesses at the bottom of an economic cycle; or they may be growth companies with short-term earnings or revenue misses, which disappoint momentum-oriented growth investors. Generally speaking, we seek long-term opportunities in companies facing short-term challenges.
The Fund this period demonstrated characteristics that have been common to the strategy over time. We have historically underweighted relative to the benchmark both Financial Services and Consumer Discretionary names, two areas that led the market from February through April this year. Instead, we tend to overweight Manufacturing, Technology and Health Care companies, areas where we think our fundamental research effort can add more value. Five of our top contributors this period were IT companies, including standouts Verint and ARM Holdings. Not surprisingly, as Technology was our largest allocation this period, it also contained some disappointments, such as Arris Group and Brocade.
Taking the fiscal year as a whole, the decisions that were most beneficial to the Fund were within the Producer Durables, Consumer Staples, and Materials & Processing areas. We were weakest relative to the benchmark in Consumer Discretionary, where our underweight was a drag as the sector rallied. Later, however, as domestic economic data revealed a more cautious level of consumer spending and anemic job creation, these sectors reversed, benefiting our relative performance through August.
Financial events over the last two years and the ensuing market volatility have forced investment professionals of all stripes to develop macroeconomic opinions and incorporate sector awareness into portfolio construction. We believe it's no longer sufficient to say we are simply stock pickers. We view the market's earlier rally in Consumer Discretionary and Financial Services stocks as a possible preview of sectors that could lead if sentiment improves. So, after extensive analysis, we have begun selectively increasing our allocations to these sectors. In Financial Services companies, we are targeting credit recovery plays and strong regional players that seem to be on course to acquire what we consider attractively priced assets. On the consumer side, we added a specialty retailer and are monitoring candidates in reta il and casual dining.
Looking ahead, although the current market is colored by uncertainty and risk aversion, we believe stock prices have discounted many of the challenges of a slow-growth global economy. Rather than viewing disappointing data points through a pessimistic lens, we prefer the assumption that the long-term trend of prosperity and growth in standards of living will continue, even in the face of serious challenges and inevitable setbacks. However, we also believe that intelligent policies concerning entitlement reform, taxation and regulation are essential to ensuring a healthier economic climate and improving investor sentiment.
Thank you for your confidence. We look forward to continue serving your investment needs.
Sincerely,


Benjamin H. Nahum, James F. McAree and Amit Solomon
Portfolio Co-Managers
The risks involved in seeking capital appreciation from investments primarily in companies with small- and mid-cap stocks are set forth in the prospectus and statement of additional information.
Small- and mid-capitalization stocks are more vulnerable to financial risks and other risks than stocks of larger companies. They also trade less frequently and in lower volume than larger company stocks, so their market prices tend to be more volatile. Large-cap stocks are subject to all the risks of stock market investing, including the risk that they may lose value due to overall market or economic conditions.
The composition, industries and holdings of the Fund are subject to change. Intrinsic Value Fund is invested in a wide array of stocks and no single holding makes up a significant portion of the Fund's total assets.
Intrinsic Value Fund
| TICKER SYMBOLS |
| Institutional Class | | NINLX |
| Class A | | NINAX |
| Class C | | NINCX |
| SECTOR ALLOCATION |
| (% of Total Investments) |
| Consumer Discretionary | | | 8.9 | % |
| Consumer Staples | | | 2.5 | |
| Energy | | | 4.6 | |
| Financial Services | | | 11.7 | |
| Health Care | | | 10.5 | |
| Materials & Processing | | | 4.5 | |
| Producer Durables | | | 24.6 | |
| Technology | | | 25.3 | |
| Utilities | | | 6.0 | |
| Short-Term | | | 1.4 | |
| Total | | | 100.0 | % |
| PERFORMANCE HIGHLIGHTS1,3 |
| | | | | Average Annual Total Return Ended 08/31/2010 |
| | | Inception Date | | 1 Year | | 5 Year | | 10 Year | | Life of Fund |
| At NAV |
Institutional Class24 | | 05/10/2010 | | | 6.68 | % | | | 3.35 | % | | | 7.75 | % | | | 10.18 | % |
Class A24 | | 05/10/2010 | | | 6.56 | % | | | 3.33 | % | | | 7.74 | % | | | 10.17 | % |
Class C24 | | 05/10/2010 | | | 6.34 | % | | | 3.28 | % | | | 7.72 | % | | | 10.15 | % |
| With Sales Charge |
Class A24 | | | | | 0.44 | % | | | 2.11 | % | | | 7.10 | % | | | 9.67 | % |
Class C24 | | | | | 5.34 | % | | | 3.28 | % | | | 7.72 | % | | | 10.15 | % |
| Index |
Russell 2000® Value Index2,19 | | | | | 6.06 | % | | | –1.33 | % | | | 6.56 | % | | | 6.45 | % |
Russell 2000® Index2,19 | | | | | 6.60 | % | | | –0.69 | % | | | 2.48 | % | | | 4.57 | % |
The inception date for Neuberger Berman Intrinsic Value Fund Class A, Class C and Institutional Class shares is May 10, 2010. Performance prior to the date is that of the Fund's predecessor, the DJG Small Cap Value Fund L.P., an unregistered limited partnership ("DJG Fund"); DJG Fund was the successor to The DJG Small Cap Value Fund, an unregistered commingled investment account ("DJG Account"), which had similar investment goals, strategies, and portfolio management team. See footnote 24 for information about the effects of the different fees paid by each class.
Performance data quoted represent past performance, which is no guarantee of future results. The investment return and principal value of an investment will fluctuate so that an investor's shares, when redeemed, may be worth more or less than their original cost. Results are shown on a "total return" basis and include reinvestment of all income dividends and distributions.
Current performance may be lower or higher than the performance data quoted. For performance data current to the most recent month end, visit www.nb.com/performance.
As stated in the Fund's most recent prospectus, the total annual operating expense ratios for fiscal year 2009 were 1.28%, 1.64% and 2.39% for Institutional Class, Class A and Class C shares, respectively (prior to any fee waivers or expense reimbursements). The expense ratios net of waivers and reimbursements were 1.00%, 1.36% and 2.11% Institutional Class, Class A and Class C shares, respectively. Neuberger Berman Management LLC has contractually agreed to limit certain expenses of the Fund through August 31, 2013 for Institutional Class, Class A and Class C shares.
Total Returns shown with a sales charge reflect the deduction of the current maximum initial sales charge of 5.75% for Class A shares and the applicable contingent deferred sales charges (CDSC) for Class C shares. The maximum CDSC for Class C shares is 1%, which is reduced to 0% after 1 year. The performance of the Fund's share classes will differ primarily due to different sales charge structures and class expenses. Please see the prospectus for more information about sales charge structures, if any, and class expenses for your share class.
Intrinsic Value Fund
| COMPARISON OF A $10,000 INVESTMENT24 |
|
This chart shows the value of a hypothetical $10,000 investment in the Fund over the past 10 fiscal years, or since the Fund's inception if it has not operated for 10 years. The graph is based on the Institutional Class shares only; performance of other classes will vary due to differences in fee structures and any applicable sales charges (see Performance Highlights chart on previous page). The result is compared with benchmarks, which may include a broad-based market index and/or a narrower index. Please note that market indexes have not been reduced to reflect any of the fees and costs of investing. All results include the reinvestment of income dividends and distributions. Neither the Fund's returns nor the market indexes shown in the graph and table reflect the effect of taxes an investor would pay on Fund distribu tions or on the redemption of Fund shares. Results represent past performance and do not indicate future results.
Large Cap Disciplined Growth Fund Commentary
For the fiscal year ended August 31, 2010, Neuberger Berman Large Cap Disciplined Growth Fund posted a positive return but underperformed its benchmark, the Russell 1000® Growth Index.
For the first six months of this reporting period, the market was positively impacted by a flight to low quality, more economically sensitive, higher beta stocks. This period of unprecedented government stimulus, loose monetary policy, better-than-expected earnings, and generally improving economic data increased investors' risk appetite. In this environment, investors favored categories including Consumer Discretionary, Industrials, Energy, Materials, and Financials stocks. At the same time, larger capitalization, higher quality securities underperformed.
During the more recent six months, the trend reversed somewhat, and market capitalization and quality were fairly neutral to performance. Whereas the market was previously very beta driven (versus being driven by individual companies' fundamentals and prospects), we saw something of a reversal here, too, demonstrated by a much larger deviation among individual stock returns.
Within the benchmark index, the largest contributors to performance were Consumer Discretionary and Consumer Staples stocks, followed by Information Technology. The biggest detractors were Energy, Financials and Utilities. The Fund was hurt by stock selection across the board this period, losing value in seven of the nine economic sectors in which we were invested during the period as the types of companies we tend to own underperformed. Our largest disappointments were within Health Care and Information Technology, while we were helped relative to the benchmark by an underweight in Materials.
From an individual contribution perspective, our top holding and the largest positive contributor to performance for the year was Apple. The company continued to impress investors with strong iPhone and Mac sales as well as the continued expansion and adoption of the app store. Apple's share price also gained positive momentum from the successful launch of the iPad tablet computer.
Amazon.com was our second largest contributor, turning in better-than-expected results. Amazon's sales continued to trend positively, with almost all categories experiencing sequential acceleration. Amazon continues to gain share from rival eBay, and is successfully managing the transition from physical books to e-books, with a 70% share of the e-book market. Further, we expect initiatives aimed at reducing the number of the company's fulfillment centers nationwide will have positive impacts on profit margins.
Citrix Systems, a desktop virtualization company, was also beneficial to performance this period. Through "cloud computing," Citrix enables computer users to access their desktops remotely, allowing businesses to centralize stored data and dramatically reduce IT hardware, software and support expenditures. Citrix Systems showed an acceleration in orders for their core virtualization product, the Xen Desktop. With a very short payback period, it is among the few IT expenditures businesses are willing to make.
QUALCOMM, the largest detractor from performance, was sold. With the next generation of handsets bifurcating between the growing and expensive smartphone market and ever-cheaper basic phones, we view their revenue licensing model as under extreme pressure. Additionally, growth in the overall handset market is slowing, which threatens volume.
Covidien, a maker of supplies and equipment for medical procedures, was weak on concerns in Europe. Austerity programs there, including price caps and rationalization, as well as a weak euro, have had a fairly negative effect on the stock. We reduced our position, not knowing how long the current "headline risk" will continue, but are confident that, longer-term, fears about this very defensive business are overstated.
Monsanto, the genetically modified seed and herbicide company, was another significant detractor. The stock declined for two reasons. First, there has been oversupply and a general slowing in the glyphosate market, impacting their leading weed killer, Roundup. At the same time, Monsanto's next generation seeds, designed to deliver more corn per acre, showed poor yield data. We eliminated the stock based on these dual concerns.
Looking ahead, government stimulus programs that helped the economy in the short term are slowly rolling off. The Cash for Clunkers program and the first-time homebuyer credit have expired, FHA high-cost loan limits are set to expire at the end of this year, and although the Fed has not yet changed policy on quantitative easing, we believe they will likely start to consider how to withdraw some liquidity from the market to avoid overinflating it. At the same time, labor markets have not improved dramatically and the health of the housing market remains in question.
Our expectation, given these factors, is for a deceleration in growth in the U.S., with a likely deceleration in earnings as well. While companies have benefited tremendously from productivity gains and cost cutting, revenue growth has not yet come through, suggesting tougher comparables for the remainder of 2010 and into 2011. Our belief is that in this type of environment, with growth more scarce, stock selection is likely to be at a premium, and that investors should be rewarded for identifying those companies whose growth rates are truly exceptional.
Sincerely,
Daniel S. Rosenblatt, John J. Barker, Daniel J. Fletcher and Lawrence K. Fisher
Portfolio Co-Managers
The risks involved in seeking capital appreciation from investments primarily in companies with large capitalizations are set forth in the prospectus and statement of additional information.
Investing in the stocks of even the largest companies involves all the risks of stock market investing, including the risk that they may lose value due to overall market or economic conditions.
The composition, industries and holdings of the Fund are subject to change. Large Cap Disciplined Growth Fund is invested in a wide array of stocks and no single holding makes up a significant portion of the Fund's total assets.
Large Cap Disciplined Growth Fund
| TICKER SYMBOLS |
| Investor Class | | NBCIX | |
| Institutional Class | | NLDIX | |
| Class A | | NLDAX | |
| Class C | | NLDCX | |
| Class R3 | | NLDRX | |
| SECTOR ALLOCATION |
| (% of Total Investments) | |
| Consumer Discretionary | | | 16.7 | % |
| Consumer Staples | | | 12.2 | |
| Energy | | | 5.4 | |
| Financials | | | 2.3 | |
| Health Care | | | 12.6 | |
| Industrials | | | 14.6 | |
| Information Technology | | | 28.6 | |
| Materials | | | 1.5 | |
| Telecommunication Services | | | 2.4 | |
| Short-Term | | | 3.7 | |
| Total | | | 100.0 | % |
| PERFORMANCE HIGHLIGHTS1,3,14 |
| | | | | Average Annual Total Return Ended 08/31/2010 |
| | | Inception Date | | 1 Year | | 5 Years | | 10 Years | | Life of Fund |
| At NAV |
| Investor Class | | 12/06/1999 | | | 2.37 | % | | | –0.10 | % | | | –7.45 | % | | | –4.37 | % |
Institutional Class20 | | 04/06/2009 | | | 2.76 | % | | | 0.01 | % | | | –7.40 | % | | | –4.32 | % |
Class A20 | | 04/06/2009 | | | 2.32 | % | | | –0.11 | % | | | –7.46 | % | | | –4.37 | % |
Class C20 | | 04/06/2009 | | | 1.66 | % | | | –0.30 | % | | | –7.55 | % | | | –4.46 | % |
Class R320 | | 05/27/2009 | | | 2.16 | % | | | –0.14 | % | | | –7.47 | % | | | –4.38 | % |
| With Sales Charge |
Class A20 | | | | | –3.59 | % | | | –1.29 | % | | | –8.01 | % | | | –4.90 | % |
Class C20 | | | | | 0.66 | % | | | –0.30 | % | | | –7.55 | % | | | –4.46 | % |
| Index |
Russell 1000® Growth Index2,19 | | | | | 6.14 | % | | | 0.10 | % | | | –5.36 | % | | | –3.73 | % |
Performance data quoted represent past performance, which is no guarantee of future results. The investment return and principal value of an investment will fluctuate so that an investor's shares, when redeemed, may be worth more or less than their original cost. Results are shown on a "total return" basis and include reinvestment of all income dividends and distributions.
Current performance may be lower or higher than the performance data quoted. For performance data current to the most recent month end, visit www.nb.com/performance.
As stated in the Fund's most recent prospectus, the total annual operating expense ratios for fiscal year 2009 were 2.53%, 1.59%, 1.80%, 2.57% and 1.65% for Investor Class, Institutional Class, Class A and Class C and Class R3 shares, respectively (prior to any fee waivers or expense reimbursements). The expense ratios net of waivers and reimbursements were 1.12%, 0.76%, 1.12%, 1.87% and 1.37% for Investor Class, Institutional Class, Class A and Class C and Class R3 shares, respectively. Neuberger Berman Management LLC has contractually agreed to limit certain expenses of the Fund through August 31, 2015 for Investor Class and through August 31, 2013 for Institutional Class, Class A, Class C and Class R3 shares.
Total Returns shown with a sales charge reflect the deduction of the current maximum initial sales charge of 5.75% for Class A shares and the applicable contingent deferred sales charges (CDSC) for Class C shares. The maximum CDSC for Class C shares is 1%, which is reduced to 0% after 1 year. The performance of the Fund's share classes will differ primarily due to different sales charge structures and class expenses. Please see the prospectus for more information about sales charge structures, if any, and class expenses for your share class.
Large Cap Disciplined Growth Fund
| COMPARISON OF A $10,000 INVESTMENT |
|
This chart shows the value of a hypothetical $10,000 investment in the Fund over the past 10 fiscal years, or since the Fund's inception if it has not operated for 10 years. The graph is based on the Investor Class shares only; performance of other classes will vary due to differences in fee structures and any applicable sales charges (see Performance Highlights chart on previous page). The result is compared with benchmarks, which may include a broad-based market index and/or a narrower index. Please note that market indexes have not been reduced to reflect any of the fees and costs of investing. All results include the reinvestment of income dividends and distributions. Neither the Fund's returns nor the market indexes shown in the graph and table reflect the effect of taxes an investor would pay on Fund distributions or on the redemption of Fund shares. Results represent past performance and do not indicate future results.
Mid Cap Growth Fund Commentary
Neuberger Berman Mid Cap Growth Fund posted strong returns on both an absolute and a relative basis for the fiscal year ended August 31, 2010, outperforming its benchmark, the Russell Midcap® Growth Index.
Taking the past 12 months as a whole, the mid-cap market returned to more "normal" condition, reflecting improved—though not robust—economic growth. Within that period, however, there were two distinct halves. During the first half, performance was still dominated by the low quality "junk rally" that had begun in March 2009. This was a headwind for our portfolio, focused as we are at the high-quality end of the spectrum, but the Fund held up fairly well. During the second half, as the market normalized and investors again rewarded companies with strong fundamentals, growth rates and management teams, the Fund outperformed. In a reversal from 2009, stubborn economic concerns have biased investors somewhat toward the highest quality companies, given the likelihood that they may be advantaged amid a still-uncer tain recovery.
Within the benchmark index, most sectors outperformed the average for the Fund's fiscal year. Only Utilities, Energy and Financials turned in weak results, while Information Technology and Consumer Discretionary stocks contributed most to the benchmark's returns. Within the Fund, Energy, although a weak sector for the index, and Information Technology were standout sectors this period.
Stock picking within Energy was one of our highlights this year, with our Energy holdings up over 30%. Three somewhat unique companies, Concho Resources, an oil-dominated exploration company, and two services companies, Core Labs and CARBO Ceramics, advanced significantly, and were among the top contributors to performance.
In Information Technology, a portfolio overweight during the past 12 months, our allocation was beneficial, but strong stock selection had the largest impact. One of our holdings, database software company Sybase, was acquired at a premium in a surprise move by SAP. Cognizant Technology, a long-term holding, was another top contributor, as was F5 Networks, a company focused on improving network speed against ever increasing Internet data loads.
Industrials was positive as well, with AMETEK, a mid-sized aerospace industrial company, and medical waste collection company Stericycle, another long-term holding, performing very well over the period. Two smaller areas of the portfolio, Telecommunications and Materials, were also beneficial. Within Materials, Cliffs Natural Resources, an iron ore producer with global reach, performed well on growth in the emerging markets. Medical and industrial gas supplier Airgas benefited on a takeout bid from a competitor early in the year.
In Telecommunications, two of our long-term holdings, cell tower companies SBA Communications and American Tower, continued to perform very well. These companies have extremely steady business models, have continued to grow their markets and earnings, and provide the portfolio with access to accelerating demand for wireless data.
From a sector perspective, the largest detractor over the year was Consumer Discretionary. Education stocks came under pressure as regulatory uncertainty caused concern. As a result, long-term holdings DeVry and Strayer performed poorly despite the fact that both companies have stellar fundamentals and surpassed expectations. WMS, a slot machine manufacturing and service company, disappointed during the second half, as major casinos worldwide extended the replacement cycle of slots given slow traffic patterns. Retailer J. Crew was a near-term disappointment. Although the company had a good quarter, a weak consumer outlook affected the stock significantly. While each of these stocks disappointed this period, we see compelling rationale for continuing to own them.
From a sector standpoint, the portfolio is currently overweighted in Information Technology, Health Care, Industrials and Energy, and underweighted in Consumer Discretionary, Consumer Staples and Financials stocks. The last two areas are typical underweights for the portfolio, as finding what we consider "true growth" in these categories is difficult.
We expect subdued economic growth for the rest of 2010 and into 2011. The recovery was unfolding well until around early summer 2010, when several factors called its sustainability into question. Internationally, China took actions to slow growth and control inflation, impacting global growth and exports. In Europe, sovereign debt issues in Greece, Spain,
Italy and Ireland worsened, increasing angst about possible regional financial crises. In the U.S., as stimulus wound down, concerns about the deficit and taxes joined ongoing worries about weak consumer spending, the driver of two-thirds of our economy. On the brighter side, companies are reinvesting into their businesses, although they have not yet resumed hiring.
While stocks are cheap by historical measures, we think balance sheets and earnings are also strong, and inflation and interest rates remain low, in our view; economic and political uncertainty is trumping these positives. After the elections and given pro-growth and -business policies, the situation could improve. On a relative basis, a subdued backdrop plays to the Fund's advantage, as the stocks we prefer—of high-growth, high-quality companies that add value in new or unique ways—often benefit in slow or moderate economic environments.
Sincerely,

Kenneth J. Turek
Portfolio Manager
The risks involved in seeking capital appreciation from investments primarily in companies with mid-market capitalization are set forth in the prospectus and statement of additional information.
Mid-capitalization stocks are more vulnerable to financial risks and other risks than stocks of larger companies. They also trade less frequently and in lower volume than larger company stocks, so their market prices tend to be more volatile.
The composition, industries and holdings of the Fund are subject to change. Mid Cap Growth Fund is invested in a wide array of stocks and no single holding makes up a significant portion of the Fund's total assets.
Mid Cap Growth Fund
| TICKER SYMBOLS |
| Investor Class | | NMANX |
| Trust Class | | NBMTX |
| Advisor Class | | NBMBX |
| Institutional Class | | NBMLX |
| Class A | | NMGAX |
| Class C | | NMGCX |
| Class R3 | | NMGRX |
| SECTOR ALLOCATION |
| (% of Total Investments) |
| Consumer Discretionary | | | 17.3 | % |
| Consumer Staples | | | 2.2 | |
| Energy | | | 6.5 | |
| Financials | | | 4.8 | |
| Health Care | | | 14.9 | |
| Industrials | | | 16.4 | |
| Information Technology | | | 25.6 | |
| Materials | | | 1.9 | |
| Telecommunication Services | | | 4.6 | |
| Short-Term | | | 5.8 | |
| Total | | | 100.0 | % |
| PERFORMANCE HIGHLIGHTS1,3,8,11 |
| | | | | Average Annual Total Return Ended 08/31/2010 |
| | | Inception Date | | 1 Year | | 5 Years | | 10 Years | | Life of Fund |
| At NAV |
| Investor Class | | 03/01/19794 | | | 13.46 | % | | | 2.50 | % | | | –4.57 | % | | | 11.21 | % |
Trust Class5 | | 08/30/1993 | | | 13.44 | % | | | 2.28 | % | | | –4.72 | % | | | 11.12 | % |
Advisor Class5 | | 09/03/1996 | | | 12.98 | % | | | 2.04 | % | | | –5.03 | % | | | 10.95 | % |
Institutional Class7 | | 04/19/2007 | | | 13.87 | % | | | 2.77 | % | | | –4.44 | % | | | 11.26 | % |
Class A21 | | 05/27/2009 | | | 13.53 | % | | | 2.51 | % | | | –4.57 | % | | | 11.21 | % |
Class C21 | | 05/27/2009 | | | 12.65 | % | | | 2.32 | % | | | –4.65 | % | | | 11.18 | % |
Class R321 | | 05/27/2009 | | | 13.24 | % | | | 2.44 | % | | | –4.60 | % | | | 11.20 | % |
| With Sales Charge |
Class A21 | | | | | 7.00 | % | | | 1.30 | % | | | –5.13 | % | | | 11.00 | % |
Class C21 | | | | | 11.65 | % | | | 2.32 | % | | | –4.65 | % | | | 11.18 | % |
| Index |
Russell Midcap® Growth Index2,19 | | | 11.58 | % | | | 0.80 | % | | | –2.50 | % | | | N/A | |
Russell Midcap® Index2,19 | | | | | 12.32 | % | | | 0.82 | % | | | 3.66 | % | | | 12.88 | % |
Performance data quoted represent past performance, which is no guarantee of future results. The investment return and principal value of an investment will fluctuate so that an investor's shares, when redeemed, may be worth more or less than their original cost. Results are shown on a "total return" basis and include reinvestment of all income dividends and distributions.
Current performance may be lower or higher than the performance data quoted. For performance data current to the most recent month end, visit www.nb.com/performance.
As stated in the Fund's most recent prospectus, the total annual operating expense ratios for fiscal year 2009 were 1.14%, 1.29%, 1.88%, 090%, 1.25%, 2.00% and 1.50% for Investor Class, Trust Class, Advisor Class, Institutional Class, Class A, Class C and Class R3 shares, respectively (prior to any fee waivers or expense reimbursements). The expense ratios net of waivers and reimbursements were 1.53%, 0.78%, 1.14%, 1.89%, and 1.39% for Advisor Class, Institutional Class, Class A, Class C and Class R3 shares, respectively. Neuberger Berman Management LLC has contractually agreed to limit certain expenses of the Fund through August 31, 2020 for Advisor Class shares and through August 31, 2013 for Institutional Class, Class A, Class C and Class R3 shares.
Total Returns shown with a sales charge reflect the deduction of the current maximum initial sales charge of 5.75% for Class A shares and the applicable contingent deferred sales charges (CDSC) for Class C shares. The maximum CDSC for Class C shares is 1%, which is reduced to 0% after 1 year. The performance of the Fund's share classes will differ primarily due to different sales charge structures and class expenses. Please see the prospectus for more information about sales charge structures, if any, and class expenses for your share class.
Mid Cap Growth Fund
| COMPARISON OF A $10,000 INVESTMENT |
|
This chart shows the value of a hypothetical $10,000 investment in the Fund over the past 10 fiscal years, or since the Fund's inception if it has not operated for 10 years. The graph is based on the Investor Class shares only; performance of other classes will vary due to differences in fee structures and any applicable sales charges (see Performance Highlights chart on previous page). The result is compared with benchmarks, which may include a broad-based market index and/or a narrower index. Please note that market indexes have not been reduced to reflect any of the fees and costs of investing. All results include the reinvestment of income dividends and distributions. Neither the Fund's returns nor the market indexes shown in the graph and table reflect the effect of taxes an investor would pay on Fund distributions or on the redemption of Fund shares. Results represent past performance and do not indicate future results.
Multi-Cap Opportunities Fund Commentary
On December 14, 2009, Neuberger Berman Research Opportunities Fund was renamed Neuberger Berman Multi-Cap Opportunities Fund, with a change in portfolio manager and strategy. Now a concentrated multi-cap portfolio, the Fund is driven by deep fundamental research and disciplined valuation analysis, focused on free cash flow and return on capital. From the management change through the reporting period ended August 31, 2010, the Fund provided a negative return and slightly underperformed its benchmark, the S&P 500 Index. Over the full fiscal year, the Fund had a positive return but lagged the benchmark.
Neuberger Berman Multi-Cap Opportunities Fund seeks investment opportunities across the market-capitalization and investment-style spectrum, dynamically allocating capital to areas that we believe offer greater return potential. Our valuation analysis incorporates sector and industry-specific factors, the state of the market cycle, and fundamental bottom-up security analysis. We seek companies whose management teams have a desire to build shareholder value, and a demonstrated ability to execute on their corporate strategies.
We divide our investment ideas across three main categories—classic investments, opportunistic investments, and special situations. We define classic investments as stocks of financially stable, recognizable companies, with consistent free cash flow from diverse sources and high returns on invested capital. Opportunistic investments are stocks of undervalued, underfollowed, or inherently misunderstood companies with high free cash flow yields and improving returns on invested capital. Finally, special situations are companies in which we see potential benefits from under-recognized recovery prospects, new management teams, restructuring potential, spin-offs or other special situations, including post-bankruptcy recapitalizations. Through a multi-tiered investment process, we critically evaluate a large and dynamic universe of prospective investments, focusing on a company's generation and use of free cash flow. Our emphasis on free cash flow is an important factor in our decision-making process, providing insight into a company's value creation potential and an assessment of its downside risk.
We entered the calendar year with a conservative outlook on growth and structured the Fund accordingly, holding a well-balanced portfolio, bar-belled between defensive and more economically sensitive companies. This positioning allowed the Fund to participate in the market's rallies while also protecting capital during its declines. We have been buying quality companies with adjusted cost structures and forward earnings visibility that we think can perform well in a moderate economic recovery. In terms of our three investment categories, the portfolio has had an overweight position relative to the benchmark in larger, classic companies as we have focused on high-quality businesses trading at attractive valuations. These investments have been drivers of performance and have stabilized returns amid volatile market conditi ons. In the current low-interest-rate environment, many of these companies are providing a stable, high dividend with, in our view, an opportunity for capital appreciation. We also entered the year with an expectation of heightened volatility and, as such, have continued selectively adding opportunistic and special situations investments.
Portfolio construction and stock selection have supported performance and helped mitigate risk since the Fund's management change. The Fund holds an overweight position in Industrials and Consumer Discretionary, two of the top three performing sectors in the S&P 500 so far this calendar year. The Fund is underweighted in Financials, Information Technology and Telecommunications. From the management change through the fiscal year-end, stock selection was a benefit within Health Care, Industrials, Materials, Consumer Staples and Consumer Discretionary. While the Fund has outperformed its benchmark index across the majority of sectors, stock selection in Financials and Utilities detracted from performance.
Consistent with our perspective in the beginning of the year, we continue to believe that the equity markets are going through the early stages of a normalization process and that this will be a slow growth recovery. This year, the equity markets have been characterized by counterbalancing themes, as investors have weighed macro concerns and the potential slowdown in the economic recovery against strong corporate profits and attractive valuations. The net result has been a slightly negative market, with high volatility, trading within a relatively narrow range.
While growth projections have slowed recently, economic conditions are still improving, albeit at a less rapid pace. In our view, the equity markets are attractively valued based on forward earnings estimates. Certain companies with strong financial positions and improving free-cash flow generation have been focused on redeploying capital back to shareholders. In a number of cases, firms that completed the majority of their cost restructuring have begun the strategic process of allocating capital to both organic growth initiatives and merger and acquisition opportunities. We believe that markets have been disconnected from company-specific fundamentals as macroeconomic concerns have been the overriding focus. Hence, individual stocks have been closely correlated with broader indices. However, we are still finding indivi dual company prospects promising and believe that as macroeconomic issues are resolved, the overhang on the markets will be mitigated.
Our analysis will continue to focus on companies' ability to generate and use free cash flow. As we evaluate both candidates and portfolio holdings, we do so with a long-term investment perspective and a two- to three-year time horizon. As always, our focus is to grow our shareholders' assets through the disciplined application of our investment philosophy and process.
Sincerely,

Richard S. Nackenson
Portfolio Manager
The risks involved in seeking capital appreciation from investments primarily in companies of large capitalization are set forth in the prospectus and statement of additional information.
To the extent that the Fund emphasizes small-, mid- or large-cap stocks, it takes on the associated risks. At times, large-cap stocks may lag other types of stocks in performance, which could cause a fund holding those stocks to perform worse than certain other funds. Small- and mid-capitalization stocks are more vulnerable to financial risks and other risks than stocks of larger companies. They also trade less frequently and in lower volume than larger company stocks, so their market prices tend to be more volatile.
Companies that are considered "special situations" include, among other things: companies that have unrecognized recovery prospects or new management teams; companies involved in restructurings or spin-offs; companies emerging from bankruptcy; initial public offerings that trade below their initial offering prices; and companies with a break-up value above their market price. The principal risk associated with special situations is that certain of such situations may not happen or the market may react differently than expected to such situations, in which case the Fund may realize losses.
The composition, industries and holdings of the Fund are subject to change. Multi-Cap Opportunities Fund is invested in a wide array of stocks and no single holding makes up a significant portion of the Fund's total assets.
Multi-Cap Opportunities Fund
| TICKER SYMBOLS |
| Institutional Class | | NMULX |
| Class A | | NMUAX |
| Class C | | NMUCX |
| SECTOR ALLOCATION |
| (% of Total Investments) | |
| Consumer Discretionary | | | 15.2 | % |
| Consumer Staples | | | 8.7 | |
| Energy | | | 11.3 | |
| Financials | | | 6.6 | |
| Health Care | | | 14.0 | |
| Industrials | | | 15.4 | |
| Information Technology | | | 15.3 | |
| Materials | | | 3.9 | |
| Utilities | | | 3.4 | |
| Other | | | 2.0 | |
| Short-Term | | | 4.2 | |
| Total | | | 100.0 | % |
| PERFORMANCE HIGHLIGHTS1,3 |
| | | | | Average Annual Total Return Ended 08/31/2010 |
| | | Inception Date | | 1 Year | | Life of Fund |
| At NAV |
Institutional Class23 | | 12/21/2009 | | | 3.02 | % | | | –3.44 | % |
Class A23 | | 12/21/2009 | | | 2.89 | % | | | –3.47 | % |
Class C23 | | 12/21/2009 | | | 2.25 | % | | | –3.63 | % |
| With Sales Charge |
Class A23 | | | | | –3.03 | % | | | –4.95 | % |
Class C23 | | | | | 1.25 | % | | | –3.63 | % |
| Index |
S&P 500 Index2,19 | | | | | 4.91 | % | | | –4.61 | % |
The performance data for each class includes the performance of the Fund's oldest share class, Trust Class, from November 2, 2006 through December 21, 2009. See footnote 23 for information about the effects of the different fees paid by each class.
Performance data quoted represent past performance, which is no guarantee of future results. The investment return and principal value of an investment will fluctuate so that an investor's shares, when redeemed, may be worth more or less than their original cost. Results are shown on a "total return" basis and include reinvestment of all income dividends and distributions.
Current performance may be lower or higher than the performance data quoted. For performance data current to the most recent month end, visit www.nb.com/performance.
Prior to December 14, 2009, Neuberger Berman Multi-Cap Opportunities Funds was known as Neuberger Berman Research Opportunities Fund, which had different investment goals, strategies, and portfolio management team.
As stated in the Fund's most recent prospectus, the total annual operating expense ratios for fiscal year 2009 were 1.28%, 1.64% and 2.39% for Institutional Class, Class A and Class C shares, respectively (prior to any fee waivers or expense reimbursements). The expense ratios net of waivers and reimbursements were 1.00%, 1.36% and 2.11% for Institutional Class, Class A and Class C shares, respectively. Neuberger Berman Management LLC has contractually agreed to limit certain expenses of the Fund through August 31, 2013 for Institutional Class, Class A and Class C shares.
Total Returns shown with a sales charge reflect the deduction of the current maximum initial sales charge of 5.75% for Class A shares and the applicable contingent deferred sales charges (CDSC) for Class C shares. The maximum CDSC for Class C shares is 1%, which is reduced to 0% after 1 year. The performance of the Fund's share classes will differ primarily due to different sales charge structures and class expenses. Please see the prospectus for more information about sales charge structures, if any, and class expenses for your share class.
Multi-Cap Opportunities Fund
| COMPARISON OF A $10,000 INVESTMENT23 |
|
This chart shows the value of a hypothetical $10,000 investment in the Fund over the past 10 fiscal years, or since the Fund's inception if it has not operated for 10 years. The graph is based on the Institutional Class shares only; performance of other classes will vary due to differences in fee structures and any applicable sales charges (see Performance Highlights chart on previous page). The result is compared with benchmarks, which may include a broad-based market index and/or a narrower index. Please note that market indexes have not been reduced to reflect any of the fees and costs of investing. All results include the reinvestment of income dividends and distributions. Neither the Fund's returns nor the market indexes shown in the graph and table reflect the effect of taxes an investor would pay on Fund distribu tions or on the redemption of Fund shares. Results represent past performance and do not indicate future results.
Partners Fund Commentary
After trending higher from September 2009 to mid-April, the stock market gave back much of its gains in the final months of the fiscal year ended August 31, 2010. For the full period, the Russell 1000® Value Index and S&P 500 Index posted modest single-digit percentage gains. Neuberger Berman Partners Fund posted a positive return; however, due primarily to relative performance shortfalls in the Consumer Discretionary, Financials and Utilities sectors, the Fund lagged these benchmark indices.
Materials sector investments had the most positive impact on relative returns, followed by Industrials and Consumer Staples. The Fund was overweighted in Materials and Industrials, two of the three best-performing sectors in the Russell 1000 Value Index. Due in large part to the strong performance of diversified resources companies Teck Resources and Xstrata PLC, and metallurgical coal producer Walter Energy, the Fund's Materials sector holdings outperformed the corresponding benchmark sector component by a wide margin. Led by mining equipment manufacturer Joy Global and energy infrastructure engineering and construction firm Chicago Bridge & Iron, our Industrials sector holdings also excelled. In addition, Consumer Staples sector holdings, most notably nutritional supplements company NBTY, which was sold to a priva te equity company, and beverage firm Dr. Pepper Snapple Group (sold during the fiscal year), buoyed relative performance.
The Fund's Consumer Discretionary sector holdings had the most negative impact on relative returns, with department store J.C. Penney, leading consumer electronics retailer Best Buy, and publisher McGraw-Hill among our detractors. All three of these companies were victims of low-end consumer deleveraging. Weakness in J.C. Penney stock was exacerbated by management's decision to close its catalog business and devote more resources to online sales, which in our opinion, could turn out to be a good long-term strategic decision.
Concern over a major overhaul of financial industry regulation disproportionately punished large-cap Financials sector holdings such as Bank of America, Citigroup, Wells Fargo and J.P. Morgan Chase. These stocks continue to languish primarily because of the current lack of transparency in the new regulations. When the ink is finally dry and investors begin evaluating the big banks' strategic responses to the new rules, we believe the stocks will rebound.
Utilities sector holdings also lagged, with independent power producer NRG Energy among the Fund's poorest performers. Reduced demand for power along with ongoing pressure on natural gas prices (which reduced the prices the producers could charge) undermined power producers' profits.
The economy has slowed considerably as evidenced by recently reported 1.7% second-quarter 2010 GDP growth. In part, we believe this is due to the elimination of effective government stimulus programs such as the tax credit for first-time home buyers and the Cash for Clunkers program. In addition, we believe the uncertainty caused by major regulatory overhauls of the health care and financial industries is restraining economic activity. Unable to accurately assess the cost of employee health care, we believe many companies, especially job-creating small companies that would normally be hiring at this stage of an economic recovery, are paying overtime or using temporary help services rather than adding new workers. Stubbornly high unemployment (coupled with the still-soft housing market) is in our view undermining consume r confidence and restraining consumer spending. Because the banks still do not know what businesses they will be permitted to participate in or the level of potential new capital requirements, they are holding onto money rather than lending it. Consequently, despite the Federal Reserve's best efforts to maximize liquidity in the financial system, credit remains tight—an additional drag on the economy.
While the economic backdrop remains uninspiring, we feel there are reasons to be encouraged about stocks. The strong relative performance of bonds versus stocks over the past decade and today's low valuation of stocks argue for better performance ahead, if history is any guide.
In closing, although the economic recovery has weakened and may remain restrained for some time, we believe fears of a double-dip recession are unwarranted. We have taken advantage of the cloud hanging over the health care industry by adding to our commitment to this undervalued sector.
In cyclical sectors, our bias is toward companies whose revenue and profit growth is being driven by still-strong demand from the emerging markets. Most importantly, we are encouraged that the stocks in the Fund, in our opinion, remain undervalued relative to long-term normalized earnings. We think these stocks will hold up well in what may continue to be a lackluster economy and excel when the economy regains momentum.
Sincerely,
S. Basu Mullick
Portfolio Manager
The risks involved in seeking capital appreciation from investments primarily in mid- to large-cap stocks are set forth in the prospectus and statement of additional information.
Mid-capitalization stocks are more vulnerable to financial risks and other risks than larger stocks. They also trade less frequently and in lower volume than larger company stocks, so their market prices tend to be more volatile. Large-cap stocks are subject to all the risks of stock market investing, including the risk that they may lose value due to overall market or economic conditions.
The composition, industries and holdings of the Fund are subject to change. Partners Fund is invested in a wide array of stocks and no single holding makes up a significant portion of the Fund's total assets.
Partners Fund
| TICKER SYMBOLS |
| Investor Class | | NPRTX |
| Trust Class | | NBPTX |
| Advisor Class | | NBPBX |
| Institutional Class | | NBPIX |
| Class A | | NPNAX |
| Class C | | NPNCX |
| Class R3 | | NPNRX |
| SECTOR ALLOCATION |
| (% of Total Investments) | |
| Consumer Discretionary | | | 11.5 | % |
| Consumer Staples | | | 6.6 | |
| Energy | | | 15.4 | |
| Financials | | | 27.4 | |
| Health Care | | | 12.5 | |
| Industrials | | | 12.1 | |
| Information Technology | | | 6.7 | |
| Materials | | | 5.2 | |
| Utilities | | | 0.7 | |
| Short-Term | | | 1.9 | |
| Total | | | 100.0 | % |
| PERFORMANCE HIGHLIGHTS1,3,8 |
| | | | | Average Annual Total Return Ended 08/31/2010 |
| | | Inception Date | | 1 Year | | 5 Years | | 10 Years | | Life of Fund |
| At NAV |
| Investor Class | | 01/20/19754 | | | 2.21 | % | | | –2.30 | % | | | 1.46 | % | | | 12.59 | % |
Trust Class5 | | 08/30/1993 | | | 2.01 | % | | | –2.48 | % | | | 1.29 | % | | | 12.53 | % |
Advisor Class5 | | 08/16/1996 | | | 1.83 | % | | | –2.62 | % | | | 1.09 | % | | | 12.40 | % |
Institutional Class7 | | 06/07/2006 | | | 2.35 | % | | | –2.17 | % | | | 1.53 | % | | | 12.61 | % |
Class A25 | | 06/21/2010 | | | 2.16 | % | | | –2.31 | % | | | 1.46 | % | | | 12.59 | % |
Class C25 | | 06/21/2010 | | | 2.02 | % | | | –2.34 | % | | | 1.44 | % | | | 12.59 | % |
Class R325 | | 06/21/2010 | | | 2.09 | % | | | –2.32 | % | | | 1.45 | % | | | 12.59 | % |
| With Sales Charge |
Class A25 | | | –3.72 | % | | | –3.46 | % | | | 0.86 | % | | | 12.40 | % |
Class C25 | | | | | 1.02 | % | | | –2.34 | % | | | 1.44 | % | | | 12.59 | % |
| Index |
Russell 1000® Value Index2,19 | | | | | 4.96 | % | | | –1.69 | % | | | 1.92 | % | | | N/A | |
S&P 500 Index2,19 | | | | | 4.91 | % | | | –0.91 | % | | | –1.81 | % | | | 11.26 | % |
Performance data quoted represent past performance, which is no guarantee of future results. The investment return and principal value of an investment will fluctuate so that an investor's shares, when redeemed, may be worth more or less than their original cost. Results are shown on a "total return" basis and include reinvestment of all income dividends and distributions.
Current performance may be lower or higher than the performance data quoted. For performance data current to the most recent month end, visit www.nb.com/performance.
As stated in the Fund's most recent prospectus, the total annual operating expense ratios for fiscal year 2009 were 0.89%, 1.05%, 1.20%, 0.71%, 1.03%, 1.78% and 1.28% for Investor Class, Trust Class, Advisor Class, Institutional Class, Class A, Class C and Class R3 shares, respectively (prior to any fee waivers or expense reimbursements).The expense ratio net of waivers and reimbursements was 0.70% for Institutional Class. Neuberger Berman Management LLC has contractually agreed to limit certain expenses of the Fund through August 31, 2020 for Advisor Class shares and through August 31, 2013 for Trust Class, Institutional Class, Class A, Class C and Class R3 shares.
Total Returns shown with a sales charge reflect the deduction of the current maximum initial sales charge of 5.75% for Class A shares and the applicable contingent deferred sales charges (CDSC) for Class C shares. The maximum CDSC for Class C shares is 1%, which is reduced to 0% after 1 year. The performance of the Fund's share classes will differ primarily due to different sales charge structures and class expenses. Please see the prospectus for more information about sales charge structures, if any, and class expenses for your share class.
Partners Fund
| COMPARISON OF A $10,000 INVESTMENT |
|
This chart shows the value of a hypothetical $10,000 investment in the Fund over the past 10 fiscal years, or since the Fund's inception if it has not operated for 10 years. The graph is based on the Investor Class shares only; performance of other classes will vary due to differences in fee structures and any applicable sales charges (see Performance Highlights chart on previous page). The result is compared with benchmarks, which may include a broad-based market index and/or a narrower index. Please note that market indexes have not been reduced to reflect any of the fees and costs of investing. All results include the reinvestment of income dividends and distributions. Neither the Fund's returns nor the market indexes shown in the graph and table reflect the effect of taxes an investor would pay on Fund distributi ons or on the redemption of Fund shares. Results represent past performance and do not indicate future results.
Real Estate Fund Commentary
Despite a period of weakness in the second half of the reporting period, overall, the real estate investment trust (REIT) market generated strong results during the fiscal year ended August 31, 2010. Against this backdrop, Neuberger Berman Real Estate Fund outperformed its benchmark, the FTSE NAREIT Equity REITs Index.
During the first seven months of the reporting period, REITs rallied sharply as credit conditions improved and economic data pointed to a recovery from the severe recession. The market was also supported by REITs' success in accessing the capital markets. However, beginning in late April 2010 and continuing through June, REITs took a step backwards, as the sovereign debt crisis in Europe and some weaker-than-expected economic data triggered a flight to quality. REIT prices then rallied sharply in July given investors' expectations for better fundamentals in the market going forward. The market then largely treaded water in August.
During the first half of the reporting period, we continued to adjust the portfolio to increase our exposure to more cyclical areas of the REIT market. For example, we increased our position in the Lodging/Resorts sector while reducing our exposure to the Health Care sector, which is commonly considered defensive. As the reporting period progressed, macroeconomic conditions weakened and unemployment remained elevated. Given these issues, we become more defensive and emphasized REITs with high quality balance sheets. From a sector perspective, we pared our exposures in the Apartments and Office sectors and increased our Health Care exposure. Collectively, our adjustments were positive for performance during the 12-month reporting period.
In terms of individual holdings, Simon Property Group was among the Fund's largest contributors to performance. This regional mall operator was rewarded for having a compelling mix of high-quality properties, as well as price-conscious outlet centers. Equity Residential, the country's largest apartment REIT, was also a top performer. The company has benefited from repositioning its portfolio into stronger long-term markets, including well-timed acquisitions in New York City and Washington D.C. Self storage firm Public Storage also boosted the Fund's performance, as it generated strong results given its low leverage and improving cash flows. On the downside, the Fund's positions in regional mall company Pennsylvania Real Estate Investment Trust, industrial REIT First Industrial Realty Trust and diversified real estate de veloper Forest City Enterprises detracted from results. These companies all have above-average leverage and were hurt during the flight to quality.
Looking ahead, our short-term outlook for the REIT market is somewhat challenged given the softer economy and continued high unemployment. However, it is our belief that demand fundamentals are at or near a bottom and should gradually improve, especially when combined with historic low levels of new supply. We remain optimistic about the intermediate and long-term prospects for the REIT market, given our view that as the economy slowly strengthens, so too should prospects for REITs. In addition, many REITs continue to have ready access to the equity and debt capital markets, and should be able to make attractive acquisitions in the coming years. As such, we continue to emphasize REITs with strong and flexible balance sheets that we believe have the ability to capitalize on this trend. On a final note, many REITs reduced their dividends or chose to pay a portion of their dividends in stock during the credit crisis. We have seen a return to all-cash dividends and, in some cases, dividend increases from select REITs supported by improved earnings. We believe there could be additional dividend hikes going forward which, in our opinion, would support investor demand for REITs in general.
Sincerely,


Steve S. Shigekawa and Brian Jones
Portfolio Co-Managers
The risks involved in seeking capital appreciation and income from investments primarily in companies, in particular REITs, with small- and mid-market capitalization are set forth in the prospectus and statement of additional information.
Small- and mid-capitalization stocks are more vulnerable to financial risks and other risks than stocks of larger companies. They also trade less frequently and in lower volume than larger company stocks, so their market prices tend to be more volatile.
The portfolio's concentration in real estate investments makes it subject to greater potential risks and volatility than a more diversified portfolio, and the value of its shares may decline due to events affecting the real estate industry.
The composition, industries and holdings of the Fund are subject to change. Real Estate Fund is invested in a wide array of stocks and no single holding makes up a significant portion of the Fund's total assets.
Real Estate Fund
| TICKER SYMBOLS |
| Trust Class | | NBRFX |
| Institutional Class | | NBRIX |
| Class A | | NREAX |
| Class C | | NRECX |
| Class R3 | | NRERX |
| SECTOR ALLOCATION |
| (% of Total Investments) | |
| Apartments | | | 13.5 | % |
| Diversified | | | 8.0 | |
| Health Care | | | 12.8 | |
| Industrial | | | 5.9 | |
| Lodging/Resorts | | | 8.9 | |
| Office | | | 11.7 | |
| Regional Malls | | | 11.8 | |
| Self Storage | | | 6.9 | |
| Shopping Centers | | | 8.0 | |
| Specialty | | | 9.0 | |
| Short-Term | | | 3.5 | |
| Total | | | 100.0 | % |
| PERFORMANCE HIGHLIGHTS1,3,8 |
| | | | | Average Annual Total Return Ended 08/31/2010 |
| | | Inception Date | | 1 Year | | 5 Years | | Life of Fund |
| At NAV |
| Trust Class | | 05/01/2002 | | | 35.09 | % | | | 4.54 | % | | | 11.61 | % |
Institutional Class7 | | 06/04/2008 | | | 35.18 | % | | | 4.64 | % | | | 11.67 | % |
Class A25 | | 06/21/2010 | | | 35.01 | % | | | 4.53 | % | | | 11.60 | % |
Class C25 | | 06/21/2010 | | | 34.87 | % | | | 4.51 | % | | | 11.58 | % |
Class R325 | | 06/21/2010 | | | 34.92 | % | | | 4.52 | % | | | 11.59 | % |
| With Sales Charge |
Class A25 | | | | | 27.25 | % | | | 3.30 | % | | | 10.81 | % |
Class C25 | | | | | 33.87 | % | | | 4.51 | % | | | 11.58 | % |
| Index |
FTSE NAREIT Equity REITs Index2,19 | | | | | 32.69 | % | | | 1.11 | % | | | 8.61 | % |
Performance data quoted represent past performance, which is no guarantee of future results. The investment return and principal value of an investment will fluctuate so that an investor's shares, when redeemed, may be worth more or less than their original cost. Results are shown on a "total return" basis and include reinvestment of all income dividends and distributions.
Current performance may be lower or higher than the performance data quoted. For performance data current to the most recent month end, visit www.nb.com/performance.
As stated in the Fund's most recent prospectus, the total annual operating expense ratio for fiscal year 2009 were 2.03% 2.82%, 1.54%, 2.29% and 1.79% for Trust Class, Institutional Class, Class A, Class C and Class R3 shares, respectively (prior to any fee waivers or expense reimbursements). The expense ratios net of waivers and reimbursements were 1.52%, 0.87%, 1.23%, 1.98% and 1.48% for Trust Class, Institutional Class, Class A, Class C and Class R3 shares, respectively. Neuberger Berman Management LLC has contractually agreed to limit certain expenses of the Fund through August 31, 2020 for Trust Class and Institutional Class shares and through August 31, 2013 for Class A, Class C and Class R3 shares.
Total Returns shown with a sales charge reflect the deduction of the current maximum initial sales charge of 5.75% for Class A shares and the applicable contingent deferred sales charges (CDSC) for Class C shares. The maximum CDSC for Class C shares is 1%, which is reduced to 0% after 1 year. The performance of the Fund's share classes will differ primarily due to different sales charge structures and class expenses. Please see the prospectus for more information about sales charge structures, if any, and class expenses for your share class.
Real Estate Fund
| COMPARISON OF A $10,000 INVESTMENT |
|
This chart shows the value of a hypothetical $10,000 investment in the Fund over the past 10 fiscal years, or since the Fund's inception if it has not operated for 10 years. The graph is based on the Trust Class shares only; performance of other classes will vary due to differences in fee structures and any applicable sales charges (see Performance Highlights chart on previous page). The result is compared with benchmarks, which may include a broad-based market index and/or a narrower index. Please note that market indexes have not been reduced to reflect any of the fees and costs of investing. All results include the reinvestment of income dividends and distributions. Neither the Fund's returns nor the market indexes shown in the graph and table reflect the effect of taxes an investor would pay on Fund distributions or on the redemption of Fund shares. Results represent past performance and do not indicate future results.
Regency Fund Commentary
Buoyed by impressive GDP growth in the fourth quarter of calendar year 2009 and the first quarter of 2010, along with better-than-expected corporate earnings, stocks trended higher through the first two thirds of the fiscal year ended August 31, 2010. Subsequently, however, the European sovereign debt crisis coupled with weaker economic data that led investors to question the strength and sustainability of the recovery reversed the rally. From the mid-April market high through the end of this reporting period, stocks drifted lower. Despite giving back some of its earlier gains, at fiscal year-end the Russell Midcap® Value Index had posted a respectable low-teen percentage gain, significantly outperforming the large-ca p S&P 500 Index. For the 12-month period, relative performance shortfalls in the Financials, Consumer Discretionary and Utilities sectors caused Neuberger Berman Regency Fund to modestly lag the Russell Midcap Value Index benchmark.
Our holdings in the Industrials sector had the most positive impact on relative returns. Relative to the benchmark, the Fund was overweighted in Industrials and benefitted from strong gains in mining equipment manufacturer Bucyrus International, commercial vehicle control systems producer WABCO Holdings, and energy infrastructure engineering and construction company Chicago Bridge & Iron. Our investments in Industrials outperformed the corresponding index benchmark component by a wide margin. Led by diversified resources company Teck Resources and iron ore producer Cliffs Natural Resources, our Materials sector holdings also delivered superior relative performance. Consumer Staples sector investments, most notably nutritional supplements company NBTY (bought out by a private equity firm) and beverage firm Dr. Pepper Snapple Group positively contributed to relative returns.
Our Financials sector investments had the most negative impact on relative returns. The specter of a major financial industry overhaul clouded the outlook for nearly all financial companies, including portfolio holdings such as Moody's, Principal Financial Group, and Synovus Financial. We believe that once there is clarity on the new regulations and we have seen financial companies' strategic responses to the new rules, this sector can rebound. Consumer Discretionary sector investments suffered as low-end consumer spending declined. Retailer J.C. Penney and publisher McGraw-Hill were among the sector holdings that disappointed. Due in part to a sharp decline in independent power producer NRG Energy, our Utilities sector investments also weakened relative returns. We think power prices will gradually rise as the economy continues to make modest progress.
The robust GDP growth in the fourth quarter of calendar year 2009 and the first quarter of calendar year 2010 was driven by highly accommodative monetary policy, the replenishing of inventories depleted by the recession, and massive government stimulus programs. Once inventories were back in line with demand and effective stimulus programs, such as the tax credit for first-time homebuyers and the Cash for Clunkers program, ran their course, it became apparent that underlying economic fundamentals were not nearly as strong as the surge in GDP growth had indicated. As a result, we were not surprised when GDP growth for the second quarter of calendar year 2010 came in at a lackluster 1.7%. It is our belief that the economy was also being undermined by uncertainty caused by major regulatory overhauls of the health care and financial industries. We think many companies that would normally be hiring at this stage of the economic cycle have postponed adding new workers because of the lack of clarity regarding the cost of employee health care. Moreover, banks are not yet sure which lines of operation they will be allowed to participate in or the level of potential new capital requirements. Although the Federal Reserve has kept pumping liquidity into the system, the banks have been holding onto cash rather than lending it.
Although economic growth has decelerated, we do not anticipate a double-dip recession. While the economic backdrop remains uninspiring, in our opinion, there are reasons that stocks remain attractive. Bonds have materially outperformed stocks over the last decade and, in our opinion, stocks are undervalued relative to bonds. If history is an indication of the future, this valuation gap should narrow. We believe health care stocks are particularly good values today. In cyclical sectors, we continue to favor companies that have been benefiting from continued strong demand from the emerging markets. Finally, we are encouraged by our assessment that the Fund's companies remain undervalued based on multiples
to long-term normalized earnings. We think these stocks will hold up even in a less-than-ideal economic environment and prosper when the economy is on firmer footing.
Sincerely,

S. Basu Mullick
Portfolio Manager
The risks involved in seeking capital appreciation from investments primarily in mid-cap stocks are set forth in the prospectus and statement of additional information.
Mid-capitalization stocks are more vulnerable to financial risks and other risks than stocks of larger companies. They also trade less frequently and in lower volume than larger company stocks, so their market prices tend to be more volatile.
The composition, industries and holdings of the Fund are subject to change. Regency Fund is invested in a wide array of stocks and no single holding makes up a significant portion of the Fund's total assets.
Regency Fund
| TICKER SYMBOLS |
| Investor Class | | NBRVX |
| Trust Class | | NBREX |
| Institutional Class | | NBRTX |
| Class A | | NBRAX |
| Class C | | NBRCX |
| Class R3 | | NBRRX |
| SECTOR ALLOCATION |
| (% of Total Investments) | |
| Consumer Discretionary | | | 12.0 | % |
| Consumer Staples | | | 3.6 | |
| Energy | | | 12.3 | |
| Financials | | | 26.7 | |
| Health Care | | | 7.7 | |
| Industrials | | | 13.7 | |
| Information Technology | | | 5.8 | |
| Materials | | | 5.2 | |
| Utilities | | | 10.2 | |
| Short-Term | | | 2.8 | |
| Total | | | 100.0 | % |
PERFORMANCE HIGHLIGHTS1,3,8 |
| | | | | Average Annual Total Return Ended 08/31/2010 |
| | | Inception Date | | 1 Year | | 5 Years | | 10 Years | | Life of Fund |
| At NAV |
| Investor Class | | 06/01/1999 | | | 11.51 | % | | | –1.41 | % | | | 4.78 | % | | | 6.87 | % |
Trust Class5 | | 06/10/1999 | | | 11.55 | % | | | –1.47 | % | | | 4.72 | % | | | 6.82 | % |
Institutional Class26 | | 03/08/2010 | | | 11.69 | % | | | –1.38 | % | | | 4.79 | % | | | 6.88 | % |
Class A25 | | 06/21/2010 | | | 11.61 | % | | | –1.39 | % | | | 4.78 | % | | | 6.88 | % |
Class C25 | | 06/21/2010 | | | 11.40 | % | | | –1.43 | % | | | 4.77 | % | | | 6.86 | % |
Class R325 | | 06/21/2010 | | | 11.50 | % | | | –1.41 | % | | | 4.78 | % | | | 6.87 | % |
| With Sales Charge |
Class A25 | | | | | 5.19 | % | | | –2.55 | % | | | 4.17 | % | | | 6.32 | % |
Class C25 | | | | | 10.40 | % | | | –1.43 | % | | | 4.77 | % | | | 6.86 | % |
| Index |
Russell Midcap® Value Index2,19 | | | | | 13.01 | % | | | 0.45 | % | | | 6.95 | % | | | 6.26 | % |
Russell Midcap® Index2,19 | | | | | 12.32 | % | | | 0.82 | % | | | 3.66 | % | | | 5.41 | % |
Performance data quoted represent past performance, which is no guarantee of future results. The investment return and principal value of an investment will fluctuate so that an investor's shares, when redeemed, may be worth more or less than their original cost. Results are shown on a "total return" basis and include reinvestment of all income dividends and distributions.
Current performance may be lower or higher than the performance data quoted. For performance data current to the most recent month end, visit www.nb.com/performance.
As stated in the Fund's most recent prospectus, the total annual operating expense ratios for fiscal year 2009 were 1.38%, 1.61%, 1.13%, 1.25%, 2.00% and 1.50% for Investor Class, Trust Class, Institutional Class, Class A, Class C and Class R3 shares, respectively (prior to any fee waivers or expense reimbursements). The expense ratios net of waivers and reimbursements were 1.27%, 0.86%, 1.22%, 1.97% and 1.47% for Trust Class, Institutional Class, Class A, Class C and Class R3 shares, respectively. Neuberger Berman Management LLC has contractually agreed to limit certain expenses of the Fund through August 31, 2020 for Investor Class and Trust Class shares and through August 31, 2013 for Institutional Class, Class A, Class C and Class R3 shares.
Total Returns shown with a sales charge reflect the deduction of the current maximum initial sales charge of 5.75% for Class A shares and the applicable contingent deferred sales charges (CDSC) for Class C shares. The maximum CDSC for Class C shares is 1%, which is reduced to 0% after 1 year. The performance of the Fund's share classes will differ primarily due to different sales charge structures and class expenses. Please see the prospectus for more information about sales charge structures, if any, and class expenses for your share class.
Regency Fund
COMPARISON OF A $10,000 INVESTMENT |
|
This chart shows the value of a hypothetical $10,000 investment in the Fund over the past 10 fiscal years, or since the Fund's inception if it has not operated for 10 years. The graph is based on the Investor Class shares only; performance of other classes will vary due to differences in fee structures and any applicable sales charges (see Performance Highlights chart on previous page). The result is compared with benchmarks, which may include a broad-based market index and/or a narrower index. Please note that market indexes have not been reduced to reflect any of the fees and costs of investing. All results include the reinvestment of income dividends and distributions. Neither the Fund's returns nor the market indexes shown in the graph and table reflect the effect of taxes an investor would pay on Fund distributions or on the redemption of Fund shares. Results represent past performance and do not indicate future results.
Select Equities Fund Commentary
Neuberger Berman Select Equities Fund posted roughly flat returns for the fiscal year ended August 31, 2010, underperforming its benchmark, the S&P 500 Index. In light of our macroeconomic viewpoint, we had positioned the portfolio conservatively by avoiding areas of the market where we considered investors' expectations overly optimistic and by holding higher-than-normal cash balances. These two decisions were the primary reasons for our underperformance this period. Importantly, most of the divergence occurred early on. More recent data has shown these decisions were prudent but early.
For the past 18 months, we have operated under the belief that the U.S. economic recovery would resemble the shape of a "Nike swoosh," a sharp downturn followed by a moderate trend upward. We continue to see evidence that supports this theory and believe we are currently bouncing along the bottom of the swoosh, with a long tail of low to moderate growth ahead. By contrast, particularly in the first quarter, the market appeared to be anticipating a much sharper V-shaped recovery. The market has been readjusting its expectations toward our slower growth projections since April.
From the end of April forward, we have been vindicated somewhat, as economic and consumer-related data have decelerated sharply, causing volatility and weakness in the stock market. This is especially true for economically sensitive areas that advanced earlier this year but which we consciously avoided in our portfolio construction due to growth expectations for these stocks that we thought were unrealistic. Since the market expectations started to readjust to the slower growth environment we had predicted, the portfolio has outperformed the benchmark.
As part of our conservative stance, we avoided Consumer Discretionary stocks this reporting period, concerned about a stressed consumer's ability to spend. Given high unemployment, restricted consumer credit, home value declines and other pressures, we expected earnings disappointments from companies tied to U.S. consumer spending. Meanwhile, investors expecting a sharper recovery drove the sector up by over 17% for the year. Our avoidance of the sector hurt relative performance during the rally, but since April, consumer spending data has turned very negative, and consequently those stocks have been performing poorly.
Other areas that limited relative performance included global banking names such as HSBC Holdings and Banco Santander Brasil. These companies underperformed in early calendar-year 2010 because of contagion concerns from the European sovereign debt crisis. Within the Health Care sector, Baxter International declined on unexpected company-specific issues. We eliminated all three stocks from the portfolio. Information Technology was also an area of relative underperformance, as Yahoo! and Microsoft disappointed.
Our largest positive contributor was our largest holding—American Tower. The cell tower company represents the exact type of business we want to own, with its significant free cash flow generation, strong competitive positioning, very predictable revenues, and industry-leading profit margins.
Caterpillar also performed well, benefiting from global infrastructure spending under a new management team that has instilled strong financial discipline. Norfolk Southern, the railroad company, and global tobacco giant Philip Morris were also significant positives.
We have decreased our cash and cash equivalents position as our expectation for economic growth—albeit below trend—has played out, and as we have found compelling investment opportunities. Cash is now down significantly from prior levels. Given the volatility of the market this period, cash's relative contribution was either positive or negative, depending on the month. For the full fiscal year, the higher-than-normal cash position was a minor drag on relative performance. We continue to think of cash as an important component of our investment strategy, a tool that helps us both preserve capital and generate impressive risk adjusted returns.
Overall, we believe corporate America is in excellent shape. The quality of earnings has been much improved, and many companies, having sharply reduced their cost structures, are generating free cash flows at a record pace. Equity valuations appear reasonable from a historical perspective, and especially in light of bond valuations, suggesting to us that stocks
remain the asset class of choice for the foreseeable future. Still, there's no question that macro-related issues have driven recent strong directional market moves as investors have struggled with the impact of the European sovereign debt crisis and its possible contagion, the potential slowing of the Chinese economy, dramatic revaluations in the foreign markets, and recent U.S. economic data. In addition, we believe an apparent tug-of-war between deflationary and inflationary pressures could impact equities for years to come. We believe these factors will continue to create high levels of stock volatility in the future.
In this fragile environment, we continue to err on the side of caution and maintain our commitment to capital preservation within the Fund, while remaining flexible and opportunistic. We believe stock selection will be paramount in delivering positive returns going forward, and that the best managed companies will prove their worth. We are confident that our positioning will allow us to take advantage of opportunities as they present themselves.
Sincerely,


Gerald Kaminsky, Michael Kaminsky and Richard Werman
Portfolio Co-Managers
The risks involved in seeking capital appreciation from investments primarily in companies of large capitalization are set forth in the prospectus and statement of additional information.
To the extent that the Fund emphasizes mid- or large-cap stocks, it takes on the associated risks. Mid-cap stocks tend to be more volatile than large-cap stocks and are usually more sensitive to economic, political, regulatory and market factors. At any given time, one or both groups of stocks may be out of favor with investors.
The composition, industries and holdings of the Fund are subject to change. Select Equities Fund is invested in a wide array of stocks and no single holding makes up a significant portion of the Fund's total assets.
Select Equities Fund
| TICKER SYMBOLS |
| Institutional Class | | NBEIX | |
| Class A | | NBEAX | |
| Class C | | NBECX | |
| SECTOR ALLOCATION |
| (% of Total Investments) | |
| Consumer Staples | | | 21.6 | % | |
| Energy | | | 9.9 | | |
| Financials | | | 6.2 | | |
| Health Care | | | 1.5 | | |
| Industrials | | | 14.7 | | |
| Information Technology | | | 15.5 | | |
| Materials | | | 11.4 | | |
| Telecommunication Services | | | 5.7 | | |
| Utilities | | | 5.7 | | |
| Short-Term | | | 7.8 | | |
| Total | | | 100.0 | % | |
PERFORMANCE HIGHLIGHTS1,3 |
| | | | | Average Annual Total Return Ended 08/31/2010 |
| | | Inception Date | | 1 Year | | Life of Fund |
| At NAV |
| Institutional Class | | 12/20/2007 | | | 0.44 | % | | | –7.38 | % |
| Class A | | 12/20/2007 | | | –0.11 | % | | | –7.61 | % |
| Class C | | 12/20/2007 | | | –0.75 | % | | | –8.30 | % |
| With Sales Charge |
| Class A | | | | | –5.84 | % | | | –9.62 | % |
| Class C | | | | | –1.72 | % | | | –8.30 | % |
| Index |
S&P 500 Index2,19 | | | | | 4.91 | % | | | –9.29 | % |
Performance data quoted represent past performance, which is no guarantee of future results. The investment return and principal value of an investment will fluctuate so that an investor's shares, when redeemed, may be worth more or less than their original cost. Results are shown on a "total return" basis and include reinvestment of all income dividends and distributions.
Current performance may be lower or higher than the performance data quoted. For performance data current to the most recent month end, visit www.nb.com/performance.
As stated in the Fund's most recent prospectus, the total annual operating expense ratios for fiscal year 2009 were 2.65%, 2.27% and 2.99% for Institutional Class, Class A and Class C shares, respectively (prior to any fee waivers or expense reimbursements). The expense ratios net of waivers and reimbursements were 0.84%, 1.29% and 2.04% for Institutional Class, Class A and Class C shares, respectively. Neuberger Berman Management LLC has contractually agreed to limit certain expenses of the Fund through August 31, 2013 for Institutional Class, Class A and Class C shares.
Total Returns shown with a sales charge reflect the deduction of the current maximum initial sales charge of 5.75% for Class A shares and the applicable contingent deferred sales charges (CDSC) for Class C shares. The maximum CDSC for Class C shares is 1%, which is reduced to 0% after 1 year. The performance of the Fund's share classes will differ primarily due to different sales charge structures and class expenses. Please see the prospectus for more information about sales charge structures, if any, and class expenses for your share class.
Select Equities Fund
| COMPARISON OF A $10,000 INVESTMENT (WITH SALES CHARGE) |
|
This chart shows the value of a hypothetical $10,000 investment in the Fund over the past 10 fiscal years, or since the Fund's inception if it has not operated for 10 years. The graph is based on the Class A shares only; performance of other classes will vary due to differences in fee structures and any applicable sales charges (see Performance Highlights chart on previous page). The result is compared with benchmarks, which may include a broad-based market index and/or a narrower index. Please note that market indexes have not been reduced to reflect any of the fees and costs of investing. All results include the reinvestment of income dividends and distributions. Neither the Fund's returns nor the market indexes shown in the graph and table reflect the effect of taxes an investor would pay on Fund distributions or on the redemption of Fund shares. Results represent past performance and do not indicate future results.
Small Cap Growth Fund Commentary
For the fiscal year ended August 31, 2010, Neuberger Berman Small Cap Growth Fund posted a positive return but underperformed its benchmark, the Russell 2000® Growth Index.
The fiscal year consisted of two distinct phases. From the second half of calendar-year 2009 into first-quarter 2010, confidence in the global economic recovery was increasing. In the small-cap market, stocks we consider to be lower quality continued the rally they had started at the end of the recession. Given our strict quality bias, this was a headwind for the portfolio.
In May and June, as confidence weakened on news from China, Europe and the U.S., volatility and fear increased, the market began to shift. Concerned investors returned to the higher-quality stocks we favor—companies at the larger end of the small-cap universe, with superior growth and earnings potential, strong balance sheets, and high return on equity (ROE). The Fund performed very well with this shift to quality, but it happened too late to overcome our deficit for the full period. Relative to the index, the weakest area of the portfolio this period was Consumer Discretionary holdings, followed by Industrials. Our largest positive contributor was Health Care.
Within Consumer Discretionary stocks, several names stand out, including Orient Express, a luxury hotel chain focused on Europe. While Orient Express participated in the hotel recovery in early calendar-year 2010, it declined sharply during the European debt crisis. We believe the company's outlook is good, however, and continue to own the stock. Sotheby's was another disappointment. The revered auction house's stock declined as the euro crisis lowered expectations for the art market, and we sold our position. Despite the fact that the overall sector was a negative for the portfolio, Royal Caribbean Cruises was a top contributor. We sold this beneficiary of the leisure and cruise recovery when it hit our price target. In that market, we continue to own Steiner Leisure, a cruise ship spa operator.
In Industrials, disappointments included Global Defense Technology, a relatively new IPO that saw the timeline for several field operations contracts extended. We continue to own the stock. Avis also disappointed. While the recovery in travel benefited Avis, the company entered a bidding war with Hertz for Dollar Thrifty. Ambiguity over the outcome prompted us to sell the stock. On the other hand, HEICO, our long-term aftermarket aircraft parts manufacturing holding, was a plus. The company operates in what we consider a great niche, with a strong competitive position, and we continue to be impressed by its management. The only negative from our perspective is the cyclicality of the airlines.
Within Health Care, our strongest area relative to the benchmark, pharmacy benefits manager SXC was a top contributor. The company does a phenomenal job signing plans, and benefited from several big wins during this period. Two of our Health Care holdings were taken out this period, which also benefited relative performance—ev3, a peripheral vascular company, and Odyssey Healthcare, a hospice company.
Information Technology, the largest sector in both the Fund and the benchmark index, generated mixed results. Top contributors included LivePerson, a leading online chat and analytics service that helps bring Internet customers to a purchasing decision, Informatica, a middleware company that we sold when it hit our price target, and Veeco, an LED manufacturing machinery firm that also hit our price target and was sold. On the negative side, Plexus, a contract components manufacturer, and Atheros, a semiconductor firm, performed well until concerns about the PC market arose. GSI Commerce, a company in the outsourced online consumer stores business, pulled back with the market shift.
Looking ahead, five key themes interest us most—Internet commerce, tablet PCs and iPads, a recovery in aerospace, health care beneficiaries, and high unit growth retailers. Within Internet commerce, in addition to LivePerson and GSI, we own names like MercadoLibre and HSN. Within our tablet PC and iPad theme, OpenTable, the online restaurant reservations company, and LogMeIn, which allows iPad users to log in to work or home computers, are examples. In Aerospace, we own Heico and BE Aerospace. In Health Care, expecting broader access to prescription drugs post health care reform, we own pharmacy benefits manager SXC. Lastly, in retail, representative holdings include Vitamin Shoppe and HHGregg.
We believe the Fund is well positioned for a likely slower growth environment, since we would expect quality companies with higher, more predictable, and more organic growth, to lead the market. The heavily cyclical names that outperformed through the first quarter could continue to stumble under this scenario. Thinking longer-term, the period we suspect we have finally emerged from feels very similar to 2003, which saw another extended low-quality rally. After that ended, the Fund outperformed as a focus on fundamentals returned in 2004 and 2005. If we are correct in this comparison, we believe the types of stocks in the portfolio could see a period of sustained outperformance.
Sincerely,

David H. Burshtan
Portfolio Manager
The risks involved in seeking capital appreciation from investments primarily in companies with small-market capitalization are set forth in the prospectus and statement of additional information.
Small-capitalization stocks are more vulnerable to financial risks and other risks than larger stocks. They are generally less liquid than larger stocks, so their market prices tend to be more volatile.
The composition, industries and holdings of the Fund are subject to change. Small Cap Growth Fund is invested in a wide array of stocks and no single holding makes up a significant portion of the Fund's total assets.
Small Cap Growth Fund
| TICKER SYMBOLS |
| Investor Class | | NBMIX |
| Trust Class | | NBMOX |
| Advisor Class | | NBMVX |
| Institutional Class | | NBSMX |
| Class A | | NSNAX |
| Class C | | NSNCX |
| Class R3 | | NSNRX |
| SECTOR ALLOCATION |
| (% of Total Investments) | |
| Consumer Discretionary | | | 19.8 | % |
| Consumer Staples | | | 3.2 | |
| Energy | | | 3.9 | |
| Financials | | | 4.3 | |
| Health Care | | | 18.8 | |
| Industrials | | | 17.2 | |
| Information Technology | | | 26.9 | |
| Materials | | | 3.3 | |
| Short-Term | | | 2.6 | |
| Total | | | 100.0 | % |
| PERFORMANCE HIGHLIGHTS1,3,8,12 |
| | | | | Average Annual Total Return Ended 08/31/2010 |
| | | Inception Date | | 1 Year | | 5 Years | | 10 Years | | Life of Fund |
| At NAV |
| Investor Class | | 10/20/1998 | | | 4.03 | % | | | –0.73 | % | | | –6.82 | % | | | 5.52 | % |
Trust Class5 | | 11/03/1998 | | | 3.47 | % | | | –0.90 | % | | | –6.95 | % | | | 5.40 | % |
Advisor Class6 | | 05/03/2002 | | | 3.23 | % | | | –1.11 | % | | | –7.01 | % | | | 5.34 | % |
Institutional Class7 | | 04/01/2008 | | | 3.93 | % | | | –0.63 | % | | | –6.77 | % | | | 5.56 | % |
Class A21 | | 05/27/2009 | | | 3.60 | % | | | –0.81 | % | | | –6.86 | % | | | 5.48 | % |
Class C21 | | 05/27/2009 | | | 2.81 | % | | | –0.99 | % | | | –6.95 | % | | | 5.40 | % |
Class R321 | | 05/27/2009 | | | 3.33 | % | | | –0.87 | % | | | –6.89 | % | | | 5.45 | % |
| With Sales Charge |
Class A21 | | | | | –2.35 | % | | | –1.98 | % | | | –7.41 | % | | | 4.96 | % |
Class C21 | | | | | 1.81 | % | | | –0.99 | % | | | –6.95 | % | | | 5.40 | % |
| Index |
Russell 2000® Growth Index2,19 | | | 7.16 | % | | | –0.17 | % | | | –1.94 | % | | | 3.69 | % |
Russell 2000® Index2,19 | | | 6.60 | % | | | –0.69 | % | | | 2.48 | % | | | 5.98 | % |
Performance data quoted represent past performance, which is no guarantee of future results. The investment return and principal value of an investment will fluctuate so that an investor's shares, when redeemed, may be worth more or less than their original cost. Results are shown on a "total return" basis and include reinvestment of all income dividends and distributions.
Current performance may be lower or higher than the performance data quoted. For performance data current to the most recent month end, visit www.nb.com/performance.
As stated in the Fund's most recent prospectus, the total annual operating expense ratios for fiscal year 2009 were 1.50%, 1.74%, 2.00%, 1.70%, 1.62%, 2.37% and 1.87% for Investor Class, Trust Class, Advisor Class, Institutional Class, Class A, Class C and Class R3 shares, respectively (prior to any fee waivers or expense reimbursements). The expense ratios net of waivers and reimbursements were 1.32%, 1.42%, 1.62%, 0.92%, 1.27%, 2.02% and 1.52% for Investor Class, Trust Class, Advisor Class, Institutional Class, Class A, Class C and Class R3 shares, respectively. Neuberger Berman Management LLC has contractually agreed to limit certain expenses of the Fund through August 31, 2020 for Investor Class, Trust Class and Advisor Class shares and through August 31, 2013 for Institutional Class, Class A, Class C and Class R3 s hares.
Total Returns shown with a sales charge reflect the deduction of the current maximum initial sales charge of 5.75% for Class A shares and the applicable contingent deferred sales charges (CDSC) for Class C shares. The maximum CDSC for Class C shares is 1%, which is reduced to 0% after 1 year. The performance of the Fund's share classes will differ primarily due to different sales charge structures and class expenses. Please see the prospectus for more information about sales charge structures, if any, and class expenses for your share class.
Small Cap Growth Fund
| COMPARISON OF A $10,000 INVESTMENT |
|
This chart shows the value of a hypothetical $10,000 investment in the Fund over the past 10 fiscal years, or since the Fund's inception if it has not operated for 10 years. The graph is based on the Investor Class shares only; performance of other classes will vary due to differences in fee structures and any applicable sales charges (see Performance Highlights chart on previous page). The result is compared with benchmarks, which may include a broad-based market index and/or a narrower index. Please note that market indexes have not been reduced to reflect any of the fees and costs of investing. All results include the reinvestment of income dividends and distributions. Neither the Fund's returns nor the market indexes shown in the graph and table reflect the effect of taxes an investor would pay on Fund distributions or on the redemption of Fund shares. Results represent past performance and do not indicate future results.
Socially Responsive Fund Commentary
We are pleased to report that, for the fiscal year ended August 31, 2010, Neuberger Berman Socially Responsive Fund generated a positive return and significantly outperformed its benchmark, the S&P 500 Index.
Market sentiment shifted sharply over the fiscal year. For the first two-thirds of the period, the economy was expanding at an above-trend rate—coming off the bottom of the recession with an inventory cycle underway. Through April 2010 there was active discussion about how the Federal Reserve might begin to exit its quantitative easing program. Against that backdrop, equities performed very well, led by shares of businesses that would be the greatest beneficiaries of a cyclical recovery, including Consumer Discretionary, Industrials, credit-sensitive Financials and Materials.
In late April and early May, as worries about sovereign debt issues in Europe increased, credit markets grew nervous and many equity investors sold their shares. This was the lead-in to the seasonally soft summer months, and throughout the summer, economic statistics—industrial production, employment, spending—weakened. Against this backdrop, some of the sectors that had outperformed came under the most pressure.
Within Neuberger Berman Socially Responsive Fund, our focus for several years has been on identifying businesses positioned to perform in a slower growth environment on the strength of their products and value to customers. Earlier this period, the shares of many traditional growth sectors performed poorly as investors favored cyclical exposure. As multiples between growth and value converged, we were able to buy high-quality growth companies at very attractive prices. That is where we have continued to make portfolio additions, purchasing strong businesses, with good secular growth, whose stocks have underperformed. We now have a meaningful Consumer Staples allocation, a different mix in Health Care, and a number of one-off names across the portfolio that share these characteristics.
Examples include McCormick, the growing global spice company that is committed to both agricultural sustainability and supplier diversity, and MasterCard, the payment processing firm long admired for its workplace and diversity programs. These businesses were defensive during the downturn, but also demonstrated that they can maintain and protect earnings in an inflationary environment. We believe, given the current environment, that such extremes are not off the table.
For the fiscal year, despite the fact that we were largely underexposed (compared to the benchmark) to the best performing sectors early on, we were able to deliver very good relative returns by executing our strategy. The largest contributors to our outperformance this period included three long-term holdings: Intuit, Altera and Novo Nordisk.
We bought Intuit years ago, believing that the business could grow in a tough environment, and they have done a remarkable job—through 2008, 2009 and today, at a double-digit pace. Altera also outperformed. While it is late in the semiconductor cycle, the secular outlook for Altera, based on what we consider superior technology, has become more apparent. Focused on the global diabetes epidemic, Novo Nordisk outperformed, having grown at a solid rate despite the economic backdrop. Millipore and Smith International—both of which were acquired by other companies—were also among the top contributors to performance. During the first quarter, we began to see increased merger and acquisition activity, which we think speaks to the growing strength of corporate balance sheets. We expect to see more going forwar d.
Disappointments included Charles Schwab, a long-term holding whose business is growing, and that stands to benefit when interest rates eventually rise. The stock underperformed as European debt and U.S. recovery concerns pushed out the likely timeline for rate increases and the related earnings upside. We continue to own this well-managed business.
Covidien, a Health Care name we added over the winter on the opportunity to buy good secular growth at an attractive value, performed well through early spring. The stock weakened on concerns about slowing utilization of medical services, related to the expiration of extended COBRA benefits. We remain positive on the stock and sector, and continue to own both Covidien and Becton Dickinson.
Washington Post, which we owned for its Kaplan education business, was frustrating. While we got the fundamentals right—Kaplan met our expectations for dramatic and contra-cyclical growth—the regulatory environment changed dramatically. As proposed regulations threaten Kaplan's business model, we eliminated our position.
From our perspective, investor expectations seem to have overshot on the upside early in the fiscal year, as inventory rebuilding drove GDP growth at a rate that we think is likely to prove greater than long-term trend. As the fiscal year progressed, credit market volatility in Europe and fears of a double-dip recession appear to have caused sentiment to overshoot on the downside. While we expect there will be challenges ahead, we think odds are that the economy will remain on course for a slow recovery.
In an uncertain world, we remain confident that the high-quality businesses in our portfolio are financially strong, thoughtful about integrating environmental initiatives into their businesses and mindful of their multiple stakeholders, and are positioned to deliver reasonable growth over a wide range of economic outcomes.
As always, we look forward to continuing to serve your investment needs.
Sincerely,


Arthur Moretti and Ingrid S. Dyott
Portfolio Co-Managers
The risks involved in seeking capital appreciation from investments in mid- to large-cap stocks that meet the Fund's financial criteria and social policy are set forth in the prospectus and statement of additional information.
Mid-capitalization stocks are more vulnerable to financial risks and other risks than larger stocks. They are generally less liquid than larger stocks, so their market prices tend to be more volatile. Large-cap stocks are subject to all the risks of stock market investing, including the risk that they may lose value.
The Fund's social policy could cause it to underperform similar funds that do not have a social policy. The composition, industries and holdings of the Fund are subject to change. Socially Responsive Fund is invested in a wide array of stocks and no single holding makes up a significant portion of the Fund's total assets.
Socially Responsive Fund
| TICKER SYMBOLS |
| Investor Class | | NBSRX |
| Trust Class | | NBSTX |
| Institutional Class | | NBSLX |
| Class A | | NRAAX |
| Class C | | NRACX |
| Class R3 | | NRARX |
| SECTOR ALLOCATION |
| (% of Total Investments) | |
| Consumer Discretionary | | | 5.7 | % |
| Consumer Staples | | | 8.8 | |
| Energy | | | 11.2 | |
| Financials | | | 12.0 | |
| Health Care | | | 12.2 | |
| Industrials | | | 16.2 | |
| Information Technology | | | 25.1 | |
| Materials | | | 3.9 | |
| Short-Term | | | 4.9 | |
| Total | | | 100.0 | % |
| PERFORMANCE HIGHLIGHTS1,3,8 |
| | | | | Average Annual Total Return Ended 08/31/2010 |
| | | Inception Date | | 1 Year | | 5 Years | | 10 Years | | Life of Fund |
| At NAV |
| Investor Class | | 03/16/1994 | | | 10.14 | % | | | 0.04 | % | | | 2.62 | % | | | 7.38 | % |
Trust Class5 | | 03/03/1997 | | | 9.94 | % | | | –0.15 | % | | | 2.40 | % | | | 7.21 | % |
Institutional Class7 | | 11/28/2007 | | | 10.36 | % | | | 0.13 | % | | | 2.67 | % | | | 7.41 | % |
Class A21 | | 05/27/2009 | | | 10.03 | % | | | 0.01 | % | | | 2.61 | % | | | 7.37 | % |
Class C21 | | 05/27/2009 | | | 9.10 | % | | | –0.19 | % | | | 2.50 | % | | | 7.31 | % |
Class R321 | | 05/27/2009 | | | 9.74 | % | | | –0.06 | % | | | 2.57 | % | | | 7.35 | % |
| With Sales Charge |
Class A21 | | | | | 3.67 | % | | | –1.17 | % | | | 2.00 | % | | | 6.99 | % |
Class C21 | | | | | 8.10 | % | | | –0.19 | % | | | 2.50 | % | | | 7.31 | % |
| Index |
S&P 500 Index2,19 | | | | | 4.91 | % | | | –0.91 | % | | | –1.81 | % | | | 7.03 | % |
Performance data quoted represent past performance, which is no guarantee of future results. The investment return and principal value of an investment will fluctuate so that an investor's shares, when redeemed, may be worth more or less than their original cost. Results are shown on a "total return" basis and include reinvestment of all income dividends and distributions.
Current performance may be lower or higher than the performance data quoted. For performance data current to the most recent month end, visit www.nb.com/performance.
As stated in the Fund's most recent prospectus, the total annual operating expense ratios for fiscal year 2009 were 0.93%, 1.13%, 0.78%, 1.17%, 1.92% and 1.42% for Investor Class, Trust Class, Institutional Class, Class A, Class C and Class R3 shares, respectively (prior to any fee waivers or expense reimbursements). The expense ratios net of waivers and reimbursements were 0.75%, 1.11%, 1.86% and 1.36% for Institutional Class, Class A, Class C and Class R3 shares, respectively. Neuberger Berman Management LLC has contractually agreed to limit certain expenses of the Fund through August 31, 2013 for Trust Class, Institutional Class, Class A, Class C and Class R3 shares.
Total Returns shown with a sales charge reflect the deduction of the current maximum initial sales charge of 5.75% for Class A shares and the applicable contingent deferred sales charges (CDSC) for Class C shares. The maximum CDSC for Class C shares is 1%, which is reduced to 0% after 1 year. The performance of the Fund's share classes will differ primarily due to different sales charge structures and class expenses. Please see the prospectus for more information about sales charge structures, if any, and class expenses for your share class.
Socially Responsive Fund
| COMPARISON OF A $10,000 INVESTMENT |
|
This chart shows the value of a hypothetical $10,000 investment in the Fund over the past 10 fiscal years, or since the Fund's inception if it has not operated for 10 years. The graph is based on the Investor Class shares only; performance of other classes will vary due to differences in fee structures and any applicable sales charges (see Performance Highlights chart on previous page). The result is compared with benchmarks, which may include a broad-based market index and/or a narrower index. Please note that market indexes have not been reduced to reflect any of the fees and costs of investing. All results include the reinvestment of income dividends and distributions. Neither the Fund's returns nor the market indexes shown in the graph and table reflect the effect of taxes an investor would pay on Fund distributions or on the redemption of Fund shares. Results represent past performance and do not indicate future results.
Endnotes
1 | "Total Return" includes reinvestment of all income dividends and distributions. Results represent past performance and do not indicate future results. The value of an investment in the Fund and the return on the investment both will fluctuate, and redemption proceeds may be higher or lower than an investor's original cost. |
2 | Please see "Glossary of Indices" starting on page 79 for a description of indices. Please note that indices do not take into account any fees and expenses or tax consequences of investing in the individual securities that they track, and that individuals cannot invest directly in any index. Data about the performance of these indices are prepared or obtained by Neuberger Berman Management LLC ("Management") and include reinvestment of all income dividends and distributions. The Fund may invest in securities not included in the described indices or may not invest in all securities included in the described indices. |
3 | Expense Caps or Waivers: These arrangements are subject to change. The total returns for these periods may have been less if Management had not reimbursed and/or waived certain operating expenses. Please see the notes to the financial statements for specific information regarding which Funds and which classes currently have a portion of their operating expenses reimbursed and/or waived by Management. |
4 | This date reflects when Management first became investment advisor to the Fund. |
5 | For each of Focus Fund, Genesis Fund, Guardian Fund, Mid Cap Growth Fund and Partners Fund, Life of Fund performance shown for the Advisor Class and the Trust Class is that of the respective Fund's Investor Class from the inception date of the Investor Class to the inception date of the Advisor Class or the Trust Class. For each of International Fund, Regency Fund, Small Cap Growth Fund and Socially Responsive Fund, Life of Fund performance shown for the Trust Class is that of the respective Fund's Investor Class from the inception date of the Investor Class to the inception date of the Trust Class. The Investor Class of each Fund has lower expenses and typically higher returns than the Advisor Class, as applicable, and the Trust Class of that Fund. |
6 | Performance shown for the Advisor Class prior to May 2002 for Small Cap Growth Fund is that of the Investor Class, which has lower expenses and typically higher returns than the Advisor Class. |
7 | Performance shown prior to July 1999 for the Institutional Class of Genesis Fund, prior to June 2006 for the Institutional Class of Partners Fund, prior to April 2007 for the Institutional Class of Mid Cap Growth Fund, prior to November 2007 for the Institutional Class of Socially Responsive Fund and prior to April 2008 for the Institutional Class of Small Cap Growth Fund is that of the respective Fund's Investor Class. Performance shown prior to October 2006 for the Institutional Class of International Large Cap Fund and prior to June 2008 for the Institutional Class of Real Estate Fund is that of the respective Fund's Trust Class. The Investor Class or Trust Class of a Fund, as applicable, has higher expenses and typically lower returns than the Institutional Class of that Fund. |
8 | The investments for the Fund are managed by the same portfolio manager(s) who manage(s) one or more other mutual funds that have similar names, investment objectives, and investment styles as the Fund. You should be aware that the Fund is likely to differ from the other mutual funds in size, cash flow pattern and tax matters. Accordingly, the holdings and performance can be expected to vary from those of the other mutual funds. |
9 | The Fund had a policy of investing mainly in large-cap stocks prior to September 1998 and investing 90% of its assets in no more than six economic sectors prior to December 17, 2007. As of April 2, 2001, the Fund changed its investment policy to become "non-diversified" under the Investment Company Act of 1940. Performance prior to these changes might have been different if current policies had been in effect. As a result of becoming "non-diversified", the Fund can invest a greater percentage of assets in any single security. This practice could increase the risk of investing in the Fund because it may own fewer securities. While the Fund's value-oriented approach is intended to limit risks, the Fund, with its concentration in a limited number of securities, may be more affected by any single economic, political or regu latory development than a more diversified mutual fund. |
10 | The Fund was relatively small during the periods shown. The same techniques used to produce returns in a small fund may not work to produce similar returns in a larger fund. |
11 | Prior to December 17, 2007, Mid Cap Growth Fund was known as the Manhattan Fund. |
12 | Prior to December 17, 2007, Small Cap Growth Fund was known as the Millennium Fund. |
13 | Performance shown prior to June 21, 2010 for Emerging Markets Equity Fund's Class R3 is that of Emerging Markets Equity Fund's Institutional Class. The performance information of Class R3 has not been adjusted to take into account differences in class specific operating expenses. The Institutional Class of the Fund has lower expenses and typically higher returns than Class R3. |
14 | As of December 17, 2007, the Fund changed its investment policy to become "non-diversified" under the Investment Company Act of 1940. Performance prior to this change might have been different if current policies had been in effect. As a result of becoming "non-diversified," the Fund can invest a greater percentage of assets in any single security. This practice could increase the risk of investing in the Fund because it may own fewer securities. Although the Fund has a policy that allows it to operate as a non-diversified investment company, on December 5, 2008, the Board adopted a policy, which cannot be changed without a shareholder vote, that the Fund will invest its portfolio so as to meet the standards of a diversified investment company. |
15 | Because the Fund had a policy of investing mainly in large-cap stocks prior to December 2002, its performance during that time might have been different if current policies had been in effect. |
16 | Because the Fund had a policy of investing primarily in mid- and large-cap stocks prior to September 1998, its performance during that time might have been different if current policies had been in effect. |
17 | During the period from November 2, 2006 through June 9, 2008, the Fund's Trust Class had only one investor, which could have impacted Fund performance. The inception date for the Fund's Institutional Class, Class A and Class C shares was June 9, 2008 and the inception date for Class R3 was June 21, 2010. Performance shown for Institutional Class, Class A, Class C and Class R3 prior to that date is that of the Trust Class, which had an inception date of November 2, 2006, and converted into the Institutional Class. The performance of Class R3 also includes that of Institutional Class from June 9, 2008 to June 21, 2010. The performance information of the Trust Class has been adjusted to reflect the appropriate sales charges applicable to Class A and Class C shares, but has not been adjusted to take into account differences in class specific operating expenses (such as Rule 12b-1 fees). The Trust Class had lower expenses and typically higher returns than Class A, Class C and Class R3. The Trust Class had moderately higher expenses and typically slightly lower returns than Institutional Class. The Institutional Class has lower expenses and typically higher returns than that of Class R3. |
18 | Performance shown prior to December 20, 2007 for Class A and Class C, and prior to May 27, 2009 for Class R3, of Neuberger Berman International Large Cap Fund is that of the Trust Class. The performance information of the Trust Class has been adjusted to reflect the appropriate sales charges applicable to Class A and Class C shares, but has not been adjusted to take into account differences in class specific operating expenses (such as Rule 12b-1 fees). The Trust Class has lower expenses and typically higher returns than Class A, Class C or Class R3. |
19 | The date used to calculate Life of Fund performance for the index is the inception date of the oldest share class. |
20 | Prior to April 9, 2009, Neuberger Berman Large Cap Disciplined Growth Fund was known as Neuberger Berman Century Fund. From April 6, 2009 through April 8, 2009, Large Cap Disciplined Growth Fund Class A, Class C and Institutional Class were known as Century Fund Class A, Class C and Institutional Class. The inception dates are April 6, 2009 for Large Cap Disciplined Growth Fund Class A, Class C and Institutional Class and May 27, 2009 for Large Cap Disciplined Growth Fund Class R3. Performance shown prior to May 27, 2009 for Class R3, and prior to April 6, 2009 for Institutional Class, Class A and Class C of Neuberger Berman Large Cap Disciplined Growth Fund is that of Neuberger Berman Century Fund Investor Class. The performance information of the Investor Class has been adjusted to reflect the appropriate sales charge s applicable to Class A and Class C shares, but has not been adjusted to take into account differences in class specific operating expenses (such as Rule 12b-1 fees). The Investor Class has lower expenses and typically higher returns than Class A, Class C or Class R3. The Institutional Class has lower expenses and typically higher returns than Investor Class. |
Endnotes (cont'd)
21 | Performance shown prior to May 27, 2009 for Class A, Class C and Class R3 of Neuberger Berman Guardian Fund, Neuberger Berman Mid Cap Growth Fund, Neuberger Berman Small Cap Growth Fund and Neuberger Berman Socially Responsive Fund is that of the respective Fund's Investor Class. The performance information of the Investor Class has been adjusted to reflect the appropriate sales charges applicable to Class A and Class C shares, but has not been adjusted to take into account differences in class specific operating expenses (such as Rule 12b-1 fees). The Investor Class of a Fund has lower expenses and typically higher returns than Class A, Class C or Class R3 of that Fund. |
22 | Performance shown prior to May 27, 2009 and June 21, 2010 for Institutional Class of Neuberger Berman Guardian Fund and Neuberger Berman Focus Fund, respectively is that of the respective Fund's Investor Class. The performance information of Institutional Class has not been adjusted to take into account differences in class specific operating expenses. Institutional Class has lower expenses and typically higher returns than Investor Class. |
23 | During the period from November 2, 2006 through December 21, 2009, the Fund's Trust Class had only one investor, which could have impacted fund performance. The inception date for the Fund's Class A, Class C and Institutional Class shares was December 21, 2009. Performance shown for Class A, Class C and Institutional Class prior to that date is that of the Trust Class, which had an inception date of November 2, 2006, and converted into the Institutional Class and ceased operations on December 21, 2009. Management had previously capped Trust Class expenses; absent this arrangement, the returns would have been lower. The Trust Class had lower capped expenses and typically higher returns than Class A and Class C shares. The Trust Class had equivalent capped expenses and, therefore, typically similar returns to the Institut ional Class. The performance information of the Trust Class has been adjusted to reflect the appropriate sales charges applicable to Class A and Class C shares, but has not been adjusted to take into account differences in class specific operating expenses (such as Rule 12b-1 fees). |
24 | The inception date for Neuberger Berman Intrinsic Value Fund Class A, C and Institutional shares is May 10, 2010. Performance shown prior to that date is that of the Fund's predecessor, the DJG Small Cap Value Fund L.P., an unregistered limited partnership ("DJG Fund"); DJG Fund was the successor to The DJG Small Cap Value Fund, an unregistered commingled investment account ("DJG Account"). The performance from July 15, 2008 is that of DJG Fund and the performance from July 8, 1997 (the Fund's commencement of operations) to July 14, 2008 is that of DJG Account. On May 10, 2010, the DJG Fund transferred its assets to the Fund in exchange for the Fund's Institutional Class shares. The investment policies, objectives, guidelines and restrictions of the Fund are in all material respects equivalent to those of DJG Fund and D JG Account (the "Predecessors"). As a mutual fund registered under the Investment Company Act of 1940, the Fund is subject to certain restrictions under the 1940 Act and the Internal Revenue Code to which the Predecessors were not subject. Had the Predecessors been registered under the 1940 Act and been subject to the provisions of the 1940 Act and the Code, its investment performance may have been adversely affected. The performance information reflects the actual expenses of the Predecessors. |
25 | Performance shown prior to June 21, 2010 for Class A and Class C of Neuberger Berman Focus Fund and Class A, Class C and Class R3 of Neuberger Berman Partners Fund, Neuberger Berman Real Estate Fund, and Neuberger Berman Regency Fund is that of the respective Fund's Investor Class. The performance information of the Investor Class has been adjusted to reflect the appropriate sales charges applicable to Class A and Class C shares, but has not been adjusted to take into account differences in class specific operating expenses (such as Rule 12b-1 fees). The Investor Class of a Fund has lower expenses and typically higher returns than Class A, Class C or Class R3 of that Fund. |
26 | Performance shown prior to March 8, 2010 for Regency Fund's Institutional Class is that of Regency Fund's Investor Class. The performance information of the Institutional Class has not been adjusted to take into account differences in class specific operating expenses. The Investor Class has higher expenses and its performance typically would have been slightly lower than that of the Institutional Class. |
For more complete information on any of the Neuberger Berman Equity Funds, call Neuberger Berman Management LLC at (800) 877-9700, or visit our website at www.nb.com. |
Glossary of Indices
| S&P 500 Index: | | The S&P 500 Index is widely regarded as the standard for measuring the performance of large-cap stocks traded on U.S. markets and includes a representative sample of leading companies in leading industries. | |
| |
Russell 1000® Index: | | Measures the performance of the 1,000 largest companies in the Russell 3000® Index (which measures the performance of the 3,000 largest U.S. companies based on total market capitalization and current index membership). The Russell 1000 Index represents approximately 90% of the U.S. market. | |
| |
Russell 1000® Value Index: | | Measures the performance of those Russell 1000® Index companies with lower price-to-book ratios and lower expected growth rates. | |
| |
Russell 1000® Growth Index: | | Measures the performance of those Russell 1000® Index companies with higher price-to-book-ratios and higher forecasted growth rates. | |
| |
Russell 2000® Index: | | An unmanaged index consisting of securities of the 2,000 issuers having the smallest capitalization in the Russell 3000® Index, representing approximately 8% of the Russell 3000 Index total market capitalization. As of the latest reconstitution, the smallest company's market capitalization was approximately $112 million. | |
| |
Russell 2000® Growth Index: | | Measures the performance of those Russell 2000® Index companies with higher price-to-book ratios and higher forecasted growth rates. | |
| |
Russell 2000® Value Index: | | Measures the performance of those Russell 2000® Index companies with lower price-to-book ratios and lower forecasted growth rates. | |
| |
Russell Midcap® Index: | | Measures the performance of the approximately 800 smallest companies in the Russell 1000® Index. | |
| |
Russell Midcap® Growth Index: | | An unmanaged index that measures the performance of those Russell Midcap® Index companies (the 800 smallest companies in the Russell 1000® Index) with higher price-to-book ratios and higher forecasted growth rates. | |
| |
Russell Midcap® Value Index: | | An unmanaged index that measures the performance of those Russell Midcap® Index companies (the 800 smallest companies in the Russell 1000® Index) with lower price-tobook ratios and lower forecasted growth rates. | |
| |
| FTSE NAREIT Equity REITs Index: | | An unmanaged free float adjusted market capitalization weighted index that tracks the performance of all Equity REITs currently listed on the New York Stock Exchange, the NASDAQ National Market System and the NYSE Amex. REITs are classified as Equity REITs if 75% or more of their gross invested book assets are invested directly or indirectly in real property. | |
| |
MSCI EAFE® Index: | | Also known as the Morgan Stanley Capital International Europe, Australasia, Far East Index. A free float-adjusted market capitalization index that is designed to measure the equity market performance of developed markets, excluding the US & Canada. As of May 27, 2010 the MSCI EAFE Index consisted of the following 22 developed market country indices: Australia, Austria, Belgium, Denmark, Finland, France, Germany, Greece, Hong Kong, Ireland, Israel, Italy, Japan, the Netherlands, New Zealand, Norway, Portugal, Singapore, Spain, Sweden, Switzerland, and the United Kingdom. | |
| |
| MSCI Emerging Markets Index: | | A free float-adjusted market capitalization index that is designed to measure equity market performance of emerging markets. As of May 27, 2010 the MSCI Emerging Markets Index consisted of the following 21 emerging market country indices: Brazil, Chile, China, Colombia, Czech Republic, Egypt, Hungary, India, Indonesia, Korea, Malaysia, Mexico, Morocco, Peru, Philippines, Poland, Russia, South Africa, Taiwan, Thailand, and Turkey. | |
| |
Glossary of Indices (cont'd)
| MSCI World Index: | | A free float-adjusted market capitalization weighted index that is designed to measure the equity market performance of developed markets. As of May 27, 2010 the MSCI World Index consisted of the following 24 developed market country indices: Australia, Austria, Belgium, Canada, Denmark, Finland, France, Germany, Greece, Hong Kong, Ireland, Israel, Italy, Japan, Netherlands, New Zealand, Norway, Portugal, Singapore, Spain, Sweden, Switzerland, the United Kingdom, and the United States. | |
| |
| HSBC Global Climate Change Index: | | The index is rule-based and uses a modified market capitalization approach that takes into account free float and revenues associated with climate change-related businesses. Recognizing that there is also a growing number of integrated players exposed to this theme, individual companies are weighted in the index according to their exposure to climate change. Exposure is defined as the percentage of overall revenues that are attributable to reducing emissions, reacting to the effects of climate change or adapting to climate change. The revenue data are based on HSBC's analysis of publicly available information and data from an external consultant specializing in renewable energy, low carbon technology and the carbon markets. Once a company has been ascribed an exposure factor and it forms part of the selection universe, HSBC monitors and modifies its climate change-related revenues, if necessary, on an annual basis. | |
| |
Please note that indices do not take into account any fees and expenses or any tax consequences of investing in the individual securities that they track and that individuals cannot invest directly in any index. Data about the performance of these indices are prepared or obtained by Management and include reinvestment of all income dividends and distributions. The Funds may invest in securities not included in the above-described indices.
Information About Your Fund's Expenses
These tables are designed to provide information regarding costs related to your investments. All mutual funds incur operating expenses, which include management fees, fees for administrative services and costs of shareholder reports, among others. The following examples are based on an investment of $1,000 made at the beginning of the six month period ended August 31, 2010 and held for the entire period. The table illustrates the fund's costs in two ways:
| Actual Expenses and Performance: | | The first section of the table provides information about actual account values and actual expenses in dollars, based on the fund's actual performance during the period. You may use the information in this line, together with the amount you invested, to estimate the expenses you paid over the period. Simply divide your account value by $1,000 (for example, an $8,600 account value divided by $1,000 = 8.6), then multiply the result by the number in the first section of the table under the heading entitled "Expenses Paid During the Period" to estimate the expenses you paid over the period. | |
| |
Hypothetical Example for Comparison Purposes: | | The second section of the table provides information about hypothetical account values and hypothetical expenses based on the fund's actual expense ratio and an assumed rate of return at 5% per year before expenses. This return is not the fund's actual return. The hypothetical account values and expenses may not be used to estimate the actual ending account balance or expenses you paid for the period. You may use this information to compare the ongoing costs of investing in these funds versus other funds. To do so, compare the expenses shown in this 5% hypothetical example with the 5% hypothetical examples that appear in the shareholder reports of other funds. | |
| |
Please note that the expenses in the tables are meant to highlight your ongoing costs only and do not reflect any transaction costs, such as sales charges (loads) or redemption fees. Therefore, the information under the heading "Hypothetical (5% annual return before expenses)" is useful in comparing ongoing costs only, and will not help you determine the relative total costs of owning different funds. In addition, if these transaction costs were included, your costs would have been higher.
Expense Information as of 8/31/10 (Unaudited)
| Neuberger Berman Equity Funds |
| | | ACTUAL | | HYPOTHETICAL (5% ANNUAL RETURN BEFORE EXPENSES)(5) |
| | | Beginning Account Value 3/1/10 | | Ending Account Value 8/31/10 | | Expenses Paid During the Period(1) 3/1/10 - 8/31/10 | | Expense Ratio | | Beginning Account Value 3/1/10 | | Ending Account Value 8/31/10 | | Expenses Paid During the Period(1) 3/1/10 - 8/31/10 | | Expense Ratio |
| Climate Change Fund | | | | | | | | | | | | | | | | | | | | | | | | | | | | | | | | |
| Institutional Class | | $ | 1,000.00 | | | $ | 945.60 | | | $ | 4.66 | | | | .95 | % | | $ | 1,000.00 | | | $ | 1,020.42 | | | $ | 4.84 | | | | .95 | % |
| Class A | | $ | 1,000.00 | | | $ | 947.00 | | | $ | 5.89 | | | | 1.20 | % | | $ | 1,000.00 | | | $ | 1,019.16 | | | $ | 6.11 | | | | 1.20 | % |
| Class C | | $ | 1,000.00 | | | $ | 943.30 | | | $ | 9.55 | | | | 1.95 | % | | $ | 1,000.00 | | | $ | 1,015.38 | | | $ | 9.91 | | | | 1.95 | % |
| Emerging Markets Equity Fund | | | | | | | | | | | | | | | | | | | | | | | | | | | | | | | | |
| Institutional Class | | $ | 1,000.00 | | | $ | 1,055.40 | | | $ | 6.53 | | | | 1.26 | % | | $ | 1,000.00 | | | $ | 1,018.85 | | | $ | 6.41 | | | | 1.26 | % |
| Class A | | $ | 1,000.00 | | | $ | 1,054.20 | | | $ | 7.82 | | | | 1.51 | % | | $ | 1,000.00 | | | $ | 1,017.59 | | | $ | 7.68 | | | | 1.51 | % |
| Class C | | $ | 1,000.00 | | | $ | 1,050.40 | | | $ | 11.68 | | | | 2.26 | % | | $ | 1,000.00 | | | $ | 1,013.81 | | | $ | 11.47 | | | | 2.26 | % |
| Class R3 | | $ | 1,000.00 | | | $ | 1,021.20 | (3) | | $ | 3.85 | | | | 1.93 | % | | $ | 1,000.00 | | | $ | 1,015.48 | | | $ | 9.80 | | | | 1.93 | % |
| Equity Income Fund | | | | | | | | | | | | | | | | | | | | | | | | | | | | | | | | |
| Institutional Class | | $ | 1,000.00 | | | $ | 1,058.50 | | | $ | 4.15 | | | | .80 | % | | $ | 1,000.00 | | | $ | 1,021.17 | | | $ | 4.08 | | | | .80 | % |
| Class A | | $ | 1,000.00 | | | $ | 1,056.90 | | | $ | 6.01 | | | | 1.16 | % | | $ | 1,000.00 | | | $ | 1,019.36 | | | $ | 5.90 | | | | 1.16 | % |
| Class C | | $ | 1,000.00 | | | $ | 1,052.90 | | | $ | 9.88 | | | | 1.91 | % | | $ | 1,000.00 | | | $ | 1,015.58 | | | $ | 9.70 | | | | 1.91 | % |
| Class R3 | | $ | 1,000.00 | | | $ | 999.60 | (3) | | $ | 2.78 | | | | 1.41 | % | | $ | 1,000.00 | | | $ | 1,018.11 | | | $ | 7.17 | | | | 1.41 | % |
| Focus Fund | | | | | | | | | | | | | | | | | | | | | | | | | | | | | | | | |
| Investor Class | | $ | 1,000.00 | | | $ | 910.50 | | | $ | 4.72 | | | | .98 | % | | $ | 1,000.00 | | | $ | 1,020.27 | | | $ | 4.99 | | | | .98 | % |
| Trust Class | | $ | 1,000.00 | | | $ | 910.00 | | | $ | 5.63 | | | | 1.17 | % | | $ | 1,000.00 | | | $ | 1,019.31 | | | $ | 5.96 | | | | 1.17 | % |
| Advisor Class | | $ | 1,000.00 | | | $ | 908.90 | | | $ | 6.40 | | | | 1.33 | % | | $ | 1,000.00 | | | $ | 1,018.50 | | | $ | 6.77 | | | | 1.33 | % |
| Institutional Class | | $ | 1,000.00 | | | $ | 904.90 | (3) | | $ | 1.41 | | | | .75 | % | | $ | 1,000.00 | | | $ | 1,021.42 | | | $ | 3.82 | | | | .75 | % |
| Class A | | $ | 1,000.00 | | | $ | 904.40 | (3) | | $ | 2.08 | | | | 1.11 | % | | $ | 1,000.00 | | | $ | 1,019.61 | | | $ | 5.65 | | | | 1.11 | % |
| Class C | | $ | 1,000.00 | | | $ | 902.70 | (3) | | $ | 3.49 | | | | 1.86 | % | | $ | 1,000.00 | | | $ | 1,015.83 | | | $ | 9.45 | | | | 1.86 | % |
| Genesis Fund | | | | | | | | | | | | | | | | | | | | | | | | | | | | | | | | |
| Investor Class | | $ | 1,000.00 | | | $ | 963.20 | | | $ | 5.29 | | | | 1.07 | % | | $ | 1,000.00 | | | $ | 1,019.81 | | | $ | 5.45 | | | | 1.07 | % |
| Trust Class | | $ | 1,000.00 | | | $ | 962.90 | | | $ | 5.59 | | | | 1.13 | % | | $ | 1,000.00 | | | $ | 1,019.51 | | | $ | 5.75 | | | | 1.13 | % |
| Advisor Class | | $ | 1,000.00 | | | $ | 962.00 | | | $ | 6.82 | | | | 1.38 | % | | $ | 1,000.00 | | | $ | 1,018.25 | | | $ | 7.02 | | | | 1.38 | % |
| Institutional Class | | $ | 1,000.00 | | | $ | 964.60 | | | $ | 4.21 | | | | .85 | % | | $ | 1,000.00 | | | $ | 1,020.92 | | | $ | 4.33 | | | | .85 | % |
| Guardian Fund | | | | | | | | | | | | | | | | | | | | | | | | | | | | | | | | |
| Investor Class | | $ | 1,000.00 | | | $ | 965.40 | | | $ | 4.71 | | | | .95 | % | | $ | 1,000.00 | | | $ | 1,020.42 | | | $ | 4.84 | | | | .95 | % |
| Trust Class | | $ | 1,000.00 | | | $ | 965.00 | | | $ | 5.50 | | | | 1.11 | % | | $ | 1,000.00 | | | $ | 1,019.61 | | | $ | 5.65 | | | | 1.11 | % |
| Advisor Class | | $ | 1,000.00 | | | $ | 962.70 | | | $ | 7.42 | | | | 1.50 | % | | $ | 1,000.00 | | | $ | 1,017.64 | | | $ | 7.63 | | | | 1.50 | % |
| Institutional Class | | $ | 1,000.00 | | | $ | 966.20 | | | $ | 3.72 | | | | .75 | % | | $ | 1,000.00 | | | $ | 1,021.42 | | | $ | 3.82 | | | | .75 | % |
| Class A | | $ | 1,000.00 | | | $ | 964.90 | | | $ | 5.50 | | | | 1.11 | % | | $ | 1,000.00 | | | $ | 1,019.61 | | | $ | 5.65 | | | | 1.11 | % |
| Class C | | $ | 1,000.00 | | | $ | 961.60 | | | $ | 9.20 | | | | 1.86 | % | | $ | 1,000.00 | | | $ | 1,015.83 | | | $ | 9.45 | | | | 1.86 | % |
| Class R3 | | $ | 1,000.00 | | | $ | 963.50 | | | $ | 6.73 | | | | 1.36 | % | | $ | 1,000.00 | | | $ | 1,018.35 | | | $ | 6.92 | | | | 1.36 | % |
| International Fund | | | | | | | | | | | | | | | | | | | | | | | | | | | | | | | | |
| Investor Class | | $ | 1,000.00 | | | $ | 1,016.80 | | | $ | 7.27 | | | | 1.43 | % | | $ | 1,000.00 | | | $ | 1,018.00 | | | $ | 7.27 | | | | 1.43 | % |
| Trust Class | | $ | 1,000.00 | | | $ | 1,017.10 | | | $ | 7.88 | | | | 1.55 | % | | $ | 1,000.00 | | | $ | 1,017.39 | | | $ | 7.88 | | | | 1.55 | % |
| International Institutional Fund | | | | | | | | | | | | | | | | | | | | | | | | | | | | | | | | |
| Institutional Class | | $ | 1,000.00 | | | $ | 1,021.40 | | | $ | 4.13 | | | | .81 | % | | $ | 1,000.00 | | | $ | 1,021.12 | | | $ | 4.13 | | | | .81 | % |
| International Large Cap Fund | | | | | | | | | | | | | | | | | | | | | | | | | | | | | | | | |
| Trust Class | | $ | 1,000.00 | | | $ | 1,013.40 | | | $ | 6.39 | | | | 1.26 | % | | $ | 1,000.00 | | | $ | 1,018.85 | | | $ | 6.41 | | | | 1.26 | % |
| Institutional Class | | $ | 1,000.00 | | | $ | 1,015.90 | | | $ | 4.62 | | | | .91 | % | | $ | 1,000.00 | | | $ | 1,020.62 | | | $ | 4.63 | | | | .91 | % |
| Class A | | $ | 1,000.00 | | | $ | 1,013.50 | | | $ | 6.34 | | | | 1.25 | % | | $ | 1,000.00 | | | $ | 1,018.90 | | | $ | 6.36 | | | | 1.25 | % |
| Class C | | $ | 1,000.00 | | | $ | 1,008.60 | | | $ | 10.18 | | | | 2.01 | % | | $ | 1,000.00 | | | $ | 1,015.07 | | | $ | 10.21 | | | | 2.01 | % |
| Class R3 | | $ | 1,000.00 | | | $ | 1,012.30 | | | $ | 7.71 | | | | 1.52 | % | | $ | 1,000.00 | | | $ | 1,017.54 | | | $ | 7.73 | | | | 1.52 | % |
Expense Information as of 8/31/10 cont'd (Unaudited)
| | | ACTUAL | | HYPOTHETICAL (5% ANNUAL RETURN BEFORE EXPENSES)(5) |
| | | Beginning Account Value 3/1/10 | | Ending Account Value 8/31/10 | | Expenses Paid During the Period(1) 3/1/10 - 8/31/10 | | Expense Ratio | | Beginning Account Value 3/1/10 | | Ending Account Value 8/31/10 | | Expenses Paid During the Period(1) 3/1/10 - 8/31/10 | | Expense Ratio |
| Intrinsic Value Fund |
| Institutional Class | | $ | 1,000.00 | | | $ | 941.00 | (2) | | $ | 3.03 | | | | 1.00 | % | | $ | 1,000.00 | | | $ | 1,020.16 | | | $ | 5.09 | | | | 1.00 | % |
| Class A | | $ | 1,000.00 | | | $ | 940.00 | (2) | | $ | 4.12 | | | | 1.36 | % | | $ | 1,000.00 | | | $ | 1,018.35 | | | $ | 6.92 | | | | 1.36 | % |
| Class C | | $ | 1,000.00 | | | $ | 938.00 | (2) | | $ | 6.39 | | | | 2.11 | % | | $ | 1,000.00 | | | $ | 1,014.57 | | | $ | 10.71 | | | | 2.11 | % |
| Large Cap Disciplined Growth Fund |
| Investor Class | | $ | 1,000.00 | | | $ | 934.90 | | | $ | 5.41 | | | | 1.11 | % | | $ | 1,000.00 | | | $ | 1,019.61 | | | $ | 5.65 | | | | 1.11 | % |
| Institutional Class | | $ | 1,000.00 | | | $ | 938.00 | | | $ | 3.66 | | | | .75 | % | | $ | 1,000.00 | | | $ | 1,021.42 | | | $ | 3.82 | | | | .75 | % |
| Class A | | $ | 1,000.00 | | | $ | 936.40 | | | $ | 5.42 | | | | 1.11 | % | | $ | 1,000.00 | | | $ | 1,019.61 | | | $ | 5.65 | | | | 1.11 | % |
| Class C | | $ | 1,000.00 | | | $ | 931.50 | | | $ | 9.06 | | | | 1.86 | % | | $ | 1,000.00 | | | $ | 1,015.83 | | | $ | 9.45 | | | | 1.86 | % |
| Class R3 | | $ | 1,000.00 | | | $ | 934.70 | | | $ | 6.63 | | | | 1.36 | % | | $ | 1,000.00 | | | $ | 1,018.35 | | | $ | 6.92 | | | | 1.36 | % |
| Mid Cap Growth Fund |
| Investor Class | | $ | 1,000.00 | | | $ | 1,000.00 | | | $ | 5.49 | | | | 1.09 | % | | $ | 1,000.00 | | | $ | 1,019.71 | | | $ | 5.55 | | | | 1.09 | % |
| Trust Class | | $ | 1,000.00 | | | $ | 1,000.00 | | | $ | 5.65 | | | | 1.12 | % | | $ | 1,000.00 | | | $ | 1,019.56 | | | $ | 5.70 | | | | 1.12 | % |
| Advisor Class | | $ | 1,000.00 | | | $ | 997.70 | | | $ | 7.55 | | | | 1.50 | % | | $ | 1,000.00 | | | $ | 1,017.64 | | | $ | 7.63 | | | | 1.50 | % |
| Institutional Class | | $ | 1,000.00 | | | $ | 1,001.20 | | | $ | 3.78 | | | | .75 | % | | $ | 1,000.00 | | | $ | 1,021.42 | | | $ | 3.82 | | | | .75 | % |
| Class A | | $ | 1,000.00 | | | $ | 1,000.00 | | | $ | 5.60 | | | | 1.11 | % | | $ | 1,000.00 | | | $ | 1,019.61 | | | $ | 5.65 | | | | 1.11 | % |
| Class C | | $ | 1,000.00 | | | $ | 996.20 | | | $ | 9.36 | | | | 1.86 | % | | $ | 1,000.00 | | | $ | 1,015.83 | | | $ | 9.45 | | | | 1.86 | % |
| Class R3 | | $ | 1,000.00 | | | $ | 998.50 | | | $ | 6.90 | | | | 1.37 | % | | $ | 1,000.00 | | | $ | 1,018.30 | | | $ | 6.97 | | | | 1.37 | % |
| Multi-Cap Opportunities Fund |
| Institutional Class | | $ | 1,000.00 | | | $ | 940.30 | | | $ | 4.89 | | | | 1.00 | % | | $ | 1,000.00 | | | $ | 1,020.16 | | | $ | 5.09 | | | | 1.00 | % |
| Class A | | $ | 1,000.00 | | | $ | 940.20 | | | $ | 6.65 | | | | 1.36 | % | | $ | 1,000.00 | | | $ | 1,018.35 | | | $ | 6.92 | | | | 1.36 | % |
| Class C | | $ | 1,000.00 | | | $ | 935.40 | | | $ | 10.29 | | | | 2.11 | % | | $ | 1,000.00 | | | $ | 1,014.57 | | | $ | 10.71 | | | | 2.11 | % |
| Partners Fund |
| Investor Class | | $ | 1,000.00 | | | $ | 914.90 | | | $ | 4.10 | | | | .85 | % | | $ | 1,000.00 | | | $ | 1,020.92 | | | $ | 4.33 | | | | .85 | % |
| Trust Class | | $ | 1,000.00 | | | $ | 913.50 | | | $ | 5.02 | | | | 1.04 | % | | $ | 1,000.00 | | | $ | 1,019.96 | | | $ | 5.30 | | | | 1.04 | % |
| Advisor Class | | $ | 1,000.00 | | | $ | 913.00 | | | $ | 5.74 | | | | 1.19 | % | | $ | 1,000.00 | | | $ | 1,019.21 | | | $ | 6.06 | | | | 1.19 | % |
| Institutional Class | | $ | 1,000.00 | | | $ | 915.30 | | | $ | 3.28 | | | | .68 | % | | $ | 1,000.00 | | | $ | 1,021.78 | | | $ | 3.47 | | | | .68 | % |
| Class A | | $ | 1,000.00 | | | $ | 920.50 | (3) | | $ | 2.10 | | | | 1.11 | % | | $ | 1,000.00 | | | $ | 1,019.61 | | | $ | 5.65 | | | | 1.11 | % |
| Class C | | $ | 1,000.00 | | | $ | 919.20 | (3) | | $ | 3.52 | | | | 1.86 | % | | $ | 1,000.00 | | | $ | 1,015.83 | | | $ | 9.45 | | | | 1.86 | % |
| Class R3 | | $ | 1,000.00 | | | $ | 919.90 | (3) | | $ | 2.58 | | | | 1.36 | % | | $ | 1,000.00 | | | $ | 1,018.35 | | | $ | 6.92 | | | | 1.36 | % |
| Real Estate Fund |
| Trust Class | | $ | 1,000.00 | | | $ | 1,164.30 | | | $ | 5.40 | | | | .99 | % | | $ | 1,000.00 | | | $ | 1,020.21 | | | $ | 5.04 | | | | .99 | % |
| Institutional Class | | $ | 1,000.00 | | | $ | 1,164.80 | | | $ | 4.64 | | | | .85 | % | | $ | 1,000.00 | | | $ | 1,020.92 | | | $ | 4.33 | | | | .85 | % |
| Class A | | $ | 1,000.00 | | | $ | 990.20 | (3) | | $ | 2.38 | | | | 1.21 | % | | $ | 1,000.00 | | | $ | 1,019.11 | | | $ | 6.16 | | | | 1.21 | % |
| Class C | | $ | 1,000.00 | | | $ | 989.20 | (3) | | $ | 3.85 | | | | 1.96 | % | | $ | 1,000.00 | | | $ | 1,015.32 | | | $ | 9.96 | | | | 1.96 | % |
| Class R3 | | $ | 1,000.00 | | | $ | 989.60 | (3) | | $ | 2.87 | | | | 1.46 | % | | $ | 1,000.00 | | | $ | 1,017.85 | | | $ | 7.43 | | | | 1.46 | % |
| Regency Fund |
| Investor Class | | $ | 1,000.00 | | | $ | 975.30 | | | $ | 5.97 | | | | 1.20 | % | | $ | 1,000.00 | | | $ | 1,019.16 | | | $ | 6.11 | | | | 1.20 | % |
| Trust Class | | $ | 1,000.00 | | | $ | 975.30 | | | $ | 6.22 | | | | 1.25 | % | | $ | 1,000.00 | | | $ | 1,018.90 | | | $ | 6.36 | | | | 1.25 | % |
| Institutional Class | | $ | 1,000.00 | | | $ | 936.00 | (4) | | $ | 3.99 | | | | .85 | % | | $ | 1,000.00 | | | $ | 1,020.92 | | | $ | 4.33 | | | | .85 | % |
| Class A | | $ | 1,000.00 | | | $ | 936.00 | (3) | | $ | 2.31 | | | | 1.21 | % | | $ | 1,000.00 | | | $ | 1,019.11 | | | $ | 6.16 | | | | 1.21 | % |
| Class C | | $ | 1,000.00 | | | $ | 934.30 | (3) | | $ | 3.74 | | | | 1.96 | % | | $ | 1,000.00 | | | $ | 1,015.32 | | | $ | 9.96 | | | | 1.96 | % |
| Class R3 | | $ | 1,000.00 | | | $ | 935.10 | (3) | | $ | 2.79 | | | | 1.46 | % | | $ | 1,000.00 | | | $ | 1,017.85 | | | $ | 7.43 | | | | 1.46 | % |
| Select Equities Fund |
| Institutional Class | | $ | 1,000.00 | | | $ | 957.60 | | | $ | 3.70 | | | | .75 | % | | $ | 1,000.00 | | | $ | 1,021.42 | | | $ | 3.82 | | | | .75 | % |
| Class A | | $ | 1,000.00 | | | $ | 955.20 | | | $ | 5.91 | | | | 1.20 | % | | $ | 1,000.00 | | | $ | 1,019.16 | | | $ | 6.11 | | | | 1.20 | % |
| Class C | | $ | 1,000.00 | | | $ | 952.00 | | | $ | 9.59 | | | | 1.95 | % | | $ | 1,000.00 | | | $ | 1,015.38 | | | $ | 9.91 | | | | 1.95 | % |
Expense Information as of 8/31/10 cont'd (Unaudited)
| | | ACTUAL | | HYPOTHETICAL (5% ANNUAL RETURN BEFORE EXPENSES)(5) |
| | | Beginning Account Value 3/1/10 | | Ending Account Value 8/31/10 | | Expenses Paid During the Period(1) 3/1/10 - 8/31/10 | Expense Ratio | | Beginning Account Value 3/1/10 | | Ending Account Value 8/31/10 | | Expenses Paid During the Period(1) 3/1/10 - 8/31/10 | Expense Ratio |
| Small Cap Growth Fund |
| Investor Class | | $ | 1,000.00 | | | $ | 949.30 | | | $ | 5.65 | | | | 1.15 | % | | $ | 1,000.00 | | | $ | 1,019.41 | | | $ | 5.85 | | | | 1.15 | % |
| Trust Class | | $ | 1,000.00 | | | $ | 944.90 | | | $ | 6.72 | | | | 1.37 | % | | $ | 1,000.00 | | | $ | 1,018.30 | | | $ | 6.97 | | | | 1.37 | % |
| Advisor Class | | $ | 1,000.00 | | | $ | 943.00 | | | $ | 7.88 | | | | 1.61 | % | | $ | 1,000.00 | | | $ | 1,017.09 | | | $ | 8.19 | | | | 1.61 | % |
| Institutional Class | | $ | 1,000.00 | | | $ | 946.30 | | | $ | 4.46 | | | | .91 | % | | $ | 1,000.00 | | | $ | 1,020.62 | | | $ | 4.63 | | | | .91 | % |
| Class A | | $ | 1,000.00 | | | $ | 945.00 | | | $ | 6.23 | | | | 1.27 | % | | $ | 1,000.00 | | | $ | 1,018.80 | | | $ | 6.46 | | | | 1.27 | % |
| Class C | | $ | 1,000.00 | | | $ | 941.80 | | | $ | 9.89 | | | | 2.02 | % | | $ | 1,000.00 | | | $ | 1,015.02 | | | $ | 10.26 | | | | 2.02 | % |
| Class R3 | | $ | 1,000.00 | | | $ | 943.90 | | | $ | 7.40 | | | | 1.51 | % | | $ | 1,000.00 | | | $ | 1,017.59 | | | $ | 7.68 | | | | 1.51 | % |
| Socially Responsive Fund |
| Investor Class | | $ | 1,000.00 | | | $ | 974.00 | | | $ | 4.73 | | | | .95 | % | | $ | 1,000.00 | | | $ | 1,020.42 | | | $ | 4.84 | | | | .95 | % |
| Trust Class | | $ | 1,000.00 | | | $ | 972.40 | | | $ | 5.57 | | | | 1.12 | % | | $ | 1,000.00 | | | $ | 1,019.56 | | | $ | 5.70 | | | | 1.12 | % |
| Institutional Class | | $ | 1,000.00 | | | $ | 974.50 | | | $ | 3.73 | | | | .75 | % | | $ | 1,000.00 | | | $ | 1,021.42 | | | $ | 3.82 | | | | .75 | % |
| Class A | | $ | 1,000.00 | | | $ | 973.00 | | | $ | 5.52 | | | | 1.11 | % | | $ | 1,000.00 | | | $ | 1,019.61 | | | $ | 5.65 | | | | 1.11 | % |
| Class C | | $ | 1,000.00 | | | $ | 969.40 | | | $ | 9.23 | | | | 1.86 | % | | $ | 1,000.00 | | | $ | 1,015.83 | | | $ | 9.45 | | | | 1.86 | % |
| Class R3 | | $ | 1,000.00 | | | $ | 972.30 | | | $ | 6.76 | | | | 1.36 | % | | $ | 1,000.00 | | | $ | 1,018.35 | | | $ | 6.92 | | | | 1.36 | % |
| (1) | For each class, expenses are equal to the annualized expense ratio for the class, multiplied by the average account value over the period, multiplied by 184/365 (to reflect the one-half year period shown), unless otherwise indicated. |
| | |
| (2) | For each class, expenses are equal to the annualized expense ratio for the class, multiplied by the average account value over the period, multiplied by 114/365 (to reflect the period shown of May 10, 2010 to August 31, 2010). |
| | |
| (3) | For each class, expenses are equal to the annualized expense ratio for the class, multiplied by the average account value over the period, multiplied by 72/365 (to reflect the period shown of June 21, 2010 to August 31, 2010). |
| | |
| (4) | For each class, expenses are equal to the annualized expense ratio for the class, multiplied by the average account value over the period, multiplied by 177/365 (to reflect the period shown of March 8, 2010 to August 31, 2010). |
| | |
| (5) | Hypothetical 5% annual return before expenses is calculated by multiplying the number of days in the most recent period divided by 365. |
Schedule of Investments Climate Change Fund
| | | | | Industry | | | |
| | 1 | | | Covanta Holding | | Environmental & Facilities Services | | | 3.7 | % | |
| | 2 | | | NextEra Energy | | Electric Utilities | | | 3.6 | % | |
| | 3 | | | CenterPoint Energy | | Multi-Utilities | | | 3.3 | % | |
| | 4 | | | ITC Holdings | | Electric Utilities | | | 3.1 | % | |
| | 5 | | | Sempra Energy | | Multi-Utilities | | | 2.8 | % | |
| | 6 | | | Entergy Corp. | | Electric Utilities | | | 2.7 | % | |
| | 7 | | | ESCO Technologies | | Industrial Machinery | | | 2.3 | % | |
| | 8 | | | Aqua America | | Water Utilities | | | 2.3 | % | |
| | 9 | | | Itron, Inc. | | Electronic Equipment & Instruments | | 2.1 | % | |
| | 10 | | | New Jersey Resources | Gas Utilities | | | 2.0 | % | |
| | Number of Shares | | Value† (000's) |
| Common Stocks (98.3%) |
| Aerospace & Defense (0.4%) |
| Curtiss-Wright | | | 400 | | | $ | 11 | |
| Agricultural Products (0.4%) |
Darling International* | | | 1,500 | | | | 11 | |
| Auto Parts & Equipment (3.1%) |
| BorgWarner, Inc.* | | | 815 | | | | 35 | |
| Johnson Controls | | | 300 | | | | 8 | |
Westport Innovations* | | | 2,000 | | | | 32 | |
| | | | 75 | |
| Coal & Consumable Fuels (1.8%) |
| Cameco Corp. | | | 1,800 | | | | 44 | |
| Commodity Chemicals (0.5%) |
| Calgon Carbon* | | | 900 | | | | 11 | |
| Communications Equipment (0.5%) |
| RuggedCom, Inc.* | | | 900 | | | | 12 | |
| Construction & Engineering (3.1%) |
| Foster Wheeler* | | | 1,000 | | | | 21 | |
| Layne Christensen* | | | 400 | | | | 10 | |
| MYR Group* | | | 700 | | | | 10 | |
| Pike Electric* | | | 1,300 | | | | 10 | |
| Quanta Services* | | | 600 | | | | 11 | |
| Shaw Group* | | | 400 | | | | 13 | |
| | | | 75 | |
| Diversified Support Services (1.6%) |
| EnerNOC, Inc.* | | | 1,200 | | | | 39 | |
| Electric Utilities (12.9%) |
Electricite de France ADR | | | 900 | | | | 7 | |
| Entergy Corp. | | | 815 | | | | 64 | |
| Exelon Corp. | | | 475 | | | | 19 | |
| FirstEnergy Corp. | | | 600 | | | | 22 | |
| ITC Holdings | | | 1,270 | | | | 74 | |
| NextEra Energy | | | 1,595 | | | | 86 | |
| Northeast Utilities | | | 1,300 | | | | 38 | |
| | | | 310 | |
Electrical Components & Equipment (6.8%) |
| A123 Systems* | | | 1,300 | | | | 9 | |
American Superconductor* | | | 400 | | | | 11 | |
| Cooper Industries PLC | | | 204 | | | | 9 | |
| EnerSys* | | | 1,100 | | | | 24 | |
| | Number of Shares | | Value†(000's) |
| First Solar* | | | 200 | | | | $ 26 | |
GT Solar International* | | | 2,000 | | | | 15 | |
JA Solar Holdings ADR* | | | 3,000 | | | | 18 | |
| Jinpan International | | | 900 | | | | 10 | |
| Roper Industries | | | 205 | | | | 12 | |
Solarfun Power Holdings ADR* | | | 1,500 | | | | 16 | |
Suntech Power Holdings ADR* | | | 1,600 | | | | 12 | |
| | | | 162 | |
| Electronic Components (0.4%) |
| KYOCERA Corp. ADR | | | 100 | | | | 9 | |
Electronic Equipment & Instruments (2.7%) |
| Itron, Inc.* | | | 918 | | | | 50 | |
| Pure Technologies* | | | 4,000 | | | | 16 | |
| | | | 66 | |
Electronic Manufacturing Services (0.4%) |
Maxwell Technologies* | | | 900 | | | | 10 | |
Environmental & Facilities Services (6.1%) |
China Everbright International | | | 33,700 | | | | 15 | |
| Covanta Holding | | | 6,175 | | | | 89 | |
| EnergySolutions Inc. | | | 4,000 | | | | 18 | |
| Fuel Tech* | | | 2,500 | | | | 14 | |
| Tetra Tech* | | | 500 | | | | 9 | |
| | | | 145 | |
| Forest Products (0.2%) |
| Weyerhaeuser Co. | | | 289 | | | | 4 | |
| Gas Utilities (5.9%) |
| National Fuel Gas | | | 550 | | | | 24 | |
New Jersey Resources | | | 1,300 | | | | 48 | |
| ONEOK, Inc. | | | 200 | | | | 9 | |
| Questar Corp. | | | 2,913 | | | | 47 | |
South Jersey Industries | | | 300 | | | | 14 | |
| | | | 142 | |
| | Number of Shares | | | Value†(000's) |
| Heavy Electrical Equipment (2.3%) | | | | | | |
| ABB Ltd. ADR | | | 338 | | | | $ 6 | |
| Alstom S.A. | | | 300 | | | | 14 | |
Vestas Wind Systems* | | | 900 | | | | 34 | |
| | | | 54 | |
| Independent Power Producers & Energy Traders (5.1%) |
| Calpine Corp.* | | | 2,988 | | | | 38 | |
| EDP Renovaveis* | | | 2,300 | | | | 13 | |
| Iberdrola Renovables | | | 9,700 | | | | 32 | |
Magma Energy*ñ | | | 10,700 | | | | 11 | |
| Ormat Technologies | | | 400 | | | | 11 | |
| Ram Power* | | | 9,000 | | | | 18 | |
| | | | 123 | |
| Industrial Conglomerates (2.3%) |
Koninklijke Philips Electronics | | | 400 | | | | 11 | |
| Siemens AG ADR | | | 500 | | | | 45 | |
| | | | 56 | |
| Industrial Gases (0.4%) |
| Praxair, Inc. | | | 100 | | | | 9 | |
| Industrial Machinery (7.0%) |
| Badger Meter | | | 1,200 | | | | 45 | |
China Valves Technology* | | | 2,800 | | | | 28 | |
Duoyuan Global Water ADR* | | | 800 | | | | 17 | |
| ESCO Technologies | | | 1,800 | | | | 56 | |
| Ingersoll-Rand PLC | | | 350 | | | | 11 | |
| Kaydon Corp. | | | 295 | | | | 10 | |
| | | | 167 | |
| IT Consulting & Other Services (0.5%) |
| Telvent GIT* | | | 700 | | | | 13 | |
| Machinery (0.9%) |
| Eaton Corp. | | | 300 | | | | 21 | |
| Multi-Utilities (10.9%) |
| Alliant Energy | | | 600 | | | | 21 | |
| CenterPoint Energy | | | 5,300 | | | | 79 | |
MDU Resources Group | | | 1,000 | | | | 19 | |
| NiSource Inc. | | | 1,400 | | | | 24 | |
Public Service Enterprise Group | | | 800 | | | | 26 | |
| Sempra Energy | | | 1,300 | | | | 66 | |
See Notes to Schedule of Investments
| | Number of Shares | | Value† (000's) |
Suez Environnement SA ADR | | | 1,300 | | | $ | 10 | |
Veolia Environnement ADR | | | 700 | | | | 16 | |
| | | | 261 | |
Oil & Gas Equipment & Services (0.9%) |
| Dresser-Rand Group* | | | 600 | | | | 21 | |
Oil & Gas Exploration & Production (3.0%) |
| Denbury Resources* | | | 700 | | | | 10 | |
| EOG Resources | | | 100 | | | | 9 | |
| Range Resources | | | 950 | | | | 32 | |
| Southwestern Energy* | | | 600 | | | | 20 | |
| | | | 71 | |
Oil & Gas Storage & Transportation (4.6%) |
| El Paso Corp. | | | 1,000 | | | | 11 | |
| Enbridge Inc. | | | 200 | | | | 10 | |
| Southern Union | | | 1,000 | | | | 22 | |
| Spectra Energy | | | 1,500 | | | | 31 | |
| TransCanada Corp. | | | 700 | | | | 25 | |
| Williams Cos. | | | 600 | | | | 11 | |
| | | | 110 | |
| Oil, Gas & Consumable Fuels (0.5%) |
| QEP Resources | | | 413 | | | | 12 | |
| Railroads (0.5%) |
| Norfolk Southern | | | 200 | | | | 11 | |
| Semiconductor Equipment (1.0%) |
| AXT, Inc.* | | | 4,500 | | | | 24 | |
| Semiconductors (3.2%) |
| Cree, Inc.* | | | 900 | | | | 48 | |
| IXYS Corp.* | | | 1,100 | | | | 10 | |
| Rambus Inc.* | | | 1,000 | | | | 18 | |
| | | | 76 | |
| Specialized Finance (0.4%) |
IntercontinentalExchange Inc.* | | | 100 | | | | 10 | |
| Specialty Chemicals (0.4%) |
| Rockwood Holdings* | | | 331 | | | | 9 | |
| Steel (0.3%) |
Allegheny Technologies | | | 200 | | | | 8 | |
| Technology Distributors (1.3%) |
Anixter International* | | | 650 | | | | 30 | |
| Water Utilities (6.0%) |
American Water Works | | | 1,100 | | | | 25 | |
| Aqua America | | | 2,700 | | | | 54 | |
Companhia de Saneamento Basico do Estado de Sao Paulo | | | 500 | | | | 19 | |
| | Number of Shares | | Value† (000's) |
| Consolidated Water | | | 1,100 | | | $ | 10 | |
| Tri-Tech Holding* | | | 1,087 | | | | 12 | |
| York Water | | | 1,600 | | | | 24 | |
| | | | 144 | |
Total Common Stocks (Cost $2,384) | | | | | | | 2,356 | |
Short-Term Investments (3.1%) |
State Street Institutional Liquid Reserves Fund Institutional Class (Cost $73) | | | 72,876 | | | | 73 | |
Total Investments## (101.4%) (Cost $2,457) | | | | | | | 2,429 | |
Liabilities, less cash, receivables and other assets [(1.4%)] | | | | | | | (34 | ) |
Total Net Assets (100.0%) | | | | | | $ | 2,395 | |
See Notes to Schedule of Investments
Schedule of Investments Emerging Markets Equity Fund
| | | | | Country | | Industry | | | |
| | 1 | | | Vale SA ADR | | Brazil | | Metals & Mining | | | 3.0 | % | |
| | 2 | | | Hyundai Mobis | | Korea | | Auto Components | | | 2.0 | % | |
| | 3 | | | Petroleo Brasileiro ADR | | Brazil | | Oil, Gas & Consumable Fuels | | | 1.9 | % | |
| | 4 | | | Samsung Electronics | | Korea | | Semiconductors & Semiconductor | | | | | |
| | | | | | | | | Equipment | | | 1.9 | % | |
| | 5 | | | Bank of China, H Shares | | China | | Commercial Banks | | | 1.9 | % | |
| | 6 | | | MTN Group | | South Africa | | Wireless Telecommunication Services | | | 1.7 | % | |
| | 7 | | | Sberbank GDR | | Russia | | Commercial Banks | | | 1.7 | % | |
| | 8 | | | CNOOC Ltd. | | China | | Oil, Gas & Consumable Fuels | | | 1.6 | % | |
| | 9 | | | Diagnosticos da America | | Brazil | | Health Care Providers & Services | | | 1.5 | % | |
| | 10 | | | Turkiye Garanti Bankasi | | Turkey | | Commercial Banks | | | 1.5 | % | |
| | Number
of Shares | | Value† (000's) |
| Common Stocks (88.8%) |
| Brazil (7.7%) |
Banco Santander Brasil | | | 9,800 | | | $ | 125 | |
| BM&FBOVESPA SA | | | 16,300 | | | | 119 | |
Cielo SAñ | | | 1,230 | | | | 11 | |
| Cielo SA | | | 15,800 | | | | 135 | |
Diagnosticos da America | | | 21,600 | | | | 226 | |
PDG Realty Empreendimentos E Participacoes | | | 19,700 | | | | 202 | |
Petroleo Brasileiro ADR | | | 2,100 | | | | 70 | |
| Porto Seguro | | | 9,600 | | | | 117 | |
| TOTVS SA | | | 1,685 | | | | 125 | |
| | | | 1,130 | |
| Canada (3.4%) |
| Bankers Petroleum* | | | 18,300 | | | | 117 | |
| Eldorado Gold | | | 8,500 | | | | 167 | |
Pacific Rubiales Energy* | | | 9,300 | | | | 219 | |
| | | | 503 | |
| Chile (1.2%) |
Sociedad Quimica y Minera de Chile ADR, B Shares | | | 3,970 | | | | 169 | |
| China (16.3%) |
Bank of China, H Shares | | | 547,400 | | | | 275 | |
Changyou.com ADR* | | | 3,280 | | | | 87 | |
China Automation Group | | | 172,700 | | | | 109 | |
China Green Holdings | | | 160,700 | | | | 151 | |
China Information Technology* | | | 11,000 | | | | 56 | |
| China Mobile | | | 20,250 | | | | 206 | |
China Shineway Pharmaceutical Group | | | 40,600 | | | | 106 | |
| | Number
of Shares | | Value† (000's) |
China South Locomotive & Rolling Stock, H Shares | | | 156,600 | | | $ | 132 | |
China Vanke, B Shares | | | 115,100 | | | | 141 | |
| CNOOC Ltd. | | | 134,000 | | | | 230 | |
GOME Electrical Appliances Holdings* | | | 353,654 | | | | 108 | |
| Inspur International | | | 784,700 | | | | 65 | |
Kingdee International Software Group | | | 371,100 | | | | 141 | |
| Minth Group | | | 82,800 | | | | 133 | |
Travelsky Technology, H Shares | | | 234,300 | | | | 202 | |
Yingde Gases Groupñ* | | | 5,100 | | | | 5 | |
Yingde Gases Group* | | | 93,000 | | | | 87 | |
Zhaojin Mining Industry, H Shares | | | 55,900 | | | | 147 | |
| | | | 2,381 | |
| India (8.6%) |
| Andhra Bank | | | 34,070 | | | | 110 | |
| Bank of Baroda | | | 4,180 | | | | 72 | |
Bharat Heavy Electricals | | | 1,905 | | | | 97 | |
| Cairn India* | | | 25,352 | | | | 179 | |
| DEN Networks* | | | 29,710 | | | | 141 | |
| Eicher Motors | | | 7,445 | | | | 199 | |
| Ess Dee Aluminium | | | 6,320 | | | | 67 | |
Sterlite Industries (India) ADR | | | 10,100 | | | | 130 | |
| Unitech Ltd. | | | 90,759 | | | | 150 | |
| United Phosphorus | | | 30,355 | | | | 119 | |
| | | | 1,264 | |
| Indonesia (3.2%) |
PT Adaro Energy Tbk | | | 709,200 | | | | 149 | |
PT Global Mediacom Tbk | | | 4,236,800 | | | | 148 | |
PT United Tractors Tbk | | | 85,235 | | | | 173 | |
| | | | 470 | |
| | Number
of Shares | | Value† (000's) |
| Israel (2.3%) |
| Israel Chemicals | | | 16,291 | | | $ | 206 | |
Teva Pharmaceutical Industries ADR | | | 2,550 | | | | 129 | |
| | | | 335 | |
| Korea (9.2%) |
| Busan Bank | | | 13,660 | | | | 145 | |
| Dongbu Insurance | | | 4,300 | | | | 121 | |
| Hyundai Mobis | | | 1,593 | | | | 288 | |
| KT Corp. ADR | | | 8,000 | | | | 149 | |
| LG Innotek | | | 785 | | | | 87 | |
| Samsung Electronics | | | 447 | | | | 282 | |
| Samsung SDI | | | 515 | | | | 72 | |
| Taewoong Co. | | | 2,287 | | | | 93 | |
| Woongjin Thinkbig | | | 5,420 | | | | 105 | |
| | | | 1,342 | |
| Luxembourg (0.8%) |
Millicom International Cellular | | | 1,250 | | | | 115 | |
| Malaysia (2.3%) |
| Axiata Group* | | | 80,400 | | | | 115 | |
| Top Glove | | | 114,400 | | | | 221 | |
| | | | 336 | |
| Mexico (2.2%) |
Empresas ICA SAB de C.V.* | | | 72,800 | | | | 166 | |
Genomma Lab Internacional Class B* | | | 84,800 | | | | 151 | |
| | | | 317 | |
| Nigeria (1.1%) |
Guaranty Trust Bank | | | 1,525,098 | | | | 155 | |
| Philippines (2.3%) |
Energy Development | | | 1,045,550 | | | | 108 | |
International Container Terminal Services | | | 313,800 | | | | 221 | |
| | | | 329 | |
See Notes to Schedule of Investments
| | Number
of Shares | | Value† (000's) |
| Russia (4.6%) |
| LUKOIL ADR | | | 2,965 | | | | | |
| Magnit GDR | | | 8,070 | | | | 172 | |
| Pharmstandard GDR* | | | 4,090 | | | | 97 | |
| Sberbank GDR | | | 848 | | | | 242 | |
| | | | 669 | |
| South Africa (8.0%) |
Aspen Pharmacare Holdings* | | | 10,340 | | | | 118 | |
| BHP Billiton | | | 6,092 | | | | 170 | |
| MTN Group | | | 15,336 | | | | 251 | |
Naspers Ltd., N Shares | | | 3,100 | | | | 125 | |
| Raubex Group | | | 52,282 | | | | 136 | |
| Shoprite Holdings | | | 9,600 | | | | 118 | |
Standard Bank Group | | | 10,247 | | | | 145 | |
| Tiger Brands | | | 4,435 | | | | 109 | |
| | | | 1,172 | |
| Sweden (0.7%) |
Oriflame Cosmetics SDR | | | 2,022 | | | | 106 | |
| Taiwan, Province Of China (8.4%) |
Hung Poo Real Estate Development | | | 70,400 | | | | 93 | |
Powertech Technology | | | 48,664 | | | | 144 | |
Prime View International* | | | 51,000 | | | | 76 | |
| Simplo Technology | | | 38,342 | | | | 187 | |
Taiwan Semiconductor Manufacturing | | | 101,439 | | | | 187 | |
| TXC Corp. | | | 102,860 | | | | 173 | |
| WPG Holdings | | | 117,856 | | | | 219 | |
Young Fast Optoelectronics | | | 13,800 | | | | 146 | |
| | | | 1,225 | |
| Thailand (1.4%) |
Thanachart Capital PCL | | | 190,300 | | | | 210 | |
| Turkey (2.3%) |
Sinpas Gayrimenkul Yatirim Ortakligi* | | | 106,856 | | | | 114 | |
Turkiye Garanti Bankasi | | | 46,476 | | | | 225 | |
| | | | 339 | |
| United Kingdom (2.8%) |
| Afren PLC* | | | 79,225 | | | | 125 | |
| Antofagasta PLC | | | 9,695 | | | | 153 | |
| Tullow Oil | | | 7,345 | | | | 137 | |
| | | | 415 | |
Total Common Stocks (Cost $11,462) | | | | | | | 12,982 | |
| | Number
of Shares | | Value† (000's) |
| Preferred Stocks (7.5%) |
| Brazil (7.5%) |
Banco Do Estado do Rio Grande do Sul Class B | | | 20,400 | | | | | |
Companhia de Bebidas das Americas ADR | | | 1,140 | | | | 126 | |
Petroleo Brasileiro ADR | | | 7,240 | | | | 214 | |
Refinaria de Petroleo IpirangaÑ*^^ | | | 173 | | | | 0 | |
Ultrapar Participacoes | | | 2,570 | | | | 142 | |
| Vale SA ADR | | | 18,425 | | | | 435 | |
| | | | | | | | | |
Total Preferred Stocks (Cost $864) | | | | | | | 1,097 | |
| | | | | | | | | |
| Short-Term Investments (3.3%) |
State Street Institutional Liquid Reserves Fund Institutional Class (Cost $483) | | | 482,863 | | | | 483 | |
| | | | | | | | | |
Total Investments## (99.6%) (Cost $12,809) | | | | | | | 14,562 | |
| | | | | | | | | |
Cash, receivables and other assets, less liabilities (0.4%) | | | | | | | 58 | |
| | | | | | | | | |
| Total Net Assets (100.0%) | | | | | | $ | 14,620 | |
See Notes to Schedule of Investments
| SUMMARY SCHEDULE OF INVESTMENTS BY INDUSTRY—EMERGING MARKETS EQUITY FUND (UNAUDITED) |
| Industry | | Investments at Value† (000's omitted) | | Percentage of Net Assets |
| Oil, Gas & Consumable Fuels | | $ | 1,740 | | | | 11.9 | % |
| Commercial Banks | | | 1,674 | | | | 11.4 | % |
| Metals & Mining | | | 1,202 | | | | 8.2 | % |
| Electronic Equipment, Instruments & Components | | | 838 | | | | 5.7 | % |
| Machinery | | | 706 | | | | 4.8 | % |
| Wireless Telecommunication Services | | | 687 | | | | 4.7 | % |
| Semiconductors & Semiconductor Equipment | | | 613 | | | | 4.2 | % |
| Pharmaceuticals | | | 601 | | | | 4.1 | % |
| Chemicals | | | 586 | | | | 4.0 | % |
| Media | | | 519 | | | | 3.6 | % |
| Auto Components | | | 421 | | | | 2.9 | % |
| IT Services | | | 404 | | | | 2.8 | % |
| Real Estate Management & Development | | | 384 | | | | 2.6 | % |
| Software | | | 353 | | | | 2.4 | % |
| Construction & Engineering | | | 302 | | | | 2.1 | % |
| Food & Staples Retailing | | | 290 | | | | 2.0 | % |
| Food Products | | | 260 | | | | 1.8 | % |
| Insurance | | | 238 | | | | 1.6 | % |
| Health Care Providers & Services | | | 226 | | | | 1.6 | % |
| Health Care Equipment & Supplies | | | 221 | | | | 1.5 | % |
| Transportation Infrastructure | | | 221 | | | | 1.5 | % |
| Consumer Finance | | | 210 | | | | 1.4 | % |
| Household Durables | | | 202 | | | | 1.4 | % |
| Computers & Peripherals | | | 187 | | | | 1.3 | % |
| Diversified Telecommunication Services | | | 149 | | | | 1.0 | % |
| Beverages | | | 126 | | | | 0.9 | % |
| Defense | | | 119 | | | | 0.8 | % |
| Real Estate Investment Trusts | | | 114 | | | | 0.8 | % |
| Independent Power Producers & Energy Traders | | | 108 | | | | 0.7 | % |
| Specialty Retail | | | 108 | | | | 0.7 | % |
| Personal Products | | | 106 | | | | 0.7 | % |
| Electrical Equipment | | | 97 | | | | 0.7 | % |
| Containers & Packaging | | | 67 | | | | 0.5 | % |
| Short-Term Investments and Other Assets—Net | | | 541 | | | | 3.7 | % |
| | | $ | 14,620 | | | | 100.0 | % |
See Notes to Schedule of Investments
Schedule of Investments Equity Income Fund
| | 1 | | | Crescent Point Energy | | | 1.8 | % | |
| | 2 | | | American Campus Communities | | | 1.6 | % | |
| | 3 | | | Exelon Corp. | | | 1.6 | % | |
| | 4 | | | PG&E Corp. | | | 1.6 | % | |
| | 5 | | | Philip Morris International | | | 1.5 | % | |
| | 6 | | | Alliant Energy | | | 1.5 | % | |
| | 7 | | | TECO Energy | | | 1.5 | % | |
| | 8 | | | Nationwide Health Properties | | | 1.5 | % | |
| | 9 | | | Norfolk Southern | | | 1.5 | % | |
| | 10 | | | Chunghwa Telecom | | | 1.5 | % | |
| | Number
of Shares | | Value† (000's) |
| Common Stocks (68.2%) |
| Air Freight & Logistics (1.4%) |
United Parcel Service Class B‡‡ØØ | | | 69,200 | | | $ | 4,415 | |
| Beverages (1.4%) |
| Foster`s Group | | | 864,000 | | | | 4,658 | |
| Capital Markets (1.4%) |
| Apollo Investment | | | 462,500 | | | | 4,426 | |
| Diversified Telecommunication Services (1.5%) |
Chunghwa Telecom ADR | | | 232,400 | | | | 4,781 | |
| Electric Utilities (3.8%) |
| Exelon Corp. | | | 127,000 | | | | 5,171 | |
| Northeast Utilities | | | 118,000 | | | | 3,419 | |
Progress Energy‡‡ØØ | | | 86,700 | | | | 3,720 | |
| | | | 12,310 | |
| Food Products (1.5%) |
| Unilever NV | | | 174,900 | | | | 4,686 | |
| Forest Products (0.9%) |
| Weyerhaeuser Co. | | | 177,106 | | | | 2,781 | |
| Gas Utilities (1.2%) |
New Jersey Resources | | | 104,900 | | | | 3,903 | |
| Insurance (0.5%) |
OneBeacon Insurance Group | | | 120,000 | | | | 1,566 | |
| Media (1.3%) |
World Wrestling Entertainment Class A | | | 307,500 | | | | 4,311 | |
| Metals & Mining (2.9%) |
Franco-Nevada Corp. | | | 157,000 | | | | 4,682 | |
Royal Gold‡‡ØØ | | | 93,100 | | | | 4,569 | |
| | | | 9,251 | |
| Multi-Utilities (8.4%) |
| Alliant Energy | | | 140,300 | | | | 4,913 | |
CenterPoint Energy | | | 309,000 | | | | 4,570 | |
| NSTAR | | | 89,400 | | | | 3,400 | |
PG&E Corp.‡‡ØØ | | | 108,300 | | | | 5,064 | |
| TECO Energy | | | 289,800 | | | | 4,892 | |
| Xcel Energy | | | 187,000 | | | | 4,172 | |
| | | | 27,011 | |
| | Number
of Shares | | Value† (000's) |
| Oil, Gas & Consumable Fuels (13.9%) |
| ARC Energy Trust | | | 224,100 | | | $ | 4,156 | |
Bonavista Energy Trust | | | 182,500 | | | | 4,200 | |
Canadian Oil Sands Trust | | | 153,300 | | | | 3,609 | |
| Cenovus Energy | | | 171,900 | | | | 4,626 | |
CNOOC Ltd. ADR‡‡ØØ | | | 25,100 | | | | 4,262 | |
Crescent Point Energy | | | 166,800 | | | | 5,852 | |
Enbridge Energy Management* | | | 51,208 | | | | 2,718 | |
Kinder Morgan Management* | | | 45,000 | | | | 2,658 | |
Knightsbridge Tankers‡‡ØØ | | | 237,000 | | | | 4,147 | |
| Spectra Energy | | | 215,200 | | | | 4,377 | |
| Total SA ADR | | | 85,100 | | | | 3,970 | |
| | | | 44,575 | |
| Pharmaceuticals (2.9%) |
| Johnson & Johnson | | | 80,000 | | | | 4,562 | |
Sanofi-Aventis ADR | | | 161,500 | | | | 4,620 | |
| | | | 9,182 | |
| Real Estate Investment Trusts (12.5%) |
| AMB Property | | | 177,700 | | | | 4,227 | |
American Campus Communities | | | 177,600 | | | | 5,291 | |
Ascendas Real Estate Investment Trust | | | 2,838,000 | | | | 4,334 | |
AvalonBay Communities | | | 19,900 | | | | 2,094 | |
| Digital Realty Trust | | | 33,700 | | | | 1,997 | |
| Duke Realty | | | 384,200 | | | | 4,307 | |
| GZI REIT | | | 9,833,000 | | | | 4,778 | |
Lippo-Mapletree Indonesia Retail Trust | | | 4,938,100 | | | | 1,676 | |
Mapletree Logistic Trust | | | 2,835,000 | | | | 1,757 | |
Nationwide Health Properties | | | 127,100 | | | | 4,890 | |
| Rayonier Inc. | | | 99,900 | | | | 4,725 | |
| | | | 40,076 | |
| Road & Rail (1.5%) |
| Norfolk Southern | | | 90,000 | | | | 4,831 | |
| | Number
of Shares | | Value† (000's) |
| Semiconductors & Semiconductor Equipment (1.3%) |
Microchip Technology | | | 147,900 | | | $ | 4,095 | |
| Software (1.4%) |
| Nintendo ADR | | | 128,500 | | | | 4,465 | |
| Thrifts & Mortgage Finance (1.3%) |
New York Community Bancorp | | | 264,900 | | | | 4,209 | |
| Tobacco (1.5%) |
Philip Morris International | | | 97,000 | | | | 4,990 | |
| Transportation Infrastructure (0.9%) |
Singapore Airport Terminal Services | | | 1,418,000 | | | | 2,919 | |
| Water Utilities (1.3%) |
| Aqua America | | | 215,200 | | | | 4,278 | |
Wireless Telecommunication Services (3.5%) |
| China Mobile ADR | | | 86,200 | | | | 4,424 | |
Philippine Long Distance Telephone ADR | | | 80,000 | | | | 4,314 | |
| Taiwan Mobile | | | 1,320,000 | | | | 2,596 | |
| | | | 11,334 | |
Total Common Stocks (Cost $210,728) | | | | | | | 219,053 | |
| Convertible Preferred Stocks (1.9%) |
| Bunge Ltd. | | | 53,000 | | | | 4,426 | |
| Vale Capital II | | | 25,000 | | | | 1,910 | |
Total Convertible Preferred Stocks (Cost $6,546) | | | | | | | 6,336 | |
| | | Principal Amount | | |
| Convertible Bonds (21.7%) |
Affiliated Managers Group, Inc., Senior Unsecured Notes, 3.95%, due 8/15/38 | | $ | 4,355,000 | | | | 4,295 | |
Bill Barrett Corp., Senior Unsecured Notes, 5.00%, due 3/15/28 | | | 3,620,000 | | | | 3,615 | |
See Notes to Schedule of Investments
| | | Principal Amount | | Value† (000's) |
Charles River Laboratories International, Inc., Senior Unsecured Notes, 2.25%, due 6/15/13 | | $ | 4,530,000 | | | $ | 4,281 | |
Covanta Holding Corp., Senior Unsecured Notes, 1.00%, due 2/1/27 | | | 4,540,000 | | | | 4,296 | |
Equinix, Inc., Subordinated Notes, 3.00%, due 10/15/14 | | | 2,300,000 | | | | 2,383 | |
Hologic, Inc., Senior Unsecured Notes, Step-Down, 2.00%/0.00%, due 12/15/37a | | | 4,650,000 | | | | 4,202 | |
Host Hotels & Resorts L.P., Guaranteed Notes, 2.63%, due 4/15/27ñ | | | 3,500,000 | | | | 3,395 | |
Iconix Brand Group, Inc., Senior Subordinated Notes, 1.88%, due 6/30/12 | | | 5,000,000 | | | | 4,775 | |
Integra Lifesciences Holdings Corp., Guaranteed Notes, 2.38%, due 6/1/12ñ | | | 3,656,000 | | | | 3,441 | |
James River Coal Co., Senior Unsecured Notes, 4.50%, due 12/1/15ñ | | | 4,000,000 | | | | 3,775 | |
Kinross Gold Corp., Senior Unsecured Notes, 1.75%, due 3/15/28 | | | 4,705,000 | | | | 4,623 | |
Lions Gate Entertainment Corp., Guaranteed Notes, 2.94%, due 10/15/24 | | | 2,600,000 | | | | 2,532 | |
NovaGold Resources, Inc., Senior Unsecured Notes, 5.50%, due 5/1/15 | | | 3,790,000 | | | | 3,913 | |
| | | Principal Amount | | Value† (000's) |
Patriot Coal Corp., Senior Unsecured Notes, 3.25%, due 5/31/13 | | $ | 4,650,000 | | | $ | 4,080 | |
PDL BioPharma, Inc., Senior Unsecured Notes, 2.00%, due 2/15/12 | | | 4,000,000 | | | | 3,855 | |
Sino-Forest Corp., Guaranteed Notes, 4.25%, due 12/15/16ñ | | | 2,750,000 | | | | 2,925 | |
SM Energy Co., Senior Unsecured Notes, 3.50%, due 4/1/27 | | | 2,350,000 | | | | 2,468 | |
Trinidad Energy Services Income Trust, Unsecured Subordinated Notes, 7.75%, due 7/31/12 | | | 3,370,000 | | | | 3,224 | |
Wright Medical Group, Inc., Senior Unsecured Notes, 2.63%, due 12/1/14 | | | 4,275,000 | | | | 3,650 | |
Total Convertible Bonds (Cost $68,596) | | | | | | | 69,728 | |
| | Number of Shares | | |
| Short-Term Investments (6.7%) |
State Street Institutional Liquid Reserves Fund Institutional Class (Cost $21,503) | | | 21,502,941 | | | | 21,503 | |
| | | | | | | | | |
Total Investments## (98.5%) (Cost $307,373) | | | | | | | 316,620 | |
Cash, receivables and other assets, less liabilities‡‡ (1.5%) | | | | | | | 4,871 | |
| | | | | | | | | |
| Total Net Assets (100.0%) | | | | | | $ | 321,491 | |
See Notes to Schedule of Investments
Schedule of Investments Focus Fund
| | 1 | | | Pfizer Inc. | | | 5.0 | % | |
| | 2 | | | Amgen Inc. | | | 4.6 | % | |
| | 3 | | | Ingersoll-Rand PLC | | | 4.4 | % | |
| | 4 | | | Microsoft Corp. | | | 4.3 | % | |
| | 5 | | | J.P. Morgan Chase | | | 3.9 | % | |
| | 6 | | | Target Corp. | | | 3.8 | % | |
| | 7 | | | Philip Morris International | | | 3.8 | % | |
| | 8 | | | Occidental Petroleum | | | 3.8 | % | |
| | 9 | | | Covidien PLC | | | 3.7 | % | |
| | 10 | | | Gilead Sciences | | | 3.5 | % | |
| | Number
of Shares | | Value† (000's) |
| Common Stocks (98.0%) |
| Aerospace & Defense (2.6%) |
| Rockwell Collins | | | 245,000 | | | $ | 13,213 | |
| Biotechnology (8.1%) |
| Amgen Inc.* | | | 450,000 | | | | 22,968 | |
| Gilead Sciences* | | | 560,000 | | | | 17,842 | |
| | | | 40,810 | |
| Capital Markets (5.3%) |
Goldman Sachs Group | | | 79,000 | | | | 10,818 | |
| State Street | | | 455,000 | | | | 15,962 | |
| | | | 26,780 | |
| Chemicals (2.2%) |
Air Products & Chemicals | | | 150,000 | | | | 11,104 | |
| Commercial Services & Supplies (2.5%) |
| Covanta Holding | | | 860,000 | | | | 12,393 | |
| Computers & Peripherals (5.7%) |
| Apple, Inc.* | | | 60,000 | | | | 14,602 | |
| Hewlett-Packard | | | 365,000 | | | | 14,045 | |
| | | | 28,647 | |
| Construction & Engineering (0.9%) |
| Foster Wheeler* | | | 220,000 | | | | 4,693 | |
| Diversified Financial Services (3.9%) |
| J.P. Morgan Chase | | | 548,000 | | | | 19,925 | |
| Electric Utilities (1.4%) |
| NextEra Energy | | | 135,000 | | | | 7,254 | |
| Electronic Equipment, Instruments & Components (1.8%) |
| Corning Inc. | | | 590,000 | | | | 9,251 | |
| Energy Equipment & Services (1.3%) |
| Schlumberger Ltd. | | | 125,000 | | | | 6,666 | |
| Food & Staples Retailing (2.5%) |
| Wal-Mart Stores | | | 250,000 | | | | 12,535 | |
Health Care Equipment & Supplies (3.7%) |
| Covidien PLC | | | 530,000 | | | | 18,730 | |
Health Care Providers & Services (1.2%) |
| Express Scripts* | | | 139,900 | | | | 5,960 | |
| | Number
of Shares | | Value† (000's) |
| Hotels, Restaurants & Leisure (2.9%) |
Brinker International | | | 935,000 | | | $ | 14,726 | |
| Insurance (6.8%) |
Prudential Financial | | | 300,000 | | | | 15,171 | |
Reinsurance Group of America | | | 310,000 | | | | 13,559 | |
| Travelers Cos. | | | 115,000 | | | | 5,633 | |
| | | | 34,363 | |
| Internet Software & Services (3.1%) |
| Yahoo! Inc.* | | | 1,200,000 | | | | 15,696 | |
| IT Services (2.2%) |
| IBM | | | 90,000 | | | | 11,091 | |
| Machinery (4.9%) |
| Deere & Co. | | | 40,000 | | | | 2,531 | |
| Ingersoll-Rand PLC | | | 680,000 | | | | 22,120 | |
| | | | 24,651 | |
| Media (4.8%) |
Comcast Corp. Class A Special | | | 710,000 | | | | 11,410 | |
| Omnicom Group | | | 365,000 | | | | 12,778 | |
| | | | 24,188 | |
| Multiline Retail (3.8%) |
| Target Corp. | | | 375,000 | | | | 19,185 | |
| Oil, Gas & Consumable Fuels (10.6%) |
Denbury Resources* | | | 1,130,000 | | | | 16,656 | |
Occidental Petroleum | | | 260,000 | | | | 19,001 | |
| Range Resources | | | 525,000 | | | | 17,750 | |
| | | | 53,407 | |
| Pharmaceuticals (5.0%) |
| Pfizer Inc. | | | 1,600,000 | | | | 25,488 | |
| Semiconductors & Semiconductor Equipment (0.5%) |
Silicon Laboratories* | | | 65,000 | | | | 2,479 | |
| Software (5.9%) |
| Activision Blizzard | | | 780,000 | | | | 8,338 | |
| Microsoft Corp. | | | 925,000 | | | | 21,719 | |
| | | | 30,057 | |
| | Number
of Shares | | Value† (000's) |
| Specialty Retail (0.6%) |
| Limited, Inc. | | | 130,000 | | | $ | 3,068 | |
| Tobacco (3.8%) |
Philip Morris International | | | 370,000 | | | | 19,033 | |
| | | | | | | | | |
Total Common Stocks (Cost $514,981) | | | | | | | 495,393 | |
| Short-Term Investments (2.0%) |
State Street Institutional Liquid Reserves Fund Institutional Class (Cost $10,268) | | | 10,267,503 | | | | 10,268 | |
| | | | | | | | | |
Total Investments## (100.0%) (Cost $525,249) | | | | | | | 505,661 | |
Liabilities, less cash, receivables and other assets [(0.0%)] | | | | | | | (114 | ) |
| | | | | | | | | |
| Total Net Assets (100.0%) | | | | | | $ | 505,547 | |
See Notes to Schedule of Investments
Schedule of Investments Genesis Fund
| | 1 | | | Compass Minerals International | | | 3.1 | % | |
| | 2 | | | AptarGroup Inc. | | | 3.0 | % | |
| | 3 | | | Church & Dwight | | | 2.7 | % | |
| | 4 | | | Solera Holdings | | | 2.1 | % | |
| | 5 | | | MICROS Systems | | | 2.0 | % | |
| | 6 | | | CLARCOR Inc. | | | 1.9 | % | |
| | 7 | | | CARBO Ceramics | | | 1.9 | % | |
| | 8 | | | Alberto-Culver Co. | | | 1.7 | % | |
| | 9 | | | Dionex Corp. | | | 1.7 | % | |
| | 10 | | | Ruddick Corp. | | | 1.6 | % | |
| | Number
of Shares | | Value† (000's) |
| Common Stocks (94.6%) |
| Aerospace & Defense (1.1%) |
Alliant Techsystems* | | | 1,469,462 | | | $ | 96,838 | |
| Air Freight & Logistics (0.5%) |
Forward Air^ | | | 1,738,700 | | | | 41,416 | |
| Auto Components (0.7%) |
| Gentex Corp. | | | 3,293,949 | | | | 57,875 | |
| Beverages (0.8%) |
Boston Beer Class A*^ | | | 1,019,019 | | | | 66,960 | |
| Capital Markets (0.8%) |
| Eaton Vance | | | 1,070,300 | | | | 27,817 | |
| Greenhill & Co. | | | 665,000 | | | | 46,836 | |
| | | | 74,653 | |
| Chemicals (1.2%) |
| Balchem Corp. | | | 877,100 | | | | 21,445 | |
| Intrepid Potash* | | | 3,157,499 | | | | 70,886 | |
| RPM International | | | 661,700 | | | | 11,183 | |
| | | | 103,514 | |
| Commercial Banks (3.7%) |
| Bank of Hawaii | | | 1,576,100 | | | | 70,389 | |
| BOK Financial | | | 1,089,894 | | | | 48,435 | |
Cullen/Frost Bankers | | | 1,473,600 | | | | 75,522 | |
First Financial Bankshares | | | 563,287 | | | | 25,162 | |
Westamerica Bancorp^ | | | 2,121,843 | | | | 107,535 | |
| | | | 327,043 | |
| Commercial Services & Supplies (4.4%) |
| Copart, Inc.* | | | 2,900,731 | | | | 95,869 | |
Healthcare Services Group^ | | | 3,896,854 | | | | 80,938 | |
Ritchie Bros. Auctioneers | | | 4,151,310 | | | | 75,678 | |
| Rollins, Inc. | | | 4,358,193 | | | | 89,256 | |
United Stationers* | | | 1,048,975 | | | | 47,088 | |
| | | | 388,829 | |
| Construction & Engineering (0.5%) |
Layne Christensen*^ | | | 1,785,121 | | | | 44,396 | |
| Containers & Packaging (3.0%) |
AptarGroup Inc.^ | | | 6,465,600 | | | | 269,292 | |
| | Number
of Shares | | Value† (000's) |
| Diversified Consumer Services (2.4%) |
Capella Education* | | | 732,274 | | | $ | 45,826 | |
| Hillenbrand, Inc. | | | 2,014,501 | | | | 38,336 | |
Matthews International Class A^ | | | 2,393,690 | | | | 75,377 | |
| Strayer Education | | | 376,111 | | | | 54,453 | |
| | | | 213,992 | |
| Diversified Financial Services (0.3%) |
| Pico Holdings* | | | 838,772 | | | | 23,418 | |
| Electronic Equipment, Instruments & Components (1.1%) |
Rofin-Sinar Technologies* | | | 307,934 | | | | 6,282 | |
Trimble Navigation* | | | 3,242,642 | | | | 91,215 | |
| | | | 97,497 | |
| Energy Equipment & Services (4.4%) |
CARBO Ceramics^ | | | 2,167,200 | | | | 164,122 | |
Lufkin Industries^ | | | 1,613,320 | | | | 62,371 | |
Natural Gas Services Group* | | | 225,000 | | | | 3,195 | |
Oceaneering International*^ | | | 2,856,612 | | | | 142,859 | |
| Pason Systems | | | 1,287,365 | | | | 14,215 | |
| | | | 386,762 | |
| Food & Staples Retailing (1.6%) |
Ruddick Corp.^ | | | 4,504,902 | | | | 145,824 | |
| Food Products (1.5%) |
| Flowers Foods | | | 1,780,200 | | | | 46,000 | |
J & J Snack Foods^ | | | 1,245,946 | | | | 47,035 | |
| Lancaster Colony | | | 837,233 | | | | 38,153 | |
| | | | 131,188 | |
| Gas Utilities (2.2%) |
New Jersey Resources | | | 1,901,500 | | | | 70,755 | |
Northwest Natural Gas | | | 730,600 | | | | 33,198 | |
South Jersey Industries | | | 1,336,000 | | | | 62,779 | |
| WGL Holdings | | | 837,000 | | | | 29,521 | |
| | | | 196,253 | |
| | Number
of Shares | | Value† (000's) |
Health Care Equipment & Supplies (8.3%) |
| Abaxis, Inc.* | | | 1,090,300 | | | $ | 19,691 | |
American Medical Systems Holdings*^ | | | 6,880,465 | | | | 125,362 | |
DENTSPLY International | | | 2,059,900 | | | | 57,306 | |
Haemonetics Corp.*^ | | | 2,690,600 | | | | 140,127 | |
IDEXX Laboratories* | | | 2,433,762 | | | | 134,514 | |
| Immucor Inc.* | | | 2,949,491 | | | | 51,911 | |
Meridian Bioscience | | | 2,124,997 | | | | 38,845 | |
Sirona Dental Systems* | | | 2,592,426 | | | | 81,713 | |
Surmodics, Inc.*^ | | | 1,349,655 | | | | 16,236 | |
West Pharmaceutical Services | | | 1,193,012 | | | | 40,109 | |
Wright Medical Group* | | | 1,875,194 | | | | 24,884 | |
| | | | 730,698 | |
Health Care Providers & Services (5.0%) |
AmSurg Corp.*^ | | | 1,832,334 | | | | 30,545 | |
| Henry Schein* | | | 2,472,140 | | | | 130,529 | |
Landauer, Inc.^ | | | 854,945 | | | | 48,048 | |
MWI Veterinary Supply*^ | | | 1,141,729 | | | | 60,626 | |
Patterson Companies | | | 3,204,600 | | | | 81,044 | |
PSS World Medical* | | | 1,441,815 | | | | 26,472 | |
| VCA Antech* | | | 3,313,905 | | | | 65,516 | |
| | | | 442,780 | |
| Health Care Technology (0.7%) |
| Quality Systems | | | 1,182,905 | | | | 66,302 | |
| Household Products (2.7%) |
Church & Dwight^ | | | 3,870,855 | | | | 237,012 | |
| Industrial Conglomerates (0.7%) |
Raven Industries^ | | | 1,872,976 | | | | 63,138 | |
| Insurance (3.9%) |
| Brown & Brown | | | 1,366,070 | | | | 26,010 | |
Hanover Insurance Group | | | 1,214,100 | | | | 52,668 | |
Harleysville Group^ | | | 1,446,219 | | | | 46,105 | |
See Notes to Schedule of Investments
| | Number
of Shares | | Value† (000's) |
HCC Insurance Holdings | | | 1,291,300 | | | $ | 32,580 | |
Infinity Property & Casualty | | | 99,400 | | | | 4,607 | |
RenaissanceRe Holdings | | | 1,401,553 | | | | 79,594 | |
RLI Corp.^ | | | 1,199,907 | | | | 62,947 | |
Safety Insurance Group | | | 158,973 | | | | 6,478 | |
| Validus Holdings | | | 1,236,100 | | | | 31,484 | |
| | | | 342,473 | |
| Internet & Catalog Retail (0.4%) |
PetMed Express^ | | | 2,502,838 | | | | 38,669 | |
| IT Services (1.4%) |
Forrester Research* | | | 1,118,353 | | | | 34,322 | |
ManTech International*^ | | | 2,426,100 | | | | 85,860 | |
| NCI, Inc. Class A* | | | 353,099 | | | | 6,762 | |
| | | | 126,944 | |
| Leisure Equipment & Products (0.6%) |
| Polaris Industries | | | 1,052,560 | | | | 56,133 | |
| Life Science Tools & Services (4.4%) |
Charles River Laboratories International* | | | 1,314,100 | | | | 37,123 | |
Dionex Corp.*^ | | | 2,041,532 | | | | 148,011 | |
ICON PLC*^ | | | 3,823,400 | | | | 84,115 | |
Pharmaceutical Product Development | | | 4,049,300 | | | | 93,012 | |
| Techne Corp. | | | 418,600 | | | | 24,166 | |
| | | | 386,427 | |
| Machinery (10.5%) |
AG Growth International | | | 612,000 | | | | 22,214 | |
Astec Industries*^ | | | 1,337,022 | | | | 34,362 | |
Bucyrus International | | | 1,546,700 | | | | 88,920 | |
| Chart Industries* | | | 546,612 | | | | 8,702 | |
CLARCOR Inc.^ | | | 5,078,522 | | | | 170,842 | |
| Donaldson Co. | | | 2,632,100 | | | | 110,285 | |
| Graco Inc. | | | 902,317 | | | | 25,184 | |
| Joy Global | | | 1,293,200 | | | | 73,376 | |
Lincoln Electric Holdings | | | 475,982 | | | | 23,594 | |
Lindsay Corp.^ | | | 1,254,550 | | | | 46,255 | |
| Nordson Corp. | | | 1,513,304 | | | | 97,109 | |
| Robbins & Myers | | | 120,882 | | | | 2,860 | |
| Toro Co. | | | 713,094 | | | | 35,583 | |
Valmont Industries | | | 1,056,904 | | | | 70,844 | |
Wabtec Corp.^ | | | 2,892,200 | | | | 123,005 | |
| | | | 933,135 | |
| Metals & Mining (3.8%) |
| Alamos Gold | | | 1,145,200 | | | | 18,294 | |
Compass Minerals International^ | | | 3,802,000 | | | | 272,793 | |
| | Number
of Shares | | Value† (000's) |
Major Drilling Group International^ | | | 1,917,900 | | | $ | 41,871 | |
| | | | 332,958 | |
| Mutual Funds (1.2%) |
| SPDR Gold Trust* | | | 900,000 | | | | 109,863 | |
| Office Electronics (0.9%) |
Zebra Technologies Class A* | | | 2,687,370 | | | | 76,913 | |
| Oil, Gas & Consumable Fuels (8.3%) |
Alpha Natural Resources* | | | 402,974 | | | | 14,962 | |
Brigham Exploration* | | | 3,058,528 | | | | 46,857 | |
| Cabot Oil & Gas | | | 2,981,700 | | | | 83,011 | |
Carrizo Oil & Gas* | | | 2,457 | | | | 51 | |
Comstock Resources* | | | 1,898,800 | | | | 41,337 | |
Concho Resources* | | | 2,249,400 | | | | 131,410 | |
Denbury Resources* | | | 6,828,269 | | | | 100,649 | |
Petrobank Energy and Resources* | | | 3,197,000 | | | | 110,836 | |
| Resolute Energy* | | | 1,299,804 | | | | 13,882 | |
| SM Energy | | | 1,989,700 | | | | 75,589 | |
Southwestern Energy* | | | 3,530,100 | | | | 115,505 | |
| | | | 734,089 | |
| Personal Products (1.7%) |
Alberto-Culver Co. | | | 4,920,950 | | | | 152,795 | |
| Professional Services (0.4%) |
Exponent, Inc.*^ | | | 1,164,735 | | | | 35,920 | |
| Software (6.6%) |
Blackbaud, Inc.^ | | | 4,122,103 | | | | 85,822 | |
FactSet Research Systems | | | 1,304,600 | | | | 95,953 | |
Jack Henry & Associates | | | 1,487,300 | | | | 35,011 | |
MICROS Systems*^ | | | 4,531,742 | | | | 172,660 | |
Solera Holdings^ | | | 4,790,753 | | | | 190,097 | |
| | | | 579,543 | |
| Specialty Retail (1.1%) |
Hibbett Sports*^ | | | 1,916,763 | | | | 44,431 | |
Sally Beauty Holdings* | | | 805,008 | | | | 6,947 | |
| Tractor Supply | | | 731,800 | | | | 49,748 | |
| | | | 101,126 | |
| Thrifts & Mortgage Finance (0.5%) |
Brookline Bancorp | | | 2,463,798 | | | | 23,061 | |
| Oritani Financial | | | 2,030,000 | | | | 19,102 | |
| | | | 42,163 | |
| | Number
of Shares | | Value† (000's) |
Trading Companies & Distributors (0.6%) |
MSC Industrial Direct Class A | | | 810,900 | | | $ | 36,142 | |
Richelieu Hardware | | | 587,500 | | | | 14,484 | |
| | | | 50,626 | |
| Water Utilities (0.7%) |
American States Water | | | 672,423 | | | | 22,412 | |
| Aqua America | | | 1,881,335 | | | | 37,401 | |
| | | | 59,813 | |
Total Common Stocks (Cost $6,174,574) | | | | | | | 8,365,270 | |
| Short-Term Investments (4.9%) |
State Street Institutional Liquid Reserves Fund Institutional Class (Cost $436,918) | | | 436,918,426 | | | | 436,918 | |
| | | | | | | | | |
Total Investments## (99.5%) (Cost $6,611,492) | | | | | | | 8,802,188 | |
Cash, receivables and other assets, less liabilities (0.5%) | | | | | | | 41,044 | |
| | | | | | | | | |
| Total Net Assets (100.0%) | | | | | | $ | 8,843,232 | |
See Notes to Schedule of Investments
Schedule of Investments Guardian Fund
| | 1 | | | Intuit Inc. | | | 4.9 | % | |
| | 2 | | | Altera Corp. | | | 4.6 | % | |
| | 3 | | | Danaher Corp. | | | 4.4 | % | |
| | 4 | | | BG Group PLC | | | 4.4 | % | |
| | 5 | | | Yahoo! Inc. | | | 4.0 | % | |
| | 6 | | | 3M Co. | | | 3.7 | % | |
| | 7 | | | Newfield Exploration | | | 3.7 | % | |
| | 8 | | | Progressive Corp. | | | 3.5 | % | |
| | 9 | | | Procter & Gamble | | | 3.4 | % | |
| | 10 | | | Schlumberger Ltd. | | | 3.3 | % | |
| | Number
of Shares | | Value† (000's) |
| Common Stocks (96.1%) |
| Beverages (2.4%) |
| Coca-Cola | | | 412,800 | | | $ | 23,084 | |
| Capital Markets (6.1%) |
Bank of New York Mellon | | | 1,193,558 | | | | 28,968 | |
| Charles Schwab | | | 2,274,755 | | | | 29,026 | |
| | | | 57,994 | |
| Commercial Services & Supplies (5.6%) |
| Republic Services | | | 1,031,050 | | | | 30,344 | |
Waste Management | | | 700,450 | | | | 23,178 | |
| | | | 53,522 | |
| Electronic Equipment, Instruments & Components (6.1%) |
Anixter International* | | | 679,585 | | | | 31,179 | |
National Instruments | | | 937,154 | | | | 27,018 | |
| | | | 58,197 | |
| Energy Equipment & Services (4.8%) |
Cameron International* | | | 399,825 | | | | 14,706 | |
| Schlumberger Ltd. | | | 591,880 | | | | 31,565 | |
| | | | 46,271 | |
| Food Products (3.1%) |
| J.M. Smucker | | | 508,100 | | | | 29,714 | |
Health Care Equipment & Supplies (6.2%) |
| C.R. Bard | | | 389,675 | | | | 29,939 | |
| Covidien PLC | | | 817,875 | | | | 28,903 | |
| | | | 58,842 | |
| Household Products (3.4%) |
| Procter & Gamble | | | 537,900 | | | | 32,096 | |
| Industrial Conglomerates (3.7%) |
| 3M Co. | | | 450,910 | | | | 35,419 | |
| Industrial Gases (2.6%) |
| Praxair, Inc. | | | 285,931 | | | | 24,599 | |
| Insurance (5.6%) |
| Markel Corp.* | | | 60,505 | | | | 19,829 | |
| Progressive Corp. | | | 1,679,950 | | | | 33,263 | |
| | | | 53,092 | |
| | Number
of Shares | | Value† (000's) |
| Internet Software & Services (4.0%) |
| Yahoo! Inc.* | | | 2,939,250 | | | $ | 38,445 | |
| IT Services (4.0%) |
MasterCard, Inc. Class A | | | 97,840 | | | | 19,408 | |
| SAIC, Inc.* | | | 1,249,406 | | | | 18,591 | |
| | | | 37,999 | |
| Machinery (4.4%) |
| Danaher Corp. | | | 1,161,754 | | | | 42,206 | |
| Media (5.5%) |
Comcast Corp. Class A Special | | | 1,429,725 | | | | 22,976 | |
Scripps Networks Interactive Class A | | | 744,110 | | | | 29,898 | |
| | | | 52,874 | |
| Oil, Gas & Consumable Fuels (8.7%) |
| BG Group PLC | | | 2,593,269 | | | | 41,740 | |
| Cimarex Energy | | | 102,135 | | | | 6,682 | |
Newfield Exploration* | | | 728,450 | | | | 34,973 | |
| | | | 83,395 | |
| Pharmaceuticals (3.1%) |
| Roche Holding AG | | | 221,453 | | | | 30,101 | |
| Road & Rail (2.0%) |
Canadian National Railway | | | 316,435 | | | | 19,309 | |
| Semiconductors & Semiconductor Equipment (7.6%) |
| Altera Corp. | | | 1,787,974 | | | | 44,109 | |
| Texas Instruments | | | 1,247,650 | | | | 28,734 | |
| | | | 72,843 | |
| Software (4.9%) |
| Intuit Inc.* | | | 1,096,152 | | | | 46,915 | |
Trading Companies & Distributors (2.3%) |
| W.W. Grainger | | | 212,040 | | | | 22,432 | |
| | | | | | | | | |
| Total Common Stocks (Cost $849,465) | | | | | | | 919,349 | |
| | Number of Shares | | Value† (000's) |
| Short-Term Investments (3.9%) |
State Street Institutional Liquid Reserves Fund Institutional Class (Cost $37,359) | | | 37,358,940 | | | $ | 37,359 | |
| | | | | | | | | |
Total Investments## (100.0%) (Cost $886,824) | | | | | 956,708 | |
Cash, receivables and other assets, less liabilities (0.0%) | | | | | 251 | |
| | | | | | | |
| Total Net Assets (100.0%) | | | | $ | 956,959 | |
See Notes to Schedule of Investments
Schedule of Investments International Fund
| | | | | Country | | Industry | | | |
| | 1 | | | Vodafone Group | | United Kingdom | | Wireless Telecommunication Services | | | 2.3 | % | |
| | 2 | | | MacDonald, Dettwiler | | Canada | | Software | | | 2.2 | % | |
| | 3 | | | Eldorado Gold | | Canada | | Metals & Mining | | | 2.1 | % | |
| | 4 | | | Unilever NV | | Netherlands | | Food Products | | | 1.8 | % | |
| | 5 | | | Jupiter Telecommunications | | Japan | | Media | | | 1.8 | % | |
| | 6 | | | Hyundai Mobis | | Korea | | Auto Components | | | 1.7 | % | |
| | 7 | | | Chemring Group | | United Kingdom | | Aerospace & Defense | | | 1.7 | % | |
| | 8 | | | Sulzer AG | | Switzerland | | Machinery | | | 1.6 | % | |
| | 9 | | | HSBC Holdings | | United Kingdom | | Commercial Banks | | | 1.5 | % | |
| | 10 | | | Sodexo | | France | | Hotels, Restaurants & Leisure | | | 1.5 | % | |
| | Number of Shares | | Value† (000's) |
| Common Stocks (95.7%) |
| Australia (0.9%) |
| BHP Billiton ADR | | | 41,100 | | | $ | 2,734 | |
| iSOFT Group | | | 2,541,542 | | | | 317 | |
| | | | 3,051 | |
| Austria (0.8%) |
Vienna Insurance Group Wiener Staedtische Versicherung | | | 52,770 | | | | 2,484 | |
| Belgium (2.8%) |
| Ageas | | | 192,640 | | | | 488 | |
Anheuser-Busch InBev | | | 41,959 | | | | 2,182 | |
| Colruyt SA | | | 11,808 | | | | 2,924 | |
Telenet Group Holding | | | 123,098 | | | | 3,674 | |
| | | | 9,268 | |
| Brazil (3.0%) |
Banco Santander Brasil ADR | | | 217,600 | | | | 2,737 | |
Petroleo Brasileiro ADR | | | 57,600 | | | | 1,921 | |
| Porto Seguro | | | 282,800 | | | | 3,446 | |
| TOTVS SA | | | 27,505 | | | | 2,036 | |
| | | | 10,140 | |
| Canada (8.8%) |
Bankers Petroleum* | | | 312,600 | | | | 1,999 | |
Corus Entertainment, B Shares | | | 169,832 | | | | 3,101 | |
| Eldorado Gold | | | 366,500 | | | | 7,197 | |
MacDonald, Dettwiler* | | | 168,730 | | | | 7,380 | |
Neo Material Technologies* | | | 398,400 | | | | 1,453 | |
Pacific Rubiales Energy* | | | 198,800 | | | | 4,689 | |
| Silver Wheaton* | | | 161,200 | | | | 3,636 | |
| | | | 29,455 | |
| | Number
of Shares | | Value† (000's) |
| Chile (1.1%) |
Sociedad Quimica y Minera de Chile ADR, B Shares | | | 88,480 | | | $ | 3,774 | |
| China (1.6%) |
Bank of China, H Shares | | | 6,800,000 | | | | 3,418 | |
Changyou.com ADR* | | | 74,100 | | | | 1,977 | |
| | | | 5,395 | |
| Denmark (1.7%) |
Novo Nordisk Class B | | | 37,129 | | | | 3,185 | |
| Trygvesta AS | | | 48,954 | | | | 2,625 | |
| | | | 5,810 | |
| France (6.7%) |
| Alcatel-Lucent* | | | 612,550 | | | | 1,579 | |
| Alstom SA | | | 46,440 | | | | 2,215 | |
| Arkema | | | 64,627 | | | | 2,691 | |
| BNP Paribas | | | 54,350 | | | | 3,401 | |
| CNP Assurances | | | 133,226 | | | | 2,262 | |
Eutelsat Communications | | | 56,544 | | | | 2,033 | |
| Ipsen SA | | | 94,260 | | | | 3,219 | |
| Sodexo | | | 86,935 | | | | 4,996 | |
| | | | 22,396 | |
| Germany (4.9%) |
| Deutsche Boerse | | | 65,744 | | | | 4,017 | |
Fresenius Medical Care | | | 58,135 | | | | 3,292 | |
| Linde AG | | | 28,037 | | | | 3,159 | |
SMA Solar Technology | | | 18,681 | | | | 2,019 | |
| Tognum AG | | | 218,313 | | | | 4,018 | |
| | | | 16,505 | |
| Hong Kong (1.6%) |
| China Mobile ADR | | | 70,665 | | | | 3,627 | |
| Kerry Properties | | | 361,000 | | | | 1,812 | |
| | | | 5,439 | |
| | Number
of Shares | | Value† (000's) |
| India (0.3%) |
State Bank of India GDR | | | 8,519 | | | $ | 1,003 | |
| Ireland (1.0%) |
| DCC PLC | | | 130,946 | | | | 3,294 | |
| Israel (1.3%) |
Makhteshim-Agan Industries | | | 625,837 | | | | 2,149 | |
Teva Pharmaceutical Industries ADR | | | 46,100 | | | | 2,332 | |
| | | | 4,481 | |
| Japan (13.4%) |
| Brother Industries | | | 292,900 | | | | 3,145 | |
| Circle K Sunkus | | | 192,000 | | | | 2,626 | |
GMO InternetÑ | | | 607,500 | | | | 2,104 | |
Jupiter Telecommunications | | | 5,698 | | | | 6,070 | |
| KDDI Corp. | | | 796 | | | | 3,837 | |
Kenedix Realty Investment | | | 968 | | | | 3,388 | |
| Makita Corp. | | | 85,300 | | | | 2,426 | |
| Nifco, Inc. | | | 119,300 | | | | 2,651 | |
| Nihon Kohden | | | 175,200 | | | | 3,554 | |
Nippon Electric Glass | | | 387,300 | | | | 4,338 | |
NSD Co.Ñ | | | 233,200 | | | | 2,512 | |
| Point, Inc. | | | 39,880 | | | | 1,866 | |
| Sankyo Co. | | | 60,100 | | | | 3,040 | |
| Sundrug Co. | | | 124,300 | | | | 3,362 | |
| | | | 44,919 | |
| Korea (2.4%) |
| Hyundai Mobis | | | 30,922 | | | | 5,597 | |
| Samsung SDI | | | 17,675 | | | | 2,477 | |
| | | | 8,074 | |
| Netherlands (10.1%) |
| Akzo Nobel | | | 74,606 | | | | 3,939 | |
| Fugro NV | | | 67,831 | | | | 3,818 | |
| Koninklijke Ahold | | | 342,299 | | | | 4,214 | |
| Nutreco Holding | | | 82,479 | | | | 4,786 | |
Sligro Food GroupÑ | | | 129,403 | | | | 3,795 | |
| TNT NV | | | 182,471 | | | | 4,632 | |
See Notes to Schedule of Investments
| | Number
of Shares | | Value† (000's) |
| Unilever NV | | | 229,669 | | | $ | 6,151 | |
| USG People* | | | 182,950 | | | | 2,326 | |
| | | | 33,661 | |
| Norway (1.9%) |
| DnB NOR | | | 376,830 | | | | 4,161 | |
| Prosafe ASA | | | 481,030 | | | | 2,310 | |
| | | | 6,471 | |
| South Africa (1.1%) |
| MTN Group | | | 229,972 | | | | 3,757 | |
| Sweden (1.4%) |
| Elekta AB, B Shares | | | 58,250 | | | | 1,681 | |
Svenska Handelsbanken, A Shares | | | 114,604 | | | | 2,992 | |
| | | | 4,673 | |
| Switzerland (8.4%) |
| Bucher Industries | | | 22,495 | | | | 2,931 | |
| Credit Suisse Group | | | 82,421 | | | | 3,620 | |
| Givaudan SA | | | 3,895 | | | | 3,722 | |
| Nestle SA | | | 73,302 | | | | 3,798 | |
| Roche Holding | | | 30,213 | | | | 4,107 | |
| SGS SA | | | 3,191 | | | | 4,620 | |
| Sulzer AG | | | 53,396 | | | | 5,296 | |
| | | | 28,094 | |
| United Kingdom (20.5%) |
| Amlin PLC | | | 781,099 | | | | 4,868 | |
| Antofagasta PLC | | | 169,857 | | | | 2,688 | |
Avanti Communications Group* | | | 138,715 | | | | 1,117 | |
Avanti Communications Groupñ* | | | 117,100 | | | | 943 | |
| Balfour Beatty | | | 420,227 | | | | 1,545 | |
| Cairn Energy* | | | 696,735 | | | | 4,994 | |
| Chemring Group | | | 140,014 | | | | 5,587 | |
| Croda International | | | 173,680 | | | | 3,409 | |
| Experian Group | | | 523,009 | | | | 4,985 | |
| Fidessa Group | | | 79,259 | | | | 1,667 | |
| HSBC Holdings | | | 516,045 | | | | 5,025 | |
| Informa PLC | | | 433,405 | | | | 2,550 | |
| Jazztel PLC* | | | 658,270 | | | | 2,311 | |
Jazztel PLCñ* | | | 161,400 | | | | 567 | |
| PureCircle Ltd.* | | | 159,700 | | | | 451 | |
| Reed Elsevier | | | 450,627 | | | | 3,621 | |
| RPS Group | | | 1,056,633 | | | | 2,757 | |
| Smith & Nephew | | | 252,129 | | | | 2,096 | |
SOCO International* | | | 280,710 | | | | 2,025 | |
| Travis Perkins* | | | 142,385 | | | | 1,664 | |
| Tullow Oil | | | 147,250 | | | | 2,751 | |
| Vodafone Group | | | 3,197,833 | | | | 7,707 | |
Willis Group Holdings | | | 116,000 | | | | 3,373 | |
| | | | 68,701 | |
| | | | | |
Total Common Stocks (Cost $286,997) | | | | | | | 320,845 | |
| | Number
of Shares | | Value† (000's) |
| Preferred Stocks (1.4%) |
| Brazil (1.4%) |
Net Servicos de Comunicacao ADR* | | | 136,000 | | | $ | 1,731 | |
Refinaria de Petroleo IpirangaÑ*^^ | | | 19,056 | | | | 11 | |
Ultrapar Participacoes ADR | | | 55,190 | | | | 3,032 | |
| | | | | | | | | |
Total Preferred Stocks (Cost $2,605) | | | | | | | 4,774 | |
| Rights (0.0%) |
| Belgium (0.0%) |
| Ageas VVPR Strip* | | | 192,640 | | | | 0 | |
Anheuser-Busch InBev VVPR Strip* | | | 177,256 | | | | 1 | |
| | | | | | | | | |
Total Rights (Cost $0) | | | | | | | 1 | |
| |
| Warrants (0.0%) |
| Italy (0.0%) |
| | | | | | | | | |
UBI Banca* (Cost $0) | | | 165,350 | | | | 2 | |
| |
| Short-Term Investments (3.0%) |
State Street Institutional Liquid Reserves Fund Institutional Class (Cost $10,082) | | | 10,081,639 | | | | 10,082 | |
| | | | | | | | | |
Total Investments## (100.1%) (Cost $299,684) | | | | | | | 335,704 | |
| | | | | | | | | |
Liabilities, less cash, receivables and other assets [(0.1%)] | | | | | | | (405 | ) |
| Total Net Assets (100.0%) | | | | | | $ | 335,299 | |
See Notes to Schedule of Investments
| SUMMARY SCHEDULE OF INVESTMENTS BY INDUSTRY—INTERNATIONAL FUND (UNAUDITED) |
| Industry | | Investments at Value† (000's omitted) | | Percentage of Net Assets |
| Chemicals | | $ | 24,297 | | | | 7.2 | % |
| Commercial Banks | | | 22,739 | | | | 6.8 | % |
| Oil, Gas & Consumable Fuels | | | 21,411 | | | | 6.4 | % |
| Insurance | | | 19,546 | | | | 5.8 | % |
| Media | | | 19,106 | | | | 5.7 | % |
| Wireless Telecommunication Services | | | 18,928 | | | | 5.6 | % |
| Food & Staples Retailing | | | 16,921 | | | | 5.0 | % |
| Metals & Mining | | | 16,255 | | | | 4.8 | % |
| Software | | | 15,572 | | | | 4.6 | % |
| Food Products | | | 15,186 | | | | 4.5 | % |
| Pharmaceuticals | | | 12,843 | | | | 3.8 | % |
| Professional Services | | | 11,931 | | | | 3.6 | % |
| Machinery | | | 10,653 | | | | 3.2 | % |
| Diversified Telecommunication Services | | | 8,611 | | | | 2.6 | % |
| Electrical Equipment | | | 8,252 | | | | 2.5 | % |
| Auto Components | | | 8,248 | | | | 2.5 | % |
| Health Care Equipment & Supplies | | | 7,331 | | | | 2.2 | % |
| Electronic Equipment, Instruments & Components | | | 6,815 | | | | 2.0 | % |
| Energy Equipment & Services | | | 6,128 | | | | 1.8 | % |
| Aerospace & Defense | | | 5,587 | | | | 1.7 | % |
| Hotels, Restaurants & Leisure | | | 4,996 | | | | 1.5 | % |
| Air Freight & Logistics | | | 4,632 | | | | 1.4 | % |
| Diversified Financial Services | | | 4,017 | | | | 1.2 | % |
| Capital Markets | | | 3,620 | | | | 1.1 | % |
| Real Estate Investment Trusts | | | 3,388 | | | | 1.0 | % |
| Industrial Conglomerates | | | 3,294 | | | | 1.0 | % |
| Health Care Providers & Services | | | 3,292 | | | | 1.0 | % |
| Office Electronics | | | 3,145 | | | | 0.9 | % |
| Leisure Equipment & Products | | | 3,040 | | | | 0.9 | % |
| Commercial Services & Supplies | | | 2,757 | | | | 0.8 | % |
| Beverages | | | 2,183 | | | | 0.7 | % |
| Internet Software & Services | | | 2,104 | | | | 0.6 | % |
| Specialty Retail | | | 1,866 | | | | 0.6 | % |
| Real Estate Management & Development | | | 1,812 | | | | 0.5 | % |
| Trading Companies & Distributors | | | 1,664 | | | | 0.5 | % |
| Communications Equipment | | | 1,579 | | | | 0.5 | % |
| Construction & Engineering | | | 1,545 | | | | 0.5 | % |
| Health Care Technology | | | 317 | | | | 0.1 | % |
| Consumer Discretionary | | | 11 | | | | 0.0 | % |
| Short-Term Investments and Other Assets—Net | | | 9,677 | | | | 2.9 | % |
| | | $ | 335,299 | | | | 100.0 | % |
See Notes to Schedule of Investments
Schedule of Investments International Institutional Fund
| | | | | Country | | | | | |
| | 1 | | | Vodafone Group | | United Kingdom | | Wireless Telecommunication Services | | | 2.2 | % | |
| | 2 | | | MacDonald, Dettwiler | | Canada | | Software | | | 2.2 | % | |
| | 3 | | | Eldorado Gold | | Canada | | Metals & Mining | | | 2.2 | % | |
| | 4 | | | Unilever NV | | Netherlands | | Food Products | | | 1.8 | % | |
| | 5 | | | Jupiter Telecommunications | | Japan | | Media | | | 1.8 | % | |
| | 6 | | | Hyundai Mobis | | Korea | | Auto Components | | | 1.7 | % | |
| | 7 | | | Chemring Group | | United Kingdom | | Aerospace & Defense | | | 1.7 | % | |
| | 8 | | | Sulzer AG | | Switzerland | | Machinery | | | 1.6 | % | |
| | 9 | | | HSBC Holdings | | United Kingdom | | Commercial Banks | | | 1.5 | % | |
| | 10 | | | Experian Group | | United Kingdom | | Professional Services | | | 1.5 | % | |
| | Number
of Shares | | Value† (000's) |
| Common Stocks (96.1%) |
| Australia (0.9%) |
| BHP Billiton ADR | | | 20,500 | | | $ | 1,364 | |
| iSOFT Group | | | 1,597,785 | | | | 199 | |
| | | | 1,563 | |
| Austria (0.8%) |
Vienna Insurance Group Wiener Staedtische Versicherung | | | 27,200 | | | | 1,281 | |
| Belgium (2.6%) |
Anheuser-Busch InBev | | | 21,078 | | | | 1,096 | |
| Colruyt SA | | | 5,935 | | | | 1,470 | |
Telenet Group Holding | | | 61,830 | | | | 1,845 | |
| | | | 4,411 | |
| Brazil (3.1%) |
Banco Santander Brasil ADR | | | 109,300 | | | | 1,375 | |
Petroleo Brasileiro ADR | | | 28,900 | | | | 964 | |
| Porto Seguro | | | 148,500 | | | | 1,810 | |
| TOTVS SA | | | 13,840 | | | | 1,024 | |
| | | | 5,173 | |
| Canada (8.8%) |
Bankers Petroleum* | | | 157,000 | | | | 1,004 | |
Corus Entertainment, B Shares | | | 85,344 | | | | 1,558 | |
| Eldorado Gold | | | 184,100 | | | | 3,615 | |
MacDonald, Dettwiler* | | | 84,794 | | | | 3,709 | |
Neo Material Technologies* | | | 200,100 | | | | 730 | |
Pacific Rubiales Energy* | | | 99,900 | | | | 2,356 | |
| Silver Wheaton* | | | 80,900 | | | | 1,825 | |
| | | | 14,797 | |
| | Number
of Shares | | Value† (000's) |
| Chile (1.1%) |
Sociedad Quimica y Minera de Chile ADR, B Shares | | | 44,405 | | | $ | 1,894 | |
| China (1.6%) |
Bank of China, H Shares | | | 3,416,000 | | | | 1,717 | |
Changyou.com ADR* | | | 37,300 | | | | 995 | |
| | | | 2,712 | |
| Denmark (1.8%) |
Novo Nordisk Class B | | | 19,495 | | | | 1,673 | |
| Trygvesta AS | | | 26,259 | | | | 1,408 | |
| | | | 3,081 | |
| France (6.7%) |
| Alcatel-Lucent* | | | 307,696 | | | | 793 | |
| Alstom SA | | | 23,335 | | | | 1,113 | |
| Arkema | | | 32,465 | | | | 1,352 | |
| BNP Paribas | | | 27,294 | | | | 1,708 | |
| CNP Assurances | | | 66,919 | | | | 1,136 | |
Eutelsat Communications | | | 28,405 | | | | 1,021 | |
| Ipsen SA | | | 47,350 | | | | 1,617 | |
| Sodexo | | | 43,670 | | | | 2,510 | |
| | | | 11,250 | |
| Germany (4.9%) |
| Deutsche Boerse | | | 33,024 | | | | 2,018 | |
Fresenius Medical Care | | | 29,205 | | | | 1,654 | |
| Linde AG | | | 14,082 | | | | 1,586 | |
SMA Solar Technology | | | 9,385 | | | | 1,014 | |
| Tognum AG | | | 109,660 | | | | 2,019 | |
| | | | 8,291 | |
| Hong Kong (1.6%) |
| China Mobile ADR | | | 35,470 | | | | 1,820 | |
| Kerry Properties | | | 181,500 | | | | 911 | |
| | | | 2,731 | |
| | Number
of Shares | | Value† (000's) |
| India (0.3%) |
State Bank of India GDR | | | 4,280 | | | $ | 504 | |
| Ireland (1.0%) |
| DCC PLC | | | 65,775 | | | | 1,654 | |
| Israel (1.4%) |
Makhteshim-Agan Industries | | | 314,370 | | | | 1,080 | |
Teva Pharmaceutical Industries ADR | | | 23,100 | | | | 1,168 | |
| | | | 2,248 | |
| Japan (13.5%) |
| Brother Industries | | | 147,100 | | | | 1,579 | |
| Circle K Sunkus | | | 96,400 | | | | 1,318 | |
| GMO Internet | | | 317,300 | | | | 1,099 | |
Jupiter Telecommunications | | | 2,864 | | | | 3,051 | |
| KDDI Corp. | | | 397 | | | | 1,914 | |
Kenedix Realty Investment | | | 487 | | | | 1,704 | |
| Makita Corp. | | | 42,900 | | | | 1,220 | |
| Nifco, Inc. | | | 59,900 | | | | 1,331 | |
| Nihon Kohden | | | 88,000 | | | | 1,785 | |
Nippon Electric Glass | | | 203,900 | | | | 2,284 | |
| NSD Co. | | | 117,200 | | | | 1,263 | |
| Point, Inc. | | | 20,040 | | | | 938 | |
| Sankyo Co. | | | 30,200 | | | | 1,528 | |
| Sundrug Co. | | | 62,400 | | | | 1,688 | |
| | | | 22,702 | |
| Korea (2.4%) |
| Hyundai Mobis | | | 15,529 | | | | 2,811 | |
| Samsung SDI | | | 8,875 | | | | 1,243 | |
| | | | 4,054 | |
| Netherlands (10.1%) |
| Akzo Nobel | | | 37,470 | | | | 1,978 | |
| Fugro NV | | | 34,074 | | | | 1,918 | |
| Koninklijke Ahold | | | 171,951 | | | | 2,117 | |
| Nutreco Holding | | | 41,416 | | | | 2,403 | |
Sligro Food GroupÑ | | | 65,001 | | | | 1,906 | |
| TNT NV | | | 91,622 | | | | 2,326 | |
| Unilever NV | | | 115,368 | | | | 3,090 | |
See Notes to Schedule of Investments
| | Number
of Shares | | Value† (000's) |
| USG People* | | | 91,100 | | | $ | 1,158 | |
| | | | 16,896 | |
| Norway (1.9%) |
| DnB NOR | | | 189,294 | | | | 2,090 | |
| Prosafe ASA | | | 241,635 | | | | 1,160 | |
| | | | 3,250 | |
| South Africa (1.1%) |
| MTN Group | | | 115,521 | | | | 1,888 | |
| Sweden (1.4%) |
| Elekta AB, B Shares | | | 29,500 | | | | 852 | |
Svenska Handelsbanken, A Shares | | | 57,570 | | | | 1,503 | |
| | | | 2,355 | |
| Switzerland (8.5%) |
| Bucher Industries | | | 11,294 | | | | 1,472 | |
| Credit Suisse Group | | | 41,129 | | | | 1,806 | |
| Givaudan SA | | | 1,955 | | | | 1,868 | |
| Nestle SA | | | 36,825 | | | | 1,908 | |
| Roche Holding | | | 15,864 | | | | 2,156 | |
| SGS SA | | | 1,597 | | | | 2,312 | |
| Sulzer AG | | | 26,825 | | | | 2,661 | |
| | | | 14,183 | |
| United Kingdom (20.6%) |
| Amlin PLC | | | 392,368 | | | | 2,445 | |
| Antofagasta PLC | | | 85,322 | | | | 1,350 | |
Avanti Communications Group* | | | 96,600 | | | | 778 | |
Avanti Communications Groupñ* | | | 57,319 | | | | 461 | |
| Balfour Beatty | | | 211,090 | | | | 776 | |
| Cairn Energy* | | | 349,990 | | | | 2,509 | |
| Chemring Group | | | 70,333 | | | | 2,807 | |
| Croda International | | | 87,457 | | | | 1,717 | |
| Experian Group | | | 264,042 | | | | 2,517 | |
| Fidessa Group | | | 39,820 | | | | 837 | |
| HSBC Holdings | | | 259,885 | | | | 2,531 | |
| Informa PLC | | | 217,706 | | | | 1,281 | |
| Jazztel PLC* | | | 340,605 | | | | 1,196 | |
Jazztel PLCñ* | | | 79,300 | | | | 278 | |
| PureCircle Ltd.* | | | 77,590 | | | | 219 | |
| Reed Elsevier | | | 226,288 | | | | 1,818 | |
| RPS Group | | | 530,774 | | | | 1,385 | |
| Smith & Nephew | | | 126,653 | | | | 1,053 | |
SOCO International* | | | 141,010 | | | | 1,017 | |
| Travis Perkins* | | | 71,520 | | | | 836 | |
| Tullow Oil | | | 73,969 | | | | 1,382 | |
| Vodafone Group | | | 1,568,657 | | | | 3,781 | |
Willis Group Holdings | | | 58,300 | | | | 1,695 | |
| | | | 34,669 | |
Total Common Stocks (Cost $151,924) | | | | | | | 161,587 | |
| | Number
of Shares | | Value† (000's) |
| Preferred Stocks (1.4%) |
| Brazil (1.4%) |
Net Servicos de Comunicacao ADR* | | | 68,200 | | | $ | 868 | |
Ultrapar Participacoes ADR | | | 27,730 | | | | 1,541 | |
| | | | | | | | | |
Total Preferred Stocks (Cost $1,284) | | | | | | | 2,409 | |
| | | | | | | | | |
| Rights (0.0%) |
| Belgium (0.0%) |
| Ageas VVPR Strip* | | | 77,074 | | | | 0 | |
Anheuser-Busch InBev VVPR Strip* | | | 101,696 | | | | 1 | |
| | | | | | | | | |
Total Rights (Cost $0) | | | | | | | 1 | |
| | | | | | | | | |
| Warrants (0.0%) |
| Italy (0.0%) |
UBI Banca* (Cost $0) | | | 89,730 | | | | 1 | |
| | | | | | | | | |
| Short-Term Investments (2.3%) |
State Street Institutional Liquid Reserves Fund Institutional Class (Cost $3,768) | | | 3,768,286 | | | | 3,768 | |
| | | | | | | | | |
Total Investments## (99.8%) (Cost $156,976) | | | | | | | 167,766 | |
Cash, receivables and other assets, less liabilities (0.2%) | | | | | | | 306 | |
| | | | | | | | | |
| Total Net Assets (100.0%) | | | | | | $ | 168,072 | |
See Notes to Schedule of Investments
| SUMMARY SCHEDULE OF INVESTMENTS BY INDUSTRY—INTERNATIONAL INSTITUTIONAL FUND (UNAUDITED) |
| Industry | | Investments at Value† (000's omitted) | | Percentage of Net Assets |
| Chemicals | | $ | 12,205 | | | | 7.3 | % |
| Commercial Banks | | | 11,429 | | | | 6.8 | % |
| Oil, Gas & Consumable Fuels | | | 10,773 | | | | 6.4 | % |
| Insurance | | | 9,775 | | | | 5.8 | % |
| Media | | | 9,598 | | | | 5.7 | % |
| Wireless Telecommunication Services | | | 9,403 | | | | 5.6 | % |
| Food & Staples Retailing | | | 8,499 | | | | 5.0 | % |
| Metals & Mining | | | 8,154 | | | | 4.8 | % |
| Software | | | 7,828 | | | | 4.7 | % |
| Food Products | | | 7,620 | | | | 4.5 | % |
| Pharmaceuticals | | | 6,614 | | | | 3.9 | % |
| Professional Services | | | 5,987 | | | | 3.6 | % |
| Machinery | | | 5,353 | | | | 3.2 | % |
| Diversified Telecommunication Services | | | 4,558 | | | | 2.7 | % |
| Electrical Equipment | | | 4,146 | | | | 2.5 | % |
| Auto Components | | | 4,142 | | | | 2.5 | % |
| Health Care Equipment & Supplies | | | 3,690 | | | | 2.2 | % |
| Electronic Equipment, Instruments & Components | | | 3,527 | | | | 2.1 | % |
| Energy Equipment & Services | | | 3,078 | | | | 1.8 | % |
| Aerospace & Defense | | | 2,807 | | | | 1.7 | % |
| Hotels, Restaurants & Leisure | | | 2,510 | | | | 1.5 | % |
| Air Freight & Logistics | | | 2,326 | | | | 1.4 | % |
| Diversified Financial Services | | | 2,018 | | | | 1.2 | % |
| Capital Markets | | | 1,806 | | | | 1.1 | % |
| Real Estate Investment Trusts | | | 1,704 | | | | 1.0 | % |
| Industrial Conglomerates | | | 1,654 | | | | 1.0 | % |
| Health Care Providers & Services | | | 1,654 | | | | 1.0 | % |
| Office Electronics | | | 1,579 | | | | 0.9 | % |
| Leisure Equipment & Products | | | 1,528 | | | | 0.9 | % |
| Commercial Services & Supplies | | | 1,384 | | | | 0.8 | % |
| Internet Software & Services | | | 1,099 | | | | 0.6 | % |
| Beverages | | | 1,097 | | | | 0.6 | % |
| Specialty Retail | | | 938 | | | | 0.6 | % |
| Real Estate Management & Development | | | 911 | | | | 0.5 | % |
| Trading Companies & Distributors | | | 836 | | | | 0.5 | % |
| Communications Equipment | | | 793 | | | | 0.5 | % |
| Construction & Engineering | | | 776 | | | | 0.5 | % |
| Health Care Technology | | | 199 | | | | 0.1 | % |
| Short-Term Investments and Other Assets—Net | | | 4,074 | | | | 2.5 | % |
| | | $ | 168,072 | | | | 100.0 | % |
See Notes to Schedule of Investments
Schedule of Investments International Large Cap Fund
| | | | | Country | | | | | |
| | 1 | | | Vodafone Group | | United Kingdom | | Wireless Telecommunication Services | | | 2.8 | % | |
| | 2 | | | Unilever NV | | Netherlands | | Food Products | | | 2.2 | % | |
| | 3 | | | Eldorado Gold | | Canada | | Metals & Mining | | | 2.1 | % | |
| | 4 | | | Hyundai Mobis | | Korea | | Auto Components | | | 2.1 | % | |
| | 5 | | | Jupiter Telecommunications | | Japan | | Media | | | 2.1 | % | |
| | 6 | | | Experian Group | | United Kingdom | | Professional Services | | | 2.0 | % | |
| | 7 | | | Cairn Energy | | United Kingdom | | Oil, Gas & Consumable Fuels | | | 2.0 | % | |
| | 8 | | | SGS SA | | Switzerland | | Professional Services | | | 1.9 | % | |
| | 9 | | | Givaudan SA | | Switzerland | | Chemicals | | | 1.9 | % | |
| | 10 | | | Amlin PLC | | United Kingdom | | Insurance | | | 1.7 | % | |
| | Number
of Shares | | Value† (000's) |
| Common Stocks (96.7%) |
| Australia (1.1%) |
| BHP Billiton ADR | | | 28,300 | | | $ | 1,883 | |
| Austria (1.0%) |
Vienna Insurance Group Wiener Staedtische Versicherung | | | 36,230 | | | | 1,706 | |
| Belgium (2.3%) |
Anheuser-Busch InBev | | | 30,782 | | | | 1,601 | |
| Colruyt SA | | | 9,095 | | | | 2,252 | |
| | | | 3,853 | |
| Brazil (3.0%) |
Banco Santander Brasil ADR | | | 149,800 | | | | 1,884 | |
Petroleo Brasileiro ADR | | | 38,700 | | | | 1,291 | |
| Porto Seguro | | | 147,900 | | | | 1,802 | |
| | | | 4,977 | |
| Canada (6.6%) |
| Bankers Petroleum* | | | 204,200 | | | | 1,306 | |
| Cenovus Energy | | | 58,605 | | | | 1,577 | |
| Eldorado Gold | | | 183,900 | | | | 3,611 | |
Pacific Rubiales Energy* | | | 93,100 | | | | 2,196 | |
| Silver Wheaton* | | | 107,300 | | | | 2,420 | |
| | | | 11,110 | |
| Chile (1.4%) |
Sociedad Quimica y Minera de Chile ADR, B Shares | | | 56,645 | | | | 2,416 | |
| China (1.0%) |
Bank of China, H Shares | | | 3,417,000 | | | | 1,718 | |
| Denmark (2.6%) |
Novo Nordisk Class B | | | 29,107 | | | | 2,497 | |
| Trygvesta AS | | | 36,154 | | | | 1,939 | |
| | | | 4,436 | |
| | Number
of Shares | | Value† (000's) |
| France (8.7%) |
| Alcatel-Lucent* | | | 456,048 | | | $ | 1,176 | |
| Alstom SA | | | 34,475 | | | | 1,644 | |
| BNP Paribas | | | 27,001 | | | | 1,689 | |
| CNP Assurances | | | 67,060 | | | | 1,139 | |
Eutelsat Communications | | | 43,670 | | | | 1,570 | |
| Ipsen SA | | | 70,299 | | | | 2,401 | |
| Schneider Electric | | | 23,600 | | | | 2,503 | |
| Sodexo | | | 43,624 | | | | 2,507 | |
| | | | 14,629 | |
| Germany (8.5%) |
| Deutsche Boerse | | | 41,032 | | | | 2,507 | |
Fresenius Medical Care | | | 36,735 | | | | 2,080 | |
| Linde AG | | | 17,485 | | | | 1,970 | |
| SAP AG ADR | | | 42,485 | | | | 1,850 | |
| Siemens AG | | | 26,023 | | | | 2,367 | |
| Tognum AG | | | 113,460 | | | | 2,089 | |
| Wincor Nixdorf | | | 24,314 | | | | 1,413 | |
| | | | 14,276 | |
| Hong Kong (2.2%) |
| China Mobile ADR | | | 43,715 | | | | 2,243 | |
| Kerry Properties | | | 272,000 | | | | 1,366 | |
| | | | 3,609 | |
| India (0.6%) |
State Bank of India GDR | | | 8,706 | | | | 1,025 | |
| Israel (1.5%) |
Makhteshim-Agan Industries | | | 403,640 | | | | 1,386 | |
Teva Pharmaceutical Industries ADR | | | 20,700 | | | | 1,047 | |
| | | | 2,433 | |
| Japan (8.8%) |
| Brother Industries | | | 111,100 | | | | 1,193 | |
| Fujitsu Ltd. | | | 203,000 | | | | 1,406 | |
Jupiter Telecommunications | | | 3,248 | | | | 3,460 | |
| KDDI Corp. | | | 492 | | | | 2,372 | |
| Makita Corp. | | | 56,700 | | | | 1,613 | |
| | Number
of Shares | | Value† (000's) |
Nippon Electric Glass | | | 238,400 | | | $ | 2,670 | |
| Sankyo Co. | | | 39,420 | | | | 1,994 | |
| | | | 14,708 | |
| Korea (2.9%) |
| Hyundai Mobis | | | 19,785 | | | | 3,581 | |
| Samsung SDI | | | 8,985 | | | | 1,259 | |
| | | | 4,840 | |
| Netherlands (8.2%) |
| Akzo Nobel | | | 44,875 | | | | 2,369 | |
| Fugro NV | | | 43,623 | | | | 2,456 | |
| Koninklijke Ahold | | | 210,005 | | | | 2,585 | |
| TNT NV | | | 104,715 | | | | 2,658 | |
| Unilever NV | | | 138,363 | | | | 3,706 | |
| | | | 13,774 | |
| Norway (1.5%) |
| DnB NOR | | | 228,553 | | | | 2,524 | |
| South Africa (1.4%) |
| MTN Group | | | 144,126 | | | | 2,355 | |
| Sweden (1.7%) |
| Elekta AB, B Shares | | | 30,200 | | | | 871 | |
Svenska Handelsbanken, A Shares | | | 78,545 | | | | 2,051 | |
| | | | 2,922 | |
| Switzerland (10.2%) |
| Credit Suisse Group | | | 40,914 | | | | 1,797 | |
| Givaudan SA | | | 3,308 | | | | 3,161 | |
| Nestle SA | | | 46,370 | | | | 2,402 | |
| Novartis AG | | | 24,908 | | | | 1,309 | |
| Roche Holding | | | 18,951 | | | | 2,576 | |
| SGS SA | | | 2,237 | | | | 3,239 | |
| Sulzer AG | | | 26,796 | | | | 2,658 | |
| | | | 17,142 | |
| United Kingdom (21.5%) |
| Amlin PLC | | | 457,213 | | | | 2,850 | |
| Antofagasta PLC | | | 142,609 | | | | 2,257 | |
| BAE Systems | | | 308,382 | | | | 1,394 | |
| BG Group | | | 76,225 | | | | 1,227 | |
| Cairn Energy* | | | 465,215 | | | | 3,335 | |
| Experian Group | | | 351,369 | | | | 3,349 | |
See Notes to Schedule of Investments
| | Number
of Shares | | Value† (000's) |
| HSBC Holdings | | | 259,999 | | | $ | 2,532 | |
| Informa PLC | | | 361,891 | | | | 2,129 | |
| Reed Elsevier | | | 280,514 | | | | 2,254 | |
| Sage Group | | | 469,160 | | | | 1,762 | |
| Smith & Nephew | | | 154,695 | | | | 1,286 | |
| Tesco PLC | | | 324,663 | | | | 2,026 | |
| Travis Perkins* | | | 71,245 | | | | 833 | |
| Tullow Oil | | | 120,021 | | | | 2,242 | |
| Vodafone Group | | | 1,922,792 | | | | 4,634 | |
Willis Group Holdings | | | 71,200 | | | | 2,070 | |
| | | | 36,180 | |
| | | | | |
Total Common Stocks (Cost $155,765) | | | | | | | 162,516 | |
| | | | | | | | | |
| Preferred Stocks (0.6%) |
| Brazil (0.6%) |
Net Servicos de Comunicacao ADR* (Cost $961) | | | 76,800 | | | | 977 | |
| | | | | | | | | |
| Rights (0.0%) |
| Belgium (0.0%) |
| Ageas VVPR Strip* | | | 23,964 | | | | 0 | |
Anheuser-Busch InBev VVPR Strip* | | | 63,890 | | | | 0 | |
| | | | | | | | | |
Total Rights (Cost $0) | | | | | | | 0 | |
| | | | | | | | | |
| Warrants (0.0%) |
| Italy (0.0%) |
UBI Banca* (Cost $0) | | | 48,665 | | | | 1 | |
| | | | | | | | | |
| Short-Term Investments (2.6%) |
State Street Institutional Liquid Reserves Fund Institutional Class (Cost $4,328) | | | 4,327,867 | | | | 4,328 | |
| | | | | | | | | |
Total Investments## (99.9%) (Cost $161,054) | | | | | | | 167,822 | |
Cash, receivables and other assets, less liabilities (0.1%) | | | | | | | 184 | |
| | | | | | | | | |
| Total Net Assets (100.0%) | | | | | | $ | 168,006 | |
See Notes to Schedule of Investments
| SUMMARY SCHEDULE OF INVESTMENTS BY INDUSTRY—INTERNATIONAL LARGE CAP FUND (UNAUDITED) |
| Industry | | Investments at Value† (000's omitted) | | Percentage of Net Assets |
| Commercial Banks | | $ | 13,424 | | | | 8.0 | % |
| Oil, Gas & Consumable Fuels | | | 13,174 | | | | 7.8 | % |
| Wireless Telecommunication Services | | | 11,604 | | | | 6.9 | % |
| Insurance | | | 11,506 | | | | 6.9 | % |
| Chemicals | | | 11,302 | | | | 6.7 | % |
| Media | | | 10,390 | | | | 6.2 | % |
| Metals & Mining | | | 10,171 | | | | 6.1 | % |
| Pharmaceuticals | | | 9,830 | | | | 5.9 | % |
| Food & Staples Retailing | | | 6,863 | | | | 4.1 | % |
| Professional Services | | | 6,588 | | | | 3.9 | % |
| Electrical Equipment | | | 6,236 | | | | 3.7 | % |
| Food Products | | | 6,108 | | | | 3.6 | % |
| Machinery | | | 4,271 | | | | 2.5 | % |
| Electronic Equipment, Instruments & Components | | | 3,929 | | | | 2.3 | % |
| Software | | | 3,612 | | | | 2.1 | % |
| Auto Components | | | 3,581 | | | | 2.1 | % |
| Computers & Peripherals | | | 2,819 | | | | 1.7 | % |
| Air Freight & Logistics | | | 2,658 | | | | 1.6 | % |
| Diversified Financial Services | | | 2,507 | | | | 1.5 | % |
| Hotels, Restaurants & Leisure | | | 2,507 | | | | 1.5 | % |
| Energy Equipment & Services | | | 2,456 | | | | 1.5 | % |
| Industrial Conglomerates | | | 2,367 | | | | 1.4 | % |
| Health Care Equipment & Supplies | | | 2,157 | | | | 1.3 | % |
| Health Care Providers & Services | | | 2,080 | | | | 1.2 | % |
| Leisure Equipment & Products | | | 1,994 | | | | 1.2 | % |
| Capital Markets | | | 1,797 | | | | 1.1 | % |
| Beverages | | | 1,601 | | | | 1.0 | % |
| Aerospace & Defense | | | 1,394 | | | | 0.8 | % |
| Real Estate Management & Development | | | 1,366 | | | | 0.8 | % |
| Office Electronics | | | 1,193 | | | | 0.7 | % |
| Communications Equipment | | | 1,176 | | | | 0.7 | % |
| Trading Companies & Distributors | | | 833 | | | | 0.5 | % |
| Short-Term Investments and Other Assets—Net | | | 4,512 | | | | 2.7 | % |
| | | $ | 168,006 | | | | 100.0 | % |
See Notes to Schedule of Investments
Schedule of Investments Intrinsic Value Fund
| | 1 | | | Crown Holdings | | | 2.6 | % | |
| | 2 | | | Cooper Companies | | | 2.6 | % | |
| | 3 | | | Constellation Brands | | | 2.5 | % | |
| | 4 | | | Verint Systems | | | 2.3 | % | |
| | 5 | | | Advance Auto Parts | | | 2.2 | % | |
| | 6 | | | TIBCO Software | | | 2.2 | % | |
| | 7 | | | Charles River Laboratories International | | | 2.1 | % | |
| | 8 | | | Avery Dennison | | | 2.0 | % | |
| | 9 | | | Sealed Air | | | 1.9 | % | |
| | 10 | | | Textron Inc. | | | 1.9 | % | |
| | Number
of Shares | | Value† (000's) |
| Common Stocks (98.7%) |
| Aerospace & Defense (3.9%) |
| Ceradyne, Inc.* | | | 41,155 | | | $ | 899 | |
| Ladish Co.* | | | 49,126 | | | | 1,223 | |
Teledyne Technologies* | | | 29,052 | | | | 1,051 | |
| | | | 3,173 | |
| Beverages (2.5%) |
Constellation Brands* | | | 124,636 | | | | 2,076 | |
| Biotechnology (0.7%) |
| Celera Corp.* | | | 86,886 | | | | 573 | |
| Commercial Banks (3.3%) |
Huntington Bancshares | | | 136,700 | | | | 723 | |
| Sterling Bancshares | | | 80,600 | | | | 400 | |
| TCF Financial | | | 39,800 | | | | 568 | |
Texas Capital Bancshares* | | | 25,400 | | | | 389 | |
| Umpqua Holdings | | | 61,100 | | | | 635 | |
| | | | 2,715 | |
| Commercial Services & Supplies (4.5%) |
| Avery Dennison | | | 51,136 | | | | 1,663 | |
| Brink`s Co. | | | 41,403 | | | | 781 | |
| Covanta Holding | | | 83,300 | | | | 1,201 | |
| | | | 3,645 | |
| Communications Equipment (8.1%) |
| Arris Group* | | | 122,369 | | | | 1,000 | |
Brocade Communications* | | | 277,359 | | | | 1,392 | |
| Ciena Corp.* | | | 58,283 | | | | 727 | |
Comverse Technology* | | | 106,458 | | | | 554 | |
| RADWARE Ltd.* | | | 41,778 | | | | 1,017 | |
SeaChange International* | | | 78,626 | | | | 608 | |
| Sierra Wireless* | | | 55,974 | | | | 461 | |
| Tekelec* | | | 79,432 | | | | 870 | |
| | | | 6,629 | |
| Computers & Peripherals (1.6%) |
| Diebold, Inc. | | | 31,192 | | | | 809 | |
| Intermec Inc.* | | | 44,500 | | | | 468 | |
| | | | 1,277 | |
| | Number
of Shares | | Value† (000's) |
| Construction & Engineering (1.9%) |
Granite Construction | | | 13,506 | | | $ | 297 | |
| KBR, Inc. | | | 52,500 | | | | 1,218 | |
| | | | 1,515 | |
| Consumer Finance (1.9%) |
| SLM Corp.* | | | 139,913 | | | | 1,546 | |
| Containers & Packaging (4.5%) |
| Crown Holdings* | | | 75,600 | | | | 2,106 | |
| Sealed Air | | | 76,958 | | | | 1,579 | |
| | | | 3,685 | |
| Diversified Consumer Services (0.9%) |
Corinthian Colleges* | | | 150,126 | | | | 733 | |
| Electrical Equipment (1.7%) |
Hubbell Inc., Class B | | | 30,203 | | | | 1,358 | |
| Electronic Equipment, Instruments & Components (2.5%) |
| Cogent Inc.* | | | 39,100 | | | | 430 | |
| CTS Corp. | | | 87,155 | | | | 701 | |
Mercury Computer Systems* | | | 49,860 | | | | 552 | |
| MTS Systems | | | 14,829 | | | | 395 | |
| | | | 2,078 | |
| Energy Equipment & Services (4.6%) |
Dresser-Rand Group* | | | 35,620 | | | | 1,265 | |
| Global Industries* | | | 117,003 | | | | 534 | |
| ION Geophysical* | | | 185,617 | | | | 635 | |
TETRA Technologies* | | | 158,943 | | | | 1,334 | |
| | | | 3,768 | |
| Health Care Equipment & Supplies (4.0%) |
| Beckman Coulter | | | 26,132 | | | | 1,192 | |
| Cooper Companies | | | 51,704 | | | | 2,086 | |
| | | | 3,278 | |
| Health Care Providers & Services (1.5%) |
| Chemed Corp. | | | 15,725 | | | | 785 | |
| Genoptix Inc* | | | 24,700 | | | | 425 | |
| | | | 1,210 | |
| | Number
of Shares | | Value† (000's) |
| Hotels, Restaurants & Leisure (1.2%) |
| Scientific Games* | | | 99,114 | | | $ | 1,012 | |
| Independent Power Producers & Energy Traders (0.7%) |
| Ormat Technologies | | | 21,856 | | | | 602 | |
| Industrial Conglomerates (1.9%) |
| Textron Inc. | | | 91,539 | | | | 1,563 | |
| Insurance (1.0%) |
First American Financial | | | 56,411 | | | | 837 | |
| Internet Software & Services (1.7%) |
| Digital River* | | | 23,563 | | | | 621 | |
| Keynote Systems | | | 76,496 | | | | 770 | |
| | | | 1,391 | |
| IT Services (5.8%) |
Broadridge Financial Solutions | | | 56,849 | | | | 1,214 | |
| Convergys Corp.* | | | 63,000 | | | | 638 | |
| CoreLogic, Inc. | | | 75,211 | | | | 1,299 | |
| DST Systems | | | 38,189 | | | | 1,556 | |
| | | | 4,707 | |
| Life Science Tools & Services (4.3%) |
| Accelrys Inc.* | | | 131,563 | | | | 797 | |
| Cambrex Corp.* | | | 231,238 | | | | 964 | |
Charles River Laboratories International* | | | 62,071 | | | | 1,754 | |
| | | | 3,515 | |
| Machinery (5.4%) |
| ESCO Technologies | | | 19,985 | | | | 622 | |
Navistar International* | | | 35,985 | | | | 1,507 | |
| Pall Corp. | | | 37,850 | | | | 1,294 | |
| Tecumseh Products* | | | 80,935 | | | | 948 | |
| | | | 4,371 | |
| Marine (1.1%) |
| Danaos Corp.* | | | 124,736 | | | | 493 | |
| Seaspan Corp. | | | 39,450 | | | | 442 | |
| | | | 935 | |
| Media (2.1%) |
| Scholastic Corp. | | | 42,468 | | | | 995 | |
Warner Music Group* | | | 167,921 | | | | 702 | |
| | | | 1,697 | |
See Notes to Schedule of Investments
| | Number
of Shares | | Value† (000's) |
| Metals & Mining (0.7%) |
Harry Winston Diamond* | | | 53,217 | | | $ | 536 | |
| Multi-Utilities (3.7%) |
| CenterPoint Energy | | | 92,300 | | | | 1,365 | |
| CMS Energy | | | 54,461 | | | | 953 | |
| OGE Energy | | | 18,830 | | | | 735 | |
| | | | 3,053 | |
| Oil, Gas & Consumable Fuels (1.5%) |
| Southern Union | | | 54,927 | | | | 1,236 | |
| Professional Services (1.2%) |
| FTI Consulting* | | | 30,500 | | | | 1,000 | |
| Road & Rail (1.8%) |
| Ryder System | | | 39,004 | | | | 1,497 | |
| Semiconductors & Semiconductor Equipment (4.6%) |
Alliance Semiconductor* | | | 89,270 | | | | 17 | |
Ikanos Communications* | | | 143,566 | | | | 124 | |
| Intersil Corp. | | | 64,213 | | | | 642 | |
MEMC Electronic Materials* | | | 97,859 | | | | 1,007 | |
| Ultratech, Inc.* | | | 58,294 | | | | 968 | |
| Zoran Corp.* | | | 118,562 | | | | 958 | |
| | | | 3,716 | |
| Software (7.2%) |
Cadence Design Systems* | | | 114,607 | | | | 779 | |
| Fair Isaac | | | 63,349 | | | | 1,419 | |
| TIBCO Software* | | | 124,019 | | | | 1,797 | |
| Verint Systems* | | | 78,805 | | | | 1,858 | |
| | | | 5,853 | |
| Specialty Retail (4.0%) |
| Advance Auto Parts | | | 33,596 | | | | 1,830 | |
| OfficeMax Inc.* | | | 87,165 | | | | 849 | |
PEP Boys-Manny Moe & Jack | | | 62,901 | | | | 567 | |
| | | | 3,246 | |
| Thrifts & Mortgage Finance (0.7%) |
First Niagara Financial Group | | | 50,800 | | | | 573 | |
| | | | | | | | | |
Total Common Stocks (Cost $75,650) | | | | | | | 80,599 | |
| | Number
of Shares | | Value† (000's) |
| Rights (0.0%) |
Pharmacopeia Drug Discovery CVR*^^ (Cost $0) | | | 136,250 | | | $ | 0 | |
| | | | | | | | | |
| Short-Term Investments (1.4%) |
State Street Institutional Liquid Reserves Fund Institutional Class (Cost $1,134) | | | 1,133,735 | | | | 1,134 | |
| | | | | | | | | |
Total Investments## (100.1%) (Cost $76,784) | | | | | 81,733 | |
Liabilities, less cash, receivables and other assets [(0.1%)] | | | | | (112 | ) |
| | | | | | | |
| Total Net Assets (100.0%) | | | | $ | 81,621 | |
See Notes to Schedule of Investments
Schedule of Investments Large Cap Disciplined Growth Fund
| | 1 | | | Apple, Inc. | | | 6.0 | % | |
| | 2 | | | Cisco Systems | | | 3.4 | % | |
| | 3 | | | Citrix Systems | | | 3.2 | % | |
| | 4 | | | Coca-Cola | | | 3.0 | % | |
| | 5 | | | Kimberly-Clark | | | 2.8 | % | |
| | 6 | | | McDonald's Corp. | | | 2.7 | % | |
| | 7 | | | Boeing Co. | | | 2.4 | % | |
| | 8 | | | Oracle Corp. | | | 2.3 | % | |
| | 9 | | | American Tower Class A | | | 2.3 | % | |
| | 10 | | | Amazon.com | | | 2.1 | % | |
| | Number
of Shares | | Value† (000's) |
| Common Stocks (96.1%) |
| Aerospace & Defense (7.1%) |
| Boeing Co. | | | 167,895 | | | $ | 10,264 | |
| Precision Castparts | | | 53,239 | | | | 6,026 | |
| Rockwell Collins | | | 144,025 | | | | 7,767 | |
| United Technologies | | | 90,482 | | | | 5,900 | |
| | | | 29,957 | |
| Auto Components (1.1%) |
| BorgWarner, Inc.* | | | 101,958 | | | | 4,450 | |
| Beverages (3.0%) |
| Coca-Cola | | | 226,587 | | | | 12,671 | |
| Biotechnology (2.7%) |
| Amgen Inc.* | | | 105,655 | | | | 5,393 | |
| Celgene Corp.* | | | 117,034 | | | | 6,029 | |
| | | | 11,422 | |
| Capital Markets (0.9%) |
Goldman Sachs Group | | | 28,712 | | | | 3,932 | |
| Communications Equipment (4.4%) |
| Cisco Systems* | | | 711,286 | | | | 14,261 | |
| F5 Networks* | | | 49,605 | | | | 4,337 | |
| | | | 18,598 | |
| Computers & Peripherals (8.6%) |
| Apple, Inc.* | | | 104,744 | | | | 25,491 | |
| EMC Corp.* | | | 349,769 | | | | 6,380 | |
| Hewlett-Packard | | | 114,814 | | | | 4,418 | |
| | | | 36,289 | |
| Diversified Financial Services (1.4%) |
| J.P. Morgan Chase | | | 156,530 | | | | 5,691 | |
| Electrical Equipment (1.2%) |
| Emerson Electric | | | 105,010 | | | | 4,899 | |
| Electronic Equipment, Instruments & Components (1.4%) |
| Corning Inc. | | | 365,140 | | | | 5,725 | |
| Energy Equipment & Services (2.0%) |
Cameron International* | | | 135,565 | | | | 4,986 | |
| Schlumberger Ltd. | | | 67,536 | | | | 3,602 | |
| | | | 8,588 | |
| Food & Staples Retailing (1.7%) |
| Walgreen Co. | | | 266,794 | | | | 7,171 | |
| | Number
of Shares | | Value† (000's) |
| Food Products (1.5%) |
Mead Johnson Nutrition | | | 117,569 | | | $ | 6,136 | |
| Health Care Equipment & Supplies (2.4%) |
| Covidien PLC | | | 111,502 | | | | 3,941 | |
| St. Jude Medical* | | | 183,549 | | | | 6,345 | |
| | | | 10,286 | |
| Health Care Providers & Services (4.3%) |
| Express Scripts* | | | 101,314 | | | | 4,316 | |
Laboratory Corp. of America Holdings* | | | 73,765 | | | | 5,357 | |
UnitedHealth Group | | | 270,173 | | | | 8,570 | |
| | | | 18,243 | |
| Hotels, Restaurants & Leisure (4.1%) |
| McDonald's Corp. | | | 155,032 | | | | 11,327 | |
| Starbucks Corp. | | | 260,521 | | | | 5,989 | |
| | | | 17,316 | |
| Household Products (6.0%) |
| Colgate-Palmolive | | | 81,762 | | | | 6,037 | |
| Kimberly-Clark | | | 180,695 | | | | 11,637 | |
| Procter & Gamble | | | 127,871 | | | | 7,630 | |
| | | | 25,304 | |
| Industrial Conglomerates (2.1%) |
| 3M Co. | | | 111,814 | | | | 8,783 | |
| Internet & Catalog Retail (5.5%) |
| Amazon.com* | | | 71,077 | | | | 8,873 | |
| NetFlix Inc.* | | | 66,647 | | | | 8,365 | |
| Priceline.com Inc.* | | | 21,153 | | | | 6,166 | |
| | | | 23,404 | |
| Internet Software & Services (1.2%) |
| Google Inc. Class A* | | | 11,012 | | | | 4,956 | |
| IT Services (2.6%) |
| Paychex, Inc. | | | 227,388 | | | | 5,660 | |
| Visa Inc. | | | 79,623 | | | | 5,492 | |
| | | | 11,152 | |
| Machinery (4.2%) |
| Caterpillar Inc. | | | 95,259 | | | | 6,207 | |
| Cummins Inc. | | | 94,822 | | | | 7,056 | |
| Danaher Corp. | | | 122,778 | | | | 4,460 | |
| | | | 17,723 | |
| | Number
of Shares | | Value† (000's) |
| Media (2.2%) |
| DIRECTV Class A* | | | 120,295 | | | $ | 4,562 | |
| Time Warner | | | 151,771 | | | | 4,550 | |
| | | | 9,112 | |
| Metals & Mining (1.5%) |
Allegheny Technologies | | | 155,111 | | | | 6,316 | |
| Multiline Retail (2.0%) |
| Target Corp. | | | 168,309 | | | | 8,611 | |
| Oil, Gas & Consumable Fuels (3.4%) |
Canadian Natural Resources | | | 181,164 | | | | 5,814 | |
Denbury Resources* | | | 142,951 | | | | 2,107 | |
| Range Resources | | | 96,461 | | | | 3,261 | |
Southwestern Energy* | | | 95,658 | | | | 3,130 | |
| | | | 14,312 | |
| Pharmaceuticals (3.1%) |
| Allergan, Inc. | | | 71,277 | | | | 4,378 | |
| Pfizer Inc. | | | 306,740 | | | | 4,886 | |
Teva Pharmaceutical Industries ADR | | | 76,422 | | | | 3,866 | |
| | | | 13,130 | |
| Software (10.4%) |
| Adobe Systems* | | | 137,343 | | | | 3,813 | |
Check Point Software Technologies* | | | 137,514 | | | | 4,798 | |
| Citrix Systems* | | | 232,224 | | | | 13,455 | |
| Microsoft Corp. | | | 250,179 | | | | 5,874 | |
| Oracle Corp. | | | 452,905 | | | | 9,909 | |
Salesforce.com, Inc.* | | | 55,845 | | | | 6,136 | |
| | | | 43,985 | |
| Textiles, Apparel & Luxury Goods (1.8%) |
| Coach, Inc. | | | 94,239 | | | | 3,378 | |
| V.F. Corp. | | | 57,508 | | | | 4,061 | |
| | | | 7,439 | |
| Wireless Telecommunication Services (2.3%) |
American Tower Class A* | | | 211,443 | | | | 9,908 | |
| | | | | | | | | |
Total Common Stocks (Cost $409,002) | | | | | | | 405,509 | |
See Notes to Schedule of Investments
| | Number
of Shares | | Value† (000's) |
| Short-Term Investments (3.7%) |
State Street Institutional Liquid Reserves Fund Institutional Class (Cost $15,610) | | | 15,609,782 | | | $ | 15,610 | |
| | | | | | | | | |
Total Investments## (99.8%) (Cost $424,612) | | | | | 421,119 | |
Cash, receivables and other assets, less liabilities (0.2%) | | | | | 920 | |
| | | | | | | |
| Total Net Assets (100.0%) | | | | $ | 422,039 | |
See Notes to Schedule of Investments
Schedule of Investments Mid Cap Growth Fund
| | 1 | | | SBA Communications Class A | | | 2.3 | % | |
| | 2 | | | Stericycle, Inc. | | | 1.9 | % | |
| | 3 | | | Concho Resources | | | 1.7 | % | |
| | 4 | | | Alexion Pharmaceuticals | | | 1.5 | % | |
| | 5 | | | Rovi Corp. | | | 1.5 | % | |
| | 6 | | | F5 Networks | | | 1.4 | % | |
| | 7 | | | Dolby Laboratories Class A | | | 1.4 | % | |
| | 8 | | | CARBO Ceramics | | | 1.4 | % | |
| | 9 | | | WMS Industries | | | 1.4 | % | |
| | 10 | | | Fastenal Co. | | | 1.4 | % | |
| | Number
of Shares | | Value† (000's) |
| Common Stocks (94.4%) |
| Aerospace & Defense (2.7%) |
| BE Aerospace* | | | 97,500 | | | $ | 2,628 | |
| Precision Castparts | | | 48,500 | | | | 5,489 | |
| Rockwell Collins | | | 71,500 | | | | 3,856 | |
| | | | 11,973 | |
| Air Freight & Logistics (1.3%) |
C.H. Robinson Worldwide | | | 92,500 | | | | 6,012 | |
| Auto Components (0.6%) |
| Gentex Corp. | | | 145,000 | | | | 2,548 | |
| Biotechnology (2.9%) |
Alexion Pharmaceuticals* | | | 120,000 | | | | 6,776 | |
BioMarin Pharmaceutical* | | | 145,000 | | | | 2,942 | |
Human Genome Sciences* | | | 110,000 | | | | 3,200 | |
| | | | 12,918 | |
| Capital Markets (1.4%) |
Affiliated Managers Group* | | | 59,500 | | | | 3,821 | |
| SEI Investments | | | 152,500 | | | | 2,699 | |
| | | | 6,520 | |
| Chemicals (1.2%) |
| Nalco Holding | | | 128,500 | | | | 2,920 | |
| Sigma-Aldrich | | | 47,000 | | | | 2,499 | |
| | | | 5,419 | |
| Commercial Services & Supplies (1.9%) |
| Stericycle, Inc.* | | | 131,000 | | | | 8,581 | |
| Communications Equipment (2.7%) |
| F5 Networks* | | | 72,500 | | | | 6,339 | |
| Juniper Networks* | | | 89,000 | | | | 2,421 | |
| Polycom, Inc.* | | | 113,500 | | | | 3,232 | |
| | | | 11,992 | |
| Computers & Peripherals (0.9%) |
| NetApp, Inc.* | | | 98,000 | | | | 3,963 | |
| Diversified Consumer Services (1.5%) |
| DeVry, Inc. | | | 80,000 | | | | 3,049 | |
| Strayer Education | | | 27,000 | | | | 3,909 | |
| | | | 6,958 | |
| | Number
of Shares | | Value† (000's) |
| Diversified Financial Services (2.1%) |
IntercontinentalExchange Inc.* | | | 46,500 | | | $ | 4,444 | |
| MSCI Inc. Class A* | | | 165,400 | | | | 4,945 | |
| | | | 9,389 | |
| Electrical Equipment (2.7%) |
| AMETEK, Inc. | | | 110,000 | | | | 4,729 | |
| Roper Industries | | | 80,000 | | | | 4,646 | |
Sensata Technologies Holding* | | | 165,000 | | | | 2,784 | |
| | | | 12,159 | |
| Electronic Equipment, Instruments & Components (4.3%) |
Amphenol Corp. Class A | | | 98,000 | | | | 3,990 | |
Dolby Laboratories Class A* | | | 112,500 | | | | 6,235 | |
National Instruments | | | 152,500 | | | | 4,397 | |
| Trimble Navigation* | | | 173,000 | | | | 4,866 | |
| | | | 19,488 | |
| Energy Equipment & Services (3.3%) |
Cameron International* | | | 75,000 | | | | 2,759 | |
| CARBO Ceramics | | | 82,000 | | | | 6,210 | |
Core Laboratories N.V. | | | 74,600 | | | | 5,888 | |
| | | | 14,857 | |
| Food Products (1.3%) |
Mead Johnson Nutrition | | | 111,000 | | | | 5,793 | |
| Health Care Equipment & Supplies (4.6%) |
Edwards Lifesciences* | | | 96,690 | | | | 5,566 | |
| Intuitive Surgical* | | | 15,000 | | | | 3,975 | |
| NuVasive, Inc.* | | | 155,000 | | | | 4,549 | |
| ResMed Inc.* | | | 90,000 | | | | 2,713 | |
| Volcano Corp.* | | | 175,000 | | | | 3,868 | |
| | | | 20,671 | |
| Health Care Providers & Services (3.1%) |
Catalyst Health Solutions* | | | 80,000 | | | | 3,207 | |
| Express Scripts* | | | 135,000 | | | | 5,751 | |
| HMS Holdings* | | | 94,500 | | | | 4,931 | |
| | | | 13,889 | |
| | Number
of Shares | | Value† (000's) |
| Health Care Technology (1.6%) |
| Cerner Corp.* | | | 68,500 | | | $ | 4,990 | |
| MedAssets Inc.* | | | 110,000 | | | | 2,180 | |
| | | | 7,170 | |
| Hotels, Restaurants & Leisure (2.5%) |
Hyatt Hotels Class A* | | | 72,500 | | | | 2,730 | |
Royal Caribbean Cruises* | | | 101,000 | | | | 2,481 | |
| WMS Industries* | | | 175,000 | | | | 6,184 | |
| | | | 11,395 | |
| Household Products (0.9%) |
| Church & Dwight | | | 68,500 | | | | 4,194 | |
| Internet & Catalog Retail (0.7%) |
| NetFlix Inc.* | | | 24,000 | | | | 3,013 | |
| Internet Software & Services (2.1%) |
| Equinix, Inc.* | | | 55,000 | | | | 5,017 | |
| GSI Commerce* | | | 120,000 | | | | 2,732 | |
| Rackspace Hosting* | | | 88,000 | | | | 1,733 | |
| | | | 9,482 | |
| IT Services (1.9%) |
Alliance Data Systems* | | | 51,000 | | | | 2,866 | |
Cognizant Technology Solutions Class A* | | | 102,500 | | | | 5,904 | |
| | | | 8,770 | |
| Leisure Equipment & Products (0.7%) |
| Hasbro, Inc. | | | 75,000 | | | | 3,027 | |
| Machinery (3.5%) |
| Cummins Inc. | | | 62,000 | | | | 4,613 | |
| Danaher Corp. | | | 136,000 | | | | 4,941 | |
| Flowserve Corp. | | | 34,500 | | | | 3,084 | |
| Pall Corp. | | | 91,500 | | | | 3,128 | |
| | | | 15,766 | |
| Media (1.5%) |
Discovery Communications Class A* | | | 94,000 | | | | 3,548 | |
Scripps Networks Interactive Class A | | | 75,000 | | | | 3,014 | |
| | | | 6,562 | |
| Metals & Mining (0.7%) |
Cliffs Natural Resources | | | 55,000 | | | | 3,365 | |
See Notes to Schedule of Investments
| | Number
of Shares | | Value† (000's) |
| Multiline Retail (2.1%) |
| Dollar Tree* | | | 132,000 | | | $ | 5,983 | |
| Nordstrom, Inc. | | | 122,500 | | | | 3,543 | |
| | | | 9,526 | |
| Oil, Gas & Consumable Fuels (3.2%) |
| Concho Resources* | | | 132,500 | | | | 7,741 | |
| Range Resources | | | 60,000 | | | | 2,029 | |
| Whiting Petroleum* | | | 56,500 | | | | 4,793 | |
| | | | 14,563 | |
| Pharmaceuticals (2.8%) |
| Perrigo Co. | | | 50,000 | | | | 2,850 | |
Salix Pharmaceuticals* | | | 122,500 | | | | 4,638 | |
Warner Chilcott Class A* | | | 92,500 | | | | 2,629 | |
Watson Pharmaceuticals* | | | 54,500 | | | | 2,347 | |
| | | | 12,464 | |
| Professional Services (1.0%) |
Verisk Analytics Class A* | | | 158,500 | | | | 4,410 | |
| Real Estate Management & Development (1.3%) |
| Jones Lang LaSalle | | | 75,000 | | | | 5,663 | |
| Road & Rail (1.0%) |
J.B. Hunt Transport Services | | | 135,500 | | | | 4,436 | |
| Semiconductors & Semiconductor Equipment (5.3%) |
| Analog Devices | | | 126,500 | | | | 3,527 | |
Avago Technologies* | | | 242,000 | | | | 4,876 | |
Marvell Technology Group* | | | 230,000 | | | | 3,666 | |
Microchip Technology | | | 169,500 | | | | 4,693 | |
Silicon Laboratories* | | | 98,500 | | | | 3,757 | |
Varian Semiconductor Equipment* | | | 140,000 | | | | 3,475 | |
| | | | 23,994 | |
| Software (8.4%) |
| ANSYS, Inc.* | | | 137,000 | | | | 5,313 | |
| Citrix Systems* | | | 90,000 | | | | 5,215 | |
| Informatica Corp.* | | | 190,000 | | | | 6,110 | |
| Intuit Inc.* | | | 59,500 | | | | 2,547 | |
| MICROS Systems* | | | 104,000 | | | | 3,962 | |
| RealD Inc.* | | | 27,500 | | | | 459 | |
| Rovi Corp.* | | | 155,000 | | | | 6,744 | |
| Salesforce.com, Inc.* | | | 43,000 | | | | 4,725 | |
| Solera Holdings | | | 71,500 | | | | 2,837 | |
| | | | 37,912 | |
| Specialty Retail (6.5%) |
Abercrombie & Fitch Class A | | | 67,000 | | | | 2,318 | |
| | Number
of Shares | | Value† (000's) |
Bed Bath & Beyond* | | | 119,000 | | | $ | 4,280 | |
Dick's Sporting Goods* | | | 70,000 | | | | 1,713 | |
| J Crew Group* | | | 100,000 | | | | 3,049 | |
| Jo-Ann Stores* | | | 75,000 | | | | 3,050 | |
| Ross Stores | | | 109,000 | | | | 5,410 | |
| Urban Outfitters* | | | 197,500 | | | | 5,988 | |
| Williams-Sonoma | | | 127,000 | | | | 3,297 | |
| | | | 29,105 | |
| Textiles, Apparel & Luxury Goods (1.3%) |
| Coach, Inc. | | | 105,000 | | | | 3,763 | |
| Phillips-Van Heusen | | | 50,000 | | | | 2,284 | |
| | | | 6,047 | |
| Trading Companies & Distributors (2.3%) |
| Fastenal Co. | | | 135,000 | | | | 6,112 | |
| W.W. Grainger | | | 41,000 | | | | 4,337 | |
| | | | 10,449 | |
| Wireless Telecommunication Services (4.6%) |
American Tower Class A* | | | 106,000 | | | | 4,967 | |
| NII Holdings* | | | 145,000 | | | | 5,256 | |
SBA Communications Class A* | | | 290,000 | | | | 10,382 | |
| | | | 20,605 | |
| | | | | | | | | |
Total Common Stocks (Cost $341,722) | | | | | | | 425,048 | |
| Short-Term Investments (5.8%) |
State Street Institutional Liquid Reserves Fund Institutional Class (Cost $26,089) | | | 26,088,604 | | | | 26,089 | |
| | | | | | | | | |
Total Investments## (100.2%) (Cost $367,811) | | | | | | | 451,137 | |
Liabilities, less cash, receivables and other assets [(0.2%)] | | | | | | | (911 | ) |
| | | | | | | | | |
| Total Net Assets (100.0%) | | | | | | $ | 450,226 | |
See Notes to Schedule of Investments
Schedule of Investments Multi-Cap Opportunities Fund
| | 1 | | | Hewlett-Packard | | | 3.7 | % | |
| | 2 | | | eBay Inc. | | | 3.7 | % | |
| | 3 | | | Boeing Co. | | | 3.5 | % | |
| | 4 | | | Omnicom Group | | | 3.5 | % | |
| | 5 | | | J.P. Morgan Chase | | | 3.4 | % | |
| | 6 | | | National Fuel Gas | | | 3.4 | % | |
| | 7 | | | McDonald's Corp. | | | 3.4 | % | |
| | 8 | | | Cenovus Energy | | | 3.3 | % | |
| | 9 | | | Schlumberger Ltd. | | | 3.3 | % | |
| | 10 | | | Morgan Stanley | | | 3.2 | % | |
| | Number of Shares | | Value† (000's) |
| Common Stocks (96.4%) |
| Aerospace & Defense (3.5%) |
| Boeing Co. | | | 27,000 | | | $ | 1,650 | |
| Beverages (3.1%) |
| PepsiCo, Inc. | | | 23,000 | | | | 1,476 | |
| Capital Markets (3.2%) |
| Morgan Stanley | | | 62,000 | | | | 1,531 | |
| Chemicals (3.9%) |
| Ecolab Inc. | | | 26,000 | | | | 1,232 | |
| Methanex Corp. | | | 30,000 | | | | 641 | |
| | | | 1,873 | |
| Commercial Services & Supplies (2.9%) |
| Covanta Holding | | | 95,000 | | | | 1,369 | |
| Communications Equipment (2.3%) |
| Cisco Systems* | | | 55,000 | | | | 1,103 | |
| Computers & Peripherals (3.7%) |
| Hewlett-Packard | | | 46,000 | | | | 1,770 | |
| Diversified Financial Services (3.4%) |
| J.P. Morgan Chase | | | 45,000 | | | | 1,636 | |
| Electrical Equipment (5.8%) |
| ABB Ltd. | | | 70,000 | | | | 1,356 | |
| Babcock & Wilcox* | | | 23,000 | | | | 515 | |
Rockwell Automation | | | 17,000 | | | | 869 | |
| | | | 2,740 | |
| Energy Equipment & Services (5.2%) |
Dresser-Rand Group* | | | 11,000 | | | | 391 | |
McDermott International* | | | 41,000 | | | | 526 | |
| Schlumberger Ltd. | | | 29,000 | | | | 1,546 | |
| | | | 2,463 | |
| Food Products (2.8%) |
| Kraft Foods | | | 44,000 | | | | 1,318 | |
| Gas Utilities (3.4%) |
| National Fuel Gas | | | 38,000 | | | | 1,633 | |
| Health Care Equipment & Supplies (0.9%) |
| Osteotech, Inc.* | | | 65,000 | | | | 416 | |
| Health Care Providers & Services (4.4%) |
| Aetna Inc. | | | 35,000 | | | | 935 | |
| Henry Schein* | | | 22,000 | | | | 1,162 | |
| | | | 2,097 | |
| | Number
of Shares | | Value† (000's) |
| Hotels, Restaurants & Leisure (6.4%) |
| Darden Restaurants | | | 35,000 | | | $ | 1,444 | |
| McDonald's Corp. | | | 22,000 | | | | 1,607 | |
| | | | 3,051 | |
| Household Products (2.9%) |
| Procter & Gamble | | | 23,000 | | | | 1,372 | |
| Industrial Conglomerates (2.8%) |
| 3M Co. | | | 17,000 | | | | 1,335 | |
| Internet Software & Services (3.7%) |
| eBay Inc.* | | | 75,000 | | | | 1,743 | |
| Life Science Tools & Services (6.1%) |
Charles River Laboratories International* | | | 50,000 | | | | 1,413 | |
Thermo Fisher Scientific* | | | 35,000 | | | | 1,474 | |
| | | | 2,887 | |
| Media (5.8%) |
| News Corp. Class A | | | 90,000 | | | | 1,131 | |
| Omnicom Group | | | 47,000 | | | | 1,646 | |
| | | | 2,777 | |
| Mutual Funds (2.0%) |
S&P 500 Depositary Receipts | | | 9,000 | | | | 949 | |
| Oil, Gas & Consumable Fuels (6.2%) |
| Cenovus Energy | | | 58,000 | | | | 1,561 | |
| Golar LNG | | | 70,000 | | | | 727 | |
| Range Resources | | | 20,000 | | | | 676 | |
| | | | 2,964 | |
| Pharmaceuticals (2.7%) |
| Pfizer Inc. | | | 80,000 | | | | 1,274 | |
| Road & Rail (0.6%) |
| Union Pacific | | | 4,000 | | | | 292 | |
| Software (5.7%) |
| Activision Blizzard | | | 120,000 | | | | 1,283 | |
| Microsoft Corp. | | | 60,000 | | | | 1,409 | |
| | | | 2,692 | |
| Specialty Retail (3.0%) |
| Bed Bath & Beyond* | | | 40,000 | | | | 1,439 | |
| | | | | | | | | |
Total Common Stocks (Cost $49,787) | | | | | | | 45,850 | |
| | Number
of Shares | | Value† (000's) |
| Short-Term Investments (4.2%) |
State Street Institutional Liquid Reserves Fund Institutional Class (Cost $1,986) | | | 1,985,640 | | | $ | 1,986 | |
| | | | | | | | | |
Total Investments## (100.6%) (Cost $51,773) | | | | | 47,836 | |
Liabilities, less cash, receivables and other assets [(0.6%)] | | | | | (281 | ) |
| | | | | | | |
| Total Net Assets (100.0%) | | | | $ | 47,555 | |
See Notes to Schedule of Investments
Schedule of Investments Partners Fund
| | 1 | | | Bank of America | | | 3.0 | % | |
| | 2 | | | Berkshire Hathaway Class B | | | 3.0 | % | |
| | 3 | | | Canadian Natural Resources | | | 2.6 | % | |
| | 4 | | | Avon Products | | | 2.4 | % | |
| | 5 | | | Shire PLC ADR | | | 2.4 | % | |
| | 6 | | | American Express | | | 2.2 | % | |
| | 7 | | | Boeing Co. | | | 2.2 | % | |
| | 8 | | | McGraw-Hill Cos. | | | 2.2 | % | |
| | 9 | | | Moody's Corp. | | | 2.2 | % | |
| | 10 | | | EOG Resources | | | 2.1 | % | |
| | Number
of Shares | | Value† (000's) |
| Common Stocks (97.7%) |
| Aerospace & Defense (2.2%) |
| Boeing Co. | | | 802,100 | | | $ | 49,032 | |
| Automobiles (1.5%) |
| Harley-Davidson | | | 1,414,266 | | | | 34,395 | |
| Beverages (0.6%) |
| Coca-Cola | | | 229,100 | | | | 12,811 | |
| Building Products (2.8%) |
| Masco Corp. | | | 1,827,462 | | | | 19,170 | |
| Owens Corning* | | | 1,614,600 | | | | 43,917 | |
| | | | 63,087 | |
| Capital Markets (6.5%) |
Goldman Sachs Group | | | 253,500 | | | | 34,714 | |
| Invesco Ltd. | | | 2,534,900 | | | | 45,882 | |
| Morgan Stanley | | | 1,317,982 | | | | 32,541 | |
| State Street | | | 883,300 | | | | 30,986 | |
| | | | 144,123 | |
| Commercial Banks (4.1%) |
Fifth Third Bancorp | | | 2,600,500 | | | | 28,735 | |
| SunTrust Banks | | | 1,070,600 | | | | 24,078 | |
| Wells Fargo | | | 1,658,200 | | | | 39,051 | |
| | | | 91,864 | |
| Computers & Peripherals (1.8%) |
| Hewlett-Packard | | | 1,010,220 | | | | 38,873 | |
| Construction & Engineering (0.9%) |
Chicago Bridge & Iron* | | | 880,051 | | | | 19,168 | |
| Consumer Finance (3.0%) |
American Express | | | 1,239,700 | | | | 49,427 | |
Capital One Financial | | | 483,800 | | | | 18,317 | |
| | | | 67,744 | |
| Diversified Financial Services (8.8%) |
| Bank of America | | | 5,322,700 | | | | 66,268 | |
| Citigroup Inc.* | | | 10,345,237 | | | | 38,484 | |
J.P. Morgan Chase | | | 1,188,100 | | | | 43,199 | |
| Moody's Corp. | | | 2,295,774 | | | | 48,533 | |
| | | | 196,484 | |
| Electrical Equipment (2.0%) |
| ABB Ltd. | | | 2,237,200 | | | | 43,335 | |
| | Number
of Shares | | Value† (000's) |
| Energy Equipment & Services (3.6%) |
| Halliburton Co. | | | 1,009,000 | | | $ | 28,464 | |
McDermott International* | | | 678,200 | | | | 8,695 | |
National Oilwell Varco | | | 653,200 | | | | 24,554 | |
Weatherford International* | | | 1,290,300 | | | | 19,238 | |
| | | | 80,951 | |
| Food & Staples Retailing (1.1%) |
| CVS Caremark | | | 908,700 | | | | 24,535 | |
| Health Care Equipment & Supplies (3.7%) |
Boston Scientific* | | | 2,254,100 | | | | 11,699 | |
| Covidien PLC | | | 961,800 | | | | 33,990 | |
| Zimmer Holdings* | | | 775,300 | | | | 36,571 | |
| | | | 82,260 | |
| Health Care Providers & Services (5.2%) |
| Aetna Inc. | | | 1,290,100 | | | | 34,471 | |
AmerisourceBergen Corp. | | | 412,200 | | | | 11,245 | |
Medco Health Solutions* | | | 722,900 | | | | 31,432 | |
| WellPoint Inc.* | | | 760,600 | | | | 37,787 | |
| | | | 114,935 | |
| Household Durables (1.2%) |
| NVR, Inc.* | | | 18,890 | | | | 11,413 | |
| Whirlpool Corp. | | | 206,300 | | | | 15,299 | |
| | | | 26,712 | |
| Household Products (1.7%) |
Energizer Holdings* | | | 595,500 | | | | 37,546 | |
| Independent Power Producers & Energy Traders (0.7%) |
| NRG Energy* | | | 778,661 | | | | 15,822 | |
| Industrial Conglomerates (1.0%) |
| Textron Inc. | | | 1,253,000 | | | | 21,389 | |
| Insurance (4.8%) |
Berkshire Hathaway Class B* | | | 835,000 | | | | 65,781 | |
| MetLife, Inc. | | | 887,242 | | | | 33,360 | |
Principal Financial Group | | | 373,400 | | | | 8,607 | |
| | | | 107,748 | |
| | Number
of Shares | | Value† (000's) |
| IT Services (1.5%) |
Lender Processing Services | | | 1,132,090 | | | $ | 33,204 | |
| Machinery (3.2%) |
Bucyrus International | | | 341,000 | | | | 19,604 | |
| Ingersoll-Rand PLC | | | 709,774 | | | | 23,089 | |
| Joy Global | | | 220,858 | | | | 12,531 | |
| Terex Corp.* | | | 891,700 | | | | 16,238 | |
| | | | 71,462 | |
| Media (2.2%) |
McGraw-Hill Cos. | | | 1,768,000 | | | | 48,885 | |
| Metals & Mining (4.9%) |
Freeport-McMoRan Copper & Gold | | | 308,000 | | | | 22,170 | |
Teck Resources Class B | | | 1,339,500 | | | | 44,712 | |
United States Steel | | | 223,000 | | | | 9,480 | |
| Walter Energy | | | 221,000 | | | | 15,921 | |
| Xstrata PLC | | | 1,064,100 | | | | 16,744 | |
| | | | 109,027 | |
| Multiline Retail (3.0%) |
| J.C. Penney | | | 1,996,932 | | | | 39,938 | |
| Macy's, Inc. | | | 1,329,200 | | | | 25,840 | |
| | | | 65,778 | |
| Oil, Gas & Consumable Fuels (11.7%) |
Canadian Natural Resources | | | 1,790,400 | | | | 57,454 | |
| Cenovus Energy | | | 1,293,200 | | | | 34,800 | |
| EOG Resources | | | 529,700 | | | | 46,015 | |
| Peabody Energy | | | 470,606 | | | | 20,142 | |
Petrohawk Energy* | | | 494,390 | | | | 7,475 | |
Petroleo Brasileiro ADR | | | 1,271,800 | | | | 42,414 | |
Southwestern Energy* | | | 1,084,225 | | | | 35,476 | |
| Talisman Energy | | | 1,092,955 | | | | 17,138 | |
| | | | 260,914 | |
| Paper & Forest Products (0.3%) |
International Paper | | | 326,000 | | | | 6,670 | |
See Notes to Schedule of Investments
| | Number
of Shares | | Value† (000's) |
| Personal Products (3.2%) |
| Avon Products | | | 1,853,217 | | | $ | 53,929 | |
| NBTY, Inc.* | | | 319,694 | | | | 17,420 | |
| | | | 71,349 | |
| Pharmaceuticals (3.6%) |
| Pfizer Inc. | | | 1,736,725 | | | | 27,666 | |
| Shire PLC ADR | | | 810,619 | | | | 52,447 | |
| | | | 80,113 | |
| Semiconductors & Semiconductor Equipment (1.1%) |
| Intel Corp. | | | 1,020,900 | | | | 18,090 | |
| Lam Research* | | | 155,500 | | | | 5,615 | |
| | | | 23,705 | |
| Software (2.3%) |
Check Point Software Technologies* | | | 712,273 | | | | 24,851 | |
| Oracle Corp. | | | 1,234,000 | | | | 27,000 | |
| | | | 51,851 | |
| Specialty Retail (3.5%) |
| Best Buy | | | 1,150,275 | | | | 36,107 | |
| Limited, Inc. | | | 201,400 | | | | 4,753 | |
| Lowe's Cos. | | | 1,862,100 | | | | 37,801 | |
| | | | 78,661 | |
| | | | | | | | | |
Total Common Stocks (Cost $1,964,027) | | | | | | | 2,174,433 | |
| |
| Short-Term Investments (1.9%) |
State Street Institutional Liquid Reserves Fund Institutional Class (Cost $42,999) | | | 42,999,030 | | | | 42,999 | |
| | | | | | | | | |
Total Investments## (99.6%) (Cost $2,007,026) | | | | | | | 2,217,432 | |
Cash, receivables and other assets, less liabilities (0.4%) | | | | | | | 9,575 | |
| | | | | | | | | |
| Total Net Assets (100.0%) | | | | | | $ | 2,227,007 | |
See Notes to Schedule of Investments
Schedule of Investments Real Estate Fund
| | 1 | | | Simon Property Group | | | 8.9 | % | |
| | 2 | | | Public Storage | | | 5.8 | % | |
| | 3 | | | Boston Properties | | | 5.0 | % | |
| | 4 | | | Vornado Realty Trust | | | 5.0 | % | |
| | 5 | | | Equity Residential | | | 4.3 | % | |
| | 6 | | | AvalonBay Communities | | | 4.1 | % | |
| | 7 | | | Digital Realty Trust | | | 3.9 | % | |
| | 8 | | | Ventas, Inc. | | | 3.9 | % | |
| | 9 | | | HCP, Inc. | | | 3.8 | % | |
| | 10 | | | ProLogis | | | 3.0 | % | |
| | Number
of Shares | | Value† (000's) |
| Common Stocks (97.2%) |
| Apartments (13.6%) |
American Campus Communities | | | 109,300 | | | $ | 3,256 | |
AvalonBay Communities | | | 58,632 | | | | 6,169 | |
Camden Property Trust | | | 44,000 | | | | 2,013 | |
| Equity Residential | | | 139,250 | | | | 6,382 | |
Essex Property Trust | | | 24,000 | | | | 2,539 | |
| | | | 20,359 | |
| Diversified (5.0%) |
Vornado Realty Trust | | | 91,723 | | | | 7,435 | |
| Health Care (12.7%) |
| HCP, Inc. | | | 162,950 | | | | 5,739 | |
Nationwide Health Properties | | | 117,600 | | | | 4,524 | |
OMEGA Healthcare Investors | | | 143,340 | | | | 3,075 | |
| Ventas, Inc. | | | 114,600 | | | | 5,788 | |
| | | | 19,126 | |
| Hotels, Restaurants & Leisure (3.0%) |
Starwood Hotels & Resorts Worldwide | | | 95,800 | | | | 4,477 | |
| Industrial (5.9%) |
| AMB Property | | | 109,110 | | | | 2,596 | |
EastGroup Properties | | | 47,100 | | | | 1,660 | |
| ProLogis | | | 419,600 | | | | 4,553 | |
| | | | 8,809 | |
| Lodging (6.0%) |
Host Hotels & Resorts | | | 343,743 | | | | 4,513 | |
LaSalle Hotel Properties | | | 105,500 | | | | 2,223 | |
Pebblebrook Hotel Trust* | | | 128,900 | | | | 2,287 | |
| | | | 9,023 | |
| Office (10.2%) |
Alexandria Real Estate Equities | | | 32,050 | | | | 2,223 | |
| Boston Properties | | | 91,900 | | | | 7,481 | |
Corporate Office Properties Trust | | | 71,570 | | | | 2,584 | |
| | Number
of Shares | | Value† (000's) |
| SL Green Realty | | | 51,000 | | | $ | 3,074 | |
| | | | 15,362 | |
| Real Estate Management & Development (4.7%) |
Brookfield Asset Management Class A | | | 118,477 | | | | 3,037 | |
Brookfield Properties | | | 163,200 | | | | 2,360 | |
Forest City Enterprises Class A* | | | 148,800 | | | | 1,677 | |
| | | | 7,074 | |
| Regional Malls (11.9%) |
General Growth Properties | | | 83,962 | | | | 1,181 | |
| Pennsylvania REIT | | | 88,700 | | | | 928 | |
Simon Property Group | | | 147,748 | | | | 13,364 | |
| Taubman Centers | | | 58,160 | | | | 2,413 | |
| | | | 17,886 | |
| Self Storage (7.0%) |
Extra Space Storage | | | 115,600 | | | | 1,767 | |
| Public Storage | | | 88,900 | | | | 8,714 | |
| | | | 10,481 | |
| Shopping Centers (8.1%) |
| Acadia Realty Trust | | | 122,000 | | | | 2,189 | |
Developers Diversified Realty | | | 202,910 | | | | 2,102 | |
Federal Realty Investment Trust | | | 51,300 | | | | 4,067 | |
| Regency Centers | | | 55,340 | | | | 2,018 | |
Tanger Factory Outlet Centers | | | 37,600 | | | | 1,738 | |
| | | | 12,114 | |
| Specialty (9.1%) |
| Digital Realty Trust | | | 98,400 | | | | 5,832 | |
Dupont Fabros Technology | | | 129,100 | | | | 3,190 | |
Entertainment Properties Trust | | | 35,600 | | | | 1,534 | |
| Rayonier Inc. | | | 65,300 | | | | 3,089 | |
| | | | 13,645 | |
| | | | | | | | | |
Total Common Stocks (Cost $117,186) | | | | | | | 145,791 | |
| | Number
of Shares | | Value† (000's) |
| Short-Term Investments (3.5%) |
State Street Institutional Liquid Reserve Fund Institutional Class (Cost $5,266) | | | 5,265,569 | | | $ | 5,266 | |
| | | | | | | |
Total Investments## (100.7%) (Cost $122,452) | | | | | 151,057 | |
Liabilities, less cash, receivables and other assets [(0.7%)] | | | | | (1,019 | ) |
| | | | | | | |
| Total Net Assets (100.0%) | | | | $ | 150,038 | |
See Notes to Schedule of Investments
Schedule of Investments Regency Fund
| | 1 | | | Whiting Petroleum | | | 2.3 | % | |
| | 2 | | | Energizer Holdings | | | 2.2 | % | |
| | 3 | | | Owens Corning | | | 2.0 | % | |
| | 4 | | | Moody's Corp. | | | 1.9 | % | |
| | 5 | | | Invesco Ltd. | | | 1.9 | % | |
| | 6 | | | Teck Resources Class B | | | 1.9 | % | |
| | 7 | | | Newfield Exploration | | | 1.8 | % | |
| | 8 | | | McGraw-Hill Cos. | | | 1.8 | % | |
| | 9 | | | Lender Processing Services | | | 1.8 | % | |
| | 10 | | | Lincoln National | | | 1.7 | % | |
| | Number
of Shares | | Value† (000's) |
| Common Stocks (95.5%) |
| Aerospace & Defense (1.3%) |
Embraer-Empresa Brasileira de Aeronautica ADR | | | 69,800 | | | $ | 1,730 | |
| Auto Components (1.8%) |
American Axle & Manufacturing Holdings* | | | 51,100 | | | | 428 | |
| Lear Corp.* | | | 27,200 | | | | 2,003 | |
| | | | 2,431 | |
| Automobiles (1.3%) |
| Harley-Davidson | | | 76,400 | | | | 1,858 | |
| Beverages (1.0%) |
Dr. Pepper Snapple Group | | | 39,200 | | | | 1,443 | |
| Building Products (2.9%) |
| Masco Corp. | | | 117,900 | | | | 1,237 | |
| Owens Corning* | | | 101,400 | | | | 2,758 | |
| | | | 3,995 | |
| Capital Markets (2.3%) |
| Invesco Ltd. | | | 143,800 | | | | 2,603 | |
| Jefferies Group | | | 24,900 | | | | 560 | |
| | | | 3,163 | |
| Commercial Banks (8.1%) |
| Comerica Inc. | | | 30,600 | | | | 1,053 | |
Fifth Third Bancorp | | | 214,700 | | | | 2,372 | |
First Horizon National* | | | 66,766 | | | | 673 | |
| KeyCorp | | | 92,500 | | | | 682 | |
| Regions Financial | | | 309,700 | | | | 1,991 | |
| SunTrust Banks | | | 94,400 | | | | 2,123 | |
| Synovus Financial | | | 308,100 | | | | 635 | |
| Zions Bancorp | | | 84,900 | | | | 1,565 | |
| | | | 11,094 | |
| Construction & Engineering (1.5%) |
Chicago Bridge & Iron* | | | 97,200 | | | | 2,117 | |
| Containers & Packaging (1.4%) |
| Temple-Inland | | | 117,600 | | | | 1,873 | |
| Diversified Financial Services (1.9%) |
| Moody's Corp. | | | 124,500 | | | | 2,632 | |
| | Number
of Shares | | Value† (000's) |
| Electric Utilities (3.5%) |
| Allegheny Energy | | | 48,800 | | | $ | 1,101 | |
| DPL Inc. | | | 65,300 | | | | 1,653 | |
| NV Energy | | | 160,500 | | | | 2,054 | |
| | | | 4,808 | |
| Electrical Equipment (0.4%) |
| Babcock & Wilcox* | | | 22,800 | | | | 511 | |
| Electronic Equipment, Instruments & Components (3.0%) |
Anixter International* | | | 41,800 | | | | 1,918 | |
| Avnet, Inc.* | | | 93,800 | | | | 2,148 | |
| | | | 4,066 | |
| Energy Equipment & Services (3.3%) |
McDermott International* | | | 45,600 | | | | 585 | |
National Oilwell Varco | | | 30,300 | | | | 1,139 | |
| Noble Corp. | | | 52,700 | | | | 1,640 | |
Oceaneering International* | | | 24,900 | | | | 1,245 | |
| | | | 4,609 | |
| Food Products (0.3%) |
| J. M. Smucker | | | 6,600 | | | | 386 | |
| Gas Utilities (1.1%) |
| Questar Corp. | | | 92,700 | | | | 1,509 | |
| Health Care Providers & Services (6.1%) |
| Aetna Inc. | | | 49,000 | | | | 1,309 | |
AmerisourceBergen Corp. | | | 79,100 | | | | 2,158 | |
| CIGNA Corp. | | | 52,000 | | | | 1,676 | |
Coventry Health Care* | | | 72,000 | | | | 1,393 | |
| MEDNAX, Inc.* | | | 39,600 | | | | 1,835 | |
| | | | 8,371 | |
| Household Durables (2.1%) |
| KB HOME | | | 137,600 | | | | 1,419 | |
| Whirlpool Corp. | | | 20,100 | | | | 1,490 | |
| | | | 2,909 | |
| Household Products (2.2%) |
Energizer Holdings* | | | 47,300 | | | | 2,982 | |
| | Number
of Shares | | Value† (000's) |
| Independent Power Producers & Energy Traders (1.4%) |
| NRG Energy* | | | 93,100 | | | $ | 1,892 | |
| Insurance (9.3%) |
| Assurant, Inc. | | | 64,200 | | | | 2,347 | |
Fidelity National Financial Class A | | | 40,000 | | | | 580 | |
| Lincoln National | | | 101,800 | | | | 2,378 | |
| PartnerRe Ltd. | | | 22,900 | | | | 1,705 | |
Principal Financial Group | | | 95,500 | | | | 2,201 | |
StanCorp Financial Group | | | 46,500 | | | | 1,657 | |
| W. R. Berkley | | | 72,700 | | | | 1,916 | |
| | | | 12,784 | |
| IT Services (1.8%) |
Lender Processing Services | | | 82,400 | | | | 2,417 | |
| Machinery (7.4%) |
| AGCO Corp.* | | | 37,800 | | | | 1,249 | |
Bucyrus International | | | 36,000 | | | | 2,070 | |
Ingersoll-Rand PLC | | | 58,000 | | | | 1,887 | |
Navistar International* | | | 20,600 | | | | 863 | |
| Terex Corp.* | | | 92,600 | | | | 1,686 | |
| WABCO Holdings* | | | 67,100 | | | | 2,366 | |
| | | | 10,121 | |
| Media (2.2%) |
Cablevision Systems | | | 23,300 | | | | 585 | |
| McGraw-Hill Cos. | | | 87,700 | | | | 2,425 | |
| | | | 3,010 | |
| Metals & Mining (3.7%) |
Cliffs Natural Resources | | | 24,300 | | | | 1,487 | |
Teck Resources Class B | | | 76,500 | | | | 2,553 | |
| United States Steel | | | 25,400 | | | | 1,080 | |
| | | | 5,120 | |
| Multi-Utilities (4.0%) |
| Alliant Energy | | | 45,100 | | | | 1,579 | |
CenterPoint Energy | | | 60,700 | | | | 898 | |
| CMS Energy | | | 127,800 | | | | 2,236 | |
| DTE Energy | | | 16,600 | | | | 778 | |
| | | | 5,491 | |
See Notes to Schedule of Investments
| | Number
of Shares | | Value† (000's) |
| Multiline Retail (3.2%) |
| J.C. Penney | | | 112,900 | | | $ | 2,258 | |
| Macy's, Inc. | | | 111,800 | | | | 2,173 | |
| | | | 4,431 | |
| Oil, Gas & Consumable Fuels (8.8%) |
| Cabot Oil & Gas | | | 34,500 | | | | 960 | |
Denbury Resources* | | | 99,100 | | | | 1,461 | |
Newfield Exploration* | | | 51,000 | | | | 2,449 | |
| Noble Energy | | | 26,400 | | | | 1,842 | |
Ship Finance International | | | 45,237 | | | | 792 | |
Southwestern Energy* | | | 42,000 | | | | 1,374 | |
Whiting Petroleum* | | | 37,000 | | | | 3,139 | |
| | | | 12,017 | |
| Pharmaceuticals (1.5%) |
| Shire PLC ADR | | | 32,000 | | | | 2,071 | |
| Real Estate Investment Trusts (4.6%) |
Alexandria Real Estate Equities | | | 12,100 | | | | 839 | |
Annaly Capital Management | | | 79,200 | | | | 1,377 | |
| Boston Properties | | | 15,900 | | | | 1,294 | |
| Macerich Co. | | | 33,988 | | | | 1,408 | |
Vornado Realty Trust | | | 16,895 | | | | 1,370 | |
| | | | 6,288 | |
| Semiconductors & Semiconductor Equipment (1.0%) |
| Lam Research* | | | 36,500 | | | | 1,318 | |
| Specialty Retail (1.1%) |
| Limited, Inc. | | | 66,400 | | | | 1,567 | |
| | | | | | | | | |
Total Common Stocks (Cost $131,743) | | | | | | | 131,014 | |
| |
| Short-Term Investments (2.7%) |
State Street Institutional Liquid Reserves Fund Institutional Class (Cost $3,739) | | | 3,738,764 | | | | 3,739 | |
| | | | | | | | | |
Total Investments## (98.2%) (Cost $135,482) | | | | | | | 134,753 | |
Cash, receivables and other assets, less liabilities (1.8%) | | | | | | | 2,425 | |
| | | | | | | | | |
| Total Net Assets (100.0%) | | | | | | $ | 137,178 | |
See Notes to Schedule of Investments
Schedule of Investments Select Equities Fund
| | 1 | | | American Tower Class A | | | 5.5 | % | |
| | 2 | | | NextEra Energy | | | 5.5 | % | |
| | 3 | | | Procter & Gamble | | | 5.2 | % | |
| | 4 | | | United Parcel Service | | | 5.1 | % | |
| | 5 | | | Colgate-Palmolive | | | 5.0 | % | |
| | 6 | | | Occidental Petroleum | | | 4.9 | % | |
| | 7 | | | Philip Morris International | | | 4.7 | % | |
| | 8 | | | Visa Inc. | | | 4.5 | % | |
| | 9 | | | Praxair, Inc. | | | 4.5 | % | |
| | 10 | | | Norfolk Southern | | | 4.2 | % | |
| | Number
of Shares | | Value† (000's) |
| Common Stocks (89.2%) |
| Air Freight & Logistics (7.5%) |
C.H. Robinson Worldwide | | | 24,233 | | | $ | 1,575 | |
United Parcel Service Class B | | | 53,772 | | | | 3,430 | |
| | | | 5,005 | |
| Beverages (3.0%) |
Coca-Cola Enterprises | | | 71,522 | | | | 2,035 | |
| Capital Markets (3.8%) |
Goldman Sachs Group | | | 18,393 | | | | 2,519 | |
| Chemicals (4.0%) |
| Ecolab Inc. | | | 56,912 | | | | 2,698 | |
| Diversified Financial Services (2.2%) |
| J.P. Morgan Chase | | | 40,997 | | | | 1,491 | |
| Electric Utilities (5.5%) |
| NextEra Energy | | | 68,473 | | | | 3,679 | |
| Food Products (3.0%) |
Mead Johnson Nutrition | | | 38,850 | | | | 2,028 | |
Health Care Providers & Services (1.5%) |
Medco Health Solutions* | | | 22,624 | | | | 984 | |
| Household Products (10.2%) |
| Colgate-Palmolive | | | 45,285 | | | | 3,344 | |
| Procter & Gamble | | | 58,556 | | | | 3,494 | |
| | | | 6,838 | |
| Industrial Gases (4.5%) |
| Praxair, Inc. | | | 34,948 | | | | 3,007 | |
| Internet Software & Services (3.2%) |
| eBay Inc.* | | | 92,665 | | | | 2,153 | |
| IT Services (8.4%) |
| IBM | | | 21,080 | | | | 2,598 | |
| Visa Inc. | | | 43,800 | | | | 3,021 | |
| | | | 5,619 | |
| Machinery (2.5%) |
| Caterpillar Inc. | | | 26,288 | | | | 1,713 | |
| Metals & Mining (2.5%) |
| BHP Billiton | | | 30,202 | | | | 1,688 | |
| | Number
of Shares | | Value† (000's) |
| Oil, Gas & Consumable Fuels (9.5%) |
Occidental Petroleum | | | 45,421 | | | $ | 3,319 | |
| Range Resources | | | 41,785 | | | | 1,413 | |
| Suncor Energy | | | 55,057 | | | | 1,666 | |
| | | | 6,398 | |
| Road & Rail (4.2%) |
| Norfolk Southern | | | 52,691 | | | | 2,828 | |
| Software (3.5%) |
| Microsoft Corp. | | | 99,860 | | | | 2,345 | |
| Tobacco (4.7%) |
Philip Morris International | | | 60,762 | | | | 3,125 | |
Wireless Telecommunication Services (5.5%) |
American Tower Class A* | | | 78,597 | | | | 3,683 | |
| | | | | | | | | |
Total Common Stocks (Cost $60,807) | | | | | | | 59,836 | |
| |
| Short-Term Investments (7.5%) |
State Street Institutional Liquid Reserves Fund Institutional Class (Cost $5,050) | | | 5,049,736 | | | | 5,050 | |
| | | | | | | | | |
Total Investments## (96.7%) (Cost $65,857) | | | | | | | 64,886 | |
Cash, receivables and other assets, less liabilities (3.3%) | | | | | | | 2,245 | |
| | | | | | | | | |
| Total Net Assets (100.0%) | | | | | | $ | 67,131 | |
See Notes to Schedule of Investments
Schedule of Investments Small Cap Growth Fund
| | 1 | | | HEICO Corp. | | | 4.0 | % | |
| | 2 | | | Ultimate Software Group | | | 2.9 | % | |
| | 3 | | | Salix Pharmaceuticals | | | 2.5 | % | |
| | 4 | | | Jones Lang LaSalle | | | 2.4 | % | |
| | 5 | | | LogMeIn, Inc. | | | 2.2 | % | |
| | 6 | | | Diamond Foods | | | 2.2 | % | |
| | 7 | | | Volcano Corp. | | | 2.2 | % | |
| | 8 | | | Alexion Pharmaceuticals | | | 2.0 | % | |
| | 9 | | | BE Aerospace | | | 2.0 | % | |
| | 10 | | | Portfolio Recovery Associates | | | 1.9 | % | |
| | Number
of Shares | | Value† (000's) |
| Common Stocks (97.6%) |
| Aerospace & Defense (6.9%) |
| BE Aerospace* | | | 143,800 | | | $ | 3,876 | |
Global Defense Technology & Systems* | | | 156,476 | | | | 1,635 | |
| HEICO Corp. | | | 183,516 | | | | 7,614 | |
| | | | 13,125 | |
| Air Freight & Logistics (1.3%) |
Hub Group Class A* | | | 95,300 | | | | 2,533 | |
| Auto Components (1.0%) |
| Tenneco Inc.* | | | 74,800 | | | | 1,849 | |
| Biotechnology (2.0%) |
Alexion Pharmaceuticals* | | | 68,900 | | | | 3,891 | |
| Chemicals (3.6%) |
| Ferro Corporation* | | | 225,800 | | | | 2,416 | |
Sensient Technologies | | | 89,600 | | | | 2,485 | |
| Solutia Inc.* | | | 139,100 | | | | 1,883 | |
| | | | 6,784 | |
| Communications Equipment (2.8%) |
| Polycom, Inc.* | | | 71,000 | | | | 2,022 | |
Riverbed Technology* | | | 86,600 | | | | 3,322 | |
| | | | 5,344 | |
| Diversified Consumer Services (3.4%) |
| Capella Education* | | | 31,700 | | | | 1,984 | |
Grand Canyon Education* | | | 119,900 | | | | 2,049 | |
| Steiner Leisure* | | | 69,500 | | | | 2,475 | |
| | | | 6,508 | |
| Diversified Financial Services (1.9%) |
Portfolio Recovery Associates* | | | 56,000 | | | | 3,567 | |
| Electrical Equipment (2.8%) |
Polypore International* | | | 102,000 | | | | 2,756 | |
| Regal-Beloit | | | 48,100 | | | | 2,661 | |
| | | | 5,417 | |
| Electronic Equipment, Instruments & Components (2.2%) |
| DTS, Inc.* | | | 36,297 | | | | 1,272 | |
| Littelfuse, Inc.* | | | 63,400 | | | | 2,361 | |
| | Number
of Shares | | Value† (000's) |
| Plexus Corp.* | | | 19,800 | | | $ | 456 | |
| | | | 4,089 | |
| Food Products (3.2%) |
| Diamond Foods | | | 100,700 | | | | 4,252 | |
| TreeHouse Foods* | | | 46,500 | | | | 1,930 | |
| | | | 6,182 | |
Health Care Equipment & Supplies (9.7%) |
| ArthroCare Corp.* | | | 72,700 | | | | 1,887 | |
| Cyberonics Inc.* | | | 107,800 | | | | 2,310 | |
Neogen Corporation* | | | 31,599 | | | | 923 | |
| NuVasive, Inc.* | | | 60,800 | | | | 1,785 | |
Sirona Dental Systems* | | | 89,700 | | | | 2,827 | |
| Thoratec Corp.* | | | 69,200 | | | | 2,228 | |
| Volcano Corp.* | | | 190,300 | | | | 4,206 | |
| Zoll Medical* | | | 85,800 | | | | 2,267 | |
| | | | 18,433 | |
Health Care Providers & Services (3.2%) |
Catalyst Health Solutions* | | | 82,600 | | | | 3,312 | |
| HMS Holdings* | | | 54,700 | | | | 2,854 | |
| | | | 6,166 | |
| Health Care Technology (1.8%) |
SXC Health Solutions* | | | 43,000 | | | | 3,345 | |
| Hotels, Restaurants & Leisure (2.7%) |
Orient-Express Hotels Class A* | | | 363,053 | | | | 3,137 | |
| WMS Industries* | | | 58,300 | | | | 2,060 | |
| | | | 5,197 | |
| Internet & Catalog Retail (1.8%) |
| HSN, Inc.* | | | 131,700 | | | | 3,462 | |
| Internet Software & Services (10.5%) |
| GSI Commerce* | | | 122,012 | | | | 2,778 | |
| LivePerson, Inc.* | | | 417,400 | | | | 2,984 | |
| LogMeIn, Inc.* | | | 130,700 | | | | 4,283 | |
| LoopNet, Inc.* | | | 220,100 | | | | 2,320 | |
| Mercadolibre Inc.* | | | 41,400 | | | | 2,730 | |
| OpenTable, Inc.* | | | 49,774 | | | | 2,653 | |
| WebMD Health* | | | 42,909 | | | | 2,186 | |
| | | | 19,934 | |
| | Number
of Shares | | Value† (000's) |
| IT Services (1.6%) |
| Gartner, Inc.* | | | 107,200 | | | $ | 3,075 | |
| Machinery (2.8%) |
Actuant Corp. Class A | | | 155,200 | | | | 3,076 | |
| Nordson Corp. | | | 36,100 | | | | 2,317 | |
| | | | 5,393 | |
| Oil, Gas & Consumable Fuels (3.9%) |
Brigham Exploration* | | | 140,000 | | | | 2,145 | |
Concho Resources* | | | 51,800 | | | | 3,026 | |
Rosetta Resources* | | | 111,600 | | | | 2,199 | |
| | | | 7,370 | |
| Pharmaceuticals (2.5%) |
Salix Pharmaceuticals* | | | 123,300 | | | | 4,668 | |
| Professional Services (1.2%) |
The Corporate Executive Board | | | 84,000 | | | | 2,355 | |
| Real Estate Management & Development (2.4%) |
| Jones Lang LaSalle | | | 60,300 | | | | 4,553 | |
| Semiconductors & Semiconductor Equipment (3.6%) |
Atheros Communications* | | | 106,300 | | | | 2,621 | |
| Cavium Networks* | | | 90,000 | | | | 2,173 | |
Volterra Semiconductor* | | | 103,300 | | | | 2,071 | |
| | | | 6,865 | |
| Software (6.5%) |
Jack Henry & Associates | | | 88,900 | | | | 2,093 | |
SS&C Technologies Holdings* | | | 165,800 | | | | 2,336 | |
| TIBCO Software* | | | 155,800 | | | | 2,258 | |
Ultimate Software Group* | | | 170,000 | | | | 5,596 | |
| | | | 12,283 | |
| Specialty Retail (6.0%) |
| hhgregg, Inc.* | | | 97,600 | | | | 1,845 | |
| Hibbett Sports* | | | 91,600 | | | | 2,123 | |
| Tractor Supply | | | 37,200 | | | | 2,529 | |
See Notes to Schedule of Investments
| | Number
of Shares | | Value† (000's) |
Ulta Salon, Cosmetics & Fragrance* | | | 89,400 | | | $ | 2,025 | |
| Vitamin Shoppe* | | | 116,300 | | | | 2,839 | |
| | | | 11,361 | |
Textiles, Apparel & Luxury Goods (4.2%) |
Maidenform Brands* | | | 101,200 | | | | 2,699 | |
| Steven Madden* | | | 75,150 | | | | 2,588 | |
| Warnaco Group* | | | 66,600 | | | | 2,789 | |
| | | | 8,076 | |
Trading Companies & Distributors (2.1%) |
MSC Industrial Direct Class A | | | 46,100 | | | | 2,055 | |
| Watsco, Inc. | | | 39,600 | | | | 2,033 | |
| | | | 4,088 | |
| | | | | | | | | |
Total Common Stocks (Cost $174,642) | | | | | | | 185,913 | |
| |
| Short-Term Investments (2.7%) |
State Street Institutional Liquid Reserves Fund Institutional Class (Cost $5,041) | | | 5,041,353 | | | | 5,041 | |
| | | | | | | | | |
Total Investments## (100.3%) (Cost $179,683) | | | | | | | 190,954 | |
Liabilities, less cash, receivables and other assets [(0.3%)] | | | | | | | (549 | ) |
| | | | | | | | | |
| Total Net Assets (100.0%) | | | | | | $ | 190,405 | |
See Notes to Schedule of Investments
Schedule of Investments Socially Responsive Fund
| | 1 | | | Intuit Inc. | | | 4.8 | % | |
| | 2 | | | Altera Corp. | | | 4.6 | % | |
| | 3 | | | Danaher Corp. | | | 4.5 | % | |
| | 4 | | | BG Group PLC | | | 4.2 | % | |
| | 5 | | | Yahoo! Inc. | | | 4.0 | % | |
| | 6 | | | Newfield Exploration | | | 3.7 | % | |
| | 7 | | | 3M Co. | | | 3.6 | % | |
| | 8 | | | Progressive Corp. | | | 3.5 | % | |
| | 9 | | | Procter & Gamble | | | 3.5 | % | |
| | 10 | | | Anixter International | | | 3.3 | % | |
| | Number
of Shares | | Value† (000's) |
| Common Stocks (92.6%) |
| Capital Markets (6.1%) |
Bank of New York Mellon | | | 1,395,907 | | | $ | 33,879 | |
| Charles Schwab | | | 2,685,159 | | | | 34,262 | |
| | | | 68,141 | |
| Commercial Services & Supplies (1.9%) |
| Herman Miller | | | 1,303,425 | | | | 21,402 | |
| Electronic Equipment, Instruments & Components (6.1%) |
Anixter International* | | | 804,105 | | | | 36,892 | |
National Instruments | | | 1,081,217 | | | | 31,172 | |
| | | | 68,064 | |
| Food Products (5.2%) |
| J.M. Smucker | | | 595,125 | | | | 34,803 | |
McCormick & Company | | | 579,350 | | | | 23,099 | |
| | | | 57,902 | |
Health Care Equipment & Supplies (6.1%) |
Becton, Dickinson & Co. | | | 503,340 | | | | 34,323 | |
| Covidien PLC | | | 973,800 | | | | 34,414 | |
| | | | 68,737 | |
| Household Products (3.5%) |
| Procter & Gamble | | | 649,600 | | | | 38,762 | |
| Industrial Conglomerates (3.6%) |
| 3M Co. | | | 520,540 | | | | 40,888 | |
| Industrial Gases (2.7%) |
| Praxair, Inc. | | | 353,500 | | | | 30,412 | |
| Insurance (5.6%) |
| Markel Corp.* | | | 70,515 | | | | 23,109 | |
| Progressive Corp. | | | 1,989,415 | | | | 39,391 | |
| | | | 62,500 | |
| Internet Software & Services (4.0%) |
| Yahoo! Inc.* | | | 3,425,250 | | | | 44,802 | |
| IT Services (2.0%) |
MasterCard, Inc. Class A | | | 112,900 | | | | 22,395 | |
| Machinery (4.5%) |
| Danaher Corp. | | | 1,395,430 | | | | 50,696 | |
| | Number
of Shares | | Value† (000's) |
| Media (5.5%) |
Comcast Corp. Class A Special | | | 1,680,175 | | | $ | 27,000 | |
Scripps Networks Interactive Class A | | | 873,620 | | | | 35,102 | |
| | | | 62,102 | |
| Oil, Gas & Consumable Fuels (10.9%) |
| BG Group PLC | | | 2,955,369 | | | | 47,569 | |
| Cimarex Energy | | | 285,004 | | | | 18,645 | |
Newfield Exploration* | | | 852,730 | | | | 40,939 | |
| Noble Energy | | | 221,795 | | | | 15,477 | |
| | | | 122,630 | |
| Pharmaceuticals (5.7%) |
Novo Nordisk A/S Class B | | | 341,497 | | | | 29,298 | |
Roche Holding AG | | | 255,666 | | | | 34,752 | |
| | | | 64,050 | |
| Professional Services (1.4%) |
| ICF International* | | | 746,500 | | | | 15,744 | |
| Road & Rail (2.1%) |
Canadian National Railway | | | 383,825 | | | | 23,421 | |
| Semiconductors & Semiconductor Equipment (7.6%) |
| Altera Corp. | | | 2,085,815 | | | | 51,457 | |
| Texas Instruments | | | 1,460,480 | | | | 33,635 | |
| | | | 85,092 | |
| Software (4.8%) |
| Intuit Inc.* | | | 1,264,825 | | | | 54,134 | |
| Specialty Chemicals (1.1%) |
Novozymes A/S Class B | | | 102,800 | | | | 12,074 | |
Trading Companies & Distributors (2.2%) |
| W.W. Grainger | | | 234,200 | | | | 24,776 | |
| | | | | | | | | |
Total Common Stocks (Cost $977,121) | | | | | | | 1,038,724 | |
| | Number
of Shares | | Value† (000's) |
| Short-Term Investments (4.8%) |
State Street Institutional Government Money Market Fund Institutional Class (Cost $53,109) | | | 53,108,506 | | | $ | 53,109 | |
| | | | | | | | | |
| | | Principal Amount | | |
| Certificates of Deposit (0.0%) |
Carver Federal Savings, 0.34%, due 9/27/10 | | $ | 100,000 | | | | 100 | |
Self Help Credit Union, 1.00%, due 10/29/10 | | | 100,000 | | | | 100 | |
Self Help Credit Union, 1.00%, due 11/16/10 | | | 100,000 | | | | 100 | |
| | | | | | | | | |
Total Certificates of Deposit# (Cost $300) | | | | | | | 300 | |
| | | | | | | | | |
Total Investments## (97.4%) (Cost $1,030,530) | | | | | | | 1,092,133 | |
Cash, receivables and other assets, less liabilities (2.6%) | | | | | | | 29,391 | |
| | | | | | | | | |
| Total Net Assets (100.0%) | | | | | | $ | 1,121,524 | |
See Notes to Schedule of Investments
Notes to Schedule of Investments
| † | In accordance with Accounting Standards Codification ("ASC") 820 "Fair Value Measurements and Disclosures" ("ASC 820"), all investments held by each of Neuberger Berman Climate Change Fund ("Climate Change"), Neuberger Berman Emerging Markets Equity Fund ("Emerging Markets Equity"), Neuberger Berman Equity Income Fund ("Equity Income"), Neuberger Berman Focus Fund ("Focus"), Neuberger Berman Genesis Fund ("Genesis"), Neuberger Berman Guardian Fund ("Guardian"), Neuberger Berman International Fund ("International"), Neuberger Berman International Institutional Fund ("International Institutional"), Neuberger Berman International Large Cap Fund ("International Large Cap"), Neuberger Berman Intrinsic Value Fund ("Intrinsic Value"), Neuberger Berman Large Cap Disciplined Growth Fund ("Large Cap Disciplined Growth"), Neuberger Berman Mid Cap Growth Fund ("Mid Cap Growth"), Neube rger Berman Multi-Cap Opportunities Fund ("Multi-Cap Opportunities") (formerly, Neuberger Berman Research Opportunities Fund), Neuberger Berman Partners Fund ("Partners"), Neuberger Berman Real Estate Fund ("Real Estate"), Neuberger Berman Regency Fund ("Regency"), Neuberger Berman Select Equities Fund ("Select Equities"), Neuberger Berman Small Cap Growth Fund ("Small Cap Growth"), and Neuberger Berman Socially Responsive Fund ("Socially Responsive") (individually a "Fund," collectively, the "Funds") are carried at the value that Neuberger Berman Management LLC ("Management") believes a fund would receive upon selling an investment in an orderly transaction to an independent buyer in the principal or most advantageous market for the investment under current market conditions. Various inputs, including the volume and level of activity for the asset or liability in the market, are considered in valuing the Funds' investments, some of which are discussed below. Significant management judgment may be necessary to value investments in accordance with ASC 820. ASC 820 established a three-tier hierarchy of inputs to create a classification of value measurements for disclosure purposes. The three-tier hierarchy of inputs is summarized in the three broad Levels listed below. |
| | | | |
| | | ● | Level 1 – quoted prices in active markets for identical investments |
| | | ● | Level 2 – other significant observable inputs (including quoted prices for similar investments, interest rates, prepayment speeds, credit risk, amortized cost, etc.) |
| | | ● | Level 3 – significant unobservable inputs (including the Funds' own assumptions in determining the fair value of investments) |
| | | | |
| | The inputs or methodology used for valuing an investment are not necessarily an indication of the risk associated with investing in those securities. The Funds' investments in equity securities and written option contracts, for which market quotations are readily available, are generally valued by Management by obtaining valuations from an independent pricing service based on the latest sale price quoted in active markets (Level 1 inputs). Securities traded primarily on the NASDAQ Stock Market are normally valued by a Fund at NASDAQ Official Closing Price ("NOCP") provided by NASDAQ each business day. The NOCP is the most recently reported price as of 4:00:02 p.m., Eastern time, unless that price is outside the range of the "inside" bid and asked prices (i.e., the bid and asked prices that dealers quote to each other when trading for their own accounts); in that case, NASDAQ will adjust the price to equal the inside bid or ask ed price, whichever is closer. Because of delays in reporting trades, the NOCP may not be based on the price of the last trade to occur before the market closes. If there is no reported sale of a security on a particular day, the independent pricing service may value the security based on reported market quotations. The value of the Funds' investments in convertible bonds is determined by Management primarily by obtaining valuations from independent pricing services based on readily available bid quotations, or if quotations are not available, by methods which include various considerations such as yields or prices of securities of comparable quality, coupon, maturity and type; indications as to values from dealers; and general market conditions (generally Level 2 inputs). |
| See Notes to Schedule of Investments | 121 | |
Notes to Schedule of Investments (cont'd)
| | | | |
| | Other Level 2 inputs used to evaluate convertible bonds generally include underlying stock data, dealer quotes, conversion premiums, listed bond and preferred stock prices and other market information which may include benchmark curves, trade execution data, and sensitivity analysis, when available. Certificates of Deposit are valued at amortized cost. Investments in State Street Institutional Government Money Market Fund Institutional Class and State Street Institutional Liquid Reserves Fund Institutional Class are valued using the respective fund's daily calculated NAV. Management has developed a process to periodically review information provided by independent pricing services for all types of securities. For both debt and equity securities, if a valuation is not available from an independent pricing service, or if Management has reason to believe that the valuation received does not represent the amount a fund might reasonably expect to receive on a current sale in an orderly transaction, the affected Fund seeks to obtain quotations from principal market makers (generally considered Level 3 inputs). If such quotations are not readily available, the security is valued using methods the Board of Trustees of Neuberger Berman Equity Funds (the "Board") has approved on the belief that they reflect fair value. Numerous factors may be considered when determining the fair value of a security based on Level 2 or 3 inputs, including available analyst, media or other reports, trading in futures or ADRs and whether the issuer of the security being fair valued has other securities outstanding. The Funds' investments in foreign securities are generally valued using the same valuation methods and inputs as other Fund investments, as discussed above. Foreign security prices are expressed in local currency values and are currently translated from the local currency into U.S. dollars using the exchange rate as of 4:00 p.m., Eastern time. The Board has approved the use of Interactive Data Pricing and Reference Data, Inc. ("Interactive") to assist in determining the fair value of foreign equity securities when changes in the value of a certain index suggest that the closing prices on the foreign exchanges may no longer represent the amount that a Fund could expect to receive for those securities. In this event, Interactive will provide adjusted prices for certain foreign e quity securities using a statistical analysis of historical correlations of multiple factors (Level 2 inputs). In the absence of precise information about the market values of these foreign securities as of the close of the New York Stock Exchange, the Board has determined on the basis of available data that prices adjusted in this way are likely to be closer to the prices a fund could realize on a current sale than are the prices of those securities established at the close of the foreign markets in which the securities primarily trade. These fair value prices are necessarily estimates, and there is no assurance that such a price will be at or close to the price at which the security is next quoted or next trades. |
| See Notes to Schedule of Investments | 122 | |
Notes to Schedule of Investments (cont'd)
The following is a summary, by category of Level, of inputs used to value the Funds' investments as of August 31, 2010:
| Asset Valuation Inputs | |
| (000's omitted) | | Level 1 | | Level 2 | | Level 3§§ | | Total | |
| Climate Change | |
| Investments: | |
| Common Stocks | |
| Aerospace & Defense | | $ | 11 | | | $ | — | | | $ | — | | | $ | 11 | | |
| Agricultural Products | | | 11 | | | | — | | | | — | | | | 11 | | |
| Auto Parts & Equipment | | | 75 | | | | — | | | | — | | | | 75 | | |
| Coal & Consumable Fuels | | | 44 | | | | — | | | | — | | | | 44 | | |
| Commodity Chemicals | | | 11 | | | | — | | | | — | | | | 11 | | |
| Communications Equipment | | | 12 | | | | — | | | | — | | | | 12 | | |
| Construction & Engineering | | | 75 | | | | — | | | | — | | | | 75 | | |
| Diversified Support Services | | | 39 | | | | — | | | | — | | | | 39 | | |
| Electric Utilities | | | 310 | | | | — | | | | — | | | | 310 | | |
| Electrical Components & Equipment | | | 162 | | | | — | | | | — | | | | 162 | | |
| Electronic Components | | | 9 | | | | — | | | | — | | | | 9 | | |
| Electronic Equipment & Instruments | | | 66 | | | | — | | | | — | | | | 66 | | |
| Electronic Manufacturing Services | | | 10 | | | | — | | | | — | | | | 10 | | |
| Environmental & Facilities Services | | | 145 | | | | — | | | | — | | | | 145 | | |
| Forest Products | | | 4 | | | | — | | | | — | | | | 4 | | |
| Gas Utilities | | | 142 | | | | — | | | | — | | | | 142 | | |
| Heavy Electrical Equipment | | | 54 | | | | — | | | | — | | | | 54 | | |
| Independent Power Producers & Energy Traders | | | 112 | | | | 11 | | | | — | | | | 123 | | |
| Industrial Conglomerates | | | 56 | | | | — | | | | — | | | | 56 | | |
| Industrial Gases | | | 9 | | | | — | | | | — | | | | 9 | | |
| Industrial Machinery | | | 167 | | | | — | | | | — | | | | 167 | | |
| IT Consulting & Other Services | | | 13 | | | | — | | | | — | | | | 13 | | |
| Machinery | | | 21 | | | | — | | | | — | | | | 21 | | |
| Multi-Utilities | | | 261 | | | | — | | | | — | | | | 261 | | |
| Oil & Gas Equipment & Services | | | 21 | | | | — | | | | — | | | | 21 | | |
| Oil & Gas Exploration & Production | | | 71 | | | | — | | | | — | | | | 71 | | |
| Oil & Gas Storage & Transportation | | | 110 | | | | — | | | | — | | | | 110 | | |
| Oil, Gas & Consumable Fuels | | | 12 | | | | — | | | | — | | | | 12 | | |
| Railroads | | | 11 | | | | — | | | | — | | | | 11 | | |
| Semiconductor Equipment | | | 24 | | | | — | | | | — | | | | 24 | | |
| Semiconductors | | | 76 | | | | — | | | | — | | | | 76 | | |
| Specialized Finance | | | 10 | | | | — | | | | — | | | | 10 | | |
| Specialty Chemicals | | | 9 | | | | — | | | | — | | | | 9 | | |
| Steel | | | 8 | | | | — | | | | — | | | | 8 | | |
| See Notes to Schedule of Investments | 123 | |
Notes to Schedule of Investments (cont'd)
| (000's omitted) | | Level 1 | | Level 2 | | Level 3§§ | | Total | |
| Technology Distributors | | $ | 30 | | | $ | — | | | $ | — | | | $ | 30 | | |
| Water Utilities | | | 144 | | | | — | | | | — | | | | 144 | | |
| Total Common Stocks | | | 2,345 | | | | 11 | | | | — | | | | 2,356 | | |
| Short-Term Investments | | | — | | | | 73 | | | | — | | | | 73 | | |
| Total Investments | | | 2,345 | | | | 84 | | | | — | | | | 2,429 | | |
| Emerging Markets Equity | |
| Investments: | |
| Common Stocks§ | | | 12,982 | | | | — | | | | — | | | | 12,982 | | |
| Preferred Stocks | | | — | | | | — | | | | — | | | | — | | |
| Brazil | | | 1,097 | | | | — | | | | 0 | | | | 1,097 | | |
| Short-Term Investments | | | — | | | | 483 | | | | — | | | | 483 | | |
| Total Investments | | | 14,079 | | | | 483 | | | | 0 | | | | 14,562 | | |
| Equity Income | |
| Investments: | |
| Common Stocks§ | | | 219,053 | | | | — | | | | — | | | | 219,053 | | |
| Convertible Preferred Stocks | | | 6,336 | | | | — | | | | — | | | | 6,336 | | |
| Convertible Bonds | | | — | | | | 69,728 | | | | — | | | | 69,728 | | |
| Short-Term Investments | | | — | | | | 21,503 | | | | — | | | | 21,503 | | |
| Total Investments | | | 225,389 | | | | 91,231 | | | | — | | | | 316,620 | | |
| Focus | |
| Investments: | |
| Common Stocks§ | | | 495,393 | | | | — | | | | — | | | | 495,393 | | |
| Short-Term Investments | | | — | | | | 10,268 | | | | — | | | | 10,268 | | |
| Total Investments | | | 495,393 | | | | 10,268 | | | | — | | | | 505,661 | | |
| Genesis | |
| Investments: | |
| Common Stocks§ | | | 8,365,270 | | | | — | | | | — | | | | 8,365,270 | | |
| Short-Term Investments | | | — | | | | 436,918 | | | | — | | | | 436,918 | | |
| Total Investments | | | 8,365,270 | | | | 436,918 | | | | — | | | | 8,802,188 | | |
| Guardian | |
| Investments: | |
| Common Stocks§ | | | 919,349 | | | | — | | | | — | | | | 919,349 | | |
| Short-Term Investments | | | — | | | | 37,359 | | | | — | | | | 37,359 | | |
| Total Investments | | | 919,349 | | | | 37,359 | | | | — | | | | 956,708 | | |
| International | |
| Investments: | |
| Common Stocks§ | | | 320,845 | | | | — | | | | — | | | | 320,845 | | |
| Preferred Stocks | |
| Brazil | | | 4,763 | | | | — | | | | 11 | | | | 4,774 | | |
| See Notes to Schedule of Investments | 124 | |
Notes to Schedule of Investments (cont'd)
| (000's omitted) | | Level 1 | | Level 2 | | Level 3§§ | | Total | |
| Rights | |
| Belgium | | $ | 1 | | | $ | — | | | $ | — | | | $ | 1 | | |
| Warrants | |
| Italy | | | 2 | | | | — | | | | — | | | | 2 | | |
| Short-Term Investments | | | — | | | | 10,082 | | | | — | | | | 10,082 | | |
| Total Investments | | | 325,611 | | | | 10,082 | | | | 11 | | | | 335,704 | | |
| International Institutional | |
| Investments: | |
| Common Stocks§ | | | 161,587 | | | | — | | | | — | | | | 161,587 | | |
| Preferred Stocks§ | | | 2,409 | | | | — | | | | — | | | | 2,409 | | |
| Rights§ | | | 1 | | | | — | | | | — | | | | 1 | | |
| Warrants§ | | | 1 | | | | — | | | | — | | | | 1 | | |
| Short-Term Investments | | | — | | | | 3,768 | | | | — | | | | 3,768 | | |
| Total Investments | | | 163,998 | | | | 3,768 | | | | — | | | | 167,766 | | |
| International Large Cap | |
| Investments: | |
| Common Stocks§ | | | 162,516 | | | | — | | | | — | | | | 162,516 | | |
| Preferred Stocks§ | | | 977 | | | | — | | | | — | | | | 977 | | |
| Rights§ | | | 0 | | | | — | | | | — | | | | 0 | | |
| Warrants§ | | | 1 | | | | — | | | | — | | | | 1 | | |
| Short-Term Investments | | | — | | | | 4,328 | | | | — | | | | 4,328 | | |
| Total Investments | | | 163,494 | | | | 4,328 | | | | — | | | | 167,822 | | |
| Intrinsic Value | |
| Investments: | |
| Common Stocks§ | | | 80,599 | | | | — | | | | — | | | | 80,599 | | |
| Rights | | | — | | | | — | | | | 0 | | | | 0 | | |
| Short-Term Investments | | | — | | | | 1,134 | | | | — | | | | 1,134 | | |
| Total Investments | | | 80,599 | | | | 1,134 | | | | 0 | | | | 81,733 | | |
| Large Cap Disciplined Growth | |
| Investments: | |
| Common Stocks§ | | | 405,509 | | | | — | | | | — | | | | 405,509 | | |
| Short-Term Investments | | | — | | | | 15,610 | | | | — | | | | 15,610 | | |
| Total Investments | | | 405,509 | | | | 15,610 | | | | — | | | | 421,119 | | |
| Mid Cap Growth | |
| Investments: | |
| Common Stocks§ | | | 425,048 | | | | — | | | | — | | | | 425,048 | | |
| Short-Term Investments | | | — | | | | 26,089 | | | | — | | | | 26,089 | | |
| Total Investments | | | 425,048 | | | | 26,089 | | | | — | | | | 451,137 | | |
| See Notes to Schedule of Investments | 125 | |
Notes to Schedule of Investments (cont'd)
| (000's omitted) | | Level 1 | | Level 2 | | Level 3§§ | | Total | |
| Multi-Cap Opportunities | |
| Investments: | |
| Common Stocks§ | | $ | 45,850 | | | $ | — | | | $ | — | | | $ | 45,850 | | |
| Short-Term Investments | | | — | | | | 1,986 | | | | — | | | | 1,986 | | |
| Total Investments | | | 45,850 | | | | 1,986 | | | | — | | | | 47,836 | | |
| Partners | |
| Investments: | |
| Common Stocks§ | | | 2,174,433 | | | | — | | | | — | | | | 2,174,433 | | |
| Short-Term Investments | | | — | | | | 42,999 | | | | — | | | | 42,999 | | |
| Total Investments | | | 2,174,433 | | | | 42,999 | | | | — | | | | 2,217,432 | | |
| Real Estate | |
| Investments: | |
| Common Stocks§ | | | 145,791 | | | | — | | | | — | | | | 145,791 | | |
| Short-Term Investments | | | — | | | | 5,266 | | | | — | | | | 5,266 | | |
| Total Investments | | | 145,791 | | | | 5,266 | | | | — | | | | 151,057 | | |
| Regency | |
| Investments: | |
| Common Stocks§ | | | 131,014 | | | | — | | | | — | | | | 131,014 | | |
| Short-Term Investments | | | — | | | | 3,739 | | | | — | | | | 3,739 | | |
| Total Investments | | | 131,014 | | | | 3,739 | | | | — | | | | 134,753 | | |
| Select Equities | |
| Investments: | |
| Common Stocks§ | | | 59,836 | | | | — | | | | — | | | | 59,836 | | |
| Short-Term Investments | | | — | | | | 5,050 | | | | — | | | | 5,050 | | |
| Total Investments | | | 59,836 | | | | 5,050 | | | | — | | | | 64,886 | | |
| Small Cap Growth | |
| Investments: | |
| Common Stocks§ | | | 185,913 | | | | — | | | | — | | | | 185,913 | | |
| Short-Term Investments | | | — | | | | 5,041 | | | | — | | | | 5,041 | | |
| Total Investments | | | 185,913 | | | | 5,041 | | | | — | | | | 190,954 | | |
| Socially Responsive | |
| Investments: | |
| Common Stocks§ | | | 1,038,724 | | | | — | | | | — | | | | 1,038,724 | | |
| Short-Term Investments | | | — | | | | 53,109 | | | | — | | | | 53,109 | | |
| Certificates of Deposit | | | — | | | | 300 | | | | — | | | | 300 | | |
| Total Investments | | | 1,038,724 | | | | 53,409 | | | | — | | | | 1,092,133 | | |
| See Notes to Schedule of Investments | 126 | |
Notes to Schedule of Investments (cont'd)
| § | The Schedule of Investments provides information on the industry or country categorization for the portfolio. |
| | |
| | As of the year ending August 31, 2010, for Climate Change, certain equity securities transferred from Level 1 to Level 2 under the valuation policies as a pricing service price was not available on August 31, 2010. For Emerging Markets Equity, certain equity securities transferred from Level 2 to Level 1 due to the availability of an exchange traded price on August 31, 2010. |
| | |
| §§ | The following is a reconciliation between the beginning and ending balances of investments in which significant unobservable inputs (Level 3) were used in determining value: |
| (000's omitted) | | Beginning balance, as of 9/1/09 | | Accrued discounts/ (premiums) | | Realized gain/loss and change in unrealized appreciation/ (depreciation) | | Net purchases/ (sales) | | Net transfers in and/or out of Level 3 | | Balance, as of 8/31/10 | | Net change in unrealized appreciation/ (depreciation) from investments still held as of 8/31/10 | |
| Investments in Securities: | |
| Emerging Markets Equity | |
Preferred Stocks Brazil | | $ | 0 | | | $ | — | | | $ | — | | | $ | — | | | $ | — | | | $ | 0 | | | $ | 0 | | |
Convertible Bonds Brazil | | | 8 | | | | — | | | | (2 | ) | | | (6 | ) | | | — | | | | — | | | | — | | |
| Total | | | 8 | | | | — | | | | (2 | ) | | | (6 | ) | | | — | | | | 0 | | | | 0 | | |
| International | |
Preferred Stocks Brazil | | | 10 | | | | — | | | | 1 | | | | — | | | | — | | | | 11 | | | | 1 | | |
| Total | | | 10 | | | | — | | | | 1 | | | | — | | | | — | | | | 11 | | | | 1 | | |
| Intrinsic Value | |
| Rights | | | — | | | | — | | | | 0 | | | | — | | | | — | | | | 0 | | | | 0 | | |
| Total | | | — | | | | — | | | | 0 | | | | — | | | | — | | | | 0 | | | | 0 | | |
Liability Valuation Inputs
| | The following is a summary, by category of Level, of inputs used to value the Fund's derivatives as of August 31, 2010: |
| (000's omitted) | | Level 1 | | Level 2 | | Level 3 | | Total | |
| Equity Income | |
| Option Contracts | | $ | (64 | ) | | $ | — | | | $ | — | | | $ | (64 | ) | |
| # | At cost, which approximates market value. |
| See Notes to Schedule of Investments | 127 | |
Notes to Schedule of Investments (cont'd)
| ## | At August 31, 2010, selected fund information on a U.S. federal income tax basis was as follows: |
| | | Cost | | Gross Unrealized Appreciation | | Gross Unrealized Depreciation | | Net Unrealized Appreciation (Depreciation) | |
| Climate Change Fund | | $ | 2,522 | | | $ | 141 | | | $ | 234 | | | $ | (93 | ) | |
| Emerging Markets Fund | | | 12,846 | | | | 2,104 | | | | 388 | | | | 1,716 | | |
| Equity Income Fund | | | 312,594 | | | | 9,262 | | | | 5,236 | | | | 4,026 | | |
| Focus Fund | | | 526,365 | | | | 19,387 | | | | 40,091 | | | | (20,704 | ) | |
| Genesis Fund | | | 6,622,151 | | | | 2,559,996 | | | | 379,959 | | | | 2,180,037 | | |
| Guardian Fund | | | 888,316 | | | | 141,630 | | | | 73,238 | | | | 68,392 | | |
| International Fund | | | 311,261 | | | | 42,850 | | | | 18,407 | | | | 24,443 | | |
| International Institutional Fund | | | 158,610 | | | | 21,263 | | | | 12,107 | | | | 9,156 | | |
| International Large Cap Fund | | | 163,065 | | | | 11,470 | | | | 6,713 | | | | 4,757 | | |
| Intrinsic Value Fund | | | 76,964 | | | | 12,927 | | | | 8,158 | | | | 4,769 | | |
| Large Cap Disciplined Growth Fund | | | 426,462 | | | | 22,713 | | | | 28,056 | | | | (5,343 | ) | |
| Mid Cap Growth Fund | | | 368,665 | | | | 89,976 | | | | 7,504 | | | | 82,472 | | |
| Multi-Cap Opportunities Fund | | | 51,832 | | | | 613 | | | | 4,609 | | | | (3,996 | ) | |
| Partners Fund | | | 2,015,174 | | | | 409,801 | | | | 207,543 | | | | 202,258 | | |
| Real Estate Fund | | | 128,727 | | | | 23,921 | | | | 1,591 | | | | 22,330 | | |
| Regency Fund | | | 138,383 | | | | 9,655 | | | | 13,285 | | | | (3,630 | ) | |
| Select Equities Fund | | | 66,165 | | | | 2,649 | | | | 3,928 | | | | (1,279 | ) | |
| Small Cap Growth Fund | | | 182,747 | | | | 16,418 | | | | 8,211 | | | | 8,207 | | |
| Socially Responsive Fund | | | 1,031,318 | | | | 142,888 | | | | 82,073 | | | | 60,815 | | |
| * | Security did not produce income during the last twelve months. |
| | |
| ^ | Affiliated issuer (see Note F of Notes to Financial Statements). |
| | |
| ‡‡ | At August 31, 2010, Equity Income had outstanding call options written as follows: |
| Shares | | Securities and Options | | Market Value of Options | |
| | 5,000 | | | CNOOC Ltd. , Call Dec 2010 @ 200 | | $ | 9,000 | | |
| | 12,500 | | | Knightsbridge Tankers, Call Dec 2010 @ 20 | | | 6,000 | | |
| | 10,000 | | | PG&E Corp, Call Mar 2011 @ 50 | | | 12,000 | | |
| | 10,000 | | | Progress Energy, Call Jan 2011 @ 46 | | | 4,000 | | |
| | 10,000 | | | Royal Gold, Call Jan 2011 @ 55 | | | 20,000 | | |
| | 10,000 | | | United Parcel Service, Call Jan 2011 @ 72.5 | | | 11,000 | | |
| | 3,100 | | | United Parcel Service, Call Jan 2011 @ 75 | | | 2,000 | | |
| | | | | Total | | $ | 64,000 | | |
| ñ | Restricted security subject to restrictions on resale under federal securities laws. These securities may be resold in transactions exempt from registration, normally to qualified institutional buyers under Rule 144A under the Securities Act of 1933, as amended, and have been deemed by the investment manager to be liquid. At August 31, |
| See Notes to Schedule of Investments | 128 | |
Notes to Schedule of Investments (cont'd)
| | 2010, these securities amounted to approximately $11,000 or 0.5% of net assets for Climate Change, approximately $16,000 or 0.1% of net assets for Emerging Markets Equity, approximately $13,536,000 or 4.2% of net assets for Equity Income, approximately $1,510,000 or 0.5% of net assets for International, and approximately $739,000 or 0.4% of net assets for International Institutional. |
| | |
| Ñ | These securities have been deemed by the investment manager to be illiquid. At August 31, 2010, these securities amounted to approximately $99 or 0.0% of net assets for Emerging Markets Equity, approximately $8,422,000 or 2.5% of net assets for International, and approximately $1,906,000 or 1.1% of net assets for International Institutional. |
| | |
| ^^ | Value of the security was determined using methods the Board has approved on the belief they reflect fair value. |
| | |
| ØØ | All or a portion of this security is segregated in connection with written options. |
| | |
| a | Step Bond: Coupon rate is a fixed rate for an initial period then resets at a specified date and rate. |
| See Notes to Schedule of Investments | 129 | |
This page has been left blank intentionally
Statements of Assets and Liabilities
Neuberger Berman Equity Funds
(000's omitted except per share amounts)
| | | CLIMATE CHANGE FUND | | EMERGING MARKETS EQUITY FUND | | EQUITY INCOME FUND | | FOCUS FUND | | GENESIS FUND | |
| | | August 31, 2010 | | August 31, 2010 | | August 31, 2010 | | August 31, 2010 | | August 31, 2010 | |
| Assets | |
| Investments in securities, at value* (Notes A & F)—see Schedule of Investments: | |
| Unaffiliated issuers | | $ | 2,429 | | | $ | 14,562 | | | $ | 316,620 | | | $ | 505,661 | | | $ | 5,149,206 | | |
| Affiliated issuers | | | — | | | | — | | | | — | | | | — | | | | 3,652,982 | | |
| | | | 2,429 | | | | 14,562 | | | | 316,620 | | | | 505,661 | | | | 8,802,188 | | |
| Cash | | | — | | | | 4 | | | | — | | | | — | | | | 1,627 | | |
| Foreign currency | | | — | | | | 67 | | | | 12 | | | | — | | | | — | | |
| Dividends and interest receivable | | | 6 | | | | 21 | | | | 2,504 | | | | 868 | | | | 7,239 | | |
| Receivable for securities sold | | | 23 | | | | 165 | | | | — | | | | — | | | | 16,802 | | |
| Receivable for Fund shares sold | | | — | | | | 23 | | | | 6,373 | | | | 25 | | | | 68,767 | | |
| Receivable from Management—net (Note B) | | | 14 | | | | 40 | | | | — | | | | — | | | | — | | |
| Prepaid expenses and other assets | | | — | | | | 1 | | | | 11 | | | | 47 | | | | 590 | | |
| Total Assets | | | 2,472 | | | | 14,883 | | | | 325,520 | | | | 506,601 | | | | 8,897,213 | | |
| Liabilities | |
| Options contracts written, at value (Note A) | | | — | | | | — | | | | 64 | | | | — | | | | — | | |
| Payable for securities purchased | | | 14 | | | | 173 | | | | 3,226 | | | | — | | | | 10,304 | | |
| Payable for Fund shares redeemed | | | 2 | | | | — | | | | 445 | | | | 470 | | | | 35,095 | | |
| Payable to investment manager—net (Notes A & B) | | | 2 | | | | 12 | | | | 139 | | | | 242 | | | | 5,147 | | |
| Payable to administrator—net (Note B) | | | — | | | | — | | | | 50 | | | | 121 | | | | 2,140 | | |
| Payable for organization costs | | | — | | | | — | | | | — | | | | — | | | | — | | |
| Accrued expenses and other payables | | | 59 | | | | 78 | | | | 105 | | | | 221 | | | | 1,295 | | |
| Total Liabilities | | | 77 | | | | 263 | | | | 4,029 | | | | 1,054 | | | | 53,981 | | |
| Net Assets at value | | $ | 2,395 | | | $ | 14,620 | | | $ | 321,491 | | | $ | 505,547 | | | $ | 8,843,232 | | |
| Net Assets consist of: | |
| Paid-in capital | | $ | 4,060 | | | $ | 12,412 | | | $ | 308,999 | | | $ | 613,837 | | | $ | 7,159,535 | | |
| Undistributed net investment income (loss) | | | — | | | | — | | | | 5,312 | | | | 3,144 | | | | (16 | ) | |
| Distributions in excess of net investment income | | | (59 | ) | | | (22 | ) | | | — | | | | — | | | | — | | |
| Accumulated net realized gains (losses) on investments | | | (1,578 | ) | | | 500 | | | | (2,078 | ) | | | (91,846 | ) | | | (506,983 | ) | |
| Net unrealized appreciation (depreciation) in value of investments | | | (28 | ) | | | 1,730 | | | | 9,258 | | | | (19,588 | ) | | | 2,190,696 | | |
| Net Assets at value | | $ | 2,395 | | | $ | 14,620 | | | $ | 321,491 | | | $ | 505,547 | | | $ | 8,843,232 | | |
| Net Assets | |
| Investor Class | | $ | — | | | $ | — | | | $ | — | | | $ | 478,831 | | | $ | 1,773,627 | | |
| Trust Class | | | — | | | | — | | | | — | | | | 18,891 | | | | 3,057,582 | | |
| Advisor Class | | | — | | | | — | | | | — | | | | 7,744 | | | | 440,214 | | |
| Institutional Class | | | 388 | | | | 8,954 | | | | 100,880 | | | | 27 | | | | 3,571,809 | | |
| Class A | | | 1,535 | | | | 5,478 | | | | 176,620 | | | | 27 | | | | — | | |
| Class C | | | 472 | | | | 157 | | | | 43,961 | | | | 27 | | | | — | | |
| Class R3 | | | — | | | | 31 | | | | 30 | | | | — | | | | — | | |
| See Notes to Schedule of Investments | 131 | |
| | | GUARDIAN FUND | | INTERNATIONAL FUND | | INTERNATIONAL INSTITUTIONAL FUND | | INTERNATIONAL LARGE CAP FUND | | INTRINSIC VALUE FUND | |
| | | August 31, 2010 | | August 31, 2010 | | August 31, 2010 | | August 31, 2010 | | August 31, 2010 | |
| Assets | |
| Investments in securities, at value* (Notes A & F)—see Schedule of Investments: | |
| Unaffiliated issuers | | $ | 956,708 | | | $ | 335,704 | | | $ | 167,766 | | | $ | 167,822 | | | $ | 81,733 | | |
| Affiliated issuers | | | — | | | | — | | | | — | | | | — | | | | — | | |
| | | | 956,708 | | | | 335,704 | | | | 167,766 | | | | 167,822 | | | | 81,733 | | |
| Cash | | | — | | | | — | | | | — | | | | — | | | | — | | |
| Foreign currency | | | — | | | | 205 | | | | 184 | | | | 88 | | | | — | | |
| Dividends and interest receivable | | | 1,324 | | | | 600 | | | | 369 | | | | 291 | | | | 60 | | |
| Receivable for securities sold | | | — | | | | 209 | | | | 105 | | | | 105 | | | | 597 | | |
| Receivable for Fund shares sold | | | 204 | | | | 63 | | | | 16 | | | | 212 | | | | — | | |
| Receivable from Management—net (Note B) | | | — | | | | — | | | | 48 | | | | — | | | | 6 | | |
| Prepaid expenses and other assets | | | 121 | | | | 22 | | | | 11 | | | | 7 | | | | 2 | | |
| Total Assets | | | 958,357 | | | | 336,803 | | | | 168,499 | | | | 168,525 | | | | 82,398 | | |
| Liabilities | |
| Options contracts written, at value (Note A) | | | — | | | | — | | | | — | | | | — | | | | — | | |
| Payable for securities purchased | | | — | | | | 492 | | | | 183 | | | | 211 | | | | 625 | | |
| Payable for Fund shares redeemed | | | 424 | | | | 402 | | | | 6 | | | | 90 | | | | — | | |
| Payable to investment manager—net (Notes A & B) | | | 434 | | | | 249 | | | | 124 | | | | 78 | | | | 61 | | |
| Payable to administrator—net (Note B) | | | 237 | | | | 80 | | | | — | | | | 37 | | | | — | | |
| Payable for organization costs | | | — | | | | — | | | | — | | | | — | | | | 17 | | |
| Accrued expenses and other payables | | | 303 | | | | 281 | | | | 114 | | | | 103 | | | | 74 | | |
| Total Liabilities | | | 1,398 | | | | 1,504 | | | | 427 | | | | 519 | | | | 777 | | |
| Net Assets at value | | $ | 956,959 | | | $ | 335,299 | | | $ | 168,072 | | | $ | 168,006 | | | $ | 81,621 | | |
| Net Assets consist of: | |
| Paid-in capital | | $ | 1,008,372 | | | $ | 534,957 | | | $ | 330,748 | | | $ | 231,804 | | | $ | 75,228 | | |
| Undistributed net investment income (loss) | | | 3,829 | | | | — | | | | — | | | | 175 | | | | 93 | | |
| Distributions in excess of net investment income | | | — | | | | (1,123 | ) | | | (399 | ) | | | — | | | | — | | |
| Accumulated net realized gains (losses) on investments | | | (125,128 | ) | | | (234,568 | ) | | | (173,081 | ) | | | (70,751 | ) | | | 1,351 | | |
| Net unrealized appreciation (depreciation) in value of investments | | | 69,886 | | | | 36,033 | | | | 10,804 | | | | 6,778 | | | | 4,949 | | |
| Net Assets at value | | $ | 956,959 | | | $ | 335,299 | | | $ | 168,072 | | | $ | 168,006 | | | $ | 81,621 | | |
| Net Assets | |
| Investor Class | | $ | 869,224 | | | $ | 172,538 | | | $ | — | | | $ | — | | | $ | — | | |
| Trust Class | | | 78,995 | | | | 162,761 | | | | — | | | | 27,694 | | | | — | | |
| Advisor Class | | | 511 | | | | — | | | | — | | | | — | | | | — | | |
| Institutional Class | | | 4,263 | | | | — | | | | 168,072 | | | | 129,461 | | | | 80,944 | | |
| Class A | | | 3,535 | | | | — | | | | — | | | | 9,284 | | | | 630 | | |
| Class C | | | 373 | | | | — | | | | — | | | | 1,506 | | | | 47 | | |
| Class R3 | | | 58 | | | | — | | | | — | | | | 61 | | | | — | | |
Statements of Assets and Liabilities (cont'd)
Neuberger Berman Equity Funds (cont'd)
(000's omitted except per share amounts)
| | | CLIMATE CHANGE FUND | | EMERGING MARKETS EQUITY FUND | | EQUITY INCOME FUND | | FOCUS FUND | | GENESIS FUND | |
| | | August 31, 2010 | | August 31, 2010 | | August 31, 2010 | | August 31, 2010 | | August 31, 2010 | |
| Shares Outstanding ($.001 par value; unlimited shares authorized) | |
| Investor Class | | | — | | | | — | | | | — | | | | 29,797 | | | | 67,073 | | |
| Trust Class | | | — | | | | — | | | | — | | | | 1,611 | | | | 80,626 | | |
| Advisor Class | | | — | | | | — | | | | — | | | | 959 | | | | 20,009 | | |
| Institutional Class | | | 62 | | | | 573 | | | | 10,066 | | | | 2 | | | | 97,707 | | |
| Class A | | | 246 | | | | 352 | | | | 17,673 | | | | 2 | | | | — | | |
| Class C | | | 77 | | | | 10 | | | | 4,414 | | | | 3 | | | | — | | |
| Class R3 | | | — | | | | 2 | | | | 3 | | | | — | | | | — | | |
| Net Asset Value, offering and redemption price per share | |
| Investor Class | | $ | — | | | $ | — | | | $ | — | | | $ | 16.07 | | | $ | 26.44 | | |
| Trust Class | | | — | | | | — | | | | — | | | | 11.73 | | | | 37.92 | | |
| Advisor Class | | | — | | | | — | | | | — | | | | 8.08 | | | | 22.00 | | |
| Institutional Class | | | 6.26 | | | | 15.61 | | | | 10.02 | | | | 16.08 | | | | 36.56 | | |
| Class R3 | | | — | | | | 15.42 | | | | 9.99 | | | | — | | | | — | | |
| Net Asset Value and redemption price per share | |
| Class A | | $ | 6.25 | | | $ | 15.57 | | | $ | 9.99 | | | $ | 11.73 | | | $ | — | | |
| Offering Price per share | |
| Class A‡ | | $ | 6.63 | | | $ | 16.52 | | | $ | 10.60 | | | $ | 12.45 | | | $ | — | | |
| Net Asset Value and offering price per share | |
| Class C^ | | $ | 6.15 | | | $ | 15.41 | | | $ | 9.96 | | | $ | 8.07 | | | $ | — | | |
| *Cost of Investments: | |
| Unaffiliated issuers | | $ | 2,457 | | | $ | 12,809 | | | $ | 307,373 | | | $ | 525,249 | | | $ | 3,913,356 | | |
| Affiliated issuers | | | — | | | | — | | | | — | | | | — | | | | 2,698,136 | | |
| Total cost of investments | | $ | 2,457 | | | $ | 12,809 | | | $ | 307,373 | | | $ | 525,249 | | | $ | 6,611,492 | | |
| Total cost of foreign currency | | $ | — | | | $ | 67 | | | $ | 12 | | | $ | — | | | $ | — | | |
‡ On single retail sales of less than $50,000. On sales of $50,000 or more or in certain other circumstances described in the Fund's prospectus, offering price is reduced.
^ Redemption price per share is equal to net asset value less any applicable contingent deferred sales charge.
| See Notes to Schedule of Investments | 133 | |
| | | GUARDIAN FUND | | INTERNATIONAL FUND | | INTERNATIONAL INSTITUTIONAL FUND | | INTERNATIONAL LARGE CAP FUND | | INTRINSIC VALUE FUND | |
| | | August 31, 2010 | | August 31, 2010 | | August 31, 2010 | | August 31, 2010 | | August 31, 2010 | |
| Shares Outstanding ($.001 par value; unlimited shares authorized) | |
| Investor Class | | | 72,553 | | | | 11,887 | | | | — | | | | — | | | | — | | |
| Trust Class | | | 8,423 | | | | 10,124 | | | | — | | | | 3,333 | | | | — | | |
| Advisor Class | | | 48 | | | | — | | | | — | | | | — | | | | — | | |
| Institutional Class | | | 355 | | | | — | | | | 20,752 | | | | 15,567 | | | | 8,598 | | |
| Class A | | | 378 | | | | — | | | | — | | | | 1,123 | | | | 67 | | |
| Class C | | | 35 | | | | — | | | | — | | | | 184 | | | | 5 | | |
| Class R3 | | | 5 | | | | — | | | | — | | | | 7 | | | | — | | |
| Net Asset Value, offering and redemption price per share | |
| Investor Class | | $ | 11.98 | | | $ | 14.51 | | | $ | — | | | $ | — | | | $ | — | | |
| Trust Class | | | 9.38 | | | | 16.08 | | | | — | | | | 8.31 | | | | — | | |
| Advisor Class | | | 10.59 | | | | — | | | | — | | | | — | | | | — | | |
| Institutional Class | | | 12.01 | | | | — | | | | 8.10 | | | | 8.32 | | | | 9.41 | | |
| Class R3 | | | 10.57 | | | | — | | | | — | | | | 8.26 | | | | — | | |
| Net Asset Value and redemption price per share | |
| Class A | | $ | 9.36 | | | $ | — | | | $ | — | | | $ | 8.27 | | | $ | 9.40 | | |
| Offering Price per share | |
| Class A‡ | | $ | 9.93 | | | $ | — | | | $ | — | | | $ | 8.77 | | | $ | 9.97 | | |
| Net Asset Value and offering price per share | |
| Class C^ | | $ | 10.51 | | | $ | — | | | $ | — | | | $ | 8.20 | | | $ | 9.38 | | |
| *Cost of Investments: | |
| Unaffiliated issuers | | $ | 886,824 | | | $ | 299,684 | | | $ | 156,976 | | | $ | 161,054 | | | $ | 76,784 | | |
| Affiliated issuers | | | — | | | | — | | | | — | | | | — | | | | — | | |
| Total cost of investments | | $ | 886,824 | | | $ | 299,684 | | | $ | 156,976 | | | $ | 161,054 | | | $ | 76,784 | | |
| Total cost of foreign currency | | $ | — | | | $ | 205 | | | $ | 180 | | | $ | 88 | | | $ | — | | |
Statements of Assets and Liabilities (cont'd)
Neuberger Berman Equity Funds
(000's omitted except per share amounts)
| | | LARGE CAP DISCIPLINED GROWTH FUND | | MID CAP GROWTH FUND | | MULTI-CAP OPPORTUNITIES FUND | | PARTNERS FUND | | REAL ESTATE FUND | |
| | | August 31, 2010 | | August 31, 2010 | | August 31, 2010 | | August 31, 2010 | | August 31, 2010 | |
| Assets | |
| Investments in securities, at value* (Notes A & F)—see Schedule of Investments: | |
| Unaffiliated issuers | | $ | 421,119 | | | $ | 451,137 | | | $ | 47,836 | | | $ | 2,217,432 | | | $ | 151,057 | | |
| Affiliated issuers | | | — | | | | — | | | | — | | | | — | | | | — | | |
| | | | 421,119 | | | | 451,137 | | | | 47,836 | | | | 2,217,432 | | | | 151,057 | | |
| Cash | | | — | | | | — | | | | — | | | | — | | | | — | | |
| Foreign currency | | | — | | | | — | | | | — | | | | — | | | | — | | |
| Dividends and interest receivable | | | 678 | | | | 315 | | | | 68 | | | | 3,001 | | | | 114 | | |
| Receivable for securities sold | | | — | | | | — | | | | — | | | | 11,964 | | | | — | | |
| Receivable for Fund shares sold | | | 3,529 | | | | 441 | | | | 107 | | | | 454 | | | | 735 | | |
| Receivable from Management—net (Note B) | | | — | | | | — | | | | 16 | | | | — | | | | 86 | | |
| Prepaid expenses and other assets | | | 22 | | | | 32 | | | | 3 | | | | 196 | | | | 7 | | |
| Total Assets | | | 425,348 | | | | 451,925 | | | | 48,030 | | | | 2,233,047 | | | | 151,999 | | |
| Liabilities | |
| Options contracts written, at value (Note A) | | | — | | | | — | | | | — | | | | — | | | | — | | |
| Payable for securities purchased | | | 2,724 | | | | 786 | | | | 402 | | | | 1,123 | | | | 1,627 | | |
| Payable for Fund shares redeemed | | | 220 | | | | 433 | | | | — | | | | 2,787 | | | | 134 | | |
| Payable to investment manager—net (Notes A & B) | | | 195 | | | | 212 | | | | 25 | | | | 937 | | | | 101 | | |
| Payable to administrator—net (Note B) | | | 64 | | | | 91 | | | | — | | | | 741 | | | | — | | |
| Payable for organization costs | | | — | | | | — | | | | — | | | | — | | | | — | | |
| Accrued expenses and other payables | | | 106 | | | | 177 | | | | 48 | | | | 452 | | | | 99 | | |
| Total Liabilities | | | 3,309 | | | | 1,699 | | | | 475 | | | | 6,040 | | | | 1,961 | | |
| Net Assets at value | | $ | 422,039 | | | $ | 450,226 | | | $ | 47,555 | | | $ | 2,227,007 | | | $ | 150,038 | | |
| Net Assets consist of: | |
| Paid-in capital | | $ | 435,276 | | | $ | 492,575 | | | $ | 52,113 | | | $ | 2,593,304 | | | $ | 144,004 | | |
| Undistributed net investment income (loss) | | | 991 | | | | — | | | | 257 | | | | 2,192 | | | | — | | |
| Distributions in excess of net investment income | | | — | | | | — | | | | — | | | | — | | | | — | | |
| Accumulated net realized gains (losses) on investments | | | (10,735 | ) | | | (125,675 | ) | | | (878 | ) | | | (578,891 | ) | | | (22,571 | ) | |
| Net unrealized appreciation (depreciation) in value of investments | | | (3,493 | ) | | | 83,326 | | | | (3,937 | ) | | | 210,402 | | | | 28,605 | | |
| Net Assets at value | | $ | 422,039 | | | $ | 450,226 | | | $ | 47,555 | | | $ | 2,227,007 | | | $ | 150,038 | | |
| Net Assets | |
| Investor Class | | $ | 11,352 | | | $ | 288,029 | | | $ | — | | | $ | 1,189,116 | | | $ | — | | |
| Trust Class | | | — | | | | 21,772 | | | | — | | | | 547,557 | | | | 126,728 | | |
| Advisor Class | | | — | | | | 5,413 | | | | — | | | | 341,512 | | | | — | | |
| Institutional Class | | | 346,626 | | | | 121,087 | | | | 47,189 | | | | 148,734 | | | | 22,607 | | |
| Class A | | | 33,034 | | | | 13,637 | | | | 300 | | | | 32 | | | | 538 | | |
| Class C | | | 30,971 | | | | 226 | | | | 66 | | | | 28 | | | | 135 | | |
| Class R3 | | | 56 | | | | 62 | | | | — | | | | 28 | | | | 30 | | |
| See Notes to Schedule of Investments | 135 | |
| | | REGENCY FUND | | SELECT EQUITIES FUND | | SMALL CAP GROWTH FUND | | SOCIALLY RESPONSIVE FUND | |
| | | August 31, 2010 | | August 31, 2010 | | August 31, 2010 | | August 31, 2010 | |
| Assets | |
| Investments in securities, at value* (Notes A & F)—see Schedule of Investments: | |
| Unaffiliated issuers | | $ | 134,753 | | | $ | 64,886 | | | $ | 190,954 | | | $ | 1,092,133 | | |
| Affiliated issuers | | | — | | | | — | | | | — | | | | — | | |
| | | | 134,753 | | | | 64,886 | | | | 190,954 | | | | 1,092,133 | | |
| Cash | | | — | | | | — | | | | — | | | | 674 | | |
| Foreign currency | | | — | | | | — | | | | — | | | | — | | |
| Dividends and interest receivable | | | 196 | | | | 135 | | | | 8 | | | | 1,527 | | |
| Receivable for securities sold | | | 2,502 | | | | 2,904 | | | | 2,518 | | | | 33,095 | | |
| Receivable for Fund shares sold | | | 19 | | | | 118 | | | | 155 | | | | 17,811 | | |
| Receivable from Management—net (Note B) | | | 3 | | | | — | | | | — | | | | — | | |
| Prepaid expenses and other assets | | | 9 | | | | 4 | | | | 14 | | | | 70 | | |
| Total Assets | | | 137,482 | | | | 68,047 | | | | 193,649 | | | | 1,145,310 | | |
| Liabilities | |
| Options contracts written, at value (Note A) | | | — | | | | — | | | | — | | | | — | | |
| Payable for securities purchased | | | — | | | | 742 | | | | 2,187 | | | | 4,004 | | |
| Payable for Fund shares redeemed | | | 161 | | | | 54 | | | | 707 | | | | 18,693 | | |
| Payable to investment manager—net (Notes A & B) | | | 62 | | | | 32 | | | | 144 | | | | 498 | | |
| Payable to administrator—net (Note B) | | | — | | | | 6 | | | | 40 | | | | 322 | | |
| Payable for organization costs | | | — | | | | — | | | | — | | | | — | | |
| Accrued expenses and other payables | | | 81 | | | | 82 | | | | 166 | | | | 269 | | |
| Total Liabilities | | | 304 | | | | 916 | | | | 3,244 | | | | 23,786 | | |
| Net Assets at value | | $ | 137,178 | | | $ | 67,131 | | | $ | 190,405 | | | $ | 1,121,524 | | |
| Net Assets consist of: | |
| Paid-in capital | | $ | 165,886 | | | $ | 66,824 | | | $ | 295,086 | | | $ | 1,232,510 | | |
| Undistributed net investment income (loss) | | | 47 | | | | 114 | | | | — | | | | 2,492 | | |
| Distributions in excess of net investment income | | | — | | | | — | | | | — | | | | — | | |
| Accumulated net realized gains (losses) on investments | | | (28,026 | ) | | | 1,164 | | | | (115,952 | ) | | | (175,084 | ) | |
| Net unrealized appreciation (depreciation) in value of investments | | | (729 | ) | | | (971 | ) | | | 11,271 | | | | 61,606 | | |
| Net Assets at value | | $ | 137,178 | | | $ | 67,131 | | | $ | 190,405 | | | $ | 1,121,524 | | |
| Net Assets | |
| Investor Class | | $ | 55,890 | | | $ | — | | | $ | 75,365 | | | $ | 582,521 | | |
| Trust Class | | | 80,496 | | | | — | | | | 22,034 | | | | 356,110 | | |
| Advisor Class | | | — | | | | — | | | | 9,716 | | | | — | | |
| Institutional Class | | | 703 | | | | 17,551 | | | | 82,630 | | | | 166,893 | | |
| Class A | | | 28 | | | | 37,956 | | | | 471 | | | | 12,446 | | |
| Class C | | | 33 | | | | 11,624 | | | | 130 | | | | 3,326 | | |
| Class R3 | | | 28 | | | | — | | | | 59 | | | | 228 | | |
Statements of Assets and Liabilities (cont'd)
Neuberger Berman Equity Funds (cont'd)
(000's omitted except per share amounts)
| | | LARGE CAP DISCIPLINED GROWTH FUND | | MID CAP GROWTH FUND | | MULTI-CAP OPPORTUNITIES FUND | | PARTNERS FUND | | REAL ESTATE FUND | |
| | | August 31, 2010 | | August 31, 2010 | | August 31, 2010 | | August 31, 2010 | | August 31, 2010 | |
| Shares Outstanding ($.001 par value; unlimited shares authorized) | |
| Investor Class | | | 1,836 | | | | 34,156 | | | | — | | | | 53,985 | | | | — | | |
| Trust Class | | | — | | | | 1,697 | | | | — | | | | 32,396 | | | | 12,387 | | |
| Advisor Class | | | — | | | | 412 | | | | — | | | | 23,409 | | | | — | | |
| Institutional Class | | | 55,909 | | | | 14,179 | | | | 5,874 | | | | 6,714 | | | | 2,205 | | |
| Class A | | | 5,347 | | | | 1,062 | | | | 37 | | | | 2 | | | | 53 | | |
| Class C | | | 5,058 | | | | 17 | | | | 8 | | | | 2 | | | | 13 | | |
| Class R3 | | | 9 | | | | 5 | | | | — | | | | 2 | | | | 3 | | |
| Net Asset Value, offering and redemption price per share | |
| Investor Class | | $ | 6.18 | | | $ | 8.43 | | | $ | — | | | $ | 22.03 | | | $ | — | | |
| Trust Class | | | — | | | | 12.83 | | | | — | | | | 16.90 | | | | 10.23 | | |
| Advisor Class | | | — | | | | 13.14 | | | | — | | | | 14.59 | | | | — | | |
| Institutional Class | | | 6.20 | | | | 8.54 | | | | 8.03 | | | | 22.15 | | | | 10.25 | | |
| Class R3 | | | 6.16 | | | | 13.17 | | | | — | | | | 14.58 | | | | 10.23 | | |
| Net Asset Value and redemption price per share | |
| Class A | | $ | 6.18 | | | $ | 12.84 | | | $ | 8.02 | | | $ | 16.90 | | | $ | 10.23 | | |
| Offering Price per share | |
| Class A‡ | | $ | 6.56 | | | $ | 13.62 | | | $ | 8.51 | | | $ | 17.93 | | | $ | 10.85 | | |
| Net Asset Value and offering price per share | |
| Class C^ | | $ | 6.12 | | | $ | 13.09 | | | $ | 7.97 | | | $ | 14.57 | | | $ | 10.24 | | |
| *Cost of Investments: | |
| Unaffiliated issuers | | $ | 424,612 | | | $ | 367,811 | | | $ | 51,773 | | | $ | 2,007,026 | | | $ | 122,452 | | |
| Affiliated issuers | | | — | | | | — | | | | — | | | | — | | | | — | | |
| Total cost of investments | | $ | 424,612 | | | $ | 367,811 | | | $ | 51,773 | | | $ | 2,007,026 | | | $ | 122,452 | | |
| Total cost of foreign currency | | $ | — | | | $ | — | | | $ | — | | | $ | — | | | $ | — | | |
‡ On single retail sales of less than $50,000. On sales of $50,000 or more or in certain other circumstances described in the Fund's prospectus, offering price is reduced.
^ Redemption price per share is equal to net asset value less any applicable contingent deferred sales charge.
| See Notes to Schedule of Investments | 137 | |
| | | REGENCY FUND | | SELECT EQUITIES FUND | | SMALL CAP GROWTH FUND | | SOCIALLY RESPONSIVE FUND | |
| | | August 31, 2010 | | August 31, 2010 | | August 31, 2010 | | August 31, 2010 | |
| Shares Outstanding ($.001 par value; unlimited shares authorized) | |
| Investor Class | | | 4,559 | | | | — | | | | 5,511 | | | | 28,308 | | |
| Trust Class | | | 7,539 | | | | — | | | | 1,476 | | | | 25,230 | | |
| Advisor Class | | | — | | | | — | | | | 979 | | | | — | | |
| Institutional Class | | | 57 | | | | 2,219 | | | | 6,008 | | | | 8,100 | | |
| Class A | | | 3 | | | | 4,817 | | | | 32 | | | | 884 | | |
| Class C | | | 3 | | | | 1,502 | | | | 13 | | | | 238 | | |
| Class R3 | | | 3 | | | | — | | | | 6 | | | | 16 | | |
| Net Asset Value, offering and redemption price per share | |
| Investor Class | | $ | 12.26 | | | $ | — | | | $ | 13.68 | | | $ | 20.58 | | |
| Trust Class | | | 10.68 | | | | — | | | | 14.93 | | | | 14.11 | | |
| Advisor Class | | | — | | | | — | | | | 9.92 | | | | — | | |
| Institutional Class | | | 12.28 | | | | 7.91 | | | | 13.75 | | | | 20.60 | | |
| Class R3 | | | 10.67 | | | | — | | | | 9.93 | | | | 14.05 | | |
| Net Asset Value and redemption price per share | |
| Class A | | $ | 10.68 | | | $ | 7.88 | | | $ | 14.95 | | | $ | 14.08 | | |
| Offering Price per share | |
| Class A‡ | | $ | 11.33 | | | $ | 8.36 | | | $ | 15.86 | | | $ | 14.94 | | |
| Net Asset Value and offering price per share | |
| Class C^ | | $ | 10.66 | | | $ | 7.74 | | | $ | 9.87 | | | $ | 13.94 | | |
| *Cost of Investments: | |
| Unaffiliated issuers | | $ | 135,482 | | | $ | 65,857 | | | $ | 179,683 | | | $ | 1,030,530 | | |
| Affiliated issuers | | | — | | | | — | | | | — | | | | — | | |
| Total cost of investments | | $ | 135,482 | | | $ | 65,857 | | | $ | 179,683 | | | $ | 1,030,530 | | |
| Total cost of foreign currency | | $ | — | | | $ | — | | | $ | — | | | $ | — | | |
Statements of Operations
Neuberger Berman Equity Funds
(000's omitted)
| | | CLIMATE CHANGE FUND | | EMERGING MARKETS EQUITY FUND | | EQUITY INCOME FUND | | FOCUS FUND | | GENESIS FUND | |
| | | For the Year Ended August 31, 2010 | | For the Year Ended August 31, 2010 | | For the Year Ended August 31, 2010 | | For the Year Ended August 31, 2010 | | For the Year Ended August 31, 2010 | |
| Investment Income: | |
| Income (Note A): | |
| Dividend income—unaffiliated issuers | | $ | 46 | | | $ | 230 | | | $ | 6,725 | | | $ | 9,093 | | | $ | 47,761 | | |
| Dividend income—affiliated issuers (Note F) | | | — | | | | — | | | | — | | | | — | | | | 42,091 | | |
| Interest income—unaffiliated issuers | | | — | | | | 1 | | | | 1,429 | | | | 21 | | | | 703 | | |
| Income from securities loaned—net (Note F) | | | — | | | | — | | | | — | | | | 41 | | | | — | | |
| Foreign taxes withheld | | | (1 | ) | | | (25 | ) | | | (358 | ) | | | — | | | | (455 | ) | |
| Total income | | $ | 45 | | | $ | 206 | | | $ | 7,796 | | | $ | 9,155 | | | $ | 90,100 | | |
| Expenses: | |
| Investment management fees (Notes A & B) | | | 26 | | | | 102 | | | | 874 | | | | 3,085 | | | | 62,529 | | |
| Administration fees (Note B) | | | 2 | | | | 6 | | | | 96 | | | | 348 | | | | 5,657 | | |
| Administration fees (Note B): | |
| Investor Class | | | — | | | | — | | | | — | | | | 1,094 | | | | 3,681 | | |
| Trust Class | | | — | | | | — | | | | — | | | | 78 | | | | 11,445 | | |
| Advisor Class | | | — | | | | — | | | | — | | | | 32 | | | | 1,540 | | |
| Institutional Class | | | 1 | | | | 6 | | | | 46 | | | | — | | | | 3,391 | | |
| Class A | | | 3 | | | | 7 | | | | 178 | | | | — | | | | — | | |
| Class C | | | 1 | | | | 1 | | | | 38 | | | | — | | | | — | | |
| Class R3 | | | — | | | | — | | | | — | | | | — | | | | — | | |
| Distribution fees (Note B): | |
| Trust Class | | | — | | | | — | | | | — | | | | 23 | | | | — | | |
| Advisor Class | | | — | | | | — | | | | — | | | | 24 | | | | 1,132 | | |
| Class A | | | 4 | | | | 9 | | | | 223 | | | | — | | | | — | | |
| Class C | | | 3 | | | | 3 | | | | 189 | | | | — | | | | — | | |
| Class R3 | | | — | | | | — | | | | — | | | | — | | | | — | | |
| Shareholder servicing agent fees: | |
| Investor Class | | | — | | | | — | | | | — | | | | 401 | | | | 1,662 | | |
| Trust Class | | | — | | | | — | | | | — | | | | 12 | | | | 280 | | |
| Advisor Class | | | — | | | | — | | | | — | | | | 10 | | | | 69 | | |
| Institutional Class | | | 7 | | | | 10 | | | | 23 | | | | 2 | | | | 245 | | |
| Class A | | | 1 | | | | — | | | | 32 | | | | 2 | | | | — | | |
| Class C | | | — | | | | — | | | | 10 | | | | 2 | | | | — | | |
| Class R3 | | | — | | | | 2 | | | | 2 | | | | — | | | | — | | |
| Organization expense (Note A) | | | — | | | | — | | | | — | | | | — | | | | — | | |
| Audit fees | | | 40 | | | | 41 | | | | 58 | | | | 58 | | | | 64 | | |
| Custodian fees (Note B) | | | 38 | | | | 216 | | | | 115 | | | | 164 | | | | 1,321 | | |
| Insurance expense | | | — | | | | — | | | | 4 | | | | 35 | | | | 557 | | |
| Legal fees | | | 66 | | | | 116 | | | | 87 | | | | 94 | | | | 170 | | |
| Registration and filing fees | | | 41 | | | | 99 | | | | 71 | | | | 88 | | | | 215 | | |
| Reimbursement of expenses previously assumed by Management (Note B) | | | — | | | | — | | | | — | | | | 3 | | | | — | | |
| Shareholder reports | | | 4 | | | | 10 | | | | 21 | | | | 76 | | | | 1,757 | | |
| Trustees' fees and expenses | | | 45 | | | | 45 | | | | 45 | | | | 45 | | | | 45 | | |
| Miscellaneous | | | 3 | | | | 9 | | | | 20 | | | | 53 | | | | 664 | | |
| Total expenses | | | 285 | | | | 682 | | | | 2,132 | | | | 5,729 | | | | 96,424 | | |
| See Notes to Schedule of Investments | 139 | |
| | | GUARDIAN FUND | | INTERNATIONAL FUND | | INTERNATIONAL INSTITUTIONAL FUND | | INTERNATIONAL LARGE CAP FUND | | INTRINSIC VALUE FUND | |
| | | For the Year Ended August 31, 2010 | | For the Year Ended August 31, 2010 | | For the Year Ended August 31, 2010 | | For the Year Ended August 31, 2010 | | For the Period from May 10, 2010 (Commencement of Operations) to August 31, 2010 | |
| Investment Income: | |
| Income (Note A): | |
| Dividend income—unaffiliated issuers | | $ | 13,942 | | | $ | 9,500 | | | $ | 5,286 | | | $ | 3,093 | | | $ | 376 | | |
| Dividend income—affiliated issuers (Note F) | | | — | | | | — | | | | — | | | | — | | | | — | | |
| Interest income—unaffiliated issuers | | | 56 | | | | 18 | | | | 10 | | | | 11 | | | | 1 | | |
| Income from securities loaned—net (Note F) | | | 7 | | | | 235 | | | | 123 | | | | 85 | | | | — | | |
| Foreign taxes withheld | | | (238 | ) | | | (771 | ) | | | (438 | ) | | | (294 | ) | | | — | | |
| Total income | | $ | 13,767 | | | $ | 8,982 | | | $ | 4,981 | | | $ | 2,895 | | | $ | 377 | | |
| Expenses: | |
| Investment management fees (Notes A & B) | | | 5,238 | | | | 3,241 | | | | 1,815 | | | | 673 | | | | 242 | | |
| Administration fees (Note B) | | | 615 | | | | 231 | | | | 128 | | | | 73 | | | | 17 | | |
| Administration fees (Note B): | |
| Investor Class | | | 1,877 | | | | 397 | | | | — | | | | — | | | | — | | |
| Trust Class | | | 274 | | | | 636 | | | | — | | | | 103 | | | | — | | |
| Advisor Class | | | 2 | | | | — | | | | — | | | | — | | | | — | | |
| Institutional Class | | | 2 | | | | — | | | | 192 | | | | 75 | | | | 25 | | |
| Class A | | | 5 | | | | — | | | | — | | | | 15 | | | | — | | |
| Class C | | | — | | | | — | | | | — | | | | 2 | | | | — | | |
| Class R3 | | | — | | | | — | | | | — | | | | — | | | | — | | |
| Distribution fees (Note B): | |
| Trust Class | | | 81 | | | | — | | | | — | | | | 30 | | | | — | | |
| Advisor Class | | | 1 | | | | — | | | | — | | | | — | | | | — | | |
| Class A | | | 7 | | | | — | | | | — | | | | 19 | | | | — | | |
| Class C | | | 2 | | | | — | | | | — | | | | 10 | | | | 1 | | |
| Class R3 | | | — | | | | — | | | | — | | | | — | | | | — | | |
| Shareholder servicing agent fees: | |
| Investor Class | | | 828 | | | | 170 | | | | — | | | | — | | | | — | | |
| Trust Class | | | 17 | | | | 96 | | | | — | | | | 20 | | | | — | | |
| Advisor Class | | | 8 | | | | — | | | | — | | | | — | | | | — | | |
| Institutional Class | | | 1 | | | | — | | | | 21 | | | | 13 | | | | 3 | | |
| Class A | | | 3 | | | | — | | | | — | | | | 3 | | | | — | | |
| Class C | | | 1 | | | | — | | | | — | | | | 1 | | | | — | | |
| Class R3 | | | 1 | | | | — | | | | — | | | | 1 | | | | — | | |
| Organization expense (Note A) | | | — | | | | — | | | | — | | | | — | | | | 196 | | |
| Audit fees | | | 59 | | | | 60 | | | | 59 | | | | 56 | | | | 22 | | |
| Custodian fees (Note B) | | | 293 | | | | 365 | | | | 215 | | | | 183 | | | | 14 | | |
| Insurance expense | | | 62 | | | | 23 | | | | 13 | | | | 6 | | | | 1 | | |
| Legal fees | | | 90 | | | | 161 | | | | 74 | | | | 85 | | | | 18 | | |
| Registration and filing fees | | | 91 | | | | 33 | | | | 5 | | | | 68 | | | | 53 | | |
| Reimbursement of expenses previously assumed by Management (Note B) | | | — | | | | — | | | | — | | | | — | | | | — | | |
| Shareholder reports | | | 169 | | | | 115 | | | | 24 | | | | 19 | | | | 12 | | |
| Trustees' fees and expenses | | | 45 | | | | 45 | | | | 45 | | | | 45 | | | | 14 | | |
| Miscellaneous | | | 79 | | | | 66 | | | | 60 | | | | 39 | | | | 1 | | |
| Total expenses | | | 9,851 | | | | 5,639 | | | | 2,651 | | | | 1,539 | | | | 619 | | |
Statements of Operations (cont'd)
Neuberger Berman Equity Funds (cont'd)
(000's omitted)
| | | CLIMATE CHANGE FUND | | EMERGING MARKETS EQUITY FUND | | EQUITY INCOME FUND | | FOCUS FUND | | GENESIS FUND | |
| | | For the Year Ended August 31, 2010 | | For the Year Ended August 31, 2010 | | For the Year Ended August 31, 2010 | | For the Year Ended August 31, 2010 | | For the Year Ended August 31, 2010 | |
| Expenses reimbursed by Management (Note B) | | | (249 | ) | | | (542 | ) | | | (324 | ) | | | (6 | ) | | | (783 | ) | |
| Investment management fees waived (Note A) | | | — | | | | — | | | | — | | | | — | | | | — | | |
| Expenses reduced by custodian fee expense offset arrangement (Note B) | | | — | | | | — | | | | — | | | | — | | | | — | | |
| Total net expenses | | | 36 | | | | 140 | | | | 1,808 | | | | 5,723 | | | | 95,641 | | |
| Net investment income (loss) | | $ | 9 | | | $ | 66 | | | $ | 5,988 | | | $ | 3,432 | | | $ | (5,541 | ) | |
| Realized and Unrealized Gain (Loss) on Investments (Note A): | |
| Net realized gain (loss) on: | |
| Sales of investment securities of unaffiliated issuers | | | 450 | | | | 904 | | | | 5,694 | | | | 48,584 | | | | 319,101 | | |
| Sales of investment securities of affiliated issuers | | | — | | | | — | | | | — | | | | 5 | | | | 8,723 | | |
| Redemption in-kind | | | — | | | | — | | | | — | | | | — | | | | — | | |
| Foreign currency | | | — | | | | (22 | ) | | | (32 | ) | | | — | | | | (16 | ) | |
| Options written | | | — | | | | — | | | | 469 | | | | — | | | | — | | |
| Change in net unrealized appreciation (depreciation) in value of: | |
| Unaffiliated investment securities | | | — | | | | 363 | | | | 6,942 | | | | (61,312 | ) | | | (157,192 | ) | |
| Affiliated investment securities | | | (437 | ) | | | — | | | | — | | | | — | | | | 563,072 | | |
| Foreign currency | | | — | | | | (1 | ) | | | (2 | ) | | | — | | | | — | | |
| Options written | | | — | | | | — | | | | 7 | | | | — | | | | — | | |
| Net gain (loss) on investments | | | 13 | | | | 1,244 | | | | 13,078 | | | | (12,723 | ) | | | 733,688 | | |
| Net increase (decrease) in net assets resulting from operations | | $ | 22 | | | $ | 1,310 | | | $ | 19,066 | | | $ | (9,291 | ) | | $ | 728,147 | | |
| See Notes to Schedule of Investments | 141 | |
| | | GUARDIAN FUND | | INTERNATIONAL FUND | | INTERNATIONAL INSTITUTIONAL FUND | | INTERNATIONAL LARGE CAP FUND | | INTRINSIC VALUE FUND | |
| | | For the Year Ended August 31, 2010 | | For the Year Ended August 31, 2010 | | For the Year Ended August 31, 2010 | | For the Year Ended August 31, 2010 | | For the Period from May 10, 2010 (Commencement of Operations) to August 31, 2010 | |
| Expenses reimbursed by Management (Note B) | | | (13 | ) | | | (16 | ) | | | (934 | ) | | | (290 | ) | | | (334 | ) | |
| Investment management fees waived (Note A) | | | — | | | | — | | | | — | | | | — | | | | — | | |
| Expenses reduced by custodian fee expense offset arrangement (Note B) | | | — | | | | — | | | | — | | | | — | | | | — | | |
| Total net expenses | | | 9,838 | | | | 5,623 | | | | 1,717 | | | | 1,249 | | | | 285 | | |
| Net investment income (loss) | | $ | 3,929 | | | $ | 3,359 | | | $ | 3,264 | | | $ | 1,646 | | | $ | 92 | | |
| Realized and Unrealized Gain (Loss) on Investments (Note A): | |
| Net realized gain (loss) on: | |
| Sales of investment securities of unaffiliated issuers | | | 5,702 | | | | 22,269 | | | | 8,803 | | | | 1,486 | | | | 1,351 | | |
| Sales of investment securities of affiliated issuers | | | 54 | | | | 177 | | | | 29 | | | | (12 | ) | | | — | | |
| Redemption in-kind | | | — | | | | — | | | | — | | | | — | | | | — | | |
| Foreign currency | | | (94 | ) | | | (407 | ) | | | (169 | ) | | | (271 | ) | | | — | | |
| Options written | | | — | | | | — | | | | — | | | | — | | | | — | | |
| Change in net unrealized appreciation (depreciation) in value of: | |
| Unaffiliated investment securities | | | 68,324 | | | | 8,247 | | | | 5,809 | | | | 1,224 | | | | (6,647 | ) | |
| Affiliated investment securities | | | — | | | | — | | | | — | | | | — | | | | — | | |
| Foreign currency | | | 10 | | | | 3 | | | | 14 | | | | 3 | | | | — | | |
| Options written | | | — | | | | — | | | | — | | | | — | | | | — | | |
| Net gain (loss) on investments | | | 73,996 | | | | 30,289 | | | | 14,486 | | | | 2,430 | | | | (5,296 | ) | |
| Net increase (decrease) in net assets resulting from operations | | $ | 77,925 | | | $ | 33,648 | | | $ | 17,750 | | | $ | 4,076 | | | $ | (5,204 | ) | |
Statements of Operations (cont'd)
Neuberger Berman Equity Funds
(000's omitted)
| | | LARGE CAP DISCIPLINED GROWTH FUND | | MID CAP GROWTH FUND | | MULTI-CAP OPPORTUNITIES FUND | | PARTNERS FUND | | REAL ESTATE FUND | |
| | | For the Year Ended August 31, 2010 | | For the Year Ended August 31, 2010 | | For the Year Ended August 31, 2010 | | For the Year Ended August 31, 2010 | | For the Year Ended August 31, 2010 | |
| Investment Income: | |
| Income (Note A): | |
| Dividend income—unaffiliated issuers | | $ | 3,987 | | | $ | 2,383 | | | $ | 493 | | | $ | 27,679 | | | $ | 2,773 | | |
| Dividend income—affiliated issuers (Note F) | | | — | | | | — | | | | — | | | | — | | | | — | | |
| Interest income—unaffiliated issuers | | | 20 | | | | 48 | | | | 3 | | | | 87 | | | | 6 | | |
| Income from securities loaned—net (Note F) | | | — | | | | 179 | | | | — | | | | 279 | | | | 7 | | |
| Foreign taxes withheld | | | (12 | ) | | | (23 | ) | | | (3 | ) | | | (537 | ) | | | (10 | ) | |
| Total income | | $ | 3,995 | | | $ | 2,587 | | | $ | 493 | | | $ | 27,508 | | | $ | 2,776 | | |
| Expenses: | |
| Investment management fees (Notes A & B) | | | 1,573 | | | | 2,628 | | | | 140 | | | | 12,291 | | | | 821 | | |
| Administration fees (Note B) | | | 173 | | | | 293 | | | | 14 | | | | 1,594 | | | | 62 | | |
| Administration fees (Note B): | |
| Investor Class | | | 23 | | | | 606 | | | | — | | | | 2,846 | | | | — | | |
| Trust Class | | | — | | | | 74 | | | | 2 | | | | 2,229 | | | | 299 | | |
| Advisor Class | | | — | | | | 21 | | | | — | | | | 1,360 | | | | — | | |
| Institutional Class | | | 184 | | | | 139 | | | | 21 | | | | 160 | | | | 13 | | |
| Class A | | | 82 | | | | 8 | | | | — | | | | — | | | | — | | |
| Class C | | | 65 | | | | — | | | | — | | | | — | | | | — | | |
| Class R3 | | | — | | | | — | | | | — | | | | — | | | | — | | |
| Distribution fees (Note B): | |
| Trust Class | | | — | | | | — | | | | 1 | | | | 656 | | | | 88 | | |
| Advisor Class | | | — | | | | 16 | | | | — | | | | 1,000 | | | | — | | |
| Class A | | | 103 | | | | 10 | | | | — | | | | — | | | | — | | |
| Class C | | | 324 | | | | 2 | | | | — | | | | — | | | | — | | |
| Class R3 | | | — | | | | — | | | | — | | | | — | | | | — | | |
| Shareholder servicing agent fees: | |
| Investor Class | | | 29 | | | | 412 | | | | — | | | | 1,009 | | | | — | | |
| Trust Class | | | — | | | | 12 | | | | 2 | | | | 59 | | | | 62 | | |
| Advisor Class | | | — | | | | 10 | | | | — | | | | 47 | | | | — | | |
| Institutional Class | | | 19 | | | | 17 | | | | 7 | | | | 19 | | | | 9 | | |
| Class A | | | 28 | | | | 2 | | | | 2 | | | | 2 | | | | 2 | | |
| Class C | | | 9 | | | | 1 | | | | 1 | | | | 2 | | | | 2 | | |
| Class R3 | | | 1 | | | | 1 | | | | — | | | | 2 | | | | 2 | | |
| Organization expense (Note A) | | | — | | | | — | | | | — | | | | — | | | | — | | |
| Audit fees | | | 23 | | | | 23 | | | | 22 | | | | 58 | | | | 60 | | |
| Custodian fees (Note B) | | | 147 | | | | 199 | | | | 30 | | | | 471 | | | | 64 | | |
| Insurance expense | | | 8 | | | | 26 | | | | 1 | | | | 147 | | | | 4 | | |
| Legal fees | | | 72 | | | | 84 | | | | 98 | | | | 90 | | | | 95 | | |
| Registration and filing fees | | | 84 | | | | 96 | | | | 57 | | | | 136 | | | | 78 | | |
| Reimbursement of expenses previously assumed by Management (Note B) | | | — | | | | 1 | | | | — | | | | 10 | | | | — | | |
| Shareholder reports | | | 77 | | | | 154 | | | | 13 | | | | 338 | | | | 37 | | |
| Trustees' fees and expenses | | | 46 | | | | 45 | | | | 45 | | | | 45 | | | | 45 | | |
| Miscellaneous | | | 26 | | | | 57 | | | | 4 | | | | 205 | | | | 11 | | |
| Total expenses | | | 3,096 | | | | 4,937 | | | | 460 | | | | 24,776 | | | | 1,754 | | |
| See Notes to Schedule of Investments | 143 | |
| | | REGENCY FUND | | SELECT EQUITIES FUND | | SMALL CAP GROWTH FUND | | SOCIALLY RESPONSIVE FUND | |
| | | For the Year Ended August 31, 2010 | | For the Year Ended August 31, 2010 | | For the Year Ended August 31, 2010 | | For the Year Ended August 31, 2010 | |
| Investment Income: | |
| Income (Note A): | |
| Dividend income—unaffiliated issuers | | $ | 1,539 | | | $ | 1,057 | | | $ | 543 | | | $ | 13,938 | | |
| Dividend income—affiliated issuers (Note F) | | | — | | | | — | | | | — | | | | — | | |
| Interest income—unaffiliated issuers | | | 11 | | | | 19 | | | | 6 | | | | 31 | | |
| Income from securities loaned—net (Note F) | | | 7 | | | | — | | | | 75 | | | | 33 | | |
| Foreign taxes withheld | | | (9 | ) | | | (7 | ) | | | — | | | | (401 | ) | |
| Total income | | $ | 1,548 | | | $ | 1,069 | | | $ | 624 | | | $ | 13,601 | | |
| Expenses: | |
| Investment management fees (Notes A & B) | | | 646 | | | | 379 | | | | 2,014 | | | | 5,653 | | |
| Administration fees (Note B) | | | 71 | | | | 41 | | | | 142 | | | | 670 | | |
| Administration fees (Note B): | |
| Investor Class | | | 113 | | | | — | | | | 284 | | | | 1,274 | | |
| Trust Class | | | 205 | | | | — | | | | 113 | | | | 1,202 | | |
| Advisor Class | | | — | | | | — | | | | 40 | | | | — | | |
| Institutional Class | | | — | | | | 12 | | | | 45 | | | | 107 | | |
| Class A | | | — | | | | 89 | | | | 1 | | | | 12 | | |
| Class C | | | — | | | | 22 | | | | — | | | | 4 | | |
| Class R3 | | | — | | | | — | | | | — | | | | — | | |
| Distribution fees (Note B): | |
| Trust Class | | | 60 | | | | — | | | | 33 | | | | 354 | | |
| Advisor Class | | | — | | | | — | | | | 29 | | | | — | | |
| Class A | | | — | | | | 112 | | | | 1 | | | | 15 | | |
| Class C | | | — | | | | 111 | | | | 1 | | | | 18 | | |
| Class R3 | | | — | | | | — | | | | — | | | | — | | |
| Shareholder servicing agent fees: | |
| Investor Class | | | 61 | | | | — | | | | 126 | | | | 507 | | |
| Trust Class | | | 26 | | | | — | | | | 21 | | | | 67 | | |
| Advisor Class | | | — | | | | — | | | | 14 | | | | — | | |
| Institutional Class | | | — | | | | 8 | | | | 13 | | | | 17 | | |
| Class A | | | 2 | | | | 37 | | | | 1 | | | | 6 | | |
| Class C | | | 2 | | | | 9 | | | | 1 | | | | 2 | | |
| Class R3 | | | 2 | | | | — | | | | 1 | | | | 1 | | |
| Organization expense (Note A) | | | — | | | | — | | | | — | | | | — | | |
| Audit fees | | | 23 | | | | 55 | | | | 24 | | | | 23 | | |
| Custodian fees (Note B) | | | 76 | | | | 53 | | | | 156 | | | | 342 | | |
| Insurance expense | | | 6 | | | | 3 | | | | 16 | | | | 64 | | |
| Legal fees | | | 88 | | | | 65 | | | | 96 | | | | 108 | | |
| Registration and filing fees | | | 94 | | | | 53 | | | | 86 | | | | 99 | | |
| Reimbursement of expenses previously assumed by Management (Note B) | | | — | | | | — | | | | — | | | | — | | |
| Shareholder reports | | | 36 | | | | 28 | | | | 230 | | | | 293 | | |
| Trustees' fees and expenses | | | 45 | | | | 45 | | | | 45 | | | | 45 | | |
| Miscellaneous | | | 15 | | | | 11 | | | | 36 | | | | 101 | | |
| Total expenses | | | 1,571 | | | | 1,133 | | | | 3,569 | | | | 10,984 | | |
Statements of Operations (cont'd)
Neuberger Berman Equity Funds (cont'd)
(000's omitted)
| | | LARGE CAP DISCIPLINED GROWTH FUND | | MID CAP GROWTH FUND | | MULTI-CAP OPPORTUNITIES FUND | | PARTNERS FUND | | REAL ESTATE FUND | |
| | | For the Year Ended August 31, 2010 | | For the Year Ended August 31, 2010 | | For the Year Ended August 31, 2010 | | For the Year Ended August 31, 2010 | | For the Year Ended August 31, 2010 | |
| Expenses reimbursed by Management (Note B) | | | (378 | ) | | | (137 | ) | | | (224 | ) | | | (6 | ) | | | (757 | ) | |
| Investment management fees waived (Note A) | | | — | | | | — | | | | — | | | | — | | | | — | | |
| Expenses reduced by custodian fee expense offset arrangement (Note B) | | | — | | | | — | | | | — | | | | — | | | | — | | |
| Total net expenses | | | 2,718 | | | | 4,800 | | | | 236 | | | | 24,770 | | | | 997 | | |
| Net investment income (loss) | | $ | 1,277 | | | $ | (2,213 | ) | | $ | 257 | | | $ | 2,738 | | | $ | 1,779 | | |
| Realized and Unrealized Gain (Loss) on Investments (Note A): | |
| Net realized gain (loss) on: | |
| Sales of investment securities of unaffiliated issuers | | | 260 | | | | 43,967 | | | | 383 | | | | (7,946 | ) | | | 10,053 | | |
| Sales of investment securities of affiliated issuers | | | — | | | | 615 | | | | — | | | | 745 | | | | 52 | | |
| Redemption in-kind | | | — | | | | — | | | | 10 | | | | — | | | | — | | |
| Foreign currency | | | — | | | | 1 | | | | — | | | | (12 | ) | | | — | | |
| Options written | | | — | | | | — | | | | — | | | | — | | | | — | | |
| Change in net unrealized appreciation (depreciation) in value of: | |
| Unaffiliated investment securities | | | (17,073 | ) | | | 25,565 | | | | (4,095 | ) | | | 82,982 | | | | 15,288 | | |
| Affiliated investment securities | | | — | | | | — | | | | — | | | | — | | | | — | | |
| Foreign currency | | | — | | | | — | | | | — | | | | (4 | ) | | | — | | |
| Options written | | | — | | | | — | | | | — | | | | — | | | | — | | |
| Net gain (loss) on investments | | | (16,813 | ) | | | 70,148 | | | | (3,702 | ) | | | 75,765 | | | | 25,393 | | |
| Net increase (decrease) in net assets resulting from operations | | $ | (15,536 | ) | | $ | 67,935 | | | $ | (3,445 | ) | | $ | 78,503 | | | $ | 27,172 | | |
| See Notes to Schedule of Investments | 145 | |
| | | REGENCY FUND | | SELECT EQUITIES FUND | | SMALL CAP GROWTH FUND | | SOCIALLY RESPONSIVE FUND | |
| | | For the Year Ended August 31, 2010 | | For the Year Ended August 31, 2010 | | For the Year Ended August 31, 2010 | | For the Year Ended August 31, 2010 | |
| Expenses reimbursed by Management (Note B) | | | (87 | ) | | | (282 | ) | | | (1,100 | ) | | | (30 | ) | |
| Investment management fees waived (Note A) | | | (37 | ) | | | — | | | | — | | | | — | | |
| Expenses reduced by custodian fee expense offset arrangement (Note B) | | | — | | | | — | | | | — | | | | — | | |
| Total net expenses | | | 1,447 | | | | 851 | | | | 2,469 | | | | 10,954 | | |
| Net investment income (loss) | | $ | 101 | | | $ | 218 | | | $ | (1,845 | ) | | $ | 2,647 | | |
| Realized and Unrealized Gain (Loss) on Investments (Note A): | |
| Net realized gain (loss) on: | |
| Sales of investment securities of unaffiliated issuers | | | 3,295 | | | | 3,708 | | | | 34,241 | | | | (19,371 | ) | |
| Sales of investment securities of affiliated issuers | | | 5 | | | | — | | | | 369 | | | | 1 | | |
| Redemption in-kind | | | — | | | | — | | | | — | | | | — | | |
| Foreign currency | | | (1 | ) | | | — | | | | — | | | | (152 | ) | |
| Options written | | | — | | | | — | | | | — | | | | — | | |
| Change in net unrealized appreciation (depreciation) in value of: | |
| Unaffiliated investment securities | | | (787 | ) | | | (4,906 | ) | | | (23,308 | ) | | | 113,639 | | |
| Affiliated investment securities | | | — | | | | — | | | | — | | | | — | | |
| Foreign currency | | | — | | | | — | | | | — | | | | 11 | | |
| Options written | | | — | | | | — | | | | — | | | | — | | |
| Net gain (loss) on investments | | | 2,512 | | | | (1,198 | ) | | | 11,302 | | | | 94,128 | | |
| Net increase (decrease) in net assets resulting from operations | | $ | 2,613 | | | $ | (980 | ) | | $ | 9,457 | | | $ | 96,775 | | |
Statements of Changes in Net Assets
Neuberger Berman Equity Funds
(000's omitted)
| | | CLIMATE CHANGE FUND | | EMERGING MARKETS EQUITY FUND | | EQUITY INCOME FUND | |
| | | Year Ended August 31, 2010 | | Year Ended August 31, 2009 | | Year Ended August 31, 2010 | | Period from October 8, 2008 (Commencement of Operations) to August 31, 2009 | | Year Ended August 31, 2010 | | Year Ended August 31, 2009 | |
| Increase (Decrease) in Net Assets: | |
| From Operations (Note A): | |
| Net investment income (loss) | | $ | 9 | | | $ | 18 | | | $ | 66 | | | $ | 48 | | | $ | 5,988 | | | $ | 1,039 | | |
| Net realized gain (loss) on investments | | | 450 | | | | (1,753 | ) | | | 882 | | | | 36 | | | | 6,131 | | | | (4,817 | ) | |
| Net increase from payments by affiliates | | | — | | | | — | | | | — | | | | 1 | | | | — | | | | — | | |
Change in net unrealized appreciation (depreciation) of investments | | | (437 | ) | | | 631 | | | | 362 | | | | 1,368 | | | | 6,947 | | | | 2,047 | | |
Net increase (decrease) in net assets resulting from operations | | | 22 | | | | (1,104 | ) | | | 1,310 | | | | 1,453 | | | | 19,066 | | | | (1,731 | ) | |
| Distributions to Shareholders From (Note A): | |
| Net investment income: | |
| Investor Class | | | — | | | | — | | | | — | | | | — | | | | — | | | | — | | |
| Trust Class | | | — | | | | — | | | | — | | | | — | | | | — | | | | — | | |
| Advisor Class | | | — | | | | — | | | | — | | | | — | | | | — | | | | — | | |
| Institutional Class | | | (7 | ) | | | (51 | ) | | | (17 | ) | | | (73 | ) | | | (1,568 | ) | | | (83 | ) | �� |
| Class A | | | (1 | ) | | | (44 | ) | | | (6 | ) | | | (3 | ) | | | (2,468 | ) | | | (593 | ) | |
| Class C | | | — | | | | (3 | ) | | | — | | | | (2 | ) | | | (389 | ) | | | (33 | ) | |
| Class R3 | | | — | | | | — | | | | — | | | | — | | | | (0 | ) | | | — | | |
| Net realized gain on investments: | |
| Investor Class | | | — | | | | — | | | | — | | | | — | | | | — | | | | — | | |
| Trust Class | | | — | | | | — | | | | — | | | | — | | | | — | | | | — | | |
| Advisor Class | | | — | | | | — | | | | — | | | | — | | | | — | | | | — | | |
| Institutional Class | | | — | | | | — | | | | (304 | ) | | | — | | | | — | | | | (8 | ) | |
| Class A | | | — | | | | — | | | | (131 | ) | | | — | | | | — | | | | (195 | ) | |
| Class C | | | — | | | | — | | | | (19 | ) | | | — | | | | — | | | | (11 | ) | |
| Tax Return of Capital: | |
| Investor Class | | | — | | | | — | | | | — | | | | — | | | | — | | | | — | | |
| Trust Class | | | — | | | | — | | | | — | | | | — | | | | — | | | | — | | |
| Advisor Class | | | — | | | | — | | | | — | | | | — | | | | — | | | | — | | |
| Institutional Class | | | — | | | | — | | | | — | | | | — | | | | — | | | | — | | |
| Class A | | | — | | | | — | | | | — | | | | — | | | | — | | | | — | | |
| Class C | | | — | | | | — | | | | — | | | | — | | | | — | | | | — | | |
| Class R3 | | | — | | | | — | | | | — | | | | — | | | | — | | | | — | | |
| Total distributions to shareholders | | | (8 | ) | | | (98 | ) | | | (477 | ) | | | (78 | ) | | | (4,425 | ) | | | (923 | ) | |
| From Fund Share Transactions (Note D): | |
| Proceeds from shares sold: | |
| Investor Class | | | — | | | | — | | | | — | | | | — | | | | — | | | | — | | |
| Trust Class | | | — | | | | — | | | | — | | | | — | | | | — | | | | — | | |
| Advisor Class | | | — | | | | — | | | | — | | | | — | | | | — | | | | — | | |
| Institutional Class | | | 430 | | | | — | | | | 4,202 | | | | 2,803 | | | | 89,935 | | | | 17,793 | | |
| Class A | | | 919 | | | | 766 | | | | 4,844 | | | | 1,839 | | | | 141,691 | | | | 34,665 | | |
| Class C | | | 431 | | | | 131 | | | | 118 | | | | 230 | | | | 40,417 | | | | 3,843 | | |
| Class R3 | | | — | | | | — | | | | 30 | | | | — | | | | 30 | | | | — | | |
| See Notes to Schedule of Investments | 147 | |
| | | FOCUS FUND | | GENESIS FUND | |
| | | Year Ended August 31, 2010 | | Year Ended August 31, 2009 | | Year Ended August 31, 2010 | | Year Ended August 31, 2009 | |
| Increase (Decrease) in Net Assets: | |
| From Operations (Note A): | |
| Net investment income (loss) | | $ | 3,432 | | | $ | 4,844 | | | $ | (5,541 | ) | | $ | 966 | | |
| Net realized gain (loss) on investments | | | 48,589 | | | | (140,203 | ) | | | 327,808 | | | | (832,740 | ) | |
| Net increase from payments by affiliates | | | — | | | | — | | | | — | | | | — | | |
Change in net unrealized appreciation (depreciation) of investments | | | (61,312 | ) | | | (59,381 | ) | | | 405,880 | | | | (2,423,686 | ) | |
Net increase (decrease) in net assets resulting from operations | | | (9,291 | ) | | | (194,740 | ) | | | 728,147 | | | | (3,255,460 | ) | |
| Distributions to Shareholders From (Note A): | |
| Net investment income: | |
| Investor Class | | | (4,238 | ) | | | (4,182 | ) | | | — | | | | — | | |
| Trust Class | | | (186 | ) | | | (216 | ) | | | — | | | | — | | |
| Advisor Class | | | (102 | ) | | | (101 | ) | | | — | | | | — | | |
| Institutional Class | | | — | | | | — | | | | — | | | | — | | |
| Class A | | | — | | | | — | | | | — | | | | — | | |
| Class C | | | — | | | | — | | | | — | | | | — | | |
| Class R3 | | | — | | | | — | | | | — | | | | — | | |
| Net realized gain on investments: | |
| Investor Class | | | — | | | | (67,093 | ) | | | — | | | | (80,456 | ) | |
| Trust Class | | | — | | | | (3,422 | ) | | | — | | | | (173,777 | ) | |
| Advisor Class | | | — | | | | (1,281 | ) | | | — | | | | (19,689 | ) | |
| Institutional Class | | | — | | | | — | | | | — | | | | (168,141 | ) | |
| Class A | | | — | | | | — | | | | — | | | | — | | |
| Class C | | | — | | | | — | | | | — | | | | — | | |
| Tax Return of Capital: | |
| Investor Class | | | — | | | | — | | | | — | | | | (4 | ) | |
| Trust Class | | | — | | | | — | | | | — | | | | (6 | ) | |
| Advisor Class | | | — | | | | — | | | | — | | | | (1 | ) | |
| Institutional Class | | | — | | | | — | | | | — | | | | (6 | ) | |
| Class A | | | — | | | | — | | | | — | | | | — | | |
| Class C | | | — | | | | — | | | | — | | | | — | | |
| Class R3 | | | — | | | | — | | | | — | | | | — | | |
| Total distributions to shareholders | | | (4,526 | ) | | | (76,295 | ) | | | — | | | | (442,080 | ) | |
| From Fund Share Transactions (Note D): | |
| Proceeds from shares sold: | |
| Investor Class | | | 7,024 | | | | 7,825 | | | | 368,995 | | | | 329,375 | | |
| Trust Class | | | 3,571 | | | | 6,788 | | | | 545,267 | | | | 732,619 | | |
| Advisor Class | | | 1,328 | | | | 1,361 | | | | 160,779 | | | | 127,612 | | |
| Institutional Class | | | 30 | | | | — | | | | 995,196 | | | | 707,914 | | |
| Class A | | | 30 | | | | — | | | | — | | | | — | | |
| Class C | | | 30 | | | | — | | | | — | | | | — | | |
| Class R3 | | | — | | | | — | | | | — | | | | — | | |
Statements of Changes in Net Assets (cont'd)
Neuberger Berman Equity Funds (cont'd)
(000's omitted)
| | | CLIMATE CHANGE FUND | | EMERGING MARKETS EQUITY FUND | | EQUITY INCOME FUND | |
| | | Year Ended August 31, 2010 | | Year Ended August 31, 2009 | | Year Ended August 31, 2010 | | Period from October 8, 2008 (Commencement of Operations) to August 31, 2009 | | Year Ended August 31, 2010 | | Year Ended August 31, 2009 | |
Proceeds from reinvestment of dividends and distributions: | |
| Investor Class | | | — | | | | — | | | | — | | | | — | | | | — | | | | — | | |
| Trust Class | | | — | | | | — | | | | — | | | | — | | | | — | | | | — | | |
| Advisor Class | | | — | | | | — | | | | — | | | | — | | | | — | | | | — | | |
| Institutional Class | | | 5 | | | | 51 | | | | 321 | | | | 73 | | | | 665 | | | | 67 | | |
| Class A | | | 1 | | | | 39 | | | | 131 | | | | 3 | | | | 1,997 | | | | 645 | | |
| Class C | | | — | | | | 3 | | | | 19 | | | | 2 | | | | 139 | | | | 19 | | |
| Class R3 | | | — | | | | — | | | | — | | | | — | | | | — | | | | — | | |
Proceeds from shares issued in connection with mergers (Note H): | |
| Institutional Class | | | — | | | | — | | | | — | | | | — | | | | — | | | | — | | |
| Class A | | | — | | | | — | | | | — | | | | — | | | | — | | | | — | | |
| Class C | | | — | | | | — | | | | — | | | | — | | | | — | | | | — | | |
Proceeds from conversion of Trust Class or Class A shares (Note H): | |
| Investor Class | | | — | | | | — | | | | — | | | | — | | | | — | | | | — | | |
| Trust Class | | | — | | | | — | | | | — | | | | — | | | | — | | | | — | | |
| Institutional Class | | | — | | | | — | | | | — | | | | — | | | | — | | | | — | | |
| Class A | | | — | | | | — | | | | — | | | | — | | | | — | | | | — | | |
| Payments for shares redeemed: | |
| Investor Class | | | — | | | | — | | | | — | | | | — | | | | — | | | | — | | |
| Trust Class | | | — | | | | — | | | | — | | | | — | | | | — | | | | — | | |
| Advisor Class | | | — | | | | — | | | | — | | | | — | | | | — | | | | — | | |
| Institutional Class | | | (1,653 | ) | | | — | | | | (166 | ) | | | — | | | | (13,484 | ) | | | (4,176 | ) | |
| Class A | | | (661 | ) | | | (740 | ) | | | (1,588 | ) | | | (158 | ) | | | (18,707 | ) | | | (13,462 | ) | |
| Class C | | | (120 | ) | | | (6 | ) | | | (231 | ) | | | (62 | ) | | | (2,005 | ) | | | (978 | ) | |
| Redemption fees retained: | |
| Investor Class | | | — | | | | — | | | | — | | | | — | | | | — | | | | — | | |
| Trust Class | | | — | | | | — | | | | — | | | | — | | | | — | | | | — | | |
| Institutional Class | | | — | | | | — | | | | 1 | | | | — | | | | — | | | | — | | |
| Class A | | | — | | | | — | | | | 1 | | | | — | | | | — | | | | — | | |
| Class C | | | — | | | | — | | | | — | | | | — | | | | — | | | | — | | |
Proceeds from shares issued in connection with the Reorganization (Note H): | |
| Institutional Class | | | — | | | | — | | | | — | | | | — | | | | — | | | | — | | |
| Net increase (decrease) from Fund share transactions | | | (648 | ) | | | 244 | | | | 7,682 | | | | 4,730 | | | | 240,678 | | | | 38,416 | | |
| Net Increase (Decrease) in Net Assets | | | (634 | ) | | | (958 | ) | | | 8,515 | | | | 6,105 | | | | 255,319 | | | | 35,762 | | |
| Net Assets: | |
| Beginning of year | | | 3,029 | | | | 3,987 | | | | 6,105 | | | | — | | | | 66,172 | | | | 30,410 | | |
| End of year | | $ | 2,395 | | | $ | 3,029 | | | $ | 14,620 | | | $ | 6,105 | | | $ | 321,491 | | | $ | 66,172 | | |
Undistributed net investment income (loss) at end of year | | $ | — | | | $ | — | | | $ | — | | | $ | — | | | $ | 5,312 | | | $ | 365 | | |
Distributions in excess of net investment income at end of year | | $ | (59 | ) | | $ | (62 | ) | | $ | (22 | ) | | $ | (45 | ) | | $ | — | | | $ | — | | |
| See Notes to Schedule of Investments | 149 | |
| | | FOCUS FUND | | GENESIS FUND | |
| | | Year Ended August 31, 2010 | | Year Ended August 31, 2009 | | Year Ended August 31, 2010 | | Year Ended August 31, 2009 | |
Proceeds from reinvestment of dividends and distributions: | |
| Investor Class | | | 3,709 | | | | 62,415 | | | | — | | | | 77,477 | | |
| Trust Class | | | 182 | | | | 3,550 | | | | — | | | | 161,758 | | |
| Advisor Class | | | 100 | | | | 1,369 | | | | — | | | | 19,082 | | |
| Institutional Class | | | — | | | | — | | | | — | | | | 167,662 | | |
| Class A | | | — | | | | — | | | | — | | | | — | | |
| Class C | | | — | | | | — | | | | — | | | | — | | |
| Class R3 | | | — | | | | — | | | | — | | | | — | | |
Proceeds from shares issued in connection with mergers (Note H): | |
| Institutional Class | | | — | | | | — | | | | — | | | | — | | |
| Class A | | | — | | | | — | | | | — | | | | — | | |
| Class C | | | — | | | | — | | | | — | | | | — | | |
Proceeds from conversion of Trust Class or Class A shares (Note H): | |
| Investor Class | | | — | | | | — | | | | — | | | | — | | |
| Trust Class | | | — | | | | — | | | | — | | | | — | | |
| Institutional Class | | | — | | | | — | | | | — | | | | — | | |
| Class A | | | — | | | | — | | | | — | | | | — | | |
| Payments for shares redeemed: | |
| Investor Class | | | (59,627 | ) | | | (73,700 | ) | | | (357,889 | ) | | | (475,531 | ) | |
| Trust Class | | | (8,171 | ) | | | (13,371 | ) | | | (1,002,217 | ) | | | (1,020,015 | ) | |
| Advisor Class | | | (3,737 | ) | | | (4,156 | ) | | | (148,456 | ) | | | (167,155 | ) | |
| Institutional Class | | | — | | | | — | | | | (998,452 | ) | | | (976,050 | ) | |
| Class A | | | — | | | | — | | | | — | | | | — | | |
| Class C | | | — | | | | — | | | | — | | | | — | | |
| Redemption fees retained: | |
| Investor Class | | | — | | | | — | | | | — | | | | — | | |
| Trust Class | | | — | | | | — | | | | — | | | | — | | |
| Institutional Class | | | — | | | | — | | | | — | | | | — | | |
| Class A | | | — | | | | — | | | | — | | | | — | | |
| Class C | | | — | | | | — | | | | — | | | | — | | |
Proceeds from shares issued in connection with the Reorganization (Note H): | |
| Institutional Class | | | — | | | | — | | | | — | | | | — | | |
| Net increase (decrease) from Fund share transactions | | | (55,531 | ) | | | (7,919 | ) | | | (436,777 | ) | | | (315,252 | ) | |
| Net Increase (Decrease) in Net Assets | | | (69,348 | ) | | | (278,954 | ) | | | 291,370 | | | | (4,012,792 | ) | |
| Net Assets: | |
| Beginning of year | | | 574,895 | | | | 853,849 | | | | 8,551,862 | | | | 12,564,654 | | |
| End of year | | $ | 505,547 | | | $ | 574,895 | | | $ | 8,843,232 | | | $ | 8,551,862 | | |
Undistributed net investment income (loss) at end of year | | $ | 3,144 | | | $ | 4,523 | | | $ | (16 | ) | | $ | (3 | ) | |
Distributions in excess of net investment income at end of year | | $ | — | | | $ | — | | | $ | — | | | $ | — | | |
Statements of Changes in Net Assets (cont'd)
Neuberger Berman Equity Funds
(000's omitted)
| | | GUARDIAN FUND | | INTERNATIONAL FUND | |
| | | Year Ended August 31, 2010 | | Year Ended August 31, 2009 | | Year Ended August 31, 2010 | | Year Ended August 31, 2009 | |
| Increase (Decrease) in Net Assets: | |
| From Operations (Note A): | |
| Net investment income (loss) | | $ | 3,929 | | | $ | 5,913 | | | $ | 3,359 | | | $ | 5,582 | | |
| Net realized gain (loss) on investments | | | 5,662 | | | | (126,046 | ) | | | 22,039 | | | | (232,506 | ) | |
| Net increase from payments by affiliates | | | — | | | | — | | | | — | | | | — | | |
Change in net unrealized appreciation (depreciation) of investments | | | 68,334 | | | | (197,808 | ) | | | 8,250 | | | | 31,789 | | |
Net increase (decrease) in net assets resulting from operations | | | 77,925 | | | | (317,941 | ) | | | 33,648 | | | | (195,135 | ) | |
| Distributions to Shareholders From (Note A): | |
| Net investment income: | |
| Investor Class | | | (4,777 | ) | | | (3,980 | ) | | | (2,021 | ) | | | (6,506 | ) | |
| Trust Class | | | (413 | ) | | | (295 | ) | | | (1,558 | ) | | | (5,862 | ) | |
| Advisor Class | | | (1 | ) | | | — | | | | — | | | | — | | |
| Institutional Class | | | (1 | ) | | | — | | | | — | | | | — | | |
| Class A | | | (9 | ) | | | — | | | | — | | | | — | | |
| Class C | | | (0 | ) | | | — | | | | — | | | | — | | |
| Class R3 | | | (0 | ) | | | — | | | | — | | | | — | | |
| Net realized gain on investments: | |
| Investor Class | | | — | | | | (94,513 | ) | | | — | | | | — | | |
| Trust Class | | | — | | | | (7,812 | ) | | | — | | | | — | | |
| Advisor Class | | | — | | | | (62 | ) | | | — | | | | — | | |
| Institutional Class | | | — | | | | — | | | | — | | | | — | | |
| Class A | | | — | | | | — | | | | — | | | | — | | |
| Class C | | | — | | | | — | | | | — | | | | — | | |
| Tax Return of Capital: | |
| Investor Class | | | — | | | | — | | | | (776 | ) | | | — | | |
| Trust Class | | | — | | | | — | | | | (661 | ) | | | — | | |
| Advisor Class | | | — | | | | — | | | | — | | | | — | | |
| Institutional Class | | | — | | | | — | | | | — | | | | — | | |
| Class A | | | — | | | | — | | | | — | | | | — | | |
| Class C | | | — | | | | — | | | | — | | | | — | | |
| Class R3 | | | — | | | | — | | | | — | | | | — | | |
| Total distributions to shareholders | | | (5,201 | ) | | | (106,662 | ) | | | (5,016 | ) | | | (12,368 | ) | |
| From Fund Share Transactions (Note D): | |
| Proceeds from shares sold: | |
| Investor Class | | | 29,249 | | | | 42,010 | | | | 7,515 | | | | 19,420 | | |
| Trust Class | | | 18,549 | | | | 12,413 | | | | 18,054 | | | | 30,446 | | |
| Advisor Class | | | 95 | | | | 204 | | | | — | | | | — | | |
| Institutional Class | | | 4,645 | | | | 50 | | | | — | | | | — | | |
| Class A | | | 5,973 | | | | 487 | | | | — | | | | — | | |
| Class C | | | 395 | | | | 50 | | | | — | | | | — | | |
| Class R3 | | | — | | | | 50 | | | | — | | | | — | | |
| See Notes to Schedule of Investments | 151 | |
| | | INTERNATIONAL INSTITUTIONAL FUND | | INTERNATIONAL LARGE CAP FUND | | INTRINSIC VALUE FUND | |
| | | Year Ended August 31, 2010 | | Year Ended August 31, 2009 | | Year Ended August 31, 2010 | | Year Ended August 31, 2009 | | Period from May 10, 2010 (Commencement of Operations) to August 31, 2010 | |
| Increase (Decrease) in Net Assets: | |
| From Operations (Note A): | |
| Net investment income (loss) | | $ | 3,264 | | | $ | 4,564 | | | $ | 1,646 | | | $ | 1,816 | | | $ | 92 | | |
| Net realized gain (loss) on investments | | | 8,663 | | | | (148,440 | ) | | | 1,203 | | | | (62,155 | ) | | | 1,351 | | |
| Net increase from payments by affiliates | | | — | | | | — | | | | — | | | | — | | | | — | | |
Change in net unrealized appreciation (depreciation) of investments | | | 5,823 | | | | 29,357 | | | | 1,227 | | | | 21,566 | | | | (6,647 | ) | |
Net increase (decrease) in net assets resulting from operations | | | 17,750 | | | | (114,519 | ) | | | 4,076 | | | | (38,773 | ) | | | (5,204 | ) | |
| Distributions to Shareholders From (Note A): | |
| Net investment income: | |
| Investor Class | | | — | | | | — | | | | — | | | | — | | | | — | | |
| Trust Class | | | — | | | | — | | | | (333 | ) | | | (848 | ) | | | — | | |
| Advisor Class | | | — | | | | — | | | | — | | | | — | | | | — | | |
| Institutional Class | | | (3,179 | ) | | | (9,897 | ) | | | (1,013 | ) | | | (2,903 | ) | | | — | | |
| Class A | | | — | | | | — | | | | (72 | ) | | | (52 | ) | | | — | | |
| Class C | | | — | | | | — | | | | (6 | ) | | | (3 | ) | | | — | | |
| Class R3 | | | — | | | | — | | | | (1 | ) | | | — | | | | — | | |
| Net realized gain on investments: | |
| Investor Class | | | — | | | | — | | | | — | | | | — | | | | — | | |
| Trust Class | | | — | | | | — | | | | — | | | | — | | | | — | | |
| Advisor Class | | | — | | | | — | | | | — | | | | — | | | | — | | |
| Institutional Class | | | — | | | | — | | | | — | | | | — | | | | — | | |
| Class A | | | — | | | | — | | | | — | | | | — | | | | — | | |
| Class C | | | — | | | | — | | | | — | | | | — | | | | — | | |
| Tax Return of Capital: | |
| Investor Class | | | — | | | | — | | | | — | | | | — | | | | — | | |
| Trust Class | | | — | | | | — | | | | — | | | | — | | | | — | | |
| Advisor Class | | | — | | | | — | | | | — | | | | — | | | | — | | |
| Institutional Class | | | — | | | | — | | | | — | | | | — | | | | — | | |
| Class A | | | — | | | | — | | | | — | | | | — | | | | — | | |
| Class C | | | — | | | | — | | | | — | | | | — | | | | — | | |
| Class R3 | | | — | | | | — | | | | — | | | | — | | | | — | | |
| Total distributions to shareholders | | | (3,179 | ) | | | (9,897 | ) | | | (1,425 | ) | | | (3,806 | ) | | | — | | |
| From Fund Share Transactions (Note D): | |
| Proceeds from shares sold: | |
| Investor Class | | | — | | | | — | | | | — | | | | — | | | | — | | |
| Trust Class | | | — | | | | — | | | | 4,570 | | | | 11,048 | | | | — | | |
| Advisor Class | | | — | | | | — | | | | — | | | | — | | | | — | | |
| Institutional Class | | | 19,694 | | | | 49,948 | | | | 64,193 | | | | 3,498 | | | | 3,148 | | |
| Class A | | | — | | | | — | | | | 6,921 | | | | 2,160 | | | | 730 | | |
| Class C | | | — | | | | — | | | | 1,241 | | | | 278 | | | | 50 | | |
| Class R3 | | | — | | | | — | | | | 3 | | | | 50 | | | | — | | |
Statements of Changes in Net Assets (cont'd)
Neuberger Berman Equity Funds (cont'd)
(000's omitted)
| | | GUARDIAN FUND | | INTERNATIONAL FUND | |
| | | Year Ended August 31, 2010 | | Year Ended August 31, 2009 | | Year Ended August 31, 2010 | | Year Ended August 31, 2009 | |
Proceeds from reinvestment of dividends and distributions: | |
| Investor Class | | | 4,474 | | | | 92,722 | | | | 2,383 | | | | 5,498 | | |
| Trust Class | | | 412 | | | | 8,083 | | | | 2,041 | | | | 5,247 | | |
| Advisor Class | | | — | | | | 56 | | | | — | | | | — | | |
| Institutional Class | | | — | | | | — | | | | — | | | | — | | |
| Class A | | | 9 | | | | — | | | | — | | | | — | | |
| Class C | | | — | | | | — | | | | — | | | | — | | |
| Class R3 | | | — | | | | — | | | | — | | | | — | | |
Proceeds from shares issued in connection with mergers (Note H): | |
| Institutional Class | | | — | | | | — | | | | — | | | | — | | |
| Class A | | | — | | | | — | | | | — | | | | — | | |
| Class C | | | — | | | | — | | | | — | | | | — | | |
Proceeds from conversion of Trust Class or Class A shares (Note H): | |
| Investor Class | | | — | | | | — | | | | — | | | | — | | |
| Trust Class | | | — | | | | — | | | | — | | | | — | | |
| Institutional Class | | | — | | | | — | | | | — | | | | — | | |
| Class A | | | — | | | | — | | | | — | | | | — | | |
| Payments for shares redeemed: | |
| Investor Class | | | (107,774 | ) | | | (120,403 | ) | | | (60,498 | ) | | | (121,991 | ) | |
| Trust Class | | | (16,152 | ) | | | (20,513 | ) | | | (73,098 | ) | | | (143,841 | ) | |
| Advisor Class | | | (170 | ) | | | (307 | ) | | | — | | | | — | | |
| Institutional Class | | | (326 | ) | | | — | | | | — | | | | — | | |
| Class A | | | (2,798 | ) | | | — | | | | — | | | | — | | |
| Class C | | | (64 | ) | | | — | | | | — | | | | — | | |
| Redemption fees retained: | |
| Investor Class | | | — | | | | — | | | | 6 | | | | 34 | | |
| Trust Class | | | — | | | | — | | | | 6 | | | | 37 | | |
| Institutional Class | | | — | | | | — | | | | — | | | | — | | |
| Class A | | | — | | | | — | | | | — | | | | — | | |
| Class C | | | — | | | | — | | | | — | | | | — | | |
Proceeds from shares issued in connection with the Reorganization (Note H): | |
| Institutional Class | | | — | | | | — | | | | — | | | | — | | |
| Net increase (decrease) from Fund share transactions | | | (63,483 | ) | | | 14,902 | | | | (103,591 | ) | | | (205,150 | ) | |
| Net Increase (Decrease) in Net Assets | | | 9,241 | | | | (409,701 | ) | | | (74,959 | ) | | | (412,653 | ) | |
| Net Assets: | |
| Beginning of year | | | 947,718 | | | | 1,357,419 | | | | 410,258 | | | | 822,911 | | |
| End of year | | $ | 956,959 | | | $ | 947,718 | | | $ | 335,299 | | | $ | 410,258 | | |
Undistributed net investment income (loss) at end of year | | $ | 3,829 | | | $ | 5,195 | | | $ | — | | | $ | — | | |
Distributions in excess of net investment income at end of year | | $ | — | | | $ | — | | | $ | (1,123 | ) | | $ | (464 | ) | |
| See Notes to Schedule of Investments | 153 | |
| | | INTERNATIONAL INSTITUTIONAL FUND | | INTERNATIONAL LARGE CAP FUND | | INTRINSIC VALUE FUND | |
| | | Year Ended August 31, 2010 | | Year Ended August 31, 2009 | | Year Ended August 31, 2010 | | Year Ended August 31, 2009 | | Period from May 10, 2010 (Commencement of Operations) to August 31, 2010 | |
Proceeds from reinvestment of dividends and distributions: | |
| Investor Class | | | — | | | | — | | | | — | | | | — | | | | — | | |
| Trust Class | | | — | | | | — | | | | 320 | | | | 823 | | | | — | | |
| Advisor Class | | | — | | | | — | | | | — | | | | — | | | | — | | |
| Institutional Class | | | 3,168 | | | | 9,873 | | | | 998 | | | | 2,264 | | | | — | | |
| Class A | | | — | | | | — | | | | 69 | | | | 48 | | | | — | | |
| Class C | | | — | | | | — | | | | 1 | | | | 2 | | | | — | | |
| Class R3 | | | — | | | | — | | | | 1 | | | | — | | | | — | | |
Proceeds from shares issued in connection with mergers (Note H): | |
| Institutional Class | | | — | | | | — | | | | — | | | | — | | | | — | | |
| Class A | | | — | | | | — | | | | — | | | | — | | | | — | | |
| Class C | | | — | | | | — | | | | — | | | | — | | | | — | | |
Proceeds from conversion of Trust Class or Class A shares (Note H): | |
| Investor Class | | | — | | | | — | | | | — | | | | — | | | | — | | |
| Trust Class | | | — | | | | — | | | | — | | | | — | | | | — | | |
| Institutional Class | | | — | | | | — | | | | — | | | | — | | | | — | | |
| Class A | | | — | | | | — | | | | — | | | | — | | | | — | | |
| Payments for shares redeemed: | |
| Investor Class | | | — | | | | — | | | | — | | | | — | | | | — | | |
| Trust Class | | | — | | | | — | | | | (7,414 | ) | | | (21,671 | ) | | | — | | |
| Advisor Class | | | — | | | | — | | | | — | | | | — | | | | — | | |
| Institutional Class | | | (93,157 | ) | | | (123,109 | ) | | | (4,664 | ) | | | (22,926 | ) | | | (10,019 | ) | |
| Class A | | | — | | | | — | | | | (1,869 | ) | | | (125 | ) | | | (52 | ) | |
| Class C | | | — | | | | — | | | | (129 | ) | | | — | | | | — | | |
| Redemption fees retained: | |
| Investor Class | | | — | | | | — | | | | — | | | | — | | | | — | | |
| Trust Class | | | — | | | | — | | | | — | | | | — | | | | — | | |
| Institutional Class | | | 2 | | | | 3 | | | | 1 | | | | 1 | | | | — | | |
| Class A | | | — | | | | — | | | | — | | | | — | | | | — | | |
| Class C | | | — | | | | — | | | | — | | | | — | | | | — | | |
Proceeds from shares issued in connection with the Reorganization (Note H): | |
| Institutional Class | | | — | | | | — | | | | — | | | | — | | | | 92,968 | | |
| Net increase (decrease) from Fund share transactions | | | (70,293 | ) | | | (63,285 | ) | | | 64,242 | | | | (24,550 | ) | | | 86,825 | | |
| Net Increase (Decrease) in Net Assets | | | (55,722 | ) | | | (187,701 | ) | | | 66,893 | | | | (67,129 | ) | | | 81,621 | | |
| Net Assets: | |
| Beginning of year | | | 223,794 | | | | 411,495 | | | | 101,113 | | | | 168,242 | | | | — | | |
| End of year | | $ | 168,072 | | | $ | 223,794 | | | $ | 168,006 | | | $ | 101,113 | | | $ | 81,621 | | |
Undistributed net investment income (loss) at end of year | | $ | — | | | $ | — | | | $ | 175 | | | $ | 226 | | | $ | 93 | | |
Distributions in excess of net investment income at end of year | | $ | (399 | ) | | $ | (293 | ) | | $ | — | | | $ | — | | | $ | — | | |
Statements of Changes in Net Assets (cont'd)
Neuberger Berman Equity Funds
(000's omitted)
| | | LARGE CAP DISCIPLINED GROWTH FUND | | MID CAP GROWTH FUND | | MULTI-CAP OPPORTUNITIES FUND | |
| | | Year Ended August 31, 2010 | | Year Ended August 31, 2009 | | Year Ended August 31, 2010 | | Year Ended August 31, 2009 | | Year Ended August 31, 2010 | | Year Ended August 31, 2009 | |
| Increase (Decrease) in Net Assets: | |
| From Operations (Note A): | |
| Net investment income (loss) | | $ | 1,277 | | | $ | 142 | | | $ | (2,213 | ) | | $ | (736 | ) | | $ | 257 | | | $ | 32 | | |
| Net realized gain (loss) on investments | | | 260 | | | | (3,314 | ) | | | 44,583 | | | | (66,868 | ) | | | 393 | | | | (1,231 | ) | |
| Net increase from payments by affiliates | | | — | | | | — | | | | — | | | | — | | | | — | | | | — | | |
Change in net unrealized appreciation (depreciation) of investments | | | (17,073 | ) | | | 12,067 | | | | 25,565 | | | | (28,479 | ) | | | (4,095 | ) | | | 139 | | |
Net increase (decrease) in net assets resulting from operations | | | (15,536 | ) | | | 8,895 | | | | 67,935 | | | | (96,083 | ) | | | (3,445 | ) | | | (1,060 | ) | |
| Distributions to Shareholders From (Note A): | |
| Net investment income: | |
| Investor Class | | | (6 | ) | | | — | | | | — | | | | — | | | | — | | | | — | | |
| Trust Class | | | — | | | | — | | | | — | | | | — | | | | (31 | ) | | | (23 | ) | |
| Advisor Class | | | — | | | | — | | | | — | | | | — | | | | — | | | | — | | |
| Institutional Class | | | (400 | ) | | | — | | | | — | | | | — | | | | — | | | | — | | |
| Class A | | | — | | | | — | | | | — | | | | — | | | | — | | | | — | | |
| Class C | | | — | | | | — | | | | — | | | | — | | | | — | | | | — | | |
| Class R3 | | | — | | | | — | | | | — | | | | — | | | | — | | | | — | | |
| Net realized gain on investments: | |
| Investor Class | | | — | | | | — | | | | — | | | | — | | | | — | | | | — | | |
| Trust Class | | | — | | | | — | | | | — | | | | — | | | | — | | | | (43 | ) | |
| Advisor Class | | | — | | | | — | | | | — | | | | — | | | | — | | | | — | | |
| Institutional Class | | | — | | | | — | | | | — | | | | — | | | | — | | | | — | | |
| Class A | | | — | | | | — | | | | — | | | | — | | | | — | | | | — | | |
| Class C | | | — | | | | — | | | | — | | | | — | | | | — | | | | — | | |
| Tax Return of Capital: | |
| Investor Class | | | — | | | | — | | | | — | | | | — | | | | — | | | | — | | |
| Trust Class | | | — | | | | — | | | | — | | | | — | | | | — | | | | — | | |
| Advisor Class | | | — | | | | — | | | | — | | | | — | | | | — | | | | — | | |
| Institutional Class | | | — | | | | — | | | | — | | | | — | | | | — | | | | — | | |
| Class A | | | — | | | | — | | | | — | | | | — | | | | — | | | | — | | |
| Class C | | | — | | | | — | | | | — | | | | — | | | | — | | | | — | | |
| Class R3 | | | — | | | | — | | | | — | | | | — | | | | — | | | | — | | |
| Total distributions to shareholders | | | (406 | ) | | | — | | | | — | | | | — | | | | (31 | ) | | | (66 | ) | |
| From Fund Share Transactions (Note D): | |
| Proceeds from shares sold: | |
| Investor Class | | | 3,226 | | | | 4,737 | | | | 7,186 | | | | 17,412 | | | | — | | | | — | | |
| Trust Class | | | — | | | | — | | | | 10,390 | | | | 14,486 | | | | — | | | | — | | |
| Advisor Class | | | — | | | | — | | | | 1,982 | | | | 5,117 | | | | — | | | | — | | |
| Institutional Class | | | 389,464 | | | | 20,375 | | | | 130,572 | | | | 116,820 | | | | 53,199 | | | | — | | |
| Class A | | | 40,400 | | | | 29,464 | | | | 15,612 | | | | 116 | | | | 515 | | | | — | | |
| Class C | | | 14,048 | | | | 7,677 | | | | 231 | | | | 51 | | | | 69 | | | | — | | |
| Class R3 | | | — | | | | 50 | | | | — | | | | 50 | | | | — | | | | — | | |
| See Notes to Schedule of Investments | 155 | |
| | | PARTNERS FUND | | REAL ESTATE FUND | |
| | | Year Ended August 31, 2010 | | Year Ended August 31, 2009 | | Year Ended August 31, 2010 | | Year Ended August 31, 2009 | |
| Increase (Decrease) in Net Assets: | |
| From Operations (Note A): | |
| Net investment income (loss) | | $ | 2,738 | | | $ | 16,726 | | | $ | 1,779 | | | $ | 1,595 | | |
| Net realized gain (loss) on investments | | | (7,213 | ) | | | (572,454 | ) | | | 10,105 | | | | (21,817 | ) | |
| Net increase from payments by affiliates | | | — | | | | — | | | | — | | | | — | | |
Change in net unrealized appreciation (depreciation) of investments | | | 82,978 | | | | (472,789 | ) | | | 15,288 | | | | 12,292 | | |
Net increase (decrease) in net assets resulting from operations | | | 78,503 | | | | (1,028,517 | ) | | | 27,172 | | | | (7,930 | ) | |
| Distributions to Shareholders From (Note A): | |
| Net investment income: | |
| Investor Class | | | (8,029 | ) | | | (5,768 | ) | | | — | | | | — | | |
| Trust Class | | | (4,115 | ) | | | (2,401 | ) | | | (1,439 | ) | | | (1,544 | ) | |
| Advisor Class | | | (2,659 | ) | | | (1,463 | ) | | | — | | | | — | | |
| Institutional Class | | | (1,236 | ) | | | (748 | ) | | | (239 | ) | | | (29 | ) | |
| Class A | | | — | | | | — | | | | (0 | ) | | | — | | |
| Class C | | | — | | | | — | | | | (0 | ) | | | — | | |
| Class R3 | | | — | | | | — | | | | (0 | ) | | | — | | |
| Net realized gain on investments: | |
| Investor Class | | | — | | | | (17,026 | ) | | | — | | | | — | | |
| Trust Class | | | — | | | | (7,858 | ) | | | — | | | | — | | |
| Advisor Class | | | — | | | | (4,741 | ) | | | — | | | | — | | |
| Institutional Class | | | — | | | | (1,593 | ) | | | — | | | | — | | |
| Class A | | | — | | | | — | | | | — | | | | — | | |
| Class C | | | — | | | | — | | | | — | | | | — | | |
| Tax Return of Capital: | |
| Investor Class | | | — | | | | — | | | | — | | | | — | | |
| Trust Class | | | — | | | | — | | | | (395 | ) | | | (466 | ) | |
| Advisor Class | | | — | | | | — | | | | — | | | | — | | |
| Institutional Class | | | — | | | | — | | | | (65 | ) | | | (11 | ) | |
| Class A | | | — | | | | — | | | | (0 | ) | | | — | | |
| Class C | | | — | | | | — | | | | (0 | ) | | | — | | |
| Class R3 | | | — | | | | — | | | | (0 | ) | | | — | | |
| Total distributions to shareholders | | | (16,039 | ) | | | (41,598 | ) | | | (2,138 | ) | | | (2,050 | ) | |
| From Fund Share Transactions (Note D): | |
| Proceeds from shares sold: | |
| Investor Class | | | 138,438 | | | | 124,679 | | | | — | | | | — | | |
| Trust Class | | | 100,153 | | | | 105,676 | | | | 81,532 | | | | 43,725 | | |
| Advisor Class | | | 71,790 | | | | 114,148 | | | | — | | | | — | | |
| Institutional Class | | | 41,170 | | | | 96,082 | | | | 17,701 | | | | 2,486 | | |
| Class A | | | 35 | | | | — | | | | 543 | | | | — | | |
| Class C | | | 30 | | | | — | | | | 137 | | | | — | | |
| Class R3 | | | 30 | | | | — | | | | 30 | | | | — | | |
Statements of Changes in Net Assets (cont'd)
Neuberger Berman Equity Funds (cont'd)
(000's omitted)
| | | LARGE CAP DISCIPLINED GROWTH FUND | | MID CAP GROWTH FUND | | MULTI-CAP OPPORTUNITIES FUND | |
| | | Year Ended August 31, 2010 | | Year Ended August 31, 2009 | | Year Ended August 31, 2010 | | Year Ended August 31, 2009 | | Year Ended August 31, 2010 | | Year Ended August 31, 2009 | |
Proceeds from reinvestment of dividends and distributions: | |
| Investor Class | | | 6 | | | | — | | | | — | | | | — | | | | — | | | | — | | |
| Trust Class | | | — | | | | — | | | | — | | | | — | | | | 31 | | | | 66 | | |
| Advisor Class | | | — | | | | — | | | | — | | | | — | | | | — | | | | — | | |
| Institutional Class | | | 196 | | | | — | | | | — | | | | — | | | | — | | | | — | | |
| Class A | | | — | | | | — | | | | — | | | | — | | | | — | | | | — | | |
| Class C | | | — | | | | — | | | | — | | | | — | | | | — | | | | — | | |
| Class R3 | | | — | | | | — | | | | — | | | | — | | | | — | | | | — | | |
Proceeds from shares issued in connection with mergers (Note H) | |
| Institutional Class | | | — | | | | 3,227 | | | | — | | | | — | | | | — | | | | — | | |
| Class A | | | — | | | | 31,234 | | | | — | | | | — | | | | — | | | | — | | |
| Class C | | | — | | | | 16,456 | | | | — | | | | — | | | | — | | | | — | | |
Proceeds from conversion of Trust Class or Class A shares (Note H): | |
| Investor Class | | | — | | | | 213 | | | | — | | | | — | | | | — | | | | — | | |
| Trust Class | | | — | | | | — | | | | — | | | | — | | | | (1,800 | ) | | | — | | |
| Institutional Class | | | — | | | | — | | | | — | | | | — | | | | 1,800 | | | | — | | |
| Class A | | | — | | | | (213 | ) | | | — | | | | — | | | | — | | | | — | | |
| Payments for shares redeemed: | |
| Investor Class | | | (3,876 | ) | | | (3,387 | ) | | | (38,004 | ) | | | (43,190 | ) | | | — | | | | — | | |
| Trust Class | | | — | | | | — | | | | (7,469 | ) | | | (8,369 | ) | | | (1,500 | ) | | | (800 | ) | |
| Advisor Class | | | — | | | | — | | | | (4,328 | ) | | | (1,295 | ) | | | — | | | | — | | |
| Institutional Class | | | (46,220 | ) | | | (2,026 | ) | | | (183,352 | ) | | | (16,789 | ) | | | (4,216 | ) | | | — | | |
| Class A | | | (74,960 | ) | | | (2,964 | ) | | | (1,451 | ) | | | (2 | ) | | | (186 | ) | | | — | | |
| Class C | | | (8,903 | ) | | | (1,014 | ) | | | (67 | ) | | | — | | | | — | | | | — | | |
| Redemption fees retained: | |
| Investor Class | | | — | | | | — | | | | — | | | | — | | | | — | | | | — | | |
| Trust Class | | | — | | | | — | | | | — | | | | — | | | | — | | | | — | | |
| Institutional Class | | | — | | | | — | | | | — | | | | — | | | | — | | | | — | | |
| Class A | | | — | | | | — | | | | — | | | | — | | | | — | | | | — | | |
| Class C | | | — | | | | — | | | | — | | | | — | | | | — | | | | — | | |
Proceeds from shares issued in connection with the Reorganization (Note H): | |
| Institutional Class | | | — | | | | — | | | | — | | | | — | | | | — | | | | — | | |
| Net increase (decrease) from Fund share transactions | | | 313,381 | | | | 103,829 | | | | (68,698 | ) | | | 84,407 | | | | 47,912 | | | | (734 | ) | |
| Net Increase (Decrease) in Net Assets | | | 297,439 | | | | 112,724 | | | | (763 | ) | | | (11,676 | ) | | | 44,436 | | | | (1,860 | ) | |
| Net Assets: | |
| Beginning of year | | | 124,600 | | | | 11,876 | | | | 450,989 | | | | 462,665 | | | | 3,119 | | | | 4,979 | | |
| End of year | | $ | 422,039 | | | $ | 124,600 | | | $ | 450,226 | | | $ | 450,989 | | | $ | 47,555 | | | $ | 3,119 | | |
Undistributed net investment income (loss) at end of year | | $ | 991 | | | $ | 120 | | | $ | — | | | $ | (1 | ) | | $ | 257 | | | $ | 31 | | |
Distributions in excess of net investment income at end of year | | $ | — | | | $ | — | | | $ | — | | | $ | — | | | $ | — | | | $ | — | | |
| See Notes to Schedule of Investments | 157 | |
| | | PARTNERS FUND | | REAL ESTATE FUND | |
| | | Year Ended August 31, 2010 | | Year Ended August 31, 2009 | | Year Ended August 31, 2010 | | Year Ended August 31, 2009 | |
Proceeds from reinvestment of dividends and distributions: | |
| Investor Class | | | 7,676 | | | | 21,824 | | | | — | | | | — | | |
| Trust Class | | | 3,880 | | | | 9,724 | | | | 1,789 | | | | 1,942 | | |
| Advisor Class | | | 2,499 | | | | 5,823 | | | | — | | | | — | | |
| Institutional Class | | | 1,199 | | | | 2,341 | | | | 49 | | | | 3 | | |
| Class A | | | — | | | | — | | | | — | | | | — | | |
| Class C | | | — | | | | — | | | | — | | | | — | | |
| Class R3 | | | — | | | | — | | | | — | | | | — | | |
Proceeds from shares issued in connection with mergers (Note H) | |
| Institutional Class | | | — | | | | — | | | | — | | | | — | | |
| Class A | | | — | | | | — | | | | — | | | | — | | |
| Class C | | | — | | | | — | | | | — | | | | — | | |
Proceeds from conversion of Trust Class or Class A shares (Note H): | |
| Investor Class | | | — | | | | — | | | | — | | | | — | | |
| Trust Class | | | — | | | | — | | | | — | | | | — | | |
| Institutional Class | | | — | | | | — | | | | — | | | | — | | |
| Class A | | | — | | | | — | | | | — | | | | — | | |
| Payments for shares redeemed: | |
| Investor Class | | | (332,108 | ) | | | (406,927 | ) | | | — | | | | — | | |
| Trust Class | | | (192,603 | ) | | | (221,949 | ) | | | (41,057 | ) | | | (25,838 | ) | |
| Advisor Class | | | (119,450 | ) | | | (149,975 | ) | | | — | | | | — | | |
| Institutional Class | | | (59,013 | ) | | | (54,780 | ) | | | (2,130 | ) | | | (759 | ) | |
| Class A | | | — | | | | — | | | | (4 | ) | | | — | | |
| Class C | | | — | | | | — | | | | — | | | | — | | |
| Redemption fees retained: | |
| Investor Class | | | — | | | | — | | | | — | | | | — | | |
| Trust Class | | | — | | | | — | | | | 24 | | | | 29 | | |
| Institutional Class | | | — | | | | — | | | | 4 | | | | 1 | | |
| Class A | | | — | | | | — | | | | — | | | | — | | |
| Class C | | | — | | | | — | | | | — | | | | — | | |
Proceeds from shares issued in connection with the Reorganization (Note H): | |
| Institutional Class | | | — | | | | — | | | | — | | | | — | | |
| Net increase (decrease) from Fund share transactions | | | (336,274 | ) | | | (353,334 | ) | | | 58,618 | | | | 21,589 | | |
| Net Increase (Decrease) in Net Assets | | | (273,810 | ) | | | (1,423,449 | ) | | | 83,652 | | | | 11,609 | | |
| Net Assets: | |
| Beginning of year | | | 2,500,817 | | | | 3,924,266 | | | | 66,386 | | | | 54,777 | | |
| End of year | | $ | 2,227,007 | | | $ | 2,500,817 | | | $ | 150,038 | | | $ | 66,386 | | |
Undistributed net investment income (loss) at end of year | | $ | 2,192 | | | $ | 16,033 | | | $ | — | | | $ | — | | |
Distributions in excess of net investment income at end of year | | $ | — | | | $ | — | | | $ | — | | | $ | — | | |
Statements of Changes in Net Assets (cont'd)
Neuberger Berman Equity Funds
(000's omitted)
| | | REGENCY FUND | | SELECT EQUITIES FUND | |
| | | Year Ended August 31, 2010 | | Year Ended August 31, 2009 | | Year Ended August 31, 2010 | | Year Ended August 31, 2009 | |
| Increase (Decrease) in Net Assets: | |
| From Operations (Note A): | |
| Net investment income (loss) | | $ | 101 | | | $ | 617 | | | $ | 218 | | | $ | 118 | | |
| Net realized gain (loss) on investments | | | 3,299 | | | | (30,946 | ) | | | 3,708 | | | | (1,082 | ) | |
| Net increase from payments by affiliates | | | — | | | | — | | | | — | | | | — | | |
Change in net unrealized appreciation (depreciation) of investments | | | (787 | ) | | | (4,490 | ) | | | (4,906 | ) | | | 4,057 | | |
Net increase (decrease) in net assets resulting from operations | | | 2,613 | | | | (34,819 | ) | | | (980 | ) | | | 3,093 | | |
| Distributions to Shareholders From (Note A): | |
| Net investment income: | |
| Investor Class | | | (336 | ) | | | (6 | ) | | | — | | | | — | | |
| Trust Class | | | (257 | ) | | | (5 | ) | | | — | | | | — | | |
| Advisor Class | | | — | | | | — | | | | — | | | | — | | |
| Institutional Class | | | — | | | | — | | | | (60 | ) | | | (1 | ) | |
| Class A | | | — | | | | — | | | | (117 | ) | | | (48 | ) | |
| Class C | | | — | | | | — | | | | — | | | | (7 | ) | |
| Class R3 | | | — | | | | — | | | | — | | | | — | | |
| Net realized gain on investments: | |
| Investor Class | | | — | | | | (2,509 | ) | | | — | | | | — | | |
| Trust Class | | | — | | | | (1,917 | ) | | | — | | | | — | | |
| Advisor Class | | | — | | | | — | | | | — | | | | — | | |
| Institutional Class | | | — | | | | — | | | | (195 | ) | | | — | | |
| Class A | | | — | | | | — | | | | (818 | ) | | | — | | |
| Class C | | | — | | | | — | | | | (184 | ) | | | — | | |
| Tax Return of Capital: | |
| Investor Class | | | — | | | | — | | | | — | | | | — | | |
| Trust Class | | | — | | | | — | | | | — | | | | — | | |
| Advisor Class | | | — | | | | — | | | | — | | | | — | | |
| Institutional Class | | | — | | | | — | | | | — | | | | — | | |
| Class A | | | — | | | | — | | | | — | | | | — | | |
| Class C | | | — | | | | — | | | | — | | | | — | | |
| Class R3 | | | — | | | | — | | | | — | | | | — | | |
| Total distributions to shareholders | | | (593 | ) | | | (4,437 | ) | | | (1,374 | ) | | | (56 | ) | |
| From Fund Share Transactions (Note D): | |
| Proceeds from shares sold: | |
| Investor Class | | | 28,267 | | | | 9,424 | | | | — | | | | — | | |
| Trust Class | | | 85,347 | | | | 15,090 | | | | — | | | | — | | |
| Advisor Class | | | — | | | | — | | | | — | | | | — | | |
| Institutional Class | | | 1,022 | | | | — | | | | 17,277 | | | | 6,127 | | |
| Class A | | | 30 | | | | — | | | | 30,804 | | | | 41,400 | | |
| Class C | | | 35 | | | | — | | | | 6,357 | | | | 6,414 | | |
| Class R3 | | | 30 | | | | — | | | | — | | | | — | | |
| See Notes to Schedule of Investments | 159 | |
| | | SMALL CAP GROWTH FUND | | SOCIALLY RESPONSIVE FUND | |
| | | Year Ended August 31, 2010 | | Year Ended August 31, 2009 | | Year Ended August 31, 2010 | | Year Ended August 31, 2009 | |
| Increase (Decrease) in Net Assets: | |
| From Operations (Note A): | |
| Net investment income (loss) | | $ | (1,845 | ) | | $ | (1,970 | ) | | $ | 2,647 | | | $ | 4,034 | | |
| Net realized gain (loss) on investments | | | 34,610 | | | | (90,630 | ) | | | (19,522 | ) | | | (149,027 | ) | |
| Net increase from payments by affiliates | | | — | | | | — | | | | — | | | | — | | |
Change in net unrealized appreciation (depreciation) of investments | | | (23,308 | ) | | | 10,318 | | | | 113,650 | | | | (126,653 | ) | |
Net increase (decrease) in net assets resulting from operations | | | 9,457 | | | | (82,282 | ) | | | 96,775 | | | | (271,646 | ) | |
| Distributions to Shareholders From (Note A): | |
| Net investment income: | |
| Investor Class | | | — | | | | — | | | | (1,891 | ) | | | (2,456 | ) | |
| Trust Class | | | — | | | | — | | | | (1,213 | ) | | | (1,472 | ) | |
| Advisor Class | | | — | | | | — | | | | — | | | | — | | |
| Institutional Class | | | — | | | | — | | | | (412 | ) | | | (334 | ) | |
| Class A | | | — | | | | — | | | | (24 | ) | | | — | | |
| Class C | | | — | | | | — | | | | (6 | ) | | | — | | |
| Class R3 | | | — | | | | — | | | | (0 | ) | | | — | | |
| Net realized gain on investments: | |
| Investor Class | | | — | | | | — | | | | — | | | | (8,128 | ) | |
| Trust Class | | | — | | | | — | | | | — | | | | (3,896 | ) | |
| Advisor Class | | | — | | | | — | | | | — | | | | — | | |
| Institutional Class | | | — | | | | — | | | | — | | | | (850 | ) | |
| Class A | | | — | | | | — | | | | — | | | | — | | |
| Class C | | | — | | | | — | | | | — | | | | — | | |
| Tax Return of Capital: | |
| Investor Class | | | — | | | | — | | | | — | | | | — | | |
| Trust Class | | | — | | | | — | | | | — | | | | — | | |
| Advisor Class | | | — | | | | — | | | | — | | | | — | | |
| Institutional Class | | | — | | | | — | | | | — | | | | — | | |
| Class A | | | — | | | | — | | | | — | | | | — | | |
| Class C | | | — | | | | — | | | | — | | | | — | | |
| Class R3 | | | — | | | | — | | | | — | | | | — | | |
| Total distributions to shareholders | | | — | | | | — | | | | (3,546 | ) | | | (17,136 | ) | |
| From Fund Share Transactions (Note D): | |
| Proceeds from shares sold: | |
| Investor Class | | | 68,483 | | | | 82,569 | | | | 72,265 | | | | 123,093 | | |
| Trust Class | | | 7,814 | | | | 27,772 | | | | 86,558 | | | | 82,486 | | |
| Advisor Class | | | 3,953 | | | | 7,571 | | | | — | | | | — | | |
| Institutional Class | | | 94,869 | | | | 5,217 | | | | 98,699 | | | | 31,056 | | |
| Class A | | | 652 | | | | 79 | | | | 12,643 | | | | 1,109 | | |
| Class C | | | 69 | | | | 63 | | | | 3,521 | | | | 92 | | |
| Class R3 | | | 1 | | | | 50 | | | | 176 | | | | 50 | | |
Statements of Changes in Net Assets (cont'd)
Neuberger Berman Equity Funds (cont'd)
(000's omitted)
| | | REGENCY FUND | | SELECT EQUITIES FUND | |
| | | Year Ended August 31, 2010 | | Year Ended August 31, 2009 | | Year Ended August 31, 2010 | | Year Ended August 31, 2009 | |
Proceeds from reinvestment of dividends and distributions: | |
| Investor Class | | | 319 | | | | 2,406 | | | | — | | | | — | | |
| Trust Class | | | 245 | | | | 1,628 | | | | — | | | | — | | |
| Advisor Class | | | — | | | | — | | | | — | | | | — | | |
| Institutional Class | | | — | | | | — | | | | 188 | | | | 1 | | |
| Class A | | | — | | | | — | | | | 669 | | | | 25 | | |
| Class C | | | — | | | | — | | | | 126 | | | | 7 | | |
| Class R3 | | | — | | | | — | | | | — | | | | — | | |
Proceeds from shares issued in connection with mergers (Note H): | |
| Institutional Class | | | — | | | | — | | | | — | | | | — | | |
| Class A | | | — | | | | — | | | | — | | | | — | | |
| Class C | | | — | | | | — | | | | — | | | | — | | |
Proceeds from conversion of Trust Class or Class A shares (Note H): | |
| Investor Class | | | — | | | | — | | | | — | | | | — | | |
| Trust Class | | | — | | | | — | | | | — | | | | — | | |
| Institutional Class | | | — | | | | — | | | | — | | | | — | | |
| Class A | | | — | | | | — | | | | — | | | | — | | |
| Payments for shares redeemed: | |
| Investor Class | | | (20,055 | ) | | | (23,262 | ) | | | — | | | | — | | |
| Trust Class | | | (30,468 | ) | | | (27,286 | ) | | | — | | | | — | | |
| Advisor Class | | | — | | | | — | | | | — | | | | — | | |
| Institutional Class | | | (258 | ) | | | — | | | | (5,470 | ) | | | (2,039 | ) | |
| Class A | | | — | | | | — | | | | (30,981 | ) | | | (10,454 | ) | |
| Class C | | | — | | | | — | | | | (1,752 | ) | | | (236 | ) | |
| Redemption fees retained: | |
| Investor Class | | | — | | | | — | | | | — | | | | — | | |
| Trust Class | | | — | | | | — | | | | — | | | | — | | |
| Institutional Class | | | — | | | | — | | | | — | | | | — | | |
| Class A | | | — | | | | — | | | | — | | | | — | | |
| Class C | | | — | | | | — | | | | — | | | | — | | |
Proceeds from shares issued in connection with the Reorganization (Note H): | |
| Institutional Class | | | — | | | | — | | | | — | | | | — | | |
| Net increase (decrease) from Fund share transactions | | | 64,514 | | | | (22,000 | ) | | | 17,218 | | | | 41,245 | | |
| Net Increase (Decrease) in Net Assets | | | 66,534 | | | | (61,256 | ) | | | 14,864 | | | | 44,282 | | |
| Net Assets: | |
| Beginning of year | | | 70,644 | | | | 131,900 | | | | 52,267 | | | | 7,985 | | |
| End of year | | $ | 137,178 | | | $ | 70,644 | | | $ | 67,131 | | | $ | 52,267 | | |
Undistributed net investment income (loss) at end of year | | $ | 47 | | | $ | 593 | | | $ | 114 | | | $ | 90 | | |
Distributions in excess of net investment income at end of year | | $ | — | | | $ | — | | | $ | — | | | $ | — | | |
| See Notes to Schedule of Investments | 161 | |
| | | SMALL CAP GROWTH FUND | | SOCIALLY RESPONSIVE FUND | |
| | | Year Ended August 31, 2010 | | Year Ended August 31, 2009 | | Year Ended August 31, 2010 | | Year Ended August 31, 2009 | |
Proceeds from reinvestment of dividends and distributions: | |
| Investor Class | | | — | | | | — | | | | 1,743 | | | | 9,888 | | |
| Trust Class | | | — | | | | — | | | | 1,197 | | | | 5,197 | | |
| Advisor Class | | | — | | | | — | | | | — | | | | — | | |
| Institutional Class | | | — | | | | — | | | | 390 | | | | 1,184 | | |
| Class A | | | — | | | | — | | | | 20 | | | | — | | |
| Class C | | | — | | | | — | | | | 4 | | | | — | | |
| Class R3 | | | — | | | | — | | | | — | | | | — | | |
Proceeds from shares issued in connection with mergers (Note H): | |
| Institutional Class | | | — | | | | — | | | | — | | | | — | | |
| Class A | | | — | | | | — | | | | — | | | | — | | |
| Class C | | | — | | | | — | | | | — | | | | — | | |
Proceeds from conversion of Trust Class or Class A shares (Note H): | |
| Investor Class | | | — | | | | — | | | | — | | | | — | | |
| Trust Class | | | — | | | | — | | | | — | | | | — | | |
| Institutional Class | | | — | | | | — | | | | — | | | | — | | |
| Class A | | | — | | | | — | | | | — | | | | — | | |
| Payments for shares redeemed: | |
| Investor Class | | | (152,060 | ) | | | (112,924 | ) | | | (148,755 | ) | | | (149,312 | ) | |
| Trust Class | | | (23,125 | ) | | | (22,460 | ) | | | (68,082 | ) | | | (59,029 | ) | |
| Advisor Class | | | (6,446 | ) | | | (5,917 | ) | | | — | | | | — | | |
| Institutional Class | | | (11,722 | ) | | | (1,114 | ) | | | (14,994 | ) | | | (10,100 | ) | |
| Class A | | | (246 | ) | | | — | | | | (1,077 | ) | | | (63 | ) | |
| Class C | | | (4 | ) | | | — | | | | (190 | ) | | | — | | |
| Redemption fees retained: | |
| Investor Class | | | — | | | | — | | | | — | | | | — | | |
| Trust Class | | | — | | | | — | | | | — | | | | — | | |
| Institutional Class | | | — | | | | — | | | | — | | | | — | | |
| Class A | | | — | | | | — | | | | — | | | | — | | |
| Class C | | | — | | | | — | | | | — | | | | — | | |
Proceeds from shares issued in connection with the Reorganization (Note H): | |
| Institutional Class | | | — | | | | — | | | | — | | | | — | | |
| Net increase (decrease) from Fund share transactions | | | (17,762 | ) | | | (19,094 | ) | | | 44,118 | | | | 35,651 | | |
| Net Increase (Decrease) in Net Assets | | | (8,305 | ) | | | (101,376 | ) | | | 137,347 | | | | (253,131 | ) | |
| Net Assets: | |
| Beginning of year | | | 198,710 | | | | 300,086 | | | | 984,177 | | | | 1,237,308 | | |
| End of year | | $ | 190,405 | | | $ | 198,710 | | | $ | 1,121,524 | | | $ | 984,177 | | |
Undistributed net investment income (loss) at end of year | | $ | — | | | $ | — | | | $ | 2,492 | | | $ | 3,543 | | |
Distributions in excess of net investment income at end of year | | $ | — | | | $ | — | | | $ | — | | | $ | — | | |
Notes to Financial Statements Equity Funds
Note A—Summary of Significant Accounting Policies:
| 1 | General: Neuberger Berman Equity Funds (the "Trust") is a Delaware statutory trust organized pursuant to an Amended and Restated Trust Instrument dated June 24, 2009. The Trust is registered as an open-end management investment company under the Investment Company Act of 1940, as amended (the "1940 Act"), and its shares are registered under the Securities Act of 1933, as amended (the "1933 Act"). The Funds are separate operating series of the Trust, each of which (except Focus, Large Cap Disciplined Growth, Multi-Cap Opportunities, Real Estate, and Select Equities) is diversified. Under the 1940 Act, the status of a Fund that was registered as non-diversified may, under certain circumstances, change to that of a diversified fund. Ten Funds offer Investor Class shares, eleven offer Trust Class shares, six offer Advisor Class shares, eighteen offer Institutional Class shares , sixteen offer Class A shares, sixteen offer Class C shares, and eleven offer Class R3 shares. During the fiscal years ended August 31, 2009 and 2010, certain of the funds and share classes participated in Fund reorganizations and share class conversions as described in Note H. Intrinsic Value had no operations until May 10, 2010 other than matters relating to its organization and registration of shares under the 1933 Act. The Board of Trustees of the Trust (the "Board") may establish additional series or classes of shares without the approval of shareholders. The assets of each Fund belong only to that Fund, and the liabilities of each Fund are borne solely by that Fund and no other. The preparation of financial statements in accordance with U.S. generally accepted accounting principles requires Management to make estimates and assumptions at the date of the financial statements. Actual results could differ from those estimates. |
| 2 | Portfolio valuation: Investment securities are valued as indicated in the notes following the Funds' Schedule of Investments. |
| 3 | Foreign currency translation: The accounting records of the Funds are maintained in U.S. dollars. Foreign currency amounts are currently translated into U.S. dollars using the exchange rate as of 4:00 p.m., Eastern time, to determine the value of investments, other assets and liabilities. Purchase and sale prices of securities, and income and expenses, are translated into U.S. dollars at the prevailing rate of exchange on the respective dates of such transactions. Net unrealized foreign currency gain (loss), if any, arises from changes in the value of assets and liabilities, other than investments in securities, as a result of changes in exchange rates and is stated separately in the Statements of Operations. |
| 4 | Securities transactions and investment income: Securities transactions are recorded on trade date for financial reporting purposes. Dividend income is recorded on the ex-dividend date or, for certain foreign dividends, as soon as the Fund becomes aware of the dividends. Non-cash dividends included in dividend income, if any, are recorded at the fair market value of the securities received. Interest income, including accretion of discount on securities for Equity Income, accretion of original issue discount, where applicable, and accretion of discount on short-term investments, is recorded on the accrual basis. Realized gains and losses from securities transactions and foreign currency transactions, if any, are recorded on th e basis of identified cost and stated separately in the Statements of Operations. Included in net realized gain (loss) on investments are proceeds from the settlements of class action litigation in which the Funds participated as class members. The amounts of such proceeds for the year ended August 31, 2010 were $1,744,357, $391,326, $851,256, $320, $19,042, $239,835, $831, $1,352,378, $12,455, $4,001 and $437,941 for Focus, Genesis, Guardian, International, Large Cap Disciplined Growth, Mid Cap Growth, Multi-Cap Opportunities, Partners, Regency, Small Cap Growth, and Socially Responsive, respectively. |
| 5 | Income tax information: The Funds are treated as separate entities for U.S. federal income tax purposes. It is the policy of each Fund, except Intrinsic Value, to continue to, and the intention of Intrinsic Value to qualify as a regulated investment company by complying with the requirements of Subchapter M of the Internal Revenue Code applicable to regulated investment companies and to distribute substantially all of its earnings to its shareholders. Therefore, no federal income or excise tax provision is required. |
| | The Funds have adopted the provisions of ASC 740 "Income Taxes" ("ASC 740"). ASC 740 sets forth a minimum threshold for financial statement recognition of the benefit of a tax position taken, or expected to be taken, in a tax return. The Funds recognize interest and penalties, if any, related to unrecognized tax benefits as an income tax expense in the Statements of Operations. The Funds are subject to examination by U.S. federal and state tax authorities for returns filed for the prior three fiscal years 2007-2009. As of August 31, 2010, the Funds did not have any unrecognized tax benefits. Income distributions and capital gain distributions are determined in accordance with income tax regulations, which may differ from U.S. generally accepted accounting principles. These differences are primarily due to differing treatments of income and gains on various investment securities held by each Fund, timing differences and differing characterization of distributions made by each Fund as a whole. The Funds may also utilize earnings and profits distributed to shareholders on redemption of their shares as a part of the dividends paid deduction for income tax purposes. As determined on August 31, 2010, permanent differences resulting primarily from different book and tax accounting for net operating losses, convertible preferred stock income adjustments, premium amortization adjustments, partnership and Trust income adjustments, foreign capital gains tax, foreign currency gains and losses, non-deductible 12b-1 fees, non-taxable dividend adjustments, contingent payment debt instrument basis adjustments, passive foreign investment companies gains and losses, return of capital distributions, common stock basis adjustments for redemptions in-kind, wash sale reversals for redemptions in-kind, disallowed redemptions in-kind, capital loss carryforwards expiring and characterization of distributions from real estate investment trusts ("REITs") and c ommon stock were reclassified at fiscal year-end. These reclassifications had no effect on net income, net asset value or net asset value per share of each Fund. The tax character of distributions paid during the years ended August 31, 2010 and August 31, 2009 were as follows: |
| | | Distributions Paid From: |
| | | Ordinary Income | Long-Term Capital Gain | Return of Capital | Total |
| | | 2010 | 2009 | 2010 | 2009 | 2010 | 2009 | 2010 | 2009 |
| Climate Change | | $ | 7,869 | | $ | 98,215 | | $ | — | | $ | — | | $ | — | | $ | — | | $ | 7,869 | | $ | 98,215 | |
Emerging Markets Equity | | | 401,423 | | | 77,563 | (1) | | 75,247 | | | — | (1) | | — | | | — | (1) | | 476,670 | | | 77,563 | (1) |
| Equity Income | | | 4,424,691 | | | 723,146 | | | — | | | 199,719 | | | — | | | — | | | 4,424,691 | | | 922,865 | |
| Focus | | | 4,526,117 | | | 4,498,471 | | | — | | | 71,795,704 | | | — | | | — | | | 4,526,117 | | | 76,294,175 | |
| Genesis | | | — | | | — | | | — | | | 442,063,981 | | | — | | | 16,648 | | | — | | | 442,080,629 | |
| Guardian | | | 5,201,382 | | | 9,781,084 | | | — | | | 96,880,945 | | | — | | | — | | | 5,201,382 | | | 106,662,029 | |
| International | | | 3,578,758 | | | 12,367,880 | | | — | | | — | | | 1,437,207 | | | — | | | 5,015,965 | | | 12,367,880 | |
International Institutional | | | 3,178,503 | | | 9,896,743 | | | — | | | — | | | — | | | — | | | 3,178,503 | | | 9,896,743 | |
International Large Cap | | | 1,424,898 | | | 3,805,457 | | | — | | | — | | | — | | | — | | | 1,424,898 | | | 3,805,457 | |
| Intrinsic Value | | | — | (2) | | — | | | — | (2) | | — | | | — | (2) | | — | | | — | (2) | | — | |
Large Cap Disciplined Growth | | | 406,207 | | | — | | | — | | | — | | | — | | | — | | | 406,207 | | | — | |
| Mid Cap Growth | | | — | | | — | | | — | | | — | | | — | | | — | | | — | | | — | |
Multi-Cap Opportunities | | | 30,769 | | | 29,440 | | | — | | | 37,033 | | | — | | | — | | | 30,769 | | | 66,473 | |
| Partners | | | 16,039,409 | | | 10,379,749 | | | — | | | 31,218,246 | | | — | | | — | | | 16,039,409 | | | 41,597,995 | |
| Real Estate | | | 1,678,446 | | | 1,572,919 | | | — | | | — | | | 459,930 | | | 477,253 | | | 2,138,376 | | | 2,050,172 | |
| Regency | | | 593,129 | | | 10,898 | | | — | | | 4,426,635 | | | — | | | — | | | 593,129 | | | 4,437,533 | |
| Select Equities | | | 1,374,065 | | | 56,266 | | | — | | | — | | | — | | | — | | | 1,374,065 | | | 56,266 | |
| Small Cap Growth | | | — | | | — | | | — | | | — | | | — | | | — | | | — | | | — | |
| Socially Responsive | | | 3,545,308 | | | 4,262,072 | | | — | | | 12,873,755 | | | — | | | — | | | 3,545,308 | | | 17,135,827 | |
(1) Period from October 8, 2008 (Commencement of Operations) to August 31, 2009.
(2) Period from May 10, 2010 (Commencement of Operations) to August 31, 2010.
| | As of August 31, 2010, the components of distributable earnings (accumulated losses) on a U.S. federal income tax basis were as follows: |
| | |
| | | Undistributed Ordinary Income | | Undistributed Long-Term Gain | | Unrealized Appreciation (Depreciation) | | Loss Carryforwards and Deferrals | | Total | |
| Climate Change | | $ | 5,731 | | | $ | — | | | $ | (93,105 | ) | | $ | (1,512,559 | ) | | $ | (1,599,933 | ) | |
| Emerging Markets Equity | | | 177,139 | | | | 400,816 | | | | 1,692,769 | | | | — | | | | 2,270,724 | | |
| Equity Income | | | 8,157,823 | | | | 297,760 | | | | 4,037,443 | | | | — | | | | 12,493,026 | | |
| Focus | | | 3,144,850 | | | | — | | | | (20,704,372 | ) | | | (90,729,914 | ) | | | (108,289,436 | ) | |
| Genesis | | | — | | | | — | | | | 2,180,036,137 | | | | (496,338,822 | ) | | | 1,683,697,315 | | |
| Guardian | | | 3,828,795 | | | | — | | | | 68,394,124 | | | | (123,635,590 | ) | | | (51,412,671 | ) | |
| International | | | — | | | | — | | | | 24,457,601 | | | | (224,115,510 | ) | | | (199,657,909 | ) | |
| International Institutional | | | — | | | | — | | | | 9,169,795 | | | | (171,841,091 | ) | | | (162,671,296 | ) | |
| International Large Cap | | | 242,932 | | | | — | | | | 4,767,346 | | | | (68,740,335 | ) | | | (63,730,057 | ) | |
| Intrinsic Value | | | 773,173 | | | | 1,042,976 | | | | 4,769,258 | | | | — | | | | 6,585,407 | | |
Large Cap Disciplined Growth(1) | | | 1,010,516 | | | | — | | | | (5,343,281 | ) | | | (8,885,272 | ) | | | (13,218,037 | ) | |
| Mid Cap Growth | | | — | | | | — | | | | 82,471,725 | | | | (124,820,931 | ) | | | (42,349,206 | ) | |
| Multi-Cap Opportunities | | | 256,641 | | | | — | | | | (3,995,428 | ) | | | (819,457 | ) | | | (4,558,244 | ) | |
| Partners | | | 2,200,239 | | | | — | | | | 202,245,169 | | | | (570,742,741 | ) | | | (366,297,333 | ) | |
| Real Estate | | | — | | | | — | | | | 22,329,854 | | | | (16,295,675 | ) | | | 6,034,179 | | |
| Regency | | | 47,075 | | | | — | | | | (3,629,563 | ) | | | (25,125,122 | ) | | | (28,707,610 | ) | |
| Select Equities | | | 628,178 | | | | 969,911 | | | | (1,278,655 | ) | | | — | | | | 319,434 | | |
| Small Cap Growth | | | — | | | | — | | | | 8,207,303 | | | | (112,888,881 | ) | | | (104,681,578 | ) | |
| Socially Responsive | | | 2,492,115 | | | | — | | | | 60,817,228 | | | | (174,295,554 | ) | | | (110,986,211 | ) | |
| | The differences between book basis and tax basis distributable earnings are primarily due to: wash sales, partnership and Trust basis adjustments, common stock basis adjustments, capital loss carryforwards, post October loss deferrals, REIT basis adjustments, organization expenses, passive foreign investment companies, contingent payment debt instrument basis adjustments, premium amortization accruals, forward contracts mark to market, non-taxable dividend adjustments and convertible preferred stock basis adjustments. To the extent each Fund's net realized capital gains, if any, can be offset by capital loss carryforwards, it is the policy of each Fund not to distribute such gains. Under current tax law, the use of a fund's capital loss carryforwards to offset future gains may be limited. As determined at August 31, 2010, the following Funds had unused capital loss carryforwards available for federal income tax purposes to offset net realized capital gains, if any, as follows: |
| | |
| | | Expiring in: | |
| | | 2011 | | 2012 | | 2013 | | 2014 | | 2015 | | 2016 | | 2017 | | 2018 | |
| Climate Change | | $ | — | | | $ | — | | | $ | — | | | $ | — | | | $ | — | | | $ | 206,442 | | | $ | 488,619 | | | $ | 817,498 | | |
| Focus | | | — | | | | — | | | | — | | | | — | | | | — | | | | — | | | | 35,105,393 | | | | 55,624,521 | | |
| Genesis | | | — | | | | — | | | | — | | | | — | | | | — | | | | — | | | | 56,608,624 | | | | 439,714,347 | | |
| Guardian | | | — | | | | — | | | | — | | | | — | | | | — | | | | — | | | | 58,796,523 | | | | 64,839,067 | | |
| International | | | — | | | | — | | | | — | | | | — | | | | — | | | | — | | | | 109,492,631 | | | | 114,220,767 | | |
International Institutional | | | — | | | | — | | | | — | | | | — | | | | — | | | | — | | | | 93,661,292 | | | | 78,127,348 | | |
International Large Cap | | | — | | | | — | | | | — | | | | — | | | | — | | | | — | | | | 32,589,988 | | | | 36,150,347 | | |
| | | Expiring in: | |
| | | 2011 | | 2012 | | 2013 | | 2014 | | 2015 | | 2016 | | 2017 | | 2018 | |
Large Cap Disciplined Growth(1) | | $ | 906,685 | | | $ | — | | | $ | — | | | $ | — | | | $ | 317,954 | | | $ | 1,325,771 | | | $ | 3,672,386 | | | $ | — | | |
| Mid Cap Growth | | | 102,695,626 | | | | — | | | | — | | | | — | | | | — | | | | — | | | | 21,093,068 | | | | 1,032,237 | | |
Multi-Cap Opportunities | | | — | | | | — | | | | — | | | | — | | | | — | | | | — | | | | 413,299 | | | | 366,768 | | |
| Partners | | | — | | | | — | | | | — | | | | — | | | | — | | | | — | | | | 81,556,791 | | | | 448,449,921 | | |
| Real Estate | | | — | | | | — | | | | — | | | | — | | | | — | | | | 1,844,454 | | | | 10,477,841 | | | | 3,973,380 | | |
| Regency | | | — | | | | — | | | | — | | | | — | | | | — | | | | — | | | | 3,350,748 | | | | 21,774,374 | | |
| Small Cap Growth | | | 33,014,006 | | | | — | | | | — | | | | — | | | | — | | | | 25,763,569 | | | | 32,917,417 | | | | 21,193,889 | | |
| Socially Responsive | | | — | | | | — | | | | — | | | | — | | | | — | | | | — | | | | 65,700,906 | | | | 92,723,680 | | |
| (1) | The capital loss carryforwards shown above for Large Cap Disciplined Growth (formerly, Century) include $1,643,725 expiring in 2015 and 2016, which were acquired on April 9, 2009 in the merger with Neuberger Berman Large Cap Disciplined Growth Fund. The use of the losses expiring in 2011 to offset future gains may be limited. Large Cap Disciplined Growth lost capital loss carryforwards of $30,961,476 due to the merger. During the year ended August 31, 2010, Equity Income, Large Cap Disciplined Growth and Select Equities utilized capital loss carryforwards of $1,390,528, $769,913 and $811,269, respectively. During the year ended August 31, 2010, Mid Cap Growth and Small Cap Growth had capital loss carryforwards expire during the year of $155,307,949 and $70,414,892, respectively. Under current tax law, certain net capital, net foreign currency losses and net passive foreign investment company mark to market losses realized after October 31 within the taxable year may be deferred and treated as occurring on the first day of the following tax year. For the year ended August 31, 2010, the Funds elected to defer the following: |
| | |
| | | Post October Capital Loss Deferral | | Post October Currency Loss Deferral | |
| Genesis | | $ | — | | | $ | 15,851 | | |
| International | | | — | | | | 402,112 | | |
| International Institutional | | | — | | | | 52,451 | | |
| Large Cap Disciplined Growth | | | 2,662,476 | | | | — | | |
| Multi-Cap Opportunities | | | 39,390 | | | | — | | |
| Partners | | | 40,736,029 | | | | — | | |
| Socially Responsive | | | 15,870,968 | | | | — | | |
| 6 | Foreign taxes: Foreign taxes withheld represent amounts withheld by foreign tax authorities, net of refunds recoverable. |
| 7 | Distributions to shareholders: Each Fund may earn income, net of expenses, daily on its investments. Distributions from net investment income and net realized capital gains, if any, generally are distributed once a year (usually in December) and are recorded on the ex-date. However, Equity Income and Real Estate generally distribute substantially all of their net investment income, if any, at the end of each calendar quarter. It is the policy of each of Equity Income, Real Estate and Regency to pass through to its shareholders substantially all REIT distributions and other income it receives, less operating expenses. The distributions received from REITs held by Equity Income, Real Estate and Regency are generally comprised of income, capital gains, and return of REIT capital, but the REITs do not report this information to Equity Income, Real Estate and Regency until the following calendar year. At August 31, 2010, Equity Income, Real Estate and Regency estimated these amounts within the financial statements since the information is not available from the REITs until after each Fund's fiscal year-end. For |
| | the year ended August 31, 2010, the character of distributions paid to shareholders for Equity Income, Real Estate and Regency disclosed within the Statements of Changes in Net Assets is based on estimates made at that time. All estimates are based upon REIT information sources available to Equity Income, Real Estate and Regency together with actual IRS Forms 1099DIV received to date. Based on past experience it is probable that a portion of each Fund's distributions during the current fiscal year will be considered tax return of capital but the actual amount of the tax return of capital, if any, is not determinable until after Equity Income's, Real Estate's and Regency's fiscal year-end. After calendar year-end, when Equity Income, Real Estate and Regency learn the nature of the distributions paid by REITs during that year, distributions previously identified as income are often recharacterized as return of capital and/or capital gain. After all applicable REITs have informed Equity Income, Real Estate and Regency of the actual breakdown of distributions paid to Equity Income, Real Estate and Regency during its fiscal year, estimates previously recorded are adjusted on the books of Equity Income, Real Estate and Regency to reflect actual results. As a result, the composition of Equity Income's, Real Estate's and Regency's distributions as reported herein may differ from the final composition determined after calendar year-end and reported to Equity Income, Real Estate and Regency shareholders on IRS Form 1099DIV. |
| 8 | Organization expenses: Costs incurred by Intrinsic Value in connection with its organization, which amounted to $196,407, have been expensed as incurred. |
| 9 | Expense allocation: Certain expenses are applicable to multiple funds. Expenses directly attributable to a Fund are charged to that Fund. Expenses of the Trust that are not directly attributable to a particular series of the Trust (e.g., a Fund) are allocated among the series of the Trust, on the basis of relative net assets, except where a more appropriate allocation of expenses to each of the series can otherwise be made fairly. Expenses borne by the complex of related investment companies, which includes open-end and closed-end investment companies for which Management serves as investment manager, that are not directly attributable to a particular investment company in the complex (e.g., the Trust) or series thereof are allocated among the investment companies in the complex or s eries thereof, on the basis of relative net assets, except where a more appropriate allocation of expenses to each of the investment companies in the complex or series thereof can otherwise be made fairly. Each Fund's expenses (other than those specific to each class) are allocated proportionally each day between the classes based upon the relative net assets of each class. |
| 10 | Security lending: A third party, eSecLending, has assisted Focus, Guardian, International, International Institutional, International Large Cap, Mid Cap Growth, Partners, Real Estate, Regency, Small Cap Growth and Socially Responsive in conducting a bidding process to try to identify a principal that would pay a guaranteed amount to each Fund in consideration of that Fund entering into an exclusive securities lending arrangement. During the fiscal year, eSecLending served as exclusive lending agent for each of these Funds. As a result of a bidding process on October 1, 2009, no principal had an exclusive securities lending arrangement with any Fund; as such, no Fund was guaranteed any particular level of inc ome during the fiscal year. As of August 27, 2010, the Funds no longer participate in a security lending program. Under the securities lending arrangements, each Fund received cash collateral at the beginning of each transaction equal to at least 102% of the prior day's market value of the loaned securities (105% in the case of international securities). Each Fund invested all the cash collateral in Neuberger Berman Securities Lending Quality Fund, LLC ("Quality Fund"), a fund managed by Neuberger Berman Fixed Income LLC ("NBFI"), an affiliate of Management, and sub-advised by Dwight Asset Management Company LLC. Quality Fund was not a money market fund registered under the 1940 Act and did not operate in accordance with all requirements of Rule 2a-7 under the 1940 Act. Each Fund has redeemed all of its investments in Quality Fund, if any, as of August 27, 2010. Net income from the applicable lending program represents any amounts received from a principal, plus income earned on the cash collateral invested in Quality Fund or in other investments, if applicable, less cash collateral fees and other expenses associated with the loans. For the fiscal year ended August 31, 2010, the approximate amount of net income received under the securities lending arrangements, which is reflected in the Statements of Operations under the caption |
| | "Income from securities loaned—net"; and the amount of interest income that was earned from Quality Fund are as follows: |
| | | Net Income Received under the Securities Lending Arrangements | | Interest Income Earned from the Quality Fund | |
| Focus | | $ | 40,758 | | | $ | 9,594 | | |
| Guardian | | | 7,041 | | | | 715 | | |
| International | | | 234,706 | | | | 39,652 | | |
| International Institutional | | | 122,811 | | | | 19,646 | | |
| International Large Cap | | | 85,026 | | | | 10,299 | | |
| Mid Cap Growth | | | 178,516 | | | | 36,247 | | |
| Partners | | | 278,992 | | | | 138,884 | | |
| Real Estate | | | 7,123 | | | | 3,360 | | |
| Regency | | | 7,391 | | | | 2,555 | | |
| Small Cap Growth | | | 74,605 | | | | 14,094 | | |
| Socially Responsive | | | 32,669 | | | | 4,095 | | |
11 | Repurchase agreements: Each Fund may enter into repurchase agreements with institutions that Management has determined are creditworthy. Each repurchase agreement is recorded at cost. Each Fund requires that the securities purchased in a repurchase agreement be transferred to the custodian in a manner sufficient to enable the Fund to assert a perfected security interest in those securities in the event of a default under the repurchase agreement. Each Fund monitors, on a daily basis, the value of the securities transferred to ensure that their value, including accrued interest, is greater than amounts owed to the Fund under each such repurchase agreement. |
| 12 | Redemption of fund shares: Each class of Emerging Markets Equity, International, International Institutional, and International Large Cap charges a redemption fee of 2%, and each class of Real Estate charges a redemption fee of 1%, on shares redeemed or exchanged for shares of another fund within 60 days or less of the purchase date. All redemption fees are paid to and recorded by each Fund as paid-in capital. For the year ended August 31, 2010, Emerging Markets Equity, International, International Institutional, International Large Cap, and Real Estate received $1,564, $11,825, $1,717, $1,202 and $27,618, respectively, in redemption fees. |
| 13 | Investments in foreign securities: Investing in foreign securities may involve certain sovereign and other risks, in addition to the credit and market risks normally associated with domestic securities. These additional risks include the possibility of adverse political and economic developments (including political instability, nationalization, expropriation, or confiscatory taxation) and the potentially adverse effects of unavailability of public information regarding issuers, less governmental supervision and regulation of financial markets, reduced liquidity of certain financial markets, and the lack of uniform accounting, auditing, and financial reporting standards or the application of standards that a re different or less stringent than those applied in the United States. Foreign securities also may experience greater price volatility, higher rates of inflation, and delays in settlement. |
| 14 | Derivative instruments: During the year ended August 31, 2010, the Funds' use of derivatives was limited to written option transactions. The Funds have adopted ASC 815 "Derivatives and Hedging" ("ASC 815"). The disclosure requirements of ASC 815 distinguish between derivatives that qualify for hedge accounting and those that do not. Because investment companies value their derivatives at fair value and recognize changes in fair value through the Statement of Operations, they do not qualify for hedge accounting. Accordingly, even though a Fund's investments in derivatives may represent economic hedges, they are considered non-hedge transactions for purposes of this disclosure. Options: Each Fund may write covered call options, and certain Funds may write put options. |
| | Premiums received by a Fund upon writing a covered call option or a put option are recorded in the liability section of each Fund's Statement of Assets and Liabilities and are subsequently adjusted to the current market value. When an option is exercised, closed, or expired, the Fund realizes a gain or loss and the liability is eliminated. For written call options, a Fund bears the risk of a decline in the price of the underlying security during the period, although any potential loss during the period would be reduced by the amount of the option premium received. For written put options, a Fund bears the risk of an increase in the price of the underlying security during the period, although if a put option a Fund has written expires unexercised, the Fund would realize a gain in the amount of the premium received. All securities covering outstanding options are held in escrow by the custodian bank. Written option transactions were used to generate incremental cash for Equity Income for the year ended August 31, 2010. Written option transactions for Equity Income for the year ended August 31, 2010 were: |
| | | Put Options | | Call Options | |
| | | Number | | Value When Written | | Number | | Value When Written | |
| Contracts outstanding 8/31/2009 | | | 40,000 | | | $ | 47,000 | | | | 183,000 | | | $ | 224,000 | | |
| Contracts written | | | 74,000 | | | | 120,000 | | | | 432,800 | | | | 508,000 | | |
| Contracts expired | | | (25,000 | ) | | | (115,000 | ) | | | (20,400 | ) | | | (275,000 | ) | |
| Contracts exercised | | | — | | | | — | | | | (59,000 | ) | | | (79,000 | ) | |
| Contracts closed | | | (89,000 | ) | | | (52,000 | ) | | | (475,800 | ) | | | (301,000 | ) | |
| Contracts outstanding 8/31/2010 | | | — | | | $ | — | | | | 60,600 | | | $ | 77,000 | | |
| | At August 31, 2010, Equity Income had the following derivatives (which did not qualify for hedge accounting under ASC 815), grouped by primary risk exposure: |
Liability Derivatives
| | | Equity Contracts Risk | |
Option Contracts Written(1) | | $ | 64,000 | | |
| Total Value | | $ | 64,000 | | |
(1) | Reflected in the Statements of Assets and Liabilities under the caption "Options contracts written, at value". The impact of the use of these derivative instruments on the Statement of Operations during the year ended August 31, 2010 was as follows: |
| | |
| | |
| | |
Realized Gain (Loss)(1)
| | | Equity Contracts Risk | |
| Option Contracts Written | | $ | 469,000 | | |
| Total Realized Gain (Loss) | | $ | 469,000 | | |
Change in Appreciation (Depreciation)(2)
| | | Equity Contracts Risk | |
| Option Contracts Written | | $ | 7,000 | | |
| Total Change in Appreciation (Depreciation) | | $ | 7,000 | | |
| (1) | Reflected in the Statements of Operations under the caption "Net realized gain (loss) on Options written". |
| | |
(2) | Reflected in the Statements of Operations under the caption "Change in net unrealized appreciation (depreciation) in value of Options written". For the year ended August 31, 2010, Equity Income had an average market value of $65,000 on written options. |
| | While the Funds may receive rights and warrants in connection with their investments in securities, these rights and warrants are not considered "derivative instruments" under ASC 815. Management has concluded that the Funds, except Equity Income, did not hold any derivative instruments during the year ended August 31, 2010 that require additional disclosures pursuant to ASC 815. |
| 15 | Indemnifications: Like many other companies, the Trust's organizational documents provide that its officers and trustees are indemnified against certain liabilities arising out of the performance of their duties to the Trust. In addition, both in some of its principal service contracts and in the normal course of its business, the Trust enters into contracts that provide indemnifications to other parties for certain types of losses or liabilities. The Trust's maximum exposure under these arrangements is unknown as this could involve future claims against the Trust. |
16 | Other: All net investment income and realized and unrealized capital gains and losses of each Fund are allocated, on the basis of relative net assets, pro rata among its respective classes. |
Note B—Management Fees, Administration Fees, Distribution Arrangements, and Other Transactions with Affiliates:
| | Each Fund retains Management as its investment manager under a Management Agreement. For such investment management services, each Fund pays Management a fee according to the following table: Investment Management Fee as a Percentage of Average Daily Net Assets: |
| | | First $250 million | | Next $250 million | | Next $250 million | | Next $250 million | | Next $500 million | | Next $500 million | | Next $500 million | | Next $1.5 billion | | Thereafter | |
| | |
| For Climate Change, Genesis, Intrinsic Value, and Small Cap Growth: | |
| | | | 0.85 | % | | | 0.80 | % | | | 0.75 | % | | | 0.70 | % | | | 0.65 | % | | | 0.65 | % | | | 0.65 | % | | | 0.65 | % | | | 0.65 | % | |
| | |
| For Emerging Markets Equity: | |
| | | | 1.00 | % | | | 0.975 | % | | | 0.95 | % | | | 0.925 | % | | | 0.90 | % | | | 0.875 | % | | | 0.875 | % | | | 0.875 | % | | | 0.85 | % | |
| | |
| For Real Estate: | |
| | | | 0.80 | % | | | 0.80 | % | | | 0.80 | % | | | 0.80 | % | | | 0.80 | % | | | 0.80 | % | | | 0.80 | % | | | 0.80 | % | | | 0.80 | % | |
| | |
| For International and International Institutional: | |
| | | | 0.85 | % | | | 0.825 | % | | | 0.80 | % | | | 0.775 | % | | | 0.75 | % | | | 0.725 | % | | | 0.725 | % | | | 0.70 | % | | | 0.70 | % | |
| | |
For Equity Income, Focus, Guardian, International Large Cap, Large Cap Disciplined Growth, Mid Cap Growth, Multi-Cap Opportunities (prior to December 14, 2009), Partners, Regency(1), Select Equities, and Socially Responsive: | |
| | | | 0.55 | % | | | 0.525 | % | | | 0.50 | % | | | 0.475 | % | | | 0.45 | % | | | 0.425 | % | | | 0.425 | % | | | 0.425 | % | | | 0.40 | % | |
| | |
| For Multi-Cap Opportunities (effective December 14, 2009): | |
| | | | 0.60 | % | | | 0.575 | % | | | 0.55 | % | | | 0.525 | % | | | 0.50 | % | | | 0.475 | % | | | 0.475 | % | | | 0.475 | % | | | 0.45 | % | |
| (1) | Management has voluntarily agreed to waive its management fee in the amount of 0.05% of the average daily net assets of Regency effective March 8, 2010. Management may, at its sole discretion, modify or terminate this voluntary waiver without notice to the Fund. For the year ended August 31, 2010, such waived fees amounted to $36,804 for Regency. Each Fund retains Management as its administrator under an Administration Agreement. Each Fund pays Management an administration fee at the annual rate of 0.06% of its average daily net assets under this Agreement. In addition, each Fund's Investor Class, Class A, Class C and Class R3 pays Management an administration fee at the annual rate of 0.20% of its average daily net assets, each Fund's Trust Class and Advisor Class pays Management an administration fee at the annual rate of 0.34% of its average daily net assets, and each Fund's Institutional Class pays Management an administration fee at the annual ra te of 0.09% of its average daily net assets. Additionally, |
| | |
| | Management retains State Street Bank and Trust Company ("State Street") as its sub-administrator under a Sub-Administration Agreement. Management pays State Street a fee for all services received under the agreement. For the Trust Class of Focus, Guardian, International Large Cap, Partners, Real Estate, Regency, Small Cap Growth and Socially Responsive (and for Multi-Cap Opportunities prior to December 21, 2009), the Advisor Class of each Fund, and Class A, Class C and Class R3 of each Fund, Management acts as agent in arranging for the sale of class shares without commission and bears advertising and promotion expenses. The Board has adopted distribution plans (each a "Plan", collectively, the "Plans") with respect to these classes, pursuant to Rule 12b-1 under the 1940 Act. The Plans provide that, as compensation for admin istrative and other services provided to these classes, Management's activities and expenses related to the sale and distribution of these classes of shares, and ongoing services provided to investors in these classes, Management receives from each of these classes a fee at the annual rate of 0.10% of such Trust Class's, 0.25% of such Advisor Class's, 0.25% of such Class A's, 1.00% of such Class C's and 0.50% of such Class R3's average daily net assets. Management receives this amount to provide distribution and shareholder servicing for those classes and pays a portion of it to institutions that provide such services. Those institutions may use the payments for, among other purposes, compensating employees engaged in sales and/or shareholder servicing. The amount of fees paid by each class during any year could have been more or less than the cost of distribution and other services provided to that class. FINRA rules limit the amount of annual distribution fees that may be paid by a mutual fund and impose a ceiling on the cumulative distribution fees paid. The Trust's Plans comply with those rules. Management has contractually agreed to forgo current payment of fees and/or reimburse certain expenses of the Investor Class of each of International, Large Cap Disciplined Growth, Regency and Small Cap Growth and the Trust Class, Advisor Class, Institutional Class, Class A, Class C and Class R3 of each Fund that offers those classes so that the total annual operating expenses of those classes do not exceed the expense limitations as detailed in the following table. These undertakings apply to a Fund's direct expenses and do not cover interest, taxes, brokerage commissions, acquired fund fees and expenses, an d extraordinary expenses, if any; consequently, net expenses may exceed the contractual expense limitations. Each Fund has agreed that each of its respective classes will repay Management for fees and expenses forgone or reimbursed for that class provided that repayment does not cause the class' annual operating expenses to exceed its contractual expense limitation. The Institutional Class of each of Equity Income and Multi-Cap Opportunities has agreed to repay the fees and expenses forgone or reimbursed for that Fund's Trust Class prior to June 9, 2008 and December 21, 2009, respectively, provided that the repayment does not cause the class' annual operating expenses to exceed its contractual expense limitation. Any such repayment must be made within three years after the year in which Management incurred the expense. During the year ended August 31, 2010, the Advisor Class of Focus, the Advisor Class of Mid Cap Growth and the Institutional Class of Partners reimbursed Management $2,550, $1,205 and $10,118, respectively, under its contractual expense limitation agreement. At August 31, 2010, contingent liabilities to Management under the agreement were as follows: |
| | | | | | | Expenses Deferred In Fiscal Period Ending, August 31, | |
| | | | | | | 2008 | | 2009 | | 2010 | |
| | | | | | | Subject to Repayment until August 31, | |
| Class | | Contractual Expense Limitation(1) | | Expiration | | 2011 | | 2012 | | 2013 | |
| Climate Change Fund Institutional Class | | | 0.95 | % | | 8/31/13 | | $ | 179,923 | (6) | | $ | 120,170 | | | $ | 102,442 | | |
| Climate Change Fund Class A | | | 1.20 | % | | 8/31/13 | | | 75,053 | (6) | | | 102,914 | | | | 124,717 | | |
| Climate Change Fund Class C | | | 1.95 | % | | 8/31/13 | | | 8,633 | (6) | | | 11,617 | | | | 21,817 | | |
| Emerging Markets Equity Fund Institutional Class | | | 1.25 | % | | 8/31/13 | | | — | | | | 371,874 | (9) | | | 337,197 | | |
| Emerging Markets Equity Fund Class A | | | 1.50 | % | | 8/31/13 | | | — | | | | 56,747 | (9) | | | 191,189 | | |
| Emerging Markets Equity Fund Class C | | | 2.25 | % | | 8/31/13 | | | — | | | | 19,340 | (9) | | | 11,530 | | |
| Emerging Markets Equity Fund Class R3 | | | 1.91 | % | | 8/31/13 | | | — | | | | — | | | | 2,284 | (19) | |
| | | | | | | Expenses Deferred In Fiscal Period Ending, August 31, | |
| | | | | | | 2008 | | 2009 | | 2010 | |
| | | | | | | Subject to Repayment until August 31, | |
| Class | | Contractual Expense Limitation(1) | | Expiration | | 2011 | | 2012 | | 2013 | |
| Equity Income Fund Institutional Class | | | 0.80 | % | | 8/31/13 | | $ | 155,052 | (15) | | $ | 18,095 | | | $ | 105,290 | | |
| Equity Income Fund Class A | | | 1.16 | % | | 8/31/13 | | | 108,121 | (8) | | | 307,047 | | | | 177,324 | | |
| Equity Income Fund Class C | | | 1.91 | % | | 8/31/13 | | | 4,441 | (8) | | | 16,896 | | | | 39,060 | | |
| Equity Income Fund Class R3 | | | 1.41 | % | | 8/31/13 | | | — | | | | — | | | | 2,040 | (19) | |
| Focus Fund Trust Class | | | 1.50 | % | | 8/31/13 | | | — | | | | — | | | | — | | |
| Focus Fund Advisor Class | | | 1.50 | % | | 8/31/20 | | | — | | | | — | | | | — | | |
| Focus Fund Institutional Class | | | 0.75 | % | | 8/31/13 | | | — | | | | — | | | | 2,035 | (19) | |
| Focus Fund Class A | | | 1.11 | % | | 8/31/13 | | | — | | | | — | | | | 2,035 | (19) | |
| Focus Fund Class C | | | 1.86 | % | | 8/31/13 | | | — | | | | — | | | | 2,036 | (19) | |
| Genesis Fund Trust Class | | | 1.50 | % | | 8/31/13 | | | — | | | | — | | | | — | | |
| Genesis Fund Advisor Class | | | 1.50 | % | | 8/31/20 | | | — | | | | — | | | | — | | |
| Genesis Fund Institutional Class | | | 0.85 | % | | 8/31/20 | | | — | | | | 510,447 | | | | 783,406 | | |
| Guardian Fund Trust Class | | | 1.50 | % | | 8/31/13 | | | — | | | | — | | | | — | | |
| Guardian Fund Advisor Class | | | 1.50 | % | | 8/31/20 | | | 18,491 | | | | 20,599 | | | | 6,275 | | |
| Guardian Fund Institutional Class | | | 0.75 | % | | 8/31/13 | | | — | | | | 603 | (11) | | | 1,361 | | |
| Guardian Fund Class A | | | 1.11 | % | | 8/31/13 | | | — | | | | 633 | (11) | | | 2,942 | | |
| Guardian Fund Class C | | | 1.86 | % | | 8/31/13 | | | — | | | | 603 | (11) | | | 1,149 | | |
| Guardian Fund Class R3 | | | 1.36 | % | | 8/31/13 | | | — | | | | 603 | (11) | | | 1,052 | | |
| International Fund Investor Class | | | 1.40 | % | | 8/31/13 | | | — | | | | — | | | | 16,392 | | |
| International Fund Trust Class | | | 2.00 | % | | 8/31/20 | | | — | | | | — | | | | — | | |
| International Institutional Fund Institutional Class | | | 0.85 | %(2) | | 8/31/20 | | | 1,304,181 | | | | 892,834 | | | | 827,327 | | |
| International Large Cap Fund Trust Class | | | 1.25 | % | | 8/31/13 | | | 51,118 | | | | 118,494 | | | | 84,392 | | |
| International Large Cap Fund Institutional Class | | | 0.90 | % | | 8/31/13 | | | 63,922 | | | | 259,193 | | | | 181,331 | | |
| International Large Cap Fund Class A | | | 1.30 | %(2) | | 8/31/13 | | | 1,930 | (3) | | | 15,881 | | | | 15,818 | | |
| International Large Cap Fund Class C | | | 2.00 | % | | 8/31/13 | | | 1,475 | (3) | | | 3,157 | | | | 2,975 | | |
| International Large Cap Fund Class R3 | | | 1.51 | % | | 8/31/13 | | | — | | | | 642 | (11) | | | 1,177 | | |
| Intrinsic Value Fund Institutional Class | | | 1.00 | % | | 8/31/13 | | | — | | | | — | | | | 331,673 | (18) | |
| Intrinsic Value Fund Class A | | | 1.36 | % | | 8/31/13 | | | — | | | | — | | | | 2,249 | (18) | |
| Intrinsic Value Fund Class C | | | 2.11 | % | | 8/31/13 | | | — | | | | — | | | | 225 | (18) | |
| Large Cap Disciplined Growth Fund Investor Class | | | 1.11 | %(12) | | 8/31/15 | | | 114,962 | | | | 110,752 | | | | 14,102 | | |
| Large Cap Disciplined Growth Fund Institutional Class | | | 0.75 | % | | 8/31/13 | | | — | | | | 40,802 | (10) | | | 236,837 | | |
| Large Cap Disciplined Growth Fund Class A | | | 1.11 | % | | 8/31/13 | | | — | | | | 120,878 | (10) | | | 79,451 | | |
| Large Cap Disciplined Growth Fund Class C | | | 1.86 | % | | 8/31/13 | | | — | | | | 57,300 | (10) | | | 46,889 | | |
| Large Cap Disciplined Growth Fund Class R3 | | | 1.36 | % | | 8/31/13 | | | — | | | | 679 | (11) | | | 1,123 | | |
| Mid Cap Growth Fund Trust Class | | | 1.50 | % | | 8/31/13 | | | — | | | | — | | | | — | | |
| Mid Cap Growth Fund Advisor Class | | | 1.50 | % | | 8/31/20 | | | 21,479 | | | | 12,953 | | | | — | | |
| Mid Cap Growth Fund Institutional Class | | | 0.75 | % | | 8/31/13 | | | 5,692 | | | | 87,923 | | | | 127,686 | | |
| Mid Cap Growth Fund Class A | | | 1.11 | % | | 8/31/13 | | | — | | | | 625 | (11) | | | 6,744 | | |
| | | | | | | Expenses Deferred In Fiscal Period Ending, August 31, | |
| | | | | | | 2008 | | 2009 | | 2010 | |
| | | | | | | Subject to Repayment until August 31, | |
| Class | | Contractual Expense Limitation(1) | | Expiration | | 2011 | | 2012 | | 2013 | |
| Mid Cap Growth Fund Class C | | | 1.86 | % | | 8/31/13 | | $ | — | | | $ | 613 | (11) | | $ | 1,365 | | |
| Mid Cap Growth Fund Class R3 | | | 1.36 | % | | 8/31/13 | | | — | | | | 613 | (11) | | | 1,110 | | |
| Multi-Cap Opportunities Fund Institutional Class | | | 1.00 | %(14) | 8/31/13 | | | 94,587 | | | | 146,100 | | | | 218,745 | (16) | |
| Multi-Cap Opportunities Fund Class A | | | 1.36 | % | | 8/31/13 | | | — | | | | — | | | | 3,135 | (13) | |
| Multi-Cap Opportunities Fund Class C | | | 2.11 | % | | 8/31/13 | | | — | | | | — | | | | 1,973 | (13) | |
| Partners Fund Trust Class | | | 1.50 | % | | 8/31/13 | | | — | | | | — | | | | — | | |
| Partners Fund Advisor Class | | | 1.50 | % | | 8/31/20 | | | — | | | | — | | | | — | | |
| Partners Fund Institutional Class | | | 0.70 | % | | 8/31/13 | | | — | | | | — | | | | — | | |
| Partners Fund Class A | | | 1.11 | % | | 8/31/13 | | | — | | | | — | | | | 2,027 | (19) | |
| Partners Fund Class C | | | 1.86 | % | | 8/31/13 | | | — | | | | — | | | | 2,027 | (19) | |
| Partners Fund Class R3 | | | 1.36 | % | | 8/31/13 | | | — | | | | — | | | | 2,029 | (19) | |
| Real Estate Fund Trust Class | | | 1.50 | %(2) | | 8/31/20 | | | 202,213 | | | | 221,579 | | | | 222,429 | | |
| Real Estate Fund Institutional Class | | | 0.85 | % | | 8/31/20 | | | 1,565 | (7) | | | 21,094 | | | | 79,150 | | |
| Real Estate Fund Class A | | | 1.21 | % | | 8/31/13 | | | — | | | | — | | | | 2,145 | (19) | |
| Real Estate Fund Class C | | | 1.96 | % | | 8/31/13 | | | — | | | | — | | | | 2,098 | (19) | |
| Real Estate Fund Class R3 | | | 1.46 | % | | 8/31/13 | | | — | | | | — | | | | 2,066 | (19) | |
| Regency Fund Investor Class | | | 1.50 | % | | 8/31/20 | | | — | | | | — | | | | — | | |
| Regency Fund Trust Class | | | 1.25 | % | | 8/31/20 | | | 64,085 | | | | 110,510 | | | | 80,831 | | |
| Regency Fund Institutional Class | | | 0.85 | % | | 8/31/13 | | | — | | | | — | | | | 576 | (17) | |
| Regency Fund Class A | | | 1.21 | % | | 8/31/13 | | | — | | | | — | | | | 2,050 | (19) | |
| Regency Fund Class C | | | 1.96 | % | | 8/31/13 | | | — | | | | — | | | | 2,052 | (19) | |
| Regency Fund Class R3 | | | 1.46 | % | | 8/31/13 | | | — | | | | — | | | | 2,055 | (19) | |
| Select Equities Fund Institutional Class | | | 0.75 | % | | 8/31/13 | | | 204,528 | (3) | | | 37,421 | | | | 61,415 | | |
| Select Equities Fund Class A | | | 1.20 | % | | 8/31/13 | | | 36,737 | (3) | | | 191,995 | | | | 176,836 | | |
| Select Equities Fund Class C | | | 1.95 | % | | 8/31/13 | | | 10,276 | (3) | | | 28,856 | | | | 43,830 | | |
| Small Cap Growth Fund Investor Class | | | 1.30 | %(2) | | 8/31/20 | | | 167,399 | | | | 307,973 | | | | 282,612 | | |
| Small Cap Growth Fund Trust Class | | | 1.40 | %(2) | | 8/31/20 | | | 61,978 | | | | 89,143 | | | | 99,170 | | |
| Small Cap Growth Fund Advisor Class | | | 1.60 | % | | 8/31/20 | | | 36,185 | | | | 39,339 | | | | 34,476 | | |
| Small Cap Growth Fund Institutional Class | | | 0.90 | % | | 8/31/13 | | | 3,615 | (5) | | | 38,496 | | | | 184,678 | | |
| Small Cap Growth Fund Class A | | | 1.26 | % | | 8/31/13 | | | — | | | | 702 | (11) | | | 2,900 | | |
| Small Cap Growth Fund Class C | | | 2.01 | % | | 8/31/13 | | | — | | | | 685 | (11) | | | 1,618 | | |
| Small Cap Growth Fund Class R3 | | | 1.51 | % | | 8/31/13 | | | — | | | | 678 | (11) | | | 1,636 | | |
| Socially Responsive Fund Trust Class | | | 1.50 | % | | 8/31/13 | | | — | | | | — | | | | — | | |
| Socially Responsive Fund Institutional Class | | | 0.75 | % | | 8/31/13 | | | 8,868 | (4) | | | 18,282 | | | | 20,190 | | |
| Socially Responsive Fund Class A | | | 1.11 | % | | 8/31/13 | | | — | | | | 628 | (11) | | | 5,979 | | |
| Socially Responsive Fund Class C | | | 1.86 | % | | 8/31/13 | | | — | | | | 603 | (11) | | | 2,285 | | |
| Socially Responsive Fund Class R3 | | | 1.36 | % | | 8/31/13 | | | — | | | | 601 | (11) | | | 1,161 | | |
| (1) | Expense limitation per annum of the respective class' average daily net assets. |
| | |
| (2) | In addition, Management has voluntarily undertaken to forgo current payment of fees and/or reimburse the Institutional Class of International Institutional, Class A of International Large Cap, the Trust Class of Real Estate, the Investor Class of Small Cap Growth and the Trust Class of Small Cap Growth, so that their Operating Expenses are limited to 0.80%, 1.24%, 0.99%, 1.15% and 1.37%, respectively, per annum of their average daily net assets. For the year ended August 31, 2010, voluntary reimbursements for the Institutional Class of International Institutional, Class A of International Large Cap, the Trust Class of Real Estate, the Investor Class of Small Cap Growth and the Trust Class of Small Cap Growth, amounted to $106,754, $4,445, $448,671, $478,711 and $ 13,740, respectively. This undertaking, which is terminable by Management upon notice to International Institutional, International Large Cap, Real Estate and Small Cap Growth, is in addition to the contractual undertaking as stated above. |
| | |
| (3) | Period from December 20, 2007 (Commencement of Operations) to August 31, 2008. |
| | |
| (4) | Period from November 28, 2007 (Commencement of Operations) to August 31, 2008. |
| | |
| (5) | Period from April 1, 2008 (Commencement of Operations) to August 31, 2008. |
| | |
| (6) | Period from May 1, 2008 (Commencement of Operations) to August 31, 2008. |
| | |
| (7) | Period from June 4, 2008 (Commencement of Operations) to August 31, 2008. |
| | |
| (8) | Period from June 9, 2008 (Commencement of Operations) to August 31, 2008. |
| | |
| (9) | Period from October 8, 2008 (Commencement of Operations) to August 31, 2009. |
| | |
| (10) | Period from April 6, 2009 (Commencement of Operations) to August 31, 2009. |
| | |
| (11) | Period from May 27, 2009 (Commencement of Operations) to August 31, 2009. |
| | |
| (12) | Expense limitation was 1.50% until April 13, 2009. |
| | |
| (13) | Period from December 21, 2009 (Commencement of Operations) to August 31, 2010. |
| | |
| (14) | From December 14, 2009 to December 20, 2009, the contractual expense limitation was 1.25% for Trust Class. In addition, Management voluntarily limited Operating Expenses of Trust Class to 1.00% per annum of average daily net assets for the same period. For the year ended August 31, 2010, the voluntary reimbursement amounted to $86. |
| (15) | On June 9, 2008, Equity Income's Trust Class was converted into the Fund's Institutional Class. The financial information of the Fund's Institutional Class includes the financial information of Trust Class shares. |
| (16) | On December 21, 2009, Multi-Cap Opportunities' Trust Class was converted into the Fund's Institutional Class. The financial information of the Fund's Institutional Class includes the financial information of Trust Class shares. |
| (17) | Period from March 8, 2010 (Commencement of Operations) to August 31, 2010. |
| (18) | Period from May 10, 2010 (Commencement of Operations) to August 31, 2010. |
| | |
| (19) | Period from June 21, 2010 (Commencement of Operations) to August 31, 2010. Neuberger Berman LLC ("Neuberger") is retained by Management to furnish it with investment recommendations and research information without added cost to the Funds. Several individuals who are officers and/or Trustees of the Trust are also employees of Neuberger and/or Management. On May 4, 2009, NBSH Acquisition, LLC ("NBSH"), an entity organized by key members of Neuberger Berman's senior management, acquired a majority interest in Neuberger Berman's business and the fixed income and certain alternative asset management businesses of Lehman Brothers Holdings Inc.'s ("LBHI") Investment Management Division (together with Neuberger Berman, the "Acquired Businesses") (the "Acquisition"). Prior to that date, the predecessor of Management and Neuberger were wholly owned subsidiaries of LBHI. On September 15, 2008, LBHI filed a voluntary petition under Chapter 11 of the U.S. Bankruptcy Code, and on December 22, 2008, the |
| | bankruptcy court having jurisdiction over the LBHI matter approved the sale of the Acquired Businesses to NBSH (or its successor or assign), as the successful bidder in a public auction. The Acquired Businesses are now indirectly owned by, among others, portfolio managers, Neuberger Berman's management team, and certain key members and senior professionals who are employed in various parts of the Neuberger Berman complex of companies, with a minority interest retained by LBHI and certain affiliates of LBHI. The closing of the Acquisition resulted in an "assignment" of the Funds' Management Agreement and Sub-Advisory Agreement. Such an assignment, by law, automatically terminated those agreements. Accordingly, prior t o the closing, the Board, including the Trustees who are not "interested persons" of the Funds' investment manager and its affiliates or the Funds, considered and approved a new Management Agreement and a new Sub-Advisory Agreement for the Funds. The new agreements, which are virtually identical to those previously in effect, were also approved by a vote of the Funds' shareholders. These events have not had a material impact on the Funds or their operations. Management and Neuberger continue to operate in the ordinary course of business as the investment manager and sub-adviser, respectively, of the Funds. Each class of shares has a distribution agreement with Management. Class A shares of each Fund are generally sold with an initial sales charge of up to 5.75% and no contingent deferred sales charge, except that a charge of 1.00% will apply to certain redemptions made within 18 months following purchases of $1 million or more without an initial sales charge. Class C shares are sold with no initial sales charge and a 1.00% contingent deferred sales charge ("CDSC") if shares are sold within one year after purchase. For the year ended August 31, 2009, Emerging Markets Equity and Socially Responsive each recorded capital contributions from Management in the amounts of $1,418 and $422, respectively. These amounts were paid in connection with losses outside each Fund's direct control incurred in the execution of a trade. For the year ended August 31, 2010, Management, acting as underwriter and broker-dealer, received net commissions from the sale of Class A and Class C shares and CDSCs from the redemptions of Class A and Class C shares as follows: |
| | | Underwriter Net Commissions | | CDSC | | Broker-Dealer Net Commissions | | CDSC | |
| Climate Change Fund Class A | | $ | 2,065 | | | $ | — | | | $ | — | | | $ | — | | |
| Climate Change Fund Class C | | | — | | | | 79 | | | | — | | | | — | | |
| Emerging Markets Equity Fund Class A | | | 2,395 | | | | — | | | | — | | | | — | | |
| Emerging Markets Equity Fund Class C | | | — | | | | 315 | | | | — | | | | — | | |
| Equity Income Fund Class A | | | 78,930 | | | | — | | | | — | | | | — | | |
| Equity Income Fund Class C | | | — | | | | 11,607 | | | | — | | | | — | | |
| Focus Fund Class A | | | — | | | | — | | | | — | | | | — | | |
| Focus Fund Class C | | | — | | | | — | | | | — | | | | — | | |
| Guardian Fund Class A | | | 1,356 | | | | — | | | | — | | | | — | | |
| Guardian Fund Class C | | | — | | | | 628 | | | | — | | | | — | | |
| International Large Cap Fund Class A | | | 1,470 | | | | 180 | | | | — | | | | — | | |
| International Large Cap Fund Class C | | | — | | | | 128 | | | | — | | | | — | | |
| Intrinsic Value Fund Class A | | | — | | | | — | | | | — | | | | — | | |
| Intrinsic Value Fund Class C | | | — | | | | — | | | | — | | | | — | | |
| Large Cap Disciplined Growth Fund Class A | | | 19,960 | | | | — | | | | — | | | | — | | |
| Large Cap Disciplined Growth Fund Class C | | | — | | | | 10,559 | | | | — | | | | — | | |
| Mid Cap Growth Fund Class A | | | 825 | | | | — | | | | — | | | | — | | |
| Mid Cap Growth Fund Class C | | | — | | | | 636 | | | | — | | | | — | | |
| | | Underwriter Net Commissions | | CDSC | | Broker-Dealer Net Commissions | | CDSC | |
| Multi-Cap Opportunities Fund Class A | | $ | — | | | $ | — | | | $ | — | | | $ | — | | |
| Multi-Cap Opportunities Fund Class C | | | — | | | | — | | | | — | | | | — | | |
| Partners Fund Class A | | | — | | | | — | | | | — | | | | — | | |
| Partners Fund Class C | | | — | | | | — | | | | — | | | | — | | |
| Real Estate Fund Class A | | | 766 | | | | — | | | | — | | | | — | | |
| Real Estate Fund Class C | | | — | | | | — | | | | — | | | | — | | |
| Regency Fund Class A | | | — | | | | — | | | | — | | | | — | | |
| Regency Fund Class C | | | — | | | | — | | | | — | | | | — | | |
| Select Equities Fund Class A | | | 14,374 | | | | — | | | | — | | | | — | | |
| Select Equities Fund Class C | | | — | | | | 4,621 | | | | — | | | | — | | |
| Small Cap Growth Fund Class A | | | 231 | | | | — | | | | — | | | | — | | |
| Small Cap Growth Fund Class C | | | — | | | | 40 | | | | — | | | | — | | |
| Socially Responsive Fund Class A | | | 11,844 | | | | — | | | | — | | | | — | | |
| Socially Responsive Fund Class C | | | — | | | | 1,219 | | | | — | | | | — | | |
| | Each Fund has an expense offset arrangement in connection with its custodian contract. For the year ended August 31, 2010, the impact of this arrangement was a reduction of expenses of $2, $7, $224, $26, $327, $25, $16, $13, $1, $4, $18, $2, $7, $151, $7, $24, $11, $16 and $64 for Climate Change, Emerging Markets Equity, Equity Income, Focus, Genesis, Guardian, International, International Institutional, International Large Cap, Intrinsic Value, Large Cap Di sciplined Growth, Mid Cap Growth, Multi-Cap Opportunities, Partners, Real Estate, Regency, Select Equities, Small Cap Growth, and Socially Responsive, respectively. |
Note C—Securities Transactions:
| | During the year ended August 31, 2010, there were purchase and sale transactions (excluding short-term securities and option contracts) as follows: |
| (000's omitted) | | Purchases | | Sales | | (000's omitted) | | Purchases | | Sales | |
| Climate Change | | $ | 6,312 | | | $ | 6,964 | | | Large Cap Disciplined Growth | | $ | 587,731 | | | $ | 286,479 | | |
| Emerging Markets Equity | | | 14,745 | | | | 7,715 | | | Mid Cap Growth | | | 318,179 | | | | 388,119 | | |
| Equity Income | | | 267,834 | | | | 42,917 | | | Multi-Cap Opportunities | | | 59,796 | | | | 13,368 | | |
| Focus | | | 496,302 | | | | 541,577 | | | Partners | | | 1,061,159 | | | | 1,379,180 | | |
| Genesis | | | 1,399,348 | | | | 1,961,439 | | | Real Estate | | | 127,029 | | | | 70,282 | | |
| Guardian | | | 348,567 | | | | 416,715 | | | Regency | | | 116,487 | | | | 55,727 | | |
| International | | | 224,729 | | | | 315,475 | | | Select Equities | | | 91,122 | | | | 73,615 | | |
| International Institutional | | | 103,472 | | | | 167,481 | | | Small Cap Growth | | | 533,362 | | | | 552,604 | | |
| International Large Cap | | | 120,566 | | | | 52,559 | | | Socially Responsive | | | 439,296 | | | | 429,316 | | |
| Intrinsic Value | | | 90,979 | | | | 16,680 | | | | | | | | | | | | |
| | During the year ended August 31, 2010, no brokerage commissions on securities transactions were paid to affiliated brokers. |
Note D—Fund Share Transactions:
| | Share activity for the years ended August 31, 2010 and August 31, 2009 was as follows: |
| | | For the Year Ended August 31, 2010 | | For the Year Ended August 31, 2009 | |
| (000's omitted) | | Shares Sold | | Shares Issued on Reinvestment of Dividends and Distributions and Conversions | | Shares Redeemed | | Total | | Shares Sold | | Shares Issued on Reinvestment of Dividends and Distributions and Conversions/ Acquisitions | | Shares Redeemed | | Total | |
| Climate Change: | | | | | | | | | | | | | | | | | | | | | | | | | | | | | | |
| Institutional Class | | | 63 | | | | 1 | | | | (242 | ) | | | (178 | ) | | | — | | | | 10 | | | | — | | | | 10 | | |
| Class A | | | 133 | | | | — | | | | (99 | ) | | | 34 | | | | 139 | | | | 8 | | | | (141 | ) | | | 6 | | |
| Class C | | | 65 | | | | — | | | | (18 | ) | | | 47 | | | | 20 | | | | 1 | | | | (1 | ) | | | 20 | | |
Emerging Markets Equity: | | | | | | | | | | | | | | | | | | |
| Institutional Class | | | 275 | | | | 21 | | | | (11 | ) | | | 285 | | | | 280 | | | | 8 | | | | — | | | | 288 | (1) | |
| Class A | | | 314 | | | | 9 | | | | (101 | ) | | | 222 | | | | 141 | | | | — | | | | (11 | ) | | | 130 | (1) | |
| Class C | | | 8 | | | | 1 | | | | (15 | ) | | | (6 | ) | | | 21 | | | | — | | | | (5 | ) | | | 16 | (1) | |
Class R3(11) | | | 2 | | | | — | | | | — | | | | 2 | | | | — | | | | — | | | | — | | | | — | | |
| Equity Income: | | | | | | | | | | | | | | | | | | | | | | | | | | | |
| Institutional Class | | | 9,207 | | | | 69 | | | | (1,371 | ) | | | 7,905 | | | | 2,171 | | | | 8 | | | | (537 | ) | | | 1,642 | | |
| Class A | | | 14,455 | | | | 209 | | | | (1,926 | ) | | | 12,738 | | | | 4,424 | | | | 82 | | | | (1,777 | ) | | | 2,729 | | |
| Class C | | | 4,115 | | | | 14 | | | | (205 | ) | | | 3,924 | | | | 488 | | | | 2 | | | | (112 | ) | | | 378 | | |
Class R3(11) | | | 3 | | | | — | | | | — | | | | 3 | | | | — | | | | — | | | | — | | | | — | | |
| Focus: | | | | | | | | | | | | | | | | | | | | | | | | | | | | | | | | | |
| Investor Class | | | 397 | | | | 214 | | | | (3,411 | ) | | | (2,800 | ) | | | 516 | | | | 4,798 | | | | (4,831 | ) | | | 483 | | |
| Trust Class | | | 278 | | | | 14 | | | | (637 | ) | | | (345 | ) | | | 516 | | | | 372 | | | | (1,213 | ) | | | (325 | ) | |
| Advisor Class | | | 150 | | | | 11 | | | | (421 | ) | | | (260 | ) | | | 179 | | | | 207 | | | | (491 | ) | | | (105 | ) | |
Institutional Class(11) | | | 2 | | | | — | | | | — | | | | 2 | | | | — | | | | — | | | | — | | | | — | | |
Class A(11) | | | 2 | | | | — | | | | — | | | | 2 | | | | — | | | | — | | | | — | | | | — | | |
Class C(11) | | | 3 | | | | — | | | | — | | | | 3 | | | | — | | | | — | | | | — | | | | — | | |
| Genesis: | | | | | | | | | | | | | | | | | | | | | | | |
| Investor Class | | | 13,475 | | | | — | | | | (13,108 | ) | | | 367 | | | | 14,600 | | | | 3,788 | | | | (19,983 | ) | | | (1,595 | ) | |
| Trust Class | | | 13,829 | | | | — | | | | (25,904 | ) | | | (12,075 | ) | | | 22,236 | | | | 5,511 | | | | (30,734 | ) | | | (2,987 | ) | |
| Advisor Class | | | 6,994 | | | | — | | | | (6,531 | ) | | | 463 | | | | 6,679 | | | | 1,116 | | | | (8,651 | ) | | | (856 | ) | |
| Institutional Class | | | 26,505 | | | | — | | | | (26,384 | ) | | | 121 | | | | 21,974 | | | | 5,954 | | | | (29,770 | ) | | | (1,842 | ) | |
| Guardian: | | | | | | | | | | | | | | | | | | | | | | |
| Investor Class | | | 2,335 | | | | 364 | | | | (8,655 | ) | | | (5,956 | ) | | | 4,085 | | | | 10,268 | | | | (11,403 | ) | | | 2,950 | | |
| Trust Class | | | 1,920 | | | | 43 | | | | (1,660 | ) | | | 303 | | | | 1,529 | | | | 1,140 | | | | (2,509 | ) | | | 160 | | |
| Advisor Class | | | 8 | | | | — | | | | (15 | ) | | | (7 | ) | | | 22 | | | | 7 | | | | (32 | ) | | | (3 | ) | |
| Institutional Class | | | 376 | | | | — | | | | (26 | ) | | | 350 | | | | 5 | | | | — | | | | — | | | | 5 | (3) | |
| Class A | | | 599 | | | | 1 | | | | (280 | ) | | | 320 | | | | 58 | | | | — | | | | — | | | | 58 | (3) | |
| Class C | | | 36 | | | | — | | | | (6 | ) | | | 30 | | | | 5 | | | | — | | | | — | | | | 5 | (3) | |
| Class R3 | | | — | | | | — | | | | — | | | | — | | | | 5 | | | | — | | | | — | | | | 5 | (3) | |
| International: | | | | | | | | | | | | | | | | | | | | | | | | | |
| Investor Class | | | 514 | | | | 162 | | | | (4,164 | ) | | | (3,488 | ) | | | 1,634 | | | | 516 | | | | (9,747 | ) | | | (7,597 | ) | |
| Trust Class | | | 1,147 | | | | 125 | | | | (4,551 | ) | | | (3,279 | ) | | | 2,448 | | | | 445 | | | | (10,990 | ) | | | (8,097 | ) | |
| | | For the Year Ended August 31, 2010 | | For the Year Ended August 31, 2009 | |
| (000's omitted) | | Shares Sold | | Shares Issued on Reinvestment of Dividends and Distributions and Conversions | | Shares Redeemed | | Total | | Shares Sold | | Shares Issued on Reinvestment of Dividends and Distributions and Conversions/ Acquisitions | | Shares Redeemed | | Total | |
International Institutional: | | | | | | | | | | | | | | | | | | | | | | | | | | | | | |
| Institutional Class | | | 2,424 | | | | 388 | | | | (11,797 | ) | | | (8.985 | ) | | | 6,536 | | | | 1,685 | | | | (20,306 | ) | | | (12,085 | ) | |
International Large Cap: | | | | | | | | | | | | | | | | | | | | | | | | | | |
| Trust Class | | | 546 | | | | 38 | | | | (895 | ) | | | (311 | ) | | | 1,543 | | | | 131 | | | | (3,123 | ) | | | (1,449 | ) | |
| Institutional Class | | | 7,475 | | | | 118 | | | | (563 | ) | | | 7,030 | | | | 478 | | | | 361 | | | | (3,577 | ) | | | (2,738 | ) | |
| Class A | | | 829 | | | | 8 | | | | (225 | ) | | | 612 | | | | 306 | | | | 8 | | | | (20 | ) | | | 294 | | |
| Class C | | | 149 | | | | — | | | | (15 | ) | | | 134 | | | | 39 | | | | — | | | | — | | | | 39 | | |
| Class R3 | | | — | | | | — | | | | — | | | | — | | | | 7 | | | | — | | | | — | | | | 7 | (3) | |
| Intrinsic Value: | | | | | | | | | | | | | | | | | | | | | | | | | | | |
Institutional Class(10) | | | 313 | | | | 9,297 | | | | (1,012 | ) | | | 8,598 | | | | — | | | | — | | | | — | | | | — | | |
Class A(10) | | | 72 | | | | — | | | | (5 | ) | | | 67 | | | | — | | | | — | | | | — | | | | — | | |
Class C(10) | | | 5 | | | | — | | | | — | | | | 5 | | | | — | | | | — | | | | — | | | | — | | |
Large Cap Disciplined Growth: | | | | | | | | | | | | | | | | | | | | | | | |
| Investor Class | | | 490 | | | | 1 | | | | (594 | ) | | | (103 | ) | | | 884 | | | | 40 | (4) | | | (592 | ) | | | 332 | | |
| Institutional Class | | | 59,000 | | | | 29 | | | | (6,979 | ) | | | 52,050 | | | | 3,604 | | | | 606 | (5) | | | (351 | ) | | | 3,859 | (2) | |
| Class A | | | 6,177 | | | | — | | | | (11,372 | ) | | | (5,195 | ) | | | 5,234 | | | | 5,829 | (4)(5) | | | (521 | ) | | | 10,542 | (2) | |
| Class C | | | 2,139 | | | | — | | | | (1,374 | ) | | | 765 | | | | 1,377 | | | | 3,092 | (5) | | | (176 | ) | | | 4,293 | (2) | |
| Class R3 | | | — | | | | — | | | | — | | | | — | | | | 9 | | | | — | | | | — | | | | 9 | (3) | |
| Mid Cap Growth: | | | | | | | | | | | | | | | | | | | | | | | |
| Investor Class | | | 847 | | | | — | | | | (4,497 | ) | | | (3,650 | ) | | | 2,627 | | | | — | | | | (6,426 | ) | | | (3,799 | ) | |
| Trust Class | | | 823 | | | | — | | | | (572 | ) | | | 251 | | | | 1,431 | | | | — | | | | (791 | ) | | | 640 | | |
| Advisor Class | | | 152 | | | | — | | | | (332 | ) | | | (180 | ) | | | 493 | | | | — | | | | (117 | ) | | | 376 | | |
| Institutional Class | | | 15,725 | | | | — | | | | (21,102 | ) | | | (5,377 | ) | | | 16,738 | | | | — | | | | (2,515 | ) | | | 14,223 | | |
| Class A | | | 1,161 | | | | — | | | | (110 | ) | | | 1,051 | | | | 11 | | | | — | | | | — | | | | 11 | (3) | |
| Class C | | | 17 | | | | — | | | | (5 | ) | | | 12 | | | | 5 | | | | — | | | | — | | | | 5 | (3) | |
| Class R3 | | | — | | | | — | | | | — | | | | — | | | | 5 | | | | — | | | | — | | | | 5 | (3) | |
Multi-Cap Opportunities: | | | | | | | | | | | | | | | | | | | | | | | |
| Trust Class | | | — | | | | (211 | )(6) | | | (182 | ) | | | (393 | ) | | | — | | | | 10 | | | | (123 | ) | | | (113 | ) | |
| Institutional Class | | | 6,158 | | | | 215 | (6) | | | (499 | ) | | | 5,874 | (7) | | | — | | | | — | | | | — | | | | — | | |
| Class A | | | 60 | | | | — | | | | (23 | ) | | | 37 | (8) | | | — | | | | — | | | | — | | | | — | | |
| Class C | | | 8 | | | | — | | | | — | | | | 8 | (8) | | | — | | | | — | | | | — | | | | — | | |
| Partners: | | | | | | | | | | | | | | | | | | | | | | |
| Investor Class | | | 5,735 | | | | 321 | | | | (13,771 | ) | | | (7,715 | ) | | | 7,189 | | | | 1,509 | | | | (22,895 | ) | | | (14,197 | ) | |
| Trust Class | | | 5,401 | | | | 211 | | | | (10,556 | ) | | | (4,944 | ) | | | 7,840 | | | | 873 | | | | (16,496 | ) | | | (7,783 | ) | |
| Advisor Class | | | 4,494 | | | | 157 | | | | (7,578 | ) | | | (2,927 | ) | | | 9,828 | | | | 604 | | | | (13,107 | ) | | | (2,675 | ) | |
| Institutional Class | | | 1,718 | | | | 50 | | | | (2,456 | ) | | | (688 | ) | | | 4,445 | | | | 161 | | | | (2,989 | ) | | | 1,617 | | |
Class A(11) | | | 2 | | | | — | | | | — | | | | 2 | | | | — | | | | — | | | | — | | | | — | | |
Class C(11) | | | 2 | | | | — | | | | — | | | | 2 | | | | — | | | | — | | | | — | | | | — | | |
Class R3(11) | | | 2 | | | | — | | | | — | | | | 2 | | | | — | | | | — | | | | — | | | | — | | |
| | | For the Year Ended August 31, 2010 | | For the Year Ended August 31, 2009 | |
| (000's omitted) | | Shares Sold | | Shares Issued on Reinvestment of Dividends and Distributions and Conversions | | Shares Redeemed | | Total | | Shares Sold | | Shares Issued on Reinvestment of Dividends and Distributions and Conversions/ Acquisitions | | Shares Redeemed | | Total | |
| Real Estate: | | | | | | | | | | | | | | | | | | | | | | | | | | | | | | | | | |
| Trust Class | | | 8,592 | | | | 198 | | | | (4,549 | ) | | | 4,241 | | | | 6,708 | | | | 317 | | | | (3,859 | ) | | | 3,166 | | |
| Institutional Class | | | 1,996 | | | | 5 | | | | (227 | ) | | | 1,774 | | | | 382 | | | | 1 | | | | (115 | ) | | | 268 | | |
Class A(11) | | | 53 | | | | — | | | | — | | | | 53 | | | | — | | | | — | | | | — | | | | — | | |
Class C(11) | | | 13 | | | | — | | | | — | | | | 13 | | | | — | | | | — | | | | — | | | | — | | |
Class R3(11) | | | 3 | | | | — | | | | — | | | | 3 | | | | — | | | | — | | | | — | | | | — | | |
| Regency: | | | | | | | | | | | | | | | | | | | | | | | | | | | | | | | | | |
| Investor Class | | | 2,177 | | | | 26 | | | | (1,599 | ) | | | 604 | | | | 1,039 | | | | 313 | | | | (2,662 | ) | | | (1,310 | ) | |
| Trust Class | | | 7,539 | | | | 23 | | | | (2,802 | ) | | | 4,760 | | | | 1,927 | | | | 243 | | | | (3,425 | ) | | | (1,255 | ) | |
Institutional Class(9) | | | 79 | | | | — | | | | (22 | ) | | | 57 | | | | — | | | | — | | | | — | | | | — | | |
Class A(11) | | | 3 | | | | — | | | | — | | | | 3 | | | | — | | | | — | | | | — | | | | — | | |
Class C(11) | | | 3 | | | | — | | | | — | | | | 3 | | | | — | | | | — | | | | — | | | | — | | |
Class R3(11) | | | 3 | | | | — | | | | — | | | | 3 | | | | — | | | | — | | | | — | | | | — | | |
| Select Equities: | | | | | | | | | | | | | | | | | | | | | | | | | | | | | | | | | |
| Institutional Class | | | 2,067 | | | | 22 | | | | (678 | ) | | | 1,411 | | | | 828 | | | | — | | | | (271 | ) | | | 557 | | |
| Class A | | | 3,672 | | | | 79 | | | | (3,697 | ) | | | 54 | | | | 5,673 | | | | 4 | | | | (1,448 | ) | | | 4,229 | | |
| Class C | | | 767 | | | | 15 | | | | (216 | ) | | | 566 | | | | 883 | | | | 1 | | | | (33 | ) | | | 851 | | |
| Small Cap Growth: | | | | | | | | | | | | | | | | | | | | | | | | | | | | |
| Investor Class | | | 4,760 | | | | — | | | | (10,205 | ) | | | (5,445 | ) | | | 6,629 | | | | — | | | | (9,065 | ) | | | (2,436 | ) | |
| Trust Class | | | 493 | | | | — | | | | (1,455 | ) | | | (962 | ) | | | 1,985 | | | | — | | | | (1,695 | ) | | | 290 | | |
| Advisor Class | | | 376 | | | | — | | | | (615 | ) | | | (239 | ) | | | 842 | | | | — | | | | (658 | ) | | | 184 | | |
| Institutional Class | | | 6,230 | | | | — | | | | (788 | ) | | | 5,442 | | | | 420 | | | | — | | | | (93 | ) | | | 327 | | |
| Class A | | | 41 | | | | — | | | | (15 | ) | | | 26 | | | | 6 | | | | — | | | | — | | | | 6 | (3) | |
| Class C | | | 6 | | | | — | | | | — | | | | 6 | | | | 7 | | | | — | | | | — | | | | 7 | (3) | |
| Class R3 | | | — | | | | — | | | | — | | | | — | | | | 6 | | | | — | | | | — | | | | 6 | (3) | |
| Socially Responsive: | | | | | | | | | | | | | | | | | | | | | | | | | | | |
| Investor Class | | | 3,415 | | | | 85 | | | | (7,056 | ) | | | (3,556 | ) | | | 7,280 | | | | 655 | | | | (8,878 | ) | | | (943 | ) | |
| Trust Class | | | 5,954 | | | | 85 | | | | (4,734 | ) | | | 1,305 | | | | 7,075 | | | | 500 | | | | (5,031 | ) | | | 2,544 | | |
| Institutional Class | | | 4,654 | | | | 19 | | | | (713 | ) | | | 3,960 | | | | 1,742 | | | | 78 | | | | (609 | ) | | | 1,211 | | |
| Class A | | | 870 | | | | 1 | | | | (72 | ) | | | 799 | | | | 90 | | | | — | | | | (5 | ) | | | 85 | (3) | |
| Class C | | | 244 | | | | — | | | | (13 | ) | | | 231 | | | | 7 | | | | — | | | | — | | | | 7 | (3) | |
| Class R3 | | | 12 | | | | — | | | | — | | | | 12 | | | | 4 | | | | — | | | | — | | | | 4 | (3) | |
| (1) | Period from October 8, 2008 (Commencement of Operations) to August 31, 2009. |
| | |
| (2) | Period from April 6, 2009 (Commencement of Operations) to August 31, 2009. |
| (3) | Period from May 27, 2009 (Commencement of Operations) to August 31, 2009. |
| (4) | Approximately 40,000 Investor Class shares were issued in connection with conversion of approximately 40,000 Class A shares (see Note H). |
| (5) | Approximately 606,000 of Institutional Class shares, 5,869,000 of Class A shares, and 3,092,000 of Class C shares were issued in connection with the acquisition of Large Cap Disciplined Growth Fund for approximately 488,000 |
| | of Acquired Fund's Institutional Class shares, 4,752,000 of Acquired Fund's Class A shares, and 2,524,000 of Acquired Fund's Class C shares (see Note H). |
| | |
| (6) | Approximately 215,000 Institutional Class shares were issued in connection with conversion of approximately 215,000 Trust Class shares (see Note H). |
| (7) | On December 21, 2009, Multi-Cap Opportunities' Trust Class was converted into the Fund's Institutional Class. |
| (8) | Period from December 21, 2009 (Commencement of Operations) to August 31, 2010. |
| (9) | Period from March 8, 2010 (Commencement of Operations) to August 31, 2010. |
| | |
| (10) | Period from May 10, 2010 (Commencement of Operations) to August 31, 2010. |
| | |
| (11) | Period from June 21, 2010 (Commencement of Operations) to August 31, 2010. |
Note E—Lines of Credit:
| | At August 31, 2010, each Fund (except Intrinsic Value and Multi-Cap Opportunities) was a participant in a single committed, unsecured $150,000,000 line of credit with State Street, to be used only for temporary or emergency purposes. As of September 17, 2010, the line of credit was increased to $200,000,000 and Intrinsic Value and Multi-Cap Opportunities became participants in the line of credit. Other investment companies managed by Management also participate in this line of credit on the same terms. Interest is charged on borrowings under this line of credit at the higher of (a) the Federal Funds Rate plus 1.25% per annum or (b) the Overnight LIBOR Rate plus 1.25% per annum. Prior to September 18, 2009, interest was charged on borrowings under this line of credit at the Federal Funds Rate plus 0.50% per annum. A facility fee of 0.15% (prior to September 18, 2009, 0.09% and as of September 17, 2010, 0.125%) per annum of the available line of credit is charged, of which each participating Fund has agreed to pay its pro rata share, based on the ratio of its individual net assets to the net assets of all participants at the time the fee is due and payable. The fee is paid quarterly in arrears. Because several mutual funds participate, there is no assurance that an individual Fund will have access to all or any part of the $150,000,000 (as of September 17, 2010, $200,000,000) at any particular time. There were no loans outstanding pursuant to this line of credit at August 31, 2010. During the year ended August 31, 2010, none of the Funds utilized this line of credit. At August 31, 2010, International, International Institutional and International Large Cap were participants in a single uncommitted, secured $100,000,000 line of credit with State Street to be used only for temporary or emergency purposes or for leverage. Another investment company managed by Management also participates in this line of credit on the same terms. Interest is charged at LIBOR, or the overnight Federal Funds Rate, plus a spread to be determined at the time of borrowing. Because several mutual funds participate, there is no assurance that a Fund will have access to all or any part of the $100,000,000 at any particular time. International, International Institutional and International Large Cap had no loans outstanding pursuant to this line of credit at August 31, 2010. During the year ended August 31, 2010, International, International Institutional, and International Large Cap did not utilize this line of credit. |
Note F—Investments In Affiliates*:
| | | Balance of Shares Held August 31, 2009 | | Gross Purchases and Additions | | Gross Sales and Reductions | | Balance of Shares Held August 31, 2010 | | Value August 31, 2010 | | Income from Investments in Affiliated Issuers Included in Total Income | |
| Focus | |
Neuberger Berman Securities Lending Quality Fund, LLC*** | | | 46,141,223 | | | | 42,310,597 | | | | 88,451,820 | | | | — | | | | | | | | | | |
| | | Balance of Shares Held August 31, 2009 | | Gross Purchases and Additions | | Gross Sales and Reductions | | Balance of Shares Held August 31, 2010 | | Value August 31, 2010 | | Income from Investments in Affiliated Issuers Included in Total Income | |
| Genesis | |
| Alberto-Culver Co.** | | | 5,742,450 | | | | — | | | | 821,500 | | | | 4,920,950 | | | | | | | | | | |
| Alliant Techsystems** | | | 1,746,962 | | | | — | | | | 277,500 | | | | 1,469,462 | | | | 96,837,546 | | | | — | | |
American Medical Systems Holdings | | | 7,874,765 | | | | — | | | | 994,300 | | | �� | 6,880,465 | | | | 125,362,072 | | | | — | | |
| AmSurg Corp. | | | 1,930,734 | | | | — | | | | 98,400 | | | | 1,832,334 | | | | 30,545,008 | | | | — | | |
| AptarGroup Inc. | | | 6,555,400 | | | | — | | | | 89,800 | | | | 6,465,600 | | | | 269,292,240 | | | | 4,113,738 | | |
| Arena Resources** | | | 3,283,628 | | | | — | | | | 3,283,628 | | | | — | | | | — | | | | — | | |
| Astec Industries | | | 1,949,622 | | | | 128,700 | | | | 741,300 | | | | 1,337,022 | | | | 34,361,465 | | | | — | | |
| Blackbaud, Inc. | | | 4,369,503 | | | | — | | | | 247,400 | | | | 4,122,103 | | | | 85,822,184 | | | | 1,845,446 | | |
| Boston Beer | | | 1,019,019 | | | | — | | | | — | | | | 1,019,019 | | | | 66,959,738 | | | | — | | |
| Bucyrus International** | | | 4,385,700 | | | | 39,900 | | | | 2,878,900 | | | | 1,546,700 | | | | 88,919,783 | | | | 325,890 | | |
| CARBO Ceramics | | | 2,217,200 | | | | — | | | | 50,000 | | | | 2,167,200 | | | | 164,122,056 | | | | 1,640,728 | | |
| Carrizo Oil & Gas** | | | 1,681,227 | | | | — | | | | 1,678,770 | | | | 2,457 | | | | 51,499 | | | | — | | |
| Chart Industries** | | | 2,188,928 | | | | — | | | | 1,642,316 | | | | 546,612 | | | | 8,702,063 | | | | — | | |
| Church & Dwight | | | 4,050,055 | | | | — | | | | 179,200 | | | | 3,870,855 | | | | 237,012,452 | | | | 2,344,438 | | |
| CLARCOR Inc. | | | 5,421,622 | | | | — | | | | 343,100 | | | | 5,078,522 | | | | 170,841,480 | | | | 2,111,566 | | |
Compass Minerals International | | | 3,802,000 | | | | — | | | | — | | | | 3,802,000 | | | | 272,793,500 | | | | 5,798,050 | | |
| Dionex Corp. | | | 2,041,532 | | | | — | | | | — | | | | 2,041,532 | | | | 148,011,070 | | | | — | | |
| Exponent, Inc. | | | 1,164,735 | | | | — | | | | — | | | | 1,164,735 | | | | 35,920,427 | | | | — | | |
| Forward Air | | | 2,043,600 | | | | — | | | | 304,900 | | | | 1,738,700 | | | | 41,415,834 | | | | 515,774 | | |
| Haemonetics Corp. | | | 2,660,600 | | | | 30,000 | | | | — | | | | 2,690,600 | | | | 140,126,448 | | | | — | | |
| Harleysville Group | | | 435,980 | | | | 1,010,239 | | | | — | | | | 1,446,219 | | | | 46,105,462 | | | | 1,099,061 | | |
| Healthcare Services Group | | | 3,606,154 | | | | 290,700 | | | | — | | | | 3,896,854 | | | | 80,937,658 | | | | 3,243,363 | | |
| Hibbett Sports | | | 1,864,063 | | | | 52,700 | | | | — | | | | 1,916,763 | | | | 44,430,566 | | | | — | | |
| ICON PLC | | | 3,798,400 | | | | 25,000 | | | | — | | | | 3,823,400 | | | | 84,114,800 | | | | — | | |
| J & J Snack Foods | | | 1,270,946 | | | | — | | | | 25,000 | | | | 1,245,946 | | | | 47,034,462 | | | | 525,735 | | |
| Landauer, Inc. | | | 542,800 | | | | 312,145 | | | | — | | | | 854,945 | | | | 48,047,909 | | | | 1,509,968 | | |
| Layne Christensen | | | 2,240,321 | | | | — | | | | 455,200 | | | | 1,785,121 | | | | 44,395,959 | | | | — | | |
| Lindsay Corp. | | | 1,342,250 | | | | — | | | | 87,700 | | | | 1,254,550 | | | | 46,255,259 | | | | 427,185 | | |
| Lufkin Industries | | | — | | | | 1,613,320 | | | | — | | | | 1,613,320 | | | | 62,370,951 | | | | 536,595 | | |
Major Drilling Group International | | | — | | | | 1,917,900 | | | | — | | | | 1,917,900 | | | | 41,870,634 | | | | 239,146 | | |
| ManTech International | | | 2,426,100 | | | | — | | | | — | | | | 2,426,100 | | | | 85,859,679 | | | | — | | |
| Matthews International | | | 3,518,900 | | | | — | | | | 1,125,210 | | | | 2,393,690 | | | | 75,377,298 | | | | 867,580 | | |
| MICROS Systems | | | 5,249,242 | | | | — | | | | 717,500 | | | | 4,531,742 | | | | 172,659,370 | | | | — | | |
| MWI Veterinary Supply | | | 1,168,629 | | | | — | | | | 26,900 | | | | 1,141,729 | | | | 60,625,810 | | | | — | | |
| NATCO Group** | | | 1,974,328 | | | | — | | | | 1,974,328 | | | | — | | | | — | | | | — | | |
| Nordson Corp.** | | | 2,405,430 | | | | — | | | | 892,126 | | | | 1,513,304 | | | | 97,108,718 | | | | 1,603,788 | | |
| | | Balance of Shares Held August 31, 2009 | | Gross Purchases and Additions | | Gross Sales and Reductions | | Balance of Shares Held August 31, 2010 | | Value August 31, 2010 | | Income from Investments in Affiliated Issuers Included in Total Income | |
| Oceaneering International | | | 1,237,700 | | | | 1,618,912 | | | | — | | | | 2,856,612 | | | | | | | | | | |
| PetMed Express | | | — | | | | 2,502,838 | | | | — | | | | 2,502,838 | | | | 38,668,847 | | | | 729,491 | | |
| Raven Industries | | | 1,872,976 | | | | — | | | | — | | | | 1,872,976 | | | | 63,138,021 | | | | 1,123,786 | | |
| Ritchie Bros. Auctioneers** | | | 5,338,160 | | | | — | | | | 1,186,850 | | | | 4,151,310 | | | | 75,678,381 | | | | 1,991,146 | | |
| Robbins & Myers** | | | 1,787,500 | | | | — | | | | 1,666,618 | | | | 120,882 | | | | 2,860,068 | | | | 257,838 | | |
| Rofin-Sinar Technologies** | | | 3,423,150 | | | | — | | | | 3,115,216 | | | | 307,934 | | | | 6,281,854 | | | | — | | |
| RLI Corp. | | | 984,407 | | | | 215,500 | | | | — | | | | 1,199,907 | | | | 62,947,121 | | | | 1,168,419 | | |
| Ruddick Corp. | | | 3,956,002 | | | | 548,900 | | | | — | | | | 4,504,902 | | | | 145,823,678 | | | | 1,968,792 | | |
| Sirona Dental Systems** | | | 2,805,726 | | | | 64,300 | | | | 277,600 | | | | 2,592,426 | | | | 81,713,268 | | | | — | | |
| Solera Holdings | | | 4,480,005 | | | | 310,748 | | | | — | | | | 4,790,753 | | | | 190,097,079 | | | | 1,184,957 | | |
| Surmodics, Inc. | | | 2,032,430 | | | | — | | | | 682,775 | | | | 1,349,655 | | | | 16,236,350 | | | | — | | |
| Titan International** | | | 2,200,047 | | | | — | | | | 2,200,047 | | | | — | | | | — | | | | 8,555 | | |
| Wabtec Corp. | | | 3,002,100 | | | | 21,600 | | | | 131,500 | | | | 2,892,200 | | | | 123,005,266 | | | | 119,814 | | |
| Westamerica Bancorp | | | 2,121,843 | | | | — | | | | — | | | | 2,121,843 | | | | 107,535,003 | | | | 3,034,235 | | |
| Zebra Technologies** | | | 3,874,247 | | | | — | | | | 1,186,877 | | | | 2,687,370 | | | | 76,912,529 | | | | — | | |
| Total | | | | | | | | | | | | | | | | | | | | | | | | | |
| Guardian | |
Neuberger Berman Securities Lending Quality Fund, LLC*** | | | 3,129,168 | | | | 18,916,394 | | | | 22,045,562 | | | | — | | | | | | | | | | |
| International | |
Neuberger Berman Securities Lending Quality Fund, LLC*** | | | 15,429,775 | | | | 224,254,950 | | | | 239,684,725 | | | | — | | | | | | | | | | |
| International Institutional | |
Neuberger Berman Securities Lending Quality Fund, LLC*** | | | 4,502,766 | | | | 117,039,794 | | | | 121,542,560 | | | | — | | | | | | | | | | |
| International Large Cap | |
Neuberger Berman Securities Lending Quality Fund, LLC*** | | | 2,310,165 | | | | 70,558,152 | | | | 72,868,317 | | | | — | | | | | | | | | | |
| Mid Cap Growth | |
Neuberger Berman Securities Lending Quality Fund, LLC*** | | | 68,669,144 | | | | 171,016,335 | | | | 239,685,479 | | | | — | | | | | | | | | | |
| Partners | |
Neuberger Berman Securities Lending Quality Fund, LLC*** | | | 120,980,475 | | | | 591,251,126 | | | | 712,231,601 | | | | — | | | | | | | | | | |
| | | Balance of Shares Held August 31, 2009 | | Gross Purchases and Additions | | Gross Sales and Reductions | | Balance of Shares Held August 31, 2010 | | Value August 31, 2010 | | Income from Investments in Affiliated Issuers Included in Total Income | |
| Real Estate | |
Neuberger Berman Securities Lending Quality Fund, LLC*** | | | 9,144,630 | | | | 32,613,436 | | | | 41,758,066 | | | | — | | | | | | | | | | |
| Regency | |
Neuberger Berman Securities Lending Quality Fund, LLC*** | | | 3,651,833 | | | | 17,932,479 | | | | 21,584,312 | | | | — | | | | | | | | | | |
| Small Cap Growth | |
Neuberger Berman Securities Lending Quality Fund, LLC*** | | | 31,671,128 | | | | 88,646,987 | | | | 120,318,115 | | | | — | | | | | | | | | | |
| Socially Responsive | |
Neuberger Berman Securities Lending Quality Fund, LLC*** | | | 4,289,134 | | | | 66,822,625 | | | | 71,111,759 | | | | — | | | | | | | | | | |
| * | Affiliated issuers, as defined in the 1940 Act, as amended. |
| ** | At August 31, 2010, the issuers of these securities were no longer affiliated with the Fund. |
| *** | Quality Fund, a fund that was managed by NBFI, an affiliate of Management, was used to invest cash the Funds received as collateral for securities loaned as approved by the Board. Because all shares of Quality Fund were held by funds in the related investment management complex, Quality Fund may have been considered an affiliate of the Funds. |
Note G—Subsequent Events:
| | In October 2010, the Board approved a plan of liquidation for Climate Change. Management expects the liquidation to occur on or about November 30, 2010. Management has determined that there are no other subsequent events that would need to be disclosed in the Funds' financial statements. |
Note H—Reorganization and Share Class Conversions:
| | On April 9, 2009, Neuberger Berman Century Fund ("Acquiring Fund") acquired all of the net assets of Neuberger Berman Large Cap Disciplined Growth Fund ("Acquired Fund") and changed its name to Neuberger Berman Large Cap Disciplined Growth Fund pursuant to a Plan of Reorganization and Dissolution approved by the Board. The reorganization was accomplished by a tax-free exchange of 5,869,273 shares of Class A of Acquiring Fund (valued at $31,234,312) for 4,752,086 shares of Class A of Acquired Fund outstanding on April 9, 2009, 3,091,731 shares of Class C of Acquiring Fund (valued at $16,455,988) for 2,524,011 shares of Class C of Acquired Fund outstanding on April 9, 2009, and 606,318 sha res of Institutional Class of Acquiring Fund (valued at $3,226,698) for 488,494 shares of Institutional Class of Acquired Fund outstanding on April 9, 2009. Acquired Fund's aggregate net assets at that date ($50,916,998, including $864,207 of net unrealized appreciation) were combined with those of Acquiring Fund. The combined net assets of Acquiring Fund immediately after the reorganization were $61,540,126. In |
| | addition, immediately after the reorganization, Class A shares of Acquiring Fund held by Grandfathered Investors (as defined below) were converted into Investor Class shares of Acquiring Fund pursuant to a share class conversion ("Investor Class Conversion"). The Investor Class Conversion was accomplished by a tax-free conversion of 40,012 Class A shares of Acquiring Fund (valued at $212,934) into 39,996 Investor Class shares of Acquiring Fund. The number of Investor Class shares of Acquiring Fund outstanding immediately after the Investor Class Conversion was 1,847,397. The net assets of Investor Class shares o f Acquiring Fund immediately after the Investor Class Conversion were $9,835,309. "Grandfathered Investors" are investors who established accounts in Investor Class or Trust Class shares of a Neuberger Berman Fund prior to March 1, 2008, and who have continuously maintained an account in Investor or Trust Class shares since that date. On December 21, 2009, Trust Class shares of Multi-Cap Opportunities converted into Institutional Class shares of Multi-Cap Opportunities pursuant to a share class conversion ("Conversion"). The Conversion was accomplished by a tax-free conversion of 214,699 Trust Class shares of Multi-Cap Opportunities (valued at $1,799,703) into 214,699 Institutional Class shares of Multi-Cap Opportunities. The number of Institutional Class shares of Multi-Cap Opportunities outstanding immediately after the Conversion was 214,699. The net assets of Institutional Class shares of Multi-Cap Opportunities immediately after the C onversion were $1,799,703. On May 7, 2010 DJC Small Cap Value Fund L.P., an unregistered limited partnership ("DJG Fund") transferred its assets to Intrinsic Value in exchange for Institutional Class shares of Intrinsic Value. The transfer was accomplished by a tax-free exchange of 9,296,816 shares of the Institutional Class of Intrinsic Value (valued at $92,968,164) for the partners capital of DJG Fund on May 7, 2010. DJG Fund's aggregate net assets on May 7, 2010 ($92,968,164, including $11,595,910 of net unrealized appreciation) were combined with those of Intrinsic Value. The net assets of Intrinsic Value immediately after the tran sfer of assets were $92,968,164. The number of Institutional Class shares of Intrinsic Value outstanding immediately after the transfer was 9,296,816 shares. |
Financial Highlights
The following tables include selected data for a share outstanding throughout each period and other performance information derived from the Financial Statements.
| | | Net Asset Value, Beginning of Year | | Net Investment Income (Loss)@ | | Net Gains or Losses on Securities (both realized and unrealized) | | Total From Investment Operations | | Dividends from Net Investment Income | | Distributions from Net Realized Capital Gains | | Tax Return of Capital | | Total Distributions | |
| Climate Change Fund | |
| Institutional Class | |
| 8/31/2010 | | $ | 6.29 | | | $ | 0.02 | | | $ | (0.03 | ) | | $ | (0.01 | ) | | $ | (0.02 | ) | | $ | — | | | $ | — | | | $ | (0.02 | ) | |
| 8/31/2009 | | $ | 8.93 | | | $ | 0.05 | | | $ | (2.47 | ) | | $ | (2.42 | ) | | $ | (0.22 | ) | | $ | — | | | $ | — | | | $ | (0.22 | ) | |
Period from 5/1/2008^ to 8/31/2008 | | $ | 10.00 | | | $ | 0.06 | | | $ | (1.13 | ) | | $ | (1.07 | ) | | $ | — | | | $ | — | | | $ | — | | | $ | — | | |
| Class A | |
| 8/31/2010 | | $ | 6.27 | | | $ | 0.03 | | | $ | (0.04 | ) | | $ | (0.01 | ) | | $ | (0.01 | ) | | $ | — | | | $ | — | | | $ | (0.01 | ) | |
| 8/31/2009 | | $ | 8.93 | | | $ | 0.03 | | | $ | (2.47 | ) | | $ | (2.44 | ) | | $ | (0.22 | ) | | $ | — | | | $ | — | | | $ | (0.22 | ) | |
Period from 5/1/2008^ to 8/31/2008 | | $ | 10.00 | | | $ | 0.05 | | | $ | (1.12 | ) | | $ | (1.07 | ) | | $ | — | | | $ | — | | | $ | — | | | $ | — | | |
| Class C | |
| 8/31/2010 | | $ | 6.21 | | | $ | (0.02 | ) | | $ | (0.04 | ) | | $ | (0.06 | ) | | $ | — | | | $ | — | | | $ | — | | | $ | — | | |
| 8/31/2009 | | $ | 8.90 | | | $ | (0.01 | ) | | $ | (2.46 | ) | | $ | (2.47 | ) | | $ | (0.22 | ) | | $ | — | | | $ | — | | | $ | (0.22 | ) | |
Period from 5/1/2008^ to 8/31/2008 | | $ | 10.00 | | | $ | 0.02 | | | $ | (1.12 | ) | | $ | (1.10 | ) | | $ | — | | | $ | — | | | $ | — | | | $ | — | | |
| Emerging Markets Equity Fund | |
| Institutional Class | |
| 8/31/2010 | | $ | 14.05 | | | $ | 0.11 | | | $ | 2.51 | | | $ | 2.62 | | | $ | (0.06 | ) | | $ | (1.00 | ) | | $ | — | | | $ | (1.06 | ) | |
Period from 10/8/2008^ to 8/31/2009 | | $ | 10.00 | | | $ | 0.15 | | | $ | 4.16 | | | $ | 4.31 | | | $ | (0.26 | ) | | $ | — | | | $ | — | | | $ | (0.26 | ) | |
| Class A | |
| 8/31/2010 | | $ | 14.02 | | | $ | 0.09 | | | $ | 2.50 | | | $ | 2.59 | | | $ | (0.04 | ) | | $ | (1.00 | ) | | $ | — | | | $ | (1.04 | ) | |
Period from 10/8/2008^ to 8/31/2009 | | $ | 10.00 | | | $ | 0.15 | | | $ | 4.13 | | | $ | 4.28 | | | $ | (0.26 | ) | | $ | — | | | $ | — | | | $ | (0.26 | ) | |
| Class C | |
| 8/31/2010 | | $ | 13.96 | | | $ | (0.10 | ) | | $ | 2.55 | | | $ | 2.45 | | | $ | — | | | $ | (1.00 | ) | | $ | — | | | $ | (1.00 | ) | |
Period from 10/8/2008^ to 8/31/2009 | | $ | 10.00 | | | $ | 0.08 | | | $ | 4.12 | | | $ | 4.20 | | | $ | (0.24 | ) | | $ | — | | | $ | — | | | $ | (0.24 | ) | |
| Class R3 | |
Period from 6/21/2010^ to 8/31/2010 | | $ | 15.10 | | | $ | (0.00 | ) | | $ | 0.32 | | | $ | 0.32 | | | $ | — | | | $ | — | | | $ | — | | | $ | — | | |
| See Notes to Financial Highlights | 185 | |
| | | Redemption Feesøø | | Net Asset Value, End of Year | | Total Return†† | | Net Assets, End of Year (in millions) | | Ratio of Gross Expenses to Average Net Assets# | | Ratio of Net Expenses to Average Net Assets | | Ratio of Net Investment Income/ (Loss) to Average Net Assets | | Portfolio Turnover Rate | |
| Climate Change Fund | |
| Institutional Class | |
| 8/31/2010 | | $ | — | | | $ | 6.26 | | | | (.17 | %) | | $ | 0.4 | | | | .96 | % | | | .96 | %‡ | | | .28 | % | | | 223 | % | |
| 8/31/2009 | | $ | — | | | $ | 6.29 | | | | (26.55 | %) | | $ | 1.5 | | | | .97 | % | | | .97 | %‡ | | | .85 | % | | | 374 | % | |
Period from 5/1/2008^ to 8/31/2008 | | $ | — | | | $ | 8.93 | | | | (10.70 | %)** | | $ | 2.1 | | | | .95 | %* | | | .95 | %‡* | | | 1.72 | %* | | | 71 | %** | |
| Class A | |
| 8/31/2010 | | $ | — | | | $ | 6.25 | | | | (.22 | %) | | $ | 1.5 | | | | 1.21 | % | | | 1.21 | %‡ | | | .40 | % | | | 223 | % | |
| 8/31/2009 | | $ | — | | | $ | 6.27 | | | | (26.77 | %) | | $ | 1.3 | | | | 1.22 | % | | | 1.22 | %‡ | | | .58 | % | | | 374 | % | |
Period from 5/1/2008^ to 8/31/2008 | | $ | — | | | $ | 8.93 | | | | (10.70 | %)** | | $ | 1.8 | | | | 1.20 | %* | | | 1.20 | %‡* | | | 1.42 | %* | | | 71 | %** | |
| Class C | |
| 8/31/2010 | | $ | — | | | $ | 6.15 | | | | (.97 | %) | | $ | 0.5 | | | | 1.96 | % | | | 1.96 | %‡ | | | (.31 | %) | | | 223 | % | |
| 8/31/2009 | | $ | — | | | $ | 6.21 | | | | (27.22 | %) | | $ | 0.2 | | | | 1.97 | % | | | 1.97 | %‡ | | | (.12 | %) | | | 374 | % | |
Period from 5/1/2008^ to 8/31/2008 | | $ | — | | | $ | 8.90 | | | | (11.00 | %)** | | $ | 0.1 | | | | 1.95 | %* | | | 1.95 | %‡* | | | .72 | %* | | | 71 | %** | |
| Emerging Markets Equity Fund | |
| Institutional Class | |
| 8/31/2010 | | $ | 0.00 | | | $ | 15.61 | | | | 18.76 | % | | $ | 9.0 | | | | 1.26 | % | | | 1.26 | %‡ | | | .72 | % | | | 81 | % | |
Period from 10/8/2008^ to 8/31/2009 | | $ | 0.00 | | | $ | 14.05 | | | | 44.66 | %** | | $ | 4.0 | | | | 1.28 | %* | | | 1.28 | %‡* | | | 1.55 | %* | | | 84 | %** | |
| Class A | |
| 8/31/2010 | | $ | 0.00 | | | $ | 15.57 | | | | 18.58 | % | | $ | 5.5 | | | | 1.51 | % | | | 1.51 | %‡ | | | .61 | % | | | 81 | % | |
Period from 10/8/2008^ to 8/31/2009 | | $ | 0.00 | | | $ | 14.02 | | | | 44.38 | %** | | $ | 1.8 | | | | 1.53 | %* | | | 1.53 | %‡* | | | 1.31 | %* | | | 84 | %** | |
| Class C | |
| 8/31/2010 | | $ | 0.00 | | | $ | 15.41 | | | | 17.62 | % | | $ | 0.2 | | | | 2.26 | % | | | 2.26 | %‡ | | | (.63 | %) | | | 81 | % | |
Period from 10/8/2008^ to 8/31/2009 | | $ | 0.00 | | | $ | 13.96 | | | | 43.42 | %** | | $ | 0.2 | | | | 2.28 | %* | | | 2.28 | %‡* | | | .77 | %* | | | 84 | %** | |
| Class R3 | |
Period from 6/21/2010^ to 8/31/2010 | | $ | 0.00 | | | $ | 15.42 | | | | 2.12 | %** | | $ | 0.0 | | | | 1.93 | %* | | | 1.93 | %* | | | (.09 | %)* | | | 81 | %Ø | |
Financial Highlights (cont'd)
| | | Net Asset Value, Beginning of Year | | Net Investment Income (Loss)@ | | Net Gains or Losses on Securities (both realized and unrealized) | | Total From Investment Operations | | Dividends from Net Investment Income | | Distributions from Net Realized Capital Gains | | Tax Return of Capital | | Total Distributions | |
| Equity Income Fund | |
| Institutional Class | |
| 8/31/2010 | | $ | 8.74 | | | $ | 0.40 | | | $ | 1.22 | | | $ | 1.62 | | | $ | (0.34 | ) | | $ | — | | | $ | — | | | $ | (0.34 | ) | |
| 8/31/2009 | | $ | 10.72 | | | $ | 0.34 | | | $ | (2.04 | ) | | $ | (1.70 | ) | | $ | (0.21 | ) | | $ | (0.07 | ) | | $ | — | | | $ | (0.28 | ) | |
8/31/2008‡‡ | | $ | 10.52 | | | $ | 0.31 | | | $ | 0.40 | | | $ | 0.71 | | | $ | (0.27 | ) | | $ | (0.24 | ) | | $ | — | | | $ | (0.51 | ) | |
Period from 11/2/2006^ to 8/31/2007‡‡ | | $ | 10.00 | | | $ | 0.25 | | | $ | 0.52 | | | $ | 0.77 | | | $ | (0.25 | ) | | $ | (0.00 | ) | | $ | — | | | $ | (0.25 | ) | |
| Class A | |
| 8/31/2010 | | $ | 8.72 | | | $ | 0.36 | | | $ | 1.22 | | | $ | 1.58 | | | $ | (0.31 | ) | | $ | — | | | $ | — | | | $ | (0.31 | ) | |
| 8/31/2009 | | $ | 10.72 | | | $ | 0.25 | | | $ | (1.99 | ) | | $ | (1.74 | ) | | $ | (0.19 | ) | | $ | (0.07 | ) | | $ | — | | | $ | (0.26 | ) | |
Period from 6/9/2008^ to 8/31/2008 | | $ | 10.95 | | | $ | 0.07 | | | $ | (0.24 | ) | | $ | (0.17 | ) | | $ | (0.06 | ) | | $ | — | | | $ | — | | | $ | (0.06 | ) | |
| Class C | |
| 8/31/2010 | | $ | 8.70 | | | $ | 0.31 | | | $ | 1.20 | | | $ | 1.51 | | | $ | (0.25 | ) | | $ | — | | | $ | — | | | $ | (0.25 | ) | |
| 8/31/2009 | | $ | 10.71 | | | $ | 0.20 | | | $ | (2.00 | ) | | $ | (1.80 | ) | | $ | (0.14 | ) | | $ | (0.07 | ) | | $ | — | | | $ | (0.21 | ) | |
Period from 6/9/2008^ to 8/31/2008 | | $ | 10.95 | | | $ | 0.05 | | | $ | (0.24 | ) | | $ | (0.19 | ) | | $ | (0.05 | ) | | $ | — | | | $ | — | | | $ | (0.05 | ) | |
| Class R3 | |
Period from 6/21/2010^ to 8/31/2010 | | $ | 10.06 | | | $ | 0.11 | | | $ | (0.12 | ) | | $ | (0.01 | ) | | $ | (0.06 | ) | | $ | — | | | $ | — | | | $ | (0.06 | ) | |
| Focus Fund | |
| Investor Class | |
| 8/31/2010 | | $ | 16.59 | | | $ | 0.11 | | | $ | (0.50 | ) | | $ | (0.39 | ) | | $ | (0.13 | ) | | $ | — | | | $ | — | | | $ | (0.13 | ) | |
| 8/31/2009 | | $ | 24.78 | | | $ | 0.14 | | | $ | (6.00 | ) | | $ | (5.86 | ) | | $ | (0.14 | ) | | $ | (2.19 | ) | | $ | — | | | $ | (2.33 | ) | |
| 8/31/2008 | | $ | 32.79 | | | $ | 0.15 | | | $ | (2.09 | ) | | $ | (1.94 | ) | | $ | (0.16 | ) | | $ | (5.91 | ) | | $ | — | | | $ | (6.07 | ) | |
| 8/31/2007 | | $ | 34.30 | | | $ | 0.15 | | | $ | 3.33 | | | $ | 3.48 | | | $ | (0.15 | ) | | $ | (4.84 | ) | | $ | — | | | $ | (4.99 | ) | |
| 8/31/2006 | | $ | 37.21 | | | $ | 0.13 | | | $ | 2.24 | | | $ | 2.37 | | | $ | (0.24 | ) | | $ | (5.04 | ) | | $ | — | | | $ | (5.28 | ) | |
| Trust Class | |
| 8/31/2010 | | $ | 12.14 | | | $ | 0.05 | | | $ | (0.36 | ) | | $ | (0.31 | ) | | $ | (0.10 | ) | | $ | — | | | $ | — | | | $ | (0.10 | ) | |
| 8/31/2009 | | $ | 18.18 | | | $ | 0.07 | | | $ | (4.40 | ) | | $ | (4.33 | ) | | $ | (0.10 | ) | | $ | (1.61 | ) | | $ | — | | | $ | (1.71 | ) | |
| 8/31/2008 | | $ | 24.09 | | | $ | 0.06 | | | $ | (1.54 | ) | | $ | (1.48 | ) | | $ | (0.09 | ) | | $ | (4.34 | ) | | $ | — | | | $ | (4.43 | ) | |
| 8/31/2007 | | $ | 25.19 | | | $ | 0.05 | | | $ | 2.46 | | | $ | 2.51 | | | $ | (0.04 | ) | | $ | (3.57 | ) | | $ | — | | | $ | (3.61 | ) | |
| 8/31/2006 | | $ | 27.36 | | | $ | 0.04 | | | $ | 1.65 | | | $ | 1.69 | | | $ | (0.16 | ) | | $ | (3.70 | ) | | $ | — | | | $ | (3.86 | ) | |
| See Notes to Financial Highlights | 187 | |
| | | Redemption Feesøø | | Net Asset Value, End of Year | | Total Return†† | | Net Assets, End of Year (in millions) | | Ratio of Gross Expenses to Average Net Assets# | | Ratio of Net Expenses to Average Net Assets | | Ratio of Net Investment Income/ (Loss) to Average Net Assets | | Portfolio Turnover Rate | |
| Equity Income Fund | |
| Institutional Class | |
| 8/31/2010 | | $ | — | | | $ | 10.02 | | | | 18.81 | % | | $ | 100.9 | | | | .80 | % | | | .80 | %‡ | | | 4.09 | % | | | 29 | % | |
| 8/31/2009 | | $ | — | | | $ | 8.74 | | | | (15.54 | %) | | $ | 18.9 | | | | .80 | % | | | .80 | %‡ | | | 3.97 | % | | | 61 | % | |
8/31/2008‡‡ | | $ | — | | | $ | 10.72 | | | | 7.01 | %††† | | $ | 5.6 | | | | .97 | % | | | .96 | %‡ | | | 2.94 | % | | | 48 | % | |
Period from 11/2/2006^ to 8/31/2007‡‡ | | $ | — | | | $ | 10.52 | | | | 7.73 | %** | | $ | 5.4 | | | | 1.00 | %* | | | 1.00 | %‡* | | | 2.81 | %* | | | 26 | %** | |
| Class A | |
| 8/31/2010 | | $ | — | | | $ | 9.99 | | | | 18.36 | % | | $ | 176.6 | | | | 1.16 | % | | | 1.16 | %‡ | | | 3.70 | % | | | 29 | % | |
| 8/31/2009 | | $ | — | | | $ | 8.72 | | | | (16.01 | %) | | $ | 43.0 | | | | 1.16 | % | | | 1.16 | %‡ | | | 3.15 | % | | | 61 | % | |
Period from 6/9/2008^ to 8/31/2008 | | $ | — | | | $ | 10.72 | | | | (1.57 | %)** | | $ | 23.6 | | | | 1.17 | %* | | | 1.16 | %‡* | | | 2.72 | %* | | | 48 | %Ø | |
| Class C | |
| 8/31/2010 | | $ | — | | | $ | 9.96 | | | | 17.59 | % | | $ | 44.0 | | | | 1.91 | % | | | 1.91 | %‡ | | | 3.15 | % | | | 29 | % | |
| 8/31/2009 | | $ | — | | | $ | 8.70 | | | | (16.60 | %) | | $ | 4.3 | | | | 1.91 | % | | | 1.91 | %‡ | | | 2.46 | % | | | 61 | % | |
Period from 6/9/2008^ to 8/31/2008 | | $ | — | | | $ | 10.71 | | | | (1.72 | %)** | | $ | 1.2 | | | | 1.92 | %* | | | 1.90 | %‡* | | | 2.22 | %* | | | 48 | %Ø | |
| Class R3 | |
Period from 6/21/2010^ to 8/31/2010 | | $ | — | | | $ | 9.99 | | | | (.04 | %)** | | $ | 0.0 | | | | 1.41 | %* | | | 1.41 | %* | | | 5.53 | %‡* | | | 29 | %Ø | |
| Focus Fund | |
| Investor Class | |
| 8/31/2010 | | $ | — | | | $ | 16.07 | | | | (2.39 | %) | | $ | 478.8 | | | | .97 | % | | | .97 | % | | | .61 | % | | | 89 | % | |
| 8/31/2009 | | $ | — | | | $ | 16.59 | | | | (21.06 | %) | | $ | 540.9 | | | | .99 | % | | | .99 | %‡ | | | .92 | % | | | 89 | % | |
| 8/31/2008 | | $ | — | | | $ | 24.78 | | | | (7.12 | %) | | $ | 795.6 | | | | .89 | % | | | .88 | %‡ | | | .56 | % | | | 90 | % | |
| 8/31/2007 | | $ | — | | | $ | 32.79 | | | | 10.71 | % | | $ | 1,018.6 | | | | .88 | % | | | .87 | %‡ | | | .44 | % | | | 53 | % | |
| 8/31/2006 | | $ | — | | | $ | 34.30 | | | | 7.00 | % | | $ | 1,093.1 | | | | .88 | % | | | .87 | %‡ | | | .37 | % | | | 41 | % | |
| Trust Class | |
| 8/31/2010 | | $ | — | | | $ | 11.73 | | | | (2.61 | %) | | $ | 18.9 | | | | 1.19 | % | | | 1.19 | % | | | .38 | % | | | 89 | % | |
| 8/31/2009 | | $ | — | | | $ | 12.14 | | | | (21.21 | %) | | $ | 23.7 | | | | 1.24 | % | | | 1.24 | %‡ | | | .65 | % | | | 89 | % | |
| 8/31/2008 | | $ | — | | | $ | 18.18 | | | | (7.37 | %) | | $ | 41.5 | | | | 1.11 | % | | | 1.10 | %‡ | | | .31 | % | | | 90 | % | |
| 8/31/2007 | | $ | — | | | $ | 24.09 | | | | 10.49 | % | | $ | 72.3 | | | | 1.08 | % | | | 1.07 | %‡ | | | .21 | % | | | 53 | % | |
| 8/31/2006 | | $ | — | | | $ | 25.19 | | | | 6.81 | % | | $ | 112.8 | | | | 1.06 | % | | | 1.06 | %‡ | | | .14 | % | | | 41 | % | |
Financial Highlights (cont'd)
| | | Net Asset Value, Beginning of Year | | Net Investment Income (Loss)@ | | Net Gains or Losses on Securities (both realized and unrealized) | | Total From Investment Operations | | Dividends from Net Investment Income | | Distributions from Net Realized Capital Gains | | Tax Return of Capital | | Total Distributions | |
| Advisor Class | |
| 8/31/2010 | | $ | 8.40 | | | $ | 0.01 | | | $ | (0.24 | ) | | $ | (0.23 | ) | | $ | (0.09 | ) | | $ | — | | | $ | — | | | $ | (0.09 | ) | |
| 8/31/2009 | | $ | 12.64 | | | $ | 0.03 | | | $ | (3.07 | ) | | $ | (3.04 | ) | | $ | (0.09 | ) | | $ | (1.11 | ) | | $ | — | | | $ | (1.20 | ) | |
| 8/31/2008 | | $ | 16.80 | | | $ | 0.02 | | | $ | (1.08 | ) | | $ | (1.06 | ) | | $ | (0.07 | ) | | $ | (3.03 | ) | | $ | — | | | $ | (3.10 | ) | |
| 8/31/2007 | | $ | 17.57 | | | $ | 0.00 | | | $ | 1.71 | | | $ | 1.71 | | | $ | — | | | $ | (2.48 | ) | | $ | — | | | $ | (2.48 | ) | |
| 8/31/2006 | | $ | 19.00 | | | $ | (0.00 | ) | | $ | 1.15 | | | $ | 1.15 | | | $ | — | | | $ | (2.58 | ) | | $ | — | | | $ | (2.58 | ) | |
| Institutional Class | |
Period from 6/21/2010^ to 8/31/2010 | | $ | 17.77 | | | $ | 0.06 | | | $ | (1.75 | ) | | $ | (1.69 | ) | | $ | — | | | $ | — | | | $ | — | | | $ | — | | |
| Class A | |
Period from 6/21/2010^ to 8/31/2010 | | $ | 12.97 | | | $ | 0.03 | | | $ | (1.27 | ) | | $ | (1.24 | ) | | $ | — | | | $ | — | | | $ | — | | | $ | — | | |
| Class C | |
Period from 6/21/2010^ to 8/31/2010 | | $ | 8.94 | | | $ | 0.01 | | | $ | (0.88 | ) | | $ | (0.87 | ) | | $ | — | | | $ | — | | | $ | — | | | $ | — | | |
| Genesis Fund | |
| Investor Class | |
| 8/31/2010 | | $ | 24.39 | | | $ | (0.03 | ) | | $ | 2.08 | | | $ | 2.05 | | | $ | — | | | $ | — | | | $ | — | | | $ | — | | |
| 8/31/2009 | | $ | 34.95 | | | $ | (0.01 | ) | | $ | (9.23 | ) | | $ | (9.24 | ) | | $ | — | | | $ | (1.32 | ) | | $ | (0.00 | ) | | $ | (1.32 | ) | |
| 8/31/2008 | | $ | 37.55 | | | $ | (0.07 | ) | | $ | 3.53 | | | $ | 3.46 | | | $ | (0.16 | ) | | $ | (5.90 | ) | | $ | — | | | $ | (6.06 | ) | |
| 8/31/2007 | | $ | 34.92 | | | $ | 0.18 | @@ | | $ | 5.58 | @@ | | $ | 5.76 | | | $ | (0.46 | ) | | $ | (2.67 | ) | | $ | — | | | $ | (3.13 | ) | |
| 8/31/2006 | | $ | 34.03 | | | $ | (0.05 | ) | | $ | 1.71 | | | $ | 1.66 | | | $ | — | | | $ | (0.77 | ) | | $ | — | | | $ | (0.77 | ) | |
| Trust Class | |
| 8/31/2010 | | $ | 35.00 | | | $ | (0.07 | ) | | $ | 2.99 | | | $ | 2.92 | | | $ | — | | | $ | — | | | $ | — | | | $ | — | | |
| 8/31/2009 | | $ | 50.16 | | | $ | (0.03 | ) | | $ | (13.24 | ) | | $ | (13.27 | ) | | $ | — | | | $ | (1.89 | ) | | $ | (0.00 | ) | | $ | (1.89 | ) | |
| 8/31/2008 | | $ | 53.69 | | | $ | (0.14 | ) | | $ | 5.12 | | | $ | 4.98 | | | $ | (0.08 | ) | | $ | (8.43 | ) | | $ | — | | | $ | (8.51 | ) | |
| 8/31/2007 | | $ | 49.89 | | | $ | 0.24 | @@ | | $ | 7.96 | @@ | | $ | 8.20 | | | $ | (0.60 | ) | | $ | (3.80 | ) | | $ | — | | | $ | (4.40 | ) | |
| 8/31/2006 | | $ | 48.66 | | | $ | (0.11 | ) | | $ | 2.44 | | | $ | 2.33 | | | $ | — | | | $ | (1.10 | ) | | $ | — | | | $ | (1.10 | ) | |
| Advisor Class | |
| 8/31/2010 | | $ | 20.35 | | | $ | (0.10 | ) | | $ | 1.75 | | | $ | 1.65 | | | $ | — | | | $ | — | | | $ | — | | | $ | — | | |
| 8/31/2009 | | $ | 29.25 | | | $ | (0.07 | ) | | $ | (7.73 | ) | | $ | (7.80 | ) | | $ | — | | | $ | (1.10 | ) | | $ | (0.00 | ) | | $ | (1.10 | ) | |
| 8/31/2008 | | $ | 31.43 | | | $ | (0.16 | ) | | $ | 2.98 | | | $ | 2.82 | | | $ | (0.07 | ) | | $ | (4.93 | ) | | $ | — | | | $ | (5.00 | ) | |
| 8/31/2007 | | $ | 29.10 | | | $ | 0.06 | @@ | | $ | 4.67 | @@ | | $ | 4.73 | | | $ | (0.18 | ) | | $ | (2.22 | ) | | $ | — | | | $ | (2.40 | ) | |
| 8/31/2006 | | $ | 28.46 | | | $ | (0.14 | ) | | $ | 1.42 | | | $ | 1.28 | | | $ | — | | | $ | (0.64 | ) | | $ | — | | | $ | (0.64 | ) | |
| See Notes to Financial Highlights | 189 | |
| | | Redemption Feesøø | | Net Asset Value, End of Year | | Total Return†† | | Net Assets, End of Year (in millions) | | Ratio of Gross Expenses to Average Net Assets# | | Ratio of Net Expenses to Average Net Assets | | Ratio of Net Investment Income/ (Loss) to Average Net Assets | | Portfolio Turnover Rate | |
| Advisor Class | |
| 8/31/2010 | | $ | — | | | $ | 8.08 | | | | (2.83 | %) | | $ | 7.7 | | | | 1.42 | % | | | 1.42 | %§ | | | .15 | % | | | 89 | % | |
| 8/31/2009 | | $ | — | | | $ | 8.40 | | | | (21.45 | %) | | $ | 10.2 | | | | 1.50 | % | | | 1.50 | %‡ | | | .40 | % | | | 89 | % | |
| 8/31/2008 | | $ | — | | | $ | 12.64 | | | | (7.55 | %) | | $ | 16.7 | | | | 1.34 | % | | | 1.33 | %‡ | | | .12 | % | | | 90 | % | |
| 8/31/2007 | | $ | — | | | $ | 16.80 | | | | 10.23 | % | | $ | 23.3 | | | | 1.29 | % | | | 1.28 | %‡ | | | .02 | % | | | 53 | % | |
| 8/31/2006 | | $ | — | | | $ | 17.57 | | | | 6.62 | % | | $ | 28.1 | | | | 1.27 | % | | | 1.26 | %‡ | | | (.03 | %) | | | 41 | % | |
| Institutional Class | |
Period from 6/21/2010^ to 8/31/2010 | | $ | — | | | $ | 16.08 | | | | (9.51 | %)** | | $ | 0.0 | | | | .75 | %* | | | .75 | %‡* | | | 1.80 | %* | | | 89 | %Ø | |
| Class A | |
Period from 6/21/2010^ to 8/31/2010 | | $ | — | | | $ | 11.73 | | | | (9.56 | %)** | | $ | 0.0 | | | | 1.11 | %* | | | 1.11 | %‡* | | | 1.44 | %* | | | 89 | %Ø | |
| Class C | |
Period from 6/21/2010^ to 8/31/2010 | | $ | — | | | $ | 8.07 | | | | (9.73 | %)** | | $ | 0.0 | | | | 1.86 | %* | | | 1.86 | %‡* | | | .69 | %* | | | 89 | %Ø | |
| Genesis Fund | |
| Investor Class | |
| 8/31/2010 | | $ | — | | | $ | 26.44 | | | | 8.41 | % | | $ | 1,773.6 | | | | 1.06 | % | | | 1.06 | % | | | (.11 | %) | | | 16 | % | |
| 8/31/2009 | | $ | — | | | $ | 24.39 | | | | (25.72 | %) | | $ | 1,626.8 | | | | 1.08 | % | | | 1.08 | %‡ | | | (.04 | %) | | | 12 | % | |
| 8/31/2008 | | $ | — | | | $ | 34.95 | | | | 10.18 | % | | $ | 2,386.8 | | | | 1.03 | % | | | 1.02 | %‡ | | | (.20 | %) | | | 18 | %## | |
| 8/31/2007 | | $ | — | | | $ | 37.55 | | | | 17.51 | % | | $ | 1,997.2 | | | | 1.03 | % | | | 1.02 | %‡ | | | .51 | %@@ | | | 25 | % | |
| 8/31/2006 | | $ | — | | | $ | 34.92 | | | | 4.89 | % | | $ | 1,901.1 | | | | 1.02 | % | | | 1.02 | %‡ | | | (.15 | %) | | | 19 | % | |
| Trust Class | |
| 8/31/2010 | | $ | — | | | $ | 37.92 | | | | 8.34 | % | | $ | 3,057.6 | | | | 1.12 | % | | | 1.12 | % | | | (.17 | %) | | | 16 | % | |
| 8/31/2009 | | $ | — | | | $ | 35.00 | | | | (25.73 | %) | | $ | 3,244.1 | | | | 1.12 | % | | | 1.12 | %‡ | | | (.09 | %) | | | 12 | % | |
| 8/31/2008 | | $ | — | | | $ | 50.16 | | | | 10.22 | % | | $ | 4,799.6 | | | | 1.09 | % | | | 1.09 | %‡ | | | (.27 | %) | | | 18 | %## | |
| 8/31/2007 | | $ | — | | | $ | 53.69 | | | | 17.41 | % | | $ | 4,985.5 | | | | 1.10 | % | | | 1.09 | %‡ | | | .48 | %@@ | | | 25 | % | |
| 8/31/2006 | | $ | — | | | $ | 49.89 | | | | 4.82 | % | | $ | 5,970.9 | | | | 1.09 | % | | | 1.09 | %‡ | | | (.22 | %) | | | 19 | % | |
| Advisor Class | |
| 8/31/2010 | | $ | — | | | $ | 22.00 | | | | 8.11 | % | | $ | 440.2 | | | | 1.38 | % | | | 1.38 | % | | | (.42 | %) | | | 16 | % | |
| 8/31/2009 | | $ | — | | | $ | 20.35 | | | | (25.95 | %) | | $ | 397.9 | | | | 1.38 | % | | | 1.38 | %‡ | | | (.34 | %) | | | 12 | % | |
| 8/31/2008 | | $ | — | | | $ | 29.25 | | | | 9.89 | % | | $ | 596.8 | | | | 1.35 | % | | | 1.34 | %‡ | | | (.53 | %) | | | 18 | %## | |
| 8/31/2007 | | $ | — | | | $ | 31.43 | | | | 17.14 | % | | $ | 547.2 | | | | 1.35 | % | | | 1.35 | %‡ | | | .20 | %@@ | | | 25 | % | |
| 8/31/2006 | | $ | — | | | $ | 29.10 | | | | 4.52 | % | | $ | 617.4 | | | | 1.35 | % | | | 1.34 | %‡ | | | (.47 | %) | | | 19 | % | |
Financial Highlights (cont'd)
| | | Net Asset Value, Beginning of Year | | Net Investment Income (Loss)@ | | Net Gains or Losses on Securities (both realized and unrealized) | | Total From Investment Operations | | Dividends from Net Investment Income | | Distributions from Net Realized Capital Gains | | Tax Return of Capital | | Total Distributions | |
| Institutional Class | |
| 8/31/2010 | | $ | 33.64 | | | $ | 0.04 | | | $ | 2.88 | | | $ | 2.92 | | | $ | — | | | $ | — | | | $ | — | | | $ | — | | |
| 8/31/2009 | | $ | 48.09 | | | $ | 0.06 | | | $ | (12.70 | ) | | $ | (12.64 | ) | | $ | — | | | $ | (1.81 | ) | | $ | (0.00 | ) | | $ | (1.81 | ) | |
| 8/31/2008 | | $ | 51.52 | | | $ | (0.01 | ) | | $ | 4.90 | | | $ | 4.89 | | | $ | (0.23 | ) | | $ | (8.09 | ) | | $ | — | | | $ | (8.32 | ) | |
| 8/31/2007 | | $ | 47.95 | | | $ | 0.32 | @@ | | $ | 7.68 | @@ | | $ | 8.00 | | | $ | (0.78 | ) | | $ | (3.65 | ) | | $ | — | | | $ | (4.43 | ) | |
| 8/31/2006 | | $ | 46.66 | | | $ | 0.01 | | | $ | 2.34 | | | $ | 2.35 | | | $ | — | | | $ | (1.06 | ) | | $ | — | | | $ | (1.06 | ) | |
| Guardian Fund | |
| Investor Class | |
| 8/31/2010 | | $ | 11.15 | | | $ | 0.05 | | | $ | 0.84 | | | $ | 0.89 | | | $ | (0.06 | ) | | $ | — | | | $ | — | | | $ | (0.06 | ) | |
| 8/31/2009 | | $ | 16.58 | | | $ | 0.07 | | | $ | (4.15 | ) | | $ | (4.08 | ) | | $ | (0.05 | ) | | $ | (1.30 | ) | | $ | — | | | $ | (1.35 | ) | |
| 8/31/2008 | | $ | 19.89 | | | $ | 0.11 | | | $ | (1.05 | ) | | $ | (0.94 | ) | | $ | (0.13 | ) | | $ | (2.24 | ) | | $ | — | | | $ | (2.37 | ) | |
| 8/31/2007 | | $ | 18.64 | | | $ | 0.14 | | | $ | 2.49 | | | $ | 2.63 | | | $ | (0.07 | ) | | $ | (1.31 | ) | | $ | — | | | $ | (1.38 | ) | |
| 8/31/2006 | | $ | 17.52 | | | $ | 0.08 | | | $ | 1.16 | | | $ | 1.24 | | | $ | (0.12 | ) | | $ | — | | | $ | — | | | $ | (0.12 | ) | |
| Trust Class | |
| 8/31/2010 | | $ | 8.75 | | | $ | 0.02 | | | $ | 0.66 | | | $ | 0.68 | | | $ | (0.05 | ) | | $ | — | | | $ | — | | | $ | (0.05 | ) | |
| 8/31/2009 | | $ | 13.02 | | | $ | 0.04 | | | $ | (3.25 | ) | | $ | (3.21 | ) | | $ | (0.04 | ) | | $ | (1.02 | ) | | $ | — | | | $ | (1.06 | ) | |
| 8/31/2008 | | $ | 15.64 | | | $ | 0.06 | | | $ | (0.82 | ) | | $ | (0.76 | ) | | $ | (0.10 | ) | | $ | (1.76 | ) | | $ | — | | | $ | (1.86 | ) | |
| 8/31/2007 | | $ | 14.66 | | | $ | 0.07 | | | $ | 1.98 | | | $ | 2.05 | | | $ | (0.04 | ) | | $ | (1.03 | ) | | $ | — | | | $ | (1.07 | ) | |
| 8/31/2006 | | $ | 13.79 | | | $ | 0.04 | | | $ | 0.91 | | | $ | 0.95 | | | $ | (0.08 | ) | | $ | — | | | $ | — | | | $ | (0.08 | ) | |
| Advisor Class | |
| 8/31/2010 | | $ | 9.87 | | | $ | (0.02 | ) | | $ | 0.75 | | | $ | 0.73 | | | $ | (0.01 | ) | | $ | — | | | $ | — | | | $ | (0.01 | ) | |
| 8/31/2009 | | $ | 14.65 | | | $ | 0.01 | | | $ | (3.65 | ) | | $ | (3.64 | ) | | $ | (0.00 | ) | | $ | (1.14 | ) | | $ | — | | | $ | (1.14 | ) | |
| 8/31/2008 | | $ | 17.55 | | | $ | (0.01 | ) | | $ | (0.92 | ) | | $ | (0.93 | ) | | $ | — | | | $ | (1.97 | ) | | $ | — | | | $ | (1.97 | ) | |
| 8/31/2007 | | $ | 16.48 | | | $ | 0.01 | | | $ | 2.22 | | | $ | 2.23 | | | $ | — | | | $ | (1.16 | ) | | $ | — | | | $ | (1.16 | ) | |
| 8/31/2006 | | $ | 15.49 | | | $ | (0.02 | ) | | $ | 1.01 | | | $ | 0.99 | | | $ | — | | | $ | — | | | $ | — | | | $ | — | | |
| Institutional Class | |
| 8/31/2010 | | $ | 11.16 | | | $ | 0.08 | | | $ | 0.84 | | | $ | 0.92 | | | $ | (0.07 | ) | | $ | — | | | $ | — | | | $ | (0.07 | ) | |
Period from 5/27/2009^ to 8/31/2009 | | $ | 10.39 | | | $ | 0.03 | | | $ | 0.74 | | | $ | 0.77 | | | $ | — | | | $ | — | | | $ | — | | | $ | — | | |
| Class A | |
| 8/31/2010 | | $ | 8.75 | | | $ | 0.02 | | | $ | 0.66 | | | $ | 0.68 | | | $ | (0.07 | ) | | $ | — | | | $ | — | | | $ | (0.07 | ) | |
Period from 5/27/2009^ to 8/31/2009 | | $ | 8.15 | | | $ | 0.01 | | | $ | 0.59 | | | $ | 0.60 | | | $ | — | | | $ | — | | | $ | — | | | $ | — | | |
| See Notes to Financial Highlights | 185 | |
| | | Redemption Feesøø | | Net Asset Value, End of Year | | Total Return†† | | Net Assets, End of Year (in millions) | | Ratio of Gross Expenses to Average Net Assets# | | Ratio of Net Expenses to Average Net Assets | | Ratio of Net Investment Income/ (Loss) to Average Net Assets | | Portfolio Turnover Rate | |
| Institutional Class | |
| 8/31/2010 | | $ | — | | | $ | 36.56 | | | | 8.68 | % | | $ | 3,571.8 | | | | .85 | % | | | .85 | %‡ | | | .11 | % | | | 16 | % | |
| 8/31/2009 | | $ | — | | | $ | 33.64 | | | | (25.55 | %) | | $ | 3,283.0 | | | | .85 | % | | | .85 | %‡ | | | .18 | % | | | 12 | % | |
| 8/31/2008 | | $ | — | | | $ | 48.09 | | | | 10.48 | % | | $ | 4,781.4 | | | | .84 | % | | | .84 | %‡ | | | (.03 | %) | | | 18 | %## | |
| 8/31/2007 | | $ | — | | | $ | 51.52 | | | | 17.73 | % | | $ | 3,307.5 | | | | .85 | % | | | .84 | %‡ | | | .65 | %@@ | | | 25 | % | |
| 8/31/2006 | | $ | — | | | $ | 47.95 | | | | 5.05 | % | | $ | 2,625.7 | | | | .85 | % | | | .85 | %‡§ | | | .03 | % | | | 19 | % | |
| Guardian Fund | |
| Investor Class | |
| 8/31/2010 | | $ | — | | | $ | 11.98 | | | | 7.99 | % | | $ | 869.2 | | | | .95 | % | | | .95 | % | | | .40 | % | | | 36 | % | |
| 8/31/2009 | | $ | — | | | $ | 11.15 | | | | (22.65 | %) | | $ | 875.5 | | | | .97 | % | | | .97 | %‡ | | | .67 | % | | | 29 | % | |
| 8/31/2008 | | $ | — | | | $ | 16.58 | | | | (5.38 | %) | | $ | 1,252.9 | | | | .89 | % | | | .88 | %‡ | | | .59 | % | | | 42 | % | |
| 8/31/2007 | | $ | — | | | $ | 19.89 | | | | 14.48 | % | | $ | 1,441.6 | | | | .88 | % | | | .87 | %‡ | | | .69 | % | | | 20 | % | |
| 8/31/2006 | | $ | — | | | $ | 18.64 | | | | 7.09 | % | | $ | 1,417.0 | | | | .89 | % | | | .88 | %‡ | | | .47 | % | | | 34 | % | |
| Trust Class | |
| 8/31/2010 | | $ | — | | | $ | 9.38 | | | | 7.75 | % | | $ | 79.0 | | | | 1.12 | % | | | 1.12 | % | | | .23 | % | | | 36 | % | |
| 8/31/2009 | | $ | — | | | $ | 8.75 | | | | (22.74 | %) | | $ | 71.0 | | | | 1.14 | % | | | 1.14 | %‡ | | | .50 | % | | | 29 | % | |
| 8/31/2008 | | $ | — | | | $ | 13.02 | | | | (5.52 | %) | | $ | 103.6 | | | | 1.07 | % | | | 1.06 | %‡ | | | .41 | % | | | 42 | % | |
| 8/31/2007 | | $ | — | | | $ | 15.64 | | | | 14.30 | % | | $ | 122.7 | | | | 1.05 | % | | | 1.05 | %‡ | | | .47 | % | | | 20 | % | |
| 8/31/2006 | | $ | — | | | $ | 14.66 | | | | 6.90 | % | | $ | 160.5 | | | | 1.05 | % | | | 1.04 | %��� | | | .31 | % | | | 34 | % | |
| Advisor Class | |
| 8/31/2010 | | $ | — | | | $ | 10.59 | | | | 7.38 | % | | $ | 0.5 | | | | 1.50 | % | | | 1.50 | %‡ | | | (.16 | %) | | | 36 | % | |
| 8/31/2009 | | $ | — | | | $ | 9.87 | | | | (23.05 | %) | | $ | 0.5 | | | | 1.50 | % | | | 1.50 | %‡ | | | .13 | % | | | 29 | % | |
| 8/31/2008 | | $ | — | | | $ | 14.65 | | | | (5.96 | %) | | $ | 0.9 | | | | 1.50 | % | | | 1.50 | %‡ | | | (.04 | %) | | | 42 | % | |
| 8/31/2007 | | $ | — | | | $ | 17.55 | | | | 13.82 | % | | $ | 1.1 | | | | 1.50 | % | | | 1.50 | %‡ | | | .04 | % | | | 20 | % | |
| 8/31/2006 | | $ | — | | | $ | 16.48 | | | | 6.39 | % | | $ | 1.3 | | | | 1.50 | % | | | 1.49 | %‡ | | | (.12 | %) | | | 34 | % | |
| Institutional Class | |
| 8/31/2010 | | $ | — | | | $ | 12.01 | | | | 8.22 | % | | $ | 4.3 | | | | .75 | % | | | .75 | %‡ | | | .65 | % | | | 36 | % | |
Period from 5/27/2009^ to 8/31/2009 | | $ | — | | | $ | 11.16 | | | | 7.41 | %** | | $ | 0.1 | | | | .75 | %* | | | .75 | %‡* | | | 1.12 | %* | | | 29 | %Ø | |
| Class A | |
| 8/31/2010 | | $ | — | | | $ | 9.36 | | | | 7.72 | % | | $ | 3.5 | | | | 1.11 | % | | | 1.11 | %‡ | | | .23 | % | | | 36 | % | |
Period from 5/27/2009^ to 8/31/2009 | | $ | — | | | $ | 8.75 | | | | 7.36 | %** | | $ | 0.5 | | | | 1.11 | %* | | | 1.11 | %‡* | | | .41 | %* | | | 29 | %Ø | |
Financial Highlights (cont'd)
| | | Net Asset Value, Beginning of Year | | Net Investment Income (Loss)@ | | Net Gains or Losses on Securities (both realized and unrealized) | | Total From Investment Operations | | Dividends from Net Investment Income | | Distributions from Net Realized Capital Gains | | Tax Return of Capital | | Total Distributions | |
| Class C | |
| 8/31/2010 | | $ | 9.86 | | | $ | (0.06 | ) | | $ | 0.76 | | | $ | 0.70 | | | $ | (0.05 | ) | | $ | — | | | $ | — | | | $ | (0.05 | ) | |
Period from 5/27/2009^ to 8/31/2009 | | $ | 9.21 | | | $ | 0.00 | | | $ | 0.65 | | | $ | 0.65 | | | $ | — | | | $ | — | | | $ | — | | | $ | — | | |
| Class R3 | |
| 8/31/2010 | | $ | 9.88 | | | $ | (0.00 | ) | | $ | 0.74 | | | $ | 0.74 | | | $ | (0.05 | ) | | $ | — | | | $ | — | | | $ | (0.05 | ) | |
Period from 5/27/2009^ to 8/31/2009 | | $ | 9.21 | | | $ | 0.01 | | | $ | 0.66 | | | $ | 0.67 | | | $ | — | | | $ | — | | | $ | — | | | $ | — | | |
| International Fund | |
| Investor Class | |
| 8/31/2010 | | $ | 13.58 | | | $ | 0.13 | | | $ | 0.99 | | | $ | 1.12 | | | $ | (0.14 | ) | | $ | — | | | $ | (0.05 | ) | | $ | (0.19 | ) | |
| 8/31/2009 | | $ | 17.64 | | | $ | 0.16 | | | $ | (3.86 | ) | | $ | (3.70 | ) | | $ | (0.36 | ) | | $ | — | | | $ | — | | | $ | (0.36 | ) | |
| 8/31/2008 | | $ | 25.68 | | | $ | 0.38 | | | $ | (4.26 | ) | | $ | (3.88 | ) | | $ | (0.80 | ) | | $ | (3.36 | ) | | $ | — | | | $ | (4.16 | ) | |
| 8/31/2007 | | $ | 24.23 | | | $ | 0.26 | | | $ | 3.81 | | | $ | 4.07 | | | $ | (0.29 | ) | | $ | (2.33 | ) | | $ | — | | | $ | (2.62 | ) | |
| 8/31/2006 | | $ | 21.01 | | | $ | 0.28 | | | $ | 3.81 | | | $ | 4.09 | | | $ | (0.13 | ) | | $ | (0.75 | ) | | $ | — | | | $ | (0.88 | ) | |
| Trust Class | |
| 8/31/2010 | | $ | 15.03 | | | $ | 0.13 | | | $ | 1.10 | | | $ | 1.23 | | | $ | (0.13 | ) | | $ | — | | | $ | (0.05 | ) | | $ | (0.18 | ) | |
| 8/31/2009 | | $ | 19.43 | | | $ | 0.17 | | | $ | (4.24 | ) | | $ | (4.07 | ) | | $ | (0.33 | ) | | $ | — | | | $ | — | | | $ | (0.33 | ) | |
| 8/31/2008 | | $ | 28.18 | | | $ | 0.39 | | | $ | (4.69 | ) | | $ | (4.30 | ) | | $ | (0.77 | ) | | $ | (3.68 | ) | | $ | — | | | $ | (4.45 | ) | |
| 8/31/2007 | | $ | 26.52 | | | $ | 0.27 | | | $ | 4.16 | | | $ | 4.43 | | | $ | (0.24 | ) | | $ | (2.53 | ) | | $ | — | | | $ | (2.77 | ) | |
| 8/31/2006 | | $ | 22.93 | | | $ | 0.31 | | | $ | 4.16 | | | $ | 4.47 | | | $ | (0.08 | ) | | $ | (0.81 | ) | | $ | — | | | $ | (0.89 | ) | |
| International Institutional Fund | |
| Institutional Class | |
| 8/31/2010 | | $ | 7.53 | | | $ | 0.12 | | | $ | 0.56 | | | $ | 0.68 | | | $ | (0.11 | ) | | $ | — | | | $ | — | | | $ | (0.11 | ) | |
| 8/31/2009 | | $ | 9.84 | | | $ | 0.13 | | | $ | (2.17 | ) | | $ | (2.04 | ) | | $ | (0.27 | ) | | $ | — | | | $ | — | | | $ | (0.27 | ) | |
| 8/31/2008 | | $ | 14.44 | | | $ | 0.28 | | | $ | (2.42 | ) | | $ | (2.14 | ) | | $ | (0.50 | ) | | $ | (1.96 | ) | | $ | — | | | $ | (2.46 | ) | |
| 8/31/2007 | | $ | 12.69 | | | $ | 0.20 | | | $ | 2.04 | | | $ | 2.24 | | | $ | (0.18 | ) | | $ | (0.31 | ) | | $ | — | | | $ | (0.49 | ) | |
| 8/31/2006 | | $ | 10.95 | | | $ | 0.22 | | | $ | 1.60 | | | $ | 1.82 | | | $ | (0.03 | ) | | $ | (0.05 | ) | | $ | — | | | $ | (0.08 | ) | |
| See Notes to Financial Highlights | 193 | |
| | | Redemption Feesøø | | Net Asset Value, End of Year | | Total Return†† | | Net Assets, End of Year (in millions) | | Ratio of Gross Expenses to Average Net Assets# | | Ratio of Net Expenses to Average Net Assets | | Ratio of Net Investment Income/ (Loss) to Average Net Assets | | Portfolio Turnover Rate | |
| Class C | |
| 8/31/2010 | | $ | — | | | $ | 10.51 | | | | 7.08 | % | | $ | 0.4 | | | | 1.86 | % | | | 1.86 | %‡ | | | (.51 | %) | | | 36 | % | |
Period from 5/27/2009^ to 8/31/2009 | | $ | — | | | $ | 9.86 | | | | 7.06 | %** | | $ | 0.1 | | | | 1.86 | %* | | | 1.86 | %‡* | | | .01 | %* | | | 29 | %Ø | |
| Class R3 | |
| 8/31/2010 | | $ | — | | | $ | 10.57 | | | | 7.51 | % | | $ | 0.1 | | | | 1.36 | % | | | 1.36 | %‡ | | | (.02 | %) | | | 36 | % | |
Period from 5/27/2009^ to 8/31/2009 | | $ | — | | | $ | 9.88 | | | | 7.27 | %** | | $ | 0.1 | | | | 1.36 | %* | | | 1.36 | %‡* | | | .51 | %* | | | 29 | %Ø | |
| International Fund | |
| Investor Class | |
| 8/31/2010 | | $ | 0.00 | | | $ | 14.51 | | | | 8.26 | % | | $ | 172.5 | | | | 1.40 | % | | | 1.40 | %‡ | | | .93 | % | | | 61 | % | |
| 8/31/2009 | | $ | 0.00 | | | $ | 13.58 | | | | (20.42 | %) | | $ | 208.8 | | | | 1.40 | % | | | 1.40 | %‡ | | | 1.38 | % | | | 81 | % | |
| 8/31/2008 | | $ | 0.00 | | | $ | 17.64 | | | | (17.11 | %) | | $ | 405.2 | | | | 1.26 | % | | | 1.25 | %‡ | | | 1.80 | % | | | 53 | % | |
| 8/31/2007 | | $ | 0.00 | | | $ | 25.68 | | | | 17.44 | % | | $ | 690.6 | | | | 1.25 | % | | | 1.23 | %‡ | | | 1.02 | % | | | 42 | % | |
| 8/31/2006 | | $ | 0.01 | | | $ | 24.23 | | | | 20.07 | % | | $ | 921.4 | | | | 1.26 | % | | | 1.25 | %ठ| | | 1.19 | % | | | 48 | % | |
| Trust Class | |
| 8/31/2010 | | $ | 0.00 | | | $ | 16.08 | | | | 8.18 | % | | $ | 162.8 | | | | 1.52 | % | | | 1.52 | % | | | .81 | % | | | 61 | % | |
| 8/31/2009 | | $ | 0.00 | | | $ | 15.03 | | | | (20.48 | %) | | $ | 201.5 | | | | 1.49 | % | | | 1.49 | %‡ | | | 1.29 | % | | | 81 | % | |
| 8/31/2008 | | $ | 0.00 | | | $ | 19.43 | | | | (17.21 | %) | | $ | 417.7 | | | | 1.36 | % | | | 1.35 | %‡ | | | 1.64 | % | | | 53 | % | |
| 8/31/2007 | | $ | 0.00 | | | $ | 28.18 | | | | 17.34 | % | | $ | 824.3 | | | | 1.34 | % | | | 1.33 | %‡ | | | .96 | % | | | 42 | % | |
| 8/31/2006 | | $ | 0.01 | | | $ | 26.52 | | | | 20.02 | % | | $ | 870.9 | | | | 1.33 | % | | | 1.32 | %ठ| | | 1.21 | % | | | 48 | % | |
| International Institutional Fund | |
| Institutional Class | |
| 8/31/2010 | | $ | 0.00 | | | $ | 8.10 | | | | 9.05 | % | | $ | 168.1 | | | | .80 | % | | | .80 | %^^ | | | 1.53 | % | | | 50 | % | |
| 8/31/2009 | | $ | 0.00 | | | $ | 7.53 | | | | (19.92 | %) | | $ | 223.8 | | | | .81 | % | | | .81 | %^^ | | | 2.01 | % | | | 98 | % | |
| 8/31/2008 | | $ | 0.00 | | | $ | 9.84 | | | | (16.90 | %) | | $ | 411.5 | | | | .81 | % | | | .80 | %^^ | | | 2.32 | % | | | 58 | % | |
| 8/31/2007 | | $ | 0.00 | | | $ | 14.44 | | | | 17.97 | % | | $ | 574.3 | | | | .83 | % | | | .83 | %^^ | | | 1.44 | % | | | 59 | % | |
| 8/31/2006 | | $ | 0.00 | | | $ | 12.69 | | | | 16.68 | % | | $ | 627.6 | | | | .85 | % | | | .85 | %^^ | | | 1.78 | % | | | 45 | % | |
Financial Highlights (cont'd)
| | | Net Asset Value, Beginning of Year | | Net Investment Income (Loss)@ | | Net Gains or Losses on Securities (both realized and unrealized) | | Total From Investment Operations | | Dividends from Net Investment Income | | Distributions from Net Realized Capital Gains | | Tax Return of Capital | | Total Distributions | |
| International Large Cap Fund | |
| Trust Class | |
| 8/31/2010 | | $ | 7.93 | | | $ | 0.09 | | | $ | 0.38 | | | $ | 0.47 | | | $ | (0.09 | ) | | $ | — | | | $ | — | | | $ | (0.09 | ) | |
| 8/31/2009 | | $ | 10.12 | | | $ | 0.11 | | | $ | (2.08 | ) | | $ | (1.97 | ) | | $ | (0.22 | ) | | $ | — | | | $ | — | | | $ | (0.22 | ) | |
| 8/31/2008 | | $ | 12.09 | | | $ | 0.24 | | | $ | (1.63 | ) | | $ | (1.39 | ) | | $ | (0.18 | ) | | $ | (0.40 | ) | | $ | — | | | $ | (0.58 | ) | |
| 8/31/2007 | | $ | 10.19 | | | $ | 0.17 | | | $ | 1.79 | | | $ | 1.96 | | | $ | (0.05 | ) | | $ | (0.01 | ) | | $ | — | | | $ | (0.06 | ) | |
Period from 8/1/2006^ to 8/31/2006 | | $ | 10.00 | | | $ | 0.01 | | | $ | 0.18 | | | $ | 0.19 | | | $ | — | | | $ | — | | | $ | — | | | $ | — | | |
| Institutional Class | |
| 8/31/2010 | | $ | 7.93 | | | $ | 0.12 | | | $ | 0.38 | | | $ | 0.50 | | | $ | (0.11 | ) | | $ | — | | | $ | — | | | $ | (0.11 | ) | |
| 8/31/2009 | | $ | 10.15 | | | $ | 0.14 | | | $ | (2.09 | ) | | $ | (1.95 | ) | | $ | (0.27 | ) | | $ | — | | | $ | — | | | $ | (0.27 | ) | |
| 8/31/2008 | | $ | 12.11 | | | $ | 0.29 | | | $ | (1.63 | ) | | $ | (1.34 | ) | | $ | (0.22 | ) | | $ | (0.40 | ) | | $ | — | | | $ | (0.62 | ) | |
Period from 10/6/2006^ to 8/31/2007 | | $ | 10.19 | | | $ | 0.19 | | | $ | 1.80 | | | $ | 1.99 | | | $ | (0.06 | ) | | $ | (0.01 | ) | | $ | — | | | $ | (0.07 | ) | |
| Class A | |
| 8/31/2010 | | $ | 7.90 | | | $ | 0.10 | | | $ | 0.37 | | | $ | 0.47 | | | $ | (0.10 | ) | | $ | — | | | $ | — | | | $ | (0.10 | ) | |
| 8/31/2009 | | $ | 10.12 | | | $ | 0.11 | | | $ | (2.08 | ) | | $ | (1.97 | ) | | $ | (0.25 | ) | | $ | — | | | $ | — | | | $ | (0.25 | ) | |
Period from 12/20/2007^ to 8/31/2008 | | $ | 11.30 | | | $ | 0.08 | | | $ | (1.26 | ) | | $ | (1.18 | ) | | $ | — | | | $ | — | | | $ | — | | | $ | — | | |
| Class C | |
| 8/31/2010 | | $ | 7.87 | | | $ | 0.04 | | | $ | 0.36 | | | $ | 0.40 | | | $ | (0.07 | ) | | $ | — | | | $ | — | | | $ | (0.07 | ) | |
| 8/31/2009 | | $ | 10.06 | | | $ | 0.08 | | | $ | (2.08 | ) | | $ | (2.00 | ) | | $ | (0.19 | ) | | $ | — | | | $ | — | | | $ | (0.19 | ) | |
Period from 12/20/2007^ to 8/31/2008 | | $ | 11.30 | | | $ | 0.16 | | | $ | (1.40 | ) | | $ | (1.24 | ) | | $ | — | | | $ | — | | | $ | — | | | $ | — | | |
| Class R3 | |
| 8/31/2010 | | $ | 7.90 | | | $ | 0.07 | | | $ | 0.37 | | | $ | 0.44 | | | $ | (0.08 | ) | | $ | — | | | $ | — | | | $ | (0.08 | ) | |
Period from 5/27/2009^ to 8/31/2009 | | $ | 7.10 | | | $ | 0.03 | | | $ | 0.77 | | | $ | 0.80 | | | $ | — | | | $ | — | | | $ | — | | | $ | — | | |
| Intrinsic Value Fund | |
| Institutional Class | |
Period from 5/10/2010^ to 8/31/2010 | | $ | 10.00 | | | $ | 0.01 | | | $ | (0.60 | ) | | $ | (0.59 | ) | | $ | — | | | $ | — | | | $ | — | | | $ | — | | |
| See Notes to Financial Highlights | 195 | |
| | | Redemption Feesøø | | Net Asset Value, End of Year | | Total Return†† | | Net Assets, End of Year (in millions) | | Ratio of Gross Expenses to Average Net Assets# | | Ratio of Net Expenses to Average Net Assets | | Ratio of Net Investment Income/ (Loss) to Average Net Assets | | Portfolio Turnover Rate | |
| International Large Cap Fund | |
| Trust Class | |
| 8/31/2010 | | $ | 0.00 | | | $ | 8.31 | | | | 5.87 | % | | $ | 27.7 | | | | 1.25 | % | | | 1.25 | %‡ | | | 1.10 | % | | | 45 | % | |
| 8/31/2009 | | $ | 0.00 | | | $ | 7.93 | | | | (18.84 | %) | | $ | 28.9 | | | | 1.27 | % | | | 1.27 | %‡ | | | 1.62 | % | | | 90 | % | |
| 8/31/2008 | | $ | 0.00 | | | $ | 10.12 | | | | (11.95 | %) | | $ | 51.5 | | | | 1.28 | % | | | 1.27 | %‡ | | | 2.07 | % | | | 97 | % | |
| 8/31/2007 | | $ | 0.00 | | | $ | 12.09 | | | | 19.24 | % | | $ | 54.2 | | | | 1.25 | % | | | 1.24 | %‡ | | | 1.42 | % | | | 23 | % | |
Period from 8/1/2006^ to 8/31/2006 | | $ | — | | | $ | 10.19 | | | | 1.90 | %** | | $ | 6.2 | | | | 1.25 | %* | | | 1.25 | %‡* | | | 1.32 | %* | | | 6 | %** | |
| Institutional Class | |
| 8/31/2010 | | $ | 0.00 | | | $ | 8.32 | | | | 6.29 | % | | $ | 129.5 | | | | .90 | % | | | .90 | %‡ | | | 1.45 | % | | | 45 | % | |
| 8/31/2009 | | $ | 0.00 | | | $ | 7.93 | | | | (18.57 | %) | | $ | 67.7 | | | | .92 | % | | | .92 | %‡ | | | 2.00 | % | | | 90 | % | |
| 8/31/2008 | | $ | 0.00 | | | $ | 10.15 | | | | (11.60 | %) | | $ | 114.4 | | | | .93 | % | | | .92 | %‡ | | | 2.59 | % | | | 97 | % | |
Period from 10/6/2006^ to 8/31/2007 | | $ | 0.00 | | | $ | 12.11 | | | | 19.56 | %** | | $ | 111.0 | | | | .90 | %* | | | .89 | %‡* | | | 1.80 | %* | | | 23 | %Ø | |
| Class A | |
| 8/31/2010 | | $ | 0.00 | | | $ | 8.27 | | | | 5.87 | % | | $ | 9.3 | | | | 1.24 | % | | | 1.24 | %‡ | | | 1.24 | % | | | 45 | % | |
| 8/31/2009 | | $ | 0.00 | | | $ | 7.90 | | | | (18.83 | %) | | $ | 4.0 | | | | 1.29 | % | | | 1.29 | %‡ | | | 1.63 | % | | | 90 | % | |
Period from 12/20/2007^ to 8/31/2008 | | $ | 0.00 | | | $ | 10.12 | | | | (10.44 | %)** | | $ | 2.2 | | | | 1.34 | %* | | | 1.34 | %‡* | | | 1.15 | %* | | | 97 | %Ø | |
| Class C | |
| 8/31/2010 | | $ | 0.00 | | | $ | 8.20 | | | | 5.02 | % | | $ | 1.5 | | | | 2.01 | % | | | 2.01 | %‡ | | | .45 | % | | | 45 | % | |
| 8/31/2009 | | $ | 0.00 | | | $ | 7.87 | | | | (19.34 | %) | | $ | 0.4 | | | | 2.01 | % | | | 2.01 | %‡ | | | 1.23 | % | | | 90 | % | |
Period from 12/20/2007^ to 8/31/2008 | | $ | 0.00 | | | $ | 10.06 | | | | (10.97 | %)** | | $ | 0.1 | | | | 2.04 | %* | | | 2.03 | %‡* | | | 2.05 | %* | | | 97 | %Ø | |
| Class R3 | |
| 8/31/2010 | | $ | 0.00 | | | $ | 8.26 | | | | 5.57 | % | | $ | 0.1 | | | | 1.51 | % | | | 1.51 | %‡ | | | .87 | % | | | 45 | % | |
Period from 5/27/2009^ to 8/31/2009 | | $ | 0.00 | | | $ | 7.90 | | | | 11.27 | %** | | $ | 0.1 | | | | 1.52 | %* | | | 1.52 | %‡* | | | 1.31 | %* | | | 90 | %Ø | |
| Intrinsic Value Fund | |
| Institutional Class | |
Period from 5/10/2010^ to 8/31/2010 | | $ | — | | | $ | 9.41 | | | | (5.90 | %)** | | $ | 80.9 | | | | 1.00 | %* | | | 1.00 | %‡* | | | .33 | %* | | | 19 | %** | |
Financial Highlights (cont'd)
| | | Net Asset Value, Beginning of Year | | Net Investment Income (Loss)@ | | Net Gains or Losses on Securities (both realized and unrealized) | | Total From Investment Operations | | Dividends from Net Investment Income | | Distributions from Net Realized Capital Gains | | Tax Return of Capital | | Total Distributions | |
| Class A | |
Period from 5/10/2010^ to 8/31/2010 | | $ | 10.00 | | | $ | (0.00 | ) | | $ | (0.60 | ) | | $ | (0.60 | ) | | $ | — | | | $ | — | | | $ | — | | | $ | — | | |
| Class C | |
Period from 5/10/2010^ to 8/31/2010 | | $ | 10.00 | | | $ | (0.02 | ) | | $ | (0.60 | ) | | $ | (0.62 | ) | | $ | — | | | $ | — | | | $ | — | | | $ | — | | |
| Large Cap Disciplined Growth Fund | |
| Investor Class | |
| 8/31/2010 | | $ | 6.04 | | | $ | 0.02 | | | $ | 0.12 | | | $ | 0.14 | | | $ | (0.00 | ) | | $ | — | | | $ | — | | | $ | (0.00 | ) | |
| 8/31/2009 | | $ | 7.39 | | | $ | 0.02 | | | $ | (1.37 | ) | | $ | (1.35 | ) | | $ | — | | | $ | — | | | $ | — | | | $ | — | | |
| 8/31/2008 | | $ | 7.45 | | | $ | (0.00 | ) | | $ | (0.06 | ) | | $ | (0.06 | ) | | $ | — | | | $ | — | | | $ | — | | | $ | — | | |
| 8/31/2007 | | $ | 6.52 | | | $ | (0.00 | ) | | $ | 0.93 | | | $ | 0.93 | | | $ | — | | | $ | — | | | $ | — | | | $ | — | | |
| 8/31/2006 | | $ | 6.22 | | | $ | (0.02 | ) | | $ | 0.33 | | | $ | 0.31 | | | $ | (0.01 | ) | | $ | — | | | $ | — | | | $ | (0.01 | ) | |
| Institutional Class | |
| 8/31/2010 | | $ | 6.05 | | | $ | 0.04 | | | $ | 0.13 | | | $ | 0.17 | | | $ | (0.02 | ) | | $ | — | | | $ | — | | | $ | (0.02 | ) | |
Period from 4/6/2009^ to 8/31/2009 | | $ | 5.28 | | | $ | 0.02 | | | $ | 0.75 | | | $ | 0.77 | | | $ | — | | | $ | — | | | $ | — | | | $ | — | | |
| Class A | |
| 8/31/2010 | | $ | 6.04 | | | $ | 0.02 | | | $ | 0.12 | | | $ | 0.14 | | | $ | — | | | $ | — | | | $ | — | | | $ | — | | |
Period from 4/6/2009^ to 8/31/2009 | | $ | 5.28 | | | $ | 0.01 | | | $ | 0.75 | | | $ | 0.76 | | | $ | — | | | $ | — | | | $ | — | | | $ | — | | |
| Class C | |
| 8/31/2010 | | $ | 6.02 | | | $ | (0.03 | ) | | $ | 0.13 | | | $ | 0.10 | | | $ | — | | | $ | — | | | $ | — | | | $ | — | | |
Period from 4/6/2009^ to 8/31/2009 | | $ | 5.28 | | | $ | (0.01 | ) | | $ | 0.75 | | | $ | 0.74 | | | $ | — | | | $ | — | | | $ | — | | | $ | — | | |
| Class R3 | |
| 8/31/2010 | | $ | 6.03 | | | $ | 0.00 | | | $ | 0.13 | | | $ | 0.13 | | | $ | — | | | $ | — | | | $ | — | | | $ | — | | |
Period from 5/27/2009^ to 8/31/2009 | | $ | 5.47 | | | $ | 0.00 | | | $ | 0.56 | | | $ | 0.56 | | | $ | — | | | $ | — | | | $ | — | | | $ | — | | |
| See Notes to Financial Highlights | 197 | |
| | | Redemption Feesøø | | Net Asset Value, End of Year | | Total Return†† | | Net Assets, End of Year (in millions) | | Ratio of Gross Expenses to Average Net Assets# | | Ratio of Net Expenses to Average Net Assets | | Ratio of Net Investment Income/ (Loss) to Average Net Assets | | Portfolio Turnover Rate | |
| Class A | |
Period from 5/10/2010^ to 8/31/2010 | | $ | — | | | $ | 9.40 | | | | (6.00 | %)** | | $ | 0.6 | | | | 1.36 | %* | | | 1.36 | %‡* | | | (.02 | %)* | | | 19 | %** | |
| Class C | |
Period from 5/10/2010^ to 8/31/2010 | | $ | — | | | $ | 9.38 | | | | (6.20 | %)** | | $ | 0.0 | | | | 2.11 | %* | | | 2.11 | %‡* | | | (.79 | %)* | | | 19 | %** | |
| Large Cap Disciplined Growth Fund | |
| Investor Class | |
| 8/31/2010 | | $ | — | | | $ | 6.18 | | | | 2.37 | % | | $ | 11.4 | | | | 1.11 | % | | | 1.11 | %‡ | | | .29 | % | | | 104 | % | |
| 8/31/2009 | | $ | — | | | $ | 6.04 | | | | (18.27 | %) | | $ | 11.7 | | | | 1.34 | % | | | 1.34 | %‡ | | | .40 | % | | | 132 | %### | |
| 8/31/2008 | | $ | — | | | $ | 7.39 | | | | (.81 | %) | | $ | 11.9 | | | | 1.51 | % | | | 1.50 | %‡ | | | (.00 | %) | | | 167 | % | |
| 8/31/2007 | | $ | — | | | $ | 7.45 | | | | 14.26 | % | | $ | 10.0 | | | | 1.51 | % | | | 1.50 | %‡ | | | (.02 | %) | | | 46 | % | |
| 8/31/2006 | | $ | — | | | $ | 6.52 | | | | 4.92 | % | | $ | 10.4 | | | | 1.51 | % | | | 1.49 | %‡ | | | (.27 | %) | | | 64 | % | |
| Institutional Class | |
| 8/31/2010 | | $ | — | | | $ | 6.20 | | | | 2.76 | % | | $ | 346.6 | | | | .75 | % | | | .75 | %‡ | | | .61 | % | | | 104 | % | |
Period from 4/6/2009^ to 8/31/2009 | | $ | — | | | $ | 6.05 | | | | 14.58 | %** | | $ | 23.3 | | | | .75 | %* | | | .75 | %‡* | | | .86 | %* | | | 132 | %Ø### | |
| Class A | |
| 8/31/2010 | | $ | — | | | $ | 6.18 | | | | 2.32 | % | | $ | 33.0 | | | | 1.11 | % | | | 1.11 | %‡ | | | .35 | % | | | 104 | % | |
Period from 4/6/2009^ to 8/31/2009 | | $ | — | | | $ | 6.04 | | | | 14.39 | %** | | $ | 63.7 | | | | 1.11 | %* | | | 1.11 | %‡* | | | .47 | %* | | | 132 | %Ø### | |
| Class C | |
| 8/31/2010 | | $ | — | | | $ | 6.12 | | | | 1.66 | % | | $ | 31.0 | | | | 1.86 | % | | | 1.86 | %‡ | | | (.46 | %) | | | 104 | % | |
Period from 4/6/2009^ to 8/31/2009 | | $ | — | | | $ | 6.02 | | | | 14.02 | %** | | $ | 25.9 | | | | 1.86 | %* | | | 1.86 | %‡* | | | (.28 | %)* | | | 132 | %Ø### | |
| Class R3 | |
| 8/31/2010 | | $ | — | | | $ | 6.16 | | | | 2.16 | % | | $ | 0.1 | | | | 1.36 | % | | | 1.36 | %‡ | | | .04 | % | | | 104 | % | |
Period from 5/27/2009^ to 8/31/2009 | | $ | — | | | $ | 6.03 | | | | 10.24 | %** | | $ | 0.1 | | | | 1.36 | %* | | | 1.36 | %‡* | | | .20 | %* | | | 132 | %Ø### | |
Financial Highlights (cont'd)
| | | Net Asset Value, Beginning of Year | | Net Investment Income (Loss)@ | | Net Gains or Losses on Securities (both realized and unrealized) | | Total From Investment Operations | | Dividends from Net Investment Income | | Distributions from Net Realized Capital Gains | | Tax Return of Capital | | Total Distributions | |
| Mid Cap Growth Fund | |
| Investor Class | |
| 8/31/2010 | | $ | 7.43 | | | $ | (0.05 | ) | | $ | 1.05 | | | $ | 1.00 | | | $ | — | | | $ | — | | | $ | — | | | $ | — | | |
| 8/31/2009 | | $ | 9.53 | | | $ | (0.02 | ) | | $ | (2.08 | ) | | $ | (2.10 | ) | | $ | — | | | $ | — | | | $ | — | | | $ | — | | |
| 8/31/2008 | | $ | 10.54 | | | $ | (0.05 | ) | | $ | (0.96 | ) | | $ | (1.01 | ) | | $ | — | | | $ | — | | | $ | — | | | $ | — | | |
| 8/31/2007 | | $ | 8.17 | | | $ | (0.03 | ) | | $ | 2.40 | | | $ | 2.37 | | | $ | — | | | $ | — | | | $ | — | | | $ | — | | |
| 8/31/2006 | | $ | 7.45 | | | $ | (0.03 | ) | | $ | 0.75 | | | $ | 0.72 | | | $ | — | | | $ | — | | | $ | — | | | $ | — | | |
| Trust Class | |
| 8/31/2010 | | $ | 11.31 | | | $ | (0.08 | ) | | $ | 1.60 | | | $ | 1.52 | | | $ | — | | | $ | — | | | $ | — | | | $ | — | | |
| 8/31/2009 | | $ | 14.54 | | | $ | (0.04 | ) | | $ | (3.19 | ) | | $ | (3.23 | ) | | $ | — | | | $ | — | | | $ | — | | | $ | — | | |
| 8/31/2008 | | $ | 16.11 | | | $ | (0.11 | ) | | $ | (1.46 | ) | | $ | (1.57 | ) | | $ | — | | | $ | — | | | $ | — | | | $ | — | | |
| 8/31/2007 | | $ | 12.53 | | | $ | (0.09 | ) | | $ | 3.67 | | | $ | 3.58 | | | $ | — | | | $ | — | | | $ | — | | | $ | — | | |
| 8/31/2006 | | $ | 11.46 | | | $ | (0.08 | ) | | $ | 1.15 | | | $ | 1.07 | | | $ | — | | | $ | — | | | $ | — | | | $ | — | | |
| Advisor Class | |
| 8/31/2010 | | $ | 11.63 | | | $ | (0.13 | ) | | $ | 1.64 | | | $ | 1.51 | | | $ | — | | | $ | — | | | $ | — | | | $ | — | | |
| 8/31/2009 | | $ | 14.98 | | | $ | (0.06 | ) | | $ | (3.29 | ) | | $ | (3.35 | ) | | $ | — | | | $ | — | | | $ | — | | | $ | — | | |
| 8/31/2008 | | $ | 16.64 | | | $ | (0.16 | ) | | $ | (1.50 | ) | | $ | (1.66 | ) | | $ | — | | | $ | — | | | $ | — | | | $ | — | | |
| 8/31/2007 | | $ | 12.96 | | | $ | (0.12 | ) | | $ | 3.80 | | | $ | 3.68 | | | $ | — | | | $ | — | | | $ | — | | | $ | — | | |
| 8/31/2006 | | $ | 11.88 | | | $ | (0.10 | ) | | $ | 1.18 | | | $ | 1.08 | | | $ | — | | | $ | — | | | $ | — | | | $ | — | | |
| Institutional Class | |
| 8/31/2010 | | $ | 7.50 | | | $ | (0.02 | ) | | $ | 1.06 | | | $ | 1.04 | | | $ | — | | | $ | — | | | $ | — | | | $ | — | | |
| 8/31/2009 | | $ | 9.57 | | | $ | 0.01 | | | $ | (2.08 | ) | | $ | (2.07 | ) | | $ | — | | | $ | — | | | $ | — | | | $ | — | | |
| 8/31/2008 | | $ | 10.55 | | | $ | (0.02 | ) | | $ | (0.96 | ) | | $ | (0.98 | ) | | $ | — | | | $ | — | | | $ | — | | | $ | — | | |
Period from 4/29/2007^ to 8/31/2007 | | $ | 9.97 | | | $ | (0.01 | ) | | $ | 0.59 | | | $ | 0.58 | | | $ | — | | | $ | — | | | $ | — | | | $ | — | | |
| Class A | |
| 8/31/2010 | | $ | 11.31 | | | $ | (0.07 | ) | | $ | 1.60 | | | $ | 1.53 | | | $ | — | | | $ | — | | | $ | — | | | $ | — | | |
Period from 5/27/2009^ to 8/31/2009 | | $ | 10.34 | | | $ | (0.00 | ) | | $ | 0.97 | | | $ | 0.97 | | | $ | — | | | $ | — | | | $ | — | | | $ | — | | |
| Class C | |
| 8/31/2010 | | $ | 11.62 | | | $ | (0.18 | ) | | $ | 1.65 | | | $ | 1.47 | | | $ | — | | | $ | — | | | $ | — | | | $ | — | | |
Period from 5/27/2009^ to 8/31/2009 | | $ | 10.64 | | | $ | (0.02 | ) | | $ | 1.00 | | | $ | 0.98 | | | $ | — | | | $ | — | | | $ | — | | | $ | — | | |
| See Notes to Financial Highlights | 199 | |
| | | Redemption Feesøø | | Net Asset Value, End of Year | | Total Return†† | | Net Assets, End of Year (in millions) | | Ratio of Gross Expenses to Average Net Assets# | | Ratio of Net Expenses to Average Net Assets | | Ratio of Net Investment Income/ (Loss) to Average Net Assets | | Portfolio Turnover Rate | |
| Mid Cap Growth Fund | |
| Investor Class | |
| 8/31/2010 | | $ | — | | | $ | 8.43 | | | | 13.46 | % | | $ | 288.0 | | | | 1.07 | % | | | 1.07 | % | | | (.55 | %) | | | 70 | % | |
| 8/31/2009 | | $ | — | | | $ | 7.43 | | | | (22.04 | %) | | $ | 280.9 | | | | 1.11 | % | | | 1.11 | %‡ | | | (.28 | %) | | | 69 | % | |
| 8/31/2008 | | $ | — | | | $ | 9.53 | | | | (9.58 | %) | | $ | 396.7 | | | | 1.01 | % | | | 1.01 | %‡ | | | (.49 | %) | | | 70 | % | |
| 8/31/2007 | | $ | — | | | $ | 10.54 | | | | 29.01 | % | | $ | 446.3 | | | | 1.03 | % | | | 1.02 | %‡ | | | (.33 | %) | | | 49 | % | |
| 8/31/2006 | | $ | — | | | $ | 8.17 | | | | 9.66 | % | | $ | 356.7 | | | | 1.05 | % | | | 1.04 | %‡ | | | (.36 | %) | | | 45 | % | |
| Trust Class | |
| 8/31/2010 | | $ | — | | | $ | 12.83 | | | | 13.44 | % | | $ | 21.8 | | | | 1.14 | % | | | 1.14 | % | | | (.61 | %) | | | 70 | % | |
| 8/31/2009 | | $ | — | | | $ | 11.31 | | | | (22.21 | %) | | $ | 16.4 | | | | 1.26 | % | | | 1.26 | %‡ | | | (.37 | %) | | | 69 | % | |
| 8/31/2008 | | $ | — | | | $ | 14.54 | | | | (9.75 | %) | | $ | 11.7 | | | | 1.25 | % | | | 1.25 | %‡ | | | (.73 | %) | | | 70 | % | |
| 8/31/2007 | | $ | — | | | $ | 16.11 | | | | 28.57 | % | | $ | 13.4 | | | | 1.31 | % | | | 1.30 | %‡ | | | (.63 | %) | | | 49 | % | |
| 8/31/2006 | | $ | — | | | $ | 12.53 | | | | 9.34 | % | | $ | 6.6 | | | | 1.33 | % | | | 1.32 | %‡ | | | (.65 | %) | | | 45 | % | |
| Advisor Class | |
| 8/31/2010 | | $ | — | | | $ | 13.14 | | | | 12.98 | % | | $ | 5.4 | | | | 1.50 | % | | | 1.50 | %§ | | | (.98 | %) | | | 70 | % | |
| 8/31/2009 | | $ | — | | | $ | 11.63 | | | | (22.36 | %) | | $ | 6.9 | | | | 1.50 | % | | | 1.50 | %‡ | | | (.57 | %) | | | 69 | % | |
| 8/31/2008 | | $ | — | | | $ | 14.98 | | | | (9.98 | %) | | $ | 3.2 | | | | 1.50 | % | | | 1.49 | %‡ | | | (.98 | %) | | | 70 | % | |
| 8/31/2007 | | $ | — | | | $ | 16.64 | | | | 28.40 | % | | $ | 1.5 | | | | 1.50 | % | | | 1.49 | %‡ | | | (.80 | %) | | | 49 | % | |
| 8/31/2006 | | $ | — | | | $ | 12.96 | | | | 9.09 | % | | $ | 0.8 | | | | 1.50 | % | | | 1.49 | %‡ | | | (.80 | %) | | | 45 | % | |
| Institutional Class | |
| 8/31/2010 | | $ | — | | | $ | 8.54 | | | | 13.87 | % | | $ | 121.1 | | | | .75 | % | | | .75 | %‡ | | | (.22 | %) | | | 70 | % | |
| 8/31/2009 | | $ | — | | | $ | 7.50 | | | | (21.63 | %) | | $ | 146.6 | | | | .75 | % | | | .75 | %‡ | | | .12 | % | | | 69 | % | |
| 8/31/2008 | | $ | — | | | $ | 9.57 | | | | (9.29 | %) | | $ | 51.1 | | | | .75 | % | | | .75 | %‡ | | | (.22 | %) | | | 70 | % | |
Period from 4/29/2007^ to 8/31/2007 | | $ | — | | | $ | 10.55 | | | | 5.82 | %** | | $ | 18.1 | | | | .75 | %* | | | .74 | %‡* | | | (.25 | %)* | | | 49 | %Ø | |
| Class A | |
| 8/31/2010 | | $ | — | | | $ | 12.84 | | | | 13.53 | % | | $ | 13.6 | | | | 1.11 | % | | | 1.11 | %‡ | | | (.51 | %) | | | 70 | % | |
Period from 5/27/2009^ to 8/31/2009 | | $ | — | | | $ | 11.31 | | | | 9.38 | %** | | $ | 0.1 | | | | 1.11 | %* | | | 1.11 | %‡* | | | (.01 | %)* | | | 69 | %Ø | |
| Class C | |
| 8/31/2010 | | $ | — | | | $ | 13.09 | | | | 12.65 | % | | $ | 0.2 | | | | 1.86 | % | | | 1.86 | %‡ | | | (1.32 | %) | | | 70 | % | |
Period from 5/27/2009^ to 8/31/2009 | | $ | — | | | $ | 11.62 | | | | 9.21 | %** | | $ | 0.1 | | | | 1.86 | %* | | | 1.86 | %‡* | | | (.64 | %)* | | | 69 | %Ø | |
Financial Highlights (cont'd)
| | | Net Asset Value, Beginning of Year | | Net Investment Income (Loss)@ | | Net Gains or Losses on Securities (both realized and unrealized) | | Total From Investment Operations | | Dividends from Net Investment Income | | Distributions from Net Realized Capital Gains | | Tax Return of Capital | | Total Distributions | |
| Class R3 | |
| 8/31/2010 | | $ | 11.63 | | | $ | (0.11 | ) | | $ | 1.65 | | | $ | 1.54 | | | $ | — | | | $ | — | | | $ | — | | | $ | — | | |
Period from 5/27/2009^ to 8/31/2009 | | $ | 10.64 | | | $ | (0.00 | ) | | $ | 0.99 | | | $ | 0.99 | | | $ | — | | | $ | — | | | $ | — | | | $ | — | | |
| | |
| Multi-Cap Opportunities Fund | |
Institutional Class‡‡‡ | |
| 8/31/2010 | | $ | 7.93 | | | $ | 0.09 | | | $ | 0.16 | | | $ | 0.25 | | | $ | (0.15 | ) | | $ | — | | | $ | — | | | $ | (0.15 | ) | |
| 8/31/2009 | | $ | 9.84 | | | $ | 0.07 | | | $ | (1.84 | ) | | $ | (1.77 | ) | | $ | (0.05 | ) | | $ | (0.09 | ) | | $ | — | | | $ | (0.14 | ) | |
| 8/31/2008 | | $ | 11.14 | | | $ | 0.05 | | | $ | (0.86 | ) | | $ | (0.81 | ) | | $ | (0.07 | ) | | $ | (0.42 | ) | | $ | — | | | $ | (0.49 | ) | |
Period from 11/2/2006^ to 8/31/2007 | | $ | 10.00 | | | $ | 0.04 | | | $ | 1.12 | | | $ | 1.16 | | | $ | (0.02 | ) | | $ | — | | | $ | — | | | $ | (0.02 | ) | |
| Class A | |
Period from 12/21/2009^ to 8/31/2010 | | $ | 8.38 | | | $ | 0.03 | | | $ | (0.39 | ) | | $ | (0.36 | ) | | $ | — | | | $ | — | | | $ | — | | | $ | — | | |
| Class C | |
Period from 12/21/2009^ to 8/31/2010 | | $ | 8.38 | | | $ | (0.01 | ) | | $ | (0.40 | ) | | $ | (0.41 | ) | | $ | — | | | $ | — | | | $ | — | | | $ | — | | |
| | |
| Partners Fund | |
| Investor Class | |
| 8/31/2010 | | $ | 21.67 | | | $ | 0.04 | | | $ | 0.45 | | | $ | 0.49 | | | $ | (0.13 | ) | | $ | — | | | $ | — | | | $ | (0.13 | ) | |
| 8/31/2009 | | $ | 28.90 | | | $ | 0.15 | | | $ | (7.04 | ) | | $ | (6.89 | ) | | $ | (0.09 | ) | | $ | (0.25 | ) | | $ | — | | | $ | (0.34 | ) | |
| 8/31/2008 | | $ | 32.10 | | | $ | 0.13 | | | $ | (2.01 | ) | | $ | (1.88 | ) | | $ | (0.12 | ) | | $ | (1.20 | ) | | $ | — | | | $ | (1.32 | ) | |
| 8/31/2007 | | $ | 28.71 | | | $ | 0.14 | | | $ | 3.96 | | | $ | 4.10 | | | $ | (0.20 | ) | | $ | (0.51 | ) | | $ | — | | | $ | (0.71 | ) | |
| 8/31/2006 | | $ | 28.62 | | | $ | 0.24 | | | $ | 1.43 | | | $ | 1.67 | | | $ | (0.27 | ) | | $ | (1.31 | ) | | $ | — | | | $ | (1.58 | ) | |
| Trust Class | |
| 8/31/2010 | | $ | 16.67 | | | $ | 0.00 | | | $ | 0.34 | | | $ | 0.34 | | | $ | (0.11 | ) | | $ | — | | | $ | — | | | $ | (0.11 | ) | |
| 8/31/2009 | | $ | 22.25 | | | $ | 0.09 | | | $ | (5.42 | ) | | $ | (5.33 | ) | | $ | (0.06 | ) | | $ | (0.19 | ) | | $ | — | | | $ | (0.25 | ) | |
| 8/31/2008 | | $ | 24.75 | | | $ | 0.06 | | | $ | (1.56 | ) | | $ | (1.50 | ) | | $ | (0.08 | ) | | $ | (0.92 | ) | | $ | — | | | $ | (1.00 | ) | |
| 8/31/2007 | | $ | 22.14 | | | $ | 0.06 | | | $ | 3.05 | | | $ | 3.11 | | | $ | (0.11 | ) | | $ | (0.39 | ) | | $ | — | | | $ | (0.50 | ) | |
| 8/31/2006 | | $ | 22.02 | | | $ | 0.15 | | | $ | 1.11 | | | $ | 1.26 | | | $ | (0.13 | ) | | $ | (1.01 | ) | | $ | — | | | $ | (1.14 | ) | |
| See Notes to Financial Highlights | 201 | |
| | | Redemption Feesøø | | Net Asset Value, End of Year | | Total Return†† | | Net Assets, End of Year (in millions) | | Ratio of Gross Expenses to Average Net Assets# | | Ratio of Net Expenses to Average Net Assets | | Ratio of Net Investment Income/ (Loss) to Average Net Assets | | Portfolio Turnover Rate | |
| Class R3 | |
| 8/31/2010 | | $ | — | | | $ | 13.17 | | | | 13.24 | % | | $ | 0.1 | | | | 1.36 | % | | | 1.36 | %‡ | | | (.84 | %) | | | 70 | % | |
Period from 5/27/2009^ to 8/31/2009 | | $ | — | | | $ | 11.63 | | | | 9.30 | %** | | $ | 0.1 | | | | 1.36 | %* | | | 1.36 | %‡* | | | (.14 | %)* | | | 69 | %Ø | |
| Multi-Cap Opportunities Fund | |
Institutional Class‡‡‡ | |
| 8/31/2010 | | $ | — | | | $ | 8.03 | | | | 3.02 | %†††† | | $ | 47.2 | | | | 1.00 | % | | | 1.00 | %‡ | | | 1.10 | % | | | 62 | % | |
| 8/31/2009 | | $ | — | | | $ | 7.93 | | | | (17.74 | %) | | $ | 3.1 | | | | 1.02 | % | | | 1.02 | %‡ | | | 1.02 | % | | | 124 | % | |
| 8/31/2008 | | $ | — | | | $ | 9.84 | | | | (7.53 | %) | | $ | 5.0 | | | | 1.01 | % | | | 1.01 | %‡ | | | .46 | % | | | 129 | % | |
Period from 11/2/2006^ to 8/31/2007 | | $ | — | | | $ | 11.14 | | | | 11.58 | %** | | $ | 8.6 | | | | 1.00 | %* | | | 1.00 | %‡* | | | .44 | %* | | | 88 | %** | |
| Class A | |
Period from 12/21/2009^ to 8/31/2010 | | $ | — | | | $ | 8.02 | | | | (4.30 | %)** | | $ | 0.3 | | | | 1.36 | %* | | | 1.36 | %‡* | | | .58 | %* | | | 62 | %Ø | |
| Class C | |
Period from 12/21/2009^ to 8/31/2010 | | $ | — | | | $ | 7.97 | | | | (4.89 | %)** | | $ | 0.1 | | | | 2.12 | %* | | | 2.12 | %‡* | | | (.18 | %)* | | | 62 | %Ø | |
| Partners Fund | |
| Investor Class | |
| 8/31/2010 | | $ | — | | | $ | 22.03 | | | | 2.21 | % | | $ | 1,189.1 | | | | .85 | % | | | .85 | % | | | .19 | % | | | 42 | % | |
| 8/31/2009 | | $ | — | | | $ | 21.67 | | | | (23.27 | %) | | $ | 1,337.2 | | | | .89 | % | | | .89 | %‡ | | | .85 | % | | | 35 | % | |
| 8/31/2008 | | $ | — | | | $ | 28.90 | | | | (6.22 | %) | | $ | 2,193.1 | | | | .81 | % | | | .80 | %‡ | | | .42 | % | | | 41 | % | |
| 8/31/2007 | | $ | — | | | $ | 32.10 | | | | 14.33 | % | | $ | 2,267.6 | | | | .81 | % | | | .80 | %‡ | | | .44 | % | | | 47 | % | |
| 8/31/2006 | | $ | — | | | $ | 28.71 | | | | 5.87 | % | | $ | 2,106.7 | | | | .82 | % | | | .82 | %‡ | | | .84 | % | | | 33 | % | |
| Trust Class | |
| 8/31/2010 | | $ | — | | | $ | 16.90 | | | | 2.01 | % | | $ | 547.6 | | | | 1.03 | % | | | 1.03 | % | | | .01 | % | | | 42 | % | |
| 8/31/2009 | | $ | — | | | $ | 16.67 | | | | (23.38 | %) | | $ | 622.6 | | | | 1.04 | % | | | 1.04 | %‡ | | | .70 | % | | | 35 | % | |
| 8/31/2008 | | $ | — | | | $ | 22.25 | | | | (6.40 | %) | | $ | 1,004.0 | | | | .99 | % | | | .99 | %‡ | | | .23 | % | | | 41 | % | |
| 8/31/2007 | | $ | — | | | $ | 24.75 | | | | 14.09 | % | | $ | 1,171.5 | | | | 1.00 | % | | | .99 | %‡ | | | .26 | % | | | 47 | % | |
| 8/31/2006 | | $ | — | | | $ | 22.14 | | | | 5.70 | % | | $ | 970.5 | | | | 1.00 | % | | | .99 | %‡ | | | .66 | % | | | 33 | % | |
Financial Highlights (cont'd)
| | | Net Asset Value, Beginning of Year | | Net Investment Income (Loss)@ | | Net Gains or Losses on Securities (both realized and unrealized) | | Total From Investment Operations | | Dividends from Net Investment Income | | Distributions from Net Realized Capital Gains | | Tax Return of Capital | | Total Distributions | |
| Advisor Class | |
| 8/31/2010 | | $ | 14.42 | | | $ | (0.02 | ) | | $ | 0.29 | | | $ | 0.27 | | | $ | (0.10 | ) | | $ | — | | | $ | — | | | $ | (0.10 | ) | |
| 8/31/2009 | | $ | 19.27 | | | $ | 0.06 | | | $ | (4.69 | ) | | $ | (4.63 | ) | | $ | (0.05 | ) | | $ | (0.17 | ) | | $ | — | | | $ | (0.22 | ) | |
| 8/31/2008 | | $ | 21.45 | | | $ | 0.02 | | | $ | (1.35 | ) | | $ | (1.33 | ) | | $ | (0.05 | ) | | $ | (0.80 | ) | | $ | — | | | $ | (0.85 | ) | |
| 8/31/2007 | | $ | 19.18 | | | $ | 0.02 | | | $ | 2.65 | | | $ | 2.67 | | | $ | (0.06 | ) | | $ | (0.34 | ) | | $ | — | | | $ | (0.40 | ) | |
| 8/31/2006 | | $ | 19.01 | | | $ | 0.10 | | | $ | 0.94 | | | $ | 1.04 | | | $ | (0.01 | ) | | $ | (0.86 | ) | | $ | — | | | $ | (0.87 | ) | |
| Institutional Class | |
| 8/31/2010 | | $ | 21.79 | | | $ | 0.08 | | | $ | 0.45 | | | $ | 0.53 | | | $ | (0.17 | ) | | $ | — | | | $ | — | | | $ | (0.17 | ) | |
| 8/31/2009 | | $ | 29.06 | | | $ | 0.18 | | | $ | (7.08 | ) | | $ | (6.90 | ) | | $ | (0.12 | ) | | $ | (0.25 | ) | | $ | — | | | $ | (0.37 | ) | |
| 8/31/2008 | | $ | 32.28 | | | $ | 0.19 | | | $ | (2.04 | ) | | $ | (1.85 | ) | | $ | (0.17 | ) | | $ | (1.20 | ) | | $ | — | | | $ | (1.37 | ) | |
| 8/31/2007 | | $ | 28.72 | | | $ | 0.19 | | | $ | 3.96 | | | $ | 4.15 | | | $ | (0.08 | ) | | $ | (0.51 | ) | | $ | — | | | $ | (0.59 | ) | |
Period from 6/7/2006^ to 8/31/2006 | | $ | 28.12 | | | $ | 0.19 | | | $ | 0.41 | | | $ | 0.60 | | | $ | — | | | $ | — | | | $ | — | | | $ | — | | |
| Class A | |
Period from 6/21/2010^ to 8/31/2010 | | $ | 18.36 | | | $ | 0.01 | | | $ | (1.47 | ) | | $ | (1.46 | ) | | $ | — | | | $ | — | | | $ | — | | | $ | — | | |
| Class C | |
Period from 6/21/2010^ to 8/31/2010 | | $ | 15.85 | | | $ | (0.02 | ) | | $ | (1.26 | ) | | $ | (1.28 | ) | | $ | — | | | $ | — | | | $ | — | | | $ | — | | |
| Class R3 | |
Period from 6/21/2010^ to 8/31/2010 | | $ | 15.85 | | | $ | (0.00 | ) | | $ | (1.27 | ) | | $ | (1.27 | ) | | $ | — | | | $ | — | | | $ | — | | | $ | — | | |
| Real Estate Fund | |
| Trust Class | |
| 8/31/2010 | | $ | 7.74 | | | $ | 0.16 | | | $ | 2.53 | | | $ | 2.69 | | | $ | (0.16 | ) | | $ | — | | | $ | (0.04 | ) | | $ | (0.20 | ) | |
| 8/31/2009 | | $ | 10.65 | | | $ | 0.24 | | | $ | (2.84 | ) | | $ | (2.60 | ) | | $ | (0.24 | ) | | $ | — | | | $ | (0.07 | ) | | $ | (0.31 | ) | |
| 8/31/2008 | | $ | 14.21 | | | $ | 0.22 | | | $ | (1.04 | ) | | $ | (0.82 | ) | | $ | (0.19 | ) | | $ | (2.39 | ) | | $ | (0.16 | ) | | $ | (2.74 | ) | |
| 8/31/2007 | | $ | 15.69 | | | $ | 0.17 | | | $ | (0.09 | ) | | $ | 0.08 | | | $ | (0.19 | ) | | $ | (1.37 | ) | | $ | — | | | $ | (1.56 | ) | |
| 8/31/2006 | | $ | 14.73 | | | $ | 0.20 | | | $ | 3.39 | | | $ | 3.59 | | | $ | (0.27 | ) | | $ | (2.36 | ) | | $ | — | | | $ | (2.63 | ) | |
| Institutional Class | |
| 8/31/2010 | | $ | 7.76 | | | $ | 0.17 | | | $ | 2.53 | | | $ | 2.70 | | | $ | (0.16 | ) | | $ | — | | | $ | (0.05 | ) | | $ | (0.21 | ) | |
| 8/31/2009 | | $ | 10.66 | | | $ | 0.24 | | | $ | (2.82 | ) | | $ | (2.58 | ) | | $ | (0.23 | ) | | $ | — | | | $ | (0.09 | ) | | $ | (0.32 | ) | |
| See Notes to Financial Highlights | 203 | |
| | | Redemption Feesøø | | Net Asset Value, End of Year | | Total Return†† | | Net Assets, End of Year (in millions) | | Ratio of Gross Expenses to Average Net Assets# | | Ratio of Net Expenses to Average Net Assets | | Ratio of Net Investment Income/ (Loss) to Average Net Assets | | Portfolio Turnover Rate | |
| Advisor Class | |
| 8/31/2010 | | $ | — | | | $ | 14.59 | | | | 1.83 | % | | $ | 341.5 | | | | 1.18 | % | | | 1.18 | % | | | (.14 | %) | | | 42 | % | |
| 8/31/2009 | | $ | — | | | $ | 14.42 | | | | (23.47 | %) | | $ | 379.7 | | | | 1.20 | % | | | 1.20 | %‡ | | | .54 | % | | | 35 | % | |
| 8/31/2008 | | $ | — | | | $ | 19.27 | | | | (6.56 | %) | | $ | 559.0 | | | | 1.15 | % | | | 1.14 | %‡ | | | .08 | % | | | 41 | % | |
| 8/31/2007 | | $ | — | | | $ | 21.45 | | | | 13.94 | % | | $ | 599.0 | | | | 1.15 | % | | | 1.14 | %‡ | | | .11 | % | | | 47 | % | |
| 8/31/2006 | | $ | — | | | $ | 19.18 | | | | 5.56 | % | | $ | 605.0 | | | | 1.15 | % | | | 1.14 | %‡ | | | .52 | % | | | 33 | % | |
| Institutional Class | |
| 8/31/2010 | | $ | — | | | $ | 22.15 | | | | 2.35 | % | | $ | 148.7 | | | | .69 | % | | | .69 | %§ | | | .35 | % | | | 42 | % | |
| 8/31/2009 | | $ | — | | | $ | 21.79 | | | | (23.10 | %) | | $ | 161.3 | | | | .70 | % | | | .70 | %‡ | | | 1.01 | % | | | 35 | % | |
| 8/31/2008 | | $ | — | | | $ | 29.06 | | | | (6.08 | %) | | $ | 168.1 | | | | .66 | % | | | .65 | %‡ | | | .59 | % | | | 41 | % | |
| 8/31/2007 | | $ | — | | | $ | 32.28 | | | | 14.49 | % | | $ | 133.5 | | | | .66 | % | | | .65 | %‡§ | | | .59 | % | | | 47 | % | |
Period from 6/7/2006^ to 8/31/2006 | | $ | — | | | $ | 28.72 | | | | 2.13 | %** | | $ | 130.5 | | | | .70 | %* | | | .69 | %‡* | | | 2.85 | %* | | | 33 | %Ø | |
| Class A | |
Period from 6/21/2010^ to 8/31/2010 | | $ | — | | | $ | 16.90 | | | | (7.95 | %)** | | $ | 0.0 | | | | 1.11 | %* | | | 1.11 | %‡* | | | .16 | %* | | | 42 | %Ø | |
| Class C | |
Period from 6/21/2010^ to 8/31/2010 | | $ | — | | | $ | 14.57 | | | | (8.08 | %)** | | $ | 0.0 | | | | 1.86 | %* | | | 1.86 | %‡* | | | (.60 | %)* | | | 42 | %Ø | |
| Class R3 | |
Period from 6/21/2010^ to 8/31/2010 | | $ | — | | | $ | 14.58 | | | | (8.01 | %)** | | $ | 0.0 | | | | 1.36 | %* | | | 1.36 | %‡* | | | (.09 | %)* | | | 42 | %Ø | |
| Real Estate Fund | |
| Trust Class | |
| 8/31/2010 | | $ | 0.00 | | | $ | 10.23 | | | | 35.09 | % | | $ | 126.7 | | | | .99 | % | | | .99 | %‡ | | | 1.73 | % | | | 70 | % | |
| 8/31/2009 | | $ | 0.00 | | | $ | 7.74 | | | | (23.69 | %) | | $ | 63.0 | | | | .99 | % | | | .99 | %‡ | | | 3.61 | % | | | 181 | % | |
| 8/31/2008 | | $ | 0.00 | | | $ | 10.65 | | | | (5.32 | %) | | $ | 53.0 | | | | 1.00 | % | | | .97 | %‡ | | | 1.93 | % | | | 187 | % | |
| 8/31/2007 | | $ | 0.00 | | | $ | 14.21 | | | | (.43 | %) | | $ | 110.4 | | | | .99 | % | | | .97 | %‡ | | | 1.06 | % | | | 99 | % | |
| 8/31/2006 | | $ | 0.00 | | | $ | 15.69 | | | | 28.50 | % | | $ | 86.7 | | | | 1.11 | % | | | 1.09 | %‡ | | | 1.39 | % | | | 97 | % | |
| Institutional Class | |
| 8/31/2010 | | $ | 0.00 | | | $ | 10.25 | | | | 35.18 | % | | $ | 22.6 | | | | .85 | % | | | .85 | %‡ | | | 1.77 | % | | | 70 | % | |
| 8/31/2009 | | $ | 0.00 | | | $ | 7.76 | | | | (23.46 | %) | | $ | 3.3 | | | | .85 | % | | | .85 | %‡ | | | 3.47 | % | | | 181 | % | |
Financial Highlights (cont'd)
| | | Net Asset Value, Beginning of Year | | Net Investment Income (Loss)@ | | Net Gains or Losses on Securities (both realized and unrealized) | | Total From Investment Operations | | Dividends from Net Investment Income | | Distributions from Net Realized Capital Gains | | Tax Return of Capital | | Total Distributions | |
Period from 6/4/2008^ to 8/31/2008 | | $ | 10.88 | | | $ | 0.07 | | | $ | (0.22 | ) | | $ | (0.15 | ) | | $ | (0.04 | ) | | $ | — | | | $ | (0.03 | ) | | $ | (0.07 | ) | |
| Class A | |
Period from 6/21/2010^ to 8/31/2010 | | $ | 10.38 | | | $ | 0.01 | | | $ | (0.11 | ) | | $ | (0.10 | ) | | $ | (0.02 | ) | | $ | — | | | $ | (0.03 | ) | | $ | (0.05 | ) | |
| Class C | |
Period from 6/21/2010^ to 8/31/2010 | | $ | 10.38 | | | $ | 0.01 | | | $ | (0.12 | ) | | $ | (0.11 | ) | | $ | (0.01 | ) | | $ | — | | | $ | (0.02 | ) | | $ | (0.03 | ) | |
| Class R3 | |
Period from 6/21/2010^ to 8/31/2010 | | $ | 10.38 | | | $ | 0.02 | | | $ | (0.13 | ) | | $ | (0.11 | ) | | $ | (0.03 | ) | | $ | — | | | $ | (0.01 | ) | | $ | (0.04 | ) | |
| Regency Fund | |
| Investor Class | |
| 8/31/2010 | | $ | 11.07 | | | $ | 0.01 | | | $ | 1.26 | | | $ | 1.27 | | | $ | (0.08 | ) | | $ | — | | | $ | — | | | $ | (0.08 | ) | |
| 8/31/2009 | | $ | 15.02 | | | $ | 0.07 | | | $ | (3.47 | ) | | $ | (3.40 | ) | | $ | (0.00 | ) | | $ | (0.55 | ) | | $ | — | | | $ | (0.55 | ) | |
| 8/31/2008 | | $ | 18.65 | | | $ | 0.07 | | | $ | (1.75 | ) | | $ | (1.68 | ) | | $ | (0.14 | ) | | $ | (1.81 | ) | | $ | — | | | $ | (1.95 | ) | |
| 8/31/2007 | | $ | 16.52 | | | $ | 0.13 | | | $ | 2.19 | | | $ | 2.32 | | | $ | (0.10 | ) | | $ | (0.09 | ) | | $ | — | | | $ | (0.19 | ) | |
| 8/31/2006 | | $ | 17.37 | | | $ | 0.13 | | | $ | 0.39 | | | $ | 0.52 | | | $ | (0.06 | ) | | $ | (1.31 | ) | | $ | — | | | $ | (1.37 | ) | |
| Trust Class | |
| 8/31/2010 | | $ | 9.66 | | | $ | 0.01 | | | $ | 1.11 | | | $ | 1.12 | | | $ | (0.10 | ) | | $ | — | | | $ | — | | | $ | (0.10 | ) | |
| 8/31/2009 | | $ | 13.09 | | | $ | 0.07 | | | $ | (3.02 | ) | | $ | (2.95 | ) | | $ | (0.00 | ) | | $ | (0.48 | ) | | $ | — | | | $ | (0.48 | ) | |
| 8/31/2008 | | $ | 16.26 | | | $ | 0.04 | | | $ | (1.52 | ) | | $ | (1.48 | ) | | $ | (0.11 | ) | | $ | (1.58 | ) | | $ | — | | | $ | (1.69 | ) | |
| 8/31/2007 | | $ | 14.41 | | | $ | 0.08 | | | $ | 1.91 | | | $ | 1.99 | | | $ | (0.06 | ) | | $ | (0.08 | ) | | $ | — | | | $ | (0.14 | ) | |
| 8/31/2006 | | $ | 15.13 | | | $ | 0.09 | | | $ | 0.34 | | | $ | 0.43 | | | $ | (0.02 | ) | | $ | (1.13 | ) | | $ | — | | | $ | (1.15 | ) | |
| Institutional Class | |
Period from 3/8/2010^ to 8/31/2010 | | $ | 13.12 | | | $ | 0.03 | | | $ | (0.87 | ) | | $ | (0.84 | ) | | $ | — | | | $ | — | | | $ | — | | | $ | — | | |
| Class A | |
Period from 6/21/2010^ to 8/31/2010 | | $ | 11.41 | | | $ | 0.00 | | | $ | (0.73 | ) | | $ | (0.73 | ) | | $ | — | | | $ | — | | | $ | — | | | $ | — | | |
| See Notes to Financial Highlights | 205 | |
| | | Redemption Feesøø | | Net Asset Value, End of Year | | Total Return†† | | Net Assets, End of Year (in millions) | | Ratio of Gross Expenses to Average Net Assets# | | Ratio of Net Expenses to Average Net Assets | | Ratio of Net Investment Income/ (Loss) to Average Net Assets | | Portfolio Turnover Rate | |
Period from 6/4/2008^ to 8/31/2008 | | $ | 0.00 | | | $ | 10.66 | | | | (1.31 | %)** | | $ | 1.7 | | | | .87 | %* | | | .86 | %‡* | | | 2.76 | %* | | | 187 | %Ø | |
| Class A | |
Period from 6/21/2010^ to 8/31/2010 | | $ | 0.00 | | | $ | 10.23 | | | | (.98 | %)** | | $ | 0.5 | | | | 1.21 | %* | | | 1.21 | %‡* | | | .68 | %* | | | 70 | %Ø | |
| Class C | |
Period from 6/21/2010^ to 8/31/2010 | | $ | 0.00 | | | $ | 10.24 | | | | (1.08 | %)** | | $ | 0.1 | | | | 1.96 | %* | | | 1.96 | %‡* | | | .66 | %* | | | 70 | %Ø | |
| Class R3 | |
Period from 6/21/2010^ to 8/31/2010 | | $ | 0.00 | | | $ | 10.23 | | | | (1.04 | %)** | | $ | 0.0 | | | | 1.46 | %* | | | 1.46 | %‡* | | | .93 | %* | | | 70 | %Ø | |
| Regency Fund | |
| Investor Class | |
| 8/31/2010 | | $ | — | | | $ | 12.26 | | | | 11.51 | % | | $ | 55.9 | | | | 1.22 | % | | | 1.22 | %‡ | | | .10 | % | | | 51 | % | |
| 8/31/2009 | | $ | — | | | $ | 11.07 | | | | (21.04 | %) | | $ | 43.8 | | | | 1.36 | % | | | 1.36 | %‡ | | | .78 | % | | | 51 | % | |
| 8/31/2008 | | $ | — | | | $ | 15.02 | | | | (9.93 | %) | | $ | 79.1 | | | | 1.13 | % | | | 1.11 | %‡ | | | .43 | % | | | 60 | % | |
| 8/31/2007 | | $ | — | | | $ | 18.65 | | | | 14.10 | % | | $ | 99.9 | | | | 1.09 | % | | | 1.08 | %‡ | | | .72 | % | | | 80 | % | |
| 8/31/2006 | | $ | — | | | $ | 16.52 | | | | 2.94 | % | | $ | 111.1 | | | | 1.12 | % | | | 1.11 | %‡ | | | .75 | % | | | 52 | % | |
| Trust Class | |
| 8/31/2010 | | $ | — | | | $ | 10.68 | | | | 11.55 | % | | $ | 80.5 | | | | 1.25 | % | | | 1.25 | %‡ | | | .07 | % | | | 51 | % | |
| 8/31/2009 | | $ | — | | | $ | 9.66 | | | | (20.96 | %) | | $ | 26.9 | | | | 1.25 | % | | | 1.25 | %‡ | | | .89 | % | | | 51 | % | |
| 8/31/2008 | | $ | — | | | $ | 13.09 | | | | (10.03 | %) | | $ | 52.8 | | | | 1.26 | % | | | 1.24 | %‡ | | | .30 | % | | | 60 | % | |
| 8/31/2007 | | $ | — | | | $ | 16.26 | | | | 13.84 | % | | $ | 55.6 | | | | 1.25 | % | | | 1.24 | %‡ | | | .51 | % | | | 80 | % | |
| 8/31/2006 | | $ | — | | | $ | 14.41 | | | | 2.81 | % | | $ | 64.2 | | | | 1.25 | % | | | 1.24 | %‡ | | | .61 | % | | | 52 | % | |
| Institutional Class | |
Period from 3/8/2010^ to 8/31/2010 | | $ | — | | | $ | 12.28 | | | | (6.40 | %)** | | $ | 0.7 | | | | .85 | %* | | | .85 | %‡* | | | .48 | %* | | | 51 | %Ø | |
| Class A | |
Period from 6/21/2010^ to 8/31/2010 | | $ | — | | | $ | 10.68 | | | | (6.40 | %)** | | $ | 0.0 | | | | 1.21 | %* | | | 1. 21 | %‡* | | | .04 | %* | | | 51 | %Ø | |
Financial Highlights (cont'd)
| | | Net Asset Value, Beginning of Year | | Net Investment Income (Loss)@ | | Net Gains or Losses on Securities (both realized and unrealized) | | Total From Investment Operations | | Dividends from Net Investment Income | | Distributions from Net Realized Capital Gains | | Tax Return of Capital | | Total Distributions | |
| Class C | |
Period from 6/21/2010^ to 8/31/2010 | | $ | 11.41 | | | $ | (0.01 | ) | | $ | (0.74 | ) | | $ | (0.75 | ) | | $ | — | | | $ | — | | | $ | — | | | $ | — | | |
| Class R3 | |
Period from 6/21/2010^ to 8/31/2010 | | $ | 11.41 | | | $ | (0.00 | ) | | $ | (0.74 | ) | | $ | (0.74 | ) | | $ | — | | | $ | — | | | $ | — | | | $ | — | | |
| Select Equities Fund | |
| Institutional Class | |
| 8/31/2010 | | $ | 8.06 | | | $ | 0.06 | | | $ | (0.01 | ) | | $ | 0.05 | | | $ | (0.05 | ) | | $ | (0.15 | ) | | $ | — | | | $ | (0.20 | ) | |
| 8/31/2009 | | $ | 9.20 | | | $ | 0.08 | | | $ | (1.19 | ) | | $ | (1.11 | ) | | $ | (0.03 | ) | | $ | — | | | $ | — | | | $ | (0.03 | ) | |
Period from 12/20/2007^ to 8/31/2008 | | $ | 10.00 | | | $ | 0.08 | | | $ | (0.88 | ) | | $ | (0.80 | ) | | $ | — | | | $ | — | | | $ | — | | | $ | — | | |
| Class A | |
| 8/31/2010 | | $ | 8.05 | | | $ | 0.03 | | | $ | (0.03 | ) | | $ | 0.00 | | | $ | (0.02 | ) | | $ | (0.15 | ) | | $ | — | | | $ | (0.17 | ) | |
| 8/31/2009 | | $ | 9.18 | | | $ | 0.04 | | | $ | (1.14 | ) | | $ | (1.10 | ) | | $ | (0.03 | ) | | $ | — | | | $ | — | | | $ | (0.03 | ) | |
Period from 12/20/2007^ to 8/31/2008 | | $ | 10.00 | | | $ | 0.04 | | | $ | (0.86 | ) | | $ | (0.82 | ) | | $ | — | | | $ | — | | | $ | — | | | $ | — | | |
| Class C | |
| 8/31/2010 | | $ | 7.94 | | | $ | (0.03 | ) | | $ | (0.02 | ) | | $ | (0.05 | ) | | $ | — | | | $ | (0.15 | ) | | $ | — | | | $ | (0.15 | ) | |
| 8/31/2009 | | $ | 9.12 | | | $ | (0.02 | ) | | $ | (1.13 | ) | | $ | (1.15 | ) | | $ | (0.03 | ) | | $ | — | | | $ | — | | | $ | (0.03 | ) | |
Period from 12/20/2007^ to 8/31/2008 | | $ | 10.00 | | | $ | (0.01 | ) | | $ | (0.87 | ) | | $ | (0.88 | ) | | $ | — | | | $ | — | | | $ | — | | | $ | — | | |
| Small Cap Growth Fund | |
| Investor Class | |
| 8/31/2010 | | $ | 13.15 | | | $ | (0.13 | ) | | $ | 0.66 | | | $ | 0.53 | | | $ | — | | | $ | — | | | $ | — | | | $ | — | | |
| 8/31/2009 | | $ | 17.92 | | | $ | (0.11 | ) | | $ | (4.66 | ) | | $ | (4.77 | ) | | $ | — | | | $ | — | | | $ | — | | | $ | — | | |
| 8/31/2008 | | $ | 19.15 | | | $ | (0.18 | ) | | $ | (1.05 | ) | | $ | (1.23 | ) | | $ | — | | | $ | — | | | $ | — | | | $ | — | | |
| 8/31/2007 | | $ | 15.01 | | | $ | (0.18 | ) | | $ | 4.32 | | | $ | 4.14 | | | $ | — | | | $ | — | | | $ | — | | | $ | — | | |
| 8/31/2006 | | $ | 14.19 | | | $ | (0.19 | ) | | $ | 1.01 | | | $ | 0.82 | | | $ | — | | | $ | — | | | $ | — | | | $ | — | | |
| See Notes to Financial Highlights | 207 | |
| | | Redemption Feesøø | | Net Asset Value, End of Year | | Total Return†† | | Net Assets, End of Year (in millions) | | Ratio of Gross Expenses to Average Net Assets# | | Ratio of Net Expenses to Average Net Assets | | Ratio of Net Investment Income/ (Loss) to Average Net Assets | | Portfolio Turnover Rate | |
| Class C | |
Period from 6/21/2010^ to 8/31/2010 | | $ | — | | | $ | 10.66 | | | | (6.57 | %)** | | $ | 0.0 | | | | 1.96 | %* | | | 1.96 | %‡* | | | (.64 | %)* | | | 51 | %Ø | |
| Class R3 | |
Period from 6/21/2010^ to 8/31/2010 | | $ | — | | | $ | 10.67 | | | | (6.49 | %)** | | $ | 0.0 | | | | 1.46 | %* | | | 1.46 | %‡* | | | (.22 | %)* | | | 51 | %Ø | |
| Select Equities Fund | |
| Institutional Class | |
| 8/31/2010 | | $ | — | | | $ | 7.91 | | | | .44 | % | | $ | 17.6 | | | | .75 | % | | | .75 | %‡ | | | .78 | % | | | 129 | % | |
| 8/31/2009 | | $ | — | | | $ | 8.06 | | | | (12.03 | %) | | $ | 6.5 | | | | .75 | % | | | .75 | %‡ | | | 1.04 | % | | | 93 | % | |
Period from 12/20/2007^ to 8/31/2008 | | $ | — | | | $ | 9.20 | | | | (8.00 | %)** | | $ | 2.3 | | | | .76 | %* | | | .76 | %‡* | | | 1.17 | %* | | | 53 | %** | |
| Class A | |
| 8/31/2010 | | $ | — | | | $ | 7.88 | | | | (.11 | %) | | $ | 38.0 | | | | 1.20 | % | | | 1.20 | %‡ | | | .36 | % | | | 129 | % | |
| 8/31/2009 | | $ | — | | | $ | 8.05 | | | | (11.95 | %) | | $ | 38.3 | | | | 1.20 | % | | | 1.20 | %‡ | | | .52 | % | | | 93 | % | |
Period from 12/20/2007^ to 8/31/2008 | | $ | — | | | $ | 9.18 | | | | (8.20 | %)** | | $ | 4.9 | | | | 1.24 | %* | | | 1.24 | %‡* | | | .63 | %* | | | 53 | %** | |
| Class C | |
| 8/31/2010 | | $ | — | | | $ | 7.74 | | | | (.75 | %) | | $ | 11.6 | | | | 1.95 | % | | | 1.95 | %‡ | | | (.41 | %) | | | 129 | % | |
| 8/31/2009 | | $ | — | | | $ | 7.94 | | | | (12.58 | %) | | $ | 7.4 | | | | 1.95 | % | | | 1.95 | %‡ | | | (.22 | %) | | | 93 | % | |
Period from 12/20/2007^ to 8/31/2008 | | $ | — | | | $ | 9.12 | | | | (8.80 | %)** | | $ | 0.8 | | | | 1.99 | %* | | | 1.98 | %‡* | | | (.08 | %)* | | | 53 | %** | |
| Small Cap Growth Fund | |
| Investor Class | |
| 8/31/2010 | | $ | — | | | $ | 13.68 | | | | 4.03 | % | | $ | 75.4 | | | | 1.15 | % | | | 1.15 | %‡ | | | (.89 | %) | | | 235 | % | |
| 8/31/2009 | | $ | — | | | $ | 13.15 | | | | (26.62 | %) | | $ | 144.1 | | | | 1.30 | % | | | 1.30 | %‡ | | | (.89 | %) | | | 292 | % | |
| 8/31/2008 | | $ | — | | | $ | 17.92 | | | | (6.42 | %) | | $ | 239.9 | | | | 1.31 | % | | | 1.29 | %‡ | | | (.93 | %) | | | 185 | % | |
| 8/31/2007 | | $ | — | | | $ | 19.15 | | | | 27.58 | % | | $ | 58.1 | | | | 1.30 | % | | | 1.27 | %‡ | | | (1.01 | %) | | | 153 | % | |
| 8/31/2006 | | $ | — | | | $ | 15.01 | | | | 5.78 | % | | $ | 46.9 | | | | 1.60 | % | | | 1.57 | %‡ | | | (1.21 | %) | | | 142 | % | |
Financial Highlights (cont'd)
| | | Net Asset Value, Beginning of Year | | Net Investment Income (Loss)@ | | Net Gains or Losses on Securities (both realized and unrealized) | | Total From Investment Operations | | Dividends from Net Investment Income | | Distributions from Net Realized Capital Gains | | Tax Return of Capital | | Total Distributions | |
| Trust Class | |
| 8/31/2010 | | $ | 14.43 | | | $ | (0.18 | ) | | $ | 0.68 | | | $ | 0.50 | | | $ | — | | | $ | — | | | $ | — | | | $ | — | | |
| 8/31/2009 | | $ | 19.67 | | | $ | (0.14 | ) | | $ | (5.10 | ) | | $ | (5.24 | ) | | $ | — | | | $ | — | | | $ | — | | | $ | — | | |
| 8/31/2008 | | $ | 21.05 | | | $ | (0.21 | ) | | $ | (1.17 | ) | | $ | (1.38 | ) | | $ | — | | | $ | — | | | $ | — | | | $ | — | | |
| 8/31/2007 | | $ | 16.52 | | | $ | (0.21 | ) | | $ | 4.74 | | | $ | 4.53 | | | $ | — | | | $ | — | | | $ | — | | | $ | — | | |
| 8/31/2006 | | $ | 15.62 | | | $ | (0.22 | ) | | $ | 1.12 | | | $ | 0.90 | | | $ | — | | | $ | — | | | $ | — | | | $ | — | | |
| Advisor Class | |
| 8/31/2010 | | $ | 9.61 | | | $ | (0.14 | ) | | $ | 0.45 | | | $ | 0.31 | | | $ | — | | | $ | — | | | $ | — | | | $ | — | | |
| 8/31/2009 | | $ | 13.13 | | | $ | (0.11 | ) | | $ | (3.41 | ) | | $ | (3.52 | ) | | $ | — | | | $ | — | | | $ | — | | | $ | — | | |
| 8/31/2008 | | $ | 14.08 | | | $ | (0.17 | ) | | $ | (0.78 | ) | | $ | (0.95 | ) | | $ | — | | | $ | — | | | $ | — | | | $ | — | | |
| 8/31/2007 | | $ | 11.07 | | | $ | (0.17 | ) | | $ | 3.18 | | | $ | 3.01 | | | $ | — | | | $ | — | | | $ | — | | | $ | — | | |
| 8/31/2006 | | $ | 10.49 | | | $ | (0.16 | ) | | $ | 0.74 | | | $ | 0.58 | | | $ | — | | | $ | — | | | $ | — | | | $ | — | | |
| Institutional Class | |
| 8/31/2010 | | $ | 13.23 | | | $ | (0.09 | ) | | $ | 0.61 | | | $ | 0.52 | | | $ | — | | | $ | — | | | $ | — | | | $ | — | | |
| 8/31/2009 | | $ | 17.95 | | | $ | (0.06 | ) | | $ | (4.66 | ) | | $ | (4.72 | ) | | $ | — | | | $ | — | | | $ | — | | | $ | — | | |
Period from 4/1/2008^ to 8/31/2008 | | $ | 17.64 | | | $ | (0.04 | ) | | $ | 0.35 | | | $ | 0.31 | | | $ | — | | | $ | — | | | $ | — | | | $ | — | | |
| Class A | |
| 8/31/2010 | | $ | 14.43 | | | $ | (0.16 | ) | | $ | 0.68 | | | $ | 0.52 | | | $ | — | | | $ | — | | | $ | — | | | $ | — | | |
Period from 5/27/2009^ to 8/31/2009 | | $ | 12.98 | | | $ | (0.03 | ) | | $ | 1.48 | | | $ | 1.45 | | | $ | — | | | $ | — | | | $ | — | | | $ | — | | |
| Class C | |
| 8/31/2010 | | $ | 9.60 | | | $ | (0.19 | ) | | $ | 0.46 | | | $ | 0.27 | | | $ | — | | | $ | — | | | $ | — | | | $ | — | | |
Period from 5/27/2009^ to 8/31/2009 | | $ | 8.65 | | | $ | (0.04 | ) | | $ | 0.99 | | | $ | 0.95 | | | $ | — | | | $ | — | | | $ | — | | | $ | — | | |
| Class R3 | |
| 8/31/2010 | | $ | 9.61 | | | $ | (0.13 | ) | | $ | 0.45 | | | $ | 0.32 | | | $ | — | | | $ | — | | | $ | — | | | $ | — | | |
Period from 5/27/2009^ to 8/31/2009 | | $ | 8.65 | | | $ | (0.02 | ) | | $ | 0.98 | | | $ | 0.96 | | | $ | — | | | $ | — | | | $ | — | | | $ | — | | |
| See Notes to Financial Highlights | 209 | |
| | | Redemption Feesøø | | Net Asset Value, End of Year | | Total Return†† | | Net Assets, End of Year (in millions) | | Ratio of Gross Expenses to Average Net Assets# | | Ratio of Net Expenses to Average Net Assets | | Ratio of Net Investment Income/ (Loss) to Average Net Assets | | Portfolio Turnover Rate | |
| Trust Class | |
| 8/31/2010 | | $ | — | | | $ | 14.93 | | | | 3.47 | % | | $ | 22.0 | | | | 1.37 | % | | | 1.37 | %‡ | | | (1.11 | %) | | | 235 | % | |
| 8/31/2009 | | $ | — | | | $ | 14.43 | | | | (26.64 | %) | | $ | 35.2 | | | | 1.40 | % | | | 1.40 | %‡ | | | (1.00 | %) | | | 292 | % | |
| 8/31/2008 | | $ | — | | | $ | 19.67 | | | | (6.56 | %) | | $ | 42.3 | | | | 1.41 | % | | | 1.39 | %‡ | | | (1.04 | %) | | | 185 | % | |
| 8/31/2007 | | $ | — | | | $ | 21.05 | | | | 27.42 | % | | $ | 8.5 | | | | 1.40 | % | | | 1.38 | %‡ | | | (1.08 | %) | | | 153 | % | |
| 8/31/2006 | | $ | — | | | $ | 16.52 | | | | 5.76 | % | | $ | 2.5 | | | | 1.66 | % | | | 1.63 | %‡ | | | (1.26 | %) | | | 142 | % | |
| Advisor Class | |
| 8/31/2010 | | $ | — | | | $ | 9.92 | | | | 3.23 | % | | $ | 9.7 | | | | 1.60 | % | | | 1.60 | %‡ | | | (1.34 | %) | | | 235 | % | |
| 8/31/2009 | | $ | — | | | $ | 9.61 | | | | (26.81 | %) | | $ | 11.7 | | | | 1.60 | % | | | 1.60 | %‡ | | | (1.19 | %) | | | 292 | % | |
| 8/31/2008 | | $ | — | | | $ | 13.13 | | | | (6.75 | %) | | $ | 13.6 | | | | 1.61 | % | | | 1.59 | %‡ | | | (1.23 | %) | | | 185 | % | |
| 8/31/2007 | | $ | — | | | $ | 14.08 | | | | 27.19 | % | | $ | 4.3 | | | | 1.60 | % | | | 1.57 | %‡ | | | (1.30 | %) | | | 153 | % | |
| 8/31/2006 | | $ | — | | | $ | 11.07 | | | | 5.53 | % | | $ | 2.2 | | | | 1.77 | % | | | 1.74 | %‡ | | | (1.36 | %) | | | 142 | % | |
| Institutional Class | |
| 8/31/2010 | | $ | — | | | $ | 13.75 | | | | 3.93 | % | | $ | 82.6 | | | | .91 | % | | | .91 | %‡ | | | (.63 | %) | | | 235 | % | |
| 8/31/2009 | | $ | — | | | $ | 13.23 | | | | (26.30 | %) | | $ | 7.5 | | | | .90 | % | | | .90 | %‡ | | | (.48 | %) | | | 292 | % | |
Period from 4/1/2008^ to 8/31/2008 | | $ | — | | | $ | 17.95 | | | | 1.76 | %** | | $ | 4.3 | | | | .91 | %* | | | .90 | %‡* | | | (.55 | %)* | | | 185 | %Ø | |
| Class A | |
| 8/31/2010 | | $ | — | | | $ | 14.95 | | | | 3.60 | % | | $ | 0.5 | | | | 1.26 | % | | | 1.26 | %‡ | | | (1.01 | %) | | | 235 | % | |
Period from 5/27/2009^ to 8/31/2009 | | $ | — | | | $ | 14.43 | | | | 11.17 | %** | | $ | 0.1 | | | | 1.26 | %* | | | 1.26 | %‡* | | | (.76 | %)* | | | 292 | %Ø | |
| Class C | |
| 8/31/2010 | | $ | — | | | $ | 9.87 | | | | 2.81 | % | | $ | 0.1 | | | | 2.01 | % | | | 2.01 | %‡ | | | (1.76 | %) | | | 235 | % | |
Period from 5/27/2009^ to 8/31/2009 | | $ | — | | | $ | 9.60 | | | | 10.98 | %** | | $ | 0.1 | | | | 2.01 | %* | | | 2.01 | %‡* | | | (1.47 | %)* | | | 292 | %Ø | |
| Class R3 | |
| 8/31/2010 | | $ | — | | | $ | 9.93 | | | | 3.33 | % | | $ | 0.1 | | | | 1.51 | % | | | 1.51 | %‡ | | | (1.25 | %) | | | 235 | % | |
Period from 5/27/2009^ to 8/31/2009 | | $ | — | | | $ | 9.61 | | | | 11.10 | %** | | $ | 0.1 | | | | 1.52 | %* | | | 1.52 | %‡* | | | (.97 | %)* | | | 292 | %Ø | |
Financial Highlights (cont'd)
| | | Net Asset Value, Beginning of Year | | Net Investment Income (Loss)@ | | Net Gains or Losses on Securities (both realized and unrealized) | | Total From Investment Operations | | Dividends from Net Investment Income | | Distributions from Net Realized Capital Gains | | Tax Return of Capital | | Total Distributions | |
| Socially Responsive Fund | |
| Investor Class | |
| 8/31/2010 | | $ | 18.74 | | | $ | 0.06 | | | $ | 1.84 | | | $ | 1.90 | | | $ | (0.06 | ) | | $ | — | | | $ | — | | | $ | (0.06 | ) | |
| 8/31/2009 | | $ | 24.51 | | | $ | 0.09 | | | $ | (5.52 | ) | | $ | (5.43 | ) | | $ | (0.08 | ) | | $ | (0.26 | ) | | $ | — | | | $ | (0.34 | ) | |
| 8/31/2008 | | $ | 27.20 | | | $ | 0.15 | | | $ | (1.85 | ) | | $ | (1.70 | ) | | $ | (0.13 | ) | | $ | (0.86 | ) | | $ | — | | | $ | (0.99 | ) | |
| 8/31/2007 | | $ | 23.88 | | | $ | 0.18 | | | $ | 3.42 | | | $ | 3.60 | | | $ | (0.04 | ) | | $ | (0.24 | ) | | $ | — | | | $ | (0.28 | ) | |
| 8/31/2006 | | $ | 22.91 | | | $ | 0.09 | | | $ | 1.73 | | | $ | 1.82 | | | $ | (0.14 | ) | | $ | (0.71 | ) | | $ | — | | | $ | (0.85 | ) | |
| Trust Class | |
| 8/31/2010 | | $ | 12.88 | | | $ | 0.01 | | | $ | 1.27 | | | $ | 1.28 | | | $ | (0.05 | ) | | $ | — | | | $ | — | | | $ | (0.05 | ) | |
| 8/31/2009 | | $ | 16.91 | | | $ | 0.04 | | | $ | (3.82 | ) | | $ | (3.78 | ) | | $ | (0.07 | ) | | $ | (0.18 | ) | | $ | — | | | $ | (0.25 | ) | |
| 8/31/2008 | | $ | 18.81 | | | $ | 0.07 | | | $ | (1.28 | ) | | $ | (1.21 | ) | | $ | (0.10 | ) | | $ | (0.59 | ) | | $ | — | | | $ | (0.69 | ) | |
| 8/31/2007 | | $ | 16.53 | | | $ | 0.08 | | | $ | 2.38 | | | $ | 2.46 | | | $ | (0.01 | ) | | $ | (0.17 | ) | | $ | — | | | $ | (0.18 | ) | |
| 8/31/2006 | | $ | 15.84 | | | $ | 0.03 | | | $ | 1.20 | | | $ | 1.23 | | | $ | (0.06 | ) | | $ | (0.48 | ) | | $ | — | | | $ | (0.54 | ) | |
| Institutional Class | |
| 8/31/2010 | | $ | 18.75 | | | $ | 0.10 | | | $ | 1.84 | | | $ | 1.94 | | | $ | (0.09 | ) | | $ | — | | | $ | — | | | $ | (0.09 | ) | |
| 8/31/2009 | | $ | 24.53 | | | $ | 0.12 | | | $ | (5.53 | ) | | $ | (5.41 | ) | | $ | (0.11 | ) | | $ | (0.26 | ) | | $ | — | | | $ | (0.37 | ) | |
Period from 11/28/2007^ to 8/31/2008 | | $ | 26.93 | | | $ | 0.16 | | | $ | (1.57 | ) | | $ | (1.41 | ) | | $ | (0.13 | ) | | $ | (0.86 | ) | | $ | — | | | $ | (0.99 | ) | |
| Class A | |
| 8/31/2010 | | $ | 12.88 | | | $ | 0.03 | | | $ | 1.26 | | | $ | 1.29 | | | $ | (0.09 | ) | | $ | — | | | $ | — | | | $ | (0.09 | ) | |
Period from 5/27/2009^ to 8/31/2009 | | $ | 12.00 | | | $ | 0.00 | | | $ | 0.88 | | | $ | 0.88 | | | $ | — | | | $ | — | | | $ | — | | | $ | — | | |
| Class C | |
| 8/31/2010 | | $ | 12.86 | | | $ | (0.08 | ) | | $ | 1.25 | | | $ | 1.17 | | | $ | (0.09 | ) | | $ | — | | | $ | — | | | $ | (0.09 | ) | |
Period from 5/27/2009^ to 8/31/2009 | | $ | 12.00 | | | $ | (0.01 | ) | | $ | 0.87 | | | $ | 0.86 | | | $ | — | | | $ | — | | | $ | — | | | $ | — | | |
| Class R3 | |
| 8/31/2010 | | $ | 12.87 | | | $ | (0.02 | ) | | $ | 1.27 | | | $ | 1.25 | | | $ | (0.07 | ) | | $ | — | | | $ | — | | | $ | (0.07 | ) | |
Period from 5/27/2009^ to 8/31/2009 | | $ | 12.00 | | | $ | 0.00 | | | $ | 0.87 | | | $ | 0.87 | | | $ | — | | | $ | — | | | $ | — | | | $ | — | | |
| See Notes to Financial Highlights | 211 | |
| | | Redemption Feesøø | | Net Asset Value, End of Year | | Total Return†† | | Net Assets, End of Year (in millions) | | Ratio of Gross Expenses to Average Net Assets# | | Ratio of Net Expenses to Average Net Assets | | Ratio of Net Investment Income/ (Loss) to Average Net Assets | | Portfolio Turnover Rate | |
| Socially Responsive Fund | |
| Investor Class | |
| 8/31/2010 | | $ | — | | | $ | 20.58 | | | | 10.14 | % | | $ | 582.5 | | | | .94 | % | | | .94 | % | | | .27 | % | | | 41 | % | |
| 8/31/2009 | | $ | — | | | $ | 18.74 | | | | (21.83 | %) | | $ | 597.1 | | | | .93 | % | | | .93 | % | | | .51 | % | | | 36 | % | |
| 8/31/2008 | | $ | — | | | $ | 24.51 | | | | (6.49 | %) | | $ | 804.0 | | | | .90 | % | | | .89 | % | | | .57 | % | | | 35 | % | |
| 8/31/2007 | | $ | — | | | $ | 27.20 | | | | 15.15 | % | | $ | 786.2 | | | | .91 | % | | | .90 | % | | | .66 | % | | | 16 | % | |
| 8/31/2006 | | $ | — | | | $ | 23.88 | | | | 8.08 | % | | $ | 487.5 | | | | .95 | % | | | .95 | % | | | .39 | % | | | 23 | % | |
| Trust Class | |
| 8/31/2010 | | $ | — | | | $ | 14.11 | | | | 9.94 | % | | $ | 356.1 | | | | 1.12 | % | | | 1.12 | % | | | .10 | % | | | 41 | % | |
| 8/31/2009 | | $ | — | | | $ | 12.88 | | | | (22.01 | %) | | $ | 308.2 | | | | 1.13 | % | | | 1.13 | % | | | .32 | % | | | 36 | % | |
| 8/31/2008 | | $ | — | | | $ | 16.91 | | | | (6.67 | %) | | $ | 361.5 | | | | 1.09 | % | | | 1.08 | % | | | .38 | % | | | 35 | % | |
| 8/31/2007 | | $ | — | | | $ | 18.81 | | | | 14.93 | % | | $ | 355.5 | | | | 1.10 | % | | | 1.09 | % | | | .45 | % | | | 16 | % | |
| 8/31/2006 | | $ | — | | | $ | 16.53 | | | | 7.93 | % | | $ | 239.2 | | | | 1.13 | % | | | 1.12 | % | | | .21 | % | | | 23 | % | |
| Institutional Class | |
| 8/31/2010 | | $ | — | | | $ | 20.60 | | | | 10.36 | % | | $ | 166.9 | | | | .75 | % | | | .75 | %‡ | | | .49 | % | | | 41 | % | |
| 8/31/2009 | | $ | — | | | $ | 18.75 | | | | (21.71 | %) | | $ | 77.6 | | | | .75 | % | | | .75 | %‡ | | | .70 | % | | | 36 | % | |
Period from 11/28/2007^ to 8/31/2008 | | $ | — | | | $ | 24.53 | | | | (5.47 | %)** | | $ | 71.8 | | | | .75 | %* | | | .74 | %‡* | | | .83 | %* | | | 35 | %Ø | |
| Class A | |
| 8/31/2010 | | $ | — | | | $ | 14.08 | | | | 10.03 | % | | $ | 12.4 | | | | 1.11 | % | | | 1.11 | %‡ | | | .18 | % | | | 41 | % | |
Period from 5/27/2009^ to 8/31/2009 | | $ | — | | | $ | 12.88 | | | | 7.33 | %** | | $ | 1.1 | | | | 1.11 | %* | | | 1.11 | %‡* | | | .11 | %* | | | 36 | %Ø | |
| Class C | |
| 8/31/2010 | | $ | — | | | $ | 13.94 | | | | 9.10 | % | | $ | 3.3 | | | | 1.86 | % | | | 1.86 | %‡ | | | (.57 | %) | | | 41 | % | |
Period from 5/27/2009^ to 8/31/2009 | | $ | — | | | $ | 12.86 | | | | 7.17 | %** | | $ | 0.1 | | | | 1.86 | %* | | | 1.86 | %‡* | | | (.40 | %)* | | | 36 | %Ø | |
| Class R3 | |
| 8/31/2010 | | $ | — | | | $ | 14.05 | | | | 9.74 | % | | $ | 0.2 | | | | 1.36 | % | | | 1.36 | %‡ | | | (.11 | %) | | | 41 | % | |
Period from 5/27/2009^ to 8/31/2009 | | $ | — | | | $ | 12.87 | | | | 7.25 | %** | | $ | 0.1 | | | | 1.36 | %* | | | 1.36 | %‡* | | | .12 | %* | | | 36 | %Ø | |
Notes to Financial Highlights
| †† | Total return based on per share net asset value reflects the effects of changes in net asset value on the performance of each Fund during each fiscal period. Returns assume income dividends and other distributions, if any, were reinvested and do not reflect the effect of sales charges. Results represent past performance and do not guarantee future results. Current returns may be lower or higher than the performance data quoted. Investment returns and principal may fluctuate and shares when redeemed may be worth more or less than original cost. For each Fund, total return would have been lower if Management had not reimbursed and/or waived certain expenses. Total return would have been higher if Management had not recouped previously reimbursed expenses. For the year ended August 31, 2009, Management reimbursed Emerging Markets Equity and Socially Responsive for losses incurred in connection with a trade error, which had no impact on total return. |
| ‡‡ | On June 9, 2008, Equity Income's Trust Class was converted into the Fund's Institutional Class. The financial information of the Fund's Institutional Class includes the financial information of Trust Class shares. Because the Trust Class had moderately higher expenses, its performance typically would have been slightly lower than the Institutional Class. |
| ‡‡‡ | On December 21, 2009, Multi-Cap Opportunities' Trust Class was converted into the Fund's Institutional Class. The financial information of the Fund's Institutional Class includes the financial information of Trust Class shares. The Trust Class had equivalent capped expenses and, therefore, typically similar return to the Institutional Class |
| ††† | During the period from November 2, 2006 through June 9, 2008, Equity Income's Trust Class had only one investor, which could have impacted Fund performance. On June 9, 2008, the Fund's Trust Class was converted into the Fund's Institutional Class and the Institutional Class was opened to the public. The total return of the Fund's Institutional Class includes the performance of the former Trust Class. |
| †††† | During the period from November 2, 2006 through December 21, 2009, Multi-Cap Opportunities' Trust Class had only one investor, which could have impacted Fund performance. On December 21, 2009, the Fund's Trust Class was converted into the Fund's Institutional Class and the Institutional Class was opened to the public. The total return of the Fund's Institutional Class includes the performance of the former Trust Class. |
| # | The Fund is required to calculate an expense ratio without taking into consideration any expense reductions related to expense offset arrangements. |
| ‡ | After reimbursement of expenses and/or waiver of a portion of the investment management fee by Management. Had Management not undertaken such actions, the annualized ratios of net expenses to average daily net assets would have been: |
| | | Year Ended August 31, | |
| | | 2010 | | 2009 | | 2008 | | 2007 | | 2006 | |
| Climate Change Fund Institutional Class | | | 9.09 | % | | | 9.85 | % | | | 25.07 | %(10) | | | — | | | | — | | |
| Climate Change Fund Class A | | | 9.44 | % | | | 9.92 | % | | | 16.79 | %(10) | | | — | | | | — | | |
| Climate Change Fund Class C | | | 10.29 | % | | | 10.94 | % | | | 28.56 | %(10) | | | — | | | | — | | |
| Emerging Markets Equity Fund Institutional Class | | | 6.65 | % | | | 14.78 | %(13) | | | — | | | | — | | | | — | | |
| Emerging Markets Equity Fund Class A | | | 6.71 | % | | | 18.97 | %(13) | | | — | | | | — | | | | — | | |
| Emerging Markets Equity Fund Class C | | | 7.05 | % | | | 17.56 | %(13) | | | — | | | | — | | | | — | | |
| Emerging Markets Equity Fund Class R3 | | | 39.77 | %(23) | | | — | | | | — | | | | — | | | | — | | |
| Equity Income Fund Institutional Class | | | 1.01 | % | | | 1.32 | % | | | 3.63 | %(12) | | | 2.91 | %(6)(19) | | | — | | |
| Equity Income Fund Class A | | | 1.36 | % | | | 2.31 | % | | | 5.67 | %(20) | | | — | | | | — | | |
| Equity Income Fund Class C | | | 2.12 | % | | | 2.80 | % | | | 6.94 | %(20) | | | — | | | | — | | |
| Equity Income Fund Class R3 | | | 36.17 | %(23) | | | — | | | | — | | | | — | | | | — | | |
Notes to Financial Highlights (cont'd)
| | | Year Ended August 31, | |
| | | 2010 | | 2009 | | 2008 | | 2007 | | 2006 | |
| Focus Fund Investor Class | | | — | | | | .99 | % | | | .89 | % | | | .87 | % | | | .87 | % | |
| Focus Fund Trust Class | | | — | | | | 1.24 | % | | | 1.10 | % | | | 1.07 | % | | | 1.06 | % | |
| Focus Fund Advisor Class | | | — | | | | 1.53 | % | | | 1.33 | % | | | 1.28 | % | | | 1.26 | % | |
| Focus Fund Institutional Class | | | 36.90 | %(3) | | | — | | | | — | | | | — | | | | — | | |
| Focus Fund Class A | | | 37.28 | %(3) | | | — | | | | — | | | | — | | | | — | | |
| Focus Fund Class C | | | 38.06 | %(3) | | | — | | | | — | | | | — | | | | — | | |
| Genesis Fund Investor Class | | | — | | | | 1.08 | % | | | 1.03 | % | | | 1.03 | % | | | 1.02 | % | |
| Genesis Fund Trust Class | | | — | | | | 1.12 | % | | | 1.09 | % | | | 1.10 | % | | | 1.09 | % | |
| Genesis Fund Advisor Class | | | — | | | | 1.38 | % | | | 1.35 | % | | | 1.35 | % | | | 1.35 | % | |
| Genesis Fund Institutional Class | | | .87 | % | | | .87 | % | | | .85 | % | | | .85 | % | | | .85 | % | |
| Guardian Fund Investor Class | | | — | | | | .97 | % | | | .89 | % | | | .87 | % | | | .88 | % | |
| Guardian Fund Trust Class | | | — | | | | 1.14 | % | | | 1.06 | % | | | 1.05 | % | | | 1.04 | % | |
| Guardian Fund Advisor Class | | | 2.59 | % | | | 5.33 | % | | | 3.44 | % | | | 2.85 | % | | | 3.13 | % | |
| Guardian Fund Institutional Class | | | 0.81 | % | | | 5.16 | %(15) | | | — | | | | — | | | | — | | |
| Guardian Fund Class A | | | 1.22 | % | | | 2.24 | %(15) | | | — | | | | — | | | | — | | |
| Guardian Fund Class C | | | 2.46 | % | | | 6.27 | %(15) | | | — | | | | — | | | | — | | |
| Guardian Fund Class R3 | | | 3.12 | % | | | 5.77 | %(15) | | | — | | | | — | | | | — | | |
| International Fund Investor Class | | | 1.41 | % | | | 1.40 | % | | | 1.26 | % | | | 1.24 | % | | | 1.25 | % | |
| International Fund Trust Class | | | — | | | | 1.49 | % | | | 1.35 | % | | | 1.33 | % | | | 1.32 | % | |
| International Large Cap Fund Trust Class | | | 1.53 | % | | | 1.73 | % | | | 1.37 | % | | | 1.48 | % | | | 37.46 | %(1) | |
| International Large Cap Fund Institutional Class | | | 1.12 | % | | | 1.30 | % | | | .97 | % | | | .99 | %(4) | | | — | | |
| International Large Cap Fund Class A | | | 1.52 | % | | | 2.17 | % | | | 1.70 | %(7) | | | — | | | | — | | |
| International Large Cap Fund Class C | | | 2.29 | % | | | 3.94 | % | | | 4.08 | %(7) | | | — | | | | — | | |
| International Large Cap Fund Class R3 | | | 3.50 | % | | | 6.18 | %(15) | | | — | | | | — | | | | — | | |
| Intrinsic Value Fund Institutional Class | | | 1.70 | %(22) | | | — | | | | — | | | | — | | | | — | | |
| Intrinsic Value Fund Class A | | | 2.11 | %(22) | | | — | | | | — | | | | — | | | | — | | |
| Intrinsic Value Fund Class C | | | 3.09 | %(22) | | | — | | | | — | | | | — | | | | — | | |
| Large Cap Disciplined Growth Fund Investor Class | | | 1.23 | % | | | 2.50 | % | | | 2.53 | % | | | 2.44 | % | | | 2.51 | % | |
| Large Cap Disciplined Growth Fund Institutional Class | | | .87 | % | | | 1.57 | %(14) | | | — | | | | — | | | | — | | |
| Large Cap Disciplined Growth Fund Class A | | | 1.30 | % | | | 1.79 | %(14) | | | — | | | | — | | | | — | | |
| Large Cap Disciplined Growth Fund Class C | | | 2.01 | % | | | 2.56 | %(14) | | | — | | | | — | | | | — | | |
| Large Cap Disciplined Growth Fund Class R3 | | | 3.23 | % | | | 6.21 | %(15) | | | — | | | | — | | | | — | | |
| Mid Cap Growth Fund Investor Class | | | — | | | | 1.11 | % | | | 1.01 | % | | | 1.02 | % | | | 1.04 | % | |
| Mid Cap Growth Fund Trust Class | | | — | | | | 1.26 | % | | | 1.25 | % | | | 1.30 | % | | | 1.32 | % | |
| Mid Cap Growth Fund Advisor Class | | | — | | | | 1.86 | % | | | 2.38 | % | | | 3.39 | % | | | 2.85 | % | |
| Mid Cap Growth Fund Institutional Class | | | .83 | % | | | .87 | % | | | .78 | % | | | 1.03 | %(5) | | | — | | |
| Mid Cap Growth Fund Class A | | | 1.28 | % | | | 4.05 | %(15) | | | — | | | | — | | | | — | | |
| Mid Cap Growth Fund Class C | | | 2.64 | % | | | 6.29 | %(15) | | | — | | | | — | | | | — | | |
| Mid Cap Growth Fund Class R3 | | | 3.15 | % | | | 5.78 | %(15) | | | — | | | | — | | | | — | | |
| Multi-Cap Opportunities Fund Institutional Class | | | 1.95 | %(16) | | | 5.67 | %(19) | | | 2.33 | %(19) | | | 2.31 | %(18)(19) | | | — | | |
| Multi-Cap Opportunities Fund Class A | | | 3.18 | %(17) | | | — | | | | — | | | | — | | | | — | | |
Notes to Financial Highlights (cont'd)
| | | Year Ended August 31, | |
| | | 2010 | | 2009 | | 2008 | | 2007 | | 2006 | |
| Multi-Cap Opportunities Fund Class C | | | 6.43 | %(17) | | | — | | | | — | | | | — | | | | — | | |
| Partners Fund Investor Class | | | — | | | | .89 | % | | | .80 | % | | | .80 | % | | | .82 | % | |
| Partners Fund Trust Class | | | — | | | | 1.05 | % | | | .99 | % | | | .99 | % | | | .99 | % | |
| Partners Fund Advisor Class | | | — | | | | 1.20 | % | | | 1.14 | % | | | 1.14 | % | | | 1.15 | % | |
| Partners Fund Institutional Class | | | — | | | | .71 | % | | | .65 | % | | | .65 | % | | | .96 | %(2) | |
| Partners Fund Class A | | | 35.72 | %(3) | | | — | | | | — | | | | — | | | | — | | |
| Partners Fund Class C | | | 37.45 | %(3) | | | — | | | | — | | | | — | | | | — | | |
| Partners Fund Class R3 | | | 36.96 | %(3) | | | — | | | | — | | | | — | | | | — | | |
| Real Estate Fund Trust Class | | | 1.75 | % | | | 2.02 | % | | | 1.83 | % | | | 1.59 | % | | | 1.90 | % | |
| Real Estate Fund Institutional Class | | | 1.39 | % | | | 2.80 | % | | | 1.77 | %(11) | | | — | | | | — | | |
| Real Estate Fund Class A | | | 12.56 | %(3) | | | — | | | | — | | | | — | | | | — | | |
| Real Estate Fund Class C | | | 20.75 | %(3) | | | — | | | | — | | | | — | | | | — | | |
| Real Estate Fund Class R3 | | | 37.36 | %(3) | | | — | | | | — | | | | — | | | | — | | |
| Regency Fund Investor Class | | | 1.24 | % | | | 1.37 | % | | | 1.12 | % | | | 1.08 | % | | | 1.12 | % | |
| Regency Fund Trust Class | | | 1.42 | % | | | 1.59 | % | | | 1.36 | % | | | 1.31 | % | | | 1.32 | % | |
| Regency Fund Institutional Class | | | 1.03 | %(21) | | | — | | | | — | | | | — | | | | — | | |
| Regency Fund Class A | | | 37.23 | %(3) | | | — | | | | — | | | | — | | | | — | | |
| Regency Fund Class C | | | 35.88 | %(3) | | | — | | | | — | | | | — | | | | — | | |
| Regency Fund Class R3 | | | 37.59 | %(3) | | | — | | | | — | | | | — | | | | — | | |
| Select Equities Fund Institutional Class | | | 1.22 | % | | | 2.57 | % | | | 13.92 | %(7) | | | — | | | | — | | |
| Select Equities Fund Class A | | | 1.60 | % | | | 2.19 | % | | | 3.99 | %(7) | | | — | | | | — | | |
| Select Equities Fund Class C | | | 2.35 | % | | | 2.91 | % | | | 7.21 | %(7) | | | — | | | | — | | |
| Small Cap Growth Fund Investor Class | | | 1.50 | % | | | 1.48 | % | | | 1.42 | % | | | 1.76 | % | | | 1.86 | % | |
| Small Cap Growth Fund Trust Class | | | 1.70 | % | | | 1.73 | % | | | 1.64 | % | | | 2.22 | % | | | 2.47 | % | |
| Small Cap Growth Fund Advisor Class | | | 1.90 | % | | | 1.99 | % | | | 1.96 | % | | | 2.58 | % | | | 3.24 | % | |
| Small Cap Growth Fund Institutional Class | | | 1.28 | % | | | 1.69 | % | | | 1.10 | %(9) | | | — | | | | — | | |
| Small Cap Growth Fund Class A | | | 2.05 | % | | | 5.34 | %(15) | | | — | | | | — | | | | — | | |
| Small Cap Growth Fund Class C | | | 3.43 | % | | | 6.65 | %(15) | | | — | | | | — | | | | — | | |
| Small Cap Growth Fund Class R3 | | | 4.16 | % | | | 6.29 | %(15) | | | — | | | | — | | | | — | | |
| Socially Responsive Fund Institutional Class | | | .77 | % | | | .78 | % | | | .76 | %(8) | | | — | | | | — | | |
| Socially Responsive Fund Class A | | | 1.21 | % | | | 1.70 | %(15) | | | — | | | | — | | | | — | | |
| Socially Responsive Fund Class C | | | 1.99 | % | | | 6.17 | %(15) | | | — | | | | — | | | | — | | |
| Socially Responsive Fund Class R3 | | | 2.95 | % | | | 5.76 | %(15) | | | — | | | | — | | | | — | | |
| | (1) | Period from August 1, 2006 to August 31, 2006. |
| | | |
| | (2) | Period from June 7, 2006 to August 31, 2006. |
| | | |
| | (3) | Period from June 21, 2010 to August 31, 2010. |
| | | |
| | (4) | Period from October 6, 2006 to August 31, 2007. |
| | | |
| | (5) | Period from April 19, 2007 to August 31, 2007. |
| | | |
| | (6) | Period from November 2, 2006 to August 31, 2007. |
| | | |
| | (7) | Period from December 20, 2007 to August 31, 2008. |
Notes to Financial Highlights (cont'd)
| | (8) | Period from November 28, 2007 to August 31, 2008. |
| | | |
| | (9) | Period from April 1, 2008 to August 31, 2008. |
| | | |
| | (10) | Period from May 1, 2008 to August 31, 2008. |
| | | |
| | (11) | Period from June 4, 2008 to August 31, 2008. |
| | | |
| | (12) | On June 9, 2008, Equity Income's Trust Class was converted into the Fund's Institutional Class. The financial information of the Fund's Institutional Class includes the financial information of Trust Class shares. |
| | | |
| | (13) | Period from October 8, 2008 to August 31, 2009. Organization expense, which is an extraordinary non-recurring expense, is included in ratios on a non-annualized basis. |
| | | |
| | (14) | Period from April 6, 2009 to August 31, 2009. |
| | | |
| | (15) | Period from May 27, 2009 to August 31, 2009. |
| | | |
| | (16) | On December 21, 2009, Multi-Cap Opportunities' Trust Class was converted into the Fund's Institutional Class. The financial information of the Fund's Institutional Class includes the financial information of Trust Class shares. |
| | | |
| | (17) | Period from December 21, 2009 to August 31, 2010. |
| | | |
| | (18) | Period from November 2, 2006 to August 31, 2007. |
| | | |
| | (19) | These ratios reflect a reduced fee schedule for certain expenses. If these expenses had not been reduced, the ratios would have been higher. |
| | | |
| | (20) | Period from June 9, 2008 to August 31, 2008. |
| | | |
| | (21) | Period from March 8, 2010 to August 31, 2010. |
| | | |
| | (22) | Period from May 10, 2010 to August 31, 2010. Organization expense, which is an extraordinary non-recurring expense, is included in ratios on a non-annualized basis. |
| ^^ | After utilization of the Line of Credit by International Institutional and/or reimbursement of expenses and/or waiver of a portion of the investment management fee by Management. Had Management not undertaken such actions, or had the Fund not utilized the Line of Credit, the annualized ratio of net expenses to average daily net assets would have been: |
| | | Year Ended August 31, | |
| | | 2010 | | 2009 | | 2008 | | 2007 | | 2006 | |
| International Institutional Fund Institutional Class | | | 1.24 | % | | | 1.26 | % | | | 1.11 | % | | | 1.12 | % | | | 1.20 | % | |
| § | After reimbursement of expenses previously paid by Management and/or waiver of a portion of the investment management fee by Management. Had a Fund not made such reimbursements or had Management not undertaken such actions, the annualized ratios of net expenses to average daily net assets would have been: |
| | | Year Ended August 31, | |
| | | 2010 | | 2009 | | 2008 | | 2007 | | 2006 | |
| Focus Fund Advisor Class | | | 1.39 | % | | | — | | | | — | | | | — | | | | — | | |
| Genesis Fund Institutional Class | | | — | | | | — | | | | — | | | | — | | | | .84 | % | |
| International Fund Investor Class | | | — | | | | — | | | | — | | | | — | | | | 1.24 | % | |
| International Fund Trust Class | | | — | | | | — | | | | — | | | | — | | | | 1.32 | % | |
| Mid Cap Growth Fund Advisor Class | | | 1.48 | % | | | — | | | | — | | | | — | | | | — | | |
| Partners Fund Institutional Class | | | .68 | % | | | — | | | | — | | | | .64 | % | | | — | | |
Notes to Financial Highlights (cont'd)
| ^ | The date investment operations commenced. |
| | |
| @ | Calculated based on the average number of shares outstanding during each fiscal period. |
| | |
| ØØ | Redemption fees are charged on Emerging Markets Equity, International, International Institutional, International Large Cap, and Real Estate. Calculated based on the average number of shares outstanding during each fiscal period. |
| | |
| * | Annualized. |
| | |
| ** | Not annualized. |
| | |
| Ø | Portfolio turnover is calculated at the Fund level. Percentage indicated was calculated for the year ended August 31, 2006 for Partners, for the year ended August 31, 2007 for International Large Cap and Mid Cap Growth, for the period ended August 31, 2008 for Equity Income, International Large Cap, Real Estate, Small Cap Growth, and Socially Responsive, for the year ended August 31, 2009 for Guardian, International Large Cap, Large Cap Disciplined Growth, Mid Cap Growth, Small Cap Growth, and Socially Responsive, and for the year ended August 31, 2010 for Emerging Markets Equity, Equity Income, Focus, Multi-Cap Opportunities, Partners, Real Estate and Regency. |
| | |
| ## | On August 15, 2008, Genesis acquired all of the net assets of Neuberger Berman Fasciano Fund pursuant to a Plan of Reorganization and Dissolution. Portfolio turnover excludes purchases and sales of securities by Fasciano (acquired fund) prior to the merger date. |
| | |
| ### | Portfolio turnover excludes purchases and sales of securities by Large Cap Disciplined Growth (acquired fund) prior to the merger date (see Note H of Notes to Financial Statements). |
| | |
| @@ | Subsequent to August 31, 2007, Genesis received notification that a substantial portion of a special cash dividend received from one of its investments, which was recorded as dividend income in the 2007 financial statements, represented a non-taxable return of capital to Genesis. The reclassification had no impact on the total or per share net assets of Genesis, but resulted in a decrease of $62,516,000 in net investment income (loss), an increase of $2,354,000 in net realized gain (loss) on investments and an increase of $60,162,000 in change in unrealized appreciation (depreciation) of investments, for that year. The financial highlights for each class of shares for the year ended August 31, 2007, have been updated to reflect the revised recharacterization. The impact on the financial highlights for each class was a r eclassification of $0.21, $0.32, $0.18 and $0.26 per share for the Investor Class, Trust Class, Advisor Class and Institutional Class, respectively, and a decrease in the Ratio of Net Investment Income (Loss) to Average Net Assets of 0.57%, 0.61%, 0.59% and 0.54% for the Investor Class, Trust Class, Advisor Class and Institutional Class, respectively. |
Report of Independent Registered Public Accounting Firm
To the Board of Trustees
Neuberger Berman Equity Funds and
Shareholders of:
Neuberger Berman Climate Change Fund
Neuberger Berman Emerging Markets Equity Fund
Neuberger Berman Equity Income Fund
Neuberger Berman Focus Fund
Neuberger Berman Genesis Fund
Neuberger Berman Guardian Fund
Neuberger Berman International Fund
Neuberger Berman International Institutional Fund
Neuberger Berman International Large Cap Fund
Neuberger Berman Partners Fund
Neuberger Berman Real Estate Fund
Neuberger Berman Select Equities Fund
We have audited the accompanying statements of assets and liabilities, including the schedules of investments, of Neuberger Berman Climate Change Fund, Neuberger Berman Emerging Markets Equity Fund, Neuberger Berman Equity Income Fund, Neuberger Berman Focus Fund, Neuberger Berman Genesis Fund, Neuberger Berman Guardian Fund, Neuberger Berman International Fund, Neuberger Berman International Institutional Fund, Neuberger Berman International Large Cap Fund, Neuberger Berman Partners Fund, Neuberger Berman Real Estate Fund, and Neuberger Berman Select Equities Fund, twelve of the series constituting Neuberger Berman Equity Funds (the "Trust"), as of August 31, 2010, and the related statements of operations for the year then ended, the statements of changes in net assets and the financial highlights for each of the periods indicated therei n. These financial statements and financial highlights are the responsibility of the Trust's management. Our responsibility is to express an opinion on these financial statements and financial highlights based on our audits.
We conducted our audits in accordance with the standards of the Public Company Accounting Oversight Board (United States). Those standards require that we plan and perform the audits to obtain reasonable assurance about whether the financial statements and financial highlights are free of material misstatement. We were not engaged to perform an audit of the Trust's internal control over financial reporting. Our audits included consideration of internal control over financial reporting as a basis for designing audit procedures that are appropriate in the circumstances, but not for the purpose of expressing an opinion on the effectiveness of the Trust's internal control over financial reporting. Accordingly, we express no such opinion. An audit also includes examining, on a test basis, evidence supporting the amounts and disclosures in the financial statements and financial highlights, assessing the accounting principles used and significant estimates made by management, and evaluating the overall financial statement presentation. Our procedures included confirmation of securities owned as of August 31, 2010, by correspondence with the custodian and brokers or by other appropriate auditing procedures where replies from brokers were not received. We believe that our audits provide a reasonable basis for our opinion.
In our opinion, the financial statements and financial highlights referred to above present fairly, in all material respects, the financial position of each of the above-mentioned series of Neuberger Berman Equity Funds as of August 31, 2010, the results of their operations for the year then ended, the changes in their net assets and the financial highlights for each of the periods indicated therein, in conformity with U.S. generally accepted accounting principles.
Boston, Massachusetts
October 15, 2010
Report of Independent Registered Public Accounting Firm
To the Board of Trustees and Shareholders
Neuberger Berman Equity Funds
We have audited the accompanying statements of assets and liabilities of the Neuberger Berman Large Cap Disciplined Growth Fund, Neuberger Berman Mid Cap Growth Fund, Neuberger Berman Regency Fund, Neuberger Berman Small Cap Growth Fund, Neuberger Berman Socially Responsive Fund, Neuberger Berman Multi-Cap Opportunities Fund (Formerly Research Opportunities Fund), and Neuberger Berman Intrinsic Value Fund, each a series of the Neuberger Berman Equity Funds (the "Trust"), including the schedules of investments, as of August 31, 2010, and the related statements of operations for the year then ended (with respect to Neuberger Berman Intrinsic Value Fund, the period May 10, 2010 to August 31, 2010), the statements of changes in net assets for each of the two years in the period then ended (with respect to Neuberger Berman Intrinsic Value Fund , the period May 10, 2010 to August 31, 2010 ), and the financial highlights for each of the five years in the period then ended (with respect to Neuberger Berman Multi-Cap Opportunities Fund (Formerly Research Opportunities Fund), the period November 2, 2006 to August 31, 2010 and with respect to Neuberger Berman Intrinsic Value Fund, the period May 10, 2010 to August 31, 2010). These financial statements and financial highlights are the responsibility of the Trust's management. Our responsibility is to express an opinion on these financial statements and financial highlights based on our audits.
We conducted our audits in accordance with the standards of the Public Company Accounting Oversight Board (United States). Those standards require that we plan and perform the audit to obtain reasonable assurance about whether the financial statements and financial highlights are free of material misstatement. The Trust is not required to have, nor were we engaged to perform, an audit of its internal control over financial reporting. Our audits included consideration of internal control over financial reporting as a basis for designing audit procedures that are appropriate in the circumstances, but not for the purpose of expressing an opinion on the effectiveness of the Trust's internal control over financial reporting. Accordingly, we express no such opinion. An audit also includes examining, on a test basis, evidence supporting the amou nts and disclosures in the financial statements, assessing the accounting principles used and significant estimates made by management, as well as evaluating the overall financial statement presentation. Our procedures included confirmation of securities owned as of August 31, 2010, by correspondence with the custodian and brokers or by other appropriate auditing procedures where replies from brokers were not received. We believe that our audits provide a reasonable basis for our opinion.
In our opinion, the financial statements and financial highlights referred to above present fairly, in all material respects, the financial position of the above mentioned series of the Neuberger Berman Equity Funds, as of August 31, 2010, and the results of their operations, the changes in their net assets, and the financial highlights for the periods indicated above, in conformity with accounting principles generally accepted in the United States of America.
Philadelphia, Pennsylvania
October 15, 2010
Directory
| Investment Manager, Administrator and Distributor Neuberger Berman Management LLC 605 Third Avenue, 2nd Floor New York, NY 10158-0180 800.877.9700 or 212.476.8800 Intermediary Client Services 800.366.6264 Sub-Adviser Neuberger Berman LLC 605 Third Avenue New York, NY 10158-3698 Custodian and Shareholder Servicing Agent State Street Bank and Trust Company 2 Avenue de Lafayette Boston, MA 02111 For Investor Class Shareholders Address correspondence to: Neuberger Berman Funds Boston Service Center P.O. Box 8403 Boston, MA 02266-8403 800.877.9700 or 212.476.8800 For Class A, Class C and Class R3 Shareholders: Please contact your investment provider | For Trust Class, Advisor Class, and Institutional Class Shareholders Address correspondence to: Neuberger Berman Management LLC 605 Third Avenue, Mail Drop 2-7 New York, NY 10158-0180 Attn: Intermediary Support Services 800.366.6264 Legal Counsel K&L Gates LLP 1601 K Street, NW Washington, DC 20006 Independent Registered Public Accounting Firms Ernst & Young LLP 200 Clarendon Street Boston, MA 02116 Tait, Weller & Baker LLP 1818 Market Street Suite 2400 Philadelphia, PA 19103 |
Trustee and Officer Information
The following tables set forth information concerning the trustees ("Trustees") and officers ("Officers") of the Trust. All persons named as Trustees and Officers also serve in similar capacities for other funds administered or managed by Management and Neuberger. The Statement of Additional Information includes additional information about Trustees and is available upon request, without charge, by calling (800) 877-9700.
Information about the Board of Trustees
Name, (Year of Birth), and Address(1) | | Position and Length of Time Served(2) | | Principal Occupation(s)(3) | | Number of Funds in Fund Complex Overseen by Fund Trustee | | Other Directorships Held Outside Fund Complex by Fund Trustee | |
| | |
| Independent Fund Trustees | |
| |
| John Cannon (1930) | | Trustee since 2000 | | Consultant; formerly, Chairman, CDC Investment Advisers (registered investment adviser), 1993 to January 1999; formerly, President and Chief Executive Officer, AMA Investment Advisors, an affiliate of the American Medical Association. | | | 43 | | | Formerly, Independent Trustee or Director of three series of Oppenheimer Funds: Oppenheimer Limited Term New York Municipal Fund, Rochester Fund Municipals, and Oppenheimer Convertible Securities Fund, 1992 to 2009. | |
| |
| Faith Colish (1935) | | Trustee since 1982 | | Counsel, Carter Ledyard & Milburn LLP (law firm) since October 2002; formerly, Attorney-at-Law and President, Faith Colish, A Professional Corporation, 1980 to 2002. | | | 43 | | | Formerly, Director, 1997 to 2003, and Advisory Director, 2003 to 2006; ABA Retirement Funds (formerly, American Bar Retirement Association) (not-for-profit membership corporation). | |
| |
Name, (Year of Birth), and Address(1) | | Position and Length of Time Served(2) | | Principal Occupation(s)(3) | | Number of Funds in Fund Complex Overseen by Fund Trustee | | Other Directorships Held Outside Fund Complex by Fund Trustee | |
| | | | | | | | | | |
| Martha C. Goss (1949) | | Trustee since 2007 | | President, Woodhill Enterprises Inc./Chase Hollow Associates LLC (personal investment vehicle), since 2006; Chief Operating and Financial Officer, Hopewell Holdings LLC/ Amwell Holdings, LLC (a holding company for a healthcare reinsurance company start-up), since 2003; formerly, Consultant, Resources Connection (temporary staffing), 2002 to 2006. | | | 43 | | | Director, Ocwen Financial Corporation (mortgage servicing), since 2005; Director, American Water (water utility), since 2003; Director, Channel Reinsurance (financial guaranty reinsurance), since 2006; Director, Allianz Life of New York (insurance), since 2005; Director, Financial Women's Association of New York (not-for-profit association), since 2003; Trustee Emerita, Brown University, since 1998; formerly, Advisory Board Member, Attensity (software developer), 2005 to 2007; formerly, Director, Bank Leumi (commercial bank), 2005 to 2007; formerly, Director, Claire's Stores, Inc. (retailer), 2005 to 2007. | |
| |
| C. Anne Harvey (1937) | | Trustee since 2000 | | President, C.A. Harvey Associates, since October 2001; formerly, Director, AARP, 1978 to December 2001. | | | 43 | | | Formerly, President, Board of Associates to The National Rehabilitation Hospital's Board of Directors, 2001 to 2002; formerly, Member, Individual Investors Advisory Committee to the New York Stock Exchange Board of Directors, 1998 to 2002. | |
| |
| Robert A. Kavesh (1927) | | Trustee since 1986 | | Retired; Marcus Nadler Professor Emeritus of Finance and Economics, New York University Stern School of Business; formerly, Executive Secretary-Treasurer, American Finance Association, 1961 to 1979. | | | 43 | | | Formerly, Director, The Caring Community (not-for-profit), 1997 to 2006; formerly, Director, DEL Laboratories, Inc. (cosmetics and pharmaceuticals), 1978 to 2004; formerly, Director, Apple Bank for Savings, 1979 to 1990; formerly, Director, Western Pacific Industries, Inc., (public company), 1972 to 1986. | |
| |
Name, (Year of Birth), and Address(1) | | Position and Length of Time Served(2) | | Principal Occupation(s)(3) | | Number of Funds in Fund Complex Overseen by Fund Trustee | | Other Directorships Held Outside Fund Complex by Fund Trustee | |
| | | | | | | | | | | | |
| Michael M. Knetter (1960) | | Trustee since 2007 | | Dean, School of Business, University of Wisconsin—Madison; formerly, Professor of International Economics and Associate Dean, Amos Tuck School of Business—Dartmouth College, 1998 to 2002. | | | 43 | | | Director, American Family Insurance (a mutual company, not publicly traded), since March 2009; Trustee, Northwestern Mutual Series Fund, Inc., since February 2007; Director, Wausau Paper, since 2005; formerly, Director, Great Wolf Resorts, 2004 to 2009. | |
| |
| Howard A. Mileaf (1937) | | Trustee since 1984 | | Retired; formerly, Vice President and General Counsel, WHX Corporation (holding company), 1993 to 2001. | | | 43 | | | Formerly, Director, Webfinancial Corporation (holding company), 2002 to 2008; formerly, Director, WHX Corporation (holding company), 2002 to 2005; formerly, Director, State Theatre of New Jersey (not-for-profit theatre), 2000 to 2005. | |
| |
| George W. Morriss (1947) | | Trustee since 2007 | | Retired; formerly, Executive Vice President and Chief Financial Officer, People's Bank, Connecticut (a financial services company), 1991 to 2001. | | | 43 | | | Manager, Old Mutual Funds of Hedge Funds fund complex (consisting of six funds), since 2006 for four funds and since February 2007 for two funds; formerly, Member NASDAQ Issuers' Affairs Committee, 1995 to 2003. | |
| |
| Edward I. O'Brien (1928) | | Trustee since 1993 | | Retired; formerly, Member, Investment Policy Committee, Edward Jones, 1993 to 2001; President, Securities Industry Association ("SIA") (securities industry's representative in government relations and regulatory matters at the federal and state levels), 1974 to 1992; Adviser to SIA, November 1992 to November 1993. | | | 43 | | | Formerly, Director, Legg Mason, Inc. (financial services holding company), 1993 to July 2008; formerly, Director, Boston Financial Group (real estate and tax shelters), 1993 to 1999. | |
| |
Name, (Year of Birth), and Address(1) | | Position and Length of Time Served(2) | | Principal Occupation(s)(3) | | Number of Funds in Fund Complex Overseen by Fund Trustee | | Other Directorships Held Outside Fund Complex by Fund Trustee | |
| | | | | | | | | | | | |
| Cornelius T. Ryan (1931) | | Trustee since 1982 | | General Partner and Adviser, TD2, TD3, and TOF1 Healthcare Venture Capital Partnerships; Founding General Partner, Oxford Partners and Oxford Bioscience Partners (venture capital investing) and President, Oxford Venture Corporation, since 1981. | | | 43 | | | Trustee, Norwalk Hospital Foundation, since 2000; Director, Supply Pro (privately held company), since 2008; formerly, Trustee, Norwalk Hospital, 1995 to 2004; formerly, President and Director, Randolph Computer Corp., 1966 to 1984; formerly, Director of numerous privately held portfolio companies of Oxford Partners and Oxford Bio Science Partners, 1981 to 2005. | |
| |
| Tom D. Seip (1950) | | Trustee since 2000; Chairman of the Board since 2008; Lead Independent Trustee from 2006 to 2008 | | General Partner, Seip Investments LP (a private investment partnership); formerly, President and CEO, Westaff, Inc. (temporary staffing), May 2001 to January 2002; formerly, Senior Executive, The Charles Schwab Corporation, 1983 to 1998, including Chief Executive Officer, Charles Schwab Investment Management, Inc., Trustee, Schwab Family of Funds and Schwab Investments, 1997 to 1998, and Executive Vice President-Retail Brokerage, Charles Schwab & Co., Inc., 1994 to 1997. | | | 43 | | | Director, H&R Block, Inc. (financial services company), since May 2001; Chairman, Compensation Committee, H&R Block, Inc., since 2006; formerly, Director, Forward Management, Inc. (asset management company), 1999 to 2006. | |
| |
Name, (Year of Birth), and Address(1) | | Position and Length of Time Served(2) | | Principal Occupation(s)(3) | | Number of Funds in Fund Complex Overseen by Fund Trustee | | Other Directorships Held Outside Fund Complex by Fund Trustee | |
| | | | | | | | | | | | |
| Candace L. Straight (1947) | | Trustee since 2000 | | Private investor and consultant specializing in the insurance industry; formerly, Advisory Director, Securitas Capital LLC (a global private equity investment firm dedicated to making investments in the insurance sector), 1998 to December 2003. | | | 43 | | | Director, Montpelier Re Holdings Ltd. (reinsurance company), since 2006; formerly, Director, National Atlantic Holdings Corporation (property and casualty insurance company), 2004 to 2008; formerly, Director, The Proformance Insurance Company (property and casualty insurance company), 2004 to 2008; formerly, Director, Providence Washington Insurance Company (property and casualty insurance company), 1998 to 2006; formerly, Director, Summit Global Partners (insurance brokerage firm), 2000 to 2005. | |
| |
| Peter P. Trapp (1944) | | Trustee since 2000 | | Retired; formerly, Regional Manager for Mid-Southern Region, Ford Motor Credit Company, September 1997 to 2007; formerly, President, Ford Life Insurance Company, April 1995 to August 1997. | | | 43 | | | None. | |
| |
Name, (Year of Birth), and Address(1) | | Position and Length of Time Served(2) | | Principal Occupation(s)(3) | | Number of Funds in Fund Complex Overseen by Fund Trustee | | Other Directorships Held Outside Fund Complex by Fund Trustee | |
| | |
| Fund Trustees who are "Interested Persons" | |
| |
| Joseph V. Amato* (1962) | | Trustee since 2009 | | President and Director, Neuberger Berman Group LLC, since 2009; President and Chief Executive Officer, Neuberger and Neuberger Berman Holdings LLC (including its predecessor, Neuberger Berman Inc.), since 2007; Chief Investment Officer, Neuberger, since 2009; Chief Investment Officer (Equities) and Managing Director, Management, since 2009; Managing Director, Neuberger Berman Fixed Income LLC ("NBFI") since 2007; Board member of NBFI since 2006; formerly, Global Head of Asset Management of Lehman Brothers Holdings Inc.'s ("LBHI") Investment Management Division, 2006 to 2009; formerly, member of LBHI's Investment Management Division's Executive Management Committee, 2006 to 2009; formerly, Managing Director, Lehman Brothers Inc. ("LBI"), 2006 to 2008; formerly, Chief Recruiting and Development Officer, LBI, 2005 to 2006; formerly, Global H ead of LBI's Equity Sales and a Member of its Equities Division Executive Committee, 2003 to 2005. | | | 43 | | | Member of Board of Advisors, McDonough School of Business, Georgetown University, since 2001; Member of New York City Board of Advisors, Teach for America, since 2005; Trustee, Montclair Kimberley Academy (private school), since 2007. | |
| |
Name, (Year of Birth), and Address(1) | | Position and Length of Time Served(2) | | Principal Occupation(s)(3) | | Number of Funds in Fund Complex Overseen by Fund Trustee | | Other Directorships Held Outside Fund Complex by Fund Trustee | |
| | | | | | | | | | | | |
| Robert Conti* (1956) | | Chief Executive Officer, President and Trustee since 2008; prior thereto, Executive Vice President in 2008 and Vice President 2000 to 2008 | | Managing Director, Neuberger, since 2007; formerly, Senior Vice President, Neuberger, 2003 to 2006; formerly, Vice President, Neuberger, 1999 to 2003; President and Chief Executive Officer, Management, since 2008; formerly, Senior Vice President, Management, 2000 to 2008. | | | 43 | | | Chairman of the Board, Staten Island Mental Health Society since 2008. | |
| |
| Jack L. Rivkin* (1940) | | Trustee since 2002; President from 2002 to 2008 | | Formerly, Executive Vice President and Chief Investment Officer, Neuberger Berman Holdings LLC (holding company), 2002 to August 2008 and 2003 to August 2008, respectively; formerly, Managing Director and Chief Investment Officer, Neuberger, December 2005 to August 2008 and 2003 to August 2008, respectively; formerly, Executive Vice President, Neuberger, December 2002 to 2005; formerly, Director and Chairman, Management, December 2002 to August 2008; formerly, Executive Vice President, Citigroup Investments, Inc., September 1995 to February 2002; formerly, Executive Vice President, Citigroup Inc., September 1995 to February 2002. | | | 43 | | | Director, Idealab (private company), since 2009; Director, Distributed World Power (private company), since 2009; Director, Dale Carnegie and Associates, Inc. (private company), since 1999; Director, Solbright, Inc. (private company), since 1998; Director, SA Agricultural Fund, since 2009; Chairman and Director, Essential Brands (consumer products) since 2008; formerly, Director, New York Society of Security Analysts, 2006 to 2008. | |
| |
| (1) | The business address of each listed person is 605 Third Avenue, New York, New York 10158. |
| | |
| (2) | Pursuant to the Trust's Trust Instrument, each of these Fund Trustees shall hold office for life or until his or her successor is elected or the Trust terminates; except that (a) any Fund Trustee may resign by delivering a written resignation; (b) any Fund Trustee may be removed with or without cause at any time by a written instrument signed by at least two-thirds of the other Fund Trustees; (c) any Fund Trustee who requests to be retired, or who has become unable to serve, may be retired by a written instrument signed by a majority of the other Fund Trustees; and (d) any Fund Trustee may be removed at any shareholder meeting by a vote of at least two-thirds of the outstanding shares. |
| | |
| (3) | Except as otherwise indicated, each individual has held the positions shown for at least the last five years. |
| | |
| * | Indicates a Fund Trustee who is an "interested person" within the meaning of the 1940 Act. Mr. Amato and Mr. Conti are interested persons of the Trust by virtue of the fact that each is an officer of Management, Neuberger and/or their affiliates. Mr. Rivkin may be deemed an interested person of the Trust by virtue of the fact that, until August 2008, he was a director of Management and an officer of Neuberger. |
Information about the Officers of the Trust
Name, (Year of Birth), and Address(1) | | Position and Length of Time Served(2) | | Principal Occupation(s)(3) | |
| | �� | | | | |
| Andrew B. Allard (1961) | | Anti-Money Laundering Compliance Officer since 2002 | | Senior Vice President, Neuberger, since 2006; Deputy General Counsel, Neuberger, since 2004; formerly, Vice President, Neuberger, 2000 to 2005; Anti-Money Laundering Compliance Officer, eight registered investment companies for which Management acts as investment manager and administrator (six since 2002, one since 2003 and one since 2006). | |
| |
| Claudia A. Brandon (1956) | | Executive Vice President since 2008 and Secretary since 1985 | | Senior Vice President, Neuberger, since 2007 and Employee since 1999; Senior Vice President, Management, since 2008 and Assistant Secretary since 2004; formerly, Vice President, Neuberger, 2002 to 2006; formerly, Vice President-Mutual Fund Board Relations, Management, 2000 to 2008; Executive Vice President, eight registered investment companies for which Management acts as investment manager and administrator (eight since 2008); Secretary, eight registered investment companies for which Management acts as investment manager and administrator (three since 1985, three since 2002, one since 2003 and one since 2006). | |
| |
| Maxine L. Gerson (1950) | | Executive Vice President since 2008 and Chief Legal Officer since 2005 (only for purposes of sections 307 and 406 of the Sarbanes-Oxley Act of 2002) | | Managing Director, Neuberger, since 2009, and Deputy General Counsel and Assistant Secretary, Neuberger, since 2001; Managing Director, Management, since 2009, and Secretary and General Counsel, Management, since 2004; formerly, Senior Vice President, Neuberger, 2002 to 2009; formerly, Senior Vice President, Management, 2006 to 2009; Executive Vice President, eight registered investment companies for which Management acts as investment manager and administrator (eight since 2008); Chief Legal Officer (only for purposes of sections 307 and 406 of the Sarbanes-Oxley Act of 2002), eight registered investment companies for which Management acts as investment manager and administrator (seven since 2005 and one since 2006). | |
| |
| Sheila R. James (1965) | | Assistant Secretary since 2002 | | Vice President, Neuberger, since 2008 and Employee since 1999; formerly, Assistant Vice President, Neuberger, 2007; Assistant Secretary, eight registered investment companies for which Management acts as investment manager and administrator (six since 2002, one since 2003 and one since 2006). | |
| |
| Brian Kerrane (1969) | | Vice President since 2008 | | Senior Vice President, Neuberger, since 2006; formerly, Vice President, Neuberger, 2002 to 2006; Vice President, Management, since 2008 and Employee since 1991; Vice President, eight registered investment companies for which Management acts as investment manager and administrator (eight since 2008). | |
| |
| Kevin Lyons (1955) | | Assistant Secretary since 2003 | | Assistant Vice President, Neuberger, since 2008 and Employee since 1999; Assistant Secretary, eight registered investment companies for which Management acts as investment manager and administrator (seven since 2003 and one since 2006). | |
| |
Name, (Year of Birth), and Address(1) | | Position and Length of Time Served(2) | | Principal Occupation(s)(3) | |
| | | | | | |
| Owen F. McEntee, Jr. (1961) | | Vice President since 2008 | | Vice President, Neuberger, since 2006; Employee, Management, since 1992; Vice President, eight registered investment companies for which Management acts as investment manager and administrator (eight since 2008). | |
| |
| John M. McGovern (1970) | | Treasurer and Principal Financial and Accounting Officer since 2005 | | Senior Vice President, Neuberger, since 2007; formerly, Vice President, Neuberger, 2004 to 2006; Employee, Management, since 1993; Treasurer and Principal Financial and Accounting Officer, eight registered investment companies for which Management acts as investment manager and administrator (seven since 2005 and one since 2006); formerly, Assistant Treasurer, seven registered investment companies for which Management acts as investment manager and administrator, 2002 to 2005. | |
| |
| Andrew Provencher (1965) | | Vice President since 2008 | | Managing Director, Management, since 2008; Managing Director, Neuberger, since 2005; formerly, Senior Vice President, Neuberger, 2003 to 2005; Vice President, eight registered investment companies for which Management acts as investment manager and administrator (eight since 2008). | |
| |
| Frank Rosato (1971) | | Assistant Treasurer since 2005 | | Vice President, Neuberger, since 2006; Employee, Management, since 1995; Assistant Treasurer, eight registered investment companies for which Management acts as investment manager and administrator (seven since 2005 and one since 2006). | |
| |
| Neil S. Siegel (1967) | | Vice President since 2008 | | Managing Director, Management, since 2008; Managing Director, Neuberger, since 2006; formerly, Senior Vice President, Neuberger, 2004 to 2006; Vice President, eight registered investment companies for which Management acts as investment manager and administrator (eight since 2008). | |
| |
| Chamaine Williams (1971) | | Chief Compliance Officer since 2005 | | Senior Vice President, Neuberger, since 2007; Chief Compliance Officer, Management, since 2006; Chief Compliance Officer, eight registered investment companies for which Management acts as investment manager and administrator (seven since 2005 and one since 2006); formerly, Senior Vice President, LBI, 2007 to 2008; formerly, Vice President, LBI, 2003 to 2006; formerly, Chief Compliance Officer, Lehman Brothers Asset Management Inc., 2003 to 2007; formerly, Chief Compliance Officer, Lehman Brothers Alternative Investment Management LLC, 2003 to 2007. | |
| |
(1) The business address of each listed person is 605 Third Avenue, New York, New York 10158.
(2) Pursuant to the By-Laws of the Trust, each officer elected by the Fund Trustees shall hold office until his or her successor shall have been elected and qualified or until his or her earlier death, inability to serve, or resignation. Officers serve at the pleasure of the Fund Trustees and may be removed at any time with or without cause.
(3) Except as otherwise indicated, each individual has held the positions shown for at least the last five years.
Proxy Voting Policies and Procedures
A description of the policies and procedures that the Trust uses to determine how to vote proxies relating to portfolio securities is available, without charge, by calling 1-800-877-9700 (toll-free) and on the website of the Securities and Exchange Commission, at www.sec.gov. Information regarding how the Trust voted proxies relating to portfolio securities during the most recent 12-month period ended June 30 is also available, without charge, by calling 1-800-877-9700 (toll-free), on the website of the Securities and Exchange Commission at www.sec.gov, and on Management's website at www.nb.com.
Quarterly Portfolio Schedule
The Trust files a complete schedule of portfolio holdings for each Fund with the Securities and Exchange Commission for the first and third quarters of each fiscal year on Form N-Q. The Trust's Forms N-Q are available on the Securities and Exchange Commission's website at www.sec.gov and may be reviewed and copied at the Securities and Exchange Commission's Public Reference Room in Washington, DC. Information on the operation of the Public Reference Room may be obtained by calling 1-800-SEC-0330. The information on Form N-Q is available upon request, without charge, by calling 1-800-877-9700 (toll-free).
Notice to Shareholders (Unaudited)
Neuberger Berman Emerging Markets Equity Fund hereby designates $75,247 as a capital gain distribution.
For the fiscal year ended August 31, 2010, each fund makes the following designation, or up to the maximum amount of such dividends allowable pursuant to the Internal Revenue Code, as qualified dividend income eligible for reduced tax rates. These lower rates range from 5% to 15% depending upon an individual's tax bracket. Complete information regarding each funds distributions during the calendar year 2010 will be reported in conjunction with Form 1099DIV.
| Fund | | Qualified Dividend Income | |
| Climate Change Fund | | | $49,056 | | |
| Emerging Markets Equity Fund | | | 230,216 | | |
| Equity Income Fund | | | 8,820,928 | | |
| Focus Fund | | | 9,055,355 | | |
| Guardian Fund | | | 13,941,795 | | |
| International Fund | | | 9,499,607 | | |
| International Institutional Fund | | | 5,286,213 | | |
| International Large Cap Fund | | | 3,092,479 | | |
| Intrinsic Value Fund | | | 376,490 | | |
| Large Cap Disciplined Growth Fund | | | 3,987,183 | | |
| Multi-Cap Opportunities Fund | | | 492,794 | | |
| Partners Fund | | | 27,562,533 | | |
| Regency Fund | | | 1,329,050 | | |
| Select Equities Fund | | | 1,027,813 | | |
| Socially Responsive Fund | | | 13,938,167 | | |
This page has been left blank intentionally
Neuberger Berman Management LLC
605 Third Avenue 2nd Floor
New York, NY 10158–0180
Shareholder Services
800.877.9700
Intermediary Client Services
800.366.6264
www.nb.com
Statistics and projections in this report are derived from sources deemed to be reliable but cannot be regarded as a representation of future results of the Funds. This report is prepared for the general information of shareholders and is not an offer of shares of the Funds. Shares are sold only through the currently effective prospectus, which must precede or accompany this report.
H0599 10/10
Large Cap Value Fund Commentary
During the volatile fiscal year ended August 31, 2010, Neuberger Berman Large Cap Value Fund posted a negative return and underperformed its benchmark, the Russell 1000® Value Index.
Within the benchmark index, the best performing sectors included Consumer Discretionary, Materials and Telecommunications stocks. Financials, Information Technology and Health Care underperformed. We had entered this period defensively positioned, which was a drawback as economically sensitive stocks outperformed. Financials provided the most significant setback for the Fund relative to the benchmark index, followed by Utilities.
In Financials, we had several difficulties relative to the index this period. The Fund was underexposed to the sector as it appreciated in early calendar year 2010, and several holdings did not perform as well as we had hoped. State Street and Bank of New York Mellon were two of our larger disappointments, as trust and processing banks generally underperformed given the continued low interest rate environment. Additionally, State Street had some company-specific issues within the period, but we think they are largely resolved. In our opinion, both of these stocks are extremely cheap, are in very strong positions from a credit perspective, and as trust and processing entities, are poised to benefit when interest rates eventually rise. Bank of America and J.P. Morgan Chase were also significant detractors within Financial s this period.
Utilities was another area of relative weakness. Here the issue was what the Fund did not own rather than what it did own. Within this sector, the regulated, larger utility companies performed best over the period, but the Fund did not own many of those. On an individual basis, NRG Energy was a detractor from performance. NRG is an independent power producer exposed to gas prices on a longer-term basis. The stock started the period at an elevated level due to an unsolicited acquisition offer. It then declined in the face of persistently low natural gas prices (which reduced the price on the power it generates, including from nuclear and coal, which do not benefit from lower input costs of lower gas prices, thus narrowing profit margins). However, the company has substantial cash flows, and with fewer distractions it can now focus on using those cash flows to enhance shareholder value. We also expect power prices, driven by gas prices, to recover over time, and think this is a great way to realize that value.
Positive areas for the Fund during the period included Industrials. Deere was a large position over the course of the year. The stock was cheap when we originally purchased it, and it did well, but we think the agriculture cycle has more room to run, which should help the company. Rail company Norfolk Southern also performed well. Rail was a favored industry this period—influenced by Warren Buffett’s purchase of Burlington Northern, efficiency gains in rail operations, climate change legislation, the condition of our interstate highways, the relative efficiency of trains over trucks, and the role of trains in transporting imports from ports to distribution hubs.
The Fund benefited from increasing merger-and-acquisition activity as well this period, in both XTO, acquired by Exxon Mobil at a premium, and Pactiv, which we sold prior to an acquisition after the price increased due to takeover speculation.
Looking ahead, we expect continued volatility, but within mildly positive markets. Our view is that the recovery seems to have stalled somewhat, but we are reassured by healthy corporate balance sheets with significant cash, and we think the stock buybacks, increased dividends, and increasing merger-and-acquisition activity we have seen should be positive for the markets if they continue. After a dramatic cutback in capital expenditures, we have started to see a small pickup in capital spending, which we believe is a good sign for the economy and markets. Further, as the new Basel III banking rules get ironed out, we believe some of the uncertainty that these widely-anticipated bank regulation proposals have created will be eliminated.
We think valuations are positive for stocks on a longer-term basis, and that if volatility continues, it will reveal compelling values along the way. Directionally, we are looking to the market for the opportunity to buy the companies we want to own at reasonable prices. With more certainty around Financials, we reduced the Fund’s underweight somewhat. We continue to see potential within Health Care, and have added slightly to Utilities. As always, we think about decisions from an overall portfolio perspective. We remain highly attuned to the interaction among holdings in an attempt to minimize risk and enhance the prospects for healthy returns.
Sincerely,
David Levine
Portfolio Manager
The risks involved in seeking capital appreciation from investments primarily in companies with large capitalization are set forth in the prospectus and statement of additional information.
Investing in the stocks of even the largest companies involves all the risks of stock market investing, including the risk that they may lose value due to overall market or economic conditions.
The composition, industries and holdings of the Fund are subject to change. Large Cap Value Fund is invested in a wide array of stocks, and no single holding makes up a significant portion of the Fund’s total assets.
| Sector Allocation | | |
| (% of Total Investments) | | |
| Consumer Discretionary | 9.1 | % |
| Consumer Staples | 6.9 | |
| Energy | 13.5 | |
| Financials | 22.4 | |
| Health Care | 14.5 | |
| Industrials | 9.8 | |
| Information Technology | 7.2 | |
| Materials | 1.7 | |
| Telecommunication Services | 3.2 | |
| Utilities | 5.7 | |
| Short-Term | 6.0 | |
| Total | 100.0 | % |
| Large Cap Value Fund | | | |
PERFORMANCE HIGHLIGHTS1,4,6 | | | |
| | | Average Annual Total Return Ended 08/31/2010 |
| | | | |
| | | | |
| | Inception Date | 1 Year | Life of Fund 11/2/2006 |
| | | | |
Institutional Class3 | 04/19/2010 | -0.71% | -2.09% |
Russell 1000® Value Index 2,5 | | 4.96% | -6.60% |
| | | | |
The performance data includes the performance of the Fund’s oldest share class, Trust Class, from November 2, 2006 through April 19, 2010. See note 6 for information about the effects of the different fees paid by each class. Performance data quoted represent past performance, which is no guarantee of future results. The investment return and principal value of an investment will fluctuate so that an investor’s shares, when redeemed, may be worth more or less than their original cost. Results are shown on a “total return” basis and include reinvestment of all income dividends and distributions. |
| | | | |
| Current performance may be lower or higher than the performance data quoted. For performance data current to the most recent month end, phone 800.877.9700. |
| | | | |
| As stated in the fund's most recent prospectus, the total annual fund operating expense ratio for fiscal year 2008 was 2.61% for Trust Class shares (prior to any fee waivers or expense reimbursements). The net expense ratio was 1.04%. Neuberger Berman Management Inc. has contractually agreed to limit certain expenses of the Fund through 8/31/2012 for Trust Class. |
COMPARISON OF A $10,000 INVESTMENT 6 |
|
This chart shows the value of a hypothetical $10,000 investment in the Fund over the past 10 fiscal years, or since the Fund’s inception if it has not operated for 10 years. The graph is based on the Institutional Class shares only; performance shown for Institutional Class prior to April 19, 2010 is that of the Trust Class. The Trust Class has moderately higher expenses and typically slightly lower returns than Institutional Class. The result is compared with a benchmark index. Please note that market indexes have not been reduced to reflect any of the fees and costs of investing. All results include the reinvestment of income dividends and distributions. Neither the Fund’s returns nor the market index shown in the graph and table reflect the effect of taxes an investor would pay on Fund distributions or on the redemption of Fund shares. Results represent past performance and do not indicate f uture results.
Endnotes
1 | “Total Return” includes reinvestment of all income dividends and distributions. Results represent past performance and do not indicate future results. The value of an investment in the Fund and the return on the investment both will fluctuate, and redemption proceeds may be higher or lower than an investor’s original cost. |
2 | Please see “Glossary of Indices” on page 7 for a description of the index. Please note that the index does do not take into account any fees and expenses or tax consequences of investing in the individual securities that it tracks and that individuals cannot invest directly in any index. Data about the performance of this index is prepared or obtained by Neuberger Berman Management LLC (“Management”) and include reinvestment of all income dividends and distributions. The Fund may invest in securities not included in the described index. |
3 | Management has contractually agreed to forgo current payment of fees and/or reimburse certain expenses of the Institutional Class of the Fund through 8/31/2013, so that the total annual operating expenses of that class are limited to 0.75% of average net assets. This undertaking applies to the Fund’s direct expenses and does not cover interest, taxes, brokerage commissions, acquired fund fees and expenses, and extraordinary expenses, if any; consequently, net expenses may exceed the contractual expense limitation. The Fund has agreed that the Institutional Class will repay Management for fees and expenses forgone or reimbursed for that class provided that repayment does not cause its annual operating expenses to exceed 0.75% of its average net assets. Any such repayment must be made within three years after the ye ar in which Management incurred the expense. Absent such foregone fees and/or expense reimbursements, the performance of the Fund's Institutional Class would have been lower. |
4 | The Fund was relatively small during the periods shown. The same techniques used to produce returns in a small fund may not work to produce similar returns in a larger fund. |
5 | The date used to calculate Life of Fund performance for the index is the inception date of the oldest share class. |
| 6 | During the period from November 2, 2006 through April 19, 2010, the Fund’s Trust Class had only one investor, which could have impacted Fund performance. The inception date for the Fund’s Institutional Class was April 19, 2010 and has had only one investor since. Performance shown for Institutional Class prior to that date is that of the Trust Class, which had an inception date of November 2, 2006, and converted into the Institutional Class and ceased operations on April 19, 2010. The Trust Class had moderately higher expenses and therefore typically slightly lower returns than Institutional Class. |
For more complete information on any of the Neuberger Berman Equity Funds, call Management at (800) 877-9700, or visit our website at www.nb.com.
Glossary of Indices
Russell 1000® Value Index: | Measures the performance of those Russell 1000® Index companies with lower price-to-book ratios and lower expected growth rates. The Russell 1000 Index measures the performance of the 1,000 largest companies in the Russell 3000® Index (which measures the performance of the 3,000 largest U.S. companies based on total market capitalization and current index membership). The Russell 1000 Index represents approximately 90% of the U.S. market. |
Please note that the index does not take into account any fees and expenses or tax consequences of investing in the individual securities that it tracks and that individuals cannot invest directly in any index. Data about the performance of this index is prepared or obtained by Management and include reinvestment of all income dividends and distributions. The Fund may invest in securities not included in the index.
Information About Your Fund’s Expenses
This table is designed to provide information regarding costs related to your investments. All mutual funds incur operating expenses, which include management fees, fees for administrative services and costs of shareholder reports, among others. The following examples are based on an investment of $1,000 made at the beginning of the six month period ended August 31, 2010 and held for the entire period. The table illustrates the fund’s costs in two ways:
| Actual Expenses and Performance: | The first section of the table provides information about actual account values and actual expenses in dollars, based on the fund’s actual performance during the period. You may use the information in this line, together with the amount you invested, to estimate the expenses you paid over the period. Simply divide your account value by $1,000 (for example, an $8,600 account value divided by $1,000 = 8.6), then multiply the result by the number in the first section of the table under the heading entitled “Expenses Paid During the Period” to estimate the expenses you paid over the period. |
| | |
| Hypothetical Example for Comparison Purposes: | The second section of the table provides information about hypothetical account values and hypothetical expenses based on the fund’s actual expense ratio and an assumed rate of return at 5% per year before expenses. This return is not the fund’s actual return. The hypothetical account values and expenses may not be used to estimate the actual ending account balance or expenses you paid for the period. You may use this information to compare the ongoing costs of investing in this fund versus other funds. To do so, compare the expenses shown in this 5% hypothetical example with the 5% hypothetical examples that appear in the shareholder reports of other funds. |
Please note that the expenses in the table are meant to highlight your ongoing costs only and do not include any transactional costs. Therefore, the information under the heading “Hypothetical (5% annual return before expenses)” is useful in comparing ongoing costs only, and will not help you determine the relative total costs of owning different funds. In addition, if these transaction costs were included, your costs would have been higher.
Expense Information As of 8/31/10 (Unaudited) | | | | | | |
| | | | | | | | |
| Neuberger Berman Equity Funds | | | | | | |
| | Actual | | Hypothetical (5% annual return before expenses) *** |
| | Beginning Account Value 3/1/10 | Ending Account Value 8/31/10 | Expenses Paid During the Period** 3/1/10 - 8/31/10 | Beginning Account Value 3/1/10 | Ending Account Value 8/31/10 | Expenses Paid During the Period** 3/1/10 - 8/31/10 |
| Large Cap Value Fund | | | | | | | |
| Institutional Class* | $1,000.00 | $930.50 | $3.99 | | $1,000.00 | $1,021.07 | $4.18 |
| | | | | | | | |
* On April 19, 2010, Large Cap Value Fund's Trust Class was converted into the Fund's Institutional Class. The financial information of Institutional Class includes the information of Trust Class shares. |
| | | | | | | | |
**Expenses are equal to the annualized expense ratio of .82%, multiplied by the average account value over the period, multiplied by 184/365 (to reflect the one-half year period shown). |
| | | | | | | | |
| *** Hypothetical 5% annual return before expenses is calculated by multiplying the number of days in the most recent period divided by 365. |
Schedule of Investments Large Cap Value Fund
| TOP TEN EQUITY HOLDINGS |
| Large Cap Value Fund |
| 1 | | J.P. Morgan Chase | 4.6 | % |
| 2 | | Pfizer Inc. | 4.6 | % |
| 3 | | Occidental Petroleum | 4.0 | % |
| 4 | | Deere & Co. | 3.3 | % |
| 5 | | Exxon Mobil | 3.1 | % |
| 6 | | Bank of America | 2.8 | % |
| 7 | | Amgen Inc. | 2.7 | % |
| 8 | | Brinker International | 2.6 | % |
| 9 | | AT&T Inc. | 2.3 | % |
| 10 | | Johnson & Johnson | 2.3 | % |
| | Number
of Shares | Value
(000's) |
| | | | | |
| Common Stocks (96.7%) | | | | |
| | | | | |
| Aerospace & Defense (2.7%) | | | | |
| Boeing Co. | 190 | | $12 | |
| Lockheed Martin | 295 | | 20 | |
| | | | 32 | |
| Beverages (1.8%) | | | | |
| Coca-Cola | 395 | | 22 | |
| | | | | |
| Biotechnology (3.7%) | | | | |
| Amgen Inc. * | 635 | | 32 | |
| Gilead Sciences * | 405 | | 13 | |
| | | | 45 | |
| Capital Markets (3.9%) | | | | |
| State Street | 745 | | 26 | |
The Bank of New York Mellon | 865 | | 21 | |
| | | | 47 | |
| Chemicals (0.6%) | | | | |
| Air Products & Chemicals | 100 | | 7 | |
| | | | | |
| Commercial Banks (4.6%) | | | | |
PNC Financial Services Group | 356 | | 18 | |
| U.S. Bancorp | 665 | | 14 | |
| Wells Fargo | 1,000 | | 23 | |
| | | | 55 | |
| Commercial Services & Supplies (0.6%) | | | | |
| Covanta Holding | 500 | | 7 | |
| | | | | |
| Computers & Peripherals (1.8%) | | | | |
| EMC Corp. * | 320 | | 6 | |
| Hewlett-Packard | 420 | | 16 | |
| | | | 22 | |
| Containers & Packaging (1.2%) | | | | |
| Crown Holdings * | 495 | | 14 | |
| | | | | |
| Diversified Financial Services (7.4%) | | | | |
| Bank of America | 2,750 | | 34 | |
| | Number of
Shares | Value†
(000's) |
| | | | | |
| J.P. Morgan Chase | 1,515 | | $55 | |
| | | | 89 | |
| | | | | |
| Diversified Telecommunication Services (3.2%) | | | | |
| AT&T Inc. | 1,060 | | 28 | |
| Verizon Communications | 364 | | 11 | |
| | | | 39 | |
| | | | | |
| Electric Utilities (3.3%) | | | | |
| Entergy Corp. | 280 | | 22 | |
| NextEra Energy | 340 | | 18 | |
| | | | 40 | |
| | | | | |
Electronic Equipment, Instruments & Components (0.5%) | | | | |
| Corning Inc. | 375 | | 6 | |
| | | | | |
| Energy Equipment & Services (0.5%) | | | | |
| Schlumberger Ltd. | 110 | | 6 | |
| | | | | |
| Food & Staples Retailing (2.4%) | | | | |
| CVS Caremark | 215 | | 6 | |
| Wal-Mart Stores | 455 | | 23 | |
| | | | 29 | |
| Health Care Equipment & Supplies (1.9%) | | | | |
| Covidien PLC | 650 | | 23 | |
| | | | | |
| Health Care Providers & Services (1.9%) | | | | |
Laboratory Corp. of America Holdings * | 135 | | 10 | |
| UnitedHealth Group | 420 | | 13 | |
| | | | 23 | |
| Hotels, Restaurants & Leisure (2.6%) | | | | |
| Brinker International | 1,980 | | 31 | |
| | | | | |
| Household Products (2.1%) | | | | |
| Kimberly-Clark | 385 | | 25 | |
| | | | | |
Independent Power Producers & Energy Traders (1.6%) | | | | |
| NRG Energy * | 970 | | 20 | |
| | | | | |
| Insurance (7.1%) | | | | |
| Lincoln National | 505 | | 11 | |
| MetLife, Inc. | 715 | | 27 | |
Reinsurance Group of America | 545 | | 24 | |
| Travelers Cos. | 490 | | 24 | |
| | | | 86 | |
| IT Services (1.4%) | | | | |
| IBM | 135 | | 17 | |
| | | | | |
| Life Science Tools & Services (0.5%) | | | | |
Charles River Laboratories International * | 220 | | 6 | |
| | | | | |
| Machinery (5.2%) | | | | |
| Deere & Co. | 635 | | 40 | |
| Ingersoll-Rand PLC | 495 | | 16 | |
| | Number
of Shares | Value†
(000's) |
| | | | | |
| WABCO Holdings * | 180 | | $7 | |
| | | | 63 | |
| Media (4.5%) | | | | |
Comcast Corp. Class A Special | 1,585 | | 26 | |
| Omnicom Group | 350 | | 12 | |
| Time Warner | 530 | | 16 | |
| | | | 54 | |
| Multi-Utilities (0.9%) | | | | |
| CenterPoint Energy | 755 | | 11 | |
| | | | | |
| Multiline Retail (2.4%) | | | | |
| Macy's, Inc. | 595 | | 12 | |
| Target Corp. | 335 | | 17 | |
| | | | 29 | |
| Office Electronics (1.3%) | | | | |
| Xerox Corp. | 1,840 | | 16 | |
| | | | | |
| Oil, Gas & Consumable Fuels (13.4%) | | | | |
| Apache Corp. | 240 | | 22 | |
| Cabot Oil & Gas | 375 | | 10 | |
| Denbury Resources * | 1,100 | | 16 | |
| EOG Resources | 65 | | 6 | |
| Exxon Mobil | 641 | | 38 | |
| Occidental Petroleum | 660 | | 48 | |
| Range Resources | 650 | | 22 | |
| | | | 162 | |
| Pharmaceuticals (6.9%) | | | | |
| Johnson & Johnson | 490 | | 28 | |
| Pfizer Inc. | 3,425 | | 55 | |
| | | | 83 | |
| Road & Rail (1.6%) | | | | |
| Norfolk Southern | 365 | | 20 | |
| | | | | |
| Software (2.4%) | | | | |
| Microsoft Corp. | 855 | | 20 | |
| Symantec Corp. * | 650 | | 9 | |
| | | | 29 | |
| Tobacco (0.8%) | | | | |
| Philip Morris International | 190 | | 10 | |
| | | | | |
Total Common Stocks (Cost $1,139) | | | 1,168 | |
| | | | | |
| Short-Term Investments (6.2%) | | | | |
State Street Institutional Liquid Reserves Fund Institutional Class (Cost $74) | 74,055 | | 74 | |
| | | | | |
Total Investments## (102.9%) (Cost $1,213) | | | 1,242 | |
| | | | | |
Liabilities, less cash, receivables and other assets [(2.9%)] | | | (35) | |
| | | | | |
| Total Net Assets (100.0%) | | | $1,207 | |
See Notes to Schedule of Investments
Notes to Schedule of Investments
| † | In accordance with Accounting Standards Codification (“ASC”) 820 “Fair Value Measurements and Disclosures” (“ASC 820”), all investments held by Neuberger Berman Large Cap Value Fund (the “Fund”) are carried at the value that Neuberger Berman Management LLC (“Management”) believes the Fund would receive upon selling an investment in an orderly transaction to an independent buyer in the principal or most advantageous market for the investment under current market conditions. Various inputs, including the volume and level of activity for the asset or liability in the market, are considered in valuing the Fund’s investments, some of which are discussed below. Significant management judgment may be necessary to value investments in accordance with ASC 820. |
| | ASC 820 established a three-tier hierarchy of inputs to create a classification of value measurements for disclosure purposes. The three-tier hierarchy of inputs is summarized in the three broad Levels listed below. |
● | Level 1 – quoted prices in active markets for identical investments |
● | Level 2 – other significant observable inputs (including quoted prices for similar investments, interest rates, prepayment speeds, credit risk, amortized cost, etc.) |
● | Level 3 – significant unobservable inputs (including the Fund’s own assumptions in determining the fair value of investments) |
The inputs or methodology used for valuing an investment are not necessarily an indication of the risk associated with investing in those securities.
| | The Fund’s investments in equity securities, for which market quotations are readily available, are generally valued by Management by obtaining valuations from an independent pricing service based on the latest sale price quoted in active markets (Level 1 inputs). Securities traded primarily on the NASDAQ Stock Market are normally valued by the Fund at the NASDAQ Official Closing Price (“NOCP”) provided by NASDAQ each business day. The NOCP is the most recently reported price as of 4:00:02 p.m., Eastern time, unless that price is outside the range of the “inside” bid and asked prices (i.e., the bid and asked prices that dealers quote to each other when trading for their own accounts); in that case, NASDAQ will adjust the price to equal the inside bid or asked price, whichever is closer. Because of delays in reporting trades, the NOCP may not be based on the price of the last trade t o occur before the market closes. If there is no reported sale of a security on a particular day, the independent pricing service may value the security based on reported market quotations. |
| | The following is a description of the Level 2 input and related valuation techniques used to value short term investments of the Fund: |
| | Short-Term Investments. Investments in State Street Institutional Liquid Reserves Fund Institutional Class are valued using the Fund’s daily calculated NAV. |
Management has developed a process to periodically review information provided by independent pricing services for all types of securities.
For equity securities, if a valuation is not available from an independent pricing service, or if Management has reason to believe that the valuation received does not represent the amount the Fund might reasonably expect to receive on a current sale in an orderly transaction, the Fund seeks to obtain quotations from principal market makers (generally considered Level 3 inputs). If such quotations are not readily available, the security is valued using methods the Board of Trustees of Neuberger Berman Equity Funds (the “Board”) has approved on the belief that they reflect fair value. Numerous factors may be considered when determining the fair value of a security based on Level 2 or 3 inputs, including available analyst, media or other reports, trading i n futures or ADRs and whether the issuer of the security being fair valued has other securities outstanding.
| | The Fund’s investments in foreign securities are generally valued using the same valuation methods and inputs as other Fund investments, as discussed above. Foreign security prices are expressed in local currency values and are currently translated from the local currency into U.S. dollars using the exchange rate as of 4:00 p.m., Eastern time. The Board has approved the use of |
See Notes to Financial Statements
Notes to Schedule of Investments cont’d
| | Interactive Data Pricing and Reference Data, Inc. (“Interactive”) to assist in determining the fair value of foreign equity securities when changes in the value of a certain index suggest that the closing prices on the foreign exchanges may no longer represent the amount that the Fund could expect to receive for those securities. In this event, Interactive will provide adjusted prices for certain foreign equity securities using a statistical analysis of historical correlations of multiple factors (Level 2 inputs). In the absence of precise information about the market values of these foreign securities as of the close of the New York Stock Exchange, the Board has determined on the basis of available data that prices adjusted in this way are likely to be closer to the prices the Fund could realize on a current sale than are the prices of those securities established at the close of the foreign markets in which the securities primarily trade. These fair value prices are necessarily estimates, and there is no assurance that such a price will be at or close to the price at which the security is next quoted or next trades. |
The following is a summary, by category of Level, of inputs used to value the Fund’s investments as of August 31, 2010:
| | Asset Valuation Inputs (000’s omitted) | Level 1 | Level 2 | Level 3 | Total |
| | Investments: | | | | |
| | Common Stocks^ | $1,168 | $— | $— | $1,168 |
| | Short-Term Investments | — | 74 | — | 74 |
| | Total Investments | $1,168 | $74 | $— | $1,242 |
| The Schedule of Investments provides information on the industry categorization for the portfolio. |
| ## | At August 31, 2010, the cost of investments for U.S. federal income tax purposes was $1,222,000. Gross unrealized appreciation of investments was $73,000 and gross unrealized depreciation of investments was $53,000, resulting in net unrealized appreciation of $20,000 based on cost for U.S. federal income tax purposes. |
| * | Security did not produce income during the last twelve months. |
See Notes to Financial Statements
| Statement of Assets and Liabilities |
| |
| Neuberger Berman Equity Funds |
| (000's omitted except per share amounts) |
| | | LARGE CAP VALUE FUND |
| | | | |
| Assets | August 31, 2010 |
| | | | |
| Investments in securities, at value * (Note A)-see Schedule of Investments: | | | |
| Unaffiliated issuers | | $ | 1,242 | |
| Dividends and interest receivable | | | 3 | |
| Receivable from Management-net (Note B) | | | 26 | |
| | | | | |
| Total Assets | | | 1,271 | |
| | | | | |
| Liabilities | | | | |
| | | | | |
| Payable to investment manager (Notes A & B) | | | 1 | |
| Accrued expenses and other payables | | | 63 | |
| Total Liabilities | | | 64 | |
| | | | | |
| Net Assets at value | | $ | 1,207 | |
| | | | | |
| Net Assets consist of: | | | | |
| | | | | |
| Paid-in capital | | $ | 2,317 | |
| Undistributed net investment income (loss) | | | 11 | |
| Accumulated net realized gains (losses) on investments | | | (1,150 | ) |
| Net unrealized appreciation (depreciation) in value of investments | | | 29 | |
| | | | | |
| Net Assets at value | | $ | 1,207 | |
| |
| Net Assets |
| Institutional Class | | $ | 1,207 | |
| Shares Outstanding ($.001 par value; unlimited shares authorized) | | | | |
| Institutional Class | | | 146 | |
| Net Asset Value, offering and redemption price per share | | | | |
| Institutional Class | | $ | 8.30 | |
| | | | | |
| * Cost of Investments: | | | | |
| | | | | |
| Unaffiliated issuers | | $ | 1,213 | |
See Notes to Financial Statements
| Statement of Operations | | |
| | | |
| Neuberger Berman Equity Funds | | |
| (000's omitted) | | |
| | | |
| | LARGE CAP VALUE FUND |
| | For the Year Ended |
| | August 31, 2010 |
| Investment Income: | | |
| Income (Note A): | | |
| Dividend income-unaffiliated issuers | $24 | |
| Interest income-unaffiliated issuers | — | |
| Total income | $24 | |
| Expenses: | | |
| Investment management fees (Notes A & B) | 7 | |
| Administration fees (Note B) | 1 | |
| Administration fees (Note B): | | |
| Trust Class | 3 | |
| Institutional Class | — | |
| Distribution fees (Note B): | | |
| Trust Class | 1 | |
| Shareholder servicing agent fees: | | |
| Trust Class | 7 | |
| Institutional Class | — | |
| Audit fees | 51 | |
| Custodian fees (Note B) | 9 | |
| Legal fees | 67 | |
| Shareholder reports | 8 | |
| Trustees' fees and expenses | 45 | |
| Miscellaneous | 1 | |
| Total expenses | 200 | |
| Expenses reimbursed by Management (Note B) | (188) | |
| Total net expenses | 12 | |
| Net investment income (loss) | $12 | |
Realized and Unrealized Gain (Loss) on Investments (Note A) | | |
| Net realized gain (loss) on: | | |
| Sales of investment securities of unaffiliated issuers | 74 | |
| Foreign currency | — | |
Change in net unrealized appreciation (depreciation) in value of: | | |
| Unaffiliated investment securities | (95) | |
| Foreign currency | — | |
| Net gain (loss) on investments | (21) | |
| Net increase (decrease) in net assets resulting from operations | $(9) | |
See Notes to Financial Statements
| Statements of Changes in Net Assets | |
| | |
| Neuberger Berman Equity Funds |
| (000's omitted) |
| | | LARGE CAP VALUE FUND | |
| | | | | |
| | | | | | | |
| | | Year Ended | | Year Ended | |
| | | August 31, | | | August 31, | |
| | | 2010 | | | 2009 | |
| | | | | | | |
| Increase (Decrease) in Net Assets: |
| |
| From Operations (Note A): |
| Net investment income (loss) | | | $12 | | | | $44 | |
| Net realized gain (loss) on investments | | | 74 | | | | (1,075 | ) |
| Change in net unrealized appreciation (depreciation) of investments | | | (95 | ) | | | (93 | ) |
| Net increase (decrease) in net assets resulting from operations | | | (9 | ) | | | (1,124 | ) |
| Distributions to Shareholders From (Note A): |
| Net investment income: |
| Trust Class | | | (32 | ) | | | (42 | ) |
| |
| From Fund Share Transactions (Note D): |
| Proceeds from reinvestment of dividends and distributions: |
| Trust Class | | | 32 | | | | 42 | |
| Conversion of Trust Class (Note E) |
| Trust Class | | | (1,400 | ) | | | — | |
| Institutional Class | | | 1,400 | | | | — | |
| Payments for shares redeemed: |
| Trust Class | | | — | | | | (2,500 | ) |
| Net increase (decrease) from Fund share transactions | | | 32 | | | | (2,458 | ) |
| | | | | | | | | |
| Net Increase (Decrease) in Net Assets | | | (9 | ) | | | (3,624 | ) |
| |
| Net Assets: |
| Beginning of year | | | 1,216 | | | | 4,840 | |
| End of year | | $ | 1,207 | | | $ | 1,216 | |
| Undistributed net investment income (loss) at end of year | | $ | 11 | | | $ | 31 | |
See Notes to Financial Statements
Notes to Financial Statements Equity Funds
Note A – Summary of Significant Accounting Policies:
1 | General: Neuberger Berman Equity Funds (the “Trust”) is a Delaware statutory trust organized pursuant to an Amended and Restated Trust Instrument dated as of June 24, 2009. The Trust is registered as an open-end management investment company under the Investment Company Act of 1940, as amended (the “1940 Act”), and its shares are registered under the Securities Act of 1933, as amended. The Fund is a separate operating series of the Trust and is diversified. On April 19, 2010 the Trust Class shares converted into the Institutional Class shares of the Fund. The Fund offers Institutional Class shares. The Board may establish additional series or classes of shares without the approval of shareholders. |
| | The assets of the Fund belong only to the Fund, and the liabilities of the Fund are borne solely by the Fund and no other. |
| | The preparation of financial statements in accordance with U.S. generally accepted accounting principles requires Management to make estimates and assumptions at the date of the financial statements. Actual results could differ from those estimates. |
| 2 | Portfolio valuation: Investment securities are valued as indicated in the notes following the Fund’s Schedule of Investments. |
| 3 | Foreign currency translation: The accounting records of the Fund are maintained in U.S. dollars. Foreign currency amounts are currently translated into U.S. dollars using the exchange rate as of 4:00 p.m., Eastern time, to determine the value of investments, other assets and liabilities. Purchase and sale prices of securities, and income and expenses, are translated into U.S. dollars at the prevailing rate of exchange on the respective dates of such transactions. Net unrealized foreign currency gain (loss), if any, arises from changes in the value of assets and liabilities, other than investments in securities, as a result of changes in exchange rates and is stated separately in the Statement of Operations. |
| 4 | Securities transactions and investment income: Securities transactions are recorded on trade date for financial reporting purposes. Dividend income is recorded on the ex-dividend date or, for certain foreign dividends, as soon as the Fund becomes aware of the dividends. Non-cash dividends included in dividend income, if any, are recorded at the fair market value of the securities received. Interest income, including accretion of original issue discount, where applicable, and accretion of discount on short-term investments, is recorded on the accrual basis. Realized gains and losses from securities transactions and foreign currency transactions, if any, are recorded on the basis of identified cost and stated separately in the Statement of Operations. |
| | Income tax information: Each series of the Trust is treated as a separate entity for U.S. federal income tax purposes. It is the policy of the Fund to continue to qualify as a regulated investment company by complying with the requirements of Subchapter M of the Internal Revenue Code applicable to regulated investment companies and to distribute substantially all of its earnings to its shareholders. Therefore, no federal income or excise tax provision is required. |
The Fund has adopted the provisions of ASC 740 "Income Taxes" ("ASC 740"). ASC 740 sets forth a minimum threshold for financial statement recognition of the benefit of a tax position taken, or expected to be taken, in a tax return. The Fund recognizes interest and penalties, if any, related to unrecognized tax benefits as an income tax expense in the Statement of Operations. The Fund is subject to examination by U.S. federal and state tax authorities for returns filed for the prior three fiscal years 2007 - 2009. As of August 31, 2010, the Fund did not have any unrecognized tax benefits.
Income distributions and capital gain distributions are determined in accordance with income tax regulations, which may differ from U.S. generally accepted accounting principles. These differences are primarily due to differing treatments of income and gains on various investment securities held by the Fund, timing differences and differing characterization of distributions made by the Fund as a whole.
As determined on August 31, 2010, permanent differences resulting primarily from different book and tax accounting for foreign currency gains and losses and non-taxable dividend adjustments were reclassified at fiscal year-end. These reclassifications had no effect on net income, net asset value or net asset value per share of the Fund.
Notes to Financial Statements Equity Funds cont'd
The tax character of distributions paid during the years ended August 31, 2010 and August 31, 2009 were as follows:
| Distributions Paid From: |
| Ordinary Income | Long –Term Capital Gain | Total | |
| 2010 | 2009 | 2010 | 2009 | 2010 | 2009 | |
| $31,594 | $41,696 | $- | $- | $31,594 | $41,696 | |
As of August 31, 2010, the components of distributable earnings (accumulated losses) on a U.S. federal income tax basis were as follows:
Undistributed Ordinary Income | Undistributed Long-Term Gain | Unrealized Appreciation (Depreciation) | Loss Carryforwards
and Deferrals | Total |
| $11,619 | $- | $19,205 | $(1,140,327) | | $(1,109,503) |
The differences between book basis and tax basis distributable earnings are primarily due to wash sales, capital loss carryforwards, and non-taxable distributions or adjustments to the prior period accumulated balances.
To the extent the Fund's net realized capital gains, if any, can be offset by capital loss carryforwards, it is the policy of the Fund not to distribute such gains. As determined at August 31, 2010, the Fund had unused capital loss carryforwards available for federal income tax purposes to offset net realized capital gains, if any, as follows:
| | Expiring in: |
| | 2016 | 2017 | 2018 |
| | $16,897 | $298,580 | $824,850 |
Under current law, the use of these losses to offset future gains may be limited.
| 6 | Foreign taxes: Foreign taxes withheld represent amounts withheld by foreign tax authorities, net of refunds recoverable. |
| 7 | Distributions to shareholders: The Fund may earn income, net of expenses, daily on its investments. Distributions from net investment income and net realized capital gains, if any, generally are distributed once a year (usually in December) and are recorded on the ex-date. |
| 8 | Expense allocation: Certain expenses are applicable to multiple funds. Expenses directly attributable to the Fund are charged to the Fund. Expenses of the Trust that are not directly attributable to a particular series of the Trust (e.g., the Fund) are allocated among the series of the Trust, on the basis of relative net assets, except where a more appropriate allocation of expenses to each of the series can otherwise be made fairly. Expenses borne by the complex of related investment companies, which includes open-end and closed-end investment companies for which Management serves as investment manager, that are not directly attributable to a particular investment company in the complex (e.g., the Trust) or series thereof are allocated among the investment companies in the complex or series thereof, on the basis of relative net assets, except where a more appropriate allocation of expenses to each of the investment companies in the complex or series thereof can otherwise be made fairly. |
| 9 | Repurchase agreements: The Fund may enter into repurchase agreements with institutions that Management has determined are creditworthy. Each repurchase agreement is recorded at cost. The Fund requires that the securities purchased in a repurchase agreement be transferred to the custodian in a manner sufficient to enable the Fund to assert a perfected security interest in those securities in the event of a default under the repurchase agreement. The Fund monitors, on a daily basis, the value of the securities transferred to ensure that their value, including accrued interest, is greater than amounts owed to the Fund under each such repurchase agreement. |
| 10 | Investments in foreign securities: Investing in foreign securities may involve certain sovereign and other risks, in addition to the credit and market risks normally associated with domestic securities. These additional risks include the possibility of |
Notes to Financial Statements Equity Funds cont'd
| | adverse political and economic developments (including political instability, nationalization, expropriation, or confiscatory taxation) and the potentially adverse effects of unavailability of public information regarding issuers, less governmental supervision and regulation of financial markets, reduced liquidity of certain financial markets, and the lack of uniform accounting, auditing, and financial reporting standards or the application of standards that are different or less stringent than those applied in the United States. Foreign securities also may experience greater price volatility, higher rates of inflation, and delays in settlement. |
| 11 | Derivative instruments: During the fiscal period ended August 31, 2010, the Fund did not hold any derivative instruments. The Fund has adopted ASC 815 “Derivatives and Hedging” (“ASC 815”). The disclosure requirements of ASC 815 distinguish between derivatives that qualify for hedge accounting and those that do not. Because investment companies value their derivatives at fair value and recognize changes in fair value through the Statement of Operations, they do not qualify for such accounting. While the Fund may receive rights and warrants in connection with their investments in securities, these rights and warrants are not considered “derivative instruments” under ASC 815. |
| 12 | Indemnifications: Like many other companies, the Trust’s organizational documents provide that its officers and trustees are indemnified against certain liabilities arising out of the performance of their duties to the Trust. In addition, both in some of its principal service contracts and in the normal course of its business, the Trust enters into contracts that provide indemnifications to other parties for certain types of losses or liabilities. The Trust’s maximum exposure under these arrangements is unknown as this could involve future claims against the Trust. |
Note B – Management Fees, Administration Fees, Distribution Arrangements, and Other Transactions with Affiliates:
The Fund retains Management as its investment manager under a Management Agreement. For such investment management services, the Fund pays Management a fee at the annual rate of 0.55% of the first $250 million of the Fund’s average daily net assets, 0.525% of the next $250 million, 0.50% of the next $250 million, 0.475% of the next $250 million, 0.45% of the next $500 million, 0.425% of the next $2.5 billion and 0.40% of average daily net assets in excess of $4 billion.
The Fund retains Management as its administrator under an Administration Agreement. The Fund pays Management an administration fee at the annual rate of 0.06% of its average daily net assets under this agreement. In addition, the Fund’s Institutional Class pays Management an administration fee at the annual rate of 0.09% of its average daily net assets under this agreement. Prior to April 19, 2010, the Fund’s Trust class paid Management an administration fee at the annual rate of 0.34% of its average daily net assets. Additionally, Management retains State Street Bank and Trust Company (“State Street”) as its sub-administrator under a Sub-Administration Agreement. Management pays State Street a fee for all services received under the agreement.
Prior to April 19, 2010, for the Fund’s Trust Class, Management acted as agent in arranging for the sale of class shares without commission and bore advertising and promotion expenses. The Board had adopted a distribution plan (the “Plan”) with respect to this class, pursuant to Rule 12b-1 under the 1940 Act. The Plan provided that, as compensation for administrative and other services provided to this class, Management’s activities and expenses related to the sale and distribution of this class of shares, and ongoing services provided to investors in this class, Management received from this class a fee at the annual rate of 0.10% of the Trust Class’ average daily net assets. Management received this amount to provide distribution and shareholder servicing for this class and paid a portion of it to institutions that provided such services. Those institutions may use the payments for, among other purposes, compensating employees engaged in sales and/or shareholder servicing. The amount of fees paid by this class during any year could have been more or less than the cost of distribution and other services provided to that class. FINRA rules limit the amount of annual distribution fees that may be paid by a mutual fund and impose a ceiling on the cumulative distribution fees paid. The Trust’s Plan complied with those rules.
Notes to Financial Statements Equity Funds cont'd
| | Management has contractually agreed to forgo current payment of fees and/or reimburse certain expenses of the Institutional Class of the Fund so that the total annual operating expenses of that class do not exceed the expense limitation as detailed in the following table. This undertaking applies to the Fund’s direct expenses and does not cover interest, taxes, brokerage commissions, acquired fund fees and expenses, and extraordinary expenses, if any; consequently, net expenses may exceed the contractual expense limitation. The Fund has agreed that the Institutional Class will repay Management for fees and expenses forgone or reimbursed for that class (including fees and expenses forgone or reimbursed for Trust Class prior to April 19, 2010) provided that repayment does not cause its annual operating expenses to exceed its contractual expense limitation. Any such repayment must be made within three years a fter the year in which Management incurred the expense. |
During the year ended August 31, 2010, there was no reimbursement to Management under this agreement. At August 31, 2010, contingent liabilities to Management under the agreement were as follows:
| | | | Expenses Deferred In Fiscal Period Ending August 31, |
| | | | |
| | | | | 2008 | 2009 | 2010 |
| | | | Subject to Repayment until August 31, |
Contractual Expense Limitation(1) | Expiration | | | | | |
| | |
| | | 2011 | 2012 | 2013 |
| | | | | | | |
.75%(2) | 8/31/13 | | | $110,529 | $258,534 | $187,742(3) |
| (1) | Expense limitation per annum of the class’ average daily net assets. |
| (2) | Prior to April 19, 2010, the contractual expense limitation was 1.00% for Trust Class. |
| (3) | On April 19, 2010, the Fund’s Trust Class was converted into the Fund’s Institutional Class. The financial information of the Fund’s Institutional Class includes the financial information of Trust Class shares. From the period September 1, 2009 to April 18, 2010, there was $107,991 of expenses deferred by the Trust Class. From April 19, 2010 to August 31, 2010 there was $79,751 of expenses deferred by the Institutional Class. |
Neuberger Berman LLC (“Neuberger”) is retained by Management to furnish it with investment recommendations and research information without added cost to the Fund. Several individuals who are officers and/or Trustees of the Trust are also employees of Neuberger and/or Management.
On May 4, 2009, NBSH Acquisition, LLC (“NBSH”), an entity organized by key members of Neuberger Berman’s senior management, acquired a majority interest in Neuberger Berman’s business and the fixed income and certain alternative asset management businesses of Lehman Brothers Holdings Inc.’s (“LBHI”) Investment Management Division (together with Neuberger Berman, the “Acquired Businesses”) (the “Acquisition”). Prior to that date, the predecessor of Management and Neuberger were wholly owned subsidiaries of LBHI. On September 15, 2008, LBHI filed a voluntary petition under Chapter 11 of the U.S. Bankruptcy Code, and on December 22, 2008, the bankruptcy court having jurisdiction over the LBHI matter approved the sale of the Acquired Businesses to NBSH (or its successor or assign), as the successful bidder in a public auction.
The Acquired Businesses are now indirectly owned by, among others, portfolio managers, Neuberger Berman’s management team, and certain key members and senior professionals who are employed in various parts of the Neuberger Berman complex of companies, with a minority interest retained by LBHI and certain affiliates of LBHI. The closing of the Acquisition resulted in an “assignment” of the Fund’s Management Agreement and Sub-Advisory Agreement. Such an assignment, by law, automatically terminated those agreements. Accordingly, prior to the closing, the Board, including the Trustees who are not “interested persons” of the Fund’s investment manager and its affiliates or the Fund, considered and approved a new Management Agreement and a new Sub-Advisory Agreement for the Fund. The new agreements, which are virtually identical to those previously in effect, were also approved by a vote of the Fund’s shareholders.
These events have not had a material impact on the Fund or its operations. Management and Neuberger continue to operate in the ordinary course of business as the investment manager and sub-adviser, respectively of the Fund.
Notes to Financial Statements Equity Funds cont'd
Prior to April 19, 2010, the Fund’s Trust Class had a distribution agreement with Management. Management received no commissions for sales or redemptions of shares of beneficial interest of that share class, but received fees from the Trust Class under the Trust Class’ Plan, as described above. Under the Institutional Class distribution agreement, Management receives no commissions for sales or redemptions of beneficial interest of that share class.
The Fund has an expense offset arrangement in connection with its custodian contract. For the year ended August 31, 2010, there was no reduction of expenses under this arrangement.
Note C – Securities Transactions:
During the year ended August 31, 2010, there were purchase and sale transactions (excluding short-term securities) of $647,361 and $655,063, respectively.
During the year ended August 31, 2010, no brokerage commissions on securities transactions were paid to affiliated brokers.
Note D – Fund Share Transactions:
Share activity for the years ended August 31, 2010 and August 31, 2009 was as follows:
| For the Year Ended August 31, 2010 |
(000’s omitted) | Shares Sold | Shares Issued on Reinvestment of Dividends and Distributions | Shares Issued in Connection with Conversion of Trust Class Shares | Shares Redeemed | Total |
| Trust Class | — | 4 | (146) | — | (142) |
| Institutional Class | — | — | 146 | — | 146 |
| For the Year Ended August 31, 2009 |
| | Shares Sold | Shares Issued on Reinvestment of Dividends and Distributions | Shares Issued in Connection with Conversion of Trust Class Shares | Shares Redeemed | Total |
| Trust Class | — | 5 | — | (345) | (340) |
Note E – Share Class Conversion:
On April 19, 2010, Trust Class shares of Large Cap Value converted into Institutional Class shares of Large Cap Value pursuant to a share class conversion (“Conversion”). The Conversion was accomplished by a tax-free conversion of 145,505 Trust Class shares of Large Cap Value (valued at $1,400,420) into 145,505 Institutional Class shares of Large Cap Value. The number of Institutional Class shares of Large Cap Value outstanding immediately after the Conversion was 145,505. The net assets of Institutional Class shares of Large Cap Value immediately after the Conversion were $1,400,420.
| Financial Highlights |
| |
| Large Cap Value Fund |
| |
The following table includes selected data for a share outstanding throughout each period and other performance information derived from the Financial Statements. |
| |
Institutional Class‡‡ |
| | | | | | | |
| | | Year Ended August 31, | | | Period from November 2, 2006ˆ to August 31, | |
| | | 2010 | | | 2009 | | | 2008 | | | 2007 | |
| | | | | | | | | | | | | |
| Net Asset Value, Beginning of Period | $8.57 | | | $10.04 | | | $10.93 | | | $10.00 | |
| | | | | | | | | | | | | |
| Income From Investment Operations: |
Net Investment Income (Loss)@ | | .08 | | | .19 | | | .24 | | | .21 | |
Net Gains or Losses on Securities (both realized and unrealized) | | (.13) | | | (1.52) | | | (.62) | | | .88 | |
| | | | | | | | | | | | | |
| Total From Investment Operations | (.05) | | | (1.33) | | | (.38) | | | 1.09 | |
| | | | | | | | | | | | | |
| Less Distributions From: | | | | | | | | | | | | |
| Net Investment Income | | (.22) | | | (.14) | | | (.24) | | | (.16) | |
| Net Capital Gains | | — | | | — | | | (.27) | | | — | |
| Total Distributions | | (.22) | | | (.14) | | | (.51) | | | (.16) | |
| | | | | | | | | | | | | |
| Net Asset Value, End of Period | | $8.30 | | | $8.57 | | | $10.04 | | | $10.93 | |
| | | | | | | | | | | | | |
Total Return†† | | (.71%)§ | | | (13.01%) | | | (3.68%) | | | 10.87% | ** |
| | | | | | | | | | | | | |
| Ratios/Supplemental Data | | | | | | | | | | | | |
| Net Assets, End of Period (in millions) | $1.2 | | | $1.2 | | | $4.8 | | | $7.1 | |
Ratio of Gross Expenses to Average Net Assets# | | .92% | | | 1.03% | | | 1.01% | | | 1.00% | * |
Ratio of Net Expenses to Average Net Assets‡ | .92% | | | 1.03% | | | 1.01% | | | 1.00% | * |
| Ratio of Net Investment Income (Loss) to Average Net Assets | | .93% | | | 2.39% | | | 2.24% | | | 2.37% | * |
| Portfolio Turnover Rate | | 52% | | | 94% | | | 53% | | | 42% | ** |
See Notes to Financial Highlights
Notes to Financial Highlights Equity Funds
| †† | Total return based on per share net asset value reflects the effects of changes in net asset value on the performance of the Fund during each fiscal period and assumes dividends and other distributions, if any, were reinvested. Results represent past performance and do not guarantee future results. Current returns may be lower or higher than the performance data quoted. Investment returns and principal may fluctuate and shares when redeemed may be worth more or less than original cost. Total return would have been lower if Management had not reimbursed and/or waived certain expenses. |
| | ‡‡ | On April 19, 2010, the Fund’s Trust Class was converted into the Fund's Institutional Class. The financial information of the Fund’s Institutional Class includes the financial information of Trust Class shares. Because the Trust Class had moderately higher expenses, its performance typically would have been slightly lower than the Institutional Class. |
| | § | During the period from September 1, 2009 through April 19, 2010, the Fund’s Trust Class had only one investor, which could have impacted Fund performance. On April 19, 2010, the Fund’s Trust Class was converted into the Fund’s Institutional Class and the Fund had only one Institutional Class investor, which could have impacted performance. The total return of the Fund’s Institutional Class includes the performance of the former Trust Class. |
| # | The Fund is required to calculate an expense ratio without taking into consideration any expense reductions related to expense offset arrangements. |
| ‡ | After reimbursement of expenses and/or waiver of the investment management fees by Management. Had Management not undertaken such actions, the annualized ratios of net expenses to average daily net assets would have been: |
| | Year Ended August 31, | Period Ended August 31, |
| | 2010(2) | 2009(2) | 2008(2) | 2007(2) |
| | 15.47%(3) | 15.05% | 2.58% | 2.54%(1) |
| (1) | Period from November 2, 2006 to August 31, 2007. |
| (2) | These ratios reflect a reduced fee schedule for certain expenses. If these expenses had not been reduced, the ratios would have been higher. |
| (3) | On April 19, 2010, the Fund’s Trust Class was converted into the Fund’s Institutional Class. The financial information of the Fund’s Institutional Class includes the financial information of Trust Class shares. |
| ^ | The date investment operations commenced. |
| @ | Calculated based on the average number of shares outstanding during each fiscal period. |
Report of Independent Registered Public Accounting Firm
To the Board of Trustees
Neuberger Berman Equity Funds and
Shareholders of Neuberger Berman Large Cap Value Fund
We have audited the accompanying statement of assets and liabilities, including the schedule of investments, of Neuberger Berman Large Cap Value Fund, a series of Neuberger Berman Equity Funds (the “Trust”), as of August 31, 2010, and the related statement of operations for the year then ended, the statements of changes in net assets for the two years in the period then ended and the financial highlights for each of the periods indicated therein. These financial statements and financial highlights are the responsibility of the Trust’s management. Our responsibility is to express an opinion on these financial statements and financial highlights based on our audits.
We conducted our audits in accordance with the standards of the Public Company Accounting Oversight Board (United States). Those standards require that we plan and perform the audits to obtain reasonable assurance about whether the financial statements and financial highlights are free of material misstatement. We were not engaged to perform an audit of the Trust’s internal control over financial reporting. Our audits included consideration of internal control over financial reporting as a basis for designing audit procedures that are appropriate in the circumstances, but not for the purpose of expressing an opinion on the effectiveness of the Trust’s internal control over financial reporting. Accordingly, we express no such opinion. An audit also includes examining, on a test basis, evidence supporting the amounts and disclosures in the financial statements and financial highlights, assessing the accounting principles used and significant estimates made by management, and evaluating the overall financial statement presentation. Our procedures included confirmation of securities owned as of August 31, 2010, by correspondence with the custodian and brokers or by other appropriate auditing procedures where replies from brokers were not received. We believe that our audits provide a reasonable basis for our opinion.
In our opinion, the financial statements and financial highlights referred to above present fairly, in all material respects, the financial position of Neuberger Berman Large Cap Value Fund as of August 31, 2010, the results of its operations for the year then ended, the changes in its net assets for the two years in the period then ended and the financial highlights for each of the periods indicated therein, in conformity with U.S. generally accepted accounting principles.
 Boston, Massachusetts
 October 14, 2010
| Directory | | | | | | | | | | |
| | | | | | | | | | | |
| | Investment Manager, Administrator and Distributor | | For Institutional Class Shareholders |
| | Neuberger Berman Management LLC | | | Address correspondence to: | |
| | 605 Third Avenue, 2nd Floor | | | | Neuberger Berman Management LLC |
| | New York, NY 10158-0180 | | | | 605 Third Avenue, Mail Drop 2-7 | |
| | 800.877.9700 or 212.476.8800 | | | | New York, NY 10158-0180 | |
| | Intermediary Client Services 800.366.6264 | | | Attn: Intermediary Support Services |
| | | | | | | | 800.366.6264 | | |
| | Sub-Adviser | | | | | | | | |
| | Neuberger Berman LLC | | | | Legal Counsel | | |
| | 605 Third Avenue | | | | | K&L Gates LLP | | |
| | New York, NY 10158-3698 | | | | 1601 K Street, NW | | |
| | | | | | | | Washington, DC 20006-1600 | |
| | Custodian and Shareholder Servicing Agent | | | | | | |
| | State Street Bank and Trust Company | | | Independent Registered Public Accounting Firm |
| | 2 Avenue de Lafayette | | | | Ernst & Young LLP | | |
| | Boston, MA 02111 | | | | | 200 Clarendon Street | | |
| | | | | | | | Boston, MA 02116 | | |
Trustee and Officer Information
The following tables set forth information concerning the trustees (“Trustees”) and officers (“Officers”) of the Trust. All persons named as Trustees and Officers also serve in similar capacities for other funds administered or managed by Management and Neuberger. The Statement of Additional Information includes additional information about Trustees and is available upon request, without charge, by calling (800) 877-9700.
Information about the Board of Trustees
Name, (Year of Birth), and Address (1) | Position and Length of Time Served (2) | Principal Occupation(s) (3) | Number of Funds in Fund Complex Overseen by Fund Trustee | Other Directorships Held Outside Fund Complex by Fund Trustee |
Independent Fund Trustees |
| John Cannon (1930) | Trustee since 2000 | Consultant; formerly, Chairman, CDC Investment Advisers (registered investment adviser), 1993 to January 1999; formerly, President and Chief Executive Officer, AMA Investment Advisors, an affiliate of the American Medical Association. | 43 | Formerly, Independent Trustee or Director of three series of Oppenheimer Funds: Oppenheimer Limited Term New York Municipal Fund, Rochester Fund Municipals, and Oppenheimer Convertible Securities Fund, 1992 to 2009. |
| Faith Colish (1935) | Trustee since 1982 | Counsel, Carter Ledyard & Milburn LLP (law firm) since October 2002; formerly, Attorney-at-Law and President, Faith Colish, A Professional Corporation, 1980 to 2002. | 43 | Formerly, Director, 1997 to 2003, and Advisory Director, 2003 to 2006; ABA Retirement Funds (formerly, American Bar Retirement Association) (not-for-profit membership corporation). |
| Martha C. Goss (1949) | Trustee since 2007 | President, Woodhill Enterprises Inc./Chase Hollow Associates LLC (personal investment vehicle), since 2006; Chief Operating and Financial Officer, Hopewell Holdings LLC/ Amwell Holdings, LLC (a holding company for a healthcare reinsurance company start-up), since 2003; formerly, Consultant, Resources Connection (temporary staffing), 2002 to 2006. | 43 | Director, Ocwen Financial Corporation (mortgage servicing), since 2005; Director, American Water (water utility), since 2003; Director, Channel Reinsurance (financial guaranty reinsurance), since 2006; Director, Allianz Life of New York (insurance), since 2005; Director, Financial Women’s Association of New York (not-for-profit association), since 2003; Trustee Emerita, Brown University, since 1998; formerly, Advisory Board Member, Attensity (software developer), 2005 to 2007; formerly, Director, Bank Leumi (commercial bank), 2005 to 2007; formerly, Director, Claire’s Stores, Inc. (retailer), 2005 to 2007. |
| C. Anne Harvey (1937) | Trustee since 2000 | President, C.A. Harvey Associates, since October 2001; formerly, Director, AARP, 1978 to December 2001. | 43 | Formerly, President, Board of Associates to The National Rehabilitation Hospital’s Board of Directors, 2001 to 2002; formerly, Member, Individual Investors Advisory Committee to the New York Stock Exchange Board of Directors, 1998 to 2002. |
Name, (Year of Birth), and Address (1) | Position and Length of Time Served (2) | Principal Occupation(s) (3) | Number of Funds in Fund Complex Overseen by Fund Trustee | Other Directorships Held Outside Fund Complex by Fund Trustee |
| Robert A. Kavesh (1927) | Trustee since 1986 | Retired; Marcus Nadler Professor Emeritus of Finance and Economics, New York University Stern School of Business; formerly, Executive Secretary-Treasurer, American Finance Association, 1961 to 1979. | 43 | Formerly, Director, The Caring Community (not-for-profit), 1997 to 2006; formerly, Director, DEL Laboratories, Inc. (cosmetics and pharmaceuticals), 1978 to 2004; formerly, Director, Apple Bank for Savings, 1979 to 1990; formerly, Director, Western Pacific Industries, Inc., (public company), 1972 to 1986. |
| Michael M. Knetter (1960) | Trustee since 2007 | Dean, School of Business, University of Wisconsin - Madison; formerly, Professor of International Economics and Associate Dean, Amos Tuck School of Business - Dartmouth College, 1998 to 2002. | 43 | Director, American Family Insurance (a mutual company, not publicly traded), since March 2009; Trustee, Northwestern Mutual Series Fund, Inc., since February 2007; Director, Wausau Paper, since 2005; formerly, Director, Great Wolf Resorts, 2004 to 2009. |
| Howard A. Mileaf (1937) | Trustee since 1984 | Retired; formerly, Vice President and General Counsel, WHX Corporation (holding company), 1993 to 2001. | 43 | Formerly, Director, Webfinancial Corporation (holding company), 2002 to 2008; formerly, Director, WHX Corporation (holding company), 2002 to 2005; formerly, Director, State Theatre of New Jersey (not-for-profit theatre), 2000 to 2005. |
| George W. Morriss (1947) | Trustee since 2007 | Retired; formerly, Executive Vice President and Chief Financial Officer, People’s Bank, Connecticut (a financial services company), 1991 to 2001. | 43 | Manager, Old Mutual Funds of Hedge Funds fund complex (consisting of six funds), since 2006 for four funds and since February 2007 for two funds; formerly, Member NASDAQ Issuers’ Affairs Committee, 1995 to 2003. |
Name, (Year of Birth), and Address (1) | Position and Length of Time Served (2) | Principal Occupation(s) (3) | Number of Funds in Fund Complex Overseen by Fund Trustee | Other Directorships Held Outside Fund Complex by Fund Trustee |
| Edward I. O’Brien (1928) | Trustee since 1993 | Retired; formerly, Member, Investment Policy Committee, Edward Jones, 1993 to 2001; President, Securities Industry Association (“SIA”) (securities industry’s representative in government relations and regulatory matters at the federal and state levels), 1974 to 1992; Adviser to SIA, November 1992 to November 1993. | 43 | Formerly, Director, Legg Mason, Inc. (financial services holding company), 1993 to July 2008; formerly, Director, Boston Financial Group (real estate and tax shelters), 1993 to 1999. |
| Cornelius T. Ryan (1931) | Trustee since 1982 | General Partner and Adviser, TD2, TD3, and TOF1 Healthcare Venture Capital Partnerships; Founding General Partner, Oxford Partners and Oxford Bioscience Partners (venture capital investing) and President, Oxford Venture Corporation, since 1981. | 43 | Trustee, Norwalk Hospital Foundation, since 2000; Director, Supply Pro (privately held company), since 2008; formerly, Trustee, Norwalk Hospital, 1995 to 2004; formerly, President and Director, Randolph Computer Corp., 1966 to 1984; formerly, Director of numerous privately held portfolio companies of Oxford Partners and Oxford Bio Science Partners, 1981 to 2005. |
| Tom D. Seip (1950) | Trustee since 2000; Chairman of the Board since 2008; Lead Independent Trustee from 2006 to 2008 | General Partner, Seip Investments LP (a private investment partnership); formerly, President and CEO, Westaff, Inc. (temporary staffing), May 2001 to January 2002; formerly, Senior Executive, The Charles Schwab Corporation, 1983 to 1998, including Chief Executive Officer, Charles Schwab Investment Management, Inc., Trustee, Schwab Family of Funds and Schwab Investments, 1997 to 1998, and Executive Vice President-Retail Brokerage, Charles Schwab & Co., Inc., 1994 to 1997. | 43 | Director, H&R Block, Inc. (financial services company), since May 2001; Chairman, Compensation Committee, H&R Block, Inc., since 2006; formerly, Director, Forward Management, Inc. (asset management company), 1999 to 2006. |
Name, (Year of Birth), and Address (1) | Position and Length of Time Served (2) | Principal Occupation(s) (3) | Number of Funds in Fund Complex Overseen by Fund Trustee | Other Directorships Held Outside Fund Complex by Fund Trustee |
| Candace L. Straight (1947) | Trustee since 2000 | Private investor and consultant specializing in the insurance industry; formerly, Advisory Director, Securitas Capital LLC (a global private equity investment firm dedicated to making investments in the insurance sector), 1998 to December 2003. | 43 | Director, Montpelier Re Holdings Ltd. (reinsurance company), since 2006; formerly, Director, National Atlantic Holdings Corporation (property and casualty insurance company), 2004 to 2008; formerly, Director, The Proformance Insurance Company (property and casualty insurance company), 2004 to 2008; formerly, Director, Providence Washington Insurance Company (property and casualty insurance company), 1998 to 2006; formerly, Director, Summit Global Partners (insurance brokerage firm), 2000 to 2005. |
| Peter P. Trapp (1944) | Trustee since 2000 | Retired; formerly, Regional Manager for Mid-Southern Region, Ford Motor Credit Company, September 1997 to 2007; formerly, President, Ford Life Insurance Company, April 1995 to August 1997. | 43 | None. |
Name, (Year of Birth), and Address (1) | Position and Length of Time Served (2) | Principal Occupation(s) (3) | Number of Funds in Fund Complex Overseen by Fund Trustee | Other Directorships Held Outside Fund Complex by Fund Trustee |
Fund Trustees who are “Interested Persons” |
Joseph V. Amato* (1962) | Trustee since 2009 | President and Director, Neuberger Berman Group LLC, since 2009; President and Chief Executive Officer, Neuberger and Neuberger Berman Holdings LLC (including its predecessor, Neuberger Berman Inc.), since 2007; Chief Investment Officer, Neuberger, since 2009; Chief Investment Officer (Equities) and Managing Director, Management, since 2009; Managing Director, Neuberger Berman Fixed Income LLC (“NBFI”) since 2007; Board member of NBFI since 2006; formerly, Global Head of Asset Management of Lehman Brothers Holdings Inc.’s (“LBHI”) Investment Management Division, 2006 to 2009; formerly, member of LBHI’s Investment Management Division's Executive Management Committee, 2006 to 2009; formerly, Managing Director, Lehman Brot hers Inc. (“LBI”), 2006 to 2008; formerly, Chief Recruiting and Development Officer, LBI, 2005 to 2006; formerly, Global Head of LBI's Equity Sales and a Member of its Equities Division Executive Committee, 2003 to 2005. | 43 | Member of Board of Advisors, McDonough School of Business, Georgetown University, since 2001; Member of New York City Board of Advisors, Teach for America, since 2005; Trustee, Montclair Kimberley Academy (private school), since 2007. |
| Robert Conti* (1956) | Chief Executive Officer, President and Trustee since 2008; prior thereto, Executive Vice President in 2008 and Vice President 2000 to 2008 | Managing Director, Neuberger, since 2007; formerly, Senior Vice President, Neuberger, 2003 to 2006; formerly, Vice President, Neuberger, 1999 to 2003; President and Chief Executive Officer, Management, since 2008; formerly, Senior Vice President, Management, 2000 to 2008. | 43 | Chairman of the Board, Staten Island Mental Health Society since 2008. |
Name, (Year of Birth), and Address (1) | Position and Length of Time Served (2) | Principal Occupation(s) (3) | Number of Funds in Fund Complex Overseen by Fund Trustee | Other Directorships Held Outside Fund Complex by Fund Trustee |
| Jack L. Rivkin* (1940) | Trustee since 2002; President from 2002 to 2008 | Formerly, Executive Vice President and Chief Investment Officer, Neuberger Berman Holdings LLC (holding company), 2002 to August 2008 and 2003 to August 2008, respectively; formerly, Managing Director and Chief Investment Officer, Neuberger, December 2005 to August 2008 and 2003 to August 2008, respectively; formerly, Executive Vice President, Neuberger, December 2002 to 2005; formerly, Director and Chairman, Management, December 2002 to August 2008; formerly, Executive Vice President, Citigroup Investments, Inc., September 1995 to February 2002; formerly, Executive Vice President, Citigroup Inc., September 1995 to February 2002. | 43 | Director, Idealab (private company), since 2009; Director, Distributed World Power (private company), since 2009; Director, Dale Carnegie and Associates, Inc. (private company), since 1999; Director, Solbright, Inc. (private company), since 1998; Director, SA Agricultural Fund, since 2009; Chairman and Director, Essential Brands (consumer products) since 2008; formerly, Director, New York Society of Security Analysts, 2006 to 2008. |
| (1) | The business address of each listed person is 605 Third Avenue, New York, New York 10158. |
| (2) | Pursuant to the Trust’s Trust Instrument, each of these Fund Trustees shall hold office for life or until his or her successor is elected or the Trust terminates; except that (a) any Fund Trustee may resign by delivering a written resignation; (b) any Fund Trustee may be removed with or without cause at any time by a written instrument signed by at least two-thirds of the other Fund Trustees; (c) any Fund Trustee who requests to be retired, or who has become unable to serve, may be retired by a written instrument signed by a majority of the other Fund Trustees; and (d) any Fund Trustee may be removed at any shareholder meeting by a vote of at least two-thirds of the outstanding shares. |
| (3) | Except as otherwise indicated, each individual has held the positions shown for at least the last five years. |
| | * | Indicates a Fund Trustee who is an “interested person” within the meaning of the 1940 Act. Mr. Amato and Mr. Conti are interested persons of the Trust by virtue of the fact that each is an officer of Management, Neuberger and/or their affiliates. Mr. Rivkin may be deemed an interested person of the Trust by virtue of the fact that, until August 2008, he was a director of Management and an officer of Neuberger. |
Information about the Officers of the Trust
Name, (Year of Birth), and Address (1) | Position and Length of Time Served (2) | Principal Occupation(s) (3) |
| Andrew B. Allard (1961) | Anti-Money Laundering Compliance Officer since 2002 | Senior Vice President, Neuberger, since 2006; Deputy General Counsel, Neuberger, since 2004; formerly, Vice President, Neuberger, 2000 to 2005; Anti-Money Laundering Compliance Officer, eight registered investment companies for which Management acts as investment manager and administrator (six since 2002, one since 2003 and one since 2006). |
| Claudia A. Brandon (1956) | Executive Vice President since 2008 and Secretary since 1985 | Senior Vice President, Neuberger, since 2007 and Employee since 1999; Senior Vice President, Management, since 2008 and Assistant Secretary since 2004; formerly, Vice President, Neuberger, 2002 to 2006; formerly, Vice President-Mutual Fund Board Relations, Management, 2000 to 2008; Executive Vice President, eight registered investment companies for which Management acts as investment manager and administrator (eight since 2008); Secretary, eight registered investment companies for which Management acts as investment manager and administrator (three since 1985, three since 2002, one since 2003 and one since 2006). |
| Maxine L. Gerson (1950) | Executive Vice President since 2008 and Chief Legal Officer since 2005 (only for purposes of sections 307 and 406 of the Sarbanes-Oxley Act of 2002) | Managing Director, Neuberger, since 2009, and Deputy General Counsel and Assistant Secretary, Neuberger, since 2001; Managing Director, Management, since 2009, and Secretary and General Counsel, Management, since 2004; formerly, Senior Vice President, Neuberger, 2002 to 2009; formerly, Senior Vice President, Management, 2006 to 2009; Executive Vice President, eight registered investment companies for which Management acts as investment manager and administrator (eight since 2008); Chief Legal Officer (only for purposes of sections 307 and 406 of the Sarbanes-Oxley Act of 2002), eight registered investment companies for which Management acts as investment manager and administrator (seven since 2005 and one since 2006). |
Name, (Year of Birth), and Address (1) | Position and Length of Time Served (2) | Principal Occupation(s) (3) |
| Sheila R. James (1965) | Assistant Secretary since 2002 | Vice President, Neuberger, since 2008 and Employee since 1999; formerly, Assistant Vice President, Neuberger, 2007; Assistant Secretary, eight registered investment companies for which Management acts as investment manager and administrator (six since 2002, one since 2003 and one since 2006). |
| Brian Kerrane (1969) | Vice President since 2008 | Senior Vice President, Neuberger, since 2006; formerly, Vice President, Neuberger, 2002 to 2006; Vice President, Management, since 2008 and Employee since 1991; Vice President, eight registered investment companies for which Management acts as investment manager and administrator (eight since 2008). |
| Kevin Lyons (1955) | Assistant Secretary since 2003 | Assistant Vice President, Neuberger, since 2008 and Employee since 1999; Assistant Secretary, eight registered investment companies for which Management acts as investment manager and administrator (seven since 2003 and one since 2006). |
| Owen F. McEntee, Jr. (1961) | Vice President since 2008 | Vice President, Neuberger, since 2006; Employee, Management, since 1992; Vice President, eight registered investment companies for which Management acts as investment manager and administrator (eight since 2008). |
| John M. McGovern (1970) | Treasurer and Principal Financial and Accounting Officer since 2005 | Senior Vice President, Neuberger, since 2007; formerly, Vice President, Neuberger, 2004 to 2006; Employee, Management, since 1993; Treasurer and Principal Financial and Accounting Officer, eight registered investment companies for which Management acts as investment manager and administrator (seven since 2005 and one since 2006); formerly, Assistant Treasurer, seven registered investment companies for which Management acts as investment manager and administrator, 2002 to 2005. |
| Andrew Provencher (1965) | Vice President since 2008 | Managing Director, Management, since 2008; Managing Director, Neuberger, since 2005; formerly, Senior Vice President, Neuberger, 2003 to 2005; Vice President, eight registered investment companies for which Management acts as investment manager and administrator (eight since 2008). |
Name, (Year of Birth), and Address (1) | Position and Length of Time Served (2) | Principal Occupation(s) (3) |
| Frank Rosato (1971) | Assistant Treasurer since 2005 | Vice President, Neuberger, since 2006; Employee, Management, since 1995; Assistant Treasurer, eight registered investment companies for which Management acts as investment manager and administrator (seven since 2005 and one since 2006). |
| Neil S. Siegel (1967) | Vice President since 2008 | Managing Director, Management, since 2008; Managing Director, Neuberger, since 2006; formerly, Senior Vice President, Neuberger, 2004 to 2006; Vice President, eight registered investment companies for which Management acts as investment manager and administrator (eight since 2008). |
| Chamaine Williams (1971) | Chief Compliance Officer since 2005 | Senior Vice President, Neuberger, since 2007; Chief Compliance Officer, Management, since 2006; Chief Compliance Officer, eight registered investment companies for which Management acts as investment manager and administrator (seven since 2005 and one since 2006); formerly, Senior Vice President, LBI, 2007 to 2008; formerly, Vice President, LBI, 2003 to 2006; formerly, Chief Compliance Officer, Lehman Brothers Asset Management Inc., 2003 to 2007; formerly, Chief Compliance Officer, Lehman Brothers Alternative Investment Management LLC, 2003 to 2007. |
| (1) | The business address of each listed person is 605 Third Avenue, New York, New York 10158. |
| (2) | Pursuant to the By-Laws of the Trust, each officer elected by the Fund Trustees shall hold office until his or her successor shall have been elected and qualified or until his or her earlier death, inability to serve, or resignation. Officers serve at the pleasure of the Fund Trustees and may be removed at any time with or without cause. |
| (3) | Except as otherwise indicated, each individual has held the positions shown for at least the last five years. |
Proxy Voting Policies and Procedures
A description of the policies and procedures that the Trust uses to determine how to vote proxies relating to portfolio securities is available, without charge, by calling 1-800-877-9700 (toll-free) and on the website of the Securities and Exchange Commission, at www.sec.gov. Information regarding how the Trust voted proxies relating to portfolio securities during the most recent 12-month period ended June 30 is also available, without charge, by calling 1-800-877-9700 (toll-free), on the website of the Securities and Exchange Commission at www.sec.gov, and on Management’s website at www.nb.com.
Quarterly Portfolio Schedule
The Trust files a complete schedule of portfolio holdings for the Fund with the Securities and Exchange Commission for the first and third quarters of each fiscal year on Form N-Q. The Trust's Forms N-Q are available on the Securities and Exchange Commission’s website at www.sec.gov and may be reviewed and copied at the Securities and Exchange Commission’s Public Reference Room in Washington, DC. Information on the operation of the Public Reference Room may be obtained by calling 1-800-SEC-0330. The information on Form N-Q is available upon request, without charge, by calling 1-800-877-9700 (toll-free).
Notice to Shareholders (Unaudited)
For the fiscal year ended August 31, 2010, the Fund makes the following designation, or up to the maximum amount of such dividends allowable pursuant to the Internal Revenue Code, as qualified dividend income eligible for reduced tax rates. These lower rates range from 5% to 15% depending upon an individual’s tax bracket. Complete information regarding each Fund’s distributions during the calendar year 2010 will be reported in conjunction with Form 1099DIV.
| | Fund | | | Qualified Dividend Income |
| | Large Cap Value Fund | | | $23,124 |
Item 2. Code of Ethics.
The Board of Trustees (“Board”) of Neuberger Berman Equity Funds (“Registrant”) adopted a code of ethics that applies to the Registrant’s principal executive officer, principal financial officer, principal accounting officer or controller, or persons performing similar functions (“Code of Ethics”). For the period covered by this Form N-CSR, there were no amendments to the Code of Ethics and there were no waivers from the Code of Ethics granted to the Registrant’s principal executive officer, principal financial officer, principal accounting officer or controller, or persons performing similar functions.
A copy of the Code of Ethics is incorporated by reference to the Registrant’s Form N-CSR, Investment Company Act file number 811-00582 (filed May 8, 2006). The Code of Ethics is also available, without charge, by calling 1-800-877-9700 (toll-free).
Item 3. Audit Committee Financial Expert.
The Board has determined that the Registrant has three audit committee financial experts serving on its audit committee. The Registrant’s audit committee financial experts are Martha Goss, George Morriss and Candace Straight. Ms. Goss, Mr. Morriss and Ms. Straight are independent trustees as defined by Form N-CSR.
Item 4. Principal Accountant Fees and Services.
Ernst & Young, LLP (“E&Y”) serves as independent registered public accounting firm to the Neuberger Berman Climate Change, Emerging Markets Equity, Equity Income, Focus, Genesis, Guardian, International, International Institutional, International Large Cap, Large Cap Value, Partners, Real Estate and Select Equities Funds.
Tait, Weller & Baker LLP (“Tait Weller”) serves as independent registered public accounting firm to the Neuberger Berman Intrinsic Value, Large Cap Disciplined Growth, Mid Cap Growth, Multi-Cap Opportunities, Regency, Small Cap Growth, and Socially Responsive Funds.
(a) Audit Fees
The aggregate fees billed for professional services rendered by E&Y for the audit of the annual financial statements or services that are normally provided by E&Y in connection with statutory and regulatory filings or engagements were $527,000 and $591,500 for the fiscal years ended 2009 and 2010, respectively.
The aggregate fees billed for professional services rendered by Tait Weller for the audit of the annual financial statements or services that are normally provided by Tait Weller in connection with statutory and regulatory filings or engagements were $119,000 and $133,000 for the fiscal years ended 2009 and 2010, respectively.
(b) Audit-Related Fees
The aggregate fees billed to the Registrant for assurance and related services by E&Y that are reasonably related to the performance of the audit of the Registrant’s financial statements and are not reported above in Audit Fees were $0 and $0 for the fiscal years ended 2009 and 2010, respectively. The Audit Committee approved 0% and 0% of these services provided by E&Y for the fiscal years ended 2009 and 2010, respectively, pursuant to the waiver provisions of Rule 2-01(c)(7)(i)(C) of Regulation S-X.
The fees billed to other entities in the investment company complex for assurance and related services by E&Y that are reasonably related to the performance of the audit that the Audit Committee was required to approve because the engagement related directly to the operations and financial reporting of the Registrant were $0 and $0 for the fiscal years ended 2009 and 2010, respectively. The Audit Committee approved 0% and 0% of these services provided by E&Y for the fiscal years ended 2009 and 2010, respectively, pursuant to the waiver provisions of Rule 2-01(c)(7)(i)(C) of Regulation S-X.
The aggregate fees billed to the Registrant for assurance and related services by Tait Weller that are reasonably related to the performance of the audit of the Registrant’s financial statements and are not reported above in Audit Fees were $0 and $0 for the fiscal years ended 2009 and 2010, respectively. The Audit Committee approved 0% and 0% of these services provided by Tait Weller for the fiscal years ended 2009 and 2010, respectively, pursuant to the waiver provisions of Rule 2-01(c)(7)(i)(C) of Regulation S-X.
The fees billed to other entities in the investment company complex for assurance and related services by Tait Weller that are reasonably related to the performance of the audit that the Audit Committee was required to approve because the engagement related directly to the operations and financial reporting of the Registrant were $0 and $0 for the fiscal years ended 2009 and 2010, respectively. The Audit Committee approved 0% and 0% of these services provided by Tait Weller for the fiscal years ended 2009 and 2010, respectively, pursuant to the waiver provisions of Rule 2-01(c)(7)(i)(C) of Regulation S-X.
(c) Tax Fees
The aggregate fees billed to the Registrant for professional services rendered by E&Y for tax compliance, tax advice, and tax planning were $124,800 and $141,500 for the fiscal years ended 2009 and 2010, respectively. The nature of the services provided were tax compliance, tax advice, and tax planning. The Audit Committee approved 0% and 0% of these services provided by E&Y for the fiscal years ended 2009 and 2010, respectively, pursuant to the waiver provisions of Rule 2-01(c)(7)(i)(C) of Regulation S-X.
The fees billed to other entities in the investment company complex for professional services rendered by E&Y for tax compliance, tax advice, and tax planning that the Audit Committee was required to approve because the engagement related directly to the operations and financial reporting of the Registrant were $0 and $0 for the fiscal years ended 2009 and 2010, respectively. The Audit Committee approved 0% and 0% of these services provided by E&Y for the fiscal years ended 2009 and 2010, respectively, pursuant to the waiver provisions of Rule 2-01(c)(7)(i)(C) of Regulation S-X.
The aggregate fees billed to the Registrant for professional services rendered by Tait Weller for tax compliance, tax advice, and tax planning were $20,500 and $26,000 for the fiscal years ended 2009 and 2010, respectively. The nature of the services provided were tax compliance, tax advice, and tax planning. The Audit Committee approved 0% and 0% of these services provided by Tait Weller for the fiscal years ended 2009 and 2010, respectively, pursuant to the waiver provisions of Rule 2-01(c)(7)(i)(C) of Regulation S-X.
The fees billed to other entities in the investment company complex for professional services rendered by Tait Weller for tax compliance, tax advice, and tax planning that the Audit Committee was required to approve because the engagement related directly to the operations and financial reporting of the Registrant were $0 and $0 for the fiscal years ended 2009 and 2010, respectively. The Audit Committee approved 0% and 0% of these services provided by Tait Weller for the fiscal years ended 2009 and 2010, respectively, pursuant to the waiver provisions of Rule 2-01(c)(7)(i)(C) of Regulation S-X.
(d) All Other Fees
The aggregate fees billed to the Registrant for products and services provided by E&Y, other than services reported in Audit Fees, Audit-Related Fees, and Tax Fees were $0 and $0 for the fiscal years ended 2009 and 2010, respectively. The Audit Committee approved 0% and 0% of these services provided by E&Y for the fiscal years ended 2009 and 2010, respectively, pursuant to the waiver provisions of Rule 2-01(c)(7)(i)(C) of Regulation S-X.
The fees billed to other entities in the investment company complex for products and services provided by E&Y, other than services reported in Audit Fees, Audit-Related Fees, and Tax Fees that the Audit Committee was required to approve because the engagement related directly to the operations and financial reporting of the Registrant were $0 and $0 for the fiscal years ended 2009 and 2010, respectively. The Audit Committee approved 0% and 0% of these services provided by E&Y for the fiscal years ended 2009 and 2010, respectively, pursuant to the waiver provisions of Rule 2-01(c)(7)(i)(C) of Regulation S-X.
The aggregate fees billed to the Registrant for products and services provided by Tait Weller, other than services reported in Audit Fees, Audit-Related Fees, and Tax Fees were $0 and $0 for the fiscal years ended 2009 and 2010, respectively. The Audit Committee approved 0% and 0% of these services provided by Tait Weller for the fiscal years ended 2009 and 2010, respectively, pursuant to the waiver provisions of Rule 2-01(c)(7)(i)(C) of Regulation S-X.
The fees billed to other entities in the investment company complex for products and services provided by Tait Weller, other than services reported in Audit Fees, Audit-Related Fees, and Tax Fees that the Audit Committee was required to approve because the engagement related directly to the operations and financial reporting of the Registrant were $0 and $0 for the fiscal years ended 2009 and 2010, respectively. The Audit Committee approved 0% and 0% of these services provided by Tait Weller for the fiscal years ended 2009 and 2010, respectively, pursuant to the waiver provisions of Rule 2-01(c)(7)(i)(C) of Regulation S-X.
(e) Audit Committee’s Pre-Approval Policies and Procedures
(1) The Audit Committee’s pre-approval policies and procedures for the Registrant to engage an accountant to render audit and non-audit services delegate to each member of the Committee the power to pre-approve services between meetings of the Committee.
(2) None of the services described in paragraphs (b) through (d) above were approved by the Audit Committee pursuant to paragraph (c)(7)(i)(C) of Rule 2-01 of Regulation S-X.
(f) Hours Attributed to Other Persons
Not applicable.
(g) Non-Audit Fees
Non-audit fees billed by E&Y for services rendered to the Registrant were $124,800 and $141,500 for the fiscal years ended 2009 and 2010, respectively.
Non-audit fees billed by E&Y for services rendered to the Registrant’s investment adviser and any entity controlling, controlled by, or under common control with the adviser that provides ongoing services to the Registrant were $334,450 and $0 for the fiscal years ended 2009 and 2010, respectively.
Non-audit fees billed by Tait Weller for services rendered to the Registrant were $20,500 and $26,000 for the fiscal years ended 2009 and 2010, respectively.
Non-audit fees billed by Tait Weller for services rendered to the Registrant’s investment adviser and any entity controlling, controlled by, or under common control with the adviser that provides ongoing services to the Registrant were $0 and $0 for the fiscal years ended 2009 and 2010, respectively.
(h) The Audit Committee of the Board considered whether the provision of non-audit services rendered to the Registrant’s investment adviser and any entity controlling, controlled by, or under common control with the adviser that provides ongoing services to the Registrant that were not pre-approved by the Audit Committee because the engagement did not relate directly to the operations and financial reporting of the Registrant is compatible with maintaining E&Y’s and Tait Weller’s independence.
Item 5. Audit Committee of Listed Registrants.
Not applicable to the Registrant.
Item 6. Schedule of Investments.
The complete schedule of investments for each series is disclosed in the Registrant’s Annual Report, which is included as Item 1 of this Form N-CSR.
Item 7. Disclosure of Proxy Voting Policies and Procedures for Closed-End Management Investment Companies.
Not applicable to the Registrant.
Item 8. Portfolio Managers of Closed-End Management Investment Companies.
Not applicable to the Registrant.
Item 9. Purchases of Equity Securities by Closed-End Management Investment Company and Affiliated Purchasers.
Not applicable to the Registrant.
Item 10. Submission of Matters to a Vote of Security Holders.
There were no changes to the procedures by which shareholders may recommend nominees to the Board.
Item 11. Controls and Procedures.
| (a) | Based on an evaluation of the disclosure controls and procedures (as defined in Rule 30a-3(c) under the Investment Company Act of 1940, as amended (the “Act”)) as of a date within 90 days of the filing date of this document, the Chief Executive Officer and Treasurer and Principal Financial and Accounting Officer of the Registrant have concluded that such disclosure controls and procedures are effectively designed to ensure that information required to be disclosed by the Registrant on Form N-CSR and Form N-Q is accumulated and communicated to the Registrant’s management to allow timely decisions regarding required disclosure. |
| | |
| (b) | There were no significant changes in the Registrant’s internal controls over financial reporting (as defined in Rule 30a-3(d) under the Act) that occurred during the Registrant’s second fiscal quarter of the period covered by this report that have materially affected, or are reasonably likely to materially affect, the Registrant’s internal control over financial reporting. |
Item 12. Exhibits
| (a)(1) | A copy of the Code of Ethics is incorporated by reference to the Registrant’s Form N-CSR, Investment Company Act file number 811-00582 (filed May 8, 2006). |
| | |
| (a)(2) | The certifications required by Rule 30a-2(a) of the Act and Section 302 of the Sarbanes-Oxley Act of 2002 (“Sarbanes-Oxley Act”) are filed herewith. |
| | |
| (a)(3) | Not applicable to the Registrant. |
| | |
| (b) | The certifications required by Rule 30a-2(b) of the Act and Section 906 of the Sarbanes-Oxley Act are filed herewith. |
The certifications provided pursuant to Rule 30a-2(b) of the Act and Section 906 of the Sarbanes-Oxley Act are not deemed “filed” for purposes of Section 18 of the Securities Exchange Act of 1934, as amended (“Exchange Act”), or otherwise subject to the liability of that section. Such certifications will not be deemed to be incorporated by reference into any filing under the Securities Act of 1933, as amended or the Exchange Act, except to the extent that the Registrant specifically incorporates them by reference.
SIGNATURES
Pursuant to the requirements of the Securities Exchange Act of 1934 and the Investment Company Act of 1940, the Registrant has duly caused this report to be signed on its behalf by the undersigned, thereunto duly authorized.
Neuberger Berman Equity Funds
| By: | /s/ Robert Conti | |
| | Robert Conti |
| | Chief Executive Officer |
Date: October 26, 2010
Pursuant to the requirements of the Securities Exchange Act of 1934 and the Investment Company Act of 1940, this report has been signed below by the following persons on behalf of the Registrant and in the capacities and on the dates indicated.
| By: | /s/ Robert Conti | |
| | Robert Conti |
| | Chief Executive Officer |
| By: | /s/ John M. McGovern | |
| | John M. McGovern |
| | Treasurer and Principal Financial |
| | and Accounting Officer |
Date: October 26, 2010