As filed with the Securities and Exchange Commission on November 1, 2013
UNITED STATES
SECURITIES AND EXCHANGE COMMISSION
Washington, D.C. 20549
FORM N-CSR
CERTIFIED SHAREHOLDER REPORT OF
REGISTERED MANAGEMENT INVESTMENT COMPANIES
Investment Company Act file number: 811-00582
NEUBERGER BERMAN EQUITY FUNDS
(Exact Name of the Registrant as Specified in Charter)
c/o Neuberger Berman Management LLC
605 Third Avenue, 2nd Floor
New York, New York 10158-0180
(Address of Principal Executive Offices – Zip Code)
Registrant's telephone number, including area code: (212) 476-8800
Robert Conti
Chief Executive Officer and President
Neuberger Berman Equity Funds
c/o Neuberger Berman Management LLC
605 Third Avenue, 2nd Floor
New York, New York 10158-0180
Arthur C. Delibert, Esq.
K&L Gates LLP
1601 K Street, N.W.
Washington, D.C. 20006-1600
(Names and Addresses of agents for service)
Date of fiscal year end: August 31, 2013
Date of reporting period: August 31, 2013
Form N-CSR is to be used by management investment companies to file reports with the Commission not later than 10 days after the transmission to stockholders of any report that is required to be transmitted to stockholders under Rule 30e-1 under the Investment Company Act of 1940 (17 CFR 270.30e-1). The Commission may use the information provided on Form N-CSR in its regulatory, disclosure review, inspection, and policymaking roles.
A registrant is required to disclose the information specified by Form N-CSR, and the Commission will make this information public. A registrant is not required to respond to the collection of information contained in Form N-CSR unless the Form displays a currently valid Office of Management and Budget (“OMB”) control number. Please direct comments concerning the accuracy of the information collection burden estimate and any suggestions for reducing the burden to the Secretary, Securities and Exchange Commission, 100 F Street, NE, Washington, DC 20549-0609. The OMB has reviewed this collection of information under the clearance requirements of 44 U.S.C. § 3507. Item 1. Report to Shareholders.

Neuberger Berman
Equity Funds
Investor Class Shares
Trust Class Shares
Advisor Class Shares
Institutional Class Shares
Emerging Markets Equity Fund
Equity Income Fund
Focus Fund
Genesis Fund
Global Equity Fund
Global Thematic Opportunities Fund
Greater China Equity Fund
Guardian Fund
International Equity Fund
(Formerly International Institutional Fund)
International Large Cap Fund
Class A Shares
Class C Shares
Class R3 Shares
Class R6 Shares
Intrinsic Value Fund
Large Cap Disciplined Growth Fund
Large Cap Value Fund
Mid Cap Growth Fund
Mid Cap Intrinsic Value Fund
Multi-Cap Opportunities Fund
Real Estate Fund
Select Equities Fund
Small Cap Growth Fund
Socially Responsive Fund
Value Fund
Annual Report
August 31, 2013
Contents
THE FUNDS
President's Letter | | | 1 | | |
PORTFOLIO COMMENTARY | |
Emerging Markets Equity Fund | | | 2 | | |
Equity Income Fund | | | 6 | | |
Focus Fund | | | 10 | | |
Genesis Fund | | | 14 | | |
Global Equity Fund | | | 18 | | |
Global Thematic Opportunities Fund | | | 22 | | |
Greater China Equity Fund | | | 26 | | |
Guardian Fund | | | 30 | | |
International Equity Fund (Formerly International Institutional Fund) | | | 34 | | |
International Large Cap Fund | | | 38 | | |
Intrinsic Value Fund | | | 42 | | |
Large Cap Disciplined Growth Fund | | | 46 | | |
Large Cap Value Fund | | | 50 | | |
Mid Cap Growth Fund | | | 54 | | |
Mid Cap Intrinsic Value Fund | | | 58 | | |
Multi-Cap Opportunities Fund | | | 62 | | |
Real Estate Fund | | | 66 | | |
Select Equities Fund | | | 70 | | |
Small Cap Growth Fund | | | 74 | | |
Socially Responsive Fund | | | 78 | | |
Value Fund | | | 82 | | |
FUND EXPENSE INFORMATION | | | 92 | | |
SCHEDULE OF INVESTMENTS/TOP TEN EQUITY HOLDINGS | |
Emerging Markets Equity Fund | | | 96 | | |
Equity Income Fund | | | 99 | | |
Focus Fund | | | 101 | | |
Genesis Fund | | | 102 | | |
Global Equity Fund | | | 105 | | |
Global Thematic Opportunities Fund | | | 108 | | |
Greater China Equity Fund | | | 110 | | |
Guardian Fund | | | 112 | | |
International Equity Fund (Formerly International Institutional Fund) | | | 113 | | |
International Large Cap Fund | | | 116 | | |
Intrinsic Value Fund | | | 119 | | |
Large Cap Disciplined Growth Fund | | | 121 | | |
Large Cap Value Fund | | | 123 | | |
Mid Cap Growth Fund | | | 125 | | |
Mid Cap Intrinsic Value Fund | | | 127 | | |
Multi-Cap Opportunities Fund | | | 129 | | |
Real Estate Fund | | | 130 | | |
Select Equities Fund | | | 131 | | |
Small Cap Growth Fund | | | 132 | | |
Socially Responsive Fund | | | 134 | | |
Value Fund | | | 135 | | |
FINANCIAL STATEMENTS | | | 147 | | |
FINANCIAL HIGHLIGHTS (ALL CLASSES) PER SHARE DATA | |
Emerging Markets Equity Fund | | | 209 | | |
Equity Income Fund | | | 211 | | |
Focus Fund | | | 213 | | |
Genesis Fund | | | 215 | | |
Global Equity Fund | | | 217 | | |
Global Thematic Opportunities Fund | | | 217 | | |
Greater China Equity Fund | | | 219 | | |
Guardian Fund | | | 219 | | |
International Equity Fund (Formerly International Institutional Fund) | | | 223 | | |
International Large Cap Fund | | | 223 | | |
Intrinsic Value Fund | | | 225 | | |
Large Cap Disciplined Growth Fund | | | 227 | | |
Large Cap Value Fund | | | 229 | | |
Mid Cap Growth Fund | | | 231 | | |
Mid Cap Intrinsic Value Fund | | | 235 | | |
Multi-Cap Opportunities Fund | | | 237 | | |
Real Estate Fund | | | 237 | | |
Select Equities Fund | | | 239 | | |
Small Cap Growth Fund | | | 241 | | |
Socially Responsive Fund | | | 243 | | |
Value Fund | | | 247 | | |
Reports of Independent Registered Public Accounting Firms | | | 252 | | |
Directory | | | 254 | | |
Trustees and Officers | | | 255 | | |
Proxy Voting Policies and Procedures | | | 263 | | |
Quarterly Portfolio Schedule | | | 263 | | |
Board Consideration of the Management and
Sub-Advisory Agreements | | | 264 | | |
Notice to Shareholders | | | 266 | | |
The "Neuberger Berman" name and logo are registered service marks of Neuberger Berman Group LLC. "Neuberger Berman Management LLC" and the individual Fund names in this piece are either service marks or registered service marks of Neuberger Berman Management LLC. ©2013 Neuberger Berman Management LLC. All rights reserved.
Dear Shareholder,
Equity markets advanced sharply this fiscal year, with the S&P 500 up over 18% for the period. International developed markets reported similarly strong gains—with the MSCI EAFE® Index advancing over 19%. Emerging markets, while positive, lagged.
Five years after the global financial crisis, the world's developed economies seemed to have turned a corner, improving investor and business confidence and fueling this reporting period's rally. With a more solid macroeconomic foundation, market activity has been less volatile. The VIX Index (a forward-looking, short-term measure of S&P 500 Index option-implied volatility), which was near 80 in late 2008, generally remained under 20 this period, but in December, spiked above 22 during the fiscal cliff crisis. Perhaps more importantly, correlations among stocks—unusually high in recent years as the market struggled with shifting macroeconomic news—dropped significantly. The Chicago Board Options Exchange Implied Correlation Index, which tracks price movement within the S&P 500, had declined nearly 50% from its 2008 highs. While lower volatility suggests a more confident, less reactive market, lower correlations are an indication that investors are weighing the fundamentals of individual companies rather than betting on direction at the market or sector level. We believe this indicates a more typical—and healthier—equity market, and one that favors active management.
While markets continued to benefit from accommodative central bank policy this past fiscal year, better-than-expected GDP growth in the U.S., which closed the period at 2.5%, was the positive surprise. The resolution of some of 2012's "manufactured" crises—particularly the fiscal cliff, and its tax and policy unknowns—finally freed businesses and investors from fear-based inertia. At the same time, housing and unemployment improved steadily. By August 2013, U.S. existing home sales had risen over 13% year-over-year, to an annual rate of almost 5.5 million units, with the median price increasing more than $27,000 over the last 12 months. August's unemployment number was the lowest since December 2008. Consumer confidence increased as well, with the Consumer Confidence Index up 20 points year-over-year in August. We believe this combination should continue to support consumer spending, the most critical component of U.S. economic growth.
Elsewhere, within the eurozone, where an untenable debt situation has been the source of market consternation time and again, 2013 economic data thus far suggested the recession had ended and that a period of slow growth had begun. An expanding economy drove equities up and bond yields among the weaker economies down. Emerging markets struggled, however, due to real and perceived pressures from slower growth in China and increased risk aversion after the U.S. Federal Reserve's tapering announcement in May. While some economies are directly tied to China, most are not. During the reporting period, however, investors largely failed to differentiate.
The U.S. is going through another contentious political season, with budget and debt ceiling negotiations. Although the U.S. deficit has dropped significantly over the past five years, the same players in Washington failed to resolve the 2011 debt ceiling negotiations without a U.S. debt downgrade. We can hope for better this time around, but may again see negative economic and market impacts from weak leadership. Bad news from the world's largest economy could certainly have contagion effects considering the relative weakness of much of the developed world. Geopolitical events also have the potential to jar the markets. Developments in Syria, Iran and elsewhere bear watching.
In our view, however, long-term positives may outweigh current risks. We believe equity valuations remain reasonable and interest rates, while rising, are low. In our opinion, corporate balance sheets are healthy, and with the benefit of reduced policy uncertainty, management teams have deployed cash in positive ways—including mergers and acquisitions, increased dividends and share buybacks, and focused capital expenditures. If the market has turned, as we believe it has, to a more fundamentals-focused "weighing machine," skilled active management could have real impact on returns. In a proactive market, we would anticipate that the opportunities our teams and strategies uncover would be rewarded.
We thank you for your confidence in Neuberger Berman and look forward to continuing to serve your investment needs.
Sincerely,

ROBERT CONTI
PRESIDENT AND CEO
NEUBERGER BERMAN MUTUAL FUNDS
1
Emerging Markets Equity Fund Commentary (Unaudited)
Neuberger Berman Emerging Markets Equity Fund Institutional Class generated a 2.77% total return for the fiscal year ended August 31, 2013 and outperformed its benchmark, the MSCI Emerging Markets (EM) Index, which reported a return of 0.87%. (Performance for all share classes is provided in the table immediately following this letter.)
The MSCI EM Index posted solid gains during the first half of the reporting period. After that, however, the index gave back nearly everything, closing the fiscal year only slightly positive. In early 2013, the index declined as investors took profits and reallocated on signs of growth in the U.S. and Japan. After May, the EM Index dropped further, primarily driven by the U.S. Federal Reserve's announcement of plans to begin unwinding its quantitative easing program. At the same time, concerns arose about the stability of the Chinese banking system.
The MSCI EM Index sharply underperformed both the MSCI EAFE Index and the S&P 500 Index for the past fiscal year, though results were mixed. From a sector perspective, Information Technology led the MSCI EM Index, up 16%, followed by Health Care and Consumer Discretionary. Meanwhile, Materials and Utilities declined roughly 10%, with Energy, Telecommunication Services and Industrials also posting negative results. By country, Korea, the Philippines and Poland outperformed—as did China—while Peru, the Czech Republic and Chile posted significant losses.
Both stock selection and sector allocation were positive for the portfolio versus the benchmark this period, with relative performance benefiting the most from stock selection within Industrials, Consumer Staples and Consumer Discretionary. By contrast, Financials and Materials were areas of relative weakness versus the benchmark. Holdings within China, Russia and Mexico drove our outperformance, while investments in India and Taiwan, and an opportunistic allocation to Canada, detracted.
Top performers during the 12-month period included China Everbright International, Coway and Kimberly-Clark de Mexico. China Everbright reported strong earnings and good momentum in its order book. Coway, the Korean door-to-door marketer of home environment appliances, increased its service fees, which we believe could boost earnings going forward. Kimberly-Clark de Mexico, a paper-based consumer products company, continued to improve margins.
Detractors during the period included DLF Limited, an Indian property manager we sold due to slower growth and tightening liquidity conditions in India. SQM in Chile, an agriculture company, was also sold having come under pressure due to South American market weakness and declining potash prices. BR Malls Participoes, a Brazilian mall operator, fell on market concerns that rising Brazilian interest rates could bring down valuations on the company's properties. As longer-term investors, we continue to see value in the company.
In May 2013, the U.S. Federal Reserve's tapering comments quickly drove U.S. yields higher, causing liquidity to exit emerging markets, and posed a particular problem for markets such as Turkey, whose current account deficits have been funded by foreign investors. This situation resulted in sharp declines in the impacted emerging equity markets and their respective currencies. Further, while the People's Bank of China eventually stepped in, June's severe leap in China's interbank lending rates raised concerns about the stability of the Chinese banking system. Many investors read this as a sign that the government wanted to rein in the rapid credit expansion, in particular off-balance lending activity.
When we step back and look at 2013 so far, we observe two internal factors: earnings and policy issues. Earnings are generally down year-to-date and there have been roughly 15% cuts in earnings estimates for full year 2013 and 2014. This appears to be driven by the more cyclical sectors like Energy and Materials, which made up over 22% of the index weight, thereby making it difficult for the EM asset class to outperform. In regards to policy, we're seeing adjustments in China, noise in Brazil and reforms in India that have started but are moving slowly. While policy adjustments may take time to implement, we believe they could ultimately benefit these economies.
We continue to favor the small- to mid-cap domestically driven companies that have aided relative returns, believing these firms will benefit further from secular local growth. By sector, our greatest overweight is Industrials—in companies we anticipate will benefit from local infrastructure spending. We have added to Consumer Staples holdings, now our
2
second largest overweight, finding smaller-cap names at what we consider good valuations. Health Care is another significant overweight, with holdings focused around consumer-driven care providers and over-the-counter brands. We are still underweighted in Financials, Energy and Materials, and reduced our exposure to commodity materials names even further in recent months, as earnings have disappointed and we believe prospects remain poor.
From a country perspective, we exited several Korean holdings for company-specific reasons. We've also trimmed some Mexican Consumer Staples names as they approached their target prices, adding to newer domestically driven names that we believe offer greater potential upside. We remain biased towards Consumer Staples names in China, while avoiding the large Energy and Materials names that we believe could be negatively impacted by current reforms.
Overall, we continue to find what we believe are excellent bottom-up opportunities across markets. As we think the past year has shown, managers with strong stock picking skills and the capability and flexibility to look beyond the index could continue to have a real opportunity to add value.
Sincerely,

CONRAD SALDANHA
PORTFOLIO MANAGER
Information about the principal risks of investing in the Fund is set forth in the prospectus and statement of additional information.
The portfolio composition, industries and holdings of the Fund are subject to change.
The opinions expressed are those of the Fund's portfolio manager. The opinions are as of the date of this report and are subject to change without notice.
3
Emerging Markets Equity Fund (Unaudited)
TICKER SYMBOLS
Institutional Class | | NEMIX | |
Class A | | NEMAX | |
Class C | | NEMCX | |
Class R3 | | NEMRX | |
Class R6 | | NREMX | |
SECTOR ALLOCATION
(as a % of Total Investments) | |
Consumer Discretionary | | | 7.8 | % | |
Consumer Staples | | | 13.3 | | |
Energy | | | 9.8 | | |
Financials | | | 17.9 | | |
Health Care | | | 6.5 | | |
Industrials | | | 12.2 | | |
Information Technology | | | 15.9 | | |
Materials | | | 6.8 | | |
Telecommunication Services | | | 3.7 | | |
Short-Term Investments | | | 6.1 | | |
Total | | | 100.0 | % | |
PERFORMANCE HIGHLIGHTS9
| | | | | Average Annual Total
Return Ended 08/31/2013 | |
| | | Inception
Date | | 1 Year | | Life of
Fund | |
At NAV | |
Institutional Class | | 10/08/2008 | | | 2.77 | % | | | 12.01 | % | |
Class A | | 10/08/2008 | | | 2.54 | % | | | 11.74 | % | |
Class C | | 10/08/2008 | | | 1.78 | % | | | 10.92 | % | |
| Class R310 | | 06/21/2010 | | | 2.11 | % | | | 11.52 | % | |
| Class R624 | | 03/15/2013 | | | 2.83 | % | | | 12.02 | % | |
With Sales Charge | | | | | | | |
Class A | | | | | –3.36 | % | | | 10.40 | % | |
Class C | | | | | 0.78 | % | | | 10.92 | % | |
Index | | | | | | | |
| MSCI Emerging Markets Index1,16 | | | | | 0.87 | % | | | 10.24 | % | |
The performance data quoted represent past performance and do not indicate future results. Current performance may be lower or higher than the performance data quoted. For more current performance data, please visit www.nb.com/performance.
The results shown in the table reflect the reinvestment of income dividends and other distributions, if any. The results do not reflect the effect of taxes a shareholder would pay on Fund distributions or on the redemption of Fund shares.
The investment return and principal value of an investment will fluctuate and shares, when redeemed, may be worth more or less than their original cost.
Returns would have been lower if Neuberger Berman Management LLC ("Management") had not reimbursed certain expenses and/or waived a portion of the investment management fees during certain of the periods shown. Repayment by a class (of expenses previously reimbursed and/or fees previously waived by Management) will decrease the class's returns. Please see Note B in the Notes to Financial Statements for specific information regarding expense reimbursement and/or fee waiver arrangements.
As stated in the Fund's most recent prospectus, the total annual operating expense ratios for fiscal year 2012 (estimated for 2013 for Class R6) were 1.77%, 2.23%, 2.94%, 2.50% and 1.49% for Institutional Class, Class A, Class C, Class R3 and Class R6 shares, respectively (before expense reimbursements and/or fee waivers, if any). These expense ratios were 1.26%, 1.51%, 2.26%, 1.92% and 1.19% for Institutional Class, Class A, Class C, Class R3 and Class R6 shares, respectively, after expense reimbursements and/or fee waivers.
Returns shown with a sales charge reflect the deduction of the current maximum initial sales charge of 5.75% for Class A shares and the applicable contingent deferred sales charges (CDSC) for Class C shares. The maximum CDSC for Class C shares is 1%, which is reduced to 0% after 1 year. The performance of the Fund's share classes will differ primarily due to different sales charge structures and class expenses. Please see the prospectus for more information about sales charge structures, if any, and class expenses for your share class.
4
Emerging Markets Equity Fund (Unaudited)
COMPARISON OF A $1,000,000 INVESTMENT
(000's Omitted)
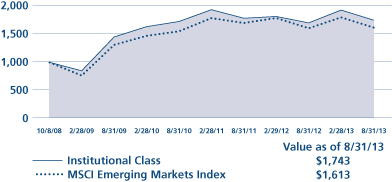
This graph shows the change in value of a hypothetical $1,000,000 investment in the Fund over the past 10 fiscal years, or since the Fund's inception if it has not operated for 10 years. The graph is based on the Institutional Class shares only; the performance of the Fund's share classes will differ primarily due to different sales charge structures and class expenses (see Performance Highlights chart on previous page). The result is compared with benchmarks, which include a broad-based market index and may include a more narrowly based index. Market indices have not been reduced to reflect any of the fees and costs of investing. The results shown in the graph reflect the reinvestment of income dividends and other distributions, if any. The results do not reflect the effect of taxes a shareholder would pay on Fund distributions or on the redemption of Fund shares. Results represent past performance and do not indicate future results.
5
Equity Income Fund Commentary (Unaudited)
Neuberger Berman Equity Income Fund Institutional Class generated a 4.79% total return for the fiscal year ended August 31, 2013 but trailed its benchmark, the S&P 500 Index, which provided an 18.70% return. (Performance for all share classes is provided in the table immediately following this letter.)
The strong U.S. equity market rally experienced during the reporting period was attributable, in our view, to improving economic data that pointed to a recovery in housing and employment. Additionally, corporate America had benefited from its ability to refinance debt at lower interest rates, which helped improve fundamentals.
While these factors were positive, not all sectors benefited equally. In particular, real estate investment trusts (REITs) and utility stocks lagged the broader U.S. market. Utilities sold off in late 2012 due to fears that the dividend tax rate could double, which it did not—thereafter utilities saw a sharp rebound, making them the best performing sector through April 2013. However, REITs and utilities fell sharply following the U.S. Federal Reserve's tapering announcement in May, which hinted at a possible slowdown of its $85 billion monthly bond purchases. Interest rates on 10-Year U.S. Treasury bonds soared, triggering losses and hurting interest-rate sensitive stocks. From early May through August, the FTSE NAREIT All Equity REITs Index lost 13.3% while the S&P 500 returned 3.0%. Historically, better economic news has generally boded well for areas such as REITs, as we have seen in the past six economic cycles where rates rose dramatically in a short period of time. Once the initial shock has hit and the dust settled, this asset class has provided handsome returns thereafter.
The Fund's significant overweight to utility stocks (representing about 19% of Fund assets at the end of the reporting period) was a negative even though our holdings outperformed the broader Utilities sector and have committed to dividend increases over the upcoming cycle. Overall, the Fund's focus is on companies with exposure to energy infrastructure in the U.S. Top contributors included names such as NV Energy (which is being acquired), Sempra Energy and NiSource, which own storage facilities and pipeline assets. We believe dividend growth and attractive businesses can help mitigate some of the negative sentiment associated with interest rate-sensitive stocks in the short run while also potentially positioning them for longer-term outperformance.
REITs (roughly 21% of Fund assets at the end of the reporting period) suffered from the perception that higher interest rates mean higher borrowing costs, which posed a drag on profitability. However, we believe that in an improving economy, higher rates indicate increasing property values and higher lease rate renewals. In the U.S., American Campus Communities and Simon Property Group were the largest detractors from performance. Though representing only a small percentage of the Fund, non-U.S. REITs were hurt by weaker currencies relative to the U.S. dollar. A Mexican REIT, Fibra Uno Administracion was a detractor. Certain emerging markets have interesting business and strong dividend growth prospects, which are now trading at historic discounts. We anticipate we will continue investing accordingly—while being mindful of the risk/reward dynamics.
One final note about Utilities and REITs: while they detracted this past fiscal year, history shows they can revert quickly to their mean and even surpass the broader equity markets soon thereafter.
The Fund had an overweight to the gold industry through names like Royal Gold and Freeport McMoRan, as well as several mining companies that include Newcrest, Newmont and Market Vectors ETF. These names detracted from returns as the U.S. dollar continued to gain strength and investors' demand for gold began to wane. We built the position as a hedge against the inflation potential of unprecedented central bank intervention, but inflation remained subdued. Elsewhere within Materials, Potash declined as its commodity price came under pressure from oversupply driven by Eastern European competitors and was sold in July, while our gold-related positions were eliminated during spring 2013.
Given the S&P 500's sector performance, several big drivers of positive attribution included Health Care holdings Roche, Novartis and Johnson & Johnson, asset manager BlackRock within Financials, and Meredith, a Consumer Discretionary name that was subsequently sold for a profit when it reached our target price. The S&P 500 has a large allocation to
6
Health Care, Financials and Consumer Discretionary stocks. As of period's end, we are significantly underweighted in each of these areas, which together represent nearly 40% of the market, and whose returns approached 30% this period.
Historically, the stock market has generated an average annual total return in the 10% to 12% range. The bond market has generated an average total return ranging between 4% to 6%. Our strategy seeks a 7%–9% return, with half derived from income and the other half from appreciation. Historically, the strategy has tended to perform well in challenging times but may not keep up in strong markets. We anticipate potential disruptions from near-term geopolitical tensions and upcoming U.S. political events. In our view, the recent underperformance of sectors like REITs and Utilities creates buying opportunities for certain companies that we believe are poised to profit from an uptick in economic growth. We remain dedicated to uncovering attractive investment opportunities, with a focus on valuations, free cash flow and dividend growth—which we feel will be rewarded over time.
Sincerely,


RICHARD S. LEVINE, TONY GLEASON AND SANDY POMEROY
PORTFOLIO CO-MANAGERS
Information about the principal risks of investing in the Fund is set forth in the prospectus and statement of additional information.
The portfolio composition, industries and holdings of the Fund are subject to change.
The opinions expressed are those of the Fund's portfolio managers. The opinions are as of the date of this report and are subject to change without notice.
7
Equity Income Fund (Unaudited)
TICKER SYMBOLS
Institutional Class | | NBHIX | |
Class A | | NBHAX | |
Class C | | NBHCX | |
Class R3 | | NBHRX | |
SECTOR ALLOCATION
(as a % of Total Investments) | |
Consumer Discretionary | | | 1.2 | % | |
Consumer Staples | | | 6.0 | | |
Energy | | | 13.4 | | |
Financials | | | 29.3 | | |
Health Care | | | 9.0 | | |
Industrials | | | 9.9 | | |
Information Technology | | | 4.3 | | |
Materials | | | 1.0 | | |
Telecommunication Services | | | 3.2 | | |
Utilities | | | 19.3 | | |
Other | | | 2.9 | | |
Short-Term Investments | | | 0.5 | | |
Total | | | 100.0 | % | |
PERFORMANCE HIGHLIGHTS9
| | | | | Average Annual Total
Return Ended 08/31/2013 | |
| | | Inception
Date* | | 1 Year | | 5 Years | | Life of
Fund | |
At NAV | |
| Institutional Class14 | | 06/09/2008 | | | 4.79 | % | | | 6.07 | % | | | 6.60 | % | |
| Class A14 | | 06/09/2008 | | | 4.32 | % | | | 5.62 | % | | | 6.27 | % | |
| Class C14 | | 06/09/2008 | | | 3.58 | % | | | 4.88 | % | | | 5.70 | % | |
| Class R314 | | 06/21/2010 | | | 3.94 | % | | | 5.59 | % | | | 6.24 | % | |
With Sales Charge | |
| Class A14 | | | | | –1.65 | % | | | 4.39 | % | | | 5.35 | % | |
| Class C14 | | | | | 2.58 | % | | | 4.88 | % | | | 5.70 | % | |
Index | |
| S&P 500 Index1,16 | | | | | 18.70 | % | | | 7.32 | % | | | 4.88 | % | |
*The performance data for each class includes the performance of the Fund's oldest share class, Trust Class, from November 2, 2006 through June 9, 2008. The performance data for Class R3 also includes the performance of the Fund's Institutional Class from June 9, 2008 through June 21, 2010. See endnote 14 for information about the effects of the different fees paid by each class.
The performance data quoted represent past performance and do not indicate future results. Current performance may be lower or higher than the performance data quoted. For more current performance data, please visit www.nb.com/performance.
The results shown in the table reflect the reinvestment of income dividends and other distributions, if any. The results do not reflect the effect of taxes a shareholder would pay on Fund distributions or on the redemption of Fund shares.
The investment return and principal value of an investment will fluctuate and shares, when redeemed, may be worth more or less than their original cost. Returns would have been lower if Neuberger Berman Management LLC ("Management") had not reimbursed certain expenses and/or waived a portion of the investment management fees during certain of the periods shown. Repayment by a class (of expenses previously reimbursed and/or fees previously waived by Management) will decrease the class's returns. Please see Note B in the Notes to Financial Statements for specific information regarding expense reimbursement and/or fee waiver arrangements.
As stated in the Fund's most recent prospectus, the total annual operating expense ratios for fiscal year 2012 were 0.71%, 1.13%, 1.84%, and 1.41% for Institutional Class, Class A, Class C, and Class R3 shares, respectively (before expense reimbursements and/or fee waivers, if any). The total annual operating expense ratio for each of Institutional Class, Class A, Class C and Class R3 includes the class's repayment of expenses previously reimbursed and/or fees previously waived by Management.
Returns shown with a sales charge reflect the deduction of the current maximum initial sales charge of 5.75% for Class A shares and the applicable contingent deferred sales charges (CDSC) for Class C shares. The maximum CDSC for Class C shares is 1%, which is reduced to 0% after 1 year. The performance of the Fund's share classes will differ primarily due to different sales charge structures and class expenses. Please see the prospectus for more information about sales charge structures, if any, and class expenses for your share class.
8
Equity Income Fund (Unaudited)
COMPARISON OF A $1,000,000 INVESTMENT14
(000's Omitted)
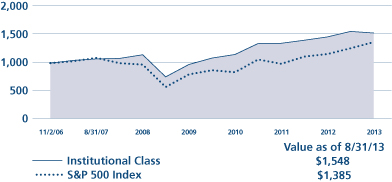
This graph shows the change in value of a hypothetical $1,000,000 investment in the Fund over the past 10 fiscal years, or since the Fund's inception if it has not operated for 10 years. The graph is based on the Institutional Class shares only; the performance of the Fund's share classes will differ primarily due to different sales charge structures and class expenses (see Performance Highlights chart on previous page). The result is compared with benchmarks, which include a broad-based market index and may include a more narrowly based index. Market indices have not been reduced to reflect any of the fees and costs of investing. The results shown in the graph reflect the reinvestment of income dividends and other distributions, if any. The results do not reflect the effect of taxes a shareholder would pay on Fund distributions or on the redemption of Fund shares. Results represent past performance and do not indicate future results.
9
Focus Fund Commentary (Unaudited)
Neuberger Berman Focus Fund Investor Class produced a 24.69% total return for the fiscal year ended August 31, 2013 and outperformed its benchmark, the S&P 500 Index, which posted an 18.70% return. (Performance for all share classes is provided in the table immediately following this letter.)
The stock market rose to record highs over the past 12 months with just a few bumps along the way, as continued sustenance from the U.S. Federal Reserve (the Fed) along with an improving domestic economy fueled momentum in equities, in our view, despite some overhanging macro issues. The first few months of the reporting period were somewhat challenging for stocks as the U.S. presidential election and ensuing policy decisions related to the fiscal cliff and other budgetary matters created uncertainty for investors. Yet the market's decline during this time marked a bottom for stocks as they quickly recovered alongside rising job growth and an improving U.S. housing market. The market received further support from a strong earnings season in January and February. Continued accommodative monetary policy on behalf of the Fed and European Central Bank perpetuated the market's steady rise over the next few months despite global woes that included weakening economic data from the eurozone and signs of a slowdown in China. The market then experienced a setback in late May/early June when investors fretted over continued sluggish U.S. manufacturing data while at the same time worried that the strengthening employment and housing markets would prompt the Fed to curb its accommodative monetary stance sooner than anticipated. However, the Fed stepped in with some reassuring language, which we believe alleviated immediate fears and cleared a path for stocks to ascend further despite mixed economic data and a rather tepid earnings season. The equity market attained new highs in July before retreating a bit in August as the focus began to turn towards the September meeting of the Fed's Federal Open Market Committee, in which it was anticipated the Fed might announce its intent to begin reducing its quantitative easing program in the near future. Escalating geopolitical tensions in the Middle East put added pressure on the market and caused a spike in oil and gas prices. Still, healthy corporate earnings projections for 2014, combined with strengthening macro data and accommodative monetary policy both at home and abroad, kept stocks in solidly positive territory for the past fiscal year.
Performance for the broad market (as measured by the S&P 500 Index) was led by the Financials and Health Care sectors, while the weakest areas were the Telecommunication Services and Information Technology (IT) sectors. Similar to the semi-annual period, Financials stocks rose over the fiscal year driven by, we believe, a stabilizing monetary system in Europe, improving credit conditions in the U.S. and a rising capital markets environment, which boosted profits for many diversified banks and brokers. The U.S. macro recovery also served the Consumer Discretionary sector as greater consumer spending lifted specialty retail stocks and a robust advertising industry drove earnings for several media companies. On the downside, the Telecommunication Services and IT sectors each suffered from the decline of a large industry bellwether, and IT had the added pressure of general sector rotation out of defensive areas and into more cyclical investments in light of the improving economy.
The Fund's return relative to the S&P 500 Index was largely attributable to strong stock selection in the Energy and IT sectors. Within the Energy sector, Cabot Oil & Gas had a total return of almost 90% over the past 12 months. Cabot is a leading low-cost gas producer in the U.S. with, in our view, the most desirable geological acreage in the Marcellus basin. Cabot's ascent was due in part to rising natural gas prices, but the stock also outperformed its gas-related peers owing to strong quarterly production results and solid forward-looking production guidance, as well as the company turning free cash flow positive during this time. Relative returns in the IT segment were lifted in part by a 30%+ rise in SanDisk during the year. SanDisk, which produces NAND flash memory, gained the most ground from January to March after industry manufacturers reported solid earnings results, which alleviated overhanging concerns about possible weak supply/demand dynamics for NAND. The company also reported a positive earnings surprise for every quarter during the past twelve months, which further boosted the stock. We continue to believe that SanDisk is well-positioned to benefit from industry tightening as companies reduce production capacity while demand for NAND rises as the technology is increasingly installed in PC's, notebooks, ultrabooks and other devices.
10
Although every sector of the Fund produced a positive overall return for the year, our investments in the Health Care and Materials segments detracted from performance on a relative basis. The primary source of loss within Health Care was Express Scripts, one of the largest pharmacy benefit managers in the U.S. The stock experienced a sharp decline in early November after management made some rather grim comments about expectations for 2013 that included "significant in-group member attrition, continued low utilization rates and increased client demands and expectations." Express Scripts traded within a limited range in the months that followed, and although we believe that management's tone was overly conservative and that Express Scripts could recover over time, we exited out of the position in late February to pursue other investment opportunities. In the Materials sector, the shortfall was largely due to gold producer Barrick Gold. We held a small position in the company during the period but the stock's decline caused a drag on absolute and relative performance. The decline in Barrick Gold was largely attributable to falling gold prices. The metal's price dropped as central banks around the world indicated a more imminent end to accommodative monetary policy, which reduced inflation expectations and caused interest rates to rise—two factors that typically have a negative impact on gold prices. Company-specific issues also weighed on the stock as Barrick Gold experienced complications that have delayed the development of its Pascua-Lama mine in Chile. In addition, concerns that the company may cut its dividend due to cash flow constraints also weighed on the stock and may continue to do so in the near term. We believe the long-term prospects for gold prices remain attractive, however; we sold out of Barrick Gold in late July to gain this exposure via other investments.
With the S&P 500 multiple closer to its historical average, we believe stocks on the whole are no longer "cheap" and further appreciation will be increasingly dependent on company fundamentals. Meanwhile, consensus estimates seem to convey that earnings growth for U.S. companies could remain strong due in part to improving economic conditions abroad in key regions such as Europe and China. While we believe the market has the potential to rise further over the long term, we maintain a balanced view in the near term in light of various macroeconomic headwinds that could materialize. We believe the domestic economy continues on a slow path to recovery but remains vulnerable to rising interest rates and negative consumer sentiment if the Fed hardens its monetary stance earlier than anticipated. The debate over the Federal debt ceiling and budget cuts has been contentious and the geopolitical crisis in the Middle East remains highly erratic—two factors that have grabbed investor attention in the past and caused heightened volatility in the market. For these reasons, we always focus our efforts on choosing stocks with what we believe are solid fundamentals and attractive valuations in order to create a fund that can appreciate over the long run despite the myriad factors that can cause the broad market to fluctuate in the interim.
Sincerely,


TIM CREEDON AND DAVID LEVINE
PORTFOLIO CO-MANAGERS
Information about the principal risks of investing in the Fund is set forth in the prospectus and statement of additional information.
The portfolio composition, industries and holdings of the Fund are subject to change.
The opinions expressed are those of the Fund's portfolio managers. The opinions are as of the date of this report and are subject to change without notice.
11
TICKER SYMBOLS
Investor Class | | NBSSX | |
Trust Class | | NBFCX | |
Advisor Class | | NBFAX | |
Institutional Class | | NFALX | |
Class A | | NFAAX | |
Class C | | NFACX | |
SECTOR ALLOCATION
(as a % of Total Investments) | |
Consumer Discretionary | | | 16.4 | % | |
Consumer Staples | | | 10.0 | | |
Energy | | | 10.5 | | |
Financials | | | 15.7 | | |
Health Care | | | 9.4 | | |
Industrials | | | 9.0 | | |
Information Technology | | | 17.8 | | |
Materials | | | 3.7 | | |
Utilities | | | 3.1 | | |
Short-Term Investments | | | 4.4 | | |
Total | | | 100.0 | % | |
PERFORMANCE HIGHLIGHTS8
| | | | | Average Annual Total
Return Ended 08/31/2013 | |
| | | Inception
Date | | 1 Year | | 5 Years | | 10 Years | | Life of
Fund | |
At NAV | |
Investor Class | | 10/19/1955 | | | 24.69 | % | | | 5.59 | % | | | 5.26 | % | | | 10.43 | % | |
| Trust Class3 | | 08/30/1993 | | | 24.48 | % | | | 5.37 | % | | | 5.05 | % | | | 10.43 | % | |
| Advisor Class4 | | 09/03/1996 | | | 24.22 | % | | | 5.15 | % | | | 4.84 | % | | | 10.37 | % | |
| Institutional Class5 | | 06/21/2010 | | | 24.89 | % | | | 5.73 | % | | | 5.33 | % | | | 10.45 | % | |
| Class A20 | | 06/21/2010 | | | 24.47 | % | | | 5.49 | % | | | 5.22 | % | | | 10.42 | % | |
| Class C20 | | 06/21/2010 | | | 23.61 | % | | | 4.99 | % | | | 4.97 | % | | | 10.38 | % | |
With Sales Charge | |
| Class A20 | | | | | 17.30 | % | | | 4.25 | % | | | 4.59 | % | | | 10.31 | % | |
| Class C20 | | | | | 22.61 | % | | | 4.99 | % | | | 4.97 | % | | | 10.38 | % | |
Index | |
| S&P 500 Index1,16 | | | | | 18.70 | % | | | 7.32 | % | | | 7.12 | % | | | 9.96 | % | |
The performance data quoted represent past performance and do not indicate future results. Current performance may be lower or higher than the performance data quoted. For more current performance data, please visit www.nb.com/performance.
The results shown in the table reflect the reinvestment of income dividends and other distributions, if any. The results do not reflect the effect of taxes a shareholder would pay on Fund distributions or on the redemption of Fund shares.
The investment return and principal value of an investment will fluctuate and shares, when redeemed, may be worth more or less than their original cost.
Returns would have been lower if Neuberger Berman Management LLC ("Management") had not reimbursed certain expenses and/or waived a portion of the investment management fees during certain of the periods shown. Repayment by a class (of expenses previously reimbursed and/or fees previously waived by Management) will decrease the class's returns. Please see Note B in the Notes to Financial Statements for specific information regarding expense reimbursement and/or fee waiver arrangements.
As stated in the Fund's most recent prospectus, the total annual operating expense ratios for fiscal year 2012 were 0.98%, 1.17%, 1.32%, 0.81%, 1.22%, and 1.97% for Investor Class, Trust Class, Advisor Class, Institutional Class, Class A and Class C shares, respectively (before expense reimbursements and/or fee waivers, if any). These expense ratios were 0.75%, 1.11%, and 1.86% for Institutional Class, Class A and Class C shares, respectively, after expense reimbursements and/or fee waivers.
Returns shown with a sales charge reflect the deduction of the current maximum initial sales charge of 5.75% for Class A shares and the applicable contingent deferred sales charges (CDSC) for Class C shares. The maximum CDSC for Class C shares is 1%, which is reduced to 0% after 1 year. The performance of the Fund's share classes will differ primarily due to different sales charge structures and class expenses. Please see the prospectus for more information about sales charge structures, if any, and class expenses for your share class.
12
COMPARISON OF A $10,000 INVESTMENT
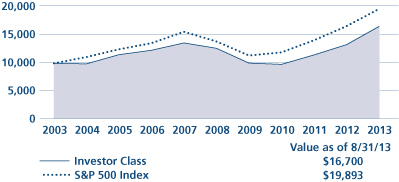
This graph shows the change in value of a hypothetical $10,000 investment in the Fund over the past 10 fiscal years, or since the Fund's inception if it has not operated for 10 years. The graph is based on the Investor Class shares only; the performance of the Fund's share classes will differ primarily due to different sales charge structures and class expenses (see Performance Highlights chart on previous page). The result is compared with benchmarks, which include a broad-based market index and may include a more narrowly based index. Market indices have not been reduced to reflect any of the fees and costs of investing. The results shown in the graph reflect the reinvestment of income dividends and other distributions, if any. The results do not reflect the effect of taxes a shareholder would pay on Fund distributions or on the redemption of Fund shares. Results represent past performance and do not indicate future results.
13
Genesis Fund Commentary (Unaudited)
Neuberger Berman Genesis Fund Investor Class posted a 23.91% total return for the fiscal year ended August 31, 2013 but underperformed its benchmark, the Russell 2000® Index, which provided a 26.27% return for the period. (Performance for all share classes is provided in the table immediately following this letter.)
Despite several periods of weakness and heightened volatility, the U.S. stock market produced strong results during the 12-month period. The market's resiliency was impressive given a number of macro issues, including the U.S. fiscal cliff and sequestration, the European sovereign debt crisis, several geopolitical issues and, more recently, indications from the U.S. Federal Reserve (the Fed) that it may begin tapering its asset purchase program. Supporting the stock market were generally solid corporate earnings and overall robust demand as investors sought to generate incremental returns in the low interest rate environment.
As well as the U.S. stock market performed, small-cap stocks generated even better returns as the Russell 2000 Index outperformed the S&P 500 Index, which gained 18.70% during the period. During the first six months of the fiscal year, small-cap companies with a high degree of financial leverage and low levels of profitability generated the strongest results. However, this trend was less evident during the second half of the period. As always, we emphasized higher-quality/less-speculative issues (companies with higher-than-average profitability and less financial leverage, which are also less cyclical) during the reporting period. This approach generally performs the best when the economy is expanding at a normal pace and is highly defensive during market downturns. Conversely, the Fund typically lags the performance of higher-leveraged/lower-quality companies when the economy is sharply accelerating. The Fund's higher-quality approach has also been a headwind given the Fed's highly accommodative monetary stance, as low interest rates tend to favor companies with higher leverage. With interest rates close to zero, we believe the penalties associated with corporations that have sizable cash positions, as well as the benefits associated with highly leveraged companies, appear to have more or less run their course.
While it produced a strong absolute return, the Fund's underperformance versus the benchmark was largely due to stock selection. In addition, while the portfolio's cash balance was modest and in line with its historical levels, it detracted from results given the market's sharp rally and the low yields available from cash instruments. The sectors that detracted the most from the Fund's performance were Industrials and Materials. Within the Industrials sector, a number of our high-quality machinery companies produced solid results, but lagged the benchmark. We experienced the same trend in the Materials sector, as a number of our stocks in the chemicals and containers and packaging industries were relative underperformers versus the benchmark. In addition, our position in Alamos Gold was detrimental to results. The company is a low cost Canadian gold miner with major operations in Mexico and Turkey. Its shares declined along with other gold mining stocks as the price of gold declined sharply. Elsewhere, in the Information Technology (IT) sector, our positions in NETGEAR and MICROS Systems detracted from performance. NETGEAR provides networking products designed for small businesses and homes. The company encountered a number of headwinds, including supply chain issues that limited its ability to ship new products and weakness in its European markets. MICROS Systems designs, manufactures, markets and services information solutions for the restaurant, hotel and retail industries. The company was negatively impacted by a slowdown in its core markets, primarily in Europe. Additionally, there is growing concern around emerging competitors that could impact MICROS Systems' business.
Contributing the most to performance was stock selection in the Financials and Energy sectors. Within Financials, our decision to not own real estate investment trusts (REITs), emanating from their low barriers to entry and frequent external financing requirements, was beneficial for results. REITs produced very poor results during the last four months of the period given expectations for Fed tapering and rising interest rates. Our position in Ocwen Financial, which is engaged in the servicing and origination of mortgage loans, was a significant contributor to performance. Its shares almost doubled during the reporting period as the company has significantly grown its business as banks continue to reduce their exposure in this area. Within the Energy sector, Oceaneering International and Gulfport Energy were standout performers. Oceaneering International produces equipment for deep water oil production and exploration. The
14
company benefited as deep water well completions are accelerating, supported by higher oil prices. Gulfport Energy is an exploration and production company with major operations in Louisiana, Ohio and Canada. The company continues to develop its Utica Shale acreage, which has highly favorable economics in our opinion.
We were generally comfortable with the Fund's overall positioning from a sector perspective during the reporting period. However, we did make several adjustments. For example, we increased our allocations to the Financials, IT and Consumer Discretionary sectors, while paring our exposures to the Materials, Energy and Utilities sectors.
While there are a number of risks that could derail the strength in equities, we believe there are several positive factors supporting the U.S. economy and, subsequently, U.S.-centric equities. The energy renaissance in the U.S. has benefited the country by improving trade imbalances and mitigating the risks associated with the Middle East, as well as benefiting both corporations and consumers via lower natural gas prices. We believe the housing market has showed continued signs of improvement and the recapitalization of the U.S. financial sector has left U.S. banks in relatively good shape versus their global peers. Potential issues worth noting are uncertainties surrounding the eventual timing and magnitude of Fed tapering, questions regarding the raising of the U.S. debt ceiling and continued high levels of debt in both the U.S. and abroad. Even though the short-term outlook for the equity market is as uncertain as ever, we remain confident that the high-quality/free-cash flow generating businesses in the portfolio could serve investors well over the long run. This is especially true as Fed policy has favored lower-quality/higher-leveraged companies in recent reporting periods.
Sincerely,


JUDITH M. VALE AND ROBERT D'ALELIO
PORTFOLIO CO-MANAGERS
Information about the principal risks of investing in the Fund is set forth in the prospectus and statement of additional information.
The portfolio composition, industries and holdings of the Fund are subject to change.
The opinions expressed are those of the Fund's portfolio managers. The opinions are as of the date of this report and are subject to change without notice.
15
TICKER SYMBOLS
Investor Class | | NBGNX | |
Trust Class | | NBGEX | |
Advisor Class | | NBGAX | |
Institutional Class | | NBGIX | |
Class R6 | | NRGSX | |
SECTOR ALLOCATION
(as a % of Total Investments) | |
Consumer Discretionary | | | 11.1 | % | |
Consumer Staples | | | 6.9 | | |
Energy | | | 7.5 | | |
Financials | | | 13.2 | | |
Health Care | | | 10.9 | | |
Industrials | | | 19.9 | | |
Information Technology | | | 14.3 | | |
Materials | | | 10.0 | | |
Utilities | | | 1.9 | | |
Short-Term Investments | | | 4.3 | | |
Total | | | 100.0 | % | |
PERFORMANCE HIGHLIGHTS
| | | | | Average Annual Total
Return Ended 08/31/2013 | |
| | | Inception
Date | | 1 Year | | 5 Years | | 10 Years | | Life of
Fund | |
Investor Class | | 09/27/1988 | | | 23.91 | % | | | 6.58 | % | | | 10.82 | % | | | 12.59 | % | |
| Trust Class3 | | 08/26/1993 | | | 23.81 | % | | | 6.51 | % | | | 10.76 | % | | | 12.58 | % | |
| Advisor Class4 | | 04/02/1997 | | | 23.46 | % | | | 6.23 | % | | | 10.47 | % | | | 12.38 | % | |
| Institutional Class5 | | 07/01/1999 | | | 24.12 | % | | | 6.79 | % | | | 11.05 | % | | | 12.74 | % | |
| Class R625 | | 03/15/2013 | | | 24.06 | % | | | 6.61 | % | | | 10.84 | % | | | 12.60 | % | |
Index | |
| Russell 2000® Index1,16 | | | | | 26.27 | % | | | 7.98 | % | | | 8.76 | % | | | 9.62 | % | |
The performance data quoted represent past performance and do not indicate future results. Current performance may be lower or higher than the performance data quoted. For more current performance data, please visit www.nb.com/performance.
The results shown in the table reflect the reinvestment of income dividends and other distributions, if any. The results do not reflect the effect of taxes a shareholder would pay on Fund distributions or on the redemption of Fund shares.
The investment return and principal value of an investment will fluctuate and shares, when redeemed, may be worth more or less than their original cost.
Returns would have been lower if Neuberger Berman Management LLC ("Management") had not reimbursed certain expenses and/or waived a portion of the investment management fees during certain of the periods shown. Repayment by a class (of expenses previously reimbursed and/or fees previously waived by Management) will decrease the class's returns. Please see Note B in the Notes to Financial Statements for specific information regarding expense reimbursement and/or fee waiver arrangements.
As stated in the Fund's most recent prospectus, the total annual operating expense ratios for fiscal year 2012 (estimated for 2013 for Class R6) were 1.03%, 1.11%, 1.38%, 0.86%, and 0.78% for Investor Class, Trust Class, Advisor Class, Institutional Class, and Class R6 shares, respectively (before expense reimbursements and/or fee waivers, if any). The expense ratio was 0.85% for Institutional Class after expense reimbursements and/or fee waivers.
16
COMPARISON OF A $10,000 INVESTMENT

This graph shows the change in value of a hypothetical $10,000 investment in the Fund over the past 10 fiscal years, or since the Fund's inception if it has not operated for 10 years. The graph is based on the Investor Class shares only; the performance of the Fund's share classes will differ primarily due to different class expenses (see Performance Highlights chart on previous page). The result is compared with benchmarks, which include a broad-based market index and may include a more narrowly based index. Market indices have not been reduced to reflect any of the fees and costs of investing. The results shown in the graph reflect the reinvestment of income dividends and other distributions, if any. The results do not reflect the effect of taxes a shareholder would pay on Fund distributions or on the redemption of Fund shares. Results represent past performance and do not indicate future results.
17
Global Equity Fund Commentary (Unaudited)
Neuberger Berman Global Equity Fund Institutional Class generated an 11.65% total return for the fiscal year ended August 31, 2013 but trailed its benchmark, the MSCI World Index, which provided a return of 18.31%. (Performance for all share classes is provided in the table immediately following this letter.)
The MSCI World Index rose significantly this period, with positive returns across all sectors. Sentiment improved over the period, with supportive European Central Bank statements and resolution of the U.S. fiscal cliff followed by improving U.S. and eurozone growth data. This May, however, the U.S. Federal Reserve's (the Fed) tapering announcement startled investors with prospects of higher global interest rates. Volatility increased as investors worked to balance rate fears and heightened geopolitical concerns with generally better (ex-China) growth data. Consumer Discretionary, Financials and Health Care stocks outperformed, while Materials, Energy and Utilities underperformed—the first two on reduced Chinese demand, and the third on interest rates concerns.
Buoyed by improving growth and investor sentiment, large index components including the U.S., Japan and much of the eurozone outperformed. While all markets were positive, Greece, Finland and Ireland saw the strongest returns. Israel, along with Materials- and Energy-focused Canada, and Norway lagged the benchmark.
Within the portfolio, relative underperformance versus the benchmark primarily resulted from Financials, where we continue to underweight the large U.S. and Japanese banks that led the index this year. An overweight and stock selection within the weak Information Technology (IT) sector was another factor, as were certain Energy holdings. We saw relative benefits from stock selection within Materials and Health Care, and from a zero allocation to Utilities. By country, holdings in Israel, Germany and Switzerland were most beneficial, while UK, Canadian and Chinese holdings detracted.
In terms of individual holdings, many top contributors this year were U.S.-based, including packaging and food safety specialist Sealed Air and asset manager BlackRock. Sealed Air saw increased demand for their packaging and high performance material products as the U.S. economy continued its recovery. BlackRock outperformed as investors moved from fixed income into higher margin equity and alternative investments. Germany's Continental was another significant contributor. The tire and auto parts firm benefited from an uptick in global auto sales.
Underperformers included Apple, New Gold and ICICI Bank. Apple disappointed the market with lower gross margins. However, we believe recent software and services innovations will allow Apple to maintain margins going forward. Canadian gold producer New Gold suffered as the price of gold continued to retreat. Indian bank ICICI sold off with the rest of the Indian market following Mr. Bernanke's tapering comments in late May. The market grew concerned about the impact capital flight would have on India's ability to fund its current account deficit and on the value of the rupee.
Equity markets enjoyed strong performance through late May with investors initially discounting weak economic indicators. More recently, however, markets reversed their positive momentum, as policy uncertainty returned to the fore. The prospect of a Fed "taper" had raised concerns of higher global interest rates and dampened risk appetite, although exact timing remains unknown. Concurrently, lack of clarity on structural reform in Japan, worries about the Chinese banking system, and unrest in a number of nations have added to market concerns.
With policy uncertainty in the U.S., Japan and China, we remain focused on identifying what we believe are high-return companies delivering bottom-line earnings growth—typically companies with stable revenue streams, often as a result of operations spanning all regions. To this end, we are overweighted in IT, refined materials, and industrial names that meet these requirements, while underweighted in the more cyclically and/or China-dependent Financials and bulk Materials areas. We reiterate our doubts on Japan, as we believe the weaker yen will raise costs (e.g., imported energy) domestically rather than just improve wages. That being said, we do have exposure to quality Japanese exporters that we believe could benefit from a weaker yen. While our emerging markets holdings have fallen—as much on currency as stock price—we believe these names have strong franchises with consumer end-markets that could benefit as these markets mature.
18
In terms of sectors, our IT overweight is focused on market-leading equipment and services businesses. In Materials, we sold our industrial/bulk Materials exposure on concerns that further slowing in China would continue to pressure prices. Instead, our overweight centers around refined chemical names that we believe have pricing power and relatively stable end markets. Industrials is a third overweight, where our focus is differentiated innovators. Our Consumer Discretionary holdings are diversified across autos, as U.S. and China car sales have been showing continued growth, and North American retailers, based on consumer spending trends. We remain underweighted in Financials as developed market banks continue to be at the mercy of central bank policy and regulatory change.
In a market caught between policy and geopolitical uncertainties and clear signs of improving global growth, we anticipate that our fundamentals-focused Quality at a Reasonable Price discipline could continue to guide us to opportunities poised to deliver strong risk-adjusted returns over the longer term.
Sincerely,


BENJAMIN SEGAL AND SAURIN SHAH
PORTFOLIO CO-MANAGERS
Information about the principal risks of investing in the Fund is set forth in the prospectus and statement of additional information.
The portfolio composition, industries and holdings of the Fund are subject to change.
The opinions expressed are those of the Fund's portfolio managers. The opinions are as of the date of this report and are subject to change without notice.
19
Global Equity Fund (Unaudited)
TICKER SYMBOLS
Institutional Class | | NGQIX | |
Class A | | NGQAX | |
Class C | | NGQCX | |
SECTOR ALLOCATION
(as a % of Total Investments) | |
Consumer Discretionary | | | 11.5 | % | |
Consumer Staples | | | 8.6 | | |
Energy | | | 7.4 | | |
Financials | | | 15.3 | | |
Health Care | | | 12.8 | | |
Industrials | | | 13.2 | | |
Information Technology | | | 16.6 | | |
Materials | | | 10.1 | | |
Telecommunication Services | | | 2.6 | | |
Short-Term Investments | | | 1.9 | | |
Total | | | 100.0 | % | |
PERFORMANCE HIGHLIGHTS9
| | | | | Average Annual Total
Return Ended 08/31/2013 | |
| | | Inception
Date | | 1 Year | | Life of
Fund | |
At NAV | |
Institutional Class | | 06/30/2011 | | | 11.65 | % | | | 2.03 | % | |
Class A | | 06/30/2011 | | | 11.20 | % | | | 1.65 | % | |
Class C | | 06/30/2011 | | | 10.34 | % | | | 0.90 | % | |
With Sales Charge | |
Class A | | | | | 4.78 | % | | | –1.08 | % | |
Class C | | | | | 9.34 | % | | | 0.90 | % | |
Index | |
| MSCI World Index1,16 | | | | | 18.31 | % | | | 8.36 | % | |
The performance data quoted represent past performance and do not indicate future results. Current performance may be lower or higher than the performance data quoted. For more current performance data, please visit www.nb.com/performance.
The results shown in the table reflect the reinvestment of income dividends and other distributions, if any. The results do not reflect the effect of taxes a shareholder would pay on Fund distributions or on the redemption of Fund shares.
The investment return and principal value of an investment will fluctuate and shares, when redeemed, may be worth more or less than their original cost.
Returns would have been lower if Neuberger Berman Management LLC ("Management") had not reimbursed certain expenses and/or waived a portion of the investment management fees during certain of the periods shown. Repayment by a class (of expenses previously reimbursed and/or fees previously waived by Management) will decrease the class's returns. Please see Note B in the Notes to Financial Statements for specific information regarding expense reimbursement and/or fee waiver arrangements.
As stated in the Fund's most recent prospectus, the total annual operating expense ratios for fiscal year 2012 were 10.85%, 11.83%, and 12.88% for Institutional Class, Class A and Class C shares, respectively (before expense reimbursements and/or fee waivers, if any). These expense ratios were 1.15%, 1.51% and 2.26% for Institutional Class, Class A and Class C shares, respectively, after expense reimbursements and/or fee waivers.
Returns shown with a sales charge reflect the deduction of the current maximum initial sales charge of 5.75% for Class A shares and the applicable contingent deferred sales charges (CDSC) for Class C shares. The maximum CDSC for Class C shares is 1%, which is reduced to 0% after 1 year. The performance of the Fund's share classes will differ primarily due to different sales charge structures and class expenses. Please see the prospectus for more information about sales charge structures, if any, and class expenses for your share class.
20
Global Equity Fund (Unaudited)
COMPARISON OF A $1,000,000 INVESTMENT
(000's Omitted)

This graph shows the change in value of a hypothetical $1,000,000 investment in the Fund over the past 10 fiscal years, or since the Fund's inception if it has not operated for 10 years. The graph is based on the Institutional Class shares only; the performance of the Fund's share classes will differ primarily due to different sales charge structures and class expenses (see Performance Highlights chart on previous page). The result is compared with benchmarks, which include a broad-based market index and may include a more narrowly based index. Market indices have not been reduced to reflect any of the fees and costs of investing. The results shown in the graph reflect the reinvestment of income dividends and other distributions, if any. The results do not reflect the effect of taxes a shareholder would pay on Fund distributions or on the redemption of Fund shares. Results represent past performance and do not indicate future results.
21
Global Thematic Opportunities Fund Commentary (Unaudited)
Neuberger Berman Global Thematic Opportunities Fund Institutional Class generated a 9.53% total return for the fiscal year ended August 31, 2013 but underperformed its benchmark, the MSCI All Country World Index, which generated a return of 16.11%. (Performance for all share classes is provided in the table immediately following this letter.)
Investor sentiment improved as this reporting period progressed—from relief last fall that the European Central Bank would not let the eurozone fail, to offsetting a slower, more internally focused China with improving economic data from the U.S.
In the U.S., macro uncertainties faded with the resolution of last year's fiscal cliff and an improvement in housing and unemployment data, in addition to a natural gas renaissance which supported optimism. Markets paused following the U.S. Federal Reserve's tapering announcement in May, but shrugged it off against the better economic news. Meanwhile in Japan, "Abenomics" (economic policies advocated by Shinz? Abe, the current prime minister of Japan) continued to drive the market. Globally, the U.S. outperformed, followed by developed international markets, while emerging markets closed the year roughly flat.
The portfolio's "Emerging Consumer" theme, the largest by exposure as the year began, and currently the second largest, saw mixed results as emerging markets underperformed. The adage, "China sneezes and the emerging markets catch a cold" held true, regardless of whether a specific market was directly threatened by China's declining demand.
Performance in the "Emerging Consumer" theme benefited from Universal Robina, a Filipino snack foods conglomerate with ambitious plans for increasing market share across Southeast Asia. We have sold the position. Sa Sa International, a Hong Kong-based cosmetics business was also additive, enjoying exposure to both luxury and value-oriented consumers in a segment that seems fairly insulated.
Detractors included Indonesia's Global Mediacom, which we sold as its price pulled back. Indonesia was among the stronger markets for the past several years, but declined as capital left emerging markets, hurting its currency. Hong Kong-based Trinity Limited, a fashion retailer that declined with waning Chinese consumer spending, was also sold.
We made a conscious decision to reduce the portfolio's emerging markets exposure over this fiscal period—down from approximately 24% to 10% of total net assets—on the basis of the Chinese slowdown. Anticipating a trickle-down fall off in demand, we cut back on holdings with direct ties to China, especially in Thailand, Indonesia and the Philippines. This year's nearly 18% disparity between the MSCI Emerging Markets Index and the S&P 500 Index is something we generally only see about once a cycle.
Our "Money in Motion" theme contained two U.S.-based top contributors. Asset manager BlackRock benefited from increased ETF investing and on margin expansion as investors shifted from fixed income to equities. We believe insurance giant American International Group is in great shape following its bailout, an investment that ultimately earned the government $17 billion.
On the negative side, Hong Kong-based First Pacific was a detractor. China's work to reduce economic excesses put pressure on this company, which operates infrastructure, mining, investment management and other businesses. Japan's Mitsubishi UFJ Financial, a newer holding, saw a short-term pullback. We believe in the company's prospects and anticipate that Japanese banks will benefit from Shinz? Abe's bold monetary policies. We began building our Japanese exposure substantially in 2012, with banks, automakers and others that were benefiting from better (ex-China) export conditions.
Within our "Up, Up and Away" theme, we believe Boeing, which should continue to benefit from increases in air travel, was additive. Though volatile during its battery problems, it was purchased at a favorable price. Honeywell International, a supplier to both sides of the Boeing/Airbus duopoly, also outperformed.
22
"Agriculture," among the weaker themes this period, was reduced as an allocation by about 10 percentage points. Japanese tractor manufacturer Kubota was a top contributor, benefiting with Japanese exports, while Canada's Potash Corporation was our largest detractor. Potash declined as Eastern European rivals created supply gluts in the commodity, thus damaging its price. Chile's SQM also declined. Each of these holdings was sold.
With inflation seemingly benign, our "Inflation/Financial Repression" theme underperformed and was retired in the second quarter. Detractor Market Vectors Gold Trust ETF was part of this theme, designed to hedge against the inflationary pressures we expected after years of unprecedented global central bank easing.
Looking ahead, while there are unknowns on the horizon from the Middle East to potentially rising interest rates, we remain optimistic. We believe the global economy is in a state of slow recovery with GDP growth modestly improving in the U.S.—the world's largest market—and better prospects in Europe. Businesses and consumers are generally healthy in our opinion, both with improved balance sheets after the downturn.
With this optimistic perspective, we are working to take advantage of the compelling valuations we see—often as good as they've been since 2008, in our opinion. We think this could position the portfolio well if the spread between the U.S. rally and the rest of the world begins to compress. We remain dedicated to scouring the globe for the most attractive niche businesses that trade at appealing valuations. We believe that even when we are early to a theme, we have learned from decades of investing that being opportunistic, disciplined and patient with our investments can be rewarded through attractive returns over time.
Sincerely,


ANTHONY GLEASON, SANDY POMEROY, WILLIAM HUNTER AND RICHARD LEVINE
PORTFOLIO CO-MANAGERS
Information about the principal risks of investing in the Fund is set forth in the prospectus and statement of additional information.
The portfolio composition, industries and holdings of the Fund are subject to change.
The opinions expressed are those of the Fund's portfolio managers. The opinions are as of the date of this report and are subject to change without notice.
23
Global Thematic Opportunities Fund (Unaudited)
TICKER SYMBOLS
Institutional Class | | NGHIX | |
Class A | | NGHAX | |
Class C | | NGHCX | |
SECTOR ALLOCATION
(as a % of Total Investments) | |
Consumer Discretionary | | | 15.8 | % | |
Consumer Staples | | | 5.7 | | |
Energy | | | 4.5 | | |
Financials | | | 22.6 | | |
Health Care | | | 8.3 | | |
Industrials | | | 18.3 | | |
Information Technology | | | 14.5 | | |
Telecommunication Services | | | 2.9 | | |
Short-Term Investments | | | 7.4 | | |
Total | | | 100.0 | % | |
PERFORMANCE HIGHLIGHTS
| | | | | Average Annual Total
Return Ended 08/31/2013 | |
| | | Inception
Date | | 1 Year | | Life of
Fund | |
At NAV | |
Institutional Class | | 06/30/2011 | | | 9.53 | % | | | –1.89 | % | |
Class A | | 06/30/2011 | | | 9.20 | % | | | –2.25 | % | |
Class C | | 06/30/2011 | | | 8.34 | % | | | –2.98 | % | |
With Sales Charge | |
Class A | | | | | 2.93 | % | | | –4.88 | % | |
Class C | | | | | 7.34 | % | | | –2.98 | % | |
Index | |
| MSCI All Country World Index1,16 | | | | | 16.11 | % | | | 6.49 | % | |
The performance data quoted represent past performance and do not indicate future results. Current performance may be lower or higher than the performance data quoted. For more current performance data, please visit www.nb.com/performance.
The results shown in the table reflect the reinvestment of income dividends and other distributions, if any. The results do not reflect the effect of taxes a shareholder would pay on Fund distributions or on the redemption of Fund shares.
The investment return and principal value of an investment will fluctuate and shares, when redeemed, may be worth more or less than their original cost.
Returns would have been lower if Neuberger Berman Management LLC ("Management") had not reimbursed certain expenses and/or waived a portion of the investment management fees during certain of the periods shown. Repayment by a class (of expenses previously reimbursed and/or fees previously waived by Management) will decrease the class's returns. Please see Note B in the Notes to Financial Statements for specific information regarding expense reimbursement and/or fee waiver arrangements.
As stated in the Fund's most recent prospectus, the total annual operating expense ratios for fiscal year 2012 were 1.87%, 2.27% and 3.13%, for Institutional Class, Class A and Class C shares, respectively (before expense reimbursements and/or fee waivers, if any). These expense ratios were 1.27%, 1.63% and 2.38% for Institutional Class, Class A and Class C shares, respectively, after expense reimbursements and/or fee waivers.
Returns shown with a sales charge reflect the deduction of the current maximum initial sales charge of 5.75% for Class A shares and the applicable contingent deferred sales charges (CDSC) for Class C shares. The maximum CDSC for Class C shares is 1%, which is reduced to 0% after 1 year. The performance of the Fund's share classes will differ primarily due to different sales charge structures and class expenses. Please see the prospectus for more information about sales charge structures, if any, and class expenses for your share class.
24
Global Thematic Opportunities Fund (Unaudited)
COMPARISON OF A $1,000,000 INVESTMENT
(000's Omitted)

This graph shows the change in value of a hypothetical $1,000,000 investment in the Fund over the past 10 fiscal years, or since the Fund's inception if it has not operated for 10 years. The graph is based on the Institutional Class shares only; the performance of the Fund's share classes will differ primarily due to different sales charge structures and class expenses (see Performance Highlights chart on previous page). The result is compared with benchmarks, which include a broad-based market index and may include a more narrowly based index. Market indices have not been reduced to reflect any of the fees and costs of investing. The results shown in the graph reflect the reinvestment of income dividends and other distributions, if any. The results do not reflect the effect of taxes a shareholder would pay on Fund distributions or on the redemption of Fund shares. Results represent past performance and do not indicate future results.
25
Greater China Equity Fund Commentary (Unaudited)
Neuberger Berman Greater China Equity Fund was launched on July 17, 2013. From its inception through August 31, 2013, the Fund's Institutional Class generated a 1.60% total return but underperformed its benchmark, the MSCI China Index, which generated a 4.79% return for the same period. During this brief reporting period, the Fund was still building its portfolio, which may have been a source of the underperformance versus the index. (Performance for all share classes is provided in the table immediately following this letter.)
The Fund seeks long-term growth of capital and aims to outperform the Greater China equity markets by focusing on what we believe are undervalued mid- and large-cap stocks. We employ a bottom-up, research-intensive and fundamentals-driven approach to selecting investments. Given the high return dispersions across Chinese companies, the investment process is rooted in stock picking. We run a "private equity-like" approach to investing which means we spend an extensive amount of time researching companies and analyzing fundamentals before building conviction on a stock. The investment team seeks to gain a deep understanding of companies through discussions with suppliers, clients, competitors and government agencies, which they believe is a key element to investing in inefficient markets. Ongoing assessments of macroeconomic and market factors augment our stock-picking discipline. We generally prefer companies with high visibility of revenues and earnings and recurring operating cash flows from core businesses.
The Fund is currently focused on domestic consumption-driven stocks, including real estate, retail, auto, food and beverage, health care and suppliers of domestic infrastructure-related machinery, equipment and utilities. As of August 31, 2013, the Fund's largest sector underweight relative to the benchmark was Energy, and the largest sector overweight was Utilities. The Fund also held underweight positions in Financials, Telecommunication Services, Information Technology, Consumer Staples and Industrials, and overweight positions in Health Care, Consumer Discretionary and Materials. The Fund's top 10 positions comprised about 39% of the Fund's of total portfolio assets at the end of August.
Reviewing the recent market environment, the domestic China A-shares market stabilized in July as liquidity concerns eased after the Shanghai Interbank Offered Rate (SHIBOR) and repo rates (the discount rate at which a central bank repurchases government securities from commercial banks) came down considerably. Despite discouraging June export data, sentiment remained relatively positive after Premier Li Keqiang underscored the Chinese government's commitment to achieve 7% GDP growth. Their stated goal is to transform the economy over time while maintaining stable economic development. Towards the end of the July, Chinese equities retreated briefly due to the People's Bank of China removing controls on lending interest rates (to reduce financing costs) and auditing local government debt. However, the China equity markets closed the month higher on expectations that the State Council would announce supportive policies.
In August, the China A-shares market outperformed global equities as strong macro data released for July boosted investors' confidence in the stability of China's growth while second-quarter earnings for a number of sectors beat expectations. Investor sentiment also improved due to increasing railway investment targets, the State Council's announcement to support consumption of information products and services, approval of Shanghai's free trade zone and reform of the financial industry. On the other hand, the offshore China equity markets (equities listed outside of
26
mainland China) were affected by tensions due to the U.S. and Syria situation, concerns over the U.S. Federal Reserve's tapering and disappointing performance from the South Asian emerging markets. The offshore market diverged from the onshore market and ended the month with relatively modest gains.
Sincerely,


LIHUI TANG AND FRANK YAO
PORTFOLIO CO-MANAGERS
Information about the principal risks of investing in the Fund is set forth in the prospectus and statement of additional information.
The portfolio composition, industries and holdings of the Fund are subject to change.
The opinions expressed are those of the Fund's portfolio managers. The opinions are as of the date of this report and are subject to change without notice.
27
Greater China Equity Fund (Unaudited)
TICKER SYMBOLS
Institutional Class | | NCEIX | |
Class A | | NCEAX | |
Class C | | NCECX | |
SECTOR ALLOCATION
(as a % of Total Investments) | |
Consumer Discretionary | | | 12.2 | % | |
Consumer Staples | | | 3.3 | | |
Energy | | | 7.9 | | |
Financials | | | 29.3 | | |
Health Care | | | 8.4 | | |
Industrials | | | 3.4 | | |
Information Technology | | | 7.5 | | |
Materials | | | 6.0 | | |
Telecommunication Services | | | 2.8 | | |
Utilities | | | 11.2 | | |
Rights | | | 0.0 | | |
Short-Term Investments | | | 8.0 | | |
Total | | | 100.0 | % | |
PERFORMANCE HIGHLIGHTS
| | | Inception
Date | | Cumulative Total
Return
Ended 08/31/2013
Life of Fund | |
At NAV | |
Institutional Class | | 07/17/2013 | | | 1.60 | % | |
Class A | | 07/17/2013 | | | 1.60 | % | |
Class C | | 07/17/2013 | | | 1.50 | % | |
With Sales Charge | |
Class A | | | | | –4.24 | % | |
Class C | | | | | 0.50 | % | |
Index | |
| MSCI China Index1,16 | | | | | 4.79 | % | |
The performance data quoted represent past performance and do not indicate future results. Current performance may be lower or higher than the performance data quoted. For more current performance data, please visit www.nb.com/performance.
The results shown in the table reflect the reinvestment of income dividends and other distributions, if any. The results do not reflect the effect of taxes a shareholder would pay on Fund distributions or on the redemption of Fund shares.
The investment return and principal value of an investment will fluctuate and shares, when redeemed, may be worth more or less than their original cost.
Returns would have been lower if Neuberger Berman Management LLC ("Management") had not reimbursed certain expenses and/or waived a portion of the investment management fees during certain of the periods shown. Repayment by a class (of expenses previously reimbursed and/or fees previously waived by Management) will decrease the class's returns. Please see Note B in the Notes to Financial Statements for specific information regarding expense reimbursement and/or fee waiver arrangements.
As stated in the Fund's most recent prospectus, the estimated total annual operating expense ratios for fiscal year 2013 were 1.91%, 2.27% and 3.02% for Institutional Class, Class A and Class C shares, respectively (before expense reimbursements and/or fee waivers, if any). These estimated expense ratios were 1.51%, 1.87% and 2.62% for Institutional Class, Class A and Class C shares, respectively, after expense reimbursements and/or fee waivers.
Returns shown with a sales charge reflect the deduction of the current maximum initial sales charge of 5.75% for Class A shares and the applicable contingent deferred sales charges (CDSC) for Class C shares. The maximum CDSC for Class C shares is 1%, which is reduced to 0% after 1 year. The performance of the Fund's share classes will differ primarily due to different sales charge structures and class expenses. Please see the prospectus for more information about sales charge structures, if any, and class expenses for your share class.
28
Greater China Equity Fund (Unaudited)
COMPARISON OF A $1,000,000 INVESTMENT
(000's Omitted)
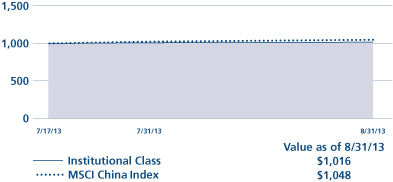
This graph shows the change in value of a hypothetical $1,000,000 investment in the Fund over the past 10 fiscal years, or since the Fund's inception if it has not operated for 10 years. The graph is based on the Institutional Class shares only; the performance of the Fund's share classes will differ primarily due to different sales charge structures and class expenses (see Performance Highlights chart on previous page). The result is compared with benchmarks, which include a broad-based market index and may include a more narrowly based index. Market indices have not been reduced to reflect any of the fees and costs of investing. The results shown in the graph reflect the reinvestment of income dividends and other distributions, if any. The results do not reflect the effect of taxes a shareholder would pay on Fund distributions or on the redemption of Fund shares. Results represent past performance and do not indicate future results.
29
Guardian Fund Commentary (Unaudited)
Neuberger Berman Guardian Fund Investor Class generated a 22.54% total return for the fiscal year ended August 31, 2013 and outperformed its benchmark, the S&P 500 Index, which generated an 18.70% return for the period. (Performance for all share classes is provided in the table immediately following this letter.)
From our perspective, the resolution of the fiscal cliff was the key external event driving equity market performance this past fiscal year. Businesses and investors closed 2012 worried about whether, how and when the fiscal cliff would be resolved—and about possible impacts on taxes, government spending, and U.S. Federal Reserve policy.
Although this resolution contained the fiscal drag of higher payroll taxes, the unwinding of several Bush tax cuts, sequester cuts and the end of stimulus spending, greater clarity on the direction forward was positive for business and investor sentiment, in our view, which in turn stimulated investment and consumer spending, thereby supporting modest but sustainable GDP growth thus far into 2013. For the equity market, greater clarity on tax rates and policy improved sentiment, which resulted in a decline in equity risk premiums and played a large role in 2013's rally.
At the company level, we are seeing management teams move forward with decisions that were held in abeyance, such as deploying liquidity toward M&A activity, capital spending, share buybacks and dividend increases—all positives for equity valuations and potential drivers of incremental earnings going forward.
Within our portfolio, our businesses continued to deliver solid execution in a slow-growth world, just as they have since the financial crisis—demonstrating growth ahead of GDP and their peers. As macroeconomic concerns abated and investor focus returned to company-specific fundamentals, strong growth was rewarded.
As such, stock selection was the dominant factor in our relative performance versus the benchmark during the reporting period, with key contributions coming from several of our largest portfolio positions. These included Texas Instruments, Danaher and Roche—long-term holdings whose strong organic growth characteristics were recognized by investors.
Performance was hindered somewhat by Newfield Exploration, which was sold, and BG Group—Energy names that saw production disappointments last fall. Altera was another laggard, although we believe the company's market position, growth plans, and shareholder-friendly policies may bode well for the future.
The summer of 2013 was the first in five where investors were not struggling to comprehend the scope and impact of a debt-induced macroeconomic challenge somewhere in the world. While the summer's market activity was generally subdued, we remained active and opportunistic. For example, we sold Target and added Costco, TJX Cos. and TW Telecom this August alone.
We re-introduced Target back in 2011 on the anticipation that its merchandising strategy, grocery sections, and customer loyalty initiatives would accelerate growth. The company executed well and earnings expanded. However, recent same-store sales comparisons decelerated as these programs matured. Considering this and growing concerns about on-line competition, we re-evaluated our premise and exited the position.
We had owned Costco in the past and continue to like its traffic-driven "treasure hunt" merchandising model which, unlike most brick and mortar retailers, has kept in-store traffic strong and consistent.
We introduced TJX Cos., leading off-price apparel and home furnishings retailer, believing it will benefit from improving employment and home-related spending. Like Costco, its stores employ a "treasure hunt" model that we believe is inherently less exposed to on-line competition. The company has enjoyed consistent same-store sales growth, reflecting the strength of its value proposition and merchandising model.
2013 is an investment year for TW Telecom, a best-in-class, enterprise-focused telecommunication and data network services provider. The company is growing a reorganized sales force to support significant new product introduction, which, if successful, could accelerate revenue growth while improving margins and returns on capital.
30
Looking ahead, macroeconomic and geopolitical risk remain—from Syria and Iran, to "new management" in China, to policy and leadership changes at the Fed, to upcoming debt ceiling and budget debates. Further, the global economic backdrop remains relatively fragile due to the developed world's debt overhang—although as the declining near-term U.S. deficit illustrates, improving economies make challenges more manageable.
While external risks persist, we continue to see visible organic growth as our holdings continue to execute well in a slow growth world. We also look to use stock-level volatility opportunistically, buying what we believe are great companies at good valuations. While the market has rallied significantly, valuations overall appear reasonable to us—and might be considered cheap if U.S. GDP trend growth were to accelerate to a more normal 2.5% or 3%. Should growth accelerate, we believe the companies in our portfolio would have meaningful operating leverage to improved earnings given how tightly they've managed expenses.
We're pleased with the portfolio's positioning and the market's apparent concurrence regarding its inherent value.
Sincerely,

ARTHUR MORETTI
PORTFOLIO MANAGER
Information about the principal risks of investing in the Fund is set forth in the prospectus and statement of additional information.
The portfolio composition, industries and holdings of the Fund are subject to change.
The opinions expressed are those of the Fund's portfolio manager. The opinions are as of the date of this report and are subject to change without notice.
31
Guardian Fund (Unaudited)
TICKER SYMBOLS
Investor Class | | NGUAX | |
Trust Class | | NBGTX | |
Advisor Class | | NBGUX | |
Institutional Class | | NGDLX | |
Class A | | NGDAX | |
Class C | | NGDCX | |
Class R3 | | NGDRX | |
SECTOR ALLOCATION
(as a % of Total Investments) | |
Consumer Discretionary | | | 14.1 | % | |
Consumer Staples | | | 12.1 | | |
Energy | | | 9.1 | | |
Financials | | | 19.5 | | |
Health Care | | | 5.5 | | |
Industrials | | | 13.8 | | |
Information Technology | | | 17.0 | | |
Materials | | | 5.9 | | |
Telecommunication Services | | | 0.9 | | |
Short-Term Investments | | | 2.1 | | |
Total | | | 100.0 | % | |
PERFORMANCE HIGHLIGHTS7,12
| | | | | Average Annual Total
Return Ended 08/31/2013 | |
| | | Inception
Date | | 1 Year | | 5 Years | | 10 Years | | Life of
Fund | |
At NAV | |
Investor Class | | 06/01/1950 | | | 22.54 | % | | | 6.41 | % | | | 8.00 | % | | | 11.08 | % | |
| Trust Class3 | | 08/03/1993 | | | 22.36 | % | | | 6.23 | % | | | 7.82 | % | | | 11.04 | % | |
| Advisor Class4 | | 09/03/1996 | | | 21.81 | % | | | 5.81 | % | | | 7.38 | % | | | 10.91 | % | |
| Institutional Class5 | | 05/27/2009 | | | 22.80 | % | | | 6.59 | % | | | 8.09 | % | | | 11.09 | % | |
| Class A20 | | 05/27/2009 | | | 22.38 | % | | | 6.25 | % | | | 7.92 | % | | | 11.07 | % | |
| Class C20 | | 05/27/2009 | | | 21.43 | % | | | 5.57 | % | | | 7.57 | % | | | 11.01 | % | |
| Class R317 | | 05/27/2009 | | | 22.03 | % | | | 6.04 | % | | | 7.81 | % | | | 11.05 | % | |
With Sales Charge | |
| Class A20 | | | | | 15.31 | % | | | 5.00 | % | | | 7.28 | % | | | 10.96 | % | |
| Class C20 | | | | | 20.43 | % | | | 5.57 | % | | | 7.57 | % | | | 11.01 | % | |
Index | |
| S&P 500 Index1,16 | | | | | 18.70 | % | | | 7.32 | % | | | 7.12 | % | | | 11.00 | % | |
The performance data quoted represent past performance and do not indicate future results. Current performance may be lower or higher than the performance data quoted. For more current performance data, please visit www.nb.com/performance.
The results shown in the table reflect the reinvestment of income dividends and other distributions, if any. The results do not reflect the effect of taxes a shareholder would pay on Fund distributions or on the redemption of Fund shares.
The investment return and principal value of an investment will fluctuate and shares, when redeemed, may be worth more or less than their original cost.
Returns would have been lower if Neuberger Berman Management LLC ("Management") had not reimbursed certain expenses and/or waived a portion of the investment management fees during certain of the periods shown. Repayment by a class (of expenses previously reimbursed and/or fees previously waived by Management) will decrease the class's returns. Please see Note B in the Notes to Financial Statements for specific information regarding expense reimbursement and/or fee waiver arrangements.
As stated in the Fund's most recent prospectus, the total annual operating expense ratios for fiscal year 2012 were 0.92%, 1.09%, 1.50%, 0.74%, 1.12%, 1.88%, and 1.39% for Investor Class, Trust Class, Advisor Class, Institutional Class, Class A, Class C and Class R3 shares, respectively (before expense reimbursements and/or fee waivers, if any). The expense ratios were 1.11%, 1.86% and 1.36% for Class A, Class C and Class R3 shares, respectively, after expense reimbursements and/or fee waivers. The total annual operating expense ratio for each of Advisor Class and Institutional Class includes the class's repayment of expenses previously reimbursed and/or fees previously waived by Management.
Returns shown with a sales charge reflect the deduction of the current maximum initial sales charge of 5.75% for Class A shares and the applicable contingent deferred sales charges (CDSC) for Class C shares. The maximum CDSC for Class C shares is 1%, which is reduced to 0% after 1 year. The performance of the Fund's share classes will differ primarily due to different sales charge structures and class expenses. Please see the prospectus for more information about sales charge structures, if any, and class expenses for your share class.
32
Guardian Fund (Unaudited)
COMPARISON OF A $10,000 INVESTMENT

This graph shows the change in value of a hypothetical $10,000 investment in the Fund over the past 10 fiscal years, or since the Fund's inception if it has not operated for 10 years. The graph is based on the Investor Class shares only; the performance of the Fund's share classes will differ primarily due to different sales charge structures and class expenses (see Performance Highlights chart on previous page). The result is compared with benchmarks, which include a broad-based market index and may include a more narrowly based index. Market indices have not been reduced to reflect any of the fees and costs of investing. The results shown in the graph reflect the reinvestment of income dividends and other distributions, if any. The results do not reflect the effect of taxes a shareholder would pay on Fund distributions or on the redemption of Fund shares. Results represent past performance and do not indicate future results.
33
International Equity Fund Commentary* (Unaudited)
Neuberger Berman International Equity Fund (formerly International Institutional Fund) Institutional Class generated a 13.82% total return for the fiscal year ended August 31, 2013 but trailed its benchmark, the MSCI EAFE® Index, which provided a 19.17% return. (Performance for all share classes is provided in the table immediately following this letter.)
International developed markets rose significantly during the 12-month period. Sentiment improved early on as 2012's supportive European Central Bank (ECB) statements were followed by data showing the U.S. growing faster than expected, and that the eurozone had shifted from recession to slow economic growth. This past May, however, the U.S. Federal Reserve's tapering announcement startled investors with prospects of higher global interest rates. Volatility increased as the period closed, as investors worked to balance rate fears and heightened geopolitical concerns with generally better (ex-China) global growth data. Consumer Discretionary and Financials stocks outperformed, followed by Industrials and Health Care. While all sectors advanced this period, Energy, Materials and Utilities were relatively weaker.
The EAFE Index and the S&P 500 Index saw similar results this year, while emerging markets lagged. Resolution of 2012's fiscal cliff supported the U.S. and other developed markets. A large EAFE component, Japan's strong performance was another benefit to the EAFE benchmark. This year, many of the "weaker" economies led, enjoying relief rallies on the basis of a supportive ECB and arrival of bailout funds. The top performers were Greece, Finland and Ireland. Weaker markets included China-impacted Singapore, Israel in light of Middle East turbulence, and Norway with global commodities and energy prices under pressure from a slower, if steadying China.
Within the portfolio, strong stock performance within Consumer Staples was a key benefit to relative performance versus the benchmark. Information Technology (IT) holdings were also positive, as was our avoidance of Utilities. We lost ground on a relative basis within Financials, from both stock selection and an underweight position, and in the Materials and Consumer Discretionary sectors. By country, holdings in Israel and an underweight to the commodities-heavy Australian market were beneficial. As Canada, another relatively weak commodities-rich economy, is not part of the EAFE, our allocation there hurt relative performance, as did holdings in the UK and France.
Top contributors included PIGEON, a Japanese baby-products company, which continues expansion into China and other Asian markets; Roche, the Swiss pharmaceuticals firm, which has enjoyed sales growth in its market-leading oncology franchise; and Japanese automaker TOYOTA MOTOR, which raised profit forecasts on increasing export sales given a weaker yen. Among detractors, New Gold and Silver Wheaton, Canadian gold and silver streaming companies, declined with the selloff in precious metals. Tullow Oil, a UK-listed African oil explorer, dropped on project delays in Uganda and Ghana.
While the EAFE benchmark had a good run over this fiscal year, international equity markets cooled somewhat after May. The prospect of Federal Reserve tapering raised concerns about higher interest rates globally, dampening risk appetite. Concurrently, lack of clarity from Japan's Prime Minister Abe on Japanese structural reform, concerns about the Chinese banking system, and pockets of social unrest have added to worries.
With uncertainty regarding government policy in the U.S., Japan and China, we remain focused on identifying high-return companies delivering bottom-line earnings growth—companies with stable revenue streams and often with operations spanning North American and developing markets. As a result, we are overweighted in IT, refined materials, consumer and health care names, while underweight the more cyclically dependent financials and bulk materials areas. In Japan, where we believe the weaker yen will raise costs domestically (e.g., imported energy), and government pressure may lead to wage inflation, we prefer quality exporters with global businesses.
By sector, our largest overweight is Industrials, centered around service and distribution businesses we think can adapt to a variety of economic conditions. IT is our second-largest overweight, with our emphasis being market-leading equipment and services providers. We sold the last of our industrial/bulk materials exposure on increasing concerns that a further slowdown in China could continue to pressure industrial raw materials prices. As such, our Materials holdings
34
are concentrated in refined chemical names we believe have pricing power and relatively stable end markets. Our Consumer Discretionary names are diversified across businesses that have had steady recurring revenue rather than the low-quality Japanese consumer-electronic names that rallied hard earlier this year. We remain underweighted in Financials as we believe the sector continues to be at the mercy of central bank policy, while weak underlying demand continues to depress returns. Given their underperformance, we also sold some of the oil services companies we owned—with many dependent on increasingly complex projects, both geologically and politically.
While our emerging markets holdings have fallen—as much on currency as on stock price—we believe these names have strong franchises with consumer end-markets that could benefit as these markets mature.
In a market caught between policy and geopolitical uncertainties and clear signs of improving global growth, we anticipate that our fundamentals-focused Quality at a Reasonable Price discipline will continue to guide us to opportunities we believe are poised to deliver strong risk-adjusted returns over the longer term.
Sincerely,

BENJAMIN SEGAL
PORTFOLIO MANAGER
* Effective December 15, 2012, Neuberger Berman International Institutional Fund changed its name to Neuberger Berman International Equity Fund. On January 25, 2013 the Neuberger Berman International Fund merged into the Neuberger Berman International Equity Fund.
Information about the principal risks of investing in the Fund is set forth in the prospectus and statement of additional information.
The portfolio composition, industries and holdings of the Fund are subject to change.
The opinions expressed are those of the Fund's portfolio manager. The opinions are as of the date of this report and are subject to change without notice.
35
International Equity Fund (Unaudited)
TICKER SYMBOLS
Investor Class | | NIQVX | |
Trust Class | | NIQTX | |
Institutional Class | | NBIIX | |
Class A | | NIQAX | |
Class C | | NIQCX | |
SECTOR ALLOCATION
(as a % of Total Investments) | |
Consumer Discretionary | | | 12.7 | % | |
Consumer Staples | | | 13.0 | | |
Energy | | | 2.8 | | |
Financials | | | 14.7 | | |
Health Care | | | 9.5 | | |
Industrials | | | 20.4 | | |
Information Technology | | | 8.4 | | |
Materials | | | 11.2 | | |
Telecommunication Services | | | 3.4 | | |
Short-Term Investments | | | 3.9 | | |
Total | | | 100.0 | % | |
PERFORMANCE HIGHLIGHTS7,22
| | | | | Average Annual Total
Return Ended 08/31/2013 | |
| | | Inception
Date | | 1 Year | | 5 Years | | Life of
Fund | |
At NAV | |
| Investor Class13 | | 01/28/2013 | | | 13.64 | % | | | 2.95 | % | | | 4.61 | % | |
| Trust Class13 | | 01/28/2013 | | | 13.61 | % | | | 2.94 | % | | | 4.61 | % | |
Institutional Class | | 06/17/2005 | | | 13.82 | % | | | 2.98 | % | | | 4.63 | % | |
| Class A13 | | 01/28/2013 | | | 13.56 | % | | | 2.93 | % | | | 4.60 | % | |
| Class C13 | | 01/28/2013 | | | 12.96 | % | | | 2.83 | % | | | 4.54 | % | |
With Sales Charge | |
| Class A13 | | | | | 7.03 | % | | | 1.72 | % | | | 3.85 | % | |
| Class C13 | | | | | 11.96 | % | | | 2.83 | % | | | 4.54 | % | |
Index | |
| MSCI EAFE® Index1,16 | | | | | 19.17 | % | | | 2.11 | % | | | 5.11 | % | |
The performance data quoted represent past performance and do not indicate future results. Current performance may be lower or higher than the performance data quoted. For more current performance data, please visit www.nb.com/performance.
The results shown in the table reflect the reinvestment of income dividends and other distributions, if any. The results do not reflect the effect of taxes a shareholder would pay on Fund distributions or on the redemption of Fund shares.
The investment return and principal value of an investment will fluctuate and shares, when redeemed, may be worth more or less than their original cost.
Returns would have been lower if Neuberger Berman Management LLC ("Management") had not reimbursed certain expenses and/or waived a portion of the investment management fees during certain of the periods shown. Repayment by a class (of expenses previously reimbursed and/or fees previously waived by Management) will decrease the class's returns. Please see Note B in the Notes to Financial Statements for specific information regarding expense reimbursement and/or fee waiver arrangements.
As stated in the Fund's most recent prospectus, the total annual operating expense ratios for fiscal year 2012 were 1.59%, 1.57%, 1.16%, 1.48% and 2.23% for Investor Class, Trust Class, Institutional Class, Class A and Class C shares, respectively (before expense reimbursements and/or fee waivers, if any). The expense ratios were 1.40%, 0.85%, 1.21% and 1.96% for Investor Class, Institutional Class, Class A and Class C, respectively, after expense reimbursements and/or fee waivers.
Returns shown with a sales charge reflect the deduction of the current maximum initial sales charge of 5.75% for Class A shares and the applicable contingent deferred sales charges (CDSC) for Class C shares. The maximum CDSC for Class C shares is 1%, which is reduced to 0% after 1 year. The performance of the Fund's share classes will differ primarily due to different sales charge structures and class expenses. Please see the prospectus for more information about sales charge structures, if any, and class expenses for your share class.
36
International Equity Fund (Unaudited)
COMPARISON OF A $1,000,000 INVESTMENT
(000's Omitted)

This graph shows the change in value of a hypothetical $1,000,000 investment in the Fund over the past 10 fiscal years, or since the Fund's inception if it has not operated for 10 years. The graph is based on the Institutional Class shares only; the performance of the Fund's share classes will differ primarily due to different sales charge structures and class expenses (see Performance Highlights chart on previous page). The result is compared with benchmarks, which include a broad-based market index and may include a more narrowly based index. Market indices have not been reduced to reflect any of the fees and costs of investing. The results shown in the graph reflect the reinvestment of income dividends and other distributions, if any. The results do not reflect the effect of taxes a shareholder would pay on Fund distributions or on the redemption of Fund shares. Results represent past performance and do not indicate future results.
37
International Large Cap Fund Commentary (Unaudited)
Neuberger Berman International Large Cap Fund Trust Class generated a 12.17% total return for the fiscal year ended August 31, 2013 but trailed its benchmark, the MSCI EAFE® Index, which provided a 19.17% return. (Performance for all share classes is provided in the table immediately following this letter.)
International developed markets rose significantly during the 12-month period. Sentiment improved early on as 2012's supportive European Central Bank (ECB) statements were followed by data showing the U.S. growing faster than expected, and that the eurozone had shifted from recession to slow economic growth. This past May, however, the U.S. Federal Reserve's tapering announcement startled investors with prospects of higher global interest rates. Volatility increased as the period closed, as investors worked to balance rate fears and heightened geopolitical concerns with generally better (ex-China) global growth data. Consumer Discretionary and Financials stocks outperformed, followed by Industrials and Health Care. While all sectors advanced this period, Energy, Materials and Utilities were relatively weaker.
The EAFE Index and the S&P 500 Index saw similar results this year, while emerging markets lagged. Resolution of 2012's fiscal cliff supported the U.S. and other developed markets. A large EAFE component, Japan's strong performance was another benefit to the EAFE benchmark. This year, many of the "weaker" economies led, enjoying relief rallies on the basis of a supportive ECB and the arrival of bailout funds. The top performers were Greece, Finland and Ireland. Weaker markets included China-impacted Singapore, Israel in light of Middle East turbulence, and Norway with global commodities and energy prices under pressure from a slower, if steadying China.
Within the portfolio, strong stock performance within Consumer Staples was a key benefit to relative performance versus the benchmark. Information Technology (IT) holdings were also positive, as was our avoidance of Utilities. We lost ground on a relative basis within Financials, from both stock selection and an underweight position, and in the Energy and Materials sectors. By country, holdings in Israel and Denmark, as well as our underweight in the commodities-heavy Australian market, were contributors to performance. Holdings within the UK and France detracted from relative performance. As Canada, another relatively weak commodities-rich economy, is not part of the EAFE, allocations there also hurt relative performance.
Top contributors included two Swiss companies, pharmaceuticals leader Roche and a fragrance and flavors firm, Givaudan. Roche enjoyed sales growth in its market-leading oncology franchise, while Givaudan benefited from prospects for improved earnings after a solid 2012. Bezeq, an Israeli telecom firm, benefited from structural changes in the sector and a large dividend payout. Among detractors, New Gold and Silver Wheaton, Canadian gold and silver streaming companies, declined with the selloff in precious metals. Tullow Oil, a UK-listed African oil explorer, dropped on project delays in Uganda and Ghana.
While the EAFE benchmark had a good run over this fiscal year, international equity markets cooled somewhat after May. The prospect of Federal Reserve tapering raised concerns about higher interest rates globally, dampening risk appetite. Concurrently, lack of clarity from Japan's Prime Minister Abe on Japanese structural reform, concerns about the Chinese banking system, and pockets of social unrest have added to worries.
With uncertainty regarding government policy in the U.S., Japan and China, we remain focused on identifying high-return companies delivering bottom-line earnings growth—companies with stable revenue streams and often with operations spanning North American and developing markets. As a result, we are overweighted in IT, refined materials, consumer and health care names, while underweight the more cyclically dependent financials and bulk materials areas. In Japan, where we believe the weaker yen will raise costs domestically (e.g., imported energy), and government pressure may lead to wage inflation, we prefer quality exporters with global businesses.
By sector, Industrials is our largest overweight, centered around service and distribution businesses we think can adapt to a variety of economic conditions. Our second largest overweight is IT, with our emphasis being market-leading equipment and services providers. We sold the last of our industrial/bulk materials exposure on increasing concerns that
38
a further slowdown in China could continue to pressure industrial raw materials prices. As such, our Materials holdings are concentrated in refined chemical names we believe have pricing power and relatively stable end markets. Our Consumer Discretionary names are diversified across businesses that have had steady recurring revenue rather than the low-quality Japanese consumer-electronic names that rallied hard earlier this year. We remain underweighted in Financials as we believe the sector continues to be at the mercy of central bank policy, while weak underlying demand continues to depress returns. Given their underperformance, we also sold some of the oil services companies we owned—with many dependent on increasingly complex projects, both geologically and politically.
While our emerging markets holdings have fallen—as much on currency as on stock price—we believe these names have strong franchises with consumer end-markets that could benefit as these markets mature.
In a market caught between policy and geopolitical uncertainties and clear signs of improving global growth, we anticipate that our fundamentals-focused Quality at a Reasonable Price discipline will continue to guide us to opportunities we believe are poised to deliver strong risk-adjusted returns over the longer term.
Sincerely,

BENJAMIN SEGAL
PORTFOLIO MANAGER
Information about the principal risks of investing in the Fund is set forth in the prospectus and statement of additional information.
The portfolio composition, industries and holdings of the Fund are subject to change.
The opinions expressed are those of the Fund's portfolio manager. The opinions are as of the date of this report and are subject to change without notice.
39
International Large Cap Fund (Unaudited)
TICKER SYMBOLS
Trust Class | | NILTX | |
Institutional Class | | NILIX | |
Class A | | NBNAX | |
Class C | | NBNCX | |
Class R3 | | NBNRX | |
SECTOR ALLOCATION
(as a % of Total Investments) | |
Consumer Discretionary | | | 13.1 | % | |
Consumer Staples | | | 10.1 | | |
Energy | | | 2.8 | | |
Financials | | | 14.7 | | |
Health Care | | | 9.8 | | |
Industrials | | | 18.5 | | |
Information Technology | | | 9.2 | | |
Materials | | | 12.7 | | |
Telecommunication Services | | | 4.2 | | |
Short-Term Investments | | | 4.9 | | |
Total | | | 100.0 | % | |
PERFORMANCE HIGHLIGHTS7
| | | | | Average Annual Total
Return Ended 08/31/2013 | |
| | | Inception
Date | | 1 Year | | 5 Years | | Life of
Fund | |
At NAV | |
Trust Class | | 08/01/2006 | | | 12.17 | % | | | 1.52 | % | | | 2.04 | % | |
| Institutional Class6 | | 10/06/2006 | | | 12.56 | % | | | 1.88 | % | | | 2.39 | % | |
| Class A15 | | 12/20/2007 | | | 12.08 | % | | | 1.52 | % | | | 2.04 | % | |
| Class C15 | | 12/20/2007 | | | 11.23 | % | | | 0.78 | % | | | 1.43 | % | |
| Class R315 | | 05/27/2009 | | | 11.83 | % | | | 1.28 | % | | | 1.87 | % | |
With Sales Charge | |
| Class A15 | | | | | 5.68 | % | | | 0.32 | % | | | 1.19 | % | |
| Class C15 | | | | | 10.23 | % | | | 0.78 | % | | | 1.43 | % | |
Index | |
| MSCI EAFE® Index1,16 | | | | | 19.17 | % | | | 2.11 | % | | | 2.24 | % | |
The performance data quoted represent past performance and do not indicate future results. Current performance may be lower or higher than the performance data quoted. For more current performance data, please visit www.nb.com/performance.
The results shown in the table reflect the reinvestment of income dividends and other distributions, if any. The results do not reflect the effect of taxes a shareholder would pay on Fund distributions or on the redemption of Fund shares.
The investment return and principal value of an investment will fluctuate and shares, when redeemed, may be worth more or less than their original cost.
Returns would have been lower if Neuberger Berman Management LLC ("Management") had not reimbursed certain expenses and/or waived a portion of the investment management fees during certain of the periods shown. Repayment by a class (of expenses previously reimbursed and/or fees previously waived by Management) will decrease the class's returns. Please see Note B in the Notes to Financial Statements for specific information regarding expense reimbursement and/or fee waiver arrangements.
As stated in the Fund's most recent prospectus, the total annual operating expense ratios for fiscal year 2012 were 1.40%, 1.00%, 1.40%, 2.13% and 1.67% for Trust Class, Institutional Class, Class A, Class C and Class R3 shares, respectively (before expense reimbursements and/or fee waivers, if any). These expense ratios were 1.25%, 0.90%, 1.30%, 2.00% and 1.51% for Trust Class, Institutional Class, Class A, Class C and Class R3 shares, respectively, after expense reimbursements and/or fee waivers.
Returns shown with a sales charge reflect the deduction of the current maximum initial sales charge of 5.75% for Class A shares and the applicable contingent deferred sales charges (CDSC) for Class C shares. The maximum CDSC for Class C shares is 1%, which is reduced to 0% after 1 year. The performance of the Fund's share classes will differ primarily due to different sales charge structures and class expenses. Please see the prospectus for more information about sales charge structures, if any, and class expenses for your share class.
40
International Large Cap Fund (Unaudited)
COMPARISON OF A $10,000 INVESTMENT
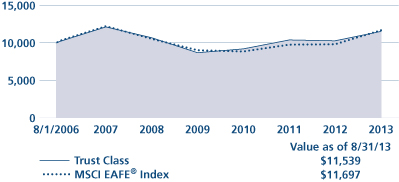
This graph shows the change in value of a hypothetical $10,000 investment in the Fund over the past 10 fiscal years, or since the Fund's inception if it has not operated for 10 years. The graph is based on the Trust Class shares only; the performance of the Fund's share classes will differ primarily due to different sales charge structures and class expenses (see Performance Highlights chart on previous page). The result is compared with benchmarks, which include a broad-based market index and may include a more narrowly based index. Market indices have not been reduced to reflect any of the fees and costs of investing. The results shown in the graph reflect the reinvestment of income dividends and other distributions, if any. The results do not reflect the effect of taxes a shareholder would pay on Fund distributions or on the redemption of Fund shares. Results represent past performance and do not indicate future results.
41
Intrinsic Value Fund Commentary (Unaudited)
Neuberger Berman Intrinsic Value Fund Institutional Class posted a 26.94% total return for the fiscal year ending August 31, 2013 and outperformed its benchmark, the Russell 2000® Value Index, which generated a 24.38% return. (Performance for all share classes is provided in the table immediately following this letter.)
The 12-month period was not without its trials and tribulations. Investment professionals had to handicap the outcome of a presidential election as well as the economic impact of looming budget cuts and tax hikes. As these issues were resolved—first the election, then sequestration and tax hikes—stock markets rallied. January was one of the strongest performing months in many years, driven by a significant surge of money flowing into mutual funds. With the benefit of hindsight, it's fair to conclude that any outcome which yielded certainty was preferable to continued political warfare and uncertainty.
Many strategists had recommended a portfolio approach predicated on one's assessment of the election. While we gave the issue a great deal of thought, we generally choose not to tailor the Fund to a particular political scenario, opting instead to focus on a gradual, broad based economic recovery that we believed would favor most cyclical companies. In fact, the combination of spending cuts and tax hikes proved to be a reasonable and balanced policy based on the continued growth of the economy and the improving fiscal health of the Federal government. Outside of the defense industry, no one industry has been disproportionately impacted by the tax hikes or sequestration. We were well served by not over-emphasizing individual companies or sectors based on our view of who would win the election.
It is fair to suggest that the events of recent years, which include the technology bubble, September 11, and the financial crisis of 2008, have taken their toll on stock market investors with the result being a market psychology that seems to move from one obsessive concern to another. At one point during the reporting period, the markets became fixated on the U.S. Federal Reserve's intended plan to reduce the amount of bonds it purchases via its quantitative easing program. Interest rates rose by more than a full percentage point in anticipation of the move. The upward move in rates, although disturbing, came from an abnormally, and in our view, unsustainably low level. By any historic measure, interest rates remain very attractive and as long as job growth continues and consumer confidence remains healthy, we believe the recovery in the critical real estate and auto industries should continue.
The economic sensitivity of our portfolio to changes in the economic outlook should not be underestimated. We believe that over half of the year's return was driven by greater confidence in the sales and profit guidance from our companies, with the balance of our performance coming from company specific events. However, drawing a precise line is problematic. For example our largest and most profitable investment during the fiscal year was OfficeMax, which agreed to merge with Office Depot. While the merger helped sentiment towards the office products group, the strengthening market for new home construction allowed OfficeMax to monetize a $250 million investment in a building products company. It used the proceeds to pay a special one-time dividend of $1.50 to shareholders. Merger and acquisition activity involving Lender Processing Services, Ceradyne, Keynote Systems and Volterra also helped performance. We believe that in the year ahead, deal making will increase as companies look to lock in attractive borrowing rates. The portfolio was not without its disappointments. We made an ill-timed investment in mobile advertising company Velti PLC, a turnaround story where the problems are more deeply rooted than we estimated. Most of the other detractors were companies that simply didn't participate in the rally rather than having a company specific challenge.
As the stock markets advanced, we redoubled our efforts to maintain an attractively valued portfolio as measured by our discount to intrinsic value.1 We introduced 21 ideas into the portfolio while eliminating 11 companies. These new investments now constitute roughly 15% of the portfolio and the percentage could grow as we gain further conviction or as market prices provide attractive entry points. At the end of August, our discount to intrinsic value was 26%, a reasonable level but below our historic average of 30%.
The overarching theme in our portfolio remains our belief that the economy's recovery will continue. We are encouraged by economic growth trends and employment gains. There are many naysayers casting doubts on the quality of
42
employment (too many part-time, low paying jobs) and pace of growth (should be faster coming out of a recession). We believe trends are improving and that we will exit 2013 at an accelerating rate of job creation and economic growth. Nonetheless, we anticipate that the fiscal year ahead will bring its fair share of challenges, some that we can foresee, like political dysfunction in Washington and geopolitical stress from the Middle East, and others that will surprise us all. We are convinced that the strategy to cope with sudden and dramatic changes is remaining true to our contrarian value philosophy. Over time, we believe buying into uncertainty and selling when fair value is reflected in stock prices has served us well.
Sincerely,


BENJAMIN H. NAHUM, JAMES F. MCAREE AND AMIT SOLOMON
PORTFOLIO CO-MANAGERS
1 Intrinsic value reflects the team's analysis and estimates of a company's value. There is no guarantee that any intrinsic values will be realized; security prices may decrease regardless of intrinsic values.
Information about the principal risks of investing in the Fund is set forth in the prospectus and statement of additional information.
The portfolio composition, industries and holdings of the Fund are subject to change.
The opinions expressed are those of the Fund's portfolio managers. The opinions are as of the date of this report and are subject to change without notice.
43
Intrinsic Value Fund (Unaudited)
TICKER SYMBOLS
Institutional Class | | NINLX | |
Class A | | NINAX | |
Class C | | NINCX | |
SECTOR ALLOCATION
(as a % of Total Investments) | |
Consumer Discretionary | | | 6.4 | % | |
Consumer Staples | | | 1.8 | | |
Energy | | | 2.5 | | |
Financial Services | | | 12.9 | | |
Health Care | | | 8.8 | | |
Materials & Processing | | | 6.0 | | |
Producer Durables | | | 23.1 | | |
Technology | | | 28.0 | | |
Utilities | | | 3.2 | | |
Short-Term Investments | | | 7.3 | | |
Total | | | 100.0 | % | |
PERFORMANCE HIGHLIGHTS
| | | | | Average Annual Total
Return Ended 08/31/2013 | |
| | | Inception
Date* | | 1 Year | | 5 Years | | 10 Years | | Life of
Fund | |
At NAV | |
| Institutional Class19 | | 05/10/2010 | | | 26.94 | % | | | 8.77 | % | | | 10.38 | % | | | 11.45 | % | |
| Class A19 | | 05/10/2010 | | | 26.61 | % | | | 8.51 | % | | | 10.24 | % | | | 11.37 | % | |
| Class C19 | | 05/10/2010 | | | 25.62 | % | | | 7.99 | % | | | 9.98 | % | | | 11.20 | % | |
With Sales Charge | |
| Class A19 | | | | | 19.33 | % | | | 7.23 | % | | | 9.59 | % | | | 10.96 | % | |
| Class C19 | | | | | 24.62 | % | | | 7.99 | % | | | 9.98 | % | | | 11.20 | % | |
Index | |
| Russell 2000® Value Index1,16 | | | | | 24.38 | % | | | 6.88 | % | | | 8.55 | % | | | 8.57 | % | |
| Russell 2000® Index1,16 | | | | | 26.27 | % | | | 7.98 | % | | | 8.76 | % | | | 7.35 | % | |
*The inception date for Neuberger Berman Intrinsic Value Fund Institutional Class, Class A, and Class C shares is May 10, 2010. Performance prior to that date is that of the Fund's predecessor, the DJG Small Cap Value Fund L.P., an unregistered limited partnership ("DJG Fund"); DJG Fund was the successor to The DJG Small Cap Value Fund, an unregistered commingled investment account ("DJG Account"), which had similar investment goals, strategies, and portfolio management team. See endnote 19 for more information.
The performance data quoted represent past performance and do not indicate future results. Current performance may be lower or higher than the performance data quoted. For more current performance data, please visit www.nb.com/performance.
The results shown in the table reflect the reinvestment of income dividends and other distributions, if any. The results do not reflect the effect of taxes a shareholder would pay on Fund distributions or on the redemption of Fund shares.
The investment return and principal value of an investment will fluctuate and shares, when redeemed, may be worth more or less than their original cost.
Returns would have been lower if Neuberger Berman Management LLC ("Management") had not reimbursed certain expenses and/or waived a portion of the investment management fees during certain of the periods shown. Repayment by a class (of expenses previously reimbursed and/or fees previously waived by Management) will decrease the class's returns. Please see Note B in the Notes to Financial Statements for specific information regarding expense reimbursement and/or fee waiver arrangements.
As stated in the Fund's most recent prospectus, the total annual operating expense ratios for fiscal year 2012 were 1.22%, 1.61% and 2.36% for Institutional Class, Class A and Class C shares, respectively (before expense reimbursements and/or fee waivers, if any). These expense ratios were 1.00%, 1.36% and 2.11%, respectively, after expense reimbursements and/or fee waivers.
Returns shown with a sales charge reflect the deduction of the current maximum initial sales charge of 5.75% for Class A shares and the applicable contingent deferred sales charges (CDSC) for Class C shares. The maximum CDSC for Class C shares is 1%, which is reduced to 0% after 1 year. The performance of the Fund's share classes will differ primarily due to different sales charge structures and class expenses. Please see the prospectus for more information about sales charge structures, if any, and class expenses for your share class.
44
Intrinsic Value Fund (Unaudited)
COMPARISON OF A $1,000,000 INVESTMENT19
(000's Omitted)

This graph shows the change in value of a hypothetical $1,000,000 investment in the Fund over the past 10 fiscal years, or since the Fund's inception if it has not operated for 10 years. The graph is based on the Institutional Class shares only; the performance of the Fund's share classes will differ primarily due to different sales charge structures and class expenses (see Performance Highlights chart on previous page). The result is compared with benchmarks, which include a broad-based market index and may include a more narrowly based index. Market indices have not been reduced to reflect any of the fees and costs of investing. The results shown in the graph reflect the reinvestment of income dividends and other distributions, if any. The results do not reflect the effect of taxes a shareholder would pay on Fund distributions or on the redemption of Fund shares. Results represent past performance and do not indicate future results.
45
Large Cap Disciplined Growth Fund Commentary (Unaudited)
Neuberger Berman Large Cap Disciplined Growth Fund Investor Class generated a 12.76% total return for the fiscal year ended August 31, 2013, but trailed its benchmark, the Russell 1000® Growth Index, which provided a return of 16.43%. (Performance for all share classes is provided in the table immediately following this letter.)
The past year brought resolution to several of the macro issues facing the markets—the U.S. elections and legal battle over Obamacare, plus the sequestration and fiscal cliff, which although they may have some impact later this year, went out with a whimper rather than a bang. Outside the U.S., while China slowed and Europe has been in recession, recent data shows Europe's GDP beginning to grow, if slowly. The market took this news very positively, rallying strongly during the reporting period.
Given the environment going into this period, we were somewhat defensively positioned. Although we reduced our defensive positioning somewhat, it was a drag on relative performance versus the benchmark in the face of a strong rally. The outperformance of smaller stocks also hurt, given our larger cap emphasis.
By sector, the portfolio benefited most from an underweight to the weak Information Technology sector and strong stock selection within Financials. The most significant areas of underperformance were allocations to the Materials—where we saw some individual disappointments—and Consumer Discretionary sectors. Although our Consumer Discretionary holdings generally outperformed, having an underweight to this strong sector was detrimental.
Significant positive contributions came from companies including ASML, Vertex Pharmaceuticals, and LinkedIn. ASML, a leader in semiconductor lithography, is the only provider of extreme ultraviolet technology—the process required for producing the next generation of microchips. As such, it's seen significant investment from companies requiring the technology's further development, including Intel and Taiwan Semi.
Toward the end of April, Vertex, a drag on performance during the first half of this period, received Phase 2 clinical trial data on VX-661. This medication was designed to be used in combination therapy with Vertex's Kalydeco in treating Cystic Fibrosis. Vertex is currently the only firm with an approved Cystic Fibrosis treatment, and while Kalydeco can treat about 4% of Cystic Fibrosis patients, it's hoped that the combination therapy (along with VX-809, in Phase 3 trials), could help approximately 50% of patients. Vertex is also developing what we expect will be a key component of a multi-drug treatment for Hepatitis C.
LinkedIn, the employment-focused social networking company, has successfully disrupted recruiting, providing companies with significant savings. LinkedIn continues to see revenues grow rapidly. We sold the stock when it reached our target price.
Disappointments included Edwards Lifesciences, Teradata and Agrium. Edwards Lifesciences makes specialized replacement heart valves that can be inserted transcatheterally. A very successful launch of these valves in Europe set extremely high expectations for the U.S. launch, but the company missed two quarters as adoption here was slower than expected. While American doctors want to do the transcatheter procedure, it's harder to make the economic case for building the specialized surgery centers required for it, as reimbursement for the procedure in the U.S. takes longer and is in lower amounts than in Europe, thereby making it take longer to recoup the cost of setting up the center.
Teradata is a hosted data storage network company whose services have traditionally been used for relational databases, roughly analogous to huge Excel spreadsheets. Most data produced today is unstructured rather than relational, and thus requires different storage, access and analytical tools. While we believe Teradata has a strong traditional data business, our hope was that the company could participate in the higher growth unstructured segment. As we became increasingly less confident this would happen in the near term, we exited the position.
Agrium, a fertilizer company, was locked in a proxy fight with an activist investor. The investor's goal was to push through what we believe are some potentially beneficial changes related to expensive acquisitions and rationalizing the size of the
46
company's retail distribution network. The stock price declined as the company prevailed in the fight. However, indications are that the firm will institute the changes regardless.
Correlations between stocks have come down recently, increasing our confidence that stock picking can have a positive impact on performance. As such, we decided to increase the size of certain positions. Our active share (measuring how different the portfolio is from the benchmark) is also relatively high, while our beta (measuring volatility relative to the index), has remained relatively low. We're comfortable with this somewhat defensive positioning given our belief that market volatility could increase considering current geopolitical risks.
The market can perform within a stable, low-growth environment, as evidenced by recent returns. Between the removal of many macro issues and indicators of improving global growth, we anticipate a generally positive environment ahead. As macro distractions have given way to a renewed focus on fundamentals, and as correlations between individual stocks have declined, we also foresee a market that, in our opinion, could be particularly good for active managers.
Sincerely,


DANIEL H. ROSENBLATT AND JOHN J. BARKER
PORTFOLIO CO-MANAGERS
Information about the principal risks of investing in the Fund is set forth in the prospectus and statement of additional information.
The portfolio composition, industries and holdings of the Fund are subject to change.
The opinions expressed are those of the Fund's portfolio managers. The opinions are as of the date of this report and are subject to change without notice.
47
Large Cap Disciplined Growth Fund (Unaudited)
TICKER SYMBOLS
Investor Class | | NBCIX | |
Institutional Class | | NLDLX | |
Class A | | NLDAX | |
Class C | | NLDCX | |
Class R3 | | NLDRX | |
SECTOR ALLOCATION
(as a % of Total Investments) | |
Consumer Discretionary | | | 15.2 | % | |
Consumer Staples | | | 16.6 | | |
Energy | | | 4.5 | | |
Financials | | | 2.6 | | |
Health Care | | | 10.7 | | |
Industrials | | | 11.7 | | |
Information Technology | | | 24.2 | | |
Materials | | | 5.2 | | |
Telecommunication Services | | | 4.7 | | |
Short-Term Investments | | | 4.6 | | |
Total | | | 100.0 | % | |
PERFORMANCE HIGHLIGHTS11
| | | | | Average Annual Total
Return Ended 08/31/2013 | |
| | | Inception
Date | | 1 Year | | 5 Years | | 10 Years | | Life of
Fund | |
At NAV | |
Investor Class | | 12/06/1999 | | | 12.76 | % | | | 4.22 | % | | | 5.31 | % | | | –0.69 | % | |
| Institutional Class5 | | 04/06/2009 | | | 13.28 | % | | | 4.55 | % | | | 5.48 | % | | | –0.57 | % | |
| Class A20 | | 04/06/2009 | | | 12.80 | % | | | 4.20 | % | | | 5.30 | % | | | –0.70 | % | |
| Class C20 | | 04/06/2009 | | | 11.93 | % | | | 3.52 | % | | | 4.96 | % | | | –0.93 | % | |
| Class R317 | | 05/27/2009 | | | 12.48 | % | | | 4.01 | % | | | 5.21 | % | | | –0.76 | % | |
With Sales Charge | |
| Class A20 | | | | | 6.29 | % | | | 2.97 | % | | | 4.68 | % | | | –1.12 | % | |
| Class C20 | | | | | 10.93 | % | | | 3.52 | % | | | 4.96 | % | | | –0.93 | % | |
Index | |
| Russell 1000® Growth Index1,16 | | | | | 16.43 | % | | | 8.40 | % | | | 7.24 | % | | | 0.87 | % | |
The performance data quoted represent past performance and do not indicate future results. Current performance may be lower or higher than the performance data quoted. For more current performance data, please visit www.nb.com/performance.
The results shown in the table reflect the reinvestment of income dividends and other distributions, if any. The results do not reflect the effect of taxes a shareholder would pay on Fund distributions or on the redemption of Fund shares.
The investment return and principal value of an investment will fluctuate and shares, when redeemed, may be worth more or less than their original cost.
Returns would have been lower if Neuberger Berman Management LLC ("Management") had not reimbursed certain expenses and/or waived a portion of the investment management fees during certain of the periods shown. Repayment by a class (of expenses previously reimbursed and/or fees previously waived by Management) will decrease the class's returns. Please see Note B in the Notes to Financial Statements for specific information regarding expense reimbursement and/or fee waiver arrangements.
As stated in the Fund's most recent prospectus, the total annual operating expense ratios for fiscal year 2012 were 1.11%, 0.78%, 1.16%, 1.90% and 1.44% for Investor Class, Institutional Class, Class A, Class C and Class R3 shares, respectively (before expense reimbursements and/or fee waivers, if any). The expense ratios were 0.75%, 1.11%, 1.86%, and 1.36% for Institutional Class, Class A, Class C and Class R3 shares, respectively, after expense reimbursements and/or fee waivers. The total annual operating expense ratio for Investor Class includes the class's repayment of expenses previously reimbursed and/or fees previously waived by Management.
Returns shown with a sales charge reflect the deduction of the current maximum initial sales charge of 5.75% for Class A shares and the applicable contingent deferred sales charges (CDSC) for Class C shares. The maximum CDSC for Class C shares is 1%, which is reduced to 0% after 1 year. The performance of the Fund's share classes will differ primarily due to different sales charge structures and class expenses. Please see the prospectus for more information about sales charge structures, if any, and class expenses for your share class.
48
Large Cap Disciplined Growth Fund (Unaudited)
COMPARISON OF A $10,000 INVESTMENT

This graph shows the change in value of a hypothetical $10,000 investment in the Fund over the past 10 fiscal years, or since the Fund's inception if it has not operated for 10 years. The graph is based on the Investor Class shares only; the performance of the Fund's share classes will differ primarily due to different sales charge structures and class expenses (see Performance Highlights chart on previous page). The result is compared with benchmarks, which include a broad-based market index and may include a more narrowly based index. Market indices have not been reduced to reflect any of the fees and costs of investing. The results shown in the graph reflect the reinvestment of income dividends and other distributions, if any. The results do not reflect the effect of taxes a shareholder would pay on Fund distributions or on the redemption of Fund shares. Results represent past performance and do not indicate future results.
49
Large Cap Value Fund Commentary (Unaudited)
Neuberger Berman Large Cap Value Fund Investor Class produced a 24.05% total return for the fiscal year ended August 31, 2013 and outperformed its benchmark, the Russell 1000® Value Index, which generated a 23.10% return. (Performance for all share classes is provided in the table immediately following this letter.)
U.S. equities delivered strong returns over the past 12 months—stronger than many may have anticipated at the start of the period. Uncertainty was high at the beginning of the Fund's fiscal year as the U.S. headed into the presidential election. However, continued low interest rates maintained by the U.S. Federal Reserve (the Fed) as well as perceived signs of growth in China, some stabilization on the European front, rising income and consumer spending data in the U.S., and a pick-up in employment and housing, sent stocks higher for most of the period.
Equities stumbled in June as market participants started to worry that the Fed would soon begin tapering the asset purchases that had been driving much of the market's momentum. The Bank of Japan, which increased stimulus sharply in April but then announced that it would hold off on any more stimulus in June, as well as the ongoing uncertainty in the Middle East, also produced large swings in global markets. Markets rebounded in July after a Fed meeting in late June led many market participants to predict that the Fed's tapering would not be immediate. However, August saw yet another reversal as turmoil in the Middle East increased sharply and as attention focused on the U.S. debt ceiling deadline, with some observers predicting that another fiscal cliff could be reached as early as mid-October.
Within the Fund's benchmark, the Russell 1000 Value Index, stocks in the Financials sector delivered the largest contribution to returns. These companies benefited from an improving overall economy, an increase in merger and acquisition activity, and a continued low interest rate environment. Consumer Discretionary, Information Technology (IT) and Health Care companies also rose as a result of the improving economy and, in the case of Health Care, as a result of decreasing uncertainty regarding the possible effects of the Affordable Care Act. The only sector within the index to deliver negative overall returns was Telecommunication Services as investors moved money to more cyclical areas of the market as economic data improved.
Financials had the greatest positive impact on the Fund's relative returns versus the benchmark. While we were similarly weighted to the index, we benefited from superior stock selection. The Fund also benefited from its Health Care holdings. The Fund's underexposure to this well-performing sector was a slight negative but superior stock selection more than made up for it. An overweight as well as poor stock selection in the Materials sector negatively impacted relative performance. Poor stock selection in IT also placed a slight drag on relative returns.
Stock selection within the Financials sector was the primary driver of the Fund's outperformance relative to our index during the reporting period. Citigroup, in particular, made an outsized positive impact. We initiated this position over a year ago when we concluded that its low market price was not justified from a normalized earnings perspective. We established an overweight position in the stock, which paid off during the past fiscal year. Goldman Sachs Group was another holding that we had determined to be a good value—a conviction that also boosted relative returns. Goldman Sachs was a particular beneficiary of the opening up of capital markets during the past 12 months. While we were about equally weighted with the index in the Financials sector during the past year, we did not own REITs or mid-cap banks. This lack of exposure also contributed to the Fund's outstanding returns in this sector.
The Fund's relative returns were negatively impacted by the Materials sector. We were overweighted in this area, which underperformed the index, and the positions we held did not perform as well as those in the index. The Mosaic Company, a major global producer of potash, was the portfolio's worst performer in the sector and was the primary detractor from overall relative returns. Share prices for potash producers fell in July when a large producer unexpectedly withdrew from a powerful consortium, igniting fears that prices for the commodity could be driven down around the world. The Mosaic position was eliminated. The Fund's second largest detractor from relative performance was also within Materials. Newmont Mining is a gold and copper mining company with significant assets in the U.S., as well as in
50
Australia, Canada, Ghana, Indonesia, Mexico, Peru and New Zealand. The company's stock suffered significantly as the price of gold and other metals fell.
We believe that equity markets will remain strong, at least through calendar year-end. However, we believe the robust performance that we have seen over the past year will be difficult to maintain and there are headwinds on the horizon. We anticipate that the Fed, at some point, will begin the process of tapering. The only uncertainty, in our opinion, is when. Gross domestic product numbers were revised upwards for August and unemployment appears to be easing. Within that environment, the Fed may soon have the confidence to withdraw some liquidity from the economy and from the market. While we think this monetary tightening could place a drag on stocks, we also believe that the economic recovery is real and that the companies that we invest in could continue to benefit from such a recovery, enabling their stocks to rise even without the significant boost the market has received from the Fed. However, other concerns remain, particularly the ongoing crisis in the Middle East and the debt ceiling crisis, both of which we believe are likely to remain center stage and produce uneasiness in the markets. We continue to see a good deal of value in equities, particularly in industrial stocks, such as airlines, as well as chemical and technology companies. We are currently seeking out stocks that we believe are undervalued based on normalized earnings whose value will be recognized by the market over time. In our view, this strategy may produce favorable risk-adjusted returns as we continue to monitor the correlation among holdings in seeking to achieve a positive risk/reward balance.
Sincerely,

ELI SALZMANN
PORTFOLIO MANAGER
Information about the principal risks of investing in the Fund is set forth in the prospectus and statement of additional information.
The portfolio composition, industries and holdings of the Fund are subject to change.
The opinions expressed are those of the Fund's portfolio manager. The opinions are as of the date of this report and are subject to change without notice.
51
Large Cap Value Fund (Unaudited)
TICKER SYMBOLS
Investor Class | | NPRTX | |
Trust Class | | NBPTX | |
Advisor Class | | NBPBX | |
Institutional Class | | NBPIX | |
Class A | | NPNAX | |
Class C | | NPNCX | |
Class R3 | | NPNRX | |
SECTOR ALLOCATION
(as a % of Total Investments) | |
Consumer Discretionary | | | 5.0 | % | |
Consumer Staples | | | 3.4 | | |
Energy | | | 12.2 | | |
Financials | | | 27.8 | | |
Health Care | | | 8.1 | | |
Industrials | | | 17.5 | | |
Information Technology | | | 14.0 | | |
Materials | | | 9.9 | | |
Short-Term Investments | | | 2.1 | | |
Total | | | 100.0 | % | |
PERFORMANCE HIGHLIGHTS7
| | | | | Average Annual Total
Return Ended 08/31/2013 | |
| | | Inception
Date | | 1 Year | | 5 Years | | 10 Years | | Life of
Fund | |
At NAV | |
Investor Class | | 01/20/19752 | | | 24.05 | % | | | 3.29 | % | | | 7.18 | % | | | 12.73 | % | |
| Trust Class3 | | 08/30/1993 | | | 23.76 | % | | | 3.09 | % | | | 6.99 | % | | | 12.66 | % | |
| Advisor Class4 | | 08/16/1996 | | | 23.58 | % | | | 2.93 | % | | | 6.81 | % | | | 12.53 | % | |
| Institutional Class5 | | 06/07/2006 | | | 24.26 | % | | | 3.46 | % | | | 7.31 | % | | | 12.77 | % | |
| Class A20 | | 06/21/2010 | | | 23.72 | % | | | 3.12 | % | | | 7.10 | % | | | 12.71 | % | |
| Class C20 | | 06/21/2010 | | | 22.87 | % | | | 2.63 | % | | | 6.84 | % | | | 12.64 | % | |
| Class R317 | | 06/21/2010 | | | 23.47 | % | | | 2.96 | % | | | 7.02 | % | | | 12.69 | % | |
With Sales Charge | |
| Class A20 | | | | | 16.63 | % | | | 1.91 | % | | | 6.47 | % | | | 12.54 | % | |
| Class C20 | | | | | 21.87 | % | | | 2.63 | % | | | 6.84 | % | | | 12.64 | % | |
Index | |
| Russell 1000® Value Index1,16 | | | | | 23.10 | % | | | 6.69 | % | | | 7.61 | % | | | N/A | | |
The performance data quoted represent past performance and do not indicate future results. Current performance may be lower or higher than the performance data quoted. For more current performance data, please visit www.nb.com/performance.
The results shown in the table reflect the reinvestment of income dividends and other distributions, if any. The results do not reflect the effect of taxes a shareholder would pay on Fund distributions or on the redemption of Fund shares.
The investment return and principal value of an investment will fluctuate and shares, when redeemed, may be worth more or less than their original cost.
Returns would have been lower if Neuberger Berman Management LLC ("Management") had not reimbursed certain expenses and/or waived a portion of the investment management fees during certain of the periods shown. Repayment by a class (of expenses previously reimbursed and/or fees previously waived by Management) will decrease the class's returns. Please see Note B in the Notes to Financial Statements for specific information regarding expense reimbursement and/or fee waiver arrangements.
As stated in the Fund's most recent prospectus, the total annual operating expense ratios for fiscal year 2012 were 0.88%, 1.06%, 1.21%, 0.71%, 1.08% 2.05% and 1.40% for Investor Class, Trust Class, Advisor Class, Institutional Class, Class A, Class C and Class R3 shares, respectively (before expense reimbursements and/or fee waivers, if any). The expense ratios were 1.87% and 1.37% for Class C and Class R3 shares, respectively, after expense reimbursements and/or fee waivers. The total annual operating expense ratio for Class A includes the class's repayment of expenses previously reimbursed and/or fees previously waived by Management.
Returns shown with a sales charge reflect the deduction of the current maximum initial sales charge of 5.75% for Class A shares and the applicable contingent deferred sales charges (CDSC) for Class C shares. The maximum CDSC for Class C shares is 1%, which is reduced to 0% after 1 year. The performance of the Fund's share classes will differ primarily due to different sales charge structures and class expenses. Please see the prospectus for more information about sales charge structures, if any, and class expenses for your share class.
52
Large Cap Value Fund (Unaudited)
COMPARISON OF A $10,000 INVESTMENT

This graph shows the change in value of a hypothetical $10,000 investment in the Fund over the past 10 fiscal years, or since the Fund's inception if it has not operated for 10 years. The graph is based on the Investor Class shares only; the performance of the Fund's share classes will differ primarily due to different sales charge structures and class expenses (see Performance Highlights chart on previous page). The result is compared with benchmarks, which include a broad-based market index and may include a more narrowly based index. Market indices have not been reduced to reflect any of the fees and costs of investing. The results shown in the graph reflect the reinvestment of income dividends and other distributions, if any. The results do not reflect the effect of taxes a shareholder would pay on Fund distributions or on the redemption of Fund shares. Results represent past performance and do not indicate future results.
53
Mid Cap Growth Fund Commentary (Unaudited)
Neuberger Berman Mid Cap Growth Fund Investor Class generated an 18.03% total return for the fiscal year ended August 31, 2013 but trailed its benchmark, the Russell Midcap® Growth Index, which returned 23.97% for the period. (Performance for all share classes is provided in the table immediately following this letter.)
A resilient economy that offered steady GDP growth amid signs of improvement in housing and employment, coupled with a liquidity-fueled market, fostered surprisingly robust double digit returns over the trailing 12 months. Despite its overall strong performance, the period's bull market had an almost underappreciated quality to it. There was a prevailing sense of general investor apathy which was likely the result of continued headline volatility around sequester-driven budget cuts, the true health of China's economy, political unrest in various emerging and developing countries, and the U.S. Federal Reserve's potential intent to taper off its quantitative easing program. From our perspective, as equity investors, the near-term impact of a practically zero-rate environment has been to cultivate dependency among yield obsessed investors for the significant number of corporations that are providing escalating dividend programs over direct capital reinvestment into their franchises, and in some cases doing so as an apparent viable short-term remedy for any fundamental shortcomings. The broad effect has been a suppression of balance sheet differentiation and a continued stylistic rotation in favor of increasingly crowded yield-driven trades and away from higher growth and higher expectation companies, exemplified by Consumer Staples and Information Technology (IT) as unexpected leading and lagging contributors to a buoyant equity market.
During the trailing twelve months, the portfolio was materially overweighted in Industrials, Telecommunication Services and IT and underweighted in Consumer Discretionary, Consumer Staples and Materials. Drilling down to industry-level decisions, relative performance versus the benchmark proved to be as much about what we didn't own as what we did, as our avoidance of, or significant underweight to, airlines, personal products, packaged food and meats, auto manufacturers and internet retail contributed to our allocation decisions being a meaningful driver of our relative underperformance. In each case, we feel our underweight was justified as the aforementioned segments were fueled by stocks that excelled in spite of what we viewed to be significant headwinds, questionable management and/or slow growth potential.
With respect to what we did own, the top contributor for the period was Cabot Oil & Gas, a domestic exploration and production company that raised guidance and which we believe remains well positioned to efficiently execute in a declining price environment. Additional contributors were Illumina, a developer of life science and genetic analysis tools that delivered a strong quarter and outlook; Affiliated Managers Group, a global asset management company that benefited from strong equity performance; and BE Aerospace, a manufacturer of aircraft interior products that benefited from an increase in Boeing's production of "wide-body" planes. In addition, AMC Networks, an operator of cable television brands, was boosted by the continued strength of its original programming titles such as Mad Men and Breaking Bad, while SBA Communications, an owner and operator of wireless towers, was rewarded for strong top-line growth and better-than-expected guidance.
Top detractors were populated by an IT sector that proved broadly challenging. Liquidity Services, which operates an online auction environment for bulk, salvage and specialty products, was the top detractor from performance on news that a recent acquisition would require capital reinvestment and dilute earnings. Additionally, Aruba Networks, a provider of mobile enterprise and network access solutions, delivered disappointing results and guidance in the face of aggressive competition from Cisco. Rackspace Hosting, a provider of cloud computing services, overestimated client adoption rates for their newest product, while MICROS Systems, a provider of enterprise information solutions to the global hospitality industry, was hindered by European economic uncertainty.
Outside of IT, Ross Stores, an operator of off-price retail apparel and home accessories stores, and Bed Bath & Beyond, a domestic merchandise and home furnishings retailer, were both negatively impacted by the combination of high expectations resulting from past strong results and the challenges of continued economic uncertainty. HMS Holdings, a provider of health care cost containment services, was hindered by the inability of their state government clients to provide critical data.
54
With the exception of Ross Stores, we exited our positions in all the aforementioned detractors.
Looking ahead we remain stout believers in the long-term resiliency of our economy and constructive on an eventual reemergence of fundamentals as the primary differentiator and driver of stock price appreciation. With valuations attractive across traditional mid cap growth sectors, and in particular for the higher-growth and higher-expectation companies we typically covet, we are cautiously optimistic that we will continue to experience a positive environment for mid cap equities.
Sincerely,

KENNETH J. TUREK
PORTFOLIO MANAGER
Information about the principal risks of investing in the Fund is set forth in the prospectus and statement of additional information.
The portfolio composition, industries and holdings of the Fund are subject to change.
The opinions expressed are those of the Fund's portfolio manager. The opinions are as of the date of this report and are subject to change without notice.
55
Mid Cap Growth Fund (Unaudited)
TICKER SYMBOLS
Investor Class | | NMANX | |
Trust Class | | NBMTX | |
Advisor Class | | NBMBX | |
Institutional Class | | NBMLX | |
Class A | | NMGAX | |
Class C | | NMGCX | |
Class R3 | | NMGRX | |
Class R6 | | NRMGX | |
SECTOR ALLOCATION
(as a % of Total Investments) | |
Consumer Discretionary | | | 21.7 | % | |
Consumer Staples | | | 6.0 | | |
Energy | | | 6.2 | | |
Financials | | | 7.4 | | |
Health Care | | | 14.6 | | |
Industrials | | | 17.9 | | |
Information Technology | | | 16.8 | | |
Materials | | | 2.3 | | |
Telecommunication Services | | | 3.1 | | |
Short-Term Investments | | | 4.0 | | |
Total | | | 100.0 | % | |
PERFORMANCE HIGHLIGHTS7
| | | | | Average Annual Total
Return Ended 08/31/2013 | |
| | | Inception
Date | | 1 Year | | 5 Years | | 10 Years | | Life of
Fund | |
At NAV | |
Investor Class | | 03/01/19792 | | | 18.03 | % | | | 8.25 | % | | | 9.77 | % | | | 11.86 | % | |
| Trust Class3 | | 08/30/1993 | | | 18.02 | % | | | 8.16 | % | | | 9.58 | % | | | 11.77 | % | |
| Advisor Class4 | | 09/03/1996 | | | 17.64 | % | | | 7.80 | % | | | 9.26 | % | | | 11.57 | % | |
| Institutional Class5 | | 04/19/2007 | | | 18.32 | % | | | 8.60 | % | | | 9.99 | % | | | 11.92 | % | |
| Class A20 | | 05/27/2009 | | | 17.91 | % | | | 8.19 | % | | | 9.73 | % | | | 11.85 | % | |
| Class C20 | | 05/27/2009 | | | 17.05 | % | | | 7.49 | % | | | 9.38 | % | | | 11.74 | % | |
| Class R317 | | 05/27/2009 | | | 17.63 | % | | | 7.95 | % | | | 9.61 | % | | | 11.81 | % | |
| Class R625 | | 03/15/2013 | | | 18.19 | % | | | 8.28 | % | | | 9.78 | % | | | 11.86 | % | |
With Sales Charge | |
| Class A20 | | | | | 11.15 | % | | | 6.91 | % | | | 9.08 | % | | | 11.66 | % | |
| Class C20 | | | | | 16.05 | % | | | 7.49 | % | | | 9.38 | % | | | 11.74 | % | |
Index | |
| Russell Midcap® Growth Index1,16 | | | | | 23.97 | % | | | 9.14 | % | | | 9.42 | % | | | N/A | | |
| Russell Midcap® Index1,16 | | | | | 24.91 | % | | | 9.08 | % | | | 10.14 | % | | | 13.46 | % | |
The performance data quoted represent past performance and do not indicate future results. Current performance may be lower or higher than the performance data quoted. For more current performance data, please visit www.nb.com/performance.
The results shown in the table reflect the reinvestment of income dividends and other distributions, if any. The results do not reflect the effect of taxes a shareholder would pay on Fund distributions or on the redemption of Fund shares.
The investment return and principal value of an investment will fluctuate and shares, when redeemed, may be worth more or less than their original cost.
Returns would have been lower if Neuberger Berman Management LLC ("Management") had not reimbursed certain expenses and/or waived a portion of the investment management fees during certain of the periods shown. Repayment by a class (of expenses previously reimbursed and/or fees previously waived by Management) will decrease the class's returns. Please see Note B in the Notes to Financial Statements for specific information regarding expense reimbursement and/or fee waiver arrangements.
As stated in the Fund's most recent prospectus, the total annual operating expense ratios for fiscal year 2012 (estimated for 2013 for Class R6) were 1.01%, 1.05%, 1.45%, 0.80%, 1.18%, 1.99%, 1.46% and 0.71% for Investor Class, Trust Class, Advisor Class, Institutional Class, Class A, Class C, Class R3 and Class R6 shares, respectively (before expense reimbursements and/or fee waivers, if any). The expense ratios were 0.76%, 1.12%, 1.87%, 1.37% and 0.69% for Institutional Class, Class A, Class C, Class R3 and Class R6 shares, respectively, after expense reimbursements and/or fee waivers. The total annual operating expense ratio for Advisor Class includes the class's repayment of expenses previously reimbursed and/or fees previously waived by Management.
Returns shown with a sales charge reflect the deduction of the current maximum initial sales charge of 5.75% for Class A shares and the applicable contingent deferred sales charges (CDSC) for Class C shares. The maximum CDSC for Class C shares is 1%, which is reduced to 0% after 1 year. The performance of the Fund's share classes will differ primarily due to different sales charge structures and class expenses. Please see the prospectus for more information about sales charge structures, if any, and class expenses for your share class.
56
Mid Cap Growth Fund (Unaudited)
COMPARISON OF A $10,000 INVESTMENT
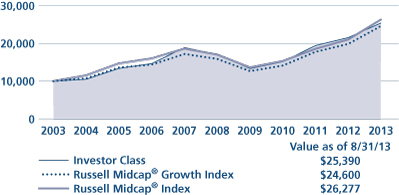
This graph shows the change in value of a hypothetical $10,000 investment in the Fund over the past 10 fiscal years, or since the Fund's inception if it has not operated for 10 years. The graph is based on the Investor Class shares only; the performance of the Fund's share classes will differ primarily due to different sales charge structures and class expenses (see Performance Highlights chart on previous page). The result is compared with benchmarks, which include a broad-based market index and may include a more narrowly based index. Market indices have not been reduced to reflect any of the fees and costs of investing. The results shown in the graph reflect the reinvestment of income dividends and other distributions, if any. The results do not reflect the effect of taxes a shareholder would pay on Fund distributions or on the redemption of Fund shares. Results represent past performance and do not indicate future results.
57
Mid Cap Intrinsic Value Fund Commentary (Unaudited)
Neuberger Berman Mid Cap Intrinsic Value Fund Investor Class generated a 28.58% total return for the fiscal year ended August 31, 2013 and outperformed its benchmark, the Russell Midcap® Value Index, which generated a 25.37% return. (Performance for all share classes is provided in the table immediately following this letter.)
Although the portfolio underperformed the benchmark in the beginning of the reporting period, as the bull market accelerated during the first quarter of 2013, many of our stocks that had lagged rebounded strongly and the portfolio began to gain ground. As equity markets continued to rise, the portfolio was helped by strategic events in several of our companies and our conservative positioning helped in June and August when the index was down sharply, putting us ahead of the benchmark for the year-to-date period and full fiscal year.
The robust stock market that prevailed during 2012 and into 2013 was, in our view, primarily driven by a combination of attractive equity valuations and the continuation of enormous liquidity provided by global monetary authorities. As a result, bond yields remained at extremely low levels and stocks became very attractive. Late in the second quarter, U.S. Federal Reserve (Fed) Chairman Bernanke suggested that the Fed might be ready to taper (not tighten) its quantitative easing (QE) programs. While hikes in the Federal Funds rates are most likely still a few years away, in our view, even the hint of a reduction in monetary policy had a significant negative impact on the 10-year Treasury, with the yield jumping to over 2.8% from a low of 1.62% in May. Since the market has been highly correlated to the QE programs, and with the dramatic rise in interest rates, major stock indices experienced their first real correction in several quarters.
Given this economic backdrop of slow growth, coupled with rising interest rates, we continue to position the portfolio in franchise companies that have been generating cash, selling at material discounts to our estimates of intrinsic value1 where management is returning cash to shareholders. We believe that these franchises, which we consider underappreciated, could become attractive takeover candidates given that the sluggish economic environment has hampered corporations' ability to meaningfully grow their revenue base. We believe these corporations, being flush with cash, and with financing costs still attractive, may use acquisitions as an avenue to grow.
During the period, most sectors performed well on an absolute basis. Relative to the benchmark, the Fund's positioning and stock selection in the Consumer Discretionary, Consumer Staples, Financial Services and Utilities sectors helped performance. In the Consumer sectors, Safeway announced a major divestiture and Virgin Media benefitted from a merger announcement (see below); Best Buy rebounded as investors gained confidence in the new management team; and Express, one of our interrupted growth scenarios, recovered from several down quarters as the company beat earnings expectations. Our underweight in Financial Services (especially REITs), coupled with strong stock picking in this sector, also contributed to performance. State Street initiated a large share repurchase program and introduced a sizeable cost-savings program and Huntington Bancshares profited from operational improvements and increased credit quality. In Utilities, NV Energy and CenterPoint Energy both announced strategic events (see below).
The portfolio benefitted from individual stocks where strategic events were announced: Symantec announced the replacement of its CEO; activist investors in ADT are pressuring the company to explore strategic options; Virgin Media agreed to be acquired by Liberty Global for approximately $48 per share in cash and stock, a 24% premium over the previous day's close; CenterPoint Energy announced the formation of an MLP with OGE Energy; BMC Software agreed to be acquired by two private equity firms; NV Energy agreed to be acquired by MidAmerican Energy Holdings, a subsidiary of Berkshire Hathaway; Devon Energy announced plans to form a publicly traded midstream MLP; Safeway, our largest position, entered into a definitive agreement to sell its Canadian operations to Sobeys for C$5.8 billion; and Ashland announced its intention to sell its elastomers business and is exploring strategic alternatives for its Water Technology business.
Our positioning in the Health Care sector hurt relative performance. Stock selection in Technology and Producer Durables also detracted. In Technology, VeriFone Systems and Nuance Communications both missed earnings estimates. We used the weakness in Nuance, a franchise company in voice recognition technology, to increase our position size. Activist investor
58
Carl Icahn also announced that he has accumulated around 15% of the shares. Other stock specific detractors included Agrium (Materials & Processing), Kohl's (Consumer Discretionary), and Western Union (Financial Services). We initiated a position in Agrium, a retail supplier of agricultural products and producer of agricultural nutrients in February and eliminated it in late July as the nature of the industry changed. Also, Kohl's has exhibited lackluster performance despite an aggressive share repurchase program, and Western Union lowered guidance for 2013.
During the year, we were active in the portfolio on both the buy and sell sides by adding 18 new positions and eliminating 23.
It appears that we are entering a new phase in the current economic recovery that may be characterized, at some point, by less stimulative monetary policy. As such, we believe market interest rates will most likely trade towards a new, higher range. We continue to believe that our cash generating franchises represent excellent value and, given value creating catalysts, have the potential to achieve good returns moving forward.
Sincerely,

MICHAEL C. GREENE
PORTFOLIO MANAGER
1 Intrinsic value reflects the team's analysis and estimates of a company's value. There is no guarantee that any intrinsic values will be realized; security prices may decrease regardless of intrinsic values.
Information about the principal risks of investing in the Fund is set forth in the prospectus and statement of additional information.
The portfolio composition, industries and holdings of the Fund are subject to change.
The opinions expressed are those of the Fund's portfolio manager. The opinions are as of the date of this report and are subject to change without notice.
59
Mid Cap Intrinsic Value Fund (Unaudited)
TICKER SYMBOLS
Investor Class | | NBRVX | |
Trust Class | | NBREX | |
Institutional Class | | NBRTX | |
Class A | | NBRAX | |
Class C | | NBRCX | |
Class R3 | | NBRRX | |
SECTOR ALLOCATION
(as a % of Total Investments) | |
Consumer Discretionary | | | 11.8 | % | |
Consumer Staples | | | 7.1 | | |
Energy | | | 6.1 | | |
Financial Services | | | 19.7 | | |
Health Care | | | 9.5 | | |
Materials & Processing | | | 2.1 | | |
Producer Durables | | | 18.5 | | |
Technology | | | 15.4 | | |
Utilities | | | 8.9 | | |
Short-Term Investments | | | 0.9 | | |
Total | | | 100.0 | % | |
PERFORMANCE HIGHLIGHTS7
| | | | | Average Annual Total
Return Ended 08/31/2013 | |
| | | Inception
Date | | 1 Year | | 5 Years | | 10 Years | | Life of
Fund | |
At NAV | |
Investor Class | | 06/01/1999 | | | 28.58 | % | | | 8.10 | % | | | 9.15 | % | | | 9.27 | % | |
| Trust Class3 | | 06/10/1999 | | | 28.45 | % | | | 8.06 | % | | | 9.07 | % | | | 9.21 | % | |
| Institutional Class5 | | 03/08/2010 | | | 28.96 | % | | | 8.35 | % | | | 9.28 | % | | | 9.36 | % | |
| Class A20 | | 06/21/2010 | | | 28.43 | % | | | 8.07 | % | | | 9.14 | % | | | 9.26 | % | |
| Class C20 | | 06/21/2010 | | | 27.51 | % | | | 7.57 | % | | | 8.89 | % | | | 9.09 | % | |
| Class R317 | | 06/21/2010 | | | 28.22 | % | | | 7.91 | % | | | 9.06 | % | | | 9.20 | % | |
With Sales Charge | |
| Class A20 | | | | | 21.07 | % | | | 6.80 | % | | | 8.49 | % | | | 8.81 | % | |
| Class C20 | | | | | 26.51 | % | | | 7.57 | % | | | 8.89 | % | | | 9.09 | % | |
Index | |
| Russell Midcap® Value Index1,16 | | | | | 25.37 | % | | | 8.87 | % | | | 10.37 | % | | | 8.84 | % | |
| Russell Midcap® Index1,16 | | | | | 24.91 | % | | | 9.08 | % | | | 10.14 | % | | | 8.27 | % | |
The performance data quoted represent past performance and do not indicate future results. Current performance may be lower or higher than the performance data quoted. For more current performance data, please visit www.nb.com/performance.
The results shown in the table reflect the reinvestment of income dividends and other distributions, if any. The results do not reflect the effect of taxes a shareholder would pay on Fund distributions or on the redemption of Fund shares.
The investment return and principal value of an investment will fluctuate and shares, when redeemed, may be worth more or less than their original cost.
Returns would have been lower if Neuberger Berman Management LLC ("Management") had not reimbursed certain expenses and/or waived a portion of the investment management fees during certain of the periods shown. Repayment by a class (of expenses previously reimbursed and/or fees previously waived by Management) will decrease the class's returns. Please see Note B in the Notes to Financial Statements for specific information regarding expense reimbursement and/or fee waiver arrangements.
As stated in the Fund's most recent prospectus, the total annual operating expense ratios for fiscal year 2012 were 1.39%, 1.61%, 1.20%, 1.61%, 2.44% and 1.89% for Investor Class, Trust Class, Institutional Class, Class A, Class C and Class R3 shares, respectively (before expense reimbursements and/or fee waivers, if any). The expense ratios were 1.25%, 0.85%, 1.21%, 1.96% and 1.46% for Trust Class, Institutional Class, Class A, Class C and Class R3 shares, respectively, after expense reimbursements and/or fee waivers.
Returns shown with a sales charge reflect the deduction of the current maximum initial sales charge of 5.75% for Class A shares and the applicable contingent deferred sales charges (CDSC) for Class C shares. The maximum CDSC for Class C shares is 1%, which is reduced to 0% after 1 year. The performance of the Fund's share classes will differ primarily due to different sales charge structures and class expenses. Please see the prospectus for more information about sales charge structures, if any, and class expenses for your share class.
60
Mid Cap Intrinsic Value Fund (Unaudited)
COMPARISON OF A $10,000 INVESTMENT
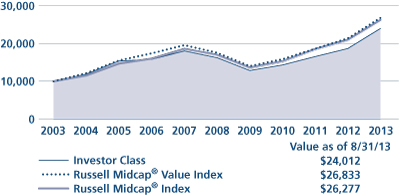
This graph shows the change in value of a hypothetical $10,000 investment in the Fund over the past 10 fiscal years, or since the Fund's inception if it has not operated for 10 years. The graph is based on the Investor Class shares only; the performance of the Fund's share classes will differ primarily due to different sales charge structures and class expenses (see Performance Highlights chart on previous page). The result is compared with benchmarks, which include a broad-based market index and may include a more narrowly based index. Market indices have not been reduced to reflect any of the fees and costs of investing. The results shown in the graph reflect the reinvestment of income dividends and other distributions, if any. The results do not reflect the effect of taxes a shareholder would pay on Fund distributions or on the redemption of Fund shares. Results represent past performance and do not indicate future results.
61
Multi-Cap Opportunities Fund Commentary (Unaudited)
Neuberger Berman Multi-Cap Opportunities Fund Institutional Class generated a 28.57% total return for the fiscal year ended August 31, 2013, outperforming its benchmark, the S&P 500 Index, which generated an 18.70% return for the period. (Performance for all share classes is provided in the table immediately following this letter.)
During the reporting period, stocks were supported by strong corporate profits, increased economic activity, and improving investor sentiment. Continued recovery in the housing and labor markets also supported consistent growth in the U.S. economy. U.S. real GDP has grown for nine consecutive quarters. This is having a positive impact on the U.S. fiscal balance, which is projected to be 4% of GDP this year, down from a high of 10% in 2009. While investors remain mindful of macro issues, stock correlations have declined signaling greater focus on company fundamentals.
Within the index, select cyclical sectors led the market. Consumer Discretionary, Financials, Health Care and Industrials all outperformed relative to the overall benchmark. Consumer Staples, Energy, Information Technology (IT), Materials, Telecommunication Services and Utilities lagged the overall benchmark. We believe declining stock correlations over the course of the year contributed to the dispersion in performance across sectors.
Within the portfolio, outperformance versus the index was driven primarily by stock selection. The portfolio generated superior stock selection in 7 of 9 sectors (the portfolio had no exposure to Telecommunication Services during the period). Stock selection in IT, Financials and Materials were most beneficial to relative performance. The Fund's underweight position in Financials and stock selection in Energy were the largest detractors from relative performance during the period. The Fund ended the fiscal year with an overweight, relative to the benchmark, in the Consumer Discretionary, Health Care, Industrials and Materials sectors. The Fund ended the fiscal year with an underweight, relative to the benchmark, in the Consumer Staples, Energy, Financials, IT, Telecommunication Services, and Utilities sectors.
Portfolio construction is an important component of our investment process and consists of three distinct investment categories: "Special Situations, Opportunistic and Classic." Special Situations have unique attributes (e.g., restructuring, spin-offs, post-bankruptcy equities) that require specific valuation methodologies and customized investment research to determine their potential worth. Opportunistic investments are companies that have become inexpensive for a tangible reason that we believe is temporary. Classic investments are those companies with long histories of shareholder friendly policies, high quality management teams and exceptional operating performance. We believe maintaining a balance of these three categories helps to mitigate risk within the portfolio.
We continue to find well-managed franchises generating stable and growing free cash flow that are trading at what we believe are attractive valuations. Over the past year, we added several new companies to the Fund. We continue to find investment opportunities across the market capitalization spectrum with risk/return profiles that we find attractive. Our investment process is based on deep fundamental research and disciplined valuation analysis to determine the prospects of individual companies.
We continue to believe the current environment is highly attractive for free cash flow oriented investing as free cash flow yields for equities relative to fixed income yields remain near historic highs. Companies with high free cash flow and prudent management teams can potentially do very well in a moderate growth environment. Dividend increases, share repurchase programs, cash accumulation, debt retirement, organic growth initiatives and selective acquisitions all may accrue to the benefit of equity holders. These positive developments are taking place at many of the companies owned by the Fund.
As noted, our style of investing is based on rigorous fundamental research. The analysis centers on the business model and a company's ability to generate and effectively utilize free cash flow. As we evaluate both potential new positions and
62
current portfolio holdings, we will continue to do so with a long-term investment perspective in mind. As always, our focus is to grow our clients' assets through the disciplined application of our investment philosophy and process.
Sincerely,

RICHARD S. NACKENSON
PORTFOLIO MANAGER
Information about the principal risks of investing in the Fund is set forth in the prospectus and statement of additional information.
The portfolio composition, industries and holdings of the Fund are subject to change.
The opinions expressed are those of the Fund's portfolio manager. The opinions are as of the date of this report and are subject to change without notice.
63
Multi-Cap Opportunities Fund (Unaudited)
TICKER SYMBOLS
Institutional Class | | NMULX | |
Class A | | NMUAX | |
Class C | | NMUCX | |
SECTOR ALLOCATION
(as a % of Total Investments) | |
Consumer Discretionary | | | 16.4 | % | |
Consumer Staples | | | 9.3 | | |
Energy | | | 9.2 | | |
Financials | | | 7.2 | | |
Health Care | | | 13.6 | | |
Industrials | | | 20.9 | | |
Information Technology | | | 8.3 | | |
Materials | | | 8.9 | | |
Utilities | | | 2.9 | | |
Short-Term Investments | | | 3.3 | | |
Total | | | 100.0 | % | |
PERFORMANCE HIGHLIGHTS9
| | | | | Average Annual Total
Return Ended 08/31/2013 | |
| | | Inception
Date* | | 1 Year | | 5 Years | | Life of
Fund | |
At NAV | |
| Institutional Class18 | | 12/21/2009 | | | 28.57 | % | | | 8.62 | % | | | 6.72 | % | |
| Class A18 | | 12/21/2009 | | | 28.22 | % | | | 8.34 | % | | | 6.52 | % | |
| Class C18 | | 12/21/2009 | | | 27.10 | % | | | 7.73 | % | | | 6.08 | % | |
With Sales Charge | |
| Class A18 | | | | | 20.88 | % | | | 7.07 | % | | | 5.61 | % | |
| Class C18 | | | | | 26.10 | % | | | 7.73 | % | | | 6.08 | % | |
Index | |
| S&P 500 Index1,16 | | | | | 18.70 | % | | | 7.32 | % | | | 4.88 | % | |
*Prior to December 14, 2009, Neuberger Berman Multi-Cap Opportunities Fund was known as Neuberger Berman Research Opportunities Fund, which had different investment goals, strategies, and portfolio management team. The performance data for each class includes the performance of the Fund's oldest share class, Trust Class, from November 2, 2006 through December 21, 2009. See endnote 18 for information about the effects of the different fees paid by each class.
The performance data quoted represent past performance and do not indicate future results. Current performance may be lower or higher than the performance data quoted. For more current performance data, please visit www.nb.com/performance.
The results shown in the table reflect the reinvestment of income dividends and other distributions, if any. The results do not reflect the effect of taxes a shareholder would pay on Fund distributions or on the redemption of Fund shares.
The investment return and principal value of an investment will fluctuate and shares, when redeemed, may be worth more or less than their original cost.
Returns would have been lower if Neuberger Berman Management LLC ("Management") had not reimbursed certain expenses and/or waived a portion of the investment management fees during certain of the periods shown. Repayment by a class (of expenses previously reimbursed and/or fees previously waived by Management) will decrease the class's returns. Please see Note B in the Notes to Financial Statements for specific information regarding expense reimbursement and/or fee waiver arrangements.
As stated in the Fund's most recent prospectus, the total annual operating expense ratios for fiscal year 2012 were 1.01%, 1.37% and 2.15% for Institutional Class, Class A and Class C shares, respectively (before expense reimbursements and/or fee waivers, if any). The expense ratio was 2.12% for Class C shares after expense reimbursements and/or fee waivers. The total annual operating expense ratio for each of Institutional Class and Class A includes the class's repayment of expenses previously reimbursed and/or fees previously waived by Management.
Returns shown with a sales charge reflect the deduction of the current maximum initial sales charge of 5.75% for Class A shares and the applicable contingent deferred sales charges (CDSC) for Class C shares. The maximum CDSC for Class C shares is 1%, which is reduced to 0% after 1 year. The performance of the Fund's share classes will differ primarily due to different sales charge structures and class expenses. Please see the prospectus for more information about sales charge structures, if any, and class expenses for your share class.
64
Multi-Cap Opportunities Fund (Unaudited)
COMPARISON OF A $1,000,000 INVESTMENT18
(000's Omitted)

This graph shows the change in value of a hypothetical $1,000,000 investment in the Fund over the past 10 fiscal years, or since the Fund's inception if it has not operated for 10 years. The graph is based on the Institutional Class shares only; the performance of the Fund's share classes will differ primarily due to different sales charge structures and class expenses (see Performance Highlights chart on previous page). The result is compared with benchmarks, which include a broad-based market index and may include a more narrowly based index. Market indices have not been reduced to reflect any of the fees and costs of investing. The results shown in the graph reflect the reinvestment of income dividends and other distributions, if any. The results do not reflect the effect of taxes a shareholder would pay on Fund distributions or on the redemption of Fund shares. Results represent past performance and do not indicate future results.
65
Real Estate Fund Commentary (Unaudited)
Neuberger Berman Real Estate Fund Trust Class generated a –2.60% total return for the fiscal year ended August 31, 2013 and lagged its benchmark, the FTSE NAREIT All Equity REITs Index, which generated a 1.44% return for the period. (Performance for all share classes is provided in the table immediately following this letter.)
After a strong start, the real estate investment trust (REIT) market gave back most of its gains during the last third of the reporting period. The overall REIT market was initially supported by strong demand given investors' interest in dividend-paying securities. In addition, REITs benefited from generally improving fundamentals and their ready access to capital. From August 31, 2012 through May 21, 2013, the index rose 21.5%. While their fundamentals did not materially change, REIT prices fell sharply during the remainder of the reporting period, with the index falling more than 16%. This turnaround was triggered by expectations that the U.S. Federal Reserve (the Fed) would begin tapering its asset purchase program. Against this backdrop, interest rates moved sharply higher and demand for REITs and dividend-paying stocks in general weakened.
Both stock selection and sector allocation detracted from the Fund's relative performance versus the benchmark during the reporting period. Looking at individual holdings, apartment REIT Equity Residential was the Fund's worst performer. The company, along with another Fund holding, AvalonBay Communities, acquired a private apartment company, Archstone, in a $16 billion transaction. Large equity offerings from each company pressured their share prices and the apartment sector as a whole. In addition, both companies were negatively impacted by strength in the "for sale" single family home market (as opposed to the "apartments for rent" market). Another meaningful detractor from performance was data center REIT Digital Realty. The company was negatively impacted by concerns of oversupply within the data center industry and Digital Realty's future rental growth rate. Elsewhere, owning Simon Property, the largest regional mall operator in the U.S., was detrimental to performance. It was pressured by signs of decelerating retail sales growth during the second half of the period.
Timber REIT Rayonier was the Fund's top performer during the reporting period. The company manages timberland and produces specialty grade wood pulp, with primary end markets such as homebuilding, cigarette filters, tire cord and cosmetics. Rayonier benefited from continued improvement in the single family housing construction market and solid export activity to China and Japan. Investor sentiment for the company also improved as it significantly raised its dividend during the period. Public Storage, the largest storage company in the U.S., was another solid contributor to results. The company's shares moved higher as it experienced strong demand. In addition, Public Storage increased its market share, largely at the expense of smaller regional and local storage companies. Elsewhere, the Fund's position in Health Care REIT was additive for results. The company owns senior housing facilities in the U.S. It has benefited from increasing demand given the aging of the baby boomer generation. Also supporting the company has been the rebound in the housing market. With prices rising, an increasing number of senior citizens have moved to sell their primary residences, further fueling demand for Health Care REIT's facilities.
As the reporting period began, we had a defensive tilt for the portfolio. This was due to a number of macro concerns and signs of slowing global growth. As some of these issues were lifted and global growth improved, we increased the Fund's allocation to several of the more cyclical areas in the benchmark, including the Industrial sector and select retail REITs. We also added to our exposure to REITs that we felt would benefit from the improving "for sale" market, including a number of companies in the Sun Belt and Southeast. In contrast, we pared our exposure to more defensive sectors, such as Health Care, as well as the Apartment sector. Overall, the Fund's sector positioning detracted from the Fund's relative performance during the period.
Looking ahead, higher interest rates could continue to be a near term headwind for REITs. However, over the longer term we have seen less correlation between REIT performance and interest rate trends. We believe this stands to reason, as rising rates are typically associated with improving economic conditions. In particular, we feel that the benefits of a strengthening economy and job market on real estate demand could outweigh higher rates. In addition, we believe REIT fundamentals remain solid overall; many REITs have used low borrowing costs and the capital markets to strengthen their balance sheets,
66
and many REITs continue to have ready access to capital. Furthermore, REIT dividends have stabilized and have begun to grow. We believe this trend may continue over the next few years as REITs experience increases in cash flow and taxable income. That being said, investor concerns over the timing and magnitude of the Fed's tapering could lead to continued market volatility in the short term.
Sincerely,


STEVE S. SHIGEKAWA AND BRIAN JONES
PORTFOLIO CO-MANAGERS
Information about the principal risks of investing in the Fund is set forth in the prospectus and statement of additional information.
The portfolio composition, industries and holdings of the Fund are subject to change.
The opinions expressed are those of the Fund's portfolio managers. The opinions are as of the date of this report and are subject to change without notice.
67
Real Estate Fund (Unaudited)
TICKER SYMBOLS
Trust Class | | NBRFX | |
Institutional Class | | NBRIX | |
Class A | | NREAX | |
Class C | | NRECX | |
Class R3 | | NRERX | |
Class R6 | | NRREX | |
SECTOR ALLOCATION
(as a % of Total Investments) | |
Apartments | | | 13.9 | % | |
Diversified | | | 17.3 | | |
Health Care | | | 10.1 | | |
Industrial | | | 7.0 | | |
Infrastructure | | | 5.9 | | |
Lodging/Resorts | | | 2.7 | | |
Office | | | 10.6 | | |
Regional Malls | | | 14.7 | | |
Self Storage | | | 6.0 | | |
Shopping Centers | | | 5.2 | | |
Timber | | | 5.6 | | |
Short-Term Investments | | | 1.0 | | |
Total | | | 100.0 | % | |
PERFORMANCE HIGHLIGHTS7,23
| | | | | Average Annual Total
Return Ended 08/31/2013 | |
| | | Inception
Date | | 1 Year | | 5 Years | | 10 Years | | Life of
Fund | |
At NAV | |
Trust Class | | 05/01/2002 | | | –2.60 | % | | | 7.12 | % | | | 11.02 | % | | | 11.45 | % | |
| Institutional Class6 | | 06/04/2008 | | | –2.48 | % | | | 7.31 | % | | | 11.13 | % | | | 11.55 | % | |
| Class A15 | | 06/21/2010 | | | –2.82 | % | | | 6.99 | % | | | 10.95 | % | | | 11.39 | % | |
| Class C15 | | 06/21/2010 | | | –3.52 | % | | | 6.48 | % | | | 10.69 | % | | | 11.15 | % | |
| Class R315 | | 06/21/2010 | | | –3.04 | % | | | 6.82 | % | | | 10.86 | % | | | 11.31 | % | |
| Class R626 | | 03/15/2013 | | | –2.45 | % | | | 7.16 | % | | | 11.04 | % | | | 11.46 | % | |
With Sales Charge | |
| Class A15 | | | | | –8.39 | % | | | 5.73 | % | | | 10.30 | % | | | 10.81 | % | |
| Class C15 | | | | | –4.46 | % | | | 6.48 | % | | | 10.69 | % | | | 11.15 | % | |
Index | |
| FTSE NAREIT All Equity REITs Index1,16 | | | | | 1.44 | % | | | 5.25 | % | | | 9.66 | % | | | 9.79 | % | |
The performance data quoted represent past performance and do not indicate future results. Current performance may be lower or higher than the performance data quoted. For more current performance data, please visit www.nb.com/performance.
The results shown in the table reflect the reinvestment of income dividends and other distributions, if any. The results do not reflect the effect of taxes a shareholder would pay on Fund distributions or on the redemption of Fund shares.
The investment return and principal value of an investment will fluctuate and shares, when redeemed, may be worth more or less than their original cost.
Returns would have been lower if Neuberger Berman Management LLC ("Management") had not reimbursed certain expenses and/or waived a portion of the investment management fees during certain of the periods shown. Repayment by a class (of expenses previously reimbursed and/or fees previously waived by Management) will decrease the class's returns. Please see Note B in the Notes to Financial Statements for specific information regarding expense reimbursement and/or fee waiver arrangements.
As stated in the Fund's most recent prospectus, the total annual operating expense ratios for fiscal year 2012 (estimated for 2013 for Class R6) were 1.47%, 1.11%, 1.52%, 2.29%, 1.74% and 0.99% for Trust Class, Institutional Class, Class A, Class C, Class R3 and Class R6 shares, respectively (before expense reimbursements and/or fee waivers, if any). The expense ratios were 0.85%, 1.21%, 1.96%, 1.46% and 0.78%, for Institutional Class, Class A, Class C, Class R3 and Class R6, respectively, after expense reimbursements and/or fee waivers.
Returns shown with a sales charge reflect the deduction of the current maximum initial sales charge of 5.75% for Class A shares and the applicable contingent deferred sales charges (CDSC) for Class C shares. The maximum CDSC for Class C shares is 1%, which is reduced to 0% after 1 year. The performance of the Fund's share classes will differ primarily due to different sales charge structures and class expenses. Please see the prospectus for more information about sales charge structures, if any, and class expenses for your share class.
68
Real Estate Fund (Unaudited)
COMPARISON OF A $10,000 INVESTMENT
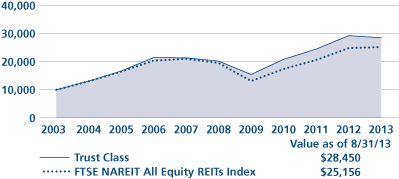
This graph shows the change in value of a hypothetical $10,000 investment in the Fund over the past 10 fiscal years, or since the Fund's inception if it has not operated for 10 years. The graph is based on the Trust Class shares only; the performance of the Fund's share classes will differ primarily due to different sales charge structures and class expenses (see Performance Highlights chart on previous page). The result is compared with benchmarks, which include a broad-based market index and may include a more narrowly based index. Market indices have not been reduced to reflect any of the fees and costs of investing. The results shown in the graph reflect the reinvestment of income dividends and other distributions, if any. The results do not reflect the effect of taxes a shareholder would pay on Fund distributions or on the redemption of Fund shares. Results represent past performance and do not indicate future results.
69
Select Equities Fund Commentary (Unaudited)
Neuberger Berman Select Equities Fund Institutional Class generated a 17.97% total return for the fiscal year ended August 31, 2013 but underperformed its benchmark, the S&P 500 Index, which generated an 18.70% return during the period. (Performance for all share classes is provided in the table immediately following this letter.)
We are pleased with the performance of the portfolio over the course of the fiscal year. We entered this reporting period with a conservative viewpoint and a relatively high cash position (of roughly 10%) given the uncertainty surrounding the fiscal cliff and an economic environment that continued to pose challenges to businesses. We were also wary because the market's positive momentum seemed to have been driven more by monetary stimulus than business fundamentals. Our conservative positioning served us well during the volatile end of 2012, while strong stock selection allowed us to keep pace with this calendar year's rally. Overall, while we are pleased with the portfolio's absolute performance, we consider our performance on a risk-adjusted basis even more gratifying. The portfolio nearly matched the market despite its relatively conservative positioning and cash holdings.
Stock selection has been the key to Fund performance over the full period. Throughout last year's rapid cycling between "risk on" and "risk off" behavior, we stuck to our knitting, continuing our search for the potential beneficiaries of longer-term secular trends and themes. As the market returned to a less distracted, more fundamentals-based stance in early 2013, we stayed the course and enjoyed the performance benefits that resulted from the shift. More recently, especially during May and July, when the market saw dislocations related to the U.S. Federal Reserve's (the Fed) tapering announcement, the fact that we had cash reserves on hand allowed us to use the market volatility as a buying opportunity. As such, we added to existing positions and initiated some new investments.
The portfolio's Information Technology and Industrials holdings had the most significant positive impact on relative performance versus the benchmark this year. We also outperformed in Energy, on the basis of both stock performance and an overweight versus the benchmark, and due to a zero allocation to Consumer Staples and Telecommunication Services—two relatively weak sectors. Historically investors have tended to own Consumer Staples companies for their perceived stability and dividends, and as interest rates increased, these stocks underperformed. We avoided Consumer Staples as we felt uncomfortable buying businesses trading at historically high price-to-earnings multiples despite little revenue growth. We do have exposure to Telecommunication Services via a leading tower company; however, it's organized as a REIT so it is categorized as a Financials holding.
Cash was the biggest detractor from relative performance, finishing the period at roughly 14% of the portfolio. Relative underperformance also resulted from our Financials and Materials holdings and our underweight in Health Care.
At the end of February of this year, we wrote that while we expected the economic recovery to continue to follow our Nike swoosh trajectory, we saw potential for acceleration further down the road. From our current vantage point, we see indications that we were correct and that we could be entering a transitional period leading to stronger, yet by historical standards, below-trend economic growth levels. In recent months, most data has tended to fall on the upside of the Nike swoosh. As one example, U.S. GDP growth, expected to come in around 2%, finished the second quarter at 2.5%. Both the housing picture and unemployment rate have continued to improve and leading economic indicators in both Europe and the Far East—specifically China—have started to turn favorably.
In our opinion, the main driver of recent stock market performance has been the change in the interest rate outlook. Rates on the 10-year Treasury have increased from 1.6% to about 3% since May, in anticipation of the end of the Fed's stimulus program. This change in rates has created significant volatility in the bond market and some volatility in stocks, particularly with respect to interest-rate sensitive sectors. We firmly believe that the 30-year trend of declining rates has ended and will be replaced by a multi-year trend of higher interest rates. This is something we had factored into our current portfolio by overweighting Industrials, Materials and Energy and having a less than historical weighting in equity-income type securities within the portfolio.
70
While fears of the negative ramifications of tapering are widespread, we look at it somewhat differently. We are attempting to embrace it, since in our opinion it implies that the Fed believes the economy is strong enough to stand on its own two feet rather than being dependent on external stimulus. We hope that the handoff from government stimulus to real economic growth will be a smooth transition. However, we remain vigilant that the transition may not be smooth.
Certain factors such as U.S. companies appearing to be in solid financial shape, an economy that could experience more significant growth, equity valuations that remain attractive even in a rising interest rate environment, and the potential that the "Great Rotation" from bonds to equities will continue, lead us to believe we could be in the early stages of a multi-year bull market.
Sincerely,


GERALD KAMINSKY, MICHAEL KAMINSKY AND RICHARD WERMAN
PORTFOLIO CO-MANAGERS
Information about the principal risks of investing in the Fund is set forth in the prospectus and statement of additional information.
The portfolio composition, industries and holdings of the Fund are subject to change.
The opinions expressed are those of the Fund's portfolio managers. The opinions are as of the date of this report and are subject to change without notice.
71
Select Equities Fund (Unaudited)
TICKER SYMBOLS
Institutional Class | | NBEIX | |
Class A | | NBEAX | |
Class C | | NBECX | |
SECTOR ALLOCATION
(as a % of Total Investments) | |
Consumer Discretionary | | | 12.0 | % | |
Energy | | | 15.9 | | |
Financials | | | 16.4 | | |
Health Care | | | 7.3 | | |
Industrials | | | 20.4 | | |
Information Technology | | | 5.1 | | |
Materials | | | 4.6 | | |
Utilities | | | 4.3 | | |
Short-Term Investments | | | 14.0 | | |
Total | | | 100.0 | % | |
PERFORMANCE HIGHLIGHTS
| | | | | Average Annual Total
Return Ended 08/31/2013 | |
| | | Inception
Date | | 1 Year | | 5 Year | | Life of
Fund | |
At NAV | |
Institutional Class | | 12/20/2007 | | | 17.97 | % | | | 6.74 | % | | | 4.37 | % | |
Class A | | 12/20/2007 | | | 17.50 | % | | | 6.39 | % | | | 4.01 | % | |
Class C | | 12/20/2007 | | | 16.60 | % | | | 5.59 | % | | | 3.22 | % | |
With Sales Charge | |
Class A | | | | | 10.71 | % | | | 5.14 | % | | | 2.93 | % | |
Class C | | | | | 15.60 | % | | | 5.59 | % | | | 3.22 | % | |
Index | |
| S&P 500 Index1,16 | | | | | 18.70 | % | | | 7.32 | % | | | 4.36 | % | |
The performance data quoted represent past performance and do not indicate future results. Current performance may be lower or higher than the performance data quoted. For more current performance data, please visit www.nb.com/performance.
The results shown in the table reflect the reinvestment of income dividends and other distributions, if any. The results do not reflect the effect of taxes a shareholder would pay on Fund distributions or on the redemption of Fund shares.
The investment return and principal value of an investment will fluctuate and shares, when redeemed, may be worth more or less than their original cost.
Returns would have been lower if Neuberger Berman Management LLC ("Management") had not reimbursed certain expenses and/or waived a portion of the investment management fees during certain of the periods shown. Repayment by a class (of expenses previously reimbursed and/or fees previously waived by Management) will decrease the class's returns. Please see Note B in the Notes to Financial Statements for specific information regarding expense reimbursement and/or fee waiver arrangements.
As stated in the Fund's most recent prospectus, the total annual operating expense ratios for fiscal year 2012 were 1.16%, 1.54% and 2.29% for Institutional Class, Class A and Class C shares, respectively (before expense reimbursements and/or fee waivers, if any). These expense ratios were 0.76%, 1.21% and 1.96%, respectively, after expense reimbursements and/or fee waivers.
Returns shown with a sales charge reflect the deduction of the current maximum initial sales charge of 5.75% for Class A shares and the applicable contingent deferred sales charges (CDSC) for Class C shares. The maximum CDSC for Class C shares is 1%, which is reduced to 0% after 1 year. The performance of the Fund's share classes will differ primarily due to different sales charge structures and class expenses. Please see the prospectus for more information about sales charge structures, if any, and class expenses for your share class.
72
Select Equities Fund (Unaudited)
COMPARISON OF A $1,000,000 INVESTMENT
(000's Omitted)

This graph shows the change in value of a hypothetical $1,000,000 investment in the Fund over the past 10 fiscal years, or since the Fund's inception if it has not operated for 10 years. The graph is based on the Institutional Class shares only; the performance of the Fund's share classes will differ primarily due to different sales charge structures and class expenses (see Performance Highlights chart on previous page). The result is compared with benchmarks, which include a broad-based market index and may include a more narrowly based index. Market indices have not been reduced to reflect any of the fees and costs of investing. The results shown in the graph reflect the reinvestment of income dividends and other distributions, if any. The results do not reflect the effect of taxes a shareholder would pay on Fund distributions or on the redemption of Fund shares. Results represent past performance and do not indicate future results.
73
Small Cap Growth Fund Commentary (Unaudited)
Neuberger Berman Small Cap Growth Fund Investor Class generated a 23.96% total return for the fiscal year ended August 31, 2013 but trailed its benchmark, the Russell 2000® Growth Index, which returned 28.14% for the period. (Performance for all share classes is provided in the table immediately following this letter.)
A resilient economy that offered steady GDP growth amid signs of improvement in housing and employment, coupled with a liquidity-fueled market, fostered surprisingly robust double digit returns over the trailing 12 months. Despite its overall strong performance, the period's bull market had an almost underappreciated quality to it. There was a prevailing sense of general investor apathy which was likely the result of continued headline volatility around sequester-driven budget cuts, uncertainty about the health of China's economy, political unrest in various emerging and developing countries, and the U.S. Federal Reserve's potential intent to taper off its quantitative easing program. From our perspective, as equity investors, the near-term impact of a practically zero-rate environment has been to cultivate dependency among yield obsessed investors for the significant number of corporations that are providing escalating dividend programs over direct capital reinvestment into their franchises, and in some cases doing so as an apparent viable short-term remedy for any fundamental shortcomings. The broad effect has been a suppression of balance sheet differentiation and a continued stylistic rotation in favor of increasingly crowded yield-driven trades and away from higher growth and higher expectation companies.
During the 12-month period, the portfolio was overweighted in Consumer Discretionary and Information Technology (IT) and underweighted in Industrials, Health Care and Materials. On a relative basis, stock selection detracted from performance as positive results in Consumer Discretionary, Energy, IT and Financials could not overcome broad weakness in both Health Care and Industrials.
Drilling down to our holdings, the top contributor to performance for the period was Fifth & Pacific Cos., a designer and marketer of retail-based brands, which was boosted by management's expected intent to divest its Juicy Couture and Lucky segments to focus solely on growing the promising Kate Spade brand. Additional contributors were Cornerstone OnDemand, a provider of human resource software-as-a-service solutions, which delivered compelling results as demand for cloud-based solutions remained strong, and Lion's Gate Entertainment, an entertainment production and distribution company that was boosted by the success of the first installment of their "Hunger Games" franchise. In addition, CoStar Group, a provider of analytical information and services to the commercial real estate industry, benefited from its successful acquisition of Loop-Net and an improving commercial real estate market, and HEICO Corp., a manufacturer of FAA-approved aircraft replacement parts, demonstrated stabilization in its business as the aerospace segment rebounded.
The Health Care sector generally proved challenging, with NuVasive, a developer of minimally disruptive surgical products and procedures for the spine, being the leading detractor to performance as it missed earnings and significantly lowered its guidance. Additionally, IPC The Hospitalist, a coordinator of hospitalized patient care, HMS Holdings, a provider of health care cost containment services, and Volcano Corporation, a developer and manufacturer of precision flow and intravascular products, also detracted from performance. The uncertainty initially surrounding the health care spending mandate negatively impacted HMS, while IPC fell short of expectations on lower hospital volumes and Volcano was negatively impacted by lowered guidance and the company's decision to raise additional capital.
Outside of Health Care, Mellanox Technologies, a data-related semiconductor fabricator, lowered its future guidance due to volatility in its primary markets, and American Vanguard, a marketer of chemical products for agricultural and commercial uses, experienced lower demand and pricing pressure due to a wet and cold planting season. Additionally, InnerWorkings, a provider of global print management and promotional solutions, unexpectedly announced the loss of a major client and a corresponding material downward earnings revision, while Boulder Brands, a marketer of "functional" food products, pulled back amid concerns that its brands outside of the fast growing gluten-free segment are showing signs of deceleration.
74
We exited our position in Lion's Gate Entertainment and all the aforementioned detractors.
Looking ahead, we remain stout believers in the long-term resiliency of our economy and constructive on an eventual reemergence of fundamentals as the primary differentiator and driver of stock price appreciation. Despite lofty trailing returns, we're still finding attractive valuations across traditional small cap growth sectors and in particular for the higher growth and higher expectation companies we typically covet, and as a result we're cautiously optimistic that it will continue to be a positive environment for small cap equities.
Sincerely,

DAVID H. BURSHTAN
PORTFOLIO MANAGER
Information about the principal risks of investing in the Fund is set forth in the prospectus and statement of additional information.
The portfolio composition, industries and holdings of the Fund are subject to change.
The opinions expressed are those of the Fund's portfolio manager. The opinions are as of the date of this report and are subject to change without notice.
75
Small Cap Growth Fund (Unaudited)
TICKER SYMBOLS
Investor Class | | NBMIX | |
Trust Class | | NBMOX | |
Advisor Class | | NBMVX | |
Institutional Class | | NBSMX | |
Class A | | NSNAX | |
Class C | | NSNCX | |
Class R3 | | NSNRX | |
SECTOR ALLOCATION
(as a % of Total Investments) | |
Consumer Discretionary | | | 18.6 | % | |
Consumer Staples | | | 3.8 | | |
Energy | | | 4.5 | | |
Financials | | | 7.6 | | |
Health Care | | | 21.3 | | |
Industrials | | | 12.5 | | |
Information Technology | | | 25.8 | | |
Materials | | | 3.7 | | |
Short-Term Investments | | | 2.2 | | |
Total | | | 100.0 | % | |
PERFORMANCE HIGHLIGHTS7
| | | | | Average Annual Total
Return Ended 08/31/2013 | |
| | | Inception
Date | | 1 Year | | 5 Years | | 10 Years | | Life of
Fund | |
At NAV | |
Investor Class | | 10/20/1998 | | | 23.96 | % | | | 6.16 | % | | | 8.30 | % | | | 8.45 | % | |
| Trust Class3 | | 11/03/1998 | | | 23.74 | % | | | 5.91 | % | | | 8.14 | % | | | 8.31 | % | |
| Advisor Class4 | | 05/03/2002 | | | 23.52 | % | | | 5.69 | % | | | 7.98 | % | | | 8.22 | % | |
| Institutional Class5 | | 04/01/2008 | | | 24.35 | % | | | 6.43 | % | | | 8.46 | % | | | 8.55 | % | |
| Class A20 | | 05/27/2009 | | | 23.93 | % | | | 6.04 | % | | | 8.24 | % | | | 8.41 | % | |
| Class C20 | | 05/27/2009 | | | 22.99 | % | | | 5.36 | % | | | 7.90 | % | | | 8.17 | % | |
| Class R317 | | 05/27/2009 | | | 23.54 | % | | | 5.80 | % | | | 8.12 | % | | | 8.33 | % | |
With Sales Charge | |
| Class A20 | | | | | 16.79 | % | | | 4.79 | % | | | 7.60 | % | | | 7.98 | % | |
| Class C20 | | | | | 21.99 | % | | | 5.36 | % | | | 7.90 | % | | | 8.17 | % | |
Index | |
| Russell 2000® Growth Index1,16 | | | | | 28.14 | % | | | 9.01 | % | | | 8.84 | % | | | 7.25 | % | |
| Russell 2000® Index1,16 | | | | | 26.27 | % | | | 7.98 | % | | | 8.76 | % | | | 8.76 | % | |
The performance data quoted represent past performance and do not indicate future results. Current performance may be lower or higher than the performance data quoted. For more current performance data, please visit www.nb.com/performance.
The results shown in the table reflect the reinvestment of income dividends and other distributions, if any. The results do not reflect the effect of taxes a shareholder would pay on Fund distributions or on the redemption of Fund shares.
The investment return and principal value of an investment will fluctuate and shares, when redeemed, may be worth more or less than their original cost.
Returns would have been lower if Neuberger Berman Management LLC ("Management") had not reimbursed certain expenses and/or waived a portion of the investment management fees during certain of the periods shown. Repayment by a class (of expenses previously reimbursed and/or fees previously waived by Management) will decrease the class's returns. Please see Note B in the Notes to Financial Statements for specific information regarding expense reimbursement and/or fee waiver arrangements.
As stated in the Fund's most recent prospectus, the total annual operating expense ratios for fiscal year 2012 were 1.58%, 1.77%, 1.87%, 1.33%, 1.80%, 2.57% and 2.12% for Investor Class, Trust Class, Advisor Class, Institutional Class, Class A, Class C and Class R3 shares, respectively (before expense reimbursements and/or fee waivers, if any). These expense ratios were 1.30%, 1.40%, 1.60%, 0.90%, 1.27%, 2.01% and 1.51% for Investor Class, Trust Class, Advisor Class, Institutional Class, Class A, Class C and Class R3 shares, respectively, after expense reimbursements and/or fee waivers.
Returns shown with a sales charge reflect the deduction of the current maximum initial sales charge of 5.75% for Class A shares and the applicable contingent deferred sales charges (CDSC) for Class C shares. The maximum CDSC for Class C shares is 1%, which is reduced to 0% after 1 year. The performance of the Fund's share classes will differ primarily due to different sales charge structures and class expenses. Please see the prospectus for more information about sales charge structures, if any, and class expenses for your share class.
76
Small Cap Growth Fund (Unaudited)
COMPARISON OF A $10,000 INVESTMENT

This graph shows the change in value of a hypothetical $10,000 investment in the Fund over the past 10 fiscal years, or since the Fund's inception if it has not operated for 10 years. The graph is based on the Investor Class shares only; the performance of the Fund's share classes will differ primarily due to different sales charge structures and class expenses (see Performance Highlights chart on previous page). The result is compared with benchmarks, which include a broad-based market index and may include a more narrowly based index. Market indices have not been reduced to reflect any of the fees and costs of investing. The results shown in the graph reflect the reinvestment of income dividends and other distributions, if any. The results do not reflect the effect of taxes a shareholder would pay on Fund distributions or on the redemption of Fund shares. Results represent past performance and do not indicate future results.
77
Socially Responsive Fund Commentary (Unaudited)
Neuberger Berman Socially Responsive Fund Investor Class generated a 24.18% total return for the fiscal year ended August 31, 2013 and outperformed its benchmark, the S&P 500 Index, which generated an 18.70% return for the period. (Performance for all share classes is provided in the table immediately following this letter.)
From our perspective, the resolution of the fiscal cliff was the key external event driving equity market performance this past fiscal year. Businesses and investors closed 2012 worried about whether, how and when the fiscal cliff would be resolved—and about possible impacts on taxes, government spending, and U.S. Federal Reserve policy.
Although this resolution contained the fiscal drag of higher payroll taxes, the unwinding of several Bush tax cuts, sequester cuts and the end of stimulus spending, greater clarity on the direction forward was positive for business and investor sentiment, in our view, which in turn stimulated investment and consumer spending, thereby supporting modest but sustainable GDP growth thus far into 2013. For the equity market, greater clarity on tax rates and policy improved sentiment, which resulted in a decline in equity risk premiums and played a large role in 2013's rally.
At the company level, we are seeing management teams move forward with decisions that were held in abeyance, such as deploying liquidity toward M&A activity, capital spending, share buybacks and dividend increases—all positives for equity valuations and potential drivers of incremental earnings going forward.
Within our portfolio, our businesses continued to deliver solid execution in a slow-growth world, just as they have since the financial crisis—demonstrating growth ahead of GDP and their peers. As macroeconomic concerns abated and investor focus returned to company-specific fundamentals, strong growth was rewarded.
As such, stock selection was the dominant factor in our relative performance versus the benchmark during the reporting period, with key contributions coming from several of our largest portfolio positions. These included Texas Instruments, Danaher and Roche—long-term holdings whose strong organic growth characteristics were recognized by investors.
Performance was hindered somewhat by Newfield Exploration, which was sold, and BG Group—Energy names that saw production disappointments last fall. Altera was another laggard, although we believe the company's market position, growth plans, and shareholder-friendly policies may bode well for the future.
The summer of 2013 was the first in five where investors were not struggling to comprehend the scope and impact of a debt-induced macroeconomic challenge somewhere in the world. While the summer's market activity was generally subdued, we remained active and opportunistic. For example, we sold Target and added Costco, TJX Cos. and TW Telecom this August alone.
We re-introduced Target back in 2011 on the anticipation that its merchandising strategy, grocery sections, and customer loyalty initiatives would accelerate growth. The company executed well and earnings expanded. However, recent same-store sales comparisons decelerated as these programs matured. Considering this and growing concerns about on-line competition, we re-evaluated our premise and exited the position.
We had owned Costco in the past and continue to like its traffic-driven "treasure hunt" merchandising model which, unlike most brick and mortar retailers, has kept in-store traffic strong and consistent. Another of Costco's appeals is its industry-leading employee benefits programs. While these may appear costly at first glance, they promote high workforce satisfaction and low employee turnover, which drives exceptional store level productivity and revenue.
We introduced TJX Cos., a leading off-price apparel and home furnishings retailer, believing it will benefit from improving employment and home-related spending. Like Costco, its stores employ a "treasure hunt" model that we believe is inherently less exposed to on-line competition. The company has enjoyed consistent same-store sales growth, reflecting the strength of its value proposition and merchandising model. TJX Cos. also benefits from highly efficient logistics and operations programs, and uses alternative energy resources in its newer processing centers.
78
2013 is an investment year for TW Telecom, a best-in-class, enterprise-focused telecommunication and data network services provider. The company is growing a reorganized sales force to support significant new product introduction, which, if successful, could accelerate revenue growth while improving margins and returns on capital.
Looking ahead, macroeconomic and geopolitical risk remain—from Syria and Iran, to "new management" in China, to policy and leadership changes at the Fed, to upcoming debt ceiling and budget debates. Further, the global economic backdrop remains relatively fragile due to the developed world's debt overhang—although as the declining near-term U.S. deficit illustrates, improving economies make challenges more manageable.
While external risks persist, we continue to see visible organic growth as our holdings continue to execute well in a slow growth world. We also look to use stock-level volatility opportunistically, buying what we believe are great companies at good valuations. While the market has rallied significantly, valuations overall appear reasonable to us—and might be considered cheap if U.S. GDP trend growth were to accelerate to a more normal 2.5% or 3%. Should growth accelerate, we believe the companies in our portfolio would have meaningful operating leverage to improved earnings given how tightly they've managed expenses.
We're pleased with the portfolio's positioning and the market's apparent concurrence regarding its inherent value.
Sincerely,


ARTHUR MORETTI AND INGRID S. DYOTT
PORTFOLIO CO-MANAGERS
Information about the principal risks of investing in the Fund is set forth in the prospectus and statement of additional information.
The portfolio composition, industries and holdings of the Fund are subject to change.
The opinions expressed are those of the Fund's portfolio managers. The opinions are as of the date of this report and are subject to change without notice.
79
Socially Responsive Fund (Unaudited)
TICKER SYMBOLS
Investor Class | | NBSRX | |
Trust Class | | NBSTX | |
Institutional Class | | NBSLX | |
Class A | | NRAAX | |
Class C | | NRACX | |
Class R3 | | NRARX | |
Class R6 | | NRSRX | |
SECTOR ALLOCATION
(as a % of Total Investments) | |
Consumer Discretionary | | | 13.5 | % | |
Consumer Staples | | | 10.9 | | |
Energy | | | 9.5 | | |
Financials | | | 15.2 | | |
Health Care | | | 9.0 | | |
Industrials | | | 15.1 | | |
Information Technology | | | 16.8 | | |
Materials | | | 5.8 | | |
Telecommunication Services | | | 0.9 | | |
Short-Term Investments | | | 3.3 | | |
Total | | | 100.0 | % | |
PERFORMANCE HIGHLIGHTS7
| | | | | Average Annual Total
Return Ended 08/31/2013 | |
| | | Inception
Date | | 1 Year | | 5 Years | | 10 Years | | Life of
Fund | |
At NAV | |
Investor Class | | 03/16/1994 | | | 24.18 | % | | | 6.72 | % | | | 7.89 | % | | | 8.83 | % | |
| Trust Class3 | | 03/03/1997 | | | 23.95 | % | | | 6.53 | % | | | 7.70 | % | | | 8.66 | % | |
| Institutional Class5 | | 11/28/2007 | | | 24.41 | % | | | 6.92 | % | | | 8.00 | % | | | 8.89 | % | |
| Class A20 | | 05/27/2009 | | | 23.89 | % | | | 6.55 | % | | | 7.81 | % | | | 8.79 | % | |
| Class C20 | | 05/27/2009 | | | 22.98 | % | | | 5.86 | % | | | 7.46 | % | | | 8.61 | % | |
| Class R317 | | 05/27/2009 | | | 23.64 | % | | | 6.33 | % | | | 7.70 | % | | | 8.73 | % | |
| Class R625 | | 03/15/2013 | | | 24.29 | % | | | 6.74 | % | | | 7.90 | % | | | 8.84 | % | |
With Sales Charge | |
| Class A20 | | | | | 16.74 | % | | | 5.30 | % | | | 7.17 | % | | | 8.46 | % | |
| Class C20 | | | | | 21.98 | % | | | 5.86 | % | | | 7.46 | % | | | 8.61 | % | |
Index | |
| S&P 500 Index1,16 | | | | | 18.70 | % | | | 7.32 | % | | | 7.12 | % | | | 8.71 | % | |
The performance data quoted represent past performance and do not indicate future results. Current performance may be lower or higher than the performance data quoted. For more current performance data, please visit www.nb.com/performance.
The results shown in the table reflect the reinvestment of income dividends and other distributions, if any. The results do not reflect the effect of taxes a shareholder would pay on Fund distributions or on the redemption of Fund shares.
The investment return and principal value of an investment will fluctuate and shares, when redeemed, may be worth more or less than their original cost.
Returns would have been lower if Neuberger Berman Management LLC ("Management") had not reimbursed certain expenses and/or waived a portion of the investment management fees during certain of the periods shown. Repayment by a class (of expenses previously reimbursed and/or fees previously waived by Management) will decrease the class's returns. Please see Note B in the Notes to Financial Statements for specific information regarding expense reimbursement and/or fee waiver arrangements.
As stated in the Fund's most recent prospectus, the total annual operating expense ratios for fiscal year 2012 (estimated for 2013 for Class R6) were 0.89%, 1.06%, 0.71%, 1.11%, 1.87%, 1.33% and 0.62% for Investor Class, Trust Class, Institutional Class, Class A, Class C, Class R3 and Class R6 shares, respectively (before expense reimbursements and/or fee waivers, if any). The expense ratio was 1.86% for Class C shares after expense reimbursements and/or fee waivers. The total annual operating expense ratio for each of Class A and Class R3 includes the class's repayment of expenses previously reimbursed and/or fees previously waived by Management.
Returns shown with a sales charge reflect the deduction of the current maximum initial sales charge of 5.75% for Class A shares and the applicable contingent deferred sales charges (CDSC) for Class C shares. The maximum CDSC for Class C shares is 1%, which is reduced to 0% after 1 year. The performance of the Fund's share classes will differ primarily due to different sales charge structures and class expenses. Please see the prospectus for more information about sales charge structures, if any, and class expenses for your share class.
80
Socially Responsive Fund (Unaudited)
COMPARISON OF A $10,000 INVESTMENT
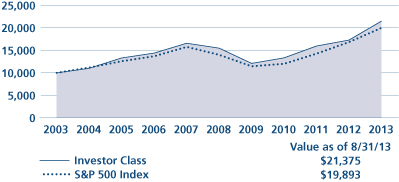
This graph shows the change in value of a hypothetical $10,000 investment in the Fund over the past 10 fiscal years, or since the Fund's inception if it has not operated for 10 years. The graph is based on the Investor Class shares only; the performance of the Fund's share classes will differ primarily due to different sales charge structures and class expenses (see Performance Highlights chart on previous page). The result is compared with benchmarks, which include a broad-based market index and may include a more narrowly based index. Market indices have not been reduced to reflect any of the fees and costs of investing. The results shown in the graph reflect the reinvestment of income dividends and other distributions, if any. The results do not reflect the effect of taxes a shareholder would pay on Fund distributions or on the redemption of Fund shares. Results represent past performance and do not indicate future results.
81
Value Fund Commentary (Unaudited)
Neuberger Berman Value Fund Institutional Class produced a 23.23% total return for the fiscal year ended August 31, 2013 and outperformed its benchmark, the Russell 1000® Value Index, which generated a 23.10% return. (Performance for all share classes is provided in the table immediately following this letter.)
U.S. equities delivered strong returns over the past 12 months—stronger than many may have anticipated at the start of the period. Uncertainty was high at the beginning of the Fund's fiscal year as the U.S. headed into the presidential election. However, continued low interest rates maintained by the U.S. Federal Reserve (the Fed) as well as perceived signs of growth in China, some stabilization on the European front, rising income and consumer spending data in the U.S., and a pick-up in employment and housing, sent stocks higher for most of the period.
Equities stumbled in June as market participants started to worry that the Fed would soon begin tapering the asset purchases that had been driving much of the market's momentum. The Bank of Japan, which increased stimulus sharply in April but then announced that it would hold off on any more stimulus in June, as well as the ongoing uncertainty in the Middle East, also produced large swings in global markets. Markets rebounded in July after a Fed meeting in late June led many market participants to predict that the Fed's tapering would not be immediate. However, August saw yet another reversal as turmoil in the Middle East increased sharply and as attention focused on the U.S. debt ceiling deadline, with some observers predicting that another fiscal cliff could be reached as early as mid-October.
Within the Fund's benchmark, the Russell 1000 Value Index, stocks in the Financials sector delivered the largest contribution to returns. These companies benefited from an improving overall economy, an increase in merger and acquisition activity, and a continued low interest rate environment. Consumer Discretionary, Information Technology (IT) and Health Care companies also rose as a result of the improving economy and, in the case of Health Care, as a result of decreasing uncertainty regarding the possible effects of the Affordable Care Act. The only sector within the index to deliver negative overall returns was Telecommunication Services as investors moved money to more cyclical areas of the market as economic data improved.
Financials had the greatest positive impact on the Fund's relative returns versus the benchmark. While we were equally weighted with the index, we benefited from superior stock selection. The Fund also benefited from its Health Care holdings. The Fund's underexposure to this well-performing sector was a slight negative but superior stock selection more than made up for it. An overweight as well as poor stock selection in the Materials sector negatively impacted relative performance. Poor stock selection in IT also placed a slight drag on relative returns.
Stock selection within the Financials sector was the primary driver of the Fund's outperformance relative to our index during the reporting period. Citigroup, in particular, made a large positive impact. We initiated this position over a year ago when we concluded that its low market price was not justified from a normalized earnings perspective. We established an overweight position in the stock versus the benchmark, which paid off during the past fiscal year. Goldman Sachs Group was another holding that we had determined to be a good value—a conviction that also boosted relative returns. Goldman Sachs was a particular beneficiary of the opening up of capital markets during the past 12 months. While we were about equally weighted with the index in the Financials sector during the past year, we did not own REITs or mid-cap banks. This lack of exposure also contributed to the Fund's outstanding returns in this sector.
The Fund's relative returns were negatively impacted by the Materials sector. We were overweighted in this area, which underperformed the index, and the positions we held did not perform as well as those in the index. The Mosaic Company, a major global producer of potash, was the portfolio's worst performer in the sector and was the primary detractor from overall relative returns. Share prices for potash producers fell in July when a large producer unexpectedly withdrew from a powerful consortium, igniting fears that prices for the commodity could be driven down around the world. The Mosaic position was eliminated. The Fund's second largest detractor from relative performance was also within Materials. Newmont Mining is a gold and copper mining company with significant assets in the U.S., as well as in
82
Australia, Canada, Ghana, Indonesia, Mexico, Peru and New Zealand. The company's stock suffered significantly as the price of gold and other metals fell.
We believe that equity markets will remain strong, at least through calendar year-end. However, we believe the robust performance that we have seen over the past year will be difficult to maintain and there are headwinds on the horizon. We anticipate that the Fed, at some point, will begin the process of tapering. The only uncertainty, in our opinion, is when. Gross domestic product numbers were revised upwards for August and unemployment appears to be easing. Within that environment, the Fed may soon have the confidence to withdraw some liquidity from the economy and from the market. While we think this monetary tightening could place a drag on stocks, we also believe that the economic recovery is real and that the companies that we invest in could continue to benefit from such a recovery, enabling their stocks to rise even without the significant boost the market has received from the Fed. However, other concerns remain, particularly the ongoing crisis in the Middle East and the debt ceiling crisis, both of which we believe are likely to remain center stage and produce uneasiness in the markets. We continue to see a good deal of value in equities, particularly in industrial stocks, such as airlines, as well as chemical and technology companies. We are currently seeking out stocks that we believe are undervalued based on normalized earnings whose value will be recognized by the market over time. In our view, this strategy may produce favorable risk-adjusted returns as we continue to monitor the correlation among holdings in seeking to achieve a positive risk/reward balance.
Sincerely,

ELI M. SALZMANN
PORTFOLIO MANAGER
Information about the principal risks of investing in the Fund is set forth in the prospectus and statement of additional information.
The portfolio composition, industries and holdings of the Fund are subject to change.
The opinions expressed are those of the Fund's portfolio manager. The opinions are as of the date of this report and are subject to change without notice.
83
TICKER SYMBOLS
Institutional Class | | NLRLX | |
Class A | | NVAAX | |
Class C | | NVACX | |
SECTOR ALLOCATION
(as a % of Total Investments) | |
Consumer Discretionary | | | 5.0 | % | |
Consumer Staples | | | 3.4 | | |
Energy | | | 12.1 | | |
Financials | | | 27.1 | | |
Health Care | | | 7.8 | | |
Industrials | | | 17.2 | | |
Information Technology | | | 13.7 | | |
Materials | | | 9.6 | | |
Short-Term Investments | | | 4.1 | | |
Total | | | 100.0 | % | |
PERFORMANCE HIGHLIGHTS9
| | | | | Average Annual Total
Return Ended 08/31/2013 | |
| | | Inception
Date* | | 1 Year | | 5 Years | | Life of
Fund | |
At NAV | |
| Institutional Class21 | | 04/19/2010 | | | 23.23 | % | | | 7.82 | % | | | 6.68 | % | |
| Class A21 | | 03/02/2011 | | | 22.72 | % | | | 7.62 | % | | | 6.53 | % | |
| Class C21 | | 03/02/2011 | | | 21.82 | % | | | 7.21 | % | | | 6.24 | % | |
With Sales Charge | |
| Class A21 | | | | | 15.66 | % | | | 6.35 | % | | | 5.61 | % | |
| Class C21 | | | | | 20.82 | % | | | 7.21 | % | | | 6.24 | % | |
Index | |
| Russell 1000® Value Index1,16 | | | | | 23.10 | % | | | 6.69 | % | | | 3.58 | % | |
*The performance data for each class includes the performance of the Fund's oldest share class, Trust Class, from November 2, 2006 through April 19, 2010. The performance data for Class A and Class C also includes the performance of the Fund's Institutional Class from April 19, 2010 through March 2, 2011. See endnote 21 for information about the effects of the different fees paid by each class.
The performance data quoted represent past performance and do not indicate future results. Current performance may be lower or higher than the performance data quoted. For more current performance data, please visit www.nb.com/performance.
The results shown in the table reflect the reinvestment of income dividends and other distributions, if any. The results do not reflect the effect of taxes a shareholder would pay on Fund distributions or on the redemption of Fund shares.
The investment return and principal value of an investment will fluctuate and shares, when redeemed, may be worth more or less than their original cost.
Returns would have been lower if Neuberger Berman Management LLC ("Management") had not reimbursed certain expenses and/or waived a portion of the investment management fees during certain of the periods shown. Repayment by a class (of expenses previously reimbursed and/or fees previously waived by Management) will decrease the class's returns. Please see Note B in the Notes to Financial Statements for specific information regarding expense reimbursement and/or fee waiver arrangements.
As stated in the Fund's most recent prospectus, the total annual operating expense ratios for fiscal year 2012 were 9.44%, 9.90% and 10.75% for Institutional Class, Class A and Class C shares, respectively (before expense reimbursements and/or fee waivers, if any). These expense ratios were 0.77%, 1.13% and 1.88%, respectively, after expense reimbursements and/or fee waivers.
Returns shown with a sales charge reflect the deduction of the current maximum initial sales charge of 5.75% for Class A shares and the applicable contingent deferred sales charges (CDSC) for Class C shares. The maximum CDSC for Class C shares is 1%, which is reduced to 0% after 1 year. The performance of the Fund's share classes will differ primarily due to different sales charge structures and class expenses. Please see the prospectus for more information about sales charge structures, if any, and class expenses for your share class.
84
COMPARISON OF A $1,000,000 INVESTMENT21
(000's Omitted)

This graph shows the change in value of a hypothetical $1,000,000 investment in the Fund over the past 10 fiscal years, or since the Fund's inception if it has not operated for 10 years. The graph is based on the Institutional Class shares only; the performance of the Fund's share classes will differ primarily due to different sales charge structures and class expenses (see Performance Highlights chart on previous page). The result is compared with benchmarks, which include a broad-based market index and may include a more narrowly based index. Market indices have not been reduced to reflect any of the fees and costs of investing. The results shown in the graph reflect the reinvestment of income dividends and other distributions, if any. The results do not reflect the effect of taxes a shareholder would pay on Fund distributions or on the redemption of Fund shares. Results represent past performance and do not indicate future results.
85
1 Please see "Glossary of Indices" on page 90 for a description of indices. Please note that indices do not take into account any fees, expenses or tax consequences of investing in the individual securities that they track, and that individuals cannot invest directly in any index. Data about the performance of an index is prepared or obtained by Neuberger Berman Management LLC ("Management") and reflects the reinvestment of income dividends and other distributions, if any. The Fund may invest in securities not included in a described index and may not invest in all securities included in a described index.
2 This date reflects when Management first became the investment manager to the Fund.
3 The performance information for the Trust Class prior to the class's inception date is that of the Fund's Investor Class. The performance information for the Investor Class has not been adjusted to take into account differences in class specific operating expenses. The Investor Class has lower expenses and typically higher returns than the Trust Class.
4 The performance information for the Advisor Class prior to the class's inception date is that of the Fund's Investor Class. The performance information for the Investor Class has not been adjusted to take into account differences in class specific operating expenses. The Investor Class has lower expenses and typically higher returns than the Advisor Class.
5 The performance information for the Institutional Class prior to the class's inception date is that of the Fund's Investor Class. The performance information for the Investor Class has not been adjusted to take into account differences in class specific operating expenses. The Investor Class has higher expenses and typically lower returns than the Institutional Class.
6 The performance information for the Institutional Class prior to the class's inception date is that of the Fund's Trust Class. The performance information for the Trust Class has not been adjusted to take into account differences in class specific operating expenses. The Trust Class has higher expenses and typically lower returns than the Institutional Class.
7 The investments for the Fund are managed by the same portfolio manager(s) who manage(s) one or more other registered funds that have names, investment objectives and investment styles that are similar to those of the Fund. You should be aware that the Fund is likely to differ from the other mutual fund(s) in size, cash flow pattern and tax matters. Accordingly, the holdings and performance of the Fund can be expected to vary from those of the other mutual fund(s).
8 The Fund had a policy of investing mainly in large-cap stocks prior to September 1998 and investing 90% of its assets in no more than six economic sectors prior to December 17, 2007. As of April 2, 2001, the Fund changed its investment policy to become "non-diversified" under the Investment Company Act of 1940 ("1940 Act"). Performance prior to these changes might have been different if current policies had been in effect. However, by operation of law under the 1940 Act, the Fund subsequently became, and currently operates as, a diversified fund. Please see the notes to the financial statements for information on a non-diversified fund becoming a diversified fund by operation of law.
9 Each of Neuberger Berman Emerging Markets Equity Fund, Neuberger Berman Equity Income Fund, Neuberger Berman Global Equity Fund, Neuberger Berman Multi-Cap Opportunities Fund and Neuberger Berman Value Fund was relatively small prior to September 2010, June 2008, August 2013, January 2010 and April 2013, respectively. The same techniques used to produce returns in a small fund may not work to produce similar returns in a larger fund.
10 The performance information for Class R3 prior to the class's inception date is that of the Fund's Institutional Class. The performance information for the Institutional Class has not been adjusted to take into account differences in
86
class specific operating expenses (such as Rule 12b-1 fees). The Institutional Class has lower expenses and typically higher returns than Class R3.
11 As of December 17, 2007, the Fund changed its investment policy to become "non-diversified" under the 1940 Act. A non-diversified fund is able to invest larger percentages of its assets in the securities of a single issuer, which could increase the fund's risk of loss. Performance prior to this change might have been different if current policies had been in effect. Although the Fund has a policy that allows it to operate as a non-diversified fund, on December 5, 2008, the Board adopted a policy, which cannot be changed without a shareholder vote, that the Fund will invest its portfolio so as to meet the standards of a diversified fund.
12 Because the Fund had a policy of investing mainly in large-cap stocks prior to December 2002, its performance during that time might have been different if current policies had been in effect.
13 The performance information for Class A, Class C, Investor Class, and Trust Class prior to the classes' inception date is that of the Fund's Institutional Class. The performance information for the Institutional Class has been adjusted to reflect the appropriate sales charges applicable to Class A and Class C shares, but has not been adjusted to take into account differences in class specific operating expenses (such as Rule 12b-1 fees). The Institutional Class has lower expenses and typically higher returns than Class A, Class C, Investor Class, and Trust Class.
14 The performance information for Institutional Class, Class A, Class C and Class R3 prior to June 9, 2008 is that of the Fund's Trust Class, which had an inception date of November 2, 2006, and converted into the Institutional Class on June 9, 2008. During the period from November 2, 2006 through June 9, 2008, the Trust Class had only one investor, which could have impacted Fund performance. The performance information for the Trust Class has been adjusted to reflect the appropriate sales charges applicable to Class A and Class C shares, but has not been adjusted to take into account differences in class specific operating expenses (such as Rule 12b-1 fees). The Trust Class had higher expenses and typically lower returns than the Institutional Class. The Trust Class had lower expenses and typically higher returns than Class A, Class C and Class R3. The performance information for Class R3 from June 9, 2008 to the class's inception date is that of the Fund's Institutional Class. The performance information for the Institutional Class has not been adjusted to take into account differences in class specific operating expenses (such as Rule 12b-1 fees). The Institutional Class has lower expenses and typically higher returns than Class R3.
15 The performance information for Class A, Class C and Class R3 prior to the classes' respective inception dates is that of the Fund's Trust Class. The performance information for the Trust Class has been adjusted to reflect the appropriate sales charges applicable to Class A and Class C shares, but has not been adjusted to take into account differences in class specific operating expenses (such as Rule 12b-1 fees). The Trust Class has lower expenses and typically higher returns than Class A, Class C and Class R3.
16 The date used to calculate Life of Fund performance for the index is the inception date of the oldest share class.
17 The performance information for Class R3 prior to the class's inception date is that of the Fund's Investor Class. The performance information for the Investor Class has not been adjusted to take into account differences in class specific operating expenses (such as Rule 12b-1 fees). The Investor Class has lower expenses and typically higher returns than Class R3.
18 Prior to December 14, 2009, Neuberger Berman Multi-Cap Opportunities Fund was known as Neuberger Berman Research Opportunities Fund, which had different investment goals, strategies and portfolio management team. The performance information for Institutional Class, Class A and Class C prior to December 21, 2009 is that of the Fund's Trust Class, which had an inception date of November 2, 2006, and converted into the Institutional Class on December 21, 2009. During the period from November 2, 2006 through December 21, 2009, the Trust Class had only one investor, which could have impacted Fund performance. The performance information for the Trust
87
Class has been adjusted to reflect the appropriate sales charges applicable to Class A and Class C shares, but has not been adjusted to take into account differences in class specific operating expenses (such as Rule 12b-1 fees). Management had previously capped Trust Class expenses; absent this arrangement, the returns would have been lower. The Trust Class had lower capped expenses and typically higher returns than Class A and Class C. The Trust Class had equivalent capped expenses and typically similar returns to the Institutional Class.
19 The performance information for Institutional Class, Class A and Class C prior to the classes' inception date is that of the Fund's predecessor, the DJG Small Cap Value Fund L.P., an unregistered limited partnership ("DJG Fund"); DJG Fund was the successor to The DJG Small Cap Value Fund, an unregistered commingled investment account ("DJG Account"). The performance from July 8, 1997 (the commencement of operations) to September 11, 2008 is that of DJG Account, and the performance from September 12, 2008 to May 10, 2010 is that of DJG Fund. On May 10, 2010, the DJG Fund transferred its assets to the Fund in exchange for the Fund's Institutional Class shares. The investment policies, objectives, guidelines and restrictions of the Fund are in all material respects equivalent to those of DJG Fund and DJG Account (the "Predecessors"). As a mutual fund registered under the 1940 Act, the Fund is subject to certain restrictions under the 1940 Act and the Internal Revenue Code ("Code") to which the Predecessors were not subject. Had the Predecessors been registered under the 1940 Act and been subject to the provisions of the 1940 Act and the Code, their investment performance may have been adversely affected. The performance information reflects the actual expenses of the Predecessors, which were generally lower than those of the Fund.
20 The performance information for Class A and Class C prior to the classes' inception date is that of the Fund's Investor Class. The performance information for the Investor Class has been adjusted to reflect the appropriate sales charges applicable to Class A and Class C shares, but has not been adjusted to take into account differences in class specific operating expenses (such as Rule 12b-1 fees). The Investor Class has lower expenses and typically higher returns than Class A and Class C.
21 The performance information for Institutional Class, Class A and Class C prior to April 19, 2010 is that of the Fund's Trust Class, which had an inception date of November 2, 2006, and converted into the Institutional Class on April 19, 2010. During the period from November 2, 2006 through April 19, 2010, the Trust Class had only one investor, which could have impacted Fund performance. The performance information for Class A and Class C from April 19, 2010 to the classes' inception date is that of the Fund's Institutional Class. During the period from April 19, 2010 through March 2, 2011, the Institutional Class had only one investor, which could have impacted Fund performance. The performance information for the Trust Class and the Institutional Class has been adjusted to reflect the appropriate sales charges applicable to Class A and Class C shares, but has not been adjusted to take into account differences in class specific operating expenses (such as Rule 12b-1 fees). The Trust Class had higher expenses and typically lower returns than the Institutional Class. The Trust Class had lower expenses and typically higher returns than Class A and Class C. The Institutional Class has lower expenses and typically higher returns than Class A and Class C.
22 Prior to December 15, 2012, Neuberger Berman International Equity Fund was known as Neuberger Berman International Institutional Fund.
23 As of June 19, 2012, the Fund changed its investment policy to become "non-diversified" under the 1940 Act. A non-diversified fund is able to invest larger percentages of its assets in the securities of a single issuer, which could increase the fund's risk of loss. Performance prior to this change might have been different if current policies had been in effect.
24 The performance information for Class R6 prior to the class's inception date is that of the Fund's Institutional Class. The performance information for the Institutional Class has not been adjusted to take into account differences in
88
class specific operating expenses. The Institutional Class has higher expenses and typically lower returns than Class R6.
25 The performance information for Class R6 prior to the class's inception date is that of the Fund's Investor Class. The performance information for the Investor Class has not been adjusted to take into account differences in class specific operating expenses. The Investor Class has higher expenses and typically lower returns than Class R6.
26 The performance information for Class R6 prior to the class's inception date is that of the Fund's Trust Class. The performance information for the Trust Class has not been adjusted to take into account differences in class specific operating expenses. The Trust Class has higher expenses and typically lower returns than Class R6.
For more complete information on any of the Neuberger Berman Equity Funds, call Neuberger Berman Management LLC at (800) 877-9700, or visit our website at www.nb.com.
89
S&P 500 Index: | | Widely regarded as the standard for measuring the performance of large-cap stocks traded on U.S. markets and includes a representative sample of leading companies in leading industries. | |
| Russell 1000® Index: | | Measures the performance of the large-cap segment of the U.S. equity market. It includes approximately 1,000 of the largest securities in the Russell 3000® Index (which measures the performance of the 3,000 largest U.S. public companies based on total market capitalization). | |
| Russell 1000® Growth Index: | | Measures the performance of the large-cap growth segment of the U.S. equity market. It includes those Russell 1000 Index companies with higher price-to-book ratios and higher forecasted growth values. | |
| Russell 1000® Value Index: | | Measures the performance of the large-cap value segment of the U.S. equity market. It includes those Russell 1000 Index companies with lower price-to-book ratios and lower expected growth values. | |
| Russell 2000® Index: | | Measures the performance of the small-cap segment of the U.S. equity market. It includes approximately 2,000 of the smallest securities in the Russell 3000 Index. | |
| Russell 2000® Growth Index: | | Measures the performance of the small-cap growth segment of the U.S. equity market. It includes those Russell 2000 Index companies with higher price-to-book ratios and higher forecasted growth values. | |
| Russell 2000® Value Index: | | Measures the performance of the small-cap value segment of the U.S. equity market. It includes those Russell 2000 Index companies with lower price-to-book ratios and lower forecasted growth values. | |
| Russell Midcap® Index: | | Measures the performance of the mid-cap segment of the U.S. equity market. It includes approximately 800 of the smallest securities in the Russell 1000 Index. | |
| Russell Midcap® Growth Index: | | Measures the performance of the mid-cap growth segment of the U.S. equity market. It includes those Russell Midcap Index companies with higher price-to-book ratios and higher forecasted growth values. | |
| Russell Midcap® Value Index: | | Measures the performance of the mid-cap value segment of the U.S. equity market. It includes those Russell Midcap Index companies with lower price-to-book ratios and lower forecasted growth values. | |
FTSE NAREIT All Equity REITs Index: | | An unmanaged free float-adjusted market capitalization weighted index that tracks the performance of all Equity REITs currently listed on the New York Stock Exchange, the NASDAQ National Market System and the NYSE MKT. Equity REITs include all tax-qualified REITs with more than 50 percent of total assets in qualifying real estate assets other than mortgages secured by real property. | |
| MSCI EAFE® Index: | | Also known as the Morgan Stanley Capital International Europe, Australasia, Far East Index. A free float-adjusted market capitalization weighted index that is designed to measure the equity market performance of developed markets, excluding the United States and Canada. The MSCI EAFE Index consists of the following 22 developed market country indices: Australia, Austria, Belgium, Denmark, Finland, France, Germany, Greece, Hong Kong, Ireland, Israel, Italy, Japan, the Netherlands, New Zealand, Norway, Portugal, Singapore, Spain, Sweden, Switzerland, and the United Kingdom. | |
90
Glossary of Indices (cont'd)
MSCI Emerging Markets Index: | | A free float-adjusted market capitalization weighted index that is designed to measure the equity market performance of emerging markets. The MSCI Emerging Markets Index consists of the following 21 emerging market country indices: Brazil, Chile, China, Colombia, Czech Republic, Egypt, Hungary, India, Indonesia, Korea, Malaysia, Mexico, Morocco, Peru, the Philippines, Poland, Russia, South Africa, Taiwan, Thailand, and Turkey. | |
MSCI World Index: | | A free float-adjusted market capitalization weighted index that is designed to measure the equity market performance of developed markets. The MSCI World Index consists of the following 24 developed market country indices: Australia, Austria, Belgium, Canada, Denmark, Finland, France, Germany, Greece, Hong Kong, Ireland, Israel, Italy, Japan, the Netherlands, New Zealand, Norway, Portugal, Singapore, Spain, Sweden, Switzerland, the United Kingdom, and the United States. | |
MSCI All Country World Index: | | A free float-adjusted market capitalization weighted index that is designed to measure the equity market performance of developed and emerging markets. The MSCI All Country World Index consists of 45 country indices comprising 24 developed and 21 emerging market country indices. The developed market country indices included are: Australia, Austria, Belgium, Canada, Denmark, Finland, France, Germany, Greece, Hong Kong, Ireland, Israel, Italy, Japan, the Netherlands, New Zealand, Norway, Portugal, Singapore, Spain, Sweden, Switzerland, the United Kingdom and the United States. The emerging market country indices included are: Brazil, Chile, China, Colombia, Czech Republic, Egypt, Hungary, India, Indonesia, Korea, Malaysia, Mexico, Morocco, Peru, the Philippines, Poland, Russia, South Africa, Taiwan, Thailand, and Turkey. | |
MSCI China Index: | | The index is a free float-adjusted market capitalization index that is designed to measure equity market performance in China. The MSCI China universe includes equity securities issued by companies incorporated in the People's Republic of China (PRC), and listed in the form of B shares on the Shanghai Stock Exchange (in US$) or Shenzhen Stock Exchange (in HK$), H shares on the Hong Kong Stock Exchange (in HK$) or N-shares on the New York Stock Exchange (in US$). The MSCI China universe also includes companies not incorporated in the PRC or the Hong Kong Special Administrative Regions. | |
91
Information About Your Fund's Expenses (Unaudited)
As a Fund shareholder, you incur two types of costs: (1) transaction costs, including sales charges (loads) on purchase payments or redemption proceeds (if applicable); and (2) ongoing costs, including management fees, distribution and/or service (12b-1) fees (if applicable), and other Fund expenses. This example is intended to help you understand your ongoing costs (in dollars) of investing in a Fund and compare these costs with the ongoing costs of investing in other mutual funds.
This table is designed to provide information regarding costs related to your investments. The following examples are based on an investment of $1,000 made at the beginning of the six month period ended August 31, 2013 and held for the entire period. The table illustrates each Fund's costs in two ways:
Actual Expenses and Performance: | | The first section of the table provides information about actual account values and actual expenses in dollars, based on the Fund's actual performance during the period. You may use the information in this line, together with the amount you invested, to estimate the expenses you paid over the period. Simply divide your account value by $1,000 (for example, an $8,600 account value divided by $1,000 = 8.6), then multiply the result by the number in the first section of the table under the heading entitled "Expenses Paid During the Period" to estimate the expenses you paid over the period. | |
Hypothetical Example for
Comparison Purposes: | | The second section of the table provides information about hypothetical account values and hypothetical expenses based on the Fund's actual expense ratio and an assumed rate of return at 5% per year before expenses. This return is not the Fund's actual return. The hypothetical account values and expenses may not be used to estimate the actual ending account balance or expenses you paid for the period. You may use this information to compare the ongoing costs of investing in a Fund versus other funds. To do so, compare the expenses shown in this 5% hypothetical example with the 5% hypothetical examples that appear in the shareholder reports of other funds. | |
Please note that the expenses in the table are meant to highlight your ongoing costs only and do not include any transaction costs, such as sales charges (loads) (if applicable). Therefore, the information under the heading "Hypothetical (5% annual return before expenses)" is useful in comparing ongoing costs only, and will not help you determine the relative total costs of owning different funds. In addition, if these transaction costs were included, your costs would have been higher.
92
Expense Information as of 8/31/13 (Unaudited)
Neuberger Berman Equity Funds | |
| | | ACTUAL | | HYPOTHETICAL (5% ANNUAL RETURN BEFORE EXPENSES)(4) | |
| | | Beginning
Account
Value
3/1/13 | | Ending
Account
Value
8/31/13 | | Expenses Paid
During the
Period(1)
3/1/13 - 8/31/13 | | Expense
Ratio | | Beginning
Account
Value
3/1/13 | | Ending
Account
Value
8/31/13 | | Expenses Paid
During the
Period(1)
3/1/13 - 8/31/13 | | Expense
Ratio | |
Emerging Markets Equity Fund | |
Institutional Class | | $ | 1,000.00 | | | $ | 907.70 | | | $ | 6.01 | | | | 1.25 | % | | $ | 1,000.00 | | | $ | 1,018.90 | | | $ | 6.36 | | | | 1.25 | % | |
Class A | | $ | 1,000.00 | | | $ | 906.20 | | | $ | 7.21 | | | | 1.50 | % | | $ | 1,000.00 | | | $ | 1,017.64 | | | $ | 7.63 | | | | 1.50 | % | |
Class C | | $ | 1,000.00 | | | $ | 903.40 | | | $ | 10.79 | | | | 2.25 | % | | $ | 1,000.00 | | | $ | 1,013.86 | | | $ | 11.42 | | | | 2.25 | % | |
Class R3 | | $ | 1,000.00 | | | $ | 904.80 | | | $ | 9.17 | | | | 1.91 | % | | $ | 1,000.00 | | | $ | 1,015.58 | | | $ | 9.70 | | | | 1.91 | % | |
Class R6 | | $ | 1,000.00 | | | $ | 911.00 | | | $ | 5.25 | (2) | | | 1.18 | % | | $ | 1,000.00 | | | $ | 1,019.26 | | | $ | 6.01 | | | | 1.18 | % | |
Equity Income Fund | |
Institutional Class | | $ | 1,000.00 | | | $ | 982.60 | | | $ | 3.40 | | | | .68 | % | | $ | 1,000.00 | | | $ | 1,021.78 | | | $ | 3.47 | | | | .68 | % | |
Class A | | $ | 1,000.00 | | | $ | 979.80 | | | $ | 5.24 | | | | 1.05 | % | | $ | 1,000.00 | | | $ | 1,019.91 | | | $ | 5.35 | | | | 1.05 | % | |
Class C | | $ | 1,000.00 | | | $ | 976.90 | | | $ | 8.92 | | | | 1.79 | % | | $ | 1,000.00 | | | $ | 1,016.18 | | | $ | 9.10 | | | | 1.79 | % | |
Class R3 | | $ | 1,000.00 | | | $ | 977.60 | | | $ | 7.03 | | | | 1.41 | % | | $ | 1,000.00 | | | $ | 1,018.10 | | | $ | 7.17 | | | | 1.41 | % | |
Focus Fund | |
Investor Class | | $ | 1,000.00 | | | $ | 1,098.00 | | | $ | 4.92 | | | | .93 | % | | $ | 1,000.00 | | | $ | 1,020.52 | | | $ | 4.74 | | | | .93 | % | |
Trust Class | | $ | 1,000.00 | | | $ | 1,097.40 | | | $ | 5.97 | | | | 1.13 | % | | $ | 1,000.00 | | | $ | 1,019.51 | | | $ | 5.75 | | | | 1.13 | % | |
Advisor Class | | $ | 1,000.00 | | | $ | 1,095.80 | | | $ | 6.76 | | | | 1.28 | % | | $ | 1,000.00 | | | $ | 1,018.75 | | | $ | 6.51 | | | | 1.28 | % | |
Institutional Class | | $ | 1,000.00 | | | $ | 1,099.10 | | | $ | 3.97 | | | | .75 | % | | $ | 1,000.00 | | | $ | 1,021.42 | | | $ | 3.82 | | | | .75 | % | |
Class A | | $ | 1,000.00 | | | $ | 1,097.40 | | | $ | 5.87 | | | | 1.11 | % | | $ | 1,000.00 | | | $ | 1,019.61 | | | $ | 5.65 | | | | 1.11 | % | |
Class C | | $ | 1,000.00 | | | $ | 1,093.10 | | | $ | 9.81 | | | | 1.86 | % | | $ | 1,000.00 | | | $ | 1,015.83 | | | $ | 9.45 | | | | 1.86 | % | |
Genesis Fund | |
Investor Class | | $ | 1,000.00 | | | $ | 1,100.20 | | | $ | 5.35 | | | | 1.01 | % | | $ | 1,000.00 | | | $ | 1,020.11 | | | $ | 5.14 | | | | 1.01 | % | |
Trust Class | | $ | 1,000.00 | | | $ | 1,099.80 | | | $ | 5.82 | | | | 1.10 | % | | $ | 1,000.00 | | | $ | 1,019.66 | | | $ | 5.60 | | | | 1.10 | % | |
Advisor Class | | $ | 1,000.00 | | | $ | 1,098.10 | | | $ | 7.30 | | | | 1.38 | % | | $ | 1,000.00 | | | $ | 1,018.25 | | | $ | 7.02 | | | | 1.38 | % | |
Institutional Class | | $ | 1,000.00 | | | $ | 1,101.10 | | | $ | 4.50 | | | | .85 | % | | $ | 1,000.00 | | | $ | 1,020.92 | | | $ | 4.33 | | | | .85 | % | |
Class R6 | | $ | 1,000.00 | | | $ | 1,069.00 | | | $ | 3.76 | (2) | | | .78 | % | | $ | 1,000.00 | | | $ | 1,021.27 | | | $ | 3.97 | | | | .78 | % | |
Global Equity Fund | |
Institutional Class | | $ | 1,000.00 | | | $ | 1,028.20 | | | $ | 5.88 | | | | 1.15 | % | | $ | 1,000.00 | | | $ | 1,019.41 | | | $ | 5.85 | | | | 1.15 | % | |
Class A | | $ | 1,000.00 | | | $ | 1,026.10 | | | $ | 7.71 | | | | 1.51 | % | | $ | 1,000.00 | | | $ | 1,017.59 | | | $ | 7.68 | | | | 1.51 | % | |
Class C | | $ | 1,000.00 | | | $ | 1,023.20 | | | $ | 11.53 | | | | 2.26 | % | | $ | 1,000.00 | | | $ | 1,013.81 | | | $ | 11.47 | | | | 2.26 | % | |
Global Thematic Opportunities Fund | |
Institutional Class | | $ | 1,000.00 | | | $ | 982.50 | | | $ | 6.25 | | | | 1.25 | % | | $ | 1,000.00 | | | $ | 1,018.90 | | | $ | 6.36 | | | | 1.25 | % | |
Class A | | $ | 1,000.00 | | | $ | 981.30 | | | $ | 8.04 | | | | 1.61 | % | | $ | 1,000.00 | | | $ | 1,017.09 | | | $ | 8.19 | | | | 1.61 | % | |
Class C | | $ | 1,000.00 | | | $ | 977.00 | | | $ | 11.76 | | | | 2.36 | % | | $ | 1,000.00 | | | $ | 1,013.31 | | | $ | 11.98 | | | | 2.36 | % | |
Greater China Equity Fund | |
Institutional Class | | $ | 1,000.00 | | | $ | 1,016.00 | | | $ | 1.91 | (3) | | | 1.50 | % | | $ | 1,000.00 | | | $ | 1,017.64 | | | $ | 7.63 | | | | 1.50 | % | |
Class A | | $ | 1,000.00 | | | $ | 1,016.00 | | | $ | 2.36 | (3) | | | 1.86 | % | | $ | 1,000.00 | | | $ | 1,015.83 | | | $ | 9.45 | | | | 1.86 | % | |
Class C | | $ | 1,000.00 | | | $ | 1,015.00 | | | $ | 3.31 | (3) | | | 2.61 | % | | $ | 1,000.00 | | | $ | 1,012.05 | | | $ | 13.24 | | | | 2.61 | % | |
Guardian Fund | |
Investor Class | | $ | 1,000.00 | | | $ | 1,082.80 | | | $ | 4.67 | | | | .89 | % | | $ | 1,000.00 | | | $ | 1,020.72 | | | $ | 4.53 | | | | .89 | % | |
Trust Class | | $ | 1,000.00 | | | $ | 1,081.70 | | | $ | 5.61 | | | | 1.07 | % | | $ | 1,000.00 | | | $ | 1,019.81 | | | $ | 5.45 | | | | 1.07 | % | |
Advisor Class | | $ | 1,000.00 | | | $ | 1,079.60 | | | $ | 7.86 | | | | 1.50 | % | | $ | 1,000.00 | | | $ | 1,017.64 | | | $ | 7.63 | | | | 1.50 | % | |
Institutional Class | | $ | 1,000.00 | | | $ | 1,083.80 | | | $ | 3.78 | | | | .72 | % | | $ | 1,000.00 | | | $ | 1,021.58 | | | $ | 3.67 | | | | .72 | % | |
Class A | | $ | 1,000.00 | | | $ | 1,081.40 | | | $ | 5.82 | | | | 1.11 | % | | $ | 1,000.00 | | | $ | 1,019.61 | | | $ | 5.65 | | | | 1.11 | % | |
Class C | | $ | 1,000.00 | | | $ | 1,076.90 | | | $ | 9.74 | | | | 1.86 | % | | $ | 1,000.00 | | | $ | 1,015.83 | | | $ | 9.45 | | | | 1.86 | % | |
Class R3 | | $ | 1,000.00 | | | $ | 1,080.50 | | | $ | 7.13 | | | | 1.36 | % | | $ | 1,000.00 | | | $ | 1,018.35 | | | $ | 6.92 | | | | 1.36 | % | |
93
Expense Information as of 8/31/13 (Unaudited) (cont'd)
| | | ACTUAL | | HYPOTHETICAL (5% ANNUAL RETURN BEFORE EXPENSES)(4) | |
| | | Beginning
Account
Value
3/1/13 | | Ending
Account
Value
8/31/13 | | Expenses Paid
During the
Period(1)
3/1/13 - 8/31/13 | | Expense
Ratio | | Beginning
Account
Value
3/1/13 | | Ending
Account
Value
8/31/13 | | Expenses Paid
During the
Period(1)
3/1/13 - 8/31/13 | | Expense
Ratio | |
International Equity Fund | |
Investor Class | | $ | 1,000.00 | | | $ | 1,019.20 | | | $ | 5.55 | | | | 1.09 | % | | $ | 1,000.00 | | | $ | 1,019.71 | | | $ | 5.55 | | | | 1.09 | % | |
Trust Class | | $ | 1,000.00 | | | $ | 1,019.20 | | | $ | 6.06 | | | | 1.19 | % | | $ | 1,000.00 | | | $ | 1,019.21 | | | $ | 6.06 | | | | 1.19 | % | |
Institutional Class | | $ | 1,000.00 | | | $ | 1,020.90 | | | $ | 4.33 | | | | .85 | % | | $ | 1,000.00 | | | $ | 1,020.92 | | | $ | 4.33 | | | | .85 | % | |
Class A | | $ | 1,000.00 | | | $ | 1,018.70 | | | $ | 6.51 | | | | 1.28 | % | | $ | 1,000.00 | | | $ | 1,018.75 | | | $ | 6.51 | | | | 1.28 | % | |
Class C | | $ | 1,000.00 | | | $ | 1,014.30 | | | $ | 10.56 | | | | 2.08 | % | | $ | 1,000.00 | | | $ | 1,014.72 | | | $ | 10.56 | | | | 2.08 | % | |
International Large Cap Fund | |
Trust Class | | $ | 1,000.00 | | | $ | 1,012.00 | | | $ | 6.34 | | | | 1.25 | % | | $ | 1,000.00 | | | $ | 1,018.90 | | | $ | 6.36 | | | | 1.25 | % | |
Institutional Class | | $ | 1,000.00 | | | $ | 1,014.00 | | | $ | 4.57 | | | | .90 | % | | $ | 1,000.00 | | | $ | 1,020.67 | | | $ | 4.58 | | | | .90 | % | |
Class A | | $ | 1,000.00 | | | $ | 1,012.10 | | | $ | 6.29 | | | | 1.24 | % | | $ | 1,000.00 | | | $ | 1,018.95 | | | $ | 6.31 | | | | 1.24 | % | |
Class C | | $ | 1,000.00 | | | $ | 1,008.10 | | | $ | 10.12 | | | | 2.00 | % | | $ | 1,000.00 | | | $ | 1,015.12 | | | $ | 10.16 | | | | 2.00 | % | |
Class R3 | | $ | 1,000.00 | | | $ | 1,011.10 | | | $ | 7.65 | | | | 1.51 | % | | $ | 1,000.00 | | | $ | 1,017.59 | | | $ | 7.68 | | | | 1.51 | % | |
Intrinsic Value Fund | |
Institutional Class | | $ | 1,000.00 | | | $ | 1,099.60 | | | $ | 5.29 | | | | 1.00 | % | | $ | 1,000.00 | | | $ | 1,020.16 | | | $ | 5.09 | | | | 1.00 | % | |
Class A | | $ | 1,000.00 | | | $ | 1,097.10 | | | $ | 7.19 | | | | 1.36 | % | | $ | 1,000.00 | | | $ | 1,018.35 | | | $ | 6.92 | | | | 1.36 | % | |
Class C | | $ | 1,000.00 | | | $ | 1,092.90 | | | $ | 11.13 | | | | 2.11 | % | | $ | 1,000.00 | | | $ | 1,014.57 | | | $ | 10.71 | | | | 2.11 | % | |
Large Cap Disciplined Growth Fund | |
Investor Class | | $ | 1,000.00 | | | $ | 1,077.70 | | | $ | 5.81 | | | | 1.11 | % | | $ | 1,000.00 | | | $ | 1,019.61 | | | $ | 5.65 | | | | 1.11 | % | |
Institutional Class | | $ | 1,000.00 | | | $ | 1,080.10 | | | $ | 3.93 | | | | .75 | % | | $ | 1,000.00 | | | $ | 1,021.42 | | | $ | 3.82 | | | | .75 | % | |
Class A | | $ | 1,000.00 | | | $ | 1,077.80 | | | $ | 5.81 | | | | 1.11 | % | | $ | 1,000.00 | | | $ | 1,019.61 | | | $ | 5.65 | | | | 1.11 | % | |
Class C | | $ | 1,000.00 | | | $ | 1,073.10 | | | $ | 9.72 | | | | 1.86 | % | | $ | 1,000.00 | | | $ | 1,015.83 | | | $ | 9.45 | | | | 1.86 | % | |
Class R3 | | $ | 1,000.00 | | | $ | 1,075.70 | | | $ | 7.12 | | | | 1.36 | % | | $ | 1,000.00 | | | $ | 1,018.35 | | | $ | 6.92 | | | | 1.36 | % | |
Large Cap Value Fund | |
Investor Class | | $ | 1,000.00 | | | $ | 1,076.80 | | | $ | 4.45 | | | | .85 | % | | $ | 1,000.00 | | | $ | 1,020.92 | | | $ | 4.33 | | | | .85 | % | |
Trust Class | | $ | 1,000.00 | | | $ | 1,075.50 | | | $ | 5.49 | | | | 1.05 | % | | $ | 1,000.00 | | | $ | 1,019.91 | | | $ | 5.35 | | | | 1.05 | % | |
Advisor Class | | $ | 1,000.00 | | | $ | 1,074.40 | | | $ | 6.22 | | | | 1.19 | % | | $ | 1,000.00 | | | $ | 1,019.21 | | | $ | 6.06 | | | | 1.19 | % | |
Institutional Class | | $ | 1,000.00 | | | $ | 1,077.40 | | | $ | 3.67 | | | | .70 | % | | $ | 1,000.00 | | | $ | 1,021.68 | | | $ | 3.57 | | | | .70 | % | |
Class A | | $ | 1,000.00 | | | $ | 1,074.90 | | | $ | 5.81 | | | | 1.11 | % | | $ | 1,000.00 | | | $ | 1,019.61 | | | $ | 5.65 | | | | 1.11 | % | |
Class C | | $ | 1,000.00 | | | $ | 1,071.30 | | | $ | 9.71 | | | | 1.86 | % | | $ | 1,000.00 | | | $ | 1,015.83 | | | $ | 9.45 | | | | 1.86 | % | |
Class R3 | | $ | 1,000.00 | | | $ | 1,073.70 | | | $ | 7.11 | | | | 1.36 | % | | $ | 1,000.00 | | | $ | 1,018.35 | | | $ | 6.92 | | | | 1.36 | % | |
Mid Cap Growth Fund | |
Investor Class | | $ | 1,000.00 | | | $ | 1,093.40 | | | $ | 5.12 | | | | .97 | % | | $ | 1,000.00 | | | $ | 1,020.32 | | | $ | 4.94 | | | | .97 | % | |
Trust Class | | $ | 1,000.00 | | | $ | 1,093.30 | | | $ | 5.43 | | | | 1.03 | % | | $ | 1,000.00 | | | $ | 1,020.01 | | | $ | 5.24 | | | | 1.03 | % | |
Advisor Class | | $ | 1,000.00 | | | $ | 1,092.00 | | | $ | 6.80 | | | | 1.29 | % | | $ | 1,000.00 | | | $ | 1,018.70 | | | $ | 6.56 | | | | 1.29 | % | |
Institutional Class | | $ | 1,000.00 | | | $ | 1,094.40 | | | $ | 3.96 | | | | .75 | % | | $ | 1,000.00 | | | $ | 1,021.42 | | | $ | 3.82 | | | | .75 | % | |
Class A | | $ | 1,000.00 | | | $ | 1,092.70 | | | $ | 5.85 | | | | 1.11 | % | | $ | 1,000.00 | | | $ | 1,019.61 | | | $ | 5.65 | | | | 1.11 | % | |
Class C | | $ | 1,000.00 | | | $ | 1,089.00 | | | $ | 9.79 | | | | 1.86 | % | | $ | 1,000.00 | | | $ | 1,015.83 | | | $ | 9.45 | | | | 1.86 | % | |
Class R3 | | $ | 1,000.00 | | | $ | 1,091.30 | | | $ | 7.17 | | | | 1.36 | % | | $ | 1,000.00 | | | $ | 1,018.35 | | | $ | 6.92 | | | | 1.36 | % | |
Class R6 | | $ | 1,000.00 | | | $ | 1,062.60 | | | $ | 3.27 | (2) | | | .68 | % | | $ | 1,000.00 | | | $ | 1,021.78 | | | $ | 3.47 | | | | .68 | % | |
Mid Cap Intrinsic Value Fund | |
Investor Class | | $ | 1,000.00 | | | $ | 1,123.50 | | | $ | 5.30 | | | | .99 | % | | $ | 1,000.00 | | | $ | 1,020.21 | | | $ | 5.04 | | | | .99 | % | |
Trust Class | | $ | 1,000.00 | | | $ | 1,121.70 | | | $ | 6.68 | | | | 1.25 | % | | $ | 1,000.00 | | | $ | 1,018.90 | | | $ | 6.36 | | | | 1.25 | % | |
Institutional Class | | $ | 1,000.00 | | | $ | 1,124.40 | | | $ | 4.55 | | | | .85 | % | | $ | 1,000.00 | | | $ | 1,020.92 | | | $ | 4.33 | | | | .85 | % | |
Class A | | $ | 1,000.00 | | | $ | 1,121.70 | | | $ | 6.47 | | | | 1.21 | % | | $ | 1,000.00 | | | $ | 1,019.11 | | | $ | 6.16 | | | | 1.21 | % | |
Class C | | $ | 1,000.00 | | | $ | 1,117.90 | | | $ | 10.46 | | | | 1.96 | % | | $ | 1,000.00 | | | $ | 1,015.32 | | | $ | 9.96 | | | | 1.96 | % | |
Class R3 | | $ | 1,000.00 | | | $ | 1,121.10 | | | $ | 7.81 | | | | 1.46 | % | | $ | 1,000.00 | | | $ | 1,017.85 | | | $ | 7.43 | | | | 1.46 | % | |
Multi-Cap Opportunities Fund | |
Institutional Class | | $ | 1,000.00 | | | $ | 1,112.40 | | | $ | 4.26 | | | | .80 | % | | $ | 1,000.00 | | | $ | 1,021.17 | | | $ | 4.08 | | | | .80 | % | |
Class A | | $ | 1,000.00 | | | $ | 1,110.40 | | | $ | 6.12 | | | | 1.15 | % | | $ | 1,000.00 | | | $ | 1,019.41 | | | $ | 5.85 | | | | 1.15 | % | |
Class C | | $ | 1,000.00 | | | $ | 1,105.50 | | | $ | 10.83 | | | | 2.04 | % | | $ | 1,000.00 | | | $ | 1,014.92 | | | $ | 10.36 | | | | 2.04 | % | |
94
Expense Information as of 8/31/13 (Unaudited) (cont'd)
| | | ACTUAL | | HYPOTHETICAL (5% ANNUAL RETURN BEFORE EXPENSES)(4) | |
| | | Beginning
Account
Value
3/1/13 | | Ending
Account
Value
8/31/13 | | Expenses Paid
During the
Period(1)
3/1/13 - 8/31/13 | | Expense
Ratio | | Beginning
Account
Value
3/1/13 | | Ending
Account
Value
8/31/13 | | Expenses Paid
During the
Period(1)
3/1/13 - 8/31/13 | | Expense
Ratio | |
Real Estate Fund | |
Trust Class | | $ | 1,000.00 | | | $ | 944.40 | | | $ | 5.10 | | | | 1.04 | % | | $ | 1,000.00 | | | $ | 1,019.96 | | | $ | 5.30 | | | | 1.04 | % | |
Institutional Class | | $ | 1,000.00 | | | $ | 944.80 | | | $ | 4.17 | | | | .85 | % | | $ | 1,000.00 | | | $ | 1,020.92 | | | $ | 4.33 | | | | .85 | % | |
Class A | | $ | 1,000.00 | | | $ | 943.60 | | | $ | 5.93 | | | | 1.21 | % | | $ | 1,000.00 | | | $ | 1,019.11 | | | $ | 6.16 | | | | 1.21 | % | |
Class C | | $ | 1,000.00 | | | $ | 940.10 | | | $ | 9.58 | | | | 1.96 | % | | $ | 1,000.00 | | | $ | 1,015.32 | | | $ | 9.96 | | | | 1.96 | % | |
Class R3 | | $ | 1,000.00 | | | $ | 942.50 | | | $ | 7.15 | | | | 1.46 | % | | $ | 1,000.00 | | | $ | 1,017.85 | | | $ | 7.43 | | | | 1.46 | % | |
Class R6 | | $ | 1,000.00 | | | $ | 930.40 | | | $ | 3.51 | (2) | | | .78 | % | | $ | 1,000.00 | | | $ | 1,021.27 | | | $ | 3.97 | | | | .78 | % | |
Select Equities Fund | |
Institutional Class | | $ | 1,000.00 | | | $ | 1,067.10 | | | $ | 3.91 | | | | .75 | % | | $ | 1,000.00 | | | $ | 1,021.42 | | | $ | 3.82 | | | | .75 | % | |
Class A | | $ | 1,000.00 | | | $ | 1,064.40 | | | $ | 6.24 | | | | 1.20 | % | | $ | 1,000.00 | | | $ | 1,019.16 | | | $ | 6.11 | | | | 1.20 | % | |
Class C | | $ | 1,000.00 | | | $ | 1,060.50 | | | $ | 10.13 | | | | 1.95 | % | | $ | 1,000.00 | | | $ | 1,015.38 | | | $ | 9.91 | | | | 1.95 | % | |
Small Cap Growth Fund | |
Investor Class | | $ | 1,000.00 | | | $ | 1,190.70 | | | $ | 6.68 | | | | 1.21 | % | | $ | 1,000.00 | | | $ | 1,019.11 | | | $ | 6.16 | | | | 1.21 | % | |
Trust Class | | $ | 1,000.00 | | | $ | 1,189.70 | | | $ | 7.73 | | | | 1.40 | % | | $ | 1,000.00 | | | $ | 1,018.15 | | | $ | 7.12 | | | | 1.40 | % | |
Advisor Class | | $ | 1,000.00 | | | $ | 1,188.60 | | | $ | 8.33 | | | | 1.51 | % | | $ | 1,000.00 | | | $ | 1,017.59 | | | $ | 7.68 | | | | 1.51 | % | |
Institutional Class | | $ | 1,000.00 | | | $ | 1,192.70 | | | $ | 4.97 | | | | .90 | % | | $ | 1,000.00 | | | $ | 1,020.67 | | | $ | 4.58 | | | | .90 | % | |
Class A | | $ | 1,000.00 | | | $ | 1,190.60 | | | $ | 6.96 | | | | 1.26 | % | | $ | 1,000.00 | | | $ | 1,018.85 | | | $ | 6.41 | | | | 1.26 | % | |
Class C | | $ | 1,000.00 | | | $ | 1,186.20 | | | $ | 11.08 | | | | 2.01 | % | | $ | 1,000.00 | | | $ | 1,015.07 | | | $ | 10.21 | | | | 2.01 | % | |
Class R3 | | $ | 1,000.00 | | | $ | 1,188.90 | | | $ | 8.33 | | | | 1.51 | % | | $ | 1,000.00 | | | $ | 1,017.59 | | | $ | 7.68 | | | | 1.51 | % | |
Socially Responsive Fund | |
Investor Class | | $ | 1,000.00 | | | $ | 1,085.80 | | | $ | 4.52 | | | | .86 | % | | $ | 1,000.00 | | | $ | 1,020.87 | | | $ | 4.38 | | | | .86 | % | |
Trust Class | | $ | 1,000.00 | | | $ | 1,084.50 | | | $ | 5.46 | | | | 1.04 | % | | $ | 1,000.00 | | | $ | 1,019.96 | | | $ | 5.30 | | | | 1.04 | % | |
Institutional Class | | $ | 1,000.00 | | | $ | 1,086.70 | | | $ | 3.58 | | | | .68 | % | | $ | 1,000.00 | | | $ | 1,021.78 | | | $ | 3.47 | | | | .68 | % | |
Class A | | $ | 1,000.00 | | | $ | 1,084.60 | | | $ | 5.67 | | | | 1.08 | % | | $ | 1,000.00 | | | $ | 1,019.76 | | | $ | 5.50 | | | | 1.08 | % | |
Class C | | $ | 1,000.00 | | | $ | 1,080.40 | | | $ | 9.70 | | | | 1.85 | % | | $ | 1,000.00 | | | $ | 1,015.88 | | | $ | 9.40 | | | | 1.85 | % | |
Class R3 | | $ | 1,000.00 | | | $ | 1,083.30 | | | $ | 6.83 | | | | 1.30 | % | | $ | 1,000.00 | | | $ | 1,018.65 | | | $ | 6.61 | | | | 1.30 | % | |
Class R6 | | $ | 1,000.00 | | | $ | 1,049.70 | | | $ | 2.96 | (2) | | | .62 | % | | $ | 1,000.00 | | | $ | 1,022.08 | | | $ | 3.16 | | | | .62 | % | |
Value Fund | |
Institutional Class | | $ | 1,000.00 | | | $ | 1,074.70 | | | $ | 3.66 | | | | .70 | % | | $ | 1,000.00 | | | $ | 1,021.68 | | | $ | 3.57 | | | | .70 | % | |
Class A | | $ | 1,000.00 | | | $ | 1,072.60 | | | $ | 5.80 | | | | 1.11 | % | | $ | 1,000.00 | | | $ | 1,019.61 | | | $ | 5.65 | | | | 1.11 | % | |
Class C | | $ | 1,000.00 | | | $ | 1,068.20 | | | $ | 9.70 | | | | 1.86 | % | | $ | 1,000.00 | | | $ | 1,015.83 | | | $ | 9.45 | | | | 1.86 | % | |
(1) For each class, expenses are equal to the annualized expense ratio for the class, multiplied by the average account value over the period, multiplied by 184/365 (to reflect the one-half year period shown), unless otherwise indicated.
(2) For each class, expenses are equal to the annualized expense ratio for the class, multiplied by the average account value over the period, multiplied by 170/365 (to reflect the period shown of March 15, 2013 to August 31, 2013).
(3) For each class, expenses are equal to the annualized expense ratio for the class, multiplied by the average account value over the period, multiplied by 46/365 (to reflect the period shown of July 17, 2013 (Commencement of Operations) to August 31, 2013).
(4) Hypothetical 5% annual return before expenses is calculated by multiplying the number of days in the most recent period divided by 365.
95
Schedule of Investments Emerging Markets Equity Fund
| | | | | Country | | Industry | | | |
| | 1 | | |
Samsung Electronics Co. Ltd. | |
Korea | | Semiconductors & Semiconductor
Equipment | | | 4.2 | % | |
| | 2 | | | Coway Co. Ltd. | | Korea | | Household Durables | | | 2.1 | % | |
| 3
| | | Industrial & Commercial Bank of China Ltd.,
H Shares | |
China | |
Commercial Banks | | | 2.0 | % | |
| | 4 | | | China Everbright International Ltd. | | China | | Commercial Services & Supplies | | | 2.0 | % | |
| 5
| | | Taiwan Semiconductor Manufacturing
Co. Ltd. | |
Taiwan, Province of China | | Semiconductors & Semiconductor
Equipment | | | 2.0 | % | |
| | 6 | | | Baidu, Inc. ADR | | China | | Internet Software & Services | | | 1.8 | % | |
| | 7 | | | Tencent Holdings Ltd. | | China | | Internet Software & Services | | | 1.8 | % | |
|
8 | | |
China Vanke Co. Ltd., B Shares | |
China | | Real Estate Management &
Development | | | 1.8 | % | |
| | 9 | | | Vale SA ADR, Preference Shares | | Brazil | | Metals & Mining | | | 1.7 | % | |
| | 10 | | | Sberbank of Russia | | Russia | | Commercial Banks | | | 1.6 | % | |
| | | Number
of Shares | | Value†
(000's)z | |
Common Stocks (93.4%) | |
Brazil (8.6%) | |
Banco Daycoval SA,
Preference Shares | | | 5,400 | | | $ | 18 | | |
Banco do Estado
do Rio Grande do
Sul SA Class B,
Preference Shares | | | 658,100 | | | | 3,939 | | |
BM&FBOVESPA SA | | | 666,600 | | | | 3,266 | | |
BR Malls
Participacoes SA | | | 464,100 | | | | 3,521 | | |
Brasil Insurance
Participacoes E
Administracao SA | | | 452,100 | | | | 3,619 | | |
Cia Hering | | | 76,200 | | | | 1,019 | | |
Companhia de
Bebidas das
Americas ADR,
Preference Shares | | | 177,200 | | | | 6,163 | | |
Qualicorp SA* | | | 433,700 | | | | 3,390 | | |
TOTVS SA | | | 240,425 | | | | 3,769 | | |
Vale SA ADR,
Preference Shares | | | 556,125 | | | | 7,218 | | |
| | | | 35,922 | | |
China (22.4%) | |
AAC Technologies
Holdings, Inc. | | | 1,087,600 | | | | 4,908 | | |
Agricultural Bank
of China Ltd.,
H Shares | | | 12,461,600 | | | | 5,327 | | |
Baidu, Inc. ADR* | | | 56,500 | | | | 7,657 | | |
Bolina Holding
Co. Ltd. | | | 3,663,300 | | | | 1,759 | | |
China Everbright
International Ltd. | | | 8,716,100 | | | | 8,217 | | |
China Lesso
Group Holdings
Ltd. | | | 6,702,800 | | | | 3,968 | | |
China Medical
System Holdings
Ltd. | | | 3,025,200 | | | | 2,515 | | |
| | |
Number
of Shares | |
Value†
(000's)z | |
China Mengniu
Dairy Co. Ltd. | | | 1,256,740 | | | $ | 5,317 | | |
China Mobile Ltd. | | | 400,950 | | | | 4,321 | | |
China State
Construction
International
Holdings Ltd. | | | 3,509,600 | | | | 5,648 | | |
China Vanke Co.
Ltd., B Shares | | | 3,792,414 | | | | 7,596 | | |
First Tractor Co.
Ltd., H Shares | | | 2,492,100 | | | | 1,524 | | |
Haier Electronics
Group Co. Ltd. | | | 3,571,100 | | | | 6,236 | | |
Industrial &
Commercial
Bank of China Ltd.,
H Shares | | | 12,703,000 | | | | 8,307 | | |
New Oriental
Education &
Technology Group,
Inc. ADR* | | | 175,100 | | | | 3,717 | | |
Prince Frog
International
Holdings Ltd. | | | 7,596,300 | | | | 4,712 | | |
Tencent Holdings
Ltd. | | | 163,300 | | | | 7,631 | | |
Zhuzhou CSR
Times Electric
Co. Ltd.,
H Shares | | | 1,235,600 | | | | 3,880 | | |
| | | | 93,240 | | |
Colombia (1.8%) | |
Ecopetrol SA ADR | | | 50,800 | | | | 2,269 | | |
Pacific Rubiales
Energy Corp. | | | 278,800 | | | | 5,275 | | |
| | | | 7,544 | | |
Czech Republic (1.1%) | |
Komercni
Banka A/S | | | 21,265 | | | | 4,586 | | |
| | |
Number
of Shares | |
Value†
(000's)z | |
India (7.7%) | |
Asian Paints Ltd. | | | 513,930 | | | $ | 3,262 | | |
Ballarpur Industries
Ltd. | | | 251,644 | | | | 38 | | |
Cairn India Ltd. | | | 669,196 | | | | 3,266 | | |
Cummins India
Ltd. | | | 509,785 | | | | 3,028 | | |
Dabur India Ltd. | | | 1,817,544 | | | | 4,538 | | |
Glenmark
Pharmaceuticals
Ltd. | | | 312,260 | | | | 2,445 | | |
Godrej Consumer
Products Ltd. | | | 316,170 | | | | 3,854 | | |
Larsen &
Toubro Ltd. | | | 186,492 | | | | 2,034 | | |
Mahindra &
Mahindra Ltd. | | | 205,285 | | | | 2,428 | | |
Petronet LNG Ltd. | | | 982,990 | | | | 1,816 | | |
Tata Global
Beverages Ltd. | | | 1,127,440 | | | | 2,369 | | |
Yes Bank Ltd. | | | 765,750 | | | | 2,836 | | |
| | | | 31,914 | | |
Indonesia (1.3%) | |
PT AKR
Corporindo Tbk | | | 5,019,800 | | | | 1,822 | | |
PT Bank Mandiri
(Persero) Tbk | | | 334,800 | | | | 217 | | |
PT Semen
Indonesia
(Persero) Tbk | | | 2,754,400 | | | | 3,171 | | |
| | | | 5,210 | | |
Korea (10.2%) | |
Coway Co. Ltd. | | | 168,185 | | | | 8,860 | | |
Hankook Tire Co.
Ltd. | | | 95,918 | | | | 4,958 | | |
Lock & Lock Co.
Ltd. | | | 178,730 | | | | 3,695 | | |
Samsung
Electronics Co. Ltd. | | | 14,293 | | | | 17,523 | | |
SFA Engineering
Corp. | | | 84,751 | | | | 3,802 | | |
See Notes to Schedule of Investments
96
| | |
Number
of Shares | |
Value†
(000's)z | |
Sung Kwang
Bend Co. Ltd. | | | 150,749 | | | $ | 3,857 | | |
| | | | 42,695 | | |
Malaysia (4.0%) | |
Axiata Group
Berhad | | | 2,748,900 | | | | 5,633 | | |
Malayan Banking
Berhad | | | 1,597,400 | | | | 4,856 | | |
Top Glove Corp.
Berhad | | | 3,247,100 | | | | 6,070 | | |
| | | | 16,559 | | |
Mexico (6.1%) | |
Alamos Gold, Inc. | | | 255,700 | | | | 4,173 | | |
Arca Continental
SAB de CV | | | 557,400 | | | | 3,579 | | |
Corp. Inmobiliaria
Vesta SAB de CV | | | 911,900 | | | | 1,768 | | |
Fibra Uno
Administracion
SA de CV | | | 703,900 | | | | 2,029 | | |
Genomma Lab
Internacional SAB
de CV Class B* | | | 2,124,600 | | | | 4,603 | | |
Grupo Financiero
Banorte SAB
de CV | | | 744,000 | | | | 4,581 | | |
Kimberly-Clark de
Mexico SAB de CV
Class A | | | 1,683,200 | | | | 4,793 | | |
| | | | 25,526 | | |
Nigeria (1.0%) | |
Afren PLC* | | | 2,020,755 | | | | 4,359 | | |
Peru (1.2%) | |
Credicorp Ltd. | | | 42,300 | | | | 5,128 | | |
Philippines (1.1%) | |
International
Container Terminal
Services, Inc. | | | 2,243,980 | | | | 4,761 | | |
Qatar (1.3%) | |
Industries Qatar
QSC | | | 129,173 | | | | 5,445 | | |
Russia (6.9%) | |
Eurasia Drilling Co.
Ltd. GDR | | | 142,630 | | | | 5,499 | | |
Magnit OJSC | | | 28,365 | | | | 6,306 | | |
QIWI PLC ADR | | | 75,100 | | | | 2,238 | | |
Rosneft GDR | | | 389,890 | | | | 2,866 | | |
Sberbank of
Russia | | | 2,433,240 | | | | 6,521 | | |
Yandex NV
Class A* | | | 175,100 | | | | 5,603 | | |
| | | 29,033 | | |
Singapore (1.2%) | |
Asian Pay
Television Trust | | | 7,599,302 | | | | 4,960 | | |
| | |
Number
of Shares | |
Value†
(000's)z | |
South Africa (4.5%) | |
Bidvest Group Ltd. | | | 173,085 | | | $ | 4,256 | | |
Life Healthcare
Group Holdings
Ltd. | | | 1,348,495 | | | | 4,643 | | |
MTN Group Ltd. | | | 291,309 | | | | 5,322 | | |
Shoprite Holdings
Ltd. | | | 279,180 | | | | 4,376 | | |
| | | | 18,597 | | |
Taiwan, Province of China (3.6%) | |
China Steel
Chemical Corp. | | | 453,400 | | | | 2,569 | | |
Simplo Technology
Co. Ltd. | | | 889,103 | | | | 4,226 | | |
Taiwan
Semiconductor
Manufacturing
Co. Ltd. | | | 2,453,939 | | | | 8,136 | | |
| | | | 14,931 | | |
Thailand (2.3%) | |
| CP ALL PCL | | | 2,611,500 | | | | 2,657 | | |
Kasikornbank
PCL NVDR | | | 595,400 | | | | 2,924 | | |
PTT PCL | | | 383,400 | | | | 3,895 | | |
| | | | 9,476 | | |
Turkey (1.7%) | |
Anadolu Efes
Biracilik Ve Malt
Sanayii A/S | | | 253,440 | | | | 2,927 | | |
Koza Altin
Isletmeleri A/S | | | 100,435 | | | | 1,579 | | |
Turkiye Garanti
Bankasi A/S | | | 761,297 | | | | 2,603 | | |
| | | | 7,109 | | |
United Arab Emirates (1.1%) | |
Dragon Oil PLC | | | 490,815 | | | | 4,507 | | |
United Kingdom (4.3%) | |
BG Group PLC | | | 234,095 | | | | 4,451 | | |
Hikma
Pharmaceuticals
PLC | | | 189,045 | | | | 2,971 | | |
Kenmare Resources
PLC* | | | 5,468,510 | | | | 2,237 | | |
SABMiller PLC | | | 127,165 | | | | 6,050 | | |
Tullow Oil PLC | | | 146,266 | | | | 2,285 | | |
| | | | 17,994 | | |
Total Common Stocks
(Cost $397,725) | | | | | 389,496 | | |
| | |
Number
of Shares | |
Value†
(000's)z | |
Short-Term Investments (6.1%) | |
State Street
Institutional
Treasury Money
Market Fund
Institutional Class
(Cost $25,403) | | | 25,403,388 | | | $ | 25,403 | | |
Total Investments## (99.5%)
(Cost $423,128) | | | | | 414,899 | | |
Cash, receivables
and other assets,
less liabilities (0.5%) | | | | | 1,880 | | |
Total Net Assets (100.0%) | | | | $ | 416,779 | | |
See Notes to Schedule of Investments
97
SUMMARY SCHEDULE OF INVESTMENTS BY INDUSTRY EMERGING MARKETS EQUITY FUND
Industry | | Investments at
Value†
(000's omitted) | | Percentage of
Net Assets | |
Commercial Banks | | $ | 51,843 | | | | 12.5 | % | |
Oil, Gas & Consumable Fuels | | | 34,989 | | | | 8.4 | % | |
Semiconductors & Semiconductor Equipment | | | 25,659 | | | | 6.2 | % | |
Internet Software & Services | | | 20,891 | | | | 5.0 | % | |
Beverages | | | 18,719 | | | | 4.5 | % | |
Wireless Telecommunication Services | | | 15,276 | | | | 3.7 | % | |
Metals & Mining | | | 15,207 | | | | 3.6 | % | |
Household Durables | | | 15,096 | | | | 3.6 | % | |
Food & Staples Retailing | | | 13,339 | | | | 3.2 | % | |
Personal Products | | | 13,104 | | | | 3.1 | % | |
Real Estate Management & Development | | | 12,885 | | | | 3.1 | % | |
Pharmaceuticals | | | 12,534 | | | | 3.0 | % | |
Industrial Conglomerates | | | 9,701 | | | | 2.3 | % | |
Building Products | | | 9,584 | | | | 2.3 | % | |
Commercial Services & Supplies | | | 8,217 | | | | 2.0 | % | |
Health Care Providers & Services | | | 8,033 | | | | 1.9 | % | |
Food Products | | | 7,686 | | | | 1.8 | % | |
Construction & Engineering | | | 7,682 | | | | 1.8 | % | |
Health Care Equipment & Supplies | | | 6,070 | | | | 1.5 | % | |
Chemicals | | | 5,831 | | | | 1.4 | % | |
Energy Equipment & Services | | | 5,499 | | | | 1.3 | % | |
Media | | | 4,960 | | | | 1.2 | % | |
Auto Components | | | 4,958 | | | | 1.2 | % | |
Communications Equipment | | | 4,908 | | | | 1.2 | % | |
Household Products | | | 4,793 | | | | 1.2 | % | |
Transportation Infrastructure | | | 4,761 | | | | 1.1 | % | |
Machinery | | | 4,552 | | | | 1.1 | % | |
Computers & Peripherals | | | 4,226 | | | | 1.0 | % | |
Electrical Equipment | | | 3,880 | | | | 0.9 | % | |
Electronic Equipment, Instruments & Components | | | 3,802 | | | | 0.9 | % | |
Software | | | 3,769 | | | | 0.9 | % | |
Diversified Consumer Services | | | 3,717 | | | | 0.9 | % | |
Containers & Packaging | | | 3,695 | | | | 0.9 | % | |
Insurance | | | 3,619 | | | | 0.9 | % | |
Diversified Financial Services | | | 3,266 | | | | 0.8 | % | |
Construction Materials | | | 3,171 | | | | 0.8 | % | |
Automobiles | | | 2,428 | | | | 0.6 | % | |
IT Services | | | 2,238 | | | | 0.5 | % | |
Real Estate Investment Trusts | | | 2,029 | | | | 0.5 | % | |
Trading Companies & Distributors | | | 1,822 | | | | 0.4 | % | |
Specialty Retail | | | 1,019 | | | | 0.2 | % | |
Paper & Forest Products | | | 38 | | | | 0.0 | % | |
Short-Term Investments and Other Assets—Net | | | 27,283 | | | | 6.6 | % | |
| | | $ | 416,779 | | | | 100.0 | % | |
See Notes to Schedule of Investments
98
Schedule of Investments Equity Income Fund
TOP TEN EQUITY HOLDINGS
| | 1 | | | Kinder Morgan, Inc. | | | 2.3 | % | |
| | 2 | | | Public Storage | | | 2.2 | % | |
| | 3 | | | Cisco Systems, Inc. | | | 2.2 | % | |
| | 4 | | | General Electric Co. | | | 2.1 | % | |
| | 5 | | | Chevron Corp. | | | 2.1 | % | |
| | 6 | | | CME Group, Inc. | | | 2.1 | % | |
| | 7 | | | NiSource, Inc. | | | 2.1 | % | |
| | 8 | | | Prologis, Inc. | | | 2.1 | % | |
| | 9 | | | Wells Fargo & Co. | | | 2.1 | % | |
| | 10 | | | Novartis AG ADR | | | 2.1 | % | |
| | |
Number
of Shares | |
Value†
(000's)z | |
Common Stocks (95.1%) | |
Aerospace & Defense (2.6%) | |
General Dynamics
Corp.‡‡ | | | 713,300 | | | $ | 59,382 | | |
Honeywell
International,
Inc.‡‡ | | | 205,000 | | | | 16,312 | | |
| | | | 75,694 | | |
Capital Markets (1.1%) | |
BlackRock, Inc. | | | 122,700 | | | | 31,941 | | |
Commercial Banks (3.6%) | |
M&T Bank Corp. | | | 135,000 | | | | 15,301 | | |
PNC Financial
Services Group,
Inc. | | | 414,000 | | | | 29,920 | | |
Wells Fargo &
Co. | | | 1,500,000 | | | | 61,620 | | |
| | | | 106,841 | | |
Communications Equipment (2.2%) | |
Cisco Systems,
Inc. | | | 2,775,000 | | | | 64,685 | | |
Diversified Financial Services (3.1%) | |
CME Group, Inc. | | | 875,000 | | | | 62,221 | | |
JPMorgan
Chase & Co. | | | 582,000 | | | | 29,409 | | |
| | | | 91,630 | | |
Diversified Telecommunication Services (1.9%) | |
Singapore
Telecommunications
Ltd. | | | 19,960,000 | | | | 54,807 | | |
Electric Utilities (4.1%) | |
Enersis SA ADR | | | 1,670,000 | | | | 26,386 | | |
Great Plains
Energy, Inc. | | | 1,520,000 | | | | 33,318 | | |
NextEra Energy,
Inc. | | | 750,000 | | | | 60,270 | | |
| | | | 119,974 | | |
Food & Staples Retailing (0.9%) | |
Wesfarmers Ltd. | | | 750,000 | | | | 27,047 | | |
Food Products (2.0%) | |
Unilever NV | | | 1,575,000 | | | | 59,267 | | |
| | |
Number
of Shares | |
Value†
(000's)z | |
Gas Utilities (1.5%) | |
Infraestructura
Energetica Nova
SAB de CV* | | | 4,435,900 | | | $ | 16,494 | | |
Questar Corp. | | | 1,280,000 | | | | 28,058 | | |
| | | | 44,552 | | |
Hotels, Restaurants & Leisure (1.2%) | |
Flight Centre Ltd. | | | 842,982 | | | | 35,077 | | |
Household Products (1.0%) | |
Kimberly-Clark
Corp. | | | 318,500 | | | | 29,773 | | |
Industrial Conglomerates (4.2%) | |
General Electric
Co. | | | 2,725,000 | | | | 63,057 | | |
Koninklijke
Philips NV | | | 1,969,000 | | | | 60,868 | | |
| | | | 123,925 | | |
Metals & Mining (1.0%) | |
BHP Billiton Ltd.
ADR | | | 475,000 | | | | 30,058 | | |
Multi-Utilities (14.0%) | |
Alliant Energy
Corp. | | | 800,000 | | | | 39,688 | | |
Ameren Corp. | | | 1,757,000 | | | | 59,404 | | |
CenterPoint
Energy, Inc. | | | 2,125,000 | | | | 48,726 | | |
Dominion
Resources, Inc. | | | 1,011,000 | | | | 58,992 | | |
National Grid
PLC | | | 3,136,000 | | | | 36,084 | | |
National Grid
PLC ADR | | | 100,000 | | | | 5,756 | | |
NiSource, Inc. | | | 2,125,000 | | | | 62,178 | | |
| Sempra Energy‡‡ | | | 721,000 | | | | 60,867 | | |
Wisconsin Energy
Corp. | | | 952,000 | | | | 39,070 | | |
| | | | 410,765 | | |
Oil, Gas & Consumable Fuels (12.6%) | |
ARC Resources
Ltd. | | | 1,365,500 | | | | 32,868 | | |
Canadian Oil
Sands Ltd. | | | 1,650,000 | | | | 31,730 | | |
Chevron Corp. | | | 519,000 | | | | 62,503 | | |
Enbridge Inc. | | | 1,415,000 | | | | 57,944 | | |
Exxon Mobil
Corp. | | | 540,000 | | | | 47,066 | | |
Kinder Morgan,
Inc. | | | 1,800,000 | | | | 68,274 | | |
| | |
Number
of Shares | |
Value†
(000's)z | |
Spectra Energy
Corp. | | | 1,100,000 | | | $ | 36,421 | | |
Williams Cos.,
Inc. | | | 920,500 | | | | 33,359 | | |
| | | | 370,165 | | |
Pharmaceuticals (8.8%) | |
Bristol-Myers
Squibb Co.‡‡ | | | 1,146,000 | | | | 47,777 | | |
Johnson &
Johnson‡‡ | | | 559,000 | | | | 48,303 | | |
Novartis AG ADR | | | 840,000 | | | | 61,303 | | |
Roche Holding
AG ADR | | | 950,000 | | | | 59,147 | | |
Sanofi ADR | | | 916,700 | | | | 43,800 | | |
| | | | 260,330 | | |
Real Estate Investment Trusts (21.0%) | |
American Campus
Communities,
Inc. | | | 1,165,000 | | | | 38,806 | | |
Ascendas Real Estate
Investment
Trust | | | 13,160,000 | | | | 22,409 | | |
Ascendas Real Estate
Investment
Trustñ | | | 1,840,000 | | | | 3,133 | | |
Equity Residential | | | 950,000 | | | | 49,295 | | |
Extra Space
Storage, Inc. | | | 850,000 | | | | 35,046 | | |
Fibra Uno
Administracion
SA de CV | | | 9,811,300 | | | | 28,279 | | |
Goodman Group | | | 3,089,000 | | | | 12,662 | | |
HCP, Inc. | | | 1,300,000 | | | | 52,949 | | |
Mapletree
Logistics Trust | | | 14,879,000 | | | | 12,279 | | |
Parkway Life
Real Estate
Investment
Trust | | | 6,059,000 | | | | 10,488 | | |
Plum Creek
Timber Co., Inc. | | | 1,050,000 | | | | 46,526 | | |
Prologis, Inc. | | | 1,750,000 | | | | 61,670 | | |
| Public Storage‡‡ | | | 425,000 | | | | 64,885 | | |
Simon Property
Group, Inc. | | | 375,000 | | | | 54,611 | | |
Suntec Real Estate
Investment
Trust | | | 11,972,000 | | | | 14,225 | | |
TF Administradora
Industrial S de
RL de CV | | | 9,177,757 | | | | 16,177 | | |
See Notes to Schedule of Investments
99
| | |
Number
of Shares | |
Value†
(000's)z | |
Ventas, Inc. | | | 925,000 | | | $ | 57,590 | | |
Vornado Realty
Trust‡‡ | | | 242,154 | | | | 19,687 | | |
Yuexiu Real Estate
Investment
Trust | | | 35,521,200 | | | | 17,795 | | |
| | | | 618,512 | | |
Road & Rail (2.1%) | |
Norfolk Southern
Corp. | | | 834,000 | | | | 60,181 | | |
Software (2.0%) | |
Microsoft Corp. | | | 1,778,100 | | | | 59,389 | | |
Tobacco (2.0%) | |
Philip Morris
International,
Inc. | | | 705,000 | | | | 58,825 | | |
Transportation Infrastructure (0.9%) | |
SATS Ltd. | | | 11,358,500 | | | | 26,768 | | |
Wireless Telecommunication Services (1.3%) | |
Philippine Long
Distance Telephone
Co. ADR | | | 613,200 | | | | 38,846 | | |
Total Common Stocks
(Cost $2,653,962) | | | | | 2,799,052 | | |
| | | Principal
Amount | | | |
Convertible Bonds (2.8%) | |
James River
Coal Co.,
Guaranteed
Notes, 10.00%,
due 6/1/18ñ | | $ | 5,491,000 | | | | 2,814 | | |
NuVasive, Inc.,
Senior Unsecured
Notes, 2.75%,
due 7/1/17 | | | 13,635,000 | | | | 13,132 | | |
Patriot Coal
Corp., Senior
Unsecured
Notes, 3.25%,
due 5/31/13‡ | | | 14,515,000 | | | | 1,706 | | |
Siemens Finan-
cieringsmaatschappij
NV, Guaranteed
Notes, 1.65%,
due 8/16/19 | | | 15,500,000 | | | | 16,411 | | |
TIBCO Software,
Inc., Senior
Unsecured
Notes, 2.25%,
due 5/1/32 | | | 17,025,000 | | | | 17,174 | | |
WebMD Health
Corp., Senior
Unsecured
Notes, 2.25%,
due 3/31/16 | | | 13,470,000 | | | | 13,192 | | |
| | |
Principal
Amount | |
Value†
(000's)z | |
WebMD Health
Corp., Senior
Unsecured
Notes, 2.50%,
due 1/31/18 | | $ | 19,600,000 | | | $ | 18,742 | | |
Total Convertible Bonds
(Cost $99,916) | | | | | 83,171 | | |
| | | Number
of Shares | | | |
Short-Term Investments (0.5%) | |
State Street
Institutional
Treasury Money
Market Fund
Institutional
Class
(Cost $13,343) | | | 13,343,328 | | | | 13,343 | | |
Total Investments## (98.4%)
(Cost $2,767,221) | | | | | 2,895,566 | | |
Cash, receivables
and other assets,
less liabilities‡‡± (1.6%) | | | | | 48,554 | | |
Total Net Assets (100.0%) | | | | $ | 2,944,120 | | |
See Notes to Schedule of Investments
100
Schedule of Investments Focus Fund
TOP TEN EQUITY HOLDINGS
| | 1 | | | C.R. Bard, Inc. | | | 4.8 | % | |
| | 2 | | | JPMorgan Chase & Co. | | | 4.2 | % | |
| | 3 | | | American International Group, Inc. | | | 4.1 | % | |
| | 4 | | | Eaton Corp. PLC | | | 3.9 | % | |
| | 5 | | | Lowe's Cos., Inc. | | | 3.5 | % | |
| | 6 | | | Comcast Corp. Class A Special | | | 3.5 | % | |
| | 7 | | | EOG Resources, Inc. | | | 3.5 | % | |
| | 8 | | | Cardinal Health, Inc. | | | 3.4 | % | |
| | 9 | | | Google, Inc. Class A | | | 3.2 | % | |
| | 10 | | | Microsoft Corp. | | | 3.2 | % | |
| | |
Number
of Shares | |
Value†
(000's)z | |
Common Stocks (95.9%) | |
Aerospace & Defense (2.9%) | |
Boeing Co. | | | 200,000 | | | $ | 20,784 | | |
Biotechnology (1.3%) | |
ARIAD
Pharmaceuticals,
Inc.* | | | 520,000 | | | | 9,672 | | |
Chemicals (1.9%) | |
WR Grace & Co.* | | | 173,000 | | | | 13,901 | | |
Commercial Banks (2.0%) | |
Comerica, Inc. | | | 360,000 | | | | 14,702 | | |
Computers & Peripherals (7.5%) | |
Apple, Inc. | | | 44,500 | | | | 21,674 | | |
EMC Corp. | | | 630,000 | | | | 16,241 | | |
SanDisk Corp. | | | 300,000 | | | | 16,554 | | |
| | | | 54,469 | | |
Containers & Packaging (1.2%) | |
Crown Holdings,
Inc.* | | | 195,000 | | | | 8,475 | | |
Diversified Consumer Services (2.1%) | |
Service Corp.
International | | | 825,000 | | | | 14,916 | | |
Diversified Financial Services (6.6%) | |
Intercontinental
Exchange, Inc.* | | | 95,000 | | | | 17,076 | | |
JPMorgan
Chase & Co. | | | 605,000 | | | | 30,571 | | |
| | | | 47,647 | | |
Electrical Equipment (3.9%) | |
Eaton Corp. PLC | | | 445,000 | | | | 28,177 | | |
Energy Equipment & Services (2.2%) | |
Schlumberger Ltd. | | | 197,000 | | | | 15,945 | | |
Food Products (4.9%) | |
Mondelez
International, Inc.
Class A | | | 590,000 | | | | 18,095 | | |
WhiteWave
Foods Co.
Class A* | | | 905,000 | | | | 17,304 | | |
| | | | 35,399 | | |
Health Care Equipment &
Supplies (4.8%) | |
C.R. Bard, Inc. | | | 300,000 | | | | 34,461 | | |
| | |
Number
of Shares | |
Value†
(000's)z | |
Health Care Providers &
Services (3.4%) | |
Cardinal Health,
Inc. | | | 485,000 | | | $ | 24,386 | | |
Household Products (2.7%) | |
Procter &
Gamble Co. | | | 255,000 | | | | 19,862 | | |
Insurance (7.2%) | |
American
International
Group, Inc.* | | | 645,000 | | | | 29,967 | | |
Aon PLC | | | 330,600 | | | | 21,945 | | |
| | | | 51,912 | | |
Internet Software & Services (3.2%) | |
Google, Inc.
Class A* | | | 27,500 | | | | 23,290 | | |
Leisure Equipment & Products (2.3%) | |
Mattel, Inc. | | | 415,000 | | | | 16,808 | | |
Machinery (2.2%) | |
Pall Corp. | | | 235,000 | | | | 16,248 | | |
Media (6.1%) | |
Comcast Corp.
Class A Special | | | 620,000 | | | | 25,259 | | |
Viacom, Inc.
Class B | | | 235,000 | | | | 18,696 | | |
| | | | 43,955 | | |
Metals & Mining (0.6%) | |
Goldcorp, Inc. | | | 150,000 | | | | 4,425 | | |
Multi-Utilities (3.1%) | |
NiSource, Inc. | | | 767,100 | | | | 22,445 | | |
Oil, Gas & Consumable Fuels (8.3%) | |
Cabot Oil & Gas
Corp. | | | 490,000 | | | | 19,174 | | |
Cenovus Energy,
Inc. | | | 560,000 | | | | 16,094 | | |
EOG Resources,
Inc. | | | 160,000 | | | | 25,128 | | |
| | | | 60,396 | | |
Personal Products (2.4%) | |
Estee Lauder Cos.,
Inc. Class A | | | 265,418 | | | | 17,348 | | |
Semiconductors & Semiconductor Equipment (2.3%) | |
Altera Corp. | | | 480,000 | | | | 16,882 | | |
| | |
Number
of Shares | |
Value†
(000's)z | |
Software (4.8%) | |
Activision
Blizzard, Inc. | | | 720,000 | | | $ | 11,750 | | |
Microsoft Corp. | | | 685,000 | | | | 22,879 | | |
| | | | 34,629 | | |
Specialty Retail (6.0%) | |
Lowe's Cos., Inc. | | | 560,000 | | | | 25,659 | | |
Urban Outfitters,
Inc.* | | | 430,000 | | | | 18,030 | | |
| | | | 43,689 | | |
Total Common Stocks
(Cost $563,464) | | | | | 694,823 | | |
Short-Term Investments (4.5%) | |
State Street
Institutional
Treasury Money
Market Fund
Institutional
Class
(Cost $32,114) | | | 32,114,436 | | | | 32,114 | | |
Total Investments## (100.4%)
(Cost $595,578) | | | | | 726,937 | | |
Liabilities, less cash,
receivables and
other assets [(0.4%)] | | | | | (2,645 | ) | |
Total Net Assets (100.0%) | | | | $ | 724,292 | | |
See Notes to Schedule of Investments
101
Schedule of Investments Genesis Fund
TOP TEN EQUITY HOLDINGS
| | 1 | | | Church & Dwight Co., Inc. | | | 2.3 | % | |
| | 2 | | | Wabtec Corp. | | | 2.1 | % | |
| | 3 | | | AptarGroup, Inc. | | | 2.0 | % | |
| | 4 | | | Oceaneering International, Inc. | | | 1.9 | % | |
| | 5 | | | Compass Minerals International, Inc. | | | 1.8 | % | |
| | 6 | | | Ocwen Financial Corp. | | | 1.8 | % | |
| | 7 | | | CLARCOR, Inc. | | | 1.7 | % | |
| | 8 | | | Polaris Industries, Inc. | | | 1.6 | % | |
| | 9 | | | Altisource Portfolio Solutions SA | | | 1.6 | % | |
| | 10 | | | Henry Schein, Inc. | | | 1.5 | % | |
| | |
Number
of Shares | |
Value†
(000's)z | |
Common Stocks (95.7%) | |
Air Freight & Logistics (0.5%) | |
Forward Air
Corp.^ | | | 1,658,000 | | | $ | 61,064 | | |
Auto Components (0.4%) | |
Gentex Corp. | | | 2,358,149 | | | | 53,129 | | |
Beverages (1.1%) | |
Boston Beer Co.,
Inc. Class A*^ | | | 702,719 | | | | 148,864 | | |
Building Products (0.6%) | |
AAON, Inc. | | | 605,921 | | | | 14,130 | | |
AO Smith Corp. | | | 1,669,548 | | | | 70,205 | | |
| | | | 84,335 | | |
Chemicals (4.1%) | |
| Balchem Corp.^ | | | 1,501,935 | | | | 71,882 | | |
Hawkins, Inc. | | | 441,373 | | | | 16,366 | | |
Innophos
Holdings, Inc.^ | | | 1,816,700 | | | | 88,964 | | |
NewMarket
Corp. | | | 296,112 | | | | 81,188 | | |
RPM
International,
Inc. | | | 2,337,644 | | | | 79,433 | | |
Sensient
Technologies
Corp.^ | | | 3,672,617 | | | | 152,267 | | |
Stepan Co. | | | 823,596 | | | | 46,484 | | |
| | | | 536,584 | | |
Commercial Banks (6.7%) | |
Bank of Hawaii
Corp.^ | | | 2,609,212 | | | | 134,374 | | |
Bank of the
Ozarks, Inc. | | | 1,134,150 | | | | 51,468 | | |
BankUnited,
Inc. | | | 3,086,498 | | | | 91,206 | | |
BOK Financial
Corp. | | | 1,421,194 | | | | 91,084 | | |
Community
Bank System,
Inc. | | | 1,233,323 | | | | 40,996 | | |
Cullen/Frost
Bankers, Inc. | | | 2,060,225 | | | | 145,946 | | |
CVB Financial
Corp. | | | 1,020,175 | | | | 12,997 | | |
First Financial
Bankshares,
Inc.^ | | | 1,908,468 | | | | 109,737 | | |
FNB Corp. | | | 3,676,246 | | | | 44,372 | | |
| | |
Number
of Shares | |
Value†
(000's)z | |
PacWest
Bancorp | | | 1,582,360 | | | $ | 52,614 | | |
ViewPoint
Financial
Group, Inc. | | | 1,633,560 | | | | 32,492 | | |
Westamerica
Bancorporation^ | | | 1,894,243 | | | | 89,162 | | |
| | | 896,448 | | |
Commercial Services & Supplies (4.8%) | |
Copart, Inc.* | | | 3,339,862 | | | | 106,107 | | |
Healthcare
Services Group,
Inc.^ | | | 5,114,481 | | | | 123,822 | | |
Ritchie Bros.
Auctioneers,
Inc. | | | 2,022,710 | | | | 37,481 | | |
Rollins, Inc. | | | 5,951,920 | | | | 147,310 | | |
Team, Inc.* | | | 828,306 | | | | 32,304 | | |
UniFirst Corp. | | | 427,850 | | | | 41,022 | | |
United
Stationers, Inc.^ | | | 3,755,341 | | | | 149,237 | | |
| | | | 637,283 | | |
Communications Equipment (0.6%) | |
| NETGEAR, Inc.*^ | | | 2,673,900 | | | | 77,383 | | |
Construction Materials (0.3%) | |
Eagle Materials,
Inc. | | | 575,000 | | | | 36,892 | | |
Containers & Packaging (2.7%) | |
AptarGroup,
Inc.^ | | | 4,538,700 | | | | 266,921 | | |
Silgan Holdings,
Inc. | | | 1,925,283 | | | | 90,835 | | |
| | | | 357,756 | | |
Distributors (1.2%) | |
| Pool Corp.^ | | | 3,117,923 | | | | 162,413 | | |
Electrical Equipment (0.6%) | |
Franklin Electric
Co., Inc. | | | 885,472 | | | | 31,806 | | |
Thermon Group
Holdings,
Inc.*^ | | | 2,068,131 | | | | 42,811 | | |
| | | | 74,617 | | |
Electronic Equipment, Instruments & Components (2.0%) | |
Badger Meter,
Inc.^ | | | 793,501 | | | | 35,771 | | |
| FEI Co.^ | | | 2,096,342 | | | | 164,102 | | |
| | |
Number
of Shares | |
Value†
(000's)z | |
Littelfuse, Inc. | | | 231,700 | | | $ | 17,093 | | |
Rogers Corp.* | | | 52,212 | | | | 2,896 | | |
Trimble
Navigation
Ltd.* | | | 1,842,988 | | | | 46,535 | | |
| | | | 266,397 | | |
Energy Equipment & Services (4.0%) | |
CARBO
Ceramics, Inc.^ | | | 1,565,657 | | | | 127,742 | | |
Natural Gas
Services Group,
Inc.*^ | | | 778,600 | | | | 21,349 | | |
Oceaneering
International,
Inc. | | | 3,327,728 | | | | 258,165 | | |
Pason Systems,
Inc.^ | | | 4,283,657 | | | | 87,154 | | |
ShawCor Ltd. | | | 785,700 | | | | 31,203 | | |
| | | | 525,613 | | |
Food & Staples Retailing (1.4%) | |
Harris Teeter
Supermarkets,
Inc.^ | | | 3,369,203 | | | | 165,596 | | |
North West
Co., Inc. | | | 904,400 | | | | 19,878 | | |
| | | | 185,474 | | |
Food Products (2.0%) | |
B&G Foods, Inc. | | | 1,001,300 | | | | 33,914 | | |
Flowers Foods,
Inc. | | | 3,379,200 | | | | 70,254 | | |
J & J Snack
Foods Corp.^ | | | 1,088,746 | | | | 83,746 | | |
Lancaster
Colony Corp. | | | 1,128,456 | | | | 83,246 | | |
| | | | 271,160 | | |
Gas Utilities (1.2%) | |
Piedmont
Natural Gas
Co., Inc. | | | 702,600 | | | | 22,666 | | |
South Jersey
Industries, Inc. | | | 1,504,044 | | | | 86,873 | | |
WGL Holdings,
Inc. | | | 1,041,277 | | | | 43,463 | | |
| | | | 153,002 | | |
Health Care Equipment & Supplies (5.9%) | |
| Abaxis, Inc.^ | | | 1,125,200 | | | | 44,085 | | |
See Notes to Schedule of Investments
102
| | |
Number
of Shares | |
Value†
(000's)z | |
DENTSPLY
International,
Inc. | | | 1,025,900 | | | $ | 43,078 | | |
Haemonetics
Corp.*^ | | | 4,787,500 | | | | 190,782 | | |
IDEXX
Laboratories,
Inc.* | | | 1,655,762 | | | | 155,344 | | |
Meridian
Bioscience, Inc.^ | | | 3,208,597 | | | | 72,161 | | |
Sirona Dental
Systems, Inc.* | | | 1,956,326 | | | | 126,711 | | |
West
Pharmaceutical
Services, Inc.^ | | | 1,971,229 | | | | 145,772 | | |
| | | | 777,933 | | |
Health Care Providers & Services (3.3%) | |
| AmSurg Corp.*^ | | | 1,682,828 | | | | 62,753 | | |
Henry Schein,
Inc.* | | | 2,014,840 | | | | 203,599 | | |
Landauer, Inc. | | | 61,100 | | | | 2,901 | | |
MWI Veterinary
Supply, Inc.*^ | | | 1,083,429 | | | | 164,768 | | |
| | | | 434,021 | | |
Hotels, Restaurants & Leisure (3.6%) | |
Bally
Technologies,
Inc.*^ | | | 2,447,392 | | | | 176,531 | | |
Brinker
International,
Inc. | | | 2,879,100 | | | | 115,135 | | |
Cheesecake
Factory, Inc. | | | 1,599,600 | | | | 66,815 | | |
Cracker Barrel
Old Country
Store, Inc. | | | 229,686 | | | | 22,606 | | |
Papa John's
International,
Inc.* | | | 766,446 | | | | 52,218 | | |
Texas
Roadhouse, Inc. | | | 1,889,900 | | | | 46,964 | | |
| | | | 480,269 | | |
Household Durables (0.2%) | |
Leggett & Platt,
Inc. | | | 1,061,800 | | | | 30,707 | | |
Household Products (2.3%) | |
Church &
Dwight Co.,
Inc. | | | 5,179,156 | | | | 307,383 | | |
Industrial Conglomerates (0.7%) | |
Raven
Industries,
Inc.^ | | | 3,369,152 | | | | 98,413 | | |
Insurance (1.3%) | |
Infinity
Property &
Casualty Corp. | | | 186,000 | | | | 11,255 | | |
| | |
Number
of Shares | |
Value†
(000's)z | |
| RLI Corp.^ | | | 1,420,407 | | | $ | 110,919 | | |
Safety Insurance
Group, Inc.^ | | | 1,039,049 | | | | 52,098 | | |
| | | | 174,272 | | |
Internet Software & Services (0.2%) | |
j2 Global, Inc. | | | 498,401 | | | | 24,541 | | |
IT Services (1.4%) | |
Jack Henry &
Associates, Inc. | | | 2,024,503 | | | | 101,023 | | |
Sapient Corp.* | | | 5,183,973 | | | | 77,500 | | |
| | | | 178,523 | | |
Leisure Equipment & Products (1.6%) | |
Polaris
Industries, Inc. | | | 1,961,120 | | | | 214,174 | | |
Life Sciences Tools & Services (1.7%) | |
| ICON PLC*^ | | | 4,363,500 | | | | 159,442 | | |
PAREXEL
International
Corp.* | | | 894,400 | | | | 41,527 | | |
Techne Corp. | | | 391,900 | | | | 30,376 | | |
| | | | 231,345 | | |
Machinery (9.7%) | |
| CLARCOR, Inc.^ | | | 4,212,822 | | | | 225,639 | | |
Donaldson Co.,
Inc. | | | 3,055,400 | | | | 107,672 | | |
Graco, Inc. | | | 825,617 | | | | 57,372 | | |
Lincoln Electric
Holdings, Inc. | | | 596,582 | | | | 37,304 | | |
| Lindsay Corp.^ | | | 932,550 | | | | 70,892 | | |
Middleby Corp.* | | | 484,306 | | | | 90,052 | | |
Nordson Corp. | | | 2,318,308 | | | | 154,515 | | |
Tennant Co. | | | 749,502 | | | | 38,502 | | |
Toro Co. | | | 1,662,188 | | | | 87,780 | | |
Valmont
Industries, Inc. | | | 1,042,804 | | | | 140,737 | | |
Wabtec Corp. | | | 4,721,300 | | | | 276,291 | | |
| | | | 1,286,756 | | |
Media (0.5%) | |
Nexstar
Broadcasting
Group, Inc.
Class A^ | | | 1,940,269 | | | | 65,135 | | |
Metals & Mining (2.5%) | |
Alamos Gold,
Inc. | | | 5,450,200 | | | | 88,893 | | |
Compass
Minerals
International,
Inc.^ | | | 3,193,700 | | | | 235,471 | | |
| | | | 324,364 | | |
Multi-Utilities (0.3%) | |
NorthWestern
Corp. | | | 930,200 | | | | 37,366 | | |
| | |
Number
of Shares | |
Value†
(000's)z | |
Office Electronics (0.9%) | |
Zebra
Technologies
Corp.
Class A*^ | | | 2,637,824 | | | $ | 120,285 | | |
Oil, Gas & Consumable Fuels (3.0%) | |
Cabot Oil &
Gas Corp. | | | 1,912,600 | | | | 74,840 | | |
Gulfport Energy
Corp.* | | | 2,456,200 | | | | 144,916 | | |
Kodiak Oil &
Gas Corp.* | | | 2,900,637 | | | | 28,977 | | |
Laredo
Petroleum
Holdings,
Inc.* | | | 1,914,400 | | | | 50,272 | | |
Oasis
Petroleum,
Inc.* | | | 1,945,780 | | | | 76,275 | | |
Painted Pony
Petroleum
Ltd.* | | | 2,919,150 | | | | 21,161 | | |
| | | | 396,441 | | |
Paper & Forest Products (0.5%) | |
Stella-Jones, Inc. | | | 550,900 | | | | 51,910 | | |
Stella-Jones,
Inc.b | | | 155,300 | | | | 14,634 | | |
| | | | 66,544 | | |
Professional Services (0.6%) | |
| Exponent, Inc.^ | | | 1,202,035 | | | | 78,289 | | |
Real Estate Management & Development (1.9%) | |
Altisource Asset
Management
Corp.*^ | | | 143,317 | | | | 45,145 | | |
Altisource
Portfolio
Solutions SA*^ | | | 1,631,270 | | | | 212,717 | | |
| | | | 257,862 | | |
Road & Rail (0.2%) | |
Genesee &
Wyoming, Inc.
Class A* | | | 267,200 | | | | 23,134 | | |
Semiconductors & Semiconductor Equipment (1.8%) | |
Hittite
Microwave
Corp.*^ | | | 2,312,765 | | | | 141,449 | | |
Power
Integrations,
Inc.^ | | | 1,974,600 | | | | 102,916 | | |
| | | | 244,365 | | |
Software (8.0%) | |
Advent
Software, Inc. | | | 1,876,501 | | | | 50,647 | | |
Blackbaud, Inc. | | | 1,375,638 | | | | 49,550 | | |
See Notes to Schedule of Investments
103
| | |
Number
of Shares | |
Value†
(000's)z | |
Computer
Modelling
Group Ltd.^ | | | 3,101,000 | | | $ | 73,366 | | |
Constellation
Software, Inc. | | | 792,800 | | | | 130,026 | | |
Enghouse
Systems Ltd. | | | 769,300 | | | | 18,011 | | |
FactSet Research
Systems, Inc. | | | 973,100 | | | | 99,597 | | |
Manhattan
Associates,
Inc.*^ | | | 1,302,807 | | | | 113,996 | | |
MICROS
Systems, Inc.* | | | 3,721,042 | | | | 181,959 | | |
Monotype
Imaging
Holdings,
Inc.^ | | | 2,093,103 | | | | 53,897 | | |
Solera
Holdings,
Inc.^ | | | 3,699,553 | | | | 190,971 | | |
Tyler
Technologies,
Inc.* | | | 1,315,832 | | | | 97,227 | | |
| | | | 1,059,247 | | |
Specialty Retail (2.9%) | |
Hibbett
Sports, Inc.*^ | | | 1,719,469 | | | | 89,068 | | |
Leon's
Furniture Ltd. | | | 601,800 | | | | 7,268 | | |
Sally Beauty
Holdings, Inc.* | | | 5,116,493 | | | | 133,694 | | |
Tractor
Supply Co. | | | 1,271,541 | | | | 155,598 | | |
| | | | 385,628 | | |
Textiles, Apparel & Luxury Goods (0.6%) | |
Wolverine World
Wide, Inc. | | | 1,390,185 | | | | 78,198 | | |
Thrifts & Mortgage Finance (3.2%) | |
Brookline
Bancorp, Inc.^ | | | 3,866,590 | | | | 34,993 | | |
Home Loan
Servicing
Solutions Ltd.^ | | | 5,181,100 | | | | 118,129 | | |
Ocwen Financial
Corp.* | | | 4,604,829 | | | | 232,268 | | |
Oritani Financial
Corp. | | | 2,236,584 | | | | 34,689 | | |
| | | 420,079 | | |
Trading Companies & Distributors (2.2%) | |
Applied
Industrial
Technologies,
Inc.^ | | | 2,493,344 | | | | 118,733 | | |
| | |
Number
of Shares | |
Value†
(000's)z | |
Beacon Roofing
Supply, Inc.* | | | 1,729,700 | | | $ | 62,840 | | |
MSC Industrial
Direct Co., Inc.
Class A | | | 747,300 | | | | 56,795 | | |
Watsco, Inc. | | | 535,804 | | | | 48,115 | | |
| | | | 286,483 | | |
Water Utilities (0.5%) | |
Aqua America,
Inc. | | | 2,148,935 | | | | 65,263 | | |
Total Common Stocks
(Cost $7,112,678) | | | | | 12,675,434 | | |
Short-Term Investments (4.3%) | |
State Street
Institutional
Treasury Money
Market Fund
Institutional
Class | | | 370,359,126 | | | | 370,359 | | |
State Street
Institutional
Treasury Plus
Fund
Institutional
Class | | | 199,091,299 | | | | 199,091 | | |
Total Short-Term Investments
(Cost $569,450) | | | | | 569,450 | | |
Total Investments## (100.0%)
(Cost $7,682,128) | | | | | 13,244,884 | | |
Liabilities, less cash,
receivables and
other assets [(0.0%)] | | | | | (2,579 | ) | |
Total Net Assets (100.0%) | | | | $ | 13,242,305 | | |
See Notes to Schedule of Investments
104
Schedule of Investments Global Equity Fund
TOP TEN EQUITY HOLDINGS
| | | | | Country | | Industry | | | |
| | 1 | | | Apple, Inc. | | United States | | Computers & Peripherals | | | 2.0 | % | |
| | 2 | | | SanDisk Corp. | | United States | | Computers & Peripherals | | | 2.0 | % | |
| | 3 | | | TOYOTA MOTOR Corp. | | Japan | | Automobiles | | | 1.7 | % | |
| | 4 | | | Capital One Financial Corp. | | United States | | Consumer Finance | | | 1.7 | % | |
|
5 | | |
Samsung Electronics Co. Ltd. | |
Korea | | Semiconductors & Semiconductor
Equipment | | | 1.7 | % | |
| | 6 | | | EMC Corp. | | United States | | Computers & Peripherals | | | 1.6 | % | |
| | 7 | | | Roche Holding AG | | Switzerland | | Pharmaceuticals | | | 1.5 | % | |
| | 8 | | | Continental AG | | Germany | | Auto Components | | | 1.5 | % | |
| | 9 | | | Unilever NV | | Netherlands | | Food Products | | | 1.5 | % | |
| | 10 | | | Sealed Air Corp. | | United States | | Containers & Packaging | | | 1.5 | % | |
| | |
Number
of Shares | |
Value†
(000's)z | |
Common Stocks (98.2%) | |
Australia (0.6%) | |
Iluka Resources
Ltd. | | | 21,920 | | | $ | 207 | | |
Canada (6.3%) | |
Agrium, Inc. | | | 2,265 | | | | 194 | | |
Alimentation
Couche Tard,
Inc. Class B | | | 4,295 | | | | 248 | | |
Cenovus Energy,
Inc. | | | 6,645 | | | | 190 | | |
Dollarama, Inc. | | | 4,820 | | | | 340 | | |
Enbridge, Inc. | | | 5,863 | | | | 241 | | |
Home Capital
Group, Inc. | | | 6,195 | | | | 377 | | |
New Gold, Inc.* | | | 35,500 | | | | 239 | | |
Silver Wheaton
Corp. | | | 11,195 | | | | 296 | | |
| | | | 2,125 | | |
China (2.7%) | |
China Mobile Ltd. | | | 38,715 | | | | 417 | | |
Haier Electronics
Group Co. Ltd. | | | 146,000 | | | | 255 | | |
Industrial &
Commercial
Bank of China
Ltd., H Shares | | | 334,000 | | | | 219 | | |
| | | | 891 | | |
France (3.8%) | |
Arkema SA | | | 3,575 | | | | 361 | | |
Pernod-Ricard SA | | | 2,145 | | | | 249 | | |
Schneider
Electric SA | | | 4,361 | | | | 334 | | |
Sodexo | | | 3,810 | | | | 336 | | |
| | | | 1,280 | | |
Germany (3.9%) | |
Continental AG | | | 3,335 | | | | 503 | | |
Linde AG | | | 2,287 | | | | 440 | | |
Volkswagen AG,
Preference
Shares | | | 1,670 | | | | 380 | | |
| | | | 1,323 | | |
| | |
Number
of Shares | |
Value†
(000's)z | |
India (0.6%) | |
ICICI Bank Ltd.
ADR | | | 7,745 | | | $ | 202 | | |
Indonesia (0.0%) | |
PT Bank Mandiri
(Persero) Tbk | | | 2,600 | | | | 2 | | |
Ireland (0.1%) | |
Mallinckrodt PLC* | | | 788 | | | | 34 | | |
Israel (2.4%) | |
Bezeq Israeli
Telecommunication
Corp. Ltd. | | | 268,025 | | | | 436 | | |
Check Point
Software
Technologies Ltd.* | | | 6,790 | | | | 381 | | |
| | | | 817 | | |
Japan (3.5%) | |
FANUC Corp. | | | 2,100 | | | | 319 | | |
SUGI HOLDINGS
Co. Ltd. | | | 7,100 | | | | 275 | | |
TOYOTA MOTOR
Corp. | | | 9,550 | | | | 574 | | |
| | | | 1,168 | | |
Korea (1.7%) | |
Samsung
Electronics Co.
Ltd. | | | 453 | | | | 555 | | |
Netherlands (4.2%) | |
| ASML Holding NV | | | 3,695 | | | | 324 | | |
Koninklijke
Ahold NV | | | 18,391 | | | | 293 | | |
Sensata
Technologies
Holding NV* | | | 7,505 | | | | 280 | | |
Unilever NV | | | 13,318 | | | | 500 | | |
| | | | 1,397 | | |
Nigeria (0.7%) | |
Afren PLC* | | | 111,975 | | | | 242 | | |
Norway (1.4%) | |
DNB ASA | | | 30,735 | | | | 477 | | |
| | |
Number
of Shares | |
Value†
(000's)z | |
Russia (0.8%) | |
Sberbank of
Russia ADR | | | 26,205 | | | $ | 276 | | |
Singapore (0.7%) | |
United Overseas
Bank Ltd. | | | 15,750 | | | | 245 | | |
Sweden (1.6%) | |
Elekta AB, B Shares | | | 10,720 | | | | 169 | | |
Telefonaktiebolaget
LM Ericsson,
B Shares | | | 30,020 | | | | 353 | | |
| | | | 522 | | |
Switzerland (9.2%) | |
Givaudan SA* | | | 288 | | | | 388 | | |
Nestle SA | | | 5,625 | | | | 369 | | |
Novartis AG | | | 5,480 | | | | 400 | | |
Partners Group
Holding AG | | | 1,360 | | | | 349 | | |
Roche Holding AG | | | 2,026 | | | | 505 | | |
SGS SA | | | 191 | | | | 435 | | |
Sika AG | | | 141 | | | | 386 | | |
Sonova Holding
AG* | | | 2,380 | | | | 263 | | |
| | | | 3,095 | | |
United Kingdom (3.0%) | |
Aon PLC | | | 5,600 | | | | 372 | | |
Experian PLC | | | 14,272 | | | | 250 | | |
SABMiller PLC | | | 8,340 | | | | 397 | | |
| | | | 1,019 | | |
United States (51.0%) | |
Actuant Corp.
Class A | | | 11,080 | | | | 396 | | |
Align Technology,
Inc.* | | | 4,410 | | | | 192 | | |
Altera Corp. | | | 11,555 | | | | 406 | | |
Amazon.com, Inc.* | | | 855 | | | | 240 | | |
American Tower
Corp. | | | 4,170 | | | | 290 | | |
AMETEK, Inc. | | | 9,885 | | | | 424 | | |
Apple, Inc. | | | 1,384 | | | | 674 | | |
BlackRock, Inc. | | | 1,713 | | | | 446 | | |
BorgWarner, Inc. | | | 2,980 | | | | 288 | | |
See Notes to Schedule of Investments
105
| | |
Number
of Shares | |
Value†
(000's)z | |
Capital One
Financial Corp. | | | 8,815 | | | $ | 569 | | |
Cardinal Health,
Inc. | | | 9,170 | | | | 461 | | |
Celgene Corp.* | | | 1,785 | | | | 250 | | |
Charles Schwab
Corp. | | | 9,055 | | | | 189 | | |
Comcast Corp.
Class A Special | | | 8,695 | | | | 354 | | |
Covidien PLC | | | 6,435 | | | | 382 | | |
CVS Caremark
Corp. | | | 6,910 | | | | 401 | | |
Deere & Co. | | | 3,765 | | | | 315 | | |
eBay, Inc.* | | | 5,005 | | | | 250 | | |
EMC Corp. | | | 20,370 | | | | 525 | | |
EOG Resources,
Inc. | | | 2,622 | | | | 412 | | |
Exxon Mobil
Corp. | | | 3,335 | | | | 291 | | |
Google, Inc.
Class A* | | | 475 | | | | 402 | | |
Graco, Inc. | | | 5,720 | | | | 398 | | |
Henry Schein,
Inc.* | | | 2,500 | | | | 253 | | |
IBM Corp. | | | 1,142 | | | | 208 | | |
Intercontinental
Exchange, Inc.* | | | 1,905 | | | | 342 | | |
Johnson &
Johnson | | | 4,640 | | | | 401 | | |
JPMorgan
Chase & Co. | | | 6,910 | | | | 349 | | |
Mead Johnson
Nutrition Co. | | | 2,365 | | | | 177 | | |
Motorola
Solutions, Inc. | | | 5,955 | | | | 334 | | |
National Oilwell
Varco, Inc. | | | 4,170 | | | | 310 | | |
Nordson Corp. | | | 5,360 | | | | 357 | | |
Nordstrom, Inc. | | | 5,600 | | | | 312 | | |
Oracle Corp. | | | 10,600 | | | | 338 | | |
Pall Corp. | | | 6,790 | | | | 470 | | |
Pioneer Natural
Resources Co. | | | 1,500 | | | | 263 | | |
Range Resources
Corp. | | | 3,095 | | | | 232 | | |
Rockwood
Holdings, Inc. | | | 3,810 | | | | 243 | | |
SanDisk Corp. | | | 12,105 | | | | 668 | | |
Schlumberger
Ltd. | | | 3,930 | | | | 318 | | |
Sealed Air Corp. | | | 17,510 | | | | 497 | | |
Sirona Dental
Systems, Inc.* | | | 6,195 | | | | 401 | | |
Taminco Corp.* | | | 8,340 | | | | 165 | | |
Target Corp. | | | 4,765 | | | | 302 | | |
UnitedHealth
Group, Inc. | | | 5,955 | | | | 427 | | |
Visa, Inc. Class A | | | 980 | | | | 171 | | |
Wabtec Corp. | | | 7,860 | | | | 460 | | |
Waters Corp.* | | | 1,785 | | | | 176 | | |
Wells Fargo &
Co. | | | 11,195 | | | | 460 | | |
| | | | 17,189 | | |
Total Common Stocks
(Cost $33,475) | | | | | 33,066 | | |
| | |
Number
of Shares | |
Value†
(000's)z | |
Short-Term Investments (1.9%) | |
State Street
Institutional
Treasury Money
Market Fund
Institutional
Class
(Cost $638) | | | 638,067 | | | $ | 638 | | |
Total Investments## (100.1%)
(Cost $34,113) | | | | | 33,704 | | |
Liabilities, less cash,
receivables and
other assets [(0.1%)] | | | | | (26 | ) | |
Total Net Assets (100.0%) | | | | $ | 33,678 | | |
See Notes to Schedule of Investments
106
SUMMARY SCHEDULE OF INVESTMENTS BY INDUSTRY GLOBAL EQUITY FUND
Industry | | Investments at
Value†
(000's omitted) | | Percentage of
Net Assets | |
Machinery | | $ | 2,715 | | | | 8.1 | % | |
Chemicals | | | 2,177 | | | | 6.5 | % | |
Commercial Banks | | | 1,881 | | | | 5.6 | % | |
Oil, Gas & Consumable Fuels | | | 1,871 | | | | 5.6 | % | |
Computers & Peripherals | | | 1,867 | | | | 5.6 | % | |
Health Care Equipment & Supplies | | | 1,407 | | | | 4.2 | % | |
Pharmaceuticals | | | 1,340 | | | | 4.0 | % | |
Semiconductors & Semiconductor Equipment | | | 1,285 | | | | 3.8 | % | |
Food & Staples Retailing | | | 1,217 | | | | 3.6 | % | |
Health Care Providers & Services | | | 1,141 | | | | 3.4 | % | |
Food Products | | | 1,046 | | | | 3.1 | % | |
Electrical Equipment | | | 1,038 | | | | 3.1 | % | |
Capital Markets | | | 984 | | | | 2.9 | % | |
Automobiles | | | 954 | | | | 2.8 | % | |
Multiline Retail | | | 954 | | | | 2.8 | % | |
Auto Components | | | 791 | | | | 2.3 | % | |
Metals & Mining | | | 742 | | | | 2.2 | % | |
Software | | | 719 | | | | 2.1 | % | |
Diversified Financial Services | | | 691 | | | | 2.1 | % | |
Communications Equipment | | | 687 | | | | 2.0 | % | |
Professional Services | | | 685 | | | | 2.0 | % | |
Internet Software & Services | | | 652 | | | | 1.9 | % | |
Beverages | | | 646 | | | | 1.9 | % | |
Energy Equipment & Services | | | 628 | | | | 1.9 | % | |
Consumer Finance | | | 569 | | | | 1.7 | % | |
Containers & Packaging | | | 497 | | | | 1.5 | % | |
Diversified Telecommunication Services | | | 436 | | | | 1.3 | % | |
Wireless Telecommunication Services | | | 417 | | | | 1.2 | % | |
IT Services | | | 379 | | | | 1.1 | % | |
Thrifts & Mortgage Finance | | | 377 | | | | 1.1 | % | |
Insurance | | | 372 | | | | 1.1 | % | |
Media | | | 354 | | | | 1.1 | % | |
Hotels, Restaurants & Leisure | | | 336 | | | | 1.0 | % | |
Real Estate Investment Trusts | | | 290 | | | | 0.9 | % | |
Household Durables | | | 255 | | | | 0.8 | % | |
Biotechnology | | | 250 | | | | 0.7 | % | |
Internet & Catalog Retail | | | 240 | | | | 0.7 | % | |
Life Sciences Tools & Services | | | 176 | | | | 0.5 | % | |
Short-Term Investments and Other Assets—Net | | | 612 | | | | 1.8 | % | |
| | | $ | 33,678 | | | | 100.0 | % | |
See Notes to Schedule of Investments
107
Schedule of Investments Global Thematic Opportunities Fund
TOP TEN EQUITY HOLDINGS
| | | | | Country | | Industry | | | |
| | 1 | | | American International Group, Inc. | | United States | | Insurance | | | 3.7 | % | |
| | 2 | | | SanDisk Corp. | | United States | | Computers & Peripherals | | | 3.5 | % | |
| | 3 | | | TOYOTA MOTOR Corp. | | Japan | | Automobiles | | | 3.3 | % | |
| | 4 | | | Google, Inc. Class A | | United States | | Internet Software & Services | | | 3.2 | % | |
| | 5 | | | Wynn Resorts Ltd. | | United States | | Hotels, Restaurants & Leisure | | | 3.1 | % | |
| | 6 | | | Mediaset Espana Comunicacion SA | | Spain | | Media | | | 3.0 | % | |
| | 7 | | | Mitsubishi UFJ Financial Group, Inc. | | Japan | | Commercial Banks | | | 3.0 | % | |
| | 8 | | |
Altera Corp. | |
United States | | Semiconductors & Semiconductor
Equipment | | | 2.9 | % | |
| | 9 | | | MTN Group Ltd. | | South Africa | | Wireless Telecommunication Services | | | 2.9 | % | |
| | 10 | | | Deere & Co. | | United States | | Machinery | | | 2.8 | % | |
| | | Number
of Shares | | Value†
(000's)z | |
Common Stocks (94.0%) | |
Brazil (0.9%) | |
Randon
Participacoes SA,
Preference Shares | | | 132,400 | | | $ | 644 | | |
China (4.6%) | |
Chow Tai Fook
Jewellery Group
Ltd. | | | 1,383,200 | | | | 1,905 | | |
First Pacific Co.
Ltd. | | | 1,433,300 | | | | 1,486 | | |
| | | | 3,391 | | |
Germany (2.0%) | |
Metro AG | | | 41,200 | | | | 1,513 | | |
Hong Kong (2.1%) | |
SA SA International
Holdings Ltd. | | | 1,456,000 | | | | 1,547 | | |
Israel (2.4%) | |
Check Point
Software
Technologies
Ltd.* | | | 31,100 | | | | 1,744 | | |
Japan (12.0%) | |
FANUC Corp. | | | 11,600 | | | | 1,761 | | |
Mitsubishi UFJ
Financial Group,
Inc. | | | 373,700 | | | | 2,178 | | |
Nissan Motor Co.
Ltd. | | | 148,000 | | | | 1,464 | | |
Sumitomo Mitsui
Financial Group,
Inc. | | | 23,050 | | | | 1,013 | | |
TOYOTA MOTOR
Corp. | | | 41,000 | | | | 2,466 | | |
| | | | 8,882 | | |
Korea (2.7%) | |
Samsung
Electronics Co.
Ltd. GDR | | | 3,330 | | | | 2,028 | | |
| | | Number
of Shares | | Value†
(000's)z | |
Netherlands (4.1%) | |
Koninklijke
Philips NV | | | 51,000 | | | $ | 1,577 | | |
Unilever NV | | | 37,800 | | | | 1,422 | | |
| | | | 2,999 | | |
Singapore (1.3%) | |
Ascott Residence
Trust | | | 1,001,000 | | | | 935 | | |
South Africa (2.9%) | |
MTN Group Ltd. | | | 118,400 | | | | 2,163 | | |
Spain (3.0%) | |
Mediaset Espana
Comunicacion
SA* | | | 224,000 | | | | 2,188 | | |
Switzerland (4.4%) | |
Novartis AG ADR | | | 20,900 | | | | 1,526 | | |
Roche Holding
AG ADR | | | 28,400 | | | | 1,768 | | |
| | | | 3,294 | | |
United Kingdom (4.9%) | |
Aon PLC | | | 22,650 | | | | 1,503 | | |
AstraZeneca PLC
ADR | | | 28,000 | | | | 1,378 | | |
Derwent London
PLC | | | 20,000 | | | | 718 | | |
| | | | 3,599 | | |
United States (46.7%) | |
Altera Corp. | | | 61,700 | | | | 2,170 | | |
American
International
Group, Inc.* | | | 58,150 | | | | 2,702 | | |
BlackRock, Inc. | | | 6,600 | | | | 1,718 | | |
Boeing Co. | | | 18,200 | | | | 1,891 | | |
C.R. Bard, Inc. | | | 13,250 | | | | 1,522 | | |
CME Group, Inc. | | | 16,000 | | | | 1,138 | | |
Deere & Co. | | | 25,000 | | | | 2,091 | | |
Franklin
Resources, Inc. | | | 31,900 | | | | 1,473 | | |
General
Dynamics Corp. | | | 21,700 | | | | 1,807 | | |
| | | Number
of Shares | | Value†
(000's)z | |
Google, Inc.
Class A* | | | 2,775 | | | $ | 2,350 | | |
Honeywell
International,
Inc. | | | 22,900 | | | | 1,822 | | |
KKR & Co. LP | | | 107,600 | | | | 2,056 | | |
Lindsay Corp. | | | 14,600 | | | | 1,110 | | |
Philip Morris
International,
Inc. | | | 16,000 | | | | 1,335 | | |
Range Resources
Corp. | | | 20,300 | | | | 1,522 | | |
SanDisk Corp. | | | 47,000 | | | | 2,593 | | |
Southwestern
Energy Co.* | | | 47,650 | | | | 1,820 | | |
Valmont
Industries, Inc. | | | 7,600 | | | | 1,026 | | |
Wynn Resorts Ltd. | | | 16,325 | | | | 2,302 | | |
| | | | 34,448 | | |
Total Common Stocks
(Cost $64,114) | | | | | 69,375 | | |
Short-Term Investments (7.5%) | |
State Street
Institutional
Treasury Money
Market Fund
Institutional Class
(Cost $5,577) | | | 5,577,222 | | | | 5,577 | | |
Total Investments## (101.5%)
(Cost $69,691) | | | | | 74,952 | | |
Liabilities, less cash,
receivables and
other assets [(1.5%)] | | | | | (1,138 | ) | |
Total Net Assets (100.0%) | | | | $ | 73,814 | | |
See Notes to Schedule of Investments
108
SUMMARY SCHEDULE OF INVESTMENTS BY INDUSTRY GLOBAL THEMATIC OPPORTUNITIES FUND
Industry | | Investments at
Value†
(000's omitted) | | Percentage of
Net Assets | |
Machinery | | $ | 6,632 | | | | 9.0 | % | |
Aerospace & Defense | | | 5,520 | | | | 7.5 | % | |
Capital Markets | | | 5,247 | | | | 7.1 | % | |
Pharmaceuticals | | | 4,672 | | | | 6.3 | % | |
Insurance | | | 4,205 | | | | 5.7 | % | |
Semiconductors & Semiconductor Equipment | | | 4,198 | | | | 5.7 | % | |
Automobiles | | | 3,930 | | | | 5.3 | % | |
Specialty Retail | | | 3,452 | | | | 4.7 | % | |
Oil, Gas & Consumable Fuels | | | 3,342 | | | | 4.5 | % | |
Commercial Banks | | | 3,191 | | | | 4.3 | % | |
Diversified Financial Services | | | 2,624 | | | | 3.6 | % | |
Computers & Peripherals | | | 2,593 | | | | 3.5 | % | |
Internet Software & Services | | | 2,350 | | | | 3.2 | % | |
Hotels, Restaurants & Leisure | | | 2,302 | | | | 3.1 | % | |
Media | | | 2,188 | | | | 3.0 | % | |
Wireless Telecommunication Services | | | 2,163 | | | | 2.9 | % | |
Software | | | 1,744 | | | | 2.4 | % | |
Real Estate Investment Trusts | | | 1,653 | | | | 2.2 | % | |
Industrial Conglomerates | | | 1,577 | | | | 2.2 | % | |
Health Care Equipment & Supplies | | | 1,522 | | | | 2.1 | % | |
Food & Staples Retailing | | | 1,513 | | | | 2.0 | % | |
Food Products | | | 1,422 | | | | 1.9 | % | |
Tobacco | | | 1,335 | | | | 1.8 | % | |
Short-Term Investments and Other Assets—Net | | | 4,439 | | | | 6.0 | % | |
| | | $ | 73,814 | | | | 100.0 | % | |
See Notes to Schedule of Investments
109
Schedule of Investments Greater China Equity Fund
TOP TEN EQUITY HOLDINGS
| | 1 | | | Tencent Holdings Ltd. | | | 4.8 | % | |
| | 2 | | | Industrial & Commercial Bank of China Ltd., H Shares | | | 4.7 | % | |
| | 3 | | | China Resources Power Holdings Co. Ltd. | | | 4.3 | % | |
| | 4 | | | Wanhua Chemical Group Co. Ltd., Class A | | | 4.2 | % | |
| | 5 | | | Brilliance China Automotive Holdings Ltd. | | | 4.1 | % | |
| | 6 | | | ENN Energy Holdings Ltd. | | | 3.4 | % | |
| | 7 | | | SAIC Motor Corp. Ltd., Class A | | | 3.4 | % | |
| | 8 | | | China Vanke Co. Ltd., Class A | | | 3.4 | % | |
| | 9 | | | Sunac China Holdings Ltd. | | | 3.3 | % | |
| | 10 | | | Huadian Fuxin Energy Corp. Ltd. | | | 3.2 | % | |
| | | Number
of Shares | | Value†
(000's)z | |
Common Stocks (70.0%) | |
Auto Components (0.9%) | |
Weifu High-
Technology
Group Co. Ltd. | | | 200,526 | | | $ | 505 | | |
Automobiles (4.1%) | |
Brilliance China
Automotive
Holdings Ltd.* | | | 1,592,000 | | | | 2,332 | | |
Commercial Banks (10.3%) | |
Agricultural Bank
of China Ltd.,
H Shares | | | 3,057,000 | | | | 1,307 | | |
China
Construction
Bank Corp. | | | 2,228,000 | | | | 1,628 | | |
China Merchants
Bank Co. Ltd. | | | 146,000 | | | | 251 | | |
Industrial &
Commercial Bank
of China Ltd.,
H Shares | | | 4,033,000 | | | | 2,637 | | |
| | | | 5,823 | | |
Communications Equipment (2.2%) | |
AAC Technologies
Holdings, Inc. | | | 281,000 | | | | 1,268 | | |
Construction Materials (1.4%) | |
China National
Building Material
Co. Ltd.,
H Shares | | | 880,000 | | | | 806 | | |
Gas Utilities (3.5%) | |
ENN Energy
Holdings Ltd. | | | 392,000 | | | | 1,952 | | |
Health Care Equipment &
Supplies (1.3%) | |
Shandong Weigao
Group Medical
Polymer Co. Ltd. | | | 764,000 | | | | 720 | | |
Health Care Providers &
Services (1.6%) | |
Sinopharm Group
Co. Ltd. | | | 370,800 | | | | 924 | | |
| | | Number
of Shares | | Value†
(000's)z | |
Independent Power Producers & Energy Traders (10.2%) | |
China Power
International
Development
Ltd. | | | 4,193,000 | | | $ | 1,532 | | |
China Resources
Power Holdings
Co. Ltd. | | | 1,060,000 | | | | 2,433 | | |
Huadian Fuxin
Energy Corp.
Ltd. | | | 5,884,000 | | | | 1,799 | | |
| | | | 5,764 | | |
Insurance (4.3%) | |
China Taiping
Insurance
Holdings Co.
Ltd.* | | | 310,600 | | | | 420 | | |
PICC Property &
Casualty Co. Ltd. | | | 222,000 | | | | 306 | | |
Ping An Insurance
Group Co. of
China Ltd. | | | 241,500 | | | | 1,687 | | |
| | | | 2,413 | | |
Internet Software & Services (4.8%) | |
Tencent Holdings
Ltd. | | | 58,300 | | | | 2,724 | | |
Machinery (1.1%) | |
Sany Heavy
Equipment
International
Holdings Co.
Ltd. | | | 2,158,000 | | | | 624 | | |
Oil, Gas & Consumable Fuels (4.2%) | |
China
Petroleum &
Chemical Corp. | | | 1,200,000 | | | | 864 | | |
CNOOC Ltd. | | | 773,000 | | | | 1,528 | | |
| | | | 2,392 | | |
Pharmaceuticals (5.0%) | |
China Medical
System Holdings
Ltd. | | | 1,464,000 | | | | 1,217 | | |
CSPC
Pharmaceutical
Group Ltd. | | | 204,000 | | | | 106 | | |
Shanghai Fosun
Pharmaceutical
Group Co. Ltd. | | | 326,000 | | | $ | 530 | | |
| | | Number
of Shares | | Value†
(000's)z | |
Sino
Biopharma-
ceutical | | | 1,356,000 | | | | 961 | | |
| | | | 2,814 | | |
Real Estate Management & Development (9.5%) | |
China Merchants
Property
Development
Co. Ltd.Ñ | | | 176,288 | | | | 550 | | |
Country Garden
Holdings Co.
Ltd. | | | 2,165,000 | | | | 1,359 | | |
Shimao Property
Holdings Ltd. | | | 642,000 | | | | 1,623 | | |
Sunac China
Holdings Ltd. | | | 2,660,000 | | | | 1,858 | | |
| | | 5,390 | | |
Specialty Retail (3.0%) | |
Belle
International
Holdings Ltd. | | | 1,244,000 | | | | 1,711 | | |
Wireless Telecommunication
Services (2.6%) | |
China Mobile Ltd. | | | 135,000 | | | | 1,455 | | |
Total Common Stocks
(Cost $39,604) | | | | | 39,617 | | |
Participatory Notes (16.2%) | |
Automobiles (3.4%) | |
SAIC Motor
Corp. Ltd.,
Class A (issuer
UBS AG),
Expiration Date
8/13/2014 | | | 56,000 | | | | 119 | | |
SAIC Motor Corp.
Ltd., Class A
(issuer Merrill
Lynch Int'l & Co.),
Expiration Date
8/29/2018 | | | 850,290 | | | | 1,815 | | |
| | | | 1,934 | | |
See Notes to Schedule of Investments
110
| | | Number
of Shares | | Value†
(000's)z | |
Beverages (0.8%) | |
Kweichow Moutai
Co. Ltd., Class A
(issuer Morgan
Stanley Asia
Products),
Expiration Date
12/26/2014 | | | 8,000 | | | $ | 221 | | |
Kweichow Moutai
Co. Ltd., Class A
(issuer Citigroup
Global Markets
Holdings, Inc.),
Expiration Date
1/20/2015ñ | | | 9,097 | | | | 251 | | |
| | | | 472 | | |
Chemicals (4.2%) | |
Wanhua Chemical
Group Co. Ltd.,
Class A (issuer
Morgan Stanley
Asia Products),
Expiration Date
7/26/2018 | | | 361,100 | | | | 996 | | |
Wanhua Chemical
Group Co. Ltd.,
Class A (issuer
Merrill Lynch
Int'l & Co.)
Expiration Date
7/19/2018 | | | 84,200 | | | | 232 | | |
Wanhua Chemical
Group Co. Ltd.,
Class A (issuer
Citigroup Global
Markets Holdings,
Inc.), Expiration
Date 1/20/2015 | | | 414,663 | | | | 1,143 | | |
| | | | 2,371 | | |
Construction & Engineering (0.9%) | |
China State
Construction
Engineering
Corp. Ltd.,
Class A (issuer
Citigroup Global
Markets Holdings,
Inc.), Expiration
Date 1/17/2014 | | | 20,000 | | | | 10 | | |
China State
Construction
Engineering
Corp. Ltd.,
Class A (issuer
UBS AG),
Expiration Date
7/18/2014 | | | 963,300 | | | | 504 | | |
| | | | 514 | | |
| | | Number
of Shares | | Value†
(000's)z | |
Electrical Equipment (1.2%) | |
NARI Technology
Development Co.
Ltd., Class A
(issuer UBS AG),
Expiration Date
3/3/2014 | | | 260,313 | | | $ | 644 | | |
NARI Technology
Development Co.
Ltd., Class A
(issuer Citigroup
Global Markets
Holdings, Inc.),
Expiration Date
1/20/2015 | | | 14,000 | | | | 35 | | |
| | | | 679 | | |
Food & Staples Retailing (0.6%) | |
Yonghui
Superstores Co.
Ltd., Class A
(issuer UBS AG),
Expiration Date
5/23/2014 | | | 89,000 | | | | 169 | | |
Yonghui
Superstores Co.
Ltd., Class A
(issuer Morgan
Stanley Asia
Products),
Expiration Date
7/18/2018 | | | 94,000 | | | | 179 | | |
| | | | 348 | | |
Food Products (1.7%) | |
Henan Shuanghui
Investment &
Development Co.
Ltd., Class A
(issuer Morgan
Stanley Asia
Products),
Expiration Date
4/11/2014 | | | 39,032 | | | | 236 | | |
Henan Shuanghui
Investment &
Development Co.
Ltd., Class A
(issuer HSBC
Bank PLC),
Expiration Date
6/11/2020 | | | 68,088 | | | | 415 | | |
Henan Shuanghui
Investment &
Development Co.
Ltd., Class A
(issuer Citigroup
Global Markets
Holding, Inc.),
Expiration Date
1/20/2015 | | | 49,026 | | | | 296 | | |
| | | | 947 | | |
| | | Number
of Shares | | Value†
(000's)z | |
Real Estate Management & Development (3.4%) | |
China Vanke Co.
Ltd., Class A
(issuer Morgan
Stanley Asia
Products),
Expiration Date
6/27/2018 | | | 166,259 | | | $ | 257 | | |
China Vanke Co.
Ltd., Class A
(issuer HSBC
Bank PLC),
Expiration Date
6/18/2020 | | | 854,900 | | | | 1,322 | | |
China Vanke Co.
Ltd., Class A
(issuer Citigroup
Global Markets
Holdings, Inc.),
Expiration Date
1/20/2015 | | | 213,700 | | | | 330 | | |
| | | | 1,909 | | |
Total Participatory Notes
(Cost $9,126) | | | | | 9,174 | | |
Rights (0.0%) | |
Commercial Banks (0.0%) | |
China Merchants
Bank Co. Ltd.,
H Shares
(Cost $0) | | | 25,404 | | | | 6 | | |
Short-Term Investments (7.5%) | |
State Street
Institutional
Government
Money Market
Fund Institutional
Class
(Cost $4,261) | | | 4,260,582 | | | | 4,261 | | |
Total Investments## (93.7%)
(Cost $52,991) | | | | | 53,058 | | |
Cash, receivables
and other assets,
less liabilities (6.3%) | | | | | 3,548 | | |
Total Net Assets (100.0%) | | | | $ | 56,606 | | |
See Notes to Schedule of Investments
111
Schedule of Investments Guardian Fund
TOP TEN EQUITY HOLDINGS
| | 1 | | | Texas Instruments, Inc. | | | 5.2 | % | |
| | 2 | | | Danaher Corp. | | | 4.9 | % | |
| | 3 | | | Anheuser-Busch InBev NV ADR | | | 4.5 | % | |
| | 4 | | | Newell Rubbermaid, Inc. | | | 4.5 | % | |
| | 5 | | | American Express Co. | | | 4.4 | % | |
| | 6 | | | Berkshire Hathaway, Inc. Class B | | | 4.2 | % | |
| | 7 | | | IntercontinentalExchange, Inc. | | | 3.8 | % | |
| | 8 | | | Progressive Corp. | | | 3.6 | % | |
| | 9 | | | Altera Corp. | | | 3.6 | % | |
| | 10 | | | 3M Co. | | | 3.4 | % | |
| | | Number
of Shares | | Value†
(000's)z | |
Common Stocks (98.2%) | |
Auto Components (2.4%) | |
BorgWarner, Inc. | | | 324,095 | | | $ | 31,301 | | |
Beverages (6.9%) | |
Anheuser-Busch
InBev NV ADR | | | 622,190 | | | | 58,081 | | |
Coca-Cola Co. | | | 825,634 | | | | 31,523 | | |
| | | | 89,604 | | |
Capital Markets (2.2%) | |
Lazard Ltd.
Class A | | | 800,308 | | | | 28,347 | | |
Chemicals (2.0%) | |
Ecolab, Inc. | | | 282,437 | | | | 25,801 | | |
Consumer Finance (4.4%) | |
American Express
Co. | | | 790,253 | | | | 56,827 | | |
Diversified Financial Services (9.4%) | |
Berkshire
Hathaway, Inc.
Class B* | | | 490,230 | | | | 54,524 | | |
CME Group, Inc. | | | 251,769 | | | | 17,903 | | |
Intercontinental
Exchange, Inc.* | | | 274,477 | | | | 49,337 | | |
| | | 121,764 | | |
Diversified Telecommunication Services (0.9%) | |
tw telecom, Inc.* | | | 414,091 | | | | 11,851 | | |
Electronic Equipment, Instruments & Components (1.9%) | |
National
Instruments
Corp. | | | 881,251 | | | | 24,455 | | |
Energy Equipment & Services (5.7%) | |
Cameron
International
Corp.* | | | 551,222 | | | | 31,304 | | |
Schlumberger Ltd. | | | 532,878 | | | | 43,131 | | |
| | | | 74,435 | | |
Food & Staples Retailing (1.0%) | |
Costco Wholesale
Corp. | | | 114,974 | | | | 12,862 | | |
Food Products (1.3%) | |
McCormick &
Co., Inc. | | | 257,763 | | | | 17,438 | | |
| | | Number
of Shares | | Value†
(000's)z | |
Health Care Equipment & Supplies (2.5%) | |
Covidien PLC | | | 554,510 | | | $ | 32,938 | | |
Household Durables (4.5%) | |
Newell
Rubbermaid,
Inc. | | | 2,285,994 | | | | 57,836 | | |
Household Products (2.9%) | |
Procter &
Gamble Co. | | | 484,459 | | | | 37,734 | | |
Industrial Conglomerates (8.3%) | |
3M Co. | | | 390,937 | | | | 44,403 | | |
Danaher Corp. | | | 963,179 | | | | 63,107 | | |
| | | | 107,510 | | |
Industrial Gases (1.9%) | |
Praxair, Inc. | | | 211,601 | | | | 24,842 | | |
Insurance (3.6%) | |
Progressive Corp. | | | 1,873,244 | | | | 46,962 | | |
Internet Software & Services (1.9%) | |
Google, Inc.
Class A* | | | 28,616 | | | | 24,235 | | |
IT Services (1.4%) | |
MasterCard, Inc.
Class A | | | 29,800 | | | | 18,061 | | |
Leisure Equipment & Products (3.1%) | |
Polaris Industries,
Inc. | | | 366,099 | | | | 39,982 | | |
Machinery (1.7%) | |
Pall Corp. | | | 318,567 | | | | 22,026 | | |
Media (2.3%) | |
Scripps Networks
Interactive, Inc.
Class A | | | 402,157 | | | | 29,571 | | |
Metals & Mining (2.0%) | |
Nucor Corp. | | | 573,741 | | | | 26,099 | | |
Oil, Gas & Consumable Fuels (3.4%) | |
BG Group PLC | | | 2,324,582 | | | | 44,201 | | |
Pharmaceuticals (2.9%) | |
Roche Holding
AG | | | 152,791 | | | | 38,114 | | |
Road & Rail (1.9%) | |
J.B. Hunt
Transport
Services, Inc. | | | 348,890 | | | | 25,120 | | |
| | | Number
of Shares | | Value†
(000's)z | |
Semiconductors & Semiconductor Equipment (8.8%) | |
Altera Corp. | | | 1,319,690 | | | $ | 46,413 | | |
Texas Instruments,
Inc. | | | 1,758,034 | | | | 67,157 | | |
| | | | 113,570 | | |
Software (3.2%) | |
Intuit, Inc. | | | 645,159 | | | | 40,987 | | |
Specialty Retail (1.9%) | |
TJX Cos., Inc. | | | 466,160 | | | | 24,576 | | |
Trading Companies & Distributors (1.9%) | |
W.W. Grainger,
Inc. | | | 102,438 | | | | 25,338 | | |
Total Common Stocks
(Cost $942,532) | | | | | 1,274,387 | | |
Short-Term Investments (2.1%) | |
State Street
Institutional
Treasury Money
Market Fund
Institutional
Class
(Cost $26,898) | | | 26,898,365 | | | | 26,898 | | |
Total Investments## (100.3%)
(Cost $969,430) | | | | | 1,301,285 | | |
Liabilities, less cash,
receivables and
other assets [(0.3%)] | | | | | (4,447 | ) | |
Total Net Assets (100.0%) | | | | $ | 1,296,838 | | |
See Notes to Schedule of Investments
112
Schedule of Investments International Equity Fund
TOP TEN EQUITY HOLDINGS
| | | | | Country | | Industry | | | |
| | 1 | | | Roche Holding AG | | Switzerland | | Pharmaceuticals | | | 2.0 | % | |
| | 2 | | | TOYOTA MOTOR Corp. | | Japan | | Automobiles | | | 1.9 | % | |
| | 3 | | | Sundrug Co. Ltd. | | Japan | | Food & Staples Retailing | | | 1.7 | % | |
| | 4 | | | Sodexo | | France | | Hotels, Restaurants & Leisure | | | 1.7 | % | |
| | 5 | | | Sulzer AG | | Switzerland | | Machinery | | | 1.7 | % | |
| | 6 | | |
Samsung Electronics Co. Ltd. | |
Korea | | Semiconductors & Semiconductor
Equipment | | | 1.6 | % | |
| | 7 | | | Rexel SA | | France | | Trading Companies & Distributors | | | 1.6 | % | |
| | 8 | | | SGS SA | | Switzerland | | Professional Services | | | 1.6 | % | |
| | 9 | | | Givaudan SA | | Switzerland | | Chemicals | | | 1.5 | % | |
| | 10 | | | Novartis AG | | Switzerland | | Pharmaceuticals | | | 1.5 | % | |
| | | Number
of Shares | | Value†
(000's)z | |
Common Stocks (95.8%) | |
Australia (1.5%) | |
Brambles Ltd. | | | 1,121,520 | | | $ | 8,740 | | |
Iluka Resources
Ltd. | | | 647,930 | | | | 6,134 | | |
| | | | 14,874 | | |
Austria (1.1%) | |
Andritz AG | | | 203,015 | | | | 11,189 | | |
Belgium (1.1%) | |
Colruyt SA | | | 197,110 | | | | 10,910 | | |
Brazil (0.7%) | |
SLC Agricola SA | | | 897,700 | | | | 7,337 | | |
Canada (8.2%) | |
Agrium, Inc. | | | 80,700 | | | | 6,922 | | |
Alimentation
Couche-Tard, Inc.
Class B | | | 82,000 | | | | 4,729 | | |
ATS Automation
Tooling Systems,
Inc.* | | | 598,000 | | | | 7,205 | | |
Cenovus Energy,
Inc. | | | 197,907 | | | | 5,670 | | |
Corus
Entertainment,
Inc., B Shares | | | 466,401 | | | | 11,181 | | |
Dollarama, Inc. | | | 143,080 | | | | 10,100 | | |
Home Capital
Group, Inc. | | | 134,000 | | | | 8,146 | | |
MacDonald,
Dettwiler &
Associates Ltd. | | | 168,133 | | | | 12,985 | | |
New Gold, Inc.* | | | 1,086,400 | | | | 7,323 | | |
Silver Wheaton
Corp. | | | 353,900 | | | | 9,354 | | |
| | | | 83,615 | | |
China (2.1%) | |
China Mobile Ltd.
ADR | | | 276,235 | | | | 14,908 | | |
Industrial &
Commercial Bank
of China Ltd.,
H Shares | | | 9,966,000 | | | | 6,517 | | |
| | | | 21,425 | | |
| | | Number
of Shares | | Value†
(000's)z | |
Denmark (1.9%) | |
Sydbank A/S* | | | 473,721 | | | $ | 11,431 | | |
Tryg A/S | | | 96,017 | | | | 8,173 | | |
| | | | 19,604 | | |
France (8.7%) | |
Arkema SA | | | 121,845 | | | | 12,315 | | |
Eutelsat
Communications
SA | | | 447,742 | | | | 13,397 | | |
Pernod-Ricard SA | | | 62,450 | | | | 7,250 | | |
Publicis Groupe
SA | | | 124,860 | | | | 9,294 | | |
Rexel SA | | | 707,612 | | | | 16,273 | | |
Sanofi | | | 139,670 | | | | 13,418 | | |
Sodexo | | | 197,400 | | | | 17,420 | | |
| | | | 89,367 | | |
Germany (9.9%) | |
Bayer AG | | | 89,775 | | | | 9,971 | | |
Brenntag AG | | | 94,260 | | | | 14,327 | | |
Continental AG | | | 84,375 | | | | 12,735 | | |
Deutsche Boerse
AG | | | 183,114 | | | | 12,839 | | |
Gerresheimer AG | | | 184,763 | | | | 11,147 | | |
Linde AG | | | 75,671 | | | | 14,551 | | |
SAP AG ADR | | | 156,100 | | | | 11,523 | | |
Volkswagen AG,
Preference Shares | | | 61,386 | | | | 13,963 | | |
| | | | 101,056 | | |
Indonesia (0.0%) | |
PT Bank Mandiri
(Persero) Tbk | | | 430,700 | | | | 279 | | |
Ireland (0.5%) | |
DCC PLC | | | 127,138 | | | | 5,042 | | |
Israel (2.7%) | |
Bezeq Israeli
Telecommunication
Corp. Ltd. | | | 7,952,124 | | | | 12,957 | | |
Check Point
Software
Technologies
Ltd.* | | | 265,400 | | | | 14,881 | | |
| | | | 27,838 | | |
| | | Number
of Shares | | Value†
(000's)z | |
Japan (15.1%) | |
FANUC Corp. | | | 95,000 | | | $ | 14,417 | | |
KANSAI PAINT
Co. Ltd. | | | 915,600 | | | | 10,563 | | |
Kenedix Realty
Investment
Corp. | | | 2,408 | | | | 9,055 | | |
KEYENCE Corp. | | | 44,200 | | | | 14,521 | | |
Nihon Kohden
Corp. | | | 303,100 | | | | 11,162 | | |
PIGEON Corp. | | | 294,000 | | | | 13,482 | | |
Pola Orbis
Holdings, Inc. | | | 160,000 | | | | 5,030 | | |
Sanrio Co. Ltd. | | | 208,200 | | | | 10,677 | | |
SMC Corp. | | | 58,500 | | | | 12,186 | | |
SOFTBANK Corp. | | | 113,200 | | | | 7,062 | | |
SUGI HOLDINGS
Co. Ltd. | | | 230,300 | | | | 8,904 | | |
Sundrug Co.
Ltd. | | | 377,300 | | | | 17,502 | | |
TOYOTA MOTOR
Corp. | | | 324,700 | | | | 19,531 | | |
| | | | 154,092 | | |
Korea (1.6%) | |
Samsung
Electronics Co.
Ltd. | | | 13,371 | | | | 16,393 | | |
Netherlands (5.8%) | |
Akzo Nobel NV | | | 178,127 | | | | 10,475 | | |
| ASML Holding NV | | | 114,495 | | | | 10,034 | | |
Koninklijke
Ahold NV | | | 760,735 | | | | 12,120 | | |
Nutreco NV | | | 252,726 | | | | 11,891 | | |
Unilever NV | | | 399,049 | | | | 14,992 | | |
| | | | 59,512 | | |
Nigeria (0.7%) | |
Afren PLC* | | | 3,170,700 | | | | 6,840 | | |
Norway (2.7%) | |
DNB ASA | | | 892,089 | | | | 13,848 | | |
Norwegian
Property ASA | | | 3,582,202 | | | | 4,724 | | |
ProSafe SE | | | 1,069,020 | | | | 9,537 | | |
| | | | 28,109 | | |
See Notes to Schedule of Investments
113
| | | Number
of Shares | | Value†
(000's)z | |
Russia (0.7%) | |
Sberbank of
Russia ADR | | | 722,090 | | | $ | 7,611 | | |
Singapore (1.7%) | |
Jardine Matheson
Holdings Ltd. | | | 195,047 | | | | 10,352 | | |
United Overseas
Bank Ltd. | | | 459,000 | | | | 7,137 | | |
| | | | 17,489 | | |
Sweden (2.5%) | |
Elekta AB,
B Shares | | | 310,953 | | | | 4,894 | | |
Nordea Bank AB | | | 872,235 | | | | 10,154 | | |
Telefonaktiebo-
laget LM Ericsson,
B Shares | | | 896,045 | | | | 10,532 | | |
| | | | 25,580 | | |
Switzerland (14.6%) | |
Bucher Industries
AG | | | 50,050 | | | | 12,281 | | |
Givaudan SA* | | | 11,735 | | | | 15,803 | | |
Julius Baer
Group Ltd.* | | | 112,700 | | | | 4,966 | | |
Kaba Holding
AG* | | | 18,605 | | | | 7,553 | | |
Nestle SA | | | 167,812 | | | | 11,011 | | |
Novartis AG | | | 207,158 | | | | 15,106 | | |
Partners Group
Holding AG | | | 41,635 | | | | 10,672 | | |
Roche Holding AG | | | 80,044 | | | | 19,967 | | |
SGS SA | | | 7,080 | | | | 16,124 | | |
Sika AG | | | 5,075 | | | | 13,898 | | |
Sulzer AG | | | 118,656 | | | | 17,305 | | |
UBS AG* | | | 256,700 | | | | 4,972 | | |
| | | | 149,658 | | |
Turkey (0.3%) | |
Sinpas
Gayrimenkul
Yatirim
Ortakligi A/S | | | 5,977,427 | | | | 2,612 | | |
United Kingdom (11.0%) | |
Amlin PLC | | | 2,008,197 | | | | 12,206 | | |
Aon PLC | | | 157,400 | | | | 10,448 | | |
Bunzl PLC | | | 667,251 | | | | 14,073 | | |
Diploma PLC | | | 864,950 | | | | 8,042 | | |
Experian PLC | | | 280,432 | | | | 4,911 | | |
ICAP PLC | | | 619,310 | | | | 3,526 | | |
Mitie Group
PLC | | | 3,186,482 | | | | 13,674 | | |
Reed Elsevier PLC | | | 897,566 | | | | 11,009 | | |
| RPS Group PLC | | | 2,416,591 | | | | 9,362 | | |
SABMiller PLC | | | 150,220 | | | | 7,156 | | |
Synergy Health
PLC | | | 673,823 | | | | 11,560 | | |
Tullow Oil PLC | | | 406,937 | | | | 6,357 | | |
| | | | 112,324 | | |
| | | Number
of Shares | | Value†
(000's)z | |
United States (0.7%) | |
Taminco Corp.* | | | 361,437 | | | $ | 7,138 | | |
Total Common Stocks
(Cost $859,561) | | | | | 979,894 | | |
Short-Term Investments (3.9%) | |
State Street
Institutional
Treasury Money
Market Fund
Institutional
Class
(Cost $39,711) | | | 39,711,264 | | | | 39,711 | | |
Total Investments## (99.7%)
(Cost $899,272) | | | | | 1,019,605 | | |
Cash, receivables
and other assets,
less liabilities (0.3%) | | | | | 3,010 | | |
Total Net Assets (100.0%) | | | | $ | 1,022,615 | | |
See Notes to Schedule of Investments
114
SUMMARY SCHEDULE OF INVESTMENTS BY INDUSTRY INTERNATIONAL EQUITY FUND
Industry | | Investments at
Value†
(000's omitted) | | Percentage of
Net Assets | |
Chemicals | | $ | 91,665 | | | | 9.0 | % | |
Machinery | | | 74,583 | | | | 7.3 | % | |
Pharmaceuticals | | | 58,462 | | | | 5.7 | % | |
Commercial Banks | | | 56,977 | | | | 5.6 | % | |
Food & Staples Retailing | | | 54,165 | | | | 5.3 | % | |
Food Products | | | 45,231 | | | | 4.4 | % | |
Media | | | 44,881 | | | | 4.4 | % | |
Trading Companies & Distributors | | | 44,673 | | | | 4.4 | % | |
Commercial Services & Supplies | | | 39,329 | | | | 3.8 | % | |
Automobiles | | | 33,494 | | | | 3.3 | % | |
Insurance | | | 30,827 | | | | 3.0 | % | |
Semiconductors & Semiconductor Equipment | | | 26,427 | | | | 2.6 | % | |
Software | | | 26,404 | | | | 2.6 | % | |
Capital Markets | | | 24,136 | | | | 2.4 | % | |
Metals & Mining | | | 22,811 | | | | 2.2 | % | |
Electronic Equipment, Instruments & Components | | | 22,563 | | | | 2.2 | % | |
Wireless Telecommunication Services | | | 21,970 | | | | 2.1 | % | |
Professional Services | | | 21,035 | | | | 2.1 | % | |
Oil, Gas & Consumable Fuels | | | 18,867 | | | | 1.8 | % | |
Hotels, Restaurants & Leisure | | | 17,420 | | | | 1.7 | % | |
Health Care Equipment & Supplies | | | 16,056 | | | | 1.6 | % | |
Industrial Conglomerates | | | 15,394 | | | | 1.5 | % | |
Beverages | | | 14,406 | | | | 1.4 | % | |
Household Products | | | 13,482 | | | | 1.3 | % | |
Aerospace & Defense | | | 12,985 | | | | 1.3 | % | |
Diversified Telecommunication Services | | | 12,957 | | | | 1.3 | % | |
Diversified Financial Services | | | 12,839 | | | | 1.3 | % | |
Auto Components | | | 12,735 | | | | 1.2 | % | |
Real Estate Investment Trusts | | | 11,667 | | | | 1.1 | % | |
Health Care Providers & Services | | | 11,560 | | | | 1.1 | % | |
Life Sciences Tools & Services | | | 11,147 | | | | 1.1 | % | |
Specialty Retail | | | 10,677 | | | | 1.0 | % | |
Communications Equipment | | | 10,532 | | | | 1.0 | % | |
Multiline Retail | | | 10,100 | | | | 1.0 | % | |
Energy Equipment & Services | | | 9,537 | | | | 0.9 | % | |
Thrifts & Mortgage Finance | | | 8,146 | | | | 0.8 | % | |
Personal Products | | | 5,030 | | | | 0.5 | % | |
Real Estate Management & Development | | | 4,724 | | | | 0.5 | % | |
Short-Term Investments and Other Assets—Net | | | 42,721 | | | | 4.2 | % | |
| | | $ | 1,022,615 | | | | 100.0 | % | |
See Notes to Schedule of Investments
115
Schedule of Investments International Large Cap Fund
TOP TEN EQUITY HOLDINGS
| | | | | Country | | Industry | | | |
| | 1 | | | Roche Holding AG | | Switzerland | | Pharmaceuticals | | | 2.5 | % | |
| | 2 | | | SGS SA | | Switzerland | | Professional Services | | | 2.3 | % | |
| | 3 | | | Givaudan SA | | Switzerland | | Chemicals | | | 2.3 | % | |
| | 4 | | | TOYOTA MOTOR Corp. | | Japan | | Automobiles | | | 2.2 | % | |
|
5 | | |
Samsung Electronics Co. Ltd. | |
Korea | | Semiconductors & Semiconductor
Equipment | | | 2.1 | % | |
| | 6 | | | Sulzer AG | | Switzerland | | Machinery | | | 1.9 | % | |
| | 7 | | | Rexel SA | | France | | Trading Companies & Distributors | | | 1.9 | % | |
| | 8 | | | Unilever NV | | Netherlands | | Food Products | | | 1.9 | % | |
|
9 | | |
KEYENCE Corp. | |
Japan | | Electronic Equipment, Instruments &
Components | | | 1.8 | % | |
| | 10 | | | SMC Corp. | | Japan | | Machinery | | | 1.8 | % | |
| | | Number
of Shares | | Value†
(000's)z | |
Common Stocks (94.8%) | |
Australia (1.7%) | |
Brambles Ltd. | | | 322,715 | | | $ | 2,515 | | |
Iluka Resources
Ltd. | | | 147,600 | | | | 1,397 | | |
| | | | 3,912 | | |
Austria (1.1%) | |
Andritz AG | | | 46,400 | | | | 2,557 | | |
Belgium (1.4%) | |
Colruyt SA | | | 56,945 | | | | 3,152 | | |
Canada (5.1%) | |
Agrium, Inc. | | | 18,800 | | | | 1,613 | | |
Alimentation
Couche Tard, Inc.
Class B | | | 18,900 | | | | 1,090 | | |
Bank of Nova
Scotia | | | 28,300 | | | | 1,572 | | |
Cenovus Energy,
Inc. | | | 43,617 | | | | 1,250 | | |
Dollarama, Inc. | | | 32,800 | | | | 2,315 | | |
New Gold, Inc.* | | | 251,100 | | | | 1,692 | | |
Silver Wheaton
Corp. | | | 81,000 | | | | 2,141 | | |
| | | | 11,673 | | |
China (2.4%) | |
China Mobile Ltd.
ADR | | | 74,115 | | | | 4,000 | | |
Industrial &
Commercial
Bank of China
Ltd., H Shares | | | 2,285,000 | | | | 1,494 | | |
| | | | 5,494 | | |
Denmark (2.3%) | |
Jyske Bank A/S* | | | 73,440 | | | | 3,389 | | |
Tryg A/S | | | 22,202 | | | | 1,890 | | |
| | | | 5,279 | | |
France (11.2%) | |
Arkema SA | | | 28,095 | | | | 2,840 | | |
| | | Number
of Shares | | Value†
(000's)z | |
Eutelsat
Communications
SA | | | 123,766 | | | $ | 3,703 | | |
Pernod-Ricard SA | | | 14,315 | | | | 1,662 | | |
Publicis Groupe
SA | | | 28,881 | | | | 2,150 | | |
Rexel SA | | | 188,723 | | | | 4,340 | | |
Sanofi | | | 37,425 | | | | 3,595 | | |
Schneider
Electric SA | | | 46,144 | | | | 3,531 | | |
Sodexo | | | 45,165 | | | | 3,986 | | |
| | | | 25,807 | | |
Germany (9.7%) | |
Bayer AG | | | 20,800 | | | | 2,310 | | |
Brenntag AG | | | 21,660 | | | | 3,292 | | |
Continental AG | | | 22,510 | | | | 3,398 | | |
Deutsche
Boerse AG | | | 57,122 | | | | 4,005 | | |
Linde AG | | | 18,520 | | | | 3,561 | | |
SAP AG ADR | | | 35,585 | | | | 2,627 | | |
Volkswagen AG,
Preference Shares | | | 13,954 | | | | 3,174 | | |
| | | | 22,367 | | |
Indonesia (0.0%) | |
PT Bank Mandiri
(Persero) Tbk | | | 99,200 | | | | 64 | | |
Israel (3.4%) | |
Bezeq Israeli
Telecommunication
Corp. Ltd. | | | 2,264,230 | | | | 3,689 | | |
Check Point
Software
Technologies
Ltd.* | | | 72,700 | | | | 4,077 | | |
| | | | 7,766 | | |
Japan (14.2%) | |
FANUC Corp. | | | 25,100 | | | | 3,809 | | |
KANSAI PAINT
Co. Ltd. | | | 326,800 | | | | 3,770 | | |
KEYENCE Corp. | | | 12,900 | | | | 4,238 | | |
LAWSON, Inc. | | | 23,600 | | | | 1,772 | | |
| | | Number
of Shares | | Value†
(000's)z | |
MIRACA
HOLDINGS, Inc. | | | 36,900 | | | $ | 1,641 | | |
Sanrio Co. Ltd. | | | 47,600 | | | | 2,441 | | |
SANTEN
PHARMACEUTICAL
Co. Ltd. | | | 39,800 | | | | 1,839 | | |
SMC Corp. | | | 20,300 | | | | 4,228 | | |
SOFTBANK Corp. | | | 32,600 | | | | 2,034 | | |
SUGI HOLDINGS
Co. Ltd. | | | 46,500 | | | | 1,798 | | |
TOYOTA MOTOR
Corp. | | | 84,400 | | | | 5,077 | | |
| | | | 32,647 | | |
Korea (2.1%) | |
Samsung
Electronics Co.
Ltd. | | | 3,916 | | | | 4,801 | | |
Netherlands (5.7%) | |
Akzo Nobel NV | | | 53,005 | | | | 3,117 | | |
| ASML Holding NV | | | 25,900 | | | | 2,270 | | |
Koninklijke
Ahold NV | | | 222,755 | | | | 3,549 | | |
Unilever NV | | | 113,513 | | | | 4,265 | | |
| | | | 13,201 | | |
Nigeria (0.8%) | |
Afren PLC* | | | 914,275 | | | | 1,972 | | |
Norway (1.4%) | |
DNB ASA | | | 205,123 | | | | 3,184 | | |
Russia (0.8%) | |
Sberbank of
Russia ADR | | | 166,345 | | | | 1,753 | | |
Singapore (1.7%) | |
Jardine Matheson
Holdings Ltd. | | | 44,300 | | | | 2,351 | | |
United Overseas
Bank Ltd. | | | 106,800 | | | | 1,661 | | |
| | | | 4,012 | | |
Sweden (3.3%) | |
Elekta AB,
B Shares | | | 107,250 | | | | 1,688 | | |
See Notes to Schedule of Investments
116
| | | Number
of Shares | | Value†
(000's)z | |
Nordea Bank AB | | | 250,745 | | | $ | 2,919 | | |
Telefonaktiebolaget
LM Ericsson,
B Shares | | | 258,445 | | | | 3,038 | | |
| | | | 7,645 | | |
Switzerland (16.7%) | |
Givaudan SA* | | | 3,891 | | | | 5,240 | | |
Julius Baer Group
Ltd.* | | | 26,000 | | | | 1,146 | | |
Nestle SA | | | 49,628 | | | | 3,256 | | |
Novartis AG | | | 55,491 | | | | 4,046 | | |
Partners Group
Holding AG | | | 9,920 | | | | 2,543 | | |
Roche Holding AG | | | 22,926 | | | | 5,719 | | |
SGS SA | | | 2,347 | | | | 5,345 | | |
Sika AG | | | 1,398 | | | | 3,828 | | |
Sonova Holding
AG* | | | 15,800 | | | | 1,749 | | |
Sulzer AG | | | 30,766 | | | | 4,487 | | |
UBS AG* | | | 59,200 | | | | 1,147 | | |
| | | | 38,506 | | |
United Arab Emirates (0.5%) | |
Dragon Oil PLC | | | 119,500 | | | | 1,097 | | |
United Kingdom (9.3%) | |
Amlin PLC | | | 560,779 | | | | 3,408 | | |
Aon PLC | | | 36,200 | | | | 2,403 | | |
Bunzl PLC | | | 183,879 | | | | 3,878 | | |
Experian PLC | | | 128,907 | | | | 2,257 | | |
ICAP PLC | | | 203,845 | | | | 1,161 | | |
Reed Elsevier PLC | | | 308,564 | | | | 3,785 | | |
SABMiller PLC | | | 56,220 | | | | 2,678 | | |
Tullow Oil PLC | | | 127,311 | | | | 1,989 | | |
| | | | 21,559 | | |
Total Common Stocks
(Cost $189,633) | | | | | 218,448 | | |
Short-Term Investments (4.9%) | |
State Street
Institutional
Treasury Money
Market Fund
Institutional Class
(Cost $11,371) | | | 11,371,456 | | | | 11,371 | | |
Total Investments## (99.7%)
(Cost $201,004) | | | | | 229,819 | | |
Cash, receivables
and other assets,
less liabilities (0.3%) | | | | | 609 | | |
Total Net Assets (100.0%) | | | | $ | 230,428 | | |
See Notes to Schedule of Investments
117
SUMMARY SCHEDULE OF INVESTMENTS BY INDUSTRY INTERNATIONAL LARGE CAP FUND
Industry | | Investments at
Value†
(000's omitted) | | Percentage of
Net Assets | |
Chemicals | | $ | 23,969 | | | | 10.4 | % | |
Pharmaceuticals | | | 17,509 | | | | 7.6 | % | |
Commercial Banks | | | 16,036 | | | | 7.1 | % | |
Machinery | | | 15,081 | | | | 6.5 | % | |
Trading Companies & Distributors | | | 11,510 | | | | 5.0 | % | |
Food & Staples Retailing | | | 11,361 | | | | 4.9 | % | |
Media | | | 9,638 | | | | 4.2 | % | |
Automobiles | | | 8,251 | | | | 3.6 | % | |
Insurance | | | 7,701 | | | | 3.3 | % | |
Professional Services | | | 7,602 | | | | 3.3 | % | |
Food Products | | | 7,521 | | | | 3.3 | % | |
Semiconductors & Semiconductor Equipment | | | 7,071 | | | | 3.1 | % | |
Software | | | 6,704 | | | | 2.9 | % | |
Oil, Gas & Consumable Fuels | | | 6,308 | | | | 2.8 | % | |
Wireless Telecommunication Services | | | 6,034 | | | | 2.6 | % | |
Capital Markets | | | 5,997 | | | | 2.6 | % | |
Metals & Mining | | | 5,230 | | | | 2.3 | % | |
Beverages | | | 4,340 | | | | 1.8 | % | |
Electronic Equipment, Instruments & Components | | | 4,238 | | | | 1.8 | % | |
Diversified Financial Services | | | 4,005 | | | | 1.7 | % | |
Hotels, Restaurants & Leisure | | | 3,986 | | | | 1.7 | % | |
Diversified Telecommunication Services | | | 3,689 | | | | 1.6 | % | |
Electrical Equipment | | | 3,531 | | | | 1.5 | % | |
Health Care Equipment & Supplies | | | 3,437 | | | | 1.5 | % | |
Auto Components | | | 3,398 | | | | 1.5 | % | |
Communications Equipment | | | 3,038 | | | | 1.3 | % | |
Commercial Services & Supplies | | | 2,515 | | | | 1.1 | % | |
Specialty Retail | | | 2,441 | | | | 1.1 | % | |
Industrial Conglomerates | | | 2,351 | | | | 1.0 | % | |
Multiline Retail | | | 2,315 | | | | 1.0 | % | |
Health Care Providers & Services | | | 1,641 | | | | 0.7 | % | |
Short-Term Investments and Other Assets—Net | | | 11,980 | | | | 5.2 | % | |
| | | $ | 230,428 | | | | 100.0 | % | |
See Notes to Schedule of Investments
118
Schedule of Investments Intrinsic Value Fund
TOP TEN EQUITY HOLDINGS
| | 1 | | | Charles River Laboratories International, Inc. | | | 2.5 | % | |
| | 2 | | | Textron, Inc. | | | 2.2 | % | |
| | 3 | | | Verint Systems, Inc. | | | 2.1 | % | |
| | 4 | | | Avery Dennison Corp. | | | 2.0 | % | |
| | 5 | | | Sealed Air Corp. | | | 1.9 | % | |
| | 6 | | | Covanta Holding Corp. | | | 1.9 | % | |
| | 7 | | | Crown Holdings, Inc. | | | 1.8 | % | |
| | 8 | | | TETRA Technologies, Inc. | | | 1.8 | % | |
| | 9 | | | Safeway, Inc. | | | 1.8 | % | |
| | 10 | | | Digital River, Inc. | | | 1.7 | % | |
| | |
Number
of Shares | |
Value†
(000's)z | |
Common Stocks (92.9%) | |
Aerospace & Defense (6.4%) | |
Aerovironment, Inc.* | | | 93,500 | | | $ | 2,049 | | |
Spirit Aerosystems
Holdings, Inc.
Class A* | | | 159,090 | | | | 3,592 | | |
Teledyne
Technologies, Inc.* | | | 40,352 | | | | 3,114 | | |
Textron, Inc. | | | 169,939 | | | | 4,578 | | |
| | | | 13,333 | | |
Auto Components (0.9%) | |
Dana Holding Corp. | | | 89,600 | | | | 1,878 | | |
Chemicals (2.2%) | |
Chemtura Corp.* | | | 150,100 | | | | 3,290 | | |
Cytec Industries, Inc. | | | 18,100 | | | | 1,354 | | |
| | | | 4,644 | | |
Commercial Banks (11.2%) | |
BankUnited, Inc. | | | 85,704 | | | | 2,533 | | |
City National Corp. | | | 31,700 | | | | 2,075 | | |
Comerica, Inc. | | | 76,874 | | | | 3,140 | | |
First Niagara
Financial Group,
Inc. | | | 303,700 | | | | 3,067 | | |
Huntington
Bancshares, Inc. | | | 431,730 | | | | 3,557 | | |
TCF Financial Corp. | | | 231,900 | | | | 3,258 | | |
Texas Capital
Bancshares, Inc.* | | | 52,200 | | | | 2,301 | | |
Umpqua Holdings
Corp. | | | 192,300 | | | | 3,123 | | |
| | | | 23,054 | | |
Commercial Services & Supplies (2.6%) | |
Clean Harbors, Inc.* | | | 26,714 | | | | 1,518 | | |
Covanta
Holding Corp. | | | 186,000 | | | | 3,930 | | |
| | | | 5,448 | | |
Communications Equipment (6.4%) | |
Arris Group, Inc.* | | | 202,169 | | | | 3,168 | | |
Aviat Networks,
Inc.* | | | 140,349 | | | | 356 | | |
Brocade
Communications
Systems, Inc.* | | | 467,559 | | | | 3,460 | | |
Ceragon
Networks Ltd.* | | | 18,245 | | | | 66 | | |
Ciena Corp.* | | | 91,283 | | | | 1,818 | | |
Infinera Corp.* | | | 281,300 | | | | 2,608 | | |
| | |
Number
of Shares | |
Value†
(000's)z | |
Sierra Wireless,
Inc.* | | | 150,074 | | | $ | 1,849 | | |
| | | | 13,325 | | |
Computers & Peripherals (0.3%) | |
Quantum Corp.* | | | 434,100 | | | | 625 | | |
Construction & Engineering (1.6%) | |
KBR, Inc. | | | 107,200 | | | | 3,201 | | |
Containers & Packaging (5.7%) | |
Avery Dennison
Corp. | | | 96,036 | | | | 4,107 | | |
Crown Holdings,
Inc.* | | | 88,000 | | | | 3,825 | | |
Sealed Air Corp. | | | 138,608 | | | | 3,936 | | |
| | | | 11,868 | | |
Electrical Equipment (1.4%) | |
II-VI, Inc.* | | | 71,530 | | | | 1,379 | | |
Regal-Beloit Corp. | | | 24,300 | | | | 1,548 | | |
| | | | 2,927 | | |
Electronic Equipment, Instruments & Components (3.6%) | |
CTS Corp. | | | 119,655 | | | | 1,666 | | |
Dolby Laboratories,
Inc. Class A | | | 56,600 | | | | 1,779 | | |
Itron, Inc.* | | | 48,120 | | | | 1,802 | | |
Mercury Systems,
Inc.* | | | 105,260 | | | | 919 | | |
OSI Systems, Inc.* | | | 17,900 | | | | 1,301 | | |
| | | | 7,467 | | |
Energy Equipment & Services (2.5%) | |
ION Geophysical
Corp.* | | | 304,117 | | | | 1,457 | | |
TETRA
Technologies, Inc.* | | | 321,292 | | | | 3,775 | | |
| | | | 5,232 | | |
Food & Staples Retailing (1.8%) | |
Safeway, Inc. | | | 143,900 | | | | 3,727 | | |
Health Care Equipment &
Supplies (1.7%) | |
Accuray, Inc.* | | | 167,670 | | | | 1,110 | | |
Given Imaging Ltd.* | | | 77,100 | | | | 1,395 | | |
Symmetry
Medical, Inc.* | | | 128,310 | | | | 1,007 | | |
| | | | 3,512 | | |
| | |
Number
of Shares | |
Value†
(000's)z | |
Health Care Providers &
Services (0.7%) | |
Chemed Corp. | | | 21,125 | | | $ | 1,471 | | |
Health Care Technology (1.6%) | |
Allscripts
Healthcare
Solutions, Inc.* | | | 228,900 | | | | 3,328 | | |
Hotels, Restaurants & Leisure (1.2%) | |
Wendy's Co. | | | 322,800 | | | | 2,440 | | |
Independent Power Producers & Energy Traders (3.3%) | |
Dynegy, Inc.* | | | 79,500 | | | | 1,545 | | |
NRG Energy, Inc. | | | 95,565 | | | | 2,509 | | |
Ormat
Technologies, Inc. | | | 106,156 | | | | 2,661 | | |
| | | | 6,715 | | |
Internet Software & Services (2.3%) | |
Bankrate, Inc.* | | | 67,800 | | | | 1,166 | | |
Digital River, Inc.* | | | 209,263 | | | | 3,616 | | |
Velti PLC* | | | 171,300 | | | | 60 | | |
| | | | 4,842 | | |
IT Services (6.3%) | |
Acxiom Corp.* | | | 82,200 | | | | 2,045 | | |
Convergys Corp. | | | 120,500 | | | | 2,124 | | |
CoreLogic, Inc.* | | | 140,511 | | | | 3,611 | | |
DST Systems, Inc. | | | 49,019 | | | | 3,499 | | |
VeriFone Systems,
Inc.* | | | 89,590 | | | | 1,776 | | |
| | | | 13,055 | | |
Life Sciences Tools & Services (4.0%) | |
Affymetrix, Inc.* | | | 264,500 | | | | 1,473 | | |
Cambrex Corp.* | | | 121,038 | | | | 1,650 | | |
Charles River
Laboratories
International, Inc.* | | | 111,371 | | | | 5,129 | | |
| | | | 8,252 | | |
Machinery (5.4%) | |
ESCO
Technologies, Inc. | | | 70,685 | | | | 2,167 | | |
ITT Corp. | | | 101,900 | | | | 3,347 | | |
Manitowoc Co.,
Inc. | | | 115,700 | | | | 2,312 | | |
Meritor, Inc.* | | | 186,150 | | | | 1,387 | | |
Twin Disc, Inc. | | | 71,100 | | | | 1,876 | | |
| | | | 11,089 | | |
See Notes to Schedule of Investments
119
| | |
Number
of Shares | |
Value†
(000's)z | |
Marine (0.6%) | |
Danaos Corp.* | | | 268,891 | | | $ | 1,186 | | |
Professional Services (0.8%) | |
FTI Consulting,
Inc.* | | | 48,806 | | | | 1,632 | | |
Road & Rail (1.3%) | |
Ryder System, Inc. | | | 47,104 | | | | 2,620 | | |
Semiconductors & Semiconductor Equipment (5.8%) | |
Alliance
Semiconductor
Corp.* | | | 82,370 | | | | 43 | | |
Ceva, Inc.* | | | 66,800 | | | | 1,211 | | |
FormFactor, Inc.* | | | 204,900 | | | | 1,244 | | |
Freescale
Semiconductor
Ltd.* | | | 129,490 | | | | 1,854 | | |
Ikanos
Communications,
Inc.* | | | 194,466 | | | | 239 | | |
Mellanox
Technologies Ltd.* | | | 34,650 | | | | 1,366 | | |
Rambus, Inc.* | | | 285,772 | | | | 2,332 | | |
Spansion, Inc.
Class A* | | | 163,140 | | | | 1,692 | | |
Ultratech, Inc.* | | | 69,894 | | | | 1,976 | | |
| | | | 11,957 | | |
Software (7.7%) | |
Accelrys, Inc.* | | | 180,363 | | | | 1,631 | | |
Cadence Design
Systems, Inc.* | | | 145,607 | | | | 1,961 | | |
Comverse, Inc.* | | | 49,335 | | | | 1,492 | | |
Rovi Corp.* | | | 192,730 | | | | 3,456 | | |
SeaChange
International,
Inc.* | | | 181,426 | | | | 1,814 | | |
TIBCO Software,
Inc.* | | | 55,500 | | | | 1,251 | | |
Verint Systems,
Inc.* | | | 128,461 | | | | 4,259 | | |
| | | | 15,864 | | |
Specialty Retail (3.6%) | |
Express, Inc.* | | | 95,300 | | | | 2,000 | | |
OfficeMax, Inc. | | | 274,719 | | | | 2,986 | | |
PEP Boys-Manny
Moe & Jack* | | | 82,500 | | | | 927 | | |
RadioShack Corp.* | | | 480,841 | | | | 1,572 | | |
| | | | 7,485 | | |
Total Common Stocks
(Cost $153,237) | | | | | 192,177 | | |
| | |
Number
of Shares | |
Value†
(000's)z | |
Short-Term Investments (7.3%) | |
State Street
Institutional Treasury
Money Market Fund
Institutional Class
(Cost $15,130) | | | 15,130,391 | | | $ | 15,130 | | |
Total Investments## (100.2%)
(Cost $168,367) | | | | | 207,307 | | |
Liabilities, less cash,
receivables and
other assets [(0.2%)] | | | | | (467 | ) | |
Total Net Assets (100.0%) | | | | $ | 206,840 | | |
See Notes to Schedule of Investments
120
Schedule of Investments Large Cap Disciplined Growth Fund
TOP TEN EQUITY HOLDINGS
| | 1 | | | Apple, Inc. | | | 5.2 | % | |
| | 2 | | | Google, Inc. Class A | | | 4.2 | % | |
| | 3 | | | Verizon Communications, Inc. | | | 3.0 | % | |
| | 4 | | | Precision Castparts Corp. | | | 2.8 | % | |
| | 5 | | | Starbucks Corp. | | | 2.8 | % | |
| | 6 | | | Coca-Cola Co. | | | 2.7 | % | |
| | 7 | | | Alliance Data Systems Corp. | | | 2.6 | % | |
| | 8 | | | Kinder Morgan, Inc. | | | 2.6 | % | |
| | 9 | | | Johnson & Johnson | | | 2.4 | % | |
| | 10 | | | Procter & Gamble Co. | | | 2.3 | % | |
| | |
Number
of Shares | |
Value†
(000's)z | |
Common Stocks (95.1%) | |
Aerospace & Defense (4.8%) | |
Boeing Co. | | | 92,564 | | | $ | 9,619 | | |
Precision Castparts
Corp. | | | 65,021 | | | | 13,735 | | |
| | | | 23,354 | | |
Air Freight & Logistics (1.7%) | |
FedEx Corp. | | | 79,549 | | | | 8,540 | | |
Beverages (4.8%) | |
Anheuser-Busch
InBev NV ADR | | | 109,522 | | | | 10,224 | | |
Coca-Cola Co. | | | 347,710 | | | | 13,275 | | |
| | | | 23,499 | | |
Biotechnology (3.0%) | |
Biogen Idec, Inc.* | | | 24,827 | | | | 5,288 | | |
Vertex
Pharmaceuticals,
Inc.* | | | 125,027 | | | | 9,396 | | |
| | | | 14,684 | | |
Chemicals (5.1%) | |
Agrium, Inc. | | | 70,166 | | | | 6,019 | | |
Monsanto Co. | | | 99,049 | | | | 9,696 | | |
Sherwin-Williams
Co. | | | 54,160 | | | | 9,337 | | |
| | | | 25,052 | | |
Computers & Peripherals (6.1%) | |
Apple, Inc. | | | 51,799 | | | | 25,229 | | |
SanDisk Corp. | | | 84,063 | | | | 4,638 | | |
| | | | 29,867 | | |
Diversified Telecommunication Services (3.0%) | |
Verizon
Communications,
Inc. | | | 313,440 | | | | 14,851 | | |
Electrical Equipment (1.6%) | |
Eaton Corp. PLC | | | 123,998 | | | | 7,852 | | |
Food & Staples Retailing (4.6%) | |
CVS Caremark
Corp. | | | 127,595 | | | | 7,407 | | |
Wal-Mart Stores,
Inc. | | | 125,537 | | | | 9,162 | | |
Whole Foods
Market, Inc. | | | 107,706 | | | | 5,681 | | |
| | | | 22,250 | | |
| | |
Number
of Shares | |
Value†
(000's)z | |
Food Products (3.6%) | |
Kraft Foods
Group, Inc. | | | 213,777 | | | $ | 11,067 | | |
Unilever NV | | | 171,966 | | | | 6,471 | | |
| | | | 17,538 | | |
Health Care Equipment &
Supplies (1.2%) | |
Edwards
Lifesciences
Corp.* | | | 85,646 | | | | 6,028 | | |
Hotels, Restaurants & Leisure (2.8%) | |
Starbucks Corp. | | | 193,697 | | | | 13,660 | | |
Household Products (2.3%) | |
Procter &
Gamble Co. | | | 145,686 | | | | 11,348 | | |
Industrial Conglomerates (1.6%) | |
Danaher Corp. | | | 116,344 | | | | 7,623 | | |
Insurance (2.6%) | |
American
International
Group, Inc.* | | | 132,585 | | | | 6,160 | | |
Aon PLC | | | 98,314 | | | | 6,526 | | |
| | | | 12,686 | | |
Internet & Catalog Retail (2.0%) | |
Amazon.com,
Inc.* | | | 35,265 | | | | 9,909 | | |
Internet Software & Services (6.8%) | |
eBay, Inc.* | | | 169,838 | | | | 8,490 | | |
Facebook, Inc.
Class A* | | | 94,708 | | | | 3,910 | | |
Google, Inc.
Class A* | | | 24,481 | | | | 20,733 | | |
| | | | 33,133 | | |
IT Services (5.8%) | |
Alliance Data
Systems Corp.* | | | 64,390 | | | | 12,601 | | |
Automatic Data
Processing, Inc. | | | 108,657 | | | | 7,732 | | |
IBM Corp. | | | 43,039 | | | | 7,845 | | |
| | | | 28,178 | | |
Life Sciences Tools & Services (0.9%) | |
Illumina, Inc.* | | | 57,576 | | | | 4,482 | | |
Media (3.6%) | |
Comcast Corp.
Class A | | | 145,418 | | | | 6,121 | | |
| | |
Number
of Shares | |
Value†
(000's)z | |
Discovery
Communications,
Inc. Class A* | | | 79,117 | | | $ | 6,132 | | |
Twenty-First
Century Fox, Inc. | | | 165,973 | | | | 5,200 | | |
| | | | 17,453 | | |
Multiline Retail (1.8%) | |
Family Dollar
Stores, Inc. | | | 124,966 | | | | 8,896 | | |
Oil, Gas & Consumable Fuels (4.5%) | |
Kinder Morgan, Inc. | | | 329,844 | | | | 12,511 | | |
Range Resources
Corp. | | | 127,707 | | | | 9,575 | | |
| | | | 22,086 | | |
Pharmaceuticals (5.5%) | |
Bristol-Myers
Squibb Co. | | | 228,305 | | | | 9,518 | | |
Johnson &
Johnson | | | 138,526 | | | | 11,970 | | |
Pfizer, Inc. | | | 188,033 | | | | 5,304 | | |
| | | | 26,792 | | |
Road & Rail (2.0%) | |
Union Pacific Corp. | | | 63,119 | | | | 9,691 | | |
Semiconductors & Semiconductor Equipment (1.9%) | |
| ASML Holding NV | | | 109,279 | | | | 9,514 | | |
Software (3.6%) | |
Check Point
Software
Technologies Ltd.* | | | 110,023 | | | | 6,169 | | |
Microsoft Corp. | | | 335,223 | | | | 11,196 | | |
| | | | 17,365 | | |
Specialty Retail (2.5%) | |
Home Depot, Inc. | | | 87,954 | | | | 6,551 | | |
O'Reilly
Automotive, Inc.* | | | 44,526 | | | | 5,464 | | |
| | | | 12,015 | | |
Textiles, Apparel &
Luxury Goods (2.5%) | |
Lululemon
Athletica, Inc.* | | | 91,379 | | | | 6,474 | | |
Michael Kors
Holdings Ltd.* | | | 78,840 | | | | 5,841 | | |
| | | | 12,315 | | |
See Notes to Schedule of Investments
121
| | |
Number
of Shares | |
Value†
(000's)z | |
Tobacco (1.3%) | |
Philip Morris
International, Inc. | | | 75,857 | | | $ | 6,330 | | |
Wireless Telecommunication
Services (1.6%) | |
Crown Castle
International
Corp.* | | | 114,286 | | | | 7,934 | | |
Total Common Stocks
(Cost $387,732) | | | | | 464,925 | | |
Short-Term Investments (4.6%) | |
State Street
Institutional Liquid
Reserves Fund
Institutional Class
(Cost $22,330) | | | 22,329,763 | | | | 22,330 | | |
Total Investments## (99.7%)
(Cost $410,062) | | | | | 487,255 | | |
Cash, receivables
and other assets,
less liabilities (0.3%) | | | | | 1,548 | | |
Total Net Assets (100.0%) | | | | $ | 488,803 | | |
See Notes to Schedule of Investments
122
Schedule of Investments Large Cap Value Fund
TOP TEN EQUITY HOLDINGS
| | 1 | | | Cummins, Inc. | | | 4.8 | % | |
| | 2 | | | JPMorgan Chase & Co. | | | 4.7 | % | |
| | 3 | | | Exxon Mobil Corp. | | | 4.5 | % | |
| | 4 | | | Citigroup, Inc. | | | 3.1 | % | |
| | 5 | | | Dow Chemical Co. | | | 3.1 | % | |
| | 6 | | | Cisco Systems, Inc. | | | 2.8 | % | |
| | 7 | | | American International Group, Inc. | | | 2.7 | % | |
| | 8 | | | LyondellBasell Industries NV Class A | | | 2.7 | % | |
| | 9 | | | Lincoln National Corp. | | | 2.6 | % | |
| | 10 | | | Wells Fargo & Co. | | | 2.5 | % | |
| | |
Number
of Shares | |
Value†
(000's)z | |
Common Stocks (96.6%) | |
Aerospace & Defense (2.9%) | |
Northrop
Grumman
Corp. | | | 312,128 | | | $ | 28,800 | | |
Raytheon Co. | | | 246,969 | | | | 18,624 | | |
| | | | 47,424 | | |
Airlines (2.9%) | |
Delta Air Lines,
Inc. | | | 205,023 | | | | 4,045 | | |
United
Continental
Holdings, Inc.* | | | 1,247,036 | | | | 35,491 | | |
US Airways
Group, Inc.* | | | 420,577 | | | | 6,796 | | |
| | | | 46,332 | | |
Auto Components (0.7%) | |
BorgWarner, Inc. | | | 122,999 | | | | 11,879 | | |
Capital Markets (6.0%) | |
Bank of New York
Mellon Corp. | | | 1,179,187 | | | | 35,069 | | |
Goldman Sachs
Group, Inc. | | | 167,401 | | | | 25,467 | | |
Invesco Ltd. | | | 531,231 | | | | 16,128 | | |
Morgan Stanley | | | 788,395 | | | | 20,309 | | |
| | | | 96,973 | | |
Chemicals (6.8%) | |
Dow Chemical
Co. | | | 1,337,775 | | | | 50,033 | | |
LyondellBasell
Industries NV
Class A | | | 629,958 | | | | 44,191 | | |
Monsanto Co. | | | 175,754 | | | | 17,205 | | |
| | | | 111,429 | | |
Commercial Banks (6.3%) | |
Comerica, Inc. | | | 292,872 | | | | 11,961 | | |
Mitsubishi UFJ
Financial Group,
Inc. ADR | | | 2,191,953 | | | | 12,779 | | |
PNC Financial
Services Group,
Inc. | | | 223,315 | | | | 16,139 | | |
Regions Financial
Corp. | | | 1,319,620 | | | | 12,405 | | |
Sumitomo Mitsui
Financial Group,
Inc. ADR | | | 975,826 | | | | 8,636 | | |
| | |
Number
of Shares | |
Value†
(000's)z | |
Wells Fargo &
Co. | | | 992,922 | | | $ | 40,789 | | |
| | | | 102,709 | | |
Communications Equipment (3.7%) | |
Cisco Systems,
Inc. | | | 1,932,090 | | | | 45,037 | | |
Juniper Networks,
Inc.* | | | 815,985 | | | | 15,422 | | |
| | | | 60,459 | | |
Computers & Peripherals (5.0%) | |
EMC Corp. | | | 1,464,254 | | | | 37,749 | | |
NetApp, Inc. | | | 518,420 | | | | 21,535 | | |
SanDisk Corp. | | | 402,104 | | | | 22,188 | | |
| | | | 81,472 | | |
Construction & Engineering (1.2%) | |
Fluor Corp. | | | 302,061 | | | | 19,160 | | |
Diversified Financial Services (9.9%) | |
Citigroup, Inc. | | | 1,041,100 | | | | 50,316 | | |
CME Group, Inc. | | | 472,183 | | | | 33,577 | | |
JPMorgan
Chase & Co. | | | 1,516,936 | | | | 76,651 | | |
| | | | 160,544 | | |
Electrical Equipment (0.9%) | |
Eaton Corp. PLC | | | 228,986 | | | | 14,499 | | |
Energy Equipment & Services (3.3%) | |
Baker Hughes, Inc. | | | 160,219 | | | | 7,449 | | |
Halliburton Co. | | | 565,387 | | | | 27,138 | | |
Rowan Cos. PLC
Class A* | | | 298,076 | | | | 10,558 | | |
Weatherford
International Ltd.* | | | 591,644 | | | | 8,821 | | |
| | | | 53,966 | | |
Food Products (2.3%) | |
Archer-Daniels-
Midland Co. | | | 829,237 | | | | 29,197 | | |
ConAgra Foods,
Inc. | | | 115,953 | | | | 3,922 | | |
WhiteWave Foods
Co. Class A* | | | 246,234 | | | | 4,708 | | |
| | | | 37,827 | | |
Health Care Equipment &
Supplies (2.7%) | |
Boston
Scientific Corp.* | | | 1,780,582 | | | | 18,838 | | |
C.R. Bard, Inc. | | | 67,738 | | | | 7,781 | | |
| | |
Number
of Shares | |
Value†
(000's)z | |
Zimmer
Holdings, Inc. | | | 216,155 | | | $ | 17,096 | | |
| | | | 43,715 | | |
Health Care Providers &
Services (3.7%) | |
Aetna, Inc. | | | 241,053 | | | | 15,280 | | |
Cigna Corp. | | | 194,629 | | | | 15,316 | | |
UnitedHealth
Group, Inc. | | | 407,475 | | | | 29,232 | | |
| | | | 59,828 | | |
Hotels, Restaurants & Leisure (1.9%) | |
Carnival Corp. | | | 850,393 | | | | 30,691 | | |
Household Products (1.1%) | |
Procter &
Gamble Co. | | | 230,024 | | | | 17,917 | | |
Insurance (5.3%) | |
American
International
Group, Inc.* | | | 962,569 | | | | 44,721 | | |
Lincoln National
Corp. | | | 989,381 | | | | 41,594 | | |
| | | | 86,315 | | |
Internet Software & Services (2.3%) | |
Facebook, Inc.
Class A* | | | 886,138 | | | | 36,580 | | |
Machinery (9.4%) | |
Cummins, Inc. | | | 629,171 | | | | 77,514 | | |
Joy Global, Inc. | | | 82,989 | | | | 4,077 | | |
Kubota Corp. ADR | | | 358,906 | | | | 24,365 | | |
Makita Corp. ADR | | | 263,474 | | | | 13,872 | | |
Manitowoc Co.,
Inc. | | | 469,840 | | | | 9,387 | | |
Parker Hannifin
Corp. | | | 245,243 | | | | 24,512 | | |
| | | | 153,727 | | |
Metals & Mining (2.9%) | |
Carpenter
Technology Corp. | | | 83,627 | | | | 4,497 | | |
Newmont Mining
Corp. | | | 671,526 | | | | 21,335 | | |
Nucor Corp. | | | 335,618 | | | | 15,267 | | |
United States
Steel Corp. | | | 330,579 | | | | 5,917 | | |
| | | | 47,016 | | |
See Notes to Schedule of Investments
123
| | |
Number
of Shares | |
Value†
(000's)z | |
Oil, Gas & Consumable Fuels (8.7%) | |
Exxon Mobil
Corp. | | | 847,086 | | | $ | 73,832 | | |
Occidental
Petroleum Corp. | | | 277,730 | | | | 24,499 | | |
Range Resources
Corp. | | | 326,772 | | | | 24,501 | | |
Spectra Energy
Corp. | | | 586,164 | | | | 19,408 | | |
| | | | 142,240 | | |
Pharmaceuticals (1.6%) | |
Merck & Co., Inc. | | | 546,938 | | | | 25,865 | | |
Semiconductors & Semiconductor Equipment (2.2%) | |
Altera Corp. | | | 665,842 | | | | 23,417 | | |
KLA-Tencor Corp. | | | 222,245 | | | | 12,257 | | |
| | | | 35,674 | | |
Software (0.6%) | |
CA, Inc. | | | 340,528 | | | | 9,960 | | |
Specialty Retail (2.3%) | |
Best Buy Co.,
Inc. | | | 438,487 | | | | 15,785 | | |
Staples, Inc. | | | 1,580,444 | | | | 21,984 | | |
| | | | 37,769 | | |
Total Common Stocks
(Cost $1,394,816) | | | | | 1,571,970 | | |
Short-Term Investments (2.0%) | |
State Street
Institutional Liquid
Reserves Fund
Institutional Class
(Cost $33,562) | | | 33,562,027 | | | | 33,562 | | |
Total Investments## (98.6%)
(Cost $1,428,378) | | | | | 1,605,532 | | |
Cash, receivables
and other assets,
less liabilities (1.4%) | | | | | 22,178 | | |
Total Net Assets (100.0%) | | | | $ | 1,627,710 | | |
See Notes to Schedule of Investments
124
Schedule of Investments Mid Cap Growth Fund
TOP TEN EQUITY HOLDINGS
| | 1 | | | SBA Communications Corp. Class A | | | 1.9 | % | |
| | 2 | | | Stericycle, Inc. | | | 1.8 | % | |
| | 3 | | | Roper Industries, Inc. | | | 1.7 | % | |
| | 4 | | | Affiliated Managers Group, Inc. | | | 1.6 | % | |
| | 5 | | | Cerner Corp. | | | 1.6 | % | |
| | 6 | | | Illumina, Inc. | | | 1.5 | % | |
| | 7 | | | AMETEK, Inc. | | | 1.5 | % | |
| | 8 | | | ANSYS, Inc. | | | 1.4 | % | |
| | 9 | | | Alliance Data Systems Corp. | | | 1.4 | % | |
| | 10 | | | IntercontinentalExchange, Inc. | | | 1.4 | % | |
| | |
Number
of Shares | |
Value†
(000's)z | |
Common Stocks (95.9%) | |
Aerospace & Defense (1.3%) | |
BE Aerospace, Inc.* | | | 148,000 | | | $ | 10,092 | | |
Airlines (0.2%) | |
Alaska Air Group,
Inc. | | | 35,000 | | | | 1,982 | | |
Auto Components (0.4%) | |
BorgWarner, Inc. | | | 30,000 | | | | 2,897 | | |
Beverages (1.6%) | |
Beam, Inc. | | | 117,000 | | | | 7,330 | | |
Monster Beverage
Corp.* | | | 90,000 | | | | 5,165 | | |
| | | | 12,495 | | |
Biotechnology (4.3%) | |
Alexion
Pharmaceuticals,
Inc.* | | | 90,000 | | | | 9,698 | | |
ARIAD
Pharmaceuticals,
Inc.* | | | 231,500 | | | | 4,306 | | |
BioMarin
Pharmaceutical,
Inc.* | | | 87,500 | | | | 5,729 | | |
Cubist
Pharmaceuticals,
Inc.* | | | 60,000 | | | | 3,802 | | |
Incyte Corp. Ltd.* | | | 100,000 | | | | 3,389 | | |
Pharmacyclics, Inc.* | | | 35,000 | | | | 3,902 | | |
Vertex
Pharmaceuticals,
Inc.* | | | 50,000 | | | | 3,758 | | |
| | | | 34,584 | | |
Building Products (1.0%) | |
Fortune Brands
Home & Security,
Inc. | | | 224,000 | | | | 8,252 | | |
Capital Markets (2.5%) | |
Affiliated
Managers Group,
Inc.* | | | 75,000 | | | | 13,074 | | |
Raymond James
Financial, Inc. | | | 160,000 | | | | 6,693 | | |
| | | | 19,767 | | |
Chemicals (1.3%) | |
Airgas, Inc. | | | 105,000 | | | | 10,673 | | |
Commercial Banks (0.5%) | |
SVB Financial Group* | | | 50,000 | | | | 4,140 | | |
| | |
Number
of Shares | |
Value†
(000's)z | |
Commercial Services & Supplies (1.8%) | |
Stericycle, Inc.* | | | 127,500 | | | $ | 14,352 | | |
Computers & Peripherals (0.3%) | |
SanDisk Corp. | | | 50,000 | | | | 2,759 | | |
Containers & Packaging (1.0%) | |
Packaging Corp.
of America | | | 150,000 | | | | 7,956 | | |
Consumer Finance (0.2%) | |
Portfolio Recovery
Associates, Inc.* | | | 26,930 | | | | 1,428 | | |
Distributors (0.8%) | |
LKQ Corp.* | | | 225,000 | | | | 6,579 | | |
Diversified Financial Services (1.4%) | |
Intercontinental
Exchange, Inc.* | | | 61,556 | | | | 11,065 | | |
Electrical Equipment (3.7%) | |
AMETEK, Inc. | | | 275,000 | | | | 11,803 | | |
Generac Holdings,
Inc. | | | 106,500 | | | | 4,216 | | |
Roper Industries,
Inc. | | | 108,500 | | | | 13,422 | | |
| | | | 29,441 | | |
Electronic Equipment, Instruments & Components (2.1%) | |
Amphenol Corp.
Class A | | | 50,000 | | | | 3,789 | | |
CDW Corp.* | | | 230,000 | | | | 5,044 | | |
Trimble
Navigation Ltd.* | | | 325,000 | | | | 8,206 | | |
| | | | 17,039 | | |
Energy Equipment & Services (2.3%) | |
Cameron
International
Corp.* | | | 60,000 | | | | 3,407 | | |
Core
Laboratories NV | | | 33,000 | | | | 5,000 | | |
Dril-Quip, Inc.* | | | 35,000 | | | | 3,570 | | |
Frank's
International NV* | | | 12,100 | | | | 335 | | |
Oceaneering
International, Inc. | | | 80,000 | | | | 6,207 | | |
| | | | 18,519 | | |
Food & Staples Retailing (1.9%) | |
PriceSmart, Inc. | | | 88,500 | | | | 7,609 | | |
| | |
Number
of Shares | |
Value†
(000's)z | |
Whole Foods
Market, Inc. | | | 143,000 | | | $ | 7,543 | | |
| | | | 15,152 | | |
Food Products (1.8%) | |
Green Mountain
Coffee Roasters,
Inc.* | | | 76,000 | | | | 6,559 | | |
J.M. Smucker Co. | | | 40,000 | | | | 4,246 | | |
WhiteWave Foods
Co. Class A* | | | 175,000 | | | | 3,346 | | |
| | | | 14,151 | | |
Health Care Equipment &
Supplies (1.3%) | |
Cooper Cos., Inc. | | | 66,500 | | | | 8,686 | | |
Wright Medical
Group, Inc.* | | | 69,900 | | | | 1,682 | | |
| | | | 10,368 | | |
Health Care Providers &
Services (2.6%) | |
Catamaran Corp.* | | | 195,000 | | | | 10,707 | | |
DaVita HealthCare
Partners, Inc.* | | | 50,000 | | | | 5,375 | | |
Envision Healthcare
Holdings, Inc.* | | | 26,700 | | | | 701 | | |
Team Health
Holdings, Inc.* | | | 102,000 | | | | 3,920 | | |
| | | | 20,703 | | |
Health Care Technology (1.6%) | |
Cerner Corp.* | | | 272,500 | | | | 12,551 | | |
Hotels, Restaurants & Leisure (1.8%) | |
Buffalo Wild
Wings, Inc.* | | | 69,000 | | | | 7,170 | | |
Starwood Hotels &
Resorts
Worldwide, Inc. | | | 110,000 | | | | 7,033 | | |
| | | | 14,203 | | |
Household Products (0.8%) | |
Church &
Dwight Co., Inc. | | | 105,000 | | | | 6,232 | | |
IT Services (1.4%) | |
Alliance Data
Systems Corp.* | | | 57,000 | | | | 11,155 | | |
Life Sciences Tools & Services (1.9%) | |
ICON PLC* | | | 90,000 | | | | 3,289 | | |
Illumina, Inc.* | | | 154,500 | | | | 12,026 | | |
| | | | 15,315 | | |
See Notes to Schedule of Investments
125
| | |
Number
of Shares | |
Value†
(000's)z | |
Machinery (1.7%) | |
Chart Industries,
Inc.* | | | 55,000 | | | $ | 6,280 | | |
Pall Corp. | | | 110,000 | | | | 7,605 | | |
| | | | 13,885 | | |
Media (2.4%) | |
AMC Networks,
Inc. Class A* | | | 161,000 | | | | 9,979 | | |
Discovery
Communications,
Inc. Class A* | | | 86,000 | | | | 6,666 | | |
Pandora Media,
Inc.* | | | 125,000 | | | | 2,302 | | |
| | | | 18,947 | | |
Multiline Retail (1.1%) | |
Dollar Tree, Inc.* | | | 173,500 | | | | 9,143 | | |
Oil, Gas & Consumable Fuels (3.9%) | |
Cabot Oil & Gas
Corp. | | | 280,000 | | | | 10,956 | | |
Concho
Resources, Inc.* | | | 65,000 | | | | 6,273 | | |
Denbury
Resources, Inc.* | | | 130,000 | | | | 2,248 | | |
Gulfport Energy
Corp.* | | | 100,000 | | | | 5,900 | | |
Oasis Petroleum,
Inc.* | | | 152,500 | | | | 5,978 | | |
| | | | 31,355 | | |
Pharmaceuticals (2.9%) | |
Actavis, Inc.* | | | 60,000 | | | | 8,111 | | |
Impax
Laboratories, Inc.* | | | 150,000 | | | | 3,057 | | |
Jazz
Pharmaceuticals
PLC* | | | 60,000 | | | | 5,261 | | |
Perrigo Co. | | | 60,000 | | | | 7,293 | | |
| | | | 23,722 | | |
Professional Services (3.1%) | |
Advisory Board
Co.* | | | 112,000 | | | | 6,134 | | |
Towers Watson &
Co. Class A | | | 94,000 | | | | 7,732 | | |
Verisk Analytics,
Inc. Class A* | | | 176,500 | | | | 10,975 | | |
| | | | 24,841 | | |
Real Estate Management & Development (1.6%) | |
Jones Lang
LaSalle, Inc. | | | 108,000 | | | | 8,882 | | |
Realogy Holdings
Corp.* | | | 100,000 | | | | 4,233 | | |
| | | | 13,115 | | |
Road & Rail (3.4%) | |
Canadian
Pacific Railway
Ltd. | | | 35,000 | | | | 4,131 | | |
| | |
Number
of Shares | |
Value†
(000's)z | |
Hertz Global
Holdings, Inc.* | | | 233,500 | | | $ | 5,611 | | |
J.B. Hunt
Transport
Services, Inc. | | | 153,500 | | | | 11,052 | | |
Kansas City
Southern | | | 65,000 | | | | 6,852 | | |
| | | | 27,646 | | |
Semiconductors & Semiconductor Equipment (3.3%) | |
Avago
Technologies
Ltd. | | | 265,000 | | | | 10,205 | | |
Cavium, Inc.* | | | 190,000 | | | | 7,214 | | |
Lam Research
Corp.* | | | 50,000 | | | | 2,334 | | |
Microchip
Technology, Inc. | | | 165,000 | | | | 6,404 | | |
| | | | 26,157 | | |
Software (9.4%) | |
ANSYS, Inc.* | | | 133,000 | | | | 11,169 | | |
Aspen
Technology, Inc.* | | | 231,000 | | | | 7,722 | | |
Citrix
Systems, Inc.* | | | 94,000 | | | | 6,652 | | |
Concur
Technologies, Inc.* | | | 72,000 | | | | 7,036 | | |
Electronic Arts,
Inc.* | | | 150,000 | | | | 3,996 | | |
Informatica
Corp.* | | | 175,000 | | | | 6,260 | | |
NetSuite, Inc.* | | | 35,000 | | | | 3,480 | | |
Red Hat, Inc.* | | | 107,000 | | | | 5,406 | | |
Salesforce.com,
Inc.* | | | 150,000 | | | | 7,370 | | |
Splunk, Inc.* | | | 107,000 | | | | 5,907 | | |
Synopsys, Inc.* | | | 100,000 | | | | 3,626 | | |
Ultimate
Software Group,
Inc.* | | | 46,000 | | | | 6,450 | | |
| | | | 75,074 | | |
Specialty Retail (10.6%) | |
Cabela's, Inc.* | | | 90,000 | | | | 5,898 | | |
Dick's Sporting
Goods, Inc. | | | 170,000 | | | | 7,890 | | |
DSW, Inc. Class A | | | 100,000 | | | | 8,609 | | |
GameStop Corp.
Class A | | | 135,000 | | | | 6,778 | | |
O'Reilly
Automotive,
Inc.* | | | 83,000 | | | | 10,185 | | |
Ross Stores, Inc. | | | 119,500 | | | | 8,037 | | |
Tile Shop
Holdings, Inc.* | | | 175,000 | | | | 4,650 | | |
Tractor Supply Co. | | | 89,000 | | | | 10,891 | | |
Ulta Salon
Cosmetics &
Fragrance, Inc.* | | | 45,000 | | | | 4,466 | | |
Urban Outfitters,
Inc.* | | | 228,500 | | | | 9,581 | | |
| | |
Number
of Shares | |
Value†
(000's)z | |
Williams-Sonoma,
Inc. | | | 140,000 | | | $ | 7,897 | | |
| | | | 84,882 | | |
Textiles, Apparel &
Luxury Goods (4.9%) | |
Fifth & Pacific
Cos., Inc.* | | | 287,500 | | | | 6,854 | | |
Hanesbrands, Inc. | | | 137,500 | | | | 8,178 | | |
Lululemon
Athletica, Inc.* | | | 55,000 | | | | 3,896 | | |
Michael Kors
Holdings Ltd.* | | | 65,000 | | | | 4,816 | | |
PVH Corp. | | | 67,500 | | | | 8,691 | | |
Under Armour,
Inc. Class A* | | | 96,500 | | | | 7,010 | | |
| | | | 39,445 | | |
Thrifts & Mortgage Finance (1.2%) | |
Ocwen Financial
Corp.* | | | 198,500 | | | | 10,012 | | |
Trading Companies &
Distributors (1.6%) | |
Fastenal Co. | | | 165,000 | | | | 7,258 | | |
United Rentals,
Inc.* | | | 104,500 | | | | 5,724 | | |
| | | | 12,982 | | |
Wireless Telecommunication
Services (3.0%) | |
Crown Castle
International
Corp.* | | | 135,000 | | | | 9,372 | | |
SBA
Communications
Corp. Class A* | | | 200,000 | | | | 15,000 | | |
| | | | 24,372 | | |
Total Common Stocks
(Cost $534,476) | | | | | 769,428 | | |
Short-Term Investments (4.0%) | |
State Street
Institutional Liquid
Reserves Fund
Institutional Class
(Cost $32,038) | | | 32,037,838 | | | | 32,038 | | |
Total Investments## (99.9%)
(Cost $566,514) | | | | | 801,466 | | |
Cash, receivables
and other assets,
less liabilities (0.1%) | | | | | 535 | | |
Total Net Assets (100.0%) | | | | $ | 802,001 | | |
See Notes to Schedule of Investments
126
Schedule of Investments Mid Cap Intrinsic Value Fund
TOP TEN EQUITY HOLDINGS
| | 1 | | | Safeway, Inc. | | | 4.3 | % | |
| | 2 | | | Corrections Corporation of America | | | 3.1 | % | |
| | 3 | | | CVS Caremark Corp. | | | 2.7 | % | |
| | 4 | | | Nuance Communications, Inc. | | | 2.6 | % | |
| | 5 | | | Fidelity National Information Services, Inc. | | | 2.5 | % | |
| | 6 | | | Devon Energy Corp. | | | 2.4 | % | |
| | 7 | | | General Dynamics Corp. | | | 2.4 | % | |
| | 8 | | | NV Energy, Inc. | | | 2.4 | % | |
| | 9 | | | Cardinal Health, Inc. | | | 2.3 | % | |
| | 10 | | | Omnicare, Inc. | | | 2.3 | % | |
| | |
Number
of Shares | |
Value†
(000's)z | |
Common Stocks (97.6%) | |
Aerospace & Defense (7.5%) | |
General Dynamics
Corp. | | | 19,850 | | | $ | 1,652 | | |
Rockwell
Collins, Inc. | | | 19,300 | | | | 1,366 | | |
Spirit Aerosystems
Holdings, Inc.
Class A* | | | 46,400 | | | | 1,048 | | |
Textron, Inc. | | | 38,300 | | | | 1,032 | | |
| | | | 5,098 | | |
Auto Components (1.6%) | |
Lear Corp. | | | 15,700 | | | | 1,079 | | |
Capital Markets (2.0%) | |
State Street Corp. | | | 20,800 | | | | 1,388 | | |
Chemicals (2.1%) | |
Ashland, Inc. | | | 16,500 | | | | 1,439 | | |
Commercial Banks (5.5%) | |
BankUnited, Inc. | | | 37,800 | | | | 1,117 | | |
BB&T Corp. | | | 25,800 | | | | 876 | | |
Comerica, Inc. | | | 26,200 | | | | 1,070 | | |
Huntington
Bancshares, Inc. | | | 84,200 | | | | 694 | | |
| | | | 3,757 | | |
Commercial Services & Supplies (5.7%) | |
ADT Corp.* | | | 16,700 | | | | 665 | | |
Covanta Holding
Corp. | | | 68,300 | | | | 1,443 | | |
Republic Services,
Inc. | | | 25,900 | | | | 842 | | |
Tyco International
Ltd. | | | 28,800 | | | | 952 | | |
| | | | 3,902 | | |
Construction & Engineering (2.1%) | |
KBR, Inc. | | | 49,200 | | | | 1,469 | | |
Containers & Packaging (1.9%) | |
Avery Dennison
Corp. | | | 30,050 | | | | 1,285 | | |
Electric Utilities (4.9%) | |
Edison International | | | 14,800 | | | | 679 | | |
NV Energy, Inc. | | | 69,900 | | | | 1,639 | | |
Pinnacle West
Capital Corp. | | | 18,700 | | | | 1,015 | | |
| | | | 3,333 | | |
| | |
Number
of Shares | |
Value†
(000's)z | |
Electrical Equipment (1.0%) | |
Regal-Beloit Corp. | | | 10,500 | | | $ | 669 | | |
Electronic Equipment, Instruments & Components (3.6%) | |
Dolby Laboratories,
Inc. Class A | | | 36,200 | | | | 1,138 | | |
Flextronics
International Ltd.* | | | 144,100 | | | | 1,294 | | |
| | | | 2,432 | | |
Energy Equipment & Services (2.0%) | |
Cameron
International
Corp.* | | | 24,000 | | | | 1,363 | | |
Food & Staples Retailing (7.0%) | |
CVS Caremark
Corp. | | | 31,600 | | | | 1,834 | | |
Safeway, Inc. | | | 113,400 | | | | 2,937 | | |
| | | | 4,771 | | |
Health Care Equipment &
Supplies (4.4%) | |
Covidien PLC | | | 24,400 | | | | 1,450 | | |
Zimmer
Holdings, Inc. | | | 19,600 | | | | 1,550 | | |
| | | | 3,000 | | |
Health Care Providers &
Services (4.7%) | |
Cardinal Health,
Inc. | | | 31,800 | | | | 1,599 | | |
Omnicare, Inc. | | | 29,400 | | | | 1,598 | | |
| | | | 3,197 | | |
Health Care Technology (0.1%) | |
Allscripts Healthcare
Solutions, Inc.* | | | 3,300 | | | | 48 | | |
Hotels, Restaurants & Leisure (1.2%) | |
Wyndham
Worldwide Corp. | | | 13,900 | | | | 825 | | |
Independent Power Producers & Energy Traders (1.9%) | |
AES Corp. | | | 102,200 | | | | 1,299 | | |
IT Services (8.1%) | |
Amdocs Ltd. | | | 39,300 | | | | 1,449 | | |
Fidelity National
Information
Services, Inc. | | | 37,800 | | | | 1,681 | | |
VeriFone Systems,
Inc.* | | | 48,000 | | | | 951 | | |
| | |
Number
of Shares | |
Value†
(000's)z | |
Western Union Co. | | | 82,100 | | | $ | 1,439 | | |
| | | | 5,520 | | |
Multi-Utilities (2.0%) | |
CenterPoint Energy,
Inc. | | | 59,400 | | | | 1,362 | | |
Multiline Retail (1.9%) | |
Kohl's Corp. | | | 25,000 | | | | 1,283 | | |
Oil, Gas & Consumable Fuels (4.0%) | |
Devon Energy
Corp. | | | 29,000 | | | | 1,656 | | |
Energy Transfer
Partners L.P. | | | 8,325 | | | | 427 | | |
Southwestern
Energy Co.* | | | 16,400 | | | | 626 | | |
| | | | 2,709 | | |
Pharmaceuticals (0.2%) | |
Mallinckrodt PLC* | | | 3,050 | | | | 133 | | |
Real Estate Investment Trusts (5.3%) | |
Corrections
Corporation of
America | | | 65,104 | | | | 2,144 | | |
Starwood Property
Trust, Inc. | | | 59,800 | | | | 1,491 | | |
| | | | 3,635 | | |
Road & Rail (0.9%) | |
Avis Budget
Group, Inc.* | | | 24,400 | | | | 653 | | |
Semiconductors & Semiconductor Equipment (1.6%) | |
Skyworks Solutions,
Inc.* | | | 44,500 | | | | 1,128 | | |
Software (6.4%) | |
Check Point
Software
Technologies Ltd.* | | | 21,500 | | | | 1,205 | | |
Nuance
Communications,
Inc.* | | | 92,500 | | | | 1,766 | | |
Symantec Corp. | | | 55,400 | | | | 1,419 | | |
| | | | 4,390 | | |
Specialty Retail (6.0%) | |
Best Buy Co., Inc. | | | 39,000 | | | | 1,404 | | |
Express, Inc.* | | | 53,900 | | | | 1,131 | | |
Staples, Inc. | | | 110,600 | | | | 1,539 | | |
| | | | 4,074 | | |
See Notes to Schedule of Investments
127
| | |
Number
of Shares | |
Value†
(000's)z | |
Thrifts & Mortgage Finance (2.0%) | |
People's United
Financial, Inc. | | | 95,900 | | | $ | 1,364 | | |
Total Common Stocks
(Cost $53,722) | | | | | 66,605 | | |
Short-Term Investments (0.8%) | |
State Street
Institutional Liquid
Reserves Fund
Institutional Class
(Cost $577) | | | 576,669 | | | | 577 | | |
Total Investments (98.4%)
(Cost $54,299) | | | | | 67,182 | | |
Cash, receivables
and other assets,
less liabilities (1.6%) | | | | | 1,059 | | |
Total Net Assets (100.0%) | | | | $ | 68,241 | | |
See Notes to Schedule of Investments
128
Schedule of Investments Multi-Cap Opportunities Fund
TOP TEN EQUITY HOLDINGS
| | 1 | | | Boeing Co. | | | 4.1 | % | |
| | 2 | | | Berkshire Hathaway, Inc. Class B | | | 3.6 | % | |
| | 3 | | | JPMorgan Chase & Co. | | | 3.6 | % | |
| | 4 | | | CSX Corp. | | | 3.3 | % | |
| | 5 | | | HCA Holdings, Inc. | | | 3.3 | % | |
| | 6 | | | Cardinal Health, Inc. | | | 3.3 | % | |
| | 7 | | | 3M Co. | | | 3.3 | % | |
| | 8 | | | Pfizer, Inc. | | | 3.2 | % | |
| | 9 | | | ConAgra Foods, Inc. | | | 3.2 | % | |
| | 10 | | | Hyatt Hotels Corp. Class A | | | 3.2 | % | |
| | |
Number
of Shares | |
Value†
(000's)z | |
Common Stocks (96.9%) | |
Aerospace & Defense (5.8%) | |
Boeing Co. | | | 585,000 | | | $ | 60,793 | | |
Raytheon Co. | | | 340,000 | | | | 25,640 | | |
| | | | 86,433 | | |
Chemicals (3.6%) | |
Ecolab, Inc. | | | 25,000 | | | | 2,284 | | |
Methanex Corp. | | | 505,000 | | | | 23,477 | | |
Scotts Miracle-Gro
Co. Class A | | | 520,000 | | | | 27,409 | | |
| | | | 53,170 | | |
Commercial Services & Supplies (1.7%) | |
Covanta Holding
Corp. | | | 825,000 | | | | 17,432 | | |
Knoll, Inc. | | | 500,000 | | | | 7,615 | | |
| | | | 25,047 | | |
Computers & Peripherals (3.2%) | |
Apple, Inc. | | | 97,000 | | | | 47,244 | | |
Containers & Packaging (2.7%) | |
Sealed Air Corp. | | | 1,400,000 | | | | 39,760 | | |
Diversified Financial Services (7.2%) | |
Berkshire
Hathaway, Inc.
Class B* | | | 485,000 | | | | 53,942 | | |
JPMorgan Chase &
Co. | | | 1,050,000 | | | | 53,057 | | |
| | | | 106,999 | | |
Electrical Equipment (3.1%) | |
ABB Ltd. ADR* | | | 1,400,000 | | | | 29,974 | | |
Rockwell
Automation, Inc. | | | 165,000 | | | | 16,043 | | |
| | | | 46,017 | | |
Energy Equipment & Services (3.1%) | |
Schlumberger Ltd. | | | 580,000 | | | | 46,945 | | |
Food Products (6.7%) | |
ConAgra Foods,
Inc. | | | 1,400,000 | | | | 47,348 | | |
Kraft Foods Group,
Inc. | | | 465,000 | | | | 24,073 | | |
Mondelez
International,
Inc. Class A | | | 920,000 | | | | 28,217 | | |
| | | | 99,638 | | |
| | |
Number
of Shares | |
Value†
(000's)z | |
Gas Utilities (2.9%) | |
National Fuel Gas
Co. | | | 665,000 | | | $ | 43,411 | | |
Health Care Equipment &
Supplies (2.2%) | |
Hill-Rom Holdings,
Inc. | | | 950,000 | | | | 32,433 | | |
Health Care Providers &
Services (8.2%) | |
Cardinal Health,
Inc. | | | 975,000 | | | | 49,023 | | |
HCA Holdings,
Inc. | | | 1,285,000 | | | | 49,074 | | |
Henry Schein,
Inc.* | | | 240,000 | | | | 24,252 | | |
| | | | 122,349 | | |
Hotels, Restaurants & Leisure (4.2%) | |
Darden Restaurants,
Inc. | | | 345,000 | | | | 15,943 | | |
Hyatt Hotels Corp.
Class A* | | | 1,090,000 | | | | 47,306 | | |
| | | | 63,249 | | |
Household Products (2.6%) | |
Procter & Gamble
Co. | | | 505,000 | | | | 39,334 | | |
Industrial Conglomerates (3.3%) | |
3M Co. | | | 430,000 | | | | 48,839 | | |
Leisure Equipment & Products (2.6%) | |
Mattel, Inc. | | | 975,000 | | | | 39,488 | | |
Media (3.7%) | |
Omnicom Group,
Inc. | | | 760,000 | | | | 46,094 | | |
Twenty-First
Century Fox, Inc. | | | 300,000 | | | | 9,399 | | |
| | | | 55,493 | | |
Metals & Mining (2.7%) | |
Carpenter
Technology Corp. | | | 740,000 | | | | 39,790 | | |
Oil, Gas & Consumable Fuels (6.0%) | |
Cenovus Energy,
Inc. | | | 1,565,000 | | | | 44,978 | | |
Range Resources
Corp. | | | 600,000 | | | | 44,988 | | |
| | | | 89,966 | | |
| | |
Number
of Shares | |
Value†
(000's)z | |
Pharmaceuticals (3.2%) | |
Pfizer, Inc. | | | 1,715,000 | | | $ | 48,380 | | |
Professional Services (2.9%) | |
Barrett Business
Services, Inc. | | | 21,000 | | | | 1,350 | | |
Nielsen
Holdings NV | | | 1,205,000 | | | | 41,572 | | |
| | | | 42,922 | | |
Road & Rail (4.3%) | |
CSX Corp. | | | 2,000,000 | | | | 49,220 | | |
Hertz Global
Holdings, Inc.* | | | 600,000 | | | | 14,418 | | |
| | | | 63,638 | | |
Software (5.2%) | |
Activision
Blizzard, Inc. | | | 2,890,000 | | | | 47,165 | | |
Microsoft Corp. | | | 900,000 | | | | 30,060 | | |
| | | | 77,225 | | |
Specialty Retail (2.8%) | |
Bed Bath &
Beyond, Inc.* | | | 560,000 | | | | 41,294 | | |
Textiles, Apparel & Luxury
Goods (3.0%) | |
Deckers Outdoor
Corp.* | | | 95,000 | | | | 5,579 | | |
Hanesbrands, Inc. | | | 660,000 | | | | 39,257 | | |
| | | | 44,836 | | |
Total Common Stocks
(Cost $1,231,025) | | | | | 1,443,900 | | |
Short-Term Investments (3.3%) | |
State Street
Institutional Liquid
Reserves Fund
Institutional Class
(Cost $49,609) | | | 49,609,115 | | | | 49,609 | | |
Total Investments## (100.2%)
(Cost $1,280,634) | | | | | 1,493,509 | | |
Liabilities, less cash,
receivables and
other assets [(0.2%)] | | | | | (2,956 | ) | |
Total Net Assets (100.0%) | | | | $ | 1,490,553 | | |
See Notes to Schedule of Investments
129
Schedule of Investments Real Estate Fund
TOP TEN EQUITY HOLDINGS
| | 1 | | | Simon Property Group, Inc. | | | 9.1 | % | |
| | 2 | | | American Tower Corp. | | | 5.8 | % | |
| | 3 | | | Public Storage | | | 5.0 | % | |
| | 4 | | | AvalonBay Communities, Inc. | | | 4.6 | % | |
| | 5 | | | Equity Residential | | | 4.4 | % | |
| | 6 | | | Boston Properties, Inc. | | | 4.3 | % | |
| | 7 | | | Prologis, Inc. | | | 4.0 | % | |
| | 8 | | | Vornado Realty Trust | | | 3.8 | % | |
| | 9 | | | HCP, Inc. | | | 3.8 | % | |
| | 10 | | | Ventas, Inc. | | | 3.7 | % | |
| | |
Number
of Shares | |
Value†
(000's)z | |
Common Stocks (98.5%) | |
Apartments (13.9%) | |
American Campus
Communities, Inc. | | | 333,100 | | | $ | 11,096 | | |
AvalonBay
Communities, Inc. | | | 339,192 | | | | 42,026 | | |
Camden Property
Trust | | | 303,198 | | | | 18,735 | | |
Equity Residential | | | 779,600 | | | | 40,453 | | |
Post Properties, Inc. | | | 318,800 | | | | 14,419 | | |
| | | | 126,729 | | |
Diversified (12.7%) | |
American
Homes 4 Rent
Class A* | | | 381,700 | | | | 6,061 | | |
American
Homes 4 Rent
Class Añ* | | | 896,000 | | | | 14,023 | | |
American
Residential
Properties, Inc.* | | | 242,800 | | | | 4,142 | | |
American
Residential
Properties, Inc.ñ* | | | 595,350 | | | | 10,157 | | |
Cousins
Properties, Inc. | | | 1,506,178 | | | | 14,956 | | |
Digital Realty
Trust, Inc. | | | 397,370 | | | | 22,094 | | |
DuPont Fabros
Technology, Inc. | | | 437,349 | | | | 9,967 | | |
Vornado Realty
Trust | | | 423,525 | | | | 34,433 | | |
| | | | 115,833 | | |
Health Care (10.0%) | |
HCP, Inc. | | | 842,500 | | | | 34,315 | | |
Health Care
REIT, Inc. | | | 381,640 | | | | 23,448 | | |
Ventas, Inc. | | | 541,130 | | | | 33,691 | | |
| | | | 91,454 | | |
Household Durables (1.8%) | |
Taylor Morrison
Home Corp.
Class A* | | | 155,300 | | | | 3,201 | | |
TRI Pointe Homes,
Inc.* | | | 923,200 | | | | 12,952 | | |
| | | | 16,153 | | |
| | |
Number
of Shares | |
Value†
(000's)z | |
Industrial (7.0%) | |
EastGroup
Properties, Inc. | | | 314,000 | | | $ | 17,647 | | |
Prologis, Inc. | | | 1,037,238 | | | | 36,552 | | |
Terreno Realty
Corp. | | | 554,100 | | | | 9,730 | | |
| | | | 63,929 | | |
Infrastructure (5.8%) | |
American Tower
Corp. | | | 768,200 | | | | 53,382 | | |
Lodging/Resorts (2.6%) | |
Host Hotels &
Resorts, Inc. | | | 1,422,443 | | | | 24,224 | | |
Office (10.5%) | |
Boston Properties,
Inc. | | | 379,050 | | | | 38,853 | | |
Corporate Office
Properties Trust | | | 503,200 | | | | 11,463 | | |
Douglas Emmett,
Inc. | | | 646,900 | | | | 14,943 | | |
Highwoods
Properties, Inc. | | | 220,886 | | | | 7,461 | | |
Kilroy Realty Corp. | | | 90,263 | | | | 4,404 | | |
Mission West
Properties, Inc. | | | 203,480 | | | | 0 | | |
SL Green Realty
Corp. | | | 217,500 | | | | 18,964 | | |
| | | | 96,088 | | |
Real Estate Management & Development (2.8%) | |
Brookfield Asset
Management, Inc.
Class A | | | 323,877 | | | | 11,200 | | |
Forest City
Enterprises, Inc.
Class A* | | | 814,500 | | | | 14,580 | | |
| | | | 25,780 | | |
Regional Malls (14.6%) | |
General Growth
Properties, Inc. | | | 1,226,900 | | | | 23,532 | | |
Macerich Co. | | | 200,288 | | | | 11,272 | | |
Simon Property
Group, Inc. | | | 570,248 | | | | 83,045 | | |
Taubman Centers,
Inc. | | | 235,062 | | | | 15,846 | | |
| | | | 133,695 | | |
| | |
Number
of Shares | |
Value†
(000's)z | |
Self Storage (6.0%) | |
Public Storage | | | 299,900 | | | $ | 45,786 | | |
Sovran Self
Storage, Inc. | | | 140,800 | | | | 9,331 | | |
| | | | 55,117 | | |
Shopping Centers (5.2%) | |
DDR Corp. | | | 1,054,750 | | | | 16,369 | | |
Federal Realty
Investment Trust | | | 200,000 | | | | 19,462 | | |
Urstadt Biddle
Properties, Inc.
Class A | | | 586,469 | | | | 11,454 | | |
| | | | 47,285 | | |
Timber (5.6%) | |
Rayonier, Inc. | | | 330,800 | | | | 18,273 | | |
Weyerhaeuser Co. | | | 1,204,698 | | | | 32,985 | | |
| | | | 51,258 | | |
Total Common Stocks
(Cost $893,004) | | | | | 900,927 | | |
Short-Term Investments (1.0%) | |
State Street
Institutional Liquid
Reserves Fund
Institutional Class
(Cost $8,895) | | | 8,895,457 | | | | 8,895 | | |
Total Investments## (99.5%)
(Cost $901,899) | | | | | 909,822 | | |
Cash, receivables
and other assets,
less liabilities (0.5%) | | | | | 4,241 | | |
Total Net Assets (100.0%) | | | | $ | 914,063 | | |
See Notes to Schedule of Investments
130
Schedule of Investments Select Equities Fund
TOP TEN EQUITY HOLDINGS
| | 1 | | | American Tower Corp. | | | 5.9 | % | |
| | 2 | | | Pioneer Natural Resources Co. | | | 5.4 | % | |
| | 3 | | | Union Pacific Corp. | | | 5.4 | % | |
| | 4 | | | Boeing Co. | | | 5.3 | % | |
| | 5 | | | eBay, Inc. | | | 5.1 | % | |
| | 6 | | | Nielsen Holdings NV | | | 4.7 | % | |
| | 7 | | | Monsanto Co. | | | 4.6 | % | |
| | 8 | | | Express Scripts Holding Co. | | | 4.5 | % | |
| | 9 | | | Calpine Corp. | | | 4.3 | % | |
| | 10 | | | American International Group, Inc. | | | 4.1 | % | |
| | |
Number
of Shares | |
Value†
(000's)z | |
Common Stocks (85.8%) | |
Aerospace & Defense (5.3%) | |
Boeing Co. | | | 47,043 | | | $ | 4,889 | | |
Auto Components (4.0%) | |
BorgWarner, Inc. | | | 38,712 | | | | 3,739 | | |
Capital Markets (3.2%) | |
BlackRock, Inc. | | | 11,456 | | | | 2,982 | | |
Chemicals (4.6%) | |
Monsanto Co. | | | 43,871 | | | | 4,295 | | |
Consumer Finance (3.1%) | |
Capital One Financial
Corp. | | | 44,147 | | | | 2,850 | | |
Health Care Providers &
Services (4.5%) | |
Express Scripts
Holding Co.* | | | 65,230 | | | | 4,167 | | |
Hotels, Restaurants & Leisure (3.9%) | |
McDonald's Corp. | | | 38,462 | | | | 3,629 | | |
Independent Power Producers & Energy Traders (4.3%) | |
Calpine Corp.* | | | 206,481 | | | | 3,991 | | |
Insurance (4.1%) | |
American International
Group, Inc.* | | | 81,865 | | | | 3,803 | | |
Internet & Catalog Retail (4.1%) | |
Amazon.com, Inc.* | | | 13,395 | | | | 3,764 | | |
Internet Software & Services (5.1%) | |
eBay, Inc.* | | | 94,099 | | | | 4,704 | | |
Oil, Gas & Consumable Fuels (15.9%) | |
Enbridge Energy
Management LLC* | | | 110,058 | | | | 3,301 | | |
Kinder Morgan,
Inc. | | | 77,477 | | | | 2,939 | | |
Pioneer Natural
Resources Co. | | | 28,560 | | | | 4,997 | | |
Range Resources
Corp. | | | 45,940 | | | | 3,444 | | |
| | | | 14,681 | | |
Pharmaceuticals (2.7%) | |
Novartis AG ADR | | | 34,884 | | | | 2,546 | | |
Professional Services (9.7%) | |
IHS Inc. Class A* | | | 29,763 | | | | 3,189 | | |
Nielsen Holdings
NV | | | 125,359 | | | | 4,325 | | |
| | |
Number
of Shares | |
Value†
(000's)z | |
Verisk Analytics,
Inc. Class A* | | | 22,955 | | | $ | 1,427 | | |
| | | | 8,941 | | |
Real Estate Investment Trusts (5.9%) | |
American Tower
Corp. | | | 79,007 | | | | 5,490 | | |
Road & Rail (5.4%) | |
Union Pacific Corp. | | | 32,399 | | | | 4,975 | | |
Total Common Stocks
(Cost $66,788) | | | | | 79,446 | | |
Short-Term Investments (14.0%) | |
State Street
Institutional Treasury
Money Market Fund
Institutional Class
(Cost $12,958) | | | 12,958,417 | | | | 12,958 | | |
Total Investments## (99.8%)
(Cost $79,746) | | | | | 92,404 | | |
Cash, receivables
and other assets,
less liabilities (0.2%) | | | | | 230 | | |
Total Net Assets (100.0%) | | | | $ | 92,634 | | |
See Notes to Schedule of Investments
131
Schedule of Investments Small Cap Growth Fund
TOP TEN EQUITY HOLDINGS
| | 1 | | | Fifth & Pacific Cos., Inc. | | | 3.9 | % | |
| | 2 | | | HEICO Corp. | | | 1.9 | % | |
| | 3 | | | TearLab Corp. | | | 1.8 | % | |
| | 4 | | | Zale Corp. | | | 1.8 | % | |
| | 5 | | | Novadaq Technologies, Inc. | | | 1.7 | % | |
| | 6 | | | FleetMatics Group PLC | | | 1.7 | % | |
| | 7 | | | QLIK Technologies, Inc. | | | 1.7 | % | |
| | 8 | | | Carriage Services, Inc. | | | 1.7 | % | |
| | 9 | | | Tuesday Morning Corp. | | | 1.6 | % | |
| | 10 | | | Ultimate Software Group, Inc. | | | 1.5 | % | |
| | |
Number
of Shares | |
Value†
(000's)z | |
Common Stocks (98.5%) | |
Aerospace & Defense (3.4%) | |
DigitalGlobe, Inc.* | | | 36,500 | | | $ | 1,102 | | |
HEICO Corp. | | | 24,270 | | �� | | 1,517 | | |
| | | | 2,619 | | |
Auto Components (1.0%) | |
Gentherm, Inc.* | | | 45,300 | | | | 758 | | |
Biotechnology (4.1%) | |
Aegerion
Pharmaceuticals,
Inc.* | | | 11,500 | | | | 997 | | |
Alkermes PLC* | | | 34,600 | | | | 1,098 | | |
Alnylam
Pharmaceuticals,
Inc.* | | | 13,200 | | | | 684 | | |
TG Therapeutics,
Inc.* | | | 72,700 | | | | 438 | | |
| | | | 3,217 | | |
Building Products (1.0%) | |
PGT, Inc.* | | | 76,200 | | | | 776 | | |
Capital Markets (0.9%) | |
WisdomTree
Investments, Inc.* | | | 63,600 | | | | 712 | | |
Chemicals (1.4%) | |
PolyOne Corp. | | | 40,600 | | | | 1,097 | | |
Commercial Banks (5.5%) | |
Cathay General
Bancorp | | | 33,100 | | | | 729 | | |
First Financial
Holdings, Inc. | | | 18,500 | | | | 996 | | |
Home BancShares,
Inc. | | | 39,100 | | | | 994 | | |
OFG Bancorp | | | 46,900 | | | | 805 | | |
Renasant Corp. | | | 31,900 | | | | 803 | | |
| | | | 4,327 | | |
Communications Equipment (1.4%) | |
Calix, Inc.* | | | 82,800 | | | | 1,064 | | |
Construction Materials (1.0%) | |
Caesar Stone
Sdot Yam Ltd.* | | | 19,500 | | | | 814 | | |
Containers & Packaging (1.2%) | |
Graphic Packaging
Holding Co.* | | | 117,100 | | | | 973 | | |
| | |
Number
of Shares | |
Value†
(000's)z | |
Diversified Consumer Services (2.9%) | |
Bright Horizons
Family Solutions,
Inc.* | | | 26,800 | | | $ | 976 | | |
Carriage Services,
Inc. | | | 73,500 | | | | 1,295 | | |
| | | | 2,271 | | |
Diversified Financial Services (1.2%) | |
Marlin Business
Services Corp. | | | 38,472 | | | | 937 | | |
Electrical Equipment (2.5%) | |
Generac Holdings,
Inc. | | | 20,400 | | | | 808 | | |
PowerSecure
International, Inc.* | | | 75,500 | | | | 1,159 | | |
| | | | 1,967 | | |
Energy Equipment & Services (1.8%) | |
C&J Energy
Services, Inc.* | | | 28,200 | | | | 579 | | |
Dawson
Geophysical Co.* | | | 23,200 | | | | 833 | | |
| | | | 1,412 | | |
Food & Staples Retailing (2.4%) | |
Natural Grocers
by Vitamin
Cottage, Inc.* | | | 26,700 | | | | 1,029 | | |
PriceSmart, Inc. | | | 9,700 | | | | 834 | | |
| | | | 1,863 | | |
Food Products (1.5%) | |
WhiteWave
Foods Co. Class A* | | | 60,400 | | | | 1,155 | | |
Health Care Equipment &
Supplies (10.7%) | |
ArthroCare Corp.* | | | 19,000 | | | | 602 | | |
Cyberonics, Inc.* | | | 17,100 | | | | 870 | | |
Endologix, Inc.* | | | 66,300 | | | | 1,049 | | |
Globus Medical,
Inc. Class A* | | | 55,300 | | | | 974 | | |
Insulet Corp.* | | | 27,300 | | | | 910 | | |
Novadaq
Technologies, Inc.* | | | 89,900 | | | | 1,339 | | |
Spectranetics
Corp.* | | | 73,100 | | | | 1,154 | | |
TearLab Corp.* | | | 109,800 | | | | 1,443 | | |
| | | | 8,341 | | |
| | |
Number
of Shares | |
Value†
(000's)z | |
Health Care Providers &
Services (1.3%) | |
Acadia Healthcare
Co., Inc.* | | | 27,195 | | | $ | 1,042 | | |
Health Care Technology (2.1%) | |
HealthStream, Inc.* | | | 24,500 | | | | 812 | | |
Omnicell, Inc.* | | | 38,100 | | | | 829 | | |
| | | | 1,641 | | |
Hotels, Restaurants & Leisure (1.1%) | |
Bally Technologies,
Inc.* | | | 12,400 | | | | 895 | | |
Internet & Catalog Retail (1.1%) | |
Blue Nile, Inc.* | | | 23,000 | | | | 832 | | |
Internet Software & Services (6.8%) | |
Cornerstone
OnDemand, Inc.* | | | 22,200 | | | | 1,143 | | |
CoStar Group, Inc.* | | | 7,600 | | | | 1,129 | | |
Demandware, Inc.* | | | 25,800 | | | | 1,086 | | |
SPS Commerce,
Inc.* | | | 17,500 | | | | 1,091 | | |
Zix Corp.* | | | 201,900 | | | | 870 | | |
| | | | 5,319 | | |
IT Services (3.6%) | |
EPAM Systems,
Inc.* | | | 35,750 | | | | 1,143 | | |
EVERTEC, Inc. | | | 33,300 | | | | 795 | | |
MAXIMUS, Inc. | | | 24,000 | | | | 900 | | |
| | | | 2,838 | | |
Life Sciences Tools & Services (1.2%) | |
ICON PLC* | | | 26,200 | | | | 957 | | |
Machinery (2.9%) | |
Chart Industries,
Inc.* | | | 7,100 | | | | 811 | | |
Mueller Industries,
Inc. | | | 13,700 | | | | 733 | | |
TriMas Corp.* | | | 21,000 | | | | 738 | | |
| | | | 2,282 | | |
Multiline Retail (1.6%) | |
Tuesday Morning
Corp.* | | | 100,100 | | | | 1,232 | | |
Oil, Gas & Consumable Fuels (2.7%) | |
Bonanza Creek
Energy, Inc.* | | | 27,600 | | | | 1,096 | | |
Oasis Petroleum,
Inc.* | | | 26,600 | | | | 1,043 | | |
| | | | 2,139 | | |
See Notes to Schedule of Investments
132
| | |
Number
of Shares | |
Value†
(000's)z | |
Pharmaceuticals (2.1%) | |
AcelRx
Pharmaceuticals,
Inc.* | | | 96,200 | | | $ | 953 | | |
Akorn, Inc.* | | | 37,100 | | | | 667 | | |
| | | | 1,620 | | |
Road & Rail (1.4%) | |
Old Dominion
Freight Line, Inc.* | | | 25,871 | | | | 1,123 | | |
Software (14.2%) | |
Aspen Technology,
Inc.* | | | 26,800 | | | | 896 | | |
CommVault
Systems, Inc.* | | | 12,600 | | | | 1,056 | | |
Concur
Technologies, Inc.* | | | 12,100 | | | | 1,182 | | |
FleetMatics
Group PLC* | | | 27,000 | | | | 1,335 | | |
Guidewire
Software, Inc.* | | | 23,300 | | | | 1,071 | | |
NetSuite, Inc.* | | | 11,300 | | | | 1,124 | | |
PTC, Inc.* | | | 41,700 | | | | 1,087 | | |
QLIK Technologies,
Inc.* | | | 40,500 | | | | 1,328 | | |
Tyler Technologies,
Inc.* | | | 11,261 | | | | 832 | | |
Ultimate Software
Group, Inc.* | | | 8,500 | | | | 1,192 | | |
| | | | 11,103 | | |
Specialty Retail (6.2%) | |
Asbury Automotive
Group, Inc.* | | | 18,700 | | | | 919 | | |
Pier 1 Imports, Inc. | | | 31,000 | | | | 679 | | |
Tile Shop Holdings,
Inc.* | | | 30,100 | | | | 800 | | |
Tractor Supply Co. | | | 8,500 | | | | 1,040 | | |
Zale Corp.* | | | 112,700 | | | | 1,410 | | |
| | | | 4,848 | | |
Textiles, Apparel & Luxury
Goods (4.9%) | |
Fifth & Pacific Cos.,
Inc.* | | | 126,500 | | | | 3,016 | | |
Iconix Brand Group,
Inc.* | | | 26,000 | | | | 853 | | |
| | | | 3,869 | | |
Trading Companies &
Distributors (1.4%) | |
Watsco, Inc. | | | 12,300 | | | | 1,105 | | |
Total Common Stocks
(Cost $67,595) | | | | | 77,148 | | |
| | |
Number
of Shares | |
Value†
(000's)z | |
Short-Term Investments (2.3%) | |
State Street
Institutional Liquid
Reserves Fund
Institutional Class
(Cost $1,775) | | | 1,775,110 | | | $ | 1,775 | | |
Total Investments## (100.8%)
(Cost $69,370) | | | | | 78,923 | | |
Liabilities, less
cash, receivables
and other assets [(0.8%)] | | | | | (591 | ) | |
Total Net Assets (100.0%) | | | | $ | 78,332 | | |
See Notes to Schedule of Investments
133
Schedule of Investments Socially Responsive Fund
TOP TEN EQUITY HOLDINGS
| | 1 | | | Texas Instruments, Inc. | | | 5.1 | % | |
| | 2 | | | Danaher Corp. | | | 4.8 | % | |
| | 3 | | | Newell Rubbermaid, Inc. | | | 4.5 | % | |
| | 4 | | | American Express Co. | | | 4.3 | % | |
| | 5 | | | IntercontinentalExchange, Inc. | | | 3.8 | % | |
| | 6 | | | Progressive Corp. | | | 3.6 | % | |
| | 7 | | | Altera Corp. | | | 3.6 | % | |
| | 8 | | | 3M Co. | | | 3.4 | % | |
| | 9 | | | BG Group PLC | | | 3.3 | % | |
| | 10 | | | Unilever NV | | | 3.3 | % | |
| | |
Number
of Shares | |
Value†
(000's)z | |
Common Stocks (97.0%) | |
Auto Components (2.4%) | |
BorgWarner, Inc. | | | 562,671 | | | $ | 54,343 | | |
Capital Markets (2.1%) | |
Lazard Ltd.
Class A | | | 1,347,787 | | | | 47,739 | | |
Chemicals (2.0%) | |
Ecolab, Inc. | | | 475,569 | | | | 43,443 | | |
Commercial Services & Supplies (1.3%) | |
Herman Miller, Inc. | | | 1,145,445 | | | | 29,174 | | |
Consumer Finance (4.3%) | |
American Express
Co. | | | 1,345,138 | | | | 96,729 | | |
Diversified Financial Services (5.2%) | |
CME Group, Inc. | | | 430,562 | | | | 30,617 | | |
Intercontinental
Exchange, Inc.* | | | 469,806 | | | | 84,448 | | |
| | | | 115,065 | | |
Diversified Telecommunication Services (0.9%) | |
tw telecom, Inc.* | | | 708,093 | | | | 20,266 | | |
Electronic Equipment, Instruments & Components (1.9%) | |
National
Instruments
Corp. | | | 1,500,220 | | | | 41,631 | | |
Energy Equipment & Services (2.4%) | |
Cameron
International
Corp.* | | | 940,880 | | | | 53,433 | | |
Food & Staples Retailing (1.4%) | |
Costco Wholesale
Corp. | | | 287,271 | | | | 32,137 | | |
Food Products (6.6%) | |
J.M. Smucker Co. | | | 408,962 | | | | 43,407 | | |
McCormick & Co.,
Inc. | | | 440,131 | | | | 29,775 | | |
Unilever NV | | | 1,937,580 | | | | 72,911 | | |
| | | | 146,093 | | |
Health Care Equipment &
Supplies (5.3%) | |
Becton, Dickinson &
Co. | | | 639,487 | | | | 62,273 | | |
Covidien PLC | | | 951,301 | | | | 56,507 | | |
| | | | 118,780 | | |
| | |
Number
of Shares | |
Value†
(000's)z | |
Household Durables (4.5%) | |
Newell
Rubbermaid, Inc. | | | 3,912,554 | | | $ | 98,988 | | |
Household Products (2.9%) | |
Procter & Gamble
Co. | | | 818,123 | | | | 63,724 | | |
Industrial Conglomerates (8.2%) | |
3M Co. | | | 668,547 | | | | 75,934 | | |
Danaher Corp. | | | 1,634,715 | | | | 107,106 | | |
| | | | 183,040 | | |
Industrial Gases (1.9%) | |
Praxair, Inc. | | | 358,870 | | | | 42,131 | | |
Insurance (3.6%) | |
Progressive Corp. | | | 3,204,855 | | | | 80,346 | | |
Internet Software & Services (1.9%) | |
Google, Inc.
Class A* | | | 48,567 | | | | 41,131 | | |
IT Services (1.4%) | |
MasterCard, Inc.
Class A | | | 51,988 | | | | 31,509 | | |
Machinery (1.7%) | |
Pall Corp. | | | 546,700 | | | | 37,799 | | |
Media (2.3%) | |
Scripps Networks
Interactive, Inc.
Class A | | | 688,246 | | | | 50,607 | | |
Metals & Mining (2.0%) | |
Nucor Corp. | | | 965,519 | | | | 43,921 | | |
Oil, Gas & Consumable Fuels (7.2%) | |
BG Group PLC | | | 3,895,670 | | | | 74,075 | | |
Cimarex
Energy Co. | | | 285,139 | | | | 23,898 | | |
Noble Energy, Inc. | | | 999,030 | | | | 61,370 | | |
| | | | 159,343 | | |
Pharmaceuticals (2.9%) | |
Roche Holding AG | | | 261,293 | | | | 65,179 | | |
Road & Rail (1.9%) | |
J.B. Hunt Transport
Services, Inc. | | | 593,106 | | | | 42,704 | | |
Semiconductors & Semiconductor Equipment (8.6%) | |
Altera Corp. | | | 2,256,599 | | | | 79,364 | | |
Texas
Instruments, Inc. | | | 2,950,859 | | | | 112,723 | | |
| | | | 192,087 | | |
| | |
Number
of Shares | |
Value†
(000's)z | |
Software (3.1%) | |
Intuit, Inc. | | | 1,089,900 | | | $ | 69,241 | | |
Specialty Chemicals (0.8%) | |
Novozymes A/S
B Shares | | | 479,600 | | | | 17,479 | | |
Specialty Retail (4.4%) | |
O'Reilly Automotive,
Inc.* | | | 452,177 | | | | 55,487 | | |
TJX Cos., Inc. | | | 798,792 | | | | 42,112 | | |
| | | | 97,599 | | |
Trading Companies &
Distributors (1.9%) | |
W.W. Grainger, Inc. | | | 175,029 | | | | 43,293 | | |
Total Common Stocks
(Cost $1,672,154) | | | | | 2,158,954 | | |
Short-Term Investments (3.3%) | |
State Street
Institutional
Treasury Money
Market Fund
Institutional Class
(Cost $73,077) | | | 73,076,701 | | | | 73,077 | | |
| | | Principal
Amount | | | |
Certificates of Deposit (0.0%) | |
Carver Federal
Savings Bank
Self Help Credit
Union, 0.20%,
due 9/23/13 | | $ | 100,000 | | | | 100 | | |
Self Help Credit
Union, 0.25%,
due 10/21/2013 | | | 250,000 | | | | 250 | | |
Self Help Credit
Union, 0.25%,
due 11/16/13 | | | 250,000 | | | | 250 | | |
Total Certificates of Deposit#
(Cost $600) | | | | | 600 | | |
Total Investments## (100.3%)
(Cost $1,745,831) | | | | | 2,232,631 | | |
Liabilities, less cash,
receivables and
other assets [(0.3%)] | | | | | (6,409 | ) | |
Total Net Assets (100.0%) | | | | $ | 2,226,222 | | |
See Notes to Schedule of Investments
134
Schedule of Investments Value Fund
TOP TEN EQUITY HOLDINGS
| | 1 | | | Cummins, Inc. | | | 4.3 | % | |
| | 2 | | | JPMorgan Chase & Co. | | | 4.2 | % | |
| | 3 | | | Exxon Mobil Corp. | | | 4.1 | % | |
| | 4 | | | Dow Chemical Co. | | | 2.7 | % | |
| | 5 | | | Citigroup, Inc. | | | 2.7 | % | |
| | 6 | | | Cisco Systems, Inc. | | | 2.5 | % | |
| | 7 | | | LyondellBasell Industries NV Class A | | | 2.4 | % | |
| | 8 | | | American International Group, Inc. | | | 2.4 | % | |
| | 9 | | | Lincoln National Corp. | | | 2.3 | % | |
| | 10 | | | Wells Fargo & Co. | | | 2.2 | % | |
| | |
Number
of Shares | |
Value†
(000's)z | |
Common Stocks (85.8%) | |
Aerospace & Defense (2.5%) | |
Northrop Grumman
Corp. | | | 1,761 | | | $ | 163 | | |
Raytheon Co. | | | 1,460 | | | | 110 | | |
| | | | 273 | | |
Airlines (2.6%) | |
Delta Air Lines, Inc. | | | 1,247 | | | | 25 | | |
United Continental
Holdings, Inc.* | | | 7,506 | | | | 214 | | |
US Airways Group,
Inc.* | | | 2,559 | | | | 41 | | |
| | | | 280 | | |
Auto Components (0.6%) | |
BorgWarner, Inc. | | | 738 | | | | 71 | | |
Capital Markets (5.3%) | |
Bank of New York
Mellon Corp. | | | 7,166 | | | | 213 | | |
Goldman Sachs
Group, Inc. | | | 1,001 | | | | 152 | | |
Invesco Ltd. | | | 3,155 | | | | 96 | | |
Morgan Stanley | | | 4,628 | | | | 119 | | |
| | | | 580 | | |
Chemicals (6.0%) | |
Dow Chemical Co. | | | 8,003 | | | | 299 | | |
LyondellBasell
Industries NV
Class A | | | 3,722 | | | | 261 | | |
Monsanto Co. | | | 997 | | | | 98 | | |
| | | | 658 | | |
Commercial Banks (5.6%) | |
Comerica, Inc. | | | 1,762 | | | | 72 | | |
Mitsubishi UFJ
Financial Group,
Inc. ADR | | | 13,154 | | | | 77 | | |
PNC Financial
Services Group, Inc. | | | 1,336 | | | | 96 | | |
Regions Financial
Corp. | | | 7,427 | | | | 70 | | |
Sumitomo Mitsui
Financial Group,
Inc. ADR | | | 5,669 | | | | 50 | | |
Wells Fargo & Co. | | | 5,959 | | | | 245 | | |
| | | | 610 | | |
Communications Equipment (3.3%) | |
Cisco Systems, Inc. | | | 11,586 | | | | 270 | | |
| | |
Number
of Shares | |
Value†
(000's)z | |
Juniper Networks,
Inc.* | | | 4,909 | | | $ | 93 | | |
| | | | 363 | | |
Computers & Peripherals (4.4%) | |
EMC Corp. | | | 8,664 | | | | 223 | | |
NetApp, Inc. | | | 3,068 | | | | 127 | | |
SanDisk Corp. | | | 2,419 | | | | 134 | | |
| | | | 484 | | |
Construction & Engineering (1.1%) | |
Fluor Corp. | | | 1,836 | | | | 116 | | |
Diversified Financial Services (8.7%) | |
Citigroup, Inc. | | | 6,047 | | | | 292 | | |
CME Group, Inc. | | | 2,789 | | | | 198 | | |
JPMorgan Chase &
Co. | | | 8,956 | | | | 453 | | |
| | | | 943 | | |
Electrical Equipment (0.8%) | |
Eaton Corp. PLC | | | 1,392 | | | | 88 | | |
Energy Equipment & Services (3.0%) | |
Baker Hughes, Inc. | | | 973 | | | | 45 | | |
Halliburton Co. | | | 3,400 | | | | 163 | | |
Rowan Cos. PLC
Class A* | | | 1,733 | | | | 62 | | |
Weatherford
International Ltd.* | | | 3,510 | | | | 52 | | |
| | | | 322 | | |
Food Products (2.0%) | |
Archer-Daniels-
Midland Co. | | | 4,826 | | | | 170 | | |
ConAgra Foods, Inc. | | | 693 | | | | 24 | | |
WhiteWave Foods
Co. Class A* | | | 1,472 | | | | 28 | | |
| | | | 222 | | |
Health Care Equipment &
Supplies (2.4%) | |
Boston Scientific
Corp.* | | | 10,493 | | | | 111 | | |
C.R. Bard, Inc. | | | 394 | | | | 45 | | |
Zimmer Holdings,
Inc. | | | 1,270 | | | | 101 | | |
| | | | 257 | | |
Health Care Providers &
Services (3.2%) | |
Aetna, Inc. | | | 1,447 | | | | 92 | | |
Cigna Corp. | | | 1,164 | | | | 91 | | |
| | |
Number
of Shares | |
Value†
(000's)z | |
UnitedHealth Group,
Inc. | | | 2,353 | | | $ | 169 | | |
| | | | 352 | | |
Hotels, Restaurants & Leisure (1.7%) | |
Carnival Corp. | | | 5,092 | | | | 184 | | |
Household Products (1.0%) | |
Procter & Gamble Co. | | | 1,359 | | | | 106 | | |
Insurance (4.7%) | |
American
International Group,
Inc.* | | | 5,600 | | | | 260 | | |
Lincoln National
Corp. | | | 5,876 | | | | 247 | | |
| | | | 507 | | |
Internet Software & Services (2.0%) | |
Facebook, Inc.
Class A* | | | 5,302 | | | | 219 | | |
Machinery (8.5%) | |
Cummins, Inc. | | | 3,764 | | | | 464 | | |
Joy Global, Inc. | | | 496 | | | | 24 | | |
Kubota Corp. ADR | | | 2,158 | | | | 147 | | |
Makita Corp. ADR | | | 1,581 | | | | 83 | | |
Manitowoc Co., Inc. | | | 2,858 | | | | 57 | | |
Parker Hannifin
Corp. | | | 1,472 | | | | 147 | | |
| | | | 922 | | |
Metals & Mining (2.5%) | |
Carpenter
Technology Corp. | | | 494 | | | | 27 | | |
Newmont Mining
Corp. | | | 3,901 | | | | 124 | | |
Nucor Corp. | | | 2,018 | | | | 92 | | |
United States Steel
Corp. | | | 1,984 | | | | 35 | | |
| | | | 278 | | |
Oil, Gas & Consumable Fuels (7.9%) | |
Exxon Mobil Corp. | | | 5,148 | | | | 449 | | |
Occidental
Petroleum Corp. | | | 1,690 | | | | 149 | | |
Range Resources
Corp. | | | 1,965 | | | | 147 | | |
Spectra Energy Corp. | | | 3,405 | | | | 113 | | |
| | | | 858 | | |
Pharmaceuticals (1.4%) | |
Merck & Co., Inc. | | | 3,221 | | | | 152 | | |
See Notes to Schedule of Investments
135
| | |
Number
of Shares | |
Value†
(000's)z | |
Semiconductors & Semiconductor Equipment (2.0%) | |
Altera Corp. | | | 3,996 | | | $ | 140 | | |
KLA-Tencor Corp. | | | 1,334 | | | | 74 | | |
| | | | 214 | | |
Software (0.5%) | |
CA, Inc. | | | 1,967 | | | | 58 | | |
Specialty Retail (2.1%) | |
Best Buy Co., Inc. | | | 2,632 | | | | 95 | | |
Staples, Inc. | | | 9,598 | | | | 133 | | |
| | | | 228 | | |
Total Common Stocks
(Cost $9,165) | | | | | 9,345 | | |
Short-Term Investments (3.6%) | |
State Street
Institutional
Treasury Money
Market Fund
Institutional Class
(Cost $394) | | | 393,847 | | | | 394 | | |
Total Investments## (89.4%)
(Cost $9,559) | | | | | 9,739 | | |
Cash, receivables
and other assets,
less liabilities (10.6%) | | | | | 1,159 | | |
Total Net Assets (100.0%) | | | | $ | 10,898 | | |
See Notes to Schedule of Investments
136
Notes to Schedule of Investments
† In accordance with Accounting Standards Codification ("ASC") 820 "Fair Value Measurements and Disclosures" ("ASC 820"), all investments held by each of Neuberger Berman Emerging Markets Equity Fund ("Emerging Markets Equity"), Neuberger Berman Equity Income Fund ("Equity Income"), Neuberger Berman Focus Fund ("Focus"), Neuberger Berman Genesis Fund ("Genesis"), Neuberger Berman Global Equity Fund ("Global Equity"), Neuberger Berman Global Thematic Opportunities Fund ("Global Thematic Opportunities"), Neuberger Berman Greater China Equity Fund ("Greater China Equity"), Neuberger Berman Guardian Fund ("Guardian"), Neuberger Berman International Equity Fund ("International Equity") (Formerly, Neuberger Berman International Institutional Fund), Neuberger Berman International Large Cap Fund ("International Large Cap"), Neuberger Berman Intrinsic Value Fund ("Intrinsic Value"), Neuberger Berman Large Cap Disciplined Growth Fund ("Large Cap Disciplined Growth"), Neuberger Berman Large Cap Value Fund ("Large Cap Value"), Neuberger Berman Mid Cap Growth Fund ("Mid Cap Growth"), Neuberger Berman Mid Cap Intrinsic Value Fund ("Mid Cap Intrinsic Value"), Neuberger Berman Multi-Cap Opportunities Fund ("Multi-Cap Opportunities"), Neuberger Berman Real Estate Fund ("Real Estate"), Neuberger Berman Select Equities Fund ("Select Equities"), Neuberger Berman Small Cap Growth Fund ("Small Cap Growth"), Neuberger Berman Socially Responsive Fund ("Socially Responsive") and Neuberger Berman Value Fund ("Value") (each individually a "Fund," and collectively, the "Funds") are carried at the value that Neuberger Berman Management LLC ("Management") believes a Fund would receive upon selling an investment in an orderly transaction to an independent buyer in the principal or most advantageous market for the investment under current market conditions. Various inputs, including the volume and level of activity for the asset or liability in the market, are considered in valuing the Funds' investments, some of which are discussed below. Significant management judgment may be necessary to value investments in accordance with ASC 820.
ASC 820 established a three-tier hierarchy of inputs to create a classification of value measurements for disclosure purposes. The three-tier hierarchy of inputs is summarized in the three broad Levels listed below.
• Level 1 – quoted prices in active markets for identical investments
• Level 2 – other significant observable inputs (including quoted prices for similar investments, interest rates, prepayment speeds, credit risk, amortized cost, etc.)
• Level 3 – significant unobservable inputs (including the Funds' own assumptions in determining the fair value of investments)
The inputs or methodology used for valuing an investment are not necessarily an indication of the risk associated with investing in those securities.
The value of the Funds' investments in equity securities, exchange traded funds, convertible preferred stocks and written option contracts, for which market quotations are readily available, is generally determined by Management by obtaining valuations from an independent pricing service based on the latest sale price quoted on a principal exchange or market for that security (Level 1 inputs). Securities traded primarily on the NASDAQ Stock Market are normally valued by a Fund at the NASDAQ Official Closing Price ("NOCP") provided by NASDAQ each business day. The NOCP is the most recently reported price as of 4:00:02 p.m., Eastern time, unless that price is outside the range of the "inside" bid and asked prices (i.e., the bid and asked prices that dealers quote to each other when trading for their own accounts); in that case, NASDAQ will adjust the price to equal the inside bid or asked price, whichever is closer. Because of delays in reporting trades, the NOCP may not be based on the price of the last trade to occur before the market closes. If there is no reported sale of a security on a particular day, the independent pricing service may value the security based on reported market quotations.
The value of the Funds' investments in convertible bonds is determined by Management primarily by obtaining valuations from independent pricing services based on readily available bid quotations, or if quotations are not available, by methods which include various considerations such as yields or prices of securities of comparable
See Notes to Financial Statements
137
Notes to Schedule of Investments (cont'd)
quality, coupon, maturity and type; indications as to values from dealers; and general market conditions (generally Level 2 inputs).
Other Level 2 inputs used by an independent pricing service to value convertible bonds generally include underlying stock data, dealer quotes, conversion premiums, listed bond and preferred stock prices and other market information, which may include benchmark curves, trade execution data, and sensitivity analysis, when available.
The value of Participatory Notes is determined by obtaining valuations from an independent pricing service based on the underlying equity security and applicable exchange rate.
Management has developed a process to periodically review information provided by independent pricing services for all types of securities.
Certificates of Deposit are valued at amortized cost. Investments in investment companies are valued using the respective fund's daily calculated net asset value per share (Level 2 inputs).
If a valuation is not available from an independent pricing service, or if Management has reason to believe that the valuation received does not represent the amount a Fund might reasonably expect to receive on a current sale in an orderly transaction, the applicable Fund seeks to obtain quotations from principal market makers (generally considered Level 3 inputs). If such quotations are not readily available, the security is valued using methods the Neuberger Berman Equity Funds' Board of Trustees (the "Board") has approved on the belief that they reflect fair value. Numerous factors may be considered when determining the fair value of a security based on Level 2 or 3 inputs, including available analyst, media or other reports, trading in futures or American Depositary Receipts (ADRs) and whether the issuer of the security being fair valued has other securities outstanding.
The value of the Funds' investments in foreign securities is generally determined using the same valuation methods and inputs as other Fund investments, as discussed above. Foreign security prices expressed in local currency values are translated from the local currency into U.S. dollars using the exchange rates as of 4:00 p.m., Eastern time. The Board has approved the use of Interactive Data Pricing and Reference Data, Inc. ("Interactive") to assist in determining the fair value of foreign equity securities when changes in the value of a certain index suggest that the closing prices on the foreign exchanges may no longer represent the amount that a Fund could expect to receive for those securities or on days when foreign markets are closed and U.S. markets are open. In each of these events, Interactive will provide adjusted prices for certain foreign equity securities using a statistical analysis of historical correlations of multiple factors (Level 2 inputs). In the absence of precise information about the market values of these foreign securities as of the close of the New York Stock Exchange, the Board has determined on the basis of available data that prices adjusted in this way are likely to be closer to the prices a fund could realize on a current sale than are the prices of those securities established at the close of the foreign markets in which the securities primarily trade.
Fair value prices are necessarily estimates, and there is no assurance that such a price will be at or close to the price at which the security is next quoted or next trades.
See Notes to Financial Statements
138
Notes to Schedule of Investments (cont'd)
The following is a summary, categorized by Level, of inputs used to value the Funds' investments as of August 31, 2013:
Asset Valuation Inputs
(000's omitted) | | Level 1 | | Level 2 | | Level 3§§ | | Total | |
Emerging Markets Equity | |
Investments: | |
Common Stocks§ | |
China | | $ | 11,374 | | | $ | 81,866 | | | $ | — | | | $ | 93,240 | | |
India | | | 11,420 | | | | 20,494 | | | | — | | | | 31,914 | | |
Indonesia | | | — | | | | 5,210 | | | | — | | | | 5,210 | | |
Korea | | | — | | | | 42,695 | | | | — | | | | 42,695 | | |
Malaysia | | | 6,070 | | | | 10,489 | | | | — | | | | 16,559 | | |
Philippines | | | — | | | | 4,761 | | | | — | | | | 4,761 | | |
Russia | | | 22,727 | | | | 6,306 | | | | — | | | | 29,033 | | |
Singapore | | | — | | | | 4,960 | | | | — | | | | 4,960 | | |
Taiwan, Province of China | | | — | | | | 14,931 | | | | — | | | | 14,931 | | |
Thailand | | | — | | | | 9,476 | | | | — | | | | 9,476 | | |
Turkey | | | — | | | | 7,109 | | | | — | | | | 7,109 | | |
Other Common Stocksß | | | 129,608 | | | | — | | | | — | | | | 129,608 | | |
Total Common Stocks | | | 181,199 | | | | 208,297 | | | | — | | | | 389,496 | | |
Short-Term Investments | | | — | | | | 25,403 | | | | — | | | | 25,403 | | |
Total Investments | | | 181,199 | | | | 233,700 | | | | — | | | | 414,899 | | |
Equity Income | |
Investments: | |
Common Stocks | |
Diversified Telecommunication Services | | | — | | | | 54,807 | | | | — | | | | 54,807 | | |
Food & Staples Retailing | | | — | | | | 27,047 | | | | — | | | | 27,047 | | |
Hotels, Restaurants & Leisure | | | — | | | | 35,077 | | | | — | | | | 35,077 | | |
Real Estate Investment Trusts | | | 525,521 | | | | 92,991 | | | | — | | | | 618,512 | | |
Transportation Infrastructure | | | — | | | | 26,768 | | | | — | | | | 26,768 | | |
Other Common Stocks§ß | | | 2,036,841 | | | | — | | | | — | | | | 2,036,841 | | |
Total Common Stocks | | | 2,562,362 | | | | 236,690 | | | | — | | | | 2,799,052 | | |
Convertible Bonds | | | — | | | | 83,171 | | | | — | | | | 83,171 | | |
Short-Term Investments | | | — | | | | 13,343 | | | | — | | | | 13,343 | | |
Total Investments | | | 2,562,362 | | | | 333,204 | | | | — | | | | 2,895,566 | | |
See Notes to Financial Statements
139
Notes to Schedule of Investments (cont'd)
(000's omitted) | | Level 1 | | Level 2 | | Level 3§§ | | Total | |
Focus | |
Investments: | |
Common Stocks§ | | $ | 694,823 | | | $ | — | | | $ | — | | | $ | 694,823 | | |
Short-Term Investments | | | — | | | | 32,114 | | | | — | | | | 32,114 | | |
Total Investments | | | 694,823 | | | | 32,114 | | | | — | | | | 726,937 | | |
Genesis | |
Investments: | |
Common Stocks§ | | | 12,675,434 | | | | — | | | | — | | | | 12,675,434 | | |
Short-Term Investments | | | — | | | | 569,450 | | | | — | | | | 569,450 | | |
Total Investments | | | 12,675,434 | | | | 569,450 | | | | — | | | | 13,244,884 | | |
Global Equity | |
Investments: | |
Common Stocks§ | |
Australia | | | — | | | | 207 | | | | — | | | | 207 | | |
China | | | — | | | | 891 | | | | — | | | | 891 | | |
Indonesia | | | — | | | | 2 | | | | — | | | | 2 | | |
Israel | | | 381 | | | | 436 | | | | — | | | | 817 | | |
Japan | | | — | | | | 1,168 | | | | — | | | | 1,168 | | |
Korea | | | — | | | | 555 | | | | — | | | | 555 | | |
Singapore | | | — | | | | 245 | | | | — | | | | 245 | | |
Other Common Stocksß | | | 29,181 | | | | — | | | | — | | | | 29,181 | | |
Total Common Stocks | | | 29,562 | | | | 3,504 | | | | — | | | | 33,066 | | |
Short-Term Investments | | | — | | | | 638 | | | | — | | | | 638 | | |
Total Investments | | | 29,562 | | | | 4,142 | | | | — | | | | 33,704 | | |
Global Thematic Opportunities | |
Investments: | |
Common Stocks§ | |
China | | | — | | | | 3,391 | | | | — | | | | 3,391 | | |
Hong Kong | | �� | — | | | | 1,547 | | | | — | | | | 1,547 | | |
Japan | | | — | | | | 8,882 | | | | — | | | | 8,882 | | |
Singapore | | | — | | | | 935 | | | | — | | | | 935 | | |
Other Common Stocksß | | | 54,620 | | | | — | | | | — | | | | 54,620 | | |
Total Common Stocks | | | 54,620 | | | | 14,755 | | | | — | | | | 69,375 | | |
Short-Term Investments | | | — | | | | 5,577 | | | | — | | | | 5,577 | | |
Total Investments | | | 54,620 | | | | 20,332 | | | | — | | | | 74,952 | | |
See Notes to Financial Statements
140
Notes to Schedule of Investments (cont'd)
(000's omitted) | | Level 1 | | Level 2 | | Level 3§§ | | Total | |
Greater China Equity | |
Investments: | |
Common Stocks§ | | $ | — | | | $ | 39,617 | | | $ | — | | | $ | 39,617 | | |
Participatory Notes§ | | | 9,174 | | | | — | | | | — | | | | 9,174 | | |
Rights§ | | | — | | | | 6 | | | | — | | | | 6 | | |
Short-Term Investments | | | — | | | | 4,261 | | | | — | | | | 4,261 | | |
Total Investments | | | 9,174 | | | | 43,884 | | | | — | | | | 53,058 | | |
Guardian | |
Investments: | |
Common Stocks§ | | | 1,274,387 | | | | — | | | | — | | | | 1,274,387 | | |
Short-Term Investments | | | — | | | | 26,898 | | | | — | | | | 26,898 | | |
Total Investments | | | 1,274,387 | | | | 26,898 | | | | — | | | | 1,301,285 | | |
International Equity | |
Investments: | |
Common Stocks§ | |
Australia | | | — | | | | 14,874 | | | | — | | | | 14,874 | | |
China | | | 14,908 | | | | 6,517 | | | | — | | | | 21,425 | | |
Indonesia | | | — | | | | 279 | | | | — | | | | 279 | | |
Israel | | | 14,881 | | | | 12,957 | | | | — | | | | 27,838 | | |
Japan | | | — | | | | 154,092 | | | | — | | | | 154,092 | | |
Korea | | | — | | | | 16,393 | | | | — | | | | 16,393 | | |
Singapore | | | — | | | | 17,489 | | | | — | | | | 17,489 | | |
Turkey | | | — | | | | 2,612 | | | | — | | | | 2,612 | | |
Other Common Stocksß | | | 724,892 | | | | — | | | | — | | | | 724,892 | | |
Total Common Stocks | | | 754,681 | | | | 225,213 | | | | — | | | | 979,894 | | |
Short-Term Investments | | | — | | | | 39,711 | | | | — | | | | 39,711 | | |
Total Investments | | | 754,681 | | | | 264,924 | | | | — | | | | 1,019,605 | | |
See Notes to Financial Statements
141
Notes to Schedule of Investments (cont'd)
(000's omitted) | | Level 1 | | Level 2 | | Level 3§§ | | Total | |
International Large Cap | |
Investments: | |
Common Stocks§ | |
Australia | | $ | — | | | $ | 3,912 | | | $ | — | | | $ | 3,912 | | |
China | | | 4,000 | | | | 1,494 | | | | — | | | | 5,494 | | |
Indonesia | | | — | | | | 64 | | | | — | | | | 64 | | |
Israel | | | 4,077 | | | | 3,689 | | | | — | | | | 7,766 | | |
Japan | | | — | | | | 32,647 | | | | — | | | | 32,647 | | |
Korea | | | — | | | | 4,801 | | | | — | | | | 4,801 | | |
Singapore | | | — | | | | 4,012 | | | | — | | | | 4,012 | | |
Other Common Stocksß | | | 159,752 | | | | — | | | | — | | | | 159,752 | | |
Total Common Stocks | | | 167,829 | | | | 50,619 | | | | — | | | | 218,448 | | |
Short-Term Investments | | | — | | | | 11,371 | | | | — | | | | 11,371 | | |
Total Investments | | | 167,829 | | | | 61,990 | | | | — | | | | 229,819 | | |
Intrinsic Value | |
Investments: | |
Common Stocks§ | | | 192,177 | | | | — | | | | — | | | | 192,177 | | |
Short-Term Investments | | | — | | | | 15,130 | | | | — | | | | 15,130 | | |
Total Investments | | | 192,177 | | | | 15,130 | | | | — | | | | 207,307 | | |
Large Cap Disciplined Growth | |
Investments: | |
Common Stocks§ | | | 464,925 | | | | — | | | | — | | | | 464,925 | | |
Short-Term Investments | | | — | | | | 22,330 | | | | — | | | | 22,330 | | |
Total Investments | | | 464,925 | | | | 22,330 | | | | — | | | | 487,255 | | |
Large Cap Value | |
Investments: | |
Common Stocks§ | | | 1,571,970 | | | | — | | | | — | | | | 1,571,970 | | |
Short-Term Investments | | | — | | | | 33,562 | | | | — | | | | 33,562 | | |
Total Investments | | | 1,571,970 | | | | 33,562 | | | | — | | | | 1,605,532 | | |
Mid Cap Growth | |
Investments: | |
Common Stocks§ | | | 769,428 | | | | — | | | | — | | | | 769,428 | | |
Short-Term Investments | | | — | | | | 32,038 | | | | — | | | | 32,038 | | |
Total Investments | | | 769,428 | | | | 32,038 | | | | — | | | | 801,466 | | |
Mid Cap Intrinsic Value | |
Investments: | |
Common Stocks§ | | | 66,605 | | | | — | | | | — | | | | 66,605 | | |
Short-Term Investments | | | — | | | | 577 | | | | — | | | | 577 | | |
Total Investments | | | 66,605 | | | | 577 | | | | — | | | | 67,182 | | |
See Notes to Financial Statements
142
Notes to Schedule of Investments (cont'd)
(000's omitted) | | Level 1 | | Level 2 | | Level 3§§ | | Total | |
Multi-Cap Opportunities | |
Investments: | |
Common Stocks§ | | $ | 1,443,900 | | | $ | — | | | $ | — | | | $ | 1,443,900 | | |
Short-Term Investments | | | — | | | | 49,609 | | | | — | | | | 49,609 | | |
Total Investments | | | 1,443,900 | | | | 49,609 | | | | — | | | | 1,493,509 | | |
Real Estate | |
Investments: | |
Common Stocks | |
Diversified | | | 91,653 | | | | 24,180 | | | | — | | | | 115,833 | | |
Other Common Stocks§ß | | | 785,094 | | | | — | | | | — | | | | 785,094 | | |
Total Common Stocks | | | 876,747 | | | | 24,180 | | | | — | | | | 900,927 | | |
Short-Term Investments | | | — | | | | 8,895 | | | | — | | | | 8,895 | | |
Total Investments | | | 876,747 | | | | 33,075 | | | | — | | | | 909,822 | | |
Select Equities | |
Investments: | |
Common Stocks§ | | | 79,446 | | | | — | | | | — | | | | 79,446 | | |
Short-Term Investments | | | — | | | | 12,958 | | | | — | | | | 12,958 | | |
Total Investments | | | 79,446 | | | | 12,958 | | | | — | | | | 92,404 | | |
Small Cap Growth | |
Investments: | |
Common Stocks§ | | | 77,148 | | | | — | | | | — | | | | 77,148 | | |
Short-Term Investments | | | — | | | | 1,775 | | | | — | | | | 1,775 | | |
Total Investments | | | 77,148 | | | | 1,775 | | | | — | | | | 78,923 | | |
Socially Responsive | |
Investments: | |
Common Stocks§ | | | 2,158,954 | | | | — | | | | — | | | | 2,158,954 | | |
Short-Term Investments | | | — | | | | 73,077 | | | | — | | | | 73,077 | | |
Certificates of Deposit | | | — | | | | 600 | | | | — | | | | 600 | | |
Total Investments | | | 2,158,954 | | | | 73,677 | | | | — | | | | 2,232,631 | | |
Value | |
Investments: | |
Common Stocks§ | | | 9,345 | | | | — | | | | — | | | | 9,345 | | |
Short-Term Investments | | | — | | | | 394 | | | | — | | | | 394 | | |
Total Investments | | | 9,345 | | | | 394 | | | | — | | | | 9,739 | | |
§ The Schedule of Investments (and Summary Schedule of Investments by Industry for the global/international funds) provides information on the industry for the portfolio.
ß Represents a geographic location and/or industry where all securities were Level 1 securities. Please refer to the Schedule of Investments for additional information.
See Notes to Financial Statements
143
Notes to Schedule of Investments (cont'd)
§§ The following is a reconciliation between the beginning and ending balances of investments in which significant unobservable inputs (Level 3) were used in determining value:
(000's omitted) | | Beginning
balance, as
of 9/1/12 | | Accrued
discounts/
(premiums) | | Realized
gain/loss | | Change in
unrealized
appreciation/
(depreciation) | | Purchases | | Sales | | Transfers
in to
Level 3 | | Transfers
out of
Level 3 | | Balance,
as of
8/31/13 | | Net change in
unrealized
appreciation/
(depreciation)
from
investments
still held
as of 8/31/13 | |
Investments in
Securities: | |
Emerging
Markets Equity | |
Preferred Stocks | |
Brazil | | $ | 0 | | | $ | — | | | $ | (0 | ) | | $ | — | | | $ | — | | | $ | (0 | ) | | $ | — | | | $ | — | | | $ | — | | | $ | — | | |
Total | | | 0 | | | | — | | | | (0 | ) | | | — | | | | — | | | | (0 | ) | | | — | | | | — | | | | — | | | | — | | |
As of the year ending August 31, 2013, certain securities were transferred from one level to another based on beginning of period market values as of August 31, 2012. Approximately $59,151,000, $116,311,000, $290,000, $1,714,000, $77,946,000, and $22,295,000 were transferred from Level 1 to Level 2 for Emerging Markets Equity, Equity Income, Global Equity, Global Thematic Opportunities, International Equity and International Large Cap. Interactive provided adjusted prices for these securities as of August 31, 2013, as stated in the description of the valuation methods of foreign equity securities in footnote † above. In addition, approximately $3,512,000 was transferred from Level 2 to Level 1 for Emerging Markets Equity due to active market activity on recognized exchanges as of August 31, 2013. These securities had been categorized as Level 2 as of August 31, 2012, due to foreign exchanges having been closed and, therefore, no prices having been readily available for the securities as of that date.
Liability Valuation Inputs
The following is a summary, categorized by Level, of inputs used to value the Fund's derivatives as of August 31, 2013:
(000's omitted) | | Level 1 | | Level 2 | | Level 3 | | Total | |
Equity Income | |
Option Contracts | | $ | (1,238 | ) | | $ | — | | | $ | — | | | $ | (1,238 | ) | |
# At cost, which approximates market value.
## At August 31, 2013, selected fund information on a U.S. federal income tax basis was as follows:
(000's omitted) | | Cost | | Gross
Unrealized
Appreciation | | Gross
Unrealized
Depreciation | | Net Unrealized
Appreciation
(Depreciation) | |
Emerging Markets Equity | | $ | 424,978 | | | $ | 28,742 | | | $ | 38,821 | | | $ | (10,079 | ) | |
Equity Income | | | 2,777,286 | | | | 208,995 | | | | 90,715 | | | | 118,280 | | |
Focus | | | 597,168 | | | | 132,524 | | | | 2,755 | | | | 129,769 | | |
Genesis | | | 7,701,003 | | | | 5,592,263 | | | | 48,382 | | | | 5,543,881 | | |
Global Equity | | | 34,126 | | | | 384 | | | | 806 | | | | (422 | ) | |
Global Thematic Opportunities | | | 69,581 | | | | 6,892 | | | | 1,521 | | | | 5,371 | | |
Greater China Equity | | | 53,041 | | | | 1,343 | | | | 1,326 | | | | 17 | | |
Guardian | | | 970,459 | | | | 332,037 | | | | 1,211 | | | | 330,826 | | |
See Notes to Financial Statements
144
Notes to Schedule of Investments (cont'd)
(000's omitted) | | Cost | | Gross
Unrealized
Appreciation | | Gross
Unrealized
Depreciation | | Net Unrealized
Appreciation
(Depreciation) | |
International Equity | | $ | 903,978 | | | $ | 136,275 | | | $ | 20,648 | | | $ | 115,627 | | |
International Large Cap | | | 201,169 | | | | 33,172 | | | | 4,522 | | | | 28,650 | | |
Intrinsic Value | | | 170,126 | | | | 43,304 | | | | 6,123 | | | | 37,181 | | |
Large Cap Disciplined Growth | | | 412,740 | | | | 79,186 | | | | 4,671 | | | | 74,515 | | |
Large Cap Value | | | 1,431,587 | | | | 188,453 | | | | 14,508 | | | | 173,945 | | |
Mid Cap Growth | | | 566,930 | | | | 237,883 | | | | 3,347 | | | | 234,536 | | |
Mid Cap Intrinsic Value | | | 54,267 | | | | 13,342 | | | | 427 | | | | 12,915 | | |
Multi-Cap Opportunities | | | 1,282,927 | | | | 216,819 | | | | 6,237 | | | | 210,582 | | |
Real Estate | | | 903,806 | | | | 41,540 | | | | 35,524 | | | | 6,016 | | |
Select Equities | | | 79,746 | | | | 13,194 | | | | 536 | | | | 12,658 | | |
Small Cap Growth | | | 69,503 | | | | 10,391 | | | | 971 | | | | 9,420 | | |
Socially Responsive | | | 1,745,231 | | | | 491,683 | | | | 4,283 | | | | 487,400 | | |
Value | | | 9,567 | | | | 364 | | | | 192 | | | | 172 | | |
* Security did not produce income during the last twelve months.
‡‡ At August 31, 2013, Equity Income had outstanding call and put options written as follows:
Name of Issuer | | Contracts | | Exercise
Price | | Expiration Date | | Market Value
of Optionsµ | |
American Campus Communities, Inc., Put | | | 37 | | | | 35 | | | December 2013 | | $ | (11,000 | ) | |
American Campus Communities, Inc., Put | | | 50 | | | | 30 | | | March 2014 | | | (6,000 | ) | |
Bristol-Myers Squibb Co., Call@ | | | 374 | | | | 45 | | | January 2014 | | | (32,000 | ) | |
Deere & Co., Put | | | 250 | | | | 70 | | | December 2013 | | | (19,000 | ) | |
Deere & Co., Put | | | 250 | | | | 72.5 | | | December 2013 | | | (26,000 | ) | |
Deere & Co., Put | | | 500 | | | | 67.5 | | | January 2014 | | | (39,000 | ) | |
Digital Realty Trust, Inc., Put | | | 250 | | | | 50 | | | January 2014 | | | (59,000 | ) | |
Digital Realty Trust, Inc., Put | | | 250 | | | | 55 | | | January 2014 | | | (103,000 | ) | |
Du Pont (E.I.) De Nemours, Put | | | 200 | | | | 46 | | | January 2014 | | | (10,000 | ) | |
Foot Locker, Inc., Put | | | 500 | | | | 30 | | | January 2014 | | | (70,000 | ) | |
Foot Locker, Inc., Put | | | 500 | | | | 29 | | | February 2014 | | | (65,000 | ) | |
General Dynamics Corp., Call@ | | | 500 | | | | 85 | | | November 2013 | | | (102,000 | ) | |
General Dynamics Corp., Call@ | | | 500 | | | | 87.5 | | | January 2014 | | | (108,000 | ) | |
General Dynamics Corp., Call@ | | | 500 | | | | 95 | | | February 2014 | | | (35,000 | ) | |
Honeywell International, Inc., Call@ | | | 500 | | | | 77.5 | | | September 2013 | | | (137,000 | ) | |
Johnson & Johnson, Call@ | | | 250 | | | | 90 | | | October 2013 | | | (17,000 | ) | |
Public Storage, Call@ | | | 400 | | | | 175 | | | September 2013 | | | (2,000 | ) | |
Public Storage, Call@ | | | 234 | | | | 185 | | | December 2013 | | | (4,000 | ) | |
Royal Gold, Inc., Put | | | 200 | | | | 55 | | | October 2013 | | | (51,000 | ) | |
Sempra Energy, Call@ | | | 500 | | | | 82.5 | | | October 2013 | | | (137,000 | ) | |
Ventas, Inc., Put | | | 250 | | | | 60 | | | November 2013 | | | (53,000 | ) | |
Ventas, Inc., Put | | | 250 | | | | 65 | | | November 2013 | | | (117,000 | ) | |
Ventas, Inc., Put | | | 250 | | | | 45 | | | February 2014 | | | (10,000 | ) | |
Ventas, Inc., Put | | | 250 | | | | 50 | | | February 2014 | | | (21,000 | ) | |
Vornado Realty Trust, Call@ | | | 250 | | | | 99 | | | January 2014 | | | (4,000 | ) | |
| | | | | | Total | | $ | (1,238,000 | ) | |
@ These securities are held in escrow by the custodian bank.
µ Rounded to the nearest thousand.
See Notes to Financial Statements
145
Notes to Schedule of Investments (cont'd)
At August 31, 2013, Equity Income had deposited $21,327,600 in a segregated account to cover requirements on put options written.
ñ Securities were purchased under Rule 144A of the Securities Act of 1933, as amended (the "1933 Act"), or are private placements and, unless registered under the 1933 Act or exempted from registration, may only be sold to qualified institutional investors. These securities have been deemed by the investment manager to be liquid. At August 31, 2013, these securities amounted to approximately $5,947,000 or 0.2% of net assets for Equity Income, approximately $251,000 or 0.4% of net assets for Greater China Equity and approximately $24,180,000 or 2.6% of net assets for Real Estate.
Ñ These securities have been deemed by the investment manager to be illiquid. At August 31, 2013, these securities amounted to approximately $550,000 or 1.0% of net assets for Greater China Equity.
b These securities have been deemed by the investment manager to be illiquid. Restricted security subject to restrictions on resale. Securities were purchased under Rule 144A of the 1933 Act or are private placements and, unless registered under the 1933 Act or exempted from registration, may only be sold to qualified institutional investors.
At August 31, 2013, these securities amounted to approximately $14,634,000 or 0.1% of net assets for Genesis.
(000's omitted) | | Restricted Security | | Acquisition
Date | | Acquisition
Cost | | Acquisition
Cost
Percentage
of Net Assets
as of
Acquisition
Date | | Value as of
August 31, 2013 | | Fair Value
Percentage
of Net Assets
as of
August 31, 2013 | |
Genesis | | Stella-Jones, Inc. | | 11/20/2012 | | $ | 10,579 | | | | 0.1 | % | | $ | 14,634 | | | | 0.1 | % | |
z A zero balance may reflect actual amounts rounding to less than $1,000.
‡ Security had an event of default.
^ Affiliated issuer (see Note F of Notes to Financial Statements).
± See Note A-11 in the Notes to Financial Statements for the Fund's open derivatives at August 31, 2013.
See Notes to Financial Statements
146
Statements of Assets and Liabilities
Neuberger Berman Equity Funds
(000's omitted except per share amounts)
| | | EMERGING
MARKETS
EQUITY FUND | | EQUITY
INCOME FUND | | FOCUS FUND | | GENESIS FUND | | GLOBAL EQUITY
FUND | |
| | | August 31,
2013 | | August 31,
2013 | | August 31,
2013 | | August 31,
2013 | | August 31,
2013 | |
Assets | |
Investments in securities, at value* (Notes A & F)—see Schedule of Investments: | |
Unaffiliated issuers | | $ | 414,899 | | | $ | 2,895,566 | | | $ | 726,937 | | | $ | 7,511,707 | | | $ | 33,704 | | |
Affiliated issuers | | | — | | | | — | | | | — | | | | 5,733,177 | | | | — | | |
| | | | 414,899 | | | | 2,895,566 | | | | 726,937 | | | | 13,244,884 | | | | 33,704 | | |
Cash | | | 216 | | | | 465 | | | | 6 | | | | 728 | | | | — | | |
Foreign currency | | | 328 | | | | 863 | | | | — | | | | — | | | | — | | |
Deposits with brokers for open option contracts | | | — | | | | 21,328 | | | | — | | | | — | | | | — | | |
Dividends and interest receivable | | | 519 | | | | 9,371 | | | | 710 | | | | 15,076 | | | | 37 | | |
Receivable for securities sold | | | 1,496 | | | | 41,902 | | | | 3,672 | | | | 3,559 | | | | 4 | | |
Receivable for Fund shares sold | | | 775 | | | | 7,110 | | | | 585 | | | | 15,704 | | | | — | | |
Receivable from Management—net (Note B) | | | 99 | | | | — | | | | — | | | | — | | | | 12 | | |
Prepaid expenses and other assets | | | 65 | | | | 139 | | | | 64 | | | | 469 | | | | 20 | | |
Total Assets | | | 418,397 | | | | 2,976,744 | | | | 731,974 | | | | 13,280,420 | | | | 33,777 | | |
Liabilities | |
Options contracts written, at value** (Note A) | | | — | | | | 1,238 | | | | — | | | | — | | | | — | | |
Payable for securities purchased | | | 843 | | | | 7,276 | | | | 6,704 | | | | 9,493 | | | | — | | |
Payable for Fund shares redeemed | | | 239 | | | | 21,346 | | | | 300 | | | | 16,855 | | | | — | | |
Payable to investment manager—net (Note B) | | | 353 | | | | 1,198 | | | | 327 | | | | 7,592 | | | | 21 | | |
Payable to administrator—net (Note B) | | | — | | | | 1,184 | | | | 172 | | | | 2,904 | | | | — | | |
Payable to trustees | | | 3 | | | | 3 | | | | 3 | | | | 3 | | | | 3 | | |
Payable for organization costs | | | — | | | | — | | | | — | | | | — | | | | — | | |
Accrued expenses and other payables | | | 180 | | | | 379 | | | | 176 | | | | 1,268 | | | | 75 | | |
Total Liabilities | | | 1,618 | | | | 32,624 | | | | 7,682 | | | | 38,115 | | | | 99 | | |
Net Assets | | $ | 416,779 | | | $ | 2,944,120 | | | $ | 724,292 | | | $ | 13,242,305 | | | $ | 33,678 | | |
Net Assets consist of: | |
Paid-in capital | | $ | 448,408 | | | $ | 2,757,398 | | | $ | 530,206 | | | $ | 6,636,490 | | | $ | 34,000 | | |
Undistributed net investment income (loss) | | | 2,526 | | | | — | | | | 4,608 | | | | 40,414 | | | | (15 | ) | |
Distributions in excess of net investment income | | | — | | | | (9,661 | ) | | | — | | | | — | | | | — | | |
Accumulated net realized gains (losses) on investments | | | (25,911 | ) | | | 68,224 | | | | 58,119 | | | | 1,002,645 | | | | 102 | | |
Net unrealized appreciation (depreciation) in value of investments | | | (8,244 | ) | | | 128,159 | | | | 131,359 | | | | 5,562,756 | | | | (409 | ) | |
Net Assets | | $ | 416,779 | | | $ | 2,944,120 | | | $ | 724,292 | | | $ | 13,242,305 | | | $ | 33,678 | | |
Net Assets | |
Investor Class | | $ | — | | | $ | — | | | $ | 636,883 | | | $ | 2,458,700 | | | $ | — | | |
Trust Class | | | — | | | | — | | | | 56,292 | | | | 3,192,361 | | | | — | | |
Advisor Class | | | — | | | | — | | | | 6,076 | | | | 626,022 | | | | — | | |
Institutional Class | | | 374,090 | | | | 1,439,435 | | | | 22,557 | | | | 5,989,287 | | | | 33,463 | | |
Class A | | | 7,305 | | | | 1,036,374 | | | | 1,864 | | | | — | | | | 146 | | |
Class C | | | 4,130 | | | | 465,731 | | | | 620 | | | | — | | | | 69 | | |
Class R3 | | | 187 | | | | 2,580 | | | | — | | | | — | | | | — | | |
Class R6 | | | 31,067 | | | | — | | | | — | | | | 975,935 | | | | — | | |
See Notes to Financial Statements
147
| | | GLOBAL
THEMATIC
OPPORTUNITIES
FUND | | GREATER
CHINA EQUITY
FUND | | GUARDIAN
FUND | | INTERNATIONAL
EQUITY
FUND | | INTERNATIONAL
LARGE CAP
FUND | |
| | | August 31,
2013 | | August 31,
2013 | | August 31,
2013 | | August 31,
2013 | | August 31,
2013 | |
Assets | |
Investments in securities, at value* (Notes A & F)—see Schedule of Investments: | |
Unaffiliated issuers | | $ | 74,952 | | | $ | 53,058 | | | $ | 1,301,285 | | | $ | 1,019,605 | | | $ | 229,819 | | |
Affiliated issuers | | | — | | | | — | | | | — | | | | — | | | | — | | |
| | | | 74,952 | | | | 53,058 | | | | 1,301,285 | | | | 1,019,605 | | | | 229,819 | | |
Cash | | | — | | | | — | | | | — | | | | — | | | | — | | |
Foreign currency | | | — | | | | 302 | | | | — | | | | 229 | | | | 11 | | |
Deposits with brokers for open option contracts | | | — | | | | — | | | | — | | | | — | | | | — | | |
Dividends and interest receivable | | | 107 | | | | — | | | | 2,325 | | | | 2,546 | | | | 521 | | |
Receivable for securities sold | | | — | | | | 5,471 | | | | 2,780 | | | | 716 | | | | 165 | | |
Receivable for Fund shares sold | | | 82 | | | | 3,703 | | | | 1,017 | | | | 1,113 | | | | 139 | | |
Receivable from Management—net (Note B) | | | 3 | | | | 35 | | | | — | | | | — | | | | — | | |
Prepaid expenses and other assets | | | 22 | | | | 52 | | | | 132 | | | | 97 | | | | 44 | | |
Total Assets | | | 75,166 | | | | 62,621 | | | | 1,307,539 | | | | 1,024,306 | | | | 230,699 | | |
Liabilities | |
Options contracts written, at value** (Note A) | | | — | | | | — | | | | — | | | | — | | | | — | | |
Payable for securities purchased | | | 1,197 | | | | 5,828 | | | | 9,192 | | | | 216 | | | | 15 | | |
Payable for Fund shares redeemed | | | 18 | | | | — | | | | 356 | | | | 334 | | | | 1 | | |
Payable to investment manager—net (Note B) | | | 54 | | | | 48 | | | | 561 | | | | 559 | | | | 111 | | |
Payable to administrator—net (Note B) | | | — | | | | — | | | | 323 | | | | 221 | | | | 35 | | |
Payable to trustees | | | 3 | | | | 5 | | | | 3 | | | | 3 | | | | 3 | | |
Payable for organization costs | | | — | | | | 47 | | | | — | | | | — | | | | — | | |
Accrued expenses and other payables | | | 80 | | | | 87 | | | | 266 | | | | 358 | | | | 106 | | |
Total Liabilities | | | 1,352 | | | | 6,015 | | | | 10,701 | | | | 1,691 | | | | 271 | | |
Net Assets | | $ | 73,814 | | | $ | 56,606 | | | $ | 1,296,838 | | | $ | 1,022,615 | | | $ | 230,428 | | |
Net Assets consist of: | |
Paid-in capital | | $ | 73,124 | | | $ | 56,379 | | | $ | 854,720 | | | $ | 1,223,257 | | | $ | 254,681 | | |
Undistributed net investment income (loss) | | | 80 | | | | (29 | ) | | | 4,053 | | | | 5,335 | | | | 1,535 | | |
Distributions in excess of net investment income | | | — | | | | — | | | | — | | | | — | | | | — | | |
Accumulated net realized gains (losses) on investments | | | (4,651 | ) | | | 212 | | | | 106,213 | | | | (326,290 | ) | | | (54,600 | ) | |
Net unrealized appreciation (depreciation) in value of investments | | | 5,261 | | | | 44 | | | | 331,852 | | | | 120,313 | | | | 28,812 | | |
Net Assets | | $ | 73,814 | | | $ | 56,606 | | | $ | 1,296,838 | | | $ | 1,022,615 | | | $ | 230,428 | | |
Net Assets | |
Investor Class | | $ | — | | | $ | — | | | $ | 1,040,343 | | | $ | 125,722 | | | $ | — | | |
Trust Class | | | — | | | | — | | | | 129,400 | | | | 111,853 | | | | 13,902 | | |
Advisor Class | | | — | | | | — | | | | 618 | | | | — | | | | — | | |
Institutional Class | | | 73,066 | | | | 56,387 | | | | 88,919 | | | | 770,321 | | | | 200,648 | | |
Class A | | | 611 | | | | 117 | | | | 34,573 | | | | 12,808 | | | | 9,287 | | |
Class C | | | 137 | | | | 102 | | | | 2,577 | | | | 1,911 | | | | 3,995 | | |
Class R3 | | | — | | | | — | | | | 408 | | | | — | | | | 2,596 | | |
Class R6 | | | — | | | | — | | | | — | | | | — | | | | — | | |
148
Statements of Assets and Liabilities (cont'd)
Neuberger Berman Equity Funds (cont'd)
(000's omitted except per share amounts)
| | | EMERGING
MARKETS
EQUITY FUND | | EQUITY
INCOME FUND | | FOCUS FUND | | GENESIS FUND | | GLOBAL EQUITY
FUND | |
| | | August 31,
2013 | | August 31,
2013 | | August 31,
2013 | | August 31,
2013 | | August 31,
2013 | |
Shares Outstanding ($.001 par value; unlimited shares authorized) | |
Investor Class | | | — | | | | — | | | | 23,674 | | | | 61,191 | | | | — | | |
Trust Class | | | — | | | | — | | | | 2,887 | | | | 53,358 | | | | — | | |
Advisor Class | | | — | | | | — | | | | 458 | | | | 19,286 | | | | — | | |
Institutional Class | | | 24,381 | | | | 122,444 | | | | 837 | | | | 103,952 | | | | 3,527 | | |
Class A | | | 478 | | | | 88,499 | | | | 96 | | | | — | | | | 16 | | |
Class C | | | 278 | | | | 39,991 | | | | 48 | | | | — | | | | 7 | | |
Class R3 | | | 12 | | | | 221 | | | | — | | | | — | | | | — | | |
Class R6 | | | 2,024 | | | | — | | | | — | | | | 16,934 | | | | — | | |
Net Asset Value, offering and redemption price per share | |
Investor Class | | $ | — | | | $ | — | | | $ | 26.90 | | | $ | 40.18 | | | $ | — | | |
Trust Class | | | — | | | | — | | | | 19.50 | | | | 59.83 | | | | — | | |
Advisor Class | | | — | | | | — | | | | 13.27 | | | | 32.46 | | | | — | | |
Institutional Class | | | 15.34 | | | | 11.76 | | | | 26.95 | | | | 57.62 | | | | 9.49 | | |
Class R3 | | | 15.02 | | | | 11.69 | | | | — | | | | — | | | | — | | |
Class R6 | | | 15.35 | | | | — | | | | — | | | | 57.63 | | | | — | | |
Net Asset Value and redemption price per share | |
Class A | | $ | 15.27 | | | $ | 11.71 | | | $ | 19.38 | | | $ | — | | | $ | 9.43 | | |
Offering Price per share | |
Class A‡ | | $ | 16.20 | | | $ | 12.42 | | | $ | 20.56 | | | $ | — | | | $ | 10.01 | | |
Net Asset Value and offering price per share | |
Class C^ | | $ | 14.87 | | | $ | 11.65 | | | $ | 13.03 | | | $ | — | | | $ | 9.28 | | |
*Cost of Investments: | |
Unaffiliated issuers | | $ | 423,128 | | | $ | 2,767,221 | | | $ | 595,578 | | | $ | 4,205,969 | | | $ | 34,113 | | |
Affiliated issuers | | | — | | | | — | | | | — | | | | 3,476,159 | | | | — | | |
Total cost of investments | | $ | 423,128 | | | $ | 2,767,221 | | | $ | 595,578 | | | $ | 7,682,128 | | | $ | 34,113 | | |
Total cost of foreign currency | | $ | 329 | | | $ | 863 | | | $ | — | | | $ | — | | | $ | — | | |
**Premium received from options written | | $ | — | | | $ | 1,064 | | | $ | — | | | $ | — | | | $ | — | | |
‡ On single retail sales of less than $50,000. On sales of $50,000 or more or in certain other circumstances described in the Fund's prospectus, offering price is reduced.
^ Redemption price per share is equal to net asset value less any applicable contingent deferred sales charge.
See Notes to Financial Statements
149
| | | GLOBAL
THEMATIC
OPPORTUNITIES
FUND | | GREATER
CHINA EQUITY
FUND | | GUARDIAN
FUND | | INTERNATIONAL
EQUITY
FUND | | INTERNATIONAL
LARGE CAP
FUND | |
| | | August 31,
2013 | | August 31,
2013 | | August 31,
2013 | | August 31,
2013 | | August 31,
2013 | |
Shares Outstanding ($.001 par value; unlimited shares authorized) | |
Investor Class | | | — | | | | — | | | | 55,986 | | | | 6,751 | | | | — | | |
Trust Class | | | — | | | | — | | | | 9,049 | | | | 5,404 | | | | 1,371 | | |
Advisor Class | | | — | | | | — | | | | 38 | | | | — | | | | — | | |
Institutional Class | | | 7,673 | | | | 5,551 | | | | 4,775 | | | | 75,078 | | | | 19,788 | | |
Class A | | | 64 | | | | 12 | | | | 2,433 | | | | 619 | | | | 922 | | |
Class C | | | 15 | | | | 10 | | | | 161 | | | | 93 | | | | 402 | | |
Class R3 | | | — | | | | — | | | | 25 | | | | — | | | | 259 | | |
Class R6 | | | — | | | | — | | | | — | | | | — | | | | — | | |
Net Asset Value, offering and redemption price per share | |
Investor Class | | $ | — | | | $ | — | | | $ | 18.58 | | | $ | 18.62 | | | $ | — | | |
Trust Class | | | — | | | | — | | | | 14.30 | | | | 20.70 | | | | 10.14 | | |
Advisor Class | | | — | | | | — | | | | 16.27 | | | | — | | | | — | | |
Institutional Class | | | 9.52 | | | | 10.16 | | | | 18.62 | | | | 10.26 | | | | 10.14 | | |
Class R3 | | | — | | | | — | | | | 16.25 | | | | — | | | | 10.01 | | |
Class R6 | | | — | | | | — | | | | — | | | | — | | | | — | | |
Net Asset Value and redemption price per share | |
Class A | | $ | 9.47 | | | $ | 10.16 | | | $ | 14.21 | | | $ | 20.69 | | | $ | 10.07 | | |
Offering Price per share | |
Class A‡ | | $ | 10.05 | | | $ | 10.78 | | | $ | 15.08 | | | $ | 21.95 | | | $ | 10.68 | | |
Net Asset Value and offering price per share | |
Class C^ | | $ | 9.35 | | | $ | 10.15 | | | $ | 15.96 | | | $ | 20.50 | | | $ | 9.93 | | |
*Cost of Investments: | |
Unaffiliated issuers | | $ | 69,691 | | | $ | 52,991 | | | $ | 969,430 | | | $ | 899,272 | | | $ | 201,004 | | |
Affiliated issuers | | | — | | | | — | | | | — | | | | — | | | | — | | |
Total cost of investments | | $ | 69,691 | | | $ | 52,991 | | | $ | 969,430 | | | $ | 899,272 | | | $ | 201,004 | | |
Total cost of foreign currency | | $ | — | | | $ | 302 | | | $ | — | | | $ | 229 | | | $ | 11 | | |
**Premium received from options written | | $ | — | | | $ | — | | | $ | — | | | $ | — | | | $ | — | | |
150
Statements of Assets and Liabilities (cont'd)
Neuberger Berman Equity Funds
(000's omitted except per share amounts)
| | INTRINSIC
VALUE FUND | | LARGE CAP
DISCIPLINED
GROWTH FUND | | LARGE CAP
VALUE FUND | | MID CAP
GROWTH
FUND | | MID CAP
INTRINSIC
VALUE FUND | |
| | | August 31,
2013 | | August 31,
2013 | | August 31,
2013 | | August 31,
2013 | | August 31,
2013 | |
Assets | |
Investments in securities, at value* (Notes A & F)—see Schedule of Investments: | |
Unaffiliated issuers | | $ | 207,307 | | | $ | 487,255 | | | $ | 1,605,532 | | | $ | 801,466 | | | $ | 67,182 | | |
Affiliated issuers | | | — | | | | — | | | | — | | | | — | | | | — | | |
| | | | 207,307 | | | | 487,255 | | | | 1,605,532 | | | | 801,466 | | | | 67,182 | | |
Cash | | | — | | | | — | | | | — | | | | — | | | | — | | |
Foreign currency | | | — | | | | — | | | | — | | | | — | | | | — | | |
Deposits with brokers for open option contracts | | | — | | | | — | | | | — | | | | — | | | | — | | |
Dividends and interest receivable | | | 96 | | | | 472 | | | | 2,860 | | | | 275 | | | | 78 | | |
Receivable for securities sold | | | 1,055 | | | | 1,000 | | | | 35,128 | | | | 2,752 | | | | 1,674 | | |
Receivable for Fund shares sold | | | 318 | | | | 1,104 | | | | 149 | | | | 1,443 | | | | 11 | | |
Receivable from Management—net (Note B) | | | — | | | | — | | | | — | | | | — | | | | — | | |
Prepaid expenses and other assets | | | 21 | | | | 35 | | | | 118 | | | | 79 | | | | 34 | | |
Total Assets | | | 208,797 | | | | 489,866 | | | | 1,643,787 | | | | 806,015 | | | | 68,979 | | |
Liabilities | |
Options contracts written, at value** (Note A) | | | — | | | | — | | | | — | | | | — | | | | — | | |
Payable for securities purchased | | | 1,691 | | | | — | | | | 12,561 | | | | 2,269 | | | | 627 | | |
Payable for Fund shares redeemed | | | 46 | | | | 648 | | | | 2,058 | | | | 1,037 | | | | 16 | | |
Payable to investment manager—net (Note B) | | | 153 | | | | 233 | | | | 690 | | | | 360 | | | | 11 | | |
Payable to administrator—net (Note B) | | | 11 | | | | 65 | | | | 467 | | | | 175 | | | | 24 | | |
Payable to trustees | | | 3 | | | | 3 | | | | 3 | | | | 3 | | | | 3 | | |
Payable for organization costs | | | — | | | | — | | | | — | | | | — | | | | — | | |
Accrued expenses and other payables | | | 53 | | | | 114 | | | | 298 | | | | 170 | | | | 57 | | |
Total Liabilities | | | 1,957 | | | | 1,063 | | | | 16,077 | | | | 4,014 | | | | 738 | | |
Net Assets | | $ | 206,840 | | | $ | 488,803 | | | $ | 1,627,710 | | | $ | 802,001 | | | $ | 68,241 | | |
Net Assets consist of: | |
Paid-in capital | | $ | 161,802 | | | $ | 350,821 | | | $ | 1,234,141 | | | $ | 536,071 | | | $ | 52,512 | | |
Undistributed net investment income (loss) | | | 275 | | | | — | | | | 18,034 | | | | (2,198 | ) | | | 882 | | |
Distributions in excess of net investment income | | | — | | | | (14 | ) | | | — | | | | — | | | | — | | |
Accumulated net realized gains (losses) on investments | | | 5,823 | | | | 60,803 | | | | 198,381 | | | | 33,176 | | | | 1,964 | | |
Net unrealized appreciation (depreciation) in value of investments | | | 38,940 | | | | 77,193 | | | | 177,154 | | | | 234,952 | | | | 12,883 | | |
Net Assets | | $ | 206,840 | | | $ | 488,803 | | | $ | 1,627,710 | | | $ | 802,001 | | | $ | 68,241 | | |
Net Assets | |
Investor Class | | $ | — | | | $ | 16,083 | | | $ | 1,149,740 | | | $ | 377,826 | | | $ | 45,910 | | |
Trust Class | | | — | | | | — | | | | 156,589 | | | | 54,862 | | | | 13,010 | | |
Advisor Class | | | — | | | | — | | | | 205,340 | | | | 11,707 | | | | — | | |
Institutional Class | | | 182,635 | | | | 409,172 | | | | 113,201 | | | | 258,609 | | | | 4,556 | | |
Class A | | | 13,922 | | | | 38,397 | | | | 1,582 | | | | 89,024 | | | | 2,652 | | |
Class C | | | 10,283 | | | | 24,777 | | | | 1,153 | | | | 4,368 | | | | 1,319 | | |
Class R3 | | | — | | | | 374 | | | | 105 | | | | 5,552 | | | | 794 | | |
Class R6 | | | — | | | | — | | | | — | | | | 53 | | | | — | | |
See Notes to Financial Statements
151
| | | MULTI-CAP
OPPORTUNITIES
FUND | | REAL ESTATE
FUND | | SELECT
EQUITIES
FUND | | SMALL CAP
GROWTH
FUND | | SOCIALLY
RESPONSIVE
FUND | |
| | | August 31,
2013 | | August 31,
2013 | | August 31,
2013 | | August 31,
2013 | | August 31,
2013 | |
Assets | |
Investments in securities, at value* (Notes A & F)—see Schedule of Investments: | |
Unaffiliated issuers | | $ | 1,493,509 | | | $ | 909,822 | | | $ | 92,404 | | | $ | 78,923 | | | $ | 2,232,631 | | |
Affiliated issuers | | | — | | | | — | | | | — | | | | — | | | | — | | |
| | | | 1,493,509 | | | | 909,822 | | | | 92,404 | | | | 78,923 | | | | 2,232,631 | | |
Cash | | | — | | | | — | | | | — | | | | — | | | | — | | |
Foreign currency | | | — | | | | — | | | | — | | | | — | | | | — | | |
Deposits with brokers for open option contracts | | | — | | | | — | | | | — | | | | — | | | | — | | |
Dividends and interest receivable | | | 2,659 | | | | 423 | | | | 118 | | | | 11 | | | | 4,820 | | |
Receivable for securities sold | | | 707 | | | | 31,667 | | | | — | | | | 1,006 | | | | 4,750 | | |
Receivable for Fund shares sold | | | 14,714 | | | | 3,544 | | | | 275 | | | | 28 | | | | 2,940 | | |
Receivable from Management—net (Note B) | | | — | | | | — | | | | — | | | | 12 | | | | — | | |
Prepaid expenses and other assets | | | 40 | | | | 95 | | | | 13 | | | | 38 | | | | 113 | | |
Total Assets | | | 1,511,629 | | | | 945,551 | | | | 92,810 | | | | 80,018 | | | | 2,245,254 | | |
Liabilities | |
Options contracts written, at value** (Note A) | | | — | | | | — | | | | — | | | | — | | | | — | | |
Payable for securities purchased | | | 19,847 | | | | 28,212 | | | | — | | | | 1,518 | | | | 16,047 | | |
Payable for Fund shares redeemed | | | 162 | | | | 2,364 | | | | 33 | | | | 33 | | | | 1,171 | | |
Payable to investment manager—net (Note B) | | | 676 | | | | 644 | | | | 43 | | | | 57 | | | | 905 | | |
Payable to administrator—net (Note B) | | | 207 | | | | 72 | | | | 13 | | | | — | | | | 559 | | |
Payable to trustees | | | 3 | | | | 3 | | | | 3 | | | | 3 | | | | 3 | | |
Payable for organization costs | | | — | | | | — | | | | — | | | | — | | | | — | | |
Accrued expenses and other payables | | | 181 | | | | 193 | | | | 84 | | | | 75 | | | | 347 | | |
Total Liabilities | | | 21,076 | | | | 31,488 | | | | 176 | | | | 1,686 | | | | 19,032 | | |
Net Assets | | $ | 1,490,553 | | | $ | 914,063 | | | $ | 92,634 | | | $ | 78,332 | | | $ | 2,226,222 | | |
Net Assets consist of: | |
Paid-in capital | | $ | 1,253,324 | | | $ | 872,327 | | | $ | 74,381 | | | $ | 91,229 | | | $ | 1,605,462 | | |
Undistributed net investment income (loss) | | | 7,949 | | | | — | | | | 34 | | | | (671 | ) | | | 17,367 | | |
Distributions in excess of net investment income | | | — | | | | — | | | | — | | | | — | | | | — | | |
Accumulated net realized gains (losses) on investments | | | 16,405 | | | | 33,813 | | | | 5,561 | | | | (21,779 | ) | | | 116,598 | | |
Net unrealized appreciation (depreciation) in value of investments | | | 212,875 | | | | 7,923 | | | | 12,658 | | | | 9,553 | | | | 486,795 | | |
Net Assets | | $ | 1,490,553 | | | $ | 914,063 | | | $ | 92,634 | | | $ | 78,332 | | | $ | 2,226,222 | | |
Net Assets | |
Investor Class | | $ | — | | | $ | — | | | $ | — | | | $ | 48,777 | | | $ | 825,220 | | |
Trust Class | | | — | | | | 319,931 | | | | — | | | | 7,163 | | | | 431,269 | | |
Advisor Class | | | — | | | | — | | | | — | | | | 3,592 | | | | — | | |
Institutional Class | | | 1,430,683 | | | | 366,449 | | | | 48,277 | | | | 14,910 | | | | 557,686 | | |
Class A | | | 51,577 | | | | 164,495 | | | | 30,726 | | | | 2,371 | | | | 109,624 | | |
Class C | | | 8,293 | | | | 39,685 | | | | 13,631 | | | | 1,110 | | | | 27,486 | | |
Class R3 | | | — | | | | 15,245 | | | | — | | | | 409 | | | | 25,308 | | |
Class R6 | | | — | | | | 8,258 | | | | — | | | | — | | | | 249,629 | | |
152
Statements of Assets and Liabilities (cont'd)
Neuberger Berman Equity Funds (cont'd)
(000's omitted except per share amounts)
| | | INTRINSIC
VALUE FUND | | LARGE CAP
DISCIPLINED
GROWTH FUND | | LARGE CAP
VALUE FUND | | MID CAP
GROWTH
FUND | | MID CAP
INTRINSIC
VALUE FUND | |
| | | August 31,
2013 | | August 31,
2013 | | August 31,
2013 | | August 31,
2013 | | August 31,
2013 | |
Shares Outstanding ($.001 par value; unlimited shares authorized) | |
Investor Class | | | — | | | | 1,966 | | | | 35,491 | | | | 28,301 | | | | 2,263 | | |
Trust Class | | | — | | | | — | | | | 6,313 | | | | 2,645 | | | | 739 | | |
Advisor Class | | | — | | | | — | | | | 9,671 | | | | 554 | | | | — | | |
Institutional Class | | | 14,254 | | | | 49,747 | | | | 3,477 | | | | 19,071 | | | | 224 | | |
Class A | | | 1,100 | | | | 4,702 | | | | 64 | | | | 4,293 | | | | 151 | | |
Class C | | | 833 | | | | 3,123 | | | | 56 | | | | 210 | | | | 76 | | |
Class R3 | | | — | | | | 46 | | | | 5 | | | | 262 | | | | 45 | | |
Class R6 | | | — | | | | — | | | | — | | | | 4 | | | | — | | |
Net Asset Value, offering and redemption price per share | |
Investor Class | | $ | — | | | $ | 8.18 | | | $ | 32.40 | | | $ | 13.35 | | | $ | 20.29 | | |
Trust Class | | | — | | | | — | | | | 24.80 | | | | 20.75 | | | | 17.61 | | |
Advisor Class | | | — | | | | — | | | | 21.23 | | | | 21.13 | | | | — | | |
Institutional Class | | | 12.81 | | | | 8.23 | | | | 32.56 | | | | 13.56 | | | | 20.33 | | |
Class R3 | | | — | | | | 8.10 | | | | 21.41 | | | | 21.16 | | | | 17.59 | | |
Class R6 | | | — | | | | — | | | | — | | | | 13.57 | | | | — | | |
Net Asset Value and redemption price per share | |
Class A | | $ | 12.65 | | | $ | 8.17 | | | $ | 24.83 | | | $ | 20.74 | | | $ | 17.60 | | |
Offering Price per share | |
Class A‡ | | $ | 13.42 | | | $ | 8.67 | | | $ | 26.34 | | | $ | 22.01 | | | $ | 18.67 | | |
Net Asset Value and offering price per share | |
Class C^ | | $ | 12.35 | | | $ | 7.93 | | | $ | 20.73 | | | $ | 20.81 | | | $ | 17.44 | | |
*Cost of Investments: | |
Unaffiliated issuers | | $ | 168,367 | | | $ | 410,062 | | | $ | 1,428,378 | | | $ | 566,514 | | | $ | 54,299 | | |
Affiliated issuers | | | — | | | | — | | | | — | | | | — | | | | — | | |
Total cost of investments | | $ | 168,367 | | | $ | 410,062 | | | $ | 1,428,378 | | | $ | 566,514 | | | $ | 54,299 | | |
Total cost of foreign currency | | $ | — | | | $ | — | | | $ | — | | | $ | — | | | $ | — | | |
**Premium received from options written | | $ | — | | | $ | — | | | $ | — | | | $ | — | | | $ | — | | |
‡ On single retail sales of less than $50,000. On sales of $50,000 or more or in certain other circumstances described in the Fund's prospectus, offering price is reduced.
^ Redemption price per share is equal to net asset value less any applicable contingent deferred sales charge.
See Notes to Financial Statements
153
| | | MULTI-CAP
OPPORTUNITIES
FUND | | REAL ESTATE
FUND | | SELECT
EQUITIES
FUND | | SMALL CAP
GROWTH
FUND | | SOCIALLY
RESPONSIVE
FUND | |
| | | August 31,
2013 | | August 31,
2013 | | August 31,
2013 | | August 31,
2013 | | August 31,
2013 | |
Shares Outstanding ($.001 par value; unlimited shares authorized) | |
Investor Class | | | — | | | | — | | | | — | | | | 2,019 | | | | 25,265 | | |
Trust Class | | | — | | | | 24,691 | | | | — | | | | 273 | | | | 19,424 | | |
Advisor Class | | | — | | | | — | | | | — | | | | 207 | | | | — | | |
Institutional Class | | | 105,518 | | | | 28,208 | | | | 4,740 | | | | 608 | | | | 17,052 | | |
Class A | | | 3,827 | | | | 12,700 | | | | 3,048 | | | | 90 | | | | 4,972 | | |
Class C | | | 628 | | | | 3,067 | | | | 1,413 | | | | 65 | | | | 1,271 | | |
Class R3 | | | — | | | | 1,178 | | | | — | | | | 24 | | | | 1,157 | | |
Class R6 | | | — | | | | 636 | | | | — | | | | — | | | | 7,631 | | |
Net Asset Value, offering and redemption price per share | |
Investor Class | | $ | — | | | $ | — | | | $ | — | | | $ | 24.16 | | | $ | 32.66 | | |
Trust Class | | | — | | | | 12.96 | | | | — | | | | 26.22 | | | | 22.20 | | |
Advisor Class | | | — | | | | — | | | | — | | | | 17.33 | | | | — | | |
Institutional Class | | | 13.56 | | | | 12.99 | | | | 10.18 | | | | 24.51 | | | | 32.70 | | |
Class R3 | | | — | | | | 12.94 | | | | — | | | | 17.37 | | | | 21.86 | | |
Class R6 | | | — | | | | 12.99 | | | | — | | | | — | | | | 32.71 | | |
Net Asset Value and redemption price per share | |
Class A | | $ | 13.48 | | | $ | 12.95 | | | $ | 10.08 | | | $ | 26.36 | | | $ | 22.05 | | |
Offering Price per share | |
Class A‡ | | $ | 14.30 | | | $ | 13.74 | | | $ | 10.69 | | | $ | 27.97 | | | $ | 23.40 | | |
Net Asset Value and offering price per share | |
Class C^ | | $ | 13.20 | | | $ | 12.94 | | | $ | 9.64 | | | $ | 17.01 | | | $ | 21.63 | | |
*Cost of Investments: | |
Unaffiliated issuers | | $ | 1,280,634 | | | $ | 901,899 | | | $ | 79,746 | | | $ | 69,370 | | | $ | 1,745,831 | | |
Affiliated issuers | | | — | | | | — | | | | — | | | | — | | | | — | | |
Total cost of investments | | $ | 1,280,634 | | | $ | 901,899 | | | $ | 79,746 | | | $ | 69,370 | | | $ | 1,745,831 | | |
Total cost of foreign currency | | $ | — | | | $ | — | | | $ | — | | | $ | — | | | $ | — | | |
**Premium received from options written | | $ | — | | | $ | — | | | $ | — | | | $ | — | | | $ | — | | |
154
Statements of Assets and Liabilities (cont'd)
Neuberger Berman Equity Funds
(000's omitted except per share amounts)
| | | VALUE FUND | |
| | | August 31,
2013 | |
Assets | |
Investments in securities, at value* (Notes A & F)—see Schedule of Investments: | |
Unaffiliated issuers | | $ | 9,739 | | |
Affiliated issuers | | | — | | |
| | | | 9,739 | | |
Cash | | | — | | |
Foreign currency | | | — | | |
Deposits with brokers for open option contracts | | | — | | |
Dividends and interest receivable | | | 16 | | |
Receivable for securities sold | | | 251 | | |
Receivable for Fund shares sold | | | 1,033 | | |
Receivable from Management—net (Note B) | | | 10 | | |
Prepaid expenses and other assets | | | 12 | | |
Total Assets | | | 11,061 | | |
Liabilities | |
Options contracts written, at value** (Note A) | | | — | | |
Payable for securities purchased | | | 79 | | |
Payable for Fund shares redeemed | | | — | | |
Payable to investment manager—net (Note B) | | | 5 | | |
Payable to administrator—net (Note B) | | | — | | |
Payable to trustees | | | 3 | | |
Payable for organization costs | | | — | | |
Accrued expenses and other payables | | | 76 | | |
Total Liabilities | | | 163 | | |
Net Assets | | $ | 10,898 | | |
Net Assets consist of: | |
Paid-in capital | | $ | 10,880 | | |
Undistributed net investment income (loss) | | | 49 | | |
Distributions in excess of net investment income | | | — | | |
Accumulated net realized gains (losses) on investments | | | (211 | ) | |
Net unrealized appreciation (depreciation) in value of investments | | | 180 | | |
Net Assets | | $ | 10,898 | | |
Net Assets | |
Investor Class | | $ | — | | |
Trust Class | | | — | | |
Advisor Class | | | — | | |
Institutional Class | | | 6,911 | | |
Class A | | | 3,680 | | |
Class C | | | 307 | | |
Class R3 | | | — | | |
Class R6 | | | — | | |
See Notes to Financial Statements
155
Statements of Assets and Liabilities (cont'd)
Neuberger Berman Equity Funds (cont'd)
(000's omitted except per share amounts)
| | | VALUE FUND | |
| | | August 31,
2013 | |
Shares Outstanding ($.001 par value; unlimited shares authorized) | |
Investor Class | | | — | | |
Trust Class | | | — | | |
Advisor Class | | | — | | |
Institutional Class | | | 511 | | |
Class A | | | 274 | | |
Class C | | | 23 | | |
Class R3 | | | — | | |
Class R6 | | | — | | |
Net Asset Value, offering and redemption price per share | |
Investor Class | | $ | — | | |
Trust Class | | | — | | |
Advisor Class | | | — | | |
Institutional Class | | | 13.52 | | |
Class R3 | | | — | | |
Class R6 | | | — | | |
Net Asset Value and redemption price per share | |
Class A | | $ | 13.44 | | |
Offering Price per share | |
Class A‡ | | $ | 14.26 | | |
Net Asset Value and offering price per share | |
Class C^ | | $ | 13.31 | | |
*Cost of Investments: | |
Unaffiliated issuers | | $ | 9,559 | | |
Affiliated issuers | | | — | | |
Total cost of investments | | $ | 9,559 | | |
Total cost of foreign currency | | $ | — | | |
**Premium received from options written | | $ | — | | |
‡ On single retail sales of less than $50,000. On sales of $50,000 or more or in certain other circumstances described in the Fund's prospectus, offering price is reduced.
^ Redemption price per share is equal to net asset value less any applicable contingent deferred sales charge.
See Notes to Financial Statements
156
Neuberger Berman Equity Funds
(000's omitted)
| | | EMERGING
MARKETS
EQUITY FUND | | EQUITY
INCOME FUND | | FOCUS FUND | | GENESIS FUND | | GLOBAL EQUITY
FUND | |
| | | For the
Year Ended
August 31,
2013 | | For the
Year Ended
August 31,
2013 | | For the
Year Ended
August 31,
2013 | | For the
Year Ended
August 31,
2013 | | For the
Year Ended
August 31,
2013 | |
Investment Income: | |
Income (Note A): | |
Dividend income—unaffiliated issuers | | $ | 7,840 | | | $ | 87,922 | | | $ | 10,707 | | | $ | 110,692 | | | $ | 127 | | |
Dividend income—affiliated issuers (Note F) | | | — | | | | — | | | | — | | | | 103,660 | | | | — | | |
Interest and other income—unaffiliated issuers | | | 6 | | | | 8,483 | | | | 1 | | | | 28 | | | | — | | |
Interest income—affiliated issuers (Note F) | | | — | | | | — | | | | — | | | | 18 | | | | — | | |
Foreign taxes withheld | | | (631 | ) | | | (4,243 | ) | | | (68 | ) | | | (1,882 | ) | | | (7 | ) | |
Total income | | $ | 7,215 | | | $ | 92,162 | | | $ | 10,640 | | | $ | 212,516 | | | $ | 120 | | |
Expenses: | |
Investment management fees (Note B) | | | 3,031 | | | | 13,499 | | | | 3,390 | | | | 81,301 | | | | 51 | | |
Administration fees (Note B) | | | 183 | | | | 1,764 | | | | 384 | | | | 7,390 | | | | 4 | | |
Administration fees (Note B): | |
Investor Class | | | — | | | | — | | | | 1,182 | | | | 4,840 | | | | — | | |
Trust Class | | | — | | | | — | | | | 75 | | | | 10,534 | | | | — | | |
Advisor Class | | | — | | | | — | | | | 20 | | | | 2,056 | | | | — | | |
Institutional Class | | | 257 | | | | 1,263 | | | | 18 | | | | 5,406 | | | | 6 | | |
Class A | | | 12 | | | | 2,179 | | | | 2 | | | | — | | | | — | | |
Class C | | | 6 | | | | 891 | | | | 1 | | | | — | | | | — | | |
Class R3 | | | — | | | | 5 | | | | — | | | | — | | | | — | | |
Class R6 | | | 2 | | | | — | | | | — | | | | 37 | | | | — | | |
Distribution fees (Note B): | |
Trust Class | | | — | | | | — | | | | 22 | | | | — | | | | — | | |
Advisor Class | | | — | | | | — | | | | 15 | | | | 1,512 | | | | — | | |
Class A | | | 15 | | | | 2,723 | | | | 3 | | | | — | | | | — | | |
Class C | | | 28 | | | | 4,456 | | | | 4 | | | | — | | | | 1 | | |
Class R3 | | | 1 | | | | 13 | | | | — | | | | — | | | | — | | |
Shareholder servicing agent fees: | |
Investor Class | | | — | | | | — | | | | 367 | | | | 1,592 | | | | — | | |
Trust Class | | | — | | | | — | | | | 4 | | | | 335 | | | | — | | |
Advisor Class | | | — | | | | — | | | | 1 | | | | 213 | | | | — | | |
Institutional Class | | | 66 | | | | 139 | | | | 2 | | | | 564 | | | | 1 | | |
Class A | | | 4 | | | | 234 | | | | 1 | | | | — | | | | — | | |
Class C | | | 1 | | | | 87 | | | | — | | | | — | | | | — | | |
Class R3 | | | — | | | | 1 | | | | — | | | | — | | | | — | | |
Class R6 | | | 2 | | | | — | | | | — | | | | 15 | | | | — | | |
Organization expense (Note A) | | | — | | | | — | | | | — | | | | — | | | | — | | |
Audit fees | | | 62 | | | | 62 | | | | 62 | | | | 64 | | | | 57 | | |
Custodian and accounting fees | | | 956 | | | | 765 | | | | 190 | | | | 1,632 | | | | 55 | | |
Insurance expense | | | 10 | | | | 139 | | | | 26 | | | | 540 | | | | — | | |
Legal fees (Note H for International Equity Fund) | | | 88 | | | | 70 | | | | 69 | | | | 75 | | | | 70 | | |
Registration and filing fees | | | 90 | | | | 208 | | | | 90 | | | | 277 | | | | 45 | | |
Repayment to Management of expenses previously assumed by Management (Note B) | | | — | | | | 3 | | | | — | | | | — | | | | — | | |
Shareholder reports | | | 23 | | | | 320 | | | | 31 | | | | 908 | | | | 7 | | |
Trustees' fees and expenses | | | 47 | | | | 47 | | | | 47 | | | | 48 | | | | 48 | | |
Miscellaneous | | | 43 | | | | 152 | | | | 30 | | | | 522 | | | | 5 | | |
Total expenses | | | 4,927 | | | | 29,020 | | | | 6,036 | | | | 119,861 | | | | 350 | | |
See Notes to Financial Statements
157
| | | GLOBAL
THEMATIC
OPPORTUNITIES
FUND | | GREATER
CHINA EQUITY
FUND | | GUARDIAN
FUND | | INTERNATIONAL
EQUITY
FUND | | INTERNATIONAL
LARGE CAP
FUND | |
| | | For the
Year Ended
August 31,
2013 | | Period from
July 17, 2013
(Commencement
of Operations) to
August 31,
2013 | | For the
Year Ended
August 31,
2013 | | For the
Year Ended
August 31,
2013 | | For the
Year Ended
August 31,
2013 | |
Investment Income: | |
Income (Note A): | |
Dividend income—unaffiliated issuers | | $ | 1,082 | | | $ | 13 | | | $ | 21,509 | | | $ | 21,459 | | | $ | 5,741 | | |
Dividend income—affiliated issuers (Note F) | | | — | | | | — | | | | — | | | | — | | | | — | | |
Interest and other income—unaffiliated issuers | | | — | | | | — | | | | 3 | | | | — | | | | — | | |
Interest income—affiliated issuers (Note F) | | | — | | | | — | | | | — | | | | — | | | | — | | |
Foreign taxes withheld | | | (64 | ) | | | — | | | | (386 | ) | | | (2,121 | ) | | | (604 | ) | |
Total income | | $ | 1,018 | | | $ | 13 | | | $ | 21,126 | | | $ | 19,338 | | | $ | 5,137 | | |
Expenses: | |
Investment management fees (Note B) | | | 486 | | | | 58 | | | | 6,063 | | | | 6,339 | | | | 1,208 | | |
Administration fees (Note B) | | | 34 | | | | 3 | | | | 725 | | | | 464 | | | | 132 | | |
Administration fees (Note B): | |
Investor Class | | | — | | | | — | | | | 1,979 | | | | 164 | | | | — | | |
Trust Class | | | — | | | | — | | | | 409 | | | | 231 | | | | 52 | | |
Advisor Class | | | — | | | | — | | | | 2 | | | | — | | | | — | | |
Institutional Class | | | 50 | | | | 5 | | | | 65 | | | | 554 | | | | 171 | | |
Class A | | | 2 | | | | — | | | | 47 | | | | 12 | | | | 19 | | |
Class C | | | 1 | | | | — | | | | 3 | | | | 2 | | | | 8 | | |
Class R3 | | | — | | | | — | | | | 1 | | | | — | | | | 2 | | |
Class R6 | | | — | | | | — | | | | — | | | | — | | | | — | | |
Distribution fees (Note B): | |
Trust Class | | | — | | | | — | | | | 120 | | | | — | | | | 15 | | |
Advisor Class | | | — | | | | — | | | | 2 | | | | — | | | | — | | |
Class A | | | 3 | | | | — | | | | 59 | | | | 15 | | | | 24 | | |
Class C | | | 1 | | | | — | | | | 17 | | | | 8 | | | | 39 | | |
Class R3 | | | — | | | | — | | | | 1 | | | | — | | | | 6 | | |
Shareholder servicing agent fees: | |
Investor Class | | | — | | | | — | | | | 743 | | | | 74 | | | | — | | |
Trust Class | | | — | | | | — | | | | 14 | | | | 33 | | | | 9 | | |
Advisor Class | | | — | | | | — | | | | — | | | | — | | | | — | | |
Institutional Class | | | 5 | | | | 2 | | | | 7 | | | | 50 | | | | 16 | | |
Class A | | | 1 | | | | 2 | | | | 5 | | | | 4 | | | | 4 | | |
Class C | | | — | | | | 2 | | | | 1 | | | | 2 | | | | 1 | | |
Class R3 | | | — | | | | — | | | | — | | | | — | | | | — | | |
Class R6 | | | — | | | | — | | | | — | | | | — | | | | — | | |
Organization expense (Note A) | | | — | | | | 107 | | | | — | | | | — | | | | — | | |
Audit fees | | | 57 | | | | 28 | | | | 62 | | | | 65 | | | | 62 | | |
Custodian and accounting fees | | | 86 | | | | 12 | | | | 306 | | | | 557 | | | | 241 | | |
Insurance expense | | | 3 | | | | — | | | | 52 | | | | 29 | | | | 9 | | |
Legal fees (Note H for International Equity Fund) | | | 70 | | | | 10 | | | | 70 | | | | 267 | | | | 70 | | |
Registration and filing fees | | | 51 | | | | 1 | | | | 114 | | | | 117 | | | | 93 | | |
Repayment to Management of expenses previously assumed by Management (Note B) | | | — | | | | — | | | | 4 | | | | — | | | | — | | |
Shareholder reports | | | 11 | | | | 7 | | | | 104 | | | | 60 | | | | 21 | | |
Trustees' fees and expenses | | | 47 | | | | 5 | | | | 47 | | | | 48 | | | | 48 | | |
Miscellaneous | | | 9 | | | | 1 | | | | 55 | | | | 59 | | | | 25 | | |
Total expenses | | | 917 | | | | 243 | | | | 11,077 | | | | 9,154 | | | | 2,275 | | |
158
Statements of Operations (cont'd)
Neuberger Berman Equity Funds (cont'd)
(000's omitted)
| | | EMERGING
MARKETS
EQUITY FUND | | EQUITY
INCOME FUND | | FOCUS FUND | | GENESIS FUND | | GLOBAL EQUITY
FUND | |
| | | For the
Year Ended
August 31,
2013 | | For the
Year Ended
August 31,
2013 | | For the
Year Ended
August 31,
2013 | | For the
Year Ended
August 31,
2013 | | For the
Year Ended
August 31,
2013 | |
Expenses reimbursed by Management (Note B) | | | (1,077 | ) | | | — | | | | (6 | ) | | | (155 | ) | | | (271 | ) | |
Investment management fees waived (Note B) | | | — | | | | — | | | | — | | | | — | | | | — | | |
Expenses reduced by custodian fee expense offset arrangement (Note A) | | | — | | | | — | | | | — | | | | (1 | ) | | | — | | |
Net expenses prior to reimbursement of insurance proceeds | | | 3,850 | | | | 29,020 | | | | 6,030 | | | | 119,705 | | | | 79 | | |
Reimbursement from insurance proceeds (Note H for International Equity Fund) | | | — | | | | — | | | | — | | | | — | | | | — | | |
Total net expenses | | | 3,850 | | | | 29,020 | | | | 6,030 | | | | 119,705 | | | | 79 | | |
Net investment income (loss) | | $ | 3,365 | | | $ | 63,142 | | | $ | 4,610 | | | $ | 92,811 | | | $ | 41 | | |
Realized and Unrealized Gain (Loss) on Investments (Note A): | |
Net realized gain (loss) on: | |
Sales of investment securities of unaffiliated issuers | | | (2,886 | ) | | | 97,069 | | | | 68,340 | | | | 1,028,159 | | | | 246 | | |
Sales of investment securities of affiliated issuers | | | — | | | | — | | | | — | | | | 185,767 | | | | — | | |
Foreign currency | | | (580 | ) | | | (1,377 | ) | | | 1 | | | | 2 | | | | (54 | ) | |
Options written | | | — | | | | 2,963 | | | | — | | | | — | | | | — | | |
Change in net unrealized appreciation (depreciation) in value of: | |
Unaffiliated investment securities | | | (13,554 | ) | | | (52,613 | ) | | | 66,874 | | | | 751,774 | | | | (507 | ) | |
Affiliated investment securities | | | — | | | | — | | | | — | | | | 566,478 | | | | — | | |
Foreign currency | | | (15 | ) | | | 36 | | | | — | | | | (1 | ) | | | — | | |
Options written | | | — | | | | 139 | | | | — | | | | — | | | | — | | |
Net gain (loss) on investments | | | (17,035 | ) | | | 46,217 | | | | 135,215 | | | | 2,532,179 | | | | (315 | ) | |
Net increase (decrease) in net assets resulting from operations | | $ | (13,670 | ) | | $ | 109,359 | | | $ | 139,825 | | | $ | 2,624,990 | | | $ | (274 | ) | |
* Change in accrued foreign capital gains tax of $(23,108).
See Notes to Financial Statements
159
| | | GLOBAL
THEMATIC
OPPORTUNITIES
FUND | | GREATER
CHINA EQUITY
FUND | | GUARDIAN
FUND | | INTERNATIONAL
EQUITY
FUND | | INTERNATIONAL
LARGE CAP
FUND | |
| | | For the
Year Ended
August 31,
2013 | | Period from
July 17, 2013
(Commencement
of Operations) to
August 31,
2013 | | For the
Year Ended
August 31,
2013 | | For the
Year Ended
August 31,
2013 | | For the
Year Ended
August 31,
2013 | |
Expenses reimbursed by Management (Note B) | | | (194 | ) | | | (165 | ) | | | — | | | | (789 | ) | | | (161 | ) | |
Investment management fees waived (Note B) | | | — | | | | — | | | | — | | | | (1,021 | ) | | | — | | |
Expenses reduced by custodian fee expense offset arrangement (Note A) | | | — | | | | — | | | | — | | | | — | | | | — | | |
Net expenses prior to reimbursement of insurance proceeds | | | 723 | | | | 78 | | | | 11,077 | | | | 7,344 | | | | 2,114 | | |
Reimbursement from insurance proceeds (Note H for International Equity Fund) | | | — | | | | — | | | | — | | | | (308 | ) | | | — | | |
Total net expenses | | | 723 | | | | 78 | | | | 11,077 | | | | 7,036 | | | | 2,114 | | |
Net investment income (loss) | | $ | 295 | | | $ | (65 | ) | | $ | 10,049 | | | $ | 12,302 | | | $ | 3,023 | | |
Realized and Unrealized Gain (Loss) on Investments (Note A): | |
Net realized gain (loss) on: | |
Sales of investment securities of unaffiliated issuers | | | (1,069 | ) | | | 249 | | | | 125,085 | | | | 23,036 | | | | 8,875 | | |
Sales of investment securities of affiliated issuers | | | — | | | | — | | | | — | | | | — | | | | — | | |
Foreign currency | | | (40 | ) | | | (1 | ) | | | (40 | ) | | | (1,206 | ) | | | (217 | ) | |
Options written | | | — | | | | — | | | | — | | | | — | | | | — | | |
Change in net unrealized appreciation (depreciation) in value of: | |
Unaffiliated investment securities | | | 4,940 | | | | 44 | * | | | 107,571 | | | | 44,590 | | | | 13,257 | | |
Affiliated investment securities | | | — | | | | — | | | | — | | | | — | | | | — | | |
Foreign currency | | | 7 | | | | — | | | | 6 | | | | (4 | ) | | | — | | |
Options written | | | — | | | | — | | | | — | | | | — | | | | — | | |
Net gain (loss) on investments | | | 3,838 | | | | 292 | | | | 232,622 | | | | 66,416 | | | | 21,915 | | |
Net increase (decrease) in net assets resulting from operations | | $ | 4,133 | | | $ | 227 | | | $ | 242,671 | | | $ | 78,718 | | | $ | 24,938 | | |
160
Statements of Operations (cont'd)
Neuberger Berman Equity Funds
(000's omitted)
| | | INTRINSIC
VALUE FUND | | LARGE CAP
DISCIPLINED
GROWTH FUND | | LARGE CAP
VALUE FUND | | MID CAP
GROWTH
FUND | | MID CAP
INTRINSIC
VALUE FUND | |
| | | For the
Year Ended
August 31,
2013 | | For the
Year Ended
August 31,
2013 | | For the
Year Ended
August 31,
2013 | | For the
Year Ended
August 31,
2013 | | For the
Year Ended
August 31,
2013 | |
Investment Income: | |
Income (Note A): | |
Dividend income—unaffiliated issuers | | $ | 2,482 | | | $ | 9,275 | | | $ | 33,591 | | | $ | 4,819 | | | $ | 1,716 | | |
Dividend income—affiliated issuers (Note F) | | | — | | | | — | | | | — | | | | — | | | | — | | |
Interest and other income—unaffiliated issuers | | | — | | | | 23 | | | | 102 | | | | 37 | | | | 3 | | |
Interest income—affiliated issuers (Note F) | | | — | | | | — | | | | — | | | | — | | | | — | | |
Foreign taxes withheld | | | — | | | | (116 | ) | | | (281 | ) | | | (18 | ) | | | (1 | ) | |
Total income | | $ | 2,482 | | | $ | 9,182 | | | $ | 33,412 | | | $ | 4,838 | | | $ | 1,718 | | |
Expenses: | |
Investment management fees (Note B) | | | 1,493 | | | | 3,207 | | | | 7,904 | | | | 3,751 | | | | 372 | | |
Administration fees (Note B) | | | 106 | | | | 362 | | | | 975 | | | | 428 | | | | 41 | | |
Administration fees (Note B): | |
Investor Class | | | — | | | | 34 | | | | 2,238 | | | | 718 | | | | 88 | | |
Trust Class | | | — | | | | — | | | | 593 | | | | 165 | | | | 46 | | |
Advisor Class | | | — | | | | — | | | | 734 | | | | 36 | | | | — | | |
Institutional Class | | | 142 | | | | 448 | | | | 102 | | | | 190 | | | | 4 | | |
Class A | | | 19 | | | | 120 | | | | 3 | | | | 153 | | | | 8 | | |
Class C | | | 16 | | | | 58 | | | | 1 | | | | 6 | | | | 2 | | |
Class R3 | | | — | | | | 1 | | | | — | | | | 9 | | | | 1 | | |
Class R6 | | | — | | | | — | | | | — | | | | — | | | | — | | |
Distribution fees (Note B): | |
Trust Class | | | — | | | | — | | | | 174 | | | | — | | | | 14 | | |
Advisor Class | | | — | | | | — | | | | 540 | | | | 27 | | | | — | | |
Class A | | | 23 | | | | 150 | | | | 4 | | | | 191 | | | | 10 | | |
Class C | | | 82 | | | | 291 | | | | 5 | | | | 32 | | | | 9 | | |
Class R3 | | | — | | | | 2 | | | | 1 | | | | 22 | | | | 1 | | |
Shareholder servicing agent fees: | |
Investor Class | | | — | | | | 26 | | | | 664 | | | | 352 | | | | 37 | | |
Trust Class | | | — | | | | — | | | | 26 | | | | 8 | | | | 13 | | |
Advisor Class | | | — | | | | — | | | | 30 | | | | 3 | | | | — | | |
Institutional Class | | | 16 | | | | 67 | | | | 15 | | | | 27 | | | | 1 | | |
Class A | | | 4 | | | | 13 | | | | 1 | | | | 35 | | | | 3 | | |
Class C | | | 2 | | | | 6 | | | | — | | | | 2 | | | | — | | |
Class R3 | | | — | | | | — | | | | — | | | | 2 | | | | — | | |
Class R6 | | | — | | | | — | | | | — | | | | 1 | | | | — | | |
Organization expense (Note A) | | | — | | | | — | | | | — | | | | — | | | | — | | |
Audit fees | | | 24 | | | | 24 | | | | 62 | | | | 24 | | | | 24 | | |
Custodian and accounting fees | | | 80 | | | | 194 | | | | 339 | | | | 221 | | | | 79 | | |
Insurance expense | | | 7 | | | | 30 | | | | 67 | | | | 31 | | | | 3 | | |
Legal fees (Note H for International Equity Fund) | | | 70 | | | | 68 | | | | 69 | | | | 87 | | | | 75 | | |
Registration and filing fees | | | 50 | | | | 110 | | | | 128 | | | | 135 | | | | 89 | | |
Repayment to Management of expenses previously assumed by Management (Note B) | | | — | | | | 11 | | | | — | | | | — | | | | — | | |
Shareholder reports | | | 17 | | | | 94 | | | | 100 | | | | 105 | | | | 20 | | |
Trustees' fees and expenses | | | 47 | | | | 48 | | | | 47 | | | | 48 | | | | 47 | | |
Miscellaneous | | | 11 | | | | 36 | | | | 79 | | | | 34 | | | | 8 | | |
Total expenses | | | 2,209 | | | | 5,400 | | | | 14,901 | | | | 6,843 | | | | 995 | | |
See Notes to Financial Statements
161
| | | MULTI-CAP
OPPORTUNITIES
FUND | | REAL ESTATE
FUND | | SELECT
EQUITIES
FUND | | SMALL CAP
GROWTH
FUND | | SOCIALLY
RESPONSIVE
FUND | |
| | | For the
Year Ended
August 31,
2013 | | For the
Year Ended
August 31,
2013 | | For the
Year Ended
August 31,
2013 | | For the
Year Ended
August 31,
2013 | | For the
Year Ended
August 31,
2013 | |
Investment Income: | |
Income (Note A): | |
Dividend income—unaffiliated issuers | | $ | 20,671 | | | $ | 17,655 | | | $ | 935 | | | $ | 515 | | | $ | 36,238 | | |
Dividend income—affiliated issuers (Note F) | | | — | | | | — | | | | — | | | | — | | | | — | | |
Interest and other income—unaffiliated issuers | | | 34 | | | | 22 | | | | — | | | | 3 | | | | 6 | | |
Interest income—affiliated issuers (Note F) | | | — | | | | — | | | | — | | | | — | | | | — | | |
Foreign taxes withheld | | | (248 | ) | | | (93 | ) | | | (22 | ) | | | (1 | ) | | | (699 | ) | |
Total income | | $ | 20,457 | | | $ | 17,584 | | | $ | 913 | | | $ | 517 | | | $ | 35,545 | | |
Expenses: | |
Investment management fees (Note B) | | | 5,145 | | | | 6,719 | | | | 432 | | | | 885 | | | | 9,494 | | |
Administration fees (Note B) | | | 550 | | | | 504 | | | | 47 | | | | 62 | | | | 1,199 | | |
Administration fees (Note B): | |
Investor Class | | | — | | | | — | | | | — | | | | 107 | | | | 1,540 | | |
Trust Class | | | — | | | | 1,188 | | | | — | | | | 48 | | | | 1,505 | | |
Advisor Class | | | — | | | | — | | | | — | | | | 16 | | | | — | | |
Institutional Class | | | 810 | | | | 286 | | | | 33 | | | | 26 | | | | 530 | | |
Class A | | | 29 | | | | 257 | | | | 60 | | | | 3 | | | | 185 | | |
Class C | | | 4 | | | | 65 | | | | 24 | | | | 2 | | | | 42 | | |
Class R3 | | | — | | | | 21 | | | | — | | | | 1 | | | | 40 | | |
Class R6 | | | — | | | | — | | | | — | | | | — | | | | 13 | | |
Distribution fees (Note B): | |
Trust Class | | | — | | | | 349 | | | | — | | | | 14 | | | | 443 | | |
Advisor Class | | | — | | | | — | | | | — | | | | 12 | | | | — | | |
Class A | | | 37 | | | | 321 | | | | 75 | | | | 4 | | | | 231 | | |
Class C | | | 19 | | | | 324 | | | | 120 | | | | 9 | | | | 212 | | |
Class R3 | | | — | | | | 52 | | | | — | | | | 1 | | | | 101 | | |
Shareholder servicing agent fees: | |
Investor Class | | | — | | | | — | | | | — | | | | 78 | | | | 631 | | |
Trust Class | | | — | | | | 77 | | | | — | | | | 16 | | | | 62 | | |
Advisor Class | | | — | | | | — | | | | — | | | | 2 | | | | — | | |
Institutional Class | | | 425 | | | | 38 | | | | 4 | | | | 11 | | | | 55 | | |
Class A | | | 5 | | | | 64 | | | | 8 | | | | 1 | | | | 36 | | |
Class C | | | 1 | | | | 22 | | | | 3 | | | | 1 | | | | 8 | | |
Class R3 | | | — | | | | 3 | | | | — | | | | 1 | | | | 3 | | |
Class R6 | | | — | | | | 2 | | | | — | | | | — | | | | 6 | | |
Organization expense (Note A) | | | — | | | | — | | | | — | | | | — | | | | — | | |
Audit fees | | | 24 | | | | 66 | | | | 60 | | | | 24 | | | | 24 | | |
Custodian and accounting fees | | | 196 | | | | 219 | | | | 50 | | | | 105 | | | | 424 | | |
Insurance expense | | | 25 | | | | 33 | | | | 3 | | | | 3 | | | | 90 | | |
Legal fees (Note H for International Equity Fund) | | | 69 | | | | 100 | | | | 70 | | | | 70 | | | | 85 | | |
Registration and filing fees | | | 72 | | | | 148 | | | | 52 | | | | 104 | | | | 142 | | |
Repayment to Management of expenses previously assumed by Management (Note B) | | | 351 | | | | — | | | | — | | | | — | | | | 21 | | |
Shareholder reports | | | 62 | | | | 283 | | | | 18 | | | | 25 | | | | 187 | | |
Trustees' fees and expenses | | | 47 | | | | 48 | | | | 47 | | | | 47 | | | | 47 | | |
Miscellaneous | | | 27 | | | | 34 | | | | 5 | | | | 11 | | | | 87 | | |
Total expenses | | | 7,898 | | | | 11,223 | | | | 1,111 | | | | 1,689 | | | | 17,443 | | |
162
Statements of Operations (cont'd)
Neuberger Berman Equity Funds (cont'd)
(000's omitted)
| | | INTRINSIC
VALUE FUND | | LARGE CAP
DISCIPLINED
GROWTH FUND | | LARGE CAP
VALUE FUND | | MID CAP
GROWTH
FUND | | MID CAP
INTRINSIC
VALUE FUND | |
| | | For the
Year Ended
August 31,
2013 | | For the
Year Ended
August 31,
2013 | | For the
Year Ended
August 31,
2013 | | For the
Year Ended
August 31,
2013 | | For the
Year Ended
August 31,
2013 | |
Expenses reimbursed by Management (Note B) | | | (326 | ) | | | (265 | ) | | | (5 | ) | | | (134 | ) | | | (22 | ) | |
Investment management fees waived (Note B) | | | — | | | | — | | | | — | | | | — | | | | (211 | ) | |
Expenses reduced by custodian fee expense offset arrangement (Note A) | | | — | | | | — | | | | — | | | | — | | | | — | | |
Net expenses prior to reimbursement of insurance proceeds | | | 1,883 | | | | 5,135 | | | | 14,896 | | | | 6,709 | | | | 762 | | |
Reimbursement from insurance proceeds (Note H for International Equity Fund) | | | — | | | | — | | | | — | | | | — | | | | — | | |
Total net expenses | | | 1,883 | | | | 5,135 | | | | 14,896 | | | | 6,709 | | | | 762 | | |
Net investment income (loss) | | $ | 599 | | | $ | 4,047 | | | $ | 18,516 | | | $ | (1,871 | ) | | $ | 956 | | |
Realized and Unrealized Gain (Loss) on Investments (Note A): | |
Net realized gain (loss) on: | |
Sales of investment securities of unaffiliated issuers | | | 8,483 | | | | 85,033 | | | | 251,101 | | | | 63,525 | | | | 7,516 | | |
Sales of investment securities of affiliated issuers | | | — | | | | — | | | | — | | | | — | | | | — | | |
Foreign currency | | | — | | | | — | | | | — | | | | — | | | | — | | |
Options written | | | — | | | | — | | | | — | | | | — | | | | — | | |
Change in net unrealized appreciation (depreciation) in value of: | |
Unaffiliated investment securities | | | 31,300 | | | | (13,128 | ) | | | 77,930 | | | | 57,235 | | | | 7,966 | | |
Affiliated investment securities | | | — | | | | — | | | | — | | | | — | | | | — | | |
Foreign currency | | | — | | | | — | | | | — | | | | — | | | | — | | |
Options written | | | — | | | | — | | | | — | | | | — | | | | — | | |
Net gain (loss) on investments | | | 39,783 | | | | 71,905 | | | | 329,031 | | | | 120,760 | | | | 15,482 | | |
Net increase (decrease) in net assets resulting from operations | | $ | 40,382 | | | $ | 75,952 | | | $ | 347,547 | | | $ | 118,889 | | | $ | 16,438 | | |
See Notes to Financial Statements
163
| | | MULTI-CAP
OPPORTUNITIES
FUND | | REAL ESTATE
FUND | | SELECT
EQUITIES
FUND | | SMALL CAP
GROWTH
FUND | | SOCIALLY
RESPONSIVE
FUND | |
| | | For the
Year Ended
August 31,
2013 | | For the
Year Ended
August 31,
2013 | | For the
Year Ended
August 31,
2013 | | For the
Year Ended
August 31,
2013 | | For the
Year Ended
August 31,
2013 | |
Expenses reimbursed by Management (Note B) | | | — | | | | (2,534 | ) | | | (243 | ) | | | (463 | ) | | | — | | |
Investment management fees waived (Note B) | | | — | | | | — | | | | — | | | | — | | | | — | | |
Expenses reduced by custodian fee expense offset arrangement (Note A) | | | — | | | | — | | | | — | | | | — | | | | — | | |
Net expenses prior to reimbursement of insurance proceeds | | | 7,898 | | | | 8,689 | | | | 868 | | | | 1,226 | | | | 17,443 | | |
Reimbursement from insurance proceeds (Note H for International Equity Fund) | | | — | | | | — | | | | — | | | | — | | | | — | | |
Total net expenses | | | 7,898 | | | | 8,689 | | | | 868 | | | | 1,226 | | | | 17,443 | | |
Net investment income (loss) | | $ | 12,559 | | | $ | 8,895 | | | $ | 45 | | | $ | (709 | ) | | $ | 18,102 | | |
Realized and Unrealized Gain (Loss) on Investments (Note A): | |
Net realized gain (loss) on: | |
Sales of investment securities of unaffiliated issuers | | | 18,489 | | | | 45,175 | | | | 7,509 | | | | 24,040 | | | | 154,659 | | |
Sales of investment securities of affiliated issuers | | | — | | | | — | | | | — | | | | — | | | | — | | |
Foreign currency | | | 2 | | | | — | | | | — | | | | — | | | | (49 | ) | |
Options written | | | — | | | | — | | | | — | | | | — | | | | — | | |
Change in net unrealized appreciation (depreciation) in value of: | |
Unaffiliated investment securities | | | 187,685 | | | | (91,260 | ) | | | 4,375 | | | | (2,206 | ) | | | 244,474 | | |
Affiliated investment securities | | | — | | | | — | | | | — | | | | — | | | | — | | |
Foreign currency | | | — | | | | — | | | | — | | | | — | | | | 20 | | |
Options written | | | — | | | | — | | | | — | | | | — | | | | — | | |
Net gain (loss) on investments | | | 206,176 | | | | (46,085 | ) | | | 11,884 | | | | 21,834 | | | | 399,104 | | |
Net increase (decrease) in net assets resulting from operations | | $ | 218,735 | | | $ | (37,190 | ) | | $ | 11,929 | | | $ | 21,125 | | | $ | 417,206 | | |
164
Statements of Operations (cont'd)
Neuberger Berman Equity Funds
(000's omitted)
| | | VALUE FUND | |
| | | For the
Year Ended
August 31,
2013 | |
Investment Income: | |
Income (Note A): | |
Dividend income—unaffiliated issuers | | $ | 98 | | |
Dividend income—affiliated issuers (Note F) | | | — | | |
Interest and other income—unaffiliated issuers | | | — | | |
Interest income—affiliated issuers (Note F) | | | — | | |
Foreign taxes withheld | | | (1 | ) | |
Total income | | $ | 97 | | |
Expenses: | |
Investment management fees (Note B) | | | 28 | | |
Administration fees (Note B) | | | 3 | | |
Administration fees (Note B): | |
Investor Class | | | — | | |
Trust Class | | | — | | |
Advisor Class | | | — | | |
Institutional Class | | | 2 | | |
Class A | | | 5 | | |
Class C | | | — | | |
Class R3 | | | — | | |
Class R6 | | | — | | |
Distribution fees (Note B): | |
Trust Class | | | — | | |
Advisor Class | | | — | | |
Class A | | | 6 | | |
Class C | | | 2 | | |
Class R3 | | | — | | |
Shareholder servicing agent fees: | |
Investor Class | | | — | | |
Trust Class | | | — | | |
Advisor Class | | | — | | |
Institutional Class | | | — | | |
Class A | | | 2 | | |
Class C | | | — | | |
Class R3 | | | — | | |
Class R6 | | | — | | |
Organization expense (Note A) | | | — | | |
Audit fees | | | 62 | | |
Custodian and accounting fees | | | 36 | | |
Insurance expense | | | — | | |
Legal fees (Note H for International Equity Fund) | | | 70 | | |
Registration and filing fees | | | 48 | | |
Repayment to Management of expenses previously assumed by Management (Note B) | | | — | | |
Shareholder reports | | | 7 | | |
Trustees' fees and expenses | | | 47 | | |
Miscellaneous | | | 3 | | |
Total expenses | | | 321 | | |
See Notes to Financial Statements
165
Statements of Operations (cont'd)
Neuberger Berman Equity Funds (cont'd)
(000's omitted)
| | | VALUE FUND | |
| | | For the
Year Ended
August 31,
2013 | |
Expenses reimbursed by Management (Note B) | | | (274 | ) | |
Investment management fees waived (Note B) | | | — | | |
Expenses reduced by custodian fee expense offset arrangement (Note A) | | | — | | |
Net expenses prior to reimbursement of insurance proceeds | | | 47 | | |
Reimbursement from insurance proceeds (Note H for International Equity Fund) | | | — | | |
Total net expenses | | | 47 | | |
Net investment income (loss) | | $ | 50 | | |
Realized and Unrealized Gain (Loss) on Investments (Note A): | |
Net realized gain (loss) on: | |
Sales of investment securities of unaffiliated issuers | | | 530 | | |
Sales of investment securities of affiliated issuers | | | — | | |
Foreign currency | | | — | | |
Options written | | | — | | |
Change in net unrealized appreciation (depreciation) in value of: | |
Unaffiliated investment securities | | | 38 | | |
Affiliated investment securities | | | — | | |
Foreign currency | | | — | | |
Options written | | | — | | |
Net gain (loss) on investments | | | 568 | | |
Net increase (decrease) in net assets resulting from operations | | $ | 618 | | |
See Notes to Financial Statements
166
Statements of Changes in Net Assets
Neuberger Berman Equity Funds
(000's omitted)
| | | EMERGING MARKETS
EQUITY FUND | | EQUITY INCOME FUND | | FOCUS FUND | |
| | | Year Ended
August 31,
2013 | | Year Ended
August 31,
2012 | | Year Ended
August 31,
2013 | | Year Ended
August 31,
2012 | | Year Ended
August 31,
2013 | | Year Ended
August 31,
2012 | |
Increase (Decrease) in Net Assets: | |
From Operations (Note A): | |
Net investment income (loss) | | $ | 3,365 | | | $ | 1,199 | | | $ | 63,142 | | | $ | 59,512 | | | $ | 4,610 | | | $ | 3,817 | | |
Net realized gain (loss) on investments | | | (3,466 | ) | | | (20,466 | ) | | | 98,655 | | | | 17,622 | | | | 68,341 | | | | 12,740 | | |
Change in net unrealized appreciation (depreciation)
of investments | | | (13,569 | ) | | | 12,566 | | | | (52,438 | ) | | | 121,130 | | | | 66,874 | | | | 64,609 | | |
Net increase (decrease) in net assets resulting from operations | | | (13,670 | ) | | | (6,701 | ) | | | 109,359 | | | | 198,264 | | | | 139,825 | | | | 81,166 | | |
Distributions to Shareholders From (Note A): | |
Net investment income: | |
Investor Class | | | — | | | | — | | | | — | | | | — | | | | (3,453 | ) | | | (2,577 | ) | |
Trust Class | | | — | | | | — | | | | — | | | | — | | | | (117 | ) | | | (92 | ) | |
Advisor Class | | | — | | | | — | | | | — | | | | — | | | | (55 | ) | | | (64 | ) | |
Institutional Class | | | (875 | ) | | | (730 | ) | | | (47,127 | ) | | | (32,984 | ) | | | (185 | ) | | | (31 | ) | |
Class A | | | (10 | ) | | | (17 | ) | | | (33,492 | ) | | | (22,888 | ) | | | (7 | ) | | | (3 | ) | |
Class C | | | — | | | | — | | | | (10,272 | ) | | | (7,031 | ) | | | (3 | ) | | | (3 | ) | |
Class R3 | | | — | | | | — | | | | (49 | ) | | | (12 | ) | | | — | | | | — | | |
Class R6 | | | — | | | | — | | | | — | | | | — | | | | — | | | | — | | |
Net realized gain on investments: | |
Investor Class | | | — | | | | — | | | | — | | | | — | | | | — | | | | — | | |
Trust Class | | | — | | | | — | | | | — | | | | — | | | | — | | | | — | | |
Advisor Class | | | — | | | | — | | | | — | | | | — | | | | — | | | | — | | |
Institutional Class | | | — | | | | — | | | | (12,237 | ) | | | (6,531 | ) | | | — | | | | — | | |
Class A | | | — | | | | — | | | | (9,976 | ) | | | (5,069 | ) | | | — | | | | — | | |
Class C | | | — | | | | — | | | | (3,952 | ) | | | (2,012 | ) | | | — | | | | — | | |
Class R3 | | | — | | | | — | | | | (16 | ) | | | (2 | ) | | | — | | | | — | | |
Class R6 | | | — | | | | — | | | | — | | | | — | | | | — | | | | — | | |
Tax return of capital: | |
Institutional Class | | | — | | | | — | | | | — | | | | — | | | | — | | | | — | | |
Class A | | | — | | | | — | | | | — | | | | — | | | | — | | | | — | | |
Class C | | | — | | | | — | | | | — | | | | — | | | | — | | | | — | | |
Total distributions to shareholders | | | (885 | ) | | | (747 | ) | | | (117,121 | ) | | | (76,529 | ) | | | (3,820 | ) | | | (2,770 | ) | |
From Fund Share Transactions (Note D): | |
Proceeds from shares sold: | |
Investor Class | | | — | | | | — | | | | — | | | | — | | | | 28,847 | | | | 3,526 | | |
Trust Class | | | — | | | | — | | | | — | | | | — | | | | 42,596 | | | | 1,086 | | |
Advisor Class | | | — | | | | — | | | | — | | | | — | | | | 1,421 | | | | 745 | | |
Institutional Class | | | 296,114 | | | | 125,596 | | | | 582,068 | | | | 687,305 | | | | 15,650 | | | | 3,022 | | |
Class A | | | 7,538 | | | | 2,464 | | | | 477,410 | | | | 595,197 | | | | 1,659 | | | | 444 | | |
Class C | | | 3,593 | | | | 1,098 | | | | 149,578 | | | | 164,762 | | | | 225 | | | | 27 | | |
Class R3 | | | 987 | | | | 973 | | | | 4,525 | | | | 890 | | | | — | | | | — | | |
Class R6 | | | 34,597 | | | | — | | | | — | | | | — | | | | — | | | | — | | |
See Notes to Financial Statements
167
| | GENESIS FUND | | GLOBAL EQUITY FUND | |
| | | Year Ended
August 31,
2013 | | Year Ended
August 31,
2012 | | Year Ended
August 31,
2013 | | Year Ended
August 31,
2012 | |
Increase (Decrease) in Net Assets: | |
From Operations (Note A): | |
Net investment income (loss) | | $ | 92,811 | | | $ | 40,785 | | | $ | 41 | | | $ | 31 | | |
Net realized gain (loss) on investments | | | 1,213,928 | | | | 385,394 | | | | 192 | | | | (133 | ) | |
Change in net unrealized appreciation (depreciation)
of investments | | | 1,318,251 | | | | 269,066 | | | | (507 | ) | | | 178 | | |
Net increase (decrease) in net assets resulting from operations | | | 2,624,990 | | | | 695,245 | | | | (274 | ) | | | 76 | | |
Distributions to Shareholders From (Note A): | |
Net investment income: | |
Investor Class | | | (12,713 | ) | | | (33,793 | ) | | | — | | | | — | | |
Trust Class | | | (6,707 | ) | | | (30,535 | ) | | | — | | | | — | | |
Advisor Class | | | (1,895 | ) | | | (9,237 | ) | | | — | | | | — | | |
Institutional Class | | | (29,115 | ) | | | (61,990 | ) | | | — | | | | (29 | ) | |
Class A | | | — | | | | — | | | | — | | | | (2 | ) | |
Class C | | | — | | | | — | | | | — | | | | (2 | ) | |
Class R3 | | | — | | | | — | | | | — | | | | — | | |
Class R6 | | | — | | | | — | | | | — | | | | — | | |
Net realized gain on investments: | |
Investor Class | | | (134,977 | ) | | | (73,488 | ) | | | — | | | | — | | |
Trust Class | | | (120,167 | ) | | | (77,749 | ) | | | — | | | | — | | |
Advisor Class | | | (41,050 | ) | | | (24,284 | ) | | | — | | | | — | | |
Institutional Class | | | (233,502 | ) | | | (120,691 | ) | | | — | | | | — | | |
Class A | | | — | | | | — | | | | — | | | | — | | |
Class C | | | — | | | | — | | | | — | | | | — | | |
Class R3 | | | — | | | | — | | | | — | | | | — | | |
Class R6 | | | — | | | | — | | | | — | | | | — | | |
Tax return of capital: | |
Institutional Class | | | — | | | | — | | | | — | | | | (42 | ) | |
Class A | | | — | | | | — | | | | — | | | | (4 | ) | |
Class C | | | — | | | | — | | | | — | | | | (2 | ) | |
Total distributions to shareholders | | | (580,126 | ) | | | (431,767 | ) | | | — | | | | (81 | ) | |
From Fund Share Transactions (Note D): | |
Proceeds from shares sold: | |
Investor Class | | | 346,454 | | | | 405,711 | | | | — | | | | — | | |
Trust Class | | | 329,155 | | | | 516,561 | | | | — | | | | — | | |
Advisor Class | | | 150,460 | | | | 186,389 | | | | — | | | | — | | |
Institutional Class | | | 1,247,941 | | | | 1,472,096 | | | | 30,851 | | | | 3,449 | | |
Class A | | | — | | | | — | | | | 64 | | | | 33 | | |
Class C | | | — | | | | — | | | | 17 | | | | — | | |
Class R3 | | | — | | | | — | | | | — | | | | — | | |
Class R6 | | | 988,848 | | | | — | | | | — | | | | — | | |
168
Statements of Changes in Net Assets (cont'd)
Neuberger Berman Equity Funds (cont'd)
(000's omitted)
| | | EMERGING MARKETS
EQUITY FUND | | EQUITY INCOME FUND | | FOCUS FUND | |
| | | Year Ended
August 31,
2013 | | Year Ended
August 31,
2012 | | Year Ended
August 31,
2013 | | Year Ended
August 31,
2012 | | Year Ended
August 31,
2013 | | Year Ended
August 31,
2012 | |
Proceeds from reinvestment of dividends and distributions: | |
Investor Class | | | — | | | | — | | | | — | | | | — | | | | 3,037 | | | | 2,256 | | |
Trust Class | | | — | | | | — | | | | — | | | | — | | | | 113 | | | | 85 | | |
Advisor Class | | | — | | | | — | | | | — | | | | — | | | | 54 | | | | 64 | | |
Institutional Class | | | 580 | | | | 422 | | | | 42,019 | | | | 26,934 | | | | 166 | | | | 30 | | |
Class A | | | 8 | | | | 14 | | | | 39,711 | | | | 25,475 | | | | 5 | | | | 2 | | |
Class C | | | — | | | | — | | | | 9,152 | | | | 5,170 | | | | 2 | | | | 3 | | |
Class R3 | | | — | | | | — | | | | 34 | | | | 7 | | | | — | | | | — | | |
Class R6 | | | — | | | | — | | | | — | | | | — | | | | — | | | | — | | |
Proceeds from shares issued in connection with the acquisition of
International Fund (Note G): | |
Investor Class | | | — | | | | — | | | | — | | | | — | | | | — | | | | — | | |
Trust Class | | | — | | | | — | | | | — | | | | — | | | | — | | | | — | | |
Class A | | | — | | | | — | | | | — | | | | — | | | | — | | | | — | | |
Class C | | | — | | | | — | | | | — | | | | — | | | | — | | | | — | | |
Payments for shares redeemed: | |
Investor Class | | | — | | | | — | | | | — | | | | — | | | | (55,470 | ) | | | (49,657 | ) | |
Trust Class | | | — | | | | — | | | | — | | | | — | | | | (5,279 | ) | | | (6,389 | ) | |
Advisor Class | | | — | | | | — | | | | — | | | | — | | | | (2,393 | ) | | | (3,702 | ) | |
Institutional Class | | | (73,488 | ) | | | (64,878 | ) | | | (391,773 | ) | | | (261,948 | ) | | | (4,586 | ) | | | (1,750 | ) | |
Class A | | | (4,314 | ) | | | (2,969 | ) | | | (494,504 | ) | | | (220,565 | ) | | | (777 | ) | | | (136 | ) | |
Class C | | | (694 | ) | | | (786 | ) | | | (70,816 | ) | | | (39,610 | ) | | | (9 | ) | | | (27 | ) | |
Class R3 | | | (1,073 | ) | | | (734 | ) | | | (2,924 | ) | | | (75 | ) | | | — | | | | — | | |
Class R6 | | | — | | | | — | | | | — | | | | — | | | | — | | | | — | | |
Net increase (decrease) from Fund share transactions | | | 263,848 | | | | 61,200 | | | | 344,480 | | | | 983,542 | | | | 25,261 | | | | (50,371 | ) | |
Net Increase (Decrease) in Net Assets | | | 249,293 | | | | 53,752 | | | | 336,718 | | | | 1,105,277 | | | | 161,266 | | | | 28,025 | | |
Net Assets: | |
Beginning of year | | | 167,486 | | | | 113,734 | | | | 2,607,402 | | | | 1,502,125 | | | | 563,026 | | | | 535,001 | | |
End of year | | $ | 416,779 | | | $ | 167,486 | | | $ | 2,944,120 | | | $ | 2,607,402 | | | $ | 724,292 | | | $ | 563,026 | | |
Undistributed net investment income (loss) at end of year | | $ | 2,526 | | | $ | 627 | | | $ | — | | | $ | — | | | $ | 4,608 | | | $ | 3,817 | | |
Distributions in excess of net investment income at end of year | | $ | — | | | $ | — | | | $ | (9,661 | ) | | $ | (1,593 | ) | | $ | — | | | $ | — | | |
See Notes to Financial Statements
169
| | GENESIS FUND | | GLOBAL EQUITY FUND | |
| | | Year Ended
August 31,
2013 | | Year Ended
August 31,
2012 | | Year Ended
August 31,
2013 | | Year Ended
August 31,
2012 | |
Proceeds from reinvestment of dividends and distributions: | |
Investor Class | | | 143,080 | | | | 103,772 | | | | — | | | | — | | |
Trust Class | | | 122,344 | | | | 104,665 | | | | — | | | | — | | |
Advisor Class | | | 38,492 | | | | 30,703 | | | | — | | | | — | | |
Institutional Class | | | 256,618 | | | | 178,822 | | | | — | | | | 71 | | |
Class A | | | — | | | | — | | | | — | | | | 6 | | |
Class C | | | — | | | | — | | | | — | | | | 4 | | |
Class R3 | | | — | | | | — | | | | — | | | | — | | |
Class R6 | | | — | | | | — | | | | — | | | | — | | |
Proceeds from shares issued in connection with the acquisition of
International Fund (Note G): | |
Investor Class | | | — | | | | — | | | | — | | | | — | | |
Trust Class | | | — | | | | — | | | | — | | | | — | | |
Class A | | | — | | | | — | | | | — | | | | — | | |
Class C | | | — | | | | — | | | | — | | | | — | | |
Payments for shares redeemed: | |
Investor Class | | | (657,617 | ) | | | (440,618 | ) | | | — | | | | — | | |
Trust Class | | | (828,383 | ) | | | (1,111,336 | ) | | | — | | | | — | | |
Advisor Class | | | (225,969 | ) | | | (238,605 | ) | | | — | | | | — | | |
Institutional Class | | | (2,259,163 | ) | | | (1,061,533 | ) | | | (1,429 | ) | | | (6 | ) | |
Class A | | | — | | | | — | | | | (28 | ) | | | (1 | ) | |
Class C | | | — | | | | — | | | | — | | | | — | | |
Class R3 | | | — | | | | — | | | | — | | | | — | | |
Class R6 | | | (35,308 | ) | | | — | | | | — | | | | — | | |
Net increase (decrease) from Fund share transactions | | | (383,048 | ) | | | 146,627 | | | | 29,475 | | | | 3,556 | | |
Net Increase (Decrease) in Net Assets | | | 1,661,816 | | | | 410,105 | | | | 29,201 | | | | 3,551 | | |
Net Assets: | |
Beginning of year | | | 11,580,489 | | | | 11,170,384 | | | | 4,477 | | | | 926 | | |
End of year | | $ | 13,242,305 | | | $ | 11,580,489 | | | $ | 33,678 | | | $ | 4,477 | | |
Undistributed net investment income (loss) at end of year | | $ | 40,414 | | | $ | — | | | $ | (15 | ) | | $ | — | | |
Distributions in excess of net investment income at end of year | | $ | — | | | $ | — | | | $ | — | | | $ | (6 | ) | |
170
Statements of Changes in Net Assets (cont'd)
Neuberger Berman Equity Funds
(000's omitted)
| | | GLOBAL THEMATIC
OPPORTUNITIES FUND | | GREATER CHINA
EQUITY FUND | | GUARDIAN FUND | |
| | | Year Ended
August 31,
2013 | | Year Ended
August 31,
2012 | | Period from
July 17, 2013
(Commencement
of Operations) to
August 31,
2013 | | Year Ended
August 31,
2013 | | Year Ended
August 31,
2012 | |
Increase (Decrease) in Net Assets: | |
From Operations (Note A): | |
Net investment income (loss) | | $ | 295 | | | $ | 219 | | | $ | (65 | ) | | $ | 10,049 | | | $ | 8,768 | | |
Net realized gain (loss) on investments | | | (1,109 | ) | | | (3,544 | ) | | | 248 | | | | 125,045 | | | | 34,173 | | |
Change in net unrealized appreciation (depreciation) of investments | | | 4,947 | | | | 1,324 | | | | 44 | | | | 107,577 | | | | 63,165 | | |
Net increase (decrease) in net assets resulting from operations | | | 4,133 | | | | (2,001 | ) | | | 227 | | | | 242,671 | | | | 106,106 | | |
Distributions to Shareholders From (Note A): | |
Net investment income: | |
Investor Class | | | — | | | | — | | | | — | | | | (11,549 | ) | | | (6,591 | ) | |
Trust Class | | | — | | | | — | | | | — | | | | (1,615 | ) | | | (913 | ) | |
Advisor Class | | | — | | | | — | | | | — | | | | (4 | ) | | | (2 | ) | |
Institutional Class | | | (276 | ) | | | (62 | ) | | | — | | | | (850 | ) | | | (459 | ) | |
Class A | | | (4 | ) | | | (0 | ) | | | — | | | | (286 | ) | | | (122 | ) | |
Class C | | | — | | | | (0 | ) | | | — | | | | (7 | ) | | | (4 | ) | |
Class R3 | | | — | | | | — | | | | — | | | | (0 | ) | | | (6 | ) | |
Class R6 | | | — | | | | — | | | | — | | | | — | | | | — | | |
Net realized gain on investments: | |
Investor Class | | | — | | | | — | | | | — | | | | (25,562 | ) | | | — | | |
Trust Class | | | — | | | | — | | | | — | | | | (3,874 | ) | | | — | | |
Advisor Class | | | — | | | | — | | | | — | | | | (17 | ) | | | — | | |
Institutional Class | | | — | | | | — | | | | — | | | | (1,633 | ) | | | — | | |
Class A | | | — | | | | — | | | | — | | | | (664 | ) | | | — | | |
Class C | | | — | | | | — | | | | — | | | | (41 | ) | | | — | | |
Class R3 | | | — | | | | — | | | | — | | | | (5 | ) | | | — | | |
Class R6 | | | — | | | | — | | | | — | | | | — | | | | — | | |
Tax return of capital: | |
Institutional Class | | | — | | | | — | | | | — | | | | — | | | | — | | |
Class A | | | — | | | | — | | | | — | | | | — | | | | — | | |
Class C | | | — | | | | — | | | | — | | | | — | | | | — | | |
Total distributions to shareholders | | | (280 | ) | | | (62 | ) | | | — | | | | (46,107 | ) | | | (8,097 | ) | |
From Fund Share Transactions (Note D): | |
Proceeds from shares sold: | |
Investor Class | | | — | | | | — | | | | — | | | | 16,860 | | | | 17,464 | | |
Trust Class | | | — | | | | — | | | | — | | | | 19,315 | | | | 25,712 | | |
Advisor Class | | | — | | | | — | | | | — | | | | 247 | | | | 110 | | |
Institutional Class | | | 33,157 | | | | 31,905 | | | | 56,198 | | | | 31,571 | | | | 33,871 | | |
Class A | | | 1,783 | | | | 631 | | | | 116 | | | | 17,756 | | | | 10,228 | | |
Class C | | | 21 | | | | 87 | | | | 100 | | | | 1,286 | | | | 268 | | |
Class R3 | | | — | | | | — | | | | — | | | | 273 | | | | 472 | | |
Class R6 | | | — | | | | — | | | | — | | | | — | | | | — | | |
See Notes to Financial Statements
171
| | INTERNATIONAL
EQUITY FUND | | INTERNATIONAL
LARGE CAP FUND | |
| | | Year Ended
August 31,
2013 | | Year Ended
August 31,
2012 | | Year Ended
August 31,
2013 | | Year Ended
August 31,
2012 | |
Increase (Decrease) in Net Assets: | |
From Operations (Note A): | |
Net investment income (loss) | | $ | 12,302 | | | $ | 7,347 | | | $ | 3,023 | | | $ | 3,224 | | |
Net realized gain (loss) on investments | | | 21,830 | | | | (8,024 | ) | | | 8,658 | | | | (3,280 | ) | |
Change in net unrealized appreciation (depreciation) of investments | | | 44,586 | | | | 10,750 | | | | 13,257 | | | | (25 | ) | |
Net increase (decrease) in net assets resulting from operations | | | 78,718 | | | | 10,073 | | | | 24,938 | | | | (81 | ) | |
Distributions to Shareholders From (Note A): | |
Net investment income: | |
Investor Class | | | — | | | | — | | | | — | | | | — | | |
Trust Class | | | — | | | | — | | | | (171 | ) | | | (179 | ) | |
Advisor Class | | | — | | | | — | | | | — | | | | — | | |
Institutional Class | | | (7,601 | ) | | | (4,223 | ) | | | (2,605 | ) | | | (2,615 | ) | |
Class A | | | — | | | | — | | | | (104 | ) | | | (68 | ) | |
Class C | | | — | | | | — | | | | (22 | ) | | | (8 | ) | |
Class R3 | | | — | | | | — | | | | (5 | ) | | | (1 | ) | |
Class R6 | | | — | | | | — | | | | — | | | | — | | |
Net realized gain on investments: | |
Investor Class | | | — | | | | — | | | | — | | | | — | | |
Trust Class | | | — | | | | — | | | | — | | | | — | | |
Advisor Class | | | — | | | | — | | | | — | | | | — | | |
Institutional Class | | | — | | | | — | | | | — | | | | — | | |
Class A | | | — | | | | — | | | | — | | | | — | | |
Class C | | | — | | | | — | | | | — | | | | — | | |
Class R3 | | | — | | | | — | | | | — | | | | — | | |
Class R6 | | | — | | | | — | | | | — | | | | — | | |
Tax return of capital: | |
Institutional Class | | | — | | | | — | | | | — | | | | — | | |
Class A | | | — | | | | — | | | | — | | | | — | | |
Class C | | | — | | | | — | | | | — | | | | — | | |
Total distributions to shareholders | | | (7,601 | ) | | | (4,223 | ) | | | (2,907 | ) | | | (2,871 | ) | |
From Fund Share Transactions (Note D): | |
Proceeds from shares sold: | |
Investor Class | | | 2,966 | | | | — | | | | — | | | | — | | |
Trust Class | | | 13,895 | | | | — | | | | 3,235 | | | | 3,074 | | |
Advisor Class | | | — | | | | — | | | | — | | | | — | | |
Institutional Class | | | 305,607 | | | | 189,326 | | | | 29,228 | | | | 36,840 | | |
Class A | | | 6,138 | | | | — | | | | 3,916 | | | | 5,056 | | |
Class C | | | 1,247 | | | | — | | | | 890 | | | | 2,374 | | |
Class R3 | | | — | | | | — | | | | 2,273 | | | | 416 | | |
Class R6 | | | — | | | | — | | | | — | | | | — | | |
172
Statements of Changes in Net Assets (cont'd)
Neuberger Berman Equity Funds (cont'd)
(000's omitted)
| | | GLOBAL THEMATIC
OPPORTUNITIES FUND | | GREATER CHINA
EQUITY FUND | | GUARDIAN FUND | |
| | | Year Ended
August 31,
2013 | | Year Ended
August 31,
2012 | | Period from
July 17, 2013
(Commencement
of Operations) to
August 31,
2013 | | Year Ended
August 31,
2013 | | Year Ended
August 31,
2012 | |
Proceeds from reinvestment of dividends and distributions: | |
Investor Class | | | — | | | | — | | | | — | | | | 34,993 | | | | 6,172 | | |
Trust Class | | | — | | | | — | | | | — | | | | 5,345 | | | | 882 | | |
Advisor Class | | | — | | | | — | | | | — | | | | 17 | | | | 2 | | |
Institutional Class | | | 276 | | | | 62 | | | | — | | | | 2,290 | | | | 415 | | |
Class A | | | 4 | | | | — | | | | — | | | | 929 | | | | 111 | | |
Class C | | | — | | | | — | | | | — | | | | 29 | | | | 3 | | |
Class R3 | | | — | | | | — | | | | — | | | | 1 | | | | 3 | | |
Class R6 | | | — | | | | — | | | | — | | | | — | | | | — | | |
Proceeds from shares issued in connection with the acquisition of
International Fund (Note G): | |
Investor Class | | | — | | | | — | | | | — | | | | — | | | | — | | |
Trust Class | | | — | | | | — | | | | — | | | | — | | | | — | | |
Class A | | | — | | | | — | | | | — | | | | — | | | | — | | |
Class C | | | — | | | | — | | | | — | | | | — | | | | — | | |
Payments for shares redeemed: | |
Investor Class | | | — | | | | — | | | | — | | | | (113,780 | ) | | | (128,001 | ) | |
Trust Class | | | — | | | | — | | | | — | | | | (27,072 | ) | | | (25,304 | ) | |
Advisor Class | | | — | | | | — | | | | — | | | | (298 | ) | | | (235 | ) | |
Institutional Class | | | (13,854 | ) | | | (7,582 | ) | | | (35 | ) | | | (16,535 | ) | | | (13,372 | ) | |
Class A | | | (1,925 | ) | | | (146 | ) | | | — | | | | (5,298 | ) | | | (4,796 | ) | |
Class C | | | (40 | ) | | | (11 | ) | | | — | | | | (265 | ) | | | (189 | ) | |
Class R3 | | | — | | | | — | | | | — | | | | (418 | ) | | | (426 | ) | |
Class R6 | | | — | | | | — | | | | — | | | | — | | | | — | | |
Net increase (decrease) from Fund share transactions | | | 19,422 | | | | 24,946 | | | | 56,379 | | | | (32,754 | ) | | | (76,610 | ) | |
Net Increase (Decrease) in Net Assets | | | 23,275 | | | | 22,883 | | | | 56,606 | | | | 163,810 | | | | 21,399 | | |
Net Assets: | |
Beginning of year | | | 50,539 | | | | 27,656 | | | | — | | | | 1,133,028 | | | | 1,111,629 | | |
End of year | | $ | 73,814 | | | $ | 50,539 | | | $ | 56,606 | | | $ | 1,296,838 | | | $ | 1,133,028 | | |
Undistributed net investment income (loss) at end of year | | $ | 80 | | | $ | 214 | | | $ | (29 | ) | | $ | 4,053 | | | $ | 8,756 | | |
Distributions in excess of net investment income at end of year | | $ | — | | | $ | — | | | $ | — | | | $ | — | | | $ | — | | |
See Notes to Financial Statements
173
| | | INTERNATIONAL
EQUITY FUND | | INTERNATIONAL
LARGE CAP FUND | |
| | | Year Ended
August 31,
2013 | | Year Ended
August 31,
2012 | | Year Ended
August 31,
2013 | | Year Ended
August 31,
2012 | |
Proceeds from reinvestment of dividends and distributions: | |
Investor Class | | | — | | | | — | | | | — | | | | — | | |
Trust Class | | | — | | | | — | | | | 157 | | | | 153 | | |
Advisor Class | | | — | | | | — | | | | — | | | | — | | |
Institutional Class | | | 7,492 | | | | 4,205 | | | | 2,489 | | | | 2,551 | | |
Class A | | | — | | | | — | | | | 100 | | | | 65 | | |
Class C | | | — | | | | — | | | | 3 | | | | 2 | | |
Class R3 | | | — | | | | — | | | | 5 | | | | 1 | | |
Class R6 | | | — | | | | — | | | | — | | | | — | | |
Proceeds from shares issued in connection with the acquisition of
International Fund (Note G): | |
Investor Class | | | 147,787 | | | | — | | | | — | | | | — | | |
Trust Class | | | 117,674 | | | | — | | | | — | | | | — | | |
Class A | | | 6,829 | | | | — | | | | — | | | | — | | |
Class C | | | 658 | | | | — | | | | — | | | | — | | |
Payments for shares redeemed: | |
Investor Class | | | (29,620 | ) | | | — | | | | — | | | | — | | |
Trust Class | | | (23,377 | ) | | | — | | | | (5,361 | ) | | | (6,848 | ) | |
Advisor Class | | | — | | | | — | | | | — | | | | — | | |
Institutional Class | | | (96,929 | ) | | | (50,412 | ) | | | (22,065 | ) | | | (26,650 | ) | |
Class A | | | (425 | ) | | | — | | | | (3,944 | ) | | | (2,066 | ) | |
Class C | | | (10 | ) | | | — | | | | (956 | ) | | | (799 | ) | |
Class R3 | | | — | | | | — | | | | (179 | ) | | | (86 | ) | |
Class R6 | | | — | | | | — | | | | — | | | | — | | |
Net increase (decrease) from Fund share transactions | | | 459,932 | | | | 143,119 | | | | 9,791 | | | | 14,083 | | |
Net Increase (Decrease) in Net Assets | | | 531,049 | | | | 148,969 | | | | 31,822 | | | | 11,131 | | |
Net Assets: | |
Beginning of year | | | 491,566 | | | | 342,597 | | | | 198,606 | | | | 187,475 | | |
End of year | | $ | 1,022,615 | | | $ | 491,566 | | | $ | 230,428 | | | $ | 198,606 | | |
Undistributed net investment income (loss) at end of year | | $ | 5,335 | | | $ | 2,665 | | | $ | 1,535 | | | $ | 1,630 | | |
Distributions in excess of net investment income at end of year | | $ | — | | | $ | — | | | $ | — | | | $ | — | | |
174
Statements of Changes in Net Assets (cont'd)
Neuberger Berman Equity Funds
(000's omitted)
| | | INTRINSIC VALUE FUND | | LARGE CAP DISCIPLINED
GROWTH FUND | | LARGE CAP VALUE FUND | |
| | | Year Ended
August 31,
2013 | | Year Ended
August 31,
2012 | | Year Ended
August 31,
2013 | | Year Ended
August 31,
2012 | | Year Ended
August 31,
2013 | | Year Ended
August 31,
2012 | |
Increase (Decrease) in Net Assets: | |
From Operations (Note A): | |
Net investment income (loss) | | $ | 599 | | | $ | (306 | ) | | $ | 4,047 | | | $ | 2,312 | | | $ | 18,516 | | | $ | 21,046 | | |
Net realized gain (loss) on investments | | | 8,483 | | | | 1,826 | | | | 85,033 | | | | 8,640 | | | | 251,101 | | | | 265,032 | | |
Change in net unrealized appreciation (depreciation)
of investments | | | 31,300 | | | | 13,923 | | | | (13,128 | ) | | | 52,228 | | | | 77,930 | | | | (176,465 | ) | |
Net increase (decrease) in net assets resulting from operations | | | 40,382 | | | | 15,443 | | | | 75,952 | | | | 63,180 | | | | 347,547 | | | | 109,613 | | |
Distributions to Shareholders From (Note A): | |
Net investment income: | |
Investor Class | | | — | | | | — | | | | (111 | ) | | | — | | | | (13,482 | ) | | | (5,044 | ) | |
Trust Class | | | — | | | | — | | | | — | | | | — | | | | (2,264 | ) | | | (744 | ) | |
Advisor Class | | | — | | | | — | | | | — | | | | — | | | | (3,397 | ) | | | (781 | ) | |
Institutional Class | | | — | | | | — | | | | (5,687 | ) | | | (1,020 | ) | | | (1,728 | ) | | | (1,276 | ) | |
Class A | | | — | | | | — | | | | (462 | ) | | | — | | | | — | | | | (337 | ) | |
Class C | | | — | | | | — | | | | (91 | ) | | | — | | | | (5 | ) | | | — | | |
Class R3 | | | — | | | | — | | | | (2 | ) | | | — | | | | — | | | | (0 | ) | |
Class R6 | | | — | | | | — | | | | — | | | | — | | | | — | | | | — | | |
Net realized gain on investments: | |
Investor Class | | | — | | | | — | | | | (777 | ) | | | (694 | ) | | | — | | | | — | | |
Trust Class | | | — | | | | — | | | | — | | | | — | | | | — | | | | — | | |
Advisor Class | | | — | | | | — | | | | — | | | | — | | | | — | | | | — | | |
Institutional Class | | | (2,306 | ) | | | (12,140 | ) | | | (25,427 | ) | | | (24,715 | ) | | | — | | | | — | | |
Class A | | | (123 | ) | | | (862 | ) | | | (3,134 | ) | | | (2,394 | ) | | | — | | | | — | | |
Class C | | | (113 | ) | | | (649 | ) | | | (1,516 | ) | | | (1,542 | ) | | | — | | | | — | | |
Class R3 | | | — | | | | — | | | | (16 | ) | | | (14 | ) | | | — | | | | — | | |
Class R6 | | | — | | | | — | | | | — | | | | — | | | | — | | | | — | | |
Tax return of capital: | |
Institutional Class | | | — | | | | — | | | | — | | | | — | | | | — | | | | — | | |
Class A | | | — | | | | — | | | | — | | | | — | | | | — | | | | — | | |
Class C | | | — | | | | — | | | | — | | | | — | | | | — | | | | — | | |
Total distributions to shareholders | | | (2,542 | ) | | | (13,651 | ) | | | (37,223 | ) | | | (30,379 | ) | | | (20,876 | ) | | | (8,182 | ) | |
From Fund Share Transactions (Note D): | |
Proceeds from shares sold: | |
Investor Class | | | — | | | | — | | | | 1,849 | | | | 4,286 | | | | 25,522 | | | | 24,450 | | |
Trust Class | | | — | | | | — | | | | — | | | | — | | | | 9,218 | | | | 17,308 | | |
Advisor Class | | | — | | | | — | | | | — | | | | — | | | | 17,573 | | | | 21,953 | | |
Institutional Class | | | 49,202 | | | | 33,373 | | | | 132,077 | | | | 279,948 | | | | 27,922 | | | | 43,403 | | |
Class A | | | 8,162 | | | | 4,404 | | | | 25,150 | | | | 51,959 | | | | 639 | | | | 41,776 | | |
Class C | | | 4,310 | | | | 3,200 | | | | 2,633 | | | | 6,513 | | | | 1,058 | | | | 105 | | |
Class R3 | | | — | | | | — | | | | 64 | | | | 178 | | | | 61 | | | | 589 | | |
Class R6 | | | — | | | | — | | | | — | | | | — | | | | — | | | | — | | |
See Notes to Financial Statements
175
| | | MID CAP GROWTH FUND | | MID CAP
INTRINSIC VALUE FUND | |
| | | Year Ended
August 31,
2013 | | Year Ended
August 31,
2012 | | Year Ended
August 31,
2013 | | Year Ended
August 31,
2012 | |
Increase (Decrease) in Net Assets: | |
From Operations (Note A): | |
Net investment income (loss) | | $ | (1,871 | ) | | $ | (2,786 | ) | | $ | 956 | | | $ | 499 | | |
Net realized gain (loss) on investments | | | 63,525 | | | | 27,805 | | | | 7,516 | | | | 10,085 | | |
Change in net unrealized appreciation (depreciation)
of investments | | | 57,235 | | | | 34,016 | | | | 7,966 | | | | (1,902 | ) | |
Net increase (decrease) in net assets resulting from operations | | | 118,889 | | | | 59,035 | | | | 16,438 | | | | 8,682 | | |
Distributions to Shareholders From (Note A): | |
Net investment income: | |
Investor Class | | | — | | | | — | | | | (294 | ) | | | (193 | ) | |
Trust Class | | | — | | | | — | | | | (89 | ) | | | (94 | ) | |
Advisor Class | | | — | | | | — | | | | — | | | | — | | |
Institutional Class | | | — | | | | — | | | | (49 | ) | | | (26 | ) | |
Class A | | | — | | | | — | | | | (30 | ) | | | (12 | ) | |
Class C | | | — | | | | — | | | | (1 | ) | | | — | | |
Class R3 | | | — | | | | — | | | | (1 | ) | | | (0 | ) | |
Class R6 | | | — | | | | — | | | | — | | | | — | | |
Net realized gain on investments: | |
Investor Class | | | (18,920 | ) | | | (637 | ) | | | — | | | | — | | |
Trust Class | | | (1,443 | ) | | | (9 | ) | | | — | | | | — | | |
Advisor Class | | | (301 | ) | | | — | | | | — | | | | — | | |
Institutional Class | | | (10,717 | ) | | | (600 | ) | | | — | | | | — | | |
Class A | | | (2,328 | ) | | | (19 | ) | | | — | | | | — | | |
Class C | | | (73 | ) | | | — | | | | — | | | | — | | |
Class R3 | | | (134 | ) | | | — | | | | — | | | | — | | |
Class R6 | | | — | | | | — | | | | — | | | | — | | |
Tax return of capital: | |
Institutional Class | | | — | | | | — | | | | — | | | | — | | |
Class A | | | — | | | | — | | | | — | | | | — | | |
Class C | | | — | | | | — | | | | — | | | | — | | |
Total distributions to shareholders | | | (33,916 | ) | | | (1,265 | ) | | | (464 | ) | | | (325 | ) | |
From Fund Share Transactions (Note D): | |
Proceeds from shares sold: | |
Investor Class | | | 7,085 | | | | 9,542 | | | | 7,498 | | | | 5,604 | | |
Trust Class | | | 17,145 | | | | 24,782 | | | | 1,848 | | | | 1,791 | | |
Advisor Class | | | 3,116 | | | | 3,283 | | | | — | | | | — | | |
Institutional Class | | | 91,661 | | | | 80,649 | | | | 1,385 | | | | 1,707 | | |
Class A | | | 34,927 | | | | 51,637 | | | | 3,392 | | | | 2,958 | | |
Class C | | | 1,873 | | | | 1,883 | | | | 691 | | | | 278 | | |
Class R3 | | | 3,150 | | | | 3,110 | | | | 533 | | | | 11 | | |
Class R6 | | | 50 | | | | — | | | | — | | | | — | | |
176
Statements of Changes in Net Assets (cont'd)
Neuberger Berman Equity Funds (cont'd)
(000's omitted)
| | | INTRINSIC VALUE FUND | | LARGE CAP DISCIPLINED
GROWTH FUND | | LARGE CAP VALUE FUND | |
| | | Year Ended
August 31,
2013 | | Year Ended
August 31,
2012 | | Year Ended
August 31,
2013 | | Year Ended
August 31,
2012 | | Year Ended
August 31,
2013 | | Year Ended
August 31,
2012 | |
Proceeds from reinvestment of dividends and distributions: | |
Investor Class | | | — | | | | — | | | | 882 | | | | 688 | | | | 12,838 | | | | 4,822 | | |
Trust Class | | | — | | | | — | | | | — | | | | — | | | | 2,176 | | | | 717 | | |
Advisor Class | | | — | | | | — | | | | — | | | | — | | | | 3,330 | | | | 754 | | |
Institutional Class | | | 1,970 | | | | 11,053 | | | | 26,541 | | | | 19,730 | | | | 1,702 | | | | 1,250 | | |
Class A | | | 102 | | | | 713 | | | | 3,136 | | | | 2,034 | | | | — | | | | 336 | | |
Class C | | | 48 | | | | 225 | | | | 569 | | | | 413 | | | | 2 | | | | — | | |
Class R3 | | | — | | | | — | | | | 3 | | | | 1 | | | | — | | | | — | | |
Class R6 | | | — | | | | — | | | | — | | | | — | | | | — | | | | — | | |
Proceeds from shares issued in connection with the acquisition of
International Fund (Note G): | |
Investor Class | | | — | | | | — | | | | — | | | | — | | | | — | | | | — | | |
Trust Class | | | — | | | | — | | | | — | | | | — | | | | — | | | | — | | |
Class A | | | — | | | | — | | | | — | | | | — | | | | — | | | | — | | |
Class C | | | — | | | | — | | | | — | | | | — | | | | — | | | | — | | |
Payments for shares redeemed: | |
Investor Class | | | — | | | | — | | | | (5,585 | ) | | | (3,368 | ) | | | (169,639 | ) | | | (205,342 | ) | |
Trust Class | | | — | | | | — | | | | — | | | | — | | | | (100,816 | ) | | | (247,987 | ) | |
Advisor Class | | | — | | | | — | | | | — | | | | — | | | | (78,135 | ) | | | (124,007 | ) | |
Institutional Class | | | (37,104 | ) | | | (26,719 | ) | | | (382,507 | ) | | | (291,213 | ) | | | (42,604 | ) | | | (153,702 | ) | |
Class A | | | (4,515 | ) | | | (5,390 | ) | | | (61,415 | ) | | | (30,384 | ) | | | (1,477 | ) | | | (42,840 | ) | |
Class C | | | (2,662 | ) | | | (2,012 | ) | | | (13,472 | ) | | | (11,602 | ) | | | (134 | ) | | | (11 | ) | |
Class R3 | | | — | | | | — | | | | (47 | ) | | | (174 | ) | | | (611 | ) | | | — | | |
Class R6 | | | — | | | | — | | | | — | | | | — | | | | — | | | | — | | |
Net increase (decrease) from Fund share transactions | | | 19,513 | | | | 18,847 | | | | (270,122 | ) | | | 29,009 | | | | (291,375 | ) | | | (616,426 | ) | |
Net Increase (Decrease) in Net Assets | | | 57,353 | | | | 20,639 | | | | (231,393 | ) | | | 61,810 | | | | 35,296 | | | | (514,995 | ) | |
Net Assets: | |
Beginning of year | | | 149,487 | | | | 128,848 | | | | 720,196 | | | | 658,386 | | | | 1,592,414 | | | | 2,107,409 | | |
End of year | | $ | 206,840 | | | $ | 149,487 | | | $ | 488,803 | | | $ | 720,196 | | | $ | 1,627,710 | | | $ | 1,592,414 | | |
Undistributed net investment income (loss) at end of year | | $ | 275 | | | $ | (265 | ) | | $ | — | | | $ | 2,292 | | | $ | 18,034 | | | $ | 20,872 | | |
Distributions in excess of net investment income at end of year | | $ | — | | | $ | — | | | $ | (14 | ) | | $ | — | | | $ | — | | | $ | — | | |
See Notes to Financial Statements
177
| | | MID CAP GROWTH FUND | | MID CAP
INTRINSIC VALUE FUND | |
| | | Year Ended
August 31,
2013 | | Year Ended
August 31,
2012 | | Year Ended
August 31,
2013 | | Year Ended
August 31,
2012 | |
Proceeds from reinvestment of dividends and distributions: | |
Investor Class | | | 17,577 | | | | 583 | | | | 276 | | | | 182 | | |
Trust Class | | | 1,438 | | | | 9 | | | | 84 | | | | 89 | | |
Advisor Class | | | 269 | | | | — | | | | — | | | | — | | |
Institutional Class | | | 10,514 | | | | 587 | | | | 45 | | | | 24 | | |
Class A | | | 2,281 | | | | 19 | | | | 27 | | | | 9 | | |
Class C | | | 67 | | | | — | | | | — | | | | — | | |
Class R3 | | | 126 | | | | — | | | | — | | | | — | | |
Class R6 | | | — | | | | — | | | | — | | | | — | | |
Proceeds from shares issued in connection with the acquisition of
International Fund (Note G): | |
Investor Class | | | — | | | | — | | | | — | | | | — | | |
Trust Class | | | — | | | | — | | | | — | | | | — | | |
Class A | | | — | | | | — | | | | — | | | | — | | |
Class C | | | — | | | | — | | | | — | | | | — | | |
Payments for shares redeemed: | |
Investor Class | | | (35,471 | ) | | | (31,832 | ) | | | (18,403 | ) | | | (11,497 | ) | |
Trust Class | | | (10,416 | ) | | | (16,029 | ) | | | (10,133 | ) | | | (9,950 | ) | |
Advisor Class | | | (3,279 | ) | | | (2,991 | ) | | | — | | | | — | | |
Institutional Class | | | (42,619 | ) | | | (35,317 | ) | | | (2,386 | ) | | | (1,255 | ) | |
Class A | | | (21,507 | ) | | | (18,501 | ) | | | (5,672 | ) | | | (888 | ) | |
Class C | | | (424 | ) | | | (237 | ) | | | (5 | ) | | | — | | |
Class R3 | | | (1,315 | ) | | | (822 | ) | | | — | | | | — | | |
Class R6 | | | — | | | | — | | | | — | | | | — | | |
Net increase (decrease) from Fund share transactions | | | 76,248 | | | | 70,355 | | | | (20,820 | ) | | | (10,937 | ) | |
Net Increase (Decrease) in Net Assets | | | 161,221 | | | | 128,125 | | | | (4,846 | ) | | | (2,580 | ) | |
Net Assets: | |
Beginning of year | | | 640,780 | | | | 512,655 | | | | 73,087 | | | | 75,667 | | |
End of year | | $ | 802,001 | | | $ | 640,780 | | | $ | 68,241 | | | $ | 73,087 | | |
Undistributed net investment income (loss) at end of year | | $ | (2,198 | ) | | $ | (2,110 | ) | | $ | 882 | | | $ | 460 | | |
Distributions in excess of net investment income at end of year | | $ | — | | | $ | — | | | $ | — | | | $ | — | | |
178
Statements of Changes in Net Assets (cont'd)
Neuberger Berman Equity Funds
(000's omitted)
| | | MULTI-CAP
OPPORTUNITIES FUND | | REAL ESTATE FUND | | SELECT EQUITIES FUND | |
| | | Year Ended
August 31,
2013 | | Year Ended
August 31,
2012 | | Year Ended
August 31,
2013 | | Year Ended
August 31,
2012 | | Year Ended
August 31,
2013 | | Year Ended
August 31,
2012 | |
Increase (Decrease) in Net Assets: | |
From Operations (Note A): | |
Net investment income (loss) | | $ | 12,559 | | | $ | 3,305 | | | $ | 8,895 | | | $ | 4,985 | | | $ | 45 | | | $ | (102 | ) | |
Net realized gain (loss) on investments | | | 18,491 | | | | 3,496 | | | | 45,175 | | | | 19,800 | | | | 7,509 | | | | 3,307 | | |
Change in net unrealized appreciation (depreciation)
of investments | | | 187,685 | | | | 23,582 | | | | (91,260 | ) | | | 59,096 | | | | 4,375 | | | | 4,444 | | |
Net increase (decrease) in net assets resulting from operations | | | 218,735 | | | | 30,383 | | | | (37,190 | ) | | | 83,881 | | | | 11,929 | | | | 7,649 | | |
Distributions to Shareholders From (Note A): | |
Net investment income: | |
Investor Class | | | — | | | | — | | | | — | | | | — | | | | — | | | | — | | |
Trust Class | | | — | | | | — | | | | (3,639 | ) | | | (3,514 | ) | | | — | | | | — | | |
Advisor Class | | | — | | | | — | | | | — | | | | — | | | | — | | | | — | | |
Institutional Class | | | (7,627 | ) | | | (257 | ) | | | (3,810 | ) | | | (2,540 | ) | | | — | | | | (62 | ) | |
Class A | | | (37 | ) | | | (0 | ) | | | (1,097 | ) | | | (681 | ) | | | — | | | | — | | |
Class C | | | (3 | ) | | | — | | | | (67 | ) | | | (79 | ) | | | — | | | | — | | |
Class R3 | | | — | | | | — | | | | (66 | ) | | | (22 | ) | | | — | | | | — | | |
Class R6 | | | — | | | | — | | | | (4 | ) | | | — | | | | — | | | | — | | |
Net realized gain on investments: | |
Investor Class | | | — | | | | — | | | | — | | | | — | | | | — | | | | — | | |
Trust Class | | | — | | | | — | | | | (8,564 | ) | | | (998 | ) | | | — | | | | — | | |
Advisor Class | | | — | | | | — | | | | — | | | | — | | | | — | | | | — | | |
Institutional Class | | | (4,824 | ) | | | (3,256 | ) | | | (7,205 | ) | | | (650 | ) | | | (2,157 | ) | | | (2,106 | ) | |
Class A | | | (29 | ) | | | (10 | ) | | | (2,687 | ) | | | (217 | ) | | | (2,114 | ) | | | (2,335 | ) | |
Class C | | | (5 | ) | | | (7 | ) | | | (715 | ) | | | (51 | ) | | | (878 | ) | | | (923 | ) | |
Class R3 | | | — | | | | — | | | | (195 | ) | | | (8 | ) | | | — | | | | — | | |
Class R6 | | | — | | | | — | | | | (13 | ) | | | — | | | | — | | | | — | | |
Tax return of capital: | |
Institutional Class | | | — | | | | — | | | | — | | | | — | | | | — | | | | — | | |
Class A | | | — | | | | — | | | | — | | | | — | | | | — | | | | — | | |
Class C | | | — | | | | — | | | | — | | | | — | | | | — | | | | — | | |
Total distributions to shareholders | | | (12,525 | ) | | | (3,530 | ) | | | (28,062 | ) | | | (8,760 | ) | | | (5,149 | ) | | | (5,426 | ) | |
From Fund Share Transactions (Note D): | |
Proceeds from shares sold: | |
Investor Class | | | — | | | | — | | | | — | | | | — | | | | — | | | | — | | |
Trust Class | | | — | | | | — | | | | 201,267 | | | | 110,949 | | | | — | | | | — | | |
Advisor Class | | | — | | | | — | | | | — | | | | — | | | | — | | | | — | | |
Institutional Class | | | 874,449 | | | | 383,753 | | | | 267,914 | | | | 125,290 | | | | 28,723 | | | | 6,440 | | |
Class A | | | 51,803 | | | | 2,776 | | | | 138,662 | | | | 46,011 | | | | 14,466 | | | | 5,242 | | |
Class C | | | 7,784 | | | | 180 | | | | 26,224 | | | | 11,776 | | | | 3,421 | | | | 1,641 | | |
Class R3 | | | — | | | | — | | | | 15,875 | | | | 4,932 | | | | — | | | | — | | |
Class R6 | | | — | | | | — | | | | 9,341 | | | | — | | | | — | | | | — | | |
See Notes to Financial Statements
179
| | SMALL CAP GROWTH FUND | | SOCIALLY
RESPONSIVE FUND | |
| | | Year Ended
August 31,
2013 | | Year Ended
August 31,
2012 | | Year Ended
August 31,
2013 | | Year Ended
August 31,
2012 | |
Increase (Decrease) in Net Assets: | |
From Operations (Note A): | |
Net investment income (loss) | | $ | (709 | ) | | $ | (1,136 | ) | | $ | 18,102 | | | $ | 14,414 | | |
Net realized gain (loss) on investments | | | 24,040 | | | | 19,098 | | | | 154,610 | | | | 58,770 | | |
Change in net unrealized appreciation (depreciation)
of investments | | | (2,206 | ) | | | (6,745 | ) | | | 244,494 | | | | 67,730 | | |
Net increase (decrease) in net assets resulting from operations | | | 21,125 | | | | 11,217 | | | | 417,206 | | | | 140,914 | | |
Distributions to Shareholders From (Note A): | |
Net investment income: | |
Investor Class | | | — | | | | — | | | | (4,747 | ) | | | (3,089 | ) | |
Trust Class | | | — | | | | — | | | | (4,131 | ) | | | (3,004 | ) | |
Advisor Class | | | — | | | | — | | | | — | | | | — | | |
Institutional Class | | | — | | | | — | | | | (4,520 | ) | | | (2,793 | ) | |
Class A | | | — | | | | — | | | | (666 | ) | | | (623 | ) | |
Class C | | | — | | | | — | | | | (50 | ) | | | (37 | ) | |
Class R3 | | | — | | | | — | | | | (119 | ) | | | (96 | ) | |
Class R6 | | | — | | | | — | | | | — | | | | — | | |
Net realized gain on investments: | |
Investor Class | | | — | | | | — | | | | — | | | | — | | |
Trust Class | | | — | | | | — | | | | — | | | | — | | |
Advisor Class | | | — | | | | — | | | | — | | | | — | | |
Institutional Class | | | — | | | | — | | | | — | | | | — | | |
Class A | | | — | | | | — | | | | — | | | | — | | |
Class C | | | — | | | | — | | | | — | | | | — | | |
Class R3 | | | — | | | | — | | | | — | | | | — | | |
Class R6 | | | — | | | | — | | | | — | | | | — | | |
Tax return of capital: | |
Institutional Class | | | — | | | | — | | | | — | | | | — | | |
Class A | | | — | | | | — | | | | — | | | | — | | |
Class C | | | — | | | | — | | | | — | | | | — | | |
Total distributions to shareholders | | | — | | | | — | | | | (14,233 | ) | | | (9,642 | ) | |
From Fund Share Transactions (Note D): | |
Proceeds from shares sold: | |
Investor Class | | | 5,046 | | | | 3,704 | | | | 108,703 | | | | 180,373 | | |
Trust Class | | | 3,324 | | | | 1,809 | | | | 86,220 | | | | 110,344 | | |
Advisor Class | | | 797 | | | | 1,317 | | | | — | | | | — | | |
Institutional Class | | | 18,132 | | | | 5,807 | | | | 275,576 | | | | 167,990 | | |
Class A | | | 1,548 | | | | 1,093 | | | | 37,427 | | | | 33,348 | | |
Class C | | | 327 | | | | 485 | | | | 9,421 | | | | 4,785 | | |
Class R3 | | | 161 | | | | 151 | | | | 8,874 | | | | 10,489 | | |
Class R6 | | | — | | | | — | | | | 251,259 | | | | — | | |
180
Statements of Changes in Net Assets (cont'd)
Neuberger Berman Equity Funds (cont'd)
(000's omitted)
| | | MULTI-CAP
OPPORTUNITIES FUND | | REAL ESTATE FUND | | SELECT EQUITIES FUND | |
| | | Year Ended
August 31,
2013 | | Year Ended
August 31,
2012 | | Year Ended
August 31,
2013 | | Year Ended
August 31,
2012 | | Year Ended
August 31,
2013 | | Year Ended
August 31,
2012 | |
Proceeds from reinvestment of dividends and distributions: | |
Investor Class | | | — | | | | — | | | | — | | | | — | | | | — | | | | — | | |
Trust Class | | | — | | | | — | | | | 12,062 | | | | 4,426 | | | | — | | | | — | | |
Advisor Class | | | — | | | | — | | | | — | | | | — | | | | — | | | | — | | |
Institutional Class | | | 659 | | | | 388 | | | | 7,711 | | | | 2,218 | | | | 1,847 | | | | 1,725 | | |
Class A | | | 60 | | | | 6 | | | | 3,308 | | | | 779 | | | | 1,956 | | | | 2,128 | | |
Class C | | | 4 | | | | 5 | | | | 644 | | | | 99 | | | | 690 | | | | 697 | | |
Class R3 | | | — | | | | — | | | | 194 | | | | 22 | | | | — | | | | — | | |
Class R6 | | | — | | | | — | | | | 16 | | | | — | | | | — | | | | — | | |
Proceeds from shares issued in connection with the acquisition of
International Fund (Note G): | |
Investor Class | | | — | | | | — | | | | — | | | | — | | | | — | | | | — | | |
Trust Class | | | — | | | | — | | | | — | | | | — | | | | — | | | | — | | |
Class A | | | — | | | | — | | | | — | | | | — | | | | — | | | | — | | |
Class C | | | — | | | | — | | | | — | | | | — | | | | — | | | | — | | |
Payments for shares redeemed: | |
Investor Class | | | — | | | | — | | | | — | | | | — | | | | — | | | | — | | |
Trust Class | | | — | | | | — | | | | (160,092 | ) | | | (80,324 | ) | | | — | | | | — | | |
Advisor Class | | | — | | | | — | | | | — | | | | — | | | | — | | | | — | | |
Institutional Class | | | (113,403 | ) | | | (36,160 | ) | | | (112,080 | ) | | | (42,253 | ) | | | (12,695 | ) | | | (9,401 | ) | |
Class A | | | (5,544 | ) | | | (508 | ) | | | (43,472 | ) | | | (13,661 | ) | | | (17,450 | ) | | | (10,087 | ) | |
Class C | | | (134 | ) | | | (93 | ) | | | (4,960 | ) | | | (1,515 | ) | | | (3,025 | ) | | | (4,115 | ) | |
Class R3 | | | — | | | | — | | | | (4,379 | ) | | | (901 | ) | | | — | | | | — | | |
Class R6 | | | — | | | | — | | | | (285 | ) | | | — | | | | — | | | | — | | |
Net increase (decrease) from Fund share transactions | | | 815,678 | | | | 350,347 | | | | 357,950 | | | | 167,848 | | | | 17,933 | | | | (5,730 | ) | |
Net Increase (Decrease) in Net Assets | | | 1,021,888 | | | | 377,200 | | | | 292,698 | | | | 242,969 | | | | 24,713 | | | | (3,507 | ) | |
Net Assets: | |
Beginning of year | | | 468,665 | | | | 91,465 | | | | 621,365 | | | | 378,396 | | | | 67,921 | | | | 71,428 | | |
End of year | | $ | 1,490,553 | | | $ | 468,665 | | | $ | 914,063 | | | $ | 621,365 | | | $ | 92,634 | | | $ | 67,921 | | |
Undistributed net investment income (loss) at end of year | | $ | 7,949 | | | $ | 3,252 | | | $ | — | | | $ | — | | | $ | 34 | | | $ | — | | |
Distributions in excess of net investment income at end of year | | $ | — | | | $ | — | | | $ | — | | | $ | — | | | $ | — | | | $ | (11 | ) | |
See Notes to Financial Statements
181
| | | SMALL CAP GROWTH FUND | | SOCIALLY
RESPONSIVE FUND | |
| | | Year Ended
August 31,
2013 | | Year Ended
August 31,
2012 | | Year Ended
August 31,
2013 | | Year Ended
August 31,
2012 | |
Proceeds from reinvestment of dividends and distributions: | |
Investor Class | | | — | | | | — | | | | 4,505 | | | | 2,906 | | |
Trust Class | | | — | | | | — | | | | 4,081 | | | | 2,971 | | |
Advisor Class | | | — | | | | — | | | | — | | | | — | | |
Institutional Class | | | — | | | | — | | | | 4,112 | | | | 2,664 | | |
Class A | | | — | | | | — | | | | 571 | | | | 517 | | |
Class C | | | — | | | | — | | | | 38 | | | | 27 | | |
Class R3 | | | — | | | | — | | | | 116 | | | | 94 | | |
Class R6 | | | — | | | | — | | | | — | | | | — | | |
Proceeds from shares issued in connection with the acquisition of
International Fund (Note G): | |
Investor Class | | | — | | | | — | | | | — | | | | — | | |
Trust Class | | | — | | | | — | | | | — | | | | — | | |
Class A | | | — | | | | — | | | | — | | | | — | | |
Class C | | | — | | | | — | | | | — | | | | — | | |
Payments for shares redeemed: | |
Investor Class | | | (27,520 | ) | | | (12,911 | ) | | | (172,173 | ) | | | (160,774 | ) | |
Trust Class | | | (14,751 | ) | | | (6,732 | ) | | | (233,763 | ) | | | (144,546 | ) | |
Advisor Class | | | (3,932 | ) | | | (3,881 | ) | | | — | | | | — | | |
Institutional Class | | | (42,243 | ) | | | (78,776 | ) | | | (362,695 | ) | | | (110,839 | ) | |
Class A | | | (620 | ) | | | (1,311 | ) | | | (29,966 | ) | | | (32,424 | ) | |
Class C | | | (73 | ) | | | (197 | ) | | | (2,765 | ) | | | (1,984 | ) | |
Class R3 | | | (61 | ) | | | (9 | ) | | | (5,531 | ) | | | (3,276 | ) | |
Class R6 | | | — | | | | — | | | | (3,663 | ) | | | — | | |
Net increase (decrease) from Fund share transactions | | | (59,865 | ) | | | (89,451 | ) | | | (19,653 | ) | | | 62,665 | | |
Net Increase (Decrease) in Net Assets | | | (38,740 | ) | | | (78,234 | ) | | | 383,320 | | | | 193,937 | | |
Net Assets: | |
Beginning of year | | | 117,072 | | | | 195,306 | | | | 1,842,902 | | | | 1,648,965 | | |
End of year | | $ | 78,332 | | | $ | 117,072 | | | $ | 2,226,222 | | | $ | 1,842,902 | | |
Undistributed net investment income (loss) at end of year | | $ | (671 | ) | | $ | (763 | ) | | $ | 17,367 | | | $ | 14,229 | | |
Distributions in excess of net investment income at end of year | | $ | — | | | $ | — | | | $ | — | | | $ | — | | |
182
Statements of Changes in Net Assets (cont'd)
Neuberger Berman Equity Funds
(000's omitted)
| | | VALUE FUND | |
| | | Year Ended
August 31,
2013 | | Year Ended
August 31,
2012 | |
Increase (Decrease) in Net Assets: | |
From Operations (Note A): | |
Net investment income (loss) | | $ | 50 | | | $ | 46 | | |
Net realized gain (loss) on investments | | | 530 | | | | 169 | | |
Change in net unrealized appreciation (depreciation) of investments | | | 38 | | | | 105 | | |
Net increase (decrease) in net assets resulting from operations | | | 618 | | | | 320 | | |
Distributions to Shareholders From (Note A): | |
Net investment income: | |
Investor Class | | | — | | | | — | | |
Trust Class | | | — | | | | — | | |
Advisor Class | | | — | | | | — | | |
Institutional Class | | | (23 | ) | | | (16 | ) | |
Class A | | | (23 | ) | | | (3 | ) | |
Class C | | | (1 | ) | | | (0 | ) | |
Class R3 | | | — | | | | — | | |
Class R6 | | | — | | | | — | | |
Net realized gain on investments: | |
Investor Class | | | — | | | | — | | |
Trust Class | | | — | | | | — | | |
Advisor Class | | | — | | | | — | | |
Institutional Class | | | — | | | | — | | |
Class A | | | — | | | | — | | |
Class C | | | — | | | | — | | |
Class R3 | | | — | | | | — | | |
Class R6 | | | — | | | | — | | |
Tax return of capital: | |
Institutional Class | | | — | | | | — | | |
Class A | | | — | | | | — | | |
Class C | | | — | | | | — | | |
Total distributions to shareholders | | | (47 | ) | | | (19 | ) | |
From Fund Share Transactions (Note D): | |
Proceeds from shares sold: | |
Investor Class | | | — | | | | — | | |
Trust Class | | | — | | | | — | | |
Advisor Class | | | — | | | | — | | |
Institutional Class | | | 5,916 | | | | 2,542 | | |
Class A | | | 2,547 | | | | 1,305 | | |
Class C | | | 244 | | | | 22 | | |
Class R3 | | | — | | | | — | | |
Class R6 | | | — | | | | — | | |
See Notes to Financial Statements
183
Statements of Changes in Net Assets (cont'd)
Neuberger Berman Equity Funds (cont'd)
(000's omitted)
| | | VALUE FUND | |
| | | Year Ended
August 31,
2013 | | Year Ended
August 31,
2012 | |
Proceeds from reinvestment of dividends and distributions: | |
Investor Class | | | — | | | | — | | |
Trust Class | | | — | | | | — | | |
Advisor Class | | | — | | | | — | | |
Institutional Class | | | 23 | | | | 16 | | |
Class A | | | 22 | | | | 3 | | |
Class C | | | 1 | | | | — | | |
Class R3 | | | — | | | | — | | |
Class R6 | | | — | | | | — | | |
Proceeds from shares issued in connection with the acquisition of International Fund (Note G): | |
Investor Class | | | — | | | | — | | |
Trust Class | | | — | | | | — | | |
Class A | | | — | | | | — | | |
Class C | | | — | | | | — | | |
Payments for shares redeemed: | |
Investor Class | | | — | | | | — | | |
Trust Class | | | — | | | | — | | |
Advisor Class | | | — | | | | — | | |
Institutional Class | | | (1,863 | ) | | | (2,733 | ) | |
Class A | | | (862 | ) | | | (168 | ) | |
Class C | | | (15 | ) | | | — | | |
Class R3 | | | — | | | | — | | |
Class R6 | | | — | | | | — | | |
Net increase (decrease) from Fund share transactions | | | 6,013 | | | | 987 | | |
Net Increase (Decrease) in Net Assets | | | 6,584 | | | | 1,288 | | |
Net Assets: | |
Beginning of year | | | 4,314 | | | | 3,026 | | |
End of year | | $ | 10,898 | | | $ | 4,314 | | |
Undistributed net investment income (loss) at end of year | | $ | 49 | | | $ | 47 | | |
Distributions in excess of net investment income at end of year | | $ | — | | | $ | — | | |
See Notes to Financial Statements
184
Notes to Financial Statements Equity Funds
Note A—Summary of Significant Accounting Policies:
1 General: Neuberger Berman Equity Funds (the "Trust") is a Delaware statutory trust organized pursuant to an Amended and Restated Trust Instrument dated June 24, 2009. The Trust is registered as an open-end management investment company under the Investment Company Act of 1940, as amended (the "1940 Act"), and its shares are registered under the 1933 Act. The Funds are separate operating series of the Trust, each of which (except Greater China Equity, Real Estate and Select Equities) is diversified (Multi-Cap Opportunities became diversified in December 2012). Under the 1940 Act, the status of a Fund that was registered as non-diversified may, under certain circumstances, change to that of a diversified fund. Ten Funds offer Investor Class shares, eleven offer Trust Class shares, six offer Advisor Class shares, twenty-one offer Institutional Class shares, twenty offer Class A shares, twenty offer Class C shares, eleven offer Class R3 shares and five offer Class R6 shares. Greater China Equity had no operations until July 17, 2013 other than matters relating to its organization and registration of shares under the 1933 Act. The Board may establish additional series or classes of shares without the approval of shareholders.
The assets of each Fund belong only to that Fund, and the liabilities of each Fund are borne solely by that Fund and no other.
A zero balance, if any, reflects an actual amount rounding to less than $1,000.
The preparation of financial statements in accordance with U.S. generally accepted accounting principles ("GAAP") requires Management to make estimates and assumptions at the date of the financial statements. Actual results could differ from those estimates.
2 Portfolio valuation: Investment securities are valued as indicated in the notes following the Funds' Schedule of Investments.
3 Foreign currency translation: The accounting records of the Funds are maintained in U.S. dollars. Foreign currency amounts are translated into U.S. dollars using the exchange rate as of 4:00 p.m., Eastern time, to determine the value of investments, other assets and liabilities. Purchase and sale prices of securities, and income and expenses, are translated into U.S. dollars at the prevailing rate of exchange on the respective dates of such transactions. Net unrealized foreign currency gain (loss), if any, arises from changes in the value of assets and liabilities, other than investments in securities, as a result of changes in exchange rates and is stated separately in the Statements of Operations.
4 Securities transactions and investment income: Securities transactions are recorded on trade date for financial reporting purposes. Dividend income is recorded on the ex-dividend date or, for certain foreign dividends, as soon as the Fund becomes aware of the dividends. Non-cash dividends included in dividend income, if any, are recorded at the fair market value of the securities received. Interest income, including accretion of discount on securities for Equity Income, accretion of original issue discount, where applicable, and accretion of discount on short-term investments, is recorded on the accrual basis. Realized gains and losses from securities transactions and foreign currency transactions, if any, are recorded on the basis of identified cost and stated separately in the Statements of Operations. Included in net realized gain (loss) on investments are proceeds from the settlements of class action litigation in which the Funds participated as class members. The amounts of such proceeds for the year ended August 31, 2013 were $153, $46,718, $130,715, $219,562, $109,565, $11,295, $1,719,728, $136,557, $12,874, $126,194 and $12,425 for Equity Income, Focus, Genesis, Guardian, Intrinsic Value, Large Cap Disciplined Growth, Large Cap Value, Mid Cap Growth, Mid Cap Intrinsic Value, Small Cap Growth and Socially Responsive, respectively.
5 Income tax information: The Funds are treated as separate entities for U.S. federal income tax purposes. It is the policy of each Fund, except Greater China Equity, to continue to, and the intention of Greater China Equity to, qualify for treatment as a regulated investment company by complying with the requirements of the U.S. Internal Revenue Code applicable to regulated investment companies and to distribute substantially all of its net investment income and
185
net realized capital gains to its shareholders. To the extent a Fund distributes substantially all of its net investment income and net realized capital gains to shareholders, no federal income or excise tax provision is required.
The Funds have adopted the provisions of ASC 740 "Income Taxes" ("ASC 740"). ASC 740 sets forth a minimum threshold for financial statement recognition of a tax position taken, or expected to be taken, in a tax return. The Funds recognize interest and penalties, if any, related to unrecognized tax positions as an income tax expense in the Statements of Operations. The Funds are subject to examination by U.S. federal and state tax authorities for returns filed for the prior three fiscal years 2010-2012. As of August 31, 2013, the Funds did not have any unrecognized tax positions.
Income distributions and capital gain distributions are determined in accordance with income tax regulations, which may differ from GAAP. These differences are primarily due to differing treatments of income and gains on various investment securities held by each Fund, timing differences and differing characterization of distributions made by each Fund. The Funds may also utilize earnings and profits distributed to shareholders on redemption of their shares as a part of the dividends-paid deduction for income tax purposes.
As determined on August 31, 2013, permanent differences resulting primarily from different book and tax accounting were reclassified at year end. Such differences may be attributed to one or more of the following: net operating losses, contingent payment debt instrument basis adjustments, premium amortization adjustments, partnership and grantor trust income adjustments, deemed distributions on shareholder redemptions, foreign currency gains and losses, non-deductible 12b-1 fees, non-taxable distributions from stocks, ordinary loss netting to reduce short term capital gains, passive foreign investment companies gains and losses, return of capital distributions and characterization of distributions from real estate investment trusts ("REITs"). These reclassifications had no effect on net income, net asset value ("NAV") or NAV per share of each Fund. For the year ended August 31, 2013, the Funds recorded the following permanent reclassifications:
| | | Paid-in Capital | | Undistributed
Net Investment
Income (Loss) | | Accumulated Net
Realized Gains
(Losses) on
Investments | |
Emerging Markets Equity | | $ | (1 | ) | | $ | (580,454 | ) | | $ | 580,455 | | |
Equity Income | | | (2 | ) | | | 19,729,962 | | | | (19,729,960 | ) | |
Focus | | | (1 | ) | | | 1,131 | | | | (1,130 | ) | |
Genesis | | | 28,121,216 | | | | (1,967,784 | ) | | | (26,153,432 | ) | |
Global Equity | | | (540 | ) | | | (49,924 | ) | | | 50,464 | | |
Global Thematic Opportunities | | | (763 | ) | | | (149,260 | ) | | | 150,023 | | |
Greater China Equity | | | (162 | ) | | | 36,526 | | | | (36,364 | ) | |
Guardian | | | — | | | | (441,189 | ) | | | 441,189 | | |
International Equity | | | 178,645,051 | | | | (2,030,931 | ) | | | (176,614,120 | ) | |
International Large Cap | | | — | | | | (211,873 | ) | | | 211,873 | | |
Intrinsic Value | | | 3 | | | | (58,658 | ) | | | 58,655 | | |
Large Cap Disciplined Growth | | | — | | | | — | | | | — | | |
Large Cap Value | | | (1 | ) | | | (477,589 | ) | | | 477,590 | | |
Mid Cap Growth | | | (1,894,619 | ) | | | 1,783,061 | | | | 111,558 | | |
Mid Cap Intrinsic Value | | | 2 | | | | (69,929 | ) | | | 69,927 | | |
Multi-Cap Opportunities | | | (1 | ) | | | (195,294 | ) | | | 195,295 | | |
Real Estate | | | — | | | | (212,600 | ) | | | 212,600 | | |
Select Equities | | | — | | | | — | | | | — | | |
Small Cap Growth | | | (801,384 | ) | | | 801,385 | | | | (1 | ) | |
Socially Responsive | | | — | | | | (730,806 | ) | | | 730,806 | | |
Value | | | (1 | ) | | | (895 | ) | | | 896 | | |
186
For tax purposes, distributions of short-term gains are taxable to shareholders as ordinary income.
The tax character of distributions paid during the years ended August 31, 2013 and August 31, 2012 were as follows:
| | | Distributions Paid From: | |
| | | Ordinary Income | | Long-Term Capital Gain | | Return of Capital | | Total | |
| | | 2013 | | 2012 | | 2013 | | 2012 | | 2013 | | 2012 | | 2013 | | 2012 | |
Emerging Markets
Equity | | $ | 884,719 | | | $ | 746,994 | | | $ | — | | | $ | — | | | $ | — | | | $ | — | | | $ | 884,719 | | | $ | 746,994 | | |
Equity Income | | | 90,941,035 | | | | 67,214,969 | | | | 26,180,631 | | | | 9,314,438 | | | | — | | | | — | | | | 117,121,666 | | | | 76,529,407 | | |
Focus | | | 3,819,785 | | | | 2,770,127 | | | | — | | | | — | | | | — | | | | — | | | | 3,819,785 | | | | 2,770,127 | | |
Genesis | | | 50,429,244 | | | | 136,435,252 | | | | 529,696,292 | | | | 295,331,935 | | | | — | | | | — | | | | 580,125,536 | | | | 431,767,187 | | |
Global Equity | | | — | | | | 32,911 | | | | — | | | | — | | | | — | | | | 48,045 | | | | — | | | | 80,956 | | |
Global Thematic
Opportunities | | | 280,038 | | | | 62,415 | | | | — | | | | — | | | | — | | | | — | | | | 280,038 | | | | 62,415 | | |
Greater China Equity | | | — | (1) | | | — | | | | — | (1) | | | — | | | | — | (1) | | | — | | | | — | (1) | | | — | | |
Guardian | | | 15,542,473 | | | | 8,096,859 | | | | 30,564,740 | | | | — | | | | — | | | | — | | | | 46,107,213 | | | | 8,096,859 | | |
International Equity | | | 7,600,707 | | | | 4,223,282 | | | | — | | | | — | | | | — | | | | — | | | | 7,600,707 | | | | 4,223,282 | | |
International Large Cap | | | 2,907,325 | | | | 2,871,419 | | | | — | | | | — | | | | — | | | | — | | | | 2,907,325 | | | | 2,871,419 | | |
Intrinsic Value | | | — | | | | 249,640 | | | | 2,542,565 | | | | 13,401,827 | | | | — | | | | — | | | | 2,542,565 | | | | 13,651,467 | | |
Large Cap Disciplined
Growth | | | 6,805,182 | | | | 1,020,034 | | | | 30,418,426 | | | | 29,359,244 | | | | — | | | | — | | | | 37,223,608 | | | | 30,379,278 | | |
Large Cap Value | | | 20,876,494 | | | | 8,181,649 | | | | — | | | | — | | | | — | | | | — | | | | 20,876,494 | | | | 8,181,649 | | |
Mid Cap Growth | | | — | | | | — | | | | 33,916,496 | | | | 1,265,496 | | | | — | | | | — | | | | 33,916,496 | | | | 1,265,496 | | |
Mid Cap Intrinsic Value | | | 464,057 | | | | 325,011 | | | | — | | | | — | | | | — | | | | — | | | | 464,057 | | | | 325,011 | | |
Multi-Cap Opportunities | | | 9,989,299 | | | | 3,530,521 | | | | 2,536,247 | | | | — | | | | — | | | | — | | | | 12,525,546 | | | | 3,530,521 | | |
Real Estate | | | 12,032,586 | | | | 6,836,033 | | | | 16,029,835 | | | | 1,924,275 | | | | — | | | | — | | | | 28,062,421 | | | | 8,760,308 | | |
Select Equities | | | 543,533 | | | | 2,880,552 | | | | 4,605,363 | | | | 2,544,641 | | | | — | | | | — | | | | 5,148,896 | | | | 5,425,193 | | |
Small Cap Growth | | | — | | | | — | | | | — | | | | — | | | | — | | | | — | | | | — | | | | — | | |
Socially Responsive | | | 14,233,383 | | | | 9,641,949 | | | | — | | | | — | | | | — | | | | — | | | | 14,233,383 | | | | 9,641,949 | | |
Value | | | 47,274 | | | | 19,494 | | | | — | | | | — | | | | — | | | | — | | | | 47,274 | | | | 19,494 | | |
(1) Period from July 17, 2013 (Commencement of Operations) to August 31, 2013.
As of August 31, 2013, the components of distributable earnings (accumulated losses) on a U.S. federal income tax basis were as follows:
| | | Undistributed
Ordinary
Income | | Undistributed
Long-Term
Gain | | Unrealized
Appreciation
(Depreciation) | | Loss
Carryforwards
and Deferrals | | Other
Temporary
Differences | |
Total | |
Emerging Markets
Equity | | $ | 2,575,080 | | | $ | — | | | $ | (10,094,843 | ) | | $ | (24,061,078 | ) | | $ | (48,392 | ) | | $ | (31,629,233 | ) | |
Equity Income | | | — | | | | 68,627,128 | | | | 118,094,682 | | | | — | | | | — | | | | 186,721,810 | | |
Focus | | | 12,294,772 | | | | 52,022,814 | | | | 129,768,879 | | | | — | | | | — | | | | 194,086,465 | | |
Genesis | | | 47,680,256 | | | | 1,014,254,036 | | | | 5,543,880,502 | | | | — | | | | — | | | | 6,605,814,794 | | |
Global Equity | | | — | | | | 105,415 | | | | (422,235 | ) | | | (4,787 | ) | | | — | | | | (321,607 | ) | |
Global Thematic
Opportunities | | | 86,685 | | | | — | | | | 5,371,071 | | | | (4,760,962 | ) | | | (6,487 | ) | | | 690,307 | | |
187
| | | Undistributed
Ordinary
Income | | Undistributed
Long-Term
Gain | | Unrealized
Appreciation
(Depreciation) | | Loss
Carryforwards
and Deferrals | | Other
Temporary
Differences | |
Total | |
Greater China Equity | | $ | 260,778 | | | $ | — | | | $ | (4,983 | ) | | $ | — | | | $ | (29,318 | ) | | $ | 226,477 | | |
Guardian | | | 24,116,518 | | | | 87,179,035 | | | | 330,822,705 | | | | — | | | | — | | | | 442,118,258 | | |
International Equity | | | 8,003,625 | | | | — | | | | 115,606,855 | | | | (324,249,107 | ) | | | (2,977 | ) | | | (200,641,604 | ) | |
International Large Cap | | | 1,584,480 | | | | — | | | | 28,646,556 | | | | (54,434,580 | ) | | | (49,382 | ) | | | (24,252,926 | ) | |
Intrinsic Value | | | 1,069,332 | | | | 6,940,955 | | | | 37,181,046 | | | | — | | | | (152,762 | ) | | | 45,038,571 | | |
Large Cap Disciplined
Growth | | | 17,533,793 | | | | 45,947,406 | | | | 74,515,239 | | | | — | | | | (14,572 | ) | | | 137,981,866 | | |
Large Cap Value | | | 112,683,711 | | | | 106,940,365 | | | | 173,944,617 | | | | — | | | | — | | | | 393,568,693 | | |
Mid Cap Growth | | | — | | | | 33,591,137 | | | | 234,535,767 | | | | (2,197,507 | ) | | | — | | | | 265,929,397 | | |
Mid Cap Intrinsic Value | | | 882,290 | | | | 1,931,673 | | | | 12,915,365 | | | | — | | | | — | | | | 15,729,328 | | |
Multi-Cap
Opportunities | | | 7,948,597 | | | | 18,698,894 | | | | 210,581,692 | | | | — | | | | — | | | | 237,229,183 | | |
Real Estate | | | — | | | | 35,720,216 | | | | 6,015,469 | | | | — | | | | — | | | | 41,735,685 | | |
Select Equities | | | 44,098 | | | | 5,909,442 | | | | 12,657,835 | | | | (348,394 | ) | | | (9,623 | ) | | | 18,253,358 | | |
Small Cap Growth | | | — | | | | — | | | | 9,420,273 | | | | (22,316,996 | ) | | | — | | | | (12,896,723 | ) | |
Socially Responsive | | | 17,367,282 | | | | 115,997,712 | | | | 487,394,437 | | | | — | | | | — | | | | 620,759,431 | | |
Value | | | 48,273 | | | | — | | | | 171,617 | | | | (202,268 | ) | | | — | | | | 17,622 | | |
The differences between book basis and tax basis distributable earnings are primarily due to: wash sales, defaulted bonds, capital loss carryforwards, post October loss deferrals, return of capital basis adjustments, organization expenses, REIT basis adjustments, passive foreign investment companies, premium amortization accruals, forward contracts mark to market, partnership and trust basis adjustments, and non-taxable dividend adjustments.
To the extent each Fund's net realized capital gains, if any, can be offset by capital loss carryforwards, it is the policy of each Fund not to distribute such gains. The Regulated Investment Company ("RIC") Modernization Act of 2010 (the "Act") became effective for the Funds on September 1, 2011 (July 17, 2013 (Commencement of Operations) for Greater China Equity). The Act modernizes several of the federal income and excise tax provisions related to RICs. Among the changes made are changes to the capital loss carryforward rules allowing for RICs to carry forward capital losses indefinitely and to retain the character of capital loss carryforwards as short-term or long-term ("Post-Enactment"). Rules in effect previously limited the carryforward period to eight years and all carryforwards were considered short-term in character ("Pre-Enactment"). As determined at August 31, 2013, the following Funds had unused capital loss carryforwards available for federal income tax purposes to offset net realized capital gains, if any, as follows:
| | | Pre-Enactment | |
| | | Expiring in: | |
| | | 2016 | | 2017 | | 2018 | |
| International Equity(1) | | $ | 46,867,022 | | | $ | 199,239,164 | | | $ | 78,142,921 | | |
International Large Cap | | | — | | | | 18,274,128 | | | | 36,160,452 | | |
Small Cap Growth | | | — | | | | 422,755 | | | | 21,223,467 | | |
Value | | | — | | | | — | | | | 200,121 | | |
188
| | | Post-Enactment (No Expiration Date) | |
| | | Long-Term | | Short-Term | |
Emerging Markets Equity | | $ | — | | | $ | 17,074,513 | | |
Global Thematic Opportunities | | | — | | | | 3,058,526 | | |
(1) The capital loss carryforwards shown above for International Equity include $46,867,022 expiring in 2016 and $114,232,268 expiring in 2017, which were acquired on January 25, 2013 in the merger with Neuberger Berman International Fund. Future utilization of these losses may be limited under current tax rules.
Post-Enactment capital loss carryforwards must be fully used before Pre-Enactment capital loss carryforwards; therefore, under certain circumstances, Pre-Enactment capital loss carryforwards available as of the report date may expire unused.
During the year ended August 31, 2013, Focus, Global Equity, International Equity, International Large Cap, Large Cap Value, Mid Cap Intrinsic Value, Small Cap Growth, Socially Responsive and Value utilized capital loss carryforwards of $8,642,610, $17,053, $15,680,671, $4,079,228, $26,442,932, $5,614,099, $23,502,118, $38,479,319 and $467,893, respectively.
Under current tax regulations, capital losses realized on investment transactions after October 31 may be deferred and treated as occurring on the first day of the following fiscal year. Under the Act, the Funds may also defer any realized late-year ordinary losses as occurring on the first day of the following fiscal year. Late-year ordinary losses represent ordinary losses realized on investment transactions after December 31 and specified losses (ordinary losses from the sale, exchange, or other disposition of property, net foreign currency losses and net passive foreign investment company mark to market losses) realized on investment transactions after October 31. For the year ended August 31, 2013, the Funds elected to defer the following late-year ordinary losses and post October capital losses:
| | Late-Year
Ordinary Loss | | Post October
Capital Loss
Deferral | |
| | Deferral | | Long-Term | | Short-Term | |
Emerging Markets Equity | | $ | — | | | $ | — | | | $ | 6,986,565 | | |
Global Equity | | | 4,787 | | | | — | | | | — | | |
Global Thematic Opportunities | | | — | | | | — | | | | 1,702,436 | | |
Mid Cap Growth | | | 2,197,507 | | | | — | | | | — | | |
Select Equities | | | — | | | | — | | | | 348,394 | | |
Small Cap Growth | | | 670,774 | | | | — | | | | — | | |
Value | | | — | | | | 2,147 | | | | — | | |
6 Foreign taxes: Foreign taxes withheld represent amounts withheld by foreign tax authorities, net of refunds recoverable.
Greater China Equity accrues deferred capital gains tax on unrealized gains for Participatory Notes domiciled in China. At August 31, 2013, this amounted to $23,108, which is reflected as part of accrued expenses and other payables with a corresponding decrease in unrealized gain or loss in the Statements of Assets and Liabilities.
7 Distributions to shareholders: Each Fund may earn income, net of expenses, daily on its investments.
Distributions from net investment income and net realized capital gains, if any, generally are distributed once a year (usually in December) and are recorded on the ex-date. However, Equity Income and Real Estate generally distribute substantially all of their net investment income, if any, at the end of each calendar quarter.
It is the policy of each of Equity Income, Mid Cap Intrinsic Value and Real Estate to pass through to its shareholders substantially all REIT distributions and other income it receives, less operating expenses. The distributions received from REITs held by Equity Income, Mid Cap Intrinsic Value and Real Estate are generally composed of income, capital gains, and/or return of REIT capital, but the REITs do not report this information to
189
Equity Income, Mid Cap Intrinsic Value and Real Estate until the following calendar year. At August 31, 2013, Equity Income, Mid Cap Intrinsic Value and Real Estate estimated these amounts within the financial statements since the information is not available from the REITs until after each Fund's fiscal year-end. For the year ended August 31, 2013, the character of distributions paid to shareholders of Equity Income, Mid Cap Intrinsic Value and Real Estate disclosed within the Statements of Changes in Net Assets is based on estimates made at that time. All estimates are based upon REIT information sources available to Equity Income, Mid Cap Intrinsic Value and Real Estate together with actual IRS Forms 1099DIV received to date. Based on past experience it is possible that a portion of Equity Income's, Mid Cap Intrinsic Value's and Real Estate's distributions during the current fiscal year will be considered tax return of capital, but the actual amount of the tax return of capital, if any, is not determinable until after each Fund's fiscal year-end. After calendar year-end, when Equity Income, Mid Cap Intrinsic Value and Real Estate learn the nature of the distributions paid by REITs during that year, distributions previously identified as income are often re-characterized as return of capital and/or capital gain. After all applicable REITs have informed Equity Income, Mid Cap Intrinsic Value and Real Estate of the actual breakdown of distributions paid to Equity Income, Mid Cap Intrinsic Value and Real Estate during its fiscal year, estimates previously recorded are adjusted on the books of Equity Income, Mid Cap Intrinsic Value and Real Estate to reflect actual results. As a result, the composition of Equity Income's, Mid Cap Intrinsic Value's and Real Estate's distributions as reported herein may differ from the final composition determined after calendar year-end and reported to Equity Income's, Mid Cap Intrinsic Value's and Real Estate's shareholders on IRS Form 1099DIV.
8 Organization expenses: Costs incurred by Greater China Equity in connection with its organization, which amounted to $106,817, which is reflected in Organization expense in the Statements of Operations, have been expensed as incurred.
9 Expense allocation: Certain expenses are applicable to multiple funds. Expenses directly attributable to a Fund are charged to that Fund. Expenses of the Trust that are not directly attributable to a particular series of the Trust (e.g., a Fund) are allocated among the series of the Trust, on the basis of relative net assets, except where a more appropriate allocation of expenses to each of the series can otherwise be made fairly. Expenses borne by the complex of related investment companies, which includes open-end and closed-end investment companies for which Management serves as investment manager, that are not directly attributable to a particular investment company in the complex (e.g., the Trust) or series thereof are allocated among the investment companies in the complex or series thereof, on the basis of relative net assets, except where a more appropriate allocation of expenses to each of the investment companies in the complex or series thereof can otherwise be made fairly. Each Fund's expenses (other than those specific to each class) are allocated proportionally each day among the classes based upon the relative net assets of each class.
10 Investments in foreign securities: Investing in foreign securities may involve certain sovereign and other risks, in addition to the credit and market risks normally associated with domestic securities. These additional risks include the possibility of adverse political and economic developments (including political instability, nationalization, expropriation, or confiscatory taxation) and the potentially adverse effects of unavailability of public information regarding issuers, less governmental supervision and regulation of financial markets, reduced liquidity of certain financial markets, and the lack of uniform accounting, auditing, and financial reporting standards or the application of standards that are different or less stringent than those applied in the United States. Foreign securities also may experience greater price volatility, higher rates of inflation, and delays in settlement.
11 Derivative instruments: During the year ended August 31, 2013, certain of the Funds' use of derivatives, as described below, was limited to written option transactions. The Funds have adopted the provisions of ASC 815 "Derivatives and Hedging" ("ASC 815"). The disclosure requirements of ASC 815 distinguish between derivatives that qualify for hedge accounting and those that do not. Because investment companies value their derivatives at fair value and recognize changes in fair value through the Statement of Operations, they do not qualify for hedge accounting. Accordingly, even though a Fund's investments in derivatives may represent economic hedges, they are considered non-hedge transactions for purposes of this disclosure.
190
Options: Premiums received by a Fund upon writing a covered call option or a put option are recorded in the liability section of the Fund's Statement of Assets and Liabilities and are subsequently adjusted to the current market value. When an option is exercised, closed, or expired, the Fund realizes a gain or loss and the liability is eliminated.
When writing a covered call option, a Fund, in return for the premium, gives up the opportunity for profit from a price increase in the underlying security above the exercise price, but conversely retains the risk of loss should the price of the security decline. When writing a put option, the Fund, in return for the premium, takes the risk that it must purchase the underlying security at a price that may be higher than the current market price of the security. If a covered call or a put option that the Fund has written expires unexercised, the Fund will realize a gain in the amount of the premium. All securities covering outstanding written options are held in escrow by the custodian bank.
Premiums paid by a Fund upon purchasing a call or put option are recorded in the asset section of the Fund's Statement of Assets and Liabilities and are subsequently adjusted to the current market value. When an option is exercised, closed, or expired, the Fund realizes a gain or loss and the asset is eliminated.
Written option transactions were used in an attempt to generate incremental returns for Equity Income for the year ended August 31, 2013. Written option transactions for Equity Income for the year ended August 31, 2013 were:
Equity Income
| | | Number | | Value When
Written | |
Contracts outstanding 8/31/2012 | | | 12,550 | | | $ | 1,485,000 | | |
Contracts written | | | 55,740 | | | | 6,493,000 | | |
Contracts expired | | | (848 | ) | | | (56,000 | ) | |
Contracts exercised | | | (9,772 | ) | | | (1,079,000 | ) | |
Contracts closed | | | (49,675 | ) | | | (5,779,000 | ) | |
Contracts outstanding 8/31/2013 | | | 7,995 | | | $ | 1,064,000 | | |
At August 31, 2013, Equity Income had the following derivatives (which did not qualify for hedge accounting under ASC 815), grouped by primary risk exposure:
Liability Derivatives
| | | Equity Risk | | Statements of
Assets and
Liabilities Location | |
Option Contracts Written | | $ | (1,238,000 | ) | | Options contracts | |
Total Value | | $ | (1,238,000 | ) | | written, at value | |
The impact of the use of these derivative instruments on the Statements of Operations during the year ended August 31, 2013 was as follows:
Realized Gain (Loss)
Equity Income | | Equity Risk | | Statements of
Operations Location | |
Option Contracts Written | | $ | 2,963,000 | | | Net realized gain | |
Total Realized Gain (Loss) | | $ | 2,963,000 | | | (loss) on: options written | |
191
Change in Appreciation (Depreciation)
Equity Income | | Equity Risk | | Statements of
Operations Location | |
Option Contracts Written
Total Change in Appreciation (Depreciation) | | |
$139,000
$139,000 | | | Change in net
unrealized appreciation
(depreciation) in value of:
options written | |
For the year ended August 31, 2013, Equity Income had an average market value of $(3,239,000) in written options.
While the Funds may receive rights and warrants in connection with their investments in securities, these rights and warrants are not considered "derivative instruments" under ASC 815. Management has concluded that the Funds, except Equity Income, did not hold any derivative instruments during the year ended August 31, 2013 that require additional disclosures pursuant to ASC 815.
12 In-kind subscriptions: Under certain circumstances, and when considered to be in the best interest of a fund, the fund may accept portfolio securities rather than cash as payment for the purchase of fund shares (in-kind subscription). For financial reporting and tax purposes, the cost basis of contributed securities is equal to the market value of the securities, plus any applicable foreign security taxes, on the date of contribution. In-kind subscriptions result in no gain or loss and no tax consequences for a fund. During the year ended August 31, 2013, International Equity accepted $48,182,440 of in-kind subscriptions.
13 Indemnifications: Like many other companies, the Trust's organizational documents provide that its officers and trustees are indemnified against certain liabilities arising out of the performance of their duties to the Trust. In addition, both in some of its principal service contracts and in the normal course of its business, the Trust enters into contracts that provide indemnifications to other parties for certain types of losses or liabilities. The Trust's maximum exposure under these arrangements is unknown as this could involve future claims against the Trust.
14 Expense offset arrangement: Prior to January 1, 2013, each Fund had an expense offset arrangement in connection with its custodian contract. For the year ended August 31, 2013, the impact of this arrangement was a reduction of expenses of $66, $323, $7, $611, $1, $3, $137, $66, $37, $6, $100, $147, $61, $3, $144, $3, $3, $4, $221 and $0 for Emerging Markets Equity, Equity Income, Focus, Genesis, Global Equity, Global Thematic Opportunities, Guardian, International Equity, International Large Cap, Intrinsic Value, Large Cap Disciplined Growth, Large Cap Value, Mid Cap Growth, Mid Cap Intrinsic Value, Multi-Cap Opportunities, Real Estate, Select Equities, Small Cap Growth, Socially Responsive and Value, respectively.
15 Other: All net investment income and realized and unrealized capital gains and losses of each Fund are allocated, on the basis of relative net assets, pro rata among its respective classes.
Note B—Management Fees, Administration Fees, Distribution Arrangements, and Other Transactions with Affiliates:
Each Fund retains Management as its investment manager under a Management Agreement. For such investment management services, each Fund pays Management a fee according to the following table:
Investment Management Fee as a Percentage of Average Daily Net Assets:
| | First
$250
million | | Next
$250
million | | Next
$250
million | | Next
$250
million | | Next
$500
million | | Next
$500
million | | Next
$500
million | | Next
$1.5
billion | | Thereafter | |
For Genesis, Intrinsic Value, and Small Cap Growth: | |
| | | | 0.85 | % | | | 0.80 | % | | | 0.75 | % | | | 0.70 | % | | | 0.65 | % | | | 0.65 | % | | | 0.65 | % | | | 0.65 | % | | | 0.65 | % | |
For Emerging Markets Equity: | |
| | | | 1.00 | % | | | 0.975 | % | | | 0.95 | % | | | 0.925 | % | | | 0.90 | % | | | 0.875 | % | | | 0.875 | % | | | 0.875 | % | | | 0.85 | % | |
192
| | First
$250
million | | Next
$250
million | | Next
$250
million | | Next
$250
million | | Next
$500
million | | Next
$500
million | | Next
$500
million | | Next
$1.5
billion | | Thereafter | |
For Real Estate: | |
| | | | 0.80 | % | | | 0.80 | % | | | 0.80 | % | | | 0.80 | % | | | 0.80 | % | | | 0.80 | % | | | 0.80 | % | | | 0.80 | % | | | 0.80 | % | |
| For International Equity(1): | |
| | | | 0.85 | % | | | 0.825 | % | | | 0.80 | % | | | 0.775 | % | | | 0.75 | % | | | 0.725 | % | | | 0.725 | % | | | 0.70 | % | | | 0.70 | % | |
| For Equity Income, Focus, Guardian, International Large Cap, Large Cap Disciplined Growth, Large Cap Value, Mid Cap Growth, Mid Cap Intrinsic Value(1), Select Equities, Socially Responsive and Value: | |
| | | | 0.55 | % | | | 0.525 | % | | | 0.50 | % | | | 0.475 | % | | | 0.45 | % | | | 0.425 | % | | | 0.425 | % | | | 0.425 | % | | | 0.40 | % | |
For Multi-Cap Opportunities: | |
| | | | 0.60 | % | | | 0.575 | % | | | 0.55 | % | | | 0.525 | % | | | 0.50 | % | | | 0.475 | % | | | 0.475 | % | | | 0.475 | % | | | 0.45 | % | |
For Global Equity: | |
| | | | 0.75 | % | | | 0.725 | % | | | 0.70 | % | | | 0.675 | % | | | 0.65 | % | | | 0.625 | % | | | 0.625 | % | | | 0.625 | % | | | 0.60 | % | |
For Global Thematic Opportunities: | |
| | | | 0.85 | % | | | 0.825 | % | | | 0.80 | % | | | 0.775 | % | | | 0.75 | % | | | 0.725 | % | | | 0.725 | % | | | 0.725 | % | | | 0.70 | % | |
For Greater China Equity: | |
| | | 1.10 | % | | | 1.10 | % | | | 1.10 | % | | | 1.10 | % | | | 0.95 | % | | | 0.95 | % | | | 0.95 | % | | | 0.95 | % | | | 0.95 | % | |
(1) Effective January 28, 2013, Management has voluntarily agreed to waive its management fee in the amount of 0.18% of the average daily net assets of International Equity. Effective May 1, 2013, Management has voluntarily agreed to waive its management fee in the amount of 0.36% of the average daily net assets of Mid Cap Intrinsic Value (0.33% effective February 1, 2013, 0.28% effective December 1, 2012 and 0.25% effective February 1, 2012). Management may, at its sole discretion, modify or terminate these voluntary waivers without notice to International Equity or Mid Cap Intrinsic Value. For the year ended August 31, 2013, such waived fees amounted to $1,020,835 and $210,832 for International Equity and Mid Cap Intrinsic Value, respectively.
Accordingly, for the year ended August 31, 2013, the management fee pursuant to the Management Agreement was equivalent to an annual effective rate of each Fund's average daily net assets, as follows:
| | | Effective
Rate | | | | Effective
Rate | |
Emerging Markets Equity | | | .99 | % | | Large Cap Disciplined Growth | | | .53 | % | |
Equity Income | | | .46 | % | | Large Cap Value | | | .49 | % | |
Focus | | | .53 | % | | Mid Cap Growth | | | .53 | % | |
Genesis | | | .66 | % | | Mid Cap Intrinsic Value | | | .24 | % | |
Global Equity | | | .75 | % | | Multi-Cap Opportunities | | | .56 | % | |
Global Thematic Opportunities | | | .85 | % | | Real Estate | | | .80 | % | |
Greater China Equity | | | 1.10 | % | | Select Equities | | | .55 | % | |
Guardian | | | .50 | % | | Small Cap Growth | | | .85 | % | |
International Equity | | | .69 | % | | Socially Responsive | | | .48 | % | |
International Large Cap | | | .55 | % | | Value | | | .55 | % | |
Intrinsic Value | | | .85 | % | | | | | |
Each Fund retains Management as its administrator under an Administration Agreement. Each Fund pays Management an administration fee at the annual rate of 0.06% of its average daily net assets under this Agreement. In addition, each Fund's Investor Class, Class A, Class C and Class R3 pays Management an administration fee at
193
the annual rate of 0.20% of its average daily net assets, each Fund's Trust Class and Advisor Class pays Management an administration fee at the annual rate of 0.34% of its average daily net assets, and each Fund's Institutional Class pays Management an administration fee at the annual rate of 0.09% of its average daily net assets and each Fund's Class R6 pays Management an administration fee of 0.02% of its average daily net assets. Additionally, Management retains State Street Bank and Trust Company ("State Street") as its sub-administrator under a Sub-Administration Agreement. Management pays State Street a fee for all services received under the agreement.
For the Trust Class of Focus, Guardian, International Large Cap, Large Cap Value, Mid Cap Intrinsic Value, Real Estate, Small Cap Growth and Socially Responsive, the Advisor Class of each Fund, and Class A, Class C and Class R3 of each Fund, Management acts as agent in arranging for the sale of class shares without commission and bears advertising and promotion expenses. The Board has adopted distribution plans (each a "Plan", collectively, the "Plans") with respect to these classes, pursuant to Rule 12b-1 under the 1940 Act. The Plans provide that, as compensation for administrative and other services provided to these classes, Management's activities and expenses related to the sale and distribution of these classes of shares, and ongoing services provided to investors in these classes, Management receives from each of these classes a fee at the annual rate of 0.10% of such Trust Class's, 0.25% of such Advisor Class's, 0.25% of such Class A's, 1.00% of such Class C's and 0.50% of such Class R3's average daily net assets. Management receives this amount to provide distribution and shareholder servicing for those classes and pays a portion of it to institutions that provide such services. Those institutions may use the payments for, among other purposes, compensating employees engaged in sales and/or shareholder servicing. The amount of fees paid by each class during any year could have been more or less than the cost of distribution and other services provided to that class. FINRA rules limit the amount of annual distribution fees that may be paid by a mutual fund and impose a ceiling on the cumulative distribution fees paid. The Trust's Plans comply with those rules.
Management has contractually agreed to waive current payment of fees and/or reimburse certain expenses of the Investor Class of each of International Equity, Large Cap Disciplined Growth, Mid Cap Intrinsic Value and Small Cap Growth and the Trust Class, Advisor Class, Institutional Class, Class A, Class C, Class R3 and Class R6 of each Fund that offers those classes so that the total annual operating expenses of those classes do not exceed the expense limitations as detailed in the following table. These undertakings apply to a Fund's direct expenses and do not cover interest, taxes, brokerage commissions, acquired fund fees and expenses, extraordinary expenses and dividend expense on short sales, if any; consequently, net expenses may exceed the contractual expense limitations. Each Fund has agreed that each of its respective classes will repay Management for fees and expenses waived or reimbursed for that class provided that repayment does not cause the class's annual operating expenses to exceed its contractual expense limitation in place at the time the fees and expenses were waived or reimbursed. Any such repayment must be made within three years after the year in which Management incurred the expense. During the year ended August 31, 2013, Class R3 of Equity Income, the Advisor Class of Guardian, Class A of Guardian, the Investor Class of Large Cap Disciplined Growth, Class C of Large Cap Value, the Institutional Class of Multi-Cap Opportunities, Class A of Multi-Cap Opportunities, Class C of Multi-Cap Opportunities, Class A of Socially Responsive and Class C of Socially Responsive reimbursed Management $2,547, $1,209, $2,589, $10,881, $2, $345,269, $3,032, $2,590, $14,871 and $5,773, respectively, under their contractual expense limitation agreements. At August 31, 2013, contingent liabilities to Management under the agreements were as follows:
| | | | | | | Expenses Reimbursed In
Fiscal Period Ending, August 31, | |
| | | | | | | 2011 | | 2012 | | 2013 | |
| | | | | | | Subject to Repayment Until
August 31, | |
Class | | Contractual
Expense
Limitation(1) | | Expiration | | 2014 | | 2015 | | 2016 | |
Emerging Markets Equity Fund Institutional Class | | | 1.25 | % | | 8/31/16 | | $ | 800,846 | | | $ | 680,473 | | | $ | 993,712 | | |
Emerging Markets Equity Fund Class A | | | 1.50 | % | | 8/31/16 | | | 114,075 | | | | 30,719 | | | | 30,312 | | |
Emerging Markets Equity Fund Class C | | | 2.25 | % | | 8/31/16 | | | 13,198 | | | | 8,678 | | | | 13,600 | | |
194
| | | | | | | Expenses Reimbursed In
Fiscal Period Ending, August 31, | |
| | | | | | | 2011 | | 2012 | | 2013 | |
| | | | | | | Subject to Repayment until
August 31, | |
Class | | Contractual
Expense
Limitation(1) | | Expiration | | 2014 | | 2015 | | 2016 | |
Emerging Markets Equity Fund Class R3 | | | 1.91 | % | | 8/31/16 | | $ | 2,132 | | | $ | 470 | | | $ | 689 | | |
Emerging Markets Equity Fund Class R6 | | | 1.18 | % | | 8/31/16 | | | — | | | | — | | | | 38,968 | (6) | |
Equity Income Fund Institutional Class | | | 0.80 | % | | 8/31/16 | | | — | | | | — | | | | — | | |
Equity Income Fund Class A | | | 1.16 | % | | 8/31/16 | | | — | | | | — | | | | — | | |
Equity Income Fund Class C | | | 1.91 | % | | 8/31/16 | | | — | | | | — | | | | — | | |
Equity Income Fund Class R3 | | | 1.41 | % | | 8/31/16 | | | 843 | | | | — | | | | — | | |
Focus Fund Trust Class | | | 1.50 | % | | 8/31/16 | | | — | | | | — | | | | — | | |
Focus Fund Advisor Class | | | 1.50 | % | | 8/31/22 | | | — | | | | — | | | | — | | |
Focus Fund Institutional Class | | | 0.75 | % | | 8/31/16 | | | 2,813 | | | | 2,815 | | | | 4,649 | | |
Focus Fund Class A | | | 1.11 | % | | 8/31/16 | | | 1,836 | | | | 570 | | | | 977 | | |
Focus Fund Class C | | | 1.86 | % | | 8/31/16 | | | 1,723 | | | | 322 | | | | 342 | | |
Genesis Fund Trust Class | | | 1.50 | % | | 8/31/16 | | | — | | | | — | | | | — | | |
Genesis Fund Advisor Class | | | 1.50 | % | | 8/31/22 | | | — | | | | — | | | | — | | |
Genesis Fund Institutional Class | | | 0.85 | % | | 8/31/22 | | | 699,320 | | | | 526,949 | | | | 117,849 | | |
Genesis Fund Class R6 | | | 0.78 | % | | 8/31/16 | | | — | | | | — | | | | 37,050 | (6) | |
Global Equity Fund Institutional Class | | | 1.15 | % | | 8/31/16 | | | 140,976 | (4) | | | 268,266 | | | | 261,844 | | |
Global Equity Fund Class A | | | 1.51 | % | | 8/31/16 | | | 11,381 | (4) | | | 7,900 | | | | 6,060 | | |
Global Equity Fund Class C | | | 2.26 | % | | 8/31/16 | | | 9,265 | (4) | | | 4,712 | | | | 2,623 | | |
Global Thematic Opportunities Fund Institutional Class | | | 1.25 | % | | 8/31/16 | | | 154,263 | (4) | | | 229,703 | | | | 188,890 | | |
Global Thematic Opportunities Fund Class A | | | 1.61 | % | | 8/31/16 | | | 2,585 | (4) | | | 3,105 | | | | 4,219 | | |
Global Thematic Opportunities Fund Class C | | | 2.36 | % | | 8/31/16 | | | 2,176 | (4) | | | 885 | | | | 695 | | |
Greater China Equity Fund Institutional Class | | | 1.50 | % | | 8/31/16 | | | — | | | | — | | | | 160,702 | (7) | |
Greater China Equity Fund Class A | | | 1.86 | % | | 8/31/16 | | | — | | | | — | | | | 2,385 | (7) | |
Greater China Equity Fund Class C | | | 2.61 | % | | 8/31/16 | | | — | | | | — | | | | 2,350 | (7) | |
Guardian Fund Trust Class | | | 1.50 | % | | 8/31/16 | | | — | | | | — | | | | — | | |
Guardian Fund Advisor Class | | | 1.50 | % | | 8/31/22 | | | — | | | | — | | | | — | | |
Guardian Fund Institutional Class | | | 0.75 | % | | 8/31/16 | | | — | | | | — | | | | — | | |
Guardian Fund Class A | | | 1.11 | % | | 8/31/16 | | | 2,166 | | | | 1,454 | | | | — | | |
Guardian Fund Class C | | | 1.86 | % | | 8/31/16 | | | 296 | | | | 279 | | | | 66 | | |
Guardian Fund Class R3 | | | 1.36 | % | | 8/31/16 | | | 140 | | | | 146 | | | | 134 | | |
International Equity Fund Investor Class | | | 1.40 | % | | 8/31/16 | | | — | | | | — | | | | — | (5) | |
International Equity Fund Trust Class | | | 2.00 | % | | 8/31/22 | | | — | | | | — | | | | — | (5) | |
International Equity Fund Institutional Class | | | 0.85 | % | | 8/31/22 | | | 976,101 | | | | 1,211,689 | | | | 784,945 | | |
International Equity Fund Class A | | | 1.21 | %(8) | | 8/31/16 | | | — | | | | — | | | | 2,253 | (5) | |
International Equity Fund Class C | | | 1.96 | %(8) | | 8/31/16 | | | — | | | | — | | | | 1,409 | (5) | |
International Large Cap Fund Trust Class | | | 1.25 | % | | 8/31/16 | | | 36,362 | | | | 23,177 | | | | 17,980 | | |
International Large Cap Fund Institutional Class | | | 0.90 | % | | 8/31/16 | | | 174,363 | | | | 151,893 | | | | 126,756 | | |
195
| | | | | | | Expenses Reimbursed In
Fiscal Period Ending, August 31, | |
| | | | | | | 2011 | | 2012 | | 2013 | |
| | | | | | | Subject to Repayment until
August 31, | |
Class | | Contractual
Expense
Limitation(1) | | Expiration | | 2014 | | 2015 | | 2016 | |
International Large Cap Fund Class A | | | 1.30 | %(2) | | 8/31/16 | | $ | 7,000 | | | $ | 6,199 | | | $ | 6,163 | | |
International Large Cap Fund Class C | | | 2.00 | % | | 8/31/16 | | | 3,222 | | | | 3,016 | | | | 3,613 | | |
International Large Cap Fund Class R3 | | | 1.51 | % | | 8/31/16 | | | 283 | | | | 438 | | | | 1,103 | | |
Intrinsic Value Fund Institutional Class | | | 1.00 | % | | 8/31/16 | | | 292,802 | | | | 271,075 | | | | 289,297 | | |
Intrinsic Value Fund Class A | | | 1.36 | % | | 8/31/16 | | | 13,592 | | | | 22,387 | | | | 20,599 | | |
Intrinsic Value Fund Class C | | | 2.11 | % | | 8/31/16 | | | 5,011 | | | | 16,110 | | | | 16,477 | | |
Large Cap Disciplined Growth Fund Investor Class | | | 1.11 | % | | 8/31/16 | | | — | | | | — | | | | — | | |
Large Cap Disciplined Growth Fund Institutional Class | | | 0.75 | % | | 8/31/16 | | | 235,665 | | | | 162,865 | | | | 219,810 | | |
Large Cap Disciplined Growth Fund Class A | | | 1.11 | % | | 8/31/16 | | | 35,879 | | | | 28,718 | | | | 29,500 | | |
Large Cap Disciplined Growth Fund Class C | | | 1.86 | % | | 8/31/16 | | | 21,490 | | | | 14,075 | | | | 15,074 | | |
Large Cap Disciplined Growth Fund Class R3 | | | 1.36 | % | | 8/31/16 | | | 258 | | | | 260 | | | | 327 | | |
Large Cap Value Fund Trust Class | | | 1.50 | % | | 8/31/16 | | | — | | | | — | | | | — | | |
Large Cap Value Fund Advisor Class | | | 1.50 | % | | 8/31/22 | | | — | | | | — | | | | — | | |
Large Cap Value Fund Institutional Class | | | 0.70 | % | | 8/31/16 | | | — | | | | — | | | | 5,228 | | |
Large Cap Value Fund Class A | | | 1.11 | % | | 8/31/16 | | | — | | | | — | | | | 45 | | |
Large Cap Value Fund Class C | | | 1.86 | % | | 8/31/16 | | | 1,629 | | | | 168 | | | | — | | |
Large Cap Value Fund Class R3 | | | 1.36 | % | | 8/31/16 | | | 1,607 | | | | 67 | | | | 83 | | |
Mid Cap Growth Fund Trust Class | | | 1.50 | % | | 8/31/16 | | | — | | | | — | | | | — | | |
Mid Cap Growth Fund Advisor Class | | | 1.50 | % | | 8/31/22 | | | — | | | | — | | | | — | | |
Mid Cap Growth Fund Institutional Class | | | 0.75 | % | | 8/31/16 | | | 94,033 | | | | 57,778 | | | | 74,654 | | |
Mid Cap Growth Fund Class A | | | 1.11 | % | | 8/31/16 | | | 16,201 | | | | 32,163 | | | | 51,584 | | |
Mid Cap Growth Fund Class C | | | 1.86 | % | | 8/31/16 | | | 821 | | | | 1,973 | | | | 2,985 | | |
Mid Cap Growth Fund Class R3 | | | 1.36 | % | | 8/31/16 | | | 397 | | | | 1,733 | | | | 3,079 | | |
Mid Cap Growth Fund Class R6 | | | 0.68 | % | | 8/31/16 | | | — | | | | — | | | | 1,565 | (6) | |
Mid Cap Intrinsic Value Fund Investor Class | | | 1.50 | % | | 8/31/22 | | | — | | | | — | | | | — | | |
Mid Cap Intrinsic Value Fund Trust Class | | | 1.25 | % | | 8/31/22 | | | 71,988 | | | | 29,878 | | | | 13,066 | | |
Mid Cap Intrinsic Value Fund Institutional Class | | | 0.85 | % | | 8/31/16 | | | 4,750 | | | | 5,012 | | | | 3,203 | | |
Mid Cap Intrinsic Value Fund Class A | | | 1.21 | % | | 8/31/16 | | | 2,672 | | | | 5,552 | | | | 5,190 | | |
Mid Cap Intrinsic Value Fund Class C | | | 1.96 | % | | 8/31/16 | | | 1,870 | | | | 524 | | | | 494 | | |
Mid Cap Intrinsic Value Fund Class R3 | | | 1.46 | % | | 8/31/16 | | | 1,691 | | | | 383 | | | | 203 | | |
Multi-Cap Opportunities Fund Institutional Class | | | 1.00 | % | | 8/31/16 | | | — | | | | — | | | | — | | |
Multi-Cap Opportunities Fund Class A | | | 1.36 | % | | 8/31/16 | | | — | | | | — | | | | — | | |
Multi-Cap Opportunities Fund Class C | | | 2.11 | % | | 8/31/16 | | | — | | | | — | | | | — | | |
Real Estate Fund Trust Class | | | 1.50 | %(2) | | 8/31/22 | | | 84,709 | | | | — | | | | — | | |
Real Estate Fund Institutional Class | | | 0.85 | % | | 8/31/22 | | | 209,367 | | | | 401,382 | | | | 707,517 | | |
Real Estate Fund Class A | | | 1.21 | % | | 8/31/16 | | | 65,175 | | | | 160,543 | | | | 336,286 | | |
Real Estate Fund Class C | | | 1.96 | % | | 8/31/16 | | | 14,827 | | | | 40,775 | | | | 90,654 | | |
196
| | | | | | | Expenses Reimbursed In
Fiscal Period Ending, August 31, | |
| | | | | | | 2011 | | 2012 | | 2013 | |
| | | | | | | Subject to Repayment until
August 31, | |
Class | | Contractual
Expense
Limitation(1) | | Expiration | | 2014 | | 2015 | | 2016 | |
Real Estate Fund Class R3 | | | 1.46 | % | | 8/31/16 | | $ | 2,177 | | | $ | 6,246 | | | $ | 24,426 | | |
Real Estate Fund Class R6 | | | 0.78 | % | | 8/31/16 | | | — | | | | — | | | | 5,033 | (6) | |
Select Equities Fund Institutional Class | | | 0.75 | % | | 8/31/16 | | | 106,173 | | | | 109,640 | | | | 125,967 | | |
Select Equities Fund Class A | | | 1.20 | % | | 8/31/16 | | | 124,091 | | | | 98,482 | | | | 84,083 | | |
Select Equities Fund Class C | | | 1.95 | % | | 8/31/16 | | | 46,670 | | | | 39,600 | | | | 33,146 | | |
Small Cap Growth Fund Investor Class | | | 1.30 | %(2) | | 8/31/22 | | | 140,394 | | | | 169,034 | | | | 177,688 | | |
Small Cap Growth Fund Trust Class | | | 1.40 | % | | 8/31/22 | | | 62,498 | | | | 63,093 | | | | 60,615 | | |
Small Cap Growth Fund Advisor Class | | | 1.60 | %(2) | | 8/31/22 | | | 21,179 | | | | 17,513 | | | | 14,942 | | |
Small Cap Growth Fund Institutional Class | | | 0.90 | % | | 8/31/16 | | | 401,065 | | | | 203,174 | | | | 147,976 | | |
Small Cap Growth Fund Class A | | | 1.26 | % | | 8/31/16 | | | 7,835 | | | | 5,555 | | | | 9,439 | | |
Small Cap Growth Fund Class C | | | 2.01 | % | | 8/31/16 | | | 1,142 | | | | 2,744 | | | | 4,742 | | |
Small Cap Growth Fund Class R3 | | | 1.51 | % | | 8/31/16 | | | 457 | | | | 1,022 | | | | 1,908 | | |
Socially Responsive Fund Trust Class | | | 1.50 | % | | 8/31/16 | | | — | | | | — | | | | — | | |
Socially Responsive Fund Institutional Class | | | 0.75 | % | | 8/31/16 | | | — | | | | — | | | | — | | |
Socially Responsive Fund Class A | | | 1.11 | % | | 8/31/16 | | | — | | | | — | | | | — | | |
Socially Responsive Fund Class C | | | 1.86 | % | | 8/31/16 | | | — | | | | — | | | | — | | |
Socially Responsive Fund Class R3 | | | 1.36 | % | | 8/31/16 | | | — | | | | — | | | | — | | |
Socially Responsive Fund Class R6 | | | 0.68 | % | | 8/31/16 | | | — | | | | — | | | | — | (6) | |
Value Fund Institutional Class | | | 0.75 | %(2) | | 8/31/16 | | | 254,006 | | | | 217,250 | | | | 122,469 | | |
Value Fund Class A | | | 1.11 | %(2) | | 8/31/16 | | | 13,297 | (3) | | | 81,085 | | | | 141,386 | | |
Value Fund Class C | | | 1.86 | % | | 8/31/16 | | | 3,825 | (3) | | | 3,750 | | | | 8,538 | | |
(1) Expense limitation per annum of the respective class's average daily net assets.
(2) In addition, Management has voluntarily undertaken to waive current payment of fees and/or reimburse certain expenses of Class A of International Large Cap, the Trust Class of Real Estate, the Investor Class of Small Cap Growth, the Advisor Class of Small Cap Growth and the Institutional Class of Value, so that their Operating Expenses are limited to 1.24%, 1.04%, 1.21% (1.25% prior to December 1, 2012), 1.51% (1.55% prior to December 1, 2012) and 0.70%, respectively, per annum of their average daily net assets. Prior to October 12, 2012, Management had also voluntarily undertaken to waive current payment of fees and/or reimburse certain expenses of Class A of Value so that its Operating Expenses were limited to 1.04% per annum of its average daily net assets. For the year ended August 31, 2013, voluntary reimbursements for Class A of International Large Cap, the Trust Class of Real Estate, the Investor Class of Small Cap Growth, the Advisor Class of Small Cap Growth, the Institutional Class of Value and Class A of Value amounted to $5,737, $1,370,231, $42,050, $3,582, $1,183 and $121, respectively. These amounts are not subject to recovery by Management. These undertakings, which are terminable by Management upon notice to International Large Cap, Real Estate, Small Cap Growth and Value, are in addition to the contractual undertakings as stated above.
(3) Period from March 2, 2011 (Commencement of Operations) to August 31, 2011.
(4) Period from June 30, 2011 (Commencement of Operations) to August 31, 2011.
197
(5) Period from January 28, 2013 (Commencement of Operations) to August 31, 2013.
(6) Period from March 15, 2013 (Commencement of Operations) to August 31, 2013.
(7) Period from July 17, 2013 (Commencement of Operations) to August 31, 2013.
(8) From January 28, 2013 to June 27, 2013, the contractual expense limitation was 1.51% for Class A and 2.26% for Class C.
Neuberger Berman LLC ("Neuberger") is retained by Management to furnish it with investment recommendations and research information without added cost to the Funds. Several individuals who are officers and/or Trustees of the Trust are also employees of Neuberger and/or Management.
Management and Neuberger are indirect subsidiaries of Neuberger Berman Group LLC (("NBG") and together with its consolidated subsidiaries ("NB Group")). NBSH Acquisition, LLC ("NBSH" and together with NBG, the "NB Parties"), which is owned by portfolio managers, members of the NB Group management team and certain of NB Group's key employees, senior professionals, and certain of their permitted transferees, owns, as of September 30, 2013, approximately 76% of NBG's equity, and Lehman Brothers Holdings Inc. ("LBHI") and certain of its subsidiaries (collectively the "LBHI Parties") own the remaining 24% of such equity. Pursuant to agreements among the NB Parties and the LBHI Parties, as well as the issuance of NBSH equity to employees with respect to their previously made equity elections relating to 2013 compensation, it is expected that NBSH will own 81% of NBG's equity as of January 1, 2014. NBG has the opportunity to continue to redeem the remaining NBG equity held by the LBHI Parties through a process that is expected to end in 2016 (and if necessary, 2017).
Each class of shares has a distribution agreement with Management. Class A shares of each Fund are generally sold with an initial sales charge of up to 5.75% and no contingent deferred sales charge ("CDSC"), except that a CDSC of 1.00% will apply to certain redemptions made within 18 months following purchases of $1 million or more without an initial sales charge. Class C shares of each Fund are sold with no initial sales charge and a 1.00% CDSC if shares are sold within one year after purchase.
For the year ended August 31, 2013, Management, acting as underwriter and broker-dealer, received net initial sales charges from the purchase of Class A shares and CDSCs from the redemptions of Class A and Class C shares as follows:
| | | Underwriter | | Broker-Dealer | |
| | | Net Initial Sales
Charge | | CDSC | | Net Initial Sales
Charge | | CDSC | |
Emerging Markets Equity Fund Class A | | $ | 15,745 | | | $ | — | | | $ | — | | | $ | — | | |
Emerging Markets Equity Fund Class C | | | — | | | | 524 | | | | — | | | | — | | |
Equity Income Fund Class A | | | 231,463 | | | | 63,549 | | | | — | | | | — | | |
Equity Income Fund Class C | | | — | | | | 72,603 | | | | — | | | | — | | |
Focus Fund Class A | | | 750 | | | | — | | | | — | | | | — | | |
Focus Fund Class C | | | — | | | | 93 | | | | — | | | | — | | |
Global Equity Fund Class A | | | — | | | | — | | | | — | | | | — | | |
Global Equity Fund Class C | | | — | | | | — | | | | — | | | | — | | |
Global Thematic Opportunities Fund Class A | | | 2,936 | | | | — | | | | — | | | | — | | |
Global Thematic Opportunities Fund Class C | | | — | | | | — | | | | — | | | | — | | |
Greater China Equity Fund Class A | | | — | | | | — | | | | — | | | | — | | |
Greater China Equity Fund Class C | | | — | | | | — | | | | — | | | | — | | |
Guardian Fund Class A | | | 422 | | | | — | | | | — | | | | — | | |
Guardian Fund Class C | | | — | | | | 424 | | | | — | | | | — | | |
International Equity Fund Class A | | | 4,490 | | | | — | | | | — | | | | — | | |
International Equity Fund Class C | | | — | | | | 26 | | | | — | | | | — | | |
198
| | | Underwriter | | Broker-Dealer | |
| | | Net Initial Sales
Charge | | CDSC | | Net Initial Sales
Charge | | CDSC | |
International Large Cap Fund Class A | | $ | 1,384 | | | $ | 1,840 | | | $ | — | | | $ | — | | |
International Large Cap Fund Class C | | | — | | | | 1,095 | | | | — | | | | — | | |
Intrinsic Value Fund Class A | | | 4,042 | | | | — | | | | — | | | | — | | |
Intrinsic Value Fund Class C | | | — | | | | 984 | | | | — | | | | — | | |
Large Cap Disciplined Growth Fund Class A | | | 3,174 | | | | 38 | | | | — | | | | — | | |
Large Cap Disciplined Growth Fund Class C | | | — | | | | 3,219 | | | | — | | | | — | | |
Large Cap Value Fund Class A | | | 1,267 | | | | — | | | | — | | | | — | | |
Large Cap Value Fund Class C | | | — | | | | 1,193 | | | | — | | | | — | | |
Mid Cap Growth Fund Class A | | | 7,535 | | | | — | | | | — | | | | — | | |
Mid Cap Growth Fund Class C | | | — | | | | 1,391 | | | | — | | | | — | | |
Mid Cap Intrinsic Value Fund Class A | | | 594 | | | | — | | | | — | | | | — | | |
Mid Cap Intrinsic Value Fund Class C | | | — | | | | — | | | | — | | | | — | | |
Multi-Cap Opportunities Fund Class A | | | 17,970 | | | | — | | | | — | | | | — | | |
Multi-Cap Opportunities Fund Class C | | | — | | | | 1,074 | | | | — | | | | — | | |
Real Estate Fund Class A | | | 91,601 | | | | 94 | | | | — | | | | — | | |
Real Estate Fund Class C | | | — | | | | 11,076 | | | | — | | | | — | | |
Select Equities Fund Class A | | | 4,832 | | | | — | | | | — | | | | — | | |
Select Equities Fund Class C | | | — | | | | 1,244 | | | | — | | | | — | | |
Small Cap Growth Fund Class A | | | 271 | | | | 683 | | | | — | | | | — | | |
Small Cap Growth Fund Class C | | — | | — | | — | |
Socially Responsive Fund Class A | | | 31,262 | | | | 2,140 | | | | — | | | | — | | |
Socially Responsive Fund Class C | | | — | | | | 1,078 | | | | — | | | | — | | |
Value Fund Class A | | | 2,013 | | | | — | | | | — | | | | — | | |
Value Fund Class C | | | — | | | | — | | | | — | | | | — | | |
Note C—Securities Transactions:
During the year ended August 31, 2013, there were purchase and sale transactions of long-term securities (excluding option contracts) as follows:
(000's omitted) | | Purchases | | Sales | | (000's omitted) | | Purchases | | Sales | |
Emerging Markets Equity | | $ | 346,006 | | | $ | 102,876 | | | Large Cap Disciplined Growth | | $ | 384,410 | | | $ | 682,595 | | |
Equity Income | | | 2,341,037 | | | | 1,932,193 | | | Large Cap Value | | | 2,461,334 | | | | 2,779,296 | | |
Focus | | | 495,621 | | | | 488,493 | | | Mid Cap Growth | | | 348,409 | | | | 316,724 | | |
Genesis | | | 2,333,203 | | | | 3,221,286 | | | Mid Cap Intrinsic Value | | | 21,670 | | | | 41,020 | | |
Global Equity | | | 32,607 | | | | 3,664 | | | Multi-Cap Opportunities | | | 885,553 | | | | 102,775 | | |
Global Thematic Opportunities | | | 72,882 | | | | 53,593 | | | Real Estate | | | 621,015 | | | | 272,403 | | |
Greater China Equity | | | 57,594 | | | | 9,112 | | | Select Equities | | | 53,539 | | | | 47,379 | | |
Guardian | | | 424,240 | | | | 485,837 | | | Small Cap Growth | | | 253,598 | | | | 312,933 | | |
International Equity | | | 460,143 | | | | 329,152 | | | Socially Responsive | | | 690,992 | | | | 733,045 | | |
International Large Cap | | | 104,344 | | | | 104,888 | | | Value | | | 16,907 | | | | 12,239 | | |
Intrinsic Value | | | 50,530 | | | | 40,909 | | | | | | | | |
199
During the year ended August 31, 2013, no brokerage commissions on securities transactions were paid to affiliated brokers.
Note D—Fund Share Transactions:
Share activity for the years ended August 31, 2013 and August 31, 2012 was as follows:
| | | For the Year Ended August 31, 2013 | | For the Year Ended August 31, 2012 | |
(000's omitted) | | Shares
Sold | | Shares
Issued on
Reinvestment
of Dividends
and
Distributions | | Shares
Issued in
Connection
with the
Acquisition
of International
Fund
(Note G) | | Shares
Redeemed | | Total | | Shares
Sold | | Shares
Issued on
Reinvestment
of Dividends
and
Distributions | | Shares
Redeemed | | Total | |
Emerging Markets Equity: | |
Institutional Class | | | 18,009 | | | | 36 | | | | — | | | | (4,452 | ) | | | 13,593 | | | | 8,454 | | | | 31 | | | | (4,511 | ) | | | 3,974 | | |
Class A | | | 466 | | | | 0 | z | | | — | | | | (265 | ) | | | 201 | | | | 170 | | | | 1 | | | | (204 | ) | | | (33 | ) | |
Class C | | | 225 | | | | — | | | | — | | | | (43 | ) | | | 182 | | | | 76 | | | | — | | | | (54 | ) | | | 22 | | |
Class R3 | | | 62 | | | | — | | | | — | | | | (68 | ) | | | (6 | ) | | | 68 | | | | — | | | | (52 | ) | | | 16 | | |
| Class R6(2) | | | 2,024 | | | | — | | | | — | | | | — | | | | 2,024 | | | | — | | | | — | | | | — | | | | — | | |
Equity Income: | |
Institutional Class | | | 47,914 | | | | 3,568 | | | | — | | | | (32,381 | ) | | | 19,101 | | | | 62,110 | | | | 2,464 | | | | (23,461 | ) | | | 41,113 | | |
Class A | | | 39,536 | | | | 3,387 | | | | — | | | | (40,945 | ) | | | 1,978 | | | | 53,460 | | | | 2,339 | | | | (19,737 | ) | | | 36,062 | | |
Class C | | | 12,451 | | | | 785 | | | | — | | | | (5,924 | ) | | | 7,312 | | | | 14,909 | | | | 476 | | | | (3,559 | ) | | | 11,826 | | |
Class R3 | | | 371 | | | | 3 | | | | — | | | | (243 | ) | | | 131 | | | | 79 | | | | 1 | | | | (7 | ) | | | 73 | | |
Focus: | |
Investor Class | | | 1,230 | | | | 137 | | | | — | | | | (2,298 | ) | | | (931 | ) | | | 176 | | | | 123 | | | | (2,489 | ) | | | (2,190 | ) | |
Trust Class | | | 2,228 | | | | 7 | | | | — | | | | (297 | ) | | | 1,938 | | | | 75 | | | | 6 | | | | (438 | ) | | | (357 | ) | |
Advisor Class | | | 116 | | | | 5 | | | | — | | | | (200 | ) | | | (79 | ) | | | 75 | | | | 7 | | | | (370 | ) | | | (288 | ) | |
Institutional Class | | | 697 | | | | 7 | | | | — | | | | (186 | ) | | | 518 | | | | 149 | | | | 2 | | | | (92 | ) | | | 59 | | |
Class A | | | 90 | | | | 0 | z | | | — | | | | (42 | ) | | | 48 | | | | 29 | | | | — | | | | (9 | ) | | | 20 | | |
Class C | | | 19 | | | | 0 | z | | | — | | | | (1 | ) | | | 18 | | | | 3 | | | | — | | | | (2 | ) | | | 1 | | |
Genesis: | |
Investor Class | | | 9,350 | | | | 4,261 | | | | — | | | | (17,524 | ) | | | (3,913 | ) | | | 11,887 | | | | 3,200 | | | | (12,920 | ) | | | 2,167 | | |
Trust Class | | | 6,000 | | | | 2,446 | | | | — | | | | (15,270 | ) | | | (6,824 | ) | | | 10,453 | | | | 2,215 | | | | (22,438 | ) | | | (9,770 | ) | |
Advisor Class | | | 5,008 | | | | 1,415 | | | | — | | | | (7,538 | ) | | | (1,115 | ) | | | 6,616 | | | | 1,152 | | | | (8,519 | ) | | | (751 | ) | |
Institutional Class | | | 23,263 | | | | 5,335 | | | | — | | | | (41,819 | ) | | | (13,221 | ) | | | 30,674 | | | | 3,928 | | | | (22,205 | ) | | | 12,397 | | |
| Class R6(2) | | | 17,541 | | | | — | | | | — | | | | (607 | ) | | | 16,934 | | | | — | | | | — | | | | — | | | | — | | |
Global Equity: | |
Institutional Class | | | 3,170 | | | | — | | | | — | | | | (153 | ) | | | 3,017 | | | | 412 | | | | 9 | | | | (1 | ) | | | 420 | | |
Class A | | | 7 | | | | — | | | | — | | | | (2 | ) | | | 5 | | | | 3 | | | | 1 | | | | — | | | | 4 | | |
Class C | | | 2 | | | | — | | | | — | | | | — | | | | 2 | | | | — | | | | — | | | | — | | | | — | | |
200
| | | For the Year Ended August 31, 2013 | | For the Year Ended August 31, 2012 | |
(000's omitted) | | Shares
Sold | | Shares
Issued on
Reinvestment
of Dividends
and
Distributions | | Shares
Issued in
Connection
with the
Acquisition
of International
Fund
(Note G) | | Shares
Redeemed | | Total | | Shares
Sold | | Shares
Issued on
Reinvestment
of Dividends
and
Distributions | | Shares
Redeemed | | Total | |
Global Thematic Opportunities: | |
Institutional Class | | | 3,423 | | | | 30 | | | | — | | | | (1,475 | ) | | | 1,978 | | | | 3,662 | | | | 8 | | | | (878 | ) | | | 2,792 | | |
Class A | | | 191 | | | | 0 | z | | | — | | | | (200 | ) | | | (9 | ) | | | 73 | | | | — | | | | (17 | ) | | | 56 | | |
Class C | | | 2 | | | | — | | | | — | | | | (4 | ) | | | (2 | ) | | | 10 | | | | — | | | | (1 | ) | | | 9 | | |
Greater China Equity: | |
Institutional
Class(3) | | | 5,554 | | | | — | | | | — | | | | (3 | ) | | | 5,551 | | | | — | | | | — | | | | — | | | | — | | |
| Class A(3) | | | 12 | | | | — | | | | — | | | | — | | | | 12 | | | | — | | | | — | | | | — | | | | — | | |
| Class C(3) | | | 10 | | | | — | | | | — | | | | — | | | | 10 | | | | — | | | | — | | | | — | | | | — | | |
Guardian: | |
Investor Class | | | 986 | | | | 2,284 | | | | — | | | | (6,763 | ) | | | (3,493 | ) | | | 1,181 | | | | 445 | | | | (8,595 | ) | | | (6,969 | ) | |
Trust Class | | | 1,432 | | | | 453 | | | | — | | | | (2,056 | ) | | | (171 | ) | | | 2,267 | | | | 82 | | | | (2,195 | ) | | | 154 | | |
Advisor Class | | | 16 | | | | 1 | | | | — | | | | (19 | ) | | | (2 | ) | | | 9 | | | | — | | | | (18 | ) | | | (9 | ) | |
Institutional Class | | | 1,798 | | | | 149 | | | | — | | | | (961 | ) | | | 986 | | | | 2,376 | | | | 29 | | | | (922 | ) | | | 1,483 | | |
Class A | | | 1,313 | | | | 79 | | | | — | | | | (399 | ) | | | 993 | | | | 888 | | | | 10 | | | | (416 | ) | | | 482 | | |
Class C | | | 83 | | | | 2 | | | | — | | | | (18 | ) | | | 67 | | | | 21 | | | | — | | | | (14 | ) | | | 7 | | |
Class R3 | | | 17 | | | | 0 | z | | | — | | | | (30 | ) | | | (13 | ) | | | 37 | | | | — | | | | (32 | ) | | | 5 | | |
International Equity: | |
| Investor Class(1) | | | 161 | | | | — | | | | 8,196 | | | | (1,606 | ) | | | 6,751 | | | | — | | | | — | | | | — | | | | — | | |
| Trust Class(1) | | | 676 | | | | — | | | | 5,868 | | | | (1,140 | ) | | | 5,404 | | | | — | | | | — | | | | — | | | | — | | |
Institutional Class | | | 30,515 | | | | 784 | | | | — | | | | (9,961 | ) | | | 21,338 | | | | 21,788 | | | | 524 | | | | (5,811 | ) | | | 16,501 | | |
| Class A(1) | | | 299 | | | | — | | | | 341 | | | | (21 | ) | | | 619 | | | | — | | | | — | | | | — | | | | — | | |
| Class C(1) | | | 61 | | | | — | | | | 33 | | | | (1 | ) | | | 93 | | | | — | | | | — | | | | — | | | | — | | |
International Large Cap: | |
Trust Class | | | 327 | | | | 16 | | | | — | | | | (529 | ) | | | (186 | ) | | | 340 | | | | 19 | | | | (792 | ) | | | (433 | ) | |
Institutional Class | | | 2,978 | | | | 260 | | | | — | | | | (2,261 | ) | | | 977 | | | | 4,295 | | | | 312 | | | | (3,050 | ) | | | 1,557 | | |
Class A | | | 397 | | | | 10 | | | | — | | | | (394 | ) | | | 13 | | | | 567 | | | | 8 | | | | (230 | ) | | | 345 | | |
Class C | | | 92 | | | | 0 | z | | | — | | | | (100 | ) | | | (8 | ) | | | 276 | | | | — | | | | (92 | ) | | | 184 | | |
Class R3 | | | 228 | | | | 1 | | | | — | | | | (18 | ) | | | 211 | | | | 49 | | | | — | | | | (9 | ) | | | 40 | | |
Intrinsic Value: | |
Institutional Class | | | 4,210 | | | | 187 | | | | — | | | | (3,231 | ) | | | 1,166 | | | | 3,370 | | | | 1,248 | | | | (2,708 | ) | | | 1,910 | | |
Class A | | | 671 | | | | 10 | | | | — | | | | (405 | ) | | | 276 | | | | 449 | | | | 81 | | | | (544 | ) | | | (14 | ) | |
Class C | | | 379 | | | | 5 | | | | — | | | | (241 | ) | | | 143 | | | | 327 | | | | 26 | | | | (210 | ) | | | 143 | | |
201
| | | For the Year Ended August 31, 2013 | | For the Year Ended August 31, 2012 | |
(000's omitted) | | Shares
Sold | | Shares
Issued on
Reinvestment
of Dividends
and
Distributions | | Shares
Issued in
Connection
with the
Acquisition
of International
Fund
(Note G) | | Shares
Redeemed | | Total | | Shares
Sold | | Shares
Issued on
Reinvestment
of Dividends
and
Distributions | | Shares
Redeemed | | Total | |
Large Cap Disciplined Growth: | |
Investor Class | | | 243 | | | | 124 | | | | — | | | | (720 | ) | | | (353 | ) | | | 572 | | | | 102 | | | | (456 | ) | | | 218 | | |
Institutional Class | | | 16,907 | | | | 3,712 | | | | — | | | | (48,805 | ) | | | (28,186 | ) | | | 38,108 | | | | 2,918 | | | | (39,358 | ) | | | 1,668 | | |
Class A | | | 3,235 | | | | 441 | | | | — | | | | (7,724 | ) | | | (4,048 | ) | | | 7,080 | | | | 302 | | | | (4,084 | ) | | | 3,298 | | |
Class C | | | 358 | | | | 82 | | | | — | | | | (1,778 | ) | | | (1,338 | ) | | | 910 | | | | 62 | | | | (1,610 | ) | | | (638 | ) | |
Class R3 | | | 8 | | | | 1 | | | | — | | | | (6 | ) | | | 3 | | | | 24 | | | | — | | | | (23 | ) | | | 1 | | |
Large Cap Value: | |
Investor Class | | | 850 | | | | 468 | | | | — | | | | (5,783 | ) | | | (4,465 | ) | | | 974 | | | | 204 | | | | (8,133 | ) | | | (6,955 | ) | |
Trust Class | | | 400 | | | | 103 | | | | — | | | | (4,516 | ) | | | (4,013 | ) | | | 909 | | | | 39 | | | | (12,816 | ) | | | (11,868 | ) | |
Advisor Class | | | 886 | | | | 185 | | | | — | | | | (4,002 | ) | | | (2,931 | ) | | | 1,332 | | | | 48 | | | | (7,498 | ) | | | (6,118 | ) | |
Institutional Class | | | 967 | | | | 62 | | | | — | | | | (1,424 | ) | | | (395 | ) | | | 1,710 | | | | 53 | | | | (5,881 | ) | | | (4,118 | ) | |
Class A | | | 28 | | | | — | | | | — | | | | (66 | ) | | | (38 | ) | | | 2,224 | | | | 19 | | | | (2,216 | ) | | | 27 | | |
Class C | | | 53 | | | | 0 | z | | | — | | | | (7 | ) | | | 46 | | | | 6 | | | | — | | | | (0 | )z | | | 6 | | |
Class R3 | | | 3 | | | | — | | | | — | | | | (34 | ) | | | (31 | ) | | | 34 | | | | — | | | | — | | | | 34 | | |
Mid Cap Growth: | |
Investor Class | | | 571 | | | | 1,560 | | | | — | | | | (2,877 | ) | | | (746 | ) | | | 822 | | | | 55 | | | | (2,778 | ) | | | (1,901 | ) | |
Trust Class | | | 910 | | | | 82 | | | | — | | | | (538 | ) | | | 454 | | | | 1,416 | | | | 1 | | | | (931 | ) | | | 486 | | |
Advisor Class | | | 160 | | | | 15 | | | | — | | | | (170 | ) | | | 5 | | | | 185 | | | | — | | | | (170 | ) | | | 15 | | |
Institutional Class | | | 7,225 | | | | 920 | | | | — | | | | (3,395 | ) | | | 4,750 | | | | 6,973 | | | | 54 | | | | (3,042 | ) | | | 3,985 | | |
Class A | | | 1,823 | | | | 130 | | | | — | | | | (1,125 | ) | | | 828 | | | | 2,995 | | | | 1 | | | | (1,057 | ) | | | 1,939 | | |
Class C | | | 96 | | | | 4 | | | | — | | | | (22 | ) | | | 78 | | | | 107 | | | | — | | | | (13 | ) | | | 94 | | |
Class R3 | | | 165 | | | | 7 | | | | — | | | | (69 | ) | | | 103 | | | | 174 | | | | — | | | | (44 | ) | | | 130 | | |
| Class R6(2) | | | 4 | | | | — | | | | — | | | | — | | | | 4 | | | | — | | | | — | | | | — | | | | — | | |
Mid Cap Intrinsic Value: | |
Investor Class | | | 408 | | | | 17 | | | | — | | | | (1,055 | ) | | | (630 | ) | | | 374 | | | | 13 | | | | (776 | ) | | | (389 | ) | |
Trust Class | | | 117 | | | | 6 | | | | — | | | | (712 | ) | | | (589 | ) | | | 138 | | | | 7 | | | | (774 | ) | | | (629 | ) | |
Institutional Class | | | 74 | | | | 3 | | | | — | | | | (127 | ) | | | (50 | ) | | | 112 | | | | 2 | | | | (85 | ) | | | 29 | | |
Class A | | | 208 | | | | 2 | | | | — | | | | (331 | ) | | | (121 | ) | | | 238 | | | | 1 | | | | (66 | ) | | | 173 | | |
Class C | | | 45 | | | | 0 | z | | | — | | | | (0 | )z | | | 45 | | | | 21 | | | | — | | | | — | | | | 21 | | |
Class R3 | | | 31 | | | | 0 | z | | | — | | | | — | | | | 31 | | | | 1 | | | | — | | | | — | | | | 1 | | |
Multi-Cap Opportunities: | |
Institutional Class | | | 71,566 | | | | 60 | | | | — | | | | (9,385 | ) | | | 62,241 | | | | 37,435 | | | | 43 | | | | (3,697 | ) | | | 33,781 | | |
Class A | | | 4,015 | | | | 6 | | | | — | | | | (457 | ) | | | 3,564 | | | | 292 | | | | 1 | | | | (51 | ) | | | 242 | | |
Class C | | | 604 | | | | 1 | | | | — | | | | (11 | ) | | | 594 | | | | 18 | | | | 1 | | | | (9 | ) | | | 10 | | |
202
| | | For the Year Ended August 31, 2013 | | For the Year Ended August 31, 2012 | |
(000's omitted) | | Shares
Sold | | Shares
Issued on
Reinvestment
of Dividends
and
Distributions | | Shares
Issued in
Connection
with the
Acquisition
of International
Fund
(Note G) | | Shares
Redeemed | | Total | | Shares
Sold | | Shares
Issued on
Reinvestment
of Dividends
and
Distributions | | Shares
Redeemed | | Total | |
Real Estate: | |
Trust Class | | | 14,497 | | | | 906 | | | | — | | | | (11,609 | ) | | | 3,794 | | | | 8,679 | | | | 370 | | | | (6,479 | ) | | | 2,570 | | |
Institutional Class | | | 19,215 | | | | 578 | | | | — | | | | (8,078 | ) | | | 11,715 | | | | 9,744 | | | | 182 | | | | (3,334 | ) | | | 6,592 | | |
Class A | | | 9,924 | | | | 248 | | | | — | | | | (3,140 | ) | | | 7,032 | | | | 3,615 | | | | 65 | | | | (1,088 | ) | | | 2,592 | | |
Class C | | | 1,877 | | | | 49 | | | | — | | | | (360 | ) | | | 1,566 | | | | 909 | | | | 8 | | | | (119 | ) | | | 798 | | |
Class R3 | | | 1,130 | | | | 14 | | | | — | | | | (315 | ) | | | 829 | | | | 388 | | | | 1 | | | | (70 | ) | | | 319 | | |
| Class R6(2) | | | 655 | | | | 1 | | | | — | | | | (20 | ) | | | 636 | | | | — | | | | — | | | | — | | | | — | | |
Select Equities: | |
Institutional Class | | | 2,915 | | | | 206 | | | | — | | | | (1,281 | ) | | | 1,840 | | | | 733 | | | | 211 | | | | (1,062 | ) | | | (118 | ) | |
Class A | | | 1,500 | | | | 220 | | | | — | | | | (1,810 | ) | | | (90 | ) | | | 594 | | | | 260 | | | | (1,142 | ) | | | (288 | ) | |
Class C | | | 362 | | | | 80 | | | | — | | | | (330 | ) | | | 112 | | | | 195 | | | | 88 | | | | (476 | ) | | | (193 | ) | |
Small Cap Growth: | |
Investor Class | | | 243 | | | | — | | | | — | | | | (1,307 | ) | | | (1,064 | ) | | | 200 | | | | — | | | | (701 | ) | | | (501 | ) | |
Trust Class | | | 147 | | | | — | | | | — | | | | (621 | ) | | | (474 | ) | | | 91 | | | | — | | | | (342 | ) | | | (251 | ) | |
Advisor Class | | | 53 | | | | — | | | | — | | | | (265 | ) | | | (212 | ) | | | 100 | | | | — | | | | (298 | ) | | | (198 | ) | |
Institutional Class | | | 840 | | | | — | | | | — | | | | (1,922 | ) | | | (1,082 | ) | | | 311 | | | | — | | | | (4,380 | ) | | | (4,069 | ) | |
Class A | | | 67 | | | | — | | | | — | | | | (27 | ) | | | 40 | | | | 56 | | | | — | | | | (67 | ) | | | (11 | ) | |
Class C | | | 22 | | | | — | | | | — | | | | (5 | ) | | | 17 | | | | 38 | | | | — | | | | (16 | ) | | | 22 | | |
Class R3 | | | 11 | | | | — | | | | — | | | | (4 | ) | | | 7 | | | | 11 | | | | — | | | | (1 | ) | | | 10 | | |
Socially Responsive: | |
Investor Class | | | 3,549 | | | | 168 | | | | — | | | | (5,811 | ) | | | (2,094 | ) | | | 7,239 | | | | 121 | | | | (6,332 | ) | | | 1,028 | | |
Trust Class | | | 4,183 | | | | 224 | | | | — | | | | (12,021 | ) | | | (7,614 | ) | | | 6,459 | | | | 182 | | | | (8,372 | ) | | | (1,731 | ) | |
Institutional Class | | | 9,100 | | | | 153 | | | | — | | | | (11,532 | ) | | | (2,279 | ) | | | 6,657 | | | | 111 | | | | (4,387 | ) | | | 2,381 | | |
Class A | | | 1,822 | | | | 31 | | | | — | | | | (1,510 | ) | | | 343 | | | | 1,943 | | | | 32 | | | | (1,876 | ) | | | 99 | | |
Class C | | | 463 | | | | 2 | | | | — | | | | (141 | ) | | | 324 | | | | 283 | | | | 1 | | | | (118 | ) | | | 166 | | |
Class R3 | | | 432 | | | | 7 | | | | — | | | | (288 | ) | | | 151 | | | | 609 | | | | 6 | | | | (191 | ) | | | 424 | | |
| Class R6(2) | | | 7,742 | | | | — | | | | — | | | | (111 | ) | | | 7,631 | | | | — | | | | — | | | | — | | | | — | | |
Value: | |
Institutional Class | | | 432 | | | | 2 | | | | — | | | | (164 | ) | | | 270 | | | | 232 | | | | 2 | | | | (259 | ) | | | (25 | ) | |
Class A | | | 202 | | | | 2 | | | | — | | | | (70 | ) | | | 134 | | | | 121 | | | | — | | | | (16 | ) | | | 105 | | |
Class C | | | 19 | | | | 0 | z | | | — | | | | (1 | ) | | | 18 | | | | 2 | | | | — | | | | — | | | | 2 | | |
(1) Period from January 28, 2013 (Commencement of Operations) to August 31, 2013.
(2) Period from March 15, 2013 (Commencement of Operations) to August 31, 2013.
(3) Period from July 17, 2013 (Commencement of Operations) to August 31, 2013.
z A zero balance may reflect actual amounts rounding to less than 1,000.
203
Note E—Lines of Credit:
At August 31, 2013, each Fund (except Greater China Equity) was a participant in a single committed, unsecured $200,000,000 line of credit with State Street, to be used only for temporary or emergency purposes. Other investment companies managed by Management also participate in this line of credit on the same terms. Interest is charged on borrowings under this line of credit at the higher of (a) the Federal Funds Rate plus 1.25% per annum or (b) the overnight LIBOR Rate plus 1.25% per annum. A commitment fee of 0.10% per annum of the available line of credit is charged, of which each participating Fund has agreed to pay its pro rata share, based on the ratio of its individual net assets to the net assets of all participants at the time the fee is due and payable. The fee is paid quarterly in arrears. Because several mutual funds participate, there is no assurance that an individual Fund will have access to all or any part of the $200,000,000 at any particular time. There were no loans outstanding pursuant to this line of credit at August 31, 2013. During the year ended August 31, 2013, no funds utilized this line of credit. In September 2013, this line of credit terminated and the Trust, on behalf of each Fund, and other investment companies managed by Management, entered into a $300,000,000 committed, unsecured line of credit with State Street, to be used only for temporary or emergency purposes. The new line of credit has substantially similar terms to the former line of credit.
At August 31, 2013, International Equity and International Large Cap were participants in a single uncommitted, secured $100,000,000 line of credit with State Street to be used only for temporary or emergency purposes or for leverage. Another investment company managed by Management also participates in this line of credit on the same terms. Interest is charged at LIBOR, or the overnight Federal Funds Rate, plus a spread to be determined at the time of borrowing. Because several mutual funds participate, there is no assurance that a Fund will have access to all or any part of the $100,000,000 at any particular time. International Equity and International Large Cap had no loans outstanding pursuant to this line of credit at August 31, 2013. During the year ended August 31, 2013, International Equity and International Large Cap did not utilize this line of credit. In September 2013, this line of credit terminated and the Trust, on behalf of each Fund, and other investment companies managed by Management, entered into a $100,000,000 uncommitted, unsecured line of credit with State Street, to be used only for temporary or emergency purposes.
Note F—Investments In Affiliates(1):
| | | Balance of
Shares Held
August 31,
2012 | | Gross
Purchases
and
Additions | | Gross
Sales
and
Reductions | | Balance of
Shares Held
August 31,
2013 | | Value
August 31,
2013 | | Income from
Investments
in Affiliated
Issuers | | Net Realized
Gain (Loss)
from
Investments
in Affiliated
Issuers | |
Genesis | |
Abaxis, Inc. | | | 1,208,100 | | | | — | | | | 82,900 | | | | 1,125,200 | | | $ | 44,085,336 | | | $ | 1,158,400 | | | $ | 813,350 | | |
AG Growth
International, Inc.(2) | | | 806,800 | | | | — | | | | 806,800 | | | | — | | | | — | | | | 636,717 | | | | (3,125,404 | ) | |
Altisource Asset
Management | | | — | | | | 143,317 | | | | — | | | | 143,317 | | | | 45,144,855 | | | | — | * | | | — | | |
Altisource Portfolio
Solutions SA | | | 908,370 | | | | 784,000 | | | | 61,100 | | | | 1,631,270 | | | | 212,717,608 | | | | 18,392,343 | | | | 1,693,534 | | |
AmSurg Corp. | | | 1,703,534 | | | | 75,194 | | | | 95,900 | | | | 1,682,828 | | | | 62,752,656 | | | | — | * | | | 701,790 | | |
Applied Industrial
Technologies, Inc. | | | 2,353,344 | | | | 294,200 | | | | 154,200 | | | | 2,493,344 | | | | 118,733,041 | | | | 2,232,979 | | | | 1,112,984 | | |
AptarGroup, Inc. | | | 5,609,200 | | | | — | | | | 1,070,500 | | | | 4,538,700 | | | | 266,920,947 | | | | 4,763,521 | | | | 40,357,719 | | |
Badger Meter, Inc. | | | 657,205 | | | | 171,696 | | | | 35,400 | | | | 793,501 | | | | 35,771,025 | | | | 490,907 | | | | (31,055 | ) | |
Balchem Corp. | | | 1,596,335 | | | | — | | | | 94,400 | | | | 1,501,935 | | | | 71,882,609 | | | | 337,730 | | | | (171,004 | ) | |
204
| | | Balance of
Shares Held
August 31,
2012 | | Gross
Purchases
and
Additions | | Gross
Sales
and
Reductions | | Balance of
Shares Held
August 31,
2013 | | Value
August 31,
2013 | | Income from
Investments
in Affiliated
Issuers | | Net Realized
Gain (Loss)
from
Investments
in Affiliated
Issuers | |
Bally Technologies, Inc. | | | 1,356,988 | | | | 1,227,104 | | | | 136,700 | | | | 2,447,392 | | | $ | 176,530,385 | | | $ | — | * | | $ | 2,549,262 | | |
Bank of Hawaii Corp. | | | 1,523,517 | | | | 1,168,195 | | | | 82,500 | | | | 2,609,212 | | | | 134,374,418 | | | | 3,999,564 | | | | 47,343 | | |
Boston Beer Co., Inc. | | | 967,419 | | | | — | | | | 264,700 | | | | 702,719 | | | | 148,863,993 | | | | — | * | | | 26,306,110 | | |
Brookline Bancorp, Inc. | | | 4,067,590 | | | | 39,100 | | | | 240,100 | | | | 3,866,590 | | | | 34,992,640 | | | | 1,325,971 | | | | (929,178 | ) | |
CARBO Ceramics, Inc. | | | 1,580,100 | | | | 199,000 | | | | 213,443 | | | | 1,565,657 | | | | 127,741,955 | | | | 1,655,985 | | | | 4,981,254 | | |
CLARCOR, Inc. | | | 4,809,422 | | | | — | | | | 596,600 | | | | 4,212,822 | | | | 225,638,746 | | | | 2,413,650 | | | | 11,123,507 | | |
Compass Minerals
International, Inc. | | | 3,512,400 | | | | — | | | | 318,700 | | | | 3,193,700 | | | | 235,471,501 | | | | 6,981,818 | | | | 14,146,539 | | |
Computer Modelling
Group Ltd. | | | 3,109,500 | | | | — | | | | 8,500 | | | | 3,101,000 | | | | 73,366,488 | | | | 2,176,957 | | | | 64,087 | | |
Exponent, Inc. | | | 1,166,935 | | | | 100,000 | | | | 64,900 | | | | 1,202,035 | | | | 78,288,540 | | | | 364,151 | | | | 1,406,262 | | |
FEI Co. | | | 877,948 | | | | 1,253,994 | | | | 35,600 | | | | 2,096,342 | | | | 164,101,652 | | | | 646,955 | | | | 558,621 | | |
First Financial
Bankshares, Inc. | | | 1,433,094 | | | | 490,574 | | | | 15,200 | | | | 1,908,468 | | | | 109,736,910 | | | | 1,624,224 | | | | (9,484 | ) | |
Forrester Research,
Inc.(2) | | | 1,178,888 | | | | — | | | | 1,178,888 | | | | — | | | | — | | | | 95,855 | | | | (2,645,271 | ) | |
Forward Air Corp. | | | 1,746,600 | | | | 14,500 | | | | 103,100 | | | | 1,658,000 | | | | 61,064,140 | | | | 672,860 | | | | 101,028 | | |
Haemonetics Corp. | | | 2,570,000 | | | | 2,471,700 | | | | 254,200 | | | | 4,787,500 | | | | 190,781,875 | | | | — | * | | | 4,066,934 | | |
Harris Teeter
Supermarkets, Inc. | | | 4,774,967 | | | | 86,200 | | | | 1,491,964 | | | | 3,369,203 | | | | 165,596,327 | | | | 5,075,444 | | | | 16,116,092 | | |
Healthcare Services
Group, Inc. | | | 5,493,381 | | | | — | | | | 378,900 | | | | 5,114,481 | | | | 123,821,585 | | | | 3,468,669 | | | | 3,337,624 | | |
Hibbett Sports, Inc. | | | 1,845,669 | | | | — | | | | 126,200 | | | | 1,719,469 | | | | 89,068,494 | | | | — | * | | | 3,326,330 | | |
Hittite Microwave
Corp. | | | 1,923,320 | | | | 470,845 | | | | 81,400 | | | | 2,312,765 | | | | 141,448,707 | | | | — | * | | | (415,761 | ) | |
Home Loan Servicing
Solutions Ltd. | | | — | | | | 5,211,200 | | | | 30,100 | | | | 5,181,100 | | | | 118,129,080 | | | | 4,385,156 | | | | 13,910 | | |
ICON PLC | | | 3,750,000 | | | | 771,800 | | | | 158,300 | | | | 4,363,500 | | | | 159,442,290 | | | | — | * | | | 73,873 | | |
Innophos Holdings, Inc. | | | 1,811,400 | | | | 129,000 | | | | 123,700 | | | | 1,816,700 | | | | 88,963,799 | | | | 2,508,100 | | | | (486,711 | ) | |
J & J Snack Foods Corp. | | | 1,169,046 | | | | — | | | | 80,300 | | | | 1,088,746 | | | | 83,746,342 | | | | 685,102 | | | | 2,786,744 | | |
| Landauer, Inc.(2) | | | 501,750 | | | | — | | | | 440,650 | | | | 61,100 | | | | 2,901,028 | | | | 946,642 | | | | (621,994 | ) | |
Lindsay Corp. | | | 1,077,341 | | | | — | | | | 144,791 | | | | 932,550 | | | | 70,892,451 | | | | 459,728 | | | | (2,929,726 | ) | |
| LSB Industries, Inc.(2) | | | 1,372,700 | | | | — | | | | 1,372,700 | | | | — | | | | — | | | | — | * | | | (6,442,397 | ) | |
Manhattan
Associates, Inc. | | | 314,600 | | | | 988,207 | | | | — | | | | 1,302,807 | | | | 113,995,613 | | | | — | * | | | — | | |
Meridian
Bioscience, Inc. | | | 3,382,797 | | | | 48,000 | | | | 222,200 | | | | 3,208,597 | | | | 72,161,347 | | | | 2,458,617 | | | | (552,052 | ) | |
MICROS
Systems, Inc.(2) | | | 4,190,242 | | | | — | | | | 469,200 | | | | 3,721,042 | | | | 181,958,954 | | | | — | * | | | 9,513,771 | | |
Monotype Imaging
Holdings, Inc. | | | — | | | | 2,093,103 | | | | — | | | | 2,093,103 | | | | 53,897,402 | | | | 128,807 | | | | — | | |
205
| | | Balance of
Shares Held
August 31,
2012 | | Gross
Purchases
and
Additions | | Gross
Sales
and
Reductions | | Balance of
Shares Held
August 31,
2013 | | Value
August 31,
2013 | | Income from
Investments
in Affiliated
Issuers | | Net Realized
Gain (Loss)
from
Investments
in Affiliated
Issuers | |
MWI Veterinary
Supply, Inc. | | | 1,171,529 | | | | — | | | | 88,100 | | | | 1,083,429 | | | $ | 164,767,882 | | | $ | — | * | | $ | 5,460,356 | | |
Natural Gas Services
Group, Inc. | | | 829,800 | | | | — | | | | 51,200 | | | | 778,600 | | | | 21,349,212 | | | | — | * | | | (118,875 | ) | |
NETGEAR, Inc. | | | 2,046,800 | | | | 699,300 | | | | 72,200 | | | | 2,673,900 | | | | 77,382,666 | | | | — | * | | | (190,936 | ) | |
Nexstar Broadcasting
Group, Inc. Class A | | | — | | | | 1,945,869 | | | | 5,600 | | | | 1,940,269 | | | | 65,134,830 | | | | 196,802 | | | | (17,202 | ) | |
Pason Systems, Inc. | | | 4,182,657 | | | | 234,000 | | | | 133,000 | | | | 4,283,657 | | | | 87,153,490 | | | | 2,060,150 | | | | (39,004 | ) | |
Pool Corp. | | | 2,690,223 | | | | 563,700 | | | | 136,000 | | | | 3,117,923 | | | | 162,412,609 | | | | 2,025,687 | | | | 1,805,883 | | |
Power
Integrations, Inc. | | | 1,071,900 | | | | 946,400 | | | | 43,700 | | | | 1,974,600 | | | | 102,916,152 | | | | 525,752 | | | | 101,841 | | |
PSS World
Medical, Inc.(2) | | | 2,914,399 | | | | — | | | | 2,914,399 | | | | — | | | | — | | | | — | * | | | 12,434,373 | | |
Raven Industries, Inc. | | | 3,584,352 | | | | — | | | | 215,200 | | | | 3,369,152 | | | | 98,412,930 | | | | 1,545,151 | | | | 1,928,637 | | |
RLI Corp. | | | 1,563,807 | | | | — | | | | 143,400 | | | | 1,420,407 | | | | 110,919,583 | | | | 9,453,822 | | | | 550,486 | | |
Safety Insurance
Group, Inc. | | | 1,115,749 | | | | — | | | | 76,700 | | | | 1,039,049 | | | | 52,097,917 | | | | 2,533,738 | | | | (198,286 | ) | |
Sensient Technologies
Corp. | | | 3,942,917 | | | | — | | | | 270,300 | | | | 3,672,617 | | | | 152,266,701 | | | | 3,361,634 | | | | (170,467 | ) | |
Solera Holdings, Inc. | | | 4,402,104 | | | | — | | | | 702,551 | | | | 3,699,553 | | | | 190,970,926 | | | | 2,050,245 | | | | 16,663,687 | | |
South Jersey
Industries, Inc.(2) | | | 1,558,844 | | | | 67,600 | | | | 122,400 | | | | 1,504,044 | | | | 86,873,581 | | | | 2,712,155 | | | | 576,033 | | |
State Street
Institutional
Treasury Plus Fund
Institutional Class(2) | | | 182,460,973 | | | | 1,455,372,626 | | | | 1,438,742,300 | | | | 199,091,299 | | | | 199,091,299 | | | | 17,948 | | | | — | | |
Thermon Group
Holdings, Inc. | | | 522,718 | | | | 1,581,913 | | | | 36,500 | | | | 2,068,131 | | | | 42,810,312 | | | | — | * | | | (64,524 | ) | |
United Stationers, Inc. | | | 4,279,541 | | | | — | | | | 524,200 | | | | 3,755,341 | | | | 149,237,251 | | | | 2,239,758 | | | | (1,627,069 | ) | |
| Wabtec Corp.(2) | | | 2,699,900 | | | | 2,524,900 | | | | 503,500 | | | | 4,721,300 | | | | 276,290,476 | | | | 573,302 | | | | 19,363,207 | | |
West Pharmaceutical
Services, Inc. | | | 1,730,229 | | | | 292,600 | | | | 51,600 | | | | 1,971,229 | | | | 145,772,385 | | | | 1,478,887 | | | | 806,115 | | |
Westamerica
Bancorporation | | | 1,995,243 | | | | — | | | | 101,000 | | | | 1,894,243 | | | | 89,162,018 | | | | 2,816,134 | | | | (549,386 | ) | |
Zebra Technologies
Corp. | | | 2,760,970 | | | | 210,754 | | | | 333,900 | | | | 2,637,824 | | | | 120,284,774 | | | | — | * | | | 2,213,322 | | |
Total | | | | | | | | | | $ | 6,480,291,733 | | | $ | 103,678,017 | | | $ | 185,766,822 | | |
(1) Affiliated issuers, as defined in the 1940 Act, as amended.
(2) At August 31, 2013, the issuers of these securities were no longer affiliated with Genesis.
* Security did not produce income during the last twelve months.
206
Note G—Reorganization:
On January 25, 2013, International Equity acquired all of the net assets of Neuberger Berman International Fund ("International") pursuant to a plan of reorganization and termination approved by the Board. The purpose of the transaction was to combine two funds managed by Management with comparable investment objectives and strategies. The merger was accomplished by a tax-free exchange of: 8,195,935 shares of the Investor Class of International Equity (valued at $147,786,970) for the 8,195,935 shares of the Investor Class of International outstanding on January 25, 2013; 5,867,925 shares of the Trust Class of International Equity (valued at $117,673,918) for the 5,867,925 shares of the Trust Class of International outstanding on January 25, 2013; 340,582 shares of Class A of International Equity (valued at $6,829,665) for the 340,582 shares of Class A of International outstanding on January 25, 2013; and 32,947 shares of Class C of International Equity (valued at $657,940) for the 32,947 shares of Class C of International outstanding on January 25, 2013. International's aggregate net assets at that date ($272,948,493, including investments with a cost of $204,366,702 and $52,807,215 of net unrealized appreciation) were combined with those of International Equity ($541,261,827). The combined net assets of International Equity immediately after the merger were $814,210,320. For financial reporting purposes, assets received and shares issued by International Equity were recorded at fair value; however, the cost basis of the investments received from International was carried forward to align ongoing reporting of International Equity's realized and unrealized gains and losses with amounts distributable to shareholders for tax purposes.
Assuming the reorganization had been completed on September 1, 2012, the beginning of the annual reporting period of International Equity, International Equity's pro forma results of operations for the fiscal year ended August 31, 2013, are as follows:
Net investment income (loss) | | $ | 12,547,737 | | |
Net realized gain (loss) on investments | | | 27,137,575 | | |
Net unrealized gain (loss) on investments | | | 64,086,832 | | |
Net increase (decrease) in net assets resulting from operations | | $ | 103,772,144 | | |
Because the combined investment portfolios have been managed as a single integrated portfolio since the reorganization was completed, it is not practicable to separate the amounts of revenue and earnings of International that have been included in International Equity's Statement of Operations as of August 31, 2013.
Note H—Legal Matters:
In January 2013, International merged into International Equity and International Equity was the surviving Fund (See Note G above for additional disclosure).
Prior to the merger, in July 2010, Benjamin J. Gamoran filed a purported "Verified Derivative Complaint" in the Supreme Court of the State of New York naming, along with other defendants, the Trust as a nominal defendant. The suit alleged that the defendants are liable for losses related to International's investments in shares of certain companies that are alleged to have illegally offered or facilitated online gambling by individuals located in the United States and asserted purported state law derivative claims for breach of fiduciary duty, negligence, and waste. In August 2010, defendants removed the action to the United States District Court for the Southern District of New York. On May 11, 2011, the District Court dismissed the action without prejudice upon plaintiff's mid-suit demand on the Board. The Board named a committee of independent, non-involved Trustees to review the plaintiff's demand and to make a recommendation to the Board regarding how to appropriately respond. The committee retained independent counsel and conducted an investigation.
On August 24, 2011, plaintiff Gamoran filed another complaint, this time in Delaware federal court ("Gamoran III"). The case was later transferred to the Southern District of New York. The substantive underlying claims alleged in the Gamoran III complaint were similar to those that appeared in the July 2010 case discussed above and an earlier voluntarily dismissed action. The Gamoran III complaint also alleged some purported class claims. It sought relief including compensatory damages for the Trust representing the loss in value of the Trust's investments resulting
207
from the allegedly illegal conduct, compensatory damages for individual shareholders for the investment losses, forfeiture and disgorgement of fees and commissions, treble and punitive damages, attorney's fees, and other items. While earlier complaints contended that demand was futile, the Gamoran III complaint alleged that plaintiff Gamoran has made demand but that filing the latest lawsuit was necessary to prevent the claims from being barred by the statute of limitations. The Gamoran III complaint named the Trust as a nominal defendant. Although none of the complaints to date appear to have sought a judgment against International, there might have been circumstances in which International could be called upon to indemnify certain defendants. A full statement of plaintiff's claims and the relief sought are set forth in the Gamoran III complaint.
Defendants moved to dismiss the Gamoran III complaint. In his brief opposing defendants' motion to dismiss, plaintiff indicated that he does not intend to pursue his putative class claims.
The committee named by the Trust's Board to evaluate the claims in plaintiff's May 2011 demand letter recommended that the Board decline to pursue those claims, and the Board adopted that recommendation. On March 16, 2012, counsel to the committee transmitted a letter to Mr. Gamoran's counsel notifying Mr. Gamoran of the Board's decision.
On June 12, 2012, the Court entered an order dismissing the initial Gamoran III complaint. Among other things, the Court rejected Gamoran's arguments that his claims under 18 U.S.C. §§ 1955(a) and 1962(c)-(d) were exempt from the demand requirement and that the Board took too long to respond to Gamoran's demand. The Court further held that, in light of the Board's refusal of Gamoran's demand, the Gamoran III complaint addressed outdated circumstances in that it was predicated on the assumption that the Board had not responded to Gamoran's demand. The Court permitted Gamoran to file an amended complaint alleging that the Board's refusal of his demand was not protected by the business judgment rule.
On July 16, 2012, Gamoran filed an amended derivative complaint repeating many of his earlier allegations and including allegations that the Board had wrongfully refused his demand. On August 24, 2012, defendants moved to dismiss.
On March 29, 2013 and April 1, 2013, respectively, the District Court entered an opinion and judgment dismissing Gamoran's amended derivative complaint in its entirety without prejudice. Among other things, the Court concluded that plaintiff's "predicate theory"—"that 18 U.S.C. § 1955['s] use of the term 'owns' includes purchasing or owning publicly traded stock in a foreign market"—is "without merit" and accordingly "dismisse[d] plaintiff's RICO claims." The Court also found that "none of plaintiff's allegations rise to the level of specificity required to overcome the strong deference owed to a board under the business judgment rule."
Plaintiff appealed the Court's decision on April 23, 2013, and defendants cross-appealed on May 3, 2013. The appeal is now fully briefed.
For the period ended August 31, 2013, the litigation, demand investigation and related fees recorded in the Statements of Operations were $237,041. The Trust has filed a claim under its insurance policy for reimbursement of certain litigation expenses. During the year ended August 31, 2013, the Trust has received $307,905 in insurance proceeds. Although there is no assurance as to whether or to what extent the insurance carrier will continue to pay on this claim, the Trust is hopeful that insurance proceeds may continue to offset a portion of its defensive litigation expenses. Costs of the demand investigation are not currently anticipated to be covered by the Trust's insurance policy.
Note I—Recent Accounting Pronouncement:
In December 2011, the Financial Accounting Standards Board issued Accounting Standards Update 2011-11 Disclosures about Offsetting Assets and Liabilities ("ASU 2011-11"). Effective for annual reporting periods beginning on or after January 1, 2013 and interim periods within those annual periods, ASU 2011-11 is intended to enhance disclosure requirements on the offsetting of financial assets and liabilities. At this time, Management is evaluating the implications of ASU 2011-11 and its impact on the financial statements.
208
The following tables include selected data for a share outstanding throughout each period and other performance information derived from the Financial Statements. Per share amounts that round to less than $0.01 or $(0.01) per share are presented as $0.00 or $(0.00), respectively. Ratios that round to less than 0.00% or (0.00%) per share are presented as 0.00% or (0.00%), respectively. Net Asset amounts with a zero balance may reflect actual amounts rounding to less than $0.1 million. A "—" indicates that the line item was not applicable in the corresponding period.
| | Net Asset
Value,
Beginning
of Year | | Net
Investment
Income (Loss)@ | | Net Gains or
Losses on
Securities
(both realized
and
unrealized) | | Total From
Investment
Operations | | Dividends
from Net
Investment
Income | | Distributions
from Net
Realized
Capital Gains | | Tax
Return of
Capital | | Total
Distributions | | Voluntary
Contribution
from
Management | |
Emerging Markets Equity Fund | |
Institutional Class | |
8/31/2013 | | $ | 14.99 | | | $ | 0.18 | | | $ | 0.24 | | | $ | 0.42 | | | $ | (0.07 | ) | | $ | — | | | $ | — | | | $ | (0.07 | ) | | $ | — | | |
8/31/2012 | | $ | 15.80 | | | $ | 0.13 | | | $ | (0.86 | ) | | $ | (0.73 | ) | | $ | (0.08 | ) | | $ | — | | | $ | — | | | $ | (0.08 | ) | | $ | — | | |
8/31/2011 | | $ | 15.61 | | | $ | 0.18 | | | $ | 0.40 | | | $ | 0.58 | | | $ | (0.03 | ) | | $ | (0.36 | ) | | $ | — | | | $ | (0.39 | ) | | $ | — | | |
8/31/2010 | | $ | 14.05 | | | $ | 0.11 | | | $ | 2.51 | | | $ | 2.62 | | | $ | (0.06 | ) | | $ | (1.00 | ) | | $ | — | | | $ | (1.06 | ) | | $ | — | | |
Period from 10/8/2008^
to 8/31/2009 | | $ | 10.00 | | | $ | 0.15 | | | $ | 4.16 | | | $ | 4.31 | | | $ | (0.26 | ) | | $ | — | | | $ | — | | | $ | (0.26 | ) | | $ | — | | |
Class A | |
8/31/2013 | | $ | 14.92 | | | $ | 0.11 | | | $ | 0.27 | | | $ | 0.38 | | | $ | (0.03 | ) | | $ | — | | | $ | — | | | $ | (0.03 | ) | | $ | — | | |
8/31/2012 | | $ | 15.74 | | | $ | 0.08 | | | $ | (0.85 | ) | | $ | (0.77 | ) | | $ | (0.05 | ) | | $ | — | | | $ | — | | | $ | (0.05 | ) | | $ | — | | |
8/31/2011 | | $ | 15.57 | | | $ | 0.03 | | | $ | 0.50 | | | $ | 0.53 | | | $ | — | | | $ | (0.36 | ) | | $ | — | | | $ | (0.36 | ) | | $ | — | | |
8/31/2010 | | $ | 14.02 | | | $ | 0.09 | | | $ | 2.50 | | | $ | 2.59 | | | $ | (0.04 | ) | | $ | (1.00 | ) | | $ | — | | | $ | (1.04 | ) | | $ | — | | |
Period from 10/8/2008^
to 8/31/2009 | | $ | 10.00 | | | $ | 0.15 | | | $ | 4.13 | | | $ | 4.28 | | | $ | (0.26 | ) | | $ | — | | | $ | — | | | $ | (0.26 | ) | | $ | — | | |
Class C | |
8/31/2013 | | $ | 14.61 | | | $ | 0.02 | | | $ | 0.24 | | | $ | 0.26 | | | $ | — | | | $ | — | | | $ | — | | | $ | — | | | $ | — | | |
8/31/2012 | | $ | 15.46 | | | $ | (0.02 | ) | | $ | (0.83 | ) | | $ | (0.85 | ) | | $ | — | | | $ | — | | | $ | — | | | $ | — | | | $ | — | | |
8/31/2011 | | $ | 15.41 | | | $ | (0.02 | ) | | $ | 0.43 | | | $ | 0.41 | | | $ | — | | | $ | (0.36 | ) | | $ | — | | | $ | (0.36 | ) | | $ | — | | |
8/31/2010 | | $ | 13.96 | | | $ | (0.10 | ) | | $ | 2.55 | | | $ | 2.45 | | | $ | — | | | $ | (1.00 | ) | | $ | — | | | $ | (1.00 | ) | | $ | — | | |
Period from 10/8/2008^
to 8/31/2009 | | $ | 10.00 | | | $ | 0.08 | | | $ | 4.12 | | | $ | 4.20 | | | $ | (0.24 | ) | | $ | — | | | $ | — | | | $ | (0.24 | ) | | $ | — | | |
Class R3 | |
8/31/2013 | | $ | 14.71 | | | $ | 0.03 | | | $ | 0.28 | | | $ | 0.31 | | | $ | — | | | $ | — | | | $ | — | | | $ | — | | | $ | — | | |
8/31/2012 | | $ | 15.52 | | | $ | 0.04 | | | $ | (0.85 | ) | | $ | (0.81 | ) | | $ | — | | | $ | — | | | $ | — | | | $ | — | | | $ | — | | |
8/31/2011 | | $ | 15.42 | | | $ | (0.01 | ) | | $ | 0.47 | | | $ | 0.46 | | | $ | — | | | $ | (0.36 | ) | | $ | — | | | $ | (0.36 | ) | | $ | — | | |
Period from 6/21/2010^
to 8/31/2010 | | $ | 15.10 | | | $ | (0.00 | ) | | $ | 0.32 | | | $ | 0.32 | | | $ | — | | | $ | — | | | $ | — | | | $ | — | | | $ | — | | |
See Notes to Financial Highlights
209
| | | Redemption
Feesøø | | Net
Asset
Value,
End of
Year | | Total
Return†† | | Net Assets,
End of Year
(in millions) | | Ratio of
Gross
Expenses
to Average
Net Assets# | | Ratio
of Net
Expenses
to Average
Net Assets‡ | | Ratio of Net
Investment
Income/
(Loss) to
Average Net
Assets | | Portfolio
Turnover
Rate | |
Emerging Markets Equity Fund | |
Institutional Class | |
8/31/2013 | | $ | — | | | $ | 15.34 | | | | 2.77 | % | | $ | 374.1 | | | | 1.60 | % | | | 1.25 | % | | | 1.10 | % | | | 36 | % | |
8/31/2012 | | $ | — | | | $ | 14.99 | | | | (4.53 | %) | | $ | 161.7 | | | | 1.77 | % | | | 1.25 | % | | | .89 | % | | | 78 | % | |
8/31/2011 | | $ | 0.00 | | | $ | 15.80 | | | | 3.44 | % | | $ | 107.7 | | | | 2.56 | % | | | 1.26 | % | | | 1.05 | % | | | 71 | % | |
8/31/2010 | | $ | 0.00 | | | $ | 15.61 | | | | 18.76 | % | | $ | 9.0 | | | | 6.65 | % | | | 1.26 | % | | | .72 | % | | | 81 | % | |
Period from 10/8/2008^
to 8/31/2009 | | $ | 0.00 | | | $ | 14.05 | | | | 44.66 | %** | | $ | 4.0 | | | | 14.78 | %* | | | 1.28 | %* | | | 1.55 | %* | | | 84 | %** | |
Class A | |
8/31/2013 | | $ | — | | | $ | 15.27 | | | | 2.54 | % | | $ | 7.3 | | | | 2.00 | % | | | 1.50 | % | | | .69 | % | | | 36 | % | |
8/31/2012 | | $ | — | | | $ | 14.92 | | | | (4.84 | %) | | $ | 4.1 | | | | 2.23 | % | | | 1.50 | % | | | .53 | % | | | 78 | % | |
8/31/2011 | | $ | 0.00 | | | $ | 15.74 | | | | 3.16 | % | | $ | 4.9 | | | | 3.22 | % | | | 1.50 | % | | | .19 | % | | | 71 | % | |
8/31/2010 | | $ | 0.00 | | | $ | 15.57 | | | | 18.58 | % | | $ | 5.5 | | | | 6.71 | % | | | 1.51 | % | | | .61 | % | | | 81 | % | |
Period from 10/8/2008^
to 8/31/2009 | | $ | 0.00 | | | $ | 14.02 | | | | 44.38 | %** | | $ | 1.8 | | | | 18.97 | %* | | | 1.53 | %* | | | 1.31 | %* | | | 84 | %** | |
Class C | |
8/31/2013 | | $ | — | | | $ | 14.87 | | | | 1.78 | % | | $ | 4.1 | | | | 2.73 | % | | | 2.25 | % | | | .13 | % | | | 36 | % | |
8/31/2012 | | $ | — | | | $ | 14.61 | | | | (5.50 | %) | | $ | 1.4 | | | | 2.93 | % | | | 2.25 | % | | | (.17 | %) | | | 78 | % | |
8/31/2011 | | $ | 0.00 | | | $ | 15.46 | | | | 2.41 | % | | $ | 1.1 | | | | 3.80 | % | | | 2.26 | % | | | (.12 | %) | | | 71 | % | |
8/31/2010 | | $ | 0.00 | | | $ | 15.41 | | | | 17.62 | % | | $ | 0.2 | | | | 7.05 | % | | | 2.26 | % | | | (.63 | %) | | | 81 | % | |
Period from 10/8/2008^
to 8/31/2009 | | $ | 0.00 | | | $ | 13.96 | | | | 43.42 | %** | | $ | 0.2 | | | | 17.56 | %* | | | 2.28 | %* | | | .77 | %* | | | 84 | %** | |
Class R3 | |
8/31/2013 | | $ | — | | | $ | 15.02 | | | | 2.11 | % | | $ | 0.2 | | | | 2.31 | % | | | 1.91 | % | | | .22 | % | | | 36 | % | |
8/31/2012 | | $ | — | | | $ | 14.71 | | | | (5.22 | %) | | $ | 0.3 | | | | 2.49 | % | | | 1.92 | % | | | .28 | % | | | 78 | % | |
8/31/2011 | | $ | 0.00 | | | $ | 15.52 | | | | 2.73 | % | | $ | 0.0 | | | | 8.02 | % | | | 1.91 | % | | | (.04 | %) | | | 71 | % | |
Period from 6/21/2010^
to 8/31/2010 | | $ | 0.00 | | | $ | 15.42 | | | | 2.12 | %** | | $ | 0.0 | | | | 39.77 | %* | | | 1.93 | %* | | | (.09 | %)* | | | 81 | %Ø | |
210
Financial Highlights (cont'd)
| | | Net Asset
Value,
Beginning
of Year | | Net
Investment
Income (Loss)@ | | Net Gains or
Losses on
Securities
(both realized
and
unrealized) | | Total From
Investment
Operations | | Dividends
from Net
Investment
Income | | Distributions
from Net
Realized
Capital Gains | | Tax
Return of
Capital | | Total
Distributions | | Voluntary
Contribution
from
Management | |
Class R6 | |
Period from 3/15/2013^
to 8/31/2013 | | $ | 16.85 | | | $ | 0.13 | | | $ | (1.63 | ) | | $ | (1.50 | ) | | $ | — | | | $ | — | | | $ | — | | | $ | — | | | $ | — | | |
Equity Income Fund | |
Institutional Class | |
8/31/2013 | | $ | 11.74 | | | $ | 0.30 | | | $ | 0.25 | | | $ | 0.55 | | | $ | (0.42 | ) | | $ | (0.11 | ) | | $ | — | | | $ | (0.53 | ) | | $ | — | | |
8/31/2012 | | $ | 11.28 | | | $ | 0.35 | | | $ | 0.57 | | | $ | 0.92 | | | $ | (0.38 | ) | | $ | (0.08 | ) | | $ | — | | | $ | (0.46 | ) | | $ | — | | |
8/31/2011 | | $ | 10.02 | | | $ | 0.33 | | | $ | 1.41 | | | $ | 1.74 | | | $ | (0.48 | ) | | $ | — | | | $ | — | | | $ | (0.48 | ) | | $ | — | | |
8/31/2010 | | $ | 8.74 | | | $ | 0.40 | | | $ | 1.22 | | | $ | 1.62 | | | $ | (0.34 | ) | | $ | — | | | $ | — | | | $ | (0.34 | ) | | $ | — | | |
8/31/2009 | | $ | 10.72 | | | $ | 0.34 | | | $ | (2.04 | ) | | $ | (1.70 | ) | | $ | (0.21 | ) | | $ | (0.07 | ) | | $ | — | | | $ | (0.28 | ) | | $ | — | | |
Class A | |
8/31/2013 | | $ | 11.70 | | | $ | 0.25 | | | $ | 0.25 | | | $ | 0.50 | | | $ | (0.38 | ) | | $ | (0.11 | ) | | $ | — | | | $ | (0.49 | ) | | $ | — | | |
8/31/2012 | | $ | 11.24 | | | $ | 0.30 | �� | | $ | 0.57 | | | $ | 0.87 | | | $ | (0.33 | ) | | $ | (0.08 | ) | | $ | — | | | $ | (0.41 | ) | | $ | — | | |
8/31/2011 | | $ | 9.99 | | | $ | 0.28 | | | $ | 1.41 | | | $ | 1.69 | | | $ | (0.44 | ) | | $ | — | | | $ | — | | | $ | (0.44 | ) | | $ | — | | |
8/31/2010 | | $ | 8.72 | | | $ | 0.36 | | | $ | 1.22 | | | $ | 1.58 | | | $ | (0.31 | ) | | $ | — | | | $ | — | | | $ | (0.31 | ) | | $ | — | | |
8/31/2009 | | $ | 10.72 | | | $ | 0.25 | | | $ | (1.99 | ) | | $ | (1.74 | ) | | $ | (0.19 | ) | | $ | (0.07 | ) | | $ | — | | | $ | (0.26 | ) | | $ | — | | |
Class C | |
8/31/2013 | | $ | 11.64 | | | $ | 0.16 | | | $ | 0.25 | | | $ | 0.41 | | | $ | (0.29 | ) | | $ | (0.11 | ) | | $ | — | | | $ | (0.40 | ) | | $ | — | | |
8/31/2012 | | $ | 11.18 | | | $ | 0.22 | | | $ | 0.58 | | | $ | 0.80 | | | $ | (0.26 | ) | | $ | (0.08 | ) | | $ | — | | | $ | (0.34 | ) | | $ | — | | |
8/31/2011 | | $ | 9.96 | | | $ | 0.20 | | | $ | 1.40 | | | $ | 1.60 | | | $ | (0.38 | ) | | $ | — | | | $ | — | | | $ | (0.38 | ) | | $ | — | | |
8/31/2010 | | $ | 8.70 | | | $ | 0.31 | | | $ | 1.20 | | | $ | 1.51 | | | $ | (0.25 | ) | | $ | — | | | $ | — | | | $ | (0.25 | ) | | $ | — | | |
8/31/2009 | | $ | 10.71 | | | $ | 0.20 | | | $ | (2.00 | ) | | $ | (1.80 | ) | | $ | (0.14 | ) | | $ | (0.07 | ) | | $ | — | | | $ | (0.21 | ) | | $ | — | | |
Class R3 | |
8/31/2013 | | $ | 11.69 | | | $ | 0.22 | | | $ | 0.23 | | | $ | 0.45 | | | $ | (0.34 | ) | | $ | (0.11 | ) | | $ | — | | | $ | (0.45 | ) | | $ | — | | |
8/31/2012 | | $ | 11.24 | | | $ | 0.29 | | | $ | 0.55 | | | $ | 0.84 | | | $ | (0.31 | ) | | $ | (0.08 | ) | | $ | — | | | $ | (0.39 | ) | | $ | — | | |
8/31/2011 | | $ | 9.99 | | | $ | 0.27 | | | $ | 1.39 | | | $ | 1.66 | | | $ | (0.41 | ) | | $ | — | | | $ | — | | | $ | (0.41 | ) | | $ | — | | |
Period from 6/21/2010^
to 8/31/2010 | | $ | 10.06 | | | $ | 0.11 | | | $ | (0.12 | ) | | $ | (0.01 | ) | | $ | (0.06 | ) | | $ | — | | | $ | — | | | $ | (0.06 | ) | | $ | — | | |
See Notes to Financial Highlights
211
| | Redemption
Feesøø | | Net
Asset
Value,
End of
Year | | Total
Return†† | | Net Assets,
End of Year
(in millions) | | Ratio of
Gross
Expenses
to Average
Net Assets# | | Ratio
of Net
Expenses
to Average
Net Assets‡ | | Ratio of Net
Investment
Income/
(Loss) to
Average Net
Assets | | Portfolio
Turnover
Rate | |
Class R6 | |
Period from 3/15/2013^
to 8/31/2013 | | $ | — | | | $ | 15.35 | | | | (8.90 | %)** | | $ | 31.1 | | | | 1.57 | %* | | | 1.18 | %* | | | 1.80 | %* | | | 36 | %Ø | |
Equity Income Fund | |
Institutional Class | |
8/31/2013 | | $ | — | | | $ | 11.76 | | | | 4.79 | % | | $ | 1,439.4 | | | | .68 | % | | | .68 | % | | | 2.45 | % | | | 70 | % | |
8/31/2012 | | $ | — | | | $ | 11.74 | | | | 8.49 | % | | $ | 1,213.6 | | | | .71 | % | | | .71 | %§ | | | 3.10 | % | | | 42 | % | |
8/31/2011 | | $ | — | | | $ | 11.28 | | | | 17.70 | % | | $ | 701.7 | | | | .80 | % | | | .80 | %§ | | | 2.93 | % | | | 22 | % | |
8/31/2010 | | $ | — | | | $ | 10.02 | | | | 18.81 | % | | $ | 100.9 | | | | 1.01 | % | | | .80 | % | | | 4.09 | % | | | 29 | % | |
8/31/2009 | | $ | — | | | $ | 8.74 | | | | (15.54 | %) | | $ | 18.9 | | | | 1.32 | % | | | .80 | % | | | 3.97 | % | | | 61 | % | |
Class A | |
8/31/2013 | | $ | — | | | $ | 11.71 | | | | 4.32 | % | | $ | 1,036.4 | | | | 1.05 | % | | | 1.05 | % | | | 2.09 | % | | | 70 | % | |
8/31/2012 | | $ | — | | | $ | 11.70 | | | | 8.09 | % | | $ | 1,012.3 | | | | 1.13 | % | | | 1.13 | %§ | | | 2.70 | % | | | 42 | % | |
8/31/2011 | | $ | — | | | $ | 11.24 | | | | 17.27 | % | | $ | 567.0 | | | | 1.16 | % | | | 1.16 | %§ | | | 2.50 | % | | | 22 | % | |
8/31/2010 | | $ | — | | | $ | 9.99 | | | | 18.36 | % | | $ | 176.6 | | | | 1.36 | % | | | 1.16 | % | | | 3.70 | % | | | 29 | % | |
8/31/2009 | | $ | — | | | $ | 8.72 | | | | (16.01 | %) | | $ | 43.0 | | | | 2.31 | % | | | 1.16 | % | | | 3.15 | % | | | 61 | % | |
Class C | |
8/31/2013 | | $ | — | | | $ | 11.65 | | | | 3.58 | % | | $ | 465.7 | | | | 1.80 | % | | | 1.80 | % | | | 1.34 | % | | | 70 | % | |
8/31/2012 | | $ | — | | | $ | 11.64 | | | | 7.40 | % | | $ | 380.4 | | | | 1.84 | % | | | 1.84 | %§ | | | 1.98 | % | | | 42 | % | |
8/31/2011 | | $ | — | | | $ | 11.18 | | | | 16.31 | % | | $ | 233.2 | | | | 1.91 | % | | | 1.91 | %§ | | | 1.81 | % | | | 22 | % | |
8/31/2010 | | $ | — | | | $ | 9.96 | | | | 17.59 | % | | $ | 44.0 | | | | 2.12 | % | | | 1.91 | % | | | 3.15 | % | | | 29 | % | |
8/31/2009 | | $ | — | | | $ | 8.70 | | | | (16.60 | %) | | $ | 4.3 | | | | 2.80 | % | | | 1.91 | % | | | 2.46 | % | | | 61 | % | |
Class R3 | |
8/31/2013 | | $ | — | | | $ | 11.69 | | | | 3.94 | % | | $ | 2.6 | | | | 1.41 | % | | | 1.41 | %§ | | | 1.78 | % | | | 70 | % | |
8/31/2012 | | $ | — | | | $ | 11.69 | | | | 7.78 | % | | $ | 1.1 | | | | 1.41 | % | | | 1.41 | %§ | | | 2.59 | % | | | 42 | % | |
8/31/2011 | | $ | — | | | $ | 11.24 | | | | 16.92 | % | | $ | 0.2 | | | | 4.32 | % | | | 1.41 | % | | | 2.44 | % | | | 22 | % | |
Period from 6/21/2010^
to 8/31/2010 | | $ | — | | | $ | 9.99 | | | | (.04 | %)** | | $ | 0.0 | | | | 36.17 | %* | | | 1.41 | %* | | | 5.53 | %* | | | 29 | %Ø | |
212
Financial Highlights (cont'd)
| | | Net Asset
Value,
Beginning
of Year | | Net
Investment
Income (Loss)@ | | Net Gains or
Losses on
Securities
(both realized
and
unrealized) | | Total From
Investment
Operations | | Dividends
from Net
Investment
Income | | Distributions
from Net
Realized
Capital Gains | | Tax
Return of
Capital | | Total
Distributions | | Voluntary
Contribution
from
Management | |
Focus Fund | |
Investor Class | |
8/31/2013 | | $ | 21.71 | | | $ | 0.18 | | | $ | 5.15 | | | $ | 5.33 | | | $ | (0.14 | ) | | $ | — | | | $ | — | | | $ | (0.14 | ) | | $ | — | | |
8/31/2012 | | $ | 18.80 | | | $ | 0.14 | | | $ | 2.87 | | | $ | 3.01 | | | $ | (0.10 | ) | | $ | — | | | $ | — | | | $ | (0.10 | ) | | $ | — | | |
8/31/2011 | | $ | 16.07 | | | $ | 0.13 | | | $ | 2.70 | | | $ | 2.83 | | | $ | (0.10 | ) | | $ | — | | | $ | — | | | $ | (0.10 | ) | | $ | — | | |
8/31/2010 | | $ | 16.59 | | | $ | 0.11 | | | $ | (0.50 | ) | | $ | (0.39 | ) | | $ | (0.13 | ) | | $ | — | | | $ | — | | | $ | (0.13 | ) | | $ | — | | |
8/31/2009 | | $ | 24.78 | | | $ | 0.14 | | | $ | (6.00 | ) | | $ | (5.86 | ) | | $ | (0.14 | ) | | $ | (2.19 | ) | | $ | — | | | $ | (2.33 | ) | | $ | — | | |
Trust Class | |
8/31/2013 | | $ | 15.78 | | | $ | 0.10 | | | $ | 3.74 | | | $ | 3.84 | | | $ | (0.12 | ) | | $ | — | | | $ | — | | | $ | (0.12 | ) | | $ | — | | |
8/31/2012 | | $ | 13.70 | | | $ | 0.07 | | | $ | 2.08 | | | $ | 2.15 | | | $ | (0.07 | ) | | $ | — | | | $ | — | | | $ | (0.07 | ) | | $ | — | | |
8/31/2011 | | $ | 11.73 | | | $ | 0.06 | | | $ | 1.98 | | | $ | 2.04 | | | $ | (0.07 | ) | | $ | — | | | $ | — | | | $ | (0.07 | ) | | $ | — | | |
8/31/2010 | | $ | 12.14 | | | $ | 0.05 | | | $ | (0.36 | ) | | $ | (0.31 | ) | | $ | (0.10 | ) | | $ | — | | | $ | — | | | $ | (0.10 | ) | | $ | — | | |
8/31/2009 | | $ | 18.18 | | | $ | 0.07 | | | $ | (4.40 | ) | | $ | (4.33 | ) | | $ | (0.10 | ) | | $ | (1.61 | ) | | $ | — | | | $ | (1.71 | ) | | $ | — | | |
Advisor Class | |
8/31/2013 | | $ | 10.79 | | | $ | 0.04 | | | $ | 2.55 | | | $ | 2.59 | | | $ | (0.11 | ) | | $ | — | | | $ | — | | | $ | (0.11 | ) | | $ | — | | |
8/31/2012 | | $ | 9.41 | | | $ | 0.04 | | | $ | 1.42 | | | $ | 1.46 | | | $ | (0.08 | ) | | $ | — | | | $ | — | | | $ | (0.08 | ) | | $ | — | | |
8/31/2011 | | $ | 8.08 | | | $ | 0.03 | | | $ | 1.36 | | | $ | 1.39 | | | $ | (0.06 | ) | | $ | — | | | $ | — | | | $ | (0.06 | ) | | $ | — | | |
8/31/2010 | | $ | 8.40 | | | $ | 0.01 | | | $ | (0.24 | ) | | $ | (0.23 | ) | | $ | (0.09 | ) | | $ | — | | | $ | — | | | $ | (0.09 | ) | | $ | — | | |
8/31/2009 | | $ | 12.64 | | | $ | 0.03 | | | $ | (3.07 | ) | | $ | (3.04 | ) | | $ | (0.09 | ) | | $ | (1.11 | ) | | $ | — | | | $ | (1.20 | ) | | $ | — | | |
Institutional Class | |
8/31/2013 | | $ | 21.76 | | | $ | 0.24 | | | $ | 5.14 | | | $ | 5.38 | | | $ | (0.19 | ) | | $ | — | | | $ | — | | | $ | (0.19 | ) | | $ | — | | |
8/31/2012 | | $ | 18.84 | | | $ | 0.19 | | | $ | 2.87 | | | $ | 3.06 | | | $ | (0.14 | ) | | $ | — | | | $ | — | | | $ | (0.14 | ) | | $ | — | | |
8/31/2011 | | $ | 16.08 | | | $ | 0.21 | | | $ | 2.66 | | | $ | 2.87 | | | $ | (0.11 | ) | | $ | — | | | $ | — | | | $ | (0.11 | ) | | $ | — | | |
Period from 6/21/2010^
to 8/31/2010 | | $ | 17.77 | | | $ | 0.06 | | | $ | (1.75 | ) | | $ | (1.69 | ) | | $ | — | | | $ | — | | | $ | — | | | $ | — | | | $ | — | | |
Class A | |
8/31/2013 | | $ | 15.71 | | | $ | 0.10 | | | $ | 3.71 | | | $ | 3.81 | | | $ | (0.14 | ) | | $ | — | | | $ | — | | | $ | (0.14 | ) | | $ | — | | |
8/31/2012 | | $ | 13.67 | | | $ | 0.09 | | | $ | 2.07 | | | $ | 2.16 | | | $ | (0.12 | ) | | $ | — | | | $ | — | | | $ | (0.12 | ) | | $ | — | | |
8/31/2011 | | $ | 11.73 | | | $ | 0.10 | | | $ | 1.95 | | | $ | 2.05 | | | $ | (0.11 | ) | | $ | — | | | $ | — | | | $ | (0.11 | ) | | $ | — | | |
Period from 6/21/2010^
to 8/31/2010 | | $ | 12.97 | | | $ | 0.03 | | | $ | (1.27 | ) | | $ | (1.24 | ) | | $ | — | | | $ | — | | | $ | — | | | $ | — | | | $ | — | | |
See Notes to Financial Highlights
213
| | | Redemption
Feesøø | | Net
Asset
Value,
End of
Year | | Total
Return†† | | Net Assets,
End of Year
(in millions) | | Ratio of
Gross
Expenses
to Average
Net Assets# | | Ratio
of Net
Expenses
to Average
Net Assets‡ | | Ratio of Net
Investment
Income/
(Loss) to
Average Net
Assets | | Portfolio
Turnover
Rate | |
Focus Fund | |
Investor Class | |
8/31/2013 | | $ | — | | | $ | 26.90 | | | | 24.69 | % | | $ | 636.9 | | | | .94 | % | | | .94 | % | | | .72 | % | | | 79 | % | |
8/31/2012 | | $ | — | | | $ | 21.71 | | | | 16.10 | % | | $ | 534.3 | | | | .97 | % | | | .97 | % | | | .72 | % | | | 96 | % | |
8/31/2011 | | $ | — | | | $ | 18.80 | | | | 17.61 | % | | $ | 503.8 | | | | .97 | % | | | .97 | % | | | .65 | % | | | 113 | % | |
8/31/2010 | | $ | — | | | $ | 16.07 | | | | (2.39 | %) | | $ | 478.8 | | | | .97 | % | | | .97 | % | | | .61 | % | | | 89 | % | |
8/31/2009 | | $ | — | | | $ | 16.59 | | | | (21.06 | %) | | $ | 540.9 | | | | .99 | % | | | .99 | % | | | .92 | % | | | 89 | % | |
Trust Class | |
8/31/2013 | | $ | — | | | $ | 19.50 | | | | 24.48 | % | | $ | 56.3 | | | | 1.14 | % | | | 1.14 | % | | | .53 | % | | | 79 | % | |
8/31/2012 | | $ | — | | | $ | 15.78 | | | | 15.82 | % | | $ | 15.0 | | | | 1.16 | % | | | 1.16 | % | | | .52 | % | | | 96 | % | |
8/31/2011 | | $ | — | | | $ | 13.70 | | | | 17.39 | % | | $ | 17.9 | | | | 1.16 | % | | | 1.16 | % | | | .45 | % | | | 113 | % | |
8/31/2010 | | $ | — | | | $ | 11.73 | | | | (2.61 | %) | | $ | 18.9 | | | | 1.19 | % | | | 1.19 | % | | | .38 | % | | | 89 | % | |
8/31/2009 | | $ | — | | | $ | 12.14 | | | | (21.21 | %) | | $ | 23.7 | | | | 1.24 | % | | | 1.24 | % | | | .65 | % | | | 89 | % | |
Advisor Class | |
8/31/2013 | | $ | — | | | $ | 13.27 | | | | 24.22 | % | | $ | 6.1 | | | | 1.29 | % | | | 1.29 | % | | | .37 | % | | | 79 | % | |
8/31/2012 | | $ | — | | | $ | 10.79 | | | | 15.68 | % | | $ | 5.8 | | | | 1.31 | % | | | 1.31 | % | | | .37 | % | | | 96 | % | |
8/31/2011 | | $ | — | | | $ | 9.41 | | | | 17.20 | % | | $ | 7.8 | | | | 1.32 | % | | | 1.32 | % | | | .30 | % | | | 113 | % | |
8/31/2010 | | $ | — | | | $ | 8.08 | | | | (2.83 | %) | | $ | 7.7 | | | | 1.42 | % | | | 1.42 | %§ | | | .15 | % | | | 89 | % | |
8/31/2009 | | $ | — | | | $ | 8.40 | | | | (21.45 | %) | | $ | 10.2 | | | | 1.53 | % | | | 1.50 | % | | | .40 | % | | | 89 | % | |
Institutional Class | |
8/31/2013 | | $ | — | | | $ | 26.95 | | | | 24.89 | % | | $ | 22.6 | | | | .77 | % | | | .75 | % | | | .96 | % | | | 79 | % | |
8/31/2012 | | $ | — | | | $ | 21.76 | | | | 16.39 | % | | $ | 6.9 | | | | .80 | % | | | .75 | % | | | .97 | % | | | 96 | % | |
8/31/2011 | | $ | — | | | $ | 18.84 | | | | 17.85 | % | | $ | 4.9 | | | | .85 | % | | | .75 | % | | | 1.03 | % | | | 113 | % | |
Period from 6/21/2010^
to 8/31/2010 | | $ | — | | | $ | 16.08 | | | | (9.51 | %)** | | $ | 0.0 | | | | 36.90 | %* | | | .75 | %* | | | 1.80 | %* | | | 89 | %Ø | |
Class A | |
8/31/2013 | | $ | — | | | $ | 19.38 | | | | 24.47 | % | | $ | 1.9 | | | | 1.19 | % | | | 1.11 | % | | | .56 | % | | | 79 | % | |
8/31/2012 | | $ | — | | | $ | 15.71 | | | | 15.96 | % | | $ | 0.7 | | | | 1.22 | % | | | 1.11 | % | | | .61 | % | | | 96 | % | |
8/31/2011 | | $ | — | | | $ | 13.67 | | | | 17.43 | % | | $ | 0.4 | | | | 2.20 | % | | | 1.11 | % | | | .66 | % | | | 113 | % | |
Period from 6/21/2010^
to 8/31/2010 | | $ | — | | | $ | 11.73 | | | | (9.56 | %)** | | $ | 0.0 | | | | 37.28 | %* | | | 1.11 | %* | | | 1.44 | %* | | | 89 | %Ø | |
214
Financial Highlights (cont'd)
| | | Net Asset
Value,
Beginning
of Year | | Net
Investment
Income (Loss)@ | | Net Gains or
Losses on
Securities
(both realized
and
unrealized) | | Total From
Investment
Operations | | Dividends
from Net
Investment
Income | | Distributions
from Net
Realized
Capital Gains | | Tax
Return of
Capital | | Total
Distributions | | Voluntary
Contribution
from
Management | |
Class C | |
8/31/2013 | | $ | 10.62 | | | $ | (0.02 | ) | | $ | 2.51 | | | $ | 2.49 | | | $ | (0.08 | ) | | $ | — | | | $ | — | | | $ | (0.08 | ) | | $ | — | | |
8/31/2012 | | $ | 9.32 | | | $ | (0.02 | ) | | $ | 1.41 | | | $ | 1.39 | | | $ | (0.09 | ) | | $ | — | | | $ | — | | | $ | (0.09 | ) | | $ | — | | |
8/31/2011 | | $ | 8.07 | | | $ | (0.02 | ) | | $ | 1.36 | | | $ | 1.34 | | | $ | (0.09 | ) | | $ | — | | | $ | — | | | $ | (0.09 | ) | | $ | — | | |
Period from 6/21/2010^
to 8/31/2010 | | $ | 8.94 | | | $ | 0.01 | | | $ | (0.88 | ) | | $ | (0.87 | ) | | $ | — | | | $ | — | | | $ | — | | | $ | — | | | $ | — | | |
Genesis Fund | |
Investor Class | |
8/31/2013 | | $ | 34.65 | | | $ | 0.26 | | | $ | 7.57 | | | $ | 7.83 | | | $ | (0.19 | ) | | $ | (2.11 | ) | | $ | — | | | $ | (2.30 | ) | | $ | — | | |
8/31/2012 | | $ | 34.28 | | | $ | 0.11 | | | $ | 1.94 | | | $ | 2.05 | | | $ | (0.53 | ) | | $ | (1.15 | ) | | $ | — | | | $ | (1.68 | ) | | $ | — | | |
8/31/2011 | | $ | 26.44 | | | $ | 0.27 | | | $ | 7.57 | | | $ | 7.84 | | | $ | — | | | $ | — | | | $ | — | | | $ | — | | | $ | — | | |
8/31/2010 | | $ | 24.39 | | | $ | (0.03 | ) | | $ | 2.08 | | | $ | 2.05 | | | $ | — | | | $ | — | | | $ | — | | | $ | — | | | $ | — | | |
8/31/2009 | | $ | 34.95 | | | $ | (0.01 | ) | | $ | (9.23 | ) | | $ | (9.24 | ) | | $ | — | | | $ | (1.32 | ) | | $ | (0.00 | ) | | $ | (1.32 | ) | | $ | — | | |
Trust Class | |
8/31/2013 | | $ | 50.47 | | | $ | 0.35 | | | $ | 11.23 | | | $ | 11.58 | | | $ | (0.11 | ) | | $ | (2.11 | ) | | $ | — | | | $ | (2.22 | ) | | $ | — | | |
8/31/2012 | | $ | 49.13 | | | $ | 0.11 | | | $ | 2.83 | | | $ | 2.94 | | | $ | (0.45 | ) | | $ | (1.15 | ) | | $ | — | | | $ | (1.60 | ) | | $ | — | | |
8/31/2011 | | $ | 37.92 | | | $ | 0.35 | | | $ | 10.86 | | | $ | 11.21 | | | $ | — | | | $ | — | | | $ | — | | | $ | — | | | $ | — | | |
8/31/2010 | | $ | 35.00 | | | $ | (0.07 | ) | | $ | 2.99 | | | $ | 2.92 | | | $ | — | | | $ | — | | | $ | — | | | $ | — | | | $ | — | | |
8/31/2009 | | $ | 50.16 | | | $ | (0.03 | ) | | $ | (13.24 | ) | | $ | (13.27 | ) | | $ | — | | | $ | (1.89 | ) | | $ | (0.00 | ) | | $ | (1.89 | ) | | $ | — | | |
Advisor Class | |
8/31/2013 | | $ | 28.42 | | | $ | 0.11 | | | $ | 6.13 | | | $ | 6.24 | | | $ | (0.09 | ) | | $ | (2.11 | ) | | $ | — | | | $ | (2.20 | ) | | $ | — | | |
8/31/2012 | | $ | 28.43 | | | $ | (0.01 | ) | | $ | 1.58 | | | $ | 1.57 | | | $ | (0.43 | ) | | $ | (1.15 | ) | | $ | — | | | $ | (1.58 | ) | | $ | — | | |
8/31/2011 | | $ | 22.00 | | | $ | 0.12 | | | $ | 6.31 | | | $ | 6.43 | | | $ | — | | | $ | — | | | $ | — | | | $ | — | | | $ | — | | |
8/31/2010 | | $ | 20.35 | | | $ | (0.10 | ) | | $ | 1.75 | | | $ | 1.65 | | | $ | — | | | $ | — | | | $ | — | | | $ | — | | | $ | — | | |
8/31/2009 | | $ | 29.25 | | | $ | (0.07 | ) | | $ | (7.73 | ) | | $ | (7.80 | ) | | $ | — | | | $ | (1.10 | ) | | $ | (0.00 | ) | | $ | (1.10 | ) | | $ | — | | |
Institutional Class | |
8/31/2013 | | $ | 48.71 | | | $ | 0.46 | | | $ | 10.81 | | | $ | 11.27 | | | $ | (0.25 | ) | | $ | (2.11 | ) | | $ | — | | | $ | (2.36 | ) | | $ | — | | |
8/31/2012 | | $ | 47.48 | | | $ | 0.24 | | | $ | 2.73 | | | $ | 2.97 | | | $ | (0.59 | ) | | $ | (1.15 | ) | | $ | — | | | $ | (1.74 | ) | | $ | — | | |
8/31/2011 | | $ | 36.56 | | | $ | 0.45 | | | $ | 10.47 | | | $ | 10.92 | | | $ | — | | | $ | — | | | $ | — | | | $ | — | | | $ | — | | |
8/31/2010 | | $ | 33.64 | | | $ | 0.04 | | | $ | 2.88 | | | $ | 2.92 | | | $ | — | | | $ | — | | | $ | — | | | $ | — | | | $ | — | | |
8/31/2009 | | $ | 48.09 | | | $ | 0.06 | | | $ | (12.70 | ) | | $ | (12.64 | ) | | $ | — | | | $ | (1.81 | ) | | $ | (0.00 | ) | | $ | (1.81 | ) | | $ | — | | |
See Notes to Financial Highlights
215
| | | Redemption
Feesøø | | Net
Asset
Value,
End of
Year | | Total
Return†† | | Net Assets,
End of Year
(in millions) | | Ratio of
Gross
Expenses
to Average
Net Assets# | | Ratio
of Net
Expenses
to Average
Net Assets‡ | | Ratio of Net
Investment
Income/
(Loss) to
Average Net
Assets | | Portfolio
Turnover
Rate | |
Class C | |
8/31/2013 | | $ | — | | | $ | 13.03 | | | | 23.61 | % | | $ | 0.6 | | | | 1.94 | % | | | 1.86 | % | | | (.20 | %) | | | 79 | % | |
8/31/2012 | | $ | — | | | $ | 10.62 | | | | 15.04 | % | | $ | 0.3 | | | | 1.97 | % | | | 1.86 | % | | | (.17 | %) | | | 96 | % | |
8/31/2011 | | $ | — | | | $ | 9.32 | | | | 16.62 | % | | $ | 0.3 | | | | 2.92 | % | | | 1.86 | % | | | (.16 | %) | | | 113 | % | |
Period from 6/21/2010^
to 8/31/2010 | | $ | — | | | $ | 8.07 | | | | (9.73 | %)** | | $ | 0.0 | | | | 38.06 | %* | | | 1.86 | %* | | | .69 | %* | | | 89 | %Ø | |
Genesis Fund | |
Investor Class | |
8/31/2013 | | $ | — | | | $ | 40.18 | | | | 23.91 | % | | $ | 2,458.7 | | | | 1.02 | % | | | 1.02 | % | | | .71 | % | | | 20 | % | |
8/31/2012 | | $ | — | | | $ | 34.65 | | | | 6.31 | % | | $ | 2,256.0 | | | | 1.03 | % | | | 1.03 | % | | | .31 | % | | | 15 | % | |
8/31/2011 | | $ | — | | | $ | 34.28 | | | | 29.65 | % | | $ | 2,157.7 | | | | 1.05 | % | | | 1.05 | % | | | .81 | % | | | 18 | % | |
8/31/2010 | | $ | — | | | $ | 26.44 | | | | 8.41 | % | | $ | 1,773.6 | | | | 1.06 | % | | | 1.06 | % | | | (.11 | %) | | | 16 | % | |
8/31/2009 | | $ | — | | | $ | 24.39 | | | | (25.72 | %) | | $ | 1,626.8 | | | | 1.08 | % | | | 1.08 | % | | | (.04 | %) | | | 12 | % | |
Trust Class | |
8/31/2013 | | $ | — | | | $ | 59.83 | | | | 23.81 | % | | $ | 3,192.4 | | | | 1.10 | % | | | 1.10 | % | | | .63 | % | | | 20 | % | |
8/31/2012 | | $ | — | | | $ | 50.47 | | | | 6.21 | % | | $ | 3,037.6 | | | | 1.11 | % | | | 1.11 | % | | | .23 | % | | | 15 | % | |
8/31/2011 | | $ | — | | | $ | 49.13 | | | | 29.56 | % | | $ | 3,436.5 | | | | 1.13 | % | | | 1.13 | % | | | .74 | % | | | 18 | % | |
8/31/2010 | | $ | — | | | $ | 37.92 | | | | 8.34 | % | | $ | 3,057.6 | | | | 1.12 | % | | | 1.12 | % | | | (.17 | %) | | | 16 | % | |
8/31/2009 | | $ | — | | | $ | 35.00 | | | | (25.73 | %) | | $ | 3,244.1 | | | | 1.12 | % | | | 1.12 | % | | | (.09 | %) | | | 12 | % | |
Advisor Class | |
8/31/2013 | | $ | — | | | $ | 32.46 | | | | 23.46 | % | | $ | 626.0 | | | | 1.38 | % | | | 1.38 | % | | | .35 | % | | | 20 | % | |
8/31/2012 | | $ | — | | | $ | 28.42 | | | | 5.91 | % | | $ | 579.8 | | | | 1.38 | % | | | 1.38 | % | | | (.04 | %) | | | 15 | % | |
8/31/2011 | | $ | — | | | $ | 28.43 | | | | 29.23 | % | | $ | 601.3 | | | | 1.40 | % | | | 1.40 | % | | | .43 | % | | | 18 | % | |
8/31/2010 | | $ | — | | | $ | 22.00 | | | | 8.11 | % | | $ | 440.2 | | | | 1.38 | % | | | 1.38 | % | | | (.42 | %) | | | 16 | % | |
8/31/2009 | | $ | — | | | $ | 20.35 | | | | (25.95 | %) | | $ | 397.9 | | | | 1.38 | % | | | 1.38 | % | | | (.34 | %) | | | 12 | % | |
Institutional Class | |
8/31/2013 | | $ | — | | | $ | 57.62 | | | | 24.12 | % | | $ | 5,989.3 | | | | .85 | % | | | .85 | % | | | .87 | % | | | 20 | % | |
8/31/2012 | | $ | — | | | $ | 48.71 | | | | 6.51 | % | | $ | 5,707.1 | | | | .86 | % | | | .85 | % | | | .49 | % | | | 15 | % | |
8/31/2011 | | $ | — | | | $ | 47.48 | | | | 29.87 | % | | $ | 4,975.0 | | | | .89 | % | | | .87 | % | | | .97 | % | | | 18 | % | |
8/31/2010 | | $ | — | | | $ | 36.56 | | | | 8.68 | % | | $ | 3,571.8 | | | | .87 | % | | | .85 | % | | | .11 | % | | | 16 | % | |
8/31/2009 | | $ | — | | | $ | 33.64 | | | | (25.55 | %) | | $ | 3,283.0 | | | | .87 | % | | | .85 | % | | | .18 | % | | | 12 | % | |
216
Financial Highlights (cont'd)
| | | Net Asset
Value,
Beginning
of Year | | Net
Investment
Income (Loss)@ | | Net Gains or
Losses on
Securities
(both realized
and
unrealized) | | Total From
Investment
Operations | | Dividends
from Net
Investment
Income | | Distributions
from Net
Realized
Capital Gains | | Tax
Return of
Capital | | Total
Distributions | | Voluntary
Contribution
from
Management | |
Class R6 | |
Period from 3/15/2013^
to 8/31/2013 | | $ | 53.91 | | | $ | 0.18 | | | $ | 3.54 | | | $ | 3.72 | | | $ | — | | | $ | — | | | $ | — | | | $ | — | | | $ | — | | |
Global Equity Fund | |
Institutional Class | |
8/31/2013 | | $ | 8.50 | | | $ | 0.06 | | | $ | 0.93 | | | $ | 0.99 | | | $ | — | | | $ | — | | | $ | — | | | $ | — | | | $ | — | | |
8/31/2012 | | $ | 9.10 | | | $ | 0.09 | | | $ | 0.09 | | | $ | 0.18 | | | $ | (0.32 | ) | | $ | — | | | $ | (0.46 | ) | | $ | (0.78 | ) | | $ | — | | |
Period from 6/30/2011^
to 8/31/2011 | | $ | 10.00 | | | $ | (0.00 | ) | | $ | (0.90 | ) | | $ | (0.90 | ) | | $ | — | | | $ | — | | | $ | — | | | $ | — | | | $ | — | | |
Class A | |
8/31/2013 | | $ | 8.48 | | | $ | 0.03 | | | $ | 0.92 | | | $ | 0.95 | | | $ | — | | | $ | — | | | $ | — | | | $ | — | | | $ | — | | |
8/31/2012 | | $ | 9.09 | | | $ | 0.04 | | | $ | 0.11 | | | $ | 0.15 | | | $ | (0.30 | ) | | $ | — | | | $ | (0.46 | ) | | $ | (0.76 | ) | | $ | — | | |
Period from 6/30/2011^
to 8/31/2011 | | $ | 10.00 | | | $ | (0.01 | ) | | $ | (0.90 | ) | | $ | (0.91 | ) | | $ | — | | | $ | — | | | $ | — | | | $ | — | | | $ | — | | |
Class C | |
8/31/2013 | | $ | 8.41 | | | $ | (0.03 | ) | | $ | 0.90 | | | $ | 0.87 | | | $ | — | | | $ | — | | | $ | — | | | $ | — | | | $ | — | | |
8/31/2012 | | $ | 9.08 | | | $ | (0.02 | ) | | $ | 0.11 | | | $ | 0.09 | | | $ | (0.30 | ) | | $ | — | | | $ | (0.46 | ) | | $ | (0.76 | ) | | $ | — | | |
Period from 6/30/2011^
to 8/31/2011 | | $ | 10.00 | | | $ | (0.02 | ) | | $ | (0.90 | ) | | $ | (0.92 | ) | | $ | — | | | $ | — | | | $ | — | | | $ | — | | | $ | — | | |
Global Thematic Opportunities Fund | |
Institutional Class | |
8/31/2013 | | $ | 8.74 | | | $ | 0.05 | | | $ | 0.78 | | | $ | 0.83 | | | $ | (0.05 | ) | | $ | — | | | $ | — | | | $ | (0.05 | ) | | $ | — | | |
8/31/2012 | | $ | 9.44 | | | $ | 0.05 | | | $ | (0.73 | ) | | $ | (0.68 | ) | | $ | (0.02 | ) | | $ | — | | | $ | — | | | $ | (0.02 | ) | | $ | — | | |
Period from 6/30/2011^
to 8/31/2011 | | $ | 10.00 | | | $ | (0.00 | ) | | $ | (0.56 | ) | | $ | (0.56 | ) | | $ | — | | | $ | — | | | $ | — | | | $ | — | | | $ | — | | |
Class A | |
8/31/2013 | | $ | 8.70 | | | $ | 0.02 | | | $ | 0.78 | | | $ | 0.80 | | | $ | (0.03 | ) | | $ | — | | | $ | — | | | $ | (0.03 | ) | | $ | — | | |
8/31/2012 | | $ | 9.44 | | | $ | 0.02 | | | $ | (0.75 | ) | | $ | (0.73 | ) | | $ | (0.01 | ) | | $ | — | | | $ | — | | | $ | (0.01 | ) | | $ | — | | |
Period from 6/30/2011^
to 8/31/2011 | | $ | 10.00 | | | $ | (0.01 | ) | | $ | (0.55 | ) | | $ | (0.56 | ) | | $ | — | | | $ | — | | | $ | — | | | $ | — | | | $ | — | | |
See Notes to Financial Highlights
217
| | | Redemption
Feesøø | | Net
Asset
Value,
End of
Year | | Total
Return†† | | Net Assets,
End of Year
(in millions) | | Ratio of
Gross
Expenses
to Average
Net Assets# | | Ratio
of Net
Expenses
to Average
Net Assets‡ | | Ratio of Net
Investment
Income/
(Loss) to
Average Net
Assets | | Portfolio
Turnover
Rate | |
Class R6 | |
Period from 3/15/2013^
to 8/31/2013 | | $ | — | | | $ | 57.63 | | | | 6.90 | %** | | $ | 975.9 | | | | .80 | %* | | | .78 | %* | | | .67 | %* | | | 20 | %Ø | |
Global Equity Fund | |
Institutional Class | |
8/31/2013 | | $ | — | | | $ | 9.49 | | | | 11.65 | % | | $ | 33.5 | | | | 5.16 | % | | | 1.15 | % | | | .63 | % | | | 43 | % | |
8/31/2012 | | $ | — | | | $ | 8.50 | | | | 2.82 | % | | $ | 4.3 | | | | 10.85 | % | | | 1.15 | % | | | 1.12 | % | | | 62 | % | |
Period from 6/30/2011^
to 8/31/2011 | | $ | — | | | $ | 9.10 | | | | (9.00 | %)** | | $ | 0.8 | | | | 55.68 | %* | | | 1.15 | %* | | | (.20 | %)* | | | 8 | %** | |
Class A | |
8/31/2013 | | $ | — | | | $ | 9.43 | | | | 11.20 | % | | $ | 0.1 | | | | 5.67 | % | | | 1.51 | % | | | .34 | % | | | 43 | % | |
8/31/2012 | | $ | — | | | $ | 8.48 | | | | 2.51 | % | | $ | 0.1 | | | | 11.83 | % | | | 1.51 | % | | | .54 | % | | | 62 | % | |
Period from 6/30/2011^
to 8/31/2011 | | $ | — | | | $ | 9.09 | | | | (9.10 | %)** | | $ | 0.1 | | | | 69.65 | %* | | | 1.51 | %* | | | (.53 | %)* | | | 8 | %** | |
Class C | |
8/31/2013 | | $ | — | | | $ | 9.28 | | | | 10.34 | % | | $ | 0.1 | | | | 6.50 | % | | | 2.26 | % | | | (.36 | %) | | | 43 | % | |
8/31/2012 | | $ | — | | | $ | 8.41 | | | | 1.77 | % | | $ | 0.0 | | | | 12.88 | % | | | 2.26 | % | | | (.30 | %) | | | 62 | % | |
Period from 6/30/2011^
to 8/31/2011 | | $ | — | | | $ | 9.08 | | | | (9.20 | %)** | | $ | 0.0 | | | | 74.49 | %* | | | 2.26 | %* | | | (1.31 | %)* | | | 8 | %** | |
Global Thematic Opportunities Fund | |
Institutional Class | |
8/31/2013 | | $ | — | | | $ | 9.52 | | | | 9.53 | % | | $ | 73.1 | | | | 1.59 | % | | | 1.25 | % | | | .53 | % | | | 98 | % | |
8/31/2012 | | $ | — | | | $ | 8.74 | | | | (7.22 | %) | | $ | 49.8 | | | | 1.84 | % | | | 1.25 | % | | | .56 | % | | | 57 | % | |
Period from 6/30/2011^
to 8/31/2011 | | $ | — | | | $ | 9.44 | | | | (5.60 | %)** | | $ | 27.4 | | | | 4.83 | %* | | | 1.25 | %* | | | (.14 | %)* | | | 11 | %** | |
Class A | |
8/31/2013 | | $ | — | | | $ | 9.47 | | | | 9.20 | % | | $ | 0.6 | | | | 2.00 | % | | | 1.61 | % | | | .23 | % | | | 98 | % | |
8/31/2012 | | $ | — | | | $ | 8.70 | | | | (7.68 | %) | | $ | 0.6 | | | | 2.25 | % | | | 1.61 | % | | | .27 | % | | | 57 | % | |
Period from 6/30/2011^
to 8/31/2011 | | $ | — | | | $ | 9.44 | | | | (5.60 | %)** | | $ | 0.2 | | | | 13.72 | %* | | | 1.61 | %* | | | (.50 | %)* | | | 11 | %** | |
218
Financial Highlights (cont'd)
| | | Net Asset
Value,
Beginning
of Year | | Net
Investment
Income (Loss)@ | | Net Gains or
Losses on
Securities
(both realized
and
unrealized) | | Total From
Investment
Operations | | Dividends
from Net
Investment
Income | | Distributions
from Net
Realized
Capital Gains | | Tax
Return of
Capital | | Total
Distributions | | Voluntary
Contribution
from
Management | |
Class C | |
8/31/2013 | | $ | 8.63 | | | $ | (0.05 | ) | | $ | 0.77 | | | $ | 0.72 | | | $ | — | | | $ | — | | | $ | — | | | $ | — | | | $ | — | | |
8/31/2012 | | $ | 9.42 | | | $ | (0.05 | ) | | $ | (0.73 | ) | | $ | (0.78 | ) | | $ | (0.01 | ) | | $ | — | | | $ | — | | | $ | (0.01 | ) | | $ | — | | |
Period from 6/30/2011^
to 8/31/2011 | | $ | 10.00 | | | $ | (0.02 | ) | | $ | (0.56 | ) | | $ | (0.58 | ) | | $ | — | | | $ | — | | | $ | — | | | $ | — | | | $ | — | | |
Greater China Equity Fund | |
Institutional Class | |
Period from 7/17/2013^
to 8/31/2013 | | $ | 10.00 | | | $ | (0.02 | ) | | $ | 0.18 | | | $ | 0.16 | | | $ | — | | | $ | — | | | $ | — | | | $ | — | | | $ | — | | |
Class A | |
Period from 7/17/2013^
to 8/31/2013 | | $ | 10.00 | | | $ | (0.02 | ) | | $ | 0.18 | | | $ | 0.16 | | | $ | — | | | $ | — | | | $ | — | | | $ | — | | | $ | — | | |
Class C | |
Period from 7/17/2013^
to 8/31/2013 | | $ | 10.00 | | | $ | (0.03 | ) | | $ | 0.18 | | | $ | 0.15 | | | $ | — | | | $ | — | | | $ | — | | | $ | — | | | $ | — | | |
Guardian Fund | |
Investor Class | |
8/31/2013 | | $ | 15.80 | | | $ | 0.14 | | | $ | 3.28 | | | $ | 3.42 | | | $ | (0.20 | ) | | $ | (0.44 | ) | | $ | — | | | $ | (0.64 | ) | | $ | — | | |
8/31/2012 | | $ | 14.49 | | | $ | 0.12 | | | $ | 1.29 | | | $ | 1.41 | | | $ | (0.10 | ) | | $ | — | | | $ | — | | | $ | (0.10 | ) | | $ | — | | |
8/31/2011 | | $ | 11.98 | | | $ | 0.11 | | | $ | 2.45 | | | $ | 2.56 | | | $ | (0.05 | ) | | $ | — | | | $ | — | | | $ | (0.05 | ) | | $ | — | | |
8/31/2010 | | $ | 11.15 | | | $ | 0.05 | | | $ | 0.84 | | | $ | 0.89 | | | $ | (0.06 | ) | | $ | — | | | $ | — | | | $ | (0.06 | ) | | $ | — | | |
8/31/2009 | | $ | 16.58 | | | $ | 0.07 | | | $ | (4.15 | ) | | $ | (4.08 | ) | | $ | (0.05 | ) | | $ | (1.30 | ) | | $ | — | | | $ | (1.35 | ) | | $ | — | | |
Trust Class | |
8/31/2013 | | $ | 12.31 | | | $ | 0.09 | | | $ | 2.53 | | | $ | 2.62 | | | $ | (0.19 | ) | | $ | (0.44 | ) | | $ | — | | | $ | (0.63 | ) | | $ | — | | |
8/31/2012 | | $ | 11.32 | | | $ | 0.07 | | | $ | 1.01 | | | $ | 1.08 | | | $ | (0.09 | ) | | $ | — | | | $ | — | | | $ | (0.09 | ) | | $ | — | | |
8/31/2011 | | $ | 9.38 | | | $ | 0.06 | | | $ | 1.92 | | | $ | 1.98 | | | $ | (0.04 | ) | | $ | — | | | $ | — | | | $ | (0.04 | ) | | $ | — | | |
8/31/2010 | | $ | 8.75 | | | $ | 0.02 | | | $ | 0.66 | | | $ | 0.68 | | | $ | (0.05 | ) | | $ | — | | | $ | — | | | $ | (0.05 | ) | | $ | — | | |
8/31/2009 | | $ | 13.02 | | | $ | 0.04 | | | $ | (3.25 | ) | | $ | (3.21 | ) | | $ | (0.04 | ) | | $ | (1.02 | ) | | $ | — | | | $ | (1.06 | ) | | $ | — | | |
See Notes to Financial Highlights
219
| | | Redemption
Feesøø | | Net
Asset
Value,
End of
Year | | Total
Return†† | | Net Assets,
End of Year
(in millions) | | Ratio of
Gross
Expenses
to Average
Net Assets# | | Ratio
of Net
Expenses
to Average
Net Assets‡ | | Ratio of Net
Investment
Income/
(Loss) to
Average Net
Assets | | Portfolio
Turnover
Rate | |
Class C | |
8/31/2013 | | $ | — | | | $ | 9.35 | | | | 8.34 | % | | $ | 0.1 | | | | 2.84 | % | | | 2.36 | % | | | (.59 | %) | | | 98 | % | |
8/31/2012 | | $ | — | | | $ | 8.63 | | | | (8.25 | %) | | $ | 0.1 | | | | 3.11 | % | | | 2.36 | % | | | (.57 | %) | | | 57 | % | |
Period from 6/30/2011^
to 8/31/2011 | | $ | — | | | $ | 9.42 | | | | (5.80 | %)** | | $ | 0.1 | | | | 21.31 | %* | | | 2.36 | %* | | | (1.32 | %)* | | | 11 | %** | |
Greater China Equity Fund | |
Institutional Class | |
Period from 7/17/2013^
to 8/31/2013 | | $ | — | | | $ | 10.16 | | | | 1.60 | %** | | $ | 56.4 | | | | 2.80 | %b* | | | 1.50 | %b* | | | (1.25 | %)b* | | | 20 | %** | |
Class A | |
Period from 7/17/2013^
to 8/31/2013 | | $ | — | | | $ | 10.16 | | | | 1.60 | %** | | $ | 0.1 | | | | 17.58 | %b* | | | 1.86 | %b* | | | (1.65 | %)b* | | | 20 | %** | |
Class C | |
Period from 7/17/2013^
to 8/31/2013 | | $ | — | | | $ | 10.15 | | | | 1.50 | %** | | $ | 0.1 | | | | 19.16 | %b* | | | 2.61 | %b* | | | (2.41 | %)b* | | | 20 | %** | |
Guardian Fund | |
Investor Class | |
8/31/2013 | | $ | — | | | $ | 18.58 | | | | 22.54 | % | | $ | 1,040.3 | | | | .90 | % | | | .90 | % | | | .85 | % | | | 36 | % | |
8/31/2012 | | $ | — | | | $ | 15.80 | | | | 9.84 | % | | $ | 939.6 | | | | .92 | % | | | .92 | % | | | .79 | % | | | 26 | % | |
8/31/2011 | | $ | — | | | $ | 14.49 | | | | 21.35 | % | | $ | 962.6 | | | | .92 | % | | | .92 | % | | | .74 | % | | | 32 | % | |
8/31/2010 | | $ | — | | | $ | 11.98 | | | | 7.99 | % | | $ | 869.2 | | | | .95 | % | | | .95 | % | | | .40 | % | | | 36 | % | |
8/31/2009 | | $ | — | | | $ | 11.15 | | | | (22.65 | %) | | $ | 875.5 | | | | .97 | % | | | .97 | % | | | .67 | % | | | 29 | % | |
Trust Class | |
8/31/2013 | | $ | — | | | $ | 14.30 | | | | 22.36 | % | | $ | 129.4 | | | | 1.08 | % | | | 1.08 | % | | | .66 | % | | | 36 | % | |
8/31/2012 | | $ | — | | | $ | 12.31 | | | | 9.68 | % | | $ | 113.5 | | | | 1.09 | % | | | 1.09 | % | | | .64 | % | | | 26 | % | |
8/31/2011 | | $ | — | | | $ | 11.32 | | | | 21.08 | % | | $ | 102.6 | | | | 1.09 | % | | | 1.09 | % | | | .55 | % | | | 32 | % | |
8/31/2010 | | $ | — | | | $ | 9.38 | | | | 7.75 | % | | $ | 79.0 | | | | 1.12 | % | | | 1.12 | % | | | .23 | % | | | 36 | % | |
8/31/2009 | | $ | — | | | $ | 8.75 | | | | (22.74 | %) | | $ | 71.0 | | | | 1.14 | % | | | 1.14 | % | | | .50 | % | | | 29 | % | |
220
Financial Highlights (cont'd)
| | | Net Asset
Value,
Beginning
of Year | | Net
Investment
Income (Loss)@ | | Net Gains or
Losses on
Securities
(both realized
and
unrealized) | | Total From
Investment
Operations | | Dividends
from Net
Investment
Income | | Distributions
from Net
Realized
Capital Gains | | Tax
Return of
Capital | | Total
Distributions | | Voluntary
Contribution
from
Management | |
Advisor Class | |
8/31/2013 | | $ | 13.91 | | | $ | 0.04 | | | $ | 2.87 | | | $ | 2.91 | | | $ | (0.11 | ) | | $ | (0.44 | ) | | $ | — | | | $ | (0.55 | ) | | $ | — | | |
8/31/2012 | | $ | 12.77 | | | $ | 0.02 | | | $ | 1.16 | | | $ | 1.18 | | | $ | (0.04 | ) | | $ | — | | | $ | — | | | $ | (0.04 | ) | | $ | — | | |
8/31/2011 | | $ | 10.59 | | | $ | 0.02 | | | $ | 2.16 | | | $ | 2.18 | | | $ | — | | | $ | — | | | $ | — | | | $ | — | | | $ | — | | |
8/31/2010 | | $ | 9.87 | | | $ | (0.02 | ) | | $ | 0.75 | | | $ | 0.73 | | | $ | (0.01 | ) | | $ | — | | | $ | — | | | $ | (0.01 | ) | | $ | — | | |
8/31/2009 | | $ | 14.65 | | | $ | 0.01 | | | $ | (3.65 | ) | | $ | (3.64 | ) | | $ | (0.00 | ) | | $ | (1.14 | ) | | $ | — | | | $ | (1.14 | ) | | $ | — | | |
Institutional Class | |
8/31/2013 | | $ | 15.83 | | | $ | 0.17 | | | $ | 3.29 | | | $ | 3.46 | | | $ | (0.23 | ) | | $ | (0.44 | ) | | $ | — | | | $ | (0.67 | ) | | $ | — | | |
8/31/2012 | | $ | 14.52 | | | $ | 0.15 | | | $ | 1.29 | | | $ | 1.44 | | | $ | (0.13 | ) | | $ | — | | | $ | — | | | $ | (0.13 | ) | | $ | — | | |
8/31/2011 | | $ | 12.01 | | | $ | 0.12 | | | $ | 2.47 | | | $ | 2.59 | | | $ | (0.08 | ) | | $ | — | | | $ | — | | | $ | (0.08 | ) | | $ | — | | |
8/31/2010 | | $ | 11.16 | | | $ | 0.08 | | | $ | 0.84 | | | $ | 0.92 | | | $ | (0.07 | ) | | $ | — | | | $ | — | | | $ | (0.07 | ) | | $ | — | | |
Period from 5/27/2009^
to 8/31/2009 | | $ | 10.39 | | | $ | 0.03 | | | $ | 0.74 | | | $ | 0.77 | | | $ | — | | | $ | — | | | $ | — | | | $ | — | | | $ | — | | |
Class A | |
8/31/2013 | | $ | 12.24 | | | $ | 0.08 | | | $ | 2.52 | | | $ | 2.60 | | | $ | (0.19 | ) | | $ | (0.44 | ) | | $ | — | | | $ | (0.63 | ) | | $ | — | | |
8/31/2012 | | $ | 11.28 | | | $ | 0.07 | | | $ | 1.00 | | | $ | 1.07 | | | $ | (0.11 | ) | | $ | — | | | $ | — | | | $ | (0.11 | ) | | $ | — | | |
8/31/2011 | | $ | 9.36 | | | $ | 0.06 | | | $ | 1.91 | | | $ | 1.97 | | | $ | (0.05 | ) | | $ | — | | | $ | — | | | $ | (0.05 | ) | | $ | — | | |
8/31/2010 | | $ | 8.75 | | | $ | 0.02 | | | $ | 0.66 | | | $ | 0.68 | | | $ | (0.07 | ) | | $ | — | | | $ | — | | | $ | (0.07 | ) | | $ | — | | |
Period from 5/27/2009^
to 8/31/2009 | | $ | 8.15 | | | $ | 0.01 | | | $ | 0.59 | | | $ | 0.60 | | | $ | — | | | $ | — | | | $ | — | | | $ | — | | | $ | — | | |
Class C | |
8/31/2013 | | $ | 13.66 | | | $ | (0.02 | ) | | $ | 2.84 | | | $ | 2.82 | | | $ | (0.08 | ) | | $ | (0.44 | ) | | $ | — | | | $ | (0.52 | ) | | $ | — | | |
8/31/2012 | | $ | 12.60 | | | $ | (0.02 | ) | | $ | 1.13 | | | $ | 1.11 | | | $ | (0.05 | ) | | $ | — | | | $ | — | | | $ | (0.05 | ) | | $ | — | | |
8/31/2011 | | $ | 10.51 | | | $ | (0.04 | ) | | $ | 2.15 | | | $ | 2.11 | | | $ | (0.02 | ) | | $ | — | | | $ | — | | | $ | (0.02 | ) | | $ | — | | |
8/31/2010 | | $ | 9.86 | | | $ | (0.06 | ) | | $ | 0.76 | | | $ | 0.70 | | | $ | (0.05 | ) | | $ | — | | | $ | — | | | $ | (0.05 | ) | | $ | — | | |
Period from 5/27/2009^
to 8/31/2009 | | $ | 9.21 | | | $ | 0.00 | | | $ | 0.65 | | | $ | 0.65 | | | $ | — | | | $ | — | | | $ | — | | | $ | — | | | $ | — | | |
Class R3 | |
8/31/2013 | | $ | 13.79 | | | $ | 0.04 | | | $ | 2.89 | | | $ | 2.93 | | | $ | (0.03 | ) | | $ | (0.44 | ) | | $ | — | | | $ | (0.47 | ) | | $ | — | | |
8/31/2012 | | $ | 12.72 | | | $ | 0.05 | | | $ | 1.13 | | | $ | 1.18 | | | $ | (0.11 | ) | | $ | — | | | $ | — | | | $ | (0.11 | ) | | $ | — | | |
8/31/2011 | | $ | 10.57 | | | $ | 0.04 | | | $ | 2.16 | | | $ | 2.20 | | | $ | (0.05 | ) | | $ | — | | | $ | — | | | $ | (0.05 | ) | | $ | — | | |
8/31/2010 | | $ | 9.88 | | | $ | (0.00 | ) | | $ | 0.74 | | | $ | 0.74 | | | $ | (0.05 | ) | | $ | — | | | $ | — | | | $ | (0.05 | ) | | $ | — | | |
Period from 5/27/2009^
to 8/31/2009 | | $ | 9.21 | | | $ | 0.01 | | | $ | 0.66 | | | $ | 0.67 | | | $ | — | | | $ | — | | | $ | — | | | $ | — | | | $ | — | | |
See Notes to Financial Highlights
221
| | | Redemption
Feesøø | | Net
Asset
Value,
End of
Year | | Total
Return†† | | Net Assets,
End of Year
(in millions) | | Ratio of
Gross
Expenses
to Average
Net Assets# | | Ratio
of Net
Expenses
to Average
Net Assets‡ | | Ratio of Net
Investment
Income/
(Loss) to
Average Net
Assets | | Portfolio
Turnover
Rate | |
Advisor Class | |
8/31/2013 | | $ | — | | | $ | 16.27 | | | | 21.81 | % | | $ | 0.6 | | | | 1.50 | % | | | 1.50 | %§ | | | .23 | % | | | 36 | % | |
8/31/2012 | | $ | — | | | $ | 13.91 | | | | 9.27 | % | | $ | 0.6 | | | | 1.50 | % | | | 1.50 | %§ | | | .19 | % | | | 26 | % | |
8/31/2011 | | $ | — | | | $ | 12.77 | | | | 20.59 | % | | $ | 0.6 | | | | 1.50 | % | | | 1.50 | %§ | | | .15 | % | | | 32 | % | |
8/31/2010 | | $ | — | | | $ | 10.59 | | | | 7.38 | % | | $ | 0.5 | | | | 2.59 | % | | | 1.50 | % | | | (.16 | %) | | | 36 | % | |
8/31/2009 | | $ | — | | | $ | 9.87 | | | | (23.05 | %) | | $ | 0.5 | | | | 5.33 | % | | | 1.50 | % | | | .13 | % | | | 29 | % | |
Institutional Class | |
8/31/2013 | | $ | — | | | $ | 18.62 | | | | 22.80 | % | | $ | 88.9 | | | | .73 | % | | | .73 | % | | | 1.00 | % | | | 36 | % | |
8/31/2012 | | $ | — | | | $ | 15.83 | | | | 10.03 | % | | $ | 60.0 | | | | .74 | % | | | .74 | %§ | | | 1.01 | % | | | 26 | % | |
8/31/2011 | | $ | — | | | $ | 14.52 | | | | 21.51 | % | | $ | 33.5 | | | | .75 | % | | | .75 | %§ | | | .77 | % | | | 32 | % | |
8/31/2010 | | $ | — | | | $ | 12.01 | | | | 8.22 | % | | $ | 4.3 | | | | .81 | % | | | .75 | % | | | .65 | % | | | 36 | % | |
Period from 5/27/2009^
to 8/31/2009 | | $ | — | | | $ | 11.16 | | | | 7.41 | %** | | $ | 0.1 | | | | 5.16 | %* | | | .75 | %* | | | 1.12 | %* | | | 29 | %Ø | |
Class A | |
8/31/2013 | | $ | — | | | $ | 14.21 | | | | 22.38 | % | | $ | 34.6 | | | | 1.11 | % | | | 1.11 | %§ | | | .62 | % | | | 36 | % | |
8/31/2012 | | $ | — | | | $ | 12.24 | | | | 9.63 | % | | $ | 17.6 | | | | 1.12 | % | | | 1.11 | % | | | .64 | % | | | 26 | % | |
8/31/2011 | | $ | — | | | $ | 11.28 | | | | 21.06 | % | | $ | 10.8 | | | | 1.15 | % | | | 1.11 | % | | | .51 | % | | | 32 | % | |
8/31/2010 | | $ | — | | | $ | 9.36 | | | | 7.72 | % | | $ | 3.5 | | | | 1.22 | % | | | 1.11 | % | | | .23 | % | | | 36 | % | |
Period from 5/27/2009^
to 8/31/2009 | | $ | — | | | $ | 8.75 | | | | 7.36 | %** | | $ | 0.5 | | | | 2.24 | %* | | | 1.11 | %* | | | .41 | %* | | | 29 | %Ø | |
Class C | |
8/31/2013 | | $ | — | | | $ | 15.96 | | | | 21.43 | % | | $ | 2.6 | | | | 1.86 | % | | | 1.86 | % | | | (.15 | %) | | | 36 | % | |
8/31/2012 | | $ | — | | | $ | 13.66 | | | | 8.83 | % | | $ | 1.3 | | | | 1.88 | % | | | 1.86 | % | | | (.13 | %) | | | 26 | % | |
8/31/2011 | | $ | — | | | $ | 12.60 | | | | 20.11 | % | | $ | 1.1 | | | | 1.90 | % | | | 1.86 | % | | | (.28 | %) | | | 32 | % | |
8/31/2010 | | $ | — | | | $ | 10.51 | | | | 7.08 | % | | $ | 0.4 | | | | 2.46 | % | | | 1.86 | % | | | (.51 | %) | | | 36 | % | |
Period from 5/27/2009^
to 8/31/2009 | | $ | — | | | $ | 9.86 | | | | 7.06 | %** | | $ | 0.1 | | | | 6.27 | %* | | | 1.86 | %* | | | .01 | %* | | | 29 | %Ø | |
Class R3 | |
8/31/2013 | | $ | — | | | $ | 16.25 | | | | 22.03 | % | | $ | 0.4 | | | | 1.41 | % | | | 1.36 | % | | | .24 | % | | | 36 | % | |
8/31/2012 | | $ | — | | | $ | 13.79 | | | | 9.40 | % | | $ | 0.5 | | | | 1.39 | % | | | 1.36 | % | | | .36 | % | | | 26 | % | |
8/31/2011 | | $ | — | | | $ | 12.72 | | | | 20.79 | % | | $ | 0.4 | | | | 1.44 | % | | | 1.36 | % | | | .28 | % | | | 32 | % | |
8/31/2010 | | $ | — | | | $ | 10.57 | | | | 7.51 | % | | $ | 0.1 | | | | 3.12 | % | | | 1.36 | % | | | (.02 | %) | | | 36 | % | |
Period from 5/27/2009^
to 8/31/2009 | | $ | — | | | $ | 9.88 | | | | 7.27 | %** | | $ | 0.1 | | | | 5.77 | %* | | | 1.36 | %* | | | .51 | %* | | | 29 | %Ø | |
222
Financial Highlights (cont'd)
| | Net Asset
Value,
Beginning
of Year | | Net
Investment
Income (Loss)@ | | Net Gains or
Losses on
Securities
(both realized
and
unrealized) | | Total From
Investment
Operations | | Dividends
from Net
Investment
Income | | Distributions
from Net
Realized
Capital Gains | | Tax
Return of
Capital | | Total
Distributions | | Voluntary
Contribution
from
Management | |
International Equity Fund | |
Investor Class | |
Period from 1/28/2013^
to 8/31/2013 | | $ | 18.03 | | | $ | 0.21 | | | $ | 0.38 | | | $ | 0.59 | | | $ | — | | | $ | — | | | $ | — | | | $ | — | | | $ | — | | |
Trust Class | |
Period from 1/28/2013^
to 8/31/2013 | | $ | 20.05 | | | $ | 0.21 | | | $ | 0.44 | | | $ | 0.65 | | | $ | — | | | $ | — | | | $ | — | | | $ | — | | | $ | — | | |
Institutional Class | |
8/31/2013 | | $ | 9.15 | | | $ | 0.15 | | | $ | 1.10 | | | $ | 1.25 | | | $ | (0.14 | ) | | $ | — | | | $ | — | | | $ | (0.14 | ) | | $ | — | | |
8/31/2012 | | $ | 9.20 | | | $ | 0.16 | | | $ | (0.10 | ) | | $ | 0.06 | | | $ | (0.11 | ) | | $ | — | | | $ | — | | | $ | (0.11 | ) | | $ | — | | |
8/31/2011 | | $ | 8.10 | | | $ | 0.16 | | | $ | 1.11 | | | $ | 1.27 | | | $ | (0.17 | ) | | $ | — | | | $ | — | | | $ | (0.17 | ) | | $ | — | | |
8/31/2010 | | $ | 7.53 | | | $ | 0.12 | | | $ | 0.56 | | | $ | 0.68 | | | $ | (0.11 | ) | | $ | — | | | $ | — | | | $ | (0.11 | ) | | $ | — | | |
8/31/2009 | | $ | 9.84 | | | $ | 0.13 | | | $ | (2.17 | ) | | $ | (2.04 | ) | | $ | (0.27 | ) | | $ | — | | | $ | — | | | $ | (0.27 | ) | | $ | — | | |
Class A | |
Period from 1/28/2013^
to 8/31/2013 | | $ | 20.05 | | | $ | 0.19 | | | $ | 0.45 | | | $ | 0.64 | | | $ | — | | | $ | — | | | $ | — | | | $ | — | | | $ | — | | |
Class C | |
Period from 1/28/2013^
to 8/31/2013 | | $ | 19.97 | | | $ | 0.09 | | | $ | 0.44 | | | $ | 0.53 | | | $ | — | | | $ | — | | | $ | — | | | $ | — | | | $ | — | | |
International Large Cap Fund | |
Trust Class | |
8/31/2013 | | $ | 9.14 | | | $ | 0.10 | | | $ | 1.01 | | | $ | 1.11 | | | $ | (0.11 | ) | | $ | — | | | $ | — | | | $ | (0.11 | ) | | $ | — | | |
8/31/2012 | | $ | 9.35 | | | $ | 0.13 | | | $ | (0.24 | ) | | $ | (0.11 | ) | | $ | (0.10 | ) | | $ | — | | | $ | — | | | $ | (0.10 | ) | | $ | — | | |
8/31/2011 | | $ | 8.31 | | | $ | 0.09 | | | $ | 1.00 | | | $ | 1.09 | | | $ | (0.05 | ) | | $ | — | | | $ | — | | | $ | (0.05 | ) | | $ | — | | |
8/31/2010 | | $ | 7.93 | | | $ | 0.09 | | | $ | 0.38 | | | $ | 0.47 | | | $ | (0.09 | ) | | $ | — | | | $ | — | | | $ | (0.09 | ) | | $ | — | | |
8/31/2009 | | $ | 10.12 | | | $ | 0.11 | | | $ | (2.08 | ) | | $ | (1.97 | ) | | $ | (0.22 | ) | | $ | — | | | $ | — | | | $ | (0.22 | ) | | $ | — | | |
Institutional Class | |
8/31/2013 | | $ | 9.14 | | | $ | 0.14 | | | $ | 1.00 | | | $ | 1.14 | | | $ | (0.14 | ) | | $ | — | | | $ | — | | | $ | (0.14 | ) | | $ | — | | |
8/31/2012 | | $ | 9.36 | | | $ | 0.15 | | | $ | (0.23 | ) | | $ | (0.08 | ) | | $ | (0.14 | ) | | $ | — | | | $ | — | | | $ | (0.14 | ) | | $ | — | | |
8/31/2011 | | $ | 8.32 | | | $ | 0.16 | | | $ | 0.96 | | | $ | 1.12 | | | $ | (0.08 | ) | | $ | — | | | $ | — | | | $ | (0.08 | ) | | $ | — | | |
8/31/2010 | | $ | 7.93 | | | $ | 0.12 | | | $ | 0.38 | | | $ | 0.50 | | | $ | (0.11 | ) | | $ | — | | | $ | — | | | $ | (0.11 | ) | | $ | — | | |
8/31/2009 | | $ | 10.15 | | | $ | 0.14 | | | $ | (2.09 | ) | | $ | (1.95 | ) | | $ | (0.27 | ) | | $ | — | | | $ | — | | | $ | (0.27 | ) | | $ | — | | |
See Notes to Financial Highlights
223
| | | Redemption
Feesøø | | Net
Asset
Value,
End of
Year | | Total
Return†† | | Net Assets,
End of Year
(in millions) | | Ratio of
Gross
Expenses
to Average
Net Assets# | | Ratio
of Net
Expenses
to Average
Net Assets‡ | | Ratio of Net
Investment
Income/
(Loss) to
Average Net
Assets | | Portfolio
Turnover
Rate | |
International Equity Fund | |
Investor Class | |
Period from 1/28/2013^
to 8/31/2013 | | $ | — | | | $ | 18.62 | | | | 3.27 | %**d | | $ | 125.7 | | | | 1.32 | %* | | | 1.09 | %* | | | 1.87 | %* | | | 44 | %Øa | |
Trust Class | |
Period from 1/28/2013^
to 8/31/2013 | | $ | — | | | $ | 20.70 | | | | 3.24 | %**d | | $ | 111.9 | | | | 1.42 | %* | | | 1.19 | %* | | | 1.73 | %* | | | 44 | %Øa | |
Institutional Class | |
8/31/2013 | | $ | — | | | $ | 10.26 | | | | 13.82 | % | | $ | 770.3 | | | | 1.14 | % | | | .85 | % | | | 1.54 | % | | | 44 | %a | |
8/31/2012 | | $ | — | | | $ | 9.15 | | | | .78 | % | | $ | 491.6 | | | | 1.16 | % | | | .84 | % | | | 1.88 | % | | | 33 | % | |
8/31/2011 | | $ | — | | | $ | 9.20 | | | | 15.62 | % | | $ | 342.6 | | | | 1.23 | % | | | .80 | % | | | 1.67 | % | | | 46 | % | |
8/31/2010 | | $ | 0.00 | | | $ | 8.10 | | | | 9.05 | % | | $ | 168.1 | | | | 1.24 | % | | | .80 | % | | | 1.53 | % | | | 50 | % | |
8/31/2009 | | $ | 0.00 | | | $ | 7.53 | | | | (19.92 | %) | | $ | 223.8 | | | | 1.26 | % | | | .81 | % | | | 2.01 | % | | | 98 | % | |
Class A | |
Period from 1/28/2013^
to 8/31/2013 | | $ | — | | | $ | 20.69 | | | | 3.19 | %**d | | $ | 12.8 | | | | 1.55 | %* | | | 1.28 | %* | | | 1.57 | %* | | | 44 | %Øa | |
Class C | |
Period from 1/28/2013^
to 8/31/2013 | | $ | — | | | $ | 20.50 | | | | 2.65 | %**d | | $ | 1.9 | | | | 2.51 | %* | | | 2.08 | %* | | | .74 | %* | | | 44 | %Øa | |
International Large Cap Fund | |
Trust Class | |
8/31/2013 | | $ | — | | | $ | 10.14 | | | | 12.17 | % | | $ | 13.9 | | | | 1.37 | % | | | 1.25 | % | | | 1.05 | % | | | 50 | % | |
8/31/2012 | | $ | — | | | $ | 9.14 | | | | (1.05 | %) | | $ | 14.2 | | | | 1.40 | % | | | 1.25 | % | | | 1.47 | % | | | 29 | % | |
8/31/2011 | | $ | 0.00 | | | $ | 9.35 | | | | 13.09 | % | | $ | 18.6 | | | | 1.39 | % | | | 1.25 | % | | | .97 | % | | | 54 | % | |
8/31/2010 | | $ | 0.00 | | | $ | 8.31 | | | | 5.87 | % | | $ | 27.7 | | | | 1.53 | % | | | 1.25 | % | | | 1.10 | % | | | 45 | % | |
8/31/2009 | | $ | 0.00 | | | $ | 7.93 | | | | (18.84 | %) | | $ | 28.9 | | | | 1.73 | % | | | 1.27 | % | | | 1.62 | % | | | 90 | % | |
Institutional Class | |
8/31/2013 | | $ | — | | | $ | 10.14 | | | | 12.56 | % | | $ | 200.6 | | | | .97 | % | | | .90 | % | | | 1.44 | % | | | 50 | % | |
8/31/2012 | | $ | — | | | $ | 9.14 | | | | (.65 | %) | | $ | 172.0 | | | | .99 | % | | | .90 | % | | | 1.76 | % | | | 29 | % | |
8/31/2011 | | $ | 0.00 | | | $ | 9.36 | | | | 13.39 | % | | $ | 161.5 | | | | 1.01 | % | | | .90 | % | | | 1.60 | % | | | 54 | % | |
8/31/2010 | | $ | 0.00 | | | $ | 8.32 | | | | 6.29 | % | | $ | 129.5 | | | | 1.12 | % | | | .90 | % | | | 1.45 | % | | | 45 | % | |
8/31/2009 | | $ | 0.00 | | | $ | 7.93 | | | | (18.57 | %) | | $ | 67.7 | | | | 1.30 | % | | | .92 | % | | | 2.00 | % | | | 90 | % | |
224
Financial Highlights (cont'd)
| | | Net Asset
Value,
Beginning
of Year | | Net
Investment
Income (Loss)@ | | Net Gains or
Losses on
Securities
(both realized
and
unrealized) | | Total From
Investment
Operations | | Dividends
from Net
Investment
Income | | Distributions
from Net
Realized
Capital Gains | | Tax
Return of
Capital | | Total
Distributions | | Voluntary
Contribution
from
Management | |
Class A | |
8/31/2013 | | $ | 9.09 | | | $ | 0.11 | | | $ | 0.98 | | | $ | 1.09 | | | $ | (0.11 | ) | | $ | — | | | $ | — | | | $ | (0.11 | ) | | $ | — | | |
8/31/2012 | | $ | 9.30 | | | $ | 0.14 | | | $ | (0.24 | ) | | $ | (0.10 | ) | | $ | (0.11 | ) | | $ | — | | | $ | — | | | $ | (0.11 | ) | | $ | — | | |
8/31/2011 | | $ | 8.27 | | | $ | 0.08 | | | $ | 1.00 | | | $ | 1.08 | | | $ | (0.05 | ) | | $ | — | | | $ | — | | | $ | (0.05 | ) | | $ | — | | |
8/31/2010 | | $ | 7.90 | | | $ | 0.10 | | | $ | 0.37 | | | $ | 0.47 | | | $ | (0.10 | ) | | $ | — | | | $ | — | | | $ | (0.10 | ) | | $ | — | | |
8/31/2009 | | $ | 10.12 | | | $ | 0.11 | | | $ | (2.08 | ) | | $ | (1.97 | ) | | $ | (0.25 | ) | | $ | — | | | $ | — | | | $ | (0.25 | ) | | $ | — | | |
Class C | |
8/31/2013 | | $ | 8.98 | | | $ | 0.04 | | | $ | 0.97 | | | $ | 1.01 | | | $ | (0.06 | ) | | $ | — | | | $ | — | | | $ | (0.06 | ) | | $ | — | | |
8/31/2012 | | $ | 9.17 | | | $ | 0.06 | | | $ | (0.21 | ) | | $ | (0.15 | ) | | $ | (0.04 | ) | | $ | — | | | $ | — | | | $ | (0.04 | ) | | $ | — | | |
8/31/2011 | | $ | 8.20 | | | $ | 0.05 | | | $ | 0.95 | | | $ | 1.00 | | | $ | (0.03 | ) | | $ | — | | | $ | — | | | $ | (0.03 | ) | | $ | — | | |
8/31/2010 | | $ | 7.87 | | | $ | 0.04 | | | $ | 0.36 | | | $ | 0.40 | | | $ | (0.07 | ) | | $ | — | | | $ | — | | | $ | (0.07 | ) | | $ | — | | |
8/31/2009 | | $ | 10.06 | | | $ | 0.08 | | | $ | (2.08 | ) | | $ | (2.00 | ) | | $ | (0.19 | ) | | $ | — | | | $ | — | | | $ | (0.19 | ) | | $ | — | | |
Class R3 | |
8/31/2013 | | $ | 9.04 | | | $ | 0.07 | | | $ | 0.99 | | | $ | 1.06 | | | $ | (0.09 | ) | | $ | — | | | $ | — | | | $ | (0.09 | ) | | $ | — | | |
8/31/2012 | | $ | 9.27 | | | $ | 0.12 | | | $ | (0.25 | ) | | $ | (0.13 | ) | | $ | (0.10 | ) | | $ | — | | | $ | — | | | $ | (0.10 | ) | | $ | — | | |
8/31/2011 | | $ | 8.26 | | | $ | 0.11 | | | $ | 0.94 | | | $ | 1.05 | | | $ | (0.04 | ) | | $ | — | | | $ | — | | | $ | (0.04 | ) | | $ | — | | |
8/31/2010 | | $ | 7.90 | | | $ | 0.07 | | | $ | 0.37 | | | $ | 0.44 | | | $ | (0.08 | ) | | $ | — | | | $ | — | | | $ | (0.08 | ) | | $ | — | | |
Period from 5/27/2009^
to 8/31/2009 | | $ | 7.10 | | | $ | 0.03 | | | $ | 0.77 | | | $ | 0.80 | | | $ | — | | | $ | — | | | $ | — | | | $ | — | | | $ | — | | |
Intrinsic Value Fund | |
Institutional Class | |
8/31/2013 | | $ | 10.26 | | | $ | 0.05 | | | $ | 2.68 | | | $ | 2.73 | | | $ | — | | | $ | (0.18 | ) | | $ | — | | | $ | (0.18 | ) | | $ | — | | |
8/31/2012 | | $ | 10.26 | | | $ | (0.01 | ) | | $ | 1.09 | | | $ | 1.08 | | | $ | — | | | $ | (1.08 | ) | | $ | — | | | $ | (1.08 | ) | | $ | — | | |
8/31/2011 | | $ | 9.41 | | | $ | (0.04 | ) | | $ | 1.32 | | | $ | 1.28 | | | $ | (0.03 | ) | | $ | (0.40 | ) | | $ | — | | | $ | (0.43 | ) | | $ | — | | |
Period from 5/10/2010^
to 8/31/2010 | | $ | 10.00 | | | $ | 0.01 | | | $ | (0.60 | ) | | $ | (0.59 | ) | | $ | — | | | $ | — | | | $ | — | | | $ | — | | | $ | — | | |
Class A | |
8/31/2013 | | $ | 10.16 | | | $ | 0.00 | | | $ | 2.67 | | | $ | 2.67 | | | $ | — | | | $ | (0.18 | ) | | $ | — | | | $ | (0.18 | ) | | $ | — | | |
8/31/2012 | | $ | 10.22 | | | $ | (0.05 | ) | | $ | 1.07 | | | $ | 1.02 | | | $ | — | | | $ | (1.08 | ) | | $ | — | | | $ | (1.08 | ) | | $ | — | | |
8/31/2011 | | $ | 9.40 | | | $ | (0.09 | ) | | $ | 1.34 | | | $ | 1.25 | | | $ | (0.03 | ) | | $ | (0.40 | ) | | $ | — | | | $ | (0.43 | ) | | $ | — | | |
Period from 5/10/2010^
to 8/31/2010 | | $ | 10.00 | | | $ | (0.00 | ) | | $ | (0.60 | ) | | $ | (0.60 | ) | | $ | — | | | $ | — | | | $ | — | | | $ | — | | | $ | — | | |
See Notes to Financial Highlights
225
| | | Redemption
Feesøø | | Net
Asset
Value,
End of
Year | | Total
Return†† | | Net Assets,
End of Year
(in millions) | | Ratio of
Gross
Expenses
to Average
Net Assets# | | Ratio
of Net
Expenses
to Average
Net Assets‡ | | Ratio of Net
Investment
Income/
(Loss) to
Average Net
Assets | | Portfolio
Turnover
Rate | |
Class A | |
8/31/2013 | | $ | — | | | $ | 10.07 | | | | 12.08 | % | | $ | 9.3 | | | | 1.36 | % | | | 1.24 | % | | | 1.16 | % | | | 50 | % | |
8/31/2012 | | $ | — | | | $ | 9.09 | | | | (.96 | %) | | $ | 8.3 | | | | 1.39 | % | | | 1.24 | % | | | 1.56 | % | | | 29 | % | |
8/31/2011 | | $ | 0.00 | | | $ | 9.30 | | | | 13.06 | % | | $ | 5.2 | | | | 1.39 | % | | | 1.24 | % | | | .81 | % | | | 54 | % | |
8/31/2010 | | $ | 0.00 | | | $ | 8.27 | | | | 5.87 | % | | $ | 9.3 | | | | 1.52 | % | | | 1.24 | % | | | 1.24 | % | | | 45 | % | |
8/31/2009 | | $ | 0.00 | | | $ | 7.90 | | | | (18.83 | %) | | $ | 4.0 | | | | 2.17 | % | | | 1.29 | % | | | 1.63 | % | | | 90 | % | |
Class C | |
8/31/2013 | | $ | — | | | $ | 9.93 | | | | 11.23 | % | | $ | 4.0 | | | | 2.09 | % | | | 2.00 | % | | | .36 | % | | | 50 | % | |
8/31/2012 | | $ | — | | | $ | 8.98 | | | | (1.64 | %) | | $ | 3.7 | | | | 2.13 | % | | | 2.00 | % | | | .65 | % | | | 29 | % | |
8/31/2011 | | $ | 0.00 | | | $ | 9.17 | | | | 12.19 | % | | $ | 2.1 | | | | 2.14 | % | | | 2.00 | % | | | .57 | % | | | 54 | % | |
8/31/2010 | | $ | 0.00 | | | $ | 8.20 | | | | 5.02 | % | | $ | 1.5 | | | | 2.29 | % | | | 2.01 | % | | | .45 | % | | | 45 | % | |
8/31/2009 | | $ | 0.00 | | | $ | 7.87 | | | | (19.34 | %) | | $ | 0.4 | | | | 3.94 | % | | | 2.01 | % | | | 1.23 | % | | | 90 | % | |
Class R3 | |
8/31/2013 | | $ | — | | | $ | 10.01 | | | | 11.83 | % | | $ | 2.6 | | | | 1.60 | % | | | 1.51 | % | | | .74 | % | | | 50 | % | |
8/31/2012 | | $ | — | | | $ | 9.04 | | | | (1.24 | %) | | $ | 0.4 | | | | 1.67 | % | | | 1.51 | % | | | 1.35 | % | | | 29 | % | |
8/31/2011 | | $ | 0.00 | | | $ | 9.27 | | | | 12.71 | % | | $ | 0.1 | | | | 1.87 | % | | | 1.51 | % | | | 1.15 | % | | | 54 | % | |
8/31/2010 | | $ | 0.00 | | | $ | 8.26 | | | | 5.57 | % | | $ | 0.1 | | | | 3.50 | % | | | 1.51 | % | | | .87 | % | | | 45 | % | |
Period from 5/27/2009^
to 8/31/2009 | | $ | 0.00 | | | $ | 7.90 | | | | 11.27 | %** | | $ | 0.1 | | | | 6.18 | %* | | | 1.52 | %* | | | 1.31 | %* | | | 90 | %Ø | |
Intrinsic Value Fund | |
Institutional Class | |
8/31/2013 | | $ | — | | | $ | 12.81 | | | | 26.94 | % | | $ | 182.6 | | | | 1.18 | % | | | 1.00 | % | | | .42 | % | | | 25 | % | |
8/31/2012 | | $ | — | | | $ | 10.26 | | | | 12.21 | % | | $ | 134.2 | | | | 1.22 | % | | | 1.00 | % | | | (.14 | %) | | | 30 | % | |
8/31/2011 | | $ | — | | | $ | 10.26 | | | | 13.08 | % | | $ | 114.7 | | | | 1.26 | % | | | 1.00 | % | | | (.35 | %) | | | 44 | % | |
Period from 5/10/2010^
to 8/31/2010 | | $ | — | | | $ | 9.41 | | | | (5.90 | %)** | | $ | 80.9 | | | | 1.70 | %* | | | 1.00 | %* | | | .33 | %* | | | 19 | %** | |
Class A | |
8/31/2013 | | $ | — | | | $ | 12.65 | | | | 26.61 | % | | $ | 13.9 | | | | 1.58 | % | | | 1.36 | % | | | .01 | % | | | 25 | % | |
8/31/2012 | | $ | — | | | $ | 10.16 | | | | 11.62 | % | | $ | 8.4 | | | | 1.61 | % | | | 1.36 | % | | | (.51 | %) | | | 30 | % | |
8/31/2011 | | $ | — | | | $ | 10.22 | | | | 12.74 | % | | $ | 8.6 | | | | 1.65 | % | | | 1.36 | % | | | (.73 | %) | | | 44 | % | |
Period from 5/10/2010^
to 8/31/2010 | | $ | — | | | $ | 9.40 | | | | (6.00 | %)** | | $ | 0.6 | | | | 2.11 | %* | | | 1.36 | %* | | | (.02 | %)* | | | 19 | %** | |
226
Financial Highlights (cont'd)
| | | Net Asset
Value,
Beginning
of Year | | Net
Investment
Income (Loss)@ | | Net Gains or
Losses on
Securities
(both realized
and
unrealized) | | Total From
Investment
Operations | | Dividends
from Net
Investment
Income | | Distributions
from Net
Realized
Capital Gains | | Tax
Return of
Capital | | Total
Distributions | | Voluntary
Contribution
from
Management | |
Class C | |
8/31/2013 | | $ | 10.00 | | | $ | (0.08 | ) | | $ | 2.61 | | | $ | 2.53 | | | $ | — | | | $ | (0.18 | ) | | $ | — | | | $ | (0.18 | ) | | $ | — | | |
8/31/2012 | | $ | 10.14 | | | $ | (0.12 | ) | | $ | 1.06 | | | $ | 0.94 | | | $ | — | | | $ | (1.08 | ) | | $ | — | | | $ | (1.08 | ) | | $ | — | | |
8/31/2011 | | $ | 9.38 | | | $ | (0.17 | ) | | $ | 1.34 | | | $ | 1.17 | | | $ | (0.01 | ) | | $ | (0.40 | ) | | $ | — | | | $ | (0.41 | ) | | $ | — | | |
Period from 5/10/2010^
to 8/31/2010 | | $ | 10.00 | | | $ | (0.02 | ) | | $ | (0.60 | ) | | $ | (0.62 | ) | | $ | — | | | $ | — | | | $ | — | | | $ | — | | | $ | — | | |
Large Cap Disciplined Growth Fund | |
Investor Class | |
8/31/2013 | | $ | 7.68 | | | $ | 0.03 | | | $ | 0.89 | | | $ | 0.92 | | | $ | (0.05 | ) | | $ | (0.37 | ) | | $ | — | | | $ | (0.42 | ) | | $ | — | | |
8/31/2012 | | $ | 7.38 | | | $ | 0.01 | | | $ | 0.62 | | | $ | 0.63 | | | $ | — | | | $ | (0.33 | ) | | $ | — | | | $ | (0.33 | ) | | $ | — | | |
8/31/2011 | | $ | 6.18 | | | $ | (0.01 | ) | | $ | 1.21 | | | $ | 1.20 | | | $ | (0.00 | ) | | $ | — | | | $ | — | | | $ | (0.00 | ) | | $ | — | | |
8/31/2010 | | $ | 6.04 | | | $ | 0.02 | | | $ | 0.12 | | | $ | 0.14 | | | $ | (0.00 | ) | | $ | — | | | $ | — | | | $ | (0.00 | ) | | $ | — | | |
8/31/2009 | | $ | 7.39 | | | $ | 0.02 | | | $ | (1.37 | ) | | $ | (1.35 | ) | | $ | — | | | $ | — | | | $ | — | | | $ | — | | | $ | — | | |
Institutional Class | |
8/31/2013 | | $ | 7.72 | | | $ | 0.06 | | | $ | 0.90 | | | $ | 0.96 | | | $ | (0.08 | ) | | $ | (0.37 | ) | | $ | — | | | $ | (0.45 | ) | | $ | — | | |
8/31/2012 | | $ | 7.41 | | | $ | 0.03 | | | $ | 0.62 | | | $ | 0.65 | | | $ | (0.01 | ) | | $ | (0.33 | ) | | $ | — | | | $ | (0.34 | ) | | $ | — | | |
8/31/2011 | | $ | 6.20 | | | $ | 0.02 | | | $ | 1.21 | | | $ | 1.23 | | | $ | (0.02 | ) | | $ | — | | | $ | — | | | $ | (0.02 | ) | | $ | — | | |
8/31/2010 | | $ | 6.05 | | | $ | 0.04 | | | $ | 0.13 | | | $ | 0.17 | | | $ | (0.02 | ) | | $ | — | | | $ | — | | | $ | (0.02 | ) | | $ | — | | |
Period from 4/6/2009^
to 8/31/2009 | | $ | 5.28 | | | $ | 0.02 | | | $ | 0.75 | | | $ | 0.77 | | | $ | — | | | $ | — | | | $ | — | | | $ | — | | | $ | — | | |
Class A | |
8/31/2013 | | $ | 7.67 | | | $ | 0.03 | | | $ | 0.89 | | | $ | 0.92 | | | $ | (0.05 | ) | | $ | (0.37 | ) | | $ | — | | | $ | (0.42 | ) | | $ | — | | |
8/31/2012 | | $ | 7.37 | | | $ | 0.00 | | | $ | 0.63 | | | $ | 0.63 | | | $ | — | | | $ | (0.33 | ) | | $ | — | | | $ | (0.33 | ) | | $ | — | | |
8/31/2011 | | $ | 6.18 | | | $ | (0.01 | ) | | $ | 1.20 | | | $ | 1.19 | | | $ | (0.00 | ) | | $ | — | | | $ | — | | | $ | (0.00 | ) | | $ | — | | |
8/31/2010 | | $ | 6.04 | | | $ | 0.02 | | | $ | 0.12 | | | $ | 0.14 | | | $ | — | | | $ | — | | | $ | — | | | $ | — | | | $ | — | | |
Period from 4/6/2009^
to 8/31/2009 | | $ | 5.28 | | | $ | 0.01 | | | $ | 0.75 | | | $ | 0.76 | | | $ | — | | | $ | — | | | $ | — | | | $ | — | | | $ | — | | |
Class C | |
8/31/2013 | | $ | 7.48 | | | $ | (0.03 | ) | | $ | 0.87 | | | $ | 0.84 | | | $ | (0.02 | ) | | $ | (0.37 | ) | | $ | — | | | $ | (0.39 | ) | | $ | — | | |
8/31/2012 | | $ | 7.26 | | | $ | (0.05 | ) | | $ | 0.60 | | | $ | 0.55 | | | $ | — | | | $ | (0.33 | ) | | $ | — | | | $ | (0.33 | ) | | $ | — | | |
8/31/2011 | | $ | 6.12 | | | $ | (0.06 | ) | | $ | 1.20 | | | $ | 1.14 | | | $ | — | | | $ | — | | | $ | — | | | $ | — | | | $ | — | | |
8/31/2010 | | $ | 6.02 | | | $ | (0.03 | ) | | $ | 0.13 | | | $ | 0.10 | | | $ | — | | | $ | — | | | $ | — | | | $ | — | | | $ | — | | |
Period from 4/6/2009^
to 8/31/2009 | | $ | 5.28 | | | $ | (0.01 | ) | | $ | 0.75 | | | $ | 0.74 | | | $ | — | | | $ | — | | | $ | — | | | $ | — | | | $ | — | | |
See Notes to Financial Highlights
227
| | | Redemption
Feesøø | | Net
Asset
Value,
End of
Year | | Total
Return†† | | Net Assets,
End of Year
(in millions) | | Ratio of
Gross
Expenses
to Average
Net Assets# | | Ratio
of Net
Expenses
to Average
Net Assets‡ | | Ratio of Net
Investment
Income/
(Loss) to
Average Net
Assets | | Portfolio
Turnover
Rate | |
Class C | |
8/31/2013 | | $ | — | | | $ | 12.35 | | | | 25.62 | % | | $ | 10.3 | | | | 2.31 | % | | | 2.11 | % | | | (.70 | %) | | | 25 | % | |
8/31/2012 | | $ | — | | | $ | 10.00 | | | | 10.87 | % | | $ | 6.9 | | | | 2.35 | % | | | 2.11 | % | | | (1.25 | %) | | | 30 | % | |
8/31/2011 | | $ | — | | | $ | 10.14 | | | | 11.91 | % | | $ | 5.5 | | | | 2.34 | % | | | 2.11 | % | | | (1.48 | %) | | | 44 | % | |
Period from 5/10/2010^
to 8/31/2010 | | $ | — | | | $ | 9.38 | | | | (6.20 | %)** | | $ | 0.0 | | | | 3.09 | %* | | | 2.11 | %* | | | (.79 | %)* | | | 19 | %** | |
Large Cap Disciplined Growth Fund | |
Investor Class | |
8/31/2013 | | $ | — | | | $ | 8.18 | | | | 12.76 | % | | $ | 16.1 | | | | 1.11 | % | | | 1.11 | %§ | | | .42 | % | | | 66 | % | |
8/31/2012 | | $ | — | | | $ | 7.68 | | | | 9.12 | % | | $ | 17.8 | | | | 1.11 | % | | | 1.11 | %§ | | | .08 | % | | | 116 | % | |
8/31/2011 | | $ | — | | | $ | 7.38 | | | | 19.44 | % | | $ | 15.5 | | | | 1.11 | % | | | 1.11 | %§ | | | (.08 | %) | | | 101 | % | |
8/31/2010 | | $ | — | | | $ | 6.18 | | | | 2.37 | % | | $ | 11.4 | | | | 1.23 | % | | | 1.11 | % | | | .29 | % | | | 104 | % | |
8/31/2009 | | $ | — | | | $ | 6.04 | | | | (18.27 | %) | | $ | 11.7 | | | | 2.50 | % | | | 1.34 | % | | | .40 | % | | | 132 | %### | |
Institutional Class | |
8/31/2013 | | $ | — | | | $ | 8.23 | | | | 13.28 | % | | $ | 409.2 | | | | .79 | % | | | .75 | % | | | .77 | % | | | 66 | % | |
8/31/2012 | | $ | — | | | $ | 7.72 | | | | 9.43 | % | | $ | 601.6 | | | | .78 | % | | | .75 | % | | | .44 | % | | | 116 | % | |
8/31/2011 | | $ | — | | | $ | 7.41 | | | | 19.79 | % | | $ | 565.4 | | | | .80 | % | | | .75 | % | | | .29 | % | | | 101 | % | |
8/31/2010 | | $ | — | | | $ | 6.20 | | | | 2.76 | % | | $ | 346.6 | | | | .87 | % | | | .75 | % | | | .61 | % | | | 104 | % | |
Period from 4/6/2009^
to 8/31/2009 | | $ | — | | | $ | 6.05 | | | | 14.58 | %** | | $ | 23.3 | | | | 1.57 | %* | | | .75 | %* | | | .86 | %* | | | 132 | %Ø### | |
Class A | |
8/31/2013 | | $ | — | | | $ | 8.17 | | | | 12.80 | % | | $ | 38.4 | | | | 1.16 | % | | | 1.11 | % | | | .42 | % | | | 66 | % | |
8/31/2012 | | $ | — | | | $ | 7.67 | | | | 9.13 | % | | $ | 67.1 | | | | 1.16 | % | | | 1.11 | % | | | .06 | % | | | 116 | % | |
8/31/2011 | | $ | — | | | $ | 7.37 | | | | 19.30 | % | | $ | 40.2 | | | | 1.19 | % | | | 1.11 | % | | | (.09 | %) | | | 101 | % | |
8/31/2010 | | $ | — | | | $ | 6.18 | | | | 2.32 | % | | $ | 33.0 | | | | 1.30 | % | | | 1.11 | % | | | .35 | % | | | 104 | % | |
Period from 4/6/2009^
to 8/31/2009 | | $ | — | | | $ | 6.04 | | | | 14.39 | %** | | $ | 63.7 | | | | 1.79 | %* | | | 1.11 | %* | | | .47 | %* | | | 132 | %Ø### | |
Class C | |
8/31/2013 | | $ | — | | | $ | 7.93 | | | | 11.93 | % | | $ | 24.8 | | | | 1.91 | % | | | 1.86 | % | | | (.34 | %) | | | 66 | % | |
8/31/2012 | | $ | — | | | $ | 7.48 | | | | 8.14 | % | | $ | 33.4 | | | | 1.90 | % | | | 1.86 | % | | | (.67 | %) | | | 116 | % | |
8/31/2011 | | $ | — | | | $ | 7.26 | | | | 18.63 | % | | $ | 37.0 | | | | 1.92 | % | | | 1.86 | % | | | (.83 | %) | | | 101 | % | |
8/31/2010 | | $ | — | | | $ | 6.12 | | | | 1.66 | % | | $ | 31.0 | | | | 2.01 | % | | | 1.86 | % | | | (.46 | %) | | | 104 | % | |
Period from 4/6/2009^
to 8/31/2009 | | $ | — | | | $ | 6.02 | | | | 14.02 | %** | | $ | 25.9 | | | | 2.56 | %* | | | 1.86 | %* | | | (.28 | %)* | | | 132 | %Ø### | |
228
Financial Highlights (cont'd)
| | | Net Asset
Value,
Beginning
of Year | | Net
Investment
Income (Loss)@ | | Net Gains or
Losses on
Securities
(both realized
and
unrealized) | | Total From
Investment
Operations | | Dividends
from Net
Investment
Income | | Distributions
from Net
Realized
Capital Gains | | Tax
Return of
Capital | | Total
Distributions | | Voluntary
Contribution
from
Management | |
Class R3 | |
8/31/2013 | | $ | 7.61 | | | $ | 0.01 | | | $ | 0.88 | | | $ | 0.89 | | | $ | (0.03 | ) | | $ | (0.37 | ) | | $ | — | | | $ | (0.40 | ) | | $ | — | | |
8/31/2012 | | $ | 7.34 | | | $ | (0.01 | ) | | $ | 0.61 | | | $ | 0.60 | | | $ | — | | | $ | (0.33 | ) | | $ | — | | | $ | (0.33 | ) | | $ | — | | |
8/31/2011 | | $ | 6.16 | | | $ | (0.02 | ) | | $ | 1.20 | | | $ | 1.18 | | | $ | — | | | $ | — | | | $ | — | | | $ | — | | | $ | — | | |
8/31/2010 | | $ | 6.03 | | | $ | 0.00 | | | $ | 0.13 | | | $ | 0.13 | | | $ | — | | | $ | — | | | $ | — | | | $ | — | | | $ | — | | |
Period from 5/27/2009^
to 8/31/2009 | | $ | 5.47 | | | $ | 0.00 | | | $ | 0.56 | | | $ | 0.56 | | | $ | — | | | $ | — | | | $ | — | | | $ | — | | | $ | — | | |
Large Cap Value Fund | |
Investor Class | |
8/31/2013 | | $ | 26.46 | | | $ | 0.36 | | | $ | 5.94 | | | $ | 6.30 | | | $ | (0.36 | ) | | $ | — | | | $ | — | | | $ | (0.36 | ) | | $ | — | | |
8/31/2012 | | $ | 24.97 | | | $ | 0.30 | | | $ | 1.30 | | | $ | 1.60 | | | $ | (0.11 | ) | | $ | — | | | $ | — | | | $ | (0.11 | ) | | $ | — | | |
8/31/2011 | | $ | 22.03 | | | $ | 0.11 | | | $ | 2.86 | | | $ | 2.97 | | | $ | (0.03 | ) | | $ | — | | | $ | — | | | $ | (0.03 | ) | | $ | — | | |
8/31/2010 | | $ | 21.67 | | | $ | 0.04 | | | $ | 0.45 | | | $ | 0.49 | | | $ | (0.13 | ) | | $ | — | | | $ | — | | | $ | (0.13 | ) | | $ | — | | |
8/31/2009 | | $ | 28.90 | | | $ | 0.15 | | | $ | (7.04 | ) | | $ | (6.89 | ) | | $ | (0.09 | ) | | $ | (0.25 | ) | | $ | — | | | $ | (0.34 | ) | | $ | — | | |
Trust Class | |
8/31/2013 | | $ | 20.30 | | | $ | 0.23 | | | $ | 4.54 | | | $ | 4.77 | | | $ | (0.27 | ) | | $ | — | | | $ | — | | | $ | (0.27 | ) | | $ | — | | |
8/31/2012 | | $ | 19.15 | | | $ | 0.19 | | | $ | 1.00 | | | $ | 1.19 | | | $ | (0.04 | ) | | $ | — | | | $ | — | | | $ | (0.04 | ) | | $ | — | | |
8/31/2011 | | $ | 16.90 | | | $ | 0.04 | | | $ | 2.21 | | | $ | 2.25 | | | $ | (0.00 | ) | | $ | — | | | $ | — | | | $ | (0.00 | ) | | $ | — | | |
8/31/2010 | | $ | 16.67 | | | $ | 0.00 | | | $ | 0.34 | | | $ | 0.34 | | | $ | (0.11 | ) | | $ | — | | | $ | — | | | $ | (0.11 | ) | | $ | — | | |
8/31/2009 | | $ | 22.25 | | | $ | 0.09 | | | $ | (5.42 | ) | | $ | (5.33 | ) | | $ | (0.06 | ) | | $ | (0.19 | ) | | $ | — | | | $ | (0.25 | ) | | $ | — | | |
Advisor Class | |
8/31/2013 | | $ | 17.46 | | | $ | 0.17 | | | $ | 3.89 | | | $ | 4.06 | | | $ | (0.29 | ) | | $ | — | | | $ | — | | | $ | (0.29 | ) | | $ | — | | |
8/31/2012 | | $ | 16.50 | | | $ | 0.14 | | | $ | 0.87 | | | $ | 1.01 | | | $ | (0.05 | ) | | $ | — | | | $ | — | | | $ | (0.05 | ) | | $ | — | | |
8/31/2011 | | $ | 14.59 | | | $ | 0.01 | | | $ | 1.90 | | | $ | 1.91 | | | $ | — | | | $ | — | | | $ | — | | | $ | — | | | $ | — | | |
8/31/2010 | | $ | 14.42 | | | $ | (0.02 | ) | | $ | 0.29 | | | $ | 0.27 | | | $ | (0.10 | ) | | $ | — | | | $ | — | | | $ | (0.10 | ) | | $ | — | | |
8/31/2009 | | $ | 19.27 | | | $ | 0.06 | | | $ | (4.69 | ) | | $ | (4.63 | ) | | $ | (0.05 | ) | | $ | (0.17 | ) | | $ | — | | | $ | (0.22 | ) | | $ | — | | |
Institutional Class | |
8/31/2013 | | $ | 26.59 | | | $ | 0.41 | | | $ | 5.97 | | | $ | 6.38 | | | $ | (0.41 | ) | | $ | — | | | $ | — | | | $ | (0.41 | ) | | $ | — | | |
8/31/2012 | | $ | 25.11 | | | $ | 0.34 | | | $ | 1.30 | | | $ | 1.64 | | | $ | (0.16 | ) | | $ | — | | | $ | — | | | $ | (0.16 | ) | | $ | — | | |
8/31/2011 | | $ | 22.15 | | | $ | 0.17 | | | $ | 2.87 | | | $ | 3.04 | | | $ | (0.08 | ) | | $ | — | | | $ | — | | | $ | (0.08 | ) | | $ | — | | |
8/31/2010 | | $ | 21.79 | | | $ | 0.08 | | | $ | 0.45 | | | $ | 0.53 | | | $ | (0.17 | ) | | $ | — | | | $ | — | | | $ | (0.17 | ) | | $ | — | | |
8/31/2009 | | $ | 29.06 | | | $ | 0.18 | | | $ | (7.08 | ) | | $ | (6.90 | ) | | $ | (0.12 | ) | | $ | (0.25 | ) | | $ | — | | | $ | (0.37 | ) | | $ | — | | |
See Notes to Financial Highlights
229
| | | Redemption
Feesøø | | Net
Asset
Value,
End of
Year | | Total
Return†† | | Net Assets,
End of Year
(in millions) | | Ratio of
Gross
Expenses
to Average
Net Assets# | | Ratio
of Net
Expenses
to Average
Net Assets‡ | | Ratio of Net
Investment
Income/
(Loss) to
Average Net
Assets | | Portfolio
Turnover
Rate | |
Class R3 | |
8/31/2013 | | $ | — | | | $ | 8.10 | | | | 12.48 | % | | $ | 0.4 | | | | 1.45 | % | | | 1.36 | % | | | .17 | % | | | 66 | % | |
8/31/2012 | | $ | — | | | $ | 7.61 | | | | 8.75 | % | | $ | 0.3 | | | | 1.44 | % | | | 1.36 | % | | | (.18 | %) | | | 116 | % | |
8/31/2011 | | $ | — | | | $ | 7.34 | | | | 19.16 | % | | $ | 0.3 | | | | 1.48 | % | | | 1.36 | % | | | (.29 | %) | | | 101 | % | |
8/31/2010 | | $ | — | | | $ | 6.16 | | | | 2.16 | % | | $ | 0.1 | | | | 3.23 | % | | | 1.36 | % | | | .04 | % | | | 104 | % | |
Period from 5/27/2009^
to 8/31/2009 | | $ | — | | | $ | 6.03 | | | | 10.24 | %** | | $ | 0.1 | | | | 6.21 | %* | | | 1.36 | %* | | | .20 | %* | | | 132 | %Ø### | |
Large Cap Value Fund | |
Investor Class | |
8/31/2013 | | $ | — | | | $ | 32.40 | | | | 24.05 | % | | $ | 1,149.7 | | | | .86 | % | | | .86 | % | | | 1.19 | % | | | 159 | % | |
8/31/2012 | | $ | — | | | $ | 26.46 | | | | 6.47 | % | | $ | 1,057.1 | | | | .87 | % | | | .87 | % | | | 1.20 | % | | | 171 | % | |
8/31/2011 | | $ | — | | | $ | 24.97 | | | | 13.48 | % | | $ | 1,171.4 | | | | .85 | % | | | .85 | % | | | .42 | % | | | 41 | % | |
8/31/2010 | | $ | — | | | $ | 22.03 | | | | 2.21 | % | | $ | 1,189.1 | | | | .85 | % | | | .85 | % | | | .19 | % | | | 42 | % | |
8/31/2009 | | $ | — | | | $ | 21.67 | | | | (23.27 | %) | | $ | 1,337.2 | | | | .89 | % | | | .89 | % | | | .85 | % | | | 35 | % | |
Trust Class | |
8/31/2013 | | $ | — | | | $ | 24.80 | | | | 23.76 | % | | $ | 156.6 | | | | 1.06 | % | | | 1.06 | % | | | 1.01 | % | | | 159 | % | |
8/31/2012 | | $ | — | | | $ | 20.30 | | | | 6.26 | % | | $ | 209.6 | | | | 1.05 | % | | | 1.05 | % | | | .97 | % | | | 171 | % | |
8/31/2011 | | $ | — | | | $ | 19.15 | | | | 13.32 | % | | $ | 424.9 | | | | 1.04 | % | | | 1.04 | % | | | .22 | % | | | 41 | % | |
8/31/2010 | | $ | — | | | $ | 16.90 | | | | 2.01 | % | | $ | 547.6 | | | | 1.03 | % | | | 1.03 | % | | | .01 | % | | | 42 | % | |
8/31/2009 | | $ | — | | | $ | 16.67 | | | | (23.38 | %) | | $ | 622.6 | | | | 1.05 | % | | | 1.04 | % | | | .70 | % | | | 35 | % | |
Advisor Class | |
8/31/2013 | | $ | — | | | $ | 21.23 | | | | 23.58 | % | | $ | 205.3 | | | | 1.21 | % | | | 1.21 | % | | | .86 | % | | | 159 | % | |
8/31/2012 | | $ | — | | | $ | 17.46 | | | | 6.13 | % | | $ | 220.0 | | | | 1.20 | % | | | 1.20 | % | | | .84 | % | | | 171 | % | |
8/31/2011 | | $ | — | | | $ | 16.50 | | | | 13.09 | % | | $ | 308.9 | | | | 1.19 | % | | | 1.19 | % | | | .07 | % | | | 41 | % | |
8/31/2010 | | $ | — | | | $ | 14.59 | | | | 1.83 | % | | $ | 341.5 | | | | 1.18 | % | | | 1.18 | % | | | (.14 | %) | | | 42 | % | |
8/31/2009 | | $ | — | | | $ | 14.42 | | | | (23.47 | %) | | $ | 379.7 | | | | 1.20 | % | | | 1.20 | % | | | .54 | % | | | 35 | % | |
Institutional Class | |
8/31/2013 | | $ | — | | | $ | 32.56 | | | | 24.26 | % | | $ | 113.2 | | | | .70 | % | | | .70 | % | | | 1.36 | % | | | 159 | % | |
8/31/2012 | | $ | — | | | $ | 26.59 | | | | 6.61 | % | | $ | 103.0 | | | | .70 | % | | | .70 | % | | | 1.35 | % | | | 171 | % | |
8/31/2011 | | $ | — | | | $ | 25.11 | | | | 13.69 | % | | $ | 200.6 | | | | .69 | % | | | .69 | % | | | .61 | % | | | 41 | % | |
8/31/2010 | | $ | — | | | $ | 22.15 | | | | 2.35 | % | | $ | 148.7 | | | | .69 | % | | | .69 | %§ | | | .35 | % | | | 42 | % | |
8/31/2009 | | $ | — | | | $ | 21.79 | | | | (23.10 | %) | | $ | 161.3 | | | | .71 | % | | | .70 | % | | | 1.01 | % | | | 35 | % | |
230
Financial Highlights (cont'd)
| | | Net Asset
Value,
Beginning
of Year | | Net
Investment
Income (Loss)@ | | Net Gains or
Losses on
Securities
(both realized
and
unrealized) | | Total From
Investment
Operations | | Dividends
from Net
Investment
Income | | Distributions
from Net
Realized
Capital Gains | | Tax
Return of
Capital | | Total
Distributions | | Voluntary
Contribution
from
Management | |
Class A | |
8/31/2013 | | $ | 20.07 | | | $ | 0.22 | | | $ | 4.54 | | | $ | 4.76 | | | $ | — | | | $ | — | | | $ | — | | | $ | — | | | $ | — | | |
8/31/2012 | | $ | 19.06 | | | $ | 0.20 | | | $ | 0.97 | | | $ | 1.17 | | | $ | (0.16 | ) | | $ | — | | | $ | — | | | $ | (0.16 | ) | | $ | — | | |
8/31/2011 | | $ | 16.90 | | | $ | 0.06 | | | $ | 2.18 | | | $ | 2.24 | | | $ | (0.08 | ) | | $ | — | | | $ | — | | | $ | (0.08 | ) | | $ | — | | |
Period from 6/21/2010^
to 8/31/2010 | | $ | 18.36 | | | $ | 0.01 | | | $ | (1.47 | ) | | $ | (1.46 | ) | | $ | — | | | $ | — | | | $ | — | | | $ | — | | | $ | — | | |
Class C | |
8/31/2013 | | $ | 17.19 | | | $ | 0.02 | | | $ | 3.85 | | | $ | 3.87 | | | $ | (0.33 | ) | | $ | — | | | $ | — | | | $ | (0.33 | ) | | $ | — | | |
8/31/2012 | | $ | 16.31 | | | $ | 0.05 | | | $ | 0.83 | | | $ | 0.88 | | | $ | — | | | $ | — | | | $ | — | | | $ | — | | | $ | — | | |
8/31/2011 | | $ | 14.57 | | | $ | (0.10 | ) | | $ | 1.90 | | | $ | 1.80 | | | $ | (0.06 | ) | | $ | — | | | $ | — | | | $ | (0.06 | ) | | $ | — | | |
Period from 6/21/2010^
to 8/31/2010 | | $ | 15.85 | | | $ | (0.02 | ) | | $ | (1.26 | ) | | $ | (1.28 | ) | | $ | — | | | $ | — | | | $ | — | | | $ | — | | | $ | — | | |
Class R3 | |
8/31/2013 | | $ | 17.34 | | | $ | 0.09 | | | $ | 3.98 | | | $ | 4.07 | | | $ | — | | | $ | — | | | $ | — | | | $ | — | | | $ | — | | |
8/31/2012 | | $ | 16.41 | | | $ | 0.15 | | | $ | 0.82 | | | $ | 0.97 | | | $ | (0.04 | ) | | $ | — | | | $ | — | | | $ | (0.04 | ) | | $ | — | | |
8/31/2011 | | $ | 14.58 | | | $ | (0.01 | ) | | $ | 1.90 | | | $ | 1.89 | | | $ | (0.06 | ) | | $ | — | | | $ | — | | | $ | (0.06 | ) | | $ | — | | |
Period from 6/21/2010^
to 8/31/2010 | | $ | 15.85 | | | $ | (0.00 | ) | | $ | (1.27 | ) | | $ | (1.27 | ) | | $ | — | | | $ | — | | | $ | — | | | $ | — | | | $ | — | | |
Mid Cap Growth Fund | |
Investor Class | |
8/31/2013 | | $ | 11.98 | | | $ | (0.04 | ) | | $ | 2.08 | | | $ | 2.04 | | | $ | — | | | $ | (0.67 | ) | | $ | — | | | $ | (0.67 | ) | | $ | — | | |
8/31/2012 | | $ | 10.84 | | | $ | (0.06 | ) | | $ | 1.22 | | | $ | 1.16 | | | $ | — | | | $ | (0.02 | ) | | $ | — | | | $ | (0.02 | ) | | $ | — | | |
8/31/2011 | | $ | 8.43 | | | $ | (0.05 | ) | | $ | 2.46 | | | $ | 2.41 | | | $ | — | | | $ | — | | | $ | — | | | $ | — | | | $ | — | | |
8/31/2010 | | $ | 7.43 | | | $ | (0.05 | ) | | $ | 1.05 | | | $ | 1.00 | | | $ | — | | | $ | — | | | $ | — | | | $ | — | | | $ | — | | |
8/31/2009 | | $ | 9.53 | | | $ | (0.02 | ) | | $ | (2.08 | ) | | $ | (2.10 | ) | | $ | — | | | $ | — | | | $ | — | | | $ | — | | | $ | — | | |
Trust Class | |
8/31/2013 | | $ | 18.23 | | | $ | (0.07 | ) | | $ | 3.24 | | | $ | 3.17 | | | $ | — | | | $ | (0.65 | ) | | $ | — | | | $ | (0.65 | ) | | $ | — | | |
8/31/2012 | | $ | 16.48 | | | $ | (0.10 | ) | | $ | 1.85 | | | $ | 1.75 | | | $ | — | | | $ | (0.00 | ) | | $ | — | | | $ | (0.00 | ) | | $ | — | | |
8/31/2011 | | $ | 12.83 | | | $ | (0.08 | ) | | $ | 3.73 | | | $ | 3.65 | | | $ | — | | | $ | — | | | $ | — | | | $ | — | | | $ | — | | |
8/31/2010 | | $ | 11.31 | | | $ | (0.08 | ) | | $ | 1.60 | | | $ | 1.52 | | | $ | — | | | $ | — | | | $ | — | | | $ | — | | | $ | — | | |
8/31/2009 | | $ | 14.54 | | | $ | (0.04 | ) | | $ | (3.19 | ) | | $ | (3.23 | ) | | $ | — | | | $ | — | | | $ | — | | | $ | — | | | $ | — | | |
See Notes to Financial Highlights
231
| | | Redemption
Feesøø | | Net
Asset
Value,
End of
Year | | Total
Return†† | | Net Assets,
End of Year
(in millions) | | Ratio of
Gross
Expenses
to Average
Net Assets# | | Ratio
of Net
Expenses
to Average
Net Assets‡ | | Ratio of Net
Investment
Income/
(Loss) to
Average Net
Assets | | Portfolio
Turnover
Rate | |
Class A | |
8/31/2013 | | $ | — | | | $ | 24.83 | | | | 23.72 | % | | $ | 1.6 | | | | 1.11 | % | | | 1.11 | % | | | .97 | % | | | 159 | % | |
8/31/2012 | | $ | — | | | $ | 20.07 | | | | 6.24 | % | | $ | 2.0 | | | | 1.07 | % | | | 1.07 | %§ | | | 1.03 | % | | | 171 | % | |
8/31/2011 | | $ | — | | | $ | 19.06 | | | | 13.20 | % | | $ | 1.4 | | | | 1.29 | % | | | 1.11 | % | | | .30 | % | | | 41 | % | |
Period from 6/21/2010^
to 8/31/2010 | | $ | — | | | $ | 16.90 | | | | (7.95 | %)** | | $ | 0.0 | | | | 35.72 | %* | | | 1.11 | %* | | | .16 | %* | | | 42 | %Ø | |
Class C | |
8/31/2013 | | $ | — | | | $ | 20.73 | | | | 22.87 | % | | $ | 1.2 | | | | 1.86 | % | | | 1.86 | %§ | | | .10 | % | | | 159 | % | |
8/31/2012 | | $ | — | | | $ | 17.19 | | | | 5.40 | % | | $ | 0.2 | | | | 2.04 | % | | | 1.86 | % | | | .27 | % | | | 171 | % | |
8/31/2011 | | $ | — | | | $ | 16.31 | | | | 12.32 | % | | $ | 0.1 | | | | 4.61 | % | | | 1.86 | % | | | (.56 | %) | | | 41 | % | |
Period from 6/21/2010^
to 8/31/2010 | | $ | — | | | $ | 14.57 | | | | (8.08 | %)** | | $ | 0.0 | | | | 37.45 | %* | | | 1.86 | %* | | | (.60 | %)* | | | 42 | %Ø | |
Class R3 | |
8/31/2013 | | $ | — | | | $ | 21.41 | | | | 23.47 | % | | $ | 0.1 | | | | 1.42 | % | | | 1.36 | % | | | .46 | % | | | 159 | % | |
8/31/2012 | | $ | — | | | $ | 17.34 | | | | 5.95 | % | | $ | 0.6 | | | | 1.39 | % | | | 1.36 | % | | | .93 | % | | | 171 | % | |
8/31/2011 | | $ | — | | | $ | 16.41 | | | | 12.93 | % | | $ | 0.0 | | | | 6.07 | % | | | 1.36 | % | | | (.08 | %) | | | 41 | % | |
Period from 6/21/2010^
to 8/31/2010 | | $ | — | | | $ | 14.58 | | | | (8.01 | %)** | | $ | 0.0 | | | | 36.96 | %* | | | 1.36 | %* | | | (.09 | %)* | | | 42 | %Ø | |
Mid Cap Growth Fund | |
Investor Class | |
8/31/2013 | | $ | — | | | $ | 13.35 | | | | 18.03 | % | | $ | 377.8 | | | | .98 | % | | | .98 | % | | | (.30 | %) | | | 46 | % | |
8/31/2012 | | $ | — | | | $ | 11.98 | | | | 10.73 | % | | $ | 347.9 | | | | 1.01 | % | | | 1.01 | % | | | (.51 | %) | | | 40 | % | |
8/31/2011 | | $ | — | | | $ | 10.84 | | | | 28.59 | % | | $ | 335.5 | | | | 1.02 | % | | | 1.02 | % | | | (.45 | %) | | | 49 | % | |
8/31/2010 | | $ | — | | | $ | 8.43 | | | | 13.46 | % | | $ | 288.0 | | | | 1.07 | % | | | 1.07 | % | | | (.55 | %) | | | 70 | % | |
8/31/2009 | | $ | — | | | $ | 7.43 | | | | (22.04 | %) | | $ | 280.9 | | | | 1.11 | % | | | 1.11 | % | | | (.28 | %) | | | 69 | % | |
Trust Class | |
8/31/2013 | | $ | — | | | $ | 20.75 | | | | 18.02 | % | | $ | 54.9 | | | | 1.04 | % | | | 1.04 | % | | | (.38 | %) | | | 46 | % | |
8/31/2012 | | $ | — | | | $ | 18.23 | | | | 10.65 | % | | $ | 39.9 | | | | 1.05 | % | | | 1.05 | % | | | (.55 | %) | | | 40 | % | |
8/31/2011 | | $ | — | | | $ | 16.48 | | | | 28.45 | % | | $ | 28.1 | | | | 1.07 | % | | | 1.07 | % | | | (.52 | %) | | | 49 | % | |
8/31/2010 | | $ | — | | | $ | 12.83 | | | | 13.44 | % | | $ | 21.8 | | | | 1.14 | % | | | 1.14 | % | | | (.61 | %) | | | 70 | % | |
8/31/2009 | | $ | — | | | $ | 11.31 | | | | (22.21 | %) | | $ | 16.4 | | | | 1.26 | % | | | 1.26 | % | | | (.37 | %) | | | 69 | % | |
232
Financial Highlights (cont'd)
| | | Net Asset
Value,
Beginning
of Year | | Net
Investment
Income (Loss)@ | | Net Gains or
Losses on
Securities
(both realized
and
unrealized) | | Total From
Investment
Operations | | Dividends
from Net
Investment
Income | | Distributions
from Net
Realized
Capital Gains | | Tax
Return of
Capital | | Total
Distributions | | Voluntary
Contribution
from
Management | |
Advisor Class | |
8/31/2013 | | $ | 18.54 | | | $ | (0.12 | ) | | $ | 3.29 | | | $ | 3.17 | | | $ | — | | | $ | (0.58 | ) | | $ | — | | | $ | (0.58 | ) | | $ | — | | |
8/31/2012 | | $ | 16.82 | | | $ | (0.17 | ) | | $ | 1.89 | | | $ | 1.72 | | | $ | — | | | $ | — | | | $ | — | | | $ | — | | | $ | — | | |
8/31/2011 | | $ | 13.14 | | | $ | (0.16 | ) | | $ | 3.84 | | | $ | 3.68 | | | $ | — | | | $ | — | | | $ | — | | | $ | — | | | $ | — | | |
8/31/2010 | | $ | 11.63 | | | $ | (0.13 | ) | | $ | 1.64 | | | $ | 1.51 | | | $ | — | | | $ | — | | | $ | — | | | $ | — | | | $ | — | | |
8/31/2009 | | $ | 14.98 | | | $ | (0.06 | ) | | $ | (3.29 | ) | | $ | (3.35 | ) | | $ | — | | | $ | — | | | $ | — | | | $ | — | | | $ | — | | |
Institutional Class | |
8/31/2013 | | $ | 12.16 | | | $ | (0.01 | ) | | $ | 2.11 | | | $ | 2.10 | | | $ | — | | | $ | (0.70 | ) | | $ | — | | | $ | (0.70 | ) | | $ | — | | |
8/31/2012 | | $ | 11.01 | | | $ | (0.03 | ) | | $ | 1.23 | | | $ | 1.20 | | | $ | — | | | $ | (0.05 | ) | | $ | — | | | $ | (0.05 | ) | | $ | — | | |
8/31/2011 | | $ | 8.54 | | | $ | (0.02 | ) | | $ | 2.49 | | | $ | 2.47 | | | $ | — | | | $ | — | | | $ | — | | | $ | — | | | $ | — | | |
8/31/2010 | | $ | 7.50 | | | $ | (0.02 | ) | | $ | 1.06 | | | $ | 1.04 | | | $ | — | | | $ | — | | | $ | — | | | $ | — | | | $ | — | | |
8/31/2009 | | $ | 9.57 | | | $ | 0.01 | | | $ | (2.08 | ) | | $ | (2.07 | ) | | $ | — | | | $ | — | | | $ | — | | | $ | — | | | $ | — | | |
Class A | |
8/31/2013 | | $ | 18.23 | | | $ | (0.08 | ) | | $ | 3.23 | | | $ | 3.15 | | | $ | — | | | $ | (0.64 | ) | | $ | — | | | $ | (0.64 | ) | | $ | — | | |
8/31/2012 | | $ | 16.49 | | | $ | (0.11 | ) | | $ | 1.86 | | | $ | 1.75 | | | $ | — | | | $ | (0.01 | ) | | $ | — | | | $ | (0.01 | ) | | $ | — | | |
8/31/2011 | | $ | 12.84 | | | $ | (0.09 | ) | | $ | 3.74 | | | $ | 3.65 | | | $ | — | | | $ | — | | | $ | — | | | $ | — | | | $ | — | | |
8/31/2010 | | $ | 11.31 | | | $ | (0.07 | ) | | $ | 1.60 | | | $ | 1.53 | | | $ | — | | | $ | — | | | $ | — | | | $ | — | | | $ | — | | |
Period from 5/27/2009^
to 8/31/2009 | | $ | 10.34 | | | $ | (0.00 | ) | | $ | 0.97 | | | $ | 0.97 | | | $ | — | | | $ | — | | | $ | — | | | $ | — | | | $ | — | | |
Class C | |
8/31/2013 | | $ | 18.31 | | | $ | (0.23 | ) | | $ | 3.26 | | | $ | 3.03 | | | $ | — | | | $ | (0.53 | ) | | $ | — | | | $ | (0.53 | ) | | $ | — | | |
8/31/2012 | | $ | 16.68 | | | $ | (0.24 | ) | | $ | 1.87 | | | $ | 1.63 | | | $ | — | | | $ | — | | | $ | — | | | $ | — | | | $ | — | | |
8/31/2011 | | $ | 13.09 | | | $ | (0.23 | ) | | $ | 3.82 | | | $ | 3.59 | | | $ | — | | | $ | — | | | $ | — | | | $ | — | | | $ | — | | |
8/31/2010 | | $ | 11.62 | | | $ | (0.18 | ) | | $ | 1.65 | | | $ | 1.47 | | | $ | — | | | $ | — | | | $ | — | | | $ | — | | | $ | — | | |
Period from 5/27/2009^
to 8/31/2009 | | $ | 10.64 | | | $ | (0.02 | ) | | $ | 1.00 | | | $ | 0.98 | | | $ | — | | | $ | — | | | $ | — | | | $ | — | | | $ | — | | |
Class R3 | |
8/31/2013 | | $ | 18.61 | | | $ | (0.13 | ) | | $ | 3.30 | | | $ | 3.17 | | | $ | — | | | $ | (0.62 | ) | | $ | — | | | $ | (0.62 | ) | | $ | — | | |
8/31/2012 | | $ | 16.87 | | | $ | (0.16 | ) | | $ | 1.90 | | | $ | 1.74 | | | $ | — | | | $ | — | | | $ | — | | | $ | — | | | $ | — | | |
8/31/2011 | | $ | 13.17 | | | $ | (0.16 | ) | | $ | 3.86 | | | $ | 3.70 | | | $ | — | | | $ | — | | | $ | — | | | $ | — | | | $ | — | | |
8/31/2010 | | $ | 11.63 | | | $ | (0.11 | ) | | $ | 1.65 | | | $ | 1.54 | | | $ | — | | | $ | — | | | $ | — | | | $ | — | | | $ | — | | |
Period from 5/27/2009^
to 8/31/2009 | | $ | 10.64 | | | $ | (0.00 | ) | | $ | 0.99 | | | $ | 0.99 | | | $ | — | | | $ | — | | | $ | — | | | $ | — | | | $ | — | | |
See Notes to Financial Highlights
233
| | | Redemption
Feesøø | | Net
Asset
Value,
End of
Year | | Total
Return†† | | Net Assets,
End of Year
(in millions) | | Ratio of
Gross
Expenses
to Average
Net Assets# | | Ratio
of Net
Expenses
to Average
Net Assets‡ | | Ratio of Net
Investment
Income/
(Loss) to
Average Net
Assets | | Portfolio
Turnover
Rate | |
Advisor Class | |
8/31/2013 | | $ | — | | | $ | 21.13 | | | | 17.64 | % | | $ | 11.7 | | | | 1.30 | % | | | 1.30 | % | | | (.62 | %) | | | 46 | % | |
8/31/2012 | | $ | — | | | $ | 18.54 | | | | 10.23 | % | | $ | 10.2 | | | | 1.44 | % | | | 1.44 | %§ | | | (.95 | %) | | | 40 | % | |
8/31/2011 | | $ | — | | | $ | 16.82 | | | | 28.01 | % | | $ | 9.0 | | | | 1.50 | % | | | 1.50 | %§ | | | (.95 | %) | | | 49 | % | |
8/31/2010 | | $ | — | | | $ | 13.14 | | | | 12.98 | % | | $ | 5.4 | | | | 1.50 | % | | | 1.50 | %§ | | | (.98 | %) | | | 70 | % | |
8/31/2009 | | $ | — | | | $ | 11.63 | | | | (22.36 | %) | | $ | 6.9 | | | | 1.86 | % | | | 1.50 | % | | | (.57 | %) | | | 69 | % | |
Institutional Class | |
8/31/2013 | | $ | — | | | $ | 13.56 | | | | 18.32 | % | | $ | 258.6 | | | | .79 | % | | | .75 | % | | | (.07 | %) | | | 46 | % | |
8/31/2012 | | $ | — | | | $ | 12.16 | | | | 10.96 | % | | $ | 174.2 | | | | .79 | % | | | .75 | % | | | (.26 | %) | | | 40 | % | |
8/31/2011 | | $ | — | | | $ | 11.01 | | | | 28.92 | % | | $ | 113.8 | | | | .81 | % | | | .75 | % | | | (.21 | %) | | | 49 | % | |
8/31/2010 | | $ | — | | | $ | 8.54 | | | | 13.87 | % | | $ | 121.1 | | | | .83 | % | | | .75 | % | | | (.22 | %) | | | 70 | % | |
8/31/2009 | | $ | — | | | $ | 7.50 | | | | (21.63 | %) | | $ | 146.6 | | | | .87 | % | | | .75 | % | | | .12 | % | | | 69 | % | |
Class A | |
8/31/2013 | | $ | — | | | $ | 20.74 | | | | 17.91 | % | | $ | 89.0 | | | | 1.18 | % | | | 1.11 | % | | | (.44 | %) | | | 46 | % | |
8/31/2012 | | $ | — | | | $ | 18.23 | | | | 10.61 | % | | $ | 63.2 | | | | 1.17 | % | | | 1.11 | % | | | (.62 | %) | | | 40 | % | |
8/31/2011 | | $ | — | | | $ | 16.49 | | | | 28.43 | % | | $ | 25.2 | | | | 1.19 | % | | | 1.11 | % | | | (.56 | %) | | | 49 | % | |
8/31/2010 | | $ | — | | | $ | 12.84 | | | | 13.53 | % | | $ | 13.6 | | | | 1.28 | % | | | 1.11 | % | | | (.51 | %) | | | 70 | % | |
Period from 5/27/2009^
to 8/31/2009 | | $ | — | | | $ | 11.31 | | | | 9.38 | %** | | $ | 0.1 | | | | 4.05 | %* | | | 1.11 | %* | | | (.01 | %)* | | | 69 | %Ø | |
Class C | |
8/31/2013 | | $ | — | | | $ | 20.81 | | | | 17.05 | % | | $ | 4.4 | | | | 1.95 | % | | | 1.86 | % | | | (1.20 | %) | | | 46 | % | |
8/31/2012 | | $ | — | | | $ | 18.31 | | | | 9.77 | % | | $ | 2.4 | | | | 1.98 | % | | | 1.86 | % | | | (1.36 | %) | | | 40 | % | |
8/31/2011 | | $ | — | | | $ | 16.68 | | | | 27.43 | % | | $ | 0.6 | | | | 2.04 | % | | | 1.86 | % | | | (1.36 | %) | | | 49 | % | |
8/31/2010 | | $ | — | | | $ | 13.09 | | | | 12.65 | % | | $ | 0.2 | | | | 2.64 | % | | | 1.86 | % | | | (1.32 | %) | | | 70 | % | |
Period from 5/27/2009^
to 8/31/2009 | | $ | — | | | $ | 11.62 | | | | 9.21 | %** | | $ | 0.1 | | | | 6.29 | %* | | | 1.86 | %* | | | (.64 | %)* | | | 69 | %Ø | |
Class R3 | |
8/31/2013 | | $ | — | | | $ | 21.16 | | | | 17.63 | % | | $ | 5.6 | | | | 1.43 | % | | | 1.36 | % | | | (.68 | %) | | | 46 | % | |
8/31/2012 | | $ | — | | | $ | 18.61 | | | | 10.31 | % | | $ | 3.0 | | | | 1.45 | % | | | 1.36 | % | | | (.89 | %) | | | 40 | % | |
8/31/2011 | | $ | — | | | $ | 16.87 | | | | 28.09 | % | | $ | 0.5 | | | | 1.50 | % | | | 1.36 | % | | | (.91 | %) | | | 49 | % | |
8/31/2010 | | $ | — | | | $ | 13.17 | | | | 13.24 | % | | $ | 0.1 | | | | 3.15 | % | | | 1.36 | % | | | (.84 | %) | | | 70 | % | |
Period from 5/27/2009^
to 8/31/2009 | | $ | — | | | $ | 11.63 | | | | 9.30 | %** | | $ | 0.1 | | | | 5.78 | %* | | | 1.36 | %* | | | (.14 | %)* | | | 69 | %Ø | |
234
Financial Highlights (cont'd)
| | | Net Asset
Value,
Beginning
of Year | | Net
Investment
Income (Loss)@ | | Net Gains or
Losses on
Securities
(both realized
and
unrealized) | | Total From
Investment
Operations | | Dividends
from Net
Investment
Income | | Distributions
from Net
Realized
Capital Gains | | Tax
Return of
Capital | | Total
Distributions | | Voluntary
Contribution
from
Management | |
Class R6 | |
Period from 3/15/2013^
to 8/31/2013 | | $ | 12.77 | | | $ | (0.01 | ) | | $ | 0.81 | | | $ | 0.80 | | | $ | — | | | $ | — | | | $ | — | | | $ | — | | | $ | — | | |
Mid Cap Intrinsic Value Fund | |
Investor Class | |
8/31/2013 | | $ | 15.90 | | | $ | 0.26 | | | $ | 4.25 | | | $ | 4.51 | | | $ | (0.12 | ) | | $ | — | | | $ | — | | | $ | (0.12 | ) | | $ | — | | |
8/31/2012 | | $ | 14.18 | | | $ | 0.10 | | | $ | 1.68 | | | $ | 1.78 | | | $ | (0.06 | ) | | $ | — | | | $ | — | | | $ | (0.06 | ) | | $ | — | | |
8/31/2011 | | $ | 12.26 | | | $ | 0.06 | | | $ | 1.88 | | | $ | 1.94 | | | $ | (0.02 | ) | | $ | — | | | $ | — | | | $ | (0.02 | ) | | $ | — | | |
8/31/2010 | | $ | 11.07 | | | $ | 0.01 | | | $ | 1.26 | | | $ | 1.27 | | | $ | (0.08 | ) | | $ | — | | | $ | — | | | $ | (0.08 | ) | | $ | — | | |
8/31/2009 | | $ | 15.02 | | | $ | 0.07 | | | $ | (3.47 | ) | | $ | (3.40 | ) | | $ | (0.00 | ) | | $ | (0.55 | ) | | $ | — | | | $ | (0.55 | ) | | $ | — | | |
Trust Class | |
8/31/2013 | | $ | 13.82 | | | $ | 0.20 | | | $ | 3.70 | | | $ | 3.90 | | | $ | (0.11 | ) | | $ | — | | | $ | — | | | $ | (0.11 | ) | | $ | — | | |
8/31/2012 | | $ | 12.34 | | | $ | 0.08 | | | $ | 1.46 | | | $ | 1.54 | | | $ | (0.06 | ) | | $ | — | | | $ | — | | | $ | (0.06 | ) | | $ | — | | |
8/31/2011 | | $ | 10.68 | | | $ | 0.04 | | | $ | 1.63 | | | $ | 1.67 | | | $ | (0.01 | ) | | $ | — | | | $ | — | | | $ | (0.01 | ) | | $ | — | | |
8/31/2010 | | $ | 9.66 | | | $ | 0.01 | | | $ | 1.11 | | | $ | 1.12 | | | $ | (0.10 | ) | | $ | — | | | $ | — | | | $ | (0.10 | ) | | $ | — | | |
8/31/2009 | | $ | 13.09 | | | $ | 0.07 | | | $ | (3.02 | ) | | $ | (2.95 | ) | | $ | (0.00 | ) | | $ | (0.48 | ) | | $ | — | | | $ | (0.48 | ) | | $ | — | | |
Institutional Class | |
8/31/2013 | | $ | 15.93 | | | $ | 0.31 | | | $ | 4.26 | | | $ | 4.57 | | | $ | (0.17 | ) | | $ | — | | | $ | — | | | $ | (0.17 | ) | | $ | — | | |
8/31/2012 | | $ | 14.22 | | | $ | 0.15 | | | $ | 1.67 | | | $ | 1.82 | | | $ | (0.11 | ) | | $ | — | | | $ | — | | | $ | (0.11 | ) | | $ | — | | |
8/31/2011 | | $ | 12.28 | | | $ | 0.11 | | | $ | 1.89 | | | $ | 2.00 | | | $ | (0.06 | ) | | $ | — | | | $ | — | | | $ | (0.06 | ) | | $ | — | | |
Period from 3/8/2010^
to 8/31/2010 | | $ | 13.12 | | | $ | 0.03 | | | $ | (0.87 | ) | | $ | (0.84 | ) | | $ | — | | | $ | — | | | $ | — | | | $ | — | | | $ | — | | |
Class A | |
8/31/2013 | | $ | 13.82 | | | $ | 0.23 | | | $ | 3.67 | | | $ | 3.90 | | | $ | (0.12 | ) | | $ | — | | | $ | — | | | $ | (0.12 | ) | | $ | — | | |
8/31/2012 | | $ | 12.34 | | | $ | 0.08 | | | $ | 1.46 | | | $ | 1.54 | | | $ | (0.06 | ) | | $ | — | | | $ | — | | | $ | (0.06 | ) | | $ | — | | |
8/31/2011 | | $ | 10.68 | | | $ | 0.05 | | | $ | 1.63 | | | $ | 1.68 | | | $ | (0.02 | ) | | $ | — | | | $ | — | | | $ | (0.02 | ) | | $ | — | | |
Period from 6/21/2010^
to 8/31/2010 | | $ | 11.41 | | | $ | 0.00 | | | $ | (0.73 | ) | | $ | (0.73 | ) | | $ | — | | | $ | — | | | $ | — | | | $ | — | | | $ | — | | |
Class C | |
8/31/2013 | | $ | 13.69 | | | $ | 0.09 | | | $ | 3.67 | | | $ | 3.76 | | | $ | (0.01 | ) | | $ | — | | | $ | — | | | $ | (0.01 | ) | | $ | — | | |
8/31/2012 | | $ | 12.25 | | | $ | (0.01 | ) | | $ | 1.45 | | | $ | 1.44 | | | $ | — | | | $ | — | | | $ | — | | | $ | — | | | $ | — | | |
8/31/2011 | | $ | 10.66 | | | $ | (0.04 | ) | | $ | 1.63 | | | $ | 1.59 | | | $ | — | | | $ | — | | | $ | — | | | $ | — | | | $ | — | | |
Period from 6/21/2010^
to 8/31/2010 | | $ | 11.41 | | | $ | (0.01 | ) | | $ | (0.74 | ) | | $ | (0.75 | ) | | $ | — | | | $ | — | | | $ | — | | | $ | — | | | $ | — | | |
See Notes to Financial Highlights
235
| | | Redemption
Feesøø | | Net
Asset
Value,
End of
Year | | Total
Return†† | | Net Assets,
End of Year
(in millions) | | Ratio of
Gross
Expenses
to Average
Net Assets# | | Ratio
of Net
Expenses
to Average
Net Assets‡ | | Ratio of Net
Investment
Income/
(Loss) to
Average Net
Assets | | Portfolio
Turnover
Rate | |
Class R6 | |
Period from 3/15/2013^
to 8/31/2013 | | $ | — | | | $ | 13.57 | | | | 6.26 | %** | | $ | 0.1 | | | | 7.22 | %* | | | .68 | %* | | | (.13 | %)* | | | 46 | %Ø | |
Mid Cap Intrinsic Value Fund | |
Investor Class | |
8/31/2013 | | $ | — | | | $ | 20.29 | | | | 28.58 | % | | $ | 45.9 | | | | 1.40 | % | | | 1.09 | % | | | 1.45 | % | | | 33 | % | |
8/31/2012 | | $ | — | | | $ | 15.90 | | | | 12.62 | % | | $ | 46.0 | | | | 1.39 | % | | | 1.18 | % | | | .69 | % | | | 118 | % | |
8/31/2011 | | $ | — | | | $ | 14.18 | | | | 15.79 | % | | $ | 46.5 | | | | 1.33 | % | | | 1.22 | % | | | .38 | % | | | 27 | % | |
8/31/2010 | | $ | — | | | $ | 12.26 | | | | 11.51 | % | | $ | 55.9 | | | | 1.24 | % | | | 1.22 | % | | | .10 | % | | | 51 | % | |
8/31/2009 | | $ | — | | | $ | 11.07 | | | | (21.04 | %) | | $ | 43.8 | | | | 1.37 | % | | | 1.36 | % | | | .78 | % | | | 51 | % | |
Trust Class | |
8/31/2013 | | $ | — | | | $ | 17.61 | | | | 28.45 | % | | $ | 13.0 | | | | 1.66 | % | | | 1.25 | % | | | 1.26 | % | | | 33 | % | |
8/31/2012 | | $ | — | | | $ | 13.82 | | | | 12.51 | % | | $ | 18.4 | | | | 1.60 | % | | | 1.25 | % | | | .61 | % | | | 118 | % | |
8/31/2011 | | $ | — | | | $ | 12.34 | | | | 15.66 | % | | $ | 24.1 | | | | 1.54 | % | | | 1.26 | % | | | .33 | % | | | 27 | % | |
8/31/2010 | | $ | — | | | $ | 10.68 | | | | 11.55 | % | | $ | 80.5 | | | | 1.42 | % | | | 1.25 | % | | | .07 | % | | | 51 | % | |
8/31/2009 | | $ | — | | | $ | 9.66 | | | | (20.96 | %) | | $ | 26.9 | | | | 1.59 | % | | | 1.25 | % | | | .89 | % | | | 51 | % | |
Institutional Class | |
8/31/2013 | | $ | — | | | $ | 20.33 | | | | 28.96 | % | | $ | 4.6 | | | | 1.23 | % | | | .85 | % | | | 1.73 | % | | | 33 | % | |
8/31/2012 | | $ | — | | | $ | 15.93 | | | | 12.94 | % | | $ | 4.4 | | | | 1.19 | % | | | .85 | % | | | 1.01 | % | | | 118 | % | |
8/31/2011 | | $ | — | | | $ | 14.22 | | | | 16.26 | % | | $ | 3.5 | | | | 1.16 | % | | | .86 | % | | | .67 | % | | | 27 | % | |
Period from 3/8/2010^
to 8/31/2010 | | $ | — | | | $ | 12.28 | | | | (6.40 | %)** | | $ | 0.7 | | | | 1.03 | %* | | | .85 | %* | | | .48 | %* | | | 51 | %Ø | |
Class A | |
8/31/2013 | | $ | — | | | $ | 17.60 | | | | 28.43 | % | | $ | 2.7 | | | | 1.65 | % | | | 1.21 | % | | | 1.45 | % | | | 33 | % | |
8/31/2012 | | $ | — | | | $ | 13.82 | | | | 12.56 | % | | $ | 3.8 | | | | 1.61 | % | | | 1.21 | % | | | .63 | % | | | 118 | % | |
8/31/2011 | | $ | — | | | $ | 12.34 | | | | 15.70 | % | | $ | 1.2 | | | | 1.91 | % | | | 1.22 | % | | | .37 | % | | | 27 | % | |
Period from 6/21/2010^
to 8/31/2010 | | $ | — | | | $ | 10.68 | | | | (6.40 | %)** | | $ | 0.0 | | | | 37.23 | %* | | | 1.21 | %* | | | .04 | %* | | | 51 | %Ø | |
Class C | |
8/31/2013 | | $ | — | | | $ | 17.44 | | | | 27.51 | % | | $ | 1.3 | | | | 2.35 | % | | | 1.96 | % | | | .54 | % | | | 33 | % | |
8/31/2012 | | $ | — | | | $ | 13.69 | | | | 11.76 | % | | $ | 0.4 | | | | 2.43 | % | | | 1.96 | % | | | (.09 | %) | | | 118 | % | |
8/31/2011 | | $ | — | | | $ | 12.25 | | | | 14.92 | % | | $ | 0.1 | | | | 3.97 | % | | | 1.97 | % | | | (.31 | %) | | | 27 | % | |
Period from 6/21/2010^
to 8/31/2010 | | $ | — | | | $ | 10.66 | | | | (6.57 | %)** | | $ | 0.0 | | | | 35.88 | %* | | | 1.96 | %* | | | (.64 | %)* | | | 51 | %Ø | |
236
Financial Highlights (cont'd)
| | Net Asset
Value,
Beginning
of Year | | Net
Investment
Income (Loss)@ | | Net Gains or
Losses on
Securities
(both realized
and
unrealized) | | Total From
Investment
Operations | | Dividends
from Net
Investment
Income | | Distributions
from Net
Realized
Capital Gains | | Tax
Return of
Capital | | Total
Distributions | | Voluntary
Contribution
from
Management | |
Class R3 | |
8/31/2013 | | $ | 13.80 | | | $ | 0.14 | | | $ | 3.73 | | | $ | 3.87 | | | $ | (0.08 | ) | | $ | — | | | $ | — | | | $ | (0.08 | ) | | $ | — | | |
8/31/2012 | | $ | 12.32 | | | $ | 0.05 | | | $ | 1.46 | | | $ | 1.51 | | | $ | (0.03 | ) | | $ | — | | | $ | — | | | $ | (0.03 | ) | | $ | — | | |
8/31/2011 | | $ | 10.67 | | | $ | 0.04 | | | $ | 1.61 | | | $ | 1.65 | | | $ | — | | | $ | — | | | $ | — | | | $ | — | | | $ | — | | |
Period from 6/21/2010^
to 8/31/2010 | | $ | 11.41 | | | $ | (0.00 | ) | | $ | (0.74 | ) | | $ | (0.74 | ) | | $ | — | | | $ | — | | | $ | — | | | $ | — | | | $ | — | | |
Multi-Cap Opportunities Fund | |
Institutional Class | |
8/31/2013 | | $ | 10.76 | | | $ | 0.17 | | | $ | 2.86 | | | $ | 3.03 | | | $ | (0.14 | ) | | $ | (0.09 | ) | | $ | — | | | $ | (0.23 | ) | | $ | — | | |
8/31/2012 | | $ | 9.59 | | | $ | 0.17 | | | $ | 1.27 | | | $ | 1.44 | | | $ | (0.02 | ) | | $ | (0.25 | ) | | $ | — | | | $ | (0.27 | ) | | $ | — | | |
8/31/2011 | | $ | 8.03 | | | $ | 0.06 | | | $ | 1.55 | | | $ | 1.61 | | | $ | (0.05 | ) | | $ | — | | | $ | — | | | $ | (0.05 | ) | | $ | — | | |
| 8/31/2010‡‡ | | $ | 7.93 | | | $ | 0.09 | | | $ | 0.16 | | | $ | 0.25 | | | $ | (0.15 | ) | | $ | — | | | $ | — | | | $ | (0.15 | ) | | $ | — | | |
| 8/31/2009‡‡ | | $ | 9.84 | | | $ | 0.07 | | | $ | (1.84 | ) | | $ | (1.77 | ) | | $ | (0.05 | ) | | $ | (0.09 | ) | | $ | — | | | $ | (0.14 | ) | | $ | — | | |
Class A | |
8/31/2013 | | $ | 10.70 | | | $ | 0.12 | | | $ | 2.86 | | | $ | 2.98 | | | $ | (0.11 | ) | | $ | (0.09 | ) | | $ | — | | | $ | (0.20 | ) | | $ | — | | |
8/31/2012 | | $ | 9.56 | | | $ | 0.13 | | | $ | 1.27 | | | $ | 1.40 | | | $ | (0.01 | ) | | $ | (0.25 | ) | | $ | — | | | $ | (0.26 | ) | | $ | — | | |
8/31/2011 | | $ | 8.02 | | | $ | 0.03 | | | $ | 1.53 | | | $ | 1.56 | | | $ | (0.02 | ) | | $ | — | | | $ | — | | | $ | (0.02 | ) | | $ | — | | |
Period from 12/21/2009^
to 8/31/2010 | | $ | 8.38 | | | $ | 0.03 | | | $ | (0.39 | ) | | $ | (0.36 | ) | | $ | — | | | $ | — | | | $ | — | | | $ | — | | | $ | — | | |
Class C | |
8/31/2013 | | $ | 10.52 | | | $ | 0.01 | | | $ | 2.81 | | | $ | 2.82 | | | $ | (0.05 | ) | | $ | (0.09 | ) | | $ | — | | | $ | (0.14 | ) | | $ | — | | |
8/31/2012 | | $ | 9.47 | | | $ | 0.07 | | | $ | 1.23 | | | $ | 1.30 | | | $ | — | | | $ | (0.25 | ) | | $ | — | | | $ | (0.25 | ) | | $ | — | | |
8/31/2011 | | $ | 7.97 | | | $ | (0.05 | ) | | $ | 1.55 | | | $ | 1.50 | | | $ | — | | | $ | — | | | $ | — | | | $ | — | | | $ | — | | |
Period from 12/21/2009^
to 8/31/2010 | | $ | 8.38 | | | $ | (0.01 | ) | | $ | (0.40 | ) | | $ | (0.41 | ) | | $ | — | | | $ | — | | | $ | — | | | $ | — | | | $ | — | | |
Real Estate Fund | |
Trust Class | |
8/31/2013 | | $ | 13.82 | | | $ | 0.15 | | | $ | (0.50 | ) | | $ | (0.35 | ) | | $ | (0.15 | ) | | $ | (0.36 | ) | | $ | — | | | $ | (0.51 | ) | | $ | — | | |
8/31/2012 | | $ | 11.80 | | | $ | 0.14 | | | $ | 2.12 | | | $ | 2.26 | | | $ | (0.19 | ) | | $ | (0.05 | ) | | $ | — | | | $ | (0.24 | ) | | $ | — | | |
8/31/2011 | | $ | 10.23 | | | $ | 0.09 | | | $ | 1.68 | | | $ | 1.77 | | | $ | (0.21 | ) | | $ | — | | | $ | — | | | $ | (0.21 | ) | | $ | — | | |
8/31/2010 | | $ | 7.74 | | | $ | 0.16 | | | $ | 2.53 | | | $ | 2.69 | | | $ | (0.16 | ) | | $ | — | | | $ | (0.04 | ) | | $ | (0.20 | ) | | $ | — | | |
8/31/2009 | | $ | 10.65 | | | $ | 0.24 | | | $ | (2.84 | ) | | $ | (2.60 | ) | | $ | (0.24 | ) | | $ | — | | | $ | (0.07 | ) | | $ | (0.31 | ) | | $ | — | | |
See Notes to Financial Highlights
237
| | | Redemption
Feesøø | | Net
Asset
Value,
End of
Year | | Total
Return†† | | Net Assets,
End of Year
(in millions) | | Ratio of
Gross
Expenses
to Average
Net Assets# | | Ratio
of Net
Expenses
to Average
Net Assets‡ | | Ratio of Net
Investment
Income/
(Loss) to
Average Net
Assets | | Portfolio
Turnover
Rate | |
Class R3 | |
8/31/2013 | | $ | — | | | $ | 17.59 | | | | 28.22 | % | | $ | 0.8 | | | | 1.86 | % | | | 1.46 | % | | | .85 | % | | | 33 | % | |
8/31/2012 | | $ | — | | | $ | 13.80 | | | | 12.25 | % | | $ | 0.2 | | | | 1.88 | % | | | 1.46 | % | | | .41 | % | | | 118 | % | |
8/31/2011 | | $ | — | | | $ | 12.32 | | | | 15.46 | % | | $ | 0.2 | | | | 6.06 | % | | | 1.47 | % | | | .32 | % | | | 27 | % | |
Period from 6/21/2010^
to 8/31/2010 | | $ | — | | | $ | 10.67 | | | | (6.49 | %)** | | $ | 0.0 | | | | 37.59 | %* | | | 1.46 | %* | | | (.22 | %)* | | | 51 | %Ø | |
Multi-Cap Opportunities Fund | |
Institutional Class | |
8/31/2013 | | $ | — | | | $ | 13.56 | | | | 28.57 | % | | $ | 1,430.7 | | | | .85 | % | | | .85 | %§ | | | 1.38 | % | | | 11 | % | |
8/31/2012 | | $ | — | | | $ | 10.76 | | | | 15.56 | % | | $ | 465.5 | | | | 1.00 | % | | | 1.00 | %§ | | | 1.70 | % | | | 29 | % | |
8/31/2011 | | $ | — | | | $ | 9.59 | | | | 20.09 | % | | $ | 91.0 | | | | 1.21 | % | | | 1.01 | %^^c | | | .64 | % | | | 105 | % | |
| 8/31/2010‡‡ | | $ | — | | | $ | 8.03 | | | | 3.02 | %††† | | $ | 47.2 | | | | 1.95 | % | | | 1.00 | % | | | 1.10 | % | | | 62 | % | |
| 8/31/2009‡‡ | | $ | — | | | $ | 7.93 | | | | (17.74 | %)††† | | $ | 3.1 | | | | 5.67 | % | | | 1.02 | % | | | 1.02 | % | | | 124 | % | |
Class A | |
8/31/2013 | | $ | — | | | $ | 13.48 | | | | 28.22 | % | | $ | 51.6 | | | | 1.18 | % | | | 1.18 | %§ | | | .91 | % | | | 11 | % | |
8/31/2012 | | $ | — | | | $ | 10.70 | | | | 15.13 | % | | $ | 2.8 | | | | 1.36 | % | | | 1.36 | %§ | | | 1.29 | % | | | 29 | % | |
8/31/2011 | | $ | — | | | $ | 9.56 | | | | 19.48 | % | | $ | 0.2 | | | | 1.69 | % | | | 1.37 | %^^ | | | .28 | % | | | 105 | % | |
Period from 12/21/2009^
to 8/31/2010 | | $ | — | | | $ | 8.02 | | | | (4.30 | %)** | | $ | 0.3 | | | | 3.18 | %* | | | 1.36 | %* | | | .58 | %* | | | 62 | %Ø | |
Class C | |
8/31/2013 | | $ | — | | | $ | 13.20 | | | | 27.10 | % | | $ | 8.3 | | | | 2.05 | % | | | 2.05 | %§ | | | .04 | % | | | 11 | % | |
8/31/2012 | | $ | — | | | $ | 10.52 | | | | 14.22 | % | | $ | 0.4 | | | | 2.14 | % | | | 2.11 | % | | | .70 | % | | | 29 | % | |
8/31/2011 | | $ | — | | | $ | 9.47 | | | | 18.82 | % | | $ | 0.2 | | | | 2.43 | % | | | 2.12 | %^^ | | | (.50 | %) | | | 105 | % | |
Period from 12/21/2009^
to 8/31/2010 | | $ | — | | | $ | 7.97 | | | | (4.89 | %)** | | $ | 0.1 | | | | 6.43 | %* | | | 2.12 | %* | | | (.18 | %)* | | | 62 | %Ø | |
Real Estate Fund | |
Trust Class | |
8/31/2013 | | $ | — | | | $ | 12.96 | | | | (2.60 | %) | | $ | 319.9 | | | | 1.43 | % | | | 1.04 | % | | | 1.09 | % | | | 33 | % | |
8/31/2012 | | $ | — | | | $ | 13.82 | | | | 19.53 | % | | $ | 288.9 | | | | 1.47 | % | | | 1.03 | % | | | 1.10 | % | | | 29 | % | |
8/31/2011 | | $ | 0.01 | | | $ | 11.80 | | | | 17.53 | % | | $ | 216.3 | | | | 1.55 | % | | | .99 | % | | | .75 | % | | | 28 | % | |
8/31/2010 | | $ | 0.00 | | | $ | 10.23 | | | | 35.09 | % | | $ | 126.7 | | | | 1.75 | % | | | .99 | % | | | 1.73 | % | | | 70 | % | |
8/31/2009 | | $ | 0.00 | | | $ | 7.74 | | | | (23.69 | %) | | $ | 63.0 | | | | 2.02 | % | | | .99 | % | | | 3.61 | % | | | 181 | % | |
238
Financial Highlights (cont'd)
| | | Net Asset
Value,
Beginning
of Year | | Net
Investment
Income (Loss)@ | | Net Gains or
Losses on
Securities
(both realized
and
unrealized) | | Total From
Investment
Operations | | Dividends
from Net
Investment
Income | | Distributions
from Net
Realized
Capital Gains | | Tax
Return of
Capital | | Total
Distributions | | Voluntary
Contribution
from
Management | |
Institutional Class | |
8/31/2013 | | $ | 13.86 | | | $ | 0.17 | | | $ | (0.51 | ) | | $ | (0.34 | ) | | $ | (0.17 | ) | | $ | (0.36 | ) | | $ | — | | | $ | (0.53 | ) | | $ | — | | |
8/31/2012 | | $ | 11.83 | | | $ | 0.15 | | | $ | 2.14 | | | $ | 2.29 | | | $ | (0.21 | ) | | $ | (0.05 | ) | | $ | — | | | $ | (0.26 | ) | | $ | — | | |
8/31/2011 | | $ | 10.25 | | | $ | 0.10 | | | $ | 1.71 | | | $ | 1.81 | | | $ | (0.23 | ) | | $ | — | | | $ | — | | | $ | (0.23 | ) | | $ | — | | |
8/31/2010 | | $ | 7.76 | | | $ | 0.17 | | | $ | 2.53 | | | $ | 2.70 | | | $ | (0.16 | ) | | $ | — | | | $ | (0.05 | ) | | $ | (0.21 | ) | | $ | — | | |
8/31/2009 | | $ | 10.66 | | | $ | 0.24 | | | $ | (2.82 | ) | | $ | (2.58 | ) | | $ | (0.23 | ) | | $ | — | | | $ | (0.09 | ) | | $ | (0.32 | ) | | $ | — | | |
Class A | |
8/31/2013 | | $ | 13.82 | | | $ | 0.12 | | | $ | (0.51 | ) | | $ | (0.39 | ) | | $ | (0.12 | ) | | $ | (0.36 | ) | | $ | — | | | $ | (0.48 | ) | | $ | — | | |
8/31/2012 | | $ | 11.80 | | | $ | 0.11 | | | $ | 2.13 | | | $ | 2.24 | | | $ | (0.17 | ) | | $ | (0.05 | ) | | $ | — | | | $ | (0.22 | ) | | $ | — | | |
8/31/2011 | | $ | 10.23 | | | $ | 0.04 | | | $ | 1.72 | | | $ | 1.76 | | | $ | (0.19 | ) | | $ | — | | | $ | — | | | $ | (0.19 | ) | | $ | — | | |
Period from 6/21/2010^
to 8/31/2010 | | $ | 10.38 | | | $ | 0.01 | | | $ | (0.11 | ) | | $ | (0.10 | ) | | $ | (0.02 | ) | | $ | — | | | $ | (0.03 | ) | | $ | (0.05 | ) | | $ | — | | |
Class C | |
8/31/2013 | | $ | 13.81 | | | $ | 0.02 | | | $ | (0.50 | ) | | $ | (0.48 | ) | | $ | (0.03 | ) | | $ | (0.36 | ) | | $ | — | | | $ | (0.39 | ) | | $ | — | | |
8/31/2012 | | $ | 11.80 | | | $ | 0.01 | | | $ | 2.14 | | | $ | 2.15 | | | $ | (0.09 | ) | | $ | (0.05 | ) | | $ | — | | | $ | (0.14 | ) | | $ | — | | |
8/31/2011 | | $ | 10.24 | | | $ | (0.05 | ) | | $ | 1.73 | | | $ | 1.68 | | | $ | (0.12 | ) | | $ | — | | | $ | — | | | $ | (0.12 | ) | | $ | — | | |
Period from 6/21/2010^
to 8/31/2010 | | $ | 10.38 | | | $ | 0.01 | | | $ | (0.12 | ) | | $ | (0.11 | ) | | $ | (0.01 | ) | | $ | — | | | $ | (0.02 | ) | | $ | (0.03 | ) | | $ | — | | |
Class R3 | |
8/31/2013 | | $ | 13.81 | | | $ | 0.08 | | | $ | (0.50 | ) | | $ | (0.42 | ) | | $ | (0.09 | ) | | $ | (0.36 | ) | | $ | — | | | $ | (0.45 | ) | | $ | — | | |
8/31/2012 | | $ | 11.80 | | | $ | 0.05 | | | $ | 2.17 | | | $ | 2.22 | | | $ | (0.16 | ) | | $ | (0.05 | ) | | $ | — | | | $ | (0.21 | ) | | $ | — | | |
8/31/2011 | | $ | 10.23 | | | $ | (0.01 | ) | | $ | 1.74 | | | $ | 1.73 | | | $ | (0.16 | ) | | $ | — | | | $ | — | | | $ | (0.16 | ) | | $ | — | | |
Period from 6/21/2010^
to 8/31/2010 | | $ | 10.38 | | | $ | 0.02 | | | $ | (0.13 | ) | | $ | (0.11 | ) | | $ | (0.03 | ) | | $ | — | | | $ | (0.01 | ) | | $ | (0.04 | ) | | $ | — | | |
Class R6 | |
Period from 3/15/2013^
to 8/31/2013 | | $ | 14.11 | | | $ | 0.06 | | | $ | (1.04 | ) | | $ | (0.98 | ) | | $ | (0.02 | ) | | $ | (0.12 | ) | | $ | — | | | $ | (0.14 | ) | | $ | — | | |
Select Equities Fund | |
Institutional Class | |
8/31/2013 | | $ | 9.34 | | | $ | 0.04 | | | $ | 1.54 | | | $ | 1.58 | | | $ | — | | | $ | (0.74 | ) | | $ | — | | | $ | (0.74 | ) | | $ | — | | |
8/31/2012 | | $ | 9.05 | | | $ | 0.02 | | | $ | 0.98 | | | $ | 1.00 | | | $ | (0.02 | ) | | $ | (0.69 | ) | | $ | — | | | $ | (0.71 | ) | | $ | — | | |
8/31/2011 | | $ | 7.91 | | | $ | 0.06 | | | $ | 1.41 | | | $ | 1.47 | | | $ | (0.07 | ) | | $ | (0.26 | ) | | $ | — | | | $ | (0.33 | ) | | $ | — | | |
8/31/2010 | | $ | 8.06 | | | $ | 0.06 | | | $ | (0.01 | ) | | $ | 0.05 | | | $ | (0.05 | ) | | $ | (0.15 | ) | | $ | — | | | $ | (0.20 | ) | | $ | — | | |
8/31/2009 | | $ | 9.20 | | | $ | 0.08 | | | $ | (1.19 | ) | | $ | (1.11 | ) | | $ | (0.03 | ) | | $ | — | | | $ | — | | | $ | (0.03 | ) | | $ | — | | |
See Notes to Financial Highlights
239
| | Redemption
Feesøø | | Net
Asset
Value,
End of
Year | | Total
Return†† | | Net Assets,
End of Year
(in millions) | | Ratio of
Gross
Expenses
to Average
Net Assets# | | Ratio
of Net
Expenses
to Average
Net Assets‡ | | Ratio of Net
Investment
Income/
(Loss) to
Average Net
Assets | | Portfolio
Turnover
Rate | |
Institutional Class | |
8/31/2013 | | $ | — | | | $ | 12.99 | | | | (2.48 | %) | | $ | 366.4 | | | | 1.07 | % | | | .85 | % | | | 1.23 | % | | | 33 | % | |
8/31/2012 | | $ | — | | | $ | 13.86 | | | | 19.77 | % | | $ | 228.6 | | | | 1.10 | % | | | .85 | % | | | 1.21 | % | | | 29 | % | |
8/31/2011 | | $ | 0.00 | | | $ | 11.83 | | | | 17.77 | % | | $ | 117.1 | | | | 1.16 | % | | | .85 | % | | | .81 | % | | | 28 | % | |
8/31/2010 | | $ | 0.00 | | | $ | 10.25 | | | | 35.18 | % | | $ | 22.6 | | | | 1.39 | % | | | .85 | % | | | 1.77 | % | | | 70 | % | |
8/31/2009 | | $ | 0.00 | | | $ | 7.76 | | | | (23.46 | %) | | $ | 3.3 | | | | 2.80 | % | | | .85 | % | | | 3.47 | % | | | 181 | % | |
Class A | |
8/31/2013 | | $ | — | | | $ | 12.95 | | | | (2.82 | %) | | $ | 164.5 | | | | 1.47 | % | | | 1.21 | % | | | .84 | % | | | 33 | % | |
8/31/2012 | | $ | — | | | $ | 13.82 | | | | 19.33 | % | | $ | 78.3 | | | | 1.51 | % | | | 1.21 | % | | | .86 | % | | | 29 | % | |
8/31/2011 | | $ | 0.00 | | | $ | 11.80 | | | | 17.33 | % | | $ | 36.3 | | | | 1.60 | % | | | 1.21 | % | | | .33 | % | | | 28 | % | |
Period from 6/21/2010^
to 8/31/2010 | | $ | 0.00 | | | $ | 10.23 | | | | (.98 | %)** | | $ | 0.5 | | | | 12.56 | %* | | | 1.21 | %* | | | .68 | %* | | | 70 | %Ø | |
Class C | |
8/31/2013 | | $ | — | | | $ | 12.94 | | | | (3.52 | %) | | $ | 39.7 | | | | 2.24 | % | | | 1.96 | % | | | .11 | % | | | 33 | % | |
8/31/2012 | | $ | — | | | $ | 13.81 | | | | 18.40 | % | | $ | 20.7 | | | | 2.28 | % | | | 1.96 | % | | | .09 | % | | | 29 | % | |
8/31/2011 | | $ | 0.00 | | | $ | 11.80 | | | | 16.44 | % | | $ | 8.3 | | | | 2.37 | % | | | 1.96 | % | | | (.46 | %) | | | 28 | % | |
Period from 6/21/2010^
to 8/31/2010 | | $ | 0.00 | | | $ | 10.24 | | | | (1.08 | %)** | | $ | 0.1 | | | | 20.75 | %* | | | 1.96 | %* | | | .66 | %* | | | 70 | %Ø | |
Class R3 | |
8/31/2013 | | $ | — | | | $ | 12.94 | | | | (3.04 | %) | | $ | 15.2 | | | | 1.70 | % | | | 1.46 | % | | | .56 | % | | | 33 | % | |
8/31/2012 | | $ | — | | | $ | 13.81 | | | | 19.07 | % | | $ | 4.8 | | | | 1.74 | % | | | 1.46 | % | | | .41 | % | | | 29 | % | |
8/31/2011 | | $ | 0.00 | | | $ | 11.80 | | | | 17.00 | % | | $ | 0.3 | | | | 2.81 | % | | | 1.46 | % | | | (.06 | %) | | | 28 | % | |
Period from 6/21/2010^
to 8/31/2010 | | $ | 0.00 | | | $ | 10.23 | | | | (1.04 | %)** | | $ | 0.0 | | | | 37.36 | %* | | | 1.46 | %* | | | .93 | %* | | | 70 | %Ø | |
Class R6 | |
Period from 3/15/2013^
to 8/31/2013 | | $ | — | | | $ | 12.99 | | | | (6.96 | %)** | | $ | 8.3 | | | | 1.11 | %* | | | .78 | %* | | | .95 | %* | | | 33 | %Ø | |
Select Equities Fund | |
Institutional Class | |
8/31/2013 | | $ | — | | | $ | 10.18 | | | | 17.97 | % | | $ | 48.3 | | | | 1.10 | % | | | .75 | % | | | .40 | % | | | 70 | % | |
8/31/2012 | | $ | — | | | $ | 9.34 | | | | 12.21 | % | | $ | 27.1 | | | | 1.15 | % | | | .75 | % | | | .26 | % | | | 93 | % | |
8/31/2011 | | $ | — | | | $ | 9.05 | | | | 18.62 | % | | $ | 27.3 | | | | 1.17 | % | | | .75 | % | | | .67 | % | | | 150 | % | |
8/31/2010 | | $ | — | | | $ | 7.91 | | | | .44 | % | | $ | 17.6 | | | | 1.22 | % | | | .75 | % | | | .78 | % | | | 129 | % | |
8/31/2009 | | $ | — | | | $ | 8.06 | | | | (12.03 | %) | | $ | 6.5 | | | | 2.57 | % | | | .75 | % | | | 1.04 | % | | | 93 | % | |
240
Financial Highlights (cont'd)
| | | Net Asset
Value,
Beginning
of Year | | Net
Investment
Income (Loss)@ | | Net Gains or
Losses on
Securities
(both realized
and
unrealized) | | Total From
Investment
Operations | | Dividends
from Net
Investment
Income | | Distributions
from Net
Realized
Capital Gains | | Tax
Return of
Capital | | Total
Distributions | | Voluntary
Contribution
from
Management | |
Class A | |
8/31/2013 | | $ | 9.29 | | | $ | (0.00 | ) | | $ | 1.53 | | | $ | 1.53 | | | $ | — | | | $ | (0.74 | ) | | $ | — | | | $ | (0.74 | ) | | $ | — | | |
8/31/2012 | | $ | 9.03 | | | $ | (0.02 | ) | | $ | 0.97 | | | $ | 0.95 | | | $ | — | | | $ | (0.69 | ) | | $ | — | | | $ | (0.69 | ) | | $ | — | | |
8/31/2011 | | $ | 7.88 | | | $ | 0.02 | | | $ | 1.41 | | | $ | 1.43 | | | $ | (0.02 | ) | | $ | (0.26 | ) | | $ | — | | | $ | (0.28 | ) | | $ | — | | |
8/31/2010 | | $ | 8.05 | | | $ | 0.03 | | | $ | (0.03 | ) | | $ | 0.00 | | | $ | (0.02 | ) | | $ | (0.15 | ) | | $ | — | | | $ | (0.17 | ) | | $ | — | | |
8/31/2009 | | $ | 9.18 | | | $ | 0.04 | | | $ | (1.14 | ) | | $ | (1.10 | ) | | $ | (0.03 | ) | | $ | — | | | $ | — | | | $ | (0.03 | ) | | $ | — | | |
Class C | |
8/31/2013 | | $ | 8.98 | | | $ | (0.07 | ) | | $ | 1.47 | | | $ | 1.40 | | | $ | — | | | $ | (0.74 | ) | | $ | — | | | $ | (0.74 | ) | | $ | — | | |
8/31/2012 | | $ | 8.82 | | | $ | (0.08 | ) | | $ | 0.93 | | | $ | 0.85 | | | $ | — | | | $ | (0.69 | ) | | $ | — | | | $ | (0.69 | ) | | $ | — | | |
8/31/2011 | | $ | 7.74 | | | $ | (0.05 | ) | | $ | 1.39 | | | $ | 1.34 | | | $ | — | | | $ | (0.26 | ) | | $ | — | | | $ | (0.26 | ) | | $ | — | | |
8/31/2010 | | $ | 7.94 | | | $ | (0.03 | ) | | $ | (0.02 | ) | | $ | (0.05 | ) | | $ | — | | | $ | (0.15 | ) | | $ | — | | | $ | (0.15 | ) | | $ | — | | |
8/31/2009 | | $ | 9.12 | | | $ | (0.02 | ) | | $ | (1.13 | ) | | $ | (1.15 | ) | | $ | (0.03 | ) | | $ | — | | | $ | — | | | $ | (0.03 | ) | | $ | — | | |
Small Cap Growth Fund | |
Investor Class | |
8/31/2013 | | $ | 19.49 | | | $ | (0.15 | ) | | $ | 4.82 | | | $ | 4.67 | | | $ | — | | | $ | — | | | $ | — | | | $ | — | | | $ | — | | |
8/31/2012 | | $ | 17.74 | | | $ | (0.17 | ) | | $ | 1.92 | | | $ | 1.75 | | | $ | — | | | $ | — | | | $ | — | | | $ | — | | | $ | — | | |
8/31/2011 | | $ | 13.68 | | | $ | (0.16 | ) | | $ | 4.22 | | | $ | 4.06 | | | $ | — | | | $ | — | | | $ | — | | | $ | — | | | $ | — | | |
8/31/2010 | | $ | 13.15 | | | $ | (0.13 | ) | | $ | 0.66 | | | $ | 0.53 | | | $ | — | | | $ | — | | | $ | — | | | $ | — | | | $ | — | | |
8/31/2009 | | $ | 17.92 | | | $ | (0.11 | ) | | $ | (4.66 | ) | | $ | (4.77 | ) | | $ | — | | | $ | — | | | $ | — | | | $ | — | | | $ | — | | |
Trust Class | |
8/31/2013 | | $ | 21.19 | | | $ | (0.20 | ) | | $ | 5.23 | | | $ | 5.03 | | | $ | — | | | $ | — | | | $ | — | | | $ | — | | | $ | — | | |
8/31/2012 | | $ | 19.32 | | | $ | (0.22 | ) | | $ | 2.09 | | | $ | 1.87 | | | $ | — | | | $ | — | | | $ | — | | | $ | — | | | $ | — | | |
8/31/2011 | | $ | 14.93 | | | $ | (0.21 | ) | | $ | 4.60 | | | $ | 4.39 | | | $ | — | | | $ | — | | | $ | — | | | $ | — | | | $ | — | | |
8/31/2010 | | $ | 14.43 | | | $ | (0.18 | ) | | $ | 0.68 | | | $ | 0.50 | | | $ | — | | | $ | — | | | $ | — | | | $ | — | | | $ | — | | |
8/31/2009 | | $ | 19.67 | | | $ | (0.14 | ) | | $ | (5.10 | ) | | $ | (5.24 | ) | | $ | — | | | $ | — | | | $ | — | | | $ | — | | | $ | — | | |
Advisor Class | |
8/31/2013 | | $ | 14.03 | | | $ | (0.15 | ) | | $ | 3.45 | | | $ | 3.30 | | | $ | — | | | $ | — | | | $ | — | | | $ | — | | | $ | — | | |
8/31/2012 | | $ | 12.81 | | | $ | (0.17 | ) | | $ | 1.39 | | | $ | 1.22 | | | $ | — | | | $ | — | | | $ | — | | | $ | — | | | $ | — | | |
8/31/2011 | | $ | 9.92 | | | $ | (0.17 | ) | | $ | 3.06 | | | $ | 2.89 | | | $ | — | | | $ | — | | | $ | — | | | $ | — | | | $ | — | | |
8/31/2010 | | $ | 9.61 | | | $ | (0.14 | ) | | $ | 0.45 | | | $ | 0.31 | | | $ | — | | | $ | — | | | $ | — | | | $ | — | | | $ | — | | |
8/31/2009 | | $ | 13.13 | | | $ | (0.11 | ) | | $ | (3.41 | ) | | $ | (3.52 | ) | | $ | — | | | $ | — | | | $ | — | | | $ | — | | | $ | — | | |
See Notes to Financial Highlights
241
| | Redemption
Feesøø | | Net
Asset
Value,
End of
Year | | Total
Return†† | | Net Assets,
End of Year
(in millions) | | Ratio of
Gross
Expenses
to Average
Net Assets# | | Ratio
of Net
Expenses
to Average
Net Assets‡ | | Ratio of Net
Investment
Income/
(Loss) to
Average Net
Assets | | Portfolio
Turnover
Rate | |
Class A | |
8/31/2013 | | $ | — | | | $ | 10.08 | | | | 17.50 | % | | $ | 30.7 | | | | 1.48 | % | | | 1.20 | % | | | (.02 | %) | | | 70 | % | |
8/31/2012 | | $ | — | | | $ | 9.29 | | | | 11.62 | % | | $ | 29.2 | | | | 1.53 | % | | | 1.20 | % | | | (.20 | %) | | | 93 | % | |
8/31/2011 | | $ | — | | | $ | 9.03 | | | | 18.15 | % | | $ | 30.9 | | | | 1.58 | % | | | 1.20 | % | | | .23 | % | | | 150 | % | |
8/31/2010 | | $ | — | | | $ | 7.88 | | | | (.11 | %) | | $ | 38.0 | | | | 1.60 | % | | | 1.20 | % | | | .36 | % | | | 129 | % | |
8/31/2009 | | $ | — | | | $ | 8.05 | | | | (11.95 | %) | | $ | 38.3 | | | | 2.19 | % | | | 1.20 | % | | | .52 | % | | | 93 | % | |
Class C | |
8/31/2013 | | $ | — | | | $ | 9.64 | | | | 16.60 | % | | $ | 13.6 | | | | 2.23 | % | | | 1.95 | % | | | (.78 | %) | | | 70 | % | |
8/31/2012 | | $ | — | | | $ | 8.98 | | | | 10.71 | % | | $ | 11.7 | | | | 2.28 | % | | | 1.95 | % | | | (.96 | %) | | | 93 | % | |
8/31/2011 | | $ | — | | | $ | 8.82 | | | | 17.29 | % | | $ | 13.2 | | | | 2.30 | % | | | 1.95 | % | | | (.53 | %) | | | 150 | % | |
8/31/2010 | | $ | — | | | $ | 7.74 | | | | (.75 | %) | | $ | 11.6 | | | | 2.35 | % | | | 1.95 | % | | | (.41 | %) | | | 129 | % | |
8/31/2009 | | $ | — | | | $ | 7.94 | | | | (12.58 | %) | | $ | 7.4 | | | | 2.91 | % | | | 1.95 | % | | | (.22 | %) | | | 93 | % | |
Small Cap Growth Fund | |
Investor Class | |
8/31/2013 | | $ | — | | | $ | 24.16 | | | | 23.96 | % | | $ | 48.8 | | | | 1.64 | % | | | 1.22 | % | | | (.72 | %) | | | 249 | % | |
8/31/2012 | | $ | — | | | $ | 19.49 | | | | 9.86 | % | | $ | 60.1 | | | | 1.58 | % | | | 1.21 | % | | | (.92 | %) | | | 294 | % | |
8/31/2011 | | $ | — | | | $ | 17.74 | | | | 29.68 | % | | $ | 63.6 | | | | 1.49 | % | | | 1.15 | % | | | (.88 | %) | | | 185 | % | |
8/31/2010 | | $ | — | | | $ | 13.68 | | | | 4.03 | % | | $ | 75.4 | | | | 1.50 | % | | | 1.15 | % | | | (.89 | %) | | | 235 | % | |
8/31/2009 | | $ | — | | | $ | 13.15 | | | | (26.62 | %) | | $ | 144.1 | | | | 1.48 | % | | | 1.30 | % | | | (.89 | %) | | | 292 | % | |
Trust Class | |
8/31/2013 | | $ | — | | | $ | 26.22 | | | | 23.74 | % | | $ | 7.2 | | | | 1.83 | % | | | 1.40 | % | | | (.91 | %) | | | 249 | % | |
8/31/2012 | | $ | — | | | $ | 21.19 | | | | 9.68 | % | | $ | 15.8 | | | | 1.77 | % | | | 1.39 | % | | | (1.10 | %) | | | 294 | % | |
8/31/2011 | | $ | — | | | $ | 19.32 | | | | 29.40 | % | | $ | 19.3 | | | | 1.67 | % | | | 1.37 | % | | | (1.10 | %) | | | 185 | % | |
8/31/2010 | | $ | — | | | $ | 14.93 | | | | 3.47 | % | | $ | 22.0 | | | | 1.70 | % | | | 1.37 | % | | | (1.11 | %) | | | 235 | % | |
8/31/2009 | | $ | — | | | $ | 14.43 | | | | (26.64 | %) | | $ | 35.2 | | | | 1.73 | % | | | 1.40 | % | | | (1.00 | %) | | | 292 | % | |
Advisor Class | |
8/31/2013 | | $ | — | | | $ | 17.33 | | | | 23.52 | % | | $ | 3.6 | | | | 1.93 | % | | | 1.52 | % | | | (1.00 | %) | | | 249 | % | |
8/31/2012 | | $ | — | | | $ | 14.03 | | | | 9.52 | % | | $ | 5.9 | | | | 1.87 | % | | | 1.58 | % | | | (1.28 | %) | | | 294 | % | |
8/31/2011 | | $ | — | | | $ | 12.81 | | | | 29.13 | % | | $ | 7.9 | | | | 1.80 | % | | | 1.60 | % | | | (1.33 | %) | | | 185 | % | |
8/31/2010 | | $ | — | | | $ | 9.92 | | | | 3.23 | % | | $ | 9.7 | | | | 1.90 | % | | | 1.60 | % | | | (1.34 | %) | | | 235 | % | |
8/31/2009 | | $ | — | | | $ | 9.61 | | | | (26.81 | %) | | $ | 11.7 | | | | 1.99 | % | | | 1.60 | % | | | (1.19 | %) | | | 292 | % | |
242
Financial Highlights (cont'd)
| | | Net Asset
Value,
Beginning
of Year | | Net
Investment
Income (Loss)@ | | Net Gains or
Losses on
Securities
(both realized
and
unrealized) | | Total From
Investment
Operations | | Dividends
from Net
Investment
Income | | Distributions
from Net
Realized
Capital Gains | | Tax
Return of
Capital | | Total
Distributions | | Voluntary
Contribution
from
Management | |
Institutional Class | |
8/31/2013 | | $ | 19.71 | | | $ | (0.09 | ) | | $ | 4.89 | | | $ | 4.80 | | | $ | — | | | $ | — | | | $ | — | | | $ | — | | | $ | — | | |
8/31/2012 | | $ | 17.88 | | | $ | (0.11 | ) | | $ | 1.94 | | | $ | 1.83 | | | $ | — | | | $ | — | | | $ | — | | | $ | — | | | $ | — | | |
8/31/2011 | | $ | 13.75 | | | $ | (0.11 | ) | | $ | 4.24 | | | $ | 4.13 | | | $ | — | | | $ | — | | | $ | — | | | $ | — | | | $ | — | | |
8/31/2010 | | $ | 13.23 | | | $ | (0.09 | ) | | $ | 0.61 | | | $ | 0.52 | | | $ | — | | | $ | — | | | $ | — | | | $ | — | | | $ | — | | |
8/31/2009 | | $ | 17.95 | | | $ | (0.06 | ) | | $ | (4.66 | ) | | $ | (4.72 | ) | | $ | — | | | $ | — | | | $ | — | | | $ | — | | | $ | — | | |
Class A | |
8/31/2013 | | $ | 21.27 | | | $ | (0.19 | ) | | $ | 5.28 | | | $ | 5.09 | | | $ | — | | | $ | — | | | $ | — | | | $ | — | | | $ | — | | |
8/31/2012 | | $ | 19.36 | | | $ | (0.19 | ) | | $ | 2.10 | | | $ | 1.91 | | | $ | — | | | $ | — | | | $ | — | | | $ | — | | | $ | — | | |
8/31/2011 | | $ | 14.95 | | | $ | (0.20 | ) | | $ | 4.61 | | | $ | 4.41 | | | $ | — | | | $ | — | | | $ | — | | | $ | — | | | $ | ��� | | |
8/31/2010 | | $ | 14.43 | | | $ | (0.16 | ) | | $ | 0.68 | | | $ | 0.52 | | | $ | — | | | $ | — | | | $ | — | | | $ | — | | | $ | — | | |
Period from 5/27/2009^
to 8/31/2009 | | $ | 12.98 | | | $ | (0.03 | ) | | $ | 1.48 | | | $ | 1.45 | | | $ | — | | | $ | — | | | $ | — | | | $ | — | | | $ | — | | |
Class C | |
8/31/2013 | | $ | 13.83 | | | $ | (0.24 | ) | | $ | 3.42 | | | $ | 3.18 | | | $ | — | | | $ | — | | | $ | — | | | $ | — | | | $ | — | | |
8/31/2012 | | $ | 12.69 | | | $ | (0.23 | ) | | $ | 1.37 | | | $ | 1.14 | | | $ | — | | | $ | — | | | $ | — | | | $ | — | | | $ | — | | |
8/31/2011 | | $ | 9.87 | | | $ | (0.22 | ) | | $ | 3.04 | | | $ | 2.82 | | | $ | — | | | $ | — | | | $ | — | | | $ | — | | | $ | — | | |
8/31/2010 | | $ | 9.60 | | | $ | (0.19 | ) | | $ | 0.46 | | | $ | 0.27 | | | $ | — | | | $ | — | | | $ | — | | | $ | — | | | $ | — | | |
Period from 5/27/2009^
to 8/31/2009 | | $ | 8.65 | | | $ | (0.04 | ) | | $ | 0.99 | | | $ | 0.95 | | | $ | — | | | $ | — | | | $ | — | | | $ | — | | | $ | — | | |
Class R3 | |
8/31/2013 | | $ | 14.06 | | | $ | (0.16 | ) | | $ | 3.47 | | | $ | 3.31 | | | $ | — | | | $ | — | | | $ | — | | | $ | — | | | $ | — | | |
8/31/2012 | | $ | 12.83 | | | $ | (0.17 | ) | | $ | 1.40 | | | $ | 1.23 | | | $ | — | | | $ | — | | | $ | — | | | $ | — | | | $ | — | | |
8/31/2011 | | $ | 9.93 | | | $ | (0.16 | ) | | $ | 3.06 | | | $ | 2.90 | | | $ | — | | | $ | — | | | $ | — | | | $ | — | | | $ | — | | |
8/31/2010 | | $ | 9.61 | | | $ | (0.13 | ) | | $ | 0.45 | | | $ | 0.32 | | | $ | — | | | $ | — | | | $ | — | | | $ | — | | | $ | — | | |
Period from 5/27/2009^
to 8/31/2009 | | $ | 8.65 | | | $ | (0.02 | ) | | $ | 0.98 | | | $ | 0.96 | | | $ | — | | | $ | — | | | $ | — | | | $ | — | | | $ | — | | |
Socially Responsive Fund | |
Investor Class | |
8/31/2013 | | $ | 26.48 | | | $ | 0.27 | | | $ | 6.09 | | | $ | 6.36 | | | $ | (0.18 | ) | | $ | — | | | $ | — | | | $ | (0.18 | ) | | $ | — | | |
8/31/2012 | | $ | 24.61 | | | $ | 0.22 | | | $ | 1.77 | | | $ | 1.99 | | | $ | (0.12 | ) | | $ | — | | | $ | — | | | $ | (0.12 | ) | | $ | — | | |
8/31/2011 | | $ | 20.58 | | | $ | 0.18 | | | $ | 3.88 | | | $ | 4.06 | | | $ | (0.03 | ) | | $ | — | | | $ | — | | | $ | (0.03 | ) | | $ | — | | |
8/31/2010 | | $ | 18.74 | | | $ | 0.06 | | | $ | 1.84 | | | $ | 1.90 | | | $ | (0.06 | ) | | $ | — | | | $ | — | | | $ | (0.06 | ) | | $ | — | | |
8/31/2009 | | $ | 24.51 | | | $ | 0.09 | | | $ | (5.52 | ) | | $ | (5.43 | ) | | $ | (0.08 | ) | | $ | (0.26 | ) | | $ | — | | | $ | (0.34 | ) | | $ | — | | |
See Notes to Financial Highlights
243
| | | Redemption
Feesøø | | Net
Asset
Value,
End of
Year | | Total
Return†† | | Net Assets,
End of Year
(in millions) | | Ratio of
Gross
Expenses
to Average
Net Assets# | | Ratio
of Net
Expenses
to Average
Net Assets‡ | | Ratio of Net
Investment
Income/
(Loss) to
Average Net
Assets | | Portfolio
Turnover
Rate | |
Institutional Class | |
8/31/2013 | | $ | — | | | $ | 24.51 | | | | 24.35 | % | | $ | 14.9 | | | | 1.41 | % | | | .90 | % | | | (.41 | %) | | | 249 | % | |
8/31/2012 | | $ | — | | | $ | 19.71 | | | | 10.23 | % | | $ | 33.3 | | | | 1.33 | % | | | .90 | % | | | (.58 | %) | | | 294 | % | |
8/31/2011 | | $ | — | | | $ | 17.88 | | | | 30.04 | % | | $ | 103.0 | | | | 1.26 | % | | | .90 | % | | | (.63 | %) | | | 185 | % | |
8/31/2010 | | $ | — | | | $ | 13.75 | | | | 3.93 | % | | $ | 82.6 | | | | 1.28 | % | | | .91 | % | | | (.63 | %) | | | 235 | % | |
8/31/2009 | | $ | — | | | $ | 13.23 | | | | (26.30 | %) | | $ | 7.5 | | | | 1.69 | % | | | .90 | % | | | (.48 | %) | | | 292 | % | |
Class A | |
8/31/2013 | | $ | — | | | $ | 26.36 | | | | 23.93 | % | | $ | 2.4 | | | | 1.83 | % | | | 1.26 | % | | | (.81 | %) | | | 249 | % | |
8/31/2012 | | $ | — | | | $ | 21.27 | | | | 9.87 | % | | $ | 1.1 | | | | 1.79 | % | | | 1.26 | % | | | (.98 | %) | | | 294 | % | |
8/31/2011 | | $ | — | | | $ | 19.36 | | | | 29.50 | % | | $ | 1.2 | | | | 1.78 | % | | | 1.26 | % | | | (1.01 | %) | | | 185 | % | |
8/31/2010 | | $ | — | | | $ | 14.95 | | | | 3.60 | % | | $ | 0.5 | | | | 2.05 | % | | | 1.26 | % | | | (1.01 | %) | | | 235 | % | |
Period from 5/27/2009^
to 8/31/2009 | | $ | — | | | $ | 14.43 | | | | 11.17 | %** | | $ | 0.1 | | | | 5.34 | %* | | | 1.26 | %* | | | (.76 | %)* | | | 292 | %Ø | |
Class C | |
8/31/2013 | | $ | — | | | $ | 17.01 | | | | 22.99 | % | | $ | 1.1 | | | | 2.56 | % | | | 2.01 | % | | | (1.58 | %) | | | 249 | % | |
8/31/2012 | | $ | — | | | $ | 13.83 | | | | 8.98 | % | | $ | 0.7 | | | | 2.57 | % | | | 2.01 | % | | | (1.73 | %) | | | 294 | % | |
8/31/2011 | | $ | — | | | $ | 12.69 | | | | 28.57 | % | | $ | 0.3 | | | | 2.52 | % | | | 2.01 | % | | | (1.72 | %) | | | 185 | % | |
8/31/2010 | | $ | — | | | $ | 9.87 | | | | 2.81 | % | | $ | 0.1 | | | | 3.43 | % | | | 2.01 | % | | | (1.76 | %) | | | 235 | % | |
Period from 5/27/2009^
to 8/31/2009 | | $ | — | | | $ | 9.60 | | | | 10.98 | %** | | $ | 0.1 | | | | 6.65 | %* | | | 2.01 | %* | | | (1.47 | %)* | | | 292 | %Ø | |
Class R3 | |
8/31/2013 | | $ | — | | | $ | 17.37 | | | | 23.54 | % | | $ | 0.4 | | | | 2.15 | % | | | 1.51 | % | | | (1.08 | %) | | | 249 | % | |
8/31/2012 | | $ | — | | | $ | 14.06 | | | | 9.59 | % | | $ | 0.2 | | | | 2.12 | % | | | 1.51 | % | | | (1.23 | %) | | | 294 | % | |
8/31/2011 | | $ | — | | | $ | 12.83 | | | | 29.20 | % | | $ | 0.1 | | | | 2.05 | % | | | 1.51 | % | | | (1.24 | %) | | | 185 | % | |
8/31/2010 | | $ | — | | | $ | 9.93 | | | | 3.33 | % | | $ | 0.1 | | | | 4.16 | % | | | 1.51 | % | | | (1.25 | %) | | | 235 | % | |
Period from 5/27/2009^
to 8/31/2009 | | $ | — | | | $ | 9.61 | | | | 11.10 | %** | | $ | 0.1 | | | | 6.29 | %* | | | 1.52 | %* | | | (.97 | %)* | | | 292 | %Ø | |
Socially Responsive Fund | |
Investor Class | |
8/31/2013 | | $ | — | | | $ | 32.66 | | | | 24.18 | % | | $ | 825.2 | | | | .87 | % | | | .87 | % | | | .91 | % | | | 35 | % | |
8/31/2012 | | $ | — | | | $ | 26.48 | | | | 8.13 | % | | $ | 724.3 | | | | .89 | % | | | .89 | % | | | .86 | % | | | 28 | % | |
8/31/2011 | | $ | — | | | $ | 24.61 | | | | 19.74 | % | | $ | 648.1 | | | | .90 | % | | | .90 | % | | | .69 | % | | | 20 | % | |
8/31/2010 | | $ | — | | | $ | 20.58 | | | | 10.14 | % | | $ | 582.5 | | | | .94 | % | | | .94 | % | | | .27 | % | | | 41 | % | |
8/31/2009 | | $ | — | | | $ | 18.74 | | | | (21.83 | %) | | $ | 597.1 | | | | .93 | % | | | .93 | % | | | .51 | % | | | 36 | % | |
244
Financial Highlights (cont'd)
| | | Net Asset
Value,
Beginning
of Year | | Net
Investment
Income (Loss)@ | | Net Gains or
Losses on
Securities
(both realized
and
unrealized) | | Total From
Investment
Operations | | Dividends
from Net
Investment
Income | | Distributions
from Net
Realized
Capital Gains | | Tax
Return of
Capital | | Total
Distributions | | Voluntary
Contribution
from
Management | |
Trust Class | |
8/31/2013 | | $ | 18.07 | | | $ | 0.15 | | | $ | 4.14 | | | $ | 4.29 | | | $ | (0.16 | ) | | $ | — | | | $ | — | | | $ | (0.16 | ) | | $ | — | | |
8/31/2012 | | $ | 16.85 | | | $ | 0.11 | | | $ | 1.21 | | | $ | 1.32 | | | $ | (0.10 | ) | | $ | — | | | $ | — | | | $ | (0.10 | ) | | $ | — | | |
8/31/2011 | | $ | 14.11 | | | $ | 0.09 | | | $ | 2.68 | | | $ | 2.77 | | | $ | (0.03 | ) | | $ | — | | | $ | — | | | $ | (0.03 | ) | | $ | — | | |
8/31/2010 | | $ | 12.88 | | | $ | 0.01 | | | $ | 1.27 | | | $ | 1.28 | | | $ | (0.05 | ) | | $ | — | | | $ | — | | | $ | (0.05 | ) | | $ | — | | |
8/31/2009 | | $ | 16.91 | | | $ | 0.04 | | | $ | (3.82 | ) | | $ | (3.78 | ) | | $ | (0.07 | ) | | $ | (0.18 | ) | | $ | — | | | $ | (0.25 | ) | | $ | — | | |
Institutional Class | |
8/31/2013 | | $ | 26.51 | | | $ | 0.33 | | | $ | 6.09 | | | $ | 6.42 | | | $ | (0.23 | ) | | $ | — | | | $ | — | | | $ | (0.23 | ) | | $ | — | | |
8/31/2012 | | $ | 24.64 | | | $ | 0.26 | | | $ | 1.77 | | | $ | 2.03 | | | $ | (0.16 | ) | | $ | — | | | $ | — | | | $ | (0.16 | ) | | $ | — | | |
8/31/2011 | | $ | 20.60 | | | $ | 0.21 | | | $ | 3.91 | | | $ | 4.12 | | | $ | (0.08 | ) | | $ | — | | | $ | — | | | $ | (0.08 | ) | | $ | — | | |
8/31/2010 | | $ | 18.75 | | | $ | 0.10 | | | $ | 1.84 | | | $ | 1.94 | | | $ | (0.09 | ) | | $ | — | | | $ | — | | | $ | (0.09 | ) | | $ | — | | |
8/31/2009 | | $ | 24.53 | | | $ | 0.12 | | | $ | (5.53 | ) | | $ | (5.41 | ) | | $ | (0.11 | ) | | $ | (0.26 | ) | | $ | — | | | $ | (0.37 | ) | | $ | — | | |
Class A | |
8/31/2013 | | $ | 17.95 | | | $ | 0.14 | | | $ | 4.12 | | | $ | 4.26 | | | $ | (0.16 | ) | | $ | — | | | $ | — | | | $ | (0.16 | ) | | $ | — | | |
8/31/2012 | | $ | 16.77 | | | $ | 0.10 | | | $ | 1.21 | | | $ | 1.31 | | | $ | (0.13 | ) | | $ | — | | | $ | — | | | $ | (0.13 | ) | | $ | — | | |
8/31/2011 | | $ | 14.08 | | | $ | 0.07 | | | $ | 2.68 | | | $ | 2.75 | | | $ | (0.06 | ) | | $ | — | | | $ | — | | | $ | (0.06 | ) | | $ | — | | |
8/31/2010 | | $ | 12.88 | | | $ | 0.03 | | | $ | 1.26 | | | $ | 1.29 | | | $ | (0.09 | ) | | $ | — | | | $ | — | | | $ | (0.09 | ) | | $ | — | | |
Period from 5/27/2009^
to 8/31/2009 | | $ | 12.00 | | | $ | 0.00 | | | $ | 0.88 | | | $ | 0.88 | | | $ | — | | | $ | — | | | $ | — | | | $ | — | | | $ | — | | |
Class C | |
8/31/2013 | | $ | 17.64 | | | $ | (0.02 | ) | | $ | 4.06 | | | $ | 4.04 | | | $ | (0.05 | ) | | $ | — | | | $ | — | | | $ | (0.05 | ) | | $ | — | | |
8/31/2012 | | $ | 16.52 | | | $ | (0.02 | ) | | $ | 1.19 | | | $ | 1.17 | | | $ | (0.05 | ) | | $ | — | | | $ | — | | | $ | (0.05 | ) | | $ | — | | |
8/31/2011 | | $ | 13.94 | | | $ | (0.06 | ) | | $ | 2.66 | | | $ | 2.60 | | | $ | (0.02 | ) | | $ | — | | | $ | — | | | $ | (0.02 | ) | | $ | — | | |
8/31/2010 | | $ | 12.86 | | | $ | (0.08 | ) | | $ | 1.25 | | | $ | 1.17 | | | $ | (0.09 | ) | | $ | — | | | $ | — | | | $ | (0.09 | ) | | $ | — | | |
Period from 5/27/2009^
to 8/31/2009 | | $ | 12.00 | | | $ | (0.01 | ) | | $ | 0.87 | | | $ | 0.86 | | | $ | — | | | $ | — | | | $ | — | | | $ | — | | | $ | — | | |
Class R3 | |
8/31/2013 | | $ | 17.81 | | | $ | 0.09 | | | $ | 4.09 | | | $ | 4.18 | | | $ | (0.13 | ) | | $ | — | | | $ | — | | | $ | (0.13 | ) | | $ | — | | |
8/31/2012 | | $ | 16.68 | | | $ | 0.07 | | | $ | 1.19 | | | $ | 1.26 | | | $ | (0.13 | ) | | $ | — | | | $ | — | | | $ | (0.13 | ) | | $ | — | | |
8/31/2011 | | $ | 14.05 | | | $ | 0.01 | | | $ | 2.69 | | | $ | 2.70 | | | $ | (0.07 | ) | | $ | — | | | $ | — | | | $ | (0.07 | ) | | $ | — | | |
8/31/2010 | | $ | 12.87 | | | $ | (0.02 | ) | | $ | 1.27 | | | $ | 1.25 | | | $ | (0.07 | ) | | $ | — | | | $ | — | | | $ | (0.07 | ) | | $ | — | | |
Period from 5/27/2009^
to 8/31/2009 | | $ | 12.00 | | | $ | 0.00 | | | $ | 0.87 | | | $ | 0.87 | | | $ | — | | | $ | — | | | $ | — | | | $ | — | | | $ | — | | |
See Notes to Financial Highlights
245
| | | Redemption
Feesøø | | Net
Asset
Value,
End of
Year | | Total
Return†† | | Net Assets,
End of Year
(in millions) | | Ratio of
Gross
Expenses
to Average
Net Assets# | | Ratio
of Net
Expenses
to Average
Net Assets‡ | | Ratio of Net
Investment
Income/
(Loss) to
Average Net
Assets | | Portfolio
Turnover
Rate | |
Trust Class | |
8/31/2013 | | $ | — | | | $ | 22.20 | | | | 23.95 | % | | $ | 431.3 | | | | 1.04 | % | | | 1.04 | % | | | .76 | % | | | 35 | % | |
8/31/2012 | | $ | — | | | $ | 18.07 | | | | 7.93 | % | | $ | 488.5 | | | | 1.06 | % | | | 1.06 | % | | | .66 | % | | | 28 | % | |
8/31/2011 | | $ | — | | | $ | 16.85 | | | | 19.60 | % | | $ | 484.7 | | | | 1.08 | % | | | 1.08 | % | | | .50 | % | | | 20 | % | |
8/31/2010 | | $ | — | | | $ | 14.11 | | | | 9.94 | % | | $ | 356.1 | | | | 1.12 | % | | | 1.12 | % | | | .10 | % | | | 41 | % | |
8/31/2009 | | $ | — | | | $ | 12.88 | | | | (22.01 | %) | | $ | 308.2 | | | | 1.13 | % | | | 1.13 | % | | | .32 | % | | | 36 | % | |
Institutional Class | |
8/31/2013 | | $ | — | | | $ | 32.70 | | | | 24.41 | % | | $ | 557.7 | | | | .69 | % | | | .69 | % | | | 1.10 | % | | | 35 | % | |
8/31/2012 | | $ | — | | | $ | 26.51 | | | | 8.32 | % | | $ | 512.4 | | | | .71 | % | | | .71 | % | | | 1.02 | % | | | 28 | % | |
8/31/2011 | | $ | — | | | $ | 24.64 | | | | 19.98 | % | | $ | 417.7 | | | | .74 | % | | | .74 | %§ | | | .82 | % | | | 20 | % | |
8/31/2010 | | $ | — | | | $ | 20.60 | | | | 10.36 | % | | $ | 166.9 | | | | .77 | % | | | .75 | % | | | .49 | % | | | 41 | % | |
8/31/2009 | | $ | — | | | $ | 18.75 | | | | (21.71 | %) | | $ | 77.6 | | | | .78 | % | | | .75 | % | | | .70 | % | | | 36 | % | |
Class A | |
8/31/2013 | | $ | — | | | $ | 22.05 | | | | 23.89 | % | | $ | 109.6 | | | | 1.09 | % | | | 1.09 | %§ | | | .67 | % | | | 35 | % | |
8/31/2012 | | $ | — | | | $ | 17.95 | | | | 7.89 | % | | $ | 83.1 | | | | 1.11 | % | | | 1.11 | %§ | | | .61 | % | | | 28 | % | |
8/31/2011 | | $ | — | | | $ | 16.77 | | | | 19.54 | % | | $ | 75.9 | | | | 1.14 | % | | | 1.11 | % | | | .42 | % | | | 20 | % | |
8/31/2010 | | $ | — | | | $ | 14.08 | | | | 10.03 | % | | $ | 12.4 | | | | 1.21 | % | | | 1.11 | % | | | .18 | % | | | 41 | % | |
Period from 5/27/2009^
to 8/31/2009 | | $ | — | | | $ | 12.88 | | | | 7.33 | %** | | $ | 1.1 | | | | 1.70 | %* | | | 1.11 | %* | | | .11 | %* | | | 36 | %Ø | |
Class C | |
8/31/2013 | | $ | — | | | $ | 21.63 | | | | 22.98 | % | | $ | 27.5 | | | | 1.86 | % | | | 1.86 | %§ | | | (.10 | %) | | | 35 | % | |
8/31/2012 | | $ | — | | | $ | 17.64 | | | | 7.08 | % | | $ | 16.7 | | | | 1.87 | % | | | 1.86 | % | | | (.12 | %) | | | 28 | % | |
8/31/2011 | | $ | — | | | $ | 16.52 | | | | 18.63 | % | | $ | 12.9 | | | | 1.89 | % | | | 1.86 | % | | | (.35 | %) | | | 20 | % | |
8/31/2010 | | $ | — | | | $ | 13.94 | | | | 9.10 | % | | $ | 3.3 | | | | 1.99 | % | | | 1.86 | % | | | (.57 | %) | | | 41 | % | |
Period from 5/27/2009^
to 8/31/2009 | | $ | — | | | $ | 12.86 | | | | 7.17 | %** | | $ | 0.1 | | | | 6.17 | %* | | | 1.86 | %* | | | (.40 | %)* | | | 36 | %Ø | |
Class R3 | |
8/31/2013 | | $ | — | | | $ | 21.86 | | | | 23.64 | % | | $ | 25.3 | | | | 1.30 | % | | | 1.30 | % | | | .46 | % | | | 35 | % | |
8/31/2012 | | $ | — | | | $ | 17.81 | | | | 7.65 | % | | $ | 17.9 | | | | 1.33 | % | | | 1.33 | %§ | | | .43 | % | | | 28 | % | |
8/31/2011 | | $ | — | | | $ | 16.68 | | | | 19.20 | % | | $ | 9.7 | | | | 1.36 | % | | | 1.36 | %§ | | | .08 | % | | | 20 | % | |
8/31/2010 | | $ | — | | | $ | 14.05 | | | | 9.74 | % | | $ | 0.2 | | | | 2.95 | % | | | 1.36 | % | | | (.11 | %) | | | 41 | % | |
Period from 5/27/2009^
to 8/31/2009 | | $ | — | | | $ | 12.87 | | | | 7.25 | %** | | $ | 0.1 | | | | 5.76 | %* | | | 1.36 | %* | | | .12 | %* | | | 36 | %Ø | |
246
Financial Highlights (cont'd)
| | Net Asset
Value,
Beginning
of Year | | Net
Investment
Income (Loss)@ | | Net Gains or
Losses on
Securities
(both realized
and
unrealized) | | Total From
Investment
Operations | | Dividends
from Net
Investment
Income | | Distributions
from Net
Realized
Capital Gains | | Tax
Return of
Capital | | Total
Distributions | | Voluntary
Contribution
from
Management | |
Class R6 | |
Period from 3/15/2013^
to 8/31/2013 | | $ | 31.16 | | | $ | 0.14 | | | $ | 1.41 | | | $ | 1.55 | | | $ | — | | | $ | — | | | $ | — | | | $ | — | | | $ | — | | |
Value Fund | |
Institutional Class | |
8/31/2013 | | $ | 11.18 | | | $ | 0.16 | | | $ | 2.40 | | | $ | 2.56 | | | $ | (0.22 | ) | | $ | — | | | $ | — | | | $ | (0.22 | ) | | $ | — | | |
8/31/2012 | | $ | 9.95 | | | $ | 0.15 | | | $ | 1.16 | | | $ | 1.31 | | | $ | (0.08 | ) | | $ | — | | | $ | — | | | $ | (0.08 | ) | | $ | — | | |
8/31/2011 | | $ | 8.30 | | | $ | 0.13 | | | $ | 1.60 | | | $ | 1.73 | | | $ | (0.08 | ) | | $ | — | | | $ | — | | | $ | (0.08 | ) | | $ | — | | |
| 8/31/2010‡‡‡ | | $ | 8.57 | | | $ | 0.08 | | | $ | (0.13 | ) | | $ | (0.05 | ) | | $ | (0.22 | ) | | $ | — | | | $ | — | | | $ | (0.22 | ) | | $ | — | | |
| 8/31/2009‡‡‡ | | $ | 10.04 | | | $ | 0.19 | | | $ | (1.52 | ) | | $ | (1.33 | ) | | $ | (0.14 | ) | | $ | — | | | $ | — | | | $ | (0.14 | ) | | $ | — | | |
Class A | |
8/31/2013 | | $ | 11.13 | | | $ | 0.10 | | | $ | 2.40 | | | $ | 2.50 | | | $ | (0.19 | ) | | $ | — | | | $ | — | | | $ | (0.19 | ) | | $ | — | | |
8/31/2012 | | $ | 9.93 | | | $ | 0.12 | | | $ | 1.15 | | | $ | 1.27 | | | $ | (0.07 | ) | | $ | — | | | $ | — | | | $ | (0.07 | ) | | $ | — | | |
Period from 3/2/2011^
to 8/31/2011 | | $ | 10.28 | | | $ | 0.06 | | | $ | (0.41 | ) | | $ | (0.35 | ) | | $ | — | | | $ | — | | | $ | — | | | $ | — | | | $ | — | | |
Class C | |
8/31/2013 | | $ | 11.05 | | | $ | 0.00 | | | $ | 2.39 | | | $ | 2.39 | | | $ | (0.13 | ) | | $ | — | | | $ | — | | | $ | (0.13 | ) | | $ | — | | |
8/31/2012 | | $ | 9.89 | | | $ | 0.03 | | | $ | 1.16 | | | $ | 1.19 | | | $ | (0.03 | ) | | $ | — | | | $ | — | | | $ | (0.03 | ) | | $ | — | | |
Period from 3/2/2011^
to 8/31/2011 | | $ | 10.28 | | | $ | 0.01 | | | $ | (0.40 | ) | | $ | (0.39 | ) | | $ | — | | | $ | — | | | $ | — | | | $ | — | | | $ | — | | |
See Notes to Financial Highlights
247
| | | Redemption
Feesøø | | Net
Asset
Value,
End of
Year | | Total
Return†† | | Net Assets,
End of Year
(in millions) | | Ratio of
Gross
Expenses
to Average
Net Assets# | | Ratio
of Net
Expenses
to Average
Net Assets‡ | | Ratio of Net
Investment
Income/
(Loss) to
Average Net
Assets | | Portfolio
Turnover
Rate | |
Class R6 | |
Period from 3/15/2013^
to 8/31/2013 | | $ | — | | | $ | 32.71 | | | | 4.97 | %** | | $ | 249.6 | | | | .62 | %* | | | .62 | %* | | | .94 | %* | | | 35 | %Ø | |
Value Fund | |
Institutional Class | |
8/31/2013 | | $ | — | | | $ | 13.52 | | | | 23.23 | % | | $ | 6.9 | | | | 5.93 | % | | | .71 | % | | | 1.25 | % | | | 250 | % | |
8/31/2012 | | $ | — | | | $ | 11.18 | | | | 13.25 | % | | $ | 2.7 | | | | 9.42 | % | | | .73 | % | | | 1.46 | % | | | 200 | % | |
8/31/2011 | | $ | — | | | $ | 9.95 | | | | 20.87 | % | | $ | 2.6 | | | | 18.35 | % | | | .75 | %c | | | 1.28 | % | | | 191 | % | |
| 8/31/2010‡‡‡ | | $ | — | | | $ | 8.30 | | | | (.71 | %)†††† | | $ | 1.2 | | | | 15.47 | % | | | .92 | %c | | | .93 | % | | | 52 | % | |
| 8/31/2009‡‡‡ | | $ | — | | | $ | 8.57 | | | | (13.01 | %)†††† | | $ | 1.2 | | | | 15.05 | % | | | 1.03 | %c | | | 2.39 | % | | | 94 | % | |
Class A | |
8/31/2013 | | $ | — | | | $ | 13.44 | | | | 22.72 | % | | $ | 3.7 | | | | 6.81 | % | | | 1.11 | % | | | .82 | % | | | 250 | % | |
8/31/2012 | | $ | — | | | $ | 11.13 | | | | 12.89 | % | | $ | 1.6 | | | | 9.88 | % | | | 1.08 | % | | | 1.08 | % | | | 200 | % | |
Period from 3/2/2011^
to 8/31/2011 | | $ | — | | | $ | 9.93 | | | | (3.40 | %)** | | $ | 0.3 | | | | 17.08 | %* | | | 1.12 | %* | | | 1.22 | %* | | | 191 | %Ø | |
Class C | |
8/31/2013 | | $ | — | | | $ | 13.31 | | | | 21.82 | % | | $ | 0.3 | | | | 7.31 | % | | | 1.87 | % | | | .01 | % | | | 250 | % | |
8/31/2012 | | $ | — | | | $ | 11.05 | | | | 12.07 | % | | $ | 0.1 | | | | 10.74 | % | | | 1.87 | % | | | .30 | % | | | 200 | % | |
Period from 3/2/2011^
to 8/31/2011 | | $ | — | | | $ | 9.89 | | | | (3.79 | %)** | | $ | 0.0 | | | | 26.31 | %* | | | 1.86 | %* | | | .26 | %* | | | 191 | %Ø | |
248
Notes to Financial Highlights
†† Total return based on per share NAV reflects the effects of changes in NAV on the performance of each Fund during each fiscal period. Returns assume income dividends and other distributions, if any, were reinvested and do not reflect the effect of sales charges. Results represent past performance and do not indicate future results. Current returns may be lower or higher than the performance data quoted. Investment returns and principal may fluctuate and shares when redeemed may be worth more or less than original cost. Total return would have been lower if Management had not reimbursed and/or waived certain expenses. Total return would have been higher if Management had not recouped previously reimbursed and/or waived expenses. Except for Large Cap Value and Small Cap Growth, no Fund's total returns were impacted by class action proceeds as listed in Note A-4 to the Financial Statements for the year ended August 31, 2013. Had Large Cap Value not received the class action proceeds, total return based on per share NAV for the year ended August 31, 2013 would have been 23.93%, 23.61%, 23.46%, 24.11%, 23.57% and 23.41% for Investor Class, Trust Class, Advisor Class, Institutional Class, Class A and Class R3, respectively. Had Small Cap Growth not received the class action proceeds, total return based on per share NAV for the year ended August 31, 2013 would have been 23.81%, 23.45%, 23.31%, 24.05%, 23.84%, 22.92% and 23.47% for Investor Class, Trust Class, Advisor Class, Institutional Class, Class A, Class C and Class R3, respectively. Had Mid Cap Intrinsic Value not received class action proceeds in 2012, total return based on per share NAV for the year ended August 31, 2012 would have been 12.48%, 12.34%, 12.86% and 12.16% for Investor Class, Trust Class, Institutional Class and Class R3, respectively.
‡‡ On December 21, 2009, Multi-Cap Opportunities' Trust Class was converted into the Fund's Institutional Class. The financial information of the Fund's Institutional Class includes the financial information of Trust Class shares. The Trust Class had equivalent capped expenses and, therefore, typically similar returns to the Institutional Class.
‡‡‡ On April 19, 2010, Value's Trust Class was converted into the Fund's Institutional Class. The financial information of the Fund's Institutional Class includes the financial information of Trust Class shares. Because the Trust Class had moderately higher expenses, its performance typically would have been slightly lower than the Institutional Class.
††† During the period from November 2, 2006 through December 21, 2009, Multi-Cap Opportunities' Trust Class had only one investor, which could have impacted Fund performance. On December 21, 2009, the Fund's Trust Class was converted into the Fund's Institutional Class and the Institutional Class was opened to the public. The total return of the Fund's Institutional Class includes the performance of the former Trust Class.
†††† During the period from November 2, 2006 through April 19, 2010, Value's Trust Class had only one investor, which could have impacted Fund performance. On April 19, 2010, the Fund's Trust Class was converted into the Fund's Institutional Class and the Fund had only one Institutional Class investor, which could have impacted performance. The total return of the Fund's Institutional Class includes the performance of the former Trust Class.
# Represents the annualized ratios of net expenses to average daily net assets if Management had not reimbursed certain expenses and/or waived a portion of the investment management fee.
‡ Prior to January 1, 2013, each Fund had an expense offset arrangement in connection with its custodian contract. The impact of expense reductions related to expense offset arrangements, if any, was less than .01%.
^^ After utilization of the Line of Credit by Multi-Cap Opportunities (2011) and/or reimbursement of expenses and/or waiver of a portion of the investment management fee by Management. The Fund is required to calculate an expense ratio without taking into consideration any expense reductions related to expense offset arrangements. Had the Fund not received expense reductions related to expense offset arrangements, and had the Fund not utilized the Line of Credit or had Management not undertaken such action, the annualized ratios of net expenses to average daily net assets would have been:
| | Year Ended August 31,
2011 | |
Multi-Cap Opportunities Fund Institutional Class | | | 1.01 | % | |
Multi-Cap Opportunities Fund Class A | | | 1.37 | % | |
Multi-Cap Opportunities Fund Class C | | | 2.12 | % | |
249
Notes to Financial Highlights (cont'd)
§ After repayment of expenses previously reimbursed and/or fees previously waived by Management, as applicable. Had the Fund not made such repayments, the annualized ratios of net expenses to average daily net assets would have been:
| | | Year Ended August 31, | |
| | | 2013 | | 2012 | | 2011 | | 2010 | | 2009 | |
Equity Income Fund Institutional Class | | | — | | | | .70 | % | | | .76 | % | | | — | | | | — | | |
Equity Income Fund Class A | | | — | | | | 1.07 | % | | | 1.16 | % | | | — | | | | — | | |
Equity Income Fund Class C | | | — | | | | 1.82 | % | | | 1.90 | % | | | — | | | | — | | |
Equity Income Fund Class R3 | | | 1.31 | % | | | 1.35 | % | | | — | | | | — | | | | — | | |
Focus Fund Advisor Class | | | — | | | | — | | | | — | | | | 1.39 | % | | | — | | |
Guardian Fund Advisor Class | | | 1.30 | % | | | 1.33 | % | | | 1.35 | % | | | — | | | | — | | |
Guardian Fund Institutional Class | | | — | | | | .74 | % | | | .74 | % | | | — | | | | — | | |
Guardian Fund Class A | | | 1.10 | % | | | — | | | | — | | | | — | | | | — | | |
Large Cap Disciplined Growth Fund Investor Class | | | 1.05 | % | | | 1.03 | % | | | 1.08 | % | | | — | | | | — | | |
Large Cap Value Fund Institutional Class | | | — | | | | — | | | | — | | | | .68 | % | | | — | | |
Large Cap Value Fund Class A | | | — | | | | 1.05 | % | | | — | | | | — | | | | — | | |
Large Cap Value Fund Class C | | | 1.86 | % | | | — | | | | — | | | | — | | | | — | | |
Mid Cap Growth Fund Advisor Class | | | — | | | | 1.31 | % | | | 1.34 | % | | | 1.48 | % | | | — | | |
Multi-Cap Opportunities Fund Institutional Class | | | .82 | % | | | .93 | % | | | — | | | | — | | | | — | | |
Multi-Cap Opportunities Fund Class A | | | 1.16 | % | | | 1.30 | % | | | — | | | | — | | | | — | | |
Multi-Cap Opportunities Fund Class C | | | 1.92 | % | | | — | | | | — | | | | — | | | | — | | |
Socially Responsive Fund Institutional Class | | | — | | | | — | | | | .72 | % | | | — | | | | — | | |
Socially Responsive Fund Class A | | | 1.08 | % | | | 1.11 | % | | | — | | | | — | | | | — | | |
Socially Responsive Fund Class C | | | 1.83 | % | | | — | | | | — | | | | — | | | | — | | |
Socially Responsive Fund Class R3 | | | — | | | | 1.32 | % | | | 1.35 | % | | | — | | | | — | | |
^ The date investment operations commenced.
@ Calculated based on the average number of shares outstanding during each fiscal period.
ØØ Prior to June 1, 2011, redemption fees were charged on Emerging Markets Equity, International Equity, International Large Cap, and Real Estate. Calculated based on the average number of shares outstanding during each fiscal period.
* Annualized.
** Not annualized.
Ø Portfolio turnover is calculated at the Fund level. Percentage indicated was calculated for the year ended August 31, 2009 for Guardian, International Large Cap, Large Cap Disciplined Growth, Mid Cap Growth, Small Cap Growth, and Socially Responsive, for the year ended August 31, 2010 for Emerging Markets Equity, Equity Income, Focus, Large Cap Value, Mid Cap Intrinsic Value, Multi-Cap Opportunities and Real Estate, for the year ended August 31, 2011 for Value and for the year ended August 31, 2013 for Emerging Markets Equity, Genesis, International Equity, Mid Cap Growth, Real Estate and Socially Responsive.
### On April 9, 2009, Large Cap Disciplined Growth (formerly, Neuberger Berman Century Fund) acquired all of the net assets of Neuberger Berman Large Cap Disciplined Growth Fund pursuant to a Plan of Reorganization and Dissolution. Portfolio turnover excludes purchases and sales of securities by Large Cap Disciplined Growth (acquired fund) prior to the merger date.
250
Notes to Financial Highlights (cont'd)
a On January 25, 2013, International Equity (formerly, Neuberger Berman International Institutional Fund) acquired all of the net assets of Neuberger Berman International Fund pursuant to a Plan of Reorganization and Dissolution. Portfolio turnover excludes purchases and sales of securities by International (acquired fund) prior to the merger date.
b Organization expense, which is a non-recurring expense, is included in these ratios on a non-annualized basis.
c These ratios reflect a reduced fee schedule for certain expenses. If these ratios had not been reduced, the ratios would have been higher.
d This class commenced operations January 28, 2013, and consequently its returns are lower than the Institutional Class which was operational for the entire fiscal year.
251
Report of Independent Registered Public Accounting Firm
To the Board of Trustees
Neuberger Berman Equity Funds and
Shareholders of:
Neuberger Berman Emerging Markets Equity Fund,
Neuberger Berman Equity Income Fund,
Neuberger Berman Focus Fund,
Neuberger Berman Genesis Fund,
Neuberger Berman Global Equity Fund,
Neuberger Berman Global Thematic Opportunities Fund,
Neuberger Berman Greater China Equity Fund,
Neuberger Berman Guardian Fund,
Neuberger Berman International Equity Fund,
Neuberger Berman International Large Cap Fund,
Neuberger Berman Large Cap Value Fund,
Neuberger Berman Real Estate Fund,
Neuberger Berman Select Equities Fund,
Neuberger Berman Value Fund
We have audited the accompanying statements of assets and liabilities of the Neuberger Berman Emerging Markets Equity Fund, Neuberger Berman Equity Income Fund, Neuberger Berman Focus Fund, Neuberger Berman Genesis Fund, Neuberger Berman Global Equity Fund, Neuberger Berman Global Thematic Opportunities Fund, Neuberger Berman Greater China Equity Fund, Neuberger Berman Guardian Fund, Neuberger Berman International Equity Fund (formerly, Neuberger Berman International Institutional Fund), Neuberger Berman International Large Cap Fund, Neuberger Berman Large Cap Value Fund, Neuberger Berman Real Estate Fund, Neuberger Berman Select Equities Fund and Neuberger Berman Value Fund, fourteen of the series constituting Neuberger Berman Equity Funds (the "Trust"), including the schedules of investments, as of August 31, 2013, and the related statements of operations, the statements of changes in net assets, and the financial highlights for each of the years or periods indicated therein. These financial statements and financial highlights are the responsibility of the Trust's management. Our responsibility is to express an opinion on these financial statements and financial highlights based on our audits.
We conducted our audits in accordance with the standards of the Public Company Accounting Oversight Board (United States). Those standards require that we plan and perform the audits to obtain reasonable assurance about whether the financial statements and financial highlights are free of material misstatement. We were not engaged to perform an audit of the Trust's internal control over financial reporting. Our audits included consideration of internal control over financial reporting as a basis for designing audit procedures that are appropriate in the circumstances, but not for the purpose of expressing an opinion on the effectiveness of the Trust's internal control over financial reporting. Accordingly, we express no such opinion. An audit also includes examining, on a test basis, evidence supporting the amounts and disclosures in the financial statements and financial highlights, assessing the accounting principles used and significant estimates made by management, and evaluating the overall financial statement presentation. Our procedures included confirmation of securities owned as of August 31, 2013 by correspondence with the custodian and brokers or by other appropriate auditing procedures where replies from brokers were not received. We believe that our audits provide a reasonable basis for our opinion.
In our opinion, the financial statements and financial highlights referred to above present fairly, in all material respects, the financial position of the above-mentioned series of the Neuberger Berman Equity Funds, at August 31, 2013, the results of their operations, the changes in their net assets, and the financial highlights for each of the periods indicated therein, in conformity with U.S. generally accepted accounting principles.

Boston, Massachusetts
October 15, 2013
252
Report of Independent Registered Public Accounting Firm
To the Board of Trustees and Shareholders
Neuberger Berman Equity Funds
We have audited the accompanying statements of assets and liabilities of the Neuberger Berman Intrinsic Value Fund, Neuberger Berman Large Cap Disciplined Growth Fund, Neuberger Berman Mid Cap Growth Fund, Neuberger Berman Mid Cap Intrinsic Value Fund , Neuberger Berman Small Cap Growth Fund, Neuberger Berman Socially Responsive Fund, and Neuberger Berman Multi-Cap Opportunities Fund, each a series of the Neuberger Berman Equity Funds (the "Trust"), including the schedules of investments, as of August 31, 2013, and the related statements of operations for the year then ended, the statements of changes in net assets and the financial highlights for each of the periods indicated therein. These financial statements and financial highlights are the responsibility of the Trust's management. Our responsibility is to express an opinion on these financial statements and financial highlights based on our audits.
We conducted our audits in accordance with the standards of the Public Company Accounting Oversight Board (United States). Those standards require that we plan and perform the audit to obtain reasonable assurance about whether the financial statements and financial highlights are free of material misstatement. The Trust is not required to have, nor were we engaged to perform, an audit of its internal control over financial reporting. Our audits included consideration of internal control over financial reporting as a basis for designing audit procedures that are appropriate in the circumstances, but not for the purpose of expressing an opinion on the effectiveness of the Trust's internal control over financial reporting. Accordingly, we express no such opinion. An audit also includes examining, on a test basis, evidence supporting the amounts and disclosures in the financial statements and financial highlights, assessing the accounting principles used and significant estimates made by management, as well as evaluating the overall financial statement presentation. Our procedures included confirmation of securities owned as of August 31, 2013, by correspondence with the custodian and brokers or by other appropriate auditing procedures where replies from brokers were not received. We believe that our audits provide a reasonable basis for our opinion.
In our opinion, the financial statements and financial highlights referred to above present fairly, in all material respects, the financial position of the above mentioned series of the Trust, as of August 31, 2013, and the results of their operations, the changes in their net assets, and the financial highlights for each of the periods indicated therein, in conformity with accounting principles generally accepted in the United States of America.

Philadelphia, Pennsylvania
October 15, 2013
253
Investment Manager, Administrator and Distributor
Neuberger Berman Management LLC
605 Third Avenue, 2nd Floor
New York, NY 10158-0180
800.877.9700 or 212.476.8800
Intermediary Client Services 800.366.6264
Sub-Adviser
Neuberger Berman LLC
605 Third Avenue
New York, NY 10158-3698
Neuberger Berman Asia Limited
Jardine House, 1 Connaught Place
Suites 2010-2020, 20th Floor
Central Hong Kong
Custodian and Shareholder Servicing Agent
State Street Bank and Trust Company
2 Avenue de Lafayette
Boston, MA 02111
For Investor Class Shareholders
Address correspondence to:
Neuberger Berman Funds
Boston Service Center
P.O. Box 8403
Boston, MA 02266-8403
800.877.9700 or 212.476.8800
For Class A, Class C, Class R3 and Class R6 Shareholders:
Please contact your investment provider
For Trust Class, Advisor Class and Institutional Class Shareholders
Address correspondence to:
Neuberger Berman Management LLC
605 Third Avenue, Mail Drop 2-7
New York, NY 10158-0180
Attn: Intermediary Client Services
800.366.6264
Legal Counsel
K&L Gates LLP
1601 K Street, NW
Washington, DC 20006
Independent Registered Public Accounting Firms
Ernst & Young LLP
200 Clarendon Street
Boston, MA 02116
Tait, Weller & Baker LLP
1818 Market Street
Suite 2400
Philadelphia, PA 19103
254
The following tables set forth information concerning the trustees ("Trustees") and officers ("Officers") of each of the Funds. All persons named as Trustees and Officers also serve in similar capacities for other funds administered or managed by Management and Neuberger. Each Fund's Statement of Additional Information includes additional information about the Trustees as of the time of the Fund's most recent public offering and is available upon request, without charge, by calling (800) 877-9700.
Information about the Board of Trustees
Name, (Year of Birth),
and Address(1) | | Position and
Length of
Time Served(2) | | Principal Occupation(s)(3) | | Number of
Funds in
Fund Complex
Overseen by
Fund Trustee | | Other Directorships Held
Outside Fund Complex by
Fund Trustee(3) | |
Independent Fund Trustees | |
Faith Colish (1935) | | Trustee since 1982 | | Counsel, Carter Ledyard & Milburn LLP (law firm) since October 2002; formerly, Attorney-at-Law and President, Faith Colish, A Professional Corporation, 1980 to 2002. | | | 54 | | | Formerly, Director, 1997 to 2003, and Advisory Director, 2003 to 2006, ABA Retirement Funds (formerly, American Bar Retirement Association) (not-for-profit membership corporation). | |
Martha C. Goss (1949) | | Trustee since 2007 | | President, Woodhill Enterprises Inc./Chase Hollow Associates LLC (personal investment vehicle), since 2006; formerly, Consultant, Resources Global Professionals (temporary staffing), 2002 to 2006. | | | 54 | | | Director, American Water (water utility), since 2003; Director, Allianz Life of New York (insurance), since 2005; Director, Financial Women's Association of New York (not-for-profit association), since 2003; Trustee Emerita, Brown University, since 1998; formerly, Non-Executive Chair and Director, Channel Reinsurance (financial guaranty reinsurance), 2006 to 2010; formerly, Director, Ocwen Financial Corporation (mortgage servicing), 2005 to 2010; formerly, Director, Claire's Stores, Inc. (retailer), 2005 to 2007; formerly, Director, Parsons Brinckerhoff Inc. (engineering consulting firm), 2007 to 2010; formerly Director, Bank Leumi (commercial bank), 2005 to 2007; formerly Advisory Board Member, Attensity (software developer), 2005 to 2007. | |
255
Name, (Year of Birth),
and Address(1) | | Position and
Length of
Time Served(2) | | Principal Occupation(s)(3) | | Number of
Funds in
Fund Complex
Overseen by
Fund Trustee | | Other Directorships Held
Outside Fund Complex by
Fund Trustee(3) | |
Michael M. Knetter (1960) | | Trustee since 2007 | | President and Chief Executive Officer, University of Wisconsin Foundation, since October 2010; formerly, Dean, School of Business, University of Wisconsin—Madison; formerly, Professor of International Economics and Associate Dean, Amos Tuck School of Business—Dartmouth College, 1998 to 2002. | | | 54 | | | Director, American Family Insurance (a mutual company, not publicly traded), since March 2009; formerly, Trustee, Northwestern Mutual Series Fund, Inc., 2007 to 2010; formerly, Director, Wausau Paper, 2005 to 2011; formerly, Director, Great Wolf Resorts, 2004 to 2009. | |
Howard A. Mileaf (1937) | | Trustee since 1984 | | Retired; formerly, Vice President and General Counsel, WHX Corporation (holding company), 1993 to 2001. | | | 54 | | | Formerly, Director, Webfinancial Corporation (holding company), 2002 to 2008; formerly, Director, WHX Corporation (holding company), 2002 to 2005; formerly, Director, State Theatre of New Jersey (not-for-profit theatre), 2000 to 2005. | |
George W. Morriss (1947) | | Trustee since 2007 | | Adjunct Faculty Member, Columbia University School of International and Public Affairs, since October 2012; formerly, Executive Vice President and Chief Financial Officer, People's Bank, Connecticut (a financial services company), 1991 to 2001. | | | 54 | | | Trustee, Steben Select Multi-Strategy Fund, since 2013; Trustee, Steben Select Multi-Strategy Master Fund, since 2013; Formerly, Manager, Larch Lane Multi-Strategy Fund complex (which consisted of three funds), 2006 to 2011; formerly, Member, NASDAQ Issuers' Affairs Committee, 1995 to 2003. | |
256
Name, (Year of Birth),
and Address(1) | | Position and
Length of
Time Served(2) | | Principal Occupation(s)(3) | | Number of
Funds in
Fund Complex
Overseen by
Fund Trustee | | Other Directorships Held
Outside Fund Complex by
Fund Trustee(3) | |
Tom D. Seip (1950) | | Trustee since 2000; Chairman of the Board since 2008; Lead Independent Trustee from 2006 to 2008 | | General Partner, Ridgefield Farm LLC (a private investment vehicle); formerly, President and CEO, Westaff, Inc. (temporary staffing), May 2001 to January 2002; formerly, Senior Executive, The Charles Schwab Corporation, 1983 to 1998, including Chief Executive Officer, Charles Schwab Investment Management, Inc.; Trustee, Schwab Family of Funds and Schwab Investments, 1997 to 1998; and Executive Vice President-Retail Brokerage, Charles Schwab & Co., Inc., 1994 to 1997. | | | 54 | | | Director, H&R Block, Inc. (financial services company), since May 2001; Chairman, Governance and Nominating Committee, H&R Block, Inc., since 2011; formerly, Chairman, Compensation Committee, H&R Block, Inc., 2006 to 2010; formerly, Director, Forward Management, Inc. (asset management company), 1999 to 2006. | |
Candace L. Straight (1947) | | Trustee since 2000 | | Private investor and consultant specializing in the insurance industry; formerly, Advisory Director, Securitas Capital LLC (a global private equity investment firm dedicated to making investments in the insurance sector), 1998 to December 2003. | | | 54 | | | Public Member, Board of Governors and Board of Trustees, Rutgers University, since 2011; Director, Montpelier Re Holdings Ltd. (reinsurance company), since 2006; formerly, Director, National Atlantic Holdings Corporation (property and casualty insurance company), 2004 to 2008; formerly, Director, The Proformance Insurance Company (property and casualty insurance company), 2004 to 2008; formerly, Director, Providence Washington Insurance Company (property and casualty insurance company), 1998 to 2006; formerly, Director, Summit Global Partners (insurance brokerage firm), 2000 to 2005. | |
257
Name, (Year of Birth),
and Address(1) | | Position and
Length of
Time Served(2) | | Principal Occupation(s)(3) | | Number of
Funds in
Fund Complex
Overseen by
Fund Trustee | | Other Directorships Held
Outside Fund Complex by
Fund Trustee(3) | |
Peter P. Trapp (1944) | | Trustee since 2000 | | Retired; formerly, Regional Manager for Mid-Southern Region, Ford Motor Credit Company, September 1997 to 2007; formerly, President, Ford Life Insurance Company, April 1995 to August 1997. | | | 54 | | | None. | |
Fund Trustees who are "Interested Persons"
| |
Joseph V. Amato* (1962) | | Trustee since 2009 | | President and Director, Neuberger Berman Group LLC, since 2009; President and Chief Executive Officer, Neuberger and Neuberger Berman Holdings LLC (including its predecessor, Neuberger Berman Inc.), since 2007; Chief Investment Officer (Equities) and Managing Director, Management, since 2009; Managing Director, Neuberger Berman Fixed Income LLC ("NBFI"), since 2007; Board member of NBFI since 2006; formerly, Global Head of Asset Management of Lehman Brothers Holdings Inc.'s ("LBHI") Investment Management Division, 2006 to 2009; formerly, member of LBHI's Investment Management Division's Executive Management Committee, 2006 to 2009; formerly, Managing Director, Lehman Brothers Inc. ("LBI"), 2006 to 2008; formerly, Chief Recruiting and Development Officer, LBI, 2005 to 2006; formerly, Global Head of LBI's Equity Sales and a Member of its Equities Division Executive Committee, 2003 to 2005. | | | 54 | | | Member of Board of Advisors, McDonough School of Business, Georgetown University, since 2001; Member of New York City Board of Advisors, Teach for America, since 2005; Trustee, Montclair Kimberley Academy (private school), since 2007. | |
258
Name, (Year of Birth),
and Address(1) | | Position and
Length of
Time Served(2) | | Principal Occupation(s)(3) | | Number of
Funds in
Fund Complex
Overseen by
Fund Trustee | | Other Directorships Held
Outside Fund Complex by
Fund Trustee(3) | |
Robert Conti* (1956) | | Chief Executive Officer, President and Trustee since 2008; prior thereto, Executive Vice President in 2008 and Vice President from 2000 to 2008 | | Managing Director, Neuberger, since 2007; Managing Director, NBFI, since 2009; formerly, Senior Vice President, Neuberger, 2003 to 2006; formerly, Vice President, Neuberger, 1999 to 2003; President and Chief Executive Officer, Management, since 2008; formerly, Senior Vice President, Management, 2000 to 2008. | | | 54 | | | Director, Staten Island Mental Health Society, since 1994; formerly, Chairman of the Board, Staten Island Mental Health Society, 2008 to 2011. | |
Jack L. Rivkin* (1940) | | Trustee since 2002 | | Formerly, Executive Vice President and Chief Investment Officer, Neuberger Berman Holdings LLC (holding company), 2002 to August 2008 and 2003 to August 2008, respectively; formerly, Managing Director and Chief Investment Officer, Neuberger, December 2005 to August 2008 and 2003 to August 2008, respectively; formerly, Executive Vice President, Neuberger, December 2002 to 2005; formerly, Director and Chairman, Management, December 2002 to August 2008; formerly, Executive Vice President, Citigroup Investments, Inc., September 1995 to February 2002; formerly, Executive Vice President, Citigroup Inc., September 1995 to February 2002. | | | 54 | | | Director, CRT Capital LLC (financial services firm), since 2012; Director, Idealab (private company), since 2009; Director, Energy Cache (private company), since 2011; Director, World Haus (private company), since 2011; Director, Distributed World Power (private company), since 2009; Director, Dale Carnegie and Associates, Inc. (private company), since 1999; Director, Operative Media, Inc. (private company), since 2010; Chairman and Director, Essential Brands (consumer products) since 2008; formerly, Director, Solbright, Inc. (private company), 1998 to 2010; formerly, Director, New York Society of Security Analysts, 2006 to 2008. | |
(1) The business address of each listed person is 605 Third Avenue, New York, New York 10158.
(2) Pursuant to the Trust's Trust Instrument, each of these Fund Trustees shall hold office for life or until his or her successor is elected or the Trust terminates; except that (a) any Fund Trustee may resign by delivering a written resignation; (b) any Fund Trustee may be removed with or without cause at any time by a written instrument signed by at least two-thirds of the other Fund Trustees; (c) any Fund Trustee who requests to be retired, or who has become unable to serve, may be retired by a written instrument signed by a majority of the other Fund
259
Trustees; and (d) any Fund Trustee may be removed at any shareholder meeting by a vote of at least two-thirds of the outstanding shares.
(3) Except as otherwise indicated, each individual has held the positions shown for at least the last five years.
* Indicates a Fund Trustee who is an "interested person" within the meaning of the 1940 Act. Mr. Amato and Mr. Conti are interested persons of the Trust by virtue of the fact that each is an officer of Management, Neuberger and/or their affiliates. Jack L. Rivkin is an interested person of the Trust by virtue of the fact that he is a director of CRT Capital LLC, which, from time to time, serves as a broker or dealer to the Funds and other funds or accounts for which Management serves as investment manager.
260
Information about the Officers of the Trust
Name, (Year of Birth),
and Address(1) | | Position and
Length of | | Principal Occupation(s)(3)
Time Served(2) | |
Andrew B. Allard (1961) | | Chief Legal Officer since 2013 (only for purposes of sections 307 and 406 of the Sarbanes-Oxley Act of 2002) and Anti-Money Laundering Compliance Officer since 2002 | | General Counsel and Senior Vice President, Management since 2013; Senior Vice President, Neuberger, since 2006 and Employee since 1999; Deputy General Counsel, Neuberger, since 2004; formerly, Vice President, Neuberger, 2000 to 2005; formerly, Employee, Management, 1994 to 1999; Chief Legal Officer since 2013 (only for purposes of sections 307 and 406 of the Sarbanes-Oxley Act of 2002), ten registered investment companies for which Management acts as investment manager and administrator (ten since 2013); Anti-Money Laundering Compliance Officer, ten registered investment companies for which Management acts as investment manager and administrator (six since 2002, one since 2003, one since 2005, one since 2006 and one since 2013). | |
Claudia A. Brandon (1956) | | Executive Vice President since 2008 and Secretary since 1985 | | Senior Vice President, Neuberger, since 2007 and Employee since 1999; Senior Vice President, Management, since 2008 and Assistant Secretary since 2004; formerly, Vice President, Neuberger, 2002 to 2006; formerly, Vice President-Mutual Fund Board Relations, Management, 2000 to 2008; formerly, Vice President, Management, 1986 to 1999 and Employee 1984 to 1999; Executive Vice President, ten registered investment companies for which Management acts as investment manager and administrator (nine since 2008 and one since 2013); Secretary, ten registered investment companies for which Management acts as investment manager and administrator (three since 1985, three since 2002, one since 2003, one since 2005, one since 2006 and one since 2013). | |
Agnes Diaz (1971) | | Vice President since 2013 | | Vice President, ten registered investment companies for which Management acts as investment manager and administrator (ten since 2013). | |
Anthony DiBernardo (1979) | | Assistant Treasurer since 2011 | | Vice President, Neuberger, since 2009; Employee, Management, since 2003; Assistant Treasurer, ten registered investment companies for which Management acts as investment manager and administrator (nine since 2011 and one since 2013). | |
Sheila R. James (1965) | | Assistant Secretary since 2002 | | Vice President, Neuberger, since 2008 and Employee since 1999; formerly, Assistant Vice President, Neuberger, 2007; formerly, Employee, Management, 1991 to 1999; Assistant Secretary, ten registered investment companies for which Management acts as investment manager and administrator (six since 2002, one since 2003, one since 2005, one since 2006 and one since 2013). | |
Brian Kerrane (1969) | | Vice President since 2008 | | Senior Vice President, Management, since 2008 and Employee since 1991; formerly, Vice President, Management, 2002 to 2008; Vice President, ten registered investment companies for which Management acts as investment manager and administrator (nine since 2008 and one since 2013). | |
261
Name, (Year of Birth),
and Address(1) | | Position and
Length of | | Principal Occupation(s)(3)
Time Served(2) | |
Kevin Lyons (1955) | | Assistant Secretary since 2003 | | Assistant Vice President, Neuberger, since 2008 and Employee since 1999; formerly, Employee, Management, 1993 to 1999; Assistant Secretary, ten registered investment companies for which Management acts as investment manager and administrator (seven since 2003, one since 2005, one since 2006 and one since 2013). | |
Owen F. McEntee, Jr. (1961) | | Vice President since 2008 | | Vice President, Neuberger, since 2006; Employee, Management, since 1992; Vice President, ten registered investment companies for which Management acts as investment manager and administrator (nine since 2008 and one since 2013). | |
John M. McGovern (1970) | | Treasurer and Principal Financial and Accounting Officer since 2005 | | Senior Vice President, Neuberger, since 2007; formerly, Vice President, Neuberger, 2004 to 2006; Employee, Management, since 1993; Treasurer and Principal Financial and Accounting Officer, ten registered investment companies for which Management acts as investment manager and administrator (eight since 2005, one since 2006 and one since 2013); formerly, Assistant Treasurer, eight registered investment companies for which Management acts as investment manager and administrator, 2002 to 2005. | |
Frank Rosato (1971) | | Assistant Treasurer since 2005 | | Vice President, Neuberger, since 2006; Employee, Management, since 1995; Assistant Treasurer, ten registered investment companies for which Management acts as investment manager and administrator (eight since 2005, one since 2006 and one since 2013). | |
Neil S. Siegel (1967) | | Vice President since 2008 | | Managing Director, Management, since 2008; Managing Director, Neuberger, since 2006; Managing Director, NBFI, since 2011; formerly, Senior Vice President, Neuberger, 2004 to 2006; Vice President, ten registered investment companies for which Management acts as investment manager and administrator (nine since 2008 and one since 2013). | |
Chamaine Williams (1971) | | Chief Compliance Officer since 2005 | | Senior Vice President, Management, since 2007; Chief Compliance Officer, Management, since 2006; Chief Compliance Officer, ten registered investment companies for which Management acts as investment manager and administrator (eight since 2005, one since 2006 and one since 2013); formerly, Senior Vice President, LBI, 2007 to 2008; formerly, Vice President, LBI, 2003 to 2006; formerly, Chief Compliance Officer, Lehman Brothers Asset Management Inc., 2003 to 2007; formerly, Chief Compliance Officer, Lehman Brothers Alternative Investment Management LLC, 2003 to 2007. | |
(1) The business address of each listed person is 605 Third Avenue, New York, New York 10158.
(2) Pursuant to the By-Laws of the Trust, each officer elected by the Fund Trustees shall hold office until his or her successor shall have been elected and qualified or until his or her earlier death, inability to serve, or resignation. Officers serve at the pleasure of the Fund Trustees and may be removed at any time with or without cause.
(3) Except as otherwise indicated, each individual has held the positions shown for at least the last five years
262
Proxy Voting Policies and Procedures
A description of the policies and procedures that the Trust uses to determine how to vote proxies relating to portfolio securities is available, without charge, by calling 800-877-9700 (toll-free) and on the website of the Securities and Exchange Commission, at www.sec.gov. Information regarding how the Trust voted proxies relating to portfolio securities during the most recent 12-month period ended June 30 is also available, without charge, by calling 800-877-9700 (toll-free), on the website of the Securities and Exchange Commission at www.sec.gov, and on Management's website at www.nb.com.
Quarterly Portfolio Schedule
The Trust files a complete schedule of portfolio holdings for each Fund with the Securities and Exchange Commission for the first and third quarters of each fiscal year on Form N-Q. The Trust's Forms N-Q are available on the Securities and Exchange Commission's website at www.sec.gov and may be reviewed and copied at the Securities and Exchange Commission's Public Reference Room in Washington, DC. Information on the operation of the Public Reference Room may be obtained by calling 800-SEC-0330. The information on Form N-Q is available upon request, without charge, by calling 800-877-9700 (toll-free).
263
Board Consideration of the Management and Sub-Advisory Agreements
At meetings held on April 23-24, 2013 and June 26-27, 2013, the Board of Trustees of Neuberger Berman Equity Funds ("Board"), including the Trustees who are not "interested persons" of Neuberger Berman Management LLC ("Management") (including its affiliates) or Neuberger Berman Equity Funds ("Independent Fund Trustees"), approved the Management and Sub-Advisory Agreements ("Agreements") for Neuberger Berman Greater China Equity Fund (the "Fund").
In evaluating the Agreements, the Board, including the Independent Fund Trustees, reviewed materials furnished by Management and met with senior representatives of Management regarding personnel, operations and financial conditions of Management and Neuberger Berman Asia Limited ("NB Asia"), the Sub-Adviser, as they relate to the Fund. The Independent Fund Trustees were advised by counsel that is experienced in Investment Company Act of 1940 matters and that is independent of Management.
The Board evaluated the terms of the Agreements, the overall fairness of the Agreements to the Fund and whether the Agreements were in the best interests of the Fund and its shareholders. The Board considered the following factors, among others, in connection with its approval of the Agreements: (1) the nature, extent, and quality of the services to be provided by Management and NB Asia; (2) the expected costs of the services to be provided; (3) the extent to which economies of scale might be realized as the Fund grows; and (4) whether fee levels reflect any such potential economies of scale for the benefit of investors in the Fund. In their deliberations, the Board members did not identify any particular information that was all-important or controlling, and each Trustee may have attributed different weights to the various factors.
With respect to the nature, extent and quality of the services provided, the Board considered the experience of the portfolio management personnel of Management and NB Asia who would perform services for the Fund. The Board also considered the performance over a several year period of a composite portfolio using similar investment objectives, policies and strategies to the Fund. The Board noted that Management also would provide certain administrative services, including fund accounting and compliance oversight. The Board also considered Management's and NB Asia's policies and practices regarding brokerage and allocation of portfolio transactions for the Fund. In addition, the Board noted the scope of the compliance program of Management and NB Asia. The Board also considered the nature of the markets in which the Fund would invest and the geographic location of the adviser, and whether those factors suggested need for special research, trading, valuation and/or compliance. The Board also considered the manner in which Management addressed various non-routine matters that have arisen from time to time, some of them a result of developments in the broader fund industry or the regulations governing it.
With respect to the overall fairness of the Agreements, the Board considered the fee structure for the Fund under the Agreements as compared to a peer group of comparable funds and any fall-out benefits likely to accrue to Management or NB Asia or their affiliates from their relationship with the Fund.
The Board reviewed a comparison of the Fund's management fee and overall expense ratio for each class of the Fund to a peer group of broadly comparable funds and classes, including how the Fund's effective management fee at different asset levels and the Fund's net expenses for each class compared to the mean and median of the peer group. In addition, the Board considered the contractual limits on the Fund's expenses undertaken by Management for the Fund. The Board considered that the Fund's fee structure provides for a reduction of payments resulting from the use of breakpoints. The Board also considered whether it would be appropriate to evaluate any anticipated economies of scale in relation to the services Management provides to the Fund, noting that it may be too soon to anticipate the economies at the start-up phase of a fund. Although advisory and administrative fees for all classes of the Fund were in the bottom quartile of the comparison group, the expense ratio was close to the median of that group, indicating that in return for its fee, Management would provide more of the required administrative services than do some other manager/administrators in the comparison group.
264
Conclusions
In approving the Agreements, the Board concluded that the terms of each Agreement are fair and reasonable to the Fund and that approval of the Agreements is in the best interests of the Fund and its shareholders. In reaching this determination, the Board considered that Management and NB Asia could be expected to provide a high level of service to the Fund; that the Fund's fee structure appeared to the Board to be reasonable given the nature and quality of services expected to be provided; and that the expected benefits accruing to Management and its affiliates by virtue of their relationship to the Fund were reasonable in comparison with the expected costs of providing the investment advisory services and the expected benefits accruing to the Fund.
265
Notice to Shareholders
Equity Income Fund, Genesis Fund, Guardian Fund, Intrinsic Value Fund, Large Cap Disciplined Growth Fund, Mid Cap Growth Fund, Multi-Cap Opportunities Fund, Real Estate Fund and Select Equities Fund hereby designate $29,980,535, $529,696,292, $30,564,740, $2,542,565, $30,418,426, $33,916,496, $2,536,247, $16,029,835 and $4,605,363, respectively, as a capital gain distribution.
For the fiscal year ended August 31, 2013, each Fund makes the following designation, or up to the maximum amount of such dividends allowable pursuant to the Internal Revenue Code, as qualified dividend income eligible for reduced tax rates. These lower rates range from 5% to 15% depending upon an individual's tax bracket. Complete information regarding each Funds distributions during the calendar year 2013 will be reported in conjunction with Form 1099DIV.
Fund | | Qualified
Dividend Income | |
Emerging Markets Equity Fund | | $ | 7,839,761 | | |
Equity Income Fund | | | 88,989,651 | | |
Focus Fund | | | 10,706,347 | | |
Genesis Fund | | | 212,604,665 | | |
Global Equity Fund | | | 126,518 | | |
Global Thematic Opportunities Fund | | | 1,082,738 | | |
Greater China Equity Fund | | | 13,020 | | |
Guardian Fund | | | 21,509,340 | | |
International Equity Fund | | | 21,458,981 | | |
International Large Cap Fund | | | 5,741,129 | | |
Intrinsic Value Fund | | | 2,455,102 | | |
Large Cap Disciplined Growth Fund | | | 9,275,276 | | |
Large Cap Value Fund | | | 33,222,835 | | |
Mid Cap Growth Fund | | | 4,818,993 | | |
Mid Cap Intrinsic Value Fund | | | 1,693,033 | | |
Multi-Cap Opportunities Fund | | | 20,797,374 | | |
Real Estate Fund | | | 19,473,451 | | |
Select Equities Fund | | | 935,352 | | |
Small Cap Growth Fund | | | 515,173 | | |
Socially Responsive Fund | | | 36,238,028 | | |
Value Fund | | | 98,465 | | |
266
This page has been left blank intentionally
267
This page has been left blank intentionally
268
This page has been left blank intentionally
269

Neuberger Berman Management LLC
605 Third Avenue 2nd Floor
New York, NY 10158–0180
Shareholder Services
800.877.9700
Intermediary Client Services
800.366.6264
www.nb.com
Statistics and projections in this report are derived from sources deemed to be reliable but cannot be regarded as a representation of future results of the Funds. This report is prepared for the general information of shareholders and is not an offer of shares of the Funds. Shares are sold only through the currently effective prospectus, which must precede or accompany this report.
 H0599 10/13
Item 2. Code of Ethics.
The Board of Trustees (“Board”) of Neuberger Berman Equity Funds (“Registrant”) adopted a code of ethics that applies to the Registrant’s principal executive officer, principal financial officer, principal accounting officer or controller, or persons performing similar functions (“Code of Ethics”). For the period covered by this Form N-CSR, there were no amendments to the Code of Ethics and there were no waivers from the Code of Ethics granted to the Registrant’s principal executive officer, principal financial officer, principal accounting officer or controller, or persons performing similar functions.
A copy of the Code of Ethics is incorporated by reference to the Registrant’s Form N-CSR, Investment Company Act file number 811-00582 (filed May 6, 2013). The Code of Ethics is also available, without charge, by calling 1-800-877-9700 (toll-free).
Item 3. Audit Committee Financial Expert.
The Board has determined that the Registrant has three audit committee financial experts serving on its audit committee. The Registrant’s audit committee financial experts are Martha Goss, George Morriss and Candace Straight. Ms. Goss, Mr. Morriss and Ms. Straight are independent trustees as defined by Form N-CSR.
Item 4. Principal Accountant Fees and Services.
Ernst & Young, LLP (“E&Y”) serves as independent registered public accounting firm to the Neuberger Berman Emerging Markets Equity, Equity Income, Focus, Genesis, Global Equity, Global Thematic Opportunities, Greater China Equity, Guardian, International Equity, International Large Cap, Large Cap Value, Real Estate, Select Equities and Value Funds.
Tait, Weller & Baker LLP (“Tait Weller”) serves as independent registered public accounting firm to the Neuberger Berman Intrinsic Value, Large Cap Disciplined Growth, Mid Cap Growth, Mid Cap Intrinsic Value, Multi-Cap Opportunities, Small Cap Growth, and Socially Responsive Funds.
(a) Audit Fees
The aggregate fees billed for professional services rendered by E&Y for the audit of the annual financial statements or services that are normally provided by E&Y in connection with statutory and regulatory filings or engagements were $656,875 and $665,750 for the fiscal years ended 2012 and 2013, respectively.
The aggregate fees billed for professional services rendered by Tait Weller for the audit of the annual financial statements or services that are normally provided by Tait Weller in connection with statutory and regulatory filings or engagements were $138,250 and $141,750 for the fiscal years ended 2012 and 2013, respectively.
(b) Audit-Related Fees
The aggregate fees billed to the Registrant for assurance and related services by E&Y that are reasonably related to the performance of the audit of the Registrant’s financial statements and are not reported above in Audit Fees were $0 and $0 for the fiscal years ended 2012 and 2013, respectively. The Audit Committee approved 0% and 0% of these services provided by E&Y for the fiscal years ended 2012 and 2013, respectively, pursuant to the waiver provisions of Rule 2-01(c)(7)(i)(C) of Regulation S-X.
The fees billed to other entities in the investment company complex for assurance and related services by E&Y that are reasonably related to the performance of the audit that the Audit Committee was required to
approve because the engagement related directly to the operations and financial reporting of the Registrant were $0 and $0 for the fiscal years ended 2012 and 2013, respectively. The Audit Committee approved 0% and 0% of these services provided by E&Y for the fiscal years ended 2012 and 2013, respectively, pursuant to the waiver provisions of Rule 2-01(c)(7)(i)(C) of Regulation S-X.
The aggregate fees billed to the Registrant for assurance and related services by Tait Weller that are reasonably related to the performance of the audit of the Registrant’s financial statements and are not reported above in Audit Fees were $0 and $0 for the fiscal years ended 2012 and 2013, respectively. The Audit Committee approved 0% and 0% of these services provided by Tait Weller for the fiscal years ended 2012 and 2013, respectively, pursuant to the waiver provisions of Rule 2-01(c)(7)(i)(C) of Regulation S-X.
The fees billed to other entities in the investment company complex for assurance and related services by Tait Weller that are reasonably related to the performance of the audit that the Audit Committee was required to approve because the engagement related directly to the operations and financial reporting of the Registrant were $0 and $0 for the fiscal years ended 2012 and 2013, respectively. The Audit Committee approved 0% and 0% of these services provided by Tait Weller for the fiscal years ended 2012 and 2013, respectively, pursuant to the waiver provisions of Rule 2-01(c)(7)(i)(C) of Regulation S-X.
(c) Tax Fees
The aggregate fees billed to the Registrant for professional services rendered by E&Y for tax compliance, tax advice, and tax planning were $173,750 and $161,950 for the fiscal years ended 2012 and 2013, respectively. The nature of the services provided includes preparation of the Federal and State tax extensions and tax returns, review of annual excise tax calculations, and preparation of form 8613, in addition to guidance with the identification of Passive Foreign Investment Companies ("PFICS"), assistance with determination of various foreign withholding taxes, and assistance with Internal Revenue Code and tax regulation requirements for fund investments. The Audit Committee approved 0% and 0% of these services provided by E&Y for the fiscal years ended 2012 and 2013, respectively, pursuant to the waiver provisions of Rule 2-01(c)(7)(i)(C) of Regulation S-X.
The fees billed to other entities in the investment company complex for professional services rendered by E&Y for tax compliance, tax advice, and tax planning that the Audit Committee was required to approve because the engagement related directly to the operations and financial reporting of the Registrant were $0 and $0 for the fiscal years ended 2012 and 2013, respectively. The Audit Committee approved 0% and 0% of these services provided by E&Y for the fiscal years ended 2012 and 2013, respectively, pursuant to the waiver provisions of Rule 2-01(c)(7)(i)(C) of Regulation S-X.
The aggregate fees billed to the Registrant for professional services rendered by Tait Weller for tax compliance, tax advice, and tax planning were $22,750 and $24,500 for the fiscal years ended 2012 and 2013, respectively. The nature of the services provided includes preparation of the Federal and State tax extensions and tax returns, review of annual excise tax calculations, and preparation of form 8613, in addition to guidance with the identification of Passive Foreign Investment Companies ("PFICS"), assistance with determination of various foreign withholding taxes, and assistance with Internal Revenue Code and tax regulation requirements for fund investments. The Audit Committee approved 0% and 0% of these services provided by Tait Weller for the fiscal years ended 2012 and 2013, respectively, pursuant to the waiver provisions of Rule 2-01(c)(7)(i)(C) of Regulation S-X.
The fees billed to other entities in the investment company complex for professional services rendered by Tait Weller for tax compliance, tax advice, and tax planning that the Audit Committee was required to approve because the engagement related directly to the operations and financial reporting of the Registrant were $0 and $0 for the fiscal years ended 2012 and 2013, respectively. The Audit Committee approved 0% and 0% of these services provided by Tait Weller for the fiscal years ended 2012 and 2013, respectively, pursuant to the waiver provisions of Rule 2-01(c)(7)(i)(C) of Regulation S-X.
(d) All Other Fees
The aggregate fees billed to the Registrant for products and services provided by E&Y, other than services reported in Audit Fees, Audit-Related Fees, and Tax Fees were $0 and $0 for the fiscal years ended 2012 and 2013, respectively. The Audit Committee approved 0% and 0% of these services provided by E&Y for the fiscal years ended 2012 and 2013, respectively, pursuant to the waiver provisions of Rule 2-01(c)(7)(i)(C) of Regulation S-X.
The fees billed to other entities in the investment company complex for products and services provided by E&Y, other than services reported in Audit Fees, Audit-Related Fees, and Tax Fees that the Audit Committee was required to approve because the engagement related directly to the operations and financial reporting of the Registrant were $0 and $0 for the fiscal years ended 2012 and 2013, respectively. The Audit Committee approved 0% and 0% of these services provided by E&Y for the fiscal years ended 2012 and 2013, respectively, pursuant to the waiver provisions of Rule 2-01(c)(7)(i)(C) of Regulation S-X.
The aggregate fees billed to the Registrant for products and services provided by Tait Weller, other than services reported in Audit Fees, Audit-Related Fees, and Tax Fees were $0 and $0 for the fiscal years ended 2012 and 2013, respectively. The Audit Committee approved 0% and 0% of these services provided by Tait Weller for the fiscal years ended 2012 and 2013, respectively, pursuant to the waiver provisions of Rule 2-01(c)(7)(i)(C) of Regulation S-X.
The fees billed to other entities in the investment company complex for products and services provided by Tait Weller, other than services reported in Audit Fees, Audit-Related Fees, and Tax Fees that the Audit Committee was required to approve because the engagement related directly to the operations and financial reporting of the Registrant were $0 and $0 for the fiscal years ended 2012 and 2013, respectively. The Audit Committee approved 0% and 0% of these services provided by Tait Weller for the fiscal years ended 2012 and 2013, respectively, pursuant to the waiver provisions of Rule 2-01(c)(7)(i)(C) of Regulation S-X.
(e) Audit Committee’s Pre-Approval Policies and Procedures
(1) The Audit Committee’s pre-approval policies and procedures for the Registrant to engage an accountant to render audit and non-audit services delegate to each member of the Committee the power to pre-approve services between meetings of the Committee.
(2) None of the services described in paragraphs (b) through (d) above were approved by the Audit Committee pursuant to paragraph (c)(7)(i)(C) of Rule 2-01 of Regulation S-X.
(f) Hours Attributed to Other Persons
Not applicable.
(g) Non-Audit Fees
Non-audit fees billed by E&Y for services rendered to the Registrant were $203,750 and $219,400 for the fiscal years ended 2012 and 2013, respectively.
Non-audit fees billed by E&Y for services rendered to the Registrant’s investment adviser and any entity controlling, controlled by, or under common control with the adviser that provides ongoing services to the Registrant were $0 and $0 for the fiscal years ended 2012 and 2013, respectively.
Non-audit fees billed by Tait Weller for services rendered to the Registrant were $22,750 and $24,500 for the fiscal years ended 2012 and 2013, respectively.
Non-audit fees billed by Tait Weller for services rendered to the Registrant’s investment adviser and any entity controlling, controlled by, or under common control with the adviser that provides ongoing services to the Registrant were $0 and $0 for the fiscal years ended 2012 and 2013, respectively.
(h) The Audit Committee of the Board considered whether the provision of non-audit services rendered to the Registrant’s investment adviser and any entity controlling, controlled by, or under common control with the adviser that provides ongoing services to the Registrant that were not pre-approved by the Audit Committee because the engagement did not relate directly to the operations and financial reporting of the Registrant is compatible with maintaining E&Y’s and Tait Weller’s independence.
Item 5. Audit Committee of Listed Registrants.
Not applicable to the Registrant.
Item 6. Schedule of Investments.
The complete schedule of investments for each series is disclosed in the Registrant’s Annual Report, which is included as Item 1 of this Form N-CSR.
Item 7. Disclosure of Proxy Voting Policies and Procedures for Closed-End Management Investment Companies.
Not applicable to the Registrant.
Item 8. Portfolio Managers of Closed-End Management Investment Companies.
Not applicable to the Registrant.
Item 9. Purchases of Equity Securities by Closed-End Management Investment Company and Affiliated Purchasers.
Not applicable to the Registrant.
Item 10. Submission of Matters to a Vote of Security Holders.
There were no changes to the procedures by which shareholders may recommend nominees to the Board.
Item 11. Controls and Procedures.
| (a) | Based on an evaluation of the disclosure controls and procedures (as defined in Rule 30a-3(c) under the Investment Company Act of 1940, as amended (the “Act”)) as of a date within 90 days of the filing date of this document, the Chief Executive Officer and Treasurer and Principal Financial and Accounting Officer of the Registrant have concluded that such disclosure controls and procedures are effectively designed to ensure that information required to be disclosed by the Registrant on Form N-CSR and Form N-Q is accumulated and communicated to the Registrant’s management to allow timely decisions regarding required disclosure. |
| | |
| (b) | There were no significant changes in the Registrant’s internal controls over financial reporting (as defined in Rule 30a-3(d) under the Act) that occurred during the Registrant’s second fiscal quarter of the period covered by this report that have materially affected, or are reasonably likely to materially affect, the Registrant’s internal control over financial reporting. |
Item 12. Exhibits.
| (a)(1) | A copy of the Code of Ethics is incorporated by reference to the Registrant’s Form N-CSR, Investment Company Act file number 811-00582 (filed May 6, 2013). |
| | |
| (a)(2) | The certifications required by Rule 30a-2(a) of the Act and Section 302 of the Sarbanes-Oxley Act of 2002 (“Sarbanes-Oxley Act”) are filed herewith. |
| | |
| (a)(3) | Not applicable to the Registrant. |
| | |
| (b) | The certifications required by Rule 30a-2(b) of the Act and Section 906 of the Sarbanes-Oxley Act are filed herewith. |
The certifications provided pursuant to Rule 30a-2(b) of the Act and Section 906 of the Sarbanes-Oxley Act are not deemed “filed” for purposes of Section 18 of the Securities Exchange Act of 1934, as amended (“Exchange Act”), or otherwise subject to the liability of that section. Such certifications will not be deemed to be incorporated by reference into any filing under the Securities Act of 1933, as amended or the Exchange Act, except to the extent that the Registrant specifically incorporates them by reference. SIGNATURES
Pursuant to the requirements of the Securities Exchange Act of 1934 and the Investment Company Act of 1940, the Registrant has duly caused this report to be signed on its behalf by the undersigned, thereunto duly authorized.
Neuberger Berman Equity Funds
| By: | /s/ Robert Conti | |
| | Robert Conti | |
| | Chief Executive Officer and President | |
| | | |
| Date: | October 31, 2013 | |
| | | |
| | | |
| Pursuant to the requirements of the Securities Exchange Act of 1934 and the Investment Company Act of 1940, this report has been signed below by the following persons on behalf of the Registrant and in the capacities and on the dates indicated. |
| | | |
| | | |
| | | |
| By: | /s/ Robert Conti | |
| | Robert Conti | |
| | Chief Executive Officer and President | |
| | | |
| Date: | October 31, 2013 | |
| | | |
| | | |
| | | |
| By: | /s/ John M. McGovern | |
| | John M. McGovern | |
| | Treasurer and Principal Financial | |
| | and Accounting Officer | |
| | | |
| Date: | October 31, 2013 | |