As filed with the Securities and Exchange Commission on October 29, 2015
UNITED STATES
SECURITIES AND EXCHANGE COMMISSION
Washington, D.C. 20549
FORM N-CSR
CERTIFIED SHAREHOLDER REPORT OF
REGISTERED MANAGEMENT INVESTMENT COMPANIES
Investment Company Act file number: 811-00582
NEUBERGER BERMAN EQUITY FUNDS
(Exact Name of Registrant as specified in charter)
c/o Neuberger Berman Management LLC
605 Third Avenue, 2nd Floor
New York, New York 10158-0180
(Address of Principal Executive Offices – Zip Code)
Registrant's telephone number, including area code: (212) 476-8800
Robert Conti
Chief Executive Officer and President
Neuberger Berman Equity Funds
c/o Neuberger Berman Management LLC
605 Third Avenue, 2nd Floor
New York, New York 10158-0180
Arthur C. Delibert, Esq.
K&L Gates LLP
1601 K Street, N.W.
Washington, D.C. 20006-1600
(Names and Addresses of agents for service)
Date of fiscal year end: August 31
Date of reporting period: August 31, 2015
Form N-CSR is to be used by management investment companies to file reports with the Commission not later than 10 days after the transmission to stockholders of any report that is required to be transmitted to stockholders under Rule 30e-1 under the Investment Company Act of 1940, as amended (“Act”) (17 CFR 270.30e-1). The Commission may use the information provided on Form N-CSR in its regulatory, disclosure review, inspection, and policymaking roles.
A registrant is required to disclose the information specified by Form N-CSR, and the Commission will make this information public. A registrant is not required to respond to the collection of information contained in Form N-CSR unless the Form displays a currently valid Office of Management and Budget (“OMB”) control number. Please direct comments concerning the accuracy of the information collection burden estimate and any suggestions for reducing the burden to the Secretary, Securities and Exchange Commission, 100 F Street, NE, Washington, DC 20549-0609. The OMB has reviewed this collection of information under the clearance requirements of 44 U.S.C. § 3507.
Item 1. Report to Shareholders.
Following is a copy of the annual report transmitted to shareholders pursuant to Rule 30e-1 under the Act.

Neuberger Berman
Equity Funds
Investor Class Shares
Trust Class Shares
Advisor Class Shares
Institutional Class Shares
All Cap Core Fund
Emerging Markets Equity Fund
Equity Income Fund
Focus Fund
Genesis Fund
Global Equity Fund
Global Real Estate Fund
Greater China Equity Fund
Guardian Fund
International Equity Fund
International Select Fund
Class A Shares
Class C Shares
Class R3 Shares
Class R6 Shares
Intrinsic Value Fund
Large Cap Disciplined Growth Fund
Large Cap Value Fund
Mid Cap Growth Fund
Mid Cap Intrinsic Value Fund
Multi-Cap Opportunities Fund
Real Estate Fund
Small Cap Growth Fund
Socially Responsive Fund
Value Fund
World Equity Fund

Annual Report
August 31, 2015
Contents
THE FUNDS
President's Letter | | | 1 | | |
PORTFOLIO COMMENTARY | |
All Cap Core Fund | | | 2 | | |
Emerging Markets Equity Fund | | | 5 | | |
Equity Income Fund | | | 8 | | |
Focus Fund | | | 11 | | |
Genesis Fund | | | 14 | | |
Global Equity Fund | | | 17 | | |
Global Real Estate Fund | | | 20 | | |
Greater China Equity Fund | | | 23 | | |
Guardian Fund | | | 27 | | |
International Equity Fund | | | 30 | | |
International Select Fund | | | 33 | | |
Intrinsic Value Fund | | | 36 | | |
Large Cap Disciplined Growth Fund | | | 39 | | |
Large Cap Value Fund | | | 42 | | |
Mid Cap Growth Fund | | | 46 | | |
Mid Cap Intrinsic Value Fund | | | 49 | | |
Multi-Cap Opportunities Fund | | | 52 | | |
Real Estate Fund | | | 55 | | |
Small Cap Growth Fund | | | 58 | | |
Socially Responsive Fund | | | 61 | | |
Value Fund | | | 64 | | |
World Equity Fund | | | 67 | | |
FUND EXPENSE INFORMATION | | | 76 | | |
SCHEDULE OF INVESTMENTS/TOP TEN EQUITY HOLDINGS | |
All Cap Core Fund | | | 80 | | |
Emerging Markets Equity Fund | | | 81 | | |
Positions by Industry | | | 83 | | |
Equity Income Fund | | | 84 | | |

Focus Fund | | | 86 | | |
Genesis Fund | | | 87 | | |
Global Equity Fund | | | 90 | | |
Positions by Industry | | | 92 | | |
Global Real Estate Fund | | | 93 | | |
Positions by Sector | | | 95 | | |
Greater China Equity Fund | | | 96 | | |
Guardian Fund | | | 98 | | |
International Equity Fund | | | 99 | | |
Positions by Industry | | | 101 | | |
International Select Fund | | | 102 | | |
Positions by Industry | | | 104 | | |
Intrinsic Value Fund | | | 105 | | |
Large Cap Disciplined Growth Fund | | | 107 | | |
Large Cap Value Fund | | | 109 | | |
Mid Cap Growth Fund | | | 110 | | |
Mid Cap Intrinsic Value Fund | | | 112 | | |
Multi-Cap Opportunities Fund | | | 114 | | |
Real Estate Fund | | | 115 | | |
Small Cap Growth Fund | | | 116 | | |
Socially Responsive Fund | | | 118 | | |
Value Fund | | | 120 | | |
World Equity Fund | | | 121 | | |
Positions by Industry | | | 123 | | |
FINANCIAL STATEMENTS | | | 135 | | |
FINANCIAL HIGHLIGHTS (ALL CLASSES)/PER SHARE DATA | |
All Cap Core Fund | | | 203 | | |
Emerging Markets Equity Fund | | | 203 | | |
Equity Income Fund | | | 205 | | |
Focus Fund | | | 207 | | |
Genesis Fund | | | 209 | | |
Global Equity Fund | | | 211 | | |
Global Real Estate Fund | | | 213 | | |
Greater China Equity Fund | | | 213 | | |
Guardian Fund | | | 215 | | |
International Equity Fund | | | 217 | | |
International Select Fund | | | 219 | | |
Intrinsic Value Fund | | | 221 | | |
Large Cap Disciplined Growth Fund | | | 223 | | |
Large Cap Value Fund | | | 225 | | |
Mid Cap Growth Fund | | | 227 | | |
Mid Cap Intrinsic Value Fund | | | 231 | | |
Multi-Cap Opportunities Fund | | | 233 | | |
Real Estate Fund | | | 235 | | |
Small Cap Growth Fund | | | 237 | | |
Socially Responsive Fund | | | 239 | | |
Value Fund | | | 243 | | |
World Equity Fund | | | 243 | | |
| Reports of Independent Registered Public Accounting Firms | | | 250 | | |
Directory | | | 253 | | |
Trustees and Officers | | | 254 | | |
Proxy Voting Policies and Procedures | | | 262 | | |
Quarterly Portfolio Schedule | | | 262 | | |
Board Consideration of the Management and
Sub-Advisory Agreements | | | 263 | | |
Notice to Shareholders | | | 265 | | |
The "Neuberger Berman" name and logo are registered service marks of Neuberger Berman Group LLC. "Neuberger Berman Management LLC" and the individual Fund names in this piece are either service marks or registered service marks of Neuberger Berman Management LLC. ©2015 Neuberger Berman Management LLC. All rights reserved.Dear Shareholder,
This report covers a period of contrasts between headlines and realities, at what in our view is likely the start of a return to more historically normal equity market conditions, both in terms of returns and investor behavior.
The S&P 500® Index closed the 12 months ended August 31, 2015 up 0.48%. For most of the period, the market was range-bound with a volatile but positive trend; in August, sentiment shifted sharply and the market gave back most of its gains.
Although the S&P 500 has enjoyed multiple years of above-average returns since 2008's financial crisis, given the combination of a global debt overhang and memories of the crisis, investor sentiment has been unusually susceptible to headline news. This reporting period was no exception. From the Ebola crisis, to the possibility of a "Grexit" from the eurozone, to falling oil and commodities prices and a strengthening U.S. dollar, to the consensus around U.S. Federal Reserve action this year, to August's slower growth, market correction, and currency revaluation in China, investors had no shortage of macro distractions.
What did not make dramatic headlines was continuing healthy corporate and economic news, particularly in the U.S., but also in Europe and Japan. Corporate earnings, profits and cash flows were generally strong this period, outside of the headwinds facing energy- and materials-related companies as well as U.S.-based multinationals from commodity pricing and the strong dollar.
Looking at the U.S. economy, both residential and non-residential construction data have been healthy (the latter being especially significant given the contraction in energy-infrastructure spending amid plunging oil prices), labor markets have continued to tighten, and auto sales have set post-crisis records. Consumer confidence is elevated, and consumer spending has been steady—with real purchasing power likely in our view to improve as wages rise and American households benefit from lower gas prices. Several weeks ago, the U.S. Bureau of Economic Analysis updated its second quarter 2015 GDP growth estimate to 3.7%, from the first quarter's increase of 0.6%. Across Europe and in Japan, GDP growth is now solidly positive, although estimates for 2015 remain behind that of the U.S.
Looking ahead, while macro events still have the potential to shock the system—including China (though the official growth rate of the world's second largest economy remains around 7%), and Federal Reserve policy (which seems likely to remain supportive of economic growth even after its eventual rise)—we believe much of this risk may play out in index-type investments, where crowds move in unison. After a period in which unprecedented global policy stimulus created a macro-driven market, we now see evidence of what we believe is a shift back to a focus on fundamentals. We believe talented stock pickers have the advantage in a more typical market, where those able to identify unique opportunities via deep research and solid, tested disciplines, are positioned to outperform.
Thank you for your confidence in Neuberger Berman. We look forward to continuing to serve your investment needs.
Sincerely,

Robert Conti
President and CEO
Neuberger Berman Mutual Funds
All Cap Core Fund Commentary (Unaudited)
Neuberger Berman All Cap Core Fund Institutional Class generated a total return of –8.91% for the fiscal year ended August 31, 2015, trailing its benchmark, the S&P 500® Index, which returned 0.48% for the same period. (Performance for all share classes is provided in the table immediately following this letter.)
Although macro headlines such as the Greek and Puerto Rican debt crises, and slowing growth and a currency devaluation in China roiled the markets as this fiscal period was closing, markets were mildly positive for most of the fiscal year. As investors weighed these issues along with expectations for economic growth, the likelihood of the Federal Reserve's first rate increase since the financial crisis, and the impacts of falling commodity prices and a strengthening dollar, sectors such as Energy and Materials saw negative results, while areas including Consumer Discretionary, Consumer Staples and Health Care stocks outperformed.
Early in the fiscal year, we made a conscious decision to reconfigure the composition of the portfolio. We reduced our exposure to the more cyclical, capital-intensive businesses such as Energy and Industrials, replacing them with select Information Technology, Health Care and Consumer Discretionary names. Our Energy holdings, overweight versus the benchmark at 13% of the portfolio as the period began, are now underweight at 7%. Industrials holdings were also reduced from 21% to an underweight. Health Care, at around 4% of the portfolio as the fiscal year began, was just at 9% as the period closed, Information Technology holdings moved from around 12% to around 26%, and Consumer Discretionary was reduced from 17.4% to 16.2%.
Even though we had reduced our exposure to Energy this period, our overweight in late 2014 played a large role in our relative underperformance for the full fiscal year, as oil's 50% price decline weighed heavily on energy-related stocks. Our Consumer Discretionary holdings also underperformed the benchmark. Information Technology was our strongest sector, with our holdings significantly outperforming. Our underweight to Materials, where oversupply has kept commodity prices low, was another relative benefit.
Anticipating the possibility of a period of heightened volatility this summer, we had increased the amount of cash equivalents in the portfolio—from a low of 5.5% at the end of May to roughly 16% today. Cash was a cushion in August when the market stumbled, and it also allowed us to use volatility to our advantage. We selectively added companies we believe will benefit from long-term secular trends, or that are undergoing significant changes we think are underappreciated by the market, at discounted valuations.
We continue to emphasize U.S.-centric positioning within the portfolio, based on our belief that growth in Europe is likely to be moderate at best, and possibly stagnant. Our exposure to China is also quite limited, given our awareness of the slowing that is happening there, and the opaqueness of the information about it.
While volatility may continue given the crowd behavior of passive funds, between the quality of the companies that comprise our repositioned portfolio and our focus on the U.S., where the economy appears to us to remain on a positive if subpar growth trend, we are confident that we are well positioned moving forward.
Sincerely,
Michael K. Kaminsky, Richard Werman, James Gartland and Mindy Schwartzapeel
Portfolio Managers
Information about principal risks of investing in the Fund is set forth in the prospectus and statement of additional information.
The portfolio composition, industries and holdings of the Fund are subject to change without notice.
The opinions expressed are those of the Fund's portfolio managers. The opinions are as of the date of this report and are subject to change without notice.
All Cap Core Fund (Unaudited)
TICKER SYMBOLS
Institutional Class | | NBEIX | |
Class A | | NBEAX | |
Class C | | NBECX | |
SECTOR ALLOCATION
(as a % of Total Investments) | |
Consumer Discretionary | | | 16.2 | % | |
Energy | | | 6.7 | | |
Financials | | | 14.5 | | |
Health Care | | | 9.0 | | |
Industrials | | | 6.5 | | |
Information Technology | | | 25.8 | | |
Utilities | | | 2.7 | | |
Other | | | 2.6 | | |
Short-Term Investments | | | 16.0 | | |
Total | | | 100.0 | % | |
PERFORMANCE HIGHLIGHTS26
| | | | | Average Annual Total
Return Ended 08/31/2015 | |
| | | Inception
Date | | 1 Year | | 5 Year | | Life of
Fund | |
At NAV | |
Institutional Class | | 12/20/2007 | | | –8.91 | % | | | 11.88 | % | | | 4.70 | % | |
Class A | | 12/20/2007 | | | –9.26 | % | | | 11.39 | % | | | 4.31 | % | |
Class C | | 12/20/2007 | | | –9.97 | % | | | 10.55 | % | | | 3.53 | % | |
With Sales Charge | |
Class A | | | | | –14.51 | % | | | 10.08 | % | | | 3.51 | % | |
Class C | | | | | –10.72 | % | | | 10.55 | % | | | 3.53 | % | |
Index | |
| S&P 500® Index1,16 | | | | | 0.48 | % | | | 15.87 | % | | | 6.34 | % | |
The performance data quoted represent past performance and do not indicate future results. Current performance may be lower or higher than the performance data quoted. For performance data current to the most recent month-end, please visit www.nb.com/performance.
The results shown in the table reflect the reinvestment of income dividends and other distributions, if any. The results do not reflect the effect of taxes a shareholder would pay on Fund distributions or on the redemption of Fund shares.
The investment return and principal value of an investment will fluctuate and shares, when redeemed, may be worth more or less than their original cost.
Returns would have been lower if Neuberger Berman Management LLC (Management) had not reimbursed certain expenses and/or waived a portion of the investment management fees during certain of the periods shown. Repayment by a class (of expenses previously reimbursed and/or fees previously waived by Management) will decrease the class's returns. Please see Note B in the Notes to Financial Statements for specific information regarding expense reimbursement and/or fee waiver arrangements.
As stated in the Fund's most recent prospectus, the total annual operating expense ratios for fiscal year 2014 were 1.04%, 1.41% and 2.16% for Institutional Class, Class A and Class C shares, respectively (before expense reimbursements and/or fee waivers, if any). The expense ratios were 0.76%, 1.21% and 1.96% for Institutional Class, Class A and Class C shares, respectively, after expense reimbursements and/or fee waivers. The expense ratios for the annual period ended August 31, 2015 can be found in the Financial Highlights section of this report.
Returns shown with a sales charge reflect the deduction of the current maximum initial sales charge of 5.75% for Class A shares and the contingent deferred sales charge (CDSC) for Class C shares. The CDSC for Class C shares is 1%, which is reduced to 0% after 1 year. The performance of the Fund's share classes will differ primarily due to different sales charge structures and class expenses. Please see the prospectus for more information about sales charge structures, if any, and class expenses for your share class.
All Cap Core Fund (Unaudited)
COMPARISON OF A $1,000,000 INVESTMENT
(000's Omitted)
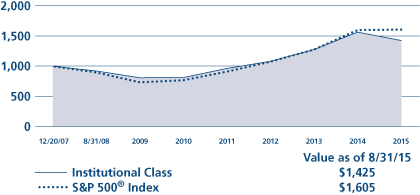
This graph shows the change in value of a hypothetical $1,000,000 investment in the Fund over the past 10 fiscal years, or since the Fund's inception if it has not operated for 10 years. The graph is based on the Institutional Class shares only; the performance of the Fund's share classes will differ primarily due to different sales charge structures and class expenses (see Performance Highlights chart on previous page). The result is compared with benchmarks, which include a broad-based market index and may include a more narrowly based index. Market indices have not been reduced to reflect any of the fees and costs of investing. The results shown in the graph reflect the reinvestment of income dividends and other distributions, if any. The results do not reflect the effect of taxes a shareholder would pay on Fund distributions or on the redemption of Fund shares. Results represent past performance and do not indicate future results.
Emerging Markets Equity Fund Commentary (Unaudited)
Neuberger Berman Emerging Markets Equity Fund Institutional Class generated a –21.22% total return for the fiscal year ended August 31, 2015, outperforming its benchmark, the MSCI Emerging Markets Index, which posted a –22.67% return for the same period. (Performance for all share classes is provided in the table immediately following this letter.)
Several factors conspired to erode the performance of emerging markets equities this fiscal period. Pressures included falling commodities prices, currencies, increased risk aversion as investors considered likely tightening by the Federal Reserve, slower GDP growth rates in emerging economies including China, and in recent months, a correction in that country's domestic stock market and an unexpected currency devaluation, which we believe damaged the government's credibility.
Nine of 10 index sectors reported double-digit negative returns for the fiscal year, with Energy and Materials being the weakest. The most resilient sector was Health Care, which was down 2.3%. By country, Greece, Colombia and Brazil were the weakest index markets. Hungary outperformed, up 6.6%, followed by the Philippines and India, although both countries posted negative results.
The Fund's Institutional Class outperformed the index as a result of stock selection and an underweight versus the benchmark to Energy, and stock selection and an overweight to Industrials and Information Technology. By country, overweight allocations to India and China, and an underweight to Brazil were advantageous.
Our top contributors were three Indian holdings, Cummins India, Glenmark Pharmaceuticals and Yes Bank. Cummins India, the industrial engine manufacturer, saw growth in both domestic and export businesses, with the potential for more gains should domestic construction and mining activity continue to pick up. Glenmark's stock rose as the company enjoyed strong earnings and profit margins driven by a healthy pipeline of new drugs. Private-sector lender Yes Bank (sold prior to period end) announced better-than-expected earnings as loan growth accelerated and non-interest income was strong.
Although the Fund as a whole outperformed, stock selection within Financials, Materials and Consumer Discretionary (as well as an overweight to the latter underperforming sector), detracted from results relative to the benchmark. By country, South African and Russian holdings detracted, as did our underweight to the outperforming Taiwanese market.
Key individual detractors included Korea-based global automaker Hyundai Motor, which underperformed as domestic sales declined and on fears that a weakening Japanese yen could hurt its global cost competitiveness in the near term. MediaTek, a Taiwanese semiconductor name, corrected on concerns about a growth deceleration in its smart phone and tablet end markets. Brazilian bank Itau Unibanco was hurt by a weakening real and higher interest rates, which constricted loan demand.
With a longer-term view, we believe the recent indiscriminate selling offers attractive opportunities in domestically focused companies in a variety of geographies, both among our current holdings and potentially in new names. We remain broadly cautious about natural resource sectors, however, as we believe that even though their valuations are even cheaper, this speaks to the uncertainty in underlying commodity prices.
We continue to search for opportunities within what we believe are the more favorable markets, targeting the companies we believe are best positioned for growth, and seeking to use near-term volatility to our longer-term advantage.
Sincerely,
Conrad Saldanha
Portfolio Manager
Information about principal risks of investing in the Fund is set forth in the prospectus and statement of additional information.
The portfolio composition, industries and holdings of the Fund are subject to change without notice.
The opinions expressed are those of the Fund's portfolio manager. The opinions are as of the date of this report and are subject to change without notice.
Emerging Markets Equity Fund (Unaudited)
TICKER SYMBOLS
Institutional Class | | NEMIX | |
Class A | | NEMAX | |
Class C | | NEMCX | |
Class R3 | | NEMRX | |
Class R6 | | NREMX | |
PERFORMANCE HIGHLIGHTS9
| | | | Average Annual Total
Return Ended 08/31/2015 | |
| | | Inception
Date | | 1 Year | | 5 Years | | Life of
Fund | |
At NAV | |
Institutional Class | | 10/08/2008 | | | –21.22 | % | | | –1.30 | % | | | 7.15 | % | |
Class A | | 10/08/2008 | | | –21.42 | % | | | –1.55 | % | | | 6.89 | % | |
Class C | | 10/08/2008 | | | –22.02 | % | | | –2.28 | % | | | 6.09 | % | |
| Class R310 | | 06/21/2010 | | | –21.70 | % | | | –1.96 | % | | | 6.61 | % | |
| Class R623 | | 03/15/2013 | | | –21.14 | % | | | –1.25 | % | | | 7.19 | % | |
With Sales Charge | |
Class A | | | | | –25.95 | % | | | –2.71 | % | | | 5.98 | % | |
Class C | | | | | –22.80 | % | | | –2.28 | % | | | 6.09 | % | |
Index | |
| MSCI Emerging Markets Index1,16 | | | | | –22.67 | % | | | –0.59 | % | | | 6.07 | % | |
The performance data quoted represent past performance and do not indicate future results. Current performance may be lower or higher than the performance data quoted. For performance data current to the most recent month-end, please visit www.nb.com/performance.
The results shown in the table reflect the reinvestment of income dividends and other distributions, if any. The results do not reflect the effect of taxes a shareholder would pay on Fund distributions or on the redemption of Fund shares.
The investment return and principal value of an investment will fluctuate and shares, when redeemed, may be worth more or less than their original cost.
Returns would have been lower if Neuberger Berman Management LLC (Management) had not reimbursed certain expenses and/or waived a portion of the investment management fees during certain of the periods shown. Repayment by a class (of expenses previously reimbursed and/or fees previously waived by Management) will decrease the class's returns. Please see Note B in the Notes to Financial Statements for specific information regarding expense reimbursement and/or fee waiver arrangements.
As stated in the Fund's most recent prospectus, the total annual operating expense ratios for fiscal year 2014 were 1.45%, 1.83%, 2.57%, 2.13% and 1.37% for Institutional Class, Class A, Class C, Class R3 and Class R6 shares, respectively (before expense reimbursements and/or fee waivers, if any). The expense ratios were 1.25%, 1.50%, 2.25%, 1.91% and 1.18% for Institutional Class, Class A, Class C, Class R3 and Class R6 shares, respectively, after expense reimbursements and/or fee waivers. The expense ratios for the annual period ended August 31, 2015 can be found in the Financial Highlights section of this report.
Returns shown with a sales charge reflect the deduction of the current maximum initial sales charge of 5.75% for Class A shares and the contingent deferred sales charge (CDSC) for Class C shares. The CDSC for Class C shares is 1%, which is reduced to 0% after 1 year. The performance of the Fund's share classes will differ primarily due to different sales charge structures and class expenses. Please see the prospectus for more information about sales charge structures, if any, and class expenses for your share class.
Emerging Markets Equity Fund (Unaudited)
COMPARISON OF A $1,000,000 INVESTMENT
(000's Omitted)
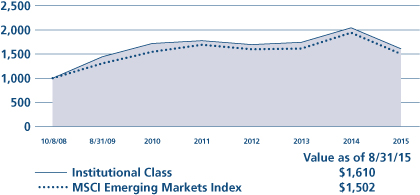
This graph shows the change in value of a hypothetical $1,000,000 investment in the Fund over the past 10 fiscal years, or since the Fund's inception if it has not operated for 10 years. The graph is based on the Institutional Class shares only; the performance of the Fund's share classes will differ primarily due to different sales charge structures and class expenses (see Performance Highlights chart on previous page). The result is compared with benchmarks, which include a broad-based market index and may include a more narrowly based index. Market indices have not been reduced to reflect any of the fees and costs of investing. The results shown in the graph reflect the reinvestment of income dividends and other distributions, if any. The results do not reflect the effect of taxes a shareholder would pay on Fund distributions or on the redemption of Fund shares. Results represent past performance and do not indicate future results.
Equity Income Fund Commentary (Unaudited)
Neuberger Berman Equity Income Fund Institutional Class generated a -4.60% total return for the fiscal year ended August 31, 2015, compared to the 0.48% return of its benchmark, the S&P 500® Index. (Performance for all share classes is provided in the table immediately following this letter.)
Several factors contributed to the loss, including a severe dislocation in the Energy, Utilities and Materials sectors. In more normal markets and historically since the inception of the strategy, the Fund's defensive characteristics and its focus on both yield and growth have allowed it to provide equity-like returns with less volatility than the broader S&P 500 Index.
This period reflected investor uncertainty surrounding the direction of U.S. interest rates, the path of global economic growth, and the imbalance between supply and demand for oil. In the fall of 2014, the Federal Reserve (Fed) announced that the U.S. economy would no longer need further economic stimulus to maintain its upward trajectory, thus ending its quantitative easing program. At the same time, the European Central Bank (ECB) launched its fiscal stimulus program. The Chinese stock market intitially hit extreme highs only to tumble sharply downward as news pointed to the country's declining economic growth rate—and since China is tied to the success of so many commodity exporters, equity markets in Brazil, Australia and even Canada were dramatically affected. Weaker demand for oil, coupled with high oil production in the U.S., fueled a sharp price correction, with West Texas Intermediate crude oil tumbling 50% during this 12-month period.
On the positive side, higher interest rates and low oil prices have typically been favorable for companies in the Financials and Consumer sectors, as was the case this year. Among Financials, three of our top contributors were REITs. On the Consumer Discretionary front, Hasbro and Home Depot (sold prior to period end) were among our top contributors.
We believe that the ECB's monetary stimulus, designed to weaken the euro, should provide further tailwinds to certain European exporters, including Royal Philips, an Industrials company that underperformed during the period.
Weak energy prices impacted several of our oil producers and midstream company holdings. ONEOK, a gas gathering and pipeline company, was hurt by the drastic decline in natural gas liquids prices. Our outlook for natural gas prices is favorable due to what we anticipate will be normalized weather-related demand, the shutdown of coal-fired power plants and LNG export facilities coming on line. A visible decline in U.S. oil production this coming winter could provide support to companies levered to oil prices. The Fund holds an overweight to Energy, with an emphasis on producers with the strongest balance sheets and which we think will be able to maintain their dividends until a pricing recovery ensues.
Looking ahead, with many positive factors driving the U.S. economy in the near term, we do not believe that modest Fed rate increases would either slow momentum in housing or choke off continued growth. Dividend-paying equities can be more attractive than bonds during economic expansions and rising rate environments because earnings often grow, leading to higher dividend payouts for shareholders. We believe the Fund is favorably positioned to benefit from these trends in the months ahead.
Sincerely,
Richard Levine, Tony Gleason and Sandy Pomeroy
Portfolio Managers
Information about principal risks of investing in the Fund is set forth in the prospectus and statement of additional information.
The portfolio composition, industries and holdings of the Fund are subject to change without notice.
The opinions expressed are those of the Fund's portfolio managers. The opinions are as of the date of this report and are subject to change without notice.
Equity Income Fund (Unaudited)
TICKER SYMBOLS
Institutional Class | | NBHIX | |
Class A | | NBHAX | |
Class C | | NBHCX | |
Class R3 | | NBHRX | |
SECTOR ALLOCATION
(as a % of Total Investments) | |
Consumer Discretionary | | | 5.5 | % | |
Consumer Staples | | | 4.6 | | |
Energy | | | 8.5 | | |
Financials | | | 37.8 | | |
Health Care | | | 10.0 | | |
Industrials | | | 5.4 | | |
Information Technology | | | 3.8 | | |
Materials | | | 2.5 | | |
Telecommunication Services | | | 2.1 | | |
Utilities | | | 14.4 | | |
Other | | | 3.7 | | |
Short-Term Investments | | | 1.7 | | |
Total | | | 100.0 | % | |
PERFORMANCE HIGHLIGHTS9
| | | | | Average Annual Total
Return Ended 08/31/2015 | |
| | | Inception
Date* | | 1 Year | | 5 Years | | Life of
Fund | |
At NAV | |
| Institutional Class14 | | 06/09/2008 | | | –4.60 | % | | | 8.92 | % | | | 6.70 | % | |
| Class A14 | | 06/09/2008 | | | –5.02 | % | | | 8.50 | % | | | 6.35 | % | |
| Class C14 | | 06/09/2008 | | | –5.65 | % | | | 7.71 | % | | | 5.73 | % | |
| Class R314 | | 06/21/2010 | | | –5.22 | % | | | 8.19 | % | | | 6.28 | % | |
With Sales Charge | |
| Class A14 | | | | | –10.47 | % | | | 7.22 | % | | | 5.64 | % | |
| Class C14 | | | | | –6.54 | % | | | 7.71 | % | | | 5.73 | % | |
Index | |
| S&P 500® Index1,16 | | | | | 0.48 | % | | | 15.87 | % | | | 6.49 | % | |
*The performance data for each class includes the performance of the Fund's oldest share class, Trust Class, from November 2, 2006 through June 9, 2008. The performance data for Class R3 also includes the performance of the Fund's Institutional Class from June 9, 2008 through June 21, 2010. See endnote 14 for information about the effects of the different fees paid by each class.
The performance data quoted represent past performance and do not indicate future results. Current performance may be lower or higher than the performance data quoted. For performance data current to the most recent month-end, please visit www.nb.com/performance.
The results shown in the table reflect the reinvestment of income dividends and other distributions, if any. The results do not reflect the effect of taxes a shareholder would pay on Fund distributions or on the redemption of Fund shares.
The investment return and principal value of an investment will fluctuate and shares, when redeemed, may be worth more or less than their original cost.
Returns would have been lower if Neuberger Berman Management LLC (Management) had not reimbursed certain expenses and/or waived a portion of the investment management fees during certain of the periods shown. Repayment by a class (of expenses previously reimbursed and/or fees previously waived by Management) will decrease the class's returns. Please see Note B in the Notes to Financial Statements for specific information regarding expense reimbursement and/or fee waiver arrangements.
As stated in the Fund's most recent prospectus, the total annual operating expense ratios for fiscal year 2014 were 0.68%, 1.05%, 1.80% and 1.34% for Institutional Class, Class A, Class C and Class R3 shares, respectively (before expense reimbursements and/or fee waivers, if any). The total annual operating expense ratio for Class R3 includes the class's repayment of expenses previously reimbursed and/or fees previously waived by Management. The expense ratios for the annual period ended August 31, 2015 can be found in the Financial Highlights section of this report.
Returns shown with a sales charge reflect the deduction of the current maximum initial sales charge of 5.75% for Class A shares and the contingent deferred sales charge (CDSC) for Class C shares. The CDSC for Class C shares is 1%, which is reduced to 0% after 1 year. The performance of the Fund's share classes will differ primarily due to different sales charge structures and class expenses. Please see the prospectus for more information about sales charge structures, if any, and class expenses for your share class.
Equity Income Fund (Unaudited)
COMPARISON OF A $1,000,000 INVESTMENT14
(000's Omitted)

This graph shows the change in value of a hypothetical $1,000,000 investment in the Fund over the past 10 fiscal years, or since the Fund's inception if it has not operated for 10 years. The graph is based on the Institutional Class shares only; the performance of the Fund's share classes will differ primarily due to different sales charge structures and class expenses (see Performance Highlights chart on previous page). The result is compared with benchmarks, which include a broad-based market index and may include a more narrowly based index. Market indices have not been reduced to reflect any of the fees and costs of investing. The results shown in the graph reflect the reinvestment of income dividends and other distributions, if any. The results do not reflect the effect of taxes a shareholder would pay on Fund distributions or on the redemption of Fund shares. Results represent past performance and do not indicate future results.
Focus Fund Commentary (Unaudited)
Neuberger Berman Focus Fund Investor Class generated a 0.49% total return for the fiscal year ended August 31, 2015, compared to its benchmark, the S&P 500® Index, which provided a 0.48% return for the same period. (Performance for all share classes is provided in the table immediately following this letter.)
Over the 12-month reporting period, the equity market withstood some major macro challenges, yet as issues mounted, investor apprehension turned into panic and led to a steep market sell-off by period-end. In the earlier months, anxiety over the Federal Reserve's (Fed) interest rate tightening plan and a sharp decline in crude oil prices caused some tumult in the market. Greece's credit issues and possible exit from the eurozone also drove equities downward at times, as did signs of economic weakness in China and Japan. Still, the market remained resilient for much of the period as focus turned to the improving U.S. economy, signs of progress in Europe and various policy actions taken around the world to provide economic stimulus. But as the September U.S. Fed meeting neared, concerns began to grow about the health of our financial market in a rising rate environment. On top of this, economic data from China appeared to worsen; an unexpected move by the Chinese central bank to devalue the nation's currency sounded an alarm to investors that the global economy could be on shaky ground, which sent the equity market reeling in the final month of the period.
Performance within the S&P 500 Index varied greatly among sectors. Health Care and Consumer Discretionary generated double-digit positive returns, while the Energy sector suffered a decline of over 30% and Materials fell by over 12%. In calmer territory were Consumer Staples, Information Technology and Financials, which eked out modest rises during the fiscal year, and Industrials and Telecommunication Services, which experienced fairly minor losses. The greatest contribution to overall performance within the Fund came from Health Care. Strong stock selection in this segment gave a large boost to returns relative to the benchmark as well. This was mainly driven by our Pharmaceuticals holdings, including Eli Lilly (LLY), which soared over 30% during the year. LLY shares appreciated rather steadily amid many positive developments for the company such as the release of constructive data from its oncology drug trial as well as for trials relating to its diabetes and Alzheimer's treatments. In our view, LLY has a very promising drug pipeline that we believe creates a path of solid earnings and revenue growth for the company going forward. On the downside, our Energy sector holdings were the greatest drag on Fund performance, both in absolute terms and on a relative basis. The segment as a whole was weak during the period but we held a few names, including Antero Resources, that experienced outsized declines. We believe the near-term picture for oil will likely remain difficult for a while, as global supplies remain elevated and demand continues to wane with consumption from China and other emerging markets slowing in response to milder economic growth.
Looking ahead, despite recent market movements, we believe the domestic stock market could recover alongside a steadily improving U.S. economy. Yet the possibility of a worse-than-expected economic slowdown in China and weakness in other emerging markets, combined with the unknown impact of rising interest rates in the U.S., keep us wary that we may see further volatility in equities. Nonetheless, we believe that our strategy of conducting in-depth research to find individual stocks with strong businesses and healthy fundamentals should enable the Fund to endure global macro risks and generate positive returns over an economic cycle.
Sincerely,
Timothy Creedon and David Levine
Portfolio Managers
Information about principal risks of investing in the Fund is set forth in the prospectus and statement of additional information.
The portfolio composition, industries and holdings of the Fund are subject to change without notice.
The opinions expressed are those of the Fund's portfolio managers. The opinions are as of the date of this report and are subject to change without notice.
TICKER SYMBOLS
Investor Class | | NBSSX | |
Trust Class | | NBFCX | |
Advisor Class | | NBFAX | |
Institutional Class | | NFALX | |
Class A | | NFAAX | |
Class C | | NFACX | |
SECTOR ALLOCATION
(as a % of Total Investments) | |
Consumer Discretionary | | | 21.1 | % | |
Consumer Staples | | | 9.6 | | |
Energy | | | 9.5 | | |
Financials | | | 16.0 | | |
Health Care | | | 10.0 | | |
Industrials | | | 9.6 | | |
Information Technology | | | 20.4 | | |
Materials | | | 2.4 | | |
Short-Term Investments | | | 1.4 | | |
Total | | | 100.0 | % | |
PERFORMANCE HIGHLIGHTS8
| | | | | Average Annual Total
Return Ended 08/31/2015 | |
| | | Inception
Date | | 1 Year | | 5 Years | | 10 Years | | Life of
Fund | |
At NAV | |
Investor Class | | 10/19/1955 | | | 0.49 | % | | | 15.98 | % | | | 5.93 | % | | | 10.45 | % | |
| Trust Class3 | | 08/30/1993 | | | 0.26 | % | | | 15.74 | % | | | 5.71 | % | | | 10.44 | % | |
| Advisor Class4 | | 09/03/1996 | | | 0.15 | % | | | 15.57 | % | | | 5.51 | % | | | 10.38 | % | |
| Institutional Class5 | | 06/21/2010 | | | 0.65 | % | | | 16.20 | % | | | 6.04 | % | | | 10.47 | % | |
| Class A20 | | 06/21/2010 | | | 0.24 | % | | | 15.77 | % | | | 5.83 | % | | | 10.44 | % | |
| Class C20 | | 06/21/2010 | | | –0.50 | % | | | 14.93 | % | | | 5.43 | % | | | 10.36 | % | |
With Sales Charge | |
| Class A20 | | | | | –5.52 | % | | | 14.40 | % | | | 5.21 | % | | | 10.33 | % | |
| Class C20 | | | | | –1.14 | % | | | 14.93 | % | | | 5.43 | % | | | 10.36 | % | |
Index | |
| S&P 500® Index1,16 | | | | | 0.48 | % | | | 15.87 | % | | | 7.15 | % | | | 10.04 | % | |
The performance data quoted represent past performance and do not indicate future results. Current performance may be lower or higher than the performance data quoted. For performance data current to the most recent month-end, please visit www.nb.com/performance.
The results shown in the table reflect the reinvestment of income dividends and other distributions, if any. The results do not reflect the effect of taxes a shareholder would pay on Fund distributions or on the redemption of Fund shares.
The investment return and principal value of an investment will fluctuate and shares, when redeemed, may be worth more or less than their original cost.
Returns would have been lower if Neuberger Berman Management LLC (Management) had not reimbursed certain expenses and/or waived a portion of the investment management fees during certain of the periods shown. Repayment by a class (of expenses previously reimbursed and/or fees previously waived by Management) will decrease the class's returns. Please see Note B in the Notes to Financial Statements for specific information regarding expense reimbursement and/or fee waiver arrangements.
As stated in the Fund's most recent prospectus, the total annual operating expense ratios for fiscal year 2014 were 0.91%, 1.11%, 1.27%, 0.76%, 1.14%, and 1.91% for Investor Class, Trust Class, Advisor Class, Institutional Class, Class A and Class C shares, respectively (before expense reimbursements and/or fee waivers, if any). The expense ratios were 0.75%, 1.11%, and 1.86% for Institutional Class, Class A and Class C shares, respectively, after expense reimbursements and/or fee waivers. The expense ratios for the annual period ended August 31, 2015 can be found in the Financial Highlights section of this report.
Returns shown with a sales charge reflect the deduction of the current maximum initial sales charge of 5.75% for Class A shares and the contingent deferred sales charge (CDSC) for Class C shares. The CDSC for Class C shares is 1%, which is reduced to 0% after 1 year. The performance of the Fund's share classes will differ primarily due to different sales charge structures and class expenses. Please see the prospectus for more information about sales charge structures, if any, and class expenses for your share class.
COMPARISON OF A $10,000 INVESTMENT

This graph shows the change in value of a hypothetical $10,000 investment in the Fund over the past 10 fiscal years, or since the Fund's inception if it has not operated for 10 years. The graph is based on the Investor Class shares only; the performance of the Fund's share classes will differ primarily due to different sales charge structures and class expenses (see Performance Highlights chart on previous page). The result is compared with benchmarks, which include a broad-based market index and may include a more narrowly based index. Market indices have not been reduced to reflect any of the fees and costs of investing. The results shown in the graph reflect the reinvestment of income dividends and other distributions, if any. The results do not reflect the effect of taxes a shareholder would pay on Fund distributions or on the redemption of Fund shares. Results represent past performance and do not indicate future results.
Genesis Fund Commentary (Unaudited)
Neuberger Berman Genesis Fund Investor Class posted a 1.52% total return for the fiscal year ended August 31, 2015, outperforming its benchmark, the Russell 2000® Index, which provided a 0.03% total return for the same period. (Performance for all share classes is provided in the table immediately following this letter.)
The U.S. stock market was volatile and generated a modest gain during the reporting period. The market was supported at times by signs of improving economic growth in the U.S. and solid demand. However, the market was periodically challenged—especially late in the period—by heightened investor risk aversion, some of which was triggered by geopolitical issues and signs of moderating growth in China. The overall U.S. stock market, as measured by the S&P 500® Index, gained 0.48% for the 12 months ended August 31, 2015. Small-cap stocks were also relatively flat, as the Russell 2000 Index returned 0.03% for the period. However, there was a significant dispersion between small-cap growth and value stocks, as the Russell 2000® Growth and Value Indexes returned 5.11% and –4.95%, respectively. This disparity was partially due to the strong performance from the biotechnology and technology industries, which make up a meaningful portion of the Russell 2000 Growth Index.
The Fund's outperformance during the reporting period was due to stock selection. In particular, the Fund's holdings in the Materials, Industrials and Information Technology sectors were the largest contributors to relative performance. In terms of individual holdings, Manhattan Associates and Constellation Software, added the most value. Manhattan Associates provides information technology solutions designed to enable efficient movement of goods through the supply chain. Constellation Software is a software holding company that acquires mission-critical vertical market software companies. On the downside, stock selection in the Financials sector was negative for performance. This was largely driven by the weak results from two mortgage service-related companies, Altisource Portfolio Solutions and Altisource Asset Management Corp. We eliminated our position on Altisource Portfolio Solutions and the Fund now has only a small allocation to Altisource Asset Management Corp.
Sector allocation, overall, detracted from performance during the reporting period. In particular, a lack of exposure to biotechnology companies detracted from results. We do not typically own these companies as they do not meet our investment criteria given their speculative nature, a general lack of earnings and their need to access the capital markets. Overweights relative to the index in the Materials and Industrials sectors were also drags on results. In contrast, overweights to the Consumer Staples and Information Technology sectors were modestly positive for performance.
Looking ahead, we have a cautiously optimistic outlook for the Fund. In a world rife with geopolitical issues and the anticipation of future Fed interest rate hikes, we feel that investors' interest in less risky/higher quality stocks could increase. This portion of the small-cap market has lagged lower quality stocks. However, in our view, the tide may turn as lower quality/higher leverage companies experience higher borrowing costs, some of which is already occurring in the marketplace. We believe this environment aligns with our investment approach. To be sure, valuations across the equity market appear to be full given where we currently are in the interest rate cycle. In addition, periods of continued heightened volatility cannot be ruled out. Regardless, we maintain our focus on stock-specific analysis and a long-term perspective, which have always been the foundation of our investment process. Furthermore, we believe the portfolio is favorably positioned given the relatively benign economic environment in the U.S.
Sincerely,
Judith M. Vale and Robert D'Alelio
Portfolio Co-Managers
Information about principal risks of investing in the Fund is set forth in the prospectus and statement of additional information.
The portfolio composition, industries and holdings of the Fund are subject to change without notice.
The opinions expressed are those of the Fund's portfolio managers. The opinions are as of the date of this report and are subject to change without notice.
TICKER SYMBOLS
Investor Class | | NBGNX | |
Trust Class | | NBGEX | |
Advisor Class | | NBGAX | |
Institutional Class | | NBGIX | |
Class R6 | | NRGSX | |
SECTOR ALLOCATION
(as a % of Total Investments) | |
Consumer Discretionary | | | 13.0 | % | |
Consumer Staples | | | 6.1 | | |
Energy | | | 2.8 | | |
Financials | | | 11.0 | | |
Health Care | | | 15.6 | | |
Industrials | | | 20.6 | | |
Information Technology | | | 19.4 | | |
Materials | | | 9.6 | | |
Short-Term Investments | | | 1.9 | | |
Total | | | 100.0 | % | |
PERFORMANCE HIGHLIGHTS
| | | | | Average Annual Total
Return Ended 08/31/2015 | |
| | | Inception
Date | | 1 Year | | 5 Years | | 10 Years | | Life of
Fund | |
Investor Class | | 09/27/1988 | | | 1.52 | % | | | 14.53 | % | | | 7.98 | % | | | 12.20 | % | |
| Trust Class3 | | 08/26/1993 | | | 1.41 | % | | | 14.43 | % | | | 7.91 | % | | | 12.18 | % | |
| Advisor Class4 | | 04/02/1997 | | | 1.11 | % | | | 14.11 | % | | | 7.62 | % | | | 11.97 | % | |
| Institutional Class5 | | 07/01/1999 | | | 1.68 | % | | | 14.72 | % | | | 8.19 | % | | | 12.35 | % | |
| Class R624 | | 03/15/2013 | | | 1.75 | % | | | 14.66 | % | | | 8.04 | % | | | 12.22 | % | |
Index | |
| Russell 2000® Index1,16 | | | | | 0.03 | % | | | 15.55 | % | | | 7.12 | % | | | 9.54 | % | |
The performance data quoted represent past performance and do not indicate future results. Current performance may be lower or higher than the performance data quoted. For performance data current to the most recent month-end, please visit www.nb.com/performance.
The results shown in the table reflect the reinvestment of income dividends and other distributions, if any. The results do not reflect the effect of taxes a shareholder would pay on Fund distributions or on the redemption of Fund shares.
The investment return and principal value of an investment will fluctuate and shares, when redeemed, may be worth more or less than their original cost.
Returns would have been lower if Neuberger Berman Management LLC (Management) had not reimbursed certain expenses and/or waived a portion of the investment management fees during certain of the periods shown. Repayment by a class (of expenses previously reimbursed and/or fees previously waived by Management) will decrease the class's returns. Please see Note B in the Notes to Financial Statements for specific information regarding expense reimbursement and/or fee waiver arrangements.
As stated in the Fund's most recent prospectus, the total annual operating expense ratios for fiscal year 2014 were 1.01%, 1.10%, 1.37%, 0.85% and 0.78% for Investor Class, Trust Class, Advisor Class, Institutional Class and Class R6 shares, respectively (before expense reimbursements and/or fee waivers, if any). The total annual operating expense ratio for each of Institutional Class and Class R6 includes the class's repayment of expenses previously reimbursed and/or fees previously waived by Management. The expense ratios for the annual period ended August 31, 2015 can be found in the Financial Highlights section of this report.
COMPARISON OF A $10,000 INVESTMENT
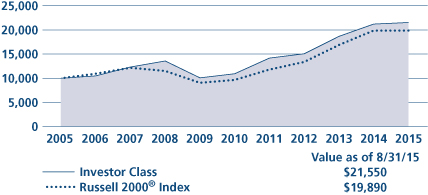
This graph shows the change in value of a hypothetical $10,000 investment in the Fund over the past 10 fiscal years, or since the Fund's inception if it has not operated for 10 years. The graph is based on the Investor Class shares only; the performance of the Fund's share classes will differ primarily due to different class expenses (see Performance Highlights chart on previous page). The result is compared with benchmarks, which include a broad-based market index and may include a more narrowly based index. Market indices have not been reduced to reflect any of the fees and costs of investing. The results shown in the graph reflect the reinvestment of income dividends and other distributions, if any. The results do not reflect the effect of taxes a shareholder would pay on Fund distributions or on the redemption of Fund shares. Results represent past performance and do not indicate future results.
Global Equity Fund Commentary (Unaudited)
Neuberger Berman Global Equity Fund Institutional Class generated a –3.16% total return for the fiscal year ended August 31, 2015, outperforming the –5.79% return of its benchmark, the MSCI All Country World Index, for the same period. (Performance for all share classes is provided in the table immediately following this letter.)
The U.S. stock market (as represented by the S&P 500® Index), while volatile, closed this period relatively flat, outperforming developed international and emerging markets equities (represented by the MSCI EAFE® and MSCI Emerging Markets indices, respectively). Outside of multinationals, hurt by dollar strength, and energy-related companies, hurt by falling oil prices, U.S. companies saw positive earnings within a generally positive environment. However, this was overshadowed by concerns that troubled international markets. Globally, markets struggled with central bank policy uncertainty, commodity prices, economic weakness, geopolitical issues, and risk aversion—especially toward the end of this period, as focus shifted from Greece's debt crisis to China's slowdown, correction and currency revaluation.
By sector, within the index, Energy and Materials reported large losses, as oil and commodities prices declined. Health Care performed best, followed by Consumer Discretionary and Consumer Staples stocks—the only sectors reporting positive results. By country, Greece, Colombia and Brazil were weakest, while Israel, Ireland and Denmark led the index.
The Fund's outperformance versus the benchmark was due to a combination of strong stock selection and advantageous sector positioning, particularly within Financials, Materials and Industrials. By country, UK and U.S. holdings outperformed. An overweight to Israel was another benefit.
Top contributors included U.S. stocks Pall Corp. (sold before period end), Sealed Air and Amazon.com. Pall, a filtration and purification specialist, accepted a takeover approach by Danaher. Sealed Air, a global leader in food safety and security, saw strong results despite the strong dollar. Amazon.com outperformed on positive news including growth in Prime subscriptions and growing profitability at Amazon Web Services.
By sector, the portfolio underperformed versus the benchmark within Health Care, Consumer Discretionary and Information Technology. By country, Switzerland, China and an underweight to Japan limited relative performance.
Detractors included SanDisk, ShawCor and Haier Electronics. U.S.-based SanDisk, the leading supplier of NAND flash technologies, struggled to set short-term earnings expectations as it transitions from a commodity supplier to a higher-margin tech solutions provider. ShawCor, the Canada-based pipeline services firm, fell on fears that lower oil prices would continue to hurt pipeline development, and was sold. Haier, the Chinese white-goods distributor, disappointed investors with lighter-than-expected earnings and committed to additional investments that hurt near-term margins.
As we look ahead, we do not believe the downward revaluation of the Chinese currency has addressed the underlying challenges China is perceived to face: excessive debt, high manufacturing costs relative to its emerging markets competitors, and muted private-sector spending. While China and emerging markets have outpaced the developed world in recent years, we believe this outperformance has come to an end and remain focused on companies with underlying exposure to Europe and North America. In Europe, earnings are improving and economies appear to have troughed. We are seeing opportunities to add to Japanese exporters—which has long been our preferred segment of this market—as we believe the yen will likely continue its slide. We remain slightly underweight U.S. stocks, with holdings concentrated among domestically oriented companies with scale in their operating niches.
We continue to believe that the cash-generative businesses with the stable demand profiles we favor offer the most value in the current environment, with a lower downside risk profile in the event of sharp market declines.
Sincerely,
Benjamin Segal and Saurin D. Shah
Portfolio Managers
Information about principal risks of investing in the Fund is set forth in the prospectus and statement of additional information.
The portfolio composition, industries and holdings of the Fund are subject to change without notice.
The opinions expressed are those of the Fund's portfolio managers. The opinions are as of the date of this report and are subject to change without notice.
Global Equity Fund (Unaudited)
TICKER SYMBOLS
Institutional Class | | NGQIX | |
Class A | | NGQAX | |
Class C | | NGQCX | |
PERFORMANCE HIGHLIGHTS9
| | |
| | Average Annual Total
Return Ended 08/31/2015 | |
| | | Inception
Date | | 1 Year | | Life of
Fund | |
At NAV | |
Institutional Class | | 06/30/2011 | | | –3.16 | % | | | 4.68 | % | |
Class A | | 06/30/2011 | | | –3.47 | % | | | 4.30 | % | |
Class C | | 06/30/2011 | | | –4.21 | % | | | 3.54 | % | |
With Sales Charge | |
Class A | | | | | | | –9.02 | % | | | 2.83 | % | |
Class C | | | | | | | –4.76 | % | | | 3.54 | % | |
Index | |
| MSCI All Country World Index1,16 | | | | | | | –5.79 | % | | | 6.75 | % | |
The performance data quoted represent past performance and do not indicate future results. Current performance may be lower or higher than the performance data quoted. For performance data current to the most recent month-end, please visit www.nb.com/performance.
The results shown in the table reflect the reinvestment of income dividends and other distributions, if any. The results do not reflect the effect of taxes a shareholder would pay on Fund distributions or on the redemption of Fund shares.
The investment return and principal value of an investment will fluctuate and shares, when redeemed, may be worth more or less than their original cost.
Returns would have been lower if Neuberger Berman Management LLC (Management) had not reimbursed certain expenses and/or waived a portion of the investment management fees during certain of the periods shown. Repayment by a class (of expenses previously reimbursed and/or fees previously waived by Management) will decrease the class's returns. Please see Note B in the Notes to Financial Statements for specific information regarding expense reimbursement and/or fee waiver arrangements.
As stated in the Fund's most recent prospectus, the total annual operating expense ratios for fiscal year 2014 were 6.65%, 7.01% and 7.76% for Institutional Class, Class A and Class C shares, respectively (before expense reimbursements and/or fee waivers, if any). The expense ratios were 1.15%, 1.51% and 2.26% for Institutional Class, Class A and Class C shares, respectively, after expense reimbursements and/or fee waivers. The expense ratios for the annual period ended August 31, 2015 can be found in the Financial Highlights section of this report.
Returns shown with a sales charge reflect the deduction of the current maximum initial sales charge of 5.75% for Class A shares and the contingent deferred sales charge (CDSC) for Class C shares. The CDSC for Class C shares is 1%, which is reduced to 0% after 1 year. The performance of the Fund's share classes will differ primarily due to different sales charge structures and class expenses. Please see the prospectus for more information about sales charge structures, if any, and class expenses for your share class.
Global Equity Fund (Unaudited)
COMPARISON OF A $1,000,000 INVESTMENT
(000's Omitted)
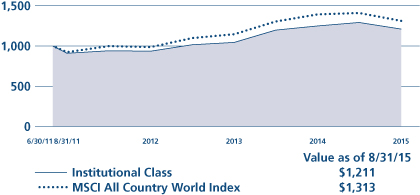
This graph shows the change in value of a hypothetical $1,000,000 investment in the Fund over the past 10 fiscal years, or since the Fund's inception if it has not operated for 10 years. The graph is based on the Institutional Class shares only; the performance of the Fund's share classes will differ primarily due to different sales charge structures and class expenses (see Performance Highlights chart on previous page). The result is compared with benchmarks, which include a broad-based market index and may include a more narrowly based index. Market indices have not been reduced to reflect any of the fees and costs of investing. The results shown in the graph reflect the reinvestment of income dividends and other distributions, if any. The results do not reflect the effect of taxes a shareholder would pay on Fund distributions or on the redemption of Fund shares. Results represent past performance and do not indicate future results.
Global Real Estate Fund Commentary (Unaudited)
Neuberger Berman Global Real Estate Fund Institutional Class generated a –5.92% total return for the period from its inception on December 30, 2014 through August 31, 2015, outperforming its benchmark, the FTSE EPRA/NAREIT Developed Index, which generated a –6.41% total return for the same period. (Performance for all share classes is provided in the table immediately following this letter.)
The global stock market was volatile and generated a negative return during the period since the Fund's launch. The market was supported at times by signs of improving economic growth in the U.S. and the eurozone and solid demand. However, the market was periodically challenged—especially late in the period—by heightened investor risk aversion, some of which was triggered by geopolitical issues and signs of moderating growth in China. Global real estate investment trusts (REITs) posted weak results during the reporting period, partially due to concerns over rising interest rates.
While it produced a negative absolute return, as noted the Fund's Institutional Class outperformed the benchmark during the reporting period. From a regional perspective, an overweight to Europe relative to the benchmark was the most beneficial for results, whereas an overweight to Japan was a small negative for relative performance. Country allocation, overall, was also positive for performance, largely driven by an overweight to the UK. In contrast, our lack of exposure to Switzerland and Spain was a drag on results. Stock selection was beneficial to the Fund's performance as well. In particular, our holdings in the Industrial & Office, Real Estate Holding & Development and Retail sectors were the most additive to results. These positives were partially offset by stock selection in the Hotel & Lodging and Specialty sectors. Finally, sector allocation, overall, was additive for performance. The Fund's cash position, along with an overweight to Real Estate Holding & Development, were the largest contributors to results. Conversely, underweights to the Retail and Residential sectors were the largest negatives for performance.
Looking ahead, economic activity in the U.S. has continued to expand at a moderate pace and in our view the Federal Reserve (Fed) is likely to continue moving toward policy normalization. We believe these two factors, an improving economy and a less accommodative Fed, should they occur, will be important drivers for real estate values over the next 12-24 months. While higher interest rates could be a headwind for REITs in the near term, we believe the benefits of a sustainable improvement in the economy and job market on real estate demand trends could outweigh this concern in the longer term. In the European real estate markets, we believe the key theme will continue to be interest rate movements. In particular, we will closely monitor how the listed real estate markets react to what we anticipate will be a rising rate environment in the UK and continued monetary easing on the Continent. Elsewhere, it is projected that Asia-Pacific countries such as Australia and China will continue to aggressively loosen monetary policies and Japan will remain committed to recreate an inflationary mindset. While such lowering of interest rates continue to lend support to real estate markets, we believe the anticipated normalization of U.S. interest rates may undermine this support during the second half of 2015 and cause the compressed cap rates to expand, particularly in Hong Kong and Singapore.
Sincerely,
Steve S. Shigekawa, Brian Jones, Gillian Tiltman and Anton Kwang
Portfolio Managers
Information about principal risks of investing in the Fund is set forth in the prospectus and statement of additional information.
The portfolio composition, industries and holdings of the Fund are subject to change without notice.
The opinions expressed are those of the Fund's portfolio managers. The opinions are as of the date of this report and are subject to change without notice.
Global Real Estate Fund (Unaudited)
TICKER SYMBOLS
Institutional Class | | NGRIX | |
Class A | | NGRAX | |
Class C | | NGRCX | |
PERFORMANCE HIGHLIGHTS9
| | |
Inception Date | | Cumulative Total Return
Ended 08/31/2015
Life of Fund | |
At NAV | |
Institutional Class | | 12/30/2014 | | | –5.92 | % | |
Class A | | 12/30/2014 | | | –6.19 | % | |
Class C | | 12/30/2014 | | | –6.64 | % | |
With Sales Charge | |
Class A | | | | | | | –11.58 | % | |
Class C | | | | | | | –7.57 | % | |
Index | |
| FTSE EPRA/NAREIT Developed Index1,16 | | | | | | | –6.41 | % | |
The performance data quoted represent past performance and do not indicate future results. Current performance may be lower or higher than the performance data quoted. For performance data current to the most recent month-end, please visit www.nb.com/performance.
The results shown in the table reflect the reinvestment of income dividends and other distributions, if any. The results do not reflect the effect of taxes a shareholder would pay on Fund distributions or on the redemption of Fund shares.
The investment return and principal value of an investment will fluctuate and shares, when redeemed, may be worth more or less than their original cost.
Returns would have been lower if Neuberger Berman Management LLC (Management) had not reimbursed certain expenses and/or waived a portion of the investment management fees during the period shown. Repayment by a class (of expenses previously reimbursed and/or fees previously waived by Management) will decrease the class's returns. Please see Note B in the Notes to Financial Statements for specific information regarding expense reimbursement and/or fee waiver arrangements.
As stated in the Fund's most recent prospectus, the estimated total annual operating expense ratios for fiscal year 2015 are 1.45%, 1.81% and 2.56% for Institutional Class, Class A and Class C shares, respectively (before expense reimbursements and/or fee waivers, if any). The expense ratios were 1.00%, 1.36% and 2.11% for Institutional Class, Class A and Class C shares, respectively, after expense reimbursements and/or fee waivers. The expense ratios for the period from December 30, 2014 through August 31, 2015 can be found in the Financial Highlights section of this report.
Returns shown with a sales charge reflect the deduction of the current maximum initial sales charge of 5.75% for Class A shares and the contingent deferred sales charge (CDSC) for Class C shares. The CDSC for Class C shares is 1%, which is reduced to 0% after 1 year. The performance of the Fund's share classes will differ primarily due to different sales charge structures and class expenses. Please see the prospectus for more information about sales charge structures, if any, and class expenses for your share class.
Global Real Estate Fund (Unaudited)
COMPARISON OF A $1,000,000 INVESTMENT
(000's Omitted)
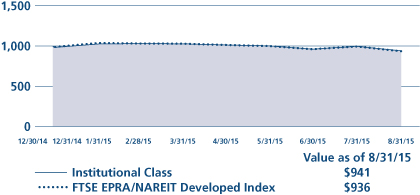
This graph shows the change in value of a hypothetical $1,000,000 investment in the Fund over the past 10 fiscal years, or since the Fund's inception if it has not operated for 10 years. The graph is based on the Institutional Class shares only; the performance of the Fund's share classes will differ primarily due to different sales charge structures and class expenses (see Performance Highlights chart on previous page). The result is compared with benchmarks, which include a broad-based market index and may include a more narrowly based index. Market indices have not been reduced to reflect any of the fees and costs of investing. The results shown in the graph reflect the reinvestment of income dividends and other distributions, if any. The results do not reflect the effect of taxes a shareholder would pay on Fund distributions or on the redemption of Fund shares. Results represent past performance and do not indicate future results.
Greater China Equity Fund Commentary (Unaudited)
Neuberger Berman Greater China Equity Fund Institutional Class generated a 2.15% total return for the fiscal year ended August 31, 2015, outperforming its benchmark, the MSCI China Index, which provided a –9.15% total return over the same period. (Performance for all share classes is provided in the table immediately following this letter.)
The China equity markets experienced high volatility over the past 12 months. Following a weak month in September 2014, affected by the protests in Hong Kong, China equity markets entered into a seven-month rally. Going into the fourth quarter of last year, markets outperformed primarily due to stabilizing earnings and positive investor sentiment tied to expectations of further policy easing. The Shanghai-Hong Kong Stock Connect program launched in November, coupled with the People's Bank of China (PBoC) unexpectedly cutting interest rates for the first time in close to three years, supported both the onshore China A-shares market and the offshore Hong Kong market. In January, positive momentum continued as expectations of the easing of monetary policy and home purchase restrictions continued to boost investor sentiment. At the beginning of February, the PBoC lowered the reserve requirement ratio by 50 basis points, and investors looked to the government's announcement of supportive policies at the National People's Congress (NPC) and Chinese People's Political Consultative Conference in March.
Despite the Chinese government setting its lowest GDP growth target in 15 years at the NPC, the China equity markets expanded trading volume on the back of a further 25-basis-point benchmark interest rate cut, Premier Li's positive comments on monetary policy easing, the PBoC's extension of its RMB 500 billion mid-term lending facility, and the announcement of "One Belt, One Road" and "Made in China 2025" plans. Going into April, markets maintained strong momentum as the PBoC unexpectedly cut the reserve requirement ratio by 1% and state-owned enterprise and resource tax reform developments led to a broad based rally and significant expansion in turnover. In May, the offshore Hong Kong market experienced a correction due to liquidity concerns resulting from initial public offerings, although the domestic market was supported by another 25-basis-point interest rate cut, the State Council's unveiling of the "China Manufacturing 2025" plan and the announcement of the China-Hong Kong Mutual Recognition of Funds program. Markets corrected sharply in June, primarily due to tightening of margin financing and Greece's debt situation. Heavy deleveraging, voluntary suspension of trading for a large number of domestic listed companies, and uncertainty regarding the U.S. Federal Reserve's potential interest rate hike contributed to negative investor sentiment, which led the China equity markets to further decline in July. The devaluation of the renminbi resulted in significant volatility across global asset classes in August. Toward the end of the month, a further market correction and capital outflow pressure prompted the PBoC to cut the reserve requirement ratio by 50 basis points and benchmark interest rates by 25 basis points, which stabilized the markets and pared losses at month-end.
For the 12-month period, the Fund's overweight versus the benchmark in Utilities and underweight in Energy contributed to performance. In contrast, the Fund's overweight position in Consumer Discretionary detracted from relative returns. Stock selection had a positive impact in Financials and Utilities and a negative impact in Information Technology and Telecommunication Services relative to the benchmark.
The Fund continues to focus on companies that appear to have sustainable top- and bottom-line growth by looking at the companies' operating cash flow from their recurring core businesses. As of August 31, 2015, the Fund's largest sector overweight relative to the benchmark was Consumer Discretionary, and the largest sector underweight was Financials. The Fund also held overweight positions in Utilities and Health Care, and underweight positions in Telecommunication Services and Energy. The Fund's top 10 positions comprised almost 48% of total portfolio assets at the end of August.
Looking ahead, we anticipate that the markets could remain volatile over the short to medium-term as China continues to press ahead with its economic rebalancing, resulting in potential growth headwinds. At the same time, equity valuations have come off the high levels observed earlier in the year, potentially indicating that some of these growth concerns have been discounted in markets. Longer-term, we think the growth outlook should stabilize towards a more sustainable, quality trajectory if various economic reforms come to fruition.
Sincerely,
Lihui Tang and Frank Yao
Portfolio Managers
Information about principal risks of investing in the Fund is set forth in the prospectus and statement of additional information.
The portfolio composition, industries and holdings of the Fund are subject to change without notice.
The opinions expressed are those of the Fund's portfolio managers. The opinions are as of the date of this report and are subject to change without notice.
Greater China Equity Fund (Unaudited)
TICKER SYMBOLS
Institutional Class | | NCEIX | |
Class A | | NCEAX | |
Class C | | NCECX | |
SECTOR ALLOCATION
(as a % of Total Investments) | |
Consumer Discretionary | | | 14.0 | % | |
Consumer Staples | | | 5.4 | | |
Energy | | | 1.2 | | |
Financials | | | 20.0 | | |
Health Care | | | 9.6 | | |
Industrials | | | 10.3 | | |
Information Technology | | | 18.1 | | |
Telecommunication Services | | | 3.8 | | |
Utilities | | | 13.6 | | |
Short-Term Investments | | | 4.0 | | |
Total | | | 100.0 | % | |
EXCHANGE ALLOCATION
(as a % of Long Term Investments) | |
Mainland China | | | 19.5 | % | |
Hong Kong | | | 65.1 | | |
United States | | | 15.4 | | |
Total | | | 100.0 | % | |
PERFORMANCE HIGHLIGHTS
| | |
| | Average Annual Total
Return Ended 08/31/2015 | |
| | | Inception
Date | | 1 Year | | Life of
Fund | |
At NAV | |
Institutional Class | | 07/17/2013 | | | 2.15 | % | | | 11.46 | % | |
Class A | | 07/17/2013 | | | 1.68 | % | | | 11.10 | % | |
Class C | | 07/17/2013 | | | 0.93 | % | | | 10.24 | % | |
With Sales Charge | |
Class A | | | | | | | –4.16 | % | | | 8.05 | % | |
Class C | | | | | | | –0.02 | % | | | 10.24 | % | |
Index | |
| MSCI China Index1,16 | | | | | | | –9.15 | % | | | 5.59 | % | |
The performance data quoted represent past performance and do not indicate future results. Current performance may be lower or higher than the performance data quoted. For performance data current to the most recent month-end, please visit www.nb.com/performance.
The results shown in the table reflect the reinvestment of income dividends and other distributions, if any. The results do not reflect the effect of taxes a shareholder would pay on Fund distributions or on the redemption of Fund shares.
The investment return and principal value of an investment will fluctuate and shares, when redeemed, may be worth more or less than their original cost.
Returns would have been lower if Neuberger Berman Management LLC (Management) had not reimbursed certain expenses and/or waived a portion of the investment management fees during certain of the periods shown. Repayment by a class (of expenses previously reimbursed and/or fees previously waived by Management) will decrease the class's returns. Please see Note B in the Notes to Financial Statements for specific information regarding expense reimbursement and/or fee waiver arrangements.
As stated in the Fund's most recent prospectus, the estimated total annual operating expense ratios for fiscal year 2014 were 1.83%, 2.31% and 2.86% for Institutional Class, Class A and Class C shares, respectively (before expense reimbursements and/or fee waivers, if any). The estimated expense ratios were 1.50%, 1.86% and 2.61% for Institutional Class, Class A and Class C shares, respectively, after expense reimbursements and/or fee waivers. The expense ratios for the annual period ended August 31, 2015 can be found in the Financial Highlights section of this report.
Returns shown with a sales charge reflect the deduction of the current maximum initial sales charge of 5.75% for Class A shares and the contingent deferred sales charge (CDSC) for Class C shares. The CDSC for Class C shares is 1%, which is reduced to 0% after 1 year. The performance of the Fund's share classes will differ primarily due to different sales charge structures and class expenses. Please see the prospectus for more information about sales charge structures, if any, and class expenses for your share class.
Greater China Equity Fund (Unaudited)
COMPARISON OF A $1,000,000 INVESTMENT
(000's Omitted)
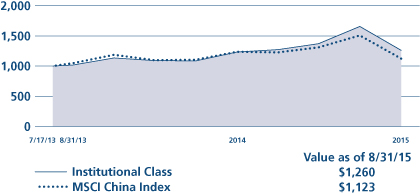
This graph shows the change in value of a hypothetical $1,000,000 investment in the Fund over the past 10 fiscal years, or since the Fund's inception if it has not operated for 10 years. The graph is based on the Institutional Class shares only; the performance of the Fund's share classes will differ primarily due to different sales charge structures and class expenses (see Performance Highlights chart on previous page). The result is compared with benchmarks, which include a broad-based market index and may include a more narrowly based index. Market indices have not been reduced to reflect any of the fees and costs of investing. The results shown in the graph reflect the reinvestment of income dividends and other distributions, if any. The results do not reflect the effect of taxes a shareholder would pay on Fund distributions or on the redemption of Fund shares. Results represent past performance and do not indicate future results.
Guardian Fund Commentary (Unaudited)
Neuberger Berman Guardian Fund Investor Class generated a –3.03% total return for the fiscal year ended August 31, 2015, trailing the 0.48% return of its benchmark, the S&P 500® Index. (Performance for all share classes is provided in the table immediately following this letter.)
Flat equity returns belie extreme volatility in the currency and commodity markets over this period. For instance, the U.S. dollar appreciated over 15% versus the currencies of major trading partners and over 20% versus those of many commodity-producing nations, with supply in chronic excess for many basic goods. Oil prices declined over 50% this period. While these forces were a headwind for U.S. multinationals and commodity producers, earnings growth for U.S. equities absent these pressures has been good, helped by a recovering domestic economy. Solid earnings supported equity markets for much of this period, with volatility increasing sharply in August as headline fears of a China slowdown had global reverberations. While Chinese economic growth remains positive, feedback from U.S. companies operating in China suggests it has been decelerating for some time.
For the Fund, top contributors included eBay and long-term holdings Progressive and Newell Rubbermaid. eBay outperformed after the company split its online retail business from PayPal, its payments unit. Shares of both benefited from investors' clearer view of business fundamentals. Low-cost insurer Progressive continued to innovate and increase its market share, and Newell Rubbermaid appears to have engineered a successful turnaround.
Detractors included Keurig Green Mountain, underperforming on challenges in transitioning to its next generation brewing technology; NOW Inc., among the Industrials names to suffer in sympathy with oil; and American Express, whose stock declined as investors digested the near-term impact of the loss of its Costco business. We continue to own each of these names.
We were opportunistic buyers and sellers this fiscal year, adding NetScout, a communications technology company. We received shares as a spinout from long-term holding Danaher, which merged its communication businesses with NetScout. We believe the core business is well positioned to capitalize on the growing need for bandwidth, with greater potential upside from network analytics, optimization and security tools. We also bought Adobe, which we believe should benefit from the convergence of digital media, marketing and payments facilitated by consumers' growing on-line presence. We sold holdings including FMC, Praxair, Costco and Sanofi, primarily on valuation concerns.
Looking ahead, while extreme financial market volatility can precipitate real world pressures, especially for an over-leveraged global economy, absent some external shock we do not foresee a return to global recession. We believe China's economy, while slower, is still growing, and that even if the Fed acts this fall, U.S. rates are likely to remain low and supportive of growth for some time.
Beyond the headlines, the U.S. economy appears to be moving forward. Auto sales have been setting post-crisis records, non-residential construction has been growing, and the labor market continued to tighten. While deflationary pressures weigh on commodity-producing nations, lower costs benefit purchasing power for consumers here and abroad. Clearly global risks remain, but we believe U.S. fundamentals appear firm and supportive for equities.
We remain pleased with our portfolio companies, believing they are positioned to outperform peers—with strong cash flow and balance sheets ready to weather a storm should one arise.
We look forward to continuing to serve your investment needs.
Sincerely,
Arthur Moretti*
Portfolio Manager
* As previously disclosed in the supplement to prospectus, Arthur Moretti recently announced he intends to retire in February 2016 after a 28-year career and 14 years at Neuberger Berman. Charles Kantor became Portfolio Manager of Neuberger Berman Guardian Fund effective October 15, 2015.
Information about principal risks of investing in the Fund is set forth in the prospectus and statement of additional information.
The portfolio composition, industries and holdings of the Fund are subject to change without notice.
The opinions expressed are those of the Fund's portfolio manager. The opinions are as of the date of this report and are subject to change without notice.
Guardian Fund (Unaudited)
TICKER SYMBOLS
Investor Class | | NGUAX | |
Trust Class | | NBGTX | |
Advisor Class | | NBGUX | |
Institutional Class | | NGDLX | |
Class A | | NGDAX | |
Class C | | NGDCX | |
Class R3 | | NGDRX | |
SECTOR ALLOCATION
(as a % of Total Investments) | |
Consumer Discretionary | | | 13.8 | % | |
Consumer Staples | | | 5.5 | | |
Energy | | | 6.0 | | |
Financials | | | 22.5 | | |
Health Care | | | 9.2 | | |
Industrials | | | 15.0 | | |
Information Technology | | | 21.6 | | |
Telecommunication Services | | | 1.4 | | |
Utilities | | | 4.0 | | |
Short-Term Investments | | | 1.0 | | |
Total | | | 100.0 | % | |
PERFORMANCE HIGHLIGHTS7,12
| | | | | Average Annual Total
Return Ended 08/31/2015 | |
| | | Inception
Date | | 1 Year | | 5 Years | | 10 Years | | Life of
Fund | |
At NAV | |
Investor Class | | 06/01/1950 | | | –3.03 | % | | | 14.06 | % | | | 6.46 | % | | | 11.01 | % | |
| Trust Class3 | | 08/03/1993 | | | –3.22 | % | | | 13.85 | % | | | 6.28 | % | | | 10.96 | % | |
| Advisor Class4 | | 09/03/1996 | | | –3.66 | % | | | 13.40 | % | | | 5.84 | % | | | 10.82 | % | |
| Institutional Class5 | | 05/27/2009 | | | –2.84 | % | | | 14.25 | % | | | 6.58 | % | | | 11.03 | % | |
| Class A20 | | 05/27/2009 | | | –3.23 | % | | | 13.84 | % | | | 6.34 | % | | | 10.99 | % | |
| Class C20 | | 05/27/2009 | | | –4.01 | % | | | 12.96 | % | | | 5.83 | % | | | 10.91 | % | |
| Class R317 | | 05/27/2009 | | | –3.53 | % | | | 13.54 | % | | | 6.17 | % | | | 10.96 | % | |
With Sales Charge | |
| Class A20 | | | | | | | –8.79 | % | | | 12.50 | % | | | 5.71 | % | | | 10.89 | % | |
| Class C20 | | | | | | | –4.82 | % | | | 12.96 | % | | | 5.83 | % | | | 10.91 | % | |
Index | |
| S&P 500® Index1,16 | | | | | | | 0.48 | % | | | 15.87 | % | | | 7.15 | % | | | 11.04 | % | |
The performance data quoted represent past performance and do not indicate future results. Current performance may be lower or higher than the performance data quoted. For performance data current to the most recent month-end, please visit www.nb.com/performance.
The results shown in the table reflect the reinvestment of income dividends and other distributions, if any. The results do not reflect the effect of taxes a shareholder would pay on Fund distributions or on the redemption of Fund shares.
The investment return and principal value of an investment will fluctuate and shares, when redeemed, may be worth more or less than their original cost.
Returns would have been lower if Neuberger Berman Management LLC (Management) had not reimbursed certain expenses and/or waived a portion of the investment management fees during certain of the periods shown. Repayment by a class (of expenses previously reimbursed and/or fees previously waived by Management) will decrease the class's returns. Please see Note B in the Notes to Financial Statements for specific information regarding expense reimbursement and/or fee waiver arrangements.
As stated in the Fund's most recent prospectus, the total annual operating expense ratios for fiscal year 2014 were 0.88%, 1.06%, 1.28%, 0.71%, 1.09%, 1.86% and 1.38% for Investor Class, Trust Class, Advisor Class, Institutional Class, Class A, Class C and Class R3 shares, respectively (before expense reimbursements and/or fee waivers, if any). The expense ratio was 1.36% for Class R3 shares after expense reimbursements and/or fee waivers. The total annual operating expense ratio for each of Class A and Class C includes the class's repayment of expenses previously reimbursed and/or fees previously waived by Management. The expense ratios for the annual period ended August 31, 2015 can be found in the Financial Highlights section of this report.
Returns shown with a sales charge reflect the deduction of the current maximum initial sales charge of 5.75% for Class A shares and the contingent deferred sales charge (CDSC) for Class C shares. The CDSC for Class C shares is 1%, which is reduced to 0% after 1 year. The performance of the Fund's share classes will differ primarily due to different sales charge structures and class expenses. Please see the prospectus for more information about sales charge structures, if any, and class expenses for your share class.
Guardian Fund (Unaudited)
COMPARISON OF A $10,000 INVESTMENT
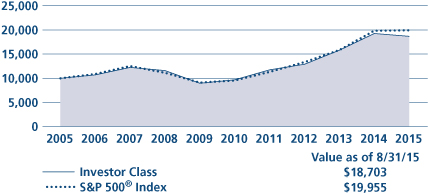
This graph shows the change in value of a hypothetical $10,000 investment in the Fund over the past 10 fiscal years, or since the Fund's inception if it has not operated for 10 years. The graph is based on the Investor Class shares only; the performance of the Fund's share classes will differ primarily due to different sales charge structures and class expenses (see Performance Highlights chart on previous page). The result is compared with benchmarks, which include a broad-based market index and may include a more narrowly based index. Market indices have not been reduced to reflect any of the fees and costs of investing. The results shown in the graph reflect the reinvestment of income dividends and other distributions, if any. The results do not reflect the effect of taxes a shareholder would pay on Fund distributions or on the redemption of Fund shares. Results represent past performance and do not indicate future results.
International Equity Fund Commentary (Unaudited)
Neuberger Berman International Equity Fund Institutional Class generated a –3.51% total return for the fiscal year ended August 31, 2015, outperforming its benchmark, the MSCI EAFE® Index, which posted a –7.08% return for the same period. (Performance for all share classes is provided in the table immediately following this letter.)
International equity markets ended this period with a loss as news of China's economic slowdown, market correction and currency devaluation impacted equity markets globally. China-related worries built on stresses that had been weighing on investor sentiment and contributing to volatility all year—including slow growth globally, falling commodities prices, a resurgence of the Greek debt crisis, and the strength of the U.S. dollar.
By sector, Health Care, Telecommunication Services and Consumer Discretionary outperformed, while Energy, Materials and Utilities lagged. By country, Israel, Ireland and Denmark—driven by locally listed large-cap multinationals—outperformed, while oil and commodities-driven Norway and Australia, along with Portugal, lagged.
The Fund's outperformance relative to the benchmark was due primarily to stock selection, notably within Financials, Consumer Staples and Materials. Sector allocations were also beneficial. By country, UK, Australian and French holdings were advantageous,
Top contributors included Euronext, PIGEON Corp. and Alimentation Couche-Tard. Euronext, the European financial exchange operator, delivered solid earnings, and set expectations for greater cost efficiencies and free cash flows plus a potential dividend. Japan's Pigeon, a maternity and elder-care products firm, announced strong earnings and improved governance measures. Alimentation Couche-Tard, a Canadian-headquartered gas retailer, announced an acquisition that was positively received as investors believe the target company's stores have the potential for substantial margin improvement.
The portfolio lagged the index within the Consumer Discretionary, Health Care and Telecommunication Services sectors. By country, allocations to Canada and Brazil were a drag on performance, as was an underweight to Japan.
Detractors included Canada-based ShawCor and Corus Entertainment, and Brazil's SLC Agricola. Pipeline services firm ShawCor fell on fears that lower oil prices would continue to hurt pipeline development, and was sold. Corus, a media and entertainment group, declined following a regulatory decision allowing consumers to buy small basic cable packages for a low, capped fee, with the option of adding services a la carte. Agricultural name SLC Agricola sold off on lower corn and soybean prices along with the weakening real.
As we look ahead, we do not believe the recent downward revaluation of the Chinese currency has addressed the underlying challenges that we believe China faces: excessive debt, high costs relative to its emerging markets manufacturing competitors, and muted private-sector spending. While China and emerging markets have outpaced the developed world in recent years, we believe this outperformance has come to an end, and we remain focused on companies with underlying exposure to Europe and North America. In Europe, earnings are improving and economies appear to have troughed. We are seeing opportunities to add to Japanese exporters—which has long been our preferred segment of this market—as we believe the yen will likely continue its slide.
We continue to believe that the cash-generative businesses with the stable demand profiles we favor offer the most value in the current environment, with a lower downside risk profile in the event of sharp market declines.
Sincerely,
Benjamin Segal
Portfolio Manager
Information about principal risks of investing in the Fund is set forth in the prospectus and statement of additional information.
The portfolio composition, industries and holdings of the Fund are subject to change without notice.
The opinions expressed are those of the Fund's portfolio manager. The opinions are as of the date of this report and are subject to change without notice.
International Equity Fund (Unaudited)
TICKER SYMBOLS
Investor Class | | NIQVX | |
Trust Class | | NIQTX | |
Institutional Class | | NBIIX | |
Class A | | NIQAX | |
Class C | | NIQCX | |
Class R6 | | NRIQX | |
PERFORMANCE HIGHLIGHTS7
| | | | | Average Annual Total
Return Ended 08/31/2015 | |
| | | Inception
Date | | 1 Year | | 5 Years | | 10 Years | | Life of
Fund | |
At NAV | |
| Investor Class13 | | 01/28/2013 | | | –3.71 | % | | | 7.41 | % | | | 3.63 | % | | | 4.48 | % | |
| Trust Class13 | | 01/28/2013 | | | –3.82 | % | | | 7.36 | % | | | 3.60 | % | | | 4.45 | % | |
Institutional Class | | 06/17/2005 | | | –3.51 | % | | | 7.54 | % | | | 3.69 | % | | | 4.54 | % | |
| Class A13 | | 01/28/2013 | | | –3.90 | % | | | 7.32 | % | | | 3.59 | % | | | 4.43 | % | |
| Class C13 | | 01/28/2013 | | | –4.61 | % | | | 6.89 | % | | | 3.38 | % | | | 4.23 | % | |
| Class R623 | | 09/03/2013 | | | –3.49 | % | | | 7.56 | % | | | 3.70 | % | | | 4.54 | % | |
With Sales Charge | |
| Class A13 | | | | | | | –9.41 | % | | | 6.06 | % | | | 2.97 | % | | | 3.83 | % | |
| Class C13 | | | | | | | –5.56 | % | | | 6.89 | % | | | 3.38 | % | | | 4.23 | % | |
Index | |
| MSCI EAFE® Index1,16 | | | | | | | –7.08 | % | | | 7.53 | % | | | 4.43 | % | | | 4.94 | % | |
The performance data quoted represent past performance and do not indicate future results. Current performance may be lower or higher than the performance data quoted. For performance data current to the most recent month-end, please visit www.nb.com/performance.
The results shown in the table reflect the reinvestment of income dividends and other distributions, if any. The results do not reflect the effect of taxes a shareholder would pay on Fund distributions or on the redemption of Fund shares.
The investment return and principal value of an investment will fluctuate and shares, when redeemed, may be worth more or less than their original cost.
Returns would have been lower if Neuberger Berman Management LLC (Management) had not reimbursed certain expenses and/or waived a portion of the investment management fees during certain of the periods shown. Repayment by a class (of expenses previously reimbursed and/or fees previously waived by Management) will decrease the class's returns. Please see Note B in the Notes to Financial Statements for specific information regarding expense reimbursement and/or fee waiver arrangements.
As stated in the Fund's most recent prospectus, the total annual operating expense ratios for fiscal year 2014 were 1.26%, 1.36%, 1.07%, 1.46%, 2.21% and 1.13% for Investor Class, Trust Class, Institutional Class, Class A, Class C and Class R6 shares, respectively (before expense reimbursements and/or fee waivers, if any). The expense ratios were 0.85%, 1.21%, 1.96% and 0.79% for Institutional Class, Class A, Class C and Class R6 shares, respectively, after expense reimbursements and/or fee waivers. The expense ratios for the annual period ended August 31, 2015 can be found in the Financial Highlights section of this report.
Returns shown with a sales charge reflect the deduction of the current maximum initial sales charge of 5.75% for Class A shares and the contingent deferred sales charge (CDSC) for Class C shares. The CDSC for Class C shares is 1%, which is reduced to 0% after 1 year. The performance of the Fund's share classes will differ primarily due to different sales charge structures and class expenses. Please see the prospectus for more information about sales charge structures, if any, and class expenses for your share class.
International Equity Fund (Unaudited)
COMPARISON OF A $1,000,000 INVESTMENT
(000's Omitted)
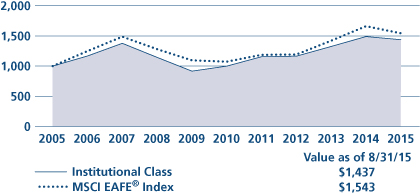
This graph shows the change in value of a hypothetical $1,000,000 investment in the Fund over the past 10 fiscal years, or since the Fund's inception if it has not operated for 10 years. The graph is based on the Institutional Class shares only; the performance of the Fund's share classes will differ primarily due to different sales charge structures and class expenses (see Performance Highlights chart on previous page). The result is compared with benchmarks, which include a broad-based market index and may include a more narrowly based index. Market indices have not been reduced to reflect any of the fees and costs of investing. The results shown in the graph reflect the reinvestment of income dividends and other distributions, if any. The results do not reflect the effect of taxes a shareholder would pay on Fund distributions or on the redemption of Fund shares. Results represent past performance and do not indicate future results.
International Select Fund Commentary (Unaudited)
Neuberger Berman International Select Fund Trust Class generated a –4.47% total return for the fiscal year ended August 31, 2015, outperforming its benchmark, the MSCI EAFE® Index, which posted a –7.08% return for the same period. (Performance for all share classes is provided in the table immediately following this letter.)
International equity markets ended the period with a loss as news of China's economic slowdown, market correction and currency devaluation impacted equity markets globally. China-related worries built on stresses that had been weighing on investor sentiment and contributing to volatility all year—including slow growth globally, falling commodities prices, a resurgence of the Greek debt crisis, and the strength of the U.S. dollar.
By sector, Health Care, Telecommunication Services, Information Technology (IT), and Consumer Discretionary outperformed, while Energy, Materials and Utilities lagged. By country, Israel, Ireland and Denmark—driven by locally listed large-cap multinationals—outperformed, while oil and commodities-driven Norway and Australia, along with Portugal, lagged.
The Fund's outperformance relative to the benchmark was due primarily to stock selection, notably within Financials, Consumer Staples and Materials. Sector allocations were also beneficial. By country, UK, Australian and German holdings were advantageous.
Top contributors included Alimentation Couche-Tard, Santen Pharmaceutical, and PICC Property & Casualty. Alimentation Couche-Tard, a Canadian-headquartered gas retailer, announced an acquisition that was positively received, as investors believe the target company's stores have the potential for substantial margin improvement. Santen, a Japanese eye-care company, reported robust sales and raised guidance for 2015. PICC, a Chinese property and casualty insurer, rallied earlier in the reporting period as the domestic Chinese market soared. We sold our position, capturing gains.
The portfolio lagged the index within the Telecommunication Services, IT and Health Care sectors. By country, an allocation to Canada and an underweight to Japan hurt relative performance, as did French holdings.
Detractors included ShawCor, Home Capital Group and Sika. ShawCor, a Canadian-based pipeline services firm, fell on fears that lower oil prices would continue to hurt pipeline development, and was sold. Shares of Home Capital, a Canadian subprime mortgage lender, were weak as investors contemplated a softening local economy. We sold shares of Sika, a Swiss-based construction materials firm, capturing long-term gains; this followed an unexpected sale by the controlling family.
As we look ahead, we do not believe the recent downward revaluation of the Chinese currency has addressed the underlying challenges that we believe China faces: excessive debt, high costs relative to its emerging markets manufacturing competitors, and muted private-sector spending. While China and emerging markets have outpaced the developed world in recent years, we believe this outperformance has come to an end, and we remain focused on companies with underlying exposure to Europe and North America. In Europe, earnings are improving and economies appear to have troughed. We are seeing opportunities to add to Japanese exporters—which has long been our preferred segment of this market—as we believe the yen will likely continue its slide.
We continue to believe that the cash-generative businesses with the stable demand profiles we favor offer the most value in the current environment, with a lower downside risk profile in the event of sharp market declines.
Sincerely,
Benjamin Segal
Portfolio Manager
Information about principal risks of investing in the Fund is set forth in the prospectus and statement of additional information.
The portfolio composition, industries and holdings of the Fund are subject to change without notice.
The opinions expressed are those of the Fund's portfolio manager. The opinions are as of the date of this report and are subject to change without notice.
International Select Fund (Unaudited)
TICKER SYMBOLS
Trust Class | | NILTX | |
Institutional Class | | NILIX | |
Class A | | NBNAX | |
Class C | | NBNCX | |
Class R3 | | NBNRX | |
PERFORMANCE HIGHLIGHTS7
| | | | | Average Annual Total
Return Ended 08/31/2015 | |
| | | Inception
Date | | 1 Year | | 5 Years | | Life of
Fund | |
At NAV | |
Trust Class | | 08/01/2006 | | | –4.47 | % | | | 5.99 | % | | | 2.30 | % | |
| Institutional Class6 | | 10/06/2006 | | | –4.18 | % | | | 6.35 | % | | | 2.65 | % | |
| Class A15 | | 12/20/2007 | | | –4.62 | % | | | 5.98 | % | | | 2.30 | % | |
| Class C15 | | 12/20/2007 | | | –5.23 | % | | | 5.20 | % | | | 1.66 | % | |
| Class R315 | | 05/27/2009 | | | –4.71 | % | | | 5.72 | % | | | 2.12 | % | |
With Sales Charge | |
| Class A15 | | | | | | | –10.10 | % | | | 4.74 | % | | | 1.63 | % | |
| Class C15 | | | | | | | –6.18 | % | | | 5.20 | % | | | 1.66 | % | |
Index | |
| MSCI EAFE® Index1,16 | | | | | | | –7.08 | % | | | 7.53 | % | | | 2.67 | % | |
The performance data quoted represent past performance and do not indicate future results. Current performance may be lower or higher than the performance data quoted. For performance data current to the most recent month-end, please visit www.nb.com/performance.
The results shown in the table reflect the reinvestment of income dividends and other distributions, if any. The results do not reflect the effect of taxes a shareholder would pay on Fund distributions or on the redemption of Fund shares.
The investment return and principal value of an investment will fluctuate and shares, when redeemed, may be worth more or less than their original cost.
Returns would have been lower if Neuberger Berman Management LLC (Management) had not reimbursed certain expenses and/or waived a portion of the investment management fees during certain of the periods shown. Repayment by a class (of expenses previously reimbursed and/or fees previously waived by Management) will decrease the class's returns. Please see Note B in the Notes to Financial Statements for specific information regarding expense reimbursement and/or fee waiver arrangements.
As stated in the Fund's most recent prospectus, the total annual operating expense ratios for fiscal year 2014 were 1.33%, 0.93%, 1.31%, 2.05% and 1.55% for Trust Class, Institutional Class, Class A, Class C and Class R3 shares, respectively (before expense reimbursements and/or fee waivers, if any). The expense ratios were 1.25%, 0.90%, 1.30%, 2.00% and 1.51% for Trust Class, Institutional Class, Class A, Class C and Class R3 shares, respectively, after expense reimbursements and/or fee waivers. The expense ratios for the annual period ended August 31, 2015 can be found in the Financial Highlights section of this report.
Returns shown with a sales charge reflect the deduction of the current maximum initial sales charge of 5.75% for Class A shares and the contingent deferred sales charge (CDSC) for Class C shares. The CDSC for Class C shares is 1%, which is reduced to 0% after 1 year. The performance of the Fund's share classes will differ primarily due to different sales charge structures and class expenses. Please see the prospectus for more information about sales charge structures, if any, and class expenses for your share class.
International Select Fund (Unaudited)
COMPARISON OF A $10,000 INVESTMENT
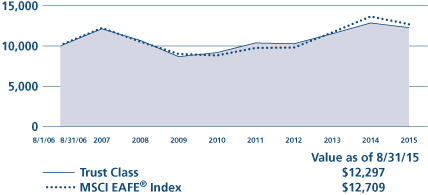
This graph shows the change in value of a hypothetical $10,000 investment in the Fund over the past 10 fiscal years, or since the Fund's inception if it has not operated for 10 years. The graph is based on the Trust Class shares only; the performance of the Fund's share classes will differ primarily due to different sales charge structures and class expenses (see Performance Highlights chart on previous page). The result is compared with benchmarks, which include a broad-based market index and may include a more narrowly based index. Market indices have not been reduced to reflect any of the fees and costs of investing. The results shown in the graph reflect the reinvestment of income dividends and other distributions, if any. The results do not reflect the effect of taxes a shareholder would pay on Fund distributions or on the redemption of Fund shares. Results represent past performance and do not indicate future results.
Intrinsic Value Fund Commentary (Unaudited)
Neuberger Berman Intrinsic Value Fund Institutional Class generated a 1.36% total return for the fiscal year ended August 31, 2015, outperforming its benchmark, the Russell 2000® Value Index, which returned -4.95% for the same period. (Performance for all share classes is provided in the table immediately following this letter.)
A time of market stability which began after the 2012 Presidential election has seemingly ended. Economic growth in the emerging markets, primarily China and Latin America, is decelerating rapidly. Commodity markets have been signaling weakness for nearly a year but it took a violent correction in Chinese stock markets to raise the issue of global growth front and center.
Historically, during periods of increasing market stress, small-cap strategies such as ours typically come under pressure as investors seek the stability of larger, less cyclical companies, many of which provide attractive dividends. We have often noted the Fund's challenge in dealing with markets when growth comes into question. When risk aversion increases, overweightings in the Technology and Producer Durables sectors render the strategy vulnerable to underperformance. In spite of the Fund's commitment to these sectors, results for the year were favorable on a relative basis but modest when viewed from an absolute perspective.
Approximately one-third of the Fund's holdings are in the Technology sector. Strong operational results as well as acquisitions drove share prices higher. Digital River was acquired by a private equity firm, Spansion and Cypress Semiconductor merged as did Freescale and NXP Semiconductor. We believe the acceleration of the speed and capacity of the Internet as well as the services that can be offered through hosted applications is a positive long-term trend for many companies in the Fund. It is our opinion that ARRIS, Gigamon, Infinera, Ciena, Viavi and Lumentum all stand to gain if investments in the Internet infrastructure by Telecom companies and large enterprises grow.
We believe that as consumers spend an increasing amount of time on the Internet and more commerce is conducted on websites, the needs for data and security grow hand in hand. In an attempt to meet these needs, companies like NeuStar and Acxiom enable digital media marketing campaigns to be more precise in their advertising. Verint, KEYW and Rambus are introducing products intended to prevent hacking and data theft. Over the near term, many of these companies are prone to profit taking as investors seek less cyclical companies, but we believe that the superior growth attributes of the markets they are addressing will justify the shorter term risks.
We continue to seek new investments for the Fund. Over the 12-month period, we introduced 17 new ideas while eliminating 17 positions. Given our large presence in the Technology and Producer Durables sectors, our preference is to increase our consumer exposure in addition to finding new ideas in Health Care. Energy is a sector we receive many questions about, and to date we have yet to muster any convincing analysis that would cause us to increase our presence in the sector.
We are ending the year on a very mixed note. Good news on the domestic front from employment and consumption is taking a back seat to concerns emanating from abroad. The Federal Reserve, in its recent decision not to increase interest rates a meager 25 basis points, focused mostly on global events and barely commented in its official statement on domestic economic conditions. And so, the stock picker and active manager's challenge remains. As much as we are enamored of our individual companies' managements and products over the shorter term, our performance remains captive to perceptions about the global economy.
We look forward to our next communication and thank you for your commitment to our Fund.
Sincerely,
Benjamin H. Nahum, James F. McAree and Amit Solomon
Portfolio Co-Managers
Information about principal risks of investing in the Fund is set forth in the prospectus and statement of additional information.
The portfolio composition, industries and holdings of the Fund are subject to change without notice.
The opinions expressed are those of the Fund's portfolio managers. The opinions are as of the date of this report and are subject to change without notice.
Intrinsic Value Fund (Unaudited)
TICKER SYMBOLS
Institutional Class | | NINLX | |
Class A | | NINAX | |
Class C | | NINCX | |
SECTOR ALLOCATION
(as a % of Total Investments) | |
Consumer Discretionary | | | 5.4 | % | |
Consumer Staples | | | 0.3 | | |
Energy | | | 1.3 | | |
Financial Services | | | 11.2 | | |
Health Care | | | 5.5 | | |
Materials & Processing | | | 5.7 | | |
Producer Durables | | | 19.8 | | |
Technology | | | 34.9 | | |
Utilities | | | 5.9 | | |
Short-Term Investments | | | 10.0 | | |
Total | | | 100.0 | % | |
PERFORMANCE HIGHLIGHTS
| | | | | Average Annual Total
Return Ended 08/31/2015 | |
| | | Inception
Date* | | 1 Year | | 5 Years | | 10 Years | | Life of
Fund | |
At NAV | |
| Institutional Class19 | | 05/10/2010 | | | 1.36 | % | | | 14.73 | % | | | 8.89 | % | | | 11.41 | % | |
| Class A19 | | 05/10/2010 | | | 0.96 | % | | | 14.30 | % | | | 8.68 | % | | | 11.29 | % | |
| Class C19 | | 05/10/2010 | | | 0.19 | % | | | 13.46 | % | | | 8.25 | % | | | 11.05 | % | |
With Sales Charge | |
| Class A19 | | | | | | | –4.84 | % | | | 12.97 | % | | | 8.03 | % | | | 10.93 | % | |
| Class C19 | | | | | | | –0.75 | % | | | 13.46 | % | | | 8.25 | % | | | 11.05 | % | |
Index | |
| Russell 2000® Value Index1,16 | | | | | | | –4.95 | % | | | 13.23 | % | | | 5.70 | % | | | 8.27 | % | |
| Russell 2000® Index1,16 | | | | | | | 0.03 | % | | | 15.55 | % | | | 7.12 | % | | | 7.48 | % | |
*The inception date for Neuberger Berman Intrinsic Value Fund Institutional Class, Class A, and Class C shares is May 10, 2010. Performance prior to that date is that of the Fund's predecessor, the DJG Small Cap Value Fund L.P., an unregistered limited partnership ("DJG Fund"); DJG Fund was the successor to The DJG Small Cap Value Fund, an unregistered commingled investment account ("DJG Account"), which had similar investment goals, strategies, and portfolio management team. See endnote 19 for more information.
The performance data quoted represent past performance and do not indicate future results. Current performance may be lower or higher than the performance data quoted. For performance data current to the most recent month-end, please visit www.nb.com/performance.
The results shown in the table reflect the reinvestment of income dividends and other distributions, if any. The results do not reflect the effect of taxes a shareholder would pay on Fund distributions or on the redemption of Fund shares.
The investment return and principal value of an investment will fluctuate and shares, when redeemed, may be worth more or less than their original cost.
Returns would have been lower if Neuberger Berman Management LLC (Management) had not reimbursed certain expenses and/or waived a portion of the investment management fees during certain of the periods shown. Repayment by a class (of expenses previously reimbursed and/or fees previously waived by Management) will decrease the class's returns. Please see Note B in the Notes to Financial Statements for specific information regarding expense reimbursement and/or fee waiver arrangements.
As stated in the Fund's most recent prospectus, the total annual operating expense ratios for fiscal year 2014 were 1.14%, 1.52% and 2.26% for Institutional Class, Class A and Class C shares, respectively (before expense reimbursements and/or fee waivers, if any). The expense ratios were 1.00%, 1.36% and 2.11% for Institutional Class, Class A and Class C shares, respectively, after expense reimbursements and/or fee waivers. The expense ratios for the annual period ended August 31, 2015 can be found in the Financial Highlights section of this report.
Returns shown with a sales charge reflect the deduction of the current maximum initial sales charge of 5.75% for Class A shares and the contingent deferred sales charge (CDSC) for Class C shares. The CDSC for Class C shares is 1%, which is reduced to 0% after 1 year. The performance of the Fund's share classes will differ primarily due to different sales charge structures and class expenses. Please see the prospectus for more information about sales charge structures, if any, and class expenses for your share class.
Intrinsic Value Fund (Unaudited)
COMPARISON OF A $1,000,000 INVESTMENT19
(000's Omitted)
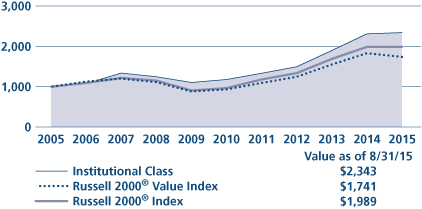
This graph shows the change in value of a hypothetical $1,000,000 investment in the Fund over the past 10 fiscal years, or since the Fund's inception if it has not operated for 10 years. The graph is based on the Institutional Class shares only; the performance of the Fund's share classes will differ primarily due to different sales charge structures and class expenses (see Performance Highlights chart on previous page). The result is compared with benchmarks, which include a broad-based market index and may include a more narrowly based index. Market indices have not been reduced to reflect any of the fees and costs of investing. The results shown in the graph reflect the reinvestment of income dividends and other distributions, if any. The results do not reflect the effect of taxes a shareholder would pay on Fund distributions or on the redemption of Fund shares. Results represent past performance and do not indicate future results.
Large Cap Disciplined Growth Fund Commentary (Unaudited)
Neuberger Berman Large Cap Disciplined Growth Fund Investor Class generated a total return of –1.92% for the fiscal year ended August 31, 2015, trailing its benchmark, the Russell 1000® Growth Index, which provided a return of 4.26% for the same period. (Performance for all share classes is provided in the table immediately following this letter.)
Following several years of a considerable run-up in stocks, returns were more muted over the past 12 months, with several periods of heightened volatility, notably in December and August. We began the year with a slightly defensive bent in the portfolio and continued to move in that direction over the course of the year, eliminating our exposure to the volatile Energy sector and reducing our Industrial holdings. Our largest increases on a sector basis were in Health Care, Consumer Discretionary and Information Technology (IT).
From a sector perspective, our greatest areas of strength this period came from stock selection in Consumer Discretionary and Health Care, and from our underweight in Industrials. The top three contributors were Apple, Amazon.com and Visa.
The Fund benefited from an overweight in Apple throughout late 2014 and early 2015 as the stock, a fantastic long-term performer, continued to outperform. In our opinion, Apple continues to be an amazing company making great products, but in early 2015 we began to reduce our exposure after the stock's strong run-up, as our expectations for the next round of products and services (such as the Apple Watch) were lower. Amazon.com continued to outperform as the theme of rising profitability and productivity continued, coupled with acceleration in both the core North American non-media business and Amazon Web Services. Visa's outperformance was driven by its affirmation, despite global GDP deceleration, of the secular conversion from paper to plastic. Enhancing the trend this year were the return of currency volatility (good for cross-border profit margins), and the company's participation in electronic payment platforms such as Square and ApplePay.
The largest drags on performance came from IT, Materials and Energy. Within IT, our exposure to semiconductors through positions in SanDisk and Micron was the largest detractor, followed by Yelp, an online local business review company.
Both SanDisk and Micron underperformed as the companies faced a weakening global PC market. We believe the stocks may recover later this year based on PC demand improving and the ironing out of several technology challenges. We believe Yelp's management made a series of missteps in 2015 that caused us to lose confidence in their ability to capitalize on the large local advertising opportunity, and we sold the position.
We continue to believe cautious optimism is appropriate as year-over-year domestic earnings and GDP growth remain relatively modest, while the risk of slowing overseas growth, particularly in China, has increased. As we enter the new fiscal year, we remain pleased with the quality of our portfolio, making conviction allocations where we believe the greatest opportunities lie. In our view, the market appears to be returning to a focus on individual fundamentals rather than the unusual macro events driving returns the past several years. Should this trend continue, we believe our high active share and increasing number of stock-specific bets should be an advantage.
Sincerely,
John J. Barker
Portfolio Manager
Information about principal risks of investing in the Fund is set forth in the prospectus and statement of additional information.
The portfolio composition, industries and holdings of the Fund are subject to change without notice.
The opinions expressed are those of the Fund's portfolio manager. The opinions are as of the date of this report and are subject to change without notice.
Large Cap Disciplined Growth Fund (Unaudited)
TICKER SYMBOLS
Investor Class | | NBCIX | |
Institutional Class | | NLDLX | |
Class A | | NLDAX | |
Class C | | NLDCX | |
Class R3 | | NLDRX | |
SECTOR ALLOCATION
(as a % of Total Investments) | |
Consumer Discretionary | | | 19.7 | % | |
Consumer Staples | | | 7.1 | | |
Financials | | | 6.1 | | |
Health Care | | | 20.4 | | |
Industrials | | | 6.7 | | |
Information Technology | | | 31.3 | | |
Materials | | | 6.4 | | |
Telecommunication Services | | | 1.9 | | |
Short-Term Investments | | | 0.4 | | |
Total | | | 100.0 | % | |
PERFORMANCE HIGHLIGHTS11
| | | | | Average Annual Total
Return Ended 08/31/2015 | |
| | | Inception
Date | | 1 Year | | 5 Years | | 10 Years | | Life of
Fund | |
At NAV | |
Investor Class | | 12/06/1999 | | | –1.92 | % | | | 11.41 | % | | | 5.50 | % | | | 0.39 | % | |
| Institutional Class5 | | 04/06/2009 | | | –1.65 | % | | | 11.77 | % | | | 5.73 | % | | | 0.52 | % | |
| Class A20 | | 04/06/2009 | | | –2.04 | % | | | 11.36 | % | | | 5.47 | % | | | 0.37 | % | |
| Class C20 | | 04/06/2009 | | | –2.79 | % | | | 10.55 | % | | | 4.98 | % | | | 0.07 | % | |
| Class R317 | | 05/27/2009 | | | –2.05 | % | | | 11.15 | % | | | 5.35 | % | | | 0.30 | % | |
With Sales Charge | |
| Class A20 | | | | | | | –7.69 | % | | | 10.04 | % | | | 4.85 | % | | | –0.01 | % | |
| Class C20 | | | | | | | –3.23 | % | | | 10.55 | % | | | 4.98 | % | | | 0.07 | % | |
Index | |
| Russell 1000® Growth Index1,16 | | | | | | | 4.26 | % | | | 17.40 | % | | | 8.41 | % | | | 2.53 | % | |
The performance data quoted represent past performance and do not indicate future results. Current performance may be lower or higher than the performance data quoted. For performance data current to the most recent month-end, please visit www.nb.com/performance.
The results shown in the table reflect the reinvestment of income dividends and other distributions, if any. The results do not reflect the effect of taxes a shareholder would pay on Fund distributions or on the redemption of Fund shares.
The investment return and principal value of an investment will fluctuate and shares, when redeemed, may be worth more or less than their original cost.
Returns would have been lower if Neuberger Berman Management LLC (Management) had not reimbursed certain expenses and/or waived a portion of the investment management fees during certain of the periods shown. Repayment by a class (of expenses previously reimbursed and/or fees previously waived by Management) will decrease the class's returns. Please see Note B in the Notes to Financial Statements for specific information regarding expense reimbursement and/or fee waiver arrangements.
As stated in the Fund's most recent prospectus, the total annual operating expense ratios for fiscal year 2014 were 1.07%, 0.84%, 1.21%, 1.96% and 1.61% for Investor Class, Institutional Class, Class A, Class C and Class R3 shares, respectively (before expense reimbursements and/or fee waivers, if any). The expense ratios were 0.75%, 1.11%, 1.86% and 1.36% for Institutional Class, Class A, Class C and Class R3 shares, respectively, after expense reimbursements and/or fee waivers. The expense ratios for the annual period ended August 31, 2015 can be found in the Financial Highlights section of this report.
Returns shown with a sales charge reflect the deduction of the current maximum initial sales charge of 5.75% for Class A shares and the contingent deferred sales charge (CDSC) for Class C shares. The CDSC for Class C shares is 1%, which is reduced to 0% after 1 year. The performance of the Fund's share classes will differ primarily due to different sales charge structures and class expenses. Please see the prospectus for more information about sales charge structures, if any, and class expenses for your share class.
Large Cap Disciplined Growth Fund (Unaudited)
COMPARISON OF A $10,000 INVESTMENT
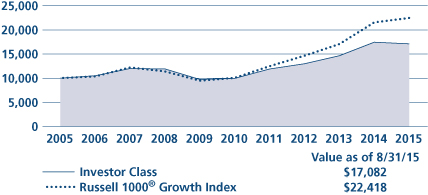
This graph shows the change in value of a hypothetical $10,000 investment in the Fund over the past 10 fiscal years, or since the Fund's inception if it has not operated for 10 years. The graph is based on the Investor Class shares only; the performance of the Fund's share classes will differ primarily due to different sales charge structures and class expenses (see Performance Highlights chart on previous page). The result is compared with benchmarks, which include a broad-based market index and may include a more narrowly based index. Market indices have not been reduced to reflect any of the fees and costs of investing. The results shown in the graph reflect the reinvestment of income dividends and other distributions, if any. The results do not reflect the effect of taxes a shareholder would pay on Fund distributions or on the redemption of Fund shares. Results represent past performance and do not indicate future results.
Large Cap Value Fund Commentary (Unaudited)
Neuberger Berman Large Cap Value Fund Investor Class generated a –7.19% total return for the fiscal year ended August 31, 2015, underperforming its benchmark, the Russell 1000® Value Index, which returned –3.48% for the same period. (Performance for all share classes is provided in the table immediately following this letter.)
Over the fiscal year, we saw an extended period of relative calm and modest equity gains promote a sense of complacency, which was shattered when underlying macro concerns escalated into a steep market correction. Stocks were somewhat choppy early in the year amid growing apprehension about the state of the global economy, the potential for a rate hike by the U.S. Federal Reserve (Fed) and the free-fall in crude oil prices. Yet, the market swiftly recovered time and again despite continued downward pressures. Issues such as the Greek sovereign debt crisis, signs of economic weakness in China and the negative impact of a rising U.S. dollar and deflated crude oil prices remained hot topics for investors throughout the period, but an improving U.S. economy and words of assurance from the Fed and other global policymakers kept the equity market in a fairly narrow trading band for several months. Tensions began to rise, however, as the September deadline for a Fed rate decision drew closer. Anxiety over China then reached a tipping point in August when the People's Bank of China unexpectedly devalued the nation's currency to prop up its economy. The move ignited a sell-off in equities that led to a double-digit drop in U.S. stocks. The market recouped some of its losses, but large-cap value stocks still ended the period with an overall decline.
There was a wide spread between the best and worst performing sectors within the Russell 1000 Value Index over the period. Health Care was at one end of the spectrum, with a double-digit positive return owed in part to robust mergers and acquisitions activity within the segment, while Energy and Materials suffered overall losses of over 30% and 18%, respectively, due largely to weak oil prices and a macro slowdown in China. In the middle, Financials, Consumer Discretionary and Consumer Staples eked out modestly positive returns while Information Technology, Industrials and Telecommunication Services produced moderate losses.
In the Fund, our strategic decision to underweight the Energy sector versus the index resulted in a large benefit to relative returns as this was by far the worst performing area of the market over the fiscal year. Oil prices fell off a cliff in December and continued to test these lows throughout the period as crude production levels remained robust in the face of weaker than expected demand, primarily from China. Health Care provided the largest lift to performance on an absolute basis, and our selection of stocks fared better than their index sector counterparts. However our lighter weighting in this area versus the index was a negative. The largest detractor from both absolute and relative performance during the period was the Materials sector. Our overweight in this segment versus the index, particularly in the Metals & Mining industry, was the main source of the loss as these companies suffered from slower demand from China and expectations of depressed future growth in that region. The second largest detractor from overall total returns was Energy.
We remain generally positive on the overall equity market, as we believe that U.S. stocks should continue to benefit from the slowly improving domestic economy. Still, we continue to be wary of the global macro picture and other external factors. Corporate profits are largely expected to grow next year as the U.S. labor market improves and consumers reap the benefits of low fuel costs; however, the latest earnings season was muted given weakness in Energy and lackluster results among large multinationals, a situation that could persist if oil prices decline further or the U.S. dollar continues to advance. The risk of a more severe economic downturn in China and other emerging markets is also a source of concern, particularly as the U.S. appears to be embarking on a path of interest rate tightening, which could leave the domestic economy more vulnerable to external shocks. While we are cognizant of these concerns, we feel the global economy is on the mend and that there are attractive opportunities in some of the most affected areas of the most recent downturn. The best way to navigate such an environment, in our view, is to take a bottom-up investment approach in looking for underappreciated stocks carrying hidden value that could be realized if specific catalysts play out over time.
Sincerely,
Eli M. Salzmann
Portfolio Manager
Information about principal risks of investing in the Fund is set forth in the prospectus and statement of additional information.
The portfolio composition, industries and holdings of the Fund are subject to change without notice.
The opinions expressed are those of the Fund's portfolio manager. The opinions are as of the date of this report and are subject to change without notice.
Large Cap Value Fund (Unaudited)
TICKER SYMBOLS
Investor Class | | NPRTX | |
Trust Class | | NBPTX | |
Advisor Class | | NBPBX | |
Institutional Class | | NBPIX | |
Class A | | NPNAX | |
Class C | | NPNCX | |
Class R3 | | NPNRX | |
SECTOR ALLOCATION
(as a % of Total Investments) | |
Consumer Discretionary | | | 16.6 | % | |
Consumer Staples | | | 1.6 | | |
Energy | | | 8.8 | | |
Financials | | | 28.2 | | |
Health Care | | | 7.1 | | |
Industrials | | | 20.2 | | |
Information Technology | | | 6.2 | | |
Materials | | | 8.4 | | |
Short-Term Investments | | | 2.9 | | |
Total | | | 100.0 | % | |
PERFORMANCE HIGHLIGHTS7
| | | | | Average Annual Total
Return Ended 08/31/2015 | |
| | | Inception
Date | | 1 Year | | 5 Years | | 10 Years | | Life of
Fund | |
At NAV | |
Investor Class | | 01/20/19752 | | | –7.19 | % | | | 11.44 | % | | | 4.35 | % | | | 12.45 | % | |
| Trust Class3 | | 08/30/1993 | | | –7.40 | % | | | 11.23 | % | | | 4.15 | % | | | 12.37 | % | |
| Advisor Class4 | | 08/16/1996 | | | –7.55 | % | | | 11.05 | % | | | 3.99 | % | | | 12.24 | % | |
| Institutional Class5 | | 06/07/2006 | | | –7.03 | % | | | 11.62 | % | | | 4.50 | % | | | 12.49 | % | |
| Class A20 | | 06/21/2010 | | | –7.44 | % | | | 11.17 | % | | | 4.21 | % | | | 12.41 | % | |
| Class C20 | | 06/21/2010 | | | –8.11 | % | | | 10.34 | % | | | 3.81 | % | | | 12.31 | % | |
| Class R317 | | 06/21/2010 | | | –7.64 | % | | | 10.90 | % | | | 4.08 | % | | | 12.38 | % | |
With Sales Charge | |
| Class A20 | | | | | | | –12.77 | % | | | 9.86 | % | | | 3.60 | % | | | 12.25 | % | |
| Class C20 | | | | | | | –8.83 | % | | | 10.34 | % | | | 3.81 | % | | | 12.31 | % | |
Index | |
| Russell 1000® Value Index1,16 | | | | | | | –3.48 | % | | | 14.68 | % | | | 6.18 | % | | | N/A | | |
The performance data quoted represent past performance and do not indicate future results. Current performance may be lower or higher than the performance data quoted. For performance data current to the most recent month-end, please visit www.nb.com/performance.
The results shown in the table reflect the reinvestment of income dividends and other distributions, if any. The results do not reflect the effect of taxes a shareholder would pay on Fund distributions or on the redemption of Fund shares.
The investment return and principal value of an investment will fluctuate and shares, when redeemed, may be worth more or less than their original cost.
Returns would have been lower if Neuberger Berman Management LLC (Management) had not reimbursed certain expenses and/or waived a portion of the investment management fees during certain of the periods shown. Repayment by a class (of expenses previously reimbursed and/or fees previously waived by Management) will decrease the class's returns. Please see Note B in the Notes to Financial Statements for specific information regarding expense reimbursement and/or fee waiver arrangements.
As stated in the Fund's most recent prospectus, the total annual operating expense ratios for fiscal year 2014 were 0.88%, 1.08%, 1.23%, 0.73%, 1.12%, 1.89% and 1.46% for Investor Class, Trust Class, Advisor Class, Institutional Class, Class A, Class C and Class R3 shares, respectively (before expense reimbursements and/or fee waivers, if any). The expense ratio was 1.39% for Class R3 shares, after expense reimbursements and/or fee waivers. The total annual operating expense ratio for each of Institutional Class, Class A and Class C includes the class's repayment of expenses previously reimbursed and/or fees previously waived by Management. The expense ratios for the annual period ended August 31, 2015 can be found in the Financial Highlights section of this report.
Returns shown with a sales charge reflect the deduction of the current maximum initial sales charge of 5.75% for Class A shares and the contingent deferred sales charge (CDSC) for Class C shares. The CDSC for Class C shares is 1%, which is reduced to 0% after 1 year. The performance of the Fund's share classes will differ primarily due to different sales charge structures and class expenses. Please see the prospectus for more information about sales charge structures, if any, and class expenses for your share class.
Large Cap Value Fund (Unaudited)
COMPARISON OF A $10,000 INVESTMENT
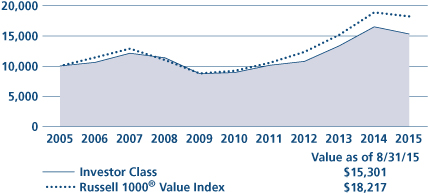
This graph shows the change in value of a hypothetical $10,000 investment in the Fund over the past 10 fiscal years, or since the Fund's inception if it has not operated for 10 years. The graph is based on the Investor Class shares only; the performance of the Fund's share classes will differ primarily due to different sales charge structures and class expenses (see Performance Highlights chart on previous page). The result is compared with benchmarks, which include a broad-based market index and may include a more narrowly based index. Market indices have not been reduced to reflect any of the fees and costs of investing. The results shown in the graph reflect the reinvestment of income dividends and other distributions, if any. The results do not reflect the effect of taxes a shareholder would pay on Fund distributions or on the redemption of Fund shares. Results represent past performance and do not indicate future results.
Mid Cap Growth Fund Commentary (Unaudited)
Neuberger Berman Mid Cap Growth Fund Investor Class generated a 10.74% total return for the fiscal year ended August 31, 2015, outpacing its benchmark, the Russell Midcap® Growth Index, which returned 2.46% for the same period. (Performance for all share classes is provided in the table immediately following this letter.)
The trailing 12 months have provided a positive environment for our style of investing. Shrugging off global macro noise, stubbornly lethargic GDP growth and currency headwinds, the market rewarded active management and stocks offering positive differentiation versus their peers, "paying up" for compelling catalysts, strong execution and the higher qualitative characteristics and fundamentals that we typically prize. The Fund also benefited from the reemergence of business capital spending as mergers and acquisitions (M&A) activity remained strong, especially within the Health Care and Information Technology (IT) segments. Finally, incremental net positives around inflation, employment and wage growth continued to build a foundation for a potential rebound in both consumer confidence and retail spending.
During the period, the Fund was materially overweight versus the benchmark in IT, Health Care and Telecommunication Services and underweight Consumer Staples, Materials, Financials, Energy, Industrials and Consumer Discretionary. Sector positioning was generally additive to performance, with our underweight to Energy and overweight to Health Care and IT providing strong contributions.
Stock selection was the primary driver of alpha over the fiscal year, with positive contributions across the portfolio, led by our Consumer Discretionary, IT and Industrial names. Drilling down to our holdings, Avago Technologies was the top contributor to performance, while Antero Resources (sold before period end) was the leading detractor. Avago, a semiconductor company, continued to execute at a high level, with strong participation in leading "smart" devices and a well-received acquisition of Broadcom. Antero, an independent exploration and production company focused on unconventional oil and natural gas resources, in the Appalachian Basin in West Virginia, Ohio and Pennsylvania, was negatively impacted by the precipitous drop in oil prices.
From our perspective, despite recent volatility the positives continue to outweigh any negatives and/or angst around the longevity of the current "bull" market. We believe the balance of 2015 should continue to benefit broadly from accommodative central banks, appealing interest rate levels and generally positive inflationary trends. In the U.S., we think incremental gains in housing, employment and wage growth, coupled with moderating currency headwinds and improving business and consumer confidence, should continue to provide a positive counterbalance to the seemingly never ending global wall of worry as well as legitimate concerns around sluggish GDP growth and extended market valuations across numerous industry groups. China-induced volatility has clouded the interest rate hike debate, but we remain confident that a rate increase, whenever it does occur, would be reasonably digested by the market and ultimately prove to be a positive for stocks. Given the aforementioned positive trends and what we see as an absence of reckless excess, we also don't believe that a more substantial and prolonged market reset is looming near-term. We believe the market should continue to seek positive differentiation through companies characterized by strong execution and fundamentals, and we would view any additional short-term volatility, should it occur, as an investment opportunity.
Sincerely,
Kenneth J. Turek
Portfolio Manager
Information about principal risks of investing in the Fund is set forth in the prospectus and statement of additional information.
The portfolio composition, industries and holdings of the Fund are subject to change without notice.
The opinions expressed are those of the Fund's portfolio manager. The opinions are as of the date of this report and are subject to change without notice.
Mid Cap Growth Fund (Unaudited)
TICKER SYMBOLS
Investor Class | | NMANX | |
Trust Class | | NBMTX | |
Advisor Class | | NBMBX | |
Institutional Class | | NBMLX | |
Class A | | NMGAX | |
Class C | | NMGCX | |
Class R3 | | NMGRX | |
Class R6 | | NRMGX | |
SECTOR ALLOCATION
(as a % of Total Investments) | |
Consumer Discretionary | | | 22.1 | % | |
Consumer Staples | | | 3.2 | | |
Energy | | | 1.4 | | |
Financials | | | 6.6 | | |
Health Care | | | 17.9 | | |
Industrials | | | 11.9 | | |
Information Technology | | | 23.8 | | |
Materials | | | 1.7 | | |
Telecommunication Services | | | 2.9 | | |
Utilities | | | 0.6 | | |
Other | | | 0.8 | | |
Short-Term Investments | | | 7.1 | | |
Total | | | 100.0 | % | |
PERFORMANCE HIGHLIGHTS7
| | | | | Average Annual Total
Return Ended 08/31/2015 | |
| | | Inception
Date | | 1 Year | | 5 Years | | 10 Years | | Life of
Fund | |
At NAV | |
Investor Class | | 03/01/19792 | | | 10.74 | % | | | 16.95 | % | | | 9.49 | % | | | 11.98 | % | |
| Trust Class3 | | 08/30/1993 | | | 10.73 | % | | | 16.87 | % | | | 9.34 | % | | | 11.89 | % | |
| Advisor Class4 | | 09/03/1996 | | | 10.39 | % | | | 16.51 | % | | | 9.03 | % | | | 11.69 | % | |
| Institutional Class5 | | 04/19/2007 | | | 10.98 | % | | | 17.21 | % | | | 9.75 | % | | | 12.05 | % | |
| Class A20 | | 05/27/2009 | | | 10.55 | % | | | 16.79 | % | | | 9.41 | % | | | 11.96 | % | |
| Class C20 | | 05/27/2009 | | | 9.72 | % | | | 15.91 | % | | | 8.90 | % | | | 11.82 | % | |
| Class R317 | | 05/27/2009 | | | 10.29 | % | | | 16.49 | % | | | 9.24 | % | | | 11.91 | % | |
| Class R624 | | 03/15/2013 | | | 11.04 | % | | | 17.11 | % | | | 9.56 | % | | | 12.00 | % | |
With Sales Charge | |
| Class A20 | | | | | | | 4.21 | % | | | 15.42 | % | | | 8.77 | % | | | 11.78 | % | |
| Class C20 | | | | | | | 8.72 | % | | | 15.91 | % | | | 8.90 | % | | | 11.82 | % | |
Index | |
| Russell Midcap® Growth Index1,16 | | | | | | | 2.46 | % | | | 17.13 | % | | | 8.66 | % | | | N/A | | |
| Russell Midcap® Index1,16 | | | | | | | 0.02 | % | | | 16.56 | % | | | 8.40 | % | | | 13.38 | % | |
The performance data quoted represent past performance and do not indicate future results. Current performance may be lower or higher than the performance data quoted. For performance data current to the most recent month-end, please visit www.nb.com/performance.
The results shown in the table reflect the reinvestment of income dividends and other distributions, if any. The results do not reflect the effect of taxes a shareholder would pay on Fund distributions or on the redemption of Fund shares.
The investment return and principal value of an investment will fluctuate and shares, when redeemed, may be worth more or less than their original cost.
Returns would have been lower if Neuberger Berman Management LLC (Management) had not reimbursed certain expenses and/or waived a portion of the investment management fees during certain of the periods shown. Repayment by a class (of expenses previously reimbursed and/or fees previously waived by Management) will decrease the class's returns. Please see Note B in the Notes to Financial Statements for specific information regarding expense reimbursement and/or fee waiver arrangements.
As stated in the Fund's most recent prospectus, the total annual operating expense ratios for fiscal year 2014 were 0.94%, 1.01%, 1.27%, 0.76%, 1.13%, 1.91%, 1.39% and 0.69% for Investor Class, Trust Class, Advisor Class, Institutional Class, Class A, Class C, Class R3 and Class R6 shares, respectively (before expense reimbursements and/or fee waivers, if any). The expense ratios were 0.75%, 1.11%, 1.86%, 1.36% and 0.68% for Institutional Class, Class A, Class C, Class R3 and Class R6 shares, respectively, after expense reimbursements and/or fee waivers. The expense ratios for the annual period ended August 31, 2015 can be found in the Financial Highlights section of this report.
Returns shown with a sales charge reflect the deduction of the current maximum initial sales charge of 5.75% for Class A shares and the contingent deferred sales charge (CDSC) for Class C shares. The CDSC for Class C shares is 1%, which is reduced to 0% after 1 year. The performance of the Fund's share classes will differ primarily due to different sales charge structures and class expenses. Please see the prospectus for more information about sales charge structures, if any, and class expenses for your share class.
Mid Cap Growth Fund (Unaudited)
COMPARISON OF A $10,000 INVESTMENT
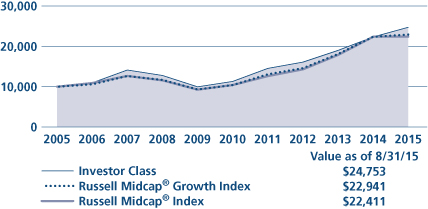
This graph shows the change in value of a hypothetical $10,000 investment in the Fund over the past 10 fiscal years, or since the Fund's inception if it has not operated for 10 years. The graph is based on the Investor Class shares only; the performance of the Fund's share classes will differ primarily due to different sales charge structures and class expenses (see Performance Highlights chart on previous page). The result is compared with benchmarks, which include a broad-based market index and may include a more narrowly based index. Market indices have not been reduced to reflect any of the fees and costs of investing. The results shown in the graph reflect the reinvestment of income dividends and other distributions, if any. The results do not reflect the effect of taxes a shareholder would pay on Fund distributions or on the redemption of Fund shares. Results represent past performance and do not indicate future results.
Mid Cap Intrinsic Value Fund Commentary (Unaudited)
Neuberger Berman Mid Cap Intrinsic Value Fund Investor Class generated a –1.09% total return for the fiscal year ended August 31, 2015 and outperformed its benchmark, the Russell Midcap® Value Index, which returned –2.54% for the same period. (Performance for all share classes is provided in the table immediately following this letter.)
While domestic economic growth remained sluggish in calendar-year 2014, it seemed to be accelerating, with many key economic indicators showing improvement. Most central banks including the Federal Reserve (Fed) continued to be accommodative. In 2015, falling oil prices, the situation in Greece, the devaluation of the Chinese currency and mixed signals regarding the timing of an interest rate hike by the Fed all contributed to investor uncertainty and led to much more volatility in the market.
During the reporting period, relative performance benefited from the Fund's overweight and stock selection in the Consumer Discretionary, Technology and Producer Durables sectors. In the Consumer Discretionary sector, Office Depot (sold prior to period end) was the strongest performer, as it received a merger offer from Staples at a significant premium to its market value. Darden Restaurant Group appointed a new CEO following the replacement of its Board of Directors by an activist shareholder and announced plans to spin off some of its real estate assets into a REIT. In the Consumer Staples sector, CVS (sold prior to period end) announced two deals that were well received by investors—the purchase of Omnicare (which we also owned) and the acquisition of Target's pharmacy and clinic business. In the Technology sector, Skyworks Solutions was the largest contributor as the market reacted positively to the company's growing earnings and cash flow, due in part to its increasing chip content on the new iPhones. Spirit AeroSystems (Producer Durables) announced the divestiture of its Gulfstream business, reported better-than-expected fourth-quarter earnings per share, and provided strong 2015 guidance.
On the negative side, we have been (in recent quarters) and continue to be underweight the Health Care sector. In our opinion, the recent mergers and acquisitions frenzy in this sector has driven valuations way too high for the value buyer. In addition, underweights and stock selection in the Financial Services sector and stock selection in Utilities hurt. Also detracting from performance during the period were our Energy holdings, including Devon Energy (sold prior to period end), Cabot Oil & Gas, Cameron International (sold prior to period end), Southwestern Energy (sold prior to period end) and ONEOK. In this sector, we have focused on high quality franchises with strong balance sheets and our contrarian nature suggests that we will look to add to these positions at the appropriate time. Other lagging investments in the portfolio during the period included Hertz (sold prior to period end), a global car and equipment rental company, Teradata, a provider of analytic data services, and Harsco, a multinational provider of industrial services.
We are into the sixth year of a bull market and have just experienced the first meaningful correction in over three years. However, valuation levels remain at or above what we consider fair value. As a result, we believe the market is very sensitive to macro events. With the domestic economy improving, the Fed is likely to raise rates sometime in 2015, in our opinion. As inflation appears under control, we believe that any Fed hikes would be slow and moderate. Additionally, investors may start to move their focus to next year's earnings, which should benefit from the combination of the drop in oil prices and the strength of the U.S. dollar. Under this scenario, we think the market can move up during the coming year, but finding the right stocks will be the key to outperformance. We believe that our focus on quality companies undergoing change should fare well in such an environment.
Sincerely,
Michael C. Greene
Portfolio Manager
Information about principal risks of investing in the Fund is set forth in the prospectus and statement of additional information.
The portfolio composition, industries and holdings of the Fund are subject to change without notice.
The opinions expressed are those of the Fund's portfolio manager. The opinions are as of the date of this report and are subject to change without notice.
Mid Cap Intrinsic Value Fund (Unaudited)
TICKER SYMBOLS
Investor Class | | NBRVX | |
Trust Class | | NBREX | |
Institutional Class | | NBRTX | |
Class A | | NBRAX | |
Class C | | NBRCX | |
Class R3 | | NBRRX | |
SECTOR ALLOCATION
(as a % of Total Investments) | |
Consumer Discretionary | | | 13.7 | % | |
Consumer Staples | | | 1.0 | | |
Energy | | | 7.5 | | |
Financial Services | | | 18.1 | | |
Health Care | | | 2.6 | | |
Materials & Processing | | | 4.1 | | |
Producer Durables | | | 20.1 | | |
Technology | | | 17.0 | | |
Utilities | | | 7.4 | | |
Short-Term Investments | | | 8.5 | | |
Total | | | 100.0 | % | |
PERFORMANCE HIGHLIGHTS7
| | | | | Average Annual Total
Return Ended 08/31/2015 | |
| | | Inception
Date | | 1 Year | | 5 Years | | 10 Years | | Life of
Fund | |
At NAV | |
Investor Class | | 06/01/1999 | | | –1.09 | % | | | 15.30 | % | | | 6.62 | % | | | 9.39 | % | |
| Trust Class3 | | 06/10/1999 | | | –1.31 | % | | | 15.10 | % | | | 6.49 | % | | | 9.30 | % | |
| Institutional Class5 | | 03/08/2010 | | | –0.90 | % | | | 15.59 | % | | | 6.77 | % | | | 9.49 | % | |
| Class A20 | | 06/21/2010 | | | –1.25 | % | | | 15.15 | % | | | 6.56 | % | | | 9.36 | % | |
| Class C20 | | 06/21/2010 | | | –2.02 | % | | | 14.31 | % | | | 6.15 | % | | | 9.10 | % | |
| Class R317 | | 06/21/2010 | | | –1.49 | % | | | 14.88 | % | | | 6.42 | % | | | 9.27 | % | |
With Sales Charge | |
| Class A20 | | | | | | | –6.91 | % | | | 13.80 | % | | | 5.93 | % | | | 8.96 | % | |
| Class C20 | | | | | | | –2.89 | % | | | 14.31 | % | | | 6.15 | % | | | 9.10 | % | |
Index | |
| Russell Midcap® Value Index1,16 | | | | | | | –2.54 | % | | | 15.96 | % | | | 7.93 | % | | | 9.15 | % | |
| Russell Midcap® Index1,16 | | | | | | | 0.02 | % | | | 16.56 | % | | | 8.40 | % | | | 8.72 | % | |
The performance data quoted represent past performance and do not indicate future results. Current performance may be lower or higher than the performance data quoted. For performance data current to the most recent month-end, please visit www.nb.com/performance.
The results shown in the table reflect the reinvestment of income dividends and other distributions, if any. The results do not reflect the effect of taxes a shareholder would pay on Fund distributions or on the redemption of Fund shares.
The investment return and principal value of an investment will fluctuate and shares, when redeemed, may be worth more or less than their original cost.
Returns would have been lower if Neuberger Berman Management LLC (Management) had not reimbursed certain expenses and/or waived a portion of the investment management fees during certain of the periods shown. Repayment by a class (of expenses previously reimbursed and/or fees previously waived by Management) will decrease the class's returns. Please see Note B in the Notes to Financial Statements for specific information regarding expense reimbursement and/or fee waiver arrangements.
As stated in the Fund's most recent prospectus, the total annual operating expense ratios for fiscal year 2014 were 1.31%, 1.56%, 1.14%, 1.54%, 2.27% and 1.81% for Investor Class, Trust Class, Institutional Class, Class A, Class C and Class R3 shares, respectively (before expense reimbursements and/or fee waivers, if any). The expense ratios were 1.25%, 0.85%, 1.21%, 1.96% and 1.46% for Trust Class, Institutional Class, Class A, Class C and Class R3 shares, respectively, after expense reimbursements and/or fee waivers. The expense ratios for the annual period ended August 31, 2015 can be found in the Financial Highlights section of this report.
Returns shown with a sales charge reflect the deduction of the current maximum initial sales charge of 5.75% for Class A shares and the contingent deferred sales charge (CDSC) for Class C shares. The CDSC for Class C shares is 1%, which is reduced to 0% after 1 year. The performance of the Fund's share classes will differ primarily due to different sales charge structures and class expenses. Please see the prospectus for more information about sales charge structures, if any, and class expenses for your share class.
Mid Cap Intrinsic Value Fund (Unaudited)
COMPARISON OF A $10,000 INVESTMENT
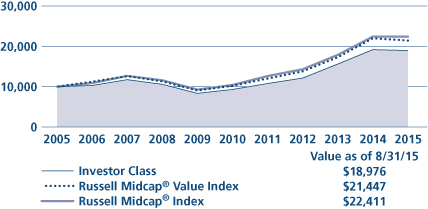
This graph shows the change in value of a hypothetical $10,000 investment in the Fund over the past 10 fiscal years, or since the Fund's inception if it has not operated for 10 years. The graph is based on the Investor Class shares only; the performance of the Fund's share classes will differ primarily due to different sales charge structures and class expenses (see Performance Highlights chart on previous page). The result is compared with benchmarks, which include a broad-based market index and may include a more narrowly based index. Market indices have not been reduced to reflect any of the fees and costs of investing. The results shown in the graph reflect the reinvestment of income dividends and other distributions, if any. The results do not reflect the effect of taxes a shareholder would pay on Fund distributions or on the redemption of Fund shares. Results represent past performance and do not indicate future results.
Multi-Cap Opportunities Fund Commentary (Unaudited)
Neuberger Berman Multi-Cap Opportunities Fund Institutional Class generated a –1.80% total return for the fiscal year ended August 31, 2015 versus a 0.48% total return for its benchmark, the S&P 500® Index. (Performance for all share classes is provided in the table immediately following this letter.)
Within the index, six of 10 sectors generated a positive return for the period. Consumer Discretionary, Consumer Staples, Financials, Health Care, Information Technology and Utilities outperformed relative to the overall benchmark. Cyclical sectors generally underperformed, as Energy, Industrials, Materials and Telecommunication Services lagged the overall benchmark. We believe heightened market volatility over the course of the year contributed to the dispersion in performance across sectors.
Within the Fund, stock selection in Information Technology and Financials benefitted performance relative to the benchmark. Stock selection in Consumer Discretionary and Energy detracted from relative performance during the period. The Fund ended the fiscal year with an overweight, relative to the benchmark, in the Financials, Industrials, Information Technology and Materials sectors. The Fund ended the fiscal year with an underweight, relative to the benchmark, in the Consumer Discretionary, Consumer Staples, Energy, Health Care, and Utilities sectors. We do not hold positions in Telecommunication Services.
Portfolio construction is an important component of our investment process and consists of three distinct investment categories: Special Situations, Opportunistic and Classic. Special Situations have unique attributes (e.g., restructuring, spin-offs, post-bankruptcy equities) that require specific valuation methodologies and customized investment research. Opportunistic investments are companies that have become inexpensive for a tangible reason that we believe is temporary. Classic investments are those companies with long histories of shareholder-friendly policies, high quality management teams and exceptional operating performance. We believe maintaining a balance of these three categories helps to mitigate risk within the portfolio. We continue to find investment opportunities across each investment category with attractive risk/return profiles.
We believe the current environment remains attractive for free cash flow-oriented investing as free cash flow yields for equities relative to fixed income yields remain near historical highs. Companies with high free cash flow and prudent management teams can potentially do very well in a moderate growth environment. Dividend increases, share repurchase programs, cash accumulation, debt retirement, organic growth initiatives and selective acquisitions can all accrue to the benefit of equity holders. These positive developments have been taking place at many of the companies owned by the Fund.
Our style of investing is based on rigorous fundamental research. The analysis centers on the business model and a company's ability to generate and effectively utilize free cash flow. As we evaluate both potential new positions and current portfolio holdings, we will continue to do so with a long-term investment perspective in mind. As always, our focus is to grow our shareholders' assets through the disciplined application of our investment philosophy and process.
Sincerely,
RICHARD S. NACKENSON
PORTFOLIO MANAGER
Information about principal risks of investing in the Fund is set forth in the prospectus and statement of additional information.
The portfolio composition, industries and holdings of the Fund are subject to change without notice.
The opinions expressed are those of the Fund's portfolio manager. The opinions are as of the date of this report and are subject to change without notice.
Multi-Cap Opportunities Fund (Unaudited)
TICKER SYMBOLS
Institutional Class | | NMULX | |
Class A | | NMUAX | |
Class C | | NMUCX | |
SECTOR ALLOCATION
(as a % of Total Investments) | |
Consumer Discretionary | | | 6.6 | % | |
Consumer Staples | | | 3.1 | | |
Energy | | | 3.6 | | |
Financials | | | 23.4 | | |
Health Care | | | 14.0 | | |
Industrials | | | 17.7 | | |
Information Technology | | | 21.7 | | |
Materials | | | 7.4 | | |
Utilities | | | 1.4 | | |
Short-Term Investments | | | 1.1 | | |
Total | | | 100.0 | % | |
PERFORMANCE HIGHLIGHTS9
| | | | | Average Annual Total
Return Ended 08/31/2015 | |
| | | Inception
Date* | | 1 Year | | 5 Years | | Life of
Fund | |
At NAV | |
| Institutional Class18 | | 12/21/2009 | | | –1.80 | % | | | 16.53 | % | | | 7.40 | % | |
| Class A18 | | 12/21/2009 | | | –2.16 | % | | | 16.09 | % | | | 7.15 | % | |
| Class C18 | | 12/21/2009 | | | –2.84 | % | | | 15.22 | % | | | 6.64 | % | |
With Sales Charge | |
| Class A18 | | | | | | | –7.77 | % | | | 14.72 | % | | | 6.44 | % | |
| Class C18 | | | | | | | –3.78 | % | | | 15.22 | % | | | 6.64 | % | |
Index | |
| S&P 500® Index1,16 | | | | | | | 0.48 | % | | | 15.87 | % | | | 6.49 | % | |
*Prior to December 14, 2009, the Fund had different investment goals, strategies, and portfolio management team. The performance data for each class includes the performance of the Fund's oldest share class, Trust Class, from November 2, 2006 through December 21, 2009. See endnote 18 for information about the effects of the different fees paid by each class.
The performance data quoted represent past performance and do not indicate future results. Current performance may be lower or higher than the performance data quoted. For performance data current to the most recent month-end, please visit www.nb.com/performance.
The results shown in the table reflect the reinvestment of income dividends and other distributions, if any. The results do not reflect the effect of taxes a shareholder would pay on Fund distributions or on the redemption of Fund shares.
The investment return and principal value of an investment will fluctuate and shares, when redeemed, may be worth more or less than their original cost.
Returns would have been lower if Neuberger Berman Management LLC (Management) had not reimbursed certain expenses and/or waived a portion of the investment management fees during certain of the periods shown. Repayment by a class (of expenses previously reimbursed and/or fees previously waived by Management) will decrease the class's returns. Please see Note B in the Notes to Financial Statements for specific information regarding expense reimbursement and/or fee waiver arrangements.
As stated in the Fund's most recent prospectus, the total annual operating expense ratios for fiscal year 2014 were 0.74%, 1.10% and 1.85% for Institutional Class, Class A and Class C shares, respectively (before expense reimbursements and/or fee waivers, if any). The expense ratios for the annual period ended August 31, 2015 can be found in the Financial Highlights section of this report.
Returns shown with a sales charge reflect the deduction of the current maximum initial sales charge of 5.75% for Class A shares and the contingent deferred sales charge (CDSC) for Class C shares. The CDSC for Class C shares is 1%, which is reduced to 0% after 1 year. The performance of the Fund's share classes will differ primarily due to different sales charge structures and class expenses. Please see the prospectus for more information about sales charge structures, if any, and class expenses for your share class.
Multi-Cap Opportunities Fund (Unaudited)
COMPARISON OF A $1,000,000 INVESTMENT18
(000's Omitted)
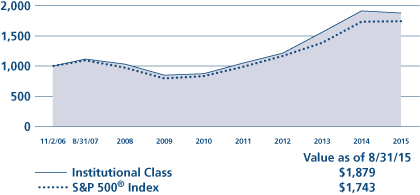
This graph shows the change in value of a hypothetical $1,000,000 investment in the Fund over the past 10 fiscal years, or since the Fund's inception if it has not operated for 10 years. The graph is based on the Institutional Class shares only; the performance of the Fund's share classes will differ primarily due to different sales charge structures and class expenses (see Performance Highlights chart on previous page). The result is compared with benchmarks, which include a broad-based market index and may include a more narrowly based index. Market indices have not been reduced to reflect any of the fees and costs of investing. The results shown in the graph reflect the reinvestment of income dividends and other distributions, if any. The results do not reflect the effect of taxes a shareholder would pay on Fund distributions or on the redemption of Fund shares. Results represent past performance and do not indicate future results.
Real Estate Fund Commentary (Unaudited)
Neuberger Berman Real Estate Fund Trust Class generated a –1.54% total return for the fiscal year ended August 31, 2015, underperforming its benchmark, the FTSE NAREIT All Equity REITs Index, which generated a –0.33% total return for the same period. (Performance for all share classes is provided in the table immediately following this letter.)
The U.S. stock market was volatile and generated a modest gain during the reporting period. The market was supported at times by signs of improving economic growth in the U.S. and solid demand. However, the market was periodically challenged—especially late in the period—by heightened investor risk aversion, some of which was triggered by geopolitical issues and signs of moderating growth in China. The overall U.S. stock market, as measured by the S&P 500® Index, gained 0.48% for the 12-month period. Real estate investment trusts (REITs) posted weak results during the period, partially due to concerns over rising interest rates.
The Fund's underperformance versus the benchmark was due to sector positioning. In particular, an overweight to Mortgage Home Financing and an underweight to Manufactured Homes were negative for results. On the upside, an overweight to Self Storage and an underweight to Mixed were the largest contributors to performance. Stock selection, overall, was a positive for performance. Contributing the most to results was stock selection in the Free Standing, Health Care and Diversified sectors. Simon Property Group, a leading commercial real estate company with both regional malls and discount outlet centers, was the largest contributor to performance. Other holdings that were additive for results were Public Storage, a self-storage REIT, and Equity Residential, an apartment REIT.
The sectors that detracted the most from the Fund's performance from a stock selection perspective were Regional Malls, Self Storage and Lodging/Resorts. Several individual holdings were also negative for results, including Host Hotels and Resorts, a lodging/resort REIT, Weyerhaeuser Co., a timber REIT, and American Tower Corp., an infrastructure REIT.
Looking ahead, it appears to us that economic activity in the U.S. continues to expand at a moderate pace and in our view the Federal Reserve (Fed) is likely to continue moving toward policy normalization. We believe these two factors, an improving economy and a less accommodative Fed, should they occur, will be important drivers for real estate values over the next 12-24 months. While higher interest rates could be a headwind for REITs in the near term, we believe the benefits of a sustainable improvement in the economy and job market on real estate demand trends could outweigh this concern in the longer term. We also believe that REIT fundamentals should show further improvement as the year progresses, which would support cash flow and dividend growth. Many REITs are currently trading at discounts to their underlying stated net asset values (NAV). If these apparent NAV discounts persist, we may experience an increase in mergers and acquisitions (M&A), additional share repurchase activity and other value realization strategies.
Sincerely,
Steve S. Shigekawa and Brian Jones
Portfolio Co-Managers
Information about principal risks of investing in the Fund is set forth in the prospectus and statement of additional information.
The portfolio composition, industries and holdings of the Fund are subject to change without notice.
The opinions expressed are those of the Fund's portfolio managers. The opinions are as of the date of this report and are subject to change without notice.
Real Estate Fund (Unaudited)
TICKER SYMBOLS
Trust Class | | NBRFX | |
Institutional Class | | NBRIX | |
Class A | | NREAX | |
Class C | | NRECX | |
Class R3 | | NRERX | |
Class R6 | | NRREX | |
SECTOR ALLOCATION
(as a % of Total Investments) | |
Apartments | | | 14.7 | % | |
Diversified | | | 8.3 | | |
Free Standing | | | 1.9 | | |
Health Care | | | 9.4 | | |
Industrial | | | 4.0 | | |
Infrastructure | | | 10.1 | | |
Lodging/Resorts | | | 5.5 | | |
Office | | | 11.2 | | |
Real Estate Operating Companies | | | 3.5 | | |
Regional Malls | | | 12.6 | | |
Self Storage | | | 7.8 | | |
Shopping Centers | | | 6.5 | | |
Timber | | | 3.3 | | |
Short-Term Investments | | | 1.2 | | |
Total | | | 100.0 | % | |
PERFORMANCE HIGHLIGHTS7,22
| | | | | Average Annual Total
Return Ended 08/31/2015 | |
| | | Inception
Date | | 1 Year | | 5 Years | | 10 Years | | Life of
Fund | |
At NAV | |
Trust Class | | 05/01/2002 | | | –1.54 | % | | | 10.52 | % | | | 7.49 | % | | | 11.19 | % | |
| Institutional Class6 | | 06/04/2008 | | | –1.34 | % | | | 10.72 | % | | | 7.64 | % | | | 11.31 | % | |
| Class A15 | | 06/21/2010 | | | –1.65 | % | | | 10.33 | % | | | 7.39 | % | | | 11.12 | % | |
| Class C15 | | 06/21/2010 | | | –2.38 | % | | | 9.50 | % | | | 6.98 | % | | | 10.80 | % | |
| Class R315 | | 06/21/2010 | | | –1.94 | % | | | 10.05 | % | | | 7.25 | % | | | 11.01 | % | |
| Class R625 | | 03/15/2013 | | | –1.26 | % | | | 10.67 | % | | | 7.57 | % | | | 11.25 | % | |
With Sales Charge | |
| Class A15 | | | | | | | –7.32 | % | | | 9.04 | % | | | 6.76 | % | | | 10.63 | % | |
| Class C15 | | | | | | | –3.31 | % | | | 9.50 | % | | | 6.98 | % | | | 10.80 | % | |
Index | |
| FTSE NAREIT All Equity REITs Index1,16 | | | | | | | –0.33 | % | | | 12.36 | % | | | 6.59 | % | | | 10.00 | % | |
The performance data quoted represent past performance and do not indicate future results. Current performance may be lower or higher than the performance data quoted. For performance data current to the most recent month-end, please visit www.nb.com/performance.
The results shown in the table reflect the reinvestment of income dividends and other distributions, if any. The results do not reflect the effect of taxes a shareholder would pay on Fund distributions or on the redemption of Fund shares.
The investment return and principal value of an investment will fluctuate and shares, when redeemed, may be worth more or less than their original cost.
Returns would have been lower if Neuberger Berman Management LLC (Management) had not reimbursed certain expenses and/or waived a portion of the investment management fees during certain of the periods shown. Repayment by a class (of expenses previously reimbursed and/or fees previously waived by Management) will decrease the class's returns. Please see Note B in the Notes to Financial Statements for specific information regarding expense reimbursement and/or fee waiver arrangements.
As stated in the Fund's most recent prospectus, the total annual operating expense ratios for fiscal year 2014 were 1.41%, 1.05%, 1.43%, 2.20%, 1.67% and 0.98% for Trust Class, Institutional Class, Class A, Class C, Class R3 and Class R6 shares, respectively (before expense reimbursements and/or fee waivers, if any). The expense ratios were 0.85%, 1.21%, 1.96%, 1.46% and 0.78% for Institutional Class, Class A, Class C, Class R3 and Class R6 shares, respectively, after expense reimbursements and/or fee waivers. The expense ratios for the annual period ended August 31, 2015 can be found in the Financial Highlights section of this report.
Returns shown with a sales charge reflect the deduction of the current maximum initial sales charge of 5.75% for Class A shares and the contingent deferred sales charge (CDSC) for Class C shares. The CDSC for Class C shares is 1%, which is reduced to 0% after 1 year. The performance of the Fund's share classes will differ primarily due to different sales charge structures and class expenses. Please see the prospectus for more information about sales charge structures, if any, and class expenses for your share class.
Real Estate Fund (Unaudited)
COMPARISON OF A $10,000 INVESTMENT
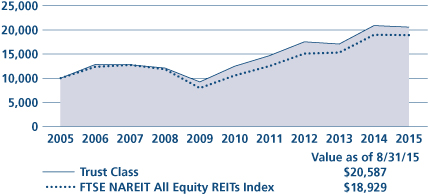
This graph shows the change in value of a hypothetical $10,000 investment in the Fund over the past 10 fiscal years, or since the Fund's inception if it has not operated for 10 years. The graph is based on the Trust Class shares only; the performance of the Fund's share classes will differ primarily due to different sales charge structures and class expenses (see Performance Highlights chart on previous page). The result is compared with benchmarks, which include a broad-based market index and may include a more narrowly based index. Market indices have not been reduced to reflect any of the fees and costs of investing. The results shown in the graph reflect the reinvestment of income dividends and other distributions, if any. The results do not reflect the effect of taxes a shareholder would pay on Fund distributions or on the redemption of Fund shares. Results represent past performance and do not indicate future results.
Small Cap Growth Fund Commentary (Unaudited)
Neuberger Berman Small Cap Growth Fund Investor Class generated a 7.51% total return for the fiscal year ended August 31, 2015, ahead of its benchmark, the Russell 2000® Growth Index, which returned 5.11% for the same period. (Performance for all share classes is provided in the table immediately following this letter.)
The trailing 12 months have generally provided a positive environment for our style of investing. Shrugging off global macro noise, stubbornly lethargic GDP growth and currency headwinds, the market rewarded active management and stocks offering positive differentiation versus their peers, "paying-up" for compelling catalysts, strong execution and the higher qualitative characteristics and fundamentals that we typically prize. Finally, incremental net positives around inflation, employment and wage growth continued to build a foundation for a potential rebound in both consumer confidence and retail spending.
During the period, the portfolio was overweight, versus the benchmark, in Consumer Discretionary, Information Technology (IT) and Health Care, and underweight Industrials, Materials, Energy, Consumer Staples and Telecommunication Services, and essentially in line with the benchmark in Financials. The Fund's sector positioning was generally additive to performance, with our underweight to Materials, Industrials and Consumer Staples and overweight to Health Care leading the way.
With respect to stock selection, positive contributions from IT, Health Care, Consumer Discretionary and Energy offset weakness from our Industrial and Consumer Staple names. Drilling down to our holdings, Bluebird Bio was the top contributor to performance, while Carrizo Oil & Gas (sold before period end) was the leading detractor. Bluebird, a biotechnology company using gene therapy to introduce a functional copy of a defective gene into patient's own cells, was boosted by encouraging data around a molecule aimed at treating blood diseases. Carrizo, an oil and natural gas exploration and production company in the U.S. and UK was negatively impacted by the precipitous drop in oil prices.
From our perspective, despite recent volatility the positives continue to outweigh any negatives and/or angst around the longevity of the current "bull" market. The balance of 2015 should, in our view, continue to benefit broadly from accommodative central banks, appealing interest rate levels and generally positive inflationary trends. In the U.S., we think incremental gains in housing, employment and wage growth coupled with moderating currency headwinds and improving business and consumer confidence, should they continue, could provide a positive counterbalance to the seemingly never-ending global wall of worry as well as legitimate concerns around sluggish GDP growth and extended market valuations across numerous industry groups. China-induced volatility has clouded the interest rate hike debate, but we remain confident that a rate increase, whenever it does occur, would be reasonably digested by the market and ultimately prove to be a positive for stocks. Given the aforementioned positive trends and what we see as an absence of reckless excess, we also don't believe that a more substantial and prolonged market reset is looming, near term. We believe the market should continue to seek positive differentiation through companies characterized by strong execution and fundamentals, and we would view any additional short-term volatility, should it occur, as an investing opportunity.
Sincerely,
David H. Burshtan
Portfolio Manager
Information about principal risks of investing in the Fund is set forth in the prospectus and statement of additional information.
The portfolio composition, industries and holdings of the Fund are subject to change without notice.
The opinions expressed are those of the Fund's portfolio manager. The opinions are as of the date of this report and are subject to change without notice.
Small Cap Growth Fund (Unaudited)
TICKER SYMBOLS
Investor Class | | NBMIX | |
Trust Class | | NBMOX | |
Advisor Class | | NBMVX | |
Institutional Class | | NBSMX | |
Class A | | NSNAX | |
Class C | | NSNCX | |
Class R3 | | NSNRX | |
SECTOR ALLOCATION
(as a % of Total Investments) | |
Consumer Discretionary | | | 21.2 | % | |
Financials | | | 8.8 | | |
Health Care | | | 26.7 | | |
Industrials | | | 10.7 | | |
Information Technology | | | 24.8 | | |
Materials | | | 3.6 | | |
Short-Term Investments | | | 4.2 | | |
Total | | | 100.0 | % | |
PERFORMANCE HIGHLIGHTS7
| | | | | Average Annual Total
Return Ended 08/31/2015 | |
| | | Inception
Date | | 1 Year | | 5 Years | | 10 Years | | Life of
Fund | |
At NAV | |
Investor Class | | 10/20/1998 | | | 7.51 | % | | | 16.61 | % | | | 7.59 | % | | | 8.69 | % | |
| Trust Class3 | | 11/03/1998 | | | 7.30 | % | | | 16.39 | % | | | 7.40 | % | | | 8.54 | % | |
| Advisor Class4 | | 05/03/2002 | | | 7.13 | % | | | 16.22 | % | | | 7.20 | % | | | 8.45 | % | |
| Institutional Class5 | | 04/01/2008 | | | 7.84 | % | | | 16.97 | % | | | 7.81 | % | | | 8.82 | % | |
| Class A20 | | 05/27/2009 | | | 7.45 | % | | | 16.55 | % | | | 7.52 | % | | | 8.65 | % | |
| Class C20 | | 05/27/2009 | | | 6.68 | % | | | 15.70 | % | | | 7.02 | % | | | 8.34 | % | |
| Class R317 | | 05/27/2009 | | | 7.22 | % | | | 16.26 | % | | | 7.35 | % | | | 8.54 | % | |
With Sales Charge | |
| Class A20 | | | | | | | 1.26 | % | | | 15.18 | % | | | 6.89 | % | | | 8.27 | % | |
| Class C20 | | | | | | | 5.68 | % | | | 15.70 | % | | | 7.02 | % | | | 8.34 | % | |
Index | |
| Russell 2000® Growth Index1,16 | | | | | | | 5.11 | % | | | 17.83 | % | | | 8.46 | % | | | 7.69 | % | |
| Russell 2000® Index1,16 | | | | | | | 0.03 | % | | | 15.55 | % | | | 7.12 | % | | | 8.73 | % | |
The performance data quoted represent past performance and do not indicate future results. Current performance may be lower or higher than the performance data quoted. For performance data current to the most recent month-end, please visit www.nb.com/performance.
The results shown in the table reflect the reinvestment of income dividends and other distributions, if any. The results do not reflect the effect of taxes a shareholder would pay on Fund distributions or on the redemption of Fund shares.
The investment return and principal value of an investment will fluctuate and shares, when redeemed, may be worth more or less than their original cost.
Returns would have been lower if Neuberger Berman Management LLC (Management) had not reimbursed certain expenses and/or waived a portion of the investment management fees during certain of the periods shown. Repayment by a class (of expenses previously reimbursed and/or fees previously waived by Management) will decrease the class's returns. Please see Note B in the Notes to Financial Statements for specific information regarding expense reimbursement and/or fee waiver arrangements.
As stated in the Fund's most recent prospectus, the total annual operating expense ratios for fiscal year 2014 were 1.67%, 1.95%, 1.97%, 1.48%, 1.81%, 2.57% and 2.16% for Investor Class, Trust Class, Advisor Class, Institutional Class, Class A, Class C and Class R3 shares, respectively (before expense reimbursements and/or fee waivers, if any). The expense ratios were 1.30%, 1.40%, 1.60%, 0.90%, 1.26%, 2.01% and 1.51% for Investor Class, Trust Class, Advisor Class, Institutional Class, Class A, Class C and Class R3 shares, respectively, after expense reimbursements and/or fee waivers. The expense ratios for the annual period ended August 31, 2015 can be found in the Financial Highlights section of this report.
Returns shown with a sales charge reflect the deduction of the current maximum initial sales charge of 5.75% for Class A shares and the contingent deferred sales charge (CDSC) for Class C shares. The CDSC for Class C shares is 1%, which is reduced to 0% after 1 year. The performance of the Fund's share classes will differ primarily due to different sales charge structures and class expenses. Please see the prospectus for more information about sales charge structures, if any, and class expenses for your share class.
Small Cap Growth Fund (Unaudited)
COMPARISON OF A $10,000 INVESTMENT

This graph shows the change in value of a hypothetical $10,000 investment in the Fund over the past 10 fiscal years, or since the Fund's inception if it has not operated for 10 years. The graph is based on the Investor Class shares only; the performance of the Fund's share classes will differ primarily due to different sales charge structures and class expenses (see Performance Highlights chart on previous page). The result is compared with benchmarks, which include a broad-based market index and may include a more narrowly based index. Market indices have not been reduced to reflect any of the fees and costs of investing. The results shown in the graph reflect the reinvestment of income dividends and other distributions, if any. The results do not reflect the effect of taxes a shareholder would pay on Fund distributions or on the redemption of Fund shares. Results represent past performance and do not indicate future results.
Socially Responsive Fund Commentary (Unaudited)
Neuberger Berman Socially Responsive Fund Investor Class generated a 0.29% total return for the fiscal year ended August 31, 2015, trailing the 0.48% return of its benchmark, the S&P 500® Index. (Performance for all share classes is provided in the table immediately following this letter.)
Flat equity returns belie extreme volatility in the currency and commodity markets over this period. For instance, the U.S. dollar appreciated over 15% versus the currencies of major trading partners and over 20% versus those of many commodity-producing nations, with supply in chronic excess for many basic goods. Oil prices declined over 50% this period. While these forces were a headwind for U.S. multinationals and commodity producers, earnings growth for U.S. equities absent these pressures has been good, helped by a recovering domestic economy. Solid earnings supported equity markets for much of this period, with volatility increasing sharply in August as headline fears of a China slowdown had global reverberations. While Chinese economic growth remains positive, feedback from U.S. companies operating in China suggests it has been decelerating for some time.
For the Fund, top contributors included long-term holdings Newell Rubbermaid, Progressive and Intercontinental Exchange. Newell Rubbermaid appears to have engineered a successful turnaround, low-cost insurer Progressive continued to innovate and take market share; and Intercontinental Exchange has benefited from the greater transparency and safety in trading and clearing required in the post-crisis regulatory environment.
Detractors included Noble Energy, a victim of the drop in energy prices, and NOW Inc., among the Industrials names to suffer in sympathy with oil. Elsewhere, Keurig Green Mountain underperformed due to challenges in transitioning to its next-generation brewing technology. We continue to own each of these names.
We were opportunistic buyers and sellers this fiscal year, adding NetScout, a communications technology company. We received shares as a spinout from long-term holding Danaher, which merged its communication businesses with NetScout. We believe the core business is well positioned to capitalize on the growing need for bandwidth, with greater potential upside from network analytics, optimization and security tools. We also bought Adobe, which we believe should benefit from the convergence of digital media, marketing and payments facilitated by consumers' growing on-line presence. We sold holdings including Praxair, Costco, Novozymes and Sanofi, primarily on valuation concerns.
Looking ahead, while extreme financial market volatility can precipitate real world pressures, especially for an over-leveraged global economy, absent some significant shock we do not foresee a return to global recession. We believe China's economy, while slower, is still growing, and that even if the Fed acts this fall, U.S. rates are likely to remain low and supportive of growth for some time.
Beyond the headlines, the U.S. economy appears to be moving forward. Auto sales have been setting post-crisis records, non-residential construction has been growing, and the labor market has continued tightening. While deflationary pressures weigh on commodity-producing nations, lower costs benefit purchasing power for consumers here and abroad. Clearly global risks remain, but U.S. fundamentals appear to us firm and supportive for equities.
We remain pleased with our portfolio companies, believing they are positioned to outperform peers—with strong cash flow and balance sheets ready to weather a storm should one arise.
We look forward to continuing to serve your investment needs.
Sincerely,
Arthur Moretti* and Ingrid S. Dyott
Portfolio Co-Managers
* As previously disclosed in the supplement to prospectus, Arthur Moretti recently announced he intends to retire in February 2016 after a 28-year career and 14 years at Neuberger Berman. Effective February 5, 2016, Ingrid Dyott and Sajjad Ladiwala will be Portfolio Co-Managers. Mamundi Subhas will remain Associate Portfolio Manager.
Information about principal risks of investing in the Fund is set forth in the prospectus and statement of additional information.
The portfolio composition, industries and holdings of the Fund are subject to change without notice.
The opinions expressed are those of the Fund's portfolio managers. The opinions are as of the date of this report and are subject to change without notice.
Socially Responsive Fund (Unaudited)
TICKER SYMBOLS
Investor Class | | NBSRX | |
Trust Class | | NBSTX | |
Institutional Class | | NBSLX | |
Class A | | NRAAX | |
Class C | | NRACX | |
Class R3 | | NRARX | |
Class R6 | | NRSRX | |
SECTOR ALLOCATION
(as a % of Total Investments) | |
Consumer Discretionary | | | 13.7 | % | |
Consumer Staples | | | 6.1 | | |
Energy | | | 6.8 | | |
Financials | | | 16.7 | | |
Health Care | | | 9.4 | | |
Industrials | | | 18.7 | | |
Information Technology | | | 20.8 | | |
Telecommunication Services | | | 1.4 | | |
Utilities | | | 3.9 | | |
Short-Term Investments | | | 2.5 | | |
Total | | | 100.0 | % | |
PERFORMANCE HIGHLIGHTS7
| | | | | Average Annual Total
Return Ended 08/31/2015 | |
| | | Inception
Date | | 1 Year | | 5 Years | | 10 Years | | Life of
Fund | |
At NAV | |
Investor Class | | 03/16/1994 | | | 0.29 | % | | | 14.41 | % | | | 6.98 | % | | | 8.98 | % | |
| Trust Class3 | | 03/03/1997 | | | 0.12 | % | | | 14.21 | % | | | 6.79 | % | | | 8.80 | % | |
| Institutional Class5 | | 11/28/2007 | | | 0.46 | % | | | 14.61 | % | | | 7.13 | % | | | 9.05 | % | |
| Class A20 | | 05/27/2009 | | | 0.11 | % | | | 14.17 | % | | | 6.85 | % | | | 8.92 | % | |
| Class C20 | | 05/27/2009 | | | –0.67 | % | | | 13.32 | % | | | 6.35 | % | | | 8.68 | % | |
| Class R317 | | 05/27/2009 | | | –0.12 | % | | | 13.91 | % | | | 6.70 | % | | | 8.84 | % | |
| Class R624 | | 03/15/2013 | | | 0.51 | % | | | 14.55 | % | | | 7.04 | % | | | 9.01 | % | |
With Sales Charge | |
| Class A20 | | | | | | | –5.66 | % | | | 12.83 | % | | | 6.22 | % | | | 8.62 | % | |
| Class C20 | | | | | | | –1.50 | % | | | 13.32 | % | | | 6.35 | % | | | 8.68 | % | |
Index | |
| S&P 500® Index1,16 | | | | | | | 0.48 | % | | | 15.87 | % | | | 7.15 | % | | | 9.03 | % | |
The performance data quoted represent past performance and do not indicate future results. Current performance may be lower or higher than the performance data quoted. For performance data current to the most recent month-end, please visit www.nb.com/performance.
The results shown in the table reflect the reinvestment of income dividends and other distributions, if any. The results do not reflect the effect of taxes a shareholder would pay on Fund distributions or on the redemption of Fund shares.
The investment return and principal value of an investment will fluctuate and shares, when redeemed, may be worth more or less than their original cost.
Returns would have been lower if Neuberger Berman Management LLC (Management) had not reimbursed certain expenses and/or waived a portion of the investment management fees during certain of the periods shown. Repayment by a class (of expenses previously reimbursed and/or fees previously waived by Management) will decrease the class's returns. Please see Note B in the Notes to Financial Statements for specific information regarding expense reimbursement and/or fee waiver arrangements.
As stated in the Fund's most recent prospectus, the total annual operating expense ratios for fiscal year 2014 were 0.86%, 1.03%, 0.68%, 1.06%, 1.80%, 1.29% and 0.61% for Investor Class, Trust Class, Institutional Class, Class A, Class C, Class R3 and Class R6 shares, respectively (before expense reimbursements and/or fee waivers, if any). The expense ratios for the annual period ended August 31, 2015 can be found in the Financial Highlights section of this report.
Returns shown with a sales charge reflect the deduction of the current maximum initial sales charge of 5.75% for Class A shares and the contingent deferred sales charge (CDSC) for Class C shares. The CDSC for Class C shares is 1%, which is reduced to 0% after 1 year. The performance of the Fund's share classes will differ primarily due to different sales charge structures and class expenses. Please see the prospectus for more information about sales charge structures, if any, and class expenses for your share class.
Socially Responsive Fund (Unaudited)
COMPARISON OF A $10,000 INVESTMENT
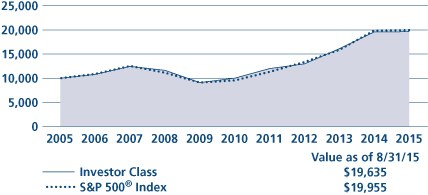
This graph shows the change in value of a hypothetical $10,000 investment in the Fund over the past 10 fiscal years, or since the Fund's inception if it has not operated for 10 years. The graph is based on the Investor Class shares only; the performance of the Fund's share classes will differ primarily due to different sales charge structures and class expenses (see Performance Highlights chart on previous page). The result is compared with benchmarks, which include a broad-based market index and may include a more narrowly based index. Market indices have not been reduced to reflect any of the fees and costs of investing. The results shown in the graph reflect the reinvestment of income dividends and other distributions, if any. The results do not reflect the effect of taxes a shareholder would pay on Fund distributions or on the redemption of Fund shares. Results represent past performance and do not indicate future results.
Value Fund Commentary (Unaudited)
Neuberger Berman Value Fund Institutional Class generated a –7.42% total return for the fiscal year ended August 31, 2015, underperforming its benchmark, the Russell 1000® Value Index, which returned –3.48% for the same period. (Performance for all share classes is provided in the table immediately following this letter.)
Over the fiscal year, we saw an extended period of relative calm and modest equity gains promote a sense of complacency, which was shattered when underlying macro concerns escalated into a steep market correction. Stocks were somewhat choppy early in the year amid growing apprehension about the state of the global economy, the potential for a rate hike by the U.S. Federal Reserve (Fed) and the free-fall in crude oil prices. Yet, the market swiftly recovered time and again despite continued downward pressures. Issues such as the Greek sovereign debt crisis, signs of economic weakness in China and the negative impact of a rising U.S. dollar and deflated crude oil prices remained hot topics for investors throughout the period, but an improving U.S. economy and words of assurance from the Fed and other global policymakers kept the equity market in a fairly narrow trading band for several months. Tensions began to rise, however, as the September deadline for a Fed rate decision drew closer. Anxiety over China then reached a tipping point in August when the People's Bank of China unexpectedly devalued the nation's currency to prop up its economy. The move ignited a sell-off in equities that led to a double-digit drop in U.S. stocks. The market recouped some of its losses but large-cap value stocks still ended the period with an overall decline.
There was a wide spread between the best and worst performing sectors within the Russell 1000 Value Index over the period. Health Care was at one end of the spectrum, with a double-digit positive return owed in part to robust mergers and acquisitions activity within the segment, while Energy and Materials suffered overall losses of over 30% and 18%, respectively, due largely to weak oil prices and a macro slowdown in China. In the middle, Financials, Consumer Discretionary and Consumer Staples eked out modestly positive returns while Information Technology, Industrials and Telecommunication Services produced moderate losses.
In the Fund, our strategic decision to underweight the Energy sector versus the index resulted in a large benefit to relative returns as this was by far the worst performing area of the market over the fiscal year. Oil prices fell off a cliff in December and continued to test these lows throughout the period as crude production levels remained robust in the face of weaker than expected demand, primarily from China. Health Care provided the largest lift to performance on an absolute basis, and our selection of stocks fared better than their index sector counterparts. However our lighter weighting in this area versus the index was a negative. The largest detractor from both absolute and relative performance during the period was the Materials sector. Our overweight in this segment versus the index, particularly in the Metals & Mining industry, was the main source of the loss as these companies suffered from slower demand from China and expectations of depressed future growth in that region. The second largest detractor from overall total returns was Energy.
We remain generally positive on the overall equity market, as we believe that U.S. stocks should continue to benefit from the slowly improving domestic economy. Still, we continue to be wary of the global macro picture and other external factors. Corporate profits are largely expected to grow next year if the U.S. labor market continues to improve and consumers continue to reap the benefits of low fuel costs; however, the latest earnings season was muted given weakness in Energy and lackluster results among large multinationals, a situation that could persist if oil prices decline further or the U.S. dollar continues to advance. The risk of a more severe economic downturn in China and other emerging markets is also a source of concern, particularly as the U.S. appears to be embarking on a path of interest rate tightening, which could leave the domestic economy more vulnerable to external shocks. While we are cognizant of these concerns, we feel the global economy is on the mend and that there are attractive opportunities in some of the most affected areas of the most recent downturn. The best way to navigate such an environment, in our view, is to take a bottom-up investment approach in looking for underappreciated stocks carrying hidden value that could be realized if specific catalysts play out over time.
Sincerely,
Eli M. Salzmann
Portfolio Manager
Information about principal risks of investing in the Fund is set forth in the prospectus and statement of additional information.
The portfolio composition, industries and holdings of the Fund are subject to change without notice.
The opinions expressed are those of the Fund's portfolio manager. The opinions are as of the date of this report and are subject to change without notice.
TICKER SYMBOLS
Institutional Class | | NLRLX | |
Class A | | NVAAX | |
Class C | | NVACX | |
SECTOR ALLOCATION
(as a % of Total Investments) | |
Consumer Discretionary | | | 17.3 | % | |
Consumer Staples | | | 1.0 | | |
Energy | | | 9.0 | | |
Financials | | | 29.2 | | |
Health Care | | | 7.3 | | |
Industrials | | | 20.9 | | |
Information Technology | | | 6.5 | | |
Materials | | | 8.8 | | |
Short-Term Investments | | | 0.0 | | |
Total | | | 100.0 | % | |
PERFORMANCE HIGHLIGHTS9
| | | | | Average Annual Total
Return Ended 08/31/2015 | |
| | | Inception
Date* | | 1 Year | | 5 Years | | Life of
Fund | |
At NAV | |
| Institutional Class21 | | 04/19/2010 | | | –7.42 | % | | | 13.94 | % | | | 6.68 | % | |
| Class A21 | | 03/02/2011 | | | –7.71 | % | | | 13.56 | % | | | 6.48 | % | |
| Class C21 | | 03/02/2011 | | | –8.44 | % | | | 12.79 | % | | | 6.07 | % | |
With Sales Charge | |
| Class A21 | | | | | | | –13.01 | % | | | 12.22 | % | | | 5.77 | % | |
| Class C21 | | | | | | | –9.30 | % | | | 12.79 | % | | | 6.07 | % | |
Index | |
| Russell 1000® Value Index1,16 | | | | | | | –3.48 | % | | | 14.68 | % | | | 4.91 | % | |
*The performance data for each class includes the performance of the Fund's oldest share class, Trust Class, from November 2, 2006 through April 19, 2010. The performance data for Class A and Class C also includes the performance of the Fund's Institutional Class from April 19, 2010 through March 2, 2011. See endnote 21 for information about the effects of the different fees paid by each class.
The performance data quoted represent past performance and do not indicate future results. Current performance may be lower or higher than the performance data quoted. For performance data current to the most recent month-end, please visit www.nb.com/performance.
The results shown in the table reflect the reinvestment of income dividends and other distributions, if any. The results do not reflect the effect of taxes a shareholder would pay on Fund distributions or on the redemption of Fund shares.
The investment return and principal value of an investment will fluctuate and shares, when redeemed, may be worth more or less than their original cost.
Returns would have been lower if Neuberger Berman Management LLC (Management) had not reimbursed certain expenses and/or waived a portion of the investment management fees during certain of the periods shown. Repayment by a class (of expenses previously reimbursed and/or fees previously waived by Management) will decrease the class's returns. Please see Note B in the Notes to Financial Statements for specific information regarding expense reimbursement and/or fee waiver arrangements.
As stated in the Fund's most recent prospectus, the total annual operating expense ratios for fiscal year 2014 were 2.44%, 2.83% and 3.60% for Institutional Class, Class A and Class C shares, respectively (before expense reimbursements and/or fee waivers, if any). The expense ratios were 0.78%, 1.14% and 1.89% for Institutional Class, Class A and Class C shares, respectively, after expense reimbursements and/or fee waivers. The expense ratios for the annual period ended August 31, 2015 can be found in the Financial Highlights section of this report.
Returns shown with a sales charge reflect the deduction of the current maximum initial sales charge of 5.75% for Class A shares and the contingent deferred sales charge (CDSC) for Class C shares. The CDSC for Class C shares is 1%, which is reduced to 0% after 1 year. The performance of the Fund's share classes will differ primarily due to different sales charge structures and class expenses. Please see the prospectus for more information about sales charge structures, if any, and class expenses for your share class.
COMPARISON OF A $1,000,000 INVESTMENT21
(000's Omitted)
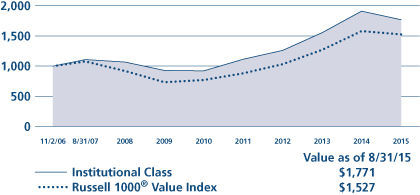
This graph shows the change in value of a hypothetical $1,000,000 investment in the Fund over the past 10 fiscal years, or since the Fund's inception if it has not operated for 10 years. The graph is based on the Institutional Class shares only; the performance of the Fund's share classes will differ primarily due to different sales charge structures and class expenses (see Performance Highlights chart on previous page). The result is compared with benchmarks, which include a broad-based market index and may include a more narrowly based index. Market indices have not been reduced to reflect any of the fees and costs of investing. The results shown in the graph reflect the reinvestment of income dividends and other distributions, if any. The results do not reflect the effect of taxes a shareholder would pay on Fund distributions or on the redemption of Fund shares. Results represent past performance and do not indicate future results.
World Equity Fund Commentary (Unaudited)
We are pleased to provide the first annual report for Neuberger Berman World Equity Fund, which was launched on June 30, 2015. The Fund seeks long-term capital appreciation by investing primarily in equity securities of companies located around the world, including companies in both developed and emerging markets. We combine both a top-down, thematic framework and fundamental bottom-up stock analyses to identify and select what we believe are attractive equity investment opportunities.
For the two-month period since its inception through August 31, 2015, the Fund's Institutional Class generated a –4.70% total return but outperformed its benchmark, the MSCI All Country World Index, which provided a –5.93% return for the same period. (Performance for all share classes is provided in the table immediately following this letter.)
From a stock perspective, the top contributors to performance during the reporting period included a French industrial company, a Japanese construction company and an Internet retailer based in the U.S. The top detractors included a Taiwanese semiconductor equipment company, a U.S. technology hardware company and a Korean cosmetics company. From a sector perspective, the top contributors during the period were Industrials, Telecommunication Services and Utilities. The top detractors were Information Technology, Financials and Health Care. The Fund's use of financial futures contracts contributed positively to the Fund's performance while equity swaps and forward foreign currency contracts detracted from performance.
We are broadly constructive on global equity markets for the remainder of 2015. In particular, we are positive on European equity markets, where we anticipate continued economic healing as suggested by a number of leading economic indicators. A weaker euro, highly accommodative monetary policy and an apparent resolution of the Greek crisis could provide further support, in our view. We are also constructive on investment opportunities in Japan, where earnings momentum has been strong and continued improvement in corporate governance is anticipated. We believe the U.S. equity market may face some uncertainties as relating to its response to a widely anticipated cycle of interest rate increases.
Sincerely,
Daniel Geber
Portfolio Manager
Information about principal risks of investing in the Fund is set forth in the prospectus and statement of additional information.
The portfolio composition, industries and holdings of the Fund are subject to change without notice.
The opinions expressed are those of the Fund's portfolio manager. The opinions are as of the date of this report and are subject to change without notice.
World Equity Fund (Unaudited)
TICKER SYMBOLS
Institutional Class | | NWTIX | |
Class A | | NWTAX | |
Class C | | NWTCX | |
PERFORMANCE HIGHLIGHTS9
| | | Inception Date | | Cumulative Total Return
Ended 08/31/2015
Life of Fund | |
At NAV | |
Institutional Class | | 06/30/2015 | | | –4.70 | % | |
Class A | | 06/30/2015 | | | –4.80 | % | |
Class C | | 06/30/2015 | | | –4.90 | % | |
With Sales Charge | |
Class A | | | | | | | –10.27 | % | |
Class C | | | | | | | –5.85 | % | |
Index | |
| MSCI All Country World Index1,16 | | | | | | | –5.93 | % | |
The performance data quoted represent past performance and do not indicate future results. Current performance may be lower or higher than the performance data quoted. For performance data current to the most recent month-end, please visit www.nb.com/performance.
The results shown in the table reflect the reinvestment of income dividends and other distributions, if any. The results do not reflect the effect of taxes a shareholder would pay on Fund distributions or on the redemption of Fund shares.
The investment return and principal value of an investment will fluctuate and shares, when redeemed, may be worth more or less than their original cost.
Returns would have been lower if Neuberger Berman Management LLC (Management) had not reimbursed certain expenses and/or waived a portion of the investment management fees during the period shown. Repayment by a class (of expenses previously reimbursed and/or fees previously waived by Management) will decrease the class's returns. Please see Note B in the Notes to Financial Statements for specific information regarding expense reimbursement and/or fee waiver arrangements.
As stated in the Fund's most recent prospectus, the estimated total annual operating expense ratios for fiscal year 2015 are 1.40%, 1.76% and 2.51% for Institutional Class, Class A and Class C shares, respectively (before expense reimbursements and/or fee waivers, if any). The estimated expense ratios were 1.01%, 1.37% and 2.12% for Institutional Class, Class A and Class C shares, respectively, after expense reimbursements and/or fee waivers. The expense ratios for the period from June 30, 2015 through August 31, 2015 can be found in the Financial Highlights section of this report.
Returns shown with a sales charge reflect the deduction of the current maximum initial sales charge of 5.75% for Class A shares and the contingent deferred sales charge (CDSC) for Class C shares. The CDSC for Class C shares is 1%, which is reduced to 0% after 1 year. The performance of the Fund's share classes will differ primarily due to different sales charge structures and class expenses. Please see the prospectus for more information about sales charge structures, if any, and class expenses for your share class.
World Equity Fund (Unaudited)
COMPARISON OF A $1,000,000 INVESTMENT
(000's Omitted)

This graph shows the change in value of a hypothetical $1,000,000 investment in the Fund over the past 10 fiscal years, or since the Fund's inception if it has not operated for 10 years. The graph is based on the Institutional Class shares only; the performance of the Fund's share classes will differ primarily due to different sales charge structures and class expenses (see Performance Highlights chart on previous page). The result is compared with benchmarks, which include a broad-based market index and may include a more narrowly based index. Market indices have not been reduced to reflect any of the fees and costs of investing. The results shown in the graph reflect the reinvestment of income dividends and other distributions, if any. The results do not reflect the effect of taxes a shareholder would pay on Fund distributions or on the redemption of Fund shares. Results represent past performance and do not indicate future results.
1 Please see "Glossary of Indices" on page 74 for a description of indices. Please note that individuals cannot invest directly in any index. The indices described in this report do not take into account any fees, expenses or tax consequences of investing in the individual securities that they track. Data about the performance of an index are prepared or obtained by Neuberger Berman Management LLC ("Management") and reflect the reinvestment of income dividends and other distributions, if any. The Fund may invest in securities not included in a described index and generally does not invest in all securities included in a described index.
2 This date reflects when Management first became the investment manager to the Fund.
3 The performance information for the Trust Class prior to the class's inception date is that of the Fund's Investor Class. The performance information for the Investor Class has not been adjusted to take into account differences in class specific operating expenses. The Investor Class has lower expenses and typically higher returns than the Trust Class.
4 The performance information for the Advisor Class prior to the class's inception date is that of the Fund's Investor Class. The performance information for the Investor Class has not been adjusted to take into account differences in class specific operating expenses. The Investor Class has lower expenses and typically higher returns than the Advisor Class.
5 The performance information for the Institutional Class prior to the class's inception date is that of the Fund's Investor Class. The performance information for the Investor Class has not been adjusted to take into account differences in class specific operating expenses. The Investor Class has higher expenses and typically lower returns than the Institutional Class.
6 The performance information for the Institutional Class prior to the class's inception date is that of the Fund's Trust Class. The performance information for the Trust Class has not been adjusted to take into account differences in class specific operating expenses. The Trust Class has higher expenses and typically lower returns than the Institutional Class.
7 The investments for the Fund are managed by the same portfolio manager(s) who manage(s) one or more other registered funds that have names, investment objectives and investment styles that are similar to those of the Fund. You should be aware that the Fund is likely to differ from those other mutual fund(s) in size, cash flow pattern and tax matters. Accordingly, the holdings and performance of the Fund can be expected to vary from those of the other mutual fund(s).
8 The Fund had a policy of investing mainly in large-cap stocks prior to September 1998 and investing 90% of its assets in no more than six economic sectors prior to December 17, 2007. As of April 2, 2001, the Fund changed its investment policy to become "non-diversified" under the Investment Company Act of 1940 ("1940 Act"). Performance prior to these changes might have been different if current policies had been in effect. However, by operation of law under the 1940 Act, the Fund subsequently became, and currently operates as, a diversified fund. Please see the notes to the financial statements for information on a non-diversified fund becoming a diversified fund by operation of law.
9 Neuberger Berman Global Real Estate Fund and Neuberger Berman World Equity Fund are relatively small. Each of Neuberger Berman Emerging Markets Equity Fund, Neuberger Berman Equity Income Fund, Neuberger Berman Global Equity Fund, Neuberger Berman Multi-Cap Opportunities Fund and Neuberger Berman Value Fund was relatively small prior to September 2010, June 2008, August 2013, January 2010 and April 2013, respectively. The same techniques used to produce returns in a small fund may not work to produce similar returns in a larger fund.
10 The performance information for Class R3 prior to the class's inception date is that of the Fund's Institutional Class. The performance information for the Institutional Class has not been adjusted to take into account differences in class specific operating expenses (such as Rule 12b-1 fees). The Institutional Class has lower expenses and typically higher returns than Class R3.
11 As of December 17, 2007, the Fund changed its investment policy to become "non-diversified" under the 1940 Act. A non-diversified fund is able to invest larger percentages of its assets in the securities of a single issuer, which could increase the fund's risk of loss. Performance prior to this change might have been different if current policies had been in effect. Although the Fund has a policy that allows it to operate as a non-diversified fund, on December 5, 2008, the Board adopted a policy, which cannot be changed without a shareholder vote, that the Fund will invest its portfolio so as to meet the standards of a diversified fund.
12 The Fund had a policy of investing mainly in large-cap stocks prior to December 2002. Its performance prior to that date might have been different if current policies had been in effect.
13 The performance information for Class A, Class C, Investor Class, and Trust Class prior to the classes' inception date is that of the Fund's Institutional Class. The performance information for the Institutional Class has been adjusted to reflect the appropriate sales charges applicable to Class A and Class C shares, but has not been adjusted to take into account differences in class specific operating expenses (such as Rule 12b-1 fees). The Institutional Class has lower expenses and typically higher returns than Class A, Class C, Investor Class, and Trust Class.
14 The performance information for Institutional Class, Class A, Class C and Class R3 prior to June 9, 2008 is that of the Fund's Trust Class, which had an inception date of November 2, 2006, and converted into the Institutional Class on June 9, 2008. During the period from November 2, 2006 through June 9, 2008, the Trust Class had only one investor, which could have impacted Fund performance. The performance information for the Trust Class has been adjusted to reflect the appropriate sales charges applicable to Class A and Class C shares, but has not been adjusted to take into account differences in class specific operating expenses (such as Rule 12b-1 fees). The Trust Class had higher expenses and typically lower returns than the Institutional Class. The Trust Class had lower expenses and typically higher returns than Class A, Class C and Class R3. The performance information for Class R3 from June 9, 2008 to the class's inception date is that of the Fund's Institutional Class. The performance information for the Institutional Class has not been adjusted to take into account differences in class specific operating expenses (such as Rule 12b-1 fees). The Institutional Class has lower expenses and typically higher returns than Class R3.
15 The performance information for Class A, Class C and Class R3 prior to the classes' respective inception dates is that of the Fund's Trust Class. The performance information for the Trust Class has been adjusted to reflect the appropriate sales charges applicable to Class A and Class C shares, but has not been adjusted to take into account differences in class specific operating expenses (such as Rule 12b-1 fees). The Trust Class has lower expenses and typically higher returns than Class A, Class C and Class R3.
16 The date used to calculate Life of Fund performance for the index is the inception date of the oldest share class.
17 The performance information for Class R3 prior to the class's inception date is that of the Fund's Investor Class. The performance information for the Investor Class has not been adjusted to take into account differences in class specific operating expenses (such as Rule 12b-1 fees). The Investor Class has lower expenses and typically higher returns than Class R3.
18 Prior to December 14, 2009, the Fund had different investment goals, strategies and portfolio management team. The performance information for Institutional Class, Class A and Class C prior to December 21, 2009 is that of the Fund's Trust Class, which had an inception date of November 2, 2006, and converted into the Institutional Class on December 21, 2009. During the period from November 2, 2006 through December 21, 2009, the Trust Class had only one investor, which could have impacted Fund performance. The performance information for the TrustClass has been adjusted to reflect the appropriate sales charges applicable to Class A and Class C shares, but has not been adjusted to take into account differences in class specific operating expenses (such as Rule 12b-1 fees). Management had previously capped Trust Class expenses; absent this arrangement, the returns would have been
lower. The Trust Class had lower capped expenses and typically higher returns than Class A and Class C. The Trust Class had equivalent capped expenses and typically similar returns to the Institutional Class.
19 The performance information for Institutional Class, Class A and Class C prior to the classes' inception date is that of the Fund's predecessor, the DJG Small Cap Value Fund L.P., an unregistered limited partnership ("DJG Fund"); DJG Fund was the successor to The DJG Small Cap Value Fund, an unregistered commingled investment account ("DJG Account"). The performance from July 8, 1997 (the commencement of operations) to September 11, 2008 is that of DJG Account, and the performance from September 12, 2008 to May 10, 2010 is that of DJG Fund. On May 10, 2010, the DJG Fund transferred its assets to the Fund in exchange for the Fund's Institutional Class shares. The investment policies, objectives, guidelines and restrictions of the Fund are in all material respects equivalent to those of DJG Fund and DJG Account (the "Predecessors"). As a mutual fund registered under the 1940 Act, the Fund is subject to certain restrictions under the 1940 Act and the Internal Revenue Code ("Code") to which the Predecessors were not subject. Had the Predecessors been registered under the 1940 Act and been subject to the provisions of the 1940 Act and the Code, their investment performance may have been adversely affected. The performance information reflects the actual expenses of the Predecessors, which were generally lower than those of the Fund.
20 The performance information for Class A and Class C prior to the classes' inception date is that of the Fund's Investor Class. The performance information for the Investor Class has been adjusted to reflect the appropriate sales charges applicable to Class A and Class C shares, but has not been adjusted to take into account differences in class specific operating expenses (such as Rule 12b-1 fees). The Investor Class has lower expenses and typically higher returns than Class A and Class C.
21 The performance information for Institutional Class, Class A and Class C prior to April 19, 2010 is that of the Fund's Trust Class, which had an inception date of November 2, 2006, and converted into the Institutional Class on April 19, 2010. During the period from November 2, 2006 through April 19, 2010, the Trust Class had only one investor, which could have impacted Fund performance. The performance information for Class A and Class C from April 19, 2010 to the classes' inception date is that of the Fund's Institutional Class. During the period from April 19, 2010 through March 2, 2011, the Institutional Class had only one investor, which could have impacted Fund performance. The performance information for the Trust Class and the Institutional Class has been adjusted to reflect the appropriate sales charges applicable to Class A and Class C shares, but has not been adjusted to take into account differences in class specific operating expenses (such as Rule 12b-1 fees). The Trust Class had higher expenses and typically lower returns than the Institutional Class. The Trust Class had lower expenses and typically higher returns than Class A and Class C. The Institutional Class has lower expenses and typically higher returns than Class A and Class C.
22 As of June 19, 2012, the Fund changed its investment policy to become "non-diversified" under the 1940 Act. A non-diversified fund is able to invest larger percentages of its assets in the securities of a single issuer, which could increase the fund's risk of loss. Performance prior to this change might have been different if current policies had been in effect.
23 The performance information for Class R6 prior to the class's inception date is that of the Fund's Institutional Class. The performance information for the Institutional Class has not been adjusted to take into account differences in class specific operating expenses. The Institutional Class has higher expenses and typically lower returns than Class R6.
24 The performance information for Class R6 prior to the class's inception date is that of the Fund's Investor Class. The performance information for the Investor Class has not been adjusted to take into account differences in class specific operating expenses. The Investor Class has higher expenses and typically lower returns than Class R6.
25 The performance information for Class R6 prior to the class's inception date is that of the Fund's Trust Class. The performance information for the Trust Class has not been adjusted to take into account differences in class specific operating expenses. The Trust Class has higher expenses and typically lower returns than Class R6.
26 The Fund had a policy of investing mainly in common stocks of companies with a market capitalization greater than $7.5 billion at the time of purchase prior to September 2, 2014. Its performance prior to that date might have been different if current policies had been in effect.
For more complete information on any of the Neuberger Berman Equity Funds, call Neuberger Berman Management LLC at (800) 877-9700, or visit our website at www.nb.com.
FTSE EPRA / NAREIT Developed Index: | | The index is a free float-adjusted market capitalization-weighted index that is designed to measure the performance of listed real estate companies and real estate investment trusts (REITs) in developed markets. | |
FTSE NAREIT All Equity REITs Index: | | The index is a free float-adjusted market capitalization-weighted index that tracks the performance of all equity real estate investment trusts (REITs) that are listed on the New York Stock Exchange, the NYSE Arca or the NASDAQ National Market List. Equity REITs include all tax-qualified REITs with more than 50% of total assets in qualifying real estate assets other than mortgages secured by real property. | |
MSCI All Country World Index: | | The index is a free float-adjusted market capitalization-weighted index that is designed to measure the equity market performance of developed and emerging markets. The index consists of 46 country indices comprising 23 developed and 23 emerging market country indices. The developed market country indices included are: Australia, Austria, Belgium, Canada, Denmark, Finland, France, Germany, Hong Kong, Ireland, Israel, Italy, Japan, the Netherlands, New Zealand, Norway, Portugal, Singapore, Spain, Sweden, Switzerland, the United Kingdom, and the United States. The emerging market country indices included are: Brazil, Chile, China, Colombia, Czech Republic, Egypt, Greece, Hungary, India, Indonesia, Korea, Malaysia, Mexico, Peru, the Philippines, Poland, Qatar, Russia, South Africa, Taiwan, Thailand, Turkey, and the UAE. | |
MSCI China Index: | | The index is a free float-adjusted market capitalization-weighted index that is designed to measure the equity market performance of Chinese securities readily accessible to nondomestic investors. The index includes equity securities issued by companies incorporated in the People's Republic of China ("PRC"), and listed in the form of China B shares on the Shanghai Stock Exchange (in US$) or Shenzhen Stock Exchange (in HK$), or China H shares on the Hong Kong Stock Exchange (in HK$) and other foreign exchanges. It also includes Red-Chips and P-Chips, which are not incorporated in the PRC and are listed on the Hong Kong Stock Exchange. Red-Chips include companies that are directly or indirectly controlled by organizations or enterprises that are owned by the state, provinces, or municipalities of the PRC. P-Chips include non-state-owned Chinese companies incorporated outside the mainland and traded in Hong Kong. The index does not include China A-shares or securities of U.S. and Singapore-listed overseas companies. (China A-shares are securities listed on the Shanghai or Shenzhen Stock Exchanges and traded in renminbi, with limited accessibility to foreign investors.) | |
| MSCI EAFE® Index (Europe, Australasia, Far East): | | The index is a free float-adjusted market capitalization-weighted index that is designed to measure the equity market performance of developed markets, excluding the United States and Canada. The index consists of the following 21 developed market country indices: Australia, Austria, Belgium, Denmark, Finland, France, Germany, Hong Kong, Ireland, Israel, Italy, Japan, the Netherlands, New Zealand, Norway, Portugal, Singapore, Spain, Sweden, Switzerland, and the United Kingdom. | |
MSCI Emerging Markets Index: | | The index is a free float-adjusted market capitalization-weighted index that is designed to measure the equity market performance of emerging markets. The index consists of the following 23 emerging market country indices: Brazil, Chile, China, Colombia, Czech Republic, Egypt, Greece, Hungary, India, Indonesia, Korea, Malaysia, Mexico, Peru, the Philippines, Poland, Qatar, Russia, South Africa, Taiwan, Thailand, Turkey, and the UAE. | |
Glossary of Indices (cont'd)
| Russell 1000® Index: | | The index is a float-adjusted market capitalization-weighted index that measures the performance of the large-cap segment of the U.S. equity market. It includes approximately 1,000 of the largest securities in the Russell 3000® Index (which measures the performance of the 3,000 largest U.S. public companies based on total market capitalization). The index is rebalanced annually in June. | |
| Russell 1000® Growth Index: | | The index is a float-adjusted market capitalization-weighted index that measures the performance of the large-cap growth segment of the U.S. equity market. It includes those Russell 1000 Index companies with higher price-to-book ratios and higher forecasted growth rates. The index is rebalanced annually in June. | |
| Russell 1000® Value Index: | | The index is a float-adjusted market capitalization-weighted index that measures the performance of the large-cap value segment of the U.S. equity market. It includes those Russell 1000 Index companies with lower price-to-book ratios and lower forecasted growth rates. The index is rebalanced annually in June. | |
| Russell 2000® Index: | | The index is a float-adjusted market capitalization-weighted index that measures the performance of the small-cap segment of the U.S. equity market. It includes approximately 2,000 of the smallest securities in the Russell 3000® Index (which measures the performance of the 3,000 largest U.S. public companies based on total market capitalization). The index is rebalanced annually in June. | |
| Russell 2000® Growth Index: | | The index is a float-adjusted market capitalization-weighted index that measures the performance of the small-cap growth segment of the U.S. equity market. It includes those Russell 2000 Index companies with higher price-to-book ratios and higher forecasted growth rates. The index is rebalanced annually in June. | |
| Russell 2000® Value Index: | | The index is a float-adjusted market capitalization-weighted index that measures the performance of the small-cap value segment of the U.S. equity market. It includes those Russell 2000 Index companies with lower price-to-book ratios and lower forecasted growth rates. The index is rebalanced annually in June. | |
| Russell Midcap® Index: | | The index is a float-adjusted market capitalization-weighted index that measures the performance of the mid-cap segment of the U.S. equity market. It includes approximately 800 of the smallest securities in the Russell 1000 Index. The index is rebalanced annually in June. | |
| Russell Midcap® Growth Index: | | The index is a float-adjusted market capitalization-weighted index that measures the performance of the mid-cap growth segment of the U.S. equity market. It includes those Russell Midcap Index companies with higher price-to-book ratios and higher forecasted growth rates. The index is rebalanced annually in June. | |
| Russell Midcap® Value Index: | | The index is a float-adjusted market capitalization-weighted index that measures the performance of the mid-cap value segment of the U.S. equity market. It includes those Russell Midcap Index companies with lower price-to-book ratios and lower forecasted growth rates. The index is rebalanced annually in June. | |
| S&P 500® Index: | | The index is a float-adjusted market capitalization-weighted index that focuses on the large-cap segment of the U.S. equity market, and includes a significant portion of the total value of the market. | |
Information About Your Fund's Expenses (Unaudited)
As a Fund shareholder, you incur two types of costs: (1) transaction costs, including sales charges (loads) on purchase payments or redemption proceeds (if applicable); and (2) ongoing costs, including management fees, distribution and/or service (12b-1) fees (if applicable), and other Fund expenses. This example is intended to help you understand your ongoing costs (in U.S. dollars) of investing in a Fund and compare these costs with the ongoing costs of investing in other mutual funds.
This table is designed to provide information regarding costs related to your investments. The following examples are based on an investment of $1,000 made at the beginning of the six month period ended August 31, 2015 and held for the entire period. The table illustrates each Fund's costs in two ways:
Actual Expenses and Performance: | | The first section of the table provides information about actual account values and actual expenses in dollars, based on the Fund's actual performance during the period indicated. You may use the information in this line, together with the amount you invested, to estimate the expenses you paid over the period. Simply divide your account value by $1,000 (for example, an $8,600 account value divided by $1,000 = 8.6), then multiply the result by the number in the first section of the table under the heading entitled "Expenses Paid During the Period" to estimate the expenses you paid over the period. | |
Hypothetical Example for
Comparison Purposes: | | The second section of the table provides information about hypothetical account values and hypothetical expenses based on the Fund's actual expense ratio and an assumed rate of return at 5% per year before expenses. This return is not the Fund's actual return. The hypothetical account values and expenses may not be used to estimate the actual ending account balance or expenses you paid for the period. You may use this information to compare the ongoing costs of investing in a Fund versus other funds. To do so, compare the expenses shown in this 5% hypothetical example with the 5% hypothetical examples that appear in the shareholder reports of other funds. | |
Please note that the expenses in the table are meant to highlight your ongoing costs only and do not include any transaction costs, such as sales charges (loads) (if applicable). Therefore, the information under the heading "Hypothetical (5% annual return before expenses)" is useful in comparing ongoing costs only, and will not help you determine the relative total costs of owning different funds. In addition, if these transaction costs were included, your costs would have been higher.
Expense Information as of 8/31/15 (Unaudited)
Neuberger Berman Equity Funds | |
| | | ACTUAL | | HYPOTHETICAL (5% ANNUAL RETURN BEFORE EXPENSES)(3) | |
| | | Beginning
Account
Value
3/1/15 | | Ending
Account
Value
8/31/15 | | Expenses Paid
During the
Period(1)
3/1/15 - 8/31/15 | | Expense
Ratio | | Beginning
Account
Value
3/1/15 | | Ending
Account
Value
8/31/15 | | Expenses Paid
During the
Period(1)
3/1/15 - 8/31/15 | | Expense
Ratio | |
All Cap Core Fund | |
Institutional Class | | $ | 1,000.00 | | | $ | 951.20 | | | $ | 3.69 | | | | 0.75 | % | | $ | 1,000.00 | | | $ | 1,021.42 | | | $ | 3.82 | | | | 0.75 | % | |
Class A | | $ | 1,000.00 | | | $ | 949.10 | | | $ | 5.90 | | | | 1.20 | % | | $ | 1,000.00 | | | $ | 1,019.16 | | | $ | 6.11 | | | | 1.20 | % | |
Class C | | $ | 1,000.00 | | | $ | 945.40 | | | $ | 9.61 | | | | 1.96 | % | | $ | 1,000.00 | | | $ | 1,015.32 | | | $ | 9.96 | | | | 1.96 | % | |
Emerging Markets Equity Fund | |
Institutional Class | | $ | 1,000.00 | | | $ | 849.50 | | | $ | 5.83 | | | | 1.25 | % | | $ | 1,000.00 | | | $ | 1,018.90 | | | $ | 6.36 | | | | 1.25 | % | |
Class A | | $ | 1,000.00 | | | $ | 848.80 | | | $ | 6.99 | | | | 1.50 | % | | $ | 1,000.00 | | | $ | 1,017.64 | | | $ | 7.63 | | | | 1.50 | % | |
Class C | | $ | 1,000.00 | | | $ | 845.60 | | | $ | 10.47 | | | | 2.25 | % | | $ | 1,000.00 | | | $ | 1,013.86 | | | $ | 11.42 | | | | 2.25 | % | |
Class R3 | | $ | 1,000.00 | | | $ | 846.80 | | | $ | 8.89 | | | | 1.91 | % | | $ | 1,000.00 | | | $ | 1,015.58 | | | $ | 9.70 | | | | 1.91 | % | |
Class R6 | | $ | 1,000.00 | | | $ | 850.20 | | | $ | 5.50 | | | | 1.18 | % | | $ | 1,000.00 | | | $ | 1,019.26 | | | $ | 6.01 | | | | 1.18 | % | |
Equity Income Fund | |
Institutional Class | | $ | 1,000.00 | | | $ | 934.90 | | | $ | 3.32 | | | | 0.68 | % | | $ | 1,000.00 | | | $ | 1,021.78 | | | $ | 3.47 | | | | 0.68 | % | |
Class A | | $ | 1,000.00 | | | $ | 932.10 | | | $ | 5.11 | | | | 1.05 | % | | $ | 1,000.00 | | | $ | 1,019.91 | | | $ | 5.35 | | | | 1.05 | % | |
Class C | | $ | 1,000.00 | | | $ | 929.00 | | | $ | 8.70 | | | | 1.79 | % | | $ | 1,000.00 | | | $ | 1,016.18 | | | $ | 9.10 | | | | 1.79 | % | |
Class R3 | | $ | 1,000.00 | | | $ | 931.70 | | | $ | 6.38 | | | | 1.31 | % | | $ | 1,000.00 | | | $ | 1,018.60 | | | $ | 6.67 | | | | 1.31 | % | |
Focus Fund | |
Investor Class | | $ | 1,000.00 | | | $ | 967.30 | | | $ | 4.51 | | | | 0.91 | % | | $ | 1,000.00 | | | $ | 1,020.62 | | | $ | 4.63 | | | | 0.91 | % | |
Trust Class | | $ | 1,000.00 | | | $ | 966.10 | | | $ | 5.45 | | | | 1.10 | % | | $ | 1,000.00 | | | $ | 1,019.66 | | | $ | 5.60 | | | | 1.10 | % | |
Advisor Class | | $ | 1,000.00 | | | $ | 965.20 | | | $ | 6.34 | | | | 1.28 | % | | $ | 1,000.00 | | | $ | 1,018.75 | | | $ | 6.51 | | | | 1.28 | % | |
Institutional Class | | $ | 1,000.00 | | | $ | 968.10 | | | $ | 3.72 | | | | 0.75 | % | | $ | 1,000.00 | | | $ | 1,021.42 | | | $ | 3.82 | | | | 0.75 | % | |
Class A | | $ | 1,000.00 | | | $ | 966.40 | | | $ | 5.50 | | | | 1.11 | % | | $ | 1,000.00 | | | $ | 1,019.61 | | | $ | 5.65 | | | | 1.11 | % | |
Class C | | $ | 1,000.00 | | | $ | 962.60 | | | $ | 9.20 | | | | 1.86 | % | | $ | 1,000.00 | | | $ | 1,015.83 | | | $ | 9.45 | | | | 1.86 | % | |
Genesis Fund | |
Investor Class | | $ | 1,000.00 | | | $ | 968.30 | | | $ | 5.01 | | | | 1.01 | % | | $ | 1,000.00 | | | $ | 1,020.11 | | | $ | 5.14 | | | | 1.01 | % | |
Trust Class | | $ | 1,000.00 | | | $ | 967.50 | | | $ | 5.50 | | | | 1.11 | % | | $ | 1,000.00 | | | $ | 1,019.61 | | | $ | 5.65 | | | | 1.11 | % | |
Advisor Class | | $ | 1,000.00 | | | $ | 965.90 | | | $ | 6.89 | | | | 1.39 | % | | $ | 1,000.00 | | | $ | 1,018.20 | | | $ | 7.07 | | | | 1.39 | % | |
Institutional Class | | $ | 1,000.00 | | | $ | 968.80 | | | $ | 4.22 | | | | 0.85 | % | | $ | 1,000.00 | | | $ | 1,020.92 | | | $ | 4.33 | | | | 0.85 | % | |
Class R6 | | $ | 1,000.00 | | | $ | 969.30 | | | $ | 3.87 | | | | 0.78 | % | | $ | 1,000.00 | | | $ | 1,021.27 | | | $ | 3.97 | | | | 0.78 | % | |
Global Equity Fund | |
Institutional Class | | $ | 1,000.00 | | | $ | 936.10 | | | $ | 5.61 | | | | 1.15 | % | | $ | 1,000.00 | | | $ | 1,019.41 | | | $ | 5.85 | | | | 1.15 | % | |
Class A | | $ | 1,000.00 | | | $ | 934.00 | | | $ | 7.36 | | | | 1.51 | % | | $ | 1,000.00 | | | $ | 1,017.59 | | | $ | 7.68 | | | | 1.51 | % | |
Class C | | $ | 1,000.00 | | | $ | 930.30 | | | $ | 11.00 | | | | 2.26 | % | | $ | 1,000.00 | | | $ | 1,013.81 | | | $ | 11.47 | | | | 2.26 | % | |
Global Real Estate Fund | |
Institutional Class | | $ | 1,000.00 | | | $ | 912.50 | | | $ | 4.82 | | | | 1.00 | % | | $ | 1,000.00 | | | $ | 1,020.16 | | | $ | 5.09 | | | | 1.00 | % | |
Class A | | $ | 1,000.00 | | | $ | 909.90 | | | $ | 6.55 | | | | 1.36 | % | | $ | 1,000.00 | | | $ | 1,018.35 | | | $ | 6.92 | | | | 1.36 | % | |
Class C | | $ | 1,000.00 | | | $ | 906.40 | | | $ | 10.14 | | | | 2.11 | % | | $ | 1,000.00 | | | $ | 1,014.57 | | | $ | 10.71 | | | | 2.11 | % | |
Greater China Equity Fund | |
Institutional Class | | $ | 1,000.00 | | | $ | 919.40 | | | $ | 7.26 | | | | 1.50 | % | | $ | 1,000.00 | | | $ | 1,017.64 | | | $ | 7.63 | | | | 1.50 | % | |
Class A | | $ | 1,000.00 | | | $ | 917.50 | | | $ | 8.99 | | | | 1.86 | % | | $ | 1,000.00 | | | $ | 1,015.83 | | | $ | 9.45 | | | | 1.86 | % | |
Class C | | $ | 1,000.00 | | | $ | 913.80 | | | $ | 12.59 | | | | 2.61 | % | | $ | 1,000.00 | | | $ | 1,012.05 | | | $ | 13.24 | | | | 2.61 | % | |
Guardian Fund | |
Investor Class | | $ | 1,000.00 | | | $ | 918.00 | | | $ | 4.21 | | | | 0.87 | % | | $ | 1,000.00 | | | $ | 1,020.82 | | | $ | 4.43 | | | | 0.87 | % | |
Trust Class | | $ | 1,000.00 | | | $ | 917.00 | | | $ | 5.12 | | | | 1.06 | % | | $ | 1,000.00 | | | $ | 1,019.86 | | | $ | 5.40 | | | | 1.06 | % | |
Advisor Class | | $ | 1,000.00 | | | $ | 913.90 | | | $ | 8.06 | | | | 1.67 | % | | $ | 1,000.00 | | | $ | 1,016.79 | | | $ | 8.49 | | | | 1.67 | % | |
Institutional Class | | $ | 1,000.00 | | | $ | 918.70 | | | $ | 3.43 | | | | 0.71 | % | | $ | 1,000.00 | | | $ | 1,021.63 | | | $ | 3.62 | | | | 0.71 | % | |
Class A | | $ | 1,000.00 | | | $ | 916.90 | | | $ | 5.17 | | | | 1.07 | % | | $ | 1,000.00 | | | $ | 1,019.81 | | | $ | 5.45 | | | | 1.07 | % | |
Class C | | $ | 1,000.00 | | | $ | 913.10 | | | $ | 8.82 | | | | 1.83 | % | | $ | 1,000.00 | | | $ | 1,015.98 | | | $ | 9.30 | | | | 1.83 | % | |
Class R3 | | $ | 1,000.00 | | | $ | 915.00 | | | $ | 6.56 | | | | 1.36 | % | | $ | 1,000.00 | | | $ | 1,018.35 | | | $ | 6.92 | | | | 1.36 | % | |
Expense Information as of 8/31/15 (Unaudited) (cont'd)
| | | ACTUAL | | HYPOTHETICAL (5% ANNUAL RETURN BEFORE EXPENSES)(3) | |
| | | Beginning
Account
Value
3/1/15 | | Ending
Account
Value
8/31/15 | | Expenses Paid
During the
Period(1)
3/1/15 - 8/31/15 | | Expense
Ratio | | Beginning
Account
Value
3/1/15 | | Ending
Account
Value
8/31/15 | | Expenses Paid
During the
Period(1)
3/1/15 - 8/31/15 | | Expense
Ratio | |
International Equity Fund | |
Investor Class | | $ | 1,000.00 | | | $ | 939.20 | | | $ | 5.08 | | | | 1.04 | % | | $ | 1,000.00 | | | $ | 1,019.96 | | | $ | 5.30 | | | | 1.04 | % | |
Trust Class | | $ | 1,000.00 | | | $ | 938.70 | | | $ | 5.62 | | | | 1.15 | % | | $ | 1,000.00 | | | $ | 1,019.41 | | | $ | 5.85 | | | | 1.15 | % | |
Institutional Class | | $ | 1,000.00 | | | $ | 940.40 | | | $ | 4.16 | | | | 0.85 | % | | $ | 1,000.00 | | | $ | 1,020.92 | | | $ | 4.33 | | | | 0.85 | % | |
Class A | | $ | 1,000.00 | | | $ | 938.60 | | | $ | 5.91 | | | | 1.21 | % | | $ | 1,000.00 | | | $ | 1,019.11 | | | $ | 6.16 | | | | 1.21 | % | |
Class C | | $ | 1,000.00 | | | $ | 934.80 | | | $ | 9.56 | | | | 1.96 | % | | $ | 1,000.00 | | | $ | 1,015.32 | | | $ | 9.96 | | | | 1.96 | % | |
Class R6 | | $ | 1,000.00 | | | $ | 940.00 | | | $ | 3.81 | | | | 0.78 | % | | $ | 1,000.00 | | | $ | 1,021.27 | | | $ | 3.97 | | | | 0.78 | % | |
International Select Fund | |
Trust Class | | $ | 1,000.00 | | | $ | 930.60 | | | $ | 6.08 | | | | 1.25 | % | | $ | 1,000.00 | | | $ | 1,018.90 | | | $ | 6.36 | | | | 1.25 | % | |
Institutional Class | | $ | 1,000.00 | | | $ | 932.20 | | | $ | 4.38 | | | | 0.90 | % | | $ | 1,000.00 | | | $ | 1,020.67 | | | $ | 4.58 | | | | 0.90 | % | |
Class A | | $ | 1,000.00 | | | $ | 930.10 | | | $ | 6.03 | | | | 1.24 | % | | $ | 1,000.00 | | | $ | 1,018.95 | | | $ | 6.31 | | | | 1.24 | % | |
Class C | | $ | 1,000.00 | | | $ | 926.70 | | | $ | 9.71 | | | | 2.00 | % | | $ | 1,000.00 | | | $ | 1,015.12 | | | $ | 10.16 | | | | 2.00 | % | |
Class R3 | | $ | 1,000.00 | | | $ | 929.60 | | | $ | 7.34 | | | | 1.51 | % | | $ | 1,000.00 | | | $ | 1,017.59 | | | $ | 7.68 | | | | 1.51 | % | |
Intrinsic Value Fund | |
Institutional Class | | $ | 1,000.00 | | | $ | 957.90 | | | $ | 4.93 | | | | 1.00 | % | | $ | 1,000.00 | | | $ | 1,020.16 | | | $ | 5.09 | | | | 1.00 | % | |
Class A | | $ | 1,000.00 | | | $ | 956.50 | | | $ | 6.71 | | | | 1.36 | % | | $ | 1,000.00 | | | $ | 1,018.35 | | | $ | 6.92 | | | | 1.36 | % | |
Class C | | $ | 1,000.00 | | | $ | 952.70 | | | $ | 10.39 | | | | 2.11 | % | | $ | 1,000.00 | | | $ | 1,014.57 | | | $ | 10.71 | | | | 2.11 | % | |
Large Cap Disciplined Growth Fund | |
Investor Class | | $ | 1,000.00 | | | $ | 941.30 | | | $ | 5.43 | | | | 1.11 | % | | $ | 1,000.00 | | | $ | 1,019.61 | | | $ | 5.65 | | | | 1.11 | % | |
Institutional Class | | $ | 1,000.00 | | | $ | 942.00 | | | $ | 3.67 | | | | 0.75 | % | | $ | 1,000.00 | | | $ | 1,021.42 | | | $ | 3.82 | | | | 0.75 | % | |
Class A | | $ | 1,000.00 | | | $ | 941.20 | | | $ | 5.43 | | | | 1.11 | % | | $ | 1,000.00 | | | $ | 1,019.61 | | | $ | 5.65 | | | | 1.11 | % | |
Class C | | $ | 1,000.00 | | | $ | 938.50 | | | $ | 9.09 | | | | 1.86 | % | | $ | 1,000.00 | | | $ | 1,015.83 | | | $ | 9.45 | | | | 1.86 | % | |
Class R3 | | $ | 1,000.00 | | | $ | 942.60 | | | $ | 6.66 | | | | 1.36 | % | | $ | 1,000.00 | | | $ | 1,018.35 | | | $ | 6.92 | | | | 1.36 | % | |
Large Cap Value Fund | |
Investor Class | | $ | 1,000.00 | | | $ | 914.10 | | | $ | 4.15 | | | | 0.86 | % | | $ | 1,000.00 | | | $ | 1,020.87 | | | $ | 4.38 | | | | 0.86 | % | |
Trust Class | | $ | 1,000.00 | | | $ | 912.80 | | | $ | 5.11 | | | | 1.06 | % | | $ | 1,000.00 | | | $ | 1,019.86 | | | $ | 5.40 | | | | 1.06 | % | |
Advisor Class | | $ | 1,000.00 | | | $ | 912.10 | | | $ | 5.83 | | | | 1.21 | % | | $ | 1,000.00 | | | $ | 1,019.11 | | | $ | 6.16 | | | | 1.21 | % | |
Institutional Class | | $ | 1,000.00 | | | $ | 914.90 | | | $ | 3.43 | | | | 0.71 | % | | $ | 1,000.00 | | | $ | 1,021.63 | | | $ | 3.62 | | | | 0.71 | % | |
Class A | | $ | 1,000.00 | | | $ | 912.80 | | | $ | 5.21 | | | | 1.08 | % | | $ | 1,000.00 | | | $ | 1,019.76 | | | $ | 5.50 | | | | 1.08 | % | |
Class C | | $ | 1,000.00 | | | $ | 909.90 | | | $ | 8.76 | | | | 1.82 | % | | $ | 1,000.00 | | | $ | 1,016.03 | | | $ | 9.25 | | | | 1.82 | % | |
Class R3 | | $ | 1,000.00 | | | $ | 912.00 | | | $ | 6.55 | | | | 1.36 | % | | $ | 1,000.00 | | | $ | 1,018.35 | | | $ | 6.92 | | | | 1.36 | % | |
Mid Cap Growth Fund | |
Investor Class | | $ | 1,000.00 | | | $ | 1,002.80 | | | $ | 4.59 | | | | 0.91 | % | | $ | 1,000.00 | | | $ | 1,020.62 | | | $ | 4.63 | | | | 0.91 | % | |
Trust Class | | $ | 1,000.00 | | | $ | 1,002.50 | | | $ | 4.95 | | | | 0.98 | % | | $ | 1,000.00 | | | $ | 1,020.27 | | | $ | 4.99 | | | | 0.98 | % | |
Advisor Class | | $ | 1,000.00 | | | $ | 1,001.20 | | | $ | 6.25 | | | | 1.24 | % | | $ | 1,000.00 | | | $ | 1,018.95 | | | $ | 6.31 | | | | 1.24 | % | |
Institutional Class | | $ | 1,000.00 | | | $ | 1,003.40 | | | $ | 3.79 | | | | 0.75 | % | | $ | 1,000.00 | | | $ | 1,021.42 | | | $ | 3.82 | | | | 0.75 | % | |
Class A | | $ | 1,000.00 | | | $ | 1,002.10 | | | $ | 5.60 | | | | 1.11 | % | | $ | 1,000.00 | | | $ | 1,019.61 | | | $ | 5.65 | | | | 1.11 | % | |
Class C | | $ | 1,000.00 | | | $ | 997.90 | | | $ | 9.37 | | | | 1.86 | % | | $ | 1,000.00 | | | $ | 1,015.83 | | | $ | 9.45 | | | | 1.86 | % | |
Class R3 | | $ | 1,000.00 | | | $ | 1,000.40 | | | $ | 6.86 | | | | 1.36 | % | | $ | 1,000.00 | | | $ | 1,018.35 | | | $ | 6.92 | | | | 1.36 | % | |
Class R6 | | $ | 1,000.00 | | | $ | 1,004.10 | | | $ | 3.38 | | | | 0.67 | % | | $ | 1,000.00 | | | $ | 1,021.83 | | | $ | 3.41 | | | | 0.67 | % | |
Mid Cap Intrinsic Value Fund | |
Investor Class | | $ | 1,000.00 | | | $ | 930.40 | | | $ | 5.11 | | | | 1.05 | % | | $ | 1,000.00 | | | $ | 1,019.91 | | | $ | 5.35 | | | | 1.05 | % | |
Trust Class | | $ | 1,000.00 | | | $ | 929.20 | | | $ | 6.08 | | | | 1.25 | % | | $ | 1,000.00 | | | $ | 1,018.90 | | | $ | 6.36 | | | | 1.25 | % | |
Institutional Class | | $ | 1,000.00 | | | $ | 930.90 | | | $ | 4.14 | | | | 0.85 | % | | $ | 1,000.00 | | | $ | 1,020.92 | | | $ | 4.33 | | | | 0.85 | % | |
Class A | | $ | 1,000.00 | | | $ | 929.60 | | | $ | 5.89 | | | | 1.21 | % | | $ | 1,000.00 | | | $ | 1,019.11 | | | $ | 6.16 | | | | 1.21 | % | |
Class C | | $ | 1,000.00 | | | $ | 925.70 | | | $ | 9.51 | | | | 1.96 | % | | $ | 1,000.00 | | | $ | 1,015.32 | | | $ | 9.96 | | | | 1.96 | % | |
Class R3 | | $ | 1,000.00 | | | $ | 928.60 | | | $ | 7.10 | | | | 1.46 | % | | $ | 1,000.00 | | | $ | 1,017.85 | | | $ | 7.43 | | | | 1.46 | % | |
Multi-Cap Opportunities Fund | |
Institutional Class | | $ | 1,000.00 | | | $ | 956.90 | | | $ | 3.60 | | | | 0.73 | % | | $ | 1,000.00 | | | $ | 1,021.53 | | | $ | 3.72 | | | | 0.73 | % | |
Class A | | $ | 1,000.00 | | | $ | 954.70 | | | $ | 5.42 | | | | 1.10 | % | | $ | 1,000.00 | | | $ | 1,019.66 | | | $ | 5.60 | | | | 1.10 | % | |
Class C | | $ | 1,000.00 | | | $ | 951.60 | | | $ | 9.05 | | | | 1.84 | % | | $ | 1,000.00 | | | $ | 1,015.93 | | | $ | 9.35 | | | | 1.84 | % | |
Expense Information as of 8/31/15 (Unaudited) (cont'd)
| | | ACTUAL | | HYPOTHETICAL (5% ANNUAL RETURN BEFORE EXPENSES)(3) | |
| | | Beginning
Account
Value
3/1/15 | | Ending
Account
Value
8/31/15 | | Expenses Paid
During the
Period(1)
3/1/15 - 8/31/15 | | Expense
Ratio | | Beginning
Account
Value
3/1/15 | | Ending
Account
Value
8/31/15 | | Expenses Paid
During the
Period(1)
3/1/15 - 8/31/15 | | Expense
Ratio | |
Real Estate Fund | |
Trust Class | | $ | 1,000.00 | | | $ | 906.90 | | | $ | 5.00 | | | | 1.04 | % | | $ | 1,000.00 | | | $ | 1,019.96 | | | $ | 5.30 | | | | 1.04 | % | |
Institutional Class | | $ | 1,000.00 | | | $ | 908.00 | | | $ | 4.09 | | | | 0.85 | % | | $ | 1,000.00 | | | $ | 1,020.92 | | | $ | 4.33 | | | | 0.85 | % | |
Class A | | $ | 1,000.00 | | | $ | 906.60 | | | $ | 5.81 | | | | 1.21 | % | | $ | 1,000.00 | | | $ | 1,019.11 | | | $ | 6.16 | | | | 1.21 | % | |
Class C | | $ | 1,000.00 | | | $ | 903.40 | | | $ | 9.40 | | | | 1.96 | % | | $ | 1,000.00 | | | $ | 1,015.32 | | | $ | 9.96 | | | | 1.96 | % | |
Class R3 | | $ | 1,000.00 | | | $ | 905.50 | | | $ | 7.01 | | | | 1.46 | % | | $ | 1,000.00 | | | $ | 1,017.85 | | | $ | 7.43 | | | | 1.46 | % | |
Class R6 | | $ | 1,000.00 | | | $ | 908.30 | | | $ | 3.75 | | | | 0.78 | % | | $ | 1,000.00 | | | $ | 1,021.27 | | | $ | 3.97 | | | | 0.78 | % | |
Small Cap Growth Fund | |
Investor Class | | $ | 1,000.00 | | | $ | 963.70 | | | $ | 5.99 | | | | 1.21 | % | | $ | 1,000.00 | | | $ | 1,019.11 | | | $ | 6.16 | | | | 1.21 | % | |
Trust Class | | $ | 1,000.00 | | | $ | 962.60 | | | $ | 6.93 | | | | 1.40 | % | | $ | 1,000.00 | | | $ | 1,018.15 | | | $ | 7.12 | | | | 1.40 | % | |
Advisor Class | | $ | 1,000.00 | | | $ | 962.00 | | | $ | 7.47 | | | | 1.51 | % | | $ | 1,000.00 | | | $ | 1,017.59 | | | $ | 7.68 | | | | 1.51 | % | |
Institutional Class | | $ | 1,000.00 | | | $ | 965.10 | | | $ | 4.46 | | | | 0.90 | % | | $ | 1,000.00 | | | $ | 1,020.67 | | | $ | 4.58 | | | | 0.90 | % | |
Class A | | $ | 1,000.00 | | | $ | 963.40 | | | $ | 6.24 | | | | 1.26 | % | | $ | 1,000.00 | | | $ | 1,018.85 | | | $ | 6.41 | | | | 1.26 | % | |
Class C | | $ | 1,000.00 | | | $ | 960.10 | | | $ | 9.93 | | | | 2.01 | % | | $ | 1,000.00 | | | $ | 1,015.07 | | | $ | 10.21 | | | | 2.01 | % | |
Class R3 | | $ | 1,000.00 | | | $ | 962.10 | | | $ | 7.47 | | | | 1.51 | % | | $ | 1,000.00 | | | $ | 1,017.59 | | | $ | 7.68 | | | | 1.51 | % | |
Socially Responsive Fund | |
Investor Class | | $ | 1,000.00 | | | $ | 940.00 | | | $ | 4.16 | | | | 0.85 | % | | $ | 1,000.00 | | | $ | 1,020.92 | | | $ | 4.33 | | | | 0.85 | % | |
Trust Class | | $ | 1,000.00 | | | $ | 939.00 | | | $ | 5.03 | | | | 1.03 | % | | $ | 1,000.00 | | | $ | 1,020.01 | | | $ | 5.24 | | | | 1.03 | % | |
Institutional Class | | $ | 1,000.00 | | | $ | 940.60 | | | $ | 3.28 | | | | 0.67 | % | | $ | 1,000.00 | | | $ | 1,021.83 | | | $ | 3.41 | | | | 0.67 | % | |
Class A | | $ | 1,000.00 | | | $ | 938.90 | | | $ | 5.13 | | | | 1.05 | % | | $ | 1,000.00 | | | $ | 1,019.91 | | | $ | 5.35 | | | | 1.05 | % | |
Class C | | $ | 1,000.00 | | | $ | 935.50 | | | $ | 8.73 | | | | 1.79 | % | | $ | 1,000.00 | | | $ | 1,016.18 | | | $ | 9.10 | | | | 1.79 | % | |
Class R3 | | $ | 1,000.00 | | | $ | 937.90 | | | $ | 6.30 | | | | 1.29 | % | | $ | 1,000.00 | | | $ | 1,018.70 | | | $ | 6.56 | | | | 1.29 | % | |
Class R6 | | $ | 1,000.00 | | | $ | 940.90 | | | $ | 2.94 | | | | 0.60 | % | | $ | 1,000.00 | | | $ | 1,022.18 | | | $ | 3.06 | | | | 0.60 | % | |
Value Fund | |
Institutional Class | | $ | 1,000.00 | | | $ | 916.30 | | | $ | 3.33 | | | | 0.69 | % | | $ | 1,000.00 | | | $ | 1,021.73 | | | $ | 3.52 | | | | 0.69 | % | |
Class A | | $ | 1,000.00 | | | $ | 915.20 | | | $ | 5.26 | | | | 1.09 | % | | $ | 1,000.00 | | | $ | 1,019.71 | | | $ | 5.55 | | | | 1.09 | % | |
Class C | | $ | 1,000.00 | | | $ | 911.60 | | | $ | 8.77 | | | | 1.82 | % | | $ | 1,000.00 | | | $ | 1,016.03 | | | $ | 9.25 | | | | 1.82 | % | |
World Equity Fund | |
Institutional Class | | $ | 1,000.00 | | | $ | 953.00 | | | $ | 1.69 | (2) | | | 1.00 | % | | $ | 1,000.00 | | | $ | 1,020.16 | | | $ | 5.09 | | | | 1.00 | % | |
Class A | | $ | 1,000.00 | | | $ | 952.00 | | | $ | 2.29 | (2) | | | 1.36 | % | | $ | 1,000.00 | | | $ | 1,018.35 | | | $ | 6.92 | | | | 1.36 | % | |
Class C | | $ | 1,000.00 | | | $ | 951.00 | | | $ | 3.55 | (2) | | | 2.11 | % | | $ | 1,000.00 | | | $ | 1,014.57 | | | $ | 10.71 | | | | 2.11 | % | |
(1) For each class, expenses are equal to the annualized expense ratio for the class, multiplied by the average account value over the period, multiplied by 184/365 (to reflect the one-half year period shown), unless otherwise indicated.
(2) For each class, expenses are equal to the annualized expense ratio for the class, multiplied by the average account value over the period, multiplied by 63/365 (to reflect the period June 30, 2015 (Commencement of Operations) to August 31, 2015).
(3) Hypothetical expenses are equal to the annualized expense ratios for each class, multiplied by the average account value over the period (assuming a 5% annual return), multiplied by 184/365 (to reflect the one-half year period shown).
Schedule of Investments All Cap Core Fund 8/31/15
TOP TEN EQUITY HOLDINGS
| | 1 | | | BlackRock, Inc. | | | 5.6 | % | |
| | 2 | | | American Tower Corp. | | | 5.2 | % | |
| | 3 | | | Google, Inc. Class C | | | 4.5 | % | |
| | 4 | | | Allergan PLC | | | 4.0 | % | |
| | 5 | | | Walt Disney Co. | | | 3.9 | % | |
| | 6 | | | JPMorgan Chase & Co. | | | 3.6 | % | |
| | 7 | | | Delphi Automotive PLC | | | 3.6 | % | |
| | 8 | | | Plains All American Pipeline LP | | | 3.5 | % | |
| | 9 | | | Verisk Analytics, Inc. | | | 3.4 | % | |
| | 10 | | | SS&C Technologies Holdings, Inc. | | | 3.3 | % | |
| | |
Number
of Shares | |
Value†
(000's)z | |
Common Stocks (78.3%) | |
Auto Components (6.5%) | |
BorgWarner, Inc. | | | 33,472 | | | $ | 1,461 | | |
Delphi
Automotive PLC | | | 23,564 | | | | 1,779 | | |
| | | | 3,240 | | |
Banks (3.6%) | |
JPMorgan Chase &
Co. | | | 28,208 | | | | 1,808 | | |
Capital Markets (5.6%) | |
BlackRock, Inc. | | | 9,340 | | | | 2,825 | | |
Health Care Equipment & Supplies (2.8%) | |
Cooper Cos., Inc. | | | 8,790 | | | | 1,428 | | |
Internet & Catalog Retail (5.8%) | |
Liberty Interactive
Corp. QVC Group
Class A* | | | 53,454 | | | | 1,445 | | |
Priceline Group, Inc.* | | | 1,165 | | | | 1,455 | | |
| | | | 2,900 | | |
Internet Software & Services (9.7%) | |
eBay, Inc.* | | | 59,189 | | | | 1,605 | | |
Facebook, Inc.
Class A* | | | 11,350 | | | | 1,015 | | |
Google, Inc. Class C* | | | 3,648 | | | | 2,255 | | |
| | | | 4,875 | | |
IT Services (5.0%) | |
PayPal Holdings,
Inc.* | | | 26,716 | | | | 935 | | |
Visa, Inc. Class A | | | 22,163 | | | | 1,580 | | |
| | | | 2,515 | | |
Media (3.9%) | |
Walt Disney Co. | | | 18,992 | | | | 1,935 | | |
Oil, Gas & Consumable Fuels (6.6%) | |
Enbridge Energy
Management LLC* | | | 56,113 | | | | 1,580 | | |
Plains All American
Pipeline LP | | | 48,285 | | | | 1,741 | | |
| | | | 3,321 | | |
Pharmaceuticals (6.1%) | |
Allergan PLC* | | | 6,676 | | | | 2,028 | | |
Teva Pharmaceutical
Industries Ltd. ADR | | | 16,002 | | | | 1,031 | | |
| | | | 3,059 | | |
| | |
Number
of Shares | |
Value†
(000's)z | |
Professional Services (6.5%) | |
Nielsen Holdings PLC | | | 34,426 | | | $ | 1,557 | | |
Verisk Analytics,
Inc.* | | | 23,006 | | | | 1,681 | | |
| | | | 3,238 | | |
Real Estate Investment Trusts (5.2%) | |
American Tower
Corp. | | | 28,223 | | | | 2,602 | | |
Software (11.0%) | |
Activision Blizzard,
Inc. | | | 42,955 | | | | 1,230 | | |
Adobe Systems,
Inc.* | | | 12,837 | | | | 1,008 | | |
Intuit, Inc. | | | 18,857 | | | | 1,617 | | |
SS&C Technologies
Holdings, Inc. | | | 24,121 | | | | 1,634 | | |
| | | | 5,489 | | |
Total Common Stocks
(Cost $35,514) | | | | | 39,235 | | |
Exchange Traded Funds (5.3%) | |
SPDR S&P 500 ETF
Trust | | | 6,476 | | | | 1,280 | | |
Utilities Select Sector
SPDR Fund | | | 32,125 | | | | 1,364 | | |
Total Exchange Traded Funds
(Cost $2,636) | | | | | 2,644 | | |
Short-Term Investments (15.9%) | |
State Street
Institutional
Treasury Money
Market Fund
Premier Class
(Cost $7,981) | | | 7,980,672 | | | | 7,981 | | |
Total Investments## (99.5%)
(Cost $46,131) | | | | | 49,860 | | |
Cash, receivables
and other assets,
less liabilities (0.5%) | | | | | 240 | | |
Total Net Assets (100.0%) | | | | $ | 50,100 | | |
See Notes to Schedule of Investments
Schedule of Investments Emerging Markets Equity Fund 8/31/15
TOP TEN EQUITY HOLDINGS
| | | | | Country | | Industry | | | |
| 1
| | | Samsung Electronics Co. Ltd.
| | Korea
| | Technology Hardware, Storage &
Peripherals | | | 3.4
| % | |
| | 2 | | | Tencent Holdings Ltd. | | China | | Internet Software & Services | | | 3.4 | % | |
| 3
| | | Taiwan Semiconductor
Manufacturing Co. Ltd. | | Taiwan, Province of
China | | Semiconductors & Semiconductor
Equipment | | | 2.3
| % | |
| | 4 | | | Cummins India Ltd. | | India | | Machinery | | | 2.0 | % | |
| | 5 | | | China Mobile Ltd. | | China | | Wireless Telecommunication Services | | | 1.9 | % | |
| | 6 | | | Coway Co. Ltd. | | Korea | | Household Durables | | | 1.9 | % | |
| 7
| | | Sunny Optical Technology Group
Co. Ltd. | | China
| | Electronic Equipment, Instruments &
Components | | | 1.8
| % | |
| | 8 | | | China Everbright International Ltd. | | China | | Commercial Services & Supplies | | | 1.7 | % | |
| | 9 | | | Magnit PJSC | | Russia | | Food & Staples Retailing | | | 1.7 | % | |
| | 10 | | | NCSoft Corp. | | Korea | | Software | | | 1.6 | % | |
| | |
Number
of Shares | |
Value†
(000's)z | |
Common Stocks (98.0%) | |
Brazil (7.0%) | |
AMBEV SA ADR | | | 865,800 | | | $ | 4,563 | | |
BB Seguridade
Participacoes SA | | | 526,900 | | | | 4,170 | | |
CCR SA | | | 973,800 | | | | 3,995 | | |
Cielo SA | | | 352,040 | | | | 3,723 | | |
Embraer SA | | | 184,000 | | | | 1,166 | | |
Embraer SA ADR | | | 120,600 | | | | 3,049 | | |
FPC Par Corretora
de Seguros SA* | | | 543,000 | | | | 1,960 | | |
Itau Unibanco
Holding SA,
Preference
Shares | | | 753,470 | | | | 5,516 | | |
Qualicorp SA | | | 187,500 | | | | 882 | | |
| | | | 29,024 | | |
Chile (0.6%) | |
SACI Falabella | | | 444,465 | | | | 2,726 | | |
China (26.9%) | |
AAC Technologies
Holdings, Inc. | | | 1,089,200 | | | | 6,135 | | |
Anhui Conch
Cement Co. Ltd.,
H Shares | | | 643,300 | | | | 1,946 | | |
Baidu, Inc. ADR* | | | 26,500 | | | | 3,902 | | |
Bolina Holding
Co. Ltd. | | | 719,600 | | | | 205 | | |
Changyou.com
Ltd. ADR* | | | 187,500 | | | | 3,936 | | |
China Child Care
Corp. Ltd. | | | 6,035,700 | | | | 553 | | |
China Everbright
International Ltd. | | | 5,440,000 | | | | 7,160 | | |
China Medical
System Holdings
Ltd. | | | 2,932,800 | | | | 3,182 | | |
China Mengniu
Dairy Co. Ltd. | | | 1,470,240 | | | | 5,141 | | |
China Mobile Ltd. | | | 653,400 | | | | 8,056 | | |
| | |
Number
of Shares | |
Value†
(000's)z | |
China State
Construction
International
Holdings Ltd. | | | 3,243,400 | | | $ | 4,336 | | |
China Vanke
Co. Ltd., H
Shares | | | 2,571,623 | | | | 5,847 | | |
CNOOC Ltd. | | | 4,535,200 | | | | 5,623 | | |
Country Garden
Holdings Co.
Ltd. | | | 7,221,600 | | | | 2,534 | | |
Galaxy
Entertainment
Group Ltd. | | | 623,600 | | | | 2,003 | | |
Haier Electronics
Group Co. Ltd. | | | 3,046,800 | | | | 5,433 | | |
Hua Hong
Semiconductor
Ltd.ñ* | | | 2,826,000 | | | | 2,527 | | |
Industrial &
Commercial
Bank of China
Ltd., H Shares | | | 11,037,900 | | | | 6,523 | | |
New Oriental
Education &
Technology
Group, Inc. ADR* | | | 180,900 | | | | 3,707 | | |
PICC Property &
Casualty Co.
Ltd., H Shares | | | 2,421,200 | | | | 4,599 | | |
Ping An Insurance
Group Co. of
China Ltd.,
H Shares | | | 1,227,900 | | | | 6,013 | | |
Sunny Optical
Technology
Group Co. Ltd. | | | 4,363,200 | | | | 7,296 | | |
Tencent Holdings
Ltd. | | | 821,500 | | | | 13,971 | | |
Zhuzhou CSR
Times Electric Co.
Ltd., H Shares | | | 196,400 | | | | 1,305 | | |
| | | | 111,933 | | |
| | |
Number
of Shares | |
Value†
(000's)z | |
Czech Republic (1.0%) | |
Komercni
Banka A/S | | | 17,855 | | | $ | 4,069 | | |
Hong Kong (0.6%) | |
AIA Group Ltd. | | | 471,800 | | | | 2,606 | | |
India (10.3%) | |
Cummins India
Ltd. | | | 496,900 | | | | 8,125 | | |
Dabur India Ltd. | | | 1,300,284 | | | | 5,358 | | |
Dewan Housing
Finance Corp.
Ltd. | | | 324,400 | | | | 2,249 | | |
Glenmark
Pharmaceuticals
Ltd.* | | | 307,200 | | | | 5,255 | | |
HDFC Bank Ltd.
ADR | | | 61,900 | | | | 3,528 | | |
Hero MotoCorp
Ltd. | | | 101,120 | | | | 3,672 | | |
ICICI Bank Ltd. | | | 747,080 | | | | 3,124 | | |
Larsen & Toubro
Ltd.* | | | 120,900 | | | | 2,919 | | |
Power Grid Corp.
of India Ltd. | | | 2,060,454 | | | | 4,042 | | |
Prestige Estates
Projects Ltd. | | | 866,630 | | | | 2,637 | | |
Tata Motors Ltd.
Class A | | | 601,034 | | | | 2,152 | | |
| | | | 43,061 | | |
Indonesia (4.5%) | |
PT AKR
Corporindo
Tbk | | | 8,091,900 | | | | 3,499 | | |
PT Bank Rakyat
Indonesia
Persero Tbk | | | 2,438,800 | | | | 1,844 | | |
PT Gudang
Garam Tbk | | | 969,300 | | | | 3,070 | | |
PT Link Net Tbk* | | | 5,809,200 | | | | 1,995 | | |
PT Matahari
Department
Store Tbk | | | 3,370,800 | | | | 4,205 | | |
See Notes to Schedule of Investments
Schedule of Investments Emerging Markets Equity Fund (cont'd)
| | |
Number
of Shares | |
Value†
(000's)z | |
PT Semen
Indonesia
(Persero) Tbk | | | 3,140,600 | | | $ | 2,068 | | |
PT Sumber
Alfaria
Trijaya Tbk | | | 48,893,300 | | | | 2,018 | | |
| | | | 18,699 | | |
Jordan (1.0%) | |
Hikma
Pharmaceuticals
PLC | | | 118,435 | | | | 4,105 | | |
Korea (12.2%) | |
Coway Co. Ltd. | | | 108,370 | | | | 7,733 | | |
Hyundai Motor Co. | | | 52,835 | | | | 6,656 | | |
NAVER Corp. | | | 10,535 | | | | 4,414 | | |
NCSoft Corp. | | | 36,865 | | | | 6,810 | | |
Samsung
Electronics
Co. Ltd. | | | 15,465 | | | | 14,239 | | |
Samsung
Engineering
Co. Ltd.* | | | 82,373 | | | | 1,839 | | |
SFA Engineering
Corp. | | | 95,992 | | | | 3,534 | | |
SK Hynix, Inc. | | | 149,730 | | | | 4,532 | | |
Sung Kwang
Bend Co. Ltd. | | | 107,400 | | | | 940 | | |
| | | | 50,697 | | |
Malaysia (0.8%) | |
Axiata Group
Berhad | | | 2,187,000 | | | | 3,199 | | |
Mexico (5.9%) | |
Arca Continental
SAB de CV | | | 675,200 | | | | 3,907 | | |
Corp. Inmobiliaria
Vesta SAB
de CV | | | 2,546,500 | | | | 3,954 | | |
Grupo
Financiero
Banorte SAB de CV,
O Shares | | | 1,054,500 | | | | 5,048 | | |
Grupo GICSA
SA de CV* | | | 2,930,500 | | | | 2,578 | | |
Grupo Mexico
SAB de CV
Series B | | | 1,245,800 | | | | 3,160 | | |
Infraestructura
Energetica Nova
SAB de CV | | | 704,100 | | | | 3,130 | | |
Unifin
Financiera
SAPI de CV* | | | 1,355,400 | | | | 2,969 | | |
| | | | 24,746 | | |
Peru (1.4%) | |
Credicorp Ltd. | | | 53,100 | | | | 5,840 | | |
| | |
Number
of Shares | |
Value†
(000's)z | |
Philippines (3.6%) | |
Ayala Corp. | | | 278,550 | | | $ | 4,391 | | |
International
Container
Terminal
Services, Inc. | | | 1,880,920 | | | | 3,731 | | |
RFM Corp. | | | 9,214,500 | | | | 804 | | |
SM Investments
Corp. | | | 111,600 | | | | 2,093 | | |
Universal Robina
Corp. | | | 957,300 | | | | 3,965 | | |
| | | | 14,984 | | |
Qatar (1.3%) | |
Industries Qatar
QSC | | | 144,823 | | | | 5,290 | | |
Russia (3.7%) | |
LUKOIL PJSC ADR | | | 82,935 | | | | 3,137 | | |
Magnit PJSC | | | 37,165 | | | | 7,105 | | |
QIWI PLC ADR | | | 125,900 | | | | 3,292 | | |
Yandex NV
Class A* | | | 146,000 | | | | 1,781 | | |
| | | | 15,315 | | |
Singapore (0.9%) | |
Asian Pay
Television
Trust | | | 6,421,602 | | | | 3,709 | | |
South Africa (5.4%) | |
Alexander Forbes
Group
Holdings
Ltd. | | | 6,384,911 | | | | 4,276 | | |
Bidvest Group
Ltd. | | | 193,979 | | | | 4,665 | | |
Life Healthcare
Group Holdings
Ltd. | | | 1,660,660 | | | | 4,767 | | |
MTN Group Ltd. | | | 214,394 | | | | 2,861 | | |
Sasol Ltd. | | | 86,565 | | | | 2,774 | | |
Standard Bank
Group Ltd. | | | 274,465 | | | | 3,024 | | |
| | | | 22,367 | | |
Taiwan, Province of China (6.3%) | |
China Steel
Chemical Corp. | | | 481,400 | | | | 1,480 | | |
eMemory
Technology,
Inc. | | | 328,200 | | | | 3,067 | | |
Hermes
Microvision,
Inc. | | | 96,640 | | | | 4,099 | | |
Hu Lane
Associate, Inc. | | | 590,600 | | | | 2,024 | | |
MediaTek, Inc. | | | 555,200 | | | | 4,283 | | |
| | |
Number
of Shares | |
Value†
(000's)z | |
Taiwan
Semiconductor
Manufacturing Co.
Ltd. | | | 2,373,739 | | | $ | 9,411 | | |
Tung Thih
Electronic Co.
Ltd. | | | 333,400 | | | | 1,870 | | |
| | | | 26,234 | | |
Thailand (1.9%) | |
Bangkok
Dusit Medical
Services PCL | | | 4,411,200 | | | | 2,400 | | |
| CP ALL PCL | | | 3,849,700 | | | | 5,477 | | |
| | | | 7,877 | | |
Turkey (1.5%) | |
Arcelik A/S | | | 611,040 | | | | 2,866 | | |
Turkiye Garanti
Bankasi A/S | | | 1,053,810 | | | | 2,672 | | |
Ulker Biskuvi
Sanayi A/S | | | 108,100 | | | | 665 | | |
| | | | 6,203 | | |
United Kingdom (1.2%) | |
SABMiller PLC | | | 105,845 | | | | 4,913 | | |
Total Common Stocks
(Cost $450,034) | | | | | 407,597 | | |
Short-Term Investments (1.3%) | |
State Street
Institutional
Treasury Money
Market Fund
Premier Class
(Cost $5,401) | | | 5,401,394 | | | | 5,401 | | |
Total Investments## (99.3%)
(Cost $455,435) | | | | | 412,998 | | |
Cash, receivables
and other assets,
less liabilities (0.7%) | | | | | 2,983 | | |
Total Net Assets (100.0%) | | | | $ | 415,981 | | |
See Notes to Schedule of Investments
POSITIONS BY INDUSTRY EMERGING MARKETS EQUITY FUND
Industry | | Investments at
Value†
(000's omitted) | | Percentage of
Net Assets | |
Banks | | $ | 41,188 | | | | 9.9 | % | |
Semiconductors & Semiconductor Equipment | | | 27,919 | | | | 6.7 | % | |
Internet Software & Services | | | 24,068 | | | | 5.8 | % | |
Insurance | | | 19,348 | | | | 4.7 | % | |
Real Estate Management & Development | | | 17,550 | | | | 4.2 | % | |
Electronic Equipment, Instruments & Components | | | 16,965 | | | | 4.1 | % | |
Household Durables | | | 16,032 | | | | 3.9 | % | |
Food & Staples Retailing | | | 14,600 | | | | 3.5 | % | |
Technology Hardware, Storage & Peripherals | | | 14,239 | | | | 3.4 | % | |
Wireless Telecommunication Services | | | 14,116 | | | | 3.4 | % | |
Beverages | | | 13,383 | | | | 3.2 | % | |
Pharmaceuticals | | | 12,542 | | | | 3.0 | % | |
Automobiles | | | 12,480 | | | | 3.0 | % | |
Industrial Conglomerates | | | 12,048 | | | | 2.9 | % | |
Oil, Gas & Consumable Fuels | | | 11,534 | | | | 2.8 | % | |
Software | | | 10,746 | | | | 2.6 | % | |
Food Products | | | 10,575 | | | | 2.5 | % | |
Construction & Engineering | | | 9,094 | | | | 2.1 | % | |
Diversified Financial Services | | | 8,667 | | | | 2.1 | % | |
Machinery | | | 8,125 | | | | 2.0 | % | |
Health Care Providers & Services | | | 8,049 | | | | 1.9 | % | |
Transportation Infrastructure | | | 7,726 | | | | 1.9 | % | |
Commercial Services & Supplies | | | 7,160 | | | | 1.7 | % | |
IT Services | | | 7,015 | | | | 1.7 | % | |
Multiline Retail | | | 6,931 | | | | 1.6 | % | |
Personal Products | | | 5,911 | | | | 1.4 | % | |
Aerospace & Defense | | | 4,215 | | | | 1.0 | % | |
Electric Utilities | | | 4,042 | | | | 1.0 | % | |
Construction Materials | | | 4,014 | | | | 1.0 | % | |
Auto Components | | | 3,894 | | | | 0.9 | % | |
Media | | | 3,709 | | | | 0.9 | % | |
Diversified Consumer Services | | | 3,707 | | | | 0.9 | % | |
Trading Companies & Distributors | | | 3,499 | | | | 0.8 | % | |
Metals & Mining | | | 3,160 | | | | 0.8 | % | |
Gas Utilities | | | 3,130 | | | | 0.8 | % | |
Tobacco | | | 3,070 | | | | 0.7 | % | |
Consumer Finance | | | 2,969 | | | | 0.7 | % | |
Thrifts & Mortgage Finance | | | 2,249 | | | | 0.5 | % | |
Hotels, Restaurants & Leisure | | | 2,003 | | | | 0.5 | % | |
Diversified Telecommunication Services | | | 1,995 | | | | 0.5 | % | |
Chemicals | | | 1,480 | | | | 0.4 | % | |
Electrical Equipment | | | 1,305 | | | | 0.3 | % | |
Building Products | | | 1,145 | | | | 0.3 | % | |
Short-Term Investments and Other Assets—Net | | | 8,384 | | | | 2.0 | % | |
| | | $ | 415,981 | | | | 100.0 | % | |
See Notes to Schedule of Investments
Schedule of Investments Equity Income Fund 8/31/15
TOP TEN EQUITY HOLDINGS
| | 1 | | | NextEra Energy, Inc. | | | 2.8 | % | |
| | 2 | | | JPMorgan Chase & Co. | | | 2.4 | % | |
| | 3 | | | Eli Lilly & Co. | | | 2.4 | % | |
| | 4 | | | Johnson & Johnson | | | 2.3 | % | |
| | 5 | | | PNC Financial Services Group, Inc. | | | 2.2 | % | |
| | 6 | | | CME Group, Inc. | | | 2.2 | % | |
| | 7 | | | MetLife, Inc. | | | 2.2 | % | |
| | 8 | | | Prologis, Inc. | | | 2.1 | % | |
| | 9 | | | Dominion Resources, Inc. | | | 2.1 | % | |
| | 10 | | | Koninklijke Philips NV | | | 2.1 | % | |
| | |
Number
of Shares | |
Value†
(000's)z | |
Common Stocks (91.9%) | |
Aerospace & Defense (0.5%) | |
Honeywell
International,
Inc. | | | 108,000 | | | $ | 10,721 | | |
Banks (6.7%) | |
JPMorgan
Chase & Co.@ | | | 800,000 | | | | 51,280 | | |
PNC Financial
Services Group,
Inc.@ | | | 520,000 | | | | 47,382 | | |
Wells Fargo & Co. | | | 800,000 | | | | 42,664 | | |
| | | | 141,326 | | |
Beverages (1.1%) | |
Coca-Cola Co. | | | 600,000 | | | | 23,592 | | |
Capital Markets (4.5%) | |
BlackRock, Inc. | | | 52,000 | | | | 15,728 | | |
Blackstone
Group LP | | | 1,145,000 | | | | 39,216 | | |
Carlyle Group LP | | | 1,240,000 | | | | 26,238 | | |
UBS Group AG* | | | 783,000 | | | | 16,225 | | |
| | | 97,407 | | |
Chemicals (2.5%) | |
E.I. du Pont de
Nemours & Co. | | | 634,000 | | | | 32,651 | | |
LyondellBasell
Industries NV
Class A | | | 240,000 | | | | 20,491 | | |
| | | | 53,142 | | |
Communications Equipment (1.9%) | |
Cisco Systems,
Inc. | | | 1,563,000 | | | | 40,450 | | |
Diversified Financial Services (2.2%) | |
| CME Group, Inc.@ | | | 500,000 | | | | 47,220 | | |
Diversified Telecommunication Services (2.1%) | |
BT Group PLC | | | 3,177,000 | | | | 21,194 | | |
Frontier
Communications
Corp. | | | 4,450,000 | | | | 22,562 | | |
| | | | 43,756 | | |
Electric Utilities (5.4%) | |
Edison
International | | | 367,000 | | | | 21,462 | | |
Exelon Corp. | | | 1,045,000 | | | | 32,145 | | |
| | |
Number
of Shares | |
Value†
(000's)z | |
NextEra Energy,
Inc.@ | | | 615,000 | | | $ | 60,522 | | |
| | | | 114,129 | | |
Energy Equipment & Services (1.5%) | |
Schlumberger Ltd. | | | 399,000 | | | | 30,871 | | |
Hotels, Restaurants & Leisure (1.3%) | |
Las Vegas
Sands Corp. | | | 602,000 | | | | 27,831 | | |
Household Products (1.5%) | |
Kimberly-Clark
Corp. | | | 300,000 | | | | 31,959 | | |
Independent Power and Renewable Electricity Producers (0.8%) | |
8Point3 Energy
Partners LP* | | | 61,400 | | | | 912 | | |
TerraForm Power,
Inc. Class A* | | | 735,000 | | | | 16,537 | | |
| | | | 17,449 | | |
Industrial Conglomerates (4.9%) | |
General Electric
Co. | | | 1,532,000 | | | | 38,024 | | |
Koninklijke
Philips NV | | | 1,700,000 | | | | 43,724 | | |
Siemens AG | | | 220,000 | | | | 21,838 | | |
| | | | 103,586 | | |
Insurance (2.2%) | |
MetLife, Inc. | | | 933,000 | | | | 46,743 | | |
Leisure Products (1.1%) | |
| Hasbro, Inc.@ | | | 322,600 | | | | 24,063 | | |
Media (3.0%) | |
Lagardere SCA | | | 1,590,000 | | | | 43,267 | | |
Regal
Entertainment
Group Class A | | | 1,129,000 | | | | 21,474 | | |
| | | | 64,741 | | |
Multi-Utilities (8.0%) | |
CenterPoint
Energy, Inc. | | | 1,492,000 | | | | 27,781 | | |
Dominion
Resources, Inc. | | | 635,000 | | | | 44,291 | | |
DTE Energy Co. | | | 465,000 | | | | 36,298 | | |
Sempra Energy | | | 280,000 | | | | 26,558 | | |
WEC Energy
Group, Inc. | | | 759,000 | | | | 36,167 | | |
| | | | 171,095 | | |
| | |
Number
of Shares | |
Value†
(000's)z | |
Oil, Gas & Consumable Fuels (6.9%) | |
Columbia Pipeline
Group, Inc. | | | 1,253,000 | | | $ | 31,776 | | |
Exxon Mobil Corp. | | | 240,000 | | | | 18,058 | | |
| Golar LNG Ltd.@ | | | 750,000 | | | | 29,205 | | |
Kinder Morgan,
Inc. | | | 767,000 | | | | 24,858 | | |
Occidental
Petroleum
Corp. | | | 248,000 | | | | 18,106 | | |
ONEOK, Inc. | | | 170,000 | | | | 6,122 | | |
Royal Dutch
Shell PLC ADR
Class A | | | 361,000 | | | | 19,104 | | |
| | | | 147,229 | | |
Personal Products (1.1%) | |
Unilever NV | | | 577,000 | | | | 23,149 | | |
Pharmaceuticals (9.4%) | |
Bristol-Myers
Squibb Co. | | | 391,100 | | | | 23,259 | | |
| Eli Lilly & Co.@ | | | 615,000 | | | | 50,645 | | |
GlaxoSmithKline
PLC ADR | | | 819,000 | | | | 33,522 | | |
Johnson &
Johnson | | | 520,000 | | | | 48,870 | | |
Roche Holding
AG ADR | | | 1,268,000 | | | | 43,308 | | |
| | | | 199,604 | | |
Real Estate Investment Trusts (20.7%) | |
AvalonBay
Communities,
Inc. | | | 143,000 | | | | 23,604 | | |
Blackstone
Mortgage Trust,
Inc. Class A | | | 1,096,000 | | | | 30,348 | | |
Care Capital
Properties, Inc.* | | | 93,950 | | | | 2,987 | | |
Crown Castle
International
Corp. | | | 433,000 | | | | 36,108 | | |
| Equinix, Inc.@ | | | 121,000 | | | | 32,642 | | |
Equity Residential | | | 489,000 | | | | 34,841 | | |
Extra Space
Storage, Inc.@ | | | 500,000 | | | | 36,740 | | |
Mapletree
Logistics Trust | | | 12,280,000 | | | | 8,529 | | |
Outfront Media,
Inc. | | | 1,030,327 | | | | 23,316 | | |
See Notes to Schedule of Investments
Schedule of Investments Equity Income Fund (cont'd)
| | |
Number
of Shares | |
Value†
(000's)z | |
Parkway Life
Real Estate
Investment
Trust | | | 5,973,000 | | | $ | 9,651 | | |
PLA
Administradora
Industrial S de
RL de CV* | | | 5,700,000 | | | | 10,781 | | |
Prologis, Inc. | | | 1,203,000 | | | | 45,714 | | |
| Public Storage@ | | | 60,000 | | | | 12,076 | | |
Simon
Property
Group, Inc. | | | 225,000 | | | | 40,347 | | |
Starwood
Property
Trust, Inc. | | | 2,050,000 | | | | 43,624 | | |
Ventas, Inc. | | | 375,800 | | | | 20,676 | | |
Weyerhaeuser
Co. | | | 1,000,000 | | | | 27,940 | | |
| | | | 439,924 | | |
Software (1.8%) | |
| Microsoft Corp.@ | | | 884,000 | | | | 38,472 | | |
Tobacco (0.8%) | |
Imperial Tobacco
Group PLC | | | 356,000 | | | | 17,136 | | |
Total Common Stocks
(Cost $1,833,161) | | | | | 1,955,595 | | |
Business Development
Companies (1.1%) | |
Apollo
Investment
Corp. | | | 1,610,000 | | | | 10,481 | | |
FS Investment
Corp. | | | 1,180,000 | | | | 11,942 | | |
Total Business
Development Companies
(Cost $24,674) | | | | | 22,423 | | |
Preferred Stocks (0.5%) | |
Allergan PLC,
Ser. A, 5.50%
(Cost $10,865) | | | 10,865 | | | | 11,158 | | |
| | | Principal
Amount | | | |
Convertible Bonds (3.6%) | |
HomeAway,
Inc., Senior
Unsecured
Notes, 0.13%,
due 4/1/19 | | $ | 4,500,000 | | | | 4,185 | | |
| | |
Principal
Amount | |
Value†
(000's)z | |
Live Nation
Entertainment,
Inc., Senior
Unsecured
Notes, 2.50%,
due 5/15/19 | | $ | 3,260,000 | | | $ | 3,378 | | |
Priceline Group,
Inc., Senior
Unsecured
Notes, 0.90%,
due 9/15/21ñ | | | 12,900,000 | | | | 12,642 | | |
SINA Corp.,
Senior
Unsecured
Notes, 1.00%,
due 12/1/18 | | | 25,100,000 | | | | 23,453 | | |
TiVo, Inc.,
Senior
Unsecured
Notes, 2.00%,
due 10/1/21ñ | | | 10,500,000 | | | | 9,299 | | |
WebMD Health
Corp., Senior
Unsecured
Notes, 2.25%,
due 3/31/16 | | | 10,000,000 | | | | 9,981 | | |
WebMD Health
Corp., Senior
Unsecured
Notes, 2.50%,
due 1/31/18 | | | 13,965,000 | | | | 14,000 | | |
Total Convertible Bonds
(Cost $75,917) | | | | | 76,938 | | |
| | | Number
of Shares | | | |
Short-Term Investments (1.7%) | |
State Street
Institutional
Treasury Money
Market Fund
Premier Class
(Cost $35,830) | | | 35,829,859 | | | | 35,830 | | |
Total Investments## (98.8%)
(Cost $1,980,447) | | | | | 2,101,944 | | |
Cash, receivables
and other assets,
less liabilities‡‡k (1.2%) | | | | | 24,942 | | |
Total Net Assets (100.0%) | | | | $ | 2,126,886 | | |
See Notes to Schedule of Investments
Schedule of Investments Focus Fund 8/31/15
TOP TEN EQUITY HOLDINGS
| | 1 | | | JPMorgan Chase & Co. | | | 5.5 | % | |
| | 2 | | | Teva Pharmaceutical Industries Ltd. ADR | | | 5.0 | % | |
| | 3 | | | Eli Lilly & Co. | | | 5.0 | % | |
| | 4 | | | Stanley Black & Decker, Inc. | | | 4.4 | % | |
| | 5 | | | Willis Group Holdings PLC | | | 4.4 | % | |
| | 6 | | | Cisco Systems, Inc. | | | 4.0 | % | |
| | 7 | | | Comcast Corp. Class A Special | | | 3.7 | % | |
| | 8 | | | Newell Rubbermaid, Inc. | | | 3.5 | % | |
| | 9 | | | CVS Health Corp. | | | 3.3 | % | |
| | 10 | | | Delta Air Lines, Inc. | | | 3.3 | % | |
| | |
Number
of Shares | |
Value†
(000's)z | |
Common Stocks (98.8%) | |
Airlines (3.3%) | |
Delta Air Lines,
Inc. | | | 590,000 | | | $ | 25,830 | | |
Banks (5.5%) | |
JPMorgan Chase &
Co. | | | 665,000 | | | | 42,626 | | |
Beverages (3.1%) | |
Coca-Cola Co. | | | 605,000 | | | | 23,789 | | |
Capital Markets (2.1%) | |
UBS Group AG* | | | 800,000 | | | | 16,552 | | |
Chemicals (1.9%) | |
FMC Corp. | | | 340,000 | | | | 14,385 | | |
Communications Equipment (4.0%) | |
Cisco Systems,
Inc. | | | 1,200,000 | | | | 31,056 | | |
Consumer Finance (3.0%) | |
American Express
Co. | | | 304,000 | | | | 23,323 | | |
Diversified Consumer Services (2.2%) | |
Service Corp.
International | | | 575,000 | | | | 17,049 | | |
Electronic Equipment, Instruments & Components (3.0%) | |
CDW Corp. | | | 578,950 | | | | 23,013 | | |
Food & Staples Retailing (3.3%) | |
CVS Health Corp. | | | 253,000 | | | | 25,907 | | |
Food Products (1.2%) | |
Diamond Foods,
Inc.* | | | 304,300 | | | | 9,181 | | |
Hotels, Restaurants & Leisure (2.1%) | |
Starwood Hotels &
Resorts
Worldwide, Inc. | | | 225,000 | | | | 16,081 | | |
Household Durables (5.0%) | |
Newell
Rubbermaid,
Inc. | | | 643,000 | | | | 27,089 | | |
Whirlpool Corp. | | | 69,000 | | | | 11,599 | | |
| | | | 38,688 | | |
| | |
Number
of Shares | |
Value†
(000's)z | |
Insurance (4.4%) | |
Willis Group
Holdings
PLC | | | 785,000 | | | $ | 33,826 | | |
Internet Software & Services (4.6%) | |
Google, Inc.
Class A* | | | 28,000 | | | | 18,139 | | |
Google, Inc.
Class C* | | | 28,076 | | | | 17,358 | | |
| | | | 35,497 | | |
Machinery (4.4%) | |
Stanley Black &
Decker, Inc. | | | 338,000 | | | | 34,314 | | |
Media (7.0%) | |
Comcast Corp.
Class A
Special | | | 500,000 | | | | 28,620 | | |
Markit Ltd.* | | | 261,600 | | | | 7,476 | | |
Time Warner, Inc. | | | 257,000 | | | | 18,273 | | |
| | | | 54,369 | | |
Metals & Mining (0.6%) | |
Steel Dynamics,
Inc. | | | 230,000 | | | | 4,480 | | |
Oil, Gas & Consumable Fuels (9.5%) | |
Columbia Pipeline
Group, Inc. | | | 870,000 | | | | 22,063 | | |
Concho Resources,
Inc.* | | | 90,000 | | | | 9,735 | | |
Devon Energy
Corp. | | | 280,000 | | | | 11,945 | | |
EOG Resources,
Inc. | | | 217,000 | | | | 16,993 | | |
Royal Dutch Shell
PLC ADR Class A | | | 242,100 | | | | 12,812 | | |
| | | | 73,548 | | |
Personal Products (2.0%) | |
Edgewell Personal
Care Co. | | | 175,000 | | | | 15,410 | | |
Pharmaceuticals (10.0%) | |
Eli Lilly & Co. | | | 470,000 | | | | 38,705 | | |
Teva
Pharmaceutical
Industries Ltd.
ADR | | | 605,000 | | | | 38,968 | | |
| | | | 77,673 | | |
| | |
Number
of Shares | |
Value†
(000's)z | |
Real Estate Investment Trusts (1.1%) | |
Weyerhaeuser Co. | | | 290,000 | | | $ | 8,103 | | |
Road & Rail (1.1%) | |
Avis Budget Group,
Inc.* | | | 200,000 | | | | 8,826 | | |
Semiconductors & Semiconductor Equipment (2.0%) | |
Freescale
Semiconductor
Ltd.* | | | 430,000 | | | | 15,364 | | |
Software (2.9%) | |
Activision Blizzard,
Inc. | | | 770,000 | | | | 22,045 | | |
Specialty Retail (3.3%) | |
Bed Bath & Beyond,
Inc.* | | | 415,000 | | | | 25,776 | | |
Technology Hardware, Storage & Peripherals (4.0%) | |
EMC Corp. | | | 660,000 | | | | 16,414 | | |
SanDisk Corp. | | | 270,000 | | | | 14,731 | | |
| | | | 31,145 | | |
Textiles, Apparel & Luxury Goods (1.5%) | |
Ralph Lauren Corp. | | | 107,000 | | | | 11,897 | | |
Trading Companies & Distributors (0.7%) | |
AerCap Holdings
NV* | | | 125,505 | | | | 5,276 | | |
Total Common Stocks
(Cost $650,342) | | | | | 765,029 | | |
Short-Term Investments (1.4%) | |
State Street
Institutional
Treasury Money
Market Fund
Premier Class
(Cost $11,016) | | | 11,015,602 | | | | 11,016 | | |
Total Investments## (100.2%)
(Cost $661,358) | | | | | 776,045 | | |
Liabilities, less cash,
receivables and
other assets [(0.2%)] | | | | | (1,346 | ) | |
Total Net Assets (100.0%) | | | | $ | 774,699 | | |
See Notes to Schedule of Investments
Schedule of Investments Genesis Fund 8/31/15
TOP TEN EQUITY HOLDINGS
| | 1 | | | Church & Dwight Co., Inc. | | | 2.7 | % | |
| | 2 | | | Wabtec Corp. | | | 2.6 | % | |
| | 3 | | | ICON PLC | | | 2.4 | % | |
| | 4 | | | West Pharmaceutical Services, Inc. | | | 2.0 | % | |
| | 5 | | | Sensient Technologies Corp. | | | 2.0 | % | |
| | 6 | | | AptarGroup, Inc. | | | 1.9 | % | |
| | 7 | | | Tyler Technologies, Inc. | | | 1.8 | % | |
| | 8 | | | Manhattan Associates, Inc. | | | 1.7 | % | |
| | 9 | | | Rollins, Inc. | | | 1.6 | % | |
| | 10 | | | Constellation Software, Inc. | | | 1.6 | % | |
| | |
Number
of Shares | |
Value†
(000's)z | |
Common Stocks (98.2%) | |
Aerospace & Defense (0.3%) | |
Astronics Corp.* | | | 637,100 | | | $ | 32,913 | | |
Air Freight & Logistics (0.7%) | |
Forward Air
Corp.^ | | | 1,783,468 | | | | 80,292 | | |
Airlines (0.4%) | |
Allegiant Travel
Co. | | | 192,600 | | | | 39,148 | | |
Auto Components (0.7%) | |
Drew Industries,
Inc. | | | 834,799 | | | | 46,131 | | |
Gentex Corp. | | | 2,210,098 | | | | 34,256 | | |
| | | | 80,387 | | |
Banks (8.8%) | |
Bank of Hawaii
Corp.^ | | | 2,290,312 | | | | 142,137 | | |
Bank of the
Ozarks, Inc. | | | 2,407,600 | | | | 100,638 | | |
BankUnited,
Inc. | | | 2,218,730 | | | | 79,075 | | |
BOK Financial
Corp. | | | 1,371,876 | | | | 86,812 | | |
Community
Bank System,
Inc. | | | 1,197,358 | | | | 42,698 | | |
Cullen/Frost
Bankers, Inc. | | | 1,721,925 | | | | 111,340 | | |
CVB Financial
Corp. | | | 4,300,272 | | | | 69,879 | | |
First Financial
Bankshares,
Inc.^ | | | 3,321,547 | | | | 103,433 | | |
FNB Corp. | | | 4,672,246 | | | | 58,683 | | |
LegacyTexas
Financial
Group, Inc. | | | 2,204,368 | | | | 62,428 | | |
PacWest
Bancorp | | | 1,619,751 | | | | 69,066 | | |
Westamerica
Bancorporation | | | 907,103 | | | | 40,947 | | |
| | | | 967,136 | | |
Beverages (0.7%) | |
Boston Beer Co.,
Inc. Class A* | | | 385,019 | | | | 78,956 | | |
Building Products (1.3%) | |
AAON, Inc. | | | 1,921,581 | | | | 39,738 | | |
| | |
Number
of Shares | |
Value†
(000's)z | |
Advanced
Drainage
Systems, Inc. | | | 875,800 | | | $ | 24,881 | | |
AO Smith Corp. | | | 1,216,348 | | | | 78,467 | | |
| | | | 143,086 | | |
Capital Markets (0.1%) | |
OM Asset
Management
PLC | | | 536,600 | | | | 8,865 | | |
Chemicals (4.4%) | |
| Balchem Corp.^ | | | 1,597,909 | | | | 93,526 | | |
Innophos
Holdings,
Inc.^ | | | 1,154,142 | | | | 55,480 | | |
NewMarket Corp. | | | 88,512 | | | | 33,921 | | |
Quaker
Chemical
Corp. | | | 269,860 | | | | 21,416 | | |
RPM
International,
Inc. | | | 1,306,044 | | | | 57,270 | | |
Sensient
Technologies
Corp.^ | | | 3,306,945 | | | | 215,447 | | |
| | | | 477,060 | | |
Commercial Services & Supplies (4.2%) | |
Essendant, Inc. | | | 1,451,121 | | | | 50,064 | | |
G&K Services,
Inc. Class A | | | 436,500 | | | | 29,512 | | |
Healthcare
Services Group,
Inc.^ | | | 3,715,881 | | | | 124,259 | | |
Rollins, Inc. | | | 6,340,230 | | | | 177,019 | | |
Team, Inc.* | | | 801,006 | | | | 33,514 | | |
UniFirst Corp. | | | 393,650 | | | | 42,675 | | |
| | | | 457,043 | | |
Communications Equipment (1.1%) | |
NETGEAR, Inc.* | | | 469,620 | | | | 14,267 | | |
NetScout
Systems, Inc.* | | | 3,032,784 | | | | 110,848 | | |
| | | | 125,115 | | |
Construction Materials (0.5%) | |
Eagle Materials,
Inc. | | | 634,000 | | | | 51,880 | | |
Containers & Packaging (2.6%) | |
AptarGroup,
Inc. | | | 3,124,500 | | | | 210,466 | | |
| | |
Number
of Shares | |
Value†
(000's)z | |
Silgan Holdings,
Inc. | | | 1,376,783 | | | $ | 72,089 | | |
| | | | 282,555 | | |
Distributors (1.6%) | |
| Pool Corp.^ | | | 2,475,598 | | | | 172,500 | | |
Diversified Financial Services (0.6%) | |
MarketAxess
Holdings, Inc. | | | 767,151 | | | | 69,366 | | |
Electrical Equipment (0.5%) | |
Franklin
Electric
Co., Inc. | | | 1,309,472 | | | | 38,354 | | |
Thermon
Group
Holdings,
Inc.* | | | 927,531 | | | | 21,222 | | |
| | | | 59,576 | | |
Electronic Equipment, Instruments & Components (5.3%) | |
Badger Meter,
Inc. | | | 605,201 | | | | 35,277 | | |
Cognex Corp. | | | 1,296,208 | | | | 46,093 | | |
FARO
Technologies,
Inc.* | | | 600,700 | | | | 23,337 | | |
FEI Co. | | | 1,823,342 | | | | 137,626 | | |
Littelfuse, Inc. | | | 688,653 | | | | 61,807 | | |
MTS Systems
Corp. | | | 490,887 | | | | 29,227 | | |
| Rogers Corp.*^ | | | 1,363,251 | | | | 75,879 | | |
Zebra
Technologies
Corp.
Class A* | | | 2,019,724 | | | | 167,395 | | |
| | | | 576,641 | | |
Energy Equipment & Services (1.8%) | |
CARBO
Ceramics,
Inc. | | | 743,157 | | | | 20,377 | | |
Dril-Quip, Inc.* | | | 315,700 | | | | 21,764 | | |
Natural Gas
Services
Group, Inc.* | | | 594,200 | | | | 12,888 | | |
Oceaneering
International,
Inc. | | | 1,850,128 | | | | 81,073 | | |
Pason Systems,
Inc.^ | | | 4,262,257 | | | | 65,701 | | |
| | | | 201,803 | | |
See Notes to Schedule of Investments
Schedule of Investments Genesis Fund (cont'd)
| | |
Number
of Shares | |
Value†
(000's)z | |
Food & Staples Retailing (0.2%) | |
North West Co.,
Inc. | | | 1,041,600 | | | $ | 21,448 | | |
Food Products (2.6%) | |
B&G Foods, Inc. | | | 1,477,400 | | | | 44,898 | | |
Calavo
Growers, Inc. | | | 38,800 | | | | 2,260 | | |
Flowers Foods,
Inc. | | | 2,826,000 | | | | 65,592 | | |
J & J Snack Foods
Corp. | | | 890,246 | | | | 101,452 | | |
Lancaster Colony
Corp. | | | 741,156 | | | | 70,284 | | |
| | | | 284,486 | | |
Health Care Equipment & Supplies (7.7%) | |
| Abaxis, Inc.^ | | | 1,378,600 | | | | 64,822 | | |
Cantel Medical
Corp. | | | 427,800 | | | | 21,232 | | |
Cyberonics,
Inc.* | | | 1,097,495 | | | | 71,710 | | |
Haemonetics
Corp.*^ | | | 2,903,300 | | | | 104,838 | | |
IDEXX
Laboratories,
Inc.* | | | 2,000,024 | | | | 142,942 | | |
Meridian
Bioscience,
Inc. | | | 1,779,297 | | | | 34,038 | | |
Natus
Medical, Inc.* | | | 371,700 | | | | 15,121 | | |
Neogen Corp.* | | | 288,800 | | | | 14,913 | | |
Sirona
Dental
Systems, Inc.* | | | 1,679,026 | | | | 160,145 | | |
West
Pharmaceutical
Services, Inc.^ | | | 3,917,758 | | | | 218,807 | | |
| | | | 848,568 | | |
Health Care Providers & Services (3.6%) | |
AmSurg Corp.* | | | 1,455,150 | | | | 114,113 | | |
Chemed Corp. | | | 811,100 | | | | 110,593 | | |
Henry Schein,
Inc.* | | | 1,105,840 | | | | 151,290 | | |
U.S. Physical
Therapy, Inc. | | | 396,900 | | | | 18,238 | | |
| | | | 394,234 | | |
Hotels, Restaurants & Leisure (3.9%) | |
Brinker
International,
Inc. | | | 2,184,500 | | | | 116,062 | | |
Cheesecake
Factory, Inc. | | | 1,153,800 | | | | 62,617 | | |
Cracker Barrel
Old Country
Store, Inc. | | | 625,827 | | | | 90,232 | | |
| | |
Number
of Shares | |
Value†
(000's)z | |
Papa John's
International,
Inc. | | | 1,111,745 | | | $ | 74,765 | | |
Texas
Roadhouse,
Inc. | | | 2,165,400 | | | | 77,933 | | |
| | | | 421,609 | | |
Household Products (2.7%) | |
Church &
Dwight Co.,
Inc. | | | 3,364,856 | | | | 290,320 | | |
Industrial Conglomerates (0.4%) | |
Raven
Industries,
Inc.^ | | | 2,568,452 | | | | 46,540 | | |
Insurance (1.4%) | |
RLI Corp. | | | 2,134,814 | | | | 111,245 | | |
Safety
Insurance
Group, Inc.^ | | | 790,949 | | | | 41,588 | | |
| | | | 152,833 | | |
Internet Software & Services (0.6%) | |
j2 Global, Inc. | | | 864,201 | | | | 60,131 | | |
IT Services (1.0%) | |
Jack Henry &
Associates,
Inc. | | | 1,542,903 | | | | 104,856 | | |
Leisure Products (1.2%) | |
Polaris
Industries,
Inc. | | | 1,035,820 | | | | 134,522 | | |
Life Sciences Tools & Services (4.0%) | |
Bio-Techne Corp. | | | 978,000 | | | | 92,401 | | |
| ICON PLC*^ | | | 3,451,300 | | | | 265,750 | | |
PAREXEL
International
Corp.* | | | 1,216,855 | | | | 79,972 | | |
| | | | 438,123 | | |
Machinery (10.1%) | |
| CLARCOR, Inc.^ | | | 2,511,788 | | | | 141,590 | | |
Donaldson
Co., Inc. | | | 1,509,400 | | | | 47,259 | | |
Graco, Inc. | | | 629,617 | | | | 43,437 | | |
| Lindsay Corp.^ | | | 729,350 | | | | 55,598 | | |
Middleby
Corp.* | | | 1,190,118 | | | | 129,187 | | |
Milacron
Holdings
Corp.* | | | 1,112,800 | | | | 22,134 | | |
Nordson Corp. | | | 1,390,608 | | | | 92,503 | | |
RBC Bearings,
Inc.* | | | 838,551 | | | | 51,873 | | |
Tennant Co. | | | 917,602 | | | | 52,597 | | |
Toro Co. | | | 1,567,188 | | | | 111,741 | | |
| | |
Number
of Shares | |
Value†
(000's)z | |
Valmont
Industries, Inc. | | | 769,004 | | | $ | 81,737 | | |
Wabtec Corp. | | | 2,928,400 | | | | 280,424 | | |
| | | | 1,110,080 | | |
Media (1.9%) | |
Gray Television,
Inc.* | | | 2,323,150 | | | | 26,925 | | |
Media
General,
Inc.* | | | 6,110,519 | | | | 71,799 | | |
Nexstar
Broadcasting
Group, Inc.
Class A^ | | | 2,395,521 | | | | 111,344 | | |
| | | | 210,068 | | |
Metals & Mining (1.4%) | |
Compass
Minerals
International,
Inc.^ | | | 1,875,573 | | | | 151,921 | | |
Oil, Gas & Consumable Fuels (0.9%) | |
Gulfport Energy
Corp.* | | | 1,673,200 | | | | 59,951 | | |
Painted
Pony
Petroleum
Ltd.* | | | 2,246,350 | | | | 11,584 | | |
Synergy
Resources
Corp.* | | | 2,861,966 | | | | 30,737 | | |
| | | | 102,272 | | |
Paper & Forest Products (0.8%) | |
Stella-Jones,
Inc. | | | 2,563,100 | | | | 87,086 | | |
Pharmaceuticals (0.3%) | |
Phibro Animal
Health Corp.
Class A^ | | | 1,048,000 | | | | 36,994 | | |
Professional Services (0.9%) | |
Exponent,
Inc.^ | | | 2,269,970 | | | | 97,041 | | |
Real Estate Management & Development (0.0%) | |
Altisource
Asset
Management
Corp.*^ | | | 125,617 | | | | 4,835 | | |
Road & Rail (0.1%) | |
Genesee &
Wyoming, Inc.
Class A* | | | 205,500 | | | | 14,052 | | |
See Notes to Schedule of Investments
Schedule of Investments Genesis Fund (cont'd)
| | |
Number
of Shares | |
Value†
(000's)z | |
Semiconductors & Semiconductor Equipment (0.9%) | |
Power
Integrations,
Inc.^ | | | 2,458,400 | | | $ | 96,492 | | |
Software (9.8%) | |
Aspen
Technology,
Inc.* | | | 1,153,100 | | | | 43,668 | | |
Computer
Modelling
Group Ltd.^ | | | 5,512,600 | | | | 50,910 | | |
Constellation
Software, Inc. | | | 409,942 | | | | 173,262 | | |
Descartes
Systems
Group, Inc.* | | | 2,442,050 | | | | 42,174 | | |
Enghouse
Systems Ltd. | | | 1,249,300 | | | | 48,848 | | |
FactSet
Research
Systems, Inc. | | | 618,600 | | | | 97,689 | | |
Fair Isaac Corp. | | | 1,067,758 | | | | 91,368 | | |
Manhattan
Associates,
Inc.* | | | 3,186,728 | | | | 186,360 | | |
Monotype
Imaging
Holdings, Inc.^ | | | 3,344,806 | | | | 70,843 | | |
NICE-Systems
Ltd. ADR | | | 537,700 | | | | 33,101 | | |
Progress
Software
Corp.* | | | 728,600 | | | | 19,738 | | |
Qualys, Inc.* | | | 491,900 | | | | 14,294 | | |
Tyler
Technologies,
Inc.* | | | 1,429,232 | | | | 197,291 | | |
| | | | 1,069,546 | | |
Specialty Retail (3.7%) | |
Asbury
Automotive
Group, Inc.* | | | 564,600 | | | | 45,490 | | |
Hibbett
Sports,
Inc.*^ | | | 1,569,369 | | | | 61,990 | | |
Lithia Motors,
Inc. Class A | | | 495,200 | | | | 52,788 | | |
Monro Muffler
Brake, Inc. | | | 459,400 | | | | 29,121 | | |
Sally Beauty
Holdings,
Inc.* | | | 3,285,293 | | | | 85,878 | | |
Tractor
Supply Co. | | | 1,535,482 | | | | 130,992 | | |
| | | | 406,259 | | |
| | |
Number
of Shares | |
Value†
(000's)z | |
Technology Hardware, Storage & Peripherals (0.8%) | |
Electronics
For Imaging,
Inc.* | | | 2,107,300 | | | $ | 92,237 | | |
Trading Companies & Distributors (1.7%) | |
Applied
Industrial
Technologies,
Inc. | | | 1,829,744 | | | | 77,471 | | |
NOW, Inc.* | | | 1,034,500 | | | | 17,649 | | |
Watsco, Inc. | | | 702,504 | | | | 86,029 | | |
| | | | 181,149 | | |
Total Common Stocks
(Cost $5,952,934) | | | | | 10,762,024 | | |
Short-Term Investments (1.9%) | |
State Street
Institutional
Treasury Money
Market Fund
Premier Class | | | 74,998,542 | | | | 74,999 | | |
State Street
Institutional
Treasury Plus
Fund Premier
Class*^ | | | 131,910,217 | | | | 131,910 | | |
Total Short-Term Investments
(Cost $206,909) | | | | | 206,909 | | |
Total Investments## (100.1%)
(Cost $6,159,843) | | | | | 10,968,933 | | |
Liabilities, less cash,
receivables and other
assets [(0.1%)] | | | | | (7,489) | | |
Total Net Assets (100.0%) | | | | $ | 10,961,444 | | |
See Notes to Schedule of Investments
Schedule of Investments Global Equity Fund 8/31/15
TOP TEN EQUITY HOLDINGS
| | | | | Country | | Industry | | | |
| | 1 | | | Apple, Inc.
| | United States
| | Technology Hardware, Storage &
Peripherals | | | 2.3
| % | |
| | 2 | | | Sealed Air Corp. | | United States | | Containers & Packaging | | | 2.3 | % | |
| | 3 | | | Cardinal Health, Inc. | | United States | | Health Care Providers & Services | | | 1.9 | % | |
| | 4 | | | Alimentation Couche-Tard, Inc. Class B | | Canada | | Food & Staples Retailing | | | 1.8 | % | |
| | 5 | | | Check Point Software Technologies Ltd. | | Israel | | Software | | | 1.8 | % | |
| | 6 | | | Wabtec Corp. | | United States | | Machinery | | | 1.8 | % | |
| | 7 | | | CVS Health Corp. | | United States | | Food & Staples Retailing | | | 1.8 | % | |
| | 8 | | | First Republic Bank | | United States | | Banks | | | 1.8 | % | |
| | 9 | | | JPMorgan Chase & Co. | | United States | | Banks | | | 1.7 | % | |
| | 10 | | | Givaudan SA | | Switzerland | | Chemicals | | | 1.7 | % | |
| | |
Number
of Shares | |
Value†
(000's)z | |
Common Stocks (97.1%) | |
Australia (1.4%) | |
Insurance
Australia
Group Ltd. | | | 14,565 | | | $ | 52 | | |
Brazil (0.6%) | |
SLC Agricola SA | | | 5,550 | | | | 25 | | |
Canada (3.4%) | |
Alimentation
Couche-Tard,
Inc. Class B | | | 1,680 | | | | 71 | | |
Home Capital
Group, Inc. | | | 850 | | | | 18 | | |
Kinaxis, Inc.* | | | 500 | | | | 14 | | |
Suncor Energy, Inc. | | | 965 | | | | 27 | | |
| | | | 130 | | |
China (1.6%) | |
Alibaba Group
Holding Ltd. ADR* | | | 350 | | | | 23 | | |
Haier Electronics
Group Co. Ltd. | | | 20,800 | | | | 37 | | |
| | | | 60 | | |
France (5.2%) | |
BNP Paribas SA | | | 635 | | | | 40 | | |
Rexel SA | | | 2,376 | | | | 36 | | |
Sanofi | | | 525 | | | | 52 | | |
Sodexo SA | | | 530 | | | | 47 | | |
Virbac SA | | | 100 | | | | 23 | | |
| | | | 198 | | |
Germany (3.6%) | |
Continental AG | | | 245 | | | | 52 | | |
Henkel AG &
Co. KGaA,
Preference Shares | | | 470 | | | | 49 | | |
Linde AG | | | 217 | | | | 38 | | |
| | | | 139 | | |
| | |
Number
of Shares | |
Value†
(000's)z | |
Israel (3.6%) | |
Bezeq Israeli
Telecommunication
Corp. Ltd. | | | 25,285 | | | $ | 46 | | |
Check Point
Software
Technologies Ltd.* | | | 915 | | | | 71 | | |
Teva
Pharmaceutical
Industries Ltd.
ADR | | | 325 | | | | 21 | | |
| | | | 138 | | |
Japan (5.9%) | |
FANUC Corp. | | | 300 | | | | 49 | | |
Nihon Kohden Corp. | | | 1,700 | | | | 34 | | |
SoftBank Group Corp. | | | 600 | | | | 35 | | |
Sundrug Co. Ltd. | | | 950 | | | | 53 | | |
TOYOTA MOTOR Corp. | | | 950 | | | | 56 | | |
| | | | 227 | | |
Korea (1.0%) | |
Samsung
Electronics Co.
Ltd. | | | 43 | | | | 40 | | |
Netherlands (2.7%) | |
| ASML Holding NV | | | 690 | | | | 63 | | |
Sensata
Technologies
Holding NV* | | | 885 | | | | 42 | | |
| | | | 105 | | |
Norway (0.7%) | |
DNB ASA | | | 1,850 | | | | 26 | | |
Spain (0.8%) | |
Banco Bilbao
Vizcaya Argentaria
SA | | | 3,093 | | | | 29 | | |
Sweden (0.8%) | |
Telefonaktiebolaget
LM Ericsson,
B Shares | | | 3,070 | | | | 30 | | |
| | |
Number
of Shares | |
Value†
(000's)z | |
Switzerland (7.2%) | |
Cie Financiere
Richemont SA | | | 450 | | | $ | 34 | | |
Givaudan SA* | | | 38 | | | | 65 | | |
Julius Baer Group
Ltd.* | | | 1,220 | | | | 59 | | |
Roche Holding AG | | | 196 | | | | 54 | | |
SGS SA | | | 21 | | | | 37 | | |
Sonova Holding AG | | | 220 | | | | 29 | | |
| | | | 278 | | |
United Kingdom (13.8%) | |
Aon PLC | | | 540 | | | | 51 | | |
Barclays PLC | | | 13,250 | | | | 53 | | |
Howden Joinery
Group PLC | | | 6,870 | | | | 50 | | |
Lloyds Banking
Group PLC | | | 25,840 | | | | 30 | | |
Pentair PLC | | | 510 | | | | 28 | | |
Prudential PLC | | | 2,960 | | | | 64 | | |
SABMiller PLC | | | 880 | | | | 41 | | |
Spectris PLC | | | 963 | | | | 27 | | |
St. James's Place PLC | | | 3,875 | | | | 54 | | |
TalkTalk Telecom
Group PLC | | | 12,035 | | | | 55 | | |
Travis Perkins PLC | | | 1,770 | | | | 55 | | |
Virgin Money
Holdings UK PLC | | | 3,490 | | | | 23 | | |
| | | 531 | | |
United States (44.8%) | |
Amazon.com, Inc.* | | | 103 | | | | 53 | | |
American Tower Corp. | | | 410 | | | | 38 | | |
Amphenol Corp.
Class A | | | 550 | | | | 29 | | |
Apple, Inc. | | | 798 | | | | 90 | | |
BlackRock, Inc. | | | 163 | | | | 49 | | |
Cabot Oil & Gas Corp. | | | 585 | | | | 14 | | |
Cardinal Health, Inc. | | | 885 | | | | 73 | | |
CDW Corp. | | | 600 | | | | 24 | | |
CVS Health Corp. | | | 675 | | | | 69 | | |
eBay, Inc.* | | | 715 | | | | 19 | | |
EMC Corp. | | | 1,550 | | | | 39 | | |
EOG Resources, Inc. | | | 489 | | | | 38 | | |
See Notes to Schedule of Investments
Schedule of Investments Global Equity Fund (cont'd)
| | |
Number
of Shares | |
Value†
(000's)z | |
Estee Lauder Cos.,
Inc. Class A | | | 500 | | | $ | 40 | | |
First Republic Bank | | | 1,120 | | | | 68 | | |
Google, Inc. Class A* | | | 45 | | | | 29 | | |
Google, Inc. Class C* | | | 45 | | | | 28 | | |
Graco, Inc. | | | 685 | | | | 47 | | |
Henry Schein, Inc.* | | | 435 | | | | 60 | | |
Intercontinental
Exchange, Inc. | | | 240 | | | | 55 | | |
JPMorgan
Chase & Co. | | | 1,025 | | | | 66 | | |
Medtronic PLC | | | 517 | | | | 37 | | |
Milacron
Holdings Corp.* | | | 1,000 | | | | 20 | | |
Motorola
Solutions, Inc. | | | 770 | | | | 50 | | |
Nielsen Holdings PLC | | | 1,355 | | | | 61 | | |
Nordstrom, Inc. | | | 525 | | | | 38 | | |
PayPal Holdings, Inc.* | | | 715 | | | | 25 | | |
Pioneer Natural
Resources Co. | | | 260 | | | | 32 | | |
Range Resources
Corp. | | | 555 | | | | 21 | | |
RPM International,
Inc. | | | 1,340 | | | | 59 | | |
Samsonite
International SA | | | 9,350 | | | | 29 | | |
SanDisk Corp. | | | 1,170 | | | | 64 | | |
Schlumberger Ltd. | | | 470 | | | | 36 | | |
Sealed Air Corp. | | | 1,695 | | | | 87 | | |
Sirona Dental
Systems, Inc.* | | | 600 | | | | 57 | | |
Visa, Inc. Class A | | | 745 | | | | 53 | | |
Wabtec Corp. | | | 735 | | | | 70 | | |
Waste
Connections, Inc. | | | 1,105 | | | | 53 | | |
| | | 1,720 | | |
Total Common Stocks
(Cost $3,610) | | | | | 3,728 | | |
Short-Term Investments (4.1%) | |
State Street
Institutional
Treasury Money
Market Fund
Premier Class
(Cost $156) | | | 155,705 | | | | 156 | | |
Total Investments## (101.2%)
(Cost $3,766) | | | | | 3,884 | | |
Liabilities, less cash,
receivables and
other assets [(1.2%)] | | | | | (44) | | |
Total Net Assets (100.0%) | | | | $ | 3,840 | | |
See Notes to Schedule of Investments
POSITIONS BY INDUSTRY GLOBAL EQUITY FUND
Industry | | Investments at
Value†
(000's omitted) | | Percentage of
Net Assets | |
Banks | | $ | 335 | | | | 8.7 | % | |
Technology Hardware, Storage & Peripherals | | | 233 | | | | 6.1 | % | |
Insurance | | | 221 | | | | 5.8 | % | |
Machinery | | | 214 | | | | 5.6 | % | |
Food & Staples Retailing | | | 193 | | | | 5.0 | % | |
Chemicals | | | 162 | | | | 4.2 | % | |
Health Care Equipment & Supplies | | | 157 | | | | 4.1 | % | |
Pharmaceuticals | | | 150 | | | | 3.9 | % | |
Health Care Providers & Services | | | 133 | | | | 3.5 | % | |
Oil, Gas & Consumable Fuels | | | 132 | | | | 3.4 | % | |
Capital Markets | | | 108 | | | | 2.8 | % | |
Diversified Telecommunication Services | | | 101 | | | | 2.6 | % | |
Internet Software & Services | | | 99 | | | | 2.6 | % | |
Professional Services | | | 98 | | | | 2.6 | % | |
Trading Companies & Distributors | | | 91 | | | | 2.4 | % | |
Containers & Packaging | | | 87 | | | | 2.3 | % | |
Software | | | 85 | | | | 2.2 | % | |
Communications Equipment | | | 80 | | | | 2.1 | % | |
Electronic Equipment, Instruments & Components | | | 80 | | | | 2.1 | % | |
IT Services | | | 78 | | | | 2.0 | % | |
Semiconductors & Semiconductor Equipment | | | 63 | | | | 1.6 | % | |
Textiles, Apparel & Luxury Goods | | | 63 | | | | 1.6 | % | |
Automobiles | | | 56 | | | | 1.5 | % | |
Diversified Financial Services | | | 55 | | | | 1.4 | % | |
Commercial Services & Supplies | | | 53 | | | | 1.4 | % | |
Internet & Catalog Retail | | | 53 | | | | 1.4 | % | |
Auto Components | | | 52 | | | | 1.3 | % | |
Specialty Retail | | | 50 | | | | 1.3 | % | |
Household Products | | | 49 | | | | 1.3 | % | |
Hotels, Restaurants & Leisure | | | 47 | | | | 1.2 | % | |
Electrical Equipment | | | 42 | | | | 1.1 | % | |
Beverages | | | 41 | | | | 1.1 | % | |
Personal Products | | | 40 | | | | 1.0 | % | |
Real Estate Investment Trusts | | | 38 | | | | 1.0 | % | |
Multiline Retail | | | 38 | | | | 1.0 | % | |
Household Durables | | | 37 | | | | 1.0 | % | |
Energy Equipment & Services | | | 36 | | | | 0.9 | % | |
Wireless Telecommunication Services | | | 35 | | | | 0.9 | % | |
Food Products | | | 25 | | | | 0.6 | % | |
Thrifts & Mortgage Finance | | | 18 | | | | 0.5 | % | |
Short-Term Investments and Other Assets—Net | | | 112 | | | | 2.9 | % | |
| | | $ | 3,840 | | | | 100.0 | % | |
See Notes to Schedule of Investments
Schedule of Investments Global Real Estate Fund 8/31/15
TOP TEN EQUITY HOLDINGS
| | | | | Country | | Sector | | | |
| | 1 | | | Simon Property Group, Inc. | | United States | | Retail REITs | | | 4.8 | % | |
| | 2 | | | Public Storage | | United States | | Specialty REITs | | | 3.7 | % | |
| | 3 | | | Mitsui Fudosan Co. Ltd. | | Japan | | Real Estate Holding & Development | | | 3.5 | % | |
| | 4 | | | Sun Hung Kai Properties Ltd. | | Hong Kong | | Real Estate Holding & Development | | | 3.5 | % | |
| | 5 | | | Equity Residential | | United States | | Residential REITs | | | 3.3 | % | |
| | 6 | | | AvalonBay Communities, Inc. | | United States | | Residential REITs | | | 2.9 | % | |
| | 7 | | | Unibail-Rodamco SE | | France | | Retail REITs | | | 2.9 | % | |
| | 8 | | | Mitsubishi Estate Co. Ltd. | | Japan | | Real Estate Holding & Development | | | 2.9 | % | |
| | 9 | | | Boston Properties, Inc. | | United States | | Industrial & Office REITs | | | 2.5 | % | |
| | 10 | | | Essex Property Trust, Inc. | | United States | | Residential REITs | | | 2.4 | % | |
| | |
Number
of Shares | |
Value†
(000's)z | |
Common Stocks (100.0%) | |
Australia (6.1%) | |
Goodman Group | | | 7,517 | | | $ | 33 | | |
Investa Office Fund | | | 7,987 | | | | 22 | | |
Mirvac Group | | | 18,313 | | | | 23 | | |
Scentre Group | | | 16,450 | | | | 44 | | |
Westfield Corp. | | | 6,411 | | | | 44 | | |
| | | | 166 | | |
Canada (3.3%) | |
Allied Properties
Real Estate
Investment Trust | | | 1,035 | | | | 28 | | |
Brookfield Asset
Management, Inc.
Class A | | | 1,120 | | | | 35 | | |
RioCan Real
Estate Investment
Trust | | | 1,422 | | | | 26 | | |
| | | | 89 | | |
France (4.2%) | |
ICADE | | | 516 | | | | 37 | | |
Unibail-Rodamco SE | | | 303 | | | | 79 | | |
| | | | 116 | | |
Germany (3.3%) | |
Deutsche
Annington
Immobilien SE | | | 1,099 | | | | 36 | | |
Deutsche
Wohnen AG | | | 2,034 | | | | 53 | | |
| | | | 89 | | |
Hong Kong (6.5%) | |
Henderson Land
Development
Co. Ltd. | | | 6,683 | | | | 41 | | |
Hongkong Land
Holdings Ltd. | | | 5,826 | | | | 40 | | |
Sun Hung Kai
Properties Ltd. | | | 7,500 | | | | 95 | | |
| | | | 176 | | |
| | |
Number
of Shares | |
Value†
(000's)z | |
Japan (12.0%) | |
Industrial &
Infrastructure
Fund Investment
Corp. | | | 7 | | | $ | 29 | | |
Kenedix Retail
REIT Corp.* | | | 13 | | | | 27 | | |
Mitsubishi Estate
Co. Ltd. | | | 3,612 | | | | 78 | | |
Mitsui Fudosan
Co. Ltd. | | | 3,459 | | | | 96 | | |
Mori Hills REIT
Investment Corp. | | | 22 | | | | 25 | | |
Nippon Building
Fund, Inc. | | | 8 | | | | 34 | | |
Sumitomo Realty &
Development
Co. Ltd. | | | 1,147 | | | | 39 | | |
| | | | 328 | | |
Singapore (2.5%) | |
CapitaLand Ltd. | | | 13,033 | | | | 26 | | |
City Developments
Ltd. | | | 2,431 | | | | 15 | | |
Mapletree
Commercial Trust | | | 27,306 | | | | 26 | | |
| | | | 67 | | |
Sweden (1.5%) | |
Hufvudstaden AB,
A Shares | | | 3,096 | | | | 40 | | |
United Kingdom (9.3%) | |
Capital & Counties
Properties PLC | | | 9,365 | | | | 63 | | |
Great Portland
Estates PLC | | | 4,434 | | | | 56 | | |
Land Securities
Group PLC | | | 3,293 | | | | 63 | | |
Segro PLC | | | 5,210 | | | | 33 | | |
Shaftesbury PLC | | | 2,810 | | | | 39 | | |
| | | | 254 | | |
| | |
Number
of Shares | |
Value†
(000's)z | |
United States (51.3%) | |
Alexandria Real
Estate
Equities, Inc. | | | 392 | | | $ | 34 | | |
American
Homes 4 Rent
Class A | | | 1,656 | | | | 27 | | |
American Tower
Corp. | | | 612 | | | | 57 | | |
AvalonBay
Communities, Inc. | | | 481 | | | | 79 | | |
Boston Properties,
Inc. | | | 592 | | | | 67 | | |
Care Capital
Properties, Inc.* | | | 252 | | | | 8 | | |
CBL & Associates
Properties, Inc. | | | 1,086 | | | | 16 | | |
DCT Industrial
Trust, Inc. | | | 787 | | | | 25 | | |
Douglas Emmett,
Inc. | | | 1,325 | | | | 37 | | |
Equinix, Inc. | | | 198 | | | | 53 | | |
Equity Residential | | | 1,265 | | | | 90 | | |
Essex Property
Trust, Inc. | | | 297 | | | | 64 | | |
Extra Space
Storage, Inc. | | | 314 | | | | 23 | | |
Federal Realty
Investment Trust | | | 313 | | | | 40 | | |
Forest City
Enterprises, Inc.
Class A* | | | 891 | | | | 19 | | |
General Growth
Properties, Inc. | | | 1,806 | | | | 46 | | |
Health Care REIT,
Inc. | | | 759 | | | | 48 | | |
Host Hotels &
Resorts, Inc. | | | 1,917 | | | | 34 | | |
Kimco Realty
Corp. | | | 2,121 | | | | 49 | | |
LaSalle Hotel
Properties | | | 833 | | | | 26 | | |
National Retail
Properties, Inc. | | | 1,290 | | | | 45 | | |
OMEGA
Healthcare
Investors, Inc. | | | 838 | | | | 28 | | |
See Notes to Schedule of Investments
Schedule of Investments Global Real Estate Fund (cont'd)
| | |
Number
of Shares | |
Value†
(000's)z | |
Prologis, Inc. | | | 1,320 | | | $ | 50 | | |
Public Storage | | | 494 | | | | 100 | | |
Regency Centers
Corp. | | | 464 | | | | 28 | | |
Simon Property
Group, Inc. | | | 733 | | | | 132 | | |
SL Green Realty
Corp. | | | 373 | | | | 39 | | |
Starwood
Hotels & Resorts
Worldwide, Inc. | | | 352 | | | | 25 | | |
Ventas, Inc. | | | 1,007 | | | | 55 | | |
Vornado Realty
Trust | | | 324 | | | | 28 | | |
Weyerhaeuser Co. | | | 941 | | | | 26 | | |
| | | | 1,398 | | |
Total Common Stocks
(Cost $2,921) | | | | | | | 2,723 | | |
Short-Term Investments (1.9%) | |
State Street
Institutional Liquid
Reserves Fund
Premier Class
(Cost $52) | | | 51,919 | | | | 52 | | |
Total Investments## (101.9%)
(Cost $2,973) | | | | | 2,775 | | |
Liabilities, less cash,
receivables and
other assets [(1.9%)] | | | | | (52 | ) | |
Total Net Assets (100.0%) | | | | $ | 2,723 | | |
See Notes to Schedule of Investments
POSITIONS BY SECTOR GLOBAL REAL ESTATE FUND
| Sector | | Investments at
Value†
(000's omitted) | | Percentage of
Net Assets | |
Real Estate Holding & Development | | $ | 676 | | | | 24.8 | % | |
Industrial & Office REITs | | | 609 | | | | 22.4 | % | |
Retail REITs | | | 588 | | | | 21.6 | % | |
Specialty REITs | | | 288 | | | | 10.6 | % | |
Residential REITs | | | 283 | | | | 10.4 | % | |
Diversified REITs | | | 194 | | | | 7.1 | % | |
Hotel & Lodging REITs | | | 85 | | | | 3.1 | % | |
Short-Term Investments and Other Assets—Net | | | 0 | z | | | 0.0 | % | |
| | $ | 2,723 | | | | 100.0 | % | |
See Notes to Schedule of Investments
Schedule of Investments Greater China Equity Fund 8/31/15
TOP TEN HOLDINGS
| | 1 | | | Tencent Holdings Ltd. | | | 5.8 | % | |
| | 2 | | | Midea Group Co. Ltd., Class A | | | 5.3 | % | |
| | 3 | | | NetEase, Inc. ADR | | | 5.3 | % | |
| | 4 | | | Zhengzhou Yutong Bus Co. Ltd. Class A | | | 5.3 | % | |
| | 5 | | | Ping An Insurance Group Co. of China Ltd., H Shares | | | 5.2 | % | |
| | 6 | | | China Power International Development Ltd. | | | 4.5 | % | |
| | 7 | | | Brilliance China Automotive Holdings Ltd. | | | 4.5 | % | |
| | 8 | | | Inner Mongolia Yili Industrial Group Co. Ltd. Class A | | | 4.3 | % | |
| | 9 | | | China Mobile Ltd. | | | 3.9 | % | |
| | 10 | | | CSPC Pharmaceutical Group Ltd. | | | 3.8 | % | |
| | |
Number
of Shares | |
Value†
(000's)z | |
Common Stocks (81.5%) | |
Automobiles (6.5%) | |
Brilliance China
Automotive
Holdings Ltd. | | | 3,942,000 | | | $ | 4,796 | | |
Great Wall
Motor Co. Ltd.,
H Shares | | | 829,500 | | | | 2,216 | | |
| | | | 7,012 | | |
Banks (3.5%) | |
Industrial &
Commercial
Bank of China
Ltd., H Shares | | | 6,307,000 | | | | 3,727 | | |
Beverages (0.0%) | |
Kweichow Moutai
Co. Ltd. Class A | | | 1,500 | | | | 46 | | |
Capital Markets (1.0%) | |
China Cinda
Asset
Management Co.
Ltd., H Shares | | | 2,855,000 | | | | 1,065 | | |
Commercial Services & Supplies (3.4%) | |
China Everbright
International Ltd. | | | 2,820,000 | | | | 3,711 | | |
Food Products (0.3%) | |
Inner Mongolia
Yili Industrial
Group Co. Ltd.
Class A | | | 147,740 | | | | 373 | | |
Independent Power and Renewable Electricity Producers (11.1%) | |
China Power
International
Development
Ltd. | | | 7,157,000 | | | | 4,811 | | |
China Resources
Power Holdings
Co. Ltd. | | | 1,004,000 | | | | 2,480 | | |
Huadian Fuxin
Energy Corp.
Ltd., H Shares | | | 3,978,000 | | | | 1,401 | | |
Huadian Power
International
Corp. Ltd.,
H Shares | | | 3,352,000 | | | | 2,734 | | |
| | |
Number
of Shares | |
Value†
(000's)z | |
Huaneng
Renewables
Corp. Ltd.,
H Shares | | | 1,356,000 | | | $ | 486 | | |
| | | | 11,912 | | |
Insurance (13.4%) | |
China Taiping
Insurance
Holdings Co. Ltd.* | | | 1,128,800 | | | | 3,204 | | |
New China Life
Insurance Co.
Ltd., H Shares | | | 599,700 | | | | 2,345 | | |
PICC Property &
Casualty Co. Ltd.,
H Shares | | | 1,676,000 | | | | 3,183 | | |
Ping An
Insurance Group
Co. of
China Ltd.,
H Shares | | | 1,150,000 | | | | 5,631 | | |
| | | | 14,363 | | |
Internet & Catalog Retail (2.6%) | |
JD.com, Inc. ADR* | | | 106,168 | | | | 2,748 | | |
Internet Software & Services (18.6%) | |
Alibaba Group
Holding Ltd.
ADR* | | | 43,737 | | | | 2,892 | | |
Baidu, Inc. ADR* | | | 17,458 | | | | 2,571 | | |
NetEase, Inc. ADR | | | 51,081 | | | | 5,679 | | |
Qihoo 360
Technology Co.
Ltd. ADR* | | | 49,510 | | | | 2,617 | | |
Tencent Holdings
Ltd. | | | 367,200 | | | | 6,245 | | |
| | | | 20,004 | | |
Machinery (1.6%) | |
Zhengzhou
Yutong Bus
Co. Ltd. Class A | | | 585,031 | | | | 1,716 | | |
Oil, Gas & Consumable Fuels (1.2%) | |
CNOOC Ltd. | | | 1,017,000 | | | | 1,261 | | |
Pharmaceuticals (6.9%) | |
China Medical
System
Holdings Ltd. | | | 3,039,000 | | | | 3,298 | | |
| | |
Number
of Shares | |
Value†
(000's)z | |
CSPC
Pharmaceutical
Group Ltd. | | | 4,464,000 | | | | $ 4,107 | | |
| | | | 7,405 | | |
Real Estate Management &
Development (2.7%) | |
Red Star Macalline
Group Corp. Ltd.,
H Sharesñ* | | | 625,400 | | | | 838 | | |
Sunac China
Holdings Ltd. | | | 3,851,000 | | | | 2,087 | | |
| | | | 2,925 | | |
Transportation Infrastructure (1.9%) | |
Shenzhen
International
Holdings Ltd. | | | 1,448,500 | | | | 2,011 | | |
Water Utilities (2.9%) | |
Beijing Enterprises
Water Group Ltd.* | | | 2,886,000 | | | | 2,071 | | |
Kangda
International
Environmental
Co. Ltd.ñ* | | | 4,096,000 | | | | 1,078 | | |
| | | | 3,149 | | |
Wireless Telecommunication
Services (3.9%) | |
China Mobile Ltd. | | | 341,000 | | | | 4,204 | | |
Total Common Stocks
(Cost $106,363) | | | | | 87,632 | | |
Participatory Notes (17.1%) | |
Beverages (1.1%) | |
Kweichow Moutai
Co. Ltd., Class A
(issuer HSBC
Bank PLC),
Expiration
Date 8/17/2018 | | | 39,100 | | | | 1,198 | | |
Food Products (4.0%) | |
Inner Mongolia
Yili Industrial
Group Co. Ltd.,
Class A (issuer
Macquarie Bank,
Ltd.), Expiration
Date 2/17/2017 | | | 1,423,014 | | | | 3,595 | | |
See Notes to Schedule of Investments
Schedule of Investments Greater China Equity Fund (cont'd)
| | |
Number
of Shares | |
Value†
(000's)z | |
Inner Mongolia
Yili Industrial
Group Co. Ltd.,
Class A (issuer
Morgan Stanley
Asia Products),
Expiration Date
12/2/2015 | | | 149,000 | | | $ | 376 | | |
Inner Mongolia
Yili Industrial
Group Co. Ltd.,
Class A (issuer
Citigroup
Global Markets
Holdings, Inc.),
Expiration Date
1/15/2016ñ | | | 133,200 | | | | 337 | | |
| | | | 4,308 | | |
Health Care Providers & Services (3.0%) | |
Huadong
Medicine Co.
Ltd., Class A
(issuer HSBC
Bank PLC),
Expiration Date
6/19/2023 | | | 74,807 | | | | 856 | | |
Huadong
Medicine Co. Ltd.,
Class A (issuer
UBS AG),
Expiration
Date 6/16/2016 | | | 18,433 | | | | 211 | | |
Huadong
Medicine Co. Ltd.,
Class A (issuer
Morgan Stanley
Asia Products),
Expiration
Date 11/12/2018 | | | 30,290 | | | | 347 | | |
Huadong
Medicine Co. Ltd.,
Class A (issuer
Citigroup Global
Markets
Holdings, Inc.),
Expiration
Date 1/15/2016ñ | | | 142,018 | | | | 1,626 | | |
Huadong
Medicine Co. Ltd.,
Class A (issuer
BNP Paribas
Arbitrage),
Expiration
Date 3/30/2016ñ | | | 12,230 | | | | 140 | | |
| | | | 3,180 | | |
| | |
Number
of Shares | |
Value†
(000's)z | |
Household Durables (5.3%) | |
Midea Group Co.
Ltd., Class A
(issuer UBS AG),
Expiration
Date 6/8/2016 | | | 280,245 | | | $ | 1,265 | | |
Midea Group Co.
Ltd., Class A
(issuer Credit
Suisse AG),
Expiration
Date 6/29/2020ñ | | | 66,600 | | | | 301 | | |
Midea Group
Co. Ltd., Class A
(issuer Goldman
Sachs Int'l),
Expiration
Date 3/13/2016 | | | 133,145 | | | | 601 | | |
Midea Group Co.
Ltd., Class A
(issuer Citigroup
Global Markets
Holdings, Inc.),
Expiration Date
1/15/2016ñ | | | 297,787 | | | | 1,344 | | |
Midea Group Co.
Ltd., Class A
(issuer BNP
Paribas
Arbitrage),
Expiration Date
1/6/2016ñ | | | 490,800 | | | | 2,216 | | |
| | | | 5,727 | | |
Machinery (3.7%) | |
Zhengzhou
Yutong Bus Co.
Ltd., Class A
(issuer BNP
Paribas Arbitrage),
Expiration Date
1/13/2017ñ | | | 927,155 | | | | 2,730 | | |
Zhengzhou
Yutong Bus Co.
Ltd., Class A
(issuer UBS AG),
Expiration
Date 1/21/2016 | | | 110,006 | | | | 324 | | |
Zhengzhou
Yutong Bus Co.
Ltd., Class A
(issuer HSBC
Bank PLC),
Expiration Date
1/13/2025 | | | 219,150 | | | | 645 | | |
| | |
Number
of Shares | |
Value†
(000's)z | |
Zhengzhou
Yutong Bus Co.
Ltd., Class A
(issuer Morgan
Stanley Asia
Products),
Expiration
Date 12/30/2015 | | | 83,400 | | | $ | 246 | | |
| | | | 3,945 | | |
Total Participatory Notes
(Cost $19,249) | | | | | 18,358 | | |
Short-Term Investments (4.1%) | |
State Street
Institutional
Government
Money Market
Fund Premier
Class
(Cost $4,463) | | | 4,463,442 | | | | 4,463 | | |
Total Investments## (102.7%)
(Cost $130,075) | | | | | 110,453 | | |
Liabilities, less cash,
receivables and
other assets [(2.7%)] | | | | | (2,876 | ) | |
Total Net Assets (100.0%) | | | | $ | 107,577 | | |
See Notes to Schedule of Investments
Schedule of Investments Guardian Fund 8/31/15
TOP TEN EQUITY HOLDINGS
| | 1 | | | Berkshire Hathaway, Inc. Class B | | | 5.5 | % | |
| | 2 | | | American Express Co. | | | 5.3 | % | |
| | 3 | | | Texas Instruments, Inc. | | | 5.2 | % | |
| | 4 | | | Progressive Corp. | | | 5.1 | % | |
| | 5 | | | Newell Rubbermaid, Inc. | | | 5.1 | % | |
| | 6 | | | Danaher Corp. | | | 4.2 | % | |
| | 7 | | | WEC Energy Group, Inc. | | | 4.0 | % | |
| | 8 | | | Schlumberger Ltd. | | | 4.0 | % | |
| | 9 | | | Intuit, Inc. | | | 3.7 | % | |
| | 10 | | | W.W. Grainger, Inc. | | | 3.6 | % | |
| | |
Number
of Shares | |
Value†
(000's)z | |
Common Stocks (97.9%) | |
Auto Components (2.5%) | |
BorgWarner, Inc. | | | 740,996 | | | $ | 32,337 | | |
Banks (3.6%) | |
U.S. Bancorp | | | 1,105,820 | | | | 46,832 | | |
Beverages (2.8%) | |
Anheuser-Busch
InBev NV ADR | | | 340,824 | | | | 37,119 | | |
Communications Equipment (1.6%) | |
NetScout
Systems, Inc.* | | | 593,878 | | | | 21,706 | | |
Consumer Finance (5.3%) | |
American
Express Co. | | | 903,838 | | | | 69,342 | | |
Diversified Financial Services (8.3%) | |
Berkshire
Hathaway,
Inc. Class B* | | | 537,308 | | | | 72,021 | | |
Intercontinental
Exchange, Inc. | | | 160,613 | | | | 36,685 | | |
| | | | 108,706 | | |
Diversified Telecommunication
Services (1.4%) | |
Level 3
Communications,
Inc.* | | | 412,615 | | | | 18,456 | | |
Energy Equipment & Services (4.0%) | |
Schlumberger Ltd. | | | 676,110 | | | | 52,311 | | |
Food Products (2.6%) | |
Keurig Green
Mountain, Inc. | | | 612,006 | | | | 34,640 | | |
Health Care Equipment & Supplies (5.8%) | |
Abbott
Laboratories | | | 720,319 | | | | 32,623 | | |
Becton,
Dickinson & Co. | | | 311,069 | | | | 43,867 | | |
| | | | 76,490 | | |
Health Care Providers & Services (1.3%) | |
Premier, Inc.
Class A* | | | 474,481 | | | | 16,915 | | |
Household Durables (5.1%) | |
Newell
Rubbermaid, Inc. | | | 1,586,260 | | | | 66,829 | | |
| | |
Number
of Shares | |
Value†
(000's)z | |
Industrial Conglomerates (6.1%) | |
3M Co. | | | 182,460 | | | $ | 25,935 | | |
Danaher Corp. | | | 629,483 | | | | 54,778 | | |
| | | | 80,713 | | |
Insurance (5.1%) | |
Progressive Corp. | | | 2,264,743 | | | | 67,852 | | |
Internet Software & Services (1.9%) | |
eBay, Inc.* | | | 915,534 | | | | 24,820 | | |
IT Services (7.0%) | |
Alliance Data
Systems Corp.* | | | 155,038 | | | | 39,874 | | |
MasterCard, Inc.
Class A | | | 225,256 | | | | 20,807 | | |
PayPal
Holdings, Inc.* | | | 903,304 | | | | 31,616 | | |
| | | | 92,297 | | |
Leisure Products (3.0%) | |
Polaris
Industries, Inc. | | | 301,347 | | | | 39,136 | | |
Machinery (3.2%) | |
Lincoln Electric
Holdings, Inc. | | | 711,743 | | | | 41,744 | | |
Multi-Utilities (4.0%) | |
WEC Energy
Group, Inc. | | | 1,104,467 | | | | 52,628 | | |
Oil, Gas & Consumable Fuels (1.9%) | |
Noble Energy,
Inc. | | | 757,300 | | | | 25,301 | | |
Pharmaceuticals (2.0%) | |
Roche
Holding AG | | | 98,148 | | | | 26,805 | | |
Semiconductors & Semiconductor Equipment (5.2%) | |
Texas
Instruments, Inc. | | | 1,429,054 | | | | 68,366 | | |
Software (5.6%) | |
Adobe
Systems, Inc.* | | | 304,065 | | | | 23,890 | | |
Intuit, Inc. | | | 574,170 | | | | 49,235 | | |
| | | | 73,125 | | |
Specialty Retail (3.1%) | |
TJX Cos., Inc. | | | 589,381 | | | | 41,445 | | |
| | |
Number
of Shares | |
Value†
(000's)z | |
Trading Companies & Distributors (5.5%) | |
NOW, Inc.* | | | 1,425,419 | | | $ | 24,318 | | |
W.W. Grainger,
Inc. | | | 214,067 | | | | 47,831 | | |
| | | | 72,149 | | |
Total Common Stocks
(Cost $1,049,376) | | | | | 1,288,064 | | |
Short-Term Investments (1.0%) | |
State Street
Institutional
Treasury Money
Market Fund
Premier Class
(Cost $12,350) | | | 12,349,677 | | | | 12,350 | | |
Total Investments## (98.9%)
(Cost $1,061,726) | | | | | 1,300,414 | | |
Cash, receivables and
other assets,
less liabilities (1.1%) | | | | | | | 14,937 | | |
Total Net Assets (100.0%) | | | | $ | 1,315,351 | | |
See Notes to Schedule of Investments
Schedule of Investments International Equity Fund 8/31/15
TOP TEN EQUITY HOLDINGS
| | | | | Country | | Industry | | | |
| | 1 | | | Check Point Software Technologies Ltd. | | Israel | | Software | | | 2.2 | % | |
| | 2 | | | Sundrug Co. Ltd. | | Japan | | Food & Staples Retailing | | | 1.9 | % | |
| | 3 | | | TOYOTA MOTOR Corp. | | Japan | | Automobiles | | | 1.7 | % | |
| | 4 | | | Lloyds Banking Group PLC | | United Kingdom | | Banks | | | 1.6 | % | |
| | 5 | | | Prudential PLC | | United Kingdom | | Insurance | | | 1.6 | % | |
| | 6 | | | Bunzl PLC | | United Kingdom | | Trading Companies & Distributors | | | 1.6 | % | |
| | 7 | | | Nielsen Holdings PLC | | United States | | Professional Services | | | 1.6 | % | |
| | 8 | | | Sodexo SA | | France | | Hotels, Restaurants & Leisure | | | 1.5 | % | |
| | 9 | | | Alimentation Couche-Tard, Inc. Class B | | Canada | | Food & Staples Retailing | | | 1.5 | % | |
| | 10 | | | Givaudan SA | | Switzerland | | Chemicals | | | 1.5 | % | |
| | |
Number
of Shares | |
Value†
(000's)z | |
Common Stocks (95.4%) | |
Australia (2.8%) | |
Brambles Ltd. | | | 1,382,645 | | | $ | 9,682 | | |
Insurance
Australia
Group Ltd. | | | 4,421,410 | | | | 15,953 | | |
Spotless Group
Holdings Ltd. | | | 5,623,303 | | | | 7,963 | | |
| | | | 33,598 | | |
Austria (1.0%) | |
Andritz AG | | | 244,280 | | | | 11,710 | | |
Belgium (1.2%) | |
Colruyt SA | | | 283,725 | | | | 13,851 | | |
Brazil (0.6%) | |
SLC Agricola SA | | | 1,702,600 | | | | 7,554 | | |
Canada (5.5%) | |
Alimentation
Couche-Tard, Inc.
Class B | | | 433,900 | | | | 18,387 | | |
ATS Automation
Tooling Systems,
Inc.* | | | 921,100 | | | | 9,529 | | |
Corus
Entertainment,
Inc., B Shares | | | 677,501 | | | | 7,359 | | |
Home Capital
Group, Inc. | | | 387,400 | | | | 8,098 | | |
Kinaxis, Inc.* | | | 166,900 | | | | 4,624 | | |
MacDonald,
Dettwiler &
Associates Ltd. | | | 191,233 | | | | 11,264 | | |
Suncor
Energy, Inc. | | | 214,500 | | | | 6,075 | | |
| | | | 65,336 | | |
China (0.6%) | |
Alibaba Group
Holding Ltd.
ADR* | | | 107,300 | | | | 7,095 | | |
Denmark (1.2%) | |
Sydbank A/S | | | 366,766 | | | | 13,962 | | |
| | |
Number
of Shares | |
Value†
(000's)z | |
France (10.8%) | |
Arkema SA | | | 136,901 | | | $ | 9,664 | | |
BNP Paribas SA | | | 238,740 | | | | 15,075 | | |
Elis SA | | | 401,370 | | | | 6,378 | | |
| Euronext NVñ | | | 308,848 | | | | 14,135 | | |
Pernod-Ricard SA | | | 101,035 | | | | 10,603 | | |
Publicis
Groupe SA | | | 153,130 | | | | 10,915 | | |
Rexel SA | | | 790,142 | | | | 12,125 | | |
Sanofi | | | 164,700 | | | | 16,295 | | |
Sodexo SA | | | 209,405 | | | | 18,430 | | |
SPIE SA* | | | 452,597 | | | | 8,641 | | |
Virbac SA | | | 26,677 | | | | 6,134 | | |
| | | 128,395 | | |
Germany (9.2%) | |
Bayer AG | | | 109,340 | | | | 14,840 | | |
Brenntag AG | | | 298,950 | | | | 16,633 | | |
Continental AG | | | 64,355 | | | | 13,681 | | |
Deutsche
Boerse AG | | | 104,474 | | | | 9,354 | | |
Gerresheimer AG | | | 147,538 | | | | 10,700 | | |
Henkel AG &
Co. KGaA,
Preference
Shares | | | 133,560 | | | | 13,983 | | |
Linde AG | | | 87,196 | | | | 15,157 | | |
SAP SE ADR | | | 229,100 | | | | 15,409 | | |
| | | | 109,757 | | |
Hong Kong (0.3%) | |
HKBN Ltd.* | | | 3,701,500 | | | | 3,811 | | |
Ireland (1.4%) | |
DCC PLC | | | 224,628 | | | | 16,661 | | |
Israel (4.1%) | |
Bezeq Israeli
Telecommunication
Corp. Ltd. | | | 8,259,979 | | | | 14,841 | | |
Check Point
Software
Technologies
Ltd.* | | | 343,200 | | | | 26,773 | | |
Teva Pharmaceutical
Industries Ltd.
ADR | | | 103,800 | | | | 6,686 | | |
| | | | 48,300 | | |
| | |
Number
of Shares | |
Value†
(000's)z | |
Italy (0.8%) | |
Azimut
Holding SpA | | | 430,435 | | | $ | 9,496 | | |
Japan (12.1%) | |
FANUC Corp. | | | 78,000 | | | | 12,684 | | |
KANSAI PAINT
Co. Ltd. | | | 996,600 | | | | 15,569 | | |
KEYENCE Corp. | | | 33,650 | | | | 15,652 | | |
Nihon Kohden
Corp. | | | 636,700 | | | | 12,715 | | |
PIGEON Corp. | | | 326,400 | | | | 8,656 | | |
SANTEN
PHARMACEUTICAL
Co. Ltd. | | | 830,400 | | | | 12,980 | | |
SMC Corp. | | | 47,700 | | | | 11,593 | | |
SoftBank Group
Corp. | | | 200,700 | | | | 11,693 | | |
Sundrug Co. Ltd. | | | 401,400 | | | | 22,580 | | |
TOYOTA MOTOR
Corp. | | | 339,100 | | | | 20,116 | | |
| | | | 144,238 | | |
Korea (1.1%) | |
Samsung
Electronics
Co. Ltd. | | | 14,111 | | | | 12,992 | | |
Netherlands (3.5%) | |
Akzo Nobel NV | | | 189,749 | | | | 12,848 | | |
| ASML Holding NV | | | 183,386 | | | | 16,809 | | |
| Flow Tradersñ | | | 74,616 | | | | 3,181 | | |
Koninklijke
Ahold NV | | | 470,014 | | | | 9,291 | | |
| | | 42,129 | | |
Norway (0.8%) | |
DNB ASA | | | 685,169 | | | | 9,807 | | |
Singapore (0.5%) | |
United Overseas
Bank Ltd. | | | 470,700 | | | | 6,465 | | |
See Notes to Schedule of Investments
Schedule of Investments International Equity Fund (cont'd)
| | |
Number
of Shares | |
Value†
(000's)z | |
Spain (1.5%) | |
Banco Bilbao
Vizcaya
Argentaria SA | | | 1,245,175 | | | $ | 11,545 | | |
| Euskaltel SAñ* | | | 582,000 | | | | 6,861 | | |
| | | | 18,406 | | |
Sweden (1.0%) | |
Telefonaktiebolaget
LM Ericsson,
B Shares | | | 1,259,465 | | | | 12,281 | | |
Switzerland (12.1%) | |
Bucher
Industries AG | | | 50,380 | | | | 11,450 | | |
Cie Financiere
Richemont SA | | | 139,785 | | | | 10,462 | | |
Givaudan SA* | | | 10,495 | | | | 18,077 | | |
Julius Baer
Group Ltd.* | | | 324,555 | | | | 15,804 | | |
Partners Group
Holding AG | | | 44,290 | | | | 14,307 | | |
Roche Holding AG | | | 61,729 | | | | 16,859 | | |
SGS SA | | | 7,195 | | | | 12,698 | | |
Sonova Holding AG | | | 67,125 | | | | 8,743 | | |
TE Connectivity Ltd. | | | 100,000 | | | | 5,929 | | |
Tecan Group AG | | | 135,633 | | | | 17,469 | | |
UBS Group AG* | | | 608,970 | | | | 12,618 | | |
| | | | 144,416 | | |
United Kingdom (21.0%) | |
Amlin PLC | | | 2,130,017 | | | | 16,767 | | |
Aon PLC | | | 168,900 | | | | 15,782 | | |
Barclays PLC | | | 3,986,000 | | | | 15,840 | | |
Bunzl PLC | | | 717,285 | | | | 18,980 | | |
Clinigen
Group PLC | | | 490,900 | | | | 5,310 | | |
Diploma PLC | | | 1,077,465 | | | | 11,833 | | |
Lloyds Banking
Group PLC | | | 16,597,930 | | | | 19,564 | | |
Mitie Group PLC | | | 3,511,963 | | | | 15,915 | | |
Pentair PLC | | | 138,400 | | | | 7,652 | | |
Prudential PLC | | | 899,885 | | | | 19,422 | | |
RELX PLC | | | 950,136 | | | | 15,149 | | |
| RPS Group PLC | | | 3,014,273 | | | | 10,743 | | |
SABMiller PLC | | | 190,305 | | | | 8,852 | | |
Spectris PLC | | | 280,682 | | | | 7,803 | | |
St. James's
Place PLC | | | 1,014,769 | | | | 14,127 | | |
Synergy
Health PLC* | | | 573,624 | | | | 14,304 | | |
TalkTalk Telecom
Group PLC | | | 3,765,245 | | | | 17,253 | | |
Travis Perkins PLC | | | 531,330 | | | | 16,571 | | |
| | | 251,867 | | |
| | |
Number
of Shares | |
Value†
(000's)z | |
United States (2.3%) | |
Nielsen
Holdings PLC | | | 410,402 | | | $ | 18,562 | | |
Samsonite
International
SA | | | 2,821,000 | | | | 8,809 | | |
| | | 27,371 | | |
Total Common Stocks
(Cost $1,074,672) | | | | | 1,139,498 | | |
Short-Term Investments (4.3%) | |
State Street
Institutional
Treasury Money
Market Fund
Premier Class
(Cost $50,726) | | | 50,725,706 | | | | 50,726 | | |
Total Investments## (99.7%)
(Cost $1,125,398) | | | | | 1,190,224 | | |
Cash, receivables
and other assets,
less liabilities (0.3%) | | | | | 4,160 | | |
Total Net Assets (100.0%) | | | | $ | 1,194,384 | | |
See Notes to Schedule of Investments
POSITIONS BY INDUSTRY INTERNATIONAL EQUITY FUND
Industry | | Investments at
Value†
(000's omitted) | | Percentage of
Net Assets | |
Banks | | $ | 92,258 | | | | 7.7 | % | |
Insurance | | | 82,051 | | | | 6.9 | % | |
Trading Companies & Distributors | | | 76,142 | | | | 6.4 | % | |
Pharmaceuticals | | | 73,794 | | | | 6.2 | % | |
Chemicals | | | 71,315 | | | | 6.0 | % | |
Machinery | | | 64,618 | | | | 5.4 | % | |
Food & Staples Retailing | | | 64,109 | | | | 5.4 | % | |
Capital Markets | | | 55,406 | | | | 4.6 | % | |
Commercial Services & Supplies | | | 50,681 | | | | 4.2 | % | |
Software | | | 46,806 | | | | 3.9 | % | |
Diversified Telecommunication Services | | | 42,766 | | | | 3.6 | % | |
Life Sciences Tools & Services | | | 33,479 | | | | 2.8 | % | |
Media | | | 33,423 | | | | 2.8 | % | |
Professional Services | | | 31,260 | | | | 2.6 | % | |
Electronic Equipment, Instruments & Components | | | 29,384 | | | | 2.5 | % | |
Diversified Financial Services | | | 23,489 | | | | 2.0 | % | |
Household Products | | | 22,639 | | | | 1.9 | % | |
Health Care Equipment & Supplies | | | 21,458 | | | | 1.8 | % | |
Automobiles | | | 20,116 | | | | 1.7 | % | |
Beverages | | | 19,455 | | | | 1.6 | % | |
Textiles, Apparel & Luxury Goods | | | 19,271 | | | | 1.6 | % | |
Hotels, Restaurants & Leisure | | | 18,430 | | | | 1.5 | % | |
Semiconductors & Semiconductor Equipment | | | 16,809 | | | | 1.4 | % | |
Industrial Conglomerates | | | 16,661 | | | | 1.4 | % | |
Health Care Providers & Services | | | 14,304 | | | | 1.2 | % | |
Auto Components | | | 13,681 | | | | 1.1 | % | |
Technology Hardware, Storage & Peripherals | | | 12,992 | | | | 1.1 | % | |
Communications Equipment | | | 12,281 | | | | 1.0 | % | |
Wireless Telecommunication Services | | | 11,693 | | | | 1.0 | % | |
Aerospace & Defense | | | 11,264 | | | | 1.0 | % | |
Construction & Engineering | | | 8,641 | | | | 0.7 | % | |
Thrifts & Mortgage Finance | | | 8,098 | | | | 0.7 | % | |
Food Products | | | 7,554 | | | | 0.6 | % | |
Internet Software & Services | | | 7,095 | | | | 0.6 | % | |
Oil, Gas & Consumable Fuels | | | 6,075 | | | | 0.5 | % | |
Short-Term Investments and Other Assets—Net | | | 54,886 | | | | 4.6 | % | |
| | | $ | 1,194,384 | | | | 100.0 | % | |
See Notes to Schedule of Investments
Schedule of Investments International Select Fund 8/31/15
TOP TEN EQUITY HOLDINGS
| | | | | Country | | Industry | | | |
| | 1 | | | Check Point Software Technologies Ltd. | | Israel | | Software | | | 2.6 | % | |
| | 2 | | | Roche Holding AG | | Switzerland | | Pharmaceuticals | | | 2.5 | % | |
| | 3 | | | Novartis AG | | Switzerland | | Pharmaceuticals | | | 2.1 | % | |
| | 4 | | | KANSAI PAINT Co. Ltd. | | Japan | | Chemicals | | | 2.1 | % | |
| | 5 | | | Lloyds Banking Group PLC | | United Kingdom | | Banks | | | 2.0 | % | |
| | 6 | | | TOYOTA MOTOR Corp. | | Japan | | Automobiles | | | 2.0 | % | |
| | 7 | | | Bunzl PLC | | United Kingdom | | Trading Companies & Distributors | | | 2.0 | % | |
| | 8 | | | Alimentation Couche-Tard, Inc. Class B | | Canada | | Food & Staples Retailing | | | 1.9 | % | |
| | 9 | | | Amlin PLC | | United Kingdom | | Insurance | | | 1.8 | % | |
| | 10 | | | Givaudan SA | | Switzerland | | Chemicals | | | 1.8 | % | |
| | |
Number
of Shares | |
Value†
(000's)z | |
Common Stocks (96.6%) | |
Australia (2.2%) | |
Brambles Ltd. | | | 302,055 | | | $ | 2,115 | | |
Insurance
Australia
Group Ltd. | | | 881,765 | | | | 3,182 | | |
| | | | 5,297 | | |
Austria (1.0%) | |
Andritz AG | | | 49,710 | | | | 2,383 | | |
Belgium (1.2%) | |
Colruyt SA | | | 58,280 | | | | 2,845 | | |
Canada (3.2%) | |
Alimentation
Couche-Tard, Inc.
Class B | | | 109,100 | | | | 4,624 | | |
Home Capital
Group, Inc. | | | 87,700 | | | | 1,833 | | |
Suncor Energy, Inc. | | | 44,000 | | | | 1,246 | | |
| | | | 7,703 | | |
China (0.6%) | |
Alibaba Group
Holding Ltd.
ADR* | | | 21,700 | | | | 1,435 | | |
Denmark (1.3%) | |
Jyske Bank A/S* | | | 56,080 | | | | 3,135 | | |
France (10.7%) | |
Arkema SA | | | 31,085 | | | | 2,195 | | |
BNP Paribas SA | | | 57,125 | | | | 3,607 | | |
Pernod-Ricard SA | | | 20,860 | | | | 2,189 | | |
Publicis
Groupe SA | | | 39,203 | | | | 2,794 | | |
Rexel SA | | | 185,418 | | | | 2,845 | | |
Sanofi | | | 41,835 | | | | 4,139 | | |
Schneider
Electric SE | | | 43,379 | | | | 2,742 | | |
Sodexo SA | | | 42,465 | | | | 3,738 | | |
SPIE SA* | | | 63,800 | | | | 1,218 | | |
| | | | 25,467 | | |
Germany (9.3%) | |
Bayer AG | | | 22,505 | | | | 3,054 | | |
Brenntag AG | | | 61,045 | | | | 3,396 | | |
| | |
Number
of Shares | |
Value†
(000's)z | |
Continental AG | | | 15,650 | | | $ | 3,327 | | |
Deutsche
Boerse AG | | | 30,557 | | | | 2,736 | | |
Henkel AG & Co.
KGaA,
Preference
Shares | | | 32,360 | | | | 3,388 | | |
Linde AG | | | 17,395 | | | | 3,024 | | |
SAP SE ADR | | | 46,485 | | | | 3,127 | | |
| | | | 22,052 | | |
Ireland (1.1%) | |
DCC PLC | | | 34,270 | | | | 2,542 | | |
Israel (4.8%) | |
Bezeq Israeli
Telecommunication
Corp. Ltd. | | | 2,128,940 | | | | 3,825 | | |
Check Point
Software
Technologies
Ltd.* | | | 78,900 | | | | 6,155 | | |
Teva
Pharmaceutical
Industries
Ltd. ADR | | | 20,400 | | | | 1,314 | | |
| | | | 11,294 | | |
Italy (0.8%) | |
Azimut Holding
SpA | | | 85,740 | | | | 1,892 | | |
Japan (13.5%) | |
FANUC Corp. | | | 17,100 | | | | 2,781 | | |
KANSAI PAINT
Co. Ltd. | | | 313,800 | | | | 4,902 | | |
KEYENCE Corp. | | | 6,900 | | | | 3,209 | | |
MIRACA
HOLDINGS, Inc. | | | 56,100 | | | | 2,411 | | |
Nihon Kohden
Corp. | | | 95,300 | | | | 1,903 | | |
SANTEN
PHARMACEUTICAL
Co. Ltd. | | | 222,800 | | | | 3,483 | | |
SMC Corp. | | | 11,900 | | | | 2,892 | | |
SoftBank Group
Corp. | | | 49,200 | | | | 2,866 | | |
Sundrug Co. Ltd. | | | 50,500 | | | | 2,841 | | |
| | |
Number
of Shares | |
Value†
(000's)z | |
TOYOTA MOTOR
Corp. | | | 78,900 | | | $ | 4,681 | | |
| | | | 31,969 | | |
Korea (1.4%) | |
Samsung
Electronics
Co. Ltd. | | | 3,666 | | | | 3,375 | | |
Netherlands (4.2%) | |
Akzo Nobel NV | | | 50,161 | | | | 3,397 | | |
| ASML Holding NV | | | 45,050 | | | | 4,129 | | |
Koninklijke
Ahold NV | | | 127,190 | | | | 2,514 | | |
| | | | 10,040 | | |
Norway (0.6%) | |
DNB ASA | | | 105,243 | | | | 1,506 | | |
Singapore (0.4%) | |
United Overseas
Bank Ltd. | | | 71,100 | | | | 976 | | |
Spain (1.0%) | |
Banco Bilbao
Vizcaya
Argentaria SA | | | 249,343 | | | | 2,312 | | |
Sweden (2.5%) | |
Nordea Bank AB | | | 257,975 | | | | 3,053 | | |
Telefonaktiebolaget
LM Ericsson,
B Shares | | | 307,395 | | | | 2,998 | | |
| | | | 6,051 | | |
Switzerland (14.3%) | |
Cie Financiere
Richemont SA | | | 28,225 | | | | 2,113 | | |
Givaudan SA* | | | 2,416 | | | | 4,161 | | |
Julius Baer
Group Ltd.* | | | 52,740 | | | | 2,568 | | |
Novartis AG | | | 51,991 | | | | 5,093 | | |
Partners Group
Holding AG | | | 9,320 | | | | 3,011 | | |
Roche
Holding AG | | | 21,571 | | | | 5,891 | | |
SGS SA | | | 2,192 | | | | 3,869 | | |
Sonova
Holding AG | | | 13,375 | | | | 1,742 | | |
See Notes to Schedule of Investments
Schedule of Investments International Select Fund (cont'd)
| | |
Number
of Shares | |
Value†
(000's)z | |
TE Connectivity
Ltd. | | | 29,900 | | | $ | 1,773 | | |
UBS Group AG* | | | 177,180 | | | | 3,671 | | |
| | | | 33,892 | | |
United Kingdom (20.1%) | |
Amlin PLC | | | 530,224 | | | | 4,174 | | |
Aon PLC | | | 43,300 | | | | 4,046 | | |
Barclays PLC | | | 966,365 | | | | 3,840 | | |
Bunzl PLC | | | 175,230 | | | | 4,637 | | |
Howden Joinery
Group PLC | | | 445,355 | | | | 3,266 | | |
Lloyds Banking
Group PLC | | | 3,997,330 | | | | 4,712 | | |
Pentair PLC | | | 28,600 | | | | 1,581 | | |
Prudential PLC | | | 179,450 | | | | 3,873 | | |
RELX PLC | | | 229,709 | | | | 3,662 | | |
SABMiller PLC | | | 44,825 | | | | 2,085 | | |
Spectris PLC | | | 57,834 | | | | 1,608 | | |
St. James's
Place PLC | | | 206,455 | | | | 2,874 | | |
TalkTalk Telecom
Group PLC | | | 880,350 | | | | 4,034 | | |
Travis Perkins PLC | | | 106,910 | | | | 3,334 | | |
| | | 47,726 | | |
United States (2.4%) | |
Nielsen
Holdings PLC | | | 82,900 | | | | 3,750 | | |
Samsonite
International SA | | | 569,700 | | | | 1,779 | | |
| | | 5,529 | | |
Total Common Stocks
(Cost $208,302) | | | | | 229,421 | | |
Short-Term Investments (3.3%) | |
State Street
Institutional
Treasury Money
Market Fund
Premier Class
(Cost $7,788) | | | 7,788,223 | | | | 7,788 | | |
Total Investments## (99.9%)
(Cost $216,090) | | | | | 237,209 | | |
Cash, receivables
and other assets,
less liabilities (0.1%) | | | | | 338 | | |
Total Net Assets (100.0%) | | | | $ | 237,547 | | |
See Notes to Schedule of Investments
POSITIONS BY INDUSTRY INTERNATIONAL SELECT FUND
Industry | | Investments at
Value†
(000's omitted) | | Percentage of
Net Assets | |
Banks | | $ | 23,141 | | | | 9.7 | % | |
Pharmaceuticals | | | 22,974 | | | | 9.7 | % | |
Insurance | | | 18,149 | | | | 7.6 | % | |
Chemicals | | | 17,679 | | | | 7.4 | % | |
Trading Companies & Distributors | | | 14,212 | | | | 6.0 | % | |
Food & Staples Retailing | | | 12,824 | | | | 5.4 | % | |
Capital Markets | | | 11,142 | | | | 4.7 | % | |
Machinery | | | 9,637 | | | | 4.1 | % | |
Software | | | 9,282 | | | | 3.9 | % | |
Diversified Telecommunication Services | | | 7,859 | | | | 3.3 | % | |
Professional Services | | | 7,619 | | | | 3.2 | % | |
Electronic Equipment, Instruments & Components | | | 6,590 | | | | 2.8 | % | |
Media | | | 6,456 | | | | 2.7 | % | |
Automobiles | | | 4,681 | | | | 2.0 | % | |
Beverages | | | 4,274 | | | | 1.8 | % | |
Semiconductors & Semiconductor Equipment | | | 4,129 | | | | 1.7 | % | |
Textiles, Apparel & Luxury Goods | | | 3,892 | | | | 1.6 | % | |
Hotels, Restaurants & Leisure | | | 3,738 | | | | 1.6 | % | |
Health Care Equipment & Supplies | | | 3,645 | | | | 1.5 | % | |
Household Products | | | 3,388 | | | | 1.4 | % | |
Technology Hardware, Storage & Peripherals | | | 3,375 | | | | 1.4 | % | |
Auto Components | | | 3,327 | | | | 1.4 | % | |
Specialty Retail | | | 3,266 | | | | 1.4 | % | |
Communications Equipment | | | 2,998 | | | | 1.3 | % | |
Wireless Telecommunication Services | | | 2,866 | | | | 1.2 | % | |
Electrical Equipment | | | 2,742 | | | | 1.2 | % | |
Diversified Financial Services | | | 2,736 | | | | 1.2 | % | |
Industrial Conglomerates | | | 2,542 | | | | 1.1 | % | |
Health Care Providers & Services | | | 2,411 | | | | 1.0 | % | |
Commercial Services & Supplies | | | 2,115 | | | | 0.9 | % | |
Thrifts & Mortgage Finance | | | 1,833 | | | | 0.8 | % | |
Internet Software & Services | | | 1,435 | | | | 0.6 | % | |
Oil, Gas & Consumable Fuels | | | 1,246 | | | | 0.5 | % | |
Construction & Engineering | | | 1,218 | | | | 0.5 | % | |
Short-Term Investments and Other Assets—Net | | | 8,126 | | | | 3.4 | % | |
| | | $ | 237,547 | | | | 100.0 | % | |
See Notes to Schedule of Investments
Schedule of Investments Intrinsic Value Fund 8/31/15
TOP TEN EQUITY HOLDINGS
| | 1 | | | Verint Systems, Inc. | | | 2.2 | % | |
| | 2 | | | Spirit AeroSystems Holdings, Inc. Class A | | | 2.2 | % | |
| | 3 | | | Charles River Laboratories International, Inc. | | | 2.2 | % | |
| | 4 | | | CoreLogic, Inc. | | | 2.2 | % | |
| | 5 | | | Rambus, Inc. | | | 2.1 | % | |
| | 6 | | | Acxiom Corp. | | | 2.0 | % | |
| | 7 | | | Avery Dennison Corp. | | | 1.8 | % | |
| | 8 | | | Crown Holdings, Inc. | | | 1.8 | % | |
| | 9 | | | NRG Energy, Inc. | | | 1.7 | % | |
| | 10 | | | Dynegy, Inc. | | | 1.7 | % | |
| | |
Number
of Shares | |
Value†
(000's)z | |
Common Stocks (90.1%) | |
Aerospace & Defense (6.1%) | |
Aerovironment,
Inc.* | | | 135,859 | | | $ | 3,267 | | |
KEYW Holding
Corp.* | | | 675,650 | | | | 5,676 | | |
Spirit AeroSystems
Holdings, Inc.
Class A* | | | 209,690 | | | | 10,717 | | |
Teledyne
Technologies,
Inc.* | | | 47,352 | | | | 4,636 | | |
Textron, Inc. | | | 138,339 | | | | 5,368 | | |
| | | | 29,664 | | |
Auto Components (0.9%) | |
Dana Holding
Corp. | | | 239,700 | | | | 4,204 | | |
Banks (7.7%) | |
BankUnited, Inc. | | | 146,604 | | | | 5,225 | | |
Comerica, Inc. | | | 99,874 | | | | 4,394 | | |
First Niagara
Financial Group,
Inc. | | | 545,500 | | | | 5,046 | | |
Huntington
Bancshares, Inc. | | | 700,630 | | | | 7,644 | | |
TCF Financial
Corp. | | | 376,100 | | | | 5,837 | | |
Texas Capital
Bancshares, Inc.* | | | 84,700 | | | | 4,562 | | |
Umpqua Holdings
Corp. | | | 311,900 | | | | 5,212 | | |
| | | | 37,920 | | |
Building Products (1.4%) | |
Owens Corning | | | 153,100 | | | | 6,781 | | |
Chemicals (1.4%) | |
Chemtura Corp.* | | | 249,500 | | | | 6,786 | | |
Commercial Services & Supplies (2.8%) | |
Clean Harbors,
Inc.* | | | 124,014 | | | | 6,092 | | |
Covanta Holding
Corp. | | | 389,000 | | | | 7,702 | | |
| | | | 13,794 | | |
Communications Equipment (6.5%) | |
ARRIS Group,
Inc.* | | | 304,269 | | | | 8,039 | | |
| | |
Number
of Shares | |
Value†
(000's)z | |
Brocade
Communications
Systems, Inc. | | | 394,159 | | | $ | 4,198 | | |
Ciena Corp.* | | | 320,183 | | | | 7,159 | | |
Infinera Corp.* | | | 323,500 | | | | 7,059 | | |
Lumentum
Holdings, Inc.* | | | 72,720 | | | | 1,435 | | |
Sonus Networks,
Inc.* | | | 308,700 | | | | 2,173 | | |
Viavi Solutions,
Inc.* | | | 363,600 | | | | 1,953 | | |
| | | | 32,016 | | |
Construction & Engineering (1.5%) | |
KBR, Inc. | | | 412,800 | | | | 7,199 | | |
Containers & Packaging (3.6%) | |
Avery Dennison
Corp. | | | 153,836 | | | | 8,935 | | |
Crown Holdings,
Inc.* | | | 179,600 | | | | 8,903 | | |
| | | | 17,838 | | |
Electrical Equipment (0.5%) | |
Regal Beloit Corp. | | | 39,500 | | | | 2,633 | | |
Electronic Equipment, Instruments & Components (5.2%) | |
Dolby
Laboratories, Inc.
Class A | | | 97,700 | | | | 3,181 | | |
II-VI, Inc.* | | | 256,330 | | | | 4,329 | | |
Itron, Inc.* | | | 184,731 | | | | 5,542 | | |
Maxwell
Technologies,
Inc.* | | | 451,600 | | | | 2,412 | | |
Mercury Systems,
Inc.* | | | 370,360 | | | | 5,866 | | |
OSI Systems, Inc.* | | | 55,200 | | | | 4,032 | | |
| | | | 25,362 | | |
Energy Equipment & Services (1.3%) | |
ION Geophysical
Corp.* | | | 707,717 | | | | 368 | | |
McDermott
International,
Inc.* | | | 280,600 | | | | 1,426 | | |
TETRA
Technologies,
Inc.* | | | 575,192 | | | | 4,423 | | |
| | | | 6,217 | | |
| | |
Number
of Shares | |
Value†
(000's)z | |
Food & Staples Retailing (0.3%) | |
Fresh Market,
Inc.* | | | 69,800 | | | $ | 1,503 | | |
Health Care Equipment & Supplies (0.8%) | |
Accuray, Inc.* | | | 594,770 | | | | 4,098 | | |
Health Care Technology (1.4%) | |
Allscripts
Healthcare
Solutions, Inc.* | | | 508,900 | | | | 7,008 | | |
Household Durables (0.3%) | |
iRobot Corp.* | | | 51,700 | | | | 1,515 | | |
Independent Power and Renewable Electricity Producers (5.0%) | |
Atlantic Power
Corp. | | | 1,017,558 | | | | 2,391 | | |
Dynegy, Inc.* | | | 321,600 | | | | 8,281 | | |
NRG Energy, Inc. | | | 426,700 | | | | 8,500 | | |
Ormat
Technologies, Inc. | | | 155,941 | | | | 5,489 | | |
| | | | 24,661 | | |
Internet Software & Services (0.7%) | |
Bankrate, Inc.* | | | 341,900 | | | | 3,371 | | |
IT Services (8.8%) | |
Acxiom Corp.* | | | 464,000 | | | | 9,725 | | |
Convergys Corp. | | | 143,800 | | | | 3,250 | | |
CoreLogic, Inc.* | | | 281,025 | | | | 10,665 | | |
DST Systems, Inc. | | | 47,619 | | | | 4,877 | | |
MoneyGram
International,
Inc.* | | | 376,200 | | | | 3,288 | | |
NeuStar, Inc.
Class A* | | | 272,909 | | | | 7,628 | | |
VeriFone Systems,
Inc.* | | | 112,990 | | | | 3,530 | | |
| | | | 42,963 | | |
Life Sciences Tools & Services (3.2%) | |
Affymetrix, Inc.* | | | 421,800 | | | | 3,935 | | |
Charles River
Laboratories
International,
Inc.* | | | 155,071 | | | | 10,683 | | |
Fluidigm Corp.* | | | 103,100 | | | | 1,257 | | |
| | | | 15,875 | | |
Machinery (4.6%) | |
Harsco Corp. | | | 380,400 | | | | 4,397 | | |
ITT Corp. | | | 93,500 | | | | 3,498 | | |
See Notes to Schedule of Investments
Schedule of Investments Intrinsic Value Fund (cont'd)
| | |
Number
of Shares | |
Value†
(000's)z | |
Manitowoc Co.,
Inc. | | | 360,900 | | | $ | 6,164 | | |
Meritor, Inc.* | | | 295,050 | | | | 3,732 | | |
Twin Disc, Inc. | | | 122,205 | | | | 1,710 | | |
Valmont
Industries, Inc. | | | 29,200 | | | | 3,104 | | |
| | | | 22,605 | | |
Marine (0.5%) | |
Danaos Corp.* | | | 389,683 | | | | 2,295 | | |
Media (0.2%) | |
Crown Media
Holdings, Inc.
Class A* | | | 218,615 | | | | 1,170 | | |
Metals & Mining (0.5%) | |
Cliffs Natural
Resources, Inc. | | | 572,200 | | | | 2,272 | | |
Personal Products (0.4%) | |
Elizabeth Arden,
Inc.* | | | 192,620 | | | | 2,125 | | |
Real Estate Investment Trusts (0.7%) | |
Communications
Sales & Leasing,
Inc. | | | 159,300 | | | | 3,202 | | |
Road & Rail (1.5%) | |
Ryder System, Inc. | | | 88,604 | | | | 7,263 | | |
Semiconductors & Semiconductor Equipment (8.4%) | |
Alliance
Semiconductor
Corp.* | | | 82,370 | | | | 59 | | |
CEVA, Inc.* | | | 108,600 | | | | 2,091 | | |
Cypress
Semiconductor
Corp.* | | | 393,135 | | | | 3,931 | | |
FormFactor, Inc.* | | | 462,100 | | | | 3,073 | | |
M/A-COM
Technology
Solutions
Holdings, Inc.* | | | 142,463 | | | | 4,204 | | |
Mellanox
Technologies
Ltd.* | | | 102,550 | | | | 4,147 | | |
Rambus, Inc.* | | | 783,544 | | | | 10,523 | | |
Rudolph
Technologies,
Inc.* | | | 128,000 | | | | 1,633 | | |
Ultratech, Inc.* | | | 440,000 | | | | 7,568 | | |
Veeco
Instruments,
Inc.* | | | 170,800 | | | | 3,941 | | |
| | | | 41,170 | | |
Software (9.5%) | |
Cadence Design
Systems, Inc.* | | | 236,307 | | | | 4,731 | | |
Comverse, Inc.* | | | 368,756 | | | | 6,947 | | |
| | |
Number
of Shares | |
Value†
(000's)z | |
Covisint Corp.* | | | 741,705 | | | $ | 2,003 | | |
Gigamon, Inc.* | | | 73,500 | | | | 1,674 | | |
Nuance
Communications,
Inc.* | | | 492,200 | | | | 8,107 | | |
Rovi Corp.* | | | 481,130 | | | | 5,326 | | |
Seachange
International,
Inc.* | | | 482,967 | | | | 2,917 | | |
Silver Spring
Networks, Inc.* | | | 364,676 | | | | 4,230 | | |
Verint Systems,
Inc.* | | | 201,861 | | | | 10,765 | | |
| | | | 46,700 | | |
Specialty Retail (2.6%) | |
Express, Inc.* | | | 252,100 | | | | 5,143 | | |
New York & Co.,
Inc.* | | | 222,600 | | | | 585 | | |
Office Depot,
Inc.* | | | 441,867 | | | | 3,504 | | |
Select Comfort
Corp.* | | | 132,700 | | | | 3,231 | | |
| | | | 12,463 | | |
Technology Hardware, Storage & Peripherals (0.3%) | |
Quantum Corp.* | | | 1,317,900 | | | | 1,542 | | |
Textiles, Apparel & Luxury
Goods (0.6%) | |
Crocs, Inc.* | | | 207,000 | | | | 3,049 | | |
Wireless Telecommunication
Services (0.9%) | |
Telephone & Data
Systems, Inc. | | | 78,600 | | | | 2,235 | | |
United States
Cellular Corp.* | | | 57,000 | | | | 2,105 | | |
| | | | 4,340 | | |
Total Common Stocks
(Cost $404,584) | | | | | 441,604 | | |
Short-Term Investments (10.0%) | |
State Street
Institutional
Treasury Money
Market Fund
Premier Class
(Cost $49,135) | | | 49,134,887 | | | | 49,135 | | |
Total Investments## (100.1%)
(Cost $453,719) | | | | | 490,739 | | |
Liabilities, less
cash, receivables
and other assets [(0.1%)] | | | | | (286 | ) | |
Total Net Assets (100.0%) | | | | $ | 490,453 | | |
See Notes to Schedule of Investments
Schedule of Investments Large Cap Disciplined Growth Fund 8/31/15
TOP TEN EQUITY HOLDINGS
| | 1 | | | Apple, Inc. | | | 4.6 | % | |
| | 2 | | | Amazon.com, Inc. | | | 4.4 | % | |
| | 3 | | | Google, Inc. Class A | | | 3.5 | % | |
| | 4 | | | Costco Wholesale Corp. | | | 2.7 | % | |
| | 5 | | | Visa, Inc. Class A | | | 2.6 | % | |
| | 6 | | | Intuit, Inc. | | | 2.5 | % | |
| | 7 | | | Sherwin-Williams Co. | | | 2.4 | % | |
| | 8 | | | HCA Holdings, Inc. | | | 2.3 | % | |
| | 9 | | | Vertex Pharmaceuticals, Inc. | | | 2.3 | % | |
| | 10 | | | Microsoft Corp. | | | 2.3 | % | |
| | |
Number
of Shares | |
Value†
(000's)z | |
Common Stocks (98.7%) | |
Aerospace & Defense (1.0%) | |
General Dynamics
Corp. | | | 4,122 | | | $ | 585 | | |
Air Freight & Logistics (1.8%) | |
FedEx Corp. | | | 7,083 | | | | 1,067 | | |
Automobiles (1.7%) | |
General Motors Co. | | | 34,637 | | | | 1,020 | | |
Banks (4.6%) | |
CIT Group, Inc. | | | 17,135 | | | | 744 | | |
Comerica, Inc. | | | 16,613 | | | | 731 | | |
JPMorgan
Chase & Co. | | | 19,413 | | | | 1,245 | | |
| | | | 2,720 | | |
Beverages (2.2%) | |
PepsiCo, Inc. | | | 14,321 | | | | 1,331 | | |
Biotechnology (4.5%) | |
Gilead Sciences, Inc. | | | 12,638 | | | | 1,328 | | |
Vertex
Pharmaceuticals,
Inc.* | | | 10,639 | | | | 1,356 | | |
| | | | 2,684 | | |
Chemicals (3.9%) | |
PPG Industries, Inc. | | | 9,692 | | | | 924 | | |
Sherwin-Williams Co. | | | 5,533 | | | | 1,415 | | |
| | | | 2,339 | | |
Construction Materials (1.3%) | |
Martin Marietta
Materials, Inc. | | | 4,644 | | | | 779 | | |
Consumer Finance (1.5%) | |
American
Express Co. | | | 11,808 | | | | 906 | | |
Diversified Telecommunication Services (1.9%) | |
Level 3
Communications,
Inc.* | | | 25,261 | | | | 1,130 | | |
Food & Staples Retailing (4.7%) | |
Costco Wholesale
Corp. | | | 11,683 | | | | 1,636 | | |
CVS Health Corp. | | | 11,742 | | | | 1,203 | | |
| | | | 2,839 | | |
Health Care Equipment & Supplies (5.2%) | |
Abbott Laboratories | | | 27,892 | | | | 1,263 | | |
| | |
Number
of Shares | |
Value†
(000's)z | |
Cooper Cos., Inc. | | | 4,982 | | | $ | 809 | | |
IDEXX
Laboratories, Inc.* | | | 14,541 | | | | 1,040 | | |
| | | | 3,112 | | |
Health Care Providers & Services (3.3%) | |
HCA Holdings,
Inc.* | | | 15,944 | | | | 1,381 | | |
UnitedHealth
Group, Inc. | | | 5,158 | | | | 597 | | |
| | | | 1,978 | | |
Hotels, Restaurants & Leisure (3.3%) | |
Starbucks Corp. | | | 12,462 | | | | 682 | | |
Starwood
Hotels & Resorts
Worldwide, Inc. | | | 18,391 | | | | 1,314 | | |
| | | | 1,996 | | |
Industrial Conglomerates (2.3%) | |
Danaher Corp. | | | 15,467 | | | | 1,346 | | |
Internet & Catalog Retail (5.5%) | |
Amazon.com, Inc.* | | | 5,092 | | | | 2,611 | | |
Netflix, Inc.* | | | 5,658 | | | | 651 | | |
| | | | 3,262 | | |
Internet Software & Services (7.3%) | |
Akamai
Technologies, Inc.* | | | 9,133 | | | | 651 | | |
eBay, Inc.* | | | 10,419 | | | | 283 | | |
Facebook, Inc.
Class A* | | | 7,781 | | | | 696 | | |
Google, Inc.
Class A* | | | 3,233 | | | | 2,094 | | |
LinkedIn Corp.
Class A* | | | 3,571 | | | | 645 | | |
| | | | 4,369 | | |
IT Services (7.5%) | |
Alliance Data
Systems Corp.* | | | 4,989 | | | | 1,283 | | |
FleetCor
Technologies, Inc.* | | | 8,354 | | | | 1,246 | | |
PayPal
Holdings, Inc.* | | | 10,419 | | | | 365 | | |
Visa, Inc. Class A | | | 22,190 | | | | 1,582 | | |
| | | | 4,476 | | |
Media (3.6%) | |
Comcast Corp.
Class A | | | 23,314 | | | | 1,313 | | |
| | |
Number
of Shares | |
Value†
(000's)z | |
Walt Disney Co. | | | 8,296 | | | $ | 845 | | |
| | | | 2,158 | | |
Metals & Mining (1.1%) | |
Alcoa, Inc. | | | 71,706 | | | | 678 | | |
Multiline Retail (1.1%) | |
Target Corp. | | | 8,156 | | | | 634 | | |
Pharmaceuticals (7.2%) | |
Allergan PLC* | | | 3,740 | | | | 1,136 | | |
Bristol-Myers
Squibb Co. | | | 18,237 | | | | 1,084 | | |
Pfizer, Inc. | | | 39,810 | | | | 1,283 | | |
Teva
Pharmaceutical
Industries Ltd.
ADR | | | 12,462 | | | | 803 | | |
| | | | 4,306 | | |
Road & Rail (1.6%) | |
Union Pacific Corp. | | | 10,985 | | | | 942 | | |
Semiconductors & Semiconductor Equipment (3.2%) | |
| ASML Holding NV | | | 10,794 | | | | 982 | | |
Micron
Technology, Inc.* | | | 54,894 | | | | 901 | | |
| | | | 1,883 | | |
Software (6.7%) | |
Activision
Blizzard, Inc. | | | 21,220 | | | | 608 | | |
Intuit, Inc. | | | 17,282 | | | | 1,482 | | |
Microsoft Corp. | | | 31,169 | | | | 1,356 | | |
Ultimate Software
Group, Inc.* | | | 3,306 | | | | 582 | | |
| | | | 4,028 | | |
Specialty Retail (4.4%) | |
AutoZone, Inc.* | | | 1,881 | | | | 1,347 | | |
Home Depot, Inc. | | | 10,977 | | | | 1,278 | | |
| | | | 2,625 | | |
Technology Hardware, Storage & Peripherals (6.3%) | |
Apple, Inc. | | | 24,152 | | | | 2,724 | | |
SanDisk Corp. | | | 19,471 | | | | 1,062 | | |
| | | | 3,786 | | |
Total Common Stocks
(Cost $55,227) | | | | | 58,979 | | |
See Notes to Schedule of Investments
Schedule of Investments Large Cap Disciplined Growth Fund (cont'd)
| | |
Number
of Shares | |
Value†
(000's)z | |
Short-Term Investments (0.4%) | |
State Street
Institutional Liquid
Reserves Fund
Premier Class
(Cost $265) | | | 265,033 | | | $ | 265 | | |
Total Investments## (99.1%)
(Cost $55,492) | | | | | | | 59,244 | | |
Cash, receivables
and other assets,
less liabilities (0.9%) | | | | | 525 | | |
Total Net Assets (100.0%) | | | | $ | 59,769 | | |
See Notes to Schedule of Investments
Schedule of Investments Large Cap Value Fund 8/31/15
TOP TEN EQUITY HOLDINGS
| | 1 | | | Carnival Corp. | | | 7.3 | % | |
| | 2 | | | Exxon Mobil Corp. | | | 5.1 | % | |
| | 3 | | | Citigroup, Inc. | | | 4.7 | % | |
| | 4 | | | JPMorgan Chase & Co. | | | 4.5 | % | |
| | 5 | | | JC Penney Co., Inc. | | | 4.1 | % | |
| | 6 | | | Eaton Corp. PLC | | | 4.0 | % | |
| | 7 | | | General Electric Co. | | | 4.0 | % | |
| | 8 | | | Delta Air Lines, Inc. | | | 3.9 | % | |
| | 9 | | | Wells Fargo & Co. | | | 3.9 | % | |
| | 10 | | | Bank of New York Mellon Corp. | | | 3.2 | % | |
| | |
Number
of Shares | |
Value†
(000's)z | |
Common Stocks (95.3%) | |
Airlines (8.8%) | |
American Airlines
Group, Inc. | | | 730,377 | | | $ | 28,470 | | |
Delta Air Lines,
Inc. | | | 1,268,962 | | | | 55,555 | | |
United
Continental
Holdings, Inc.* | | | 702,075 | | | | 39,997 | | |
| | | | 124,022 | | |
Auto Components (3.4%) | |
Delphi
Automotive PLC | | | 229,929 | | | | 17,364 | | |
Johnson
Controls, Inc. | | | 747,530 | | | | 30,754 | | |
| | | | 48,118 | | |
Banks (15.4%) | |
Citigroup, Inc. | | | 1,244,305 | | | | 66,545 | | |
JPMorgan
Chase & Co. | | | 994,132 | | | | 63,724 | | |
M&T Bank Corp. | | | 56,270 | | | | 6,653 | | |
Wells Fargo & Co. | | | 1,018,462 | | | | 54,315 | | |
Zions
Bancorporation | | | 882,653 | | | | 25,597 | | |
| | | | 216,834 | | |
Biotechnology (2.0%) | |
Celgene Corp.* | | | 118,347 | | | | 13,974 | | |
Gilead
Sciences, Inc. | | | 133,309 | | | | 14,007 | | |
| | | | 27,981 | | |
Capital Markets (6.8%) | |
Bank of New York
Mellon Corp. | | | 1,149,888 | | | | 45,766 | | |
Goldman Sachs
Group, Inc. | | | 141,975 | | | | 26,776 | | |
Morgan Stanley | | | 669,453 | | | | 23,063 | | |
| | | | 95,605 | | |
Communications Equipment (2.7%) | |
Cisco Systems, Inc. | | | 716,207 | | | | 18,535 | | |
Juniper
Networks, Inc. | | | 734,955 | | | | 18,896 | | |
| | | | 37,431 | | |
Construction Materials (2.0%) | |
Vulcan
Materials Co. | | | 298,782 | | | | 27,972 | | |
| | |
Number
of Shares | |
Value†
(000's)z | |
Diversified Financial Services (2.4%) | |
CME Group, Inc. | | | 355,844 | | | $ | 33,606 | | |
Electrical Equipment (4.0%) | |
Eaton Corp. PLC | | | 994,180 | | | | 56,728 | | |
Energy Equipment & Services (0.3%) | |
Schlumberger Ltd. | | | 52,301 | | | | 4,046 | | |
Food & Staples Retailing (1.5%) | |
Wal-Mart
Stores, Inc. | | | 335,279 | | | | 21,703 | | |
Health Care Providers & Services (2.2%) | |
HCA Holdings,
Inc.* | | | 270,400 | | | | 23,422 | | |
Tenet Healthcare
Corp.* | | | 152,041 | | | | 7,485 | | |
| | | | 30,907 | | |
Hotels, Restaurants & Leisure (7.3%) | |
Carnival Corp. | | | 2,084,065 | | | | 102,598 | | |
Industrial Conglomerates (4.0%) | |
General
Electric Co. | | | 2,280,356 | | | | 56,598 | | |
Insurance (3.1%) | |
Lincoln
National Corp. | | | 857,484 | | | | 43,552 | | |
Machinery (3.0%) | |
Cummins, Inc. | | | 124,696 | | | | 15,182 | | |
Joy Global, Inc. | | | 1,087,495 | | | | 26,339 | | |
| | | | 41,521 | | |
Metals & Mining (6.3%) | |
BHP Billiton Ltd.
ADR | | | 625,459 | | | | 23,036 | | |
Newmont
Mining Corp. | | | 2,417,268 | | | | 41,263 | | |
United States
Steel Corp. | | | 1,504,067 | | | | 24,636 | | |
| | | | 88,935 | | |
Multiline Retail (4.1%) | |
JC Penney Co.,
Inc.* | | | 6,292,541 | | | | 57,325 | | |
Oil, Gas & Consumable Fuels (8.3%) | |
Devon Energy
Corp. | | | 492,902 | | | | 21,027 | | |
Exxon Mobil Corp. | | | 960,744 | | | | 72,287 | | |
Pioneer Natural
Resources Co. | | | 193,817 | | | | 23,851 | | |
| | | | 117,165 | | |
| | |
Number
of Shares | |
Value†
(000's)z | |
Pharmaceuticals (2.8%) | |
Teva
Pharmaceutical
Industries Ltd.
ADR | | | 608,563 | | | $ | 39,198 | | |
Specialty Retail (1.5%) | |
Staples, Inc. | | | 1,524,854 | | | | 21,668 | | |
Technology Hardware, Storage & Peripherals (3.4%) | |
EMC Corp. | | | 950,975 | | | | 23,651 | | |
SanDisk Corp. | | | 452,747 | | | | 24,702 | | |
| | | | 48,353 | | |
Total Common Stocks
(Cost $1,362,877) | | | | | 1,341,866 | | |
Short-Term Investments (2.8%) | |
State Street
Institutional
Liquid Reserves
Fund Premier
Class
(Cost $39,698) | | | 39,698,351 | | | | 39,698 | | |
Total Investments## (98.1%)
(Cost $1,402,575) | | | | | 1,381,564 | | |
Cash, receivables
and other assets,
less liabilities (1.9%) | | | | | 26,664 | | |
Total Net Assets (100.0%) | | | | $ | 1,408,228 | | |
See Notes to Schedule of Investments
Schedule of Investments Mid Cap Growth Fund 8/31/15
TOP TEN EQUITY HOLDINGS
| | 1 | | | O'Reilly Automotive, Inc. | | | 1.8 | % | |
| | 2 | | | Alaska Air Group, Inc. | | | 1.7 | % | |
| | 3 | | | SBA Communications Corp. Class A | | | 1.7 | % | |
| | 4 | | | Under Armour, Inc. Class A | | | 1.6 | % | |
| | 5 | | | Acadia Healthcare Co., Inc. | | | 1.6 | % | |
| | 6 | | | Stericycle, Inc. | | | 1.6 | % | |
| | 7 | | | Envision Healthcare Holdings, Inc. | | | 1.4 | % | |
| | 8 | | | Hanesbrands, Inc. | | | 1.4 | % | |
| | 9 | | | Roper Technologies, Inc. | | | 1.4 | % | |
| | 10 | | | Alliance Data Systems Corp. | | | 1.4 | % | |
| | |
Number
of Shares | |
Value†
(000's)z | |
Common Stocks (92.7%) | |
Airlines (1.7%) | |
Alaska Air
Group, Inc. | | | 275,000 | | | $ | 20,586 | | |
Banks (1.0%) | |
SVB Financial
Group* | | | 92,500 | | | | 11,570 | | |
Biotechnology (4.9%) | |
Alkermes PLC* | | | 170,000 | | | | 10,125 | | |
AMAG
Pharmaceuticals,
Inc.* | | | 165,000 | | | | 10,319 | | |
BioMarin
Pharmaceutical,
Inc.* | | | 90,000 | | | | 11,632 | | |
Cepheid, Inc.* | | | 150,000 | | | | 7,311 | | |
Clovis
Oncology, Inc.* | | | 66,000 | | | | 5,139 | | |
Incyte Corp.* | | | 110,000 | | | | 12,781 | | |
| | | | 57,307 | | |
Capital Markets (2.9%) | |
Affiliated
Managers
Group, Inc.* | | | 80,000 | | | | 14,915 | | |
E*TRADE
Financial Corp.* | | | 325,000 | | | | 8,544 | | |
Raymond James
Financial, Inc. | | | 205,000 | | | | 10,863 | | |
| | | | 34,322 | | |
Chemicals (0.6%) | |
Sensient
Technologies
Corp. | | | 110,000 | | | | 7,166 | | |
Commercial Services & Supplies (1.6%) | |
Stericycle, Inc.* | | | 130,000 | | | | 18,348 | | |
Communications Equipment (2.9%) | |
F5 Networks, Inc.* | | | 80,000 | | | | 9,713 | | |
Infinera Corp.* | | | 475,000 | | | | 10,364 | | |
Palo Alto
Networks, Inc.* | | | 85,000 | | | | 13,959 | | |
| | | | 34,036 | | |
Containers & Packaging (1.1%) | |
Packaging Corp.
of America | | | 185,000 | | | | 12,415 | | |
Distributors (1.1%) | |
LKQ Corp.* | | | 425,000 | | | | 12,746 | | |
| | |
Number
of Shares | |
Value†
(000's)z | |
Diversified Consumer Services (0.8%) | |
Service Corp.
International | | | 330,000 | | | $ | 9,784 | | |
Diversified Financial Services (0.9%) | |
CBOE Holdings,
Inc. | | | 170,000 | | | | 10,754 | | |
Electrical Equipment (2.4%) | |
Acuity Brands,
Inc. | | | 67,500 | | | | 13,154 | | |
AMETEK, Inc. | | | 270,000 | | | | 14,531 | | |
| | | | 27,685 | | |
Electronic Equipment, Instruments & Components (2.9%) | |
Amphenol Corp.
Class A | | | 200,000 | | | | 10,472 | | |
CDW Corp. | | | 300,000 | | | | 11,925 | | |
Zebra
Technologies
Corp. Class A* | | | 145,000 | | | | 12,018 | | |
| | | | 34,415 | | |
Food & Staples Retailing (0.8%) | |
Rite Aid Corp.* | | | 1,200,000 | | | | 9,900 | | |
Food Products (2.4%) | |
Mead Johnson
Nutrition Co. | | | 70,000 | | | | 5,484 | | |
Pinnacle
Foods, Inc. | | | 200,000 | | | | 8,968 | | |
WhiteWave
Foods Co.* | | | 300,000 | | | | 13,842 | | |
| | | | 28,294 | | |
Health Care Equipment & Supplies (3.6%) | |
DENTSPLY
International,
Inc. | | | 175,000 | | | | 9,172 | | |
DexCom, Inc.* | | | 100,000 | | | | 9,414 | | |
NuVasive, Inc.* | | | 100,000 | | | | 5,272 | | |
Teleflex, Inc. | | | 95,000 | | | | 12,426 | | |
Wright Medical
Group, Inc.* | | | 270,300 | | | | 6,236 | | |
| | | | 42,520 | | |
Health Care Providers & Services (5.0%) | |
Acadia
Healthcare Co.,
Inc.* | | | 255,000 | | | | 18,623 | | |
| | |
Number
of Shares | |
Value†
(000's)z | |
Envision
Healthcare
Holdings, Inc.* | | | 400,000 | | | $ | 16,388 | | |
Quest
Diagnostics,
Inc. | | | 125,000 | | | | 8,475 | | |
Universal Health
Services, Inc.
Class B | | | 110,000 | | | | 15,085 | | |
| | | | 58,571 | | |
Hotels, Restaurants & Leisure (2.3%) | |
Bloomin'
Brands, Inc. | | | 300,000 | | | | 6,210 | | |
Buffalo Wild
Wings, Inc.* | | | 50,000 | | | | 9,484 | | |
Norwegian
Cruise Line
Holdings Ltd.* | | | 200,000 | | | | 11,520 | | |
| | | | 27,214 | | |
Household Durables (0.8%) | |
Jarden Corp.* | | | 175,000 | | | | 8,984 | | |
Independent Power and Renewable Electricity Producers (0.7%) | |
Dynegy, Inc.* | | | 300,000 | | | | 7,725 | | |
Industrial Conglomerates (1.4%) | |
Roper
Technologies,
Inc. | | | 100,000 | | | | 16,209 | | |
Insurance (0.8%) | |
Assurant, Inc. | | | 125,000 | | | | 9,294 | | |
Internet & Catalog Retail (1.5%) | |
Liberty Interactive
Corp. QVC
Group Class A* | | | 275,000 | | | | 7,436 | | |
Netflix, Inc.* | | | 87,500 | | | | 10,065 | | |
| | | | 17,501 | | |
Internet Software & Services (2.7%) | |
Akamai
Technologies,
Inc.* | | | 150,000 | | | | 10,696 | | |
CoStar
Group, Inc.* | | | 70,000 | | | | 12,393 | | |
Demandware,
Inc.* | | | 150,000 | | | | 8,369 | | |
| | | | 31,458 | | |
See Notes to Schedule of Investments
Schedule of Investments Mid Cap Growth Fund (cont'd)
| | |
Number
of Shares | |
Value†
(000's)z | |
IT Services (3.0%) | |
Alliance Data
Systems Corp.* | | | 62,500 | | | $ | 16,074 | | |
Fiserv, Inc.* | | | 107,500 | | | | 9,167 | | |
FleetCor
Technologies,
Inc.* | | | 70,000 | | | | 10,441 | | |
| | | | 35,682 | | |
Leisure Products (0.9%) | |
Polaris
Industries, Inc. | | | 80,000 | | | | 10,390 | | |
Life Sciences Tools & Services (1.0%) | |
Illumina, Inc.* | | | 60,000 | | | | 11,857 | | |
Machinery (2.0%) | |
Milacron
Holdings Corp.* | | | 262,200 | | | | 5,215 | | |
PACCAR, Inc. | | | 115,000 | | | | 6,782 | | |
Wabtec Corp. | | | 125,000 | | | | 11,970 | | |
| | | | 23,967 | | |
Media (1.4%) | |
Charter
Communications,
Inc. Class A* | | | 45,000 | | | | 8,173 | | |
Starz Class A* | | | 225,000 | | | | 8,462 | | |
| | | | 16,635 | | |
Multiline Retail (2.1%) | |
Burlington
Stores, Inc.* | | | 225,000 | | | | 11,945 | | |
Dollar Tree, Inc.* | | | 172,000 | | | | 13,117 | | |
| | | | 25,062 | | |
Oil, Gas & Consumable Fuels (1.4%) | |
Cabot Oil &
Gas Corp. | | | 250,000 | | | | 5,918 | | |
Concho
Resources, Inc.* | | | 95,000 | | | | 10,275 | | |
| | | | 16,193 | | |
Pharmaceuticals (3.5%) | |
Endo
International
PLC* | | | 155,000 | | | | 11,935 | | |
Jazz
Pharmaceuticals
PLC* | | | 75,000 | | | | 12,662 | | |
Pacira
Pharmaceuticals,
Inc.* | | | 100,000 | | | | 5,755 | | |
Zoetis, Inc. | | | 245,000 | | | | 10,993 | | |
| | | | 41,345 | | |
Professional Services (1.2%) | |
Nielsen
Holdings PLC | | | 175,000 | | | | 7,915 | | |
WageWorks, Inc.* | | | 150,000 | | | | 6,722 | | |
| | | | 14,637 | | |
| | |
Number
of Shares | |
Value†
(000's)z | |
Real Estate Management & Development (1.0%) | |
Jones Lang
LaSalle, Inc. | | | 80,000 | | | $ | 11,910 | | |
Road & Rail (1.7%) | |
J.B. Hunt
Transport
Services, Inc. | | | 110,000 | | | | 8,006 | | |
Old Dominion
Freight Line, Inc.* | | | 175,000 | | | | 11,635 | | |
| | | | 19,641 | | |
Semiconductors & Semiconductor Equipment (5.2%) | |
Avago
Technologies
Ltd. | | | 87,500 | | | | 11,023 | | |
Cavium, Inc.* | | | 230,000 | | | | 15,645 | | |
Lam Research
Corp. | | | 130,000 | | | | 9,460 | | |
Monolithic
Power Systems,
Inc. | | | 225,000 | | | | 10,820 | | |
NXP
Semiconductors
NV* | | | 165,000 | | | | 13,967 | | |
| | | | 60,915 | | |
Software (7.3%) | |
Activision
Blizzard, Inc. | | | 300,000 | | | | 8,589 | | |
Electronic Arts,
Inc.* | | | 155,000 | | | | 10,253 | | |
Fortinet, Inc.* | | | 182,500 | | | | 7,691 | | |
Mobileye NV* | | | 125,000 | | | | 7,070 | | |
ServiceNow, Inc.* | | | 195,000 | | | | 13,837 | | |
Splunk, Inc.* | | | 87,600 | | | | 5,429 | | |
Synchronoss
Technologies,
Inc.* | | | 275,000 | | | | 11,107 | | |
Tableau
Software, Inc.
Class A* | | | 95,000 | | | | 8,946 | | |
Tyler
Technologies,
Inc.* | | | 37,500 | | | | 5,176 | | |
Ultimate
Software
Group, Inc.* | | | 42,500 | | | | 7,488 | | |
| | | | 85,586 | | |
Specialty Retail (6.8%) | |
Lithia Motors,
Inc. Class A | | | 110,000 | | | | 11,726 | | |
O'Reilly
Automotive,
Inc.* | | | 89,500 | | | | 21,486 | | |
Ross Stores, Inc. | | | 258,000 | | | | 12,544 | | |
Signet Jewelers
Ltd. | | | 60,000 | | | | 8,280 | | |
| | |
Number
of Shares | |
Value†
(000's)z | |
Tractor
Supply Co. | | | 170,000 | | | $ | 14,503 | | |
Williams-Sonoma,
Inc. | | | 149,500 | | | | 11,366 | | |
| | | | 79,905 | | |
Textiles, Apparel & Luxury Goods (4.5%) | |
Carter's, Inc. | | | 125,000 | | | | 12,289 | | |
Hanesbrands, Inc. | | | 540,000 | | | | 16,259 | | |
lululemon
athletica, Inc.* | | | 85,000 | | | | 5,441 | | |
Under Armour,
Inc. Class A* | | | 200,000 | | | | 19,106 | | |
| | | | 53,095 | | |
Wireless Telecommunication Services (2.9%) | |
SBA
Communications
Corp. Class A* | | | 172,500 | | | | 20,389 | | |
T-Mobile US, Inc.* | | | 350,000 | | | | 13,864 | | |
| | | | 34,253 | | |
Total Common Stocks
(Cost $806,243) | | | | | 1,089,877 | | |
Exchange Traded Funds (0.8%) | |
iShares Russell
Mid-Cap
Growth ETF
(Cost $9,278) | | | 100,000 | | | | 9,242 | | |
Short-Term Investments (7.1%) | |
State Street
Institutional
Liquid Reserves
Fund Premier
Class
(Cost $83,557) | | | 83,557,029 | | | | 83,557 | | |
Total Investments## (100.6%)
(Cost $899,078) | | | | | 1,182,676 | | |
Liabilities, less
cash, receivables
and other assets [(0.6%)] | | | | | (7,474 | ) | |
Total Net Assets (100.0%) | | | | $ | 1,175,202 | | |
See Notes to Schedule of Investments
Schedule of Investments Mid Cap Intrinsic Value Fund 8/31/15
TOP TEN EQUITY HOLDINGS
| | 1 | | | ADT Corp. | | | 4.1 | % | |
| | 2 | | | ONEOK, Inc. | | | 3.4 | % | |
| | 3 | | | Nuance Communications, Inc. | | | 3.4 | % | |
| | 4 | | | Cabot Oil & Gas Corp. | | | 2.9 | % | |
| | 5 | | | BankUnited, Inc. | | | 2.7 | % | |
| | 6 | | | Zimmer Biomet Holdings, Inc. | | | 2.6 | % | |
| | 7 | | | Avis Budget Group, Inc. | | | 2.5 | % | |
| | 8 | | | Covanta Holding Corp. | | | 2.5 | % | |
| | 9 | | | Best Buy Co., Inc. | | | 2.4 | % | |
| | 10 | | | Amdocs Ltd. | | | 2.4 | % | |
| | |
Number
of Shares | |
Value†
(000's)z | |
Common Stocks (91.4%) | |
Aerospace & Defense (4.0%) | |
General Dynamics
Corp. | | | 15,950 | | | $ | 2,265 | | |
Spirit AeroSystems
Holdings, Inc.
Class A* | | | 40,500 | | | | 2,070 | | |
| | | | 4,335 | | |
Airlines (0.6%) | |
United Continental
Holdings, Inc.* | | | 10,900 | | | | 621 | | |
Banks (7.9%) | |
BankUnited, Inc. | | | 82,600 | | | | 2,944 | | |
BB&T Corp. | | | 31,100 | | | | 1,148 | | |
Comerica, Inc. | | | 47,900 | | | | 2,107 | | |
Huntington
Bancshares, Inc. | | | 86,500 | | | | 944 | | |
M&T Bank Corp. | | | 11,500 | | | | 1,360 | | |
| | | | 8,503 | | |
Building Products (1.0%) | |
Owens Corning | | | 23,900 | | | | 1,058 | | |
Capital Markets (0.9%) | |
State Street Corp. | | | 14,100 | | | | 1,014 | | |
Chemicals (1.3%) | |
Ashland, Inc. | | | 13,600 | | | | 1,428 | | |
Commercial Services & Supplies (8.2%) | |
ADT Corp. | | | 135,300 | | | | 4,435 | | |
Covanta
Holding Corp. | | | 136,300 | | | | 2,699 | | |
Tyco
International PLC | | | 44,700 | | | | 1,622 | | |
| | | | 8,756 | | |
Construction & Engineering (1.2%) | |
KBR, Inc. | | | 72,300 | | | | 1,261 | | |
Containers & Packaging (1.6%) | |
Avery Dennison
Corp. | | | 29,300 | | | | 1,702 | | |
Electric Utilities (2.3%) | |
Edison
International | | | 42,200 | | | | 2,468 | | |
Electronic Equipment, Instruments & Components (2.3%) | |
Flextronics
International Ltd.* | | | 91,500 | | | | 962 | | |
Itron, Inc.* | | | 51,900 | | | | 1,557 | | |
| | | | 2,519 | | |
| | |
Number
of Shares | |
Value†
(000's)z | |
Food & Staples Retailing (1.0%) | |
Whole Foods
Market, Inc. | | | 32,100 | | | $ | 1,052 | | |
Health Care Equipment & Supplies (2.6%) | |
Zimmer Biomet
Holdings, Inc. | | | 27,000 | | | | 2,796 | | |
Hotels, Restaurants & Leisure (1.2%) | |
Darden
Restaurants, Inc. | | | 19,100 | | | | 1,299 | | |
Independent Power and Renewable Electricity Producers (3.6%) | |
AES Corp. | | | 193,600 | | | | 2,323 | | |
NRG Energy, Inc. | | | 74,700 | | | | 1,488 | | |
| | | | 3,811 | | |
Insurance (1.4%) | |
Lincoln
National Corp. | | | 30,100 | | | | 1,529 | | |
IT Services (4.6%) | |
Amdocs Ltd. | | | 44,200 | | | | 2,529 | | |
Teradata Corp.* | | | 81,300 | | | | 2,376 | | |
| | | | 4,905 | | |
Leisure Products (1.0%) | |
Mattel, Inc. | | | 46,900 | | | | 1,099 | | |
Machinery (5.0%) | |
Harsco Corp. | | | 99,900 | | | | 1,155 | | |
Manitowoc Co.,
Inc. | | | 131,700 | | | | 2,250 | | |
Valmont
Industries, Inc. | | | 18,500 | | | | 1,966 | | |
| | | | 5,371 | | |
Media (1.0%) | |
CBS Corp. Class B | | | 24,400 | | | | 1,104 | | |
Multi-Utilities (1.6%) | |
CenterPoint
Energy, Inc. | | | 90,900 | | | | 1,693 | | |
Multiline Retail (1.9%) | |
Kohl's Corp. | | | 40,700 | | | | 2,077 | | |
Oil, Gas & Consumable Fuels (7.5%) | |
Cabot Oil &
Gas Corp. | | | 129,700 | | | | 3,070 | | |
Energy Transfer
Partners LP | | | 26,125 | | | | 1,284 | | |
ONEOK, Inc. | | | 101,700 | | | | 3,662 | | |
| | | | 8,016 | | |
| | |
Number
of Shares | |
Value†
(000's)z | |
Real Estate Investment Trusts (5.6%) | |
Corrections
Corporation of
America | | | 71,104 | | | $ | 2,089 | | |
Starwood
Property Trust,
Inc. | | | 87,600 | | | | 1,864 | | |
Starwood
Waypoint
Residential Trust | | | 84,560 | | | | 2,037 | | |
| | | | 5,990 | | |
Road & Rail (2.5%) | |
Avis Budget
Group, Inc.* | | | 61,600 | | | | 2,718 | | |
Semiconductors & Semiconductor Equipment (2.9%) | |
ON
Semiconductor
Corp.* | | | 174,200 | | | | 1,664 | | |
Skyworks
Solutions, Inc. | | | 16,400 | | | | 1,433 | | |
| | | | 3,097 | | |
Software (6.3%) | |
Cadence Design
Systems, Inc.* | | | 63,100 | | | | 1,263 | | |
Check Point
Software
Technologies
Ltd.* | | | 24,200 | | | | 1,888 | | |
Nuance
Communications,
Inc.* | | | 221,000 | | | | 3,640 | | |
| | | | 6,791 | | |
Specialty Retail (4.0%) | |
Best Buy Co., Inc. | | | 69,300 | | | | 2,546 | | |
Staples, Inc. | | | 123,000 | | | | 1,748 | | |
| | | | 4,294 | | |
Technology Hardware, Storage & Peripherals (2.3%) | |
SanDisk Corp. | | | 45,700 | | | | 2,493 | | |
Textiles, Apparel & Luxury Goods (1.9%) | |
Deckers
Outdoor Corp.* | | | 32,300 | | | | 2,080 | | |
See Notes to Schedule of Investments
Schedule of Investments Mid Cap Intrinsic Value Fund (cont'd)
| | |
Number
of Shares | |
Value†
(000's)z | |
Trading Companies & Distributors (2.2%) | |
AerCap
Holdings NV* | | | 56,100 | | | $ | 2,358 | | |
Total Common Stocks
(Cost $94,849) | | | | | 98,238 | | |
Rights (0.0%) | |
Food & Staples Retailing (0.0%) | |
Safeway, Inc.
(Casa Ley)Ñ* | | | 21,100 | | | | 7 | | |
Safeway, Inc.
(Property
Development
Centers)Ñf* | | | 21,100 | | | | 1 | | |
Total Rights
(Cost $22) | | | | | 8 | | |
Short-Term Investments (8.5%) | |
State Street
Institutional
Liquid Reserves
Fund Premier
Class
(Cost $9,201) | | | 9,200,667 | | | | 9,201 | | |
Total Investments## (99.9%)
(Cost $104,072) | | | | | 107,447 | | |
Cash, receivables
and other assets,
less liabilities (0.1%) | | | | | 58 | | |
Total Net Assets (100.0%) | | | | $ | 107,505 | | |
See Notes to Schedule of Investments
Schedule of Investments Multi-Cap Opportunities Fund 8/31/15
TOP TEN EQUITY HOLDINGS
| | 1 | | | JPMorgan Chase & Co. | | | 4.5 | % | |
| | 2 | | | Goldman Sachs Group, Inc. | | | 4.4 | % | |
| | 3 | | | Intercontinental Exchange, Inc. | | | 4.4 | % | |
| | 4 | | | Berkshire Hathaway, Inc. Class B | | | 3.8 | % | |
| | 5 | | | Pfizer, Inc. | | | 3.5 | % | |
| | 6 | | | Google, Inc. Class C | | | 3.4 | % | |
| | 7 | | | Cardinal Health, Inc. | | | 3.4 | % | |
| | 8 | | | Sealed Air Corp. | | | 3.3 | % | |
| | 9 | | | American Express Co. | | | 3.2 | % | |
| | 10 | | | Stanley Black & Decker, Inc. | | | 3.2 | % | |
| | |
Number
of Shares | |
Value†
(000's)z | |
Common Stocks (98.6%) | |
Aerospace & Defense (4.5%) | |
Boeing Co. | | | 468,000 | | | $ | 61,158 | | |
Raytheon Co. | | | 440,000 | | | | 45,127 | | |
| | | | 106,285 | | |
Banks (7.5%) | |
JPMorgan
Chase & Co. | | | 1,635,000 | | | | 104,803 | | |
Wells Fargo & Co. | | | 1,345,000 | | | | 71,729 | | |
| | | | 176,532 | | |
Capital Markets (4.4%) | |
Goldman Sachs
Group, Inc. | | | 545,000 | | | | 102,787 | | |
Chemicals (2.7%) | |
Methanex Corp. | | | 600,000 | | | | 24,456 | | |
Scotts Miracle-Gro
Co. Class A | | | 640,000 | | | | 39,802 | | |
| | | | 64,258 | | |
Commercial Services & Supplies (3.1%) | |
Covanta
Holding Corp. | | | 1,070,000 | | | | 21,186 | | |
Pitney
Bowes, Inc. | | | 2,625,000 | | | | 52,001 | | |
| | | | 73,187 | | |
Communications Equipment (4.8%) | |
Cisco
Systems, Inc. | | | 1,900,000 | | | | 49,172 | | |
Motorola
Solutions, Inc. | | | 970,000 | | | | 62,875 | | |
| | | | 112,047 | | |
Consumer Finance (3.2%) | |
American
Express Co. | | | 975,000 | | | | 74,802 | | |
Containers & Packaging (3.3%) | |
Sealed Air Corp. | | | 1,492,000 | | | | 76,763 | | |
Diversified Financial Services (8.1%) | |
Berkshire
Hathaway, Inc.
Class B* | | | 655,000 | | | | 87,796 | | |
Intercontinental
Exchange, Inc. | | | 450,000 | | | | 102,785 | | |
| | | | 190,581 | | |
Electrical Equipment (0.8%) | |
Rockwell
Automation, Inc. | | | 175,000 | | | | 19,570 | | |
| | |
Number
of Shares | |
Value†
(000's)z | |
Energy Equipment & Services (2.0%) | |
Schlumberger Ltd. | | | 615,000 | | | $ | 47,582 | | |
Food Products (1.7%) | |
Mondelez
International, Inc.
Class A | | | 930,000 | | | | 39,395 | | |
Gas Utilities (1.4%) | |
National Fuel
Gas Co. | | | 620,000 | | | | 33,455 | | |
Health Care Equipment & Supplies (1.9%) | |
Hill-Rom
Holdings, Inc. | | | 850,000 | | | | 44,914 | | |
Health Care Providers & Services (8.6%) | |
Aetna, Inc. | | | 305,000 | | | | 34,929 | | |
Cardinal Health,
Inc. | | | 960,000 | | | | 78,979 | | |
HCA Holdings,
Inc.* | | | 607,000 | | | | 52,578 | | |
Henry Schein,
Inc.* | | | 245,000 | | | | 33,519 | | |
| | | | 200,005 | | |
Hotels, Restaurants & Leisure (2.0%) | |
Hyatt Hotels Corp.
Class A* | | | 920,000 | | | | 47,132 | | |
Household Products (1.4%) | |
Procter &
Gamble Co. | | | 450,000 | | | | 31,801 | | |
Industrial Conglomerates (2.8%) | |
3M Co. | | | 455,000 | | | | 64,674 | | |
Internet Software & Services (5.5%) | |
eBay, Inc.* | | | 1,765,000 | | | | 47,849 | | |
Google, Inc.
Class C* | | | 130,000 | | | | 80,373 | | |
| | | | 128,222 | | |
IT Services (2.6%) | |
PayPal
Holdings, Inc.* | | | 1,765,000 | | | | 61,775 | | |
Machinery (3.2%) | |
Stanley Black &
Decker, Inc. | | | 735,000 | | | | 74,617 | | |
Media (4.5%) | |
Omnicom
Group, Inc. | | | 680,000 | | | | 45,546 | | |
| | |
Number
of Shares | |
Value†
(000's)z | |
Twenty-First
Century Fox,
Inc. Class A | | | 2,210,000 | | | $ | 60,532 | | |
| | | | 106,078 | | |
Metals & Mining (1.4%) | |
Carpenter
Technology
Corp. | | | 830,000 | | | | 32,370 | | |
Oil, Gas & Consumable Fuels (1.6%) | |
Cabot Oil &
Gas Corp. | | | 1,540,000 | | | | 36,452 | | |
Pharmaceuticals (3.5%) | |
Pfizer, Inc. | | | 2,540,000 | | | | 81,839 | | |
Professional Services (1.7%) | |
Nielsen
Holdings PLC | | | 855,000 | | | | 38,672 | | |
Road & Rail (1.6%) | |
CSX Corp. | | | 1,350,000 | | | | 36,963 | | |
Software (3.8%) | |
Activision
Blizzard, Inc. | | | 1,865,000 | | | | 53,395 | | |
Microsoft Corp. | | | 815,000 | | | | 35,469 | | |
| | | | 88,864 | | |
Technology Hardware, Storage & Peripherals (5.0%) | |
Apple, Inc. | | | 398,000 | | | | 44,878 | | |
EMC Corp. | | | 1,600,000 | | | | 39,792 | | |
NCR Corp.* | | | 1,275,000 | | | | 31,990 | | |
| | | | 116,660 | | |
Total Common Stocks
(Cost $1,925,904) | | | | | 2,308,282 | | |
Short-Term Investments (1.1%) | |
State Street
Institutional
Liquid Reserves
Fund Premier
Class
(Cost $25,965) | | | 25,965,461 | | | | 25,965 | | |
Total Investments## (99.7%)
(Cost $1,951,869) | | | | | 2,334,247 | | |
Cash, receivables
and other assets,
less liabilities (0.3%) | | | | | 6,051 | | |
Total Net Assets (100.0%) | | | | $ | 2,340,298 | | |
See Notes to Schedule of Investments
Schedule of Investments Real Estate Fund 8/31/15
TOP TEN EQUITY HOLDINGS
| | 1 | | | Simon Property Group, Inc. | | | 9.1 | % | |
| | 2 | | | American Tower Corp. | | | 6.4 | % | |
| | 3 | | | Equity Residential | | | 5.9 | % | |
| | 4 | | | Public Storage | | | 5.4 | % | |
| | 5 | | | AvalonBay Communities, Inc. | | | 5.1 | % | |
| | 6 | | | Boston Properties, Inc. | | | 4.6 | % | |
| | 7 | | | Crown Castle International Corp. | | | 3.7 | % | |
| | 8 | | | Essex Property Trust, Inc. | | | 3.7 | % | |
| | 9 | | | Ventas, Inc. | | | 3.6 | % | |
| | 10 | | | Prologis, Inc. | | | 3.0 | % | |
| | |
Number
of Shares | |
Value†
(000's)z | |
Common Stocks (99.2%) | |
Apartments (14.7%) | |
AvalonBay
Communities,
Inc. | | | 248,992 | | | $ | 41,099 | | |
Equity Residential | | | 668,100 | | | | 47,602 | | |
Essex Property
Trust, Inc. | | | 139,500 | | | | 29,939 | | |
| | | | 118,640 | | |
Diversified (8.3%) | |
American Homes
4 Rent Class A | | | 1,047,800 | | | | 16,744 | | |
CoreSite Realty
Corp. | | | 233,421 | | | | 11,365 | | |
Digital Realty
Trust, Inc. | | | 137,400 | | | | 8,700 | | |
Equinix, Inc. | | | 71,000 | | | | 19,154 | | |
Vornado Realty
Trust | | | 129,923 | | | | 11,328 | | |
| | | | 67,291 | | |
Free Standing (1.9%) | |
National Retail
Properties, Inc. | | | 224,000 | | | | 7,784 | | |
Spirit Realty
Capital, Inc. | | | 812,903 | | | | 7,804 | | |
| | | | 15,588 | | |
Health Care (9.5%) | |
Care Capital
Properties, Inc.* | | | 132,358 | | | | 4,208 | | |
HCP, Inc. | | | 337,900 | | | | 12,522 | | |
Health Care
REIT, Inc. | | | 285,940 | | | | 18,114 | | |
OMEGA
Healthcare
Investors, Inc. | | | 372,375 | | | | 12,579 | | |
Ventas, Inc. | | | 525,330 | | | | 28,904 | | |
| | | | 76,327 | | |
Hotels, Restaurants & Leisure (0.9%) | |
Starwood
Hotels & Resorts
Worldwide, Inc. | | | 103,500 | | | | 7,397 | | |
Industrial (4.0%) | |
DCT Industrial
Trust, Inc. | | | 255,400 | | | | 8,201 | | |
Prologis, Inc. | | | 638,638 | | | | 24,268 | | |
| | | | 32,469 | | |
| | |
Number
of Shares | |
Value†
(000's)z | |
Infrastructure (10.2%) | |
American Tower
Corp. | | | 561,400 | | | $ | 51,756 | | |
Crown Castle
International
Corp. | | | 360,600 | | | | 30,070 | | |
| | | | 81,826 | | |
Lodging/Resorts (4.6%) | |
Host Hotels &
Resorts, Inc. | | | 1,069,443 | | | | 18,961 | | |
LaSalle Hotel
Properties | | | 350,100 | | | | 11,014 | | |
Sunstone Hotel
Investors, Inc. | | | 535,628 | | | | 7,408 | | |
| | | | 37,383 | | |
Office (11.2%) | |
Alexandria Real
Estate Equities,
Inc. | | | 146,300 | | | | 12,580 | | |
Boston Properties,
Inc. | | | 326,784 | | | | 37,051 | | |
Douglas Emmett,
Inc. | | | 467,625 | | | | 12,921 | | |
Hudson Pacific
Properties, Inc. | | | 286,400 | | | | 8,131 | | |
SL Green
Realty Corp. | | | 190,715 | | | | 19,741 | | |
| | | | 90,424 | | |
Real Estate Management & Development (3.5%) | |
Brookfield Asset
Management,
Inc. Class A | | | 465,415 | | | | 14,637 | | |
Forest City
Enterprises, Inc.
Class A* | | | 647,884 | | | | 13,949 | | |
| | | | 28,586 | | |
Regional Malls (12.7%) | |
CBL & Associates
Properties, Inc. | | | 581,297 | | | | 8,650 | | |
General Growth
Properties, Inc. | | | 790,632 | | | | 20,066 | | |
Simon Property
Group, Inc. | | | 408,948 | | | | 73,333 | | |
| | | | 102,049 | | |
Self Storage (7.8%) | |
Extra Space
Storage, Inc. | | | 121,740 | | | | 8,945 | | |
| | |
Number
of Shares | |
Value†
(000's)z | |
Public Storage | | | 214,800 | | | $ | 43,233 | | |
Sovran Self
Storage, Inc. | | | 118,000 | | | | 10,588 | | |
| | | | 62,766 | | |
Shopping Centers (6.6%) | |
Federal Realty
Investment Trust | | | 160,800 | | | | 20,756 | | |
Kimco Realty
Corp. | | | 799,200 | | | | 18,421 | | |
Regency
Centers Corp. | | | 230,057 | | | | 13,645 | | |
| | | | 52,822 | | |
Timber (3.3%) | |
Plum Creek
Timber Co., Inc. | | | 273,100 | | | | 10,512 | | |
Weyerhaeuser
Co. | | | 563,296 | | | | 15,738 | | |
| | | | 26,250 | | |
Total Common Stocks
(Cost $758,679) | | | | | 799,818 | | |
Short-Term Investments (1.2%) | |
State Street
Institutional
Liquid Reserves
Fund Premier
Class
(Cost $9,563) | | | 9,563,033 | | | | 9,563 | | |
Total Investments## (100.4%)
(Cost $768,242) | | | | | 809,381 | | |
Liabilities, less cash,
receivables and
other assets [(0.4%)] | | | | | (3,023 | ) | |
Total Net Assets (100.0%) | | | | $ | 806,358 | | |
See Notes to Schedule of Investments
Schedule of Investments Small Cap Growth Fund 8/31/15
TOP TEN EQUITY HOLDINGS
| | 1 | | | AMAG Pharmaceuticals, Inc. | | | 2.6 | % | |
| | 2 | | | Barnes & Noble Education, Inc. | | | 2.5 | % | |
| | 3 | | | Acadia Healthcare Co., Inc. | | | 2.0 | % | |
| | 4 | | | EPAM Systems, Inc. | | | 2.0 | % | |
| | 5 | | | Cavium, Inc. | | | 2.0 | % | |
| | 6 | | | AmSurg Corp. | | | 1.9 | % | |
| | 7 | | | Bright Horizons Family Solutions, Inc. | | | 1.9 | % | |
| | 8 | | | Opus Bank | | | 1.8 | % | |
| | 9 | | | Qlik Technologies, Inc. | | | 1.7 | % | |
| | 10 | | | FCB Financial Holdings, Inc. Class A | | | 1.7 | % | |
| | |
Number
of Shares | |
Value†
(000's)z | |
Common Stocks (95.9%) | |
Aerospace & Defense (1.2%) | |
Aerojet
Rocketdyne
Holdings, Inc.* | | | 50,000 | | | $ | 1,028 | | |
Air Freight & Logistics (1.0%) | |
Hub Group, Inc.
Class A* | | | 22,600 | | | | 852 | | |
Banks (7.6%) | |
FCB Financial
Holdings, Inc.
Class A* | | | 44,200 | | | | 1,458 | | |
Hanmi Financial
Corp. | | | 47,100 | | | | 1,141 | | |
Opus Bank | | | 43,200 | | | | 1,589 | | |
Seacoast Banking
Corp. of Florida* | | | 71,400 | | | | 1,111 | | |
Simmons First
National Corp.
Class A | | | 28,100 | | | | 1,233 | | |
| | | | 6,532 | | |
Biotechnology (9.5%) | |
AMAG
Pharmaceuticals,
Inc.* | | | 36,500 | | | | 2,283 | | |
Amicus
Therapeutics, Inc.* | | | 31,000 | | | | 446 | | |
Bluebird Bio, Inc.* | | | 2,600 | | | | 346 | | |
Cepheid, Inc.* | | | 22,200 | | | | 1,082 | | |
Clovis Oncology,
Inc.* | | | 11,500 | | | | 895 | | |
Dynavax
Technologies
Corp.* | | | 35,200 | | | | 998 | | |
Insys Therapeutics,
Inc.* | | | 13,400 | | | | 434 | | |
Prothena Corp.
PLC* | | | 7,400 | | | | 426 | | |
PTC Therapeutics,
Inc.* | | | 8,700 | | | | 332 | | |
Radius Health, Inc.* | | | 7,600 | | | | 463 | | |
Retrophin, Inc.* | | | 19,200 | | | | 527 | | |
| | | | 8,232 | | |
Chemicals (1.4%) | |
Sensient
Technologies Corp. | | | 18,400 | | | | 1,199 | | |
Commercial Services & Supplies (5.0%) | |
Interface, Inc. | | | 45,400 | | | | 1,100 | | |
| | |
Number
of Shares | |
Value†
(000's)z | |
Multi-Color Corp. | | | 15,800 | | | $ | 1,041 | | |
SP Plus Corp.* | | | 49,700 | | | | 1,142 | | |
Team, Inc.* | | | 25,300 | | | | 1,059 | | |
| | | | 4,342 | | |
Communications Equipment (1.6%) | |
Infinera Corp.* | | | 62,000 | | | | 1,353 | | |
Construction Materials (2.2%) | |
Headwaters, Inc.* | | | 44,500 | | | | 898 | | |
Summit Materials,
Inc. Class A* | | | 43,400 | | | | 1,018 | | |
| | | | 1,916 | | |
Diversified Consumer Services (1.9%) | |
Bright Horizons
Family Solutions,
Inc.* | | | 27,000 | | | | 1,650 | | |
Health Care Equipment & Supplies (5.5%) | |
DexCom, Inc.* | | | 9,700 | | | | 913 | | |
Globus Medical, Inc.
Class A* | | | 43,900 | | | | 1,072 | | |
Insulet Corp.* | | | 27,900 | | | | 829 | | |
K2M Group
Holdings, Inc.* | | | 45,800 | | | | 973 | | |
NuVasive, Inc.* | | | 19,200 | | | | 1,012 | | |
| | | | 4,799 | | |
Health Care Providers & Services (8.9%) | |
Acadia Healthcare
Co., Inc.* | | | 24,195 | | | | 1,767 | | |
AMN Healthcare
Services, Inc.* | | | 35,600 | | | | 1,196 | | |
AmSurg Corp.* | | | 21,400 | | | | 1,678 | | |
HealthEquity, Inc.* | | | 38,300 | | | | 1,123 | | |
Molina Healthcare,
Inc.* | | | 10,400 | | | | 776 | | |
WellCare Health
Plans, Inc.* | | | 12,300 | | | | 1,115 | | |
| | | | 7,655 | | |
Hotels, Restaurants & Leisure (5.4%) | |
Boyd Gaming
Corp.* | | | 69,800 | | | | 1,124 | | |
Cheesecake
Factory, Inc. | | | 15,900 | | | | 863 | | |
Penn National
Gaming, Inc.* | | | 72,400 | | | | 1,315 | | |
Vail Resorts, Inc. | | | 12,700 | | | | 1,370 | | |
| | | | 4,672 | | |
| | |
Number
of Shares | |
Value†
(000's)z | |
Household Durables (1.0%) | |
WCI Communities,
Inc.* | | | 35,100 | | | $ | 875 | | |
Internet & Catalog Retail (0.8%) | |
HSN, Inc. | | | 11,500 | | | | 699 | | |
Internet Software & Services (5.2%) | |
Benefitfocus, Inc.* | | | 34,600 | | | | 1,269 | | |
comScore, Inc.* | | | 17,200 | | | | 898 | | |
Marketo, Inc.* | | | 45,200 | | | | 1,266 | | |
Q2 Holdings, Inc.* | | | 39,200 | | | | 1,026 | | |
| | | | 4,459 | | |
IT Services (2.9%) | |
EPAM Systems,
Inc.* | | | 24,700 | | | | 1,744 | | |
Euronet Worldwide,
Inc.* | | | 11,400 | | | | 735 | | |
| | | | 2,479 | | |
Leisure Products (1.4%) | |
Brunswick Corp. | | | 24,100 | | | | 1,198 | | |
Multiline Retail (1.3%) | |
Burlington Stores,
Inc.* | | | 20,500 | | | | 1,088 | | |
Pharmaceuticals (2.7%) | |
Foamix
Pharmaceuticals
Ltd.* | | | 75,600 | | | | 768 | | |
Intersect ENT, Inc.* | | | 31,700 | | | | 807 | | |
Pacira
Pharmaceuticals,
Inc.* | | | 13,900 | | | | 800 | | |
| | | | 2,375 | | |
Professional Services (2.1%) | |
Huron Consulting
Group, Inc.* | | | 14,000 | | | | 1,014 | | |
On Assignment, Inc.* | | | 23,600 | | | | 849 | | |
| | | | 1,863 | | |
Road & Rail (1.3%) | |
Old Dominion
Freight Line, Inc.* | | | 17,271 | | | | 1,148 | | |
Semiconductors & Semiconductor Equipment (4.2%) | |
Cavium, Inc.* | | | 25,600 | | | | 1,741 | | |
M/A-COM
Technology
Solutions
Holdings, Inc.* | | | 32,000 | | | | 944 | | |
See Notes to Schedule of Investments
Schedule of Investments Small Cap Growth Fund (cont'd)
| | |
Number
of Shares | |
Value†
(000's)z | |
Monolithic Power
Systems, Inc. | | | 19,600 | | | $ | 943 | | |
| | | | 3,628 | | |
Software (11.0%) | |
BroadSoft Inc.* | | | 19,900 | | | | 628 | | |
FleetMatics
Group PLC* | | | 26,400 | | | | 1,182 | | |
Fortinet, Inc.* | | | 25,700 | | | | 1,083 | | |
Gigamon, Inc.* | | | 19,900 | | | | 453 | | |
Paylocity Holding
Corp.* | | | 35,900 | | | | 1,185 | | |
Proofpoint, Inc.* | | | 18,900 | | | | 1,065 | | |
Qlik Technologies,
Inc.* | | | 39,700 | | | | 1,503 | | |
Tyler Technologies,
Inc.* | | | 9,700 | | | | 1,339 | | |
Ultimate Software
Group, Inc.* | | | 6,300 | | | | 1,110 | | |
| | | | 9,548 | | |
Specialty Retail (8.2%) | |
Barnes & Noble
Education, Inc.* | | | 168,904 | | | | 2,179 | | |
Lithia Motors, Inc.
Class A | | | 12,500 | | | | 1,333 | | |
Men's Wearhouse,
Inc. | | | 19,300 | | | | 1,089 | | |
Monro Muffler
Brake, Inc. | | | 19,800 | | | | 1,255 | | |
Restoration
Hardware
Holdings, Inc.* | | | 13,400 | | | | 1,239 | | |
| | | | 7,095 | | |
Textiles, Apparel & Luxury Goods (1.3%) | |
G-III Apparel
Group Ltd.* | | | 15,900 | | | | 1,102 | | |
Thrifts & Mortgage Finance (1.3%) | |
EverBank Financial
Corp. | | | 55,200 | | | | 1,092 | | |
Total Common Stocks
(Cost $83,198) | | | | | 82,879 | | |
Short-Term Investments (4.2%) | |
State Street
Institutional
Liquid Reserves
Fund Premier
Class
(Cost $3,644) | | | 3,643,518 | | | | 3,644 | | |
Total Investments## (100.1%)
(Cost $86,842) | | | | | 86,523 | | |
Liabilities, less cash,
receivables and
other assets [(0.1%)] | | | | | (112 | ) | |
Total Net Assets (100.0%) | | | | $ | 86,411 | | |
See Notes to Schedule of Investments
Schedule of Investments Socially Responsive Fund 8/31/15
TOP TEN EQUITY HOLDINGS
| | 1 | | | American Express Co. | | | 5.3 | % | |
| | 2 | | | Texas Instruments, Inc. | | | 5.1 | % | |
| | 3 | | | Newell Rubbermaid, Inc. | | | 5.1 | % | |
| | 4 | | | Progressive Corp. | | | 5.1 | % | |
| | 5 | | | Danaher Corp. | | | 4.0 | % | |
| | 6 | | | Schlumberger Ltd. | | | 4.0 | % | |
| | 7 | | | Eversource Energy | | | 3.9 | % | |
| | 8 | | | Intuit, Inc. | | | 3.7 | % | |
| | 9 | | | W.W. Grainger, Inc. | | | 3.7 | % | |
| | 10 | | | U.S. Bancorp | | | 3.6 | % | |
| | |
Number
of Shares | |
Value†
(000's)z | |
Common Stocks (97.9%) | |
Airlines (2.3%) | |
Ryanair Holdings
PLC ADR | | | 696,282 | | | $ | 50,794 | | |
Auto Components (2.4%) | |
BorgWarner, Inc. | | | 1,239,989 | | | | 54,113 | | |
Banks (3.6%) | |
U.S. Bancorp | | | 1,907,782 | | | | 80,795 | | |
Commercial Services & Supplies (0.9%) | |
Herman Miller,
Inc. | | | 790,473 | | | | 21,430 | | |
Communications Equipment (1.6%) | |
NetScout Systems,
Inc.* | | | 983,441 | | | | 35,945 | | |
Consumer Finance (5.3%) | |
American
Express Co. | | | 1,536,243 | | | | 117,861 | | |
Diversified Financial Services (2.8%) | |
Intercontinental
Exchange, Inc. | | | 277,794 | | | | 63,451 | | |
Diversified Telecommunication Services (1.4%) | |
Level 3
Communications,
Inc.* | | | 690,133 | | | | 30,870 | | |
Electric Utilities (3.9%) | |
Eversource
Energy | | | 1,855,967 | | | | 87,676 | | |
Energy Equipment & Services (4.0%) | |
Schlumberger
Ltd. | | | 1,152,977 | | | | 89,206 | | |
Food Products (2.6%) | |
Keurig Green
Mountain, Inc. | | | 1,031,420 | | | | 58,378 | | |
Health Care Equipment & Supplies (6.0%) | |
Abbott
Laboratories | | | 1,246,456 | | | | 56,452 | | |
Becton,
Dickinson & Co. | | | 557,050 | | | | 78,555 | | |
| | | | 135,007 | | |
Health Care Providers & Services (1.3%) | |
Premier, Inc.
Class A* | | | 810,431 | | | | 28,892 | | |
| | |
Number
of Shares | |
Value†
(000's)z | |
Household Durables (5.1%) | |
Newell
Rubbermaid,
Inc. | | | 2,709,575 | | | $ | 114,154 | | |
Industrial Conglomerates (6.0%) | |
3M Co. | | | 304,953 | | | | 43,346 | | |
Danaher Corp. | | | 1,037,176 | | | | 90,255 | | |
| | | | 133,601 | | |
Insurance (5.1%) | |
Progressive
Corp. | | | 3,809,054 | | | | 114,119 | | |
Internet Software & Services (1.8%) | |
eBay, Inc.* | | | 1,528,017 | | | | 41,424 | | |
IT Services (6.9%) | |
Alliance Data
Systems Corp.* | | | 250,941 | | | | 64,539 | | |
MasterCard, Inc.
Class A | | | 385,476 | | | | 35,606 | | |
PayPal Holdings,
Inc.* | | | 1,528,017 | | | | 53,481 | | |
| | | | 153,626 | | |
Oil, Gas & Consumable Fuels (2.9%) | |
Cimarex
Energy Co. | | | 186,045 | | | | 20,560 | | |
Noble Energy,
Inc. | | | 1,299,112 | | | | 43,403 | | |
| | | | 63,963 | | |
Personal Products (3.5%) | |
Unilever NV | | | 1,942,705 | | | | 77,941 | | |
Pharmaceuticals (2.1%) | |
Roche
Holding AG | | | 169,607 | | | | 46,321 | | |
Professional Services (4.1%) | |
ManpowerGroup,
Inc. | | | 385,537 | | | | 33,503 | | |
Robert Half
International,
Inc. | | | 1,151,410 | | | | 58,757 | | |
| | | | 92,260 | | |
Semiconductors & Semiconductor Equipment (5.1%) | |
Texas
Instruments,
Inc. | | | 2,391,184 | | | | 114,394 | | |
| | |
Number
of Shares | |
Value†
(000's)z | |
Software (5.5%) | |
Adobe Systems,
Inc.* | | | 500,310 | | | $ | 39,309 | | |
Intuit, Inc. | | | 977,561 | | | | 83,826 | | |
| | | | 123,135 | | |
Specialty Retail (5.0%) | |
O'Reilly
Automotive, Inc.* | | | 161,632 | | | | 38,803 | | |
TJX Cos., Inc. | | | 1,052,402 | | | | 74,005 | | |
| | | | 112,808 | | |
Textiles, Apparel & Luxury Goods (1.2%) | |
Gildan Activewear,
Inc. | | | 827,600 | | | | 25,970 | | |
Trading Companies & Distributors (5.5%) | |
NOW, Inc.* | | | 2,412,742 | | | | 41,161 | | |
W.W. Grainger,
Inc. | | | 365,998 | | | | 81,779 | | |
| | | | 122,940 | | |
Total Common Stocks
(Cost $1,793,785) | | | | | 2,191,074 | | |
| | | Principal
Amount | | | |
Short-Term Investments (2.5%) | |
Certificates of Deposit (0.0%) | |
Carver
Federal
Savings Bank
Self Help
Credit Union,
0.20%, due
9/22/15 | | $ | 100,000 | | | | 100 | | |
Self Help Credit
Union, 0.25%,
due 10/13/15 | | | 250,000 | | | | 250 | | |
Self Help Credit
Union, 0.25%,
due 11/16/15 | | | 250,000 | | | | 250 | | |
| | | | 600 | # | |
See Notes to Schedule of Investments
Schedule of Investments Socially Responsive Fund (cont'd)
| | |
Number
of Shares | |
Value†
(000's)z | |
Money Market Fund (2.5%) | |
State Street
Institutional
Treasury
Money
Market Fund
Premier Class | | | 55,103,763 | | | $ | 55,104 | | |
Total Short-Term Investments
(Cost $55,704) | | | | | 55,704 | | |
Total Investments## (100.4%)
(Cost $1,849,489) | | | | | 2,246,778 | | |
Liabilities, less cash,
receivables and
other assets [(0.4%)] | | | | | (9,767 | ) | |
Total Net Assets (100.0%) | | | | $ | 2,237,011 | | |
See Notes to Schedule of Investments
Schedule of Investments Value Fund 8/31/15
TOP TEN EQUITY HOLDINGS
| | 1 | | | Carnival Corp. | | | 7.7 | % | |
| | 2 | | | Exxon Mobil Corp. | | | 5.4 | % | |
| | 3 | | | Citigroup, Inc. | | | 5.0 | % | |
| | 4 | | | JPMorgan Chase & Co. | | | 4.8 | % | |
| | 5 | | | JC Penney Co., Inc. | | | 4.3 | % | |
| | 6 | | | General Electric Co. | | | 4.2 | % | |
| | 7 | | | Eaton Corp. PLC | | | 4.2 | % | |
| | 8 | | | Delta Air Lines, Inc. | | | 4.2 | % | |
| | 9 | | | Wells Fargo & Co. | | | 4.0 | % | |
| | 10 | | | Bank of New York Mellon Corp. | | | 3.4 | % | |
| | |
Number
of Shares | |
Value†
(000's)z | |
Common Stocks (99.5%) | |
Airlines (9.3%) | |
American Airlines
Group, Inc. | | | 11,413 | | | $ | 445 | | |
Delta Air Lines, Inc. | | | 19,854 | | | | 869 | | |
United Continental
Holdings, Inc.* | | | 10,847 | | | | 618 | | |
| | | | 1,932 | | |
Auto Components (3.6%) | |
Delphi
Automotive PLC | | | 3,604 | | | | 272 | | |
Johnson Controls,
Inc. | | | 11,393 | | | | 469 | | |
| | | | 741 | | |
Banks (16.2%) | |
Citigroup, Inc. | | | 19,468 | | | | 1,041 | | |
JPMorgan
Chase & Co. | | | 15,484 | | | | 993 | | |
M&T Bank Corp. | | | 879 | | | | 104 | | |
Wells Fargo & Co. | | | 15,742 | | | | 839 | | |
Zions
Bancorporation | | | 13,821 | | | | 401 | | |
| | | | 3,378 | | |
Biotechnology (2.1%) | |
Celgene Corp.* | | | 1,853 | | | | 219 | | |
Gilead Sciences,
Inc. | | | 2,087 | | | | 219 | | |
| | | | 438 | | |
Capital Markets (7.1%) | |
Bank of New
York Mellon
Corp. | | | 18,003 | | | | 717 | | |
Goldman Sachs
Group, Inc. | | | 2,204 | | | | 416 | | |
Morgan Stanley | | | 10,404 | | | | 358 | | |
| | | | 1,491 | | |
Communications Equipment (2.9%) | |
Cisco Systems,
Inc. | | | 11,728 | | | | 303 | | |
Juniper Networks,
Inc. | | | 11,508 | | | | 296 | | |
| | | | 599 | | |
Construction Materials (2.1%) | |
Vulcan Materials Co. | | | 4,676 | | | | 438 | | |
Diversified Financial Services (2.5%) | |
CME Group, Inc. | | | 5,564 | | | | 525 | | |
| | |
Number
of Shares | |
Value†
(000's)z | |
Electrical Equipment (4.2%) | |
Eaton Corp. PLC | | | 15,249 | | | $ | 870 | | |
Energy Equipment & Services (0.3%) | |
Schlumberger Ltd. | | | 783 | | | | 61 | | |
Food & Staples Retailing (1.0%) | |
Wal-Mart Stores,
Inc. | | | 3,258 | | | | 211 | | |
Health Care Providers & Services (2.2%) | |
HCA Holdings,
Inc.* | | | 4,050 | | | | 351 | | |
Tenet Healthcare
Corp.* | | | 2,381 | | | | 117 | | |
| | | | 468 | | |
Hotels, Restaurants & Leisure (7.7%) | |
Carnival Corp. | | | 32,665 | | | | 1,608 | | |
Industrial Conglomerates (4.2%) | |
General Electric Co. | | | 35,702 | | | | 886 | | |
Insurance (3.3%) | |
Lincoln National
Corp. | | | 13,425 | | | | 682 | | |
Machinery (3.1%) | |
Cummins, Inc. | | | 1,955 | | | | 238 | | |
Joy Global, Inc. | | | 17,041 | | | | 413 | | |
| | | | 651 | | |
Metals & Mining (6.7%) | |
BHP Billiton
Ltd. ADR | | | 9,793 | | | | 361 | | |
Newmont Mining
Corp. | | | 38,451 | | | | 656 | | |
United States
Steel Corp. | | | 23,089 | | | | 378 | | |
| | | | 1,395 | | |
Multiline Retail (4.3%) | |
JC Penney Co.,
Inc.* | | | 98,556 | | | | 898 | | |
Oil, Gas & Consumable Fuels (8.6%) | |
Devon Energy
Corp. | | | 7,383 | | | | 315 | | |
Exxon Mobil Corp. | | | 15,021 | | | | 1,130 | | |
Pioneer Natural
Resources Co. | | | 2,903 | | | | 357 | | |
| | | | 1,802 | | |
| | |
Number
of Shares | |
Value†
(000's)z | |
Pharmaceuticals (2.9%) | |
Teva Pharmaceutical
Industries Ltd. ADR | | | 9,485 | | | $ | 611 | | |
Specialty Retail (1.6%) | |
Staples, Inc. | | | 23,874 | | | | 339 | | |
Technology Hardware, Storage & Peripherals (3.6%) | |
EMC Corp. | | | 14,889 | | | | 370 | | |
SanDisk Corp. | | | 6,944 | | | | 379 | | |
| | | | 749 | | |
Total Common Stocks
(Cost $21,530) | | | | | 20,773 | | |
Short-Term Investments (0.0%) | |
State Street
Institutional
Treasury Money
Market Fund
Premier Class
(Cost $0) | | | 1 | | | | 0 | | |
Total Investments## (99.5%)
(Cost $21,530) | | | | | 20,773 | | |
Cash, receivables and
other assets,
less liabilities (0.5%) | | | | | 96 | | |
Total Net Assets (100.0%) | | | | $ | 20,869 | | |
See Notes to Schedule of Investments
Schedule of Investments World Equity Fund 8/31/15
TOP TEN EQUITY HOLDINGS
| | | | | Country | | Industry | | | |
| | 1 | | | Energy Select Sector SPDR Fund | | United States | | Exchange Traded Funds | | | 2.7 | % | |
| | 2 | | | SPDR S&P Oil & Gas Exploration &
Production ETF | | United States
| | Exchange Traded Funds
| | | 2.5
| % | |
| | 3 | | | iShares MSCI Emerging Markets ETF | | United States | | Exchange Traded Funds | | | 2.5 | % | |
| | 4 | | | Thales SA | | France | | Aerospace & Defense | | | 2.0 | % | |
| | 5 | | | Apple, Inc.
| | United States
| | Technology Hardware, Storage &
Peripherals | | | 1.7
| % | |
| | 6 | | | NIKE, Inc. Class B | | United States | | Textiles, Apparel & Luxury Goods | | | 1.6 | % | |
| | 7 | | | Fiserv, Inc. | | United States | | IT Services | | | 1.6 | % | |
| | 8 | | | HCA Holdings, Inc. | | United States | | Health Care Providers & Services | | | 1.5 | % | |
| | 9 | | | Walt Disney Co. | | United States | | Media | | | 1.4 | % | |
| | 10 | | | Foot Locker, Inc. | | United States | | Specialty Retail | | | 1.4 | % | |
| | |
Number
of Shares | |
Value†
(000's)z | |
Common Stocks (78.7%) | |
Austria (0.4%) | |
ams AG | | | 551 | | | $ | 20 | | |
Belgium (2.5%) | |
Ackermans &
van Haaren NV | | | 175 | | | | 26 | | |
Anheuser-Busch
InBev NV | | | 204 | | | | 22 | | |
Ion Beam
ApplicationsØØ | | | 1,381 | | | | 43 | | |
| KBC Groep NVØØ | | | 466 | | | | 31 | | |
| | | | 122 | | |
China (0.4%) | |
Tencent
Holdings Ltd. | | | 1,033 | | | | 18 | | |
France (5.1%) | |
Cap Gemini SA | | | 138 | | | | 12 | | |
Ingenico Group | | | 195 | | | | 24 | | |
L'Oreal SA | | | 138 | | | | 24 | | |
Legrand SA | | | 435 | | | | 25 | | |
Orpea | | | 352 | | | | 27 | | |
SCOR SE | | | 1,038 | | | | 37 | | |
| Thales SAØØ | | | 1,393 | | | | 96 | | |
| | | | 245 | | |
Germany (6.1%) | |
Bayer AG | | | 262 | | | | 36 | | |
Daimler AG | | | 242 | | | | 19 | | |
Deutsche Annington
Immobilien SE | | | 1,562 | | | | 51 | | |
Deutsche
Wohnen AG | | | 1,379 | | | | 36 | | |
Dialog
Semiconductor
PLC*ØØ | | | 273 | | | | 13 | | |
Fresenius
SE & Co. KGaA | | | 677 | | | | 48 | | |
Hella KGaA
Hueck & Co.* | | | 416 | | | | 18 | | |
KUKA AG | | | 448 | | | | 36 | | |
ProSiebenSat.1
Media SE | | | 748 | | | | 36 | | |
| | | | 293 | | |
| | |
Number
of Shares | |
Value†
(000's)z | |
Hong Kong (0.6%) | |
AIA Group Ltd. | | | 1,669 | | | $ | 9 | | |
Bank of China Ltd.,
H Shares | | | 19,696 | | | | 9 | | |
China Construction
Bank Corp.,
H Shares | | | 13,984 | | | | 10 | | |
| | | | 28 | | |
Israel (1.2%) | |
Teva Pharmaceutical
Industries Ltd.
ADRØØ | | | 846 | | | | 55 | | |
Italy (3.1%) | |
Brembo SpA | | | 585 | | | | 24 | | |
Enel SpA | | | 2,806 | | | | 13 | | |
Intesa Sanpaolo
SpAØØ | | | 13,287 | | | | 48 | | |
Mediobanca
SpAØØ | | | 6,237 | | | | 63 | | |
| | | | 148 | | |
Japan (11.5%) | |
Daicel Corp. | | | 1,951 | | | | 26 | | |
Don Quijote
Holdings Co. Ltd. | | | 600 | | | | 23 | | |
East Japan
Railway Co. | | | 381 | | | | 35 | | |
Fuji Heavy
Industries Ltd. | | | 694 | | | | 24 | | |
Hiroshima Bank Ltd. | | | 2,093 | | | | 12 | | |
Japan Airlines
Co. Ltd. | | | 1,000 | | | | 36 | | |
Kirin Holdings
Co. Ltd. | | | 1,822 | | | | 27 | | |
Mitsubishi UFJ
Financial Group,
Inc. | | | 3,459 | | | | 23 | | |
Mizuho Financial
Group, Inc. | | | 11,557 | | | | 24 | | |
Nomura Holdings,
Inc. | | | 5,357 | | | | 34 | | |
Nomura Research
Institute Ltd. | | | 600 | | | | 24 | | |
| NTT Data Corp.ØØ | | | 1,267 | | | | 61 | | |
| | |
Number
of Shares | |
Value†
(000's)z | |
NTT DOCOMO,
Inc.ØØ | | | 1,966 | | | $ | 41 | | |
Seibu Holdings, Inc. | | | 1,100 | | | | 24 | | |
Sumitomo Mitsui
Financial Group,
Inc. | | | 566 | | | | 23 | | |
Sumitomo Mitsui
Trust Holdings, Inc. | | | 5,000 | | | | 21 | | |
Taisei Corp. | | | 4,358 | | | | 29 | | |
Takeda
Pharmaceutical
Co. Ltd. | | | 525 | | | | 26 | | |
West Japan Railway
Co.ØØ | | | 594 | | | | 40 | | |
| | | | 553 | | |
Netherlands (1.6%) | |
| ASML Holding NV | | | 111 | | | | 10 | | |
| ING Groep NVØØ | | | 1,943 | | | | 30 | | |
NXP
Semiconductors NV* | | | 200 | | | | 17 | | |
Royal Dutch Shell
PLC ADR Class A | | | 400 | | | | 21 | | |
| | | 78 | | |
South Africa (0.5%) | |
Brait SE* | | | 2,170 | | | | 24 | | |
Spain (0.8%) | |
Industria de
Diseno Textil SA | | | 1,131 | | | | 38 | | |
Sweden (0.8%) | |
Assa Abloy AB
Class B | | | 1,937 | | | | 37 | | |
Switzerland (1.3%) | |
Novartis AG | | | 251 | | | | 25 | | |
UBS Group AG* | | | 1,715 | | | | 36 | | |
| | | 61 | | |
Taiwan (0.2%) | |
Taiwan
Semiconductor
Manufacturing
Co. Ltd. ADR | | | 568 | | | | 11 | | |
See Notes to Schedule of Investments
Schedule of Investments World Equity Fund (cont'd)
| | |
Number
of Shares | |
Value†
(000's)z | |
United States (42.6%) | |
Accenture PLC
Class AØØ | | | 515 | | | $ | 49 | | |
Aetna, Inc. | | | 293 | | | | 34 | | |
| Allegion PLCØØ | | | 705 | | | | 42 | | |
Allergan PLC* | | | 100 | | | | 30 | | |
Amazon.com, Inc.* | | | 58 | | | | 30 | | |
| Apple, Inc.ØØ | | | 727 | | | | 82 | | |
Bank of America
Corp.ØØ | | | 1,480 | | | | 24 | | |
Bristol-Myers
Squibb Co.ØØ | | | 727 | | | | 43 | | |
| Celgene Corp.*ØØ | | | 327 | | | | 39 | | |
Centene Corp.* | | | 466 | | | | 29 | | |
Charles Schwab
Corp.ØØ | | | 2,149 | | | | 65 | | |
Cigna Corp. | | | 152 | | | | 21 | | |
CVS Health
Corp.ØØ | | | 592 | | | | 61 | | |
| Eli Lilly & Co.ØØ | | | 582 | | | | 48 | | |
Express Scripts
Holding Co.* | | | 421 | | | | 35 | | |
Facebook, Inc.
Class A*ØØ | | | 579 | | | | 52 | | |
| Fiserv, Inc.*ØØ | | | 902 | | | | 77 | | |
| Foot Locker, Inc.ØØ | | | 937 | | | | 66 | | |
Goldman Sachs
Group, Inc.ØØ | | | 172 | | | | 32 | | |
HCA Holdings,
Inc.*ØØ | | | 824 | | | | 71 | | |
Health Net, Inc.* | | | 586 | | | | 38 | | |
| Home Depot, Inc.ØØ | | | 450 | | | | 52 | | |
JPMorgan
Chase & Co.ØØ | | | 921 | | | | 59 | | |
Lockheed Martin
Corp.ØØ | | | 254 | | | | 51 | | |
Morgan Stanley | | | 971 | | | | 33 | | |
Newell Rubbermaid,
Inc. | | | 914 | | | | 39 | | |
NextEra Energy, Inc. | | | 253 | | | | 25 | | |
| NIKE, Inc. Class BØØ | | | 694 | | | | 78 | | |
Northrop Grumman
Corp. | | | 236 | | | | 39 | | |
Raytheon Co. | | | 354 | | | | 36 | | |
Reinsurance Group of
America, Inc. | | | 394 | | | | 36 | | |
salesforce.com, inc.* | | | 532 | | | | 37 | | |
SBA Communications
Corp. Class A*ØØ | | | 323 | | | | 38 | | |
Service Corp.
InternationalØØ | | | 2,132 | | | | 63 | | |
Sherwin-Williams
Co.ØØ | | | 180 | | | | 46 | | |
Stanley Black &
Decker, Inc. | | | 356 | | | | 36 | | |
Starbucks Corp. | | | 700 | | | | 38 | | |
SVB Financial
Group*ØØ | | | 164 | | | | 21 | | |
T-Mobile US,
Inc.*ØØ | | | 1,601 | | | | 63 | | |
Time Warner, Inc. | | | 291 | | | | 21 | | |
| | |
Number
of Shares | |
Value†
(000's)z | |
UnitedHealth
Group, Inc. | | | 308 | | | $ | 36 | | |
Valero Energy
Corp.ØØ | | | 788 | | | | 47 | | |
| Visa, Inc. Class AØØ | | | 930 | | | | 66 | | |
| Walt Disney Co.ØØ | | | 659 | | | | 67 | | |
| Wells Fargo & Co.ØØ | | | 888 | | | | 47 | | |
| | | 2,042 | | |
Total Common Stocks
(Cost $3,865) | | | | | 3,773 | | |
Exchange Traded Funds (8.7%) | |
United States (8.7%) | |
Energy Select Sector
SPDR Fund | | | 1,947 | | | | 129 | | |
iShares MSCI
Emerging
Markets ETF | | | 3,568 | | | | 121 | | |
iShares MSCI India
ETFØØ | | | 1,600 | | | | 45 | | |
SPDR S&P Oil &
Gas Exploration &
Production ETF | | | 3,200 | | | | 122 | | |
Total Exchange Traded Funds
(Cost $421) | | | | | 417 | | |
Short-Term Investments (16.5%) | |
State Street
Institutional
Treasury Money
Market Fund
Premier Class
(Cost $789) | | | 789,085 | | | | 789 | | |
Total Investments## (103.9%)
(Cost $5,075) | | | | | 4,979 | | |
Liabilities, less cash,
receivables and
other assetsk [(3.9%)] | | | | | (187 | ) | |
Total Net Assets (100.0%) | | | | $ | 4,792 | | |
See Notes to Schedule of Investments
POSITIONS BY INDUSTRY WORLD EQUITY FUND
Industry | | Investments at
Value†
(000's omitted) | | Percentage of
Net Assets | |
Exchange Traded Funds | | $ | 417 | | | | 8.7 | % | |
Banks | | | 382 | | | | 8.0 | % | |
Health Care Providers & Services | | | 339 | | | | 7.1 | % | |
IT Services | | | 289 | | | | 6.0 | % | |
Capital Markets | | | 287 | | | | 6.0 | % | |
Pharmaceuticals | | | 263 | | | | 5.5 | % | |
Aerospace & Defense | | | 222 | | | | 4.6 | % | |
Specialty Retail | | | 156 | | | | 3.3 | % | |
Wireless Telecommunication Services | | | 142 | | | | 3.0 | % | |
Media | | | 124 | | | | 2.6 | % | |
Real Estate Management & Development | | | 87 | | | | 1.8 | % | |
Technology Hardware, Storage & Peripherals | | | 82 | | | | 1.7 | % | |
Insurance | | | 82 | | | | 1.7 | % | |
Building Products | | | 79 | | | | 1.6 | % | |
Textiles, Apparel & Luxury Goods | | | 78 | | | | 1.6 | % | |
Road & Rail | | | 75 | | | | 1.6 | % | |
Chemicals | | | 72 | | | | 1.5 | % | |
Machinery | | | 72 | | | | 1.5 | % | |
Semiconductors & Semiconductor Equipment | | | 71 | | | | 1.5 | % | |
Internet Software & Services | | | 70 | | | | 1.5 | % | |
Oil, Gas & Consumable Fuels | | | 68 | | | | 1.4 | % | |
Diversified Consumer Services | | | 63 | | | | 1.3 | % | |
Food & Staples Retailing | | | 61 | | | | 1.3 | % | |
Beverages | | | 49 | | | | 1.0 | % | |
Automobiles | | | 43 | | | | 0.9 | % | |
Health Care Equipment & Supplies | | | 43 | | | | 0.9 | % | |
Auto Components | | | 42 | | | | 0.9 | % | |
Biotechnology | | | 39 | | | | 0.8 | % | |
Household Durables | | | 39 | | | | 0.8 | % | |
Electric Utilities | | | 38 | | | | 0.8 | % | |
Hotels, Restaurants & Leisure | | | 38 | | | | 0.8 | % | |
Software | | | 37 | | | | 0.8 | % | |
Airlines | | | 36 | | | | 0.7 | % | |
Internet & Catalog Retail | | | 30 | | | | 0.6 | % | |
Construction & Engineering | | | 29 | | | | 0.6 | % | |
Diversified Financial Services | | | 26 | | | | 0.5 | % | |
Electrical Equipment | | | 25 | | | | 0.5 | % | |
Electronic Equipment, Instruments & Components | | | 24 | | | | 0.5 | % | |
Industrial Conglomerates | | | 24 | | | | 0.5 | % | |
Personal Products | | | 24 | | | | 0.5 | % | |
Multiline Retail | | | 23 | | | | 0.5 | % | |
Short-Term Investments and Other Assets—Net | | | 602 | | | | 12.6 | % | |
| | | $ | 4,792 | | | | 100.0 | % | |
See Notes to Schedule of Investments
Notes to Schedule of Investments
† In accordance with Accounting Standards Codification ("ASC") 820 "Fair Value Measurement" ("ASC 820"), all investments held by each of Neuberger Berman All Cap Core Fund ("All Cap Core"), Neuberger Berman Emerging Markets Equity Fund ("Emerging Markets Equity"), Neuberger Berman Equity Income Fund ("Equity Income"), Neuberger Berman Focus Fund ("Focus"), Neuberger Berman Genesis Fund ("Genesis"), Neuberger Berman Global Equity Fund ("Global Equity"), Neuberger Berman Global Real Estate Fund ("Global Real Estate"), Neuberger Berman Greater China Equity Fund ("Greater China Equity"), Neuberger Berman Guardian Fund ("Guardian"), Neuberger Berman International Equity Fund ("International Equity"), Neuberger Berman International Select Fund ("International Select"), Neuberger Berman Intrinsic Value Fund ("Intrinsic Value"), Neuberger Berman Large Cap Disciplined Growth Fund ("Large Cap Disciplined Growth"), Neuberger Berman Large Cap Value Fund ("Large Cap Value"), Neuberger Berman Mid Cap Growth Fund ("Mid Cap Growth"), Neuberger Berman Mid Cap Intrinsic Value Fund ("Mid Cap Intrinsic Value"), Neuberger Berman Multi-Cap Opportunities Fund ("Multi-Cap Opportunities"), Neuberger Berman Real Estate Fund ("Real Estate"), Neuberger Berman Small Cap Growth Fund ("Small Cap Growth"), Neuberger Berman Socially Responsive Fund ("Socially Responsive"), Neuberger Berman Value Fund ("Value") and Neuberger Berman World Equity Fund ("World Equity") (each individually a "Fund," and collectively, the "Funds") are carried at the value that Neuberger Berman Management LLC ("Management") believes a Fund would receive upon selling an investment in an orderly transaction to an independent buyer in the principal or most advantageous market for the investment under current market conditions. Various inputs, including the volume and level of activity for the asset or liability in the market, are considered in valuing the Funds' investments, some of which are discussed below. Significant Management judgment may be necessary to value investments in accordance with ASC 820.
ASC 820 established a three-tier hierarchy of inputs to create a classification of value measurements for disclosure purposes. The three-tier hierarchy of inputs is summarized in the three broad Levels listed below.
• Level 1 – quoted prices in active markets for identical investments
• Level 2 – other observable inputs (including quoted prices for similar investments, interest rates, prepayment speeds, credit risk, amortized cost, etc.)
• Level 3 – unobservable inputs (including a Fund's own assumptions in determining the fair value of investments)
The inputs or methodology used for valuing an investment are not necessarily an indication of the risk associated with investing in those securities.
The value of the Funds' investments in equity securities, exchange traded funds, preferred stocks, rights and written option contracts, for which market quotations are readily available, is generally determined by Management by obtaining valuations from independent pricing services based on the latest sale price quoted on a principal exchange or market for that security (Level 1 inputs). Securities traded primarily on the NASDAQ Stock Market are normally valued at the NASDAQ Official Closing Price ("NOCP") provided by NASDAQ each business day. The NOCP is the most recently reported price as of 4:00:02 p.m., Eastern time, unless that price is outside the range of the "inside" bid and asked prices (i.e., the bid and asked prices that dealers quote to each other when trading for their own accounts); in that case, NASDAQ will adjust the price to equal the inside bid or asked price, whichever is closer. Because of delays in reporting trades, the NOCP may not be based on the price of the last trade to occur before the market closes. If there is no reported sale of a security on a particular day, the independent pricing services may value the security based on reported market quotations.
The value of the Funds' investments in convertible bonds is determined by Management primarily by obtaining valuations from independent pricing services based on readily available bid quotations or, if quotations are not available, by methods which include various considerations such as yields or prices of securities of comparable
See Notes to Financial Statements
Notes to Schedule of Investments(cont'd)
quality, coupon, maturity and type, indications as to values from dealers, and general market conditions (generally Level 2 inputs).
Other Level 2 inputs used by independent pricing services to value convertible bonds generally include underlying stock data, dealer quotes, conversion premiums, listed bond and preferred stock prices and other market information which may include benchmark curves, trade execution data, and sensitivity analysis, when available.
The value of participatory notes is determined by Management by obtaining valuations from independent pricing services based on the underlying equity security and applicable exchange rate (Level 1 inputs).
The value of financial futures contracts ("financial futures") is determined by Management by obtaining valuations from independent pricing services at the settlement price at the market close (Level 1 inputs).
The value of forward foreign currency contracts ("forward contracts") is determined by Management by obtaining valuations from independent pricing services based on actual traded currency rates on independent pricing services' networks, along with other traded and quoted currency rates provided to the pricing services by leading market participants (Level 2 inputs).
The value of equity swap contracts ("equity swaps") is determined by Management by obtaining valuations from independent pricing services using the underlying security and stated London Interbank Offered Rate ("LIBOR") or Federal Funds floating rate (Level 2 inputs).
Management has developed a process to periodically review information provided by independent pricing services for all types of securities.
Certificates of deposit are valued at amortized cost.
Investments in non-exchange traded investment companies are valued using the respective fund's daily calculated net asset value per share (Level 2 inputs).
If a valuation is not available from an independent pricing service, or if Management has reason to believe that the valuation received does not represent the amount a Fund might reasonably expect to receive on a current sale in an orderly transaction, Management seeks to obtain quotations from brokers or dealers (generally considered Level 2 or Level 3 inputs depending on the number of quotes available). If such quotations are not readily available, the security is valued using methods the Neuberger Berman Equity Funds' Board of Trustees (the "Board") has approved in the good-faith belief that the resulting valuation will reflect the fair value of the security. Numerous factors may be considered when determining the fair value of a security based on Level 2 or Level 3 inputs, including available analyst, media or other reports, trading in financial futures or American Depositary Receipts ("ADRs") and whether the issuer of the security being fair valued has other securities outstanding.
The value of the Funds' investments in foreign securities is generally determined using the same valuation methods and inputs as other Fund investments, as discussed above. Foreign security prices expressed in local currency values are translated from the local currency into U.S. dollars using the exchange rates as of the end of regular trading on the New York Stock Exchange ("NYSE") on business days, usually 4:00 p.m., Eastern time. The Board has approved the use of Interactive Data Pricing and Reference Data, Inc. ("Interactive") to assist in determining the fair value of foreign equity securities when changes in the value of a certain index suggest that the closing prices on the foreign exchanges may no longer represent the amount that a Fund could expect to receive for those securities or on days when foreign markets are closed and U.S. markets are open. In each of these events, Interactive will provide adjusted prices for certain foreign equity securities using a statistical analysis of historical correlations of multiple factors (Level 2 inputs). In the absence of precise information about the market values of these foreign securities as of the close of the NYSE, the Board has determined on the basis of available data that
See Notes to Financial Statements
Notes to Schedule of Investments(cont'd)
prices adjusted in this way are likely to be closer to the prices a Fund could realize on a current sale than are the prices of those securities established at the close of the foreign markets in which the securities primarily trade.
Fair value prices are necessarily estimates, and there is no assurance that such a price will be at or close to the price at which the security is next quoted or next trades.
The following is a summary, categorized by Level, of inputs used to value the Funds' investments as of August 31, 2015:
Asset Valuation Inputs
(000's omitted) | | Level 1 | | Level 2 | | Level 3§§ | | Total | |
All Cap Core | |
Investments: | |
Common Stocks§ | | $ | 39,235 | | | $ | — | | | $ | — | | | $ | 39,235 | | |
Exchange Traded Funds | | | 2,644 | | | | — | | | | — | | | | 2,644 | | |
Short-Term Investments | | | — | | | | 7,981 | | | | — | | | | 7,981 | | |
Total Investments | | | 41,879 | | | | 7,981 | | | | — | | | | 49,860 | | |
Emerging Markets Equity | |
Investments: | |
Common Stocks§ | |
Jordan | | | — | | | | 4,105 | | | | — | | | | 4,105 | | |
Malaysia | | | — | | | | 3,199 | | | | — | | | | 3,199 | | |
Philippines | | | — | | | | 14,984 | | | | — | | | | 14,984 | | |
Russia | | | 5,073 | | | | 10,242 | | | | — | | | | 15,315 | | |
Thailand | | | — | | | | 7,877 | | | | — | | | | 7,877 | | |
Other Common Stocksß | | | 362,117 | | | | — | | | | — | | | | 362,117 | | |
Total Common Stocks | | | 367,190 | | | | 40,407 | | | | — | | | | 407,597 | | |
Short-Term Investments | | | — | | | | 5,401 | | | | — | | | | 5,401 | | |
Total Investments | | | 367,190 | | | | 45,808 | | | | — | | | | 412,998 | | |
Equity Income | |
Investments: | |
Common Stocks | |
Diversified Telecommunication Services | | | 22,562 | | | | 21,194 | | | | — | | | | 43,756 | | |
Tobacco | | | — | | | | 17,136 | | | | — | | | | 17,136 | | |
Other Common Stocks§ | | | 1,894,703 | | | | — | | | | — | | | | 1,894,703 | | |
Total Common Stocks | | | 1,917,265 | | | | 38,330 | | | | — | | | | 1,955,595 | | |
Business Development Companies | | | 22,423 | | | | — | | | | — | | | | 22,423 | | |
Preferred Stocks | | | 11,158 | | | | — | | | | — | | | | 11,158 | | |
Convertible Bonds | | | — | | | | 76,938 | | | | — | | | | 76,938 | | |
Short-Term Investments | | | — | | | | 35,830 | | | | — | | | | 35,830 | | |
Total Investments | | | 1,950,846 | | | | 151,098 | | | | — | | | | 2,101,944 | | |
See Notes to Financial Statements
Notes to Schedule of Investments(cont'd)
(000's omitted) | | Level 1 | | Level 2 | | Level 3§§ | | Total | |
Focus | |
Investments: | |
Common Stocks§ | | $ | 765,029 | | | $ | — | | | $ | — | | | $ | 765,029 | | |
Short-Term Investments | | | — | | | | 11,016 | | | | — | | | | 11,016 | | |
Total Investments | | | 765,029 | | | | 11,016 | | | | — | | | | 776,045 | | |
Genesis | |
Investments: | |
Common Stocks | |
Food & Staples Retailing | | | — | | | | 21,448 | | | | — | | | | 21,448 | | |
Paper & Forest Products | | | — | | | | 87,086 | | | | — | | | | 87,086 | | |
Other Common Stocks§ | | | 10,653,490 | | | | — | | | | — | | | | 10,653,490 | | |
Total Common Stocks | | | 10,653,490 | | | | 108,534 | | | | — | | | | 10,762,024 | | |
Short-Term Investments | | | — | | | | 206,909 | | | | — | | | | 206,909 | | |
Total Investments | | | 10,653,490 | | | | 315,443 | | | | — | | | | 10,968,933 | | |
Global Equity | |
Investments: | |
Common Stocks§ | |
United Kingdom | | | 79 | | | | 452 | | | | — | | | | 531 | | |
Other Common Stocksß | | | 3,197 | | | | — | | | | — | | | | 3,197 | | |
Total Common Stocks | | | 3,276 | | | | 452 | | | | — | | | | 3,728 | | |
Short-Term Investments | | | — | | | | 156 | | | | — | | | | 156 | | |
Total Investments | | | 3,276 | | | | 608 | | | | — | | | | 3,884 | | |
Global Real Estate | |
Investments: | |
Common Stocks§ | |
United Kingdom | | | — | | | | 254 | | | | — | | | | 254 | | |
Other Common Stocksß | | | 2,469 | | | | — | | | | — | | | | 2,469 | | |
Total Common Stocks | | | 2,469 | | | | 254 | | | | — | | | | 2,723 | | |
Short-Term Investments | | | — | | | | 52 | | | | — | | | | 52 | | |
Total Investments | | | 2,469 | | | | 306 | | | | — | | | | 2,775 | | |
Greater China Equity | |
Investments: | |
Common Stocks§ | | | 87,632 | | | | — | | | | — | | | | 87,632 | | |
Participatory Notes§ | | | 18,358 | | | | — | | | | — | | | | 18,358 | | |
Short-Term Investments | | | — | | | | 4,463 | | | | — | | | | 4,463 | | |
Total Investments | | | 105,990 | | | | 4,463 | | | | — | | | | 110,453 | | |
See Notes to Financial Statements
Notes to Schedule of Investments(cont'd)
(000's omitted) | | Level 1 | | Level 2 | | Level 3§§ | | Total | |
Guardian | |
Investments: | |
Common Stocks§ | | $ | 1,288,064 | | | $ | — | | | $ | — | | | $ | 1,288,064 | | |
Short-Term Investments | | | — | | | | 12,350 | | | | — | | | | 12,350 | | |
Total Investments | | | 1,288,064 | | | | 12,350 | | | | — | | | | 1,300,414 | | |
International Equity | |
Investments: | |
Common Stocks§ | |
Ireland | | | — | | | | 16,661 | | | | — | | | | 16,661 | | |
United Kingdom | | | 37,738 | | | | 214,129 | | | | — | | | | 251,867 | | |
Other Common Stocksß | | | 870,970 | | | | — | | | | — | | | | 870,970 | | |
Total Common Stocks | | | 908,708 | | | | 230,790 | | | | — | | | | 1,139,498 | | |
Short-Term Investments | | | — | | | | 50,726 | | | | — | | | | 50,726 | | |
Total Investments | | | 908,708 | | | | 281,516 | | | | — | | | | 1,190,224 | | |
International Select | |
Investments: | |
Common Stocks§ | |
Ireland | | | — | | | | 2,542 | | | | — | | | | 2,542 | | |
United Kingdom | | | 5,627 | | | | 42,099 | | | | — | | | | 47,726 | | |
Other Common Stocksß | | | 179,153 | | | | — | | | | — | | | | 179,153 | | |
Total Common Stocks | | | 184,780 | | | | 44,641 | | | | — | | | | 229,421 | | |
Short-Term Investments | | | — | | | | 7,788 | | | | — | | | | 7,788 | | |
Total Investments | | | 184,780 | | | | 52,429 | | | | — | | | | 237,209 | | |
Intrinsic Value | |
Investments: | |
Common Stocks§ | | | 441,604 | | | | — | | | | — | | | | 441,604 | | |
Short-Term Investments | | | — | | | | 49,135 | | | | — | | | | 49,135 | | |
Total Investments | | | 441,604 | | | | 49,135 | | | | — | | | | 490,739 | | |
Large Cap Disciplined Growth | |
Investments: | |
Common Stocks§ | | | 58,979 | | | | — | | | | — | | | | 58,979 | | |
Short-Term Investments | | | — | | | | 265 | | | | — | | | | 265 | | |
Total Investments | | | 58,979 | | | | 265 | | | | — | | | | 59,244 | | |
Large Cap Value | |
Investments: | |
Common Stocks§ | | | 1,341,866 | | | | — | | | | — | | | | 1,341,866 | | |
Short-Term Investments | | | — | | | | 39,698 | | | | — | | | | 39,698 | | |
Total Investments | | | 1,341,866 | | | | 39,698 | | | | — | | | | 1,381,564 | | |
See Notes to Financial Statements
Notes to Schedule of Investments(cont'd)
(000's omitted) | | Level 1 | | Level 2 | | Level 3§§ | | Total | |
Mid Cap Growth | |
Investments: | |
Common Stocks§ | | $ | 1,089,877 | | | $ | — | | | $ | — | | | $ | 1,089,877 | | |
Exchange Traded Funds | | | 9,242 | | | | — | | | | — | | | | 9,242 | | |
Short-Term Investments | | | — | | | | 83,557 | | | | — | | | | 83,557 | | |
Total Investments | | | 1,099,119 | | | | 83,557 | | | | — | | | | 1,182,676 | | |
Mid Cap Intrinsic Value | |
Investments: | |
Common Stocks§ | | | 98,238 | | | | — | | | | — | | | | 98,238 | | |
Rights | | | — | | | | — | | | | 8 | | | | 8 | | |
Short-Term Investments | | | — | | | | 9,201 | | | | — | | | | 9,201 | | |
Total Investments | | | 98,238 | | | | 9,201 | | | | 8 | | | | 107,447 | | |
Multi-Cap Opportunities | |
Investments: | |
Common Stocks§ | | | 2,308,282 | | | | — | | | | — | | | | 2,308,282 | | |
Short-Term Investments | | | — | | | | 25,965 | | | | — | | | | 25,965 | | |
Total Investments | | | 2,308,282 | | | | 25,965 | | | | — | | | | 2,334,247 | | |
Real Estate | |
Investments: | |
Common Stocks§ | | | 799,818 | | | | — | | | | — | | | | 799,818 | | |
Short-Term Investments | | | — | | | | 9,563 | | | | — | | | | 9,563 | | |
Total Investments | | | 799,818 | | | | 9,563 | | | | — | | | | 809,381 | | |
Small Cap Growth | |
Investments: | |
Common Stocks§ | | | 82,879 | | | | — | | | | — | | | | 82,879 | | |
Short-Term Investments | | | — | | | | 3,644 | | | | — | | | | 3,644 | | |
Total Investments | | | 82,879 | | | | 3,644 | | | | — | | | | 86,523 | | |
Socially Responsive | |
Investments: | |
Common Stocks§ | | | 2,191,074 | | | | — | | | | — | | | | 2,191,074 | | |
Short-Term Investments§ | | | — | | | | 55,704 | | | | — | | | | 55,704 | | |
Total Investments | | | 2,191,074 | | | | 55,704 | | | | — | | | | 2,246,778 | | |
Value | |
Investments: | |
Common Stocks§ | | | 20,773 | | | | — | | | | — | | | | 20,773 | | |
Short-Term Investments | | | — | | | | 0 | z | | | — | | | | 0 | z | |
Total Investments | | | 20,773 | | | | 0 | z | | | — | | | | 20,773 | | |
See Notes to Financial Statements
Notes to Schedule of Investments(cont'd)
(000's omitted) | | Level 1 | | Level 2 | | Level 3§§ | | Total | |
World Equity | |
Investments: | |
Common Stocks§ | | $ | 3,773 | | | $ | — | | | $ | — | | | $ | 3,773 | | |
Exchange Traded Funds | | | 417 | | | | — | | | | — | | | | 417 | | |
Short-Term Investments | | | — | | | | 789 | | | | — | | | | 789 | | |
Total Investments | | | 4,190 | | | | 789 | | | | — | | | | 4,979 | | |
§ The Schedule of Investments (or Positions by Industry or Sector for the global/international funds) provides information on the industry or sector categorization for the portfolio.
ß All Level 1 securities that represent multiple geographic locations and/or industries. Please refer to the Schedule of Investments for additional information.
§§ The following is a reconciliation between the beginning and ending balances of investments in which unobservable inputs (Level 3) were used in determining value:
Mid Cap Intrinsic Value
| | | Beginning
balance, as
of 9/1/14 | | Accrued
discounts/
(premiums) | | Realized
gain/
loss | | Change
in unrealized
appreciation/
(depreciation) | | Purchases | | Sales | | Transfers
into
Level 3 | | Transfers
out of
Level 3 | | Balance,
as of
8/31/15 | | Net change in
unrealized
appreciation/
(depreciation)
from
investments
still held
as of 8/31/15 | |
(000's omitted)
Investments in Securities: | |
| Rights‡ | |
Food & Staples
Retailing | | $ | — | | | $ | — | | | $ | — | | | $ | (14 | ) | | $ | 22 | | | $ | — | | | $ | — | | | $ | — | | | $ | 8 | | | $ | (14 | ) | |
Total | | $ | — | | | $ | — | | | $ | — | | | $ | (14 | ) | | $ | 22 | | | $ | — | | | $ | — | | | $ | — | | | $ | 8 | | | $ | (14 | ) | |
‡ For the year ended August 31, 2015, Mid Cap Intrinsic Value's Level 3 investments were valued based on a single quotation obtained from a dealer or, where such a quotation was not readily available, using methods the Board has approved in the good-faith belief that the resulting valuation will reflect the fair value of the security. The investments did not have a material impact on the Fund's net assets; therefore, unobservable inputs used in formulating such valuations are not presented.
As of the year ended August 31, 2015, certain securities were transferred from one level (as of August 31, 2014) to another. Based on beginning of period market values as of September 1, 2014, approximately $30,996,000, $91,092,000, $2,745,000, $172,214,000 and $31,546,000 was transferred from Level 1 to Level 2 for Emerging Markets Equity, Genesis, Global Equity, International Equity and International Select, respectively. Interactive provided adjusted prices for these securities as of August 31, 2015, as stated in the description of the valuation methods of foreign equity securities in footnote † above. In addition, approximately $44,561,000, $491,000, $14,956,000 and $3,970,000 was transferred from Level 2 to Level 1 for Emerging Markets Equity, Global Equity, International Equity and International Select, respectively, due to active market activity on recognized exchanges as of August 31, 2015. These securities had been categorized as Level 2 as of August 31, 2014, due to foreign exchanges having been closed and, therefore, no prices having been readily available for the securities as of that date.
See Notes to Financial Statements
Notes to Schedule of Investments(cont'd)
The following is a summary, categorized by Level, of inputs used to value the Fund's derivatives as of August 31, 2015:
Asset Valuation Inputs
(000's omitted) | | Level 1 | | Level 2 | | Level 3 | | Total | |
World Equity | |
Equity swaps | | $ | — | | | $ | 6 | | | $ | — | | | $ | 6 | | |
Total | | $ | — | | | $ | 6 | | | $ | — | | | $ | 6 | | |
The following is a summary, categorized by Level, of inputs used to value the Fund's derivatives as of August 31, 2015:
Liability Valuation Inputs
(000's omitted) | | Level 1 | | Level 2 | | Level 3 | | Total | |
Equity Income | |
Option Contracts | | $ | (1,965 | ) | | $ | — | | | $ | — | | | $ | (1,965 | ) | |
Total | | $ | (1,965 | ) | | $ | — | | | $ | — | | | $ | (1,965 | ) | |
World Equity | |
Equity swaps | | $ | — | | | $ | (35 | ) | | $ | — | | | $ | (35 | ) | |
Forward contracts (unrealized depreciation) | | | — | | | | (3 | ) | | | — | | | | (3 | ) | |
Total | | $ | — | | | $ | (38 | ) | | $ | — | | | $ | (38 | ) | |
## At August 31, 2015, selected fund information on a U.S. federal income tax basis was as follows:
| (000's omitted) | | Cost | | Gross
Unrealized
Appreciation | | Gross
Unrealized
Depreciation | | Net Unrealized
Appreciation
(Depreciation) | |
All Cap Core | | $ | 46,131 | | | $ | 4,001 | | | $ | 272 | | | $ | 3,729 | | |
Emerging Markets Equity | | | 456,267 | | | | 40,204 | | | | 83,473 | | | | (43,269 | ) | |
Equity Income | | | 1,977,673 | | | | 223,907 | | | | 99,636 | | | | 124,271 | | |
Focus | | | 663,019 | | | | 137,666 | | | | 24,640 | | | | 113,026 | | |
Genesis | | | 6,169,882 | | | | 4,974,429 | | | | 175,378 | | | | 4,799,051 | | |
Global Equity | | | 3,769 | | | | 419 | | | | 304 | | | | 115 | | |
Global Real Estate | | | 2,976 | | | | 41 | | | | 242 | | | | (201 | ) | |
Greater China Equity | | | 132,029 | | | | 1,691 | | | | 23,267 | | | | (21,576 | ) | |
Guardian | | | 1,062,121 | | | | 301,833 | | | | 63,540 | | | | 238,293 | | |
International Equity | | | 1,126,118 | | | | 139,524 | | | | 75,418 | | | | 64,106 | | |
International Select | | | 216,194 | | | | 32,635 | | | | 11,620 | | | | 21,015 | | |
Intrinsic Value | | | 454,725 | | | | 70,786 | | | | 34,772 | | | | 36,014 | | |
Large Cap Disciplined Growth | | | 56,140 | | | | 6,120 | | | | 3,016 | | | | 3,104 | | |
Large Cap Value | | | 1,408,667 | | | | 78,669 | | | | 105,772 | | | | (27,103 | ) | |
Mid Cap Growth | | | 899,179 | | | | 297,749 | | | | 14,252 | | | | 283,497 | | |
Mid Cap Intrinsic Value | | | 103,858 | | | | 11,072 | | | | 7,483 | | | | 3,589 | | |
Multi-Cap Opportunities | | | 1,952,651 | | | | 446,960 | | | | 65,364 | | | | 381,596 | | |
Real Estate | | | 768,658 | | | | 66,009 | | | | 25,286 | | | | 40,723 | | |
Small Cap Growth | | | 87,299 | | | | 3,122 | | | | 3,898 | | | | (776 | ) | |
See Notes to Financial Statements
Notes to Schedule of Investments(cont'd)
| (000's omitted) | | Cost | | Gross
Unrealized
Appreciation | | Gross
Unrealized
Depreciation | | Net Unrealized
Appreciation
(Depreciation) | |
Socially Responsive | | $ | 1,849,632 | | | $ | 483,118 | | | $ | 85,972 | | | $ | 397,146 | | |
Value | | | 21,664 | | | | 841 | | | | 1,732 | | | | (891 | ) | |
World Equity | | | 5,098 | | | | 83 | | | | 202 | | | | (119 | ) | |
| ‡‡ | At August 31, 2015, Equity Income had outstanding call and put options written as follows: |
| |
Name of Issuer | | Contracts | | Exercise
Price | | Expiration Date | | Market Value
of Optionsµ | |
Best Buy Co., Inc., Put | | | 250 | | | | 30 | | | December 2015 | | $ | (19,000 | ) | |
CME Group, Inc., Call | | | 150 | | | | 105 | | | December 2015 | | | (17,000 | ) | |
CME Group, Inc., Call | | | 13 | | | | 110 | | | January 2016 | | | (0 | )z | |
Eli Lilly & Co, Call | | | 250 | | | | 90 | | | January 2016 | | | (57,000 | ) | |
Eli Lilly & Co, Call | | | 250 | | | | 95 | | | January 2016 | | | (30,000 | ) | |
Equinix, Inc., Call | | | 125 | | | | 320 | | | March 2016 | | | (40,000 | ) | |
Equinix, Inc., Call | | | 50 | | | | 330 | | | March 2016 | | | (10,000 | ) | |
Equinix, Inc., Call | | | 4 | | | | 340 | | | March 2016 | | | (0 | )z | |
Extra Space Storage, Inc., Call | | | 250 | | | | 80 | | | March 2016 | | | (48,000 | )f | |
Golar LNG Ltd., Call | | | 250 | | | | 75 | | | January 2016 | | | (5,000 | ) | |
Hasbro, Inc., Call | | | 300 | | | | 70 | | | January 2016 | | | (228,000 | ) | |
Hasbro, Inc., Call | | | 200 | | | | 80 | | | January 2016 | | | (49,000 | ) | |
Hasbro, Inc., Call | | | 200 | | | | 82.5 | | | January 2016 | | | (33,000 | ) | |
Hasbro, Inc., Call | | | 200 | | | | 85 | | | January 2016 | | | (23,000 | ) | |
Honeywell International, Inc., Put | | | 250 | | | | 85 | | | January 2016 | | | (47,000 | ) | |
JPMorgan Chase & Co., Call | | | 228 | | | | 72.5 | | | December 2015 | | | (12,000 | ) | |
JPMorgan Chase & Co., Call | | | 250 | | | | 72.5 | | | January 2016 | | | (20,000 | ) | |
JPMorgan Chase & Co., Call | | | 250 | | | | 75 | | | January 2016 | | | (10,000 | ) | |
Linear Technology Corp., Put | | | 250 | | | | 34 | | | February 2016 | | | (31,000 | ) | |
Linear Technology Corp., Put | | | 250 | | | | 35 | | | February 2016 | | | (37,000 | ) | |
Lockheed Martin Corp., Put | | | 2 | | | | 165 | | | January 2016 | | | (0 | )z | |
McDonald's Corp., Put | | | 250 | | | | 87.5 | | | January 2016 | | | (62,000 | ) | |
McDonald's Corp., Put | | | 250 | | | | 90 | | | January 2016 | | | (80,000 | ) | |
McDonald's Corp., Put | | | 250 | | | | 85 | | | March 2016 | | | (67,000 | ) | |
Microsoft Corp., Call | | | 250 | | | | 52.5 | | | April 2016 | | | (15,000 | ) | |
NextEra Energy, Inc., Call | | | 300 | | | | 115 | | | December 2015 | | | (20,000 | ) | |
NextEra Energy, Inc., Call | | | 152 | | | | 120 | | | March 2016 | | | (4,000 | ) | |
PNC Financial Services Group, Inc., Call | | | 7 | | | | 105 | | | January 2016 | | | (0 | )z | |
Procter & Gamble Co., Put | | | 250 | | | | 72.5 | | | October 2015 | | | (79,000 | ) | |
Public Storage, Call | | | 150 | | | | 220 | | | March 2016 | | | (66,000 | ) | |
Public Storage, Call | | | 150 | | | | 230 | | | March 2016 | | | (26,000 | ) | |
SanDisk Corp., Put | | | 250 | | | | 55 | | | October 2015 | | | (99,000 | ) | |
SanDisk Corp., Put | | | 250 | | | | 47.5 | | | January 2016 | | | (78,000 | ) | |
SanDisk Corp., Put | | | 250 | | | | 50 | | | January 2016 | | | (98,000 | ) | |
SanDisk Corp., Put | | | 250 | | | | 52.5 | | | January 2016 | | | (139,000 | ) | |
See Notes to Financial Statements
Notes to Schedule of Investments(cont'd)
Name of Issuer | | Contracts | | Exercise
Price | | Expiration Date | | Market Value
of Optionsµ | |
Union Pacific Corp., Put | | | 250 | | | | 85 | | | November 2015 | | $ | (104,000 | ) | |
Union Pacific Corp., Put | | | 250 | | | | 82.5 | | | January 2016 | | | (110,000 | ) | |
Union Pacific Corp., Put | | | 5 | | | | 87.5 | | | January 2016 | | | (3,000 | ) | |
Union Pacific Corp., Put | | | 200 | | | | 80 | | | February 2016 | | | (80,000 | ) | |
Union Pacific Corp., Put | | | 200 | | | | 85 | | | February 2016 | | | (119,000 | ) | |
| | | | | | Total | | $ | (1,965,000 | ) | |
µ Rounded to the nearest thousand.
z A zero balance, if any, may reflect actual amounts rounding to less than $1,000.
f Value of the security was determined using methods the Board has approved in the good-faith belief that the resulting valuation will reflect the fair value of the security.
At August 31, 2015, Equity Income had deposited $22,450,313 in a segregated account to cover requirements on put options written.
| # | At cost, which approximates market value. |
| |
* | Security did not produce income during the last twelve months. |
| | |
| @ | All or a portion of this security is pledged in connection with outstanding call options written. |
| | |
| ØØ | All or a portion of this security is segregated in connection with obligations for equity swaps and/or forward contracts. |
| | |
| ñ | Securities were purchased under Rule 144A of the Securities Act of 1933, as amended (the "1933 Act"), or are private placements and, unless registered under the 1933 Act or exempted from registration, may only be sold to qualified institutional investors. These securities have been deemed by the investment manager to be liquid. At August 31, 2015, these securities amounted to approximately $2,527,000 or 0.6% of net assets for Emerging Markets Equity, approximately $21,941,000 or 1.0% of net assets for Equity Income, approximately $10,610,000 or 9.9% of net assets for Greater China Equity and approximately $24,177,000 or 2.0% of net assets for International Equity. |
| | |
| Ñ | These securities have been deemed by the investment manager to be illiquid. At August 31, 2015, these securities amounted to approximately $8,000 or 0.0% of net assets for Mid Cap Intrinsic Value. |
| | |
| z | A zero balance, if any, may reflect actual amounts rounding to less than $1,000. |
| | |
| ^ | Affiliated issuer (see Note F of Notes to Financial Statements). |
| | |
| f | Value of the security was determined using methods the Board has approved in the good-faith belief that the resulting valuation will reflect the fair value of the security. |
| | |
| k | See Note A in the Notes to Financial Statements for the Fund's open positions in derivatives at August 31, 2015. |
See Notes to Financial Statements
This page has been left blank intentionally
Statements of Assets and Liabilities
Neuberger Berman Equity Funds
(000's omitted except per share amounts)
| | | ALL CAP CORE
FUND | | EMERGING
MARKETS
EQUITY FUND | | EQUITY
INCOME FUND | | FOCUS FUND | | GENESIS FUND | | GLOBAL EQUITY
FUND | | GLOBAL REAL
ESTATE FUND | | GREATER
CHINA EQUITY
FUND | | GUARDIAN
FUND | | INTERNATIONAL
EQUITY
FUND | |
| | | August 31,
2015 | | August 31,
2015 | | August 31,
2015 | | August 31,
2015 | | August 31,
2015 | | August 31,
2015 | | August 31,
2015 | | August 31,
2015 | | August 31,
2015 | | August 31,
2015 | |
Assets | |
Investments in securities, at value* (Notes A & F)—see Schedule of Investments: | |
Unaffiliated issuers | | $ | 49,860 | | | $ | 412,998 | | | $ | 2,101,944 | | | $ | 776,045 | | | $ | 8,086,466 | | | $ | 3,884 | | | $ | 2,775 | | | $ | 110,453 | | | $ | 1,300,414 | | | $ | 1,190,224 | | |
Affiliated issuers | | | — | | | | — | | | | — | | | | — | | | | 2,882,467 | | | | — | | | | — | | | | — | | | | — | | | | — | | |
| | | | 49,860 | | | | 412,998 | | | | 2,101,944 | | | | 776,045 | | | | 10,968,933 | | | | 3,884 | | | | 2,775 | | | | 110,453 | | | | 1,300,414 | | | | 1,190,224 | | |
Cash | | | — | | | | 48 | | | | — | | | | — | | | | — | | | | — | | | | — | | | | — | | | | — | | | | — | | |
Foreign currency* | | | — | | | | 4,393 | | | | 270 | | | | — | | | | — | | | | — | | | | — | | | | 143 | | | | — | | | | — | | |
Cash collateral segregated for open option contracts | | | — | | | | — | | | | 22,450 | | | | — | | | | — | | | | — | | | | — | | | | — | | | | — | | | | — | | |
Dividends and interest receivable | | | 54 | | | | 199 | | | | 9,265 | | | | 901 | | | | 13,113 | | | | 19 | | | | 4 | | | | 58 | | | | 2,447 | | | | 3,515 | | |
Receivable for securities sold | | | 2,895 | | | | 3,597 | | | | 5,900 | | | | 20,058 | | | | 15,355 | | | | — | | | | — | | | | 2,063 | | | | 21,167 | | | | — | | |
Receivable for Fund shares sold | | | 4 | | | | 85 | | | | 1,213 | | | | 40 | | | | 5,063 | | | | — | | | | — | | | | 885 | | | | 304 | | | | 3,181 | | |
Receivable from Management—net (Note B) | | | 2 | | | | — | | | | — | | | | — | | | | — | | | | 22 | | | | 15 | | | | 29 | | | | — | | | | — | | |
Open swap contracts, at value (Note A) | | | — | | | | — | | | | — | | | | — | | | | — | | | | — | | | | — | | | | — | | | | — | | | | — | | |
Prepaid expenses and other assets | | | 10 | | | | 45 | | | | 74 | | | | 55 | | | | 238 | | | | 21 | | | | 27 | | | | 25 | | | | 112 | | | | 63 | | |
Total Assets | | | 52,825 | | | | 421,365 | | | | 2,141,116 | | | | 797,099 | | | | 11,002,702 | | | | 3,946 | | | | 2,821 | | | | 113,656 | | | | 1,324,444 | | | | 1,196,983 | | |
Liabilities | |
Options contracts written, at value** (Note A) | | | — | | | | — | | | | 1,965 | | | | — | | | | — | | | | — | | | | — | | | | — | | | | — | | | | — | | |
Open swap contracts, at value (Note A) | | | — | | | | — | | | | — | | | | — | | | | — | | | | — | | | | — | | | | — | | | | — | | | | — | | |
Payable for open forward foreign currency contracts (Note A) | | | — | | | | — | | | | — | | | | — | | | | — | | | | — | | | | — | | | | — | | | | — | | | | — | | |
Due to custodian | | | — | | | | — | | | | — | | | | — | | | | 77 | | | | — | | | | 10 | | | | — | | | | — | | | | 327 | | |
Payable for securities purchased | | | 2,578 | | | | 1,562 | | | | 7,490 | | | | 21,210 | | | | 10,308 | | | | — | | | | — | | | | 1,902 | | | | 7,199 | | | | 131 | | |
Payable for Fund shares redeemed | | | 14 | | | | 3,040 | | | | 2,742 | | | | 404 | | | | 20,990 | | | | — | | | | — | | | | 3,867 | | | | 657 | | | | 965 | | |
Payable to investment manager—net (Note B) | | | 25 | | | | 373 | | | | 896 | | | | 357 | | | | 6,431 | | | | 3 | | | | 2 | | | | 117 | | | | 577 | | | | 652 | | |
Payable to administrator—net (Note B) | | | — | | | | 102 | | | | 770 | | | | 201 | | | | 2,092 | | | | — | | | | — | | | | — | | | | 335 | | | | 236 | | |
Payable to trustees | | | 4 | | | | 4 | | | | 4 | | | | 4 | | | | 4 | | | | 4 | | | | 3 | | | | 4 | | | | 4 | | | | 4 | | |
Payable for organization costs | | | — | | | | — | | | | — | | | | — | | | | — | | | | — | | | | — | | | | — | | | | — | | | | — | | |
Interest payable | | | — | | | | — | | | | — | | | | — | | | | — | | | | — | | | | — | | | | 2 | | | | — | | | | — | | |
Accrued capital gains taxes | | | — | | | | — | | | | — | | | | — | | | | — | | | | — | | | | — | | | | 35 | | | | — | | | | — | | |
Accrued expenses and other payables | | | 104 | | | | 303 | | | | 363 | | | | 224 | | | | 1,356 | | | | 99 | | | | 83 | | | | 152 | | | | 321 | | | | 284 | | |
Total Liabilities | | | 2,725 | | | | 5,384 | | | | 14,230 | | | | 22,400 | | | | 41,258 | | | | 106 | | | | 98 | | | | 6,079 | | | | 9,093 | | | | 2,599 | | |
Net Assets | | $ | 50,100 | | | $ | 415,981 | | | $ | 2,126,886 | | | $ | 774,699 | | | $ | 10,961,444 | | | $ | 3,840 | | | $ | 2,723 | | | $ | 107,577 | | | $ | 1,315,351 | | | $ | 1,194,384 | | |
Net Assets consist of: | |
Paid-in capital | | $ | 45,651 | | | $ | 494,863 | | | $ | 1,937,778 | | | $ | 635,824 | | | $ | 5,200,824 | | | $ | 3,745 | | | $ | 2,924 | | | $ | 116,402 | | | $ | 1,000,832 | | | $ | 1,355,159 | | |
Undistributed net investment income (loss) | | | (144 | ) | | | 2,273 | | | | — | | | | 3,830 | | | | 19,793 | | | | — | | | | — | | | | 837 | | | | 5,845 | | | | 7,983 | | |
Distributions in excess of net investment income | | | — | | | | — | | | | (1,857 | ) | | | — | | | | — | | | | (2 | ) | | | (2 | ) | | | — | | | | — | | | | — | | |
Accumulated net realized gains (losses) on investments | | | 864 | | | | (38,648 | ) | | | 70,117 | | | | 20,358 | | | | 931,737 | | | | (19 | ) | | | (1 | ) | | | 9,960 | | | | 70,015 | | | | (233,398 | ) | |
Net unrealized appreciation (depreciation) in value of investments | | | 3,729 | | | | (42,507 | ) | | | 120,848 | | | | 114,687 | | | | 4,809,090 | | | | 116 | | | | (198 | ) | | | (19,622 | ) | | | 238,659 | | | | 64,640 | | |
Net Assets | | $ | 50,100 | | | $ | 415,981 | | | $ | 2,126,886 | | | $ | 774,699 | | | $ | 10,961,444 | | | $ | 3,840 | | | $ | 2,723 | | | $ | 107,577 | | | $ | 1,315,351 | | | $ | 1,194,384 | | |
Net Assets | |
Investor Class | | $ | — | | | $ | — | | | $ | — | | | $ | 639,829 | | | $ | 2,023,644 | | | $ | — | | | $ | — | | | $ | — | | | $ | 1,034,879 | | | $ | 117,749 | | |
Trust Class | | | — | | | | — | | | | — | | | | 92,727 | | | | 2,003,422 | | | | — | | | | — | | | | — | | | | 103,822 | | | | 55,279 | | |
Advisor Class | | | — | | | | — | | | | — | | | | 6,105 | | | | 451,319 | | | | — | | | | — | | | | — | | | | 296 | | | | — | | |
Institutional Class | | | 34,527 | | | | 307,536 | | | | 1,443,678 | | | | 28,714 | | | | 3,685,027 | | | | 3,204 | | | | 1,874 | | | | 103,430 | | | | 94,146 | | | | 886,477 | | |
Class A | | | 7,383 | | | | 13,384 | | | | 289,473 | | | | 4,390 | | | | — | | | | 410 | | | | 616 | | | | 3,985 | | | | 79,276 | | | | 90,976 | | |
Class C | | | 8,190 | | | | 6,182 | | | | 389,961 | | | | 2,934 | | | | — | | | | 226 | | | | 233 | | | | 162 | | | | 2,416 | | | | 11,191 | | |
Class R3 | | | — | | | | 764 | | | | 3,774 | | | | — | | | | — | | | | — | | | | — | | | | — | | | | 516 | | | | — | | |
Class R6 | | | — | | | | 88,115 | | | | — | | | | — | | | | 2,798,032 | | | | — | | | | — | | | | — | | | | — | | | | 32,712 | | |
See Notes to Financial Statements
Statements of Assets and Liabilities (cont'd)
Neuberger Berman Equity Funds (cont'd)
(000's omitted except per share amounts)
| | | ALL CAP CORE
FUND | | EMERGING
MARKETS
EQUITY FUND | | EQUITY
INCOME FUND | | FOCUS FUND | | GENESIS FUND | | GLOBAL EQUITY
FUND | | GLOBAL REAL
ESTATE FUND | | GREATER
CHINA EQUITY
FUND | | GUARDIAN
FUND | | INTERNATIONAL
EQUITY
FUND | |
| | | August 31,
2015 | | August 31,
2015 | | August 31,
2015 | | August 31,
2015 | | August 31,
2015 | | August 31,
2015 | | August 31,
2015 | | August 31,
2015 | | August 31,
2015 | | August 31,
2015 | |
Shares Outstanding ($.001 par value; unlimited shares authorized) | |
Investor Class | | | — | | | | — | | | | — | | | | 25,143 | | | | 55,738 | | | | — | | | | — | | | | — | | | | 60,423 | | | | 5,952 | | |
Trust Class | | | — | | | | — | | | | — | | | | 5,709 | | | | 33,949 | | | | — | | | | — | | | | — | | | | 8,615 | | | | 2,506 | | |
Advisor Class | | | — | | | | — | | | | — | | | | 710 | | | | 16,440 | | | | — | | | | — | | | | — | | | | 21 | | | | — | | |
Institutional Class | | | 3,935 | | | | 22,054 | | | | 123,004 | | | | 1,126 | | | | 65,246 | | | | 509 | | | | 201 | | | | 8,889 | | | | 5,484 | | | | 82,726 | | |
Class A | | | 861 | | | | 965 | | | | 24,754 | | | | 273 | | | | — | | | | 66 | | | | 66 | | | | 345 | | | | 6,652 | | | | 4,136 | | |
Class C | | | 1,029 | | | | 461 | | | | 33,567 | | | | 356 | | | | — | | | | 38 | | | | 25 | | | | 14 | | | | 173 | | | | 517 | | |
Class R3 | | | — | | | | 56 | | | | 323 | | | | — | | | | — | | | | — | | | | — | | | | — | | | | 36 | | | | — | | |
Class R6 | | | — | | | | 6,313 | | | | — | | | | — | | | | 49,526 | | | | — | | | | — | | | | — | | | | — | | | | 3,025 | | |
Net Asset Value, offering and redemption price per share | |
Investor Class | | $ | — | | | $ | — | | | $ | — | | | $ | 25.45 | | | $ | 36.31 | | | $ | — | | | $ | — | | | $ | — | | | $ | 17.13 | | | $ | 19.78 | | |
Trust Class | | | — | | | | — | | | | — | | | | 16.24 | | | | 59.01 | | | | — | | | | — | | | | — | | | | 12.05 | | | �� | 22.06 | | |
Advisor Class | | | — | | | | — | | | | — | | | | 8.60 | | | | 27.45 | | | | — | | | | — | | | | — | | | | 14.33 | | | | — | | |
Institutional Class | | | 8.77 | | | | 13.94 | | | | 11.74 | | | | 25.50 | | | | 56.48 | | | | 6.30 | | | | 9.32 | | | | 11.64 | | | | 17.17 | | | | 10.72 | | |
Class R3 | | | — | | | | 13.60 | | | | 11.67 | | | | — | | | | — | | | | — | | | | — | | | | — | | | | 14.31 | | | | — | | |
Class R6 | | | — | | | | 13.96 | | | | — | | | | — | | | | 56.50 | | | | — | | | | — | | | | — | | | | — | | | | 10.81 | | |
Net Asset Value and redemption price per share | |
Class A | | $ | 8.58 | | | $ | 13.87 | | | $ | 11.69 | | | $ | 16.10 | | | $ | — | | | $ | 6.23 | | | $ | 9.31 | | | $ | 11.56 | | | $ | 11.92 | | | $ | 22.00 | | |
Offering Price per share | |
Class A‡ | | $ | 9.10 | | | $ | 14.72 | | | $ | 12.40 | | | $ | 17.08 | | | $ | — | | | $ | 6.61 | | | $ | 9.88 | | | $ | 12.27 | | | $ | 12.65 | | | $ | 23.34 | | |
Net Asset Value and offering price per share | |
Class C^ | | $ | 7.96 | | | $ | 13.42 | | | $ | 11.62 | | | $ | 8.24 | | | $ | — | | | $ | 6.01 | | | $ | 9.30 | | | $ | 11.45 | | | $ | 13.97 | | | $ | 21.65 | | |
*Cost of Investments: | | | | | |
Unaffiliated issuers | | $ | 46,131 | | | $ | 455,435 | | | $ | 1,980,447 | | | $ | 661,358 | | | $ | 4,409,312 | | | $ | 3,766 | | | $ | 2,973 | | | $ | 130,075 | | | $ | 1,061,726 | | | $ | 1,125,398 | | |
Affiliated issuers | | | — | | | | — | | | | — | | | | — | | | | 1,750,531 | | | | — | | | | — | | | | — | | | | — | | | | — | | |
Total cost of investments | | $ | 46,131 | | | $ | 455,435 | | | $ | 1,980,447 | | | $ | 661,358 | | | $ | 6,159,843 | | | $ | 3,766 | | | $ | 2,973 | | | $ | 130,075 | | | $ | 1,061,726 | | | $ | 1,125,398 | | |
Total cost of foreign currency | | $ | — | | | $ | 4,460 | | | $ | 271 | | | $ | — | | | $ | — | | | $ | — | | | $ | — | | | $ | 143 | | | $ | — | | | $ | — | | |
**Premium received from option contracts written | | $ | — | | | $ | — | | | $ | 1,325 | | | $ | — | | | $ | — | | | $ | — | | | $ | — | | | $ | — | | | $ | — | | | $ | — | | |
‡ | On single retail sales of less than $50,000. On sales of $50,000 or more or in certain other circumstances described in the Fund's prospectus, offering price is reduced. |
| |
^ | Redemption price per share is equal to net asset value less any applicable contingent deferred sales charge. |
See Notes to Financial Statements
Statements of Assets and Liabilities (cont'd)
Neuberger Berman Equity Funds
(000's omitted except per share amounts)
| | | INTERNATIONAL
SELECT
FUND | | INTRINSIC
VALUE FUND | | LARGE CAP
DISCIPLINED
GROWTH FUND | | LARGE CAP
VALUE FUND | | MID CAP
GROWTH
FUND | | MID CAP
INTRINSIC
VALUE FUND | | MULTI-CAP
OPPORTUNITIES
FUND | | REAL ESTATE
FUND | | SMALL CAP
GROWTH
FUND | | SOCIALLY
RESPONSIVE
FUND | |
| | | August 31,
2015 | | August 31,
2015 | | August 31,
2015 | | August 31,
2015 | | August 31,
2015 | | August 31,
2015 | | August 31,
2015 | | August 31,
2015 | | August 31,
2015 | | August 31,
2015 | |
Assets | |
Investments in securities, at value* (Notes A & F)—see Schedule of Investments: | |
Unaffiliated issuers | | $ | 237,209 | | | $ | 490,739 | | | $ | 59,244 | | | $ | 1,381,564 | | | $ | 1,182,676 | | | $ | 107,447 | | | $ | 2,334,247 | | | $ | 809,381 | | | $ | 86,523 | | | $ | 2,246,778 | | |
Affiliated issuers | | | — | | | | — | | | | — | | | | — | | | | — | | | | — | | | | — | | | | — | | | | — | | | | — | | |
| | | | 237,209 | | | | 490,739 | | | | 59,244 | | | | 1,381,564 | | | | 1,182,676 | | | | 107,447 | | | | 2,334,247 | | | | 809,381 | | | | 86,523 | | | | 2,246,778 | | |
Cash | | | — | | | | — | | | | — | | | | — | | | | — | | | | — | | | | — | | | | — | | | | — | | | | — | | |
Foreign currency* | | | — | | | | — | | | | — | | | | — | | | | — | | | | — | | | | — | | | | — | | | | — | | | | — | | |
Cash collateral segregated for open option contracts | | | — | | | | — | | | | — | | | | — | | | | — | | | | — | | | | — | | | | — | | | | — | | | | — | | |
Dividends and interest receivable | | | 736 | | | | 181 | | | | 48 | | | | 2,553 | | | | 441 | | | | 74 | | | | 4,414 | | | | 282 | | | | 13 | | | | 4,399 | | |
Receivable for securities sold | | | — | | | | — | | | | 675 | | | | 58,441 | | | | 5,007 | | | | — | | | | 12,953 | | | | — | | | | 3,672 | | | | — | | |
Receivable for Fund shares sold | | | 202 | | | | 2,359 | | | | 9 | | | | 146 | | | | 1,964 | | | | 262 | | | | 2,667 | | | | 406 | | | | 142 | | | | 4,047 | | |
Receivable from Management—net (Note B) | | | — | | | | — | | | | — | | | | — | | | | — | | | | — | | | | — | | | | — | | | | 11 | | | | — | | |
Open swap contracts, at value (Note A) | | | — | | | | — | | | | — | | | | — | | | | — | | | | — | | | | — | | | | — | | | | — | | | | — | | |
Prepaid expenses and other assets | | | 38 | | | | 38 | | | | 18 | | | | 93 | | | | 58 | | | | 35 | | | | 35 | | | | 60 | | | | 35 | | | | 77 | | |
Total Assets | | | 238,185 | | | | 493,317 | | | | 59,994 | | | | 1,442,797 | | | | 1,190,146 | | | | 107,818 | | | | 2,354,316 | | | | 810,129 | | | | 90,396 | | | | 2,255,301 | | |
Liabilities | |
Options contracts written, at value** (Note A) | | | — | | | | — | | | | — | | | | — | | | | — | | | | — | | | | — | | | | — | | | | — | | | | — | | |
Open swap contracts, at value (Note A) | | | — | | | | — | | | | — | | | | — | | | | — | | | | — | | | | — | | | | — | | | | — | | | | — | | |
Payable for open forward foreign currency contracts (Note A) | | | — | | | | — | | | | — | | | | — | | | | — | | | | — | | | | — | | | | — | | | | — | | | | — | | |
Due to custodian | | | 85 | | | | — | | | | — | | | | — | | | | — | | | | — | | | | — | | | | — | | | | — | | | | — | | |
Payable for securities purchased | | | — | | | | 2,118 | | | | — | | | | 32,644 | | | | 13,175 | | | | — | | | | 10,960 | | | | — | | | | 3,802 | | | | 13,681 | | |
Payable for Fund shares redeemed | | | 239 | | | | 239 | | | | 99 | | | | 594 | | | | 735 | | | | 160 | | | | 1,276 | | | | 2,842 | | | | 16 | | | | 2,733 | | |
Payable to investment manager—net (Note B) | | | 115 | | | | 340 | | | | 30 | | | | 612 | | | | 514 | | | | 36 | | | | 1,070 | | | | 593 | | | | 66 | | | | 923 | | |
Payable to administrator—net (Note B) | | | 35 | | | | 52 | | | | 3 | | | | 397 | | | | 271 | | | | 24 | | | | 389 | | | | 97 | | | | — | | | | 566 | | |
Payable to trustees | | | 4 | | | | 4 | | | | 4 | | | | 4 | | | | 4 | | | | 4 | | | | 4 | | | | 4 | | | | 4 | | | | 4 | | |
Payable for organization costs | | | — | | | | — | | | | — | | | | — | | | | — | | | | — | | | | — | | | | — | | | | — | | | | — | | |
Interest payable | | | — | | | | — | | | | — | | | | — | | | | — | | | | — | | | | — | | | | — | | | | — | | | | — | | |
Accrued capital gains taxes | | | — | | | | — | | | | — | | | | — | | | | — | | | | — | | | | — | | | | — | | | | — | | | | — | | |
Accrued expenses and other payables | | | 160 | | | | 111 | | | | 89 | | | | 318 | | | | 245 | | | | 89 | | | | 319 | | | | 235 | | | | 97 | | | | 383 | | |
Total Liabilities | | | 638 | | | | 2,864 | | | | 225 | | | | 34,569 | | | | 14,944 | | | | 313 | | | | 14,018 | | | | 3,771 | | | | 3,985 | | | | 18,290 | | |
Net Assets | | $ | 237,547 | | | $ | 490,453 | | | $ | 59,769 | | | $ | 1,408,228 | | | $ | 1,175,202 | | | $ | 107,505 | | | $ | 2,340,298 | | | $ | 806,358 | | | $ | 86,411 | | | $ | 2,237,011 | | |
Net Assets consist of: | |
Paid-in capital | | $ | 250,135 | | | $ | 430,851 | | | $ | 57,814 | | | $ | 1,309,778 | | | $ | 820,886 | | | $ | 93,216 | | | $ | 1,897,774 | | | $ | 719,846 | | | $ | 82,671 | | | $ | 1,701,733 | | |
Undistributed net investment income (loss) | | | 1,580 | | | | (127 | ) | | | (11 | ) | | | 14,004 | | | | (3,669 | ) | | | — | | | | 12,040 | | | | — | | | | — | | | | 13,587 | | |
Distributions in excess of net investment income | | | — | | | | — | | | | — | | | | — | | | | — | | | | — | | | | — | | | | — | | | | — | | | | — | | |
Accumulated net realized gains (losses) on investments | | | (35,252 | ) | | | 22,709 | | | | (1,786 | ) | | | 105,457 | | | | 74,387 | | | | 10,914 | | | | 48,106 | | | | 45,373 | | | | 4,059 | | | | 124,449 | | |
Net unrealized appreciation (depreciation) in value of investments | | | 21,084 | | | | 37,020 | | | | 3,752 | | | | (21,011 | ) | | | 283,598 | | | | 3,375 | | | | 382,378 | | | | 41,139 | | | | (319 | ) | | | 397,242 | | |
Net Assets | | $ | 237,547 | | | $ | 490,453 | | | $ | 59,769 | | | $ | 1,408,228 | | | $ | 1,175,202 | | | $ | 107,505 | | | $ | 2,340,298 | | | $ | 806,358 | | | $ | 86,411 | | | $ | 2,237,011 | | |
Net Assets | |
Investor Class | | $ | — | | | $ | — | | | $ | 9,506 | | | $ | 1,045,631 | | | $ | 437,488 | | | $ | 42,114 | | | $ | — | | | $ | — | | | $ | 49,296 | | | $ | 757,989 | | |
Trust Class | | | 10,206 | | | | — | | | | — | | | | 108,215 | | | | 91,724 | | | | 11,923 | | | | — | | | | 250,792 | | | | 5,290 | | | | 318,316 | | |
Advisor Class | | | — | | | | — | | | | — | | | | 162,321 | | | | 10,664 | | | | — | | | | — | | | | — | | | | 2,746 | | | | — | | |
Institutional Class | | | 216,430 | | | | 420,302 | | | | 36,414 | | | | 86,403 | | | | 423,294 | | | | 33,976 | | | | 2,191,387 | | | | 336,462 | | | | 20,654 | | | | 714,760 | | |
Class A | | | 3,816 | | | | 44,321 | | | | 3,813 | | | | 2,923 | | | | 102,304 | | | | 14,811 | | | | 102,781 | | | | 137,022 | | | | 5,103 | | | | 140,907 | | |
Class C | | | 3,697 | | | | 25,830 | | | | 9,850 | | | | 2,659 | | | | 8,449 | | | | 3,501 | | | | 46,130 | | | | 29,850 | | | | 2,274 | | | | 52,245 | | |
Class R3 | | | 3,398 | | | | — | | | | 186 | | | | 76 | | | | 12,689 | | | | 1,180 | | | | — | | | | 22,352 | | | | 1,048 | | | | 30,384 | | |
Class R6 | | | — | | | | — | | | | — | | | | — | | | | 88,590 | | | | — | | | | — | | | | 29,880 | | | | — | | | | 222,410 | | |
See Notes to Financial Statements
Statements of Assets and Liabilities (cont'd)
Neuberger Berman Equity Funds (cont'd)
(000's omitted except per share amounts)
| | | INTERNATIONAL
SELECT
FUND | | INTRINSIC
VALUE FUND | | LARGE CAP
DISCIPLINED
GROWTH FUND | | LARGE CAP
VALUE FUND | | MID CAP
GROWTH
FUND | | MID CAP
INTRINSIC
VALUE FUND | | MULTI-CAP
OPPORTUNITIES
FUND | | REAL ESTATE
FUND | | SMALL CAP
GROWTH
FUND | | SOCIALLY
RESPONSIVE
FUND | |
| | | August 31,
2015 | | August 31,
2015 | | August 31,
2015 | | August 31,
2015 | | August 31,
2015 | | August 31,
2015 | | August 31,
2015 | | August 31,
2015 | | August 31,
2015 | | August 31,
2015 | |
Shares Outstanding ($.001 par value; unlimited shares authorized) | |
Investor Class | | | — | | | | — | | | | 2,468 | | | | 38,081 | | | | 30,610 | | | | 2,007 | | | | — | | | | — | | | | 1,671 | | | | 22,812 | | |
Trust Class | | | 964 | | | | — | | | | — | | | | 5,774 | | | | 3,838 | | | | 673 | | | | — | | | | 18,435 | | | | 166 | | | | 15,550 | | |
Advisor Class | | | — | | | | — | | | | — | | | | 11,092 | | | | 439 | | | | — | | | | — | | | | — | | | | 131 | | | | — | | |
Institutional Class | | | 20,451 | | | | 29,318 | | | | 9,329 | | | | 3,127 | | | | 29,018 | | | | 1,616 | | | | 143,115 | | | | 24,664 | | | | 686 | | | | 21,475 | | |
Class A | | | 363 | | | | 3,153 | | | | 992 | | | | 156 | | | | 4,290 | | | | 837 | | | | 6,769 | | | | 10,076 | | | | 159 | | | | 6,948 | | |
Class C | | | 357 | | | | 1,916 | | | | 2,804 | | | | 191 | | | | 357 | | | | 201 | | | | 3,132 | | | | 2,195 | | | | 111 | | | | 2,647 | | |
Class R3 | | | 326 | | | | — | | | | 49 | | | | 5 | | | | 522 | | | | 67 | | | | — | | | | 1,646 | | | | 50 | | | | 1,514 | | |
Class R6 | | | — | | | | — | | | | — | | | | — | | | | 6,060 | | | | — | | | | — | | | | 2,191 | | | | — | | | | 6,678 | | |
Net Asset Value, offering and redemption price per share | |
Investor Class | | $ | — | | | $ | — | | | $ | 3.85 | | | $ | 27.46 | | | $ | 14.29 | | | $ | 20.99 | | | $ | — | | | $ | — | | | $ | 29.50 | | | $ | 33.23 | | |
Trust Class | | | 10.59 | | | | — | | | | — | | | | 18.74 | | | | 23.90 | | | | 17.71 | | | | — | | | | 13.60 | | | | 31.89 | | | | 20.47 | | |
Advisor Class | | | — | | | | — | | | | — | | | | 14.63 | | | | 24.31 | | | | — | | | | — | | | | — | | | | 21.03 | | | | — | | |
Institutional Class | | | 10.58 | | | | 14.34 | | | | 3.90 | | | | 27.64 | | | | 14.59 | | | | 21.02 | | | | 15.31 | | | | 13.64 | | | | 30.11 | | | | 33.28 | | |
Class R3 | | | 10.43 | | | | — | | | | 3.78 | | | | 14.82 | | | | 24.31 | | | | 17.70 | | | | — | | | | 13.58 | | | | 21.09 | | | | 20.07 | | |
Class R6 | | | — | | | | — | | | | — | | | | — | | | | 14.62 | | | | — | | | | — | | | | 13.64 | | | | — | | | | 33.30 | | |
Net Asset Value and redemption price per share | |
Class A | | $ | 10.51 | | | $ | 14.06 | | | $ | 3.84 | | | $ | 18.74 | | | $ | 23.85 | | | $ | 17.70 | | | $ | 15.18 | | | $ | 13.60 | | | $ | 32.15 | | | $ | 20.28 | | |
Offering Price per share | |
Class A‡ | | $ | 11.15 | | | $ | 14.92 | | | $ | 4.07 | | | $ | 19.88 | | | $ | 25.31 | | | $ | 18.78 | | | $ | 16.11 | | | $ | 14.43 | | | $ | 34.11 | | | $ | 21.52 | | |
Net Asset Value and offering price per share | |
Class C^ | | $ | 10.36 | | | $ | 13.48 | | | $ | 3.51 | | | $ | 13.94 | | | $ | 23.70 | | | $ | 17.45 | | | $ | 14.73 | | | $ | 13.60 | | | $ | 20.44 | | | $ | 19.74 | | |
*Cost of Investments: | |
Unaffiliated issuers | | $ | 216,090 | | | $ | 453,719 | | | $ | 55,492 | | | $ | 1,402,575 | | | $ | 899,078 | | | $ | 104,072 | | | $ | 1,951,869 | | | $ | 768,242 | | | $ | 86,842 | | | $ | 1,849,489 | | |
Affiliated issuers | | | — | | | | — | | | | — | | | | — | | | | — | | | | — | | | | — | | | | — | | | | — | | | | — | | |
Total cost of investments | | $ | 216,090 | | | $ | 453,719 | | | $ | 55,492 | | | $ | 1,402,575 | | | $ | 899,078 | | | $ | 104,072 | | | $ | 1,951,869 | | | $ | 768,242 | | | $ | 86,842 | | | $ | 1,849,489 | | |
Total cost of foreign currency | | $ | — | | | $ | — | | | $ | — | | | $ | — | | | $ | — | | | $ | — | | | $ | — | | | $ | — | | | $ | — | | | $ | — | | |
**Premium received from option contracts written | | $ | — | | | $ | — | | | $ | — | | | $ | — | | | $ | — | | | $ | — | | | $ | — | | | $ | — | | | $ | — | | | $ | — | | |
‡ | On single retail sales of less than $50,000. On sales of $50,000 or more or in certain other circumstances described in the Fund's prospectus, offering price is reduced. |
| |
^ | Redemption price per share is equal to net asset value less any applicable contingent deferred sales charge. |
See Notes to Financial Statements
Statements of Assets and Liabilities (cont'd)
Neuberger Berman Equity Funds
(000's omitted except per share amounts)
| | VALUE FUND | | WORLD
EQUITY FUND | |
| | | August 31,
2015 | | August 31,
2015 | |
Assets | |
Investments in securities, at value* (Notes A & F)—see Schedule of Investments: | |
Unaffiliated issuers | | $ | 20,773 | | | $ | 4,979 | | |
Affiliated issuers | | | — | | | | — | | |
| | | | 20,773 | | | | 4,979 | | |
Cash | | | — | | | | 1 | | |
Foreign currency* | | | — | | | | 38 | | |
Cash collateral segregated for open option contracts | | | — | | | | — | | |
Dividends and interest receivable | | | 40 | | | | 3 | | |
Receivable for securities sold | | | 1,080 | | | | 193 | | |
Receivable for Fund shares sold | | | 1 | | | | — | | |
Receivable from Management—net (Note B) | | | 21 | | | | 28 | | |
Open swap contracts, at value (Note A) | | | — | | | | 6 | | |
Prepaid expenses and other assets | | | 13 | | | | 46 | | |
Total Assets | | | 21,928 | | | | 5,294 | | |
Liabilities | |
Options contracts written, at value** (Note A) | | | — | | | | — | | |
Open swap contracts, at value (Note A) | | | — | | | | 35 | | |
Payable for open forward foreign currency contracts (Note A) | | | — | | | | 3 | | |
Due to custodian | | | 484 | | | | — | | |
Payable for securities purchased | | | 454 | | | | 338 | | |
Payable for Fund shares redeemed | | | 6 | | | | — | | |
Payable to investment manager—net (Note B) | | | 11 | | | | 3 | | |
Payable to administrator—net (Note B) | | | — | | | | — | | |
Payable to trustees | | | 4 | | | | 4 | | |
Payable for organization costs | | | — | | | | 55 | | |
Interest payable | | | — | | | | — | | |
Accrued capital gains taxes | | | — | | | | — | | |
Accrued expenses and other payables | | | 100 | | | | 64 | | |
Total Liabilities | | | 1,059 | | | | 502 | | |
Net Assets | | $ | 20,869 | | | $ | 4,792 | | |
Net Assets consist of: | |
Paid-in capital | | $ | 21,360 | | | $ | 4,990 | | |
Undistributed net investment income (loss) | | | 203 | | | | 29 | | |
Distributions in excess of net investment income | | | — | | | | — | | |
Accumulated net realized gains (losses) on investments | | | 63 | | | | (99 | ) | |
Net unrealized appreciation (depreciation) in value of investments | | | (757 | ) | | | (128 | ) | |
Net Assets | | $ | 20,869 | | | $ | 4,792 | | |
Net Assets | |
Investor Class | | $ | — | | | $ | — | | |
Trust Class | | | — | | | | — | | |
Advisor Class | | | — | | | | — | | |
Institutional Class | | | 13,082 | | | | 3,811 | | |
Class A | | | 7,257 | | | | 476 | | |
Class C | | | 530 | | | | 505 | | |
Class R3 | | | — | | | | — | | |
Class R6 | | | — | | | | — | | |
See Notes to Financial Statements
Statements of Assets and Liabilities (cont'd)
Neuberger Berman Equity Funds (cont'd)
(000's omitted except per share amounts) | |
| | VALUE FUND | | WORLD
EQUITY FUND | |
| | | August 31,
2015 | | August 31,
2015 | |
Shares Outstanding ($.001 par value; unlimited shares authorized) | |
Investor Class | | | — | | | | — | | |
Trust Class | | | — | | | | — | | |
Advisor Class | | | — | | | | — | | |
Institutional Class | | | 911 | | | | 400 | | |
Class A | | | 509 | | | | 50 | | |
Class C | | | 38 | | | | 53 | | |
Class R3 | | | — | | | | — | | |
Class R6 | | | — | | | | — | | |
Net Asset Value, offering and redemption price per share | |
Investor Class | | $ | — | | | $ | — | | |
Trust Class | | | — | | | | — | | |
Advisor Class | | | — | | | | — | | |
Institutional Class | | | 14.35 | | | | 9.53 | | |
Class R3 | | | — | | | | — | | |
Class R6 | | | — | | | | — | | |
Net Asset Value and redemption price per share | |
Class A | | $ | 14.25 | | | $ | 9.52 | | |
Offering Price per share | |
Class A‡ | | $ | 15.12 | | | $ | 10.10 | | |
Net Asset Value and offering price per share | |
Class C^ | | $ | 14.02 | | | $ | 9.51 | | |
*Cost of Investments: | |
Unaffiliated issuers | | $ | 21,530 | | | $ | 5,075 | | |
Affiliated issuers | | | — | | | | — | | |
Total cost of investments | | $ | 21,530 | | | $ | 5,075 | | |
Total cost of foreign currency | | $ | — | | | $ | 38 | | |
**Premium received from option contracts written | | $ | — | | | $ | — | | |
‡ | On single retail sales of less than $50,000. On sales of $50,000 or more or in certain other circumstances described in the Fund's prospectus, offering price is reduced. |
| |
^ | Redemption price per share is equal to net asset value less any applicable contingent deferred sales charge. |
See Notes to Financial Statements
Neuberger Berman Equity Funds
(000's omitted)
| | | ALL CAP CORE
FUND | | EMERGING
MARKETS
EQUITY FUND | | EQUITY
INCOME FUND | | FOCUS FUND | | GENESIS FUND | | GLOBAL EQUITY
FUND | | GLOBAL REAL
ESTATE FUND | | GREATER
CHINA EQUITY
FUND | | GUARDIAN
FUND | | INTERNATIONAL
EQUITY
FUND | |
| | | For the
Year Ended
August 31,
2015 | | For the
Year Ended
August 31,
2015 | | For the
Year Ended
August 31,
2015 | | For the
Year Ended
August 31,
2015 | | For the
Year Ended
August 31,
2015 | | For the
Year Ended
August 31,
2015 | | For the Period from
December 30, 2014
(Commencement
of Operations) to
August 31,
2015 | | For the
Year Ended
August 31,
2015 | | For the
Year Ended
August 31,
2015 | | For the
Year Ended
August 31,
2015 | |
Investment Income: | |
Income (Note A): | |
Dividend income—unaffiliated issuers | | $ | 813 | | | $ | 11,769 | | | $ | 79,583 | | | $ | 14,165 | | | $ | 92,752 | | | $ | 127 | | | $ | 46 | | | $ | 2,912 | | | $ | 23,146 | | | $ | 25,413 | | |
Dividend income—affiliated issuers (Note F) | | | — | | | | — | | | | — | | | | — | | | | 71,820 | | | | — | | | | — | | | | — | | | | — | | | | — | | |
Interest income—unaffiliated issuers | | | — | | | | 1 | | | | 2,136 | | | | — | | | | 3 | | | | — | | | | — | | | | — | | | | — | | | | 6 | | |
Foreign taxes withheld (Note A) | | | (17 | ) | | | (1,113 | ) | | | (1,270 | ) | | | (241 | ) | | | (1,640 | ) | | | (14 | ) | | | (2 | ) | | | (173 | ) | | | (522 | ) | | | (2,577 | ) | |
Total income | | $ | 796 | | | $ | 10,657 | | | $ | 80,449 | | | $ | 13,924 | | | $ | 162,935 | | | $ | 113 | | | $ | 44 | | | $ | 2,739 | | | $ | 22,624 | | | $ | 22,842 | | |
Expenses: | |
Investment management fees (Note B) | | | 427 | | | | 5,263 | | | | 11,249 | | | | 4,329 | | | | 82,941 | | | | 56 | | | | 16 | | | | 1,340 | | | | 7,296 | | | | 9,285 | | |
Administration fees (Note B) | | | 47 | | | | 321 | | | | 1,447 | | | | 499 | | | | 7,541 | | | | 5 | | | | 1 | | | | 73 | | | | 890 | | | | 693 | | |
Administration fees (Note B): | |
Investor Class | | | — | | | | — | | | | — | | | | 1,362 | | | | 4,500 | | | | — | | | | — | | | | — | | | | 2,298 | | | | 246 | | |
Trust Class | | | — | | | | — | | | | — | | | | 400 | | | | 8,470 | | | | — | | | | — | | | | — | | | | 427 | | | | 209 | | |
Advisor Class | | | — | | | | — | | | | — | | | | 22 | | | | 1,783 | | | | — | | | | — | | | | — | | | | 1 | | | | — | | |
Institutional Class | | | 48 | | | | 380 | | | | 1,451 | | | | 18 | | | | 3,954 | | | | 6 | | | | 1 | | | | 106 | | | | 110 | | | | 793 | | |
Class A | | | 26 | | | | 34 | | | | 715 | | | | 10 | | | | — | | | | 1 | | | | 1 | | | | 8 | | | | 164 | | | | 110 | | |
Class C | | | 23 | | | | 14 | | | | 876 | | | | 5 | | | | — | | | | — | | | | — | | | | — | | | | 6 | | | | 16 | | |
Class R3 | | | — | | | | 1 | | | | 8 | | | | — | | | | — | | | | — | | | | — | | | | — | | | | 1 | | | | — | | |
Class R6 | | | — | | | | 18 | | | | — | | | | — | | | | 582 | | | | — | | | | — | | | | — | | | | — | | | | 5 | | |
Distribution fees (Note B): | |
Trust Class | | | — | | | | — | | | | — | | | | 118 | | | | — | | | | — | | | | — | | | | — | | | | 125 | | | | — | | |
Advisor Class | | | — | | | | — | | | | — | | | | 16 | | | | 1,311 | | | | — | | | | — | | | | — | | | | 1 | | | | — | | |
Class A | | | 32 | | | | 42 | | | | 894 | | | | 12 | | | | — | | | | 1 | | | | 1 | | | | 10 | | | | 205 | | | | 137 | | |
Class C | | | 117 | | | | 69 | | | | 4,381 | | | | 24 | | | | — | | | | 2 | | | | 2 | | | | 2 | | | | 29 | | | | 79 | | |
Class R3 | | | — | | | | 4 | | | | 19 | | | | — | | | | — | | | | — | | | | — | | | | — | | | | 4 | | | | — | | |
Shareholder servicing agent fees: | |
Investor Class | | | — | | | | — | | | | — | | | | 351 | | | | 1,254 | | | | — | | | | — | | | | — | | | | 722 | | | | 113 | | |
Trust Class | | | — | | | | — | | | | — | | | | 12 | | | | 209 | | | | — | | | | — | | | | — | | | | 12 | | | | 38 | | |
Advisor Class | | | — | | | | — | | | | — | | | | 2 | | | | 229 | | | | — | | | | — | | | | — | | | | 1 | | | | — | | |
Institutional Class | | | 6 | | | | 93 | | | | 136 | | | | 2 | | | | 331 | | | | 1 | | | | 2 | | | | 18 | | | | 10 | | | | 68 | | |
Class A | | | 5 | | | | 5 | | | | 85 | | | | 2 | | | | — | | | | 1 | | | | 2 | | | | 2 | | | | 10 | | | | 13 | | |
Class C | | | 3 | | | | 1 | | | | 55 | | | | 1 | | | | — | | | | — | | | | 1 | | | | — | | | | 1 | | | | 2 | | |
Class R3 | | | — | | | | 1 | | | | 1 | | | | — | | | | — | | | | — | | | | — | | | | — | | | | — | | | | — | | |
Class R6 | | | — | | | | 6 | | | | — | | | | — | | | | 205 | | | | — | | | | — | | | | — | | | | — | | | | 2 | | |
Organization expense (Note A) | | | — | | | | — | | | | — | | | | — | | | | — | | | | — | | | | 87 | | | | — | | | | — | | | | — | | |
Audit fees | | | 60 | | | | 60 | | | | 62 | | | | 62 | | | | 70 | | | | 57 | | | | 26 | | | | 56 | | | | 62 | | | | 64 | | |
Custodian and accounting fees | | | 50 | | | | 974 | | | | 508 | | | | 218 | | | | 1,655 | | | | 56 | | | | 30 | | | | 111 | | | | 325 | | | | 548 | | |
Insurance expense | | | 2 | | | | 13 | | | | 60 | | | | 20 | | | | 343 | | | | 1 | | | | — | | | | 2 | | | | 36 | | | | 28 | | |
Legal fees | | | 96 | | | | 108 | | | | 95 | | | | 89 | | | | 217 | | | | 87 | | | | 56 | | | | 153 | | | | 93 | | | | 92 | | |
Registration and filing fees | | | 52 | | | | 94 | | | | 105 | | | | 94 | | | | 267 | | | | 43 | | | | 32 | | | | 46 | | | | 110 | | | | 116 | | |
Repayment to Management of expenses previously assumed by
Management (Note B) | | | — | | | | — | | | | — | | | | — | | | | — | | | | — | | | | — | | | | — | | | | — | | | | 186 | | |
Shareholder reports | | | 10 | | | | 28 | | | | 212 | | | | 58 | | | | 1,231 | | | | 1 | | | | 20 | | | | 3 | | | | 110 | | | | 81 | | |
Trustees' fees and expenses | | | 35 | | | | 35 | | | | 35 | | | | 35 | | | | 35 | | | | 35 | | | | 12 | | | | 35 | | | | 35 | | | | 35 | | |
Interest expense | | | 1 | | | | — | | | | 15 | | | | — | | | | 11 | | | | — | | | | — | | | | 3 | (Note E) | | | — | | | | — | | |
Miscellaneous | | | 9 | | | | 130 | | | | 148 | | | | 46 | | | | 632 | | | | 7 | | | | 2 | | | | 11 | | | | 78 | | | | 85 | | |
Total expenses | | | 1,049 | | | | 7,694 | | | | 22,557 | | | | 7,807 | | | | 117,771 | | | | 360 | | | | 292 | | | | 1,979 | | | | 13,162 | | | | 13,044 | | |
See Notes to Financial Statements
Statements of Operations (cont'd)
Neuberger Berman Equity Funds (cont'd)
(000's omitted)
| | | ALL CAP CORE
FUND | | EMERGING
MARKETS
EQUITY FUND | | EQUITY
INCOME FUND | | FOCUS FUND | | GENESIS FUND | | GLOBAL EQUITY
FUND | | GLOBAL REAL
ESTATE FUND | | GREATER
CHINA EQUITY
FUND | | GUARDIAN
FUND | | INTERNATIONAL
EQUITY
FUND | |
| | | For the
Year Ended
August 31,
2015 | | For the
Year Ended
August 31,
2015 | | For the
Year Ended
August 31,
2015 | | For the
Year Ended
August 31,
2015 | | For the
Year Ended
August 31,
2015 | | For the
Year Ended
August 31,
2015 | | For the Period from
December 30, 2014
(Commencement
of Operations) to
August 31,
2015 | | For the
Year Ended
August 31,
2015 | | For the
Year Ended
August 31,
2015 | | For the
Year Ended
August 31,
2015 | |
Expenses reimbursed by Management (Note B) | | | (266 | ) | | | (950 | ) | | | — | | | | (3 | ) | | | (213 | ) | | | (271 | ) | | | (269 | ) | | | (134 | ) | | | — | | | | — | | |
Investment management fees waived (Note B) | | | — | | | | — | | | | — | | | | — | | | | — | | | | — | | | | — | | | | — | | | | — | | | | (2,298 | ) | |
Net expenses prior to reimbursement of insurance proceeds | | | 783 | | | | 6,744 | | | | 22,557 | | | | 7,804 | | | | 117,558 | | | | 89 | | | | 23 | | | | 1,845 | | | | 13,162 | | | | 10,746 | | |
Reimbursement from insurance proceeds (Note G for International
Equity Fund) | | | — | | | | — | | | | — | | | | — | | | | — | | | | — | | | | — | | | | — | | | | — | | | | (280 | ) | |
Total net expenses | | | 783 | | | | 6,744 | | | | 22,557 | | | | 7,804 | | | | 117,558 | | | | 89 | | | | 23 | | | | 1,845 | | | | 13,162 | | | | 10,466 | | |
Net investment income (loss) | | $ | 13 | | | $ | 3,913 | | | $ | 57,892 | | | $ | 6,120 | | | $ | 45,377 | | | $ | 24 | | | $ | 21 | | | $ | 894 | | | $ | 9,462 | | | $ | 12,376 | | |
Realized and Unrealized Gain (Loss) on Investments (Note A): | |
Net realized gain (loss) on: | |
Sales of investment securities of unaffiliated issuers | | | 5,719 | | | | (12,926 | ) | | | 84,210 | | | | 30,551 | | | | 981,464 | | | | 3,152 | | | | 1 | | | | 18,841 | * | | | 109,267 | | | | 44,379 | | |
Sales of investment securities of affiliated issuers | | | — | | | | — | | | | — | | | | — | | | | 366,253 | | | | — | | | | — | | | | — | | | | — | | | | — | | |
Foreign currency | | | — | | | | (540 | ) | | | (302 | ) | | | — | | | | (89 | ) | | | (13 | ) | | | (1 | ) | | | (28 | ) | | | (39 | ) | | | (400 | ) | |
Financial futures contracts | | | — | | | | — | | | | — | | | | — | | | | — | | | | — | | | | — | | | | — | | | | — | | | | — | | |
Forward foreign currency contracts | | | — | | | | — | | | | — | | | | — | | | | — | | | | — | | | | — | | | | — | | | | — | | | | — | | |
Option contracts written | | | — | | | | — | | | | 2,442 | | | | — | | | | — | | | | — | | | | — | | | | — | | | | — | | | | — | | |
Swap contracts | | | — | | | | — | | | | — | | | | — | | | | — | | | | — | | | | — | | | | — | | | | — | | | | — | | |
Change in net unrealized appreciation (depreciation) in value of: | |
Unaffiliated investment securities | | | (13,191 | ) | | | (110,696 | )** | | | (252,211 | ) | | | (31,019 | ) | | | (702,792 | ) | | | (4,659 | ) | | | (198 | ) | | | (26,428 | )** | | | (155,106 | ) | | | (108,624 | ) | |
Affiliated investment securities | | | — | | | | — | | | | — | | | | — | | | | (438,201 | ) | | | — | | | | — | | | | — | | | | — | | | | — | | |
Forward foreign currency contracts | | | — | | | | — | | | | — | | | | — | | | | — | | | | — | | | | — | | | | — | | | | — | | | | — | | |
Foreign currency | | | — | | | | (59 | ) | | | (10 | ) | | | — | | | | — | | | | (2 | ) | | | — | | | | — | | | | (23 | ) | | | (131 | ) | |
Option contracts written | | | — | | | | — | | | | (103 | ) | | | — | | | | — | | | | — | | | | — | | | | — | | | | — | | | | — | | |
Swap contracts | | | — | | | | — | | | | — | | | | — | | | | — | | | | — | | | | — | | | | — | | | | — | | | | — | | |
Net gain (loss) on investments | | | (7,472 | ) | | | (124,221 | ) | | | (165,974 | ) | | | (468 | ) | | | 206,635 | | | | (1,522 | ) | | | (198 | ) | | | (7,615 | ) | | | (45,901 | ) | | | (64,776 | ) | |
Net increase (decrease) in net assets resulting from operations | | $ | (7,459 | ) | | $ | (120,308 | ) | | $ | (108,082 | ) | | $ | 5,652 | | | $ | 252,012 | | | $ | (1,498 | ) | | $ | (177 | ) | | $ | (6,721 | ) | | $ | (36,439 | ) | | $ | (52,400 | ) | |
* | Net of foreign capital gains tax $(4,450). |
| |
** | Change in accrued foreign capital gains tax amounted to $92,069 for Emerging Markets Equity and $155,575 for Greater China Equity. |
See Notes to Financial Statements
Statements of Operations (cont'd)
Neuberger Berman Equity Funds
(000's omitted)
| | | INTERNATIONAL
SELECT
FUND | | INTRINSIC
VALUE FUND | | LARGE CAP
DISCIPLINED
GROWTH FUND | | LARGE CAP
VALUE FUND | | MID CAP
GROWTH
FUND | | MID CAP
INTRINSIC
VALUE FUND | | MULTI-CAP
OPPORTUNITIES
FUND | | REAL ESTATE
FUND | | SMALL CAP
GROWTH
FUND | | SOCIALLY
RESPONSIVE
FUND | |
| | | For the
Year Ended
August 31,
2015 | | For the
Year Ended
August 31,
2015 | | For the
Year Ended
August 31,
2015 | | For the
Year Ended
August 31,
2015 | | For the
Year Ended
August 31,
2015 | | For the
Year Ended
August 31,
2015 | | For the
Year Ended
August 31,
2015 | | For the
Year Ended
August 31,
2015 | | For the
Year Ended
August 31,
2015 | | For the
Year Ended
August 31,
2015 | |
Investment Income: | |
Income (Note A): | |
Dividend income—unaffiliated issuers | | $ | 5,665 | | | $ | 2,216 | | | $ | 1,411 | | | $ | 31,563 | | | $ | 4,495 | | | $ | 1,382 | | | $ | 41,055 | | | $ | 23,024 | | | $ | 221 | | | $ | 39,760 | | |
Dividend income—affiliated issuers (Note F) | | | — | | | | — | | | | — | | | | — | | | | — | | | | — | | | | — | | | | — | | | | — | | | | — | | |
Interest income—unaffiliated issuers | | | 2 | | | | — | | | | 2 | | | | 49 | | | | 44 | | | | 8 | | | | 29 | | | | 8 | | | | 2 | | | | 2 | | |
Foreign taxes withheld (Note A) | | | (591 | ) | | | (8 | ) | | | (7 | ) | | | (168 | ) | | | (18 | ) | | | — | | | | (327 | ) | | | (36 | ) | | | (2 | ) | | | (878 | ) | |
Total income | | $ | 5,076 | | | $ | 2,208 | | | $ | 1,406 | | | $ | 31,444 | | | $ | 4,521 | | | $ | 1,390 | | | $ | 40,757 | | | $ | 22,996 | | | $ | 221 | | | $ | 38,884 | | |
Expenses: | |
Investment management fees (Note B) | | | 1,357 | | | | 3,109 | | | | 616 | | | | 7,918 | | | | 5,541 | | | | 538 | | | | 13,356 | | | | 8,111 | | | | 749 | | | | 11,265 | | |
Administration fees (Note B) | | | 148 | | | | 224 | | | | 67 | | | | 977 | | | | 655 | | | | 59 | | | | 1,561 | | | | 609 | | | | 53 | | | | 1,449 | | |
Administration fees (Note B): | |
Investor Class | | | — | | | | — | | | | 21 | | | | 2,359 | | | | 870 | | | | 89 | | | | — | | | | — | | | | 103 | | | | 1,631 | | |
Trust Class | | | 40 | | | | — | | | | — | | | | 441 | | | | 269 | | | | 47 | | | | — | | | | 1,029 | | | | 19 | | | | 1,292 | | |
Advisor Class | | | — | | | | — | | | | — | | | | 670 | | | | 38 | | | | — | | | | — | | | | — | | | | 10 | | | | — | | |
Institutional Class | | | 198 | | | | 297 | | | | 72 | | | | 104 | | | | 366 | | | | 25 | | | | 2,184 | | | | 398 | | | | 18 | | | | 666 | | |
Class A | | | 15 | | | | 50 | | | | 11 | | | | 7 | | | | 193 | | | | 17 | | | | 249 | | | | 345 | | | | 9 | | | | 289 | | |
Class C | | | 9 | | | | 36 | | | | 31 | | | | 6 | | | | 14 | | | | 5 | | | | 101 | | | | 79 | | | | 4 | | | | 102 | | |
Class R3 | | | 6 | | | | — | | | | — | | | | — | | | | 19 | | | | 1 | | | | — | | | | 51 | | | | 2 | | | | 65 | | |
Class R6 | | | — | | | | — | | | | — | | | | — | | | | 10 | | | | — | | | | — | | | | 6 | | | | — | | | | 50 | | |
Distribution fees (Note B): | |
Trust Class | | | 12 | | | | — | | | | — | | | | 130 | | | | — | | | | 14 | | | | — | | | | 303 | | | | 5 | | | | 380 | | |
Advisor Class | | | — | | | | — | | | | — | | | | 493 | | | | 28 | | | | — | | | | — | | | | — | | | | 8 | | | | — | | |
Class A | | | 18 | | | | 63 | | | | 14 | | | | 8 | | | | 242 | | | | 21 | | | | 311 | | | | 431 | | | | 12 | | | | 362 | | |
Class C | | | 42 | | | | 179 | | | | 154 | | | | 31 | | | | 69 | | | | 25 | | | | 503 | | | | 396 | | | | 19 | | | | 508 | | |
Class R3 | | | 16 | | | | — | | | | 1 | | | | 1 | | | | 48 | | | | 3 | | | | — | | | | 127 | | | | 4 | | | | 163 | | |
Shareholder servicing agent fees: | |
Investor Class | | | — | | | | — | | | | 20 | | | | 628 | | | | 357 | | | | 30 | | | | — | | | | — | | | | 68 | | | | 631 | | |
Trust Class | | | 7 | | | | — | | | | — | | | | 14 | | | | 9 | | | | 10 | | | | — | | | | 55 | | | | 4 | | | | 42 | | |
Advisor Class | | | — | | | | — | | | | — | | | | 20 | | | | 2 | | | | — | | | | — | | | | — | | | | 2 | | | | — | | |
Institutional Class | | | 16 | | | | 30 | | | | 5 | | | | 8 | | | | 33 | | | | 3 | | | | 603 | | | | 42 | | | | 2 | | | | 63 | | |
Class A | | | 2 | | | | 13 | | | | 3 | | | | 1 | | | | 18 | | | | 4 | | | | 45 | | | | 43 | | | | 2 | | | | 29 | | |
Class C | | | 1 | | | | 4 | | | | 2 | | | | — | | | | 3 | | | | 1 | | | | 13 | | | | 13 | | | | 1 | | | | 9 | | |
Class R3 | | | 1 | | | | — | | | | — | | | | — | | | | 3 | | | | — | | | | — | | | | 5 | | | | 1 | | | | 4 | | |
Class R6 | | | — | | | | — | | | | — | | | | — | | | | 4 | | | | — | | | | — | | | | 3 | | | | — | | | | 18 | | |
Organization expense (Note A) | | | — | | | | — | | | | — | | | | — | | | | — | | | | — | | | | — | | | | — | | | | — | | | | — | | |
Audit fees | | | 62 | | | | 26 | | | | 26 | | | | 62 | | | | 26 | | | | 26 | | | | 26 | | | | 64 | | | | 26 | | | | 26 | | |
Custodian and accounting fees | | | 204 | | | | 127 | | | | 103 | | | | 339 | | | | 275 | | | | 90 | | | | 401 | | | | 251 | | | | 102 | | | | 477 | | |
Insurance expense | | | 6 | | | | 7 | | | | 6 | | | | 42 | | | | 24 | | | | 2 | | | | 60 | | | | 25 | | | | 2 | | | | 58 | | |
Legal fees | | | 108 | | | | 99 | | | | 88 | | | | 100 | | | | 90 | | | | 89 | | | | 93 | | | | 89 | | | | 88 | | | | 92 | | |
Registration and filing fees | | | 86 | | | | 69 | | | | 80 | | | | 124 | | | | 125 | | | | 86 | | | | 84 | | | | 126 | | | | 101 | | | | 145 | | |
Repayment to Management of expenses previously assumed by
Management (Note B) | | | — | | | | — | | | | — | | | | 2 | | | | 68 | | | | — | | | | — | | | | — | | | | — | | | | — | | |
Shareholder reports | | | 10 | | | | 28 | | | | — | | | | 123 | | | | 129 | | | | 14 | | | | 127 | | | | 117 | | | | 16 | | | | 239 | | |
Trustees' fees and expenses | | | 35 | | | | 35 | | | | 35 | | | | 35 | | | | 35 | | | | 35 | | | | 35 | | | | 35 | | | | 35 | | | | 35 | | |
Interest expense | | | — | | | | — | | | | 18 | | | | 5 | | | | — | | | | — | | | | 5 | | | | 2 | | | | — | | | | — | | |
Miscellaneous | | | 33 | | | | 20 | | | | 10 | | | | 88 | | | | 57 | | | | 10 | | | | 128 | | | | 55 | | | | 11 | | | | 124 | | |
Total expenses | | | 2,432 | | | | 4,416 | | | | 1,383 | | | | 14,736 | | | | 9,620 | | | | 1,244 | | | | 19,885 | | | | 12,810 | | | | 1,476 | | | | 20,214 | | |
See Notes to Financial Statements
Statements of Operations (cont'd)
Neuberger Berman Equity Funds (cont'd)
(000's omitted)
| | | INTERNATIONAL
SELECT
FUND | | INTRINSIC
VALUE FUND | | LARGE CAP
DISCIPLINED
GROWTH FUND | | LARGE CAP
VALUE FUND | | MID CAP
GROWTH
FUND | | MID CAP
INTRINSIC
VALUE FUND | | MULTI-CAP
OPPORTUNITIES
FUND | | REAL ESTATE
FUND | | SMALL CAP
GROWTH
FUND | | SOCIALLY
RESPONSIVE
FUND | |
| | | For the
Year Ended
August 31,
2015 | | For the
Year Ended
August 31,
2015 | | For the
Year Ended
August 31,
2015 | | For the
Year Ended
August 31,
2015 | | For the
Year Ended
August 31,
2015 | | For the
Year Ended
August 31,
2015 | | For the
Year Ended
August 31,
2015 | | For the
Year Ended
August 31,
2015 | | For the
Year Ended
August 31,
2015 | | For the
Year Ended
August 31,
2015 | |
Expenses reimbursed by Management (Note B) | | | (77 | ) | | | (397 | ) | | | (295 | ) | | | — | | | | (3 | ) | | | (23 | ) | | | — | | | | (2,421 | ) | | | (434 | ) | | | — | | |
Investment management fees waived (Note B) | | | — | | | | — | | | | — | | | | — | | | | — | | | | (183 | ) | | | — | | | | — | | | | — | | | | — | | |
Net expenses prior to reimbursement of insurance proceeds | | | 2,355 | | | | 4,019 | | | | 1,088 | | | | 14,736 | | | | 9,617 | | | | 1,038 | | | | 19,885 | | | | 10,389 | | | | 1,042 | | | | 20,214 | | |
Reimbursement from insurance proceeds (Note G for International
Equity Fund) | | | — | | | | — | | | | — | | | | — | | | | — | | | | — | | | | — | | | | — | | | | — | | | | — | | |
Total net expenses | | | 2,355 | | | | 4,019 | | | | 1,088 | | | | 14,736 | | | | 9,617 | | | | 1,038 | | | | 19,885 | | | | 10,389 | | | | 1,042 | | | | 20,214 | | |
Net investment income (loss) | | $ | 2,721 | | | $ | (1,811 | ) | | $ | 318 | | | $ | 16,708 | | | $ | (5,096 | ) | | $ | 352 | | | $ | 20,872 | | | $ | 12,607 | | | $ | (821 | ) | | $ | 18,670 | | |
Realized and Unrealized Gain (Loss) on Investments (Note A): | |
Net realized gain (loss) on: | |
Sales of investment securities of unaffiliated issuers | | | 7,658 | | | | 28,680 | | | | 37,436 | | | | 158,090 | | | | 97,490 | | | | 12,634 | | | | 69,930 | | | | 80,044 | | | | 13,201 | | | | 181,312 | | |
Sales of investment securities of affiliated issuers | | | — | | | | — | | | | — | | | | — | | | | — | | | | — | | | | — | | | | — | | | | — | | | | — | | |
Foreign currency | | | (91 | ) | | | — | | | | — | | | | — | | | | — | | | | — | | | | (5 | ) | | | — | | | | — | | | | (83 | ) | |
Financial futures contracts | | | — | | | | — | | | | — | | | | — | | | | — | | | | — | | | | — | | | | — | | | | — | | | | — | | |
Forward foreign currency contracts | | | — | | | | — | | | | — | | | | — | | | | — | | | | — | | | | — | | | | — | | | | — | | | | — | | |
Option contracts written | | | — | | | | — | | | | — | | | | — | | | | — | | | | — | | | | — | | | | — | | | | — | | | | — | | |
Swap contracts | | | — | | | | — | | | | — | | | | — | | | | — | | | | — | | | | — | | | | — | | | | — | | | | — | | |
Change in net unrealized appreciation (depreciation) in value of: | |
Unaffiliated investment securities | | | (20,287 | ) | | | (31,465 | ) | | | (38,893 | ) | | | (285,678 | ) | | | 13,126 | | | | (15,395 | ) | | | (130,767 | ) | | | (99,105 | ) | | | (6,370 | ) | | | (184,828 | ) | |
Affiliated investment securities | | | — | | | | — | | | | — | | | | — | | | | — | | | | — | | | | — | | | | — | | | | — | | | | — | | |
Forward foreign currency contracts | | | — | | | | — | | | | — | | | | — | | | | — | | | | — | | | | — | | | | — | | | | — | | | | — | | |
Foreign currency | | | (28 | ) | | | — | | | | — | | | | — | | | | — | | | | — | | | | — | | | | — | | | | — | | | | (37 | ) | |
Option contracts written | | | — | | | | — | | | | — | | | | — | | | | — | | | | — | | | | — | | | | — | | | | — | | | | — | | |
Swap contracts | | | — | | | | — | | | | — | | | | — | | | | — | | | | — | | | | — | | | | — | | | | — | | | | — | | |
Net gain (loss) on investments | | | (12,748 | ) | | | (2,785 | ) | | | (1,457 | ) | | | (127,588 | ) | | | 110,616 | | | | (2,761 | ) | | | (60,842 | ) | | | (19,061 | ) | | | 6,831 | | | | (3,636 | ) | |
Net increase (decrease) in net assets resulting from operations | | $ | (10,027 | ) | | $ | (4,596 | ) | | $ | (1,139 | ) | | $ | (110,880 | ) | | $ | 105,520 | | | $ | (2,409 | ) | | $ | (39,970 | ) | | $ | (6,454 | ) | | $ | 6,010 | | | $ | 15,034 | | |
See Notes to Financial Statements
Statements of Operations (cont'd)
Neuberger Berman Equity Funds
(000's omitted)
| | | VALUE FUND | | WORLD
EQUITY FUND | |
| | For the
Year Ended
August 31,
2015 | | For the Period from
June 30, 2015
(Commencement
of Operations) to
August 31,
2015 | |
Investment Income: | |
Income (Note A): | |
Dividend income—unaffiliated issuers | | $ | 486 | | | $ | 7 | | |
Dividend income—affiliated issuers (Note F) | | | — | | | | — | | |
Interest income—unaffiliated issuers | | | — | | | | — | | |
Foreign taxes withheld (Note A) | | | (2 | ) | | | — | | |
Total income | | $ | 484 | | | $ | 7 | | |
Expenses: | |
Investment management fees (Note B) | | | 138 | | | | 6 | | |
Administration fees (Note B) | | | 15 | | | | 1 | | |
Administration fees (Note B): | |
Investor Class | | | — | | | | — | | |
Trust Class | | | — | | | | — | | |
Advisor Class | | | — | | | | — | | |
Institutional Class | | | 14 | | | | — | | |
Class A | | | 18 | | | | — | | |
Class C | | | 1 | | | | — | | |
Class R3 | | | — | | | | — | | |
Class R6 | | | — | | | | — | | |
Distribution fees (Note B): | |
Trust Class | | | — | | | | — | | |
Advisor Class | | | — | | | | — | | |
Class A | | | 23 | | | | — | | |
Class C | | | 6 | | | | 1 | | |
Class R3 | | | — | | | | — | | |
Shareholder servicing agent fees: | |
Investor Class | | | — | | | | — | | |
Trust Class | | | — | | | | — | | |
Advisor Class | | | — | | | | — | | |
Institutional Class | | | 2 | | | | 2 | | |
Class A | | | 3 | | | | 2 | | |
Class C | | | — | | | | 1 | | |
Class R3 | | | — | | | | — | | |
Class R6 | | | — | | | | — | | |
Organization expense (Note A) | | | — | | | | 62 | | |
Audit fees | | | 62 | | | | 23 | | |
Custodian and accounting fees | | | 41 | | | | 11 | | |
Insurance expense | | | — | | | | — | | |
Legal fees | | | 88 | | | | 14 | | |
Registration and filing fees | | | 46 | | | | 6 | | |
Repayment to Management of expenses previously assumed by Management (Note B) | | | — | | | | — | | |
Shareholder reports | | | 2 | | | | 10 | | |
Trustees' fees and expenses | | | 35 | | | | 4 | | |
Interest expense | | | — | | | | — | | |
Miscellaneous | | | 5 | | | | 1 | | |
Total expenses | | | 499 | | | | 144 | | |
See Notes to Financial Statements
Statements of Operations (cont'd)
Neuberger Berman Equity Funds (cont'd)
(000's omitted)
| | | VALUE FUND | | WORLD
EQUITY FUND | |
| | For the
Year Ended
August 31,
2015 | | For the Period from
June 30, 2015
(Commencement
of Operations) to
August 31,
2015 | |
Expenses reimbursed by Management (Note B) | | | (283 | ) | | | (134 | ) | |
Investment management fees waived (Note B) | | | — | | | | — | | |
Net expenses prior to reimbursement of insurance proceeds | | | 216 | | | | 10 | | |
Reimbursement from insurance proceeds (Note G for International Equity Fund) | | | — | | | | — | | |
Total net expenses | | | 216 | | | | 10 | | |
Net investment income (loss) | | $ | 268 | | | $ | (3 | ) | |
Realized and Unrealized Gain (Loss) on Investments (Note A): | |
Net realized gain (loss) on: | |
Sales of investment securities of unaffiliated issuers | | | 430 | | | | (93 | ) | |
Sales of investment securities of affiliated issuers | | | — | | | | — | | |
Foreign currency | | | — | | | | (1 | ) | |
Financial futures contracts | | | — | | | | 4 | | |
Forward foreign currency contracts | | | — | | | | (9 | ) | |
Option contracts written | | | — | | | | — | | |
Swap contracts | | | — | | | | (10 | ) | |
Change in net unrealized appreciation (depreciation) in value of: | |
Unaffiliated investment securities | | | (2,389 | ) | | | (96 | ) | |
Affiliated investment securities | | | — | | | | — | | |
Forward foreign currency contracts | | | — | | | | (3 | ) | |
Foreign currency | | | — | | | | — | | |
Option contracts written | | | — | | | | — | | |
Swap contracts | | | — | | | | (29 | ) | |
Net gain (loss) on investments | | | (1,959 | ) | | | (237 | ) | |
Net increase (decrease) in net assets resulting from operations | | $ | (1,691 | ) | | $ | (240 | ) | |
See Notes to Financial Statements
Statements of Changes in Net Assets
Neuberger Berman Equity Funds
(000's omitted)
| | | ALL CAP CORE FUND | | EMERGING MARKETS
EQUITY FUND | | EQUITY INCOME FUND | | FOCUS FUND | | GENESIS FUND | |
| | | Year Ended
August 31,
2015 | | Year Ended
August 31,
2014 | | Year Ended
August 31,
2015 | | Year Ended
August 31,
2014 | | Year Ended
August 31,
2015 | | Year Ended
August 31,
2014 | | Year Ended
August 31,
2015 | | Year Ended
August 31,
2014 | | Year Ended
August 31,
2015 | | Year Ended
August 31,
2014 | |
Increase (Decrease) in Net Assets: | |
From Operations: | |
Net investment income (loss) (Note A) | | $ | 13 | | | $ | (218 | ) | | $ | 3,913 | | | $ | 5,142 | | | $ | 57,892 | | | $ | 59,668 | | | $ | 6,120 | | | $ | 4,837 | | | $ | 45,377 | | | $ | 38,400 | | |
Net realized gain (loss) on investments (Note A) | | | 5,719 | | | | 15,486 | | | | (13,466 | ) | | | (278 | ) | | | 86,350 | | | | 168,735 | | | | 30,551 | | | | 139,112 | | | | 1,347,628 | | | | 1,370,465 | | |
Net increase from payments by affiliates (Note B) | | | — | | | | 12 | | | | — | | | | 8 | | | | — | | | | 72 | | | | — | | | | 15 | | | | — | | | | 619 | | |
| Change in net unrealized appreciation (depreciation) of investments (Note A) | | | (13,191 | ) | | | 4,262 | | | | (110,755 | ) | | | 76,492 | | | | (252,324 | ) | | | 245,013 | | | | (31,019 | ) | | | 14,347 | | | | (1,140,993 | ) | | | 387,327 | | |
Net increase (decrease) in net assets resulting from operations | | | (7,459 | ) | | | 19,542 | | | | (120,308 | ) | | | 81,364 | | | | (108,082 | ) | | | 473,488 | | | | 5,652 | | | | 158,311 | | | | 252,012 | | | | 1,796,811 | | |
Distributions to Shareholders From (Note A): | |
Net investment income: | |
Investor Class | | | — | | | | — | | | | — | | | | — | | | | — | | | | — | | | | (3,689 | ) | | | (4,481 | ) | | | (7,717 | ) | | | (14,369 | ) | |
Trust Class | | | — | | | | — | | | | — | | | | — | | | | — | | | | — | | | | (975 | ) | | | (788 | ) | | | (1,507 | ) | | | (9,946 | ) | |
Advisor Class | | | — | | | | — | | | | — | | | | — | | | | — | | | | — | | | | (81 | ) | | | (78 | ) | | | (694 | ) | | | (1,169 | ) | |
Institutional Class | | | — | | | | (37 | ) | | | (4,661 | ) | | | (2,211 | ) | | | (38,126 | ) | | | (34,499 | ) | | | (76 | ) | | | (63 | ) | | | (14,769 | ) | | | (29,067 | ) | |
Class A | | | — | | | | — | | | | (148 | ) | | | (44 | ) | | | (6,984 | ) | | | (17,649 | ) | | | (30 | ) | | | (26 | ) | | | — | | | | — | | |
Class C | | | — | | | | — | | | | (18 | ) | | | — | | | | (5,457 | ) | | | (6,745 | ) | | | (15 | ) | | | (8 | ) | | | — | | | | — | | |
Class R3 | | | — | | | | — | | | | (4 | ) | | | (0 | ) | | | (66 | ) | | | (58 | ) | | | — | | | | — | | | | — | | | | — | | |
Class R6 | | | — | | | | — | | | | (901 | ) | | | (322 | ) | | | — | | | | — | | | | — | | | | — | | | | (10,902 | ) | | | (11,801 | ) | |
Net realized gain on investments: | |
Investor Class | | | — | | | | — | | | | — | | | | — | | | | — | | | | — | | | | (97,070 | ) | | | (60,554 | ) | | | (276,734 | ) | | | (268,282 | ) | |
Trust Class | | | — | | | | — | | | | — | | | | — | | | | — | | | | — | | | | (26,590 | ) | | | (10,218 | ) | | | (207,811 | ) | | | (230,081 | ) | |
Advisor Class | | | — | | | | — | | | | — | | | | — | | | | — | | | | — | | | | (2,190 | ) | | | (1,196 | ) | | | (82,457 | ) | | | (85,753 | ) | |
Institutional Class | | | (10,035 | ) | | | (4,589 | ) | | | — | | | | — | | | | (72,214 | ) | | | (54,106 | ) | | | (1,506 | ) | | | (687 | ) | | | (386,062 | ) | | | (405,133 | ) | |
Class A | | | (2,289 | ) | | | (2,810 | ) | | | — | | | | — | | | | (16,802 | ) | | | (32,919 | ) | | | (845 | ) | | | (346 | ) | | | — | | | | — | | |
Class C | | | (2,258 | ) | | | (1,393 | ) | | | — | | | | — | | | | (19,379 | ) | | | (19,266 | ) | | | (532 | ) | | | (156 | ) | | | — | | | | — | | |
Class R3 | | | — | | | | — | | | | — | | | | — | | | | (166 | ) | | | (121 | ) | | | — | | | | — | | | | — | | | | — | | |
Class R6 | | | — | | | | — | | | | — | | | | — | | | | — | | | | — | | | | — | | | | — | | | | (224,407 | ) | | | (148,025 | ) | |
Total distributions to shareholders | | | (14,582 | ) | | | (8,829 | ) | | | (5,732 | ) | | | (2,577 | ) | | | (159,194 | ) | | | (165,363 | ) | | | (133,599 | ) | �� | | (78,601 | ) | | | (1,213,060 | ) | | | (1,203,626 | ) | |
From Fund Share Transactions (Note D): | |
Proceeds from shares sold: | |
Investor Class | | | — | | | | — | | | | — | | | | — | | | | — | | | | — | | | | 8,055 | | | | 7,131 | | | | 208,626 | | | | 326,973 | | |
Trust Class | | | — | | | | — | | | | — | | | | — | | | | — | | | | — | | | | 18,496 | | | | 80,497 | | | | 169,016 | | | | 326,902 | | |
Advisor Class | | | — | | | | — | | | | — | | | | — | | | | — | | | | — | | | | 1,767 | | | | 2,124 | | | | 95,330 | | | | 152,697 | | |
Institutional Class | | | 20,777 | | | | 24,829 | | | | 87,329 | | | | 187,999 | | | | 381,003 | | | | 532,610 | | | | 24,211 | | | | 2,677 | | | | 679,324 | | | | 1,138,280 | | |
Class A | | | 2,229 | | | | 5,449 | | | | 7,072 | | | | 16,283 | | | | 59,143 | | | | 124,552 | | | | 5,983 | | | | 2,686 | | | | — | | | | — | | |
Class C | | | 815 | | | | 2,667 | | | | 2,549 | | | | 3,307 | | | | 53,763 | | | | 44,793 | | | | 2,437 | | | | 699 | | | | — | | | | — | | |
Class R3 | | | — | | | | — | | | | 669 | | | | 591 | | | | 1,504 | | | | 1,334 | | | | — | | | | — | | | | — | | | | — | | |
Class R6 | | | — | | | | — | | | | 27,239 | | | | 45,242 | | | | — | | | | — | | | | — | | | | — | | | | 681,153 | | | | 1,881,331 | | |
See Notes to Financial Statements
Statements of Changes in Net Assets (cont'd)
Neuberger Berman Equity Funds (cont'd)
(000's omitted)
| | | ALL CAP CORE FUND | | EMERGING MARKETS
EQUITY FUND | | EQUITY INCOME FUND | | FOCUS FUND | | GENESIS FUND | |
| | | Year Ended
August 31,
2015 | | Year Ended
August 31,
2014 | | Year Ended
August 31,
2015 | | Year Ended
August 31,
2014 | | Year Ended
August 31,
2015 | | Year Ended
August 31,
2014 | | Year Ended
August 31,
2015 | | Year Ended
August 31,
2014 | | Year Ended
August 31,
2015 | | Year Ended
August 31,
2014 | |
Proceeds from reinvestment of dividends and distributions: | |
Investor Class | | | — | | | | — | | | | — | | | | — | | | | — | | | | — | | | | 90,410 | | | | 57,841 | | | | 276,966 | | | | 273,964 | | |
Trust Class | | | — | | | | — | | | | — | | | | — | | | | — | | | | — | | | | 27,462 | | | | 10,913 | | | | 204,115 | | | | 233,324 | | |
Advisor Class | | | — | | | | — | | | | — | | | | — | | | | — | | | | — | | | | 2,257 | | | | 1,253 | | | | 67,182 | | | | 75,501 | | |
Institutional Class | | | 9,084 | | | | 3,966 | | | | 2,815 | | | | 1,376 | | | | 88,651 | | | | 65,965 | | | | 1,390 | | | | 686 | | | | 370,058 | | | | 417,802 | | |
Class A | | | 1,946 | | | | 2,561 | | | | 100 | | | | 24 | | | | 20,683 | | | | 46,131 | | | | 791 | | | | 337 | | | | — | | | | — | | |
Class C | | | 1,897 | | | | 1,139 | | | | 5 | | | | — | | | | 16,915 | | | | 17,727 | | | | 468 | | | | 143 | | | | — | | | | — | | |
Class R3 | | | — | | | | — | | | | 2 | | | | — | | | | 153 | | | | 116 | | | | — | | | | — | | | | — | | | | — | | |
Class R6 | | | — | | | | — | | | | 901 | | | | 322 | | | | — | | | | — | | | | — | | | | — | | | | 235,309 | | | | 159,826 | | |
Payments for shares redeemed: | |
Investor Class | | | — | | | | — | | | | — | | | | — | | | | — | | | | — | | | | (61,339 | ) | | | (74,233 | ) | | | (655,995 | ) | | | (671,817 | ) | |
Trust Class | | | — | | | | — | | | | — | | | | — | | | | — | | | | — | | | | (52,974 | ) | | | (28,246 | ) | | | (1,146,512 | ) | | | (997,456 | ) | |
Advisor Class | | | — | | | | — | | | | — | | | | — | | | | — | | | | — | | | | (2,734 | ) | | | (2,419 | ) | | | (234,491 | ) | | | (251,670 | ) | |
Institutional Class | | | (39,639 | ) | | | (23,483 | ) | | | (199,441 | ) | | | (115,052 | ) | | | (424,474 | ) | | | (618,006 | ) | | | (4,552 | ) | | | (17,988 | ) | | | (2,116,517 | ) | | | (2,820,340 | ) | |
Class A | | | (18,968 | ) | | | (16,557 | ) | | | (9,601 | ) | | | (6,143 | ) | | | (214,296 | ) | | | (840,833 | ) | | | (5,617 | ) | | | (1,132 | ) | | | — | | | | — | | |
Class C | | | (6,533 | ) | | | (3,385 | ) | | | (1,616 | ) | | | (1,261 | ) | | | (82,624 | ) | | | (131,062 | ) | | | (830 | ) | | | (6 | ) | | | — | | | | — | | |
Class R3 | | | — | | | | — | | | | (351 | ) | | | (197 | ) | | | (862 | ) | | | (969 | ) | | | — | | | | — | | | | — | | | | — | | |
Class R6 | | | — | | | | — | | | | (1,867 | ) | | | (1,841 | ) | | | — | | | | — | | | | — | | | | — | | | | (634,879 | ) | | | (357,000 | ) | |
Net increase (decrease) from Fund share transactions | | | (28,392 | ) | | | (2,814 | ) | | | (84,195 | ) | | | 130,650 | | | | (100,441 | ) | | | (757,642 | ) | | | 55,681 | | | | 42,963 | | | | (1,801,315 | ) | | | (111,683 | ) | |
Net Increase (Decrease) in Net Assets | | | (50,433 | ) | | | 7,899 | | | | (210,235 | ) | | | 209,437 | | | | (367,717 | ) | | | (449,517 | ) | | | (72,266 | ) | | | 122,673 | | | | (2,762,363 | ) | | | 481,502 | | |
Net Assets: | |
Beginning of year | | | 100,533 | | | | 92,634 | | | | 626,216 | | | | 416,779 | | | | 2,494,603 | | | | 2,944,120 | | | | 846,965 | | | | 724,292 | | | | 13,723,807 | | | | 13,242,305 | | |
End of year | | $ | 50,100 | | | $ | 100,533 | | | $ | 415,981 | | | $ | 626,216 | | | $ | 2,126,886 | | | $ | 2,494,603 | | | $ | 774,699 | | | $ | 846,965 | | | $ | 10,961,444 | | | $ | 13,723,807 | | |
Undistributed net investment income (loss) at end of year | | $ | (144 | ) | | $ | — | | | $ | 2,273 | | | $ | 4,627 | | | $ | — | | | $ | — | | | $ | 3,830 | | | $ | 3,504 | | | $ | 19,793 | | | $ | 12,211 | | |
Distributions in excess of net investment income at end of year | | $ | — | | | $ | (8 | ) | | $ | — | | | $ | — | | | $ | (1,857 | ) | | $ | (2,844 | ) | | $ | — | | | $ | — | | | $ | — | | | $ | — | | |
See Notes to Financial Statements
Statements of Changes in Net Assets (cont'd)
Neuberger Berman Equity Funds
(000's omitted)
| | | GLOBAL EQUITY FUND | | GLOBAL REAL
ESTATE FUND | | GREATER CHINA
EQUITY FUND | | GUARDIAN FUND | | INTERNATIONAL
EQUITY FUND | |
| | | Year Ended
August 31,
2015 | | Year Ended
August 31,
2014 | | Period from
December 30, 2014
(Commencement
of Operations) to
August 31,
2015 | | Year Ended
August 31,
2015 | | Year Ended
August 31,
2014 | | Year Ended
August 31,
2015 | | Year Ended
August 31,
2014 | | Year Ended
August 31,
2015 | | Year Ended
August 31,
2014 | |
Increase (Decrease) in Net Assets: | |
From Operations: | |
Net investment income (loss) (Note A) | | $ | 24 | | | $ | 201 | | | $ | 21 | | | $ | 894 | | | $ | 534 | | | $ | 9,462 | | | $ | 11,713 | | | $ | 12,376 | | | $ | 16,304 | | |
Net realized gain (loss) on investments (Note A) | | | 3,139 | | | | 1,112 | | | | — | | | | 18,813 | | | | 4,596 | | | | 109,228 | | | | 205,016 | | | | 43,979 | | | | 57,808 | | |
Net increase from payments by affiliates (Note B) | | | — | | | | — | | | | — | | | | — | | | | — | | | | — | | | | 31 | | | | — | | | | 24 | | |
Change in net unrealized appreciation (depreciation)
of investments (Note A) | | | (4,661 | ) | | | 5,186 | | | | (198 | ) | | | (26,428 | ) | | | 6,762 | | | | (155,129 | ) | | | 61,936 | | | | (108,755 | ) | | | 53,082 | | |
Net increase (decrease) in net assets resulting from operations | | | (1,498 | ) | | | 6,499 | | | | (177 | ) | | | (6,721 | ) | | | 11,892 | | | | (36,439 | ) | | | 278,696 | | | | (52,400 | ) | | | 127,218 | | |
Distributions to Shareholders From (Note A): | |
Net investment income: | |
Investor Class | | | — | | | | — | | | | — | | | | — | | | | — | | | | (8,219 | ) | | | (5,725 | ) | | | (885 | ) | | | (1,141 | ) | |
Trust Class | | | — | | | | — | | | | — | | | | — | | | | — | | | | (1,086 | ) | | | (769 | ) | | | (220 | ) | | | (881 | ) | |
Advisor Class | | | — | | | | — | | | | — | | | | — | | | | — | | | | (1 | ) | | | (8 | ) | | | — | | | | — | | |
Institutional Class | | | (226 | ) | | | (124 | ) | | | (19 | ) | | | (634 | ) | | | — | | | | (1,123 | ) | | | (704 | ) | | | (15,333 | ) | | | (15,790 | ) | |
Class A | | | (24 | ) | | | (0 | ) | | | (5 | ) | | | (21 | ) | | | — | | | | (735 | ) | | | (297 | ) | | | (133 | ) | | | (155 | ) | |
Class C | | | (7 | ) | | | — | | | | (1 | ) | | | — | | | | — | | | | — | | | | (0 | ) | | | (6 | ) | | | (8 | ) | |
Class R3 | | | — | | | | — | | | | — | | | | — | | | | — | | | | (4 | ) | | | (2 | ) | | | — | | | | — | | |
Class R6 | | | — | | | | — | | | | — | | | | — | | | | — | | | | — | | | | — | | | | (387 | ) | | | (1 | ) | |
Net realized gain on investments: | |
Investor Class | | | — | | | | — | | | | — | | | | — | | | | — | | | | (147,601 | ) | | | (104,953 | ) | | | — | | | | — | | |
Trust Class | | | — | | | | — | | | | — | | | | — | | | | — | | | | (22,148 | ) | | | (17,108 | ) | | | — | | | | — | | |
Advisor Class | | | — | | | | — | | | | — | | | | — | | | | — | | | | (53 | ) | | | (197 | ) | | | — | | | | — | | |
Institutional Class | | | (1,193 | ) | | | (308 | ) | | | — | | | | (4,747 | ) | | | (798 | ) | | | (16,294 | ) | | | (9,818 | ) | | | — | | | | — | | |
Class A | | | (130 | ) | | | (2 | ) | | | — | | | | (165 | ) | | | (4 | ) | | | (13,689 | ) | | | (5,882 | ) | | | — | | | | — | | |
Class C | | | (41 | ) | | | (1 | ) | | | — | | | | (7 | ) | | | (1 | ) | | | (454 | ) | | | (363 | ) | | | — | | | | — | | |
Class R3 | | | — | | | | — | | | | — | | | | — | | | | — | | | | (110 | ) | | | (58 | ) | | | — | | | | — | | |
Class R6 | | | — | | | | — | | | | — | | | | — | | | | — | | | | — | | | | — | | | | — | | | | — | | |
Total distributions to shareholders | | | (1,621 | ) | | | (435 | ) | | | (25 | ) | | | (5,574 | ) | | | (803 | ) | | | (211,517 | ) | | | (145,884 | ) | | | (16,964 | ) | | | (17,976 | ) | |
From Fund Share Transactions (Note D): | |
Proceeds from shares sold: | |
Investor Class | | | — | | | | — | | | | — | | | | — | | | | — | | | | 18,391 | | | | 20,340 | | | | 12,561 | | | | 6,504 | | |
Trust Class | | | — | | | | — | | | | — | | | | — | | | | — | | | | 9,083 | | | | 11,693 | | | | 8,341 | | | | 15,396 | | |
Advisor Class | | | — | | | | — | | | | — | | | | — | | | | — | | | | 43 | | | | 1,420 | | | | — | | | | — | | |
Institutional Class | | | 105 | | | | 51 | | | | 2,003 | | | | 121,023 | | | | 21,058 | | | | 25,421 | | | | 44,468 | | | | 231,021 | | | | 283,123 | | |
Class A | | | 183 | | | | 281 | | | | 660 | | | | 7,076 | | | | 1,495 | | | | 28,946 | | | | 40,412 | | | | 83,310 | | | | 23,348 | | |
Class C | | | 129 | | | | 88 | | | | 250 | | | | 61 | | | | — | | | | 566 | | | | 1,032 | | | | 7,899 | | | | 4,449 | | |
Class R3 | | | — | | | | — | | | | — | | | | — | | | | — | | | | 348 | | | | 298 | | | | — | | | | — | | |
Class R6 | | | — | | | | — | | | | — | | | | — | | | | — | | | | — | | | | — | | | | 19,021 | | | | 21,390 | | |
See Notes to Financial Statements
Statements of Changes in Net Assets (cont'd)
Neuberger Berman Equity Funds (cont'd)
(000's omitted)
| | | GLOBAL EQUITY FUND | | GLOBAL REAL
ESTATE FUND | | GREATER CHINA
EQUITY FUND | | GUARDIAN FUND | | INTERNATIONAL
EQUITY FUND | |
| | | Year Ended
August 31,
2015 | | Year Ended
August 31,
2014 | | Period from
December 30, 2014
(Commencement
of Operations) to
August 31,
2015 | | Year Ended
August 31,
2015 | | Year Ended
August 31,
2014 | | Year Ended
August 31,
2015 | | Year Ended
August 31,
2014 | | Year Ended
August 31,
2015 | | Year Ended
August 31,
2014 | |
Proceeds from reinvestment of dividends and distributions: | |
Investor Class | | | — | | | | — | | | | — | | | | — | | | | — | | | | 147,253 | | | | 104,346 | | | | 848 | | | | 1,057 | | |
Trust Class | | | — | | | | — | | | | — | | | | — | | | | — | | | | 22,602 | | | | 17,409 | | | | 210 | | | | 851 | | |
Advisor Class | | | — | | | | — | | | | — | | | | — | | | | — | | | | 45 | | | | 195 | | | | — | | | | — | | |
Institutional Class | | | 1,419 | | | | 431 | | | | 8 | | | | 1,518 | | | | 70 | | | | 15,531 | | | | 9,698 | | | | 14,223 | | | | 14,839 | | |
Class A | | | 152 | | | | 2 | | | | 4 | | | | 186 | | | | 4 | | | | 14,308 | | | | 6,099 | | | | 123 | | | | 142 | | |
Class C | | | 48 | | | | 1 | | | | — | | | | 7 | | | | 1 | | | | 290 | | | | 219 | | | | 4 | | | | 5 | | |
Class R3 | | | — | | | | — | | | | — | | | | — | | | | — | | | | 73 | | | | 37 | | | | — | | | | — | | |
Class R6 | | | — | | | | — | | | | — | | | | — | | | | — | | | | — | | | | — | | | | 387 | | | | 1 | | |
Payments for shares redeemed: | |
Investor Class | | | — | | | | — | | | | — | | | | — | | | | — | | | | (110,151 | ) | | | (109,604 | ) | | | (14,441 | ) | | | (22,722 | ) | |
Trust Class | | | — | | | | — | | | | — | | | | — | | | | — | | | | (38,509 | ) | | | (30,736 | ) | | | (18,488 | ) | | | (73,369 | ) | |
Advisor Class | | | — | | | | — | | | | — | | | | — | | | | — | | | | (101 | ) | | | (1,803 | ) | | | — | | | | — | | |
Institutional Class | | | (34,371 | ) | | | (1,015 | ) | | | — | | | | (79,281 | ) | | | (16,343 | ) | | | (57,871 | ) | | | (24,298 | ) | | | (193,534 | ) | | | (260,918 | ) | |
Class A | | | (138 | ) | | | (89 | ) | | | — | | | | (4,668 | ) | | | (21 | ) | | | (20,575 | ) | | | (10,790 | ) | | | (12,714 | ) | | | (11,803 | ) | |
Class C | | | (52 | ) | | | (8 | ) | | | — | | | | (9 | ) | | | — | | | | (792 | ) | | | (1,116 | ) | | | (2,101 | ) | | | (530 | ) | |
Class R3 | | | — | | | | — | | | | — | | | | — | | | | — | | | | (474 | ) | | | (89 | ) | | | — | | | | — | | |
Class R6 | | | — | | | | — | | | | — | | | | — | | | | — | | | | — | | | | — | | | | (6,445 | ) | | | (97 | ) | |
Net increase (decrease) from Fund share transactions | | | (32,525 | ) | | | (258 | ) | | | 2,925 | | | | 45,913 | | | | 6,264 | | | | 54,427 | | | | 79,230 | | | | 130,225 | | | | 1,666 | | |
Net Increase (Decrease) in Net Assets | | | (35,644 | ) | | | 5,806 | | | | 2,723 | | | | 33,618 | | | | 17,353 | | | | (193,529 | ) | | | 212,042 | | | | 60,861 | | | | 110,908 | | |
Net Assets: | |
Beginning of year | | | 39,484 | | | | 33,678 | | | | — | | | | 73,959 | | | | 56,606 | | | | 1,508,880 | | | | 1,296,838 | | | | 1,133,523 | | | | 1,022,615 | | |
End of year | | $ | 3,840 | | | $ | 39,484 | | | $ | 2,723 | | | $ | 107,577 | | | $ | 73,959 | | | $ | 1,315,351 | | | $ | 1,508,880 | | | $ | 1,194,384 | | | $ | 1,133,523 | | |
Undistributed net investment income (loss) at end of year | | $ | — | | | $ | 226 | | | $ | — | | | $ | 837 | | | $ | 627 | | | $ | 5,845 | | | $ | 8,457 | | | $ | 7,983 | | | $ | 12,034 | | |
Distributions in excess of net investment income at end of year | | $ | (2 | ) | | $ | — | | | $ | (2 | ) | | $ | — | | | $ | — | | | $ | — | | | $ | — | | | $ | — | | | $ | — | | |
See Notes to Financial Statements
Statements of Changes in Net Assets (cont'd)
Neuberger Berman Equity Funds
(000's omitted)
| | | INTERNATIONAL
SELECT FUND | | INTRINSIC VALUE FUND | | LARGE CAP DISCIPLINED
GROWTH FUND | | LARGE CAP VALUE FUND | | MID CAP GROWTH FUND | |
| | | Year Ended
August 31,
2015 | | Year Ended
August 31,
2014 | | Year Ended
August 31,
2015 | | Year Ended
August 31,
2014 | | Year Ended
August 31,
2015 | | Year Ended
August 31,
2014 | | Year Ended
August 31,
2015 | | Year Ended
August 31,
2014 | | Year Ended
August 31,
2015 | | Year Ended
August 31,
2014 | |
Increase (Decrease) in Net Assets: | |
From Operations: | |
Net investment income (loss) (Note A) | | $ | 2,721 | | | $ | 3,849 | | | $ | (1,811 | ) | | $ | (1,235 | ) | | $ | 318 | | | $ | 2,137 | | | $ | 16,708 | | | $ | 16,693 | | | $ | (5,096 | ) | | $ | (4,179 | ) | |
Net realized gain (loss) on investments (Note A) | | | 7,567 | | | | 11,612 | | | | 28,680 | | | | 18,710 | | | | 37,436 | | | | 101,237 | | | | 158,090 | | | | 252,529 | | | | 97,490 | | | | 115,249 | | |
Net increase from payments by affiliates (Note B) | | | — | | | | 8 | | | | — | | | | 5 | | | | — | | | | 26 | | | | — | | | | 101 | | | | — | | | | 39 | | |
| Change in net unrealized appreciation (depreciation) of investments (Note A) | | | (20,315 | ) | | | 12,587 | | | | (31,465 | ) | | | 29,545 | | | | (38,893 | ) | | | (34,548 | ) | | | (285,678 | ) | | | 87,513 | | | | 13,126 | | | | 35,520 | | |
Net increase (decrease) in net assets resulting from operations | | | (10,027 | ) | | | 28,056 | | | | (4,596 | ) | | | 47,025 | | | | (1,139 | ) | | | 68,852 | | | | (110,880 | ) | | | 356,836 | | | | 105,520 | | | | 146,629 | | |
Distributions to Shareholders From (Note A): | |
Net investment income: | |
Investor Class | | | — | | | | — | | | | — | | | | — | | | | — | | | | (27 | ) | | | (10,234 | ) | | | (14,083 | ) | | | — | | | | — | | |
Trust Class | | | (131 | ) | | | (129 | ) | | | — | | | | — | | | | — | | | | — | | | | (1,405 | ) | | | (2,047 | ) | | | — | | | | — | | |
Advisor Class | | | — | | | | — | | | | — | | | | — | | | | — | | | | — | | | | (2,553 | ) | | | (3,265 | ) | | | — | | | | — | | |
Institutional Class | | | (3,070 | ) | | | (2,764 | ) | | | — | | | | (425 | ) | | | (166 | ) | | | (2,087 | ) | | | (1,391 | ) | | | (1,523 | ) | | | — | | | | — | | |
Class A | | | (92 | ) | | | (101 | ) | | | — | | | | (4 | ) | | | — | | | | — | | | | (28 | ) | | | (30 | ) | | | — | | | | — | | |
Class C | | | (14 | ) | | | (13 | ) | | | — | | | | — | | | | — | | | | — | | | | (29 | ) | | | (22 | ) | | | — | | | | — | | |
Class R3 | | | (27 | ) | | | (23 | ) | | | — | | | | — | | | | — | | | | — | | | | (1 | ) | | | (2 | ) | | | — | | | | — | | |
Class R6 | | | — | | | | — | | | | — | | | | — | | | | — | | | | — | | | | — | | | | — | | | | — | | | | — | | |
Net realized gain on investments: | |
Investor Class | | | — | | | | — | | | | — | | | | — | | | | (5,509 | ) | | | (2,434 | ) | | | (141,939 | ) | | | (168,785 | ) | | | (49,241 | ) | | | (27,005 | ) | |
Trust Class | | | — | | | | — | | | | — | | | | — | | | | — | | | | — | | | | (21,949 | ) | | | (27,921 | ) | | | (5,201 | ) | | | (2,672 | ) | |
Advisor Class | | | — | | | | — | | | | — | | | | — | | | | — | | | | — | | | | (41,088 | ) | | | (46,194 | ) | | | (701 | ) | | | (469 | ) | |
Institutional Class | | | — | | | | — | | | | (14,661 | ) | | | (8,209 | ) | | | (48,281 | ) | | | (60,585 | ) | | | (16,389 | ) | | | (16,225 | ) | | | (45,198 | ) | | | (23,431 | ) | |
Class A | | | — | | | | — | | | | (923 | ) | | | (723 | ) | | | (3,492 | ) | | | (5,333 | ) | | | (433 | ) | | | (394 | ) | | | (7,034 | ) | | | (3,978 | ) | |
Class C | | | — | | | | — | | | | (765 | ) | | | (448 | ) | | | (10,313 | ) | | | (3,776 | ) | | | (675 | ) | | | (350 | ) | | | (470 | ) | | | (195 | ) | |
Class R3 | | | — | | | | — | | | | — | | | | — | | | | (96 | ) | | | (20 | ) | | | (26 | ) | | | (25 | ) | | | (602 | ) | | | (289 | ) | |
Class R6 | | | — | | | | — | | | | — | | | | — | | | | — | | | | — | | | | — | | | | — | | | | (3,588 | ) | | | (391 | ) | |
Total distributions to shareholders | | | (3,334 | ) | | | (3,030 | ) | | | (16,349 | ) | | | (9,809 | ) | | | (67,857 | ) | | | (74,262 | ) | | | (238,140 | ) | | | (280,866 | ) | | | (112,035 | ) | | | (58,430 | ) | |
From Fund Share Transactions (Note D): | |
Proceeds from shares sold: | |
Investor Class | | | — | | | | — | | | | — | | | | — | | | | 1,045 | | | | 1,319 | | | | 16,941 | | | | 15,524 | | | | 15,922 | | | | 7,315 | | |
Trust Class | | | 435 | | | | 797 | | | | — | | | | — | | | | — | | | | — | | | | 6,232 | | | | 7,321 | | | | 29,016 | | | | 17,099 | | |
Advisor Class | | | — | | | | — | | | | — | | | | — | | | | — | | | | — | | | | 12,640 | | | | 16,068 | | | | 5,341 | | | | 3,095 | | |
Institutional Class | | | 34,971 | | | | 26,904 | | | | 213,263 | | | | 60,529 | | | | 28,223 | | | | 71,898 | | | | 15,926 | | | | 28,473 | | | | 108,137 | | | | 156,573 | | |
Class A | | | 1,652 | | | | 2,698 | | | | 40,847 | | | | 10,596 | | | | 2,197 | | | | 4,517 | | | | 5,905 | | | | 2,414 | | | | 30,607 | | | | 27,567 | | |
Class C | | | 640 | | | | 1,133 | | | | 16,290 | | | | 3,170 | | | | 7,070 | | | | 3,648 | | | | 1,014 | | | | 2,187 | | | | 3,088 | | | | 1,931 | | |
Class R3 | | | 2,161 | | | | 814 | | | | — | | | | — | | | | 91 | | | | 21 | | | | 85 | | | | 20 | | | | 8,331 | | | | 3,691 | | |
Class R6 | | | — | | | | — | | | | — | | | | — | | | | — | | | | — | | | | — | | | | — | | | | 70,359 | | | | 23,439 | | |
See Notes to Financial Statements
164
Statements of Changes in Net Assets (cont'd)
Neuberger Berman Equity Funds (cont'd)
(000's omitted)
| | | INTERNATIONAL
SELECT FUND | | INTRINSIC VALUE FUND | | LARGE CAP DISCIPLINED
GROWTH FUND | | LARGE CAP VALUE FUND | | MID CAP GROWTH FUND | |
| | | Year Ended
August 31,
2015 | | Year Ended
August 31,
2014 | | Year Ended
August 31,
2015 | | Year Ended
August 31,
2014 | | Year Ended
August 31,
2015 | | Year Ended
August 31,
2014 | | Year Ended
August 31,
2015 | | Year Ended
August 31,
2014 | | Year Ended
August 31,
2015 | | Year Ended
August 31,
2014 | |
Proceeds from reinvestment of dividends and distributions: | |
Investor Class | | | — | | | | — | | | | — | | | | — | | | | 5,470 | | | | 2,438 | | | | 144,740 | | | | 174,745 | | | | 46,576 | | | | 25,390 | | |
Trust Class | | | 127 | | | | 124 | | | | — | | | | — | | | | — | | | | — | | | | 23,101 | | | | 29,591 | | | | 5,194 | | | | 2,663 | | |
Advisor Class | | | — | | | | — | | | | — | | | | — | | | | — | | | | — | | | | 42,453 | | | | 48,458 | | | | 638 | | | | 419 | | |
Institutional Class | | | 3,011 | | | | 2,645 | | | | 11,950 | | | | 7,037 | | | | 37,610 | | | | 50,883 | | | | 17,318 | | | | 17,308 | | | | 45,062 | | | | 23,283 | | |
Class A | | | 84 | | | | 94 | | | | 869 | | | | 702 | | | | 1,578 | | | | 4,387 | | | | 430 | | | | 360 | | | | 6,930 | | | | 3,886 | | |
Class C | | | 3 | | | | 2 | | | | 504 | | | | 236 | | | | 3,331 | | | | 1,066 | | | | 438 | | | | 201 | | | | 448 | | | | 182 | | |
Class R3 | | | 25 | | | | 23 | | | | — | | | | — | | | | 46 | | | | 10 | | | | 10 | | | | 10 | | | | 551 | | | | 276 | | |
Class R6 | | | — | | | | — | | | | — | | | | — | | | | — | | | | — | | | | — | | | | — | | | | 3,408 | | | | 291 | | |
Payments for shares redeemed: | |
Investor Class | | | — | | | | — | | | | — | | | | — | | | | (2,540 | ) | | | (8,922 | ) | | | (120,876 | ) | | | (172,279 | ) | | | (34,928 | ) | | | (32,660 | ) | |
Trust Class | | | (2,752 | ) | | | (3,347 | ) | | | — | | | | — | | | | — | | | | — | | | | (30,149 | ) | | | (54,387 | ) | | | (13,956 | ) | | | (12,340 | ) | |
Advisor Class | | | — | | | | — | | | | — | | | | — | | | | — | | | | — | | | | (51,994 | ) | | | (48,961 | ) | | | (6,069 | ) | | | (6,226 | ) | |
Institutional Class | | | (20,857 | ) | | | (40,351 | ) | | | (39,704 | ) | | | (31,282 | ) | | | (165,272 | ) | | | (340,441 | ) | | | (65,347 | ) | | | (23,652 | ) | | | (108,212 | ) | | | (84,259 | ) | |
Class A | | | (7,197 | ) | | | (3,809 | ) | | | (8,740 | ) | | | (14,163 | ) | | | (9,131 | ) | | | (34,983 | ) | | | (5,449 | ) | | | (1,706 | ) | | | (37,969 | ) | | | (30,915 | ) | |
Class C | | | (1,340 | ) | | | (927 | ) | | | (2,095 | ) | | | (2,667 | ) | | | (12,964 | ) | | | (6,948 | ) | | | (826 | ) | | | (600 | ) | | | (1,213 | ) | | | (1,026 | ) | |
Class R3 | | | (754 | ) | | | (1,555 | ) | | | — | | | | — | | | | (6 | ) | | | (269 | ) | | | (119 | ) | | | — | | | | (4,615 | ) | | | (2,052 | ) | |
Class R6 | | | — | | | | — | | | | — | | | | — | | | | — | | | | — | | | | — | | | | — | | | | (6,463 | ) | | | (2,288 | ) | |
Net increase (decrease) from Fund share transactions | | | 10,209 | | | | (14,755 | ) | | | 233,184 | | | | 34,158 | | | | (103,252 | ) | | | (251,376 | ) | | | 12,473 | | | | 41,095 | | | | 166,183 | | | | 125,334 | | |
Net Increase (Decrease) in Net Assets | | | (3,152 | ) | | | 10,271 | | | | 212,239 | | | | 71,374 | | | | (172,248 | ) | | | (256,786 | ) | | | (336,547 | ) | | | 117,065 | | | | 159,668 | | | | 213,533 | | |
Net Assets: | |
Beginning of year | | | 240,699 | | | | 230,428 | | | | 278,214 | | | | 206,840 | | | | 232,017 | | | | 488,803 | | | | 1,744,775 | | | | 1,627,710 | | | | 1,015,534 | | | | 802,001 | | |
End of year | | $ | 237,547 | | | $ | 240,699 | | | $ | 490,453 | | | $ | 278,214 | | | $ | 59,769 | | | $ | 232,017 | | | $ | 1,408,228 | | | $ | 1,744,775 | | | $ | 1,175,202 | | | $ | 1,015,534 | | |
Undistributed net investment income (loss) at end of year | | $ | 1,580 | | | $ | 2,273 | | | $ | (127 | ) | | $ | — | | | $ | (11 | ) | | $ | — | | | $ | 14,004 | | | $ | 13,641 | | | $ | (3,669 | ) | | $ | (2,889 | ) | |
Distributions in excess of net investment income at end of year | | $ | — | | | $ | — | | | $ | — | | | $ | (124 | ) | | $ | — | | | $ | (13 | ) | | $ | — | | | $ | — | | | $ | — | | | $ | — | | |
See Notes to Financial Statements
Statements of Changes in Net Assets (cont'd)
Neuberger Berman Equity Funds
(000's omitted)
| | | MID CAP
INTRINSIC VALUE FUND | | MULTI-CAP
OPPORTUNITIES FUND | | REAL ESTATE FUND | | SMALL CAP GROWTH FUND | | SOCIALLY
RESPONSIVE FUND | |
| | | Year Ended
August 31,
2015 | | Year Ended
August 31,
2014 | | Year Ended
August 31,
2015 | | Year Ended
August 31,
2014 | | Year Ended
August 31,
2015 | | Year Ended
August 31,
2014 | | Year Ended
August 31,
2015 | | Year Ended
August 31,
2014 | | Year Ended
August 31,
2015 | | Year Ended
August 31,
2014 | |
Increase (Decrease) in Net Assets: | |
From Operations: | |
Net investment income (loss) (Note A) | | $ | 352 | | | $ | 905 | | | $ | 20,872 | | | $ | 22,465 | | | $ | 12,607 | | | $ | 11,456 | | | $ | (821 | ) | | $ | (731 | ) | | $ | 18,670 | | | $ | 20,990 | | |
Net realized gain (loss) on investments (Note A) | | | 12,634 | | | | 8,719 | | | | 69,925 | | | | 87,642 | | | | 80,044 | | | | 50,573 | | | | 13,201 | | | | 14,211 | | | | 181,229 | | | | 339,559 | | |
Net increase from payments by affiliates (Note B) | | | — | | | | 6 | | | | — | | | | 19 | | | | — | | | | 16 | | | | — | | | | 4 | | | | — | | | | 52 | | |
| Change in net unrealized appreciation (depreciation) of investments (Note A) | | | (15,395 | ) | | | 5,887 | | | | (130,767 | ) | | | 300,270 | | | | (99,105 | ) | | | 132,321 | | | | (6,370 | ) | | | (3,502 | ) | | | (184,865 | ) | | | 95,312 | | |
Net increase (decrease) in net assets resulting from operations | | | (2,409 | ) | | | 15,517 | | | | (39,970 | ) | | | 410,396 | | | | (6,454 | ) | | | 194,366 | | | | 6,010 | | | | 9,982 | | | | 15,034 | | | | 455,913 | | |
Distributions to Shareholders From (Note A): | |
Net investment income: | |
Investor Class | | | (385 | ) | | | (578 | ) | | | — | | | | — | | | | — | | | | — | | | | — | | | | — | | | | (5,556 | ) | | | (6,812 | ) | |
Trust Class | | | (112 | ) | | | (208 | ) | | | — | | | | — | | | | (3,770 | ) | | | (3,764 | ) | | | — | | | | — | | | | (3,953 | ) | | | (4,600 | ) | |
Advisor Class | | | — | | | | — | | | | — | | | | — | | | | — | | | | — | | | | — | | | | — | | | | — | | | | — | | |
Institutional Class | | | (259 | ) | | | (266 | ) | | | (23,005 | ) | | | (12,809 | ) | | | (6,372 | ) | | | (5,763 | ) | | | — | | | | — | | | | (6,267 | ) | | | (6,382 | ) | |
Class A | | | (48 | ) | | | (67 | ) | | | (682 | ) | | | (571 | ) | | | (1,812 | ) | | | (1,768 | ) | | | — | | | | — | | | | (1,493 | ) | | | (1,231 | ) | |
Class C | | | (6 | ) | | | (16 | ) | | | (62 | ) | | | (80 | ) | | | (107 | ) | | | (117 | ) | | | — | | | | — | | | | (271 | ) | | | (86 | ) | |
Class R3 | | | (2 | ) | | | (5 | ) | | | — | | | | — | | | | (216 | ) | | | (153 | ) | | | — | | | | — | | | | (272 | ) | | | (204 | ) | |
Class R6 | | | — | | | | — | | | | — | | | | — | | | | (451 | ) | | | (194 | ) | | | — | | | | — | | | | (2,421 | ) | | | (2,006 | ) | |
Net realized gain on investments: | |
Investor Class | | | (3,860 | ) | | | (1,556 | ) | | | — | | | | — | | | | — | | | | — | | | | — | | | | — | | | | (78,302 | ) | | | (50,122 | ) | |
Trust Class | | | (1,421 | ) | | | (618 | ) | | | — | | | | — | | | | (15,179 | ) | | | (18,399 | ) | | | — | | | | — | | | | (58,788 | ) | | | (40,943 | ) | |
Advisor Class | | | — | | | | — | | | | — | | | | — | | | | — | | | | — | | | | — | | | | — | | | | — | | | | — | | |
Institutional Class | | | (2,170 | ) | | | (633 | ) | | | (80,461 | ) | | | (26,066 | ) | | | (21,811 | ) | | | (23,729 | ) | | | — | | | | — | | | | (69,181 | ) | | | (40,032 | ) | |
Class A | | | (544 | ) | | | (195 | ) | | | (4,187 | ) | | | (1,431 | ) | | | (8,468 | ) | | | (9,795 | ) | | | — | | | | — | | | | (21,497 | ) | | | (11,439 | ) | |
Class C | | | (214 | ) | | | (69 | ) | | | (1,736 | ) | | | (322 | ) | | | (2,008 | ) | | | (2,421 | ) | | | — | | | | — | | | | (7,205 | ) | | | (3,098 | ) | |
Class R3 | | | (40 | ) | | | (18 | ) | | | — | | | | — | | | | (1,276 | ) | | | (1,051 | ) | | | — | | | | — | | | | (4,908 | ) | | | (2,602 | ) | |
Class R6 | | | — | | | | — | | | | — | | | | — | | | | (1,405 | ) | | | (564 | ) | | | — | | | | — | | | | (24,850 | ) | | | (11,964 | ) | |
Total distributions to shareholders | | | (9,061 | ) | | | (4,229 | ) | | | (110,133 | ) | | | (41,279 | ) | | | (62,875 | ) | | | (67,718 | ) | | | — | | | | — | | | | (284,964 | ) | | | (181,521 | ) | |
From Fund Share Transactions (Note D): | |
Proceeds from shares sold: | |
Investor Class | | | 4,599 | | | | 3,859 | | | | — | | | | — | | | | — | | | | — | | | | 1,497 | | | | 2,997 | | | | 69,572 | | | | 71,171 | | |
Trust Class | | | 1,581 | | | | 1,326 | | | | — | | | | — | | | | 52,339 | | | | 71,310 | | | | 406 | | | | 542 | | | | 54,071 | | | | 71,994 | | |
Advisor Class | | | — | | | | — | | | | — | | | | — | | | | — | | | | — | | | | 830 | | | | 914 | | | | — | | | | — | | |
Institutional Class | | | 25,010 | | | | 14,710 | | | | 210,581 | | | | 1,018,161 | | | | 123,794 | | | | 181,199 | | | | 6,147 | | | | 4,881 | | | | 206,662 | | | | 224,677 | | |
Class A | | | 12,692 | | | | 3,992 | | | | 36,459 | | | | 129,361 | | | | 63,436 | | | | 72,692 | | | | 3,145 | | | | 7,810 | | | | 47,761 | | | | 52,427 | | |
Class C | | | 2,123 | | | | 449 | | | | 15,280 | | | | 40,707 | | | | 5,220 | | | | 5,321 | | | | 786 | | | | 1,059 | | | | 16,166 | | | | 15,201 | | |
Class R3 | | | 992 | | | | 50 | | | | — | | | | — | | | | 12,721 | | | | 11,166 | | | | 791 | | | | 261 | | | | 8,582 | | | | 8,898 | | |
Class R6 | | | — | | | | — | | | | — | | | | — | | | | 11,285 | | | | 17,458 | | | | — | | | | — | | | | 67,738 | | | | 193,825 | | |
See Notes to Financial Statements
Statements of Changes in Net Assets (cont'd)
Neuberger Berman Equity Funds (cont'd)
(000's omitted)
| | | MID CAP
INTRINSIC VALUE FUND | | MULTI-CAP
OPPORTUNITIES FUND | | REAL ESTATE FUND | | SMALL CAP GROWTH FUND | | SOCIALLY
RESPONSIVE FUND | |
| | | Year Ended
August 31,
2015 | | Year Ended
August 31,
2014 | | Year Ended
August 31,
2015 | | Year Ended
August 31,
2014 | | Year Ended
August 31,
2015 | | Year Ended
August 31,
2014 | | Year Ended
August 31,
2015 | | Year Ended
August 31,
2014 | | Year Ended
August 31,
2015 | | Year Ended
August 31,
2014 | |
Proceeds from reinvestment of dividends and distributions: | |
Investor Class | | | 4,040 | | | | 2,010 | | | | — | | | | — | | | | — | | | | — | | | | — | | | | — | | | | 80,661 | | | | 54,086 | | |
Trust Class | | | 1,451 | | | | 780 | | | | — | | | | — | | | | 18,790 | | | | 21,915 | | | | — | | | | — | | | | 62,288 | | | | 45,143 | | |
Advisor Class | | | — | | | | — | | | | — | | | | — | | | | — | | | | — | | | | — | | | | — | | | | — | | | | — | | |
Institutional Class | | | 2,366 | | | | 872 | | | | 14,388 | | | | 3,824 | | | | 22,144 | | | | 21,360 | | | | — | | | | — | | | | 68,496 | | | | 42,684 | | |
Class A | | | 576 | | | | 236 | | | | 4,327 | | | | 1,823 | | | | 9,562 | | | | 10,171 | | | | — | | | | — | | | | 21,325 | | | | 11,025 | | |
Class C | | | 55 | | | | 15 | | | | 1,493 | | | | 344 | | | | 1,794 | | | | 2,086 | | | | — | | | | — | | | | 6,180 | | | | 2,585 | | |
Class R3 | | | 42 | | | | 23 | | | | — | | | | — | | | | 1,371 | | | | 1,041 | | | | — | | | | — | | | | 5,038 | | | | 2,739 | | |
Class R6 | | | — | | | | — | | | | — | | | | — | | | | 1,856 | | | | 758 | | | | — | | | | — | | | | 27,271 | | | | 13,970 | | |
Payments for shares redeemed: | |
Investor Class | | | (5,217 | ) | | | (15,323 | ) | | | — | | | | — | | | | — | | | | — | | | | (6,649 | ) | | | (7,503 | ) | | | (133,905 | ) | | | (231,387 | ) | |
Trust Class | | | (3,866 | ) | | | (2,676 | ) | | | — | | | | — | | | | (114,518 | ) | | | (138,623 | ) | | | (971 | ) | | | (3,068 | ) | | | (158,470 | ) | | | (170,160 | ) | |
Advisor Class | | | — | | | | — | | | | — | | | | — | | | | — | | | | — | | | | (1,773 | ) | | | (1,497 | ) | | | — | | | | — | | |
Institutional Class | | | (7,888 | ) | | | (3,821 | ) | | | (459,676 | ) | | | (233,691 | ) | | | (243,059 | ) | | | (160,265 | ) | | | (5,784 | ) | | | (2,873 | ) | | | (194,272 | ) | | | (196,402 | ) | |
Class A | | | (2,444 | ) | | | (2,174 | ) | | | (74,313 | ) | | | (57,088 | ) | | | (95,912 | ) | | | (97,375 | ) | | | (2,692 | ) | | | (5,795 | ) | | | (39,136 | ) | | | (50,967 | ) | |
Class C | | | (175 | ) | | | (132 | ) | | | (18,122 | ) | | | (3,127 | ) | | | (14,886 | ) | | | (11,829 | ) | | | (407 | ) | | | (482 | ) | | | (6,487 | ) | | | (3,965 | ) | |
Class R3 | | | (120 | ) | | | (567 | ) | | | — | | | | — | | | | (13,178 | ) | | | (6,639 | ) | | | (262 | ) | | | (223 | ) | | | (10,264 | ) | | | (7,268 | ) | |
Class R6 | | | — | | | | — | | | | — | | | | — | | | | (6,947 | ) | | | (2,582 | ) | | | — | | | | — | | | | (128,504 | ) | | | (214,722 | ) | |
Net increase (decrease) from Fund share transactions | | | 35,817 | | | | 3,629 | | | | (269,583 | ) | | | 900,314 | | | | (164,188 | ) | | | (836 | ) | | | (4,936 | ) | | | (2,977 | ) | | | 70,773 | | | | (64,446 | ) | |
Net Increase (Decrease) in Net Assets | | | 24,347 | | | | 14,917 | | | | (419,686 | ) | | | 1,269,431 | | | | (233,517 | ) | | | 125,812 | | | | 1,074 | | | | 7,005 | | | | (199,157 | ) | | | 209,946 | | |
Net Assets: | |
Beginning of year | | | 83,158 | | | | 68,241 | | | | 2,759,984 | | | | 1,490,553 | | | | 1,039,875 | | | | 914,063 | | | | 85,337 | | | | 78,332 | | | | 2,436,168 | | | | 2,226,222 | | |
End of year | | $ | 107,505 | | | $ | 83,158 | | | $ | 2,340,298 | | | $ | 2,759,984 | | | $ | 806,358 | | | $ | 1,039,875 | | | $ | 86,411 | | | $ | 85,337 | | | $ | 2,237,011 | | | $ | 2,436,168 | | |
Undistributed net investment income (loss) at end of year | | $ | — | | | $ | 593 | | | $ | 12,040 | | | $ | 16,877 | | | $ | — | | | $ | — | | | $ | — | | | $ | (445 | ) | | $ | 13,587 | | | $ | 17,453 | | |
Distributions in excess of net investment income at end of year | | $ | — | | | $ | — | | | $ | — | | | $ | — | | | $ | — | | | $ | — | | | $ | — | | | $ | — | | | $ | — | | | $ | — | | |
See Notes to Financial Statements
Statements of Changes in Net Assets (cont'd)
Neuberger Berman Equity Funds
(000's omitted)
| | | VALUE FUND | | WORLD EQUITY
FUND | |
| | | Year Ended
August 31,
2015 | | Year Ended
August 31,
2014 | | Period from
June 30, 2015
(Commencement
of Operations) to
August 31,
2015 | |
Increase (Decrease) in Net Assets: | |
From Operations: | |
Net investment income (loss) (Note A) | | $ | 268 | | | $ | 147 | | | $ | (3 | ) | |
Net realized gain (loss) on investments (Note A) | | | 430 | | | | 1,387 | | | | (109 | ) | |
Net increase from payments by affiliates (Note B) | | | — | | | | — | | | | — | | |
Change in net unrealized appreciation (depreciation)
of investments (Note A) | | | (2,389 | ) | | | 1,452 | | | | (128 | ) | |
Net increase (decrease) in net assets resulting from operations | | | (1,691 | ) | | | 2,986 | | | | (240 | ) | |
Distributions to Shareholders From (Note A): | |
Net investment income: | |
Investor Class | | | — | | | | — | | | | — | | |
Trust Class | | | — | | | | — | | | | — | | |
Advisor Class | | | — | | | | — | | | | — | | |
Institutional Class | | | (130 | ) | | | (57 | ) | | | — | | |
Class A | | | (49 | ) | | | (17 | ) | | | — | | |
Class C | | | (0 | ) | | | — | | | | — | | |
Class R3 | | | — | | | | — | | | | — | | |
Class R6 | | | — | | | | — | | | | — | | |
Net realized gain on investments: | |
Investor Class | | | — | | | | — | | | | — | | |
Trust Class | | | — | | | | — | | | | — | | |
Advisor Class | | | — | | | | — | | | | — | | |
Institutional Class | | | (748 | ) | | | — | | | | — | | |
Class A | | | (433 | ) | | | — | | | | — | | |
Class C | | | (32 | ) | | | — | | | | — | | |
Class R3 | | | — | | | | — | | | | — | | |
Class R6 | | | — | | | | — | | | | — | | |
Total distributions to shareholders | | | (1,392 | ) | | | (74 | ) | | | — | | |
From Fund Share Transactions (Note D): | |
Proceeds from shares sold: | |
Investor Class | | | — | | | | — | | | | — | | |
Trust Class | | | — | | | | — | | | | — | | |
Advisor Class | | | — | | | | — | | | | — | | |
Institutional Class | | | 8,079 | | | | 8,780 | | | | 4,000 | | |
Class A | | | 3,543 | | | | 4,764 | | | | 500 | | |
Class C | | | 213 | | | | 230 | | | | 532 | | |
Class R3 | | | — | | | | — | | | | — | | |
Class R6 | | | — | | | | — | | | | — | | |
See Notes to Financial Statements
Statements of Changes in Net Assets (cont'd)
Neuberger Berman Equity Funds (cont'd)
(000's omitted)
| | | VALUE FUND | | WORLD EQUITY
FUND | |
| | | Year Ended
August 31,
2015 | | Year Ended
August 31,
2014 | | Period from
June 30, 2015
(Commencement
of Operations) to
August 31,
2015 | |
Proceeds from reinvestment of dividends and distributions: | |
Investor Class | | | — | | | | — | | | | — | | |
Trust Class | | | — | | | | — | | | | — | | |
Advisor Class | | | — | | | | — | | | | — | | |
Institutional Class | | | 878 | | | | 29 | | | | — | | |
Class A | | | 435 | | | | 15 | | | | — | | |
Class C | | | 31 | | | | — | | | | — | | |
Class R3 | | | — | | | | — | | | | — | | |
Class R6 | | | — | | | | — | | | | — | | |
Payments for shares redeemed: | |
Investor Class | | | — | | | | — | | | | — | | |
Trust Class | | | — | | | | — | | | | — | | |
Advisor Class | | | — | | | | — | | | | — | | |
Institutional Class | | | (6,637 | ) | | | (4,951 | ) | | | — | | |
Class A | | | (3,554 | ) | | | (1,463 | ) | | | — | | |
Class C | | | (195 | ) | | | (55 | ) | | | — | | |
Class R3 | | | — | | | | — | | | | — | | |
Class R6 | | | — | | | | — | | | | — | | |
Net increase (decrease) from Fund share transactions | | | 2,793 | | | | 7,349 | | | | 5,032 | | |
Net Increase (Decrease) in Net Assets | | | (290 | ) | | | 10,261 | | | | 4,792 | | |
Net Assets: | |
Beginning of year | | | 21,159 | | | | 10,898 | | | | — | | |
End of year | | $ | 20,869 | | | $ | 21,159 | | | $ | 4,792 | | |
Undistributed net investment income (loss) at end of year | | $ | 203 | | | $ | 121 | | | $ | 29 | | |
Distributions in excess of net investment income at end of year | | $ | — | | | $ | — | | | $ | — | | |
See Notes to Financial Statements
Notes to Financial Statements Equity Funds
Note A—Summary of Significant Accounting Policies:
1 | General: Neuberger Berman Equity Funds (the "Trust") is a Delaware statutory trust organized pursuant to an Amended and Restated Trust Instrument dated March 27, 2014. The Trust is registered as an open-end management investment company under the Investment Company Act of 1940, as amended (the "1940 Act"), and its shares are registered under the 1933 Act. The Funds are separate operating series of the Trust, each of which (except All Cap Core, Global Real Estate, Greater China Equity and Real Estate) is diversified. Under the 1940 Act, the status of a Fund that was registered as non-diversified may, under certain circumstances, change to that of a diversified fund (Multi-Cap Opportunities became diversified in December 2012). Ten Funds offer Investor Class shares, eleven offer Trust Class shares, six offer Advisor Class shares, twenty-two offer Institutional Class shares, twenty-one offer Class A shares, twenty-one offer Class C shares, eleven offer Class R3 shares and six offer Class R6 shares. Global Real Estate had no operations until December 30, 2014, other than matters relating to its organization and registration of shares under the 1933 Act. World Equity had no operations until June 30, 2015, other than matters relating to its organization and registration of shares under the 1933 Act. The Board may establish additional series or classes of shares without the approval of shareholders. A zero balance, if any, reflects an actual amount rounding to less than $1,000. The assets of each Fund belong only to that Fund, and the liabilities of each Fund are borne solely by that Fund and no other. Each Fund is an investment company and accordingly follows the investment company accounting and reporting guidance of the Financial Accounting Standards Board (FASB) Accounting Standard Codification Topic 946 "Financial Services—Investment Companies." The preparation of financial statements in accordance with U.S. generally accepted accounting principles ("GAAP") requires Management to make estimates and assumptions at the date of the financial statements. Actual results could differ from those estimates. |
| | |
| 2 | Portfolio valuation: Investment securities are valued as indicated in the notes following the Funds' Schedule of Investments. |
| | |
| 3 | Foreign currency translation: The accounting records of the Funds are maintained in U.S. dollars. Foreign currency amounts are translated into U.S. dollars using the exchange rate as of the end of regular trading on the NYSE on business days, usually 4:00 p.m., Eastern time, to determine the value of investments, other assets and liabilities. Purchase and sale prices of securities, and income and expenses, are translated into U.S. dollars at the prevailing rate of exchange on the respective dates of such transactions. Net unrealized foreign currency gain (loss), if any, arises from changes in the value of assets and liabilities, other than investments in securities, as a result of changes in exchange rates and is stated separately in the Statements of Operations. |
| | |
| 4 | Securities transactions and investment income: Securities transactions are recorded on trade date for financial reporting purposes. Dividend income is recorded on the ex-dividend date or, for certain foreign dividends, as soon as the Fund becomes aware of the dividends. Non-cash dividends included in dividend income, if any, are recorded at the fair market value of the securities received. Interest income, including accretion of discount on securities for Equity Income, accretion of original issue discount, where applicable, and accretion of discount on short-term investments, is recorded on the accrual basis. Realized gains and losses from securities transactions and foreign currency transactions, if any, are recorded on the basis of identified cost and stated separately in the Statements of Operations. Included in net realized gain (loss) on investments are proceeds from the settlements of class action litigation in which the Funds participated as class members. The amounts of such proceeds for the year ended August 31, 2015 were $7,495, $354,526, $191,067, $14,011, $4,703, $5,709, $872,438, $35,676, $19,979, $434, $359,031 and $151,170, for Focus, Genesis, Guardian, International Equity, International Select, Large Cap |
| Disciplined Growth, Large Cap Value, Mid Cap Growth, Mid Cap Intrinsic Value, Multi-Cap Opportunities, Small Cap Growth and Socially Responsive, respectively. |
| | |
| 5 | Income tax information: Each Fund is treated as a separate entity for U.S. federal income tax purposes. It is the policy of each Fund, except Global Real Estate and World Equity, to continue to, and the intention of Global Real Estate and World Equity to, qualify for treatment as a regulated investment company ("RIC") by complying with the requirements of the U.S. Internal Revenue Code applicable to RICs and to distribute substantially all of its net investment income and net realized capital gains to its shareholders. To the extent a Fund distributes substantially all of its net investment income and net realized capital gains to shareholders, no federal income or excise tax provision is required. The Funds have adopted the provisions of ASC 740 "Income Taxes" ("ASC 740"). ASC 740 sets forth a minimum threshold for financial statement recognition of a tax position taken, or expected to be taken, in a tax return. The Funds recognize interest and penalties, if any, related to unrecognized tax positions as an income tax expense in the Statements of Operations. The Funds are subject to examination by U.S. federal and state tax authorities for returns filed for the tax years for which the applicable statutes of limitations have not yet expired. As of August 31, 2015, the Funds did not have any unrecognized tax positions. Income distributions and capital gain distributions are determined in accordance with income tax regulations, which may differ from GAAP. These differences are primarily due to differing treatments of income and gains on various investment securities held by each Fund, timing differences and differing characterization of distributions made by each Fund. The Funds may also utilize earnings and profits distributed to shareholders on redemption of their shares as a part of the dividends-paid deduction for income tax purposes. As determined on August 31, 2015, permanent differences resulting primarily from different book and tax accounting were reclassified at year end. Such differences may be attributed to the tax treatment of one or more of the following: net operating loss netted against short term capital gains or written-off, non-taxable distributions from real estate investment trusts ("REITs") and other underlying investments, gains and losses on equity swap contracts, foreign currency gains and losses, gains and losses from passive foreign investment companies (PFICs), non-deductible stock issuance fees and deemed distributions on shareholder redemptions. For the year ended August 31, 2015, the Funds recorded the following permanent reclassifications: |
| | Paid-in Capital | | Undistributed
Net Investment
Income (Loss) | | Accumulated Net
Realized Gains
(Losses) on
Investments | |
All Cap Core | | $ | 2,475,936 | | | $ | (148,445 | ) | | $ | (2,327,491 | ) | |
Emerging Markets Equity | | | — | | | | (535,097 | ) | | | 535,097 | | |
Equity Income | | | 18,700,410 | | | | (6,272,238 | ) | | | (12,428,172 | ) | |
Focus | | | 6,973,837 | | | | (927,712 | ) | | | (6,046,125 | ) | |
Genesis | | | 201,340,347 | | | | (2,206,326 | ) | | | (199,134,021 | ) | |
Global Equity | | | 2,527,964 | | | | 4,853 | | | | (2,532,817 | ) | |
Global Real Estate | | | (1,010 | ) | | | 2,462 | | | | (1,452 | ) | |
Greater China Equity | | | 7,846,085 | | | | (28,371 | ) | | | (7,817,714 | ) | |
Guardian | | | 12,454,993 | | | | (906,084 | ) | | | (11,548,909 | ) | |
International Equity | | | — | | | | 537,597 | | | | (537,597 | ) | |
International Select | | | — | | | | (79,874 | ) | | | 79,874 | | |
Intrinsic Value | | | 1,707,152 | | | | 1,808,333 | | | | (3,515,485 | ) | |
Large Cap Disciplined Growth | | | 33,596,988 | | | | (150,228 | ) | | | (33,446,760 | ) | |
Large Cap Value | | | 22,069,159 | | | | (705,119 | ) | | | (21,364,040 | ) | |
| | Paid-in Capital | | Undistributed
Net Investment
Income (Loss) | | Accumulated Net
Realized Gains
(Losses) on
Investments | |
Mid Cap Growth | | $ | (3,016,582 | ) | | $ | 4,315,459 | | | $ | (1,298,877 | ) | |
Mid Cap Intrinsic Value | | | 1,258,190 | | | | (132,745 | ) | | | (1,125,445 | ) | |
Multi-Cap Opportunities | | | 13,718,785 | | | | (1,959,889 | ) | | | (11,758,896 | ) | |
Real Estate | | | 12,543,004 | | | | 121,641 | | | | (12,664,645 | ) | |
Small Cap Growth | | | 315,742 | | | | 1,266,295 | | | | (1,582,037 | ) | |
Socially Responsive | | | 30,170,352 | | | | (2,302,381 | ) | | | (27,867,971 | ) | |
Value | | | 337,824 | | | | (6,808 | ) | | | (331,016 | ) | |
World Equity | | | (41,556 | ) | | | 31,980 | | | | 9,576 | | |
| The tax character of distributions paid during the years ended August 31, 2015 and August 31, 2014 were as follows: |
| | Distributions Paid From: | |
| | Ordinary Income | | Long-Term Capital Gain | | Return of Capital | | Total | |
| | 2015 | | 2014 | | 2015 | | 2014 | | 2015 | | 2014 | | 2015 | | 2014 | |
All Cap Core | | $ | 2,189,581 | | | $ | 392,027 | | | $ | 12,392,546 | | | $ | 8,437,994 | | | $ | — | | | $ | — | | | $ | 14,582,127 | | | $ | 8,830,021 | | |
Emerging Markets
Equity | | | 5,731,674 | | | | 2,577,895 | | | | — | | | | — | | | | — | | | | — | | | | 5,731,674 | | | | 2,577,895 | | |
Equity Income | | | 65,720,431 | | | | 62,522,140 | | | | 93,473,349 | | | | 102,840,935 | | | | — | | | | — | | | | 159,193,780 | | | | 165,363,075 | | |
Focus | | | 19,619,019 | | | | 14,850,876 | | | | 113,979,974 | | | | 63,750,537 | | | | — | | | | — | | | | 133,598,993 | | | | 78,601,413 | | |
Genesis | | | 35,589,396 | | | | 66,351,341 | | | | 1,177,470,479 | | | | 1,137,274,077 | | | | — | | | | — | | | | 1,213,059,875 | | | | 1,203,625,418 | | |
Global Equity | | | 827,724 | | | | 191,068 | | | | 793,061 | | | | 243,211 | | | | — | | | | — | | | | 1,620,785 | | | | 434,279 | | |
Global Real Estate | | | 24,956 | (1) | | | — | | | | — | (1) | | | — | | | | — | (1) | | | — | | | | 24,956 | (1) | | | — | | |
Greater China
Equity | | | 4,726,685 | | | | 803,283 | | | | 847,483 | | | | — | | | | — | | | | — | | | | 5,574,168 | | | | 803,283 | | |
Guardian | | | 18,290,813 | | | | 33,366,130 | | | | 193,226,409 | | | | 112,517,878 | | | | — | | | | — | | | | 211,517,222 | | | | 145,884,008 | | |
International Equity | | | 16,964,183 | | | | 17,975,975 | | | | — | | | | — | | | | — | | | | — | | | | 16,964,183 | | | | 17,975,975 | | |
International Select | | | 3,333,956 | | | | 3,029,765 | | | | — | | | | — | | | | — | | | | — | | | | 3,333,956 | | | | 3,029,765 | | |
Intrinsic Value | | | 3,457,299 | | | | 1,071,106 | | | | 12,891,705 | | | | 8,738,393 | | | | — | | | | — | | | | 16,349,004 | | | | 9,809,499 | | |
Large Cap
Disciplined
Growth | | | 10,825,277 | | | | 21,926,193 | | | | 57,031,255 | | | | 52,335,028 | | | | — | | | | — | | | | 67,856,532 | | | | 74,261,221 | | |
Large Cap Value | | | 106,665,862 | | | | 145,323,607 | | | | 131,474,524 | | | | 135,542,504 | | | | — | | | | — | | | | 238,140,386 | | | | 280,866,111 | | |
Mid Cap Growth | | | — | | | | — | | | | 112,035,066 | | | | 58,429,501 | | | | — | | | | — | | | | 112,035,066 | | | | 58,429,501 | | |
Mid Cap Intrinsic
Value | | | 1,552,865 | | | | 1,173,749 | | | | 7,508,109 | | | | 3,055,247 | | | | — | | | | — | | | | 9,060,974 | | | | 4,228,996 | | |
Multi-Cap
Opportunities | | | 23,749,224 | | | | 13,459,794 | | | | 86,383,844 | | | | 27,819,682 | | | | — | | | | — | | | | 110,133,068 | | | | 41,279,476 | | |
Real Estate | | | 14,563,346 | | | | 16,336,584 | | | | 48,311,493 | | | | 51,381,659 | | | | — | | | | — | | | | 62,874,839 | | | | 67,718,243 | | |
Small Cap Growth | | | — | | | | — | | | | — | | | | — | | | | — | | | | — | | | | — | | | | — | | |
Socially Responsive | | | 29,152,122 | | | | 31,881,495 | | | | 255,811,829 | | | | 149,639,493 | | | | — | | | | — | | | | 284,963,951 | | | | 181,520,988 | | |
Value | | | 1,232,049 | | | | 73,519 | | | | 160,048 | | | | — | | | | — | | | | — | | | | 1,392,097 | | | | 73,519 | | |
World Equity | | | — | (2) | | | — | | | | — | (2) | | | — | | | | — | (2) | | | — | | | | — | (2) | | | — | | |
(1) | Period from December 30, 2014 (Commencement of Operations) to August 31, 2015. |
| |
(2) | Period from June 30, 2015 (Commencement of Operations) to August 31, 2015. |
| As of August 31, 2015, the components of distributable earnings (accumulated losses) on a U.S. federal income tax basis were as follows: |
| | Undistributed
Ordinary
Income | | Undistributed
Long-Term
Capital Gain | | Unrealized
Appreciation
(Depreciation) | | Loss
Carryforwards
and Deferrals | | Other
Temporary
Differences | | Total | |
All Cap Core | | $ | — | | | $ | 864,378 | | | $ | 3,728,591 | | | $ | (136,214 | ) | | $ | (7,543 | ) | | $ | 4,449,212 | | |
Emerging Markets
Equity | | | 2,327,788 | | | | — | | | | (43,355,563 | ) | | | (37,815,620 | ) | | | (38,793 | ) | | | (78,882,188 | ) | |
Equity Income | | | — | | | | 65,485,836 | | | | 123,622,180 | | | | — | | | | — | | | | 189,108,016 | | |
Focus | | | 3,830,625 | | | | 22,018,934 | | | | 113,025,836 | | | | — | | | | — | | | | 138,875,395 | | |
Genesis | | | 19,792,727 | | | | 941,775,682 | | | | 4,799,050,993 | | | | — | | | | 1 | | | | 5,760,619,403 | | |
Global Equity | | | — | | | | — | | | | 113,791 | | | | (18,498 | ) | | | — | | | | 95,293 | | |
Global Real Estate | | | 2,877 | | | | — | | | | (201,164 | ) | | | (937 | ) | | | (2,475 | ) | | | (201,699 | ) | |
Greater China Equity | | | 12,867,927 | | | | — | | | | (21,575,643 | ) | | | — | | | | (117,266 | ) | | | (8,824,982 | ) | |
Guardian | | | 5,845,457 | | | | 70,409,073 | | | | 238,264,632 | | | | — | | | | — | | | | 314,519,162 | | |
International Equity | | | 7,985,185 | | | | — | | | | 63,919,899 | | | | (232,677,834 | ) | | | (2,096 | ) | | | (160,774,846 | ) | |
International Select | | | 1,617,259 | | | | — | | | | 20,979,788 | | | | (35,147,641 | ) | | | (36,909 | ) | | | (12,587,503 | ) | |
Intrinsic Value | | | 730,420 | | | | 22,984,342 | | | | 36,014,134 | | | | — | | | | (126,575 | ) | | | 59,602,321 | | |
Large Cap Disciplined
Growth | | | �� | | | | — | | | | 3,104,403 | | | | (1,138,464 | ) | | | (11,422 | ) | | | 1,954,517 | | |
Large Cap Value | | | 14,003,603 | | | | 111,549,784 | | | | (27,103,133 | ) | | | — | | | | 1 | | | | 98,450,255 | | |
Mid Cap Growth | | | — | | | | 74,487,845 | | | | 283,497,126 | | | | (3,669,554 | ) | | | — | | | | 354,315,417 | | |
Mid Cap Intrinsic
Value | | | 652,068 | | | | 10,046,909 | | | | 3,589,105 | | | | — | | | | — | | | | 14,288,082 | | |
Multi-Cap
Opportunities | | | 12,040,328 | | | | 48,888,336 | | | | 381,596,270 | | | | — | | | | 1 | | | | 442,524,935 | | |
Real Estate | | | — | | | | 45,789,063 | | | | 40,723,260 | | | | — | | | | 1 | | | | 86,512,324 | | |
Small Cap Growth | | | 2,337,131 | | | | 2,179,059 | | | | (776,250 | ) | | | — | | | | — | | | | 3,739,940 | | |
Socially Responsive | | | 15,966,236 | | | | 122,213,641 | | | | 397,098,714 | | | | — | | | | — | | | | 535,278,591 | | |
Value | | | 202,950 | | | | 196,284 | | | | (890,838 | ) | | | — | | | | — | | | | (491,604 | ) | |
World Equity | | | — | | | | — | | | | (118,042 | ) | | | (79,784 | ) | | | — | | | | (197,826 | ) | |
| The differences between book basis and tax basis distributable earnings are primarily due to: losses disallowed and recognized on wash sales, capital loss carryforwards, post-October capital loss and late-year ordinary loss deferrals, unamortized organization expenses, non-deductible foreign capital gain taxes, and tax adjustments related to REITs, PFICs, partnerships, swap contracts and other investments. To the extent each Fund's net realized capital gains, if any, can be offset by capital loss carryforwards, it is the policy of each Fund not to distribute such gains. The Regulated Investment Company ("RIC") Modernization Act of 2010 (the "Act") became effective for the Funds on September 1, 2011 (July 17, 2013 (Commencement of Operations) for Greater China Equity; December 30, 2014 (Commencement of Operations) for Global Real Estate; and June 30, 2015 (Commencement of Operations) for World Equity). The Act modernizes several of the federal income and excise tax provisions related to RICs. Among the changes made are changes to the capital loss carryforward rules allowing for RICs to carry forward capital losses indefinitely and to retain the character of capital loss carryforwards as short-term or long-term ("Post-Enactment"). Rules in effect previously limited the carryforward period to eight years and all carryforwards were considered short-term in character ("Pre-Enactment"). As |
| determined at August 31, 2015, the following Funds had unused capital loss carryforwards available for federal income tax purposes to offset net realized capital gains, if any, as follows: |
| | | Pre-Enactment | |
| | | Expiring in: | |
| | | 2016 | | 2017 | | 2018 | |
| International Equity(1) | | $ | 4,896,907 | | | $ | 149,638,006 | | | $ | 78,142,921 | | |
International Select | | | — | | | | — | | | | 35,147,641 | | |
| | | Post-Enactment (No Expiration Date) | |
| | | Long-Term | | Short-Term | |
Emerging Markets Equity | | $ | 11,906,360 | | | $ | 25,909,260 | | |
Global Real Estate | | | — | | | | 937 | | |
World Equity | | | — | | | | 79,784 | | |
(1) | The capital loss carryforwards shown above for International Equity include $4,896,907 expiring in 2016 and $114,232,268 expiring in 2017, which were acquired on January 25, 2013 in the merger with Neuberger Berman International Fund. Future utilization of these losses may be limited under current tax rules. Post-Enactment capital loss carryforwards must be fully used before Pre-Enactment capital loss carryforwards; therefore, under certain circumstances, Pre-Enactment capital loss carryforwards available as of the report date may expire unused. During the year ended August 31, 2015, International Equity, International Select and Small Cap Growth utilized capital loss carryforwards of $43,094,027, $7,668,960 and $7,030,740, respectively. Under current tax regulations, capital losses realized on investment transactions after October 31 may be deferred and treated as occurring on the first day of the following fiscal year. Under the Act, the Funds may also defer any realized late-year ordinary losses as occurring on the first day of the following fiscal year. Late-year ordinary losses represent ordinary losses realized on investment transactions after December 31 and specified losses (ordinary losses from the sale, exchange, or other disposition of property, net foreign currency losses and net passive foreign investment company mark to market losses) realized on investment transactions after October 31. For the year ended August 31, 2015, the Funds elected to defer the following late-year ordinary losses and post October capital losses: |
| | | Late-Year
Ordinary Loss | | Post October
Capital Loss
Deferral | |
| | | Deferral | | Long-Term | | Short-Term | |
All Cap Core | | $ | 136,214 | | | $ | — | | | $ | — | | |
Global Equity | | | 2,134 | | | | — | | | | 16,364 | | |
Large Cap Disciplined Growth | | | — | | | | — | | | | 1,138,464 | | |
Mid Cap Growth | | | 3,669,554 | | | | — | | | | — | | |
6 | Foreign taxes: Foreign taxes withheld, if any, represent amounts withheld by foreign tax authorities, net of refunds recoverable. Emerging Markets Equity accrues deferred capital gains tax on unrealized gains for certain securities of issuers domiciled in India. At August 31, 2015, there were no outstanding balances of accrued deferred capital gains tax for Emerging Markets Equity. A change in the capital gains tax provision for Greater China Equity for the period ended August 31, 2015 arose due to changes in the tax rules in the People's Republic of China ("PRC") effective November 17, 2014 (the |
| "effective date"). Capital gains derived from the trading of PRC equity investments after the effective date are temporarily exempt from PRC withholding tax. Greater China Equity had accrued deferred capital gains tax on unrealized gains on participatory notes on such investments. Accordingly, a reversal of capital gains tax provisions from prior periods attributable to unrealized appreciation in those participatory notes as of the effective date which amounted to $316,202, is included as part of the change in unrealized appreciation/depreciation in the Statements of Operations. At August 31, 2015, $34,868 of tax attributable to gains realized through the effective date remained payable and is included as accrued capital gains taxes in the Statements of Assets and Liabilities. The tax laws and regulations in the PRC are subject to change, possibly with retroactive effect. |
| | |
| 7 | Distributions to shareholders: Each Fund may earn income, net of expenses, daily on its investments. Distributions from net investment income and net realized capital gains, if any, generally are distributed once a year (usually in December) and are recorded on the ex-date. However, Equity Income, Global Real Estate and Real Estate generally distribute substantially all of their net investment income, if any, at the end of each calendar quarter. It is the policy of each of Equity Income, Global Real Estate, Mid Cap Intrinsic Value, Real Estate and Small Cap Growth to pass through to its shareholders substantially all REIT distributions and other income it receives, less operating expenses. The distributions received from REITs held by Equity Income, Global Real Estate, Mid Cap Intrinsic Value, Real Estate and Small Cap Growth are generally composed of income, capital gains, and/or return of REIT capital, but the REITs do not report this information to Equity Income, Global Real Estate, Mid Cap Intrinsic Value, Real Estate and Small Cap Growth until the following calendar year. At August 31, 2015, Equity Income, Global Real Estate, Mid Cap Intrinsic Value, Real Estate and Small Cap Growth estimated these amounts for the period January 1, 2015 to August 31, 2015 within the financial statements since the information is not available from the REITs until after each Fund's fiscal year-end. All estimates are based upon REIT information sources available to Equity Income, Global Real Estate, Mid Cap Intrinsic Value, Real Estate and Small Cap Growth together with actual IRS Forms 1099-DIV received to date. For the year ended August 31, 2015, the character of distributions paid to shareholders of Equity Income, Global Real Estate, Mid Cap Intrinsic Value and Real Estate disclosed within the Statements of Changes in Net Assets is based on estimates made at that time. Based on past experience it is possible that a portion of Equity Income's, Global Real Estate's, Mid Cap Intrinsic Value's, Real Estate's and Small Cap Growth's distributions during the current fiscal year, if any, will be considered tax return of capital, but the actual amount of the tax return of capital, if any, is not determinable until after each Fund's fiscal year-end. After calendar year-end, when Equity Income, Global Real Estate, Mid Cap Intrinsic Value, Real Estate and Small Cap Growth learn the nature of the distributions paid by REITs during that year, distributions previously identified as income are often recharacterized as return of capital and/or capital gain. After all applicable REITs have informed Equity Income, Global Real Estate, Mid Cap Intrinsic Value, Real Estate and Small Cap Growth of the actual breakdown of distributions paid to Equity Income, Global Real Estate, Mid Cap Intrinsic Value, Real Estate and Small Cap Growth during its fiscal year, estimates previously recorded are adjusted on the books of Equity Income, Global Real Estate, Mid Cap Intrinsic Value, Real Estate and Small Cap Growth to reflect actual results. As a result, the composition of Equity Income's, Global Real Estate's, Mid Cap Intrinsic Value's and Real Estate's distributions as reported herein may differ from the final composition determined after calendar year-end and reported to Equity Income, Global Real Estate, Mid Cap Intrinsic Value and Real Estate shareholders on IRS Form 1099-DIV. |
| | |
| 8 | Organization expenses: Costs incurred by Global Real Estate and World Equity in connection with their organization, which amounted to $87,044 and $61,840, respectively, and are reflected in Organization expense in the Statements of Operations, have been expensed as incurred. |
| | |
| 9 | Expense allocation: Certain expenses are applicable to multiple funds within the complex of related investment companies. Expenses directly attributable to a Fund are charged to that Fund. Expenses of the Trust that are not directly attributable to a particular series of the Trust (e.g., a Fund) are allocated among the series of the Trust, on |
| the basis of relative net assets, except where a more appropriate allocation of expenses to each of the series can otherwise be made fairly. Expenses borne by the complex of related investment companies, which includes open-end and closed-end investment companies for which Management serves as investment manager, that are not directly attributable to a particular investment company in the complex (e.g., the Trust) or series thereof are allocated among the investment companies in the complex or series thereof on the basis of relative net assets, except where a more appropriate allocation of expenses to each of the investment companies in the complex or series thereof can otherwise be made fairly. Each Fund's expenses (other than those specific to each class) are allocated proportionally each day among the classes based upon the relative net assets of each class. |
| | |
| 10 | Investments in foreign securities: Investing in foreign securities may involve certain sovereign and other risks, in addition to the credit and market risks normally associated with domestic securities. These additional risks include the possibility of adverse political and economic developments (including political instability, nationalization, expropriation, or confiscatory taxation) and the potentially adverse effects of unavailability of public information regarding issuers, less governmental supervision and regulation of financial markets, reduced liquidity of certain financial markets, and the lack of uniform accounting, auditing, and financial reporting standards or the application of standards that are different or less stringent than those applied in the United States. Foreign securities also may experience greater price volatility, higher rates of inflation, and delays in settlement. |
| | |
| 11 | Derivative instruments: During the year ended August 31, 2015, certain of the Funds' use of derivatives, as described below, was limited to equity swaps, financial futures, forward contracts and written option transactions. The Funds have adopted the provisions of ASC 815 "Derivatives and Hedging" ("ASC 815"). The disclosure requirements of ASC 815 distinguish between derivatives that qualify for hedge accounting and those that do not. Because investment companies value their derivatives at fair value and recognize changes in fair value through the Statements of Operations, they do not qualify for hedge accounting. Accordingly, even though a Fund's investments in derivatives may represent economic hedges, they are considered non-hedge transactions for purposes of this disclosure. Equity swap contracts: During the period ended August 31, 2015, World Equity used equity swaps to enhance returns, to manage or adjust the risk profile of the Fund or individual positions, to replace more traditional direct investments, to obtain investment exposure to certain markets, to establish net short or net long positions for individual markets, currencies or securities, to gain exposure to securities, markets, sectors or geographical areas and to hedge risk. Equity swaps are two-party contracts in which counterparties exchange the return on a specified reference security, basket of securities, security index or index component for the return based on a fixed or floating interest rate during the period of the swap. Equity swaps are marked to market daily based on the value of the underlying reference entity and the change, if any, is recorded as an unrealized gain or loss. Equity swaps normally do not involve the delivery of securities or other underlying assets. If the other party to an equity swap defaults, the Fund's risk of loss consists of the net amount of payments that the Fund is contractually entitled to receive, if any. Equity swaps are derivatives and their value can be very volatile. To the extent that future market trends, the values of assets or economic factors are not accurately analyzed and predicted, the Fund may suffer a loss, which may exceed the related amounts shown in the Statements of Assets and Liabilities. Periodic payments received or paid by the Fund are recorded as realized gains or losses. At August 31, 2015, the outstanding equity swaps* for World Equity were as follows: |
| Counterparty | | Description | | Expiration
Date(s) | | Value | |
| | | | | | | | | | |
| Goldman Sachs & Co. | | The Fund receives the total return on long positions and pays a specified LIBOR or Federal Funds floating rate, which is denominated in various foreign currencies based on the local currencies of the positions. | | 12/30/2015-
2/6/2017 | | $ | (9,857 | ) | |
| * | The following table represents the individual long positions and related values of the equity swaps as of August 31, 2015. |
| Reference Entity | | Shares | | Notional
Value(a)(b) | | Net Unrealized
Appreciation
(Depreciation) | |
Long Positions | |
United Kingdom | |
Barclays PLC | | | 3,136 | | | $ | 12,935 | | | $ | (311 | ) | |
Barratt Developments PLC | | | 2,573 | | | | 24,968 | | | | 367 | | |
CRH PLC | | | 342 | | | | 10,234 | | | | (113 | ) | |
CRH PLC | | | 1,281 | | | | 36,308 | | | | 1,827 | | |
Croda International PLC | | | 544 | | | | 25,303 | | | | (1,079 | ) | |
Croda International PLC | | | 559 | | | | 24,385 | | | | 506 | | |
Derwent London PLC | | | 463 | | | | 24,843 | | | | 884 | | |
Imperial Tobacco Group PLC | | | 246 | | | | 12,881 | | | | (916 | ) | |
Imperial Tobacco Group PLC | | | 254 | | | | 12,373 | | | | (181 | ) | |
InterContinental Hotels Group PLC | | | 608 | | | | 24,765 | | | | (2,020 | ) | |
ITV PLC | | | 6,008 | | | | 26,332 | | | | (3,187 | ) | |
ITV PLC | | | 3,371 | | | | 14,072 | | | | (1,086 | ) | |
Lloyds Banking Group PLC | | | 18,491 | | | | 24,913 | | | | (2,882 | ) | |
Next PLC | | | 212 | | | | 24,924 | | | | 1,010 | | |
Shire PLC | | | 301 | | | | 24,238 | | | | (950 | ) | |
Vodafone Group PLC | | | 6,692 | | | | 24,436 | | | | (1,077 | ) | |
Wolseley PLC | | | 188 | | | | 12,659 | | | | (481 | ) | |
Wolseley PLC | | | 378 | | | | 24,366 | | | | 119 | | |
Total Long Positions of Equity Swaps | | | | | | | (9,570 | ) | |
Financing Costs and Other Payables | | | | | | | (287 | ) | |
Equity Swaps, at Value Goldman Sachs & Co. | | | | | | $ | (9,857 | ) | |
| Counterparty | | Description | | Expiration
Date(s) | | Value | |
| | | | | | | | | | |
| Morgan Stanley | | The Fund receives the total return on long positions and pays a specified LIBOR or Federal Funds floating rate, which is denominated in various foreign currencies based on the local currencies of the positions. | | 1/2/2017-
2/10/2017 | | $ | (1,052 | ) | |
| * | The following table represents the individual long positions and related values of the equity swaps as of August 31, 2015. |
| Reference Entity | | Shares | | Notional
Value(a)(b) | | Net Unrealized
Appreciation
(Depreciation) | |
Long Positions | |
Germany | |
Rheinmetall AG | | | 9 | | | $ | 500 | | | $ | 55 | | |
Rheinmetall AG | | | 184 | | | | 10,476 | | | | 876 | | |
Rheinmetall AG | | | 460 | | | | 27,992 | | | | 388 | | |
| | | | | | | 1,319 | | |
Reference Entity | | Shares | | Notional
Value(a)(b) | | Net Unrealized
Appreciation
(Depreciation) | |
United Kingdom | |
Barclays PLC | | | 8,972 | | | $ | 36,980 | | | $ | (863 | ) | |
Land Securities Group PLC | | | 1,239 | | | | 25,349 | | | | (1,464 | ) | |
| | | | | | | (2,327 | ) | |
Total Long Positions of Equity Swaps | | | | | | | (1,008 | ) | |
Financing Costs and Other Payables | | | | | | | (44 | ) | |
Equity Swaps, at Value Morgan Stanley | | | | | | | (1,052 | ) | |
| Counterparty | | Description | | Expiration
Date(s) | | Value | |
| | | | | | | | | | |
Merrill Lynch Pierce
Fenner & Smith, Inc. | | The Fund receives the total return on long positions and pays a specified LIBOR or Federal Funds floating rate, which is denominated in various foreign currencies based on the local currencies of the positions. | | 12/30/2016-
2/6/2017 | | $ | (17,655 | ) | |
| * | The following table represents the individual long positions and related values of the equity swaps as of August 31, 2015. |
| Reference Entity | | Shares | | Notional
Value(a)(b) | | Net Unrealized
Appreciation
(Depreciation) | |
Long Positions | |
Taiwan | |
Hermes Microvision, Inc. | | | 450 | | | $ | 30,151 | | | $ | (11,020 | ) | |
Largan Precision Co. Ltd. | | | 211 | | | | 24,167 | | | | (4,536 | ) | |
| | | | | | | (15,556 | ) | |
United Kingdom | |
British American Tobacco PLC | | | 239 | | | | 13,695 | | | | (893 | ) | |
British American Tobacco PLC | | | 209 | | | | 12,389 | | | | (1,194 | ) | |
| | | | | | | (2,087 | ) | |
Total Long Positions of Equity Swaps | | | | | | | (17,643 | ) | |
Financing Costs and Other Payables | | | | | | | (12 | ) | |
Equity Swaps, at Value Merrill Lynch
Pierce Fenner & Smith, Inc. | | | | | | $ | (17,655 | ) | |
Equity Swaps, at Value Total | | | | | | $ | (28,564 | ) | |
(a) | Notional value represents the value (including any fees or commissions) of the long positions when they were established. |
| |
(b) | For the year ended August 31, 2015, the average notional value of equity swaps was $511,692 for long positions. |
Financial futures contracts: During the period ended August 31, 2015, World Equity used financial futures to enhance returns, to manage or adjust the risk profile of the Fund or individual positions, to replace more traditional direct investments, to obtain investment exposure to certain markets, to establish net short or net long positions for individual markets, currencies or securities, to gain exposure to securities, markets, sectors or geographical areas and to hedge risk.
At the time the Fund enters into a financial futures contract, it is required to deposit with the futures commission merchant a specified amount of cash or liquid securities, known as "initial margin," which is a percentage of the value of the financial futures contract being traded that is set by the exchange upon which the futures contract is traded. Each day, the futures contract is valued at the official settlement price of the board of trade or U.S. commodity exchange on which such futures contract is traded. Subsequent payments, known as "variation margin," to and from the broker are made on a daily basis, or as needed, as the market price of the financial futures contract fluctuates. Daily variation margin adjustments, arising from this "mark to market," are recorded by the Fund as unrealized gains or losses.
Although some financial futures by their terms call for actual delivery or acquisition of the underlying securities or currency, in most cases the contracts are closed out prior to delivery by offsetting purchases or sales of matching financial futures. When the contracts are closed, the Fund recognizes a gain or loss. Risks of entering into futures contracts include the possibility there may be an illiquid market, possibly at a time of rapidly declining prices, and/or a change in the value of the contract may not correlate with changes in the value of the underlying securities. Futures executed on regulated futures exchanges have minimal counterparty risk to the Fund because the exchange's clearinghouse assumes the position of the counterparty in each transaction. Thus, the Fund is exposed to risk only in connection with the clearinghouse and not in connection with the original counterparty to the transaction.
For U.S. federal income tax purposes, the futures transactions undertaken by the Fund may cause the Fund to recognize gains or losses from marking contracts to market even though its positions have not been sold or terminated, may affect the character of the gains or losses recognized as long-term or short-term, and may affect the timing of some capital gains and losses realized by the Fund. Also, the Fund's losses on transactions involving futures contracts may be deferred rather than being taken into account currently in calculating the Fund's taxable income.
At August 31, 2015, there were no open positions in financial futures for World Equity.
During the year ended August 31, 2015, the average notional value of financial futures for World Equity was $39,702 for long positions.
Forward foreign currency contracts: During the period ended August 31, 2015, World Equity used forward contracts to enhance returns, to manage or adjust the risk profile of the Fund or individual positions, to replace more traditional direct investments, to obtain investment exposure to certain markets, to establish net short or net long positions for individual markets, currencies or securities, to gain exposure to securities, markets, sectors or geographical areas and to hedge risk.
A forward contract is an agreement between two parties to buy or sell a specific currency for another at a set price on a future date, and is individually negotiated and privately traded by currency traders and their customers in the interbank market. The market value of a forward contract fluctuates with changes in forward currency exchange rates. Forward contracts are marked to market daily, and the change in value is recorded by the Fund as an unrealized gain or loss. At the consummation of a forward contract to purchase or sell currency, the Fund may either exchange the currencies specified at the maturity of the forward contract or enter into a closing transaction involving the purchase or sale of an offsetting forward contract. Closing transactions with respect to forward contracts are usually performed with the counterparty to the original forward contract. The gain or loss arising from the difference between the U.S. dollar cost of the original contract and the value of the foreign currency in
U.S. dollars upon closing a contract is included in "Net realized gain (loss) on forward foreign currency contracts" in the Statements of Operations. These contracts may involve market risk in excess of the unrealized gain or loss reflected in the Statements of Assets and Liabilities. In addition, the Fund could be exposed to risk if the counterparties are unable to meet the terms of the contracts or if the value of the currency changes unfavorably to the U.S. dollar.
At August 31, 2015, open forward contracts for World Equity were as follows:
| Contracts to Deliver | | In Exchange For | | Counterparty | | Settlement
Date | | Net
Unrealized
Appreciation
(Depreciation) | |
| | 6,500,000 | | | Japanese Yen | | $ | 52,328 | | | Bank of America, N.A. | | 9/18/2015 | | $ | (1,300 | ) | |
| | 217,500 | | | Euro Currency | | | 242,062 | | | Bank of America, N.A. | | 9/18/2015 | | | (2,062 | ) | |
| | | | | | | | | | $ | (3,362 | ) | |
For the year ended August 31, 2015, World Equity's investment in forward contracts had an average notional value of $293,493.
Options: Premiums received by a Fund upon writing a covered call option or a put option are recorded in the liability section of the Fund's Statement of Assets and Liabilities and are subsequently adjusted to the current market value. When an option is exercised, closed, or expired, the Fund realizes a gain or loss and the liability is eliminated.
When writing a covered call option, a Fund, in return for the premium, gives up the opportunity for profit from a price increase in the underlying security above the exercise price, but conversely retains the risk of loss should the price of the security decline. When writing a put option, a Fund, in return for the premium, takes the risk that it must purchase the underlying security at a price that may be higher than the current market price of the security. If a covered call or a put option that a Fund has written expires unexercised, the Fund will realize a gain in the amount of the premium. All securities covering outstanding written options are held in escrow by the custodian bank.
Premiums paid by a Fund upon purchasing a call or put option are recorded in the asset section of the Fund's Statement of Assets and Liabilities and are subsequently adjusted to the current market value. When an option is exercised, closed, or expired, the Fund realizes a gain or loss and the asset is eliminated.
Written option transactions were used in an attempt to generate incremental returns for Equity Income for the year ended August 31, 2015. Written option transactions for Equity Income for the year ended August 31, 2015 were:
Equity Income
| | Number of
Contracts | | Premium
Received | |
Outstanding 8/31/2014 | | | 11,767 | | | $ | 1,527,430 | | |
Options written | | | 34,467 | | | | 5,351,581 | | |
Options expired | | | (1,200 | ) | | | (176,196 | ) | |
Options exercised | | | (3,427 | ) | | | (417,191 | ) | |
Options closed | | | (33,721 | ) | | | (4,960,373 | ) | |
Outstanding 8/31/2015 | | | 7,886 | | | $ | 1,325,251 | | |
For the year ended August 31, 2015, Equity Income had an average market value of $(1,939,567) in written options.
At August 31, 2015, Equity Income and World Equity had the following derivatives (which did not qualify as hedging instruments under ASC 815), grouped by primary risk exposure:
Asset Derivatives
| Derivative Type | | Statements of
Assets and
Liabilities Location | | Interest
Rate Risk | | Currency Risk | | Equity Risk | | Total | |
World Equity | |
Swap contracts | | Open swap contracts, at value(1) | | $ | — | | | $ | — | | | $ | 6,032 | | | $ | 6,032 | | |
Total Value—Assets | | | | $ | — | | | $ | — | | | $ | 6,032 | | | $ | 6,032 | | |
Liability Derivatives
| Derivative Type | | Statements of
Assets and
Liabilities Location | | Interest
Rate Risk | | Currency Risk | | Equity Risk | | Total | |
Equity Income | |
Option contracts written | | Option contracts written, at value | | $ | — | | | $ | — | | | $ | (1,964,860 | ) | | $ | (1,964,860 | ) | |
Total Value—Liabilities | | | | $ | — | | | $ | — | | | $ | (1,964,860 | ) | | $ | (1,964,860 | ) | |
World Equity | |
Swap contracts | | Open swap contracts, at value(1) | | $ | — | | | $ | — | | | $ | (34,596 | ) | | $ | (34,596 | ) | |
Forward contracts | | Payable for open forward foreign currency contracts | | | — | | | | (3,362 | ) | | | — | | | | (3,362 | ) | |
Total Value—Liabilities | | | | $ | — | | | $ | (3,362 | ) | | $ | (34,596 | ) | | $ | (37,958 | ) | |
(1) | "Swap contracts" reflects the appreciation (depreciation) of the equity swap contracts plus accrued interest as of August 31, 2015, which is reflected in the Statements of Assets and Liabilities under the caption "Open swap contracts, at value (Note A)." The impact of the use of these derivative instruments on the Statements of Operations during the year ended August 31, 2015, was as follows: |
Realized Gain (Loss)
| Derivative Type | | Statements of
Operations Location | | Interest
Rate Risk | | Currency Risk | | Equity Risk | | Total | |
Equity Income | |
Option contracts written | | Net realized gain (loss) on: option contracts written | | $ | — | | | $ | — | | | $ | 2,441,713 | | | $ | 2,441,713 | | |
Total Realized Gain (Loss) | | | | $ | — | | | $ | — | | | $ | 2,441,713 | | | $ | 2,441,713 | | |
| Derivative Type | | Statements of
Operations Location | | Interest
Rate Risk | | Currency Risk | | Equity Risk | | Total | |
World Equity | |
Swap contracts | | Net realized gain (loss) on: swap contracts | | $ | — | | | $ | — | | | $ | (9,727 | ) | | $ | (9,727 | ) | |
Futures contracts | | Net realized gain (loss) on: financial futures contracts | | | — | | | | — | | | | 3,637 | | | | 3,637 | | |
Forward contracts | | Net realized gain (loss) on: forward foreign currency contracts | | | — | | | | (8,571 | ) | | | — | | | | (8,571 | ) | |
Total Realized Gain (Loss) | | | | $ | — | | | $ | (8,571 | ) | | $ | (6,090 | ) | | $ | (14,661 | ) | |
Change in Appreciation (Depreciation)
| Derivative Type | | Statements of
Operations Location | | Interest
Rate Risk | | Currency Risk | | Equity Risk | | Total | |
Equity Income | |
Option contracts written | | Change in net unrealized appreciation (depreciation) in value of: option contracts written | | $ | — | | | $ | — | | | $ | (102,797 | ) | | $ | (102,797 | ) | |
Total Change in
Appreciation (Depreciation) | | | | $ | — | | | $ | — | | | $ | (102,797 | ) | | $ | (102,797 | ) | |
World Equity | |
Swap contracts | | Change in net unrealized appreciation (depreciation) in value of: swap contracts | | $ | — | | | $ | — | | | $ | (28,564 | ) | | $ | (28,564 | ) | |
Forward contracts | | Change in net unrealized appreciation (depreciation) in value of: forward foreign currency contracts | | | — | | | | (3,362 | ) | | | — | | | | (3,362 | ) | |
| Total Change in Appreciation (Depreciation) | | | | $ | — | | | $ | (3,362 | ) | | $ | (28,564 | ) | | $ | (31,926 | ) | |
While the Funds may receive rights and warrants in connection with their investments in securities, these rights and warrants are not considered "derivative instruments" under ASC 815. Management has concluded that the Funds, except Equity Income and World Equity, did not hold any derivative instruments during the year ended August 31, 2015 that require additional disclosures pursuant to ASC 815.
The Funds adopted the provisions of Accounting Standards Update ("ASU") 2011-11 Disclosures about Offsetting Assets and Liabilities ("ASU 2011-11"). ASU 2011-11 is intended to enhance disclosure requirements on the offsetting of financial assets and liabilities. Pursuant to ASU 2011-11, an entity is required to disclose both gross and net information for assets and liabilities related to derivatives, repurchase and reverse repurchase agreements, and securities lending and securities borrowing transactions that are eligible for offset or subject to an enforceable master netting or similar agreement. ASU 2011-11 is applicable to only World Equity at August 31, 2015. World Equity's derivative assets and liabilities at fair value by type are reported gross in the Statements of Assets and Liabilities. The following tables present World Equity's derivative assets and liabilities by counterparty, net of
amounts available for offset under a master netting agreement and net of the related collateral received by World Equity for assets, if any, and pledged by World Equity for liabilities, if any, as of August 31, 2015.
| Description | | Gross Amounts of
Recognized Assets | | Gross Amounts Offset
in the Statements of
Assets and Liabilities | | Net Amounts of Assets
Presented in the Statements
of Assets and Liabilities | |
Swap contracts | | $ | 6,032 | | | $ | — | | | $ | 6,032 | | |
Forward contracts | | | — | | | | — | | | | — | | |
Total | | $ | 6,032 | | | $ | — | | | $ | 6,032 | | |
Gross Amounts Not Offset in the Statements of Assets and Liabilities
| Counterparty | | Net Amounts of
Assets Presented in
the Statements of Assets
and Liabilities | | Financial
Instruments | | Cash Collateral
Received(a) | | Net Amount(b) | |
Goldman Sachs & Co. | | $ | 4,713 | | | $ | (4,713 | ) | | $ | — | | | $ | — | | |
Morgan Stanley | | | 1,319 | | | | (1,319 | ) | | | — | | | | — | | |
Total | | $ | 6,032 | | | $ | (6,032 | ) | | $ | — | | | $ | — | | |
| Description | | Gross Amounts of
Recognized Liabilities | | Gross Amounts Offset
in the Statements of
Assets and Liabilities | | Net Amounts of Liabilities
Presented in the Statements
of Assets and Liabilities | |
Swap contracts | | $ | (34,596 | ) | | $ | — | | | $ | (34,596 | ) | |
Forward contracts | | | (3,362 | ) | | | — | | | | (3,362 | ) | |
Total | | $ | (37,958 | ) | | $ | — | | | $ | (37,958 | ) | |
Gross Amounts Not Offset in the Statements of Assets and Liabilities
| Counterparty | | Net Amounts of
Liabilities Presented in
the Statements of Assets
and Liabilities | | Financial
Instruments | | Cash Collateral
Pledged(a) | | Net Amount(c) | |
Bank of America, N.A. | | $ | (3,362 | ) | | $ | — | | | $ | — | | | $ | (3,362 | ) | |
Goldman Sachs & Co. | | | (14,570 | ) | | | 4,713 | | | | — | | | | (9,857 | ) | |
Morgan Stanley | | | (2,371 | ) | | | 1,319 | | | | — | | | | (1,052 | ) | |
Merrill Lynch Pierce Fenner & Smith, Inc. | | | (17,655 | ) | | | — | | | | | | (17,655 | ) | |
Total | | $ | (37,958 | ) | | $ | 6,032 | | | $ | — | | | $ | (31,926 | ) | |
(a) | Collateral received (or pledged) is limited to an amount not to exceed 100% of the net amount of assets (or liabilities) in the tables presented above, for each respective counterparty. |
| | |
| (b) | Net Amount represents amounts subject to loss as of August 31, 2015, in the event of a counterparty failure. |
| | |
| (c) | Net Amount represents amounts under-collateralized by World Equity to each counterparty as of August 31, 2015. |
| | |
| 12 | In-kind subscriptions: Under certain circumstances, and when considered to be in the best interest of a Fund, the Fund may accept portfolio securities rather than cash as payment for the purchase of Fund shares (in-kind subscription). For financial reporting and tax purposes, the cost basis of contributed securities is equal to the market value of the securities, less any applicable foreign security taxes, on the date of contribution. In-kind subscriptions result in no gain or loss and no tax consequences for a Fund. During the year ended August 31, 2014, Socially Responsive accepted $8,240,922 of in-kind subscriptions. |
| | |
| 13 | In-kind redemptions: In accordance with guidelines described in a Fund's prospectus, a Fund may distribute portfolio securities rather than cash as payment for a redemption of Fund shares (in-kind redemption). For |
| financial reporting purposes, the Fund recognizes a gain on in-kind redemptions to the extent the value of the distributed securities on the date of redemption exceeds the cost of those securities. Gains and losses realized on in-kind redemptions are not recognized for tax purposes and are reclassified from undistributed net realized gain (loss) to paid-in capital. During the year ended August 31, 2014, Socially Responsive realized $22,727,127 of net gain on $68,411,909 of in-kind redemptions. |
| | |
| 14 | Indemnifications: Like many other companies, the Trust's organizational documents provide that its officers ("Officers") and trustees ("Trustees") are indemnified against certain liabilities arising out of the performance of their duties to the Trust. In addition, both in some of its principal service contracts and in the normal course of its business, the Trust enters into contracts that provide indemnifications to other parties for certain types of losses or liabilities. The Trust's maximum exposure under these arrangements is unknown as this could involve future claims against the Trust. |
| | |
| 15 | Other: All net investment income and realized and unrealized capital gains and losses of each Fund are allocated, on the basis of relative net assets, pro rata among its respective classes. |
Note B—Investment Management Fees, Administration Fees, Distribution Arrangements, and Other Transactions with Affiliates:
Each Fund retains Management as its investment manager under an Investment Management Agreement. For such investment management services, each Fund pays Management a fee according to the following table:
Investment Management Fee as a Percentage of Average Daily Net Assets:
| | First
$250
million | | Next
$250
million | | Next
$250
million | | Next
$250
million | | Next
$500
million | | Next
$500
million | | Next
$500
million | | Next
$1.5
billion | | Thereafter | |
For Genesis, Intrinsic Value, and Small Cap Growth: | |
| | | | 0.85 | % | | | 0.80 | % | | | 0.75 | % | | | 0.70 | % | | | 0.65 | % | | | 0.65 | % | | | 0.65 | % | | | 0.65 | % | | | 0.65 | % | |
For Emerging Markets Equity: | |
| | | | 1.00 | % | | | 0.975 | % | | | 0.95 | % | | | 0.925 | % | | | 0.90 | % | | | 0.875 | % | | | 0.875 | % | | | 0.875 | % | | | 0.85 | % | |
For Global Real Estate and Real Estate: | |
| | | | 0.80 | % | | | 0.80 | % | | | 0.80 | % | | | 0.80 | % | | | 0.80 | % | | | 0.80 | % | | | 0.80 | % | | | 0.80 | % | | | 0.80 | % | |
| For International Equity(1): | |
| | | | 0.85 | % | | | 0.825 | % | | | 0.80 | % | | | 0.775 | % | | | 0.75 | % | | | 0.725 | % | | | 0.725 | % | | | 0.70 | % | | | 0.70 | % | |
| For All Cap Core, Equity Income, Focus, Guardian, International Select, Large Cap Disciplined Growth, Large Cap Value, Mid Cap Growth, Mid Cap Intrinsic Value(1), Socially Responsive and Value: | |
| | | | 0.55 | % | | | 0.525 | % | | | 0.50 | % | | | 0.475 | % | | | 0.45 | % | | | 0.425 | % | | | 0.425 | % | | | 0.425 | % | | | 0.40 | % | |
For Multi-Cap Opportunities: | |
| | | 0.60 | % | | | 0.575 | % | | | 0.55 | % | | | 0.525 | % | | | 0.50 | % | | | 0.475 | % | | | 0.475 | % | | | 0.475 | % | | | 0.45 | % | |
For Global Equity: | |
| | | | 0.75 | % | | | 0.725 | % | | | 0.70 | % | | | 0.675 | % | | | 0.65 | % | | | 0.625 | % | | | 0.625 | % | | | 0.625 | % | | | 0.60 | % | |
For Greater China Equity: | |
| | | 1.10 | % | | | 1.10 | % | | | 1.10 | % | | | 1.10 | % | | | 0.95 | % | | | 0.95 | % | | | 0.95 | % | | | 0.95 | % | | | 0.95 | % | |
For World Equity: | |
| | | 0.70 | % | | | 0.675 | % | | | 0.65 | % | | | 0.625 | % | | | 0.60 | % | | | 0.575 | % | | | 0.575 | % | | | 0.575 | % | | | 0.50 | % | |
(1) | Effective May 1, 2015, Management has voluntarily agreed to waive its management fee in the amount of 0.18% of the average daily net assets of International Equity (0.21% effective February 1, 2014, and 0.18% effective January 28, 2013). Effective March 1, 2015, Management has voluntarily agreed to waive its management fee in the amount of 0.16% of the average daily net assets of Mid Cap Intrinsic Value (0.20% effective October 13, 2014, 0.30% effective February 1, 2014, 0.36% effective May 1, 2013, 0.33% effective February 1, 2013, 0.28% effective December 1, 2012 and 0.25% effective February 1, 2012). Management may, at its sole discretion, modify or terminate these voluntary waivers without notice to International Equity or Mid Cap Intrinsic Value. For the year ended August 31, 2015, such waived fees amounted to $2,297,851 and $183,271for International Equity and Mid Cap Intrinsic Value, respectively. These amounts are not subject to recovery by Management. Accordingly, for the year ended August 31, 2015, the investment management fee pursuant to the Investment Management Agreement was equivalent to an annual effective rate of each Fund's average daily net assets, as follows: |
| | | Effective
Rate | | | | Effective
Rate |
All Cap Core | | | 0.55 | % | | Intrinsic Value | | | 0.83 | % |
Emerging Markets Equity | | | 0.98 | % | | Large Cap Disciplined Growth | | | 0.55 | % |
Equity Income | | | 0.47 | % | | Large Cap Value | | | 0.49 | % |
Focus | | | 0.52 | % | | Mid Cap Growth | | | 0.51 | % |
Genesis | | | 0.66 | % | | Mid Cap Intrinsic Value | | | 0.55 | %(2) |
Global Equity | | | 0.75 | % | | Multi-Cap Opportunities | | | 0.51 | % |
Global Real Estate | | | 0.80 | % | | Real Estate | | | 0.80 | % |
Greater China Equity | | | 1.10 | % | | Small Cap Growth | | | 0.85 | % |
Guardian | | | 0.49 | % | | Socially Responsive | | | 0.47 | % |
International Equity | | | 0.80 | %(1) | | Value | | | 0.55 | % |
International Select | | | 0.55 | % | | World Equity | | | 0.70 | % |
(1) | 0.61% annual effective net rate of the Fund's average daily net assets. |
| | |
| (2) | 0.36% annual effective net rate of the Fund's average daily net assets. Each Fund retains Management as its administrator under an Administration Agreement. Each Fund pays Management an administration fee at the annual rate of 0.06% of its average daily net assets under this agreement. In addition, Investor Class, Class A, Class C and Class R3 of each Fund that offers those classes pays Management an administration fee at the annual rate of 0.20% of its average daily net assets, Trust Class and Advisor Class of each Fund that offers those classes pays Management an administration fee at the annual rate of 0.34% of its average daily net assets, Institutional Class of each Fund pays Management an administration fee at the annual rate of 0.09% of its average daily net assets, and Class R6 of each Fund that offers that class pays Management an administration fee of 0.02% of its average daily net assets, under this agreement. Additionally, Management retains State Street Bank and Trust Company ("State Street") as its sub-administrator under a Sub-Administration Agreement. Management pays State Street a fee for all services received under the agreement. For the Trust Class of Focus, Guardian, International Select, Large Cap Value, Mid Cap Intrinsic Value, Real Estate, Small Cap Growth and Socially Responsive, the Advisor Class of each Fund that offers that class, and Class A, Class C and Class R3 of each Fund that offers those classes, Management acts as agent in arranging for the sale of class shares without commission and bears advertising and promotion expenses. The Board has adopted distribution plans (each a "Plan", collectively, the "Plans") with respect to these classes, pursuant to Rule 12b-1 under the 1940 Act. The Plans provide that, as compensation for administrative and other services provided to these classes, Management's activities and expenses related to the sale and distribution of these classes, and ongoing services provided to investors in these classes, Management receives from each of these classes a fee at the annual rate of 0.10% of such Trust Class's, 0.25% of such Advisor Class's, 0.25% of such Class A's, 1.00% of such Class C's |
and 0.50% of such Class R3's average daily net assets. Management receives this amount to provide distribution and shareholder servicing for those classes and pays a portion of it to institutions that provide such services. Those institutions may use the payments for, among other purposes, compensating employees engaged in sales and/or shareholder servicing. The amount of fees paid by each class during any year could have been more or less than the cost of distribution and other services provided to that class. FINRA rules limit the amount of annual distribution fees that may be paid by a mutual fund and impose a ceiling on the cumulative distribution fees paid. The Trust's Plans comply with those rules.
Management has contractually agreed to waive fees and/or reimburse certain expenses of the Investor Class of each of International Equity, Large Cap Disciplined Growth, Mid Cap Intrinsic Value and Small Cap Growth and the Trust Class, Advisor Class, Institutional Class, Class A, Class C, Class R3 and Class R6 of each Fund that offers those classes so that the total annual operating expenses of those classes do not exceed the expense limitations as detailed in the following table. These undertakings apply to a Fund's direct expenses and exclude interest, taxes, brokerage commissions, acquired fund fees and expenses, extraordinary expenses, and dividend and interest expenses relating to short sales, if any; consequently, net expenses may exceed the contractual expense limitations. Each Fund has agreed that each of its respective classes will repay Management for fees and expenses waived or reimbursed for that class provided that repayment does not cause that class's annual operating expenses to exceed its contractual expense limitation in place at the time the fees and expenses were waived or reimbursed, or the expense limitation in place at the time the Fund repays Management, whichever is lower. Any such repayment must be made within three years after the year in which Management incurred the expense.
During the year ended August 31, 2015, the following classes repaid Management under their contractual expense limitation agreements as follows:
Class | | Expenses
Repaid to
Management | |
International Equity Fund Institutional Class | | $ | 180,278 | | |
International Equity Fund Class A | | | 3,941 | | |
International Equity Fund Class R6 | | | 1,490 | | |
Large Cap Value Fund Institutional Class | | | 1,631 | | |
Large Cap Value Fund Class C | | | 168 | | |
Mid Cap Growth Fund Institutional Class | | | 61,470 | | |
Mid Cap Growth Fund Class A | | | 4,864 | | |
Mid Cap Growth Fund Class R6 | | | 1,815 | | |
| | | | | | |
At August 31, 2015, contingent liabilities to Management under the agreements were as follows:
| | | | | | | Expenses Reimbursed in
Fiscal Period Ending August 31, | |
| | | | | | | 2013 | | 2014 | | 2015 | |
| | | | | | | Subject to Repayment until
August 31, | |
Class | | Contractual
Expense
Limitation(1) | | Expiration | | 2016 | | 2017 | | 2018 | |
All Cap Core Fund Institutional Class | | | 0.75 | % | | 8/31/18 | | $ | 125,967 | | | $ | 142,102 | | | $ | 193,802 | | |
All Cap Core Fund Class A | | | 1.20 | % | | 8/31/18 | | | 84,083 | | | | 64,707 | | | | 38,933 | | |
All Cap Core Fund Class C | | | 1.95 | % | | 8/31/18 | | | 33,146 | | | | 30,603 | | | | 33,756 | | |
Emerging Markets Equity Fund Institutional Class | | | 1.25 | % | | 8/31/18 | | | 993,712 | | | | 883,793 | | | | 744,611 | | |
Emerging Markets Equity Fund Class A | | | 1.50 | % | | 8/31/18 | | | 30,312 | | | | 50,749 | | | | 48,820 | | |
Emerging Markets Equity Fund Class C | | | 2.25 | % | | 8/31/18 | | | 13,600 | | | | 17,601 | | | | 19,352 | | |
| | | | | | | Expenses Reimbursed in
Fiscal Period Ending August 31, | |
| | | | | | 2013 | | 2014 | | 2015 | |
| | | | | | Subject to Repayment until
August 31, | |
| Class | | Contractual
Expense
Limitation(1) | | Expiration | | 2016 | | 2017 | | 2018 | |
Emerging Markets Equity Fund Class R3 | | | 1.91 | % | | 8/31/18 | | $ | 689 | | | $ | 937 | | | $ | 1,334 | | |
Emerging Markets Equity Fund Class R6 | | | 1.18 | % | | 8/31/18 | | | 38,968 | (4) | | | 122,359 | | | | 135,881 | | |
Equity Income Fund Institutional Class | | | 0.80 | % | | 8/31/18 | | | — | | | | — | | | | — | | |
Equity Income Fund Class A | | | 1.16 | % | | 8/31/18 | | | — | | | | — | | | | — | | |
Equity Income Fund Class C | | | 1.91 | % | | 8/31/18 | | | — | | | | — | | | | — | | |
Equity Income Fund Class R3 | | | 1.41 | % | | 8/31/18 | | | — | | | | — | | | | — | | |
Focus Fund Trust Class | | | 1.50 | % | | 8/31/18 | | | — | | | | — | | | | — | | |
Focus Fund Advisor Class | | | 1.50 | % | | 8/31/22 | | | — | | | | — | | | | — | | |
Focus Fund Institutional Class | | | 0.75 | % | | 8/31/18 | | | 4,649 | | | | 521 | | | | 1,569 | | |
Focus Fund Class A | | | 1.11 | % | | 8/31/18 | | | 977 | | | | 726 | | | | 1,267 | | |
Focus Fund Class C | | | 1.86 | % | | 8/31/18 | | | 342 | | | | 435 | | | | 714 | | |
Genesis Fund Trust Class | | | 1.50 | % | | 8/31/18 | | | — | | | | — | | | | — | | |
Genesis Fund Advisor Class | | | 1.50 | % | | 8/31/22 | | | — | | | | — | | | | — | | |
Genesis Fund Institutional Class | | | 0.85 | % | | 8/31/22 | | | 117,849 | | | | — | | | | 114,064 | | |
Genesis Fund Class R6 | | | 0.78 | % | | 8/31/18 | | | — | (4) | | | — | | | | 98,555 | | |
Global Equity Fund Institutional Class | | | 1.15 | % | | 8/31/18 | | | 261,844 | | | | 210,511 | | | | 250,677 | | |
Global Equity Fund Class A | | | 1.51 | % | | 8/31/18 | | | 6,060 | | | | 2,179 | | | | 14,279 | | |
Global Equity Fund Class C | | | 2.26 | % | | 8/31/18 | | | 2,623 | | | | 967 | | | | 5,804 | | |
Global Real Estate Fund Institutional Class | | | 1.00 | % | | 8/31/18 | | | — | | | | — | | | | 185,695 | (8) | |
Global Real Estate Fund Class A | | | 1.36 | % | | 8/31/18 | | | — | | | | — | | | | 58,618 | (8) | |
Global Real Estate Fund Class C | | | 2.11 | % | | 8/31/18 | | | — | | | | — | | | | 24,540 | (8) | |
Greater China Equity Fund Institutional Class | | | 1.50 | % | | 8/31/18 | | | 160,702 | (5) | | | 193,960 | | | | 127,913 | | |
Greater China Equity Fund Class A | | | 1.86 | % | | 8/31/18 | | | 2,385 | (5) | | | 1,756 | | | | 5,520 | | |
Greater China Equity Fund Class C | | | 2.61 | % | | 8/31/18 | | | 2,350 | (5) | | | 264 | | | | 302 | | |
Guardian Fund Trust Class | | | 1.50 | % | | 8/31/18 | | | — | | | | — | | | | — | | |
Guardian Fund Advisor Class | | | 1.50 | % | | 8/31/22 | | | — | | | | — | | | | 147 | | |
Guardian Fund Institutional Class | | | 0.75 | % | | 8/31/18 | | | — | | | | — | | | | — | | |
Guardian Fund Class A | | | 1.11 | % | | 8/31/18 | | | — | | | | — | | | | — | | |
Guardian Fund Class C | | | 1.86 | % | | 8/31/18 | | | — | | | | — | | | | — | | |
Guardian Fund Class R3 | | | 1.36 | % | | 8/31/18 | | | 134 | | | | 114 | | | | 82 | | |
International Equity Fund Investor Class | | | 1.40 | % | | 8/31/18 | | | — | (3) | | | — | | | | — | | |
International Equity Fund Trust Class | | | 2.00 | % | | 8/31/22 | | | — | (3) | | | — | | | | — | | |
International Equity Fund Institutional Class | | | 0.85 | % | | 8/31/22 | | | 784,945 | | | | 213,333 | | | | — | | |
International Equity Fund Class A | | | 1.21 | %(6) | | 8/31/18 | | | — | (3) | | | 8,879 | | | | — | | |
International Equity Fund Class C | | | 1.96 | %(6) | | 8/31/18 | | | 1,409 | (3) | | | 1,864 | | | | 280 | | |
International Equity Fund Class R6 | | | 0.78 | % | | 8/31/18 | | | — | | | | — | (7) | | | — | | |
International Select Fund Trust Class | | | 1.25 | % | | 8/31/18 | | | 17,980 | | | | 10,697 | | | | 9,411 | | |
| | | | | | | Expenses Reimbursed in
Fiscal Period Ending August 31, | |
| | | | | | 2013 | | 2014 | | 2015 | |
| | | | | | Subject to Repayment until
August 31, | |
| Class | | Contractual
Expense
Limitation(1) | | Expiration | | 2016 | | 2017 | | 2018 | |
International Select Fund Institutional Class | | | 0.90 | % | | 8/31/18 | | $ | 126,756 | | | $ | 58,414 | | | $ | 59,370 | | |
International Select Fund Class A | | | 1.30 | %(2) | | 8/31/18 | | | 6,163 | | | | 430 | | | | 535 | | |
International Select Fund Class C | | | 2.00 | % | | 8/31/18 | | | 3,613 | | | | 2,151 | | | | 1,862 | | |
International Select Fund Class R3 | | | 1.51 | % | | 8/31/18 | | | 1,103 | | | | 1,076 | | | | 1,375 | | |
Intrinsic Value Fund Institutional Class | | | 1.00 | % | | 8/31/18 | | | 289,297 | | | | 302,070 | | | | 340,028 | | |
Intrinsic Value Fund Class A | | | 1.36 | % | | 8/31/18 | | | 20,599 | | | | 28,539 | | | | 36,427 | | |
Intrinsic Value Fund Class C | | | 2.11 | % | | 8/31/18 | | | 16,477 | | | | 17,391 | | | | 20,091 | | |
Large Cap Disciplined Growth Fund Investor Class | | | 1.11 | % | | 8/31/18 | | | — | | | | — | | | | 24,759 | | |
Large Cap Disciplined Growth Fund Institutional Class | | | 0.75 | % | | 8/31/18 | | | 219,810 | | | | 239,882 | | | | 207,321 | | |
Large Cap Disciplined Growth Fund Class A | | | 1.11 | % | | 8/31/18 | | | 29,500 | | | | 32,217 | | | | 17,358 | | |
Large Cap Disciplined Growth Fund Class C | | | 1.86 | % | | 8/31/18 | | | 15,074 | | | | 23,600 | | | | 44,223 | | |
Large Cap Disciplined Growth Fund Class R3 | | | 1.36 | % | | 8/31/18 | | | 327 | | | | 375 | | | | 845 | | |
Large Cap Value Fund Trust Class | | | 1.50 | % | | 8/31/18 | | | — | | | | — | | | | — | | |
Large Cap Value Fund Advisor Class | | | 1.50 | % | | 8/31/22 | | | — | | | | — | | | | — | | |
Large Cap Value Fund Institutional Class | | | 0.70 | % | | 8/31/18 | | | — | | | | — | | | | — | | |
Large Cap Value Fund Class A | | | 1.11 | % | | 8/31/18 | | | — | | | | — | | | | — | | |
Large Cap Value Fund Class C | | | 1.86 | % | | 8/31/18 | | | — | | | | — | | | | — | | |
Large Cap Value Fund Class R3 | | | 1.36 | % | | 8/31/18 | | | 83 | | | | 82 | | | | 150 | | |
Mid Cap Growth Fund Trust Class | | | 1.50 | % | | 8/31/18 | | | — | | | | — | | | | — | | |
Mid Cap Growth Fund Advisor Class | | | 1.50 | % | | 8/31/22 | | | — | | | | — | | | | — | | |
Mid Cap Growth Fund Institutional Class | | | 0.75 | % | | 8/31/18 | | | 70,962 | | | | 6,497 | | | | — | | |
Mid Cap Growth Fund Class A | | | 1.11 | % | | 8/31/18 | | | 51,584 | | | | 19,819 | | | | — | | |
Mid Cap Growth Fund Class C | | | 1.86 | % | | 8/31/18 | | | 2,985 | | | | 2,522 | | | | 1,417 | | |
Mid Cap Growth Fund Class R3 | | | 1.36 | % | | 8/31/18 | | | 3,079 | | | | 1,821 | | | | 1,091 | | |
Mid Cap Growth Fund Class R6 | | | 0.68 | % | | 8/31/18 | | | — | (4) | | | — | | | | — | | |
Mid Cap Intrinsic Value Fund Investor Class | | | 1.50 | % | | 8/31/22 | | | — | | | | — | | | | — | | |
Mid Cap Intrinsic Value Fund Trust Class | | | 1.25 | % | | 8/31/22 | | | 13,066 | | | | — | | | | 5,431 | | |
Mid Cap Intrinsic Value Fund Institutional Class | | | 0.85 | % | | 8/31/18 | | | 3,203 | | | | — | | | | 9,476 | | |
Mid Cap Intrinsic Value Fund Class A | | | 1.21 | % | | 8/31/18 | | | 5,190 | | | | — | | | | 6,502 | | |
Mid Cap Intrinsic Value Fund Class C | | | 1.96 | % | | 8/31/18 | | | 494 | | | | — | | | | 1,413 | | |
Mid Cap Intrinsic Value Fund Class R3 | | | 1.46 | % | | 8/31/18 | | | 203 | | | | 60 | | | | 515 | | |
Multi-Cap Opportunities Fund Institutional Class | | | 1.00 | % | | 8/31/18 | | | — | | | | — | | | | — | | |
Multi-Cap Opportunities Fund Class A | | | 1.36 | % | | 8/31/18 | | | — | | | | — | | | | — | | |
Multi-Cap Opportunities Fund Class C | | | 2.11 | % | | 8/31/18 | | | — | | | | — | | | | — | | |
Real Estate Fund Trust Class | | | 1.50 | %(2) | | 8/31/22 | | | — | | | | — | | | | — | | |
Real Estate Fund Institutional Class | | | 0.85 | % | | 8/31/22 | | | 707,517 | | | | 817,481 | | | | 815,617 | | |
Real Estate Fund Class A | | | 1.21 | % | | 8/31/18 | | | 336,286 | | | | 372,528 | | | | 344,667 | | |
| | | | | | | Expenses Reimbursed in
Fiscal Period Ending August 31, | |
| | | | | | | 2013 | | 2014 | | 2015 | |
| | | | | | | Subject to Repayment until
August 31, | |
Class | | Contractual
Expense
Limitation(1) | | Expiration | | 2016 | | 2017 | | 2018 | |
Real Estate Fund Class C | | | 1.96 | % | | 8/31/18 | | $ | 90,654 | | | $ | 95,712 | | | $ | 82,791 | | |
Real Estate Fund Class R3 | | | 1.46 | % | | 8/31/18 | | | 24,426 | | | | 40,953 | | | | 50,213 | | |
Real Estate Fund Class R6 | | | 0.78 | % | | 8/31/18 | | | 5,033 | (4) | | | 29,668 | | | | 58,233 | | |
Small Cap Growth Fund Investor Class | | | 1.30 | %(2) | | 8/31/22 | | | 177,688 | | | | 192,480 | | | | 193,142 | | |
Small Cap Growth Fund Trust Class | | | 1.40 | % | | 8/31/22 | | | 60,615 | | | | 34,116 | | | | 25,252 | | |
Small Cap Growth Fund Advisor Class | | | 1.60 | %(2) | | 8/31/22 | | | 14,942 | | | | 14,620 | | | | 12,127 | | |
Small Cap Growth Fund Institutional Class | | | 0.90 | % | | 8/31/18 | | | 147,976 | | | | 95,710 | | | | 111,321 | | |
Small Cap Growth Fund Class A | | | 1.26 | % | | 8/31/18 | | | 9,439 | | | | 28,007 | | | | 26,944 | | |
Small Cap Growth Fund Class C | | | 2.01 | % | | 8/31/18 | | | 4,742 | | | | 9,549 | | | | 10,735 | | |
Small Cap Growth Fund Class R3 | | | 1.51 | % | | 8/31/18 | | | 1,908 | | | | 3,116 | | | | 4,968 | | |
Socially Responsive Fund Trust Class | | | 1.50 | % | | 8/31/18 | | | — | | | | — | | | | — | | |
Socially Responsive Fund Institutional Class | | | 0.75 | % | | 8/31/18 | | | — | | | | — | | | | — | | |
Socially Responsive Fund Class A | | | 1.11 | % | | 8/31/18 | | | — | | | | — | | | | — | | |
Socially Responsive Fund Class C | | | 1.86 | % | | 8/31/18 | | | — | | | | — | | | | — | | |
Socially Responsive Fund Class R3 | | | 1.36 | % | | 8/31/18 | | | — | | | | — | | | | — | | |
Socially Responsive Fund Class R6 | | | 0.68 | % | | 8/31/18 | | | — | (4) | | | — | | | | — | | |
Value Fund Institutional Class | | | 0.75 | %(2) | | 8/31/18 | | | 122,469 | | | | 156,332 | | | | 166,457 | | |
Value Fund Class A | | | 1.11 | %(2) | | 8/31/18 | | | 141,386 | | | | 94,806 | | | | 98,743 | | |
Value Fund Class C | | | 1.86 | %(2) | | 8/31/18 | | | 8,538 | | | | 7,238 | | | | 7,050 | | |
World Equity Fund Institutional Class | | | 1.00 | % | | 8/31/18 | | | — | | | | — | | | | 105,110 | (9) | |
World Equity Fund Class A | | | 1.36 | % | | 8/31/18 | | | — | | | | — | | | | 14,475 | (9) | |
World Equity Fund Class C | | | 2.11 | % | | 8/31/18 | | | — | | | | — | | | | 14,548 | (9) | |
(1) | Expense limitation per annum of the respective class's average daily net assets. |
| |
(2) | In addition, Management has voluntarily undertaken to waive current payment of fees and/or reimburse certain expenses of Class A of International Select, the Trust Class of Real Estate, the Investor Class of Small Cap Growth, the Advisor Class of Small Cap Growth, the Institutional Class of Value, Class A of Value and Class C of Value, so that their Operating Expenses are limited to 1.24%, 1.04%, 1.21% (1.25% prior to December 1, 2012), 1.51% (1.55% prior to December 1, 2012), 0.70%, 1.08% (effective December 12, 2014; 1.06% from September 12, 2014 to December 11, 2014; 1.08% from June 13, 2014 to September 11, 2014; 1.09% from March 14, 2014 to June 12, 2014; and 1.04% prior to October 12, 2012), and 1.83% (effective December 12, 2014), respectively, per annum of their average daily net assets. For the year ended August 31, 2015, voluntary reimbursements for Class A of International Select, the Trust Class of Real Estate, the Investor Class of Small Cap Growth, the Advisor Class of Small Cap Growth, the Institutional Class of Value, Class A of Value and Class C of Value amounted to $4,437, $1,069,784, $46,449, $2,764, $8,233, $2,745 and $168, respectively. These amounts are not subject to recovery by Management. These undertakings, which are terminable by Management upon notice to International Select, Real Estate, Small Cap Growth and Value, are in addition to the contractual undertakings as stated above. |
| |
(3) | Period from January 28, 2013 (Commencement of Operations) to August 31, 2013. |
(4) | Period from March 15, 2013 (Commencement of Operations) to August 31, 2013. |
| |
(5) | Period from July 17, 2013 (Commencement of Operations) to August 31, 2013. |
| |
(6) | From January 28, 2013 to June 27, 2013, the contractual expense limitation was 1.51% for Class A and 2.26% for Class C. |
| | |
| (7) | Period from September 3, 2013 (Commencement of Operations) to August 31, 2014. |
| | |
| (8) | Period from December 30, 2014 (Commencement of Operations) to August 31, 2015. |
| | |
| (9) | Period from June 30, 2015 (Commencement of Operations) to August 31, 2015. Neuberger Berman LLC ("Neuberger"), as the sub-adviser to each Fund (except Greater China Equity), is retained by Management to furnish it with investment recommendations, research information and related services without added cost to the Funds. Neuberger Berman Asia Limited ("Neuberger Asia"), as the sub-adviser to Greater China Equity, is retained by Management to choose the Fund's investments and handle its day-to-day business. Several individuals who are Officers and/or Trustees of the Trust are also employees of Neuberger and/or Management. Each class of shares has a distribution agreement with Management. Class A shares of each Fund are generally sold with an initial sales charge of up to 5.75% and no contingent deferred sales charge ("CDSC"), except that a CDSC of 1.00% applies to certain redemptions made within 18 months following purchases of $1 million or more without an initial sales charge. Class C shares of each Fund are sold with no initial sales charge and a 1.00% CDSC if shares are sold within one year after purchase. For the year ended August 31, 2015, Management, acting as underwriter and broker-dealer, received net initial sales charges from the purchase of Class A shares and CDSCs from the redemptions of Class A and Class C shares as follows: |
| | | Underwriter | | Broker-Dealer | |
| | | Net Initial Sales
Charge | | CDSC | | Net Initial Sales
Charge | | CDSC | |
All Cap Core Fund Class A | | $ | 2,847 | | | $ | — | | | $ | — | | | $ | — | | |
All Cap Core Fund Class C | | | — | | | | 1,038 | | | | — | | | | — | | |
Emerging Markets Equity Fund Class A | | | 3,375 | | | | — | | | | — | | | | — | | |
Emerging Markets Equity Fund Class C | | | — | | | | 4,845 | | | | — | | | | — | | |
Equity Income Fund Class A | | | 91,040 | | | | — | | | | — | | | | — | | |
Equity Income Fund Class C | | | — | | | | 26,616 | | | | — | | | | — | | |
Focus Fund Class A | | | 1,548 | | | | — | | | | — | | | | — | | |
Focus Fund Class C | | | — | | | | 5,092 | | | | — | | | | — | | |
Global Equity Fund Class A | | | 746 | | | | — | | | | — | | | | — | | |
Global Equity Fund Class C | | | — | | | | 16 | | | | — | | | | — | | |
| Global Real Estate Fund Class A(1) | | | — | | | | — | | | | — | | | | — | | |
| Global Real Estate Fund Class C(1) | | | — | | | | — | | | | — | | | | — | | |
Greater China Equity Fund Class A | | | 3,334 | | | | — | | | | — | | | | — | | |
Greater China Equity Fund Class C | | | — | | | | — | | | | — | | | | — | | |
Guardian Fund Class A | | | 3,928 | | | | — | | | | — | | | | — | | |
Guardian Fund Class C | | | — | | | | 220 | | | | — | | | | — | | |
International Equity Fund Class A | | | 16,839 | | | | — | | | | — | | | | — | | |
International Equity Fund Class C | | | — | | | | 6,008 | | | | — | | | | — | | |
International Select Fund Class A | | | 791 | | | | — | | | | — | | | | — | | |
International Select Fund Class C | | | — | | | | 819 | | | | — | | | | — | | |
| | | Underwriter | | Broker-Dealer | |
| | | Net Initial Sales
Charge | | CDSC | | Net Initial Sales
Charge | | CDSC | |
Intrinsic Value Fund Class A | | $ | 38,000 | | | $ | — | | | $ | — | | | $ | — | | |
Intrinsic Value Fund Class C | | | — | | | | 4,234 | | | | — | | | | — | | |
Large Cap Disciplined Growth Fund Class A | | | 2,649 | | | | — | | | | — | | | | — | | |
Large Cap Disciplined Growth Fund Class C | | | — | | | | 2,129 | | | | — | | | | — | | |
Large Cap Value Fund Class A | | | 2,429 | | | | — | | | | — | | | | — | | |
Large Cap Value Fund Class C | | | — | | | | 395 | | | | — | | | | — | | |
Mid Cap Growth Fund Class A | | | 14,484 | | | | — | | | | — | | | | — | | |
Mid Cap Growth Fund Class C | | | — | | | | 1,645 | | | | — | | | | — | | |
Mid Cap Intrinsic Value Fund Class A | | | 5,349 | | | | — | | | | — | | | | — | | |
Mid Cap Intrinsic Value Fund Class C | | | — | | | | 403 | | | | — | | | | — | | |
Multi-Cap Opportunities Fund Class A | | | 31,308 | | | | — | | | | — | | | | — | | |
Multi-Cap Opportunities Fund Class C | | | — | | | | 39,028 | | | | — | | | | — | | |
Real Estate Fund Class A | | | 9,439 | | | | — | | | | — | | | | — | | |
Real Estate Fund Class C | | | — | | | | 3,041 | | | | — | | | | — | | |
Small Cap Growth Fund Class A | | | 3,338 | | | | — | | | | — | | | | — | | |
Small Cap Growth Fund Class C | | | — | | | | 3,544 | | | | — | | | | — | | |
Socially Responsive Fund Class A | | | 53,441 | | | | — | | | | — | | | | — | | |
Socially Responsive Fund Class C | | | — | | | | 7,851 | | | | — | | | | — | | |
Value Fund Class A | | | 1,301 | | | | — | | | | — | | | | — | | |
Value Fund Class C | | | — | | | | 923 | | | | — | | | | — | | |
| World Equity Fund Class A(2) | | | — | | | | — | | | | — | | | | — | | |
| World Equity Fund Class C(2) | | | — | | | | — | | | | — | | | | — | | |
(1) | Period from December 30, 2014 (Commencement of Operations) to August 31, 2015. |
| |
(2) | Period from June 30, 2015 (Commencement of Operations) to August 31, 2015. |
| | |
| | On June 3, 2014, Management made a voluntary contribution to certain of the Funds in connection with a payment matter related to the Funds' investment in a State Street money market fund as follows: |
| | | Contribution
Amount | | | | Contribution
Amount | |
All Cap Core | | $ | 11,607 | | | Large Cap Disciplined Growth | | $ | 25,583 | | |
Emerging Markets Equity | | | 8,197 | | | Large Cap Value | | | 101,072 | | |
Equity Income | | | 72,008 | | | Mid Cap Growth | | | 39,098 | | |
Focus | | | 14,932 | | | Mid Cap Intrinsic Value | | | 5,917 | | |
Genesis | | | 619,373 | | | Multi-Cap Opportunities | | | 18,804 | | |
Guardian | | | 30,585 | | | Real Estate | | | 15,705 | | |
International Equity | | | 24,281 | | | Small Cap Growth | | | 3,827 | | |
International Select | | | 8,356 | | | Socially Responsive | | | 52,169 | | |
Intrinsic Value | | | 4,946 | | | | | | |
Note C—Securities Transactions:
During the year ended August 31, 2015, there were purchase and sale transactions of long-term securities (excluding equity swaps, financial futures, forward contracts and option contracts) as follows:
(000's omitted) | | Purchases | | Sales | | (000's omitted) | | Purchases | | Sales | |
All Cap Core | | $ | 67,469 | | | $ | 108,289 | | | Intrinsic Value | | $ | 254,225 | | | $ | 75,933 | | |
Emerging Markets Equity | | | 187,898 | | | | 263,674 | | | Large Cap Disciplined Growth | | | 86,613 | | | | 251,864 | | |
Equity Income | | | 1,144,456 | | | | 1,346,315 | | | Large Cap Value | | | 2,407,155 | | | | 2,570,499 | | |
Focus | | | 423,370 | | | | 479,094 | | | Mid Cap Growth | | | 533,528 | | | | 518,858 | | |
Genesis | | | 1,616,517 | | | | 4,041,935 | | | Mid Cap Intrinsic Value | | | 67,094 | | | | 44,726 | | |
Global Equity | | | 1,590 | | | | 34,012 | | | Multi-Cap Opportunities | | | 681,923 | | | | 1,008,734 | | |
| Global Real Estate(1) | | | 3,375 | | | | 450 | | | Real Estate | | | 322,924 | | | | 529,401 | | |
Greater China Equity | | | 244,535 | | | | 202,550 | | | Small Cap Growth | | | 286,672 | | | | 294,766 | | |
Guardian | | | 443,563 | | | | 583,853 | | | Socially Responsive | | | 648,156 | | | | 818,021 | | |
International Equity | | | 375,427 | | | | 274,258 | | | Value | | | 42,439 | | | | 39,301 | | |
International Select | | | 63,380 | | | | 57,770 | | | World Equity(2) | | | 6,590 | | | | 1,634 | | |
(1) | Period from December 30, 2014 (Commencement of Operations) to August 31, 2015. |
| |
(2) | Period from June 30, 2015 (Commencement of Operations) to August 31, 2015. |
| | |
| | During the year ended August 31, 2015, no brokerage commissions on securities transactions were paid to affiliated brokers. |
Note D—Fund Share Transactions:
Share activity for the years ended August 31, 2015 and August 31, 2014 was as follows:
| | | For the Year Ended August 31, 2015 | | For the Year Ended August 31, 2014 | |
(000's omitted) | | Shares
Sold | | Shares
Issued on
Reinvestment
of Dividends
and
Distributions | | Shares
Redeemed | | Total | | Shares
Sold | | Shares
Issued on
Reinvestment
of Dividends
and
Distributions | | Shares
Redeemed | | Total | |
All Cap Core: | |
Institutional Class | | | 1,960 | | | | 1,031 | | | | (4,248 | ) | | | (1,257 | ) | | | 2,268 | | | | 385 | | | | (2,201 | ) | | | 452 | | |
Class A | | | 231 | | | | 225 | | | | (1,876 | ) | | | (1,420 | ) | | | 514 | | | | 252 | | | | (1,533 | ) | | | (767 | ) | |
Class C | | | 94 | | | | 235 | | | | (763 | ) | | | (434 | ) | | | 264 | | | | 118 | | | | (332 | ) | | | 50 | | |
Emerging Markets Equity: | |
Institutional Class | | | 5,409 | | | | 180 | | | | (12,309 | ) | | | (6,720 | ) | | | 11,289 | | | | 84 | | | | (6,980 | ) | | | 4,393 | | |
Class A | | | 439 | | | | 6 | | | | (601 | ) | | | (156 | ) | | | 1,008 | | | | 1 | | | | (366 | ) | | | 643 | | |
Class C | | | 160 | | | | 0 | z | | | (103 | ) | | | 57 | | | | 205 | | | | — | | | | (79 | ) | | | 126 | | |
Class R3 | | | 41 | | | | 0 | z | | | (22 | ) | | | 19 | | | | 36 | | | | 0 | z | | | (11 | ) | | | 25 | | |
Class R6 | | | 1,689 | | | | 58 | | | | (115 | ) | | | 1,632 | | | | 2,745 | | | | 20 | | | | (108 | ) | | | 2,657 | | |
| | For the Year Ended August 31, 2015 | | For the Year Ended August 31, 2014 | |
| (000's omitted) | | Shares
Sold | | Shares
Issued on
Reinvestment
of Dividends
and
Distributions | | Shares
Redeemed | | Total | | Shares
Sold | | Shares
Issued on
Reinvestment
of Dividends
and
Distributions | | Shares
Redeemed | | Total | |
Equity Income: | |
Institutional Class | | | 29,741 | | | | 7,206 | | | | (33,615 | ) | | | 3,332 | | | | 42,043 | | | | 5,515 | | | | (50,330 | ) | | | (2,772 | ) | |
Class A | | | 4,659 | | | | 1,689 | | | | (16,802 | ) | | | (10,454 | ) | | | 10,109 | | | | 3,876 | | | | (67,276 | ) | | | (53,291 | ) | |
Class C | | | 4,276 | | | | 1,391 | | | | (6,561 | ) | | | (894 | ) | | | 3,640 | | | | 1,500 | | | | (10,670 | ) | | | (5,530 | ) | |
Class R3 | | | 119 | | | | 12 | | | | (68 | ) | | | 63 | | | | 107 | | | | 10 | | | | (78 | ) | | | 39 | | |
Focus: | |
Investor Class | | | 292 | | | | 3,621 | | | | (2,261 | ) | | | 1,652 | | | | 252 | | | | 2,175 | | | | (2,610 | ) | | | (183 | ) | |
Trust Class | | | 955 | | | | 1,721 | | | | (3,055 | ) | | | (379 | ) | | | 4,036 | | | | 591 | | | | (1,426 | ) | | | 3,201 | | |
Advisor Class | | | 173 | | | | 267 | | | | (272 | ) | | | 168 | | | | 165 | | | | 107 | | | | (188 | ) | | | 84 | | |
Institutional Class | | | 925 | | | | 56 | | | | (171 | ) | | | 810 | | | | 94 | | | | 26 | | | | (641 | ) | | | (521 | ) | |
Class A | | | 348 | | | | 50 | | | | (316 | ) | | | 82 | | | | 135 | | | | 18 | | | | (58 | ) | | | 95 | | |
Class C | | | 273 | | | | 58 | | | | (91 | ) | | | 240 | | | | 56 | | | | 13 | | | | (1 | ) | | | 68 | | |
Genesis: | |
Investor Class | | | 5,468 | | | | 7,864 | | | | (17,210 | ) | | | (3,878 | ) | | | 7,896 | | | | 6,750 | | | | (16,221 | ) | | | (1,575 | ) | |
Trust Class | | | 2,766 | | | | 3,563 | | | | (18,819 | ) | | | (12,490 | ) | | | 5,132 | | | | 3,716 | | | | (15,767 | ) | | | (6,919 | ) | |
Advisor Class | | | 3,289 | | | | 2,515 | | | | (7,977 | ) | | | (2,173 | ) | | | 4,636 | | | | 2,357 | | | | (7,666 | ) | | | (673 | ) | |
Institutional Class | | | 11,595 | | | | 6,762 | | | | (36,467 | ) | | | (18,110 | ) | | | 18,630 | | | | 6,939 | | | | (46,165 | ) | | | (20,596 | ) | |
Class R6 | | | 11,786 | | | | 4,300 | | | | (10,853 | ) | | | 5,233 | | | | 30,589 | | | | 2,654 | | | | (5,884 | ) | | | 27,359 | | |
Global Equity: | |
Institutional Class | | | 15 | | | | 225 | | | | (3,202 | ) | | | (2,962 | ) | | | 5 | | | | 42 | | | | (103 | ) | | | (56 | ) | |
Class A | | | 26 | | | | 24 | | | | (19 | ) | | | 31 | | | | 27 | | | | 0 | z | | | (8 | ) | | | 19 | | |
Class C | | | 20 | | | | 8 | | | | (5 | ) | | | 23 | | | | 9 | | | | 0 | z | | | (1 | ) | | | 8 | | |
Global Real Estate: | |
| Institutional Class(2) | | | 200 | | | | 1 | | | | — | | | | 201 | | | | — | | | | — | | | | — | | | | — | | |
| Class A(2) | | | 66 | | | | 0 | z | | | — | | | | 66 | | | | — | | | | — | | | | — | | | | — | | |
| Class C(2) | | | 25 | | | | 0 | z | | | — | | | | 25 | | | | — | | | | — | | | | — | | | | — | | |
Greater China Equity: | |
Institutional Class | | | 8,957 | | | | 129 | | | | (6,123 | ) | | | 2,963 | | | | 1,890 | | | | 6 | | | | (1,521 | ) | | | 375 | | |
Class A | | | 529 | | | | 16 | | | | (339 | ) | | | 206 | | | | 129 | | | | 0 | z | | | (2 | ) | | | 127 | | |
Class C | | | 4 | | | | 1 | | | | (1 | ) | | | 4 | | | | — | | | | 0 | z | | | — | | | | 0 | z | |
Guardian: | |
Investor Class | | | 961 | | | | 8,305 | | | | (5,876 | ) | | | 3,390 | | | | 1,051 | | | | 5,601 | | | | (5,605 | ) | | | 1,047 | | |
Trust Class | | | 671 | | | | 1,810 | | | | (2,853 | ) | | | (372 | ) | | | 794 | | | | 1,254 | | | | (2,110 | ) | | | (62 | ) | |
Advisor Class | | | 3 | | | | 3 | | | | (6 | ) | | | 0 | z | | | 81 | | | | 12 | | | | (110 | ) | | | (17 | ) | |
Institutional Class | | | 1,343 | | | | 875 | | | | (3,053 | ) | | | (835 | ) | | | 2,275 | | | | 520 | | | | (1,251 | ) | | | 1,544 | | |
Class A | | | 2,162 | | | | 1,159 | | | | (1,566 | ) | | | 1,755 | | | | 2,764 | | | | 443 | | | | (743 | ) | | | 2,464 | | |
Class C | | | 36 | | | | 20 | | | | (52 | ) | | | 4 | | | | 62 | | | | 14 | | | | (68 | ) | | | 8 | | |
Class R3 | | | 22 | | | | 5 | | | | (31 | ) | | | (4 | ) | | | 18 | | | | 2 | | | | (5 | ) | | | 15 | | |
| | For the Year Ended August 31, 2015 | | For the Year Ended August 31, 2014 | |
(000's omitted) | | Shares
Sold | | Shares
Issued on
Reinvestment
of Dividends
and
Distributions | | Shares
Redeemed | | Total | | Shares
Sold | | Shares
Issued on
Reinvestment
of Dividends
and
Distributions | | Shares
Redeemed | | Total | |
International Equity: | |
Investor Class | | | 603 | | | | 43 | | | | (703 | ) | | | (57 | ) | | | 316 | | | | 54 | | | | (1,112 | ) | | | (742 | ) | |
Trust Class | | | 360 | | | | 10 | | | | (806 | ) | | | (436 | ) | | | 688 | | | | 39 | | | | (3,189 | ) | | | (2,462 | ) | |
Institutional Class | | | 20,402 | | | | 1,346 | | | | (17,406 | ) | | | 4,342 | | | | 25,238 | | | | 1,373 | | | | (23,305 | ) | | | 3,306 | | |
Class A | | | 3,542 | | | | 6 | | | | (550 | ) | | | 2,998 | | | | 1,030 | | | | 7 | | | | (518 | ) | | | 519 | | |
Class C | | | 342 | | | | 0 | z | | | (93 | ) | | | 249 | | | | 198 | | | | 0 | z | | | (23 | ) | | | 175 | | |
Class R6 | | | 1,637 | | | | 36 | | | | (562 | ) | | | 1,111 | | | | 1,922 | | | | 0 | z | | | (8 | ) | | | 1,914 | (1) | |
International Select: | |
Trust Class | | | 39 | | | | 12 | | | | (243 | ) | | | (192 | ) | | | 72 | | | | 11 | | | | (298 | ) | | | (215 | ) | |
Institutional Class | | | 3,139 | | | | 287 | | | | (1,855 | ) | | | 1,571 | | | | 2,428 | | | | 245 | | | | (3,581 | ) | | | (908 | ) | |
Class A | | | 148 | | | | 8 | | | | (628 | ) | | | (472 | ) | | | 246 | | | | 8 | | | | (341 | ) | | | (87 | ) | |
Class C | | | 58 | | | | 0 | z | | | (122 | ) | | | (64 | ) | | | 105 | | | | 0 | z | | | (86 | ) | | | 19 | | |
Class R3 | | | 195 | | | | 2 | | | | (68 | ) | | | 129 | | | | 74 | | | | 2 | | | | (138 | ) | | | (62 | ) | |
Intrinsic Value: | |
Institutional Class | | | 14,311 | | | | 887 | | | | (2,699 | ) | | | 12,499 | | | | 4,235 | | | | 510 | | | | (2,180 | ) | | | 2,565 | | |
Class A | | | 2,767 | | | | 66 | | | | (598 | ) | | | 2,235 | | | | 750 | | | | 52 | | | | (984 | ) | | | (182 | ) | |
Class C | | | 1,140 | | | | 39 | | | | (150 | ) | | | 1,029 | | | | 229 | | | | 17 | | | | (192 | ) | | | 54 | | |
Large Cap Disciplined Growth: | |
Investor Class | | | 222 | | | | 1,421 | | | | (519 | ) | | | 1,124 | | | | 161 | | | | 317 | | | | (1,100 | ) | | | (622 | ) | |
Institutional Class | | | 6,125 | | | | 9,668 | | | | (28,538 | ) | | | (12,745 | ) | | | 8,757 | | | | 6,591 | | | | (43,021 | ) | | | (27,673 | ) | |
Class A | | | 520 | | | | 411 | | | | (1,466 | ) | | | (535 | ) | | | 561 | | | | 570 | | | | (4,306 | ) | | | (3,175 | ) | |
Class C | | | 1,946 | | | | 943 | | | | (2,938 | ) | | | (49 | ) | | | 480 | | | | 143 | | | | (893 | ) | | | (270 | ) | |
Class R3 | | | 19 | | | | 12 | | | | (1 | ) | | | 30 | | | | 3 | | | | 1 | | | | (31 | ) | | | (27 | ) | |
Large Cap Value: | |
Investor Class | | | 561 | | | | 4,959 | | | | (3,948 | ) | | | 1,572 | | | | 479 | | | | 5,792 | | | | (5,253 | ) | | | 1,018 | | |
Trust Class | | | 290 | | | | 1,157 | | | | (1,422 | ) | | | 25 | | | | 306 | | | | 1,354 | | | | (2,224 | ) | | | (564 | ) | |
Advisor Class | | | 763 | | | | 2,721 | | | | (3,134 | ) | | | 350 | | | | 821 | | | | 2,701 | | | | (2,451 | ) | | | 1,071 | | |
Institutional Class | | | 515 | | | | 590 | | | | (2,183 | ) | | | (1,078 | ) | | | 872 | | | | 571 | | | | (715 | ) | | | 728 | | |
Class A | | | 287 | | | | 21 | | | | (263 | ) | | | 45 | | | | 102 | | | | 16 | | | | (71 | ) | | | 47 | | |
Class C | | | 62 | | | | 29 | | | | (53 | ) | | | 38 | | | | 114 | | | | 11 | | | | (28 | ) | | | 97 | | |
Class R3 | | | 5 | | | | 1 | | | | (8 | ) | | | (2 | ) | | | 2 | | | | 0 | z | | | — | | | | 2 | | |
Mid Cap Growth: | |
Investor Class | | | 1,103 | | | | 3,591 | | | | (2,454 | ) | | | 2,240 | | | | 515 | | | | 1,861 | | | | (2,307 | ) | | | 69 | | |
Trust Class | | | 1,206 | | | | 239 | | | | (588 | ) | | | 857 | | | | 766 | | | | 122 | | | | (552 | ) | | | 336 | | |
Advisor Class | | | 224 | | | | 29 | | | | (248 | ) | | | 5 | | | | 135 | | | | 19 | | | | (274 | ) | | | (120 | ) | |
Institutional Class | | | 7,353 | | | | 3,406 | | | | (7,429 | ) | | | 3,330 | | | | 10,799 | | | | 1,681 | | | | (5,863 | ) | | | 6,617 | | |
Class A | | | 1,256 | | | | 320 | | | | (1,607 | ) | | | (31 | ) | | | 1,231 | | | | 179 | | | | (1,382 | ) | | | 28 | | |
Class C | | | 129 | | | | 21 | | | | (52 | ) | | | 98 | | | | 86 | | | | 8 | | | | (45 | ) | | | 49 | | |
Class R3 | | | 338 | | | | 25 | | | | (189 | ) | | | 174 | | | | 163 | | | | 12 | | | | (89 | ) | | | 86 | | |
Class R6 | | | 4,743 | | | | 257 | | | | (447 | ) | | | 4,553 | | | | 1,642 | | | | 21 | | | | (160 | ) | | | 1,503 | | |
| | | For the Year Ended August 31, 2015 | | For the Year Ended August 31, 2014 | |
(000's omitted) | | Shares
Sold | | Shares
Issued on
Reinvestment
of Dividends
and
Distributions | | Shares
Redeemed | | Total | | Shares
Sold | | Shares
Issued on
Reinvestment
of Dividends
and
Distributions | | Shares
Redeemed | | Total | |
Mid Cap Intrinsic Value: | |
Investor Class | | | 205 | | | | 194 | | | | (232 | ) | | | 167 | | | | 176 | | | | 97 | | | | (696 | ) | | | (423 | ) | |
Trust Class | | | 83 | | | | 82 | | | | (203 | ) | | | (38 | ) | | | 70 | | | | 44 | | | | (142 | ) | | | (28 | ) | |
Institutional Class | | | 1,096 | | | | 114 | | | | (355 | ) | | | 855 | | | | 667 | | | | 42 | | | | (172 | ) | | | 537 | | |
Class A | | | 673 | | | | 33 | | | | (126 | ) | | | 580 | | | | 210 | | | | 13 | | | | (117 | ) | | | 106 | | |
Class C | | | 113 | | | | 3 | | | | (9 | ) | | | 107 | | | | 24 | | | | 1 | | | | (7 | ) | | | 18 | | |
Class R3 | | | 53 | | | | 2 | | | | (6 | ) | | | 49 | | | | 3 | | | | 1 | | | | (31 | ) | | | (27 | ) | |
Multi-Cap Opportunities: | |
Institutional Class | | | 13,322 | | | | 947 | | | | (28,934 | ) | | | (14,665 | ) | | | 67,275 | | | | 258 | | | | (15,271 | ) | | | 52,262 | | |
Class A | | | 2,308 | | | | 286 | | | | (4,697 | ) | | | (2,103 | ) | | | 8,625 | | | | 124 | | | | (3,704 | ) | | | 5,045 | | |
Class C | | | 997 | | | | 101 | | | | (1,182 | ) | | | (84 | ) | | | 2,771 | | | | 24 | | | | (207 | ) | | | 2,588 | | |
Real Estate: | |
Trust Class | | | 3,541 | | | | 1,310 | | | | (7,796 | ) | | | (2,945 | ) | | | 5,241 | | | | 1,742 | | | | (10,294 | ) | | | (3,311 | ) | |
Institutional Class | | | 8,301 | | | | 1,540 | | | | (16,623 | ) | | | (6,782 | ) | | | 13,294 | | | | 1,691 | | | | (11,747 | ) | | | 3,238 | | |
Class A | | | 4,281 | | | | 667 | | | | (6,573 | ) | | | (1,625 | ) | | | 5,346 | | | | 809 | | | | (7,154 | ) | | | (999 | ) | |
Class C | | | 350 | | | | 125 | | | | (1,031 | ) | | | (556 | ) | | | 395 | | | | 167 | | | | (878 | ) | | | (316 | ) | |
Class R3 | | | 857 | | | | 96 | | | | (906 | ) | | | 47 | | | | 830 | | | | 83 | | | | (492 | ) | | | 421 | | |
Class R6 | | | 751 | | | | 129 | | | | (477 | ) | | | 403 | | | | 1,282 | | | | 59 | | | | (189 | ) | | | 1,152 | | |
Small Cap Growth: | |
Investor Class | | | 50 | | | | — | | | | (227 | ) | | | (177 | ) | | | 108 | | | | — | | | | (279 | ) | | | (171 | ) | |
Trust Class | | | 13 | | | | — | | | | (31 | ) | | | (18 | ) | | | 18 | | | | — | | | | (107 | ) | | | (89 | ) | |
Advisor Class | | | 40 | | | | — | | | | (86 | ) | | | (46 | ) | | | 48 | | | | — | | | | (78 | ) | | | (30 | ) | |
Institutional Class | | | 198 | | | | — | | | | (192 | ) | | | 6 | | | | 178 | | | | — | | | | (106 | ) | | | 72 | | |
Class A | | | 96 | | | | — | | | | (84 | ) | | | 12 | | | | 256 | | | | — | | | | (199 | ) | | | 57 | | |
Class C | | | 36 | | | | — | | | | (20 | ) | | | 16 | | | | 55 | | | | — | | | | (25 | ) | | | 30 | | |
Class R3 | | | 36 | | | | — | | | | (11 | ) | | | 25 | | | | 13 | | | | — | | | | (12 | ) | | | 1 | | |
Socially Responsive: | |
Investor Class | | | 1,957 | | | | 2,406 | | | | (3,777 | ) | | | 586 | | | | 2,027 | | | | 1,608 | | | | (6,674 | ) | | | (3,039 | ) | |
Trust Class | | | 2,448 | | | | 3,011 | | | | (7,166 | ) | | | (1,707 | ) | | | 3,087 | | | | 2,042 | | | | (7,296 | ) | | | (2,167 | ) | |
Institutional Class | | | 5,838 | | | | 2,041 | | | | (5,495 | ) | | | 2,384 | | | | 6,348 | | | | 1,268 | | | | (5,577 | ) | | | 2,039 | | |
Class A | | | 2,128 | | | | 1,040 | | | | (1,788 | ) | | | 1,380 | | | | 2,274 | | | | 502 | | | | (2,180 | ) | | | 596 | | |
Class C | | | 757 | | | | 308 | | | | (305 | ) | | | 760 | | | | 671 | | | | 119 | | | | (174 | ) | | | 616 | | |
Class R3 | | | 394 | | | | 248 | | | | (478 | ) | | | 164 | | | | 387 | | | | 126 | | | | (320 | ) | | | 193 | | |
Class R6 | | | 1,911 | | | | 813 | | | | (3,597 | ) | | | (873 | ) | | | 5,548 | | | | 415 | | | | (6,043 | ) | | | (80 | ) | |
Value: | |
Institutional Class | | | 517 | | | | 58 | | | | (427 | ) | | | 148 | | | | 560 | | | | 2 | | | | (310 | ) | | | 252 | | |
Class A | | | 228 | | | | 28 | | | | (235 | ) | | | 21 | | | | 308 | | | | 1 | | | | (95 | ) | | | 214 | | |
Class C | | | 14 | | | | 2 | | | | (13 | ) | | | 3 | | | | 15 | | | | — | | | | (3 | ) | | | 12 | | |
| | | For the Year Ended August 31, 2015 | | For the Year Ended August 31, 2014 | |
(000's omitted) | | Shares
Sold | | Shares
Issued on
Reinvestment
of Dividends
and
Distributions | | Shares
Redeemed | | Total | | Shares
Sold | | Shares
Issued on
Reinvestment
of Dividends
and
Distributions | | Shares
Redeemed | | Total | |
World Equity: | |
| Institutional Class(3) | | | 400 | | | | — | | | | — | | | | 400 | | | | — | | | | — | | | | — | | | | — | | |
| Class A(3) | | | 50 | | | | — | | | | — | | | | 50 | | | | — | | | | — | | | | — | | | | — | | |
| Class C(3) | | | 53 | | | | — | | | | — | | | | 53 | | | | — | | | | — | | | | — | | | | — | | |
(1) | Period from September 3, 2013 (Commencement of Operations) to August 31, 2014. |
| |
(2) | Period from December 30, 2014 (Commencement of Operations) to August 31, 2015. |
| |
(3) | Period from June 30, 2015 (Commencement of Operations) to August 31, 2015. |
| | |
| z | A zero balance, if any, may reflect actual amounts rounding to less than 1,000. |
Note E—Lines of Credit:
At August 31, 2015, each Fund was a participant in a syndicated committed, unsecured $700,000,000 line of credit (the "Credit Facility"), to be used only for temporary or emergency purposes. Other investment companies managed by Management also participate in this line of credit on the same terms. Under the terms of the Credit Facility, each Fund has agreed to pay its pro rata share of the annual commitment fee, based on the ratio of its individual net assets to the net assets of all participants at the time the fee is due and payable, and interest charged on any borrowing made by such Fund and other costs incurred by such Fund. Because several mutual funds participate in the Credit Facility, there is no assurance that an individual Fund will have access to all or any part of the $700,000,000 at any particular time. There were no loans outstanding under the Credit Facility at August 31, 2015. During the period from January 9, 2015 (the date of the Credit Facility) through August 31, 2015, Greater China Equity had borrowings under the Credit Facility for a period of four business days with the greatest amount borrowed being $19,900,000. On these borrowings, Greater China Equity paid an interest rate of 1.1890%. The total interest amount Greater China Equity paid was $3,106, which is reflected in the Statements of Operations under the caption "Interest expense (Note E)." The Credit Facility replaced the State Street lines of credit referred to below.
During the reporting period, from September 1, 2014 through January 9, 2015, each Fund other than World Equity, which was not yet operational, was a participant in a committed, unsecured $300,000,000 line of credit with State Street and an uncommitted, unsecured $100,000,000 line of credit with State Street, both to be used only for temporary or emergency purposes. During the year ended August 31, 2015, none of the Funds utilized either line of credit with State Street.
Note F—Investments In Affiliates(1):
| | | Balance of
Shares Held
August 31,
2014 | | Gross
Purchases
and
Additions | | Gross
Sales
and
Reductions | | Balance of
Shares Held
August 31,
2015 | | Value
August 31,
2015 | | Distributions
from
Investments
in Affiliated
Issuers | | Net Realized
Gain (Loss)
from
Investments
in Affiliated
Issuers | |
Genesis | |
Abaxis, Inc. | | | 1,162,400 | | | | 325,000 | | | | 108,800 | | | | 1,378,600 | | | $ | 64,821,772 | | | $ | 415,218 | | | $ | 2,922,292 | | |
| Altisource Asset Management Corp. | | | 155,717 | | | | — | | | | 30,100 | | | | 125,617 | | | | 4,834,998 | | | | — | * | | | 2,761,255 | | |
| Altisource Portfolio Solutions SA(2) | | | 1,595,670 | | | | 122,900 | | | | 1,718,570 | | | | — | | | | — | | | | — | * | | | (106,102,945 | ) | |
| Applied Industrial Technologies, Inc.(2) | | | 2,403,244 | | | | — | | | | 573,500 | | | | 1,829,744 | | | | 77,471,361 | | | | 2,199,547 | | | | 520,078 | | |
| AptarGroup, Inc.2) | | | 3,977,400 | | | | — | | | | 852,900 | | | | 3,124,500 | | | | 210,466,320 | | | | 3,916,444 | | | | 42,193,697 | | |
| Badger Meter, Inc.(2) | | | 727,301 | | | | — | | | | 122,100 | | | | 605,201 | | | | 35,277,166 | | | | 498,172 | | | | 1,785,889 | | |
Balchem Corp. | | | 1,643,735 | | | | 167,400 | | | | 213,226 | | | | 1,597,909 | | | | 93,525,614 | | | | 495,009 | | | | 1,520,915 | | |
Bank of Hawaii Corp. | | | 2,393,212 | | | | 157,700 | | | | 260,600 | | | | 2,290,312 | | | | 142,136,763 | | | | 4,049,572 | | | | 2,763,332 | | |
| CARBO Ceramics, Inc.(2) | | | 1,362,257 | | | | — | | | | 619,100 | | | | 743,157 | | | | 20,377,365 | | | | 953,436 | | | | (6,859,896 | ) | |
CLARCOR, Inc. | | | 3,492,088 | | | | — | | | | 980,300 | | | | 2,511,788 | | | | 141,589,490 | | | | 2,451,830 | | | | 37,351,297 | | |
| Compass Minerals International, Inc. | | | 2,697,873 | | | | — | | | | 822,300 | | | | 1,875,573 | | | | 151,921,413 | | | | 5,546,158 | | | | 57,140,444 | | |
| Computer Modelling Group Ltd. | | | 5,948,400 | | | | 34,700 | | | | 470,500 | | | | 5,512,600 | | | | 50,909,964 | | | | 2,005,273 | | | | 1,288,255 | | |
| Essendant, Inc.(2(3) | | | 2,780,741 | | | | — | | | | 1,329,620 | | | | 1,451,121 | | | | 50,063,675 | | | | 1,418,726 | | | | 17,941,737 | | |
Exponent, Inc. | | | 1,122,035 | | | | 1,202,335 | | | | 54,400 | | | | 2,269,970 | | | | 97,041,218 | | | | 1,236,894 | | | | 1,179,131 | | |
| First Financial Bankshares, Inc. | | | 3,628,036 | | | | 189,311 | | | | 495,800 | | | | 3,321,547 | | | | 103,432,974 | | | | 1,970,781 | | | | 1,651,094 | | |
Forward Air Corp. | | | 1,737,200 | | | | 214,900 | | | | 168,632 | | | | 1,783,468 | | | | 80,291,729 | | | | 883,140 | | | | 1,910,860 | | |
Haemonetics Corp. | | | 4,260,500 | | | | — | | | | 1,357,200 | | | | 2,903,300 | | | | 104,838,163 | | | | — | * | | | 20,321,882 | | |
| Healthcare Services Group, Inc. | | | 4,687,081 | | | | — | | | | 971,200 | | | | 3,715,881 | | | | 124,259,061 | | | | 2,878,021 | | | | 17,163,505 | | |
Hibbett Sports, Inc. | | | 1,778,969 | | | | 40,000 | | | | 249,600 | | | | 1,569,369 | | | | 61,990,076 | | | | — | * | | | 4,344,871 | | |
| Home Loan Servicing Solutions Ltd.(2) | | | 5,407,600 | | | | 117,900 | | | | 5,525,500 | | | | — | | | | — | | | | 3,851,172 | | | | (47,004,453 | ) | |
ICON PLC | | | 4,109,500 | | | | 62,400 | | | | 720,600 | | | | 3,451,300 | | | | 265,750,100 | | | | — | * | | | 20,028,889 | | |
| Innophos Holdings, Inc. | | | 1,586,542 | | | | — | | | | 432,400 | | | | 1,154,142 | | | | 55,479,606 | | | | 2,615,121 | | | | 1,870,887 | | |
| J & J Snack Foods Corp.(2) | | | 997,646 | | | | 60,600 | | | | 168,000 | | | | 890,246 | | | | 101,452,434 | | | | 1,338,808 | | | | 13,095,035 | | |
Lindsay Corp. | | | 872,250 | | | | — | | | | 142,900 | | | | 729,350 | | | | 55,598,351 | | | | 852,777 | | | | (1,473,479 | ) | |
| Manhattan Associates, Inc.(2) | | | 5,217,228 | | | | 153,500 | | | | 2,184,000 | | | | 3,186,728 | | | | 186,359,853 | | | | — | * | | | 75,951,615 | | |
| | | Balance of
Shares Held
August 31,
2014 | | Gross
Purchases
and
Additions | | Gross
Sales
and
Reductions | | Balance of
Shares Held
August 31,
2015 | | Value
August 31,
2015 | | Distributions
from
Investments
in Affiliated
Issuers | | Net Realized
Gain (Loss)
from
Investments
in Affiliated
Issuers | |
| Meridian Bioscience, Inc.(2) | | | 2,537,797 | | | | — | | | | 758,500 | | | | 1,779,297 | | | $ | 34,037,952 | | | $ | 1,782,758 | | | $ | (818,309 | ) | |
| Monotype Imaging Holdings, Inc. | | | 2,986,745 | | | | 513,161 | | | | 155,100 | | | | 3,344,806 | | | | 70,842,991 | | | | 1,153,341 | | | | (424,676 | ) | |
| MWI Veterinary Supply, Inc.(2) | | | 1,213,705 | | | | — | | | | 1,213,705 | | | | — | | | | — | | | | — | * | | | 166,527,336 | | |
| Natural Gas Services Group, Inc.(2) | | | 713,700 | | | | — | | | | 119,500 | | | | 594,200 | �� | | | 12,888,198 | | | | — | * | | | 558,110 | | |
| NETGEAR, Inc.(2) | | | 2,893,300 | | | | 152,600 | | | | 2,576,280 | | | | 469,620 | | | | 14,267,056 | | | | — | * | | | (7,753,567 | ) | |
| Nexstar Broadcasting Group, Inc. Class A | | | 2,748,021 | | | | 80,100 | | | | 432,600 | | | | 2,395,521 | | | | 111,343,816 | | | | 1,839,750 | | | | 2,221,563 | | |
Pason Systems, Inc. | | | 4,710,557 | | | | 183,100 | | | | 631,400 | | | | 4,262,257 | | | | 65,700,561 | | | | 2,598,850 | | | | (1,806,219 | ) | |
| Phibro Animal Health Corp. Class A | | | — | | | | 1,048,000 | | | | — | | | | 1,048,000 | | | | 36,994,400 | | | | 263,190 | | | | — | | |
Pool Corp. | | | 3,049,798 | | | | 103,400 | | | | 677,600 | | | | 2,475,598 | | | | 172,499,669 | | | | 2,628,268 | | | | 11,267,976 | | |
| Power Integrations, Inc. | | | 2,530,900 | | | | 216,200 | | | | 288,700 | | | | 2,458,400 | | | | 96,492,200 | | | | 1,236,564 | | | | (1,530,829 | ) | |
Raven Industries, Inc. | | | 3,087,352 | | | | — | | | | 518,900 | | | | 2,568,452 | | | | 46,540,350 | | | | 1,466,752 | | | | 1,521,222 | | |
| RLI Corp.(2) | | | 2,522,414 | | | | — | | | | 387,600 | | | | 2,134,814 | | | | 111,245,158 | | | | 8,969,967 | | | | 7,464,382 | | |
Rogers Corp. | | | 856,551 | | | | 545,800 | | | | 39,100 | | | | 1,363,251 | | | | 75,878,551 | | | | — | * | | | (80,115 | ) | |
| Safety Insurance Group, Inc. | | | 950,949 | | | | — | | | | 160,000 | | | | 790,949 | | | | 41,588,098 | | | | 2,367,150 | | | | 1,874,751 | | |
| Sensient Technologies Corp. | | | 3,975,245 | | | | — | | | | 668,300 | | | | 3,306,945 | | | | 215,447,467 | | | | 3,644,868 | | | | 10,462,091 | | |
| State Street Institutional Treasury Plus Fund Premier Class | | | 255,161,152 | | | | 1,995,874,417 | | | | 2,119,125,352 | | | | 131,910,217 | | | | 131,910,217 | | | | — | * | | | — | | |
| Tennant Co.(2) | | | 948,802 | | | | 22,600 | | | | 53,800 | | | | 917,602 | | | | 52,596,947 | | | | 745,542 | | | | (189,202 | ) | |
| Tyler Technologies(2) | | | 1,718,232 | | | | — | | | | 289,000 | | | | 1,429,232 | | | | 197,291,185 | | | | — | * | | | 5,645,564 | | |
| West Pharmaceutical Services, Inc. | | | 4,051,158 | | | | 251,500 | | | | 384,900 | | | | 3,917,758 | | | | 218,806,784 | | | | 1,841,987 | | | | 6,346,796 | | |
| Westamerica Bancorporation(2) | | | 1,566,743 | | | | — | | | | 659,640 | | | | 907,103 | | | | 40,946,629 | | | | 1,705,027 | | | | 699,681 | | |
Total | | | | | | | | | | $ | 4,027,207,695 | | | $ | 71,820,113 | | | $ | 366,252,742 | | |
(1) | Affiliated issuers, as defined in the Investment Company Act of 1940, as amended. |
| |
(2) | At August 31, 2015, the issuers of these securities were no longer affiliated with Genesis. |
| |
(3) | Effective June 1, 2015, this security underwent a name change from United Stationers, Inc. to Essendant, Inc. |
| | |
| * | Security did not produce income during the last twelve months. |
Other: At August 31, 2015, Neuberger Berman Inflation Managed Fund, which is also managed by Management, held 0.36% of the outstanding shares of Emerging Markets Equity. At August 31, 2015, Neuberger Berman Global Allocation Fund, which is also managed by Management, held 0.59% and 0.30% of the outstanding shares of Emerging Markets Equity and International Equity, respectively.
In addition, at August 31, 2015, affiliated investors owned 1.83%, 0.02%, 3.14%, 85.86%, 0.23%, 0.01%, 0.01%, 0.01%, 0.06%, 1.37%, 0.22% and 99.37% of the outstanding shares of Emerging Markets Equity, Focus, Global Equity, Global Real Estate, Greater China Equity, International Equity, Large Cap Value, Mid Cap Growth, Mid Cap Intrinsic Value, Real Estate, Value and World Equity, respectively.
Note G—Legal Matters:
Beginning in July 2010, shareholder Benjamin J. Gamoran filed a series of lawsuits naming, along with other defendants, the Trust as a nominal defendant. The suits included derivative claims purportedly on behalf of the Trust alleging that the defendants were liable for losses related to the predecessor to International Equity's investments in shares of certain companies that were alleged to have illegally offered or facilitated online gambling by individuals located in the United States. Gamoran also eventually made a demand on the Trust's board seeking to have the board authorize the Trust to pursue such claims. The board refused Gamoran's demand, and all of Gamoran's lawsuits were dismissed for reasons including Gamoran's initial failure to make demand on the board and his failure to show that the Trust's board improperly refused the demand he eventually made.
On October 28, 2013, the United States Court of Appeals for the Second Circuit entered a summary order affirming the dismissal of the plaintiff 's most recent derivative complaint (which alleged that the board had wrongfully refused Gamoran's demand that the board bring a lawsuit) and directing the District Court to enter a judgment of dismissal with prejudice, which the District Court did on or about November 28, 2013. There has been no further action with respect to any of the Gamoran lawsuits.
For the year ended August 31, 2015, the litigation, demand investigation and related fees recorded in the Statements of Operations were $0. During the year ended August 31, 2015, the Trust received $279,908 in insurance proceeds. The Trust does not anticipate additional payments from its insurance carrier.
Note H—Recent Accounting Pronouncement:
In June 2014, FASB issued ASU 2014-11 Transfers & Servicing (Topic 860): Repurchase-to-Maturity Transactions, Repurchase Financings, and Disclosures to improve the financial reporting of repurchase agreements and other similar transactions. The guidance includes expanded disclosure requirements for entities that enter into repurchase agreements or securities lending transactions. The guidance is effective for financial statements with fiscal years beginning on or after January 1, 2015, and interim periods within those fiscal years. At this time, Management is evaluating the impact, if any, of this guidance on the Funds' financial statement disclosures. ASU 2014-11 is effective for World Equity as of August 31, 2015; however, no additional disclosure was necessary.
Note I—Other (Unaudited):
In addition, at August 31, 2015, one investor owned 30.51% of the outstanding shares of Emerging Markets Equity, and one investor owned 9.97% of the outstanding shares of Mid Cap Intrinsic Value.
The following tables include selected data for a share outstanding throughout each period and other performance information derived from the Financial Statements. Per share amounts that round to less than $0.01 or $(0.01) per share are presented as $0.00 or $(0.00), respectively. Ratios that round to less than 0.00% or (0.00%) are presented as 0.00% or (0.00%), respectively. Net Asset amounts with a zero balance, if any, may reflect actual amounts rounding to less than $0.1 million. A "—" indicates that the line item was not applicable in the corresponding period.
| | | Net Asset
Value,
Beginning
of Year | | Net
Investment
Income (Loss)@ | | Net Gains or
Losses on
Securities
(both realized
and
unrealized) | | Total From
Investment
Operations | | Dividends
from Net
Investment
Income | | Distributions
from Net
Realized
Capital Gains | | Tax
Return of
Capital | | Total
Distributions | | Voluntary
Contributions
from
Management | | Redemption
Feesøø | | Net
Asset
Value,
End of
Year | | Total Return†d | | Net Assets,
End of
Year
(in millions) | | Ratio of
Gross
Expenses
to Average
Net Assets# | | Ratio
of Net
Expenses
to Average
Net Assets‡ | | Ratio of Net
Investment
Income/
(Loss) to
Average Net
Assets | | Portfolio
Turnover Rate | |
All Cap Core Fund | |
Institutional Class | |
8/31/2015 | | $ | 11.42 | | | $ | 0.03 | | | $ | (1.04 | ) | | $ | (1.01 | ) | | $ | — | | | $ | (1.64 | ) | | $ | — | | | $ | (1.64 | ) | | $ | — | | | $ | — | | | $ | 8.77 | | | | (8.91 | %) | | $ | 34.5 | | | | 1.12 | % | | | 0.75 | % | | | 0.28 | % | | | 95 | % | |
8/31/2014 | | $ | 10.18 | | | $ | 0.01 | | | $ | 2.18 | | | $ | 2.19 | | | $ | (0.01 | ) | | $ | (0.94 | ) | | $ | — | | | $ | (0.95 | ) | | $ | 0.00 | | | $ | — | | | $ | 11.42 | | | | 22.55 | %g | $ | 59.3 | | | | 1.03 | % | | | 0.75 | % | | | 0.12 | % | | | 62 | % | |
8/31/2013 | | $ | 9.34 | | | $ | 0.04 | | | $ | 1.54 | | | $ | 1.58 | | | $ | — | | | $ | (0.74 | ) | | $ | — | | | $ | (0.74 | ) | | $ | — | | | $ | — | | | $ | 10.18 | | | | 17.97 | % | | $ | 48.3 | | | | 1.10 | % | | | 0.75 | % | | | 0.40 | % | | | 70 | % | |
8/31/2012 | | $ | 9.05 | | | $ | 0.02 | | | $ | 0.98 | | | $ | 1.00 | | | $ | (0.02 | ) | | $ | (0.69 | ) | | $ | — | | | $ | (0.71 | ) | | $ | — | | | $ | — | | | $ | 9.34 | | | | 12.21 | % | | $ | 27.1 | | | | 1.15 | % | | | 0.75 | % | | | 0.26 | % | | | 93 | % | |
8/31/2011 | | $ | 7.91 | | | $ | 0.06 | | | $ | 1.41 | | | $ | 1.47 | | | $ | (0.07 | ) | | $ | (0.26 | ) | | $ | — | | | $ | (0.33 | ) | | $ | — | | | $ | — | | | $ | 9.05 | | | | 18.62 | % | | $ | 27.3 | | | | 1.17 | % | | | 0.75 | % | | | 0.67 | % | | | 150 | % | |
Class A | |
8/31/2015 | | $ | 11.25 | | | $ | (0.02 | ) | | $ | (1.01 | ) | | $ | (1.03 | ) | | $ | — | | | $ | (1.64 | ) | | $ | — | | | $ | (1.64 | ) | | $ | — | | | $ | — | | | $ | 8.58 | | | | (9.26 | %) | | $ | 7.4 | | | | 1.50 | % | | | 1.20 | % | | | (0.19 | %) | | | 95 | % | |
8/31/2014 | | $ | 10.08 | | | $ | (0.04 | ) | | $ | 2.15 | | | $ | 2.11 | | | $ | — | | | $ | (0.94 | ) | | $ | — | | | $ | (0.94 | ) | | $ | 0.00 | | | $ | — | | | $ | 11.25 | | | | 21.95 | %g | $ | 25.7 | | | | 1.40 | % | | | 1.20 | % | | | (0.34 | %) | | | 62 | % | |
8/31/2013 | | $ | 9.29 | | | $ | (0.00 | ) | | $ | 1.53 | | | $ | 1.53 | | | $ | — | | | $ | (0.74 | ) | | $ | — | | | $ | (0.74 | ) | | $ | — | | | $ | — | | | $ | 10.08 | | | | 17.50 | % | | $ | 30.7 | | | | 1.48 | % | | | 1.20 | % | | | (0.02 | %) | | | 70 | % | |
8/31/2012 | | $ | 9.03 | | | $ | (0.02 | ) | | $ | 0.97 | | | $ | 0.95 | | | $ | — | | | $ | (0.69 | ) | | $ | — | | | $ | (0.69 | ) | | $ | — | | | $ | — | | | $ | 9.29 | | | | 11.62 | % | | $ | 29.2 | | | | 1.53 | % | | | 1.20 | % | | | (0.20 | %) | | | 93 | % | |
8/31/2011 | | $ | 7.88 | | | $ | 0.02 | | | $ | 1.41 | | | $ | 1.43 | | | $ | (0.02 | ) | | $ | (0.26 | ) | | $ | — | | | $ | (0.28 | ) | | $ | — | | | $ | — | | | $ | 9.03 | | | | 18.15 | % | | $ | 30.9 | | | | 1.58 | % | | | 1.20 | % | | | 0.23 | % | | | 150 | % | |
Class C | |
8/31/2015 | | $ | 10.64 | | | $ | (0.08 | ) | | $ | (0.96 | ) | | $ | (1.04 | ) | | $ | — | | | $ | (1.64 | ) | | $ | — | | | $ | (1.64 | ) | | $ | — | | | $ | — | | | $ | 7.96 | | | | (9.97 | %) | | $ | 8.2 | | | | 2.24 | % | | | 1.95 | % | | | (0.93 | %) | | | 95 | % | |
8/31/2014 | | $ | 9.64 | | | $ | (0.11 | ) | | $ | 2.05 | | | $ | 1.94 | | | $ | — | | | $ | (0.94 | ) | | $ | — | | | $ | (0.94 | ) | | $ | 0.00 | | | $ | — | | | $ | 10.64 | | | | 21.13 | %g | $ | 15.6 | | | | 2.15 | % | | | 1.95 | % | | | (1.08 | %) | | | 62 | % | |
8/31/2013 | | $ | 8.98 | | | $ | (0.07 | ) | | $ | 1.47 | | | $ | 1.40 | | | $ | — | | | $ | (0.74 | ) | | $ | — | | | $ | (0.74 | ) | | $ | — | | | $ | — | | | $ | 9.64 | | | | 16.60 | % | | $ | 13.6 | | | | 2.23 | % | | | 1.95 | % | | | (0.78 | %) | | | 70 | % | |
8/31/2012 | | $ | 8.82 | | | $ | (0.08 | ) | | $ | 0.93 | | | $ | 0.85 | | | $ | — | | | $ | (0.69 | ) | | $ | — | | | $ | (0.69 | ) | | $ | — | | | $ | — | | | $ | 8.98 | | | | 10.71 | % | | $ | 11.7 | | | | 2.28 | % | | | 1.95 | % | | | (0.96 | %) | | | 93 | % | |
8/31/2011 | | $ | 7.74 | | | $ | (0.05 | ) | | $ | 1.39 | | | $ | 1.34 | | | $ | — | | | $ | (0.26 | ) | | $ | — | | | $ | (0.26 | ) | | $ | — | | | $ | — | | | $ | 8.82 | | | | 17.29 | % | | $ | 13.2 | | | | 2.30 | % | | | 1.95 | % | | | (0.53 | %) | | | 150 | % | |
Emerging Markets Equity Fund | |
Institutional Class | |
8/31/2015 | | $ | 17.89 | | | $ | 0.12 | | | $ | (3.90 | ) | | $ | (3.78 | ) | | $ | (0.17 | ) | | $ | — | | | $ | — | | | $ | (0.17 | ) | | $ | — | | | $ | — | | | $ | 13.94 | | | | (21.22 | %) | | $ | 307.5 | | | | 1.43 | % | | | 1.25 | % | | | 0.73 | % | | | 36 | % | |
8/31/2014 | | $ | 15.34 | | | $ | 0.16 | | | $ | 2.48 | | | $ | 2.64 | | | $ | (0.09 | ) | | $ | — | | | $ | — | | | $ | (0.09 | ) | | $ | 0.00 | | | $ | — | | | $ | 17.89 | | | | 17.24 | %g | $ | 514.8 | | | | 1.45 | % | | | 1.25 | % | | | 0.96 | % | | | 36 | % | |
8/31/2013 | | $ | 14.99 | | | $ | 0.18 | | | $ | 0.24 | | | $ | 0.42 | | | $ | (0.07 | ) | | $ | — | | | $ | — | | | $ | (0.07 | ) | | $ | — | | | $ | — | | | $ | 15.34 | | | | 2.77 | % | | $ | 374.1 | | | | 1.60 | % | | | 1.25 | % | | | 1.10 | % | | | 36 | % | |
8/31/2012 | | $ | 15.80 | | | $ | 0.13 | | | $ | (0.86 | ) | | $ | (0.73 | ) | | $ | (0.08 | ) | | $ | — | | | $ | — | | | $ | (0.08 | ) | | $ | — | | | $ | — | | | $ | 14.99 | | | | (4.53 | %) | $ | 161.7 | | | | 1.77 | % | | | 1.25 | % | | | 0.89 | % | | | 78 | % | |
8/31/2011 | | $ | 15.61 | | | $ | 0.18 | | | $ | 0.40 | | | $ | 0.58 | | | $ | (0.03 | ) | | $ | (0.36 | ) | | $ | — | | | $ | (0.39 | ) | | $ | — | | | $ | 0.00 | | | $ | 15.80 | | | | 3.44 | % | | $ | 107.7 | | | | 2.56 | % | | | 1.26 | % | | | 1.05 | % | | | 71 | % | |
See Notes to Financial Highlights
Financial Highlights (cont'd)
| | | Net Asset
Value,
Beginning
of Year | | Net
Investment
Income (Loss)@ | | Net Gains or
Losses on
Securities
(both realized
and
unrealized) | | Total From
Investment
Operations | | Dividends
from Net
Investment
Income | | Distributions
from Net
Realized
Capital Gains | | Tax
Return of
Capital | | Total
Distributions | | Voluntary
Contributions
from
Management | | Redemption
Feesøø | | Net
Asset
Value,
End of
Year | | Total Return†d | | Net Assets,
End of
Year
(in millions) | | Ratio of
Gross
Expenses
to Average
Net Assets# | | Ratio
of Net
Expenses
to Average
Net Assets‡ | | Ratio of Net
Investment
Income/
(Loss) to
Average Net
Assets | | Portfolio
Turnover Rate | |
Emerging Markets Equity Fund (cont'd) | |
Class A | |
8/31/2015 | | $ | 17.80 | | | $ | 0.08 | | | $ | (3.88 | ) | | $ | (3.80 | ) | | $ | (0.13 | ) | | $ | — | | | $ | — | | | $ | (0.13 | ) | | $ | — | | | $ | — | | | $ | 13.87 | | | | (21.42 | %) | | $ | 13.4 | | | | 1.79 | % | | | 1.50 | % | | | 0.49 | % | | | 36 | % | |
8/31/2014 | | $ | 15.27 | | | $ | 0.15 | | | $ | 2.44 | | | $ | 2.59 | | | $ | (0.06 | ) | | $ | — | | | $ | — | | | $ | (0.06 | ) | | $ | 0.00 | | | $ | — | | | $ | 17.80 | | | | 16.99 | %g | | $ | 19.9 | | | | 1.82 | % | | | 1.50 | % | | | 0.88 | % | | | 36 | % | |
8/31/2013 | | $ | 14.92 | | | $ | 0.11 | | | $ | 0.27 | | | $ | 0.38 | | | $ | (0.03 | ) | | $ | — | | | $ | — | | | $ | (0.03 | ) | | $ | — | | | $ | — | | | $ | 15.27 | | | | 2.54 | % | | $ | 7.3 | | | | 2.00 | % | | | 1.50 | % | | | 0.69 | % | | | 36 | % | |
8/31/2012 | | $ | 15.74 | | | $ | 0.08 | | | $ | (0.85 | ) | | $ | (0.77 | ) | | $ | (0.05 | ) | | $ | — | | | $ | — | | | $ | (0.05 | ) | | $ | — | | | $ | — | | | $ | 14.92 | | | | (4.84 | %) | | $ | 4.1 | | | | 2.23 | % | | | 1.50 | % | | | 0.53 | % | | | 78 | % | |
8/31/2011 | | $ | 15.57 | | | $ | 0.03 | | | $ | 0.50 | | | $ | 0.53 | | | $ | — | | | $ | (0.36 | ) | | $ | — | | | $ | (0.36 | ) | | $ | — | | | $ | 0.00 | | | $ | 15.74 | | | | 3.16 | % | | $ | 4.9 | | | | 3.22 | % | | | 1.50 | % | | | 0.19 | % | | | 71 | % | |
Class C | |
8/31/2015 | | $ | 17.26 | | | $ | (0.03 | ) | | $ | (3.77 | ) | | $ | (3.80 | ) | | $ | (0.04 | ) | | $ | — | | | $ | — | | | $ | (0.04 | ) | | $ | — | | | $ | — | | | $ | 13.42 | | | | (22.02 | %) | | $ | 6.2 | | | | 2.53 | % | | | 2.25 | % | | | (0.20 | %) | | | 36 | % | |
8/31/2014 | | $ | 14.87 | | | $ | 0.00 | | | $ | 2.39 | | | $ | 2.39 | | | $ | — | | | $ | — | | | $ | — | | | $ | — | | | $ | 0.00 | | | $ | — | | | $ | 17.26 | | | | 16.07 | %g | | $ | 7.0 | | | | 2.56 | % | | | 2.25 | % | | | 0.01 | % | | | 36 | % | |
8/31/2013 | | $ | 14.61 | | | $ | 0.02 | | | $ | 0.24 | | | $ | 0.26 | | | $ | — | | | $ | — | | | $ | — | | | $ | — | | | $ | — | | | $ | — | | | $ | 14.87 | | | | 1.78 | % | | $ | 4.1 | | | | 2.73 | % | | | 2.25 | % | | | 0.13 | % | | | 36 | % | |
8/31/2012 | | $ | 15.46 | | | $ | (0.02 | ) | | $ | (0.83 | ) | | $ | (0.85 | ) | | $ | — | | | $ | — | | | $ | — | | | $ | — | | | $ | — | | | $ | — | | | $ | 14.61 | | | | (5.50 | %) | | $ | 1.4 | | | | 2.93 | % | | | 2.25 | % | | | (0.17 | %) | | | 78 | % | |
8/31/2011 | | $ | 15.41 | | | $ | (0.02 | ) | | $ | 0.43 | | | $ | 0.41 | | | $ | — | | | $ | (0.36 | ) | | $ | — | | | $ | (0.36 | ) | | $ | — | | | $ | 0.00 | | | $ | 15.46 | | | | 2.41 | % | | $ | 1.1 | | | | 3.80 | % | | | 2.26 | % | | | (0.12 | %) | | | 71 | % | |
Class R3 | |
8/31/2015 | | $ | 17.47 | | | $ | 0.02 | | | $ | (3.80 | ) | | $ | (3.78 | ) | | $ | (0.09 | ) | | $ | — | | | $ | — | | | $ | (0.09 | ) | | $ | — | | | $ | — | | | $ | 13.60 | | | | (21.70 | %) | | $ | 0.8 | | | | 2.09 | % | | | 1.91 | % | | | 0.14 | % | | | 36 | % | |
8/31/2014 | | $ | 15.02 | | | $ | 0.07 | | | $ | 2.39 | | | $ | 2.46 | | | $ | (0.01 | ) | | $ | — | | | $ | — | | | $ | (0.01 | ) | | $ | 0.00 | | | $ | — | | | $ | 17.47 | | | | 16.42 | %g | | $ | 0.6 | | | | 2.13 | % | | | 1.91 | % | | | 0.45 | % | | | 36 | % | |
8/31/2013 | | $ | 14.71 | | | $ | 0.03 | | | $ | 0.28 | | | $ | 0.31 | | | $ | — | | | $ | — | | | $ | — | | | $ | — | | | $ | — | | | $ | — | | | $ | 15.02 | | | | 2.11 | % | | $ | 0.2 | | | | 2.31 | % | | | 1.91 | % | | | 0.22 | % | | | 36 | % | |
8/31/2012 | | $ | 15.52 | | | $ | 0.04 | | | $ | (0.85 | ) | | $ | (0.81 | ) | | $ | — | | | $ | — | | | $ | — | | | $ | — | | | $ | — | | | $ | — | | | $ | 14.71 | | | | (5.22 | %) | | $ | 0.3 | | | | 2.49 | % | | | 1.92 | % | | | 0.28 | % | | | 78 | % | |
8/31/2011 | | $ | 15.42 | | | $ | (0.01 | ) | | $ | 0.47 | | | $ | 0.46 | | | $ | — | | | $ | (0.36 | ) | | $ | — | | | $ | (0.36 | ) | | $ | — | | | $ | 0.00 | | | $ | 15.52 | | | | 2.73 | % | | $ | 0.0 | | | | 8.02 | % | | | 1.91 | % | | | (0.04 | %) | | | 71 | % | |
Class R6 | |
8/31/2015 | | $ | 17.91 | | | $ | 0.14 | | | $ | (3.91 | ) | | $ | (3.77 | ) | | $ | (0.18 | ) | | $ | — | | | $ | — | | | $ | (0.18 | ) | | $ | — | | | $ | — | | | $ | 13.96 | | | | (21.14 | %) | | $ | 88.1 | | | | 1.34 | % | | | 1.18 | % | | | 0.88 | % | | | 36 | % | |
8/31/2014 | | $ | 15.35 | | | $ | 0.18 | | | $ | 2.47 | | | $ | 2.65 | | | $ | (0.09 | ) | | $ | — | | | $ | — | | | $ | (0.09 | ) | | $ | 0.00 | | | $ | — | | | $ | 17.91 | | | | 17.35 | %g | | $ | 83.8 | | | | 1.37 | % | | | 1.18 | % | | | 1.08 | % | | | 36 | % | |
Period from 3/15/2013^
to 8/31/2013 | | $ | 16.85 | | | $ | 0.13 | | | $ | (1.63 | ) | | $ | (1.50 | ) | | $ | — | | | $ | — | | | $ | — | | | $ | — | | | $ | — | | | $ | — | | | $ | 15.35 | | | | (8.90 | %)** | | $ | 31.1 | | | | 1.57 | %* | | | 1.18 | %* | | | 1.80 | %* | | | 36 | %Ø |
Equity Income Fund | |
Institutional Class | |
8/31/2015 | | $ | 13.19 | | | $ | 0.34 | | | $ | (0.92 | ) | | $ | (0.58 | ) | | $ | (0.30 | ) | | $ | (0.57 | ) | | $ | — | | | $ | (0.87 | ) | | $ | — | | | $ | — | | | $ | 11.74 | | | | (4.60 | %) | | $ | 1,443.7 | | | | 0.68 | % | | | 0.68 | % | | | 2.66 | % | | | 48 | % | |
8/31/2014 | | $ | 11.76 | | | $ | 0.33 | | | $ | 1.94 | | | $ | 2.27 | | | $ | (0.33 | ) | | $ | (0.51 | ) | | $ | — | | | $ | (0.84 | ) | | $ | 0.00 | | | $ | — | | | $ | 13.19 | | | | 20.11 | %g | | $ | 1,578.5 | | | | 0.68 | % | | | 0.68 | % | | | 2.66 | % | | | 41 | % | |
8/31/2013 | | $ | 11.74 | | | $ | 0.30 | | | $ | 0.25 | | | $ | 0.55 | | | $ | (0.42 | ) | | $ | (0.11 | ) | | $ | — | | | $ | (0.53 | ) | | $ | — | | | $ | — | | | $ | 11.76 | | | | 4.79 | % | | $ | 1,439.4 | | | | 0.68 | % | | | 0.68 | % | | | 2.45 | % | | | 70 | % | |
8/31/2012 | | $ | 11.28 | | | $ | 0.35 | | | $ | 0.57 | | | $ | 0.92 | | | $ | (0.38 | ) | | $ | (0.08 | ) | | $ | — | | | $ | (0.46 | ) | | $ | — | | | $ | — | | | $ | 11.74 | | | | 8.49 | % | | $ | 1,213.6 | | | | 0.71 | % | | | 0.71 | %§ | | 3.10 | % | | | 42 | % | |
8/31/2011 | | $ | 10.02 | | | $ | 0.33 | | | $ | 1.41 | | | $ | 1.74 | | | $ | (0.48 | ) | | $ | — | | | $ | — | | | $ | (0.48 | ) | | $ | — | | | $ | — | | | $ | 11.28 | | | | 17.70 | % | | $ | 701.7 | | | | 0.80 | % | | | 0.80 | %§ | | 2.93 | % | | | 22 | % | |
See Notes to Financial Highlights
Financial Highlights (cont'd)
| | | Net Asset
Value,
Beginning
of Year | | Net
Investment
Income (Loss)@ | | Net Gains or
Losses on
Securities
(both realized
and
unrealized) | | Total From
Investment
Operations | | Dividends
from Net
Investment
Income | | Distributions
from Net
Realized
Capital Gains | | Tax
Return of
Capital | | Total
Distributions | | Voluntary
Contributions
from
Management | | Redemption
Feesøø | | Net
Asset
Value,
End of
Year | | Total Return†d | | Net Assets,
End of
Year
(in millions) | | Ratio of
Gross
Expenses
to Average
Net Assets# | | Ratio
of Net
Expenses
to Average
Net Assets‡ | | Ratio of Net
Investment
Income/
(Loss) to
Average Net
Assets | | Portfolio
Turnover Rate | |
Equity Income Fund (cont'd) | |
Class A | |
8/31/2015 | | $ | 13.14 | | | $ | 0.29 | | | $ | (0.93 | ) | | $ | (0.64 | ) | | $ | (0.24 | ) | | $ | (0.57 | ) | | $ | — | | | $ | (0.81 | ) | | $ | — | | | $ | — | | | $ | 11.69 | | | | (5.02 | %) | | $ | 289.5 | | | | 1.05 | % | | | 1.05 | % | | | 2.26 | % | | | 48 | % | |
8/31/2014 | | $ | 11.71 | | | $ | 0.27 | | | $ | 1.95 | | | $ | 2.22 | | | $ | (0.28 | ) | | $ | (0.51 | ) | | $ | — | | | $ | (0.79 | ) | | $ | 0.00 | | | $ | — | | | $ | 13.14 | | | | 19.72 | %g | | $ | 462.6 | | | | 1.05 | % | | | 1.05 | % | | | 2.21 | % | | | 41 | % | |
8/31/2013 | | $ | 11.70 | | | $ | 0.25 | | | $ | 0.25 | | | $ | 0.50 | | | $ | (0.38 | ) | | $ | (0.11 | ) | | $ | — | | | $ | (0.49 | ) | | $ | — | | | $ | — | | | $ | 11.71 | | | | 4.32 | % | | $ | 1,036.4 | | | | 1.05 | % | | | 1.05 | % | | | 2.09 | % | | | 70 | % | |
8/31/2012 | | $ | 11.24 | | | $ | 0.30 | | | $ | 0.57 | | | $ | 0.87 | | | $ | (0.33 | ) | | $ | (0.08 | ) | | $ | — | | | $ | (0.41 | ) | | $ | — | | | $ | — | | | $ | 11.70 | | | | 8.09 | % | | $ | 1,012.3 | | | | 1.13 | % | | | 1.13 | %§ | | | 2.70 | % | | | 42 | % | |
8/31/2011 | | $ | 9.99 | | | $ | 0.28 | | | $ | 1.41 | | | $ | 1.69 | | | $ | (0.44 | ) | | $ | — | | | $ | — | | | $ | (0.44 | ) | | $ | — | | | $ | — | | | $ | 11.24 | | | | 17.27 | % | | $ | 567.0 | | | | 1.16 | % | | | 1.16 | %§ | | | 2.50 | % | | | 22 | % | |
Class C | |
8/31/2015 | | $ | 13.06 | | | $ | 0.20 | | | $ | (0.92 | ) | | $ | (0.72 | ) | | $ | (0.15 | ) | | $ | (0.57 | ) | | $ | — | | | $ | (0.72 | ) | | $ | — | | | $ | — | | | $ | 11.62 | | | | (5.65 | %) | | $ | 390.0 | | | | 1.79 | % | | | 1.79 | % | | | 1.55 | % | | | 48 | % | |
8/31/2014 | | $ | 11.65 | | | $ | 0.19 | | | $ | 1.92 | | | $ | 2.11 | | | $ | (0.19 | ) | | $ | (0.51 | ) | | $ | — | | | $ | (0.70 | ) | | $ | 0.00 | | | $ | — | | | $ | 13.06 | | | | 18.77 | %g | | $ | 450.1 | | | | 1.79 | % | | | 1.79 | % | | | 1.54 | % | | | 41 | % | |
8/31/2013 | | $ | 11.64 | | | $ | 0.16 | | | $ | 0.25 | | | $ | 0.41 | | | $ | (0.29 | ) | | $ | (0.11 | ) | | $ | — | | | $ | (0.40 | ) | | $ | — | | | $ | — | | | $ | 11.65 | | | | 3.58 | % | | $ | 465.7 | | | | 1.80 | % | | | 1.80 | % | | | 1.34 | % | | | 70 | % | |
8/31/2012 | | $ | 11.18 | | | $ | 0.22 | | | $ | 0.58 | | | $ | 0.80 | | | $ | (0.26 | ) | | $ | (0.08 | ) | | $ | — | | | $ | (0.34 | ) | | $ | — | | | $ | — | | | $ | 11.64 | | | | 7.40 | % | | $ | 380.4 | | | | 1.84 | % | | | 1.84 | %§ | | | 1.98 | % | | | 42 | % | |
8/31/2011 | | $ | 9.96 | | | $ | 0.20 | | | $ | 1.40 | | | $ | 1.60 | | | $ | (0.38 | ) | | $ | — | | | $ | — | | | $ | (0.38 | ) | | $ | — | | | $ | — | | | $ | 11.18 | | | | 16.31 | % | | $ | 233.2 | | | | 1.91 | % | | | 1.91 | %§ | | | 1.81 | % | | | 22 | % | |
Class R3 | |
8/31/2015 | | $ | 13.12 | | | $ | 0.26 | | | $ | (0.92 | ) | | $ | (0.66 | ) | | $ | (0.22 | ) | | $ | (0.57 | ) | | $ | — | | | $ | (0.79 | ) | | $ | — | | | $ | — | | | $ | 11.67 | | | | (5.22 | %) | | $ | 3.8 | | | | 1.31 | % | | | 1.31 | % | | | 2.05 | % | | | 48 | % | |
8/31/2014 | | $ | 11.69 | | | $ | 0.25 | | | $ | 1.93 | | | $ | 2.18 | | | $ | (0.24 | ) | | $ | (0.51 | ) | | $ | — | | | $ | (0.75 | ) | | $ | 0.00 | | | $ | — | | | $ | 13.12 | | | | 19.42 | %g | | $ | 3.4 | | | | 1.34 | % | | | 1.34 | %§ | | | 2.04 | % | | | 41 | % | |
8/31/2013 | | $ | 11.69 | | | $ | 0.22 | | | $ | 0.23 | | | $ | 0.45 | | | $ | (0.34 | ) | | $ | (0.11 | ) | | $ | — | | | $ | (0.45 | ) | | $ | — | | | $ | — | | | $ | 11.69 | | | | 3.94 | % | | $ | 2.6 | | | | 1.41 | % | | | 1.41 | %§ | | | 1.78 | % | | | 70 | % | |
8/31/2012 | | $ | 11.24 | | | $ | 0.29 | | | $ | 0.55 | | | $ | 0.84 | | | $ | (0.31 | ) | | $ | (0.08 | ) | | $ | — | | | $ | (0.39 | ) | | $ | — | | | $ | — | | | $ | 11.69 | | | | 7.78 | % | | $ | 1.1 | | | | 1.41 | % | | | 1.41 | %§ | | | 2.59 | % | | | 42 | % | |
8/31/2011 | | $ | 9.99 | | | $ | 0.27 | | | $ | 1.39 | | | $ | 1.66 | | | $ | (0.41 | ) | | $ | — | | | $ | — | | | $ | (0.41 | ) | | $ | — | | | $ | — | | | $ | 11.24 | | | | 16.92 | % | | $ | 0.2 | | | | 4.32 | % | | | 1.41 | % | | | 2.44 | % | | | 22 | % | |
Focus Fund | |
Investor Class | |
8/31/2015 | | $ | 29.77 | | | $ | 0.21 | | | $ | (0.15 | ) | | $ | 0.06 | | | $ | (0.16 | ) | | $ | (4.22 | ) | | $ | — | | | $ | (4.38 | ) | | $ | — | | | $ | — | | | $ | 25.45 | | | | 0.49 | % | | $ | 639.8 | | | | 0.91 | % | | | 0.91 | % | | | 0.77 | % | | | 52 | % | |
8/31/2014 | | $ | 26.90 | | | $ | 0.18 | | | $ | 5.57 | | | $ | 5.75 | | | $ | (0.20 | ) | | $ | (2.68 | ) | | $ | — | | | $ | (2.88 | ) | | $ | 0.00 | | | $ | — | | | $ | 29.77 | | | | 22.65 | %g | | $ | 699.4 | | | | 0.91 | % | | | 0.91 | % | | | 0.64 | % | | | 84 | % | |
8/31/2013 | | $ | 21.71 | | | $ | 0.18 | | | $ | 5.15 | | | $ | 5.33 | | | $ | (0.14 | ) | | $ | — | | | $ | — | | | $ | (0.14 | ) | | $ | — | | | $ | — | | | $ | 26.90 | | | | 24.69 | % | | $ | 636.9 | | | | 0.94 | % | | | 0.94 | % | | | 0.72 | % | | | 79 | % | |
8/31/2012 | | $ | 18.80 | | | $ | 0.14 | | | $ | 2.87 | | | $ | 3.01 | | | $ | (0.10 | ) | | $ | — | | | $ | — | | | $ | (0.10 | ) | | $ | — | | | $ | — | | | $ | 21.71 | | | | 16.10 | % | | $ | 534.3 | | | | 0.97 | % | | | 0.97 | % | | | 0.72 | % | | | 96 | % | |
8/31/2011 | | $ | 16.07 | | | $ | 0.13 | | | $ | 2.70 | | | $ | 2.83 | | | $ | (0.10 | ) | | $ | — | | | $ | — | | | $ | (0.10 | ) | | $ | — | | | $ | — | | | $ | 18.80 | | | | 17.61 | % | | $ | 503.8 | | | | 0.97 | % | | | 0.97 | % | | | 0.65 | % | | | 113 | % | |
Trust Class | |
8/31/2015 | | $ | 20.64 | | | $ | 0.10 | | | $ | (0.13 | ) | | $ | (0.03 | ) | | $ | (0.15 | ) | | $ | (4.22 | ) | | $ | — | | | $ | (4.37 | ) | | $ | — | | | $ | — | | | $ | 16.24 | | | | 0.26 | % | | $ | 92.7 | | | | 1.10 | % | | | 1.10 | % | | | 0.57 | % | | | 52 | % | |
8/31/2014 | | $ | 19.50 | | | $ | 0.09 | | | $ | 3.94 | | | $ | 4.03 | | | $ | (0.21 | ) | | $ | (2.68 | ) | | $ | — | | | $ | (2.89 | ) | | $ | 0.00 | | | $ | — | | | $ | 20.64 | | | | 22.40 | %g | | $ | 125.7 | | | | 1.11 | % | | | 1.11 | % | | | 0.47 | % | | | 84 | % | |
8/31/2013 | | $ | 15.78 | | | $ | 0.10 | | | $ | 3.74 | | | $ | 3.84 | | | $ | (0.12 | ) | | $ | — | | | $ | — | | | $ | (0.12 | ) | | $ | — | | | $ | — | | | $ | 19.50 | | | | 24.48 | % | | $ | 56.3 | | | | 1.14 | % | | | 1.14 | % | | | 0.53 | % | | | 79 | % | |
8/31/2012 | | $ | 13.70 | | | $ | 0.07 | | | $ | 2.08 | | | $ | 2.15 | | | $ | (0.07 | ) | | $ | — | | | $ | — | | | $ | (0.07 | ) | | $ | — | | | $ | — | | | $ | 15.78 | | | | 15.82 | % | | $ | 15.0 | | | | 1.16 | % | | | 1.16 | % | | | 0.52 | % | | | 96 | % | |
8/31/2011 | | $ | 11.73 | | | $ | 0.06 | | | $ | 1.98 | | | $ | 2.04 | | | $ | (0.07 | ) | | $ | — | | | $ | — | | | $ | (0.07 | ) | | $ | — | | | $ | — | | | $ | 13.70 | | | | 17.39 | % | | $ | 17.9 | | | | 1.16 | % | | | 1.16 | % | | | 0.45 | % | | | 113 | % | |
See Notes to Financial Highlights
Financial Highlights (cont'd)
| | | Net Asset
Value,
Beginning
of Year | | Net
Investment
Income (Loss)@ | | Net Gains or
Losses on
Securities
(both realized
and
unrealized) | | Total From
Investment
Operations | | Dividends
from Net
Investment
Income | | Distributions
from Net
Realized
Capital Gains | | Tax
Return of
Capital | | Total
Distributions | | Voluntary
Contributions
from
Management | | Redemption
Feesøø | | Net
Asset
Value,
End of
Year | | Total Return†d | | Net Assets,
End of
Year
(in millions) | | Ratio of
Gross
Expenses
to Average
Net Assets# | | Ratio
of Net
Expenses
to Average
Net Assets‡ | | Ratio of Net
Investment
Income/
(Loss) to
Average Net
Assets | | Portfolio
Turnover
Rate | |
Focus Fund (cont'd) | |
Advisor Class | |
8/31/2015 | | $ | 13.03 | | | $ | 0.04 | | | $ | (0.09 | ) | | $ | (0.05 | ) | | $ | (0.16 | ) | | $ | (4.22 | ) | | $ | — | | | $ | (4.38 | ) | | $ | — | | | $ | — | | | $ | 8.60 | | | | 0.15 | % | | $ | 6.1 | | | | 1.27 | % | | | 1.27 | % | | | 0.39 | % | | | 52 | % | |
8/31/2014 | | $ | 13.27 | | | $ | 0.04 | | | $ | 2.57 | | | $ | 2.61 | | | $ | (0.17 | ) | | $ | (2.68 | ) | | $ | — | | | $ | (2.85 | ) | | $ | 0.00 | | | $ | — | | | $ | 13.03 | | | | 22.21 | %g | | $ | 7.1 | | | | 1.27 | % | | | 1.27 | % | | | 0.28 | % | | | 84 | % | |
8/31/2013 | | $ | 10.79 | | | $ | 0.04 | | | $ | 2.55 | | | $ | 2.59 | | | $ | (0.11 | ) | | $ | — | | | $ | — | | | $ | (0.11 | ) | | $ | — | | | $ | — | | | $ | 13.27 | | | | 24.22 | % | | $ | 6.1 | | | | 1.29 | % | | | 1.29 | % | | | 0.37 | % | | | 79 | % | |
8/31/2012 | | $ | 9.41 | | | $ | 0.04 | | | $ | 1.42 | | | $ | 1.46 | | | $ | (0.08 | ) | | $ | — | | | $ | — | | | $ | (0.08 | ) | | $ | — | | | $ | — | | | $ | 10.79 | | | | 15.68 | % | | $ | 5.8 | | | | 1.31 | % | | | 1.31 | % | | | 0.37 | % | | | 96 | % | |
8/31/2011 | | $ | 8.08 | | | $ | 0.03 | | | $ | 1.36 | | | $ | 1.39 | | | $ | (0.06 | ) | | $ | — | | | $ | — | | | $ | (0.06 | ) | | $ | — | | | $ | — | | | $ | 9.41 | | | | 17.20 | % | | $ | 7.8 | | | | 1.32 | % | | | 1.32 | % | | | 0.30 | % | | | 113 | % | |
Institutional Class | |
8/31/2015 | | $ | 29.83 | | | $ | 0.26 | | | $ | (0.16 | ) | | $ | 0.10 | | | $ | (0.21 | ) | | $ | (4.22 | ) | | $ | — | | | $ | (4.43 | ) | | $ | — | | | $ | — | | | $ | 25.50 | | | | 0.65 | % | | $ | 28.7 | | | | 0.76 | % | | | 0.75 | % | | | 0.96 | % | | | 52 | % | |
8/31/2014 | | $ | 26.95 | | | $ | 0.21 | | | $ | 5.60 | | | $ | 5.81 | | | $ | (0.25 | ) | | $ | (2.68 | ) | | $ | — | | | $ | (2.93 | ) | | $ | 0.00 | | | $ | — | | | $ | 29.83 | | | | 22.86 | %g | | $ | 9.4 | | | | 0.76 | % | | | 0.75 | % | | | 0.72 | % | | | 84 | % | |
8/31/2013 | | $ | 21.76 | | | $ | 0.24 | | | $ | 5.14 | | | $ | 5.38 | | | $ | (0.19 | ) | | $ | — | | | $ | — | | | $ | (0.19 | ) | | $ | — | | | $ | — | | | $ | 26.95 | | | | 24.89 | % | | $ | 22.6 | | | | 0.77 | % | | | 0.75 | % | | | 0.96 | % | | | 79 | % | |
8/31/2012 | | $ | 18.84 | | | $ | 0.19 | | | $ | 2.87 | | | $ | 3.06 | | | $ | (0.14 | ) | | $ | — | | | $ | — | | | $ | (0.14 | ) | | $ | — | | | $ | — | | | $ | 21.76 | | | | 16.39 | % | | $ | 6.9 | | | | 0.80 | % | | | 0.75 | % | | | 0.97 | % | | | 96 | % | |
8/31/2011 | | $ | 16.08 | | | $ | 0.21 | | | $ | 2.66 | | | $ | 2.87 | | | $ | (0.11 | ) | | $ | — | | | $ | — | | | $ | (0.11 | ) | | $ | — | | | $ | — | | | $ | 18.84 | | | | 17.85 | % | | $ | 4.9 | | | | 0.85 | % | | | 0.75 | % | | | 1.03 | % | | | 113 | % | |
Class A | |
8/31/2015 | | $ | 20.50 | | | $ | 0.10 | | | $ | (0.13 | ) | | $ | (0.03 | ) | | $ | (0.15 | ) | | $ | (4.22 | ) | | $ | — | | | $ | (4.37 | ) | | $ | — | | | $ | — | | | $ | 16.10 | | | | 0.24 | % | | $ | 4.4 | | | | 1.14 | % | | | 1.11 | % | | | 0.58 | % | | | 52 | % | |
8/31/2014 | | $ | 19.38 | | | $ | 0.09 | | | $ | 3.91 | | | $ | 4.00 | | | $ | (0.20 | ) | | $ | (2.68 | ) | | $ | — | | | $ | (2.88 | ) | | $ | 0.00 | | | $ | — | | | $ | 20.50 | | | | 22.40 | %g | | $ | 3.9 | | | | 1.13 | % | | | 1.11 | % | | | 0.47 | % | | | 84 | % | |
8/31/2013 | | $ | 15.71 | | | $ | 0.10 | | | $ | 3.71 | | | $ | 3.81 | | | $ | (0.14 | ) | | $ | — | | | $ | — | | | $ | (0.14 | ) | | $ | — | | | $ | — | | | $ | 19.38 | | | | 24.47 | % | | $ | 1.9 | | | | 1.19 | % | | | 1.11 | % | | | 0.56 | % | | | 79 | % | |
8/31/2012 | | $ | 13.67 | | | $ | 0.09 | | | $ | 2.07 | | | $ | 2.16 | | | $ | (0.12 | ) | | $ | — | | | $ | — | | | $ | (0.12 | ) | | $ | — | | | $ | — | | | $ | 15.71 | | | | 15.96 | % | | $ | 0.7 | | | | 1.22 | % | | | 1.11 | % | | | 0.61 | % | | | 96 | % | |
8/31/2011 | | $ | 11.73 | | | $ | 0.10 | | | $ | 1.95 | | | $ | 2.05 | | | $ | (0.11 | ) | | $ | — | | | $ | — | | | $ | (0.11 | ) | | $ | — | | | $ | — | | | $ | 13.67 | | | | 17.43 | % | | $ | 0.4 | | | | 2.20 | % | | | 1.11 | % | | | 0.66 | % | | | 113 | % | |
Class C | |
8/31/2015 | | $ | 12.70 | | | $ | (0.02 | ) | | $ | (0.10 | ) | | $ | (0.12 | ) | | $ | (0.12 | ) | | $ | (4.22 | ) | | $ | — | | | $ | (4.34 | ) | | $ | — | | | $ | — | | | $ | 8.24 | | | | (0.50 | %) | | $ | 2.9 | | | | 1.89 | % | | | 1.86 | % | | | (0.18 | %) | | | 52 | % | |
8/31/2014 | | $ | 13.03 | | | $ | (0.03 | ) | | $ | 2.52 | | | $ | 2.49 | | | $ | (0.14 | ) | | $ | (2.68 | ) | | $ | — | | | $ | (2.82 | ) | | $ | 0.00 | | | $ | — | | | $ | 12.70 | | | | 21.52 | %g | | $ | 1.5 | | | | 1.91 | % | | | 1.86 | % | | | (0.27 | %) | | | 84 | % | |
8/31/2013 | | $ | 10.62 | | | $ | (0.02 | ) | | $ | 2.51 | | | $ | 2.49 | | | $ | (0.08 | ) | | $ | — | | | $ | — | | | $ | (0.08 | ) | | $ | — | | | $ | — | | | $ | 13.03 | | | | 23.61 | % | | $ | 0.6 | | | | 1.94 | % | | | 1.86 | % | | | (0.20 | %) | | | 79 | % | |
8/31/2012 | | $ | 9.32 | | | $ | (0.02 | ) | | $ | 1.41 | | | $ | 1.39 | | | $ | (0.09 | ) | | $ | — | | | $ | — | | | $ | (0.09 | ) | | $ | — | | | $ | — | | | $ | 10.62 | | | | 15.04 | % | | $ | 0.3 | | | | 1.97 | % | | | 1.86 | % | | | (0.17 | %) | | | 96 | % | |
8/31/2011 | | $ | 8.07 | | | $ | (0.02 | ) | | $ | 1.36 | | | $ | 1.34 | | | $ | (0.09 | ) | | $ | — | | | $ | — | | | $ | (0.09 | ) | | $ | — | | | $ | — | | | $ | 9.32 | | | | 16.62 | % | | $ | 0.3 | | | | 2.92 | % | | | 1.86 | % | | | (0.16 | %) | | | 113 | % | |
Genesis Fund | |
Investor Class | |
8/31/2015 | | $ | 40.89 | | | $ | 0.11 | | | $ | 0.36 | | | $ | 0.47 | | | $ | (0.14 | ) | | $ | (4.91 | ) | | $ | — | | | $ | (5.05 | ) | | $ | — | | | $ | — | | | $ | 36.31 | | | | 1.52 | % | | $ | 2,023.6 | | | | 1.01 | % | | | 1.01 | % | | | 0.29 | % | | | 13 | % | |
8/31/2014 | | $ | 40.18 | | | $ | 0.08 | | | $ | 5.37 | | | $ | 5.45 | | | $ | (0.24 | ) | | $ | (4.50 | ) | | $ | — | | | $ | (4.74 | ) | | $ | 0.00 | | | $ | — | | | $ | 40.89 | | | | 13.65 | %g | | $ | 2,437.6 | | | | 1.01 | % | | | 1.01 | % | | | 0.20 | % | | | 14 | % | |
8/31/2013 | | $ | 34.65 | | | $ | 0.26 | | | $ | 7.57 | | | $ | 7.83 | | | $ | (0.19 | ) | | $ | (2.11 | ) | | $ | — | | | $ | (2.30 | ) | | $ | — | | | $ | — | | | $ | 40.18 | | | | 23.91 | % | | $ | 2,458.7 | | | | 1.02 | % | | | 1.02 | % | | | 0.71 | % | | | 20 | % | |
8/31/2012 | | $ | 34.28 | | | $ | 0.11 | | | $ | 1.94 | | | $ | 2.05 | | | $ | (0.53 | ) | | $ | (1.15 | ) | | $ | — | | | $ | (1.68 | ) | | $ | — | | | $ | — | | | $ | 34.65 | | | | 6.31 | % | | $ | 2,256.0 | | | | 1.03 | % | | | 1.03 | % | | | 0.31 | % | | | 15 | % | |
8/31/2011 | | $ | 26.44 | | | $ | 0.27 | | | $ | 7.57 | | | $ | 7.84 | | | $ | — | | | $ | — | | | $ | — | | | $ | — | | | $ | — | | | $ | — | | | $ | 34.28 | | | | 29.65 | % | | $ | 2,157.7 | | | | 1.05 | % | | | 1.05 | % | | | 0.81 | % | | | 18 | % | |
See Notes to Financial Highlights
Financial Highlights (cont'd)
| | | Net Asset
Value,
Beginning
of Year | | Net
Investment
Income (Loss)@ | | Net Gains or
Losses on
Securities
(both realized
and
unrealized) | | Total From
Investment
Operations | | Dividends
from Net
Investment
Income | | Distributions
from Net
Realized
Capital Gains | | Tax
Return of
Capital | | Total
Distributions | | Voluntary
Contributions
from
Management | | Redemption
Feesøø | | Net
Asset
Value,
End of
Year | | Total Return†d | | Net Assets,
End of
Year
(in millions) | | Ratio of
Gross
Expenses
to Average
Net Assets# | | Ratio
of Net
Expenses
to Average
Net Assets‡ | | Ratio of Net
Investment
Income/
(Loss) to
Average Net
Assets | | Portfolio
Turnover
Rate | |
Genesis Fund (cont'd) | |
Trust Class | |
8/31/2015 | | $ | 63.21 | | | $ | 0.12 | | | $ | 0.63 | | | $ | 0.75 | | | $ | (0.04 | ) | | $ | (4.91 | ) | | $ | — | | | $ | (4.95 | ) | | $ | — | | | $ | — | | | $ | 59.01 | | | | 1.41 | % | | $ | 2,003.4 | | | | 1.10 | % | | | 1.10 | % | | | 0.19 | % | | | 13 | % | |
8/31/2014 | | $ | 59.83 | | | $ | 0.07 | | | $ | 8.00 | | | $ | 8.07 | | | $ | (0.19 | ) | | $ | (4.50 | ) | | $ | — | | | $ | (4.69 | ) | | $ | 0.00 | | | $ | — | | | $ | 63.21 | | | | 13.55 | %g | | $ | 2,935.3 | | | | 1.10 | % | | | 1.10 | % | | | 0.11 | % | | | 14 | % | |
8/31/2013 | | $ | 50.47 | | | $ | 0.35 | | | $ | 11.23 | | | $ | 11.58 | | | $ | (0.11 | ) | | $ | (2.11 | ) | | $ | — | | | $ | (2.22 | ) | | $ | — | | | $ | — | | | $ | 59.83 | | | | 23.81 | % | | $ | 3,192.4 | | | | 1.10 | % | | | 1.10 | % | | | 0.63 | % | | | 20 | % | |
8/31/2012 | | $ | 49.13 | | | $ | 0.11 | | | $ | 2.83 | | | $ | 2.94 | | | $ | (0.45 | ) | | $ | (1.15 | ) | | $ | — | | | $ | (1.60 | ) | | $ | — | | | $ | — | | | $ | 50.47 | | | | 6.21 | % | | $ | 3,037.6 | | | | 1.11 | % | | | 1.11 | % | | | 0.23 | % | | | 15 | % | |
8/31/2011 | | $ | 37.92 | | | $ | 0.35 | | | $ | 10.86 | | | $ | 11.21 | | | $ | — | | | $ | — | | | $ | — | | | $ | — | | | $ | — | | | $ | — | | | $ | 49.13 | | | | 29.56 | % | | $ | 3,436.5 | | | | 1.13 | % | | | 1.13 | % | | | 0.74 | % | | | 18 | % | |
Advisor Class | |
8/31/2015 | | $ | 32.18 | | | $ | (0.03 | ) | | $ | 0.25 | | | $ | 0.22 | | | $ | (0.04 | ) | | $ | (4.91 | ) | | $ | — | | | $ | (4.95 | ) | | $ | — | | | $ | — | | | $ | 27.45 | | | | 1.11 | % | | $ | 451.3 | | | | 1.39 | % | | | 1.39 | % | | | (0.09 | %) | | | 13 | % | |
8/31/2014 | | $ | 32.46 | | | $ | (0.05 | ) | | $ | 4.32 | | | $ | 4.27 | | | $ | (0.05 | ) | | $ | (4.50 | ) | | $ | — | | | $ | (4.55 | ) | | $ | 0.00 | | | $ | — | | | $ | 32.18 | | | | 13.24 | %g | | $ | 598.9 | | | | 1.37 | % | | | 1.37 | % | | | (0.16 | %) | | | 14 | % | |
8/31/2013 | | $ | 28.42 | | | $ | 0.11 | | | $ | 6.13 | | | $ | 6.24 | | | $ | (0.09 | ) | | $ | (2.11 | ) | | $ | — | | | $ | (2.20 | ) | | $ | — | | | $ | — | | | $ | 32.46 | | | | 23.46 | % | | $ | 626.0 | | | | 1.38 | % | | | 1.38 | % | | | 0.35 | % | | | 20 | % | |
8/31/2012 | | $ | 28.43 | | | $ | (0.01 | ) | | $ | 1.58 | | | $ | 1.57 | | | $ | (0.43 | ) | | $ | (1.15 | ) | | $ | — | | | $ | (1.58 | ) | | $ | — | | | $ | — | | | $ | 28.42 | | | | 5.91 | % | | $ | 579.8 | | | | 1.38 | % | | | 1.38 | % | | | (0.04 | %) | | | 15 | % | |
8/31/2011 | | $ | 22.00 | | | $ | 0.12 | | | $ | 6.31 | | | $ | 6.43 | | | $ | — | | | $ | — | | | $ | — | | | $ | — | | | $ | — | | | $ | — | | | $ | 28.43 | | | | 29.23 | % | | $ | 601.3 | | | | 1.40 | % | | | 1.40 | % | | | 0.43 | % | | | 18 | % | |
Institutional Class | |
8/31/2015 | | $ | 60.72 | | | $ | 0.26 | | | $ | 0.60 | | | $ | 0.86 | | | $ | (0.19 | ) | | $ | (4.91 | ) | | $ | — | | | $ | (5.10 | ) | | $ | — | | | $ | — | | | $ | 56.48 | | | | 1.68 | % | | $ | 3,685.0 | | | | 0.85 | % | | | 0.85 | % | | | 0.45 | % | | | 13 | % | |
8/31/2014 | | $ | 57.62 | | | $ | 0.22 | | | $ | 7.70 | | | $ | 7.92 | | | $ | (0.32 | ) | | $ | (4.50 | ) | | $ | — | | | $ | (4.82 | ) | | $ | 0.00 | | | $ | — | | | $ | 60.72 | | | | 13.82 | %g | | $ | 5,061.4 | | | | 0.85 | % | | | 0.85 | %§ | | | 0.36 | % | | | 14 | % | |
8/31/2013 | | $ | 48.71 | | | $ | 0.46 | | | $ | 10.81 | | | $ | 11.27 | | | $ | (0.25 | ) | | $ | (2.11 | ) | | $ | — | | | $ | (2.36 | ) | | $ | — | | | $ | — | | | $ | 57.62 | | | | 24.12 | % | | $ | 5,989.3 | | | | 0.85 | % | | | 0.85 | % | | | 0.87 | % | | | 20 | % | |
8/31/2012 | | $ | 47.48 | | | $ | 0.24 | | | $ | 2.73 | | | $ | 2.97 | | | $ | (0.59 | ) | | $ | (1.15 | ) | | $ | — | | | $ | (1.74 | ) | | $ | — | | | $ | — | | | $ | 48.71 | | | | 6.51 | % | | $ | 5,707.1 | | | | 0.86 | % | | | 0.85 | % | | | 0.49 | % | | | 15 | % | |
8/31/2011 | | $ | 36.56 | | | $ | 0.45 | | | $ | 10.47 | | | $ | 10.92 | | | $ | — | | | $ | — | | | $ | — | | | $ | — | | | $ | — | | | $ | — | | | $ | 47.48 | | | | 29.87 | % | | $ | 4,975.0 | | | | 0.89 | % | | | 0.87 | % | | | 0.97 | % | | | 18 | % | |
Class R6 | |
8/31/2015 | | $ | 60.75 | | | $ | 0.30 | | | $ | 0.60 | | | $ | 0.90 | | | $ | (0.24 | ) | | $ | (4.91 | ) | | $ | — | | | $ | (5.15 | ) | | $ | — | | | $ | — | | | $ | 56.50 | | | | 1.75 | % | | $ | 2,798.0 | | | | 0.78 | % | | | 0.78 | % | | | 0.52 | % | | | 13 | % | |
8/31/2014 | | $ | 57.63 | | | $ | 0.28 | | | $ | 7.70 | | | $ | 7.98 | | | $ | (0.36 | ) | | $ | (4.50 | ) | | $ | — | | | $ | (4.86 | ) | | $ | 0.00 | | | $ | — | | | $ | 60.75 | | | | 13.92 | %g | | $ | 2,690.7 | | | | 0.78 | % | | | 0.78 | %§ | | | 0.45 | % | | | 14 | % | |
Period from 3/15/2013^
to 8/31/2013 | | $ | 53.91 | | | $ | 0.18 | | | $ | 3.54 | | | $ | 3.72 | | | $ | — | | | $ | — | | | $ | — | | | $ | — | | | $ | — | | | $ | — | | | $ | 57.63 | | | | 6.90 | %** | | $ | 975.9 | | | | 0.80 | %* | | | 0.78 | %* | | | 0.67 | %* | | | 20 | %Ø | |
Global Equity Fund | |
Institutional Class | |
8/31/2015 | | $ | 11.22 | | | $ | 0.03 | | | $ | (0.38 | ) | | $ | (0.35 | ) | | $ | (0.73 | ) | | $ | (3.84 | ) | | $ | — | | | $ | (4.57 | ) | | $ | — | | | $ | — | | | $ | 6.30 | | | | (3.16 | %) | | $ | 3.2 | | | | 4.76 | % | | | 1.15 | % | | | 0.35 | % | | | 18 | % | |
8/31/2014 | | $ | 9.49 | | | $ | 0.06 | | | $ | 1.80 | | | $ | 1.86 | | | $ | (0.04 | ) | | $ | (0.09 | ) | | $ | — | | | $ | (0.13 | ) | | $ | — | | | $ | — | | | $ | 11.22 | | | | 19.67 | % | | $ | 38.9 | | | | 1.72 | % | | | 1.15 | % | | | 0.54 | % | | | 39 | % | |
8/31/2013 | | $ | 8.50 | | | $ | 0.06 | | | $ | 0.93 | | | $ | 0.99 | | | $ | — | | | $ | — | | | $ | — | | | $ | — | | | $ | — | | | $ | — | | | $ | 9.49 | | | | 11.65 | % | | $ | 33.5 | | | | 5.16 | % | | | 1.15 | % | | | 0.63 | % | | | 43 | % | |
8/31/2012 | | $ | 9.10 | | | $ | 0.09 | | | $ | 0.09 | | | $ | 0.18 | | | $ | (0.32 | ) | | $ | — | | | $ | (0.46 | ) | | $ | (0.78 | ) | | $ | — | | | $ | — | | | $ | 8.50 | | | | 2.82 | % | | $ | 4.3 | | | | 10.85 | % | | | 1.15 | % | | | 1.12 | % | | | 62 | % | |
Period from 6/30/2011^
to 8/31/2011 | | $ | 10.00 | | | $ | (0.00 | ) | | $ | (0.90 | ) | | $ | (0.90 | ) | | $ | — | | | $ | — | | | $ | — | | | $ | — | | | $ | — | | | $ | — | | | $ | 9.10 | | | | (9.00 | %)** | | $ | 0.8 | | | | 55.68 | %* | | | 1.15 | %* | | | (0.20 | %)* | | | 8 | %** | |
See Notes to Financial Highlights
Financial Highlights (cont'd)
| | | Net Asset
Value,
Beginning
of Year | | Net
Investment
Income (Loss)@ | | Net Gains or
Losses on
Securities
(both realized
and
unrealized) | | Total From
Investment
Operations | | Dividends
from Net
Investment
Income | | Distributions
from Net
Realized
Capital Gains | | Tax
Return of
Capital | | Total
Distributions | | Voluntary
Contributions
from
Management | | Redemption
Feesøø | | Net
Asset
Value,
End of
Year | | Total Return†d | | Net Assets,
End of
Year
(in millions) | | Ratio of
Gross
Expenses
to Average
Net Assets# | | Ratio
of Net
Expenses
to Average
Net Assets‡ | | Ratio of Net
Investment
Income/
(Loss) to
Average Net
Assets | | Portfolio
Turnover
Rate | |
Global Equity Fund (cont'd) | |
Class A | |
8/31/2015 | | $ | 11.14 | | | $ | 0.01 | | | $ | (0.38 | ) | | $ | (0.37 | ) | | $ | (0.70 | ) | | $ | (3.84 | ) | | $ | — | | | $ | (4.54 | ) | | $ | — | | | $ | — | | | $ | 6.23 | | | | (3.47 | %) | | $ | 0.4 | | | | 5.24 | % | | | 1.51 | % | | | 0.09 | % | | | 18 | % | |
8/31/2014 | | $ | 9.43 | | | $ | 0.03 | | | $ | 1.77 | | | $ | 1.80 | | | $ | (0.00 | ) | | $ | (0.09 | ) | | $ | — | | | $ | (0.09 | ) | | $ | — | | | $ | — | | | $ | 11.14 | | | | 19.18 | % | | $ | 0.4 | | | | 2.18 | % | | | 1.51 | % | | | 0.28 | % | | | 39 | % | |
8/31/2013 | | $ | 8.48 | | | $ | 0.03 | | | $ | 0.92 | | | $ | 0.95 | | | $ | — | | | $ | — | | | $ | — | | | $ | — | | | $ | — | | | $ | — | | | $ | 9.43 | | | | 11.20 | % | | $ | 0.1 | | | | 5.67 | % | | | 1.51 | % | | | 0.34 | % | | | 43 | % | |
8/31/2012 | | $ | 9.09 | | | $ | 0.04 | | | $ | 0.11 | | | $ | 0.15 | | | $ | (0.30 | ) | | $ | — | | | $ | (0.46 | ) | | $ | (0.76 | ) | | $ | — | | | $ | — | | | $ | 8.48 | | | | 2.51 | % | | $ | 0.1 | | | | 11.83 | % | | | 1.51 | % | | | 0.54 | % | | | 62 | % | |
Period from 6/30/2011^
to 8/31/2011 | | $ | 10.00 | | | $ | (0.01 | ) | | $ | (0.90 | ) | | $ | (0.91 | ) | | $ | — | | | $ | — | | | $ | — | | | $ | — | | | $ | — | | | $ | — | | | $ | 9.09 | | | | (9.10 | %)** | | $ | 0.1 | | | | 69.65 | %* | | | 1.51 | %* | | | (0.53 | %)* | | | 8 | %** | |
Class C | |
8/31/2015 | | $ | 10.89 | | | $ | (0.05 | ) | | $ | (0.37 | ) | | $ | (0.42 | ) | | $ | (0.62 | ) | | $ | (3.84 | ) | | $ | — | | | $ | (4.46 | ) | | $ | — | | | $ | — | | | $ | 6.01 | | | | (4.21 | %) | | $ | 0.2 | | | | 6.00 | % | | | 2.26 | % | | | (0.68 | %) | | | 18 | % | |
8/31/2014 | | $ | 9.28 | | | $ | (0.06 | ) | | $ | 1.76 | | | $ | 1.70 | | | $ | — | | | $ | (0.09 | ) | | $ | — | | | $ | (0.09 | ) | | $ | — | | | $ | — | | | $ | 10.89 | | | | 18.39 | % | | $ | 0.2 | | | | 2.96 | % | | | 2.26 | % | | | (0.54 | %) | | | 39 | % | |
8/31/2013 | | $ | 8.41 | | | $ | (0.03 | ) | | $ | 0.90 | | | $ | 0.87 | | | $ | — | | | $ | — | | | $ | — | | | $ | — | | | $ | — | | | $ | — | | | $ | 9.28 | | | | 10.34 | % | | $ | 0.1 | | | | 6.50 | % | | | 2.26 | % | | | (0.36 | %) | | | 43 | % | |
8/31/2012 | | $ | 9.08 | | | $ | (0.02 | ) | | $ | 0.11 | | | $ | 0.09 | | | $ | (0.30 | ) | | $ | — | | | $ | (0.46 | ) | | $ | (0.76 | ) | | $ | — | | | $ | — | | | $ | 8.41 | | | | 1.77 | % | | $ | 0.0 | | | | 12.88 | % | | | 2.26 | % | | | (0.30 | %) | | | 62 | % | |
Period from 6/30/2011^
to 8/31/2011 | | $ | 10.00 | | | $ | (0.02 | ) | | $ | (0.90 | ) | | $ | (0.92 | ) | | $ | — | | | $ | — | | | $ | — | | | $ | — | | | $ | — | | | $ | — | | | $ | 9.08 | | | | (9.20 | %)** | | $ | 0.0 | | | | 74.49 | %* | | | 2.26 | %* | | | (1.31 | %)* | | | 8 | %** | |
Global Real Estate Fund | |
Institutional Class | |
Period from 12/30/2014^
to 8/31/2015 | | $ | 10.00 | | | $ | 0.08 | | | $ | (0.67 | ) | | $ | (0.59 | ) | | $ | (0.09 | ) | | $ | — | | | $ | — | | | $ | (0.09 | ) | | $ | — | | | $ | — | | | $ | 9.32 | | | | (5.92 | %)** | | $ | 1.9 | | | | 13.21 | %b* | | | 1.00 | %b* | | | 1.22 | %b* | | | 16 | %** | |
Class A | |
Period from 12/30/2014^
to 8/31/2015 | | $ | 10.00 | | | $ | 0.06 | | | $ | (0.67 | ) | | $ | (0.61 | ) | | $ | (0.08 | ) | | $ | — | | | $ | — | | | $ | (0.08 | ) | | $ | — | | | $ | — | | | $ | 9.31 | | | | (6.19 | %)** | | $ | 0.6 | | | | 13.62 | %b* | | | 1.36 | %b* | | | 0.94 | %b* | | | 16 | %** | |
Class C | |
Period from 12/30/2014^
to 8/31/2015 | | $ | 10.00 | | | $ | 0.01 | | | $ | (0.67 | ) | | $ | (0.66 | ) | | $ | (0.04 | ) | | $ | — | | | $ | — | | | $ | (0.04 | ) | | $ | — | | | $ | — | | | $ | 9.30 | | | | (6.64 | %)** | | $ | 0.2 | | | | 15.16 | %b* | | | 2.11 | %b* | | | 0.11 | %b* | | | 16 | %** | |
Greater China Equity Fund | |
Institutional Class | |
8/31/2015 | | $ | 12.17 | | | $ | 0.10 | | | $ | 0.17 | | | $ | 0.27 | | | $ | (0.09 | ) | | $ | (0.71 | ) | | $ | — | | | $ | (0.80 | ) | | $ | — | | | $ | — | | | $ | 11.64 | | | | 2.15 | % | | $ | 103.4 | | | | 1.61 | % | | | 1.50 | %^^ | | | 0.75 | % | | | 176 | % | |
8/31/2014 | | $ | 10.16 | | | $ | 0.10 | | | $ | 2.06 | | | $ | 2.16 | | | $ | — | | | $ | (0.15 | ) | | $ | — | | | $ | (0.15 | ) | | $ | — | | | $ | — | | | $ | 12.17 | | | | 21.37 | % | | $ | 72.1 | | | | 1.83 | % | | | 1.50 | % | | | 0.90 | % | | | 171 | % | |
Period from 7/17/2013^
to 8/31/2013 | | $ | 10.00 | | | $ | (0.02 | ) | | $ | 0.18 | | | $ | 0.16 | | | $ | — | | | $ | — | | | $ | — | | | $ | — | | | $ | — | | | $ | — | | | $ | 10.16 | | | | 1.60 | %** | | $ | 56.4 | | | | 2.80 | %b* | | | 1.50 | %b* | | | (1.25 | %)b* | | | 20 | %** | |
See Notes to Financial Highlights
Financial Highlights (cont'd)
| | | Net Asset
Value,
Beginning
of Year | | Net
Investment
Income (Loss)@ | | Net Gains or
Losses on
Securities
(both realized
and
unrealized) | | Total From
Investment
Operations | | Dividends
from Net
Investment
Income | | Distributions
from Net
Realized
Capital Gains | | Tax
Return of
Capital | | Total
Distributions | | Voluntary
Contributions
from
Management | | Redemption
Feesøø | | Net
Asset
Value,
End of
Year | | Total Return†d | | Net Assets,
End of
Year
(in millions) | | Ratio of
Gross
Expenses
to Average
Net Assets# | | Ratio
of Net
Expenses
to Average
Net Assets‡ | | Ratio of Net
Investment
Income/
(Loss) to
Average Net
Assets | | Portfolio
Turnover
Rate | |
Greater China Equity Fund (cont'd) | |
Class A | |
8/31/2015 | | $ | 12.14 | | | $ | 0.05 | | | $ | 0.17 | | | $ | 0.22 | | | $ | (0.09 | ) | | $ | (0.71 | ) | | $ | — | | | $ | (0.80 | ) | | $ | — | | | $ | — | | | $ | 11.56 | | | | 1.68 | % | | $ | 4.0 | | | | 2.00 | % | | | 1.86 | %^^ | | | 0.34 | % | | | 176 | % | |
8/31/2014 | | $ | 10.16 | | | $ | 0.13 | | | $ | 2.00 | | | $ | 2.13 | | | $ | — | | | $ | (0.15 | ) | | $ | — | | | $ | (0.15 | ) | | $ | — | | | $ | — | | | $ | 12.14 | | | | 21.07 | % | | $ | 1.7 | | | | 2.30 | % | | | 1.86 | % | | | 1.19 | % | | | 171 | % | |
Period from 7/17/2013^
to 8/31/2013 | | $ | 10.00 | | | $ | (0.02 | ) | | $ | 0.18 | | | $ | 0.16 | | | $ | — | | | $ | — | | | $ | — | | | $ | — | | | $ | — | | | $ | — | | | $ | 10.16 | | | | 1.60 | %** | | $ | 0.1 | | | | 17.58 | %b* | | | 1.86 | %b* | | | (1.65 | %)b* | | | 20 | %** | |
Class C | |
8/31/2015 | | $ | 12.03 | | | $ | (0.07 | ) | | $ | 0.20 | | | $ | 0.13 | | | $ | — | | | $ | (0.71 | ) | | $ | — | | | $ | (0.71 | ) | | $ | — | | | $ | — | | | $ | 11.45 | | | | 0.93 | % | | $ | 0.2 | | | | 2.80 | % | | | 2.61 | %^^ | | | (0.52 | %) | | | 176 | % | |
8/31/2014 | | $ | 10.15 | | | $ | (0.02 | ) | | $ | 2.05 | | | $ | 2.03 | | | $ | — | | | $ | (0.15 | ) | | $ | — | | | $ | (0.15 | ) | | $ | — | | | $ | — | | | $ | 12.03 | | | | 20.09 | % | | $ | 0.1 | | | | 2.85 | % | | | 2.61 | % | | | (0.20 | %) | | | 171 | % | |
Period from 7/17/2013^
to 8/31/2013 | | $ | 10.00 | | | $ | (0.03 | ) | | $ | 0.18 | | | $ | 0.15 | | | $ | — | | | $ | — | | | $ | — | | | $ | — | | | $ | — | | | $ | — | | | $ | 10.15 | | | | 1.50 | %** | | $ | 0.1 | | | | 19.16 | %b* | | | 2.61 | %b* | | | (2.41 | %)b* | | | 20 | %** | |
Guardian Fund | |
Investor Class | |
8/31/2015 | | $ | 20.43 | | | $ | 0.12 | | | $ | (0.64 | ) | | $ | (0.52 | ) | | $ | (0.15 | ) | | $ | (2.63 | ) | | $ | — | | | $ | (2.78 | ) | | $ | — | | | $ | — | | | $ | 17.13 | | | | (3.03 | %) | | $ | 1,034.9 | | | | 0.87 | % | | | 0.87 | % | | | 0.65 | % | | | 31 | % | |
8/31/2014 | | $ | 18.58 | | | $ | 0.16 | | | $ | 3.70 | | | $ | 3.86 | | | $ | (0.10 | ) | | $ | (1.91 | ) | | $ | — | | | $ | (2.01 | ) | | $ | 0.00 | | | $ | — | | | $ | 20.43 | | | | 21.87 | %g | | $ | 1,165.1 | | | | 0.88 | % | | | 0.88 | % | | | 0.83 | % | | | 37 | % | |
8/31/2013 | | $ | 15.80 | | | $ | 0.14 | | | $ | 3.28 | | | $ | 3.42 | | | $ | (0.20 | ) | | $ | (0.44 | ) | | $ | — | | | $ | (0.64 | ) | | $ | — | | | $ | — | | | $ | 18.58 | | | | 22.54 | % | | $ | 1,040.3 | | | | 0.90 | % | | | 0.90 | % | | | 0.85 | % | | | 36 | % | |
8/31/2012 | | $ | 14.49 | | | $ | 0.12 | | | $ | 1.29 | | | $ | 1.41 | | | $ | (0.10 | ) | | $ | — | | | $ | — | | | $ | (0.10 | ) | | $ | — | | | $ | — | | | $ | 15.80 | | | | 9.84 | % | | $ | 939.6 | | | | 0.92 | % | | | 0.92 | % | | | 0.79 | % | | | 26 | % | |
8/31/2011 | | $ | 11.98 | | | $ | 0.11 | | | $ | 2.45 | | | $ | 2.56 | | | $ | (0.05 | ) | | $ | — | | | $ | — | | | $ | (0.05 | ) | | $ | — | | | $ | — | | | $ | 14.49 | | | | 21.35 | % | | $ | 962.6 | | | | 0.92 | % | | | 0.92 | % | | | 0.74 | % | | | 32 | % | |
Trust Class | |
8/31/2015 | | $ | 15.20 | | | $ | 0.06 | | | $ | (0.45 | ) | | $ | (0.39 | ) | | $ | (0.13 | ) | | $ | (2.63 | ) | | $ | — | | | $ | (2.76 | ) | | $ | — | | | $ | — | | | $ | 12.05 | | | | (3.22 | %) | | $ | 103.8 | | | | 1.06 | % | | | 1.06 | % | | | 0.46 | % | | | 31 | % | |
8/31/2014 | | $ | 14.30 | | | $ | 0.09 | | | $ | 2.81 | | | $ | 2.90 | | | $ | (0.09 | ) | | $ | (1.91 | ) | | $ | — | | | $ | (2.00 | ) | | $ | 0.00 | | | $ | — | | | $ | 15.20 | | | | 21.61 | %g | | $ | 136.6 | | | | 1.06 | % | | | 1.06 | % | | | 0.64 | % | | | 37 | % | |
8/31/2013 | | $ | 12.31 | | | $ | 0.09 | | | $ | 2.53 | | | $ | 2.62 | | | $ | (0.19 | ) | | $ | (0.44 | ) | | $ | — | | | $ | (0.63 | ) | | $ | — | | | $ | — | | | $ | 14.30 | | | | 22.36 | % | | $ | 129.4 | | | | 1.08 | % | | | 1.08 | % | | | 0.66 | % | | | 36 | % | |
8/31/2012 | | $ | 11.32 | | | $ | 0.07 | | | $ | 1.01 | | | $ | 1.08 | | | $ | (0.09 | ) | | $ | — | | | $ | — | | | $ | (0.09 | ) | | $ | — | | | $ | — | | | $ | 12.31 | | | | 9.68 | % | | $ | 113.5 | | | | 1.09 | % | | | 1.09 | % | | | 0.64 | % | | | 26 | % | |
8/31/2011 | | $ | 9.38 | | | $ | 0.06 | | | $ | 1.92 | | | $ | 1.98 | | | $ | (0.04 | ) | | $ | — | | | $ | — | | | $ | (0.04 | ) | | $ | — | | | $ | — | | | $ | 11.32 | | | | 21.08 | % | | $ | 102.6 | | | | 1.09 | % | | | 1.09 | % | | | 0.55 | % | | | 32 | % | |
Advisor Class | |
8/31/2015 | | $ | 17.55 | | | $ | 0.00 | | | $ | (0.54 | ) | | $ | (0.54 | ) | | $ | (0.05 | ) | | $ | (2.63 | ) | | $ | — | | | $ | (2.68 | ) | | $ | — | | | $ | — | | | $ | 14.33 | | | | (3.66 | %) | | $ | 0.3 | | | | 1.54 | % | | | 1.50 | % | | | 0.03 | % | | | 31 | % | |
8/31/2014 | | $ | 16.27 | | | $ | 0.04 | | | $ | 3.24 | | | $ | 3.28 | | | $ | (0.09 | ) | | $ | (1.91 | ) | | $ | — | | | $ | (2.00 | ) | | $ | 0.00 | | | $ | — | | | $ | 17.55 | | | | 21.27 | %g | | $ | 0.4 | | | | 1.28 | % | | | 1.28 | % | | | 0.25 | % | | | 37 | % | |
8/31/2013 | | $ | 13.91 | | | $ | 0.04 | | | $ | 2.87 | | | $ | 2.91 | | | $ | (0.11 | ) | | $ | (0.44 | ) | | $ | — | | | $ | (0.55 | ) | | $ | — | | | $ | — | | | $ | 16.27 | | | | 21.81 | % | | $ | 0.6 | | | | 1.50 | % | | | 1.50 | %§ | | | 0.23 | % | | | 36 | % | |
8/31/2012 | | $ | 12.77 | | | $ | 0.02 | | | $ | 1.16 | | | $ | 1.18 | | | $ | (0.04 | ) | | $ | — | | | $ | — | | | $ | (0.04 | ) | | $ | — | | | $ | — | | | $ | 13.91 | | | | 9.27 | % | | $ | 0.6 | | | | 1.50 | % | | | 1.50 | %§ | | | 0.19 | % | | | 26 | % | |
8/31/2011 | | $ | 10.59 | | | $ | 0.02 | | | $ | 2.16 | | | $ | 2.18 | | | $ | — | | | $ | — | | | $ | — | | | $ | — | | | $ | — | | | $ | — | | | $ | 12.77 | | | | 20.59 | % | | $ | 0.6 | | | | 1.50 | % | | | 1.50 | %§ | | | 0.15 | % | | | 32 | % | |
See Notes to Financial Highlights
Financial Highlights (cont'd)
| | | Net Asset
Value,
Beginning
of Year | | Net
Investment
Income (Loss)@ | | Net Gains or
Losses on
Securities
(both realized
and
unrealized) | | Total From
Investment
Operations | | Dividends
from Net
Investment
Income | | Distributions
from Net
Realized
Capital Gains | | Tax
Return of
Capital | | Total
Distributions | | Voluntary
Contributions
from
Management | | Redemption
Feesøø | | Net
Asset
Value,
End of
Year | | Total Return†d | | Net Assets,
End of
Year
(in millions) | | Ratio of
Gross
Expenses
to Average
Net Assets# | | Ratio
of Net
Expenses
to Average
Net Assets‡ | | Ratio of Net
Investment
Income/
(Loss) to
Average Net
Assets | | Portfolio
Turnover
Rate | |
Guardian Fund (cont'd) | |
Institutional Class | |
8/31/2015 | | $ | 20.47 | | | $ | 0.16 | | | $ | (0.65 | ) | | $ | (0.49 | ) | | $ | (0.18 | ) | | $ | (2.63 | ) | | $ | — | | | $ | (2.81 | ) | | $ | — | | | $ | — | | | $ | 17.17 | | | | (2.84 | %) | | $ | 94.1 | | | | 0.71 | % | | | 0.71 | % | | | 0.82 | % | | | 31 | % | |
8/31/2014 | | $ | 18.62 | | | $ | 0.20 | | | $ | 3.70 | | | $ | 3.90 | | | $ | (0.14 | ) | | $ | (1.91 | ) | | $ | — | | | $ | (2.05 | ) | | $ | 0.00 | | | $ | — | | | $ | 20.47 | | | | 22.03 | %g | | $ | 129.4 | | | | 0.71 | % | | | 0.71 | % | | | 1.01 | % | | | 37 | % | |
8/31/2013 | | $ | 15.83 | | | $ | 0.17 | | | $ | 3.29 | | | $ | 3.46 | | | $ | (0.23 | ) | | $ | (0.44 | ) | | $ | — | | | $ | (0.67 | ) | | $ | — | | | $ | — | | | $ | 18.62 | | | | 22.80 | % | | $ | 88.9 | | | | 0.73 | % | | | 0.73 | % | | | 1.00 | % | | | 36 | % | |
8/31/2012 | | $ | 14.52 | | | $ | 0.15 | | | $ | 1.29 | | | $ | 1.44 | | | $ | (0.13 | ) | | $ | — | | | $ | — | | | $ | (0.13 | ) | | $ | — | | | $ | — | | | $ | 15.83 | | | | 10.03 | % | | $ | 60.0 | | | | 0.74 | % | | | 0.74 | %§ | | | 1.01 | % | | | 26 | % | |
8/31/2011 | | $ | 12.01 | | | $ | 0.12 | | | $ | 2.47 | | | $ | 2.59 | | | $ | (0.08 | ) | | $ | — | | | $ | — | | | $ | (0.08 | ) | | $ | — | | | $ | — | | | $ | 14.52 | | | | 21.51 | % | | $ | 33.5 | | | | 0.75 | % | | | 0.75 | %§ | | | 0.77 | % | | | 32 | % | |
Class A | |
8/31/2015 | | $ | 15.08 | | | $ | 0.06 | | | $ | (0.45 | ) | | $ | (0.39 | ) | | $ | (0.14 | ) | | $ | (2.63 | ) | | $ | — | | | $ | (2.77 | ) | | $ | — | | | $ | — | | | $ | 11.92 | | | | (3.23 | %) | | $ | 79.3 | | | | 1.07 | % | | | 1.07 | % | | | 0.46 | % | | | 31 | % | |
8/31/2014 | | $ | 14.21 | | | $ | 0.09 | | | $ | 2.79 | | | $ | 2.88 | | | $ | (0.10 | ) | | $ | (1.91 | ) | | $ | — | | | $ | (2.01 | ) | | $ | 0.00 | | | $ | — | | | $ | 15.08 | | | | 21.62 | %g | | $ | 73.8 | | | | 1.09 | % | | | 1.09 | %§ | | | 0.64 | % | | | 37 | % | |
8/31/2013 | | $ | 12.24 | | | $ | 0.08 | | | $ | 2.52 | | | $ | 2.60 | | | $ | (0.19 | ) | | $ | (0.44 | ) | | $ | — | | | $ | (0.63 | ) | | $ | — | | | $ | — | | | $ | 14.21 | | | | 22.38 | % | | $ | 34.6 | | | | 1.11 | % | | | 1.11 | %§ | | | 0.62 | % | | | 36 | % | |
8/31/2012 | | $ | 11.28 | | | $ | 0.07 | | | $ | 1.00 | | | $ | 1.07 | | | $ | (0.11 | ) | | $ | — | | | $ | — | | | $ | (0.11 | ) | | $ | — | | | $ | — | | | $ | 12.24 | | | | 9.63 | % | | $ | 17.6 | | | | 1.12 | % | | | 1.11 | % | | | 0.64 | % | | | 26 | % | |
8/31/2011 | | $ | 9.36 | | | $ | 0.06 | | | $ | 1.91 | | | $ | 1.97 | | | $ | (0.05 | ) | | $ | — | | | $ | — | | | $ | (0.05 | ) | | $ | — | | | $ | — | | | $ | 11.28 | | | | 21.06 | % | | $ | 10.8 | | | | 1.15 | % | | | 1.11 | % | | | 0.51 | % | | | 32 | % | |
Class C | |
8/31/2015 | | $ | 17.18 | | | $ | (0.05 | ) | | $ | (0.53 | ) | | $ | (0.58 | ) | | $ | — | | | $ | (2.63 | ) | | $ | — | | | $ | (2.63 | ) | | $ | — | | | $ | — | | | $ | 13.97 | | | | (4.01 | %) | | $ | 2.4 | | | | 1.83 | % | | | 1.83 | % | | | (0.30 | %) | | | 31 | % | |
8/31/2014 | | $ | 15.96 | | | $ | (0.03 | ) | | $ | 3.16 | | | $ | 3.13 | | | $ | (0.00 | ) | | $ | (1.91 | ) | | $ | — | | | $ | (1.91 | ) | | $ | 0.00 | | | $ | — | | | $ | 17.18 | | | | 20.71 | %g | | $ | 2.9 | | | | 1.86 | % | | | 1.86 | %§ | | | (0.15 | %) | | | 37 | % | |
8/31/2013 | | $ | 13.66 | | | $ | (0.02 | ) | | $ | 2.84 | | | $ | 2.82 | | | $ | (0.08 | ) | | $ | (0.44 | ) | | $ | — | | | $ | (0.52 | ) | | $ | — | | | $ | — | | | $ | 15.96 | | | | 21.43 | % | | $ | 2.6 | | | | 1.86 | % | | | 1.86 | % | | | (0.15 | %) | | | 36 | % | |
8/31/2012 | | $ | 12.60 | | | $ | (0.02 | ) | | $ | 1.13 | | | $ | 1.11 | | | $ | (0.05 | ) | | $ | — | | | $ | — | | | $ | (0.05 | ) | | $ | — | | | $ | — | | | $ | 13.66 | | | | 8.83 | % | | $ | 1.3 | | | | 1.88 | % | | | 1.86 | % | | | (0.13 | %) | | | 26 | % | |
8/31/2011 | | $ | 10.51 | | | $ | (0.04 | ) | | $ | 2.15 | | | $ | 2.11 | | | $ | (0.02 | ) | | $ | — | | | $ | — | | | $ | (0.02 | ) | | $ | — | | | $ | — | | | $ | 12.60 | | | | 20.11 | % | | $ | 1.1 | | | | 1.90 | % | | | 1.86 | % | | | (0.28 | %) | | | 32 | % | |
Class R3 | |
8/31/2015 | | $ | 17.54 | | | $ | 0.02 | | | $ | (0.54 | ) | | $ | (0.52 | ) | | $ | (0.08 | ) | | $ | (2.63 | ) | | $ | — | | | $ | (2.71 | ) | | $ | — | | | $ | — | | | $ | 14.31 | | | | (3.53 | %) | | $ | 0.5 | | | | 1.37 | % | | | 1.36 | % | | | 0.15 | % | | | 31 | % | |
8/31/2014 | | $ | 16.25 | | | $ | 0.06 | | | $ | 3.21 | | | $ | 3.27 | | | $ | (0.07 | ) | | $ | (1.91 | ) | | $ | — | | | $ | (1.98 | ) | | $ | 0.00 | | | $ | — | | | $ | 17.54 | | | | 21.29 | %g | | $ | 0.7 | | | | 1.38 | % | | | 1.36 | % | | | 0.37 | % | | | 37 | % | |
8/31/2013 | | $ | 13.79 | | | $ | 0.04 | | | $ | 2.89 | | | $ | 2.93 | | | $ | (0.03 | ) | | $ | (0.44 | ) | | $ | — | | | $ | (0.47 | ) | | $ | — | | | $ | — | | | $ | 16.25 | | | | 22.03 | % | | $ | 0.4 | | | | 1.41 | % | | | 1.36 | % | | | 0.24 | % | | | 36 | % | |
8/31/2012 | | $ | 12.72 | | | $ | 0.05 | | | $ | 1.13 | | | $ | 1.18 | | | $ | (0.11 | ) | | $ | — | | | $ | — | | | $ | (0.11 | ) | | $ | — | | | $ | — | | | $ | 13.79 | | | | 9.40 | % | | $ | 0.5 | | | | 1.39 | % | | | 1.36 | % | | | 0.36 | % | | | 26 | % | |
8/31/2011 | | $ | 10.57 | | | $ | 0.04 | | | $ | 2.16 | | | $ | 2.20 | | | $ | (0.05 | ) | | $ | — | | | $ | — | | | $ | (0.05 | ) | | $ | — | | | $ | — | | | $ | 12.72 | | | | 20.79 | % | | $ | 0.4 | | | | 1.44 | % | | | 1.36 | % | | | 0.28 | % | | | 32 | % | |
International Equity Fund | |
Investor Class | |
8/31/2015 | | $ | 20.70 | | | $ | 0.19 | | | $ | (0.96 | ) | | $ | (0.77 | ) | | $ | (0.15 | ) | | $ | — | | | $ | — | | | $ | (0.15 | ) | | $ | — | | | $ | — | | | $ | 19.78 | | | | (3.71 | %) | | $ | 117.7 | | | | 1.25 | % | | | 1.02 | % | | | 0.93 | % | | | 25 | % | |
8/31/2014 | | $ | 18.62 | | | $ | 0.26 | | | $ | 1.99 | | | $ | 2.25 | | | $ | (0.17 | ) | | $ | — | | | $ | — | | | $ | (0.17 | ) | | $ | 0.00 | | | $ | — | | | $ | 20.70 | | | | 12.14 | %g | | $ | 124.4 | | | | 1.26 | % | | | 1.07 | % | | | 1.29 | % | | | 34 | % | |
Period from 1/28/2013^
to 8/31/2013 | | $ | 18.03 | | | $ | 0.21 | | | $ | 0.38 | | | $ | 0.59 | | | $ | — | | | $ | — | | | $ | — | | | $ | — | | | $ | — | | | $ | — | | | $ | 18.62 | | | | 3.27 | %** | | $ | 125.7 | | | | 1.32 | %* | | | 1.09 | %* | | | 1.87 | %* | | | 44 | %Øa | |
See Notes to Financial Highlights
Financial Highlights (cont'd)
| | | Net Asset
Value,
Beginning
of Year | | Net
Investment
Income (Loss)@ | | Net Gains or
Losses on
Securities
(both realized
and
unrealized) | | Total From
Investment
Operations | | Dividends
from Net
Investment
Income | | Distributions
from Net
Realized
Capital Gains | | Tax
Return of
Capital | | Total
Distributions | | Voluntary
Contributions
from
Management | | Redemption
Feesøø | | Net
Asset
Value,
End of
Year | | Total Return†d | | Net Assets,
End of
Year
(in millions) | | Ratio of
Gross
Expenses
to Average
Net Assets# | | Ratio
of Net
Expenses
to Average
Net Assets‡ | | Ratio of Net
Investment
Income/
(Loss) to
Average Net
Assets | | Portfolio
Turnover
Rate | |
International Equity Fund (cont'd) | |
Trust Class | |
8/31/2015 | | $ | 23.02 | | | $ | 0.19 | | | $ | (1.07 | ) | | $ | (0.88 | ) | | $ | (0.08 | ) | | $ | — | | | $ | — | | | $ | (0.08 | ) | | $ | — | | | $ | — | | | $ | 22.06 | | | | (3.82 | %) | | $ | 55.3 | | | | 1.36 | % | | | 1.13 | % | | | 0.81 | % | | | 25 | % | |
8/31/2014 | | $ | 20.70 | | | $ | 0.28 | | | $ | 2.20 | | | $ | 2.48 | | | $ | (0.16 | ) | | $ | — | | | $ | — | | | $ | (0.16 | ) | | $ | 0.00 | | | $ | — | | | $ | 23.02 | | | | 12.02 | %g | | $ | 67.7 | | | | 1.36 | % | | | 1.16 | % | | | 1.23 | % | | | 34 | % | |
Period from 1/28/2013^
to 8/31/2013 | | $ | 20.05 | | | $ | 0.21 | | | $ | 0.44 | | | $ | 0.65 | | | $ | — | | | $ | — | | | $ | — | | | $ | — | | | $ | — | | | $ | — | | | $ | 20.70 | | | | 3.24 | %** | | $ | 111.9 | | | | 1.42 | %* | | | 1.19 | %* | | | 1.73 | %* | | | 44 | %Øa | |
Institutional Class | |
8/31/2015 | | $ | 11.32 | | | $ | 0.13 | | | $ | (0.53 | ) | | $ | (0.40 | ) | | $ | (0.20 | ) | | $ | — | | | $ | — | | | $ | (0.20 | ) | | $ | — | | | $ | — | | | $ | 10.72 | | | | (3.51 | %) | | $ | 886.5 | | | | 1.07 | % | | | 0.85 | %§ | | | 1.11 | % | | | 25 | % | |
8/31/2014 | | $ | 10.26 | | | $ | 0.17 | | | $ | 1.09 | | | $ | 1.26 | | | $ | (0.20 | ) | | $ | — | | | $ | — | | | $ | (0.20 | ) | | $ | 0.00 | | | $ | — | | | $ | 11.32 | | | | 12.38 | %g | | $ | 887.3 | | | | 1.07 | % | | | 0.85 | % | | | 1.49 | % | | | 34 | % | |
8/31/2013 | | $ | 9.15 | | | $ | 0.15 | | | $ | 1.10 | | | $ | 1.25 | | | $ | (0.14 | ) | | $ | — | | | $ | — | | | $ | (0.14 | ) | | $ | — | | | $ | — | | | $ | 10.26 | | | | 13.82 | % | | $ | 770.3 | | | | 1.14 | % | | | 0.85 | % | | | 1.54 | % | | | 44 | %a | |
8/31/2012 | | $ | 9.20 | | | $ | 0.16 | | | $ | (0.10 | ) | | $ | 0.06 | | | $ | (0.11 | ) | | $ | — | | | $ | — | | | $ | (0.11 | ) | | $ | — | | | $ | — | | | $ | 9.15 | | | | 0.78 | % | | $ | 491.6 | | | | 1.16 | % | | | 0.84 | % | | | 1.88 | % | | | 33 | % | |
8/31/2011 | | $ | 8.10 | | | $ | 0.16 | | | $ | 1.11 | | | $ | 1.27 | | | $ | (0.17 | ) | | $ | — | | | $ | — | | | $ | (0.17 | ) | | $ | — | | | $ | — | | | $ | 9.20 | | | | 15.62 | % | | $ | 342.6 | | | | 1.23 | % | | | 0.80 | % | | | 1.67 | % | | | 46 | % | |
Class A | |
8/31/2015 | | $ | 23.01 | | | $ | 0.25 | | | $ | (1.15 | ) | | $ | (0.90 | ) | | $ | (0.11 | ) | | $ | — | | | $ | — | | | $ | (0.11 | ) | | $ | — | | | $ | — | | | $ | 22.00 | | | | (3.90 | %) | | $ | 91.0 | | | | 1.43 | % | | | 1.21 | %§ | | | 1.09 | % | | | 25 | % | |
8/31/2014 | | $ | 20.69 | | | $ | 0.28 | | | $ | 2.19 | | | $ | 2.47 | | | $ | (0.15 | ) | | $ | — | | | $ | — | | | $ | (0.15 | ) | | $ | 0.00 | | | $ | — | | | $ | 23.01 | | | | 11.98 | %g | | $ | 26.2 | | | | 1.45 | % | | | 1.21 | % | | | 1.23 | % | | | 34 | % | |
Period from 1/28/2013^
to 8/31/2013 | | $ | 20.05 | | | $ | 0.19 | | | $ | 0.45 | | | $ | 0.64 | | | $ | — | | | $ | — | | | $ | — | | | $ | — | | | $ | — | | | $ | — | | | $ | 20.69 | | | | 3.19 | %** | | $ | 12.8 | | | | 1.55 | %* | | | 1.28 | %* | | | 1.57 | %* | | | 44 | %Øa | |
Class C | |
8/31/2015 | | $ | 22.72 | | | $ | 0.00 | | | $ | (1.05 | ) | | $ | (1.05 | ) | | $ | (0.02 | ) | | $ | — | | | $ | — | | | $ | (0.02 | ) | | $ | — | | | $ | — | | | $ | 21.65 | | | | (4.61 | %) | | $ | 11.2 | | | | 2.18 | % | | | 1.96 | % | | | 0.02 | % | | | 25 | % | |
8/31/2014 | | $ | 20.50 | | | $ | 0.13 | | | $ | 2.15 | | | $ | 2.28 | | | $ | (0.06 | ) | | $ | — | | | $ | — | | | $ | (0.06 | ) | | $ | 0.00 | | | $ | — | | | $ | 22.72 | | | | 11.16 | %g | | $ | 6.1 | | | | 2.21 | % | | | 1.96 | % | | | 0.59 | % | | | 34 | % | |
Period from 1/28/2013^
to 8/31/2013 | | $ | 19.97 | | | $ | 0.09 | | | $ | 0.44 | | | $ | 0.53 | | | $ | — | | | $ | — | | | $ | — | | | $ | — | | | $ | — | | | $ | — | | | $ | 20.50 | | | | 2.65 | %** | | $ | 1.9 | | | | 2.51 | %* | | | 2.08 | %* | | | 0.74 | %* | | | 44 | %Øa | |
Class R6 | |
8/31/2015 | | $ | 11.42 | | | $ | 0.14 | | | $ | (0.54 | ) | | $ | (0.40 | ) | | $ | (0.21 | ) | | $ | — | | | $ | — | | | $ | (0.21 | ) | | $ | — | | | $ | — | | | $ | 10.81 | | | | (3.49 | %) | | $ | 32.7 | | | | 0.99 | % | | | 0.77 | %§ | | | 1.24 | % | | | 25 | % | |
Period from 9/3/2013^
to 8/31/2014 | | $ | 10.26 | | | $ | 0.08 | | | $ | 1.19 | | | $ | 1.27 | | | $ | (0.11 | ) | | $ | — | | | $ | — | | | $ | (0.11 | ) | | $ | 0.00 | | | $ | — | | | $ | 11.42 | | | | 12.46 | %**g | | $ | 21.9 | | | | 1.12 | %* | | | 0.79 | %* | | | 0.73 | %* | | | 34 | %Ø | |
International Select Fund | |
Trust Class | |
8/31/2015 | | $ | 11.21 | | | $ | 0.09 | | | $ | (0.59 | ) | | $ | (0.50 | ) | | $ | (0.12 | ) | | $ | — | | | $ | — | | | $ | (0.12 | ) | | $ | — | | | $ | — | | | $ | 10.59 | | | | (4.47 | %) | | $ | 10.2 | | | | 1.33 | % | | | 1.25 | % | | | 0.76 | % | | | 24 | % | |
8/31/2014 | | $ | 10.14 | | | $ | 0.13 | | | $ | 1.04 | | | $ | 1.17 | | | $ | (0.10 | ) | | $ | — | | | $ | — | | | $ | (0.10 | ) | | $ | 0.00 | | | $ | — | | | $ | 11.21 | | | | 11.56 | %g | | $ | 13.0 | | | | 1.33 | % | | | 1.25 | % | | | 1.19 | % | | | 27 | % | |
8/31/2013 | | $ | 9.14 | | | $ | 0.10 | | | $ | 1.01 | | | $ | 1.11 | | | $ | (0.11 | ) | | $ | — | | | $ | — | | | $ | (0.11 | ) | | $ | — | | | $ | — | | | $ | 10.14 | | | | 12.17 | % | | $ | 13.9 | | | | 1.37 | % | | | 1.25 | % | | | 1.05 | % | | | 50 | % | |
8/31/2012 | | $ | 9.35 | | | $ | 0.13 | | | $ | (0.24 | ) | | $ | (0.11 | ) | | $ | (0.10 | ) | | $ | — | | | $ | — | | | $ | (0.10 | ) | | $ | — | | | $ | — | | | $ | 9.14 | | | | (1.05 | %) | | $ | 14.2 | | | | 1.40 | % | | | 1.25 | % | | | 1.47 | % | | | 29 | % | |
8/31/2011 | | $ | 8.31 | | | $ | 0.09 | | | $ | 1.00 | | | $ | 1.09 | | | $ | (0.05 | ) | | $ | — | | | $ | — | | | $ | (0.05 | ) | | $ | — | | | $ | 0.00 | | | $ | 9.35 | | | | 13.09 | % | | $ | 18.6 | | | | 1.39 | % | | | 1.25 | % | | | 0.97 | % | | | 54 | % | |
See Notes to Financial Highlights
Financial Highlights (cont'd)
| | | Net Asset
Value,
Beginning
of Year | | Net
Investment
Income (Loss)@ | | Net Gains or
Losses on
Securities
(both realized
and
unrealized) | | Total From
Investment
Operations | | Dividends
from Net
Investment
Income | | Distributions
from Net
Realized
Capital Gains | | Tax
Return of
Capital | | Total
Distributions | | Voluntary
Contributions
from
Management | | Redemption
Feesøø | | Net
Asset
Value,
End of
Year | | Total Return†d | | Net Assets,
End of
Year
(in millions) | | Ratio of
Gross
Expenses
to Average
Net Assets# | | Ratio
of Net
Expenses
to Average
Net Assets‡ | | Ratio of Net
Investment
Income/
(Loss) to
Average Net
Assets | | Portfolio
Turnover
Rate | |
International Select Fund (cont'd) | |
Institutional Class | |
8/31/2015 | | $ | 11.21 | | | $ | 0.13 | | | $ | (0.60 | ) | | $ | (0.47 | ) | | $ | (0.16 | ) | | $ | — | | | $ | — | | | $ | (0.16 | ) | | $ | — | | | $ | — | | | $ | 10.58 | | | | (4.18 | %) | | $ | 216.4 | | | | 0.93 | % | | | 0.90 | % | | | 1.16 | % | | | 24 | % | |
8/31/2014 | | $ | 10.14 | | | $ | 0.18 | | | $ | 1.03 | | | $ | 1.21 | | | $ | (0.14 | ) | | $ | — | | | $ | — | | | $ | (0.14 | ) | | $ | 0.00 | | | $ | — | | | $ | 11.21 | | | | 11.98 | %g | | $ | 211.6 | | | | 0.93 | % | | | 0.90 | % | | | 1.58 | % | | | 27 | % | |
8/31/2013 | | $ | 9.14 | | | $ | 0.14 | | | $ | 1.00 | | | $ | 1.14 | | | $ | (0.14 | ) | | $ | — | | | $ | — | | | $ | (0.14 | ) | | $ | — | | | $ | — | | | $ | 10.14 | | | | 12.56 | % | | $ | 200.6 | | | | 0.97 | % | | | 0.90 | % | | | 1.44 | % | | | 50 | % | |
8/31/2012 | | $ | 9.36 | | | $ | 0.15 | | | $ | (0.23 | ) | | $ | (0.08 | ) | | $ | (0.14 | ) | | $ | — | | | $ | — | | | $ | (0.14 | ) | | $ | — | | | $ | — | | | $ | 9.14 | | | | (0.65 | %) | | $ | 172.0 | | | | 0.99 | % | | | 0.90 | % | | | 1.76 | % | | | 29 | % | |
8/31/2011 | | $ | 8.32 | | | $ | 0.16 | | | $ | 0.96 | | | $ | 1.12 | | | $ | (0.08 | ) | | $ | — | | | $ | — | | | $ | (0.08 | ) | | $ | — | | | $ | 0.00 | | | $ | 9.36 | | | | 13.39 | % | | $ | 161.5 | | | | 1.01 | % | | | 0.90 | % | | | 1.60 | % | | | 54 | % | |
Class A | |
8/31/2015 | | $ | 11.14 | | | $ | 0.08 | | | $ | (0.59 | ) | | $ | (0.51 | ) | | $ | (0.12 | ) | | $ | — | | | $ | — | | | $ | (0.12 | ) | | $ | — | | | $ | — | | | $ | 10.51 | | | | (4.62 | %) | | $ | 3.8 | | | | 1.31 | % | | | 1.24 | % | | | 0.71 | % | | | 24 | % | |
8/31/2014 | | $ | 10.07 | | | $ | 0.14 | | | $ | 1.03 | | | $ | 1.17 | | | $ | (0.10 | ) | | $ | — | | | $ | — | | | $ | (0.10 | ) | | $ | 0.00 | | | $ | — | | | $ | 11.14 | | | | 11.69 | %g | | $ | 9.3 | | | | 1.30 | % | | | 1.24 | % | | | 1.25 | % | | | 27 | % | |
8/31/2013 | | $ | 9.09 | | | $ | 0.11 | | | $ | 0.98 | | | $ | 1.09 | | | $ | (0.11 | ) | | $ | — | | | $ | — | | | $ | (0.11 | ) | | $ | — | | | $ | — | | | $ | 10.07 | | | | 12.08 | % | | $ | 9.3 | | | | 1.36 | % | | | 1.24 | % | | | 1.16 | % | | | 50 | % | |
8/31/2012 | | $ | 9.30 | | | $ | 0.14 | | | $ | (0.24 | ) | | $ | (0.10 | ) | | $ | (0.11 | ) | | $ | — | | | $ | — | | | $ | (0.11 | ) | | $ | — | | | $ | — | | | $ | 9.09 | | | | (0.96 | %) | | $ | 8.3 | | | | 1.39 | % | | | 1.24 | % | | | 1.56 | % | | | 29 | % | |
8/31/2011 | | $ | 8.27 | | | $ | 0.08 | | | $ | 1.00 | | | $ | 1.08 | | | $ | (0.05 | ) | | $ | — | | | $ | — | | | $ | (0.05 | ) | | $ | — | | | $ | 0.00 | | | $ | 9.30 | | | | 13.06 | % | | $ | 5.2 | | | | 1.39 | % | | | 1.24 | % | | | 0.81 | % | | | 54 | % | |
Class C | |
8/31/2015 | | $ | 10.97 | | | $ | 0.01 | | | $ | (0.58 | ) | | $ | (0.57 | ) | | $ | (0.04 | ) | | $ | — | | | $ | — | | | $ | (0.04 | ) | | $ | — | | | $ | — | | | $ | 10.36 | | | | (5.23 | %) | | $ | 3.7 | | | | 2.04 | % | | | 2.00 | % | | | 0.06 | % | | | 24 | % | |
8/31/2014 | | $ | 9.93 | | | $ | 0.05 | | | $ | 1.02 | | | $ | 1.07 | | | $ | (0.03 | ) | | $ | — | | | $ | — | | | $ | (0.03 | ) | | $ | 0.00 | | | $ | — | | | $ | 10.97 | | | | 10.79 | %g | | $ | 4.6 | | | | 2.05 | % | | | 2.00 | % | | | 0.42 | % | | | 27 | % | |
8/31/2013 | | $ | 8.98 | | | $ | 0.04 | | | $ | 0.97 | | | $ | 1.01 | | | $ | (0.06 | ) | | $ | — | | | $ | — | | | $ | (0.06 | ) | | $ | — | | | $ | — | | | $ | 9.93 | | | | 11.23 | % | | $ | 4.0 | | | | 2.09 | % | | | 2.00 | % | | | 0.36 | % | | | 50 | % | |
8/31/2012 | | $ | 9.17 | | | $ | 0.06 | | | $ | (0.21 | ) | | $ | (0.15 | ) | | $ | (0.04 | ) | | $ | — | | | $ | — | | | $ | (0.04 | ) | | $ | — | | | $ | — | | | $ | 8.98 | | | | (1.64 | %) | | $ | 3.7 | | | | 2.13 | % | | | 2.00 | % | | | 0.65 | % | | | 29 | % | |
8/31/2011 | | $ | 8.20 | | | $ | 0.05 | | | $ | 0.95 | | | $ | 1.00 | | | $ | (0.03 | ) | | $ | — | | | $ | — | | | $ | (0.03 | ) | | $ | — | | | $ | 0.00 | | | $ | 9.17 | | | | 12.19 | % | | $ | 2.1 | | | | 2.14 | % | | | 2.00 | % | | | 0.57 | % | | | 54 | % | |
Class R3 | |
8/31/2015 | | $ | 11.05 | | | $ | 0.06 | | | $ | (0.58 | ) | | $ | (0.52 | ) | | $ | (0.10 | ) | | $ | — | | | $ | — | | | $ | (0.10 | ) | | $ | — | | | $ | — | | | $ | 10.43 | | | | (4.71 | %) | | $ | 3.4 | | | | 1.55 | % | | | 1.51 | % | | | 0.56 | % | | | 24 | % | |
8/31/2014 | | $ | 10.01 | | | $ | 0.11 | | | $ | 1.02 | | | $ | 1.13 | | | $ | (0.09 | ) | | $ | — | | | $ | — | | | $ | (0.09 | ) | | $ | 0.00 | | | $ | — | | | $ | 11.05 | | | | 11.35 | %g | | $ | 2.2 | | | | 1.55 | % | | | 1.51 | % | | | 1.03 | % | | | 27 | % | |
8/31/2013 | | $ | 9.04 | | | $ | 0.07 | | | $ | 0.99 | | | $ | 1.06 | | | $ | (0.09 | ) | | $ | — | | | $ | — | | | $ | (0.09 | ) | | $ | — | | | $ | — | | | $ | 10.01 | | | | 11.83 | % | | $ | 2.6 | | | | 1.60 | % | | | 1.51 | % | | | 0.74 | % | | | 50 | % | |
8/31/2012 | | $ | 9.27 | | | $ | 0.12 | | | $ | (0.25 | ) | | $ | (0.13 | ) | | $ | (0.10 | ) | | $ | — | | | $ | — | | | $ | (0.10 | ) | | $ | — | | | $ | — | | | $ | 9.04 | | | | (1.24 | %) | | $ | 0.4 | | | | 1.67 | % | | | 1.51 | % | | | 1.35 | % | | | 29 | % | |
8/31/2011 | | $ | 8.26 | | | $ | 0.11 | | | $ | 0.94 | | | $ | 1.05 | | | $ | (0.04 | ) | | $ | — | | | $ | — | | | $ | (0.04 | ) | | $ | — | | | $ | 0.00 | | | $ | 9.27 | | | | 12.71 | % | | $ | 0.1 | | | | 1.87 | % | | | 1.51 | % | | | 1.15 | % | | | 54 | % | |
Intrinsic Value Fund | |
Institutional Class | |
8/31/2015 | | $ | 14.98 | | | $ | (0.06 | ) | | $ | 0.21 | | | $ | 0.15 | | | $ | — | | | $ | (0.79 | ) | | $ | — | | | $ | (0.79 | ) | | $ | — | | | $ | — | | | $ | 14.34 | | | | 1.36 | % | | $ | 420.3 | | | | 1.10 | % | | | 1.00 | % | | | (0.41 | %) | | | 22 | % | |
8/31/2014 | | $ | 12.81 | | | $ | (0.06 | ) | | $ | 2.80 | | | $ | 2.74 | | | $ | (0.03 | ) | | $ | (0.54 | ) | | $ | — | | | $ | (0.57 | ) | | $ | 0.00 | | | $ | — | | | $ | 14.98 | | | | 21.74 | %g | | $ | 252.0 | | | | 1.13 | % | | | 1.00 | % | | | (0.40 | %) | | | 24 | % | |
8/31/2013 | | $ | 10.26 | | | $ | 0.05 | | | $ | 2.68 | | | $ | 2.73 | | | $ | — | | | $ | (0.18 | ) | | $ | — | | | $ | (0.18 | ) | | $ | — | | | $ | — | | | $ | 12.81 | | | | 26.94 | % | | $ | 182.6 | | | | 1.18 | % | | | 1.00 | % | | | 0.42 | % | | | 25 | % | |
8/31/2012 | | $ | 10.26 | | | $ | (0.01 | ) | | $ | 1.09 | | | $ | 1.08 | | | $ | — | | | $ | (1.08 | ) | | $ | — | | | $ | (1.08 | ) | | $ | — | | | $ | — | | | $ | 10.26 | | | | 12.21 | % | | $ | 134.2 | | | | 1.22 | % | | | 1.00 | % | | | (0.14 | %) | | | 30 | % | |
8/31/2011 | | $ | 9.41 | | | $ | (0.04 | ) | | $ | 1.32 | | | $ | 1.28 | | | $ | (0.03 | ) | | $ | (0.40 | ) | | $ | — | | | $ | (0.43 | ) | | $ | — | | | $ | — | | | $ | 10.26 | | | | 13.08 | % | | $ | 114.7 | | | | 1.26 | % | | | 1.00 | % | | | (0.35 | %) | | | 44 | % | |
See Notes to Financial Highlights
Financial Highlights (cont'd)
| | | Net Asset
Value,
Beginning
of Year | | Net
Investment
Income (Loss)@ | | Net Gains or
Losses on
Securities
(both realized
and
unrealized) | | Total From
Investment
Operations | | Dividends
from Net
Investment
Income | | Distributions
from Net
Realized
Capital Gains | | Tax
Return of
Capital | | Total
Distributions | | Voluntary
Contributions
from
Management | | Redemption
Feesøø | | Net
Asset
Value,
End of
Year | | Total Return†d | | Net Assets,
End of
Year
(in millions) | | Ratio of
Gross
Expenses
to Average
Net Assets# | | Ratio
of Net
Expenses
to Average
Net Assets‡ | | Ratio of Net
Investment
Income/
(Loss) to
Average Net
Assets | | Portfolio
Turnover
Rate | |
Intrinsic Value Fund (cont'd) | |
Class A | |
8/31/2015 | | $ | 14.76 | | | $ | (0.11 | ) | | $ | 0.20 | | | $ | 0.09 | | | $ | — | | | $ | (0.79 | ) | | $ | — | | | $ | (0.79 | ) | | $ | — | | | $ | — | | | $ | 14.06 | | | | 0.96 | % | | $ | 44.3 | | | | 1.50 | % | | | 1.36 | % | | | (0.77 | %) | | | 22 | % | |
8/31/2014 | | $ | 12.65 | | | $ | (0.11 | ) | | $ | 2.76 | | | $ | 2.65 | | | $ | (0.00 | ) | | $ | (0.54 | ) | | $ | — | | | $ | (0.54 | ) | | $ | 0.00 | | | $ | — | | | $ | 14.76 | | | | 21.31 | %g | | $ | 13.5 | | | | 1.51 | % | | | 1.36 | % | | | (0.77 | %) | | | 24 | % | |
8/31/2013 | | $ | 10.16 | | | $ | 0.00 | | | $ | 2.67 | | | $ | 2.67 | | | $ | — | | | $ | (0.18 | ) | | $ | — | | | $ | (0.18 | ) | | $ | — | | | $ | — | | | $ | 12.65 | | | | 26.61 | % | | $ | 13.9 | | | | 1.58 | % | | | 1.36 | % | | | 0.01 | % | | | 25 | % | |
8/31/2012 | | $ | 10.22 | | | $ | (0.05 | ) | | $ | 1.07 | | | $ | 1.02 | | | $ | — | | | $ | (1.08 | ) | | $ | — | | | $ | (1.08 | ) | | $ | — | | | $ | — | | | $ | 10.16 | | | | 11.62 | % | | $ | 8.4 | | | | 1.61 | % | | | 1.36 | % | | | (0.51 | %) | | | 30 | % | |
8/31/2011 | | $ | 9.40 | | | $ | (0.09 | ) | | $ | 1.34 | | | $ | 1.25 | | | $ | (0.03 | ) | | $ | (0.40 | ) | | $ | — | | | $ | (0.43 | ) | | $ | — | | | $ | — | | | $ | 10.22 | | | | 12.74 | % | | $ | 8.6 | | | | 1.65 | % | | | 1.36 | % | | | (0.73 | %) | | | 44 | % | |
Class C | |
8/31/2015 | | $ | 14.29 | | | $ | (0.21 | ) | | $ | 0.19 | | | $ | (0.02 | ) | | $ | — | | | $ | (0.79 | ) | | $ | — | | | $ | (0.79 | ) | | $ | — | | | $ | — | | | $ | 13.48 | | | | 0.19 | % | | $ | 25.8 | | | | 2.22 | % | | | 2.11 | % | | | (1.52 | %) | | | 22 | % | |
8/31/2014 | | $ | 12.35 | | | $ | (0.21 | ) | | $ | 2.69 | | | $ | 2.48 | | | $ | — | | | $ | (0.54 | ) | | $ | — | | | $ | (0.54 | ) | | $ | 0.00 | | | $ | — | | | $ | 14.29 | | | | 20.40 | %g | | $ | 12.7 | | | | 2.26 | % | | | 2.11 | % | | | (1.51 | %) | | | 24 | % | |
8/31/2013 | | $ | 10.00 | | | $ | (0.08 | ) | | $ | 2.61 | | | $ | 2.53 | | | $ | — | | | $ | (0.18 | ) | | $ | — | | | $ | (0.18 | ) | | $ | — | | | $ | — | | | $ | 12.35 | | | | 25.62 | % | | $ | 10.3 | | | | 2.31 | % | | | 2.11 | % | | | (0.70 | %) | | | 25 | % | |
8/31/2012 | | $ | 10.14 | | | $ | (0.12 | ) | | $ | 1.06 | | | $ | 0.94 | | | $ | — | | | $ | (1.08 | ) | | $ | — | | | $ | (1.08 | ) | | $ | — | | | $ | — | | | $ | 10.00 | | | | 10.87 | % | | $ | 6.9 | | | | 2.35 | % | | | 2.11 | % | | | (1.25 | %) | | | 30 | % | |
8/31/2011 | | $ | 9.38 | | | $ | (0.17 | ) | | $ | 1.34 | | | $ | 1.17 | | | $ | (0.01 | ) | | $ | (0.40 | ) | | $ | — | | | $ | (0.41 | ) | | $ | — | | | $ | — | | | $ | 10.14 | | | | 11.91 | % | | $ | 5.5 | | | | 2.34 | % | | | 2.11 | % | | | (1.48 | %) | | | 44 | % | |
Large Cap Disciplined Growth Fund | |
Investor Class | |
8/31/2015 | | $ | 8.33 | | | $ | 0.01 | | | $ | (0.17 | ) | | $ | (0.16 | ) | | $ | — | | | $ | (4.32 | ) | | $ | — | | | $ | (4.32 | ) | | $ | — | | | $ | — | | | $ | 3.85 | | | | (1.92 | %) | | $ | 9.5 | | | | 1.36 | % | | | 1.13 | % | | | 0.15 | % | | | 77 | % | |
8/31/2014 | | $ | 8.18 | | | $ | 0.04 | | | $ | 1.41 | | | $ | 1.45 | | | $ | (0.01 | ) | | $ | (1.29 | ) | | $ | — | | | $ | (1.30 | ) | | $ | 0.00 | | | $ | — | | | $ | 8.33 | | | | 19.09 | %g | | $ | 11.2 | | | | 1.07 | % | | | 1.07 | % | | | 0.44 | % | | | 61 | % | |
8/31/2013 | | $ | 7.68 | | | $ | 0.03 | | | $ | 0.89 | | | $ | 0.92 | | | $ | (0.05 | ) | | $ | (0.37 | ) | | $ | — | | | $ | (0.42 | ) | | $ | — | | | $ | — | | | $ | 8.18 | | | | 12.76 | % | | $ | 16.1 | | | | 1.11 | % | | | 1.11 | %§ | | | 0.42 | % | | | 66 | % | |
8/31/2012 | | $ | 7.38 | | | $ | 0.01 | | | $ | 0.62 | | | $ | 0.63 | | | $ | — | | | $ | (0.33 | ) | | $ | — | | | $ | (0.33 | ) | | $ | — | | | $ | — | | | $ | 7.68 | | | | 9.12 | % | | $ | 17.8 | | | | 1.11 | % | | | 1.11 | %§ | | | 0.08 | % | | | 116 | % | |
8/31/2011 | | $ | 6.18 | | | $ | (0.01 | ) | | $ | 1.21 | | | $ | 1.20 | | | $ | (0.00 | ) | | $ | — | | | $ | — | | | $ | (0.00 | ) | | $ | — | | | $ | — | | | $ | 7.38 | | | | 19.44 | % | | $ | 15.5 | | | | 1.11 | % | | | 1.11 | %§ | | | (0.08 | %) | | | 101 | % | |
Institutional Class | |
8/31/2015 | | $ | 8.38 | | | $ | 0.03 | | | $ | (0.18 | ) | | $ | (0.15 | ) | | $ | (0.01 | ) | | $ | (4.32 | ) | | $ | — | | | $ | (4.33 | ) | | $ | — | | | $ | — | | | $ | 3.90 | | | | (1.65 | %) | | $ | 36.4 | | | | 1.02 | % | | | 0.77 | % | | | 0.48 | % | | | 77 | % | |
8/31/2014 | | $ | 8.23 | | | $ | 0.06 | | | $ | 1.42 | | | $ | 1.48 | | | $ | (0.04 | ) | | $ | (1.29 | ) | | $ | — | | | $ | (1.33 | ) | | $ | 0.00 | | | $ | — | | | $ | 8.38 | | | | 19.41 | %g | | $ | 185.0 | | | | 0.83 | % | | | 0.75 | % | | | 0.71 | % | | | 61 | % | |
8/31/2013 | | $ | 7.72 | | | $ | 0.06 | | | $ | 0.90 | | | $ | 0.96 | | | $ | (0.08 | ) | | $ | (0.37 | ) | | $ | — | | | $ | (0.45 | ) | | $ | — | | | $ | — | | | $ | 8.23 | | | | 13.28 | % | | $ | 409.2 | | | | 0.79 | % | | | 0.75 | % | | | 0.77 | % | | | 66 | % | |
8/31/2012 | | $ | 7.41 | | | $ | 0.03 | | | $ | 0.62 | | | $ | 0.65 | | | $ | (0.01 | ) | | $ | (0.33 | ) | | $ | — | | | $ | (0.34 | ) | | $ | — | | | $ | — | | | $ | 7.72 | | | | 9.43 | % | | $ | 601.6 | | | | 0.78 | % | | | 0.75 | % | | | 0.44 | % | | | 116 | % | |
8/31/2011 | | $ | 6.20 | | | $ | 0.02 | | | $ | 1.21 | | | $ | 1.23 | | | $ | (0.02 | ) | | $ | — | | | $ | — | | | $ | (0.02 | ) | | $ | — | | | $ | — | | | $ | 7.41 | | | | 19.79 | % | | $ | 565.4 | | | | 0.80 | % | | | 0.75 | % | | | 0.29 | % | | | 101 | % | |
Class A | |
8/31/2015 | | $ | 8.33 | | | $ | 0.01 | | | $ | (0.18 | ) | | $ | (0.17 | ) | | $ | — | | | $ | (4.32 | ) | | $ | — | | | $ | (4.32 | ) | | $ | — | | | $ | — | | | $ | 3.84 | | | | (2.04 | %) | | $ | 3.8 | | | | 1.44 | % | | | 1.13 | % | | | 0.15 | % | | | 77 | % | |
8/31/2014 | | $ | 8.17 | | | $ | 0.03 | | | $ | 1.42 | | | $ | 1.45 | | | $ | — | | | $ | (1.29 | ) | | $ | — | | | $ | (1.29 | ) | | $ | 0.00 | | | $ | — | | | $ | 8.33 | | | | 19.05 | %g | | $ | 12.7 | | | | 1.21 | % | | | 1.11 | % | | | 0.38 | % | | | 61 | % | |
8/31/2013 | | $ | 7.67 | | | $ | 0.03 | | | $ | 0.89 | | | $ | 0.92 | | | $ | (0.05 | ) | | $ | (0.37 | ) | | $ | — | | | $ | (0.42 | ) | | $ | — | | | $ | — | | | $ | 8.17 | | | | 12.80 | % | | $ | 38.4 | | | | 1.16 | % | | | 1.11 | % | | | 0.42 | % | | | 66 | % | |
8/31/2012 | | $ | 7.37 | | | $ | 0.00 | | | $ | 0.63 | | | $ | 0.63 | | | $ | — | | | $ | (0.33 | ) | | $ | — | | | $ | (0.33 | ) | | $ | — | | | $ | — | | | $ | 7.67 | | | | 9.13 | % | | $ | 67.1 | | | | 1.16 | % | | | 1.11 | % | | | 0.06 | % | | | 116 | % | |
8/31/2011 | | $ | 6.18 | | | $ | (0.01 | ) | | $ | 1.20 | | | $ | 1.19 | | | $ | (0.00 | ) | | $ | — | | | $ | — | | | $ | (0.00 | ) | | $ | — | | | $ | — | | | $ | 7.37 | | | | 19.30 | % | | $ | 40.2 | | | | 1.19 | % | | | 1.11 | % | | | (0.09 | %) | | | 101 | % | |
See Notes to Financial Highlights
Financial Highlights (cont'd)
| | | Net Asset
Value,
Beginning
of Year | | Net
Investment
Income (Loss)@ | | Net Gains or
Losses on
Securities
(both realized
and
unrealized) | | Total From
Investment
Operations | | Dividends
from Net
Investment
Income | | Distributions
from Net
Realized
Capital Gains | | Tax
Return of
Capital | | Total
Distributions | | Voluntary
Contributions
from
Management | | Redemption
Feesøø | | Net
Asset
Value,
End of
Year | | Total Return†d | | Net Assets,
End of
Year
(in millions) | | Ratio of
Gross
Expenses
to Average
Net Assets# | | Ratio
of Net
Expenses
to Average
Net Assets‡ | | Ratio of Net
Investment
Income/
(Loss) to
Average Net
Assets | | Portfolio
Turnover
Rate | |
Large Cap Disciplined Growth Fund (cont'd) | |
Class C | |
8/31/2015 | | $ | 8.03 | | | $ | (0.03 | ) | | $ | (0.17 | ) | | $ | (0.20 | ) | | $ | ��� | | | $ | (4.32 | ) | | $ | — | | | $ | (4.32 | ) | | $ | — | | | $ | — | | | $ | 3.51 | | | | (2.79 | %) | | $ | 9.9 | | | | 2.16 | % | | | 1.88 | % | | | (0.61 | %) | | | 77 | % | |
8/31/2014 | | $ | 7.93 | | | $ | (0.03 | ) | | $ | 1.38 | | | $ | 1.35 | | | $ | — | | | $ | (1.25 | ) | | $ | — | | | $ | (1.25 | ) | | $ | 0.00 | | | $ | — | | | $ | 8.03 | | | | 18.29 | %g | | $ | 22.9 | | | | 1.96 | % | | | 1.86 | % | | | (0.34 | %) | | | 61 | % | |
8/31/2013 | | $ | 7.48 | | | $ | (0.03 | ) | | $ | 0.87 | | | $ | 0.84 | | | $ | (0.02 | ) | | $ | (0.37 | ) | | $ | — | | | $ | (0.39 | ) | | $ | — | | | $ | — | | | $ | 7.93 | | | | 11.93 | % | | $ | 24.8 | | | | 1.91 | % | | | 1.86 | % | | | (0.34 | %) | | | 66 | % | |
8/31/2012 | | $ | 7.26 | | | $ | (0.05 | ) | | $ | 0.60 | | | $ | 0.55 | | | $ | — | | | $ | (0.33 | ) | | $ | — | | | $ | (0.33 | ) | | $ | — | | | $ | — | | | $ | 7.48 | | | | 8.14 | % | | $ | 33.4 | | | | 1.90 | % | | | 1.86 | % | | | (0.67 | %) | | | 116 | % | |
8/31/2011 | | $ | 6.12 | | | $ | (0.06 | ) | | $ | 1.20 | | | $ | 1.14 | | | $ | — | | | $ | — | | | $ | — | | | $ | — | | | $ | — | | | $ | — | | | $ | 7.26 | | | | 18.63 | % | | $ | 37.0 | | | | 1.92 | % | | | 1.86 | % | | | (0.83 | %) | | | 101 | % | |
Class R3 | |
8/31/2015 | | $ | 8.27 | | | $ | (0.00 | ) | | $ | (0.17 | ) | | $ | (0.17 | ) | | $ | — | | | $ | (4.32 | ) | | $ | — | | | $ | (4.32 | ) | | $ | — | | | $ | — | | | $ | 3.78 | | | | (2.05 | %) | | $ | 0.2 | | | | 1.84 | % | | | 1.38 | % | | | (0.10 | %) | | | 77 | % | |
8/31/2014 | | $ | 8.10 | | | $ | 0.01 | | | $ | 1.41 | | | $ | 1.42 | | | $ | — | | | $ | (1.25 | ) | | $ | — | | | $ | (1.25 | ) | | $ | 0.00 | | | $ | — | | | $ | 8.27 | | | | 18.82 | %g | | $ | 0.2 | | | | 1.60 | % | | | 1.36 | % | | | 0.12 | % | | | 61 | % | |
8/31/2013 | | $ | 7.61 | | | $ | 0.01 | | | $ | 0.88 | | | $ | 0.89 | | | $ | (0.03 | ) | | $ | (0.37 | ) | | $ | — | | | $ | (0.40 | ) | | $ | — | | | $ | — | | | $ | 8.10 | | | | 12.48 | % | | $ | 0.4 | | | | 1.45 | % | | | 1.36 | % | | | 0.17 | % | | | 66 | % | |
8/31/2012 | | $ | 7.34 | | | $ | (0.01 | ) | | $ | 0.61 | | | $ | 0.60 | | | $ | — | | | $ | (0.33 | ) | | $ | — | | | $ | (0.33 | ) | | $ | — | | | $ | — | | | $ | 7.61 | | | | 8.75 | % | | $ | 0.3 | | | | 1.44 | % | | | 1.36 | % | | | (0.18 | %) | | | 116 | % | |
8/31/2011 | | $ | 6.16 | | | $ | (0.02 | ) | | $ | 1.20 | | | $ | 1.18 | | | $ | — | | | $ | — | | | $ | — | | | $ | — | | | $ | — | | | $ | — | | | $ | 7.34 | | | | 19.16 | % | | $ | 0.3 | | | | 1.48 | % | | | 1.36 | % | | | (0.29 | %) | | | 101 | % | |
Large Cap Value Fund | |
Investor Class | |
8/31/2015 | | $ | 33.92 | | | $ | 0.33 | | | $ | (2.51 | ) | | $ | (2.18 | ) | | $ | (0.29 | ) | | $ | (3.99 | ) | | $ | — | | | $ | (4.28 | ) | | $ | — | | | $ | — | | | $ | 27.46 | | | | (7.19 | %) | | $ | 1,045.6 | | | | 0.86 | % | | | 0.86 | % | | | 1.08 | % | | | 153 | % | |
8/31/2014 | | $ | 32.40 | | | $ | 0.34 | | | $ | 6.62 | | | $ | 6.96 | | | $ | (0.42 | ) | | $ | (5.02 | ) | | $ | — | | | $ | (5.44 | ) | | $ | 0.00 | | | $ | — | | | $ | 33.92 | | | | 23.57 | %g | | $ | 1,238.3 | | | | 0.85 | % | | | 0.85 | % | | | 1.04 | % | | | 104 | % | |
8/31/2013 | | $ | 26.46 | | | $ | 0.36 | | | $ | 5.94 | | | $ | 6.30 | | | $ | (0.36 | ) | | $ | — | | | $ | — | | | $ | (0.36 | ) | | $ | — | | | $ | — | | | $ | 32.40 | | | | 24.05 | % | | $ | 1,149.7 | | | | 0.86 | % | | | 0.86 | % | | | 1.19 | % | | | 159 | % | |
8/31/2012 | | $ | 24.97 | | | $ | 0.30 | | | $ | 1.30 | | | $ | 1.60 | | | $ | (0.11 | ) | | $ | — | | | $ | — | | | $ | (0.11 | ) | | $ | — | | | $ | — | | | $ | 26.46 | | | | 6.47 | % | | $ | 1,057.1 | | | | 0.87 | % | | | 0.87 | % | | | 1.20 | % | | | 171 | % | |
8/31/2011 | | $ | 22.03 | | | $ | 0.11 | | | $ | 2.86 | | | $ | 2.97 | | | $ | (0.03 | ) | | $ | — | | | $ | — | | | $ | (0.03 | ) | | $ | — | | | $ | — | | | $ | 24.97 | | | | 13.48 | % | | $ | 1,171.4 | | | | 0.85 | % | | | 0.85 | % | | | 0.42 | % | | | 41 | % | |
Trust Class | |
8/31/2015 | | $ | 24.54 | | | $ | 0.19 | | | $ | (1.74 | ) | | $ | (1.55 | ) | | $ | (0.26 | ) | | $ | (3.99 | ) | | $ | — | | | $ | (4.25 | ) | | $ | — | | | $ | — | | | $ | 18.74 | | | | (7.40 | %) | | $ | 108.2 | | | | 1.05 | % | | | 1.05 | % | | | 0.88 | % | | | 153 | % | |
8/31/2014 | | $ | 24.80 | | | $ | 0.20 | | | $ | 4.93 | | | $ | 5.13 | | | $ | (0.37 | ) | | $ | (5.02 | ) | | $ | — | | | $ | (5.39 | ) | | $ | 0.00 | | | $ | — | | | $ | 24.54 | | | | 23.36 | %g | | $ | 141.1 | | | | 1.05 | % | | | 1.05 | % | | | 0.83 | % | | | 104 | % | |
8/31/2013 | | $ | 20.30 | | | $ | 0.23 | | | $ | 4.54 | | | $ | 4.77 | | | $ | (0.27 | ) | | $ | — | | | $ | — | | | $ | (0.27 | ) | | $ | — | | | $ | — | | | $ | 24.80 | | | | 23.76 | % | | $ | 156.6 | | | | 1.06 | % | | | 1.06 | % | | | 1.01 | % | | | 159 | % | |
8/31/2012 | | $ | 19.15 | | | $ | 0.19 | | | $ | 1.00 | | | $ | 1.19 | | | $ | (0.04 | ) | | $ | — | | | $ | — | | | $ | (0.04 | ) | | $ | — | | | $ | — | | | $ | 20.30 | | | | 6.26 | % | | $ | 209.6 | | | | 1.05 | % | | | 1.05 | % | | | 0.97 | % | | | 171 | % | |
8/31/2011 | | $ | 16.90 | | | $ | 0.04 | | | $ | 2.21 | | | $ | 2.25 | | | $ | (0.00 | ) | | $ | — | | | $ | — | | | $ | (0.00 | ) | | $ | — | | | $ | — | | | $ | 19.15 | | | | 13.32 | % | | $ | 424.9 | | | | 1.04 | % | | | 1.04 | % | | | 0.22 | % | | | 41 | % | |
Advisor Class | |
8/31/2015 | | $ | 20.12 | | | $ | 0.12 | | | $ | (1.37 | ) | | $ | (1.25 | ) | | $ | (0.25 | ) | | $ | (3.99 | ) | | $ | — | | | $ | (4.24 | ) | | $ | — | | | $ | — | | | $ | 14.63 | | | | (7.55 | %) | | $ | 162.3 | | | | 1.20 | % | | | 1.20 | % | | | 0.73 | % | | | 153 | % | |
8/31/2014 | | $ | 21.23 | | | $ | 0.14 | | | $ | 4.12 | | | $ | 4.26 | | | $ | (0.35 | ) | | $ | (5.02 | ) | | $ | — | | | $ | (5.37 | ) | | $ | 0.00 | | | $ | — | | | $ | 20.12 | | | | 23.17 | %g | | $ | 216.1 | | | | 1.20 | % | | | 1.20 | % | | | 0.69 | % | | | 104 | % | |
8/31/2013 | | $ | 17.46 | | | $ | 0.17 | | | $ | 3.89 | | | $ | 4.06 | | | $ | (0.29 | ) | | $ | — | | | $ | — | | | $ | (0.29 | ) | | $ | — | | | $ | — | | | $ | 21.23 | | | | 23.58 | % | | $ | 205.3 | | | | 1.21 | % | | | 1.21 | % | | | 0.86 | % | | | 159 | % | |
8/31/2012 | | $ | 16.50 | | | $ | 0.14 | | | $ | 0.87 | | | $ | 1.01 | | | $ | (0.05 | ) | | $ | — | | | $ | — | | | $ | (0.05 | ) | | $ | — | | | $ | — | | | $ | 17.46 | | | | 6.13 | % | | $ | 220.0 | | | | 1.20 | % | | | 1.20 | % | | | 0.84 | % | | | 171 | % | |
8/31/2011 | | $ | 14.59 | | | $ | 0.01 | | | $ | 1.90 | | | $ | 1.91 | | | $ | — | | | $ | — | | | $ | — | | | $ | — | | | $ | — | | | $ | — | | | $ | 16.50 | | | | 13.09 | % | | $ | 308.9 | | | | 1.19 | % | | | 1.19 | % | | | 0.07 | % | | | 41 | % | |
See Notes to Financial Highlights
Financial Highlights (cont'd)
| | | Net Asset
Value,
Beginning
of Year | | Net
Investment
Income (Loss)@ | | Net Gains or
Losses on
Securities
(both realized
and
unrealized) | | Total From
Investment
Operations | | Dividends
from Net
Investment
Income | | Distributions
from Net
Realized
Capital Gains | | Tax
Return of
Capital | | Total
Distributions | | Voluntary
Contributions
from
Management | | Redemption
Feesøø | | Net
Asset
Value,
End of
Year | | Total Return†d | | Net Assets,
End of
Year
(in millions) | | Ratio of
Gross
Expenses
to Average
Net Assets# | | Ratio
of Net
Expenses
to Average
Net Assets‡ | | Ratio of Net
Investment
Income/
(Loss) to
Average Net
Assets | | Portfolio
Turnover
Rate | |
Large Cap Value Fund (cont'd) | |
Institutional Class | |
8/31/2015 | | $ | 34.11 | | | $ | 0.37 | | | $ | (2.51 | ) | | $ | (2.14 | ) | | $ | (0.34 | ) | | $ | (3.99 | ) | | $ | — | | | $ | (4.33 | ) | | $ | — | | | $ | — | | | $ | 27.64 | | | | (7.03 | %) | | $ | 86.4 | | | | 0.70 | % | | | 0.70 | %§ | | | 1.19 | % | | | 153 | % | |
8/31/2014 | | $ | 32.56 | | | $ | 0.39 | | | $ | 6.65 | | | $ | 7.04 | | | $ | (0.47 | ) | | $ | (5.02 | ) | | $ | — | | | $ | (5.49 | ) | | $ | 0.00 | | | $ | — | | | $ | 34.11 | | | | 23.74 | %g | | $ | 143.5 | | | | 0.70 | % | | | 0.70 | %§ | | | 1.18 | % | | | 104 | % | |
8/31/2013 | | $ | 26.59 | | | $ | 0.41 | | | $ | 5.97 | | | $ | 6.38 | | | $ | (0.41 | ) | | $ | — | | | $ | — | | | $ | (0.41 | ) | | $ | — | | | $ | — | | | $ | 32.56 | | | | 24.26 | % | | $ | 113.2 | | | | 0.70 | % | | | 0.70 | % | | | 1.36 | % | | | 159 | % | |
8/31/2012 | | $ | 25.11 | | | $ | 0.34 | | | $ | 1.30 | | | $ | 1.64 | | | $ | (0.16 | ) | | $ | — | | | $ | — | | | $ | (0.16 | ) | | $ | — | | | $ | — | | | $ | 26.59 | | | | 6.61 | % | | $ | 103.0 | | | | 0.70 | % | | | 0.70 | % | | | 1.35 | % | | | 171 | % | |
8/31/2011 | | $ | 22.15 | | | $ | 0.17 | | | $ | 2.87 | | | $ | 3.04 | | | $ | (0.08 | ) | | $ | — | | | $ | — | | | $ | (0.08 | ) | | $ | — | | | $ | — | | | $ | 25.11 | | | | 13.69 | % | | $ | 200.6 | | | | 0.69 | % | | | 0.69 | % | | | 0.61 | % | | | 41 | % | |
Class A | |
8/31/2015 | | $ | 24.55 | | | $ | 0.20 | | | $ | (1.76 | ) | | $ | (1.56 | ) | | $ | (0.26 | ) | | $ | (3.99 | ) | | $ | — | | | $ | (4.25 | ) | | $ | — | | | $ | — | | | $ | 18.74 | | | | (7.44 | %) | | $ | 2.9 | | | | 1.09 | % | | | 1.09 | % | | | 0.96 | % | | | 153 | % | |
8/31/2014 | | $ | 24.83 | | | $ | 0.19 | | | $ | 4.94 | | | $ | 5.13 | | | $ | (0.39 | ) | | $ | (5.02 | ) | | $ | — | | | $ | (5.41 | ) | | $ | 0.00 | | | $ | — | | | $ | 24.55 | | | | 23.31 | %g | | $ | 2.7 | | | | 1.08 | % | | | 1.08 | %§ | | | 0.78 | % | | | 104 | % | |
8/31/2013 | | $ | 20.07 | | | $ | 0.22 | | | $ | 4.54 | | | $ | 4.76 | | | $ | — | | | $ | — | | | $ | — | | | $ | — | | | $ | — | | | $ | — | | | $ | 24.83 | | | | 23.72 | % | | $ | 1.6 | | | | 1.11 | % | | | 1.11 | % | | | 0.97 | % | | | 159 | % | |
8/31/2012 | | $ | 19.06 | | | $ | 0.20 | | | $ | 0.97 | | | $ | 1.17 | | | $ | (0.16 | ) | | $ | — | | | $ | — | | | $ | (0.16 | ) | | $ | — | | | $ | — | | | $ | 20.07 | | | | 6.24 | % | | $ | 2.0 | | | | 1.07 | % | | | 1.07 | %§ | | | 1.03 | % | | | 171 | % | |
8/31/2011 | | $ | 16.90 | | | $ | 0.06 | | | $ | 2.18 | | | $ | 2.24 | | | $ | (0.08 | ) | | $ | — | | | $ | — | | | $ | (0.08 | ) | | $ | — | | | $ | — | | | $ | 19.06 | | | | 13.20 | % | | $ | 1.4 | | | | 1.29 | % | | | 1.11 | % | | | 0.30 | % | | | 41 | % | |
Class C | |
8/31/2015 | | $ | 19.40 | | | $ | 0.02 | | | $ | (1.32 | ) | | $ | (1.30 | ) | | $ | (0.17 | ) | | $ | (3.99 | ) | | $ | — | | | $ | (4.16 | ) | | $ | — | | | $ | — | | | $ | 13.94 | | | | (8.11 | %) | | $ | 2.7 | | | | 1.82 | % | | | 1.82 | %§ | | | 0.11 | % | | | 153 | % | |
8/31/2014 | | $ | 20.73 | | | $ | 0.00 | | | $ | 4.01 | | | $ | 4.01 | | | $ | (0.32 | ) | | $ | (5.02 | ) | | $ | — | | | $ | (5.34 | ) | | $ | 0.00 | | | $ | — | | | $ | 19.40 | | | | 22.37 | %g | | $ | 3.0 | | | | 1.86 | % | | | 1.86 | %§ | | | 0.03 | % | | | 104 | % | |
8/31/2013 | | $ | 17.19 | | | $ | 0.02 | | | $ | 3.85 | | | $ | 3.87 | | | $ | (0.33 | ) | | $ | — | | | $ | — | | | $ | (0.33 | ) | | $ | — | | | $ | — | | | $ | 20.73 | | | | 22.87 | % | | $ | 1.2 | | | | 1.86 | % | | | 1.86 | %§ | | | 0.10 | % | | | 159 | % | |
8/31/2012 | | $ | 16.31 | | | $ | 0.05 | | | $ | 0.83 | | | $ | 0.88 | | | $ | — | | | $ | — | | | $ | — | | | $ | — | | | $ | — | | | $ | — | | | $ | 17.19 | | | | 5.40 | % | | $ | 0.2 | | | | 2.04 | % | | | 1.86 | % | | | 0.27 | % | | | 171 | % | |
8/31/2011 | | $ | 14.57 | | | $ | (0.10 | ) | | $ | 1.90 | | | $ | 1.80 | | | $ | (0.06 | ) | | $ | — | | | $ | — | | | $ | (0.06 | ) | | $ | — | | | $ | — | | | $ | 16.31 | | | | 12.32 | % | | $ | 0.1 | | | | 4.61 | % | | | 1.86 | % | | | (0.56 | %) | | | 41 | % | |
Class R3 | |
8/31/2015 | | $ | 20.32 | | | $ | 0.09 | | | $ | (1.38 | ) | | $ | (1.29 | ) | | $ | (0.22 | ) | | $ | (3.99 | ) | | $ | — | | | $ | (4.21 | ) | | $ | — | | | $ | — | | | $ | 14.82 | | | | (7.64 | %) | | $ | 0.1 | | | | 1.51 | % | | | 1.36 | % | | | 0.53 | % | | | 153 | % | |
8/31/2014 | | $ | 21.41 | | | $ | 0.11 | | | $ | 4.16 | | | $ | 4.27 | | | $ | (0.34 | ) | | $ | (5.02 | ) | | $ | — | | | $ | (5.36 | ) | | $ | 0.00 | | | $ | — | | | $ | 20.32 | | | | 22.94 | %g | | $ | 0.1 | | | | 1.43 | % | | | 1.36 | % | | | 0.53 | % | | | 104 | % | |
8/31/2013 | | $ | 17.34 | | | $ | 0.09 | | | $ | 3.98 | | | $ | 4.07 | | | $ | — | | | $ | — | | | $ | — | | | $ | — | | | $ | — | | | $ | — | | | $ | 21.41 | | | | 23.47 | % | | $ | 0.1 | | | | 1.42 | % | | | 1.36 | % | | | 0.46 | % | | | 159 | % | |
8/31/2012 | | $ | 16.41 | | | $ | 0.15 | | | $ | 0.82 | | | $ | 0.97 | | | $ | (0.04 | ) | | $ | — | | | $ | — | | | $ | (0.04 | ) | | $ | — | | | $ | — | | | $ | 17.34 | | | | 5.95 | % | | $ | 0.6 | | | | 1.39 | % | | | 1.36 | % | | | 0.93 | % | | | 171 | % | |
8/31/2011 | | $ | 14.58 | | | $ | (0.01 | ) | | $ | 1.90 | | | $ | 1.89 | | | $ | (0.06 | ) | | $ | — | | | $ | — | | | $ | (0.06 | ) | | $ | — | | | $ | — | | | $ | 16.41 | | | | 12.93 | % | | $ | 0.0 | | | | 6.07 | % | | | 1.36 | % | | | (0.08 | %) | | | 41 | % | |
Mid Cap Growth Fund | |
Investor Class | |
8/31/2015 | | $ | 14.65 | | | $ | (0.07 | ) | | $ | 1.47 | | | $ | 1.40 | | | $ | — | | | $ | (1.76 | ) | | $ | — | | | $ | (1.76 | ) | | $ | — | | | $ | — | | | $ | 14.29 | | | | 10.74 | % | | $ | 437.5 | | | | 0.92 | % | | | 0.92 | % | | | (0.50 | %) | | | 50 | % | |
8/31/2014 | | $ | 13.35 | | | $ | (0.07 | ) | | $ | 2.34 | | | $ | 2.27 | | | $ | — | | | $ | (0.97 | ) | | $ | — | | | $ | (0.97 | ) | | $ | 0.00 | | | $ | — | | | $ | 14.65 | | | | 17.54 | %g | | $ | 415.6 | | | | 0.93 | % | | | 0.93 | % | | | (0.47 | %) | | | 63 | % | |
8/31/2013 | | $ | 11.98 | | | $ | (0.04 | ) | | $ | 2.08 | | | $ | 2.04 | | | $ | — | | | $ | (0.67 | ) | | $ | — | | | $ | (0.67 | ) | | $ | — | | | $ | — | | | $ | 13.35 | | | | 18.03 | % | | $ | 377.8 | | | | 0.98 | % | | | 0.98 | % | | | (0.30 | %) | | | 46 | % | |
8/31/2012 | | $ | 10.84 | | | $ | (0.06 | ) | | $ | 1.22 | | | $ | 1.16 | | | $ | — | | | $ | (0.02 | ) | | $ | — | | | $ | (0.02 | ) | | $ | — | | | $ | — | | | $ | 11.98 | | | | 10.73 | % | | $ | 347.9 | | | | 1.01 | % | | | 1.01 | % | | | (0.51 | %) | | | 40 | % | |
8/31/2011 | | $ | 8.43 | | | $ | (0.05 | ) | | $ | 2.46 | | | $ | 2.41 | | | $ | — | | | $ | — | | | $ | — | | | $ | — | | | $ | — | | | $ | — | | | $ | 10.84 | | | | 28.59 | % | | $ | 335.5 | | | | 1.02 | % | | | 1.02 | % | | | (0.45 | %) | | | 49 | % | |
See Notes to Financial Highlights
Financial Highlights (cont'd)
| | | Net Asset
Value,
Beginning
of Year | | Net
Investment
Income (Loss)@ | | Net Gains or
Losses on
Securities
(both realized
and
unrealized) | | Total From
Investment
Operations | | Dividends
from Net
Investment
Income | | Distributions
from Net
Realized
Capital Gains | | Tax
Return of
Capital | | Total
Distributions | | Voluntary
Contributions
from
Management | | Redemption
Feesøø | | Net
Asset
Value,
End of
Year | | Total Return†d | | Net Assets,
End of
Year
(in millions) | | Ratio of
Gross
Expenses
to Average
Net Assets# | | Ratio
of Net
Expenses
to Average
Net Assets‡ | | Ratio of Net
Investment
Income/
(Loss) to
Average Net
Assets | | Portfolio
Turnover
Rate | |
Mid Cap Growth Fund (cont'd) | |
Trust Class | |
8/31/2015 | | $ | 23.33 | | | $ | (0.14 | ) | | $ | 2.47 | | | $ | 2.33 | | | $ | — | | | $ | (1.76 | ) | | $ | — | | | $ | (1.76 | ) | | $ | — | | | $ | — | | | $ | 23.90 | | | | 10.73 | % | | $ | 91.7 | | | | 0.99 | % | | | 0.99 | % | | | (0.58 | %) | | | 50 | % | |
8/31/2014 | | $ | 20.75 | | | $ | (0.12 | ) | | $ | 3.66 | | | $ | 3.54 | | | $ | — | | | $ | (0.96 | ) | | $ | — | | | $ | (0.96 | ) | | $ | 0.00 | | | $ | — | | | $ | 23.33 | | | | 17.40 | %g | | $ | 69.6 | | | | 1.00 | % | | | 1.00 | % | | | (0.54 | %) | | | 63 | % | |
8/31/2013 | | $ | 18.23 | | | $ | (0.07 | ) | | $ | 3.24 | | | $ | 3.17 | | | $ | — | | | $ | (0.65 | ) | | $ | — | | | $ | (0.65 | ) | | $ | — | | | $ | — | | | $ | 20.75 | | | | 18.02 | % | | $ | 54.9 | | | | 1.04 | % | | | 1.04 | % | | | (0.38 | %) | | | 46 | % | |
8/31/2012 | | $ | 16.48 | | | $ | (0.10 | ) | | $ | 1.85 | | | $ | 1.75 | | | $ | — | | | $ | (0.00 | ) | | $ | — | | | $ | (0.00 | ) | | $ | — | | | $ | — | | | $ | 18.23 | | | | 10.65 | % | | $ | 39.9 | | | | 1.05 | % | | | 1.05 | % | | | (0.55 | %) | | | 40 | % | |
8/31/2011 | | $ | 12.83 | | | $ | (0.08 | ) | | $ | 3.73 | | | $ | 3.65 | | | $ | — | | | $ | — | | | $ | — | | | $ | — | | | $ | — | | | $ | — | | | $ | 16.48 | | | | 28.45 | % | | $ | 28.1 | | | | 1.07 | % | | | 1.07 | % | | | (0.52 | %) | | | 49 | % | |
Advisor Class | |
8/31/2015 | | $ | 23.77 | | | $ | (0.20 | ) | | $ | 2.50 | | | $ | 2.30 | | | $ | — | | | $ | (1.76 | ) | | $ | — | | | $ | (1.76 | ) | | $ | — | | | $ | — | | | $ | 24.31 | | | | 10.39 | % | | $ | 10.7 | | | | 1.25 | % | | | 1.25 | % | | | (0.84 | %) | | | 50 | % | |
8/31/2014 | | $ | 21.13 | | | $ | (0.18 | ) | | $ | 3.74 | | | $ | 3.56 | | | $ | — | | | $ | (0.92 | ) | | $ | — | | | $ | (0.92 | ) | | $ | 0.00 | | | $ | — | | | $ | 23.77 | | | | 17.16 | %g | | $ | 10.3 | | | | 1.26 | % | | | 1.26 | % | | | (0.81 | %) | | | 63 | % | |
8/31/2013 | | $ | 18.54 | | | $ | (0.12 | ) | | $ | 3.29 | | | $ | 3.17 | | | $ | — | | | $ | (0.58 | ) | | $ | — | | | $ | (0.58 | ) | | $ | — | | | $ | — | | | $ | 21.13 | | | | 17.64 | % | | $ | 11.7 | | | | 1.30 | % | | | 1.30 | % | | | (0.62 | %) | | | 46 | % | |
8/31/2012 | | $ | 16.82 | | | $ | (0.17 | ) | | $ | 1.89 | | | $ | 1.72 | | | $ | — | | | $ | — | | | $ | — | | | $ | — | | | $ | — | | | $ | — | | | $ | 18.54 | | | | 10.23 | % | | $ | 10.2 | | | | 1.44 | % | | | 1.44 | %§ | | | (0.95 | %) | | | 40 | % | |
8/31/2011 | | $ | 13.14 | | | $ | (0.16 | ) | | $ | 3.84 | | | $ | 3.68 | | | $ | — | | | $ | — | | | $ | — | | | $ | — | | | $ | — | | | $ | — | | | $ | 16.82 | | | | 28.01 | % | | $ | 9.0 | | | | 1.50 | % | | | 1.50 | %§ | | | (0.95 | %) | | | 49 | % | |
Institutional Class | |
8/31/2015 | | $ | 14.89 | | | $ | (0.05 | ) | | $ | 1.51 | | | $ | 1.46 | | | $ | — | | | $ | (1.76 | ) | | $ | — | | | $ | (1.76 | ) | | $ | — | | | $ | — | | | $ | 14.59 | | | | 10.98 | % | | $ | 423.3 | | | | 0.75 | % | | | 0.75 | %§ | | | (0.34 | %) | | | 50 | % | |
8/31/2014 | | $ | 13.56 | | | $ | (0.04 | ) | | $ | 2.37 | | | $ | 2.33 | | | $ | — | | | $ | (1.00 | ) | | $ | — | | | $ | (1.00 | ) | | $ | 0.00 | | | $ | — | | | $ | 14.89 | | | | 17.74 | %g | | $ | 382.5 | | | | 0.75 | % | | | 0.75 | % | | | (0.29 | %) | | | 63 | % | |
8/31/2013 | | $ | 12.16 | | | $ | (0.01 | ) | | $ | 2.11 | | | $ | 2.10 | | | $ | — | | | $ | (0.70 | ) | | $ | — | | | $ | (0.70 | ) | | $ | — | | | $ | — | | | $ | 13.56 | | | | 18.32 | % | | $ | 258.6 | | | | 0.79 | % | | | 0.75 | % | | | (0.07 | %) | | | 46 | % | |
8/31/2012 | | $ | 11.01 | | | $ | (0.03 | ) | | $ | 1.23 | | | $ | 1.20 | | | $ | — | | | $ | (0.05 | ) | | $ | — | | | $ | (0.05 | ) | | $ | — | | | $ | — | | | $ | 12.16 | | | | 10.96 | % | | $ | 174.2 | | | | 0.79 | % | | | 0.75 | % | | | (0.26 | %) | | | 40 | % | |
8/31/2011 | | $ | 8.54 | | | $ | (0.02 | ) | | $ | 2.49 | | | $ | 2.47 | | | $ | — | | | $ | — | | | $ | — | | | $ | — | | | $ | — | | | $ | — | | | $ | 11.01 | | | | 28.92 | % | | $ | 113.8 | | | | 0.81 | % | | | 0.75 | % | | | (0.21 | %) | | | 49 | % | |
Class A | |
8/31/2015 | | $ | 23.32 | | | $ | (0.16 | ) | | $ | 2.45 | | | $ | 2.29 | | | $ | — | | | $ | (1.76 | ) | | $ | — | | | $ | (1.76 | ) | | $ | — | | | $ | — | | | $ | 23.85 | | | | 10.55 | % | | $ | 102.3 | | | | 1.11 | % | | | 1.11 | %§ | | | (0.69 | %) | | | 50 | % | |
8/31/2014 | | $ | 20.74 | | | $ | (0.15 | ) | | $ | 3.67 | | | $ | 3.52 | | | $ | — | | | $ | (0.94 | ) | | $ | — | | | $ | (0.94 | ) | | $ | 0.00 | | | $ | — | | | $ | 23.32 | | | | 17.33 | %g | | $ | 100.7 | | | | 1.13 | % | | | 1.11 | % | | | (0.65 | %) | | | 63 | % | |
8/31/2013 | | $ | 18.23 | | | $ | (0.08 | ) | | $ | 3.23 | | | $ | 3.15 | | | $ | — | | | $ | (0.64 | ) | | $ | — | | | $ | (0.64 | ) | | $ | — | | | $ | — | | | $ | 20.74 | | | | 17.91 | % | | $ | 89.0 | | | | 1.18 | % | | | 1.11 | % | | | (0.44 | %) | | | 46 | % | |
8/31/2012 | | $ | 16.49 | | | $ | (0.11 | ) | | $ | 1.86 | | | $ | 1.75 | | | $ | — | | | $ | (0.01 | ) | | $ | — | | | $ | (0.01 | ) | | $ | — | | | $ | — | | | $ | 18.23 | | | | 10.61 | % | | $ | 63.2 | | | | 1.17 | % | | | 1.11 | % | | | (0.62 | %) | | | 40 | % | |
8/31/2011 | | $ | 12.84 | | | $ | (0.09 | ) | | $ | 3.74 | | | $ | 3.65 | | | $ | — | | | $ | — | | | $ | — | | | $ | — | | | $ | — | | | $ | — | | | $ | 16.49 | | | | 28.43 | % | | $ | 25.2 | | | | 1.19 | % | | | 1.11 | % | | | (0.56 | %) | | | 49 | % | |
Class C | |
8/31/2015 | | $ | 23.35 | | | $ | (0.34 | ) | | $ | 2.45 | | | $ | 2.11 | | | $ | — | | | $ | (1.76 | ) | | $ | — | | | $ | (1.76 | ) | | $ | — | | | $ | — | | | $ | 23.70 | | | | 9.72 | % | | $ | 8.4 | | | | 1.88 | % | | | 1.86 | % | | | (1.45 | %) | | | 50 | % | |
8/31/2014 | | $ | 20.81 | | | $ | (0.31 | ) | | $ | 3.68 | | | $ | 3.37 | | | $ | — | | | $ | (0.83 | ) | | $ | — | | | $ | (0.83 | ) | | $ | 0.00 | | | $ | — | | | $ | 23.35 | | | | 16.46 | %g | | $ | 6.0 | | | | 1.91 | % | | | 1.86 | % | | | (1.40 | %) | | | 63 | % | |
8/31/2013 | | $ | 18.31 | | | $ | (0.23 | ) | | $ | 3.26 | | | $ | 3.03 | | | $ | — | | | $ | (0.53 | ) | | $ | — | | | $ | (0.53 | ) | | $ | — | | | $ | — | | | $ | 20.81 | | | | 17.05 | % | | $ | 4.4 | | | | 1.95 | % | | | 1.86 | % | | | (1.20 | %) | | | 46 | % | |
8/31/2012 | | $ | 16.68 | | | $ | (0.24 | ) | | $ | 1.87 | | | $ | 1.63 | | | $ | — | | | $ | — | | | $ | — | | | $ | — | | | $ | — | | | $ | — | | | $ | 18.31 | | | | 9.77 | % | | $ | 2.4 | | | | 1.98 | % | | | 1.86 | % | | | (1.36 | %) | | | 40 | % | |
8/31/2011 | | $ | 13.09 | | | $ | (0.23 | ) | | $ | 3.82 | | | $ | 3.59 | | | $ | — | | | $ | — | | | $ | — | | | $ | — | | | $ | — | | | $ | — | | | $ | 16.68 | | | | 27.43 | % | | $ | 0.6 | | | | 2.04 | % | | | 1.86 | % | | | (1.36 | %) | | | 49 | % | |
See Notes to Financial Highlights
Financial Highlights (cont'd)
| | | Net Asset
Value,
Beginning
of Year | | Net
Investment
Income (Loss)@ | | Net Gains or
Losses on
Securities
(both realized
and
unrealized) | | Total From
Investment
Operations | | Dividends
from Net
Investment
Income | | Distributions
from Net
Realized
Capital Gains | | Tax
Return of
Capital | | Total
Distributions | | Voluntary
Contributions
from
Management | | Redemption
Feesøø | | Net
Asset
Value,
End of
Year | | Total Return†d | | Net Assets,
End of
Year
(in millions) | | Ratio of
Gross
Expenses
to Average
Net Assets# | | Ratio
of Net
Expenses
to Average
Net Assets‡ | | Ratio of Net
Investment
Income/
(Loss) to
Average Net
Assets | | Portfolio
Turnover
Rate | |
Mid Cap Growth Fund (cont'd) | |
Class R3 | |
8/31/2015 | | $ | 23.79 | | | $ | (0.23 | ) | | $ | 2.51 | | | $ | 2.28 | | | $ | — | | | $ | (1.76 | ) | | $ | — | | | $ | (1.76 | ) | | $ | — | | | $ | — | | | $ | 24.31 | | | | 10.29 | % | | $ | 12.7 | | | | 1.37 | % | | | 1.36 | % | | | (0.95 | %) | | | 50 | % | |
8/31/2014 | | $ | 21.16 | | | $ | (0.21 | ) | | $ | 3.75 | | | $ | 3.54 | | | $ | — | | | $ | (0.91 | ) | | $ | — | | | $ | (0.91 | ) | | $ | 0.00 | | | $ | — | | | $ | 23.79 | | | | 17.02 | %g | | $ | 8.3 | | | | 1.38 | % | | | 1.36 | % | | | (0.90 | %) | | | 63 | % | |
8/31/2013 | | $ | 18.61 | | | $ | (0.13 | ) | | $ | 3.30 | | | $ | 3.17 | | | $ | — | | | $ | (0.62 | ) | | $ | — | | | $ | (0.62 | ) | | $ | — | | | $ | — | | | $ | 21.16 | | | | 17.63 | % | | $ | 5.6 | | | | 1.43 | % | | | 1.36 | % | | | (0.68 | %) | | | 46 | % | |
8/31/2012 | | $ | 16.87 | | | $ | (0.16 | ) | | $ | 1.90 | | | $ | 1.74 | | | $ | — | | | $ | — | | | $ | — | | | $ | — | | | $ | — | | | $ | — | | | $ | 18.61 | | | | 10.31 | % | | $ | 3.0 | | | | 1.45 | % | | | 1.36 | % | | | (0.89 | %) | | | 40 | % | |
8/31/2011 | | $ | 13.17 | | | $ | (0.16 | ) | | $ | 3.86 | | | $ | 3.70 | | | $ | — | | | $ | — | | | $ | — | | | $ | — | | | $ | — | | | $ | — | | | $ | 16.87 | | | | 28.09 | % | | $ | 0.5 | | | | 1.50 | % | | | 1.36 | % | | | (0.91 | %) | | | 49 | % | |
Class R6 | |
8/31/2015 | | $ | 14.91 | | | $ | (0.04 | ) | | $ | 1.51 | | | $ | 1.47 | | | $ | — | | | $ | (1.76 | ) | | $ | — | | | $ | (1.76 | ) | | $ | — | | | $ | — | | | $ | 14.62 | | | | 11.04 | % | | $ | 88.6 | | | | 0.67 | % | | | 0.67 | %§ | | | (0.26 | %) | | | 50 | % | |
8/31/2014 | | $ | 13.57 | | | $ | (0.03 | ) | | $ | 2.38 | | | $ | 2.35 | | | $ | — | | | $ | (1.01 | ) | | $ | — | | | $ | (1.01 | ) | | $ | 0.00 | | | $ | — | | | $ | 14.91 | | | | 17.89 | %g | | $ | 22.5 | | | | 0.68 | % | | | 0.68 | % | | | (0.21 | %) | | | 63 | % | |
Period from 3/15/2013^
to 8/31/2013 | | $ | 12.77 | | | $ | (0.01 | ) | | $ | 0.81 | | | $ | 0.80 | | | $ | — | | | $ | — | | | $ | — | | | $ | — | | | $ | — | | | $ | — | | | $ | 13.57 | | | | 6.26 | %** | | $ | 0.1 | | | | 7.22 | %* | | | 0.68 | %* | | | (0.13 | %)* | | | 46 | %Ø | |
Mid Cap Intrinsic Value Fund | |
Investor Class | |
8/31/2015 | | $ | 23.56 | | | $ | 0.08 | | | $ | (0.36 | ) | | $ | (0.28 | ) | | $ | (0.21 | ) | | $ | (2.08 | ) | | $ | — | | | $ | (2.29 | ) | | $ | — | | | $ | — | | | $ | 20.99 | | | | (1.09 | %) | | $ | 42.1 | | | | 1.24 | % | | | 1.05 | % | | | 0.37 | % | | | 50 | % | |
8/31/2014 | | $ | 20.29 | | | $ | 0.26 | | | $ | 4.20 | | | $ | 4.46 | | | $ | (0.32 | ) | | $ | (0.87 | ) | | $ | — | | | $ | (1.19 | ) | | $ | 0.00 | | | $ | — | | | $ | 23.56 | | | | 22.84 | %g | | $ | 43.4 | | | | 1.31 | % | | | 0.98 | % | | | 1.21 | % | | | 34 | % | |
8/31/2013 | | $ | 15.90 | | | $ | 0.26 | | | $ | 4.25 | | | $ | 4.51 | | | $ | (0.12 | ) | | $ | — | | | $ | — | | | $ | (0.12 | ) | | $ | — | | | $ | — | | | $ | 20.29 | | | | 28.58 | % | | $ | 45.9 | | | | 1.40 | % | | | 1.09 | % | | | 1.45 | % | | | 33 | % | |
8/31/2012 | | $ | 14.18 | | | $ | 0.10 | | | $ | 1.68 | | | $ | 1.78 | | | $ | (0.06 | ) | | $ | — | | | $ | — | | | $ | (0.06 | ) | | $ | — | | | $ | — | | | $ | 15.90 | | | | 12.62 | % | | $ | 46.0 | | | | 1.39 | % | | | 1.18 | % | | | 0.69 | % | | | 118 | % | |
8/31/2011 | | $ | 12.26 | | | $ | 0.06 | | | $ | 1.88 | | | $ | 1.94 | | | $ | (0.02 | ) | | $ | — | | | $ | — | | | $ | (0.02 | ) | | $ | — | | | $ | — | | | $ | 14.18 | | | | 15.79 | % | | $ | 46.5 | | | | 1.33 | % | | | 1.22 | % | | | 0.38 | % | | | 27 | % | |
Trust Class | |
8/31/2015 | | $ | 20.24 | | | $ | 0.03 | | | $ | (0.32 | ) | | $ | (0.29 | ) | | $ | (0.16 | ) | | $ | (2.08 | ) | | $ | — | | | $ | (2.24 | ) | | $ | — | | | $ | — | | | $ | 17.71 | | | | (1.31 | %) | | $ | 11.9 | | | | 1.48 | % | | | 1.25 | % | | | 0.17 | % | | | 50 | % | |
8/31/2014 | | $ | 17.61 | | | $ | 0.18 | | | $ | 3.61 | | | $ | 3.79 | | | $ | (0.29 | ) | | $ | (0.87 | ) | | $ | — | | | $ | (1.16 | ) | | $ | 0.00 | | | $ | — | | | $ | 20.24 | | | | 22.47 | %g | | $ | 14.4 | | | | 1.57 | % | | | 1.25 | %§ | | | 0.97 | % | | | 34 | % | |
8/31/2013 | | $ | 13.82 | | | $ | 0.20 | | | $ | 3.70 | | | $ | 3.90 | | | $ | (0.11 | ) | | $ | — | | | $ | — | | | $ | (0.11 | ) | | $ | — | | | $ | — | | | $ | 17.61 | | | | 28.45 | % | | $ | 13.0 | | | | 1.66 | % | | | 1.25 | % | | | 1.26 | % | | | 33 | % | |
8/31/2012 | | $ | 12.34 | | | $ | 0.08 | | | $ | 1.46 | | | $ | 1.54 | | | $ | (0.06 | ) | | $ | — | | | $ | — | | | $ | (0.06 | ) | | $ | — | | | $ | — | | | $ | 13.82 | | | | 12.51 | % | | $ | 18.4 | | | | 1.60 | % | | | 1.25 | % | | | 0.61 | % | | | 118 | % | |
8/31/2011 | | $ | 10.68 | | | $ | 0.04 | | | $ | 1.63 | | | $ | 1.67 | | | $ | (0.01 | ) | | $ | — | | | $ | — | | | $ | (0.01 | ) | | $ | — | | | $ | — | | | $ | 12.34 | | | | 15.66 | % | | $ | 24.1 | | | | 1.54 | % | | | 1.26 | % | | | 0.33 | % | | | 27 | % | |
Institutional Class | |
8/31/2015 | | $ | 23.59 | | | $ | 0.13 | | | $ | (0.37 | ) | | $ | (0.24 | ) | | $ | (0.25 | ) | | $ | (2.08 | ) | | $ | — | | | $ | (2.33 | ) | | $ | — | | | $ | — | | | $ | 21.02 | | | | (0.90 | %) | | $ | 34.0 | | | | 1.07 | % | | | 0.85 | % | | | 0.59 | % | | | 50 | % | |
8/31/2014 | | $ | 20.33 | | | $ | 0.33 | | | $ | 4.17 | | | $ | 4.50 | | | $ | (0.37 | ) | | $ | (0.87 | ) | | $ | — | | | $ | (1.24 | ) | | $ | 0.00 | | | $ | — | | | $ | 23.59 | | | | 22.99 | %g | | $ | 18.0 | | | | 1.17 | % | | | 0.85 | %§ | | | 1.48 | % | | | 34 | % | |
8/31/2013 | | $ | 15.93 | | | $ | 0.31 | | | $ | 4.26 | | | $ | 4.57 | | | $ | (0.17 | ) | | $ | — | | | $ | — | | | $ | (0.17 | ) | | $ | — | | | $ | — | | | $ | 20.33 | | | | 28.96 | % | | $ | 4.6 | | | | 1.23 | % | | | 0.85 | % | | | 1.73 | % | | | 33 | % | |
8/31/2012 | | $ | 14.22 | | | $ | 0.15 | | | $ | 1.67 | | | $ | 1.82 | | | $ | (0.11 | ) | | $ | — | | | $ | — | | | $ | (0.11 | ) | | $ | — | | | $ | — | | | $ | 15.93 | | | | 12.94 | % | | $ | 4.4 | | | | 1.19 | % | | | 0.85 | % | | | 1.01 | % | | | 118 | % | |
8/31/2011 | | $ | 12.28 | | | $ | 0.11 | | | $ | 1.89 | | | $ | 2.00 | | | $ | (0.06 | ) | | $ | — | | | $ | — | | | $ | (0.06 | ) | | $ | — | | | $ | — | | | $ | 14.22 | | | | 16.26 | % | | $ | 3.5 | | | | 1.16 | % | | | 0.86 | % | | | 0.67 | % | | | 27 | % | |
See Notes to Financial Highlights
Financial Highlights (cont'd)
| | | Net Asset
Value,
Beginning
of Year | | Net
Investment
Income (Loss)@ | | Net Gains or
Losses on
Securities
(both realized
and
unrealized) | | Total From
Investment
Operations | | Dividends
from Net
Investment
Income | | Distributions
from Net
Realized
Capital Gains | | Tax
Return of
Capital | | Total
Distributions | | Voluntary
Contributions
from
Management | | Redemption
Feesøø | | Net
Asset
Value,
End of
Year | | Total Return†d | | Net Assets,
End of
Year
(in millions) | | Ratio of
Gross
Expenses
to Average
Net Assets# | | Ratio
of Net
Expenses
to Average
Net Assets‡ | | Ratio of Net
Investment
Income/
(Loss) to
Average Net
Assets | | Portfolio
Turnover
Rate | |
Mid Cap Intrinsic Value Fund (cont'd) | |
Class A | |
8/31/2015 | | $ | 20.24 | | | $ | 0.04 | | | $ | (0.32 | ) | | $ | (0.28 | ) | | $ | (0.18 | ) | | $ | (2.08 | ) | | $ | — | | | $ | (2.26 | ) | | $ | — | | | $ | — | | | $ | 17.70 | | | | (1.25 | %) | | $ | 14.8 | | | | 1.47 | % | | | 1.21 | % | | | 0.20 | % | | | 50 | % | |
8/31/2014 | | $ | 17.60 | | | $ | 0.18 | | | $ | 3.63 | | | $ | 3.81 | | | $ | (0.30 | ) | | $ | (0.87 | ) | | $ | — | | | $ | (1.17 | ) | | $ | 0.00 | | | $ | — | | | $ | 20.24 | | | | 22.60 | %g | | $ | 5.2 | | | | 1.53 | % | | | 1.21 | %§ | | | 0.96 | % | | | 34 | % | |
8/31/2013 | | $ | 13.82 | | | $ | 0.23 | | | $ | 3.67 | | | $ | 3.90 | | | $ | (0.12 | ) | | $ | — | | | $ | — | | | $ | (0.12 | ) | | $ | — | | | $ | — | | | $ | 17.60 | | | | 28.43 | % | | $ | 2.7 | | | | 1.65 | % | | | 1.21 | % | | | 1.45 | % | | | 33 | % | |
8/31/2012 | | $ | 12.34 | | | $ | 0.08 | | | $ | 1.46 | | | $ | 1.54 | | | $ | (0.06 | ) | | $ | — | | | $ | — | | | $ | (0.06 | ) | | $ | — | | | $ | — | | | $ | 13.82 | | | | 12.56 | % | | $ | 3.8 | | | | 1.61 | % | | | 1.21 | % | | | 0.63 | % | | | 118 | % | |
8/31/2011 | | $ | 10.68 | | | $ | 0.05 | | | $ | 1.63 | | | $ | 1.68 | | | $ | (0.02 | ) | | $ | — | | | $ | — | | | $ | (0.02 | ) | | $ | — | | | $ | — | | | $ | 12.34 | | | | 15.70 | % | | $ | 1.2 | | | | 1.91 | % | | | 1.22 | % | | | 0.37 | % | | | 27 | % | |
Class C | |
8/31/2015 | | $ | 20.00 | | | $ | (0.10 | ) | | $ | (0.31 | ) | | $ | (0.41 | ) | | $ | (0.06 | ) | | $ | (2.08 | ) | | $ | — | | | $ | (2.14 | ) | | $ | — | | | $ | — | | | $ | 17.45 | | | | (2.02 | %) | | $ | 3.5 | | | | 2.20 | % | | | 1.96 | % | | | (0.53 | %) | | | 50 | % | |
8/31/2014 | | $ | 17.44 | | | $ | 0.05 | | | $ | 3.58 | | | $ | 3.63 | | | $ | (0.20 | ) | | $ | (0.87 | ) | | $ | — | | | $ | (1.07 | ) | | $ | 0.00 | | | $ | — | | | $ | 20.00 | | | | 21.64 | %g | | $ | 1.9 | | | | 2.28 | % | | | 1.96 | %§ | | | 0.24 | % | | | 34 | % | |
8/31/2013 | | $ | 13.69 | | | $ | 0.09 | | | $ | 3.67 | | | $ | 3.76 | | | $ | (0.01 | ) | | $ | — | | | $ | — | | | $ | (0.01 | ) | | $ | — | | | $ | — | | | $ | 17.44 | | | | 27.51 | % | | $ | 1.3 | | | | 2.35 | % | | | 1.96 | % | | | 0.54 | % | | | 33 | % | |
8/31/2012 | | $ | 12.25 | | | $ | (0.01 | ) | | $ | 1.45 | | | $ | 1.44 | | | $ | — | | | $ | — | | | $ | — | | | $ | — | | | $ | — | | | $ | — | | | $ | 13.69 | | | | 11.76 | % | | $ | 0.4 | | | | 2.43 | % | | | 1.96 | % | | | (0.09 | %) | | | 118 | % | |
8/31/2011 | | $ | 10.66 | | | $ | (0.04 | ) | | $ | 1.63 | | | $ | 1.59 | | | $ | — | | | $ | — | | | $ | — | | | $ | — | | | $ | — | | | $ | — | | | $ | 12.25 | | | | 14.92 | % | | $ | 0.1 | | | | 3.97 | % | | | 1.97 | % | | | (0.31 | %) | | | 27 | % | |
Class R3 | |
8/31/2015 | | $ | 20.23 | | | $ | 0.00 | | | $ | (0.32 | ) | | $ | (0.32 | ) | | $ | (0.13 | ) | | $ | (2.08 | ) | | $ | — | | | $ | (2.21 | ) | | $ | — | | | $ | — | | | $ | 17.70 | | | | (1.49 | %) | | $ | 1.2 | | | | 1.73 | % | | | 1.46 | % | | | 0.03 | % | | | 50 | % | |
8/31/2014 | | $ | 17.59 | | | $ | 0.15 | | | $ | 3.61 | | | $ | 3.76 | | | $ | (0.25 | ) | | $ | (0.87 | ) | | $ | — | | | $ | (1.12 | ) | | $ | 0.00 | | | $ | — | | | $ | 20.23 | | | | 22.23 | %g | | $ | 0.4 | | | | 1.80 | % | | | 1.46 | % | | | 0.80 | % | | | 34 | % | |
8/31/2013 | | $ | 13.80 | | | $ | 0.14 | | | $ | 3.73 | | | $ | 3.87 | | | $ | (0.08 | ) | | $ | — | | | $ | — | | | $ | (0.08 | ) | | $ | — | | | $ | — | | | $ | 17.59 | | | | 28.22 | % | | $ | 0.8 | | | | 1.86 | % | | | 1.46 | % | | | 0.85 | % | | | 33 | % | |
8/31/2012 | | $ | 12.32 | | | $ | 0.05 | | | $ | 1.46 | | | $ | 1.51 | | | $ | (0.03 | ) | | $ | — | | | $ | — | | | $ | (0.03 | ) | | $ | — | | | $ | — | | | $ | 13.80 | | | | 12.25 | % | | $ | 0.2 | | | | 1.88 | % | | | 1.46 | % | | | 0.41 | % | | | 118 | % | |
8/31/2011 | | $ | 10.67 | | | $ | 0.04 | | | $ | 1.61 | | | $ | 1.65 | | | $ | — | | | $ | — | | | $ | — | | | $ | — | | | $ | — | | | $ | — | | | $ | 12.32 | | | | 15.46 | % | | $ | 0.2 | | | | 6.06 | % | | | 1.47 | % | | | 0.32 | % | | | 27 | % | |
Multi-Cap Opportunities Fund | |
Institutional Class | |
8/31/2015 | | $ | 16.27 | | | $ | 0.13 | | | $ | (0.43 | ) | | $ | (0.30 | ) | | $ | (0.15 | ) | | $ | (0.51 | ) | | $ | — | | | $ | (0.66 | ) | | $ | — | | | $ | — | | | $ | 15.31 | | | | (1.80 | %) | | $ | 2,191.4 | | | | 0.73 | % | | | 0.73 | % | | | 0.84 | % | | | 27 | % | |
8/31/2014 | | $ | 13.56 | | | $ | 0.16 | | | $ | 2.88 | | | $ | 3.04 | | | $ | (0.11 | ) | | $ | (0.22 | ) | | $ | — | | | $ | (0.33 | ) | | $ | 0.00 | | | $ | — | | | $ | 16.27 | | | | 22.65 | %g | | $ | 2,566.4 | | | | 0.74 | % | | | 0.74 | % | | | 1.06 | % | | | 17 | % | |
8/31/2013 | | $ | 10.76 | | | $ | 0.17 | | | $ | 2.86 | | | $ | 3.03 | | | $ | (0.14 | ) | | $ | (0.09 | ) | | $ | — | | | $ | (0.23 | ) | | $ | — | | | $ | — | | | $ | 13.56 | | | | 28.57 | % | | $ | 1,430.7 | | | | 0.85 | % | | | 0.85 | %§ | | | 1.38 | % | | | 11 | % | |
8/31/2012 | | $ | 9.59 | | | $ | 0.17 | | | $ | 1.27 | | | $ | 1.44 | | | $ | (0.02 | ) | | $ | (0.25 | ) | | $ | — | | | $ | (0.27 | ) | | $ | — | | | $ | — | | | $ | 10.76 | | | | 15.56 | % | | $ | 465.5 | | | | 1.00 | % | | | 1.00 | %§ | | | 1.70 | % | | | 29 | % | |
8/31/2011 | | $ | 8.03 | | | $ | 0.06 | | | $ | 1.55 | | | $ | 1.61 | | | $ | (0.05 | ) | | $ | — | | | $ | — | | | $ | (0.05 | ) | | $ | — | | | $ | — | | | $ | 9.59 | | | | 20.09 | % | | $ | 91.0 | | | | 1.21 | % | | | 1.01 | %^^ | | | 0.64 | % | | | 105 | % | |
Class A | |
8/31/2015 | | $ | 16.13 | | | $ | 0.07 | | | $ | (0.43 | ) | | $ | (0.36 | ) | | $ | (0.08 | ) | | $ | (0.51 | ) | | $ | — | | | $ | (0.59 | ) | | $ | — | | | $ | — | | | $ | 15.18 | | | | (2.16 | %) | | $ | 102.8 | | | | 1.10 | % | | | 1.10 | % | | | 0.47 | % | | | 27 | % | |
8/31/2014 | | $ | 13.48 | | | $ | 0.11 | | | $ | 2.85 | | | $ | 2.96 | | | $ | (0.09 | ) | | $ | (0.22 | ) | | $ | — | | | $ | (0.31 | ) | | $ | 0.00 | | | $ | — | | | $ | 16.13 | | | | 22.17 | %g | | $ | 143.1 | | | | 1.10 | % | | | 1.10 | % | | | 0.71 | % | | | 17 | % | |
8/31/2013 | | $ | 10.70 | | | $ | 0.12 | | | $ | 2.86 | | | $ | 2.98 | | | $ | (0.11 | ) | | $ | (0.09 | ) | | $ | — | | | $ | (0.20 | ) | | $ | — | | | $ | — | | | $ | 13.48 | | | | 28.22 | % | | $ | 51.6 | | | | 1.18 | % | | | 1.18 | %§ | | | 0.91 | % | | | 11 | % | |
8/31/2012 | | $ | 9.56 | | | $ | 0.13 | | | $ | 1.27 | | | $ | 1.40 | | | $ | (0.01 | ) | | $ | (0.25 | ) | | $ | — | | | $ | (0.26 | ) | | $ | — | | | $ | — | | | $ | 10.70 | | | | 15.13 | % | | $ | 2.8 | | | | 1.36 | % | | | 1.36 | %§ | | | 1.29 | % | | | 29 | % | |
8/31/2011 | | $ | 8.02 | | | $ | 0.03 | | | $ | 1.53 | | | $ | 1.56 | | | $ | (0.02 | ) | | $ | — | | | $ | — | | | $ | (0.02 | ) | | $ | — | | | $ | — | | | $ | 9.56 | | | | 19.48 | % | | $ | 0.2 | | | | 1.69 | % | | | 1.37 | %^^ | | | 0.28 | % | | | 105 | % | |
See Notes to Financial Highlights
Financial Highlights (cont'd)
| | | Net Asset
Value,
Beginning
of Year | | Net
Investment
Income (Loss)@ | | Net Gains or
Losses on
Securities
(both realized
and
unrealized) | | Total From
Investment
Operations | | Dividends
from Net
Investment
Income | | Distributions
from Net
Realized
Capital Gains | | Tax
Return of
Capital | | Total
Distributions | | Voluntary
Contributions
from
Management | | Redemption
Feesøø | | Net
Asset
Value,
End of
Year | | Total Return†d | | Net Assets,
End of
Year
(in millions) | | Ratio of
Gross
Expenses
to Average
Net Assets# | | Ratio
of Net
Expenses
to Average
Net Assets‡ | | Ratio of Net
Investment
Income/
(Loss) to
Average Net
Assets | | Portfolio
Turnover
Rate | |
Multi-Cap Opportunities Fund (cont'd) | |
Class C | |
8/31/2015 | | $ | 15.71 | | | $ | (0.04 | ) | | $ | (0.41 | ) | | $ | (0.45 | ) | | $ | (0.02 | ) | | $ | (0.51 | ) | | $ | — | | | $ | (0.53 | ) | | $ | — | | | $ | — | | | $ | 14.73 | | | | (2.84 | %) | | $ | 46.1 | | | | 1.84 | % | | | 1.84 | % | | | (0.27 | %) | | | 27 | % | |
8/31/2014 | | $ | 13.20 | | | $ | (0.00 | ) | | $ | 2.79 | | | $ | 2.79 | | | $ | (0.06 | ) | | $ | (0.22 | ) | | $ | — | | | $ | (0.28 | ) | | $ | 0.00 | | | $ | — | | | $ | 15.71 | | | | 21.30 | %g | | $ | 50.5 | | | | 1.85 | % | | | 1.85 | % | | | (0.01 | %) | | | 17 | % | |
8/31/2013 | | $ | 10.52 | | | $ | 0.01 | | | $ | 2.81 | | | $ | 2.82 | | | $ | (0.05 | ) | | $ | (0.09 | ) | | $ | — | | | $ | (0.14 | ) | | $ | — | | | $ | — | | | $ | 13.20 | | | | 27.10 | % | | $ | 8.3 | | | | 2.05 | % | | | 2.05 | %§ | | | 0.04 | % | | | 11 | % | |
8/31/2012 | | $ | 9.47 | | | $ | 0.07 | | | $ | 1.23 | | | $ | 1.30 | | | $ | — | | | $ | (0.25 | ) | | $ | — | | | $ | (0.25 | ) | | $ | — | | | $ | — | | | $ | 10.52 | | | | 14.22 | % | | $ | 0.4 | | | | 2.14 | % | | | 2.11 | % | | | 0.70 | % | | | 29 | % | |
8/31/2011 | | $ | 7.97 | | | $ | (0.05 | ) | | $ | 1.55 | | | $ | 1.50 | | | $ | — | | | $ | — | | | $ | — | | | $ | — | | | $ | — | | | $ | — | | | $ | 9.47 | | | | 18.82 | % | | $ | 0.2 | | | | 2.43 | % | | | 2.12 | %^^ | | | (0.50 | %) | | | 105 | % | |
Real Estate Fund | |
Trust Class | |
8/31/2015 | | $ | 14.70 | | | $ | 0.18 | | | $ | (0.37 | ) | | $ | (0.19 | ) | | $ | (0.18 | ) | | $ | (0.73 | ) | | $ | — | | | $ | (0.91 | ) | | $ | — | | | $ | — | | | $ | 13.60 | | | | (1.54 | %) | | $ | 250.8 | | | | 1.39 | % | | | 1.04 | % | | | 1.24 | % | | | 33 | % | |
8/31/2014 | | $ | 12.96 | | | $ | 0.16 | | | $ | 2.56 | | | $ | 2.72 | | | $ | (0.17 | ) | | $ | (0.81 | ) | | $ | — | | | $ | (0.98 | ) | | $ | 0.00 | | | $ | — | | | $ | 14.70 | | | | 22.36 | %g | | $ | 314.3 | | | | 1.41 | % | | | 1.04 | % | | | 1.19 | % | | | 36 | % | |
8/31/2013 | | $ | 13.82 | | | $ | 0.15 | | | $ | (0.50 | ) | | $ | (0.35 | ) | | $ | (0.15 | ) | | $ | (0.36 | ) | | $ | — | | | $ | (0.51 | ) | | $ | — | | | $ | — | | | $ | 12.96 | | | | (2.60 | %) | | $ | 319.9 | | | | 1.43 | % | | | 1.04 | % | | | 1.09 | % | | | 33 | % | |
8/31/2012 | | $ | 11.80 | | | $ | 0.14 | | | $ | 2.12 | | | $ | 2.26 | | | $ | (0.19 | ) | | $ | (0.05 | ) | | $ | — | | | $ | (0.24 | ) | | $ | — | | | $ | — | | | $ | 13.82 | | | | 19.53 | % | | $ | 288.9 | | | | 1.47 | % | | | 1.03 | % | | | 1.10 | % | | | 29 | % | |
8/31/2011 | | $ | 10.23 | | | $ | 0.09 | | | $ | 1.68 | | | $ | 1.77 | | | $ | (0.21 | ) | | $ | — | | | $ | — | | | $ | (0.21 | ) | | $ | — | | | $ | 0.01 | | | $ | 11.80 | | | | 17.53 | % | | $ | 216.3 | | | | 1.55 | % | | | 0.99 | % | | | 0.75 | % | | | 28 | % | |
Institutional Class | |
8/31/2015 | | $ | 14.74 | | | $ | 0.21 | | | $ | (0.37 | ) | | $ | (0.16 | ) | | $ | (0.21 | ) | | $ | (0.73 | ) | | $ | — | | | $ | (0.94 | ) | | $ | — | | | $ | — | | | $ | 13.64 | | | | (1.34 | %) | | $ | 336.5 | | | | 1.03 | % | | | 0.85 | % | | | 1.42 | % | | | 33 | % | |
8/31/2014 | | $ | 12.99 | | | $ | 0.18 | | | $ | 2.57 | | | $ | 2.75 | | | $ | (0.19 | ) | | $ | (0.81 | ) | | $ | — | | | $ | (1.00 | ) | | $ | 0.00 | | | $ | — | | | $ | 14.74 | | | | 22.63 | %g | | $ | 463.5 | | | | 1.05 | % | | | 0.85 | % | | | 1.35 | % | | | 36 | % | |
8/31/2013 | | $ | 13.86 | | | $ | 0.17 | | | $ | (0.51 | ) | | $ | (0.34 | ) | | $ | (0.17 | ) | | $ | (0.36 | ) | | $ | — | | | $ | (0.53 | ) | | $ | — | | | $ | — | | | $ | 12.99 | | | | (2.48 | %) | | $ | 366.4 | | | | 1.07 | % | | | 0.85 | % | | | 1.23 | % | | | 33 | % | |
8/31/2012 | | $ | 11.83 | | | $ | 0.15 | | | $ | 2.14 | | | $ | 2.29 | | | $ | (0.21 | ) | | $ | (0.05 | ) | | $ | — | | | $ | (0.26 | ) | | $ | — | | | $ | — | | | $ | 13.86 | | | | 19.77 | % | | $ | 228.6 | | | | 1.10 | % | | | 0.85 | % | | | 1.21 | % | | | 29 | % | |
8/31/2011 | | $ | 10.25 | | | $ | 0.10 | | | $ | 1.71 | | | $ | 1.81 | | | $ | (0.23 | ) | | $ | — | | | $ | — | | | $ | (0.23 | ) | | $ | — | | | $ | 0.00 | | | $ | 11.83 | | | | 17.77 | % | | $ | 117.1 | | | | 1.16 | % | | | 0.85 | % | | | 0.81 | % | | | 28 | % | |
Class A | |
8/31/2015 | | $ | 14.69 | | | $ | 0.15 | | | $ | (0.35 | ) | | $ | (0.20 | ) | | $ | (0.16 | ) | | $ | (0.73 | ) | | $ | — | | | $ | (0.89 | ) | | $ | — | | | $ | — | | | $ | 13.60 | | | | (1.65 | %) | | $ | 137.0 | | | | 1.41 | % | | | 1.21 | % | | | 1.04 | % | | | 33 | % | |
8/31/2014 | | $ | 12.95 | | | $ | 0.14 | | | $ | 2.55 | | | $ | 2.69 | | | $ | (0.14 | ) | | $ | (0.81 | ) | | $ | — | | | $ | (0.95 | ) | | $ | 0.00 | | | $ | — | | | $ | 14.69 | | | | 22.17 | %g | | $ | 171.9 | | | | 1.43 | % | | | 1.21 | % | | | 1.02 | % | | | 36 | % | |
8/31/2013 | | $ | 13.82 | | | $ | 0.12 | | | $ | (0.51 | ) | | $ | (0.39 | ) | | $ | (0.12 | ) | | $ | (0.36 | ) | | $ | — | | | $ | (0.48 | ) | | $ | — | | | $ | — | | | $ | 12.95 | | | | (2.82 | %) | | $ | 164.5 | | | | 1.47 | % | | | 1.21 | % | | | 0.84 | % | | | 33 | % | |
8/31/2012 | | $ | 11.80 | | | $ | 0.11 | | | $ | 2.13 | | | $ | 2.24 | | | $ | (0.17 | ) | | $ | (0.05 | ) | | $ | — | | | $ | (0.22 | ) | | $ | — | | | $ | — | | | $ | 13.82 | | | | 19.33 | % | | $ | 78.3 | | | | 1.51 | % | | | 1.21 | % | | | 0.86 | % | | | 29 | % | |
8/31/2011 | | $ | 10.23 | | | $ | 0.04 | | | $ | 1.72 | | | $ | 1.76 | | | $ | (0.19 | ) | | $ | — | | | $ | — | | | $ | (0.19 | ) | | $ | — | | | $ | 0.00 | | | $ | 11.80 | | | | 17.33 | % | | $ | 36.3 | | | | 1.60 | % | | | 1.21 | % | | | 0.33 | % | | | 28 | % | |
Class C | |
8/31/2015 | | $ | 14.68 | | | $ | 0.04 | | | $ | (0.35 | ) | | $ | (0.31 | ) | | $ | (0.04 | ) | | $ | (0.73 | ) | | $ | — | | | $ | (0.77 | ) | | $ | — | | | $ | — | | | $ | 13.60 | | | | (2.38 | %) | | $ | 29.9 | | | | 2.17 | % | | | 1.96 | % | | | 0.30 | % | | | 33 | % | |
8/31/2014 | | $ | 12.94 | | | $ | 0.04 | | | $ | 2.55 | | | $ | 2.59 | | | $ | (0.04 | ) | | $ | (0.81 | ) | | $ | — | | | $ | (0.85 | ) | | $ | 0.00 | | | $ | — | | | $ | 14.68 | | | | 21.24 | %g | | $ | 40.4 | | | | 2.20 | % | | | 1.96 | % | | | 0.26 | % | | | 36 | % | |
8/31/2013 | | $ | 13.81 | | | $ | 0.02 | | | $ | (0.50 | ) | | $ | (0.48 | ) | | $ | (0.03 | ) | | $ | (0.36 | ) | | $ | — | | | $ | (0.39 | ) | | $ | — | | | $ | — | | | $ | 12.94 | | | | (3.52 | %) | | $ | 39.7 | | | | 2.24 | % | | | 1.96 | % | | | 0.11 | % | | | 33 | % | |
8/31/2012 | | $ | 11.80 | | | $ | 0.01 | | | $ | 2.14 | | | $ | 2.15 | | | $ | (0.09 | ) | | $ | (0.05 | ) | | $ | — | | | $ | (0.14 | ) | | $ | — | | | $ | — | | | $ | 13.81 | | | | 18.40 | % | | $ | 20.7 | | | | 2.28 | % | | | 1.96 | % | | | 0.09 | % | | | 29 | % | |
8/31/2011 | | $ | 10.24 | | | $ | (0.05 | ) | | $ | 1.73 | | | $ | 1.68 | | | $ | (0.12 | ) | | $ | — | | | $ | — | | | $ | (0.12 | ) | | $ | — | | | $ | 0.00 | | | $ | 11.80 | | | | 16.44 | % | | $ | 8.3 | | | | 2.37 | % | | | 1.96 | % | | | (0.46 | %) | | | 28 | % | |
See Notes to Financial Highlights
Financial Highlights (cont'd)
| | | Net Asset
Value,
Beginning
of Year | | Net
Investment
Income (Loss)@ | | Net Gains or
Losses on
Securities
(both realized
and
unrealized) | | Total From
Investment
Operations | | Dividends
from Net
Investment
Income | | Distributions
from Net
Realized
Capital Gains | | Tax
Return of
Capital | | Total
Distributions | | Voluntary
Contributions
from
Management | | Redemption
Feesøø | | Net
Asset
Value,
End of
Year | | Total Return†d | | Net Assets,
End of
Year
(in millions) | | Ratio of
Gross
Expenses
to Average
Net Assets# | | Ratio
of Net
Expenses
to Average
Net Assets‡ | | Ratio of Net
Investment
Income/
(Loss) to
Average Net
Assets | | Portfolio
Turnover
Rate | |
Real Estate Fund (cont'd) | |
Class R3 | |
8/31/2015 | | $ | 14.68 | | | $ | 0.12 | | | $ | (0.37 | ) | | $ | (0.25 | ) | | $ | (0.12 | ) | | $ | (0.73 | ) | | $ | — | | | $ | (0.85 | ) | | $ | — | | | $ | — | | | $ | 13.58 | | | | (1.94 | %) | | $ | 22.4 | | | | 1.66 | % | | | 1.46 | % | | | 0.81 | % | | | 33 | % | |
8/31/2014 | | $ | 12.94 | | | $ | 0.10 | | | $ | 2.56 | | | $ | 2.66 | | | $ | (0.11 | ) | | $ | (0.81 | ) | | $ | — | | | $ | (0.92 | ) | | $ | 0.00 | | | $ | — | | | $ | 14.68 | | | | 21.89 | %g | | $ | 23.5 | | | | 1.67 | % | | | 1.46 | % | | | 0.71 | % | | | 36 | % | |
8/31/2013 | | $ | 13.81 | | | $ | 0.08 | | | $ | (0.50 | ) | | $ | (0.42 | ) | | $ | (0.09 | ) | | $ | (0.36 | ) | | $ | — | | | $ | (0.45 | ) | | $ | — | | | $ | — | | | $ | 12.94 | | | | (3.04 | %) | | $ | 15.2 | | | | 1.70 | % | | | 1.46 | % | | | 0.56 | % | | | 33 | % | |
8/31/2012 | | $ | 11.80 | | | $ | 0.05 | | | $ | 2.17 | | | $ | 2.22 | | | $ | (0.16 | ) | | $ | (0.05 | ) | | $ | — | | | $ | (0.21 | ) | | $ | — | | | $ | — | | | $ | 13.81 | | | | 19.07 | % | | $ | 4.8 | | | | 1.74 | % | | | 1.46 | % | | | 0.41 | % | | | 29 | % | |
8/31/2011 | | $ | 10.23 | | | $ | (0.01 | ) | | $ | 1.74 | | | $ | 1.73 | | | $ | (0.16 | ) | | $ | — | | | $ | — | | | $ | (0.16 | ) | | $ | — | | | $ | 0.00 | | | $ | 11.80 | | | | 17.00 | % | | $ | 0.3 | | | | 2.81 | % | | | 1.46 | % | | | (0.06 | %) | | | 28 | % | |
Class R6 | |
8/31/2015 | | $ | 14.74 | | | $ | 0.21 | | | $ | (0.36 | ) | | $ | (0.15 | ) | | $ | (0.22 | ) | | $ | (0.73 | ) | | $ | — | | | $ | (0.95 | ) | | $ | — | | | $ | — | | | $ | 13.64 | | | | (1.26 | %) | | $ | 29.9 | | | | 0.97 | % | | | 0.78 | % | | | 1.40 | % | | | 33 | % | |
8/31/2014 | | $ | 12.99 | | | $ | 0.18 | | | $ | 2.59 | | | $ | 2.77 | | | $ | (0.21 | ) | | $ | (0.81 | ) | | $ | — | | | $ | (1.02 | ) | | $ | 0.00 | | | $ | — | | | $ | 14.74 | | | | 22.72 | %g | | $ | 26.3 | | | | 0.98 | % | | | 0.78 | % | | | 1.33 | % | | | 36 | % | |
Period from 3/15/2013^
to 8/31/2013 | | $ | 14.11 | | | $ | 0.06 | | | $ | (1.04 | ) | | $ | (0.98 | ) | | $ | (0.02 | ) | | $ | (0.12 | ) | | $ | — | | | $ | (0.14 | ) | | $ | — | | | $ | — | | | $ | 12.99 | | | | (6.96 | %)** | | $ | 8.3 | | | | 1.11 | %* | | | 0.78 | %* | | | 0.95 | %* | | | 33 | %Ø | |
Small Cap Growth Fund | |
Investor Class | |
8/31/2015 | | $ | 27.44 | | | $ | (0.28 | ) | | $ | 2.34 | | | $ | 2.06 | | | $ | — | | | $ | — | | | $ | — | | | $ | — | | | $ | — | | | $ | — | | | $ | 29.50 | | | | 7.51 | % | | $ | 49.3 | | | | 1.67 | % | | | 1.21 | % | | | (0.96 | %) | | | 336 | % | |
8/31/2014 | | $ | 24.16 | | | $ | (0.23 | ) | | $ | 3.51 | | | $ | 3.28 | | | $ | — | | | $ | — | | | $ | — | | | $ | — | | | $ | 0.00 | | | $ | — | | | $ | 27.44 | | | | 13.58 | %g | | $ | 50.7 | | | | 1.67 | % | | | 1.21 | % | | | (0.85 | %) | | | 284 | % | |
8/31/2013 | | $ | 19.49 | | | $ | (0.15 | ) | | $ | 4.82 | | | $ | 4.67 | | | $ | — | | | $ | — | | | $ | — | | | $ | — | | | $ | — | | | $ | — | | | $ | 24.16 | | | | 23.96 | % | | $ | 48.8 | | | | 1.64 | % | | | 1.22 | % | | | (0.72 | %) | | | 249 | % | |
8/31/2012 | | $ | 17.74 | | | $ | (0.17 | ) | | $ | 1.92 | | | $ | 1.75 | | | $ | — | | | $ | — | | | $ | — | | | $ | — | | | $ | — | | | $ | — | | | $ | 19.49 | | | | 9.86 | % | | $ | 60.1 | | | | 1.58 | % | | | 1.21 | % | | | (0.92 | %) | | | 294 | % | |
8/31/2011 | | $ | 13.68 | | | $ | (0.16 | ) | | $ | 4.22 | | | $ | 4.06 | | | $ | — | | | $ | — | | | $ | — | | | $ | — | | | $ | — | | | $ | — | | | $ | 17.74 | | | | 29.68 | % | | $ | 63.6 | | | | 1.49 | % | | | 1.15 | % | | | (0.88 | %) | | | 185 | % | |
Trust Class | |
8/31/2015 | | $ | 29.72 | | | $ | (0.37 | ) | | $ | 2.54 | | | $ | 2.17 | | | $ | — | | | $ | — | | | $ | — | | | $ | — | | | $ | — | | | $ | — | | | $ | 31.89 | | | | 7.30 | % | | $ | 5.3 | | | | 1.86 | % | | | 1.40 | % | | | (1.15 | %) | | | 336 | % | |
8/31/2014 | | $ | 26.22 | | | $ | (0.30 | ) | | $ | 3.80 | | | $ | 3.50 | | | $ | — | | | $ | — | | | $ | — | | | $ | — | | | $ | 0.00 | | | $ | — | | | $ | 29.72 | | | | 13.35 | %g | | $ | 5.5 | | | | 1.95 | % | | | 1.40 | % | | | (1.02 | %) | | | 284 | % | |
8/31/2013 | | $ | 21.19 | | | $ | (0.20 | ) | | $ | 5.23 | | | $ | 5.03 | | | $ | — | | | $ | — | | | $ | — | | | $ | — | | | $ | — | | | $ | — | | | $ | 26.22 | | | | 23.74 | % | | $ | 7.2 | | | | 1.83 | % | | | 1.40 | % | | | (0.91 | %) | | | 249 | % | |
8/31/2012 | | $ | 19.32 | | | $ | (0.22 | ) | | $ | 2.09 | | | $ | 1.87 | | | $ | — | | | $ | — | | | $ | — | | | $ | — | | | $ | — | | | $ | — | | | $ | 21.19 | | | | 9.68 | % | | $ | 15.8 | | | | 1.77 | % | | | 1.39 | % | | | (1.10 | %) | | | 294 | % | |
8/31/2011 | | $ | 14.93 | | | $ | (0.21 | ) | | $ | 4.60 | | | $ | 4.39 | | | $ | — | | | $ | — | | | $ | — | | | $ | — | | | $ | — | | | $ | — | | | $ | 19.32 | | | | 29.40 | % | | $ | 19.3 | | | | 1.67 | % | | | 1.37 | % | | | (1.10 | %) | | | 185 | % | |
Advisor Class | |
8/31/2015 | | $ | 19.63 | | | $ | (0.26 | ) | | $ | 1.66 | | | $ | 1.40 | | | $ | — | | | $ | — | | | $ | — | | | $ | — | | | $ | — | | | $ | — | | | $ | 21.03 | | | | 7.13 | % | | $ | 2.7 | | | | 2.00 | % | | | 1.51 | % | | | (1.26 | %) | | | 336 | % | |
8/31/2014 | | $ | 17.33 | | | $ | (0.22 | ) | | $ | 2.52 | | | $ | 2.30 | | | $ | — | | | $ | — | | | $ | — | | | $ | — | | | $ | 0.00 | | | $ | — | | | $ | 19.63 | | | | 13.27 | %g | | $ | 3.5 | | | | 1.96 | % | | | 1.51 | % | | | (1.15 | %) | | | 284 | % | |
8/31/2013 | | $ | 14.03 | | | $ | (0.15 | ) | | $ | 3.45 | | | $ | 3.30 | | | $ | — | | | $ | — | | | $ | — | | | $ | — | | | $ | — | | | $ | — | | | $ | 17.33 | | | | 23.52 | % | | $ | 3.6 | | | | 1.93 | % | | | 1.52 | % | | | (1.00 | %) | | | 249 | % | |
8/31/2012 | | $ | 12.81 | | | $ | (0.17 | ) | | $ | 1.39 | | | $ | 1.22 | | | $ | — | | | $ | — | | | $ | — | | | $ | — | | | $ | — | | | $ | — | | | $ | 14.03 | | | | 9.52 | % | | $ | 5.9 | | | | 1.87 | % | | | 1.58 | % | | | (1.28 | %) | | | 294 | % | |
8/31/2011 | | $ | 9.92 | | | $ | (0.17 | ) | | $ | 3.06 | | | $ | 2.89 | | | $ | — | | | $ | — | | | $ | — | | | $ | — | | | $ | — | | | $ | — | | | $ | 12.81 | | | | 29.13 | % | | $ | 7.9 | | | | 1.80 | % | | | 1.60 | % | | | (1.33 | %) | | | 185 | % | |
See Notes to Financial Highlights
Financial Highlights (cont'd)
| | | Net Asset
Value,
Beginning
of Year | | Net
Investment
Income (Loss)@ | | Net Gains or
Losses on
Securities
(both realized
and
unrealized) | | Total From
Investment
Operations | | Dividends
from Net
Investment
Income | | Distributions
from Net
Realized
Capital Gains | | Tax
Return of
Capital | | Total
Distributions | | Voluntary
Contributions
from
Management | | Redemption
Feesøø | | Net
Asset
Value,
End of
Year | | Total Return†d | | Net Assets,
End of
Year
(in millions) | | Ratio of
Gross
Expenses
to Average
Net Assets# | | Ratio
of Net
Expenses
to Average
Net Assets‡ | | Ratio of Net
Investment
Income/
(Loss) to
Average Net
Assets | | Portfolio
Turnover
Rate | |
Small Cap Growth Fund (cont'd) | |
Institutional Class | |
8/31/2015 | | $ | 27.92 | | | $ | (0.20 | ) | | $ | 2.39 | | | $ | 2.19 | | | $ | — | | | $ | — | | | $ | — | | | $ | — | | | $ | — | | | $ | — | | | $ | 30.11 | | | | 7.84 | % | | $ | 20.7 | | | | 1.44 | % | | | 0.90 | % | | | (0.65 | %) | | | 336 | % | |
8/31/2014 | | $ | 24.51 | | | $ | (0.15 | ) | | $ | 3.56 | | | $ | 3.41 | | | $ | — | | | $ | — | | | $ | — | | | $ | — | | | $ | 0.00 | | | $ | — | | | $ | 27.92 | | | | 13.91 | %g | | $ | 19.0 | | | | 1.48 | % | | | 0.90 | % | | | (0.54 | %) | | | 284 | % | |
8/31/2013 | | $ | 19.71 | | | $ | (0.09 | ) | | $ | 4.89 | | | $ | 4.80 | | | $ | — | | | $ | — | | | $ | — | | | $ | — | | | $ | — | | | $ | — | | | $ | 24.51 | | | | 24.35 | % | | $ | 14.9 | | | | 1.41 | % | | | 0.90 | % | | | (0.41 | %) | | | 249 | % | |
8/31/2012 | | $ | 17.88 | | | $ | (0.11 | ) | | $ | 1.94 | | | $ | 1.83 | | | $ | — | | | $ | — | | | $ | — | | | $ | — | | | $ | — | | | $ | — | | | $ | 19.71 | | | | 10.23 | % | | $ | 33.3 | | | | 1.33 | % | | | 0.90 | % | | | (0.58 | %) | | | 294 | % | |
8/31/2011 | | $ | 13.75 | | | $ | (0.11 | ) | | $ | 4.24 | | | $ | 4.13 | | | $ | — | | | $ | — | | | $ | — | | | $ | — | | | $ | — | | | $ | — | | | $ | 17.88 | | | | 30.04 | % | | $ | 103.0 | | | | 1.26 | % | | | 0.90 | % | | | (0.63 | %) | | | 185 | % | |
Class A | |
8/31/2015 | | $ | 29.92 | | | $ | (0.33 | ) | | $ | 2.56 | | | $ | 2.23 | | | $ | — | | | $ | — | | | $ | — | | | $ | — | | | $ | — | | | $ | — | | | $ | 32.15 | | | | 7.45 | % | | $ | 5.1 | | | | 1.83 | % | | | 1.26 | % | | | (1.01 | %) | | | 336 | % | |
8/31/2014 | | $ | 26.36 | | | $ | (0.28 | ) | | $ | 3.84 | | | $ | 3.56 | | | $ | — | | | $ | — | | | $ | — | | | $ | — | | | $ | 0.00 | | | $ | — | | | $ | 29.92 | | | | 13.51 | %g | | $ | 4.4 | | | | 1.81 | % | | | 1.26 | % | | | (0.96 | %) | | | 284 | % | |
8/31/2013 | | $ | 21.27 | | | $ | (0.19 | ) | | $ | 5.28 | | | $ | 5.09 | | | $ | — | | | $ | — | | | $ | — | | | $ | — | | | $ | — | | | $ | — | | | $ | 26.36 | | | | 23.93 | % | | $ | 2.4 | | | | 1.83 | % | | | 1.26 | % | | | (0.81 | %) | | | 249 | % | |
8/31/2012 | | $ | 19.36 | | | $ | (0.19 | ) | | $ | 2.10 | | | $ | 1.91 | | | $ | — | | | $ | — | | | $ | — | | | $ | — | | | $ | — | | | $ | — | | | $ | 21.27 | | | | 9.87 | % | | $ | 1.1 | | | | 1.79 | % | | | 1.26 | % | | | (0.98 | %) | | | 294 | % | |
8/31/2011 | | $ | 14.95 | | | $ | (0.20 | ) | | $ | 4.61 | | | $ | 4.41 | | | $ | — | | | $ | — | | | $ | — | | | $ | — | | | $ | — | | | $ | — | | | $ | 19.36 | | | | 29.50 | % | | $ | 1.2 | | | | 1.78 | % | | | 1.26 | % | | | (1.01 | %) | | | 185 | % | |
Class C | |
8/31/2015 | | $ | 19.16 | | | $ | (0.36 | ) | | $ | 1.64 | | | $ | 1.28 | | | $ | — | | | $ | — | | | $ | — | | | $ | — | | | $ | — | | | $ | — | | | $ | 20.44 | | | | 6.68 | % | | $ | 2.3 | | | | 2.58 | % | | | 2.01 | % | | | (1.76 | %) | | | 336 | % | |
8/31/2014 | | $ | 17.01 | | | $ | (0.32 | ) | | $ | 2.47 | | | $ | 2.15 | | | $ | — | | | $ | — | | | $ | — | | | $ | — | | | $ | 0.00 | | | $ | — | | | $ | 19.16 | | | | 12.64 | %g | | $ | 1.8 | | | | 2.57 | % | | | 2.01 | % | | | (1.68 | %) | | | 284 | % | |
8/31/2013 | | $ | 13.83 | | | $ | (0.24 | ) | | $ | 3.42 | | | $ | 3.18 | | | $ | — | | | $ | — | | | $ | — | | | $ | — | | | $ | — | | | $ | — | | | $ | 17.01 | | | | 22.99 | % | | $ | 1.1 | | | | 2.56 | % | | | 2.01 | % | | | (1.58 | %) | | | 249 | % | |
8/31/2012 | | $ | 12.69 | | | $ | (0.23 | ) | | $ | 1.37 | | | $ | 1.14 | | | $ | — | | | $ | — | | | $ | — | | | $ | — | | | $ | — | | | $ | — | | | $ | 13.83 | | | | 8.98 | % | | $ | 0.7 | | | | 2.57 | % | | | 2.01 | % | | | (1.73 | %) | | | 294 | % | |
8/31/2011 | | $ | 9.87 | | | $ | (0.22 | ) | | $ | 3.04 | | | $ | 2.82 | | | $ | — | | | $ | — | | | $ | — | | | $ | — | | | $ | — | | | $ | — | | | $ | 12.69 | | | | 28.57 | % | | $ | 0.3 | | | | 2.52 | % | | | 2.01 | % | | | (1.72 | %) | | | 185 | % | |
Class R3 | |
8/31/2015 | | $ | 19.67 | | | $ | (0.27 | ) | | $ | 1.69 | | | $ | 1.42 | | | $ | — | | | $ | — | | | $ | — | | | $ | — | | | $ | — | | | $ | — | | | $ | 21.09 | | | | 7.22 | % | | $ | 1.0 | | | | 2.15 | % | | | 1.51 | % | | | (1.25 | %) | | | 336 | % | |
8/31/2014 | | $ | 17.37 | | | $ | (0.22 | ) | | $ | 2.52 | | | $ | 2.30 | | | $ | — | | | $ | — | | | $ | — | | | $ | — | | | $ | 0.00 | | | $ | — | | | $ | 19.67 | | | | 13.24 | %g | | $ | 0.5 | | | | 2.16 | % | | | 1.51 | % | | | (1.15 | %) | | | 284 | % | |
8/31/2013 | | $ | 14.06 | | | $ | (0.16 | ) | | $ | 3.47 | | | $ | 3.31 | | | $ | — | | | $ | — | | | $ | — | | | $ | — | | | $ | — | | | $ | — | | | $ | 17.37 | | | | 23.54 | % | | $ | 0.4 | | | | 2.15 | % | | | 1.51 | % | | | (1.08 | %) | | | 249 | % | |
8/31/2012 | | $ | 12.83 | | | $ | (0.17 | ) | | $ | 1.40 | | | $ | 1.23 | | | $ | — | | | $ | — | | | $ | — | | | $ | — | | | $ | — | | | $ | — | | | $ | 14.06 | | | | 9.59 | % | | $ | 0.2 | | | | 2.12 | % | | | 1.51 | % | | | (1.23 | %) | | | 294 | % | |
8/31/2011 | | $ | 9.93 | | | $ | (0.16 | ) | | $ | 3.06 | | | $ | 2.90 | | | $ | — | | | $ | — | | | $ | — | | | $ | — | | | $ | — | | | $ | — | | | $ | 12.83 | | | | 29.20 | % | | $ | 0.1 | | | | 2.05 | % | | | 1.51 | % | | | (1.24 | %) | | | 185 | % | |
Socially Responsive Fund | |
Investor Class | |
8/31/2015 | | $ | 36.94 | | | $ | 0.27 | | | $ | (0.12 | ) | | $ | 0.15 | | | $ | (0.26 | ) | | $ | (3.60 | ) | | $ | — | | | $ | (3.86 | ) | | $ | — | | | $ | — | | | $ | 33.23 | | | | 0.29 | % | | $ | 758.0 | | | | 0.85 | % | | | 0.85 | % | | | 0.76 | % | | | 28 | % | |
8/31/2014 | | $ | 32.66 | | | $ | 0.31 | | | $ | 6.48 | | | $ | 6.79 | | | $ | (0.30 | ) | | $ | (2.21 | ) | | $ | — | | | $ | (2.51 | ) | | $ | 0.00 | | | $ | — | | | $ | 36.94 | | | | 21.54 | %g | | $ | 821.1 | | | | 0.86 | % | | | 0.86 | % | | | 0.87 | % | | | 36 | % | |
8/31/2013 | | $ | 26.48 | | | $ | 0.27 | | | $ | 6.09 | | | $ | 6.36 | | | $ | (0.18 | ) | | $ | — | | | $ | — | | | $ | (0.18 | ) | | $ | — | | | $ | — | | | $ | 32.66 | | | | 24.18 | % | | $ | 825.2 | | | | 0.87 | % | | | 0.87 | % | | | 0.91 | % | | | 35 | % | |
8/31/2012 | | $ | 24.61 | | | $ | 0.22 | | | $ | 1.77 | | | $ | 1.99 | | | $ | (0.12 | ) | | $ | — | | | $ | — | | | $ | (0.12 | ) | | $ | — | | | $ | — | | | $ | 26.48 | | | | 8.13 | % | | $ | 724.3 | | | | 0.89 | % | | | 0.89 | % | | | 0.86 | % | | | 28 | % | |
8/31/2011 | | $ | 20.58 | | | $ | 0.18 | | | $ | 3.88 | | | $ | 4.06 | | | $ | (0.03 | ) | | $ | — | | | $ | — | | | $ | (0.03 | ) | | $ | — | | | $ | — | | | $ | 24.61 | | | | 19.74 | % | | $ | 648.1 | | | | 0.90 | % | | | 0.90 | % | | | 0.69 | % | | | 20 | % | |
See Notes to Financial Highlights
Financial Highlights (cont'd)
| | | Net Asset
Value,
Beginning
of Year | | Net
Investment
Income (Loss)@ | | Net Gains or
Losses on
Securities
(both realized
and
unrealized) | | Total From
Investment
Operations | | Dividends
from Net
Investment
Income | | Distributions
from Net
Realized
Capital Gains | | Tax
Return of
Capital | | Total
Distributions | | Voluntary
Contributions
from
Management | | Redemption
Feesøø | | Net
Asset
Value,
End of
Year | | Total Return†d | | Net Assets,
End of
Year
(in millions) | | Ratio of
Gross
Expenses
to Average
Net Assets# | | Ratio
of Net
Expenses
to Average
Net Assets‡ | | Ratio of Net
Investment
Income/
(Loss) to
Average Net
Assets | | Portfolio
Turnover
Rate | |
Socially Responsive Fund (cont'd) | |
Trust Class | |
8/31/2015 | | $ | 24.24 | | | $ | 0.13 | | | $ | (0.06 | ) | | $ | 0.07 | | | $ | (0.24 | ) | | $ | (3.60 | ) | | $ | — | | | $ | (3.84 | ) | | $ | — | | | $ | — | | | $ | 20.47 | | | | 0.12 | % | | $ | 318.3 | | | | 1.03 | % | | | 1.03 | % | | | 0.58 | % | | | 28 | % | |
8/31/2014 | | $ | 22.20 | | | $ | 0.16 | | | $ | 4.34 | | | $ | 4.50 | | | $ | (0.25 | ) | | $ | (2.21 | ) | | $ | — | | | $ | (2.46 | ) | | $ | 0.00 | | | $ | — | | | $ | 24.24 | | | | 21.32 | %g | | $ | 418.4 | | | | 1.03 | % | | | 1.03 | % | | | 0.70 | % | | | 36 | % | |
8/31/2013 | | $ | 18.07 | | | $ | 0.15 | | | $ | 4.14 | | | $ | 4.29 | | | $ | (0.16 | ) | | $ | — | | | $ | — | | | $ | (0.16 | ) | | $ | — | | | $ | — | | | $ | 22.20 | | | | 23.95 | % | | $ | 431.3 | | | | 1.04 | % | | | 1.04 | % | | | 0.76 | % | | | 35 | % | |
8/31/2012 | | $ | 16.85 | | | $ | 0.11 | | | $ | 1.21 | | | $ | 1.32 | | | $ | (0.10 | ) | | $ | — | | | $ | — | | | $ | (0.10 | ) | | $ | — | | | $ | — | | | $ | 18.07 | | | | 7.93 | % | | $ | 488.5 | | | | 1.06 | % | | | 1.06 | % | | | 0.66 | % | | | 28 | % | |
8/31/2011 | | $ | 14.11 | | | $ | 0.09 | | | $ | 2.68 | | | $ | 2.77 | | | $ | (0.03 | ) | | $ | — | | | $ | — | | | $ | (0.03 | ) | | $ | — | | | $ | — | | | $ | 16.85 | | | | 19.60 | % | | $ | 484.7 | | | | 1.08 | % | | | 1.08 | % | | | 0.50 | % | | | 20 | % | |
Institutional Class | |
8/31/2015 | | $ | 37.00 | | | $ | 0.33 | | | $ | (0.12 | ) | | $ | 0.21 | | | $ | (0.33 | ) | | $ | (3.60 | ) | | $ | — | | | $ | (3.93 | ) | | $ | — | | | $ | — | | | $ | 33.28 | | | | 0.46 | % | | $ | 714.8 | | | | 0.67 | % | | | 0.67 | % | | | 0.94 | % | | | 28 | % | |
8/31/2014 | | $ | 32.70 | | | $ | 0.37 | | | $ | 6.49 | | | $ | 6.86 | | | $ | (0.35 | ) | | $ | (2.21 | ) | | $ | — | | | $ | (2.56 | ) | | $ | 0.00 | | | $ | — | | | $ | 37.00 | | | | 21.76 | %g | | $ | 706.5 | | | | 0.68 | % | | | 0.68 | % | | | 1.06 | % | | | 36 | % | |
8/31/2013 | | $ | 26.51 | | | $ | 0.33 | | | $ | 6.09 | | | $ | 6.42 | | | $ | (0.23 | ) | | $ | — | | | $ | — | | | $ | (0.23 | ) | | $ | — | | | $ | — | | | $ | 32.70 | | | | 24.41 | % | | $ | 557.7 | | | | 0.69 | % | | | 0.69 | % | | | 1.10 | % | | | 35 | % | |
8/31/2012 | | $ | 24.64 | | | $ | 0.26 | | | $ | 1.77 | | | $ | 2.03 | | | $ | (0.16 | ) | | $ | — | | | $ | — | | | $ | (0.16 | ) | | $ | — | | | $ | — | | | $ | 26.51 | | | | 8.32 | % | | $ | 512.4 | | | | 0.71 | % | | | 0.71 | % | | | 1.02 | % | | | 28 | % | |
8/31/2011 | | $ | 20.60 | | | $ | 0.21 | | | $ | 3.91 | | | $ | 4.12 | | | $ | (0.08 | ) | | $ | — | | | $ | — | | | $ | (0.08 | ) | | $ | — | | | $ | — | | | $ | 24.64 | | | | 19.98 | % | | $ | 417.7 | | | | 0.74 | % | | | 0.74 | %§ | | | 0.82 | % | | | 20 | % | |
Class A | |
8/31/2015 | | $ | 24.06 | | | $ | 0.13 | | | $ | (0.06 | ) | | $ | 0.07 | | | $ | (0.25 | ) | | $ | (3.60 | ) | | $ | — | | | $ | (3.85 | ) | | $ | — | | | $ | — | | | $ | 20.28 | | | | 0.11 | % | | $ | 140.9 | | | | 1.05 | % | | | 1.05 | % | | | 0.57 | % | | | 28 | % | |
8/31/2014 | | $ | 22.05 | | | $ | 0.16 | | | $ | 4.30 | | | $ | 4.46 | | | $ | (0.24 | ) | | $ | (2.21 | ) | | $ | — | | | $ | (2.45 | ) | | $ | 0.00 | | | $ | — | | | $ | 24.06 | | | | 21.28 | %g | | $ | 134.0 | | | | 1.05 | % | | | 1.05 | % | | | 0.68 | % | | | 36 | % | |
8/31/2013 | | $ | 17.95 | | | $ | 0.14 | | | $ | 4.12 | | | $ | 4.26 | | | $ | (0.16 | ) | | $ | — | | | $ | — | | | $ | (0.16 | ) | | $ | — | | | $ | — | | | $ | 22.05 | | | | 23.89 | % | | $ | 109.6 | | | | 1.09 | % | | | 1.09 | %§ | | | 0.67 | % | | | 35 | % | |
8/31/2012 | | $ | 16.77 | | | $ | 0.10 | | | $ | 1.21 | | | $ | 1.31 | | | $ | (0.13 | ) | | $ | — | | | $ | — | | | $ | (0.13 | ) | | $ | — | | | $ | — | | | $ | 17.95 | | | | 7.89 | % | | $ | 83.1 | | | | 1.11 | % | | | 1.11 | %§ | | | 0.61 | % | | | 28 | % | |
8/31/2011 | | $ | 14.08 | | | $ | 0.07 | | | $ | 2.68 | | | $ | 2.75 | | | $ | (0.06 | ) | | $ | — | | | $ | — | | | $ | (0.06 | ) | | $ | — | | | $ | — | | | $ | 16.77 | | | | 19.54 | % | | $ | 75.9 | | | | 1.14 | % | | | 1.11 | % | | | 0.42 | % | | | 20 | % | |
Class C | |
8/31/2015 | | $ | 23.57 | | | $ | (0.04 | ) | | $ | (0.05 | ) | | $ | (0.09 | ) | | $ | (0.14 | ) | | $ | (3.60 | ) | | $ | — | | | $ | (3.74 | ) | | $ | — | | | $ | — | | | $ | 19.74 | | | | (0.67 | %) | | $ | 52.2 | | | | 1.79 | % | | | 1.79 | % | | | (0.18 | %) | | | 28 | % | |
8/31/2014 | | $ | 21.63 | | | $ | (0.01 | ) | | $ | 4.22 | | | $ | 4.21 | | | $ | (0.06 | ) | | $ | (2.21 | ) | | $ | — | | | $ | (2.27 | ) | | $ | 0.00 | | | $ | — | | | $ | 23.57 | | | | 20.42 | %g | | $ | 44.5 | | | | 1.80 | % | | | 1.80 | % | | | (0.05 | %) | | | 36 | % | |
8/31/2013 | | $ | 17.64 | | | $ | (0.02 | ) | | $ | 4.06 | | | $ | 4.04 | | | $ | (0.05 | ) | | $ | — | | | $ | — | | | $ | (0.05 | ) | | $ | — | | | $ | — | | | $ | 21.63 | | | | 22.98 | % | | $ | 27.5 | | | | 1.86 | % | | | 1.86 | %§ | | | (0.10 | %) | | | 35 | % | |
8/31/2012 | | $ | 16.52 | | | $ | (0.02 | ) | | $ | 1.19 | | | $ | 1.17 | | | $ | (0.05 | ) | | $ | — | | | $ | — | | | $ | (0.05 | ) | | $ | — | | | $ | — | | | $ | 17.64 | | | | 7.08 | % | | $ | 16.7 | | | | 1.87 | % | | | 1.86 | % | | | (0.12 | %) | | | 28 | % | |
8/31/2011 | | $ | 13.94 | | | $ | (0.06 | ) | | $ | 2.66 | | | $ | 2.60 | | | $ | (0.02 | ) | | $ | — | | | $ | — | | | $ | (0.02 | ) | | $ | — | | | $ | — | | | $ | 16.52 | | | | 18.63 | % | | $ | 12.9 | | | | 1.89 | % | | | 1.86 | % | | | (0.35 | %) | | | 20 | % | |
Class R3 | |
8/31/2015 | | $ | 23.85 | | | $ | 0.07 | | | $ | (0.05 | ) | | $ | 0.02 | | | $ | (0.20 | ) | | $ | (3.60 | ) | | $ | — | | | $ | (3.80 | ) | | $ | — | | | $ | — | | | $ | 20.07 | | | | (0.12 | %) | | $ | 30.4 | | | | 1.29 | % | | | 1.29 | % | | | 0.31 | % | | | 28 | % | |
8/31/2014 | | $ | 21.86 | | | $ | 0.10 | | | $ | 4.27 | | | $ | 4.37 | | | $ | (0.17 | ) | | $ | (2.21 | ) | | $ | — | | | $ | (2.38 | ) | | $ | 0.00 | | | $ | — | | | $ | 23.85 | | | | 21.02 | %g | | $ | 32.2 | | | | 1.29 | % | | | 1.29 | % | | | 0.45 | % | | | 36 | % | |
8/31/2013 | | $ | 17.81 | | | $ | 0.09 | | | $ | 4.09 | | | $ | 4.18 | | | $ | (0.13 | ) | | $ | — | | | $ | — | | | $ | (0.13 | ) | | $ | — | | | $ | — | | | $ | 21.86 | | | | 23.64 | % | | $ | 25.3 | | | | 1.30 | % | | | 1.30 | % | | | 0.46 | % | | | 35 | % | |
8/31/2012 | | $ | 16.68 | | | $ | 0.07 | | | $ | 1.19 | | | $ | 1.26 | | | $ | (0.13 | ) | | $ | — | | | $ | — | | | $ | (0.13 | ) | | $ | — | | | $ | — | | | $ | 17.81 | | | | 7.65 | % | | $ | 17.9 | | | | 1.33 | % | | | 1.33 | %§ | | | 0.43 | % | | | 28 | % | |
8/31/2011 | | $ | 14.05 | | | $ | 0.01 | | | $ | 2.69 | | | $ | 2.70 | | | $ | (0.07 | ) | | $ | — | | | $ | — | | | $ | (0.07 | ) | | $ | — | | | $ | — | | | $ | 16.68 | | | | 19.20 | % | | $ | 9.7 | | | | 1.36 | % | | | 1.36 | %§ | | | 0.08 | % | | | 20 | % | |
See Notes to Financial Highlights
Financial Highlights (cont'd)
| | | Net Asset
Value,
Beginning
of Year | | Net
Investment
Income (Loss)@ | | Net Gains or
Losses on
Securities
(both realized
and
unrealized) | | Total From
Investment
Operations | | Dividends
from Net
Investment
Income | | Distributions
from Net
Realized
Capital Gains | | Tax
Return of
Capital | | Total
Distributions | | Voluntary
Contributions
from
Management | | Redemption
Feesøø | | Net
Asset
Value,
End of
Year | | Total Return†d | | Net Assets,
End of
Year
(in millions) | | Ratio of
Gross
Expenses
to Average
Net Assets# | | Ratio
of Net
Expenses
to Average
Net Assets‡ | | Ratio of Net
Investment
Income/
(Loss) to
Average Net
Assets | | Portfolio
Turnover
Rate | |
Socially Responsive Fund (cont'd) | |
Class R6 | |
8/31/2015 | | $ | 37.03 | | | $ | 0.36 | | | $ | (0.14 | ) | | $ | 0.22 | | | $ | (0.35 | ) | | $ | (3.60 | ) | | $ | — | | | $ | (3.95 | ) | | $ | — | | | $ | — | | | $ | 33.30 | | | | 0.51 | % | | $ | 222.4 | | | | 0.60 | % | | | 0.60 | % | | | 1.02 | % | | | 28 | % | |
8/31/2014 | | $ | 32.71 | | | $ | 0.39 | | | $ | 6.51 | | | $ | 6.90 | | | $ | (0.37 | ) | | $ | (2.21 | ) | | $ | — | | | $ | (2.58 | ) | | $ | 0.00 | | | $ | — | | | $ | 37.03 | | | | 21.88 | %g | | $ | 279.6 | | | | 0.60 | % | | | 0.60 | % | | | 1.11 | % | | | 36 | % | |
Period from 3/15/2013^
to 8/31/2013 | | $ | 31.16 | | | $ | 0.14 | | | $ | 1.41 | | | $ | 1.55 | | | $ | — | | | $ | — | | | $ | — | | | $ | — | | | $ | — | | | $ | — | | | $ | 32.71 | | | | 4.97 | %** | | $ | 249.6 | | | | 0.62 | %* | | | 0.62 | %* | | | 0.94 | %* | | | 35 | %Ø | |
Value Fund | |
Institutional Class | |
8/31/2015 | | $ | 16.51 | | | $ | 0.19 | | | $ | (1.35 | ) | | $ | (1.16 | ) | | $ | (0.15 | ) | | $ | (0.85 | ) | | $ | — | | | $ | (1.00 | ) | | $ | — | | | $ | — | | | $ | 14.35 | | | | (7.42 | %) | | $ | 13.1 | | | | 1.82 | % | | | 0.70 | % | | | 1.24 | % | | | 166 | % | |
8/31/2014 | | $ | 13.52 | | | $ | 0.17 | | | $ | 2.92 | | | $ | 3.09 | | | $ | (0.10 | ) | | $ | — | | | $ | — | | | $ | (0.10 | ) | | $ | — | | | $ | — | | | $ | 16.51 | | | | 22.98 | % | | $ | 12.6 | | | | 2.41 | % | | | 0.70 | % | | | 1.12 | % | | | 129 | % | |
8/31/2013 | | $ | 11.18 | | | $ | 0.16 | | | $ | 2.40 | | | $ | 2.56 | | | $ | (0.22 | ) | | $ | — | | | $ | — | | | $ | (0.22 | ) | | $ | — | | | $ | — | | | $ | 13.52 | | | | 23.23 | % | | $ | 6.9 | | | | 5.93 | % | | | 0.71 | % | | | 1.25 | % | | | 250 | % | |
8/31/2012 | | $ | 9.95 | | | $ | 0.15 | | | $ | 1.16 | | | $ | 1.31 | | | $ | (0.08 | ) | | $ | — | | | $ | — | | | $ | (0.08 | ) | | $ | — | | | $ | — | | | $ | 11.18 | | | | 13.25 | % | | $ | 2.7 | | | | 9.42 | % | | | 0.73 | % | | | 1.46 | % | | | 200 | % | |
8/31/2011 | | $ | 8.30 | | | $ | 0.13 | | | $ | 1.60 | | | $ | 1.73 | | | $ | (0.08 | ) | | $ | — | | | $ | — | | | $ | (0.08 | ) | | $ | — | | | $ | — | | | $ | 9.95 | | | | 20.87 | % | | $ | 2.6 | | | | 18.35 | % | | | 0.75 | %c | | | 1.28 | % | | | 191 | % | |
Class A | |
8/31/2015 | | $ | 16.40 | | | $ | 0.13 | | | $ | (1.33 | ) | | $ | (1.20 | ) | | $ | (0.10 | ) | | $ | (0.85 | ) | | $ | — | | | $ | (0.95 | ) | | $ | — | | | $ | — | | | $ | 14.25 | | | | (7.71 | %) | | $ | 7.3 | | | | 2.21 | % | | | 1.08 | % | | | 0.84 | % | | | 166 | % | |
8/31/2014 | | $ | 13.44 | | | $ | 0.11 | | | $ | 2.90 | | | $ | 3.01 | | | $ | (0.05 | ) | | $ | — | | | $ | — | | | $ | (0.05 | ) | | $ | — | | | $ | — | | | $ | 16.40 | | | | 22.43 | % | | $ | 8.0 | | | | 2.80 | % | | | 1.10 | % | | | 0.74 | % | | | 129 | % | |
8/31/2013 | | $ | 11.13 | | | $ | 0.10 | | | $ | 2.40 | | | $ | 2.50 | | | $ | (0.19 | ) | | $ | — | | | $ | — | | | $ | (0.19 | ) | | $ | — | | | $ | — | | | $ | 13.44 | | | | 22.72 | % | | $ | 3.7 | | | | 6.81 | % | | | 1.11 | % | | | 0.82 | % | | | 250 | % | |
8/31/2012 | | $ | 9.93 | | | $ | 0.12 | | | $ | 1.15 | | | $ | 1.27 | | | $ | (0.07 | ) | | $ | — | | | $ | — | | | $ | (0.07 | ) | | $ | — | | | $ | — | | | $ | 11.13 | | | | 12.89 | % | | $ | 1.6 | | | | 9.88 | % | | | 1.08 | % | | | 1.08 | % | | | 200 | % | |
Period from 3/2/2011^
to 8/31/2011 | | $ | 10.28 | | | $ | 0.06 | | | $ | (0.41 | ) | | $ | (0.35 | ) | | $ | — | | | $ | — | | | $ | — | | | $ | — | | | $ | — | | | $ | — | | | $ | 9.93 | | | | (3.40 | %)** | | $ | 0.3 | | | | 17.08 | %* | | | 1.12 | %* | | | 1.22 | %* | | | 191 | %Ø | |
Class C | |
8/31/2015 | | $ | 16.18 | | | $ | 0.01 | | | $ | (1.32 | ) | | $ | (1.31 | ) | | $ | (0.00 | ) | | $ | (0.85 | ) | | $ | — | | | $ | (0.85 | ) | | $ | — | | | $ | — | | | $ | 14.02 | | | | (8.44 | %) | | $ | 0.5 | | | | 2.98 | % | | | 1.83 | % | | | 0.07 | % | | | 166 | % | |
8/31/2014 | | $ | 13.31 | | | $ | (0.01 | ) | | $ | 2.88 | | | $ | 2.87 | | | $ | — | | | $ | — | | | $ | — | | | $ | — | | | $ | — | | | $ | — | | | $ | 16.18 | | | | 21.56 | % | | $ | 0.6 | | | | 3.57 | % | | | 1.86 | % | | | (0.05 | %) | | | 129 | % | |
8/31/2013 | | $ | 11.05 | | | $ | 0.00 | | | $ | 2.39 | | | $ | 2.39 | | | $ | (0.13 | ) | | $ | — | | | $ | — | | | $ | (0.13 | ) | | $ | — | | | $ | — | | | $ | 13.31 | | | | 21.82 | % | | $ | 0.3 | | | | 7.31 | % | | | 1.87 | % | | | 0.01 | % | | | 250 | % | |
8/31/2012 | | $ | 9.89 | | | $ | 0.03 | | | $ | 1.16 | | | $ | 1.19 | | | $ | (0.03 | ) | | $ | — | | | $ | — | | | $ | (0.03 | ) | | $ | — | | | $ | — | | | $ | 11.05 | | | | 12.07 | % | | $ | 0.1 | | | | 10.74 | % | | | 1.87 | % | | | 0.30 | % | | | 200 | % | |
Period from 3/2/2011^
to 8/31/2011 | | $ | 10.28 | | | $ | 0.01 | | | $ | (0.40 | ) | | $ | (0.39 | ) | | $ | — | | | $ | — | | | $ | — | | | $ | — | | | $ | — | | | $ | — | | | $ | 9.89 | | | | (3.79 | %)** | | $ | 0.0 | | | | 26.31 | %* | | | 1.86 | %* | | | 0.26 | %* | | | 191 | %Ø | |
World Equity Fund | |
Institutional Class | |
Period from 6/30/2015^
to 8/31/2015 | | $ | 10.00 | | | $ | (0.00 | ) | | $ | (0.47 | ) | | $ | (0.47 | ) | | $ | — | | | $ | — | | | $ | — | | | $ | — | | | $ | — | | | $ | — | | | $ | 9.53 | | | | (4.70 | %)** | | $ | 3.8 | | | | 10.33 | %b* | | | 1.00 | %b* | | | (0.14 | %)b* | | | 39 | %** | |
Class A | |
Period from 6/30/2015^
to 8/31/2015 | | $ | 10.00 | | | $ | (0.01 | ) | | $ | (0.47 | ) | | $ | (0.48 | ) | | $ | — | | | $ | — | | | $ | — | | | $ | — | | | $ | — | | | $ | — | | | $ | 9.52 | | | | (4.80 | %)** | | $ | 0.5 | | | | 12.25 | %b* | | | 1.36 | %b* | | | (0.50 | %)b* | | | 39 | %** | |
See Notes to Financial Highlights
Financial Highlights (cont'd)
| | | Net Asset
Value,
Beginning
of Year | | Net
Investment
Income (Loss)@ | | Net Gains or
Losses on
Securities
(both realized
and
unrealized) | | Total From
Investment
Operations | | Dividends
from Net
Investment
Income | | Distributions
from Net
Realized
Capital Gains | | Tax
Return of
Capital | | Total
Distributions | | Voluntary
Contributions
from
Management | | Redemption
Feesøø | | Net
Asset
Value,
End of
Year | | Total Return†d | | Net Assets,
End of
Year
(in millions) | | Ratio of
Gross
Expenses
to Average
Net Assets# | | Ratio
of Net
Expenses
to Average
Net Assets‡ | | Ratio of Net
Investment
Income/
(Loss) to
Average Net
Assets | | Portfolio
Turnover
Rate | |
World Equity Fund (cont'd) | |
Class C | |
Period from 6/30/2015^
to 8/31/2015 | | $ | 10.00 | | | $ | (0.02 | ) | | $ | (0.47 | ) | | $ | (0.49 | ) | | $ | — | | | $ | — | | | $ | — | | | $ | — | | | $ | — | | | $ | — | | | $ | 9.51 | | | | (4.90 | %)** | | $ | 0.5 | | | | 12.92 | %b* | | | 2.11 | %b* | | | (1.26 | %)b* | | | 39 | %** | |
See Notes to Financial Highlights
Notes to Financial Highlights Equity Funds
| † | Total return based on per share NAV reflects the effects of changes in NAV on the performance of each Fund during each fiscal period. Returns assume income dividends and other distributions, if any, were reinvested but do not reflect the effect of sales charges. Results represent past performance and do not indicate future results. Current returns may be lower or higher than the performance data quoted. Investment returns and principal may fluctuate and shares when redeemed may be worth more or less than original cost. Total return would have been lower if Management had not reimbursed and/or waived certain expenses. Total return would have been higher if Management had not recouped previously reimbursed and/or waived expenses. |
| |
| d | Except for the Fund classes listed below, the class action proceeds listed in Note A-4 of the Notes to Financial Statements, if any, had no impact on the Funds' total returns for the year ended August 31, 2015. Had the Fund classes listed below not received class action proceeds in 2015, total return based on per share NAV for the year ended August 31, 2015 would have been: |
| |
Large Cap Value Fund Investor Class | | | (7.26 | )% | |
Large Cap Value Fund Trust Class | | | (7.45 | )% | |
Large Cap Value Fund Institutional Class | | | (7.09 | )% | |
Large Cap Value Fund Class A | | | (7.49 | )% | |
Large Cap Value Fund Class R3 | | | (7.71 | )% | |
Small Cap Growth Fund Investor Class | | | 7.07 | % | |
Small Cap Growth Fund Trust Class | | | 6.86 | % | |
Small Cap Growth Fund Advisor Class | | | 6.72 | % | |
Small Cap Growth Fund Institutional Class | | | 7.41 | % | |
Small Cap Growth Fund Class A | | | 7.05 | % | |
Small Cap Growth Fund Class C | | | 6.37 | % | |
Small Cap Growth Fund Class R3 | | | 6.81 | % | |
Except for the Fund classes listed below, the class action proceeds received in 2014, 2013 and 2012, if any, had no impact on the Funds' total returns for the years ended August 31, 2014, 2013 and 2012. Had the Fund classes listed below not received class action proceeds in 2014, 2013 and/or 2012, total return based on per share NAV for the years ended August 31, 2014, 2013 and/or 2012 would have been:
| | Year Ended August 31, | |
| | 2014 | | 2013 | | 2012 | |
Genesis Fund Investor Class | | | 13.62 | % | | | — | | | | — | | |
Genesis Fund Trust Class | | | 13.51 | % | | | — | | | | — | | |
Genesis Fund Advisor Class | | | 13.21 | % | | | — | | | | — | | |
Genesis Fund Institutional Class | | | 13.78 | % | | | — | | | | — | | |
Genesis Fund Class R6 | | | 13.90 | % | | | — | | | | — | | |
Large Cap Value Fund Investor Class | | | — | | | | 23.93 | % | | | — | | |
Large Cap Value Fund Trust Class | | | — | | | | 23.61 | % | | | — | | |
Large Cap Value Fund Advisor Class | | | — | | | | 23.46 | % | | | — | | |
Large Cap Value Fund Institutional Class | | | — | | | | 24.11 | % | | | — | | |
Large Cap Value Fund Class A | | | — | | | | 23.57 | % | | | — | | |
Large Cap Value Fund Class R3 | | | — | | | | 23.41 | % | | | — | | |
Mid Cap Intrinsic Value Fund Investor Class | | | 22.79 | % | | | — | | | | 12.48 | % | |
Mid Cap Intrinsic Value Fund Trust Class | | | 22.41 | % | | | — | | | | 12.34 | % | |
Mid Cap Intrinsic Value Fund Institutional Class | | | — | | | | — | | | | 12.86 | % | |
Mid Cap Intrinsic Value Fund Class R3 | | | 22.17 | % | | | — | | | | 12.16 | % | |
Notes to Financial Highlights Equity Funds (cont'd)
| | Year Ended August 31, | |
| | 2014 | | 2013 | | 2012 | |
Small Cap Growth Fund Investor Class | | | — | | | | 23.81 | % | | | — | | |
Small Cap Growth Fund Trust Class | | | — | | | | 23.45 | % | | | — | | |
Small Cap Growth Fund Advisor Class | | | — | | | | 23.31 | % | | | — | | |
Small Cap Growth Fund Institutional Class | | | — | | | | 24.05 | % | | | — | | |
Small Cap Growth Fund Class A | | | — | | | | 23.84 | % | | | — | | |
Small Cap Growth Fund Class C | | | — | | | | 22.92 | % | | | — | | |
Small Cap Growth Fund Class R3 | | | — | | | | 23.47 | % | | | — | | |
# Represents the annualized ratios of net expenses to average daily net assets if Management had not reimbursed certain expenses and/or waived a portion of the investment management fee.
‡ Prior to January 1, 2013, each Fund had an expense offset arrangement in connection with its custodian contract. The impact of expense reductions related to expense offset arrangements, if any, was less than 0.01%.
^^ After utilization of the Line of Credit by Greater China Equity (2015) and Multi-Cap Opportunities (2011) and/or reimbursement of expenses and/or waiver of a portion of the investment management fee by Management. The Funds are required to calculate an expense ratio without taking into consideration any expense reductions related to expense offset arrangements. Had Greater China Equity and Multi-Cap Opportunities not received expense reductions related to expense offset arrangements, and had Greater China Equity and Multi-Cap Opportunities not utilized the Line of Credit or had Management not undertaken such action, the annualized ratios of net expenses to average daily net assets would have been:
| | Year Ended August 31, | |
| | | 2015 | | 2011 | |
Greater China Equity Fund Institutional Class | | | 1.50 | % | | | — | | |
Greater China Equity Fund Class A | | | 1.86 | % | | | — | | |
Greater China Equity Fund Class C | | | 2.61 | % | | | — | | |
Multi-Cap Opportunities Fund Institutional Class | | | — | | | | 1.01 | % | |
Multi-Cap Opportunities Fund Class A | | | — | | | | 1.37 | % | |
Multi-Cap Opportunities Fund Class C | | | — | | | | 2.12 | % | |
§ After repayment of expenses previously reimbursed and/or fees previously waived by Management, as applicable. Had the Fund not made such repayments, the annualized ratios of net expenses to average daily net assets would have been:
| | | Year Ended August 31, | |
| | | 2015 | | 2014 | | 2013 | | 2012 | | 2011 | |
Equity Income Fund Institutional Class | | | — | | | | — | | | | — | | | | .70 | % | | | .76 | % | |
Equity Income Fund Class A | | | — | | | | — | | | | — | | | | 1.07 | % | | | 1.16 | % | |
Equity Income Fund Class C | | | — | | | | — | | | | — | | | | 1.82 | % | | | 1.90 | % | |
Equity Income Fund Class R3 | | | — | | | | 1.32 | % | | | 1.31 | % | | | 1.35 | % | | | — | | |
Genesis Fund Institutional Class | | | — | | | | .85 | % | | | — | | | | — | | | | — | | |
Genesis Fund Class R6 | | | — | | | | .78 | % | | | — | | | | — | | | | — | | |
Guardian Fund Advisor Class | | | — | | | | — | | | | 1.30 | % | | | 1.33 | % | | | 1.35 | % | |
Guardian Fund Institutional Class | | | — | | | | — | | | | — | | | | .74 | % | | | .74 | % | |
Guardian Fund Class A | | | — | | | | 1.08 | % | | | 1.10 | % | | | — | | | | — | | |
Guardian Fund Class C | | | — | | | | 1.84 | % | | | — | | | | — | | | | — | | |
International Equity Fund Institutional Class | | | .83 | % | | | — | | | | — | | | | — | | | | — | | |
Notes to Financial Highlights Equity Funds (cont'd)
| | | Year Ended August 31, | |
| | | 2015 | | 2014 | | 2013 | | 2012 | | 2011 | |
International Equity Fund Class A | | | 1.20 | % | | | — | | | | — | | | | — | | | | — | | |
International Equity Fund Class R6 | | | .76 | % | | | — | | | | — | | | | — | | | | — | | |
Large Cap Disciplined Growth Fund Investor Class | | | — | | | | — | | | | 1.05 | % | | | 1.03 | % | | | 1.08 | % | |
Large Cap Value Fund Institutional Class | | | .70 | % | | | .70 | % | | | — | | | | — | | | | — | | |
Large Cap Value Fund Class A | | | — | | | | 1.08 | % | | | — | | | | 1.05 | % | | | — | | |
Large Cap Value Fund Class C | | | 1.82 | % | | | 1.82 | % | | | 1.86 | % | | | — | | | | — | | |
Mid Cap Growth Fund Advisor Class | | | — | | | | — | | | | — | | | | 1.31 | % | | | 1.34 | % | |
Mid Cap Growth Fund Institutional Class | | | .73 | % | | | — | | | | — | | | | — | | | | — | | |
Mid Cap Growth Fund Class A | | | 1.10 | % | | | — | | | | — | | | | — | | | | — | | |
Mid Cap Growth Fund Class R6 | | | .67 | % | | | — | | | | — | | | | — | | | | — | | |
Mid Cap Intrinsic Value Fund Trust Class | | | — | | | | 1.23 | % | | | — | | | | — | | | | — | | |
Mid Cap Intrinsic Value Fund Institutional Class | | | — | | | | .82 | % | | | — | | | | — | | | | — | | |
Mid Cap Intrinsic Value Fund Class A | | | — | | | | 1.21 | % | | | — | | | | — | | | | — | | |
Mid Cap Intrinsic Value Fund Class C | | | — | | | | 1.94 | % | | | — | | | | — | | | | — | | |
Multi-Cap Opportunities Fund Institutional Class | | | — | | | | — | | | | .82 | % | | | .93 | % | | | — | | |
Multi-Cap Opportunities Fund Class A | | | — | | | | — | | | | 1.16 | % | | | 1.30 | % | | | — | | |
Multi-Cap Opportunities Fund Class C | | | — | | | | — | | | | 1.92 | % | | | — | | | | — | | |
Socially Responsive Fund Institutional Class | | | — | | | | — | | | | — | | | | — | | | | .72 | % | |
Socially Responsive Fund Class A | | | — | | | | — | | | | 1.08 | % | | | 1.11 | % | | | — | | |
Socially Responsive Fund Class C | | | — | | | | — | | | | 1.83 | % | | | — | | | | — | | |
Socially Responsive Fund Class R3 | | | — | | | | — | | | | — | | | | 1.32 | % | | | 1.35 | % | |
^ The date investment operations commenced.
@ Calculated based on the average number of shares outstanding during each fiscal period.
ØØ Prior to June 1, 2011, redemption fees were charged on Emerging Markets Equity, International Equity, International Select, and Real Estate. Calculated based on the average number of shares outstanding during each fiscal period.
* Annualized.
** Not annualized.
Ø Portfolio turnover is calculated at the Fund level. Percentage indicated was calculated for the year ended August 31, 2011 for Value, for the year ended August 31, 2013 for Emerging Markets Equity, Genesis, International Equity, Mid Cap Growth, Real Estate and Socially Responsive, and for the year ended August 31, 2014 for International Equity.
a On January 25, 2013, International Equity acquired all of the net assets of Neuberger Berman International Fund pursuant to a Plan of Reorganization and Dissolution. Portfolio turnover excludes purchases and sales of securities by International (acquired fund) prior to the merger date.
b Organization expense, which is a non-recurring expense, is included in these ratios on a non-annualized basis.
c This ratio reflects a reduced fee schedule for certain expenses. If this ratio had not been reduced, the ratio would have been higher.
g The voluntary contribution listed in Note B of the Notes to Financial Statements had no impact on the Funds' total returns for the year ended August 31, 2014.
Report of Independent Registered Public Accounting Firm
To the Board of Trustees
Neuberger Berman Equity Funds and
Shareholders of:
Neuberger Berman All Cap Core Fund,
Neuberger Berman Emerging Markets Equity Fund,
Neuberger Berman Equity Income Fund,
Neuberger Berman Focus Fund,
Neuberger Berman Genesis Fund,
Neuberger Berman Global Equity Fund,
Neuberger Berman Global Real Estate Fund,
Neuberger Berman Greater China Equity Fund,
Neuberger Berman Guardian Fund,
Neuberger Berman International Equity Fund,
Neuberger Berman International Select Fund,
Neuberger Berman Large Cap Value Fund,
Neuberger Berman Real Estate Fund,
Neuberger Berman Value Fund,
Neuberger Berman World Equity Fund
We have audited the accompanying statements of assets and liabilities of Neuberger Berman All Cap Core Fund, Neuberger Berman Emerging Markets Equity Fund, Neuberger Berman Equity Income Fund, Neuberger Berman Focus Fund, Neuberger Berman Genesis Fund, Neuberger Berman Global Equity Fund, Neuberger Berman Global Real Estate Fund, Neuberger Berman Greater China Equity Fund, Neuberger Berman Guardian Fund, Neuberger Berman International Equity Fund, Neuberger Berman International Select Fund, Neuberger Berman Large Cap Value Fund, Neuberger Berman Real Estate Fund, Neuberger Berman Value Fund and Neuberger Berman World Equity Fund, fifteen of the series constituting Neuberger Berman Equity Funds (the "Trust"), including the schedules of investments, as of August 31, 2015, and the related statements of operations for the period then ended, the statements of changes in net assets for each of the periods indicated therein and the financial highlights for each of the periods indicated therein. These financial statements and financial highlights are the responsibility of the Trust's management. Our responsibility is to express an opinion on these financial statements and financial highlights based on our audits.
We conducted our audits in accordance with the standards of the Public Company Accounting Oversight Board (United States). Those standards require that we plan and perform the audit to obtain reasonable assurance about whether the financial statements and financial highlights are free of material misstatement. We were not engaged to perform an audit of the Trust's internal control over financial reporting. Our audits included consideration of internal control over financial reporting as a basis for designing audit procedures that are appropriate in the circumstances, but not for the purpose of expressing an opinion on the effectiveness of the Trust's internal control over financial reporting. Accordingly, we express no such opinion. An audit also includes examining, on a test basis, evidence supporting the amounts and disclosures in the financial statements and financial highlights, assessing the accounting principles used and significant estimates made by management, and evaluating the overall financial statement presentation. Our procedures included confirmation of securities owned as of August 31, 2015, by correspondence with the custodian and others or by other appropriate auditing procedures where replies from others were not received. We believe that our audits provide a reasonable basis for our opinion.
In our opinion, the financial statements and financial highlights referred to above present fairly, in all material respects, the financial position of the above-mentioned series of the Neuberger Berman Equity Funds, at August 31, 2015, the results of their operations for the period then ended, the changes in their net assets for each of the periods indicated therein, and the financial highlights for each of the periods indicated therein, in conformity with U.S. generally accepted accounting principles.

Boston, Massachusetts
October 16, 2015
Report of Independent Registered Public Accounting Firm
To the Board of Trustees and Shareholders
Neuberger Berman Equity Funds
We have audited the accompanying statements of assets and liabilities of the Neuberger Berman Intrinsic Value Fund, Neuberger Berman Large Cap Disciplined Growth Fund, Neuberger Berman Mid Cap Growth Fund, Neuberger Berman Mid Cap Intrinsic Value Fund, Neuberger Berman Multi-Cap Opportunities Fund, Neuberger Berman Small Cap Growth Fund, and Neuberger Berman Socially Responsive Fund, each a series of Neuberger Berman Equity Funds (the "Trust"), including the schedules of investments, as of August 31, 2015, and the related statements of operations for the year then ended, the statements of changes in net assets and the financial highlights for the periods indicated therein. These financial statements and financial highlights are the responsibility of the Trust's management. Our responsibility is to express an opinion on these financial statements and financial highlights based on our audits.
We conducted our audits in accordance with the standards of the Public Company Accounting Oversight Board (United States). Those standards require that we plan and perform the audit to obtain reasonable assurance about whether the financial statements and financial highlights are free of material misstatement. The Trust is not required to have, nor were we engaged to perform, an audit of its internal control over financial reporting. Our audits included consideration of internal control over financial reporting as a basis for designing audit procedures that are appropriate in the circumstances, but not for the purpose of expressing an opinion on the effectiveness of the Trust's internal control over financial reporting. Accordingly, we express no such opinion. An audit also includes examining, on a test basis, evidence supporting the amounts and disclosures in the financial statements and financial highlights, assessing the accounting principles used and significant estimates made by management, as well as evaluating the overall financial statement presentation. Our procedures included confirmation of securities owned as of August 31, 2015, by correspondence with the custodian and brokers or by other appropriate auditing procedures where replies from brokers were not received. We believe that our audits provide a reasonable basis for our opinion.
In our opinion, the financial statements and financial highlights referred to above present fairly, in all material respects, the financial position of the above mentioned series of the Trust, as of August 31, 2015, and the results of their operations, the changes in their net assets, and the financial highlights for the periods indicated therein, in conformity with accounting principles generally accepted in the United States of America.

Philadelphia, Pennsylvania
October 15, 2015
Investment Manager, Administrator and Distributor
Neuberger Berman Management LLC
605 Third Avenue, 2nd Floor
New York, NY 10158-0180
800.877.9700 or 212.476.8800
Intermediary Client Services 800.366.6264
Sub-Advisers
Neuberger Berman LLC
605 Third Avenue
New York, NY 10158-3698
Neuberger Berman Asia Limited
Jardine House, 1 Connaught Place
Suites 2010-2020, 20th Floor
Central Hong Kong
Custodian and Shareholder Servicing Agent
State Street Bank and Trust Company
One Lincoln Street
Boston, MA 02111
For Investor Class Shareholders
Address correspondence to:
Neuberger Berman Funds
Boston Service Center
P.O. Box 8403
Boston, MA 02266-8403
800.877.9700 or 212.476.8800
For Class A, Class C, Class R3 and Class R6 Shareholders:
Please contact your investment provider
For Trust Class, Advisor Class and Institutional Class Shareholders
Address correspondence to:
Neuberger Berman Management LLC
605 Third Avenue, Mail Drop 2-7
New York, NY 10158-0180
Attn: Intermediary Client Services
800.366.6264
Legal Counsel
K&L Gates LLP
1601 K Street, NW
Washington, DC 20006-1600
Independent Registered Public Accounting Firms
Ernst & Young LLP
200 Clarendon Street
Boston, MA 02116
Tait, Weller & Baker LLP
1818 Market Street
Suite 2400
Philadelphia, PA 19103
The following tables set forth information concerning the Trustees and Officers of each of the Funds. All persons named as Trustees and Officers also serve in similar capacities for other funds administered or managed by Management and Neuberger. Each Fund's Statement of Additional Information includes additional information about the Trustees as of the time of the Fund's most recent public offering and is available upon request, without charge, by calling (800) 877-9700.
Information about the Board of Trustees
Name, (Year of Birth),
and Address(1) | | Position(s) and Length of
Time Served(2) | | Principal Occupation(s)(3) | | Number of
Funds in
Fund Complex
Overseen by
Fund Trustee | | Other Directorships Held
Outside Fund Complex by
Fund Trustee(3) | |
Independent Trustees | |
Faith Colish (1935) | | Trustee since 1982 | | Counsel, Carter Ledyard & Milburn LLP (law firm) since October 2002; formerly, Attorney-at-Law and President, Faith Colish, A Professional Corporation, 1980 to 2002. | | | 61 | | | Formerly, Director, 1997 to 2003, and Advisory Director, 2003 to 2006, ABA Retirement Funds (formerly, American Bar Retirement Association) (not-for-profit membership corporation). | |
Name, (Year of Birth),
and Address(1) | | Position(s) and Length of
Time Served(2) | | Principal Occupation(s)(3) | | Number of
Funds in
Fund Complex
Overseen by
Fund Trustee | | Other Directorships Held
Outside Fund Complex by
Fund Trustee(3) | |
Martha C. Goss (1949) | | Trustee since 2007 | | President, Woodhill Enterprises Inc./Chase Hollow Associates LLC (personal investment vehicle), since 2006; formerly, Consultant, Resources Global Professionals (temporary staffing), 2002 to 2006. | | | 61 | | | Director, American Water (water utility), since 2003; Director, Allianz Life of New York (insurance), since 2005; Director, Berger Group Holdings, Inc. (engineering consulting firm), since 2013; Director, Financial Women's Association of New York (not-for-profit association), since 2003; Trustee Emerita, Brown University, since 1998; Director, Museum of American Finance (not-for-profit), since 2013; formerly, Non-Executive Chair and Director, Channel Reinsurance (financial guaranty reinsurance), 2006 to 2010; formerly, Director, Ocwen Financial Corporation (mortgage servicing), 2005 to 2010; formerly, Director, Claire's Stores, Inc. (retailer), 2005 to 2007; formerly, Director, Parsons Brinckerhoff Inc. (engineering consulting firm), 2007 to 2010; formerly, Director, Bank Leumi (commercial bank), 2005 to 2007; formerly, Advisory Board Member, Attensity (software developer), 2005 to 2007. | |
Michael M. Knetter (1960) | | Trustee since 2007 | | President and Chief Executive Officer, University of Wisconsin Foundation, since October 2010; formerly, Dean, School of Business, University of Wisconsin—Madison; formerly, Professor of International Economics and Associate Dean, Amos Tuck School of Business—Dartmouth College, 1998 to 2002. | | | 61 | | | Board Member, American Family Insurance (a mutual company, not publicly traded), since March 2009; formerly, Trustee, Northwestern Mutual Series Fund, Inc., 2007 to 2011; formerly, Director, Wausau Paper, 2005 to 2011; formerly, Director, Great Wolf Resorts, 2004 to 2009. | |
Name, (Year of Birth),
and Address(1) | | Position(s) and Length of
Time Served(2) | | Principal Occupation(s)(3) | | Number of
Funds in
Fund Complex
Overseen by
Fund Trustee | | Other Directorships Held
Outside Fund Complex by
Fund Trustee(3) | |
Howard A. Mileaf (1937) | | Trustee since 1984 | | Retired; formerly, Vice President and General Counsel, WHX Corporation (holding company), 1993 to 2001. | | | 61 | | | Formerly, Director, Webfinancial Corporation (holding company), 2002 to 2008; formerly, Director, WHX Corporation (holding company), 2002 to 2005; formerly, Director, State Theatre of New Jersey (not-for-profit theatre), 2000 to 2005. | |
George W. Morriss (1947) | | Trustee since 2007 | | Adjunct Professor, Columbia University School of International and Public Affairs, since October 2012; formerly, Executive Vice President and Chief Financial Officer, People's Bank, Connecticut (a financial services company), 1991 to 2001. | | | 61 | | | Director and Treasurer, National Association of Corporate Directors, Connecticut Chapter, since 2011; Trustee, Steben Alternative Investment Funds, Steben Select Multi-Strategy Fund, and Steben Select Multi-Strategy Master Fund, since 2013; formerly, Manager, Larch Lane Multi-Strategy Fund complex (which consisted of three funds), 2006 to 2011; formerly, Member, NASDAQ Issuers' Affairs Committee, 1995 to 2003. | |
Tom D. Seip (1950) | | Trustee since 2000; Chairman of the Board since 2008; formerly, Lead Independent Trustee from 2006 to 2008 | | General Partner, Ridgefield Farm LLC (a private investment vehicle); formerly, President and CEO, Westaff, Inc. (temporary staffing), May 2001 to January 2002; formerly, Senior Executive, The Charles Schwab Corporation, 1983 to 1998, including Chief Executive Officer, Charles Schwab Investment Management, Inc.; Trustee, Schwab Family of Funds and Schwab Investments, 1997 to 1998; and Executive Vice President-Retail Brokerage, Charles Schwab & Co., Inc., 1994 to 1997. | | | 61 | | | Director, H&R Block, Inc. (financial services company), since May 2001; Chairman, Governance and Nominating Committee, H&R Block, Inc., since 2011; formerly, Chairman, Compensation Committee, H&R Block, Inc., 2006 to 2010; formerly, Director, Forward Management, Inc. (asset management company), 1999 to 2006. | |
Name, (Year of Birth),
and Address(1) | | Position(s) and Length of
Time Served(2) | | Principal Occupation(s)(3) | | Number of
Funds in
Fund Complex
Overseen by
Fund Trustee | | Other Directorships Held
Outside Fund Complex by
Fund Trustee(3) | |
Candace L. Straight (1947) | | Trustee since 2000 | | Private investor and consultant specializing in the insurance industry; formerly, Advisory Director, Securitas Capital LLC (a global private equity investment firm dedicated to making investments in the insurance sector), 1998 to 2003. | | | 61 | | | Public Member, Board of Governors and Board of Trustees, Rutgers University, since 2011; Director, Montpelier Re Holdings Ltd. (reinsurance company), since 2006; formerly, Director, National Atlantic Holdings Corporation (property and casualty insurance company), 2004 to 2008; formerly, Director, The Proformance Insurance Company (property and casualty insurance company), 2004 to 2008; formerly, Director, Providence Washington Insurance Company (property and casualty insurance company), 1998 to 2006; formerly, Director, Summit Global Partners (insurance brokerage firm), 2000 to 2005. | |
Peter P. Trapp (1944) | | Trustee since 2000 | | Retired; formerly, Regional Manager for Mid-Southern Region, Ford Motor Credit Company, September 1997 to 2007; formerly, President, Ford Life Insurance Company, April 1995 to August 1997. | | | 61 | | | None. | |
Name, (Year of Birth),
and Address(1) | | Position(s) and Length of
Time Served(2) | | Principal Occupation(s)(3) | | Number of
Funds in
Fund Complex
Overseen by
Fund Trustee | | Other Directorships Held
Outside Fund Complex by
Fund Trustee(3) | |
Trustees who are "Interested Persons" | |
Joseph V. Amato* (1962) | | Trustee since 2009 | | President and Director, Neuberger Berman Group LLC, since 2009; President and Chief Executive Officer, Neuberger and Neuberger Berman Holdings LLC (including its predecessor, Neuberger Berman Inc.), since 2007; Chief Investment Officer (Equities) and Managing Director, Management, since 2009; Managing Director, Neuberger Berman Fixed Income LLC ("NBFI"), since 2007; Board member of NBFI since 2006; formerly, Global Head of Asset Management of Lehman Brothers Holdings Inc.'s ("LBHI") Investment Management Division, 2006 to 2009; formerly, member of LBHI's Investment Management Division's Executive Management Committee, 2006 to 2009; formerly, Managing Director, Lehman Brothers Inc. ("LBI"), 2006 to 2008; formerly, Chief Recruiting and Development Officer, LBI, 2005 to 2006; formerly, Global Head of LBI's Equity Sales and a Member of its Equities Division Executive Committee, 2003 to 2005. | | | 61 | | | Member of Board of Advisors, McDonough School of Business, Georgetown University, since 2001; Member of New York City Board of Advisors, Teach for America, since 2005; Trustee, Montclair Kimberley Academy (private school), since 2007; Member of Board of Regents, Georgetown University, since 2013. | |
Name, (Year of Birth),
and Address(1) | | Position(s) and Length of
Time Served(2) | | Principal Occupation(s)(3) | | Number of
Funds in
Fund Complex
Overseen by
Fund Trustee | | Other Directorships Held
Outside Fund Complex by
Fund Trustee(3) | |
Robert Conti* (1956) | | Chief Executive Officer, President and Trustee since 2008; prior thereto, Executive Vice President in 2008 and Vice President from 2000 to 2008 | | Managing Director, Neuberger, since 2007; Managing Director, NBFI, since 2009; formerly, Senior Vice President, Neuberger, 2003 to 2006; formerly, Vice President, Neuberger, 1999 to 2003; President and Chief Executive Officer, Management, since 2008; formerly, Senior Vice President, Management, 2000 to 2008. | | | 61 | | | Director, Staten Island Mental Health Society, since 1994; formerly, Chairman of the Board, Staten Island Mental Health Society, 2008 to 2011. | |
(1) The business address of each listed person is 605 Third Avenue, New York, New York 10158.
(2) Pursuant to the Trust's Trust Instrument, each of these Trustees shall hold office for life or until his or her successor is elected or the Trust terminates; except that (a) any Trustee may resign by delivering a written resignation; (b) any Trustee may be removed with or without cause at any time by a written instrument signed by at least two-thirds of the other Trustees; (c) any Trustee who requests to be retired, or who has become unable to serve, may be retired by a written instrument signed by a majority of the other Trustees; and (d) any Trustee may be removed at any shareholder meeting by a vote of at least two-thirds of the outstanding shares.
(3) Except as otherwise indicated, each individual has held the positions shown for at least the last five years.
* Indicates a Trustee who is an "interested person" within the meaning of the 1940 Act. Mr. Amato and Mr. Conti are interested persons of the Trust by virtue of the fact that each is an officer of Management, Neuberger and/or their affiliates.
Information about the Officers of the Trust
Name, (Year of Birth),
and Address(1) | | Position(s)
and Length of
Time Served(2) | | Principal Occupation(s)(3) | |
Andrew B. Allard (1961) | | Chief Legal Officer since 2013 (only for purposes of sections 307 and 406 of the Sarbanes-Oxley Act of 2002) and Anti-Money Laundering Compliance Officer since 2002 | | General Counsel and Senior Vice President, Management, since 2013; Senior Vice President, Neuberger, since 2006 and Employee since 1999; Deputy General Counsel, Neuberger, since 2004; formerly, Vice President, Neuberger, 2000 to 2005; formerly, Employee, Management, 1994 to 1999; Chief Legal Officer (only for purposes of sections 307 and 406 of the Sarbanes-Oxley Act of 2002), ten registered investment companies for which Management acts as investment manager and administrator (ten since 2013); Anti-Money Laundering Compliance Officer, ten registered investment companies for which Management acts as investment manager and administrator (six since 2002, one since 2003, one since 2005, one since 2006 and one since 2013). | |
Claudia A. Brandon (1956) | | Executive Vice President since 2008 and Secretary since 1985 | | Senior Vice President, Neuberger, since 2007 and Employee since 1999; Senior Vice President, Management, since 2008 and Assistant Secretary since 2004; formerly, Vice President, Neuberger, 2002 to 2006; formerly, Vice President-Mutual Fund Board Relations, Management, 2000 to 2008; formerly, Vice President, Management, 1986 to 1999 and Employee 1984 to 1999; Executive Vice President, ten registered investment companies for which Management acts as investment manager and administrator (nine since 2008 and one since 2013); Secretary, ten registered investment companies for which Management acts as investment manager and administrator (three since 1985, three since 2002, one since 2003, one since 2005, one since 2006 and one since 2013). | |
Agnes Diaz (1971) | | Vice President since 2013 | | Senior Vice President, Neuberger, since 2012; Employee, Management, since 1996; formerly, Vice President, Neuberger, 2007 to 2012; Vice President, ten registered investment companies for which Management acts as investment manager and administrator (ten since 2013). | |
Anthony DiBernardo (1979) | | Assistant Treasurer since 2011 | | Senior Vice President, Neuberger, since 2014; Employee, Management, since 2003; formerly, Vice President, Neuberger, 2009 to 2014; Assistant Treasurer, ten registered investment companies for which Management acts as investment manager and administrator (nine since 2011 and one since 2013). | |
Sheila R. James (1965) | | Assistant Secretary since 2002 | | Vice President, Neuberger, since 2008 and Employee since 1999; formerly, Assistant Vice President, Neuberger, 2007; formerly, Employee, Management, 1991 to 1999; Assistant Secretary, ten registered investment companies for which Management acts as investment manager and administrator (six since 2002, one since 2003, one since 2005, one since 2006 and one since 2013). | |
Name, (Year of Birth),
and Address(1) | | Position(s)
and Length of
Time Served(2) | | Principal Occupation(s)(3) | |
Brian Kerrane (1969) | | Chief Operating Officer since 2015 and Vice President since 2008 | | Managing Director, Neuberger, since 2014; Vice President, Management, since 2008 and Employee since 1991; formerly, Senior Vice President, Neuberger, 2006 to 2014; Chief Operating Officer, ten registered investment companies for which Management acts as investment manager and administrator (ten since 2015); Vice President, ten registered investment companies for which Management acts as investment manager and administrator (nine since 2008 and one since 2013). | |
Kevin Lyons (1955) | | Assistant Secretary since 2003 | | Assistant Vice President, Neuberger, since 2008 and Employee since 1999; formerly, Employee, Management, 1993 to 1999; Assistant Secretary, ten registered investment companies for which Management acts as investment manager and administrator (seven since 2003, one since 2005, one since 2006 and one since 2013). | |
Anthony Maltese (1959) | | Vice President since 2015 | | Senior Vice President, Neuberger, since 2014 and Employee since 2000; Vice President, ten registered investment companies for which Management acts as investment manager and administrator (ten since 2015). | |
Owen F. McEntee, Jr. (1961) | | Vice President since 2008 | | Vice President, Neuberger, since 2006; Employee, Management, since 1992; Vice President, ten registered investment companies for which Management acts as investment manager and administrator (nine since 2008 and one since 2013). | |
John M. McGovern (1970) | | Treasurer and Principal Financial and Accounting Officer since 2005 | | Senior Vice President, Neuberger, since 2007; Employee, Management, since 1993; Treasurer and Principal Financial and Accounting Officer, ten registered investment companies for which Management acts as investment manager and administrator (eight since 2005, one since 2006 and one since 2013); formerly, Vice President, Neuberger, 2004 to 2006; formerly, Assistant Treasurer, eight registered investment companies for which Management acts as investment manager and administrator, 2002 to 2005. | |
Frank Rosato (1971) | | Assistant Treasurer since 2005 | | Vice President, Neuberger, since 2006; Employee, Management, since 1995; Assistant Treasurer, ten registered investment companies for which Management acts as investment manager and administrator (eight since 2005, one since 2006 and one since 2013). | |
Chamaine Williams (1971) | | Chief Compliance Officer since 2005 | | Senior Vice President, Neuberger, since 2007; Chief Compliance Officer, Management, since 2006; Chief Compliance Officer, ten registered investment companies for which Management acts as investment manager and administrator (eight since 2005, one since 2006 and one since 2013); formerly, Senior Vice President, LBI, 2007 to 2008; formerly, Vice President, LBI, 2003 to 2006; formerly, Chief Compliance Officer, Lehman Brothers Asset Management Inc., 2003 to 2007; formerly, Chief Compliance Officer, Lehman Brothers Alternative Investment Management LLC, 2003 to 2007. | |
(1) The business address of each listed person is 605 Third Avenue, New York, New York 10158.
(2) Pursuant to the By-Laws of the Trust, each officer elected by the Trustees shall hold office until his or her successor shall have been elected and qualified or until his or her earlier death, inability to serve, or resignation. Officers serve at the pleasure of the Trustees and may be removed at any time with or without cause.
(3) Except as otherwise indicated, each individual has held the positions shown for at least the last five years.
Proxy Voting Policies and Procedures
A description of the policies and procedures that the Trust uses to determine how to vote proxies relating to portfolio securities is available, without charge, by calling 800-877-9700 (toll-free) and on the Securities and Exchange Commission's website, at www.sec.gov. Information regarding how the Trust voted proxies relating to portfolio securities during the most recent 12-month period ended June 30 is also available upon request, without charge, by calling 800-877-9700 (toll-free), on the Securities and Exchange Commission's website at www.sec.gov, and on Management's website at www.nb.com.
Quarterly Portfolio Schedule
The Trust files a complete schedule of portfolio holdings for each Fund with the Securities and Exchange Commission for the first and third quarters of each fiscal year on Form N-Q. The Trust's Forms N-Q are available on the Securities and Exchange Commission's website at www.sec.gov and may be reviewed and copied at the Securities and Exchange Commission's Public Reference Room in Washington, DC. Information on the operation of the Public Reference Room may be obtained by calling 800-SEC-0330. The information on Form N-Q is available upon request, without charge, by calling 800-877-9700 (toll-free).
Board Consideration of the Management and Sub-Advisory Agreements
At a meeting held on March 25-26, 2015, the Board of the Trust, including the Independent Fund Trustees, evaluated and approved the management agreement with Management (the "Management Agreement") and the sub-advisory agreement between Management and Neuberger (the "Sub-Advisory Agreement" and collectively with the Management Agreement, the "Agreements") with respect to Neuberger Berman World Equity Fund (the "Fund"). The Independent Fund Trustees were advised by counsel that is experienced in Investment Company Act of 1940 matters and that is independent of Management ("Independent Counsel").
In evaluating the Agreements, the Board, including the Independent Fund Trustees, reviewed materials provided by Management and met with senior representatives of Management regarding its personnel and operations as they relate to the Fund.
In connection with its deliberations, the Board also considered the broad range of information relevant to the annual contract review that is provided to the Board (including its various standing committees) at meetings throughout the year and for the annual consideration of continuance of contracts for other series of the Trust that were approved during the Board's annual contract review in October 2014. To assist the Board in its deliberations regarding contract review, the Board has established a Contract Review Committee comprised of Independent Fund Trustees, as well as other committees that focus throughout the year on specific areas relevant to contract review, such as compliance matters.
The Independent Trustees receive from Independent Counsel a memorandum, at least annually, discussing the legal standards for their consideration of management and advisory agreements. During the course of their deliberations regarding their review of the Agreements, the Independent Fund Trustees met with Independent Counsel together with and separately from representatives of Management and Neuberger.
In connection with its approval of the Agreements, the Board evaluated the terms of the Agreements, the overall fairness of the Agreements to the Fund and whether the Agreements were in the best interests of the Fund and its shareholders. The Board considered all factors it deemed relevant with respect to the Fund, including the following factors: (1) the nature, extent, and quality of the services to be provided by Management and Neuberger; (2) the expected costs of the services to be provided; (3) the extent to which economies of scale might be realized as the Fund grows; and (4) whether proposed fee levels reflect any such potential economies of scale for the benefit of investors in the Fund. While each Trustee may have attributed different weights to the various factors, the Board's determination to approve the Agreements was based on a comprehensive consideration of all information provided to the Board, and the Board members did not identify any particular information or factor that was all-important or controlling. The Board focused on the overall costs and benefits of the Agreements relating to the Fund and, through the Fund, its shareholders.
With respect to the nature, extent and quality of the services to be provided, the Board considered the investment philosophy and decision-making processes of Management and Neuberger and the qualifications, experience and capabilities of and the resources available to the portfolio management personnel of Management and Neuberger who would perform services for the Fund. The Board noted that Management also would provide certain administrative services, including fund accounting and compliance oversight. The Board also considered Management's and Neuberger's policies and practices regarding brokerage and allocation of portfolio transactions for the Fund. The Board also considered that Management's responsibilities include daily management of investment, operational, enterprise, legal, regulatory and compliance risks as they relate to the Fund, and considered information regarding Management's processes for managing risk. In addition, the Board considered the scope and depth of the compliance programs of Management and Neuberger.
With respect to the overall fairness of the Agreements, the Board considered the fee structures proposed under the Agreements for the three classes to be registered initially as compared to a peer group of comparable funds and any fall-out benefits likely to accrue to Management and Neuberger or their affiliates from their relationship with the Fund. The Board reviewed a comparison of the Fund's proposed management fee and overall expense ratio to a peer group and a larger group of broadly comparable funds and determined that, for two of the three classes, the total expense ratio, net of the contractual limit, was above the median total expense ratio of the larger group. In this analysis, it was assumed that
the Fund had not grown large enough to trigger any breakpoints in the schedule of management fees. The Board noted that the comparative management fee analysis includes, in the Fund's management fee, the separate administrative fee paid to Management, but it was not clear whether this was the case for all funds in the peer group or the full category. In addition, the Board considered the proposed contractual limit on expenses of each class of the Fund. The Board also considered whether it would be appropriate to evaluate any anticipated economies of scale in relation to the services Management would provide to the Fund, noting that it may be too soon to anticipate the economies at the start-up phase of a fund. The Board concluded that the benefits expected to accrue to Management and its affiliates by virtue of their relationship to the Fund were reasonable in light of the costs of providing the investment advisory and other services and the benefits expected to accrue to the Fund.
Conclusions
In approving the Agreements, the Board concluded that the terms of each Agreement are fair and reasonable to the Fund and that approval of the Agreements is in the best interests of the Fund and its shareholders. In reaching this determination, the Board considered that Management and Neuberger could be expected to provide a high level of service to the Fund; that the Fund's proposed fee structure appeared to the Board to be reasonable given the nature, extent and quality of services expected to be provided; and that the benefits expected to accrue to Management and its affiliates by virtue of their relationship to the Fund were reasonable in light of the costs of providing the investment advisory and other services and the benefits expected to accrue to the Fund.
Notice to Shareholders
Neuberger Berman All Cap Core Fund, Equity Income Fund, Focus Fund, Genesis Fund, Global Equity Fund, Greater China Equity Fund, Guardian Fund, Intrinsic Value Fund, Large Cap Disciplined Growth Fund, Large Cap Value Fund, Mid Cap Growth Fund, Mid Cap Intrinsic Value Fund, Multi-Cap Opportunities Fund, Real Estate Fund, Small Cap Growth Fund, Socially Responsive Fund and Value Fund hereby designate $12,056,895, $92,823,939, $113,979,974, $1,177,470,479, $3,317,428, $847,483, $193,226,409, $12,891,705, $57,031,255, $131,474,524, $112,035,066, $8,766,299, $86,383,844, $46,882,028, $183,741, $255,811,829 and $160,048, respectively, as a capital gain distribution. Neuberger Berman Equity Income Fund and Real Estate Fund hereby designate $649,410 and $1,429,465, respectively, as Section 1250 gain distributions.
For the fiscal year ended August 31, 2015, each Fund makes the following designation, or up to the maximum amount of such dividends allowable pursuant to the Internal Revenue Code, as qualified dividend income eligible for reduced tax rates. These lower rates range from 5% to 15% depending upon an individual's tax bracket. Complete information regarding each Funds distributions during the calendar year 2015 will be reported in conjunction with Form 1099-DIV.
Fund | | Qualified
Dividend Income | |
All Cap Core | | $ | 812,462 | | |
Emerging Markets Equity | | | 11,769,536 | | |
Equity Income | | | 79,583,549 | | |
Focus | | | 13,946,682 | | |
Genesis | | | 164,121,572 | | |
Global Equity | | | 127,169 | | |
Global Real Estate | | | 46,416 | | |
Greater China Equity | | | 2,912,311 | | |
Guardian | | | 23,145,930 | | |
International Equity | | | 25,412,409 | | |
International Select | | | 5,664,394 | | |
Intrinsic Value | | | 2,206,226 | | |
Large Cap Disciplined Growth | | | 1,411,165 | | |
Large Cap Value | | | 31,791,519 | | |
Mid Cap Growth | | | 4,495,773 | | |
Mid Cap Intrinsic Value | | | 1,639,477 | | |
Multi-Cap Opportunities | | | 41,115,517 | | |
Real Estate | | | 23,023,912 | | |
Small Cap Growth | | | 224,205 | | |
Socially Responsive | | | 39,760,029 | | |
Value | | | 488,908 | | |
World Equity | | | 7,746 | | |
Neuberger Berman Management LLC
605 Third Avenue 2nd Floor
New York, NY 10158–0180
Shareholder Services
800.877.9700
Intermediary Client Services
800.366.6264
www.nb.com
Statistics and projections in this report are derived from sources deemed to be reliable but cannot be regarded as a representation of future results of the Funds. This report is prepared for the general information of shareholders and is not an offer of shares of the Funds. Shares are sold only through the currently effective prospectus, which must precede or accompany this report.
 H0599 10/15
Item 2. Code of Ethics.
The Board of Trustees (“Board”) of Neuberger Berman Equity Funds (“Registrant”) has adopted a code of ethics that applies to the Registrant’s principal executive officer, principal financial officer, principal accounting officer or controller, or persons performing similar functions (“Code of Ethics”). During the period covered by this Form N-CSR, there were no substantive amendments to the Code of Ethics and there were no waivers from the Code of Ethics granted to the Registrant’s principal executive officer, principal financial officer, principal accounting officer or controller, or persons performing similar functions.
A copy of the Code of Ethics is filed with this annual report on Form N-CSR. The Code of Ethics is also available, without charge, by calling 1-800-877-9700 (toll-free).
Item 3. Audit Committee Financial Expert.
The Board has determined that the Registrant has two audit committee financial experts serving on its audit committee. The Registrant’s audit committee financial experts are Candace L. Straight and George W. Morriss. Ms. Straight and Mr. Morriss are independent trustees as defined by Form N-CSR.
Item 4. Principal Accountant Fees and Services.
Ernst & Young, LLP (“E&Y”) serves as independent registered public accounting firm to the Neuberger Berman All Cap Core, Emerging Markets Equity, Equity Income, Focus, Genesis, Global Equity, Global Real Estate, Greater China Equity, Guardian, International Equity, International Select, Large Cap Value, Real Estate, Value and World Equity Funds.
Tait, Weller & Baker LLP (“Tait Weller”) serves as independent registered public accounting firm to the Neuberger Berman Intrinsic Value, Large Cap Disciplined Growth, Mid Cap Growth, Mid Cap Intrinsic Value, Multi-Cap Opportunities, Small Cap Growth, and Socially Responsive Funds.
(a) Audit Fees
The aggregate fees billed for professional services rendered by E&Y for the audit of the annual financial statements or services that are normally provided by E&Y in connection with statutory and regulatory filings or engagements were $680,750 and $659,150 for the fiscal years ended 2014 and 2015, respectively.
The aggregate fees billed for professional services rendered by Tait Weller for the audit of the annual financial statements or services that are normally provided by Tait Weller in connection with statutory and regulatory filings or engagements were $146,300 and $150,675 for the fiscal years ended 2014 and 2015, respectively.
(b) Audit-Related Fees
The aggregate fees billed to the Registrant for assurance and related services by E&Y that are reasonably related to the performance of the audit of the Registrant’s financial statements and are not reported above in Audit Fees were $0 and $0 for the fiscal years ended 2014 and 2015, respectively. The Audit Committee approved 0% and 0% of these services provided by E&Y for the fiscal years ended 2014 and 2015, respectively, pursuant to the waiver provisions of Rule 2-01(c)(7)(i)(C) of Regulation S-X.
The fees billed to other entities in the investment company complex for assurance and related services by E&Y that are reasonably related to the performance of the audit that the Audit Committee was required to approve because the engagement related directly to the operations and financial reporting of the Registrant were $0 and $0 for the fiscal years ended 2014 and 2015, respectively. The Audit Committee approved 0%
and 0% of these services provided by E&Y for the fiscal years ended 2014 and 2015, respectively, pursuant to the waiver provisions of Rule 2-01(c)(7)(i)(C) of Regulation S-X.
The aggregate fees billed to the Registrant for assurance and related services by Tait Weller that are reasonably related to the performance of the audit of the Registrant’s financial statements and are not reported above in Audit Fees were $0 and $0 for the fiscal years ended 2014 and 2015, respectively. The Audit Committee approved 0% and 0% of these services provided by Tait Weller for the fiscal years ended 2014 and 2015, respectively, pursuant to the waiver provisions of Rule 2-01(c)(7)(i)(C) of Regulation S-X.
The fees billed to other entities in the investment company complex for assurance and related services by Tait Weller that are reasonably related to the performance of the audit that the Audit Committee was required to approve because the engagement related directly to the operations and financial reporting of the Registrant were $0 and $0 for the fiscal years ended 2014 and 2015, respectively. The Audit Committee approved 0% and 0% of these services provided by Tait Weller for the fiscal years ended 2014 and 2015, respectively, pursuant to the waiver provisions of Rule 2-01(c)(7)(i)(C) of Regulation S-X.
(c) Tax Fees
The aggregate fees billed to the Registrant for professional services rendered by E&Y for tax compliance, tax advice, and tax planning were $157,200 and $182,250 for the fiscal years ended 2014 and 2015, respectively. The nature of the services provided includes preparation of the Federal and State tax extensions and tax returns, review of annual excise tax calculations, and preparation of form 8613, in addition to guidance with the identification of Passive Foreign Investment Companies ("PFICs"), assistance with determination of various foreign withholding taxes, and assistance with Internal Revenue Code and tax regulation requirements for fund investments. The Audit Committee approved 0% and 0% of these services provided by E&Y for the fiscal years ended 2014 and 2015, respectively, pursuant to the waiver provisions of Rule 2-01(c)(7)(i)(C) of Regulation S-X.
The fees billed to other entities in the investment company complex for professional services rendered by E&Y for tax compliance, tax advice, and tax planning that the Audit Committee was required to approve because the engagement related directly to the operations and financial reporting of the Registrant were $0 and $0 for the fiscal years ended 2014 and 2015, respectively. The Audit Committee approved 0% and 0% of these services provided by E&Y for the fiscal years ended 2014 and 2015, respectively, pursuant to the waiver provisions of Rule 2-01(c)(7)(i)(C) of Regulation S-X.
The aggregate fees billed to the Registrant for professional services rendered by Tait Weller for tax compliance, tax advice, and tax planning were $32,200 and $33,250 for the fiscal years ended 2014 and 2015, respectively. The nature of the services provided includes preparation of the Federal and State tax extensions and tax returns, review of annual excise tax calculations, and preparation of form 8613, in addition to guidance with the identification of PFICs, assistance with determination of various foreign withholding taxes, and assistance with Internal Revenue Code and tax regulation requirements for fund investments. The Audit Committee approved 0% and 0% of these services provided by Tait Weller for the fiscal years ended 2014 and 2015, respectively, pursuant to the waiver provisions of Rule 2-01(c)(7)(i)(C) of Regulation S-X.
The fees billed to other entities in the investment company complex for professional services rendered by Tait Weller for tax compliance, tax advice, and tax planning that the Audit Committee was required to approve because the engagement related directly to the operations and financial reporting of the Registrant were $0 and $0 for the fiscal years ended 2014 and 2015, respectively. The Audit Committee approved 0% and 0% of these services provided by Tait Weller for the fiscal years ended 2014 and 2015, respectively, pursuant to the waiver provisions of Rule 2-01(c)(7)(i)(C) of Regulation S-X.
(d) All Other Fees
The aggregate fees billed to the Registrant for products and services provided by E&Y, other than services reported in Audit Fees, Audit-Related Fees, and Tax Fees were $0 and $0 for the fiscal years ended 2014 and 2015, respectively. The Audit Committee approved 0% and 0% of these services provided by E&Y for the fiscal years ended 2014 and 2015, respectively, pursuant to the waiver provisions of Rule 2-01(c)(7)(i)(C) of Regulation S-X.
The fees billed to other entities in the investment company complex for products and services provided by E&Y, other than services reported in Audit Fees, Audit-Related Fees, and Tax Fees that the Audit Committee was required to approve because the engagement related directly to the operations and financial reporting of the Registrant were $0 and $0 for the fiscal years ended 2014 and 2015, respectively. The Audit Committee approved 0% and 0% of these services provided by E&Y for the fiscal years ended 2014 and 2015, respectively, pursuant to the waiver provisions of Rule 2-01(c)(7)(i)(C) of Regulation S-X.
The aggregate fees billed to the Registrant for products and services provided by Tait Weller, other than services reported in Audit Fees, Audit-Related Fees, and Tax Fees were $0 and $0 for the fiscal years ended 2014 and 2015, respectively. The Audit Committee approved 0% and 0% of these services provided by Tait Weller for the fiscal years ended 2014 and 2015, respectively, pursuant to the waiver provisions of Rule 2-01(c)(7)(i)(C) of Regulation S-X.
The fees billed to other entities in the investment company complex for products and services provided by Tait Weller, other than services reported in Audit Fees, Audit-Related Fees, and Tax Fees that the Audit Committee was required to approve because the engagement related directly to the operations and financial reporting of the Registrant were $0 and $0 for the fiscal years ended 2014 and 2015, respectively. The Audit Committee approved 0% and 0% of these services provided by Tait Weller for the fiscal years ended 2014 and 2015, respectively, pursuant to the waiver provisions of Rule 2-01(c)(7)(i)(C) of Regulation S-X.
(e) Audit Committee’s Pre-Approval Policies and Procedures
(1) The Audit Committee’s pre-approval policies and procedures for the Registrant to engage an accountant to render audit and non-audit services delegate to each member of the Committee the power to pre-approve services between meetings of the Committee.
(2) None of the services described in paragraphs (b) through (d) above were approved by the Audit Committee pursuant to paragraph (c)(7)(i)(C) of Rule 2-01 of Regulation S-X.
(f) Hours Attributed to Other Persons
Not applicable.
(g) Non-Audit Fees
Non-audit fees billed by E&Y for services rendered to the Registrant were $228,100 and $249,450 for the fiscal years ended 2014 and 2015, respectively.
Non-audit fees billed by E&Y for services rendered to the Registrant’s investment adviser and any entity controlling, controlled by, or under common control with the adviser that provides ongoing services to the Registrant were $0 and $0 for the fiscal years ended 2014 and 2015, respectively.
Non-audit fees billed by Tait Weller for services rendered to the Registrant were $32,200 and $33,250 for the fiscal years ended 2014 and 2015, respectively.
Non-audit fees billed by Tait Weller for services rendered to the Registrant’s investment adviser and any entity controlling, controlled by, or under common control with the adviser that provides ongoing services to the Registrant were $0 and $0 for the fiscal years ended 2014 and 2015, respectively.
(h) The Audit Committee of the Board considered whether the provision of non-audit services rendered to the Registrant’s investment adviser and any entity controlling, controlled by, or under common control with the adviser that provides ongoing services to the Registrant that were not pre-approved by the Audit Committee because the engagement did not relate directly to the operations and financial reporting of the Registrant is compatible with maintaining E&Y’s and Tait Weller’s independence.
Item 5. Audit Committee of Listed Registrants.
Not applicable to the Registrant.
Item 6. Schedule of Investments.
The complete schedule of investments for each series is disclosed in the Registrant’s annual report included as Item 1 of this Form N-CSR.
Item 7. Disclosure of Proxy Voting Policies and Procedures for Closed-End Management Investment Companies.
Not applicable to the Registrant.
Item 8. Portfolio Managers of Closed-End Management Investment Companies.
Not applicable to the Registrant.
Item 9. Purchases of Equity Securities by Closed-End Management Investment Company and Affiliated Purchasers.
Not applicable to the Registrant.
Item 10. Submission of Matters to a Vote of Security Holders.
There were no changes to the procedures by which shareholders may recommend nominees to the Board.
Item 11. Controls and Procedures.
| (a) | Based on an evaluation of the disclosure controls and procedures (as defined in Rule 30a-3(c) under the Act) as of a date within 90 days of the filing date of this report, the Chief Executive Officer and President and the Treasurer and Principal Financial and Accounting Officer of the Registrant have concluded that such disclosure controls and procedures are effectively designed to ensure that information required to be disclosed by the Registrant on Form N-CSR is accumulated and communicated to the Registrant’s management to allow timely decisions regarding required disclosure. |
| (b) | There were no significant changes in the Registrant’s internal controls over financial reporting (as defined in Rule 30a-3(d) under the Act) that occurred during the Registrant’s second fiscal quarter of the period covered by this report that have materially affected, or are reasonably likely to materially affect, the Registrant’s internal control over financial reporting. |
Item 12. Exhibits.
| (a)(1) | A copy of the Code of Ethics is filed herewith. |
| | |
| (a)(2) | The certifications required by Rule 30a-2(a) under the Act and Section 302 of the Sarbanes-Oxley Act of 2002 (“Sarbanes-Oxley Act”) are filed herewith. |
| | |
| (a)(3) | Not applicable to the Registrant. |
| | |
| (b) | The certification required by Rule 30a-2(b) under the Act and Section 906 of the Sarbanes-Oxley Act is furnished herewith. |
The certification furnished pursuant to Rule 30a-2(b) under the Act and Section 906 of the Sarbanes-Oxley Act will not be deemed “filed” for purposes of Section 18 of the Securities Exchange Act of 1934, as amended (“Exchange Act”), or otherwise subject to the liability of that section. Such certification will not be deemed to be incorporated by reference into any filing under the Securities Act of 1933, as amended, or the Exchange Act, except to the extent that the Registrant specifically incorporates it by reference.
SIGNATURES
Pursuant to the requirements of the Securities Exchange Act of 1934 and the Investment Company Act of 1940, the Registrant has duly caused this report to be signed on its behalf by the undersigned, thereunto duly authorized.
Neuberger Berman Equity Funds
| By: | /s/ Robert Conti | |
| | Robert Conti | |
| | Chief Executive Officer and President | |
Date: October 29, 2015
Pursuant to the requirements of the Securities Exchange Act of 1934 and the Investment Company Act of 1940, this report has been signed below by the following persons on behalf of the Registrant and in the capacities and on the dates indicated.
| By: | /s/ Robert Conti | |
| | Robert Conti | |
| | Chief Executive Officer and President | |
Date: October 29, 2015
| By: | /s/ John M. McGovern | |
| | John M. McGovern | |
| Treasurer and Principal Financial | |
| and Accounting Officer | |
Date: October 29, 2015