As filed with the Securities and Exchange Commission on November 3, 2016
UNITED STATES
SECURITIES AND EXCHANGE COMMISSION
Washington, D.C. 20549
FORM N-CSR
CERTIFIED SHAREHOLDER REPORT OF
REGISTERED MANAGEMENT INVESTMENT COMPANIES
Investment Company Act file number: 811-00582
NEUBERGER BERMAN EQUITY FUNDS
(Exact Name of Registrant as specified in charter)
c/o Neuberger Berman Investment Advisers LLC
605 Third Avenue, 2nd Floor
New York, New York 10158-0180
(Address of Principal Executive Offices – Zip Code)
Registrant's telephone number, including area code: (212) 476-8800
Robert Conti
Chief Executive Officer and President
Neuberger Berman Equity Funds
c/o Neuberger Berman Investment Advisers LLC
605 Third Avenue, 2nd Floor
New York, New York 10158-0180
Arthur C. Delibert, Esq.
K&L Gates LLP
1601 K Street, N.W.
Washington, D.C. 20006-1600
(Names and Addresses of agents for service)
Date of fiscal year end: August 31
Date of reporting period: August 31, 2016
Form N-CSR is to be used by management investment companies to file reports with the Commission not later than 10 days after the transmission to stockholders of any report that is required to be transmitted to stockholders under Rule 30e-1 under the Investment Company Act of 1940, as amended (“Act”) (17 CFR 270.30e-1). The Commission may use the information provided on Form N-CSR in its regulatory, disclosure review, inspection, and policymaking roles.
A registrant is required to disclose the information specified by Form N-CSR, and the Commission will make this information public. A registrant is not required to respond to the collection of information contained in Form N-CSR unless the Form displays a currently valid Office of Management and Budget (“OMB”) control number. Please direct comments concerning the accuracy of the information collection burden estimate and any suggestions for reducing the burden to the Secretary, Securities and Exchange Commission, 100 F Street, NE, Washington, DC 20549-0609. The OMB has reviewed this collection of information under the clearance requirements of 44 U.S.C. § 3507.
Item 1. Report to Shareholders.
Following is a copy of the annual report transmitted to shareholders pursuant to Rule 30e-1 under the Act.

Neuberger Berman
Equity Funds
Investor Class Shares
Trust Class Shares
Advisor Class Shares
Institutional Class Shares
Dividend Growth Fund
Emerging Markets Equity Fund
Equity Income Fund
Focus Fund
Genesis Fund
Global Equity Fund
Global Real Estate Fund
Greater China Equity Fund
Guardian Fund
International Equity Fund
Class A Shares
Class C Shares
Class R3 Shares
Class R6 Shares
International Select Fund
Intrinsic Value Fund
Large Cap Value Fund
Mid Cap Growth Fund
Mid Cap Intrinsic Value Fund
Multi-Cap Opportunities Fund
Real Estate Fund
Small Cap Growth Fund
Socially Responsive Fund
Value Fund

Annual Report
August 31, 2016
Contents
THE FUNDS
President's Letter | | | 1 | | |
PORTFOLIO COMMENTARY | |
Dividend Growth Fund | | | 2 | | |
Emerging Markets Equity Fund | | | 5 | | |
Equity Income Fund | | | 8 | | |
Focus Fund | | | 11 | | |
Genesis Fund | | | 14 | | |
Global Equity Fund | | | 17 | | |
Global Real Estate Fund | | | 20 | | |
Greater China Equity Fund | | | 23 | | |
Guardian Fund | | | 27 | | |
International Equity Fund | | | 30 | | |
International Select Fund | | | 33 | | |
Intrinsic Value Fund | | | 36 | | |
Large Cap Value Fund | | | 39 | | |
Mid Cap Growth Fund | | | 42 | | |
Mid Cap Intrinsic Value Fund | | | 45 | | |
Multi-Cap Opportunities Fund | | | 49 | | |
Real Estate Fund | | | 52 | | |
Small Cap Growth Fund | | | 55 | | |
Socially Responsive Fund | | | 58 | | |
Value Fund | | | 62 | | |
FUND EXPENSE INFORMATION | | | 71 | | |
SCHEDULE OF INVESTMENTS | |
Dividend Growth Fund | | | 75 | | |
Emerging Markets Equity Fund | | | 77 | | |
Positions by Industry | | | 79 | | |
Equity Income Fund | | | 81 | | |
Focus Fund | | | 85 | | |

Genesis Fund | | | 88 | | |
Global Equity Fund | | | 91 | | |
Positions by Industry | | | 93 | | |
Global Real Estate Fund | | | 95 | | |
Positions by Sector | | | 96 | | |
Greater China Equity Fund | | | 98 | | |
Guardian Fund | | | 101 | | |
International Equity Fund | | | 106 | | |
Positions by Industry | | | 108 | | |
International Select Fund | | | 110 | | |
Positions by Industry | | | 112 | | |
Intrinsic Value Fund | | | 114 | | |
Large Cap Value Fund | | | 117 | | |
Mid Cap Growth Fund | | | 119 | | |
Mid Cap Intrinsic Value Fund | | | 122 | | |
Multi-Cap Opportunities Fund | | | 124 | | |
Real Estate Fund | | | 126 | | |
Small Cap Growth Fund | | | 128 | | |
Socially Responsive Fund | | | 130 | | |
Value Fund | | | 132 | | |
FINANCIAL STATEMENTS | | | 135 | | |
FINANCIAL HIGHLIGHTS (ALL CLASSES)/PER SHARE DATA | |
Dividend Growth Fund | | | 193 | | |
Emerging Markets Equity Fund | | | 193 | | |
Equity Income Fund | | | 195 | | |
Focus Fund | | | 197 | | |
Genesis Fund | | | 199 | | |
Global Equity Fund | | | 201 | | |
Global Real Estate Fund | | | 203 | | |
Greater China Equity Fund | | | 203 | | |
Guardian Fund | | | 205 | | |
International Equity Fund | | | 207 | | |
International Select Fund | | | 209 | | |
Intrinsic Value Fund | | | 211 | | |
Large Cap Value Fund | | | 213 | | |
Mid Cap Growth Fund | | | 215 | | |
Mid Cap Intrinsic Value Fund | | | 219 | | |
Multi-Cap Opportunities Fund | | | 221 | | |
Real Estate Fund | | | 223 | | |
Small Cap Growth Fund | | | 225 | | |
Socially Responsive Fund | | | 227 | | |
Value Fund | | | 231 | | |
Reports of Independent Registered Public Accounting Firms | | | 237 | | |
Directory | | | 240 | | |
Trustees and Officers | | | 241 | | |
Proxy Voting Policies and Procedures | | | 251 | | |
Quarterly Portfolio Schedule | | | 251 | | |
Notice to Shareholders | | | 252 | | |
The "Neuberger Berman" name and logo are registered service marks of Neuberger Berman Group LLC. "Neuberger Berman Investment Advisers LLC" and the individual Fund names in this piece are either service marks or registered service marks of Neuberger Berman Investment Advisers LLC. ©2016 Neuberger Berman LLC, distributor. All rights reserved.
Volatility may be the "new normal" in equity markets, at least for the foreseeable future, and this fiscal year was a case in point. Even as major global markets closed the 12 months ended August 31, 2016 with very healthy returns, the period contained several sharp downturns and just as many quick recoveries.
Although we are now in the eighth year of an economic expansion, we believe the continued slow growth environment we've experienced since the global financial crisis has been a weak foundation for equity markets, making them unusually susceptible to shocks and shifts in sentiment. This has been underscored by the rapid sector rotation and changes from risk-on to risk-off behavior that's punctuated the past several years.
This period, volatile throughout, saw two major selloffs. The first was in January/February, when negative interest rates—an outgrowth of the unprecedented levels of global central bank stimulus we've seen since the crisis—caused fears about the banking sector. This spread uncertainty, as banking activity can underpin overall economic growth. The second was in June, when UK voters defied expectations in the "Brexit" referendum, voting in favor of leaving the European Union. After both of those events, markets rebounded as investors' worst fears failed to materialize. The fact that the U.S. Federal Reserve (Fed) appears unlikely to raise rates again before December, and a recovery in commodity and energy prices, has also benefited the markets.
Looking at the U.S. economy, consumer spending, which makes up two-thirds of U.S. GDP, has been relatively strong all year. In September, the Census Bureau reported that household income, which had been stagnant, was up a full 5.2% in 2015. Unemployment has continued to decline, closing the period at 4.9%. Low gas prices benefited consumers as well, and though they have started to increase, they remain low enough to free up discretionary spending. Even as the Fed hesitates on its next rate move, we anticipate a steady, if slow, growth.
On the negative side, the upcoming U.S. presidential election has called trade and economic policy into question, and this, along with ongoing geopolitical risks, continues to mean uncertainty for investors and also for corporate management teams.
We believe uncertain, volatile markets can mean opportunity for skilled active managers, providing temporary dislocations and mis-pricings. In our view, managers who follow a disciplined approach and have done their research can use volatility to buy into companies when prices decline without a fundamental basis, and to sell when target prices of portfolio holdings are met or exceeded in a rebound or sector rotation.
From our perspective, equities will continue to be the most important asset class for investors seeking to meet long-term needs, and the markets we've seen over the past several years continue to make the case for active management.
We thank you for your confidence in Neuberger Berman and look forward to continuing to serve you in the future.
Sincerely,

ROBERT CONTI
PRESIDENT AND CEO
NEUBERGER BERMAN MUTUAL FUNDS
1
Dividend Growth Fund Commentary (Unaudited)
Neuberger Berman Dividend Growth Fund launched on December 15, 2015. Since launching, the Institutional Class has generated an 11.10% total return for the period ending August 31, 2016, outperforming its benchmark, the S&P 500® Index which rose 9.08% for the same period. (Performance for all share classes is provided in the table immediately following this letter.)
The objective of the Fund is to provide gross current income, with an emphasis on capital appreciation driven by earnings per share and dividend per share growth. We believe this approach can identify companies with strong business models which provide both cash to reinvest to grow their businesses, and real and growing cash return to shareholders. We focus on companies with strong balance sheets, solid management teams, and attractive free cash flow yields, with a clear capital allocation strategy.
Since inception, the portfolio benefitted from its overweight position to the Materials sector, with Newmont Mining being the top overall contributor. As part of its plan, management has created a schedule to grow its dividend in lockstep with gold prices, which has been supported throughout the year by increased investor appetite. Sticking with commodities, Energy related stocks staged an impressive rebound with our overweight position driving returns. Devon Energy Corporation was among our top performers as this exploration and production company was rewarded given its attractive asset mix. Looking ahead, we remain bullish on the trajectory of oil prices as global consumption is likely to lend further support into 2017.
Information Technology (IT) holdings enjoy relatively mature businesses with reduced cyclicality relative to their past, which, in our view, could enable managements to remain focused on disciplined capital allocation, namely offering compelling and growing dividends. Stock selection within IT drove returns, with Applied Materials rising to the top. We believe this name could see meaningful acceleration of its dividend program given its strong leadership position within the semiconductor equipment space.
Elsewhere, Financials and Health Care positions modestly hindered results. Headwinds from unorthodox central bank policies impacted the profitability of many institutions including Lincoln National and UBS Group. Ultimately, both positions were sold after revisiting our investment thesis, with the proceeds used to fund opportunities elsewhere. However, we feel exposure to the sector is prudent as we believe Financials stand to benefit from a gradually steepening yield curve, with the Fund maintaining a bias towards domestic banking and insurance stocks.
Lastly, Health Care dampened returns following disappointing clinical results from Bristol-Myers Squibb's lung cancer drug Opdivo. Despite this setback we remain encouraged by Bristol's drug pipeline and feel this offers attractive upside potential for disciplined investors. While the upcoming election cycle could weigh on the sector, it is our opinion that favorable demographic trends remain a long term structural tailwind.
Looking ahead, we believe a defensive approach is warranted as equity markets could see increased volatility related to the U.S. presidential election, along with hawkish rhetoric from Fed officials. In our view, a rate hike is justified, as favorable employment trends and modest inflationary trends highlight improving fundamentals. In the event of pullback, we believe our flexible mandate remains poised to capitalize on dislocations with emphasis on companies exhibiting attractive and growing dividend profiles.
Sincerely,
RICHARD S. LEVINE, DAVID A. KIEFER AND WILLIAM D. HUNTER
PORTFOLIO MANAGERS
Information about principal risks of investing in the Fund is set forth in the prospectus and statement of additional information.
The portfolio composition, industries and holdings of the Fund are subject to change without notice.
The opinions expressed are those of the Fund's portfolio managers. The opinions are as of the date of this report and are subject to change without notice.
2
Dividend Growth Fund (Unaudited)
TICKER SYMBOLS
Institutional Class | | NDGIX | |
Class A | | NDGAX | |
Class C | | NDGCX | |
Class R6 | | NRDGX | |
SECTOR ALLOCATION
(as a % of Total Investments*) | |
Consumer Discretionary | | | 6.4 | % | |
Consumer Staples | | | 10.6 | | |
Energy | | | 10.0 | | |
Financials | | | 15.8 | | |
Health Care | | | 5.6 | | |
Industrials | | | 9.4 | | |
Information Technology | | | 22.3 | | |
Materials | | | 6.0 | | |
Telecommunication Services | | | 1.9 | | |
Utilities | | | 1.6 | | |
Short-Term Investment | | | 10.4 | | |
Total | | | 100.0 | % | |
* Derivatives, if any, are excluded from this chart.
PERFORMANCE HIGHLIGHTS
| | | Inception
Date | | Cumulative Total Return
Ended 08/31/2016
Life of Fund | |
At NAV | |
Institutional Class | | 12/15/2015 | | | 11.10 | % | |
Class A | | 12/15/2015 | | | 10.90 | % | |
Class C | | 12/15/2015 | | | 10.00 | % | |
Class R6 | | 12/15/2015 | | | 11.10 | % | |
With Sales Charge | |
Class A | | | | | | | 4.52 | % | |
Class C | | | | | | | 9.00 | % | |
Index | |
| S&P 500® Index1,15 | | | | | | | 9.08 | % | |
The performance data quoted represent past performance and do not indicate future results. Current performance may be lower or higher than the performance data quoted. For performance data current to the most recent month-end, please visit www.nb.com/performance.
The results shown in the table reflect the reinvestment of income dividends and other distributions, if any. The results do not reflect the effect of taxes a shareholder would pay on Fund distributions or on the redemption of Fund shares.
The investment return and principal value of an investment will fluctuate and shares, when redeemed, may be worth more or less than their original cost.
Returns would have been lower if Neuberger Berman Investment Advisers LLC ("Management") had not reimbursed certain expenses and/or waived a portion of the investment management fees during certain of the periods shown. Repayment by a class (of expenses previously reimbursed and/or fees previously waived by Management) will decrease the class's returns. Please see Note B in the Notes to Financial Statements for specific information regarding expense reimbursement and/or fee waiver arrangements.
As stated in the Fund's most recent prospectus, the estimated total annual operating expense ratios for fiscal year 2016 are 1.01%, 1.37%, 2.12% and 0.94% for Institutional Class, Class A, Class C and Class R6 shares, respectively (before expense reimbursements and/or fee waivers, if any). The estimated expense ratios are 0.69%, 1.05%, 1.80% and 0.62% for Institutional Class, Class A, Class C and Class R6 shares, respectively, after expense reimbursements and/or fee waivers. The expense ratios for the period from December 15, 2015 through August 31, 2016 can be found in the Financial Highlights section of this report.
Returns shown with a sales charge reflect the deduction of the current maximum initial sales charge of 5.75% for Class A shares and the contingent deferred sales charge (CDSC) for Class C shares. The CDSC for Class C shares is 1%, which is reduced to 0% after 1 year. The performance of the Fund's share classes will differ primarily due to different sales charge structures and class expenses. Please see the prospectus for more information about sales charge structures, if any, and class expenses for your share class.
3
Dividend Growth Fund (Unaudited)
COMPARISON OF A $1,000,000 INVESTMENT
(000's Omitted)
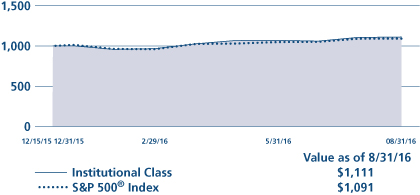
This graph shows the change in value of a hypothetical $1,000,000 investment in the Fund over the past 10 fiscal years, or since the Fund's inception if it has not operated for 10 years. The graph is based on the Institutional Class shares only; the performance of the Fund's share classes will differ primarily due to different sales charge structures and class expenses (see Performance Highlights chart on previous page). The result is compared with benchmarks, which include a broad-based market index and may include a more narrowly based index. Market indices have not been reduced to reflect any of the fees and costs of investing. The results shown in the graph reflect the reinvestment of income dividends and other distributions, if any. The results do not reflect the effect of taxes a shareholder would pay on Fund distributions or on the redemption of Fund shares. Results represent past performance and do not indicate future results.
4
Emerging Markets Equity Fund Commentary (Unaudited)
Neuberger Berman Emerging Markets Equity Fund Institutional Class generated a total return of 15.64% for the fiscal year ended August 31, 2016, outperforming its benchmark, the MSCI Emerging Markets Index (the Index), which reported returns of 12.25% for the same period. (Performance for all share classes is provided in the table immediately following this letter.)
Emerging markets (EM) equities closed this period in strongly positive territory, shrugging off a volatile year of heightened geopolitical uncertainty within a slow global growth environment. EM equity performance represents a significant rebound from the middle of this reporting period, when they were in sharply negative territory. The sharp rebound as the period progressed was fueled both by supportive statements from central banks and by a recovery in commodity prices.
Information Technology (IT) stocks led the Index, joined by the commodity-related sectors, Materials and Energy. By country, Brazil and Hungary were among top performers in the Index for the period.
The portfolio's outperformance resulted almost entirely from stock selection, the majority of which was within IT names. By country, our holdings from China, Korea and Taiwan were most beneficial.
Chinese holdings Sunny Optical and Tencent, along with Korea's Samsung topped our individual contributors list for the year. Sunny Optical, a consumer electronics and auto-safety lens manufacturer, continues to enjoy strong growth across its business units. Tencent, the Chinese Internet and mobile platform provider, announced record earnings during the period. Samsung, the consumer electronics and semiconductor giant, posted strong results as their latest handset sales climbed. Further, outlooks improved in their components (NAND, DRAM, OLED and LCD) businesses.
Not every sector within the Index saw strong returns this period. Performance for Telecommunication Services was negative, and Industrials and Health Care also underperformed significantly. On a country basis, Greece was the weakest market, followed by Czech Republic.
From a portfolio perspective, our overweight to Industrials along with stock selection within that sector was the most significant drag on relative performance. By country, Brazil was the leading headwind, as our domestically-driven names lagged their cyclically-driven peers. Elsewhere, an off-benchmark holding with ties to the Middle East, Hikma Pharmaceuticals, suffered a short-term correction after a strong run last year.
Our largest detractors were Qiwi, the Russian payment kiosk operator, which we sold as local regulations and the economic environment worsened, along with Glenmark Pharmaceuticals and Cummins India. News that the U.S. Food and Drug Administration had sent notice to a peer regarding manufacturing standards hurt Glenmark, the Indian drug manufacturer. The company's exposure to certain struggling economies added to concerns. Cummins India, the generator manufacturer, declined on concerns that foreign end-market demand was slowing. We continue to maintain positions in both Glenmark and Cummins.
Among factors we see as contributing to the EM recovery this period is investors' realization that while EM GDP growth has slowed, it still offers a premium to developed economies. We believe global interest rates also now offer a benign backdrop, with U.S. interest rates increases seemingly on hold and negative interest rates in the EU and Japan. Lastly, the EM currencies that had retreated in 2015 have shown resilience thus far in 2016.
These positive factors could aid domestically driven growth—an area of focus for us. We are pleased with the names in our portfolio and expect stock picking skills to continue to be an advantage as we look ahead.
Sincerely,
CONRAD SALDANHA
PORTFOLIO MANAGER
Information about principal risks of investing in the Fund is set forth in the prospectus and statement of additional information.
The portfolio composition, industries and holdings of the Fund are subject to change without notice.
The opinions expressed are those of the Fund's portfolio manager. The opinions are as of the date of this report and are subject to change without notice.
5
Emerging Markets Equity Fund (Unaudited)
TICKER SYMBOLS
Institutional Class | | NEMIX | |
Class A | | NEMAX | |
Class C | | NEMCX | |
Class R3 | | NEMRX | |
Class R6 | | NREMX | |
PERFORMANCE HIGHLIGHTS9
| | | | | Average Annual Total Return
Ended 08/31/2016 | |
| | | Inception
Date | | 1 Year | | 5 Years | | Life of
Fund | |
At NAV | |
Institutional Class | | 10/08/2008 | | | 15.64 | % | | | 0.94 | % | | | 8.18 | % | |
Class A | | 10/08/2008 | | | 15.31 | % | | | 0.68 | % | | | 7.92 | % | |
Class C | | 10/08/2008 | | | 14.46 | % | | | –0.07 | % | | | 7.11 | % | |
| Class R310 | | 06/21/2010 | | | 14.88 | % | | | 0.27 | % | | | 7.62 | % | |
| Class R622 | | 03/15/2013 | | | 15.64 | % | | | 0.99 | % | | | 8.22 | % | |
With Sales Charge | |
Class A | | | | | | | 8.65 | % | | | –0.51 | % | | | 7.12 | % | |
Class C | | | | | | | 13.46 | % | | | –0.07 | % | | | 7.11 | % | |
Index | |
| MSCI Emerging Markets Index1,15 | | | | | | | 12.25 | % | | | –0.07 | % | | | 6.83 | % | |
The performance data quoted represent past performance and do not indicate future results. Current performance may be lower or higher than the performance data quoted. For performance data current to the most recent month-end, please visit www.nb.com/performance.
The results shown in the table reflect the reinvestment of income dividends and other distributions, if any. The results do not reflect the effect of taxes a shareholder would pay on Fund distributions or on the redemption of Fund shares.
The investment return and principal value of an investment will fluctuate and shares, when redeemed, may be worth more or less than their original cost.
Returns would have been lower if Neuberger Berman Investment Advisers LLC ("Management") had not reimbursed certain expenses and/or waived a portion of the investment management fees during certain of the periods shown. Repayment by a class (of expenses previously reimbursed and/or fees previously waived by Management) will decrease the class's returns. Please see Note B in the Notes to Financial Statements for specific information regarding expense reimbursement and/or fee waiver arrangements.
As stated in the Fund's most recent prospectus, the total annual operating expense ratios for fiscal year 2015 were 1.43%, 1.79%, 2.53%, 2.09% and 1.34% for Institutional Class, Class A, Class C, Class R3 and Class R6 shares, respectively (before expense reimbursements and/or fee waivers, if any). The expense ratios were 1.25%, 1.50%, 2.25%, 1.91% and 1.18% for Institutional Class, Class A, Class C, Class R3 and Class R6 shares, respectively, after expense reimbursements and/or fee waivers. The expense ratios for the annual period ended August 31, 2016 can be found in the Financial Highlights section of this report.
Returns shown with a sales charge reflect the deduction of the current maximum initial sales charge of 5.75% for Class A shares and the contingent deferred sales charge (CDSC) for Class C shares. The CDSC for Class C shares is 1%, which is reduced to 0% after 1 year. The performance of the Fund's share classes will differ primarily due to different sales charge structures and class expenses. Please see the prospectus for more information about sales charge structures, if any, and class expenses for your share class.
6
Emerging Markets Equity Fund (Unaudited)
COMPARISON OF A $1,000,000 INVESTMENT
(000's Omitted)
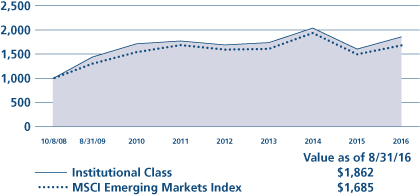
This graph shows the change in value of a hypothetical $1,000,000 investment in the Fund over the past 10 fiscal years, or since the Fund's inception if it has not operated for 10 years. The graph is based on the Institutional Class shares only; the performance of the Fund's share classes will differ primarily due to different sales charge structures and class expenses (see Performance Highlights chart on previous page). The result is compared with benchmarks, which include a broad-based market index and may include a more narrowly based index. Market indices have not been reduced to reflect any of the fees and costs of investing. The results shown in the graph reflect the reinvestment of income dividends and other distributions, if any. The results do not reflect the effect of taxes a shareholder would pay on Fund distributions or on the redemption of Fund shares. Results represent past performance and do not indicate future results.
7
Equity Income Fund Commentary (Unaudited)
Neuberger Berman Equity Income Fund Institutional Class generated a 13.03% total return for the fiscal year ending August 31, 2016, outperforming its benchmark, the S&P 500® Index which posted a 12.55% return for the same period. (Performance for all share classes is provided in the table immediately following this letter.)
The Fund's objective is to deliver total return, which it pursues by investing in stocks and convertible securities that have a history of limited volatility relative to the broader equity market. This portfolio is diversified among dividend-paying stocks, real estate investment trusts (REITs), and convertible bonds. We select our portfolio companies through extensive analysis of the company's fundamentals, cash flow prospects, and factors we believe demonstrate their ability to sustain and grow dividends. We utilize several valuation methodologies to determine companies that we believe have the appropriate risk to reward trade-off. We believe our rigorous security selection, and portfolio construction, has the potential to perform well in both weak and strong economic environments.
During this period, the portfolio benefitted from its allocation to yield oriented sectors, which were key contributors. Within REITs, the Fund's overweight position drove returns. Data center owner Equinix was our top overall performer driven by favorable supply/demand dynamics within cloud computing. Elsewhere, Utilities experienced a tailwind in part from lower U.S. Treasury rates. In July, the yield on the benchmark 10-year Treasury note, which moves inversely to price, closed at a record low of 1.37%. Our bias toward regulated utilities exhibiting higher than average dividend growth was rewarded, as Florida's NextEra Energy was our key contributor within the space. During this period, the Fund reduced its Utilities exposure, with proceeds used primarily to build positions across Information Technology stocks. Microsoft was among our top performers as the tech giant has gained substantial market share in its cloud computing offerings.
In contrast, Energy and Financials exposure hindered results. During the year, oil/gas related stocks experienced increased volatility, with liquefied natural gas shipping company Golar LNG being our greatest detractor. This was ultimately sold after revisiting our investment thesis. Within Financials, UBS Group (sold during the period) and MetLife experienced downward pressure as negative interest rate policies from global central banks impacted profitability. From a portfolio construction standpoint, we believe Financials remain crucial to counterbalance rate sensitive assets classes. This sector tends to have a negative correlation to rising treasury yields—since higher rates allow these companies to earn attractive margins on lending and insurance related activities.
The Fund increased its weighting in convertible bonds over the period. The convertible bond market has contracted dramatically over the course of the last 10 years. The result has been a declining supply of convertible bonds with metrics we find attractive: higher yields to maturity and lower conversion premiums. Over the period, dislocations in the stock prices of several companies provided interesting entry points for convertible bonds of companies with what we believe are attractive balance sheets, free cash flows, and the potential for equity appreciation.
The Fund's use of written options contributed to performance during the period.
Looking ahead, we believe a defensive approach is warranted as equity markets could see increased volatility related to the U.S. presidential election, along with hawkish rhetoric from Fed officials. In our view, a rate hike is justified, as favorable employment trends and inflationary trends highlight improving fundamentals. In the event of pullback, we believe our flexible mandate remains poised to capitalize on dislocations across domestic and global markets with emphasis on companies exhibiting attractive and growing dividend profiles.
Sincerely,
RICHARD LEVINE AND SANDY POMEROY
PORTFOLIO MANAGERS
Information about principal risks of investing in the Fund is set forth in the prospectus and statement of additional information.
The portfolio composition, industries and holdings of the Fund are subject to change without notice.
The opinions expressed are those of the Fund's portfolio managers. The opinions are as of the date of this report and are subject to change without notice.
8
Equity Income Fund (Unaudited)
TICKER SYMBOLS
Institutional Class | | NBHIX | |
Class A | | NBHAX | |
Class C | | NBHCX | |
Class R3 | | NBHRX | |
SECTOR ALLOCATION
(as a % of Total Investments*) | |
Consumer Discretionary | | | 4.1 | % | |
Consumer Staples | | | 5.6 | | |
Energy | | | 9.1 | | |
Financials | | | 29.0 | | |
Health Care | | | 7.1 | | |
Industrials | | | 8.0 | | |
Information Technology | | | 11.1 | | |
Materials | | | 1.7 | | |
Telecommunication Services | | | 1.9 | | |
Utilities | | | 15.2 | | |
Other | | | 5.4 | | |
Short-Term Investment | | | 1.8 | | |
Total | | | 100.0 | % | |
* Derivatives, if any, are excluded from this chart.
PERFORMANCE HIGHLIGHTS9
| | | | | Average Annual Total Return
Ended 08/31/2016 | |
| | | Inception
Date* | | 1 Year | | 5 Years | | Life of
Fund | |
At NAV | |
| Institutional Class13 | | 06/09/2008 | | | 13.03 | % | | | 8.05 | % | | | 7.33 | % | |
| Class A13 | | 06/09/2008 | | | 12.64 | % | | | 7.63 | % | | | 6.97 | % | |
| Class C13 | | 06/09/2008 | | | 11.77 | % | | | 6.86 | % | | | 6.33 | % | |
| Class R313 | | 06/21/2010 | | | 12.26 | % | | | 7.32 | % | | | 6.87 | % | |
With Sales Charge | |
| Class A13 | | | | | | | 6.19 | % | | | 6.35 | % | | | 6.33 | % | |
| Class C13 | | | | | | | 10.77 | % | | | 6.86 | % | | | 6.33 | % | |
Index | |
| S&P 500® Index1,15 | | | | | | | 12.55 | % | | | 14.69 | % | | | 7.09 | % | |
*The performance data for each class includes the performance of the Fund's oldest share class, Trust Class, from November 2, 2006 through June 9, 2008. The performance data for Class R3 also includes the performance of the Fund's Institutional Class from June 9, 2008 through June 21, 2010. See endnote 13 for information about the effects of the different fees paid by each class.
The performance data quoted represent past performance and do not indicate future results. Current performance may be lower or higher than the performance data quoted. For performance data current to the most recent month-end, please visit www.nb.com/performance.
The results shown in the table reflect the reinvestment of income dividends and other distributions, if any. The results do not reflect the effect of taxes a shareholder would pay on Fund distributions or on the redemption of Fund shares.
The investment return and principal value of an investment will fluctuate and shares, when redeemed, may be worth more or less than their original cost.
Returns would have been lower if Neuberger Berman Investment Advisers LLC ("Management") had not reimbursed certain expenses and/or waived a portion of the investment management fees during certain of the periods shown. Repayment by a class (of expenses previously reimbursed and/or fees previously waived by Management) will decrease the class's returns. Please see Note B in the Notes to Financial Statements for specific information regarding expense reimbursement and/or fee waiver arrangements.
As stated in the Fund's most recent prospectus, the total annual operating expense ratios for fiscal year 2015 were 0.74%, 1.12%, 1.85% and 1.37% for Institutional Class, Class A, Class C and Class R3 shares, respectively (before expense reimbursements and/or fee waivers, if any). The expense ratios for the annual period ended August 31, 2016 can be found in the Financial Highlights section of this report.
Returns shown with a sales charge reflect the deduction of the current maximum initial sales charge of 5.75% for Class A shares and the contingent deferred sales charge (CDSC) for Class C shares. The CDSC for Class C shares is 1%, which is reduced to 0% after 1 year. The performance of the Fund's share classes will differ primarily due to different sales charge structures and class expenses. Please see the prospectus for more information about sales charge structures, if any, and class expenses for your share class.
9
Equity Income Fund (Unaudited)
COMPARISON OF A $1,000,000 INVESTMENT13
(000's Omitted)
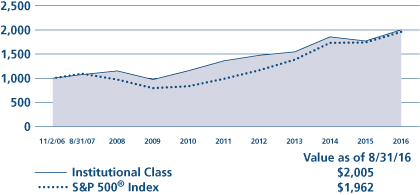
This graph shows the change in value of a hypothetical $1,000,000 investment in the Fund over the past 10 fiscal years, or since the Fund's inception if it has not operated for 10 years. The graph is based on the Institutional Class shares only; the performance of the Fund's share classes will differ primarily due to different sales charge structures and class expenses (see Performance Highlights chart on previous page). The result is compared with benchmarks, which include a broad-based market index and may include a more narrowly based index. Market indices have not been reduced to reflect any of the fees and costs of investing. The results shown in the graph reflect the reinvestment of income dividends and other distributions, if any. The results do not reflect the effect of taxes a shareholder would pay on Fund distributions or on the redemption of Fund shares. Results represent past performance and do not indicate future results.
10
Focus Fund Commentary (Unaudited)
Neuberger Berman Focus Fund Investor Class generated a 6.68% total return for the fiscal year ended August 31, 2016, underperforming its benchmark, the S&P 500® Index (the Index), which provided a 12.55% return for the same period. (Performance for all share classes is provided in the table immediately following this letter.)
The stock market appreciated over the past year but ongoing macro issues caused some steep corrections along the way. Rising concerns about economic softness in China and other emerging markets caused equities to drop early in the period, yet the market's strong recovery cleared a path for a much-anticipated Fed rate hike in December. This led to a surge in the U.S. dollar and a fall in oil prices, which reignited investor uncertainty about the state of the global economy and sent stocks reeling once more. Still, the market rebounded after each drop, bolstered by a strengthening domestic economy, some commodity price recovery and accommodative global monetary policies. In June, equities took another hit due to the unexpected UK decision to exit the European Union. After the dust settled however, investors were encouraged by continued monetary easing in Europe and delayed rate tightening at home which, combined with the relative stability of the U.S. economy, enticed investors into the market and pushed equities to new heights towards the end of the period.
Performance was positive across all ten sectors of the S&P 500 during the year, yet with interest rates and bond yields persistently low, the generally higher dividend-paying Utilities and Telecommunication Services sectors became the best performing segments of the market. The Information Technology and Consumer Staples sectors were also among the strongest areas while Health Care, Financials and Energy eked out the lowest returns.
The Energy sector gave the largest boost to Fund performance relative to the Index. In aggregate, our Energy names outperformed, led by Concho Resources (CXO). The stock appreciated as oil prices recovered during the year, and even while the commodity pulled back late in the summer, CXO held onto its gains as investors gave the company credit for its favorable oil price hedges. The Fund also benefited relative to the index from an overweight allocation to Telecommunication Services, which was one of the strongest segments of the general market over the period. Our Industrials and Consumer Discretionary sector investments caused a majority of the Fund's underperformance for the period. The shortfall in Industrials was due in large part to our exposure to Delta Air Lines (DAL). Airlines in general faltered during the latter half of the period, due to several factors including strengthening oil prices, as well as a seeming uptick in terrorist attacks throughout the world, which can curb travel activity. In addition, the Brexit vote has had a significant impact on airline stocks as some predict that it will depress air travel both to and from the UK. Given these developments, we exited our position in DAL and invested the proceeds in other areas. The Fund lost further ground in Consumer Discretionary where select names were hit particularly hard as a result of a more challenging retail environment, which included rising competition from key players in online shopping.
The Fund's use of purchased and written options contributed to performance during the period.
The market's record-breaking uptrend has largely been due to persistently low interest rates at home and negative rates abroad. This has resulted in stock valuations that appear stretched relative to history, particularly as corporate earnings growth has been slowing due to low oil prices and adverse currency effects. With stock prices at these levels, we believe the market could be vulnerable to a downturn when the Fed tightens rates again or if deteriorating circumstances in areas such as China, Japan or Europe provokes fear among investors. Yet the timing and magnitude of such events remains elusive. Accordingly, we remain focused on bottom-up investing and conduct extensive fundamental research on individual stocks to create a portfolio that we believe can sustain the ups and downs in the overall market and generate positive returns over an economic cycle.
Sincerely,
TIMOTHY CREEDON AND DAVID LEVINE
PORTFOLIO MANAGERS
Information about principal risks of investing in the Fund is set forth in the prospectus and statement of additional information.
The portfolio composition, industries and holdings of the Fund are subject to change without notice.
The opinions expressed are those of the Fund's portfolio managers. The opinions are as of the date of this report and are subject to change without notice.
11
TICKER SYMBOLS
Investor Class | | NBSSX | |
Trust Class | | NBFCX | |
Advisor Class | | NBFAX | |
Institutional Class | | NFALX | |
Class A | | NFAAX | |
Class C | | NFACX | |
SECTOR ALLOCATION
(as a % of Total Investments*) | |
Consumer Discretionary | | | 12.6 | % | |
Consumer Staples | | | 9.5 | | |
Energy | | | 7.8 | | |
Financials | | | 16.0 | | |
Health Care | | | 14.7 | | |
Industrials | | | 2.4 | | |
Information Technology | | | 21.9 | | |
Materials | | | 3.4 | | |
Telecommunication Services | | | 5.1 | | |
Utilities | | | 2.2 | | |
Other | | | 0.0 | | |
Short-Term Investment | | | 4.4 | | |
Total | | | 100.0 | % | |
* Derivatives, if any, are excluded from this chart.
PERFORMANCE HIGHLIGHTS8
| | | | | Average Annual Total Return
Ended 08/31/2016 | |
| | | Inception
Date | | 1 Year | | 5 Years | | 10 Years | | Life of
Fund | |
At NAV | |
Investor Class | | 10/19/1955 | | | 6.68 | % | | | 13.74 | % | | | 5.90 | % | | | 10.39 | % | |
| Trust Class3 | | 08/30/1993 | | | 6.50 | % | | | 13.51 | % | | | 5.68 | % | | | 10.37 | % | |
| Advisor Class4 | | 09/03/1996 | | | 6.33 | % | | | 13.34 | % | | | 5.48 | % | | | 10.31 | % | |
| Institutional Class5 | | 06/21/2010 | | | 6.86 | % | | | 13.95 | % | | | 6.02 | % | | | 10.41 | % | |
| Class A19 | | 06/21/2010 | | | 6.52 | % | | | 13.53 | % | | | 5.79 | % | | | 10.37 | % | |
| Class C19 | | 06/21/2010 | | | 5.75 | % | | | 12.70 | % | | | 5.31 | % | | | 10.29 | % | |
With Sales Charge | |
| Class A19 | | | | | | | 0.40 | % | | | 12.20 | % | | | 5.16 | % | | | 10.26 | % | |
| Class C19 | | | | | | | 4.85 | % | | | 12.70 | % | | | 5.31 | % | | | 10.29 | % | |
Index | |
| S&P 500® Index1,15 | | | | | | | 12.55 | % | | | 14.69 | % | | | 7.51 | % | | | 10.08 | % | |
The performance data quoted represent past performance and do not indicate future results. Current performance may be lower or higher than the performance data quoted. For performance data current to the most recent month-end, please visit www.nb.com/performance.
The results shown in the table reflect the reinvestment of income dividends and other distributions, if any. The results do not reflect the effect of taxes a shareholder would pay on Fund distributions or on the redemption of Fund shares.
The investment return and principal value of an investment will fluctuate and shares, when redeemed, may be worth more or less than their original cost.
Returns would have been lower if Neuberger Berman Investment Advisers LLC ("Management") had not reimbursed certain expenses and/or waived a portion of the investment management fees during certain of the periods shown. Repayment by a class (of expenses previously reimbursed and/or fees previously waived by Management) will decrease the class's returns. Please see Note B in the Notes to Financial Statements for specific information regarding expense reimbursement and/or fee waiver arrangements.
As stated in the Fund's most recent prospectus, the total annual operating expense ratios for fiscal year 2015 were 0.91%, 1.10%, 1.27%, 0.76%, 1.14%, and 1.89% for Investor Class, Trust Class, Advisor Class, Institutional Class, Class A and Class C shares, respectively (before expense reimbursements and/or fee waivers, if any). The expense ratios were 0.75%, 1.11%, and 1.86% for Institutional Class, Class A and Class C shares, respectively, after expense reimbursements and/or fee waivers. The expense ratios for the annual period ended August 31, 2016 can be found in the Financial Highlights section of this report.
Returns shown with a sales charge reflect the deduction of the current maximum initial sales charge of 5.75% for Class A shares and the contingent deferred sales charge (CDSC) for Class C shares. The CDSC for Class C shares is 1%, which is reduced to 0% after 1 year. The performance of the Fund's share classes will differ primarily due to different sales charge structures and class expenses. Please see the prospectus for more information about sales charge structures, if any, and class expenses for your share class.
12
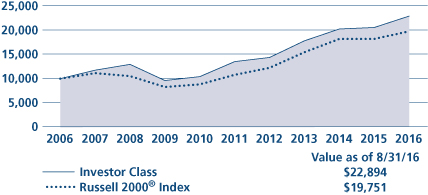
COMPARISON OF A $10,000 INVESTMENT
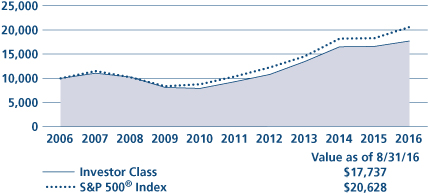
This graph shows the change in value of a hypothetical $10,000 investment in the Fund over the past 10 fiscal years, or since the Fund's inception if it has not operated for 10 years. The graph is based on the Investor Class shares only; the performance of the Fund's share classes will differ primarily due to different sales charge structures and class expenses (see Performance Highlights chart on previous page). The result is compared with benchmarks, which include a broad-based market index and may include a more narrowly based index. Market indices have not been reduced to reflect any of the fees and costs of investing. The results shown in the graph reflect the reinvestment of income dividends and other distributions, if any. The results do not reflect the effect of taxes a shareholder would pay on Fund distributions or on the redemption of Fund shares. Results represent past performance and do not indicate future results.
13
Genesis Fund Commentary (Unaudited)
Neuberger Berman Genesis Fund Investor Class posted an 11.43% total return for the fiscal year ended August 31, 2016, outperforming its benchmark, the Russell 2000® Index, which provided an 8.59% total return for the same period. (Performance for all share classes is provided in the table immediately following this letter.)
The U.S. stock market generated strong results during the reporting period. The market was supported by overall positive investor demand, certain resilient economic data and continued supportive Fed monetary policy. The overall U.S. stock market, as measured by the S&P 500® Index, rose 12.55% for the 12-month period. Small-cap stocks produced less robust results, as the Russell 2000 Index gained 8.59% for the period. There was a significant dispersion between small-cap growth and value stocks, as the Russell 2000® Growth and Value Indexes returned 3.55% and 13.80%, respectively.
The Fund's outperformance relative to the benchmark was due to stock selection. The Fund benefited from our preference for higher quality, less cyclical and less speculative companies. In particular, our holdings in the Health Care and Consumer Discretionary sectors added the most value during the reporting period. In terms of individual holdings, West Pharmaceutical Services, Inc. and Pool Corp. added the most value. Along with a dominant position in drug packaging (rubber stoppers for injectable drug vials), West Pharmaceutical Services operates a promising drug delivery segment. Pool Corp. is the country's largest wholesale distributor of swimming pool supplies and equipment. On the downside, stock selection in the Materials and Information Technology sectors were the largest detractors from relative performance. Individual holdings that had negative results included Wabtec Corp. and Polaris Industries Inc. Wabtec provides value-added, technology-based equipment and services to lower costs and improve efficiency, productivity and safety of global rail industry. Polaris Industries designs and manufactures off-road vehicles for recreational and utility purposes.
Sector allocation, overall, detracted from performance during the reporting period. In particular, having no exposure to real estate investment trusts (REITs) was negative for results. We do not typically own REITs, as they do not meet our investment criteria. Having no allocation to the Utilities sector was also a drag on performance. On the upside, having no exposure to Biotechnology stocks contributed to relative results as they generated extremely poor returns. We do not typically own biotechnology companies as they do not meet our investment criteria given their speculative nature, a general lack of earnings and their need to access the capital markets. Elsewhere, an overweight to Containers & Packaging (within the Materials sector) and Household Products (within the Consumer Staples sector) were beneficial for performance.
Looking ahead, while market volatility has been subdued of late, we believe this could change in the coming months. Investor sentiment may be challenged at times given a host of uncertainties, including the outcome from the November elections, the timing of additional Fed interest rate hikes and the trajectory for growth in China. On the upside, even though U.S. economic growth has been far from robust, we believe it remains relatively solid when compared to many other countries. As a U.S. small-cap manager, we are less exposed to overseas growth than our larger-cap counterparts. Furthermore, our portfolio is comprised of companies with differentiated business models that have consistently generated solid free cash flow, enjoyed healthy levels of profitability and maintained conservative balance sheets. In our opinion, these businesses, on a relative basis, tend to perform well in challenging macro environments. In addition, given their generally low leverage, we believe the portfolio's holdings should be less susceptible to Fed rates hikes when they eventually occur.
Sincerely,
JUDITH M. VALE AND ROBERT W. D'ALELIO
PORTFOLIO CO-MANAGERS
Information about principal risks of investing in the Fund is set forth in the prospectus and statement of additional information.
The portfolio composition, industries and holdings of the Fund are subject to change without notice.
The opinions expressed are those of the Fund's portfolio managers. The opinions are as of the date of this report and are subject to change without notice.
14
TICKER SYMBOLS
Investor Class | | NBGNX | |
Trust Class | | NBGEX | |
Advisor Class | | NBGAX | |
Institutional Class | | NBGIX | |
Class R6 | | NRGSX | |
SECTOR ALLOCATION
(as a % of Total Investments*) | |
Consumer Discretionary | | | 12.4 | % | |
Consumer Staples | | | 6.9 | | |
Energy | | | 2.0 | | |
Financials | | | 13.6 | | |
Health Care | | | 15.9 | | |
Industrials | | | 20.7 | | |
Information Technology | | | 18.6 | | |
Materials | | | 8.8 | | |
Short-Term Investments | | | 1.1 | | |
Total | | | 100.0 | % | |
* Derivatives, if any, are excluded from this chart.
PERFORMANCE HIGHLIGHTS
| | | | | Average Annual Total Return
Ended 08/31/2016 | |
| | | Inception
Date | | 1 Year | | 5 Years | | 10 Years | | Life of
Fund | |
Investor Class | | 09/27/1988 | | | 11.43 | % | | | 11.11 | % | | | 8.64 | % | | | 12.17 | % | |
| Trust Class3 | | 08/26/1993 | | | 11.35 | % | | | 11.01 | % | | | 8.57 | % | | | 12.15 | % | |
| Advisor Class4 | | 04/02/1997 | | | 11.06 | % | | | 10.71 | % | | | 8.28 | % | | | 11.93 | % | |
| Institutional Class5 | | 07/01/1999 | | | 11.62 | % | | | 11.30 | % | | | 8.85 | % | | | 12.32 | % | |
| Class R623 | | 03/15/2013 | | | 11.69 | % | | | 11.29 | % | | | 8.72 | % | | | 12.20 | % | |
Index | |
| Russell 2000® Index1,15 | | | | | 8.59 | % | | | 12.85 | % | | | 7.04 | % | | | 9.50 | % | |
The performance data quoted represent past performance and do not indicate future results. Current performance may be lower or higher than the performance data quoted. For performance data current to the most recent month-end, please visit www.nb.com/performance.
The results shown in the table reflect the reinvestment of income dividends and other distributions, if any. The results do not reflect the effect of taxes a shareholder would pay on Fund distributions or on the redemption of Fund shares.
The investment return and principal value of an investment will fluctuate and shares, when redeemed, may be worth more or less than their original cost.
Returns would have been lower if Neuberger Berman Investment Advisers LLC ("Management") had not reimbursed certain expenses and/or waived a portion of the investment management fees during certain of the periods shown. Repayment by a class (of expenses previously reimbursed and/or fees previously waived by Management) will decrease the class's returns. Please see Note B in the Notes to Financial Statements for specific information regarding expense reimbursement and/or fee waiver arrangements.
As stated in the Fund's most recent prospectus, the total annual operating expense ratios for fiscal year 2015 were 1.01%, 1.10%, 1.39%, 0.85% and 0.78% for Investor Class, Trust Class, Advisor Class, Institutional Class and Class R6 shares, respectively (before expense reimbursements and/or fee waivers, if any). The expense ratios for the annual period ended August 31, 2016 can be found in the Financial Highlights section of this report.
15
COMPARISON OF A $10,000 INVESTMENT
This graph shows the change in value of a hypothetical $10,000 investment in the Fund over the past 10 fiscal years, or since the Fund's inception if it has not operated for 10 years. The graph is based on the Investor Class shares only; the performance of the Fund's share classes will differ primarily due to different class expenses (see Performance Highlights chart on previous page). The result is compared with benchmarks, which include a broad-based market index and may include a more narrowly based index. Market indices have not been reduced to reflect any of the fees and costs of investing. The results shown in the graph reflect the reinvestment of income dividends and other distributions, if any. The results do not reflect the effect of taxes a shareholder would pay on Fund distributions or on the redemption of Fund shares. Results represent past performance and do not indicate future results.
16
Global Equity Fund Commentary (Unaudited)
Neuberger Berman Global Equity Fund Institutional Class generated a total return of 5.76% for the fiscal year ended August 31, 2016, underperforming the 7.86% return of its benchmark, the MSCI All Country World Index (the Index). (Performance for all share classes is provided in the table immediately following this letter.)
Healthy returns masked the volatility present in global markets throughout this fiscal year. In addition to concerns about low commodity prices and slow growth, both globally and in specific economies such as China, markets saw two major selloffs. The first was triggered by negative interest rates and fears about their impact on the economically important Eurozone and Japanese banking sectors; then in June, markets sold off again on the surprise outcome of the "Brexit" referendum and its potential impacts in the UK and economies across the Eurozone. Each time, markets rebounded fairly quickly. The U.S. and emerging markets, each up over 12% for the period, outperformed developed international markets, where Brexit and banking concerns were most pronounced.
Within the Index, by sector, Information Technology (IT) stocks performed best, followed by Consumer Staples, which benefited from a flight to safety. By country, New Zealand and Brazil were top performers.
Within the portfolio, stock selection within Consumer Staples along with an overweight to IT provided the greatest benefit. By country, strong stock picking in Japan and U.S.-based holdings, such as our top individual contributors, SanDisk, Amazon.com, and Waste Connections, contributed positively to performance.
SanDisk, the leading supplier of NAND flash technologies, received a bid from Western Digital. Amazon.com, the e-commerce giant, saw better-than-expected results from its web and cloud services, and an announced merger between U.S.-based Waste Connections and Progressive Waste was well received by investors.
The weakest Index sectors included Health Care, which posted a small loss, and Financials. Greece and Italy were the weakest individual markets.
Within the portfolio, stock selection in Industrials and Telecommunication Services, and, by country, UK-based holdings, contributed to our relative shortfall. Key detractors this period included UK-based holdings Barclays, TalkTalk, and Travis Perkins. UK based bank Barclays, and Travis Perkins, the UK builders' merchant, were hurt by fears about the economic impact in the UK of the Brexit referendum. TalkTalk, a UK Telecom/TV/Internet service provider, was the victim of a cyber-attack. We continue to own each of these names. Elsewhere, limited exposure to the top-performing Brazilian market was a detriment.
Looking ahead, Brexit may lead to additional political, economic and market uncertainty for the UK and EU. We do not believe it will lead to a full-blown crisis, however. We believe it is clear that political risk has increased for other nations, with French elections, most notably, coming in 2017, which is likely to dampen consumer and corporate risk appetite. Weaker growth for the next 12 to 18 months may be the likely result.
Given this uncertainty, we made changes to the portfolio over the latter part of the period, preferring to invest on conviction once the dust settles, rather than trade during a period of significant volatility. Our conviction on quality is unshaken, as is our affinity for domestically focused U.S. businesses and European multinationals. As ever, our focus remains on investing in companies with sustainable profitability and growth characteristics at attractive valuations, believing this is the best way to add value over the long term.
Sincerely,
BENJAMIN SEGAL AND SAURIN D. SHAH
PORTFOLIO MANAGERS
Information about principal risks of investing in the Fund is set forth in the prospectus and statement of additional information.
The portfolio composition, industries and holdings of the Fund are subject to change without notice.
The opinions expressed are those of the Fund's portfolio managers. The opinions are as of the date of this report and are subject to change without notice.
17
Global Equity Fund (Unaudited)
TICKER SYMBOLS
Institutional Class | | NGQIX | |
Class A | | NGQAX | |
Class C | | NGQCX | |
PERFORMANCE HIGHLIGHTS9
| | | | | Average Annual Total
Return Ended 08/31/2016 | |
| | | Inception
Date | | 1 Year | | 5 Years | | Life of
Fund | |
At NAV | |
Institutional Class | | 06/30/2011 | | | 5.76 | % | | | 7.07 | % | | | 4.89 | % | |
Class A | | 06/30/2011 | | | 5.46 | % | | | 6.70 | % | | | 4.52 | % | |
Class C | | 06/30/2011 | | | 4.66 | % | | | 5.92 | % | | | 3.75 | % | |
With Sales Charge | |
Class A | | | | | | | –0.61 | % | | | 5.45 | % | | | 3.33 | % | |
Class C | | | | | | | 3.66 | % | | | 5.92 | % | | | 3.75 | % | |
Index | |
| MSCI All Country World Index1,15 | | | | | | | 7.86 | % | | | 8.91 | % | | | 6.96 | % | |
The performance data quoted represent past performance and do not indicate future results. Current performance may be lower or higher than the performance data quoted. For performance data current to the most recent month-end, please visit www.nb.com/performance.
The results shown in the table reflect the reinvestment of income dividends and other distributions, if any. The results do not reflect the effect of taxes a shareholder would pay on Fund distributions or on the redemption of Fund shares.
The investment return and principal value of an investment will fluctuate and shares, when redeemed, may be worth more or less than their original cost.
Returns would have been lower if Neuberger Berman Investment Advisers LLC ("Management") had not reimbursed certain expenses and/or waived a portion of the investment management fees during certain of the periods shown. Repayment by a class (of expenses previously reimbursed and/or fees previously waived by Management) will decrease the class's returns. Please see Note B in the Notes to Financial Statements for specific information regarding expense reimbursement and/or fee waiver arrangements.
As stated in the Fund's most recent prospectus, the total annual operating expense ratios for fiscal year 2015 were 4.77%, 5.24% and 6.00% for Institutional Class, Class A and Class C shares, respectively (before expense reimbursements and/or fee waivers, if any). The expense ratios were 1.16%, 1.51% and 2.26% for Institutional Class, Class A and Class C shares, respectively, after expense reimbursements and/or fee waivers. The expense ratios for the annual period ended August 31, 2016 can be found in the Financial Highlights section of this report.
Returns shown with a sales charge reflect the deduction of the current maximum initial sales charge of 5.75% for Class A shares and the contingent deferred sales charge (CDSC) for Class C shares. The CDSC for Class C shares is 1%, which is reduced to 0% after 1 year. The performance of the Fund's share classes will differ primarily due to different sales charge structures and class expenses. Please see the prospectus for more information about sales charge structures, if any, and class expenses for your share class.
18
Global Equity Fund (Unaudited)
COMPARISON OF A $1,000,000 INVESTMENT
(000's Omitted)
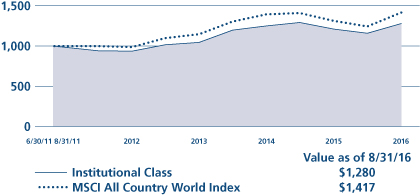
This graph shows the change in value of a hypothetical $1,000,000 investment in the Fund over the past 10 fiscal years, or since the Fund's inception if it has not operated for 10 years. The graph is based on the Institutional Class shares only; the performance of the Fund's share classes will differ primarily due to different sales charge structures and class expenses (see Performance Highlights chart on previous page). The result is compared with benchmarks, which include a broad-based market index and may include a more narrowly based index. Market indices have not been reduced to reflect any of the fees and costs of investing. The results shown in the graph reflect the reinvestment of income dividends and other distributions, if any. The results do not reflect the effect of taxes a shareholder would pay on Fund distributions or on the redemption of Fund shares. Results represent past performance and do not indicate future results.
19
Global Real Estate Fund Commentary (Unaudited)
Neuberger Berman Global Real Estate Fund Institutional Class generated a 16.49% total return for the fiscal year ended August 31, 2016, underperforming its benchmark, the FTSE EPRA/NAREIT Developed Index, which generated an 18.36% total return for the period. (Performance for all share classes is provided in the table immediately following this letter.)
Despite periods of elevated volatility, the global stock market generated a positive return during the reporting period. The market was negatively impacted at times given concerns over moderating global growth, geopolitical issues, and uncertainties regarding the UK electorate's vote to leave the European Union (Brexit) and investor risk aversion. However, these issues were overshadowed by periods of solid investor demand and continued supportive monetary policy. Comparatively, global real estate investment trusts (REITs) posted even stronger results, partially due to overall positive investor demand and generally declining longer-term interest rates.
While it produced a strong absolute return, the Fund underperformed the benchmark during the reporting period. The Fund's positioning from the regional/country perspective detracted from results during the reporting period. An overweight to the UK was the largest negative for returns as it performed poorly given concerns about the fallout from Brexit. We pared back the Fund's allocation to the UK during the reporting period. An overweight to France was also a headwind for performance. On the upside, having no exposures to Spain and the Netherlands were the most additive for relative results.
Sector allocation, overall, was negative for performance. An overweight to the Real Estate Holding & Development sector, along with underweights to the Retail REITs and Diversified REITs sectors, were the largest detractors from results. Conversely, an overweight to the Specialty REITs sector and an underweight to Hotel & Lodging REITs sector were the largest contributors to returns.
Finally, stock selection, overall, detracted from the Fund's performance. The largest negative for results was the Fund's holdings in the Industrial & Office REITs sector. Stock selection in the Hotel & Lodging REITs sector was also a headwind for performance. On the upside, our holdings in the Specialty REITs and Real Estate Holding & Development sectors were the most additive for results.
The U.S. economy has been fairly resilient in the face of global headwinds. Turning to the Fed, it appears likely to us that the central bank will take a measured and cautious approach in terms of normalizing policy. We believe continued economic growth and modest inflation should be supportive for the U.S. commercial property market. Overseas, post the outcome of the Brexit vote, we believe that the medium-term consequences for both the UK. and the Continent are negative, although the longer term impact at this point remains unclear. At this point, UK REITs are trading at relatively low valuations, and we believe there is still downside risk to net asset values. We are also worried about the cyclical and structural headwinds still to come in the UK property market. On the Continental side, however, we are positive on the stirrings of recovery in the French economy and have positioned the portfolio to take advantage of what we hope to be a broad-based recovery in France. Elsewhere, in Asia Pacific, we believe the deferral of the consumption tax hike removed a potential risk from Japan, but market confidence is substantially shaken by the country's negative interest rate policy. In our opinion, Australia remains the brightest spot in Asia Pacific. Elsewhere, we believe Hong Kong and Singapore markets could experience a sustained gradual correction.
Sincerely,
STEVE SHIGEKAWA, BRIAN C. JONES, GILLIAN TILTMAN AND ANTON KWANG
PORTFOLIO MANAGERS
Information about principal risks of investing in the Fund is set forth in the prospectus and statement of additional information.
The portfolio composition, industries and holdings of the Fund are subject to change without notice.
The opinions expressed are those of the Fund's portfolio managers. The opinions are as of the date of this report and are subject to change without notice.
20
Global Real Estate Fund (Unaudited)
TICKER SYMBOLS
Institutional Class | | NGRIX | |
Class A | | NGRAX | |
Class C | | NGRCX | |
PERFORMANCE HIGHLIGHTS9
| | |
| | Average Annual Total
Return Ended 08/31/2016 | |
| | | Inception
Date | | 1 Year | | Life of
Fund | |
At NAV | |
Institutional Class | | 12/30/2014 | | | 16.49 | % | | | 5.62 | % | |
Class A | | 12/30/2014 | | | 16.09 | % | | | 5.23 | % | |
Class C | | 12/30/2014 | | | 15.15 | % | | | 4.41 | % | |
With Sales Charge | |
Class A | | | | | | | 9.40 | % | | | 1.57 | % | |
Class C | | | | | | | 14.15 | % | | | 4.41 | % | |
Index | |
| FTSE EPRA/NAREIT Developed Index1,15 | | | | | | | 18.36 | % | | | 6.30 | % | |
The performance data quoted represent past performance and do not indicate future results. Current performance may be lower or higher than the performance data quoted. For performance data current to the most recent month-end, please visit www.nb.com/performance.
The results shown in the table reflect the reinvestment of income dividends and other distributions, if any. The results do not reflect the effect of taxes a shareholder would pay on Fund distributions or on the redemption of Fund shares.
The investment return and principal value of an investment will fluctuate and shares, when redeemed, may be worth more or less than their original cost.
Returns would have been lower if Neuberger Berman Investment Advisers LLC ("Management") had not reimbursed certain expenses and/or waived a portion of the investment management fees during certain of the periods shown. Repayment by a class (of expenses previously reimbursed and/or fees previously waived by Management) will decrease the class's returns. Please see Note B in the Notes to Financial Statements for specific information regarding expense reimbursement and/or fee waiver arrangements.
As stated in the Fund's most recent prospectus, the total annual operating expense ratios for fiscal year 2015 were 10.18%, 10.80% and 12.12% for Institutional Class, Class A and Class C shares, respectively (before expense reimbursements and/or fee waivers, if any). The expense ratios were 1.00%, 1.36% and 2.11% for Institutional Class, Class A and Class C shares, respectively, after expense reimbursements and/or fee waivers. The expense ratios for the annual period ended August 31, 2016 can be found in the Financial Highlights section of this report.
Returns shown with a sales charge reflect the deduction of the current maximum initial sales charge of 5.75% for Class A shares and the contingent deferred sales charge (CDSC) for Class C shares. The CDSC for Class C shares is 1%, which is reduced to 0% after 1 year. The performance of the Fund's share classes will differ primarily due to different sales charge structures and class expenses. Please see the prospectus for more information about sales charge structures, if any, and class expenses for your share class.
21
Global Real Estate Fund (Unaudited)
COMPARISON OF A $1,000,000 INVESTMENT
(000's Omitted)
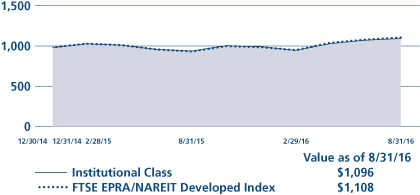
This graph shows the change in value of a hypothetical $1,000,000 investment in the Fund over the past 10 fiscal years, or since the Fund's inception if it has not operated for 10 years. The graph is based on the Institutional Class shares only; the performance of the Fund's share classes will differ primarily due to different sales charge structures and class expenses (see Performance Highlights chart on previous page). The result is compared with benchmarks, which include a broad-based market index and may include a more narrowly based index. Market indices have not been reduced to reflect any of the fees and costs of investing. The results shown in the graph reflect the reinvestment of income dividends and other distributions, if any. The results do not reflect the effect of taxes a shareholder would pay on Fund distributions or on the redemption of Fund shares. Results represent past performance and do not indicate future results.
22
Greater China Equity Fund Commentary (Unaudited)
Neuberger Berman Greater China Equity Fund Institutional Class generated a 12.09% total return for the fiscal year ended August 31, 2016, outperforming its benchmark, the MSCI China Index, which returned 8.28% over the same period. (Performance for all share classes is provided in the table immediately following this letter.)
Over the past 12 months, China equity markets continued to be volatile. The domestic China A-shares market underperformed in September due to weaker than expected macroeconomic data released for August. Markets rebounded after the China National Day holidays, primarily due to the U.S. Federal Open Market Committee delaying interest rates hike, stabilizing China Purchasing Managers Index (PMI) and supportive policies such as cutting the purchase tax for automobiles and reducing down payment requirements for first time home buyers. Published third quarter 2015 GDP growth of 6.9% and another round of interest rate and reserve requirement ratio (RRR) cuts by 25 basis points and 50 basis points, respectively, further supported markets. In November, China's Fifth Plenum led to the abolition of its One Child Policy and anticipation of the Shenzhen-Hong Kong Stock Connect program. Towards calendar year-end, the onshore market performed well due to ongoing state-owned enterprises reforms and the International Monetary Fund including the renminbi (RMB) in the special drawing rights basket. In January, China equity markets declined mainly because of concerns over RMB depreciation and major shareholders selling their positions after the ban was lifted, which triggered the new China A-shares circuit breaker twice in the first four trading days. The circuit breaker was subsequently suspended by the China Securities Regulatory Commission (CSRC). Markets stabilized in early February due to January PMI, rising oil prices and expectations of supply side reform.
In March, both the offshore and onshore markets rebounded strongly after the People's Bank of China cut RRR by 50 basis points, the government's announcement of additional home purchase easing measures, and the supportive outcome of the National People's Congress. Markets consolidated in April and trading turnover sharply declined as investor sentiment remained cautious. In May, markets declined further due to Caixin PMI being lower than expected, sliding onshore commodities futures, concerns over restrictions in Mergers & Acquisitions, refinancing activities by Chinese regulators and another potential interest rate hike in the U.S. In early June, markets rallied as investor sentiment was encouraged by the impending announcement of the Shenzhen Stock Connect, but trading volume turnover significantly declined in response to the Brexit vote, after which China equities were sold off along with global markets but stabilized quickly and pared losses by month-end. Markets performed well in July as second quarter 2016 GDP growth, Industrial Output and Retail Sales figures all reported better than market estimates. However, the CSRC potentially implementing tighter rules against wealth management products resulted in profit-taking towards month-end. The offshore market outperformed in August after the CSRCs approval of Stock Connect, but sentiment turned cautious as investors focused on companies' earnings results for the first half of the year.
For the 12-month period, the Fund's underweights versus the benchmark in Information Technology (IT) and Financials contributed to performance. In contrast, the Fund's overweight position in Utilities and Industrials detracted from relative returns. Stock selection had a positive impact in IT, Industrials and Consumer Staples, whereas stock selection had a negative impact in Financials and Utilities, relative to the benchmark.
The Fund continues to focus on companies that we believe have sustainable top and bottom line growth by looking at the companies' operating cash flow from their recurring core businesses. As of August 31, 2016, the Fund's largest sector overweight relative to the benchmark was Industrials, followed by Health Care and Utilities. The largest sector underweight was IT, followed by Energy and Financials. The Fund's top 10 equity positions constituted approximately 57% of total portfolio assets at the end of the period.
We believe the China equity markets will continue to experience volatility throughout the remainder of 2016, driven by the ongoing implementation of various structural reforms by the Chinese government. It is our opinion that markets will also likely be subject to shorter-term oscillations given macroeconomic and political uncertainties abroad. Given the above, we continue to stress the importance of selectivity and focus on company fundamentals in navigating China equity markets for the coming years. We had previously discussed the opportunities for active management resulting from the bifurcation of China's economic structure. This remains the case, as indicated by first quarter corporate
23
earnings where companies operating in sectors more aligned with the ongoing economic rebalancing generally reported healthier results versus those companies in sectors that are not. We anticipate such trends to continue to play out over time.
Sincerely,
LIHUI TANG AND FRANK YAO
PORTFOLIO MANAGERS
Information about principal risks of investing in the Fund is set forth in the prospectus and statement of additional information.
The portfolio composition, industries and holdings of the Fund are subject to change without notice.
The opinions expressed are those of the Fund's portfolio managers. The opinions are as of the date of this report and are subject to change without notice.
24
Greater China Equity Fund (Unaudited)
TICKER SYMBOLS
Institutional Class | | NCEIX | |
Class A | | NCEAX | |
Class C | | NCECX | |
SECTOR ALLOCATION
(as a % of Total Investments*) | |
Consumer Discretionary | | | 10.5 | % | |
Consumer Staples | | | 3.0 | | |
Financials | | | 27.4 | | |
Health Care | | | 7.0 | | |
Industrials | | | 12.2 | | |
Information Technology | | | 23.3 | | |
Telecommunication Services | | | 7.7 | | |
Utilities | | | 5.7 | | |
Short-Term Investment | | | 3.2 | | |
Total | | | 100.0 | % | |
* Derivatives, if any, are excluded from this chart.
EXCHANGE ALLOCATION
(as a % Of Long Term Investments) | |
Mainland China | | | 22.7 | % | |
Hong Kong | | | 63.0 | | |
United States | | | 14.3 | | |
Total | | | 100.0 | % | |
PERFORMANCE HIGHLIGHTS
| | |
| | Average Annual Total
Return Ended 08/31/2016 | |
| | | Inception
Date | | 1 Year | | Life of
Fund | |
At NAV | |
Institutional Class | | 07/17/2013 | | | 12.09 | % | | | 11.65 | % | |
Class A | | 07/17/2013 | | | 12.19 | % | | | 11.43 | % | |
Class C | | 07/17/2013 | | | 10.93 | % | | | 10.45 | % | |
With Sales Charge | |
Class A | | | | | | | 5.69 | % | | | 9.34 | % | |
Class C | | | | | | | 9.94 | % | | | 10.45 | % | |
Index | |
| MSCI China Index1,15 | | | | | | | 8.28 | % | | | 6.44 | % | |
The performance data quoted represent past performance and do not indicate future results. Current performance may be lower or higher than the performance data quoted. For performance data current to the most recent month-end, please visit www.nb.com/performance.
The results shown in the table reflect the reinvestment of income dividends and other distributions, if any. The results do not reflect the effect of taxes a shareholder would pay on Fund distributions or on the redemption of Fund shares.
The investment return and principal value of an investment will fluctuate and shares, when redeemed, may be worth more or less than their original cost.
Returns would have been lower if Neuberger Berman Investment Advisers LLC ("Management") had not reimbursed certain expenses and/or waived a portion of the investment management fees during certain of the periods shown. Repayment by a class (of expenses previously reimbursed and/or fees previously waived by Management) will decrease the class's returns. Please see Note B in the Notes to Financial Statements for specific information regarding expense reimbursement and/or fee waiver arrangements.
As stated in the Fund's most recent prospectus, the total annual operating expense ratios for fiscal year 2015 were 1.61%, 2.01% and 2.81% for Institutional Class, Class A and Class C shares, respectively (before expense reimbursements and/or fee waivers, if any). The expense ratios were 1.51%, 1.87% and 2.62% for Institutional Class, Class A and Class C shares, respectively, after expense reimbursements and/or fee waivers. The expense ratios for the annual period ended August 31, 2016 can be found in the Financial Highlights section of this report.
Returns shown with a sales charge reflect the deduction of the current maximum initial sales charge of 5.75% for Class A shares and the contingent deferred sales charge (CDSC) for Class C shares. The CDSC for Class C shares is 1%, which is reduced to 0% after 1 year. The performance of the Fund's share classes will differ primarily due to different sales charge structures and class expenses. Please see the prospectus for more information about sales charge structures, if any, and class expenses for your share class.
25
Greater China Equity Fund (Unaudited)
COMPARISON OF A $1,000,000 INVESTMENT
(000's Omitted)
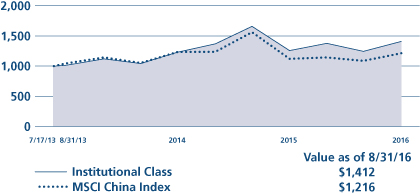
This graph shows the change in value of a hypothetical $1,000,000 investment in the Fund over the past 10 fiscal years, or since the Fund's inception if it has not operated for 10 years. The graph is based on the Institutional Class shares only; the performance of the Fund's share classes will differ primarily due to different sales charge structures and class expenses (see Performance Highlights chart on previous page). The result is compared with benchmarks, which include a broad-based market index and may include a more narrowly based index. Market indices have not been reduced to reflect any of the fees and costs of investing. The results shown in the graph reflect the reinvestment of income dividends and other distributions, if any. The results do not reflect the effect of taxes a shareholder would pay on Fund distributions or on the redemption of Fund shares. Results represent past performance and do not indicate future results.
26
Guardian Fund Commentary (Unaudited)
Neuberger Berman Guardian Fund Investor Class generated an 8.45% total return for the fiscal year ended August 31, 2016, underperforming the 12.55% return of its benchmark, the S&P 500® Index for the same period. (Performance for all share classes is provided in the table immediately following this letter.)
Despite the uptick in volatility during the reporting period, the U.S. stock market generated positive results. The market was supported by overall positive investor demand, certain resilient economic data and continued supportive Fed monetary policy. The overall U.S. stock market, as measured by the S&P 500 Index, rose 12.55% for the 12-month period. Within the market, large-cap stocks outperformed their mid- and small-cap counterparts during the reporting period.
The Fund's investments fall into three buckets: Growth, Total Return and Opportunistic. Growth companies are those companies that have been growing their revenues and, as they did so, generating free cash flow that has been reinvested in the business at what we identify as attractive risk-adjusted returns. Total Return investments have demonstrated sustainable and/or growing streams of income that we believe are underpinned by asset value and which may result in growing cash returns to shareholders (e.g., increased dividends, share repurchases, return of capital). Finally, Opportunistic investments are those that we believe have identifiable catalysts. This bucket may include companies with management changes, company reorganizations, merger and acquisition activity, "hidden assets," or other market dislocations that have the potential to unlock intrinsic value.1
The Fund's relative underperformance during the reporting period versus the S&P 500 Index was largely due to stock selection. In particular, selection in the Industrials, Health Care and Consumer Discretionary sectors were the largest detractors from results. On the upside, stock selection in the Utilities and Financials sectors was beneficial for performance. During the period, the Fund's cash & cash equivalents position overall was also a headwind for results. Sector allocation also detracted for the period, primarily driven by underweights to Consumer Staples and Industrials. Conversely, underweights to Health Care and Information Technology contributed to results from a sector allocation perspective during the reporting period.
The Fund's use of purchased and written options contributed to performance during the period.
We believe the U.S. economy will continue to grow steadily, while a still highly accommodative Fed may create a longer than anticipated U.S. business cycle (albeit certainly slower than the markets expected). In our view, corporate managers' willingness to drive innovation, enhance productivity, allocate capital to the best risk-adjusted return and compete on a global scale could ultimately provide investors with suitable long-term returns for the risks they bear. Nevertheless, we are very mindful of the complex world in which we live and invest. Given the impact of an increasingly global economy, we intend to remain flexible in our decisions and open-minded to new ideas across different asset classes and geographies.
Sincerely,
CHARLES KANTOR
PORTFOLIO MANAGER
1 Intrinsic value reflects the portfolio management team's analysis and estimates of a company's value. There is no guarantee that any intrinsic values will be realized; security prices may decrease regardless of intrinsic values.
Information about principal risks of investing in the Fund is set forth in the prospectus and statement of additional information.
The portfolio composition, industries and holdings of the Fund are subject to change without notice.
The opinions expressed are those of the Fund's portfolio manager. The opinions are as of the date of this report and are subject to change without notice.
27
Guardian Fund (Unaudited)
TICKER SYMBOLS
Investor Class | | NGUAX | |
Trust Class | | NBGTX | |
Advisor Class | | NBGUX | |
Institutional Class | | NGDLX | |
Class A | | NGDAX | |
Class C | | NGDCX | |
Class R3 | | NGDRX | |
SECTOR ALLOCATION
(as a % of Total Investments*) | |
Consumer Discretionary | | | 14.8 | % | |
Consumer Staples | | | 13.0 | | |
Energy | | | 5.7 | | |
Financials | | | 12.6 | | |
Health Care | | | 11.6 | | |
Industrials | | | 9.8 | | |
Information Technology | | | 18.9 | | |
Materials | | | 3.0 | | |
Telecommunication Services | | | 4.1 | | |
Utilities | | | 4.5 | | |
Other | | | 0.0 | | |
Short-Term Investment | | | 2.0 | | |
Total | | | 100.0 | % | |
* Derivatives, if any, are excluded from this chart.
PERFORMANCE HIGHLIGHTS7,11
| | | | | Average Annual Total
Return Ended 08/31/2016 | |
| | | Inception
Date | | 1 Year | | 5 Years | | 10 Years | | Life of
Fund | |
At NAV | |
Investor Class | | 06/01/1950 | | | 8.45 | % | | | 11.52 | % | | | 6.60 | % | | | 10.97 | % | |
| Trust Class3 | | 08/03/1993 | | | 8.31 | % | | | 11.34 | % | | | 6.42 | % | | | 10.92 | % | |
| Advisor Class4 | | 09/03/1996 | | | 8.03 | % | | | 10.93 | % | | | 6.01 | % | | | 10.78 | % | |
| Institutional Class5 | | 05/27/2009 | | | 8.68 | % | | | 11.73 | % | | | 6.74 | % | | | 10.99 | % | |
| Class A19 | | 05/27/2009 | | | 8.32 | % | | | 11.33 | % | | | 6.46 | % | | | 10.95 | % | |
| Class C19 | | 05/27/2009 | | | 7.47 | % | | | 10.48 | % | | | 5.87 | % | | | 10.85 | % | |
| Class R316 | | 05/27/2009 | | | 8.00 | % | | | 11.02 | % | | | 6.26 | % | | | 10.91 | % | |
With Sales Charge | |
| Class A19 | | | | | | | 2.07 | % | | | 10.02 | % | | | 5.83 | % | | | 10.85 | % | |
| Class C19 | | | | | | | 6.54 | % | | | 10.48 | % | | | 5.87 | % | | | 10.85 | % | |
Index | |
| S&P 500® Index1,15 | | | | | | | 12.55 | % | | | 14.69 | % | | | 7.51 | % | | | 11.06 | % | |
The performance data quoted represent past performance and do not indicate future results. Current performance may be lower or higher than the performance data quoted. For performance data current to the most recent month-end, please visit www.nb.com/performance.
The results shown in the table reflect the reinvestment of income dividends and other distributions, if any. The results do not reflect the effect of taxes a shareholder would pay on Fund distributions or on the redemption of Fund shares.
The investment return and principal value of an investment will fluctuate and shares, when redeemed, may be worth more or less than their original cost.
Returns would have been lower if Neuberger Berman Investment Advisers LLC ("Management") had not reimbursed certain expenses and/or waived a portion of the investment management fees during certain of the periods shown. Repayment by a class (of expenses previously reimbursed and/or fees previously waived by Management) will decrease the class's returns. Please see Note B in the Notes to Financial Statements for specific information regarding expense reimbursement and/or fee waiver arrangements.
As stated in the Fund's most recent prospectus, the total annual operating expense ratios for fiscal year 2015 were 0.87%, 1.06%, 1.54%, 0.71%, 1.07%, 1.83% and 1.37% for Investor Class, Trust Class, Advisor Class, Institutional Class, Class A, Class C and Class R3 shares, respectively (before expense reimbursements and/or fee waivers, if any). The expense ratios were 1.50% and 1.36% for Advisor Class and Class R3 shares, respectively, after expense reimbursements and/or fee waivers. The expense ratios for the annual period ended August 31, 2016 can be found in the Financial Highlights section of this report.
Returns shown with a sales charge reflect the deduction of the current maximum initial sales charge of 5.75% for Class A shares and the contingent deferred sales charge (CDSC) for Class C shares. The CDSC for Class C shares is 1%, which is reduced to 0% after 1 year. The performance of the Fund's share classes will differ primarily due to different sales charge structures and class expenses. Please see the prospectus for more information about sales charge structures, if any, and class expenses for your share class.
28
Guardian Fund (Unaudited)
COMPARISON OF A $10,000 INVESTMENT
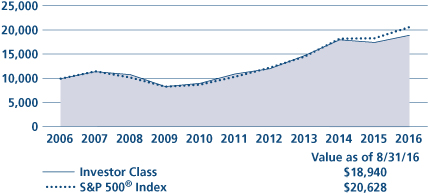
This graph shows the change in value of a hypothetical $10,000 investment in the Fund over the past 10 fiscal years, or since the Fund's inception if it has not operated for 10 years. The graph is based on the Investor Class shares only; the performance of the Fund's share classes will differ primarily due to different sales charge structures and class expenses (see Performance Highlights chart on previous page). The result is compared with benchmarks, which include a broad-based market index and may include a more narrowly based index. Market indices have not been reduced to reflect any of the fees and costs of investing. The results shown in the graph reflect the reinvestment of income dividends and other distributions, if any. The results do not reflect the effect of taxes a shareholder would pay on Fund distributions or on the redemption of Fund shares. Results represent past performance and do not indicate future results.
29
International Equity Fund Commentary (Unaudited)
Neuberger Berman International Equity Fund Institutional Class generated a total return of 4.78% for the fiscal year ended August 31, 2016, outperforming its benchmark, the MSCI EAFE® Index (the Index), which provided a 0.38% return for the same period. (Performance for all share classes is provided in the table immediately following this letter.)
From an Index perspective, volatility continued to limit returns in international developed equity markets, as geopolitical factors compounded ongoing global growth and commodity pricing concerns. The most significant selloffs happened in mid-February, over negative interest rate concerns and their impact on Eurozone and Japanese banking sectors, and in late June, over potential ramifications of the surprising outcome of the "Brexit" referendum.
Within the Index, Consumer Staples led winners, posting double-digit positive results, in part due to a flight to safety during the period's uncertainty. Information Technology (IT), Industrials, and Materials stocks also outperformed, as did Energy—the latter two driven by 2016's commodities pricing recovery. By country, New Zealand and Australia saw the strongest returns.
Four Index sectors had losses this period, with Financials hardest hit by the above-mentioned monetary policy concerns, followed by Health Care, Telecommunication Services, and Consumer Discretionary stocks. By country, Italy and Spain were weakest.
This was a good year for disciplined active investors, with the majority of our outperformance driven by stock selection (although sector allocation decisions were also additive). Stocks from within the IT and Financials sectors, and by market, from Switzerland and Japan, had the largest positive impact.
Top contributors included KEYENCE, Sundrug, and Synergy Health. KEYENCE, the Japanese factory automation equipment supplier, continued to implement its growth strategy, deepening its product portfolio and adding marketing resources to gain market share globally. Sundrug, the Japanese drugstore chain, continued to see steady growth in sales and profits, combined with good cost control, despite weak economic conditions in Japan. Early in the period, a takeover of Synergy Health, a UK-based health care services name, was approved, leading to a significant rise in its stock price, leading us to sell off the position.
Weaker relative returns came from Telecommunication Services names, an underweight to the recovering Energy sector, holdings domiciled in the UK, and limited exposure to the top-performing Australian market. Detractors included UK-based banks Barclays and Lloyds, and Travis Perkins, the UK builders' merchant. All were hurt by fears about the local economic impact of the Brexit referendum. We continue to own all three.
Looking ahead, the Brexit vote could lead to a protracted period of political, economic and market uncertainty for the UK and EU. We do not believe it will lead to a full-blown crisis however. What is clear, in our opinion, is that political risk has increased for other nations—with French elections, most notably, coming in 2017—which is likely to dampen consumer and corporate risk appetite. Weaker growth for the next 12 to 18 months is the likely result.
We made changes to the portfolio during the fiscal year, preferring to invest on conviction once the dust settles rather than trade during a period of significant volatility. Our emphasis on quality is unshaken, and as ever, our focus remains on investing in companies with sustainable profitability and growth characteristics, at attractive valuations.
Sincerely,
BENJAMIN SEGAL
PORTFOLIO MANAGER
Information about principal risks of investing in the Fund is set forth in the prospectus and statement of additional information.
The portfolio composition, industries and holdings of the Fund are subject to change without notice.
The opinions expressed are those of the Fund's portfolio manager. The opinions are as of the date of this report and are subject to change without notice.
30
International Equity Fund (Unaudited)
TICKER SYMBOLS
Investor Class | | NIQVX | |
Trust Class | | NIQTX | |
Institutional Class | | NBIIX | |
Class A | | NIQAX | |
Class C | | NIQCX | |
Class R6 | | NRIQX | |
PERFORMANCE HIGHLIGHTS7
| | | | | Average Annual Total
Return Ended 08/31/2016 | |
| | | Inception
Date | | 1 Year | | 5 Years | | 10 Years | | Life of
Fund | |
At NAV | |
| Investor Class12 | | 01/28/2013 | | | 4.60 | % | | | 5.28 | % | | | 2.50 | % | | | 4.49 | % | |
| Trust Class12 | | 01/28/2013 | | | 4.59 | % | | | 5.23 | % | | | 2.48 | % | | | 4.46 | % | |
Institutional Class | | 06/17/2005 | | | 4.78 | % | | | 5.44 | % | | | 2.58 | % | | | 4.56 | % | |
| Class A12 | | 01/28/2013 | | | 4.48 | % | | | 5.17 | % | | | 2.45 | % | | | 4.44 | % | |
| Class C12 | | 01/28/2013 | | | 3.70 | % | | | 4.59 | % | | | 2.17 | % | | | 4.18 | % | |
| Class R622 | | 09/03/2013 | | | 5.02 | % | | | 5.51 | % | | | 2.61 | % | | | 4.59 | % | |
With Sales Charge | |
| Class A12 | | | | | | | –1.52 | % | | | 3.93 | % | | | 1.84 | % | | | 3.89 | % | |
| Class C12 | | | | | | | 2.70 | % | | | 4.59 | % | | | 2.17 | % | | | 4.18 | % | |
Index | |
| MSCI EAFE® Index1,15 | | | | | | | 0.38 | % | | | 5.48 | % | | | 2.19 | % | | | 4.52 | % | |
The performance data quoted represent past performance and do not indicate future results. Current performance may be lower or higher than the performance data quoted. For performance data current to the most recent month-end, please visit www.nb.com/performance.
The results shown in the table reflect the reinvestment of income dividends and other distributions, if any. The results do not reflect the effect of taxes a shareholder would pay on Fund distributions or on the redemption of Fund shares.
The investment return and principal value of an investment will fluctuate and shares, when redeemed, may be worth more or less than their original cost.
Returns would have been lower if Neuberger Berman Investment Advisers LLC ("Management") had not reimbursed certain expenses and/or waived a portion of the investment management fees during certain of the periods shown. Repayment by a class (of expenses previously reimbursed and/or fees previously waived by Management) will decrease the class's returns. Please see Note B in the Notes to Financial Statements for specific information regarding expense reimbursement and/or fee waiver arrangements.
As stated in the Fund's most recent prospectus, the total annual operating expense ratios for fiscal year 2015 were 1.25%, 1.36%, 1.07%, 1.43%, 2.18% and 0.99% for Investor Class, Trust Class, Institutional Class, Class A, Class C and Class R6 shares, respectively (before expense reimbursements and/or fee waivers, if any). The expense ratios were 0.85%, 1.21%, 1.96% and 0.78% for Institutional Class, Class A, Class C and Class R6 shares, respectively, after expense reimbursements and/or fee waivers. The total annual operating expense ratio for each of Institutional Class, Class A and Class R6 includes the class's repayment of expenses previously reimbursed and/or fees previously waived by Management. The expense ratios for the annual period ended August 31, 2016 can be found in the Financial Highlights section of this report.
Returns shown with a sales charge reflect the deduction of the current maximum initial sales charge of 5.75% for Class A shares and the contingent deferred sales charge (CDSC) for Class C shares. The CDSC for Class C shares is 1%, which is reduced to 0% after 1 year. The performance of the Fund's share classes will differ primarily due to different sales charge structures and class expenses. Please see the prospectus for more information about sales charge structures, if any, and class expenses for your share class.
31
International Equity Fund (Unaudited)
COMPARISON OF A $1,000,000 INVESTMENT
(000's Omitted)
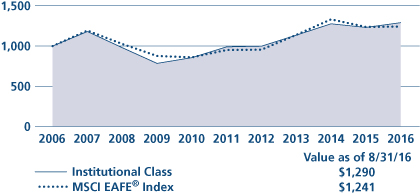
This graph shows the change in value of a hypothetical $1,000,000 investment in the Fund over the past 10 fiscal years, or since the Fund's inception if it has not operated for 10 years. The graph is based on the Institutional Class shares only; the performance of the Fund's share classes will differ primarily due to different sales charge structures and class expenses (see Performance Highlights chart on previous page). The result is compared with benchmarks, which include a broad-based market index and may include a more narrowly based index. Market indices have not been reduced to reflect any of the fees and costs of investing. The results shown in the graph reflect the reinvestment of income dividends and other distributions, if any. The results do not reflect the effect of taxes a shareholder would pay on Fund distributions or on the redemption of Fund shares. Results represent past performance and do not indicate future results.
32
International Select Fund Commentary (Unaudited)
Neuberger Berman International Select Fund Trust Class generated a total return of 3.65% for the fiscal year ended August 31, 2016, outperforming its benchmark, the MSCI EAFE® Index (the Index), which provided a 0.38% return for the same period. (Performance for all share classes is provided in the table immediately following this letter.)
From an Index perspective, volatility continued to limit returns in international developed equity markets, as geopolitical factors compounded ongoing global growth and commodity pricing concerns. The most significant selloffs happened in mid-February, over negative interest rate concerns and their impact on Eurozone and Japanese banking sectors, and in late June, over potential ramifications of the surprising outcome of the "Brexit" referendum.
In the Index, Consumer Staples led winners, posting double-digit positive results, in part due to a flight to safety during the period's uncertainty. Information Technology (IT), Industrials, and Materials stocks also outperformed, as did Energy—the latter two driven by 2016's commodities pricing recovery. By country, New Zealand and Australia saw the strongest returns.
Four Index sectors had losses this period, with Financials hardest hit by the above-mentioned monetary policy concerns, followed by Health Care, Telecommunication Services, and Consumer Discretionary stocks. By country, Italy and Spain were weakest.
This was a good year for disciplined active investors, with the majority of our outperformance driven by stock selection (although sector allocation decisions were also additive).
Stocks from within the IT and Industrials sectors—both helped by overweighting the better-performing sectors—and by market, from Japan and off-benchmark holdings, had the largest relative positive impact.
Top contributors included KEYENCE, Amlin, and Partners Group. KEYENCE, the Japanese factory automation equipment supplier, continued to implement its growth strategy, deepening its product portfolio and adding marketing resources to gain market share globally. Amlin, the UK-based reinsurer received a takeover bid at a premium early this fiscal period, and we sold our position. Partners Group, a Swiss alternative investment manager, benefited from heightened earnings guidance.
Weaker relative returns came from the Health Care and Telecommunication Services sectors, holdings domiciled in the UK and limited exposure to the top-performing Australian market. Detractors included UK-based banks Barclays and Lloyds, which were hurt by fears about the local economic impact of the Brexit referendum, and TalkTalk, a UK Telecom/TV/Internet service provider, which was the victim of a cyber-attack earlier in the period. We continue to own all three.
Looking ahead, we believe the Brexit vote could lead to a protracted period of political, economic and market uncertainty for the UK and EU. We do not believe it will lead to a full-blown crisis however. What is clear, in our opinion, is that political risk has increased for other nations—with French elections, most notably, coming in 2017—which is likely to dampen consumer and corporate risk appetite. Weaker growth for the next 12 to 18 months is the likely result.
We made changes to the portfolio during the fiscal year, preferring to invest on conviction once the dust settles rather than trade during a period of significant volatility. Our emphasis on quality is unshaken, and as ever, our focus remains on investing in companies with sustainable profitability and growth characteristics, at attractive valuations.
Sincerely,
BENJAMIN SEGAL
PORTFOLIO MANAGER
Information about principal risks of investing in the Fund is set forth in the prospectus and statement of additional information.
The portfolio composition, industries and holdings of the Fund are subject to change without notice.
The opinions expressed are those of the Fund's portfolio manager. The opinions are as of the date of this report and are subject to change without notice.
33
International Select Fund (Unaudited)
TICKER SYMBOLS
Trust Class | | NILTX | |
Institutional Class | | NILIX | |
Class A | | NBNAX | |
Class C | | NBNCX | |
Class R3 | | NBNRX | |
PERFORMANCE HIGHLIGHTS7
| | | | | Average Annual Total
Return Ended 08/31/2016 | |
| | | Inception
Date | | 1 Year | | 5 Years | | 10 Years | | Life of
Fund | |
At NAV | |
Trust Class | | 08/01/2006 | | | 3.65 | % | | | 4.16 | % | | | 2.26 | % | | | 2.43 | % | |
| Institutional Class6 | | 10/06/2006 | | | 3.94 | % | | | 4.52 | % | | | 2.61 | % | | | 2.78 | % | |
| Class A14 | | 12/20/2007 | | | 3.69 | % | | | 4.16 | % | | | 2.26 | % | | | 2.43 | % | |
| Class C14 | | 12/20/2007 | | | 2.89 | % | | | 3.40 | % | | | 1.60 | % | | | 1.78 | % | |
| Class R314 | | 05/27/2009 | | | 3.33 | % | | | 3.90 | % | | | 2.06 | % | | | 2.23 | % | |
With Sales Charge | |
| Class A14 | | | | | | | –2.26 | % | | | 2.93 | % | | | 1.66 | % | | | 1.83 | % | |
| Class C14 | | | | | | | 1.89 | % | | | 3.40 | % | | | 1.60 | % | | | 1.78 | % | |
Index | |
| MSCI EAFE® Index1,15 | | | | | | | 0.38 | % | | | 5.48 | % | | | 2.19 | % | | | 2.44 | % | |
The performance data quoted represent past performance and do not indicate future results. Current performance may be lower or higher than the performance data quoted. For performance data current to the most recent month-end, please visit www.nb.com/performance.
The results shown in the table reflect the reinvestment of income dividends and other distributions, if any. The results do not reflect the effect of taxes a shareholder would pay on Fund distributions or on the redemption of Fund shares.
The investment return and principal value of an investment will fluctuate and shares, when redeemed, may be worth more or less than their original cost.
Returns would have been lower if Neuberger Berman Investment Advisers LLC ("Management") had not reimbursed certain expenses and/or waived a portion of the investment management fees during certain of the periods shown. Repayment by a class (of expenses previously reimbursed and/or fees previously waived by Management) will decrease the class's returns. Please see Note B in the Notes to Financial Statements for specific information regarding expense reimbursement and/or fee waiver arrangements.
As stated in the Fund's most recent prospectus, the total annual operating expense ratios for fiscal year 2015 were 1.33%, 0.93%, 1.31%, 2.05% and 1.55% for Trust Class, Institutional Class, Class A, Class C and Class R3 shares, respectively (before expense reimbursements and/or fee waivers, if any). The expense ratios were 1.25%, 0.90%, 1.30%, 2.00% and 1.51% for Trust Class, Institutional Class, Class A, Class C and Class R3 shares, respectively, after expense reimbursements and/or fee waivers. The expense ratios for the annual period ended August 31, 2016 can be found in the Financial Highlights section of this report.
Returns shown with a sales charge reflect the deduction of the current maximum initial sales charge of 5.75% for Class A shares and the contingent deferred sales charge (CDSC) for Class C shares. The CDSC for Class C shares is 1%, which is reduced to 0% after 1 year. The performance of the Fund's share classes will differ primarily due to different sales charge structures and class expenses. Please see the prospectus for more information about sales charge structures, if any, and class expenses for your share class.
34
International Select Fund (Unaudited)
COMPARISON OF A $10,000 INVESTMENT
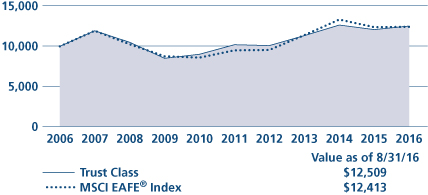
This graph shows the change in value of a hypothetical $10,000 investment in the Fund over the past 10 fiscal years, or since the Fund's inception if it has not operated for 10 years. The graph is based on the Trust Class shares only; the performance of the Fund's share classes will differ primarily due to different sales charge structures and class expenses (see Performance Highlights chart on previous page). The result is compared with benchmarks, which include a broad-based market index and may include a more narrowly based index. Market indices have not been reduced to reflect any of the fees and costs of investing. The results shown in the graph reflect the reinvestment of income dividends and other distributions, if any. The results do not reflect the effect of taxes a shareholder would pay on Fund distributions or on the redemption of Fund shares. Results represent past performance and do not indicate future results.
35
Intrinsic Value Fund Commentary (Unaudited)
Neuberger Berman Intrinsic Value Fund Institutional Class generated a 2.96% total return for the fiscal year ended August 31, 2016, underperforming its benchmark, the Russell 2000® Value Index, which returned 13.80% for the same period. (Performance for all share classes is provided in the table immediately following this letter.)
Since mid-February lows, equity markets have rallied amid mostly positive U.S. economic data. Manufacturing figures improved, employment and wage growth continued, housing starts and new home sales were higher than expected and retail sales were mostly strong. The extreme volatility which marked most of the year has subsided over the past few months due to better than expected second quarter earnings results and optimism about the domestic economy. Our cyclically sensitive portfolio underperformed, as investors sought refuge in less cyclical and more yield oriented investments. Our Financial Services sector mismatch (long regional banks, limited real estate investment trust (REIT) exposure) was a drag on relative performance. Investors turned pessimistic on the ability of banks to increase their net interest margins while REIT yields looked more appealing as the Fed continued to delay interest rate hikes.
Our investments in independent power producers continued to disappoint during the period. Dynegy, NRG Energy and Covanta Holding declined between 20% and 50%, as they continued to be plagued by commodity and power price weakness. Even though these companies are utilities, they are levered, complex, and at their core, commodity plays.
Other sector biases also played a part in the portfolio's underperformance. Nearly 38% of our strategy is invested in the Technology sector, which cost us around 250 basis points of relative return. Infinera, Verint Systems, Seachange, Bankrate and VeriFone Systems all reported disappointing earnings and lowered guidance over the past 12 months. There were, however, some solid performers in the Technology sector. Rovi Corp. is acquiring TiVo in what is generally believed to be a highly accretive merger. Ultratech's profitability is improving, as the company recorded its second straight positive quarter driven by strength in its Advanced Packaging business and Laser Spike Annealing (LSA) tool orders. Mercury Systems completed the acquisition of Microsemi which is believed to contribute about 30% of the company's forecasted revenue in 2017.
Also on the positive side, oil and gas prices remained relatively low and the portfolio benefitted from our minimal commitment to this sector. Given our large presence in the Technology and Industrial sectors our preference is to increase our exposure to the Health Care and Consumer sectors. During the year we added new positions in Health Care and in Consumer companies. Our Health Care companies performed well. Affymetrix was acquired by Thermo Fisher, and we sold it for a gain. Charles River Laboratories which provides a growing number of products used in laboratory research, has used its strong cash flow to make acquisitions that are additive to earnings while also repurchasing its shares. HeartWare, a new holding, was acquired by Medtronic at a 95% premium to our cost, and we sold it, realizing a gain.
In short, we believe that this year's underperformance can be summed up in one word—Yield. Over the past 12 months, our lack of exposure to REITs and dividend-paying utilities has cost us dearly. Our minimal exposure to REITs, which were up 28% for the fiscal year period, had a significant impact on our relative returns.
While more recently released economic reports have been encouraging, we believe economic uncertainty remains. A number of developments abroad could affect U.S. markets. At home, the possibility of a Fed rate hike before the end of the year and the outcome of the presidential election could lead to increased market volatility.
We look forward to our next communication and thank you for your commitment to our Fund.
Sincerely,
BENJAMIN H. NAHUM, JAMES F. MCAREE AND AMIT SOLOMON
PORTFOLIO CO-MANAGERS
Information about principal risks of investing in the Fund is set forth in the prospectus and statement of additional information.
The portfolio composition, industries and holdings of the Fund are subject to change without notice.
The opinions expressed are those of the Fund's portfolio managers. The opinions are as of the date of this report and are subject to change without notice.
36
Intrinsic Value Fund (Unaudited)
TICKER SYMBOLS
Institutional Class | | NINLX | |
Class A | | NINAX | |
Class C | | NINCX | |
SECTOR ALLOCATION
(as a % of Total Investments*) | |
Consumer Discretionary | | | 6.5 | % | |
Consumer Staples | | | 0.8 | | |
Energy | | | 1.1 | | |
Financial Services | | | 10.6 | | |
Health Care | | | 8.5 | | |
Materials & Processing | | | 5.7 | | |
Producer Durables | | | 17.9 | | |
Technology | | | 37.6 | | |
Utilities | | | 4.5 | | |
Short-Term Investment | | | 6.8 | | |
Total | | | 100.0 | % | |
* Derivatives, if any, are excluded from this chart.
PERFORMANCE HIGHLIGHTS
| | | | | Average Annual Total
Return Ended 08/31/2016 | |
| | | Inception
Date* | | 1 Year | | 5 Years | | 10 Years | | Life of
Fund | |
At NAV | |
| Institutional Class18 | | 05/10/2010 | | | 2.96 | % | | | 12.60 | % | | | 8.40 | % | | | 10.95 | % | |
| Class A18 | | 05/10/2010 | | | 2.58 | % | | | 12.17 | % | | | 8.15 | % | | | 10.82 | % | |
| Class C18 | | 05/10/2010 | | | 1.85 | % | | | 11.34 | % | | | 7.65 | % | | | 10.55 | % | |
With Sales Charge | |
| Class A18 | | | | | | | –3.33 | % | | | 10.85 | % | | | 7.51 | % | | | 10.47 | % | |
| Class C18 | | | | | | | 0.88 | % | | | 11.34 | % | | | 7.65 | % | | | 10.55 | % | |
Index | |
| Russell 2000® Value Index1,15 | | | | | | | 13.80 | % | | | 12.63 | % | | | 5.80 | % | | | 8.55 | % | |
| Russell 2000® Index1,15 | | | | | | | 8.59 | % | | | 12.85 | % | | | 7.04 | % | | | 7.54 | % | |
*The inception date for Neuberger Berman Intrinsic Value Fund Institutional Class, Class A, and Class C shares is May 10, 2010. Performance prior to that date is that of the Fund's predecessor, the DJG Small Cap Value Fund L.P., an unregistered limited partnership ("DJG Fund"); DJG Fund was the successor to The DJG Small Cap Value Fund, an unregistered commingled investment account ("DJG Account"), which had similar investment goals, strategies, and portfolio management team. See endnote 18 for more information.
The performance data quoted represent past performance and do not indicate future results. Current performance may be lower or higher than the performance data quoted. For performance data current to the most recent month-end, please visit www.nb.com/performance.
The results shown in the table reflect the reinvestment of income dividends and other distributions, if any. The results do not reflect the effect of taxes a shareholder would pay on Fund distributions or on the redemption of Fund shares.
The investment return and principal value of an investment will fluctuate and shares, when redeemed, may be worth more or less than their original cost.
Returns would have been lower if Neuberger Berman Investment Advisers LLC ("Management") had not reimbursed certain expenses and/or waived a portion of the investment management fees during certain of the periods shown. Repayment by a class (of expenses previously reimbursed and/or fees previously waived by Management) will decrease the class's returns. Please see Note B in the Notes to Financial Statements for specific information regarding expense reimbursement and/or fee waiver arrangements.
As stated in the Fund's most recent prospectus, the total annual operating expense ratios for fiscal year 2015 were 1.10%, 1.51% and 2.22% for Institutional Class, Class A and Class C shares, respectively (before expense reimbursements and/or fee waivers, if any). The expense ratios were 1.00%, 1.36% and 2.11% for Institutional Class, Class A and Class C shares, respectively, after expense reimbursements and/or fee waivers. The expense ratios for the annual period ended August 31, 2016 can be found in the Financial Highlights section of this report.
Returns shown with a sales charge reflect the deduction of the current maximum initial sales charge of 5.75% for Class A shares and the contingent deferred sales charge (CDSC) for Class C shares. The CDSC for Class C shares is 1%, which is reduced to 0% after 1 year. The performance of the Fund's share classes will differ primarily due to different sales charge structures and class expenses. Please see the prospectus for more information about sales charge structures, if any, and class expenses for your share class.
37
Intrinsic Value Fund (Unaudited)
COMPARISON OF A $1,000,000 INVESTMENT18
(000's Omitted)
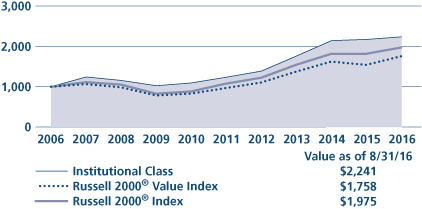
This graph shows the change in value of a hypothetical $1,000,000 investment in the Fund over the past 10 fiscal years, or since the Fund's inception if it has not operated for 10 years. The graph is based on the Institutional Class shares only; the performance of the Fund's share classes will differ primarily due to different sales charge structures and class expenses (see Performance Highlights chart on previous page). The result is compared with benchmarks, which include a broad-based market index and may include a more narrowly based index. Market indices have not been reduced to reflect any of the fees and costs of investing. The results shown in the graph reflect the reinvestment of income dividends and other distributions, if any. The results do not reflect the effect of taxes a shareholder would pay on Fund distributions or on the redemption of Fund shares. Results represent past performance and do not indicate future results.
38
Large Cap Value Fund Commentary (Unaudited)
Neuberger Berman Large Cap Value Fund Investor Class generated a 13.16% total return for the fiscal year ended August 31, 2016, outperforming its benchmark, the Russell 1000® Value Index (the Index), which returned 12.92% for the same period. (Performance for all share classes is provided in the table immediately following this letter.)
Over the past fiscal year, equities experienced some wild fluctuations as the global economy, oil prices and monetary policy decisions swayed trading activity. At the start of the period the market dropped as investors fretted over economic softness in China and other emerging markets; stocks regained their footing but plunged again in early 2016, when a fall in oil prices and a newly tighter U.S. monetary environment exacerbated the ongoing global concerns. The market rebounded quickly, however, as the Fed took a more dovish tone on interest rates, oil prices began to recover and the U.S. economy exhibited signs of health. Stocks remained on an upward path, propped up by easy monetary policies around the world, until attention turned toward Britain's vote to exit the European Union. The market plummeted in June on news of the "Brexit" decision, but then rose to new heights in August, as global investors in search of higher returns and greater stability bought up U.S. investments.
Within the Index, returns were positive across all ten sectors. Performance leadership spanned both the defensive and cyclical arenas with Information Technology, Telecommunication Services, Industrials and Utilities as the strongest segments of the market. Sectors that lagged the overall market included Consumer Discretionary, Energy and Financials.
In terms of Fund performance, Materials was the greatest source of upside relative to the Index. This was due to our heavier exposure to the overall sector, and specifically, our investment in gold producer, Newmont Mining (NEM). The stock outperformed over the period due to a rise in gold prices, which were driven higher by persistently low interest rates in the U.S. and ongoing concerns about the global economy. Consumer Discretionary caused the heaviest loss for the Fund versus the Index. The shortfall largely stemmed from weakness in luxury retailer Ralph Lauren Corp. (RL), which began to sell off after the company reported disappointing fiscal third quarter 2016 earnings and lowered its outlook for 2016, citing issues that included unfavorable product assortment and a decline in customer traffic. We continue to see value in RL, however, as management continues to scale back its brands, cut costs and identify opportunities for growth, which we believe should allow the stock to move higher as challenged end markets improve over time.
Going forward, we believe that easy monetary policy combined with a stabilizing U.S. economy could continue to prop up equities, but we remain wary as stock multiples are reaching historically high levels and corporate earnings growth has been slowing. Moreover, while companies have been avidly returning cash to shareholders via buybacks and dividends, it is our view that many investors are growing concerned that this is being done to the detriment of capital investment. In addition, we still see significant macro risks for the market that include another Fed rate move, the outcome and aftermath of the U.S. presidential election, the ongoing Brexit fallout and signs of further economic weakness in China and Japan. However, rather than trying to gauge the timing and impact of such events, we instead focus our efforts on evaluating individual stocks and continue to pursue our strategy of seeking underappreciated names with hidden value that can be realized as specific catalysts play out over time. We believe that this approach is key to creating a portfolio that can generate favorable returns over the long term.
Sincerely,
ELI M. SALZMANN
PORTFOLIO MANAGER
Information about principal risks of investing in the Fund is set forth in the prospectus and statement of additional information.
The portfolio composition, industries and holdings of the Fund are subject to change without notice.
The opinions expressed are those of the Fund's portfolio manager. The opinions are as of the date of this report and are subject to change without notice.
39
Large Cap Value Fund (Unaudited)
TICKER SYMBOLS
Investor Class | | NPRTX | |
Trust Class | | NBPTX | |
Advisor Class | | NBPBX | |
Institutional Class | | NBPIX | |
Class A | | NPNAX | |
Class C | | NPNCX | |
Class R3 | | NPNRX | |
SECTOR ALLOCATION
(as a % of Total Investments*) | |
Consumer Discretionary | | | 7.1 | % | |
Consumer Staples | | | 4.3 | | |
Energy | | | 16.1 | | |
Financials | | | 30.1 | | |
Health Care | | | 3.4 | | |
Industrials | | | 16.5 | | |
Information Technology | | | 4.5 | | |
Materials | | | 9.1 | | |
Telecommunication Services | | | 1.5 | | |
Utilities | | | 1.1 | | |
Short-Term Investment | | | 6.3 | | |
Total | | | 100.0 | % | |
* Derivatives, if any, are excluded from this chart.
PERFORMANCE HIGHLIGHTS7
| | | | | Average Annual Total
Return Ended 08/31/2016 | |
| | | Inception
Date | | 1 Year | | 5 Years | | 10 Years | | Life of
Fund | |
At NAV | |
Investor Class | | 01/20/19752 | | | 13.16 | % | | | 11.38 | % | | | 5.04 | % | | | 12.47 | % | |
| Trust Class3 | | 08/30/1993 | | | 12.97 | % | | | 11.16 | % | | | 4.85 | % | | | 12.38 | % | |
| Advisor Class4 | | 08/16/1996 | | | 12.81 | % | | | 11.00 | % | | | 4.69 | % | | | 12.25 | % | |
| Institutional Class5 | | 06/07/2006 | | | 13.38 | % | | | 11.56 | % | | | 5.22 | % | | | 12.51 | % | |
| Class A19 | | 06/21/2010 | | | 12.94 | % | | | 11.12 | % | | | 4.89 | % | | | 12.43 | % | |
| Class C19 | | 06/21/2010 | | | 12.09 | % | | | 10.29 | % | | | 4.40 | % | | | 12.30 | % | |
| Class R316 | | 06/21/2010 | | | 12.58 | % | | | 10.83 | % | | | 4.72 | % | | | 12.38 | % | |
With Sales Charge | |
| Class A19 | | | | | | | 6.46 | % | | | 9.82 | % | | | 4.27 | % | | | 12.27 | % | |
| Class C19 | | | | | | | 11.15 | % | | | 10.29 | % | | | 4.40 | % | | | 12.30 | % | |
Index | |
| Russell 1000® Value Index1,15 | | | | | | | 12.92 | % | | | 14.39 | % | | | 6.08 | % | | | N/A | | |
The performance data quoted represent past performance and do not indicate future results. Current performance may be lower or higher than the performance data quoted. For performance data current to the most recent month-end, please visit www.nb.com/performance.
The results shown in the table reflect the reinvestment of income dividends and other distributions, if any. The results do not reflect the effect of taxes a shareholder would pay on Fund distributions or on the redemption of Fund shares.
The investment return and principal value of an investment will fluctuate and shares, when redeemed, may be worth more or less than their original cost.
Returns would have been lower if Neuberger Berman Investment Advisers LLC ("Management") had not reimbursed certain expenses and/or waived a portion of the investment management fees during certain of the periods shown. Repayment by a class (of expenses previously reimbursed and/or fees previously waived by Management) will decrease the class's returns. Please see Note B in the Notes to Financial Statements for specific information regarding expense reimbursement and/or fee waiver arrangements.
As stated in the Fund's most recent prospectus, the total annual operating expense ratios for fiscal year 2015 were 0.87%, 1.06%, 1.21%, 0.71%, 1.10%, 1.83% and 1.52% for Investor Class, Trust Class, Advisor Class, Institutional Class, Class A, Class C and Class R3 shares, respectively (before expense reimbursements and/or fee waivers, if any). The expense ratio was 1.37% for Class R3 shares, after expense reimbursements and/or fee waivers. The total annual operating expense ratio for each of Institutional Class and Class C includes the class's repayment of expenses previously reimbursed and/or fees previously waived by Management. The expense ratios for the annual period ended August 31, 2016 can be found in the Financial Highlights section of this report.
Returns shown with a sales charge reflect the deduction of the current maximum initial sales charge of 5.75% for Class A shares and the contingent deferred sales charge (CDSC) for Class C shares. The CDSC for Class C shares is 1%, which is reduced to 0% after 1 year. The performance of the Fund's share classes will differ primarily due to different sales charge structures and class expenses. Please see the prospectus for more information about sales charge structures, if any, and class expenses for your share class.
40
Large Cap Value Fund (Unaudited)
COMPARISON OF A $10,000 INVESTMENT
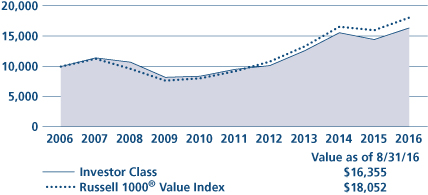
This graph shows the change in value of a hypothetical $10,000 investment in the Fund over the past 10 fiscal years, or since the Fund's inception if it has not operated for 10 years. The graph is based on the Investor Class shares only; the performance of the Fund's share classes will differ primarily due to different sales charge structures and class expenses (see Performance Highlights chart on previous page). The result is compared with benchmarks, which include a broad-based market index and may include a more narrowly based index. Market indices have not been reduced to reflect any of the fees and costs of investing. The results shown in the graph reflect the reinvestment of income dividends and other distributions, if any. The results do not reflect the effect of taxes a shareholder would pay on Fund distributions or on the redemption of Fund shares. Results represent past performance and do not indicate future results.
41
Mid Cap Growth Fund Commentary (Unaudited)
Neuberger Berman Mid Cap Growth Fund Investor Class generated a –1.70% total return for the fiscal year ended August 31, 2016, lagging its benchmark, the Russell Midcap® Growth Index, which returned 7.00% for the same period. (Performance for all share classes is provided in the table immediately following this letter.)
The trailing twelve months offered up an unpredictable roller-coaster of highs and lows, beginning with a meaningful market correction, driven in the middle by the highly correlated power of oil, the dollar, and economic news out of China, and closing with a healthy dose of nationalistic cynicism and uncertainty courtesy of the upcoming U.S. presidential election and Great Britain's surprising decision to leave the European Union. Not to be upstaged, the Fed continued its very public, ongoing rate debate, complete with dueling hawkish and dovish postures around the overall health and direction of our economy. Driven by the aforementioned, we believe the market's demeanor has ranged from highly irrational to oddly calm, which, depending on the day, may have proved challenging to active managers. Despite the push towards new highs, this market hasn't represented a sustained shift to risk-on or an embracing of positive momentum. Instead, we believe this has been a safe-haven rally, driven by an overabundance of caution and characterized by unexpected correlations, generally low volume and a continued "free money" distortion of the capital allocation process. However, the good news, likely lost amid the headlines and intermittent volatility, is that most companies generally continued to execute and deliver reasonably good earnings.
On average during the period, the portfolio was overweight in Information Technology (IT), Health Care, Telecommunication Services and Energy and underweight in Consumer Staples, Financials, Materials, Consumer Discretionary and Industrials relative to its benchmark. Two sudden and ruthless market rotations (August/September 2015 and January/February 2016), away from higher anticipation investment stories proved extremely challenging to our approach and portfolio positioning, particularly within IT, which accounted for nearly half of our relative underperformance. Our significant underweight to real estate investment trusts (REITs) also proved to be a drag, as investors continued to seek yield and flock towards the perceived safety of income-generating investments. The period was also impacted by poor results from several holdings, as Tableau Software, Stericycle, Alliance Data Systems and Zebra Technologies (each sold during the year) all delivered results and guidance that surprised and disappointed the market. For the period, Burlington Stores was the top performing holding, while Envision Health Care was the leading detractor. Burlington, a national off-price retailer of branded apparel, rose above the sorry state of retail to deliver strong results that were enthusiastically received by the market. Envision, a provider of outsourced facility-based physician and healthcare transportation services, delivered surprisingly poor results as they overestimated demand for physician outsourcing and then struggled to adjust their staffing levels accordingly. We elected to sell our position in Envision.
Despite the occasional bouts of extreme volatility, we believe the market proved fairly adept at shaking off the aforementioned macro-level worries and largely rolling with the seemingly endless fiscal, monetary and political chatter. Underpinning that market resiliency has been reasonably solid corporate earnings and continued broadly positive economic indicators, trends that we believe are certainly capable of continuing through year-end and into 2017. As a result, bullish sentiment continues to outweigh bearish, and we simply can't discount the market's ability to keep steaming forward, even if it doesn't always make sense or follow past formulas. Given the continued potential for volatility, it's more incumbent upon us to strike the proper risk/reward balance within the portfolio. With that said, we remain cautiously optimistic that what we view as higher growth companies, offering intriguing catalysts and compelling fundamentals, will continue to gain greater traction with the market and provide an attractive alternative to the yield-centric and flight-to-safety trades that have become increasingly crowded.
Sincerely,
KENNETH J. TUREK
PORTFOLIO MANAGER
Information about principal risks of investing in the Fund is set forth in the prospectus and statement of additional information.
The portfolio composition, industries and holdings of the Fund are subject to change without notice.
The opinions expressed are those of the Fund's portfolio manager. The opinions are as of the date of this report and are subject to change without notice.
42
Mid Cap Growth Fund (Unaudited)
TICKER SYMBOLS
Investor Class | | NMANX | |
Trust Class | | NBMTX | |
Advisor Class | | NBMBX | |
Institutional Class | | NBMLX | |
Class A | | NMGAX | |
Class C | | NMGCX | |
Class R3 | | NMGRX | |
Class R6 | | NRMGX | |
SECTOR ALLOCATION
(as a % of Total Investments*) | |
Consumer Discretionary | | | 22.5 | % | |
Consumer Staples | | | 3.2 | | |
Energy | | | 1.7 | | |
Financials | | | 6.3 | | |
Health Care | | | 19.0 | | |
Industrials | | | 13.9 | | |
Information Technology | | | 23.7 | | |
Materials | | | 3.9 | | |
Telecommunication Services | | | 1.6 | | |
Short-Term Investment | | | 4.2 | | |
Total | | | 100.0 | % | |
* Derivatives, if any, are excluded from this chart.
PERFORMANCE HIGHLIGHTS7
| | | | | Average Annual Total
Return Ended 08/31/2016 | |
| | | Inception
Date | | 1 Year | | 5 Years | | 10 Years | | Life of
Fund | |
At NAV | |
Investor Class | | 03/01/19792 | | | –1.70 | % | | | 10.83 | % | | | 8.30 | % | | | 11.59 | % | |
| Trust Class3 | | 08/30/1993 | | | –1.77 | % | | | 10.77 | % | | | 8.17 | % | | | 11.50 | % | |
| Advisor Class4 | | 09/03/1996 | | | –2.04 | % | | | 10.45 | % | | | 7.87 | % | | | 11.30 | % | |
| Institutional Class5 | | 04/19/2007 | | | –1.52 | % | | | 11.06 | % | | | 8.58 | % | | | 11.67 | % | |
| Class A19 | | 05/27/2009 | | | –1.91 | % | | | 10.66 | % | | | 8.20 | % | | | 11.56 | % | |
| Class C19 | | 05/27/2009 | | | –2.62 | % | | | 9.84 | % | | | 7.61 | % | | | 11.40 | % | |
| Class R316 | | 05/27/2009 | | | –2.12 | % | | | 10.39 | % | | | 8.00 | % | | | 11.51 | % | |
| Class R623 | | 03/15/2013 | | | –1.44 | % | | | 11.05 | % | | | 8.40 | % | | | 11.62 | % | |
With Sales Charge | |
| Class A19 | | | | | | | –7.56 | % | | | 9.35 | % | | | 7.56 | % | | | 11.39 | % | |
| Class C19 | | | | | | | –3.54 | % | | | 9.84 | % | | | 7.61 | % | | | 11.40 | % | |
Index | |
| Russell Midcap® Growth Index1,15 | | | | | | | 7.00 | % | | | 13.43 | % | | | 8.76 | % | | | N/A | | |
| Russell Midcap® Index1,15 | | | | | | | 9.91 | % | | | 14.29 | % | | | 8.49 | % | | | 13.28 | % | |
The performance data quoted represent past performance and do not indicate future results. Current performance may be lower or higher than the performance data quoted. For performance data current to the most recent month-end, please visit www.nb.com/performance.
The results shown in the table reflect the reinvestment of income dividends and other distributions, if any. The results do not reflect the effect of taxes a shareholder would pay on Fund distributions or on the redemption of Fund shares.
The investment return and principal value of an investment will fluctuate and shares, when redeemed, may be worth more or less than their original cost.
Returns would have been lower if Neuberger Berman Investment Advisers LLC ("Management") had not reimbursed certain expenses and/or waived a portion of the investment management fees during certain of the periods shown. Repayment by a class (of expenses previously reimbursed and/or fees previously waived by Management) will decrease the class's returns. Please see Note B in the Notes to Financial Statements for specific information regarding expense reimbursement and/or fee waiver arrangements.
As stated in the Fund's most recent prospectus, the total annual operating expense ratios for fiscal year 2015 were 0.93%, 1.00%, 1.26%, 0.76%, 1.12%, 1.89%, 1.38% and 0.68% for Investor Class, Trust Class, Advisor Class, Institutional Class, Class A, Class C, Class R3 and Class R6 shares, respectively (before expense reimbursements and/or fee waivers, if any). The expense ratios were 1.12%, 1.87% and 1.37% for Class A, Class C and Class R3 shares, respectively, after expense reimbursements and/or fee waivers. The total annual operating expense ratio for each of Institutional Class, Class A and Class R6 includes the class's repayment of expenses previously reimbursed and/or fees previously waived by Management. The expense ratios for the annual period ended August 31, 2016 can be found in the Financial Highlights section of this report.
Returns shown with a sales charge reflect the deduction of the current maximum initial sales charge of 5.75% for Class A shares and the contingent deferred sales charge (CDSC) for Class C shares. The CDSC for Class C shares is 1%, which is reduced to 0% after 1 year. The performance of the Fund's share classes will differ primarily due to different sales charge structures and class expenses. Please see the prospectus for more information about sales charge structures, if any, and class expenses for your share class.
43
Mid Cap Growth Fund (Unaudited)
COMPARISON OF A $10,000 INVESTMENT
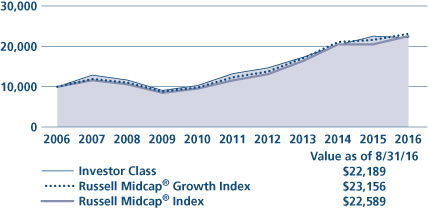
This graph shows the change in value of a hypothetical $10,000 investment in the Fund over the past 10 fiscal years, or since the Fund's inception if it has not operated for 10 years. The graph is based on the Investor Class shares only; the performance of the Fund's share classes will differ primarily due to different sales charge structures and class expenses (see Performance Highlights chart on previous page). The result is compared with benchmarks, which include a broad-based market index and may include a more narrowly based index. Market indices have not been reduced to reflect any of the fees and costs of investing. The results shown in the graph reflect the reinvestment of income dividends and other distributions, if any. The results do not reflect the effect of taxes a shareholder would pay on Fund distributions or on the redemption of Fund shares. Results represent past performance and do not indicate future results.
44
Mid Cap Intrinsic Value Fund Commentary (Unaudited)
Neuberger Berman Mid Cap Intrinsic Value Fund Investor Class generated a 5.85% total return for the fiscal year ended August 31, 2016, underperforming its benchmark, the Russell Midcap® Value Index, which returned 12.88% for the same period. (Performance for all share classes is provided in the table immediately following this letter.)
During the period, the market was dominated by momentum and income producing securities. Our strong value orientation led us to invest in contrarian stocks in the cheaper, more cyclically oriented sectors of the market, and as a result, the Fund underperformed.
Equity markets became volatile and sensitive to changes in the economic backdrop during the last several months of 2015. Volatility continued into the second quarter of this year, heightened in June by Britain's surprising decision to exit the European Union (Brexit). Over the past few months, volatility has subsided due to several factors. Second quarter earnings results were better than expected, and recent U.S. economic news has been mostly positive. Both the ISM Manufacturing and Non-Manufacturing Indices were higher than anticipated, jobs reports were strong and wage growth beat expectations. Housing starts and new home sales were materially higher than anticipated, and retail sales were mostly strong.
During the period, performance benefitted from the Fund's stock selection in the Energy and Health Care sectors and both an overweight and stock selection in Producer Durables. Merger and acquisition activity also helped. Our largest holding during the period, ADT, which is engaged in the electronic security business, was acquired by Apollo; Tyco International completed its merger with Johnson Controls in a $14 billion deal creating a new giant provider of commercial-building systems; and SanDisk, a Technology company engaged in manufacturing flash memory products, was acquired by Western Digital. ONEOK, a diversified energy company, and Devon Energy, an independent oil and natural gas exploration and production company, benefitted from a recovery in commodity prices. Zimmer Biomet Holdings, a manufacturer of medical devices, continued to profit from cross selling and growth acceleration resulting from the Biomet merger in 2015. In Producer Durables, Itron benefitted from improved operational performance and recovering end markets, and Avery Dennison posted strong fundamentals consistently beating sales and earnings estimates. Colony Starwood Homes emerged in early 2016, when Starwood Waypoint (our former holding) merged with Colony Homes, creating the leading single family rental real estate investment trust. The company gained recognition in its category and benefitted from significant cost synergies resulting from the merger.
On the negative side, underweights in two of the benchmark's better performing sectors, Consumer Staples and Utilities, hurt performance. Overweights in the Consumer Discretionary sector also detracted. Lagging investments included Corrections Corporation of America (CXW), a Financial Services company engaged in the operation of correctional facilities. Shares plummeted in mid-August following a U.S. Department of Justice announcement regarding plans to reduce future reliance on privately operated facilities. Presently only 7% of CXW's total annual revenue is derived from contracts which may be affected by the decision upon their expiration. A few of our regional banks (BankUnited, Huntington Bancshares) lagged due to the low rate environment although this has reversed in recent months. NRG Energy (Utilities), which was sold in February, continued to be impacted by commodity and power price weakness. Hertz Global Holdings was slow to rightsize its fleet, and shares remained suppressed, despite improving trends in the car rental business. Staples (sold in December) and Office Depot were hurt by a Federal Court ruling blocking their merger, which would have created substantial cost synergies.
While more recently released economic reports were encouraging, we believe economic uncertainty remains. The possibility of a Fed rate hike before the end of the year and the outcome of the U.S. presidential election could lead to increased market volatility. A number of developments abroad, including Brexit and uncertainty about China's growth rate, might also have a negative impact on U.S. markets. We believe that our focus on what we see as quality companies—companies who are selling at a discount to intrinsic value1 with a potential catalyst for value creation—should fare well in such an environment.
45
Sincerely,
MICHAEL C. GREENE
PORTFOLIO MANAGER
1 Intrinsic value reflects the portfolio management team's analysis and estimates of a company's value. There is no guarantee that any intrinsic values will be realized; security prices may decrease regardless of intrinsic values.
Information about principal risks of investing in the Fund is set forth in the prospectus and statement of additional information.
The portfolio composition, industries and holdings of the Fund are subject to change without notice.
The opinions expressed are those of the Fund's portfolio manager. The opinions are as of the date of this report and are subject to change without notice.
46
Mid Cap Intrinsic Value Fund (Unaudited)
TICKER SYMBOLS
Investor Class | | NBRVX | |
Trust Class | | NBREX | |
Institutional Class | | NBRTX | |
Class A | | NBRAX | |
Class C | | NBRCX | |
Class R3 | | NBRRX | |
SECTOR ALLOCATION
(as a % of Total Investments*) | |
Consumer Discretionary | | | 14.5 | % | |
Consumer Staples | | | 4.2 | | |
Energy | | | 6.4 | | |
Financial Services | | | 20.4 | | |
Health Care | | | 4.3 | | |
Materials & Processing | | | 5.3 | | |
Producer Durables | | | 18.2 | | |
Technology | | | 18.8 | | |
Utilities | | | 5.8 | | |
Short-Term Investment | | | 2.1 | | |
Total | | | 100.0 | % | |
* Derivatives, if any, are excluded from this chart.
PERFORMANCE HIGHLIGHTS7
| | | | | Average Annual Total
Return Ended 08/31/2016 | |
| | | Inception
Date | | 1 Year | | 5 Years | | 10 Years | | Life of
Fund | |
At NAV | |
Investor Class | | 06/01/1999 | | | 5.85 | % | | | 13.26 | % | | | 6.91 | % | | | 9.18 | % | |
| Trust Class3 | | 06/10/1999 | | | 5.80 | % | | | 13.07 | % | | | 6.80 | % | | | 9.10 | % | |
| Institutional Class5 | | 03/08/2010 | | | 6.18 | % | | | 13.51 | % | | | 7.10 | % | | | 9.29 | % | |
| Class A19 | | 06/21/2010 | | | 5.76 | % | | | 13.10 | % | | | 6.85 | % | | | 9.14 | % | |
| Class C19 | | 06/21/2010 | | | 5.01 | % | | | 12.27 | % | | | 6.36 | % | | | 8.85 | % | |
| Class R316 | | 06/21/2010 | | | 5.54 | % | | | 12.83 | % | | | 6.69 | % | | | 9.05 | % | |
With Sales Charge | |
| Class A19 | | | | | | | –0.32 | % | | | 11.78 | % | | | 6.22 | % | | | 8.77 | % | |
| Class C19 | | | | | | | 4.10 | % | | | 12.27 | % | | | 6.36 | % | | | 8.85 | % | |
Index | |
| Russell Midcap® Value Index1,15 | | | | | | | 12.88 | % | | | 15.03 | % | | | 7.98 | % | | | 9.36 | % | |
| Russell Midcap® Index1,15 | | | | | | | 9.91 | % | | | 14.29 | % | | | 8.49 | % | | | 8.79 | % | |
The performance data quoted represent past performance and do not indicate future results. Current performance may be lower or higher than the performance data quoted. For performance data current to the most recent month-end, please visit www.nb.com/performance.
The results shown in the table reflect the reinvestment of income dividends and other distributions, if any. The results do not reflect the effect of taxes a shareholder would pay on Fund distributions or on the redemption of Fund shares.
The investment return and principal value of an investment will fluctuate and shares, when redeemed, may be worth more or less than their original cost.
Returns would have been lower if Neuberger Berman Investment Advisers LLC ("Management") had not reimbursed certain expenses and/or waived a portion of the investment management fees during certain of the periods shown. Repayment by a class (of expenses previously reimbursed and/or fees previously waived by Management) will decrease the class's returns. Please see Note B in the Notes to Financial Statements for specific information regarding expense reimbursement and/or fee waiver arrangements.
As stated in the Fund's most recent prospectus, the total annual operating expense ratios for fiscal year 2015 were 1.25%, 1.49%, 1.08%, 1.48%, 2.21% and 1.74% for Investor Class, Trust Class, Institutional Class, Class A, Class C and Class R3 shares, respectively (before expense reimbursements and/or fee waivers, if any). The expense ratios were 1.26%, 0.86%, 1.22%, 1.97% and 1.47% for Trust Class, Institutional Class, Class A, Class C and Class R3 shares, respectively, after expense reimbursements and/or fee waivers. The expense ratios for the annual period ended August 31, 2016 can be found in the Financial Highlights section of this report.
Returns shown with a sales charge reflect the deduction of the current maximum initial sales charge of 5.75% for Class A shares and the contingent deferred sales charge (CDSC) for Class C shares. The CDSC for Class C shares is 1%, which is reduced to 0% after 1 year. The performance of the Fund's share classes will differ primarily due to different sales charge structures and class expenses. Please see the prospectus for more information about sales charge structures, if any, and class expenses for your share class.
47
Mid Cap Intrinsic Value Fund (Unaudited)
COMPARISON OF A $10,000 INVESTMENT
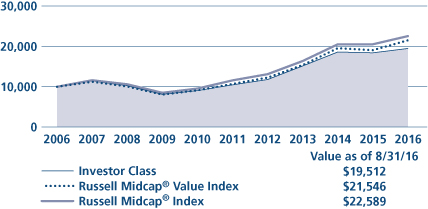
This graph shows the change in value of a hypothetical $10,000 investment in the Fund over the past 10 fiscal years, or since the Fund's inception if it has not operated for 10 years. The graph is based on the Investor Class shares only; the performance of the Fund's share classes will differ primarily due to different sales charge structures and class expenses (see Performance Highlights chart on previous page). The result is compared with benchmarks, which include a broad-based market index and may include a more narrowly based index. Market indices have not been reduced to reflect any of the fees and costs of investing. The results shown in the graph reflect the reinvestment of income dividends and other distributions, if any. The results do not reflect the effect of taxes a shareholder would pay on Fund distributions or on the redemption of Fund shares. Results represent past performance and do not indicate future results.
48
Multi-Cap Opportunities Fund Commentary (Unaudited)
Neuberger Berman Multi-Cap Opportunities Fund Institutional Class generated an 8.94% total return for the fiscal year ended August 31, 2016 versus a 12.55% total return for its benchmark, the S&P 500® Index (the Index), for the same period. (Performance for all share classes is provided in the table immediately following this letter.)
Within the Index, all ten sectors generated a positive return for the period. Consumer Staples, Industrials, Information Technology (IT), Materials, Telecommunication Services and Utilities outperformed relative to the overall benchmark. Consumer Discretionary, Energy, Financials and Health Care all lagged the overall benchmark. We believe heightened market volatility over the course of the year contributed to the dispersion in performance across sectors.
Within the portfolio, stock selection in Consumer Staples and IT benefitted relative performance. Stock selection in Consumer Discretionary and Energy detracted from relative performance during the period. The Fund ended the fiscal year with an overweight, relative to the benchmark, in the Financials, Health Care, Industrials, IT, and Materials sectors. The Fund ended the fiscal year with an underweight, relative to the benchmark, in the Consumer Discretionary, Consumer Staples, Energy, Telecommunication Services, and Utilities sectors.
Portfolio construction is an important component of our investment process and consists of three distinct investment categories: Special Situations, Opportunistic and Classic. Special Situations have unique attributes (e.g., restructuring, spin-offs, post-bankruptcy equities) that require specific valuation methodologies and customized investment research. Opportunistic investments are companies that have become inexpensive for a tangible reason that we believe is temporary. Classic investments are those companies with long histories of shareholder friendly policies, high quality management teams and exceptional operating performance. We believe maintaining a balance of these three categories helps to mitigate risk within the portfolio. We continue to find investment opportunities that we believe show attractive risk/return profiles across each investment category.
We believe the current environment is attractive for free cash flow oriented investing because company balance sheets are healthy and free cash flow generation remains strong. As a result, management teams have a significant opportunity to create value for shareholders by allocating capital effectively. Dividend increases, share repurchase programs, cash accumulation, debt retirement, organic growth initiatives, selective and highly accretive acquisitions—all can accrue to the benefit of equity holders. When company specific drivers are in focus, high conviction active managers have the potential to add value for their clients through stock selection. We believe deep fundamental analysis centered on free cash flow and capital structure efficiency may be an important driver of performance going forward.
Our style of investing is based on rigorous fundamental research. The analysis centers on the business model and a company's ability to generate and effectively utilize free cash flow. As we evaluate both potential new positions and current portfolio holdings, we will continue to do so with a long-term investment perspective in mind. As always, our focus is to grow our clients' assets through the disciplined application of our investment philosophy and process.
Sincerely,
RICHARD S. NACKENSON
PORTFOLIO MANAGER
Information about principal risks of investing in the Fund is set forth in the prospectus and statement of additional information.
The portfolio composition, industries and holdings of the Fund are subject to change without notice.
The opinions expressed are those of the Fund's portfolio manager. The opinions are as of the date of this report and are subject to change without notice.
49
Multi-Cap Opportunities Fund (Unaudited)
TICKER SYMBOLS
Institutional Class | | NMULX | |
Class A | | NMUAX | |
Class C | | NMUCX | |
SECTOR ALLOCATION
(as a % of Total Investments*) | |
Consumer Discretionary | | | 4.7 | % | |
Consumer Staples | | | 3.9 | | |
Energy | | | 4.3 | | |
Financials | | | 23.8 | | |
Health Care | | | 17.0 | | |
Industrials | | | 14.2 | | |
Information Technology | | | 27.3 | | |
Materials | | | 3.9 | | |
Short-Term Investment | | | 0.9 | | |
Total | | | 100.0 | % | |
* Derivatives, if any, are excluded from this chart.
PERFORMANCE HIGHLIGHTS9
| | | | | Average Annual Total
Return Ended 08/31/2016 | |
| | | Inception
Date* | | 1 Year | | 5 Years | | Life of
Fund | |
At NAV | |
| Institutional Class17 | | 12/21/2009 | | | 8.94 | % | | | 14.28 | % | | | 7.55 | % | |
| Class A17 | | 12/21/2009 | | | 8.53 | % | | | 13.88 | % | | | 7.29 | % | |
| Class C17 | | 12/21/2009 | | | 7.73 | % | | | 13.03 | % | | | 6.75 | % | |
With Sales Charge | |
| Class A17 | | | | | | | 2.26 | % | | | 12.54 | % | | | 6.65 | % | |
| Class C17 | | | | | | | 6.73 | % | | | 13.03 | % | | | 6.75 | % | |
Index | |
| S&P 500® Index1,15 | | | | | | | 12.55 | % | | | 14.69 | % | | | 7.09 | % | |
*Prior to December 14, 2009, the Fund had different investment goals, strategies, and portfolio management team. The performance data for each class includes the performance of the Fund's oldest share class, Trust Class, from November 2, 2006 through December 21, 2009. See endnote 17 for information about the effects of the different fees paid by each class.
The performance data quoted represent past performance and do not indicate future results. Current performance may be lower or higher than the performance data quoted. For performance data current to the most recent month-end, please visit www.nb.com/performance.
The results shown in the table reflect the reinvestment of income dividends and other distributions, if any. The results do not reflect the effect of taxes a shareholder would pay on Fund distributions or on the redemption of Fund shares.
The investment return and principal value of an investment will fluctuate and shares, when redeemed, may be worth more or less than their original cost.
Returns would have been lower if Neuberger Berman Investment Advisers LLC ("Management") had not reimbursed certain expenses and/or waived a portion of the investment management fees during certain of the periods shown. Repayment by a class (of expenses previously reimbursed and/or fees previously waived by Management) will decrease the class's returns. Please see Note B in the Notes to Financial Statements for specific information regarding expense reimbursement and/or fee waiver arrangements.
As stated in the Fund's most recent prospectus, the total annual operating expense ratios for fiscal year 2015 were 0.73%, 1.10% and 1.84% for Institutional Class, Class A and Class C shares, respectively (before expense reimbursements and/or fee waivers, if any). The expense ratios for the annual period ended August 31, 2016 can be found in the Financial Highlights section of this report.
Returns shown with a sales charge reflect the deduction of the current maximum initial sales charge of 5.75% for Class A shares and the contingent deferred sales charge (CDSC) for Class C shares. The CDSC for Class C shares is 1%, which is reduced to 0% after 1 year. The performance of the Fund's share classes will differ primarily due to different sales charge structures and class expenses. Please see the prospectus for more information about sales charge structures, if any, and class expenses for your share class.
50
Multi-Cap Opportunities Fund (Unaudited)
COMPARISON OF A $1,000,000 INVESTMENT17
(000's Omitted)
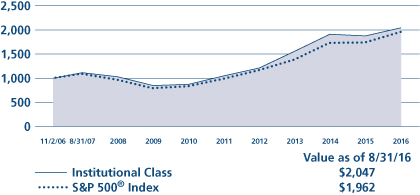
This graph shows the change in value of a hypothetical $1,000,000 investment in the Fund over the past 10 fiscal years, or since the Fund's inception if it has not operated for 10 years. The graph is based on the Institutional Class shares only; the performance of the Fund's share classes will differ primarily due to different sales charge structures and class expenses (see Performance Highlights chart on previous page). The result is compared with benchmarks, which include a broad-based market index and may include a more narrowly based index. Market indices have not been reduced to reflect any of the fees and costs of investing. The results shown in the graph reflect the reinvestment of income dividends and other distributions, if any. The results do not reflect the effect of taxes a shareholder would pay on Fund distributions or on the redemption of Fund shares. Results represent past performance and do not indicate future results.
51
Real Estate Fund Commentary (Unaudited)
Neuberger Berman Real Estate Fund Trust Class generated a 21.59% total return for the for the fiscal year ended August 31, 2016, underperforming its benchmark, the FTSE NAREIT All Equity REITs Index, which generated a 25.37% total return for the period. (Performance for all share classes is provided in the table immediately following this letter.)
The U.S. stock market generated strong results during the reporting period. The market was supported by overall positive investor demand, certain resilient economic data and continued supportive Fed monetary policy. The overall U.S. stock market, as measured by the S&P 500® Index, rose 12.55% for the 12-month period. Comparatively, real estate investment trusts (REITs) posted even stronger results during the period, partially due to robust investor demand and declining longer-term interest rates.
Sector positioning, overall, detracted from the Fund's relative performance during the reporting period. In particular, an overweight to Real Estate Operating Companies (non-REIT real estate related securities) and an underweight to Free Standing were negative for results. On the upside, an underweight to Lodging/Resorts and an overweight to Single Family Homes were the largest contributors to performance. Stock selection, overall, was modestly positive for performance. Contributing the most to results was stock selection in the Diversified, Mixed and Lodging/Resorts sectors. Simon Property Group, a leading commercial real estate company with both regional malls and discount outlet centers, American Tower Corp., an operator and developer of wireless communications towers, and Public Storage, a self-storage REIT, were the largest contributors to performance.
The sectors that detracted the most from the Fund's performance from a stock selection perspective were Apartments, Office and Free Standing. Several individual holdings were also negative for results, including Forest City Realty Trust, Inc., a diversified REIT, as well as Host Hotels & Resorts, Inc. and LaSalle Hotel Properties, two Lodging/Resorts REITs. We eliminated all three positions during the reporting period.
The U.S. economy has been fairly resilient in the face of global headwinds. Turning to the Fed, it appears likely to us that the central bank will take a measured and cautious approach in terms of normalizing policy. We believe continued economic growth and modest inflation should be supportive for the U.S. commercial property market. As in the past, we believe real estate fundamentals, not interest rates, will be the long-term driver of performance in the REIT market. In particular, we believe real estate companies with sustainable cash flow and dividend growth have the potential to perform well. Strong, flexible balance sheets that can withstand capital markets volatility will likely also be important. We are focused on companies with management teams that can capitalize on pricing differences between the public and private real estate markets.
Sincerely,
STEVE SHIGEKAWA AND BRIAN C. JONES
PORTFOLIO CO-MANAGERS
Information about principal risks of investing in the Fund is set forth in the prospectus and statement of additional information.
The portfolio composition, industries and holdings of the Fund are subject to change without notice.
The opinions expressed are those of the Fund's portfolio managers. The opinions are as of the date of this report and are subject to change without notice.
52
Real Estate Fund (Unaudited)
TICKER SYMBOLS
Trust Class | | NBRFX | |
Institutional Class | | NBRIX | |
Class A | | NREAX | |
Class C | | NRECX | |
Class R3 | | NRERX | |
Class R6 | | NRREX | |
SECTOR ALLOCATION
(as a % of Total Investments*) | |
Apartments | | | 11.0 | % | |
Data Centers | | | 5.0 | | |
Diversified | | | 3.1 | | |
Free Standing | | | 3.3 | | |
Health Care | | | 10.2 | | |
Industrial | | | 4.9 | | |
Infrastructure | | | 9.8 | | |
Lodging/Resorts | | | 1.6 | | |
Manufactured Homes | | | 2.5 | | |
Office | | | 12.3 | | |
Real Estate Operating Companies | | | 1.7 | | |
Regional Malls | | | 10.5 | | |
Self Storage | | | 5.5 | | |
Shopping Centers | | | 9.4 | | |
Single Family Homes | | | 2.8 | | |
Specialty | | | 1.5 | | |
Timber | | | 3.7 | | |
Short-Term Investment | | | 1.2 | | |
Total | | | 100.0 | % | |
* Derivatives, if any, are excluded from this chart.
PERFORMANCE HIGHLIGHTS7,21
| | | | | Average Annual Total
Return Ended 08/31/2016 | |
| | | Inception
Date | | 1 Year | | 5 Years | | 10 Years | | Life of
Fund | |
At NAV | |
Trust Class | | 05/01/2002 | | | 21.59 | % | | | 11.27 | % | | | 6.90 | % | | | 11.89 | % | |
| Institutional Class6 | | 06/04/2008 | | | 21.84 | % | | | 11.48 | % | | | 7.07 | % | | | 12.01 | % | |
| Class A14 | | 06/21/2010 | | | 21.37 | % | | | 11.08 | % | | | 6.78 | % | | | 11.80 | % | |
| Class C14 | | 06/21/2010 | | | 20.45 | % | | | 10.24 | % | | | 6.29 | % | | | 11.44 | % | |
| Class R314 | | 06/21/2010 | | | 21.03 | % | | | 10.80 | % | | | 6.61 | % | | | 11.68 | % | |
| Class R624 | | 03/15/2013 | | | 21.85 | % | | | 11.48 | % | | | 7.00 | % | | | 11.96 | % | |
With Sales Charge | |
| Class A14 | | | | | | | 14.39 | % | | | 9.77 | % | | | 6.15 | % | | | 11.34 | % | |
| Class C14 | | | | | | | 19.45 | % | | | 10.24 | % | | | 6.29 | % | | | 11.44 | % | |
Index | |
| FTSE NAREIT All Equity REITs Index1,15 | | | | | | | 25.37 | % | | | 13.65 | % | | | 6.73 | % | | | 11.00 | % | |
The performance data quoted represent past performance and do not indicate future results. Current performance may be lower or higher than the performance data quoted. For performance data current to the most recent month-end, please visit www.nb.com/performance.
The results shown in the table reflect the reinvestment of income dividends and other distributions, if any. The results do not reflect the effect of taxes a shareholder would pay on Fund distributions or on the redemption of Fund shares.
The investment return and principal value of an investment will fluctuate and shares, when redeemed, may be worth more or less than their original cost.
Returns would have been lower if Neuberger Berman Investment Advisers LLC ("Management") had not reimbursed certain expenses and/or waived a portion of the investment management fees during certain of the periods shown. Repayment by a class (of expenses previously reimbursed and/or fees previously waived by Management) will decrease the class's returns. Please see Note B in the Notes to Financial Statements for specific information regarding expense reimbursement and/or fee waiver arrangements.
As stated in the Fund's most recent prospectus, the total annual operating expense ratios for fiscal year 2015 were 1.39%, 1.04%, 1.41%, 2.17%, 1.66% and 0.97% for Trust Class, Institutional Class, Class A, Class C, Class R3 and Class R6 shares, respectively (before expense reimbursements and/or fee waivers, if any). The expense ratios were 0.85%, 1.21%, 1.96%, 1.46% and 0.78% for Institutional Class, Class A, Class C, Class R3 and Class R6 shares, respectively, after expense reimbursements and/or fee waivers. The expense ratios for the annual period ended August 31, 2016 can be found in the Financial Highlights section of this report.
Returns shown with a sales charge reflect the deduction of the current maximum initial sales charge of 5.75% for Class A shares and the contingent deferred sales charge (CDSC) for Class C shares. The CDSC for Class C shares is 1%, which is reduced to 0% after 1 year. The performance of the Fund's share classes will differ primarily due to different sales charge structures and class expenses. Please see the prospectus for more information about sales charge structures, if any, and class expenses for your share class.
53
Real Estate Fund (Unaudited)
COMPARISON OF A $10,000 INVESTMENT
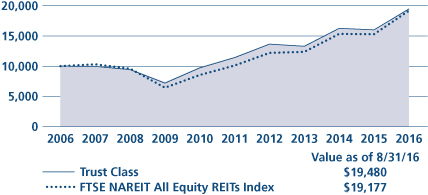
This graph shows the change in value of a hypothetical $10,000 investment in the Fund over the past 10 fiscal years, or since the Fund's inception if it has not operated for 10 years. The graph is based on the Trust Class shares only; the performance of the Fund's share classes will differ primarily due to different sales charge structures and class expenses (see Performance Highlights chart on previous page). The result is compared with benchmarks, which include a broad-based market index and may include a more narrowly based index. Market indices have not been reduced to reflect any of the fees and costs of investing. The results shown in the graph reflect the reinvestment of income dividends and other distributions, if any. The results do not reflect the effect of taxes a shareholder would pay on Fund distributions or on the redemption of Fund shares. Results represent past performance and do not indicate future results.
54
Small Cap Growth Fund Commentary (Unaudited)
Neuberger Berman Small Cap Growth Fund Investor Class generated a –3.16% total return for the fiscal year ended August 31, 2016, lagging its benchmark, the Russell 2000® Growth Index, which returned 3.55% for the same period. (Performance for all share classes is provided in the table immediately following this letter.)
The trailing twelve months offered up an unpredictable roller-coaster of highs and lows, beginning with a meaningful market correction, driven in the middle by the highly correlated power of oil, the U.S. dollar, and economic news out of China and closing with a healthy dose of nationalistic cynicism and uncertainty courtesy of the upcoming U.S. presidential election and Great Britain's surprising decision to leave the European Union. Not to be upstaged, the Fed continued its very public, ongoing rate debate, complete with dueling hawkish and dovish postures around the overall health and direction of our economy. Driven by the aforementioned, we believe the market's demeanor has ranged from highly irrational to oddly calm, which, depending on the day, may have proved challenging to active managers. Despite the push towards new highs, this market hasn't represented a sustained shift to risk-on or an embracing of positive momentum. Instead, we believe this has been a safe-haven rally driven by an overabundance of caution and characterized by unexpected correlations, generally low volume and a continued "free money" distortion of the capital allocation process. However, the good news, likely lost amid the headlines and intermittent volatility, is that in general, companies continued to execute and deliver reasonably good earnings.
On average during the period, the portfolio was overweight in Information Technology, Energy and Health Care and underweight in Materials, Industrials, Financials, Consumer Staples, Telecommunication Services and Consumer Discretionary relative to its benchmark. Two sudden and ruthless market rotations (August/September 2015 and January/February 2016), away from higher expectation investment stories proved extremely challenging to our approach and portfolio positioning, particularly within Health Care which faced a perfect storm fueled by elevated valuations, drug pricing politics and the implosion of large-cap Valeant Pharmaceuticals (We did not hold this security). For the period, Burlington Stores was the top performing holding, while Pacira Pharmaceuticals was the leading detractor. Burlington, a national off-price retailer of branded apparel, rose above the sorry state of retail to deliver strong results that were enthusiastically received by the market. Pacira, which develops non-opioid products for postsurgical pain control, lagged expectations for the re-launch of their key product, which negatively impacted their earnings. Given the increased uncertainty, extremely unforgiving environment and headwinds for the specialty pharmaceutical segment, we elected to exit our position.
Despite the occasional bouts of extreme volatility, we believe the market proved fairly adept at shaking off the aforementioned macro-level worries and largely rolling with the seemingly endless fiscal, monetary and political chatter. Underpinning that market resiliency have been reasonably solid corporate earnings and continued broadly positive economic indicators, trends that we believe are certainly capable of continuing through year-end and into 2017. As a result, bullish sentiment continues to outweigh bearish, and we simply can't discount the market's ability to keep steaming forward, even if it doesn't always make sense or follow past formulas. Given the continued potential for volatility, it's more incumbent upon us to strike the proper risk/reward balance within the portfolio. With that said, we remain cautiously optimistic that companies with a recent history of higher growth, offering what we believe are intriguing catalysts and compelling fundamentals, will continue to gain greater traction with the market and provide an attractive alternative to the yield-centric and flight-to-safety trades that have become increasingly crowded.
Sincerely,
KENNETH J. TUREK
PORTFOLIO MANAGER
Information about principal risks of investing in the Fund is set forth in the prospectus and statement of additional information.
The portfolio composition, industries and holdings of the Fund are subject to change without notice.
The opinions expressed are those of the Fund's portfolio manager. The opinions are as of the date of this report and are subject to change without notice.
55
Small Cap Growth Fund (Unaudited)
TICKER SYMBOLS
Investor Class | | NBMIX | |
Trust Class | | NBMOX | |
Advisor Class | | NBMVX | |
Institutional Class | | NBSMX | |
Class A | | NSNAX | |
Class C | | NSNCX | |
Class R3 | | NSNRX | |
SECTOR ALLOCATION
(as a % of Total Investments*) | |
Consumer Discretionary | | | 15.9 | % | |
Consumer Staples | | | 3.0 | | |
Energy | | | 1.7 | | |
Financials | | | 5.6 | | |
Health Care | | | 25.9 | | |
Industrials | | | 15.6 | | |
Information Technology | | | 27.9 | | |
Materials | | | 1.9 | | |
Short-Term Investment | | | 2.5 | | |
Total | | | 100.0 | % | |
* Derivatives, if any, are excluded from this chart.
PERFORMANCE HIGHLIGHTS
| | | | | Average Annual Total
Return Ended 08/31/2016 | |
| | | Inception
Date | | 1 Year | | 5 Years | | 10 Years | | Life of
Fund | |
At NAV | |
Investor Class | | 10/20/1998 | | | –3.16 | % | | | 10.00 | % | | | 6.65 | % | | | 7.99 | % | |
| Trust Class3 | | 11/03/1998 | | | –3.27 | % | | | 9.81 | % | | | 6.44 | % | | | 7.84 | % | |
| Advisor Class4 | | 05/03/2002 | | | –3.40 | % | | | 9.66 | % | | | 6.26 | % | | | 7.75 | % | |
| Institutional Class5 | | 04/01/2008 | | | –2.82 | % | | | 10.35 | % | | | 6.90 | % | | | 8.13 | % | |
| Class A19 | | 05/27/2009 | | | –3.18 | % | | | 9.95 | % | | | 6.57 | % | | | 7.95 | % | |
| Class C19 | | 05/27/2009 | | | –3.92 | % | | | 9.13 | % | | | 5.99 | % | | | 7.62 | % | |
| Class R316 | | 05/27/2009 | | | –3.44 | % | | | 9.68 | % | | | 6.38 | % | | | 7.84 | % | |
With Sales Charge | |
| Class A19 | | | | | | | –8.74 | % | | | 8.66 | % | | | 5.94 | % | | | 7.59 | % | |
| Class C19 | | | | | | | –4.80 | % | | | 9.13 | % | | | 5.99 | % | | | 7.62 | % | |
Index | |
| Russell 2000® Growth Index1,15 | | | | | | | 3.55 | % | | | 13.02 | % | | | 8.20 | % | | | 7.45 | % | |
| Russell 2000® Index1,15 | | | | | | | 8.59 | % | | | 12.85 | % | | | 7.04 | % | | | 8.72 | % | |
The performance data quoted represent past performance and do not indicate future results. Current performance may be lower or higher than the performance data quoted. For performance data current to the most recent month-end, please visit www.nb.com/performance.
The results shown in the table reflect the reinvestment of income dividends and other distributions, if any. The results do not reflect the effect of taxes a shareholder would pay on Fund distributions or on the redemption of Fund shares.
The investment return and principal value of an investment will fluctuate and shares, when redeemed, may be worth more or less than their original cost.
Returns would have been lower if Neuberger Berman Investment Advisers LLC ("Management") had not reimbursed certain expenses and/or waived a portion of the investment management fees during certain of the periods shown. Repayment by a class (of expenses previously reimbursed and/or fees previously waived by Management) will decrease the class's returns. Please see Note B in the Notes to Financial Statements for specific information regarding expense reimbursement and/or fee waiver arrangements.
As stated in the Fund's most recent prospectus, the total annual operating expense ratios for fiscal year 2015 were 1.68%, 1.86%, 2.00%, 1.45%, 1.83%, 2.58% and 2.15% for Investor Class, Trust Class, Advisor Class, Institutional Class, Class A, Class C and Class R3 shares, respectively (before expense reimbursements and/or fee waivers, if any). The expense ratios were 1.31%, 1.40%, 1.60%, 0.91%, 1.26%, 2.01% and 1.51% for Investor Class, Trust Class, Advisor Class, Institutional Class, Class A, Class C and Class R3 shares, respectively, after expense reimbursements and/or fee waivers. The expense ratios for the annual period ended August 31, 2016 can be found in the Financial Highlights section of this report.
Returns shown with a sales charge reflect the deduction of the current maximum initial sales charge of 5.75% for Class A shares and the contingent deferred sales charge (CDSC) for Class C shares. The CDSC for Class C shares is 1%, which is reduced to 0% after 1 year. The performance of the Fund's share classes will differ primarily due to different sales charge structures and class expenses. Please see the prospectus for more information about sales charge structures, if any, and class expenses for your share class.
56
Small Cap Growth Fund (Unaudited)
COMPARISON OF A $10,000 INVESTMENT
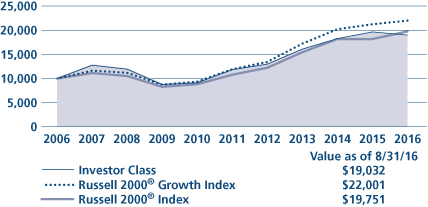
This graph shows the change in value of a hypothetical $10,000 investment in the Fund over the past 10 fiscal years, or since the Fund's inception if it has not operated for 10 years. The graph is based on the Investor Class shares only; the performance of the Fund's share classes will differ primarily due to different sales charge structures and class expenses (see Performance Highlights chart on previous page). The result is compared with benchmarks, which include a broad-based market index and may include a more narrowly based index. Market indices have not been reduced to reflect any of the fees and costs of investing. The results shown in the graph reflect the reinvestment of income dividends and other distributions, if any. The results do not reflect the effect of taxes a shareholder would pay on Fund distributions or on the redemption of Fund shares. Results represent past performance and do not indicate future results.
57
Socially Responsive Fund Commentary (Unaudited)
Neuberger Berman Socially Responsive Fund Investor Class reported a total return of 10.49% for the fiscal year ended August 31, 2016, trailing the 12.55% return of the S&P 500® Index for the same period. (Performance for all share classes is provided in the table immediately following this letter.)
Strong returns masked the volatility in the equity markets this period. For instance, by mid-February, the S&P declined nearly 12% as worries of a slowing China combined with weakness in U.S. businesses impacted by weak energy and commodity related markets led to fears of a U.S. downturn. Similarly, in June, fears of implications from the UK electorate's vote to leave the European Union reignited concerns of a global economic slowdown and caused an immediate flight to safety and a sell-off in global equity markets.
Despite market turmoil, steady growth in the U.S. and stability in other major economies helped commodity prices rally from their lows and arrested the appreciation of the U.S. dollar. While uncertainties remain—including elections in the U.S. and the corresponding lack of clarity on trade and economic policies potentially creating volatility, we continue to believe that U.S. job growth, consumer strength and an accommodative Fed should result in a favorable backdrop for continued slow growth.
For the Fund, top contributors included long-term holdings Texas Instruments, Intuit and Newell Brands. Each executed well, with Texas Instruments benefiting from its strong position in analog chips and Newell Brands benefiting from progress in its recent Jarden acquisition. Intuit continued to benefit from its dominant position in tax preparation for consumers and its move to a Software as a Service model for its accounting solutions for small business.
Detractors included American Express and Alliance Data Systems, both high returns businesses that saw multiples compress on rising worries about the credit cycle. Robert Half International, a predominantly U.S.-based skilled labor services business supporting professional and small businesses, also hurt performance. We continue to own all three, believing these businesses will benefit if continued steady U.S. economic growth dispels some of the fears embedded in their valuations.
During the fiscal year, we took advantage of market volatility to opportunistically add some well-positioned businesses including JP Morgan, Medtronic, Weyerhaeuser, Motorola Solutions, and Delphi Automotive. Delphi emerged in 2010 from its post-crisis bankruptcy as a streamlined, disciplined and innovative company with global manufacturing scale. We believe Delphi's presence in the growing active safety, fuel economy and wireless connectivity segments position it to grow at an advantaged pace. Delphi's content growth, we believe, is likely to be higher in hybrid and electric cars.
With much of the post-financial crisis regulatory landscape clarified, we consider JP Morgan, a premier consumer and commercial banking, asset management and investment banking firm, well positioned to navigate and grow within a heavily regulated industry and slow growth environment. In our opinion, the company benefits from scale and diversification, and the value of its businesses remains compelling. We exited positions that we considered fully valued, including Adobe Systems, O'Reilly Automotive, Herman Miller, PayPal and Keurig Green Mountain (upon a private equity takeover offer.)
Looking ahead, absent some external shock, we anticipate slow growth continuing. We believe the U.S. economic backdrop is resilient, and while the Fed has begun to increase rates, the trajectory remains very measured. Thus, we believe monetary policy is likely to continue to be supportive of growth. Clearly global risks remain, but, in our opinion, U.S. fundamentals appear firm and supportive for equities.
We remain pleased with our portfolio companies, believing they are positioned to outperform peers—with strong cash flow and balance sheets ready to weather a storm, should one arise.
We look forward to continuing to serve your investment needs.
58
Sincerely,
INGRID S. DYOTT AND SAJJAD S. LADIWALA
CO-PORTFOLIO MANAGERS
Information about principal risks of investing in the Fund is set forth in the prospectus and statement of additional information.
The portfolio composition, industries and holdings of the Fund are subject to change without notice.
The opinions expressed are those of the Fund's portfolio managers. The opinions are as of the date of this report and are subject to change without notice.
59
Socially Responsive Fund (Unaudited)
TICKER SYMBOLS
Investor Class | | NBSRX | |
Trust Class | | NBSTX | |
Institutional Class | | NBSLX | |
Class A | | NRAAX | |
Class C | | NRACX | |
Class R3 | | NRARX | |
Class R6 | | NRSRX | |
SECTOR ALLOCATION
(as a % of Total Investments*) | |
Consumer Discretionary | | | 9.9 | % | |
Consumer Staples | | | 4.0 | | |
Energy | | | 8.6 | | |
Financials | | | 16.2 | | |
Health Care | | | 16.7 | | |
Industrials | | | 14.8 | | |
Information Technology | | | 21.7 | | |
Materials | | | 1.0 | | |
Telecommunication Services | | | 3.1 | | |
Utilities | | | 2.8 | | |
Short-Term Investments | | | 1.2 | | |
Total | | | 100.0 | % | |
* Derivatives, if any, are excluded from this chart.
PERFORMANCE HIGHLIGHTS7
| | | | | Average Annual Total
Return Ended 08/31/2016 | |
| | | Inception
Date | | 1 Year | | 5 Years | | 10 Years | | Life of
Fund | |
At NAV | |
Investor Class | | 03/16/1994 | | | 10.49 | % | | | 12.58 | % | | | 7.22 | % | | | 9.04 | % | |
| Trust Class3 | | 03/03/1997 | | | 10.29 | % | | | 12.38 | % | | | 7.02 | % | | | 8.87 | % | |
| Institutional Class5 | | 11/28/2007 | | | 10.70 | % | | | 12.78 | % | | | 7.38 | % | | | 9.12 | % | |
| Class A19 | | 05/27/2009 | | | 10.27 | % | | | 12.34 | % | | | 7.07 | % | | | 8.98 | % | |
| Class C19 | | 05/27/2009 | | | 9.44 | % | | | 11.51 | % | | | 6.48 | % | | | 8.71 | % | |
| Class R316 | | 05/27/2009 | | | 10.01 | % | | | 12.10 | % | | | 6.88 | % | | | 8.89 | % | |
| Class R623 | | 03/15/2013 | | | 10.78 | % | | | 12.77 | % | | | 7.31 | % | | | 9.09 | % | |
With Sales Charge | |
| Class A19 | | | | | | | 3.92 | % | | | 11.02 | % | | | 6.44 | % | | | 8.69 | % | |
| Class C19 | | | | | | | 8.45 | % | | | 11.51 | % | | | 6.48 | % | | | 8.71 | % | |
Index | |
| S&P 500® Index1,15 | | | | | | | 12.55 | % | | | 14.69 | % | | | 7.51 | % | | | 9.16 | % | |
The performance data quoted represent past performance and do not indicate future results. Current performance may be lower or higher than the performance data quoted. For performance data current to the most recent month-end, please visit www.nb.com/performance.
The results shown in the table reflect the reinvestment of income dividends and other distributions, if any. The results do not reflect the effect of taxes a shareholder would pay on Fund distributions or on the redemption of Fund shares.
The investment return and principal value of an investment will fluctuate and shares, when redeemed, may be worth more or less than their original cost.
Returns would have been lower if Neuberger Berman Investment Advisers LLC ("Management") had not reimbursed certain expenses and/or waived a portion of the investment management fees during certain of the periods shown. Repayment by a class (of expenses previously reimbursed and/or fees previously waived by Management) will decrease the class's returns. Please see Note B in the Notes to Financial Statements for specific information regarding expense reimbursement and/or fee waiver arrangements.
As stated in the Fund's most recent prospectus, the total annual operating expense ratios for fiscal year 2015 were 0.85%, 1.03%, 0.68%, 1.05%, 1.79%, 1.29% and 0.60% for Investor Class, Trust Class, Institutional Class, Class A, Class C, Class R3 and Class R6 shares, respectively (before expense reimbursements and/or fee waivers, if any). The expense ratios for the annual period ended August 31, 2016 can be found in the Financial Highlights section of this report.
Returns shown with a sales charge reflect the deduction of the current maximum initial sales charge of 5.75% for Class A shares and the contingent deferred sales charge (CDSC) for Class C shares. The CDSC for Class C shares is 1%, which is reduced to 0% after 1 year. The performance of the Fund's share classes will differ primarily due to different sales charge structures and class expenses. Please see the prospectus for more information about sales charge structures, if any, and class expenses for your share class.
60
Socially Responsive Fund (Unaudited)
COMPARISON OF A $10,000 INVESTMENT
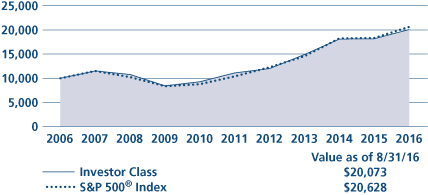
This graph shows the change in value of a hypothetical $10,000 investment in the Fund over the past 10 fiscal years, or since the Fund's inception if it has not operated for 10 years. The graph is based on the Investor Class shares only; the performance of the Fund's share classes will differ primarily due to different sales charge structures and class expenses (see Performance Highlights chart on previous page). The result is compared with benchmarks, which include a broad-based market index and may include a more narrowly based index. Market indices have not been reduced to reflect any of the fees and costs of investing. The results shown in the graph reflect the reinvestment of income dividends and other distributions, if any. The results do not reflect the effect of taxes a shareholder would pay on Fund distributions or on the redemption of Fund shares. Results represent past performance and do not indicate future results.
61
Value Fund Commentary (Unaudited)
Neuberger Berman Value Fund Institutional Class generated a 13.23% total return for the fiscal year ended August 31, 2016, outperforming its benchmark, the Russell 1000® Value Index (the Index), which returned 12.92% for the same period. (Performance for all share classes is provided in the table immediately following this letter.)
Over the past fiscal year, equities experienced some wild fluctuations as the global economy, oil prices and monetary policy decisions swayed trading activity. At the start of the period the market dropped as investors fretted over economic softness in China and other emerging markets; stocks regained their footing but plunged again in early 2016, when a fall in oil prices and a newly tighter U.S. monetary environment exacerbated the ongoing global concerns. The market rebounded quickly, however, as the Fed took a more dovish tone on interest rates, oil prices began to recover and the U.S. economy exhibited signs of health. Stocks remained on an upward path, propped up by easy monetary policies around the world, until attention turned toward Britain's vote to exit the European Union. The market plummeted in June on news of the "Brexit" decision, but then rose to new heights in August, as global investors in search of higher returns and greater stability bought up U.S. investments.
Within the Index, returns were positive across all ten sectors. Performance leadership spanned both the defensive and cyclical arenas with Information Technology, Telecommunication Services, Industrials and Utilities as the strongest segments of the market. Sectors that lagged the overall market included Consumer Discretionary, Energy and Financials.
In terms of Fund performance, Materials was the greatest source of upside relative to the Index. This was due to our heavier exposure to the overall sector, and specifically, our investment in gold producer, Newmont Mining (NEM). The stock outperformed over the period due to a rise in gold prices, which were driven higher by persistently low interest rates in the U.S. and ongoing concerns about the global economy. Consumer Discretionary caused the heaviest loss for the Fund versus the Index. The shortfall largely stemmed from weakness in luxury retailer Ralph Lauren Corp. (RL), which began to sell off after the company reported disappointing fiscal third quarter 2016 earnings and lowered its outlook for 2016, citing issues that included unfavorable product assortment and a decline in customer traffic. We continue to see value in RL, however, as management continues to scale back its brands, cut costs and identify opportunities for growth, which we believe should allow the stock to move higher as challenged end markets improve over time.
Going forward, we believe that easy monetary policy combined with a stabilizing U.S. economy could continue to prop up equities, but we remain wary as stock multiples are reaching historically high levels and corporate earnings growth has been slowing. Moreover, while companies have been avidly returning cash to shareholders via buybacks and dividends, it is our view that many investors are growing concerned that this is being done to the detriment of capital investment. In addition, we still see significant macro risks for the market that include another Fed rate move, the outcome and aftermath of the U.S. presidential election, the ongoing Brexit fallout and signs of further economic weakness in China and Japan. However, rather than trying to gauge the timing and impact of such events, we instead focus our efforts on evaluating individual stocks and continue to pursue our strategy of seeking out underappreciated names that we think have hidden value that can be realized if specific catalysts play out over time. We believe that this approach is key to creating a portfolio that can generate favorable returns over the long term.
Sincerely,
ELI M. SALZMANN
PORTFOLIO MANAGER
Information about principal risks of investing in the Fund is set forth in the prospectus and statement of additional information.
The portfolio composition, industries and holdings of the Fund are subject to change without notice.
The opinions expressed are those of the Fund's portfolio manager. The opinions are as of the date of this report and are subject to change without notice.
62
TICKER SYMBOLS
Institutional Class | | NLRLX | |
Class A | | NVAAX | |
Class C | | NVACX | |
SECTOR ALLOCATION
(as a % of Total Investments*) | |
Consumer Discretionary | | | 7.1 | % | |
Consumer Staples | | | 4.3 | | |
Energy | | | 16.1 | | |
Financials | | | 30.1 | | |
Health Care | | | 3.4 | | |
Industrials | | | 16.5 | | |
Information Technology | | | 4.5 | | |
Materials | | | 9.1 | | |
Telecommunication Services | | | 1.5 | | |
Utilities | | | 1.0 | | |
Short-Term Investment | | | 6.4 | | |
Total | | | 100.0 | % | |
* Derivatives, if any, are excluded from this chart.
PERFORMANCE HIGHLIGHTS9
| | | | | Average Annual Total
Return Ended 08/31/2016 | |
| | | Inception
Date* | | 1 Year | | 5 Years | | Life of
Fund | |
At NAV | |
| Institutional Class20 | | 04/19/2010 | | | 13.23 | % | | | 12.46 | % | | | 7.33 | % | |
| Class A20 | | 03/02/2011 | | | 12.70 | % | | | 12.02 | % | | | 7.09 | % | |
| Class C20 | | 03/02/2011 | | | 11.92 | % | | | 11.21 | % | | | 6.65 | % | |
With Sales Charge | |
| Class A20 | | | | | | | 6.22 | % | | | 10.70 | % | | | 6.45 | % | |
| Class C20 | | | | | | | 10.92 | % | | | 11.21 | % | | | 6.65 | % | |
Index | |
| Russell 1000® Value Index1,15 | | | | | | | 12.92 | % | | | 14.39 | % | | | 5.69 | % | |
*The performance data for each class includes the performance of the Fund's oldest share class, Trust Class, from November 2, 2006 through April 19, 2010. The performance data for Class A and Class C also includes the performance of the Fund's Institutional Class from April 19, 2010 through March 2, 2011. See endnote 20 for information about the effects of the different fees paid by each class.
The performance data quoted represent past performance and do not indicate future results. Current performance may be lower or higher than the performance data quoted. For performance data current to the most recent month-end, please visit www.nb.com/performance.
The results shown in the table reflect the reinvestment of income dividends and other distributions, if any. The results do not reflect the effect of taxes a shareholder would pay on Fund distributions or on the redemption of Fund shares.
The investment return and principal value of an investment will fluctuate and shares, when redeemed, may be worth more or less than their original cost.
Returns would have been lower if Neuberger Berman Investment Advisers LLC ("Management") had not reimbursed certain expenses and/or waived a portion of the investment management fees during certain of the periods shown. Repayment by a class (of expenses previously reimbursed and/or fees previously waived by Management) will decrease the class's returns. Please see Note B in the Notes to Financial Statements for specific information regarding expense reimbursement and/or fee waiver arrangements.
As stated in the Fund's most recent prospectus, the total annual operating expense ratios for fiscal year 2015 were 1.83%, 2.22% and 2.99% for Institutional Class, Class A and Class C shares, respectively (before expense reimbursements and/or fee waivers, if any). The expense ratios were 0.76%, 1.12% and 1.87% for Institutional Class, Class A and Class C shares, respectively, after expense reimbursements and/or fee waivers. The expense ratios for the annual period ended August 31, 2016 can be found in the Financial Highlights section of this report.
Returns shown with a sales charge reflect the deduction of the current maximum initial sales charge of 5.75% for Class A shares and the contingent deferred sales charge (CDSC) for Class C shares. The CDSC for Class C shares is 1%, which is reduced to 0% after 1 year. The performance of the Fund's share classes will differ primarily due to different sales charge structures and class expenses. Please see the prospectus for more information about sales charge structures, if any, and class expenses for your share class.
63
COMPARISON OF A $1,000,000 INVESTMENT20
(000's Omitted)
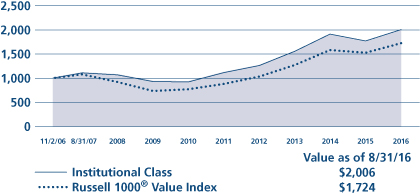
This graph shows the change in value of a hypothetical $1,000,000 investment in the Fund over the past 10 fiscal years, or since the Fund's inception if it has not operated for 10 years. The graph is based on the Institutional Class shares only; the performance of the Fund's share classes will differ primarily due to different sales charge structures and class expenses (see Performance Highlights chart on previous page). The result is compared with benchmarks, which include a broad-based market index and may include a more narrowly based index. Market indices have not been reduced to reflect any of the fees and costs of investing. The results shown in the graph reflect the reinvestment of income dividends and other distributions, if any. The results do not reflect the effect of taxes a shareholder would pay on Fund distributions or on the redemption of Fund shares. Results represent past performance and do not indicate future results.
64
1 Please see "Glossary of Indices" on page 69 for a description of indices. Please note that individuals cannot invest directly in any index. The indices described in this report do not take into account any fees, expenses or tax consequences of investing in the individual securities that they track. Data about the performance of an index are prepared or obtained by Neuberger Berman Investment Advisers LLC* ("Management") and reflect the reinvestment of income dividends and other distributions, if any. The Fund may invest in securities not included in a described index and generally does not invest in all securities included in a described index.
2 This date reflects when Management first became the investment manager to the Fund.
3 The performance information for the Trust Class prior to the class's inception date is that of the Fund's Investor Class. The performance information for the Investor Class has not been adjusted to take into account differences in class specific operating expenses. The Investor Class has lower expenses and typically higher returns than the Trust Class.
4 The performance information for the Advisor Class prior to the class's inception date is that of the Fund's Investor Class. The performance information for the Investor Class has not been adjusted to take into account differences in class specific operating expenses. The Investor Class has lower expenses and typically higher returns than the Advisor Class.
5 The performance information for the Institutional Class prior to the class's inception date is that of the Fund's Investor Class. The performance information for the Investor Class has not been adjusted to take into account differences in class specific operating expenses. The Investor Class has higher expenses and typically lower returns than the Institutional Class.
6 The performance information for the Institutional Class prior to the class's inception date is that of the Fund's Trust Class. The performance information for the Trust Class has not been adjusted to take into account differences in class specific operating expenses. The Trust Class has higher expenses and typically lower returns than the Institutional Class.
7 The investments for the Fund are managed by the same portfolio manager(s) who manage(s) one or more other registered funds that have names, investment objectives and investment styles that are similar to those of the Fund. You should be aware that the Fund is likely to differ from those other mutual fund(s) in size, cash flow pattern and tax matters. Accordingly, the holdings and performance of the Fund can be expected to vary from those of the other mutual fund(s).
8 The Fund had a policy of investing mainly in large-cap stocks prior to September 1998 and investing 90% of its assets in no more than six economic sectors prior to December 17, 2007. As of April 2, 2001, the Fund changed its investment policy to become "non-diversified" under the Investment Company Act of 1940 ("1940 Act"). Performance prior to these changes might have been different if current policies had been in effect. However, by operation of law under the 1940 Act, the Fund subsequently became, and currently operates as, a diversified fund. Please see the notes to the financial statements for information on a non-diversified fund becoming a diversified fund by operation of law.
9 Neuberger Berman Global Real Estate Fund is relatively small. Each of Neuberger Berman Emerging Markets Equity Fund, Neuberger Berman Equity Income Fund, Neuberger Berman Global Equity Fund, Neuberger Berman Multi-Cap Opportunities Fund and Neuberger Berman Value Fund were relatively small prior to September 2010, June 2008, August 2013, January 2010 and April 2013, respectively. The same techniques used to produce returns in a small fund may not work to produce similar returns in a larger fund.
10 The performance information for Class R3 prior to the class's inception date is that of the Fund's Institutional Class. The performance information for the Institutional Class has not been adjusted to take into account
65
differences in class specific operating expenses (such as Rule 12b-1 fees). The Institutional Class has lower expenses and typically higher returns than Class R3.
11 The Fund had a policy of investing mainly in large-cap stocks prior to December 2002. Its performance prior to that date might have been different if current policies had been in effect.
12 The performance information for Class A, Class C, Investor Class, and Trust Class prior to the classes' inception date is that of the Fund's Institutional Class. The performance information for the Institutional Class has been adjusted to reflect the appropriate sales charges applicable to Class A and Class C shares, but has not been adjusted to take into account differences in class specific operating expenses (such as Rule 12b-1 fees). The Institutional Class has lower expenses and typically higher returns than Class A, Class C, Investor Class, and Trust Class.
13 The performance information for Institutional Class, Class A, Class C and Class R3 prior to June 9, 2008 is that of the Fund's Trust Class, which had an inception date of November 2, 2006, and converted into the Institutional Class on June 9, 2008. During the period from November 2, 2006 through June 9, 2008, the Trust Class had only one investor, which could have impacted Fund performance. The performance information for the Trust Class has been adjusted to reflect the appropriate sales charges applicable to Class A and Class C shares, but has not been adjusted to take into account differences in class specific operating expenses (such as Rule 12b-1 fees). The Trust Class had higher expenses and typically lower returns than the Institutional Class. The Trust Class had lower expenses and typically higher returns than Class A, Class C and Class R3. The performance information for Class R3 from June 9, 2008 to the class's inception date is that of the Fund's Institutional Class. The performance information for the Institutional Class has not been adjusted to take into account differences in class specific operating expenses (such as Rule 12b-1 fees). The Institutional Class has lower expenses and typically higher returns than Class R3.
14 The performance information for Class A, Class C and Class R3 prior to the classes' respective inception dates is that of the Fund's Trust Class. The performance information for the Trust Class has been adjusted to reflect the appropriate sales charges applicable to Class A and Class C shares, but has not been adjusted to take into account differences in class specific operating expenses (such as Rule 12b-1 fees). The Trust Class has lower expenses and typically higher returns than Class A, Class C and Class R3.
15 The date used to calculate Life of Fund performance for the index is the inception date of the oldest share class.
16 The performance information for Class R3 prior to the class's inception date is that of the Fund's Investor Class. The performance information for the Investor Class has not been adjusted to take into account differences in class specific operating expenses (such as Rule 12b-1 fees). The Investor Class has lower expenses and typically higher returns than Class R3.
17 Prior to December 14, 2009, the Fund had different investment goals, strategies and portfolio management team. The performance information for Institutional Class, Class A and Class C prior to December 21, 2009 is that of the Fund's Trust Class, which had an inception date of November 2, 2006, and converted into the Institutional Class on December 21, 2009. During the period from November 2, 2006 through December 21, 2009, the Trust Class had only one investor, which could have impacted Fund performance. The performance information for the Trust Class has been adjusted to reflect the appropriate sales charges applicable to Class A and Class C shares, but has not been adjusted to take into account differences in class specific operating expenses (such as Rule 12b-1 fees). Management had previously capped Trust Class expenses; absent this arrangement, the returns would have been lower. The Trust Class had lower capped expenses and typically higher returns than Class A and Class C. The Trust Class had equivalent capped expenses and typically similar returns to the Institutional Class.
18 The performance information for Institutional Class, Class A and Class C prior to the classes' inception date is that of the Fund's predecessor, the DJG Small Cap Value Fund L.P., an unregistered limited partnership ("DJG Fund");
66
DJG Fund was the successor to The DJG Small Cap Value Fund, an unregistered commingled investment account ("DJG Account"). The performance from July 8, 1997 (the commencement of operations) to September 11, 2008 is that of DJG Account, and the performance from September 12, 2008 to May 10, 2010 is that of DJG Fund. On May 10, 2010, the DJG Fund transferred its assets to the Fund in exchange for the Fund's Institutional Class shares. The investment policies, objectives, guidelines and restrictions of the Fund are in all material respects equivalent to those of DJG Fund and DJG Account (the "Predecessors"). As a mutual fund registered under the 1940 Act, the Fund is subject to certain restrictions under the 1940 Act and the Internal Revenue Code ("Code") to which the Predecessors were not subject. Had the Predecessors been registered under the 1940 Act and been subject to the provisions of the 1940 Act and the Code, their investment performance may have been adversely affected. The performance information reflects the actual expenses of the Predecessors, which were generally lower than those of the Fund.
19 The performance information for Class A and Class C prior to the classes' inception date is that of the Fund's Investor Class. The performance information for the Investor Class has been adjusted to reflect the appropriate sales charges applicable to Class A and Class C shares, but has not been adjusted to take into account differences in class specific operating expenses (such as Rule 12b-1 fees). The Investor Class has lower expenses and typically higher returns than Class A and Class C.
20 The performance information for Institutional Class, Class A and Class C prior to April 19, 2010 is that of the Fund's Trust Class, which had an inception date of November 2, 2006, and converted into the Institutional Class on April 19, 2010. During the period from November 2, 2006 through April 19, 2010, the Trust Class had only one investor, which could have impacted Fund performance. The performance information for Class A and Class C from April 19, 2010 to the classes' inception date is that of the Fund's Institutional Class. During the period from April 19, 2010 through March 2, 2011, the Institutional Class had only one investor, which could have impacted Fund performance. The performance information for the Trust Class and the Institutional Class has been adjusted to reflect the appropriate sales charges applicable to Class A and Class C shares, but has not been adjusted to take into account differences in class specific operating expenses (such as Rule 12b-1 fees). The Trust Class had higher expenses and typically lower returns than the Institutional Class. The Trust Class had lower expenses and typically higher returns than Class A and Class C. The Institutional Class has lower expenses and typically higher returns than Class A and Class C.
21 As of June 19, 2012, the Fund changed its investment policy to become "non-diversified" under the 1940 Act. A non-diversified fund is able to invest larger percentages of its assets in the securities of a single issuer, which could increase the fund's risk of loss. Performance prior to this change might have been different if current policies had been in effect.
22 The performance information for Class R6 prior to the class's inception date is that of the Fund's Institutional Class. The performance information for the Institutional Class has not been adjusted to take into account differences in class specific operating expenses. The Institutional Class has higher expenses and typically lower returns than Class R6.
23 The performance information for Class R6 prior to the class's inception date is that of the Fund's Investor Class. The performance information for the Investor Class has not been adjusted to take into account differences in class specific operating expenses. The Investor Class has higher expenses and typically lower returns than Class R6.
24 The performance information for Class R6 prior to the class's inception date is that of the Fund's Trust Class. The performance information for the Trust Class has not been adjusted to take into account differences in class specific operating expenses. The Trust Class has higher expenses and typically lower returns than Class R6.
On January 1, 2016, Neuberger Berman Management LLC ("NBM") and Neuberger Berman LLC ("Neuberger Berman") transferred to Neuberger Berman Fixed Income LLC ("NBFI") their rights and obligations pertaining to all services they
67
provided to any Fund under any investment management, investment sub-advisory, and/or administration agreement, as applicable (the "Agreements"). Following such transfer, NBFI was renamed Neuberger Berman Investment Advisers LLC ("NBIA" or "Management"). Following the consolidation, the investment professionals of NBM and Neuberger Berman who provided services to the Funds under the Agreements continue to provide the same services, except that they provide those services in their new capacities as investment professionals of NBIA. Further, the consolidation did not result in any change in the investment processes currently employed by the Funds, the nature or level of services provided to the Funds, or the fees any Fund pays under its Agreements.
On July 1, 2016, NBM was reorganized into Neuberger Berman (the "Reorganization"). Upon the completion of the Reorganization, Neuberger Berman assumed all rights and obligations pertaining to all services NBM provided to any Fund under any distribution agreement or distribution and services agreement (the "Agreements") or plan adopted pursuant to Rule 12b-1 under the Investment Company Act of 1940, as amended, (the "Plans"). Accordingly, after the Reorganization, Neuberger Berman became each Fund's distributor and the services previously provided by NBM under the Agreements and Plans will be provided by Neuberger Berman.
Following the Reorganization, the employees of NBM who currently provide services to each Fund under the Agreements and Plans will continue to provide the same services, except that they will provide those services in their capacities as employees of Neuberger Berman. Further, the Reorganization will not result in any change in the nature or level of services provided to each Fund, or the fees, if any, each Fund pays under the Agreements or the Plans.
For more complete information on any of the Neuberger Berman Equity Funds, call us at (800) 877-9700, or visit our website at www.nb.com.
68
FTSE EPRA / NAREIT Developed Index: | | The index is a free float-adjusted market capitalization-weighted index that is designed to measure the performance of listed real estate companies and real estate investment trusts (REITs) in developed markets. | |
FTSE NAREIT All Equity REITs Index: | | The index is a free-float adjusted, market capitalization-weighted index of U.S. Equity REITs. Constituents of the Index include all tax-qualified REITs with more than 50 percent of total assets in qualifying real estate assets other than mortgages secured by real property. | |
MSCI All Country World Index: | | The index is a free float-adjusted market capitalization-weighted index that is designed to measure the equity market performance of developed and emerging markets. The index consists of 46 country indices comprising 23 developed and 23 emerging market country indices. The developed market country indices included are: Australia, Austria, Belgium, Canada, Denmark, Finland, France, Germany, Hong Kong, Ireland, Israel, Italy, Japan, the Netherlands, New Zealand, Norway, Portugal, Singapore, Spain, Sweden, Switzerland, the United Kingdom, and the United States. The emerging market country indices included are: Brazil, Chile, China, Colombia, Czech Republic, Egypt, Greece, Hungary, India, Indonesia, Korea, Malaysia, Mexico, Peru, the Philippines, Poland, Qatar, Russia, South Africa, Taiwan, Thailand, Turkey, and the UAE. | |
MSCI China Index: | | The index is a free float-adjusted market capitalization-weighted index that is designed to measure the equity market performance of Chinese securities readily accessible to nondomestic investors. The index includes equity securities issued by companies incorporated in the People's Republic of China ("PRC"), and listed in the form of China B shares on the Shanghai Stock Exchange (in US$) or Shenzhen Stock Exchange (in HK$), or China H shares on the Hong Kong Stock Exchange (in HK$) and other foreign exchanges. It also includes Red-Chips and P-Chips, which are not incorporated in the PRC and are listed on the Hong Kong Stock Exchange. Red-Chips include companies that are directly or indirectly controlled by organizations or enterprises that are owned by the state, provinces, or municipalities of the PRC. P-Chips include non-state-owned Chinese companies incorporated outside the mainland and traded in Hong Kong. Starting December 1, 2015, MSCI began including U.S.-listed China stocks in the index. The index does not include China A-shares. (China A-shares are securities listed on the Shanghai or Shenzhen Stock Exchanges and traded in renminbi, with limited accessibility to foreign investors.) | |
MSCI EAFE® Index (Europe, Australasia, Far East): | | The index is a free float-adjusted market capitalization-weighted index that is designed to measure the equity market performance of developed markets, excluding the United States and Canada. The index consists of the following 21 developed market country indices: Australia, Austria, Belgium, Denmark, Finland, France, Germany, Hong Kong, Ireland, Israel, Italy, Japan, the Netherlands, New Zealand, Norway, Portugal, Singapore, Spain, Sweden, Switzerland, and the United Kingdom. | |
MSCI Emerging Markets Index: | | The index is a free float-adjusted market capitalization-weighted index that is designed to measure the equity market performance of emerging markets. The index consists of the following 23 emerging market country indices: Brazil, Chile, China, Colombia, Czech Republic, Egypt, Greece, Hungary, India, Indonesia, Korea, Malaysia, Mexico, Peru, the Philippines, Poland, Qatar, Russia, South Africa, Taiwan, Thailand, Turkey, and the UAE. | |
69
Glossary of Indices (cont'd)
Russell 1000® Index: | | The index is a float-adjusted market capitalization-weighted index that measures the performance of the large-cap segment of the U.S. equity market. It includes approximately 1,000 of the largest securities in the Russell 3000® Index (which measures the performance of the 3,000 largest U.S. public companies based on total market capitalization). The index is rebalanced annually in June. | |
Russell 1000® Value Index: | | The index is a float-adjusted market capitalization-weighted index that measures the performance of the large-cap value segment of the U.S. equity market. It includes those Russell 1000 Index companies with lower price-to-book ratios and lower forecasted growth rates. The index is rebalanced annually in June. | |
Russell 2000® Index: | | The index is a float-adjusted market capitalization-weighted index that measures the performance of the small-cap segment of the U.S. equity market. It includes approximately 2,000 of the smallest securities in the Russell 3000® Index (which measures the performance of the 3,000 largest U.S. public companies based on total market capitalization). The index is rebalanced annually in June. | |
Russell 2000® Growth Index: | | The index is a float-adjusted market capitalization-weighted index that measures the performance of the small-cap growth segment of the U.S. equity market. It includes those Russell 2000 Index companies with higher price-to-book ratios and higher forecasted growth rates. The index is rebalanced annually in June. | |
Russell 2000® Value Index: | | The index is a float-adjusted market capitalization-weighted index that measures the performance of the small-cap value segment of the U.S. equity market. It includes those Russell 2000 Index companies with lower price-to-book ratios and lower forecasted growth rates. The index is rebalanced annually in June. | |
Russell Midcap® Index: | | The index is a float-adjusted market capitalization-weighted index that measures the performance of the mid-cap segment of the U.S. equity market. It includes approximately 800 of the smallest securities in the Russell 1000 Index. The index is rebalanced annually in June. | |
Russell Midcap® Growth Index: | | The index is a float-adjusted market capitalization-weighted index that measures the performance of the mid-cap growth segment of the U.S. equity market. It includes those Russell Midcap Index companies with higher price-to-book ratios and higher forecasted growth rates. The index is rebalanced annually in June. | |
Russell Midcap® Value Index: | | The index is a float-adjusted market capitalization-weighted index that measures the performance of the mid-cap value segment of the U.S. equity market. It includes those Russell Midcap Index companies with lower price-to-book ratios and lower forecasted growth rates. The index is rebalanced annually in June. | |
S&P 500® Index: | | The index is a float-adjusted market capitalization-weighted index that focuses on the large-cap segment of the U.S. equity market, and includes a significant portion of the total value of the market. | |
70
Information About Your Fund's Expenses (Unaudited)
As a Fund shareholder, you incur two types of costs: (1) transaction costs, including sales charges (loads) on purchase payments or redemption proceeds (if applicable); and (2) ongoing costs, including management fees, distribution and/or service (12b-1) fees (if applicable), and other Fund expenses. This example is intended to help you understand your ongoing costs (in U.S. dollars) of investing in a Fund and compare these costs with the ongoing costs of investing in other mutual funds.
This table is designed to provide information regarding costs related to your investments. The following examples are based on an investment of $1,000 made at the beginning of the six month period ended August 31, 2016 and held for the entire period. The table illustrates each Fund's costs in two ways:
Actual Expenses and Performance: | | The first section of the table provides information about actual account values and actual expenses in dollars, based on the Fund's actual performance during the period indicated. You may use the information in this line, together with the amount you invested, to estimate the expenses you paid over the period. Simply divide your account value by $1,000 (for example, an $8,600 account value divided by $1,000 = 8.6), then multiply the result by the number in the first section of the table under the heading entitled "Expenses Paid During the Period" to estimate the expenses you paid over the period. | |
Hypothetical Example for
Comparison Purposes: | | The second section of the table provides information about hypothetical account values and hypothetical expenses based on the Fund's actual expense ratio and an assumed rate of return at 5% per year before expenses. This return is not the Fund's actual return. The hypothetical account values and expenses may not be used to estimate the actual ending account balance or expenses you paid for the period. You may use this information to compare the ongoing costs of investing in a Fund versus other funds. To do so, compare the expenses shown in this 5% hypothetical example with the 5% hypothetical examples that appear in the shareholder reports of other funds. | |
Please note that the expenses in the table are meant to highlight your ongoing costs only and do not include any transaction costs, such as sales charges (loads) (if applicable). Therefore, the information under the heading "Hypothetical (5% annual return before expenses)" is useful in comparing ongoing costs only, and will not help you determine the relative total costs of owning different funds. In addition, if these transaction costs were included, your costs would have been higher.
71
Expense Information as of 8/31/16 (Unaudited)
Neuberger Berman Equity Funds | |
| | | ACTUAL | | HYPOTHETICAL (5% ANNUAL RETURN BEFORE EXPENSES) | |
| | | Beginning
Account
Value
3/1/16 | | Ending
Account
Value
8/31/16 | | Expenses Paid
During the
Period(1)
3/1/16 - 8/31/16 | | Expense
Ratio | | Beginning
Account
Value
3/1/16 | | Ending
Account
Value
8/31/16 | | Expenses Paid
During the
Period(2)
3/1/16 - 8/31/16 | | Expense
Ratio | |
Dividend Growth Fund | |
Institutional Class | | $ | 1,000.00 | | | $ | 1,151.30 | | | $ | 3.79 | | | | 0.70 | % | | $ | 1,000.00 | | | $ | 1,021.62 | | | $ | 3.56 | | | | 0.70 | % | |
Class A | | $ | 1,000.00 | | | $ | 1,149.20 | | | $ | 5.67 | | | | 1.05 | % | | $ | 1,000.00 | | | $ | 1,019.86 | | | $ | 5.33 | | | | 1.05 | % | |
Class C | | $ | 1,000.00 | | | $ | 1,143.30 | | | $ | 9.70 | | | | 1.80 | % | | $ | 1,000.00 | | | $ | 1,016.09 | | | $ | 9.12 | | | | 1.80 | % | |
Class R6 | | $ | 1,000.00 | | | $ | 1,151.10 | | | $ | 3.35 | | | | 0.62 | % | | $ | 1,000.00 | | | $ | 1,022.02 | | | $ | 3.15 | | | | 0.62 | % | |
Emerging Markets Equity Fund | |
Institutional Class | | $ | 1,000.00 | | | $ | 1,230.60 | | | $ | 7.01 | | | | 1.25 | % | | $ | 1,000.00 | | | $ | 1,018.85 | | | $ | 6.34 | | | | 1.25 | % | |
Class A | | $ | 1,000.00 | | | $ | 1,229.30 | | | $ | 8.41 | | | | 1.50 | % | | $ | 1,000.00 | | | $ | 1,017.60 | | | $ | 7.61 | | | | 1.50 | % | |
Class C | | $ | 1,000.00 | | | $ | 1,223.90 | | | $ | 12.58 | | | | 2.25 | % | | $ | 1,000.00 | | | $ | 1,013.83 | | | $ | 11.39 | | | | 2.25 | % | |
Class R3 | | $ | 1,000.00 | | | $ | 1,226.60 | | | $ | 10.69 | | | | 1.91 | % | | $ | 1,000.00 | | | $ | 1,015.53 | | | $ | 9.68 | | | | 1.91 | % | |
Class R6 | | $ | 1,000.00 | | | $ | 1,231.40 | | | $ | 6.62 | | | | 1.18 | % | | $ | 1,000.00 | | | $ | 1,019.20 | | | $ | 5.99 | | | | 1.18 | % | |
Equity Income Fund | |
Institutional Class | | $ | 1,000.00 | | | $ | 1,128.50 | | | $ | 3.75 | | | | 0.70 | % | | $ | 1,000.00 | | | $ | 1,021.62 | | | $ | 3.56 | | | | 0.70 | % | |
Class A | | $ | 1,000.00 | | | $ | 1,126.00 | | | $ | 5.72 | | | | 1.07 | % | | $ | 1,000.00 | | | $ | 1,019.76 | | | $ | 5.43 | | | | 1.07 | % | |
Class C | | $ | 1,000.00 | | | $ | 1,121.80 | | | $ | 9.65 | | | | 1.81 | % | | $ | 1,000.00 | | | $ | 1,016.04 | | | $ | 9.17 | | | | 1.81 | % | |
Class R3 | | $ | 1,000.00 | | | $ | 1,123.90 | | | $ | 7.15 | | | | 1.34 | % | | $ | 1,000.00 | | | $ | 1,018.40 | | | $ | 6.80 | | | | 1.34 | % | |
Focus Fund | |
Investor Class | | $ | 1,000.00 | | | $ | 1,152.70 | | | $ | 5.14 | | | | 0.95 | % | | $ | 1,000.00 | | | $ | 1,020.36 | | | $ | 4.82 | | | | 0.95 | % | |
Trust Class | | $ | 1,000.00 | | | $ | 1,152.10 | | | $ | 6.00 | | | | 1.11 | % | | $ | 1,000.00 | | | $ | 1,019.56 | | | $ | 5.63 | | | | 1.11 | % | |
Advisor Class | | $ | 1,000.00 | | | $ | 1,150.40 | | | $ | 6.70 | | | | 1.24 | % | | $ | 1,000.00 | | | $ | 1,018.90 | | | $ | 6.29 | | | | 1.24 | % | |
Institutional Class | | $ | 1,000.00 | | | $ | 1,153.90 | | | $ | 4.06 | | | | 0.75 | % | | $ | 1,000.00 | | | $ | 1,021.37 | | | $ | 3.81 | | | | 0.75 | % | |
Class A | | $ | 1,000.00 | | | $ | 1,152.20 | | | $ | 6.00 | | | | 1.11 | % | | $ | 1,000.00 | | | $ | 1,019.56 | | | $ | 5.63 | | | | 1.11 | % | |
Class C | | $ | 1,000.00 | | | $ | 1,147.10 | | | $ | 10.04 | | | | 1.86 | % | | $ | 1,000.00 | | | $ | 1,015.79 | | | $ | 9.42 | | | | 1.86 | % | |
Genesis Fund | |
Investor Class | | $ | 1,000.00 | | | $ | 1,161.30 | | | $ | 5.54 | | | | 1.02 | % | | $ | 1,000.00 | | | $ | 1,020.01 | | | $ | 5.18 | | | | 1.02 | % | |
Trust Class | | $ | 1,000.00 | | | $ | 1,160.70 | | | $ | 5.97 | | | | 1.10 | % | | $ | 1,000.00 | | | $ | 1,019.61 | | | $ | 5.58 | | | | 1.10 | % | |
Advisor Class | | $ | 1,000.00 | | | $ | 1,159.30 | | | $ | 7.33 | | | | 1.35 | % | | $ | 1,000.00 | | | $ | 1,018.35 | | | $ | 6.85 | | | | 1.35 | % | |
Institutional Class | | $ | 1,000.00 | | | $ | 1,162.10 | | | $ | 4.62 | | | | 0.85 | % | | $ | 1,000.00 | | | $ | 1,020.86 | | | $ | 4.32 | | | | 0.85 | % | |
Class R6 | | $ | 1,000.00 | | | $ | 1,162.50 | | | $ | 4.24 | | | | 0.78 | % | | $ | 1,000.00 | | | $ | 1,021.22 | | | $ | 3.96 | | | | 0.78 | % | |
Global Equity Fund | |
Institutional Class | | $ | 1,000.00 | | | $ | 1,104.70 | | | $ | 6.08 | | | | 1.15 | % | | $ | 1,000.00 | | | $ | 1,019.36 | | | $ | 5.84 | | | | 1.15 | % | |
Class A | | $ | 1,000.00 | | | $ | 1,102.30 | | | $ | 7.98 | | | | 1.51 | % | | $ | 1,000.00 | | | $ | 1,017.55 | | | $ | 7.66 | | | | 1.51 | % | |
Class C | | $ | 1,000.00 | | | $ | 1,097.70 | | | $ | 11.92 | | | | 2.26 | % | | $ | 1,000.00 | | | $ | 1,013.77 | | | $ | 11.44 | | | | 2.26 | % | |
Global Real Estate Fund | |
Institutional Class | | $ | 1,000.00 | | | $ | 1,153.30 | | | $ | 5.41 | | | | 1.00 | % | | $ | 1,000.00 | | | $ | 1,020.11 | | | $ | 5.08 | | | | 1.00 | % | |
Class A | | $ | 1,000.00 | | | $ | 1,151.50 | | | $ | 7.36 | | | | 1.36 | % | | $ | 1,000.00 | | | $ | 1,018.30 | | | $ | 6.90 | | | | 1.36 | % | |
Class C | | $ | 1,000.00 | | | $ | 1,146.50 | | | $ | 11.38 | | | | 2.11 | % | | $ | 1,000.00 | | | $ | 1,014.53 | | | $ | 10.68 | | | | 2.11 | % | |
Greater China Equity Fund | |
Institutional Class | | $ | 1,000.00 | | | $ | 1,240.60 | | | $ | 8.50 | | | | 1.51 | % | | $ | 1,000.00 | | | $ | 1,017.55 | | | $ | 7.66 | | | | 1.51 | % | |
Class A | | $ | 1,000.00 | | | $ | 1,237.90 | | | $ | 10.52 | | | | 1.87 | % | | $ | 1,000.00 | | | $ | 1,015.74 | | | $ | 9.48 | | | | 1.87 | % | |
Class C | | $ | 1,000.00 | | | $ | 1,233.00 | | | $ | 14.71 | | | | 2.62 | % | | $ | 1,000.00 | | | $ | 1,011.97 | | | $ | 13.25 | | | | 2.62 | % | |
Guardian Fund | |
Investor Class | | $ | 1,000.00 | | | $ | 1,119.80 | | | $ | 5.01 | | | | 0.94 | % | | $ | 1,000.00 | | | $ | 1,020.41 | | | $ | 4.77 | | | | 0.94 | % | |
Trust Class | | $ | 1,000.00 | | | $ | 1,118.40 | | | $ | 5.75 | | | | 1.08 | % | | $ | 1,000.00 | | | $ | 1,019.71 | | | $ | 5.48 | | | | 1.08 | % | |
Advisor Class | | $ | 1,000.00 | | | $ | 1,117.80 | | | $ | 6.07 | | | | 1.14 | % | | $ | 1,000.00 | | | $ | 1,019.41 | | | $ | 5.79 | | | | 1.14 | % | |
Institutional Class | | $ | 1,000.00 | | | $ | 1,120.90 | | | $ | 3.89 | | | | 0.73 | % | | $ | 1,000.00 | | | $ | 1,021.47 | | | $ | 3.71 | | | | 0.73 | % | |
Class A | | $ | 1,000.00 | | | $ | 1,118.90 | | | $ | 5.59 | | | | 1.05 | % | | $ | 1,000.00 | | | $ | 1,019.86 | | | $ | 5.33 | | | | 1.05 | % | |
Class C | | $ | 1,000.00 | | | $ | 1,113.70 | | | $ | 9.83 | | | | 1.85 | % | | $ | 1,000.00 | | | $ | 1,015.84 | | | $ | 9.37 | | | | 1.85 | % | |
Class R3 | | $ | 1,000.00 | | | $ | 1,117.40 | | | $ | 7.24 | | | | 1.36 | % | | $ | 1,000.00 | | | $ | 1,018.30 | | | $ | 6.90 | | | | 1.36 | % | |
72
Expense Information as of 8/31/16 (Unaudited) (cont'd)
| | | ACTUAL | | HYPOTHETICAL (5% ANNUAL RETURN BEFORE EXPENSES) | |
| | | Beginning
Account
Value
3/1/16 | | Ending
Account
Value
8/31/16 | | Expenses Paid
During the
Period(1)
3/1/16 - 8/31/16 | | Expense
Ratio | | Beginning
Account
Value
3/1/16 | | Ending
Account
Value
8/31/16 | | Expenses Paid
During the
Period(2)
3/1/16 - 8/31/16 | | Expense
Ratio | |
International Equity Fund | |
Investor Class | | $ | 1,000.00 | | | $ | 1,091.10 | | | $ | 5.73 | | | | 1.09 | % | | $ | 1,000.00 | | | $ | 1,019.66 | | | $ | 5.53 | | | | 1.09 | % | |
Trust Class | | $ | 1,000.00 | | | $ | 1,091.50 | | | $ | 5.68 | | | | 1.08 | % | | $ | 1,000.00 | | | $ | 1,019.71 | | | $ | 5.48 | | | | 1.08 | % | |
Institutional Class | | $ | 1,000.00 | | | $ | 1,092.60 | | | $ | 4.47 | | | | 0.85 | % | | $ | 1,000.00 | | | $ | 1,020.86 | | | $ | 4.32 | | | | 0.85 | % | |
Class A | | $ | 1,000.00 | | | $ | 1,090.40 | | | $ | 6.36 | | | | 1.21 | % | | $ | 1,000.00 | | | $ | 1,019.05 | | | $ | 6.14 | | | | 1.21 | % | |
Class C | | $ | 1,000.00 | | | $ | 1,086.10 | | | $ | 10.28 | | | | 1.96 | % | | $ | 1,000.00 | | | $ | 1,015.28 | | | $ | 9.93 | | | | 1.96 | % | |
Class R6 | | $ | 1,000.00 | | | $ | 1,093.80 | | | $ | 4.11 | | | | 0.78 | % | | $ | 1,000.00 | | | $ | 1,021.22 | | | $ | 3.96 | | | | 0.78 | % | |
International Select Fund | |
Trust Class | | $ | 1,000.00 | | | $ | 1,090.20 | | | $ | 6.57 | | | | 1.25 | % | | $ | 1,000.00 | | | $ | 1,018.85 | | | $ | 6.34 | | | | 1.25 | % | |
Institutional Class | | $ | 1,000.00 | | | $ | 1,091.50 | | | $ | 4.73 | | | | 0.90 | % | | $ | 1,000.00 | | | $ | 1,020.61 | | | $ | 4.57 | | | | 0.90 | % | |
Class A | | $ | 1,000.00 | | | $ | 1,089.80 | | | $ | 6.51 | | | | 1.24 | % | | $ | 1,000.00 | | | $ | 1,018.90 | | | $ | 6.29 | | | | 1.24 | % | |
Class C | | $ | 1,000.00 | | | $ | 1,085.70 | | | $ | 10.49 | | | | 2.00 | % | | $ | 1,000.00 | | | $ | 1,015.08 | | | $ | 10.13 | | | | 2.00 | % | |
Class R3 | | $ | 1,000.00 | | | $ | 1,088.40 | | | $ | 7.93 | | | | 1.51 | % | | $ | 1,000.00 | | | $ | 1,017.55 | | | $ | 7.66 | | | | 1.51 | % | |
Intrinsic Value Fund | |
Institutional Class | | $ | 1,000.00 | | | $ | 1,129.70 | | | $ | 5.35 | | | | 1.00 | % | | $ | 1,000.00 | | | $ | 1,020.11 | | | $ | 5.08 | | | | 1.00 | % | |
Class A | | $ | 1,000.00 | | | $ | 1,126.90 | | | $ | 7.27 | | | | 1.36 | % | | $ | 1,000.00 | | | $ | 1,018.30 | | | $ | 6.90 | | | | 1.36 | % | |
Class C | | $ | 1,000.00 | | | $ | 1,122.70 | | | $ | 11.26 | | | | 2.11 | % | | $ | 1,000.00 | | | $ | 1,014.53 | | | $ | 10.68 | | | | 2.11 | % | |
Large Cap Value Fund | |
Investor Class | | $ | 1,000.00 | | | $ | 1,233.60 | | | $ | 5.05 | | | | 0.90 | % | | $ | 1,000.00 | | | $ | 1,020.61 | | | $ | 4.57 | | | | 0.90 | % | |
Trust Class | | $ | 1,000.00 | | | $ | 1,232.70 | | | $ | 5.95 | | | | 1.06 | % | | $ | 1,000.00 | | | $ | 1,019.81 | | | $ | 5.38 | | | | 1.06 | % | |
Advisor Class | | $ | 1,000.00 | | | $ | 1,231.60 | | | $ | 6.79 | | | | 1.21 | % | | $ | 1,000.00 | | | $ | 1,019.05 | | | $ | 6.14 | | | | 1.21 | % | |
Institutional Class | | $ | 1,000.00 | | | $ | 1,235.10 | | | $ | 3.93 | | | | 0.70 | % | | $ | 1,000.00 | | | $ | 1,021.62 | | | $ | 3.56 | | | | 0.70 | % | |
Class A | | $ | 1,000.00 | | | $ | 1,232.20 | | | $ | 6.06 | | | | 1.08 | % | | $ | 1,000.00 | | | $ | 1,019.71 | | | $ | 5.48 | | | | 1.08 | % | |
Class C | | $ | 1,000.00 | | | $ | 1,227.80 | | | $ | 10.19 | | | | 1.82 | % | | $ | 1,000.00 | | | $ | 1,015.99 | | | $ | 9.22 | | | | 1.82 | % | |
Class R3 | | $ | 1,000.00 | | | $ | 1,230.60 | | | $ | 7.63 | | | | 1.36 | % | | $ | 1,000.00 | | | $ | 1,018.30 | | | $ | 6.90 | | | | 1.36 | % | |
Mid Cap Growth Fund | |
Investor Class | | $ | 1,000.00 | | | $ | 1,142.90 | | | $ | 5.22 | | | | 0.97 | % | | $ | 1,000.00 | | | $ | 1,020.26 | | | $ | 4.93 | | | | 0.97 | % | |
Trust Class | | $ | 1,000.00 | | | $ | 1,142.90 | | | $ | 5.28 | | | | 0.98 | % | | $ | 1,000.00 | | | $ | 1,020.21 | | | $ | 4.98 | | | | 0.98 | % | |
Advisor Class | | $ | 1,000.00 | | | $ | 1,141.10 | | | $ | 6.73 | | | | 1.25 | % | | $ | 1,000.00 | | | $ | 1,018.85 | | | $ | 6.34 | | | | 1.25 | % | |
Institutional Class | | $ | 1,000.00 | | | $ | 1,144.80 | | | $ | 4.04 | | | | 0.75 | % | | $ | 1,000.00 | | | $ | 1,021.37 | | | $ | 3.81 | | | | 0.75 | % | |
Class A | | $ | 1,000.00 | | | $ | 1,142.30 | | | $ | 5.98 | | | | 1.11 | % | | $ | 1,000.00 | | | $ | 1,019.56 | | | $ | 5.63 | | | | 1.11 | % | |
Class C | | $ | 1,000.00 | | | $ | 1,138.10 | | | $ | 10.00 | | | | 1.86 | % | | $ | 1,000.00 | | | $ | 1,015.79 | | | $ | 9.42 | | | | 1.86 | % | |
Class R3 | | $ | 1,000.00 | | | $ | 1,140.60 | | | $ | 7.32 | | | | 1.36 | % | | $ | 1,000.00 | | | $ | 1,018.30 | | | $ | 6.90 | | | | 1.36 | % | |
Class R6 | | $ | 1,000.00 | | | $ | 1,145.30 | | | $ | 3.61 | | | | 0.67 | % | | $ | 1,000.00 | | | $ | 1,021.77 | | | $ | 3.40 | | | | 0.67 | % | |
Mid Cap Intrinsic Value Fund | |
Investor Class | | $ | 1,000.00 | | | $ | 1,147.30 | | | $ | 6.37 | | | | 1.18 | % | | $ | 1,000.00 | | | $ | 1,019.20 | | | $ | 5.99 | | | | 1.18 | % | |
Trust Class | | $ | 1,000.00 | | | $ | 1,146.90 | | | $ | 6.75 | | | | 1.25 | % | | $ | 1,000.00 | | | $ | 1,018.85 | | | $ | 6.34 | | | | 1.25 | % | |
Institutional Class | | $ | 1,000.00 | | | $ | 1,148.90 | | | $ | 4.59 | | | | 0.85 | % | | $ | 1,000.00 | | | $ | 1,020.86 | | | $ | 4.32 | | | | 0.85 | % | |
Class A | | $ | 1,000.00 | | | $ | 1,146.40 | | | $ | 6.53 | | | | 1.21 | % | | $ | 1,000.00 | | | $ | 1,019.05 | | | $ | 6.14 | | | | 1.21 | % | |
Class C | | $ | 1,000.00 | | | $ | 1,142.40 | | | $ | 10.56 | | | | 1.96 | % | | $ | 1,000.00 | | | $ | 1,015.28 | | | $ | 9.93 | | | | 1.96 | % | |
Class R3 | | $ | 1,000.00 | | | $ | 1,145.80 | | | $ | 7.87 | | | | 1.46 | % | | $ | 1,000.00 | | | $ | 1,017.80 | | | $ | 7.41 | | | | 1.46 | % | |
Multi-Cap Opportunities Fund | |
Institutional Class | | $ | 1,000.00 | | | $ | 1,133.20 | | | $ | 4.13 | | | | 0.77 | % | | $ | 1,000.00 | | | $ | 1,021.27 | | | $ | 3.91 | | | | 0.77 | % | |
Class A | | $ | 1,000.00 | | | $ | 1,131.20 | | | $ | 6.00 | | | | 1.12 | % | | $ | 1,000.00 | | | $ | 1,019.51 | | | $ | 5.69 | | | | 1.12 | % | |
Class C | | $ | 1,000.00 | | | $ | 1,127.20 | | | $ | 9.89 | | | | 1.85 | % | | $ | 1,000.00 | | | $ | 1,015.84 | | | $ | 9.37 | | | | 1.85 | % | |
73
Expense Information as of 8/31/16 (Unaudited) (cont'd)
| | | ACTUAL | | HYPOTHETICAL (5% ANNUAL RETURN BEFORE EXPENSES) | |
| | | Beginning
Account
Value
3/1/16 | | Ending
Account
Value
8/31/16 | | Expenses Paid
During the
Period(1)
3/1/16 - 8/31/16 | | Expense
Ratio | | Beginning
Account
Value
3/1/16 | | Ending
Account
Value
8/31/16 | | Expenses Paid
During the
Period(2)
3/1/16 - 8/31/16 | | Expense
Ratio | |
Real Estate Fund | |
Trust Class | | $ | 1,000.00 | | | $ | 1,156.40 | | | $ | 5.64 | | | | 1.04 | % | | $ | 1,000.00 | | | $ | 1,019.91 | | | $ | 5.28 | | | | 1.04 | % | |
Institutional Class | | $ | 1,000.00 | | | $ | 1,157.70 | | | $ | 4.61 | | | | 0.85 | % | | $ | 1,000.00 | | | $ | 1,020.86 | | | $ | 4.32 | | | | 0.85 | % | |
Class A | | $ | 1,000.00 | | | $ | 1,155.40 | | | $ | 6.56 | | | | 1.21 | % | | $ | 1,000.00 | | | $ | 1,019.05 | | | $ | 6.14 | | | | 1.21 | % | |
Class C | | $ | 1,000.00 | | | $ | 1,151.20 | | | $ | 10.60 | | | | 1.96 | % | | $ | 1,000.00 | | | $ | 1,015.28 | | | $ | 9.93 | | | | 1.96 | % | |
Class R3 | | $ | 1,000.00 | | | $ | 1,153.50 | | | $ | 7.90 | | | | 1.46 | % | | $ | 1,000.00 | | | $ | 1,017.80 | | | $ | 7.41 | | | | 1.46 | % | |
Class R6 | | $ | 1,000.00 | | | $ | 1,157.40 | | | $ | 4.23 | | | | 0.78 | % | | $ | 1,000.00 | | | $ | 1,021.22 | | | $ | 3.96 | | | | 0.78 | % | |
Small Cap Growth Fund | |
Investor Class | | $ | 1,000.00 | | | $ | 1,222.60 | | | $ | 6.76 | | | | 1.21 | % | | $ | 1,000.00 | | | $ | 1,019.05 | | | $ | 6.14 | | | | 1.21 | % | |
Trust Class | | $ | 1,000.00 | | | $ | 1,222.30 | | | $ | 7.65 | | | | 1.37 | % | | $ | 1,000.00 | | | $ | 1,018.25 | | | $ | 6.95 | | | | 1.37 | % | |
Advisor Class | | $ | 1,000.00 | | | $ | 1,221.10 | | | $ | 8.43 | | | | 1.51 | % | | $ | 1,000.00 | | | $ | 1,017.55 | | | $ | 7.66 | | | | 1.51 | % | |
Institutional Class | | $ | 1,000.00 | | | $ | 1,225.00 | | | $ | 5.03 | | | | 0.90 | % | | $ | 1,000.00 | | | $ | 1,020.61 | | | $ | 4.57 | | | | 0.90 | % | |
Class A | | $ | 1,000.00 | | | $ | 1,222.80 | | | $ | 7.04 | | | | 1.26 | % | | $ | 1,000.00 | | | $ | 1,018.80 | | | $ | 6.39 | | | | 1.26 | % | |
Class C | | $ | 1,000.00 | | | $ | 1,217.90 | | | $ | 11.21 | | | | 2.01 | % | | $ | 1,000.00 | | | $ | 1,015.03 | | | $ | 10.18 | | | | 2.01 | % | |
Class R3 | | $ | 1,000.00 | | | $ | 1,221.20 | | | $ | 8.43 | | | | 1.51 | % | | $ | 1,000.00 | | | $ | 1,017.55 | | | $ | 7.66 | | | | 1.51 | % | |
Socially Responsive Fund | |
Investor Class | | $ | 1,000.00 | | | $ | 1,132.60 | | | $ | 4.61 | | | | 0.86 | % | | $ | 1,000.00 | | | $ | 1,020.81 | | | $ | 4.37 | | | | 0.86 | % | |
Trust Class | | $ | 1,000.00 | | | $ | 1,131.00 | | | $ | 5.52 | | | | 1.03 | % | | $ | 1,000.00 | | | $ | 1,019.96 | | | $ | 5.23 | | | | 1.03 | % | |
Institutional Class | | $ | 1,000.00 | | | $ | 1,133.50 | | | $ | 3.59 | | | | 0.67 | % | | $ | 1,000.00 | | | $ | 1,021.77 | | | $ | 3.40 | | | | 0.67 | % | |
Class A | | $ | 1,000.00 | | | $ | 1,131.40 | | | $ | 5.63 | | | | 1.05 | % | | $ | 1,000.00 | | | $ | 1,019.86 | | | $ | 5.33 | | | | 1.05 | % | |
Class C | | $ | 1,000.00 | | | $ | 1,126.70 | | | $ | 9.57 | | | | 1.79 | % | | $ | 1,000.00 | | | $ | 1,016.14 | | | $ | 9.07 | | | | 1.79 | % | |
Class R3 | | $ | 1,000.00 | | | $ | 1,129.90 | | | $ | 6.91 | | | | 1.29 | % | | $ | 1,000.00 | | | $ | 1,018.65 | | | $ | 6.55 | | | | 1.29 | % | |
Class R6 | | $ | 1,000.00 | | | $ | 1,133.80 | | | $ | 3.22 | | | | 0.60 | % | | $ | 1,000.00 | | | $ | 1,022.12 | | | $ | 3.05 | | | | 0.60 | % | |
Value Fund | |
Institutional Class | | $ | 1,000.00 | | | $ | 1,236.80 | | | $ | 3.99 | | | | 0.71 | % | | $ | 1,000.00 | | | $ | 1,021.57 | | | $ | 3.61 | | | | 0.71 | % | |
Class A | | $ | 1,000.00 | | | $ | 1,233.80 | | | $ | 6.12 | | | | 1.09 | % | | $ | 1,000.00 | | | $ | 1,019.66 | | | $ | 5.53 | | | | 1.09 | % | |
Class C | | $ | 1,000.00 | | | $ | 1,230.30 | | | $ | 10.26 | | | | 1.83 | % | | $ | 1,000.00 | | | $ | 1,015.94 | | | $ | 9.27 | | | | 1.83 | % | |
(1) For each class, expenses are equal to the annualized expense ratio for the class, multiplied by the average account value over the period, multiplied by 184/366 (to reflect the one-half year period shown), unless otherwise indicated.
(2) Hypothetical expenses are equal to the annualized expense ratios for each class, multiplied by the average account value over the period (assuming a 5% annual return), multiplied by 184/366 (to reflect the one-half year period shown).
74
Schedule of Investments Dividend Growth Fund 8/31/16
| | |
Number
of Shares | |
Value
(000's) | |
Common Stocks (89.6%) | |
Aerospace & Defense (5.0%) | |
General Dynamics
Corp. | | | 2,775 | | | $ | 422 | | |
Raytheon Co. | | | 2,550 | | | | 357 | | |
Rockwell Collins,
Inc. | | | 2,900 | | | | 243 | | |
| | | | 1,022 | | |
Air Freight & Logistics (1.5%) | |
United Parcel
Service, Inc.
Class B | | | 2,850 | | | | 311 | | |
Banks (8.7%) | |
Citigroup, Inc. | | | 8,950 | | | | 427 | | |
Citizens Financial
Group, Inc. | | | 18,600 | | | | 461 | | |
First Hawaiian,
Inc.* | | | 4,900 | | | | 130 | | |
JPMorgan
Chase & Co. | | | 6,550 | | | | 442 | | |
PNC Financial
Services Group,
Inc. | | | 3,600 | | | | 325 | | |
| | | | 1,785 | | |
Communications Equipment (3.5%) | |
Cisco Systems, Inc. | | | 13,150 | | | | 414 | | |
Motorola
Solutions, Inc. | | | 3,900 | | | | 300 | | |
| | | | 714 | | |
Consumer Finance (1.8%) | |
Synchrony
Financial | | | 13,175 | | | | 367 | | |
Diversified Telecommunication Services (1.9%) | |
Frontier
Communications
Corp. | | | 85,000 | | | | 391 | | |
Electric Utilities (1.6%) | |
Exelon Corp. | | | 9,850 | | | | 335 | | |
Electrical Equipment (1.8%) | |
Hubbell, Inc. | | | 3,500 | | | | 379 | | |
Electronic Equipment, Instruments & Components (3.4%) | |
CDW Corp. | | | 6,750 | | | | 301 | | |
TE Connectivity Ltd. | | | 6,400 | | | | 407 | | |
| | | | 708 | | |
Energy Equipment & Services (1.4%) | |
Schlumberger Ltd. | | | 3,625 | | | | 286 | | |
Food Products (6.8%) | |
Bunge Ltd. | | | 7,150 | | | | 457 | | |
ConAgra Foods,
Inc. | | | 6,400 | | | | 298 | | |
| | |
Number
of Shares | |
Value
(000's) | |
Mondelez
International,
Inc. Class A | | | 7,750 | | | $ | 349 | | |
Pinnacle Foods,
Inc. | | | 5,850 | | | | 296 | | |
| | | | 1,400 | | |
Health Care Providers & Services (1.6%) | |
Express Scripts
Holding Co.* | | | 4,500 | | | | 327 | | |
Hotels, Restaurants & Leisure (2.0%) | |
Carnival Corp. | | | 8,500 | | | | 406 | | |
Household Products (1.9%) | |
Procter &
Gamble Co. | | | 4,450 | | | | 389 | | |
Insurance (3.8%) | |
Chubb Ltd. | | | 2,850 | | | | 362 | | |
MetLife, Inc. | | | 9,600 | | | | 416 | | |
| | | | 778 | | |
IT Services (3.9%) | |
Automatic Data
Processing, Inc. | | | 4,475 | | | | 402 | | |
Leidos Holdings,
Inc. | | | 9,800 | | | | 397 | | |
| | | | 799 | | |
Machinery (1.1%) | |
Kennametal Inc. | | | 8,000 | | | | 224 | | |
Media (3.0%) | |
Comcast Corp.
Class A | | | 4,750 | | | | 310 | | |
Omnicom Group,
Inc. | | | 3,600 | | | | 310 | | |
| | | | 620 | | |
Metals & Mining (6.0%) | |
Lundin Mining
Corp.* | | | 85,350 | | | | 323 | | |
Newmont Mining
Corp. | | | 11,400 | | | | 436 | | |
Royal Gold, Inc. | | | 6,500 | | | | 476 | | |
| | | | 1,235 | | |
Oil, Gas & Consumable Fuels (8.6%) | |
Devon Energy
Corp. | | | 12,200 | | | | 529 | | |
EOG Resources,
Inc. | | | 5,250 | | | | 465 | | |
Noble Energy, Inc. | | | 7,000 | | | | 241 | | |
Occidental
Petroleum Corp. | | | 3,150 | | | | 242 | | |
Suncor Energy, Inc. | | | 11,250 | | | | 305 | | |
| | | | 1,782 | | |
| | |
Number
of Shares | |
Value
(000's) | |
Pharmaceuticals (4.0%) | |
Bristol-Myers
Squibb Co. | | | 3,850 | | | $ | 221 | | |
Eli Lilly & Co. | | | 2,550 | | | | 198 | | |
Teva
Pharmaceutical
Industries Ltd.
ADR | | | 8,250 | | | | 416 | | |
| | | | 835 | | |
Real Estate Investment Trusts (1.5%) | |
American Tower
Corp. | | | 2,800 | | | | 317 | | |
Semiconductors & Semiconductor Equipment (5.8%) | |
Applied Materials,
Inc. | | | 14,150 | | | | 422 | | |
Maxim Integrated
Products, Inc. | | | 8,600 | | | | 350 | | |
NXP
Semiconductors
NV* | | | 4,900 | | | | 432 | | |
| | | | 1,204 | | |
Software (3.7%) | |
Microsoft Corp. | | | 8,050 | | | | 463 | | |
Oracle Corp. | | | 7,400 | | | | 305 | | |
| | | | 768 | | |
Technology Hardware, Storage & Peripherals (2.0%) | |
Apple, Inc. | | | 3,875 | | | | 411 | | |
Textiles, Apparel & Luxury Goods (1.4%) | |
Coach, Inc. | | | 7,400 | | | | 283 | | |
Tobacco (1.9%) | |
Philip Morris
International, Inc. | | | 3,950 | | | | 395 | | |
Total Common Stocks
(Cost $16,682) | | | | | 18,471 | | |
Short-Term Investment (10.4%) | |
Investment Company (10.4%) | |
State Street
Institutional
Treasury Money
Market Fund
Premier Class,
0.19%(a)
(Cost $2,140) | | | 2,140,393 | | | | 2,140 | | |
Total Investments (100.0%)
(Cost $18,822) | | | | | 20,611 | | |
Other Assets Less
Liabilities (0.0%) | | | | | 6 | | |
Net Assets (100.0%) | | | | $ | 20,617 | | |
* Non-income producing security.
(a) Represents 7-day effective yield as of 8/31/2016.
See Notes to Financial Statements
75
Schedule of Investments Dividend Growth Fund (cont'd)
The following is a summary, categorized by Level (see Note A of Notes to Financial Statements), of inputs used to value the Fund's investments as of August 31, 2016:
Asset Valuation Inputs | |
(000's omitted) | | Level 1 | | Level 2 | | Level 3 | | Total | |
Investments: | |
| Common Stocks(a) | | $ | 18,471 | | | $ | — | | | $ | — | | | $ | 18,471 | | |
Short-Term Investment | | | — | | | | 2,140 | | | | — | | | | 2,140 | | |
Total Investments | | $ | 18,471 | | | $ | 2,140 | | | $ | — | | | $ | 20,611 | | |
(a) The Schedule of Investments provides information on the industry categorization for the portfolio.
As of the year ended August 31, 2016, no securities were transferred from one level (as of August 31, 2015) to another.
See Notes to Financial Statements
76
Schedule of Investments Emerging Markets Equity Fund 8/31/16
| | |
Number
of Shares | |
Value
(000's) | |
Common Stocks (97.3%) | |
Brazil (7.2%) | |
AMBEV SA ADR | | | 1,205,900 | | | $ | 7,151 | | |
BB Seguridade
Participacoes SA | | | 539,200 | | | | 4,867 | | |
Cielo SA | | | 467,408 | | | | 4,862 | | |
Embraer SA ADR | | | 73,100 | | | | 1,287 | | |
Energisa SA | | | 254,500 | | | | 1,652 | | |
FPC Par
Corretora de
Seguros SA | | | 534,100 | | | | 2,150 | | |
Itau Unibanco
Holding SA,
Preference
Shares | | | 794,970 | | | | 8,826 | | |
Kroton
Educacional SA | | | 487,300 | | | | 2,083 | | |
| | | | 32,878 | | |
Chile (0.9%) | |
SACI Falabella | | | 614,445 | | | | 4,343 | | |
China (23.5%) | |
Alibaba Group
Holding Ltd.
ADR* | | | 45,900 | | | | 4,461 | | |
Baidu, Inc. ADR* | | | 42,600 | | | | 7,287 | | |
Beijing
Enterprises
Holdings Ltd. | | | 774,400 | | | | 4,442 | | |
Changyou.com
Ltd. ADR* | | | 167,700 | | | | 4,156 | | |
China
Everbright
International
Ltd. | | | 5,946,900 | | | | 7,605 | | |
China Medical
System
Holdings Ltd. | | | 2,756,800 | | | | 4,620 | | |
China Mengniu
Dairy Co. Ltd. | | | 1,249,970 | | | | 2,372 | | |
China Mobile Ltd. | | | 831,000 | | | | 10,262 | | |
China State
Construction
International
Holdings Ltd. | | | 3,025,400 | | | | 3,611 | | |
China Vanke
Co. Ltd.,
H Shares | | | 1,605,223 | | | | 4,118 | | |
CNOOC Ltd. | | | 2,612,400 | | | | 3,209 | | |
Haier Electronics
Group Co. Ltd. | | | 2,874,800 | | | | 4,810 | | |
Hua Hong
Semiconductor
Ltd.(a) | | | 1,072,900 | | | | 1,176 | | |
Industrial &
Commercial
Bank of China
Ltd., H Shares | | | 14,948,400 | | | | 9,500 | | |
| | |
Number
of Shares | |
Value
(000's) | |
PICC Property &
Casualty Co.
Ltd., H Shares | | | 2,363,200 | | | $ | 3,905 | | |
Ping An
Insurance
Group Co. of
China Ltd.,
H Shares | | | 1,136,900 | | | | 5,884 | | |
Sunny Optical
Technology
Group Co. Ltd. | | | 1,570,000 | | | | 8,389 | | |
Tencent
Holdings Ltd. | | | 671,300 | | | | 17,463 | | |
| | | | 107,270 | | |
Czech Republic (0.8%) | |
Komercni
Banka A/S | | | 111,450 | | | | 3,772 | | |
Hong Kong (1.6%) | |
AIA Group Ltd. | | | 714,000 | | | | 4,515 | | |
Galaxy
Entertainment
Group Ltd. | | | 915,400 | | | | 2,979 | | |
| | | | 7,494 | | |
India (12.1%) | |
Cairn India Ltd. | | | 1,201,575 | | | | 3,586 | | |
Cummins India
Ltd. | | | 378,798 | | | | 5,180 | | |
Dabur India Ltd. | | | 1,205,309 | | | | 5,247 | | |
Dewan Housing
Finance
Corp. Ltd. | | | 911,840 | | | | 3,945 | | |
Glenmark
Pharmaceuticals
Ltd. | | | 285,185 | | | | 3,575 | | |
HDFC Bank
Ltd. ADR | | | 58,300 | | | | 4,177 | | |
Hindustan
Unilever Ltd. | | | 163,385 | | | | 2,233 | | |
Housing
Development
Finance Corp. Ltd. | | | 163,770 | | | | 3,448 | | |
IndusInd Bank
Ltd. | | | 200,240 | | | | 3,543 | | |
InterGlobe
Aviation Ltd.*(a) | | | 114,690 | | | | 1,514 | | |
Maruti Suzuki
India Ltd. | | | 71,175 | | | | 5,374 | | |
Parag Milk
Foods Ltd.*(a) | | | 589,655 | | | | 2,870 | | |
Power Grid
Corp. of
India Ltd. | | | 1,946,066 | | | | 5,335 | | |
Prestige Estates
Projects Ltd. | | | 873,175 | | | | 2,434 | | |
SH Kelkar &
Co. Ltd.(a) | | | 523,030 | | | | 2,667 | | |
| | | | 55,128 | | |
| | |
Number
of Shares | |
Value
(000's) | |
Indonesia (3.6%) | |
PT AKR
Corporindo Tbk | | | 3,548,400 | | | $ | 1,785 | | |
PT Bank Negara
Indonesia
Persero Tbk | | | 11,067,500 | | | | 4,902 | | |
PT Gudang
Garam Tbk | | | 812,500 | | | | 3,945 | | |
PT Link Net Tbk | | | 426,600 | | | | 143 | | |
PT Matahari
Department
Store Tbk | | | 2,175,000 | | | | 3,279 | | |
PT Sumber
Alfaria Trijaya
Tbk | | | 53,085,000 | | | | 2,261 | | |
| | | | 16,315 | | |
Jordan (0.7%) | |
Hikma
Pharmaceuticals
PLC | | | 110,630 | | | | 3,109 | | |
Korea (13.1%) | |
Com2uS Corp.* | | | 19,200 | | | | 1,777 | | |
Coway Co. Ltd. | | | 97,975 | | | | 7,328 | | |
Hyundai
Motor Co. | | | 49,875 | | | | 5,949 | | |
LG Chem Ltd. | | | 14,500 | | | | 3,518 | | |
NAVER Corp. | | | 9,840 | | | | 7,457 | | |
NCSoft Corp. | | | 1,800 | | | | 436 | | |
Orion Corp. | | | 7,920 | | | | 5,278 | | |
Samsung
Electronics
Co. Ltd. | | | 12,205 | | | | 17,733 | | |
SFA Engineering
Corp. | | | 78,397 | | | | 3,748 | | |
SK Hynix, Inc. | | | 199,265 | | | | 6,514 | | |
| | | | 59,738 | | |
Malaysia (0.6%) | |
Inari Amertron
Bhd | | | 3,530,625 | | | | 2,757 | | |
Mexico (5.6%) | |
Arca
Continental
SAB de CV | | | 366,600 | | | | 2,289 | | |
Corp.
Inmobiliaria
Vesta SAB
de CV | | | 2,397,000 | | | | 3,416 | | |
Fomento
Economico
Mexicano
SAB de CV | | | 354,000 | | | | 3,243 | | |
Grupo
Financiero
Banorte SAB
de CV,
O Shares | | | 947,100 | | | | 5,104 | | |
See Notes to Financial Statements
77
Schedule of Investments Emerging Markets Equity Fund (cont'd)
| | |
Number
of Shares | |
Value
(000's) | |
Grupo GICSA
SA de CV* | | | 2,746,100 | | | $ | 1,913 | | |
Grupo Mexico
SAB de CV
Series B | | | 1,681,500 | | | | 4,204 | | |
Infraestructura
Energetica
Nova SAB de CV | | | 660,900 | | | | 2,551 | | |
Unifin Financiera
SAPI de CV | | | 921,500 | | | | 2,667 | | |
| | | | 25,387 | | |
Peru (1.0%) | |
Credicorp Ltd. | | | 28,000 | | | | 4,387 | | |
Philippines (3.0%) | |
Ayala Corp. | | | 265,280 | | | | 4,982 | | |
International
Container
Terminal
Services, Inc. | | | 200,000 | | | | 360 | | |
Metropolitan
Bank &
Trust Co. | | | 1,078,600 | | | | 1,933 | | |
SM Investments
Corp. | | | 244,880 | | | | 3,574 | | |
Universal Robina
Corp. | | | 730,510 | | | | 2,932 | | |
| | | | 13,781 | | |
Russia (3.6%) | |
LUKOIL PJSC ADR | | | 53,540 | | | | 2,395 | | |
LUKOIL PJSC ADR | | | 78,985 | | | | 3,542 | | |
| Magnit PJSC(b) | | | 24,240 | | | | 3,805 | | |
X5 Retail Group
NV GDR* | | | 255,015 | | | | 6,745 | | |
| | | | 16,487 | | |
South Africa (5.4%) | |
Alexander
Forbes Group
Holdings Ltd. | | | 4,565,990 | | | | 2,106 | | |
Bid Corp. Ltd.* | | | 231,524 | | | | 4,252 | | |
FirstRand Ltd. | | | 1,436,915 | | | | 4,307 | | |
Life Healthcare
Group
Holdings Ltd. | | | 1,564,625 | | | | 4,097 | | |
Naspers Ltd.,
N Shares | | | 45,525 | | | | 7,450 | | |
Sasol Ltd. | | | 88,800 | | | | 2,236 | | |
| | | | 24,448 | | |
Taiwan, Province of China (10.4%) | |
Accton
Technology
Corp. | | | 2,752,400 | | | | 4,328 | | |
Advanced
Ceramic X Corp. | | | 342,000 | | | | 2,161 | | |
Delta Electronics,
Inc. | | | 937,200 | | | | 4,873 | | |
| | |
Number
of Shares | |
Value
(000's) | |
eMemory
Technology, Inc. | | | 315,200 | | | $ | 3,278 | | |
Hermes
Microvision, Inc. | | | 165,640 | | | | 7,100 | | |
Hu Lane
Associate, Inc. | | | 532,200 | | | | 2,692 | | |
Kingpak
Technology, Inc. | | | 220,448 | | | | 1,730 | | |
MediaTek, Inc. | | | 524,200 | | | | 4,122 | | |
Parade
Technologies
Ltd. | | | 409,300 | | | | 3,986 | | |
Taiwan
Semiconductor
Manufacturing
Co. Ltd. | | | 2,343,739 | | | | 13,000 | | |
| | | | 47,270 | | |
Thailand (1.6%) | |
Bangkok Dusit
Medical
Services PCL(b) | | | 4,122,500 | | | | 2,799 | | |
| CP ALL PCL(b) | | | 2,419,000 | | | | 4,350 | | |
| | | | 7,149 | | |
Turkey (1.4%) | |
Tofas Turk
Otomobil
Fabrikasi A/S | | | 282,985 | | | | 2,082 | | |
Ulker Biskuvi
Sanayi A/S | | | 609,585 | | | | 4,291 | | |
| | | | 6,373 | | |
United Kingdom (1.2%) | |
SABMiller PLC | | | 99,075 | | | | 5,708 | | |
Total Common Stocks
(Cost $393,603) | | | | | 443,794 | | |
Short-Term Investment (4.1%) | |
Investment Company (4.1%) | |
State Street
Institutional
Treasury Money
Market Fund
Premier
Class, 0.19%(c)
(Cost $18,812) | | | 18,812,214 | | | | 18,812 | | |
Total Investments (101.4%)
(Cost $412,415) | | | | | 462,606 | | |
Other Assets Less
Liabilities [(1.4%)] | | | | | (6,426 | ) | |
Net Assets (100.0%) | | | | $ | 456,180 | | |
* Non-income producing security.
(a) Securities were purchased under Rule 144A of the Securities
Act of 1933, as amended (the "1933 Act"), or are otherwise restricted and, unless registered under the 1933 Act or exempted from registration, may only be sold to qualified institutional investors or may have other restrictions on resale. At 8/31/2016, these securities amounted to approximately $8,227,000, or 1.8% of net assets for the Fund. These securities have been deemed by the investment manager to be liquid.
(b) Security fair valued as of 8/31/2016 in accordance with procedures approved by the Fund's Board of Trustees. Total value of all such securities at 8/31/2016 amounted to approximately $10,954,000, which represents 2.4% of net assets of the Fund.
(c) Represents 7-day effective yield as of 8/31/2016.
See Notes to Financial Statements
78
POSITIONS BY INDUSTRY EMERGING MARKETS EQUITY FUND
Industry | | Investments at
Value
(000's omitted) | | Percentage of
Net Assets | |
Banks | | $ | 46,144 | | | | 10.1 | % | |
Semiconductors & Semiconductor Equipment | | | 39,176 | | | | 8.6 | % | |
Internet Software & Services | | | 36,668 | | | | 8.0 | % | |
Electronic Equipment, Instruments & Components | | | 21,497 | | | | 4.7 | % | |
Food & Staples Retailing | | | 21,413 | | | | 4.7 | % | |
Insurance | | | 21,321 | | | | 4.7 | % | |
Beverages | | | 18,391 | | | | 4.0 | % | |
Food Products | | | 17,743 | | | | 3.9 | % | |
Technology Hardware, Storage & Peripherals | | | 17,733 | | | | 3.9 | % | |
Oil, Gas & Consumable Fuels | | | 14,968 | | | | 3.3 | % | |
Automobiles | | | 13,405 | | | | 2.9 | % | |
Household Durables | | | 12,138 | | | | 2.7 | % | |
Real Estate Management & Development | | | 11,881 | | | | 2.6 | % | |
Diversified Financial Services | | | 11,395 | | | | 2.5 | % | |
Pharmaceuticals | | | 11,304 | | | | 2.5 | % | |
Wireless Telecommunication Services | | | 10,262 | | | | 2.2 | % | |
Industrial Conglomerates | | | 8,016 | | | | 1.8 | % | |
Multiline Retail | | | 7,622 | | | | 1.7 | % | |
Commercial Services & Supplies | | | 7,605 | | | | 1.7 | % | |
Media | | | 7,450 | | | | 1.6 | % | |
Thrifts & Mortgage Finance | | | 7,393 | | | | 1.6 | % | |
Electric Utilities | | | 6,987 | | | | 1.5 | % | |
Health Care Providers & Services | | | 6,896 | | | | 1.5 | % | |
Communications Equipment | | | 6,489 | | | | 1.4 | % | |
Software | | | 6,369 | | | | 1.4 | % | |
Chemicals | | | 6,185 | | | | 1.4 | % | |
Personal Products | | | 5,247 | | | | 1.1 | % | |
Machinery | | | 5,180 | | | | 1.1 | % | |
IT Services | | | 4,862 | | | | 1.1 | % | |
Metals & Mining | | | 4,204 | | | | 0.9 | % | |
Tobacco | | | 3,945 | | | | 0.9 | % | |
Construction & Engineering | | | 3,611 | | | | 0.8 | % | |
Hotels, Restaurants & Leisure | | | 2,979 | | | | 0.6 | % | |
Auto Components | | | 2,692 | | | | 0.6 | % | |
Consumer Finance | | | 2,667 | | | | 0.6 | % | |
Gas Utilities | | | 2,551 | | | | 0.6 | % | |
Household Products | | | 2,233 | | | | 0.5 | % | |
Diversified Consumer Services | | | 2,083 | | | | 0.5 | % | |
Trading Companies & Distributors | | | 1,785 | | | | 0.4 | % | |
Airlines | | | 1,514 | | | | 0.3 | % | |
Aerospace & Defense | | | 1,287 | | | | 0.3 | % | |
Transportation Infrastructure | | | 360 | | | | 0.1 | % | |
Diversified Telecommunication Services | | | 143 | | | | 0.0 | % | |
Short-Term Investment and Other Assets—Net | | | 12,386 | | | | 2.7 | % | |
| | | $ | 456,180 | | | | 100.0 | % | |
See Notes to Financial Statements
79
Schedule of Investments Emerging Markets Equity Fund (cont'd)
The following is a summary, categorized by Level (see Note A of Notes to Financial Statements), of inputs used to value the Fund's investments as of August 31, 2016:
Asset Valuation Inputs | |
(000's omitted) | | Level 1 | | Level 2 | | Level 3 | | Total | |
Investments: | |
Common Stocks | |
Malaysia | | $ | — | | | $ | 2,757 | | | $ | — | | | $ | 2,757 | | |
Russia | | | 12,682 | | | | 3,805 | | | | — | | | | 16,487 | | |
Thailand | | | — | | | | 7,149 | | | | — | | | | 7,149 | | |
Other Common Stocks(a) | | | 417,401 | | | | — | | | | — | | | | 417,401 | | |
Total Common Stocks | | | 430,083 | | | | 13,711 | | | | — | | | | 443,794 | | |
Short-Term Investment | | | — | | | | 18,812 | | | | — | | | | 18,812 | | |
Total Investments | | $ | 430,083 | | | $ | 32,523 | | | $ | — | | | $ | 462,606 | | |
(a) The Schedule of Investments provides a geographic categorization as well as a Positions by Industry summary.
As of the year ended August 31, 2016, certain securities were transferred from one level (as of August 31, 2015) to another. Based on beginning of period market values as of September 1, 2015, approximately $18,286,000, was transferred from Level 2 to Level 1 due to active market activity on recognized exchanges as of August 31, 2016. These securities had been categorized as Level 2 as of August 31, 2015, due to foreign exchanges having been closed and, therefore, no prices having been readily available for the securities as of that date.
See Notes to Financial Statements
80
Schedule of Investments Equity Income Fund 8/31/16
| | |
Number
of Shares | |
Value
(000's) | |
Common Stocks (90.4%) | |
Aerospace & Defense (0.9%) | |
Lockheed
Martin Corp. | | | 61,330 | | | $ | 14,901 | | |
Air Freight & Logistics (1.4%) | |
United Parcel
Service, Inc.
Class B(a) | | | 206,100 | | | | 22,510 | | |
Banks (6.5%) | |
First Hawaiian,
Inc.* | | | 413,700 | | | | 10,996 | | |
JPMorgan
Chase & Co.(a) | | | 659,000 | | | | 44,483 | | |
PNC Financial
Services
Group, Inc. | | | 99,900 | | | | 9,001 | | |
Umpqua
Holdings Corp. | | | 2,093,451 | | | | 34,374 | | |
Wells
Fargo & Co. | | | 175,000 | | | | 8,890 | | |
| | | | 107,744 | | |
Beverages (1.3%) | |
Anheuser-Busch
InBev NV ADR | | | 170,000 | | | | 21,085 | | |
Communications Equipment (2.7%) | |
Cisco Systems,
Inc.(a)(b) | | | 1,415,300 | | | | 44,497 | | |
Containers & Packaging (1.7%) | |
International
Paper Co.(a) | | | 568,000 | | | | 27,542 | | |
Diversified Telecommunication Services (1.9%) | |
AT&T, Inc. | | | 433,500 | | | | 17,721 | | |
Frontier
Communications
Corp. | | | 2,882,100 | | | | 13,258 | | |
| | | | 30,979 | | |
Electric Utilities (8.4%) | |
Edison
International(a) | | | 412,500 | | | | 29,997 | | |
Entergy Corp. | | | 478,700 | | | | 37,435 | | |
Exelon Corp. | | | 982,500 | | | | 33,405 | | |
NextEra
Energy, Inc.(a) | | | 315,200 | | | | 38,120 | | |
| | | | 138,957 | | |
Energy Equipment & Services (3.1%) | |
Helmerich &
Payne, Inc. | | | 255,247 | | | | 15,432 | | |
Schlumberger
Ltd. | | | 462,100 | | | | 36,506 | | |
| | | | 51,938 | | |
| | |
Number
of Shares | |
Value
(000's) | |
Food Products (2.0%) | |
ConAgra
Foods, Inc.(a) | | | 731,000 | | | $ | 34,072 | | |
Household Products (2.2%) | |
Procter &
Gamble Co.(a) | | | 418,400 | | | | 36,531 | | |
Industrial Conglomerates (4.1%) | |
General
Electric Co. | | | 869,100 | | | | 27,151 | | |
Koninklijke
Philips NV | | | 620,400 | | | | 18,020 | | |
Siemens AG | | | 198,000 | | | | 23,643 | | |
| | | | 68,814 | | |
Insurance (2.0%) | |
MetLife, Inc. | | | 772,700 | | | | 33,535 | | |
IT Services (0.9%) | |
Leidos
Holdings, Inc. | | | 381,507 | | | | 15,455 | | |
Media (2.5%) | |
Regal
Entertainment
Group Class A | | | 1,934,500 | | | | 41,360 | | |
Multi-Utilities (6.8%) | |
| Ameren Corp.(a) | | | 670,300 | | | | 33,126 | | |
Black Hills Corp. | | | 280,000 | | | | 16,383 | | |
| DTE Energy Co.(a) | | | 360,100 | | | | 33,453 | | |
WEC Energy
Group, Inc. | | | 488,800 | | | | 29,270 | | |
| | | | 112,232 | | |
Oil, Gas & Consumable Fuels (4.7%) | |
Exxon Mobil
Corp. | | | 390,200 | | | | 34,002 | | |
Occidental
Petroleum
Corp. | | | 235,100 | | | | 18,068 | | |
Suncor
Energy, Inc. | | | 590,900 | | | | 16,019 | | |
Williams
Cos., Inc. | | | 360,000 | | | | 10,058 | | |
| | | | 78,147 | | |
Pharmaceuticals (6.1%) | |
Bristol-Myers
Squibb Co. | | | 289,000 | | | | 16,586 | | |
Eli Lilly &
Co.(a) | | | 210,200 | | | | 16,343 | | |
GlaxoSmithKline
PLC ADR | | | 835,300 | | | | 36,302 | | |
Johnson &
Johnson(a) | | | 269,100 | | | | 32,114 | | |
| | | | 101,345 | | |
| | |
Number
of Shares | |
Value
(000's) | |
Real Estate Investment Trusts (20.5%) | |
Blackstone
Mortgage
Trust, Inc.
Class A | | | 789,900 | | | $ | 23,555 | | |
Crown Castle
International
Corp. | | | 467,200 | | | | 44,277 | | |
DCT Industrial
Trust, Inc. | | | 440,500 | | | | 21,457 | | |
Douglas
Emmett, Inc. | | | 623,600 | | | | 23,422 | | |
EPR Properties | | | 247,900 | | | | 19,416 | | |
| Equinix, Inc.(a) | | | 89,500 | | | | 32,994 | | |
Iron
Mountain, Inc. | | | 504,900 | | | | 19,393 | | |
| Prologis, Inc.(a) | | | 838,200 | | | | 44,517 | | |
| Public Storage(a) | | | 60,000 | | | | 13,436 | | |
Simon Property
Group, Inc.(a) | | | 157,500 | | | | 33,936 | | |
Starwood
Property
Trust, Inc. | | | 1,252,700 | | | | 28,687 | | |
Weyerhaeuser
Co. | | | 1,065,100 | | | | 33,923 | | |
| | | | 339,013 | | |
Road & Rail (1.6%) | |
Union Pacific
Corp. | | | 279,900 | | | | 26,739 | | |
Semiconductors & Semiconductor Equipment (4.0%) | |
Linear
Technology
Corp.(a) | | | 190,700 | | | | 11,107 | | |
Maxim
Integrated
Products, Inc. | | | 493,300 | | | | 20,087 | | |
QUALCOMM,
Inc.(a) | | | 500,000 | | | | 31,535 | | |
Texas
Instruments,
Inc.(a) | | | 50,000 | | | | 3,477 | | |
| | | | 66,206 | | |
Software (2.2%) | |
Microsoft
Corp.(a) | | | 631,000 | | | | 36,257 | | |
Specialty Retail (1.6%) | |
Best Buy
Co., Inc. | | | 683,000 | | | | 26,282 | | |
Technology Hardware, Storage & Peripherals (1.3%) | |
Western Digital
Corp. | | | 451,000 | | | | 21,048 | | |
Total Common Stocks
(Cost $1,296,332) | | | | | 1,497,189 | | |
See Notes to Financial Statements
81
Schedule of Investments Equity Income Fund (cont'd)
| | |
Number
of Shares | |
Value
(000's) | |
Preferred Stocks (2.2%) | |
Oil, Gas & Consumable Fuels (1.2%) | |
El Paso Energy
Capital Trust I,
4.75% | | | 397,579 | | | $ | 20,670 | | |
Pharmaceuticals (1.0%) | |
Allergan PLC,
Ser. A, 5.50% | | | 19,365 | | | | 16,125 | | |
Total Preferred Stocks
(Cost $34,485) | | | | | 36,795 | | |
| | | Principal
Amount | | | |
Convertible Bonds (5.4%) | |
Electronic Equipment, Instruments & Components (0.1%) | |
Knowles Corp.,
Senior
Unsecured
Notes, 3.25%,
due 11/1/21(c) | | $ 2,050,000 | | | 2,150 | | |
Real Estate Investment Trusts (2.2%) | |
Extra Space
Storage LP,
Guaranteed
Notes, 3.13%,
due 10/1/35(c) | | 33,260,000 | | | 36,108 | | |
Internet & Direct Marketing
Retail (0.8%) | |
Priceline Group,
Inc., Senior
Unsecured
Notes, 0.90%,
due 9/15/21 | | 12,900,000 | | | 13,714 | | |
Internet Software & Services (1.8%) | |
LinkedIn Corp.,
Senior
Unsecured
Notes, 0.5%,
due 11/1/19 | | 8,600,000 | | | 8,536 | | |
SINA Corp.,
Senior
Unsecured
Notes, 1.00%,
due 12/1/18 | | 17,000,000 | | | 16,989 | | |
Twitter, Inc.,
Senior
Unsecured
Notes, 1.00.%,
due 9/15/21 | | 4,710,000 | | | 4,339 | | |
| | | 29,864 | | |
| |
Principal
Amount | |
Value
(000's) | |
Media (0.5%) | |
Liberty Media
Corp., Senior
Unsecured
Notes, 2.25%,
due 9/30/46(c) | | $ 4,307,000 | | $ 4,423 | |
Live Nation
Entertainment,
Inc., Senior
Unsecured
Notes, 2.50%,
due 5/15/19 | | 3,260,000 | | | 3,476 | | |
| | | 7,899 | | |
Total Convertible Bonds
(Cost $83,563) | | | | | 89,735 | | |
| | Number
of Shares | | | |
Short-Term Investment (1.9%) | |
Investment Company (1.9%) | |
State Street
Institutional
Treasury
Money Market
Fund Premier
Class, 0.19%(b)(d)
(Cost $30,529) | | | 30,529,159 | | | | 30,529 | | |
Total Investments (99.9%)
(Cost $1,444,909) | | | | | 1,654,248 | | |
Other Assets Less
Liabilities (0.1%)(e) | | | | | 2,016 | | |
Net Assets (100.0%) | | | | $ | 1,656,264 | | |
* Non-income producing security.
(a) All or a portion of the security is pledged as collateral for options written.
(b) All or a portion of this security is segregated in connection for options written with a total value of approximately $69,999,000.
(c) Securities were purchased under Rule 144A of the 1933 Act, as amended (the "1933 Act"), or are otherwise restricted and, unless registered under the 1933 Act or exempted from registration, may only be sold to
qualified institutional investors or may have other restrictions on resale. At 8/31/2016, these securities amounted to approximately $42,681,000, or 2.6% of net assets for the Fund. These securities have been deemed by the investment manager to be liquid.
(d) Represents 7-day effective yield as of 8/31/2016.
(e) Includes the impact of the Fund's open positions in derivatives at 8/31/2016.
See Notes to Financial Statements
82
Schedule of Investments Equity Income Fund (cont'd)
Derivative Instruments
Written option contracts ("options written")
At August 31, 2016, the Fund had outstanding options written as follows:
Name of Issuer | | Contracts | | Exercise
Price | | Expiration Date | | Market Value
of Options | |
Ameren Corp., Call | | | 250 | | | $ | 55 | | | 12/16/2016 | | $ | (9,375 | ) | |
Anheuser-Busch Inbev NV ADR, Put | | | 200 | | | | 115 | | | 12/16/2016 | | | (56,000 | ) | |
Anheuser-Busch Inbev NV ADR, Put | | | 200 | | | | 115 | | | 1/20/2017 | | | (70,000 | ) | |
Anheuser-Busch Inbev NV ADR, Put | | | 200 | | | | 110 | | | 3/17/2017 | | | (62,000 | ) | |
Best Buy Co, Inc., Call | | | 250 | | | | 44 | | | 12/16/2016 | | | (15,875 | ) | |
Best Buy Co, Inc., Call | | | 250 | | | | 45 | | | 3/17/2017 | | | (30,125 | ) | |
Cisco Systems, Inc., Call | | | 400 | | | | 31 | | | 1/20/2017 | | | (62,800 | ) | |
Cisco Systems, Inc., Call | | | 400 | | | | 32 | | | 1/20/2017 | | | (42,800 | ) | |
Cisco Systems, Inc., Call | | | 400 | | | | 34 | | | 4/21/2017 | | | (30,800 | ) | |
ConAgra Foods, Inc., Call | | | 250 | | | | 46 | | | 9/16/2016 | | | (26,250 | ) | |
ConAgra Foods, Inc., Call | | | 248 | | | | 50 | | | 12/16/2016 | | | (14,880 | ) | |
DTE Energy Co., Call | | | 150 | | | | 100 | | | 1/20/2017 | | | (13,875 | ) | |
Edison International, Call | | | 300 | | | | 80 | | | 1/20/2017 | | | (19,500 | ) | |
Equinix, Inc., Call | | | 100 | | | | 360 | | | 9/16/2016 | | | (119,500 | ) | |
Equinix, Inc., Call | | | 200 | | | | 390 | | | 9/16/2016 | | | (9,500 | ) | |
International Paper Co., Call | | | 250 | | | | 48 | | | 1/20/2017 | | | (71,000 | ) | |
Johnson & Johnson, Call | | | 248 | | | | 140 | | | 6/16/2017 | | | (12,772 | ) | |
Linear Technology Corp., Call | | | 175 | | | | 52.5 | | | 1/20/2017 | | | (91,000 | ) | |
Linear Technology Corp., Call | | | 250 | | | | 55 | | | 2/17/2017 | | | (98,750 | ) | |
Lockheed Martin Corp., Call | | | 100 | | | | 260 | | | 1/20/2017 | | | (32,500 | ) | |
Microsoft Corp., Call | | | 250 | | | | 60 | | | 11/18/2016 | | | (24,125 | ) | |
Microsoft Corp., Call | | | 250 | | | | 62.5 | | | 1/20/2017 | | | (20,500 | ) | |
Microsoft Corp., Call | | | 250 | | | | 65 | | | 4/21/2017 | | | (26,000 | ) | |
NextEra Energy, Inc., Call | | | 200 | | | | 130 | | | 1/20/2017 | | | (31,500 | ) | |
Procter & Gamble Co., Call | | | 250 | | | | 95 | | | 4/21/2017 | | | (23,625 | ) | |
Prologis, Inc., Call | | | 250 | | | | 49 | | | 11/18/2016 | | | (126,250 | ) | |
Prologis, Inc., Call | | | 250 | | | | 55 | | | 2/17/2017 | | | (41,250 | ) | |
QUALCOMM, Inc., Call | | | 250 | | | | 70 | | | 3/17/2017 | | | (35,500 | ) | |
QUALCOMM, Inc., Call | | | 250 | | | | 72.5 | | | 4/21/2017 | | | (30,625 | ) | |
Simon Property Group, Inc., Call | | | 15 | | | | 240 | | | 1/20/2017 | | | (2,333 | ) | |
Texas Instruments, Inc., Call | | | 250 | | | | 65 | | | 10/21/2016 | | | (128,750 | ) | |
Texas Instruments, Inc., Call | | | 250 | | | | 67.5 | | | 1/20/2017 | | | (116,250 | ) | |
United Parcel Service, Inc., Call | | | 250 | | | | 115 | | | 1/20/2017 | | | (34,500 | ) | |
Total | | | | | | | | $ | (1,530,510 | ) | |
See Notes to Financial Statements
83
Schedule of Investments Equity Income Fund (cont'd)
At August 31, 2016, the Fund had deposited $830,000 in a segregated account to cover requirements on options written.
Options written for the Fund for the year ended August 31, 2016 were as follows:
| | Number of
Contracts | | Premium
Received | |
Outstanding 8/31/2015 | | | 7,886 | | | $ | 1,325,251 | | |
Options written | | | 28,120 | | | | 4,057,715 | | |
Options expired | | | (450 | ) | | | (49,674 | ) | |
Options exercised | | | (1,480 | ) | | | (288,910 | ) | |
Options closed | | | (26,290 | ) | | | (3,860,604 | ) | |
Outstanding 8/31/2016 | | | 7,786 | | | $ | 1,183,778 | | |
For the year ended August 31, 2016, the Fund had an average market value of $(1,676,842) in options written.
The following is a summary, categorized by Level (see Note A of Notes to Financial Statements), of inputs used to value the Fund's investments as of August 31, 2016:
Asset Valuation Inputs | |
(000's omitted) | | Level 1 | | Level 2 | | Level 3 | | Total | |
Investments: | |
Common Stocks(a) | | $ | 1,497,189 | | | $ | — | | | $ | — | | | $ | 1,497,189 | | |
Preferred Stocks(a) | | | 36,795 | | | | — | | | | — | | | | 36,795 | | |
Convertible Bonds(a) | | | — | | | | 89,735 | | | | — | | | | 89,735 | | |
Short-Term Investment | | | — | | | | 30,529 | | | | — | | | | 30,529 | | |
Total Investments | | $ | 1,533,984 | | | $ | 120,264 | | | $ | — | | | $ | 1,654,248 | | |
(a) The Schedule of Investments provides information on the industry categorization for the portfolio.
As of the year ended August 31, 2016, no securities were transferred from one level (as of August 31, 2015) to another.
The following is a summary, categorized by Level (see Note A of Notes to Financial Statements), of inputs used to value the Fund's derivatives as of August 31, 2016:
Other Financial Instruments | |
(000's omitted) | | Level 1 | | Level 2 | | Level 3 | | Total | |
Options written | |
Liabilities | | $ | (1,531 | ) | | $ | — | | | $ | — | | | $ | (1,531 | ) | |
Total | | $ | (1,531 | ) | | $ | — | | | $ | — | | | $ | (1,531 | ) | |
See Notes to Financial Statements
84
Schedule of Investments Focus Fund 8/31/16
| | |
Number
of Shares | |
Value
(000's) | |
Common Stocks (95.7%) | |
Auto Components (3.5%) | |
Johnson
Controls, Inc. | | | 575,000 | | | $ | 25,231 | | |
Banks (6.6%) | |
JPMorgan
Chase & Co. | | | 530,000 | | | | 35,775 | | |
PNC Financial
Services Group,
Inc. | | | 125,000 | | | | 11,262 | | |
| | | | 47,037 | | |
Capital Markets (2.8%) | |
Intercontinental
Exchange, Inc. | | | 72,000 | | | | 20,305 | | |
Chemicals (1.9%) | |
WR Grace & Co. | | | 172,000 | | | | 13,438 | | |
Communications Equipment (2.6%) | |
Motorola
Solutions, Inc. | | | 243,000 | | | | 18,709 | | |
Containers & Packaging (1.1%) | |
Silgan Holdings,
Inc. | | | 159,000 | | | | 7,651 | | |
Electronic Equipment, Instruments & Components (1.7%) | |
CDW Corp. | | | 272,000 | | | | 12,145 | | |
Food & Staples Retailing (3.4%) | |
US Foods
Holding Corp.* | | | 230,800 | | | | 5,597 | | |
Wal-Mart
Stores, Inc.(a) | | | 260,000 | | | | 18,574 | | |
| | | | 24,171 | | |
Food Products (2.6%) | |
Blue Buffalo Pet
Products, Inc.*(b) | | | 400,000 | | | | 10,312 | | |
Mondelez
International,
Inc. Class A | | | 180,000 | | | | 8,104 | | |
| | | | 18,416 | | |
Health Care Providers & Services (2.5%) | |
Centene Corp.* | | | 259,000 | | | | 17,687 | | |
Health Care Technology (2.7%) | |
IMS Health
Holdings, Inc.* | | | 645,000 | | | | 19,234 | | |
Household Durables (5.7%) | |
Newell Brands,
Inc.(b) | | | 257,000 | | | | 13,641 | | |
Whirlpool Corp. | | | 153,000 | | | | 27,332 | | |
| | | | 40,973 | | |
Household Products (3.6%) | |
Procter &
Gamble Co.(b) | | | 291,000 | | | | 25,407 | | |
| | |
Number
of Shares | |
Value
(000's) | |
Independent Power and Renewable Electricity Producers (2.2%) | |
Calpine Corp.* | | | 1,265,000 | | | $ | 15,787 | | |
Insurance (6.6%) | |
Chubb Ltd. | | | 115,000 | | | | 14,597 | | |
Willis Towers
Watson PLC | | | 261,000 | | | | 32,367 | | |
| | | | 46,964 | | |
Internet & Catalog Retail (2.2%) | |
Amazon.com,
Inc.*(b) | | | 7,000 | | | | 5,384 | | |
Liberty Interactive
Corp. QVC
Group Class A* | | | 500,000 | | | | 10,565 | | |
| | | | 15,949 | | |
Internet Software & Services (4.1%) | |
Alphabet, Inc.
Class A* | | | 19,000 | | | | 15,007 | | |
Alphabet, Inc.
Class C* | | | 19,000 | | | | 14,574 | | |
| | | | 29,581 | | |
IT Services (2.9%) | |
Leidos Holdings,
Inc. | | | 510,000 | | | | 20,660 | | |
Media (1.1%) | |
Comcast Corp.
Class A | | | 118,000 | | | | 7,701 | | |
Metals & Mining (0.5%) | |
Agnico-Eagle
Mines Ltd. | | | 70,000 | | | | 3,546 | | |
Oil, Gas & Consumable Fuels (7.8%) | |
Cabot Oil &
Gas Corp. | | | 830,000 | | | | 20,443 | | |
Concho
Resources, Inc.* | | | 38,000 | | | | 4,909 | | |
EOG Resources,
Inc. | | | 236,000 | | | | 20,884 | | |
Phillips 66 | | | 117,000 | | | | 9,179 | | |
| | | | 55,415 | | |
Pharmaceuticals (9.5%) | |
| Allergan PLC*(b) | | | 108,000 | | | | 25,330 | | |
Eli Lilly & Co. | | | 242,000 | | | | 18,816 | | |
Teva
Pharmaceutical
Industries
Ltd. ADR(b) | | | 477,000 | | | | 24,036 | | |
| | | | 68,182 | | |
Road & Rail (2.4%) | |
Avis Budget
Group, Inc.*(b) | | | 477,000 | | | | 17,234 | | |
Semiconductors & Semiconductor Equipment (2.0%) | |
NXP
Semiconductors
NV* | | | 160,000 | | | | 14,083 | | |
| | |
Number
of Shares | |
Value
(000's) | |
Software (6.6%) | |
Activision
Blizzard, Inc. | | | 353,000 | | | $ | 14,604 | | |
Oracle Corp. | | | 451,000 | | | | 18,590 | | |
Symantec Corp. | | | 565,000 | | | | 13,633 | | |
| | | | 46,827 | | |
Technology Hardware, Storage & Peripherals (2.0%) | |
Western Digital
Corp.(b) | | | 306,300 | | | | 14,295 | | |
Wireless Telecommunication
Services (5.1%) | |
T-Mobile US, Inc.* | | | 780,000 | | | | 36,145 | | |
Total Common Stocks
(Cost $605,123) | | | | | 682,773 | | |
| | | Number of
Contracts | | | |
Options Purchased (0.0%) | |
Technology Hardware, Storage & Peripherals (0.0%) | |
Western Digital
Corp. Call,
expiring
11/18/2016 @ 52.5 | | | 760 | | | | 93 | | |
Western Digital
Corp. Put,
expiring
10/21/2016 @ 37.5 | | | 700 | | | | 24 | | |
Total Options Purchased
(Cost $120) | | | | | 117 | | |
| | | Number
of Shares | | | |
Short-Term Investment (4.4%) | |
Investment Company (4.4%) | |
State Street
Institutional
U.S. Government
Money Market
Fund Premier
Class, 0.26%(a)(c)
(Cost $31,074) | | | 31,073,597 | | | | 31,074 | | |
Total Investments (100.1%)
(Cost $636,317) | | | | | 713,964 | | |
Other Assets Less
Liabilities [(0.1%)](d) | | | | | (587 | ) | |
Net Assets (100.0%) | | | | $ | 713,377 | | |
* Non-income producing security.
See Notes to Financial Statements
85
Schedule of Investments Focus Fund (cont'd)
(a) All or a portion of this security is segregated in connection for options written with a total value of approximately $49,648,000.
(b) All or a portion of the security is pledged as collateral for options written.
(c) Represents 7-day effective yield as of 8/31/2016.
(d) Includes the impact of the Fund's open positions in derivatives at 8/31/2016.
Derivative Instruments
Written option contracts ("options written")
At August 31, 2016, the Fund had outstanding options written as follows:
Name of Issuer | | Contracts | | Exercise
Price | | Expiration
Date | | Market Value
of Options | |
Allergan PLC, Put | | | 60 | | | $ | 225 | | | 9/16/2016 | | $ | (11,250 | ) | |
Amazon.com, Inc., Put | | | 30 | | | | 640 | | | 11/18/2016 | | | (17,700 | ) | |
Blue Buffalo Pet Products, Inc., Call | | | 300 | | | | 30 | | | 9/16/2016 | | | (0 | )(a)(b)(c) | |
Newell Brands, Inc., Call | | | 350 | | | | 55 | | | 12/16/2016 | | | (63,000 | ) | |
Procter & Gamble Co., Put | | | 250 | | | | 70 | | | 10/21/2016 | | | (3,000 | ) | |
Procter & Gamble Co., Put | | | 300 | | | | 70 | | | 1/20/2017 | | | (21,300 | ) | |
Teva Pharmaceutical Industries Ltd., Put | | | 250 | | | | 48 | | | 9/2/2016 | | | (1,875 | ) | |
Teva Pharmaceutical Industries Ltd., Put | | | 250 | | | | 50 | | | 9/2/2016 | | | (12,750 | ) | |
Western Digital Corp., Call | | | 500 | | | | 50 | | | 11/18/2016 | | | (96,500 | ) | |
Western Digital Corp., Put | | | 700 | | | | 42.5 | | | 10/21/2016 | | | (77,000 | ) | |
Total | | | | | | | | $ | (304,375 | ) | |
(a) Amount less than one dollar.
(b) Illiquid security.
(c) Security fair valued as of 8/31/2016 in accordance with procedures approved by the Fund's Board of Trustees.
Written option transactions for the Fund for the year ended August 31, 2016 were:
| | | Number of
Contracts | | Premium
Received | |
Outstanding 8/31/2015 | | | — | | | $ | — | | |
Options written | | | 6,300 | | | | 847,736 | | |
Options expired | | | (1,210 | ) | | | (104,114 | ) | |
Options exercised | | | (1,300 | ) | | | (123,099 | ) | |
Options closed | | | (800 | ) | | | (152,545 | ) | |
Outstanding 8/31/2016 | | | 2,990 | | | $ | 467,978 | | |
For the year ended August 31, 2016, the Fund had an average market value of $8,965 in purchased option contracts, and $(83,146) in options written, respectively.
See Notes to Financial Statements
86
Schedule of Investments Focus Fund (cont'd)
The following is a summary, categorized by Level (see Note A of Notes to Financial Statements), of inputs used to value the Fund's investments as of August 31, 2016:
Asset Valuation Inputs | |
(000's omitted) | | Level 1 | | Level 2 | | Level 3 | | Total | |
Investments: | |
Common Stocks(a) | | $ | 682,773 | | | $ | — | | | $ | — | | | $ | 682,773 | | |
Options Purchased(a) | | | 117 | | | | — | | | | — | | | | 117 | | |
Short-Term Investment | | | — | | | | 31,074 | | | | — | | | | 31,074 | | |
Total Investments | | $ | 682,890 | | | $ | 31,074 | | | $ | — | | | $ | 713,964 | | |
(a) The Schedule of Investments provides information on the industry categorization for the portfolio.
As of the year ended August 31, 2016, no securities were transferred from one level (as of August 31, 2015) to another.
The following is a summary, categorized by Level (see Note A of Notes to Financial Statements), of inputs used to value the Fund's derivatives as of August 31, 2016:
Other Financial Instruments | |
(000's omitted) | | Level 1 | | Level 2 | | Level 3(b) | | Total | |
Options written | |
Liabilities | | $ | (304 | ) | | $ | — | | | $ | (0 | )(d) | | $ | (304 | ) | |
Total | | $ | (304 | ) | | $ | — | | | $ | (0 | ) | | $ | (304 | ) | |
(b) The following is a reconciliation between the beginning and ending balances of investments in which unobservable inputs (Level 3) were used in determining value:
| | | Beginning
balance, as
of 9/1/2015 | | Accrued
discounts/
(premiums) | | Realized
gain/
(loss) | | Change
in unrealized
appreciation/
(depreciation) | | Purchases | | Sales | | Transfers
into
Level 3 | | Transfers
out of
Level 3 | | Balance,
as of
8/31/2016 | | Net change in
unrealized
appreciation/
(depreciation)
from
investments
still held as
of 8/31/2016 | |
(000's omitted)
Other Financial Instruments: | |
Options
written(c) | | $ | — | | | $ | — | | | $ | — | | | $ | 30 | | | $ | — | | | $ | (30 | ) | | $ | — | | | $ | — | | | $ | (0 | )(d) | | $ | 30 | | |
Total | | $ | — | | | $ | — | | | $ | — | | | $ | 30 | | | $ | — | | | $ | (30 | ) | | $ | — | | | $ | — | | | $ | (0 | ) | | $ | 30 | | |
(c) As of the year ended August 31, 2016, these investments did not have a material impact on the Fund's net assets and, therefore, disclosure of unobservable inputs used in formulating valuations is not presented.
(d) Amount less than one thousand.
See Notes to Financial Statements
87
Schedule of Investments Genesis Fund 8/31/16
| | |
Number
of Shares | |
Value
(000's) | |
Common Stocks (98.9%) | |
Aerospace & Defense (0.4%) | |
Astronics Corp.* | | | 1,050,865 | | | $ | 47,089 | | |
Air Freight & Logistics (0.7%) | |
Forward Air
Corp. | | | 1,503,668 | | | | 69,289 | | |
Airlines (0.5%) | |
Allegiant
Travel Co. | | | 380,803 | | | | 52,642 | | |
Auto Components (1.6%) | |
Drew Industries,
Inc. | | | 1,094,569 | | | | 111,482 | | |
Gentex Corp. | | | 3,011,298 | | | | 53,571 | | |
| | | | 165,053 | | |
Banks (9.5%) | |
Bank of Hawaii
Corp.(a) | | | 2,218,312 | | | | 159,807 | | |
Bank of the
Ozarks, Inc. | | | 2,594,800 | | | | 101,664 | | |
BankUnited, Inc. | | | 2,101,130 | | | | 67,551 | | |
BOK Financial
Corp. | | | 1,182,176 | | | | 81,653 | | |
Community
Bank System,
Inc. | | | 1,470,458 | | | | 69,773 | | |
Cullen/Frost
Bankers, Inc. | | | 1,573,925 | | | | 114,739 | | |
CVB Financial
Corp.(a) | | | 5,731,072 | | | | 101,956 | | |
First Financial
Bankshares, Inc. | | | 3,045,047 | | | | 111,510 | | |
FNB Corp. | | | 6,169,246 | | | | 77,054 | | |
LegacyTexas
Financial
Group, Inc. | | | 1,878,818 | | | | 56,985 | | |
PacWest
Bancorp | | | 1,459,251 | | | | 63,200 | | |
| | | | 1,005,892 | | |
Beverages (0.4%) | |
Boston Beer
Co., Inc.
Class A* | | | 238,819 | | | | 43,620 | | |
Building Products (1.6%) | |
AAON, Inc. | | | 2,479,610 | | | | 70,173 | | |
Advanced
Drainage
Systems, Inc. | | | 236,224 | | | | 5,464 | | |
AO Smith
Corp. | | | 984,548 | | | | 94,989 | | |
| | | | 170,626 | | |
Capital Markets (2.5%) | |
Artisan Partners
Asset
Management,
Inc. Class A | | | 1,079,178 | | | | 28,221 | | |
| | |
Number
of Shares | |
Value
(000's) | |
FactSet Research
Systems, Inc. | | | 521,100 | | | $ | 92,771 | | |
MarketAxess
Holdings, Inc. | | | 806,051 | | | | 135,852 | | |
OM Asset
Management
PLC | | | 536,600 | | | | 7,244 | | |
| | | | 264,088 | | |
Chemicals (4.1%) | |
Balchem Corp. | | | 1,424,309 | | | | 99,744 | | |
NewMarket
Corp. | | | 71,412 | | | | 30,989 | | |
Quaker
Chemical Corp. | | | 338,860 | | | | 33,886 | | |
RPM
International,
Inc. | | | 1,101,044 | | | | 60,040 | | |
Sensient
Technologies
Corp.(a) | | | 2,824,245 | | | | 206,820 | | |
| | | | 431,479 | | |
Commercial Services & Supplies (4.0%) | |
G&K Services,
Inc. Class A | | | 531,800 | | | | 51,760 | | |
Healthcare
Services Group,
Inc. | | | 3,132,281 | | | | 126,450 | | |
Ritchie Bros.
Auctioneers,
Inc. | | | 1,458,900 | | | | 50,814 | | |
Rollins, Inc. | | | 5,224,930 | | | | 148,911 | | |
UniFirst Corp. | | | 389,550 | | | | 50,014 | | |
| | | | 427,949 | | |
Communications Equipment (1.0%) | |
NetScout
Systems, Inc.* | | | 3,690,384 | | | | 109,162 | | |
Construction & Engineering (0.8%) | |
Valmont
Industries, Inc. | | | 678,704 | | | | 88,550 | | |
Construction Materials (0.9%) | |
Eagle Materials,
Inc. | | | 1,181,800 | | | | 94,981 | | |
Containers & Packaging (2.3%) | |
AptarGroup, Inc. | | | 2,526,300 | | | | 197,001 | | |
Silgan Holdings,
Inc. | | | 1,027,583 | | | | 49,447 | | |
| | | | 246,448 | | |
Distributors (2.0%) | |
Pool Corp. | | | 2,053,498 | | | | 207,136 | | |
Electrical Equipment (0.4%) | |
AZZ, Inc. | | | 454,900 | | | | 30,219 | | |
Thermon Group
Holdings, Inc.* | | | 686,731 | | | | 12,931 | | |
| | | | 43,150 | | |
| | |
Number
of Shares | |
Value
(000's) | |
Electronic Equipment, Instruments & Components (3.9%) | |
Badger Meter,
Inc. | | | 168,770 | | | $ | 11,137 | | |
Cognex Corp. | | | 1,444,554 | | | | 71,881 | | |
FEI Co. | | | 327,542 | | | | 34,873 | | |
Littelfuse, Inc. | | | 1,115,311 | | | | 141,422 | | |
| Rogers Corp.*(a) | | | 1,149,551 | | | | 64,271 | | |
Zebra
Technologies
Corp. Class A* | | | 1,345,624 | | | | 94,140 | | |
| | | | 417,724 | | |
Energy Equipment & Services (1.0%) | |
Dril-Quip, Inc.* | | | 265,400 | | | | 14,748 | | |
Natural Gas
Services
Group, Inc.* | | | 500,800 | | | | 11,839 | | |
Oceaneering
International,
Inc. | | | 957,728 | | | | 25,399 | | |
Pason Systems,
Inc.(b) | | | 3,679,657 | | | | 52,470 | | |
| | | | 104,456 | | |
Food & Staples Retailing (0.2%) | |
North West Co.,
Inc.(b) | | | 877,400 | | | | 19,617 | | |
Food Products (3.4%) | |
B&G Foods, Inc. | | | 381,500 | | | | 18,114 | | |
Blue Buffalo Pet
Products, Inc.* | | | 1,581,688 | | | | 40,776 | | |
Cal-Maine Foods,
Inc. | | | 1,218,800 | | | | 55,992 | | |
Calavo Growers,
Inc. | | | 613,702 | | | | 36,178 | | |
Flowers Foods,
Inc. | | | 2,161,700 | | | | 32,231 | | |
J & J Snack
Foods Corp. | | | 749,846 | | | | 91,481 | | |
Lancaster
Colony Corp. | | | 624,356 | | | | 83,994 | | |
| | | | 358,766 | | |
Health Care Equipment & Supplies (8.1%) | |
| Abaxis, Inc.(a) | | | 1,161,900 | | | | 58,258 | | |
Atrion Corp. | | | 43,399 | | | | 19,612 | | |
Cantel Medical
Corp. | | | 806,903 | | | | 61,010 | | |
Dentsply Sirona,
Inc. | | | 2,336,018 | | | | 143,572 | | |
Haemonetics
Corp.* | | | 1,235,038 | | | | 45,894 | | |
IDEXX
Laboratories,
Inc.* | | | 1,596,324 | | | | 179,874 | | |
Natus Medical,
Inc.* | | | 1,159,713 | | | | 45,124 | | |
Neogen Corp.* | | | 379,200 | | | | 22,395 | | |
See Notes to Financial Statements
88
Schedule of Investments Genesis Fund (cont'd)
| | |
Number
of Shares | |
Value
(000's) | |
Vascular
Solutions, Inc.* | | | 701,800 | | | $ | 33,806 | | |
West
Pharmaceutical
Services, Inc. | | | 3,073,258 | | | | 251,485 | | |
| | | | 861,030 | | |
Health Care Providers & Services (3.7%) | |
Amsurg Corp.* | | | 733,950 | | | | 47,648 | | |
Chemed Corp. | | | 636,000 | | | | 85,815 | | |
Henry Schein,
Inc.* | | | 885,940 | | | | 145,108 | | |
Surgery
Partners, Inc.* | | | 1,021,700 | | | | 19,678 | | |
Surgical Care
Affiliates, Inc.* | | | 964,961 | | | | 39,805 | | |
U.S. Physical
Therapy, Inc.(a) | | | 791,800 | | | | 49,923 | | |
| | | | 387,977 | | |
Hotels, Restaurants & Leisure (3.5%) | |
Brinker
International,
Inc. | | | 1,687,100 | | | | 90,614 | | |
Cheesecake
Factory, Inc. | | | 1,045,900 | | | | 53,770 | | |
Cracker Barrel
Old Country
Store, Inc. | | | 527,527 | | | | 80,242 | | |
Papa John's
International,
Inc. | | | 908,745 | | | | 68,001 | | |
Texas
Roadhouse, Inc. | | | 1,825,300 | | | | 80,806 | | |
| | | | 373,433 | | |
Household Products (3.0%) | |
Church &
Dwight Co., Inc. | | | 2,321,356 | | | | 230,789 | | |
Energizer
Holdings, Inc. | | | 1,207,300 | | | | 59,665 | | |
WD-40 Co. | | | 229,200 | | | | 27,126 | | |
| | | | 317,580 | | |
Industrial Conglomerates (0.3%) | |
Raven
Industries, Inc. | | | 1,421,952 | | | | 34,895 | | |
Insurance (1.6%) | |
AMERISAFE, Inc. | | | 519,700 | | | | 31,187 | | |
RLI Corp. | | | 1,817,814 | | | | 129,029 | | |
Safety Insurance
Group, Inc. | | | 200,949 | | | | 13,353 | | |
| | | | 173,569 | | |
Internet Software & Services (0.1%) | |
NIC, Inc. | | | 648,800 | | | | 14,909 | | |
IT Services (1.1%) | |
Jack Henry &
Associates, Inc. | | | 1,316,503 | | | | 114,891 | | |
| | |
Number
of Shares | |
Value
(000's) | |
Leisure Products (0.7%) | |
Polaris
Industries, Inc. | | | 874,020 | | | $ | 75,725 | | |
Life Sciences Tools & Services (3.7%) | |
Bio-Techne Corp. | | | 1,144,700 | | | | 120,594 | | |
ICON PLC* | | | 2,696,800 | | | | 207,088 | | |
PAREXEL
International
Corp.* | | | 1,025,755 | | | | 69,782 | | |
| | | | 397,464 | | |
Machinery (9.4%) | |
CLARCOR, Inc. | | | 1,512,188 | | | | 99,003 | | |
Donaldson Co.,
Inc. | | | 1,206,300 | | | | 45,297 | | |
Franklin Electric
Co., Inc. | | | 1,319,372 | | | | 50,466 | | |
Graco, Inc. | | | 714,217 | | | | 52,616 | | |
| Lindsay Corp.(a) | | | 668,350 | | | | 48,094 | | |
Middleby Corp.* | | | 986,618 | | | | 126,435 | | |
Nordson Corp. | | | 1,172,408 | | | | 115,752 | | |
RBC Bearings,
Inc.*(a) | | | 1,347,240 | | | | 106,553 | | |
| Tennant Co.(a) | | | 963,802 | | | | 62,387 | | |
Toro Co. | | | 1,449,888 | | | | 140,857 | | |
Wabtec Corp. | | | 1,924,300 | | | | 147,421 | | |
| | | | 994,881 | | |
Marine (0.3%) | |
Kirby Corp.* | | | 556,500 | | | | 28,994 | | |
Media (1.4%) | |
Gray Television,
Inc.*(a) | | | 4,097,350 | | | | 46,013 | | |
Nexstar
Broadcasting
Group, Inc.
Class A(a) | | | 2,019,021 | | | | 106,443 | | |
| | | | 152,456 | | |
Metals & Mining (0.6%) | |
Compass
Minerals
International,
Inc. | | | 863,073 | | | | 64,325 | | |
Oil, Gas & Consumable Fuels (1.0%) | |
Diamondback
Energy, Inc.* | | | 300,401 | | | | 28,613 | | |
Gulfport Energy
Corp.* | | | 958,871 | | | | 27,424 | | |
Matador
Resources Co.* | | | 819,700 | | | | 18,812 | | |
RSP Permian,
Inc.* | | | 877,100 | | | | 34,251 | | |
| | | | 109,100 | | |
Paper & Forest Products (0.9%) | |
Stella-Jones,
Inc.(b) | | | 2,928,200 | | | | 99,274 | | |
| | |
Number
of Shares | |
Value
(000's) | |
Pharmaceuticals (0.4%) | |
Prestige Brands
Holdings, Inc.* | | | 975,900 | | | $ | 46,970 | | |
Professional Services (0.9%) | |
| Exponent, Inc.(a) | | | 1,968,670 | | | | 99,280 | | |
Semiconductors & Semiconductor Equipment (1.6%) | |
MKS
Instruments, Inc. | | | 1,007,200 | | | | 49,091 | | |
Power
Integrations,
Inc.(a) | | | 2,073,300 | | | | 121,081 | | |
| | | | 170,172 | | |
Software (10.0%) | |
Aspen
Technology,
Inc.* | | | 2,142,000 | | | | 97,375 | | |
Computer
Modelling
Group Ltd.(a)(b) | | | 4,651,700 | | | | 33,095 | | |
Constellation
Software, Inc. | | | 339,342 | | | | 147,261 | | |
Descartes
Systems
Group, Inc.* | | | 2,315,850 | | | | 49,443 | | |
Enghouse
Systems Ltd.(b) | | | 1,073,400 | | | | 45,616 | | |
Fair Isaac Corp. | | | 1,174,358 | | | | 150,247 | | |
Manhattan
Associates, Inc.* | | | 2,710,228 | | | | 164,023 | | |
Monotype
Imaging
Holdings, Inc.(a) | | | 3,058,306 | | | | 64,530 | | |
Nice Ltd. ADR | | | 751,141 | | | | 51,401 | | |
Progress
Software
Corp.* | | | 1,480,800 | | | | 42,958 | | |
Qualys, Inc.* | | | 765,800 | | | | 26,343 | | |
Tyler
Technologies,
Inc.* | | | 1,182,132 | | | | 193,811 | | |
| | | | 1,066,103 | | |
Specialty Retail (3.2%) | |
Asbury
Automotive
Group, Inc.* | | | 558,200 | | | | 29,986 | | |
Hibbett Sports,
Inc.*(a) | | | 1,132,969 | | | | 43,472 | | |
Lithia Motors,
Inc. Class A | | | 823,500 | | | | 68,161 | | |
Monro Muffler
Brake, Inc. | | | 738,000 | | | | 41,631 | | |
Sally Beauty
Holdings, Inc.* | | | 2,298,993 | | | | 62,579 | | |
Tractor Supply
Co. | | | 1,154,182 | | | | 96,893 | | |
| | | | 342,722 | | |
See Notes to Financial Statements
89
Schedule of Investments Genesis Fund (cont'd)
| | |
Number
of Shares | |
Value
(000's) | |
Technology Hardware, Storage & Peripherals (0.8%) | |
Electronics For
Imaging, Inc.* | | | 1,801,500 | | | $ | 84,815 | | |
Trading Companies & Distributors (1.4%) | |
Applied
Industrial
Technologies,
Inc. | | | 781,944 | | | | 37,158 | | |
Watsco, Inc. | | | 754,604 | | | | 111,576 | | |
| | | | 148,734 | | |
Total Common Stocks
(Cost $5,584,556) | | | | | 10,527,016 | | |
Short-Term Investments (1.1%) | |
Investment Companies (1.1%) | |
State Street
Institutional
Treasury
Money Market
Fund Premier
Class, 0.19%(c) | | | 56,753,277 | | | | 56,753 | | |
| | |
Number
of Shares | |
Value
(000's) | |
State Street
Institutional
Treasury Plus
Fund Premier
Class, 0.20%(c) | | | 61,446,672 | | | $ | 61,447 | | |
Total Short-Term Investments
(Cost $118,200) | | | | | 118,200 | | |
Total Investments (100.0%)
(Cost $5,702,756) | | | | | 10,645,216 | | |
Other Assets Less
Liabilities [(0.0%)] | | | | | (968 | ) | |
Net Assets (100.0%) | | | | $ | 10,644,248 | | |
* Non-income producing security.
(a) Affiliated issuer (see Note F of Notes to Financial Statements).
(b) Security fair valued as of 8/31/2016 in accordance with
procedures approved by the Board of Trustees. Total value of all such securities at 8/31/2016, amounted to approximately $250,072,000, which represents approximately 2.3% of net assets.
(c) Represents 7-day effective yield as of 8/31/2016.
The following is a summary, categorized by Level (see Note A of Notes to Financial Statements), of inputs used to value the Fund's investments as of August 31, 2016:
Asset Valuation Inputs | |
(000's omitted) | | Level 1 | | Level 2 | | Level 3 | | Total | |
Investments: | |
Common Stocks | |
Energy Equipment & Services | | $ | 51,986 | | | $ | 52,470 | | | $ | — | | | $ | 104,456 | | |
Food & Staples Retailing | | | — | | | | 19,617 | | | | — | | | | 19,617 | | |
Paper & Forest Products | | | — | | | | 99,274 | | | | — | | | | 99,274 | | |
Software | | | 987,392 | | | | 78,711 | | | | — | | | | 1,066,103 | | |
| Other Common Stocks(a) | | | 9,237,566 | | | | — | | | | — | | | | 9,237,566 | | |
Total Common Stocks | | | 10,276,944 | | | | 250,072 | | | | | | 10,527,016 | | |
Short-Term Investments | | | — | | | | 118,200 | | | | — | | | | 118,200 | | |
Total Investments | | $ | 10,276,944 | | | $ | 368,272 | | | $ | — | | | $ | 10,645,216 | | |
(a) The Schedule of Investments provides information on the industry categorization for the portfolio.
As of the year ended August 31, 2016, certain securities were transferred from one level (as of August 31, 2015) to another. Based on beginning of period market values as of September 1, 2015, $165,458,000 was transferred from Level 1 to Level 2. Interactive provided adjusted prices for these securities as of August 31, 2016, as stated in the description of the valuation methods of foreign equity securities in footnote 2 of the Notes to Financial Statements.
See Notes to Financial Statements
90
Schedule of Investments Global Equity Fund 8/31/16
| | |
Number
of Shares | |
Value
(000's) | |
Common Stocks (100.2%) | |
Australia (1.5%) | |
Insurance Australia
Group Ltd. | | | 15,400 | | | $ | 64 | | |
Canada (6.1%) | |
Alimentation
Couche-Tard, Inc.
Class B | | | 1,805 | | | | 93 | | |
Home Capital
Group, Inc. | | | 850 | | | | 19 | | |
Kinaxis, Inc.* | | | 710 | | | | 34 | | |
Suncor Energy, Inc. | | | 1,001 | | | | 27 | | |
Waste
Connections, Inc. | | | 1,170 | | | | 89 | | |
| | | | 262 | | |
China (3.6%) | |
Alibaba Group
Holding Ltd.
ADR* | | | 635 | | | | 62 | | |
Baidu, Inc. ADR* | | | 315 | | | | 54 | | |
Haier Electronics
Group Co. Ltd. | | | 21,800 | | | | 36 | | |
| | | | 152 | | |
France (5.5%) | |
Air Liquide SA | | | 375 | | | | 41 | | |
BNP Paribas SA | | | 700 | | | | 36 | | |
Sodexo SA | | | 570 | | | | 66 | | |
Valeo SA | | | 860 | | | | 45 | | |
Virbac SA* | | | 235 | | | | 48 | | |
| | | | 236 | | |
Germany (2.8%) | |
Continental AG | | | 260 | | | | 54 | | |
Henkel AG & Co.
KGaA, Preference
Shares | | | 500 | | | | 66 | | |
| | | | 120 | | |
Israel (3.7%) | |
Bezeq Israeli
Telecommunication
Corp. Ltd. | | | 27,145 | | | | 54 | | |
Check Point
Software
Technologies Ltd.* | | | 725 | | | | 56 | | |
Teva
Pharmaceutical
Industries Ltd.
ADR | | | 970 | | | | 49 | | |
| | | | 159 | | |
Japan (3.4%) | |
Daikin Industries
Ltd. | | | 550 | | | | 51 | | |
Sundrug Co. Ltd. | | | 450 | | | | 33 | | |
| | |
Number
of Shares | |
Value
(000's) | |
TOYOTA MOTOR
Corp. | | | 1,050 | | | $ | 63 | | |
| | | | 147 | | |
Netherlands (4.8%) | |
AerCap Holdings
NV* | | | 1,330 | | | | 53 | | |
| ASML Holding NV | | | 745 | | | | 79 | | |
| Intertrust NV*(a) | | | 1,015 | | | | 23 | | |
NXP
Semiconductors
NV* | | | 585 | | | | 52 | | |
| | | | 207 | | |
Spain (0.7%) | |
Banco Bilbao
Vizcaya
Argentaria SA | | | 4,900 | | | | 31 | | |
Switzerland (8.9%) | |
Cie Financiere
Richemont SA | | | 640 | | | | 37 | | |
Givaudan SA | | | 36 | | | | 74 | | |
Julius Baer Group
Ltd.* | | | 1,310 | | | | 55 | | |
Roche Holding AG | | | 241 | | | | 59 | | |
SGS SA | | | 26 | | | | 57 | | |
Sonova Holding
AG | | | 340 | | | | 47 | | |
TE Connectivity
Ltd. | | | 835 | | | | 53 | | |
| | | | 382 | | |
United Kingdom (11.2%) | |
Aon PLC | | | 575 | | | | 64 | | |
Barclays PLC | | | 14,589 | | | | 33 | | |
Howden Joinery
Group PLC | | | 9,705 | | | | 58 | | |
Lloyds Banking
Group PLC | | | 28,544 | | | | 22 | | |
Prudential PLC | | | 3,130 | | | | 56 | | |
Spectris PLC | | | 1,665 | | | | 42 | | |
St. James's Place
PLC | | | 4,240 | | | | 55 | | |
TalkTalk Telecom
Group PLC | | | 12,920 | | | | 36 | | |
Travis Perkins PLC | | | 2,439 | | | | 53 | | |
Virgin Money
Holdings UK PLC | | | 6,909 | | | | 29 | | |
Worldpay Group
PLC(a) | | | 7,875 | | | | 31 | | |
| | | | 479 | | |
United States (48.0%) | |
Activision Blizzard,
Inc. | | | 1,255 | | | | 52 | | |
Alphabet, Inc.
Class A* | | | 45 | | | | 36 | | |
| | |
Number
of Shares | |
Value
(000's) | |
Alphabet, Inc.
Class C* | | | 45 | | | $ | 35 | | |
Amazon.com,
Inc.* | | | 103 | | | | 79 | | |
Apple, Inc. | | | 748 | | | | 79 | | |
Biogen, Inc.* | | | 100 | | | | 31 | | |
BlackRock, Inc. | | | 150 | | | | 56 | | |
Blue Buffalo Pet
Products, Inc.* | | | 1,675 | | | | 43 | | |
Cabot Oil & Gas
Corp. | | | 1,290 | | | | 32 | | |
Cardinal Health,
Inc. | | | 940 | | | | 75 | | |
CDW Corp. | | | 1,105 | | | | 49 | | |
Centene Corp.* | | | 610 | | | | 42 | | |
CVS Health Corp. | | | 720 | | | | 67 | | |
EOG Resources,
Inc. | | | 519 | | | | 46 | | |
Estee Lauder Cos.,
Inc. Class A | | | 530 | | | | 47 | | |
Fidelity National
Information
Services, Inc. | | | 815 | | | | 65 | | |
First Republic Bank | | | 770 | | | | 59 | | |
Gilead Sciences,
Inc. | | | 415 | | | | 33 | | |
Graco, Inc. | | | 725 | | | | 53 | | |
Henry Schein,
Inc.* | | | 460 | | | | 75 | | |
Intercontinental
Exchange, Inc. | | | 220 | | | | 62 | | |
JPMorgan
Chase & Co. | | | 1,085 | | | | 73 | | |
Medtronic PLC | | | 682 | | | | 59 | | |
Milacron Holdings
Corp.* | | | 2,515 | | | | 43 | | |
Mobileye NV* | | | 1,055 | | | | 52 | | |
Monsanto Co. | | | 385 | | | | 41 | | |
Nielsen Holdings
PLC | | | 1,330 | | | | 71 | | |
Nordstrom, Inc. | | | 555 | | | | 28 | | |
Pioneer Natural
Resources Co. | | | 275 | | | | 49 | | |
Range Resources
Corp. | | | 860 | | | | 33 | | |
RPM International,
Inc. | | | 1,030 | | | | 56 | | |
Samsonite
International SA | | | 9,950 | | | | 31 | | |
Schlumberger Ltd. | | | 500 | | | | 40 | | |
Sealed Air Corp. | | | 1,360 | | | | 64 | | |
Sensata
Technologies
Holding NV* | | | 1,400 | | | | 53 | | |
Service Corp.
International | | | 1,055 | | | | 28 | | |
T-Mobile US, Inc.* | | | 1,070 | | | | 50 | | |
VF Corp. | | | 830 | | | | 52 | | |
See Notes to Financial Statements
91
Schedule of Investments Global Equity Fund (cont'd)
| | |
Number
of Shares | |
Value
(000's) | |
Visa, Inc. Class A | | | 660 | | | $ | 53 | | |
Wabtec Corp. | | | 525 | | | | 40 | | |
Western Digital
Corp. | | | 575 | | | | 27 | | |
| | | | 2,059 | | |
Total Common Stocks
(Cost $4,019) | | | | | 4,298 | | |
Short-Term Investment (0.0%) | |
Investment Company (0.0%) | |
State Street
Institutional
Treasury Money
Market Fund
Premier Class,
0.19%(b)(c)
(Cost $0)(c) | | | 1 | | | | 0 | | |
Total Investments (100.2%)
(Cost $4,019) | | | | | 4,298 | | |
Other Assets Less
Liabilities [(0.2%)] | | | | | (8 | ) | |
Net Assets (100.0%) | | | | $ | 4,290 | | |
* Non-income producing security.
(a) Securities were purchased under Rule 144A of the 1933 Act, as amended (the "1933 Act"), or are otherwise restricted and, unless registered under the 1933 Act or exempted from registration, may only be sold to qualified institutional investors or may have other restictions on resale. At 8/31/2016, these securities amounted to approximately $54,000, or 1.3% of net assets for the Fund. These securities have been deemed by the investment manager to be liquid.
(b) Represents 7-day effective yield as of 8/31/2016.
(c) Amount less than one thousand.
See Notes to Financial Statements
92
POSITIONS BY INDUSTRY GLOBAL EQUITY FUND
Industry | | Investments at
Value
(000's omitted) | | Percentage of
Net Assets | |
Banks | | $ | 283 | | | | 6.6 | % | |
Insurance | | | 239 | | | | 5.6 | % | |
Chemicals | | | 212 | | | | 4.9 | % | |
Capital Markets | | | 196 | | | | 4.6 | % | |
Software | | | 194 | | | | 4.5 | % | |
Food & Staples Retailing | | | 193 | | | | 4.5 | % | |
Health Care Providers & Services | | | 192 | | | | 4.5 | % | |
Internet Software & Services | | | 187 | | | | 4.4 | % | |
Oil, Gas & Consumable Fuels | | | 187 | | | | 4.4 | % | |
Trading Companies & Distributors | | | 164 | | | | 3.8 | % | |
Pharmaceuticals | | | 156 | | | | 3.6 | % | |
IT Services | | | 149 | | | | 3.5 | % | |
Electronic Equipment, Instruments & Components | | | 144 | | | | 3.4 | % | |
Machinery | | | 136 | | | | 3.2 | % | |
Semiconductors & Semiconductor Equipment | | | 131 | | | | 3.1 | % | |
Professional Services | | | 128 | | | | 3.0 | % | |
Textiles, Apparel & Luxury Goods | | | 120 | | | | 2.8 | % | |
Technology Hardware, Storage & Peripherals | | | 106 | | | | 2.5 | % | |
Health Care Equipment & Supplies | | | 106 | | | | 2.5 | % | |
Auto Components | | | 99 | | | | 2.3 | % | |
Diversified Telecommunication Services | | | 90 | | | | 2.1 | % | |
Commercial Services & Supplies | | | 89 | | | | 2.1 | % | |
Internet & Catalog Retail | | | 79 | | | | 1.8 | % | |
Hotels, Restaurants & Leisure | | | 66 | | | | 1.5 | % | |
Household Products | | | 66 | | | | 1.5 | % | |
Biotechnology | | | 64 | | | | 1.5 | % | |
Containers & Packaging | | | 64 | | | | 1.5 | % | |
Automobiles | | | 63 | | | | 1.5 | % | |
Electrical Equipment | | | 53 | | | | 1.2 | % | |
Building Products | | | 51 | | | | 1.2 | % | |
Wireless Telecommunication Services | | | 50 | | | | 1.2 | % | |
Personal Products | | | 47 | | | | 1.1 | % | |
Food Products | | | 43 | | | | 1.0 | % | |
Energy Equipment & Services | | | 40 | | | | 0.9 | % | |
Household Durables | | | 36 | | | | 0.8 | % | |
Diversified Consumer Services | | | 28 | | | | 0.6 | % | |
Multiline Retail | | | 28 | | | | 0.6 | % | |
Thrifts & Mortgage Finance | | | 19 | | | | 0.4 | % | |
Short-Term Investment and Other Assets—Net | | | (8 | ) | | | (0.2 | )% | |
| | | $ | 4,290 | | | | 100.0 | % | |
See Notes to Financial Statements
93
Schedule of Investments Global Equity Fund (cont'd)
The following is a summary, categorized by Level (see Note A of Notes to Financial Statements), of inputs used to value the Fund's investments as of August 31, 2016:
Asset Valuation Inputs | |
(000's omitted) | | Level 1 | | Level 2 | | Level 3 | | Total | |
Investments: | |
Common Stocks(a) | | $ | 4,298 | | | $ | — | | | $ | — | | | $ | 4,298 | | |
Short-Term Investment | | | — | | | | 0 | (b) | | | — | | | | 0 | (b) | |
Total Investments | | $ | 4,298 | | | $ | 0 | (b) | | $ | — | | | $ | 4,298 | | |
(a) The Schedule of Investments provides a geographic categorization as well as a Positions by Industry summary.
(b) Amount less than one thousand.
As of the year ended August 31, 2016, certain securities were transferred from one level (as of August 31, 2015) to another. Based on beginning of period market values as of September 1, 2015, approximately $411,000, was transferred from Level 2 to Level 1 due to active market activity on recognized exchanges as of August 31, 2016. These securities had been categorized as Level 2 as of August 31, 2015, due to foreign exchanges having been closed and, therefore, no prices having been readily available for the securities as of that date.
See Notes to Financial Statements
94
Schedule of Investments Global Real Estate Fund 8/31/16
| | |
Number
of Shares | |
Value
(000's) | |
Common Stocks (100.2%) | |
Australia (6.9%) | |
Goodman Group | | | 8,400 | | | $ | 48 | | |
Investa Office Fund | | | 11,820 | | | | 40 | | |
Mirvac Group | | | 25,531 | | | | 44 | | |
Scentre Group | | | 22,108 | | | | 83 | | |
| | | | 215 | | |
Canada (3.1%) | |
Allied Properties
Real Estate
Investment Trust | | | 1,000 | | | | 28 | | |
Brookfield Asset
Management,
Inc. Class A | | | 1,083 | | | | 37 | | |
Canadian
Apartment
Properties REIT | | | 1,402 | | | | 32 | | |
| | | | 97 | | |
France (5.0%) | |
ICADE | | | 781 | | | | 60 | | |
Unibail-Rodamco
SE | | | 354 | | | | 97 | | |
| | | | 157 | | |
Germany (4.2%) | |
Deutsche
Wohnen AG | | | 2,092 | | | | 79 | | |
Vonovia SE | | | 1,346 | | | | 52 | | |
| | | | 131 | | |
Hong Kong (7.7%) | |
Henderson Land
Development Co.
Ltd. | | | 7,198 | | | | 42 | | |
Hongkong Land
Holdings Ltd. | | | 5,705 | | | | 37 | | |
Sun Hung Kai
Properties Ltd. | | | 8,344 | | | | 118 | | |
Wharf Holdings
Ltd. | | | 6,000 | | | | 42 | | |
| | | | 239 | | |
Japan (10.8%) | |
Industrial &
Infrastructure
Fund Investment
Corp. | | | 7 | | | | 35 | | |
Kenedix Retail
REIT Corp. | | | 13 | | | | 32 | | |
Mitsubishi Estate
Co. Ltd. | | | 3,537 | | | | 67 | | |
Mitsui Fudosan
Co. Ltd. | | | 3,458 | | | | 74 | | |
Mitsui Fudosan
Logistics Park,
Inc.* | | | 6 | | | | 17 | | |
| | |
Number
of Shares | |
Value
(000's) | |
Mori Hills REIT
Investment Corp. | | | 21 | | | $ | 32 | | |
Nippon Building
Fund, Inc. | | | 8 | | | | 49 | | |
Sumitomo Realty &
Development Co.
Ltd. | | | 1,123 | | | | 30 | | |
| | | | 336 | | |
Singapore (1.9%) | |
Ascendas Real
Estate Investment
Trust | | | 16,267 | | | | 29 | | |
CapitaLand Ltd. | | | 12,762 | | | | 29 | | |
| | | | 58 | | |
Sweden (1.7%) | |
Hufvudstaden AB,
A Shares | | | 3,032 | | | | 53 | | |
United Kingdom (4.9%) | |
Great Portland
Estates PLC | | | 3,117 | | | | 28 | | |
Land Securities
Group PLC | | | 2,257 | | | | 32 | | |
Safestore
Holdings PLC | | | 5,482 | | | | 27 | | |
Segro PLC | | | 5,101 | | | | 30 | | |
Shaftesbury PLC | | | 2,752 | | | | 35 | | |
| | | | 152 | | |
United States (54.0%) | |
American Homes
4 Rent Class A | | | 1,802 | | | | 39 | | |
Apartment
Investment &
Management Co.
Class A | | | 700 | | | | 32 | | |
AvalonBay
Communities, Inc. | | | 221 | | | | 39 | | |
Boston Properties,
Inc. | | | 514 | | | | 72 | | |
Colony Starwood
Homes | | | 759 | | | | 23 | | |
CoreSite Realty
Corp. | | | 321 | | | | 25 | | |
Crown Castle
International
Corp. | | | 459 | | | | 43 | | |
DCT Industrial
Trust, Inc. | | | 856 | | | | 42 | | |
Douglas Emmett,
Inc. | | | 687 | | | | 26 | | |
Duke Realty Corp. | | | 1,747 | | | | 49 | | |
DuPont Fabros
Technology, Inc. | | | 691 | | | | 29 | | |
EPR Properties | | | 390 | | | | 31 | | |
Equinix, Inc. | | | 160 | | | | 59 | | |
Equity
Commonwealth* | | | 834 | | | | 26 | | |
| | |
Number
of Shares | |
Value
(000's) | |
Equity Lifestyle
Properties, Inc. | | | 695 | | | $ | 54 | | |
Equity Residential | | | 1,175 | | | | 76 | | |
Essex Property
Trust, Inc. | | | 276 | | | | 63 | | |
Extra Space
Storage, Inc. | | | 293 | | | | 24 | | |
Federal Realty
Investment Trust | | | 374 | | | | 59 | | |
General Growth
Properties, Inc. | | | 1,369 | | | | 40 | | |
HCP, Inc. | | | 1,000 | | | | 39 | | |
Healthcare Trust
of America, Inc.
Class A | | | 970 | | | | 33 | | |
Kilroy Realty Corp. | | | 577 | | | | 42 | | |
Kimco Realty Corp. | | | 2,508 | | | | 75 | | |
Kite Realty Group
Trust | | | 1,324 | | | | 38 | | |
National Retail
Properties, Inc. | | | 1,329 | | | | 67 | | |
Public Storage | | | 286 | | | | 64 | | |
Simon Property
Group, Inc. | | | 713 | | | | 154 | | |
SL Green Realty
Corp. | | | 438 | | | | 52 | | |
Starwood
Hotels & Resorts
Worldwide, Inc. | | | 513 | | | | 40 | | |
Taubman Centers,
Inc. | | | 290 | | | | 22 | | |
Ventas, Inc. | | | 872 | | | | 63 | | |
Vornado Realty Trust | | | 580 | | | | 60 | | |
Welltower, Inc. | | | 655 | | | | 50 | | |
Weyerhaeuser Co. | | | 909 | | | | 29 | | |
| | | | 1,679 | | |
Total Common Stocks
(Cost $2,932) | | | | | 3,117 | | |
Short-Term Investment (1.6%) | |
Investment Company (1.6%) | |
State Street
Institutional
U.S. Government
Money Market
Fund Premier
Class, 0.26%(a)
(Cost $52) | | | 51,735 | | | | 52 | | |
Total Investments (101.8%)
(Cost $2,984) | | | | | 3,169 | | |
Other Assets Less
Liabilities [(1.8%)] | | | | | (57 | ) | |
Net Assets (100.0%) | | | | $ | 3,112 | | |
* Non-income producing security.
(a) Represents 7-day effective yield as of 8/31/2016.
See Notes to Financial Statements
95
POSITIONS BY SECTOR GLOBAL REAL ESTATE FUND
Sector | | Investments at
Value
(000's omitted) | | Percentage of
Net Assets | |
Industrial & Office REITs | | $ | 822 | | | | 26.4 | % | |
Retail REITs | | | 702 | | | | 22.6 | % | |
Real Estate Holding & Development | | | 660 | | | | 21.2 | % | |
Residential REITs | | | 402 | | | | 12.9 | % | |
Specialty REITs | | | 380 | | | | 12.2 | % | |
Diversified REITs | | | 111 | | | | 3.6 | % | |
Hotel & Lodging REITs | | | 40 | | | | 1.3 | % | |
Short-Term Investment and Other Assets-Net | | | (5 | ) | | | (0.2 | )% | |
| | | $ | 3,112 | | | | 100.0 | % | |
See Notes to Financial Statements
96
Schedule of Investments Global Real Estate Fund (cont'd)
The following is a summary, categorized by Level (see Note A of Notes to Financial Statements), of inputs used to value the Fund's investments as of August 31, 2016:
Asset Valuation Inputs | |
(000's omitted) | | Level 1 | | Level 2 | | Level 3 | | Total | |
Investments: | |
Common Stocks(a) | | $ | 3,117 | | | $ | — | | | $ | — | | | $ | 3,117 | | |
Short-Term Investment | | | — | | | | 52 | | | | — | | | | 52 | | |
Total Investments | | $ | 3,117 | | | $ | 52 | | | $ | — | | | $ | 3,169 | | |
(a) The Schedule of Investments provides a geographic categorization as well as a Positions by Sector summary.
As of the year ended August 31, 2016, certain securities were transferred from one level (as of August 31, 2015) to another. Based on beginning of period market values as of September 1, 2015, approximately $191,000, was transferred from Level 2 to Level 1 due to active market activity on recognized exchanges as of August 31, 2016. These securities had been categorized as Level 2 as of August 31, 2015, due to foreign exchanges having been closed and, therefore, no prices having been readily available for the securities as of that date.
See Notes to Financial Statements
97
Schedule of Investments Greater China Equity Fund 8/31/16
| | |
Number
of Shares | |
Value
(000's) | |
Common Stocks (81.5%) | |
Automobiles (3.4%) | |
Brilliance China
Automotive
Holdings Ltd. | | | 1,868,000 | | | $ | 2,136 | | |
Geely
Automobile
Holdings Ltd. | | | 640,000 | | | | 513 | | |
Great Wall
Motor Co. Ltd.,
H Shares | | | 643,500 | | | | 625 | | |
| | | | 3,274 | | |
Banks (13.9%) | |
Bank of China
Ltd., H Shares | | | 11,837,000 | | | | 5,325 | | |
China
Construction
Bank Corp.,
H Shares | | | 2,666,000 | | | | 1,993 | | |
Industrial &
Commercial
Bank of China
Ltd., H Shares | | | 9,418,911 | | | | 5,986 | | |
| | | | 13,304 | | |
Beverages (0.7%) | |
Kweichow
Moutai Co. Ltd.
Class A | | | 14,672 | | | | 681 | | |
Commercial Services & Supplies (3.1%) | |
China Everbright
International
Ltd. | | | 2,278,000 | | | | 2,913 | | |
Diversified Consumer Services (0.5%) | |
TAL Education
Group ADR* | | | 8,007 | | | | 479 | | |
Food Products (0.1%) | |
Inner Mongolia
Yili Industrial
Group Co. Ltd.
Class A | | | 28,000 | | | | 71 | | |
Inner Mongolia
Yili Industrial
Group Co. Ltd.
Class A | | | 13,422 | | | | 34 | | |
| | | | 105 | | |
Independent Power and Renewable Electricity Producers (2.7%) | |
China Power
International
Development
Ltd. | | | 4,107,000 | | | | 1,551 | | |
Huadian Fuxin
Energy Corp.
Ltd., H Shares | | | 3,942,000 | | | | 1,011 | | |
| | | | 2,562 | | |
| | |
Number
of Shares | |
Value
(000's) | |
Insurance (6.0%) | |
PICC Property &
Casualty Co.
Ltd., H Shares | | | 2,142,000 | | | $ | 3,540 | | |
Ping An
Insurance
Group Co. of
China Ltd.,
H Shares | | | 426,000 | | | | 2,205 | | |
| | | | 5,745 | | |
Internet & Catalog Retail (2.3%) | |
JD.com, Inc.
ADR* | | | 87,015 | | | | 2,211 | | |
Internet Software & Services (20.6%) | |
58.com, Inc.
ADR* | | | 14,200 | | | | 646 | | |
Alibaba Group
Holding Ltd.
ADR* | | | 75,184 | | | | 7,307 | | |
NetEase, Inc.
ADR | | | 11,103 | | | | 2,354 | | |
Tencent
Holdings Ltd. | | | 358,600 | | | | 9,328 | | |
| | | | 19,635 | | |
Machinery (0.8%) | |
Zhengzhou
Yutong Bus Co.
Ltd. Class A | | | 53,336 | | | | 173 | | |
Zhengzhou
Yutong Bus Co.
Ltd. Class A | | | 171,531 | | | | 555 | | |
| | | | 728 | | |
Pharmaceuticals (6.0%) | |
China Medical
System
Holdings Ltd. | | | 1,109,000 | | | | 1,859 | | |
CSPC
Pharmaceutical
Group Ltd. | | | 3,844,000 | | | | 3,731 | | |
Jiangsu Hengrui
Medicine Co.
Ltd. Class A | | | 27,760 | | | | 180 | | |
| | | | 5,770 | | |
Real Estate Management & Development (6.9%) | |
China Overseas
Land &
Investment Ltd. | | | 1,204,000 | | | | 3,981 | | |
Poly Real Estate
Group Co. Ltd.
Class A | | | 1,394,987 | | | | 2,045 | | |
Sunac China
Holdings Ltd. | | | 753,000 | | | | 523 | | |
| | | | 6,549 | | |
| | |
Number
of Shares | |
Value
(000's) | |
Transportation Infrastructure (4.0%) | |
Shanghai
International
Airport Co. Ltd.
Class A | | | 912,397 | | | $ | 3,791 | | |
Water Utilities (2.9%) | |
Beijing
Enterprises
Water Group
Ltd.* | | | 4,018,000 | | | | 2,802 | | |
Wireless Telecommunication Services (7.6%) | |
China Mobile
Ltd. | | | 588,000 | | | | 7,261 | | |
Total Common Stocks
(Cost $74,349) | | | | | 77,810 | | |
Participatory Notes (13.8%) | |
Beverages (1.7%) | |
Kweichow
Moutai Co. Ltd.,
Class A (issuer
HSBC Bank PLC),
Expiration
Date 8/17/2018 | | | 35,700 | | | | 1,658 | | |
Commercial Services & Supplies (1.8%) | |
Beijing
Originwater
Technology Co.
Ltd., Class A
(issuer Morgan
Stanley Asia
Products),
Expiration
Date 7/16/2018(a) | | | 294,486 | | | | 828 | | |
Beijing
Originwater
Technology Co.
Ltd., Class A
(issuer UBS AG),
Expiration
Date 4/27/2017 | | | 163,641 | | | | 460 | | |
Beijing
Originwater
Technology Co.
Ltd., Class A
(issuer HSBC
Bank PLC),
Expiration
Date 9/17/2024 | | | 37,200 | | | | 105 | | |
Beijing
Originwater
Technology Co.
Ltd., Class A
(issuer HSBC
Bank PLC),
Expiration
Date 3/15/2019 | | | 105,717 | | | | 298 | | |
| | | | 1,691 | | |
See Notes to Financial Statements
98
Schedule of Investments Greater China Equity Fund (cont'd)
| | |
Number
of Shares | |
Value
(000's) | |
Food Products (0.5%) | |
Inner Mongolia
Yili Industrial
Group Co. Ltd.,
Class A (issuer
Macquarie
Bank, Ltd.),
Expiration
Date 2/17/2017 | | | 174,450 | | | $ | 440 | | |
Health Care Providers & Services (0.8%) | |
Huadong
Medicine Co.
Ltd., Class A
(issuer UBS AG),
Expiration
Date 1/17/2017 | | | 35,602 | | | | 361 | | |
Huadong
Medicine Co.
Ltd., Class A
(issuer HSBC
Bank PLC),
Expiration
Date 6/26/2023 | | | 43,941 | | | | 445 | | |
| | | | 806 | | |
Household Durables (4.1%) | |
Midea Group
Co. Ltd.,
Class A (issuer
Credit Suisse
AG), Expiration
Date 6/29/2020(a) | | | 99,900 | | | | 410 | | |
Midea Group
Co. Ltd.,
Class A (issuer
BNP Paribas
Arbitrage),
Expiration
Date 12/21/2016(a) | | | 458,485 | | | | 1,882 | | |
Midea Group
Co. Ltd.,
Class A (issuer
Citigroup
Global Markets
Holdings, Inc.),
Expiration
Date 1/17/2017 | | | 70,423 | | | | 289 | | |
Midea Group
Co. Ltd.,
Class A (issuer
Goldman Sachs
International),
Expiration
Date 3/7/2017 | | | 78,985 | | | | 324 | | |
| | |
Number
of Shares | |
Value
(000's) | |
Midea Group
Co. Ltd.,
Class A (issuer
UBS AG),
Expiration
Date 1/17/2017 | | | 251,581 | | | $ | 1,032 | | |
| | | | 3,937 | | |
Internet Software & Services (2.4%) | |
Wangsu
Science &
Technology Co.
Ltd., Class A
(issuer Citigroup
Global Markets
Holdings, Inc.),
Expiration
Date 1/17/2017 | | | 220,224 | | | | 2,265 | | |
Machinery (2.2%) | |
Zhengzhou
Yutong Bus Co.
Ltd., Class A
(issuer BNP
Paribas
Arbitrage),
Expiration
Date 1/5/2017(a) | | | 461,858 | | | | 1,496 | | |
Zhengzhou
Yutong Bus Co.
Ltd., Class A
(issuer Morgan
Stanley Asia
Products),
Expiration
Date 10/27/2017(a) | | | 61,700 | | | | 200 | | |
Zhengzhou
Yutong Bus Co.
Ltd., Class A
(issuer UBS AG),
Expiration
Date 1/17/2017 | | | 110,006 | | | | 356 | | |
| | | | 2,052 | | |
Real Estate Management & Development (0.0%) | |
Poly Real Estate
Group Co. Ltd.,
Class A (issuer
Morgan Stanley
Asia Products),
Expiration
Date 7/16/2018(a) | | | 13,600 | | | | 20 | | |
| | |
Number
of Shares | |
Value
(000's) | |
Transportation Infrastructure (0.3%) | |
Shanghai
International
Airport Co. Ltd.,
Class A (issuer
Morgan Stanley
Asia Products),
Expiration
Date 7/16/2018(a) | | | 9,700 | | | $ | 40 | | |
Shanghai
International
Airport Co. Ltd.,
Class A (issuer
Macquarie Bank
Ltd.), Expiration
Date 10/30/2017 | | | 61,189 | | | | 255 | | |
| | | | 295 | | |
Total Participatory Notes
(Cost $11,221) | | | | | 13,164 | | |
Short-Term Investment (3.2%) | |
Investment Company (3.2%) | |
State Street
Institutional U.S.
Government
Money Market
Fund Premier
Class, 0.26%(b)
(Cost $3,057) | | | 3,057,399 | | | | 3,057 | | |
Total Investments (98.5%)
(Cost $88,627) | | | | | 94,031 | | |
Other Assets Less
Liabilities (1.5%) | | | | | 1,458 | | |
Net Assets (100.0%) | | | | $ | 95,489 | | |
* Non-income producing security.
(a) Securities were purchased under Rule 144A of the 1933 Act, as amended (the "1933 Act"), or are otherwise restricted and, unless registered under the 1933 Act or exempted from registration, may only be sold to qualified institutional investors or may have other restrictions on resale. At 8/31/2016, these securities amounted to approximately $4,876,000, or 5.1% of net assets for the Fund. These securities have been deemed by the investment manager to be liquid.
See Notes to Financial Statements
99
Schedule of Investments Greater China Equity Fund (cont'd)
(b) Represents 7-day effective yield as of 8/31/2016.
The following is a summary, categorized by Level (see Note A of Notes to Financial Statements), of inputs used to value the Fund's investments as of August 31, 2016:
Asset Valuation Inputs | |
(000's omitted) | | Level 1 | | Level 2 | | Level 3 | | Total | |
Investments: | |
Common Stocks(a) | | $ | 77,810 | | | $ | — | | | $ | — | | | $ | 77,810 | | |
Participatory Notes(a) | | | 13,164 | | | | — | | | | — | | | | 13,164 | | |
Short-Term Investment | | | — | | | | 3,057 | | | | — | | | | 3,057 | | |
Total Investments | | $ | 90,974 | | | $ | 3,057 | | | $ | — | | | $ | 94,031 | | |
(a) The Schedule of Investments provides information on the industry categorization for the portfolio.
As of the year ended August 31, 2016, no securities were transferred from one level (as of August 31, 2015) to another.
See Notes to Financial Statements
100
Schedule of Investments Guardian Fund 8/31/16
| | |
Number
of Shares | |
Value
(000's) | |
Common Stocks (96.9%) | |
Airlines (1.6%) | |
Delta Air Lines,
Inc.(a) | | | 488,750 | | | $ | 17,962 | | |
Banks (4.3%) | |
JPMorgan
Chase & Co. | | | 290,095 | | | | 19,581 | | |
U.S. Bancorp | | | 666,590 | | | | 29,430 | | |
| | | | 49,011 | | |
Beverages (3.5%) | |
Anheuser-Busch
InBev NV ADR | | | 140,000 | | | | 17,364 | | |
PepsiCo, Inc. | | | 207,000 | | | | 22,097 | | |
| | | | 39,461 | | |
Biotechnology (2.8%) | |
Celgene Corp.* | | | 241,870 | | | | 25,817 | | |
Gilead Sciences,
Inc. | | | 70,935 | | | | 5,560 | | |
| | | | 31,377 | | |
Capital Markets (5.6%) | |
| BlackRock, Inc.(a) | | | 38,500 | | | | 14,353 | | |
Brookfield Asset
Management,
Inc. Class A | | | 920,000 | | | | 30,995 | | |
CME Group, Inc. | | | 167,510 | | | | 18,150 | | |
| | | | 63,498 | | |
Chemicals (3.0%) | |
Ashland, Inc. | | | 207,000 | | | | 24,235 | | |
Sherwin-Williams
Co. | | | 35,000 | | | | 9,930 | | |
| | | | 34,165 | | |
Construction & Engineering (0.0%) | |
Brookfield
Business
Partners LP | | | 17,279 | | | | 399 | | |
Consumer Finance (1.6%) | |
Synchrony
Financial(a) | | | 656,865 | | | | 18,281 | | |
Diversified Telecommunication Services (4.1%) | |
Level 3
Communications,
Inc.* | | | 489,000 | | | | 24,269 | | |
SBA
Communications
Corp. Class A(a)* | | | 196,960 | | | | 22,483 | | |
| | | | 46,752 | | |
Electric Utilities (2.5%) | |
Brookfield
Infrastructure
Partners LP | | | 600,560 | | | | 28,791 | | |
| | |
Number
of Shares | |
Value
(000's) | |
Electronic Equipment, Instruments & Components (2.2%) | |
CDW Corp. | | | 549,000 | | | $ | 24,513 | | |
Energy Equipment & Services (2.5%) | |
Schlumberger
Ltd. | | | 358,470 | | | | 28,319 | | |
Food & Staples Retailing (6.7%) | |
Costco
Wholesale
Corp. | | | 110,100 | | | | 17,846 | | |
CVS Health
Corp.(b) | | | 324,000 | | | | 30,262 | | |
Whole Foods
Market, Inc.(a) | | | 925,000 | | | | 28,101 | | |
| | | | 76,209 | | |
Food Products (2.7%) | |
ConAgra Foods,
Inc.(a) | | | 658,000 | | | | 30,669 | | |
Health Care Equipment & Supplies (2.7%) | |
Dentsply Sirona,
Inc. | | | 494,875 | | | | 30,415 | | |
Health Care Providers & Services (4.5%) | |
DaVita
HealthCare
Partners, Inc.* | | | 470,000 | | | | 30,376 | | |
UnitedHealth
Group, Inc. | | | 152,000 | | | | 20,680 | | |
| | | | 51,056 | | |
Hotels, Restaurants & Leisure (2.5%) | |
McDonald's
Corp. | | | 153,500 | | | | 17,754 | | |
Starbucks
Corp.(a) | | | 186,355 | | | | 10,479 | | |
| | | | 28,233 | | |
Industrial Conglomerates (2.3%) | |
3M Co. | | | 147,215 | | | | 26,387 | | |
Internet & Catalog Retail (3.8%) | |
Amazon.com,
Inc.* | | | 27,200 | | | | 20,921 | | |
Priceline Group,
Inc.* | | | 15,180 | | | | 21,506 | | |
| | | | 42,427 | | |
Internet Software & Services (6.3%) | |
Alphabet, Inc.
Class A* | | | 48,850 | | | | 38,584 | | |
eBay, Inc.* | | | 1,023,980 | | | | 32,931 | | |
| | | | 71,515 | | |
IT Services (2.2%) | |
Alliance Data
Systems Corp.* | | | 20,000 | | | | 4,092 | | |
Visa, Inc. Class A | | | 260,395 | | | | 21,066 | | |
| | | | 25,158 | | |
| | |
Number
of Shares | |
Value
(000's) | |
Machinery (2.1%) | |
Allison
Transmission
Holdings, Inc. | | | 291,000 | | | $ | 8,072 | | |
Ingersoll-Rand
PLC | | | 227,000 | | | | 15,434 | | |
| | | | 23,506 | | |
Multi-Utilities (1.9%) | |
WEC Energy
Group, Inc. | | | 363,000 | | | | 21,736 | | |
Oil, Gas & Consumable Fuels (3.2%) | |
Cheniere Energy,
Inc.* | | | 87,075 | | | | 3,735 | | |
Enbridge, Inc. | | | 699,990 | | | | 27,643 | | |
Kinder Morgan,
Inc. | | | 202,000 | | | | 4,414 | | |
| | | | 35,792 | | |
Pharmaceuticals (0.9%) | |
Bristol-Myers
Squibb Co. | | | 172,875 | | | | 9,921 | | |
Professional Services (3.4%) | |
IHS Markit Ltd.* | | | 722,555 | | | | 26,966 | | |
Nielsen Holdings
PLC | | | 217,000 | | | | 11,562 | | |
| | | | 38,528 | | |
Real Estate Investment Trusts (1.0%) | |
Weyerhaeuser
Co.(a) | | | 341,015 | | | | 10,861 | | |
Road & Rail (0.3%) | |
Canadian Pacific
Railway Ltd. | | | 24,000 | | | | 3,675 | | |
Semiconductors & Semiconductor Equipment (1.1%) | |
Texas
Instruments, Inc. | | | 180,000 | | | | 12,517 | | |
Software (4.2%) | |
Adobe Systems,
Inc.* | | | 62,629 | | | | 6,408 | | |
Intuit, Inc. | | | 153,319 | | | | 17,087 | | |
Microsoft Corp. | | | 408,970 | | | | 23,499 | | |
| | | | 46,994 | | |
Specialty Retail (5.3%) | |
Home Depot, Inc. | | | 213,000 | | | | 28,568 | | |
TJX Cos., Inc. | | | 203,000 | | | | 15,720 | | |
Tractor Supply
Co.(a) | | | 193,000 | | | | 16,202 | | |
| | | | 60,490 | | |
Technology Hardware, Storage & Peripherals (2.9%) | |
Apple, Inc. | | | 311,300 | | | | 33,029 | | |
See Notes to Financial Statements
101
Schedule of Investments Guardian Fund (cont'd)
| | |
Number
of Shares | |
Value
(000's) | |
Textiles, Apparel & Luxury Goods (3.2%) | |
lululemon
athletica, Inc.(a)* | | | 80,000 | | | $ | 6,121 | | |
| PVH Corp.(a) | | | 275,215 | | | | 29,657 | | |
| | | | 35,778 | | |
Total Common Stocks
(Cost $978,691) | | | | | 1,097,425 | | |
Preferred Stock (0.8%) | |
Health Care (0.8%) | |
Moderna
Therapeutics
Ser. F(c)(f)
(Cost $8,700) | | | 990,888 | | | | 8,700 | | |
| | |
Number of
Contracts | |
Value
(000's) | |
Options Purchased (0.0%) | |
Food & Staples Retailing (0.0%) | |
Whole Foods
Market, Inc. Call
1/20/2017 @ 36 | | | 1,875 | | | $ | 139 | | |
Whole Foods
Market, Inc. Call
9/16/2016 @ 34 | | | 400 | | | | 2 | | |
| | | | 141 | | |
Textiles, Apparel & Luxury Goods (0.0%) | |
PVH Corp. Call
9/16/2016 @ 100 | | | 250 | | | | 186 | | |
Total Options Purchased
(Cost $556) | | | | | 327 | | |
| | |
Number
of Shares | |
Value
(000's) | |
Short-Term Investment (2.0%) | |
Investment Company (2.0%) | |
State Street
Institutional
Treasury Money
Market Fund
Premier Class,
0.19%(b)(d)
(Cost $23,134) | | | 23,134,023 | | | $ | 23,134 | | |
Total Investments (99.7%)
(Cost $1,011,081) | | | | | 1,129,586 | | |
Other Assets Less
Liabilities (0.3%)(e) | | | | | 3,046 | | |
Net Assets (100.0%) | | | | $ | 1,132,632 | | |
* Non-income producing security.
(a) All or a portion of the security is pledged as collateral for options written.
(b) All or a portion of this security is segregated in connection for options written with a total value of approximately $38,265,000.
(c) Security fair valued as of 8/31/2016 in accordance with procedures approved by the Board of Trustees. Total value of all such securities at 8/31/2016, amounted to approximately $8,700,000, which represents 0.8% of net assets of the Fund.
(d) Represents 7-day effective yield as of 8/31/2016.
(e) Includes the impact of the Fund's open positions in derivatives at 8/31/2016.
(f) Security has been deemed by the investment manager to be illiquid, and is subject to restrictions on resale. At 8/31/2016, this security amounted to approximately $8,700,000, which represents 0.8% of net assets.
(000's omitted)
Restricted Security | | Acquisition
Date | | Acquisition
Cost | | Acquisition
Cost
Percentage
of Net Assets | | Value as of
8/31/2016 | | Fair Value
Percentage
of Net Assets
as of
8/31/2016 | |
Moderna Therapeutics
(Series F Preferred Shares) | | 8/10/2016 | | $ | 8,700 | | | | 0.8 | % | | $ | 8,700 | | | | 0.8 | % | |
See Notes to Financial Statements
102
Schedule of Investments Guardian Fund (cont'd)
Derivative Instruments
Written option contracts ("options written")
At August 31, 2016, the Fund had outstanding options written as follows:
Name of Issuer | | Contracts | | Exercise
Price | | Expiration Date | | Market Value
of Options | |
BlackRock, Inc., Call | | | 38 | | | $ | 370 | | | 10/21/2016 | | $ | (45,600 | ) | |
Cheniere Energy, Inc., Call | | | 500 | | | | 45 | | | 12/16/2016 | | | (122,500 | ) | |
ConAgra Foods, Inc., Put | | | 400 | | | | 44 | | | 9/16/2016 | | | (7,000 | ) | |
Delta Airlines, Inc., Put | | | 345 | | | | 40 | | | 9/16/2016 | | | (118,163 | ) | |
Delta Airlines, Inc., Call | | | 345 | | | | 50 | | | 9/16/2016 | | | (1,035 | ) | |
JPMorgan Chase & Co., Call | | | 700 | | | | 67.5 | | | 9/16/2016 | | | (61,950 | ) | |
PVH Corp., Put | | | 250 | | | | 90 | | | 9/16/2016 | | | (0 | )(a)(b) | |
PVH Corp., Put | | | 500 | | | | 100 | | | 9/16/2016 | | | (16,250 | ) | |
SBA Communications Corp., Put | | | 84 | | | | 100 | | | 9/16/2016 | | | (1,260 | ) | |
SBA Communications Corp., Put | | | 220 | | | | 100 | | | 1/20/2017 | | | (39,600 | ) | |
Starbucks Corp., Put | | | 340 | | | | 52.5 | | | 10/21/2016 | | | (12,920 | ) | |
Starbucks Corp., Put | | | 500 | | | | 48.75 | | | 1/20/2017 | | | (44,250 | ) | |
Synchrony Financial, Put | | | 845 | | | | 24 | | | 12/16/2016 | | | (46,475 | ) | |
Tractor Supply Co., Put | | | 100 | | | | 80 | | | 9/16/2016 | | | (3,250 | ) | |
Weyerhaeuser Co., Call | | | 610 | | | | 34 | | | 10/21/2016 | | | (7,625 | ) | |
Whole Foods Market, Inc., Put | | | 800 | | | | 27 | | | 9/16/2016 | | | (4,000 | ) | |
Whole Foods Market, Inc., Put | | | 600 | | | | 28 | | | 1/20/2017 | | | (76,200 | ) | |
Whole Foods Market, Inc., Put | | | 1,000 | | | | 32 | | | 1/20/2017 | | | (317,500 | ) | |
Total | | | | | | | | $ | (925,578 | ) | |
(a) Amount less than one dollar.
(b) Security fair valued as of 8/31/2016 in accordance with procedures approved by the Fund's Board of Trustees.
Written option transactions for the Fund for the year ended August 31, 2016 were:
| | | Number of
Contracts | | Premium
Received | |
Outstanding 8/31/2015 | | | — | | | $ | — | | |
Options written | | | 16,052 | | | | 2,652,136 | | |
Options expired | | | (2,354 | ) | | | (250,688 | ) | |
Options exercised | | | (650 | ) | | | (122,032 | ) | |
Options closed | | | (4,871 | ) | | | (973,316 | ) | |
Outstanding 8/31/2016 | | | 8,177 | | | $ | 1,306,100 | | |
For the year ended August 31, 2016, the Fund had an average market value of $62,880 in purchased option contracts, and $(305,728) in options written, respectively.
See Notes to Financial Statements
103
Schedule of Investments Guardian Fund (cont'd)
The following is a summary, categorized by Level (see Note A of Notes to Financial Statements), of inputs used to value the Fund's investments as of August 31, 2016:
Asset Valuation Inputs | |
(000's omitted) | | Level 1 | | Level 2 | | Level 3(b) | | Total | |
Investments: | |
Common Stocks(a) | | $ | 1,097,425 | | | $ | — | | | $ | — | | | $ | 1,097,425 | | |
Preferred Stock(a) | | | — | | | | — | | | | 8,700 | | | | 8,700 | | |
Options Purchased(a) | | | 327 | | | | — | | | | — | | | | 327 | | |
Short-Term Investment | | | — | | | | 23,134 | | | | — | | | | 23,134 | | |
Total Investments | | $ | 1,097,752 | | | $ | 23,134 | | | $ | 8,700 | | | $ | 1,129,586 | | |
(a) The Schedule of Investments provides information on the industry categorization for the portfolio.
(b) The following is a reconciliation between the beginning and ending balances of investments in which unobservable inputs (Level 3) were used in determining value:
| | | Beginning
balance, as
of 9/1/2015 | | Accrued
discounts/
(premiums) | | Realized
gain/
loss | | Change
in unrealized
appreciation/
(depreciation) | | Purchases | | Sales | | Transfers
into
Level 3 | | Transfers
out of
Level 3 | | Balance,
as of
8/31/2016 | | Net change in
unrealized
appreciation/
(depreciation)
from
investments
still held as
of 8/31/2016 | |
(000's omitted)
Investments in Securities: | |
Preferred
Stock | |
Health
Care | | $ | — | | | $ | — | | | $ | — | | | $ | — | | | $ | 8,700 | | | $ | — | | | $ | — | | | $ | — | | | $ | 8,700 | | | $ | — | | |
Total | | $ | — | | | $ | — | | | $ | — | | | $ | — | | | $ | 8,700 | | | $ | — | | | $ | — | | | $ | — | | | $ | 8,700 | | | $ | — | | |
The following table presents additional information about valuation techniques and inputs used for investments that are measured at fair value and categorized within Level 3 as of August 31, 2016.
Asset
class | | Fair value
at 8/31/2016 | | Valuation
techniques | | Unobservable
input | | Amount or
range
per unit | | Input value
per unit | | Impact to
valuation
from
decrease
in input(a) | |
Preferred
Stock | | $ | 8,699,997 | | | Market
Transaction
Method | | Transaction Price | | $ | 8.78 | | | $ | 8.78 | | | Decrease | |
(a) Represents the expected directional change in the fair value of the Level 3 investments that would result from a decrease in the corresponding input. An increase to the unobservable input would have the opposite effect. Significant changes in these inputs could result in significantly higher or lower fair value measurements.
See Notes to Financial Statements
104
Schedule of Investments Guardian Fund (cont'd)
As of the year ended August 31, 2016, no securities were transferred from one level (as of August 31, 2015) to another.
The following is a summary, categorized by Level (see Note A of Notes to Financial Statements), of inputs used to value the Fund's derivatives as of August 31, 2016:
Other Financial Instruments | |
(000's omitted) | | Level 1 | | Level 2 | | Level 3(c) | | Total | |
Options written | |
Liabilities | | $ | (926 | ) | | $ | — | | | $ | (0 | )(e) | | $ | (926 | ) | |
Total | | $ | (926 | ) | | $ | — | | | $ | (0 | ) | | $ | (926 | ) | |
(c) The following is a reconciliation between the beginning and ending balances of investments in which unobservable inputs (Level 3) were used in determining value:
| | | Beginning
balance, as
of 9/1/2015 | | Accrued
discounts/
(premiums) | | Realized
gain/
loss | | Change
in unrealized
appreciation/
(depreciation) | | Purchases | | Sales | | Transfers
into
Level 3 | | Transfers
out of
Level 3 | | Balance,
as of
8/31/2016 | | Net change in
unrealized
appreciation/
(depreciation)
from
investments
still held as
of 8/31/2016 | |
(000's omitted)
Other Financial Instruments: | |
Options
written(d) | | $ | — | | | $ | — | | | $ | — | | | $ | 43 | | | $ | — | | | $ | (43 | ) | | $ | — | | | $ | — | | | $ | (0 | )(e) | | $ | 43 | | |
Total | | $ | — | | | $ | — | | | $ | — | | | $ | 43 | | | $ | — | | | $ | (43 | ) | | $ | — | | | $ | — | | | $ | (0 | ) | | $ | 43 | | |
(d) As of the year ended August 31, 2016, these investments did not have a material impact on the Fund's net assets and, therefore, disclosure of unobservable inputs used in formulating valuations is not presented.
(e) Amount less than one thousand.
See Notes to Financial Statements
105
Schedule of Investments International Equity Fund 8/31/16
| | |
Number
of Shares | |
Value
(000's) | |
Common Stocks (94.7%) | |
Australia (2.3%) | |
Insurance
Australia Group
Ltd. | | | 5,263,590 | | | $ | 21,994 | | |
Reliance
Worldwide
Corp. Ltd.* | | | 3,800,000 | | | | 8,882 | | |
Steadfast Group
Ltd. | | | 1,860,417 | | | | 3,076 | | |
| | | | 33,952 | | |
Austria (1.2%) | |
Andritz AG | | | 351,990 | | | | 17,961 | | |
Belgium (1.0%) | |
Colruyt SA | | | 123,952 | | | | 6,803 | | |
Ontex Group NV | | | 220,895 | | | | 7,942 | | |
| | | | 14,745 | | |
Canada (5.0%) | |
Alimentation
Couche-Tard,
Inc. Class B | | | 402,400 | | | | 20,752 | | |
ATS Automation
Tooling
Systems, Inc.* | | | 1,105,800 | | | | 9,115 | | |
Home Capital
Group, Inc. | | | 462,100 | | | | 10,325 | | |
Kinaxis, Inc.* | | | 204,800 | | | | 9,704 | | |
MacDonald,
Dettwiler &
Associates Ltd. | | | 162,833 | | | | 10,750 | | |
Peyto
Exploration &
Development
Corp. | | | 274,000 | | | | 7,875 | | |
Suncor Energy,
Inc. | | | 269,680 | | | | 7,313 | | |
| | | | 75,834 | | |
China (2.7%) | |
Alibaba Group
Holding Ltd.
ADR* | | | 222,800 | | | | 21,654 | | |
Baidu, Inc. ADR* | | | 109,200 | | | | 18,681 | | |
| | | | 40,335 | | |
Denmark (0.8%) | |
Sydbank A/S | | | 369,811 | | | | 11,718 | | |
France (11.8%) | |
Air Liquide SA | | | 128,645 | | | | 14,110 | | |
Arkema SA | | | 205,586 | | | | 18,353 | | |
BNP Paribas SA | | | 289,280 | | | | 14,716 | | |
| Elior Group(a) | | | 438,657 | | | | 10,060 | | |
Euler Hermes
Group | | | 51,460 | | | | 4,253 | | |
Pernod-Ricard
SA | | | 171,975 | | | | 19,739 | | |
| | |
Number
of Shares | |
Value
(000's) | |
Publicis Groupe
SA | | | 152,990 | | | $ | 11,357 | | |
Sodexo SA | | | 145,255 | | | | 16,826 | | |
SPIE SA | | | 795,767 | | | | 15,356 | | |
TOTAL SA | | | 457,038 | | | | 21,794 | | |
Valeo SA | | | 368,160 | | | | 19,051 | | |
Virbac SA* | | | 57,381 | | | | 11,815 | | |
| | | | 177,430 | | |
Germany (9.2%) | |
Bayer AG | | | 130,555 | | | | 13,976 | | |
Brenntag AG | | | 275,345 | | | | 14,985 | | |
Continental AG | | | 76,835 | | | | 16,104 | | |
Deutsche
Boerse AG* | | | 126,324 | | | | 10,794 | | |
GEA Group AG | | | 234,845 | | | | 12,604 | | |
Gerresheimer
AG | | | 247,708 | | | | 20,571 | | |
Henkel AG & Co.
KGaA,
Preference
Shares | | | 159,880 | | | | 20,981 | | |
SAP SE ADR | | | 318,200 | | | | 27,992 | | |
| | | | 138,007 | | |
Hong Kong (1.1%) | |
HKBN Ltd. | | | 14,565,300 | | | | 16,260 | | |
Ireland (0.7%) | |
Greencore
Group PLC | | | 2,314,586 | | | | 10,668 | | |
Israel (3.7%) | |
Bezeq Israeli
Telecommunication
Corp. Ltd. | | | 8,383,809 | | | | 16,828 | | |
Check Point
Software
Technologies
Ltd.* | | | 336,900 | | | | 25,854 | | |
Teva
Pharmaceutical
Industries Ltd.
ADR | | | 273,000 | | | | 13,756 | | |
| | | | 56,438 | | |
Italy (0.8%) | |
Azimut Holding
SpA | | | 816,890 | | | | 12,538 | | |
Japan (10.6%) | |
Daikin Industries
Ltd. | | | 198,000 | | | | 18,350 | | |
KANSAI PAINT
Co. Ltd. | | | 921,000 | | | | 20,287 | | |
KEYENCE Corp. | | | 42,100 | | | | 29,513 | | |
Nabtesco Corp. | | | 344,450 | | | | 8,885 | | |
SANTEN
PHARMACEUTICAL
Co. Ltd. | | | 988,500 | | | | 12,439 | | |
Sato Holdings
Corp. | | | 204,600 | | | | 4,307 | | |
| | |
Number
of Shares | |
Value
(000's) | |
SMC Corp. | | | 84,800 | | | $ | 23,883 | | |
Sundrug Co. Ltd. | | | 240,700 | | | | 17,448 | | |
TOYOTA
MOTOR Corp. | | | 411,700 | | | | 24,822 | | |
| | | | 159,934 | | |
Netherlands (6.0%) | |
AerCap
Holdings NV* | | | 446,300 | | | | 17,839 | | |
Akzo Nobel NV | | | 268,588 | | | | 18,149 | | |
ASML Holding
NV | | | 219,741 | | | | 23,376 | | |
Koninklijke
Ahold Delhaize
NV | | | 537,514 | | | | 12,870 | | |
NXP
Semiconductors
NV* | | | 204,500 | | | | 18,000 | | |
| | | | 90,234 | | |
Norway (0.9%) | |
Skandiabanken
ASA*(a) | | | 1,734,160 | | | | 13,319 | | |
Spain (1.5%) | |
Banco Bilbao
Vizcaya
Argentaria SA | | | 1,700,681 | | | | 10,581 | | |
| Euskaltel SA*(a) | | | 1,389,699 | | | | 12,324 | | |
| | | | 22,905 | | |
Sweden (1.3%) | |
Nordea Bank AB | | | 1,208,240 | | | | 11,813 | | |
Resurs Holding
AB*(a) | | | 1,126,237 | | | | 7,078 | | |
| | | | 18,891 | | |
Switzerland (14.3%) | |
Bucher
Industries AG | | | 57,940 | | | | 14,668 | | |
Cie Financiere
Richemont SA | | | 168,760 | | | | 9,720 | | |
Givaudan SA | | | 12,535 | | | | 25,910 | | |
Julius Baer
Group Ltd.* | | | 442,540 | | | | 18,551 | | |
Novartis AG | | | 185,900 | | | | 14,629 | | |
Partners Group
Holding AG | | | 45,585 | | | | 20,903 | | |
Roche Holding
AG | | | 82,524 | | | | 20,120 | | |
SGS SA | | | 8,960 | | | | 19,687 | | |
Sonova Holding
AG | | | 117,810 | | | | 16,302 | | |
TE Connectivity
Ltd. | | | 230,700 | | | | 14,666 | | |
Tecan Group AG | | | 160,298 | | | | 25,262 | | |
UBS Group AG | | | 982,100 | | | | 14,199 | | |
| | | | 214,617 | | |
See Notes to Financial Statements
106
Schedule of Investments International Equity Fund (cont'd)
| | |
Number
of Shares | |
Value
(000's) | |
United Kingdom (17.3%) | |
Aon PLC | | | 199,200 | | | $ | 22,181 | | |
Barclays PLC | | | 6,083,389 | | | | 13,760 | | |
Bunzl PLC | | | 735,535 | | | | 22,775 | | |
Clinigen Group
PLC | | | 1,917,309 | | | | 16,101 | | |
Compass Group
PLC | | | 853,446 | | | | 16,161 | | |
DCC PLC | | | 231,593 | | | | 21,075 | | |
Howden Joinery
Group PLC | | | 1,330,900 | | | | 7,976 | | |
Lloyds Banking
Group PLC | | | 25,781,584 | | | | 20,093 | | |
Prudential PLC | | | 1,071,475 | | | | 19,185 | | |
RELX PLC | | | 1,158,417 | | | | 21,981 | | |
| RPS Group PLC | | | 3,027,205 | | | | 7,245 | | |
Spectris PLC | | | 576,803 | | | | 14,664 | | |
St. James's Place
PLC | | | 1,245,035 | | | | 16,055 | | |
TalkTalk Telecom
Group PLC | | | 4,523,715 | | | | 12,534 | | |
Travis Perkins
PLC | | | 803,675 | | | | 17,571 | | |
Worldpay Group
PLC(a) | | | 2,757,224 | | | | 10,818 | | |
| | | | 260,175 | | |
United States (2.5%) | |
Nielsen Holdings
PLC | | | 421,002 | | | | 22,431 | | |
Samsonite
International SA | | | 4,951,900 | | | | 15,671 | | |
| | | | 38,102 | | |
Total Common Stocks
(Cost $1,329,540) | | | | | 1,424,063 | | |
Short-Term Investment (5.2%) | |
Investment Company (5.2%) | |
State Street
Institutional
Treasury Money
Market Fund
Premier Class,
0.19%(b)
(Cost $77,443) | | | 77,442,750 | | | | 77,443 | | |
Total Investments (99.9%)
(Cost $1,406,983) | | | | | 1,501,506 | | |
Other Assets Less
Liabilities (0.1%) | | | | | 1,629 | | |
Net Assets (100.0%) | | | | $ | 1,503,135 | | |
* Non-income producing security.
(a) Securities were purchased under Rule 144A of 1933 Act, as amended (the "1933 Act"), or are
otherwise restricted and, unless registered under the 1933 Act or exempted from registration, may only be sold to qualified institutional investors or may have other restrictions on resale. At 8/31/2016, these securities amounted to approximately $53,599,000, or 3.6% of net assets for the Fund. These securities have been deemed by the investment manager to be liquid.
(b) Represents 7-day effective yield as of 8/31/2016.
See Notes to Financial Statements
107
POSITIONS BY INDUSTRY INTERNATIONAL EQUITY FUND
Industry | | Investments at
Value
(000's omitted) | | Percentage of
Net Assets | |
Chemicals | | $ | 96,809 | | | | 6.4 | % | |
Banks | | | 96,000 | | | | 6.4 | % | |
Machinery | | | 87,116 | | | | 5.8 | % | |
Insurance | | | 86,744 | | | | 5.8 | % | |
Pharmaceuticals | | | 86,735 | | | | 5.8 | % | |
Trading Companies & Distributors | | | 81,146 | | | | 5.4 | % | |
Capital Markets | | | 76,985 | | | | 5.1 | % | |
Professional Services | | | 64,099 | | | | 4.3 | % | |
Software | | | 63,550 | | | | 4.2 | % | |
Life Sciences Tools & Services | | | 61,934 | | | | 4.1 | % | |
Electronic Equipment, Instruments & Components | | | 58,843 | | | | 3.9 | % | |
Diversified Telecommunication Services | | | 57,946 | | | | 3.9 | % | |
Food & Staples Retailing | | | 57,873 | | | | 3.9 | % | |
Hotels, Restaurants & Leisure | | | 43,047 | | | | 2.8 | % | |
Semiconductors & Semiconductor Equipment | | | 41,376 | | | | 2.8 | % | |
Internet Software & Services | | | 40,335 | | | | 2.7 | % | |
Oil, Gas & Consumable Fuels | | | 36,982 | | | | 2.5 | % | |
Auto Components | | | 35,155 | | | | 2.3 | % | |
Building Products | | | 27,232 | | | | 1.8 | % | |
Textiles, Apparel & Luxury Goods | | | 25,391 | | | | 1.7 | % | |
Automobiles | | | 24,822 | | | | 1.6 | % | |
Industrial Conglomerates | | | 21,075 | | | | 1.4 | % | |
Household Products | | | 20,981 | | | | 1.4 | % | |
Beverages | | | 19,739 | | | | 1.3 | % | |
Health Care Equipment & Supplies | | | 16,302 | | | | 1.1 | % | |
Construction & Engineering | | | 15,356 | | | | 1.0 | % | |
Commercial Services & Supplies | | | 11,552 | | | | 0.8 | % | |
Media | | | 11,357 | | | | 0.7 | % | |
IT Services | | | 10,818 | | | | 0.7 | % | |
Aerospace & Defense | | | 10,750 | | | | 0.7 | % | |
Food Products | | | 10,668 | | | | 0.7 | % | |
Thrifts & Mortgage Finance | | | 10,325 | | | | 0.7 | % | |
Personal Products | | | 7,942 | | | | 0.5 | % | |
Consumer Finance | | | 7,078 | | | | 0.5 | % | |
Short-Term Investment and Other Assets—Net | | | 79,072 | | | | 5.3 | % | |
| | | $ | 1,503,135 | | | | 100.0 | % | |
See Notes to Financial Statements
108
Schedule of Investments International Equity Fund (cont'd)
The following is a summary, categorized by Level (see Note A of Notes to Financial Statements), of inputs used to value the Fund's investments as of August 31, 2016:
Asset Valuation Inputs | |
(000's omitted) | | Level 1 | | Level 2 | | Level 3 | | Total | |
Investments: | |
Common Stocks(a) | | $ | 1,424,063 | | | $ | — | | | $ | — | | | $ | 1,424,063 | | |
Short-Term Investment | | | — | | | | 77,443 | | | | — | | | | 77,443 | | |
Total Investments | | $ | 1,424,063 | | | $ | 77,443 | | | $ | — | | | $ | 1,501,506 | | |
(a) The Schedule of Investments provides a geographic categorization as well as a Positions by Industry summary.
As of the year ended August 31, 2016, certain securities were transferred from one level (as of August 31, 2015) to another. Based on beginning of period market values as of September 1, 2015, approximately $177,422,000, was transferred from Level 2 to Level 1 due to active market activity on recognized exchanges as of August 31, 2016. These securities had been categorized as Level 2 as of August 31, 2015, due to foreign exchanges having been closed and, therefore, no prices having been readily available for the securities as of that date.
See Notes to Financial Statements
109
Schedule of Investments International Select Fund 8/31/16
| | |
Number
of Shares | |
Value
(000's) | |
Common Stocks (95.5%) | |
Australia (2.0%) | |
Brambles Ltd. | | | 122,149 | | | $ | 1,131 | | |
Insurance
Australia Group
Ltd. | | | 829,380 | | | | 3,466 | | |
| | | | 4,597 | | |
Austria (1.2%) | |
Andritz AG | | | 54,895 | | | | 2,801 | | |
Belgium (0.5%) | |
Colruyt SA | | | 19,375 | | | | 1,063 | | |
Canada (3.5%) | |
Alimentation
Couche-Tard,
Inc. Class B | | | 75,600 | | | | 3,899 | | |
Home Capital
Group, Inc. | | | 82,400 | | | | 1,841 | | |
Peyto
Exploration &
Development
Corp. | | | 42,800 | | | | 1,230 | | |
Suncor Energy,
Inc. | | | 42,480 | | | | 1,152 | | |
| | | | 8,122 | | |
China (2.8%) | |
Alibaba Group
Holding Ltd.
ADR* | | | 34,800 | | | | 3,382 | | |
Baidu, Inc. ADR* | | | 18,500 | | | | 3,165 | | |
| | | | 6,547 | | |
France (13.3%) | |
Air Liquide SA | | | 20,095 | | | | 2,204 | | |
Arkema SA | | | 32,170 | | | | 2,872 | | |
BNP Paribas SA | | | 54,790 | | | | 2,787 | | |
| Elior Group(a) | | | 89,770 | | | | 2,059 | | |
Euler Hermes
Group | | | 8,085 | | | | 668 | | |
Pernod-Ricard
SA | | | 26,960 | | | | 3,095 | | |
Publicis Groupe
SA | | | 32,048 | | | | 2,379 | | |
Schneider
Electric SE | | | 40,664 | | | | 2,771 | | |
Sodexo SA | | | 22,630 | | | | 2,621 | | |
SPIE SA | | | 122,230 | | | | 2,359 | | |
TOTAL SA | | | 71,738 | | | | 3,421 | | |
Valeo SA | | | 69,345 | | | | 3,588 | | |
| | | | 30,824 | | |
Germany (9.6%) | |
Bayer AG | | | 21,095 | | | | 2,258 | | |
Brenntag AG | | | 42,845 | | | | 2,332 | | |
Continental AG | | | 14,665 | | | | 3,074 | | |
Deutsche Boerse
AG* | | | 29,792 | | | | 2,545 | | |
GEA Group AG | | | 37,840 | | | | 2,031 | | |
| | |
Number
of Shares | |
Value
(000's) | |
Gerresheimer
AG | | | 10,000 | | | $ | 830 | | |
Henkel AG & Co.
KGaA,
Preference
Shares | | | 30,335 | | | | 3,981 | | |
SAP SE ADR | | | 56,985 | | | | 5,013 | | |
| | | | 22,064 | | |
Israel (4.5%) | |
Bezeq Israeli
Telecommunication
Corp. Ltd. | | | 1,569,500 | | | | 3,150 | | |
Check Point
Software
Technologies
Ltd.* | | | 60,700 | | | | 4,658 | | |
Teva
Pharmaceutical
Industries Ltd.
ADR | | | 53,500 | | | | 2,696 | | |
| | | | 10,504 | | |
Italy (0.9%) | |
Azimut Holding
SpA | | | 128,075 | | | | 1,966 | | |
Japan (12.9%) | |
Daikin Industries
Ltd. | | | 31,000 | | | | 2,873 | | |
KANSAI PAINT
Co. Ltd. | | | 180,000 | | | | 3,965 | | |
KEYENCE Corp. | | | 7,000 | | | | 4,907 | | |
MIRACA
HOLDINGS, Inc. | | | 52,500 | | | | 2,489 | | |
Nabtesco Corp. | | | 53,900 | | | | 1,390 | | |
SANTEN
PHARMACEUTICAL
Co. Ltd. | | | 208,800 | | | | 2,628 | | |
SMC Corp. | | | 15,500 | | | | 4,365 | | |
Sundrug Co. Ltd. | | | 36,900 | | | | 2,675 | | |
TOYOTA
MOTOR Corp. | | | 73,900 | | | | 4,455 | | |
| | | | 29,747 | | |
Netherlands (6.9%) | |
AerCap
Holdings NV* | | | 69,200 | | | | 2,766 | | |
Akzo Nobel NV | | | 48,190 | | | | 3,257 | | |
ASML Holding
NV | | | 42,220 | | | | 4,491 | | |
Koninklijke
Ahold Delhaize
NV | | | 112,517 | | | | 2,694 | | |
NXP
Semiconductors
NV* | | | 31,900 | | | | 2,808 | | |
| | | | 16,016 | | |
| | |
Number
of Shares | |
Value
(000's) | |
Spain (0.7%) | |
Banco Bilbao
Vizcaya
Argentaria SA | | | 266,035 | | | $ | 1,655 | | |
Sweden (1.3%) | |
Nordea Bank AB | | | 313,565 | | | | 3,066 | | |
Switzerland (14.4%) | |
Cie Financiere
Richemont SA | | | 26,550 | | | | 1,529 | | |
Givaudan SA | | | 2,296 | | | | 4,746 | | |
Julius Baer
Group Ltd.* | | | 55,495 | | | | 2,326 | | |
Novartis AG | | | 48,731 | | | | 3,835 | | |
Partners Group
Holding AG | | | 7,160 | | | | 3,283 | | |
Roche Holding
AG | | | 20,221 | | | | 4,930 | | |
SGS SA | | | 2,052 | | | | 4,509 | | |
Sonova Holding
AG | | | 18,350 | | | | 2,539 | | |
TE Connectivity
Ltd. | | | 44,700 | | | | 2,842 | | |
UBS Group AG | | | 184,255 | | | | 2,664 | | |
| | | | 33,203 | | |
United Kingdom (18.4%) | |
Aon PLC | | | 40,500 | | | | 4,510 | | |
Barclays PLC | | | 1,135,674 | | | | 2,569 | | |
Bunzl PLC | | | 134,906 | | | | 4,177 | | |
Compass Group
PLC | | | 132,756 | | | | 2,514 | | |
DCC PLC | | | 32,125 | | | | 2,923 | | |
Howden Joinery
Group PLC | | | 517,725 | | | | 3,103 | | |
Lloyds Banking
Group PLC | | | 4,583,624 | | | | 3,572 | | |
Prudential PLC | | | 169,020 | | | | 3,026 | | |
RELX PLC | | | 218,471 | | | | 4,146 | | |
Spectris PLC | | | 89,978 | | | | 2,288 | | |
St. James's Place
PLC | | | 197,388 | | | | 2,545 | | |
TalkTalk Telecom
Group PLC | | | 826,615 | | | | 2,290 | | |
Travis Perkins
PLC | | | 141,330 | | | | 3,090 | | |
Worldpay
Group PLC(a) | | | 430,860 | | | | 1,691 | | |
| | | | 42,444 | | |
United States (2.6%) | |
Nielsen Holdings
PLC | | | 67,900 | | | | 3,617 | | |
Samsonite
International SA | | | 774,100 | | | | 2,450 | | |
| | | | 6,067 | | |
Total Common Stocks
(Cost $198,312) | | | | | 220,686 | | |
See Notes to Financial Statements
110
Schedule of Investments International Select Fund (cont'd)
| | |
Number
of Shares | |
Value
(000's) | |
Short-Term Investment (4.4%) | |
Investment Company (4.4%) | |
State Street
Institutional
Treasury Money
Market Fund
Premier Class,
0.19%(b)
(Cost $10,283) | | | 10,282,942 | | | $ | 10,283 | | |
Total Investments (99.9%)
(Cost $208,595) | | | | | 230,969 | | |
Other Assets Less
Liabilities (0.1%) | | | | | 233 | | |
Net Assets (100.0%) | | | | $ | 231,202 | | |
* Non-income producing security.
(a) Securities were purchased under Rule 144A of 1933 Act, as amended (the "1933 Act"), or are otherwise restricted and, unless registered under the 1933 Act or exempted from registration, may only be sold to qualified institutional investors or may have other restrictions on resale. At 8/31/2016, these securities amounted to approximately $3,750,000, or 1.6% of net assets for the Fund. These securities have been deemed by the investment manager to be liquid.
(b) Represents 7-day effective yield as of 8/31/2016.
See Notes to Financial Statements
111
POSITIONS BY INDUSTRY INTERNATIONAL SELECT FUND
Industry | | Investments at
Value
(000's omitted) | | Percentage of
Net Assets | |
Chemicals | | $ | 17,044 | | | | 7.4 | % | |
Pharmaceuticals | | | 16,347 | | | | 7.1 | % | |
Trading Companies & Distributors | | | 15,468 | | | | 6.7 | % | |
Insurance | | | 14,215 | | | | 6.1 | % | |
Banks | | | 13,649 | | | | 5.9 | % | |
Capital Markets | | | 12,784 | | | | 5.6 | % | |
Professional Services | | | 12,272 | | | | 5.3 | % | |
Machinery | | | 10,587 | | | | 4.6 | % | |
Food & Staples Retailing | | | 10,331 | | | | 4.5 | % | |
Electronic Equipment, Instruments & Components | | | 10,037 | | | | 4.3 | % | |
Software | | | 9,671 | | | | 4.2 | % | |
Semiconductors & Semiconductor Equipment | | | 7,299 | | | | 3.2 | % | |
Hotels, Restaurants & Leisure | | | 7,194 | | | | 3.1 | % | |
Auto Components | | | 6,662 | | | | 2.9 | % | |
Internet Software & Services | | | 6,547 | | | | 2.8 | % | |
Oil, Gas & Consumable Fuels | | | 5,803 | | | | 2.5 | % | |
Diversified Telecommunication Services | | | 5,440 | | | | 2.4 | % | |
Automobiles | | | 4,455 | | | | 1.9 | % | |
Household Products | | | 3,981 | | | | 1.7 | % | |
Textiles, Apparel & Luxury Goods | | | 3,979 | | | | 1.7 | % | |
Beverages | | | 3,095 | | | | 1.3 | % | |
Industrial Conglomerates | | | 2,923 | | | | 1.3 | % | |
Building Products | | | 2,873 | | | | 1.2 | % | |
Electrical Equipment | | | 2,771 | | | | 1.2 | % | |
Health Care Equipment & Supplies | | | 2,539 | | | | 1.1 | % | |
Health Care Providers & Services | | | 2,489 | | | | 1.1 | % | |
Media | | | 2,379 | | | | 1.0 | % | |
Construction & Engineering | | | 2,359 | | | | 1.0 | % | |
Thrifts & Mortgage Finance | | | 1,841 | | | | 0.8 | % | |
IT Services | | | 1,691 | | | | 0.7 | % | |
Commercial Services & Supplies | | | 1,131 | | | | 0.5 | % | |
Life Sciences Tools & Services | | | 830 | | | | 0.4 | % | |
Short-Term Investment and Other Assets—Net | | | 10,516 | | | | 4.5 | % | |
| | | $ | 231,202 | | | | 100.0 | % | |
See Notes to Financial Statements
112
Schedule of Investments International Select Fund (cont'd)
The following is a summary, categorized by Level (see Note A of Notes to Financial Statements), of inputs used to value the Fund's investments as of August 31, 2016:
Asset Valuation Inputs | |
(000's omitted) | | Level 1 | | Level 2 | | Level 3 | | Total | |
Investments: | |
Common Stocks(a) | | $ | 220,686 | | | $ | — | | | $ | — | | | $ | 220,686 | | |
Short-Term Investment | | | — | | | | 10,283 | | | | — | | | | 10,283 | | |
Total Investments | | $ | 220,686 | | | $ | 10,283 | | | $ | — | | | $ | 230,969 | | |
(a) The Schedule of Investments provides a geographic categorization as well as a Positions by Industry summary.
As of the year ended August 31, 2016, certain securities were transferred from one level (as of August 31, 2015) to another. Based on beginning of period market values as of September 1, 2015, approximately $38,382,000, was transferred from Level 2 to Level 1 due to active market activity on recognized exchanges as of August 31, 2016. These securities had been categorized as Level 2 as of August 31, 2015, due to foreign exchanges having been closed and, therefore, no prices having been readily available for the securities as of that date.
See Notes to Financial Statements
113
Schedule of Investments Intrinsic Value Fund 8/31/16
| | |
Number
of Shares | |
Value
(000's) | |
Common Stocks (93.2%) | |
Aerospace & Defense (8.1%) | |
Aerovironment,
Inc.* | | | 263,659 | | | $ | 6,523 | | |
KEYW Holding
Corp.* | | | 1,039,206 | | | | 10,361 | | |
Mercury
Systems, Inc.* | | | 487,660 | | | | 11,060 | | |
Spirit
AeroSystems
Holdings, Inc.
Class A* | | | 280,690 | | | | 12,861 | | |
Teledyne
Technologies,
Inc.* | | | 63,052 | | | | 6,755 | | |
Textron, Inc. | | | 185,039 | | | | 7,559 | | |
| | | | 55,119 | | |
Banks (6.6%) | |
BankUnited, Inc. | | | 193,304 | | | | 6,215 | | |
Comerica, Inc. | | | 133,774 | | | | 6,326 | | |
Huntington
Bancshares, Inc. | | | 1,120,130 | | | | 11,212 | | |
TCF Financial
Corp. | | | 524,900 | | | | 7,690 | | |
Texas Capital
Bancshares,
Inc.* | | | 125,800 | | | | 6,607 | | |
Umpqua
Holdings Corp. | | | 417,600 | | | | 6,857 | | |
| | | | 44,907 | | |
Biotechnology (0.5%) | |
Myriad
Genetics, Inc.* | | | 164,000 | | | | 3,339 | | |
Building Products (1.0%) | |
Owens Corning | | | 125,100 | | | | 6,870 | | |
Chemicals (1.0%) | |
Chemtura
Corp.* | | | 218,000 | | | | 6,538 | | |
Commercial Services & Supplies (2.5%) | |
Clean Harbors,
Inc.* | | | 186,214 | | | | 8,901 | | |
Covanta Holding
Corp. | | | 552,500 | | | | 8,227 | | |
| | | | 17,128 | | |
Communications Equipment (7.3%) | |
ARRIS
International
PLC* | | | 615,369 | | | | 17,273 | | |
Brocade
Communications
Systems, Inc. | | | 471,059 | | | | 4,230 | | |
Ciena Corp.* | | | 496,683 | | | | 10,654 | | |
Infinera Corp.* | | | 872,200 | | | | 7,484 | | |
| | |
Number
of Shares | |
Value
(000's) | |
Sonus Networks,
Inc.* | | | 615,700 | | | $ | 5,307 | | |
Viavi Solutions,
Inc.* | | | 589,600 | | | | 4,587 | | |
| | | | 49,535 | | |
Construction & Engineering (2.1%) | |
KBR, Inc. | | | 611,700 | | | | 8,980 | | |
Valmont
Industries, Inc. | | | 39,200 | | | | 5,114 | | |
| | | | 14,094 | | |
Containers & Packaging (4.2%) | |
Avery Dennison
Corp. | | | 176,136 | | | | 13,640 | | |
Crown Holdings,
Inc.* | | | 280,200 | | | | 15,195 | | |
| | | | 28,835 | | |
Electronic Equipment, Instruments & Components (4.6%) | |
II-VI, Inc.* | | | 277,430 | | | | 5,879 | | |
Itron, Inc.* | | | 243,331 | | | | 11,590 | | |
Maxwell
Technologies,
Inc.* | | | 604,600 | | | | 3,065 | | |
OSI Systems,
Inc.* | | | 95,700 | | | | 6,418 | | |
VeriFone
Systems, Inc.* | | | 216,890 | | | | 4,307 | | |
| | | | 31,259 | | |
Energy Equipment & Services (1.1%) | |
ION Geophysical
Corp.* | | | 49,531 | | | | 289 | | |
McDermott
International,
Inc.* | | | 375,500 | | | | 1,964 | | |
TETRA
Technologies,
Inc.* | | | 890,892 | | | | 5,390 | | |
| | | | 7,643 | | |
Health Care Equipment & Supplies (2.2%) | |
Accuray, Inc.* | | | 1,234,970 | | | | 6,582 | | |
Analogic Corp. | | | 62,300 | | | | 5,545 | | |
Haemonetics
Corp.* | | | 81,200 | | | | 3,017 | | |
| | | | 15,144 | | |
Health Care Providers & Services (0.4%) | |
Molina
Healthcare,
Inc.* | | | 53,761 | | | | 2,893 | | |
Health Care Technology (1.5%) | |
Allscripts
Healthcare
Solutions, Inc.* | | | 789,200 | | | | 10,189 | | |
| | |
Number
of Shares | |
Value
(000's) | |
Household Durables (0.5%) | |
iRobot Corp.* | | | 91,800 | | | $ | 3,659 | | |
Independent Power and Renewable Electricity Producers (3.1%) | |
Atlantic Power
Corp.* | | | 1,361,458 | | | | 3,512 | | |
Dynegy, Inc.* | | | 309,400 | | | | 3,920 | | |
NRG Energy, Inc. | | | 465,400 | | | | 5,636 | | |
Ormat
Technologies,
Inc. | | | 171,441 | | | | 8,298 | | |
| | | | 21,366 | | |
Internet Software & Services (0.5%) | |
Bankrate, Inc.* | | | 453,900 | | | | 3,559 | | |
IT Services (7.9%) | |
Acxiom Corp.* | | | 528,500 | | | | 13,736 | | |
CoreLogic, Inc.* | | | 407,925 | | | | 16,733 | | |
DST Systems, Inc. | | | 63,519 | | | | 7,718 | | |
MoneyGram
International,
Inc.* | | | 522,398 | | | | 3,798 | | |
NeuStar, Inc.
Class A* | | | 471,709 | | | | 11,986 | | |
| | | | 53,971 | | |
Life Sciences Tools & Services (3.9%) | |
Charles River
Laboratories
International,
Inc.* | | | 218,871 | | | | 18,212 | | |
Fluidigm Corp.* | | | 382,600 | | | | 3,486 | | |
Luminex Corp.* | | | 238,400 | | | | 5,023 | | |
| | | | 26,721 | | |
Machinery (3.4%) | |
Harsco Corp. | | | 508,800 | | | | 5,063 | | |
ITT, Inc. | | | 125,000 | | | | 4,522 | | |
Manitowoc Co.,
Inc. | | | 483,000 | | | | 2,367 | | |
Manitowoc
Foodservice,
Inc.* | | | 228,000 | | | | 3,678 | | |
Meritor, Inc.* | | | 510,850 | | | | 5,696 | | |
Twin Disc, Inc.* | | | 168,857 | | | | 2,193 | | |
| | | | 23,519 | | |
Marine (0.3%) | |
Danaos Corp.* | | | 534,459 | | | | 1,726 | | |
Metals & Mining (0.8%) | |
Cliffs Natural
Resources, Inc.* | | | 931,000 | | | | 5,307 | | |
Real Estate Investment Trusts (1.0%) | |
Communications
Sales & Leasing,
Inc. | | | 228,800 | | | | 7,139 | | |
See Notes to Financial Statements
114
Schedule of Investments Intrinsic Value Fund (cont'd)
| | |
Number
of Shares | |
Value
(000's) | |
Road & Rail (2.9%) | |
Avis Budget
Group, Inc.* | | | 301,900 | | | $ | 10,908 | | |
Ryder System,
Inc. | | | 134,204 | | | | 8,793 | | |
| | | | 19,701 | | |
Semiconductors & Semiconductor Equipment (11.3%) | |
Alliance
Semiconductor
Corp.* | | | 82,370 | | | | 59 | | |
CEVA, Inc.* | | | 186,600 | | | | 5,874 | | |
Cypress
Semiconductor
Corp. | | | 526,035 | | | | 6,276 | | |
FormFactor, Inc.* | | | 618,603 | | | | 6,403 | | |
MACOM
Technology
Solutions
Holdings, Inc.* | | | 216,663 | | | | 8,926 | | |
Mellanox
Technologies
Ltd.* | | | 210,350 | | | | 9,222 | | |
Rambus, Inc.* | | | 1,081,544 | | | | 14,947 | | |
Rudolph
Technologies,
Inc.* | | | 171,500 | | | | 3,008 | | |
Ultratech, Inc.* | | | 589,000 | | | | 14,731 | | |
Veeco
Instruments,
Inc.* | | | 368,800 | | | | 7,254 | | |
| | | | 76,700 | | |
Software (8.5%) | |
Cadence Design
Systems, Inc.* | | | 269,607 | | | | 6,859 | | |
Covisint Corp.* | | | 996,005 | | | | 2,211 | | |
Nuance
Communications,
Inc.* | | | 749,900 | | | | 10,933 | | |
Rovi Corp.* | | | 679,530 | | | | 13,910 | | |
Seachange
International,
Inc.* | | | 767,567 | | | | 2,241 | | |
Silver Spring
Networks, Inc.* | | | 527,076 | | | | 7,195 | | |
Verint Systems,
Inc.* | | | 423,761 | | | | 14,459 | | |
| | | | 57,808 | | |
Specialty Retail (3.5%) | |
Express, Inc.* | | | 396,900 | | | | 4,695 | | |
GNC Holdings,
Inc. Class A | | | 254,000 | | | | 5,342 | | |
New York & Co.,
Inc.* | | | 288,000 | | | | 648 | | |
Office Depot,
Inc. | | | 1,069,867 | | | | 3,937 | | |
| | |
Number
of Shares | |
Value
(000's) | |
Restoration
Hardware
Holdings, Inc.* | | | 82,524 | | | $ | 2,784 | | |
Select Comfort
Corp.* | | | 235,100 | | | | 6,171 | | |
| | | | 23,577 | | |
Technology Hardware, Storage & Peripherals (0.2%) | |
Quantum Corp.* | | | 1,763,100 | | | | 1,131 | | |
Textiles, Apparel & Luxury Goods (1.5%) | |
Crocs, Inc.* | | | 462,900 | | | | 3,999 | | |
Deckers Outdoor
Corp.* | | | 91,900 | | | | 6,006 | | |
| | | | 10,005 | | |
Wireless Telecommunication Services (0.8%) | |
Telephone &
Data Systems,
Inc. | | | 105,200 | | | | 2,932 | | |
United States
Cellular Corp.* | | | 76,100 | | | | 2,832 | | |
| | | | 5,764 | | |
Total Common Stocks
(Cost $578,386) | | | | | 635,146 | | |
Convertible Preferred Stock (0.6%) | |
Independent Power and Renewable Electricity Producers (0.6%) | |
Dynegy, Inc.,
7.00%,
due 7/1/19
(Cost $4,905) | | | 46,200 | | | | 3,969 | | |
Short-Term Investment (6.8%) | |
Investment Company (6.8%) | |
State Street
Institutional
Treasury Money
Market Fund
Premier Class,
0.19%(a)
(Cost $46,328) | | | 46,328,202 | | | | 46,328 | | |
Total Investments (100.6%)
(Cost $629,619) | | | | | 685,443 | | |
Other Assets Less
Liabilities [(0.6%)] | | | | | (4,412 | ) | |
Net Assets (100.0%) | | | | $ | 681,031 | | |
* Non-income producing security.
(a) Represents 7-day effective yield as of 8/31/2016.
See Notes to Financial Statements
115
Schedule of Investments Intrinsic Value Fund (cont'd)
The following is a summary, categorized by Level (see Note A of Notes to Financial Statements), of inputs used to value the Fund's investments as of August 31, 2016:
Asset Valuation Inputs | |
(000's omitted) | | Level 1 | | Level 2 | | Level 3 | | Total | |
Investments: | |
Common Stocks(a) | | $ | 635,146 | | | $ | — | | | $ | — | | | $ | 635,146 | | |
Convertible Preferred Stock(a) | | | 3,969 | | | | — | | | | — | | | | 3,969 | | |
Short-Term Investment | | | — | | | | 46,328 | | | | — | | | | 46,328 | | |
Total Investments | | $ | 639,115 | | | $ | 46,328 | | | $ | — | | | $ | 685,443 | | |
(a) The Schedule of Investments provides information on the industry categorization for the portfolio.
As of the year ended August 31, 2016, no securities were transferred from one level (as of August 31, 2015) to another.
See Notes to Financial Statements
116
Schedule of Investments Large Cap Value Fund 8/31/16
| | |
Number
of Shares | |
Value
(000's) | |
Common Stocks (93.4%) | |
Airlines (0.6%) | |
Delta Air Lines,
Inc. | | | 211,349 | | | $ | 7,767 | | |
Banks (19.2%) | |
Bank of America
Corp. | | | 933,534 | | | | 15,067 | | |
BB&T Corp. | | | 286,539 | | | | 11,032 | | |
Citigroup, Inc. | | | 1,370,419 | | | | 65,424 | | |
Commerce
Bancshares, Inc. | | | 68,912 | | | | 3,492 | | |
JPMorgan
Chase & Co. | | | 948,445 | | | | 64,020 | | |
KeyCorp | | | 461,852 | | | | 5,801 | | |
M&T Bank Corp. | | | 132,350 | | | | 15,661 | | |
PNC Financial
Services Group,
Inc. | | | 349,011 | | | | 31,446 | | |
SunTrust Banks,
Inc. | | | 252,215 | | | | 11,115 | | |
Synovus
Financial Corp. | | | 83,351 | | | | 2,757 | | |
U.S. Bancorp | | | 175,613 | | | | 7,753 | | |
Wells Fargo &
Co. | | | 534,991 | | | | 27,178 | | |
| | | | 260,746 | | |
Capital Markets (8.2%) | |
Bank of
New York
Mellon Corp. | | | 1,247,266 | | | | 51,974 | | |
CME Group, Inc. | | | 317,552 | | | | 34,407 | | |
Goldman Sachs
Group, Inc. | | | 147,825 | | | | 25,050 | | |
| | | | 111,431 | | |
Chemicals (0.2%) | |
FMC Corp. | | | 49,133 | | | | 2,306 | | |
Communications Equipment (1.3%) | |
Cisco Systems,
Inc. | | | 555,616 | | | | 17,469 | | |
Construction & Engineering (0.3%) | |
Jacobs
Engineering
Group, Inc.* | | | 63,331 | | | | 3,337 | | |
Diversified Telecommunication Services (1.5%) | |
Verizon
Communications,
Inc. | | | 391,880 | | | | 20,507 | | |
Electric Utilities (0.8%) | |
Exelon Corp. | | | 309,045 | | | | 10,508 | | |
Electrical Equipment (6.2%) | |
Eaton Corp. PLC | | | 1,113,491 | | | | 74,091 | | |
Emerson Electric
Co. | | | 175,906 | | | | 9,267 | | |
| | | | 83,358 | | |
| | |
Number
of Shares | |
Value
(000's) | |
Energy Equipment & Services (3.2%) | |
Schlumberger
Ltd. | | | 543,695 | | | $ | 42,952 | | |
Food & Staples Retailing (1.4%) | |
Wal-Mart Stores,
Inc. | | | 268,786 | | | | 19,202 | | |
Health Care Equipment & Supplies (0.8%) | |
Medtronic PLC | | | 75,001 | | | | 6,528 | | |
Zimmer Biomet
Holdings, Inc. | | | 38,054 | | | | 4,932 | | |
| | | | 11,460 | | |
Hotels, Restaurants & Leisure (4.1%) | |
Carnival Corp. | | | 1,155,586 | | | | 55,237 | | |
Household Products (2.9%) | |
Procter &
Gamble Co. | | | 452,383 | | | | 39,498 | | |
Independent Power and Renewable Electricity Producers (0.2%) | |
Calpine Corp.* | | | 227,842 | | | | 2,843 | | |
Industrial Conglomerates (2.2%) | |
General Electric
Co. | | | 964,932 | | | | 30,144 | | |
Insurance (2.6%) | |
Lincoln National
Corp. | | | 557,016 | | | | 26,753 | | |
MetLife, Inc. | | | 181,633 | | | | 7,883 | | |
| | | | 34,636 | | |
Machinery (7.2%) | |
Caterpillar, Inc. | | | 610,348 | | | | 50,018 | | |
Illinois Tool
Works, Inc. | | | 119,430 | | | | 14,194 | | |
Joy Global, Inc. | | | 1,245,284 | | | | 33,972 | | |
| | | | 98,184 | | |
Metals & Mining (8.9%) | |
BHP Billiton Ltd.
ADR | | | 1,431,736 | | | | 42,952 | | |
Newmont
Mining Corp. | | | 1,825,591 | | | | 69,811 | | |
United States
Steel Corp. | | | 408,950 | | | | 7,950 | | |
| | | | 120,713 | | |
Oil, Gas & Consumable Fuels (12.9%) | |
Cabot Oil & Gas
Corp. | | | 438,920 | | | | 10,811 | | |
Devon Energy
Corp. | | | 307,285 | | | | 13,315 | | |
EOG Resources,
Inc. | | | 394,192 | | | | 34,882 | | |
Exxon Mobil
Corp. | | | 768,402 | | | | 66,959 | | |
| | |
Number
of Shares | |
Value
(000's) | |
Pioneer Natural
Resources Co. | | | 216,556 | | | $ | 38,774 | | |
Range Resources
Corp. | | | 265,064 | | | | 10,223 | | |
| | | | 174,964 | | |
Pharmaceuticals (2.5%) | |
Pfizer, Inc. | | | 978,765 | | | | 34,061 | | |
Semiconductors & Semiconductor Equipment (0.8%) | |
NXP
Semiconductors
NV* | | | 125,204 | | | | 11,020 | | |
Software (0.5%) | |
CA, Inc. | | | 199,634 | | | | 6,770 | | |
Technology Hardware, Storage & Peripherals (1.9%) | |
Western Digital
Corp. | | | 550,892 | | | | 25,710 | | |
Textiles, Apparel & Luxury Goods (3.0%) | |
Ralph Lauren
Corp. | | | 393,085 | | | | 40,731 | | |
Total Common Stocks
(Cost $1,148,695) | | | | | 1,265,554 | | |
Short-Term Investment (6.3%) | |
Investment Company (6.3%) | |
State Street
Institutional U.S.
Government
Money Market
Fund Premier
Class, 0.26%(a)
(Cost $85,209) | | | 85,208,898 | | | | 85,209 | | |
Total Investments (99.7%)
(Cost $1,233,904) | | | | | 1,350,763 | | |
Other Assets Less
Liabilities (0.3%) | | | | | 4,200 | | |
Net Assets (100.0%) | | | | $ | 1,354,963 | | |
* Non-income producing security.
(a) Represents 7-day effective yield as of 8/31/2016.
See Notes to Financial Statements
117
Schedule of Investments Large Cap Value Fund (cont'd)
The following is a summary, categorized by Level (see Note A of Notes to Financial Statements), of inputs used to value the Fund's investments as of August 31, 2016:
Asset Valuation Inputs | |
(000's omitted) | | Level 1 | | Level 2 | | Level 3 | | Total | |
Investments: | |
Common Stocks(a) | | $ | 1,265,554 | | | $ | — | | | $ | — | | | $ | 1,265,554 | | |
Short-Term Investment | | | — | | | | 85,209 | | | | — | | | | 85,209 | | |
Total Investments | | $ | 1,265,554 | | | $ | 85,209 | | | $ | — | | | $ | 1,350,763 | | |
(a) The Schedule of Investments provides information on the industry categorization for the portfolio.
As of the year ended August 31, 2016, no securities were transferred from one level (as of August 31, 2015) to another.
See Notes to Financial Statements
118
Schedule of Investments Mid Cap Growth Fund 8/31/16
| | |
Number
of Shares | |
Value
(000's) | |
Common Stocks (96.1%) | |
Aerospace & Defense (0.5%) | |
B/E Aerospace,
Inc. | | | 100,000 | | | $ | 5,055 | | |
Airlines (0.7%) | |
Alaska Air
Group, Inc. | | | 120,000 | | | | 8,104 | | |
Banks (1.8%) | |
Signature Bank* | | | 85,000 | | | | 10,371 | | |
SVB Financial
Group* | | | 80,000 | | | | 8,885 | | |
| | | | 19,256 | | |
Biotechnology (3.1%) | |
BioMarin
Pharmaceutical,
Inc.* | | | 167,500 | | | | 15,727 | | |
Incyte Corp.* | | | 95,000 | | | | 7,704 | | |
Vertex
Pharmaceuticals,
Inc.* | | | 107,000 | | | | 10,113 | | |
| | | | 33,544 | | |
Capital Markets (2.8%) | |
Affiliated
Managers
Group, Inc.* | | | 40,000 | | | | 5,682 | | |
CBOE Holdings,
Inc. | | | 182,500 | | | | 12,536 | | |
Raymond James
Financial, Inc. | | | 210,000 | | | | 12,216 | | |
| | | | 30,434 | | |
Chemicals (3.9%) | |
RPM
International,
Inc. | | | 204,500 | | | | 11,151 | | |
Scotts
Miracle-Gro Co.
Class A | | | 133,500 | | | | 11,054 | | |
Sensient
Technologies
Corp. | | | 170,000 | | | | 12,449 | | |
WR Grace & Co. | | | 100,000 | | | | 7,813 | | |
| | | | 42,467 | | |
Commercial Services & Supplies (1.3%) | |
Cintas Corp. | | | 25,000 | | | | 2,938 | | |
Waste
Connections,
Inc. | | | 150,000 | | | | 11,464 | | |
| | | | 14,402 | | |
Communications Equipment (0.4%) | |
Palo Alto
Networks, Inc.* | | | 37,500 | | | | 4,994 | | |
Distributors (1.5%) | |
LKQ Corp.* | | | 450,000 | | | | 16,240 | | |
| | |
Number
of Shares | |
Value
(000's) | |
Diversified Consumer Services (1.8%) | |
Bright Horizons
Family
Solutions, Inc.* | | | 162,000 | | | $ | 11,042 | | |
Service Corp.
International | | | 350,000 | | | | 9,254 | | |
| | | | 20,296 | | |
Electrical Equipment (1.3%) | |
Acuity Brands,
Inc. | | | 52,500 | | | | 14,444 | | |
Electronic Equipment, Instruments & Components (2.3%) | |
Amphenol Corp.
Class A | | | 209,500 | | | | 13,054 | | |
CDW Corp. | | | 282,500 | | | | 12,614 | | |
| | | | 25,668 | | |
Food Products (3.2%) | |
ConAgra Foods,
Inc. | | | 115,000 | | | | 5,360 | | |
Pinnacle Foods,
Inc. | | | 235,000 | | | | 11,903 | | |
Post Holdings,
Inc.* | | | 77,500 | | | | 6,571 | | |
WhiteWave
Foods Co.* | | | 210,000 | | | | 11,640 | | |
| | | | 35,474 | | |
Health Care Equipment & Supplies (9.7%) | |
C.R. Bard, Inc. | | | 55,000 | | | | 12,146 | | |
DexCom, Inc.* | | | 100,000 | | | | 9,109 | | |
Edwards
Lifesciences
Corp.* | | | 142,500 | | | | 16,410 | | |
Integra
LifeSciences
Holdings Corp.* | | | 116,500 | | | | 10,068 | | |
Nevro Corp.* | | | 162,500 | | | | 15,345 | | |
NuVasive, Inc.* | | | 235,000 | | | | 15,386 | | |
Penumbra, Inc.* | | | 50,000 | | | | 3,528 | | |
Teleflex, Inc. | | | 65,000 | | | | 11,901 | | |
Wright Medical
Group NV* | | | 500,000 | | | | 12,380 | | |
| | | | 106,273 | | |
Health Care Providers & Services (2.7%) | |
Amsurg Corp.* | | | 85,000 | | | | 5,518 | | |
Centene Corp.* | | | 185,500 | | | | 12,668 | | |
HealthSouth
Corp. | | | 295,000 | | | | 12,009 | | |
| | | | 30,195 | | |
Hotels, Restaurants & Leisure (3.3%) | |
Aramark | | | 272,500 | | | | 10,336 | | |
MGM Resorts
International* | | | 400,000 | | | | 9,556 | | |
| | |
Number
of Shares | |
Value
(000's) | |
Red Rock
Resorts, Inc.
Class A | | | 350,000 | | | $ | 7,889 | | |
Vail Resorts, Inc. | | | 50,000 | | | | 7,921 | | |
| | | | 35,702 | | |
Household Durables (2.5%) | |
Newell Brands,
Inc. | | | 358,350 | | | | 19,021 | | |
Whirlpool Corp. | | | 48,500 | | | | 8,664 | | |
| | | | 27,685 | | |
Industrial Conglomerates (1.3%) | |
Roper
Technologies,
Inc. | | | 80,000 | | | | 14,204 | | |
Insurance (1.3%) | |
Assurant, Inc. | | | 158,000 | | | | 14,149 | | |
Internet & Catalog Retail (1.4%) | |
Expedia, Inc. | | | 77,000 | | | | 8,402 | | |
Liberty
Interactive
Corp. QVC
Group Class A* | | | 340,000 | | | | 7,184 | | |
| | | | 15,586 | | |
Internet Software & Services (1.6%) | |
CoStar Group,
Inc.* | | | 82,500 | | | | 17,098 | | |
IT Services (5.9%) | |
CSRA, Inc. | | | 290,000 | | | | 7,363 | | |
Euronet
Worldwide,
Inc.* | | | 147,500 | | | | 11,447 | | |
Fiserv, Inc.* | | | 116,500 | | | | 12,005 | | |
Global
Payments, Inc. | | | 121,500 | | | | 9,228 | | |
Sabre Corp. | | | 305,000 | | | | 8,586 | | |
Vantiv, Inc.
Class A* | | | 290,000 | | | | 15,585 | | |
| | | | 64,214 | | |
Life Sciences Tools & Services (1.2%) | |
Agilent
Technologies,
Inc. | | | 272,500 | | | | 12,802 | | |
Machinery (3.7%) | |
CLARCOR, Inc. | | | 97,500 | | | | 6,383 | | |
Fortive Corp. | | | 150,000 | | | | 7,901 | | |
IDEX Corp. | | | 119,000 | | | | 11,119 | | |
Milacron
Holdings Corp.* | | | 262,200 | | | | 4,528 | | |
Stanley Black &
Decker, Inc. | | | 90,000 | | | | 11,138 | | |
| | | | 41,069 | | |
See Notes to Financial Statements
119
Schedule of Investments Mid Cap Growth Fund (cont'd)
| | |
Number
of Shares | |
Value
(000's) | |
Media (1.0%) | |
DISH Network
Corp. Class A* | | | 135,000 | | | $ | 6,781 | | |
Viacom, Inc.
Class B | | | 100,000 | | | | 4,034 | | |
| | | | 10,815 | | |
Multiline Retail (0.9%) | |
Dollar Tree, Inc.* | | | 125,000 | | | | 10,337 | | |
Oil, Gas & Consumable Fuels (1.7%) | |
Concho
Resources, Inc.* | | | 85,500 | | | | 11,046 | | |
Diamondback
Energy, Inc.* | | | 77,500 | | | | 7,382 | | |
| | | | 18,428 | | |
Pharmaceuticals (2.4%) | |
Jazz
Pharmaceuticals
PLC* | | | 77,500 | | | | 9,597 | | |
Zoetis, Inc. | | | 330,000 | | | | 16,863 | | |
| | | | 26,460 | | |
Professional Services (2.2%) | |
Nielsen Holdings
PLC | | | 187,500 | | | | 9,990 | | |
WageWorks,
Inc.* | | | 223,500 | | | | 13,810 | | |
| | | | 23,800 | | |
Real Estate Investment Trusts (0.5%) | |
Extra Space
Storage, Inc. | | | 70,000 | | | | 5,639 | | |
Road & Rail (2.0%) | |
J.B. Hunt
Transport
Services, Inc. | | | 140,000 | | | | 11,114 | | |
Old Dominion
Freight Line,
Inc.* | | | 160,000 | | | | 11,381 | | |
| | | | 22,495 | | |
Semiconductors & Semiconductor Equipment (5.6%) | |
Lam Research
Corp. | | | 120,000 | | | | 11,198 | | |
MACOM
Technology
Solutions
Holdings, Inc.* | | | 200,000 | | | | 8,240 | | |
Microsemi
Corp.* | | | 150,000 | | | | 5,994 | | |
Monolithic
Power Systems,
Inc. | | | 187,500 | | | | 14,385 | | |
NVIDIA Corp. | | | 225,000 | | | | 13,802 | | |
| | |
Number
of Shares | |
Value
(000's) | |
NXP
Semiconductors
NV* | | | 85,000 | | | $ | 7,482 | | |
| | | | 61,101 | | |
Software (8.0%) | |
Activision
Blizzard, Inc. | | | 321,000 | | | | 13,280 | | |
Electronic Arts,
Inc.* | | | 175,000 | | | | 14,215 | | |
Guidewire
Software, Inc.* | | | 127,500 | | | | 7,845 | | |
Manhattan
Associates,
Inc.* | | | 136,500 | | | | 8,261 | | |
Red Hat, Inc.* | | | 115,000 | | | | 8,393 | | |
ServiceNow,
Inc.* | | | 165,500 | | | | 12,027 | | |
Tyler
Technologies,
Inc.* | | | 75,500 | | | | 12,378 | | |
Ultimate
Software
Group, Inc.* | | | 52,500 | | | | 10,969 | | |
| | | | 87,368 | | |
Specialty Retail (9.1%) | |
Burlington
Stores, Inc.* | | | 233,000 | | | | 18,924 | | |
Dick's Sporting
Goods, Inc. | | | 100,000 | | | | 5,860 | | |
Five Below, Inc.* | | | 125,000 | | | | 5,570 | | |
Lithia Motors,
Inc. Class A | | | 95,000 | | | | 7,863 | | |
O'Reilly
Automotive,
Inc.* | | | 70,000 | | | | 19,597 | | |
Ross Stores, Inc. | | | 297,500 | | | | 18,517 | | |
Tractor Supply
Co. | | | 177,500 | | | | 14,901 | | |
Ulta Salon
Cosmetics &
Fragrance, Inc.* | | | 34,000 | | | | 8,405 | | |
| | | | 99,637 | | |
Textiles, Apparel & Luxury Goods (1.1%) | |
Hanesbrands,
Inc. | | | 437,500 | | | | 11,611 | | |
Trading Companies & Distributors (0.9%) | |
W.W. Grainger,
Inc. | | | 42,500 | | | | 9,803 | | |
Wireless Telecommunication Services (1.5%) | |
T-Mobile US,
Inc.* | | | 367,500 | | | | 17,030 | | |
Total Common Stocks
(Cost $838,739) | | | | | 1,053,879 | | |
| | |
Number
of Shares | |
Value
(000's) | |
Short-Term Investment (4.2%) | |
Investment Company (4.2%) | |
State Street
Institutional U.S.
Government
Money Market
Fund Premier
Class, 0.26%(a)
(Cost $46,106) | | | 46,106,094 | | | $ | 46,106 | | |
Total Investments (100.3%)
(Cost $884,845) | | | | | 1,099,985 | | |
Other Assets
Less Liabilities [(0.3%)] | | | | | (3,735 | ) | |
Net Assets (100.0%) | | | | $ | 1,096,250 | | |
* Non-income producing security.
(a) Represents 7-day effective yield as of 8/31/2016.
See Notes to Financial Statements
120
Schedule of Investments Mid Cap Growth Fund (cont'd)
The following is a summary, categorized by Level (see Note A of Notes to Financial Statements), of inputs used to value the Fund's investments as of August 31, 2016:
Asset Valuation Inputs | |
(000's omitted) | | Level 1 | | Level 2 | | Level 3 | | Total | |
Investments: | |
Common Stocks(a) | | $ | 1,053,879 | | | $ | — | | | $ | — | | | $ | 1,053,879 | | |
Short-Term Investment | | | — | | | | 46,106 | | | | — | | | | 46,106 | | |
Total Investments | | $ | 1,053,879 | | | $ | 46,106 | | | $ | — | | | $ | 1,099,985 | | |
(a) The Schedule of Investments provides information on the industry categorization for the portfolio.
As of the year ended August 31, 2016, no securities were transferred from one level (as of August 31, 2015) to another.
See Notes to Financial Statements
121
Schedule of Investments Mid Cap Intrinsic Value Fund 8/31/16
| | |
Number
of Shares | |
Value
(000's) | |
Common Stocks (98.0%) | |
Aerospace & Defense (6.8%) | |
B/E Aerospace,
Inc. | | | 37,600 | | | $ | 1,901 | | |
General Dynamics
Corp. | | | 15,650 | | | | 2,382 | | |
Spirit AeroSystems
Holdings, Inc.
Class A* | | | 39,800 | | | | 1,824 | | |
| | | | 6,107 | | |
Airlines (1.8%) | |
American Airlines
Group, Inc. | | | 44,300 | | | | 1,608 | | |
Banks (9.2%) | |
BankUnited, Inc. | | | 81,300 | | | | 2,614 | | |
BB&T Corp. | | | 30,600 | | | | 1,178 | | |
Comerica, Inc. | | | 47,100 | | | | 2,227 | | |
Huntington
Bancshares, Inc. | | | 85,100 | | | | 852 | | |
M&T Bank Corp. | | | 11,300 | | | | 1,337 | | |
| | | | 8,208 | | |
Capital Markets (1.1%) | |
State Street Corp. | | | 13,900 | | | | 976 | | |
Chemicals (2.7%) | |
Ashland, Inc. | | | 20,400 | | | | 2,389 | | |
Commercial Services & Supplies (5.1%) | |
Covanta
Holding Corp. | | | 136,100 | | | | 2,027 | | |
Tyco
International PLC | | | 57,600 | | | | 2,516 | | |
| | | | 4,543 | | |
Construction & Engineering (2.7%) | |
Valmont
Industries, Inc. | | | 18,200 | | | | 2,375 | | |
Containers & Packaging (1.8%) | |
Avery Dennison
Corp. | | | 20,700 | | | | 1,603 | | |
Electric Utilities (1.5%) | |
Edison
International | | | 18,100 | | | | 1,316 | | |
Electronic Equipment, Instruments & Components (3.6%) | |
Flextronics
International Ltd.* | | | 90,000 | | | | 1,192 | | |
Itron, Inc.* | | | 42,000 | | | | 2,000 | | |
| | | | 3,192 | | |
Food & Staples Retailing (3.0%) | |
Whole Foods
Market, Inc. | | | 88,200 | | | | 2,680 | | |
| | |
Number
of Shares | |
Value
(000's) | |
Health Care Equipment &
Supplies (3.3%) | |
Zimmer Biomet
Holdings, Inc. | | | 22,800 | | | $ | 2,955 | | |
Hotels, Restaurants & Leisure (1.0%) | |
Wyndham
Worldwide Corp. | | | 13,200 | | | | 934 | | |
Independent Power and Renewable Electricity Producers (2.6%) | |
AES Corp. | | | 190,400 | | | | 2,298 | | |
IT Services (4.9%) | |
Amdocs Ltd. | | | 31,000 | | | | 1,864 | | |
Teradata Corp.* | | | 80,000 | | | | 2,538 | | |
| | | | 4,402 | | |
Media (3.1%) | |
CBS Corp. Class B | | | 36,300 | | | | 1,852 | | |
Lions Gate
Entertainment
Corp. | | | 43,200 | | | | 906 | | |
| | | | 2,758 | | |
Multi-Utilities (1.8%) | |
CenterPoint
Energy, Inc. | | | 69,400 | | | | 1,559 | | |
Multiline Retail (1.3%) | |
Macy's, Inc. | | | 32,200 | | | | 1,165 | | |
Oil, Gas & Consumable Fuels (6.4%) | |
Cabot Oil &
Gas Corp. | | | 80,000 | | | | 1,970 | | |
Devon Energy
Corp. | | | 41,100 | | | | 1,781 | | |
ONEOK, Inc. | | | 41,500 | | | | 1,946 | | |
| | | | 5,697 | | |
Pharmaceuticals (1.0%) | |
Perrigo Co. PLC | | | 9,900 | | | | 901 | | |
Real Estate Investment Trusts (6.4%) | |
Colony Starwood
Homes | | | 83,160 | | | | 2,578 | | |
Corrections
Corporation of
America | | | 69,904 | | | | 1,114 | | |
Starwood
Property Trust,
Inc. | | | 86,200 | | | | 1,974 | | |
| | | | 5,666 | | |
Road & Rail (3.1%) | |
Avis Budget
Group, Inc.* | | | 34,100 | | | | 1,232 | | |
Hertz Global
Holdings, Inc.* | | | 31,480 | | | | 1,551 | | |
| | | | 2,783 | | |
| | |
Number
of Shares | |
Value
(000's) | |
Semiconductors & Semiconductor Equipment (4.6%) | |
ON
Semiconductor
Corp.* | | | 188,500 | | | $ | 2,036 | | |
Skyworks
Solutions, Inc. | | | 27,900 | | | | 2,088 | | |
| | | | 4,124 | | |
Software (5.9%) | |
Cadence Design
Systems, Inc.* | | | 62,100 | | | | 1,580 | | |
Check Point
Software
Technologies
Ltd.* | | | 23,800 | | | | 1,826 | | |
Nuance
Communications,
Inc.* | | | 129,900 | | | | 1,894 | | |
| | | | 5,300 | | |
Specialty Retail (4.4%) | |
Best Buy Co., Inc. | | | 53,900 | | | | 2,074 | | |
GNC Holdings, Inc.
Class A | | | 51,200 | | | | 1,077 | | |
Office Depot, Inc. | | | 212,100 | | | | 780 | | |
| | | | 3,931 | | |
Technology Hardware, Storage & Peripherals (2.0%) | |
Western Digital
Corp. | | | 37,436 | | | | 1,747 | | |
Textiles, Apparel &
Luxury Goods (2.8%) | |
Deckers
Outdoor Corp.* | | | 38,100 | | | | 2,490 | | |
Trading Companies &
Distributors (4.1%) | |
AerCap
Holdings NV* | | | 83,500 | | | | 3,337 | | |
Herc Holdings,
Inc.* | | | 10,493 | | | | 355 | | |
| | | | 3,692 | | |
Total Common Stocks
(Cost $79,752) | | | | | 87,399 | | |
Rights (0.0%) | |
Food & Staples Retailing (0.0%) | |
Safeway, Inc.
(Casa Ley)*(a) | | | 21,100 | | | | 5 | | |
Safeway, Inc.
(Property
Development
Centers)*(a) | | | 21,100 | | | | 1 | | |
Total Rights
(Cost $22) | | | | | 6 | | |
See Notes to Financial Statements
122
Schedule of Investments Mid Cap Intrinsic Value Fund (cont'd)
| | |
Number
of Shares | |
Value
(000's) | |
Short-Term Investment (2.1%) | |
Investment Company (2.1%) | |
State Street
Institutional
U.S. Government
Money Market
Fund Premier
Class, 0.26%(b)
(Cost $1,837) | | | 1,837,323 | | | $ | 1,837 | | |
Total Investments## (100.1%)
(Cost $81,611) | | | | | 89,242 | | |
Other Assets Less
Liabilities [(0.1%)] | | | | | (51 | ) | |
Net Assets (100.0%) | | | | $ | 89,191 | | |
* Non-income producing security.
(a) Illiquid Security.
(b) Represents 7-day effective yield as of 8/31/2016.
The following is a summary, categorized by Level (see Note A of Notes to Financial Statements), of inputs used to value the Fund's investments as of August 31, 2016:
Asset Valuation Inputs | |
(000's omitted) | | Level 1 | | Level 2 | | Level 3(b) | | Total | |
Investments: | |
Common Stocks(a) | | $ | 87,399 | | | $ | — | | | $ | — | | | $ | 87,399 | | |
Rights(a) | | | — | | | | — | | | | 6 | | | | 6 | | |
Short-Term Investment | | | — | | | | 1,837 | | | | — | | | | 1,837 | | |
Total Investments | | $ | 87,399 | | | $ | 1,837 | | | $ | 6 | | | $ | 89,242 | | |
(a) The Schedule of Investments provides information on the industry categorization for the portfolio.
(b) The following is a reconciliation between the beginning and ending balances of investments in which unobservable inputs (Level 3) were used in determining value:
| | | Beginning
balance, as
of 9/1/2015 | | Accrued
discounts/
(premiums) | | Realized
gain/
loss | | Change
in unrealized
appreciation/
(depreciation) | | Purchases | | Sales | | Transfers
into
Level 3 | | Transfers
out of
Level 3 | | Balance,
as of
8/31/2016 | | Net change in
unrealized
appreciation/
(depreciation)
from
investments
still held as
of 8/31/2016 | |
(000's omitted)
Investments in Securities: | |
Rights‡ | |
Food & Staples
Retailing | | $ | 8 | | | $ | — | | | $ | — | | | $ | (2 | ) | | $ | — | | | $ | — | | | $ | — | | | $ | — | | | $ | 6 | | | $ | (2 | ) | |
Total | | $ | 8 | | | $ | — | | | $ | — | | | $ | (2 | ) | | $ | — | | | $ | — | | | $ | — | | | $ | — | | | $ | 6 | | | $ | (2 | ) | |
‡ As of the year ended August 31, 2016, these investments did not have a material impact on the Fund's net assets and, therefore, disclosure of unobservable inputs used in formulating valuations is not presented.
As of the year ended August 31, 2016, no securities were transferred from one level (as of August 31, 2015) to another.
See Notes to Financial Statements
123
Schedule of Investments Multi-Cap Opportunities Fund 8/31/16
| | |
Number
of Shares | |
Value
(000's) | |
Common Stocks (99.1%) | |
Aerospace & Defense (3.9%) | |
Boeing Co. | | | 220,000 | | | $ | 28,479 | | |
Raytheon Co. | | | 320,000 | | | | 44,842 | | |
| | | | 73,321 | | |
Banks (6.9%) | |
JPMorgan
Chase & Co. | | | 1,340,000 | | | | 90,450 | | |
Wells Fargo & Co. | | | 775,000 | | | | 39,370 | | |
| | | | 129,820 | | |
Capital Markets (12.1%) | |
Charles Schwab
Corp. | | | 1,540,000 | | | | 48,448 | | |
Goldman Sachs
Group, Inc. | | | 547,000 | | | | 92,695 | | |
Intercontinental
Exchange, Inc. | | | 300,000 | | | | 84,606 | | |
| | | | 225,749 | | |
Chemicals (0.5%) | |
Methanex Corp. | | | 290,000 | | | | 8,410 | | |
Commercial Services & Supplies (1.1%) | |
Pitney
Bowes, Inc. | | | 1,100,000 | | | | 20,636 | | |
Health Care Equipment &
Supplies (2.1%) | |
Hill-Rom
Holdings, Inc. | | | 655,000 | | | | 38,848 | | |
Communications Equipment (8.8%) | |
Cisco
Systems, Inc. | | | 2,170,000 | | | | 68,225 | | |
Motorola
Solutions, Inc. | | | 1,245,000 | | | | 95,852 | | |
| | | | 164,077 | | |
Containers & Packaging (3.5%) | |
Sealed Air Corp. | | | 1,387,000 | | | | 65,369 | | |
Diversified Financial Services (4.8%) | |
Berkshire
Hathaway, Inc.
Class B* | | | 595,000 | | | | 89,542 | | |
Electrical Equipment (1.2%) | |
Rockwell
Automation, Inc. | | | 200,000 | | | | 23,186 | | |
Energy Equipment & Services (2.7%) | |
Schlumberger Ltd. | | | 630,000 | | | | 49,770 | | |
Food & Staples Retailing (2.0%) | |
US Foods
Holding Corp.* | | | 1,550,000 | | | | 37,587 | | |
Food Products (1.9%) | |
Mondelez
International, Inc.
Class A | | | 780,000 | | | | 35,116 | | |
| | |
Number
of Shares | |
Value
(000's) | |
Health Care Providers &
Services (10.4%) | |
Aetna, Inc. | | | 260,000 | | | $ | 30,451 | | |
Cardinal Health,
Inc. | | | 825,000 | | | | 65,728 | | |
HCA Holdings,
Inc.* | | | 890,000 | | | | 67,240 | | |
Henry Schein,
Inc.* | | | 190,000 | | | | 31,120 | | |
| | | | 194,539 | | |
Hotels, Restaurants & Leisure (1.4%) | |
Bloomin'
Brands, Inc. | | | 1,315,000 | | | | 25,695 | | |
Industrial Conglomerates (3.1%) | |
3M Co. | | | 327,000 | | | | 58,611 | | |
Internet Software & Services (5.3%) | |
Alphabet, Inc.
Class C* | | | 102,000 | | | | 78,239 | | |
eBay, Inc.* | | | 630,000 | | | | 20,261 | | |
| | | | 98,500 | | |
IT Services (2.1%) | |
PayPal Holdings,
Inc.* | | | 1,080,000 | | | | 40,122 | | |
Machinery (3.4%) | |
Stanley Black &
Decker, Inc. | | | 515,000 | | | | 63,731 | | |
Media (3.3%) | |
Omnicom Group,
Inc. | | | 150,000 | | | | 12,919 | | |
Twenty-First
Century Fox,
Inc. Class A | | | 2,020,000 | | | | 49,571 | | |
| | | | 62,490 | | |
Oil, Gas & Consumable Fuels (1.7%) | |
EOG Resources,
Inc. | | | 355,000 | | | | 31,414 | | |
Pharmaceuticals (4.5%) | |
Allergan PLC* | | | 85,000 | | | | 19,936 | | |
Pfizer, Inc. | | | 1,830,000 | | | | 63,684 | | |
| | | | 83,620 | | |
Road & Rail (1.3%) | |
CSX Corp. | | | 890,000 | | | | 25,169 | | |
Software (5.7%) | |
Activision
Blizzard, Inc. | | | 1,050,000 | | | | 43,439 | | |
Microsoft Corp. | | | 315,000 | | | | 18,100 | | |
Symantec Corp. | | | 1,825,000 | | | | 44,037 | | |
| | | | 105,576 | | |
| | |
Number
of Shares | |
Value
(000's) | |
Technology Hardware, Storage & Peripherals (5.4%) | |
Apple, Inc. | | | 485,000 | | | $ | 51,458 | | |
NCR Corp.* | | | 1,475,000 | | | | 49,929 | | |
| | | | 101,387 | | |
Total Common Stocks
(Cost $1,400,300) | | | | | 1,852,285 | | |
Short-Term Investment (0.9%) | |
Investment Company (0.9%) | |
State Street
Institutional
Treasury Money
Market Fund
Premier Class,
0.19%(a)
(Cost $17,692) | | | 17,691,612 | | | | 17,692 | | |
Total Investments (100.0%)
(Cost $1,417,992) | | | | | 1,869,977 | | |
Other Assets Less
Liabilities [(0.0%)] | | | | | (129 | ) | |
Net Assets (100.0%) | | | | $ | 1,869,848 | | |
* Non-income producing security.
(a) Represents 7-day effective yield as of 8/31/2016.
See Notes to Financial Statements
124
Schedule of Investments Multi-Cap Opportunities Fund (cont'd)
The following is a summary, categorized by Level (see Note A of Notes to Financial Statements), of inputs used to value the Fund's investments as of August 31, 2016:
Asset Valuation Inputs | |
(000's omitted) | | Level 1 | | Level 2 | | Level 3 | | Total | |
Investments: | |
| Common Stocks(a) | | $ | 1,852,285 | | | $ | — | | | $ | — | | | $ | 1,852,285 | | |
Short-Term Investment | | | — | | | | 17,692 | | | | — | | | | 17,692 | | |
Total Investments | | $ | 1,852,285 | | | $ | 17,692 | | | $ | — | | | $ | 1,869,977 | | |
(a) The Schedule of Investments provides information on the industry categorization for the portfolio.
As of the year ended August 31, 2016, no securities were transferred from one level (as of August 31, 2015) to another.
See Notes to Financial Statements
125
Schedule of Investments Real Estate Fund 8/31/16
| | |
Number
of Shares | |
Value
(000's) | |
Common Stocks (98.3%) | |
Apartments (10.9%) | |
Apartment
Investment &
Management Co.
Class A | | | 262,200 | | | $ | 11,846 | | |
AvalonBay
Communities,
Inc. | | | 94,392 | | | | 16,520 | | |
Equity Residential | | | 402,700 | | | | 26,123 | | |
Essex Property
Trust, Inc. | | | 92,400 | | | | 20,984 | | |
| | | | 75,473 | | |
Data Centers (5.0%) | |
DuPont Fabros
Technology, Inc. | | | 153,000 | | | | 6,487 | | |
Equinix, Inc. | | | 75,234 | | | | 27,735 | | |
| | | | 34,222 | | |
Diversified (3.1%) | |
Vornado Realty
Trust | | | 209,023 | | | | 21,594 | | |
Free Standing (3.3%) | |
National Retail
Properties, Inc. | | | 318,800 | | | | 15,972 | | |
Realty Income
Corp. | | | 101,200 | | | | 6,652 | | |
| | | | 22,624 | | |
Health Care (10.1%) | |
HCP, Inc. | | | 176,600 | | | | 6,946 | | |
Healthcare
Trust of America,
Inc. Class A | | | 428,900 | | | | 14,471 | | |
OMEGA
Healthcare
Investors, Inc. | | | 209,975 | | | | 7,601 | | |
Ventas, Inc. | | | 293,930 | | | | 21,360 | | |
Welltower, Inc. | | | 252,740 | | | | 19,398 | | |
| | | | 69,776 | | |
Hotels, Restaurants & Leisure (1.6%) | |
Starwood
Hotels & Resorts
Worldwide, Inc. | | | 137,800 | | | | 10,674 | | |
Industrial (4.8%) | |
Duke Realty Corp. | | | 475,100 | | | | 13,360 | | |
Prologis, Inc. | | | 377,438 | | | | 20,045 | | |
| | | | 33,405 | | |
Infrastructure (9.8%) | |
American
Tower Corp. | | | 337,100 | | | | 38,220 | | |
Crown Castle
International
Corp. | | | 306,400 | | | | 29,038 | | |
| | | | 67,258 | | |
| | |
Number
of Shares | |
Value
(000's) | |
Manufactured Homes (2.5%) | |
Equity LifeStyle
Properties, Inc. | | | 225,460 | | | $ | 17,480 | | |
Office (12.2%) | |
Boston
Properties, Inc. | | | 208,984 | | | | 29,285 | | |
Douglas
Emmett, Inc. | | | 240,425 | | | | 9,030 | | |
Equity
Commonwealth* | | | 272,030 | | | | 8,512 | | |
Kilroy Realty
Corp. | | | 235,200 | | | | 17,083 | | |
SL Green Realty
Corp. | | | 173,600 | | | | 20,436 | | |
| | | | 84,346 | | |
Real Estate Management & Development (1.7%) | |
Brookfield Asset
Management, Inc.
Class A | | | 354,415 | | | | 11,940 | | |
Regional Malls (10.4%) | |
General Growth
Properties, Inc. | | | 567,032 | | | | 16,523 | | |
Pennsylvania REIT | | | 277,400 | | | | 6,960 | | |
Simon Property
Group, Inc. | | | 223,973 | | | | 48,260 | | |
| | | | 71,743 | | |
Self Storage (5.5%) | |
Extra Space
Storage, Inc. | | | 93,940 | | | | 7,567 | | |
Public Storage | | | 134,400 | | | | 30,097 | | |
| | | | 37,664 | | |
Shopping Centers (9.4%) | |
Federal Realty
Investment Trust | | | 115,200 | | | | 18,317 | | |
Kimco Realty
Corp. | | | 715,220 | | | | 21,492 | | |
Kite Realty
Group Trust | | | 312,100 | | | | 9,013 | | |
Regency Centers
Corp. | | | 194,257 | | | | 15,646 | | |
| | | | 64,468 | | |
Single Family Homes (2.8%) | |
American
Homes 4 Rent
Class A | | | 554,500 | | | | 12,127 | | |
Colony Starwood
Homes | | | 239,300 | | | | 7,418 | | |
| | | | 19,545 | | |
Specialty (1.5%) | |
EPR Properties | | | 129,800 | | | | 10,166 | | |
| | |
Number
of Shares | |
Value
(000's) | |
Timber (3.7%) | |
Weyerhaeuser Co. | | | 793,299 | | | $ | 25,267 | | |
Total Common Stocks
(Cost $588,472) | | | | | 677,645 | | |
Short-Term Investment (1.2%) | |
Investment Company (1.2%) | |
State Street
Institutional
U.S. Government
Money Market
Fund Premier
Class, 0.26%(a)
(Cost $8,202) | | | 8,201,794 | | | | 8,202 | | |
Total Investments (99.5%)
(Cost $596,674) | | | | | 685,847 | | |
Other Assets
Less Liabilities (0.5%) | | | | | 3,584 | | |
Net Assets (100.0%) | | | | $ | 689,431 | | |
* Non-income producing security.
(a) Represents 7-day effective yield as of 8/31/2016.
See Notes to Financial Statements
126
Schedule of Investments Real Estate Fund (cont'd)
The following is a summary, categorized by Level (see Note A of Notes to Financial Statements), of inputs used to value the Fund's investments as of August 31, 2016:
Asset Valuation Inputs | |
(000's omitted) | | Level 1 | | Level 2 | | Level 3 | | Total | |
Investments: | |
| Common Stocks(a) | | $ | 677,645 | | | $ | — | | | $ | — | | | $ | 677,645 | | |
Short-Term Investment | | | — | | | | 8,202 | | | | — | | | | 8,202 | | |
Total Investments | | $ | 677,645 | | | $ | 8,202 | | | $ | — | | | $ | 685,847 | | |
(a) The Schedule of Investments provides information on the sector categorization for the portfolio.
As of the year ended August 31, 2016, no securities were transferred from one level (as of August 31, 2015) to another.
See Notes to Financial Statements
127
Schedule of Investments Small Cap Growth Fund 8/31/16
| | |
Number
of Shares | |
Value
(000's) | |
Common Stocks (97.6%) | |
Aerospace & Defense (3.3%) | |
HEICO Corp.
Class A | | | 24,000 | | | $ | 1,365 | | |
KLX, Inc.* | | | 22,000 | | | | 822 | | |
| | | | 2,187 | | |
Auto Components (1.3%) | |
Dorman
Products, Inc.* | | | 14,000 | | | | 883 | | |
Banks (2.9%) | |
BNC Bancorp | | | 30,000 | | | | 737 | | |
Seacoast Banking
Corp. of Florida* | | | 50,000 | | | | 823 | | |
Webster Financial
Corp. | | | 10,000 | | | | 386 | | |
| | | | 1,946 | | |
Beverages (0.5%) | |
MGP
Ingredients, Inc. | | | 9,000 | | | | 359 | | |
Biotechnology (12.6%) | |
Alder
Biopharmaceuticals,
Inc.* | | | 25,000 | | | | 824 | | |
Bluebird Bio, Inc.* | | | 9,500 | | | | 469 | | |
Eagle
Pharmaceuticals,
Inc.* | | | 15,500 | | | | 926 | | |
Exelixis, Inc.* | | | 85,000 | | | | 948 | | |
Five Prime
Therapeutics,
Inc.* | | | 11,000 | | | | 484 | | |
Neurocrine
Biosciences, Inc.* | | | 14,000 | | | | 678 | | |
Ophthotech
Corp.* | | | 7,500 | | | | 396 | | |
Prothena Corp.
PLC* | | | 19,500 | | | | 975 | | |
Radius Health,
Inc.* | | | 12,500 | | | | 685 | | |
Spark
Therapeutics, Inc.* | | | 19,000 | | | | 1,075 | | |
TESARO, Inc.* | | | 10,500 | | | | 889 | | |
| | | | 8,349 | | |
Building Products (0.6%) | |
Gibraltar
Industries, Inc.* | | | 10,000 | | | | 382 | | |
Capital Markets (1.5%) | |
MarketAxess
Holdings, Inc. | | | 6,000 | | | | 1,011 | | |
Chemicals (1.9%) | |
Sensient
Technologies
Corp. | | | 17,500 | | | | 1,281 | | |
| | |
Number
of Shares | |
Value
(000's) | |
Commercial Services & Supplies (1.8%) | |
Healthcare
Services Group,
Inc. | | | 29,000 | | | $ | 1,171 | | |
Distributors (0.9%) | |
Core-Mark
Holding Co., Inc. | | | 16,000 | | | | 610 | | |
Diversified Consumer Services (2.1%) | |
Bright Horizons
Family
Solutions, Inc.* | | | 20,000 | | | | 1,363 | | |
Food & Staples Retailing (0.9%) | |
Casey's General
Stores, Inc. | | | 4,500 | | | | 591 | | |
Food Products (1.5%) | |
Amplify Snack
Brands, Inc.* | | | 60,000 | | | | 1,016 | | |
Health Care Equipment &
Supplies (9.0%) | |
ABIOMED, Inc.* | | | 7,500 | | | | 884 | | |
Integra
LifeSciences
Holdings Corp.* | | | 9,000 | | | | 778 | | |
Nevro Corp.* | | | 11,000 | | | | 1,039 | | |
Novadaq
Technologies,
Inc.* | | | 22,000 | | | | 270 | | |
NuVasive, Inc.* | | | 17,000 | | | | 1,113 | | |
Penumbra, Inc.* | | | 15,500 | | | | 1,094 | | |
Wright Medical
Group NV* | | | 32,000 | | | | 792 | | |
| | | | 5,970 | | |
Health Care Providers &
Services (1.4%) | |
HealthSouth Corp. | | | 22,500 | | | | 916 | | |
Hotels, Restaurants & Leisure (2.9%) | |
Red Rock Resorts,
Inc. Class A | | | 39,000 | | | | 879 | | |
Vail Resorts, Inc. | | | 6,500 | | | | 1,030 | | |
| | | | 1,909 | | |
Household Durables (2.4%) | |
Cavco Industries,
Inc.* | | | 5,000 | | | | 523 | | |
Helen of Troy Ltd.* | | | 11,500 | | | | 1,039 | | |
| | | | 1,562 | | |
Insurance (0.6%) | |
Primerica, Inc. | | | 6,500 | | | | 370 | | |
Internet Software & Services (1.8%) | |
Benefitfocus, Inc.* | | | 15,000 | | | | 606 | | |
Q2 Holdings, Inc.* | | | 20,000 | | | | 566 | | |
| | | | 1,172 | | |
| | |
Number
of Shares | |
Value
(000's) | |
IT Services (2.9%) | |
EPAM Systems,
Inc.* | | | 10,500 | | | $ | 716 | | |
Euronet
Worldwide, Inc.* | | | 15,900 | | | | 1,234 | | |
| | | | 1,950 | | |
Machinery (3.7%) | |
CLARCOR, Inc. | | | 17,500 | | | | 1,146 | | |
John Bean
Technologies
Corp. | | | 18,500 | | | | 1,270 | | |
| | | | 2,416 | | |
Media (1.5%) | |
Cable One, Inc. | | | 1,250 | | | | 676 | | |
IMAX Corp.* | | | 10,000 | | | | 305 | | |
| | | | 981 | | |
Oil, Gas & Consumable Fuels (1.7%) | |
Carrizo Oil &
Gas, Inc.* | | | 30,000 | | | | 1,149 | | |
Pharmaceuticals (2.9%) | |
Aclaris
Therapeutics,
Inc.* | | | 13,000 | | | | 262 | | |
Collegium
Pharmaceutical,
Inc.* | | | 20,000 | | | | 167 | | |
Heska Corp.* | | | 17,000 | | | | 928 | | |
Supernus
Pharmaceuticals,
Inc.* | | | 27,000 | | | | 577 | | |
| | | | 1,934 | | |
Professional Services (1.9%) | |
WageWorks, Inc.* | | | 20,000 | | | | 1,236 | | |
Real Estate Investment Trusts (0.6%) | |
CyrusOne, Inc. | | | 7,500 | | | | 381 | | |
Road & Rail (1.1%) | |
Genesee &
Wyoming, Inc.
Class A* | | | 11,000 | | | | 748 | | |
Semiconductors & Semiconductor Equipment (5.7%) | |
Inphi Corp.* | | | 25,000 | | | | 1,077 | | |
MACOM
Technology
Solutions
Holdings, Inc.* | | | 25,000 | | | | 1,030 | | |
Mellanox
Technologies
Ltd.* | | | 11,500 | | | | 504 | | |
Monolithic Power
Systems, Inc. | | | 15,000 | | | | 1,151 | | |
| | | | 3,762 | | |
See Notes to Financial Statements
128
Schedule of Investments Small Cap Growth Fund (cont'd)
| | |
Number
of Shares | |
Value
(000's) | |
Software (17.5%) | |
BroadSoft, Inc.* | | | 20,000 | | | $ | 914 | | |
Descartes Systems
Group, Inc.* | | | 45,000 | | | | 961 | | |
Ellie Mae, Inc.* | | | 5,000 | | | | 489 | | |
Gigamon, Inc.* | | | 18,500 | | | | 818 | | |
Guidewire
Software, Inc.* | | | 9,000 | | | | 554 | | |
Manhattan
Associates, Inc.* | | | 17,500 | | | | 1,059 | | |
Paylocity Holding
Corp.* | | | 26,000 | | | | 1,171 | | |
Proofpoint, Inc.* | | | 21,000 | | | | 1,616 | | |
Take-Two
Interactive
Software, Inc.* | | | 32,000 | | | | 1,391 | | |
Tyler Technologies,
Inc.* | | | 8,500 | | | | 1,393 | | |
Ultimate Software
Group, Inc.* | | | 6,000 | | | | 1,254 | | |
| | | | 11,620 | | |
Specialty Retail (4.0%) | |
Burlington Stores,
Inc.* | | | 18,000 | | | | 1,462 | | |
Five Below, Inc.* | | | 17,500 | | | | 780 | | |
Lithia Motors, Inc.
Class A | | | 5,000 | | | | 414 | | |
| | | | 2,656 | | |
Textiles, Apparel &
Luxury Goods (0.9%) | |
Deckers Outdoor
Corp.* | | | 9,500 | | | | 621 | | |
| | |
Number
of Shares | |
Value
(000's) | |
Trading Companies &
Distributors (3.3%) | |
Beacon Roofing
Supply, Inc.* | | | 23,000 | | | $ | 1,057 | | |
MSC Industrial
Direct Co., Inc.
Class A | | | 11,500 | | | | 840 | | |
Watsco, Inc. | | | 2,000 | | | | 296 | | |
| | | | 2,193 | | |
Total Common Stocks
(Cost $56,179) | | | | | 64,695 | | |
Short-Term Investment (2.5%) | |
Investment Company (2.5%) | |
State Street
Institutional
U.S. Government
Money Market
Fund Premier
Class, 0.26%(a)
(Cost $1,657) | | | 1,656,922 | | | | 1,657 | | |
Total Investments (100.1%)
(Cost $57,836) | | | | | 66,352 | | |
Other Assets Less
Liabilities [(0.1%)] | | | | | (96 | ) | |
Net Assets (100.0%) | | | | $ | 66,256 | | |
* Non-income producing security.
(a) Represents 7-day effective yield as of 8/31/2016.
The following is a summary, categorized by Level (see Note A of Notes to Financial Statements), of inputs used to value the Fund's investments as of August 31, 2016:
Asset Valuation Inputs | |
(000's omitted) | | Level 1 | | Level 2 | | Level 3 | | Total | |
Investments: | |
| Common Stocks(a) | | $ | 64,695 | | | $ | — | | | $ | — | | | $ | 64,695 | | |
Short-Term Investment | | | — | | | | 1,657 | | | | — | | | | 1,657 | | |
Total Investments | | $ | 64,695 | | | $ | 1,657 | | | $ | — | | | $ | 66,352 | | |
(a) The Schedule of Investments provides information on the industry categorization for the portfolio.
As of the year ended August 31, 2016, no securities were transferred from one level (as of August 31, 2015) to another.
See Notes to Financial Statements
129
Schedule of Investments Socially Responsive Fund 8/31/16
| | |
Number
of Shares | |
Value
(000's) | |
Common Stocks (98.8%) | |
Airlines (1.9%) | |
Ryanair Holdings
PLC ADR | | | 630,437 | | | $ | 45,776 | | |
Auto Components (3.3%) | |
BorgWarner, Inc. | | | 1,220,799 | | | | 41,983 | | |
Delphi
Automotive PLC | | | 491,066 | | | | 34,699 | | |
| | | | 76,682 | | |
Banks (4.4%) | |
JPMorgan
Chase & Co. | | | 623,691 | | | | 42,099 | | |
U.S. Bancorp | | | 1,372,680 | | | | 60,604 | | |
| | | | 102,703 | | |
Capital Markets (2.9%) | |
Intercontinental
Exchange, Inc. | | | 242,817 | | | | 68,479 | | |
Communications Equipment (3.1%) | |
Motorola
Solutions, Inc. | | | 491,748 | | | | 37,860 | | |
NetScout
Systems, Inc.* | | | 1,194,090 | | | | 35,321 | | |
| | | | 73,181 | | |
Consumer Finance (2.8%) | |
American
Express Co. | | | 990,919 | | | | 64,985 | | |
Diversified Telecommunication Services (3.1%) | |
Level 3
Communications,
Inc.* | | | 1,464,498 | | | | 72,683 | | |
Electric Utilities (2.8%) | |
Eversource
Energy | | | 1,231,831 | | | | 66,482 | | |
Energy Equipment & Services (3.9%) | |
Schlumberger
Ltd. | | | 1,149,211 | | | | 90,788 | | |
Health Care Equipment &
Supplies (13.3%) | |
Abbott
Laboratories | | | 1,735,841 | | | | 72,940 | | |
Becton,
Dickinson & Co. | | | 554,362 | | | | 98,238 | | |
Danaher Corp. | | | 941,414 | | | | 76,641 | | |
Medtronic PLC | | | 732,892 | | | | 63,784 | | |
| | | | 311,603 | | |
Health Care Providers &
Services (1.3%) | |
Premier, Inc.
Class A* | | | 954,755 | | | | 30,218 | | |
| | |
Number
of Shares | |
Value
(000's) | |
Household Durables (4.5%) | |
Newell
Brands, Inc. | | | 2,005,686 | | | $ | 106,462 | | |
Industrial Conglomerates (2.1%) | |
3M Co. | | | 281,175 | | | | 50,398 | | |
Industrial Gases (1.0%) | |
Praxair, Inc. | | | 201,124 | | | | 24,545 | | |
Insurance (4.3%) | |
Progressive
Corp. | | | 3,134,717 | | | | 102,066 | | |
Internet Software & Services (6.2%) | |
Alphabet, Inc.
Class A* | | | 72,257 | | | | 57,072 | | |
eBay, Inc.* | | | 2,721,321 | | | | 87,518 | | |
| | | | 144,590 | | |
IT Services (4.6%) | |
Alliance Data
Systems Corp.* | | | 289,442 | | | | 59,214 | | |
MasterCard, Inc.
Class A | | | 495,043 | | | | 47,836 | | |
| | | | 107,050 | | |
Machinery (1.2%) | |
Fortive Corp. | | | 529,456 | | | | 27,886 | | |
Oil, Gas & Consumable Fuels (4.7%) | |
Cimarex
Energy Co. | | | 320,979 | | | | 42,427 | | |
Noble Energy, Inc. | | | 1,963,697 | | | | 67,708 | | |
| | | | 110,135 | | |
Personal Products (4.0%) | |
Unilever NV | | | 2,052,073 | | | | 94,621 | | |
Pharmaceuticals (2.2%) | |
Roche
Holding AG | | | 208,313 | | | | 50,789 | | |
Professional Services (3.1%) | |
ManpowerGroup,
Inc. | | | 452,297 | | | | 32,321 | | |
Robert Half
International, Inc. | | | 1,029,108 | | | | 39,446 | | |
| | | | 71,767 | | |
Real Estate Investment Trusts (1.7%) | |
Weyerhaeuser
Co. | | | 1,292,567 | | | | 41,168 | | |
Road & Rail (1.7%) | |
J.B. Hunt
Transport
Services, Inc. | | | 503,848 | | | | 40,001 | | |
Semiconductors & Semiconductor Equipment (4.9%) | |
Texas
Instruments,
Inc. | | | 1,650,704 | | | | 114,790 | | |
| | |
Number
of Shares | |
Value
(000's) | |
Software (3.0%) | |
Intuit, Inc. | | | 631,999 | | | $ | 70,436 | | |
Specialty Retail (1.0%) | |
TJX Cos., Inc. | | | 293,080 | | | | 22,696 | | |
Textiles, Apparel & Luxury
Goods (1.1%) | |
Gildan
Activewear, Inc. | | | 844,944 | | | | 24,909 | | |
Trading Companies &
Distributors (4.7%) | |
NOW, Inc.* | | | 1,151,730 | | | | 23,772 | | |
W.W. Grainger,
Inc. | | | 377,402 | | | | 87,051 | | |
| | | | 110,823 | | |
Total Common Stocks
(Cost $1,801,710) | | | | | 2,318,712 | | |
| | | Principal
Amount | | | |
Short-Term Investments (1.2%) | |
Certificates of Deposit (0.0%) | |
Carver
Federal
Savings Bank
Self Help
Credit Union,
0.20%, due
9/23/16 | | $ | 100,000 | | | | 100 | | |
Self Help Credit
Union, 0.25%,
due 10/5/16 | | | 250,000 | | | | 250 | | |
Self Help Credit
Union, 0.25%,
due 11/16/16 | | | 250,000 | | | | 250 | | |
| | | | 600 | | |
| | | Number
of Shares | | | |
Investment Company (1.2%) | |
State Street
Institutional
Treasury
Money
Market Fund
Premier Class,
0.19%(a) | | | 26,883,994 | | | | 26,884 | | |
Total Short-Term Investments
(Cost $27,484) | | | | | 27,484 | | |
Total Investments (100.0%)
(Cost $1,829,194) | | | | | 2,346,196 | | |
Other Assets Less
Liabilities (0.0%) | | | | | 650 | | |
Net Assets (100.0%) | | | | $ | 2,346,846 | | |
See Notes to Financial Statements
130
Schedule of Investments Socially Responsive Fund (cont'd)
* Non-income producing security.
(a) Represents 7-day effective yield as of 8/31/2016.
The following is a summary, categorized by Level (see Note A of Notes to Financial Statements), of inputs used to value the Fund's investments as of August 31, 2016:
Asset Valuation Inputs | |
(000's omitted) | | Level 1 | | Level 2 | | Level 3 | | Total | |
Investments: | |
| Common Stocks(a) | | $ | 2,318,712 | | | $ | — | | | $ | — | | | $ | 2,318,712 | | |
| Short-Term Investments(a) | | | — | | | | 27,484 | | | | — | | | | 27,484 | | |
Total Investments | | $ | 2,318,712 | | | $ | 27,484 | | | $ | — | | | $ | 2,346,196 | | |
(a) The Schedule of Investments provides information on the industry categorization for the portfolio.
As of the year ended August 31, 2016, no securities were transferred from one level (as of August 31, 2015) to another.
See Notes to Financial Statements
131
Schedule of Investments Value Fund 8/31/16
| | |
Number
of Shares | |
Value
(000's) | |
Common Stocks (93.3%) | |
Airlines (0.6%) | |
Delta Air Lines, Inc. | | | 2,099 | | | $ | 77 | | |
Banks (19.2%) | |
Bank of America
Corp. | | | 9,309 | | | | 150 | | |
BB&T Corp. | | | 2,848 | | | | 110 | | |
Citigroup, Inc. | | | 13,613 | | | | 650 | | |
Commerce
Bancshares, Inc. | | | 685 | | | | 35 | | |
JPMorgan
Chase & Co. | | | 9,421 | | | | 636 | | |
KeyCorp | | | 4,594 | | | | 58 | | |
M&T Bank Corp. | | | 1,315 | | | | 156 | | |
PNC Financial
Services
Group, Inc. | | | 3,467 | | | | 312 | | |
SunTrust
Banks, Inc. | | | 2,507 | | | | 110 | | |
Synovus
Financial Corp. | | | 828 | | | | 27 | | |
U.S. Bancorp | | | 1,753 | | | | 77 | | |
Wells Fargo & Co. | | | 5,314 | | | | 270 | | |
| | | | 2,591 | | |
Capital Markets (8.2%) | |
Bank of New York
Mellon Corp. | | | 12,450 | | | | 519 | | |
CME Group, Inc. | | | 3,136 | | | | 340 | | |
Goldman Sachs
Group, Inc. | | | 1,455 | | | | 246 | | |
| | | | 1,105 | | |
Chemicals (0.2%) | |
FMC Corp. | | | 489 | | | | 23 | | |
Communications Equipment (1.3%) | |
Cisco Systems, Inc. | | | 5,520 | | | | 174 | | |
Construction & Engineering (0.2%) | |
Jacobs
Engineering
Group, Inc.* | | | 629 | | | | 33 | | |
Diversified Telecommunication Services (1.5%) | |
Verizon
Communications,
Inc. | | | 3,895 | | | | 204 | | |
Electric Utilities (0.8%) | |
Exelon Corp. | | | 3,072 | | | | 104 | | |
Electrical Equipment (6.2%) | |
Eaton Corp. PLC | | | 11,062 | | | | 736 | | |
Emerson
Electric Co. | | | 1,756 | | | | 93 | | |
| | | | 829 | | |
Energy Equipment & Services (3.2%) | |
Schlumberger Ltd. | | | 5,430 | | | | 429 | | |
| | |
Number
of Shares | |
Value
(000's) | |
Food & Staples Retailing (1.4%) | |
Wal-Mart
Stores, Inc. | | | 2,670 | | | $ | 191 | | |
Health Care Equipment &
Supplies (0.8%) | |
Medtronic PLC | | | 738 | | | | 64 | | |
Zimmer Biomet
Holdings, Inc. | | | 378 | | | | 49 | | |
| | | | 113 | | |
Hotels, Restaurants & Leisure (4.1%) | |
Carnival Corp. | | | 11,486 | | | | 549 | | |
Household Products (2.9%) | |
Procter &
Gamble Co. | | | 4,496 | | | | 393 | | |
Independent Power and Renewable Electricity Producers (0.2%) | |
Calpine Corp.* | | | 2,264 | | | | 28 | | |
Industrial Conglomerates (2.2%) | |
General Electric Co. | | | 9,644 | | | | 301 | | |
Insurance (2.6%) | |
Lincoln
National Corp. | | | 5,563 | | | | 267 | | |
MetLife, Inc. | | | 1,807 | | | | 79 | | |
| | | | 346 | | |
Machinery (7.2%) | |
Caterpillar, Inc. | | | 6,064 | | | | 497 | | |
Illinois Tool
Works, Inc. | | | 1,187 | | | | 141 | | |
Joy Global, Inc. | | | 12,371 | | | | 338 | | |
| | | | 976 | | |
Metals & Mining (8.9%) | |
BHP Billiton Ltd.
ADR | | | 14,222 | | | | 426 | | |
Newmont Mining
Corp. | | | 18,141 | | | | 694 | | |
United States
Steel Corp. | | | 4,100 | | | | 80 | | |
| | | | 1,200 | | |
Oil, Gas & Consumable Fuels (12.9%) | |
Cabot Oil & Gas
Corp. | | | 4,360 | | | | 107 | | |
Devon Energy
Corp. | | | 3,054 | | | | 132 | | |
EOG Resources,
Inc. | | | 3,918 | | | | 347 | | |
Exxon Mobil Corp. | | | 7,559 | | | | 659 | | |
Pioneer Natural
Resources Co. | | | 2,152 | | | | 385 | | |
Range Resources
Corp. | | | 2,630 | | | | 102 | | |
| | | | 1,732 | | |
Pharmaceuticals (2.5%) | |
Pfizer, Inc. | | | 9,727 | | | | 338 | | |
| | |
Number
of Shares | |
Value
(000's) | |
Semiconductors & Semiconductor Equipment (0.8%) | |
NXP
Semiconductors NV* | | | 1,251 | | | $ | 110 | | |
Software (0.5%) | |
CA, Inc. | | | 1,984 | | | | 67 | | |
Technology Hardware, Storage & Peripherals (1.9%) | |
Western Digital
Corp. | | | 5,475 | | | | 256 | | |
Textiles, Apparel & Luxury
Goods (3.0%) | |
Ralph Lauren
Corp. | | | 3,907 | | | | 405 | | |
Total Common Stocks
(Cost $11,424) | | | | | 12,574 | | |
Short-Term Investment (6.4%) | |
Investment Company (6.4%) | |
State Street
Institutional
Treasury Money
Market Fund
Premier Class,
0.19%(a)
(Cost $857) | | | 857,336 | | | | 857 | | |
Total Investments (99.7%)
(Cost $12,281) | | | | | 13,431 | | |
Other Assets Less
Liabilities (0.3%) | | | | | 46 | | |
Net Assets (100.0%) | | | | $ | 13,477 | | |
* Non-income producing security.
(a) Represents 7-day effective yield as of 8/31/2016.
See Notes to Financial Statements
132
Schedule of Investments Value Fund (cont'd)
The following is a summary, categorized by Level (see Note A of Notes to Financial Statements), of inputs used to value the Fund's investments as of August 31, 2016:
Asset Valuation Inputs | |
(000's omitted) | | Level 1 | | Level 2 | | Level 3 | | Total | |
Investments: | |
| Common Stocks(a) | | $ | 12,574 | | | $ | — | | | $ | — | | | $ | 12,574 | | |
Short-Term Investment | | | — | | | | 857 | | | | — | | | | 857 | | |
Total Investments | | $ | 12,574 | | | $ | 857 | | | $ | — | | | $ | 13,431 | | |
(a) The Schedule of Investments provides information on the industry categorization for the portfolio.
As of the year ended August 31, 2016, no securities were transferred from one level (as of August 31, 2015) to another.
See Notes to Financial Statements
133
This page has been left blank intentionally
134
Statements of Assets and Liabilities
Neuberger Berman Equity Funds
(000's omitted except per share amounts)
| | | DIVIDEND
GROWTH FUND | | EMERGING
MARKETS
EQUITY FUND | | EQUITY
INCOME FUND | | FOCUS FUND | | GENESIS FUND | | GLOBAL EQUITY
FUND | | GLOBAL REAL
ESTATE FUND | | GREATER
CHINA EQUITY
FUND | | GUARDIAN
FUND | | INTERNATIONAL
EQUITY
FUND | |
| | | August 31,
2016 | | August 31,
2016 | | August 31,
2016 | | August 31,
2016 | | August 31,
2016 | | August 31,
2016 | | August 31,
2016 | | August 31,
2016 | | August 31,
2016 | | August 31,
2016 | |
Assets | |
Investments in securities, at value* (Notes A & F)—see Schedule of Investments: | |
Unaffiliated issuers | | $ | 20,611 | | | $ | 462,606 | | | $ | 1,654,248 | | | $ | 713,964 | | | $ | 9,273,233 | | | $ | 4,298 | | | $ | 3,169 | | | $ | 94,031 | | | $ | 1,129,586 | | | $ | 1,501,506 | | |
Affiliated issuers | | | — | | | | — | | | | — | | | | — | | | | 1,371,983 | | | | — | | | | — | | | | — | | | | — | | | | — | | |
| | | | 20,611 | | | | 462,606 | | | | 1,654,248 | | | | 713,964 | | | | 10,645,216 | | | | 4,298 | | | | 3,169 | | | | 94,031 | | | | 1,129,586 | | | | 1,501,506 | | |
Cash | | | — | | | | — | | | | 16 | | | | 31 | | | | 197 | | | | — | | | | — | | | | — | | | | — | | | | — | | |
Foreign currency* | | | — | | | | 237 | | | | — | | | | — | | | | — | | | | — | | | | 3 | | | | 1,548 | | | | — | | | | — | | |
Cash collateral segregated for option contracts (Note A) | | | — | | | | — | | | | 830 | | | | — | | | | — | | | | — | | | | — | | | | — | | | | — | | | | — | | |
Dividends and interest receivable | | | 32 | | | | 241 | | | | 7,723 | | | | 791 | | | | 12,201 | | | | 19 | | | | 5 | | | | 9 | | | | 2,890 | | | | 4,510 | | |
Due from affiliate (Note B) | | | — | | | | — | | | | — | | | | — | | | | — | | | | — | | | | — | | | | — | | | | 1,989 | | | | — | | |
Receivable for securities sold | | | — | | | | 1,143 | | | | 3,006 | | | | — | | | | 13,604 | | | | 85 | | | | — | | | | — | | | | 1,643 | | | | — | | |
Receivable for Fund shares sold | | | — | | | | 414 | | | | 1,185 | | | | 3 | | | | 16,972 | | | | — | | | | — | | | | 114 | | | | 120 | | | | 3,905 | | |
Receivable from Management—net (Note B) | | | 13 | | | | 5 | | | | — | | | | — | | | | — | | | | 33 | | | | 23 | | | | — | | | | — | | | | — | | |
Prepaid expenses and other assets | | | 42 | | | | 64 | | | | 94 | | | | 65 | | | | 375 | | | | 20 | | | | 8 | | | | 24 | | | | 125 | | | | 106 | | |
Total Assets | | | 20,698 | | | | 464,710 | | | | 1,667,102 | | | | 714,854 | | | | 10,688,565 | | | | 4,455 | | | | 3,208 | | | | 95,726 | | | | 1,136,353 | | | | 1,510,027 | | |
Liabilities | |
Options contracts written, at value** (Note A) | | | — | | | | — | | | | 1,531 | | | | 304 | | | | — | | | | — | | | | — | | | | — | | | | 926 | | | | — | | |
Due to custodian | | | — | | | | — | | | | 185 | | | | 119 | | | | — | | | | 4 | | | | — | | | | — | | | | 124 | | | | — | | |
Due to affiliate (Note B) | | | — | | | | — | | | | 1,989 | | | | — | | | | — | | | | — | | | | — | | | | — | | | | — | | | | — | | |
Payable for securities purchased | | | — | | | | 1,751 | | | | 3,440 | | | | — | | | | 15,110 | | | | 61 | | | | — | | | | — | | | | 1,161 | | | | 485 | | |
Payable for Fund shares redeemed | | | — | | | | 5,868 | | | | 2,129 | | | | 310 | | | | 20,265 | | | | — | | | | — | | | | 6 | | | | 386 | | | | 5,131 | | |
Payable to investment manager—net (Note B) | | | 9 | | | | 387 | | | | 683 | | | | 321 | | | | 5,935 | | | | 3 | | | | 2 | | | | 87 | | | | 489 | | | | 777 | | |
Payable to administrator—net (Note B) | | | — | | | | — | | | | 605 | | | | 176 | | | | 1,936 | | | | — | | | | — | | | | 28 | | | | 265 | | | | 237 | | |
Payable to trustees | | | 6 | | | | 6 | | | | 6 | | | | 6 | | | | 6 | | | | 6 | | | | 6 | | | | 6 | | | | 6 | | | | 6 | | |
Accrued capital gains tax | | | — | | | | 282 | | | | — | | | | — | | | | — | | | | — | | | | — | | | | — | | | | — | | | | — | | |
Accrued expenses and other payables | | | 66 | | | | 236 | | | | 270 | | | | 241 | | | | 1,065 | | | | 91 | | | | 88 | | | | 110 | | | | 364 | | | | 256 | | |
Total Liabilities | | | 81 | | | | 8,530 | | | | 10,838 | | | | 1,477 | | | | 44,317 | | | | 165 | | | | 96 | | | | 237 | | | | 3,721 | | | | 6,892 | | |
Net Assets | | $ | 20,617 | | | $ | 456,180 | | | $ | 1,656,264 | | | $ | 713,377 | | | $ | 10,644,248 | | | $ | 4,290 | | | $ | 3,112 | | | $ | 95,489 | | | $ | 1,132,632 | | | $ | 1,503,135 | | |
Net Assets consist of: | |
Paid-in capital | | $ | 18,664 | | | $ | 474,883 | | | $ | 1,388,157 | | | $ | 576,690 | | | $ | 5,107,609 | | | $ | 3,984 | | | $ | 2,935 | | | $ | 103,544 | | | $ | 894,378 | | | $ | 1,615,081 | | |
Undistributed net investment income (loss) | | | 284 | | | | 1,800 | | | | 5,133 | | | | 2,377 | | | | 22,874 | | | | 21 | | | | 1 | | | | 336 | | | | 2,687 | | | | 13,044 | | |
Distributions in excess of net investment income | | | — | | | | — | | | | — | | | | — | | | | — | | | | — | | | | — | | | | — | | | | — | | | | — | | |
Accumulated net realized gains (losses) on investments | | | (120 | ) | | | (70,410 | ) | | | 53,980 | | | | 56,499 | | | | 571,305 | | | | 8 | | | | (9 | ) | | | (13,793 | ) | | | 116,723 | | | | (219,348 | ) | |
Net unrealized appreciation (depreciation) in value of investments | | | 1,789 | | | | 49,907 | | | | 208,994 | | | | 77,811 | | | | 4,942,460 | | | | 277 | | | | 185 | | | | 5,402 | | | | 118,844 | | | | 94,358 | | |
Net Assets | | $ | 20,617 | | | $ | 456,180 | | | $ | 1,656,264 | | | $ | 713,377 | | | $ | 10,644,248 | | | $ | 4,290 | | | $ | 3,112 | | | $ | 95,489 | | | $ | 1,132,632 | | | $ | 1,503,135 | | |
Net Assets | |
Investor Class | | $ | — | | | $ | — | | | $ | — | | | $ | 626,762 | | | $ | 1,752,816 | | | $ | — | | | $ | — | | | $ | — | | | $ | 993,307 | | | $ | 104,005 | | |
Trust Class | | | — | | | | — | | | | — | | | | 70,441 | | | | 1,760,971 | | | | — | | | | — | | | | — | | | | 70,565 | | | | 48,445 | | |
Advisor Class | | | — | | | | — | | | | — | | | | 3,942 | | | | 264,939 | | | | — | | | | — | | | | — | | | | 235 | | | | — | | |
Institutional Class | | | 20,330 | | | | 318,932 | | | | 1,076,456 | | | | 6,825 | | | | 3,483,897 | | | | 3,640 | | | | 2,136 | | | | 93,253 | | | | 59,021 | | | | 1,184,306 | | |
Class A | | | 225 | | | | 23,503 | | | | 243,055 | | | | 3,208 | | | | — | | | | 498 | | | | 694 | | | | 2,091 | | | | 6,558 | | | | 104,899 | | |
Class C | | | 5 | | | | 5,176 | | | | 334,100 | | | | 2,199 | | | | — | | | | 152 | | | | 282 | | | | 145 | | | | 2,373 | | | | 14,745 | | |
Class R3 | | | — | | | | 1,205 | | | | 2,653 | | | | — | | | | — | | | | — | | | | — | | | | — | | | | 573 | | | | — | | |
Class R6 | | | 57 | | | | 107,364 | | | | — | | | | — | | | | 3,381,625 | | | | — | | | | — | | | | — | | | | — | | | | 46,735 | | |
See Notes to Financial Statements
135
136
Statements of Assets and Liabilities (cont'd)
Neuberger Berman Equity Funds (cont'd)
(000's omitted except per share amounts)
| | | DIVIDEND
GROWTH FUND | | EMERGING
MARKETS
EQUITY FUND | | EQUITY
INCOME FUND | | FOCUS FUND | | GENESIS FUND | | GLOBAL EQUITY
FUND | | GLOBAL REAL
ESTATE FUND | | GREATER
CHINA EQUITY
FUND | | GUARDIAN
FUND | | INTERNATIONAL
EQUITY
FUND | |
| | | August 31,
2016 | | August 31,
2016 | | August 31,
2016 | | August 31,
2016 | | August 31,
2016 | | August 31,
2016 | | August 31,
2016 | | August 31,
2016 | | August 31,
2016 | | August 31,
2016 | |
Shares Outstanding ($.001 par value; unlimited shares authorized) | |
Investor Class | | | — | | | | — | | | | — | | | | 24,288 | | | | 51,364 | | | | — | | | | — | | | | — | | | | 60,388 | | | | 5,048 | | |
Trust Class | | | — | | | | — | | | | — | | | | 4,408 | | | | 29,587 | | | | — | | | | — | | | | — | | | | 6,439 | | | | 2,105 | | |
Advisor Class | | | — | | | | — | | | | — | | | | 505 | | | | 10,900 | | | | — | | | | — | | | | — | | | | 17 | | | | — | | |
Institutional Class | | | 1,830 | | | | 19,919 | | | | 86,470 | | | | 264 | | | | 61,505 | | | | 548 | | | | 201 | | | | 8,107 | | | | 3,578 | | | | 106,756 | | |
Class A | | | 20 | | | | 1,476 | | | | 19,596 | | | | 203 | | | | — | | | | 76 | | | | 65 | | | | 182 | | | | 606 | | | | 4,577 | | |
Class C | | | 0 | Z | | | 337 | | | | 27,120 | | | | 297 | | | | — | | | | 24 | | | | 27 | | | | 13 | | | | 182 | | | | 657 | | |
Class R3 | | | — | | | | 77 | | | | 214 | | | | — | | | | — | | | | — | | | | — | | | | — | | | | 43 | | | | — | | |
Class R6 | | | 5 | | | | 6,700 | | | | — | | | | — | | | | 59,689 | | | | — | | | | — | | | | — | | | | — | | | | 4,174 | | |
Net Asset Value, offering and redemption price per share | |
Investor Class | | $ | — | | | $ | — | | | $ | — | | | $ | 25.81 | | | $ | 34.13 | | | $ | — | | | $ | — | | | $ | — | | | $ | 16.45 | | | $ | 20.60 | | |
Trust Class | | | — | | | | — | | | | — | | | | 15.98 | | | | 59.52 | | | | — | | | | — | | | | — | | | | 10.96 | | | | 23.02 | | |
Advisor Class | | | — | | | | — | | | | — | | | | 7.80 | | | | 24.31 | | | | — | | | | — | | | | — | | | | 13.47 | | | | — | | |
Institutional Class | | | 11.11 | | | | 16.01 | | | | 12.45 | | | | 25.86 | | | | 56.64 | | | | 6.65 | | | | 10.62 | | | | 11.50 | | | | 16.50 | | | | 11.09 | | |
Class R3 | | | — | | | | 15.59 | | | | 12.37 | | | | — | | | | — | | | | — | | | | — | | | | — | | | | 13.42 | | | | — | | |
Class R6 | | | 11.11 | | | | 16.02 | | | | — | | | | — | | | | 56.65 | | | | — | | | | — | | | | — | | | | — | | | | 11.20 | | |
Net Asset Value and redemption price per share | |
Class A | | $ | 11.09 | | | $ | 15.92 | | | $ | 12.40 | | | $ | 15.82 | | | $ | — | | | $ | 6.57 | | | $ | 10.61 | | | $ | 11.50 | | | $ | 10.82 | | | $ | 22.92 | | |
Offering Price per share | |
Class A‡ | | $ | 11.77 | | | $ | 16.89 | | | $ | 13.16 | | | $ | 16.79 | | | $ | — | | | $ | 6.97 | | | $ | 11.26 | | | $ | 12.20 | | | $ | 11.48 | | | $ | 24.32 | | |
Net Asset Value and offering price per share | |
Class C^ | | $ | 11.00 | | | $ | 15.36 | | | $ | 12.32 | | | $ | 7.41 | | | $ | — | | | $ | 6.29 | | | $ | 10.59 | | | $ | 11.27 | | | $ | 13.03 | | | $ | 22.45 | | |
*Cost of Investments: | |
Unaffiliated issuers | | $ | 18,822 | | | $ | 412,415 | | | $ | 1,444,909 | | | $ | 636,317 | | | $ | 4,749,811 | | | $ | 4,019 | | | $ | 2,984 | | | $ | 88,627 | | | $ | 1,011,081 | | | $ | 1,406,983 | | |
Affiliated issuers | | | — | | | | — | | | | — | | | | — | | | | 952,945 | | | | — | | | | — | | | | — | | | | — | | | | — | | |
Total cost of investments | | $ | 18,822 | | | $ | 412,415 | | | $ | 1,444,909 | | | $ | 636,317 | | | $ | 5,702,756 | | | $ | 4,019 | | | $ | 2,984 | | | $ | 88,627 | | | $ | 1,011,081 | | | $ | 1,406,983 | | |
Total cost of foreign currency | | $ | — | | | $ | 237 | | | $ | — | | | $ | — | | | $ | — | | | $ | — | | | $ | 3 | | | $ | 1,551 | | | $ | — | | | $ | — | | |
| | **Premium received from option contracts written | | | $ | — | | | $ | — | | | $ | 1,184 | | | $ | 468 | | | $ | — | | | $ | — | | | $ | — | �� | | $ | — | | | $ | 1,306 | | | $ | — | | |
‡ On single retail sales of less than $50,000. On sales of $50,000 or more or in certain other circumstances described in the Fund's prospectus, offering price is reduced.
^ Redemption price per share is equal to net asset value less any applicable contingent deferred sales charge.
Z Amount less than one thousand.
See Notes to Financial Statements
137
138
Statements of Assets and Liabilities (cont'd)
Neuberger Berman Equity Funds
(000's omitted except per share amounts)
| | | INTERNATIONAL
SELECT FUND | | INTRINSIC
VALUE FUND | | LARGE CAP
VALUE FUND | | MID CAP
GROWTH FUND | | MID CAP
INTRINSIC
VALUE FUND | | MULTI-CAP
OPPORTUNITIES
FUND | | REAL ESTATE
FUND | | SMALL CAP
GROWTH FUND | | SOCIALLY
RESPONSIVE
FUND | | VALUE FUND | |
| | | August 31,
2016 | | August 31,
2016 | | August 31,
2016 | | August 31,
2016 | | August 31,
2016 | | August 31,
2016 | | August 31,
2016 | | August 31,
2016 | | August 31,
2016 | | August 31,
2016 | |
Assets | |
Investments in securities, at value* (Notes A & F)—see Schedule of Investments: | |
Unaffiliated issuers | | $ | 230,969 | | | $ | 685,443 | | | $ | 1,350,763 | | | $ | 1,099,985 | | | $ | 89,242 | | | $ | 1,869,977 | | | $ | 685,847 | | | $ | 66,352 | | | $ | 2,346,196 | | | $ | 13,431 | | |
Affiliated issuers | | | — | | | | — | | | | — | | | | — | | | | — | | | | — | | | | — | | | | — | | | | — | | | | — | | |
| | | | 230,969 | | | | 685,443 | | | | 1,350,763 | | | | 1,099,985 | | | | 89,242 | | | | 1,869,977 | | | | 685,847 | | | | 66,352 | | | | 2,346,196 | | | | 13,431 | | |
Cash | | | — | | | | — | | | | — | | | | — | | | | — | | | | — | | | | — | | | | — | | | | — | | | | — | | |
Foreign currency* | | | — | | | | — | | | | — | | | | — | | | | — | | | | — | | | | — | | | | — | | | | — | | | | — | | |
Cash collateral segregated for option contracts (Note A) | | | — | | | | — | | | | — | | | | — | | | | — | | | | — | | | | — | | | | — | | | | — | | | | — | | |
Dividends and interest receivable | | | 930 | | | | 153 | | | | 2,493 | | | | 919 | | | | 64 | | | | 3,234 | | | | 254 | | | | 17 | | | | 3,846 | | | | 25 | | |
Due from affiliate (Note B) | | | — | | | | — | | | | — | | | | — | | | | — | | | | — | | | | — | | | | — | | | | — | | | | — | | |
Receivable for securities sold | | | — | | | | — | | | | 103,637 | | | | 3,580 | | | | — | | | | — | | | | 42,526 | | | | — | | | | — | | | | 1,027 | | |
Receivable for Fund shares sold | | | 85 | | | | 2,296 | | | | 69 | | | | 639 | | | | 22 | | | | 73 | | | | 1,968 | | | | 3 | | | | 1,263 | | | | 42 | | |
Receivable from Management—net (Note B) | | | — | | | | — | | | | — | | | | — | | | | — | | | | — | | | | — | | | | 25 | | | | — | | | | 25 | | |
Prepaid expenses and other assets | | | 51 | | | | 48 | | | | 106 | | | | 87 | | | | 35 | | | | 60 | | | | 62 | | | | 38 | | | | 108 | | | | 13 | | |
Total Assets | | | 232,035 | | | | 687,940 | | | | 1,457,068 | | | | 1,105,210 | | | | 89,363 | | | | 1,873,344 | | | | 730,657 | | | | 66,435 | | | | 2,351,413 | | | | 14,563 | | |
Liabilities | |
Options contracts written, at value** (Note A) | | | — | | | | — | | | | — | | | | — | | | | — | | | | — | | | | — | | | | — | | | | — | | | | — | | |
Due to custodian | | | — | | | | — | | | | — | | | | — | | | | — | | | | — | | | | — | | | | — | | | | — | | | | — | | |
Due to affiliate (Note B) | | | — | | | | — | | | | — | | | | — | | | | — | | | | — | | | | — | | | | — | | | | — | | | | — | | |
Payable for securities purchased | | | 243 | | | | 932 | | | | 98,755 | | | | 5,543 | | | | — | | | | — | | | | 39,006 | | | | — | | | | — | | | | 986 | | |
Payable for Fund shares redeemed | | | 335 | | | | 5,353 | | | | 2,062 | | | | 2,443 | | | | 46 | | | | 2,014 | | | | 1,463 | | | | 33 | | | | 2,755 | | | | — | | |
Payable to investment manager—net (Note B) | | | 108 | | | | 467 | | | | 571 | | | | 473 | | | | 5 | | | | 842 | | | | 481 | | | | 47 | | | | 931 | | | | 6 | | |
Payable to administrator—net (Note B) | | | 14 | | | | 37 | | | | 360 | | | | 226 | | | | 34 | | | | 299 | | | | 85 | | | | — | | | | 536 | | | | — | | |
Payable to trustees | | | 6 | | | | 6 | | | | 6 | | | | 6 | | | | 6 | | | | 6 | | | | 6 | | | | 6 | | | | 6 | | | | 6 | | |
Accrued capital gains tax | | | — | | | | — | | | | — | | | | — | | | | — | | | | — | | | | — | | | | — | | | | — | | | | — | | |
Accrued expenses and other payables | | | 127 | | | | 114 | | | | 351 | | | | 269 | | | | 81 | | | | 335 | | | | 185 | | | | 93 | | | | 339 | | | | 88 | | |
Total Liabilities | | | 833 | | | | 6,909 | | | | 102,105 | | | | 8,960 | | | | 172 | | | | 3,496 | | | | 41,226 | | | | 179 | | | | 4,567 | | | | 1,086 | | |
Net Assets | | $ | 231,202 | | | $ | 681,031 | | | $ | 1,354,963 | | | $ | 1,096,250 | | | $ | 89,191 | | | $ | 1,869,848 | | | $ | 689,431 | | | $ | 66,256 | | | $ | 2,346,846 | | | $ | 13,477 | | |
Net Assets consist of: | |
Paid-in capital | | $ | 238,209 | | | $ | 618,191 | | | $ | 1,238,971 | | | $ | 850,869 | | | $ | 82,191 | | | $ | 1,359,662 | | | $ | 540,158 | | | $ | 71,128 | | | $ | 1,758,512 | | | $ | 13,135 | | |
Undistributed net investment income (loss) | | | 2,074 | | | | (113 | ) | | | 10,386 | | | | (1,654 | ) | | | — | | | | 10,815 | | | | — | | | | — | | | | 12,472 | | | | 150 | | |
Distributions in excess of net investment income | | | — | | | | — | | | | — | | | | — | | | | — | | | | — | | | | — | | | | (348 | ) | | | — | | | | — | | |
Accumulated net realized gains (losses) on investments | | | (31,425 | ) | | | 7,129 | | | | (11,253 | ) | | | 31,895 | | | | (631 | ) | | | 47,386 | | | | 60,100 | | | | (13,040 | ) | | | 58,925 | | | | (958 | ) | |
Net unrealized appreciation (depreciation) in value of investments | | | 22,344 | | | | 55,824 | | | | 116,859 | | | | 215,140 | | | | 7,631 | | | | 451,985 | | | | 89,173 | | | | 8,516 | | | | 516,937 | | | | 1,150 | | |
Net Assets | | $ | 231,202 | | | $ | 681,031 | | | $ | 1,354,963 | | | $ | 1,096,250 | | | $ | 89,191 | | | $ | 1,869,848 | | | $ | 689,431 | | | $ | 66,256 | | | $ | 2,346,846 | | | $ | 13,477 | | |
Net Assets | |
Investor Class | | $ | — | | | $ | — | | | $ | 1,069,808 | | | $ | 415,141 | | | $ | 37,874 | | | $ | — | | | $ | — | | | $ | 44,005 | | | $ | 738,964 | | | $ | — | | |
Trust Class | | | 7,838 | | | | — | | | | 77,642 | | | | 66,728 | | | | 10,264 | | | | — | | | | 212,364 | | | | 4,441 | | | | 270,579 | | | | — | | |
Advisor Class | | | — | | | | — | | | | 145,898 | | | | 11,541 | | | | — | | | | — | | | | — | | | | 2,105 | | | | — | | | | — | | |
Institutional Class | | | 211,711 | | | | 611,327 | | | | 56,207 | | | | 307,604 | | | | 22,702 | | | | 1,757,195 | | | | 259,053 | | | | 9,364 | | | | 745,488 | | | | 9,096 | | |
Class A | | | 4,626 | | | | 44,524 | | | | 3,216 | | | | 76,947 | | | | 13,255 | | | | 73,042 | | | | 118,776 | | | | 3,482 | | | | 131,566 | | | | 3,836 | | |
Class C | | | 3,241 | | | | 25,180 | | | | 2,123 | | | | 10,898 | | | | 3,714 | | | | 39,611 | | | | 29,268 | | | | 1,794 | | | | 53,533 | | | | 545 | | |
Class R3 | | | 3,786 | | | | — | | | | 69 | | | | 13,712 | | | | 1,382 | | | | — | | | | 24,977 | | | | 1,065 | | | | 33,342 | | | | — | | |
Class R6 | | | — | | | | — | | | | — | | | | 193,679 | | | | — | | | | — | | | | 44,993 | | | | — | | | | 373,374 | | | | — | | |
See Notes to Financial Statements
139
140
Statements of Assets and Liabilities (cont'd)
Neuberger Berman Equity Funds (cont'd)
(000's omitted except per share amounts)
| | | INTERNATIONAL
SELECT FUND | | INTRINSIC
VALUE FUND | | LARGE CAP
VALUE FUND | | MID CAP
GROWTH FUND | | MID CAP
INTRINSIC
VALUE FUND | | MULTI-CAP
OPPORTUNITIES
FUND | | REAL ESTATE
FUND | | SMALL CAP
GROWTH FUND | | SOCIALLY
RESPONSIVE
FUND | | VALUE FUND | |
| | | August 31,
2016 | | August 31,
2016 | | August 31,
2016 | | August 31,
2016 | | August 31,
2016 | | August 31,
2016 | | August 31,
2016 | | August 31,
2016 | | August 31,
2016 | | August 31,
2016 | |
Shares Outstanding ($.001 par value; unlimited shares authorized) | |
Investor Class | | | — | | | | — | | | | 37,873 | | | | 32,237 | | | | 1,922 | | | | — | | | | — | | | | 1,631 | | | | 21,421 | | | | — | | |
Trust Class | | | 721 | | | | — | | | | 4,223 | | | | 2,991 | | | | 632 | | | | — | | | | 14,043 | | | | 152 | | | | 13,280 | | | | — | | |
Advisor Class | | | — | | | | — | | | | 10,632 | | | | 509 | | | | — | | | | — | | | | — | | | | 112 | | | | — | | | | — | | |
Institutional Class | | | 19,486 | | | | 43,596 | | | | 1,975 | | | | 23,309 | | | | 1,149 | | | | 109,277 | | | | 17,080 | | | | 339 | | | | 21,576 | | | | 579 | | |
Class A | | | 429 | | | | 3,254 | | | | 175 | | | | 3,462 | | | | 818 | | | | 4,578 | | | | 7,857 | | | | 118 | | | | 6,529 | | | | 246 | | |
Class C | | | 305 | | | | 1,938 | | | | 163 | | | | 497 | | | | 234 | | | | 2,569 | | | | 1,936 | | | | 99 | | | | 2,736 | | | | 36 | | |
Class R3 | | | 354 | | | | — | | | | 5 | | | | 606 | | | | 85 | | | | — | | | | 1,655 | | | | 57 | | | | 1,674 | | | | — | | |
Class R6 | | | — | | | | — | | | | — | | | | 14,631 | | | | — | | | | — | | | | 2,967 | | | | — | | | | 10,800 | | | | — | | |
Net Asset Value, offering and redemption price per share | |
Investor Class | | $ | — | | | $ | — | | | $ | 28.25 | | | $ | 12.88 | | | $ | 19.71 | | | $ | — | | | $ | — | | | $ | 26.97 | | | $ | 34.50 | | | $ | — | | |
Trust Class | | | 10.88 | | | | — | | | | 18.38 | | | | 22.31 | | | | 16.24 | | | | — | | | | 15.12 | | | | 29.25 | | | | 20.37 | | | | — | | |
Advisor Class | | | — | | | | — | | | | 13.72 | | | | 22.65 | | | | — | | | | — | | | | — | | | | 18.72 | | | | — | | | | — | | |
Institutional Class | | | 10.86 | | | | 14.02 | | | | 28.47 | | | | 13.20 | | | | 19.75 | | | | 16.08 | | | | 15.17 | | | | 27.66 | | | | 34.55 | | | | 15.72 | | |
Class R3 | | | 10.71 | | | | — | | | | 13.93 | | | | 22.63 | | | | 16.19 | | | | — | | | | 15.09 | | | | 18.77 | | | | 19.92 | | | | — | | |
Class R6 | | | — | | | | — | | | | — | | | | 13.24 | | | | — | | | | — | | | | 15.16 | | | | — | | | | 34.57 | | | | — | | |
Net Asset Value and redemption price per share | |
Class A | | $ | 10.80 | | | $ | 13.68 | | | $ | 18.36 | | | $ | 22.23 | | | $ | 16.21 | | | $ | 15.95 | | | $ | 15.12 | | | $ | 29.53 | | | $ | 20.15 | | | $ | 15.62 | | |
Offering Price per share | |
Class A‡ | | $ | 11.46 | | | $ | 14.51 | | | $ | 19.48 | | | $ | 23.59 | | | $ | 17.20 | | | $ | 16.92 | | | $ | 16.04 | | | $ | 31.33 | | | $ | 21.38 | | | $ | 16.57 | | |
Net Asset Value and offering price per share | |
Class C^ | | $ | 10.64 | | | $ | 12.99 | | | $ | 12.99 | | | $ | 21.92 | | | $ | 15.88 | | | $ | 15.42 | | | $ | 15.12 | | | $ | 18.05 | | | $ | 19.56 | | | $ | 15.33 | | |
*Cost of Investments: | |
Unaffiliated issuers | | $ | 208,595 | | | $ | 629,619 | | | $ | 1,233,904 | | | $ | 884,845 | | | $ | 81,611 | | | $ | 1,417,992 | | | $ | 596,674 | | | $ | 57,836 | | | $ | 1,829,194 | | | $ | 12,281 | | |
Affiliated issuers | | | — | | | | — | | | | — | | | | — | | | | — | | | | — | | | | — | | | | — | | | | — | | | | — | | |
Total cost of investments | | $ | 208,595 | | | $ | 629,619 | | | $ | 1,233,904 | | | $ | 884,845 | | | $ | 81,611 | | | $ | 1,417,992 | | | $ | 596,674 | | | $ | 57,836 | | | $ | 1,829,194 | | | $ | 12,281 | | |
Total cost of foreign currency | | $ | — | | | $ | — | | | $ | — | | | $ | — | | | $ | — | | | $ | — | | | $ | — | | | $ | — | | | $ | — | | | $ | — | | |
| | **Premium received from option contracts written | | | $ | — | | | $ | — | | | $ | — | | | $ | — | | | $ | — | | | $ | — | | | $ | — | | | $ | — | | | $ | — | | | $ | — | | |
‡ On single retail sales of less than $50,000. On sales of $50,000 or more or in certain other circumstances described in the Fund's prospectus, offering price is reduced.
^ Redemption price per share is equal to net asset value less any applicable contingent deferred sales charge.
See Notes to Financial Statements
141
142
Neuberger Berman Equity Funds
(000's omitted)
| | | DIVIDEND
GROWTH FUND | | EMERGING
MARKETS
EQUITY FUND | | EQUITY
INCOME FUND | | FOCUS FUND | | GENESIS FUND | | GLOBAL
EQUITY
FUND | | GLOBAL REAL
ESTATE FUND | | GREATER CHINA
EQUITY
FUND | | GUARDIAN
FUND | | INTERNATIONAL
EQUITY FUND | |
| | | For the Period from
December 15, 2015
(Commencement
of Operations) to
August 31,
2016 | | For the
Year Ended
August 31,
2016 | | For the
Year Ended
August 31,
2016 | | For the
Year Ended
August 31,
2016 | | For the
Year Ended
August 31,
2016 | | For the
Year Ended
August 31,
2016 | | For the
Year Ended
August 31,
2016 | | For the
Year Ended
August 31,
2016 | | For the
Year Ended
August 31,
2016 | | For the
Year Ended
August 31,
2016 | |
Investment Income: | |
Income (Note A): | |
Dividend income—unaffiliated issuers | | $ | 367 | | | $ | 9,065 | | | $ | 67,137 | | | $ | 11,481 | | | $ | 96,596 | | | $ | 75 | | | $ | 82 | | | $ | 1,933 | | | $ | 17,931 | | | $ | 33,863 | | |
Dividend income—affiliated issuers (Note F) | | | — | | | | — | | | | — | | | | — | | | | 39,430 | | | | — | | | | — | | | | — | | | | — | | | | — | | |
Interest income—unaffiliated issuers | | | 2 | | | | 26 | | | | 2,942 | | | | 29 | | | | 60 | | | | — | | | | — | | | | 3 | | | | 90 | | | | 53 | | |
Income from investments in affiliated issuers (Note F) | | | — | | | | — | | | | — | | | | — | | | | 161 | | | | — | | | | — | | | | — | | | | — | | | | — | | |
Foreign taxes withheld (Note A) | | | (2 | ) | | | (956 | ) | | | (481 | ) | | | (101 | ) | | | (1,221 | ) | | | (5 | ) | | | (5 | ) | | | (130 | ) | | | (444 | ) | | | (2,814 | ) | |
Total income | | $ | 367 | | | $ | 8,135 | | | $ | 69,598 | | | $ | 11,409 | | | $ | 135,026 | | | $ | 70 | | | $ | 77 | | | $ | 1,806 | | | $ | 17,577 | | | $ | 31,102 | | |
Expenses: | |
Investment management fees (Note B) | | | 59 | | | | 4,025 | | | | 8,628 | | | | 3,801 | | | | 67,934 | | | | 29 | | | | 23 | | | | 1,021 | | | | 5,908 | | | | 10,741 | | |
Administration fees (Note B) | | | 7 | | | | 244 | | | | 1,077 | | | | 434 | | | | 6,155 | | | | 2 | | | | 2 | | | | 56 | | | | 704 | | | | 809 | | |
Administration fees (Note B): | |
Investor Class | | | — | | | | — | | | | — | | | | 1,234 | | | | 3,493 | | | | — | | | | — | | | | — | | | | 1,989 | | | | 226 | | |
Trust Class | | | — | | | | — | | | | — | | | | 273 | | | | 6,016 | | | | — | | | | — | | | | — | | | | 292 | | | | 176 | | |
Advisor Class | | | — | | | | — | | | | — | | | | 16 | | | | 1,167 | | | | — | | | | — | | | | — | | | | 1 | | | | — | | |
Institutional Class | | | 9 | | | | 263 | | | | 1,065 | | | | 13 | | | | 3,066 | | | | 3 | | | | 2 | | | | 81 | | | | 61 | | | | 933 | | |
Class A | | | 1 | | | | 35 | | | | 513 | | | | 8 | | | | — | | | | 1 | | | | 1 | | | | 5 | | | | 45 | | | | 192 | | |
Class C | | | 1 | | | | 10 | | | | 705 | | | | 5 | | | | — | | | | 1 | | | | — | | | | — | | | | 5 | | | | 26 | | |
Class R3 | | | — | | | | 2 | | | | 5 | | | | — | | | | — | | | | — | | | | — | | | | — | | | | 1 | | | | — | | |
Class R6 | | | — | | | | 18 | | | | — | | | | — | | | | 599 | | | | — | | | | — | | | | — | | | | — | | | | 8 | | |
Distribution fees (Note B): | |
Trust Class | | | — | | | | — | | | | — | | | | 80 | | | | — | | | | — | | | | — | | | | — | | | | 86 | | | | — | | |
Advisor Class | | | — | | | | — | | | | — | | | | 12 | | | | 858 | | | | — | | | | — | | | | — | | | | 1 | | | | — | | |
Institutional Class | | | — | | | | — | | | | — | | | | — | | | | — | | | | — | | | | — | | | | — | | | | — | | | | — | | |
Class A | | | 1 | | | | 43 | | | | 641 | | | | 9 | | | | — | | | | 1 | | | | 2 | | | | 6 | | | | 56 | | | | 240 | | |
Class C | | | 4 | | | | 52 | | | | 3,527 | | | | 26 | | | | — | | | | 2 | | | | 2 | | | | 1 | | | | 24 | | | | 133 | | |
Class R3 | | | — | | | | 5 | | | | 14 | | | | — | | | | — | | | | — | | | | — | | | | — | | | | 3 | | | | — | | |
Class R6 | | | — | | | | — | | | | — | | | | — | | | | — | | | | — | | | | — | | | | — | | | | — | | | | — | | |
Shareholder servicing agent fees: | |
Investor Class | | | — | | | | — | | | | — | | | | 435 | | | | 1,127 | | | | — | | | | — | | | | — | | | | 861 | | | | 140 | | |
Trust Class | | | — | | | | — | | | | — | | | | — | | | | — | | | | — | | | | — | | | | — | | | | — | | | | 11 | | |
Advisor Class | | | — | | | | — | | | | — | | | | — | | | | 102 | | | | — | | | | — | | | | — | | | | — | | | | — | | |
Institutional Class | | | 2 | | | | 117 | | | | — | | | | — | | | | — | | | | — | | | | — | | | | 40 | | | | — | | | | — | | |
Class A | | | 2 | | | | 11 | | | | 34 | | | | 1 | | | | — | | | | 1 | | | | — | | | | 2 | | | | 1 | | | | 14 | | |
Class C | | | 2 | | | | — | | | | 12 | | | | 1 | | | | — | | | | — | | | | — | | | | — | | | | — | | | | 3 | | |
Class R3 | | | — | | | | 1 | | | | 1 | | | | — | | | | — | | | | — | | | | — | | | | — | | | | — | | | | — | | |
Class R6 | | | 2 | | | | — | | | | — | | | | — | | | | — | | | | — | | | | — | | | | — | | | | — | | | | — | | |
Organization expense (Note A) | | | 65 | | | | — | | | | — | | | | — | | | | — | | | | — | | | | — | | | | — | | | | — | | | | — | | |
Audit fees | | | 23 | | | | 60 | | | | 65 | | | | 60 | | | | 72 | | | | 57 | | | | 41 | | | | 57 | | | | 63 | | | | 59 | | |
Custodian and accounting fees | | | 29 | | | | 614 | | | | 378 | | | | 202 | | | | 1,395 | | | | 52 | | | | 39 | | | | 129 | | | | 277 | | | | 474 | | |
Insurance expense | | | — | | | | 19 | | | | 92 | | | | 30 | | | | 438 | | | | — | | | | — | | | | 5 | | | | 52 | | | | 49 | | |
Legal fees | | | 45 | | | | 91 | | | | 92 | | | | 88 | | | | 96 | | | | 87 | | | | 86 | | | | 113 | | | | 130 | | | | 88 | | |
Registration and filing fees | | | 36 | | | | 87 | | | | 104 | | | | 93 | | | | 278 | | | | 45 | | | | 62 | | | | 52 | | | | 109 | | | | 145 | | |
Repayment to Management of expenses previously assumed by
Management (Note B) | | | — | | | | — | | | | — | | | | — | | | | 86 | | | | — | | | | — | | | | — | | | | — | | | | 33 | | |
Shareholder reports | | | 15 | | | | 23 | | | | 191 | | | | 50 | | | | 956 | | | | 2 | | | | 1 | | | | 5 | | | | 122 | | | | 97 | | |
Trustees' fees and expenses | | | 31 | | | | 47 | | | | 50 | | | | 48 | | | | 68 | | | | 47 | | | | 47 | | | | 47 | | | | 49 | | | | 49 | | |
Interest expense | | | — | | | | 1 | | | | 56 | | | | — | | | | 14 | | | | — | | | | — | | | | 10 | (Note E) | | | 2 | | | | 5 | | |
Miscellaneous | | | 3 | | | | 77 | | | | 112 | | | | 50 | | | | 587 | | | | 13 | | | | 12 | | | | 19 | | | | 79 | | | | 122 | | |
Total expenses | | | 337 | | | | 5,845 | | | | 17,362 | | | | 6,969 | | | | 94,507 | | | | 343 | | | | 320 | | | | 1,649 | | | | 10,921 | | | | 14,773 | | |
See Notes to Financial Statements
143
144
Statements of Operations (cont'd)
Neuberger Berman Equity Funds (cont'd)
(000's omitted)
| | | DIVIDEND
GROWTH FUND | | EMERGING
MARKETS
EQUITY FUND | | EQUITY
INCOME FUND | | FOCUS FUND | | GENESIS FUND | | GLOBAL
EQUITY
FUND | | GLOBAL REAL
ESTATE FUND | | GREATER CHINA
EQUITY
FUND | | GUARDIAN
FUND | | INTERNATIONAL
EQUITY FUND | |
| | | For the Period from
December 15, 2015
(Commencement
of Operations) to
August 31,
2016 | | For the
Year Ended
August 31,
2016 | | For the
Year Ended
August 31,
2016 | | For the
Year Ended
August 31,
2016 | | For the
Year Ended
August 31,
2016 | | For the
Year Ended
August 31,
2016 | | For the
Year Ended
August 31,
2016 | | For the
Year Ended
August 31,
2016 | | For the
Year Ended
August 31,
2016 | | For the
Year Ended
August 31,
2016 | |
Expenses reimbursed by Management (Note B) | | | (250 | ) | | | (725 | ) | | | — | | | | (3 | ) | | | — | | | | (294 | ) | | | (287 | ) | | | (237 | ) | | | — | | | | (12 | ) | |
Investment management fees waived (Note B) | | | — | | | | — | | | | — | | | | — | | | | — | | | | — | | | | — | | | | — | | | | — | | | | (2,428 | ) | |
Total net expenses | | | 87 | | | | 5,120 | | | | 17,362 | | | | 6,966 | | | | 94,507 | | | | 49 | | | | 33 | | | | 1,412 | | | | 10,921 | | | | 12,333 | | |
Net investment income (loss) | | $ | 280 | | | $ | 3,015 | | | $ | 52,236 | | | $ | 4,443 | | | $ | 40,519 | | | $ | 21 | | | $ | 44 | | | $ | 394 | | | $ | 6,656 | | | $ | 18,769 | | |
Realized and Unrealized Gain (Loss) on Investments (Note A): | |
Net realized gain (loss) on: | |
Sales of investment securities of unaffiliated issuers | | | (120 | ) | | | (31,762 | ) | | | 61,950 | | | | 76,930 | | | | 787,469 | | | | 37 | | | | 10 | | | | (11,747 | )* | | | 204,284 | | | | 14,298 | | |
Sales of investment securities of affiliated issuers | | | — | | | | — | | | | — | | | | — | | | | 168,072 | | | | — | | | | — | | | | — | | | | — | | | | — | | |
Foreign currency | | | — | | | | (763 | ) | | | (214 | ) | | | — | | | | (17 | ) | | | — | | | | — | | | | (32 | ) | | | (58 | ) | | | (352 | ) | |
Option contracts written | | | — | | | | — | | | | 1,835 | | | | 49 | | | | — | | | | — | | | | — | | | | — | | | | 445 | | | | — | | |
Net increase from payments by affiliates (Note B) | | | — | | | | — | | | | — | | | | — | | | | — | | | | — | | | | — | | | | — | | | | — | | | | — | | |
Change in net unrealized appreciation (depreciation) in value of: | |
Unaffiliated investment securities | | | 1,789 | | | | 92,347 | ** | | | 87,842 | | | | (37,040 | ) | | | (20,341 | ) | | | 161 | | | | 383 | | | | 25,026 | | | | (120,183 | ) | | | 29,697 | | |
Affiliated investment securities | | | — | | | | — | | | | — | | | | — | | | | 153,711 | | | | — | | | | — | | | | — | | | | — | | | | — | | |
Foreign currency | | | — | | | | 67 | | | | 11 | | | | — | | | | — | | | | — | | | | — | | | | (2 | ) | | | (13 | ) | | | 21 | | |
Option contracts written | | | — | | | | — | | | | 293 | | | | 164 | | | | — | | | | — | | | | — | | | | — | | | | 381 | | | | — | | |
Net gain (loss) on investments | | | 1,669 | | | | 59,889 | | | | 151,717 | | | | 40,103 | | | | 1,088,894 | | | | 198 | | | | 393 | | | | 13,245 | | | | 84,856 | | | | 43,664 | | |
Net increase (decrease) in net assets resulting from operations | | $ | 1,949 | | | $ | 62,904 | | | $ | 203,953 | | | $ | 44,546 | | | $ | 1,129,413 | | | $ | 219 | | | $ | 437 | | | $ | 13,639 | | | $ | 91,512 | | | $ | 62,433 | | |
* Reversal of capital gains tax $43,359.
** Change in accrued foreign capital gains tax amounted to $(282,181).
See Notes to Financial Statements
145
146
Statements of Operations (cont'd)
Neuberger Berman Equity Funds
(000's omitted)
| | | INTERNATIONAL
SELECT FUND | | INTRINSIC
VALUE FUND | | LARGE CAP
VALUE FUND | | MID CAP
GROWTH FUND | | MID CAP
INTRINSIC
VALUE FUND | | MULTI-CAP
OPPORTUNITIES
FUND | | REAL ESTATE
FUND | | SMALL CAP
GROWTH FUND | | SOCIALLY
RESPONSIVE
FUND | | VALUE FUND | |
| | | For the
Year Ended
August 31,
2016 | | For the
Year Ended
August 31,
2016 | | For the
Year Ended
August 31,
2016 | | For the
Year Ended
August 31,
2016 | | For the
Year Ended
August 31,
2016 | | For the
Year Ended
August 31,
2016 | | For the
Year Ended
August 31,
2016 | | For the
Year Ended
August 31,
2016 | | For the
Year Ended
August 31,
2016 | | For the
Year Ended
August 31,
2016 | |
Investment Income: | |
Income (Note A): | |
Dividend income—unaffiliated issuers | | $ | 6,171 | | | $ | 3,360 | | | $ | 27,245 | | | $ | 6,863 | | | $ | 1,909 | | | $ | 36,134 | | | $ | 17,640 | | | $ | 265 | | | $ | 36,373 | | | $ | 295 | | |
Dividend income—affiliated issuers (Note F) | | | — | | | | — | | | | — | | | | — | | | | — | | | | — | | | | — | | | | — | | | | — | | | | — | | |
Interest income—unaffiliated issuers | | | 5 | | | | 42 | | | | 130 | | | | 158 | | | | 6 | | | | 37 | | | | 28 | | | | 7 | | | | 53 | | | | — | | |
Income from investments in affiliated issuers (Note F) | | | — | | | | — | | | | — | | | | — | | | | — | | | | — | | | | — | | | | — | | | | — | | | | — | | |
Foreign taxes withheld (Note A) | | | (536 | ) | | | (3 | ) | | | — | | | | — | | | | (1 | ) | | | (97 | ) | | | (54 | ) | | | — | | | | (659 | ) | | | — | | |
Total income | | $ | 5,640 | | | $ | 3,399 | | | $ | 27,375 | | | $ | 7,021 | | | $ | 1,914 | | | $ | 36,074 | | | $ | 17,614 | | | $ | 272 | | | $ | 35,767 | | | $ | 295 | | |
Expenses: | |
Investment management fees (Note B) | | | 1,287 | | | | 4,466 | | | | 6,494 | | | | 5,776 | | | | 521 | | | | 10,844 | | | | 5,944 | | | | 606 | | | | 10,529 | | | | 77 | | |
Administration fees (Note B) | | | 140 | | | | 328 | | | | 782 | | | | 687 | | | | 57 | | | | 1,244 | | | | 446 | | | | 43 | | | | 1,345 | | | | 8 | | |
Administration fees (Note B): | |
Investor Class | | | — | | | | — | | | | 2,007 | | | | 813 | | | | 77 | | | | — | | | | — | | | | 86 | | | | 1,472 | | | | — | | |
Trust Class | | | 29 | | | | — | | | | 299 | | | | 265 | | | | 36 | | | | — | | | | 778 | | | | 15 | | | | 987 | | | | — | | |
Advisor Class | | | — | | | | — | | | | 496 | | | | 37 | | | | — | | | | — | | | | — | | | | 8 | | | | — | | | | — | | |
Institutional Class | | | 193 | | | | 426 | | | | 55 | | | | 350 | | | | 24 | | | | 1,748 | | | | 271 | | | | 13 | | | | 641 | | | | 8 | | |
Class A | | | 9 | | | | 94 | | | | 6 | | | | 177 | | | | 27 | | | | 174 | | | | 250 | | | | 8 | | | | 269 | | | | 9 | | |
Class C | | | 7 | | | | 51 | | | | 4 | | | | 21 | | | | 7 | | | | 86 | | | | 59 | | | | 4 | | | | 104 | | | | 1 | | |
Class R3 | | | 7 | | | | — | | | | — | | | | 27 | | | | 3 | | | | — | | | | 46 | | | | 2 | | | | 63 | | | | — | | |
Class R6 | | | — | | | | — | | | | — | | | | 29 | | | | — | | | | — | | | | 7 | | | | — | | | | 57 | | | | — | | |
Distribution fees (Note B): | |
Trust Class | | | 9 | | | | — | | | | 88 | | | | — | | | | 11 | | | | — | | | | 229 | | | | 5 | | | | 290 | | | | — | | |
Advisor Class | | | — | | | | — | | | | 365 | | | | 28 | | | | — | | | | — | | | | — | | | | 6 | | | | — | | | | — | | |
Institutional Class | | | — | | | | — | | | | — | | | | — | | | | — | | | | — | | | | — | | | | — | | | | — | | | | — | | |
Class A | | | 11 | | | | 118 | | | | 8 | | | | 221 | | | | 34 | | | | 218 | | | | 312 | | | | 9 | | | | 336 | | | | 11 | | |
Class C | | | 34 | | | | 258 | | | | 21 | | | | 103 | | | | 36 | | | | 429 | | | | 294 | | | | 20 | | | | 518 | | | | 5 | | |
Class R3 | | | 18 | | | | — | | | | — | | | | 67 | | | | 6 | | | | — | | | | 116 | | | | 6 | | | | 158 | | | | — | | |
Class R6 | | | — | | | | — | | | | — | | | | — | | | | — | | | | — | | | | — | | | | — | | | | — | | | | — | | |
Shareholder servicing agent fees: | |
Investor Class | | | — | | | | — | | | | 772 | | | | 454 | | | | 38 | | | | — | | | | — | | | | 89 | | | | 570 | | | | — | | |
Trust Class | | | 9 | | | | — | | | | 3 | | | | 1 | | | | 4 | | | | — | | | | 36 | | | | 2 | | | | 10 | | | | — | | |
Advisor Class | | | — | | | | — | | | | 4 | | | | 2 | | | | — | | | | — | | | | — | | | | 1 | | | | — | | | | — | | |
Institutional Class | | | — | | | | 1 | | | | — | | | | 5 | | | | — | | | | 742 | | | | 3 | | | | 1 | | | | 7 | | | | — | | |
Class A | | | 1 | | | | 24 | | | | — | | | | 15 | | | | 5 | | | | 31 | | | | 18 | | | | 2 | | | | 17 | | | | 3 | | |
Class C | | | — | | | | 3 | | | | — | | | | 4 | | | | 1 | | | | 9 | | | | 5 | | | | — | | | | 4 | | | | — | | |
Class R3 | | | 1 | | | | — | | | | — | | | | 5 | | | | 1 | | | | — | | | | 5 | | | | 1 | | | | 3 | | | | — | | |
Class R6 | | | — | | | | — | | | | — | | | | 2 | | | | — | | | | — | | | | 1 | | | | — | | | | — | | | | — | | |
Organization expense (Note A) | | | — | | | | — | | | | — | | | | — | | | | — | | | | — | | | | — | | | | — | | | | — | | | | — | | |
Audit fees | | | 70 | | | | 28 | | | | 60 | | | | 28 | | | | 28 | | | | 28 | | | | 56 | | | | 28 | | | | 28 | | | | 52 | | |
Custodian and accounting fees | | | 168 | | | | 150 | | | | 288 | | | | 279 | | | | 84 | | | | 336 | | | | 219 | | | | 91 | | | | 410 | | | | 35 | | |
Insurance expense | | | 10 | | | | 18 | | | | 58 | | | | 43 | | | | 4 | | | | 89 | | | | 35 | | | | 3 | | | | 89 | | | | 1 | | |
Legal fees | | | 111 | | | | 109 | | | | 89 | | | | 88 | | | | 87 | | | | 89 | | | | 88 | | | | 89 | | | | 92 | | | | 88 | | |
Registration and filing fees | | | 101 | | | | 92 | | | | 127 | | | | 137 | | | | 89 | | | | 60 | | | | 121 | | | | 101 | | | | 145 | | | | 43 | | |
Repayment to Management of expenses previously assumed by
Management (Note B) | | | — | | | | — | | | | — | | | | 82 | | | | — | | | | — | | | | — | | | | — | | | | — | | | | — | | |
Shareholder reports | | | 13 | | | | 106 | | | | 88 | | | | 143 | | | | 21 | | | | 90 | | | | 86 | | | | 21 | | | | 246 | | | | 4 | | |
Trustees' fees and expenses | | | 47 | | | | 48 | | | | 49 | | | | 49 | | | | 47 | | | | 51 | | | | 48 | | | | 47 | | | | 51 | | | | 47 | | |
Interest expense | | | — | | | | — | | | | 7 | | | | — | | | | 2 | | | | 38 | | | | 8 | | | | — | | | | 1 | | | | 1 | (Note E) | |
Miscellaneous | | | 49 | | | | 34 | | | | 88 | | | | 76 | | | | 10 | | | | 133 | | | | 51 | | | | 10 | | | | 141 | | | | 4 | | |
Total expenses | | | 2,324 | | | | 6,354 | | | | 12,258 | | | | 10,014 | | | | 1,260 | | | | 16,439 | | | | 9,532 | | | | 1,317 | | | | 18,583 | | | | 397 | | |
See Notes to Financial Statements
147
148
Statements of Operations (cont'd)
Neuberger Berman Equity Funds (cont'd)
(000's omitted)
| | | INTERNATIONAL
SELECT FUND | | INTRINSIC
VALUE FUND | | LARGE CAP
VALUE FUND | | MID CAP
GROWTH FUND | | MID CAP
INTRINSIC
VALUE FUND | | MULTI-CAP
OPPORTUNITIES
FUND | | REAL ESTATE
FUND | | SMALL CAP
GROWTH FUND | | SOCIALLY
RESPONSIVE
FUND | | VALUE FUND | |
| | | For the
Year Ended
August 31,
2016 | | For the
Year Ended
August 31,
2016 | | For the
Year Ended
August 31,
2016 | | For the
Year Ended
August 31,
2016 | | For the
Year Ended
August 31,
2016 | | For the
Year Ended
August 31,
2016 | | For the
Year Ended
August 31,
2016 | | For the
Year Ended
August 31,
2016 | | For the
Year Ended
August 31,
2016 | | For the
Year Ended
August 31,
2016 | |
Expenses reimbursed by Management (Note B) | | | (112 | ) | | | (438 | ) | | | (7 | ) | | | (4 | ) | | | (57 | ) | | | — | | | | (1,881 | ) | | | (463 | ) | | | — | | | | (275 | ) | |
Investment management fees waived (Note B) | | | — | | | | — | | | | — | | | | — | | | | (141 | ) | | | — | | | | — | | | | — | | | | — | | | | — | | |
Total net expenses | | | 2,212 | | | | 5,916 | | | | 12,251 | | | | 10,010 | | | | 1,062 | | | | 16,439 | | | | 7,651 | | | | 854 | | | | 18,583 | | | | 122 | | |
Net investment income (loss) | | $ | 3,428 | | | $ | (2,517 | ) | | $ | 15,124 | | | $ | (2,989 | ) | | $ | 852 | | | $ | 19,635 | | | $ | 9,963 | | | $ | (582 | ) | | $ | 17,184 | | | $ | 173 | | |
Realized and Unrealized Gain (Loss) on Investments (Note A): | |
Net realized gain (loss) on: | |
Sales of investment securities of unaffiliated issuers | | | 3,816 | | | | 13,888 | | | | 2,357 | | | | 46,790 | | | | (701 | ) | | | 71,256 | | | | 90,375 | | | | (12,590 | ) | | | 91,687 | | | | (848 | ) | |
Sales of investment securities of affiliated issuers | | | — | | | | — | | | | — | | | | — | | | | — | | | | — | | | | — | | | | — | | | | — | | | | — | | |
Foreign currency | | | (45 | ) | | | (1 | ) | | | — | | | | — | | | | — | | | | — | | | | — | | | | — | | | | (9 | ) | | | — | | |
Option contracts written | | | — | | | | — | | | | — | | | | — | | | | — | | | | — | | | | — | | | | — | | | | — | | | | — | | |
Net increase from payments by affiliates (Note B) | | | — | | | | — | | | | — | | | | 1,007 | | | | — | | | | — | | | | — | | | | — | | | | — | | | | — | | |
Change in net unrealized appreciation (depreciation) in value of: | |
Unaffiliated investment securities | | | 1,255 | | | | 18,804 | | | | 137,870 | | | | (68,458 | ) | | | 4,256 | | | | 69,607 | | | | 48,034 | | | | 8,835 | | | | 119,713 | | | | 1,907 | | |
Affiliated investment securities | | | — | | | | — | | | | — | | | | — | | | | — | | | | — | | | | — | | | | — | | | | — | | | | — | | |
Foreign currency | | | 5 | | | | — | | | | — | | | | — | | | | — | | | | — | | | | — | | | | — | | | | (18 | ) | | | — | | |
Option contracts written | | | — | | | | — | | | | — | | | | — | | | | — | | | | — | | | | — | | | | — | | | | — | | | | — | | |
Net gain (loss) on investments | | | 5,031 | | | | 32,691 | | | | 140,227 | | | | (20,661 | ) | | | 3,555 | | | | 140,863 | | | | 138,409 | | | | (3,755 | ) | | | 211,373 | | | | 1,059 | | |
Net increase (decrease) in net assets resulting from operations | | $ | 8,459 | | | $ | 30,174 | | | $ | 155,351 | | | $ | (23,650 | ) | | $ | 4,407 | | | $ | 160,498 | | | $ | 148,372 | | | $ | (4,337 | ) | | $ | 228,557 | | | $ | 1,232 | | |
See Notes to Financial Statements
149
150
Statements of Changes in Net Assets
Neuberger Berman Equity Funds
(000's omitted)
| | | DIVIDEND
GROWTH FUND | | EMERGING MARKETS
EQUITY FUND | | EQUITY INCOME FUND | | FOCUS FUND | | GENESIS FUND | |
| | | Period from
December 15, 2015
(Commencement
of Operations) to
August 31,
2016 | | Year Ended
August 31,
2016 | | Year Ended
August 31,
2015 | | Year Ended
August 31,
2016 | | Year Ended
August 31,
2015 | | Year Ended
August 31,
2016 | | Year Ended
August 31,
2015 | | Year Ended
August 31,
2016 | | Year Ended
August 31,
2015 | |
Increase (Decrease) in Net Assets: | |
From Operations: | |
Net investment income (loss) (Note A) | | $ | 280 | | | $ | 3,015 | | | $ | 3,913 | | | $ | 52,236 | | | $ | 57,892 | | | $ | 4,443 | | | $ | 6,120 | | | $ | 40,519 | | | $ | 45,377 | | |
Net realized gain (loss) on investments (Note A) | | | (120 | ) | | | (32,525 | ) | | | (13,466 | ) | | | 63,571 | | | | 86,350 | | | | 76,979 | | | | 30,551 | | | | 955,524 | | | | 1,347,628 | | |
Net increase from payments by affiliates (Note B) | | | — | | | | — | | | | — | | | | — | | | | — | | | | — | | | | — | | | | — | | | | — | | |
Change in net unrealized appreciation (depreciation)
of investments (Note A) | | | 1,789 | | | | 92,414 | | | | (110,755 | ) | | | 88,146 | | | | (252,324 | ) | | | (36,876 | ) | | | (31,019 | ) | | | 133,370 | | | | (1,140,993 | ) | |
Net increase (decrease) in net assets resulting from operations | | | 1,949 | | | | 62,904 | | | | (120,308 | ) | | | 203,953 | | | | (108,082 | ) | | | 44,546 | | | | 5,652 | | | | 1,129,413 | | | | 252,012 | | |
Distributions to Shareholders From (Note A): | |
Net investment income: | |
Investor Class | | | — | | | | — | | | | — | | | | — | | | | — | | | | (4,272 | ) | | | (3,689 | ) | | | (7,480 | ) | | | (7,717 | ) | |
Trust Class | | | — | | | | — | | | | — | | | | — | | | | — | | | | (798 | ) | | | (975 | ) | | | (1,035 | ) | | | (1,507 | ) | |
Advisor Class | | | — | | | | — | | | | — | | | | — | | | | — | | | | (115 | ) | | | (81 | ) | | | (419 | ) | | | (694 | ) | |
Institutional Class | | | — | | | | (1,980 | ) | | | (4,661 | ) | | | (33,197 | ) | | | (38,126 | ) | | | (221 | ) | | | (76 | ) | | | (13,363 | ) | | | (14,769 | ) | |
Class A | | | — | | | | (70 | ) | | | (148 | ) | | | (6,196 | ) | | | (6,984 | ) | | | (45 | ) | | | (30 | ) | | | — | | | | — | | |
Class C | | | — | | | | — | | | | (18 | ) | | | (5,844 | ) | | | (5,457 | ) | | | (53 | ) | | | (15 | ) | | | — | | | | — | | |
Class R3 | | | — | | | | (2 | ) | | | (4 | ) | | | (65 | ) | | | (66 | ) | | | — | | | | — | | | | — | | | | — | | |
Class R6 | | | — | | | | (673 | ) | | | (901 | ) | | | — | | | | — | | | | — | | | | — | | | | (13,260 | ) | | | (10,902 | ) | |
Net realized gain on investments: | |
Investor Class | | | — | | | | — | | | | — | | | | — | | | | — | | | | (27,199 | ) | | | (97,070 | ) | | | (261,273 | ) | | | (276,734 | ) | |
Trust Class | | | — | | | | — | | | | — | | | | — | | | | — | | | | (5,819 | ) | | | (26,590 | ) | | | (167,895 | ) | | | (207,811 | ) | |
Advisor Class | | | — | | | | — | | | | — | | | | — | | | | — | | | | (710 | ) | | | (2,190 | ) | | | (69,131 | ) | | | (82,457 | ) | |
Institutional Class | | | — | | | | — | | | | — | | | | (44,180 | ) | | | (72,214 | ) | | | (1,116 | ) | | | (1,506 | ) | | | (345,517 | ) | | | (386,062 | ) | |
Class A | | | — | | | | — | | | | — | | | | (9,346 | ) | | | (16,802 | ) | | | (307 | ) | | | (845 | ) | | | — | | | | — | | |
Class C | | | — | | | | — | | | | — | | | | (13,040 | ) | | | (19,379 | ) | | | (399 | ) | | | (532 | ) | | | — | | | | — | | |
Class R3 | | | — | | | | — | | | | — | | | | (112 | ) | | | (166 | ) | | | — | | | | — | | | | — | | | | — | | |
Class R6 | | | — | | | | — | | | | — | | | | — | | | | — | | | | — | | | | — | | | | (281,756 | ) | | | (224,407 | ) | |
Total distributions to shareholders | | | — | | | | (2,725 | ) | | | (5,732 | ) | | | (111,980 | ) | | | (159,194 | ) | | | (41,054 | ) | | | (133,599 | ) | | | (1,161,129 | ) | | | (1,213,060 | ) | |
From Fund Share Transactions (Note D): | |
Proceeds from shares sold: | |
Investor Class | | | — | | | | — | | | | — | | | | — | | | | — | | | | 5,207 | | | | 8,055 | | | | 166,774 | | | | 208,626 | | |
Trust Class | | | — | | | | — | | | | — | | | | — | | | | — | | | | 1,694 | | | | 18,496 | | | | 131,035 | | | | 169,016 | | |
Advisor Class | | | — | | | | — | | | | — | | | | — | | | | — | | | | 637 | | | | 1,767 | | | | 50,785 | | | | 95,330 | | |
Institutional Class | | | 20,184 | | | | 113,068 | | | | 87,329 | | | | 179,243 | | | | 381,003 | | | | 2,431 | | | | 24,211 | | | | 868,352 | | | | 679,324 | | |
Class A | | | 716 | | | | 15,370 | | | | 7,072 | | | | 30,839 | | | | 59,143 | | | | 463 | | | | 5,983 | | | | — | | | | — | | |
Class C | | | 601 | | | | 567 | | | | 2,549 | | | | 25,033 | | | | 53,763 | | | | 522 | | | | 2,437 | | | | — | | | | — | | |
Class R3 | | | — | | | | 476 | | | | 669 | | | | 566 | | | | 1,504 | | | | — | | | | — | | | | — | | | | — | | |
Class R6 | | | 1,000 | | | | 11,499 | | | | 27,239 | | | | — | | | | — | | | | — | | | | — | | | | 656,719 | | | | 681,153 | | |
See Notes to Financial Statements
151
152
Statements of Changes in Net Assets (cont'd)
Neuberger Berman Equity Funds (cont'd)
(000's omitted)
| | | DIVIDEND
GROWTH FUND | | EMERGING MARKETS
EQUITY FUND | | EQUITY INCOME FUND | | FOCUS FUND | | GENESIS FUND | |
| | | Period from
December 15, 2015
(Commencement
of Operations) to
August 31,
2016 | | Year Ended
August 31,
2016 | | Year Ended
August 31,
2015 | | Year Ended
August 31,
2016 | | Year Ended
August 31,
2015 | | Year Ended
August 31,
2016 | | Year Ended
August 31,
2015 | | Year Ended
August 31,
2016 | | Year Ended
August 31,
2015 | |
Proceeds from reinvestment of dividends and distributions: | |
Investor Class | | | — | | | | — | | | | — | | | | — | | | | — | | | | 28,301 | | | | 90,410 | | | | 259,291 | | | | 276,966 | | |
Trust Class | | | — | | | | — | | | | — | | | | — | | | | — | | | | 6,580 | | | | 27,462 | | | | 164,812 | | | | 204,115 | | |
Advisor Class | | | — | | | | — | | | | — | | | | — | | | | — | | | | 825 | | | | 2,257 | | | | 64,441 | | | | 67,182 | | |
Institutional Class | | | — | | | | 1,168 | | | | 2,815 | | | | 64,068 | | | | 88,651 | | | | 505 | | | | 1,390 | | | | 330,269 | | | | 370,058 | | |
Class A | | | — | | | | 49 | | | | 100 | | | | 13,328 | | | | 20,683 | | | | 340 | | | | 791 | | | | — | | | | — | | |
Class C | | | — | | | | — | | | | 5 | | | | 13,078 | | | | 16,915 | | | | 358 | | | | 468 | | | | — | | | | — | | |
Class R3 | | | — | | | | 1 | | | | 2 | | | | 120 | | | | 153 | | | | — | | | | — | | | | — | | | | — | | |
Class R6 | | | — | | | | 673 | | | | 901 | | | | — | | | | — | | | | — | | | | — | | | | 295,016 | | | | 235,309 | | |
Payments for shares redeemed: | |
Investor Class | | | — | | | | — | | | | — | | | | — | | | | — | | | | (54,961 | ) | | | (61,339 | ) | | | (618,036 | ) | | | (655,995 | ) | |
Trust Class | | | — | | | | — | | | | — | | | | — | | | | — | | | | (28,349 | ) | | | (52,974 | ) | | | (555,220 | ) | | | (1,146,512 | ) | |
Advisor Class | | | — | | | | — | | | | — | | | | — | | | | — | | | | (3,048 | ) | | | (2,734 | ) | | | (267,459 | ) | | | (234,491 | ) | |
Institutional Class | | | (1,547 | ) | | | (145,964 | ) | | | (199,441 | ) | | | (668,925 | ) | | | (424,474 | ) | | | (23,239 | ) | | | (4,552 | ) | | | (1,402,884 | ) | | | (2,116,517 | ) | |
Class A | | | (562 | ) | | | (8,099 | ) | | | (9,601 | ) | | | (104,754 | ) | | | (214,296 | ) | | | (1,796 | ) | | | (5,617 | ) | | | — | | | | — | | |
Class C | | | (667 | ) | | | (2,251 | ) | | | (1,616 | ) | | | (113,279 | ) | | | (82,624 | ) | | | (1,284 | ) | | | (830 | ) | | | — | | | | — | | |
Class R3 | | | — | | | | (183 | ) | | | (351 | ) | | | (1,912 | ) | | | (862 | ) | | | — | | | | — | | | | — | | | | — | | |
Class R6 | | | (1,057 | ) | | | (6,354 | ) | | | (1,867 | ) | | | — | | | | — | | | | — | | | | — | | | | (429,375 | ) | | | (634,879 | ) | |
Net increase (decrease) from Fund share transactions | | | 18,668 | | | | (19,980 | ) | | | (84,195 | ) | | | (562,595 | ) | | | (100,441 | ) | | | (64,814 | ) | | | 55,681 | | | | (285,480 | ) | | | (1,801,315 | ) | |
Net Increase (Decrease) in Net Assets | | | 20,617 | | | | 40,199 | | | | (210,235 | ) | | | (470,622 | ) | | | (367,717 | ) | | | (61,322 | ) | | | (72,266 | ) | | | (317,196 | ) | | | (2,762,363 | ) | |
Net Assets: | |
Beginning of year | | | — | | | | 415,981 | | | | 626,216 | | | | 2,126,886 | | | | 2,494,603 | | | | 774,699 | | | | 846,965 | | | | 10,961,444 | | | | 13,723,807 | | |
End of year | | $ | 20,617 | | | $ | 456,180 | | | $ | 415,981 | | | $ | 1,656,264 | | | $ | 2,126,886 | | | $ | 713,377 | | | $ | 774,699 | | | $ | 10,644,248 | | | $ | 10,961,444 | | |
Undistributed net investment income (loss) at end of year | | $ | 284 | | | $ | 1,800 | | | $ | 2,273 | | | $ | 5,133 | | | $ | — | | | $ | 2,377 | | | $ | 3,830 | | | $ | 22,874 | | | $ | 19,793 | | |
Distributions in excess of net investment income at end of year | | $ | — | | | $ | — | | | $ | — | | | $ | — | | | $ | (1,857 | ) | | $ | — | | | $ | — | | | $ | — | | | $ | — | | |
See Notes to Financial Statements
153
154
Statements of Changes in Net Assets (cont'd)
Neuberger Berman Equity Funds
(000's omitted)
| | | GLOBAL EQUITY FUND | | GLOBAL REAL ESTATE FUND | | GREATER CHINA
EQUITY FUND | | GUARDIAN FUND | | INTERNATIONAL
EQUITY FUND | |
| | | Year Ended
August 31,
2016 | | Year Ended
August 31,
2015 | | Year Ended
August 31,
2016 | | Period from
December 30, 2014
(Commencement
of Operations) to
August 31,
2015 | | Year Ended
August 31,
2016 | | Year Ended
August 31,
2015 | | Year Ended
August 31,
2016 | | Year Ended
August 31,
2015 | | Year Ended
August 31,
2016 | | Year Ended
August 31,
2015 | |
Increase (Decrease) in Net Assets: | |
From Operations: | |
Net investment income (loss) (Note A) | | $ | 21 | | | $ | 24 | | | $ | 44 | | | $ | 21 | | | $ | 394 | | | $ | 894 | | | $ | 6,656 | | | $ | 9,462 | | | $ | 18,769 | | | $ | 12,376 | | |
Net realized gain (loss) on investments (Note A) | | | 37 | | | | 3,139 | | | | 10 | | | | — | | | | (11,779 | ) | | | 18,813 | | | | 204,671 | | | | 109,228 | | | | 13,946 | | | | 43,979 | | |
Net increase from payments by affiliates (Note B) | | | — | | | | — | | | | — | | | | — | | | | — | | | | — | | | | — | | | | — | | | | — | | | | — | | |
Change in net unrealized appreciation (depreciation)
of investments (Note A) | | | 161 | | | | (4,661 | ) | | | 383 | | | | (198 | ) | | | 25,024 | | | | (26,428 | ) | | | (119,815 | ) | | | (155,129 | ) | | | 29,718 | | | | (108,755 | ) | |
Net increase (decrease) in net assets resulting
from operations | | | 219 | | | | (1,498 | ) | | | 437 | | | | (177 | ) | | | 13,639 | | | | (6,721 | ) | | | 91,512 | | | | (36,439 | ) | | | 62,433 | | | | (52,400 | ) | |
Distributions to Shareholders From (Note A): | |
Net investment income: | |
Investor Class | | | — | | | | — | | | | — | | | | — | | | | — | | | | — | | | | (7,114 | ) | | | (8,219 | ) | | | (510 | ) | | | (885 | ) | |
Trust Class | | | — | | | | — | | | | — | | | | — | | | | — | | | | — | | | | (694 | ) | | | (1,086 | ) | | | (126 | ) | | | (220 | ) | |
Advisor Class | | | — | | | | — | | | | — | | | | — | | | | — | | | | — | | | | (0 | ) | | | (1 | ) | | | — | | | | — | | |
Institutional Class | | | (6 | ) | | | (226 | ) | | | (44 | ) | | | (19 | ) | | | (857 | ) | | | (634 | ) | | | (699 | ) | | | (1,123 | ) | | | (12,200 | ) | | | (15,333 | ) | |
Class A | | | — | | | | (24 | ) | | | (12 | ) | | | (5 | ) | | | (6 | ) | | | (21 | ) | | | (63 | ) | | | (735 | ) | | | (269 | ) | | | (133 | ) | |
Class C | | | — | | | | (7 | ) | | | (3 | ) | | | (1 | ) | | | — | | | | — | | | | — | | | | — | | | | — | | | | (6 | ) | |
Class R3 | | | — | | | | — | | | | — | | | | — | | | | — | | | | — | | | | (2 | ) | | | (4 | ) | | | — | | | | — | | |
Class R6 | | | — | | | | — | | | | — | | | | — | | | | — | | | | — | | | | — | | | | — | | | | (499 | ) | | | (387 | ) | |
Net realized gain on investments: | |
Investor Class | | | — | | | | — | | | | — | | | | — | | | | — | | | | — | | | | (109,463 | ) | | | (147,601 | ) | | | — | | | | — | | |
Trust Class | | | — | | | | — | | | | — | | | | — | | | | — | | | | — | | | | (14,321 | ) | | | (22,148 | ) | | | — | | | | — | | |
Advisor Class | | | — | | | | — | | | | — | | | | — | | | | — | | | | — | | | | (37 | ) | | | (53 | ) | | | — | | | | — | | |
Institutional Class | | | — | | | | (1,193 | ) | | | (0 | ) | | | — | | | | (11,719 | ) | | | (4,747 | ) | | | (8,681 | ) | | | (16,294 | ) | | | — | | | | — | | |
Class A | | | — | | | | (130 | ) | | | (0 | ) | | | — | | | | (270 | ) | | | (165 | ) | | | (1,333 | ) | | | (13,689 | ) | | | — | | | | — | | |
Class C | | | — | | | | (41 | ) | | | (0 | ) | | | — | | | | (17 | ) | | | (7 | ) | | | (316 | ) | | | (454 | ) | | | — | | | | — | | |
Class R3 | | | — | | | | — | | | | — | | | | — | | | | — | | | | — | | | | (68 | ) | | | (110 | ) | | | — | | | | — | | |
Class R6 | | | — | | | | — | | | | — | | | | — | | | | — | | | | — | | | | — | | | | — | | | | — | | | | — | | |
Total distributions to shareholders | | | (6 | ) | | | (1,621 | ) | | | (59 | ) | | | (25 | ) | | | (12,869 | ) | | | (5,574 | ) | | | (142,791 | ) | | | (211,517 | ) | | | (13,604 | ) | | | (16,964 | ) | |
From Fund Share Transactions (Note D): | |
Proceeds from shares sold: | |
Investor Class | | | — | | | | — | | | | — | | | | — | | | | — | | | | — | | | | 9,981 | | | | 18,391 | | | | 8,007 | | | | 12,561 | | |
Trust Class | | | — | | | | — | | | | — | | | | — | | | | — | | | | — | | | | 4,128 | | | | 9,083 | | | | 7,668 | | | | 8,341 | | |
Advisor Class | | | — | | | | — | | | | — | | | | — | | | | — | | | | — | | | | 149 | | | | 43 | | | | — | | | | — | | |
Institutional Class | | | 615 | | | | 105 | | | | 1 | | | | 2,003 | | | | 47,239 | | | | 121,023 | | | | 12,277 | | | | 25,421 | | | | 490,552 | | | | 231,021 | | |
Class A | | | 202 | | | | 183 | | | | 4 | | | | 660 | | | | 8,257 | | | | 7,076 | | | | 4,814 | | | | 28,946 | | | | 50,530 | | | | 83,310 | | |
Class C | | | 19 | | | | 129 | | | | 16 | | | | 250 | | | | — | | | | 61 | | | | 631 | | | | 566 | | | | 7,343 | | | | 7,899 | | |
Class R3 | | | — | | | | — | | | | — | | | | — | | | | — | | | | — | | | | 127 | | | | 348 | | | | — | | | | — | | |
Class R6 | | | — | | | | — | | | | — | | | | — | | | | — | | | | — | | | | — | | | | — | | | | 18,266 | | | | 19,021 | | |
See Notes to Financial Statements
155
156
Statements of Changes in Net Assets (cont'd)
Neuberger Berman Equity Funds (cont'd)
(000's omitted)
| | | GLOBAL EQUITY FUND | | GLOBAL REAL ESTATE FUND | | GREATER CHINA
EQUITY FUND | | GUARDIAN FUND | | INTERNATIONAL
EQUITY FUND | |
| | | Year Ended
August 31,
2016 | | Year Ended
August 31,
2015 | | Year Ended
August 31,
2016 | | Period from
December 30, 2014
(Commencement
of Operations) to
August 31,
2015 | | Year Ended
August 31,
2016 | | Year Ended
August 31,
2015 | | Year Ended
August 31,
2016 | | Year Ended
August 31,
2015 | | Year Ended
August 31,
2016 | | Year Ended
August 31,
2015 | |
Proceeds from reinvestment of dividends and distributions: | |
Investor Class | | | — | | | | — | | | | — | | | | — | | | | — | | | | — | | | | 109,903 | | | | 147,253 | | | | 491 | | | | 848 | | |
Trust Class | | | — | | | | — | | | | — | | | | — | | | | — | | | | — | | | | 14,782 | | | | 22,602 | | | | 122 | | | | 210 | | |
Advisor Class | | | — | | | | — | | | | — | | | | — | | | | — | | | | — | | | | 34 | | | | 45 | | | | — | | | | — | | |
Institutional Class | | | 6 | | | | 1,419 | | | | 12 | | | | 8 | | | | 4,363 | | | | 1,518 | | | | 8,851 | | | | 15,531 | | | | 10,984 | | | | 14,223 | | |
Class A | | | — | | | | 152 | | | | 8 | | | | 4 | | | | 273 | | | | 186 | | | | 1,331 | | | | 14,308 | | | | 163 | | | | 123 | | |
Class C | | | — | | | | 48 | | | | — | | | | — | | | | 16 | | | | 7 | | | | 212 | | | | 290 | | | | — | | | | 4 | | |
Class R3 | | | — | | | | — | | | | — | | | | — | | | | — | | | | — | | | | 45 | | | | 73 | | | | — | | | | — | | |
Class R6 | | | — | | | | — | | | | — | | | | — | | | | — | | | | — | | | | — | | | | — | | | | 498 | | | | 387 | | |
Payments for shares redeemed: | |
Investor Class | | | — | | | | — | | | | — | | | | — | | | | — | | | | — | | | | (124,444 | ) | | | (110,151 | ) | | | (26,294 | ) | | | (14,441 | ) | |
Trust Class | | | — | | | | — | | | | — | | | | — | | | | — | | | | — | | | | (43,451 | ) | | | (38,509 | ) | | | (16,752 | ) | | | (18,488 | ) | |
Advisor Class | | | — | | | | — | | | | — | | | | — | | | | — | | | | — | | | | (232 | ) | | | (101 | ) | | | — | | | | — | | |
Institutional Class | | | (367 | ) | | | (34,371 | ) | | | (12 | ) | | | — | | | | (62,736 | ) | | | (79,281 | ) | | | (50,412 | ) | | | (57,871 | ) | | | (240,561 | ) | | | (193,534 | ) | |
Class A | | | (135 | ) | | | (138 | ) | | | (18 | ) | | | — | | | | (10,239 | ) | | | (4,668 | ) | | | (79,367 | ) | | | (20,575 | ) | | | (40,438 | ) | | | (12,714 | ) | |
Class C | | | (103 | ) | | | (52 | ) | | | — | | | | — | | | | (31 | ) | | | (9 | ) | | | (714 | ) | | | (792 | ) | | | (4,269 | ) | | | (2,101 | ) | |
Class R3 | | | — | | | | — | | | | — | | | | — | | | | — | | | | — | | | | (85 | ) | | | (474 | ) | | | — | | | | — | | |
Class R6 | | | — | | | | — | | | | — | | | | — | | | | — | | | | — | | | | — | | | | — | | | | (6,388 | ) | | | (6,445 | ) | |
Net increase (decrease) from Fund share transactions | | | 237 | | | | (32,525 | ) | | | 11 | | | | 2,925 | | | | (12,858 | ) | | | 45,913 | | | | (131,440 | ) | | | 54,427 | | | | 259,922 | | | | 130,225 | | |
Net Increase (Decrease) in Net Assets | | | 450 | | | | (35,644 | ) | | | 389 | | | | 2,723 | | | | (12,088 | ) | | | 33,618 | | | | (182,719 | ) | | | (193,529 | ) | | | 308,751 | | | | 60,861 | | |
Net Assets: | |
Beginning of year | | | 3,840 | | | | 39,484 | | | | 2,723 | | | | — | | | | 107,577 | | | | 73,959 | | | | 1,315,351 | | | | 1,508,880 | | | | 1,194,384 | | | | 1,133,523 | | |
End of year | | $ | 4,290 | | | $ | 3,840 | | | $ | 3,112 | | | $ | 2,723 | | | $ | 95,489 | | | $ | 107,577 | | | $ | 1,132,632 | | | $ | 1,315,351 | | | $ | 1,503,135 | | | $ | 1,194,384 | | |
Undistributed net investment income (loss) at end of year | | $ | 21 | | | $ | — | | | $ | 1 | | | $ | — | | | $ | 336 | | | $ | 837 | | | $ | 2,687 | | | $ | 5,845 | | | $ | 13,044 | | | $ | 7,983 | | |
Distributions in excess of net investment income at end of year | | $ | — | | | $ | (2 | ) | | $ | — | | | $ | (2 | ) | | $ | — | | | $ | — | | | $ | — | | | $ | — | | | $ | — | | | $ | — | | |
See Notes to Financial Statements
157
158
Statements of Changes in Net Assets (cont'd)
Neuberger Berman Equity Funds
(000's omitted)
| | | INTERNATIONAL
SELECT FUND | | INTRINSIC VALUE FUND | | LARGE CAP VALUE FUND | | MID CAP GROWTH FUND | | MID CAP
INTRINSIC VALUE FUND | |
| | | Year Ended
August 31,
2016 | | Year Ended
August 31,
2015 | | Year Ended
August 31,
2016 | | Year Ended
August 31,
2015 | | Year Ended
August 31,
2016 | | Year Ended
August 31,
2015 | | Year Ended
August 31,
2016 | | Year Ended
August 31,
2015 | | Year Ended
August 31,
2016 | | Year Ended
August 31,
2015 | |
Increase (Decrease) in Net Assets: | |
From Operations: | |
Net investment income (loss) (Note A) | | $ | 3,428 | | | $ | 2,721 | | | $ | (2,517 | ) | | $ | (1,811 | ) | | $ | 15,124 | | | $ | 16,708 | | | $ | (2,989 | ) | | $ | (5,096 | ) | | $ | 852 | | | $ | 352 | | |
Net realized gain (loss) on investments (Note A) | | | 3,771 | | | | 7,567 | | | | 13,887 | | | | 26,680 | | | | 2,357 | | | | 158,090 | | | | 46,790 | | | | 97,490 | | | | (701 | ) | | | 12,634 | | |
Net increase from payments by affiliates (Note B) | | | — | | | | — | | | | — | | | | — | | | | — | | | | — | | | | 1,007 | | | | — | | | | — | | | | — | | |
Change in net unrealized appreciation (depreciation)
of investments (Note A) | | | 1,260 | | | | (20,315 | ) | | | 18,804 | | | | (31,465 | ) | | | 137,870 | | | | (285,678 | ) | | | (68,458 | ) | | | 13,126 | | | | 4,256 | | | | (15,395 | ) | |
Net increase (decrease) in net assets resulting from operations | | | 8,459 | | | | (10,027 | ) | | | 30,174 | | | | (4,596 | ) | | | 155,351 | | | | (110,880 | ) | | | (23,650 | ) | | | 105,520 | | | | 4,407 | | | | (2,409 | ) | |
Distributions to Shareholders From (Note A): | |
Net investment income: | |
Investor Class | | | — | | | | — | | | | — | | | | — | | | | (11,530 | ) | | | (10,234 | ) | | | — | | | | — | | | | (190 | ) | | | (385 | ) | |
Trust Class | | | (91 | ) | | | (131 | ) | | | — | | | | — | | | | (1,539 | ) | | | (1,405 | ) | | | — | | | | — | | | | (59 | ) | | | (112 | ) | |
Advisor Class | | | — | | | | — | | | | — | | | | — | | | | (2,955 | ) | | | (2,553 | ) | | | — | | | | — | | | | — | | | | — | | |
Institutional Class | | | (2,723 | ) | | | (3,070 | ) | | | — | | | | — | | | | (711 | ) | | | (1,391 | ) | | | — | | | | — | | | | (235 | ) | | | (259 | ) | |
Class A | | | (35 | ) | | | (92 | ) | | | — | | | | — | | | | (53 | ) | | | (28 | ) | | | — | | | | — | | | | (82 | ) | | | (48 | ) | |
Class C | | | (7 | ) | | | (14 | ) | | | — | | | | — | | | | (27 | ) | | | (29 | ) | | | — | | | | — | | | | (13 | ) | | | (6 | ) | |
Class R3 | | | (22 | ) | | | (27 | ) | | | — | | | | — | | | | (1 | ) | | | (1 | ) | | | — | | | | — | | | | (7 | ) | | | (2 | ) | |
Class R6 | | | — | | | | — | | | | — | | | | — | | | | — | | | | — | | | | — | | | | — | | | | — | | | | — | | |
Net realized gain on investments: | |
Investor Class | | | — | | | | — | | | | — | | | | — | | | | (76,307 | ) | | | (141,939 | ) | | | (33,896 | ) | | | (49,241 | ) | | | (4,071 | ) | | | (3,860 | ) | |
Trust Class | | | — | | | | — | | | | — | | | | — | | | | (11,016 | ) | | | (21,949 | ) | | | (4,306 | ) | | | (5,201 | ) | | | (1,358 | ) | | | (1,421 | ) | |
Advisor Class | | | — | | | | — | | | | — | | | | — | | | | (21,422 | ) | | | (41,088 | ) | | | (570 | ) | | | (701 | ) | | | — | | | | — | | |
Institutional Class | | | — | | | | — | | | | (20,020 | ) | | | (14,661 | ) | | | (4,239 | ) | | | (16,389 | ) | | | (34,461 | ) | | | (45,198 | ) | | | (3,332 | ) | | | (2,170 | ) | |
Class A | | | — | | | | — | | | | (2,291 | ) | | | (923 | ) | | | (367 | ) | | | (433 | ) | | | (5,057 | ) | | | (7,034 | ) | | | (1,707 | ) | | | (544 | ) | |
Class C | | | — | | | | — | | | | (1,408 | ) | | | (765 | ) | | | (334 | ) | | | (675 | ) | | | (525 | ) | | | (470 | ) | | | (474 | ) | | | (214 | ) | |
Class R3 | | | — | | | | — | | | | — | | | | — | | | | (10 | ) | | | (26 | ) | | | (647 | ) | | | (602 | ) | | | (174 | ) | | | (40 | ) | |
Class R6 | | | — | | | | — | | | | — | | | | — | | | | — | | | | — | | | | (11,059 | ) | | | (3,588 | ) | | | — | | | | — | | |
Total distributions to shareholders | | | (2,878 | ) | | | (3,334 | ) | | | (23,719 | ) | | | (16,349 | ) | | | (130,511 | ) | | | (238,140 | ) | | | (90,521 | ) | | | (112,035 | ) | | | (11,702 | ) | | | (9,061 | ) | |
From Fund Share Transactions (Note D): | |
Proceeds from shares sold: | |
Investor Class | | | — | | | | — | | | | — | | | | — | | | | 15,530 | | | | 16,941 | | | | 30,726 | | | | 15,922 | | | | 2,183 | | | | 4,599 | | |
Trust Class | | | 703 | | | | 435 | | | | — | | | | — | | | | 4,646 | | | | 6,232 | | | | 13,829 | | | | 29,016 | | | | 434 | | | | 1,581 | | |
Advisor Class | | | — | | | | — | | | | — | | | | — | | | | 11,413 | | | | 12,640 | | | | 4,806 | | | | 5,341 | | | | — | | | | — | | |
Institutional Class | | | 15,103 | | | | 34,971 | | | | 334,188 | | | | 213,263 | | | | 7,155 | | | | 15,926 | | | | 135,219 | | | | 108,137 | | | | 7,328 | | | | 25,010 | | |
Class A | | | 2,006 | | | | 1,652 | | | | 30,062 | | | | 40,847 | | | | 1,185 | | | | 5,905 | | | | 34,869 | | | | 30,607 | | | | 4,006 | | | | 12,692 | | |
Class C | | | 121 | | | | 640 | | | | 6,203 | | | | 16,290 | | | | 776 | | | | 1,014 | | | | 5,176 | | | | 3,088 | | | | 1,122 | | | | 2,123 | | |
Class R3 | | | 1,396 | | | | 2,161 | | | | — | | | | — | | | | 3 | | | | 85 | | | | 6,637 | | | | 8,331 | | | | 604 | | | | 992 | | |
Class R6 | | | — | | | | — | | | | — | | | | — | | | | — | | | | — | | | | 135,445 | | | | 70,359 | | | | — | | | | — | | |
See Notes to Financial Statements
159
160
Statements of Changes in Net Assets (cont'd)
Neuberger Berman Equity Funds (cont'd)
(000's omitted)
| | | INTERNATIONAL
SELECT FUND | | INTRINSIC VALUE FUND | | LARGE CAP VALUE FUND | | MID CAP GROWTH FUND | | MID CAP
INTRINSIC VALUE FUND | |
| | | Year Ended
August 31,
2016 | | Year Ended
August 31,
2015 | | Year Ended
August 31,
2016 | | Year Ended
August 31,
2015 | | Year Ended
August 31,
2016 | | Year Ended
August 31,
2015 | | Year Ended
August 31,
2016 | | Year Ended
August 31,
2015 | | Year Ended
August 31,
2016 | | Year Ended
August 31,
2015 | |
Proceeds from reinvestment of dividends and distributions: | |
Investor Class | | | — | | | | — | | | | — | | | | — | | | | 84,421 | | | | 144,740 | | | | 31,963 | | | | 46,576 | | | | 4,057 | | | | 4,040 | | |
Trust Class | | | 88 | | | | 127 | | | | — | | | | — | | | | 12,472 | | | | 23,101 | | | | 4,301 | | | | 5,194 | | | | 1,391 | | | | 1,451 | | |
Advisor Class | | | — | | | | — | | | | — | | | | — | | | | 23,911 | | | | 42,453 | | | | 461 | | | | 638 | | | | — | | | | — | | |
Institutional Class | | | 2,673 | | | | 3,011 | | | | 17,259 | | | | 11,950 | | | | 4,727 | | | | 17,318 | | | | 34,137 | | | | 45,062 | | | | 3,513 | | | | 2,366 | | |
Class A | | | 31 | | | | 84 | | | | 2,112 | | | | 869 | | | | 402 | | | | 430 | | | | 4,971 | | | | 6,930 | | | | 1,394 | | | | 576 | | |
Class C | | | 2 | | | | 3 | | | | 1,094 | | | | 504 | | | | 246 | | | | 438 | | | | 500 | | | | 448 | | | | 254 | | | | 55 | | |
Class R3 | | | 20 | | | | 25 | | | | — | | | | — | | | | 8 | | | | 10 | | | | 591 | | | | 551 | | | | 171 | | | | 42 | | |
Class R6 | | | — | | | | — | | | | — | | | | — | | | | — | | | | — | | | | 10,862 | | | | 3,408 | | | | — | | | | — | | |
Payments for shares redeemed: | |
Investor Class | | | — | | | | — | | | | — | | | | — | | | | (112,554 | ) | | | (120,876 | ) | | | (46,371 | ) | | | (34,928 | ) | | | (8,233 | ) | | | (5,217 | ) | |
Trust Class | | | (3,237 | ) | | | (2,752 | ) | | | — | | | | — | | | | (43,086 | ) | | | (30,149 | ) | | | (36,422 | ) | | | (13,956 | ) | | | (2,571 | ) | | | (3,866 | ) | |
Advisor Class | | | — | | | | — | | | | — | | | | — | | | | (43,929 | ) | | | (51,994 | ) | | | (3,648 | ) | | | (6,069 | ) | | | — | | | | — | | |
Institutional Class | | | (27,684 | ) | | | (20,857 | ) | | | (168,231 | ) | | | (39,704 | ) | | | (42,832 | ) | | | (65,347 | ) | | | (237,894 | ) | | | (108,212 | ) | | | (19,558 | ) | | | (7,888 | ) | |
Class A | | | (1,364 | ) | | | (7,197 | ) | | | (31,554 | ) | | | (8,740 | ) | | | (1,221 | ) | | | (5,449 | ) | | | (53,600 | ) | | | (37,969 | ) | | | (5,823 | ) | | | (2,444 | ) | |
Class C | | | (657 | ) | | | (1,340 | ) | | | (7,010 | ) | | | (2,095 | ) | | | (1,365 | ) | | | (826 | ) | | | (2,505 | ) | | | (1,213 | ) | | | (842 | ) | | | (175 | ) | |
Class R3 | | | (1,127 | ) | | | (754 | ) | | | — | | | | — | | | | (13 | ) | | | (119 | ) | | | (5,380 | ) | | | (4,615 | ) | | | (449 | ) | | | (120 | ) | |
Class R6 | | | — | | | | — | | | | — | | | | — | | | | — | | | | — | | | | (33,454 | ) | | | (6,463 | ) | | | — | | | | — | | |
Net increase (decrease) from Fund share transactions | | | (11,926 | ) | | | 10,209 | | | | 184,123 | | | | 233,184 | | | | (78,105 | ) | | | 12,473 | | | | 35,219 | | | | 166,183 | | | | (11,019 | ) | | | 35,817 | | |
Net Increase (Decrease) in Net Assets | | | (6,345 | ) | | | (3,152 | ) | | | 190,578 | | | | 212,239 | | | | (53,265 | ) | | | (336,547 | ) | | | (78,952 | ) | | | 159,668 | | | | (18,314 | ) | | | 24,347 | | |
Net Assets: | |
Beginning of year | | | 237,547 | | | | 240,699 | | | | 490,453 | | | | 278,214 | | | | 1,408,228 | | | | 1,744,775 | | | | 1,175,202 | | | | 1,015,534 | | | | 107,505 | | | | 83,158 | | |
End of year | | $ | 231,202 | | | $ | 237,547 | | | $ | 681,031 | | | $ | 490,453 | | | $ | 1,354,963 | | | $ | 1,408,228 | | | $ | 1,096,250 | | | $ | 1,175,202 | | | $ | 89,191 | | | $ | 107,505 | | |
Undistributed net investment income (loss) at end of year | | $ | 2,074 | | | $ | 1,580 | | | $ | (113 | ) | | $ | (127 | ) | | $ | 10,386 | | | $ | 14,004 | | | $ | (1,654 | ) | | $ | (3,669 | ) | | $ | — | | | $ | — | | |
Distributions in excess of net investment income at end of year | | $ | — | | | $ | — | | | $ | — | | | $ | — | | | $ | — | | | $ | — | | | $ | — | | | $ | — | | | $ | — | | | $ | — | | |
See Notes to Financial Statements
161
162
Statements of Changes in Net Assets (cont'd)
Neuberger Berman Equity Funds
(000's omitted)
| | | MULTI-CAP
OPPORTUNITIES FUND | | REAL ESTATE FUND | | SMALL CAP
GROWTH FUND | | SOCIALLY
RESPONSIVE FUND | | VALUE FUND | |
| | | Year Ended
August 31,
2016 | | Year Ended
August 31,
2015 | | Year Ended
August 31,
2016 | | Year Ended
August 31,
2015 | | Year Ended
August 31,
2016 | | Year Ended
August 31,
2015 | | Year Ended
August 31,
2016 | | Year Ended
August 31,
2015 | | Year Ended
August 31,
2016 | | Year Ended
August 31,
2015 | |
Increase (Decrease) in Net Assets: | |
From Operations: | |
Net investment income (loss) (Note A) | | $ | 19,635 | | | $ | 20,872 | | | $ | 9,963 | | | $ | 12,607 | | | $ | (582 | ) | | $ | (821 | ) | | $ | 17,184 | | | $ | 18,670 | | | $ | 173 | | | $ | 268 | | |
Net realized gain (loss) on investments (Note A) | | | 71,256 | | | | 69,925 | | | | 90,375 | | | | 80,044 | | | | (12,590 | ) | | | 13,201 | | | | 91,678 | | | | 181,229 | | | | (848 | ) | | | 430 | | |
Net increase from payments by affiliates (Note B) | | | — | | | | — | | | | — | | | | — | | | | — | | | | — | | | | — | | | | — | | | | — | | | | — | | |
Change in net unrealized appreciation (depreciation)
of investments (Note A) | | | 69,607 | | | | (130,767 | ) | | | 48,034 | | | | (99,105 | ) | | | 8,835 | | | | (6,370 | ) | | | 119,695 | | | | (184,865 | ) | | | 1,907 | | | | (2,389 | ) | |
Net increase (decrease) in net assets resulting from operations | | | 160,498 | | | | (39,970 | ) | | | 148,372 | | | | (6,454 | ) | | | (4,337 | ) | | | 6,010 | | | | 228,557 | | | | 15,034 | | | | 1,232 | | | | (1,691 | ) | |
Distributions to Shareholders From (Note A): | |
Net investment income: | |
Investor Class | | | — | | | | — | | | | — | | | | — | | | | — | | | | — | | | | (4,849 | ) | | | (5,556 | ) | | | — | | | | — | | |
Trust Class | | | — | | | | — | | | | (3,347 | ) | | | (3,770 | ) | | | — | | | | — | | | | (3,097 | ) | | | (3,953 | ) | | | — | | | | — | | |
Advisor Class | | | — | | | | — | | | | — | | | | — | | | | — | | | | — | | | | — | | | | — | | | | — | | | | — | | |
Institutional Class | | | (19,825 | ) | | | (23,005 | ) | | | (5,052 | ) | | | (6,372 | ) | | | — | | | | — | | | | (6,167 | ) | | | (6,267 | ) | | | (141 | ) | | | (130 | ) | |
Class A | | | (486 | ) | | | (682 | ) | | | (1,575 | ) | | | (1,812 | ) | | | — | | | | — | | | | (1,475 | ) | | | (1,493 | ) | | | (53 | ) | | | (49 | ) | |
Class C | | | (26 | ) | | | (62 | ) | | | (146 | ) | | | (107 | ) | | | — | | | | — | | | | (188 | ) | | | (271 | ) | | | (3 | ) | | | (0 | ) | |
Class R3 | | | — | | | | — | | | | (232 | ) | | | (216 | ) | | | — | | | | — | | | | (265 | ) | | | (272 | ) | | | — | | | | — | | |
Class R6 | | | — | | | | — | | | | (569 | ) | | | (451 | ) | | | — | | | | — | | | | (2,260 | ) | | | (2,421 | ) | | | — | | | | — | | |
Net realized gain on investments: | |
Investor Class | | | — | | | | — | | | | — | | | | — | | | | (2,547 | ) | | | — | | | | (40,560 | ) | | | (78,302 | ) | | | — | | | | — | | |
Trust Class | | | — | | | | — | | | | (17,429 | ) | | | (15,179 | ) | | | (255 | ) | | | — | | | | (26,827 | ) | | | (58,788 | ) | | | — | | | | — | | |
Advisor Class | | | — | | | | — | | | | — | | | | — | | | | (199 | ) | | | — | | | | — | | | | — | | | | — | | | | — | | |
Institutional Class | | | (56,652 | ) | | | (80,461 | ) | | | (24,580 | ) | | | (21,811 | ) | | | (998 | ) | | | — | | | | (39,602 | ) | | | (69,181 | ) | | | (126 | ) | | | (748 | ) | |
Class A | | | (2,628 | ) | | | (4,187 | ) | | | (9,296 | ) | | | (8,468 | ) | | | (225 | ) | | | — | | | | (12,413 | ) | | | (21,497 | ) | | | (69 | ) | | | (433 | ) | |
Class C | | | (1,252 | ) | | | (1,736 | ) | | | (2,189 | ) | | | (2,008 | ) | | | (188 | ) | | | — | | | | (4,776 | ) | | | (7,205 | ) | | | (7 | ) | | | (32 | ) | |
Class R3 | | | — | | | | — | | | | (1,705 | ) | | | (1,276 | ) | | | (105 | ) | | | — | | | | (2,843 | ) | | | (4,908 | ) | | | — | | | | — | | |
Class R6 | | | — | | | | — | | | | (2,354 | ) | | | (1,405 | ) | | | — | | | | — | | | | (13,351 | ) | | | (24,850 | ) | | | — | | | | — | | |
Total distributions to shareholders | | | (80,869 | ) | | | (110,133 | ) | | | (68,474 | ) | | | (62,875 | ) | | | (4,517 | ) | | | — | | | | (158,673 | ) | | | (284,964 | ) | | | (399 | ) | | | (1,392 | ) | |
From Fund Share Transactions (Note D): | |
Proceeds from shares sold: | |
Investor Class | | | — | | | | — | | | | — | | | | — | | | | 968 | | | | 1,497 | | | | 75,553 | | | | 69,572 | | | | — | | | | — | | |
Trust Class | | | — | | | | — | | | | 22,476 | | | | 52,339 | | | | 312 | | | | 406 | | | | 35,105 | | | | 54,071 | | | | — | | | | — | | |
Advisor Class | | | — | | | | — | | | | — | | | | — | | | | 467 | | | | 830 | | | | — | | | | — | | | | — | | | | — | | |
Institutional Class | | | 93,383 | | | | 210,581 | | | | 87,082 | | | | 123,794 | | | | 2,475 | | | | 6,147 | | | | 212,232 | | | | 206,662 | | | | 2,513 | | | | 8,079 | | |
Class A | | | 13,768 | | | | 36,459 | | | | 37,989 | | | | 63,436 | | | | 1,084 | | | | 3,145 | | | | 27,754 | | | | 47,761 | | | | 406 | | | | 3,543 | | |
Class C | | | 5,123 | | | | 15,280 | | | | 2,210 | | | | 5,220 | | | | 451 | | | | 786 | | | | 9,208 | | | | 16,166 | | | | 126 | | | | 213 | | |
Class R3 | | | — | | | | — | | | | 8,186 | | | | 12,721 | | | | 1,026 | | | | 791 | | | | 9,985 | | | | 8,582 | | | | — | | | | — | | |
Class R6 | | | — | | | | — | | | | 17,098 | | | | 11,285 | | | | — | | | | — | | | | 167,892 | | | | 67,738 | | | | — | | | | — | | |
See Notes to Financial Statements
163
164
Statements of Changes in Net Assets (cont'd)
Neuberger Berman Equity Funds (cont'd)
(000's omitted)
| | | MULTI-CAP
OPPORTUNITIES FUND | | REAL ESTATE FUND | | SMALL CAP
GROWTH FUND | | SOCIALLY
RESPONSIVE FUND | | VALUE FUND | |
| | | Year Ended
August 31,
2016 | | Year Ended
August 31,
2015 | | Year Ended
August 31,
2016 | | Year Ended
August 31,
2015 | | Year Ended
August 31,
2016 | | Year Ended
August 31,
2015 | | Year Ended
August 31,
2016 | | Year Ended
August 31,
2015 | | Year Ended
August 31,
2016 | | Year Ended
August 31,
2015 | |
Proceeds from reinvestment of dividends and distributions: | |
Investor Class | | | — | | | | — | | | | — | | | | — | | | | 2,498 | | | | — | | | | 43,969 | | | | 80,661 | | | | — | | | | — | | |
Trust Class | | | — | | | | — | | | | 20,576 | | | | 18,790 | | | | 249 | | | | — | | | | 29,722 | | | | 62,288 | | | | — | | | | — | | |
Advisor Class | | | — | | | | — | | | | — | | | | — | | | | 196 | | | | — | | | | — | | | | — | | | | — | | | | — | | |
Institutional Class | | | 12,661 | | | | 14,388 | | | | 23,584 | | | | 22,144 | | | | 680 | | | | — | | | | 41,836 | | | | 68,496 | | | | 267 | | | | 878 | | |
Class A | | | 2,761 | | | | 4,327 | | | | 10,136 | | | | 9,562 | | | | 222 | | | | — | | | | 12,834 | | | | 21,325 | | | | 105 | | | | 435 | | |
Class C | | | 1,106 | | | | 1,493 | | | | 1,968 | | | | 1,794 | | | | 170 | | | | — | | | | 4,114 | | | | 6,180 | | | | 10 | | | | 31 | | |
Class R3 | | | — | | | | — | | | | 1,808 | | | | 1,371 | | | | 84 | | | | — | | | | 3,009 | | | | 5,038 | | | | — | | | | — | | |
Class R6 | | | — | | | | — | | | | 2,922 | | | | 1,856 | | | | — | | | | — | | | | 15,611 | | | | 27,271 | | | | — | | | | — | | |
Payments for shares redeemed: | |
Investor Class | | | — | | | | — | | | | — | | | | — | | | | (4,410 | ) | | | (6,649 | ) | | | (167,651 | ) | | | (133,905 | ) | | | — | | | | — | | |
Trust Class | | | — | | | | — | | | | (105,898 | ) | | | (114,518 | ) | | | (925 | ) | | | (971 | ) | | | (110,618 | ) | | | (158,470 | ) | | | — | | | | — | | |
Advisor Class | | | — | | | | — | | | | — | | | | — | | | | (962 | ) | | | (1,773 | ) | | | — | | | | — | | | | — | | | | — | | |
Institutional Class | | | (615,578 | ) | | | (459,676 | ) | | | (220,377 | ) | | | (243,059 | ) | | | (11,757 | ) | | | (5,784 | ) | | | (251,018 | ) | | | (194,272 | ) | | | (7,301 | ) | | | (6,637 | ) | |
Class A | | | (48,887 | ) | | | (74,313 | ) | | | (80,084 | ) | | | (95,912 | ) | | | (2,448 | ) | | | (2,692 | ) | | | (48,836 | ) | | | (39,136 | ) | | | (4,190 | ) | | | (3,554 | ) | |
Class C | | | (14,416 | ) | | | (18,122 | ) | | | (7,907 | ) | | | (14,886 | ) | | | (756 | ) | | | (407 | ) | | | (11,809 | ) | | | (6,487 | ) | | | (161 | ) | | | (195 | ) | |
Class R3 | | | — | | | | — | | | | (9,775 | ) | | | (13,178 | ) | | | (925 | ) | | | (262 | ) | | | (9,928 | ) | | | (10,264 | ) | | | — | | | | — | | |
Class R6 | | | — | | | | — | | | | (8,819 | ) | | | (6,947 | ) | | | — | | | | — | | | | (49,013 | ) | | | (128,504 | ) | | | — | | | | — | | |
Net increase (decrease) from Fund share transactions | | | (550,079 | ) | | | (269,583 | ) | | | (196,825 | ) | | | (164,188 | ) | | | (11,301 | ) | | | (4,936 | ) | | | 39,951 | | | | 70,773 | | | | (8,225 | ) | | | 2,793 | | |
Net Increase (Decrease) in Net Assets | | | (470,450 | ) | | | (419,686 | ) | | | (116,927 | ) | | | (233,517 | ) | | | (20,155 | ) | | | 1,074 | | | | 109,835 | | | | (199,157 | ) | | | (7,392 | ) | | | (290 | ) | |
Net Assets: | |
Beginning of year | | | 2,340,298 | | | | 2,759,984 | | | | 806,358 | | | | 1,039,875 | | | | 86,411 | | | | 85,337 | | | | 2,237,011 | | | | 2,436,168 | | | | 20,869 | | | | 21,159 | | |
End of year | | $ | 1,869,848 | | | $ | 2,340,298 | | | $ | 689,431 | | | $ | 806,358 | | | $ | 66,256 | | | $ | 86,411 | | | $ | 2,346,846 | | | $ | 2,237,011 | | | $ | 13,477 | | | $ | 20,869 | | |
Undistributed net investment income (loss) at end of year | | $ | 10,815 | | | $ | 12,040 | | | $ | — | | | $ | — | | | $ | — | | | $ | — | | | $ | 12,472 | | | $ | 13,587 | | | $ | 150 | | | $ | 203 | | |
Distributions in excess of net investment income at end of year | | $ | — | | | $ | — | | | $ | — | | | $ | — | | | $ | (348 | ) | | $ | — | | | $ | — | | | $ | — | | | $ | — | | | $ | — | | |
See Notes to Financial Statements
165
166
Notes to Financial Statements Equity Funds
Note A—Summary of Significant Accounting Policies:
1 General: Neuberger Berman Equity Funds (the "Trust") is a Delaware statutory trust organized pursuant to an Amended and Restated Trust Instrument dated March 27, 2014. The Trust is registered as an open-end management investment company under the Investment Company Act of 1940, as amended (the "1940 Act"), and its shares are registered under the Securities Act of 1933, as amended (the "1933 Act"). Neuberger Berman Dividend Growth Fund ("Dividend Growth"), Neuberger Berman Emerging Markets Equity Fund ("Emerging Markets Equity"), Neuberger Berman Equity Income Fund ("Equity Income"), Neuberger Berman Focus Fund ("Focus"), Neuberger Berman Genesis Fund ("Genesis"), Neuberger Berman Global Equity Fund ("Global Equity"), Neuberger Berman Global Real Estate Fund ("Global Real Estate"), Neuberger Berman Greater China Equity Fund ("Greater China Equity"), Neuberger Berman Guardian Fund ("Guardian"), Neuberger Berman International Equity Fund ("International Equity"), Neuberger Berman International Select Fund ("International Select"), Neuberger Berman Intrinsic Value Fund ("Intrinsic Value"), Neuberger Berman Large Cap Value Fund ("Large Cap Value"), Neuberger Berman Mid Cap Growth Fund ("Mid Cap Growth"), Neuberger Berman Mid Cap Intrinsic Value Fund ("Mid Cap Intrinsic Value"), Neuberger Berman Multi-Cap Opportunities Fund ("Multi-Cap Opportunities"), Neuberger Berman Real Estate Fund ("Real Estate"), Neuberger Berman Small Cap Growth Fund ("Small Cap Growth"), Neuberger Berman Socially Responsive Fund ("Socially Responsive") and Neuberger Berman Value Fund ("Value") (each individually a "Fund," and collectively, the "Funds") are separate operating series of the Trust, each of which (except Global Real Estate, Greater China Equity and Real Estate) is diversified. Under the 1940 Act, the status of a Fund that was registered as non-diversified may, under certain circumstances, change to that of a diversified fund (Multi-Cap Opportunities became diversified in December 2012). Nine Funds offer Investor Class shares, eleven offer Trust Class shares, six offer Advisor Class shares, twenty offer Institutional Class shares, nineteen offer Class A shares, nineteen offer Class C shares, ten offer Class R3 shares and seven offer Class R6 shares. Global Real Estate had no operations until December 30, 2014, other than matters relating to its organization and registration of shares under the 1933 Act. Dividend Growth had no operations until December 15, 2015, other than matters relating to its organization and registration of shares under the 1933 Act. The Neuberger Berman Equity Funds' Board of Trustees (the "Board") may establish additional series or classes of shares without the approval of shareholders.
A zero balance, if any, reflects an actual amount rounding to less than $1,000.
The assets of each Fund belong only to that Fund, and the liabilities of each Fund are borne solely by that Fund and no other.
Each Fund is an investment company and accordingly follows the investment company accounting and reporting guidance of the Financial Accounting Standards Board ("FASB") Accounting Standard Codification Topic 946 "Financial Services—Investment Companies."
The preparation of financial statements in accordance with U.S. generally accepted accounting principles ("GAAP") requires Neuberger Berman Investment Advisers LLC ("Management") to make estimates and assumptions at the date of the financial statements. Actual results could differ from those estimates.
2 Portfolio valuation: In accordance with Accounting Standards Codification ("ASC") 820 "Fair Value Measurement" ("ASC 820"), all investments held by each of the Funds are carried at the value that Management believes a Fund would receive upon selling an investment in an orderly transaction to an independent buyer in the principal or most advantageous market for the investment under current market conditions. Various inputs, including the volume and level of activity for the asset or liability in the market, are considered in valuing the Funds' investments, some of which are discussed below. Significant Management judgment may be necessary to value investments in accordance with ASC 820.
167
ASC 820 established a three-tier hierarchy of inputs to create a classification of value measurements for disclosure purposes. The three-tier hierarchy of inputs is summarized in the three broad Levels listed below.
• Level 1 – quoted prices in active markets for identical investments
• Level 2 – other observable inputs (including quoted prices for similar investments, interest rates, prepayment speeds, credit risk, amortized cost, etc.)
• Level 3 – unobservable inputs (including a Fund's own assumptions in determining the fair value of investments)
The inputs or methodology used for valuing an investment are not necessarily an indication of the risk associated with investing in those securities.
The value of the Funds' investments in equity securities, exchange traded funds, preferred stocks, exchange traded options purchased and options written, convertible preferred stocks and rights, for which market quotations are readily available, is generally determined by Management by obtaining valuations from independent pricing services based on the latest sale price quoted on a principal exchange or market for that security (Level 1 inputs). Securities traded primarily on the NASDAQ Stock Market are normally valued at the NASDAQ Official Closing Price ("NOCP") provided by NASDAQ each business day. The NOCP is the most recently reported price as of 4:00:02 p.m., Eastern Time, unless that price is outside the range of the "inside" bid and asked prices (i.e., the bid and asked prices that dealers quote to each other when trading for their own accounts); in that case, NASDAQ will adjust the price to equal the inside bid or asked price, whichever is closer. Because of delays in reporting trades, the NOCP may not be based on the price of the last trade to occur before the market closes. If there is no sale of a security on a particular day, the independent pricing services may value the security based on market quotations.
The value of the Funds' investments in convertible bonds is determined by Management primarily by obtaining valuations from independent pricing services based on readily available bid quotations or, if quotations are not available, by methods which include various considerations such as yields or prices of securities of comparable quality, coupon, maturity and type, indications as to values from dealers, and general market conditions (generally Level 2 inputs).
Other Level 2 inputs used by independent pricing services to value convertible bonds generally include underlying stock data, dealer quotes, conversion premiums, listed bond and preferred stock prices and other market information which may include benchmark curves, trade execution data, and sensitivity analysis, when available.
The value of participatory notes is determined by Management by obtaining valuations from independent pricing services based on the underlying equity security and applicable exchange rate (Level 1 inputs).
Management has developed a process to periodically review information provided by independent pricing services for all types of securities.
Certificates of deposit are valued at amortized cost.
Investments in non-exchange traded investment companies are valued using the respective fund's daily calculated net asset value per share (Level 2 inputs).
If a valuation is not available from an independent pricing service, or if Management has reason to believe that the valuation received does not represent the amount a Fund might reasonably expect to receive on a current sale in an orderly transaction, Management seeks to obtain quotations from brokers or dealers (generally considered Level 2 or Level 3 inputs depending on the number of quotes available). If such quotations are not readily available, the security is valued using methods the Board has approved in the good-faith belief that the resulting valuation will reflect the fair value of the security. Numerous factors may be considered when determining the fair value of a security based on Level 2 or Level 3 inputs, including available analyst, media or other reports, trading in financial futures or American Depositary Receipts ("ADRs") and whether the issuer of the security being fair valued has other securities outstanding.
168
The value of the Funds' investments in foreign securities is generally determined using the same valuation methods and inputs as other Fund investments, as discussed above. Foreign security prices expressed in local currency values are translated from the local currency into U.S. dollars using the exchange rates as of the end of regular trading on the New York Stock Exchange ("NYSE") on business days, usually 4:00 p.m., Eastern Time. The Board has approved the use of Interactive Data Pricing and Reference Data, Inc. ("Interactive") to assist in determining the fair value of foreign equity securities when changes in the value of a certain index suggest that the closing prices on the foreign exchanges may no longer represent the amount that a Fund could expect to receive for those securities or on days when foreign markets are closed and U.S. markets are open. In each of these events, Interactive will provide adjusted prices for certain foreign equity securities using a statistical analysis of historical correlations of multiple factors (Level 2 inputs). In the absence of precise information about the market values of these foreign securities as of the close of the NYSE, the Board has determined on the basis of available data that prices adjusted in this way are likely to be closer to the prices a Fund could realize on a current sale than are the prices of those securities established at the close of the foreign markets in which the securities primarily trade.
Fair value prices are necessarily estimates, and there is no assurance that such a price will be at or close to the price at which the security is next quoted or next trades.
3 Foreign currency translation: The accounting records of the Funds are maintained in U.S. dollars. Foreign currency amounts are translated into U.S. dollars using the exchange rate as of the end of regular trading on the NYSE on business days, usually 4:00 p.m., Eastern Time, to determine the value of investments, other assets and liabilities. Purchase and sale prices of securities, and income and expenses, are translated into U.S. dollars at the prevailing rate of exchange on the respective dates of such transactions. Net unrealized foreign currency gain (loss), if any, arises from changes in the value of assets and liabilities, other than investments in securities, as a result of changes in exchange rates and is stated separately in the Statements of Operations.
4 Securities transactions and investment income: Securities transactions are recorded on trade date for financial reporting purposes. Dividend income is recorded on the ex-dividend date or, for certain foreign dividends, as soon as the Fund becomes aware of the dividends. Non-cash dividends included in dividend income, if any, are recorded at the fair market value of the securities received. Interest income, including accretion of discount on securities for Equity Income, accretion of original issue discount, where applicable, and accretion of discount on short-term investments, is recorded on the accrual basis. Realized gains and losses from securities transactions and foreign currency transactions, if any, are recorded on the basis of identified cost and stated separately in the Statements of Operations. Included in net realized gain (loss) on investments are proceeds from the settlements of class action litigation in which the Funds participated as class members. The amounts of such proceeds for the year ended August 31, 2016 were $60,346, $11,419, $6,817, $49,161, $98,383, $3,325, $4,029, $95,071, $11,048 and $271, for Focus, Guardian, Intrinsic Value, Large Cap Value, Mid Cap Growth, Mid Cap Intrinsic Value, Multi-Cap Opportunities, Small Cap Growth, Socially Responsive and Value, respectively.
5 Income tax information: Each Fund is treated as a separate entity for U.S. federal income tax purposes. It is the policy of each Fund, except Dividend Growth, to continue to, and the intention of Dividend Growth to, qualify for treatment as a regulated investment company ("RIC") by complying with the requirements of the U.S. Internal Revenue Code applicable to RICs and to distribute substantially all of its net investment income and net realized capital gains to its shareholders. To the extent a Fund distributes substantially all of its net investment income and net realized capital gains to shareholders, no federal income or excise tax provision is required.
The Funds have adopted the provisions of ASC 740 "Income Taxes" ("ASC 740"). ASC 740 sets forth a minimum threshold for financial statement recognition of a tax position taken, or expected to be taken, in a tax return. The Funds recognize interest and penalties, if any, related to unrecognized tax positions as an income tax expense in the Statements of Operations. The Funds are subject to examination by U.S. federal and state tax authorities for returns filed for the tax years for which the applicable statutes of limitations have not yet expired. As of August 31, 2016, the Funds did not have any unrecognized tax positions.
169
At August 31, 2016, selected fund information on a U.S. federal income tax basis was as follows:
(000's omitted) | | Cost of Investments | | Gross
Unrealized
Appreciation | | Gross
Unrealized
Depreciation | | Net Unrealized
Appreciation
(Depreciation) | |
Dividend Growth | | $ | 18,845 | | | $ | 2,040 | | | $ | 274 | | | $ | 1,766 | | |
Emerging Markets Equity | | | 414,062 | | | | 76,509 | | | | 27,965 | | | | 48,544 | | |
Equity Income | | | 1,444,757 | | | | 231,498 | | | | 22,007 | | | | 209,491 | | |
Focus | | | 636,839 | | | | 90,944 | | | | 13,819 | | | | 77,125 | | |
Genesis | | | 5,717,764 | | | | 5,054,640 | | | | 127,188 | | | | 4,927,452 | | |
Global Equity | | | 4,042 | | | | 525 | | | | 269 | | | | 256 | | |
Global Real Estate | | | 3,030 | | | | 228 | | | | 89 | | | | 139 | | |
Greater China Equity | | | 91,506 | | | | 6,301 | | | | 3,776 | | | | 2,525 | | |
Guardian | | | 1,011,417 | | | | 136,341 | | | | 18,172 | | | | 118,169 | | |
International Equity | | | 1,408,660 | | | | 194,548 | | | | 101,702 | | | | 92,846 | | |
International Select | | | 208,950 | | | | 38,925 | | | | 16,906 | | | | 22,019 | | |
Intrinsic Value | | | 630,517 | | | | 100,311 | | | | 45,385 | | | | 54,926 | | |
Large Cap Value | | | 1,262,987 | | | | 104,917 | | | | 17,141 | | | | 87,776 | | |
Mid Cap Growth | | | 884,901 | | | | 229,289 | | | | 14,205 | | | | 215,084 | | |
Mid Cap Intrinsic Value | | | 81,438 | | | | 13,561 | | | | 5,757 | | | | 7,804 | | |
Multi-Cap Opportunities | | | 1,418,761 | | | | 479,703 | | | | 28,487 | | | | 451,216 | | |
Real Estate | | | 597,607 | | | | 90,546 | | | | 2,306 | | | | 88,240 | | |
Small Cap Growth | | | 58,092 | | | | 9,337 | | | | 1,077 | | | | 8,260 | | |
Socially Responsive | | | 1,831,509 | | | | 566,939 | | | | 52,252 | | | | 514,687 | | |
Value | | | 12,828 | | | | 801 | | | | 198 | | | | 603 | | |
Income distributions and capital gain distributions are determined in accordance with income tax regulations, which may differ from GAAP. These differences are primarily due to differing treatments of income and gains on various investment securities held by each Fund, timing differences and differing characterization of distributions made by each Fund. The Funds may also utilize earnings and profits distributed to shareholders on redemption of their shares as a part of the dividends-paid deduction for income tax purposes.
As determined on August 31, 2016, permanent differences resulting primarily from different book and tax accounting were reclassified at year end. Such differences may be attributed to the tax treatment of one or more of the following: net operating loss netted against short term capital gains, distributions re-designated, partnership adjustments, net operating losses, adjustments related to real estate investment trusts ("REITs") and other underlying investments, non-taxable adjustments to income, non-REIT income and basis adjustments, non-taxable distributions from underlying investments, foreign currency gains and losses, gains and losses from passive foreign investment companies (PFICs), non-deductible stock issuance fees and deemed distributions on shareholder redemptions. For the year ended August 31, 2016, the Funds recorded the following permanent reclassifications:
| | | Paid-in Capital | | Undistributed
Net Investment
Income (Loss) | | Accumulated Net
Realized Gains
(Losses) on
Investments | |
Dividend Growth | | $ | (4,083 | ) | | $ | 4,084 | | | $ | (1 | ) | |
Emerging Markets Equity | | | — | | | | (763,093 | ) | | | 763,093 | | |
Equity Income | | | 12,974,543 | | | | 55,916 | | | | (13,030,459 | ) | |
Focus | | | 5,679,932 | | | | (392,178 | ) | | | (5,287,754 | ) | |
170
| | | Paid-in Capital | | Undistributed
Net Investment
Income (Loss) | | Accumulated Net
Realized Gains
(Losses) on
Investments | |
Genesis | | $ | 192,264,680 | | | $ | (1,881,049 | ) | | $ | (190,383,631 | ) | |
Global Equity | | | 2,024 | | | | 7,860 | | | | (9,884 | ) | |
Global Real Estate | | | — | | | | 17,688 | | | | (17,688 | ) | |
Greater China Equity | | | — | | | | (31,565 | ) | | | 31,565 | | |
Guardian | | | 24,985,500 | | | | (1,242,017 | ) | | | (23,743,483 | ) | |
International Equity | | | — | | | | (104,419 | ) | | | 104,419 | | |
International Select | | | — | | | | (55,922 | ) | | | 55,922 | | |
Intrinsic Value | | | 3,216,571 | | | | 2,531,470 | | | | (5,748,041 | ) | |
Large Cap Value | | | 7,298,700 | | | | (1,926,037 | ) | | | (5,372,663 | ) | |
Mid Cap Growth | | | (5,235,945 | ) | | | 5,003,550 | | | | 232,395 | | |
Mid Cap Intrinsic Value | | | (5,686 | ) | | | (266,569 | ) | | | 272,255 | | |
Multi-Cap Opportunities | | | 11,966,679 | | | | (522,469 | ) | | | (11,444,210 | ) | |
Real Estate | | | 17,137,140 | | | | 958,260 | | | | (18,095,400 | ) | |
Small Cap Growth | | | (242,076 | ) | | | 233,600 | | | | 8,476 | | |
Socially Responsive | | | 16,828,429 | | | | 1,614 | | | | (16,830,043 | ) | |
Value | | | — | | | | (28,557 | ) | | | 28,557 | | |
The tax character of distributions paid during the years ended August 31, 2016 and August 31, 2015 was as follows:
| | | Distributions Paid From: | |
| | | Ordinary Income | | Long-Term Capital Gain | | Return of Capital | | Total | |
| | | 2016 | | 2015 | | 2016 | | 2015 | | 2016 | | 2015 | | 2016 | | 2015 | |
Dividend Growth | | $ | — | (2) | | $ | — | | | $ | — | (2) | | $ | — | | | $ | — | (2) | | $ | — | | | $ | — | (2) | | $ | — | | |
Emerging Markets
Equity | | | 2,725,387 | | | | 5,731,674 | | | | — | | | | — | | | | — | | | | — | | | | 2,725,387 | | | | 5,731,674 | | |
Equity Income | | | 45,301,642 | | | | 65,720,431 | | | | 66,678,398 | | | | 93,473,349 | | | | — | | | | — | | | | 111,980,040 | | | | 159,193,780 | | |
Focus | | | 5,504,703 | | | | 19,619,019 | | | | 35,550,318 | | | | 113,979,974 | | | | — | | | | — | | | | 41,055,021 | | | | 133,598,993 | | |
Genesis | | | 35,557,259 | | | | 35,589,396 | | | | 1,125,571,976 | | | | 1,177,470,479 | | | | — | | | | — | | | | 1,161,129,235 | | | | 1,213,059,875 | | |
Global Equity | | | 6,357 | | | | 827,724 | | | | — | | | | 793,061 | | | | — | | | | — | | | | 6,357 | | | | 1,620,785 | | |
Global Real Estate | | | 58,229 | | | | 24,956 | (1) | | | 341 | | | | — | (1) | | | — | | | | — | (1) | | | 58,570 | | | | 24,956 | (1) | |
Greater China
Equity | | | 12,868,372 | | | | 4,726,685 | | | | — | | | | 847,483 | | | | — | | | | — | | | | 12,868,372 | | | | 5,574,168 | | |
Guardian | | | 8,572,126 | | | | 18,290,813 | | | | 134,218,623 | | | | 193,226,409 | | | | — | | | | — | | | | 142,790,749 | | | | 211,517,222 | | |
International
Equity | | | 13,604,543 | | | | 16,964,183 | | | | — | | | | — | | | | — | | | | — | | | | 13,604,543 | | | | 16,964,183 | | |
International
Select | | | 2,878,253 | | | | 3,333,956 | | | | — | | | | — | | | | — | | | | — | | | | 2,878,253 | | | | 3,333,956 | | |
Intrinsic Value | | | 733,120 | | | | 3,457,299 | | | | 22,985,868 | | | | 12,891,705 | | | | — | | | | — | | | | 23,718,988 | | | | 16,349,004 | | |
Large Cap Value | | | 16,816,512 | | | | 106,665,862 | | | | 113,694,976 | | | | 131,474,524 | | | | — | | | | — | | | | 130,511,488 | | | | 238,140,386 | | |
Mid Cap Growth | | | — | | | | — | | | | 90,521,333 | | | | 112,035,066 | | | | — | | | | — | | | | 90,521,333 | | | | 112,035,066 | | |
Mid Cap Intrinsic
Value | | | 1,384,820 | | | | 1,552,865 | | | | 10,316,948 | | | | 7,508,109 | | | | — | | | | — | | | | 11,701,768 | | | | 9,060,974 | | |
Multi-Cap
Opportunities | | | 20,337,175 | | | | 23,749,224 | | | | 60,531,847 | | | | 86,383,844 | | | | — | | | | — | | | | 80,869,022 | | | | 110,133,068 | | |
171
| | | Distributions Paid From: | |
| | | Ordinary Income | | Long-Term Capital Gain | | Return of Capital | | Total | |
| | | 2016 | | 2015 | | 2016 | | 2015 | | 2016 | | 2015 | | 2016 | | 2015 | |
Real Estate | | $ | 15,994,363 | | | $ | 14,563,346 | | | $ | 52,479,919 | | | $ | 48,311,493 | | | $ | — | | | $ | — | | | $ | 68,474,282 | | | $ | 62,874,839 | | |
Small Cap Growth | | | 2,335,252 | | | | — | | | | 2,181,399 | | | | — | | | | — | | | | — | | | | 4,516,651 | | | | — | | |
Socially
Responsive | | | 20,668,806 | | | | 29,152,122 | | | | 138,003,445 | | | | 255,811,829 | | | | — | | | | — | | | | 158,672,251 | | | | 284,963,951 | | |
Value | | | 197,220 | | | | 1,232,049 | | | | 202,164 | | | | 160,048 | | | | — | | | | — | | | | 399,384 | | | | 1,392,097 | | |
(1) Period from December 30, 2014 (Commencement of Operations) to August 31, 2015.
(2) Period from December 15, 2015 (Commencement of Operations) to August 31, 2016.
As of August 31, 2016, the components of distributable earnings (accumulated losses) on a U.S. federal income tax basis were as follows:
| | | Undistributed
Ordinary
Income | | Undistributed
Long-Term
Capital Gain | | Unrealized
Appreciation
(Depreciation) | | Loss
Carryforwards
and Deferrals | | Other
Temporary
Differences | | Total | |
Dividend Growth | | $ | 283,700 | | | $ | — | | | $ | 1,765,940 | | | $ | (96,571 | ) | | $ | — | | | $ | 1,953,069 | | |
Emerging Markets
Equity | | | 1,834,507 | | | | — | | | | 48,258,964 | | | | (68,762,310 | ) | | | (33,992 | ) | | | (18,702,831 | ) | |
Equity Income | | | 5,411,525 | | | | 53,826,960 | | | | 209,146,953 | | | | — | | | | (279,051 | ) | | | 268,106,387 | | |
Focus | | | 2,376,522 | | | | 57,022,350 | | | | 77,288,343 | | | | — | | | | — | | | | 136,687,215 | | |
Genesis | | | 22,874,327 | | | | 586,313,834 | | | | 4,927,451,623 | | | | — | | | | — | | | | 5,536,639,784 | | |
Global Equity | | | 20,514 | | | | 29,423 | | | | 255,145 | | | | — | | | | — | | | | 305,082 | | |
Global Real Estate | | | 45,376 | | | | — | | | | 139,800 | | | | (5,890 | ) | | | (2,302 | ) | | | 176,984 | | |
Greater China Equity | | | 359,675 | | | | — | | | | 2,522,238 | | | | (10,913,881 | ) | | | (23,423 | ) | | | (8,055,391 | ) | |
Guardian | | | 2,687,160 | | | | 117,059,267 | | | | 118,507,323 | | | | — | | | | — | | | | 238,253,750 | | |
International Equity | | | 13,045,359 | | | | — | | | | 92,680,280 | | | | (217,670,127 | ) | | | (1,654 | ) | | | (111,946,142 | ) | |
International Select | | | 2,104,443 | | | | — | | | | 21,989,610 | | | | (31,070,807 | ) | | | (30,672 | ) | | | (7,007,426 | ) | |
Intrinsic Value | | | 2,019,395 | | | | 6,007,702 | | | | 54,926,148 | | | | — | | | | (113,480 | ) | | | 62,839,765 | | |
Large Cap Value | | | 10,385,792 | | | | 17,829,807 | | | | 87,776,081 | | | | — | | | | — | | | | 115,991,680 | | |
Mid Cap Growth | | | — | | | | 31,951,364 | | | | 215,084,622 | | | | (1,654,483 | ) | | | — | | | | 245,381,503 | | |
Mid Cap Intrinsic
Value | | | — | | | | — | | | | 7,803,587 | | | | (803,937 | ) | | | — | | | | 6,999,650 | | |
Multi-Cap
Opportunities | | | 10,815,330 | | | | 48,155,675 | | | | 451,216,054 | | | | — | | | | — | | | | 510,187,059 | | |
Real Estate | | | 7,176,688 | | | | 53,855,942 | | | | 88,239,635 | | | | — | | | | — | | | | 149,272,265 | | |
Small Cap Growth | | | — | | | | — | | | | 8,260,114 | | | | (13,131,953 | ) | | | — | | | | (4,871,839 | ) | |
Socially Responsive | | | 12,471,429 | | | | 61,240,444 | | | | 514,621,883 | | | | — | | | | — | | | | 588,333,756 | | |
Value | | | 150,027 | | | | — | | | | 602,503 | | | | (411,111 | ) | | | — | | | | 341,419 | | |
The differences between book basis and tax basis distributable earnings are primarily due to: losses disallowed and recognized on wash sales, capital loss carryforwards, post-October capital loss and late-year ordinary loss deferrals, unamortized organization expenses and tax adjustments related to REITs, PFICs, partnerships and other investments.
172
To the extent each Fund's net realized capital gains, if any, can be offset by capital loss carryforwards, it is the policy of each Fund not to distribute such gains. The Regulated Investment Company Modernization Act of 2010 (the "Act") made changes to the capital loss carryforward rules allowing for RICs to carry forward capital losses indefinitely and to retain the character of capital loss carryforwards as short-term or long-term ("Post-Enactment"). Rules in effect previously limited the carryforward period to eight years and all carryforwards were considered short-term in character ("Pre-Enactment"). As determined at August 31, 2016, the following Funds had unused capital loss carryforwards available for federal income tax purposes to offset net realized capital gains, if any, as follows:
| | | Pre-Enactment | |
| | | Expiring in: | |
| | 2017 | | 2018 | |
| International Equity(1) | | $ | 139,527,206 | | | $ | 78,142,921 | | |
International Select | | | — | | | | 31,070,807 | | |
| | | Post-Enactment (No Expiration Date) | |
| | | Long-Term | | Short-Term | |
Dividend Growth | | $ | — | | | $ | 96,571 | | |
Emerging Markets Equity | | | 37,231,297 | | | | 31,531,013 | | |
Global Real Estate | | | 2,641 | | | | 3,249 | | |
Greater China Equity | | | 1,574,848 | | | | 9,339,033 | | |
Small Cap Growth | | | — | | | | 12,783,851 | | |
Value | | | — | | | | 411,111 | | |
(1) The capital loss carryforwards shown above for International Equity includes $105,823,041 expiring in 2017, which was acquired on January 25, 2013 in the merger with Neuberger Berman International Fund. Future utilization of these losses may be limited under current tax rules.
Post-Enactment capital loss carryforwards must be fully used before Pre-Enactment capital loss carryforwards; therefore, under certain circumstances, Pre-Enactment capital loss carryforwards available as of the report date may expire unused.
During the year ended August 31, 2016, International Equity and International Select utilized capital loss carryforwards of $15,255,423, and $4,066,435, respectively.
Under current tax regulations, capital losses realized on investment transactions after October 31 may be deferred and treated as occurring on the first day of the following fiscal year. Under the Act, the Funds may also defer any realized late-year ordinary losses as occurring on the first day of the following fiscal year. Late-year ordinary losses represent ordinary losses realized on investment transactions after December 31 and specified losses (ordinary losses from the sale, exchange, or other disposition of property, net foreign currency losses and net passive foreign investment company mark to market losses) realized on investment transactions after October 31. For the year ended August 31, 2016, the Funds elected to defer the following late-year ordinary losses and post October capital losses:
| | | Late-Year
Ordinary Loss | | Post October
Capital Loss
Deferral | |
| | | Deferral | | Long-Term | | Short-Term | |
Mid Cap Growth | | $ | 1,654,483 | | | $ | — | | | $ | — | | |
Mid Cap Intrinsic Value | | | — | | | | — | | | | 803,937 | | |
Small Cap Growth | | | 348,102 | | | | — | | | | — | | |
173
6 Foreign taxes: Foreign taxes withheld, if any, represent amounts withheld by foreign tax authorities, net of refunds recoverable.
Emerging Markets Equity accrues deferred capital gains tax on unrealized gains for certain securities of issuers domiciled in India. At August 31, 2016, Emerging Markets Equity had accrued capital gains taxes of $282,181, which is reflected in the Statements of Assets and Liabilities.
Effective November 17, 2014 ("Effective Date"), a change in the capital gains tax provision for Greater China Equity arose due to changes in the tax rules in the People's Republic of China ("PRC"). Capital gains derived from the trading of PRC equity investments after the Effective Date are temporarily exempt from PRC withholding tax.
Prior to the Effective Date, Greater China Equity had accrued deferred capital gains tax on unrealized gains on participatory notes. During the year ended August 31, 2015, $316,202 of capital gains tax provisions from prior periods were reversed and are included as part of the change in net unrealized appreciation (depreciation) of investments in the Statements of Changes in Net Assets. During the year ended August 31, 2016, $43,359 of capital gains taxes on gains previously realized were reversed and are included as part of net realized gain (loss) on sales of investment securities of unaffiliated issuers in the Statements of Operations. The tax laws and regulations in the PRC are subject to change, possibly with retroactive effect.
7 Distributions to shareholders: Each Fund may earn income, net of expenses, daily on its investments.
Distributions from net investment income and net realized capital gains, if any, are generally distributed once a year (usually in December) and are recorded on the ex-date. However, Equity Income, Global Real Estate and Real Estate generally distribute substantially all of their net investment income, if any, at the end of each calendar quarter.
It is the policy of each of Equity Income, Global Real Estate, Intrinsic Value, Mid Cap Intrinsic Value, Real Estate, Small Cap Growth and Socially Responsive to pass through to its shareholders substantially all REIT distributions and other income it receives, less operating expenses. The distributions received from REITs are generally composed of income, capital gains, and/or return of REIT capital, but the REITs do not report this information to these Funds until the following calendar year. At August 31, 2016, these Funds estimated these amounts for the period January 1, 2016 to August 31, 2016 within the financial statements because the 2016 information is not available from the REITs until after each Fund's fiscal period. All estimates are based upon REIT information sources available to these Funds together with actual IRS Forms 1099-DIV received to date. For the year ended August 31, 2016, the character of distributions paid to shareholders of these Funds disclosed within the Statements of Changes in Net Assets is based on estimates made at that time. Based on past experience it is possible that a portion of these Funds' distributions during the current fiscal year will be considered tax return of capital, but the actual amount of the tax return of capital, if any, is not determinable until after each Fund's fiscal year-end. After calendar year-end, when these Funds learn the nature of the distributions paid by REITs during that year, distributions previously identified as income are often recharacterized as return of capital and/or capital gain. After all applicable REITs have informed these Funds of the actual breakdown of distributions paid to these Funds during their fiscal year, estimates previously recorded are adjusted on the books of these Funds to reflect actual results. As a result, the composition of these Funds' distributions as reported herein may differ from the final composition determined after calendar year-end and reported to these Funds shareholders on IRS Form 1099-DIV.
8 Organization expenses: Costs incurred by Dividend Growth in connection with its organization, which amounted to $65,309 and are reflected in Organization expense in the Statements of Operations, have been expensed as incurred.
9 Expense allocation: Certain expenses are applicable to multiple funds within the complex of related investment companies. Expenses directly attributable to a Fund are charged to that Fund. Expenses of the Trust that are not directly attributable to a particular series of the Trust (e.g., a Fund) are allocated among the series of the Trust, on the basis of relative net assets, except where a more appropriate allocation of expenses to each of the series can otherwise be made fairly. Expenses borne by the complex of related investment companies, which includes
174
open-end and closed-end investment companies for which Management serves as investment manager, that are not directly attributable to a particular investment company in the complex (e.g., the Trust) or series thereof are allocated among the investment companies in the complex or series thereof on the basis of relative net assets, except where a more appropriate allocation of expenses to each of the investment companies in the complex or series thereof can otherwise be made fairly. Each Fund's expenses (other than those specific to each class) are allocated proportionally each day among the classes based upon the relative net assets of each class.
10 Investments in foreign securities: Investing in foreign securities may involve sovereign and other risks, in addition to the credit and market risks normally associated with domestic securities. These additional risks include the possibility of adverse political and economic developments (including political instability, nationalization, expropriation, or confiscatory taxation) and the potentially adverse effects of unavailability of public information regarding issuers, less governmental supervision and regulation of financial markets, reduced liquidity of certain financial markets, and the lack of uniform accounting, auditing, and financial reporting standards or the application of standards that are different or less stringent than those applied in the United States. Foreign securities also may experience greater price volatility, higher rates of inflation, and delays in settlement.
11 Derivative instruments: Certain Funds' use of derivatives during the year ended August 31, 2016, is described below. Please see the Schedule of Investments for each Fund's open positions in derivatives, if any, at August 31, 2016. The Funds have adopted the provisions of ASC 815 "Derivatives and Hedging" ("ASC 815"). The disclosure requirements of ASC 815 distinguish between derivatives that qualify for hedge accounting and those that do not. Because investment companies value their derivatives at fair value and recognize changes in fair value through the Statements of Operations, they do not qualify for hedge accounting. Accordingly, even though a Fund's investments in derivatives may represent economic hedges, they are considered non-hedge transactions for purposes of this disclosure.
Options: For the year ended August 31, 2016, Equity Income, Focus and Guardian used options written and Focus and Guardian used purchased option contracts ("options purchased"). Equity Income used options written in an attempt to generate incremental returns. Focus used options written to enhance income; written calls were used for hedging purposes and to manage the risk profile of the Fund, and written puts were used in an attempt to enhance returns and to gain exposure to certain securities. Focus used options purchased for hedging purposes and as a risk management tool. Guardian used written and purchased options to enhance income, to gain exposure more efficiently than through a direct purchase of the underlying security, to gain exposure to securities, markets, sectors or geographical areas and to manage or adjust the risk profile of the Fund or the risk of individual positions.
Premiums paid by a Fund upon purchasing a call or put option are recorded in the asset section of the Fund's Statement of Assets and Liabilities and are subsequently adjusted to the current market value. When an option is exercised, closed, or expired, the Fund realizes a gain or loss and the asset is eliminated.
For purchased call options, a Fund's loss is limited to the amount of the option premium paid.
Premiums received by a Fund upon writing a covered call option or a put option are recorded in the liability section of the Fund's Statement of Assets and Liabilities and are subsequently adjusted to the current market value. When an option is exercised, closed, or expired, the Fund realizes a gain or loss and the liability is eliminated.
When writing a covered call option, a Fund, in return for the premium, gives up the opportunity for profit from a price increase in the underlying security above the exercise price, but conversely retains the risk of loss should the price of the security decline. When writing a put option, a Fund, in return for the premium, takes the risk that it must purchase the underlying security at a price that may be higher than the current market price of the security. If a covered call or a put option that a Fund has written expires unexercised, the Fund will realize a gain in the amount of the premium. All securities covering outstanding written options are held in escrow by the custodian bank.
175
At August 31, 2016, Equity Income, Focus and Guardian had pledged securities in the amount of $55,520,104, $20,027,635 and $59,543,996, respectively, to cover collateral requirements for options written.
At August 31, 2016, Equity Income, Focus and Guardian had the following derivatives (which did not qualify as hedging instruments under ASC 815), grouped by primary risk exposure:
Asset Derivatives
Derivative Type | | Statements of Assets and Liabilities Location | | Equity Risk | | Total | |
Focus | |
Options purchased | | Investments in securities, at value | | $ | 116,550 | | | $ | 116,550 | | |
Total Value—Assets | | | | $ | 116,550 | | | $ | 116,550 | | |
Guardian | |
Options purchased | | Investments in securities, at value | | $ | 326,600 | | | $ | 326,600 | | |
Total Value—Assets | | | | $ | 326,600 | | | $ | 326,600 | | |
Liability Derivatives
Derivative Type | | Statements of Assets and Liabilities Location | | Equity Risk | | Total | |
Equity Income | |
Options written | | Option contracts written, at value | | $ | (1,530,510 | ) | | $ | (1,530,510 | ) | |
Total Value—Liabilities | | | | $ | (1,530,510 | ) | | $ | (1,530,510 | ) | |
Focus | |
Options written | | Option contracts written, at value | | $ | (304,375 | ) | | $ | (304,375 | ) | |
Total Value-Liabilities | | | | $ | (304,375 | ) | | $ | (304,375 | ) | |
Guardian | |
Options written | | Option contracts written, at value | | $ | (925,578 | ) | | $ | (925,578 | ) | |
Total Value—Liabilities | | | | $ | (925,578 | ) | | $ | (925,578 | ) | |
The impact of the use of these derivative instruments on the Statements of Operations during the year ended August 31, 2016, was as follows:
Realized Gain (Loss)
Derivative Type | | Statements of Operations Location | | Equity Risk | | Total | |
Equity Income | |
Options written | | Net realized gain (loss) on: option contracts written | | $ | 1,835,332 | | | $ | 1,835,332 | | |
Total Realized Gain (Loss) | | | | $ | 1,835,332 | | | $ | 1,835,332 | | |
Focus | |
Options written | | Net realized gain (loss) on: option contracts written | | $ | 48,676 | | | $ | 48,676 | | |
Total Realized Gain (Loss) | | | | $ | 48,676 | | | $ | 48,676 | | |
Guardian | |
Options purchased | | Net realized gain (loss) on: sales of investment
securities of unaffiliated issuers | | $ | 179,722 | | | $ | 179,722 | | |
Options written | | Net realized gain (loss) on: option contracts written | | | 445,456 | | | | 445,456 | | |
Total Realized Gain (Loss) | | | | $ | 625,178 | | | $ | 625,178 | | |
Change in Appreciation (Depreciation)
Derivative Type | | Statements of Operations Location | | Equity Risk | | Total | |
Equity Income | |
Options written | | Change in net unrealized appreciation (depreciation) in
value of: option contracts written | | $ | 292,877 | | | $ | 292,877 | | |
Total Change in Appreciation (Depreciation) | | | | $ | 292,877 | | | $ | 292,877 | | |
176
Change in Appreciation (Depreciation)
Derivative Type | | Statements of Operations Location | | Equity Risk | | Total | |
Focus | |
Options purchased | | Change in net unrealized appreciation (depreciation)
in value of: unaffiliated investment securities | | $ | (3,677 | ) | | $ | (3,677 | ) | |
Options written | | Change in net unrealized appreciation (depreciation)
in value of: option contracts written | | | 163,603 | | | | 163,603 | | |
Total Change in Appreciation (Depreciation) | | | | $ | 159,926 | | | $ | 159,926 | | |
Guardian | |
| Options purchased | | Change in net unrealized appreciation (depreciation)
in value of: unaffiliated investment securities | | $ | (229,451 | ) | | $ | (229,451 | ) | |
Options written | | Change in net unrealized appreciation (depreciation)
in value of: option contracts written | | | 380,522 | | | | 380,522 | | |
Total Change in Appreciation (Depreciation) | | | | $ | 151,071 | | | $ | 151,071 | | |
While the Funds may receive rights and warrants in connection with their investments in securities, these rights and warrants are not considered "derivative instruments" under ASC 815. Management has concluded that the Funds, except Equity Income, Focus and Guardian, did not hold any derivative instruments during the year ended August 31, 2016 that require additional disclosures pursuant to ASC 815.
12 Indemnifications: Like many other companies, the Trust's organizational documents provide that its officers ("Officers") and trustees ("Trustees") are indemnified against certain liabilities arising out of the performance of their duties to the Trust. In addition, both in some of its principal service contracts and in the normal course of its business, the Trust enters into contracts that provide indemnifications to other parties for certain types of losses or liabilities. The Trust's maximum exposure under these arrangements is unknown as this could involve future claims against the Trust.
13 The Funds may invest in shares of other registered investment companies, including exchange-traded funds ("ETFs"), within the limitations prescribed by the 1940 Act. Some ETFs seek to track the performance of a particular market index. These indices include both broad-based market indices and more narrowly-based indices, including those relating to particular sectors, markets, regions or industries. However, some ETFs have actively-managed investment objectives. ETF shares are traded like traditional equity securities on a national securities exchange or NASDAQ. A Fund will indirectly bear its proportionate share of any management fees and other expenses paid by such other investment companies, which will increase expenses and decrease returns.
14 Other: All net investment income and realized and unrealized capital gains and losses of each Fund are allocated, on the basis of relative net assets, pro rata among its respective classes.
Note B—Investment Management Fees, Administration Fees, Distribution Arrangements, and Other Transactions with Affiliates:
Each Fund retains Management as its investment manager under a Management Agreement. For such investment management services, each Fund pays Management a fee according to the following table:
Investment Management Fee as a Percentage of Average Daily Net Assets:
| | First
$250
million | | Next
$250
million | | Next
$250
million | | Next
$250
million | | Next
$500
million | | Next
$500
million | | Next
$500
million | | Next
$1.5
billion | | Thereafter | |
For Genesis, Intrinsic Value, and Small Cap Growth: | |
| | | | 0.85 | % | | | 0.80 | % | | | 0.75 | % | | | 0.70 | % | | | 0.65 | % | | | 0.65 | % | | | 0.65 | % | | | 0.65 | % | | | 0.65 | % | |
177
| | First
$250
million | | Next
$250
million | | Next
$250
million | | Next
$250
million | | Next
$500
million | | Next
$500
million | | Next
$500
million | | Next
$1.5
billion | | Thereafter | |
For Emerging Markets Equity: | |
| | | | 1.00 | % | | | 0.975 | % | | | 0.95 | % | | | 0.925 | % | | | 0.90 | % | | | 0.875 | % | | | 0.875 | % | | | 0.875 | % | | | 0.85 | % | |
For Global Real Estate and Real Estate: | |
| | | | 0.80 | % | | | 0.80 | % | | | 0.80 | % | | | 0.80 | % | | | 0.80 | % | | | 0.80 | % | | | 0.80 | % | | | 0.80 | % | | | 0.80 | % | |
| For International Equity(1): | |
| | | | 0.85 | % | | | 0.825 | % | | | 0.80 | % | | | 0.775 | % | | | 0.75 | % | | | 0.725 | % | | | 0.725 | % | | | 0.70 | % | | | 0.70 | % | |
| For Equity Income, Focus, Guardian, International Select, Large Cap Value, Mid Cap Growth, Mid Cap Intrinsic Value(1), Socially Responsive and Value: | |
| | | | 0.55 | % | | | 0.525 | % | | | 0.50 | % | | | 0.475 | % | | | 0.45 | % | | | 0.425 | % | | | 0.425 | % | | | 0.425 | % | | | 0.40 | % | |
For Multi-Cap Opportunities: | |
| | | | 0.60 | % | | | 0.575 | % | | | 0.55 | % | | | 0.525 | % | | | 0.50 | % | | | 0.475 | % | | | 0.475 | % | | | 0.475 | % | | | 0.45 | % | |
For Global Equity: | |
| | | | 0.75 | % | | | 0.725 | % | | | 0.70 | % | | | 0.675 | % | | | 0.65 | % | | | 0.625 | % | | | 0.625 | % | | | 0.625 | % | | | 0.60 | % | |
For Greater China Equity: | |
| | | | 1.10 | % | | | 1.10 | % | | | 1.10 | % | | | 1.10 | % | | | 0.95 | % | | | 0.95 | % | | | 0.95 | % | | | 0.95 | % | | | 0.95 | % | |
For Dividend Growth: | |
| | | | 0.50 | % | | | 0.50 | % | | | 0.50 | % | | | 0.50 | % | | | 0.50 | % | | | 0.475 | % | | | 0.475 | % | | | 0.475 | % | | | 0.45 | % | |
(1) Effective May 1, 2015, Management has voluntarily agreed to waive its management fee in the amount of 0.18% of the average daily net assets of International Equity (0.21% effective February 1, 2014, and 0.18% effective January 28, 2013). Effective August 31, 2016, Management has voluntarily agreed to waive its management fee in the amount of 2.89% of the average daily net asset of Mid Cap Intrinsic Value (1.21% effective August 23, 2016, 0.11% effective November 1, 2015, 0.16% effective March 1, 2015, 0.20% effective October 13, 2014, 0.30% effective February 1, 2014, 0.36% effective May 1, 2013, 0.33% effective February 1, 2013, 0.28% effective December 1, 2012 and 0.25% effective February 1, 2012). Effective September 1, 2016, the voluntary waiver was 0.15% of the average daily net assets of Mid Cap Intrinsic Value. Management may, at its sole discretion, modify or terminate these voluntary waivers without notice to International Equity or Mid Cap Intrinsic Value. For the year ended August 31, 2016, such waived fees amounted to $2,427,972 and $141,269 for International Equity and Mid Cap Intrinsic Value, respectively. These amounts are not subject to recovery by Management.
Accordingly, for the year ended August 31, 2016, the investment management fee pursuant to the Management Agreement was equivalent to an annual effective rate of each Fund's average daily net assets, as follows:
| | | Effective
Rate | | | | Effective
Rate | |
Dividend Growth | | | 0.50 | % | | International Select | | | 0.55 | % | |
Emerging Markets Equity | | | 0.99 | % | | Intrinsic Value | | | 0.82 | % | |
Equity Income | | | 0.48 | % | | Large Cap Value | | | 0.50 | % | |
Focus | | | 0.53 | % | | Mid Cap Growth | | | 0.50 | % | |
Genesis | | | 0.66 | % | | Mid Cap Intrinsic Value | | | 0.55 | %(2) | |
Global Equity | | | 0.75 | % | | Multi-Cap Opportunities | | | 0.52 | % | |
Global Real Estate | | | 0.80 | % | | Real Estate | | | 0.80 | % | |
Greater China Equity | | | 1.10 | % | | Small Cap Growth | | | 0.85 | % | |
Guardian | | | 0.50 | % | | Socially Responsive | | | 0.47 | % | |
International Equity | | | 0.80 | %(1) | | Value | | | 0.55 | % | |
(1) 0.62% annual effective net rate of the Fund's average daily net assets.
178
(2) 0.40% annual effective net rate of the Fund's average daily net assets.
Each Fund retains Management as its administrator under an Administration Agreement. Each Fund pays Management an administration fee at the annual rate of 0.06% of its average daily net assets under this agreement. In addition, Investor Class, Class A, Class C and Class R3 of each Fund that offers those classes pays Management an administration fee at the annual rate of 0.20% of its average daily net assets, Trust Class and Advisor Class of each Fund that offers those classes pays Management an administration fee at the annual rate of 0.34% of its average daily net assets, Institutional Class of each Fund pays Management an administration fee at the annual rate of 0.09% of its average daily net assets, and Class R6 of each Fund that offers that class pays Management an administration fee of 0.02% of its average daily net assets, under this agreement. Additionally, Management retains State Street Bank and Trust Company ("State Street") as its sub-administrator under a Sub-Administration Agreement. Management pays State Street a fee for all services received under the agreement.
Management has contractually agreed to waive fees and/or reimburse certain expenses of the Investor Class of each of International Equity, Mid Cap Intrinsic Value and Small Cap Growth and the Trust Class, Advisor Class, Institutional Class, Class A, Class C, Class R3 and Class R6 of each Fund that offers those classes so that the total annual operating expenses of those classes do not exceed the expense limitations as detailed in the following table. These undertakings apply to a Fund's direct expenses and exclude interest, taxes, brokerage commissions, acquired fund fees and expenses, extraordinary expenses, and dividend and interest expenses relating to short sales, if any; consequently, net expenses may exceed the contractual expense limitations. Each Fund has agreed that each of its respective classes will repay Management for fees and expenses waived or reimbursed for that class provided that repayment does not cause that class's annual operating expenses to exceed its contractual expense limitation in place at the time the fees and expenses were waived or reimbursed, or the expense limitation in place at the time the Fund repays Management, whichever is lower. Any such repayment must be made within three years after the year in which Management incurred the expense.
During the year ended August 31, 2016, the following classes repaid Management under their contractual expense limitation agreements as follows:
Class | | Expenses
Repaid to
Management | |
Genesis Institutional Class | | $ | 53,485 | | |
Genesis Class R6 | | | 32,566 | | |
Guardian Advisor Class | | | 147 | | |
International Equity Institutional Class | | | 33,116 | | |
Mid Cap Growth Institutional Class | | | 77,459 | | |
Mid Cap Growth Class A | | | 5,418 | | |
At August 31, 2016, contingent liabilities to Management under the agreements were as follows:
| | | | | | | Expenses Reimbursed in
Fiscal Year Ending August 31, | |
| | | | | | | 2014 | | 2015 | | 2016 | |
| | | | | | | Subject to Repayment until
August 31, | |
Class | | Contractual
Expense
Limitation(1) | | Expiration | | 2017 | | 2018 | | 2019 | |
Dividend Growth Institutional Class | | | 0.69 | % | | 8/31/19 | | $ | — | | | $ | — | | | $ | 215,047 | (5) | |
Dividend Growth Class A | | | 1.05 | % | | 8/31/19 | | | — | | | | — | | | | 9,994 | (5) | |
Dividend Growth Class C | | | 1.80 | % | | 8/31/19 | | | — | | | | — | | | | 9,444 | (5) | |
Dividend Growth Class R6 | | | 0.62 | % | | 8/31/19 | | | — | | | | — | | | | 15,585 | (5) | |
179
| | | | | | | Expenses Reimbursed in
Fiscal Year Ending August 31, | |
| | | | | | | 2014 | | 2015 | | 2016 | |
| | | | | | | Subject to Repayment until
August 31, | |
Class | | Contractual
Expense
Limitation(1) | | Expiration | | 2017 | | 2018 | | 2019 | |
Emerging Markets Equity Institutional Class | | | 1.25 | % | | 8/31/19 | | $ | 883,793 | | | $ | 744,611 | | | $ | 528,129 | | |
Emerging Markets Equity Class A | | | 1.50 | % | | 8/31/19 | | | 50,749 | | | | 48,820 | | | | 54,600 | | |
Emerging Markets Equity Class C | | | 2.25 | % | | 8/31/19 | | | 17,601 | | | | 19,352 | | | | 13,399 | | |
Emerging Markets Equity Class R3 | | | 1.91 | % | | 8/31/19 | | | 937 | | | | 1,334 | | | | 1,403 | | |
Emerging Markets Equity Class R6 | | | 1.18 | % | | 8/31/19 | | | 122,359 | | | | 135,881 | | | | 127,742 | | |
Equity Income Institutional Class | | | 0.80 | % | | 8/31/19 | | | — | | | | — | | | | — | | |
Equity Income Class A | | | 1.16 | % | | 8/31/19 | | | — | | | | — | | | | — | | |
Equity Income Class C | | | 1.91 | % | | 8/31/19 | | | — | | | | — | | | | — | | |
Equity Income Class R3 | | | 1.41 | % | | 8/31/19 | | | — | | | | — | | | | — | | |
Focus Trust Class | | | 1.50 | % | | 8/31/19 | | | — | | | | — | | | | — | | |
Focus Advisor Class | | | 1.50 | % | | 8/31/22 | | | — | | | | — | | | | — | | |
Focus Institutional Class | | | 0.75 | % | | 8/31/19 | | | 521 | | | | 1,569 | | | | 755 | | |
Focus Class A | | | 1.11 | % | | 8/31/19 | | | 726 | | | | 1,267 | | | | 1,451 | | |
Focus Class C | | | 1.86 | % | | 8/31/19 | | | 435 | | | | 714 | | | | 893 | | |
Genesis Trust Class | | | 1.50 | % | | 8/31/19 | | | — | | | | — | | | | — | | |
Genesis Advisor Class | | | 1.50 | % | | 8/31/22 | | | — | | | | — | | | | — | | |
Genesis Institutional Class | | | 0.85 | % | | 8/31/22 | | | — | | | | 114,064 | | | | — | | |
Genesis Class R6 | | | 0.78 | % | | 8/31/19 | | | — | | | | 65,989 | | | | — | | |
Global Equity Institutional Class | | | 1.15 | % | | 8/31/19 | | | 210,511 | | | | 250,677 | | | | 240,098 | | |
Global Equity Class A | | | 1.51 | % | | 8/31/19 | | | 2,179 | | | | 14,279 | | | | 38,361 | | |
Global Equity Class C | | | 2.26 | % | | 8/31/19 | | | 967 | | | | 5,804 | | | | 16,073 | | |
Global Real Estate Institutional Class | | | 1.00 | % | | 8/31/19 | | | — | | | | 185,695 | (4) | | | 197,159 | | |
Global Real Estate Class A | | | 1.36 | % | | 8/31/19 | | | — | | | | 58,618 | (4) | | | 64,529 | | |
Global Real Estate Class C | | | 2.11 | % | | 8/31/19 | | | — | | | | 24,540 | (4) | | | 25,169 | | |
Greater China Equity Institutional Class | | | 1.50 | % | | 8/31/19 | | | 193,960 | | | | 127,913 | | | | 229,329 | | |
Greater China Equity Class A | | | 1.86 | % | | 8/31/19 | | | 1,756 | | | | 5,520 | | | | 7,590 | | |
Greater China Equity Class C | | | 2.61 | % | | 8/31/19 | | | 264 | | | | 302 | | | | 320 | | |
Guardian Trust Class | | | 1.50 | % | | 8/31/19 | | | — | | | | — | | | | — | | |
Guardian Advisor Class | | | 1.50 | % | | 8/31/22 | | | — | | | | — | | | | — | | |
Guardian Institutional Class | | | 0.75 | % | | 8/31/19 | | | — | | | | — | | | | — | | |
Guardian Class A | | | 1.11 | % | | 8/31/19 | | | — | | | | — | | | | — | | |
Guardian Class C | | | 1.86 | % | | 8/31/19 | | | — | | | | — | | | | — | | |
Guardian Class R3 | | | 1.36 | % | | 8/31/19 | | | 114 | | | | 82 | | | | 148 | | |
International Equity Investor Class | | | 1.40 | % | | 8/31/19 | | | — | | | | — | | | | — | | |
International Equity Trust Class | | | 2.00 | % | | 8/31/22 | | | — | | | | — | | | | — | | |
International Equity Institutional Class | | | 0.85 | % | | 8/31/22 | | | 213,333 | | | | — | | | | — | | |
International Equity Class A | | | 1.21 | % | | 8/31/19 | | | 8,879 | | | | — | | | | 10,042 | | |
180
| | | | | | | Expenses Reimbursed in
Fiscal Year Ending August 31, | |
| | | | | | | 2014 | | 2015 | | 2016 | |
| | | | | | | Subject to Repayment until
August 31, | |
Class | | Contractual
Expense
Limitation(1) | | Expiration | | 2017 | | 2018 | | 2019 | |
International Equity Class C | | | 1.96 | % | | 8/31/19 | | $ | 1,864 | | | $ | 280 | | | $ | 2,521 | | |
International Equity Class R6 | | | 0.78 | % | | 8/31/19 | | | — | (3) | | | — | | | | — | | |
International Select Trust Class | | | 1.25 | % | | 8/31/19 | | | 10,697 | | | | 9,411 | | | | 12,258 | | |
International Select Institutional Class | | | 0.90 | % | | 8/31/19 | | | 58,414 | | | | 59,370 | | | | 91,989 | | |
International Select Class A | | | 1.30 | %(2) | | 8/31/19 | | | 430 | | | | 535 | | | | 1,276 | | |
International Select Class C | | | 2.00 | % | | 8/31/19 | | | 2,151 | | | | 1,862 | | | | 1,955 | | |
International Select Class R3 | | | 1.51 | % | | 8/31/19 | | | 1,076 | | | | 1,375 | | | | 2,218 | | |
Intrinsic Value Institutional Class | | | 1.00 | % | | 8/31/19 | | | 302,070 | | | | 340,028 | | | | 357,588 | | |
Intrinsic Value Class A | | | 1.36 | % | | 8/31/19 | | | 28,539 | | | | 36,427 | | | | 58,200 | | |
Intrinsic Value Class C | | | 2.11 | % | | 8/31/19 | | | 17,391 | | | | 20,091 | | | | 22,495 | | |
Large Cap Value Trust Class | | | 1.50 | % | | 8/31/19 | | | — | | | | — | | | | — | | |
Large Cap Value Advisor Class | | | 1.50 | % | | 8/31/22 | | | — | | | | — | | | | — | | |
Large Cap Value Institutional Class | | | 0.70 | % | | 8/31/19 | | | — | | | | — | | | | 6,431 | | |
Large Cap Value Class A | | | 1.11 | % | | 8/31/19 | | | — | | | | — | | | | — | | |
Large Cap Value Class C | | | 1.86 | % | | 8/31/19 | | | — | | | | — | | | | — | | |
Large Cap Value Class R3 | | | 1.36 | % | | 8/31/19 | | | 82 | | | | 150 | | | | 126 | | |
Mid Cap Growth Trust Class | | | 1.50 | % | | 8/31/19 | | | — | | | | — | | | | — | | |
Mid Cap Growth Advisor Class | | | 1.50 | % | | 8/31/22 | | | — | | | | — | | | | — | | |
Mid Cap Growth Institutional Class | | | 0.75 | % | | 8/31/19 | | | — | | | | — | | | | — | | |
Mid Cap Growth Class A | | | 1.11 | % | | 8/31/19 | | | 19,819 | | | | — | | | | — | | |
Mid Cap Growth Class C | | | 1.86 | % | | 8/31/19 | | | 2,522 | | | | 1,417 | | | | 1,762 | | |
Mid Cap Growth Class R3 | | | 1.36 | % | | 8/31/19 | | | 1,821 | | | | 1,091 | | | | 2,657 | | |
Mid Cap Growth Class R6 | | | 0.68 | % | | 8/31/19 | | | — | | | | — | | | | — | | |
Mid Cap Intrinsic Value Investor Class | | | 1.50 | % | | 8/31/22 | | | — | | | | — | | | | — | | |
Mid Cap Intrinsic Value Trust Class | | | 1.25 | % | | 8/31/22 | | | — | | | | 5,431 | | | | 8,167 | | |
Mid Cap Intrinsic Value Institutional Class | | | 0.85 | % | | 8/31/19 | | | — | | | | 9,476 | | | | 24,711 | | |
Mid Cap Intrinsic Value Class A | | | 1.21 | % | | 8/31/19 | | | — | | | | 6,502 | | | | 17,891 | | |
Mid Cap Intrinsic Value Class C | | | 1.96 | % | | 8/31/19 | | | — | | | | 1,413 | | | | 4,388 | | |
Mid Cap Intrinsic Value Class R3 | | | 1.46 | % | | 8/31/19 | | | 60 | | | | 515 | | | | 1,736 | | |
Multi-Cap Opportunities Institutional Class | | | 1.00 | % | | 8/31/19 | | | — | | | | — | | | | — | | |
Multi-Cap Opportunities Class A | | | 1.36 | % | | 8/31/19 | | | — | | | | — | | | | — | | |
Multi-Cap Opportunities Class C | | | 2.11 | % | | 8/31/19 | | | — | | | | — | | | | — | | |
Real Estate Trust Class | | | 1.50 | %(2) | | 8/31/22 | | | — | | | | — | | | | — | | |
Real Estate Institutional Class | | | 0.85 | % | | 8/31/22 | | | 817,481 | | | | 815,617 | | | | 588,136 | | |
Real Estate Class A | | | 1.21 | % | | 8/31/19 | | | 372,528 | | | | 344,667 | | | | 261,138 | | |
Real Estate Class C | | | 1.96 | % | | 8/31/19 | | | 95,712 | | | | 82,791 | | | | 62,906 | | |
Real Estate Class R3 | | | 1.46 | % | | 8/31/19 | | | 40,953 | | | | 50,213 | | | | 50,219 | | |
181
| | | | | | | Expenses Reimbursed in
Fiscal Year Ending August 31, | |
| | | | | | | 2014 | | 2015 | | 2016 | |
| | | | | | | Subject to Repayment until
August 31, | |
Class | | Contractual
Expense
Limitation(1) | | Expiration | | 2017 | | 2018 | | 2019 | |
Real Estate Class R6 | | | 0.78 | % | | 8/31/19 | | $ | 29,668 | | | $ | 58,233 | | | $ | 70,754 | | |
Small Cap Growth Investor Class | | | 1.30 | %(2) | | 8/31/22 | | | 192,480 | | | | 193,142 | | | | 243,435 | | |
Small Cap Growth Trust Class | | | 1.40 | %(2) | | 8/31/22 | | | 34,116 | | | | 25,252 | | | | 24,155 | | |
Small Cap Growth Advisor Class | | | 1.60 | %(2) | | 8/31/22 | | | 14,620 | | | | 12,127 | | | | 10,968 | | |
Small Cap Growth Institutional Class | | | 0.90 | % | | 8/31/19 | | | 95,710 | | | | 111,321 | | | | 94,448 | | |
Small Cap Growth Class A | | | 1.26 | % | | 8/31/19 | | | 28,007 | | | | 26,944 | | | | 26,066 | | |
Small Cap Growth Class C | | | 2.01 | % | | 8/31/19 | | | 9,549 | | | | 10,735 | | | | 13,463 | | |
Small Cap Growth Class R3 | | | 1.51 | % | | 8/31/19 | | | 3,116 | | | | 4,968 | | | | 8,774 | | |
Socially Responsive Trust Class | | | 1.50 | % | | 8/31/19 | | | — | | | | — | | | | — | | |
Socially Responsive Institutional Class | | | 0.75 | % | | 8/31/19 | | | — | | | | — | | | | — | | |
Socially Responsive Class A | | | 1.11 | % | | 8/31/19 | | | — | | | | — | | | | — | | |
Socially Responsive Class C | | | 1.86 | % | | 8/31/19 | | | — | | | | — | | | | — | | |
Socially Responsive Class R3 | | | 1.36 | % | | 8/31/19 | | | — | | | | — | | | | — | | |
Socially Responsive Class R6 | | | 0.68 | % | | 8/31/19 | | | — | | | | — | | | | — | | |
Value Institutional Class | | | 0.75 | %(2) | | 8/31/19 | | | 156,332 | | | | 166,457 | | | | 172,294 | | |
Value Class A | | | 1.11 | %(2) | | 8/31/19 | | | 94,806 | | | | 98,743 | | | | 87,821 | | |
Value Class C | | | 1.86 | %(2) | | 8/31/19 | | | 7,238 | | | | 7,050 | | | | 9,526 | | |
(1) Expense limitation per annum of the respective class's average daily net assets.
(2) In addition, Management has voluntarily undertaken to waive current payment of fees and/or reimburse certain expenses of Class A of International Select, the Trust Class of Real Estate, the Investor Class of Small Cap Growth, the Trust Class of Small Cap Growth, the Advisor Class of Small Cap Growth, the Institutional Class of Value, Class A of Value and Class C of Value, so that their Operating Expenses are limited to 1.24%, 1.04%, 1.21%, 1.37% (effective September 1, 2015), 1.51%, 0.70% (effective December 30, 2015 and prior to September 18, 2015; 0.71% from September 18, 2015 to December 29, 2015), 1.09% (effective December 30, 2015; 1.10% from September 18, 2015 to December 29, 2015; 1.08% from December 12, 2014 to September 17, 2015; 1.06% from September 12, 2014 to December 11, 2014; 1.08% from June 13, 2014 to September 11, 2014; 1.09% from March 14, 2014 to June 12, 2014, and 1.83% (effective December 12, 2014), respectively, per annum of their average daily net assets. For the year ended August 31, 2016, voluntary reimbursements for Class A of International Select, the Trust Class of Real Estate, the Investor Class of Small Cap Growth, the Trust Class of Small Cap Growth, the Advisor Class of Small Cap Growth, the Institutional Class of Value, Class A of Value and Class C of Value amounted to $2,580, $848,017, $38,636, $1,362, $2,051, $4,195, $901 and $157, respectively. These amounts are not subject to recovery by Management. These undertakings, which are terminable by Management upon notice to International Select, Real Estate, Small Cap Growth and Value, are in addition to the contractual undertakings as stated above.
(3) Period from September 3, 2013 (Commencement of Operations) to August 31, 2014.
(4) Period from December 30, 2014 (Commencement of Operations) to August 31, 2015.
(5) Period from December 15, 2015 (Commencement of Operations) to August 31, 2016.
182
Neuberger Berman Asia Limited ("NB Asia"), as the sub-adviser to Greater China Equity, is retained by Management to choose the Fund's investments and handle its day-to-day investment business.
Neuberger Berman LLC ("Neuberger Berman"), as the sub-adviser to each Fund (except Greater China Equity), was retained by Management through December 31, 2015, to furnish it with investment recommendations, research information and related services without added cost to the Funds. Several individuals who are Officers and/or Trustees of the Trust are also employees of Neuberger Berman and/or Management. As a result of the entity consolidation described on page 67 of this Annual Report, the services previously provided by Neuberger Berman under the subadvisory agreements are being provided by NBIA as of January 1, 2016.
Each Fund also has a distribution agreement with Neuberger Berman with respect to each class of shares. Neuberger Berman acts as agent in arranging for the sale of class shares without sales commission or other compensation, except as described below, and bears the advertising and promotion expenses.
However, Neuberger Berman receives fees from Trust Class of Focus, Guardian, International Select, Large Cap Value, Mid Cap Intrinsic Value, Real Estate, Small Cap Growth and Socially Responsive, Advisor Class of each Fund that offers that class, and Class A, Class C and Class R3 of each Fund that offers those classes under their distribution plans (each a "Plan", collectively, the "Plans") pursuant to Rule 12b-1 under the 1940 Act. The Plans provide that, as compensation for administrative and other services provided to these classes, Neuberger Berman's activities and expenses related to the sale and distribution of these classes, and ongoing services provided to investors in these classes, Neuberger Berman receives from each of these respective classes a fee at the annual rate of 0.10% of such Trust Class's, 0.25% of such Advisor Class's, 0.25% of such Class A's, 1.00% of such Class C's and 0.50% of such Class R3's average daily net assets. Neuberger Berman receives this amount to provide distribution and shareholder servicing for these classes and pays a portion of it to institutions that provide such services. Those institutions may use the payments for, among other purposes, compensating employees engaged in sales and/or shareholder servicing. The amount of fees paid by each class during any year may be more or less than the cost of distribution and other services provided to that class. FINRA rules limit the amount of annual distribution fees that may be paid by a mutual fund and impose a ceiling on the cumulative distribution fees paid. The Trust's Plans comply with those rules.
Class A shares of each Fund are generally sold with an initial sales charge of up to 5.75% and no contingent deferred sales charge ("CDSC"), except that a CDSC of 1.00% applies to certain redemptions made within 18 months following purchases of $1 million or more without an initial sales charge. Class C shares of each Fund are sold with no initial sales charge and a 1.00% CDSC if shares are sold within one year after purchase.
For the year ended August 31, 2016, Neuberger Berman, acting as underwriter and broker-dealer, received net initial sales charges from the purchase of Class A shares and CDSCs from the redemptions of Class A and Class C shares as follows:
| | | Underwriter | | Broker-Dealer | |
| | | Net Initial Sales
Charge | | CDSC | | Net Initial Sales
Charge | | CDSC | |
| Dividend Growth Fund Class A(1) | | $ | 8 | | | $ | — | | | $ | — | | | $ | — | | |
| Dividend Growth Fund Class C(1) | | | — | | | | — | | | | — | | | | — | | |
Emerging Markets Equity Fund Class A | | | 1,905 | | | | — | | | | — | | | | — | | |
Emerging Markets Equity Fund Class C | | | — | | | | 961 | | | | — | | | | — | | |
Equity Income Fund Class A | | | 27,539 | | | | — | | | | — | | | | — | | |
Equity Income Fund Class C | | | — | | | | 42,446 | | | | — | | | | — | | |
Focus Fund Class A | | | 353 | | | | — | | | | — | | | | — | | |
Focus Fund Class C | | | — | | | | 385 | | | | — | | | | — | | |
Global Equity Fund Class A | | | 74 | | | | — | | | | — | | | | — | | |
Global Equity Fund Class C | | | — | | | | 5 | | | | — | | | | — | | |
183
| | | Underwriter | | Broker-Dealer | |
| | | Net Initial Sales
Charge | | CDSC | | Net Initial Sales
Charge | | CDSC | |
Global Real Estate Fund Class A | | $ | — | | | $ | — | | | $ | — | | | $ | — | | |
Global Real Estate Fund Class C | | | — | | | | — | | | | — | | | | — | | |
Greater China Equity Fund Class A | | | 515 | | | | — | | | | — | | | | — | | |
Greater China Equity Fund Class C | | | — | | | | — | | | | — | | | | — | | |
Guardian Fund Class A | | | 563 | | | | — | | | | — | | | | — | | |
Guardian Fund Class C | | | — | | | | 80 | | | | — | | | | — | | |
International Equity Fund Class A | | | 7,106 | | | | — | | | | — | | | | — | | |
International Equity Fund Class C | | | — | | | | 10,574 | | | | — | | | | — | | |
International Select Fund Class A | | | 206 | | | | — | | | | — | | | | — | | |
International Select Fund Class C | | | — | | | | 575 | | | | — | | | | — | | |
Intrinsic Value Fund Class A | | | 19,538 | | | | — | | | | — | | | | — | | |
Intrinsic Value Fund Class C | | | — | | | | 8,548 | | | | — | | | | — | | |
Large Cap Value Fund Class A | | | 130 | | | | — | | | | — | | | | — | | |
Large Cap Value Fund Class C | | | — | | | | 362 | | | | — | | | | — | | |
Mid Cap Growth Fund Class A | | | 21,794 | | | | — | | | | — | | | | — | | |
Mid Cap Growth Fund Class C | | | — | | | | 7,325 | | | | — | | | | — | | |
Mid Cap Intrinsic Value Fund Class A | | | 1,850 | | | | — | | | | — | | | | — | | |
Mid Cap Intrinsic Value Fund Class C | | | — | | | | 1,661 | | | | — | | | | — | | |
Multi-Cap Opportunities Fund Class A | | | 12,271 | | | | — | | | | — | | | | — | | |
Multi-Cap Opportunities Fund Class C | | | — | | | | 6,357 | | | | — | | | | — | | |
Real Estate Fund Class A | | | 5,753 | | | | — | | | | — | | | | — | | |
Real Estate Fund Class C | | | — | | | | 2,360 | | | | — | | | | — | | |
Small Cap Growth Fund Class A | | | 688 | | | | — | | | | — | | | | — | | |
Small Cap Growth Fund Class C | | | — | | | | 230 | | | | — | | | | — | | |
Socially Responsive Fund Class A | | | 28,470 | | | | — | | | | — | | | | — | | |
Socially Responsive Fund Class C | | | — | | | | 8,955 | | | | — | | | | — | | |
Value Fund Class A | | | 129 | | | | — | | | | — | | | | — | | |
Value Fund Class C | | | — | | | | — | | | | — | | | | — | | |
(1) Period from December 15, 2015 (Commencement of Operations) to August 31, 2016.
For the year ended August 31, 2016, Mid Cap Growth recorded a capital contribution from Management in the amount of $1,006,679. This amount was paid in connection with losses incurred in the execution of a trade.
As a result of a collateral processing error relating to option transactions, $1,988,625 of pledged collateral is due to Guardian from Equity Income which is reflected in the Statements of Assets and Liabilities under the headers "Due from affiliate" and "Due to affiliate", respectively. Subsequent to August 31, 2016, the collateral was returned to Guardian.
184
Note C—Securities Transactions:
During the year ended August 31, 2016, there were purchase and sale transactions of long-term securities (excluding option contracts) as follows:
(000's omitted) | | Purchases | | Sales | | (000's omitted) | | Purchases | | Sales | |
| Dividend Growth(1) | | $ | 20,250 | | | $ | 3,448 | | | International Select | | $ | 49,479 | | | $ | 68,284 | | |
Emerging Markets Equity | | | 168,828 | | | | 193,493 | | | Intrinsic Value | | | 253,448 | | | | 85,591 | | |
Equity Income | | | 864,624 | | | | 1,452,367 | | | Large Cap Value | | | 1,604,382 | | | | 1,820,872 | | |
Focus | | | 632,622 | | | | 751,148 | | | Mid Cap Growth | | | 687,598 | | | | 707,397 | | |
Genesis | | | 1,600,162 | | | | 2,924,035 | | | Mid Cap Intrinsic Value | | | 26,471 | | | | 39,950 | | |
Global Equity | | | 1,969 | | | | 1,602 | | | Multi-Cap Opportunities | | | 359,979 | | | | 956,835 | | |
Global Real Estate | | | 1,288 | | | | 1,267 | | | Real Estate | | | 357,969 | | | | 607,904 | | |
Greater China Equity | | | 108,325 | | | | 136,631 | | | Small Cap Growth | | | 114,334 | | | | 128,666 | | |
Guardian | | | 1,104,745 | | | | 1,354,990 | | | Socially Responsive | | | 544,923 | | | | 628,449 | | |
International Equity | | | 633,342 | | | | 394,961 | | | Value | | | 16,581 | | | | 25,841 | | |
(1) Period from December 15, 2015 (Commencement of Operations) to August 31, 2016.
During the year ended August 31, 2016, no brokerage commissions on securities transactions were paid to affiliated brokers.
Note D—Fund Share Transactions:
Share activity for the years ended August 31, 2016 and August 31, 2015 was as follows:
| | | For the Year Ended August 31, 2016 | | For the Year Ended August 31, 2015 | |
(000's omitted) | | Shares
Sold | | Shares
Issued on
Reinvestment
of Dividends
and
Distributions | | Shares
Redeemed | | Total | | Shares
Sold | | Shares
Issued on
Reinvestment
of Dividends
and
Distributions | | Shares
Redeemed | | Total | |
Dividend Growth: | |
| Institutional Class(2) | | | 1,972 | | | | — | | | | (142 | ) | | | 1,830 | | | | — | | | | — | | | | — | | | | — | | |
| Class A(2) | | | 70 | | | | — | | | | (50 | ) | | | 20 | | | | — | | | | — | | | | — | | | | — | | |
| Class C(2) | | | 60 | | | | — | | | | (60 | ) | | | 0 | z | | | — | | | | — | | | | — | | | | — | | |
| Class R6(2) | | | 100 | | | | — | | | | (95 | ) | | | 5 | | | | — | | | | — | | | | — | | | | — | | |
Emerging Markets Equity: | |
Institutional Class | | | 7,953 | | | | 83 | | | | (10,171 | ) | | | (2,135 | ) | | | 5,409 | | | | 180 | | | | (12,309 | ) | | | (6,720 | ) | |
Class A | | | 1,078 | | | | 3 | | | | (570 | ) | | | 511 | | | | 439 | | | | 6 | | | | (601 | ) | | | (156 | ) | |
Class C | | | 41 | | | | — | | | | (165 | ) | | | (124 | ) | | | 160 | | | | 0 | z | | | (103 | ) | | | 57 | | |
Class R3 | | | 34 | | | | 0 | z | | | (13 | ) | | | 21 | | | | 41 | | | | 0 | z | | | (22 | ) | | | 19 | | |
Class R6 | | | 764 | | | | 48 | | | | (425 | ) | | | 387 | | | | 1,689 | | | | 58 | | | | (115 | ) | | | 1,632 | | |
185
| | | For the Year Ended August 31, 2016 | | For the Year Ended August 31, 2015 | |
(000's omitted) | | Shares
Sold | | Shares
Issued on
Reinvestment
of Dividends
and
Distributions | | Shares
Redeemed | | Total | | Shares
Sold | | Shares
Issued on
Reinvestment
of Dividends
and
Distributions | | Shares
Redeemed | | Total | |
Equity Income: | |
Institutional Class | | | 15,255 | | | | 5,579 | | | | (57,368 | ) | | | (36,534 | ) | | | 29,741 | | | | 7,206 | | | | (33,615 | ) | | | 3,332 | | |
Class A | | | 2,639 | | | | 1,164 | | | | (8,961 | ) | | | (5,158 | ) | | | 4,659 | | | | 1,689 | | | | (16,802 | ) | | | (10,454 | ) | |
Class C | | | 2,158 | | | | 1,150 | | | | (9,755 | ) | | | (6,447 | ) | | | 4,276 | | | | 1,391 | | | | (6,561 | ) | | | (894 | ) | |
Class R3 | | | 48 | | | | 11 | | | | (168 | ) | | | (109 | ) | | | 119 | | | | 12 | | | | (68 | ) | | | 63 | | |
Focus: | |
Investor Class | | | 209 | | | | 1,150 | | | | (2,214 | ) | | | (855 | ) | | | 292 | | | | 3,621 | | | | (2,261 | ) | | | 1,652 | | |
Trust Class | | | 111 | | | | 431 | | | | (1,843 | ) | | | (1,301 | ) | | | 955 | | | | 1,721 | | | | (3,055 | ) | | | (379 | ) | |
Advisor Class | | | 83 | | | | 111 | | | | (399 | ) | | | (205 | ) | | | 173 | | | | 267 | | | | (272 | ) | | | 168 | | |
Institutional Class | | | 97 | | | | 21 | | | | (980 | ) | | | (862 | ) | | | 925 | | | | 56 | | | | (171 | ) | | | 810 | | |
Class A | | | 31 | | | | 23 | | | | (124 | ) | | | (70 | ) | | | 348 | | | | 50 | | | | (316 | ) | | | 82 | | |
Class C | | | 69 | | | | 50 | | | | (178 | ) | | | (59 | ) | | | 273 | | | | 58 | | | | (91 | ) | | | 240 | | |
Genesis: | |
Investor Class | | | 5,103 | | | | 8,432 | | | | (17,909 | ) | | | (4,374 | ) | | | 5,468 | | | | 7,864 | | | | (17,210 | ) | | | (3,878 | ) | |
Trust Class | | | 2,360 | | | | 3,071 | | | | (9,793 | ) | | | (4,362 | ) | | | 2,766 | | | | 3,563 | | | | (18,819 | ) | | | (12,490 | ) | |
Advisor Class | | | 2,144 | | | | 2,934 | | | | (10,618 | ) | | | (5,540 | ) | | | 3,289 | | | | 2,515 | | | | (7,977 | ) | | | (2,173 | ) | |
Institutional Class | | | 16,116 | | | | 6,478 | | | | (26,335 | ) | | | (3,741 | ) | | | 11,595 | | | | 6,762 | | | | (36,467 | ) | | | (18,110 | ) | |
Class R6 | | | 12,364 | | | | 5,788 | | | | (7,989 | ) | | | 10,163 | | | | 11,786 | | | | 4,300 | | | | (10,853 | ) | | | 5,233 | | |
Global Equity: | |
Institutional Class | | | 96 | | | | 1 | | | | (58 | ) | | | 39 | | | | 15 | | | | 225 | | | | (3,202 | ) | | | (2,962 | ) | |
Class A | | | 32 | | | | — | | | | (22 | ) | | | 10 | | | | 26 | | | | 24 | | | | (19 | ) | | | 31 | | |
Class C | | | 3 | | | | — | | | | (17 | ) | | | (14 | ) | | | 20 | | | | 8 | | | | (5 | ) | | | 23 | | |
Global Real Estate: | |
Institutional Class | | | 0 | z | | | 1 | | | | (1 | ) | | | 0 | z | | | 200 | | | | 1 | | | | — | | | | 201 | (1) | |
Class A | | | 0 | z | | | 1 | | | | (2 | ) | | | (1 | ) | | | 66 | | | | 0 | z | | | — | | | | 66 | (1) | |
Class C | | | 2 | | | | 0 | z | | | — | | | | 2 | | | | 25 | | | | 0 | z | | | — | | | | 25 | (1) | |
Greater China Equity: | |
Institutional Class | | | 4,367 | | | | 389 | | | | (5,538 | ) | | | (782 | ) | | | 8,957 | | | | 129 | | | | (6,123 | ) | | | 2,963 | | |
Class A | | | 690 | | | | 24 | | | | (877 | ) | | | (163 | ) | | | 529 | | | | 16 | | | | (339 | ) | | | 206 | | |
Class C | | | — | | | | 1 | | | | (2 | ) | | | (1 | ) | | | 4 | | | | 1 | | | | (1 | ) | | | 4 | | |
Guardian: | |
Investor Class | | | 620 | | | | 7,174 | | | | (7,829 | ) | | | (35 | ) | | | 961 | | | | 8,305 | | | | (5,876 | ) | | | 3,390 | | |
Trust Class | | | 386 | | | | 1,446 | | | | (4,008 | ) | | | (2,176 | ) | | | 671 | | | | 1,810 | | | | (2,853 | ) | | | (372 | ) | |
Advisor Class | | | 12 | | | | 3 | | | | (19 | ) | | | (4 | ) | | | 3 | | | | 3 | | | | (6 | ) | | | 0 | z | |
Institutional Class | | | 767 | | | | 577 | | | | (3,250 | ) | | | (1,906 | ) | | | 1,343 | | | | 875 | | | | (3,053 | ) | | | (835 | ) | |
Class A | | | 416 | | | | 132 | | | | (6,594 | ) | | | (6,046 | ) | | | 2,162 | | | | 1,159 | | | | (1,566 | ) | | | 1,755 | | |
Class C | | | 51 | | | | 17 | | | | (59 | ) | | | 9 | | | | 36 | | | | 20 | | | | (52 | ) | | | 4 | | |
Class R3 | | | 10 | | | | 4 | | | | (7 | ) | | | 7 | | | | 22 | | | | 5 | | | | (31 | ) | | | (4 | ) | |
186
| | | For the Year Ended August 31, 2016 | | For the Year Ended August 31, 2015 | |
(000's omitted) | | Shares
Sold | | Shares
Issued on
Reinvestment
of Dividends
and
Distributions | | Shares
Redeemed | | Total | | Shares
Sold | | Shares
Issued on
Reinvestment
of Dividends
and
Distributions | | Shares
Redeemed | | Total | |
International Equity: | |
Investor Class | | | 402 | | | | 25 | | | | (1,331 | ) | | | (904 | ) | | | 603 | | | | 43 | | | | (703 | ) | | | (57 | ) | |
Trust Class | | | 346 | | | | 5 | | | | (752 | ) | | | (401 | ) | | | 360 | | | | 10 | | | | (806 | ) | | | (436 | ) | |
Institutional Class | | | 45,647 | | | | 1,013 | | | | (22,630 | ) | | | 24,030 | | | | 20,402 | | | | 1,346 | | | | (17,406 | ) | | | 4,342 | | |
Class A | | | 2,299 | | | | 7 | | | | (1,865 | ) | | | 441 | | | | 3,542 | | | | 6 | | | | (550 | ) | | | 2,998 | | |
Class C | | | 337 | | | | — | | | | (197 | ) | | | 140 | | | | 342 | | | | 0 | z | | | (93 | ) | | | 249 | | |
Class R6 | | | 1,696 | | | | 45 | | | | (592 | ) | | | 1,149 | | | | 1,637 | | | | 36 | | | | (562 | ) | | | 1,111 | | |
International Select: | |
Trust Class | | | 66 | | | | 8 | | | | (317 | ) | | | (243 | ) | | | 39 | | | | 12 | | | | (243 | ) | | | (192 | ) | |
Institutional Class | | | 1,457 | | | | 252 | | | | (2,674 | ) | | | (965 | ) | | | 3,139 | | | | 287 | | | | (1,855 | ) | | | 1,571 | | |
Class A | | | 193 | | | | 3 | | | | (130 | ) | | | 66 | | | | 148 | | | | 8 | | | | (628 | ) | | | (472 | ) | |
Class C | | | 12 | | | | 0 | z | | | (64 | ) | | | (52 | ) | | | 58 | | | | 0 | z | | | (122 | ) | | | (64 | ) | |
Class R3 | | | 134 | | | | 2 | | | | (108 | ) | | | 28 | | | | 195 | | | | 2 | | | | (68 | ) | | | 129 | | |
Intrinsic Value: | |
Institutional Class | | | 25,670 | | | | 1,318 | | | | (12,710 | ) | | | 14,278 | | | | 14,311 | | | | 887 | | | | (2,699 | ) | | | 12,499 | | |
Class A | | | 2,339 | | | | 165 | | | | (2,403 | ) | | | 101 | | | | 2,767 | | | | 66 | | | | (598 | ) | | | 2,235 | | |
Class C | | | 496 | | | | 89 | | | | (563 | ) | | | 22 | | | | 1,140 | | | | 39 | | | | (150 | ) | | | 1,029 | | |
Large Cap Value: | |
Investor Class | | | 605 | | | | 3,565 | | | | (4,378 | ) | | | (208 | ) | | | 561 | | | | 4,959 | | | | (3,948 | ) | | | 1,572 | | |
Trust Class | | | 275 | | | | 808 | | | | (2,634 | ) | | | (1,551 | ) | | | 290 | | | | 1,157 | | | | (1,422 | ) | | | 25 | | |
Advisor Class | | | 886 | | | | 2,074 | | | | (3,420 | ) | | | (460 | ) | | | 763 | | | | 2,721 | | | | (3,134 | ) | | | 350 | | |
Institutional Class | | | 271 | | | | 198 | | | | (1,621 | ) | | | (1,152 | ) | | | 515 | | | | 590 | | | | (2,183 | ) | | | (1,078 | ) | |
Class A | | | 66 | | | | 26 | | | | (73 | ) | | | 19 | | | | 287 | | | | 21 | | | | (263 | ) | | | 45 | | |
Class C | | | 66 | | | | 22 | | | | (116 | ) | | | (28 | ) | | | 62 | | | | 29 | | | | (53 | ) | | | 38 | | |
Class R3 | | | 0 | z | | | 1 | | | | (1 | ) | | | 0 | z | | | 5 | | | | 1 | | | | (8 | ) | | | (2 | ) | |
Mid Cap Growth: | |
Investor Class | | | 2,763 | | | | 2,578 | | | | (3,714 | ) | | | 1,627 | | | | 1,103 | | | | 3,591 | | | | (2,454 | ) | | | 2,240 | | |
Trust Class | | | 642 | | | | 201 | | | | (1,690 | ) | | | (847 | ) | | | 1,206 | | | | 239 | | | | (588 | ) | | | 857 | | |
Advisor Class | | | 215 | | | | 21 | | | | (166 | ) | | | 70 | | | | 224 | | | | 29 | | | | (248 | ) | | | 5 | | |
Institutional Class | | | 10,390 | | | | 2,690 | | | | (18,789 | ) | | | (5,709 | ) | | | 7,353 | | | | 3,406 | | | | (7,429 | ) | | | 3,330 | | |
Class A | | | 1,629 | | | | 232 | | | | (2,689 | ) | | | (828 | ) | | | 1,256 | | | | 320 | | | | (1,607 | ) | | | (31 | ) | |
Class C | | | 237 | | | | 23 | | | | (120 | ) | | | 140 | | | | 129 | | | | 21 | | | | (52 | ) | | | 98 | | |
Class R3 | | | 302 | | | | 27 | | | | (245 | ) | | | 84 | | | | 338 | | | | 25 | | | | (189 | ) | | | 174 | | |
Class R6 | | | 10,337 | | | | 854 | | | | (2,620 | ) | | | 8,571 | | | | 4,743 | | | | 257 | | | | (447 | ) | | | 4,553 | | |
187
| | | For the Year Ended August 31, 2016 | | For the Year Ended August 31, 2015 | |
(000's omitted) | | Shares
Sold | | Shares
Issued on
Reinvestment
of Dividends
and
Distributions | | Shares
Redeemed | | Total | | Shares
Sold | | Shares
Issued on
Reinvestment
of Dividends
and
Distributions | | Shares
Redeemed | | Total | |
Mid Cap Intrinsic Value: | |
Investor Class | | | 116 | | | | 231 | | | | (432 | ) | | | (85 | ) | | | 205 | | | | 194 | | | | (232 | ) | | | 167 | | |
Trust Class | | | 28 | | | | 96 | | | | (165 | ) | | | (41 | ) | | | 83 | | | | 82 | | | | (203 | ) | | | (38 | ) | |
Institutional Class | | | 378 | | | | 200 | | | | (1,045 | ) | | | (467 | ) | | | 1,096 | | | | 114 | | | | (355 | ) | | | 855 | | |
Class A | | | 264 | | | | 96 | | | | (379 | ) | | | (19 | ) | | | 673 | | | | 33 | | | | (126 | ) | | | 580 | | |
Class C | | | 72 | | | | 18 | | | | (57 | ) | | | 33 | | | | 113 | | | | 3 | | | | (9 | ) | | | 107 | | |
Class R3 | | | 37 | | | | 12 | | | | (31 | ) | | | 18 | | | | 53 | | | | 2 | | | | (6 | ) | | | 49 | | |
Multi-Cap Opportunities: | |
Institutional Class | | | 6,282 | | | | 844 | | | | (40,964 | ) | | | (33,838 | ) | | | 13,322 | | | | 947 | | | | (28,934 | ) | | | (14,665 | ) | |
Class A | | | 915 | | | | 185 | | | | (3,291 | ) | | | (2,191 | ) | | | 2,308 | | | | 286 | | | | (4,697 | ) | | | (2,103 | ) | |
Class C | | | 352 | | | | 76 | | | | (991 | ) | | | (563 | ) | | | 997 | | | | 101 | | | | (1,182 | ) | | | (84 | ) | |
Real Estate: | |
Trust Class | | | 1,581 | | | | 1,493 | | | | (7,466 | ) | | | (4,392 | ) | | | 3,541 | | | | 1,310 | | | | (7,796 | ) | | | (2,945 | ) | |
Institutional Class | | | 6,130 | | | | 1,707 | | | | (15,421 | ) | | | (7,584 | ) | | | 8,301 | | | | 1,540 | | | | (16,623 | ) | | | (6,782 | ) | |
Class A | | | 2,661 | | | | 736 | | | | (5,616 | ) | | | (2,219 | ) | | | 4,281 | | | | 667 | | | | (6,573 | ) | | | (1,625 | ) | |
Class C | | | 155 | | | | 143 | | | | (557 | ) | | | (259 | ) | | | 350 | | | | 125 | | | | (1,031 | ) | | | (556 | ) | |
Class R3 | | | 571 | | | | 131 | | | | (693 | ) | | | 9 | | | | 857 | | | | 96 | | | | (906 | ) | | | 47 | | |
Class R6 | | | 1,175 | | | | 211 | | | | (610 | ) | | | 776 | | | | 751 | | | | 129 | | | | (477 | ) | | | 403 | | |
Small Cap Growth: | |
Investor Class | | | 38 | | | | 95 | | | | (173 | ) | | | (40 | ) | | | 50 | | | | — | | | | (227 | ) | | | (177 | ) | |
Trust Class | | | 11 | | | | 9 | | | | (34 | ) | | | (14 | ) | | | 13 | | | | — | | | | (31 | ) | | | (18 | ) | |
Advisor Class | | | 25 | | | | 11 | | | | (55 | ) | | | (19 | ) | | | 40 | | | | — | | | | (86 | ) | | | (46 | ) | |
Institutional Class | | | 94 | | | | 25 | | | | (466 | ) | | | (347 | ) | | | 198 | | | | — | | | | (192 | ) | | | 6 | | |
Class A | | | 40 | | | | 8 | | | | (89 | ) | | | (41 | ) | | | 96 | | | | — | | | | (84 | ) | | | 12 | | |
Class C | | | 24 | | | | 10 | | | | (46 | ) | | | (12 | ) | | | 36 | | | | — | | | | (20 | ) | | | 16 | | |
Class R3 | | | 55 | | | | 5 | | | | (53 | ) | | | 7 | | | | 36 | | | | — | | | | (11 | ) | | | 25 | | |
Socially Responsive: | |
Investor Class | | | 2,321 | | | | 1,365 | | | | (5,077 | ) | | | (1,391 | ) | | | 1,957 | | | | 2,406 | | | | (3,777 | ) | | | 586 | | |
Trust Class | | | 1,800 | | | | 1,560 | | | | (5,630 | ) | | | (2,270 | ) | | | 2,448 | | | | 3,011 | | | | (7,166 | ) | | | (1,707 | ) | |
Institutional Class | | | 6,451 | | | | 1,298 | | | | (7,648 | ) | | | 101 | | | | 5,838 | | | | 2,041 | | | | (5,495 | ) | | | 2,384 | | |
Class A | | | 1,444 | | | | 681 | | | | (2,544 | ) | | | (419 | ) | | | 2,128 | | | | 1,040 | | | | (1,788 | ) | | | 1,380 | | |
Class C | | | 490 | | | | 224 | | | | (625 | ) | | | 89 | | | | 757 | | | | 308 | | | | (305 | ) | | | 760 | | |
Class R3 | | | 524 | | | | 161 | | | | (525 | ) | | | 160 | | | | 394 | | | | 248 | | | | (478 | ) | | | 164 | | |
Class R6 | | | 5,148 | | | | 484 | | | | (1,510 | ) | | | 4,122 | | | | 1,911 | | | | 813 | | | | (3,597 | ) | | | (873 | ) | |
Value: | |
Institutional Class | | | 177 | | | | 20 | | | | (529 | ) | | | (332 | ) | | | 517 | | | | 58 | | | | (427 | ) | | | 148 | | |
Class A | | | 29 | | | | 8 | | | | (300 | ) | | | (263 | ) | | | 228 | | | | 28 | | | | (235 | ) | | | 21 | | |
Class C | | | 9 | | | | 1 | | | | (12 | ) | | | (2 | ) | | | 14 | | | | 2 | | | | (13 | ) | | | 3 | | |
(1) Period from December 30, 2014 (Commencement of Operations) to August 31, 2015.
188
(2) Period from December 15, 2015 (Commencement of Operations) to August 31, 2016.
z Amount less than one thousand.
Note E—Line of Credit:
At August 31, 2016, each Fund was a participant in a syndicated committed, unsecured $700,000,000 line of credit (the "Credit Facility"), to be used only for temporary or emergency purposes. Series of other investment companies managed by Management also participate in this line of credit on substantially the same terms except that some do not have access to the full amount of the Credit Facility. Interest is charged on borrowings under this Credit Facility at the higher of (a) the Federal Funds Rate plus 1.00% per annum or (b) the one month LIBOR Rate plus 1.00% per annum. The Credit Facility has an annual commitment fee of 0.15% per annum of the available line of credit. Each Fund has agreed to pay its pro rata share of the annual commitment fee, based on the ratio of its individual net assets to the net assets of all participants at the time the fee is due and payable and the level of its access to the Credit Facility, and interest charged on any borrowing made by such Fund and other costs incurred by such Fund. Because several mutual funds participate in the Credit Facility, there is no assurance that an individual Fund will have access to all or any part of the $700,000,000 at any particular time. There were no loans outstanding under the Credit Facility at August 31, 2016.
During the period from September 1, 2015 through August 31, 2016, the following Funds had borrowings under the Credit Facility:
Fund | | Number of
Days Borrowed | | Greatest
Amount Borrowed | | Average
Interest Rate | | Interest Paid(1) | |
Greater China Equity | | | 6 | | | $ | 11,150,000 | | | | 1.43 | % | | $ | 2,502 | | |
Value | | | 2 | | | | 1,350,000 | | | | 1.19 | % | | | 90 | | |
(1) Interest Paid is reflected in the Statements of Operations under the caption "Interest expense."
Note F—Investments In Affiliates(1):
| | | Balance of
Shares Held
August 31,
2015 | | Gross
Purchases
and
Additions | | Gross
Sales
and
Reductions | | Balance of
Shares Held
August 31,
2016 | | Value
August 31,
2016 | | Distributions
from
Investments
in Affiliated
Issuers | | Net Realized
Gain (Loss)
from
Investments
in Affiliated
Issuers | |
Genesis | |
Abaxis, Inc. | | | 1,378,600 | | | | — | | | | 216,700 | | | | 1,161,900 | | | $ | 58,257,666 | | | $ | 713,364 | | | $ | (1,012,523 | ) | |
Altisource Asset
Management Corp.(2) | | | 125,617 | | | | — | | | | 125,617 | | | | — | | | | — | | | | — | * | | | (14,309,310 | ) | |
| Balchem Corp.(2) | | | 1,597,909 | | | | 77,200 | | | | 250,800 | | | | 1,424,309 | | | | 99,744,359 | | | | 493,139 | | | | 2,873,216 | | |
Bank of Hawaii Corp. | | | 2,290,312 | | | | 227,900 | | | | 299,900 | | | | 2,218,312 | | | | 159,807,196 | | | | 3,910,231 | | | | 4,653,732 | | |
| CLARCOR, Inc.(2) | | | 2,511,788 | | | | — | | | | 999,600 | | | | 1,512,188 | | | | 99,002,948 | | | | 1,697,993 | | | | 29,165,542 | | |
Compass Minerals
International, Inc.(2) | | | 1,875,573 | | | | — | | | | 1,012,500 | | | | 863,073 | | | | 64,324,831 | | | | 3,418,497 | | | | 60,566,631 | | |
Computer Modelling
Group Ltd. | | | 5,512,600 | | | | — | | | | 860,900 | | | | 4,651,700 | | | | 33,094,678 | | | | 1,540,667 | | | | (635,261 | ) | |
CVB Financial Corp. | | | 4,300,272 | | | | 1,666,900 | | | | 236,100 | | | | 5,731,072 | | | | 101,955,771 | | | | 2,296,727 | | | | (67,948 | ) | |
Exponent, Inc. | | | 2,269,970 | | | | 56,900 | | | | 358,200 | | | | 1,968,670 | | | | 99,280,028 | | | | 1,736,279 | | | | 9,759,288 | | |
First Financial
Bankshares, Inc.(2) | | | 3,321,547 | | | | 162,100 | | | | 438,600 | | | | 3,045,047 | | | | 111,509,621 | | | | 2,020,929 | | | | 4,656,448 | | |
189
| | | Balance of
Shares Held
August 31,
2015 | | Gross
Purchases
and
Additions | | Gross
Sales
and
Reductions | | Balance of
Shares Held
August 31,
2016 | | Value
August 31,
2016 | | Distributions
from
Investments
in Affiliated
Issuers | | Net Realized
Gain (Loss)
from
Investments
in Affiliated
Issuers | |
| Forward Air Corp.(2) | | | 1,783,468 | | | | — | | | | 279,800 | | | | 1,503,668 | | | $ | 69,289,021 | | | $ | 761,097 | | | $ | 17,164 | | |
Gray Television, Inc. | | | 2,323,150 | | | | 2,018,800 | | | | 244,600 | | | | 4,097,350 | | | | 46,013,241 | | | | — | * | | | 450,253 | | |
| Haemonetics Corp.(2) | | | 2,903,300 | | | | — | | | | 1,668,262 | | | | 1,235,038 | | | | 45,894,012 | | | | — | * | | | 13,615,130 | | |
Healthcare Services
Group, Inc.(2) | | | 3,715,881 | | | | — | | | | 583,600 | | | | 3,132,281 | | | | 126,450,184 | | | | 2,407,165 | | | | 13,572,425 | | |
Hibbett Sports, Inc. | | | 1,569,369 | | | | — | | | | 436,400 | | | | 1,132,969 | | | | 43,472,021 | | | | — | * | | | 2,319,268 | | |
| ICON PLC(2) | | | 3,451,300 | | | | — | | | | 754,500 | | | | 2,696,800 | | | | 207,087,272 | | | | — | * | | | 29,844,783 | | |
Innophos
Holdings, Inc.(2) | | | 1,154,142 | | | | — | | | | 1,154,142 | | | | — | | | | — | | | | 299,012 | | | | (17,517,738 | ) | |
Lindsay Corp. | | | 729,350 | | | | 52,100 | | | | 113,100 | | | | 668,350 | | | | 48,094,466 | | | | 762,198 | | | | (2,210,472 | ) | |
Monotype Imaging
Holdings, Inc. | | | 3,344,806 | | | | 205,400 | | | | 491,900 | | | | 3,058,306 | | | | 64,530,257 | | | | 1,281,797 | | | | (3,092,529 | ) | |
Nexstar Broadcasting
Group, Inc. Class A | | | 2,395,521 | | | | — | | | | 376,500 | | | | 2,019,021 | | | | 106,442,787 | | | | 1,940,717 | | | | 2,115,026 | | |
| Pason Systems, Inc.(2) | | | 4,262,257 | | | | 115,700 | | | | 698,300 | | | | 3,679,657 | | | | 52,470,327 | | | | 1,981,643 | | | | (4,636,974 | ) | |
Phibro Animal Health
Corp. Class A(2) | | | 1,048,000 | | | | 233,744 | | | | 1,281,744 | | | | — | | | | — | | | | 315,019 | | | | (17,732,299 | ) | |
| Pool Corp.(2) | | | 2,475,598 | | | | — | | | | 422,100 | | | | 2,053,498 | | | | 207,136,343 | | | | 2,491,994 | | | | 17,631,857 | | |
Power Integrations,
Inc. | | | 2,458,400 | | | | — | | | | 385,100 | | | | 2,073,300 | | | | 121,080,720 | | | | 1,111,473 | | | | (3,747,843 | ) | |
Raven Industries,
Inc.(2) | | | 2,568,452 | | | | — | | | | 1,146,500 | | | | 1,421,952 | | | | 34,894,702 | | | | 912,822 | | | | (1,374,400 | ) | |
RBC Bearings, Inc. | | | 838,551 | | | | 543,789 | | | | 35,100 | | | | 1,347,240 | | | | 106,553,212 | | | | — | * | | | (267,965 | ) | |
Rogers Corp. | | | 1,363,251 | | | | — | | | | 213,700 | | | | 1,149,551 | | | | 64,271,396 | | | | — | * | | | (3,795,656 | ) | |
Safety Insurance
Group, Inc.(2) | | | 790,949 | | | | — | | | | 590,000 | | | | 200,949 | | | | 13,353,061 | | | | 1,220,423 | | | | 8,211,554 | | |
Sensient
Technologies Corp. | | | 3,306,945 | | | | 19,900 | | | | 502,600 | | | | 2,824,245 | | | | 206,819,461 | | | | 3,235,837 | | | | 12,604,844 | | |
State Street
Institutional
Treasury Plus Fund
Premier Class(2) | | | 131,910,217 | | | | 1,253,834,595 | | | | 1,324,298,140 | | | | 61,446,672 | | | | 61,446,672 | | | | 160,943 | | | | — | | |
Tennant Co. | | | 917,602 | | | | 139,100 | | | | 92,900 | | | | 963,802 | | | | 62,386,903 | | | | 804,602 | | | | (1,426,247 | ) | |
U.S. Physical
Therapy, Inc. | | | 396,900 | | | | 394,900 | | | | — | | | | 791,800 | | | | 49,922,990 | | | | 413,651 | | | | — | | |
West Pharmaceutical
Services, Inc.(2) | | | 3,917,758 | | | | — | | | | 844,500 | | | | 3,073,258 | | | | 251,484,702 | | | | 1,663,120 | | | | 27,842,396 | | |
Total | | | | | | | | | | $ | 2,816,070,848 | | | $ | 39,591,339 | | | $ | 168,072,392 | | |
(1) Affiliated issuers, as defined in the 1940 Act.
190
(2) At August 31, 2016, the issuers of these securities were no longer affiliated with Genesis.
* Security did not produce income during the last twelve months.
Other: At August 31, 2016, Neuberger Berman Inflation Managed Fund, which is also managed by Management, held 0.16% of the outstanding shares of Emerging Markets Equity. At August 31, 2016, Neuberger Berman Global Allocation Fund, which is also managed by Management, held 0.56%, 0.01% and 0.23% of the outstanding shares of Emerging Markets Equity, Genesis and International Equity, respectively.
In addition, at August 31, 2016, affiliated investors owned 0.28%, 0.22%, 0.03%, 62.52%, 85.58%, 4.70%, 0.01%, 0.01%, 0.07%, 0.17% and 0.38% of the outstanding shares of Dividend Growth, Emerging Markets Equity, Focus, Global Equity, Global Real Estate, Greater China Equity, Large Cap Value, Mid Cap Growth, Mid Cap Intrinsic Value, Real Estate and Value, respectively.
191
This page has been left blank intentionally
192
The following tables include selected data for a share outstanding throughout each year and other performance information derived from the Financial Statements. Amounts that do not round to $0.01 or $(0.01) per share are presented as $0.00 or $(0.00), respectively. Ratios that do not round to 0.01% or (0.01)% are presented as 0.00% or (0.00)%, respectively. Net Asset amounts with a zero balance, if any, may reflect actual amounts rounding to less than $0.1 million. A "—" indicates that the line item was not applicable in the corresponding period.
| | | Net Asset
Value,
Beginning
of Year | | Net
Investment
Income/(Loss)@ | | Net Gains or
Losses on
Securities
(both realized
and
unrealized) | | Total From
Investment
Operations | | Dividends
from Net
Investment
Income | | Distributions
from Net
Realized
Capital Gains | | Tax
Return of
Capital | | Total
Distributions | | Voluntary
Contribution
from
Management | | Net Asset
Value, End of
Year | | Total Return†d | | Net Assets,
End of Year
(in millions) | | Ratio of Gross
Expenses to
Average Net
Assets# | | Ratio of Net
Expenses to
Average Net
Assets‡ | | Ratio of Net
Investment
Income/
(Loss) to
Average Net
Assets | | Portfolio
Turnover
Rate | |
Dividend Growth Fund | |
Institutional Class | |
Period from 12/15/2015^
to 8/31/2016 | | $ | 10.00 | | | $ | 0.18 | | | $ | 0.93 | | | $ | 1.11 | | | $ | — | | | $ | — | | | $ | — | | | $ | — | | | $ | — | | | $ | 11.11 | | | | 11.10 | %** | | $ | 20.3 | | | | 2.61 | %*b | | | 0.69 | %*b | | | 2.44 | %*b | | | 23 | %** | |
Class A | |
Period from 12/15/2015^
to 8/31/2016 | | $ | 10.00 | | | $ | 0.16 | | | $ | 0.93 | | | $ | 1.09 | | | $ | — | | | $ | — | | | $ | — | | | $ | — | | | $ | — | | | $ | 11.09 | | | | 10.90 | %** | | $ | 0.2 | | | | 3.36 | %*b | | | 1.05 | %*b | | | 2.14 | %*b | | | 23 | %** | |
Class C | |
Period from 12/15/2015^
to 8/31/2016 | | $ | 10.00 | | | $ | 0.08 | | | $ | 0.92 | | | $ | 1.00 | | | $ | — | | | $ | — | | | $ | — | | | $ | — | | | $ | — | | | $ | 11.00 | | | | 10.00 | %** | | $ | 0.0 | | | | 4.11 | %*b | | | 1.80 | %*b | | | 1.17 | %*b | | | 23 | %** | |
Class R6 | |
Period from 12/15/2015^
to 8/31/2016 | | $ | 10.00 | | | $ | 0.15 | | | $ | 0.96 | | | $ | 1.11 | | | $ | — | | | $ | — | | | $ | — | | | $ | — | | | $ | — | | | $ | 11.11 | | | | 11.10 | %** | | $ | 0.1 | | | | 2.75 | %*b | | | 0.62 | %*b | | | 2.06 | %*b | | | 23 | %** | |
Emerging Markets Equity Fund | |
Institutional Class | |
8/31/2016 | | $ | 13.94 | | | $ | 0.11 | | | $ | 2.06 | | | $ | 2.17 | | | $ | (0.10 | ) | | $ | — | | | $ | — | | | $ | (0.10 | ) | | $ | — | | | $ | 16.01 | | | | 15.64 | % | | $ | 318.9 | | | | 1.43 | % | | | 1.25 | % | | | 0.74 | % | | | 43 | % | |
8/31/2015 | | $ | 17.89 | | | $ | 0.12 | | | $ | (3.90 | ) | | $ | (3.78 | ) | | $ | (0.17 | ) | | $ | — | | | $ | — | | | $ | (0.17 | ) | | $ | — | | | $ | 13.94 | | | | (21.22 | )% | | $ | 307.5 | | | | 1.43 | % | | | 1.25 | % | | | 0.73 | % | | | 36 | % | |
8/31/2014 | | $ | 15.34 | | | $ | 0.16 | | | $ | 2.48 | | | $ | 2.64 | | | $ | (0.09 | ) | | $ | — | | | $ | — | | | $ | (0.09 | ) | | $ | 0.00 | | | $ | 17.89 | | | | 17.24 | %g | | $ | 514.8 | | | | 1.45 | % | | | 1.25 | % | | | 0.96 | % | | | 36 | % | |
8/31/2013 | | $ | 14.99 | | | $ | 0.18 | | | $ | 0.24 | | | $ | 0.42 | | | $ | (0.07 | ) | | $ | — | | | $ | — | | | $ | (0.07 | ) | | $ | — | | | $ | 15.34 | | | | 2.77 | % | | $ | 374.1 | | | | 1.60 | % | | | 1.25 | % | | | 1.10 | % | | | 36 | % | |
8/31/2012 | | $ | 15.80 | | | $ | 0.13 | | | $ | (0.86 | ) | | $ | (0.73 | ) | | $ | (0.08 | ) | | $ | — | | | $ | — | | | $ | (0.08 | ) | | $ | — | | | $ | 14.99 | | | | (4.53 | )% | | $ | 161.7 | | | | 1.77 | % | | | 1.25 | % | | | 0.89 | % | | | 78 | % | |
Class A | |
8/31/2016 | | $ | 13.87 | | | $ | 0.09 | | | $ | 2.02 | | | $ | 2.11 | | | $ | (0.06 | ) | | $ | — | | | $ | — | | | $ | (0.06 | ) | | $ | — | | | $ | 15.92 | | | | 15.31 | % | | $ | 23.5 | | | | 1.82 | % | | | 1.50 | % | | | 0.60 | % | | | 43 | % | |
8/31/2015 | | $ | 17.80 | | | $ | 0.08 | | | $ | (3.88 | ) | | $ | (3.80 | ) | | $ | (0.13 | ) | | $ | — | | | $ | — | | | $ | (0.13 | ) | | $ | — | | | $ | 13.87 | | | | (21.42 | )% | | $ | 13.4 | | | | 1.79 | % | | | 1.50 | % | | | 0.49 | % | | | 36 | % | |
8/31/2014 | | $ | 15.27 | | | $ | 0.15 | | | $ | 2.44 | | | $ | 2.59 | | | $ | (0.06 | ) | | $ | — | | | $ | — | | | $ | (0.06 | ) | | $ | 0.00 | | | $ | 17.80 | | | | 16.99 | %g | | $ | 19.9 | | | | 1.82 | % | | | 1.50 | % | | | 0.88 | % | | | 36 | % | |
8/31/2013 | | $ | 14.92 | | | $ | 0.11 | | | $ | 0.27 | | | $ | 0.38 | | | $ | (0.03 | ) | | $ | — | | | $ | — | | | $ | (0.03 | ) | | $ | — | | | $ | 15.27 | | | | 2.54 | % | | $ | 7.3 | | | | 2.00 | % | | | 1.50 | % | | | 0.69 | % | | | 36 | % | |
8/31/2012 | | $ | 15.74 | | | $ | 0.08 | | | $ | (0.85 | ) | | $ | (0.77 | ) | | $ | (0.05 | ) | | $ | — | | | $ | — | | | $ | (0.05 | ) | | $ | — | | | $ | 14.92 | | | | (4.84 | )% | | $ | 4.1 | | | | 2.23 | % | | | 1.50 | % | | | 0.53 | % | | | 78 | % | |
See Notes to Financial Highlights
193
194
Financial Highlights (cont'd)
| | | Net Asset
Value,
Beginning
of Year | | Net
Investment
Income/(Loss)@ | | Net Gains or
Losses on
Securities
(both realized
and
unrealized) | | Total From
Investment
Operations | | Dividends
from Net
Investment
Income | | Distributions
from Net
Realized
Capital Gains | | Tax
Return of
Capital | | Total
Distributions | | Voluntary
Contribution
from
Management | | Net Asset
Value, End of
Year | | Total Return†d | | Net Assets,
End of Year
(in millions) | | Ratio of Gross
Expenses to
Average Net
Assets# | | Ratio of Net
Expenses to
Average Net
Assets‡ | | Ratio of Net
Investment
Income/
(Loss) to
Average Net
Assets | | Portfolio
Turnover
Rate | |
Emerging Markets Equity Fund (cont'd) | |
Class C | |
8/31/2016 | | $ | 13.42 | | | $ | (0.04 | ) | | $ | 1.98 | | | $ | 1.94 | | | $ | — | | | $ | — | | | $ | — | | | $ | — | | | $ | — | | | $ | 15.36 | | | | 14.46 | % | | $ | 5.2 | | | | 2.51 | % | | | 2.25 | % | | | (0.30 | )% | | | 43 | % | |
8/31/2015 | | $ | 17.26 | | | $ | (0.03 | ) | | $ | (3.77 | ) | | $ | (3.80 | ) | | $ | (0.04 | ) | | $ | — | | | $ | — | | | $ | (0.04 | ) | | $ | — | | | $ | 13.42 | | | | (22.02 | )% | | $ | 6.2 | | | | 2.53 | % | | | 2.25 | % | | | (0.20 | )% | | | 36 | % | |
8/31/2014 | | $ | 14.87 | | | $ | 0.00 | | | $ | 2.39 | | | $ | 2.39 | | | $ | — | | | $ | — | | | $ | — | | | $ | — | | | $ | 0.00 | | | $ | 17.26 | | | | 16.07 | %g | | $ | 7.0 | | | | 2.56 | % | | | 2.25 | % | | | 0.01 | % | | | 36 | % | |
8/31/2013 | | $ | 14.61 | | | $ | 0.02 | | | $ | 0.24 | | | $ | 0.26 | | | $ | — | | | $ | — | | | $ | — | | | $ | — | | | $ | — | | | $ | 14.87 | | | | 1.78 | % | | $ | 4.1 | | | | 2.73 | % | | | 2.25 | % | | | 0.13 | % | | | 36 | % | |
8/31/2012 | | $ | 15.46 | | | $ | (0.02 | ) | | $ | (0.83 | ) | | $ | (0.85 | ) | | $ | — | | | $ | — | | | $ | — | | | $ | — | | | $ | — | | | $ | 14.61 | | | | (5.50 | )% | | $ | 1.4 | | | | 2.93 | % | | | 2.25 | % | | | (0.17 | )% | | | 78 | % | |
Class R3 | |
8/31/2016 | | $ | 13.60 | | | $ | 0.02 | | | $ | 2.00 | | | $ | 2.02 | | | $ | (0.03 | ) | | $ | — | | | $ | — | | | $ | (0.03 | ) | | $ | — | | | $ | 15.59 | | | | 14.88 | % | | $ | 1.2 | | | | 2.06 | % | | | 1.91 | % | | | 0.16 | % | | | 43 | % | |
8/31/2015 | | $ | 17.47 | | | $ | 0.02 | | | $ | (3.80 | ) | | $ | (3.78 | ) | | $ | (0.09 | ) | | $ | — | | | $ | — | | | $ | (0.09 | ) | | $ | — | | | $ | 13.60 | | | | (21.70 | )% | | $ | 0.8 | | | | 2.09 | % | | | 1.91 | % | | | 0.14 | % | | | 36 | % | |
8/31/2014 | | $ | 15.02 | | | $ | 0.07 | | | $ | 2.39 | | | $ | 2.46 | | | $ | (0.01 | ) | | $ | — | | | $ | — | | | $ | (0.01 | ) | | $ | 0.00 | | | $ | 17.47 | | | | 16.42 | %g | | $ | 0.6 | | | | 2.13 | % | | | 1.91 | % | | | 0.45 | % | | | 36 | % | |
8/31/2013 | | $ | 14.71 | | | $ | 0.03 | | | $ | 0.28 | | | $ | 0.31 | | | $ | — | | | $ | — | | | $ | — | | | $ | — | | | $ | — | | | $ | 15.02 | | | | 2.11 | % | | $ | 0.2 | | | | 2.31 | % | | | 1.91 | % | | | 0.22 | % | | | 36 | % | |
8/31/2012 | | $ | 15.52 | | | $ | 0.04 | | | $ | (0.85 | ) | | $ | (0.81 | ) | | $ | — | | | $ | — | | | $ | — | | | $ | — | | | $ | — | | | $ | 14.71 | | | | (5.22 | )% | | $ | 0.3 | | | | 2.49 | % | | | 1.92 | % | | | 0.28 | % | | | 78 | % | |
Class R6 | |
8/31/2016 | | $ | 13.96 | | | $ | 0.12 | | | $ | 2.05 | | | $ | 2.17 | | | $ | (0.11 | ) | | $ | — | | | $ | — | | | $ | (0.11 | ) | | $ | — | | | $ | 16.02 | | | | 15.64 | % | | $ | 107.4 | | | | 1.32 | % | | | 1.18 | % | | | 0.83 | % | | | 43 | % | |
8/31/2015 | | $ | 17.91 | | | $ | 0.14 | | | $ | (3.91 | ) | | $ | (3.77 | ) | | $ | (0.18 | ) | | $ | — | | | $ | — | | | $ | (0.18 | ) | | $ | — | | | $ | 13.96 | | | | (21.14 | )% | | $ | 88.1 | | | | 1.34 | % | | | 1.18 | % | | | 0.88 | % | | | 36 | % | |
8/31/2014 | | $ | 15.35 | | | $ | 0.18 | | | $ | 2.47 | | | $ | 2.65 | | | $ | (0.09 | ) | | $ | — | | | $ | — | | | $ | (0.09 | ) | | $ | 0.00 | | | $ | 17.91 | | | | 17.35 | %g | | $ | 83.8 | | | | 1.37 | % | | | 1.18 | % | | | 1.08 | % | | | 36 | % | |
Period from 3/15/2013^
to 8/31/2013 | | $ | 16.85 | | | $ | 0.13 | | | $ | (1.63 | ) | | $ | (1.50 | ) | | $ | — | | | $ | — | | | $ | — | | | $ | — | | | $ | — | | | $ | 15.35 | | | | (8.90 | )%** | | $ | 31.1 | | | | 1.57 | %* | | | 1.18 | %* | | | 1.80 | %* | | | 36 | %Ø | |
Equity Income Fund | |
Institutional Class | |
8/31/2016 | | $ | 11.74 | | | $ | 0.37 | | | $ | 1.08 | | | $ | 1.45 | | | $ | (0.32 | ) | | $ | (0.42 | ) | | $ | — | | | $ | (0.74 | ) | | $ | — | | | $ | 12.45 | | | | 13.03 | % | | $ | 1,076.5 | | | | 0.69 | % | | | 0.69 | % | | | 3.18 | % | | | 49 | % | |
8/31/2015 | | $ | 13.19 | | | $ | 0.34 | | | $ | (0.92 | ) | | $ | (0.58 | ) | | $ | (0.30 | ) | | $ | (0.57 | ) | | $ | — | | | $ | (0.87 | ) | | $ | — | | | $ | 11.74 | | | | (4.60 | )% | | $ | 1,443.7 | | | | 0.68 | % | | | 0.68 | % | | | 2.66 | % | | | 48 | % | |
8/31/2014 | | $ | 11.76 | | | $ | 0.33 | | | $ | 1.94 | | | $ | 2.27 | | | $ | (0.33 | ) | | $ | (0.51 | ) | | $ | — | | | $ | (0.84 | ) | | $ | 0.00 | | | $ | 13.19 | | | | 20.11 | %g | | $ | 1,578.5 | | | | 0.68 | % | | | 0.68 | % | | | 2.66 | % | | | 41 | % | |
8/31/2013 | | $ | 11.74 | | | $ | 0.30 | | | $ | 0.25 | | | $ | 0.55 | | | $ | (0.42 | ) | | $ | (0.11 | ) | | $ | — | | | $ | (0.53 | ) | | $ | — | | | $ | 11.76 | | | | 4.79 | % | | $ | 1,439.4 | | | | 0.68 | % | | | 0.68 | % | | | 2.45 | % | | | 70 | % | |
8/31/2012 | | $ | 11.28 | | | $ | 0.35 | | | $ | 0.57 | | | $ | 0.92 | | | $ | (0.38 | ) | | $ | (0.08 | ) | | $ | — | | | $ | (0.46 | ) | | $ | — | | | $ | 11.74 | | | | 8.49 | % | | $ | 1,213.6 | | | | 0.71 | % | | | 0.71 | %§ | | | 3.10 | % | | | 42 | % | |
Class A | |
8/31/2016 | | $ | 11.69 | | | $ | 0.33 | | | $ | 1.08 | | | $ | 1.41 | | | $ | (0.28 | ) | | $ | (0.42 | ) | | $ | — | | | $ | (0.70 | ) | | $ | — | | | $ | 12.40 | | | | 12.64 | % | | $ | 243.1 | | | | 1.07 | % | | | 1.07 | % | | | 2.81 | % | | | 49 | % | |
8/31/2015 | | $ | 13.14 | | | $ | 0.29 | | | $ | (0.93 | ) | | $ | (0.64 | ) | | $ | (0.24 | ) | | $ | (0.57 | ) | | $ | — | | | $ | (0.81 | ) | | $ | — | | | $ | 11.69 | | | | (5.02 | )% | | $ | 289.5 | | | | 1.05 | % | | | 1.05 | % | | | 2.26 | % | | | 48 | % | |
8/31/2014 | | $ | 11.71 | | | $ | 0.27 | | | $ | 1.95 | | | $ | 2.22 | | | $ | (0.28 | ) | | $ | (0.51 | ) | | $ | — | | | $ | (0.79 | ) | | $ | 0.00 | | | $ | 13.14 | | | | 19.72 | %g | | $ | 462.6 | | | | 1.05 | % | | | 1.05 | % | | | 2.21 | % | | | 41 | % | |
8/31/2013 | | $ | 11.70 | | | $ | 0.25 | | | $ | 0.25 | | | $ | 0.50 | | | $ | (0.38 | ) | | $ | (0.11 | ) | | $ | — | | | $ | (0.49 | ) | | $ | — | | | $ | 11.71 | | | | 4.32 | % | | $ | 1,036.4 | | | | 1.05 | % | | | 1.05 | % | | | 2.09 | % | | | 70 | % | |
8/31/2012 | | $ | 11.24 | | | $ | 0.30 | | | $ | 0.57 | | | $ | 0.87 | | | $ | (0.33 | ) | | $ | (0.08 | ) | | $ | — | | | $ | (0.41 | ) | | $ | — | | | $ | 11.70 | | | | 8.09 | % | | $ | 1,012.3 | | | | 1.13 | % | | | 1.13 | %§ | | | 2.70 | % | | | 42 | % | |
See Notes to Financial Highlights
195
196
Financial Highlights (cont'd)
| | | Net Asset
Value,
Beginning
of Year | | Net
Investment
Income/(Loss)@ | | Net Gains or
Losses on
Securities
(both realized
and
unrealized) | | Total From
Investment
Operations | | Dividends
from Net
Investment
Income | | Distributions
from Net
Realized
Capital Gains | | Tax
Return of
Capital | | Total
Distributions | | Voluntary
Contribution
from
Management | | Net Asset
Value, End of
Year | | Total Return†d | | Net Assets,
End of Year
(in millions) | | Ratio of Gross
Expenses to
Average Net
Assets# | | Ratio of Net
Expenses to
Average Net
Assets‡ | | Ratio of Net
Investment
Income/
(Loss) to
Average Net
Assets | | Portfolio
Turnover
Rate | |
Equity Income Fund (cont'd) | |
Class C | |
8/31/2016 | | $ | 11.62 | | | $ | 0.24 | | | $ | 1.07 | | | $ | 1.31 | | | $ | (0.19 | ) | | $ | (0.42 | ) | | $ | — | | | $ | (0.61 | ) | | $ | — | | | $ | 12.32 | | | | 11.77 | % | | $ | 334.1 | | | | 1.81 | % | | | 1.81 | % | | | 2.07 | % | | | 49 | % | |
8/31/2015 | | $ | 13.06 | | | $ | 0.20 | | | $ | (0.92 | ) | | $ | (0.72 | ) | | $ | (0.15 | ) | | $ | (0.57 | ) | | $ | — | | | $ | (0.72 | ) | | $ | — | | | $ | 11.62 | | | | (5.65 | )% | | $ | 390.0 | | | | 1.79 | % | | | 1.79 | % | | | 1.55 | % | | | 48 | % | |
8/31/2014 | | $ | 11.65 | | | $ | 0.19 | | | $ | 1.92 | | | $ | 2.11 | | | $ | (0.19 | ) | | $ | (0.51 | ) | | $ | — | | | $ | (0.70 | ) | | $ | 0.00 | | | $ | 13.06 | | | | 18.77 | %g | | $ | 450.1 | | | | 1.79 | % | | | 1.79 | % | | | 1.54 | % | | | 41 | % | |
8/31/2013 | | $ | 11.64 | | | $ | 0.16 | | | $ | 0.25 | | | $ | 0.41 | | | $ | (0.29 | ) | | $ | (0.11 | ) | | $ | — | | | $ | (0.40 | ) | | $ | — | | | $ | 11.65 | | | | 3.58 | % | | $ | 465.7 | | | | 1.80 | % | | | 1.80 | % | | | 1.34 | % | | | 70 | % | |
8/31/2012 | | $ | 11.18 | | | $ | 0.22 | | | $ | 0.58 | | | $ | 0.80 | | | $ | (0.26 | ) | | $ | (0.08 | ) | | $ | — | | | $ | (0.34 | ) | | $ | — | | | $ | 11.64 | | | | 7.40 | % | | $ | 380.4 | | | | 1.84 | % | | | 1.84 | %§ | | | 1.98 | % | | | 42 | % | |
Class R3 | |
8/31/2016 | | $ | 11.67 | | | $ | 0.30 | | | $ | 1.07 | | | $ | 1.37 | | | $ | (0.25 | ) | | $ | (0.42 | ) | | $ | — | | | $ | (0.67 | ) | | $ | — | | | $ | 12.37 | | | | 12.26 | % | | $ | 2.7 | | | | 1.33 | % | | | 1.33 | % | | | 2.53 | % | | | 49 | % | |
8/31/2015 | | $ | 13.12 | | | $ | 0.26 | | | $ | (0.92 | ) | | $ | (0.66 | ) | | $ | (0.22 | ) | | $ | (0.57 | ) | | $ | — | | | $ | (0.79 | ) | | $ | — | | | $ | 11.67 | | | | (5.22 | )% | | $ | 3.8 | | | | 1.31 | % | | | 1.31 | % | | | 2.05 | % | | | 48 | % | |
8/31/2014 | | $ | 11.69 | | | $ | 0.25 | | | $ | 1.93 | | | $ | 2.18 | | | $ | (0.24 | ) | | $ | (0.51 | ) | | $ | — | | | $ | (0.75 | ) | | $ | 0.00 | | | $ | 13.12 | | | | 19.42 | %g | | $ | 3.4 | | | | 1.34 | % | | | 1.34 | %§ | | | 2.04 | % | | | 41 | % | |
8/31/2013 | | $ | 11.69 | | | $ | 0.22 | | | $ | 0.23 | | | $ | 0.45 | | | $ | (0.34 | ) | | $ | (0.11 | ) | | $ | — | | | $ | (0.45 | ) | | $ | — | | | $ | 11.69 | | | | 3.94 | % | | $ | 2.6 | | | | 1.41 | % | | | 1.41 | %§ | | | 1.78 | % | | | 70 | % | |
8/31/2012 | | $ | 11.24 | | | $ | 0.29 | | | $ | 0.55 | | | $ | 0.84 | | | $ | (0.31 | ) | | $ | (0.08 | ) | | $ | — | | | $ | (0.39 | ) | | $ | — | | | $ | 11.69 | | | | 7.78 | % | | $ | 1.1 | | | | 1.41 | % | | | 1.41 | %§ | | | 2.59 | % | | | 42 | % | |
Focus Fund | |
Investor Class | |
8/31/2016 | | $ | 25.45 | | | $ | 0.16 | | | $ | 1.48 | | | $ | 1.64 | | | $ | (0.18 | ) | | $ | (1.10 | ) | | $ | — | | | $ | (1.28 | ) | | $ | — | | | $ | 25.81 | | | | 6.68 | % | | $ | 626.8 | | | | 0.94 | % | | | 0.94 | % | | | 0.63 | % | | | 89 | % | |
8/31/2015 | | $ | 29.77 | | | $ | 0.21 | | | $ | (0.15 | ) | | $ | 0.06 | | | $ | (0.16 | ) | | $ | (4.22 | ) | | $ | — | | | $ | (4.38 | ) | | $ | — | | | $ | 25.45 | | | | 0.49 | % | | $ | 639.8 | | | | 0.91 | % | | | 0.91 | % | | | 0.77 | % | | | 52 | % | |
8/31/2014 | | $ | 26.90 | | | $ | 0.18 | | | $ | 5.57 | | | $ | 5.75 | | | $ | (0.20 | ) | | $ | (2.68 | ) | | $ | — | | | $ | (2.88 | ) | | $ | 0.00 | | | $ | 29.77 | | | | 22.65 | %g | | $ | 699.4 | | | | 0.91 | % | | | 0.91 | % | | | 0.64 | % | | | 84 | % | |
8/31/2013 | | $ | 21.71 | | | $ | 0.18 | | | $ | 5.15 | | | $ | 5.33 | | | $ | (0.14 | ) | | $ | — | | | $ | — | | | $ | (0.14 | ) | | $ | — | | | $ | 26.90 | | | | 24.69 | % | | $ | 636.9 | | | | 0.94 | % | | | 0.94 | % | | | 0.72 | % | | | 79 | % | |
8/31/2012 | | $ | 18.80 | | | $ | 0.14 | | | $ | 2.87 | | | $ | 3.01 | | | $ | (0.10 | ) | | $ | — | | | $ | — | | | $ | (0.10 | ) | | $ | — | | | $ | 21.71 | | | | 16.10 | % | | $ | 534.3 | | | | 0.97 | % | | | 0.97 | % | | | 0.72 | % | | | 96 | % | |
Trust Class | |
8/31/2016 | | $ | 16.24 | | | $ | 0.07 | | | $ | 0.93 | | | $ | 1.00 | | | $ | (0.16 | ) | | $ | (1.10 | ) | | $ | — | | | $ | (1.26 | ) | | $ | — | | | $ | 15.98 | | | | 6.50 | % | | $ | 70.4 | | | | 1.11 | % | | | 1.11 | % | | | 0.47 | % | | | 89 | % | |
8/31/2015 | | $ | 20.64 | | | $ | 0.10 | | | $ | (0.13 | ) | | $ | (0.03 | ) | | $ | (0.15 | ) | | $ | (4.22 | ) | | $ | — | | | $ | (4.37 | ) | | $ | — | | | $ | 16.24 | | | | 0.26 | % | | $ | 92.7 | | | | 1.10 | % | | | 1.10 | % | | | 0.57 | % | | | 52 | % | |
8/31/2014 | | $ | 19.50 | | | $ | 0.09 | | | $ | 3.94 | | | $ | 4.03 | | | $ | (0.21 | ) | | $ | (2.68 | ) | | $ | — | | | $ | (2.89 | ) | | $ | 0.00 | | | $ | 20.64 | | | | 22.40 | %g | | $ | 125.7 | | | | 1.11 | % | | | 1.11 | % | | | 0.47 | % | | | 84 | % | |
8/31/2013 | | $ | 15.78 | | | $ | 0.10 | | | $ | 3.74 | | | $ | 3.84 | | | $ | (0.12 | ) | | $ | — | | | $ | — | | | $ | (0.12 | ) | | $ | — | | | $ | 19.50 | | | | 24.48 | % | | $ | 56.3 | | | | 1.14 | % | | | 1.14 | % | | | 0.53 | % | | | 79 | % | |
8/31/2012 | | $ | 13.70 | | | $ | 0.07 | | | $ | 2.08 | | | $ | 2.15 | | | $ | (0.07 | ) | | $ | — | | | $ | — | | | $ | (0.07 | ) | | $ | — | | | $ | 15.78 | | | | 15.82 | % | | $ | 15.0 | | | | 1.16 | % | | | 1.16 | % | | | 0.52 | % | | | 96 | % | |
Advisor Class | |
8/31/2016 | | $ | 8.60 | | | $ | 0.03 | | | $ | 0.45 | | | $ | 0.48 | | | $ | (0.18 | ) | | $ | (1.10 | ) | | $ | — | | | $ | (1.28 | ) | | $ | — | | | $ | 7.80 | | | | 6.33 | % | | $ | 3.9 | | | | 1.26 | % | | | 1.26 | % | | | 0.33 | % | | | 89 | % | |
8/31/2015 | | $ | 13.03 | | | $ | 0.04 | | | $ | (0.09 | ) | | $ | (0.05 | ) | | $ | (0.16 | ) | | $ | (4.22 | ) | | $ | — | | | $ | (4.38 | ) | | $ | — | | | $ | 8.60 | | | | 0.15 | % | | $ | 6.1 | | | | 1.27 | % | | | 1.27 | % | | | 0.39 | % | | | 52 | % | |
8/31/2014 | | $ | 13.27 | | | $ | 0.04 | | | $ | 2.57 | | | $ | 2.61 | | | $ | (0.17 | ) | | $ | (2.68 | ) | | $ | — | | | $ | (2.85 | ) | | $ | 0.00 | | | $ | 13.03 | | | | 22.21 | %g | | $ | 7.1 | | | | 1.27 | % | | | 1.27 | % | | | 0.28 | % | | | 84 | % | |
8/31/2013 | | $ | 10.79 | | | $ | 0.04 | | | $ | 2.55 | | | $ | 2.59 | | | $ | (0.11 | ) | | $ | — | | | $ | — | | | $ | (0.11 | ) | | $ | — | | | $ | 13.27 | | | | 24.22 | % | | $ | 6.1 | | | | 1.29 | % | | | 1.29 | % | | | 0.37 | % | | | 79 | % | |
8/31/2012 | | $ | 9.41 | | | $ | 0.04 | | | $ | 1.42 | | | $ | 1.46 | | | $ | (0.08 | ) | | $ | — | | | $ | — | | | $ | (0.08 | ) | | $ | — | | | $ | 10.79 | | | | 15.68 | % | | $ | 5.8 | | | | 1.31 | % | | | 1.31 | % | | | 0.37 | % | | | 96 | % | |
See Notes to Financial Highlights
197
198
Financial Highlights (cont'd)
| | | Net Asset
Value,
Beginning
of Year | | Net
Investment
Income/(Loss)@ | | Net Gains or
Losses on
Securities
(both realized
and
unrealized) | | Total From
Investment
Operations | | Dividends
from Net
Investment
Income | | Distributions
from Net
Realized
Capital Gains | | Tax
Return of
Capital | | Total
Distributions | | Voluntary
Contribution
from
Management | | Net Asset
Value, End of
Year | | Total Return†d | | Net Assets,
End of Year
(in millions) | | Ratio of Gross
Expenses to
Average Net
Assets# | | Ratio of Net
Expenses to
Average Net
Assets‡ | | Ratio of Net
Investment
Income/
(Loss) to
Average Net
Assets | | Portfolio
Turnover
Rate | |
Focus Fund (cont'd) | |
Institutional Class | |
8/31/2016 | | $ | 25.50 | | | $ | 0.22 | | | $ | 1.46 | | | $ | 1.68 | | | $ | (0.22 | ) | | $ | (1.10 | ) | | $ | — | | | $ | (1.32 | ) | | $ | — | | | $ | 25.86 | | | | 6.86 | % | | $ | 6.8 | | | | 0.76 | % | | | 0.75 | % | | | 0.89 | % | | | 89 | % | |
8/31/2015 | | $ | 29.83 | | | $ | 0.26 | | | $ | (0.16 | ) | | $ | 0.10 | | | $ | (0.21 | ) | | $ | (4.22 | ) | | $ | — | | | $ | (4.43 | ) | | $ | — | | | $ | 25.50 | | | | 0.65 | % | | $ | 28.7 | | | | 0.76 | % | | | 0.75 | % | | | 0.96 | % | | | 52 | % | |
8/31/2014 | | $ | 26.95 | | | $ | 0.21 | | | $ | 5.60 | | | $ | 5.81 | | | $ | (0.25 | ) | | $ | (2.68 | ) | | $ | — | | | $ | (2.93 | ) | | $ | 0.00 | | | $ | 29.83 | | | | 22.86 | %g | | $ | 9.4 | | | | 0.76 | % | | | 0.75 | % | | | 0.72 | % | | | 84 | % | |
8/31/2013 | | $ | 21.76 | | | $ | 0.24 | | | $ | 5.14 | | | $ | 5.38 | | | $ | (0.19 | ) | | $ | — | | | $ | — | | | $ | (0.19 | ) | | $ | — | | | $ | 26.95 | | | | 24.89 | % | | $ | 22.6 | | | | 0.77 | % | | | 0.75 | % | | | 0.96 | % | | | 79 | % | |
8/31/2012 | | $ | 18.84 | | | $ | 0.19 | | | $ | 2.87 | | | $ | 3.06 | | | $ | (0.14 | ) | | $ | — | | | $ | — | | | $ | (0.14 | ) | | $ | — | | | $ | 21.76 | | | | 16.39 | % | | $ | 6.9 | | | | 0.80 | % | | | 0.75 | % | | | 0.97 | % | | | 96 | % | |
Class A | |
8/31/2016 | | $ | 16.10 | | | $ | 0.07 | | | $ | 0.92 | | | $ | 0.99 | | | $ | (0.17 | ) | | $ | (1.10 | ) | | $ | — | | | $ | (1.27 | ) | | $ | — | | | $ | 15.82 | | | | 6.52 | % | | $ | 3.2 | | | | 1.15 | % | | | 1.11 | % | | | 0.48 | % | | | 89 | % | |
8/31/2015 | | $ | 20.50 | | | $ | 0.10 | | | $ | (0.13 | ) | | $ | (0.03 | ) | | $ | (0.15 | ) | | $ | (4.22 | ) | | $ | — | | | $ | (4.37 | ) | | $ | — | | | $ | 16.10 | | | | 0.24 | % | | $ | 4.4 | | | | 1.14 | % | | | 1.11 | % | | | 0.58 | % | | | 52 | % | |
8/31/2014 | | $ | 19.38 | | | $ | 0.09 | | | $ | 3.91 | | | $ | 4.00 | | | $ | (0.20 | ) | | $ | (2.68 | ) | | $ | — | | | $ | (2.88 | ) | | $ | 0.00 | | | $ | 20.50 | | | | 22.40 | %g | | $ | 3.9 | | | | 1.13 | % | | | 1.11 | % | | | 0.47 | % | | | 84 | % | |
8/31/2013 | | $ | 15.71 | | | $ | 0.10 | | | $ | 3.71 | | | $ | 3.81 | | | $ | (0.14 | ) | | $ | — | | | $ | — | | | $ | (0.14 | ) | | $ | — | | | $ | 19.38 | | | | 24.47 | % | | $ | 1.9 | | | | 1.19 | % | | | 1.11 | % | | | 0.56 | % | | | 79 | % | |
8/31/2012 | | $ | 13.67 | | | $ | 0.09 | | | $ | 2.07 | | | $ | 2.16 | | | $ | (0.12 | ) | | $ | — | | | $ | — | | | $ | (0.12 | ) | | $ | — | | | $ | 15.71 | | | | 15.96 | % | | $ | 0.7 | | | | 1.22 | % | | | 1.11 | % | | | 0.61 | % | | | 96 | % | |
Class C | |
8/31/2016 | | $ | 8.24 | | | $ | (0.02 | ) | | $ | 0.44 | | | $ | 0.42 | | | $ | (0.15 | ) | | $ | (1.10 | ) | | $ | — | | | $ | (1.25 | ) | | $ | — | | | $ | 7.41 | | | | 5.75 | % | | $ | 2.2 | | | | 1.90 | % | | | 1.86 | % | | | (0.27 | )% | | | 89 | % | |
8/31/2015 | | $ | 12.70 | | | $ | (0.02 | ) | | $ | (0.10 | ) | | $ | (0.12 | ) | | $ | (0.12 | ) | | $ | (4.22 | ) | | $ | — | | | $ | (4.34 | ) | | $ | — | | | $ | 8.24 | | | | (0.50 | )% | | $ | 2.9 | | | | 1.89 | % | | | 1.86 | % | | | (0.18 | )% | | | 52 | % | |
8/31/2014 | | $ | 13.03 | | | $ | (0.03 | ) | | $ | 2.52 | | | $ | 2.49 | | | $ | (0.14 | ) | | $ | (2.68 | ) | | $ | — | | | $ | (2.82 | ) | | $ | 0.00 | | | $ | 12.70 | | | | 21.52 | %g | | $ | 1.5 | | | | 1.91 | % | | | 1.86 | % | | | (0.27 | )% | | | 84 | % | |
8/31/2013 | | $ | 10.62 | | | $ | (0.02 | ) | | $ | 2.51 | | | $ | 2.49 | | | $ | (0.08 | ) | | $ | — | | | $ | — | | | $ | (0.08 | ) | | $ | — | | | $ | 13.03 | | | | 23.61 | % | | $ | 0.6 | | | | 1.94 | % | | | 1.86 | % | | | (0.20 | )% | | | 79 | % | |
8/31/2012 | | $ | 9.32 | | | $ | (0.02 | ) | | $ | 1.41 | | | $ | 1.39 | | | $ | (0.09 | ) | | $ | — | | | $ | — | | | $ | (0.09 | ) | | $ | — | | | $ | 10.62 | | | | 15.04 | % | | $ | 0.3 | | | | 1.97 | % | | | 1.86 | % | | | (0.17 | )% | | | 96 | % | |
Genesis Fund | |
Investor Class | |
8/31/2016 | | $ | 36.31 | | | $ | 0.09 | | | $ | 3.43 | | | $ | 3.52 | | | $ | (0.15 | ) | | $ | (5.55 | ) | | $ | — | | | $ | (5.70 | ) | | $ | — | | | $ | 34.13 | | | | 11.43 | % | | $ | 1,752.8 | | | | 1.03 | % | | | 1.03 | % | | | 0.28 | % | | | 16 | % | |
8/31/2015 | | $ | 40.89 | | | $ | 0.11 | | | $ | 0.36 | | | $ | 0.47 | | | $ | (0.14 | ) | | $ | (4.91 | ) | | $ | — | | | $ | (5.05 | ) | | $ | — | | | $ | 36.31 | | | | 1.52 | % | | $ | 2,023.6 | | | | 1.01 | % | | | 1.01 | % | | | 0.29 | % | | | 13 | % | |
8/31/2014 | | $ | 40.18 | | | $ | 0.08 | | | $ | 5.37 | | | $ | 5.45 | | | $ | (0.24 | ) | | $ | (4.50 | ) | | $ | — | | | $ | (4.74 | ) | | $ | 0.00 | | | $ | 40.89 | | | | 13.65 | %g | | $ | 2,437.6 | | | | 1.01 | % | | | 1.01 | % | | | 0.20 | % | | | 14 | % | |
8/31/2013 | | $ | 34.65 | | | $ | 0.26 | | | $ | 7.57 | | | $ | 7.83 | | | $ | (0.19 | ) | | $ | (2.11 | ) | | $ | — | | | $ | (2.30 | ) | | $ | — | | | $ | 40.18 | | | | 23.91 | % | | $ | 2,458.7 | | | | 1.02 | % | | | 1.02 | % | | | 0.71 | % | | | 20 | % | |
8/31/2012 | | $ | 34.28 | | | $ | 0.11 | | | $ | 1.94 | | | $ | 2.05 | | | $ | (0.53 | ) | | $ | (1.15 | ) | | $ | — | | | $ | (1.68 | ) | | $ | — | | | $ | 34.65 | | | | 6.31 | % | | $ | 2,256.0 | | | | 1.03 | % | | | 1.03 | % | | | 0.31 | % | | | 15 | % | |
Trust Class | |
8/31/2016 | | $ | 59.01 | | | $ | 0.12 | | | $ | 5.97 | | | $ | 6.09 | | | $ | (0.03 | ) | | $ | (5.55 | ) | | $ | — | | | $ | (5.58 | ) | | $ | — | | | $ | 59.52 | | | | 11.35 | % | | $ | 1,761.0 | | | | 1.10 | % | | | 1.10 | % | | | 0.21 | % | | | 16 | % | |
8/31/2015 | | $ | 63.21 | | | $ | 0.12 | | | $ | 0.63 | | | $ | 0.75 | | | $ | (0.04 | ) | | $ | (4.91 | ) | | $ | — | | | $ | (4.95 | ) | | $ | — | | | $ | 59.01 | | | | 1.41 | % | | $ | 2,003.4 | | | | 1.10 | % | | | 1.10 | % | | | 0.19 | % | | | 13 | % | |
8/31/2014 | | $ | 59.83 | | | $ | 0.07 | | | $ | 8.00 | | | $ | 8.07 | | | $ | (0.19 | ) | | $ | (4.50 | ) | | $ | — | | | $ | (4.69 | ) | | $ | 0.00 | | | $ | 63.21 | | | | 13.55 | %g | | $ | 2,935.3 | | | | 1.10 | % | | | 1.10 | % | | | 0.11 | % | | | 14 | % | |
8/31/2013 | | $ | 50.47 | | | $ | 0.35 | | | $ | 11.23 | | | $ | 11.58 | | | $ | (0.11 | ) | | $ | (2.11 | ) | | $ | — | | | $ | (2.22 | ) | | $ | — | | | $ | 59.83 | | | | 23.81 | % | | $ | 3,192.4 | | | | 1.10 | % | | | 1.10 | % | | | 0.63 | % | | | 20 | % | |
8/31/2012 | | $ | 49.13 | | | $ | 0.11 | | | $ | 2.83 | | | $ | 2.94 | | | $ | (0.45 | ) | | $ | (1.15 | ) | | $ | — | | | $ | (1.60 | ) | | $ | — | | | $ | 50.47 | | | | 6.21 | % | | $ | 3,037.6 | | | | 1.11 | % | | | 1.11 | % | | | 0.23 | % | | | 15 | % | |
See Notes to Financial Highlights
199
200
Financial Highlights (cont'd)
| | | Net Asset
Value,
Beginning
of Year | | Net
Investment
Income/(Loss)@ | | Net Gains or
Losses on
Securities
(both realized
and
unrealized) | | Total From
Investment
Operations | | Dividends
from Net
Investment
Income | | Distributions
from Net
Realized
Capital Gains | | Tax
Return of
Capital | | Total
Distributions | | Voluntary
Contribution
from
Management | | Net Asset
Value, End of
Year | | Total Return†d | | Net Assets,
End of Year
(in millions) | | Ratio of Gross
Expenses to
Average Net
Assets# | | Ratio of Net
Expenses to
Average Net
Assets‡ | | Ratio of Net
Investment
Income/
(Loss) to
Average Net
Assets | | Portfolio
Turnover
Rate | |
Genesis Fund (cont'd) | |
Advisor Class | |
8/31/2016 | | $ | 27.45 | | | $ | (0.02 | ) | | $ | 2.46 | | | $ | 2.44 | | | $ | (0.03 | ) | | $ | (5.55 | ) | | $ | — | | | $ | (5.58 | ) | | $ | — | | | $ | 24.31 | | | | 11.06 | % | | $ | 264.9 | | | | 1.38 | % | | | 1.38 | % | | | (0.07 | )% | | | 16 | % | |
8/31/2015 | | $ | 32.18 | | | $ | (0.03 | ) | | $ | 0.25 | | | $ | 0.22 | | | $ | (0.04 | ) | | $ | (4.91 | ) | | $ | — | | | $ | (4.95 | ) | | $ | — | | | $ | 27.45 | | | | 1.11 | % | | $ | 451.3 | | | | 1.39 | % | | | 1.39 | % | | | (0.09 | )% | | | 13 | % | |
8/31/2014 | | $ | 32.46 | | | $ | (0.05 | ) | | $ | 4.32 | | | $ | 4.27 | | | $ | (0.05 | ) | | $ | (4.50 | ) | | $ | — | | | $ | (4.55 | ) | | $ | 0.00 | | | $ | 32.18 | | | | 13.24 | %g | | $ | 598.9 | | | | 1.37 | % | | | 1.37 | % | | | (0.16 | )% | | | 14 | % | |
8/31/2013 | | $ | 28.42 | | | $ | 0.11 | | | $ | 6.13 | | | $ | 6.24 | | | $ | (0.09 | ) | | $ | (2.11 | ) | | $ | — | | | $ | (2.20 | ) | | $ | — | | | $ | 32.46 | | | | 23.46 | % | | $ | 626.0 | | | | 1.38 | % | | | 1.38 | % | | | 0.35 | % | | | 20 | % | |
8/31/2012 | | $ | 28.43 | | | $ | (0.01 | ) | | $ | 1.58 | | | $ | 1.57 | | | $ | (0.43 | ) | | $ | (1.15 | ) | | $ | — | | | $ | (1.58 | ) | | $ | — | | | $ | 28.42 | | | | 5.91 | % | | $ | 579.8 | | | | 1.38 | % | | | 1.38 | % | | | (0.04 | )% | | | 15 | % | |
Institutional Class | |
8/31/2016 | | $ | 56.48 | | | $ | 0.25 | | | $ | 5.67 | | | $ | 5.92 | | | $ | (0.21 | ) | | $ | (5.55 | ) | | $ | — | | | $ | (5.76 | ) | | $ | — | | | $ | 56.64 | | | | 11.62 | % | | $ | 3,483.9 | | | | 0.85 | % | | | 0.85 | %§ | | | 0.47 | % | | | 16 | % | |
8/31/2015 | | $ | 60.72 | | | $ | 0.26 | | | $ | 0.60 | | | $ | 0.86 | | | $ | (0.19 | ) | | $ | (4.91 | ) | | $ | — | | | $ | (5.10 | ) | | $ | — | | | $ | 56.48 | | | | 1.68 | % | | $ | 3,685.0 | | | | 0.85 | % | | | 0.85 | % | | | 0.45 | % | | | 13 | % | |
8/31/2014 | | $ | 57.62 | | | $ | 0.22 | | | $ | 7.70 | | | $ | 7.92 | | | $ | (0.32 | ) | | $ | (4.50 | ) | | $ | — | | | $ | (4.82 | ) | | $ | 0.00 | | | $ | 60.72 | | | | 13.82 | %g | | $ | 5,061.4 | | | | 0.85 | % | | | 0.85 | %§ | | | 0.36 | % | | | 14 | % | |
8/31/2013 | | $ | 48.71 | | | $ | 0.46 | | | $ | 10.81 | | | $ | 11.27 | | | $ | (0.25 | ) | | $ | (2.11 | ) | | $ | — | | | $ | (2.36 | ) | | $ | — | | | $ | 57.62 | | | | 24.12 | % | | $ | 5,989.3 | | | | 0.85 | % | | | 0.85 | % | | | 0.87 | % | | | 20 | % | |
8/31/2012 | | $ | 47.48 | | | $ | 0.24 | | | $ | 2.73 | | | $ | 2.97 | | | $ | (0.59 | ) | | $ | (1.15 | ) | | $ | — | | | $ | (1.74 | ) | | $ | — | | | $ | 48.71 | | | | 6.51 | % | | $ | 5,707.1 | | | | 0.86 | % | | | 0.85 | % | | | 0.49 | % | | | 15 | % | |
Class R6 | |
8/31/2016 | | $ | 56.50 | | | $ | 0.29 | | | $ | 5.67 | | | $ | 5.96 | | | $ | (0.26 | ) | | $ | (5.55 | ) | | $ | — | | | $ | (5.81 | ) | | $ | — | | | $ | 56.65 | | | | 11.69 | % | | $ | 3,381.6 | | | | 0.78 | % | | | 0.78 | %§ | | | 0.54 | % | | | 16 | % | |
8/31/2015 | | $ | 60.75 | | | $ | 0.30 | | | $ | 0.60 | | | $ | 0.90 | | | $ | (0.24 | ) | | $ | (4.91 | ) | | $ | — | | | $ | (5.15 | ) | | $ | — | | | $ | 56.50 | | | | 1.75 | % | | $ | 2,798.0 | | | | 0.78 | % | | | 0.78 | % | | | 0.52 | % | | | 13 | % | |
8/31/2014 | | $ | 57.63 | | | $ | 0.28 | | | $ | 7.70 | | | $ | 7.98 | | | $ | (0.36 | ) | | $ | (4.50 | ) | | $ | — | | | $ | (4.86 | ) | | $ | 0.00 | | | $ | 60.75 | | | | 13.92 | %g | | $ | 2,690.7 | | | | 0.78 | % | | | 0.78 | %§ | | | 0.45 | % | | | 14 | % | |
Period from 3/15/2013^
to 8/31/2013 | | $ | 53.91 | | | $ | 0.18 | | | $ | 3.54 | | | $ | 3.72 | | | $ | — | | | $ | — | | | $ | — | | | $ | — | | | $ | — | | | $ | 57.63 | | | | 6.90 | %** | | $ | 975.9 | | | | 0.80 | %* | | | 0.78 | %* | | | 0.67 | %* | | | 20 | %Ø | |
Global Equity Fund | |
Institutional Class | |
8/31/2016 | | $ | 6.30 | | | $ | 0.04 | | | $ | 0.32 | | | $ | 0.36 | | | $ | (0.01 | ) | | $ | — | | | $ | — | | | $ | (0.01 | ) | | $ | — | | | $ | 6.65 | | | | 5.76 | % | | $ | 3.6 | | | | 8.67 | % | | | 1.15 | % | | | 0.64 | % | | | 41 | % | |
8/31/2015 | | $ | 11.22 | | | $ | 0.03 | | | $ | (0.38 | ) | | $ | (0.35 | ) | | $ | (0.73 | ) | | $ | (3.84 | ) | | $ | — | | | $ | (4.57 | ) | | $ | — | | | $ | 6.30 | | | | (3.16 | )% | | $ | 3.2 | | | | 4.76 | % | | | 1.15 | % | | | 0.35 | % | | | 18 | % | |
8/31/2014 | | $ | 9.49 | | | $ | 0.06 | | | $ | 1.80 | | | $ | 1.86 | | | $ | (0.04 | ) | | $ | (0.09 | ) | | $ | — | | | $ | (0.13 | ) | | $ | — | | | $ | 11.22 | | | | 19.67 | % | | $ | 38.9 | | | | 1.72 | % | | | 1.15 | % | | | 0.54 | % | | | 39 | % | |
8/31/2013 | | $ | 8.50 | | | $ | 0.06 | | | $ | 0.93 | | | $ | 0.99 | | | $ | — | | | $ | — | | | $ | — | | | $ | — | | | $ | — | | | $ | 9.49 | | | | 11.65 | % | | $ | 33.5 | | | | 5.16 | % | | | 1.15 | % | | | 0.63 | % | | | 43 | % | |
8/31/2012 | | $ | 9.10 | | | $ | 0.09 | | | $ | 0.09 | | | $ | 0.18 | | | $ | (0.32 | ) | | $ | — | | | $ | (0.46 | ) | | $ | (0.78 | ) | | $ | — | | | $ | 8.50 | | | | 2.82 | % | | $ | 4.3 | | | | 10.85 | % | | | 1.15 | % | | | 1.12 | % | | | 62 | % | |
Class A | |
8/31/2016 | | $ | 6.23 | | | $ | 0.02 | | | $ | 0.32 | | | $ | 0.34 | | | $ | — | | | $ | — | | | $ | — | | | $ | — | | | $ | — | | | $ | 6.57 | | | | 5.46 | % | | $ | 0.5 | | | | 9.12 | % | | | 1.51 | % | | | 0.31 | % | | | 41 | % | |
8/31/2015 | | $ | 11.14 | | | $ | 0.01 | | | $ | (0.38 | ) | | $ | (0.37 | ) | | $ | (0.70 | ) | | $ | (3.84 | ) | | $ | — | | | $ | (4.54 | ) | | $ | — | | | $ | 6.23 | | | | (3.47 | )% | | $ | 0.4 | | | | 5.24 | % | | | 1.51 | % | | | 0.09 | % | | | 18 | % | |
8/31/2014 | | $ | 9.43 | | | $ | 0.03 | | | $ | 1.77 | | | $ | 1.80 | | | $ | (0.00 | ) | | $ | (0.09 | ) | | $ | — | | | $ | (0.09 | ) | | $ | — | | | $ | 11.14 | | | | 19.18 | % | | $ | 0.4 | | | | 2.18 | % | | | 1.51 | % | | | 0.28 | % | | | 39 | % | |
8/31/2013 | | $ | 8.48 | | | $ | 0.03 | | | $ | 0.92 | | | $ | 0.95 | | | $ | — | | | $ | — | | | $ | — | | | $ | — | | | $ | — | | | $ | 9.43 | | | | 11.20 | % | | $ | 0.1 | | | | 5.67 | % | | | 1.51 | % | | | 0.34 | % | | | 43 | % | |
8/31/2012 | | $ | 9.09 | | | $ | 0.04 | | | $ | 0.11 | | | $ | 0.15 | | | $ | (0.30 | ) | | $ | — | | | $ | (0.46 | ) | | $ | (0.76 | ) | | $ | — | | | $ | 8.48 | | | | 2.51 | % | | $ | 0.1 | | | | 11.83 | % | | | 1.51 | % | | | 0.54 | % | | | 62 | % | |
See Notes to Financial Highlights
201
202
Financial Highlights (cont'd)
| | | Net Asset
Value,
Beginning
of Year | | Net
Investment
Income/(Loss)@ | | Net Gains or
Losses on
Securities
(both realized
and
unrealized) | | Total From
Investment
Operations | | Dividends
from Net
Investment
Income | | Distributions
from Net
Realized
Capital Gains | | Tax
Return of
Capital | | Total
Distributions | | Voluntary
Contribution
from
Management | | Net Asset
Value, End of
Year | | Total Return†d | | Net Assets,
End of Year
(in millions) | | Ratio of Gross
Expenses to
Average Net
Assets# | | Ratio of Net
Expenses to
Average Net
Assets‡ | | Ratio of Net
Investment
Income/
(Loss) to
Average Net
Assets | | Portfolio
Turnover
Rate | |
Global Equity Fund (cont'd) | |
Class C | |
8/31/2016 | | $ | 6.01 | | | $ | (0.03 | ) | | $ | 0.31 | | | $ | 0.28 | | | $ | — | | | $ | — | | | $ | — | | | $ | — | | | $ | — | | | $ | 6.29 | | | | 4.66 | % | | $ | 0.2 | | | | 9.80 | % | | | 2.26 | % | | | (0.45 | )% | | | 41 | % | |
8/31/2015 | | $ | 10.89 | | | $ | (0.05 | ) | | $ | (0.37 | ) | | $ | (0.42 | ) | | $ | (0.62 | ) | | $ | (3.84 | ) | | $ | — | | | $ | (4.46 | ) | | $ | — | | | $ | 6.01 | | | | (4.21 | )% | | $ | 0.2 | | | | 6.00 | % | | | 2.26 | % | | | (0.68 | )% | | | 18 | % | |
8/31/2014 | | $ | 9.28 | | | $ | (0.06 | ) | | $ | 1.76 | | | $ | 1.70 | | | $ | — | | | $ | (0.09 | ) | | $ | — | | | $ | (0.09 | ) | | $ | — | | | $ | 10.89 | | | | 18.39 | % | | $ | 0.2 | | | | 2.96 | % | | | 2.26 | % | | | (0.54 | )% | | | 39 | % | |
8/31/2013 | | $ | 8.41 | | | $ | (0.03 | ) | | $ | 0.90 | | | $ | 0.87 | | | $ | — | | | $ | — | | | $ | — | | | $ | — | | | $ | — | | | $ | 9.28 | | | | 10.34 | % | | $ | 0.1 | | | | 6.50 | % | | | 2.26 | % | | | (0.36 | )% | | | 43 | % | |
8/31/2012 | | $ | 9.08 | | | $ | (0.02 | ) | | $ | 0.11 | | | $ | 0.09 | | | $ | (0.30 | ) | | $ | — | | | $ | (0.46 | ) | | $ | (0.76 | ) | | $ | — | | | $ | 8.41 | | | | 1.77 | % | | $ | 0.0 | | | | 12.88 | % | | | 2.26 | % | | | (0.30 | )% | | | 62 | % | |
Global Real Estate Fund | |
Institutional Class | |
8/31/2016 | | $ | 9.32 | | | $ | 0.17 | | | $ | 1.35 | | | $ | 1.52 | | | $ | (0.22 | ) | | $ | (0.00 | ) | | $ | — | | | $ | (0.22 | ) | | $ | — | | | $ | 10.62 | | | | 16.49 | % | | $ | 2.1 | | | | 10.93 | % | | | 1.00 | % | | | 1.68 | % | | | 44 | % | |
Period from 12/30/2014^
to 8/31/2015 | | $ | 10.00 | | | $ | 0.08 | | | $ | (0.67 | ) | | $ | (0.59 | ) | | $ | (0.09 | ) | | $ | — | | | $ | — | | | $ | (0.09 | ) | | $ | — | | | $ | 9.32 | | | | (5.92 | )%** | | $ | 1.9 | | | | 13.21 | %b* | | | 1.00 | %b* | | | 1.22 | %b* | | | 16 | %** | |
Class A | |
8/31/2016 | | $ | 9.31 | | | $ | 0.13 | | | $ | 1.35 | | | $ | 1.48 | | | $ | (0.18 | ) | | $ | (0.00 | ) | | $ | — | | | $ | (0.18 | ) | | $ | — | | | $ | 10.61 | | | | 16.09 | % | | $ | 0.7 | | | | 11.31 | % | | | 1.36 | % | | | 1.32 | % | | | 44 | % | |
Period from 12/30/2014^
to 8/31/2015 | | $ | 10.00 | | | $ | 0.06 | | | $ | (0.67 | ) | | $ | (0.61 | ) | | $ | (0.08 | ) | | $ | — | | | $ | — | | | $ | (0.08 | ) | | $ | — | | | $ | 9.31 | | | | (6.19 | )%** | | $ | 0.6 | | | | 13.62 | %b* | | | 1.36 | %b* | | | 0.94 | %b* | | | 16 | %** | |
Class C | |
8/31/2016 | | $ | 9.30 | | | $ | 0.06 | | | $ | 1.34 | | | $ | 1.40 | | | $ | (0.11 | ) | | $ | (0.00 | ) | | $ | — | | | $ | (0.11 | ) | | $ | — | | | $ | 10.59 | | | | 15.15 | % | | $ | 0.3 | | | | 12.04 | % | | | 2.11 | % | | | 0.56 | % | | | 44 | % | |
Period from 12/30/2014^
to 8/31/2015 | | $ | 10.00 | | | $ | 0.01 | | | $ | (0.67 | ) | | $ | (0.66 | ) | | $ | (0.04 | ) | | $ | — | | | $ | — | | | $ | (0.04 | ) | | $ | — | | | $ | 9.30 | | | | (6.64 | )%** | | $ | 0.2 | | | | 15.16 | %b* | | | 2.11 | %b* | | | 0.11 | %b* | | | 16 | %** | |
Greater China Equity Fund | |
Institutional Class | |
8/31/2016 | | $ | 11.64 | | | $ | 0.05 | | | $ | 1.32 | | | $ | 1.37 | | | $ | (0.10 | ) | | $ | (1.41 | ) | | $ | — | | | $ | (1.51 | ) | | $ | — | | | $ | 11.50 | | | | 12.09 | % | | $ | 93.3 | | | | 1.76 | % | | | 1.51 | %^^ | | | 0.44 | % | | | 120 | % | |
8/31/2015 | | $ | 12.17 | | | $ | 0.10 | | | $ | 0.17 | | | $ | 0.27 | | | $ | (0.09 | ) | | $ | (0.71 | ) | | $ | — | | | $ | (0.80 | ) | | $ | — | | | $ | 11.64 | | | | 2.15 | % | | $ | 103.4 | | | | 1.61 | % | | | 1.50 | %^^ | | | 0.75 | % | | | 176 | % | |
8/31/2014 | | $ | 10.16 | | | $ | 0.10 | | | $ | 2.06 | | | $ | 2.16 | | | $ | — | | | $ | (0.15 | ) | | $ | — | | | $ | (0.15 | ) | | $ | — | | | $ | 12.17 | | | | 21.37 | % | | $ | 72.1 | | | | 1.83 | % | | | 1.50 | % | | | 0.90 | % | | | 171 | % | |
Period from 7/17/2013^
to 8/31/2013 | | $ | 10.00 | | | $ | (0.02 | ) | | $ | 0.18 | | | $ | 0.16 | | | $ | — | | | $ | — | | | $ | — | | | $ | — | | | $ | — | | | $ | 10.16 | | | | 1.60 | %** | | $ | 56.4 | | | | 2.80 | %b* | | | 1.50 | %b* | | | (1.25 | )%b* | | | 20 | %** | |
Class A | |
8/31/2016 | | $ | 11.56 | | | $ | (0.01 | ) | | $ | 1.39 | | | $ | 1.38 | | | $ | (0.03 | ) | | $ | (1.41 | ) | | $ | — | | | $ | (1.44 | ) | | $ | — | | | $ | 11.50 | | | | 12.19 | % | | $ | 2.1 | | | | 2.19 | % | | | 1.87 | %^^ | | | (0.08 | )% | | | 120 | % | |
8/31/2015 | | $ | 12.14 | | | $ | 0.05 | | | $ | 0.17 | | | $ | 0.22 | | | $ | (0.09 | ) | | $ | (0.71 | ) | | $ | — | | | $ | (0.80 | ) | | $ | — | | | $ | 11.56 | | | | 1.68 | % | | $ | 4.0 | | | | 2.00 | % | | | 1.86 | %^^ | | | 0.34 | % | | | 176 | % | |
8/31/2014 | | $ | 10.16 | | | $ | 0.13 | | | $ | 2.00 | | | $ | 2.13 | | | $ | — | | | $ | (0.15 | ) | | $ | — | | | $ | (0.15 | ) | | $ | — | | | $ | 12.14 | | | | 21.07 | % | | $ | 1.7 | | | | 2.30 | % | | | 1.86 | % | | | 1.19 | % | | | 171 | % | |
Period from 7/17/2013^
to 8/31/2013 | | $ | 10.00 | | | $ | (0.02 | ) | | $ | 0.18 | | | $ | 0.16 | | | $ | — | | | $ | — | | | $ | — | | | $ | — | | | $ | — | | | $ | 10.16 | | | | 1.60 | %** | | $ | 0.1 | | | | 17.58 | %b* | | | 1.86 | %b* | | | (1.65 | )%b* | | | 20 | %** | |
See Notes to Financial Highlights
203
204
Financial Highlights (cont'd)
| | | Net Asset
Value,
Beginning
of Year | | Net
Investment
Income/(Loss)@ | | Net Gains or
Losses on
Securities
(both realized
and
unrealized) | | Total From
Investment
Operations | | Dividends
from Net
Investment
Income | | Distributions
from Net
Realized
Capital Gains | | Tax
Return of
Capital | | Total
Distributions | | Voluntary
Contribution
from
Management | | Net Asset
Value, End of
Year | | Total Return†d | | Net Assets,
End of Year
(in millions) | | Ratio of Gross
Expenses to
Average Net
Assets# | | Ratio of Net
Expenses to
Average Net
Assets‡ | | Ratio of Net
Investment
Income/
(Loss) to
Average Net
Assets | | Portfolio
Turnover
Rate | |
Greater China Equity Fund (cont'd) | |
Class C | |
8/31/2016 | | $ | 11.45 | | | $ | (0.07 | ) | | $ | 1.30 | | | $ | 1.23 | | | $ | — | | | $ | (1.41 | ) | | $ | — | | | $ | (1.41 | ) | | $ | — | | | $ | 11.27 | | | | 10.93 | % | | $ | 0.1 | | | | 2.86 | % | | | 2.62 | %^^ | | | (0.65 | )% | | | 120 | % | |
8/31/2015 | | $ | 12.03 | | | $ | (0.07 | ) | | $ | 0.20 | | | $ | 0.13 | | | $ | — | | | $ | (0.71 | ) | | $ | — | | | $ | (0.71 | ) | | $ | — | | | $ | 11.45 | | | | 0.93 | % | | $ | 0.2 | | | | 2.80 | % | | | 2.61 | %^^ | | | (0.52 | )% | | | 176 | % | |
8/31/2014 | | $ | 10.15 | | | $ | (0.02 | ) | | $ | 2.05 | | | $ | 2.03 | | | $ | — | | | $ | (0.15 | ) | | $ | — | | | $ | (0.15 | ) | | $ | — | | | $ | 12.03 | | | | 20.09 | % | | $ | 0.1 | | | | 2.85 | % | | | 2.61 | % | | | (0.20 | )% | | | 171 | % | |
Period from 7/17/2013^
to 8/31/2013 | | $ | 10.00 | | | $ | (0.03 | ) | | $ | 0.18 | | | $ | 0.15 | | | $ | — | | | $ | — | | | $ | — | | | $ | — | | | $ | — | | | $ | 10.15 | | | | 1.50 | %** | | $ | 0.1 | | | | 19.16 | %b* | | | 2.61 | %b* | | | (2.41 | )%b* | | | 20 | %** | |
Guardian Fund | |
Investor Class | |
8/31/2016 | | $ | 17.13 | | | $ | 0.09 | | | $ | 1.21 | | | $ | 1.30 | | | $ | (0.12 | ) | | $ | (1.86 | ) | | $ | — | | | $ | (1.98 | ) | | $ | — | | | $ | 16.45 | | | | 8.45 | % | | $ | 993.3 | | | | 0.93 | % | | | 0.93 | % | | | 0.58 | % | | | 99 | % | |
8/31/2015 | | $ | 20.43 | | | $ | 0.12 | | | $ | (0.64 | ) | | $ | (0.52 | ) | | $ | (0.15 | ) | | $ | (2.63 | ) | | $ | — | | | $ | (2.78 | ) | | $ | — | | | $ | 17.13 | | | | (3.03 | )% | | $ | 1,034.9 | | | | 0.87 | % | | | 0.87 | % | | | 0.65 | % | | | 31 | % | |
8/31/2014 | | $ | 18.58 | | | $ | 0.16 | | | $ | 3.70 | | | $ | 3.86 | | | $ | (0.10 | ) | | $ | (1.91 | ) | | $ | — | | | $ | (2.01 | ) | | $ | 0.00 | | | $ | 20.43 | | | | 21.87 | %g | | $ | 1,165.1 | | | | 0.88 | % | | | 0.88 | % | | | 0.83 | % | | | 37 | % | |
8/31/2013 | | $ | 15.80 | | | $ | 0.14 | | | $ | 3.28 | | | $ | 3.42 | | | $ | (0.20 | ) | | $ | (0.44 | ) | | $ | — | | | $ | (0.64 | ) | | $ | — | | | $ | 18.58 | | | | 22.54 | % | | $ | 1,040.3 | | | | 0.90 | % | | | 0.90 | % | | | 0.85 | % | | | 36 | % | |
8/31/2012 | | $ | 14.49 | | | $ | 0.12 | | | $ | 1.29 | | | $ | 1.41 | | | $ | (0.10 | ) | | $ | — | | | $ | — | | | $ | (0.10 | ) | | $ | — | | | $ | 15.80 | | | | 9.84 | % | | $ | 939.6 | | | | 0.92 | % | | | 0.92 | % | | | 0.79 | % | | | 26 | % | |
Trust Class | |
8/31/2016 | | $ | 12.05 | | | $ | 0.04 | | | $ | 0.82 | | | $ | 0.86 | | | $ | (0.09 | ) | | $ | (1.86 | ) | | $ | — | | | $ | (1.95 | ) | | $ | — | | | $ | 10.96 | | | | 8.31 | % | | $ | 70.6 | | | | 1.08 | % | | | 1.08 | % | | | 0.41 | % | | | 99 | % | |
8/31/2015 | | $ | 15.20 | | | $ | 0.06 | | | $ | (0.45 | ) | | $ | (0.39 | ) | | $ | (0.13 | ) | | $ | (2.63 | ) | | $ | — | | | $ | (2.76 | ) | | $ | — | | | $ | 12.05 | | | | (3.22 | )% | | $ | 103.8 | | | | 1.06 | % | | | 1.06 | % | | | 0.46 | % | | | 31 | % | |
8/31/2014 | | $ | 14.30 | | | $ | 0.09 | | | $ | 2.81 | | | $ | 2.90 | | | $ | (0.09 | ) | | $ | (1.91 | ) | | $ | — | | | $ | (2.00 | ) | | $ | 0.00 | | | $ | 15.20 | | | | 21.61 | %g | | $ | 136.6 | | | | 1.06 | % | | | 1.06 | % | | | 0.64 | % | | | 37 | % | |
8/31/2013 | | $ | 12.31 | | | $ | 0.09 | | | $ | 2.53 | | | $ | 2.62 | | | $ | (0.19 | ) | | $ | (0.44 | ) | | $ | — | | | $ | (0.63 | ) | | $ | — | | | $ | 14.30 | | | | 22.36 | % | | $ | 129.4 | | | | 1.08 | % | | | 1.08 | % | | | 0.66 | % | | | 36 | % | |
8/31/2012 | | $ | 11.32 | | | $ | 0.07 | | | $ | 1.01 | | | $ | 1.08 | | | $ | (0.09 | ) | | $ | — | | | $ | — | | | $ | (0.09 | ) | | $ | — | | | $ | 12.31 | | | | 9.68 | % | | $ | 113.5 | | | | 1.09 | % | | | 1.09 | % | | | 0.64 | % | | | 26 | % | |
Advisor Class | |
8/31/2016 | | $ | 14.33 | | | $ | 0.03 | | | $ | 0.99 | | | $ | 1.02 | | | $ | (0.02 | ) | | $ | (1.86 | ) | | $ | — | | | $ | (1.88 | ) | | $ | — | | | $ | 13.47 | | | | 8.03 | % | | $ | 0.2 | | | | 1.31 | % | | | 1.31 | %§ | | | 0.20 | % | | | 99 | % | |
8/31/2015 | | $ | 17.55 | | | $ | 0.00 | | | $ | (0.54 | ) | | $ | (0.54 | ) | | $ | (0.05 | ) | | $ | (2.63 | ) | | $ | — | | | $ | (2.68 | ) | | $ | — | | | $ | 14.33 | | | | (3.66 | )% | | $ | 0.3 | | | | 1.54 | % | | | 1.50 | % | | | 0.03 | % | | | 31 | % | |
8/31/2014 | | $ | 16.27 | | | $ | 0.04 | | | $ | 3.24 | | | $ | 3.28 | | | $ | (0.09 | ) | | $ | (1.91 | ) | | $ | — | | | $ | (2.00 | ) | | $ | 0.00 | | | $ | 17.55 | | | | 21.27 | %g | | $ | 0.4 | | | | 1.28 | % | | | 1.28 | % | | | 0.25 | % | | | 37 | % | |
8/31/2013 | | $ | 13.91 | | | $ | 0.04 | | | $ | 2.87 | | | $ | 2.91 | | | $ | (0.11 | ) | | $ | (0.44 | ) | | $ | — | | | $ | (0.55 | ) | | $ | — | | | $ | 16.27 | | | | 21.81 | % | | $ | 0.6 | | | | 1.50 | % | | | 1.50 | %§ | | | 0.23 | % | | | 36 | % | |
8/31/2012 | | $ | 12.77 | | | $ | 0.02 | | | $ | 1.16 | | | $ | 1.18 | | | $ | (0.04 | ) | | $ | — | | | $ | — | | | $ | (0.04 | ) | | $ | — | | | $ | 13.91 | | | | 9.27 | % | | $ | 0.6 | | | | 1.50 | % | | | 1.50 | %§ | | | 0.19 | % | | | 26 | % | |
Institutional Class | |
8/31/2016 | | $ | 17.17 | | | $ | 0.12 | | | $ | 1.22 | | | $ | 1.34 | | | $ | (0.15 | ) | | $ | (1.86 | ) | | $ | — | | | $ | (2.01 | ) | | $ | — | | | $ | 16.50 | | | | 8.68 | % | | $ | 59.0 | | | | 0.72 | % | | | 0.72 | % | | | 0.73 | % | | | 99 | % | |
8/31/2015 | | $ | 20.47 | | | $ | 0.16 | | | $ | (0.65 | ) | | $ | (0.49 | ) | | $ | (0.18 | ) | | $ | (2.63 | ) | | $ | — | | | $ | (2.81 | ) | | $ | — | | | $ | 17.17 | | | | (2.84 | )% | | $ | 94.1 | | | | 0.71 | % | | | 0.71 | % | | | 0.82 | % | | | 31 | % | |
8/31/2014 | | $ | 18.62 | | | $ | 0.20 | | | $ | 3.70 | | | $ | 3.90 | | | $ | (0.14 | ) | | $ | (1.91 | ) | | $ | — | | | $ | (2.05 | ) | | $ | 0.00 | | | $ | 20.47 | | | | 22.03 | %g | | $ | 129.4 | | | | 0.71 | % | | | 0.71 | % | | | 1.01 | % | | | 37 | % | |
8/31/2013 | | $ | 15.83 | | | $ | 0.17 | | | $ | 3.29 | | | $ | 3.46 | | | $ | (0.23 | ) | | $ | (0.44 | ) | | $ | — | | | $ | (0.67 | ) | | $ | — | | | $ | 18.62 | | | | 22.80 | % | | $ | 88.9 | | | | 0.73 | % | | | 0.73 | % | | | 1.00 | % | | | 36 | % | |
8/31/2012 | | $ | 14.52 | | | $ | 0.15 | | | $ | 1.29 | | | $ | 1.44 | | | $ | (0.13 | ) | | $ | — | | | $ | — | | | $ | (0.13 | ) | | $ | — | | | $ | 15.83 | | | | 10.03 | % | | $ | 60.0 | | | | 0.74 | % | | | 0.74 | %§ | | | 1.01 | % | | | 26 | % | |
See Notes to Financial Highlights
205
206
Financial Highlights (cont'd)
| | | Net Asset
Value,
Beginning
of Year | | Net
Investment
Income/(Loss)@ | | Net Gains or
Losses on
Securities
(both realized
and
unrealized) | | Total From
Investment
Operations | | Dividends
from Net
Investment
Income | | Distributions
from Net
Realized
Capital Gains | | Tax
Return of
Capital | | Total
Distributions | | Voluntary
Contribution
from
Management | | Net Asset
Value, End of
Year | | Total Return†d | | Net Assets,
End of Year
(in millions) | | Ratio of Gross
Expenses to
Average Net
Assets# | | Ratio of Net
Expenses to
Average Net
Assets‡ | | Ratio of Net
Investment
Income/
(Loss) to
Average Net
Assets | | Portfolio
Turnover
Rate | |
Guardian Fund (cont'd) | |
Class A | |
8/31/2016 | | $ | 11.92 | | | $ | 0.03 | | | $ | 0.82 | | | $ | 0.85 | | | $ | (0.09 | ) | | $ | (1.86 | ) | | $ | — | | | $ | (1.95 | ) | | $ | — | | | $ | 10.82 | | | | 8.32 | % | | $ | 6.6 | | | | 1.07 | % | | | 1.07 | % | | | 0.27 | % | | | 99 | % | |
8/31/2015 | | $ | 15.08 | | | $ | 0.06 | | | $ | (0.45 | ) | | $ | (0.39 | ) | | $ | (0.14 | ) | | $ | (2.63 | ) | | $ | — | | | $ | (2.77 | ) | | $ | — | | | $ | 11.92 | | | | (3.23 | )% | | $ | 79.3 | | | | 1.07 | % | | | 1.07 | % | | | 0.46 | % | | | 31 | % | |
8/31/2014 | | $ | 14.21 | | | $ | 0.09 | | | $ | 2.79 | | | $ | 2.88 | | | $ | (0.10 | ) | | $ | (1.91 | ) | | $ | — | | | $ | (2.01 | ) | | $ | 0.00 | | | $ | 15.08 | | | | 21.62 | %g | | $ | 73.8 | | | | 1.09 | % | | | 1.09 | %§ | | | 0.64 | % | | | 37 | % | |
8/31/2013 | | $ | 12.24 | | | $ | 0.08 | | | $ | 2.52 | | | $ | 2.60 | | | $ | (0.19 | ) | | $ | (0.44 | ) | | $ | — | | | $ | (0.63 | ) | | $ | — | | | $ | 14.21 | | | | 22.38 | % | | $ | 34.6 | | | | 1.11 | % | | | 1.11 | %§ | | | 0.62 | % | | | 36 | % | |
8/31/2012 | | $ | 11.28 | | | $ | 0.07 | | | $ | 1.00 | | | $ | 1.07 | | | $ | (0.11 | ) | | $ | — | | | $ | — | | | $ | (0.11 | ) | | $ | — | | | $ | 12.24 | | | | 9.63 | % | | $ | 17.6 | | | | 1.12 | % | | | 1.11 | % | | | 0.64 | % | | | 26 | % | |
Class C | |
8/31/2016 | | $ | 13.97 | | | $ | (0.04 | ) | | $ | 0.96 | | | $ | 0.92 | | | $ | — | | | $ | (1.86 | ) | | $ | — | | | $ | (1.86 | ) | | $ | — | | | $ | 13.03 | | | | 7.47 | % | | $ | 2.4 | | | | 1.85 | % | | | 1.85 | % | | | (0.34 | )% | | | 99 | % | |
8/31/2015 | | $ | 17.18 | | | $ | (0.05 | ) | | $ | (0.53 | ) | | $ | (0.58 | ) | | $ | — | | | $ | (2.63 | ) | | $ | — | | | $ | (2.63 | ) | | $ | — | | | $ | 13.97 | | | | (4.01 | )% | | $ | 2.4 | | | | 1.83 | % | | | 1.83 | % | | | (0.30 | )% | | | 31 | % | |
8/31/2014 | | $ | 15.96 | | | $ | (0.03 | ) | | $ | 3.16 | | | $ | 3.13 | | | $ | (0.00 | ) | | $ | (1.91 | ) | | $ | — | | | $ | (1.91 | ) | | $ | 0.00 | | | $ | 17.18 | | | | 20.71 | %g | | $ | 2.9 | | | | 1.86 | % | | | 1.86 | %§ | | | (0.15 | )% | | | 37 | % | |
8/31/2013 | | $ | 13.66 | | | $ | (0.02 | ) | | $ | 2.84 | | | $ | 2.82 | | | $ | (0.08 | ) | | $ | (0.44 | ) | | $ | — | | | $ | (0.52 | ) | | $ | — | | | $ | 15.96 | | | | 21.43 | % | | $ | 2.6 | | | | 1.86 | % | | | 1.86 | % | | | (0.15 | )% | | | 36 | % | |
8/31/2012 | | $ | 12.60 | | | $ | (0.02 | ) | | $ | 1.13 | | | $ | 1.11 | | | $ | (0.05 | ) | | $ | — | | | $ | — | | | $ | (0.05 | ) | | $ | — | | | $ | 13.66 | | | | 8.83 | % | | $ | 1.3 | | | | 1.88 | % | | | 1.86 | % | | | (0.13 | )% | | | 26 | % | |
Class R3 | |
8/31/2016 | | $ | 14.31 | | | $ | 0.02 | | | $ | 0.99 | | | $ | 1.01 | | | $ | (0.04 | ) | | $ | (1.86 | ) | | $ | — | | | $ | (1.90 | ) | | $ | — | | | $ | 13.42 | | | | 8.00 | % | | $ | 0.6 | | | | 1.39 | % | | | 1.36 | % | | | 0.15 | % | | | 99 | % | |
8/31/2015 | | $ | 17.54 | | | $ | 0.02 | | | $ | (0.54 | ) | | $ | (0.52 | ) | | $ | (0.08 | ) | | $ | (2.63 | ) | | $ | — | | | $ | (2.71 | ) | | $ | — | | | $ | 14.31 | | | | (3.53 | )% | | $ | 0.5 | | | | 1.37 | % | | | 1.36 | % | | | 0.15 | % | | | 31 | % | |
8/31/2014 | | $ | 16.25 | | | $ | 0.06 | | | $ | 3.21 | | | $ | 3.27 | | | $ | (0.07 | ) | | $ | (1.91 | ) | | $ | — | | | $ | (1.98 | ) | | $ | 0.00 | | | $ | 17.54 | | | | 21.29 | %g | | $ | 0.7 | | | | 1.38 | % | | | 1.36 | % | | | 0.37 | % | | | 37 | % | |
8/31/2013 | | $ | 13.79 | | | $ | 0.04 | | | $ | 2.89 | | | $ | 2.93 | | | $ | (0.03 | ) | | $ | (0.44 | ) | | $ | — | | | $ | (0.47 | ) | | $ | — | | | $ | 16.25 | | | | 22.03 | % | | $ | 0.4 | | | | 1.41 | % | | | 1.36 | % | | | 0.24 | % | | | 36 | % | |
8/31/2012 | | $ | 12.72 | | | $ | 0.05 | | | $ | 1.13 | | | $ | 1.18 | | | $ | (0.11 | ) | | $ | — | | | $ | — | | | $ | (0.11 | ) | | $ | — | | | $ | 13.79 | | | | 9.40 | % | | $ | 0.5 | | | | 1.39 | % | | | 1.36 | % | | | 0.36 | % | | | 26 | % | |
International Equity Fund | |
Investor Class | |
8/31/2016 | | $ | 19.78 | | | $ | 0.24 | | | $ | 0.67 | | | $ | 0.91 | | | $ | (0.09 | ) | | $ | — | | | $ | — | | | $ | (0.09 | ) | | $ | — | | | $ | 20.60 | | | | 4.60 | % | | $ | 104.0 | | | | 1.26 | % | | | 1.08 | % | | | 1.20 | % | | | 30 | % | |
8/31/2015 | | $ | 20.70 | | | $ | 0.19 | | | $ | (0.96 | ) | | $ | (0.77 | ) | | $ | (0.15 | ) | | $ | — | | | $ | — | | | $ | (0.15 | ) | | $ | — | | | $ | 19.78 | | | | (3.71 | )% | | $ | 117.7 | | | | 1.25 | % | | | 1.02 | % | | | 0.93 | % | | | 25 | % | |
8/31/2014 | | $ | 18.62 | | | $ | 0.26 | | | $ | 1.99 | | | $ | 2.25 | | | $ | (0.17 | ) | | $ | — | | | $ | — | | | $ | (0.17 | ) | | $ | 0.00 | | | $ | 20.70 | | | | 12.14 | %g | | $ | 124.4 | | | | 1.26 | % | | | 1.07 | % | | | 1.29 | % | | | 34 | % | |
Period from 1/28/2013^
to 8/31/2013 | | $ | 18.03 | | | $ | 0.21 | | | $ | 0.38 | | | $ | 0.59 | | | $ | — | | | $ | — | | | $ | — | | | $ | — | | | $ | — | | | $ | 18.62 | | | | 3.27 | %** | | $ | 125.7 | | | | 1.32 | %* | | | 1.09 | %* | | | 1.87 | %* | | | 44 | %Øa | |
Trust Class | |
8/31/2016 | | $ | 22.06 | | | $ | 0.26 | | | $ | 0.75 | | | $ | 1.01 | | | $ | (0.05 | ) | | $ | — | | | $ | — | | | $ | (0.05 | ) | | $ | — | | | $ | 23.02 | | | | 4.59 | % | | $ | 48.4 | | | | 1.30 | % | | | 1.12 | % | | | 1.15 | % | | | 30 | % | |
8/31/2015 | | $ | 23.02 | | | $ | 0.19 | | | $ | (1.07 | ) | | $ | (0.88 | ) | | $ | (0.08 | ) | | $ | — | | | $ | — | | | $ | (0.08 | ) | | $ | — | | | $ | 22.06 | | | | (3.82 | )% | | $ | 55.3 | | | | 1.36 | % | | | 1.13 | % | | | 0.81 | % | | | 25 | % | |
8/31/2014 | | $ | 20.70 | | | $ | 0.28 | | | $ | 2.20 | | | $ | 2.48 | | | $ | (0.16 | ) | | $ | — | | | $ | — | | | $ | (0.16 | ) | | $ | 0.00 | | | $ | 23.02 | | | | 12.02 | %g | | $ | 67.7 | | | | 1.36 | % | | | 1.16 | % | | | 1.23 | % | | | 34 | % | |
Period from 1/28/2013^
to 8/31/2013 | | $ | 20.05 | | | $ | 0.21 | | | $ | 0.44 | | | $ | 0.65 | | | $ | — | | | $ | — | | | $ | — | | | $ | — | | | $ | — | | | $ | 20.70 | | | | 3.24 | %** | | $ | 111.9 | | | | 1.42 | %* | | | 1.19 | %* | | | 1.73 | %* | | | 44 | %Øa | |
See Notes to Financial Highlights
207
208
Financial Highlights (cont'd)
| | | Net Asset
Value,
Beginning
of Year | | Net
Investment
Income/(Loss)@ | | Net Gains or
Losses on
Securities
(both realized
and
unrealized) | | Total From
Investment
Operations | | Dividends
from Net
Investment
Income | | Distributions
from Net
Realized
Capital Gains | | Tax
Return of
Capital | | Total
Distributions | | Voluntary
Contribution
from
Management | | Net Asset
Value, End of
Year | | Total Return†d | | Net Assets,
End of Year
(in millions) | | Ratio of Gross
Expenses to
Average Net
Assets# | | Ratio of Net
Expenses to
Average Net
Assets‡ | | Ratio of Net
Investment
Income/
(Loss) to
Average Net
Assets | | Portfolio
Turnover
Rate | |
International Equity Fund (cont'd) | |
Institutional Class | |
8/31/2016 | | $ | 10.72 | | | $ | 0.16 | | | $ | 0.35 | | | $ | 0.51 | | | $ | (0.14 | ) | | $ | — | | | $ | — | | | $ | (0.14 | ) | | $ | — | | | $ | 11.09 | | | | 4.78 | % | | $ | 1,184.3 | | | | 1.03 | % | | | 0.85 | %§ | | | 1.46 | % | | | 30 | % | |
8/31/2015 | | $ | 11.32 | | | $ | 0.13 | | | $ | (0.53 | ) | | $ | (0.40 | ) | | $ | (0.20 | ) | | $ | — | | | $ | — | | | $ | (0.20 | ) | | $ | — | | | $ | 10.72 | | | | (3.51 | )% | | $ | 886.5 | | | | 1.07 | % | | | 0.85 | %§ | | | 1.11 | % | | | 25 | % | |
8/31/2014 | | $ | 10.26 | | | $ | 0.17 | | | $ | 1.09 | | | $ | 1.26 | | | $ | (0.20 | ) | | $ | — | | | $ | — | | | $ | (0.20 | ) | | $ | 0.00 | | | $ | 11.32 | | | | 12.38 | %g | | $ | 887.3 | | | | 1.07 | % | | | 0.85 | % | | | 1.49 | % | | | 34 | % | |
8/31/2013 | | $ | 9.15 | | | $ | 0.15 | | | $ | 1.10 | | | $ | 1.25 | | | $ | (0.14 | ) | | $ | — | | | $ | — | | | $ | (0.14 | ) | | $ | — | | | $ | 10.26 | | | | 13.82 | % | | $ | 770.3 | | | | 1.14 | % | | | 0.85 | % | | | 1.54 | % | | | 44 | %a | |
8/31/2012 | | $ | 9.20 | | | $ | 0.16 | | | $ | (0.10 | ) | | $ | 0.06 | | | $ | (0.11 | ) | | $ | — | | | $ | — | | | $ | (0.11 | ) | | $ | — | | | $ | 9.15 | | | | 0.78 | % | | $ | 491.6 | | | | 1.16 | % | | | 0.84 | % | | | 1.88 | % | | | 33 | % | |
Class A | |
8/31/2016 | | $ | 22.00 | | | $ | 0.23 | | | $ | 0.75 | | | $ | 0.98 | | | $ | (0.06 | ) | | $ | — | | | $ | — | | | $ | (0.06 | ) | | $ | — | | | $ | 22.92 | | | | 4.48 | % | | $ | 104.9 | | | | 1.40 | % | | | 1.21 | % | | | 1.05 | % | | | 30 | % | |
8/31/2015 | | $ | 23.01 | | | $ | 0.25 | | | $ | (1.15 | ) | | $ | (0.90 | ) | | $ | (0.11 | ) | | $ | — | | | $ | — | | | $ | (0.11 | ) | | $ | — | | | $ | 22.00 | | | | (3.90 | )% | | $ | 91.0 | | | | 1.43 | % | | | 1.21 | %§ | | | 1.09 | % | | | 25 | % | |
8/31/2014 | | $ | 20.69 | | | $ | 0.28 | | | $ | 2.19 | | | $ | 2.47 | | | $ | (0.15 | ) | | $ | — | | | $ | — | | | $ | (0.15 | ) | | $ | 0.00 | | | $ | 23.01 | | | | 11.98 | %g | | $ | 26.2 | | | | 1.45 | % | | | 1.21 | % | | | 1.23 | % | | | 34 | % | |
Period from 1/28/2013^
to 8/31/2013 | | $ | 20.05 | | | $ | 0.19 | | | $ | 0.45 | | | $ | 0.64 | | | $ | — | | | $ | — | | | $ | — | | | $ | — | | | $ | — | | | $ | 20.69 | | | | 3.19 | %** | | $ | 12.8 | | | | 1.55 | %* | | | 1.28 | %* | | | 1.57 | %* | | | 44 | %Øa | |
Class C | |
8/31/2016 | | $ | 21.65 | | | $ | 0.08 | | | $ | 0.72 | | | $ | 0.80 | | | $ | — | | | $ | — | | | $ | — | | | $ | — | | | $ | — | | | $ | 22.45 | | | | 3.70 | % | | $ | 14.7 | | | | 2.16 | % | | | 1.96 | % | | | 0.37 | % | | | 30 | % | |
8/31/2015 | | $ | 22.72 | | | $ | 0.00 | | | $ | (1.05 | ) | | $ | (1.05 | ) | | $ | (0.02 | ) | | $ | — | | | $ | — | | | $ | (0.02 | ) | | $ | — | | | $ | 21.65 | | | | (4.61 | )% | | $ | 11.2 | | | | 2.18 | % | | | 1.96 | % | | | 0.02 | % | | | 25 | % | |
8/31/2014 | | $ | 20.50 | | | $ | 0.13 | | | $ | 2.15 | | | $ | 2.28 | | | $ | (0.06 | ) | | $ | — | | | $ | — | | | $ | (0.06 | ) | | $ | 0.00 | | | $ | 22.72 | | | | 11.16 | %g | | $ | 6.1 | | | | 2.21 | % | | | 1.96 | % | | | 0.59 | % | | | 34 | % | |
Period from 1/28/2013^
to 8/31/2013 | | $ | 19.97 | | | $ | 0.09 | | | $ | 0.44 | | | $ | 0.53 | | | $ | — | | | $ | — | | | $ | — | | | $ | — | | | $ | — | | | $ | 20.50 | | | | 2.65 | %** | | $ | 1.9 | | | | 2.51 | %* | | | 2.08 | %* | | | 0.74 | %* | | | 44 | %Øa | |
Class R6 | |
8/31/2016 | | $ | 10.81 | | | $ | 0.16 | | | $ | 0.38 | | | $ | 0.54 | | | $ | (0.15 | ) | | $ | — | | | $ | — | | | $ | (0.15 | ) | | $ | — | | | $ | 11.20 | | | | 5.02 | % | | $ | 46.7 | | | | 0.96 | % | | | 0.78 | % | | | 1.49 | % | | | 30 | % | |
8/31/2015 | | $ | 11.42 | | | $ | 0.14 | | | $ | (0.54 | ) | | $ | (0.40 | ) | | $ | (0.21 | ) | | $ | — | | | $ | — | | | $ | (0.21 | ) | | $ | — | | | $ | 10.81 | | | | (3.49 | )% | | $ | 32.7 | | | | 0.99 | % | | | 0.77 | %§ | | | 1.24 | % | | | 25 | % | |
Period from 9/3/2013^
to 8/31/2014 | | $ | 10.26 | | | $ | 0.08 | | | $ | 1.19 | | | $ | 1.27 | | | $ | (0.11 | ) | | $ | — | | | $ | — | | | $ | (0.11 | ) | | $ | 0.00 | | | $ | 11.42 | | | | 12.46 | %**g | | $ | 21.9 | | | | 1.12 | %* | | | 0.79 | %* | | | 0.73 | %* | | | 34 | %Ø | |
International Select Fund | |
Trust Class | |
8/31/2016 | | $ | 10.59 | | | $ | 0.11 | | | $ | 0.27 | | | $ | 0.38 | | | $ | (0.09 | ) | | $ | — | | | $ | — | | | $ | (0.09 | ) | | $ | — | | | $ | 10.88 | | | | 3.65 | % | | $ | 7.8 | | | | 1.39 | % | | | 1.25 | % | | | 1.06 | % | | | 22 | % | |
8/31/2015 | | $ | 11.21 | | | $ | 0.09 | | | $ | (0.59 | ) | | $ | (0.50 | ) | | $ | (0.12 | ) | | $ | — | | | $ | — | | | $ | (0.12 | ) | | $ | — | | | $ | 10.59 | | | | (4.47 | )% | | $ | 10.2 | | | | 1.33 | % | | | 1.25 | % | | | 0.76 | % | | | 24 | % | |
8/31/2014 | | $ | 10.14 | | | $ | 0.13 | | | $ | 1.04 | | | $ | 1.17 | | | $ | (0.10 | ) | | $ | — | | | $ | — | | | $ | (0.10 | ) | | $ | 0.00 | | | $ | 11.21 | | | | 11.56 | %g | | $ | 13.0 | | | | 1.33 | % | | | 1.25 | % | | | 1.19 | % | | | 27 | % | |
8/31/2013 | | $ | 9.14 | | | $ | 0.10 | | | $ | 1.01 | | | $ | 1.11 | | | $ | (0.11 | ) | | $ | — | | | $ | — | | | $ | (0.11 | ) | | $ | — | | | $ | 10.14 | | | | 12.17 | % | | $ | 13.9 | | | | 1.37 | % | | | 1.25 | % | | | 1.05 | % | | | 50 | % | |
8/31/2012 | | $ | 9.35 | | | $ | 0.13 | | | $ | (0.24 | ) | | $ | (0.11 | ) | | $ | (0.10 | ) | | $ | — | | | $ | — | | | $ | (0.10 | ) | | $ | — | | | $ | 9.14 | | | | (1.05 | )% | | $ | 14.2 | | | | 1.40 | % | | | 1.25 | % | | | 1.47 | % | | | 29 | % | |
See Notes to Financial Highlights
209
210
Financial Highlights (cont'd)
| | | Net Asset
Value,
Beginning
of Year | | Net
Investment
Income/(Loss)@ | | Net Gains or
Losses on
Securities
(both realized
and
unrealized) | | Total From
Investment
Operations | | Dividends
from Net
Investment
Income | | Distributions
from Net
Realized
Capital Gains | | Tax
Return of
Capital | | Total
Distributions | | Voluntary
Contribution
from
Management | | Net Asset
Value, End of
Year | | Total Return†d | | Net Assets,
End of Year
(in millions) | | Ratio of Gross
Expenses to
Average Net
Assets# | | Ratio of Net
Expenses to
Average Net
Assets‡ | | Ratio of Net
Investment
Income/
(Loss) to
Average Net
Assets | | Portfolio
Turnover
Rate | |
International Select Fund (cont'd) | |
Institutional Class | |
8/31/2016 | | $ | 10.58 | | | $ | 0.16 | | | $ | 0.25 | | | $ | 0.41 | | | $ | (0.13 | ) | | $ | — | | | $ | — | | | $ | (0.13 | ) | | $ | — | | | $ | 10.86 | | | | 3.94 | % | | $ | 211.7 | | | | 0.94 | % | | | 0.90 | % | | | 1.51 | % | | | 22 | % | |
8/31/2015 | | $ | 11.21 | | | $ | 0.13 | | | $ | (0.60 | ) | | $ | (0.47 | ) | | $ | (0.16 | ) | | $ | — | | | $ | — | | | $ | (0.16 | ) | | $ | — | | | $ | 10.58 | | | | (4.18 | )% | | $ | 216.4 | | | | 0.93 | % | | | 0.90 | % | | | 1.16 | % | | | 24 | % | |
8/31/2014 | | $ | 10.14 | | | $ | 0.18 | | | $ | 1.03 | | | $ | 1.21 | | | $ | (0.14 | ) | | $ | — | | | $ | — | | | $ | (0.14 | ) | | $ | 0.00 | | | $ | 11.21 | | | | 11.98 | %g | | $ | 211.6 | | | | 0.93 | % | | | 0.90 | % | | | 1.58 | % | | | 27 | % | |
8/31/2013 | | $ | 9.14 | | | $ | 0.14 | | | $ | 1.00 | | | $ | 1.14 | | | $ | (0.14 | ) | | $ | — | | | $ | — | | | $ | (0.14 | ) | | $ | — | | | $ | 10.14 | | | | 12.56 | % | | $ | 200.6 | | | | 0.97 | % | | | 0.90 | % | | | 1.44 | % | | | 50 | % | |
8/31/2012 | | $ | 9.36 | | | $ | 0.15 | | | $ | (0.23 | ) | | $ | (0.08 | ) | | $ | (0.14 | ) | | $ | — | | | $ | — | | | $ | (0.14 | ) | | $ | — | | | $ | 9.14 | | | | (0.65 | )% | | $ | 172.0 | | | | 0.99 | % | | | 0.90 | % | | | 1.76 | % | | | 29 | % | |
Class A | |
8/31/2016 | | $ | 10.51 | | | $ | 0.13 | | | $ | 0.26 | | | $ | 0.39 | | | $ | (0.10 | ) | | $ | — | | | $ | — | | | $ | (0.10 | ) | | $ | — | | | $ | 10.80 | | | | 3.69 | % | | $ | 4.6 | | | | 1.33 | % | | | 1.24 | % | | | 1.25 | % | | | 22 | % | |
8/31/2015 | | $ | 11.14 | | | $ | 0.08 | | | $ | (0.59 | ) | | $ | (0.51 | ) | | $ | (0.12 | ) | | $ | — | | | $ | — | | | $ | (0.12 | ) | | $ | — | | | $ | 10.51 | | | | (4.62 | )% | | $ | 3.8 | | | | 1.31 | % | | | 1.24 | % | | | 0.71 | % | | | 24 | % | |
8/31/2014 | | $ | 10.07 | | | $ | 0.14 | | | $ | 1.03 | | | $ | 1.17 | | | $ | (0.10 | ) | | $ | — | | | $ | — | | | $ | (0.10 | ) | | $ | 0.00 | | | $ | 11.14 | | | | 11.69 | %g | | $ | 9.3 | | | | 1.30 | % | | | 1.24 | % | | | 1.25 | % | | | 27 | % | |
8/31/2013 | | $ | 9.09 | | | $ | 0.11 | | | $ | 0.98 | | | $ | 1.09 | | | $ | (0.11 | ) | | $ | — | | | $ | — | | | $ | (0.11 | ) | | $ | — | | | $ | 10.07 | | | | 12.08 | % | | $ | 9.3 | | | | 1.36 | % | | | 1.24 | % | | | 1.16 | % | | | 50 | % | |
8/31/2012 | | $ | 9.30 | | | $ | 0.14 | | | $ | (0.24 | ) | | $ | (0.10 | ) | | $ | (0.11 | ) | | $ | — | | | $ | — | | | $ | (0.11 | ) | | $ | — | | | $ | 9.09 | | | | (0.96 | )% | | $ | 8.3 | | | | 1.39 | % | | | 1.24 | % | | | 1.56 | % | | | 29 | % | |
Class C | |
8/31/2016 | | $ | 10.36 | | | $ | 0.04 | | | $ | 0.26 | | | $ | 0.30 | | | $ | (0.02 | ) | | $ | — | | | $ | — | | | $ | (0.02 | ) | | $ | — | | | $ | 10.64 | | | | 2.89 | % | | $ | 3.2 | | | | 2.06 | % | | | 2.00 | % | | | 0.39 | % | | | 22 | % | |
8/31/2015 | | $ | 10.97 | | | $ | 0.01 | | | $ | (0.58 | ) | | $ | (0.57 | ) | | $ | (0.04 | ) | | $ | — | | | $ | — | | | $ | (0.04 | ) | | $ | — | | | $ | 10.36 | | | | (5.23 | )% | | $ | 3.7 | | | | 2.04 | % | | | 2.00 | % | | | 0.06 | % | | | 24 | % | |
8/31/2014 | | $ | 9.93 | | | $ | 0.05 | | | $ | 1.02 | | | $ | 1.07 | | | $ | (0.03 | ) | | $ | — | | | $ | — | | | $ | (0.03 | ) | | $ | 0.00 | | | $ | 10.97 | | | | 10.79 | %g | | $ | 4.6 | | | | 2.05 | % | | | 2.00 | % | | | 0.42 | % | | | 27 | % | |
8/31/2013 | | $ | 8.98 | | | $ | 0.04 | | | $ | 0.97 | | | $ | 1.01 | | | $ | (0.06 | ) | | $ | — | | | $ | — | | | $ | (0.06 | ) | | $ | — | | | $ | 9.93 | | | | 11.23 | % | | $ | 4.0 | | | | 2.09 | % | | | 2.00 | % | | | 0.36 | % | | | 50 | % | |
8/31/2012 | | $ | 9.17 | | | $ | 0.06 | | | $ | (0.21 | ) | | $ | (0.15 | ) | | $ | (0.04 | ) | | $ | — | | | $ | — | | | $ | (0.04 | ) | | $ | — | | | $ | 8.98 | | | | (1.64 | )% | | $ | 3.7 | | | | 2.13 | % | | | 2.00 | % | | | 0.65 | % | | | 29 | % | |
Class R3 | |
8/31/2016 | | $ | 10.43 | | | $ | 0.10 | | | $ | 0.25 | | | $ | 0.35 | | | $ | (0.07 | ) | | $ | — | | | $ | — | | | $ | (0.07 | ) | | $ | — | | | $ | 10.71 | | | | 3.33 | % | | $ | 3.8 | | | | 1.57 | % | | | 1.51 | % | | | 0.95 | % | | | 22 | % | |
8/31/2015 | | $ | 11.05 | | | $ | 0.06 | | | $ | (0.58 | ) | | $ | (0.52 | ) | | $ | (0.10 | ) | | $ | — | | | $ | — | | | $ | (0.10 | ) | | $ | — | | | $ | 10.43 | | | | (4.71 | )% | | $ | 3.4 | | | | 1.55 | % | | | 1.51 | % | | | 0.56 | % | | | 24 | % | |
8/31/2014 | | $ | 10.01 | | | $ | 0.11 | | | $ | 1.02 | | | $ | 1.13 | | | $ | (0.09 | ) | | $ | — | | | $ | — | | | $ | (0.09 | ) | | $ | 0.00 | | | $ | 11.05 | | | | 11.35 | %g | | $ | 2.2 | | | | 1.55 | % | | | 1.51 | % | | | 1.03 | % | | | 27 | % | |
8/31/2013 | | $ | 9.04 | | | $ | 0.07 | | | $ | 0.99 | | | $ | 1.06 | | | $ | (0.09 | ) | | $ | — | | | $ | — | | | $ | (0.09 | ) | | $ | — | | | $ | 10.01 | | | | 11.83 | % | | $ | 2.6 | | | | 1.60 | % | | | 1.51 | % | | | 0.74 | % | | | 50 | % | |
8/31/2012 | | $ | 9.27 | | | $ | 0.12 | | | $ | (0.25 | ) | | $ | (0.13 | ) | | $ | (0.10 | ) | | $ | — | | | $ | — | | | $ | (0.10 | ) | | $ | — | | | $ | 9.04 | | | | (1.24 | )% | | $ | 0.4 | | | | 1.67 | % | | | 1.51 | % | | | 1.35 | % | | | 29 | % | |
Intrinsic Value Fund | |
Institutional Class | |
8/31/2016 | | $ | 14.34 | | | $ | (0.05 | ) | | $ | 0.43 | | | $ | 0.38 | | | $ | — | | | $ | (0.70 | ) | | $ | — | | | $ | (0.70 | ) | | $ | — | | | $ | 14.02 | | | | 2.96 | % | | $ | 611.3 | | | | 1.08 | % | | | 1.00 | % | | | (0.38 | )% | | | 17 | % | |
8/31/2015 | | $ | 14.98 | | | $ | (0.06 | ) | | $ | 0.21 | | | $ | 0.15 | | | $ | — | | | $ | (0.79 | ) | | $ | — | | | $ | (0.79 | ) | | $ | — | | | $ | 14.34 | | | | 1.36 | % | | $ | 420.3 | | | | 1.10 | % | | | 1.00 | % | | | (0.41 | )% | | | 22 | % | |
8/31/2014 | | $ | 12.81 | | | $ | (0.06 | ) | | $ | 2.80 | | | $ | 2.74 | | | $ | (0.03 | ) | | $ | (0.54 | ) | | $ | — | | | $ | (0.57 | ) | | $ | 0.00 | | | $ | 14.98 | | | | 21.74 | %g | | $ | 252.0 | | | | 1.13 | % | | | 1.00 | % | | | (0.40 | )% | | | 24 | % | |
8/31/2013 | | $ | 10.26 | | | $ | 0.05 | | | $ | 2.68 | | | $ | 2.73 | | | $ | — | | | $ | (0.18 | ) | | $ | — | | | $ | (0.18 | ) | | $ | — | | | $ | 12.81 | | | | 26.94 | % | | $ | 182.6 | | | | 1.18 | % | | | 1.00 | % | | | 0.42 | % | | | 25 | % | |
8/31/2012 | | $ | 10.26 | | | $ | (0.01 | ) | | $ | 1.09 | | | $ | 1.08 | | | $ | — | | | $ | (1.08 | ) | | $ | — | | | $ | (1.08 | ) | | $ | — | | | $ | 10.26 | | | | 12.21 | % | | $ | 134.2 | | | | 1.22 | % | | | 1.00 | % | | | (0.14 | )% | | | 30 | % | |
See Notes to Financial Highlights
211
212
Financial Highlights (cont'd)
| | | Net Asset
Value,
Beginning
of Year | | Net
Investment
Income/(Loss)@ | | Net Gains or
Losses on
Securities
(both realized
and
unrealized) | | Total From
Investment
Operations | | Dividends
from Net
Investment
Income | | Distributions
from Net
Realized
Capital Gains | | Tax
Return of
Capital | | Total
Distributions | | Voluntary
Contribution
from
Management | | Net Asset
Value, End of
Year | | Total Return†d | | Net Assets,
End of Year
(in millions) | | Ratio of Gross
Expenses to
Average Net
Assets# | | Ratio of Net
Expenses to
Average Net
Assets‡ | | Ratio of Net
Investment
Income/
(Loss) to
Average Net
Assets | | Portfolio
Turnover
Rate | |
Intrinsic Value Fund (cont'd) | |
Class A | |
8/31/2016 | | $ | 14.06 | | | $ | (0.10 | ) | | $ | 0.42 | | | $ | 0.32 | | | $ | — | | | $ | (0.70 | ) | | $ | — | | | $ | (0.70 | ) | | $ | — | | | $ | 13.68 | | | | 2.58 | % | | $ | 44.5 | | | | 1.48 | % | | | 1.36 | % | | | (0.72 | )% | | | 17 | % | |
8/31/2015 | | $ | 14.76 | | | $ | (0.11 | ) | | $ | 0.20 | | | $ | 0.09 | | | $ | — | | | $ | (0.79 | ) | | $ | — | | | $ | (0.79 | ) | | $ | — | | | $ | 14.06 | | | | 0.96 | % | | $ | 44.3 | | | | 1.50 | % | | | 1.36 | % | | | (0.77 | )% | | | 22 | % | |
8/31/2014 | | $ | 12.65 | | | $ | (0.11 | ) | | $ | 2.76 | | | $ | 2.65 | | | $ | (0.00 | ) | | $ | (0.54 | ) | | $ | — | | | $ | (0.54 | ) | | $ | 0.00 | | | $ | 14.76 | | | | 21.31 | %g | | $ | 13.5 | | | | 1.51 | % | | | 1.36 | % | | | (0.77 | )% | | | 24 | % | |
8/31/2013 | | $ | 10.16 | | | $ | 0.00 | | | $ | 2.67 | | | $ | 2.67 | | | $ | — | | | $ | (0.18 | ) | | $ | — | | | $ | (0.18 | ) | | $ | — | | | $ | 12.65 | | | | 26.61 | % | | $ | 13.9 | | | | 1.58 | % | | | 1.36 | % | | | 0.01 | % | | | 25 | % | |
8/31/2012 | | $ | 10.22 | | | $ | (0.05 | ) | | $ | 1.07 | | | $ | 1.02 | | | $ | — | | | $ | (1.08 | ) | | $ | — | | | $ | (1.08 | ) | | $ | — | | | $ | 10.16 | | | | 11.62 | % | | $ | 8.4 | | | | 1.61 | % | | | 1.36 | % | | | (0.51 | )% | | | 30 | % | |
Class C | |
8/31/2016 | | $ | 13.48 | | | $ | (0.18 | ) | | $ | 0.39 | | | $ | 0.21 | | | $ | — | | | $ | (0.70 | ) | | $ | — | | | $ | (0.70 | ) | | $ | — | | | $ | 12.99 | | | | 1.85 | % | | $ | 25.2 | | | | 2.20 | % | | | 2.11 | % | | | (1.47 | )% | | | 17 | % | |
8/31/2015 | | $ | 14.29 | | | $ | (0.21 | ) | | $ | 0.19 | | | $ | (0.02 | ) | | $ | — | | | $ | (0.79 | ) | | $ | — | | | $ | (0.79 | ) | | $ | — | | | $ | 13.48 | | | | 0.19 | % | | $ | 25.8 | | | | 2.22 | % | | | 2.11 | % | | | (1.52 | )% | | | 22 | % | |
8/31/2014 | | $ | 12.35 | | | $ | (0.21 | ) | | $ | 2.69 | | | $ | 2.48 | | | $ | — | | | $ | (0.54 | ) | | $ | — | | | $ | (0.54 | ) | | $ | 0.00 | | | $ | 14.29 | | | | 20.40 | %g | | $ | 12.7 | | | | 2.26 | % | | | 2.11 | % | | | (1.51 | )% | | | 24 | % | |
8/31/2013 | | $ | 10.00 | | | $ | (0.08 | ) | | $ | 2.61 | | | $ | 2.53 | | | $ | — | | | $ | (0.18 | ) | | $ | — | | | $ | (0.18 | ) | | $ | — | | | $ | 12.35 | | | | 25.62 | % | | $ | 10.3 | | | | 2.31 | % | | | 2.11 | % | | | (0.70 | )% | | | 25 | % | |
8/31/2012 | | $ | 10.14 | | | $ | (0.12 | ) | | $ | 1.06 | | | $ | 0.94 | | | $ | — | | | $ | (1.08 | ) | | $ | — | | | $ | (1.08 | ) | | $ | — | | | $ | 10.00 | | | | 10.87 | % | | $ | 6.9 | | | | 2.35 | % | | | 2.11 | % | | | (1.25 | )% | | | 30 | % | |
Large Cap Value Fund | |
Investor Class | |
8/31/2016 | | $ | 27.46 | | | $ | 0.31 | | | $ | 2.85 | | | $ | 3.16 | | | $ | (0.31 | ) | | $ | (2.06 | ) | | $ | — | | | $ | (2.37 | ) | | $ | — | | | $ | 28.25 | | | | 13.16 | % | | $ | 1,069.8 | | | | 0.90 | % | | | 0.90 | % | | | 1.20 | % | | | 126 | % | |
8/31/2015 | | $ | 33.92 | | | $ | 0.33 | | | $ | (2.51 | ) | | $ | (2.18 | ) | | $ | (0.29 | ) | | $ | (3.99 | ) | | $ | — | | | $ | (4.28 | ) | | $ | — | | | $ | 27.46 | | | | (7.19 | )% | | $ | 1,045.6 | | | | 0.86 | % | | | 0.86 | % | | | 1.08 | % | | | 153 | % | |
8/31/2014 | | $ | 32.40 | | | $ | 0.34 | | | $ | 6.62 | | | $ | 6.96 | | | $ | (0.42 | ) | | $ | (5.02 | ) | | $ | — | | | $ | (5.44 | ) | | $ | 0.00 | | | $ | 33.92 | | | | 23.57 | %g | | $ | 1,238.3 | | | | 0.85 | % | | | 0.85 | % | | | 1.04 | % | | | 104 | % | |
8/31/2013 | | $ | 26.46 | | | $ | 0.36 | | | $ | 5.94 | | | $ | 6.30 | | | $ | (0.36 | ) | | $ | — | | | $ | — | | | $ | (0.36 | ) | | $ | — | | | $ | 32.40 | | | | 24.05 | % | | $ | 1,149.7 | | | | 0.86 | % | | | 0.86 | % | | | 1.19 | % | | | 159 | % | |
8/31/2012 | | $ | 24.97 | | | $ | 0.30 | | | $ | 1.30 | | | $ | 1.60 | | | $ | (0.11 | ) | | $ | — | | | $ | — | | | $ | (0.11 | ) | | $ | — | | | $ | 26.46 | | | | 6.47 | % | | $ | 1,057.1 | | | | 0.87 | % | | | 0.87 | % | | | 1.20 | % | | | 171 | % | |
Trust Class | |
8/31/2016 | | $ | 18.74 | | | $ | 0.18 | | | $ | 1.80 | | | $ | 1.98 | | | $ | (0.28 | ) | | $ | (2.06 | ) | | $ | — | | | $ | (2.34 | ) | | $ | — | | | $ | 18.38 | | | | 12.97 | % | | $ | 77.6 | | | | 1.07 | % | | | 1.07 | % | | | 1.03 | % | | | 126 | % | |
8/31/2015 | | $ | 24.54 | | | $ | 0.19 | | | $ | (1.74 | ) | | $ | (1.55 | ) | | $ | (0.26 | ) | | $ | (3.99 | ) | | $ | — | | | $ | (4.25 | ) | | $ | — | | | $ | 18.74 | | | | (7.40 | )% | | $ | 108.2 | | | | 1.05 | % | | | 1.05 | % | | | 0.88 | % | | | 153 | % | |
8/31/2014 | | $ | 24.80 | | | $ | 0.20 | | | $ | 4.93 | | | $ | 5.13 | | | $ | (0.37 | ) | | $ | (5.02 | ) | | $ | — | | | $ | (5.39 | ) | | $ | 0.00 | | | $ | 24.54 | | | | 23.36 | %g | | $ | 141.1 | | | | 1.05 | % | | | 1.05 | % | | | 0.83 | % | | | 104 | % | |
8/31/2013 | | $ | 20.30 | | | $ | 0.23 | | | $ | 4.54 | | | $ | 4.77 | | | $ | (0.27 | ) | | $ | — | | | $ | — | | | $ | (0.27 | ) | | $ | — | | | $ | 24.80 | | | | 23.76 | % | | $ | 156.6 | | | | 1.06 | % | | | 1.06 | % | | | 1.01 | % | | | 159 | % | |
8/31/2012 | | $ | 19.15 | | | $ | 0.19 | | | $ | 1.00 | | | $ | 1.19 | | | $ | (0.04 | ) | | $ | — | | | $ | — | | | $ | (0.04 | ) | | $ | — | | | $ | 20.30 | | | | 6.26 | % | | $ | 209.6 | | | | 1.05 | % | | | 1.05 | % | | | 0.97 | % | | | 171 | % | |
Advisor Class | |
8/31/2016 | | $ | 14.63 | | | $ | 0.11 | | | $ | 1.32 | | | $ | 1.43 | | | $ | (0.28 | ) | | $ | (2.06 | ) | | $ | — | | | $ | (2.34 | ) | | $ | — | | | $ | 13.72 | | | | 12.81 | % | | $ | 145.9 | | | | 1.22 | % | | | 1.22 | % | | | 0.88 | % | | | 126 | % | |
8/31/2015 | | $ | 20.12 | | | $ | 0.12 | | | $ | (1.37 | ) | | $ | (1.25 | ) | | $ | (0.25 | ) | | $ | (3.99 | ) | | $ | — | | | $ | (4.24 | ) | | $ | — | | | $ | 14.63 | | | | (7.55 | )% | | $ | 162.3 | | | | 1.20 | % | | | 1.20 | % | | | 0.73 | % | | | 153 | % | |
8/31/2014 | | $ | 21.23 | | | $ | 0.14 | | | $ | 4.12 | | | $ | 4.26 | | | $ | (0.35 | ) | | $ | (5.02 | ) | | $ | — | | | $ | (5.37 | ) | | $ | 0.00 | | | $ | 20.12 | | | | 23.17 | %g | | $ | 216.1 | | | | 1.20 | % | | | 1.20 | % | | | 0.69 | % | | | 104 | % | |
8/31/2013 | | $ | 17.46 | | | $ | 0.17 | | | $ | 3.89 | | | $ | 4.06 | | | $ | (0.29 | ) | | $ | — | | | $ | — | | | $ | (0.29 | ) | | $ | — | | | $ | 21.23 | | | | 23.58 | % | | $ | 205.3 | | | | 1.21 | % | | | 1.21 | % | | | 0.86 | % | | | 159 | % | |
8/31/2012 | | $ | 16.50 | | | $ | 0.14 | | | $ | 0.87 | | | $ | 1.01 | | | $ | (0.05 | ) | | $ | — | | | $ | — | | | $ | (0.05 | ) | | $ | — | | | $ | 17.46 | | | | 6.13 | % | | $ | 220.0 | | | | 1.20 | % | | | 1.20 | % | | | 0.84 | % | | | 171 | % | |
See Notes to Financial Highlights
213
214
Financial Highlights (cont'd)
| | | Net Asset
Value,
Beginning
of Year | | Net
Investment
Income/(Loss)@ | | Net Gains or
Losses on
Securities
(both realized
and
unrealized) | | Total From
Investment
Operations | | Dividends
from Net
Investment
Income | | Distributions
from Net
Realized
Capital Gains | | Tax
Return of
Capital | | Total
Distributions | | Voluntary
Contribution
from
Management | | Net Asset
Value, End of
Year | | Total Return†d | | Net Assets,
End of Year
(in millions) | | Ratio of Gross
Expenses to
Average Net
Assets# | | Ratio of Net
Expenses to
Average Net
Assets‡ | | Ratio of Net
Investment
Income/
(Loss) to
Average Net
Assets | | Portfolio
Turnover
Rate | |
Large Cap Value Fund (cont'd) | |
Institutional Class | |
8/31/2016 | | $ | 27.64 | | | $ | 0.36 | | | $ | 2.87 | | | $ | 3.23 | | | $ | (0.34 | ) | | $ | (2.06 | ) | | $ | — | | | $ | (2.40 | ) | | $ | — | | | $ | 28.47 | | | | 13.38 | % | | $ | 56.2 | | | | 0.71 | % | | | 0.70 | % | | | 1.38 | % | | | 126 | % | |
8/31/2015 | | $ | 34.11 | | | $ | 0.37 | | | $ | (2.51 | ) | | $ | (2.14 | ) | | $ | (0.34 | ) | | $ | (3.99 | ) | | $ | — | | | $ | (4.33 | ) | | $ | — | | | $ | 27.64 | | | | (7.03 | )% | | $ | 86.4 | | | | 0.70 | % | | | 0.70 | %§ | | | 1.19 | % | | | 153 | % | |
8/31/2014 | | $ | 32.56 | | | $ | 0.39 | | | $ | 6.65 | | | $ | 7.04 | | | $ | (0.47 | ) | | $ | (5.02 | ) | | $ | — | | | $ | (5.49 | ) | | $ | 0.00 | | | $ | 34.11 | | | | 23.74 | %g | | $ | 143.5 | | | | 0.70 | % | | | 0.70 | %§ | | | 1.18 | % | | | 104 | % | |
8/31/2013 | | $ | 26.59 | | | $ | 0.41 | | | $ | 5.97 | | | $ | 6.38 | | | $ | (0.41 | ) | | $ | — | | | $ | — | | | $ | (0.41 | ) | | $ | — | | | $ | 32.56 | | | | 24.26 | % | | $ | 113.2 | | | | 0.70 | % | | | 0.70 | % | | | 1.36 | % | | | 159 | % | |
8/31/2012 | | $ | 25.11 | | | $ | 0.34 | | | $ | 1.30 | | | $ | 1.64 | | | $ | (0.16 | ) | | $ | — | | | $ | — | | | $ | (0.16 | ) | | $ | — | | | $ | 26.59 | | | | 6.61 | % | | $ | 103.0 | | | | 0.70 | % | | | 0.70 | % | | | 1.35 | % | | | 171 | % | |
Class A | |
8/31/2016 | | $ | 18.74 | | | $ | 0.17 | | | $ | 1.80 | | | $ | 1.97 | | | $ | (0.29 | ) | | $ | (2.06 | ) | | $ | — | | | $ | (2.35 | ) | | $ | — | | | $ | 18.36 | | | | 12.94 | % | | $ | 3.2 | | | | 1.09 | % | | | 1.09 | % | | | 1.02 | % | | | 126 | % | |
8/31/2015 | | $ | 24.55 | | | $ | 0.20 | | | $ | (1.76 | ) | | $ | (1.56 | ) | | $ | (0.26 | ) | | $ | (3.99 | ) | | $ | — | | | $ | (4.25 | ) | | $ | — | | | $ | 18.74 | | | | (7.44 | )% | | $ | 2.9 | | | | 1.09 | % | | | 1.09 | % | | | 0.96 | % | | | 153 | % | |
8/31/2014 | | $ | 24.83 | | | $ | 0.19 | | | $ | 4.94 | | | $ | 5.13 | | | $ | (0.39 | ) | | $ | (5.02 | ) | | $ | — | | | $ | (5.41 | ) | | $ | 0.00 | | | $ | 24.55 | | | | 23.31 | %g | | $ | 2.7 | | | | 1.08 | % | | | 1.08 | %§ | | | 0.78 | % | | | 104 | % | |
8/31/2013 | | $ | 20.07 | | | $ | 0.22 | | | $ | 4.54 | | | $ | 4.76 | | | $ | — | | | $ | — | | | $ | — | | | $ | — | | | $ | — | | | $ | 24.83 | | | | 23.72 | % | | $ | 1.6 | | | | 1.11 | % | | | 1.11 | % | | | 0.97 | % | | | 159 | % | |
8/31/2012 | | $ | 19.06 | | | $ | 0.20 | | | $ | 0.97 | | | $ | 1.17 | | | $ | (0.16 | ) | | $ | — | | | $ | — | | | $ | (0.16 | ) | | $ | — | | | $ | 20.07 | | | | 6.24 | % | | $ | 2.0 | | | | 1.07 | % | | | 1.07 | %§ | | | 1.03 | % | | | 171 | % | |
Class C | |
8/31/2016 | | $ | 13.94 | | | $ | 0.03 | | | $ | 1.24 | | | $ | 1.27 | | | $ | (0.16 | ) | | $ | (2.06 | ) | | $ | — | | | $ | (2.22 | ) | | $ | — | | | $ | 12.99 | | | | 12.09 | % | | $ | 2.1 | | | | 1.83 | % | | | 1.83 | % | | | 0.26 | % | | | 126 | % | |
8/31/2015 | | $ | 19.40 | | | $ | 0.02 | | | $ | (1.32 | ) | | $ | (1.30 | ) | | $ | (0.17 | ) | | $ | (3.99 | ) | | $ | — | | | $ | (4.16 | ) | | $ | — | | | $ | 13.94 | | | | (8.11 | )% | | $ | 2.7 | | | | 1.82 | % | | | 1.82 | %§ | | | 0.11 | % | | | 153 | % | |
8/31/2014 | | $ | 20.73 | | | $ | 0.00 | | | $ | 4.01 | | | $ | 4.01 | | | $ | (0.32 | ) | | $ | (5.02 | ) | | $ | — | | | $ | (5.34 | ) | | $ | 0.00 | | | $ | 19.40 | | | | 22.37 | %g | | $ | 3.0 | | | | 1.86 | % | | | 1.86 | %§ | | | 0.03 | % | | | 104 | % | |
8/31/2013 | | $ | 17.19 | | | $ | 0.02 | | | $ | 3.85 | | | $ | 3.87 | | | $ | (0.33 | ) | | $ | — | | | $ | — | | | $ | (0.33 | ) | | $ | — | | | $ | 20.73 | | | | 22.87 | % | | $ | 1.2 | | | | 1.86 | % | | | 1.86 | %§ | | | 0.10 | % | | | 159 | % | |
8/31/2012 | | $ | 16.31 | | | $ | 0.05 | | | $ | 0.83 | | | $ | 0.88 | | | $ | — | | | $ | — | | | $ | — | | | $ | — | | | $ | — | | | $ | 17.19 | | | | 5.40 | % | | $ | 0.2 | | | | 2.04 | % | | | 1.86 | % | | | 0.27 | % | | | 171 | % | |
Class R3 | |
8/31/2016 | | $ | 14.82 | | | $ | 0.10 | | | $ | 1.33 | | | $ | 1.43 | | | $ | (0.26 | ) | | $ | (2.06 | ) | | $ | — | | | $ | (2.32 | ) | | $ | — | | | $ | 13.93 | | | | 12.58 | % | | $ | 0.1 | | | | 1.54 | % | | | 1.36 | % | | | 0.75 | % | | | 126 | % | |
8/31/2015 | | $ | 20.32 | | | $ | 0.09 | | | $ | (1.38 | ) | | $ | (1.29 | ) | | $ | (0.22 | ) | | $ | (3.99 | ) | | $ | — | | | $ | (4.21 | ) | | $ | — | | | $ | 14.82 | | | | (7.64 | )% | | $ | 0.1 | | | | 1.51 | % | | | 1.36 | % | | | 0.53 | % | | | 153 | % | |
8/31/2014 | | $ | 21.41 | | | $ | 0.11 | | | $ | 4.16 | | | $ | 4.27 | | | $ | (0.34 | ) | | $ | (5.02 | ) | | $ | — | | | $ | (5.36 | ) | | $ | 0.00 | | | $ | 20.32 | | | | 22.94 | %g | | $ | 0.1 | | | | 1.43 | % | | | 1.36 | % | | | 0.53 | % | | | 104 | % | |
8/31/2013 | | $ | 17.34 | | | $ | 0.09 | | | $ | 3.98 | | | $ | 4.07 | | | $ | — | | | $ | — | | | $ | — | | | $ | — | | | $ | — | | | $ | 21.41 | | | | 23.47 | % | | $ | 0.1 | | | | 1.42 | % | | | 1.36 | % | | | 0.46 | % | | | 159 | % | |
8/31/2012 | | $ | 16.41 | | | $ | 0.15 | | | $ | 0.82 | | | $ | 0.97 | | | $ | (0.04 | ) | | $ | — | | | $ | — | | | $ | (0.04 | ) | | $ | — | | | $ | 17.34 | | | | 5.95 | % | | $ | 0.6 | | | | 1.39 | % | | | 1.36 | % | | | 0.93 | % | | | 171 | % | |
Mid Cap Growth Fund | |
Investor Class | |
8/31/2016 | | $ | 14.29 | | | $ | (0.04 | ) | | $ | (0.26 | ) | | $ | (0.30 | ) | | $ | — | | | $ | (1.12 | ) | | $ | — | | | $ | (1.12 | ) | | $ | 0.01 | | | $ | 12.88 | | | | (1.70 | )%h | | $ | 415.1 | | | | 0.95 | % | | | 0.95 | % | | | (0.34 | )% | | | 63 | % | |
8/31/2015 | | $ | 14.65 | | | $ | (0.07 | ) | | $ | 1.47 | | | $ | 1.40 | | | $ | — | | | $ | (1.76 | ) | | $ | — | | | $ | (1.76 | ) | | $ | — | | | $ | 14.29 | | | | 10.74 | % | | $ | 437.5 | | | | 0.92 | % | | | 0.92 | % | | | (0.50 | )% | | | 50 | % | |
8/31/2014 | | $ | 13.35 | | | $ | (0.07 | ) | | $ | 2.34 | | | $ | 2.27 | | | $ | — | | | $ | (0.97 | ) | | $ | — | | | $ | (0.97 | ) | | $ | 0.00 | | | $ | 14.65 | | | | 17.54 | %g | | $ | 415.6 | | | | 0.93 | % | | | 0.93 | % | | | (0.47 | )% | | | 63 | % | |
8/31/2013 | | $ | 11.98 | | | $ | (0.04 | ) | | $ | 2.08 | | | $ | 2.04 | | | $ | — | | | $ | (0.67 | ) | | $ | — | | | $ | (0.67 | ) | | $ | — | | | $ | 13.35 | | | | 18.03 | % | | $ | 377.8 | | | | 0.98 | % | | | 0.98 | % | | | (0.30 | )% | | | 46 | % | |
8/31/2012 | | $ | 10.84 | | | $ | (0.06 | ) | | $ | 1.22 | | | $ | 1.16 | | | $ | — | | | $ | (0.02 | ) | | $ | — | | | $ | (0.02 | ) | | $ | — | | | $ | 11.98 | | | | 10.73 | % | | $ | 347.9 | | | | 1.01 | % | | | 1.01 | % | | | (0.51 | )% | | | 40 | % | |
See Notes to Financial Highlights
215
216
Financial Highlights (cont'd)
| | | Net Asset
Value,
Beginning
of Year | | Net
Investment
Income/(Loss)@ | | Net Gains or
Losses on
Securities
(both realized
and
unrealized) | | Total From
Investment
Operations | | Dividends
from Net
Investment
Income | | Distributions
from Net
Realized
Capital Gains | | Tax
Return of
Capital | | Total
Distributions | | Voluntary
Contribution
from
Management | | Net Asset
Value, End of
Year | | Total Return†d | | Net Assets,
End of Year
(in millions) | | Ratio of Gross
Expenses to
Average Net
Assets# | | Ratio of Net
Expenses to
Average Net
Assets‡ | | Ratio of Net
Investment
Income/
(Loss) to
Average Net
Assets | | Portfolio
Turnover
Rate | |
Mid Cap Growth Fund (cont'd) | |
Trust Class | |
8/31/2016 | | $ | 23.90 | | | $ | (0.08 | ) | | $ | (0.42 | ) | | $ | (0.50 | ) | | $ | — | | | $ | (1.12 | ) | | $ | — | | | $ | (1.12 | ) | | $ | 0.03 | | | $ | 22.31 | | | | (1.77 | )%h | | $ | 66.7 | | | | 0.98 | % | | | 0.98 | % | | | (0.37 | )% | | | 63 | % | |
8/31/2015 | | $ | 23.33 | | | $ | (0.14 | ) | | $ | 2.47 | | | $ | 2.33 | | | $ | — | | | $ | (1.76 | ) | | $ | — | | | $ | (1.76 | ) | | $ | — | | | $ | 23.90 | | | | 10.73 | % | | $ | 91.7 | | | | 0.99 | % | | | 0.99 | % | | | (0.58 | )% | | | 50 | % | |
8/31/2014 | | $ | 20.75 | | | $ | (0.12 | ) | | $ | 3.66 | | | $ | 3.54 | | | $ | — | | | $ | (0.96 | ) | | $ | — | | | $ | (0.96 | ) | | $ | 0.00 | | | $ | 23.33 | | | | 17.40 | %g | | $ | 69.6 | | | | 1.00 | % | | | 1.00 | % | | | (0.54 | )% | | | 63 | % | |
8/31/2013 | | $ | 18.23 | | | $ | (0.07 | ) | | $ | 3.24 | | | $ | 3.17 | | | $ | — | | | $ | (0.65 | ) | | $ | — | | | $ | (0.65 | ) | | $ | — | | | $ | 20.75 | | | | 18.02 | % | | $ | 54.9 | | | | 1.04 | % | | | 1.04 | % | | | (0.38 | )% | | | 46 | % | |
8/31/2012 | | $ | 16.48 | | | $ | (0.10 | ) | | $ | 1.85 | | | $ | 1.75 | | | $ | — | | | $ | (0.00 | ) | | $ | — | | | $ | (0.00 | ) | | $ | — | | | $ | 18.23 | | | | 10.65 | % | | $ | 39.9 | | | | 1.05 | % | | | 1.05 | % | | | (0.55 | )% | | | 40 | % | |
Advisor Class | |
8/31/2016 | | $ | 24.31 | | | $ | (0.14 | ) | | $ | (0.42 | ) | | $ | (0.56 | ) | | $ | — | | | $ | (1.12 | ) | | $ | — | | | $ | (1.12 | ) | | $ | 0.02 | | | $ | 22.65 | | | | (2.04 | )%h | | $ | 11.5 | | | | 1.24 | % | | | 1.24 | % | | | (0.63 | )% | | | 63 | % | |
8/31/2015 | | $ | 23.77 | | | $ | (0.20 | ) | | $ | 2.50 | | | $ | 2.30 | | | $ | — | | | $ | (1.76 | ) | | $ | — | | | $ | (1.76 | ) | | $ | — | | | $ | 24.31 | | | | 10.39 | % | | $ | 10.7 | | | | 1.25 | % | | | 1.25 | % | | | (0.84 | )% | | | 50 | % | |
8/31/2014 | | $ | 21.13 | | | $ | (0.18 | ) | | $ | 3.74 | | | $ | 3.56 | | | $ | — | | | $ | (0.92 | ) | | $ | — | | | $ | (0.92 | ) | | $ | 0.00 | | | $ | 23.77 | | | | 17.16 | %g | | $ | 10.3 | | | | 1.26 | % | | | 1.26 | % | | | (0.81 | )% | | | 63 | % | |
8/31/2013 | | $ | 18.54 | | | $ | (0.12 | ) | | $ | 3.29 | | | $ | 3.17 | | | $ | — | | | $ | (0.58 | ) | | $ | — | | | $ | (0.58 | ) | | $ | — | | | $ | 21.13 | | | | 17.64 | % | | $ | 11.7 | | | | 1.30 | % | | | 1.30 | % | | | (0.62 | )% | | | 46 | % | |
8/31/2012 | | $ | 16.82 | | | $ | (0.17 | ) | | $ | 1.89 | | | $ | 1.72 | | | $ | — | | | $ | — | | | $ | — | | | $ | — | | | $ | — | | | $ | 18.54 | | | | 10.23 | % | | $ | 10.2 | | | | 1.44 | % | | | 1.44 | %§ | | | (0.95 | )% | | | 40 | % | |
Institutional Class | |
8/31/2016 | | $ | 14.59 | | | $ | (0.02 | ) | | $ | (0.27 | ) | | $ | (0.29 | ) | | $ | — | | | $ | (1.12 | ) | | $ | — | | | $ | (1.12 | ) | | $ | 0.02 | | | $ | 13.20 | | | | (1.52 | )%h | | $ | 307.6 | | | | 0.75 | % | | | 0.75 | %§ | | | (0.14 | )% | | | 63 | % | |
8/31/2015 | | $ | 14.89 | | | $ | (0.05 | ) | | $ | 1.51 | | | $ | 1.46 | | | $ | — | | | $ | (1.76 | ) | | $ | — | | | $ | (1.76 | ) | | $ | — | | | $ | 14.59 | | | | 10.98 | % | | $ | 423.3 | | | | 0.75 | % | | | 0.75 | %§ | | | (0.34 | )% | | | 50 | % | |
8/31/2014 | | $ | 13.56 | | | $ | (0.04 | ) | | $ | 2.37 | | | $ | 2.33 | | | $ | — | | | $ | (1.00 | ) | | $ | — | | | $ | (1.00 | ) | | $ | 0.00 | | | $ | 14.89 | | | | 17.74 | %g | | $ | 382.5 | | | | 0.75 | % | | | 0.75 | % | | | (0.29 | )% | | | 63 | % | |
8/31/2013 | | $ | 12.16 | | | $ | (0.01 | ) | | $ | 2.11 | | | $ | 2.10 | | | $ | — | | | $ | (0.70 | ) | | $ | — | | | $ | (0.70 | ) | | $ | — | | | $ | 13.56 | | | | 18.32 | % | | $ | 258.6 | | | | 0.79 | % | | | 0.75 | % | | | (0.07 | )% | | | 46 | % | |
8/31/2012 | | $ | 11.01 | | | $ | (0.03 | ) | | $ | 1.23 | | | $ | 1.20 | | | $ | — | | | $ | (0.05 | ) | | $ | — | | | $ | (0.05 | ) | | $ | — | | | $ | 12.16 | | | | 10.96 | % | | $ | 174.2 | | | | 0.79 | % | | | 0.75 | % | | | (0.26 | )% | | | 40 | % | |
Class A | |
8/31/2016 | | $ | 23.85 | | | $ | (0.11 | ) | | $ | (0.42 | ) | | $ | (0.53 | ) | | $ | — | | | $ | (1.12 | ) | | $ | — | | | $ | (1.12 | ) | | $ | 0.03 | | | $ | 22.23 | | | | (1.91 | )%h | | $ | 76.9 | | | | 1.11 | % | | | 1.11 | %§ | | | (0.51 | )% | | | 63 | % | |
8/31/2015 | | $ | 23.32 | | | $ | (0.16 | ) | | $ | 2.45 | | | $ | 2.29 | | | $ | — | | | $ | (1.76 | ) | | $ | — | | | $ | (1.76 | ) | | $ | — | | | $ | 23.85 | | | | 10.55 | % | | $ | 102.3 | | | | 1.11 | % | | | 1.11 | %§ | | | (0.69 | )% | | | 50 | % | |
8/31/2014 | | $ | 20.74 | | | $ | (0.15 | ) | | $ | 3.67 | | | $ | 3.52 | | | $ | — | | | $ | (0.94 | ) | | $ | — | | | $ | (0.94 | ) | | $ | 0.00 | | | $ | 23.32 | | | | 17.33 | %g | | $ | 100.7 | | | | 1.13 | % | | | 1.11 | % | | | (0.65 | )% | | | 63 | % | |
8/31/2013 | | $ | 18.23 | | | $ | (0.08 | ) | | $ | 3.23 | | | $ | 3.15 | | | $ | — | | | $ | (0.64 | ) | | $ | — | | | $ | (0.64 | ) | | $ | — | | | $ | 20.74 | | | | 17.91 | % | | $ | 89.0 | | | | 1.18 | % | | | 1.11 | % | | | (0.44 | )% | | | 46 | % | |
8/31/2012 | | $ | 16.49 | | | $ | (0.11 | ) | | $ | 1.86 | | | $ | 1.75 | | | $ | — | | | $ | (0.01 | ) | | $ | — | | | $ | (0.01 | ) | | $ | — | | | $ | 18.23 | | | | 10.61 | % | | $ | 63.2 | | | | 1.17 | % | | | 1.11 | % | | | (0.62 | )% | | | 40 | % | |
Class C | |
8/31/2016 | | $ | 23.70 | | | $ | (0.26 | ) | | $ | (0.41 | ) | | $ | (0.67 | ) | | $ | — | | | $ | (1.12 | ) | | $ | — | | | $ | (1.12 | ) | | $ | 0.01 | | | $ | 21.92 | | | | (2.62 | )%h | | $ | 10.9 | | | | 1.88 | % | | | 1.86 | % | | | (1.24 | )% | | | 63 | % | |
8/31/2015 | | $ | 23.35 | | | $ | (0.34 | ) | | $ | 2.45 | | | $ | 2.11 | | | $ | — | | | $ | (1.76 | ) | | $ | — | | | $ | (1.76 | ) | | $ | — | | | $ | 23.70 | | | | 9.72 | % | | $ | 8.4 | | | | 1.88 | % | | | 1.86 | % | | | (1.45 | )% | | | 50 | % | |
8/31/2014 | | $ | 20.81 | | | $ | (0.31 | ) | | $ | 3.68 | | | $ | 3.37 | | | $ | — | | | $ | (0.83 | ) | | $ | — | | | $ | (0.83 | ) | | $ | 0.00 | | | $ | 23.35 | | | | 16.46 | %g | | $ | 6.0 | | | | 1.91 | % | | | 1.86 | % | | | (1.40 | )% | | | 63 | % | |
8/31/2013 | | $ | 18.31 | | | $ | (0.23 | ) | | $ | 3.26 | | | $ | 3.03 | | | $ | — | | | $ | (0.53 | ) | | $ | — | | | $ | (0.53 | ) | | $ | — | | | $ | 20.81 | | | | 17.05 | % | | $ | 4.4 | | | | 1.95 | % | | | 1.86 | % | | | (1.20 | )% | | | 46 | % | |
8/31/2012 | | $ | 16.68 | | | $ | (0.24 | ) | | $ | 1.87 | | | $ | 1.63 | | | $ | — | | | $ | — | | | $ | — | | | $ | — | | | $ | — | | | $ | 18.31 | | | | 9.77 | % | | $ | 2.4 | | | | 1.98 | % | | | 1.86 | % | | | (1.36 | )% | | | 40 | % | |
See Notes to Financial Highlights
217
218
Financial Highlights (cont'd)
| | | Net Asset
Value,
Beginning
of Year | | Net
Investment
Income/(Loss)@ | | Net Gains or
Losses on
Securities
(both realized
and
unrealized) | | Total From
Investment
Operations | | Dividends
from Net
Investment
Income | | Distributions
from Net
Realized
Capital Gains | | Tax
Return of
Capital | | Total
Distributions | | Voluntary
Contribution
from
Management | | Net Asset
Value, End of
Year | | Total Return†d | | Net Assets,
End of Year
(in millions) | | Ratio of Gross
Expenses to
Average Net
Assets# | | Ratio of Net
Expenses to
Average Net
Assets‡ | | Ratio of Net
Investment
Income/
(Loss) to
Average Net
Assets | | Portfolio
Turnover
Rate | |
Mid Cap Growth Fund (cont'd) | |
Class R3 | |
8/31/2016 | | $ | 24.31 | | | $ | (0.16 | ) | | $ | (0.42 | ) | | $ | (0.58 | ) | | $ | — | | | $ | (1.12 | ) | | $ | — | | | $ | (1.12 | ) | | $ | 0.02 | | | $ | 22.63 | | | | (2.12 | )%h | | $ | 13.7 | | | | 1.38 | % | | | 1.36 | % | | | (0.74 | )% | | | 63 | % | |
8/31/2015 | | $ | 23.79 | | | $ | (0.23 | ) | | $ | 2.51 | | | $ | 2.28 | | | $ | — | | | $ | (1.76 | ) | | $ | — | | | $ | (1.76 | ) | | $ | — | | | $ | 24.31 | | | | 10.29 | % | | $ | 12.7 | | | | 1.37 | % | | | 1.36 | % | | | (0.95 | )% | | | 50 | % | |
8/31/2014 | | $ | 21.16 | | | $ | (0.21 | ) | | $ | 3.75 | | | $ | 3.54 | | | $ | — | | | $ | (0.91 | ) | | $ | — | | | $ | (0.91 | ) | | $ | 0.00 | | | $ | 23.79 | | | | 17.02 | %g | | $ | 8.3 | | | | 1.38 | % | | | 1.36 | % | | | (0.90 | )% | | | 63 | % | |
8/31/2013 | | $ | 18.61 | | | $ | (0.13 | ) | | $ | 3.30 | | | $ | 3.17 | | | $ | — | | | $ | (0.62 | ) | | $ | — | | | $ | (0.62 | ) | | $ | — | | | $ | 21.16 | | | | 17.63 | % | | $ | 5.6 | | | | 1.43 | % | | | 1.36 | % | | | (0.68 | )% | | | 46 | % | |
8/31/2012 | | $ | 16.87 | | | $ | (0.16 | ) | | $ | 1.90 | | | $ | 1.74 | | | $ | — | | | $ | — | | | $ | — | | | $ | — | | | $ | — | | | $ | 18.61 | | | | 10.31 | % | | $ | 3.0 | | | | 1.45 | % | | | 1.36 | % | | | (0.89 | )% | | | 40 | % | |
Class R6 | |
8/31/2016 | | $ | 14.62 | | | $ | (0.00 | ) | | $ | (0.27 | ) | | $ | (0.27 | ) | | $ | — | | | $ | (1.12 | ) | | $ | — | | | $ | (1.12 | ) | | $ | 0.01 | | | $ | 13.24 | | | | (1.44 | )%h | | $ | 193.7 | | | | 0.66 | % | | | 0.66 | % | | | (0.02 | )% | | | 63 | % | |
8/31/2015 | | $ | 14.91 | | | $ | (0.04 | ) | | $ | 1.51 | | | $ | 1.47 | | | $ | — | | | $ | (1.76 | ) | | $ | — | | | $ | (1.76 | ) | | $ | — | | | $ | 14.62 | | | | 11.04 | % | | $ | 88.6 | | | | 0.67 | % | | | 0.67 | %§ | | | (0.26 | )% | | | 50 | % | |
8/31/2014 | | $ | 13.57 | | | $ | (0.03 | ) | | $ | 2.38 | | | $ | 2.35 | | | $ | — | | | $ | (1.01 | ) | | $ | — | | | $ | (1.01 | ) | | $ | 0.00 | | | $ | 14.91 | | | | 17.89 | %g | | $ | 22.5 | | | | 0.68 | % | | | 0.68 | % | | | (0.21 | )% | | | 63 | % | |
Period from 3/15/2013^
to 8/31/2013 | | $ | 12.77 | | | $ | (0.01 | ) | | $ | 0.81 | | | $ | 0.80 | | | $ | — | | | $ | — | | | $ | — | | | $ | — | | | $ | — | | | $ | 13.57 | | | | 6.26 | %** | | $ | 0.1 | | | | 7.22 | %* | | | 0.68 | %* | | | (0.13 | )%* | | | 46 | %Ø | |
Mid Cap Intrinsic Value Fund | |
Investor Class | |
8/31/2016 | | $ | 20.99 | | | $ | 0.16 | | | $ | 0.79 | | | $ | 0.95 | | | $ | (0.10 | ) | | $ | (2.13 | ) | | $ | — | | | $ | (2.23 | ) | | $ | — | | | $ | 19.71 | | | | 5.85 | % | | $ | 37.9 | | | | 1.30 | % | | | 1.15 | % | | | 0.86 | % | | | 29 | % | |
8/31/2015 | | $ | 23.56 | | | $ | 0.08 | | | $ | (0.36 | ) | | $ | (0.28 | ) | | $ | (0.21 | ) | | $ | (2.08 | ) | | $ | — | | | $ | (2.29 | ) | | $ | — | | | $ | 20.99 | | | | (1.09 | )% | | $ | 42.1 | | | | 1.24 | % | | | 1.05 | % | | | 0.37 | % | | | 50 | % | |
8/31/2014 | | $ | 20.29 | | | $ | 0.26 | | | $ | 4.20 | | | $ | 4.46 | | | $ | (0.32 | ) | | $ | (0.87 | ) | | $ | — | | | $ | (1.19 | ) | | $ | 0.00 | | | $ | 23.56 | | | | 22.84 | %g | | $ | 43.4 | | | | 1.31 | % | | | 0.98 | % | | | 1.21 | % | | | 34 | % | |
8/31/2013 | | $ | 15.90 | | | $ | 0.26 | | | $ | 4.25 | | | $ | 4.51 | | | $ | (0.12 | ) | | $ | — | | | $ | — | | | $ | (0.12 | ) | | $ | — | | | $ | 20.29 | | | | 28.58 | % | | $ | 45.9 | | | | 1.40 | % | | | 1.09 | % | | | 1.45 | % | | | 33 | % | |
8/31/2012 | | $ | 14.18 | | | $ | 0.10 | | | $ | 1.68 | | | $ | 1.78 | | | $ | (0.06 | ) | | $ | — | | | $ | — | | | $ | (0.06 | ) | | $ | — | | | $ | 15.90 | | | | 12.62 | % | | $ | 46.0 | | | | 1.39 | % | | | 1.18 | % | | | 0.69 | % | | | 118 | % | |
Trust Class | |
8/31/2016 | | $ | 17.71 | | | $ | 0.12 | | | $ | 0.64 | | | $ | 0.76 | | | $ | (0.10 | ) | | $ | (2.13 | ) | | $ | — | | | $ | (2.23 | ) | | $ | — | | | $ | 16.24 | | | | 5.80 | % | | $ | 10.3 | | | | 1.48 | % | | | 1.25 | % | | | 0.77 | % | | | 29 | % | |
8/31/2015 | | $ | 20.24 | | | $ | 0.03 | | | $ | (0.32 | ) | | $ | (0.29 | ) | | $ | (0.16 | ) | | $ | (2.08 | ) | | $ | — | | | $ | (2.24 | ) | | $ | — | | | $ | 17.71 | | | | (1.31 | )% | | $ | 11.9 | | | | 1.48 | % | | | 1.25 | % | | | 0.17 | % | | | 50 | % | |
8/31/2014 | | $ | 17.61 | | | $ | 0.18 | | | $ | 3.61 | | | $ | 3.79 | | | $ | (0.29 | ) | | $ | (0.87 | ) | | $ | — | | | $ | (1.16 | ) | | $ | 0.00 | | | $ | 20.24 | | | | 22.47 | %g | | $ | 14.4 | | | | 1.57 | % | | | 1.25 | %§ | | | 0.97 | % | | | 34 | % | |
8/31/2013 | | $ | 13.82 | | | $ | 0.20 | | | $ | 3.70 | | | $ | 3.90 | | | $ | (0.11 | ) | | $ | — | | | $ | — | | | $ | (0.11 | ) | | $ | — | | | $ | 17.61 | | | | 28.45 | % | | $ | 13.0 | | | | 1.66 | % | | | 1.25 | % | | | 1.26 | % | | | 33 | % | |
8/31/2012 | | $ | 12.34 | | | $ | 0.08 | | | $ | 1.46 | | | $ | 1.54 | | | $ | (0.06 | ) | | $ | — | | | $ | — | | | $ | (0.06 | ) | | $ | — | | | $ | 13.82 | | | | 12.51 | % | | $ | 18.4 | | | | 1.60 | % | | | 1.25 | % | | | 0.61 | % | | | 118 | % | |
Institutional Class | |
8/31/2016 | | $ | 21.02 | | | $ | 0.22 | | | $ | 0.79 | | | $ | 1.01 | | | $ | (0.15 | ) | | $ | (2.13 | ) | | $ | — | | | $ | (2.28 | ) | | $ | — | | | $ | 19.75 | | | | 6.18 | % | | $ | 22.7 | | | | 1.09 | % | | | 0.85 | % | | | 1.18 | % | | | 29 | % | |
8/31/2015 | | $ | 23.59 | | | $ | 0.13 | | | $ | (0.37 | ) | | $ | (0.24 | ) | | $ | (0.25 | ) | | $ | (2.08 | ) | | $ | — | | | $ | (2.33 | ) | | $ | — | | | $ | 21.02 | | | | (0.90 | )% | | $ | 34.0 | | | | 1.07 | % | | | 0.85 | % | | | 0.59 | % | | | 50 | % | |
8/31/2014 | | $ | 20.33 | | | $ | 0.33 | | | $ | 4.17 | | | $ | 4.50 | | | $ | (0.37 | ) | | $ | (0.87 | ) | | $ | — | | | $ | (1.24 | ) | | $ | 0.00 | | | $ | 23.59 | | | | 22.99 | %g | | $ | 18.0 | | | | 1.17 | % | | | 0.85 | %§ | | | 1.48 | % | | | 34 | % | |
8/31/2013 | | $ | 15.93 | | | $ | 0.31 | | | $ | 4.26 | | | $ | 4.57 | | | $ | (0.17 | ) | | $ | — | | | $ | — | | | $ | (0.17 | ) | | $ | — | | | $ | 20.33 | | | | 28.96 | % | | $ | 4.6 | | | | 1.23 | % | | | 0.85 | % | | | 1.73 | % | | | 33 | % | |
8/31/2012 | | $ | 14.22 | | | $ | 0.15 | | | $ | 1.67 | | | $ | 1.82 | | | $ | (0.11 | ) | | $ | — | | | $ | — | | | $ | (0.11 | ) | | $ | — | | | $ | 15.93 | | | | 12.94 | % | | $ | 4.4 | | | | 1.19 | % | | | 0.85 | % | | | 1.01 | % | | | 118 | % | |
See Notes to Financial Highlights
219
220
Financial Highlights (cont'd)
| | | Net Asset
Value,
Beginning
of Year | | Net
Investment
Income/(Loss)@ | | Net Gains or
Losses on
Securities
(both realized
and
unrealized) | | Total From
Investment
Operations | | Dividends
from Net
Investment
Income | | Distributions
from Net
Realized
Capital Gains | | Tax
Return of
Capital | | Total
Distributions | | Voluntary
Contribution
from
Management | | Net Asset
Value, End of
Year | | Total Return†d | | Net Assets,
End of Year
(in millions) | | Ratio of Gross
Expenses to
Average Net
Assets# | | Ratio of Net
Expenses to
Average Net
Assets‡ | | Ratio of Net
Investment
Income/
(Loss) to
Average Net
Assets | | Portfolio
Turnover
Rate | |
Mid Cap Intrinsic Value Fund (cont'd) | |
Class A | |
8/31/2016 | | $ | 17.70 | | | $ | 0.13 | | | $ | 0.62 | | | $ | 0.75 | | | $ | (0.11 | ) | | $ | (2.13 | ) | | $ | — | | | $ | (2.24 | ) | | $ | — | | | $ | 16.21 | | | | 5.76 | % | | $ | 13.3 | | | | 1.49 | % | | | 1.21 | % | | | 0.81 | % | | | 29 | % | |
8/31/2015 | | $ | 20.24 | | | $ | 0.04 | | | $ | (0.32 | ) | | $ | (0.28 | ) | | $ | (0.18 | ) | | $ | (2.08 | ) | | $ | — | | | $ | (2.26 | ) | | $ | — | | | $ | 17.70 | | | | (1.25 | )% | | $ | 14.8 | | | | 1.47 | % | | | 1.21 | % | | | 0.20 | % | | | 50 | % | |
8/31/2014 | | $ | 17.60 | | | $ | 0.18 | | | $ | 3.63 | | | $ | 3.81 | | | $ | (0.30 | ) | | $ | (0.87 | ) | | $ | — | | | $ | (1.17 | ) | | $ | 0.00 | | | $ | 20.24 | | | | 22.60 | %g | | $ | 5.2 | | | | 1.53 | % | | | 1.21 | %§ | | | 0.96 | % | | | 34 | % | |
8/31/2013 | | $ | 13.82 | | | $ | 0.23 | | | $ | 3.67 | | | $ | 3.90 | | | $ | (0.12 | ) | | $ | — | | | $ | — | | | $ | (0.12 | ) | | $ | — | | | $ | 17.60 | | | | 28.43 | % | | $ | 2.7 | | | | 1.65 | % | | | 1.21 | % | | | 1.45 | % | | | 33 | % | |
8/31/2012 | | $ | 12.34 | | | $ | 0.08 | | | $ | 1.46 | | | $ | 1.54 | | | $ | (0.06 | ) | | $ | — | | | $ | — | | | $ | (0.06 | ) | | $ | — | | | $ | 13.82 | | | | 12.56 | % | | $ | 3.8 | | | | 1.61 | % | | | 1.21 | % | | | 0.63 | % | | | 118 | % | |
Class C | |
8/31/2016 | | $ | 17.45 | | | $ | 0.01 | | | $ | 0.61 | | | $ | 0.62 | | | $ | (0.06 | ) | | $ | (2.13 | ) | | $ | — | | | $ | (2.19 | ) | | $ | — | | | $ | 15.88 | | | | 5.01 | % | | $ | 3.7 | | | | 2.23 | % | | | 1.96 | % | | | 0.05 | % | | | 29 | % | |
8/31/2015 | | $ | 20.00 | | | $ | (0.10 | ) | | $ | (0.31 | ) | | $ | (0.41 | ) | | $ | (0.06 | ) | | $ | (2.08 | ) | | $ | — | | | $ | (2.14 | ) | | $ | — | | | $ | 17.45 | | | | (2.02 | )% | | $ | 3.5 | | | | 2.20 | % | | | 1.96 | % | | | (0.53 | )% | | | 50 | % | |
8/31/2014 | | $ | 17.44 | | | $ | 0.05 | | | $ | 3.58 | | | $ | 3.63 | | | $ | (0.20 | ) | | $ | (0.87 | ) | | $ | — | | | $ | (1.07 | ) | | $ | 0.00 | | | $ | 20.00 | | | | 21.64 | %g | | $ | 1.9 | | | | 2.28 | % | | | 1.96 | %§ | | | 0.24 | % | | | 34 | % | |
8/31/2013 | | $ | 13.69 | | | $ | 0.09 | | | $ | 3.67 | | | $ | 3.76 | | | $ | (0.01 | ) | | $ | — | | | $ | — | | | $ | (0.01 | ) | | $ | — | | | $ | 17.44 | | | | 27.51 | % | | $ | 1.3 | | | | 2.35 | % | | | 1.96 | % | | | 0.54 | % | | | 33 | % | |
8/31/2012 | | $ | 12.25 | | | $ | (0.01 | ) | | $ | 1.45 | | | $ | 1.44 | | | $ | — | | | $ | — | | | $ | — | | | $ | — | | | $ | — | | | $ | 13.69 | | | | 11.76 | % | | $ | 0.4 | | | | 2.43 | % | | | 1.96 | % | | | (0.09 | )% | | | 118 | % | |
Class R3 | |
8/31/2016 | | $ | 17.70 | | | $ | 0.09 | | | $ | 0.62 | | | $ | 0.71 | | | $ | (0.09 | ) | | $ | (2.13 | ) | | $ | — | | | $ | (2.22 | ) | | $ | — | | | $ | 16.19 | | | | 5.54 | % | | $ | 1.4 | | | | 1.75 | % | | | 1.46 | % | | | 0.56 | % | | | 29 | % | |
8/31/2015 | | $ | 20.23 | | | $ | 0.00 | | | $ | (0.32 | ) | | $ | (0.32 | ) | | $ | (0.13 | ) | | $ | (2.08 | ) | | $ | — | | | $ | (2.21 | ) | | $ | — | | | $ | 17.70 | | | | (1.49 | )% | | $ | 1.2 | | | | 1.73 | % | | | 1.46 | % | | | 0.03 | % | | | 50 | % | |
8/31/2014 | | $ | 17.59 | | | $ | 0.15 | | | $ | 3.61 | | | $ | 3.76 | | | $ | (0.25 | ) | | $ | (0.87 | ) | | $ | — | | | $ | (1.12 | ) | | $ | 0.00 | | | $ | 20.23 | | | | 22.23 | %g | | $ | 0.4 | | | | 1.80 | % | | | 1.46 | % | | | 0.80 | % | | | 34 | % | |
8/31/2013 | | $ | 13.80 | | | $ | 0.14 | | | $ | 3.73 | | | $ | 3.87 | | | $ | (0.08 | ) | | $ | — | | | $ | — | | | $ | (0.08 | ) | | $ | — | | | $ | 17.59 | | | | 28.22 | % | | $ | 0.8 | | | | 1.86 | % | | | 1.46 | % | | | 0.85 | % | | | 33 | % | |
8/31/2012 | | $ | 12.32 | | | $ | 0.05 | | | $ | 1.46 | | | $ | 1.51 | | | $ | (0.03 | ) | | $ | — | | | $ | — | | | $ | (0.03 | ) | | $ | — | | | $ | 13.80 | | | | 12.25 | % | | $ | 0.2 | | | | 1.88 | % | | | 1.46 | % | | | 0.41 | % | | | 118 | % | |
Multi-Cap Opportunities Fund | |
Institutional Class | |
8/31/2016 | | $ | 15.31 | | | $ | 0.15 | | | $ | 1.18 | | | $ | 1.33 | | | $ | (0.15 | ) | | $ | (0.41 | ) | | $ | — | | | $ | (0.56 | ) | | $ | — | | | $ | 16.08 | | | | 8.94 | % | | $ | 1,757.2 | | | | 0.76 | % | | | 0.76 | % | | | 0.99 | % | | | 18 | % | |
8/31/2015 | | $ | 16.27 | | | $ | 0.13 | | | $ | (0.43 | ) | | $ | (0.30 | ) | | $ | (0.15 | ) | | $ | (0.51 | ) | | $ | — | | | $ | (0.66 | ) | | $ | — | | | $ | 15.31 | | | | (1.80 | )% | | $ | 2,191.4 | | | | 0.73 | % | | | 0.73 | % | | | 0.84 | % | | | 27 | % | |
8/31/2014 | | $ | 13.56 | | | $ | 0.16 | | | $ | 2.88 | | | $ | 3.04 | | | $ | (0.11 | ) | | $ | (0.22 | ) | | $ | — | | | $ | (0.33 | ) | | $ | 0.00 | | | $ | 16.27 | | | | 22.65 | %g | | $ | 2,566.4 | | | | 0.74 | % | | | 0.74 | % | | | 1.06 | % | | | 17 | % | |
8/31/2013 | | $ | 10.76 | | | $ | 0.17 | | | $ | 2.86 | | | $ | 3.03 | | | $ | (0.14 | ) | | $ | (0.09 | ) | | $ | — | | | $ | (0.23 | ) | | $ | — | | | $ | 13.56 | | | | 28.57 | % | | $ | 1,430.7 | | | | 0.85 | % | | | 0.85 | %§ | | | 1.38 | % | | | 11 | % | |
8/31/2012 | | $ | 9.59 | | | $ | 0.17 | | | $ | 1.27 | | | $ | 1.44 | | | $ | (0.02 | ) | | $ | (0.25 | ) | | $ | — | | | $ | (0.27 | ) | | $ | — | | | $ | 10.76 | | | | 15.56 | % | | $ | 465.5 | | | | 1.00 | % | | | 1.00 | %§ | | | 1.70 | % | | | 29 | % | |
Class A | |
8/31/2016 | | $ | 15.18 | | | $ | 0.09 | | | $ | 1.17 | | | $ | 1.26 | | | $ | (0.08 | ) | | $ | (0.41 | ) | | $ | — | | | $ | (0.49 | ) | | $ | — | | | $ | 15.95 | | | | 8.53 | % | | $ | 73.0 | | | | 1.11 | % | | | 1.11 | % | | | 0.62 | % | | | 18 | % | |
8/31/2015 | | $ | 16.13 | | | $ | 0.07 | | | $ | (0.43 | ) | | $ | (0.36 | ) | | $ | (0.08 | ) | | $ | (0.51 | ) | | $ | — | | | $ | (0.59 | ) | | $ | — | | | $ | 15.18 | | | | (2.16 | )% | | $ | 102.8 | | | | 1.10 | % | | | 1.10 | % | | | 0.47 | % | | | 27 | % | |
8/31/2014 | | $ | 13.48 | | | $ | 0.11 | | | $ | 2.85 | | | $ | 2.96 | | | $ | (0.09 | ) | | $ | (0.22 | ) | | $ | — | | | $ | (0.31 | ) | | $ | 0.00 | | | $ | 16.13 | | | | 22.17 | %g | | $ | 143.1 | | | | 1.10 | % | | | 1.10 | % | | | 0.71 | % | | | 17 | % | |
8/31/2013 | | $ | 10.70 | | | $ | 0.12 | | | $ | 2.86 | | | $ | 2.98 | | | $ | (0.11 | ) | | $ | (0.09 | ) | | $ | — | | | $ | (0.20 | ) | | $ | — | | | $ | 13.48 | | | | 28.22 | % | | $ | 51.6 | | | | 1.18 | % | | | 1.18 | %§ | | | 0.91 | % | | | 11 | % | |
8/31/2012 | | $ | 9.56 | | | $ | 0.13 | | | $ | 1.27 | | | $ | 1.40 | | | $ | (0.01 | ) | | $ | (0.25 | ) | | $ | — | | | $ | (0.26 | ) | | $ | — | | | $ | 10.70 | | | | 15.13 | % | | $ | 2.8 | | | | 1.36 | % | | | 1.36 | %§ | | | 1.29 | % | | | 29 | % | |
See Notes to Financial Highlights
221
222
Financial Highlights (cont'd)
| | | Net Asset
Value,
Beginning
of Year | | Net
Investment
Income/(Loss)@ | | Net Gains or
Losses on
Securities
(both realized
and
unrealized) | | Total From
Investment
Operations | | Dividends
from Net
Investment
Income | | Distributions
from Net
Realized
Capital Gains | | Tax
Return of
Capital | | Total
Distributions | | Voluntary
Contribution
from
Management | | Net Asset
Value, End of
Year | | Total Return†d | | Net Assets,
End of Year
(in millions) | | Ratio of Gross
Expenses to
Average Net
Assets# | | Ratio of Net
Expenses to
Average Net
Assets‡ | | Ratio of Net
Investment
Income/
(Loss) to
Average Net
Assets | | Portfolio
Turnover
Rate | |
Multi-Cap Opportunities Fund (cont'd) | |
Class C | |
8/31/2016 | | $ | 14.73 | | | $ | (0.02 | ) | | $ | 1.13 | | | $ | 1.11 | | | $ | (0.01 | ) | | $ | (0.41 | ) | | $ | — | | | $ | (0.42 | ) | | $ | — | | | $ | 15.42 | | | | 7.73 | % | | $ | 39.6 | | | | 1.85 | % | | | 1.85 | % | | | (0.11 | )% | | | 18 | % | |
8/31/2015 | | $ | 15.71 | | | $ | (0.04 | ) | | $ | (0.41 | ) | | $ | (0.45 | ) | | $ | (0.02 | ) | | $ | (0.51 | ) | | $ | — | | | $ | (0.53 | ) | | $ | — | | | $ | 14.73 | | | | (2.84 | )% | | $ | 46.1 | | | | 1.84 | % | | | 1.84 | % | | | (0.27 | )% | | | 27 | % | |
8/31/2014 | | $ | 13.20 | | | $ | (0.00 | ) | | $ | 2.79 | | | $ | 2.79 | | | $ | (0.06 | ) | | $ | (0.22 | ) | | $ | — | | | $ | (0.28 | ) | | $ | 0.00 | | | $ | 15.71 | | | | 21.30 | %g | | $ | 50.5 | | | | 1.85 | % | | | 1.85 | % | | | (0.01 | )% | | | 17 | % | |
8/31/2013 | | $ | 10.52 | | | $ | 0.01 | | | $ | 2.81 | | | $ | 2.82 | | | $ | (0.05 | ) | | $ | (0.09 | ) | | $ | — | | | $ | (0.14 | ) | | $ | — | | | $ | 13.20 | | | | 27.10 | % | | $ | 8.3 | | | | 2.05 | % | | | 2.05 | %§ | | | 0.04 | % | | | 11 | % | |
8/31/2012 | | $ | 9.47 | | | $ | 0.07 | | | $ | 1.23 | | | $ | 1.30 | | | $ | — | | | $ | (0.25 | ) | | $ | — | | | $ | (0.25 | ) | | $ | — | | | $ | 10.52 | | | | 14.22 | % | | $ | 0.4 | | | | 2.14 | % | | | 2.11 | % | | | 0.70 | % | | | 29 | % | |
Real Estate Fund | |
Trust Class | |
8/31/2016 | | $ | 13.60 | | | $ | 0.19 | | | $ | 2.60 | | | $ | 2.79 | | | $ | (0.20 | ) | | $ | (1.07 | ) | | $ | — | | | $ | (1.27 | ) | | $ | — | | | $ | 15.12 | | | | 21.59 | % | | $ | 212.4 | | | | 1.41 | % | | | 1.04 | % | | | 1.34 | % | | | 49 | % | |
8/31/2015 | | $ | 14.70 | | | $ | 0.18 | | | $ | (0.37 | ) | | $ | (0.19 | ) | | $ | (0.18 | ) | | $ | (0.73 | ) | | $ | — | | | $ | (0.91 | ) | | $ | — | | | $ | 13.60 | | | | (1.54 | )% | | $ | 250.8 | | | | 1.39 | % | | | 1.04 | % | | | 1.24 | % | | | 33 | % | |
8/31/2014 | | $ | 12.96 | | | $ | 0.16 | | | $ | 2.56 | | | $ | 2.72 | | | $ | (0.17 | ) | | $ | (0.81 | ) | | $ | — | | | $ | (0.98 | ) | | $ | 0.00 | | | $ | 14.70 | | | | 22.36 | %g | | $ | 314.3 | | | | 1.41 | % | | | 1.04 | % | | | 1.19 | % | | | 36 | % | |
8/31/2013 | | $ | 13.82 | | | $ | 0.15 | | | $ | (0.50 | ) | | $ | (0.35 | ) | | $ | (0.15 | ) | | $ | (0.36 | ) | | $ | — | | | $ | (0.51 | ) | | $ | — | | | $ | 12.96 | | | | (2.60 | )% | | $ | 319.9 | | | | 1.43 | % | | | 1.04 | % | | | 1.09 | % | | | 33 | % | |
8/31/2012 | | $ | 11.80 | | | $ | 0.14 | | | $ | 2.12 | | | $ | 2.26 | | | $ | (0.19 | ) | | $ | (0.05 | ) | | $ | — | | | $ | (0.24 | ) | | $ | — | | | $ | 13.82 | | | | 19.53 | % | | $ | 288.9 | | | | 1.47 | % | | | 1.03 | % | | | 1.10 | % | | | 29 | % | |
Institutional Class | |
8/31/2016 | | $ | 13.64 | | | $ | 0.22 | | | $ | 2.61 | | | $ | 2.83 | | | $ | (0.23 | ) | | $ | (1.07 | ) | | $ | — | | | $ | (1.30 | ) | | $ | — | | | $ | 15.17 | | | | 21.84 | % | | $ | 259.1 | | | | 1.05 | % | | | 0.85 | % | | | 1.53 | % | | | 49 | % | |
8/31/2015 | | $ | 14.74 | | | $ | 0.21 | | | $ | (0.37 | ) | | $ | (0.16 | ) | | $ | (0.21 | ) | | $ | (0.73 | ) | | $ | — | | | $ | (0.94 | ) | | $ | — | | | $ | 13.64 | | | | (1.34 | )% | | $ | 336.5 | | | | 1.03 | % | | | 0.85 | % | | | 1.42 | % | | | 33 | % | |
8/31/2014 | | $ | 12.99 | | | $ | 0.18 | | | $ | 2.57 | | | $ | 2.75 | | | $ | (0.19 | ) | | $ | (0.81 | ) | | $ | — | | | $ | (1.00 | ) | | $ | 0.00 | | | $ | 14.74 | | | | 22.63 | %g | | $ | 463.5 | | | | 1.05 | % | | | 0.85 | % | | | 1.35 | % | | | 36 | % | |
8/31/2013 | | $ | 13.86 | | | $ | 0.17 | | | $ | (0.51 | ) | | $ | (0.34 | ) | | $ | (0.17 | ) | | $ | (0.36 | ) | | $ | — | | | $ | (0.53 | ) | | $ | — | | | $ | 12.99 | | | | (2.48 | )% | | $ | 366.4 | | | | 1.07 | % | | | 0.85 | % | | | 1.23 | % | | | 33 | % | |
8/31/2012 | | $ | 11.83 | | | $ | 0.15 | | | $ | 2.14 | | | $ | 2.29 | | | $ | (0.21 | ) | | $ | (0.05 | ) | | $ | — | | | $ | (0.26 | ) | | $ | — | | | $ | 13.86 | | | | 19.77 | % | | $ | 228.6 | | | | 1.10 | % | | | 0.85 | % | | | 1.21 | % | | | 29 | % | |
Class A | |
8/31/2016 | | $ | 13.60 | | | $ | 0.17 | | | $ | 2.60 | | | $ | 2.77 | | | $ | (0.18 | ) | | $ | (1.07 | ) | | $ | — | | | $ | (1.25 | ) | | $ | — | | | $ | 15.12 | | | | 21.37 | % | | $ | 118.8 | | | | 1.42 | % | | | 1.21 | % | | | 1.16 | % | | | 49 | % | |
8/31/2015 | | $ | 14.69 | | | $ | 0.15 | | | $ | (0.35 | ) | | $ | (0.20 | ) | | $ | (0.16 | ) | | $ | (0.73 | ) | | $ | — | | | $ | (0.89 | ) | | $ | — | | | $ | 13.60 | | | | (1.65 | )% | | $ | 137.0 | | | | 1.41 | % | | | 1.21 | % | | | 1.04 | % | | | 33 | % | |
8/31/2014 | | $ | 12.95 | | | $ | 0.14 | | | $ | 2.55 | | | $ | 2.69 | | | $ | (0.14 | ) | | $ | (0.81 | ) | | $ | — | | | $ | (0.95 | ) | | $ | 0.00 | | | $ | 14.69 | | | | 22.17 | %g | | $ | 171.9 | | | | 1.43 | % | | | 1.21 | % | | | 1.02 | % | | | 36 | % | |
8/31/2013 | | $ | 13.82 | | | $ | 0.12 | | | $ | (0.51 | ) | | $ | (0.39 | ) | | $ | (0.12 | ) | | $ | (0.36 | ) | | $ | — | | | $ | (0.48 | ) | | $ | — | | | $ | 12.95 | | | | (2.82 | )% | | $ | 164.5 | | | | 1.47 | % | | | 1.21 | % | | | 0.84 | % | | | 33 | % | |
8/31/2012 | | $ | 11.80 | | | $ | 0.11 | | | $ | 2.13 | | | $ | 2.24 | | | $ | (0.17 | ) | | $ | (0.05 | ) | | $ | — | | | $ | (0.22 | ) | | $ | — | | | $ | 13.82 | | | | 19.33 | % | | $ | 78.3 | | | | 1.51 | % | | | 1.21 | % | | | 0.86 | % | | | 29 | % | |
Class C | |
8/31/2016 | | $ | 13.60 | | | $ | 0.06 | | | $ | 2.60 | | | $ | 2.66 | | | $ | (0.07 | ) | | $ | (1.07 | ) | | $ | — | | | $ | (1.14 | ) | | $ | — | | | $ | 15.12 | | | | 20.45 | % | | $ | 29.3 | | | | 2.17 | % | | | 1.96 | % | | | 0.39 | % | | | 49 | % | |
8/31/2015 | | $ | 14.68 | | | $ | 0.04 | | | $ | (0.35 | ) | | $ | (0.31 | ) | | $ | (0.04 | ) | | $ | (0.73 | ) | | $ | — | | | $ | (0.77 | ) | | $ | — | | | $ | 13.60 | | | | (2.38 | )% | | $ | 29.9 | | | | 2.17 | % | | | 1.96 | % | | | 0.30 | % | | | 33 | % | |
8/31/2014 | | $ | 12.94 | | | $ | 0.04 | | | $ | 2.55 | | | $ | 2.59 | | | $ | (0.04 | ) | | $ | (0.81 | ) | | $ | — | | | $ | (0.85 | ) | | $ | 0.00 | | | $ | 14.68 | | | | 21.24 | %g | | $ | 40.4 | | | | 2.20 | % | | | 1.96 | % | | | 0.26 | % | | | 36 | % | |
8/31/2013 | | $ | 13.81 | | | $ | 0.02 | | | $ | (0.50 | ) | | $ | (0.48 | ) | | $ | (0.03 | ) | | $ | (0.36 | ) | | $ | — | | | $ | (0.39 | ) | | $ | — | | | $ | 12.94 | | | | (3.52 | )% | | $ | 39.7 | | | | 2.24 | % | | | 1.96 | % | | | 0.11 | % | | | 33 | % | |
8/31/2012 | | $ | 11.80 | | | $ | 0.01 | | | $ | 2.14 | | | $ | 2.15 | | | $ | (0.09 | ) | | $ | (0.05 | ) | | $ | — | | | $ | (0.14 | ) | | $ | — | | | $ | 13.81 | | | | 18.40 | % | | $ | 20.7 | | | | 2.28 | % | | | 1.96 | % | | | 0.09 | % | | | 29 | % | |
See Notes to Financial Highlights
223
224
Financial Highlights (cont'd)
| | | Net Asset
Value,
Beginning
of Year | | Net
Investment
Income/(Loss)@ | | Net Gains or
Losses on
Securities
(both realized
and
unrealized) | | Total From
Investment
Operations | | Dividends
from Net
Investment
Income | | Distributions
from Net
Realized
Capital Gains | | Tax
Return of
Capital | | Total
Distributions | | Voluntary
Contribution
from
Management | | Net Asset
Value, End of
Year | | Total Return†d | | Net Assets,
End of Year
(in millions) | | Ratio of Gross
Expenses to
Average Net
Assets# | | Ratio of Net
Expenses to
Average Net
Assets‡ | | Ratio of Net
Investment
Income/
(Loss) to
Average Net
Assets | | Portfolio
Turnover
Rate | |
Real Estate Fund (cont'd) | |
Class R3 | |
8/31/2016 | | $ | 13.58 | | | $ | 0.12 | | | $ | 2.60 | | | $ | 2.72 | | | $ | (0.14 | ) | | $ | (1.07 | ) | | $ | — | | | $ | (1.21 | ) | | $ | — | | | $ | 15.09 | | | | 21.03 | % | | $ | 25.0 | | | | 1.68 | % | | | 1.46 | % | | | 0.87 | % | | | 49 | % | |
8/31/2015 | | $ | 14.68 | | | $ | 0.12 | | | $ | (0.37 | ) | | $ | (0.25 | ) | | $ | (0.12 | ) | | $ | (0.73 | ) | | $ | — | | | $ | (0.85 | ) | | $ | — | | | $ | 13.58 | | | | (1.94 | )% | | $ | 22.4 | | | | 1.66 | % | | | 1.46 | % | | | 0.81 | % | | | 33 | % | |
8/31/2014 | | $ | 12.94 | | | $ | 0.10 | | | $ | 2.56 | | | $ | 2.66 | | | $ | (0.11 | ) | | $ | (0.81 | ) | | $ | — | | | $ | (0.92 | ) | | $ | 0.00 | | | $ | 14.68 | | | | 21.89 | %g | | $ | 23.5 | | | | 1.67 | % | | | 1.46 | % | | | 0.71 | % | | | 36 | % | |
8/31/2013 | | $ | 13.81 | | | $ | 0.08 | | | $ | (0.50 | ) | | $ | (0.42 | ) | | $ | (0.09 | ) | | $ | (0.36 | ) | | $ | — | | | $ | (0.45 | ) | | $ | — | | | $ | 12.94 | | | | (3.04 | )% | | $ | 15.2 | | | | 1.70 | % | | | 1.46 | % | | | 0.56 | % | | | 33 | % | |
8/31/2012 | | $ | 11.80 | | | $ | 0.05 | | | $ | 2.17 | | | $ | 2.22 | | | $ | (0.16 | ) | | $ | (0.05 | ) | | $ | — | | | $ | (0.21 | ) | | $ | — | | | $ | 13.81 | | | | 19.07 | % | | $ | 4.8 | | | | 1.74 | % | | | 1.46 | % | | | 0.41 | % | | | 29 | % | |
Class R6 | |
8/31/2016 | | $ | 13.64 | | | $ | 0.21 | | | $ | 2.62 | | | $ | 2.83 | | | $ | (0.24 | ) | | $ | (1.07 | ) | | $ | — | | | $ | (1.31 | ) | | $ | — | | | $ | 15.16 | | | | 21.85 | % | | $ | 45.0 | | | | 0.98 | % | | | 0.78 | % | | | 1.48 | % | | | 49 | % | |
8/31/2015 | | $ | 14.74 | | | $ | 0.21 | | | $ | (0.36 | ) | | $ | (0.15 | ) | | $ | (0.22 | ) | | $ | (0.73 | ) | | $ | — | | | $ | (0.95 | ) | | $ | — | | | $ | 13.64 | | | | (1.26 | )% | | $ | 29.9 | | | | 0.97 | % | | | 0.78 | % | | | 1.40 | % | | | 33 | % | |
8/31/2014 | | $ | 12.99 | | | $ | 0.18 | | | $ | 2.59 | | | $ | 2.77 | | | $ | (0.21 | ) | | $ | (0.81 | ) | | $ | — | | | $ | (1.02 | ) | | $ | 0.00 | | | $ | 14.74 | | | | 22.72 | %g | | $ | 26.3 | | | | 0.98 | % | | | 0.78 | % | | | 1.33 | % | | | 36 | % | |
Period from 3/15/2013^
to 8/31/2013 | | $ | 14.11 | | | $ | 0.06 | | | $ | (1.04 | ) | | $ | (0.98 | ) | | $ | (0.02 | ) | | $ | (0.12 | ) | | $ | — | | | $ | (0.14 | ) | | $ | — | | | $ | 12.99 | | | | (6.96 | )%** | | $ | 8.3 | | | | 1.11 | %* | | | 0.78 | %* | | | 0.95 | %* | | | 33 | %Ø | |
Small Cap Growth Fund | |
Investor Class | |
8/31/2016 | | $ | 29.50 | | | $ | (0.21 | ) | | $ | (0.77 | ) | | $ | (0.98 | ) | | $ | — | | | $ | (1.55 | ) | | $ | — | | | $ | (1.55 | ) | | $ | — | | | $ | 26.97 | | | | (3.16 | )% | | $ | 44.0 | | | | 1.87 | % | | | 1.21 | % | | | (0.83 | )% | | | 164 | % | |
8/31/2015 | | $ | 27.44 | | | $ | (0.28 | ) | | $ | 2.34 | | | $ | 2.06 | | | $ | — | | | $ | — | | | $ | — | | | $ | — | | | $ | — | | | $ | 29.50 | | | | 7.51 | % | | $ | 49.3 | | | | 1.67 | % | | | 1.21 | % | | | (0.96 | )% | | | 336 | % | |
8/31/2014 | | $ | 24.16 | | | $ | (0.23 | ) | | $ | 3.51 | | | $ | 3.28 | | | $ | — | | | $ | — | | | $ | — | | | $ | — | | | $ | 0.00 | | | $ | 27.44 | | | | 13.58 | %g | | $ | 50.7 | | | | 1.67 | % | | | 1.21 | % | | | (0.85 | )% | | | 284 | % | |
8/31/2013 | | $ | 19.49 | | | $ | (0.15 | ) | | $ | 4.82 | | | $ | 4.67 | | | $ | — | | | $ | — | | | $ | — | | | $ | — | | | $ | — | | | $ | 24.16 | | | | 23.96 | % | | $ | 48.8 | | | | 1.64 | % | | | 1.22 | % | | | (0.72 | )% | | | 249 | % | |
8/31/2012 | | $ | 17.74 | | | $ | (0.17 | ) | | $ | 1.92 | | | $ | 1.75 | | | $ | — | | | $ | — | | | $ | — | | | $ | — | | | $ | — | | | $ | 19.49 | | | | 9.86 | % | | $ | 60.1 | | | | 1.58 | % | | | 1.21 | % | | | (0.92 | )% | | | 294 | % | |
Trust Class | |
8/31/2016 | | $ | 31.89 | | | $ | (0.27 | ) | | $ | (0.82 | ) | | $ | (1.09 | ) | | $ | — | | | $ | (1.55 | ) | | $ | — | | | $ | (1.55 | ) | | $ | — | | | $ | 29.25 | | | | (3.27 | )% | | $ | 4.4 | | | | 1.93 | % | | | 1.37 | % | | | (0.99 | )% | | | 164 | % | |
8/31/2015 | | $ | 29.72 | | | $ | (0.37 | ) | | $ | 2.54 | | | $ | 2.17 | | | $ | — | | | $ | — | | | $ | — | | | $ | — | | | $ | — | | | $ | 31.89 | | | | 7.30 | % | | $ | 5.3 | | | | 1.86 | % | | | 1.40 | % | | | (1.15 | )% | | | 336 | % | |
8/31/2014 | | $ | 26.22 | | | $ | (0.30 | ) | | $ | 3.80 | | | $ | 3.50 | | | $ | — | | | $ | — | | | $ | — | | | $ | — | | | $ | 0.00 | | | $ | 29.72 | | | | 13.35 | %g | | $ | 5.5 | | | | 1.95 | % | | | 1.40 | % | | | (1.02 | )% | | | 284 | % | |
8/31/2013 | | $ | 21.19 | | | $ | (0.20 | ) | | $ | 5.23 | | | $ | 5.03 | | | $ | — | | | $ | — | | | $ | — | | | $ | — | | | $ | — | | | $ | 26.22 | | | | 23.74 | % | | $ | 7.2 | | | | 1.83 | % | | | 1.40 | % | | | (0.91 | )% | | | 249 | % | |
8/31/2012 | | $ | 19.32 | | | $ | (0.22 | ) | | $ | 2.09 | | | $ | 1.87 | | | $ | — | | | $ | — | | | $ | — | | | $ | — | | | $ | — | | | $ | 21.19 | | | | 9.68 | % | | $ | 15.8 | | | | 1.77 | % | | | 1.39 | % | | | (1.10 | )% | | | 294 | % | |
Advisor Class | |
8/31/2016 | | $ | 21.03 | | | $ | (0.20 | ) | | $ | (0.56 | ) | | $ | (0.76 | ) | | $ | — | | | $ | (1.55 | ) | | $ | — | | | $ | (1.55 | ) | | $ | — | | | $ | 18.72 | | | | (3.40 | )% | | $ | 2.1 | | | | 2.08 | % | | | 1.51 | % | | | (1.13 | )% | | | 164 | % | |
8/31/2015 | | $ | 19.63 | | | $ | (0.26 | ) | | $ | 1.66 | | | $ | 1.40 | | | $ | — | | | $ | — | | | $ | — | | | $ | — | | | $ | — | | | $ | 21.03 | | | | 7.13 | % | | $ | 2.7 | | | | 2.00 | % | | | 1.51 | % | | | (1.26 | )% | | | 336 | % | |
8/31/2014 | | $ | 17.33 | | | $ | (0.22 | ) | | $ | 2.52 | | | $ | 2.30 | | | $ | — | | | $ | — | | | $ | — | | | $ | — | | | $ | 0.00 | | | $ | 19.63 | | | | 13.27 | %g | | $ | 3.5 | | | | 1.96 | % | | | 1.51 | % | | | (1.15 | )% | | | 284 | % | |
8/31/2013 | | $ | 14.03 | | | $ | (0.15 | ) | | $ | 3.45 | | | $ | 3.30 | | | $ | — | | | $ | — | | | $ | — | | | $ | — | | | $ | — | | | $ | 17.33 | | | | 23.52 | % | | $ | 3.6 | | | | 1.93 | % | | | 1.52 | % | | | (1.00 | )% | | | 249 | % | |
8/31/2012 | | $ | 12.81 | | | $ | (0.17 | ) | | $ | 1.39 | | | $ | 1.22 | | | $ | — | | | $ | — | | | $ | — | | | $ | — | | | $ | — | | | $ | 14.03 | | | | 9.52 | % | | $ | 5.9 | | | | 1.87 | % | | | 1.58 | % | | | (1.28 | )% | | | 294 | % | |
See Notes to Financial Highlights
225
226
Financial Highlights (cont'd)
| | | Net Asset
Value,
Beginning
of Year | | Net
Investment
Income/(Loss)@ | | Net Gains or
Losses on
Securities
(both realized
and
unrealized) | | Total From
Investment
Operations | | Dividends
from Net
Investment
Income | | Distributions
from Net
Realized
Capital Gains | | Tax
Return of
Capital | | Total
Distributions | | Voluntary
Contribution
from
Management | | Net Asset
Value, End of
Year | | Total Return†d | | Net Assets,
End of Year
(in millions) | | Ratio of Gross
Expenses to
Average Net
Assets# | | Ratio of Net
Expenses to
Average Net
Assets‡ | | Ratio of Net
Investment
Income/
(Loss) to
Average Net
Assets | | Portfolio
Turnover
Rate | |
Small Cap Growth Fund (cont'd) | |
Institutional Class | |
8/31/2016 | | $ | 30.11 | | | $ | (0.14 | ) | | $ | (0.76 | ) | | $ | (0.90 | ) | | $ | — | | | $ | (1.55 | ) | | $ | — | | | $ | (1.55 | ) | | $ | — | | | $ | 27.66 | | | | (2.82 | )% | | $ | 9.4 | | | | 1.55 | % | | | 0.90 | % | | | (0.53 | )% | | | 164 | % | |
8/31/2015 | | $ | 27.92 | | | $ | (0.20 | ) | | $ | 2.39 | | | $ | 2.19 | | | $ | — | | | $ | — | | | $ | — | | | $ | — | | | $ | — | | | $ | 30.11 | | | | 7.84 | % | | $ | 20.7 | | | | 1.44 | % | | | 0.90 | % | | | (0.65 | )% | | | 336 | % | |
8/31/2014 | | $ | 24.51 | | | $ | (0.15 | ) | | $ | 3.56 | | | $ | 3.41 | | | $ | — | | | $ | — | | | $ | — | | | $ | — | | | $ | 0.00 | | | $ | 27.92 | | | | 13.91 | %g | | $ | 19.0 | | | | 1.48 | % | | | 0.90 | % | | | (0.54 | )% | | | 284 | % | |
8/31/2013 | | $ | 19.71 | | | $ | (0.09 | ) | | $ | 4.89 | | | $ | 4.80 | | | $ | — | | | $ | — | | | $ | — | | | $ | — | | | $ | — | | | $ | 24.51 | | | | 24.35 | % | | $ | 14.9 | | | | 1.41 | % | | | 0.90 | % | | | (0.41 | )% | | | 249 | % | |
8/31/2012 | | $ | 17.88 | | | $ | (0.11 | ) | | $ | 1.94 | | | $ | 1.83 | | | $ | — | | | $ | — | | | $ | — | | | $ | — | | | $ | — | | | $ | 19.71 | | | | 10.23 | % | | $ | 33.3 | | | | 1.33 | % | | | 0.90 | % | | | (0.58 | )% | | | 294 | % | |
Class A | |
8/31/2016 | | $ | 32.15 | | | $ | (0.25 | ) | | $ | (0.82 | ) | | $ | (1.07 | ) | | $ | — | | | $ | (1.55 | ) | | $ | — | | | $ | (1.55 | ) | | $ | — | | | $ | 29.53 | | | | (3.18 | )% | | $ | 3.5 | | | | 1.95 | % | | | 1.26 | % | | | (0.88 | )% | | | 164 | % | |
8/31/2015 | | $ | 29.92 | | | $ | (0.33 | ) | | $ | 2.56 | | | $ | 2.23 | | | $ | — | | | $ | — | | | $ | — | | | $ | — | | | $ | — | | | $ | 32.15 | | | | 7.45 | % | | $ | 5.1 | | | | 1.83 | % | | | 1.26 | % | | | (1.01 | )% | | | 336 | % | |
8/31/2014 | | $ | 26.36 | | | $ | (0.28 | ) | | $ | 3.84 | | | $ | 3.56 | | | $ | — | | | $ | — | | | $ | — | | | $ | — | | | $ | 0.00 | | | $ | 29.92 | | | | 13.51 | %g | | $ | 4.4 | | | | 1.81 | % | | | 1.26 | % | | | (0.96 | )% | | | 284 | % | |
8/31/2013 | | $ | 21.27 | | | $ | (0.19 | ) | | $ | 5.28 | | | $ | 5.09 | | | $ | — | | | $ | — | | | $ | — | | | $ | — | | | $ | — | | | $ | 26.36 | | | | 23.93 | % | | $ | 2.4 | | | | 1.83 | % | | | 1.26 | % | | | (0.81 | )% | | | 249 | % | |
8/31/2012 | | $ | 19.36 | | | $ | (0.19 | ) | | $ | 2.10 | | | $ | 1.91 | | | $ | — | | | $ | — | | | $ | — | | | $ | — | | | $ | — | | | $ | 21.27 | | | | 9.87 | % | | $ | 1.1 | | | | 1.79 | % | | | 1.26 | % | | | (0.98 | )% | | | 294 | % | |
Class C | |
8/31/2016 | | $ | 20.44 | | | $ | (0.28 | ) | | $ | (0.56 | ) | | $ | (0.84 | ) | | $ | — | | | $ | (1.55 | ) | | $ | — | | | $ | (1.55 | ) | | $ | — | | | $ | 18.05 | | | | (3.92 | )% | | $ | 1.8 | | | | 2.68 | % | | | 2.01 | % | | | (1.63 | )% | | | 164 | % | |
8/31/2015 | | $ | 19.16 | | | $ | (0.36 | ) | | $ | 1.64 | | | $ | 1.28 | | | $ | — | | | $ | — | | | $ | — | | | $ | — | | | $ | — | | | $ | 20.44 | | | | 6.68 | % | | $ | 2.3 | | | | 2.58 | % | | | 2.01 | % | | | (1.76 | )% | | | 336 | % | |
8/31/2014 | | $ | 17.01 | | | $ | (0.32 | ) | | $ | 2.47 | | | $ | 2.15 | | | $ | — | | | $ | — | | | $ | — | | | $ | — | | | $ | 0.00 | | | $ | 19.16 | | | | 12.64 | %g | | $ | 1.8 | | | | 2.57 | % | | | 2.01 | % | | | (1.68 | )% | | | 284 | % | |
8/31/2013 | | $ | 13.83 | | | $ | (0.24 | ) | | $ | 3.42 | | | $ | 3.18 | | | $ | — | | | $ | — | | | $ | — | | | $ | — | | | $ | — | | | $ | 17.01 | | | | 22.99 | % | | $ | 1.1 | | | | 2.56 | % | | | 2.01 | % | | | (1.58 | )% | | | 249 | % | |
8/31/2012 | | $ | 12.69 | | | $ | (0.23 | ) | | $ | 1.37 | | | $ | 1.14 | | | $ | — | | | $ | — | | | $ | — | | | $ | — | | | $ | — | | | $ | 13.83 | | | | 8.98 | % | | $ | 0.7 | | | | 2.57 | % | | | 2.01 | % | | | (1.73 | )% | | | 294 | % | |
Class R3 | |
8/31/2016 | | $ | 21.09 | | | $ | (0.20 | ) | | $ | (0.57 | ) | | $ | (0.77 | ) | | $ | — | | | $ | (1.55 | ) | | $ | — | | | $ | (1.55 | ) | | $ | — | | | $ | 18.77 | | | | (3.44 | )% | | $ | 1.1 | | | | 2.24 | % | | | 1.51 | % | | | (1.12 | )% | | | 164 | % | |
8/31/2015 | | $ | 19.67 | | | $ | (0.27 | ) | | $ | 1.69 | | | $ | 1.42 | | | $ | — | | | $ | — | | | $ | — | | | $ | — | | | $ | — | | | $ | 21.09 | | | | 7.22 | % | | $ | 1.0 | | | | 2.15 | % | | | 1.51 | % | | | (1.25 | )% | | | 336 | % | |
8/31/2014 | | $ | 17.37 | | | $ | (0.22 | ) | | $ | 2.52 | | | $ | 2.30 | | | $ | — | | | $ | — | | | $ | — | | | $ | — | | | $ | 0.00 | | | $ | 19.67 | | | | 13.24 | %g | | $ | 0.5 | | | | 2.16 | % | | | 1.51 | % | | | (1.15 | )% | | | 284 | % | |
8/31/2013 | | $ | 14.06 | | | $ | (0.16 | ) | | $ | 3.47 | | | $ | 3.31 | | | $ | — | | | $ | — | | | $ | — | | | $ | — | | | $ | — | | | $ | 17.37 | | | | 23.54 | % | | $ | 0.4 | | | | 2.15 | % | | | 1.51 | % | | | (1.08 | )% | | | 249 | % | |
8/31/2012 | | $ | 12.83 | | | $ | (0.17 | ) | | $ | 1.40 | | | $ | 1.23 | | | $ | — | | | $ | — | | | $ | — | | | $ | — | | | $ | — | | | $ | 14.06 | | | | 9.59 | % | | $ | 0.2 | | | | 2.12 | % | | | 1.51 | % | | | (1.23 | )% | | | 294 | % | |
Socially Responsive Fund | |
Investor Class | |
8/31/2016 | | $ | 33.23 | | | $ | 0.24 | | | $ | 3.10 | | | $ | 3.34 | | | $ | (0.22 | ) | | $ | (1.85 | ) | | $ | — | | | $ | (2.07 | ) | | $ | — | | | $ | 34.50 | | | | 10.49 | % | | $ | 739.0 | | | | 0.86 | % | | | 0.86 | % | | | 0.74 | % | | | 25 | % | |
8/31/2015 | | $ | 36.94 | | | $ | 0.27 | | | $ | (0.12 | ) | | $ | 0.15 | | | $ | (0.26 | ) | | $ | (3.60 | ) | | $ | — | | | $ | (3.86 | ) | | $ | — | | | $ | 33.23 | | | | 0.29 | % | | $ | 758.0 | | | | 0.85 | % | | | 0.85 | % | | | 0.76 | % | | | 28 | % | |
8/31/2014 | | $ | 32.66 | | | $ | 0.31 | | | $ | 6.48 | | | $ | 6.79 | | | $ | (0.30 | ) | | $ | (2.21 | ) | | $ | — | | | $ | (2.51 | ) | | $ | 0.00 | | | $ | 36.94 | | | | 21.54 | %g | | $ | 821.1 | | | | 0.86 | % | | | 0.86 | % | | | 0.87 | % | | | 36 | % | |
8/31/2013 | | $ | 26.48 | | | $ | 0.27 | | | $ | 6.09 | | | $ | 6.36 | | | $ | (0.18 | ) | | $ | — | | | $ | — | | | $ | (0.18 | ) | | $ | — | | | $ | 32.66 | | | | 24.18 | % | | $ | 825.2 | | | | 0.87 | % | | | 0.87 | % | | | 0.91 | % | | | 35 | % | |
8/31/2012 | | $ | 24.61 | | | $ | 0.22 | | | $ | 1.77 | | | $ | 1.99 | | | $ | (0.12 | ) | | $ | — | | | $ | — | | | $ | (0.12 | ) | | $ | — | | | $ | 26.48 | | | | 8.13 | % | | $ | 724.3 | | | | 0.89 | % | | | 0.89 | % | | | 0.86 | % | | | 28 | % | |
See Notes to Financial Highlights
227
228
Financial Highlights (cont'd)
| | | Net Asset
Value,
Beginning
of Year | | Net
Investment
Income/(Loss)@ | | Net Gains or
Losses on
Securities
(both realized
and
unrealized) | | Total From
Investment
Operations | | Dividends
from Net
Investment
Income | | Distributions
from Net
Realized
Capital Gains | | Tax
Return of
Capital | | Total
Distributions | | Voluntary
Contribution
from
Management | | Net Asset
Value, End of
Year | | Total Return†d | | Net Assets,
End of Year
(in millions) | | Ratio of Gross
Expenses to
Average Net
Assets# | | Ratio of Net
Expenses to
Average Net
Assets‡ | | Ratio of Net
Investment
Income/
(Loss) to
Average Net
Assets | | Portfolio
Turnover
Rate | |
Socially Responsive Fund (cont'd) | |
Trust Class | |
8/31/2016 | | $ | 20.47 | | | $ | 0.11 | | | $ | 1.85 | | | $ | 1.96 | | | $ | (0.21 | ) | | $ | (1.85 | ) | | $ | — | | | $ | (2.06 | ) | | $ | — | | | $ | 20.37 | | | | 10.29 | % | | $ | 270.6 | | | | 1.03 | % | | | 1.03 | % | | | 0.58 | % | | | 25 | % | |
8/31/2015 | | $ | 24.24 | | | $ | 0.13 | | | $ | (0.06 | ) | | $ | 0.07 | | | $ | (0.24 | ) | | $ | (3.60 | ) | | $ | — | | | $ | (3.84 | ) | | $ | — | | | $ | 20.47 | | | | 0.12 | % | | $ | 318.3 | | | | 1.03 | % | | | 1.03 | % | | | 0.58 | % | | | 28 | % | |
8/31/2014 | | $ | 22.20 | | | $ | 0.16 | | | $ | 4.34 | | | $ | 4.50 | | | $ | (0.25 | ) | | $ | (2.21 | ) | | $ | — | | | $ | (2.46 | ) | | $ | 0.00 | | | $ | 24.24 | | | | 21.32 | %g | | $ | 418.4 | | | | 1.03 | % | | | 1.03 | % | | | 0.70 | % | | | 36 | % | |
8/31/2013 | | $ | 18.07 | | | $ | 0.15 | | | $ | 4.14 | | | $ | 4.29 | | | $ | (0.16 | ) | | $ | — | | | $ | — | | | $ | (0.16 | ) | | $ | — | | | $ | 22.20 | | | | 23.95 | % | | $ | 431.3 | | | | 1.04 | % | | | 1.04 | % | | | 0.76 | % | | | 35 | % | |
8/31/2012 | | $ | 16.85 | | | $ | 0.11 | | | $ | 1.21 | | | $ | 1.32 | | | $ | (0.10 | ) | | $ | — | | | $ | — | | | $ | (0.10 | ) | | $ | — | | | $ | 18.07 | | | | 7.93 | % | | $ | 488.5 | | | | 1.06 | % | | | 1.06 | % | | | 0.66 | % | | | 28 | % | |
Institutional Class | |
8/31/2016 | | $ | 33.28 | | | $ | 0.30 | | | $ | 3.11 | | | $ | 3.41 | | | $ | (0.29 | ) | | $ | (1.85 | ) | | $ | — | | | $ | (2.14 | ) | | $ | — | | | $ | 34.55 | | | | 10.70 | % | | $ | 745.5 | | | | 0.67 | % | | | 0.67 | % | | | 0.93 | % | | | 25 | % | |
8/31/2015 | | $ | 37.00 | | | $ | 0.33 | | | $ | (0.12 | ) | | $ | 0.21 | | | $ | (0.33 | ) | | $ | (3.60 | ) | | $ | — | | | $ | (3.93 | ) | | $ | — | | | $ | 33.28 | | | | 0.46 | % | | $ | 714.8 | | | | 0.67 | % | | | 0.67 | % | | | 0.94 | % | | | 28 | % | |
8/31/2014 | | $ | 32.70 | | | $ | 0.37 | | | $ | 6.49 | | | $ | 6.86 | | | $ | (0.35 | ) | | $ | (2.21 | ) | | $ | — | | | $ | (2.56 | ) | | $ | 0.00 | | | $ | 37.00 | | | | 21.76 | %g | | $ | 706.5 | | | | 0.68 | % | | | 0.68 | % | | | 1.06 | % | | | 36 | % | |
8/31/2013 | | $ | 26.51 | | | $ | 0.33 | | | $ | 6.09 | | | $ | 6.42 | | | $ | (0.23 | ) | | $ | — | | | $ | — | | | $ | (0.23 | ) | | $ | — | | | $ | 32.70 | | | | 24.41 | % | | $ | 557.7 | | | | 0.69 | % | | | 0.69 | % | | | 1.10 | % | | | 35 | % | |
8/31/2012 | | $ | 24.64 | | | $ | 0.26 | | | $ | 1.77 | | | $ | 2.03 | | | $ | (0.16 | ) | | $ | — | | | $ | — | | | $ | (0.16 | ) | | $ | — | | | $ | 26.51 | | | | 8.32 | % | | $ | 512.4 | | | | 0.71 | % | | | 0.71 | % | | | 1.02 | % | | | 28 | % | |
Class A | |
8/31/2016 | | $ | 20.28 | | | $ | 0.11 | | | $ | 1.83 | | | $ | 1.94 | | | $ | (0.22 | ) | | $ | (1.85 | ) | | $ | — | | | $ | (2.07 | ) | | $ | — | | | $ | 20.15 | | | | 10.27 | % | | $ | 131.6 | | | | 1.05 | % | | | 1.05 | % | | | 0.56 | % | | | 25 | % | |
8/31/2015 | | $ | 24.06 | | | $ | 0.13 | | | $ | (0.06 | ) | | $ | 0.07 | | | $ | (0.25 | ) | | $ | (3.60 | ) | | $ | — | | | $ | (3.85 | ) | | $ | — | | | $ | 20.28 | | | | 0.11 | % | | $ | 140.9 | | | | 1.05 | % | | | 1.05 | % | | | 0.57 | % | | | 28 | % | |
8/31/2014 | | $ | 22.05 | | | $ | 0.16 | | | $ | 4.30 | | | $ | 4.46 | | | $ | (0.24 | ) | | $ | (2.21 | ) | | $ | — | | | $ | (2.45 | ) | | $ | 0.00 | | | $ | 24.06 | | | | 21.28 | %g | | $ | 134.0 | | | | 1.05 | % | | | 1.05 | % | | | 0.68 | % | | | 36 | % | |
8/31/2013 | | $ | 17.95 | | | $ | 0.14 | | | $ | 4.12 | | | $ | 4.26 | | | $ | (0.16 | ) | | $ | — | | | $ | — | | | $ | (0.16 | ) | | $ | — | | | $ | 22.05 | | | | 23.89 | % | | $ | 109.6 | | | | 1.09 | % | | | 1.09 | %§ | | | 0.67 | % | | | 35 | % | |
8/31/2012 | | $ | 16.77 | | | $ | 0.10 | | | $ | 1.21 | | | $ | 1.31 | | | $ | (0.13 | ) | | $ | — | | | $ | — | | | $ | (0.13 | ) | | $ | — | | | $ | 17.95 | | | | 7.89 | % | | $ | 83.1 | | | | 1.11 | % | | | 1.11 | %§ | | | 0.61 | % | | | 28 | % | |
Class C | |
8/31/2016 | | $ | 19.74 | | | $ | (0.04 | ) | | $ | 1.78 | | | $ | 1.74 | | | $ | (0.07 | ) | | $ | (1.85 | ) | | $ | — | | | $ | (1.92 | ) | | $ | — | | | $ | 19.56 | | | | 9.44 | % | | $ | 53.5 | | | | 1.79 | % | | | 1.79 | % | | | (0.19 | )% | | | 25 | % | |
8/31/2015 | | $ | 23.57 | | | $ | (0.04 | ) | | $ | (0.05 | ) | | $ | (0.09 | ) | | $ | (0.14 | ) | | $ | (3.60 | ) | | $ | — | | | $ | (3.74 | ) | | $ | — | | | $ | 19.74 | | | | (0.67 | )% | | $ | 52.2 | | | | 1.79 | % | | | 1.79 | % | | | (0.18 | )% | | | 28 | % | |
8/31/2014 | | $ | 21.63 | | | $ | (0.01 | ) | | $ | 4.22 | | | $ | 4.21 | | | $ | (0.06 | ) | | $ | (2.21 | ) | | $ | — | | | $ | (2.27 | ) | | $ | 0.00 | | | $ | 23.57 | | | | 20.42 | %g | | $ | 44.5 | | | | 1.80 | % | | | 1.80 | % | | | (0.05 | )% | | | 36 | % | |
8/31/2013 | | $ | 17.64 | | | $ | (0.02 | ) | | $ | 4.06 | | | $ | 4.04 | | | $ | (0.05 | ) | | $ | — | | | $ | — | | | $ | (0.05 | ) | | $ | — | | | $ | 21.63 | | | | 22.98 | % | | $ | 27.5 | | | | 1.86 | % | | | 1.86 | %§ | | | (0.10 | )% | | | 35 | % | |
8/31/2012 | | $ | 16.52 | | | $ | (0.02 | ) | | $ | 1.19 | | | $ | 1.17 | | | $ | (0.05 | ) | | $ | — | | | $ | — | | | $ | (0.05 | ) | | $ | — | | | $ | 17.64 | | | | 7.08 | % | | $ | 16.7 | | | | 1.87 | % | | | 1.86 | % | | | (0.12 | )% | | | 28 | % | |
Class R3 | |
8/31/2016 | | $ | 20.07 | | | $ | 0.06 | | | $ | 1.81 | | | $ | 1.87 | | | $ | (0.17 | ) | | $ | (1.85 | ) | | $ | — | | | $ | (2.02 | ) | | $ | — | | | $ | 19.92 | | | | 10.01 | % | | $ | 33.3 | | | | 1.29 | % | | | 1.29 | % | | | 0.30 | % | | | 25 | % | |
8/31/2015 | | $ | 23.85 | | | $ | 0.07 | | | $ | (0.05 | ) | | $ | 0.02 | | | $ | (0.20 | ) | | $ | (3.60 | ) | | $ | — | | | $ | (3.80 | ) | | $ | — | | | $ | 20.07 | | | | (0.12 | )% | | $ | 30.4 | | | | 1.29 | % | | | 1.29 | % | | | 0.31 | % | | | 28 | % | |
8/31/2014 | | $ | 21.86 | | | $ | 0.10 | | | $ | 4.27 | | | $ | 4.37 | | | $ | (0.17 | ) | | $ | (2.21 | ) | | $ | — | | | $ | (2.38 | ) | | $ | 0.00 | | | $ | 23.85 | | | | 21.02 | %g | | $ | 32.2 | | | | 1.29 | % | | | 1.29 | % | | | 0.45 | % | | | 36 | % | |
8/31/2013 | | $ | 17.81 | | | $ | 0.09 | | | $ | 4.09 | | | $ | 4.18 | | | $ | (0.13 | ) | | $ | — | | | $ | — | | | $ | (0.13 | ) | | $ | — | | | $ | 21.86 | | | | 23.64 | % | | $ | 25.3 | | | | 1.30 | % | | | 1.30 | % | | | 0.46 | % | | | 35 | % | |
8/31/2012 | | $ | 16.68 | | | $ | 0.07 | | | $ | 1.19 | | | $ | 1.26 | | | $ | (0.13 | ) | | $ | — | | | $ | — | | | $ | (0.13 | ) | | $ | — | | | $ | 17.81 | | | | 7.65 | % | | $ | 17.9 | | | | 1.33 | % | | | 1.33 | %§ | | | 0.43 | % | | | 28 | % | |
See Notes to Financial Highlights
229
230
Financial Highlights (cont'd)
| | | Net Asset
Value,
Beginning
of Year | | Net
Investment
Income/(Loss)@ | | Net Gains or
Losses on
Securities
(both realized
and
unrealized) | | Total From
Investment
Operations | | Dividends
from Net
Investment
Income | | Distributions
from Net
Realized
Capital Gains | | Tax
Return of
Capital | | Total
Distributions | | Voluntary
Contribution
from
Management | | Net Asset
Value, End of
Year | | Total Return†d | | Net Assets,
End of Year
(in millions) | | Ratio of Gross
Expenses to
Average Net
Assets# | | Ratio of Net
Expenses to
Average Net
Assets‡ | | Ratio of Net
Investment
Income/
(Loss) to
Average Net
Assets | | Portfolio
Turnover
Rate | |
Socially Responsive Fund (cont'd) | |
Class R6 | |
8/31/2016 | | $ | 33.30 | | | $ | 0.32 | | | $ | 3.11 | | | $ | 3.43 | | | $ | (0.31 | ) | | $ | (1.85 | ) | | $ | — | | | $ | (2.16 | ) | | $ | — | | | $ | 34.57 | | | | 10.78 | % | | $ | 373.4 | | | | 0.60 | % | | | 0.60 | % | | | 0.96 | % | | | 25 | % | |
8/31/2015 | | $ | 37.03 | | | $ | 0.36 | | | $ | (0.14 | ) | | $ | 0.22 | | | $ | (0.35 | ) | | $ | (3.60 | ) | | $ | — | | | $ | (3.95 | ) | | $ | — | | | $ | 33.30 | | | | 0.51 | % | | $ | 222.4 | | | | 0.60 | % | | | 0.60 | % | | | 1.02 | % | | | 28 | % | |
8/31/2014 | | $ | 32.71 | | | $ | 0.39 | | | $ | 6.51 | | | $ | 6.90 | | | $ | (0.37 | ) | | $ | (2.21 | ) | | $ | — | | | $ | (2.58 | ) | | $ | 0.00 | | | $ | 37.03 | | | | 21.88 | %g | | $ | 279.6 | | | | 0.60 | % | | | 0.60 | % | | | 1.11 | % | | | 36 | % | |
Period from 3/15/2013^
to 8/31/2013 | | $ | 31.16 | | | $ | 0.14 | | | $ | 1.41 | | | $ | 1.55 | | | $ | — | | | $ | — | | | $ | — | | | $ | — | | | $ | — | | | $ | 32.71 | | | | 4.97 | %** | | $ | 249.6 | | | | 0.62 | %* | | | 0.62 | %* | | | 0.94 | %* | | | 35 | %Ø | |
Value Fund | |
Institutional Class | |
8/31/2016 | | $ | 14.35 | | | $ | 0.20 | | | $ | 1.61 | | | $ | 1.81 | | | $ | (0.23 | ) | | $ | (0.21 | ) | | $ | — | | | $ | (0.44 | ) | | $ | — | | | $ | 15.72 | | | | 13.23 | % | | $ | 9.1 | | | | 2.68 | % | | | 0.72 | %^^ | | | 1.40 | % | | | 118 | % | |
8/31/2015 | | $ | 16.51 | | | $ | 0.19 | | | $ | (1.35 | ) | | $ | (1.16 | ) | | $ | (0.15 | ) | | $ | (0.85 | ) | | $ | — | | | $ | (1.00 | ) | | $ | — | | | $ | 14.35 | | | | (7.42 | )% | | $ | 13.1 | | | | 1.82 | % | | | 0.70 | % | | | 1.24 | % | | | 166 | % | |
8/31/2014 | | $ | 13.52 | | | $ | 0.17 | | | $ | 2.92 | | | $ | 3.09 | | | $ | (0.10 | ) | | $ | — | | | $ | — | | | $ | (0.10 | ) | | $ | — | | | $ | 16.51 | | | | 22.98 | % | | $ | 12.6 | | | | 2.41 | % | | | 0.70 | % | | | 1.12 | % | | | 129 | % | |
8/31/2013 | | $ | 11.18 | | | $ | 0.16 | | | $ | 2.40 | | | $ | 2.56 | | | $ | (0.22 | ) | | $ | — | | | $ | — | | | $ | (0.22 | ) | | $ | — | | | $ | 13.52 | | | | 23.23 | % | | $ | 6.9 | | | | 5.93 | % | | | 0.71 | % | | | 1.25 | % | | | 250 | % | |
8/31/2012 | | $ | 9.95 | | | $ | 0.15 | | | $ | 1.16 | | | $ | 1.31 | | | $ | (0.08 | ) | | $ | — | | | $ | — | | | $ | (0.08 | ) | | $ | — | | | $ | 11.18 | | | | 13.25 | % | | $ | 2.7 | | | | 9.42 | % | | | 0.73 | % | | | 1.46 | % | | | 200 | % | |
Class A | |
8/31/2016 | | $ | 14.25 | | | $ | 0.14 | | | $ | 1.60 | | | $ | 1.74 | | | $ | (0.16 | ) | | $ | (0.21 | ) | | $ | — | | | $ | (0.37 | ) | | $ | — | | | $ | 15.62 | | | | 12.70 | % | | $ | 3.8 | | | | 3.08 | % | | | 1.10 | %^^ | | | 1.02 | % | | | 118 | % | |
8/31/2015 | | $ | 16.40 | | | $ | 0.13 | | | $ | (1.33 | ) | | $ | (1.20 | ) | | $ | (0.10 | ) | | $ | (0.85 | ) | | $ | — | | | $ | (0.95 | ) | | $ | — | | | $ | 14.25 | | | | (7.71 | )% | | $ | 7.3 | | | | 2.21 | % | | | 1.08 | % | | | 0.84 | % | | | 166 | % | |
8/31/2014 | | $ | 13.44 | | | $ | 0.11 | | | $ | 2.90 | | | $ | 3.01 | | | $ | (0.05 | ) | | $ | — | | | $ | — | | | $ | (0.05 | ) | | $ | — | | | $ | 16.40 | | | | 22.43 | % | | $ | 8.0 | | | | 2.80 | % | | | 1.10 | % | | | 0.74 | % | | | 129 | % | |
8/31/2013 | | $ | 11.13 | | | $ | 0.10 | | | $ | 2.40 | | | $ | 2.50 | | | $ | (0.19 | ) | | $ | — | | | $ | — | | | $ | (0.19 | ) | | $ | — | | | $ | 13.44 | | | | 22.72 | % | | $ | 3.7 | | | | 6.81 | % | | | 1.11 | % | | | 0.82 | % | | | 250 | % | |
8/31/2012 | | $ | 9.93 | | | $ | 0.12 | | | $ | 1.15 | | | $ | 1.27 | | | $ | (0.07 | ) | | $ | — | | | $ | — | | | $ | (0.07 | ) | | $ | — | | | $ | 11.13 | | | | 12.89 | % | | $ | 1.6 | | | | 9.88 | % | | | 1.08 | % | | | 1.08 | % | | | 200 | % | |
Class C | |
8/31/2016 | | $ | 14.02 | | | $ | 0.04 | | | $ | 1.57 | | | $ | 1.61 | | | $ | (0.09 | ) | | $ | (0.21 | ) | | $ | — | | | $ | (0.30 | ) | | $ | — | | | $ | 15.33 | | | | 11.92 | % | | $ | 0.5 | | | | 3.87 | % | | | 1.84 | %^^ | | | 0.29 | % | | | 118 | % | |
8/31/2015 | | $ | 16.18 | | | $ | 0.01 | | | $ | (1.32 | ) | | $ | (1.31 | ) | | $ | (0.00 | ) | | $ | (0.85 | ) | | $ | — | | | $ | (0.85 | ) | | $ | — | | | $ | 14.02 | | | | (8.44 | )% | | $ | 0.5 | | | | 2.98 | % | | | 1.83 | % | | | 0.07 | % | | | 166 | % | |
8/31/2014 | | $ | 13.31 | | | $ | (0.01 | ) | | $ | 2.88 | | | $ | 2.87 | | | $ | — | | | $ | — | | | $ | — | | | $ | — | | | $ | — | | | $ | 16.18 | | | | 21.56 | % | | $ | 0.6 | | | | 3.57 | % | | | 1.86 | % | | | (0.05 | )% | | | 129 | % | |
8/31/2013 | | $ | 11.05 | | | $ | 0.00 | | | $ | 2.39 | | | $ | 2.39 | | | $ | (0.13 | ) | | $ | — | | | $ | — | | | $ | (0.13 | ) | | $ | — | | | $ | 13.31 | | | | 21.82 | % | | $ | 0.3 | | | | 7.31 | % | | | 1.87 | % | | | 0.01 | % | | | 250 | % | |
8/31/2012 | | $ | 9.89 | | | $ | 0.03 | | | $ | 1.16 | | | $ | 1.19 | | | $ | (0.03 | ) | | $ | — | | | $ | — | | | $ | (0.03 | ) | | $ | — | | | $ | 11.05 | | | | 12.07 | % | | $ | 0.1 | | | | 10.74 | % | | | 1.87 | % | | | 0.30 | % | | | 200 | % | |
See Notes to Financial Highlights
231
232
Notes to Financial Highlights Equity Funds
† Total return based on per share NAV reflects the effects of changes in NAV on the performance of each Fund during each fiscal period. Returns assume income dividends and other distributions, if any, were reinvested but do not reflect the effect of sales charges. Results represent past performance and do not indicate future results. Current returns may be lower or higher than the performance data quoted. Investment returns and principal may fluctuate and shares when redeemed may be worth more or less than original cost. Total return would have been lower if Management had not reimbursed and/or waived certain expenses. Total return would have been higher if Management had not recouped previously reimbursed and/or waived expenses.
# Represents the annualized ratios of net expenses to average daily net assets if Management had not reimbursed certain expenses and/or waived a portion of the investment management fee.
‡ Prior to January 1, 2013, each Fund had an expense offset arrangement in connection with its custodian contract. The impact of expense reductions related to expense offset arrangements, if any, was less than 0.01%.
^^ After utilization of the Line of Credit by Greater China Equity (2015 and 2016) and Value (2016) and/or reimbursement of expenses and/or waiver of a portion of the investment management fee by Management. The Funds are required to calculate an expense ratio without taking into consideration any expense reductions related to expense offset arrangements. Had Greater China Equity and Value not utilized the Line of Credit, or had Management not undertaken such action, the annualized ratios of net expenses to average daily net assets would have been:
| | | Year Ended August 31, | |
| | | 2016 | | 2015 | |
Greater China Equity Institutional Class | | | 1.51 | % | | | 1.50 | % | |
Greater China Equity Class A | | | 1.87 | % | | | 1.86 | % | |
Greater China Equity Class C | | | 2.62 | % | | | 2.61 | % | |
Value Institutional Class | | | 0.71 | % | | | — | | |
Value Class A | | | 1.10 | % | | | — | | |
Value Class C | | | 1.84 | % | | | — | | |
§ After repayment of expenses previously reimbursed and/or fees previously waived by Management, as applicable. Had the Fund not made such repayments, the annualized ratios of net expenses to average daily net assets would have been:
| | | Year Ended August 31, | |
| | | 2016 | | 2015 | | 2014 | | 2013 | | 2012 | |
Equity Income Institutional Class | | | — | | | | — | | | | — | | | | — | | | | 0.70 | % | |
Equity Income Class A | | | — | | | | — | | | | — | | | | — | | | | 1.07 | % | |
Equity Income Class C | | | — | | | | — | | | | — | | | | — | | | | 1.82 | % | |
Equity Income Class R3 | | | — | | | | — | | | | 1.32 | % | | | 1.31 | % | | | 1.35 | % | |
Genesis Institutional Class | | | 0.85 | % | | | — | | | | 0.85 | % | | | — | | | | — | | |
Genesis Class R6 | | | 0.78 | % | | | — | | | | 0.78 | % | | | — | | | | — | | |
Guardian Advisor Class | | | 1.26 | % | | | — | | | | — | | | | 1.30 | % | | | 1.33 | % | |
Guardian Institutional Class | | | — | | | | — | | | | — | | | | — | | | | 0.74 | % | |
Guardian Class A | | | — | | | | — | | | | 1.08 | % | | | 1.10 | % | | | — | | |
Guardian Class C | | | — | | | | — | | | | 1.84 | % | | | — | | | | — | | |
International Equity Institutional Class | | | 0.85 | % | | | 0.83 | % | | | — | | | | — | | | | — | | |
233
Notes to Financial Highlights Equity Funds (cont'd)
| | | Year Ended August 31, | |
| | | 2016 | | 2015 | | 2014 | | 2013 | | 2012 | |
International Equity Class A | | | — | | | | 1.20 | % | | | — | | | | — | | | | — | | |
International Equity Class R6 | | | — | | | | 0.76 | % | | | — | | | | — | | | | — | | |
Large Cap Value Institutional Class | | | — | | | | 0.70 | % | | | 0.70 | % | | | — | | | | — | | |
Large Cap Value Class A | | | — | | | | — | | | | 1.08 | % | | | — | | | | 1.05 | % | |
Large Cap Value Class C | | | — | | | | 1.82 | % | | | 1.82 | % | | | 1.86 | % | | | — | | |
Mid Cap Growth Advisor Class | | | — | | | | — | | | | — | | | | — | | | | 1.31 | % | |
Mid Cap Growth Institutional Class | | | 0.73 | % | | | 0.73 | % | | | — | | | | — | | | | — | | |
Mid Cap Growth Class A | | | 1.10 | % | | | 1.10 | % | | | — | | | | — | | | | — | | |
Mid Cap Growth Class R6 | | | — | | | | 0.67 | % | | | — | | | | — | | | | — | | |
Mid Cap Intrinsic Value Trust Class | | | — | | | | — | | | | 1.23 | % | | | — | | | | — | | |
Mid Cap Intrinsic Value Institutional Class | | | — | | | | — | | | | 0.82 | % | | | — | | | | — | | |
Mid Cap Intrinsic Value Class A | | | — | | | | — | | | | 1.21 | % | | | — | | | | — | | |
Mid Cap Intrinsic Value Class C | | | — | | | | — | | | | 1.94 | % | | | — | | | | — | | |
Multi-Cap Opportunities Institutional Class | | | — | | | | — | | | | — | | | | 0.82 | % | | | 0.93 | % | |
Multi-Cap Opportunities Class A | | | — | | | | — | | | | — | | | | 1.16 | % | | | 1.30 | % | |
Multi-Cap Opportunities Class C | | | — | | | | — | | | | — | | | | 1.92 | % | | | — | | |
Socially Responsive Class A | | | — | | | | — | | | | — | | | | 1.08 | % | | | 1.11 | % | |
Socially Responsive Class C | | | — | | | | — | | | | — | | | | 1.83 | % | | | — | | |
Socially Responsive Class R3 | | | — | | | | — | | | | — | | | | — | | | | 1.32 | % | |
^ The date investment operations commenced.
@ Calculated based on the average number of shares outstanding during each fiscal period.
* Annualized.
** Not annualized.
Ø Portfolio turnover is calculated at the Fund level. Percentage indicated was calculated for the year ended August 31, 2013 for Emerging Markets Equity, Genesis, International Equity, Mid Cap Growth, Real Estate and Socially Responsive, and for the year ended August 31, 2014 for International Equity.
a On January 25, 2013, International Equity acquired all of the net assets of Neuberger Berman International Fund pursuant to a Plan of Reorganization and Dissolution. Portfolio turnover excludes purchases and sales of securities by International (acquired fund) prior to the merger date.
b Organization expense, which is a non-recurring expense, is included in these ratios on a non-annualized basis.
234
Notes to Financial Highlights Equity Funds (cont'd)
d Except for the Fund classes listed below, the class action proceeds listed in Note A of the Notes to Financial Statements, if any, had no impact on the Funds' total returns for the year ended August 31, 2016. Had the Fund classes listed below not received class action proceeds in 2016, total return based on per share NAV for the year ended August 31, 2016 would have been:
Small Cap Growth Investor Class | | | (3.27 | )% | |
Small Cap Growth Trust Class | | | (3.40 | )% | |
Small Cap Growth Advisor Class | | | (3.50 | )% | |
Small Cap Growth Institutional Class | | | (2.99 | )% | |
Small Cap Growth Class A | | | (3.31 | )% | |
Small Cap Growth Class C | | | (4.02 | )% | |
Small Cap Growth Class R3 | | | (3.54 | )% | |
Except for the Fund classes listed below, the class action proceeds received in 2015, 2014, 2013 and 2012, if any, had no impact on the Funds' total returns for the years ended August 31, 2015, 2014, 2013 and 2012. Had the Fund classes listed below not received class action proceeds in 2015, 2014, 2013 and/or 2012, total return based on per share NAV for the years ended August 31, 2015, 2014, 2013 and/or 2012 would have been:
| | Year Ended August 31, | |
| | 2015 | | 2014 | | 2013 | | 2012 | |
Genesis Investor Class | | | — | | | | 13.62 | % | | | — | | | | — | | |
Genesis Trust Class | | | — | | | | 13.51 | % | | | — | | | | — | | |
Genesis Advisor Class | | | — | | | | 13.21 | % | | | — | | | | — | | |
Genesis Institutional Class | | | — | | | | 13.78 | % | | | — | | | | — | | |
Genesis Class R6 | | | — | | | | 13.90 | % | | | — | | | | — | | |
Large Cap Value Investor Class | | | (7.26 | )% | | | — | | | | 23.93 | % | | | — | | |
Large Cap Value Trust Class | | | (7.45 | )% | | | — | | | | 23.61 | % | | | — | | |
Large Cap Value Advisor Class | | | — | | | | — | | | | 23.46 | % | | | — | | |
Large Cap Value Institutional Class | | | (7.09 | )% | | | — | | | | 24.11 | % | | | — | | |
Large Cap Value Class A | | | (7.49 | )% | | | — | | | | 23.57 | % | | | — | | |
Large Cap Value Class R3 | | | (7.71 | )% | | | — | | | | 23.41 | % | | | — | | |
Mid Cap Intrinsic Value Investor Class | | | — | | | | 22.79 | % | | | — | | | | 12.48 | % | |
Mid Cap Intrinsic Value Trust Class | | | — | | | | 22.41 | % | | | — | | | | 12.34 | % | |
Mid Cap Intrinsic Value Institutional Class | | | — | | | | — | | | | — | | | | 12.86 | % | |
Mid Cap Intrinsic Value Class R3 | | | — | | | | 22.17 | % | | | — | | | | 12.16 | % | |
Small Cap Growth Investor Class | | | 7.07 | % | | | — | | | | 23.81 | % | | | — | | |
Small Cap Growth Trust Class | | | 6.86 | % | | | — | | | | 23.45 | % | | | — | | |
Small Cap Growth Advisor Class | | | 6.72 | % | | | — | | | | 23.31 | % | | | — | | |
Small Cap Growth Institutional Class | | | 7.41 | % | | | — | | | | 24.05 | % | | | — | | |
Small Cap Growth Class A | | | 7.05 | % | | | — | | | | 23.84 | % | | | — | | |
Small Cap Growth Class C | | | 6.37 | % | | | — | | | | 22.92 | % | | | — | | |
Small Cap Growth Class R3 | | | 6.81 | % | | | — | | | | 23.47 | % | | | — | | |
g The voluntary contributions received in 2014 had no impact on the Funds' total returns for the year ended August 31, 2014.
235
Notes to Financial Highlights Equity Funds (cont'd)
h Had Mid Cap Growth not received the voluntary contribution listed in Note B of the Notes to Financial Statements, the total return based on per share NAV for the year ended August 31, 2016, would have been:
Mid Cap Growth Investor Class | | | (1.78 | )% | |
Mid Cap Growth Trust Class | | | (1.90 | )% | |
Mid Cap Growth Advisor Class | | | (2.13 | )% | |
Mid Cap Growth Institutional Class | | | (1.66 | )% | |
Mid Cap Growth Class A | | | (2.04 | )% | |
Mid Cap Growth Class C | | | (2.66 | )% | |
Mid Cap Growth Class R3 | | | (2.21 | )% | |
Mid Cap Growth Class R6 | | | (1.51 | )% | |
236
Report of Independent Registered Public Accounting Firm
To the Board of Trustees
Neuberger Berman Equity Funds and Shareholders of:
Neuberger Berman Dividend Growth Fund,
Neuberger Berman Emerging Markets Equity Fund,
Neuberger Berman Equity Income Fund,
Neuberger Berman Focus Fund,
Neuberger Berman Genesis Fund,
Neuberger Berman Global Equity Fund,
Neuberger Berman Global Real Estate Fund,
Neuberger Berman Greater China Equity Fund,
Neuberger Berman Guardian Fund,
Neuberger Berman International Equity Fund,
Neuberger Berman International Select Fund,
Neuberger Berman Large Cap Value Fund,
Neuberger Berman Real Estate Fund,
Neuberger Berman Value Fund
We have audited the accompanying statements of assets and liabilities, including the schedules of investments, of Neuberger Berman Dividend Growth Fund, Neuberger Berman Emerging Markets Equity Fund, Neuberger Berman Equity Income Fund, Neuberger Berman Focus Fund, Neuberger Berman Genesis Fund, Neuberger Berman Global Equity Fund, Neuberger Berman Global Real Estate Fund, Neuberger Berman Greater China Equity Fund, Neuberger Berman Guardian Fund, Neuberger Berman International Equity Fund, Neuberger Berman International Select Fund, Neuberger Berman Large Cap Value Fund, Neuberger Berman Real Estate Fund, and Neuberger Berman Value Fund, fourteen of the series constituting Neuberger Berman Equity Funds (the "Trust") as of August 31, 2016, and the related statements of operations for the period then ended, the statements of changes in net assets and the financial highlights for each of the periods indicated therein. These financial statements and financial highlights are the responsibility of the Trust's management. Our responsibility is to express an opinion on these financial statements and financial highlights based on our audits.
We conducted our audits in accordance with the standards of the Public Company Accounting Oversight Board (United States). Those standards require that we plan and perform the audit to obtain reasonable assurance about whether the financial statements and financial highlights are free of material misstatement. We were not engaged to perform an audit of the Trust's internal control over financial reporting. Our audits included consideration of internal control over financial reporting as a basis for designing audit procedures that are appropriate in the circumstances, but not for the purpose of expressing an opinion on the effectiveness of the Trust's internal control over financial reporting. Accordingly, we express no such opinion. An audit also includes examining, on a test basis, evidence supporting the amounts and disclosures in the financial statements and financial highlights, assessing the accounting principles used and significant estimates made by management, and evaluating the overall financial statement presentation. Our procedures included confirmation of securities owned as of August 31, 2016, by correspondence with the custodian and others or by other appropriate auditing procedures where replies from others were not received. We believe that our audits provide a reasonable basis for our opinion.
237
Report of Independent Registered Public Accounting Firm
In our opinion, the financial statements and financial highlights referred to above present fairly, in all material respects, the financial position of the above-mentioned series of the Neuberger Berman Equity Funds, at August 31, 2016, the results of their operations for the period then ended, the changes in their net assets and the financial highlights for each of the periods indicated therein, in conformity with U.S. generally accepted accounting principles.

Boston, Massachusetts
October 24, 2016
238
Report of Independent Registered Public Accounting Firm
To the Board of Trustees and Shareholders
Neuberger Berman Equity Funds
We have audited the accompanying statements of assets and liabilities of the Neuberger Berman Intrinsic Value Fund, Neuberger Berman Mid Cap Growth Fund, Neuberger Berman Mid Cap Intrinsic Value Fund, Neuberger Berman Multi-Cap Opportunities Fund, Neuberger Berman Small Cap Growth Fund, and Neuberger Berman Socially Responsive Fund, each a series of Neuberger Berman Equity Funds (the "Trust"), including the schedules of investments, as of August 31, 2016, and the related statements of operations for the year then ended, the statements of changes in net assets and the financial highlights for the periods indicated therein. These financial statements and financial highlights are the responsibility of the Trust's management. Our responsibility is to express an opinion on these financial statements and financial highlights based on our audits.
We conducted our audits in accordance with the standards of the Public Company Accounting Oversight Board (United States). Those standards require that we plan and perform the audit to obtain reasonable assurance about whether the financial statements and financial highlights are free of material misstatement. The Trust is not required to have, nor were we engaged to perform, an audit of its internal control over financial reporting. Our audits included consideration of internal control over financial reporting as a basis for designing audit procedures that are appropriate in the circumstances, but not for the purpose of expressing an opinion on the effectiveness of the Trust's internal control over financial reporting. Accordingly, we express no such opinion. An audit also includes examining, on a test basis, evidence supporting the amounts and disclosures in the financial statements and financial highlights, assessing the accounting principles used and significant estimates made by management, as well as evaluating the overall financial statement presentation. Our procedures included confirmation of securities owned as of August 31, 2016, by correspondence with the custodian and brokers. We believe that our audits provide a reasonable basis for our opinion.
In our opinion, the financial statements and financial highlights referred to above present fairly, in all material respects, the financial position of the above mentioned series of the Trust, as of August 31, 2016, and the results of their operations, the changes in their net assets, and the financial highlights for the periods indicated therein, in conformity with accounting principles generally accepted in the United States of America.

Philadelphia, Pennsylvania
October 17, 2016
239
Investment Manager and Administrator
Neuberger Berman Investment Advisers LLC
605 Third Avenue, 2nd Floor
New York, NY 10158-0180
Intermediary Client Services 800.366.6264
Distributor
Neuberger Berman LLC
605 Third Avenue, 2nd Floor
New York, NY 10158-0180
800.877.9700 or 212.476.8800
Intermediary Client Services
800.366.6264
Sub-Adviser (prior to January 1, 2016)
Neuberger Berman LLC
605 Third Avenue
New York, NY 10158-3698
Sub-Adviser
Neuberger Berman Asia Limited
Jardine House, 1 Connaught Place
Suites 2010-2020, 20th Floor
Central Hong Kong
Custodian and Shareholder Servicing Agent
State Street Bank and Trust Company
One Lincoln Street
Boston, MA 02111
For Investor Class Shareholders
Address correspondence to:
Neuberger Berman Funds
Boston Service Center
P.O. Box 8403
Boston, MA 02266-8403
800.877.9700 or 212.476.8800
For Class A, Class C, Class R3 and Class R6 Shareholders:
Please contact your investment provider
For Trust Class, Advisor Class and Institutional Class Shareholders
Address correspondence to:
Neuberger Berman Investment Advisers LLC
605 Third Avenue, 2nd Floor
New York, NY 10158-0180
Attn: Intermediary Client Services
800.366.6264
Legal Counsel
K&L Gates LLP
1601 K Street, NW
Washington, DC 20006-1600
Independent Registered Public Accounting Firms
Ernst & Young LLP
200 Clarendon Street
Boston, MA 02116
Tait, Weller & Baker LLP
1818 Market Street
Suite 2400
Philadelphia, PA 19103
240
The following tables set forth information concerning the Trustees and Officers of each of the Funds. All persons named as Trustees and Officers also serve in similar capacities for other funds administered or managed by Management and Neuberger Berman LLC ("Neuberger Berman"). Each Fund's Statement of Additional Information includes additional information about the Trustees as of the time of the Fund's most recent public offering and is available upon request, without charge, by calling (800) 877-9700.
Information about the Board of Trustees
Name, (Year of Birth),
and Address(1) | | Position(s)
and Length of
Time Served(2) | | Principal Occupation(s)(3) | | Number of
Funds in
Fund Complex | | Other Directorships Held
Outside Fund Complex by
Fund Trustee(3)
Overseen by
Fund Trustee | |
Independent Fund Trustees | |
Faith Colish (1935) | | Trustee since 1982 | | Counsel, Carter Ledyard & Milburn LLP (law firm) since October 2002; formerly, Attorney-at-Law and President, Faith Colish, A Professional Corporation, 1980 to 2002. | | | 54 | | | Formerly, Director, 1997 to 2003, and Advisory Director, 2003 to 2006, ABA Retirement Funds (formerly, American Bar Retirement Association) (not-for-profit membership corporation). | |
Michael J. Cosgrove (1949) | | Trustee since 2015 | | President, Carragh Consulting USA, since 2014; formerly, Executive, General Electric Company, 1982 to 2014, including President, Mutual Funds and Global Investment Programs, GE Asset Management, 2011 to 2014, President and Chief Executive Officer, Mutual Funds and Intermediary Business, GE Asset Management, 2007 to 2011, and President, Institutional Sales and Marketing, GE Asset Management, 1998 to 2007. | | | 54 | | | Formerly, Director, The Gabelli Go Anywhere Trust, June 2015 to June 2016; Director, America Press, Inc. (not-for-profit Jesuit publisher), since 2015; Director, Fordham University, since 2001; Director, Skin Cancer Foundation (not-for-profit), since 2006; formerly, Director, GE Investments Funds, Inc., 1997 to 2014; Trustee, GE Institutional Funds, 1997 to 2014; Director, GE Asset Management, 1988 to 2014; Director, Elfun Trusts, 1988 to 2014. | |
241
Name, (Year of Birth),
and Address(1) | | Position(s)
and Length of
Time Served(2) | | Principal Occupation(s)(3) | | Number of
Funds in
Fund Complex | | Other Directorships Held
Outside Fund Complex by
Fund Trustee(3)
Overseen by
Fund Trustee | |
Marc Gary (1952) | | Trustee since 2015 | | Executive Vice Chancellor and Chief Operating Officer, Jewish Theological Seminary, since 2012; formerly, Executive Vice President and General Counsel, Fidelity Investments, 2007 to 2012; Executive Vice President and General Counsel, BellSouth Corporation, 2004 to 2007; Vice President and Associate General Counsel, BellSouth Corporation, 2000 to 2004; Associate, Partner, and National Litigation Practice Co-Chair, Mayer, Brown LLP, 1981 to 2000; Associate Independent Counsel, Office of Independent Counsel, 1990 to 1992. | | | 54 | | | Trustee, Jewish Theological Seminary, since 2015; Director, Counsel on Call (privately held for-profit company), since 2012; Director, Lawyers Committee for Civil Rights Under Law (not-for-profit), since 2005; formerly, Director, Equal Justice Works (not-for-profit), 2005 to 2014; Director, Corporate Counsel Institute, Georgetown University Law Center, 2007 to 2012; Director, Greater Boston Legal Services (not-for-profit), 2007 to 2012. | |
242
Name, (Year of Birth),
and Address(1) | | Position(s)
and Length of
Time Served(2) | | Principal Occupation(s)(3) | | Number of
Funds in
Fund Complex | | Other Directorships Held
Outside Fund Complex by
Fund Trustee(3)
Overseen by
Fund Trustee | |
Martha C. Goss (1949) | | Trustee since 2007 | | President, Woodhill Enterprises Inc./Chase Hollow Associates LLC (personal investment vehicle), since 2006; formerly, Consultant, Resources Global Professionals (temporary staffing), 2002 to 2006. | | | 54 | | | Director, American Water (water utility), since 2003; Director, Allianz Life of New York (insurance), since 2005; Director, Berger Group Holdings, Inc. (engineering consulting firm), since 2013; Director, Financial Women's Association of New York (not-for-profit association), since 2003; Trustee Emerita, Brown University, since 1998; Director, Museum of American Finance (not-for-profit), since 2013; formerly, Non-Executive Chair and Director, Channel Reinsurance (financial guaranty reinsurance), 2006 to 2010; formerly, Director, Ocwen Financial Corporation (mortgage servicing), 2005 to 2010; formerly, Director, Claire's Stores, Inc. (retailer), 2005 to 2007; formerly, Director, Parsons Brinckerhoff Inc. (engineering consulting firm), 2007 to 2010; formerly, Director, Bank Leumi (commercial bank), 2005 to 2007; formerly, Advisory Board Member, Attensity (software developer), 2005 to 2007. | |
Michael M. Knetter (1960) | | Trustee since 2007 | | President and Chief Executive Officer, University of Wisconsin Foundation, since October 2010; formerly, Dean, School of Business, University of Wisconsin—Madison; formerly, Professor of International Economics and Associate Dean, Amos Tuck School of Business—Dartmouth College, 1998 to 2002. | | | 54 | | | Board Member, American Family Insurance (a mutual company, not publicly traded), since March 2009; formerly, Trustee, Northwestern Mutual Series Fund, Inc., 2007 to 2011; formerly, Director, Wausau Paper, 2005 to 2011; formerly, Director, Great Wolf Resorts, 2004 to 2009. | |
243
Name, (Year of Birth),
and Address(1) | | Position(s)
and Length of
Time Served(2) | | Principal Occupation(s)(3) | | Number of
Funds in
Fund Complex | | Other Directorships Held
Outside Fund Complex by
Fund Trustee(3)
Overseen by
Fund Trustee | |
Deborah C. McLean (1954) | | Trustee since 2015 | | Member, Circle Financial Group (private wealth management membership practice), since 2011; Managing Director, Golden Seeds LLC (an angel investing group), since 2009; Adjunct Professor, Columbia University School of International and Public Affairs, since 2008; formerly, Visiting Assistant Professor, Fairfield University, Dolan School of Business, Fall 2007; formerly, Adjunct Associate Professor of Finance, Richmond, The American International University in London, 1999 to 2007. | | | 54 | | | Board member, Norwalk Community College Foundation, since 2014; Dean's Advisory Council, Radcliffe Institute for Advanced Study, since 2014; formerly, Director and Treasurer, At Home in Darien (not-for-profit), 2012 to 2014; Director, National Executive Service Corps (not-for-profit), 2012 to 2013; Trustee, Richmond, The American International University in London, 1999 to 2013. | |
Howard A. Mileaf (1937) | | Trustee since 1999 | | Retired; formerly, Vice President and General Counsel, WHX Corporation (holding company), 1993 to 2001. | | | 54 | | | Formerly, Director, Webfinancial Corporation (holding company), 2002 to 2008; formerly, Director, WHX Corporation (holding company), 2002 to 2005; formerly, Director, State Theatre of New Jersey (not-for-profit theatre), 2000 to 2005. | |
George W. Morriss (1947) | | Trustee since 2007 | | Adjunct Professor, Columbia University School of International and Public Affairs, since October 2012; formerly, Executive Vice President and Chief Financial Officer, People's Bank, Connecticut (a financial services company), 1991 to 2001. | | | 54 | | | Director and Treasurer, National Association of Corporate Directors, Connecticut Chapter, since 2011; Trustee, Steben Alternative Investment Funds, Steben Select Multi-Strategy Fund, and Steben Select Multi-Strategy Master Fund, since 2013; formerly, Manager, Larch Lane Multi-Strategy Fund complex (which consisted of three funds), 2006 to 2011; formerly, Member, NASDAQ Issuers' Affairs Committee, 1995 to 2003. | |
244
Name, (Year of Birth),
and Address(1) | | Position(s)
and Length of
Time Served(2) | | Principal Occupation(s)(3) | | Number of
Funds in
Fund Complex | | Other Directorships Held
Outside Fund Complex by
Fund Trustee(3)
Overseen by
Fund Trustee | |
Tom D. Seip (1950) | | Trustee since 2000; Chairman of the Board since 2008; formerly Lead Independent Trustee from 2006 to 2008 | | General Partner, Ridgefield Farm LLC (a private investment vehicle); formerly, President and CEO, Westaff, Inc. (temporary staffing), May 2001 to January 2002; formerly, Senior Executive, The Charles Schwab Corporation, 1983 to 1998, including Chief Executive Officer, Charles Schwab Investment Management, Inc.; Trustee, Schwab Family of Funds and Schwab Investments, 1997 to 1998; and Executive Vice President-Retail Brokerage, Charles Schwab & Co., Inc., 1994 to 1997. | | | 54 | | | Director, H&R Block, Inc. (financial services company), since May 2001; Chairman, Governance and Nominating Committee, H&R Block, Inc., since 2011; formerly, Chairman, Compensation Committee, H&R Block, Inc., 2006 to 2010; formerly, Director, Forward Management, Inc. (asset management company), 1999 to 2006. | |
James G. Stavridis (1955) | | Trustee since 2015 | | Dean, Fletcher School of Law and Diplomacy, Tufts University since 2013; formerly, Admiral, United States Navy, 2006 to 2013, including Supreme Allied Commander, NATO and Commander, European Command, 2009 to 2013, and Commander, United States Southern Command, 2006 to 2009. | | | 54 | | | Director, Utilidata Inc., since 2015; Director, BMC Software Federal, LLC, since 2014; Director, Vertical Knowledge, LLC, since 2013; formerly, Director, Navy Federal Credit Union, 2000-2002. | |
245
Name, (Year of Birth),
and Address(1) | | Position(s)
and Length of
Time Served(2) | | Principal Occupation(s)(3) | | Number of
Funds in
Fund Complex | | Other Directorships Held
Outside Fund Complex by
Fund Trustee(3)
Overseen by
Fund Trustee | |
Candace L. Straight (1947) | | Trustee since 1999 | | Private investor and consultant specializing in the insurance industry; formerly, Advisory Director, Securitas Capital LLC (a global private equity investment firm dedicated to making investments in the insurance sector), 1998 to 2003. | | | 54 | | | Public Member, Board of Governors and Board of Trustees, Rutgers University, since 2011; Director, Montpelier Re Holdings Ltd. (reinsurance company), since 2006; formerly, Director, National Atlantic Holdings Corporation (property and casualty insurance company), 2004 to 2008; formerly, Director, The Proformance Insurance Company (property and casualty insurance company), 2004 to 2008; formerly, Director, Providence Washington Insurance Company (property and casualty insurance company), 1998 to 2006; formerly, Director, Summit Global Partners (insurance brokerage firm), 2000 to 2005. | |
Peter P. Trapp (1944) | | Trustee since 1984 | | Retired; formerly, Regional Manager for Mid-Southern Region, Ford Motor Credit Company, September 1997 to 2007; formerly, President, Ford Life Insurance Company, April 1995 to August 1997. | | | 54 | | | None. | |
246
Name, (Year of Birth),
and Address(1) | | Position(s)
and Length of
Time Served(2) | | Principal Occupation(s)(3) | | Number of
Funds in
Fund Complex | | Other Directorships Held
Outside Fund Complex by
Fund Trustee(3)
Overseen by
Fund Trustee | |
Fund Trustees who are "Interested Persons" | |
Joseph V. Amato* (1962) | | Trustee since 2009 | | President and Director, Neuberger Berman Group LLC, since 2009; President and Chief Executive Officer, Neuberger Berman and Neuberger Berman Holdings LLC (including its predecessor, Neuberger Berman Inc.), since 2007; Chief Investment Officer (Equities) and Managing Director, Neuberger Berman Investment Advisers LLC ("NBIA") (formerly, Neuberger Berman Fixed Income LLC ("NBFI") and including predecessor entities), since 2007, and Board Member of NBIA since 2006; formerly, Global Head of Asset Management of Lehman Brothers Holdings Inc.'s ("LBHI") Investment Management Division, 2006 to 2009; formerly, member of LBHI's Investment Management Division's Executive Management Committee, 2006 to 2009; formerly, Managing Director, Lehman Brothers Inc. ("LBI"), 2006 to 2008; formerly, Chief Recruiting and Development Officer, LBI, 2005 to 2006; formerly, Global Head of LBI's Equity Sales and a Member of its Equities Division Executive Committee, 2003 to 2005. | | | 54 | | | Member of Board of Advisors, McDonough School of Business, Georgetown University, since 2001; Member of New York City Board of Advisors, Teach for America, since 2005; Trustee, Montclair Kimberley Academy (private school), since 2007; Member of Board of Regents, Georgetown University, since 2013. | |
247
Name, (Year of Birth),
and Address(1) | | Position(s)
and Length of
Time Served(2) | | Principal Occupation(s)(3) | | Number of
Funds in
Fund Complex | | Other Directorships Held
Outside Fund Complex by
Fund Trustee(3)
Overseen by
Fund Trustee | |
Robert Conti* (1956) | | Chief Executive Officer, President and Trustee since 2008; prior thereto, Executive Vice President in 2008 and Vice President from 2000 to 2008 | | Managing Director, Neuberger Berman, since 2007; Managing Director and President—Mutual Funds, NBIA, since 2008; formerly, Senior Vice President, Neuberger Berman, 2003 to 2006; formerly, Vice President, Neuberger Berman, 1999 to 2003; President and Chief Executive Officer, twenty-eight registered investment companies for which NBIA acts as investment manager and/or administrator. | | | 54 | | | Director, Staten Island Mental Health Society, since 1994; formerly, Chairman of the Board, Staten Island Mental Health Society, 2008 to 2011. | |
(1) The business address of each listed person is 605 Third Avenue, New York, New York 10158.
(2) Pursuant to the Trust's Trust Instrument, each of these Trustees shall hold office for life or until his or her successor is elected or the Trust terminates; except that (a) any Trustee may resign by delivering a written resignation; (b) any Trustee may be removed with or without cause at any time by a written instrument signed by at least two-thirds of the other Trustees; (c) any Trustee who requests to be retired, or who has become unable to serve, may be retired by a written instrument signed by a majority of the other Trustees; and (d) any Trustee may be removed at any shareholder meeting by a vote of at least two-thirds of the outstanding shares.
(3) Except as otherwise indicated, each individual has held the positions shown for at least the last five years.
* Indicates a Trustee who is an "interested person" within the meaning of the 1940 Act. Mr. Amato and Mr. Conti are interested persons of the Trust by virtue of the fact that each is an officer of Management, Neuberger Berman and/or their affiliates.
248
Information about the Officers of the Trust
Name, (Year of Birth),
and Address(1) | | Position(s)
and Length of
Time Served(2) | | Principal Occupation(s)(3) | |
Claudia A. Brandon (1956) | | Executive Vice President since 2008 and Secretary since 1985 | | Senior Vice President, Neuberger Berman, since 2007 and Employee since 1999; Senior Vice President, NBIA, since 2008 and Assistant Secretary since 2004; formerly, Vice President, Neuberger Berman, 2002 to 2006; formerly, Vice President—Mutual Fund Board Relations, NBIA, 2000 to 2008; formerly, Vice President, NBIA, 1986 to 1999 and Employee, 1984 to 1999; Executive Vice President, twenty-eight registered investment companies for which NBIA acts as investment manager and/or administrator; Secretary, fifteen registered investment companies for which NBIA acts as investment manager and/or administrator. | |
Agnes Diaz (1971) | | Vice President since 2013 | | Senior Vice President, Neuberger Berman, since 2012; Employee, NBIA, since 1996; formerly, Vice President, Neuberger Berman, 2007 to 2012; Vice President, twenty-eight registered investment companies for which NBIA acts as investment manager and/or administrator. | |
Anthony DiBernardo (1979) | | Assistant Treasurer since 2011 | | Senior Vice President, Neuberger Berman, since 2014; Employee, NBIA, since 2003; formerly, Vice President, Neuberger Berman, 2009 to 2014; Assistant Treasurer, ten registered investment companies for which NBIA acts as investment manager and administrator. | |
Corey A. Issing (1978) | | Chief Legal Officer since 2016 (only for purposes of sections 307 and 406 of the Sarbanes-Oxley Act of 2002) and Anti-Money Laundering Compliance Officer since 2016 | | General Counsel and Head of Compliance—Mutual Funds since 2016 and Senior Vice President, NBIA, since 2013, formerly, Associate General Counsel (2015 to 2016), Counsel (2007 to 2015), Vice President (2009-2013) Chief Legal Officer (only for purposes of sections 307 and 406 of the Sarbanes-Oxley Act of 2002), twenty-eight registered investment companies for which NBIA acts as investment manager and/or administrator; Anti-Money Laundering Compliance Officer, twenty-eight registered investment companies for which NBIA acts as investment manager and/or administrator. | |
Sheila R. James (1965) | | Assistant Secretary since 2002 | | Vice President, Neuberger Berman, since 2008 and Employee since 1999; formerly, Assistant Vice President, Neuberger Berman, 2007; formerly, Employee, NBIA, 1991 to 1999; Assistant Secretary, twenty-eight registered investment companies for which NBIA acts as investment manager and/or administrator. | |
Brian Kerrane (1969) | | Chief Operating Officer since 2015 and Vice President since 2008 | | Managing Director, Neuberger Berman, since 2014; Vice President, NBIA, since 2008 and Employee since 1991; formerly, Senior Vice President, Neuberger Berman, 2006 to 2014; Chief Operating Officer, ten registered investment companies for which NBIA acts as investment manager and/or administrator; Vice President, twenty-eight registered investment companies for which NBIA acts as investment manager and/or administrator. | |
249
Name, (Year of Birth),
and Address(1) | | Position(s)
and Length of
Time Served(2) | | Principal Occupation(s)(3) | |
Kevin Lyons (1955) | | Assistant Secretary since 2003 | | Assistant Vice President, Neuberger Berman, since 2008 and Employee since 1999; formerly, Employee, NBIA, 1993 to 1999; Assistant Secretary, ten registered investment companies for which NBIA acts as investment manager and administrator. | |
Anthony Maltese (1959) | | Vice President since 2015 | | Senior Vice President, Neuberger Berman, since 2014 and Employee since 2000; Vice President, ten registered investment companies for which NBIA acts as investment manager and administrator. | |
Owen F. McEntee, Jr. (1961) | | Vice President since 2008 | | Vice President, Neuberger Berman, since 2006; Employee, NBIA, since 1992; Vice President, ten registered investment companies for which NBIA acts as investment manager and administrator. | |
John M. McGovern (1970) | | Treasurer and Principal Financial and Accounting Officer since 2005 | | Senior Vice President, Neuberger Berman, since 2007; Employee, NBIA, since 1993; formerly, Vice President, Neuberger Berman, 2004 to 2006; formerly, Assistant Treasurer, 2002 to 2005; Treasurer and Principal Financial and Accounting Officer, twenty-eight registered investment companies for which NBIA acts as investment manager and/or administrator. | |
Frank Rosato (1971) | | Assistant Treasurer since 2005 | | Vice President, Neuberger Berman, since 2006; Employee, NBIA, since 1995; Assistant Treasurer, ten registered investment companies for which NBIA acts as investment manager and administrator. | |
Chamaine Williams (1971) | | Chief Compliance Officer since 2005 | | Senior Vice President, Neuberger Berman, since 2007; Chief Compliance Officer, NBIA, since 2006; formerly, Senior Vice President, LBI, 2007 to 2008; formerly, Vice President, LBI, 2003 to 2006; formerly, Chief Compliance Officer, Lehman Brothers Asset Management Inc., 2003 to 2007; formerly, Chief Compliance Officer, Lehman Brothers Alternative Investment Management LLC, 2003 to 2007; Chief Compliance Officer, fifteen registered investment companies for which NBIA acts as investment manager and/or administrator. | |
(1) The business address of each listed person is 605 Third Avenue, New York, New York 10158.
(2) Pursuant to the By-Laws of the Trust, each officer elected by the Trustees shall hold office until his or her successor shall have been elected and qualified or until his or her earlier death, inability to serve, or resignation. Officers serve at the pleasure of the Trustees and may be removed at any time with or without cause.
(3) Except as otherwise indicated, each individual has held the positions shown for at least the last five years.
250
Proxy Voting Policies and Procedures
A description of the policies and procedures that the Trust uses to determine how to vote proxies relating to portfolio securities is available, without charge, by calling 800-877-9700 (toll-free) and on the Securities and Exchange Commission's website, at www.sec.gov. Information regarding how the Trust voted proxies relating to portfolio securities during the most recent 12-month period ended June 30 is also available upon request, without charge, by calling 800-877-9700 (toll-free), on the Securities and Exchange Commission's website at www.sec.gov, and on Management's website at www.nb.com.
Quarterly Portfolio Schedule
The Trust files a complete schedule of portfolio holdings for each Fund with the Securities and Exchange Commission for the first and third quarters of each fiscal year on Form N-Q. The Trust's Forms N-Q are available on the Securities and Exchange Commission's website at www.sec.gov and may be reviewed and copied at the Securities and Exchange Commission's Public Reference Room in Washington, DC. Information on the operation of the Public Reference Room may be obtained by calling 800-SEC-0330. The information on Form N-Q is available upon request, without charge, by calling 800-877-9700 (toll-free).
251
Notice to Shareholders
Equity Income, Focus, Genesis, Global Real Estate, Guardian, Intrinsic Value, Large Cap Value, Mid Cap Growth, Mid Cap Intrinsic Value, Multi-Cap Opportunities, Real Estate, Small Cap Growth, Socially Responsive and Value hereby designate $66,678,398, $35,550,318, $1,125,571,976, $341, $134,218,623, $22,985,868, $113,694,976, $90,521,333, $10,316,948, $60,531,847, $52,279,106, $2,181,399, $138,003,445 and $202,164, respectively, as a capital gain distribution. Real Estate hereby designates $200,813, as Section 1250 gain distribution.
For the fiscal year ended August 31, 2016, each Fund makes the following designation, or up to the maximum amount of such dividends allowable pursuant to the Internal Revenue Code, as qualified dividend income eligible for reduced tax rates. These lower rates range from 5% to 15% depending upon an individual's tax bracket. Complete information regarding each Funds distributions during the calendar year 2016 will be reported in conjunction with Form 1099-DIV.
| Fund | | Qualified
Dividend Income | |
Dividend Growth | | $ | 366,752 | | |
Emerging Markets Equity | | | 9,065,530 | | |
Equity Income | | | 65,143,562 | | |
Focus | | | 11,301,143 | | |
Genesis | | | 135,833,166 | | |
Global Equity | | | 75,106 | | |
Global Real Estate | | | 82,753 | | |
Greater China Equity | | | 1,933,000 | | |
Guardian | | | 17,847,953 | | |
International Equity | | | 33,862,596 | | |
International Select | | | 6,170,950 | | |
Intrinsic Value | | | 3,341,230 | | |
Large Cap Value | | | 26,630,008 | | |
Mid Cap Growth | | | 6,766,310 | | |
Mid Cap Intrinsic Value | | | 1,844,367 | | |
Multi-Cap Opportunities | | | 35,975,832 | | |
Real Estate | | | 18,598,039 | | |
Small Cap Growth | | | 261,132 | | |
Socially Responsive | | | 36,597,747 | | |
Value | | | 287,657 | | |
252
This page has been left blank intentionally
253
Neuberger Berman Investment Advisers LLC
605 Third Avenue 2nd Floor
New York, NY 10158–0180
Shareholder Services
800.877.9700
Intermediary Client Services
800.366.6264
www.nb.com
Statistics and projections in this report are derived from sources deemed to be reliable but cannot be regarded as a representation of future results of the Funds. This report is prepared for the general information of shareholders and is not an offer of shares of the Funds. Shares are sold only through the currently effective prospectus which you can obtain by calling 887.628.2583. An investor should consider carefully a Fund's investment objectives, risks and fees and expenses, which are described in its prospectus, before investing.
 H0599 10/16
Item 2. Code of Ethics.
The Board of Trustees (“Board”) of Neuberger Berman Equity Funds (“Registrant”) has adopted a code of ethics that applies to the Registrant’s principal executive officer, principal financial officer, principal accounting officer or controller, or persons performing similar functions (“Code of Ethics”). During the period covered by this Form N-CSR, there were no substantive amendments to the Code of Ethics and there were no waivers from the Code of Ethics granted to the Registrant’s principal executive officer, principal financial officer, principal accounting officer or controller, or persons performing similar functions.
A copy of the Code of Ethics is incorporated by reference to Neuberger Berman Advisers Management Trust’s Form N-CSRS, Investment Company Act file number 811-04255 (filed August 25, 2016). The Code of Ethics is also available, without charge, by calling 1-800-877-9700 (toll-free).
Item 3. Audit Committee Financial Expert.
The Board has determined that the Registrant has four audit committee financial experts serving on its audit committee. The Registrant’s audit committee financial experts are Michael J. Cosgrove, Deborah C. McLean, George W. Morriss, and Candace L. Straight. Mr. Cosgrove, Ms. McLean, Mr. Morriss, and Ms. Straight are independent trustees as defined by Form N-CSR.
Item 4. Principal Accountant Fees and Services.
Ernst & Young, LLP (“E&Y”) serves as independent registered public accounting firm to the Neuberger Berman Dividend Growth, Emerging Markets Equity, Equity Income, Focus, Genesis, Global Equity, Global Real Estate, Greater China Equity, Guardian, International Equity, International Select, Large Cap Value, Real Estate, and Value Funds.
Tait, Weller & Baker LLP (“Tait Weller”) serves as independent registered public accounting firm to the Neuberger Berman Intrinsic Value, Mid Cap Growth, Mid Cap Intrinsic Value, Multi-Cap Opportunities, Small Cap Growth, and Socially Responsive Funds.
(a) Audit Fees
The aggregate fees billed for professional services rendered by E&Y for the audit of the annual financial statements or services that are normally provided by E&Y in connection with statutory and regulatory filings or engagements were $659,150 and $643,555 for the fiscal years ended 2015 and 2016, respectively.
The aggregate fees billed for professional services rendered by Tait Weller for the audit of the annual financial statements or services that are normally provided by Tait Weller in connection with statutory and regulatory filings or engagements were $150,675 and $133,020 for the fiscal years ended 2015 and 2016, respectively.
(b) Audit-Related Fees
The aggregate fees billed to the Registrant for assurance and related services by E&Y that are reasonably related to the performance of the audit of the Registrant’s financial statements and are not reported above in Audit Fees were $0 and $0 for the fiscal years ended 2015 and 2016, respectively. The Audit Committee approved 0% and 0% of these services provided by E&Y for the fiscal years ended 2015 and 2016, respectively, pursuant to the waiver provisions of Rule 2-01(c)(7)(i)(C) of Regulation S-X.
The fees billed to other entities in the investment company complex for assurance and related services by E&Y that are reasonably related to the performance of the audit that the Audit Committee was required to
approve because the engagement related directly to the operations and financial reporting of the Registrant were $0 and $0 for the fiscal years ended 2015 and 2016, respectively. The Audit Committee approved 0% and 0% of these services provided by E&Y for the fiscal years ended 2015 and 2016, respectively, pursuant to the waiver provisions of Rule 2-01(c)(7)(i)(C) of Regulation S-X.
The aggregate fees billed to the Registrant for assurance and related services by Tait Weller that are reasonably related to the performance of the audit of the Registrant’s financial statements and are not reported above in Audit Fees were $0 and $0 for the fiscal years ended 2015 and 2016, respectively. The Audit Committee approved 0% and 0% of these services provided by Tait Weller for the fiscal years ended 2015 and 2015, respectively, pursuant to the waiver provisions of Rule 2-01(c)(7)(i)(C) of Regulation S-X.
The fees billed to other entities in the investment company complex for assurance and related services by Tait Weller that are reasonably related to the performance of the audit that the Audit Committee was required to approve because the engagement related directly to the operations and financial reporting of the Registrant were $0 and $0 for the fiscal years ended 2015 and 2016, respectively. The Audit Committee approved 0% and 0% of these services provided by Tait Weller for the fiscal years ended 2015 and 2016, respectively, pursuant to the waiver provisions of Rule 2-01(c)(7)(i)(C) of Regulation S-X.
(c) Tax Fees
The aggregate fees billed to the Registrant for professional services rendered by E&Y for tax compliance, tax advice, and tax planning were $182,250 and $178,000 for the fiscal years ended 2015 and 2016, respectively. The nature of the services provided includes preparation of the Federal and State tax extensions and tax returns, review of annual excise tax calculations, and preparation of form 8613, in addition to guidance with the identification of Passive Foreign Investment Companies ("PFICs"), assistance with determination of various foreign withholding taxes, and assistance with Internal Revenue Code and tax regulation requirements for fund investments. The Audit Committee approved 0% and 0% of these services provided by E&Y for the fiscal years ended 2015 and 2016, respectively, pursuant to the waiver provisions of Rule 2-01(c)(7)(i)(C) of Regulation S-X.
The fees billed to other entities in the investment company complex for professional services rendered by E&Y for tax compliance, tax advice, and tax planning that the Audit Committee was required to approve because the engagement related directly to the operations and financial reporting of the Registrant were $0 and $0 for the fiscal years ended 2015 and 2016, respectively. The Audit Committee approved 0% and 0% of these services provided by E&Y for the fiscal years ended 2015 and 2016, respectively, pursuant to the waiver provisions of Rule 2-01(c)(7)(i)(C) of Regulation S-X.
The aggregate fees billed to the Registrant for professional services rendered by Tait Weller for tax compliance, tax advice, and tax planning were $33,250 and $34,900 for the fiscal years ended 2015 and 2016, respectively. The nature of the services provided includes preparation of the Federal and State tax extensions and tax returns, review of annual excise tax calculations, and preparation of form 8613, in addition to guidance with the identification of PFICs, assistance with determination of various foreign withholding taxes, and assistance with Internal Revenue Code and tax regulation requirements for fund investments. The Audit Committee approved 0% and 0% of these services provided by Tait Weller for the fiscal years ended 2015 and 2016, respectively, pursuant to the waiver provisions of Rule 2-01(c)(7)(i)(C) of Regulation S-X.
The fees billed to other entities in the investment company complex for professional services rendered by Tait Weller for tax compliance, tax advice, and tax planning that the Audit Committee was required to approve because the engagement related directly to the operations and financial reporting of the Registrant were $0 and $0 for the fiscal years ended 2015 and 2016, respectively. The Audit Committee approved 0% and 0% of these services provided by Tait Weller for the fiscal years ended 2015 and 2016, respectively, pursuant to the waiver provisions of Rule 2-01(c)(7)(i)(C) of Regulation S-X.
(d) All Other Fees
The aggregate fees billed to the Registrant for products and services provided by E&Y, other than services reported in Audit Fees, Audit-Related Fees, and Tax Fees were $0 and $0 for the fiscal years ended 2015 and 2016, respectively. The Audit Committee approved 0% and 0% of these services provided by E&Y for the fiscal years ended 2015 and 2016, respectively, pursuant to the waiver provisions of Rule 2-01(c)(7)(i)(C) of Regulation S-X.
The fees billed to other entities in the investment company complex for products and services provided by E&Y, other than services reported in Audit Fees, Audit-Related Fees, and Tax Fees that the Audit Committee was required to approve because the engagement related directly to the operations and financial reporting of the Registrant were $0 and $0 for the fiscal years ended 2015 and 2016, respectively. The Audit Committee approved 0% and 0% of these services provided by E&Y for the fiscal years ended 2015 and 2016, respectively, pursuant to the waiver provisions of Rule 2-01(c)(7)(i)(C) of Regulation S-X.
The aggregate fees billed to the Registrant for products and services provided by Tait Weller, other than services reported in Audit Fees, Audit-Related Fees, and Tax Fees were $0 and $0 for the fiscal years ended 2015 and 2016, respectively. The Audit Committee approved 0% and 0% of these services provided by Tait Weller for the fiscal years ended 2015 and 2016, respectively, pursuant to the waiver provisions of Rule 2-01(c)(7)(i)(C) of Regulation S-X.
The fees billed to other entities in the investment company complex for products and services provided by Tait Weller, other than services reported in Audit Fees, Audit-Related Fees, and Tax Fees that the Audit Committee was required to approve because the engagement related directly to the operations and financial reporting of the Registrant were $0 and $0 for the fiscal years ended 2015 and 2016, respectively. The Audit Committee approved 0% and 0% of these services provided by Tait Weller for the fiscal years ended 2015 and 2016, respectively, pursuant to the waiver provisions of Rule 2-01(c)(7)(i)(C) of Regulation S-X.
(e) Audit Committee’s Pre-Approval Policies and Procedures
(1) The Audit Committee’s pre-approval policies and procedures for the Registrant to engage an accountant to render audit and non-audit services delegate to each member of the Committee the power to pre-approve services between meetings of the Committee.
(2) None of the services described in paragraphs (b) through (d) above were approved by the Audit Committee pursuant to paragraph (c)(7)(i)(C) of Rule 2-01 of Regulation S-X.
(f) Hours Attributed to Other Persons
Not applicable.
(g) Non-Audit Fees
Non-audit fees billed by E&Y for services rendered to the Registrant were $249,450 and $325,380 for the fiscal years ended 2015 and 2016, respectively.
Non-audit fees billed by E&Y for services rendered to the Registrant’s investment adviser and any entity controlling, controlled by, or under common control with the adviser that provides ongoing services to the Registrant were $0 and $0 for the fiscal years ended 2015 and 2016, respectively.
Non-audit fees billed by Tait Weller for services rendered to the Registrant were $33,250 and $34,900 for the fiscal years ended 2015 and 2016, respectively.
Non-audit fees billed by Tait Weller for services rendered to the Registrant’s investment adviser and any entity controlling, controlled by, or under common control with the adviser that provides ongoing services to the Registrant were $0 and $0 for the fiscal years ended 2015 and 2016, respectively.
(h) The Audit Committee of the Board considered whether the provision of non-audit services rendered to the Registrant’s investment adviser and any entity controlling, controlled by, or under common control with the adviser that provides ongoing services to the Registrant that were not pre-approved by the Audit Committee because the engagement did not relate directly to the operations and financial reporting of the Registrant is compatible with maintaining E&Y’s and Tait Weller’s independence.
Item 5. Audit Committee of Listed Registrants.
Not applicable to the Registrant.
Item 6. Schedule of Investments.
The complete schedule of investments for each series is disclosed in the Registrant’s annual report included as Item 1 of this Form N-CSR.
Item 7. Disclosure of Proxy Voting Policies and Procedures for Closed-End Management Investment Companies.
Not applicable to the Registrant.
Item 8. Portfolio Managers of Closed-End Management Investment Companies.
Not applicable to the Registrant.
Item 9. Purchases of Equity Securities by Closed-End Management Investment Company and Affiliated Purchasers.
Not applicable to the Registrant.
Item 10. Submission of Matters to a Vote of Security Holders.
There were no changes to the procedures by which shareholders may recommend nominees to the Board.
Item 11. Controls and Procedures.
| (a) | Based on an evaluation of the disclosure controls and procedures (as defined in Rule 30a-3(c) under the Act) as of a date within 90 days of the filing date of this report, the Chief Executive Officer and President and the Treasurer and Principal Financial and Accounting Officer of the Registrant have concluded that such disclosure controls and procedures are effectively designed to ensure that information required to be disclosed by the Registrant on Form N-CSR is accumulated and communicated to the Registrant’s management to allow timely decisions regarding required disclosure. |
| (b) | There were no significant changes in the Registrant’s internal controls over financial reporting (as defined in Rule 30a-3(d) under the Act) that occurred during the Registrant’s second fiscal quarter of the period covered by this report that have materially affected, or are reasonably likely to materially affect, the Registrant’s internal control over financial reporting. |
Item 12. Exhibits.
| (a)(1) | A copy of the Code of Ethics is incorporated by reference to Neuberger Berman Advisers Management Trust’s Form N-CSRS, Investment Company Act file number 811-04255 (filed August 25, 2016). |
| (a)(2) | The certifications required by Rule 30a-2(a) under the Act and Section 302 of the Sarbanes-Oxley Act of 2002 (“Sarbanes-Oxley Act”) are filed herewith. |
| (a)(3) | Not applicable to the Registrant. |
| (b) | The certification required by Rule 30a-2(b) under the Act and Section 906 of the Sarbanes-Oxley Act is furnished herewith. |
The certification furnished pursuant to Rule 30a-2(b) under the Act and Section 906 of the Sarbanes-Oxley Act will not be deemed “filed” for purposes of Section 18 of the Securities Exchange Act of 1934, as amended (“Exchange Act”), or otherwise subject to the liability of that section. Such certification will not be deemed to be incorporated by reference into any filing under the Securities Act of 1933, as amended, or the Exchange Act, except to the extent that the Registrant specifically incorporates it by reference.
SIGNATURES
Pursuant to the requirements of the Securities Exchange Act of 1934 and the Investment Company Act of 1940, the Registrant has duly caused this report to be signed on its behalf by the undersigned, thereunto duly authorized.
Neuberger Berman Equity Funds
By: | /s/ Robert Conti | |
| Robert Conti |
| Chief Executive Officer and President |
Date: November 3, 2016
Pursuant to the requirements of the Securities Exchange Act of 1934 and the Investment Company Act of 1940, this report has been signed below by the following persons on behalf of the Registrant and in the capacities and on the dates indicated.
By: | /s/ Robert Conti | |
| Robert Conti |
| Chief Executive Officer and President |
Date: November 3, 2016
By: | /s/ John M. McGovern | |
| John M. McGovern |
| Treasurer and Principal Financial |
| | and Accounting Officer |
Date: November 3, 2016