UNITED STATES
SECURITIES AND EXCHANGE COMMISSION
WASHINGTON, D.C. 20549
FORM N-CSR
CERTIFIED SHAREHOLDER REPORT OF REGISTERED
MANAGEMENT INVESTMENT COMPANIES
Investment Company Act file number 811-1512
Oppenheimer Capital Income Fund
(Exact name of registrant as specified in charter)
6803 South Tucson Way, Centennial, Colorado 80112-3924
(Address of principal executive offices) (Zip code)
Cynthia Lo Bessette
OFI Global Asset Management, Inc.
225 Liberty Street, New York, New York 10281-1008
(Name and address of agent for service)
Registrant’s telephone number, including area code: (303) 768-3200
Date of fiscal year end: August 31
Date of reporting period: 8/31/2018
Item 1. Reports to Stockholders.
Class A Shares
AVERAGE ANNUAL TOTAL RETURNS AT 8/31/18
| | | | | | | | | | | | | | | | | | | | |
| | | Class A Shares of the Fund | | | | | | | | | | |
| | | | | | | | | | | | Bloomberg | | | | |
| | | Without Sales | | | With Sales | | | Russell 3000 | | | Barclays U.S. | | | Reference Index | |
| | | Charge | | | Charge | | | Index | | | Aggregate Bond | | | | |
| | | | | | | | | | | | Index | | | | |
| 1-Year | | | 4.10% | | | | -1.88% | | | | 20.25% | | | | -1.05% | | | | 6.15% | |
| 5-Year | | | 5.05 | | | | 3.81 | | | | 14.25 | | | | 2.49 | | | | 6.69 | |
| 10-Year | | | 3.16 | | | | 2.55 | | | | 10.89 | | | | 3.70 | | | | 6.73 | |
Performance data quoted represents past performance, which does not guarantee future results. The investment return and principal value of an investment in the Fund will fluctuate so that an investor’s shares, when redeemed, may be worth more or less than their original cost. Fund returns include changes in share price, reinvested distributions, and a 5.75% maximum applicable sales charge except where “without sales charge” is indicated. Current performance may be lower or higher than the performance quoted. Returns do not consider capital gains or income taxes on an individual’s investment. Returns for periods of less than one year are cumulative and not annualized. For performance data current to the most recent month-end, visit oppenheimerfunds.com or call 1.800.CALL OPP (225.5677). See Fund prospectuses and summary prospectuses for more information on share classes and sales charges.
2 OPPENHEIMER CAPITAL INCOME FUND
Fund Performance Discussion
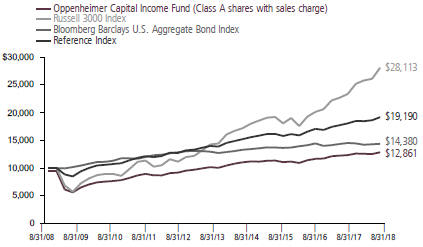
The Fund’s Class A shares (without sales charge) generated a total return of 4.10% during the one-year period ended 8/31/18. On a relative basis, the Fund underperformed its Reference Index, a customized weighted index comprised of 65% Bloomberg Barclays U.S. Aggregate Bond Index (Bloomberg Barclays Index) and 35% Russell 3000 Index, which returned 6.15%. Measured separately, the Bloomberg Barclays Index returned -1.05% and the Russell 3000 Index returned 20.25%. The Fund marginally underperformed the Morningstar 30-50% Equity Category average, which returned 4.35%.
All three of the Fund’s strategies generated positive returns during the reporting period. The High Grade Fixed Income and Opportunistic strategies both outperformed the return of the Bloomberg Barclays Index. The Equity & Equity Like strategy generated a double-digit return, but underperformed the Russell 3000 Index. The underperformance of the Fund versus its Reference Index
was the result of underperformance in the equity strategy. During the reporting period, in equities broadly speaking, growth substantially outperformed value and the strong performance was driven by a narrow handful of stocks. Given these dynamics, it is not surprising that a core domestic-focused equity portfolio with a conservative tilt underperformed. The Opportunistic strategy
COMPARISON OF CHANGE IN VALUE OF $10,000 HYPOTHETICAL INVESTMENTS IN:
3 OPPENHEIMER CAPITAL INCOME FUND
outperformed the Bloomberg Barclays Index by more than 650 basis points (bps) during the period on the back of strong security selection. The Fund has continued to deliver on its value proposition of attractive total returns combined with low volatility (3.63% standard deviation versus 9.08% for the S&P 500 and 8.64% for the Russell 3000 Index during the reporting period), good downside risk mitigation, an attractive yield, and high risk-adjusted returns. For the period from April 2009 to August 2018 (the time that Michelle Borré has been lead portfolio manager), the Fund has generated a Sharpe Ratio of 1.69 versus 1.25 for the Morningstar 30-50% Equity Allocation Category peer group average and a Sortino Ratio of 3.88 versus 2.39 for the peer group average. (A higher number indicates a superior risk-adjusted return.)
The Fund’s Class A shares paid four dividends during the period: $0.0609 per share in June 2018, $0.0608 per share in March 2018, $0.0856 per share in December 2017 and $0.0613 per share in September 2017 for a total of $0.2686 per share in the last 12 months. (The Fund’s Class A shares had a net asset value (NAV) of $10.28 per share on 8/31/18.) In addition, we believe that upside/ downside capture ratios provide a good measure of the Fund’s downside protection. The upside capture ratio is the cumulative performance of the Fund in all up months of positive return divided by the cumulative performance of the index in those months. The downside capture ratio is the cumulative performance of the Fund in all down months
of negative return divided by the cumulative performance of the index in those months. For the period from April 2009 to August 2018 (the time that Michelle Borré has been lead portfolio manager), the Fund’s upside capture has been 94% of the Morningstar 30-50% Equity Allocation Category peer group average and its downside capture has been 60%. For the same period, the Fund’s upside capture has been 98% of the Reference Index and its downside capture has been 90%. This level of asymmetry means that the Fund has delivered significantly more upside than downside during that period. In our view, these distributions, combined with our upside/ downside capture ratios, are a testament to the Fund’s intelligent blending of multiple asset classes.
More broadly, the Fund seeks to deliver total return by providing a stream of income along with capital appreciation while attempting to mitigate downside risk. The Fund invests opportunistically in a broad range of securities across asset classes and capital structures. The portfolio is designed as a conservative investment vehicle with income, upside potential, strong risk-adjusted returns, controlled drawdowns and low volatility. Our investment process combines top down and bottom up analyses both within and across asset classes. We are fundamentally driven and longer-term, value-oriented investors.
MARKET OVERVIEW
Regarding the macro environment, risk assets around the world rallied from the date of
4 OPPENHEIMER CAPITAL INCOME FUND
President Donald Trump’s election victory in November 2016 through 12/31/17, pushing valuations close to all-time highs for a variety of asset classes. During the first eight months of 2018, however, many of these asset classes have reversed course and posted losses. For example, although the S&P 500 generated a positive total return of 9.94% in the first eight months of 2018, the DAX Index (a measure of blue chip German stocks) has fallen 4.29%, the MSCI Emerging Markets Index has fallen 6.99%, and the Shanghai Composite Index has fallen 15.72% over the same period. In addition, the performance difference between growth and value equities has continued to be enormous, with the Russell 1000 Growth Index generating a 27.23% return during the reporting period compared to the 12.47% return for the Russell 1000 Value Index. Against this backdrop, interest rates have continued to climb higher, with the yield on the 10-year Treasury note rising from 1.85% on election day to 2.86% by the end of the reporting period for an increase of 101 bps. Fixed income has come under pressure as rates have continued to back up, with the Bloomberg Barclays Index falling 1.05% during the reporting period. In our view, Treasuries could become less helpful to investors during market selloffs, in part because they offer low yields, making the risk/ reward tradeoff unattractive. We believe this is especially true as the Federal Reserve (Fed) continues on its well-telegraphed path of raising rates while simultaneously shrinking its balance sheet.
The Trump administration has injected a level of policy uncertainty into the markets that investors have not seen in quite a while. At the same time, we believe structural flaws in both Europe and Japan remain unresolved. China and other emerging markets will likely eventually face slower long-term growth because the current growth is overly reliant, in our view, on excessive credit expansion. Meanwhile, we believe that in a number of countries there has been a meaningful change in the relationship between elected representatives and voters, or stated differently, between those who make policies and those who actually pay for those policies. We have discussed in previous commentaries the impact of Brexit along with the rise of populist parties in Europe. In March 2018, Italian voters shunned center left parties and instead voted for populist and center right candidates, resulting in a hung parliament. Although the Euro-skeptic/ populist Five Star party and the anti-immigrant League party have subsequently formed a ruling coalition, it remains to be seen how effectively they can govern and for how long. The new government is also likely to test the existing budget constraints in the EU. More recently, in September 2018, Sweden held elections but no single party won enough votes to form a government. The nationalist Sweden Democrats (SD) won 18% of the vote although the center-left ruling coalition and the center-right alliance (both with approximately 40% of the vote) have refused to govern with SD. Shortly after that election, Prime Minister Stefan Löfven lost a no-confidence vote and will be forced
5 OPPENHEIMER CAPITAL INCOME FUND
to step down. A major issue in the election was Sweden’s immigration policy. Joining the EU opened the door to new problems like immigration and the need to bail out peripheral nations. However, the EU does not seem capable of solving these issues, in our opinion, which has caused significant internal tension. We believe the EU in its current form is unsustainable, although we do not know what specific catalysts might cause changes in its structure or when those changes might occur.
Moreover, we believe investors now face rising geopolitical risks both in the U.S. and around the world. Trade disputes between the U.S. and China, Europe, Japan, Canada and Mexico have the potential to escalate meaningfully. At the same time, the Trump administration faces challenges at home including an investigation by special counsel Robert Mueller, a growing list of announced retirements by Republicans in Congress, and looming mid-term elections. Under these circumstances, we believe investors could benefit from a broader toolkit than was needed during the risk-on, quantitative easing (QE)-supported market of the past several years and a different toolkit than has been effective in the past because of the unfavorable risk/reward in conservative fixed income. Part of this broader toolkit could include the Fund’s ability to take short positions, which can profit from market declines. This kind of short exposure is available through the Opportunistic strategy of the Fund. (Because the Fund does not have a prime broker, we do not short
individual securities. However, we can take negative positions, or the functional equivalent of short exposures, through a variety of different financial instruments.)
FUND REVIEW
Equity & Equity Like Strategy. The Fund’s Equity & Equity-Like strategy may include common stocks, equity derivatives and hybrid securities with equity sensitivity. This strategy generated a double-digit return during the reporting period, but underperformed the Russell 3000 Index. The strongest contributors to performance were our call options on the S&P 500 and our positions in Cisco and Apple. The largest detractors were our positions in Philip Morris International, General Electric, and Dish Network.
Our call options on the S&P 500 contributed to performance as the index climbed 19.66% in the period on the back of strong earnings acceleration, solid quarterly results, and continued economic growth in the U.S. We like the asymmetry of the call options, which we believe have limited downside and considerably more potential upside.
Our position in Cisco Systems (CSCO), a manufacturer of networking hardware and telecommunications equipment, also contributed to performance. The company’s shares have benefited from a variety of factors. First, Cisco is showing tangible evidence of its ability to transition to a higher mix of recurring revenue through a
6 OPPENHEIMER CAPITAL INCOME FUND
subscription model. Second, the company has been a major beneficiary of capital repatriation enabled by the recently enacted tax reforms. Management has made clear that it will use these funds to improve its shareholder capital allocation program. Finally, Cisco has benefited from overall improvement in the enterprise spending environment on the back of improved economic conditions, higher corporate cash flows (resulting from lower taxes), and accelerated depreciation available under the new tax laws.
Our position in Apple Inc. (AAPL), a technology company that designs and sells consumer electronics and online services, contributed to performance as the company benefited from investor anticipation surrounding its upcoming product cycle. In addition, investors have gained a better appreciation of the benefit of Apple’s recurring revenue stream from services as well as its aggressive plans to return capital to shareholders. In this regard, in May 2018, management announced a new $100 billion share repurchase program and increased the dividend by 16%. The buyback program commenced in June 2018 and management expects to complete it at a fast pace. The increase in the dividend is the largest since the company re-introduced the dividend in 2012.
In contrast, our position in Philip Morris International (PM), a cigarette and tobacco company, detracted from performance. The shares suffered as investors have become
concerned about possible market saturation for iQOS in Japan. Although we expect growth to slow in that market, the global rollout of iQOS is still in the early stages. We expect the heat-not-burn technology to enjoy a multi-year penetration trend and expect iQOS to be accretive to market share and potentially to margins for the company.
Our holdings in General Electric (GE), an industrial conglomerate focused on aviation, power, energy, and healthcare, underperformed during the period in part due to investors’ concerns about the magnitude of revisions to the earnings outlook for 2017-2018. The concerns stem from a weaker global gas power generation outlook, a longer recovery period for the Oil & Gas business and a slowing wide-body aerospace cycle. The market has also been penalizing GE’s lower free cash flow conversion rate of 65% versus its historical rate of 80%. The announced 50% dividend cut in November 2017 was also a negative that hurt the stock, but gives the company needed flexibility to fund future capital expenditures. The January 2018 announcement of a reinsurance charge and required cash contribution for GE Capital compounded the problem. However, subsequent to the end of the reporting period, the company announced the appointment of a new CEO, Larry Culp, to help turn the company around. Mr. Culp’s success in leading Danaher for 14 years and his reputation for operating excellence, combined with investors’ confidence in his strategic vision, has resulted in GE’s stock moving noticeably higher since the announcement.
7 OPPENHEIMER CAPITAL INCOME FUND
We believe these actions should translate into improved free cash flow generation over time.
Our position in Dish Network (DISH), a television services provider, was also a detractor. The shares have suffered as there had been investor expectations that management could monetize the company’s existing spectrum holdings now that all service providers are free to discuss mergers, joint ventures and partnerships. For the last few years, these conversations weren’t possible because of anti-collusion rules that were in place as the government executed several spectrum auctions. While it’s uncertain when, or if, DISH will partner with another company, we are confident that in a capacity-constrained world, its spectrum is valuable and management will be opportunistic in monetizing these assets.
Opportunistic strategy. In this strategy we seek asymmetric risk/reward opportunities and investments where the return profile has a low correlation to traditional investment strategies. We also seek investments that can help to achieve the broader objectives of the Fund. At the end of the reporting period, this strategy included investments in senior loans through Oppenheimer Master Loan Fund, LLC, asset-backed securities (ABS), corporate bonds, and certain derivatives. This strategy outperformed the Bloomberg Barclays Index by over 650 bps during the reporting period, largely on the back of strong security selection. Among the top performers in this strategy were our positions in senior bank loans, the preferred stock of Citigroup, and
our spread position in European sovereign debt. The biggest detractors were our position in gold, our pair trade that was long the U.S. dollar and short the Thai baht, and our holdings in bonds issued by Wells Fargo.
Our holdings in the Oppenheimer Master Loan Fund, LLC contributed to performance in the period. The economy continued to grow while still easy financial conditions prevailed. Floating rate loans have benefited from the rise in U.S. interest rates as well as the rise in Libor since Trump’s election victory. The floating rate nature of these securities tends to make them more attractive than fixed rate securities in a rising rate environment. Credit spreads tightened in the period as solid economic growth continues to support asset prices. Default rates remain under 2%, which is below the historical average.
Our position in the preferred stock of Citigroup also contributed to performance. Citigroup Capital XIII is a trust preferred security that pays a floating interest rate of 3-month Libor plus 637 bps; currently, 3-month Libor is 234 bps. Since this is a floating rate security, it contributed to performance during a period of rising yields on longer-dated Treasuries. In addition, Citigroup Capital XIII outperformed the S&P Preferred Stock Index during the twelve months ended 8/31/18.
Our long/short position in European credit spreads contributed to performance as well. This position benefits from wider spreads between Germany and less creditworthy
8 OPPENHEIMER CAPITAL INCOME FUND
European sovereigns (i.e., Italy, Spain and France). In March 2018, Italian voters shunned center left parties and instead voted for populist and center right candidates, resulting in a hung parliament. Since then, the Euro-skeptic/populist Five Star party and the anti-immigrant League party have formed a ruling coalition. The government’s plans call for a larger fiscal deficit, which detracts from Italy’s credit profile. Furthermore, we believe it increases the strain on the EU. Both of these factors caused Italian credit spreads to widen, benefiting our position.
In contrast, our position in gold (GLD) detracted from performance as the yellow metal declined by 9.1% to $1,201 per troy ounce in the period. Gold bullion, which began the period at $1,321, oscillated in a $206 range before ending the period with a loss of $120 per ounce. The precious metals complex fell on the back of a stronger dollar (the U.S. Dollar Index climbed 2.7% in the period), continued solid economic growth, rising U.S. interest rates, and moderate inflation expectations. We believe some investors are increasingly viewing gold and other precious metals as warrants (i.e., long-dated options) on monetary policy going off the rails or a potential hedge against competitive currency debasement or adverse geopolitical events.
Our pair trade that was long U.S. dollar / short Thai baht detracted from performance as well. We exited this position in June. These bonds were fixed to floating rate securities that were paying a fixed rate of
5.9%. If these securities were not called (redeemed) in June of 2024, they would pay a floating rate of 3-month Libor plus 311 bps. The bonds were negatively impacted in the period by rising yields on longer-dated Treasuries as well as by widening credit spreads. Wider spreads reduced the probability that these bonds would be called, which in turn negatively impacted performance. During the twelve months ended 8/31/18, the total return from these securities outperformed the return from longer-dated Treasuries, but underperformed the return from the S&P Preferred Stock Index.
High Grade Fixed Income strategy.
The High Grade Fixed Income strategy generated positive returns and outperformed the Bloomberg Barclays Index during the reporting period. This strategy continues to favor corporate bonds, mortgages, and other securitized products over government debt. The dollar was generally stronger during the period against a basket of currencies for the largest trading partners of the U.S. In addition, the yield on the 10-year Treasury note climbed from 1.85% to 2.86% by the end of the period. Contributing to this strategy’s outperformance was an allocation to non-agency mortgage-backed securities (MBS), which benefited from solid fundamentals and a strong technical environment. Also benefiting relative performance was an allocation to BB-rated corporate bonds, an underweight to U.S. Treasuries, and solid security selection.
9 OPPENHEIMER CAPITAL INCOME FUND
The economic expansion continues as the U.S. economy is nearing the Fed’s dual mandate of full employment and price stability. Underlying inflation is converging toward the Fed’s 2% target. The High Grade Fixed Income Team believes the Fed is on track to deliver two additional rate hikes in 2018 after hiking by 25 bps three separate times during the reporting period. The Fed has signaled that it will tighten policy gradually, and so far, the hiking cycle has been orderly.
The High Grade Fixed Income Team believes macroeconomic fundamentals should remain solid with a continued increase in U.S. growth resulting from fiscal stimulus and tax reform. Although the Team generally remains neutral duration, in light of rising Treasury yields, particularly at the front of the curve, the Team maintained its slightly shorter effective duration than the Bloomberg Barclays Index at the end of the reporting period. At the sector level, the Team continues to maintain its strategic underweight to U.S. Treasuries. In lieu of Treasuries, the Team continues to maintain its overweight in agency MBS relative to the Bloomberg Barclays Index. The Team believes the sector’s high quality and spread above Treasuries make it an attractive area to add incremental yield potential to the portfolio. Within structured credit, the Team continues to favor auto ABS given their attractive fundamentals, carry and solid structures. The Team has also maintained a small overweight in commercial mortgage-backed securities (CMBS) and remains up-in-structure. Overall, the High Grade Fixed Income Team is more cautious on
credit as it believes we currently reside in the fourth quarter of the credit cycle. The Team remains cautiously engaged in investment grade corporate credit with modest exposure to typically high Sharpe Ratio BB-rated corporates. As a result, the Team is less likely to increase credit risk meaningfully, absent specific relative value opportunities. The Team typically avoids corporate bonds that are rated B or below and also avoids emerging market debt.
STRATEGY & OUTLOOK
After a nearly two-year hiatus, volatility and drawdowns have returned. In our view, the sudden spike in volatility and 10% drop in the S&P 500 in January were overdue. We believe the actual outlier was 2017 with its 50-year lows in equity volatility, 30-year lows in Treasury volatility, and a maximum drawdown of 2.8% on the S&P 500—well below the annual average of more than 10%. In particular, by the end of 2017, it had been more than 380 days since the last 5% drawdown on the S&P 500, far longer than the 90-day average of the last nine decades. The market was due for a spike in volatility and a meaningful drawdown, both of which occurred in late January as the CBOE Volatility Index (VIX Index) jumped more than 250% and the S&P 500 fell 10.1%. The bumpiness continued as the VIX Index spiked 65% in late March and the S&P 500 sold off 7.5%. Prolonged periods of low volatility breed complacency and a lack of mindfulness about downside risk, in our view. We believe many investors are starting to pay attention again.
10 OPPENHEIMER CAPITAL INCOME FUND
The combination of tax cuts, fiscal stimulus and a tight labor market could lead to higher inflation and higher rates than many investors expect. The Trump administration is pursuing a triple play of tax cuts, higher federal spending, and a major proposed infrastructure plan. Significantly, these efforts are taking place as the economy is accelerating and during a tight labor market. The fact that the administration is pursuing these policies in the absence of a recession makes them unusual. The fact that it is pursuing them all at the same time and so late in the economic cycle makes them highly unusual. We believe this stimulus increases the dual risks of higher inflation and tighter monetary policy.
U.S. Equities are Outperforming International Equities for a Reason this Year. The S&P 500 is meaningfully outperforming most developed and emerging market equity indices thus far in 2018—and there is a reason why. In the fourth quarter of 2017, the Fed was raising interest rates and starting to shrink its balance sheet. Simply put, quantitative easing was morphing into quantitative tightening. By the end of the reporting period, Congress had enacted tax reforms, it had agreed to two years of fiscal stimulus, and the Trump administration had drafted an infrastructure program. As a result, the federal government was borrowing more at a time when the U.S. Treasury was selling assets. This combination of factors effectively pulled U.S. dollars out of the rest of the world, making it more expensive to borrow in
dollars. The good news for U.S. companies is that they have enjoyed the benefits of several offsets in the form of lower tax rates, increased fiscal stimulus, consistent deregulation by the Trump administration, and accelerating economic growth. In contrast, companies in other developed markets as well as those in the emerging markets have enjoyed few (if any) such offsets. This is part of the reason why economic growth in the U.S. and earnings growth for the S&P 500 have been so robust relative to other markets thus far in 2018, in our view.
The trade winds are shifting but by how much remains to be seen. In the wake of Trump’s election victory, we wrote in our fourth quarter commentary for 2016 that international trade was one area of public policy where Trump did not need the approval of Congress to effect meaningful change. That view has proved to be correct so far as the U.S. has engaged in simultaneous trade disputes with China, Europe, Japan, Mexico, and Canada. The dispute with Mexico may be heading toward resolution, but the other disputes remain outstanding and how or when they are resolved remains uncertain. We do know, however, that trade barriers tend to make goods and services more expensive, and on a longer-term basis, they tend to slow economic growth, although the impact may not be apparent for some time.
There is a changing of the guard at the Fed. Jerome Powell became the new Chairman of the Federal Reserve when Janet
11 OPPENHEIMER CAPITAL INCOME FUND
Yellen’s term expired in February. Richard Clarida recently joined the Fed as Vice Chairman and Randy Quarles joined the Fed in early 2018. Trump has also nominated Professor Marvin Goodfriend and Michelle Bowman to positions as Fed Governors. Their confirmation hearings took place earlier this year but the Senate has yet to vote on these nominees. If a newly reconstituted Fed is more hawkish than investors currently expect, then the Trump administration could ultimately shift the tide away from the current easy money policies of central banks around the world. The Fed has raised the Fed Funds rate by 25 bps seven times since December 2015, including twice in 2018, and indicated that it plans two additional hikes in 2018, three in 2019, and one in 2020. It also started to normalize its $4.5 trillion balance sheet in October, which is effectively additional monetary policy tightening. At the Fed’s stated pace, that balance sheet should shrink below $4.0 trillion by the end of 2018.
The Fed is not alone—other central banks are moving in the same direction. Almost a dozen central banks around the world have started hiking rates this year in response to rising inflation and a falling local currency. Among the G-4 central banks, the Bank of England recently hiked rates for the second time in a decade, the European Central Bank is currently tapering its QE program (which is expected to end in December 2018), and the Bank of Japan has signaled that it could let the yield on 10-year Japanese government bonds start to rise
next year. All of this is a notable regime shift after years of coordinated monetary policy easing on a global basis. We could possibly see the first reduction of QE on a global basis in a while in 2019 as other central banks follow the U.S. in reducing stimulus. In fact, the rate at which G-4 central bank balance sheets are expanding has already slowed dramatically since the Fed started shrinking its balance sheet in October 2017. In our opinion, the next step is for the collective size of those balance sheets to start contracting. Today, only the Fed’s balance sheet is contracting. This change could be significant because central bank buying of assets globally has impacted interest rates around the world. We have constructed the portfolio with an eye toward delivering low volatility, effective diversification, strong downside risk mitigation, and high risk-adjusted returns in a variety of market conditions.
U.S. stocks and bonds remain expensive. Valuations for stocks and bonds in the U.S. are at or near their highest deciles going back 100 years. The fact that both asset classes are so expensive at the same time is unusual. Regarding equities, there is an earnings boost coming from tax reform but in the long term, buying stocks at high valuations typically means lower expected future returns for investors. At the same time, U.S. fixed income is expensive relative to historical valuations and the Fed has repeatedly warned of additional rate hikes through 2020. Moreover, the Trump administration’s fiscal and economic policies have caused a meaningful change in the
12 OPPENHEIMER CAPITAL INCOME FUND
outlook for fixed income. Treasury rates had been range bound for some time, with yields oscillating between 1.25% to 3.0%. In the longer run, however, we did not believe rates this low were sustainable. Trump’s election victory sent rates higher as the 10-year yield jumped from 1.85% on election day to 2.86% by 8/31/18. We have become more bearish on fixed income after the election. In our view, a strong focus on valuations is critical at this point in the economic, equity and credit cycles.
Seeking attractive investment opportunities later in the cycle. We believe the U.S. economy still has attractive growth potential in certain areas, and are waiting to see what additional pro-growth policies the Trump administration can actually implement. We recognize that there are pockets of innovation and disruption in different industries including consumer packaged goods, pharmaceuticals, consumer discretionary, real estate, and technology. Nonetheless, we are mindful that the U.S. equity bull market became the longest on record as of 8/22/18, eclipsing the prior record which ran from October 1990 to March 2000. We also recognize that extended periods of low equity volatility historically have not been sustainable, and they typically resolve with a period of meaningfully higher volatility. In part because of the Fed’s multiple rounds of quantitative easing in the wake of the global financial crisis, the U.S. equity market entered an extended period of
low volatility that began in early 2012 and continues through today. Over the last 30 years, the average maximum drawdown for the S&P 500 during periods of low volatility has been just under 10%. In sharp contrast, the average maximum drawdown for the S&P 500 during periods of high volatility has been just over 40%. The dual risks for investors are that volatility moves meaningfully higher and drawdowns become much more severe.
Moreover, we recognize that U.S. equity valuations are pushing up against the edge of bubble territory after several years when S&P 500 Index performance ran well ahead of earnings growth, leading to significant multiple expansion. (Since the S&P 500 bottomed in March 2009, it has climbed by more than 330% through 8/31/18, while S&P earnings have grown by less than one third of that figure.) In fact, the only time in the last four decades when the S&P 500 Index has traded at a higher price-earnings multiple on next 12 months’ consensus earnings was during the Tech Bubble in 1997-2000.
Accordingly, we continue to pick our spots, selecting securities that we believe offer attractive risk-adjusted returns. We remain focused, as always, on controlling volatility and mitigating downside risk. We expect to be in a cross-current heavy world for a while. We believe that the ability to generate attractive returns efficiently and without taking on undue risk, controlling volatility and limiting drawdowns will be of greater value to
13 OPPENHEIMER CAPITAL INCOME FUND
investors in this kind of environment, and that is where our investment team’s efforts are focused.
| | |
 | | 
Michelle Borré, CFA Portfolio Manager |
|
| | |
 | | 
Krishna Memani Portfolio Manager |
|
14 OPPENHEIMER CAPITAL INCOME FUND
Portfolio Positioning
| | | | | | | | | | | | |
| PORTFOLIO POSITIONING | | | | | | | | | | | | |
| | | Long | | | Short | | | Net | |
High-Grade Fixed Income Strategy | | | 42.4% | | | | -20.5% | | | | 21.9% | |
Equity Strategy | | | 39.3 | | | | -0.6 | | | | 38.7 | |
Opportunistic Strategy | | | 30.9 | | | | -14.6 | | | | 16.3 | |
| | | |
| HIGH-GRADE FIXED INCOME STRATEGY | | | | | | | | | | | | |
| | | Long | | | Short | | | Net | |
Corporate Bonds | | | 18.2% | | | | 0.0% | | | | 18.2% | |
Mortgage Related Securities | | | 16.4 | | | | 0.0 | | | | 16.4 | |
Asset Backed Securities | | | 5.2 | | | | 0.0 | | | | 5.2 | |
Duration Hedges | | | 2.7 | | | | -20.5 | | | | -17.8 | |
Credit Default Swaps | | | 0.0 | | | | 0.0 | | | | 0.0 | |
| | | |
| TOP TEN EQUITY HOLDINGS | | | | | | | | | | | | |
| | | Long | | | Short | | | Net | |
Apple, Inc. | | | 1.3% | | | | 0.0% | | | | 1.3% | |
M&T Bank Corp. | | | 1.2 | | | | 0.0 | | | | 1.2 | |
Chubb Ltd. | | | 1.2 | | | | 0.0 | | | | 1.2 | |
Alphabet, Inc., Cl. A | | | 1.1 | | | | 0.0 | | | | 1.1 | |
UnitedHealth Group, Inc. | | | 1.1 | | | | 0.0 | | | | 1.1 | |
Philip Morris International, Inc. | | | 1.1 | | | | 0.0 | | | | 1.1 | |
Blackstone Mortgage Trust, Inc., Cl. A | | | 1.0 | | | | 0.0 | | | | 1.0 | |
Lockheed Martin Corp. | | | 1.0 | | | | 0.0 | | | | 1.0 | |
Cisco Systems, Inc. | | | 0.9 | | | | 0.0 | | | | 0.9 | |
Xilinx, Inc. | | | 0.9 | | | | 0.0 | | | | 0.9 | |
Portfolio holdings and allocations are dollar-weighted based on total net assets and are subject to change. Percentages are as of August 31, 2018. Holdings exclude cash and cash equivalents. As of August 31, 2018, the Fund held approximately 6.6% in cash and cash equivalents. Negative weightings may result from the use of leverage. Leverage involves the use of various financial instruments or borrowed capital in an attempt to increase investment return. Leverage risks include potential for higher volatility, greater decline of the Fund’s net asset value and fluctuations of dividends and distributions paid by the Fund. Asset tables may not display cash weightings. Net total exposure may not equal the sum of long and short exposure due to rounding. For more current Fund holdings, please visit oppenheimerfunds.com.
15 OPPENHEIMER CAPITAL INCOME FUND
| | | | | | | | | | | | |
OPPORTUNISTIC STRATEGY | | | | | | | | | | | | |
| | | Long | | | Short | | | Net | |
Senior Loans | | | 13.0% | | | | 0.0% | | | | 13.0% | |
Corporate Bonds & Hybrids | | | 5.7 | | | | 0.0 | | | | 5.7 | |
Asset Backed Securities | | | 5.3 | | | | 0.0 | | | | 5.3 | |
Commodities | | | 1.0 | | | | 0.0 | | | | 1.0 | |
Sovereign | | | 1.9 | | | | -5.3 | | | | -3.4 | |
Interest Rates | | | 0.0 | | | | -3.3 | | | | -3.3 | |
Relative Value | | | 2.8 | | | | -3.6 | | | | -0.8 | |
Currencies | | | 0.0 | | | | -2.4 | | | | -2.4 | |
Catastrophe Bonds | | | 1.1 | | | | 0.0 | | | | 1.1 | |
Portfolio holdings and allocations are dollar-weighted based on total net assets and are subject to change. Percentages are as of August 31, 2018. Holdings exclude cash and cash equivalents. As of August 31, 2018, the Fund held approximately 6.6% in cash and cash equivalents. Negative weightings may result from the use of leverage. Leverage involves the use of various financial instruments or borrowed capital in an attempt to increase investment return. Leverage risks include potential for higher volatility, greater decline of the Fund’s net asset value and fluctuations of dividends and distributions paid by the Fund. Asset tables may not display cash weightings. Net total exposure may not equal the sum of long and short exposure due to rounding. For more current Fund holdings, please visit oppenheimerfunds. com.
16 OPPENHEIMER CAPITAL INCOME FUND
Share Class Performance
AVERAGE ANNUAL TOTAL RETURNS WITHOUT SALES CHARGE AS 8/31/18
| | | | | | | | | | | | | | | | | | | | |
| | | Inception
Date | | | 1-Year | | | 5-Year | | | 10-Year | | | | |
| Class A (OPPEX) | | | 12/1/70 | | | | 4.10 | % | | | 5.05 | % | | | 3.16 | % | | | | |
| Class C (OPECX) | | | 11/1/95 | | | | 3.24 | | | | 4.25 | | | | 2.32 | | | | | |
| Class I (OCIIX) | | | 12/27/13 | | | | 4.44 | | | | 4.65 | * | | | N/A | | | | | |
| Class R (OCINX) | | | 3/1/01 | | | | 3.73 | | | | 4.75 | | | | 2.82 | | | | | |
| Class Y (OCIYX) | | | 1/28/11 | | | | 4.25 | | | | 5.29 | | | | 5.86 | * | | | | |
| |
AVERAGE ANNUAL TOTAL RETURNS WITH SALES CHARGE AS OF 8/31/18 | | | | | |
| | | Inception
Date | | | 1-Year | | | 5-Year | | | 10-Year | | | | |
| Class A (OPPEX) | | | 12/1/70 | | | | -1.88 | % | | | 3.81 | % | | | 2.55 | % | | | | |
| Class C (OPECX) | | | 11/1/95 | | | | 2.24 | | | | 4.25 | | | | 2.32 | | | | | |
| Class I (OCIIX) | | | 12/27/13 | | | | 4.44 | | | | 4.65 | * | | | N/A | | | | | |
| Class R (OCINX) | | | 3/1/01 | | | | 3.73 | | | | 4.75 | | | | 2.82 | | | | | |
| Class Y (OCIYX) | | | 1/28/11 | | | | 4.25 | | | | 5.29 | | | | 5.86 | * | | | | |
* Shows performance since inception.
Performance data quoted represents past performance, which does not guarantee future results. The investment return and principal value of an investment in the Fund will fluctuate so that an investor’s shares, when redeemed, may be worth more or less than their original cost. Current performance may be lower or higher than the performance quoted. Returns do not consider capital gains or income taxes on an individual’s investment. For performance data current to the most recent month-end, visit oppenheimerfunds.com or call 1.800. CALL OPP (225.5677). Fund returns include changes in share price, reinvested distributions, and the applicable sales charge: for Class A shares, the current maximum initial sales charge of 5.75% and for Class C shares, the contingent deferred sales charge of 1% for the 1-year period. There is no sales charge for Class I, Class R and Class Y shares. Returns for periods of less than one year are cumulative and not annualized. See Fund prospectuses and summary prospectuses for more information on share classes and sales charges.
The Fund’s performance is compared to the performance of the Russell 3000 Index, the Bloomberg Barclays U.S. Aggregate Bond Index and the Fund’s Reference Index. The Russell 3000 Index measures the performance of the largest 3,000 U.S. companies, representing approximately 98% of the investable U.S. equity market. The Bloomberg Barclays U.S. Aggregate Bond Index is an index of U.S. dollar-denominated, investment-grade U.S. corporate government and mortgage-backed securities. The Fund’s Reference Index is a customized weighted index currently comprised of 35% Russell 3000 Index and 65% Bloomberg Barclays U.S. Aggregate Bond Index. The indices are unmanaged and cannot be purchased directly by investors. While index comparisons may be useful to provide a benchmark for the Fund’s performance, it must be noted that the Fund’s investments are not limited to the investments comprising the indices. Index performance includes reinvestment of income, but does not reflect transaction costs, fees, expenses or taxes. Index performance is shown for illustrative purposes only as a benchmark for the Fund’s performance, and does not predict or depict
17 OPPENHEIMER CAPITAL INCOME FUND
performance of the Fund. The Fund’s performance reflects the effects of the Fund’s business and operating expenses.
The Morningstar 30-50% Equity Allocation Category Average is the average return of the mutual funds within the investment category as defined by Morningstar. Returns include the reinvestment of distributions but do not consider sales charges. The Morningstar 30-50% Equity Category Average performance is shown for illustrative purposes only and does not predict or depict the performance of the Fund.
The views in the Fund Performance Discussion represent the opinions of this Fund’s portfolio manager(s) and are not intended as investment advice or to predict or depict the performance of any investment. These views are as of the close of business on August 31, 2018, and are subject to change based on subsequent developments. The Fund’s portfolio and strategies are subject to change.
Before investing in any of the Oppenheimer funds, investors should carefully consider a fund’s investment objectives, risks, charges and expenses. Fund prospectuses and summary prospectuses contain this and other information about the funds, and may be obtained by asking your financial advisor, visiting oppenheimerfunds.com, or calling 1.800.CALL OPP (225.5677). Read prospectuses and summary prospectuses carefully before investing.
Shares of Oppenheimer funds are not deposits or obligations of any bank, are not guaranteed by any bank, are not insured by the FDIC or any other agency, and involve investment risks, including the possible loss of the principal amount invested.
18 OPPENHEIMER CAPITAL INCOME FUND
Fund Expenses
Fund Expenses. As a shareholder of the Fund, you incur two types of costs: (1) transaction costs, which may include sales charges (loads) on purchase payments and/or contingent deferred sales charges on redemptions; and (2) ongoing costs, including management fees; distribution and service fees; and other Fund expenses. These examples are intended to help you understand your ongoing costs (in dollars) of investing in the Fund and to compare these costs with the ongoing costs of investing in other mutual funds.
The examples are based on an investment of $1,000.00 invested at the beginning of the period and held for the entire 6-month period ended August 31, 2018.
Actual Expenses. The first section of the table provides information about actual account values and actual expenses. You may use the information in this section for the class of shares you hold, together with the amount you invested, to estimate the expense that you paid over the period. Simply divide your account value by $1,000.00 (for example, an $8,600.00 account value divided by $1,000.00 = 8.60), then multiply the result by the number in the first section under the heading entitled “Expenses Paid During 6 Months Ended August 31, 2018” to estimate the expenses you paid on your account during this period.
Hypothetical Example for Comparison Purposes. The second section of the table provides information about hypothetical account values and hypothetical expenses based on the Fund’s actual expense ratio for each class of shares, and an assumed rate of return of 5% per year for each class before expenses, which is not the Fund’s actual return. The hypothetical account values and expenses may not be used to estimate the actual ending account balance or expenses you paid for the period. You may use this information to compare the ongoing costs of investing in the Fund and other funds. To do so, compare this 5% hypothetical example for the class of shares you hold with the 5% hypothetical examples that appear in the shareholder reports of the other funds.
Please note that the expenses shown in the table are meant to highlight your ongoing costs only and do not reflect any transactional costs, such as front-end or contingent deferred sales charges (loads). Therefore, the “hypothetical” section of the table is useful in comparing ongoing costs only, and will not help you determine the relative total costs of owning different funds. In addition, if these transactional costs were included, your costs would have been higher.
19 OPPENHEIMER CAPITAL INCOME FUND
| | | | | | | | | | | | |
| Actual | | Beginning Account Value March 1, 2018 | | Ending Account Value August 31, 2018 | | Expenses Paid During 6 Months Ended August 31, 2018 |
Class A | | $ | 1,000.00 | | | $ | 1,022.20 | | | $ | 4.96 | |
Class C | | | 1,000.00 | | | | 1,018.10 | | | | 8.89 | |
Class I | | | 1,000.00 | | | | 1,024.10 | | | | 2.91 | |
Class R | | | 1,000.00 | | | | 1,020.30 | | | | 6.33 | |
Class Y | | | 1,000.00 | | | | 1,023.30 | | | | 3.78 | |
| | | |
| Hypothetical | | | | | | | | | | | | |
| (5% return before expenses) | | | | | | |
Class A | | | 1,000.00 | | | | 1,020.32 | | | | 4.95 | |
Class C | | | 1,000.00 | | | | 1,016.43 | | | | 8.88 | |
Class I | | | 1,000.00 | | | | 1,022.33 | | | | 2.91 | |
Class R | | | 1,000.00 | | | | 1,018.95 | | | | 6.33 | |
Class Y | | | 1,000.00 | | | | 1,021.48 | | | | 3.78 | |
Expenses are equal to the Fund’s annualized expense ratio for that class, multiplied by the average account value over the period, multiplied by 184/365 (to reflect the one-half year period). Those annualized expense ratios, excluding indirect expenses from affiliated funds, based on the 6-month period ended August 31, 2018 are as follows:
| | | | |
| Class | | Expense Ratios | |
Class A | | | 0.97% | |
Class C | | | 1.74 | |
Class I | | | 0.57 | |
Class R | | | 1.24 | |
Class Y | | | 0.74 | |
The expense ratios reflect voluntary and/or contractual waivers and/or reimbursements of expenses by the Fund’s Manager and Transfer Agent. Some of these undertakings may be modified or terminated at any time, as indicated in the Fund’s prospectus. The “Consolidated Financial Highlights” tables in the Fund’s financial statements, included in this report, also show the gross expense ratios, without such waivers or reimbursements and reduction to custodian expenses, if applicable.
20 OPPENHEIMER CAPITAL INCOME FUND
CONSOLIDATED
STATEMENT OF INVESTMENTS August 31, 2018
| | | | | | |
| | | Shares | | | Value |
| Common Stocks—34.8% | | | | | | |
| Consumer Discretionary—1.4% | | | | | | |
| Household Durables—0.2% | | | | | | |
| Mohawk Industries, Inc.1 | | | 30,740 | | | $ 5,889,477 |
| Media—0.8% | | | | | | |
| DISH Network Corp., Cl. A1 | | | 266,644 | | | 9,425,865 |
| Live Nation Entertainment, Inc.1 | | | 196,560 | | | 9,765,101 |
| | | | | | 19,190,966 |
| Specialty Retail—0.4% | | | | | | |
Lowe’s Cos., Inc. | | | 87,440 | | | 9,509,099 |
| Consumer Staples—2.3% | | | | | | |
| Beverages—0.7% | | | | | | |
Coca-Cola Co. (The) | | | 404,900 | | | 18,046,393 |
| Tobacco—1.6% | | | | | | |
| Altria Group, Inc. | | �� | 241,365 | | | 14,124,680 |
| Philip Morris International, Inc. | | | 347,030 | | | 27,030,166 |
| | | | | | 41,154,846 |
| Energy—3.2% | | | | | | |
| Energy Equipment & Services—0.4% | | | | | | |
| Halliburton Co. | | | 93,584 | | | 3,733,066 |
| Schlumberger Ltd. | | | 98,866 | | | 6,244,376 |
| | | | | | 9,977,442 |
| Oil, Gas & Consumable Fuels—2.8% | | | | | | |
| Canadian Natural Resources Ltd. | | | 146,947 | | | 5,017,593 |
| Chevron Corp. | | | 68,018 | | | 8,057,412 |
| ConocoPhillips | | | 126,054 | | | 9,256,145 |
| EOG Resources, Inc. | | | 34,830 | | | 4,117,951 |
| Noble Energy, Inc. | | | 160,008 | | | 4,755,438 |
| Occidental Petroleum Corp. | | | 132,573 | | | 10,588,605 |
| TOTAL SA, Sponsored ADR | | | 289,860 | | | 18,185,816 |
| Valero Energy Corp. | | | 82,120 | | | 9,680,306 |
| | | | | | 69,659,266 |
| Financials—5.8% | | | | | | |
| Capital Markets—1.0% | | | | | | |
| Goldman Sachs Group, Inc. (The) | | | 43,820 | | | 10,420,834 |
| Raymond James Financial, Inc. | | | 56,478 | | | 5,254,713 |
| State Street Corp. | | | 108,930 | | | 9,467,107 |
| | | | | | 25,142,654 |
| Commercial Banks—1.5% | | | | | | |
| M&T Bank Corp. | | | 172,050 | | | 30,478,657 |
21 OPPENHEIMER CAPITAL INCOME FUND
CONSOLIDATED
STATEMENT OF INVESTMENTS Continued
| | | | | | |
| | | Shares | | | Value |
| Commercial Banks (Continued) | | | | | | |
| PNC Financial Services Group, Inc. (The) | | | 47,678 | | | $ 6,843,700 |
| | | | | | 37,322,357 |
| Insurance—1.5% | | | | | | |
| Allstate Corp. (The) | | | 46,334 | | | 4,659,810 |
| Chubb Ltd. | | | 218,727 | | | 29,580,640 |
| Travelers Cos., Inc. (The) | | | 32,690 | | | 4,302,004 |
| | | | | | 38,542,454 |
| Real Estate Investment Trusts (REITs)—1.6% | | | | | | |
| Blackstone Mortgage Trust, Inc., Cl. A | | | 747,750 | | | 25,468,365 |
| Starwood Property Trust, Inc. | | | 742,622 | | | 16,359,963 |
| | | | | | 41,828,328 |
| Thrifts & Mortgage Finance—0.2% | | | | | | |
WSFS Financial Corp. | | | 82,100 | | | 4,006,480 |
| Health Care—6.9% | | | | | | |
| Biotechnology—0.5% | | | | | | |
Shire plc, ADR | | | 70,552 | | | 12,365,649 |
| Health Care Equipment & Supplies—0.7% | | | | | | |
| Abbott Laboratories | | | 107,567 | | | 7,189,778 |
| Medtronic plc | | | 110,011 | | | 10,606,161 |
| | | | | | 17,795,939 |
| Health Care Providers & Services—2.9% | | | | | | |
| AMN Healthcare Services, Inc.1 | | | 68,930 | | | 4,018,619 |
| Cigna Corp. | | | 72,671 | | | 13,686,856 |
| Envision Healthcare Corp.1 | | | 113,090 | | | 5,129,762 |
| HCA Healthcare, Inc. | | | 86,632 | | | 11,618,217 |
| Premier, Inc., Cl. A1 | | | 252,390 | | | 11,163,210 |
| UnitedHealth Group, Inc. | | | 105,460 | | | 28,311,792 |
| | | | | | 73,928,456 |
| Pharmaceuticals—2.8% | | | | | | |
| Allergan plc | | | 37,960 | | | 7,277,312 |
| Johnson & Johnson | | | 89,150 | | | 12,007,614 |
| Merck & Co., Inc. | | | 300,930 | | | 20,640,789 |
| Mylan NV1 | | | 247,740 | | | 9,694,066 |
| Novartis AG, Sponsored ADR | | | 96,520 | | | 8,012,125 |
| Roche Holding AG | | | 48,008 | | | 11,914,632 |
| | | | | | 69,546,538 |
| Industrials—5.0% | | | | | | |
| Aerospace & Defense—2.8% | | | | | | |
| L3 Technologies, Inc. | | | 56,946 | | | 12,170,499 |
| Lockheed Martin Corp. | | | 75,030 | | | 24,040,363 |
| Northrop Grumman Corp. | | | 60,878 | | | 18,171,474 |
22 OPPENHEIMER CAPITAL INCOME FUND
| | | | | | |
| | | Shares | | | Value |
| Aerospace & Defense (Continued) | | | | | | |
| Raytheon Co. | | | 77,570 | | | $ 15,470,561 |
| | | | | | 69,852,897 |
| Air Freight & Couriers—0.2% | | | | | | |
FedEx Corp. | | | 20,444 | | | 4,987,314 |
| Commercial Services & Supplies—0.6% | | | | | | |
Republic Services, Inc., Cl. A | | | 184,790 | | | 13,556,194 |
| Construction & Engineering—0.1% | | | | | | |
Granite Construction, Inc. | | | 75,190 | | | 3,434,679 |
| Industrial Conglomerates—1.0% | | | | | | |
| General Electric Co. | | | 729,100 | | | 9,434,554 |
| Honeywell International, Inc. | | | 96,905 | | | 15,413,709 |
| | | | | | 24,848,263 |
| Machinery—0.3% | | | | | | |
Stanley Black & Decker, Inc. | | | 59,984 | | | 8,429,552 |
| Information Technology—5.0% | | | | | | |
| Communications Equipment—1.3% | | | | | | |
| Cisco Systems, Inc. | | | 499,676 | | | 23,869,523 |
| CommScope Holding Co., Inc.1 | | | 280,590 | | | 8,891,897 |
| | | | | | 32,761,420 |
| Internet Software & Services—1.1% | | | | | | |
Alphabet, Inc., Cl. A1 | | | 23,876 | | | 29,410,457 |
| Semiconductors & Semiconductor Equipment—1.3% | | | | | | |
| QUALCOMM, Inc. | | | 156,413 | | | 10,747,137 |
| Xilinx, Inc. | | | 282,932 | | | 22,020,598 |
| | | | | | 32,767,735 |
| Technology Hardware, Storage & Peripherals—1.3% | | | | | | |
Apple, Inc. | | | 142,315 | | | 32,395,163 |
| Materials—1.8% | | | | | | |
| Chemicals—0.6% | | | | | | |
| Celanese Corp., Cl. A | | | 129,241 | | | 15,099,226 |
| Containers & Packaging—1.0% | | | | | | |
| Packaging Corp. of America | | | 77,325 | | | 8,499,564 |
| Sonoco Products Co. | | | 289,971 | | | 16,249,975 |
| | | | | | 24,749,539 |
| Metals & Mining—0.2% | | | | | | |
| Steel Dynamics, Inc. | | | 92,760 | | | 4,241,915 |
23 OPPENHEIMER CAPITAL INCOME FUND
CONSOLIDATED
STATEMENT OF INVESTMENTS Continued
| | | | | | |
| | | Shares | | | Value |
| Telecommunication Services—1.8% | | | | | | |
| Diversified Telecommunication Services—1.8% | | | | | | |
| AT&T, Inc. | | | 631,170 | | | $ 20,159,570 |
| BCE, Inc. | | | 238,140 | | | 9,708,968 |
| Swisscom AG | | | 18,525 | | | 8,267,491 |
| Verizon Communications, Inc. | | | 154,377 | | | 8,393,477 |
| | | | | | 46,529,506 |
| Utilities—1.6% | | | | | | |
| Electric Utilities—1.0% | | | | | | |
| American Electric Power Co., Inc. | | | 210,180 | | | 15,076,211 |
| Edison International | | | 91,620 | | | 6,022,183 |
| PG&E Corp. | | | 102,530 | | | 4,734,835 |
| | | | | | 25,833,229 |
| Multi-Utilities—0.6% | | | | | | |
| CMS Energy Corp. | | | 319,016 | | | 15,708,348 |
| Total Common Stocks (Cost $927,919,812) | | | | | | 878,511,781 |
| Preferred Stocks—1.5% | | | | | | |
| Citigroup Capital XIII, 7.75% Cum., Non-Vtg. [US0003M+637]2 | | | 1,133,000 | | | 30,806,270 |
| M&T Bank Corp., 6.375% Cum., Series A, Non-Vtg. | | | 1,833 | | | 1,851,330 |
| M&T Bank Corp., 6.375% Cum., Series C, Non-Vtg. | | | 4,500 | | | 4,545,000 |
| Total Preferred Stocks (Cost $36,592,296) | | | | | | 37,202,600 |
| | |
| | | Principal Amount | | | |
| Asset-Backed Securities—9.0% | | | | | | |
| Accredited Mortgage Loan Trust: | | | | | | |
| Series 2005-3, Cl. M3, 2.764% [US0001M+48], 9/25/352 | | $ | 7,222,280 | | | 6,998,143 |
| Series 2005-4, Cl. M1, 2.465% [US0001M+40], 12/25/352 | | | 1,919,000 | | | 1,867,104 |
| American Credit Acceptance Receivables Trust: | | | | | | |
| Series 2015-3, Cl. D, 5.86%, 7/12/223 | | | 955,000 | | | 966,481 |
| Series 2016-4, Cl. B, 2.11%, 2/12/213 | | | 318,519 | | | 318,349 |
| Series 2017-3, Cl. B, 2.25%, 1/11/213 | | | 425,000 | | | 424,374 |
| Series 2017-4, Cl. B, 2.61%, 5/10/213 | | | 477,000 | | | 475,546 |
| Series 2017-4, Cl. C, 2.94%, 1/10/243 | | | 1,351,000 | | | 1,343,725 |
| Series 2017-4, Cl. D, 3.57%, 1/10/243 | | | 1,952,000 | | | 1,937,248 |
| Series 2018-2, Cl. B, 3.46%, 8/10/223 | | | 1,860,000 | | | 1,861,616 |
| Series 2018-2, Cl. C, 3.70%, 7/10/243 | | | 1,835,000 | | | 1,836,305 |
| AmeriCredit Automobile Receivables Trust: | | | | | | |
| Series 2015-2, Cl. D, 3.00%, 6/8/21 | | | 1,555,000 | | | 1,555,450 |
| Series 2017-2, Cl. D, 3.42%, 4/18/23 | | | 2,065,000 | | | 2,055,894 |
| Series 2017-4, Cl. D, 3.08%, 12/18/23 | | | 940,000 | | | 922,562 |
| Bear Stearns Structured Products Trust: | | | | | | |
| Series 2007-EMX1, Cl. A2, 3.365% [US0001M+130], 3/25/372,3 | | | 5,900,000 | | | 6,086,940 |
| Series 2007-EMX1, Cl. M1, 4.065% [US0001M+200], 3/25/372,3 | | | 8,000,000 | | | 7,952,268 |
| Cabela’s Credit Card Master Note Trust: | | | | | | |
| Series 2015-1A, Cl. A2, 2.603% [US0001M+54], 3/15/232 | | | 2,855,000 | | | 2,869,530 |
| Series 2015-2, Cl. A2, 2.733% [US0001M+67], 7/17/232 | | | 3,170,000 | | | 3,194,131 |
| Series 2016-1, Cl. A1, 1.78%, 6/15/22 | | | 3,735,000 | | | 3,707,444 |
24 OPPENHEIMER CAPITAL INCOME FUND
| | | | | | |
| | | Principal Amount | | | Value |
| Asset-Backed Securities (Continued) | | | | | | |
| Cabela’s Credit Card Master Note Trust: (Continued) | | | | | | |
| Series 2016-1, Cl. A2, 2.913% [US0001M+85], 6/15/222 | | $ | 1,745,000 | | | $ 1,754,124 |
| Capital Auto Receivables Asset Trust, Series 2017-1, Cl. D, 3.15%, 2/20/253 | | | 275,000 | | | 273,085 |
| CarFinance Capital Auto Trust, Series 2015-1A, Cl. A, 1.75%, 6/15/213 | | | 41,224 | | | 41,186 |
| CarMax Auto Owner Trust: | | | | | | |
| Series 2015-2, Cl. D, 3.04%, 11/15/21 | | | 655,000 | | | 653,802 |
| Series 2015-3, Cl. D, 3.27%, 3/15/22 | | | 1,975,000 | | | 1,973,884 |
| Series 2016-1, Cl. D, 3.11%, 8/15/22 | | | 1,300,000 | | | 1,295,551 |
| Series 2017-1, Cl. D, 3.43%, 7/17/23 | | | 1,565,000 | | | 1,557,897 |
| Series 2017-4, Cl. D, 3.30%, 5/15/24 | | | 705,000 | | | 694,209 |
| Series 2018-1, Cl. D, 3.37%, 7/15/24 | | | 515,000 | | | 506,977 |
| CCG Receivables Trust: | | | | | | |
| Series 2017-1, Cl. B, 2.75%, 11/14/233 | | | 1,580,000 | | | 1,555,457 |
| Series 2018-1, Cl. B, 3.09%, 6/16/253 | | | 620,000 | | | 613,920 |
| Series 2018-1, Cl. C, 3.42%, 6/16/253 | | | 175,000 | | | 173,179 |
| Series 2018-2, Cl. C, 3.87%, 12/15/253 | | | 415,000 | | | 415,617 |
| CIG Auto Receivables Trust, Series 2017-1A, Cl. A, 2.71%, 5/15/233 | | | 542,289 | | | 538,983 |
| Citibank Credit Card Issuance Trust, Series 2014-A6, Cl. A6, 2.15%, 7/15/21 | | | 3,545,000 | | | 3,528,997 |
| CNH Equipment Trust, Series 2017-C, Cl. B, 2.54%, 5/15/25 | | | 475,000 | | | 464,587 |
| CPS Auto Receivables Trust: | | | | | | |
| Series 2017-C, Cl. A, 1.78%, 9/15/203 | | | 201,547 | | | 201,041 |
| Series 2017-C, Cl. B, 2.30%, 7/15/213 | | | 685,000 | | | 681,143 |
| Series 2017-D, Cl. B, 2.43%, 1/18/223 | | | 1,180,000 | | | 1,169,044 |
| Series 2018-A, Cl. B, 2.77%, 4/18/223 | | | 975,000 | | | 968,089 |
| Series 2018-B, Cl. B, 3.23%, 7/15/223 | | | 1,090,000 | | | 1,087,890 |
| CPS Auto Trust, Series 2017-A, Cl. B, 2.68%, 5/17/213 | | | 210,000 | | | 209,678 |
| Credit Acceptance Auto Loan Trust: | | | | | | |
| Series 2017-3A, Cl. C, 3.48%, 10/15/263 | | | 1,415,000 | | | 1,397,821 |
| Series 2018-1A, Cl. B, 3.60%, 4/15/273 | | | 920,000 | | | 916,427 |
| Series 2018-1A, Cl. C, 3.77%, 6/15/273 | | | 1,305,000 | | | 1,295,079 |
| Series 2018-2A, Cl. C, 4.16%, 9/15/273 | | | 770,000 | | | 775,199 |
| Dell Equipment Finance Trust: | | | | | | |
| Series 2017-2, Cl. B, 2.47%, 10/24/223 | | | 470,000 | | | 464,000 |
| Series 2018-1, Cl. B, 3.34%, 6/22/233 | | | 590,000 | | | 591,912 |
| Drive Auto Receivables Trust: | | | | | | |
| Series 2015-BA, Cl. D, 3.84%, 7/15/213 | | | 113,604 | | | 114,178 |
| Series 2016-CA, Cl. D, 4.18%, 3/15/243 | | | 1,070,000 | | | 1,082,479 |
| Series 2017-3, Cl. C, 2.80%, 7/15/22 | | | 785,000 | | | 782,738 |
| Series 2017-AA, Cl. C, 2.98%, 1/18/223 | | | 1,210,000 | | | 1,209,580 |
| Series 2017-BA, Cl. D, 3.72%, 10/17/223 | | | 1,525,000 | | | 1,532,710 |
| Series 2018-1, Cl. D, 3.81%, 5/15/24 | | | 1,190,000 | | | 1,187,105 |
| Series 2018-2, Cl. D, 4.14%, 8/15/24 | | | 2,160,000 | | | 2,173,706 |
| Series 2018-3, Cl. D, 4.30%, 9/16/24 | | | 1,420,000 | | | 1,437,471 |
| DT Auto Owner Trust: | | | | | | |
| Series 2015-2A, Cl. D, 4.25%, 2/15/223 | | | 685,870 | | | 689,211 |
| Series 2016-4A, Cl. E, 6.49%, 9/15/233 | | | 495,000 | | | 509,749 |
| Series 2017-1A, Cl. C, 2.70%, 11/15/223 | | | 565,000 | | | 563,660 |
| Series 2017-1A, Cl. D, 3.55%, 11/15/223 | | | 1,060,000 | | | 1,061,749 |
25 OPPENHEIMER CAPITAL INCOME FUND
CONSOLIDATED
STATEMENT OF INVESTMENTS Continued
| | | | | | |
| | | Principal Amount | | | Value |
| Asset-Backed Securities (Continued) | | | | | | |
| DT Auto Owner Trust: (Continued) | | | | | | |
| Series 2017-1A, Cl. E, 5.79%, 2/15/243 | | $ | 1,025,000 | | | $ 1,042,308 |
| Series 2017-2A, Cl. D, 3.89%, 1/15/233 | | | 1,165,000 | | | 1,168,244 |
| Series 2017-3A, Cl. B, 2.40%, 5/17/213 | | | 1,235,000 | | | 1,231,510 |
| Series 2017-3A, Cl. E, 5.60%, 8/15/243 | | | 1,015,000 | | | 1,026,975 |
| Series 2017-4A, Cl. C, 2.86%, 7/17/233 | | | 285,000 | | | 283,570 |
| Series 2017-4A, Cl. D, 3.47%, 7/17/233 | | | 1,675,000 | | | 1,664,501 |
| Series 2017-4A, Cl. E, 5.15%, 11/15/243 | | | 990,000 | | | 991,134 |
| Series 2018-1A, Cl. B, 3.04%, 1/18/223 | | | 1,055,000 | | | 1,053,201 |
| Series 2018-2A, Cl. B, 3.43%, 5/16/223 | | | 555,000 | | | 555,323 |
| Element Rail Leasing I LLC, Series 2014-1A, Cl. A1, 2.299%, 4/19/443 | | | 872,515 | | | 860,855 |
| Evergreen Credit Card Trust Series, Series 2018-2, Cl. A, 2.427% [US0001M+35], 7/15/222,3 | | | 2,755,000 | | | 2,758,283 |
| Exeter Automobile Receivables Trust, Series 2018-1A, Cl. B, 2.75%, 4/15/223 | | | 1,065,000 | | | 1,057,157 |
| Fieldstone Mortgage Investment Trust, Series 2004-5, Cl. M3, 4.09% [US0001M+202.5], 2/25/352 | | | 4,434,759 | | | 4,272,103 |
| Flagship Credit Auto Trust: | | | | | | |
| Series 2014-1, Cl. D, 4.83%, 6/15/203 | | | 200,000 | | | 200,848 |
| Series 2016-1, Cl. C, 6.22%, 6/15/223 | | | 2,410,000 | | | 2,501,841 |
| FRS I LLC, Series 2013-1A, Cl. A1, 1.80%, 4/15/433 | | | 53,247 | | | 52,977 |
| GLS Auto Receivables Trust, Series 2018-1A, Cl. A, 2.82%, 7/15/223 | | | 2,038,172 | | | 2,032,307 |
| GM Financial Automobile Leasing Trust: | | | | | | |
| Series 2017-3, Cl. C, 2.73%, 9/20/21 | | | 795,000 | | | 786,991 |
| Series 2018-2, Cl. C, 3.50%, 4/20/22 | | | 965,000 | | | 965,572 |
| GSAMP Trust: | | | | | | |
| Series 2005-HE4, Cl. M3, 2.845% [US0001M+78], 7/25/452 | | | 13,300,000 | | | 13,272,325 |
| Series 2005-HE5, Cl. M3, 2.525% [US0001M+46], 11/25/352 | | | 4,060,889 | | | 3,933,451 |
| Series 2007-HS1, Cl. M4, 4.315% [US0001M+225], 2/25/472 | | | 4,849,000 | | | 4,944,379 |
| JP Morgan Mortgage Acquisition Corp., Series 2005-OPT2, Cl. M2, 2.515% [US0001M+45], 12/25/352 | | | 5,480,000 | | | 5,471,558 |
| JP Morgan Mortgage Acquisition Trust: | | | | | | |
| Series 2007-CH1, Cl. MV10, 3.065% [US0001M+100], 11/25/362,3 | | | 5,010,000 | | | 4,884,491 |
| Series 2007-CH1, Cl. MV8, 3.065% [US0001M+100], 11/25/362 | | | 5,400,000 | | | 5,332,171 |
| Long Beach Mortgage Loan Trust, Series 2005-WL3, Cl. M1, 2.71% [US0001M+64.5], 11/25/352 | | | 1,739,910 | | | 1,727,410 |
| Morgan Stanley ABS Capital I, Inc. Trust, Series 2006-NC1, Cl. M1, 2.445% [US0001M+38], 12/25/352 | | | 12,287,000 | | | 12,250,403 |
| Navistar Financial Dealer Note Master Owner Trust II: | | | | | | |
| Series 2016-1, Cl. D, 5.365% [LIBOR01M+330], 9/27/212,3 | | | 495,000 | | | 495,778 |
| Series 2017-1, Cl. C, 3.615% [LIBOR01M+155], 6/27/222,3 | | | 400,000 | | | 401,549 |
| Series 2017-1, Cl. D, 4.365% [LIBOR01M+230], 6/27/222,3 | | | 465,000 | | | 465,548 |
| New Century Home Equity Loan Trust: | | | | | | |
| Series 2005-1, Cl. M2, 2.785% [US0001M+72], 3/25/352 | | | 4,383,661 | | | 4,237,705 |
| Series 2005-2, Cl. M3, 2.80% [US0001M+73.5], 6/25/352 | | | 5,500,000 | | | 5,519,414 |
| RASC Series Trust, Series 2006-KS2, Cl. M2, 2.455% [US0001M+39], 3/25/362 | | | 4,875,000 | | | 4,765,775 |
| Raspro Trust, Series 2005-1A, Cl. G, 2.725% [LIBOR03M+40], 3/23/242,3 | | | 1,405,920 | | | 1,414,398 |
26 OPPENHEIMER CAPITAL INCOME FUND
| | | | | | | | |
| | | Principal Amount | | | Value | |
| Asset-Backed Securities (Continued) | | | | | | | | |
| Santander Drive Auto Receivables Trust: | | | | | | | | |
| Series 2016-2, Cl. D, 3.39%, 4/15/22 | | $ | 825,000 | | | $ | 827,301 | |
| Series 2017-1, Cl. D, 3.17%, 4/17/23 | | | 1,085,000 | | | | 1,078,531 | |
| Series 2017-1, Cl. E, 5.05%, 7/15/243 | | | 2,735,000 | | | | 2,783,054 | |
| Series 2017-2, Cl. D, 3.49%, 7/17/23 | | | 390,000 | | | | 389,700 | |
| Series 2017-3, Cl. D, 3.20%, 11/15/23 | | | 1,900,000 | | | | 1,885,042 | |
| Series 2018-1, Cl. D, 3.32%, 3/15/24 | | | 760,000 | | | | 748,652 | |
| Series 2018-2, Cl. D, 3.88%, 2/15/24 | | | 1,165,000 | | | | 1,162,325 | |
| Series 2018-3, Cl. C, 3.51%, 8/15/23 | | | 2,950,000 | | | | 2,954,164 | |
| Santander Retail Auto Lease Trust, Series 2017-A, Cl. C, 2.96%, 11/21/223 | | | 1,275,000 | | | | 1,258,326 | |
| SG Mortgage Securities Trust, Series 2005-OPT1, Cl. M2, 2.515% [US0001M+45], 10/25/352 | | | 6,129,000 | | | | 6,082,168 | |
| TCF Auto Receivables Owner Trust, Series 2015-1A, Cl. D, 3.53%, 3/15/223 | | | 1,075,000 | | | | 1,070,911 | |
| United Auto Credit Securitization Trust, Series 2018-1, Cl. C, 3.05%, 9/10/213 | | | 1,635,000 | | | | 1,629,639 | |
| Verizon Owner Trust, Series 2017-3A, Cl. A1A, 2.06%, 4/20/223 | | | 1,260,000 | | | | 1,242,845 | |
| Veros Automobile Receivables Trust, Series 2017-1, Cl. A, 2.84%, 4/17/233 | | | 516,264 | | | | 514,515 | |
| Westlake Automobile Receivables Trust: | | | | | | | | |
| Series 2016-1A, Cl. E, 6.52%, 6/15/223 | | | 1,760,000 | | | | 1,793,213 | |
| Series 2017-2A, Cl. E, 4.63%, 7/15/243 | | | 2,090,000 | | | | 2,101,476 | |
| Series 2018-1A, Cl. C, 2.92%, 5/15/233 | | | 1,100,000 | | | | 1,091,800 | |
| Series 2018-1A, Cl. D, 3.41%, 5/15/233 | | | 2,275,000 | | | | 2,262,303 | |
| Series 2018-3A, Cl. B, 3.32%, 10/16/233 | | | 1,019,000 | | | | 1,018,839 | |
| World Financial Network Credit Card Master Trust: | | | | | | | | |
| Series 2012-D, Cl. A, 2.15%, 4/17/23 | | | 1,040,000 | | | | 1,034,626 | |
| Series 2016-C, Cl. A, 1.72%, 8/15/23 | | | 4,470,000 | | | | 4,408,529 | |
| Series 2017-A, Cl. A, 2.12%, 3/15/24 | | | 2,775,000 | | | | 2,732,677 | |
| Series 2017-B, Cl. A, 1.98%, 6/15/23 | | | 2,105,000 | | | | 2,089,886 | |
| Series 2017-C, Cl. A, 2.31%, 8/15/24 | | | 2,845,000 | | | | 2,798,761 | |
| Series 2018-A, Cl. A, 3.07%, 12/16/24 | | | 3,695,000 | | | | 3,680,812 | |
| | | | | | | | |
| Total Asset-Backed Securities (Cost $217,999,419) | | | | | | | 226,778,374 | |
| Mortgage-Backed Obligations—17.7% | | | | | | | | |
| Government Agency—10.5% | | | | | | | | |
| FHLMC/FNMA/FHLB/Sponsored—9.3% | | | | | | | | |
| Federal Home Loan Mortgage Corp. Gold Pool: | | | | | | | | |
| 4.50%, 5/1/19 | | | 51,194 | | | | 51,704 | |
| 5.00%, 12/1/34 | | | 36,024 | | | | 38,362 | |
| 6.50%, 7/1/28-4/1/34 | | | 107,680 | | | | 119,010 | |
| 7.00%, 10/1/31 | | | 79,473 | | | | 86,408 | |
| 9.00%, 8/1/22-5/1/25 | | | 3,514 | | | | 3,737 | |
| Federal Home Loan Mortgage Corp., Interest-Only Stripped Mtg.-Backed Security: | | | | | | | | |
| Series 183,Cl. IO, 80.873%, 4/1/274 | | | 69,924 | | | | 15,771 | |
| Series 192,Cl. IO, 99.999%, 2/1/284 | | | 22,839 | | | | 4,658 | |
| Series 243,Cl. 6, 0.00%, 12/15/324,5 | | | 72,223 | | | | 11,999 | |
| Federal Home Loan Mortgage Corp., Mtg.-Linked Amortizing Global Debt Securities, Series 2012-1, Cl. A10, 2.06%, 1/15/22 | | | 1,748,122 | | | | 1,712,076 | |
| Federal Home Loan Mortgage Corp., Principal-Only Stripped Mtg.- Backed Security, Series 176, Cl. PO, 4.127%, 6/1/266 | | | 22,750 | | | | 20,882 | |
27 OPPENHEIMER CAPITAL INCOME FUND
CONSOLIDATED
STATEMENT OF INVESTMENTS Continued
| | | | | | | | |
| | | Principal Amount | | | Value | |
| FHLMC/FNMA/FHLB/Sponsored (Continued) | | | | | | | | |
| Federal Home Loan Mortgage Corp., Real Estate Mtg. Investment Conduit Multiclass Pass-Through Certificates: | |
| Series 2034,Cl. Z, 6.50%, 2/15/28 | | $ | 54,740 | | | $ | 59,052 | |
| Series 2043,Cl. ZP, 6.50%, 4/15/28 | | | 240,524 | | | | 263,801 | |
| Series 2053,Cl. Z, 6.50%, 4/15/28 | | | 48,769 | | | | 53,589 | |
| Series 2279,Cl. PK, 6.50%, 1/15/31 | | | 99,208 | | | | 107,969 | |
| Series 2326,Cl. ZP, 6.50%, 6/15/31 | | | 44,100 | | | | 47,417 | |
| Series 2427,Cl. ZM, 6.50%, 3/15/32 | | | 185,175 | | | | 202,484 | |
| Series 2461,Cl. PZ, 6.50%, 6/15/32 | | | 212,172 | | | | 229,782 | |
| Series 2626,Cl. TB, 5.00%, 6/15/33 | | | 167,733 | | | | 173,228 | |
| Series 2635,Cl. AG, 3.50%, 5/15/32 | | | 56,082 | | | | 55,753 | |
| Series 2707,Cl. QE, 4.50%, 11/15/18 | | | 4,763 | | | | 4,759 | |
| Series 2770,Cl. TW, 4.50%, 3/15/19 | | | 4,733 | | | | 4,741 | |
| Series 3010,Cl. WB, 4.50%, 7/15/20 | | | 47,303 | | | | 47,705 | |
| Series 3025,Cl. SJ, 17.187% [-3.667 x LIBOR01M+2,475], 8/15/352 | | | 27,190 | | | | 38,591 | |
| Series 3030,Cl. FL, 2.463% [LIBOR01M+40], 9/15/352 | | | 373,646 | | | | 375,322 | |
| Series 3645,Cl. EH, 3.00%, 12/15/20 | | | 3,715 | | | | 3,714 | |
| Series 3741,Cl. PA, 2.15%, 2/15/35 | | | 14,614 | | | | 14,600 | |
| Series 3815,Cl. BD, 3.00%, 10/15/20 | | | 1,189 | | | | 1,189 | |
| Series 3822,Cl. JA, 5.00%, 6/15/40 | | | 64,583 | | | | 66,081 | |
| Series 3840,Cl. CA, 2.00%, 9/15/18 | | | 162 | | | | 161 | |
| Series 3848,Cl. WL, 4.00%, 4/15/40 | | | 311,628 | | | | 313,930 | |
| Series 3857,Cl. GL, 3.00%, 5/15/40 | | | 29,484 | | | | 29,605 | |
| Series 4221,Cl. HJ, 1.50%, 7/15/23 | | | 738,733 | | | | 721,372 | |
| Federal Home Loan Mortgage Corp., Real Estate Mtg. Investment Conduit Multiclass Pass-Through Certificates, Interest-Only Stripped Mtg.-Backed Security: | |
| Series 2130,Cl. SC, 83.043%, 3/15/294 | | | 52,142 | | | | 6,605 | |
| Series 2796,Cl. SD, 99.999%, 7/15/264 | | | 90,872 | | | | 10,479 | |
| Series 2920,Cl. S, 56.073%, 1/15/354 | | | 572,702 | | | | 75,911 | |
| Series 2922,Cl. SE, 20.242%, 2/15/354 | | | 134,620 | | | | 16,842 | |
| Series 2937,Cl. SY, 11.389%, 2/15/354 | | | 1,521,027 | | | | 183,850 | |
| Series 2981,Cl. AS, 2.531%, 5/15/354 | | | 1,066,655 | | | | 110,510 | |
| Series 3397,Cl. GS, 0.00%, 12/15/374,5 | | | 277,754 | | | | 43,303 | |
| Series 3424,Cl. EI, 0.00%, 4/15/384,5 | | | 81,213 | | | | 6,651 | |
| Series 3450,Cl. BI, 12.817%, 5/15/384 | | | 653,295 | | | | 87,754 | |
| Series 3606,Cl. SN, 13.929%, 12/15/394 | | | 269,546 | | | | 32,639 | |
| Series 4057,Cl. QI, 5.741%, 6/15/274 | | | 4,514,720 | | | | 377,571 | |
| Series 4818,Cl. BI, 2.648%, 3/15/454 | | | 1,524,299 | | | | 284,594 | |
| Federal National Mortgage Assn.: | | | | | | | | |
| 2.50%, 9/1/337 | | | 13,260,000 | | | | 12,894,104 | |
| 3.00%, 9/1/33-9/1/487 | | | 29,295,000 | | | | 28,623,681 | |
| 3.50%, 9/1/33-9/1/487 | | | 93,390,000 | | | | 93,103,899 | |
| 4.00%, 9/1/33-9/1/487 | | | 28,015,000 | | | | 28,569,883 | |
| 4.50%, 9/1/487 | | | 43,650,000 | | | | 45,323,748 | |
| 5.00%, 9/1/487 | | | 8,525,000 | | | | 9,012,886 | |
| Federal National Mortgage Assn. Pool: | | | | | | | | |
| 5.00%, 3/1/21 | | | 5,644 | | | | 5,786 | |
| 5.50%, 2/1/35-4/1/39 | | | 716,525 | | | | 775,884 | |
| 6.50%, 10/1/19-11/1/31 | | | 268,470 | | | | 294,401 | |
| 7.00%, 12/1/32-4/1/35 | | | 22,544 | | | | 23,900 | |
28 OPPENHEIMER CAPITAL INCOME FUND
| | | | | | |
| | | Principal Amount | | | Value |
| FHLMC/FNMA/FHLB/Sponsored (Continued) | | | | | | |
| Federal National Mortgage Assn. Pool: (Continued) | | | | | | |
| 7.50%, 1/1/33-3/1/33 | | $ | 1,318,570 | | | $ 1,510,730 |
| 8.50%, 7/1/32 | | | 2,423 | | | 2,460 |
| Federal National Mortgage Assn., Interest-Only Stripped Mtg.-Backed Security: | | | | | | |
| Series 222,Cl. 2, 99.999%, 6/25/234 | | | 130,822 | | | 15,466 |
| Series 252,Cl. 2, 99.999%, 11/25/234 | | | 109,737 | | | 14,871 |
| Series 303,Cl. IO, 97.675%, 11/25/294 | | | 64,235 | | | 14,939 |
| Series 308,Cl. 2, 79.058%, 9/25/304 | | | 162,017 | | | 38,478 |
| Series 320,Cl. 2, 52.582%, 4/25/324 | | | 584,210 | | | 141,937 |
| Series 321,Cl. 2, 23.601%, 4/25/324 | | | 403,509 | | | 95,319 |
| Series 331,Cl. 9, 20.612%, 2/25/334 | | | 156,202 | | | 31,121 |
| Series 334,Cl. 17, 27.725%, 2/25/334 | | | 83,413 | | | 20,087 |
| Series 339,Cl. 12, 0.00%, 6/25/334,5 | | | 279,172 | | | 70,963 |
| Series 339,Cl. 7, 0.00%, 11/25/334,5 | | | 330,876 | | | 72,704 |
| Series 343,Cl. 13, 0.00%, 9/25/334,5 | | | 289,309 | | | 55,398 |
| Series 343,Cl. 18, 0.00%, 5/25/344,5 | | | 78,623 | | | 18,591 |
| Series 345,Cl. 9, 0.00%, 1/25/344,5 | | | 134,397 | | | 30,689 |
| Series 351,Cl. 10, 0.00%, 4/25/344,5 | | | 88,303 | | | 21,423 |
| Series 351,Cl. 8, 0.00%, 4/25/344,5 | | | 156,555 | | | 30,710 |
| Series 356,Cl. 10, 0.00%, 6/25/354,5 | | | 111,532 | | | 23,491 |
| Series 356,Cl. 12, 0.00%, 2/25/354,5 | | | 54,849 | | | 11,953 |
| Series 362,Cl. 13, 0.00%, 8/25/354,5 | | | 197,936 | | | 40,381 |
| Series 364,Cl. 16, 0.00%, 9/25/354,5 | | | 239,062 | | | 48,224 |
| Series 365,Cl. 16, 0.00%, 3/25/364,5 | | | 520,400 | | | 106,253 |
| Federal National Mortgage Assn., Real Estate Mtg. Investment Conduit Multiclass Pass-Through Certificates: | | | | | | |
| Series 1993-87,Cl. Z, 6.50%, 6/25/23 | | | 113,480 | | | 119,283 |
| Series 1998-61,Cl. PL, 6.00%, 11/25/28 | | | 64,947 | | | 70,061 |
| Series 1999-54,Cl. LH, 6.50%, 11/25/29 | | | 105,634 | | | 114,315 |
| Series 2001-51,Cl. OD, 6.50%, 10/25/31 | | | 154,762 | | | 163,462 |
| Series 2003-130,Cl. CS, 9.971% [-2 x LIBOR01M+1,410], 12/25/332 | | | 42,983 | | | 44,096 |
| Series 2003-28,Cl. KG, 5.50%, 4/25/23 | | | 242,993 | | | 251,969 |
| Series 2003-84,Cl. GE, 4.50%, 9/25/18 | | | 5 | | | 5 |
| Series 2004-25,Cl. PC, 5.50%, 1/25/34 | | | 27,066 | | | 27,169 |
| Series 2005-104,Cl. MC, 5.50%, 12/25/25 | | | 1,327,772 | | | 1,394,550 |
| Series 2005-31,Cl. PB, 5.50%, 4/25/35 | | | 1,430,000 | | | 1,556,460 |
| Series 2005-73,Cl. DF, 2.315% [LIBOR01M+25], 8/25/352 | | | 329,762 | | | 330,922 |
| Series 2006-11,Cl. PS, 16.996% [-3.667 x LIBOR01M+2,456.67], 3/25/362 | | | 94,073 | | | 134,306 |
| Series 2006-46,Cl. SW, 16.629% [-3.667 x LIBOR01M+2,419.92], 6/25/362 | | | 67,420 | | | 92,673 |
| Series 2006-50,Cl. KS, 16.629% [-3.667 x LIBOR01M+2,420], 6/25/362 | | | 126,001 | | | 176,730 |
| Series 2006-50,Cl. SK, 16.629% [-3.667 x LIBOR01M+2,420], 6/25/362 | | | 26,010 | | | 35,791 |
| Series 2008-75,Cl. DB, 4.50%, 9/25/23 | | | 8,281 | | | 8,280 |
| Series 2009-113,Cl. DB, 3.00%, 12/25/20 | | | 49,907 | | | 49,844 |
| Series 2009-36,Cl. FA, 3.005% [LIBOR01M+94], 6/25/372 | | | 122,048 | | | 124,855 |
| Series 2009-70,Cl. TL, 4.00%, 8/25/19 | | | 7,992 | | | 7,986 |
29 OPPENHEIMER CAPITAL INCOME FUND
CONSOLIDATED
STATEMENT OF INVESTMENTS Continued
| | | | | | |
| | | Principal Amount | | | Value |
| FHLMC/FNMA/FHLB/Sponsored (Continued) | | | | | | |
| Federal National Mortgage Assn., Real Estate Mtg. Investment Conduit Multiclass Pass-Through Certificates: (Continued) |
| Series 2010-43,Cl. KG, 3.00%, 1/25/21 | | $ | 39,811 | | | $ 39,787 |
| Series 2011-15,Cl. DA, 4.00%, 3/25/41 | | | 68,811 | | | 68,486 |
| Series 2011-3,Cl. EL, 3.00%, 5/25/20 | | | 56,107 | | | 56,022 |
| Series 2011-3,Cl. KA, 5.00%, 4/25/40 | | | 464,680 | | | 482,464 |
| Series 2011-38,Cl. AH, 2.75%, 5/25/20 | | | 178 | | | 177 |
| Series 2011-82,Cl. AD, 4.00%, 8/25/26 | | | 136,318 | | | 136,411 |
| Federal National Mortgage Assn., Real Estate Mtg. Investment Conduit Multiclass Pass-Through Certificates, Interest-Only Stripped Mtg.-Backed Security: |
| Series 2001-15,Cl. SA, 99.999%, 3/17/314 | | | 9,373 | | | 712 |
| Series 2001-65,Cl. S, 47.49%, 11/25/314 | | | 137,248 | | | 25,804 |
| Series 2001-81,Cl. S, 48.553%, 1/25/324 | | | 36,299 | | | 5,880 |
| Series 2002-47,Cl. NS, 32.314%, 4/25/324 | | | 87,766 | | | 15,221 |
| Series 2002-51,Cl. S, 32.965%, 8/25/324 | | | 80,581 | | | 13,975 |
| Series 2002-52,Cl. SD, 63.988%, 9/25/324 | | | 123,551 | | | 20,711 |
| Series 2002-60,Cl. SM, 22.84%, 8/25/324 | | | 108,087 | | | 14,394 |
| Series 2002-7,Cl. SK, 33.645%, 1/25/324 | | | 34,286 | | | 4,904 |
| Series 2002-75,Cl. SA, 38.847%, 11/25/324 | | | 176,131 | | | 28,779 |
| Series 2002-77,Cl. BS, 30.543%, 12/18/324 | | | 76,274 | | | 12,546 |
| Series 2002-77,Cl. SH, 47.708%, 12/18/324 | | | 51,939 | | | 8,024 |
| Series 2002-89,Cl. S, 64.271%, 1/25/334 | | | 275,069 | | | 47,925 |
| Series 2002-9,Cl. MS, 30.895%, 3/25/324 | | | 46,554 | | | 8,335 |
| Series 2002-90,Cl. SN, 23.465%, 8/25/324 | | | 55,658 | | | 7,412 |
| Series 2002-90,Cl. SY, 29.905%, 9/25/324 | | | 28,232 | | | 3,858 |
| Series 2003-33,Cl. SP, 33.988%, 5/25/334 | | | 151,418 | | | 29,270 |
| Series 2003-46,Cl. IH, 0.00%, 6/25/234,5 | | | 224,104 | | | 20,183 |
| Series 2004-54,Cl. DS, 99.999%, 11/25/304 | | | 110,101 | | | 15,497 |
| Series 2004-56,Cl. SE, 13.002%, 10/25/334 | | | 207,655 | | | 34,061 |
| Series 2005-12,Cl. SC, 28.76%, 3/25/354 | | | 61,648 | | | 8,578 |
| Series 2005-19,Cl. SA, 52.942%, 3/25/354 | | | 1,317,126 | | | 174,116 |
| Series 2005-40,Cl. SA, 52.522%, 5/25/354 | | | 288,959 | | | 37,113 |
| Series 2005-52,Cl. JH, 26.679%, 5/25/354 | | | 678,286 | | | 80,544 |
| Series 2005-6,Cl. SE, 99.999%, 2/25/354 | | | 578,257 | | | 76,459 |
| Series 2005-93,Cl. SI, 10.612%, 10/25/354 | | | 323,359 | | | 43,214 |
| Series 2008-55,Cl. SA, 0.00%, 7/25/384,5 | | | 132,286 | | | 11,061 |
| Series 2009-8,Cl. BS, 0.00%, 2/25/244,5 | | | 4,489 | | | 225 |
| Series 2011-96,Cl. SA, 7.462%, 10/25/414 | | | 762,689 | | | 101,996 |
| Series 2012-134,Cl. SA, 2.256%, 12/25/424 | | | 2,374,548 | | | 394,204 |
| Series 2012-40,Cl. PI, 9.302%, 4/25/414 | | | 2,420,954 | | | 377,931 |
| Federal National Mortgage Assn., Real Estate Mtg. Investment Conduit Multiclass Pass-Through Certificates, Principal-Only Stripped Mtg.-Backed Security, Series 1993-184, Cl. M, 5.135%, 9/25/236 | | | 51,328 | | | 47,650 |
| | | | | | 234,317,207 |
| GNMA/Guaranteed—1.2% | | | | | | |
| Government National Mortgage Assn. II Pool, 3.50%, 9/1/487 | | | 30,795,000 | | | 30,895,445 |
| Government National Mortgage Assn., Interest-Only Stripped Mtg.-Backed Security: | | | | | | |
| Series 2002-15,Cl. SM, 99.025%, 2/16/324 | | | 133,190 | | | 1,381 |
30 OPPENHEIMER CAPITAL INCOME FUND
| | | | | | |
| | | Principal Amount | | | Value |
| GNMA/Guaranteed (Continued) | | | | | | |
| Government National Mortgage Assn., Interest-Only Stripped Mtg.-Backed Security: (Continued) | | | | | | |
| Series 2002-41,Cl. GS, 45.494%, 6/16/324 | | $ | 17,708 | | | $ 729 |
| Series 2002-76,Cl. SY, 87.91%, 12/16/264 | | | 269,049 | | | 26,012 |
| Series 2007-17,Cl. AI, 40.146%, 4/16/374 | | | 1,322,193 | | | 179,640 |
| Series 2011-52,Cl. HS, 19.423%, 4/16/414 | | | 1,501,728 | | | 166,795 |
| Series 2017-136, Cl. LI, 5.259%, 9/16/474 | | | 3,223,763 | | | 675,245 |
| | | | | | 31,945,247 |
| Non-Agency—7.2% | | | | | | |
| Commercial—2.9% | | | | | | |
| BCAP LLC Trust, Series 2011-R11, Cl. 18A5, 3.41% [H15T1Y+210], 9/26/352,3 | | | 218,543 | | | 219,629 |
| Benchmark Mortgage Trust, Interest-Only Commercial Mtg. Pass- Through Certificates, Series 2018-B1, Cl. XA, 14.071%, 1/15/514 | | | 16,702,697 | | | 649,424 |
| CD Mortgage Trust, Interest-Only Commercial Mtg. Pass-Through Certificates, Series 2017-CD6, Cl. XA, 14.674%, 11/13/504 | | | 5,843,897 | | | 357,479 |
| Chase Mortgage Finance Trust, Series 2005-A2, Cl. 1A3, 3.665%, 1/25/368 | | | 759,754 | | | 721,648 |
| Citigroup Commercial Mortgage Trust: | | | | | | |
| Series 2012-GC8,Cl. AAB, 2.608%, 9/10/45 | | | 712,152 | | | 705,794 |
| Series 2014-GC21,Cl. AAB, 3.477%, 5/10/47 | | | 710,000 | | | 716,560 |
| Citigroup Commercial Mortgage Trust, Interest-Only Commercial Mtg. Pass-Through Certificates: | | | | | | |
| Series 2013-GC17,Cl. XA, 0.00%, 11/10/464,5 | | | 2,555,641 | | | 86,864 |
| Series 2017-C4, Cl. XA, 13.838%, 10/12/504 | | | 15,324,818 | | | 1,111,944 |
| COMM Mortgage Trust: | | | | | | |
| Series 2012-CR3,Cl. ASB, 2.372%, 10/15/45 | | | 133,480 | | | 131,729 |
| Series 2012-LC4,Cl. A3, 3.069%, 12/10/44 | | | 278,443 | | | 278,333 |
| Series 2013-CR13,Cl. ASB, 3.706%, 11/10/46 | | | 1,355,000 | | | 1,376,330 |
| Series 2013-CR6,Cl. AM, 3.147%, 3/10/463 | | | 1,520,000 | | | 1,494,274 |
| Series 2014-CR17,Cl. ASB, 3.598%, 5/10/47 | | | 1,955,000 | | | 1,979,135 |
| Series 2014-CR20,Cl. ASB, 3.305%, 11/10/47 | | | 475,000 | | | 476,464 |
| Series 2014-CR21,Cl. AM, 3.987%, 12/10/47 | | | 4,410,000 | | | 4,481,363 |
| Series 2014-LC15,Cl. AM, 4.198%, 4/10/47 | | | 980,000 | | | 1,007,786 |
| Series 2014-UBS6,Cl. AM, 4.048%, 12/10/47 | | | 3,020,000 | | | 3,051,954 |
| Series 2015-CR22,Cl. A2, 2.856%, 3/10/48 | | | 865,000 | | | 863,518 |
| COMM Mortgage Trust, Interest-Only Stripped Mtg.-Backed Security, Series 2012-CR5, Cl. XA, 22.20%, 12/10/454 | | | 4,455,205 | | | 241,346 |
| CSMC Mortgage-Backed Trust, Series 2006-6, Cl. 1A4, 6.00%, 7/25/36 | | | 1,049,914 | | | 875,432 |
| First Horizon Alternative Mortgage Securities Trust, Series 2005-FA8, Cl. 1A6, 2.715% [US0001M+65], 11/25/352 | | | 446,307 | | | 344,336 |
| FREMF Mortgage Trust: | | | | | | |
| Series 2010-K6,Cl. B, 5.542%, 12/25/463,8 | | | 390,000 | | | 400,448 |
| Series 2012-K705,Cl. C, 4.316%, 9/25/443,8 | | | 920,000 | | | 917,898 |
| Series 2012-K710,Cl. B, 3.941%, 6/25/473,8 | | | 195,000 | | | 195,928 |
| Series 2012-K711,Cl. B, 3.684%, 8/25/453,8 | | | 85,000 | | | 85,213 |
| Series 2012-K711,Cl. C, 3.684%, 8/25/453,8 | | | 920,000 | | | 920,273 |
| Series 2013-K25,Cl. C, 3.744%, 11/25/453,8 | | | 350,000 | | | 346,004 |
31 OPPENHEIMER CAPITAL INCOME FUND
CONSOLIDATED
STATEMENT OF INVESTMENTS Continued
| | | | | | |
| | | Principal Amount | | | Value |
| Commercial (Continued) | | | | | | |
| FREMF Mortgage Trust: (Continued) | | | | | | |
| Series 2013-K26,Cl. C, 3.721%, 12/25/453,8 | | $ | 460,000 | | | $ 449,213 |
| Series 2013-K27,Cl. C, 3.615%, 1/25/463,8 | | | 400,000 | | | 387,605 |
| Series 2013-K28,Cl. C, 3.61%, 6/25/463,8 | | | 2,460,000 | | | 2,429,956 |
| Series 2013-K712,Cl. C, 3.473%, 5/25/453,8 | | | 505,000 | | | 504,590 |
| Series 2013-K713,Cl. C, 3.263%, 4/25/463,8 | | | 480,000 | | | 477,699 |
| Series 2014-K714,Cl. C, 3.981%, 1/25/473,8 | | | 325,000 | | | 326,155 |
| Series 2014-K715,Cl. C, 4.265%, 2/25/463,8 | | | 155,000 | | | 154,580 |
| Series 2015-K44,Cl. B, 3.809%, 1/25/483,8 | | | 170,000 | | | 166,501 |
| Series 2017-K62,Cl. B, 4.004%, 1/25/503,8 | | | 150,000 | | | 147,419 |
| GS Mortgage Securities Corp. Trust, Series 2012-SHOP, Cl. A, 2.933%, 6/5/313 | | | 3,155,000 | | | 3,158,288 |
| GS Mortgage Securities Trust: | | | | | | |
| Series 2012-GC6,Cl. A3, 3.482%, 1/10/45 | | | 313,815 | | | 316,491 |
| Series 2013-GC12,Cl. AAB, 2.678%, 6/10/46 | | | 242,058 | | | 239,616 |
| Series 2013-GC16,Cl. AS, 4.649%, 11/10/46 | | | 455,000 | | | 477,349 |
| Series 2014-GC18,Cl. AAB, 3.648%, 1/10/47 | | | 620,000 | | | 625,313 |
| GSMSC Pass-Through Trust, Series 2009-3R, Cl. 1A2, 6.00%, 4/25/373,8 | | | 857,853 | | | 827,637 |
| JP Morgan Chase Commercial Mortgage Securities Trust: | | | | | | |
| Series 2012-C6,Cl. ASB, 3.144%, 5/15/45 | | | 956,488 | | | 957,344 |
| Series 2012-LC9,Cl. A4, 2.611%, 12/15/47 | | | 160,000 | | | 157,943 |
| Series 2013-C10,Cl. AS, 3.372%, 12/15/47 | | | 2,110,000 | | | 2,094,278 |
| Series 2013-C16,Cl. AS, 4.517%, 12/15/46 | | | 2,005,000 | | | 2,084,280 |
| Series 2013-LC11,Cl. AS, 3.216%, 4/15/46 | | | 578,000 | | | 568,570 |
| Series 2013-LC11,Cl. ASB, 2.554%, 4/15/46 | | | 339,837 | | | 335,623 |
| Series 2014-C20,Cl. AS, 4.043%, 7/15/47 | | | 1,570,000 | | | 1,595,500 |
| Series 2016-JP3,Cl. A2, 2.435%, 8/15/49 | | | 1,520,000 | | | 1,485,185 |
| JP Morgan Mortgage Trust, Series 2007-A1, Cl. 5A1, 3.843%, 7/25/358 | | | 663,733 | | | 683,048 |
| JP Morgan Resecuritization Trust, Series 2009-5, Cl. 1A2, 4.422%, 7/26/363,8 | | | 646,939 | | | 654,094 |
| JPMBB Commercial Mortgage Securities Trust: | | | | | | |
| Series 2013-C17,Cl. ASB, 3.705%, 1/15/47 | | | 530,000 | | | 537,884 |
| Series 2014-C18,Cl. A3, 3.578%, 2/15/47 | | | 745,000 | | | 746,560 |
| Series 2014-C19,Cl. ASB, 3.584%, 4/15/47 | | | 295,000 | | | 298,215 |
| Series 2014-C24,Cl. B, 4.116%, 11/15/478 | | | 1,945,000 | | | 1,964,085 |
| Series 2014-C25,Cl. AS, 4.065%, 11/15/47 | | | 3,600,000 | | | 3,664,416 |
| Series 2014-C26,Cl. AS, 3.80%, 1/15/48 | | | 1,775,000 | | | 1,782,319 |
| Morgan Stanley Bank of America Merrill Lynch Trust: | | | | | | |
| Series 2013-C7,Cl. AAB, 2.469%, 2/15/46 | | | 669,560 | | | 660,671 |
| Series 2013-C9,Cl. AS, 3.456%, 5/15/46 | | | 1,670,000 | | | 1,656,159 |
| Series 2014-C14,Cl. B, 4.792%, 2/15/478 | | | 80,000 | | | 83,622 |
| Series 2014-C19,Cl. AS, 3.832%, 12/15/47 | | | 3,650,000 | | | 3,643,472 |
| Morgan Stanley Capital I Trust: | | | | | | |
| Series 2011-C1,Cl. A4, 5.033%, 9/15/473,8 | | | 285,927 | | | 295,392 |
| Series 2011-C2,Cl. A4, 4.661%, 6/15/443 | | | 355,000 | | | 367,149 |
| Morgan Stanley Capital I, Inc., Interest-Only Commercial Mtg. Pass- Through Certificates, Series 2017-HR2, Cl. XA, 12.821%, 12/15/504 | | | 5,632,924 | | | 330,107 |
32 OPPENHEIMER CAPITAL INCOME FUND
| | | | | | |
| | | Principal Amount | | | Value |
| Commercial (Continued) | | | | | | |
| Morgan Stanley Re-Remic Trust, Series 2012-R3, Cl. 1B, 3.076%, 11/26/363,8 | | $ | 1,851,561 | | | $ 1,740,783 |
| Morgan Stanley Resecuritization Trust, Series 2013-R9, Cl. 3A, 3.479%, 6/26/463,8 | | | 482,686 | | | 481,796 |
| RBSSP Resecuritization Trust, Series 2010-1, Cl. 2A1, 3.688%, 7/26/453,8 | | | 146,719 | | | 150,420 |
| Structured Adjustable Rate Mortgage Loan Trust, Series 2004-10, Cl. 2A, 4.278%, 8/25/348 | | | 382,702 | | | 384,878 |
| UBS Commercial Mortgage Trust, Interest-Only Commercial Mtg. Pass-Through Certificates, Series 2017-C5, Cl. XA, 14.169%, 11/15/504 | | | 10,001,926 | | | 654,450 |
| Wells Fargo Commercial Mortgage Trust, Series 2015-NXS1, Cl. ASB, 2.934%, 5/15/48 | | | 2,415,000 | | | 2,388,468 |
| Wells Fargo Commercial Mortgage Trust, Interest-Only Commercial Mtg. Pass-Through Certificates, Series 2017-C42, Cl. XA, 12.495%, 12/15/504 | | | 7,804,925 | | | 520,603 |
| WF-RBS Commercial Mortgage Trust: | | | | | | |
| Series 2013-C14,Cl. AS, 3.488%, 6/15/46 | | | 1,045,000 | | | 1,035,872 |
| Series 2014-C20,Cl. AS, 4.176%, 5/15/47 | | | 905,000 | | | 928,632 |
| Series 2014-C22,Cl. A3, 3.528%, 9/15/57 | | | 320,000 | | | 322,362 |
| Series 2014-C25,Cl. AS, 3.984%, 11/15/47 | | | 1,085,000 | | | 1,087,972 |
| Series 2014-LC14,Cl. AS, 4.351%, 3/15/478 | | | 1,065,000 | | | 1,098,542 |
| WF-RBS Commercial Mortgage Trust, Interest-Only Commercial Mtg. Pass-Through Certificates, Series 2011-C3, Cl. XA, 28.785%, 3/15/443,4 | | | 10,222,234 | | | 290,548 |
| | | | | | |
| | | | | | 72,456,760 |
| Multi-Family—0.1% | | | | | | |
| Connecticut Avenue Securities: | | | | | | |
| Series 2014-C02,Cl. 1M1, 3.015% [US0001M+95], 5/25/242 | | | 607,919 | | | 609,335 |
| Series 2017-C04,Cl. 2M1, 2.915% [US0001M+85], 11/25/292 | | | 2,007,307 | | | 2,014,678 |
| | | | | | |
| | | | | | 2,624,013 |
| Residential—4.2% | | | | | | |
| Asset-Backed Funding Certificates Trust, Series 2005-HE2, Cl. M3, 2.845% [US0001M+78], 6/25/352 | | | 3,616,198 | | | 3,645,727 |
| Banc of America Funding Trust: | | | | | | |
| Series 2007-1,Cl. 1A3, 6.00%, 1/25/37 | | | 127,292 | | | 122,096 |
| Series 2007-C,Cl. 1A4, 3.789%, 5/20/368 | | | 119,835 | | | 116,113 |
| Series 2014-R7,Cl. 3A1, 3.917%, 3/26/363,8 | | | 761,768 | | | 765,753 |
| Banc of America Mortgage Trust, Series 2007-1, Cl. 1A24, 6.00%, 3/25/37 | | | 387,084 | | | 367,202 |
| Bear Stearns ARM Trust: | | | | | | |
| Series 2005-9,Cl. A1, 4.73% [H15T1Y+230], 10/25/352 | | | 721,893 | | | 732,260 |
| Series 2006-1,Cl. A1, 3.67% [H15T1Y+225], 2/25/362 | | | 1,013,289 | | | 1,023,298 |
| Bear Stearns Asset Backed Securities I Trust, Series 2005-HE6, Cl. M2, 3.07% [US0001M+100.5], 6/25/352 | | | 2,935,975 | | | 2,975,759 |
| CHL Mortgage Pass-Through Trust: | | | | | | |
| Series 2005-26,Cl. 1A8, 5.50%, 11/25/35 | | | 491,440 | | | 443,452 |
33 OPPENHEIMER CAPITAL INCOME FUND
CONSOLIDATED
STATEMENT OF INVESTMENTS Continued
| | | | | | |
| | | Principal Amount | | | Value |
| Residential (Continued) | | | | | | |
| CHL Mortgage Pass-Through Trust: (Continued) | | | | | | |
| Series 2006-6,Cl. A3, 6.00%, 4/25/36 | | $ | 274,683 | | | $ 234,924 |
| Citigroup Mortgage Loan Trust, Inc.: | | | | | | |
| Series 2004-OPT1,Cl. M3, 3.01% [US0001M+94.5], 10/25/342 | | | 3,750,000 | | | 3,788,636 |
| Series 2006-AR1,Cl. 1A1, 4.28% [H15T1Y+240], 10/25/352 | | | 2,055,542 | | | 2,081,938 |
| Connecticut Avenue Securities: | | | | | | |
| Series 2014-C03,Cl. 1M2, 5.065% [US0001M+300], 7/25/242 | | | 2,257,173 | | | 2,417,816 |
| Series 2016-C03,Cl. 1M1, 4.065% [US0001M+200], 10/25/282 | | | 494,099 | | | 500,327 |
| Series 2016-C07,Cl. 2M1, 3.365% [US0001M+130], 5/25/292 | | | 837,561 | | | 840,507 |
| Series 2017-C02,Cl. 2M1, 3.215% [US0001M+115], 9/25/292 | | | 2,664,990 | | | 2,681,929 |
| Series 2017-C03,Cl. 1M1, 3.015% [US0001M+95], 10/25/292 | | | 2,437,622 | | | 2,451,168 |
| Series 2017-C05,Cl. 1M1, 2.615% [US0001M+55], 1/25/302 | | | 523,545 | | | 523,967 |
| Series 2017-C06,Cl. 1M1, 2.815% [US0001M+75], 2/25/302 | | | 829,708 | | | 831,559 |
| Series 2017-C07,Cl. 1M1, 2.715% [US0001M+65], 5/25/302 | | | 1,989,609 | | | 1,994,043 |
| Series 2017-C07,Cl. 1M2, 4.465% [US0001M+240], 5/25/302 | | | 1,475,000 | | | 1,528,271 |
| Series 2017-C07,Cl. 2M1, 2.715% [US0001M+65], 5/25/302 | | | 1,484,622 | | | 1,485,466 |
| Series 2018-C01,Cl. 1M1, 2.665% [US0001M+60], 7/25/302 | | | 1,814,945 | | | 1,816,045 |
| Series 2018-C02,Cl. 2M1, 2.715% [US0001M+65], 8/25/302 | | | 768,079 | | | 768,789 |
| Series 2018-C03,Cl. 1M1, 2.745% [US0001M+68], 10/25/302 | | | 1,720,890 | | | 1,723,070 |
| Series 2018-C04,Cl. 2M1, 2.815% [US0001M+75], 12/25/302 | | | 1,907,332 | | | 1,909,986 |
| Series 2018-C05,Cl. 1M1, 2.785% [US0001M+72], 1/25/312 | | | 729,211 | | | 730,627 |
| Countrywide Alternative Loan Trust: | | | | | | |
| Series 2005-21CB,Cl. A7, 5.50%, 6/25/35 | | | 638,643 | | | 604,112 |
| Series 2005-J10,Cl. 1A17, 5.50%, 10/25/35 | | | 2,397,789 | | | 2,180,489 |
| GMACM Home Equity Loan Trust, Series 2007-HE2, Cl. A2, 6.054%, 12/25/378 | | | 7,098 | | | 6,963 |
| GSR Mortgage Loan Trust, Series 2005-AR4, Cl. 6A1, 4.36%, 7/25/358 | | | 204,515 | | | 206,457 |
| HomeBanc Mortgage Trust, Series 2005-3, Cl. A2, 2.375% [US0001M+31], 7/25/352 | | | 255,674 | | | 255,419 |
| RAMP Trust: | | | | | | |
| Series 2005-RS2,Cl. M4, 2.785% [US0001M+72], 2/25/352 | | | 4,469,000 | | | 4,476,194 |
| Series 2005-RS6,Cl. M4, 3.04% [US0001M+97.5], 6/25/352 | | | 5,700,000 | | | 5,721,831 |
| Series 2006-EFC1,Cl. M2, 2.465% [US0001M+40], 2/25/362 | | | 5,490,000 | | | 5,457,900 |
| STACR Trust, Series 2018-DNA2, Cl. M1, 2.865% [US0001M+80], 12/25/302,3 | | | 2,565,000 | | | 2,572,760 |
| Structured Agency Credit Risk Debt Nts.: | | | | | | |
| Series 2013-DN2,Cl. M2, 6.315% [US0001M+425], 11/25/232 | | | 1,528,062 | | | 1,701,222 |
| Series 2014-DN1,Cl. M2, 4.265% [US0001M+220], 2/25/242 | | | 298,390 | | | 306,853 |
| Series 2014-DN1,Cl. M3, 6.565% [US0001M+450], 2/25/242 | | | 1,180,000 | | | 1,363,330 |
| Series 2014-DN2,Cl. M3, 5.665% [US0001M+360], 4/25/242 | | | 1,835,000 | | | 2,044,648 |
| Series 2014-HQ2,Cl. M3, 5.815% [US0001M+375], 9/25/242 | | | 2,270,000 | | | 2,601,975 |
| Series 2015-HQA2,Cl. M2, 4.865% [US0001M+280], 5/25/282 | | | 168,419 | | | 173,113 |
| Series 2016-DNA1,Cl. M2, 4.965% [US0001M+290], 7/25/282 | | | 435,633 | | | 446,841 |
| Series 2016-DNA4,Cl. M1, 2.865% [US0001M+80], 3/25/292 | | | 206,610 | | | 206,751 |
| Series 2016-DNA4,Cl. M3, 5.865% [US0001M+380], 3/25/292 | | | 2,290,000 | | | 2,581,508 |
| Series 2016-HQA3,Cl. M1, 2.865% [US0001M+80], 3/25/292 | | | 1,223,631 | | | 1,224,982 |
| Series 2016-HQA3,Cl. M3, 5.915% [US0001M+385], 3/25/292 | | | 765,000 | | | 864,649 |
| Series 2016-HQA4,Cl. M1, 2.865% [US0001M+80], 4/25/292 | | | 825,936 | | | 826,725 |
34 OPPENHEIMER CAPITAL INCOME FUND
| | | | | | |
| | | Principal Amount | | | Value |
| Residential (Continued) | | | | | | |
| Structured Agency Credit Risk Debt Nts.: (Continued) | | | | | | |
| Series 2016-HQA4,Cl. M3, 5.965% [US0001M+390], 4/25/292 | | $ | 2,270,000 | | | $ 2,572,264 |
| Series 2017-HQA1,Cl. M1, 3.265% [US0001M+120], 8/25/292 | | | 3,731,977 | | | 3,757,931 |
| Series 2017-HQA2,Cl. M1, 2.865% [US0001M+80], 12/25/292 | | | 1,267,120 | | | 1,271,014 |
| Series 2017-HQA3,Cl. M1, 2.615% [US0001M+55], 4/25/302 | | | 3,119,035 | | | 3,119,865 |
| Series 2018-DNA1,Cl. M1, 2.515% [US0001M+45], 7/25/302 | | | 4,200,656 | | | 4,189,858 |
| Series 2018-DNA1,Cl. M2, 3.865% [US0001M+180], 7/25/302 | | | 3,145,000 | | | 3,135,587 |
| Structured Asset Securities Corp. Mortgage Loan Trust, Series 2007- GEL2, Cl. A2, 2.385% [US0001M+32], 5/25/372,3 | | | 6,549,581 | | | 6,523,713 |
| WaMu Mortgage Pass-Through Certificates Trust: | | | | | | |
| Series 2003-AR10,Cl. A7, 3.47%, 10/25/338 | | | 354,056 | | | 360,159 |
| Series 2005-AR14,Cl. 1A4, 3.457%, 12/25/358 | | | 485,436 | | | 490,722 |
| Series 2005-AR16,Cl. 1A1, 3.422%, 12/25/358 | | | 523,839 | | | 526,455 |
| Wells Fargo Mortgage-Backed Securities Trust: | | | | | | |
| Series 2005-AR15,Cl. 1A2, 4.60%, 9/25/358 | | | 743,284 | | | 726,569 |
| Series 2005-AR15,Cl. 1A6, 4.60%, 9/25/358 | | | 380,390 | | | 369,188 |
| Series 2005-AR4,Cl. 2A2, 4.002%, 4/25/358 | | | 1,856,580 | | | 1,874,289 |
| Series 2006-AR10,Cl. 1A1, 4.256%, 7/25/368 | | | 279,183 | | | 274,093 |
| Series 2006-AR10,Cl. 5A5, 4.422%, 7/25/368 | | | 1,267,322 | | | 1,288,138 |
| Series 2006-AR2,Cl. 2A3, 3.917%, 3/25/368 | | | 174,727 | | | 177,081 |
| Series 2006-AR7,Cl. 2A4, 4.324%, 5/25/368 | | | 161,124 | | | 165,306 |
| Series 2007-16,Cl. 1A1, 6.00%, 12/28/37 | | | 155,857 | | | 158,324 |
| | | | | | 105,306,006 |
| Total Mortgage-Backed Obligations (Cost $440,710,082) | | | | | | 446,649,233 |
| U.S. Government Obligation—0.2% | | | | | | |
| United States Treasury Nts., 1.50%, 5/31/199,10 (Cost $4,534,520) | | | 4,530,000 | | | 4,500,626 |
| Non-Convertible Corporate Bonds and Notes—22.2% | | | | | | |
| Consumer Discretionary—2.9% | | | | | | |
| Automobiles—0.8% | | | | | | |
| Daimler Finance North America LLC: | | | | | | |
| 2.20% Sr. Unsec. Nts., 5/5/203 | | | 1,947,000 | | | 1,914,602 |
| 3.75% Sr. Unsec. Nts., 2/22/283 | | | 1,891,000 | | | 1,867,036 |
| Ford Motor Credit Co. LLC: | | | | | | |
| 3.20% Sr. Unsec. Nts., 1/15/21 | | | 1,360,000 | | | 1,335,939 |
| 3.664% Sr. Unsec. Nts., 9/8/24 | | | 1,629,000 | | | 1,533,095 |
| General Motors Co., 6.25% Sr. Unsec. Nts., 10/2/43 | | | 581,000 | | | 603,231 |
| General Motors Financial Co., Inc., 4.15% Sr. Unsec. Nts., 6/19/23 | | | 1,931,000 | | | 1,927,864 |
| Harley-Davidson Financial Services, Inc., 2.40% Sr. Unsec. Nts., 6/15/203 | | | 2,326,000 | | | 2,285,671 |
| Hyundai Capital America: | | | | | | |
| 1.75% Sr. Unsec. Nts., 9/27/193 | | | 1,746,000 | | | 1,716,563 |
| 4.125% Sr. Unsec. Nts., 6/8/233 | | | 2,263,000 | | | 2,262,674 |
| Nissan Motor Acceptance Corp., 2.15% Sr. Unsec. Nts., 9/28/203 | | | 1,466,000 | | | 1,430,097 |
| Volkswagen Group of America Finance LLC, 2.45% Sr. Unsec. Nts., 11/20/193 | | | 2,290,000 | | | 2,272,120 |
| | | | | | 19,148,892 |
35 OPPENHEIMER CAPITAL INCOME FUND
CONSOLIDATED
STATEMENT OF INVESTMENTS Continued
| | | | | | |
| | | Principal Amount | | | Value |
| Diversified Consumer Services—0.1% | | | | | | |
| Service Corp. International, 4.625% Sr. Unsec. Nts., 12/15/27 | | $ | 2,496,000 | | | $ 2,402,400 |
| Hotels, Restaurants & Leisure—0.2% | | | | | | |
| Aramark Services, Inc., 5.00% Sr. Unsec. Nts., 4/1/253 | | | 1,210,000 | | | 1,220,587 |
| Hyatt Hotels Corp., 4.375% Sr. Unsec. Nts., 9/15/28 | | | 519,000 | | | 516,236 |
| Royal Caribbean Cruises Ltd., 2.65% Sr. Unsec. Nts., 11/28/20 | | | 2,086,000 | | | 2,051,803 |
| Starbucks Corp., 3.80% Sr. Unsec. Nts., 8/15/25 | | | 2,205,000 | | | 2,206,718 |
| | | | | | 5,995,344 |
| Household Durables—0.4% | | | | | | |
| DR Horton, Inc., 2.55% Sr. Unsec. Nts., 12/1/20 | | | 2,284,000 | | | 2,241,698 |
| Lennar Corp., 4.75% Sr. Unsec. Nts., 5/30/25 | | | 2,323,000 | | | 2,293,963 |
| Newell Brands, Inc., 5.00% Sr. Unsec. Nts., 11/15/23 | | | 1,142,000 | | | 1,154,024 |
| PulteGroup, Inc., 5.00% Sr. Unsec. Nts., 1/15/27 | | | 1,676,000 | | | 1,602,675 |
| Toll Brothers Finance Corp.: | | | | | | |
| 4.375% Sr. Unsec. Nts., 4/15/23 | | | 1,720,000 | | | 1,718,228 |
| 4.875% Sr. Unsec. Nts., 3/15/27 | | | 485,000 | | | 465,600 |
| | | | | | 9,476,188 |
| Internet & Catalog Retail—0.2% | | | | | | |
| Amazon.com, Inc., 4.95% Sr. Unsec. Nts., 12/5/44 | | | 816,000 | | | 927,367 |
| QVC, Inc., 4.45% Sr. Sec. Nts., 2/15/25 | | | 4,050,000 | | | 3,891,886 |
| | | | | | 4,819,253 |
| Media—0.6% | | | | | | |
| 21st Century Fox America, Inc., 4.75% Sr. Unsec. Nts., 11/15/46 | | | 856,000 | | | 919,797 |
| Charter Communications Operating LLC/Charter Communications Operating Capital, 5.375% Sr. Sec. Nts., 5/1/47 | | | 1,012,000 | | | 947,249 |
| Comcast Cable Communications Holdings, Inc., 9.455% Sr. Unsec. Nts., 11/15/22 | | | 2,206,000 | | | 2,708,809 |
| Comcast Corp., 4.00% Sr. Unsec. Nts., 3/1/48 | | | 1,175,000 | | | 1,064,245 |
| Interpublic Group of Cos., Inc. (The), 4.20% Sr. Unsec. Nts., 4/15/24 | | | 2,250,000 | | | 2,253,886 |
| Sky plc, 3.75% Sr. Unsec. Nts., 9/16/243 | | | 1,104,000 | | | 1,105,538 |
| Time Warner Cable LLC, 4.50% Sr. Unsec. Unsub. Nts., 9/15/42 | | | 1,618,000 | | | 1,368,010 |
| Viacom, Inc., 4.375% Sr. Unsec. Nts., 3/15/43 | | | 725,000 | | | 626,407 |
| Virgin Media Secured Finance plc, 5.25% Sr. Sec. Nts., 1/15/263 | | | 2,366,000 | | | 2,310,281 |
| WPP Finance 2010, 3.75% Sr. Unsec. Nts., 9/19/24 | | | 2,554,000 | | | 2,468,901 |
| | | | | | 15,773,123 |
| Multiline Retail—0.1% | | | | | | |
Dollar Tree, Inc., 4.00% Sr. Unsec. Nts., 5/15/25 | | | 2,334,000 | | | 2,309,355 |
| Specialty Retail—0.4% | | | | | | |
| AutoZone, Inc., 1.625% Sr. Unsec. Nts., 4/21/19 | | | 412,000 | | | 408,988 |
| Best Buy Co., Inc., 5.50% Sr. Unsec. Nts., 3/15/21 | | | 2,216,000 | | | 2,325,815 |
| L Brands, Inc., 5.625% Sr. Unsec. Nts., 2/15/22 | | | 2,209,000 | | | 2,244,896 |
| Ross Stores, Inc., 3.375% Sr. Unsec. Nts., 9/15/24 | | | 2,328,000 | | | 2,300,328 |
36 OPPENHEIMER CAPITAL INCOME FUND
| | | | | | |
| | | Principal Amount | | | Value |
| Specialty Retail (Continued) | | | | | | |
| Signet UK Finance plc, 4.70% Sr. Unsec. Nts., 6/15/24 | | $ | 2,318,000 | | | $ 2,178,825 |
| | | | | | 9,458,852 |
| Textiles, Apparel & Luxury Goods—0.1% | | | | | | |
| Hanesbrands, Inc., 4.875% Sr. Unsec. Nts., 5/15/263 | | | 2,333,000 | | | 2,257,178 |
| Levi Strauss & Co., 5.00% Sr. Unsec. Nts., 5/1/25 | | | 1,633,000 | | | 1,649,330 |
| | | | | | 3,906,508 |
| Consumer Staples—1.6% | | | | | | |
| Beverages—0.5% | | | | | | |
| Anheuser-Busch InBev Finance, Inc.: | | | | | | |
| 3.65% Sr. Unsec. Nts., 2/1/26 | | | 764,000 | | | 748,099 |
| 4.90% Sr. Unsec. Nts., 2/1/46 | | | 333,000 | | | 339,688 |
| Anheuser-Busch InBev Worldwide, Inc., 8.20% Sr. Unsec. Unsub. Nts., 1/15/39 | | | 1,355,000 | | | 1,938,555 |
| Bacardi Ltd., 4.70% Sr. Unsec. Nts., 5/15/283 | | | 1,181,000 | | | 1,179,216 |
| Keurig Dr Pepper, Inc.: | | | | | | |
| 4.057% Sr. Unsec. Nts., 5/25/233 | | | 2,351,000 | | | 2,366,755 |
| 4.597% Sr. Unsec. Nts., 5/25/283 | | | 1,166,000 | | | 1,184,652 |
| Molson Coors Brewing Co.: | | | | | | |
| 1.45% Sr. Unsec. Nts., 7/15/19 | | | 782,000 | | | 772,337 |
| 2.10% Sr. Unsec. Nts., 7/15/21 | | | 2,059,000 | | | 1,985,277 |
| Pernod Ricard SA, 4.25% Sr. Unsec. Nts., 7/15/223 | | | 2,234,000 | | | 2,284,323 |
| | | | | | 12,798,902 |
| Food & Staples Retailing—0.2% | | | | | | |
| Alimentation Couche-Tard, Inc., 2.35% Sr. Unsec. Nts., 12/13/193 | | | 2,505,000 | | | 2,480,930 |
| Kroger Co. (The): | | | | | | |
| 2.00% Sr. Unsec. Nts., 1/15/19 | | | 156,000 | | | 155,571 |
| 4.45% Sr. Unsec. Nts., 2/1/47 | | | 642,000 | | | 599,410 |
| 6.90% Sr. Unsec. Nts., 4/15/38 | | | 596,000 | | | 717,577 |
| | | | | | 3,953,488 |
| Food Products—0.5% | | | | | | |
| Bunge Ltd. Finance Corp.: | | | | | | |
| 3.25% Sr. Unsec. Nts., 8/15/26 | | | 1,427,000 | | | 1,305,818 |
| 3.50% Sr. Unsec. Nts., 11/24/20 | | | 2,226,000 | | | 2,225,934 |
| Campbell Soup Co., 3.30% Sr. Unsec. Nts., 3/15/21 | | | 2,322,000 | | | 2,311,270 |
| General Mills, Inc., 4.70% Sr. Unsec. Nts., 4/17/48 | | | 747,000 | | | 732,115 |
| Kraft Heinz Foods Co., 3.95% Sr. Unsec. Nts., 7/15/25 | | | 1,315,000 | | | 1,296,191 |
| Lamb Weston Holdings, Inc., 4.875% Sr. Unsec. Nts., 11/1/263 | | | 2,292,000 | | | 2,263,350 |
| Smithfield Foods, Inc.: | | | | | | |
| 2.70% Sr. Unsec. Nts., 1/31/203 | | | 1,001,000 | | | 986,586 |
| 3.35% Sr. Unsec. Nts., 2/1/223 | | | 1,232,000 | | | 1,192,069 |
| Tyson Foods, Inc., 3.55% Sr. Unsec. Nts., 6/2/27 | | | 1,252,000 | | | 1,190,076 |
| | | | | | 13,503,409 |
| Tobacco—0.4% | | | | | | |
| Altria Group, Inc., 4.00% Sr. Unsec. Nts., 1/31/24 | | | 1,613,000 | | | 1,648,585 |
37 OPPENHEIMER CAPITAL INCOME FUND
CONSOLIDATED
STATEMENT OF INVESTMENTS Continued
| | | | | | |
| | | Principal Amount | | | Value |
| Tobacco (Continued) | | | | | | |
| BAT Capital Corp.: | | | | | | |
| 2.297% Sr. Unsec. Nts., 8/14/203 | | $ | 2,410,000 | | | $ 2,367,277 |
| 3.557% Sr. Unsec. Nts., 8/15/273 | | | 1,257,000 | | | 1,179,604 |
| Imperial Brands Finance plc, 3.75% Sr. Unsec. Nts., 7/21/223 | | | 2,197,000 | | | 2,193,543 |
| Philip Morris International, Inc., 2.50% Sr. Unsec. Nts., 11/2/22 | | | 2,059,000 | | | 1,990,729 |
| | | | | | 9,379,738 |
| Energy—2.7% | | | | | | |
| Energy Equipment & Services—0.1% | | | | | | |
| Halliburton Co., 5.00% Sr. Unsec. Nts., 11/15/45 | | | 521,000 | | | 555,879 |
| Helmerich & Payne International Drilling Co., 4.65% Sr. Unsec. Nts., 3/15/25 | | | 1,300,000 | | | 1,345,004 |
| Schlumberger Holdings Corp., 4.00% Sr. Unsec. Nts., 12/21/253 | | | 1,351,000 | | | 1,360,296 |
| | | | | | 3,261,179 |
| Oil, Gas & Consumable Fuels—2.6% | | | | | | |
| Anadarko Petroleum Corp.: | | | | | | |
| 4.50% Sr. Unsec. Nts., 7/15/44 | | | 431,000 | | | 406,609 |
| 6.20% Sr. Unsec. Nts., 3/15/40 | | | 380,000 | | | 429,555 |
| Andeavor, 3.80% Sr. Unsec. Nts., 4/1/28 | | | 1,893,000 | | | 1,827,268 |
| Andeavor Logistics LP/Tesoro Logistics Finance Corp.: | | | | | | |
| 4.25% Sr. Unsec. Nts., 12/1/27 | | | 1,208,000 | | | 1,193,699 |
| 5.25% Sr. Unsec. Nts., 1/15/25 | | | 1,142,000 | | | 1,170,550 |
| Apache Corp., 4.375% Sr. Unsec. Nts., 10/15/28 | | | 2,306,000 | | | 2,280,966 |
| Buckeye Partners LP, 3.95% Sr. Unsec. Nts., 12/1/26 | | | 557,000 | | | 513,152 |
| Columbia Pipeline Group, Inc.: | | | | | | |
| 3.30% Sr. Unsec. Nts., 6/1/20 | | | 2,069,000 | | | 2,063,540 |
| 4.50% Sr. Unsec. Nts., 6/1/25 | | | 1,122,000 | | | 1,134,603 |
| ConocoPhillips Co.: | | | | | | |
| 4.95% Sr. Unsec. Nts., 3/15/26 | | | 247,000 | | | 267,462 |
| 5.95% Sr. Unsec. Nts., 3/15/46 | | | 511,000 | | | 654,946 |
| Devon Energy Corp., 4.75% Sr. Unsec. Nts., 5/15/42 | | | 545,000 | | | 533,791 |
| Energy Transfer Equity LP, 4.25% Sr. Sec. Nts., 3/15/23 | | | 1,755,000 | | | 1,764,302 |
| Energy Transfer Partners LP, 5.30% Sr. Unsec. Nts., 4/15/47 | | | 638,000 | | | 620,303 |
| Enterprise Products Operating LLC: | | | | | | |
| 4.85% Sr. Unsec. Nts., 8/15/42 | | | 541,000 | | | 554,994 |
| 4.90% Sr. Unsec. Nts., 5/15/46 | | | 271,000 | | | 280,647 |
| EQT Corp., 2.50% Sr. Unsec. Nts., 10/1/20 | | | 2,304,000 | | | 2,255,506 |
| Kinder Morgan Energy Partners LP, 5.80% Sr. Unsec. Nts., 3/1/21 | | | 887,000 | | | 935,440 |
| Kinder Morgan, Inc.: | | | | | | |
| 5.20% Sr. Unsec. Nts., 3/1/48 | | | 595,000 | | | 594,981 |
| 5.55% Sr. Unsec. Nts., 6/1/45 | | | 1,012,000 | | | 1,056,847 |
| Lukoil International Finance BV, 6.125% Sr. Unsec. Nts., 11/9/203 | | | 16,315,000 | | | 16,966,131 |
| Noble Energy, Inc., 5.05% Sr. Unsec. Nts., 11/15/44 | | | 621,000 | | | 610,599 |
| ONEOK Partners LP, 8.625% Sr. Unsec. Nts., 3/1/19 | | | 1,389,000 | | | 1,427,396 |
| Pioneer Natural Resources Co., 3.45% Sr. Unsec. Nts., 1/15/21 | | | 2,375,000 | | | 2,381,297 |
| Resolute Energy Corp., 8.50% Sr. Unsec. Nts., 5/1/20 | | | 12,800,000 | | | 12,808,000 |
| Sabine Pass Liquefaction LLC: | | | | | | |
| 4.20% Sr. Sec. Nts., 3/15/28 | | | 1,232,000 | | | 1,199,973 |
38 OPPENHEIMER CAPITAL INCOME FUND
| | | | | | |
| | | Principal Amount | | | Value |
| Oil, Gas & Consumable Fuels (Continued) | | | | | | |
Sabine Pass Liquefaction LLC: (Continued)
5.625% Sr. Sec. Nts., 2/1/21 | | $ | 1,779,000 | | | $ 1,856,211 |
| Shell International Finance BV, 4.00% Sr. Unsec. Nts., 5/10/46 | | | 805,000 | | | 792,052 |
| Sunoco Logistics Partners Operations LP, 4.00% Sr. Unsec. Nts., 10/1/27 | | | 1,401,000 | | | 1,341,908 |
| TransCanada PipeLines Ltd., 7.625% Sr. Unsec. Nts., 1/15/39 | | | 521,000 | | | 697,886 |
| Western Gas Partners LP, 5.50% Sr. Unsec. Nts., 8/15/48 | | | 299,000 | | | 290,981 |
| Williams Cos., Inc. (The): | | | | | | |
| 3.70% Sr. Unsec. Unsub. Nts., 1/15/23 | | | 2,245,000 | | | 2,225,356 |
| 3.75% Sr. Unsec. Nts., 6/15/27 | | | 960,000 | | | 922,405 |
| | | | | | 64,059,356 |
| Financials—8.1% | | | | | | |
| Capital Markets—2.2% | | | | | | |
| Apollo Management Holdings LP, 4.00% Sr. Unsec. Nts., 5/30/243 | | | 1,355,000 | | | 1,359,380 |
| Blackstone Holdings Finance Co. LLC, 3.15% Sr. Unsec. Nts., 10/2/273 | | | 877,000 | | | 818,843 |
| Brookfield Asset Management, Inc., 4.00% Sr. Unsec. Nts., 1/15/25 | | | 1,851,000 | | | 1,828,468 |
| Credit Suisse AG (New York), 3.625% Sr. Unsec. Nts., 9/9/24 | | | 1,389,000 | | | 1,378,850 |
| Credit Suisse Group AG, 3.869% [US0003M+141] Sr. Unsec. Nts., 1/12/292,3 | | | 1,396,000 | | | 1,335,100 |
| Credit Suisse Group Funding Guernsey Ltd., 4.55% Sr. Unsec. Nts., 4/17/26 | | | 1,064,000 | | | 1,078,698 |
| E*TRADE Financial Corp., 5.875% [US0003M+443.5] Jr. Sub. Perpetual Bonds2,11 | | | 2,245,000 | | | 2,329,187 |
| Goldman Sachs Capital II, 4.00% [US0003M+76.75] Jr. Sub. Perpetual Bonds2,11 | | | 296,000 | | | 249,558 |
| Goldman Sachs Group, Inc. (The): | | | | | | |
| 3.50% Sr. Unsec. Nts., 11/16/26 | | | 1,238,000 | | | 1,179,893 |
| 3.75% Sr. Unsec. Nts., 2/25/26 | | | 1,223,000 | | | 1,199,198 |
| 3.814% [US0003M+115.8] Sr. Unsec. Nts., 4/23/292 | | | 1,965,000 | | | 1,880,316 |
| 4.017% [US0003M+137.3] Sr. Unsec. Nts., 10/31/382 | | | 946,000 | | | 881,020 |
| 5.375% [US0003M+392.2] Jr. Sub. Perpetual Bonds2,11 | | | 16,468,000 | | | 16,879,700 |
| 5.70% [US0003M+388.4] Jr. Sub. Perpetual Bonds, Series L2,11 | | | 11,792,000 | | | 11,970,177 |
| Morgan Stanley: | | | | | | |
| 4.375% Sr. Unsec. Nts., 1/22/47 | | | 1,587,000 | | | 1,556,698 |
| 5.00% Sub. Nts., 11/24/25 | | | 1,904,000 | | | 1,982,256 |
| MSCI, Inc., 4.75% Sr. Unsec. Nts., 8/1/263 | | | 2,341,000 | | | 2,341,000 |
| Northern Trust Corp., 3.375% [US0003M+113.1] Sub. Nts., 5/8/322 | | | 861,000 | | | 812,595 |
| Raymond James Financial, Inc., 3.625% Sr. Unsec. Nts., 9/15/26 | | | 1,125,000 | | | 1,088,948 |
| TD Ameritrade Holding Corp., 3.30% Sr. Unsec. Nts., 4/1/27 | | | 1,419,000 | | | 1,372,240 |
| UBS Group Funding Switzerland AG: | | | | | | |
| 4.125% Sr. Unsec. Nts., 4/15/263 | | | 1,155,000 | | | 1,155,461 |
| 4.253% Sr. Unsec. Nts., 3/23/283 | | | 943,000 | | | 945,422 |
| | | | | | 55,623,008 |
| Commercial Banks—3.7% | | | | | | |
| ABN AMRO Bank NV, 4.40% [USSW5+219.7] Sub. Nts., 3/27/282,17 | | | 2,800,000 | | | 2,769,088 |
39 OPPENHEIMER CAPITAL INCOME FUND
CONSOLIDATED
STATEMENT OF INVESTMENTS Continued
| | | | | | |
| | | Principal Amount | | | Value |
| Commercial Banks (Continued) | | | | | | |
| Bank of America Corp.: | | | | | | |
| 3.248% Sr. Unsec. Nts., 10/21/27 | | $ | 1,973,000 | | | $ 1,855,053 |
| 3.366% [US0003M+81] Sr. Unsec. Nts., 1/23/262 | | | 1,965,000 | | | 1,898,875 |
| 3.824% [US0003M+157.5] Sr. Unsec. Nts., 1/20/282 | | | 1,353,000 | | | 1,323,146 |
| 4.271% [US0003M+131] Sr. Unsec. Nts., 7/23/292 | | | 1,803,000 | | | 1,817,391 |
| 6.25% [US0003M+370.5] Jr. Sub. Perpetual Bonds2,11 | | | 28,813,000 | | | 30,433,731 |
| 7.75% Jr. Sub. Nts., 5/14/38 | | | 1,620,000 | | | 2,210,803 |
| BB&T Corp., 2.85% Sr. Unsec. Nts., 10/26/24 | | | 1,831,000 | | | 1,761,107 |
| BNP Paribas SA: | | | | | | |
| 4.40% Sr. Unsec. Nts., 8/14/283 | | | 900,000 | | | 895,472 |
| 4.625% Sub. Nts., 3/13/273 | | | 1,361,000 | | | 1,356,103 |
| BPCE SA, 4.50% Sub. Nts., 3/15/253 | | | 1,371,000 | | | 1,356,373 |
| Citigroup, Inc.: | | | | | | |
| 4.075% [US0003M+119.2] Sr. Unsec. Nts., 4/23/292 | | | 1,856,000 | | | 1,828,995 |
| 4.281% [US0003M+183.9] Sr. Unsec. Nts., 4/24/482 | | | 1,840,000 | | | 1,782,694 |
| 4.75% Sub. Nts., 5/18/46 | | | 910,000 | | | 900,646 |
| Citizens Bank NA (Providence RI): | | | | | | |
| 2.55% Sr. Unsec. Nts., 5/13/21 | | | 1,124,000 | | | 1,097,794 |
| 2.65% Sr. Unsec. Nts., 5/26/22 | | | 471,000 | | | 456,105 |
| Compass Bank, 2.875% Sr. Unsec. Nts., 6/29/22 | | | 2,120,000 | | | 2,053,570 |
| Credit Agricole SA, 4.375% Sub. Nts., 3/17/253 | | | 2,296,000 | | | 2,264,556 |
| Fifth Third Bank (Cincinnati OH), 3.85% Sub. Nts., 3/15/26 | | | 1,209,000 | | | 1,190,393 |
| First Republic Bank, 4.375% Sub. Nts., 8/1/46 | | | 942,000 | | | 889,198 |
| HSBC Holdings plc: | | | | | | |
| 3.95% [US0003M+98.72] Sr. Unsec. Nts., 5/18/242 | | | 739,000 | | | 740,716 |
| 4.041% [US0003M+154.6] Sr. Unsec. Nts., 3/13/282 | | | 923,000 | | | 903,429 |
| 4.583% [US0003M+153.46] Sr. Unsec. Nts., 6/19/292 | | | 1,227,000 | | | 1,247,574 |
| Huntington Bancshares, Inc., 4.00% Sr. Unsec. Nts., 5/15/25 | | | 2,275,000 | | | 2,290,853 |
| Intesa Sanpaolo SpA, 3.875% Sr. Unsec. Nts., 7/14/273 | | | 1,672,000 | | | 1,438,203 |
| JPMorgan Chase & Co.: | | | | | | |
| 3.54% [US0003M+138] Sr. Unsec. Nts., 5/1/282 | | | 1,829,000 | | | 1,756,293 |
| 3.782% [US0003M+133.7] Sr. Unsec. Nts., 2/1/282 | | | 3,432,000 | | | 3,357,803 |
| 3.797% [US0003M+89] Sr. Unsec. Nts., 7/23/242 | | | 2,242,000 | | | 2,251,059 |
| Lloyds Banking Group plc: | | | | | | |
| 6.413% [US0003M+149.5] Jr. Sub. Perpetual Bonds2,3,11 | | | 125,000 | | | 126,875 |
| 6.657% [US0003M+127] Jr. Sub. Perpetual Bonds2,11,12 | | | 1,913,000 | | | 1,972,781 |
| M&T Bank Corp., 3.55% Sr. Unsec. Nts., 7/26/23 | | | 918,000 | | | 919,863 |
| PNC Bank NA, 4.05% Sub. Nts., 7/26/28 | | | 1,580,000 | | | 1,600,922 |
| PNC Financial Services Group, Inc. (The), 3.15% Sr. Unsec. Nts., 5/19/27 | | | 1,742,000 | | | 1,671,254 |
| Regions Financial Corp., 2.75% Sr. Unsec. Nts., 8/14/22 | | | 1,285,000 | | | 1,247,239 |
| SunTrust Bank (Atlanta GA), 3.30% Sub. Nts., 5/15/26 | | | 812,000 | | | 774,432 |
| Synovus Financial Corp., 3.125% Sr. Unsec. Nts., 11/1/22 | | | 1,337,000 | | | 1,281,849 |
| Toronto-Dominion Bank (The), 3.50% Sr. Unsec. Nts., 7/19/23 | | | 1,791,000 | | | 1,800,171 |
| US Bancorp: | | | | | | |
| 3.10% Sub. Nts., 4/27/26 | | | 1,468,000 | | | 1,400,521 |
| 3.15% Sr. Unsec. Nts., 4/27/27 | | | 448,000 | | | 432,111 |
| US Bank NA (Cincinnati OH), 3.40% Sr. Unsec. Nts., 7/24/23 | | | 2,573,000 | | | 2,574,796 |
40 OPPENHEIMER CAPITAL INCOME FUND
| | | | | | | | |
| | | Principal Amount | | | Value | |
| Commercial Banks (Continued) | | | | | | | | |
| Wells Fargo & Co.: | | | | | | | | |
| 3.584% [US0003M+131] Sr. Unsec. Nts., 5/22/282 | | $ | 1,938,000 | | | $ | 1,869,471 | |
| 4.75% Sub. Nts., 12/7/46 | | | 1,184,000 | | | | 1,175,328 | |
| | | | | | | | |
| | | | | | | 92,974,636 | |
| Consumer Finance—0.2% | | | | | | | | |
| American Express Co., 2.50% Sr. Unsec. Nts., 8/1/22 | | | 762,000 | | | | 734,301 | |
| American Express Credit Corp., 3.30% Sr. Unsec. Nts., 5/3/27 | | | 1,393,000 | | | | 1,360,817 | |
| Capital One Financial Corp., 3.75% Sr. Unsec. Nts., 3/9/27 | | | 761,000 | | | | 727,185 | |
| Discover Financial Services: | | | | | | | | |
| 3.75% Sr. Unsec. Nts., 3/4/25 | | | 926,000 | | | | 891,969 | |
| 4.10% Sr. Unsec. Nts., 2/9/27 | | | 963,000 | | | | 934,662 | |
| Electricite de France SA, 6.50% Sr. Unsec. Nts., 1/26/193 | | | 1,657,000 | | | | 1,682,092 | |
| | | | | | | | |
| | | | | | | 6,331,026 | |
| Diversified Financial Services—0.2% | | | | | | | | |
| Berkshire Hathaway Energy Co.: | | | | | | | | |
| 2.00% Sr. Unsec. Nts., 11/15/18 | | | 690,000 | | | | 689,590 | |
| 3.80% Sr. Unsec. Nts., 7/15/48 | | | 548,000 | | | | 502,194 | |
| Peachtree Corners Funding Trust, 3.976% Sr. Unsec. Nts., 2/15/253 | | | 909,000 | | | | 900,653 | |
| Precision Castparts Corp., 2.50% Sr. Unsec. Nts., 1/15/23 | | | 1,364,000 | | | | 1,320,221 | |
| Voya Financial, Inc., 5.65% [US0003M+358] Jr. Sub. Nts., 5/15/532 | | | 2,240,000 | | | | 2,245,600 | |
| | | | | | | | |
| | | | | | | | 5,658,258 | |
| Insurance—1.3% | | | | | | | | |
| AXA Equitable Holdings, Inc., 4.35% Sr. Unsec. Nts., 4/20/283 | | | 1,243,000 | | | | 1,206,126 | |
| AXIS Specialty Finance plc, 5.15% Sr. Unsec. Nts., 4/1/45 | | | 1,226,000 | | | | 1,218,611 | |
| Boardwalk Pipelines LP, 4.95% Sr. Unsec. Nts., 12/15/24 | | | 1,165,000 | | | | 1,190,816 | |
| Brighthouse Financial, Inc., 3.70% Sr. Unsec. Nts., 6/22/27 | | | 478,000 | | | | 427,510 | |
| CNA Financial Corp., 3.45% Sr. Unsec. Nts., 8/15/27 | | | 1,749,000 | | | | 1,643,037 | |
| Hartford Financial Services Group, Inc. (The), 4.40% Sr. Unsec. Nts., 3/15/48 | | | 1,431,000 | | | | 1,410,686 | |
| Lincoln National Corp., 3.80% Sr. Unsec. Nts., 3/1/28 | | | 1,421,000 | | | | 1,382,552 | |
| Manulife Financial Corp., 4.061% [USISDA05+164.7] Sub. Nts., 2/24/322 | | | 1,402,000 | | | | 1,341,524 | |
| Marsh & McLennan Cos., Inc., 4.35% Sr. Unsec. Nts., 1/30/47 | | | 775,000 | | | | 786,578 | |
| MetLife, Inc., 10.75% Jr. Sub. Nts., 8/1/39 | | | 10,900,000 | | | | 16,813,250 | |
| Nuveen Finance LLC, 4.125% Sr. Unsec. Nts., 11/1/243 | | | 2,261,000 | | | | 2,254,926 | |
| Prudential Financial, Inc.: | | | | | | | | |
| 5.20% [US0003M+304] Jr. Sub. Nts., 3/15/442 | | | 1,742,000 | | | | 1,752,888 | |
| 5.375% [US0003M+303.1] Jr. Sub. Nts., 5/15/452 | | | 426,000 | | | | 431,325 | |
| | | | | | | | |
| | | | | | | 31,859,829 | |
| Real Estate Investment Trusts (REITs)—0.5% | | | | | | | | |
| American Tower Corp.: | | | | | | | | |
| 2.80% Sr. Unsec. Nts., 6/1/20 | | | 472,000 | | | | 468,335 | |
| 3.00% Sr. Unsec. Nts., 6/15/23 | | | 1,889,000 | | | | 1,822,442 | |
| 3.60% Sr. Unsec. Nts., 1/15/28 | | | 1,249,000 | | | | 1,175,031 | |
| 5.05% Sr. Unsec. Unsub. Nts., 9/1/20 | | | 1,354,000 | | | | 1,397,084 | |
41 OPPENHEIMER CAPITAL INCOME FUND
CONSOLIDATED
STATEMENT OF INVESTMENTS Continued
| | | | | | |
| | | Principal Amount | | | Value |
| Real Estate Investment Trusts (REITs) (Continued) | | | | | | |
| Crown Castle International Corp., 3.65% Sr. Unsec. Nts., 9/1/27 | | $ | 1,156,000 | | | $ 1,092,965 |
| Digital Realty Trust LP: | | | | | | |
| 3.40% Sr. Unsec. Nts., 10/1/20 | | | 208,000 | | | 208,472 |
| 5.875% Sr. Unsec. Nts., 2/1/20 | | | 860,000 | | | 885,122 |
| HCP, Inc., 2.625% Sr. Unsec. Nts., 2/1/20 | | | 2,382,000 | | | 2,365,788 |
| Lamar Media Corp., 5.75% Sr. Unsec. Nts., 2/1/26 | | | 2,252,000 | | | 2,347,710 |
| VEREIT Operating Partnership LP, 3.00% Sr. Unsec. Nts., 2/6/19 | | | 859,000 | | | 858,909 |
| | | | | | 12,621,858 |
| Health Care—1.5% | | | | | | |
| Biotechnology—0.3% | | | | | | |
| AbbVie, Inc.: | | | | | | |
| 3.60% Sr. Unsec. Nts., 5/14/25 | | | 1,422,000 | | | 1,390,122 |
| 4.70% Sr. Unsec. Nts., 5/14/45 | | | 420,000 | | | 411,403 |
| Amgen, Inc., 4.563% Sr. Unsec. Nts., 6/15/48 | | | 827,000 | | | 814,174 |
| Biogen, Inc., 5.20% Sr. Unsec. Nts., 9/15/45 | | | 599,000 | | | 645,282 |
| Celgene Corp.: | | | | | | |
| 3.875% Sr. Unsec. Nts., 8/15/25 | | | 1,384,000 | | | 1,365,943 |
| 5.00% Sr. Unsec. Nts., 8/15/45 | | | 257,000 | | | 255,719 |
| Gilead Sciences, Inc., 4.75% Sr. Unsec. Nts., 3/1/46 | | | 983,000 | | | 1,024,349 |
| Shire Acquisitions Investments Ireland DAC, 2.40% Sr. Unsec. Nts., 9/23/21 | | | 2,299,000 | | | 2,223,156 |
| | | | | | 8,130,148 |
| Health Care Equipment & Supplies—0.3% | | | | | | |
| Abbott Laboratories: | | | | | | |
| 2.35% Sr. Unsec. Nts., 11/22/19 | | | 421,000 | | | 418,289 |
| 3.75% Sr. Unsec. Nts., 11/30/26 | | | 2,038,000 | | | 2,024,151 |
| Becton Dickinson & Co.: | | | | | | |
| 2.404% Sr. Unsec. Nts., 6/5/20 | | | 1,442,000 | | | 1,418,873 |
| 3.70% Sr. Unsec. Nts., 6/6/27 | | | 1,806,000 | | | 1,732,538 |
| Hologic, Inc., 4.375% Sr. Unsec. Nts., 10/15/253 | | | 89,000 | | | 86,108 |
| Medtronic, Inc., 4.625% Sr. Unsec. Nts., 3/15/45 | | | 995,000 | | | 1,066,971 |
| | | | | | 6,746,930 |
| Health Care Providers & Services—0.4% | | | | | | |
| Cigna Corp., 5.125% Sr. Unsec. Nts., 6/15/20 | | | 2,090,000 | | | 2,157,143 |
| CVS Health Corp.: | | | | | | |
| 2.125% Sr. Unsec. Nts., 6/1/21 | | | 2,440,000 | | | 2,364,507 |
| 5.05% Sr. Unsec. Nts., 3/25/48 | | | 2,113,000 | | | 2,149,593 |
| Fresenius Medical Care US Finance II, Inc., 5.875% Sr. Unsec. Nts., 1/31/223 | | | 3,044,000 | | | 3,226,995 |
| UnitedHealth Group, Inc., 2.75% Sr. Unsec. Nts., 2/15/23 | | | 1,860,000 | | | 1,816,349 |
| | | | | | 11,714,587 |
| Life Sciences Tools & Services—0.2% | | | | | | |
| IQVIA, Inc., 5.00% Sr. Unsec. Nts., 10/15/263 | | | 2,151,000 | | | 2,132,179 |
| Life Technologies Corp., 6.00% Sr. Unsec. Nts., 3/1/20 | | | 1,799,000 | | | 1,869,752 |
42 OPPENHEIMER CAPITAL INCOME FUND
| | | | | | |
| | | Principal Amount | | | Value |
| Life Sciences Tools & Services (Continued) | | | | | | |
| Thermo Fisher Scientific, Inc., 4.15% Sr. Unsec. Nts., 2/1/24 | | $ | 904,000 | | | $ 925,981 |
| | | | | | 4,927,912 |
| Pharmaceuticals—0.3% | | | | | | |
| Allergan Funding SCS, 3.00% Sr. Unsec. Nts., 3/12/20 | | | 2,382,000 | | | 2,376,377 |
| Bayer US Finance II LLC: | | | | | | |
| 3.875% Sr. Unsec. Nts., 12/15/233 | | | 2,244,000 | | | 2,246,352 |
| 4.375% Sr. Unsec. Nts., 12/15/283 | | | 1,624,000 | | | 1,612,591 |
| Elanco Animal Health, Inc., 4.90% Sr. Unsec. Nts., 8/28/283 | | | 974,000 | | | 983,300 |
| | | | | | 7,218,620 |
| Industrials—1.3% | | | | | | |
| Aerospace & Defense—0.3% | | | | | | |
| BAE Systems Holdings, Inc., 3.85% Sr. Unsec. Nts., 12/15/253 | | | 1,889,000 | | | 1,875,785 |
| Huntington Ingalls Industries, Inc., 3.483% Sr. Unsec. Nts., 12/1/27 | | | 1,304,000 | | | 1,241,669 |
| L3 Technologies, Inc., 3.85% Sr. Unsec. Nts., 6/15/23 | | | 2,257,000 | | | 2,272,585 |
| Northrop Grumman Corp., 4.75% Sr. Unsec. Nts., 6/1/43 | | | 1,295,000 | | | 1,344,928 |
| United Technologies Corp.: | | | | | | |
| 3.35% Sr. Unsec. Nts., 8/16/21 | | | 548,000 | | | 549,900 |
| 3.95% Sr. Unsec. Nts., 8/16/25 | | | 1,370,000 | | | 1,378,084 |
| | | | | | 8,662,951 |
| Air Freight & Couriers—0.1% | | | | | | |
| CH Robinson Worldwide, Inc., 4.20% Sr. Unsec. Nts., 4/15/28 | | | 1,170,000 | | | 1,162,200 |
| FedEx Corp., 4.40% Sr. Unsec. Nts., 1/15/47 | | | 489,000 | | | 464,912 |
| | | | | | 1,627,112 |
| Building Products—0.1% | | | | | | |
Allegion US Holding Co., Inc., 3.55% Sec. Nts., 10/1/27 | | | 1,951,000 | | | 1,801,655 |
| Electrical Equipment—0.1% | | | | | | |
Sensata Technologies BV, 4.875% Sr. Unsec. Nts., 10/15/233 | | | 2,231,000 | | | 2,239,366 |
| Industrial Conglomerates—0.1% | | | | | | |
| GE Capital International Funding Co. Unlimited Co., 3.373% Sr. Unsec. Nts., 11/15/25 | | | 735,000 | | | 711,816 |
| Roper Technologies, Inc., 3.65% Sr. Unsec. Nts., 9/15/23 | | | 2,215,000 | | | 2,219,086 |
| | | | | | 2,930,902 |
| Machinery—0.2% | | | | | | |
| Fortive Corp., 1.80% Sr. Unsec. Nts., 6/15/19 | | | 2,365,000 | | | 2,342,916 |
| John Deere Capital Corp., 2.70% Sr. Unsec. Nts., 1/6/23 | | | 1,042,000 | | | 1,018,327 |
| Nvent Finance Sarl, 4.55% Sr. Unsec. Nts., 4/15/283 | | | 1,210,000 | | | 1,196,985 |
| Stanley Black & Decker, Inc., 2.451% Sub. Nts., 11/17/18 | | | 514,000 | | | 513,868 |
| Wabtec Corp., 3.45% Sr. Unsec. Nts., 11/15/26 | | | 865,000 | | | 805,573 |
| | | | | | 5,877,669 |
43 OPPENHEIMER CAPITAL INCOME FUND
CONSOLIDATED
STATEMENT OF INVESTMENTS Continued
| | | | | | |
| | | Principal Amount | | | Value |
| Professional Services—0.0% | | | | | | |
IHS Markit Ltd., 4.125% Sr. Unsec. Nts., 8/1/23 | | $ | 1,409,000 | | | $ 1,414,143 |
| Road & Rail—0.2% | | | | | | |
| Penske Truck Leasing Co. LP/PTL Finance Corp., 3.40% Sr. Unsec. Nts., 11/15/263 | | | 1,940,000 | | | 1,827,028 |
| Ryder System, Inc.: | | | | | | |
| 3.50% Sr. Unsec. Nts., 6/1/21 | | | 530,000 | | | 532,124 |
| 3.75% Sr. Unsec. Nts., 6/9/23 | | | 2,251,000 | | | 2,264,855 |
| | | | | | 4,624,007 |
| Trading Companies & Distributors—0.2% | | | | | | |
| Air Lease Corp.: | | | | | | |
| 3.25% Sr. Unsec. Nts., 3/1/25 | | | 737,000 | | | 696,083 |
| 3.625% Sr. Unsec. Nts., 4/1/27 | | | 763,000 | | | 716,370 |
| GATX Corp., 3.50% Sr. Unsec. Nts., 3/15/28 | | | 1,940,000 | | | 1,803,825 |
| United Rentals North America, Inc., 4.625% Sr. Unsec. Nts., 10/15/25 | | | 1,228,000 | | | 1,203,440 |
| | | | | | 4,419,718 |
| Information Technology—1.1% | | | | | | |
| Communications Equipment—0.1% | | | | | | |
| Motorola Solutions, Inc., 4.60% Sr. Unsec. Nts., 2/23/28 | | | 1,747,000 | | | 1,742,072 |
| Electronic Equipment, Instruments, & Components—0.1% | | | | | | |
| Arrow Electronics, Inc., 3.875% Sr. Unsec. Nts., 1/12/28 | | | 1,701,000 | | | 1,609,348 |
| CDW LLC/CDW Finance Corp., 5.50% Sr. Unsec. Nts., 12/1/24 | | | 368,000 | | | 384,560 |
| Tech Data Corp., 4.95% Sr. Unsec. Nts., 2/15/27 | | | 1,745,000 | | | 1,716,808 |
| | | | | | 3,710,716 |
| Internet Software & Services—0.1% | | | | | | |
| VeriSign, Inc.: | | | | | | |
| 4.75% Sr. Unsec. Nts., 7/15/27 | | | 1,285,000 | | | 1,243,237 |
| 5.25% Sr. Unsec. Nts., 4/1/25 | | | 710,000 | | | 723,348 |
| | | | | | 1,966,585 |
| IT Services—0.2% | | | | | | |
| DXC Technology Co.: | | | | | | |
| 2.875% Sr. Unsec. Nts., 3/27/20 | | | 1,678,000 | | | 1,663,953 |
| 4.75% Sr. Unsec. Nts., 4/15/27 | | | 1,734,000 | | | 1,771,273 |
| Fidelity National Information Services, Inc., 4.25% Sr. Unsec. Nts., 5/15/28 | | | 1,166,000 | | | 1,180,667 |
| | | | | | 4,615,893 |
| Semiconductors & Semiconductor Equipment—0.1% | | | | | | |
| Intel Corp., 3.734% Sr. Unsec. Nts., 12/8/47 | | | 676,000 | | | 634,583 |
| Microchip Technology, Inc., 3.922% Sr. Sec. Nts., 6/1/213 | | | 2,288,000 | | | 2,287,474 |
| | | | | | 2,922,057 |
44 OPPENHEIMER CAPITAL INCOME FUND
| | | | | | |
| | | Principal Amount | | | Value |
| Software—0.4% | | | | | | |
| Autodesk, Inc., 4.375% Sr. Unsec. Nts., 6/15/25 | | $ | 708,000 | | | $ 714,621 |
| Dell International LLC/EMC Corp.: | | | | | | |
| 4.42% Sr. Sec. Nts., 6/15/213 | | | 1,975,000 | | | 2,009,788 |
| 6.02% Sr. Sec. Nts., 6/15/263 | | | 1,460,000 | | | 1,549,027 |
| Open Text Corp., 5.625% Sr. Unsec. Nts., 1/15/233 | | | 1,538,000 | | | 1,595,675 |
| Oracle Corp.: | | | | | | |
| 2.40% Sr. Unsec. Nts., 9/15/23 | | | 1,464,000 | | | 1,403,996 |
| 2.95% Sr. Unsec. Nts., 5/15/25 | | | 1,440,000 | | | 1,397,873 |
| VMware, Inc.: | | | | | | |
| 2.30% Sr. Unsec. Nts., 8/21/20 | | | 699,000 | | | 685,047 |
| 3.90% Sr. Unsec. Nts., 8/21/27 | | | 1,151,000 | | | 1,091,550 |
| | | | | | 10,447,577 |
| Technology Hardware, Storage & Peripherals—0.1% | | | | | | |
| Apple, Inc., 4.375% Sr. Unsec. Nts., 5/13/45 | | | 1,407,000 | | | 1,471,998 |
| Hewlett Packard Enterprise Co., 3.60% Sr. Unsec. Nts., 10/15/20 | | | 2,356,000 | | | 2,373,103 |
| | | | | | 3,845,101 |
| Materials—1.0% | | | | | | |
| Chemicals—0.4% | | | | | | |
| LyondellBasell Industries NV, 5.00% Sr. Unsec. Nts., 4/15/19 | | | 1,750,000 | | | 1,763,612 |
| Nutrien Ltd.: | | | | | | |
| 3.375% Sr. Unsec. Nts., 3/15/25 | | | 743,000 | | | 706,201 |
| 4.125% Sr. Unsec. Nts., 3/15/35 | | | 513,000 | | | 477,860 |
| PolyOne Corp., 5.25% Sr. Unsec. Nts., 3/15/23 | | | 2,001,000 | | | 2,069,134 |
| RPM International, Inc.: | | | | | | |
| 3.45% Sr. Unsec. Unsub. Nts., 11/15/22 | | | 1,882,000 | | | 1,867,709 |
| 3.75% Sr. Unsec. Nts., 3/15/27 | | | 665,000 | | | 637,262 |
| Yara International ASA, 4.75% Sr. Unsec. Nts., 6/1/283 | | | 1,730,000 | | | 1,760,358 |
| | | | | | 9,282,136 |
| Construction Materials—0.1% | | | | | | |
| James Hardie International Finance DAC, 4.75% Sr. Unsec. Nts., 1/15/253 | | | 1,430,000 | | | 1,393,363 |
| Martin Marietta Materials, Inc., 3.50% Sr. Unsec. Nts., 12/15/27 | | | 1,177,000 | | | 1,094,085 |
| | | | | | 2,487,448 |
| Containers & Packaging—0.3% | | | | | | |
| International Paper Co.: | | | | | | |
| 3.00% Sr. Unsec. Nts., 2/15/27 | | | 1,038,000 | | | 962,283 |
| 4.80% Sr. Unsec. Nts., 6/15/44 | | | 914,000 | | | 906,095 |
| Packaging Corp. of America: | | | | | | |
| 3.65% Sr. Unsec. Nts., 9/15/24 | | | 525,000 | | | 517,297 |
| 4.50% Sr. Unsec. Nts., 11/1/23 | | | 1,744,000 | | | 1,809,734 |
| Silgan Holdings, Inc., 4.75% Sr. Unsec. Nts., 3/15/25 | | | 1,855,000 | | | 1,785,438 |
| WestRock Co., 4.00% Sr. Unsec. Nts., 3/15/283 | | | 1,110,000 | | | 1,103,348 |
| | | | | | 7,084,195 |
45 OPPENHEIMER CAPITAL INCOME FUND
CONSOLIDATED
STATEMENT OF INVESTMENTS Continued
| | | | | | |
| | | Principal Amount | | | Value |
| Metals & Mining—0.2% | | | | | | |
| Anglo American Capital plc: | | | | | | |
| 3.625% Sr. Unsec. Nts., 9/11/243 | | $ | 582,000 | | | $ 552,705 |
| 4.00% Sr. Unsec. Nts., 9/11/273 | | | 1,010,000 | | | 932,244 |
| ArcelorMittal, 6.125% Sr. Unsec. Nts., 6/1/25 | | | 2,055,000 | | | 2,241,251 |
| Goldcorp, Inc., 5.45% Sr. Unsec. Nts., 6/9/44 | | | 662,000 | | | 707,024 |
| | | | | | 4,433,224 |
| Paper & Forest Products—0.0% | | | | | | |
| Georgia-Pacific LLC, 3.734% Sr. Unsec. Nts., 7/15/233 | | | 448,000 | | | 453,533 |
| Louisiana-Pacific Corp., 4.875% Sr. Unsec. Nts., 9/15/24 | | | 1,231,000 | | | 1,224,845 |
| | | | | | 1,678,378 |
| Telecommunication Services—0.9% | | | | | | |
| Diversified Telecommunication Services—0.7% | | | | | | |
| AT&T, Inc.: | | | | | | |
| 4.30% Sr. Unsec. Nts., 2/15/303 | | | 1,849,000 | | | 1,775,208 |
| 4.35% Sr. Unsec. Nts., 6/15/45 | | | 1,843,000 | | | 1,582,499 |
| 4.50% Sr. Unsec. Nts., 3/9/48 | | | 980,000 | | | 849,253 |
| British Telecommunications plc, 9.625% Sr. Unsec. Nts., 12/15/30 | | | 1,965,000 | | | 2,809,808 |
| Deutsche Telekom International Finance BV, 4.375% Sr. Unsec. Nts., 6/21/283 | | | 1,079,000 | | | 1,087,167 |
| Telecom Italia SpA, 5.303% Sr. Unsec. Nts., 5/30/243 | | | 2,218,000 | | | 2,220,772 |
| Telefonica Emisiones SAU: | | | | | | |
| 4.103% Sr. Unsec. Nts., 3/8/27 | | | 657,000 | | | 639,988 |
| 5.213% Sr. Unsec. Nts., 3/8/47 | | | 818,000 | | | 807,759 |
| 7.045% Sr. Unsec. Unsub. Nts., 6/20/36 | | | 857,000 | | | 1,041,875 |
| T-Mobile USA, Inc., 6.50% Sr. Unsec. Nts., 1/15/26 | | | 2,159,000 | | | 2,287,871 |
| Verizon Communications, Inc.: | | | | | | |
| 4.125% Sr. Unsec. Nts., 8/15/46 | | | 952,000 | | | 844,177 |
| 4.522% Sr. Unsec. Nts., 9/15/48 | | | 1,317,000 | | | 1,241,125 |
| 5.15% Sr. Unsec. Nts., 9/15/23 | | | 565,000 | | | 606,494 |
| | | | | | 17,793,996 |
| Wireless Telecommunication Services—0.2% | | | | | | |
| Vodafone Group plc: | | | | | | |
| 3.75% Sr. Unsec. Nts., 1/16/24 | | | 2,269,000 | | | 2,252,415 |
| 4.375% Sr. Unsec. Nts., 5/30/28 | | | 1,147,000 | | | 1,139,505 |
| 6.15% Sr. Unsec. Nts., 2/27/37 | | | 701,000 | | | 787,711 |
| | | | | | 4,179,631 |
| Utilities—1.1% | | | | | | |
| Electric Utilities—0.8% | | | | | | |
| AEP Texas, Inc., 3.95% Sr. Unsec. Nts., 6/1/283 | | | 1,166,000 | | | 1,176,181 |
| Arizona Public Service Co., 4.20% Sr. Unsec. Nts., 8/15/48 | | | 777,000 | | | 776,176 |
| Duke Energy Corp.: | | | | | | |
| 3.15% Sr. Unsec. Nts., 8/15/27 | | | 1,179,000 | | | 1,107,687 |
| 3.75% Sr. Unsec. Nts., 9/1/46 | | | 1,117,000 | | | 1,003,385 |
| Edison International: | | | | | | |
| 2.125% Sr. Unsec. Nts., 4/15/20 | | | 868,000 | | | 851,519 |
46 OPPENHEIMER CAPITAL INCOME FUND
| | | | | | |
| | | Principal Amount | | | Value |
| Electric Utilities (Continued) | | | | | | |
Edison International: (Continued)
2.95% Sr. Unsec. Nts., 3/15/23 | | $ | 1,392,000 | | | $ 1,337,529 |
| EDP Finance BV, 3.625% Sr. Unsec. Nts., 7/15/243 | | | 1,587,000 | | | 1,533,709 |
| Emera US Finance LP, 2.15% Sr. Unsec. Nts., 6/15/19 | | | 1,968,000 | | | 1,954,048 |
| Exelon Corp.: | | | | | | |
| 2.45% Sr. Unsec. Nts., 4/15/21 | | | 1,131,000 | | | 1,100,948 |
| 4.45% Sr. Unsec. Nts., 4/15/46 | | | 644,000 | | | 637,188 |
| FirstEnergy Corp., 3.90% Sr. Unsec. Nts., 7/15/27 | | | 1,265,000 | | | 1,244,597 |
| Indiana Michigan Power Co.: | | | | | | |
| 4.25% Sr. Unsec. Nts., 8/15/48 | | | 533,000 | | | 536,913 |
| 4.55% Sr. Unsec. Nts., Series K, 3/15/46 | | | 577,000 | | | 607,203 |
| ITC Holdings Corp.: | | | | | | |
| 3.35% Sr. Unsec. Nts., 11/15/27 | | | 54,000 | | | 51,242 |
| 5.30% Sr. Unsec. Nts., 7/1/43 | | | 527,000 | | | 590,632 |
| Mid-Atlantic Interstate Transmission LLC, 4.10% Sr. Unsec. Nts., 5/15/283 | | | 1,162,000 | | | 1,170,512 |
| NextEra Energy Operating Partners LP, 4.25% Sr. Unsec. Nts., 9/15/243 | | | 193,000 | | | 188,657 |
| Pennsylvania Electric Co., 5.20% Sr. Unsec. Nts., 4/1/20 | | | 368,000 | | | 376,697 |
| PPL WEM Ltd./Western Power Distribution Ltd., 5.375% Sr. Unsec. Unsub. Nts., 5/1/213 | | | 2,159,000 | | | 2,239,122 |
| Southern Co. Gas Capital Corp., 4.40% Sr. Unsec. Nts., 5/30/47 | | | 788,000 | | | 765,181 |
| Trans-Allegheny Interstate Line Co., 3.85% Sr. Unsec. Nts., 6/1/253 | | | 1,321,000 | | | 1,324,365 |
| | | | | | 20,573,491 |
| Multi-Utilities—0.3% | | | | | | |
| Black Hills Corp., 2.50% Sr. Unsec. Nts., 1/11/19 | | | 1,228,000 | | | 1,226,582 |
| CenterPoint Energy Resources Corp., 4.50% Sr. Unsec. Nts., 1/15/21 | | | 820,000 | | | 837,463 |
| Dominion Energy, Inc.: | | | | | | |
| 2.579% Jr. Sub. Nts., 7/1/20 | | | 2,122,000 | | | 2,093,777 |
| 4.90% Sr. Unsec. Nts., 8/1/41 | | | 857,000 | | | 902,176 |
| Public Service Enterprise Group, Inc., 1.60% Sr. Unsec. Nts., 11/15/19 | | | 1,897,000 | | | 1,868,558 |
| | | | | | 6,928,556 |
| Total Non-Convertible Corporate Bonds and Notes (Cost $565,579,867) | | | | | | 561,341,378 |
| Corporate Loans—3.4% | | | | | | |
| Axalta Coating Systems US Holdings, Inc., Sr. Sec. Credit Facilities 1st Lien Term Loan, 4.084% [LIBOR4+175], 6/1/242 | | | 18,686,990 | | | 18,724,364 |
| Delos Finance Sarl, Sr. Sec. Credit Facilities 1st Lien Term Loan, Tranche B, 4.084% [LIBOR4+175], 10/6/232 | | | 17,000,000 | | | 17,076,160 |
| Hilton Worldwide Finance LLC, Sr. Sec. Credit Facilities 1st Lien Term Loan, Tranche B2, 3.815% [LIBOR12+175], 10/25/232 | | | 11,840,089 | | | 11,890,054 |
| Neiman Marcus Group Ltd. LLC, Sr. Sec. Credit Facilities 1st Lien Term Loan, 5.33% [LIBOR12+325], 10/25/202 | | | 3,233,811 | | | 3,011,486 |
| TransDigm, Inc., Sr. Sec. Credit Facilities 1st Lien Term Loan: | | | | | | |
| Tranche F, 4.576%, [LIBOR12+250], 6/9/232 | | | 5,895,375 | | | 5,890,688 |
| Tranche G, 4.576%, [LIBOR4+250], 8/22/242 | | | 14,887,594 | | | 14,874,791 |
47 OPPENHEIMER CAPITAL INCOME FUND
CONSOLIDATED
STATEMENT OF INVESTMENTS Continued
| | | | | | |
| | | Principal Amount | | | Value |
| Corporate Loans (Continued) | | | | | | |
| Vistra Operations Co. LLC, Sr. Sec. Credit Facilities 1st Lien Term Loan, Tranche B2, 4.326% [LIBOR12+275], 12/14/232 | | $ | 13,513,108 | | | $ 13,530,743 |
| Total Corporate Loans (Cost $85,126,439) | | | | | | 84,998,286 |
| Event-Linked Bonds—1.1% | | | | | | |
| Acorn Re Ltd. Catastrophe Linked Nts., 4.883% [US0003M+275], 11/10/212,3 | | | 2,250,000 | | | 2,252,250 |
| Akibare Re Ltd.: | | | | | | |
| 4.237% [US0003M+190], 4/7/222,3 | | | 250,000 | | | 253,363 |
| 4.681% [US0006M+234], 4/7/202,3 | | | 2,250,000 | | | 2,283,862 |
| Alamo Re Ltd. Catastrophe Linked Nts., 5.344% [T-BILL 1MO+325], 6/7/212,3 | | | 1,375,000 | | | 1,371,906 |
| Aozora Re Ltd. Catastrophe Linked Nts., 4.22% [US0006M+200], 4/7/212,3 | | | 2,250,000 | | | 2,290,838 |
| Cranberry Re Ltd. Catastrophe Linked Nts., 4.117% [US0006M+200], 7/13/202,3 | | | 2,250,000 | | | 2,285,213 |
| Golden State Re II Ltd. Catastrophe Linked Nts., 4.294% [T-BILL 3MO+220], 1/8/192,3 | | | 2,250,000 | | | 2,259,112 |
| International Bank for Reconstruction & Development: | | | | | | |
| 4.614% [US0003M+250], 2/15/212,12,17 | | | 2,500,000 | | | 2,494,375 |
| 5.114% [US0003M+300], 2/15/212,3,17 | | | 2,083,000 | | | 2,098,935 |
| Long Point Re III Ltd. Catastrophe Linked Nts., 4.849% [T-BILL 3MO+275], 6/1/222,3 | | | 2,250,000 | | | 2,270,138 |
| Manatee Re II Ltd. Catastrophe Linked Nts., 6.349% [T-BILL 3MO+425], 6/7/212,3 | | | 2,000,000 | | | 2,029,100 |
| Merna Re Ltd.: | | | | | | |
| 4.099% [T-BILL 3MO+200], 4/8/202,3 | | | 750,000 | | | 755,513 |
| 4.099% [T-BILL 3MO+200], 4/8/212,12 | | | 1,100,000 | | | 1,102,695 |
| 4.349% [T-BILL 3MO+225], 4/8/192,3 | | | 250,000 | | | 251,462 |
| Nakama Re Ltd. Catastrophe Linked Nts., 4.28% [US0006M+220], 10/13/212,12 | | | 2,250,000 | | | 2,289,037 |
| Pelican IV Re Ltd. Catastrophe Linked Nts., 4.293% [US0003M+225], 5/7/212,3 | | | 2,250,000 | | | 2,269,912 |
| Total Event-Linked Bonds (Cost $28,454,728) | | | | | | 28,557,711 |
| | | Shares | | | |
| Structured Securities—0.4% | | | | | | |
| Toronto-Dominion Bank (The), Enterprise Products Partners LP Equity Linked Nts., 5/30/19-6/6/19 (Cost $9,034,894)3 | | | 9,020,000 | | | 9,708,255 |
| | | | | | | | | | | | | | | | | | |
| | | | | | | | | | | | Notional | | | | | |
| | | | | | | Exercise Expiration | | | Amount | | Contracts | | | |
| | | | | | | Price | | Date | | | (000’s) | | (000’s) | | | |
| Exchange-Traded Option Purchased—0.1% | | | | | | | | | | | | | | |
| S&P 500 Index Call1 (Cost $1,321,459) | | USD 2,850.000 | | | 10/19/18 | | | USD 120,703 | | USD 013 | | | 3,092,960 | |
48 OPPENHEIMER CAPITAL INCOME FUND
| | | | | | | | | | | | | | | | |
| | | | | | | | | | Notional | | | | | |
| | | Counter- | | Exercise Expiration | | | Amount | | Contracts | | | |
| | | party | | Price | | Date | | | (000’s) | | (000’s) | | Value | |
| Over-the-Counter Option Purchased—0.0% | | | | | | | | | | | | |
| CNH Currency Put1 (Cost $1,044,786) | | GSCO-OT | | CNH6.869 | | | 8/27/19 | | | CNH 397,000 | | CNH 275,000 | | $ | 1,033,175 | |
| | | | | | | | | | | | | | | | | | | | | | | | | | | | |
| | | | | | Pay/Receive
Floating
Rate | | | Floating
Rate | | | Fixed
Rate | | | Expiration Date | | | Notional
Amount
(000’s) | | | | |
| Over-the-Counter Interest Rate Swaptions Purchased—0.2% | | | | | | | | | |
| Interest Rate Swap Maturing 04/30/31 Call1 | | | GSCOI | | | | Receive | | |
| Six-Month
JPY BBA
LIBOR |
| | | 0.485% | | | | 4/27/21 JPY | | | | 5,250,000 | | | | 846,196 | |
| Interest Rate Swap maturing 1/28/30 Call1 | | | GSCOI | | | | Receive | | |
| Three-
Month USD
BBA LIBOR |
| | | 2.974 | | | | 1/24/20 USD | | | | 60,450 | | | | 1,618,431 | |
| Interest Rate Swap Maturing 1/28/31 Call1 | | | GSCOI | | | | Receive | | |
| Six-Month
JPY BBA
LIBOR |
| | | 0.523 | | | | 1/26/21 JPY | | | | 1,744,000 | | | | 226,570 | |
| Interest Rate Swap maturing 11/21/28 Call1 | | | GSCOI | | | | Receive | | |
| Six-Month
JPY BBA
LIBOR |
| | | 0.850 | | | | 11/19/18 JPY | | | | 512,000 | | | | 704 | |
| Interest Rate Swap maturing 11/24/30 Call1 | | | BAC | | | | Receive | | |
| Three-
Month USD
BBA LIBOR |
| | | 2.595 | | | | 11/20/20 USD | | | | 3,000 | | | | 157,759 | |
| Interest Rate Swap Maturing 12/16/30 Call1 | | | BAC | | | | Receive | | |
| Three-
Month USD
BBA LIBOR |
| | | 2.619 | | | | 12/14/20 USD | | | | 30,000 | | | | 1,553,552 | |
| Total Over-the-Counter Interest Rate Swaptions Purchased (Cost $4,887,180) | | | | | | | | | | | | | | | | 4,403,212 | |
| | | | | | |
| | | Shares | | | |
| Investment Companies—19.1% | | | | | | |
| Oppenheimer Institutional Government Money Market Fund, Cl. E, 1.91%14,15 | | | 49,969,794 | | | 49,969,794 |
| Oppenheimer Master Loan Fund, LLC14 | | | 15,497,138 | | | 269,972,549 |
| Oppenheimer Ultra-Short Duration Fund, Cl. Y14 | | | 27,727,533 | | | 138,637,663 |
| SPDR Gold Trust Exchange Traded Fund1,16 | | | 215,700 | | | 24,484,107 |
| Total Investment Companies (Cost $491,054,858) | | | | | | 483,064,113 |
| Total Investments, at Value (Cost $2,814,260,340) | | | 109.7% | | | 2,769,841,704 |
| Net Other Assets (Liabilities) | | | (9.7) | | | (243,932,769) |
| Net Assets | | | 100.0% | | | $ 2,525,908,935 |
| | | |
Footnotes to Consolidated Statement of Investments
1. Non-income producing security.
49 OPPENHEIMER CAPITAL INCOME FUND
CONSOLIDATED
STATEMENT OF INVESTMENTS Continued
Footnotes to Consolidated Statement of Investments (continued)
2. Represents the current interest rate for a variable or increasing rate security, determined as [Referenced Rate + Basis-point spread].
3. Represents securities sold under Rule 144A, which are exempt from registration under the Securities Act of 1933, as amended. These securities have been determined to be liquid under guidelines established by the Board of Trustees. These securities amount to $269,939,775 or 10.69% of the Fund’s net assets at period end.
4. Interest-Only Strips represent the right to receive the monthly interest payments on an underlying pool of mortgage loans. These securities typically decline in price as interest rates decline. Most other fixed income securities increase in price when interest rates decline. The principal amount of the underlying pool represents the notional amount on which current interest is calculated. The price of these securities is typically more sensitive to changes in prepayment rates than traditional mortgage-backed securities (for example, GNMA pass-throughs). Interest rates disclosed represent current yields based upon the current cost basis and estimated timing and amount of future cash flows. These securities amount to $9,087,634 or 0.36% of the Fund’s net assets at period end.
5. Interest rate is less than 0.0005%.
6. Principal-Only Strips represent the right to receive the monthly principal payments on an underlying pool of mortgage loans. The value of these securities generally increases as interest rates decline and prepayment rates rise. The price of these securities is typically more volatile than that of coupon-bearing bonds of the same maturity. Interest rates disclosed represent current yields based upon the current cost basis and estimated timing of future cash flows. These securities amount to $68,532 or 0.00% of the Fund’s net assets at period end.
7. All or a portion of the security position is when-issued or delayed delivery to be delivered and settled after period end. See Note 4 of the accompanying Consolidated Notes.
8. This interest rate resets periodically. Interest rate shown reflects the rate in effect at period end. The rate on this variable rate security is not based on a published reference rate and spread but is determined by the issuer or agent based on current market conditions.
9. All or a portion of the security position is held in segregated accounts and pledged to cover margin requirements under certain derivative contracts. The aggregate market value of such securities is $262,288. See Note 6 of the accompanying Consolidated Notes.
10. All or a portion of the security position is held in accounts at a futures clearing merchant and pledged to cover margin requirements on open futures contracts and written options on futures, if applicable. The aggregate market value of such securities is $2,582,147. See Note 6 of the accompanying Consolidated Notes.
11. This bond has no contractual maturity date, is not redeemable and contractually pays an indefinite stream of interest.
12. Restricted security. The aggregate value of restricted securities at period end was $7,858,888, which represents 0.31% of the Fund’s net assets. See Note 4 of the accompanying Consolidated Notes. Information concerning restricted securities is as follows:
| | | | | | | | | | | | | | | | |
| Security | | Acquisition Dates | | | Cost | | | Value | | | Unrealized
Appreciation/
(Depreciation) | |
| International Bank for Reconstruction & Development, 4.614% [US0003M+250], 2/15/21 | | | 5/29/18 | | | $ | 2,507,986 | | | $ | 2,494,375 | | | $ | (13,611 | ) |
| Lloyds Banking Group plc, 6.657% [US0003M+127] Jr. Sub. Perpetual Bonds | | | 6/20/14-10/24/14 | | | | 2,157,261 | | | | 1,972,781 | | | | (184,480 | ) |
| Merna Re Ltd., 4.099% [T-BILL 3MO+200], 4/8/21 | | | 6/18/18-7/31/18 | | | | 1,105,709 | | | | 1,102,695 | | | | (3,014 | ) |
| Nakama Re Ltd. Catastrophe Linked Nts., 4.28% [US0006M+220], 10/13/21 | | | 7/19/18 | | | | 2,285,941 | | | | 2,289,037 | | | | 3,096 | |
| | | | | | $ | 8,056,897 | | | $ | 7,858,888 | | | $ | (198,009 | ) |
| | | | | | | | | | | | | | | | |
13. Number of contracts are less than 500.
50 OPPENHEIMER CAPITAL INCOME FUND
Footnotes to Consolidated Statement of Investments (continued)
14. Is or was an affiliate, as defined in the Investment Company Act of 1940, as amended, at or during the reporting period, by virtue of the Fund owning at least 5% of the voting securities of the issuer or as a result of the Fund and the issuer having the same investment adviser. Transactions during the reporting period in which the issuer was an affiliate are as follows:
| | | | | | | | | | | | | | | | |
| | | Shares
August 31, 2017 | | | Gross
Additions | | | Gross
Reductions | | | Shares
August 31, 2018 | |
| Investment Company | | | | | | | | | | | | | | | | |
| Oppenheimer Institutional Government Money Market Fund, Cl. E | | | 65,992,768 | | | | 779,020,221 | | | | 795,043,195 | | | | 49,969,794 | |
| Oppenheimer Ultra-Short Duration Fund, Cl. Y | | | 60,077,426 | | | | 68,692,422 | | | | 101,042,315 | | | | 27,727,533 | |
| Oppenheimer Master Loan Fund, LLC | | | 15,497,138 | | | | — | | | | — | | | | 15,497,138 | |
| | | | |
| | | Value | | | Income | | | Realized
Gain (Loss) | | | Change in
Unrealized Gain (Loss) | |
| Investment Company | | | | | | | | | | | | | | | | |
| Oppenheimer Institutional Government Money Market Fund, Cl. E | | $ | 49,969,794 | | | $ | 695,756 | | | $ | — | | | $ | — | |
| Oppenheimer Ultra-Short Duration Fund, Cl. Y | | | 138,637,663 | | | | 3,607,995 | | | | (326,855 | ) | | | (10,208 | ) |
| Oppenheimer Master Loan Fund, LLC | | | 269,972,549 | | | | 15,289,698 | a | | | 511,762 | a | | | (1,441,742 | )a |
| | | | |
| Total | | $ | 458,580,006 | | | $ | 19,593,449 | | | $ | 184,907 | | | $ | (1,451,950 | ) |
| | | | |
a. Represents the amount allocated to the Fund from Oppenheimer Master Loan Fund, LLC.
15. Rate shown is the 7-day yield at period end.
16. All or a portion of this security is owned by the subsidiary. See Note 2 of the accompanying Consolidated Notes.
17. Represents securities sold under Regulation S, which are exempt from registration under the Securities Act of 1933, as amended. These securities may not be offered or sold in the United States without and exemption from, or in a transaction not subject to, the registration requirements of the Securities Act of 1933. These securities amount to $7,362,398 or 0.29% of the Fund’s net assets at period end.
| | | | | | | | | | | | | | | | | | | | | | | | | | | | |
| Forward Currency Exchange Contracts as of August 31, 2018 | |
Counter -party | | Settlement
Month(s) | | | Currency
Purchased (000’s) | | | Currency Sold
(000’s) | | | Unrealized
Appreciation | | | Unrealized
Depreciation | |
| BAC | | | 11/2018 | | | | USD | | | | 1,762 | | | | CNH | | | | 12,000 | | | $ | 11,275 | | | $ | — | |
| BOA | | | 11/2018 | | | | USD | | | | 969 | | | | CNH | | | | 6,580 | | | | 8,449 | | | | — | |
| CITNA-B | | | 11/2018 | | | | USD | | | | 36,267 | | | | CNH | | | | 246,180 | | | | 342,326 | | | | — | |
| DEU | | | 09/2018 | | | | USD | | | | 14,983 | | | | CAD | | | | 19,900 | | | | — | | | | 272,277 | |
| Total Unrealized Appreciation and Depreciation | | | | | | | $ | 362,050 | | | $ | 272,277 | |
| | | | | | | | | | | | | | | | | | | | | | | | | | | | |
| | | | | | | | | | | | | | | | | | |
| Futures Contracts as of August 31, 2018 |
| Description | | Buy/Sell | | Expiration
Date | | | Number
of Contracts | | | Notional Amount
(000’s) | | Value | | | Unrealized
Appreciation/
(Depreciation) |
| Euro-BONO | | Sell | | | 9/6/18 | | | | 75 | | | EUR 12,595 | | $ | 12,605,745 | | | $ (10,494) |
| Euro-BTP | | Sell | | | 9/6/18 | | | | 174 | | | EUR 25,501 | | | 24,773,701 | | | 726,898 |
51 OPPENHEIMER CAPITAL INCOME FUND
CONSOLIDATED
STATEMENT OF INVESTMENTS Continued
| | | | | | | | | | | | | | | | | | | | | | |
| Futures Contracts (Continued) | |
| Description | | Buy/Sell | | | Expiration
Date | | | Number
of Contracts | | | Notional Amount
(000’s) | | Value | | | Unrealized
Appreciation/
(Depreciation) | |
| Euro-BUND | | | Buy | | | | 9/13/18 | | | | 250 | | | EUR 46,813 | | $ | 47,378,912 | | | $ | 565,584 | |
| Euro-OAT S&P MID 400 | | | Sell | | | | 9/6/18 | | | | 70 | | | EUR 12,436 | | | 12,562,449 | | | | (126,020 | ) |
| E-Mini Index United States Treasury Long | | | Buy | | | | 9/21/18 | | | | 122 | | | USD 24,485 | | | 24,956,320 | | | | 471,275 | |
| Bonds | | | Buy | | | | 12/19/18 | | | | 45 | | | USD 6,472 | | | 6,489,844 | | | | 17,766 | |
| United States Treasury Nts., 10 yr. | | | Sell | | | | 12/19/18 | | | | 1,076 | | | USD 129,386 | | | 129,405,813 | | | | (19,968 | ) |
| United States Treasury Nts., 2 yr. | | | Sell | | | | 12/31/18 | | | | 1,967 | | | USD 415,547 | | | 415,743,893 | | | | (197,363 | ) |
| United States Treasury Nts., 5 yr. | | | Sell | | | | 12/31/18 | | | | 299 | | | USD 33,944 | | | 33,906,133 | | | | 37,432 | |
| United States Ultra Bonds | | | Buy | | | | 12/19/18 | | | | 384 | | | USD 61,445 | | | 61,176,000 | | | | (268,539 | ) |
| | | | | | | | | | | | | | | | | | | | $ | 1,196,571 | |
| | | | | | | | | | | | | | | | | | | | | | |
| | | | | | | | | | | | | | | | | | | | | | | | | | | | |
| Centrally Cleared Credit Default Swaps at August 31, 2018 | |
| Reference Asset | | Buy/Sell
Protection | | | Fixed
Rate | | | Maturity
Date | | | Notional
Amount
(000’s) | | | Premiums
Received/
(Paid) | | | Value | | | Unrealized Appreciation/ (Depreciation) | |
| CDX.HY.29 | | | Buy | | | | 5.000% | | | | 12/20/22 | | | | USD 1,500 | | | $ | 112,100 | | | $ | (122,680 | ) | | $ | (10,580 | ) |
| CDX.HY.30 | | | Buy | | | | 5.000 | | | | 6/20/23 | | | | USD 19,500 | | | | 1,326,433 | | | | (1,536,905 | ) | | | (210,472 | ) |
| CDX.IG.23 | | | Sell | | | | 1.000 | | | | 12/20/19 | | | | USD 25,000 | | | | (177,124 | ) | | | 292,435 | | | | 115,311 | |
| CDX.IG.25 | | | Sell | | | | 1.000 | | | | 12/20/20 | | | | USD 4,800 | | | | (50,881 | ) | | | 85,163 | | | | 34,282 | |
| CDX.IG.26 | | | Sell | | | | 1.000 | | | | 6/20/21 | | | | USD 6,400 | | | | (86,068 | ) | | | 130,051 | | | | 43,983 | |
| CDX.IG.30 | | | Sell | | | | 1.000 | | | | 6/20/23 | | | | USD 4,900 | | | | (87,539 | ) | | | 96,258 | | | | 8,719 | |
| CDX.IG.30 | | | Sell | | | | 1.000 | | | | 6/20/23 | | | | USD 900 | | | | (16,005 | ) | | | 17,680 | | | | 1,675 | |
| CDX.NA.HY.21 | | | Buy | | | | 5.000 | | | | 12/20/18 | | | | USD 14,229 | | | | 881,408 | | | | (322,400 | ) | | | 559,008 | |
| CDX.NA.HY.25 | | | Buy | | | | 5.000 | | | | 12/20/20 | | | | USD 6,480 | | | | 339,840 | | | | (480,450 | ) | | | (140,610 | ) |
| Federation of Malayasia | | | Buy | | | | 1.000 | | | | 12/20/22 | | | | USD 33,400 | | | | 495,511 | | | | (273,311 | ) | | | 222,200 | |
| Federation of Malayasia | | | Buy | | | | 1.000 | | | | 12/20/22 | | | | USD 50,000 | | | | 720,077 | | | | (409,152 | ) | | | 310,925 | |
| iTraxx.Main.27 | | | Buy | | | | 1.000 | | | | 6/20/22 | | | | EUR 32,500 | | | | 775,487 | | | | (828,680 | ) | | | (53,193 | ) |
| iTraxx.Main.28 | | | Buy | | | | 1.000 | | | | 12/20/22 | | | | EUR 1,900 | | | | 54,835 | | | | (43,276 | ) | | | 11,559 | |
| iTraxx.Main.29 | | | Buy | | | | 1.000 | | | | 6/20/23 | | | | EUR 2,400 | | | | 45,742 | | | | (47,022 | ) | | | (1,280 | ) |
| Neiman Marcus Group LLC (The) | | | Buy | | | | 5.000 | | | | 12/20/20 | | | | USD 3,095 | | | | 179,341 | | | | 90,742 | | | | 270,083 | |
| Total Centrally Cleared Credit Default Swaps | | | $ | 4,513,157 | | | $ | (3,351,547) | | | $ | 1,161,610 | |
| | | | | | | | | | | | | | | | | | | | | | | | | | | | |
| | | | | | | | | | | | | | | | | | | | | | | | | | | | | | | | |
| Over-the-Counter Credit Default Swaps at August 31, 2018 | |
Reference Asset | | Counter-
party | | | Buy/Sell Protection | | | Fixed
Rate | | | Maturity
Date | | | Notional Amount (000’s) | | Premiums
Received/
(Paid) | | | Value | | | Unrealized
Appreciation/ (Depreciation) | |
| CDX.NA.HY.21 | | | CITNA-B | | | | Sell | | | | 5.000% | | | | 12/20/18 | | | USD 1,543 | | $ | 861,248 | | | $ | 4,038 | | | $ | 865,286 | |
| CDX.NA.HY.21 | | | GSCOI | | | | Sell | | | | 5.000 | | | | 12/20/18 | | | USD 469 | | | 256,347 | | | | 1,228 | | | | 257,575 | |
52 OPPENHEIMER CAPITAL INCOME FUND
| | | | | | | | | | | | | | | | | | | | | | | | | | | | | | | | | | | | |
Over-the-Counter Credit Default Swaps (Continued) | | | | | | | | | | | | | | | | | | | | | |
Reference Asset | | Counter-
party | | | Buy/Sell Protection | | | Fixed
Rate | | | Maturity
Date | | | Notional
Amount
(000’s) | | | Premiums
Received/
(Paid) | | | Value | | | Unrealized
Appreciation/ (Depreciation) | |
| CDX.NA.HY.25 | | | GSCOI | | | | Sell | | | | 5.000% | | | | 12/20/20 | | | | USD | | | | 1,975 | | | $ | 1,310,769 | | | $ | (345,866 | ) | | $ | 964,903 | |
| Total Over-the-Counter Credit Default Swaps | | | $ | 2,428,364 | | | $ | (340,600 | ) | | $ | 2,087,764 | |
| | | | | | | | | | | | | | | | | | | | | | | | | | | | | | | | | | | | |
The table that follows shows the undiscounted maximum potential payment by the Fund related to selling credit protection in credit default swaps:
| | | | | | | | |
Type of Reference Asset on which the Fund Sold Protection | | Total Maximum Potential Payments
for Selling Credit
Protection
(Undiscounted) | | Amount Recoverable* | | Reference
Asset Rating
Range** | |
| Investment Grade Corporate Debt Indexes | | $5,800,000 | | $— | | | BBB+ | |
| Non-Investment Grade Corporate Debt Indexes | | 40,186,963 | | 20,709,000 | | | BB to B- | |
| | | | | | |
| Total | | $45,986,963 | | $20,709,000 | | | | |
| | | | | | |
* Amounts recoverable includes potential payments from related purchased protection for instances where the Fund is the seller of protection. In addition, the Fund has no recourse provisions under the credit derivatives and holds no collateral which can offset or reduce potential payments under a triggering event.
** The period end reference asset security ratings, as rated by any rating organization, are included in the equivalent Standard & Poor’s rating category. The reference asset rating represents the likelihood of a potential credit event on the reference asset which would result in a related payment by the Fund.
| | |
| Glossary: | | |
| Counterparty Abbreviations |
| BAC | | Barclays Bank plc |
| BOA | | Bank of America NA |
| CITNA-B | | Citibank NA |
| DEU | | Deutsche Bank AG |
| GSCOI | | Goldman Sachs International |
| GSCO-OT | | Goldman Sachs Bank USA |
|
| Currency abbreviations indicate amounts reporting in currencies |
| CAD | | Canadian Dollar |
| CNH | | Offshore Chinese Renminbi |
| EUR | | Euro |
| JPY | | Japanese Yen |
| |
| Definitions | | |
| BBA LIBOR | | British Bankers’ Association London - Interbank Offered Rate |
| BONO | | Spanish Government Bonds |
| BTP | | Italian Treasury Bonds |
| BUND | | German Federal Obligation |
| CDX.HY.29 | | Markit CDX High Yield Index |
| CDX.HY.30 | | Markit CDX High Yield Index |
| CDX.IG.23 | | Markit CDX Investment Grade Index |
| CDX.IG.25 | | Markit CDX Investment Grade Index |
| CDX.IG.26 | | Markit CDX Investment Grade Index |
| CDX.IG.30 | | Markit CDX Investment Grade Index |
53 OPPENHEIMER CAPITAL INCOME FUND
CONSOLIDATED
STATEMENT OF INVESTMENTS Continued
| | |
| Definitions (Continued) |
| CDX.NA.HY.21 | | Markit CDX North American High Yield |
| CDX.NA.HY.25 | | Markit CDX North American High Yield |
| H15T1Y | | US Treasury Yield Curve Rate T Note Constant Maturity 1 Year |
| ICE LIBOR | | Intercontinental Exchange London Interbank Offered Rate |
| iTraxx.Main.27 | | Credit Default Swap Trading Index for a Specific Basket of Securities |
| iTraxx.Main.28 | | Credit Default Swap Trading Index for a Specific Basket of Securities |
| iTraxx.Main.29 | | Credit Default Swap Trading Index for a Specific Basket of Securities |
| LIBOR01M | | ICE LIBOR USD 1 Month |
| LIBOR03M | | ICE LIBOR USD 3 Month |
| LIBOR4 | | London Interbank Offered Rate-Quarterly |
| LIBOR12 | | London Interbank Offered Rate-Monthly |
| MSCI | | Morgan Stanley Capital International |
| OAT | | French Government Bonds |
| S&P | | Standard & Poor’s |
| T-BILL 1MO | | US Treasury Bill 1 Month |
| T-BILL 3MO | | US Treasury Bill 3 Month |
| US0001M | | ICE LIBOR USD 1 Month |
| US0003M | | ICE LIBOR USD 3 Month |
| US0006M | | ICE LIBOR USD 6 Month |
| USISDA05 | | USD ICE Swap Rate 11:00am NY 5 Year |
| USSW5 | | USD Swap Semi 30/360 5 Year |
See accompanying Notes to Consolidated Financial Statements.
54 OPPENHEIMER CAPITAL INCOME FUND
CONSOLIDATED STATEMENT OF
ASSETS AND LIABILITIES August 31, 2018
| | | | |
| Assets | | | | |
| Investments, at value—see accompanying consolidated statement of investments: | | | | |
| Unaffiliated companies (cost $2,348,595,252) | | $ | 2,311,261,698 | |
| Affiliated companies (cost $465,665,088) | | | 458,580,006 | |
| | | | |
| | | | 2,769,841,704 | |
| Cash | | | 2,498,931 | |
| Cash used for collateral on futures | | | 1,143,800 | |
| Cash used for collateral on OTC derivatives | | | 259,000 | |
| Cash used for collateral on centrally cleared swaps | | | 6,323,417 | |
| Unrealized appreciation on forward currency exchange contracts | | | 362,050 | |
| Swaps, at value (premiums received $1,117,595) | | | 5,266 | |
| Centrally cleared swaps, at value (net premiums paid $238,276) | | | 712,329 | |
| Receivables and other assets: | | | | |
| Investments sold (including $78,078,340 sold on a when-issued or delayed delivery basis) | | | 79,895,819 | |
| Interest, dividends and principal paydowns | | | 10,948,090 | |
| Shares of beneficial interest sold | | | 606,520 | |
| Variation margin receivable | | | 202,674 | |
| Other | | | 257,049 | |
| | | | |
| Total assets | | | 2,873,056,649 | |
| Liabilities | | | | |
| Unrealized depreciation on forward currency exchange contracts | | | 272,277 | |
| Swaps, at value (premiums received $1,310,769) | | | 345,866 | |
| Centrally cleared swaps, at value (premiums received $4,751,433) | | | 4,063,876 | |
| Payables and other liabilities: | | | | |
| Investments purchased (including $325,382,416 purchased on a when-issued or delayed delivery basis) | | | 339,772,831 | |
| Shares of beneficial interest redeemed | | | 1,538,103 | |
| Distribution and service plan fees | | | 395,212 | |
| Variation margin payable | | | 379,059 | |
| Trustees’ compensation | | | 201,076 | |
| Shareholder communications | | | 23,078 | |
| Other | | | 156,336 | |
| | | | |
| Total liabilities | | | 347,147,714 | |
| Net Assets | | $ | 2,525,908,935 | |
| | | | |
| | | | |
| Composition of Net Assets | | | | |
| Par value of shares of beneficial interest | | $ | 247,042 | |
| Additional paid-in capital | | | 2,561,772,331 | |
| Accumulated net investment income | | | 12,317,861 | |
| Accumulated net realized loss on investments and foreign currency transactions | | | (8,543,101) | |
| Net unrealized depreciation on investments and translation of assets and liabilities denominated in foreign currencies | | | (39,885,198) | |
| | | | |
| Net Assets | | $ | 2,525,908,935 | |
| | | | |
55 OPPENHEIMER CAPITAL INCOME FUND
CONSOLIDATED STATEMENT OF
ASSETS AND LIABILITIES Continued
| | | | |
| Net Asset Value Per Share | | | | |
| Class A Shares: | | | | |
| |
| Net asset value and redemption price per share (based on net assets of $1,462,784,920 and 142,341,704 shares of beneficial interest outstanding) | | $ | 10.28 | |
| |
| Maximum offering price per share (net asset value plus sales charge of 5.75% of offering price) | | $ | 10.91 | |
| |
| Class C Shares: | | | | |
| |
| Net asset value, redemption price (excludes applicable contingent deferred sales charge) and offering price per share (based on net assets of $321,786,091 and 32,416,704 shares of beneficial interest outstanding) | | $ | 9.93 | |
| |
| Class I Shares: | | | | |
| |
| Net asset value, redemption price and offering price per share (based on net assets of $130,975,801 and 12,748,752 shares of beneficial interest outstanding) | | $ | 10.27 | |
| |
| Class R Shares: | | | | |
| |
| Net asset value, redemption price (excludes applicable contingent deferred sales charge) and offering price per share (based on net assets of $74,277,085 and 7,337,070 shares of beneficial interest outstanding) | | $ | 10.12 | |
| |
| Class Y Shares: | | | | |
| |
| Net asset value, redemption price and offering price per share (based on net assets of $536,085,038 and 52,197,813 shares of beneficial interest outstanding) | | $ | 10.27 | |
See accompanying Notes to Consolidated Financial Statements.
56 OPPENHEIMER CAPITAL INCOME FUND
CONSOLIDATED STATEMENT OF
OPERATIONS For the Year Ended August 31, 2018
| | | | |
| Allocation of Income and Expenses from Master Funds1 | | | | |
| Net investment income allocated from Oppenheimer Master Loan Fund, LLC: | | | | |
| Interest | | $ | 14,954,051 | |
| Dividends | | | 335,647 | |
| Net expenses | | | (950,432) | |
Net investment income allocated from Oppenheimer Master Loan Fund, LLC | | | 14,339,266 | |
| Investment Income | | | | |
| Interest (net of foreign withholding taxes of $400) | | | 47,061,694 | |
| Dividends: | | | | |
| Unaffiliated companies (net of foreign withholding taxes of $703,658) | | | 27,358,658 | |
| Affiliated companies | | | 4,303,751 | |
| Fee income on when-issued securities | | | 5,705,149 | |
Total investment income | | | 84,429,252 | |
| Expenses | | | | |
| Management fees | | | 14,203,717 | |
| Distribution and service plan fees: | | | | |
| Class A | | | 3,532,429 | |
| Class B2 | | | 18,848 | |
| Class C | | | 3,503,600 | |
| Class R | | | 347,506 | |
| Transfer and shareholder servicing agent fees: | | | | |
| Class A | | | 3,104,810 | |
| Class B2 | | | 4,030 | |
| Class C | | | 714,825 | |
| Class I | | | 31,571 | |
| Class R | | | 142,264 | |
| Class Y | | | 1,220,184 | |
| Shareholder communications: | | | | |
| Class A | | | 58,480 | |
| Class B2 | | | 1,036 | |
| Class C | | | 12,725 | |
| Class I | | | 473 | |
| Class R | | | 2,027 | |
| Class Y | | | 17,727 | |
| Custodian fees and expenses | | | 166,256 | |
| Trustees’ compensation | | | 99,491 | |
| Borrowing fees | | | 93,904 | |
| Other | | | 305,928 | |
| Total expenses | | | 27,581,831 | |
| Less reduction to custodian expenses | | | (1,465) | |
| Less waivers and reimbursements of expenses | | | (1,694,113) | |
Net expenses | | | 25,886,253 | |
| Net Investment Income | | | 72,882,265 | |
57 OPPENHEIMER CAPITAL INCOME FUND
CONSOLIDATED STATEMENT OF
OPERATIONS Continued
| | | | |
| Realized and Unrealized Gain (Loss) | | | | |
| Net realized gain (loss) on: | | | | |
| Investment transactions in: | | | | |
Unaffiliated companies | | $ | 48,386,376 | |
Affiliated companies | | | (326,855) | |
| Option contracts written | | | 864,032 | |
| Futures contracts | | | 392,465 | |
| Foreign currency transactions | | | (392,990) | |
| Forward currency exchange contracts | | | (5,185,582) | |
| Swap contracts | | | (2,415,818) | |
| Swaption contracts written | | | 62,321 | |
| Net realized gain allocated from Oppenheimer Master Loan Fund, LLC | | | 511,762 | |
| | | | |
| Net realized gain | | | 41,895,711 | |
| Net change in unrealized appreciation/depreciation on: | | | | |
| Investment transactions in: | | | | |
Unaffiliated companies | | | (16,806,873) | |
Affiliated companies | | | (10,208) | |
| Translation of assets and liabilities denominated in foreign currencies | | | (68,378) | |
| Forward currency exchange contracts | | | 4,846,269 | |
| Futures contracts | | | 1,235,835 | |
| Option contracts written | | | (864,032) | |
| Swap contracts | | | 560,533 | |
| Net change in unrealized appreciation/depreciation allocated from Oppenheimer Master Loan | | | | |
| Fund, LLC | | | (1,441,742) | |
| | | | |
Net change in unrealized appreciation/depreciation | | | (12,548,596) | |
| Net Increase in Net Assets Resulting from Operations | | $ | 102,229,380 | |
| | | | |
1. The Fund invests in an affiliated mutual fund that expects to be treated as a partnership for tax purposes. See Note 4 of the accompanying Consolidated Notes.
2. Effective June 1, 2018, all Class B shares converted to Class A shares.
See accompanying Notes to Consolidated Financial Statements.
58 OPPENHEIMER CAPITAL INCOME FUND
CONSOLIDATED STATEMENTS OF CHANGES IN NET ASSETS
| | | | | | |
| | | Year Ended | | | Year Ended |
| | | August 31, 2018 | | | August 31, 2017 |
| Operations | | | | | | |
| Net investment income | | $ | 72,882,265 | | | $ 68,000,837 |
| Net realized gain | | | 41,895,711 | | | 169,977,459 |
| Net change in unrealized appreciation/depreciation | | | (12,548,596 | ) | | (88,004,885) |
| | | |
| Net increase in net assets resulting from operations | | | 102,229,380 | | | 149,973,411 |
| | | | | | |
| Dividends and/or Distributions to Shareholders | | | | | | |
| Dividends from net investment income: | | | | | | |
| Class A | | | (40,420,905 | ) | | (44,632,911) |
| Class B1 | | | (39,050 | ) | | (159,191) |
| Class C | | | (6,992,077 | ) | | (8,069,787) |
| Class I | | | (3,139,141 | ) | | (497,594) |
| Class R | | | (1,660,873 | ) | | (859,896) |
| Class Y | | | (17,423,653 | ) | | (15,247,130) |
| | | |
| | | (69,675,699 | ) | | (69,466,509) |
| | | | | | |
| Beneficial Interest Transactions | | | | | | |
| Net increase (decrease) in net assets resulting from beneficial interest transactions: | | | | | | |
| Class A | | | (140,607,809 | ) | | (189,977,382) |
| Class B1 | | | (4,927,477 | ) | | (7,423,467) |
| Class C | | | (57,291,954 | ) | | (56,832,545) |
| Class I | | | 109,506,241 | | | 4,521,969 |
| Class R | | | 22,177,292 | | | 18,387,755 |
| Class Y | | | (93,347,864 | ) | | 125,398,162 |
| | | |
| | | (164,491,571 | ) | | (105,925,508) |
| | | | | | |
| Net Assets | | | | | | |
| Total decrease | | | (131,937,890 | ) | | (25,418,606) |
| Beginning of period | | | 2,657,846,825 | | | 2,683,265,431 |
| | | |
| End of period (including accumulated net investment income of $12,317,861 and $13,547,898, respectively) | | $ | 2,525,908,935 | | | $ 2,657,846,825 |
| | | |
1. Effective June 1, 2018, all Class B shares converted to Class A shares.
See accompanying Notes to Consolidated Financial Statements.
59 OPPENHEIMER CAPITAL INCOME FUND
CONSOLIDATED FINANCIAL HIGHLIGHTS
| | | | | | | | | | | | |
| Class A | | Year Ended
August 31,
2018 | | | Year Ended
August 31,
2017 | | Year Ended
August 31,
2016 | | Year Ended
August 31,
2015 | | Year Ended
August 29,
20141 |
| Per Share Operating Data | | | | | | | | | | | | |
| Net asset value, beginning of period | | | $10.14 | | | $9.84 | | $9.62 | | $10.03 | | $9.29 |
| Income (loss) from investment operations: | | | | | | | | | | | | |
| Net investment income2 | | | 0.28 | | | 0.26 | | 0.25 | | 0.25 | | 0.34 |
| Net realized and unrealized gain (loss) | | | 0.13 | | | 0.31 | | 0.25 | | (0.35) | | 0.71 |
| | | |
| Total from investment operations | | | 0.41 | | | 0.57 | | 0.50 | | (0.10) | | 1.05 |
| Dividends and/or distributions to shareholders: | | | | | | | | | | | | |
| Dividends from net investment income | | | (0.27) | | | (0.27) | | (0.28) | | (0.31) | | (0.31) |
| Net asset value, end of period | | | $10.28 | | | $10.14 | | $9.84 | | $9.62 | | $10.03 |
| | | |
| | | | | | | | | | | | |
| Total Return, at Net Asset Value3 | | | 4.10% | | | 5.84% | | 5.31% | | (1.07)% | | 11.44% |
| | | | | | | | | | | | |
| Ratios/Supplemental Data | | | | | | | | | | | | |
| Net assets, end of period (in thousands) | | | $1,462,785 | | | $1,584,024 | | $1,723,245 | | $1,735,068 | | $1,730,245 |
| Average net assets (in thousands) | | | $1,524,510 | | | $1,662,753 | | $1,712,506 | | $1,764,700 | | $1,627,867 |
| Ratios to average net assets:4,5 | | | | | | | | | | | | |
| Net investment income | | | 2.79% | | | 2.63% | | 2.66% | | 2.54% | | 3.55% |
| Expenses excluding specific expenses listed below | | | 1.04% | | | 1.05% | | 1.05% | | 1.05% | | 1.04% |
| Interest and fees from borrowings | | | 0.00%6 | | | 0.00%6 | | 0.00%6 | | 0.00%6 | | 0.00% |
| | | |
| Total expenses7 | | | 1.04% | | | 1.05% | �� | 1.05% | | 1.05% | | 1.04% |
| Expenses after payments, waivers and/or reimbursements and reduction to custodian expenses | | | 0.97% | | | 0.99% | | 1.00% | | 0.99% | | 0.98% |
| Portfolio turnover rate8 | | | 88% | | | 92% | | 54% | | 79% | | 93% |
60 OPPENHEIMER CAPITAL INCOME FUND
1. Represents the last business day of the Fund’s reporting period.
2. Per share amounts calculated based on the average shares outstanding during the period.
3. Assumes an initial investment on the business day before the first day of the fiscal period, with all dividends and distributions reinvested in additional shares on the reinvestment date, and redemption at the net asset value calculated on the last business day of the fiscal period. Sales charges are not reflected in the total returns. Total returns are not annualized for periods less than one full year. Returns do not reflect the deduction of taxes that a shareholder would pay on fund distributions or the redemption of fund shares.
4. Annualized for periods less than one full year.
5. Includes the Fund’s share of the allocated expenses and/or net investment income from the master funds.
6. Less than 0.005%.
7. Total expenses including indirect expenses from affiliated fund fees and expenses were as follows:
| | | | | | | | |
| | Year Ended August 31, 2018 | | | 1.06 | % | | |
| | Year Ended August 31, 2017 | | | 1.07 | % | | |
| | Year Ended August 31, 2016 | | | 1.07 | % | | |
| | Year Ended August 21, 2015 | | | 1.07 | % | | |
| | Year Ended August 29, 2014 | | | 1.06 | % | | |
8. The portfolio turnover rate excludes purchase and sale transactions of To Be Announced (TBA) mortgage-related securities as follows:
| | | | | | |
| | | Purchase Transactions | | | Sale Transactions |
| Year Ended August 31, 2018 | | | $4,932,579,131 | | | $5,044,273,340 |
| Year Ended August 31, 2017 | | | $4,620,692,203 | | | $4,544,059,262 |
| Year Ended August 31, 2016 | | | $4,212,529,231 | | | $4,192,313,269 |
| Year Ended August 21, 2015 | | | $4,664,260,054 | | | $4,590,883,479 |
| Year Ended August 29, 2014 | | | $2,958,051,509 | | | $2,894,379,022 |
See accompanying Notes to Consolidated Financial Statements.
61 OPPENHEIMER CAPITAL INCOME FUND
CONSOLIDATED FINANCIAL HIGHLIGHTS Continued
| | | | | | | | | | | | | | | | | | | | |
| Class C | | Year Ended
August 31,
2018 | | | Year Ended
August 31,
2017 | | | Year Ended
August 31,
2016 | | | Year Ended
August 31,
2015 | | | Year Ended
August 29,
20141 | |
| Per Share Operating Data | | | | | | | | | | | | | | | | | | | | |
| Net asset value, beginning of period | | | $9.81 | | | | $9.52 | | | | $9.32 | | | | $9.74 | | | | $9.03 | |
| Income (loss) from investment operations: | | | | | | | | | | | | | | | | | | | | |
| Net investment income2 | | | 0.20 | | | | 0.18 | | | | 0.17 | | | | 0.17 | | | | 0.26 | |
| Net realized and unrealized gain (loss) | | | 0.11 | | | | 0.30 | | | | 0.24 | | | | (0.35) | | | | 0.69 | |
| | | | |
| Total from investment operations | | | 0.31 | | | | 0.48 | | | | 0.41 | | | | (0.18) | | | | 0.95 | |
| Dividends and/or distributions to shareholders: | | | | | | | | | | | | | | | | | | | | |
| Dividends from net investment income | | | (0.19) | | | | (0.19) | | | | (0.21) | | | | (0.24) | | | | (0.24) | |
| Net asset value, end of period | | | $9.93 | | | | $9.81 | | | | $9.52 | | | | $9.32 | | | | $9.74 | |
| | | | |
| | | | | | | | | | | | | | | | | | | | |
| Total Return, at Net Asset Value3 | | | 3.24% | | | | 5.13% | | | | 4.47% | | | | (1.89)% | | | | 10.66% | |
| | | | | | | | | | | | | | | | | | | | |
| Ratios/Supplemental Data | | | | | | | | | | | | | | | | | | | | |
| Net assets, end of period (in thousands) | | | $321,786 | | | | $375,081 | | | | $420,117 | | | | $403,758 | | | | $296,136 | |
| Average net assets (in thousands) | | | $350,563 | | | | $400,146 | | | | $413,522 | | | | $369,218 | | | | $230,619 | |
| Ratios to average net assets:4,5 | | | | | | | | | | | | | | | | | | | | |
| Net investment income | | | 2.02% | | | | 1.87% | | | | 1.87% | | | | 1.75% | | | | 2.76% | |
| Expenses excluding specific expenses listed below | | | 1.80% | | | | 1.81% | | | | 1.82% | | | | 1.81% | | | | 1.82% | |
| Interest and fees from borrowings | | | 0.00%6 | | | | 0.00%6 | | | | 0.00%6 | | | | 0.00%6 | | | | 0.00% | |
| | | | |
| Total expenses7 | | | 1.80% | | | | 1.81% | | | | 1.82% | | | | 1.81% | | | | 1.82% | |
| Expenses after payments, waivers and/or reimbursements and reduction to custodian expenses | | | 1.73% | | | | 1.75% | | | | 1.76% | | | | 1.75% | | | | 1.76% | |
| Portfolio turnover rate8 | | | 88% | | | | 92% | | | | 54% | | | | 79% | | | | 93% | |
62 OPPENHEIMER CAPITAL INCOME FUND
1. Represents the last business day of the Fund’s reporting period.
2. Per share amounts calculated based on the average shares outstanding during the period.
3. Assumes an initial investment on the business day before the first day of the fiscal period, with all dividends and distributions reinvested in additional shares on the reinvestment date, and redemption at the net asset value calculated on the last business day of the fiscal period. Sales charges are not reflected in the total returns. Total returns are not annualized for periods less than one full year. Returns do not reflect the deduction of taxes that a shareholder would pay on fund distributions or the redemption of fund shares.
4. Annualized for periods less than one full year.
5. Includes the Fund’s share of the allocated expenses and/or net investment income from the master funds.
6. Less than 0.005%.
7. Total expenses including indirect expenses from affiliated fund fees and expenses were as follows:
| | | | | | | | |
| | Year Ended August 31, 2018 | | | 1.82 | % | | |
| | Year Ended August 31, 2017 | | | 1.83 | % | | |
| | Year Ended August 31, 2016 | | | 1.84 | % | | |
| | Year Ended August 31, 2015 | | | 1.83 | % | | |
| | Year Ended August 29, 2014 | | | 1.84 | % | | |
8. The portfolio turnover rate excludes purchase and sale transactions of To Be Announced (TBA) mortgage-related securities as follows:
| | | | | | |
| | | Purchase Transactions | | | Sale Transactions |
| Year Ended August 31, 2018 | | | $4,932,579,131 | | | $5,044,273,340 |
| Year Ended August 31, 2017 | | | $4,620,692,203 | | | $4,544,059,262 |
| Year Ended August 31, 2016 | | | $4,212,529,231 | | | $4,192,313,269 |
| Year Ended August 21, 2015 | | | $4,664,260,054 | | | $4,590,883,479 |
| Year Ended August 29, 2014 | | | $2,958,051,509 | | | $2,894,379,022 |
See accompanying Notes to Consolidated Financial Statements.
63 OPPENHEIMER CAPITAL INCOME FUND
CONSOLIDATED FINANCIAL HIGHLIGHTS Continued
| | | | | | | | | | | | | | | | | | | | |
| Class I | | Year Ended
August 31,
2018 | | | Year Ended
August 31,
2017 | | | Year Ended
August 31,
2016 | | | Year Ended
August 31,
2015 | | | Period Ended
August 29,
20141,2 | |
| Per Share Operating Data | | | | | | | | | | | | | | | | | | | | |
| Net asset value, beginning of period | | | $10.14 | | | | $9.84 | | | | $9.62 | | | | $10.03 | | | | $9.60 | |
| Income (loss) from investment operations: | | | | | | | | | | | | | | | | | | | | |
| Net investment income3 | | | 0.32 | | | | 0.30 | | | | 0.30 | | | | 0.29 | | | | 0.26 | |
| Net realized and unrealized gain (loss) | | | 0.12 | | | | 0.31 | | | | 0.24 | | | | (0.35) | | | | 0.31 | |
| | | | |
| Total from investment operations | | | 0.44 | | | | 0.61 | | | | 0.54 | | | | (0.06) | | | | 0.57 | |
| Dividends and/or distributions to shareholders: | | | | | | | | | | | | | | | | | | | | |
| Dividends from net investment income | | | (0.31) | | | | (0.31) | | | | (0.32) | | | | (0.35) | | | | (0.14) | |
| Net asset value, end of period | | | $10.27 | | | | $10.14 | | | | $9.84 | | | | $9.62 | | | | $10.03 | |
| | | | |
| | | | | | | | | | | | | | | | | | | | |
| Total Return, at Net Asset Value4 | | | 4.44% | | | | 6.29% | | | | 5.78% | | | | (0.65)% | | | | 6.01% | |
| | | | | | | | | | | | | | | | | | | | |
| Ratios/Supplemental Data | | | | | | | | | | | | | | | | | | | | |
| Net assets, end of period (in thousands) | | | $130,976 | | | | $20,176 | | | | $15,142 | | | | $12,625 | | | | $10,894 | |
| Average net assets (in thousands) | | | $105,548 | | | | $16,342 | | | | $14,088 | | | | $12,629 | | | | $7,047 | |
| Ratios to average net assets:5,6 | | | | | | | | | | | | | | | | | | | | |
| Net investment income | | | 3.19% | | | | 3.04% | | | | 3.08% | | | | 2.96% | | | | 3.87% | |
| Expenses excluding specific expenses listed below | | | 0.63% | | | | 0.62% | | | | 0.63% | | | | 0.62% | | | | 0.64% | |
| Interest and fees from borrowings | | | 0.00%7 | | | | 0.00%7 | | | | 0.00%7 | | | | 0.00%7 | | | | 0.00% | |
| | | | |
| Total expenses8 | | | 0.63% | | | | 0.62% | | | | 0.63% | | | | 0.62% | | | | 0.64% | |
| Expenses after payments, waivers and/or reimbursements and reduction to custodian expenses | | | 0.57% | | | | 0.56% | | | | 0.57% | | | | 0.56% | | | | 0.58% | |
| Portfolio turnover rate9 | | | 88% | | | | 92% | | | | 54% | | | | 79% | | | | 93% | |
64 OPPENHEIMER CAPITAL INCOME FUND
1. Represents the last business day of the Fund’s reporting period.
2. For the period from December 27, 2013 (inception of offering) to August 29, 2014.
3. Per share amounts calculated based on the average shares outstanding during the period.
4. Assumes an initial investment on the business day before the first day of the fiscal period, with all dividends and distributions reinvested in additional shares on the reinvestment date, and redemption at the net asset value calculated on the last business day of the fiscal period. Sales charges are not reflected in the total returns. Total returns are not annualized for periods less than one full year. Returns do not reflect the deduction of taxes that a shareholder would pay on fund distributions or the redemption of fund shares.
5. Annualized for periods less than one full year.
6. Includes the Fund’s share of the allocated expenses and/or net investment income from the master funds.
7. Less than 0.005%.
8. Total expenses including indirect expenses from affiliated fund fees and expenses were as follows:
| | | | | | | | |
| | Year Ended August 31, 2018 | | | 0.65 | % | | |
| | Year Ended August 31, 2017 | | | 0.64 | % | | |
| | Year Ended August 31, 2016 | | | 0.65 | % | | |
| | Year Ended August 21, 2015 | | | 0.64 | % | | |
| | Year Ended August 29, 2014 | | | 0.66 | % | | |
9. The portfolio turnover rate excludes purchase and sale transactions of To Be Announced (TBA) mortgage-related securities as follows:
| | | | | | |
| | | Purchase Transactions | | | Sale Transactions |
| Year Ended August 31, 2018 | | | $4,932,579,131 | | | $5,044,273,340 |
| Year Ended August 31, 2017 | | | $4,620,692,203 | | | $4,544,059,262 |
| Year Ended August 31, 2016 | | | $4,212,529,231 | | | $4,192,313,269 |
| Year Ended August 21, 2015 | | | $4,664,260,054 | | | $4,590,883,479 |
| Year Ended August 29, 2014 | | | $2,958,051,509 | | | $2,894,379,022 |
See accompanying Notes to Consolidated Financial Statements.
65 OPPENHEIMER CAPITAL INCOME FUND
CONSOLIDATED FINANCIAL HIGHLIGHTS Continued
| | | | | | | | | | | | |
| Class R | | Year Ended
August 31,
2018 | | | Year Ended
August 31,
2017 | | Year Ended
August 31,
2016 | | Year Ended
August 31,
2015 | | Year Ended
August 29,
20141 |
| Per Share Operating Data | | | | | | | | | | | | |
| Net asset value, beginning of period | | | $10.00 | | | $9.71 | | $9.50 | | $9.91 | | $9.18 |
| Income (loss) from investment operations: | | | | | | | | | | | | |
| Net investment income2 | | | 0.25 | | | 0.23 | | 0.23 | | 0.22 | | 0.31 |
| Net realized and unrealized gain (loss) | | | 0.12 | | | 0.30 | | 0.24 | | (0.35) | | 0.70 |
| | | |
| Total from investment operations | | | 0.37 | | | 0.53 | | 0.47 | | (0.13) | | 1.01 |
| Dividends and/or distributions to shareholders: | | | | | | | | | | | | |
| Dividends from net investment income | | | (0.25) | | | (0.24) | | (0.26) | | (0.28) | | (0.28) |
| Net asset value, end of period | | | $10.12 | | | $10.00 | | $9.71 | | $9.50 | | $9.91 |
| | | |
| | | | | | | | | | | | |
| Total Return, at Net Asset Value3 | | | 3.73% | | | 5.57% | | 5.02% | | (1.32)% | | 11.15% |
| | | | | | | | | | | | |
| Ratios/Supplemental Data | | | | | | | | | | | | |
| Net assets, end of period (in thousands) | | | $74,277 | | | $51,324 | | $31,806 | | $27,151 | | $23,798 |
| Average net assets (in thousands) | | | $70,353 | | | $37,273 | | $28,769 | | $25,957 | | $22,251 |
| Ratios to average net assets:4,5 | | | | | | | | | | | | |
| Net investment income | | | 2.53% | | | 2.33% | | 2.39% | | 2.28% | | 3.27% |
| Expenses excluding specific expenses listed below | | | 1.30% | | | 1.30% | | 1.31% | | 1.30% | | 1.32% |
| Interest and fees from borrowings | | | 0.00%6 | | | 0.00%6 | | 0.00%6 | | 0.00%6 | | 0.00% |
| | | |
| Total expenses7 | | | 1.30% | | | 1.30% | | 1.31% | | 1.30% | | 1.32% |
| Expenses after payments, waivers and/or reimbursements and reduction to custodian expenses | | | 1.23% | | | 1.24% | | 1.25% | | 1.24% | | 1.26% |
| Portfolio turnover rate8 | | | 88% | | | 92% | | 54% | | 79% | | 93% |
66 OPPENHEIMER CAPITAL INCOME FUND
1. Represents the last business day of the Fund’s reporting period.
2. Per share amounts calculated based on the average shares outstanding during the period.
3. Assumes an initial investment on the business day before the first day of the fiscal period, with all dividends and distributions reinvested in additional shares on the reinvestment date, and redemption at the net asset value calculated on the last business day of the fiscal period. Sales charges are not reflected in the total returns. Total returns are not annualized for periods less than one full year. Returns do not reflect the deduction of taxes that a shareholder would pay on fund distributions or the redemption of fund shares.
4. Annualized for periods less than one full year.
5. Includes the Fund’s share of the allocated expenses and/or net investment income from the master funds.
6. Less than 0.005%.
7. Total expenses including indirect expenses from affiliated fund fees and expenses were as follows:
| | | | | | | | |
| | Year Ended August 31, 2018 | | | 1.32 | % | | |
| | Year Ended August 31, 2017 | | | 1.32 | % | | |
| | Year Ended August 31, 2016 | | | 1.33 | % | | |
| | Year Ended August 31, 2015 | | | 1.32 | % | | |
| | Year Ended August 29, 2014 | | | 1.34 | % | | |
8. The portfolio turnover rate excludes purchase and sale transactions of To Be Announced (TBA) mortgage-related securities as follows:
| | | | | | |
| | | Purchase Transactions | | | Sale Transactions |
| Year Ended August 31, 2018 | | | $4,932,579,131 | | | $5,044,273,340 |
| Year Ended August 31, 2017 | | | $4,620,692,203 | | | $4,544,059,262 |
| Year Ended August 31, 2016 | | | $4,212,529,231 | | | $4,192,313,269 |
| Year Ended August 31, 2015 | | | $4,664,260,054 | | | $4,590,883,479 |
| Year Ended August 29, 2014 | | | $2,958,051,509 | | | $2,894,379,022 |
See accompanying Notes to Consolidated Financial Statements.
67 OPPENHEIMER CAPITAL INCOME FUND
CONSOLIDATED FINANCIAL HIGHLIGHTS Continued
| | | | | | | | | | | | | | | | | | | | |
| Class Y | | Year Ended
August 31,
2018 | | | Year Ended
August 31,
2017 | | | Year Ended
August 31,
2016 | | | Year Ended
August 31,
2015 | | | Year Ended
August 29,
20141 | |
| Per Share Operating Data | | | | | | | | | | | | | | | | | | | | |
| Net asset value, beginning of period | | | $10.14 | | | | $9.84 | | | | $9.62 | | | | $10.03 | | | | $9.29 | |
| Income (loss) from investment operations: | | | | | | | | | | | | | | | | | | | | |
| Net investment income2 | | | 0.31 | | | | 0.28 | | | | 0.27 | | | | 0.27 | | | | 0.37 | |
| Net realized and unrealized gain (loss) | | | 0.11 | | | | 0.31 | | | | 0.25 | | | | (0.35) | | | | 0.70 | |
| | | | |
| Total from investment operations | | | 0.42 | | | | 0.59 | | | | 0.52 | | | | (0.08) | | | | 1.07 | |
| Dividends and/or distributions to shareholders: | | | | | | | | | | | | | | | | | | | | |
| Dividends from net investment income | | | (0.29) | | | | (0.29) | | | | (0.30) | | | | (0.33) | | | | (0.33) | |
| Net asset value, end of period | | | $10.27 | | | | $10.14 | | | | $9.84 | | | | $9.62 | | | | $10.03 | |
| | | | |
| | | | | | | | | | | | | | | | | | | | |
| Total Return, at Net Asset Value3 | | | 4.25% | | | | 6.21% | | | | 5.47% | | | | (0.82)% | | | | 11.74% | |
| | | | | | | | | | | | | | | | | | | | |
| Ratios/Supplemental Data | | | | | | | | | | | | | | | | | | | | |
| Net assets, end of period (in thousands) | | | $536,085 | | | | $622,331 | | | | $480,847 | | | | $447,319 | | | | $280,000 | |
| Average net assets (in thousands) | | | $598,353 | | | | $534,372 | | | | $453,299 | | | | $401,249 | | | | $162,609 | |
| Ratios to average net assets:4,5 | | | | | | | | | | | | | | | | | | | | |
| Net investment income | | | 3.02% | | | | 2.85% | | | | 2.86% | | | | 2.74% | | | | 3.77% | |
| Expenses excluding specific expenses listed below | | | 0.80% | | | | 0.81% | | | | 0.82% | | | | 0.82% | | | | 0.81% | |
| Interest and fees from borrowings | | | 0.00%6 | | | | 0.00%6 | | | | 0.00%6 | | | | 0.00% | 6 | | | 0.00% | |
| | | | |
| Total expenses7 | | | 0.80% | | | | 0.81% | | | | 0.82% | | | | 0.82% | | | | 0.81% | |
| Expenses after payments, waivers and/or reimbursements and reduction to custodian expenses | | | 0.73% | | | | 0.75% | | | | 0.76% | | | | 0.76% | | | | 0.75% | |
| Portfolio turnover rate8 | | | 88% | | | | 92% | | | | 54% | | | | 79% | | | | 93% | |
68 OPPENHEIMER CAPITAL INCOME FUND
1. Represents the last business day of the Fund’s reporting period.
2. Per share amounts calculated based on the average shares outstanding during the period.
3. Assumes an initial investment on the business day before the first day of the fiscal period, with all dividends and distributions reinvested in additional shares on the reinvestment date, and redemption at the net asset value calculated on the last business day of the fiscal period. Sales charges are not reflected in the total returns. Total returns are not annualized for periods less than one full year. Returns do not reflect the deduction of taxes that a shareholder would pay on fund distributions or the redemption of fund shares.
4. Annualized for periods less than one full year.
5. Includes the Fund’s share of the allocated expenses and/or net investment income from the master funds.
6. Less than 0.005%.
7. Total expenses including indirect expenses from affiliated fund fees and expenses were as follows:
| | | | | | | | |
| | Year Ended August 31, 2018 | | | 0.82 | % | | |
| | Year Ended August 31, 2017 | | | 0.83 | % | | |
| | Year Ended August 31, 2016 | | | 0.84 | % | | |
| | Year Ended August 21, 2015 | | | 0.84 | % | | |
| | Year Ended August 29, 2014 | | | 0.83 | % | | |
8. The portfolio turnover rate excludes purchase and sale transactions of To Be Announced (TBA) mortgage-related securities as follows:
| | | | | | |
| | | Purchase Transactions | | | Sale Transactions |
| Year Ended August 31, 2018 | | | $4,932,579,131 | | | $5,044,273,340 |
| Year Ended August 31, 2017 | | | $4,620,692,203 | | | $4,544,059,262 |
| Year Ended August 31, 2016 | | | $4,212,529,231 | | | $4,192,313,269 |
| Year Ended August 21, 2015 | | | $4,664,260,054 | | | $4,590,883,479 |
| Year Ended August 29, 2014 | | | $2,958,051,509 | | | $2,894,379,022 |
See accompanying Notes to Consolidated Financial Statements.
69 OPPENHEIMER CAPITAL INCOME FUND
NOTES TO CONSOLIDATED
FINANCIAL STATEMENTS August 31, 2018
1. Organization
Oppenheimer Capital Income Fund (the “Fund”) is a diversified open-end management investment company registered under the Investment Company Act of 1940 (“1940 Act”), as amended. The Fund’s investment objective is to seek total return. The Fund’s investment adviser is OFI Global Asset Management, Inc. (“OFI Global” or the “Manager”), a wholly-owned subsidiary of OppenheimerFunds, Inc. (“OFI” or the “Sub-Adviser”). The Manager has entered into a sub-advisory agreement with OFI.
The Fund offers Class A, Class C, Class I, Class R and Class Y shares, and previously offered Class B shares for new purchase through June 29, 2012. Subsequent to that date, no new purchases of Class B shares were permitted. Reinvestment of dividend and/or capital gain distributions and exchanges of Class B shares into and from other Oppenheimer funds were permitted through May 31, 2018. Effective June 1, 2018 (the “Conversion Date”), all Class B shares converted to Class A shares. Class A shares are sold at their offering price, which is normally net asset value plus a front-end sales charge. Class C and Class R shares are sold, and Class B shares were sold, without a front-end sales charge but may be subject to a contingent deferred sales charge (“CDSC”). Class R shares are sold only through retirement plans. Retirement plans that offer Class R shares may impose charges on those accounts. Class I and Class Y shares are sold to certain institutional investors or intermediaries without either a front-end sales charge or a CDSC, however, the intermediaries may impose charges on their accountholders who beneficially own Class I and Class Y shares. All classes of shares have identical rights and voting privileges with respect to the Fund in general and exclusive voting rights on matters that affect that class alone. Earnings, net assets and net asset value per share may differ due to each class having its own expenses, such as transfer and shareholder servicing agent fees and shareholder communications, directly attributable to that class. Class A, C and R shares have, and Class B shares had, separate distribution and/or service plans under which they pay, and Class B shares paid, fees. Class I and Class Y shares do not pay such fees. Previously issued Class B shares automatically converted to Class A shares 72 months after the date of purchase.
The following is a summary of significant accounting policies followed in the Fund’s preparation of financial statements in accordance with accounting principles generally accepted in the United States (“U.S. GAAP”).
2. Significant Accounting Policies
Security Valuation. All investments in securities are recorded at their estimated fair value, as described in Note 3.
Basis for Consolidation. The Fund has established a Cayman Islands exempted company, Oppenheimer Capital Income Fund Cayman Ltd. (the “Subsidiary”), which is wholly-owned and controlled by the Fund. The Fund and Subsidiary are both managed by the Manager. The Fund may invest up to 25% of its total assets in the Subsidiary. The Subsidiary invests primarily in commodity-linked derivatives (including commodity futures, financial futures, options and swap contracts) and certain fixed-income securities and other investments that may serve as
70 OPPENHEIMER CAPITAL INCOME FUND
2. Significant Accounting Policies (Continued)
margin or collateral for its derivatives positions. The Fund applies its investment restrictions and compliance policies and procedures, on a look-through basis, to the Subsidiary.
The financial statements have been consolidated and include accounts of the Fund and the Subsidiary. Accordingly, all inter-company transactions and balances have been eliminated. At period end, the Fund owned 10,487 shares with net assets of $24,489,908 in the Subsidiary.
Other financial information at period end:
| | | | |
| Total market value of investments | | $ | 24,484,107 | |
| Net assets | | $ | 24,489,908 | |
| Net income (loss) | | $ | (224,618) | |
| Net realized gain (loss) | | $ | — | |
| Net change in unrealized appreciation/depreciation | | $ | (2,593,385) | |
Foreign Currency Translation. The books and records of the Fund are maintained in U.S. dollars. Any foreign currency amounts are translated into U.S. dollars on the following basis:
(1) Value of investment securities, other assets and liabilities — at the exchange rates prevailing at market close as described in Note 3.
(2) Purchases and sales of investment securities, income and expenses — at the rates of exchange prevailing on the respective dates of such transactions.
Although the net assets and the values are presented at the foreign exchange rates at market close, the Fund does not isolate the portion of the results of operations resulting from changes in foreign exchange rates on investments from the fluctuations arising from changes in prices of securities held. Such fluctuations are included with the net realized and unrealized gains or losses from investments shown in the Consolidated Statement of Operations.
For securities, which are subject to foreign withholding tax upon disposition, realized and unrealized gains or losses on such securities are recorded net of foreign withholding tax.
Reported net realized foreign exchange gains or losses arise from sales of foreign currencies, currency gains or losses realized between the trade and settlement dates on securities transactions, the difference between the amounts of dividends, interest, and foreign withholding tax reclaims recorded on the Fund’s books, and the U.S. dollar equivalent of the amounts actually received or paid. Net unrealized foreign exchange gains and losses arise from changes in the value of assets and liabilities other than investments in securities, resulting from changes in the exchange rate.
Allocation of Income, Expenses, Gains and Losses. Income, expenses (other than those attributable to a specific class), gains and losses are allocated on a daily basis to each class of shares based upon the relative proportion of net assets represented by such class. Operating expenses directly attributable to a specific class are charged against the operations of that class.
Dividends and Distributions to Shareholders. Dividends and distributions to shareholders, which are determined in accordance with income tax regulations and may differ from U.S. GAAP, are recorded on the ex-dividend date. Income distributions, if any, are
71 OPPENHEIMER CAPITAL INCOME FUND
NOTES TO CONSOLIDATED
FINANCIAL STATEMENTS Continued
2. Significant Accounting Policies (Continued)
declared and paid quarterly. Capital gain distributions, if any, are declared and paid annually or at other times as determined necessary by the Manager.
Investment Income. Dividend income is recorded on the ex-dividend date or upon ex-dividend notification in the case of certain foreign dividends where the ex-dividend date may have passed. Non-cash dividends included in dividend income, if any, are recorded at the fair value of the securities received. Withholding taxes on foreign dividends, if any, and capital gains taxes on foreign investments, if any, have been provided for in accordance with the Fund’s understanding of the applicable tax rules and regulations. Interest income, if any, is recognized on an accrual basis. Discount and premium, which are included in interest income on the Consolidated Statement of Operations, are amortized or accreted daily.
Return of Capital Estimates. Distributions received from the Fund’s investments in Real Estate Investments Trusts (REITs), generally are comprised of income and return of capital. The Fund records investment income and return of capital based on estimates. Such estimates are based on historical information available from each REIT and other industry sources. These estimates may subsequently be revised based on information received from REITs after their tax reporting periods are concluded.
Custodian Fees. “Custodian fees and expenses” in the Consolidated Statement of Operations may include interest expense incurred by the Fund on any cash overdrafts of its custodian account during the period. Such cash overdrafts may result from the effects of failed trades in portfolio securities and from cash outflows resulting from unanticipated shareholder redemption activity. The Fund pays interest to its custodian on such cash overdrafts, to the extent they are not offset by positive cash balances maintained by the Fund, at a rate equal to the Federal Funds Rate plus 2.00%. The “Reduction to custodian expenses” line item, if applicable, represents earnings on cash balances maintained by the Fund during the period. Such interest expense and other custodian fees may be paid with these earnings.
Security Transactions. Security transactions are recorded on the trade date. Realized gains and losses on securities sold are determined on the basis of identified cost.
Indemnifications. The Fund’s organizational documents provide current and former Trustees and officers with a limited indemnification against liabilities arising in connection with the performance of their duties to the Fund. In the normal course of business, the Fund may also enter into contracts that provide general indemnifications. The Fund’s maximum exposure under these arrangements is unknown as this would be dependent on future claims that may be made against the Fund. The risk of material loss from such claims is considered remote.
Federal Taxes. The Fund intends to comply with provisions of the Internal Revenue Code applicable to regulated investment companies and to distribute substantially all of its investment company taxable income, including any net realized gain on investments not offset
72 OPPENHEIMER CAPITAL INCOME FUND
2. Significant Accounting Policies (Continued)
by capital loss carryforwards, if any, to shareholders. Therefore, no federal income or excise tax provision is required. The Fund files income tax returns in U.S. federal and applicable state jurisdictions. The statute of limitations on the Fund’s tax return filings generally remains open for the three preceding fiscal reporting period ends. The Fund has analyzed its tax positions for the fiscal year ended August 31, 2018, including open tax years, and does not believe there are any uncertain tax positions requiring recognition in the Fund’s financial statements.
Subchapter M requires, among other things, that at least 90% of the Fund’s gross income be derived from securities or derived with respect to its business of investing in securities (typically referred to as “qualifying income”). Income from commodity-linked derivatives may not be treated as “qualifying income” for purposes of the 90% gross income requirement. The Internal Revenue Service (IRS) has previously issued a number of private letter rulings which conclude that income derived from commodity index-linked notes and investments in a wholly-owned subsidiary will be “qualifying income.” As a result, the Fund will gain exposure to commodities through commodity-linked notes and its wholly-owned subsidiary.
The IRS has suspended the granting of private letter rulings pending further review. As a result, there can be no assurance that the IRS will not change its position with respect to commodity-linked notes and wholly-owned subsidiaries. In addition, future legislation and guidance from the Treasury and the IRS may adversely affect the Fund’s ability to gain exposure to commodities through commodity-linked notes and its wholly-owned subsidiary.
The Fund is required to include in income for federal income tax purposes all of the subsidiary’s net income and gains whether or not such income is distributed by the subsidiary. Net income and gains from the subsidiary are generally treated as ordinary income by the Fund, regardless of the character of the subsidiary’s underlying income. Net losses from the subsidiary do not pass through to the Fund for federal income tax purposes.
The tax components of capital shown in the following table represent distribution requirements the Fund must satisfy under the income tax regulations, losses the Fund may be able to offset against income and gains realized in future years and unrealized appreciation or depreciation of securities and other investments for federal income tax purposes.
| | | | | | | | | | | | |
Undistributed Net Investment Income | | Undistributed
Long-Term
Gain | | | Accumulated
Loss
Carryforward1,2,3
| | | Net Unrealized
Depreciation
Based on cost of Securities and
Other Investments
for Federal Income
Tax Purposes | |
| |
| | | | | | | | | | | | |
| $2,245,706 | | | $— | | | | $— | | | | $36,368,122 | |
1. During the reporting period, the Fund utilized $59,753,552 of capital loss carryforward to offset capital gains realized in that fiscal year.
2. During the previous reporting period, the Fund utilized $148,718,360 of capital loss carryforward to offset capital gains realized in that fiscal year.
3. During the reporting period, $98,529,920 of unused capital loss carryforward expired.
73 OPPENHEIMER CAPITAL INCOME FUND
NOTES TO CONSOLIDATED
FINANCIAL STATEMENTS Continued
2. Significant Accounting Policies (Continued)
Net investment income (loss) and net realized gain (loss) may differ for financial statement and tax purposes. The character of dividends and distributions made during the fiscal year from net investment income or net realized gains are determined in accordance with federal income tax requirements, which may differ from the character of net investment income or net realized gains presented in those financial statements in accordance with U.S. GAAP. Also, due to timing of dividends and distributions, the fiscal year in which amounts are distributed may differ from the fiscal year in which the income or net realized gain was recorded by the Fund.
Accordingly, the following amounts have been reclassified for the reporting period. Net assets of the Fund were unaffected by the reclassifications.
| | | | | | | | |
Reduction to Paid-in Capital | | Reduction to Accumulated Net Investment Income | | | Reduction to Accumulated Net Realized Loss
on Investments | |
| |
| $98,490,242 | | | $ 4,436,603 | | | | $ 102,926,845 | |
The tax character of distributions paid during the reporting periods:
| | | | | | | | |
| | | Year Ended
August 31, 2018 | | | Year Ended
August 31, 2017 | |
| |
| Distributions paid from: | | | | | | | | |
| Ordinary income | | $ | 69,675,699 | | | $ | 69,466,509 | |
The aggregate cost of securities and other investments and the composition of unrealized appreciation and depreciation of securities and other investments for federal income tax purposes at period end are noted in the following table. The primary difference between book and tax appreciation or depreciation of securities and other investments, if applicable, is attributable to the tax deferral of losses or tax realization of financial statement unrealized gain or loss.
| | | | |
Federal tax cost of securities | | $ | 2,804,436,051 | |
Federal tax cost of other investments | | | 767,193,021 | |
| | | | |
| Total federal tax cost | | $ | 3,571,629,072 | |
| | | | |
Gross unrealized appreciation | | $ | 55,717,522 | |
Gross unrealized depreciation | | | (92,085,644) | |
| | | | |
| Net unrealized depreciation | | $ | (36,368,122) | |
| | | | |
Use of Estimates. The preparation of financial statements in conformity with U.S. GAAP requires management to make estimates and assumptions that affect the reported amounts of assets and liabilities and disclosure of contingent assets and liabilities at the date of the financial statements and the reported amounts of increases and decreases in net assets from operations during the reporting period. Actual results could differ from those estimates.
New Accounting Pronouncement. In March 2017, Financial Accounting Standards Board
74 OPPENHEIMER CAPITAL INCOME FUND
2. Significant Accounting Policies (Continued)
(“FASB”) issued Accounting Standards Update (“ASU”), ASU 2017-08. This provides guidance related to the amortization period for certain purchased callable debt securities held at a premium. The ASU is effective for annual periods beginning after December 15, 2018, and interim periods within those annual periods. The Manager is evaluating the impacts of these changes on the financial statements.
3. Securities Valuation
The Fund calculates the net asset value of its shares as of 4:00 P.M. Eastern Time, on each day the New York Stock Exchange (the “Exchange”) is open for trading, except in the case of a scheduled early closing of the Exchange, in which case the Fund will calculate net asset value of the shares as of the scheduled early closing time of the Exchange.
The Fund’s Board has adopted procedures for the valuation of the Fund’s securities and has delegated the day-to-day responsibility for valuation determinations under those procedures to the Manager. The Manager has established a Valuation Committee which is responsible for determining a fair valuation for any security for which market quotations are not readily available. The Valuation Committee’s fair valuation determinations are subject to review, approval and ratification by the Fund’s Board at least quarterly or more frequently, if necessary.
Valuation Methods and Inputs
Securities are valued primarily using unadjusted quoted market prices, when available, as supplied by third party pricing services or broker-dealers.
The following methodologies are used to determine the market value or the fair value of the types of securities described below:
Equity securities traded on a securities exchange (including exchange-traded derivatives other than futures and futures options) are valued based on the official closing price on the principal exchange on which the security is traded, as identified by the Manager, prior to the time when the Fund’s assets are valued. If the official closing price is unavailable, the security is valued at the last sale price on the principal exchange on which it is traded, or if no sales occurred, the security is valued at the mean between the quoted bid and asked prices. Over-the-counter equity securities are valued at the last published sale price, or if no sales occurred, at the mean between the quoted bid and asked prices. Events occurring after the close of trading on foreign exchanges may result in adjustments to the valuation of foreign securities to more accurately reflect their fair value as of the time when the Fund’s assets are valued.
Shares of a registered investment company that are not traded on an exchange are valued at that investment company’s net asset value per share.
Corporate and government debt securities (of U.S. or foreign issuers) and municipal debt securities, short-term notes, mortgage-backed securities, collateralized mortgage obligations, and asset-backed securities are valued at the mean between the bid and asked prices utilizing evaluated prices obtained from third party pricing services or broker-dealers who may use matrix pricing methods to determine the evaluated prices. Pricing services generally price debt
75 OPPENHEIMER CAPITAL INCOME FUND
NOTES TO CONSOLIDATED
FINANCIAL STATEMENTS Continued
3. Securities Valuation (Continued)
securities assuming orderly transactions of an institutional “round lot” size, but some trades may occur in smaller, “odd lot” sizes, sometimes at lower prices than institutional round lot trades. Standard inputs generally considered by third-party pricing vendors include reported trade data, broker-dealer price quotations, benchmark yields, issuer spreads on comparable securities, the credit quality, yield, maturity, as well as other appropriate factors.
Event-linked bonds, are valued at the mean between the bid and asked prices utilizing evaluated prices obtained from third party pricing services or broker-dealers. Standard inputs generally considered by third-party pricing vendors include reported trade data and broker-dealer price quotations.
Loans are valued at the mean between the bid and asked prices utilizing evaluated prices obtained from third party pricing services or broker-dealers. Standard inputs generally considered by third-party pricing vendors include information obtained from market participants regarding broker-dealer price quotations.
Structured securities, swaps, swaptions, and other over-the-counter derivatives are valued utilizing evaluated prices obtained from third party pricing services or broker-dealers. Standard inputs generally considered by third-party pricing vendors include market information relevant to the underlying reference asset such as the price of financial instruments, stock market indices, foreign currencies, interest rate spreads, commodities, credit spreads, credit event probabilities, index values, individual security values, forward interest rates, variable interest rates, volatility measures, and forward currency rates, or the occurrence of other specific events.
Forward foreign currency exchange contracts are valued utilizing current and forward currency rates obtained from third party pricing services. When the settlement date of a contract is an interim date for which a quotation is not available, interpolated values are derived using the nearest dated forward currency rate.
Futures contracts and futures options traded on a commodities or futures exchange will be valued at the final settlement price or official closing price on the principal exchange as reported by such principal exchange at its trading session ending at, or most recently prior to, the time when the Fund’s assets are valued.
Securities for which market quotations are not readily available, or when a significant event has occurred that would materially affect the value of the security, are fair valued either (i) by a standardized fair valuation methodology applicable to the security type or the significant event as previously approved by the Valuation Committee and the Fund’s Board or (ii) as determined in good faith by the Manager’s Valuation Committee. The Valuation Committee considers all relevant facts that are reasonably available, through either public information or information available to the Manager, when determining the fair value of a security. Those standardized fair valuation methodologies include, but are not limited to, valuing securities at the last sale price or initially at cost and subsequently adjusting the value based on: changes in company specific fundamentals, changes in an appropriate securities index, or changes in the value of similar securities which may be further adjusted for any discounts related to security-specific resale restrictions. When possible, such methodologies use observable market inputs such as unadjusted quoted prices of similar securities, observable interest
76 OPPENHEIMER CAPITAL INCOME FUND
3. Securities Valuation (Continued)
rates, currency rates and yield curves. The methodologies used for valuing securities are not necessarily an indication of the risks associated with investing in those securities nor can it be assured that the Fund can obtain the fair value assigned to a security if it were to sell the security.
Classifications
Each investment asset or liability of the Fund is assigned a level at measurement date based on the significance and source of the inputs to its valuation. Various data inputs may be used in determining the value of each of the Fund’s investments as of the reporting period end.
These data inputs are categorized in the following hierarchy under applicable financial accounting standards:
1) Level 1-unadjusted quoted prices in active markets for identical assets or liabilities (including securities actively traded on a securities exchange)
2) Level 2-inputs other than unadjusted quoted prices that are observable for the asset or liability (such as unadjusted quoted prices for similar assets and market corroborated inputs such as interest rates, prepayment speeds, credit risks, etc.)
3) Level 3-significant unobservable inputs (including the Manager’s own judgments about assumptions that market participants would use in pricing the asset or liability).
The inputs used for valuing securities are not necessarily an indication of the risks associated with investing in those securities.
The Fund classifies each of its investments in investment companies which are publicly offered as Level 1. Investment companies that are not publicly offered, if any, are classified as Level 2 in the fair value hierarchy.
The table below categorizes amounts that are included in the Fund’s Consolidated Statement of Assets and Liabilities at period end based on valuation input level:
| | | | | | | | | | | | | | | | |
| | | Level 1—
Unadjusted Quoted Prices | | | Level 2— Other Significant
Observable Inputs | | | Level 3—
Significant
Unobservable
Inputs | | | Value | |
| |
| Assets Table | | | | | | | | | | | | | | | | |
| Investments, at Value: | | | | | | | | | | | | | | | | |
| Common Stocks | | | | | | | | | | | | | | | | |
Consumer Discretionary | | $ | 34,589,542 | | | $ | — | | | $ | — | | | $ | 34,589,542 | |
Consumer Staples | | | 59,201,239 | | | | — | | | | — | | | | 59,201,239 | |
Energy | | | 79,636,708 | | | | — | | | | — | | | | 79,636,708 | |
Financials | | | 146,842,273 | | | | — | | | | — | | | | 146,842,273 | |
Health Care | | | 161,721,950 | | | | 11,914,632 | | | | — | | | | 173,636,582 | |
Industrials | | | 125,108,899 | | | | — | | | | — | | | | 125,108,899 | |
Information Technology | | | 127,334,775 | | | | — | | | | — | | | | 127,334,775 | |
Materials | | | 44,090,680 | | | | — | | | | — | | | | 44,090,680 | |
Telecommunication Services | | | 38,262,015 | | | | 8,267,491 | | | | — | | | | 46,529,506 | |
Utilities | | | 41,541,577 | | | | — | | | | — | | | | 41,541,577 | |
| Preferred Stocks | | | 30,806,270 | | | | 6,396,330 | | | | — | | | | 37,202,600 | |
77 OPPENHEIMER CAPITAL INCOME FUND
NOTES TO CONSOLIDATED
FINANCIAL STATEMENTS Continued
3. Securities Valuation (Continued)
| | | | | | | | | | | | | | | | |
| | | Level 1— Unadjusted Quoted Prices | | | Level 2— Other Significant Observable Inputs | | | Level 3—
Significant Unobservable
Inputs | | | Value | |
| Investments, at Value: (Continued) | | | | | | | | | | | | | | | | |
| Asset-Backed Securities | | $ | — | | | $ | 226,778,374 | | | $ | — | | | $ | 226,778,374 | |
| Mortgage-Backed Obligations | | | — | | | | 446,649,233 | | | | — | | | | 446,649,233 | |
| U.S. Government Obligation | | | — | | | | 4,500,626 | | | | — | | | | 4,500,626 | |
| Non-Convertible Corporate Bonds and Notes | | | — | | | | 561,341,378 | | | | — | | | | 561,341,378 | |
| Corporate Loans | | | — | | | | 84,998,286 | | | | — | | | | 84,998,286 | |
| Event-Linked Bonds | | | — | | | | 28,557,711 | | | | — | | | | 28,557,711 | |
| Structured Securities | | | — | | | | 9,708,255 | | | | — | | | | 9,708,255 | |
| Exchange-Traded Option Purchased | | | 3,092,960 | | | | — | | | | — | | | | 3,092,960 | |
| Over-the-Counter Option Purchased | | | — | | | | 1,033,175 | | | | — | | | | 1,033,175 | |
| Over-the-Counter Interest Rate | | | | | | | | | | | | | | | | |
| Swaptions Purchased | | | — | | | | 4,403,212 | | | | — | | | | 4,403,212 | |
| Investment Companies | | | 213,091,564 | | | | 269,972,549 | | | | — | | | | 483,064,113 | |
| | | | |
| Total Investments, at Value | | | 1,105,320,452 | | | | 1,664,521,252 | | | | — | | | | 2,769,841,704 | |
| Other Financial Instruments: | | | | | | | | | | | | | | | | |
| Swaps, at value | | | — | | | | 5,266 | | | | — | | | | 5,266 | |
| Centrally cleared swaps, at value | | | — | | | | 712,329 | | | | — | | | | 712,329 | |
| Futures contracts | | | 1,818,955 | | | | — | | | | — | | | | 1,818,955 | |
| Forward currency exchange contracts | | | — | | | | 362,050 | | | | — | | | | 362,050 | |
| | | | |
| Total Assets | | $ | 1,107,139,407 | | | $ | 1,665,600,897 | | | $ | — | | | $ | 2,772,740,304 | |
| | | | |
| Liabilities Table | | | | | | | | | | | | | | | | |
| Other Financial Instruments: | | | | | | | | | | | | | | | | |
| Swaps, at value | | $ | — | | | $ | (345,866 | ) | | $ | — | | | $ | (345,866 | ) |
| Centrally cleared swaps, at value | | | — | | | | (4,063,876 | ) | | | — | | | | (4,063,876 | ) |
| Futures contracts | | | (622,384 | ) | | | — | | | | — | | | | (622,384 | ) |
| Forward currency exchange contracts | | | — | | | | (272,277 | ) | | | — | | | | (272,277 | ) |
| | | | |
| Total Liabilities | | $ | (622,384 | ) | | $ | (4,682,019 | ) | | $ | — | | | $ | (5,304,403 | ) |
| | | | |
Forward currency exchange contracts and futures contracts, if any, are reported at their unrealized appreciation/depreciation at measurement date, which represents the change in the contract’s value from trade date. All additional assets and liabilities included in the above table are reported at their market value at measurement date.
For the reporting period, there were no transfers between levels.
4. Investments and Risks
Investments in Affiliated Funds. The Fund is permitted to invest in other mutual funds advised by the Manager (“Affiliated Funds”). Affiliated Funds are open-end management investment companies registered under the 1940 Act, as amended. The Manager is the investment adviser of, and the Sub-Adviser provides investment and related advisory services to, the Affiliated Funds. When applicable, the Fund’s investments in Affiliated Funds are included in the Consolidated Statement of Investments. Shares of Affiliated Funds are valued
78 OPPENHEIMER CAPITAL INCOME FUND
4. Investments and Risks (Continued)
at their net asset value per share. As a shareholder, the Fund is subject to its proportional share of the Affiliated Funds’ expenses, including their management fee. The Manager will waive fees and/or reimburse Fund expenses in an amount equal to the indirect management fees incurred through the Fund’s investment in the Affiliated Funds.
Each of the Affiliated Funds in which the Fund invests has its own investment risks, and those risks can affect the value of the Fund’s investments and therefore the value of the Fund’s shares. To the extent that the Fund invests more of its assets in one Affiliated Fund than in another, the Fund will have greater exposure to the risks of that Affiliated Fund.
Investments in Money Market Instruments. The Fund is permitted to invest its free cash balances in money market instruments to provide liquidity or for defensive purposes. The Fund may invest in money market instruments by investing in Class E shares of Oppenheimer Institutional Government Money Market Fund (“IGMMF”), which is an Affiliated Fund. IGMMF is regulated as a money market fund under the 1940 Act, as amended. The Fund may also invest in money market instruments directly or in other affiliated or unaffiliated money market funds.
Investment in Oppenheimer Master Fund. The Fund is permitted to invest in entities sponsored and/or advised by the Manager or an affiliate. Certain of these entities in which the Fund invests are mutual funds registered under the 1940 Act, as amended, that expect to be treated as partnerships for tax purposes, specifically Oppenheimer Master Loan Fund,
LLC (the “Master Fund”). The Master Fund has its own investment risks, and those risks can affect the value of the Fund’s investments and therefore the value of the Fund’s shares. To the extent that the Fund invests more of its assets in the Master Fund, the Fund will have greater exposure to the risks of the Master Fund.
The investment objective of the Master Fund is to seek income. The Fund’s investment in the Master Fund is included in the Consolidated Statement of Investments. The Fund recognizes income and gain/(loss) on its investment in the Master Fund according to its allocated pro-rata share, based on its relative proportion of total outstanding Master Fund shares held, of the total net income earned and the net gain/(loss) realized on investments sold by the Master Fund. As a shareholder, the Fund is subject to its proportional share of the Master Fund’s expenses, including its management fee. The Manager will waive fees and/ or reimburse Fund expenses in an amount equal to the indirect management fees incurred through the Fund’s investment in the Master Fund. The Fund owns 20.1% of the Master Fund at period end.
Structured Securities. The Fund invests in structured securities whose market values, interest rates and/or redemption prices are linked to the performance of underlying foreign currencies, interest rate spreads, stock market indices, prices of individual securities, commodities or other financial instruments or the occurrence of other specific events. The structured securities are often leveraged, increasing the volatility of each note’s market value relative to the change in the underlying linked financial element or event. Fluctuations in
79 OPPENHEIMER CAPITAL INCOME FUND
NOTES TO CONSOLIDATED
FINANCIAL STATEMENTS Continued
4. Investments and Risks (Continued)
value of these securities are recorded as unrealized gains and losses in the accompanying Consolidated Statement of Operations. The Fund records a realized gain or loss when a structured security is sold or matures.
Event-Linked Bonds. The Fund may invest in “event-linked” bonds. Event-linked bonds, which are sometimes referred to as “catastrophe” bonds, are fixed income securities for which the return of principal and payment of interest is contingent on the non-occurrence of a specific trigger event, such as a hurricane, earthquake, or other occurrence that leads to physical or economic loss. If the trigger event occurs prior to maturity, the Fund may lose all or a portion of its principal in addition to interest otherwise due from the security. Event-linked bonds may expose the Fund to certain other risks, including issuer default, adverse regulatory or jurisdictional interpretations, liquidity risk and adverse tax consequences. The Fund records the net change in market value of event-linked bonds on the Consolidated Statement of Operations as a change in unrealized appreciation or depreciation on investments. The Fund records a realized gain or loss on the Consolidated Statement of Operations upon the sale or maturity of such securities.
Loans. The Fund invests in loans made to U.S. and foreign borrowers that are corporations, partnerships or other business entities. The Fund will do so directly as an original lender or by assignment or indirectly through participation agreements or certain derivative instruments. While many of these loans will be collateralized, the Fund can also invest in uncollateralized loans. Loans are often issued in connection with recapitalizations, acquisitions, leveraged buyouts, and refinancing of borrowers. The loans often pay interest at rates that float above (or are adjusted periodically based on) a benchmark that reflects current interest rates although the Fund can also invest in loans with fixed interest rates.
When investing in loans, the Fund generally will have a contractual relationship only with the lender, not with the relevant borrower. As a result, the Fund generally will have the right to receive payments of principal, interest, and any fees to which it is entitled only from the lender selling the participation and only upon receipt by the lender of the payments from the relevant borrower. The Fund may not directly benefit from the collateral supporting the debt obligation in which it has purchased the participation. As a result, the Fund will assume the credit risk of both the borrower and the institution selling the participation to the Fund.
Securities on a When-Issued or Delayed Delivery Basis. The Fund may purchase securities on a “when-issued” basis, and may purchase or sell securities on a “delayed delivery” basis. “When-issued” or “delayed delivery” refers to securities whose terms and indenture are available and for which a market exists, but which are not available for immediate delivery. Delivery and payment for securities that have been purchased by the Fund on a when-issued basis normally takes place within six months and possibly as long as two years or more after the trade date. During this period, such securities do not earn interest, are subject to market fluctuation and may increase or decrease in value prior to their delivery. The purchase of securities on a when-issued basis may increase the volatility of the Fund’s net
80 OPPENHEIMER CAPITAL INCOME FUND
4. Investments and Risks (Continued)
asset value to the extent the Fund executes such transactions while remaining substantially fully invested. When the Fund engages in when-issued or delayed delivery transactions, it relies on the buyer or seller, as the case may be, to complete the transaction. Their failure to do so may cause the Fund to lose the opportunity to obtain or dispose of the security at a price and yield it considers advantageous. The Fund may also sell securities that it purchased on a when-issued basis or forward commitment prior to settlement of the original purchase.
At period end, the Fund had purchased securities issued on a when-issued or delayed delivery basis and sold securities issued on a delayed delivery basis as follows:
| | | | |
When-Issued or Delayed Delivery Basis Transactions | |
| Purchased securities | | | $325,382,416 | |
| Sold securities | | | 78,078,340 | |
The Fund may enter into “forward roll” transactions with respect to mortgage-related securities. In this type of transaction, the Fund sells a mortgage-related security to a buyer and simultaneously agrees to repurchase a similar security (same type, coupon and maturity) at a later date at a set price. During the period between the sale and the repurchase, the Fund will not be entitled to receive interest and principal payments on the securities that have been sold. The Fund records the incremental difference between the forward purchase and sale of each forward roll as realized gain (loss) on investments or as fee income in the case of such transactions that have an associated fee in lieu of a difference in the forward purchase and sale price.
Forward roll transactions may be deemed to entail embedded leverage since the Fund purchases mortgage-related securities with extended settlement dates rather than paying for the securities under a normal settlement cycle. This embedded leverage increases the Fund’s market value of investments relative to its net assets which can incrementally increase the volatility of the Fund’s performance. Forward roll transactions can be replicated over multiple settlement periods.
Risks of entering into forward roll transactions include the potential inability of the counterparty to meet the terms of the agreement; the potential of the Fund to receive inferior securities at redelivery as compared to the securities sold to the counterparty; and counterparty credit risk.
At period end, the counterparty pledged $722,607 of collateral to the Fund for forward roll transactions.
Restricted Securities. At period end, investments in securities included issues that are restricted. A restricted security may have a contractual restriction on its resale and is valued under methods approved by the Board of Trustees as reflecting fair value. Securities that are restricted are marked with an applicable footnote on the Consolidated Statement of Investments. Restricted securities are reported on a schedule following the Consolidated
81 OPPENHEIMER CAPITAL INCOME FUND
NOTES TO CONSOLIDATED
FINANCIAL STATEMENTS Continued
4. Investments and Risks (Continued)
Statement of Investments.
Equity Security Risk. Stocks and other equity securities fluctuate in price. The value of the Fund’s portfolio may be affected by changes in the equity markets generally. Equity markets may experience significant short-term volatility and may fall sharply at times. Different markets may behave differently from each other and U.S. equity markets may move in the opposite direction from one or more foreign stock markets. Adverse events in any part of the equity or fixed-income markets may have unexpected negative effects on other market segments.
The prices of individual equity securities generally do not all move in the same direction at the same time and a variety of factors can affect the price of a particular company’s securities. These factors may include, but are not limited to, poor earnings reports, a loss of customers, litigation against the company, general unfavorable performance of the company’s sector or industry, or changes in government regulations affecting the company or its industry.
5. Market Risk Factors
The Fund’s investments in securities and/or financial derivatives may expose the Fund to various market risk factors:
Commodity Risk. Commodity risk relates to the change in value of commodities or commodity indexes as they relate to increases or decreases in the commodities market. Commodities are physical assets that have tangible properties. Examples of these types of assets are crude oil, heating oil, metals, livestock, and agricultural products.
Credit Risk. Credit risk relates to the ability of the issuer of debt to meet interest and principal payments, or both, as they come due. In general, lower-grade, higher-yield debt securities are subject to credit risk to a greater extent than lower-yield, higher-quality securities.
Equity Risk. Equity risk relates to the change in value of equity securities as they relate to increases or decreases in the general market.
Foreign Exchange Rate Risk. Foreign exchange rate risk relates to the change in the U.S. dollar value of a security held that is denominated in a foreign currency. The U.S. dollar value of a foreign currency denominated security will decrease as the dollar appreciates against the currency, while the U.S. dollar value will increase as the dollar depreciates against the currency.
Interest Rate Risk. Interest rate risk refers to the fluctuations in value of fixed-income securities resulting from the inverse relationship between price and yield. For example, an increase in general interest rates will tend to reduce the market value of already issued fixed-income investments, and a decline in general interest rates will tend to increase their value. In addition, debt securities with longer maturities, which tend to have higher yields, are subject to potentially greater fluctuations in value from changes in interest rates than obligations with shorter maturities.
Volatility Risk. Volatility risk refers to the magnitude of the movement, but not the direction of the movement, in a financial instrument’s price over a defined time period.
82 OPPENHEIMER CAPITAL INCOME FUND
5. Market Risk Factors (Continued)
Large increases or decreases in a financial instrument’s price over a relative time period typically indicate greater volatility risk, while small increases or decreases in its price typically indicate lower volatility risk.
6. Use of Derivatives
The Fund’s investment objective not only permits the Fund to purchase investment securities, it also allows the Fund to enter into various types of derivatives contracts, including, but not limited to, futures contracts, forward currency exchange contracts, credit default swaps, interest rate swaps, total return swaps, variance swaps and purchased and written options. In doing so, the Fund will employ strategies in differing combinations to permit it to increase, decrease, or change the level or types of exposure to market risk factors. These instruments may allow the Fund to pursue its objectives more quickly and efficiently than if it were to make direct purchases or sales of securities capable of effecting a similar response to market factors. Such contracts may be entered into through a bilateral over-the-counter (“OTC”) transaction, or through a securities or futures exchange and cleared through a clearinghouse.
Derivatives may have little or no initial cash investment relative to their market value exposure and therefore can produce significant gains or losses in excess of their cost due to changes in the market risk factors and the overall market. This use of embedded leverage allows the Fund to increase its market value exposure relative to its net assets and can substantially increase the volatility of the Fund’s performance. In instances where the Fund is using derivatives to decrease, or hedge, exposures to market risk factors for securities held by the Fund, there are also risks that those derivatives may not perform as expected resulting in losses for the combined or hedged positions. Some derivatives have the potential for unlimited loss, regardless of the size of the Fund’s initial investment.
Additional associated risks from investing in derivatives also exist and potentially could have significant effects on the valuation of the derivative and the Fund. Typically, the associated risks are not the risks that the Fund is attempting to increase or decrease exposure to, per its investment objectives, but are the additional risks from investing in derivatives. Examples of these associated risks are liquidity risk, which is the risk that the Fund will not be able to sell the derivative in the open market in a timely manner, and counterparty credit risk, which is the risk that the counterparty will not fulfill its obligation to the Fund.
The Fund’s actual exposures to these market risk factors and associated risks during the period are discussed in further detail, by derivative type, below.
Forward Currency Exchange Contracts
The Fund may enter into forward currency exchange contracts (“forward contracts”) for the purchase or sale of a foreign currency at a negotiated rate at a future date. Such contracts are traded in the OTC inter-bank currency dealer market.
Forward contracts are reported on a schedule following the Consolidated Statement of Investments. The unrealized appreciation (depreciation) is reported in the Consolidated Statement of Assets and Liabilities as a receivable (or payable) and in the Consolidated
83 OPPENHEIMER CAPITAL INCOME FUND
NOTES TO CONSOLIDATED
FINANCIAL STATEMENTS Continued
6. Use of Derivatives (Continued)
Statement of Operations within the change in unrealized appreciation (depreciation). At contract close, the difference between the original cost of the contract and the value at the close date is recorded as a realized gain (loss) in the Consolidated Statement of Operations.
The Fund may enter into forward foreign currency exchange contracts in order to decrease exposure to foreign exchange rate risk associated with either specific transactions or portfolio instruments or to increase exposure to foreign exchange rate risk.
During the reporting period, the Fund had daily average contract amounts on forward contracts to buy and sell of $12,633,933 and $98,560,662, respectively.
Additional associated risk to the Fund includes counterparty credit risk. Counterparty credit risk arises from the possibility that the counterparty to a forward contract will default and fail to perform its obligations to the Fund.
Futures Contracts
A futures contract is a commitment to buy or sell a specific amount of a commodity, financial instrument or currency at a negotiated price on a stipulated future date. The Fund may buy and sell futures contracts and may also buy or write put or call options on these futures contracts. Futures contracts and options thereon are generally entered into on a regulated futures exchange and cleared through a clearinghouse associated with the exchange.
Upon entering into a futures contract, the Fund is required to deposit either cash or securities (initial margin) in an amount equal to a certain percentage of the contract value in an account registered in the futures commission merchant’s name. Subsequent payments (variation margin) are paid to or from the futures commission merchant each day equal to the daily changes in the contract value. Such payments are recorded as unrealized gains and losses. Should the Fund fail to make requested variation margin payments, the futures commission merchant can gain access to the initial margin to satisfy the Fund’s payment obligations.
Futures contracts are reported on a schedule following the Consolidated Statement of Investments. Securities held by a futures commission merchant to cover initial margin requirements on open futures contracts are noted in the Consolidated Statement of Investments. Cash held by a futures commission merchant to cover initial margin requirements on open futures contracts and the receivable and/or payable for the daily mark to market for the variation margin are noted in the Consolidated Statement of Assets and Liabilities. The net change in unrealized appreciation and depreciation is reported in the Consolidated Statement of Operations. Realized gains (losses) are reported in the Consolidated Statement of Operations at the closing or expiration of futures contracts.
The Fund may purchase and/or sell financial futures contracts and options on futures contracts to gain exposure to, or decrease exposure to interest rate risk, equity risk, foreign exchange rate risk, volatility risk, or commodity risk.
During the reporting period, the Fund had an ending monthly average market value of $161,675,038 and $381,364,762 on futures contracts purchased and sold, respectively.
Additional associated risks of entering into futures contracts (and related options) include the possibility that there may be an illiquid market where the Fund is unable to liquidate the
84 OPPENHEIMER CAPITAL INCOME FUND
6. Use of Derivatives (Continued)
contract or enter into an offsetting position and, if used for hedging purposes, the risk that the price of the contract will correlate imperfectly with the prices of the Fund’s securities.
Option Activity
The Fund may buy and sell put and call options, or write put and call options. When an option is written, the Fund receives a premium and becomes obligated to sell or purchase the underlying security, currency or other underlying financial instrument at a fixed price, upon exercise of the option.
Options can be traded through an exchange or through a privately negotiated arrangement with a dealer in an OTC transaction. Options traded through an exchange are generally cleared through a clearinghouse (such as The Options Clearing Corporation). The difference between the premium received or paid, and market value of the option, is recorded as unrealized appreciation or depreciation. The net change in unrealized appreciation or depreciation is reported in the Consolidated Statement of Operations. When an option is exercised, the cost of the security purchased or the proceeds of the security sale are adjusted by the amount of premium received or paid. Upon the expiration or closing of the option transaction, a gain or loss is reported in the Consolidated Statement of Operations.
Foreign Currency Options. The Fund may purchase or write call and put options on currencies to increase or decrease exposure to foreign exchange rate risk. A purchased call, or written put option becomes more valuable as the price of the underlying financial instrument appreciates relative to the strike price. A purchased put, or written call option becomes more valuable as the price of the underlying financial instrument depreciates relative to the strike price.
Index/Security Options. The Fund may purchase or write call and put options on individual equity securities and/or equity indexes to increase or decrease exposure to equity risk. A purchased call or written put option becomes more valuable as the price of the underlying financial instrument appreciates relative to the strike price. A purchased put or written call option becomes more valuable as the price of the underlying financial instrument depreciates relative to the strike price.
During the reporting period, the Fund had an ending monthly average market value of $2,158,630 and $637,690 on purchased call options and purchased put options, respectively.
Options written, if any, are reported in a schedule following the Consolidated Statement of Investments and as a liability in the Consolidated Statement of Assets and Liabilities. Securities held in collateral accounts to cover potential obligations with respect to outstanding written options are noted in the Consolidated Statement of Investments.
The risk in writing a call option is the market price of the underlying security increasing above the strike price and the option being exercised. The Fund must then purchase the underlying security at the higher market price and deliver it for the strike price or, if it owns the underlying security, deliver it at the strike price and forego any benefit from the increase in the price of the underlying security above the strike price. The risk in writing a put option is the market price of the underlying security decreasing below the strike price and the option being exercised. The Fund must then purchase the underlying security at the strike price when the
85 OPPENHEIMER CAPITAL INCOME FUND
NOTES TO CONSOLIDATED
FINANCIAL STATEMENTS Continued
6. Use of Derivatives (Continued)
market price of the underlying security is below the strike price. Alternatively, the Fund could also close out a written option position, in which case the risk is that the closing transaction will require a premium to be paid by the Fund that is greater than the premium the Fund received. When writing options, the Fund has the additional risk that there may be an illiquid market where the Fund is unable to close the contact. The risk in buying an option is that the Fund pays a premium for the option, and the option may be worth less than the premium paid or expire worthless.
Additional associated risks to the Fund include counterparty credit risk and liquidity risk. At period end, the Fund had no written options outstanding.
Swap Contracts
The Fund may enter into swap contract agreements with a counterparty to exchange a series of cash flows based on either specified reference rates, the price or volatility of asset or non-asset references, or the occurrence of a credit event, over a specified period. Swaps can be executed in a bi-lateral privately negotiated arrangement with a dealer in an OTC transaction (“OTC swaps”) or executed on a regulated market. Certain swaps, regardless of the venue of their execution, are required to be cleared through a clearinghouse (“centrally cleared swaps”). Swap contracts may include interest rate, equity, debt, index, total return, credit default, currency, and volatility swaps.
Swap contracts are reported on a schedule following the Consolidated Statement of Investments. The values of centrally cleared swap and OTC swap contracts are aggregated by positive and negative values and disclosed separately on the Consolidated Statement of Assets and Liabilities. The unrealized appreciation (depreciation) related to the change in the valuation of the notional amount of the swap is combined with the accrued interest due to (owed by) the Fund, if any, at termination or settlement. The net change in this amount during the period is included on the Consolidated Statement of Operations. The Fund also records any periodic payments received from (paid to) the counterparty, including at termination, under such contracts as realized gain (loss) on the Consolidated Statement of Operations.
Swap contract agreements are exposed to the market risk factor of the specific underlying reference rate or asset. Swap contracts are typically more attractively priced compared to similar investments in related cash securities because they isolate the risk to one market risk factor and eliminate the other market risk factors. Investments in cash securities (for instance bonds) have exposure to multiple risk factors (credit and interest rate risk). Because swaps have embedded leverage, they can expose the Fund to substantial risk in the isolated market risk factor.
Credit Default Swap Contracts. A credit default swap is a contract that enables an investor to buy or sell protection against a defined-issuer credit event, such as the issuer’s failure to make timely payments of interest or principal on a debt security, bankruptcy or restructuring. The Fund may enter into credit default swaps either by buying or selling protection on a corporate issuer, sovereign issuer, or a basket or index of issuers (the “reference asset”).
The buyer of protection pays a periodic fee to the seller of protection based on the
86 OPPENHEIMER CAPITAL INCOME FUND
6. Use of Derivatives (Continued)
notional amount of the swap contract. The seller of protection agrees to compensate the buyer of protection for future potential losses as a result of a credit event on the reference asset. The contract effectively transfers the credit event risk of the reference asset from the buyer of protection to the seller of protection.
The ongoing value of the contract will fluctuate throughout the term of the contract based primarily on the credit risk of the reference asset. If the credit quality of the reference asset improves relative to the credit quality at contract initiation, the buyer of protection may have an unrealized loss greater than the anticipated periodic fee owed. This unrealized loss would be the result of current credit protection being cheaper than the cost of credit protection at contract initiation. If the buyer elects to terminate the contract prior to its maturity, and there has been no credit event, this unrealized loss will become realized. If the contract is held to maturity, and there has been no credit event, the realized loss will be equal to the periodic fee paid over the life of the contract.
If there is a credit event, the buyer of protection can exercise its rights under the contract and receive a payment from the seller of protection equal to the notional amount of the swap less the market value of specified debt securities issued by the reference asset. Upon exercise of the contract the difference between such value and the notional amount is recorded as realized gain (loss) and is included on the Consolidated Statement of Operations.
The Fund may purchase or sell credit protection through credit default swaps to increase or decrease exposure to the credit risk of individual issuers and/or indexes of issuers that are either unavailable or considered to be less attractive in the bond market.
For the reporting period, the Fund had ending monthly average notional amounts of $150,216,901 and $45,722,065 on credit default swaps to buy protection and credit default swaps to sell protection, respectively.
Additional associated risks to the Fund include counterparty credit risk and liquidity risk.
Swaption Transactions
The Fund may enter into a swaption contract which grants the purchaser the right, but not the obligation, to enter into a swap transaction at preset terms detailed in the underlying agreement within a specified period of time. The purchaser pays a premium to the swaption writer who bears the risk of unfavorable changes in the preset terms on the underlying swap.
Purchased swaptions are reported as a component of investments in the Consolidated Statement of Investments and the Consolidated Statement of Assets and Liabilities. Written swaptions are reported on a schedule following the Consolidated Statement of Investments and their value is reported as a separate asset or liability line item in the Consolidated Statement of Assets and Liabilities. The net change in unrealized appreciation or depreciation on written swaptions is separately reported in the Consolidated Statement of Operations. When a swaption is exercised, the cost of the swap is adjusted by the amount of premium paid or received. Upon the expiration or closing of an unexercised swaption contract, a gain or loss is reported in the Consolidated Statement of Operations for the amount of the premium paid or received.
87 OPPENHEIMER CAPITAL INCOME FUND
NOTES TO CONSOLIDATED
FINANCIAL STATEMENTS Continued
6. Use of Derivatives (Continued)
The Fund generally will incur a greater risk when it writes a swaption than when it purchases a swaption. When the Fund writes a swaption it will become obligated, upon exercise of the swaption, according to the terms of the underlying agreement. Swaption contracts written by the Fund do not give rise to counterparty credit risk prior to exercise as they obligate the Fund, not its counterparty, to perform. When the Fund purchases a swaption it only risks losing the amount of the premium it paid if the swaption expires unexercised. However, when the Fund exercises a purchased swaption there is a risk that the counterparty will fail to perform or otherwise default on its obligations under the swaption contract.
The Fund may purchase swaptions which give it the option to enter into an interest rate swap in which it pays a floating or fixed interest rate and receives a fixed or floating interest rate in order to increase or decrease exposure to interest rate risk. Purchasing the fixed portion of this swaption becomes more valuable as the reference interest rate decreases relative to the preset interest rate. Purchasing the floating portion of this swaption becomes more valuable as the reference interest rate increases relative to the preset interest rate.
The Fund may purchase swaptions which give it the option to buy or sell credit protection through credit default swaps in order to decrease or increase exposure to the credit risk of individual issuers and/ or indexes of issuers. A swaption selling protection becomes more valuable as the likelihood of a credit event on the reference asset decreases. A swaption buying protection becomes more valuable as the likelihood of a credit event on the reference asset increases.
The Fund may write swaptions which give it the obligation, if exercised by the purchaser, to sell or buy credit protection through credit default swaps in order to increase or decrease exposure to the credit risk of individual issuers and/or indexes of issuers. A written swaption selling protection becomes more valuable as the likelihood of a credit event on the reference asset decreases. A written swaption buying protection becomes more valuable as the likelihood of a credit event on the reference asset increases.
During the reporting period, the Fund had an ending monthly average market value of $3,266,861 and $3,679 on purchased and written swaptions, respectively.
At period end, the Fund had no written swaption contracts outstanding.
Counterparty Credit Risk. Derivative positions are subject to the risk that the counterparty will not fulfill its obligation to the Fund. The Fund intends to enter into derivative transactions with counterparties that the Manager believes to be creditworthy at the time of the transaction.
The Fund’s risk of loss from counterparty credit risk on OTC derivatives is generally limited to the aggregate unrealized gain netted against any collateral held by the Fund. For OTC options purchased, the Fund bears the risk of loss of the amount of the premiums paid plus the positive change in market values net of any collateral held by the Fund should the counterparty fail to perform under the contracts. Options written by the Fund do not typically give rise to counterparty credit risk, as options written generally obligate the Fund and not the counterparty to perform.
To reduce counterparty risk with respect to OTC transactions, the Fund has entered
88 OPPENHEIMER CAPITAL INCOME FUND
6. Use of Derivatives (Continued)
into master netting arrangements, established within the Fund’s International Swap and Derivatives Association, Inc. (“ISDA”) master agreements, which allow the Fund to make (or to have an entitlement to receive) a single net payment in the event of default (close-out netting) for outstanding payables and receivables with respect to certain OTC positions in swaps, options, swaptions, and forward currency exchange contracts for each individual counterparty. In addition, the Fund may require that certain counterparties post cash and/or securities in collateral accounts to cover their net payment obligations for those derivative contracts subject to ISDA master agreements. If the counterparty fails to perform under these contracts and agreements, the cash and/or securities will be made available to the Fund.
At period end, the Fund has required certain counterparties to post collateral of $5,245,909.
ISDA master agreements include credit related contingent features which allow counterparties to OTC derivatives to terminate derivative contracts prior to maturity in the event that, for example, the Fund’s net assets decline by a stated percentage or the Fund fails to meet the terms of its ISDA master agreements, which would cause the Fund to accelerate payment of any net liability owed to the counterparty.
For financial reporting purposes, the Fund does not offset derivative assets and derivative liabilities that are subject to netting arrangements in the Consolidated Statement of Assets and Liabilities. Bankruptcy or insolvency laws of a particular jurisdiction may impose restrictions on or prohibitions against the right of offset in bankruptcy, insolvency or other events.
The Fund’s risk of loss from counterparty credit risk on exchange-traded derivatives cleared through a clearinghouse and for centrally cleared swaps is generally considered lower than as compared to OTC derivatives. However, counterparty credit risk exists with respect to initial and variation margin deposited/paid by the Fund that is held in futures commission merchant, broker and/or clearinghouse accounts for such exchange-traded derivatives and for centrally cleared swaps.
With respect to centrally cleared swaps, such transactions will be submitted for clearing, and if cleared, will be held in accounts at futures commission merchants or brokers that are members of clearinghouses. While brokers, futures commission merchants and clearinghouses are required to segregate customer margin from their own assets, in the event that a broker, futures commission merchant or clearinghouse becomes insolvent or goes into bankruptcy and at that time there is a shortfall in the aggregate amount of margin held by the broker, futures commission merchant or clearinghouse for all its customers, U.S. bankruptcy laws will typically allocate that shortfall on a pro-rata basis across all the broker’s, futures commission merchant’s or clearinghouse’s customers, potentially resulting in losses to the Fund.
There is the risk that a broker, futures commission merchant or clearinghouse will decline to clear a transaction on the Fund’s behalf, and the Fund may be required to pay a termination fee to the executing broker with whom the Fund initially enters into the transaction. Clearinghouses may also be permitted to terminate centrally cleared swaps at any time. The Fund is also subject to the risk that the broker or futures commission merchant will improperly use the Fund’s assets deposited/paid as initial or variation margin to satisfy payment
89 OPPENHEIMER CAPITAL INCOME FUND
NOTES TO CONSOLIDATED
FINANCIAL STATEMENTS Continued
6. Use of Derivatives (Continued)
obligations of another customer. In the event of a default by another customer of the broker or futures commission merchant, the Fund might not receive its variation margin payments from the clearinghouse, due to the manner in which variation margin payments are aggregated for all customers of the broker/futures commission merchant.
Collateral and margin requirements differ by type of derivative. Margin requirements are established by the broker, futures commission merchant or clearinghouse for exchange-traded and cleared derivatives, including centrally cleared swaps. Brokers, futures commission merchants and clearinghouses can ask for margin in excess of the regulatory minimum, or increase the margin amount, in certain circumstances.
Collateral terms are contract specific for OTC derivatives. For derivatives traded under an ISDA master agreement, the collateral requirements are typically calculated by netting the mark to market amount for each transaction under such agreement and comparing that amount to the value of any collateral currently pledged by the Fund or the counterparty.
For financial reporting purposes, cash collateral that has been pledged to cover obligations of the Fund, if any, is reported separately on the Consolidated Statement of Assets and Liabilities as cash pledged as collateral. Non-cash collateral pledged by the Fund, if any, is noted in the Consolidated Statement of Investments. Generally, the amount of collateral due from or to a party must exceed a minimum transfer amount threshold (e.g., $250,000) before a transfer has to be made. To the extent amounts due to the Fund from its counterparties are not fully collateralized, contractually or otherwise, the Fund bears the risk of loss from counterparty nonperformance.
The following table presents by counterparty the Fund’s OTC derivative assets net of the related collateral pledged by the Fund at period end:
| | | | | | | | | | | | | | | | | | | | |
| | | | | | Gross Amounts Not Offset in the Consolidated
Statement of Assets & Liabilities | | | | |
| Counterparty | | Gross Amounts
Not Offset in the
Consolidated
Statement of Assets &
Liabilities* | | | Financial
Instruments
Available for
Offset | | | Financial
Instruments
Collateral
Received** | | | Cash Collateral
Received** | | | Net Amount | |
| Bank of America NA | | $ | 8,449 | | | $ | – | | | $ | – | | | $ | – | | | $ | 8,449 | |
| Barclays Bank plc | | | 1,722,586 | | | | – | | | | (1,722,586) | | | | – | | | | – | |
| Citibank NA | | | 346,364 | | | | – | | | | – | | | | (100,000) | | | | 246,364 | |
| Goldman Sachs Bank USA | | | 1,033,175 | | | | – | | | | – | | | | (970,000) | | | | 63,175 | |
| Goldman Sachs International | | | 2,693,129 | | | | (345,866) | | | | – | | | | (2,244,000) | | | | 103,263 | |
| | | | |
| | $ | 5,803,703 | | | $ | (345,866) | | | $ | (1,722,586) | | | $ | (3,314,000) | | | $ | 421,251 | |
| | | | |
*OTC derivatives are reported gross on the Consolidated Statement of Assets and Liabilities. Exchange traded options and margin related to centrally cleared swaps and futures, if any, are excluded from these reported amounts.
**Reported collateral posted for the benefit of the Fund within this table is limited to the net outstanding amount due from an individual counterparty. The collateral posted for the benefit of the Fund may exceed these amounts.
90 OPPENHEIMER CAPITAL INCOME FUND
6. Use of Derivatives (Continued)
The following table presents by counterparty the Fund’s OTC derivative liabilities net of the related collateral pledged by the Fund at period end:
| | | | | | | | | | | | | | | | | | |
| | | | | | Gross Amounts Not Offset in the Consolidated
Statement of Assets & Liabilities | | | | |
| Counterparty | | Gross Amounts
Not Offset in the
Consolidated
Statement of Assets &
Liabilities* | | | Financial
Instruments
Available for
Offset | | Financial
Instruments
Collateral
Pledged** | | | Cash Collateral Pledged** | | | Net Amount | |
| Deutsche Bank AG | | $ | (272,277) | | | $ – | | $ | 262,288 | | | $ | – | | | $ | (9,989) | |
| Goldman Sachs International | | | (345,866) | | | 345,866 | | | – | | | | – | | | | – | |
| | | | |
| | $ | (618,143) | | | $ 345,866 | | $ | 262,288 | | | $ | – | | | $ | (9,989) | |
| | | | |
*OTC derivatives are reported gross on the Consolidated Statement of Assets and Liabilities. Exchange traded options and margin related to centrally cleared swaps and futures, if any, are excluded from these reported amounts.
**Reported collateral pledged within this table is limited to the net outstanding amount due from the Fund. The securities pledged as collateral by the Fund as reported on the Consolidated Statement of Investments may exceed these amounts.
The following table presents the valuations of derivative instruments by risk exposure as reported within the Consolidated Statement of Assets and Liabilities at period end:
| | | | | | | | | | | | |
| | | Asset Derivatives | | | Liability Derivatives | |
Derivatives Not Accounted for as Hedging Instruments | | Consolidated Statement of Assets and Liabilities Location | | Value | | Consolidated Statement of Assets and Liabilities Location | | Value |
| Credit contracts | | Swaps, at value | | $ | 5,266 | | | Swaps, at value | | $ | 345,866 | |
| Credit contracts | | Centrally cleared swaps, at value | | | 712,329 | | | Centrally cleared swaps, at value | | | 4,063,876 | |
| Equity contracts | | Variation margin receivable | | | 58,560 | * | | | | | | |
| Interest rate contracts Variation margin receivable | | | 144,114 | * | | Variation margin payable | | | 379,059 | * |
| Forward currency exchange contracts | | Unrealized appreciation on foreign currency exchange contracts | | | 362,050 | | | Unrealized depreciation on foreign currency exchange contracts | | | 272,277 | |
| Equity contracts | | Investments, at value | | | 3,092,960 | ** | | | | | | |
| Forward currency exchange contracts | | Investments, at value | | | 1,033,175 | ** | | | | | | |
| Interest rate contracts Investments, at value | | | 4,403,212 | ** | | | | | | |
| | | | | | | | | | | | |
| Total | | | | $ | 9,811,666 | | | | | $ | 5,061,078 | |
| | | | | | | | | | | | |
*Includes only the current day’s variation margin. Prior variation margin movements have been reflected in cash on the Consolidated Statement of Assets and Liabilities upon receipt or payment.
**Amounts relate to purchased option contracts and purchased swaption contracts, if any.
The effect of derivative instruments on the Consolidated Statement of Operations is as follows:
91 OPPENHEIMER CAPITAL INCOME FUND
NOTES TO CONSOLIDATED
FINANCIAL STATEMENTS Continued
6. Use of Derivatives (Continued)
| | | | | | | | | | | | | | | | |
| Amount of Realized Gain or (Loss) Recognized on Derivatives | |
| |
Derivatives Not Accounted for as Hedging Instruments | | Investment
transactions
in unaffiliated
companies* | | | Swaption
contracts
written | | | Option contracts written | | | Futures contracts | |
| |
| Credit contracts | | $ | (131,399) | | | $ | 62,321 | | | $ | — | | | $ | — | |
| Equity contracts | | | 15,218,308 | | | | — | | | | — | | | | 518,432 | |
| Forward currency exchange contracts | | | (2,872,153) | | | | — | | | | 864,032 | | | | — | |
| Interest rate contracts | | | (2,394,646) | | | | — | | | | — | | | | (125,967) | |
| | | | |
| Total | | $ | 9,820,110 | | | $ | 62,321 | | | $ | 864,032 | | | $ | 392,465 | |
| | | | |
| | | | | | | | | | | | |
| Amount of Realized Gain or (Loss) Recognized on Derivatives (Continued) | |
| |
Derivatives Not Accounted for as Hedging Instruments | | Forward
currency
exchange
contracts | | | Swap contracts | | | Total | |
| |
| Credit contracts | | $ | — | | | $ | (2,415,818) | | | $ | (2,484,896) | |
| Equity contracts | | | — | | | | — | | | | 15,736,740 | |
| Forward currency exchange contracts | | | (5,185,582) | | | | — | | | | (7,193,703) | |
| Interest rate contracts | | | — | | | | — | | | | (2,520,613) | |
| | | | |
| Total | | $ | (5,185,582) | | | $ | (2,415,818) | | | $ | 3,537,528 | |
| | | | |
*Includes purchased option contracts and purchased swaption contracts, if any.
| | | | | | | | | | | | |
| Amount of Change in Unrealized Gain or (Loss) Recognized on Derivatives | |
| |
Derivatives Not Accounted for as Hedging Instruments | | Investment
transactions
in unaffiliated
companies* | | | Option
contracts
written | | | Futures contracts | |
| |
| Credit contracts | | $ | — | | | $ | — | | | $ | — | |
| Equity contracts | | | 2,087,044 | | | | — | | | | 471,275 | |
| Forward currency exchange contracts | | | 2,238,430 | | | | (864,032) | | | | — | |
| Interest rate contracts | | | 3,043,689 | | | | — | | | | 764,560 | |
| | | | |
| Total | | $ | 7,369,163 | | | $ | (864,032) | | | $ | 1,235,835 | |
| | | | |
|
| Amount of Change in Unrealized Gain or (Loss) Recognized on Derivatives (Continued) | |
| |
Derivatives Not Accounted for as Hedging Instruments | | Forward
currency
exchange
contracts | | | Swap contracts | | | Total | |
| |
| Credit contracts | | $ | — | | | $ | 560,533 | | | $ | 560,533 | |
| Equity contracts | | | — | | | | — | | | | 2,558,319 | |
| Forward currency exchange contracts | | | 4,846,269 | | | | — | | | | 6,220,667 | |
| Interest rate contracts | | | — | | | | — | | | | 3,808,249 | |
| | | | |
| Total | | $ | 4,846,269 | | | $ | 560,533 | | | $ | 13,147,768 | |
| | | | |
92 OPPENHEIMER CAPITAL INCOME FUND
6. Use of Derivatives (Continued)
*Includes purchased option contracts and purchased swaption contracts, if any.
7. Shares of Beneficial Interest
The Fund has authorized an unlimited number of $0.001 par value shares of beneficial interest of each class. Transactions in shares of beneficial interest were as follows:
| | | | | | | | | | | | | | | | |
| | | Year Ended August 31, 2018 | | | Year Ended August 31, 2017 | |
| | | Shares | | | Amount | | | Shares | | | Amount |
| |
| Class A | | | | | | | | | | | | | | | | |
| Sold1 | | | 9,825,423 | | | $ | 100,102,620 | | | | 13,503,190 | | | $ | 134,303,665 | |
| Dividends and/or distributions reinvested | | | 3,823,865 | | | | 38,634,071 | | | | 4,254,741 | | | | 42,179,895 | |
| Redeemed | | | (27,456,141 | ) | | | (279,344,500 | ) | | | (36,742,628 | ) | | | (366,460,942) | |
| | | | |
| Net decrease | | | (13,806,853 | ) | | $ | (140,607,809 | ) | | | (18,984,697 | ) | | $ | (189,977,382) | |
| | | | |
| | | | |
| |
| Class B | | | | | | | | | | | | | | | | |
| Sold | | | 3,961 | | | $ | 39,659 | | | | 40,700 | | | $ | 395,847 | |
| Dividends and/or distributions reinvested | | | 3,874 | | | | 38,532 | | | | 16,200 | | | | 156,856 | |
| Redeemed1 | | | (502,920 | ) | | | (5,005,668 | ) | | | (820,551 | ) | | | (7,976,170) | |
| | | | |
| Net decrease | | | (495,085 | ) | | $ | (4,927,477 | ) | | | (763,651 | ) | | $ | (7,423,467) | |
| | | | |
| | | | |
| |
| Class C | | | | | | | | | | | | | | | | |
| Sold | | | 2,924,481 | | | $ | 28,829,257 | | | | 5,462,749 | | | $ | 52,579,149 | |
| Dividends and/or distributions reinvested | | | 658,734 | | | | 6,443,526 | | | | 741,809 | | | | 7,121,396 | |
| Redeemed | | | (9,408,696 | ) | | | (92,564,737 | ) | | | (12,080,759 | ) | | | (116,533,090) | |
| | | | |
| Net decrease | | | (5,825,481 | ) | | $ | (57,291,954 | ) | | | (5,876,201 | ) | | $ | (56,832,545) | |
| | | | |
| | | | |
| |
| Class I | | | | | | | | | | | | | | | | |
| Sold | | | 17,218,874 | | | $ | 175,446,718 | | | | 803,929 | | | $ | 8,050,947 | |
| Dividends and/or distributions reinvested | | | 311,216 | | | | 3,136,436 | | | | 50,101 | | | | 496,570 | |
| Redeemed | | | (6,771,239 | ) | | | (69,076,913 | ) | | | (403,679 | ) | | | (4,025,548) | |
| | | | |
| Net increase | | | 10,758,851 | | | $ | 109,506,241 | | | | 450,351 | | | $ | 4,521,969 | |
| | | | |
| | | | |
| |
| Class R | | | | | | | | | | | | | | | | |
| Sold | | | 3,492,826 | | | $ | 35,124,928 | | | | 2,763,935 | | | $ | 27,328,592 | |
| Dividends and/or distributions reinvested | | | 164,782 | | | | 1,640,319 | | | | 84,256 | | | | 825,249 | |
| Redeemed | | | (1,452,411 | ) | | | (14,587,955 | ) | | | (992,909 | ) | | | (9,766,086) | |
| | | | |
| Net increase | | | 2,205,197 | | | $ | 22,177,292 | | | | 1,855,282 | | | $ | 18,387,755 | |
| | | | |
| | | | |
| |
| Class Y | | | | | | | | | | | | | | | | |
| Sold | | | 13,532,558 | | | $ | 137,664,987 | | | | 28,295,834 | | | $ | 282,621,289 | |
| Dividends and/or distributions reinvested | | | 1,432,646 | | | | 14,457,761 | | | | 1,253,476 | | | | 12,435,046 | |
| Redeemed | | | (24,149,383 | ) | | | (245,470,612 | ) | | | (17,057,606 | ) | | | (169,658,173) | |
| | | | |
| Net increase (decrease) | | | (9,184,179 | ) | | $ | (93,347,864 | ) | | | 12,491,704 | | | $ | 125,398,162 | |
| | | | |
| | | | |
1. All outstanding Class B shares converted to Class A shares on June 1, 2018.
93 OPPENHEIMER CAPITAL INCOME FUND
NOTES TO CONSOLIDATED
FINANCIAL STATEMENTS Continued
8. Purchases and Sales of Securities
The aggregate cost of purchases and proceeds from sales of securities, other than short-term obligations and investments in IGMMF, for the reporting period were as follows:
| | | | | | | | |
| | | Purchases | | | Sales | |
| |
| Investment securities | | | $2,276,046,765 | | | | $2,433,968,541 | |
| U.S. government and government agency obligations | | | — | | | | 1,390,563 | |
| To Be Announced (TBA) mortgage-related securities | | | 4,932,579,131 | | | | 5,044,273,340 | |
9. Fees and Other Transactions with Affiliates
Management Fees. Under the investment advisory agreement, the Fund pays the Manager a management fee based on the daily net assets of the Fund at an annual rate as shown in the following table:
| | | | | | | | |
Fee Schedule | |
| Up to $100 million | | | 0.75 | % | | | | |
| Next $100 million | | | 0.70 | | | | | |
| Next $100 million | | | 0.65 | | | | | |
| Next $100 million | | | 0.60 | | | | | |
| Next $100 million | | | 0.55 | | | | | |
| Next $4.5 billion | | | 0.50 | | | | | |
| Over $5 billion | | | 0.48 | | | | | |
The Manager also provides investment management related services to the Subsidiary. The Subsidiary pays the Manager a monthly management fee at an annual rate according to the above schedule. The Subsidiary also pays certain other expenses including custody and directors’ fees.
The Fund’s effective management fee for the reporting period was 0.53% of average annual net assets before any Subsidiary management fees or any applicable waivers.
Sub-Adviser Fees. The Manager has retained the Sub-Adviser to provide the day-to-day portfolio management of the Fund and the Subsidiary. Under the Sub-Advisory Agreement, the Manager pays the Sub-Adviser an annual fee in monthly installments, equal to a percentage of the investment management fee collected by the Manager from the Fund and the Subsidiary, which shall be calculated after any investment management fee waivers. The fee paid to the Sub-Adviser is paid by the Manager, not by the Fund.
Transfer Agent Fees. OFI Global (the “Transfer Agent”) serves as the transfer and shareholder servicing agent for the Fund. The Fund pays the Transfer Agent a fee based on annual net assets, which shall be calculated after any applicable fee waivers. Fees incurred and average net assets for each class with respect to these services are detailed in the Consolidated Statement of Operations and Consolidated Financial Highlights, respectively.
Sub-Transfer Agent Fees. The Transfer Agent has retained Shareholder Services, Inc., a wholly-owned subsidiary of OFI (the “Sub-Transfer Agent”), to provide the day-to-day transfer agent and shareholder servicing of the Fund. Under the Sub-Transfer Agency Agreement, the Transfer Agent pays the Sub-Transfer Agent an annual fee in monthly installments, equal to a
94 OPPENHEIMER CAPITAL INCOME FUND
9. Fees and Other Transactions with Affiliates (Continued)
percentage of the transfer agent fee collected by the Transfer Agent from the Fund, which shall be calculated after any applicable fee waivers. The fee paid to the Sub-Transfer Agent is paid by the Transfer Agent, not by the Fund.
Trustees’ Compensation. The Fund’s Board of Trustees (“Board”) has adopted a compensation deferral plan for Independent Trustees that enables Trustees to elect to defer receipt of all or a portion of the annual compensation they are entitled to receive from the Fund. For purposes of determining the amount owed to the Trustees under the plan, deferred amounts are treated as though equal dollar amounts had been invested in shares of the Fund or in other Oppenheimer funds selected by the Trustees. The Fund purchases shares of the funds selected for deferral by the Trustees in amounts equal to his or her deemed investment, resulting in a Fund asset equal to the deferred compensation liability. Such assets are included as a component of “Other” within the asset section of the Consolidated Statement of Assets and Liabilities. Deferral of Trustees’ fees under the plan will not affect the net assets of the Fund and will not materially affect the Fund’s assets, liabilities or net investment income per share. Amounts will be deferred until distributed in accordance with the compensation deferral plan.
Distribution and Service Plan (12b-1) Fees. Under its General Distributor’s Agreement with the Fund, OppenheimerFunds Distributor, Inc. (the “Distributor”) acts as the Fund’s principal underwriter in the continuous public offering of the Fund’s classes of shares.
Service Plan for Class A Shares. The Fund has adopted a Service Plan (the “Plan”) for Class A shares pursuant to Rule 12b-1 under the 1940 Act. Under the Plan, the Fund reimburses the Distributor for a portion of its costs incurred for services provided to accounts that hold Class A shares. Reimbursement is made periodically at an annual rate of up to 0.25% of the daily net assets of Class A shares of the Fund. The Distributor currently uses all of those fees to pay dealers, brokers, banks and other financial institutions periodically for providing personal service and maintenance of accounts of their customers that hold Class A shares. Any unreimbursed expenses the Distributor incurs with respect to Class A shares in any fiscal year cannot be recovered in subsequent periods. Fees incurred by the Fund under the Plan are detailed in the Consolidated Statement of Operations.
Distribution and Service Plans for Class B, Class C and Class R Shares. The Fund has adopted Distribution and Service Plans (the “Plans”) for Class C and Class R shares, and had previously adopted a similar plan for Class B shares, pursuant to Rule 12b-1 under the 1940 Act to compensate the Distributor for distributing those share classes, maintaining accounts and providing shareholder services. Under the Plans, the Fund pays the Distributor an annual asset-based sales charge of 0.75% on Class C shares’ daily net assets and 0.25% on Class R shares’ daily net assets. The Fund paid the Distributor an annual asset-based sales charge of 0.75% on Class B shares prior to their Conversion Date. The Fund also pays a service fee under the Plans at an annual rate of 0.25% of daily net assets and previously paid this fee
95 OPPENHEIMER CAPITAL INCOME FUND
NOTES TO CONSOLIDATED
FINANCIAL STATEMENTS Continued
9. Fees and Other Transactions with Affiliates (Continued)
for Class B prior to their Conversion Date. The Plans continue in effect from year to year only if the Fund’s Board of Trustees votes annually to approve their continuance at an in person meeting called for that purpose. Fees incurred by the Fund under the Plans are detailed in the Consolidated Statement of Operations.
Sales Charges. Front-end sales charges and CDSC do not represent expenses of the Fund. They are deducted from the proceeds of sales of Fund shares prior to investment or from redemption proceeds prior to remittance, as applicable. The sales charges retained by the Distributor from the sale of shares and the CDSC retained by the Distributor on the redemption of shares is shown in the following table for the period indicated.
| | | | | | | | | | | | | | | | | | | | |
| Year Ended | | Class A Front-End Sales Charges Retained by
Distributor | | | Class A Contingent Deferred Sales Charges Retained by
Distributor | | | Class B Contingent Deferred Sales Charges Retained by Distributor1 | | | Class C Contingent Deferred Sales Charges Retained by Distributor | | | Class R Contingent Deferred Sales Charges Retained by Distributor | |
| |
| August 31, 2018 | | | $266,073 | | | | $24,491 | | | | $867 | | | | $21,159 | | | | $— | |
1. Effective June 1, 2018, all Class B shares converted to Class A shares.
Waivers and Reimbursements of Expenses. The Manager has contractually agreed to waive the management fee it receives from the Fund in an amount equal to the management fee it receives from the Subsidiary. During the reporting period, the Manager waived $195,039. This fee waiver and/or expense reimbursement may not be amended or withdrawn for one year from the date of the Fund’s prospectus, unless approved by the Board.
Effective for the period January 1, 2017 through December 31, 2017, the Transfer Agent voluntarily waived and/or reimbursed Fund expenses in an amount equal to 0.015% of average annual net assets for Classes A, B, C, R and Y.
During the reporting period, the Transfer Agent waived fees and/or reimbursed the Fund for transfer agent and shareholder servicing agent fees as follows:
| | | | |
| Class A | | | $78,774 | |
| Class B1 | | | 190 | |
| Class C | | | 18,517 | |
| Class R | | | 3,116 | |
| Class Y | | | 31,679 | |
1. Effective June 1, 2018, all Class B shares converted to Class A shares.
The Manager will waive fees and/or reimburse Fund expenses in an amount equal to the indirect management fees incurred through the Fund’s investments in Affiliated Funds. During the reporting period, the Manager waived fees and/or reimbursed the Fund $1,366,798 for these management fees. This fee waiver and/or expense reimbursement may not be amended or withdrawn for one year from the date of the Fund’s prospectus, unless approved by the Board.
96 OPPENHEIMER CAPITAL INCOME FUND
10. Borrowings and Other Financing
Joint Credit Facility. A number of mutual funds managed by the Manager participate in a $1.95 billion revolving credit facility (the “Facility”) intended to provide short-term financing, if necessary, subject to certain restrictions in connection with atypical redemption activity. Expenses and fees related to the Facility are paid by the participating funds and are disclosed separately or as other expenses on the Consolidated Statement of Operations. The Fund did not utilize the Facility during the reporting period.
11. Subsequent Event
On October 18, 2018, Massachusetts Mutual Life Insurance Company (“MassMutual”), an indirect corporate parent of the Sub-Adviser and the Manager announced that it has entered into a definitive agreement, whereby Invesco Ltd. (“Invesco”), a global investment management company, will acquire the Sub-Adviser. As of the time of the announcement, the transaction is expected to close in the second quarter of 2019, pending necessary regulatory and other third-party approvals. This is subject to change.
97 OPPENHEIMER CAPITAL INCOME FUND
REPORT OF INDEPENDENT REGISTERED PUBLIC ACCOUNTING FIRM
To the Shareholders and Board of Trustees
Oppenheimer Capital Income Fund:
Opinion on the Consolidated Financial Statements
We have audited the accompanying consolidated statement of assets and liabilities of Oppenheimer Capital Income Fund (the “Fund”) and subsidiary, including the consolidated statement of investments, as of August 31, 2018, the related consolidated statement of operations for the year then ended, the consolidated statements of changes in net assets for each of the years in the two year period then ended, and the related consolidated notes (collectively, the “consolidated financial statements”) and the consolidated financial highlights for each of the years or periods in the five year period then ended. In our opinion, the consolidated financial statements and consolidated financial highlights present fairly, in all material respects, the financial position of the Fund and subsidiary as of August 31, 2018, the results of their consolidated operations for the year then ended, the changes in their consolidated net assets for each of the years in the two year period then ended, and the consolidated financial highlights for each of the years or periods in the five year period then ended, in conformity with U.S. generally accepted accounting principles.
Basis for Opinion
These consolidated financial statements and consolidated financial highlights are the responsibility of the Fund’s management. Our responsibility is to express an opinion on these consolidated financial statements and consolidated financial highlights based on our audits. We are a public accounting firm registered with the Public Company Accounting Oversight Board (United States) (“PCAOB”) and are required to be independent with respect to the Fund and subsidiary in accordance with the U.S. federal securities laws and the applicable rules and regulations of the Securities and Exchange Commission and the PCAOB.
We conducted our audits in accordance with the standards of the PCAOB. Those standards require that we plan and perform the audit to obtain reasonable assurance about whether the consolidated financial statements and consolidated financial highlights are free of material misstatement, whether due to error or fraud. Our audits included performing procedures to assess the risks of material misstatement of the consolidated financial statements and consolidated financial highlights, whether due to error or fraud, and performing procedures that respond to those risks. Such procedures included examining, on a test basis, evidence regarding the amounts and disclosures in the consolidated financial statements and consolidated financial highlights. Such procedures also included confirmation of securities owned as of August 31, 2018, by correspondence with the custodian, brokers and the transfer agent, or by other appropriate auditing procedures. Our audits also included evaluating the accounting principles used and significant estimates made by management, as well as evaluating the overall presentation of the consolidated financial statements and consolidated financial highlights. We believe that our audits provide a reasonable basis for our opinion.
KPMG LLP
We have not been able to determine the specific year that we began serving as the auditor of one or more Oppenheimer Funds investment companies, however we are aware that we have served as the auditor of one or more Oppenheimer Funds investment companies since at least 1969.
Denver, Colorado
October 25, 2018
98 OPPENHEIMER CAPITAL INCOME FUND
FEDERAL INCOME TAX INFORMATION Unaudited
In early 2018, if applicable, shareholders of record received information regarding all dividends and distributions paid to them by the Fund during calendar year 2017.
Dividends, if any, paid by the Fund during the reporting period which are not designated as capital gain distributions should be multiplied by the maximum amount allowable but not less than 41.70% to arrive at the amount eligible for the corporate dividend-received deduction.
A portion, if any, of the dividends paid by the Fund during the reporting period which are not designated as capital gain distributions are eligible for lower individual income tax rates to the extent that the Fund has received qualified dividend income as stipulated by recent tax legislation. The maximum amount allowable but not less than $31,497,212 of the Fund’s fiscal year taxable income may be eligible for the lower individual income tax rates. In early 2018, shareholders of record received information regarding the percentage of distributions that are eligible for lower individual income tax rates.
Recent tax legislation allows a regulated investment company to designate distributions not designated as capital gain distributions, as either interest related dividends or short-term capital gain dividends, both of which are exempt from the U.S. withholding tax applicable to non U.S. taxpayers. For the reporting period, the maximum amount allowable but not less than $35,388,326 of the ordinary distributions to be paid by the Fund qualifies as an interest related dividend.
The foregoing information is presented to assist shareholders in reporting distributions received from the Fund to the Internal Revenue Service. Because of the complexity of the federal regulations which may affect your individual tax return and the many variations in state and local tax regulations, we recommend that you consult your tax advisor for specific guidance.
99 OPPENHEIMER CAPITAL INCOME FUND
BOARD APPROVAL OF THE FUND’S INVESTMENT ADVISORY AND SUB-ADVISORY AGREEMENTS Unaudited
The Fund has entered into an investment advisory agreement with OFI Global Asset Management, Inc. (“OFI Global” or the “Adviser”), a wholly-owned subsidiary of OppenheimerFunds, Inc. (“OFI” or the “Sub-Adviser”) (“OFI Global” and “OFI” together the “Managers”) and OFI Global has entered into a sub-advisory agreement with OFI whereby OFI provides investment sub-advisory services to the Fund (collectively, the “Agreements”). Each year, the Board of Trustees (the “Board”), including a majority of the independent Trustees, is required to determine whether to approve the terms of the Agreements and the renewal thereof. The Investment Company Act of 1940 requires that the Board request and evaluate, and that the Managers provide, such information as may be reasonably necessary to evaluate the terms of the Agreements. The Board employs an independent consultant to prepare a report that provides information, including comparative information that the Board requests for that purpose. In addition to in-person meetings focused on this evaluation, the Board receives information throughout the year regarding Fund services, fees, expenses and performance.
The Managers and the independent consultant provided information to the Board on the following factors: (i) the nature, quality and extent of the Managers’ services, (ii) the comparative investment performance of the Fund and the Managers, (iii) the fees and expenses of the Fund, including comparative fee and expense information, (iv) the profitability of the Managers and their affiliates, including an analysis of the cost of providing services, (v) whether economies of scale are realized as the Fund grows and whether fee levels reflect these economies of scale for Fund investors and (vi) other benefits to the Managers from their relationship with the Fund. The Board was aware that there are alternatives to retaining the Managers.
Outlined below is a summary of the principal information considered by the Board as well as the Board’s conclusions.
Nature, Quality and Extent of Services. The Board considered information about the nature, quality and extent of the services provided to the Fund and information regarding the Managers’ key personnel who provide such services. The Managers’ duties include providing the Fund with the services of the Sub-Adviser’s portfolio managers and investment team, who provide research, analysis and other advisory services in regard to the Fund’s investments; and securities trading services. OFI Global is responsible for oversight of third-party service providers; monitoring compliance with applicable Fund policies and procedures and adherence to the Fund’s investment restrictions; risk management; and oversight of the Sub-Adviser. OFI Global is also responsible for providing certain administrative services to the Fund. Those services include providing and supervising all administrative and clerical personnel who are necessary in order to provide effective corporate administration for the Fund; compiling and maintaining records with respect to the Fund’s operations; preparing and filing reports required by the U.S. Securities and Exchange Commission; preparing periodic reports regarding the operations of the Fund for its shareholders; preparing proxy materials for shareholder meetings; and preparing the registration statements required by federal and state securities laws for the sale of the Fund’s shares. OFI Global also provides the Fund with office space, facilities and equipment.
100 OPPENHEIMER CAPITAL INCOME FUND
The Board also considered the quality of the services provided and the quality of the Managers’ resources that are available to the Fund. The Board took account of the fact that the Sub-Adviser has over fifty years of experience as an investment adviser and that its assets under management rank it among the top mutual fund managers in the United States. The Board evaluated the Managers’ advisory, administrative, accounting, legal, compliance and risk management services, among other services, and information the Board has received regarding the experience and professional qualifications of the Managers’ key personnel and the size and functions of their staff. In its evaluation of the quality of the portfolio management services provided, the Board considered the experience of Michelle Borré and Krishna Memani, the portfolio managers for the Fund, and the Sub-Adviser’s investment team and analysts. The Board members also considered the totality of their experiences with the Managers as directors or trustees of the Fund and other funds advised by the Managers. The Board considered information regarding the quality of services provided by affiliates of the Managers, which the Board members have become knowledgeable about through their experiences with the Managers and in connection with the review or renewal of the Fund’s service agreements or service providers. The Board concluded, in light of the Managers’ experience, reputation, personnel, operations and resources that the Fund benefits from the services provided under the Agreements.
Investment Performance of the Managers and the Fund. Throughout the year, the Managers provided information on the investment performance of the Fund, the Adviser and the Sub-Adviser, including comparative performance information. The Board also reviewed information, prepared by the Managers and by the independent consultant, comparing the Fund’s historical performance to relevant benchmarks or market indices and to the performance of other retail funds in the 30% to 50% equity allocation category. The Board considered the Managers’ assertion that the performance among funds within the 30% to 50% equity allocation category may vary significantly due to the range of equity allocations, which results in significantly different risk profiles among funds in the category. The Board considered that, while the Fund underperformed its category median for all periods, recent underperformance was largely the result of underperformance in 2017. To that end, the Board noted that the Fund ranked in the 2nd, 2nd, and 3rd quintiles of its category for the 2014, 2015 and 2016 calendar years, respectively. Given the effect of a single year’s performance on the overall performance record of the Fund, the calendar year-end performance for each of the prior three years, and recent personnel changes in the investment team, the Board considered it was reasonable to allow the portfolio management team time to address the single year 2017 underperformance.
Fees and Expenses of the Fund. The Board reviewed the fees paid to the Adviser and the other expenses borne by the Fund. The Board noted that the Adviser, not the Fund, pays the Sub-Adviser’s fee under the sub-advisory agreement. The independent consultant provided comparative data in regard to the fees and expenses of the Fund and other retail front-end load funds in the 30% to 50% equity allocation category with comparable asset levels and distribution features. The Board considered that the Fund’s contractual
101 OPPENHEIMER CAPITAL INCOME FUND
BOARD APPROVAL OF THE FUND’S INVESTMENT ADVISORY AND SUB-ADVISORY
AGREEMENTS Unaudited / Continued
management fee was lower than its peer group median and category median and its total expenses were lower than its category median and equal to its peer group median. The Board noted that the Adviser has contractually agreed to waive fees and/or reimburse Fund expenses in an amount equal to the management fees it receives from the Fund’s subsidiary; this waiver and/or reimbursement will continue to be in effect for so long as the Fund invests in the subsidiary and may not be terminated unless approved by the Board. The Board further noted that the Adviser has also contractually agreed to waive fees and/or reimburse expenses in an amount equal to the management fees incurred indirectly through the Fund’s investment in funds managed by the Adviser or its affiliates; this waiver and/or reimbursement may not be amended or withdrawn for one year from the date of the Fund’s prospectus, unless approved by the Board. Finally, the Board considered that the Adviser, in its capacity as the Fund’s transfer agent, voluntarily waived and/or reimbursed the Fund for transfer agent fees in an amount equal to 0.015% of average annual net assets, and that effective January 1, 2018, after discussions with the Board, the Fund’s transfer agent fee rate was decreased.
Economies of Scale and Profits Realized by the Managers. The Board considered information regarding the Managers’ costs in serving as the Fund’s investment adviser and sub-adviser, including the costs associated with the personnel and systems necessary to manage the Fund, and information regarding the Managers’ profitability from their relationship with the Fund. The Board also considered that the Managers must be able to pay and retain experienced professional personnel at competitive rates to provide quality services to the Fund. The Board reviewed whether the Managers may realize economies of scale in managing and supporting the Fund. The Board noted that the Fund currently has management fee breakpoints, which are intended to share with Fund shareholders economies of scale that may exist as the Fund’s assets grow and which are appropriate given the Fund’s current size.
Other Benefits to the Managers. In addition to considering the profits realized by the Managers, the Board considered information that was provided regarding the direct and indirect benefits the Managers receive as a result of their relationship with the Fund, including compensation paid to the Managers’ affiliates and research provided to the Adviser in connection with permissible brokerage arrangements (soft dollar arrangements).
Conclusions. These factors were also considered by the independent Trustees meeting separately from the full Board, assisted by experienced counsel to the Fund and to the independent Trustees. Fund counsel and the independent Trustees’ counsel are independent of the Managers within the meaning and intent of the Securities and Exchange Commission Rules.
Based on its review of the information it received and its evaluations described above, the Board, including a majority of the independent Trustees, decided to continue the Agreements through August 31, 2019. In arriving at its decision, the Board did not identify any factor
102 OPPENHEIMER CAPITAL INCOME FUND
or factors as being more important than others, but considered all of the above information, and considered the terms and conditions of the Agreements, including the management fees, in light of all the surrounding circumstances.
103 OPPENHEIMER CAPITAL INCOME FUND
PORTFOLIO PROXY VOTING POLICIES AND GUIDELINES;
UPDATES TO STATEMENT OF INVESTMENTS Unaudited
The Fund has adopted Portfolio Proxy Voting Policies and Guidelines under which the Fund votes proxies relating to securities (“portfolio proxies”) held by the Fund. A description of the Fund’s Portfolio Proxy Voting Policies and Guidelines is available (i) without charge, upon request, by calling the Fund toll-free at 1.800.CALL OPP (225.5677), (ii) on the Fund’s website at www.oppenheimerfunds.com, and (iii) on the SEC’s website at www.sec.gov. In addition, the Fund is required to file Form N-PX, with its complete proxy voting record for the 12 months ended June 30th, no later than August 31st of each year. The Fund’s voting record is available (i) without charge, upon request, by calling the Fund toll-free at 1.800.CALL OPP (225.5677), and (ii) in the Form N-PX filing on the SEC’s website at www.sec.gov.
The Fund files its complete schedule of portfolio holdings with the SEC for the first quarter and the third quarter of each fiscal year on Form N-Q. The Fund’s Form N-Q filings are available on the SEC’s website at www.sec.gov. Those forms may be reviewed and copied at the SEC’s Public Reference Room in Washington, D.C. Information on the operation of the Public Reference Room may be obtained by calling 1-800-SEC-0330.
Householding—Delivery of Shareholder Documents
This is to inform you about OppenheimerFunds’ “householding” policy. If more than one member of your household maintains an account in a particular fund, OppenheimerFunds will mail only one copy of the fund’s prospectus (or, if available, the fund’s summary prospectus), annual and semiannual report and privacy policy. The consolidation of these mailings, called householding, benefits your fund through reduced mailing expense, and benefits you by reducing the volume of mail you receive from OppenheimerFunds. Householding does not affect the delivery of your account statements.
Please note that we will continue to household these mailings for as long as you remain an OppenheimerFunds shareholder, unless you request otherwise. If you prefer to receive multiple copies of these materials, please call us at 1.800.CALL-OPP (225-5677). You may also notify us in writing or via email. We will begin sending you individual copies of the prospectus (or, if available, the summary prospectus), reports and privacy policy within 30 days of receiving your request to stop householding.
104 OPPENHEIMER CAPITAL INCOME FUND
TRUSTEES AND OFFICERS Unaudited
| | |
| Name, Position(s) Held with the Fund, Length of Service, Year of Birth | | Principal Occupation(s) During the Past 5 Years; Other Trusteeships/Directorships Held; Number of Portfolios in the Fund Complex Currently Overseen |
| |
| INDEPENDENT TRUSTEES | | The address of each Trustee in the chart below is 6803 S. Tucson Way, Centennial, Colorado 80112-3924. Each Trustee serves for an indefinite term, or until his or her resignation,retirement, death or removal. Each of the Trustees in the chart below oversees 58 portfolios in the OppenheimerFunds complex. |
| |
Robert J. Malone, Chairman of the Board of Trustees (since 2016), Trustee (since 2002) Year of Birth: 1944 | | Chairman - Colorado Market of MidFirst Bank (since January 2015); Chairman of the Board (2012-2016) and Director (August 2005-January 2016) of Jones International University (educational organization); Trustee of the Gallagher Family Foundation (non-profit organization) (2000-2016); Chairman, Chief Executive Officer and Director of Steele Street Bank Trust (commercial banking) (August 2003-January 2015); Director of Opera Colorado Foundation (non-profit organization) (2008-2012); Director of Colorado UpLIFT (charitable organization) (1986-2010); Director of Jones Knowledge, Inc. (2006-2010); Former Chairman of U.S. Bank-Colorado (subsidiary of U.S. Bancorp and formerly Colorado National Bank) (July 1996-April 1999); Director of Commercial Assets, Inc. (real estate investment trust) (1993-2000); Director of U.S. Exploration, Inc. (oil and gas exploration) (1997-February 2004); Chairman of the Board (1991-1994) and Trustee (1985-1994) of Regis University; and Chairman of the Board (1990-1991) and Member (1984-1999) of Young Presidents Organization. Mr. Malone has served on the Boards of certain Oppenheimer funds since 2002, during which time he has become familiar with the Fund’s (and other Oppenheimer funds’) financial, accounting, regulatory and investment matters and has contributed to the Board’s deliberations. |
| |
Andrew J. Donohue, Trustee (since 2017) Year of Birth: 1950 | | Director, Mutual Fund Directors Forum (since February 2018); Of Counsel, Shearman & Sterling LLP (since September 2017); Chief of Staff of the U.S. Securities and Exchange Commission (regulator) (June 2015-February 2017); Managing Director and Investment Company General Counsel of Goldman Sachs (investment bank) (November 2012-May 2015); Partner at Morgan Lewis & Bockius, LLP (law firm) (March 2011-October 2012); Director of the Division of Investment Management of U.S. Securities and Exchange Commission (regulator) (May 2006-November 2010); Global General Counsel of Merrill Lynch Investment Managers (investment firm) (May 2003-May 2006); General Counsel (October 1991-November 2001) and Executive Vice President (January 1993-November 2001) of OppenheimerFunds, Inc. (investment firm) (June 1991-November 2001). Mr. Donohue has served on the Boards of certain Oppenheimer funds since 2017, during which time he has become familiar with the Fund’s (and other Oppenheimer funds’) financial, accounting, regulatory and investment matters and has contributed to the Board’s deliberations. |
| |
Richard F. Grabish, Trustee (since 2012) Year of Birth: 1948 | | Formerly Senior Vice President and Assistant Director of Sales and Marketing (March 1997-December 2007), Director (March 1987-December 2007) and Manager of Private Client Services (June 1985-June 2005) of A.G. Edwards & Sons, Inc. (broker/dealer and investment firm); Chairman and Chief Executive Officer of A.G. Edwards Trust Company, FSB (March 2001-December 2007); President and Vice Chairman of A.G. Edwards Trust Company, FSB (investment adviser) (April 1987-March 2001); President of A.G. Edwards Trust Company, FSB (investment adviser) (June 2005-December 2007). Mr. Grabish has served on the Boards of certain Oppenheimer funds since 2001, during which time he has become familiar with the Fund’s (and other Oppenheimer funds’) financial, accounting, regulatory and investment matters and has contributed to the Board’s deliberations. |
105 OPPENHEIMER CAPITAL INCOME FUND
TRUSTEES AND OFFICERS Unaudited / Continued
| | |
| |
Beverly L. Hamilton, Trustee (since 2002) Year of Birth: 1946 | | Trustee of Monterey Institute for International Studies (educational organization) (2000-2014); Board Member of Middlebury College (educational organization) (December 2005-June 2011); Director of the Board (1991-2016), Vice Chairman of the Board (2006-2009) and Chairman of the Board (2010-2013) of American Funds’ Emerging Markets Growth Fund, Inc. (mutual fund); Director of The California Endowment (philanthropic organization) (April 2002-April 2008); Director (February 2002-2005) and Chairman of Trustees (2006-2007) of the Community Hospital of Monterey Peninsula; President of ARCO Investment Management Company (February 1991-April 2000); Member of the investment committees of The Rockefeller Foundation (2001-2006) and The University of Michigan (since 2000); Advisor at Credit Suisse First Boston’s Sprout venture capital unit (venture capital fund) (1994-January 2005); Trustee of MassMutual Institutional Funds (investment company) (1996-June 2004); Trustee of MML Series Investment Fund (investment company) (April 1989-June 2004); Member of the investment committee of Hartford Hospital (2000-2003); and Advisor to Unilever (Holland) pension fund (2000-2003). Ms. Hamilton has served on the Boards of certain Oppenheimer funds since 2002, during which time she has become familiar with the Fund’s (and other Oppenheimer funds’) financial, accounting, regulatory and investment matters and has contributed to the Board’s deliberations. |
| |
Victoria J. Herget, Trustee (since 2012) Year of Birth:1951 | | Board Chair (2008-2015) and Director (2004-Present) of United Educators (insurance company); Trustee (since 2000) and Chair (2010-2017) of Newberry Library (independent research library); Trustee, Mather LifeWays (senior living organization) (since 2001); Independent Director of the First American Funds (mutual fund family) (2003-2011); former Managing Director (1993-2001), Principal (1985-1993), Vice President (1978-1985) and Assistant Vice President (1973-1978) of Zurich Scudder Investments (investment adviser) (and its predecessor firms); Trustee (1992-2007), Chair of the Board of Trustees (1999- 2007), Investment Committee Chair (1994-1999) and Investment Committee member (2007-2010) of Wellesley College; Trustee, BoardSource (non-profit organization) (2006-2009) and Chicago City Day School (K-8 School) (1994- 2005). Ms. Herget has served on the Boards of certain Oppenheimer funds since 2012, during which time she has become familiar with the Fund’s (and other Oppenheimer funds’) financial, accounting, regulatory and investment matters and has contributed to the Board’s deliberations. |
| |
Karen L. Stuckey, Trustee (since 2012) Year of Birth: 1953 | | Member (since May 2015) of Desert Mountain Community Foundation Advisory Board (non-profit organization); Partner (1990-2012) of PricewaterhouseCoopers LLP (professional services firm) (held various positions 1975-1990); Trustee (1992-2006); member of Executive, Nominating and Audit Committees and Chair of Finance Committee (1992-2006), and Emeritus Trustee (since 2006) of Lehigh University; member, Women’s Investment Management Forum (professional organization) (since inception) and Trustee of Jennies School for Little Children (non-profit) (2011-2014). Ms. Stuckey has served on the Boards of certain Oppenheimer funds since 2012, during which time she has become familiar with the Fund’s (and other Oppenheimer funds’) financial, accounting, regulatory and investment matters and has contributed to the Board’s deliberations. |
106 OPPENHEIMER CAPITAL INCOME FUND
| | |
James D. Vaughn, Trustee (since 2012) Year of Birth:1945 | | Retired; former managing partner (1994-2001) of Denver office of Deloitte & Touche LLP, (held various positions in Denver and New York offices from 1969- 1993); Trustee and Chairman of the Audit Committee of Schroder Funds (2003- 2012); Board member and Chairman of Audit Committee of AMG National Trust Bank (since 2005); Trustee and Investment Committee member, University of South Dakota Foundation (since 1996); Board member, Audit Committee Member and past Board Chair, Junior Achievement (since 1993); former Board member, Mile High United Way, Boys and Girls Clubs, Boy Scouts, Colorado Business Committee for the Arts, Economic Club of Colorado and Metro Denver Network. Mr. Vaughn has served on the Boards of certain Oppenheimer funds since 2012, during which time he has become familiar with the Fund’s (and other Oppenheimer funds’) financial, accounting, regulatory and investment matters and has contributed to the Board’s deliberations. |
| INTERESTED TRUSTEE AND OFFICER | | Mr. Steinmetz is an “Interested Trustee” because he is affiliated with the Manager and the Sub-Adviser by virtue of his positions as Chairman and director of the Sub-Adviser and officer and director of the Manager. Both as a Trustee and as an officer, Mr. Steinmetz serves for an indefinite term, or until his resignation, retirement, death or removal. Mr. Steinmetz’s address is 225 Liberty Street, New York, New York 10281-1008. Mr. Steinmetz is an officer of 106 portfolios in the OppenheimerFunds complex. |
| |
Arthur P. Steinmetz, Trustee (since 2015), President and Principal Executive Officer (since 2014) Year of Birth: 1958 | | Chairman of OppenheimerFunds, Inc. (since January 2015); CEO and Chairman of OFI Global Asset Management, Inc. (since July 2014), President of OFI Global Asset Management, Inc. (since May 2013), a Director of OFI Global Asset Management, Inc. (since January 2013), Director of OppenheimerFunds, Inc. (since July 2014), President, Management Director and CEO of Oppenheimer Acquisition Corp. (OppenheimerFunds, Inc.‘s parent holding company) (since July 2014), and President and Director of OFI SteelPath, Inc. (since January 2013). Chief Investment Officer of the OppenheimerFunds advisory entities (January 2013-December 2013); Executive Vice President of OFI Global Asset Management, Inc. (January 2013-May 2013); Chief Investment Officer of OppenheimerFunds, Inc. (October 2010-December 2012); Chief Investment Officer, Fixed-Income, of OppenheimerFunds, Inc. (April 2009-October 2010); Executive Vice President of OppenheimerFunds, Inc. (October 2009-December 2012); Director of Fixed Income of OppenheimerFunds, Inc. (January 2009-April 2009); and a Senior Vice President of OppenheimerFunds, Inc. (March 1993-September 2009). |
| OTHER OFFICERS OF THE FUND | | The addresses of the Officers in the chart below are as follows: for Mr. Memani, Mss. Borré, Lo Bessette, Foxson and Picciotto, 225 Liberty Street, New York, New York 10281-1008, for Mr. Petersen, 6803 S. Tucson Way, Centennial, Colorado 80112-3924. Each Officer serves for an indefinite term or until his or her resignation, retirement, death or removal. |
| |
Michelle Borré, Vice President (since 2009) Year of Birth: 1967 | | Senior Vice President of the Sub-Adviser (since January 2016); Senior Portfolio Manager of the Sub-Adviser (since April 2009);Vice President of the Sub-Adviser (April 2003-January 2016); Senior Research Analyst of the Sub-Adviser (February 2003-April 2009). Ms. Borre held various positions, including Managing Director and Partner, at J&W Seligman (July 1996 -January 2003); Adjunct Professor of Finance and Economics at Columbia Business School (2003-2013); Served on the Executive Advisory Board at the Heilbrunn Center for Graham and Dodd Investing at Columbia Business School (from 2004 to 2005). |
107 OPPENHEIMER CAPITAL INCOME FUND
TRUSTEES AND OFFICERS Unaudited / Continued
| | |
Krishna Memani, Vice President (since 2009) Year of Birth: 1960 | | President of the Sub-Adviser (since January 2013); Executive Vice President of the Manager (since January 2014); Chief Investment Officer of the OppenheimerFunds advisory entities (since January 2014); Chief Investment Officer, Fixed Income of the Sub-Adviser (January 2013-December 2013); Head of the Investment Grade Fixed Income Team of the Sub-Adviser (March 2009-January 2014); Director of Fixed Income of the Sub-Adviser (October 2010-December 2012); Senior Vice President of the Sub-Adviser (March 2009-December 2012); Senior Vice President of OFI Global Institutional, Inc. (April 2009-December 2012). Managing Director and Head of the U.S. and European Credit Analyst Team at Deutsche Bank Securities (June 2006-January 2009); Chief Credit Strategist at Credit Suisse Securities (August 2002-March 2006); Managing Director and Senior Portfolio Manager at Putnam Investments (September 1998-June 2002). |
| |
Cynthia Lo Bessette, Secretary and Chief Legal Officer (since 2016) Year of Birth: 1969 | | Executive Vice President, General Counsel and Secretary of OFI Global Asset Management, Inc. (since February 2016); Senior Vice President and Deputy General Counsel of OFI Global Asset Management, Inc. (March 2015-February 2016); Chief Legal Officer of OppenheimerFunds, Inc. and OppenheimerFunds Distributor, Inc. (since February 2016); Vice President, General Counsel and Secretary of Oppenheimer Acquisition Corp. (since February 2016); General Counsel of OFI SteelPath, Inc., OFI Advisors, LLC and Index Management Solutions, LLC (since February 2016); Chief Legal Officer of OFI Global Institutional, Inc., HarbourView Asset Management Corporation, OFI Global Trust Company, Oppenheimer Real Asset Management, Inc., OFI Private Investments Inc., Shareholder Services, Inc. and Trinity Investment Management Corporation (since February 2016); Corporate Counsel (February 2012-March 2015) and Deputy Chief Legal Officer (April 2013-March 2015) of Jennison Associates LLC; Assistant General Counsel (April 2008-September 2009) and Deputy General Counsel (October 2009-February 2012) of Lord Abbett & Co. LLC. |
| |
Jennifer Foxson, Vice President and Chief Business Officer (since 2014) Year of Birth: 1969 | | Senior Vice President of OppenheimerFunds Distributor, Inc. (since June 2014); Vice President of OppenheimerFunds Distributor, Inc. (April 2006-June 2014); Vice President of OppenheimerFunds, Inc. (January 1998-March 2006); Assistant Vice President of OppenheimerFunds, Inc. (October 1991-December 1998). |
| |
Mary Ann Picciotto, Chief Compliance Officer and Chief Anti-Money Laundering Officer (since 2014) Year of Birth: 1973 | | Senior Vice President and Chief Compliance Officer of OFI Global Asset Management, Inc. (since March 2014); Chief Compliance Officer of OppenheimerFunds, Inc., OFI SteelPath, Inc., OFI Global Institutional, Inc., Oppenheimer Real Asset Management, Inc., OFI Private Investments Inc., Harborview Asset Management Corporation, Trinity Investment Management Corporation, and Shareholder Services, Inc. (since March 2014); Managing Director of Morgan Stanley Investment Management Inc. and certain of its various affiliated entities; Chief Compliance Officer of various Morgan Stanley Funds (May 2010-January 2014); Chief Compliance Officer of Morgan Stanley Investment Management Inc. (April 2007-January 2014). |
| |
Brian S. Petersen, Treasurer and Principal Financial & Accounting Officer (since 1999) Year of Birth: 1959 | | Senior Vice President of OFI Global Asset Management, Inc. (since January 2017); Vice President of OFI Global Asset Management, Inc. (January 2013-January 2017); Vice President of OppenheimerFunds, Inc. (February 2007-December 2012); Assistant Vice President of OppenheimerFunds, Inc. (August 2002-2007). |
The Fund’s Statement of Additional Information contains additional information about the Fund’s Trustees and Officers and is available without charge upon request by calling 1.800.CALL OPP (225.5677).
108 OPPENHEIMER CAPITAL INCOME FUND
OPPENHEIMER CAPITAL INCOME FUND
| | |
| |
| Manager | | OFI Global Asset Management, Inc. |
| |
| Sub-Adviser | | OppenheimerFunds, Inc. |
| |
| Distributor | | OppenheimerFunds Distributor, Inc. |
| |
Transfer and Shareholder Servicing Agent | | OFI Global Asset Management, Inc. |
| |
| Sub-Transfer Agent | | Shareholder Services, Inc. DBA OppenheimerFunds Services |
| |
Independent Registered Public Accounting Firm | | KPMG LLP |
| |
| Legal Counsel | | Ropes & Gray LLP |
© 2018 OppenheimerFunds, Inc. All rights reserved.
109 OPPENHEIMER CAPITAL INCOME FUND
PRIVACY NOTICE
As an Oppenheimer fund shareholder, you are entitled to know how we protect your personal information and how we limit its disclosure.
Information Sources
We obtain non-public personal information about our shareholders from the following sources:
| ● | | Applications or other forms. |
| ● | | When you create a user ID and password for online account access. |
| ● | | When you enroll in eDocs Direct,SM our electronic document delivery service. |
| ● | | Your transactions with us, our affiliates or others. |
| ● | | Technologies on our website, including: “cookies” and web beacons, which are used to collect data on the pages you visit and the features you use. |
If you visit oppenheimerfunds.com and do not log on to the secure account information areas, we do not obtain any personal information about you. When you do log on to a secure area, we do obtain your user ID and password to identify you. We also use this information to provide you with products and services you have requested, to inform you about products and services that you may be interested in and assist you in other ways.
We do not collect personal information through our website unless you willingly provide it to us, either directly by email or in those areas of the website that request information. In order to update your personal information (including your mailing address, email address and phone number) you must first log on and visit your user profile.
If you have set your browser to warn you before accepting cookies, you will receive the warning message with each cookie. You can refuse cookies by turning them off in your browser. However, doing so may limit your access to certain sections of our website.
We use cookies to help us improve and manage our website. For example, cookies help us recognize new versus repeat visitors to the site, track the pages visited, and enable some special features on the website. This data helps us provide better service for our website visitors.
Protection of Information
We do not disclose any non-public personal information (such as names on a customer list) about current or former customers to anyone, except as permitted by law.
Disclosure of Information
Copies of confirmations, account statements and other documents reporting activity in your fund accounts are made available to your financial advisor (as designated by you). We may also use details about you and your investments to help us, our financial service affiliates, or firms that jointly market their financial products and services with ours, to better serve your investment needs or suggest educational material that may be of interest to you. If this requires us to provide you with an opportunity to “opt in” or “opt out” of such information sharing with a firm not affiliated with us, you will receive notification on how to do so, before any such sharing takes place.
Right of Refusal
We will not disclose your personal information to unaffiliated third parties (except as permitted by law), unless we first offer you a reasonable opportunity to refuse or “opt out” of such disclosure.
110 OPPENHEIMER CAPITAL INCOME FUND
Internet Security and Encryption
In general, the email services provided by our website are encrypted and provide a secure and private means of communication with us. To protect your own privacy, confidential and/ or personal information should only be communicated via email when you are advised that you are using a secure website.
As a security measure, we do not include personal or account information in non-secure emails, and we advise you not to send such information to us in non-secure emails. Instead, you may take advantage of the secure features of our website to encrypt your email correspondence. To do this, you will need to use a browser that supports Secure Sockets Layer (SSL) protocol.
| ● | | All transactions conducted via our websites, including redemptions, exchanges and purchases, are secured by the highest encryption standards available. SSL is used to establish a secure connection between your PC and OppenheimerFunds’ server. It transmits information in an encrypted and scrambled format. |
| ● | | Encryption is achieved through an electronic scrambling technology that uses a “key” to code and then decode the data. Encryption acts like the cable converter box you may have on your television set. It scrambles data with a secret code so that no one can make sense of it while it is being transmitted. When the data reaches its destination, the same software unscrambles the data. |
| ● | | You can exit the secure area by closing your browser or, for added security, you can use the Log Out button before you close your browser. |
Other Security Measures
We maintain physical, electronic and procedural safeguards to protect your personal account information. Our employees and agents have access to that information only so that they may offer you products or provide services, for example, when responding to your account questions.
How You Can Help
You can also do your part to keep your account information private and to prevent unauthorized transactions. If you obtain a user ID and password for your account, safeguard that information. Strengthening your online credentials–your online security profile–typically your user name, password, and security questions and answers, can be one of your most important lines of defense on the Internet. For additional information on how you can help prevent identity theft, visit https://www. oppenheimerfunds.com/security.
Who We Are
This joint notice describes the privacy policies of the Oppenheimer funds, OppenheimerFunds, Inc., each of its investment adviser subsidiaries, OppenheimerFunds Distributor, Inc. and OFI Global Trust Co. It applies to all Oppenheimer fund accounts you presently have, or may open in the future, using your Social Security number—whether or not you remain a shareholder of our funds. This notice was last updated as of November 2017. In the event it is updated or changed, we will post an updated notice on our website at oppenheimerfunds.com. If you have any questions about this privacy policy, email us by clicking on the Contact Us section of our website at oppenheimerfunds.com, write to us at P.O. Box 5270, Denver, CO 80217-5270, or call us at 800 CALL OPP (225 5677).
111 OPPENHEIMER CAPITAL INCOME FUND
| | | | |
| | 
OppenheimerFunds® The Right Way to Invest Visit us at oppenheimerfunds.com for 24-hr access to account information and transactions or call us at 800.CALL OPP (800.225.5677) for 24-hr automated information and automated transactions. Representatives also available Mon–Fri 8am-8pm ET. | | |
| | |
Visit Us oppenheimerfunds.com | | | | |
| | |
Call Us 800 225 5677 | | | | |
Follow us 
| | Oppenheimer funds are distributed by OppenheimerFunds Distributor, Inc. 225 Liberty Street, New York, NY 10281-1008 © 2018 OppenheimerFunds Distributor, Inc. All rights reserved. RA0300.001.0818 October 25, 2018 | | |
Item 2. Code of Ethics.
The registrant has adopted a code of ethics that applies to the registrant’s principal executive officer, principal financial officer, principal accounting officer or controller or persons performing similar functions.
Item 3. Audit Committee Financial Expert.
The Board of Trustees of the registrant has determined that Karen L. Stuckey, the Chairwoman of the Board’s Audit Committee, is the audit committee financial expert and that Ms. Stuckey is “independent” for purposes of this Item 3.
Item 4. Principal Accountant Fees and Services.
The principal accountant for the audit of the registrant’s annual financial statements billed $78,400 in fiscal 2018 and $77,100 in fiscal 2017.
The principal accountant for the audit of the registrant’s annual financial statements billed $3,500 in fiscal 2018 and $6,000 in fiscal 2017.
The principal accountant for the audit of the registrant’s annual financial statements billed $292,986 in fiscal 2018 and $289,000 in fiscal 2017 to the registrant’s investment adviser or any entity controlling, controlled by, or under common control with the adviser that provides ongoing services to the registrant.
Such services include: Internal control reviews, GIPS attestation procedures, custody audits, incremental, and additional, audit services.
The principal accountant for the audit of the registrant’s annual financial statements billed no such fees in fiscal 2018 and no such fees in fiscal 2017.
The principal accountant for the audit of the registrant’s annual financial statements billed $533,392 in fiscal 2018 and $528,317 in fiscal 2017 to the registrant’s investment adviser or any entity controlling, controlled by, or under common control with the adviser that provides ongoing services to the registrant.
Such services include: tax compliance, tax planning and tax advice. Tax compliance generally involves preparation of original and amended tax returns, claims for a refund and tax payment-planning services. Tax planning and tax advice includes assistance with tax audits and appeals, tax advice related to mergers and acquisitions and requests for rulings or technical advice from taxing authorities.
The principal accountant for the audit of the registrant’s annual financial statements billed no such fees in fiscal 2018 and no such fees in fiscal 2017.
The principal accountant for the audit of the registrant’s annual financial statements billed no such fees in fiscal 2018 and no such fees in fiscal 2017 to the registrant’s investment adviser or any entity controlling, controlled by, or under common control with the adviser that provides ongoing services to the registrant.
Such fees would include the cost to the principal accountant of attending audit committee meetings and consultations regarding the registrant’s retirement plan with respect to its Trustees.
| (e) | (1) During its regularly scheduled periodic meetings, the registrant’s audit committee will pre-approve all audit, audit-related, tax and other services to be provided by the principal accountants of the registrant. |
The audit committee has delegated pre-approval authority to its Chairman for any subsequent new engagements that arise between regularly scheduled meeting dates provided that any fees such pre-approved are presented to the audit committee at its next regularly scheduled meeting.
Under applicable laws, pre-approval of non-audit services may be waived provided that: 1) the aggregate amount of all such services provided constitutes no more than five percent of the total amount of fees paid by the registrant to its principal accountant during the fiscal year in which services are provided 2) such services were not recognized by the registrant at the time of engagement as non-audit services and 3) such services are promptly brought to the attention of the audit committee of the registrant and approved prior to the completion of the audit.
(2) 0%
| (f) | Not applicable as less than 50%. |
| (g) | The principal accountant for the audit of the registrant’s annual financial statements billed $826,378 in fiscal 2018 and $817,317 in fiscal 2017 to the registrant and the registrant’s investment adviser or any entity controlling, controlled by, or under common control with the adviser that provides ongoing services to the registrant related to non-audit fees. Those billings did not include any prohibited non-audit services as defined by the Securities Exchange Act of 1934. |
| (h) | The registrant’s audit committee of the board of Trustees has considered whether the provision of non-audit services that were rendered to the registrant’s investment adviser, and any entity controlling, controlled by, or under common control with the investment adviser that provides ongoing services to the registrant that were not pre-approved pursuant to paragraph (c)(7)(ii) of Rule 2-01 of Regulation S-X is compatible with maintaining the principal accountant’s independence. No such services were rendered. |
Item 5. Audit Committee of Listed Registrants
Not applicable.
Item 6. Schedule of Investments.
a) Not applicable. The complete schedule of investments is included in Item 1 of this Form N-CSR.
b) Not applicable.
Item 7. Disclosure of Proxy Voting Policies and Procedures for Closed-End Management Investment Companies.
Not applicable.
Item 8. Portfolio Managers of Closed-End Management Investment Companies.
Not applicable.
Item 9. Purchases of Equity Securities by Closed-End Management Investment Company and Affiliated Purchasers.
Not applicable.
Item 10. Submission of Matters to a Vote of Security Holders.
The Fund’s Governance Committee Provisions with Respect to Nominations of Directors/Trustees to the Respective Boards
None
Item 11. Controls and Procedures.
Based on their evaluation of the registrant’s disclosure controls and procedures (as defined in rule 30a-3(c) under the Investment Company Act of 1940 (17 CFR 270.30a-3(c)) as of 8/31/2018, the registrant’s principal executive officer and principal financial officer found the registrant’s disclosure controls and procedures to provide reasonable assurances that information required to be disclosed by the registrant in the reports that it files under the Securities Exchange Act of 1934 (a) is accumulated and communicated to registrant’s management, including its principal executive officer and principal financial officer, to allow timely decisions regarding required disclosure, and (b) is recorded, processed, summarized and reported, within the time periods specified in the rules and forms adopted by the U.S. Securities and Exchange Commission.
There have been no changes in the registrant’s internal controls over financial reporting that occurred during the registrant’s second fiscal quarter of the period covered by this report that have materially affected, or are reasonably likely to materially affect, the registrant’s internal control over financial reporting.
Item 12. Disclosure of Securities Lending Activities for Closed-End Management Investment Companies.
Not applicable.
Item 13. Exhibits.
| (a) | (1) Exhibit attached hereto. |
(2) Exhibits attached hereto.
SIGNATURES
Pursuant to the requirements of the Securities Exchange Act of 1934 and the Investment Company Act of 1940, the registrant has duly caused this report to be signed on its behalf by the undersigned, thereunto duly authorized.
| | |
| Oppenheimer Capital Income Fund |
| |
| By: | | /s/ Arthur P. Steinmetz |
| | Arthur P. Steinmetz |
| | Principal Executive Officer |
| Date: | | 10/19/2018 |
Pursuant to the requirements of the Securities Exchange Act of 1934 and the Investment Company Act of 1940, this report has been signed below by the following persons on behalf of the registrant and in the capacities and on the dates indicated.
| | |
| By: | | /s/ Arthur P. Steinmetz |
| | Arthur P. Steinmetz |
| | Principal Executive Officer |
| Date: | | 10/19/2018 |
| | |
| By: | | /s/ Brian S. Petersen |
| | Brian S. Petersen |
| | Principal Financial Officer |
| Date: | | 10/19/2018 |