UNITED STATES
SECURITIES AND EXCHANGE COMMISSION
WASHINGTON, D.C. 20549
FORM N-CSR
CERTIFIED SHAREHOLDER REPORT OF REGISTERED MANAGEMENT
INVESTMENT COMPANIES
Investment Company Act file number 811-1512
Oppenheimer Capital Income Fund
(Exact name of registrant as specified in charter)
6803 South Tucson Way, Centennial, Colorado 80112-3924
(Address of principal executive offices) (Zip code)
Cynthia Lo Bessette
OFI Global Asset Management, Inc.
225 Liberty Street, New York, New York 10281-1008
(Name and address of agent for service)
Registrant’s telephone number, including area code: (303) 768-3200
Date of fiscal year end: August 31
Date of reporting period: 8/31/2016
Item 1. Reports to Stockholders.
Table of Contents
Class A Shares
AVERAGE ANNUAL TOTAL RETURNS AT 8/31/16
| | | | | | | | | | | | | | | | | | |
| | | Class A Shares of the Fund | | | | | | | | | |
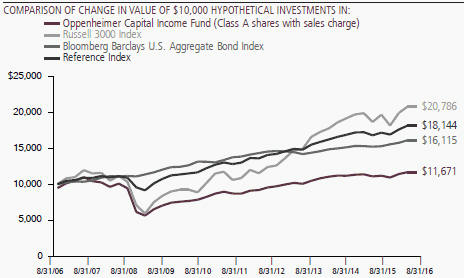
| | | Without Sales Charge | | | With Sales Charge | | | Russell 3000 Index | | | Bloomberg Barclays U.S. Aggregate Bond Index | | | Reference Index |
| 1-Year | | | 5.31% | | | | -0.74% | | | | 11.44% | | | | 5.97% | | | 8.21% |
| 5-Year | | | 6.04 | | | | 4.80 | | | | 14.46 | | | | 3.24 | | | 7.36 |
| 10-Year | | | 2.16 | | | | 1.56 | | | | 7.59 | | | | 4.89 | | | 6.45 |
Performance data quoted represents past performance, which does not guarantee future results. The investment return and principal value of an investment in the Fund will fluctuate so that an investor’s shares, when redeemed, may be worth more or less than their original cost. Fund returns include changes in share price, reinvested distributions, and a 5.75% maximum applicable sales charge except where “without sales charge” is indicated. Current performance may be lower or higher than the performance quoted. Returns do not consider capital gains or income taxes on an individual’s investment. For performance data current to the most recent month-end, visit oppenheimerfunds.com or call 1.800.CALL OPP (225.5677). See Fund prospectuses and summary prospectuses for more information on share classes and sales charges.
2 OPPENHEIMER CAPITAL INCOME FUND
Fund Performance Discussion
The Fund’s Class A shares (without sales charge) generated a total return of 5.31% during the reporting period. On a relative basis, the Fund underperformed its Reference Index, a customized weighted index comprised of 65% Bloomberg Barclays U.S. Aggregate Bond Index (Bloomberg Barclays Index) and 35% Russell 3000 Index, which returned 8.21%. Measured separately, the Bloomberg Barclays Index returned 5.97% and the Russell 3000 Index returned 11.44%. The Fund underperformed the Morningstar 30-50% Equity Category average (formerly called Conservative Allocation), which returned 6.03%.
The High Grade Fixed Income strategy generated solid absolute returns during the period and outperformed the Bloomberg Barclays Index. The Equity & Equity-Like strategy also generated attractive absolute returns but underperformed the Russell 3000 Index, due in part to our marginal underweight in this strategy. The
Opportunistic strategy generated positive returns but underperformed the Bloomberg Barclays Index more significantly, which was also due in part to our underweight to the strategy. In addition, many of our defensive hedging positions detracted from performance in a “rising-tide-lifts-all-boats” market environment in 2016.
|
| 3 OPPENHEIMER CAPITAL INCOME FUND |
The Fund continues to deliver on its value proposition of attractive total returns (with a mid-single digit return in the reporting period) combined with low volatility (4.20% standard deviation vs. 12.97% for the broad U.S. equity market (as measured by the S&P 500) during the reporting period), good downside risk mitigation, a yield in the 2.5% to 4.0% range and high risk-adjusted returns. Significantly, the Fund held up well during the most pronounced risk-off episodes of the last 12 months. For example, in the first six weeks of 2016 (12/31/15-2/11/16), the S&P 500 fell 10.27% while the Fund declined 72% less or 2.86%, outperforming the Morningstar 30-50% Equity Category average by 169 basis points. Similarly, in the immediate aftermath of the Brexit vote (6/24/16-6/27/16), the S&P 500 declined 5.34% while the Fund declined 75% less or 1.32%, again outperforming its Morningstar Category average by 108 basis points.
The Fund’s Class A shares paid four dividends during the period: $0.0619 per share in June 2016, $0.0619 per share in March 2016, $0.0919 per share in December 2015 and $0.0620 per share in September 2015 for a total of $0.2777 per share in the last 12 months. (The Fund’s Class A shares had a NAV of $9.84 per share on 8/31/16.) In addition, we believe that upside/downside capture ratios provide a good measure of the Fund’s downside protection. The upside capture ratio is the cumulative performance of the Fund in all up months of positive return divided by the cumulative performance of the index in those months. The downside
capture ratio is the cumulative performance of the Fund in all down months of negative return divided by the cumulative performance of the index in those months. For the period from April 2009 to August 2016 (the time that Michelle Borré has been lead portfolio manager), the Fund’s upside capture has been 96.34% of the Morningstar 30-50% Equity Category peer group average and its downside capture has been 59.52%. This level of asymmetry means that the Fund has delivered significantly more upside than downside during that period. In our view, these distributions, combined with our upside/ downside capture ratios, are a testament to the Fund’s intelligent blending of multiple asset classes as well as its primary goal of total return, involving a combination of price appreciation, downside risk mitigation and income.
We believe the periodic sharp declines in the equity markets over the last several years, combined with spikes in volatility (including the dramatic declines in stocks and spikes in volatility during August and December of 2015, the first six weeks of 2016 and the immediate aftermath of the Brexit vote) suggest that investors should remain mindful of risk. Structural flaws in Europe and Japan remain unresolved, and certain emerging markets continue to slow while certain developed markets struggle to tread water. Portions of the Eurozone are facing persistently slow growth combined with inflation that is well below their targets. Russia, Brazil, Greece, Argentina, Ecuador and Venezuela are all in recessions today.
|
| 4 OPPENHEIMER CAPITAL INCOME FUND |
Regarding geopolitical risks, conflicts in both Syria and Ukraine could escalate. Regional warfare rages on in the Middle East. North Korea is testing missiles and nuclear weapons while China is still building islands in the South China Sea. The refugee crisis continues unabated in Europe. Several factors have helped to mask structural weaknesses that we believe remain unaddressed, including highly accommodative central bank policies around the world, the Federal Reserve’s (Fed) delay in raising rates this year, relatively low market volatility and seemingly adequate liquidity. The Fund’s multi-asset class approach offers the flexibility to navigate what we see as a dynamic, unpredictable and still challenging environment.
The Fund attempts to deliver total return by providing a stream of income along with capital appreciation while attempting to mitigate downside risk. The Fund invests opportunistically in a broad range of securities across asset classes and capital structures. The portfolio is designed as a conservative investment vehicle with income, upside potential, strong risk-adjusted returns and low volatility. Our investment process combines top down and bottom up analysis both within and across asset classes. We are fundamentally driven and longer-term value oriented investors.
MARKET OVERVIEW
The global capital markets began to undergo several meaningful changes during the reporting period. Certain of these changes
resulted from the Fed’s decision last December to raise the Fed Funds rate for the first time in nine years. Although the increase was only 25 basis points, it was accompanied by Fed guidance that the market could be facing up to four rate hikes in 2016 and an additional four hikes in 2017. The possibility of eight rate hikes over the next 24 months was enough to spark a global selloff, with the S&P 500 falling 10.27% in the first six weeks of 2016. During the same period, the FTSE 100 Index fell 11.11%, the Nikkei 225 Index fell 17.44%, the MSCI Emerging Markets Index fell 10.17% and WTI crude oil collapsed 29.92% to a new cycle low of $26 per barrel. The severity of this selloff surprised the Fed, causing it to walk back market expectations about the steepness of the path to rate normalization. Instead of proceeding with eight rate hikes over 2016-2017, the Fed immediately hit pause and has not raised rates again for the last ten months. It remains to be seen when the Fed will start hiking again and what the path toward rate normalization will look like. However, one thing is certain—when the Fed hikes again it will only be widening a divergence of monetary policy that investors have never faced before. This is especially true since the European Central Bank (ECB), the Bank of Japan (BoJ), the Bank of England (BoE) and the Peoples’ Bank of China (PBOC), among others, continue to execute quantitative easing (QE), negative interest rate policies or other forms of monetary easing. (In fact, the central banks in Russia, Turkey and Indonesia all cut interest rates within a week of one another during September.) Each of these
|
| 5 OPPENHEIMER CAPITAL INCOME FUND |
central bank programs, like the four rounds of QE that the Fed executed from 2009-2014, are designed to help boost the economy by keeping mortgage rates and other long-term interest rates low, but a primary benefit to investors has turned out to be their contribution to asset price inflation.
Although the Fed stopped purchases under its most recent QE program on Halloween of 2014, the combination of the ECB’s and BoE’s new QE programs, and the BoJ’s acceleration of its existing QE program, have more than made up for the cessation of the Fed’s purchases, further adding to global liquidity in both 2015 and 2016. Significantly, we do not expect this year-on-year acceleration in total global QE to continue indefinitely. Moreover, the results in the Eurozone and Japan have not been particularly impressive so far. Inflation has remained well below target and economic growth has remained anemic in both regions. Real Gross Domestic Product (“GDP”) growth in the Eurozone was only 0.3% year-on-year in the second quarter of 2016, and it was just 0.2% in Japan for that period.
As investors have begun to appreciate the broader implications of these changes in both monetary policy and global liquidity, risk asset classes have started to behave differently. For example, during the 25 year period ending 12/31/15, the average annual total return for the S&P 500 was 9.81%. However, four rounds of QE by the Fed during 2009-2014 accelerated economic growth, inflated risk asset prices and pulled forward financial
returns. In fact, during that six year period, the average annual total return for the S&P 500 increased to 17.2%. When the last of those QE programs ended on 10/31/14, economic growth slowed and financial returns declined sharply. In this regard, the total return for the S&P 500 in 2015—the first full year after QE3 ended—was just 1.38%. While the total return for the S&P 500 has improved to 7.82% year to date (as of 8/30/16), we believe a critical driver of that improvement has been the fact that the Fed has not raised rates again in the last 10 months. Going forward, we believe that returns for the S&P 500 will be more muted than they have been over the last seven years, with an average annual return of approximately 5% or less on a longer term basis. In short, we expect structurally lower returns and higher volatility in a post-QE world (at least in the U.S.) where extremely accommodative monetary policies stimulated growth, inflated risk asset prices and pulled forward financial returns.
More broadly, we believe that in a number of countries there has been a meaningful change in the relationship between elected representatives and voters, or stated differently, between those who make policies and those who actually pay for those policies. This change was typified by Brexit where voters in the U.K. surprised the capital markets by electing to leave the European Union (EU). This outcome caused Prime Minister David Cameron to resign and many economists have opined that Brexit would negatively impact growth and could ultimately
|
| 6 OPPENHEIMER CAPITAL INCOME FUND |
send the U.K. into a recession. Yet in the wake of that vote, risk assets around the world sold off sharply for just two days, and then started rising again as the BoE promised additional monetary stimulus to counteract the effects of any slowdown. To be clear, the U.K. has not yet left the EU, and the terms of its withdrawal have not yet been negotiated. This means that the full impact of the Brexit vote, and its true economic cost, are still to be determined.
In other countries, voter dissatisfaction with ruling parties continues to grow. For example, German Chancellor Angela Merkel’s Christian Democratic Union posted disappointing losses in several recent elections, due in part to voter anger over Germany’s acceptance of more than one million refugees from the Middle East and Africa. In Austria, the highest court recently voided the results of the Presidential election held in April, citing improper handling of write-in votes. The far-right Freedom Party candidate narrowly lost that contest but is now leading in the polls ahead of a second election scheduled for December. In Spain, Acting Prime Minister Mariano Rajoy has twice failed to form a coalition government, and seems unable to break the stalemate that he says threatens the country’s economic recovery. In Turkey, President Recep Erdogan put down an attempted military coup in July and then implemented a broad-based purge of his political enemies. In the Philippines, newly elected right-wing President Rodrigo Duterte is remaking his country through a hyper-aggressive war on corruption as well as a lurch away from the U.S. and toward China.
In short, the chasm between politicians who decide social and fiscal policies and the voters who actually pay for those policies is growing. Austria has an election in December while both Germany and France hold elections in 2017, and Italy has an election in 2018. We believe the results could lead to additional fragmentation in Europe. Meanwhile, voter dissatisfaction is on full display in the U.S. with presidential candidate Donald Trump running a campaign to effect radical change in Washington. Each of these elections has the potential to create significant geopolitical change that could increase volatility in the capital markets.
Finally, the reporting period was bookended by sharp selloffs in risk assets combined with spikes in volatility. For example, the S&P 500 sold off sharply in August 2015 (surprise Chinese yuan devaluation), December 2015 (weak economic data), January/February 2016 (Fed rate hike) and June 2016 (Brexit), while the Chicago Board Options Exchange SPX Volatility Index (VIX Index) spiked in each of those months. During the one year period ended 8/31/16, the yield on the 10-year Treasury note oscillated between a high of 2.37% on 11/9/15 and a low of 1.32% on 7/6/16 before ending the period at 1.58% for a decline of 64 basis points. Against this backdrop, the Bloomberg Barclays Index delivered a total return of 5.97% during the period while the CS Leveraged Loan Index had a total return of 3.74% and the Merrill Lynch U.S. High Yield Index had a total return of 9.18%. In other words, these bond indices delivered single digit returns with relatively
|
| 7 OPPENHEIMER CAPITAL INCOME FUND |
high volatility. In our view, Treasuries could become less helpful to investors during market selloffs in part because they offer paltry yields, making the risk/reward tradeoff unattractive. This is especially true as the Fed moves closer to raising rates again.
In our view, equity markets are exhibiting significantly increased volatility but are no longer rising consistently, and traditional fixed income investments are not providing as much ballast to diversified portfolios during a challenging market environment. Under these circumstances, we believe investors could benefit from a broader toolkit than was needed during the risk-on market of 2009-2014 and a different toolkit than has been effective in the past because of the unfavorable risk/reward in conservative fixed income. Part of this broader toolkit could include the ability to take positions with short exposure which can actually profit from market declines. This kind of short exposure is available through the Opportunistic strategy of the Fund. (Because the Fund does not have a prime broker, we do not short individual securities. However, we can take negative positions, or the functional equivalent of short exposures, through a variety of different financial instruments.)
FUND REVIEW
Equity strategy. The Fund’s Equity & Equity-Like strategy may include common stocks, high delta convertible bonds, preferred stocks and structured notes. This strategy generated an attractive absolute return but
underperformed the Russell 3000 Index during the reporting period. The strongest contributors to performance were our positions in Altria Group, AT&T and Lockheed Martin, while the biggest detractors included Allergan, Novartis and Universal Health Services.
Altria Group (MO), which manufactures and sells cigarettes and tobacco products, contributed to performance during the period as it benefited from a variety of factors. First, the domestic cigarette industry continues to exhibit competitive discipline, which has resulted in a solid pricing environment. Second, the combination of a slowly improving domestic economy and lower gasoline prices has resulted in better-than-anticipated industry sales volumes. Third, investors have been attracted to the company’s dividend yield in the current low interest rate environment. Finally, exclusively domestic exposure has made the company more attractive to consumer staples investors who are attempting to avoid the macro and currency volatility in international markets. Going forward, we are optimistic about the prospects for the new iQOS heat sticks (for which the company has an exclusive license in the U.S.). We believe the introduction of this product could be a positive catalyst for the company. Consumers have been receptive to heat sticks in international markets thus far, and we believe this product could drive share gains for Altria in the U.S.
AT&T (T), a telecommunications provider, also contributed to performance. The
|
| 8 OPPENHEIMER CAPITAL INCOME FUND |
company’s shares have climbed on the back of strong execution and management’s ability to generate synergies from the Direct TV acquisition. In this regard, management has cut programming costs and successfully bundled Direct TV with its wireless services. The additional cash flow from Direct TV has bolstered the company’s financial profile, thereby providing investors with greater confidence in the sustainability of the dividend (approximately 4.6% as of 9/26/16) in a low rate environment.
Lockheed Martin (LMT), a leading U.S.-based defense company, was a positive contributor as well. The company is a significant beneficiary of geopolitical instability. In addition, during the reporting period, Lockheed benefited from upside earnings surprises in three of the last four quarters, and management raised the company’s earnings outlook for 2016. Lockheed closed its acquisition of Sikorsky during the past year and management hinted at potential upside for that business later in 2016. Management’s commentary also suggests that margins on the F-35 program could hit double digits as early as 2017. Finally, in a challenging macro environment, investors have been attracted to the company’s robust free cash flow (which has resulted in dividend and stock buyback increases) and earnings visibility (with ~$80 billion in backlog) from the improving outlook for the U.S. defense budget, the ramp up of the Joint Strike Fighter program, and an overall increase in international defense spending.
In contrast, Allergan (AGN), formerly known as Actavis, detracted from performance during the period. AGN is a specialty pharmaceutical company that markets branded drugs for patients suffering from diseases principally in the eye care, neuroscience, medical aesthetics/dermatology, women’s health and gastroenterology categories. Last July, Allergan announced the sale of its generics business, with ~1,000 generic and branded generic pharmaceutical products globally, to Teva Pharmaceuticals for $40.5 billon. The transaction closed in mid-2016 and will allow AGN to pursue additional opportunities in the branded pharmaceuticals business. In November 2015, the company announced a merger with Pfizer to create one of the largest global pharmaceutical companies, and expected the deal to close in the second half of 2016. However, the merger was called off in early April after unprecedented actions by the U.S. Treasury made the economics of the transaction unattractive. We continue to like Allergan as a stand-alone company on the basis of its organic and inorganic growth opportunities, and we have added to our position following the break-up of the Pfizer acquisition.
Novartis (NVS), a global healthcare company that develops treatments for unmet medical needs across three main divisions—branded pharmaceuticals, Alcon (eye care), and Sandoz (generic pharmaceuticals)—detracted from performance as well. Novartis underperformed over the last twelve months due in large part to concerns over the slowdown in its Alcon eye care business.
|
| 9 OPPENHEIMER CAPITAL INCOME FUND |
Management responded by restructuring that division and has brought in new leaders to shepherd the turnaround. Despite the near-term headwinds in Alcon, we are still positive on the strength of the company’s pharmaceutical pipeline (including two major launches that are in their early stages), its ongoing margin improvement/portfolio optimization initiatives, and its leading Sandoz generics business in the emerging field of generic biologic pharmaceuticals.
Universal Health Services (UHS) is a leading hospital management company that operates behavioral health facilities, acute care hospitals and ambulatory centers in the U.S. and Puerto Rico. The company detracted from performance during the period due in part to a slowdown in admissions growth at its behavioral facilities caused by a temporary shortage of nursing staff in select markets. UHS is working to remedy this issue and expects to be in a better position by the end of the year as recruitment and retention initiatives gain traction. Despite this near-term headwind, we remain optimistic about the longer-term demand for behavioral health and addiction treatment services. In addition, the company’s solid balance sheet and strong cash flow should enable UHS to pursue accretive acquisitions and also return capital to shareholders through dividends and share repurchases.
Opportunistic strategy. In this strategy we seek asymmetric risk/reward opportunities and investments where the return profile has a low correlation to traditional investment
strategies. We also seek investments which can help to achieve our broader fund objectives. At the end of the fiscal year, this strategy included investments in senior loans through Oppenheimer Master Loan Fund, LLC, asset-backed securities (ABS), corporate bonds, convertible securities and small positions (measured by market value) in derivatives. This strategy produced a positive absolute return but underperformed the Bloomberg Barclays Index. Among the top performers in this strategy were our long positions in senior bank loans, gold and the corporate debt of Lukoil. The biggest detractors were our long positon in an ABS backed by aircraft engines, our short position in the Japanese yen and our option position on higher U.S. interest rates.
Our position in the Oppenheimer Master Loan Fund, LLC contributed to performance during the period. Credit spreads widened from the beginning of 2016 into February, and then tightened dramatically through the end of the period as concerns about slowing U.S. growth and high corporate leverage dissipated due primarily to mixed-but-improving economic data combined with signals that the Fed was unlikely to raise rates quickly. Furthermore, the global contraction in yields exacerbated the search for yield among investors, and generally improved returns on fixed income instruments. The overall tightening of credit spreads drove performance of the Master Loan Fund. These macro developments overwhelmed the continued upward trend in defaults. In this regard, the default rate rose from 1.3% in the
|
| 10 OPPENHEIMER CAPITAL INCOME FUND |
twelve month period through August 2015 to 2.0% in the twelve month period through August 2016. We continue to monitor the trends in default rates closely.
Our long position in gold (GLD) also contributed to performance as the yellow metal climbed by 15.33% (or $174) to $1,308 per troy ounce during the period. Gold bullion, which began the period at $1,134 per ounce, declined into the end of 2015 but started rising sharply in 2016, reaching a high of $1,375 on 7/11/16 before easing to end the period at $1,308. Investors bid up the price of the metal as a safe haven play, a warrant against monetary policy going off the rails, protection against negative interest rate policies and a potential hedge against competitive currency debasement.
Our long position in the unsecured corporate debt of Lukoil, a Russian integrated oil company, contributed to performance as well. Lukoil’s ability to generate revenue is driven by the price of oil while its operating costs are denominated in rubles. Although the decline in the price of oil (~9% for WTI crude oil) during the period decreased revenue, several factors served to stabilize Lukoil’s credit fundamentals. The 1.82% decline in the Russian ruble versus the dollar reduced both operating and capital costs for the company. Russian tariffs and taxes declined along with the drop in the price of oil. At the same time, Lukoil’s conservative capital structure limited the impact of declining cash flows. From a credit perspective, the company is quite solid in
terms of cash flow coverage and asset values relative to debt. The Fund holds Lukoil debt that is denominated in U.S. dollars, so the weakness in the ruble is less of a concern, except for the fact that the company now owes more than it did previously.
In contrast, our position in Blade 20016-1AW A1, an ABS backed by a portfolio of aircraft engines, detracted from performance during the period. Some of Blade’s engines are associated with planes that are older and in lower demand. The bond has underperformed as some of those engines have sold at prices that were below appraisal values, calling into question the value of the engine portfolio. On the positive side, however, both principal and interest payments on the bond are insured by Assured Guaranty.
Long dollar / short JPY. We are short several different currencies relative to the U.S. dollar, including the Japanese yen (JPY). This positon detracted from performance in the period as the yen strengthened relative to dollar. Simply put, the yen has appreciated substantially after the BoJ introduced negative interest rates in early 2016. Although the negative rate policy was intended to stimulate the Japanese economy, the stress that negative rates put on Japanese financial institutions overwhelmed any stimulative impact on the economy. Under the current policy, Japanese banks must pay to park reserves at the central bank. While this increases the incentives for banks to lend rather than pay negative rates, loan demand has not been adequate to soak up the excess
|
| 11 OPPENHEIMER CAPITAL INCOME FUND |
reserves. Furthermore, it has proven difficult for banks to pass the negative rates on to depositors. The strain this policy has put on banks makes the extension of the program problematic. These drawbacks combined with the size of the BoJ’s balance sheet have led some to conclude that the BoJ does not have capacity to stimulate the Japanese economy further, and may need to shift to less accommodative policy. The prospect of less stimulus going forward has caused the yen to appreciate relative to the dollar, negatively impacting our short position.
Our payer swaption on U.S. interest rates, GOL US L PY 2.505 10Y OPT, detracted from performance as well. This option position benefits from higher U.S. rates. However, interest rates declined during the period, which reduced the value of this position. Rates fell because economic growth was slower than anticipated, and Brexit as well as other international risks caused the Fed to remain cautious about raising rates. A decline in the estimated long term neutral rate suggested the Fed’s hiking path would be shallower than in previous cycles, causing our option position to decline in value.
High Grade Fixed Income strategy. The High Grade Fixed Income strategy generated solid absolute returns and outperformed the Bloomberg Barclays Index during the reporting period. This strategy continues to favor corporate bonds, mortgages and other securitized products over government debt.
The dollar was mixed against a basket of currencies for the largest trading partners of the U.S., falling sharply against the Japanese yen and Australian dollar but rising sharply against the British pound and Mexican peso. The yield in the 10-year Treasury note oscillated between a high of 2.37% and a low of 1.32% before ending the period at 1.58%, or 64 basis points below where it started. Against this backdrop, the High Grade Fixed Income strategy’s positioning within corporates in the first half of the reporting period, including its underweight in the Metals & Mining and Oilfield Service sectors, helped performance as the price of crude oil dropped sharply. However, the Automotive sector underperformed as U.S. auto manufacturer bonds suffered after news of the Volkswagen emissions scandal broke late in 2015. Corporates contributed modestly positive relative performance, while the Fund’s underweight Treasury position detracted slightly into year end.
As we entered 2016, credit spreads widened amid stock market weakness. The Fed’s statement in January suggested it would continue raising rates gradually this year which further roiled markets as global growth continued to slow. Risk asset weakness and the BoJ’s decision in January to implement negative interest rates helped push down U.S. Treasury yields dramatically. By mid-February, markets began to turn. The ECB hinted it would likely ease further, the BoJ’s tone remained dovish, China signaled it would provide further stimulus, and better than expected economic data helped turn
|
| 12 OPPENHEIMER CAPITAL INCOME FUND |
sentiment. A dovish Fed statement in mid-March and further dovish comments from Chairperson Janet Yellen helped support the improving trend in risk sentiment.
After the Brexit vote in June, Treasuries caught a flight-to-quality bid to finish the first half of the year near 1.50%. Security selection and sector allocation in investment grade, agency mortgages and ABS were the strongest contributors to relative performance late in the reporting period. Allocation to high yield was a modest drag on performance. At the end of the period, the High Grade Fixed Income strategy remained overweight credit exposure because the team believes that the U.S. credit cycle, while maturing, has not yet turned. Strong demand for investment grade corporates continues as yields elsewhere in the world have plummeted and in many regions are negative, even for higher-rated corporate debt. This has caused flows into U.S. investment grade fixed income markets. While the technicals remain strong for high quality U.S. dollar assets, credit spreads could be challenged and volatile. As a result, the team has been taking a more defensive stance toward credit. In particular, later in the reporting period car loan ABS exposure was reduced by more than a third and will continue to be reduced as bonds mature or are pre-paid. Underwriting of car loans in the last few years appears to have been less rigorous than with earlier post-crisis vintages and is a cause for some caution. The team continues to look for opportunities in agency MBS, adjusting exposures among the various mortgage securities available. Within
corporates, we have made few changes to the portfolio, maintaining overweights in banks and automotives. The strategy also maintains a position in BB-rated corporates concentrated in domestic names. The High Grade Fixed Income strategy remains focused on credits with improving profiles that offer attractive valuations.
STRATEGY & OUTLOOK
The macro environment remains complex and we continue to see numerous cross currents. While equities look interesting versus bonds in the mid to longer term, we saw a shorter term disconnect between the strong performance in equities, softness in earnings growth, and negative earnings revisions for the S&P 500 in 2015. Importantly, those negative earnings revisions have continued into 2016 and may persist into 2017. (Consensus estimates at the start of last year called for S&P 500 earnings growth of 7-8% in 2015, but actual growth was just 0.4% on a pro forma basis, and -12.7% on a GAAP (Generally Accepted Accounting Principles) basis; consensus estimates at the end of 2015 called for 7-8% earnings growth in 2016, but those estimates have since been reduced to ~2%, which still may prove too high. Earnings estimates for 2017 are starting to be revised down as well.) Simply put, the U.S. equity market has moved meaningfully ahead of earnings growth, and valuations have climbed to the point where U.S. equities are no longer inexpensive. In addition, late cycle warning signs are starting to flash yellow. Default rates on subprime auto loans
|
| 13 OPPENHEIMER CAPITAL INCOME FUND |
are starting to tick up. Automobile sales, along with home sales, have supported much of the economic growth in the U.S. for the last several years. Similarly, default rates on senior bank loans and high yield bonds have started to tick up. Profit margins for the S&P 500 have peaked and are starting to decline. The question for investors is whether earnings growth will reaccelerate. While we believe a rebound in earnings for energy companies is likely, we do not expect any rebound to be broad based across sectors.
As a result, security selection has become even more important. In our view, volatility was likely to increase, which it did with a vengeance in August of 2015 when China devalued the yuan. This heightened volatility continued through late 2015 on the back of weak economic data, into early 2016 as the Fed hiked rates for the first time in nine years, and then into mid-year with the Brexit vote. Extremely accommodative monetary policy around the world has impacted all asset classes, including equities, and has been an important driver of rising asset prices during the last several years. This exceptional accommodation was evident in 2015 with at least 35 central banks cutting rates collectively more than 55 times. It has continued into 2016 with additional rate cuts so far this year by the ECB, the BoJ, the BoE and central banks in Russia, India, Australia, Indonesia, Singapore, Norway and Turkey, among others. (As mentioned above, central banks in Russia, Turkey and Indonesia all cut rates again within a week of one another during September.)
Under these circumstances, we believed that any normalization of rates and/or the withdrawal of central bank stimulus could pressure risk asset prices significantly, and that is precisely what happened as the Fed raised rates in December. We continue to believe that there is more risk lurking beneath the surface of the market than many investors recognize, but it has been masked by unusually accommodative monetary policy, unusually low interest rates, unusually low volatility and adequate market liquidity. Some of that risk became evident in 2015 with the flare-up of the Greek debt crisis in April, the extraordinary backup in yields on German bunds during May/June, the 30-40% drop in Chinese equities in June, the Chinese yuan devaluation in August, the double digit drop in the S&P 500 during August, sovereign debt downgrades in Brazil (to junk status) and Japan, and the global equity selloffs in December as well as the first six weeks of 2016. It has also shown up in the extreme pressure year-to-date on the share price of Deutsche Bank, which is a systemically important bank for both Germany and the Eurozone. In our view, the market is caught between two unattractive outcomes—if growth really resumes, it will lead to sustained tightening. If growth tapers off, the tightening will be avoided but challenging underlying fundamentals will remain.
More broadly, Treasury rates seem range bound in the near term absent some exogenous shock, with yields oscillating between 1.25% to 3.0%, although a significant negative development in the
|
| 14 OPPENHEIMER CAPITAL INCOME FUND |
emerging markets could push rates below the lower end of this range. The market came close to this outcome when 10-year Treasury yields dipped to 1.32% on 7/6/16. In the longer run, however, we do not believe rates this low are sustainable. Over the past several quarters, economic growth has slowed and central banks around the world have resorted to increasingly aggressive and distorting monetary policy. This included large scale purchases of government bonds and other debt, which pushed the price of those securities up and the yield down. In addition, investors increasingly sought the safety of these securities, partly as a result of the macro risks they saw. Zero interest rate policies morphed into negative interest rate policies. In fact, approximately 23% of global GDP today comes from countries with negative interest rates, including the Eurozone (19 countries), Japan, Switzerland and Norway. However, we believe the ECB and the BoJ are finally starting to recognize the outer limits of what negative rates can accomplish. We believe that negative rates have put significant strain on banks in both Europe and Japan by artificially repressing rates, flattening yield curves and attempting to force those banks to make loans to customers they otherwise would not have lent to. Moreover, the ECB and the BoJ are literally running out of bonds to buy in their massive monthly purchase programs. If these central banks pull back on their monetary policies, it could be quite disruptive to the capital markets. The next question becomes whether these central banks will start funding
government-mandated fiscal programs, and if they do, the outcome could be quite inflationary.
Against this backdrop, the Fed ended its latest QE program in October 2014, which helped to send the dollar higher against many major currencies. Partly as a result of this, combined with slowing economies in China and numerous emerging markets as well as issues specific to the various regions in question, we hold positions that are long the U.S. dollar and short other currencies including the Australian dollar, euro and Japanese yen. We also added several new positions in 2015 that are designed to protect against the risk of further slowing in the emerging markets. These include a short position in the Chinese yuan (added before the devaluation of the yuan last August), a short position in the Thai baht and a credit default swap on the sovereign debt of Malaysia. In our view, the markets face a new paradigm of slower economic growth in China, and investors need to adjust to it. We also believe this relative divergence in monetary policy could ultimately feed through to interest rates. Currently, the moves that historically could have occurred in the rates markets are being pushed to the currency markets due to the central banks’ aggressive monetary policies holding rates low.
Moreover, while some market commentators are calling for further depreciation (or perhaps another devaluation) of the yuan, we believe such a move would negatively impact Asian trading partners and commodity producers.
|
| 15 OPPENHEIMER CAPITAL INCOME FUND |
Private credit growth and bank loans in China have continued to grow at a much higher rate than GDP. This level of credit growth is unsustainable, and at some point it will need to slow, which will act as a new drag on GDP in China. In our view, the longer term trend in China is still toward slower growth. The data we analyze indicates that there has been no meaningful shift in that economy, and so far the efforts to stimulate domestic consumption have not been able to overcome the negative impact of the industrial slowdown.
Although the U.S. economy remains stuck in first gear with average annual real GDP growth of 1.4% over the last seven years (dipping to 0.8% in 1Q 2016 and 1.4% in 2Q 2016), that growth rate has been relatively attractive compared to certain other developed markets. We are mindful that economies around the world likely will not decouple so long as the engines of global growth are slowing. The yield on the 10-year Treasury at 1.58% (as of 8/31/16) is an order of magnitude higher than those in other parts of the developed world, with yields on 10-year German Bunds and 10-year Japanese Government Bonds both (coincidently) at -0.07% on that date. Japan is becoming more desperate as consumption falls and evidence mounts that Abenomics is not working as planned. That policy was designed to revive the Japanese economy with “three arrows.” The third arrow in the quiver—meaningful structural reform—is proving to be a significant challenge. The Japanese economy narrowly avoided its sixth recession in nine years during early 2016,
and its real GDP growth was only 0.2% in the second quarter. In addition, the economy has not bounced back as expected from an increase in the consumption tax, and inflation has remained stubbornly below the BoJ’s target of 2%. Moreover, excessive leverage in the banking system is weighing on growth. In our view, early evidence that the market is becoming disillusioned with Abenomics has centered on a weakening yen. The BoJ’s implementation of negative interest rates in the first quarter of 2016 had the opposite effect than what the central bank intended, with the yen strengthening dramatically and the equity market falling by double digits. Additional evidence could involve investors’ loss of faith in the supposed omnipotence of the BoJ and the efficacy of its continuing QE and negative interest rate efforts. This is beginning to cause investors to be less responsive to central bank talk and require more actions. Significantly, the Fed has hiked rates less than expected in 2016. As a result, monetary policy in the U.S. has been tightened less than expected, yet it is still meaningfully tighter than policies in either Japan or the Eurozone.
We may be closer to a potential inflection point regarding investors’ faith in stimulus spending for China. There is a growing realization that boosting spending on infrastructure is only adding to the excess capacity problem in China, which is exacerbating deflation. More stimulus spending can make the problem worse instead of better. Fixing the oversupply by shutting it down is contractionary for GDP.
|
| 16 OPPENHEIMER CAPITAL INCOME FUND |
This is in contrast to past government actions of increasing spending which were additive to GDP. This could mark the beginning of a new phase where the markets no longer have the same faith in the ability of central banks to boost growth. The massive credit growth in China over the last 18 months may not result in the GDP growth that is hoped for, and even if it does, that GDP growth is unsustainable absent further boosts in credit growth in the future.
At the same time, growth in parts of Europe is stagnating with numerous countries facing an increasing risk of deflation. Precisely because growth is so slow in the Eurozone, the ECB has now implemented its own form of QE seven years after the U.S. first went down that path. However, the results so far have been underwhelming, which has led the ECB to extend the end date of the program, increase the amount of monthly debt purchases by 33%, expand the scope of the bonds it buys and further lower interest rates. By accelerating QE and expanding its balance sheet aggressively, the ECB seeks to inflate asset prices, just as it did in early 2015. Unfortunately, the real impediment to Eurozone growth is the lack of meaningful structural reform over the past seven years. Furthermore, the investor playbook of overweighting equities in countries where there is aggressive QE is not working this year, even after the snapback in risk assets over the last several months. The equity markets in Japan and Europe are lagging the U.S. equity market this year, even though the BoJ and ECB are executing QE
and have adopted negative interest rates, while the Fed has ended QE and is hiking rates, not implementing negative rates. In short, negative interest rates appear to have backfired as a form of monetary stimulus, with the banks selling off and equities underperforming, and with the yen and euro actually strengthening versus the U.S. dollar. This is not what the ECB or the BoJ predicted or intended. In tacit recognition of this, Japan is now taking unprecedented measures targeting both ends of the yield curve with the goal of keeping yields on 10-year Japanese Government Bonds at zero.
Moreover, geopolitical risk remains elevated as evidenced by Brexit and the election results favoring populist/separatist parties in the U.K., Greece, Spain, Portugal, Austria, Germany and the Philippines. Simply put, political instability in the Eurozone appears to be contained for now but it is by no means resolved. We believe continued immigration from the Middle East will only exacerbate tensions. More broadly, while some economic acceleration is visible in China as a result of excessive credit growth, we believe this acceleration may fade in time as that credit growth slows. Moreover, we do not believe any improvement in China will be enough to offset slowing momentum in the Eurozone, Japan and many of the emerging markets.
We believe the U.S. economy still has attractive growth potential in certain areas. A variety of changes in technology could create a host of winners and losers, and could drive growth for companies that are
|
| 17 OPPENHEIMER CAPITAL INCOME FUND |
able to successfully implement and harness the power of new technologies. There are pockets of innovation in different industries including pharmaceuticals, consumer discretionary and technology. Nonetheless, we are mindful that U.S. equity valuations were pushing up against the edge of bubble territory after several years when S&P 500 Index performance ran well ahead of earnings growth, leading to significant multiple expansion. In fact, the only time in the last four decades when the S&P 500 Index has traded at a higher price-earnings (P/E) multiple on next 12 months’ consensus earnings was during the Tech Bubble in 1997-2000. While valuations came down somewhat following the equity selloff in early 2016, they climbed back up as earnings estimates were reduced and the market made new all-time highs. Furthermore, volatility has been artificially restrained over the last several years by highly accommodative monetary policy, but this started to change in August of 2015 when China devalued the yuan, causing the VIX Index to spike sharply, and that index has spiked almost a dozen times since then, including in the immediate aftermath of the Brexit vote. In the past few years,
whenever equities sold off, buyers typically stepped in quickly because valuations were still relatively attractive. Since valuations are less attractive today, we could reach a point where it takes longer for buyers to appear after selloffs. Moreover, banking regulations are significantly stricter, the fixed income markets are a lot less liquid, and banks are taking on much less risk. Under these circumstances, we believe that any softness in the markets could lead to more volatility on the fixed income side than we have seen in recent years. That was certainly evident in the fourth quarter of 2015 and in early 2016, and we expect it to continue. Accordingly, we continue to pick our spots, selecting securities that we believe offer attractive risk-adjusted returns. We remain focused, as always, on controlling volatility and mitigating downside risk. We expect to be in a low return world for a while. We believe that the ability to generate attractive returns efficiently and without taking on undue risk, controlling volatility and limiting drawdowns will be of greater value to investors in a low return world, and that is where our investment team’s efforts are focused.
| | |

| | 
Michelle Borré, CFA Portfolio Manager |
| | |

| | 
Krishna Memani Portfolio Manager |
|
| 18 OPPENHEIMER CAPITAL INCOME FUND |
Portfolio Positioning
PORTFOLIO POSITIONING
| | | | | | | | | | | | |
| | | Long | | | Short | | | Net | |
| High-Grade Fixed Income Strategy | | | 46.0% | | | | -2.1% | | | | 43.9% | |
| Equity Strategy | | | 37.8 | | | | – | | | | 37.8 | |
| Opportunistic Strategy | | | 28.1 | | | | -12.6 | | | | 15.5 | |
HIGH-GRADE FIXED INCOME | | | | | | | | | | | | |
| | | Long | | | Short | | | Net | |
| Corporate Bonds | | | 17.7% | | | | –% | | | | 17.7% | |
| Mortgage Related Securities | | | 17.6 | | | | – | | | | 17.6 | |
| Duration | | | 7.0 | | | | -1.3 | | | | 5.7 | |
| Asset-Backed Securities | | | 3.7 | | | | – | | | | 3.7 | |
| Credit Default Swaps | | | – | | | | -0.8 | | | | -0.8 | |
TOP TEN EQUITY HOLDINGS | | | | | | | | | | | | |
| | | Long | | | Short | | | Net | |
| Lockheed Martin Corp. | | | 1.2% | | | | –% | | | | 1.2% | |
| Honeywell International, Inc. | | | 1.2 | | | | – | | | | 1.2 | |
| Apple, Inc. | | | 1.1 | | | | – | | | | 1.1 | |
| UnitedHealth Group, Inc. | | | 1.1 | | | | – | | | | 1.1 | |
| Chubb Ltd. | | | 1.1 | | | | – | | | | 1.1 | |
| M&T Bank Corp. | | | 1.0 | | | | – | | | | 1.0 | |
| Republic Services, Inc., Cl. A | | | 1.0 | | | | – | | | | 1.0 | |
| Altria Group, Inc. | | | 0.9 | | | | – | | | | 0.9 | |
| Xilinx, Inc. | | | 0.9 | | | | – | | | | 0.9 | |
| British American Tobacco plc | | | 0.9 | | | | – | | | | 0.9 | |
Portfolio holdings and allocations are dollar-weighted based on total net assets and are subject to change. Percentages are as of August 31, 2016. Holdings exclude cash and cash equivalents. As of August 31, 2016, the Fund held approximately 7.3% in cash. Negative weightings may result from the use of leverage. Leverage involves the use of various financial instruments or borrowed capital in an attempt to increase investment return. Leverage risks include potential for higher volatility, greater decline of the Fund’s net asset value and fluctuations of dividends and distributions paid by the Fund. Asset tables may not display cash weightings. Net total exposure may not equal the sum of long and short exposure due to rounding.
|
| 19 OPPENHEIMER CAPITAL INCOME FUND |
OPPORTUNISTIC STRATEGY
| | | | | | | | | | | | |
| | | Long | | | Short | | | Net | |
| Senior Loans | | | 10.8% | | | | –% | | | | 10.8% | |
| Corporate Bonds | | | 6.9 | | | | – | | | | 6.9 | |
| Asset-Backed Securities | | | 4.6 | | | | – | | | | 4.6 | |
| Mortgage Related Securities | | | 1.6 | | | | – | | | | 1.6 | |
| Commodities | | | 0.9 | | | | – | | | | 0.9 | |
| Equity Like | | | 0.8 | | | | – | | | | 0.8 | |
| Preferred Securities | | | 0.2 | | | | – | | | | 0.2 | |
| Interest Rates | | | 0.6 | | | | -0.9 | | | | -0.3 | |
| Duration | | | – | | | | -0.3 | | | | -0.3 | |
| Currencies | | | 0.2 | | | | -4.8 | | | | -4.6 | |
| Credit Default Swaps | | | 1.5 | | | | -6.6 | | | | -5.1 | |
Portfolio holdings and allocations are dollar-weighted based on total net assets and are subject to change. Percentages are as of August 31, 2016. Holdings exclude cash and cash equivalents. As of August 31, 2016, the Fund held approximately 7.3% in cash. Negative weightings may result from the use of leverage. Leverage involves the use of various financial instruments or borrowed capital in an attempt to increase investment return. Leverage risks include potential for higher volatility, greater decline of the Fund’s net asset value and fluctuations of dividends and distributions paid by the Fund. Asset tables may not display cash weightings. Net total exposure may not equal the sum of long and short exposure due to rounding.
|
| 20 OPPENHEIMER CAPITAL INCOME FUND |
Share Class Performance
AVERAGE ANNUAL TOTAL RETURNS WITHOUT SALES CHARGE AS 8/31/16
| | | | | | | | |
| | | Inception Date | | 1-Year | | 5-Year | | 10-Year |
| Class A (OPPEX) | | 12/1/70 | | 5.31% | | 6.04% | | 2.16% |
| Class B (OPEBX) | | 8/17/93 | | 4.45 | | 5.15 | | 1.61 |
| Class C (OPECX) | | 11/1/95 | | 4.47 | | 5.22 | | 1.32 |
| Class I (OCIIX) | | 12/27/13 | | 5.78 | | 4.12* | | N/A |
| Class R (OCINX) | | 3/1/01 | | 5.02 | | 5.75 | | 1.82 |
| Class Y (OCIYX) | | 1/28/11 | | 5.47 | | 6.32 | | 6.09* |
AVERAGE ANNUAL TOTAL RETURNS WITH SALES CHARGE AS OF 8/31/16
| | | | | | | | |
| | | Inception Date | | 1-Year | | 5-Year | | 10-Year |
| Class A (OPPEX) | | 12/1/70 | | -0.74% | | 4.80% | | 1.56% |
| Class B (OPEBX) | | 8/17/93 | | -0.55 | | 4.82 | | 1.61 |
| Class C (OPECX) | | 11/1/95 | | 3.47 | | 5.22 | | 1.32 |
| Class I (OCIIX) | | 12/27/13 | | 5.78 | | 4.12* | | N/A |
| Class R (OCINX) | | 3/1/01 | | 5.02 | | 5.75 | | 1.82 |
| Class Y (OCIYX) | | 1/28/11 | | 5.47 | | 6.32 | | 6.09* |
* Shows performance since inception. |
Performance data quoted represents past performance, which does not guarantee future results. The investment return and principal value of an investment in the Fund will fluctuate so that an investor’s shares, when redeemed, may be worth more or less than their original cost. Current performance may be lower or higher than the performance quoted. Returns do not consider capital gains or income taxes on an individual’s investment. For performance data current to the most recent month-end, visit oppenheimerfunds.com or call 1.800. CALL OPP (225.5677). Fund returns include changes in share price, reinvested distributions, and the applicable sales charge: for Class A shares, the current maximum initial sales charge of 5.75%; for Class B shares, the contingent deferred sales charge of 5% (1-year) and 2% (5-year); and for Class C shares, the contingent deferred sales charge (“CDSC”) of 1% for the 1-year period. There is no sales charge for Class I, Class R and Class Y shares. Because Class B shares convert to Class A shares 72 months after purchase, the 10-year return for Class B shares uses Class A performance for the period after conversion. Returns for periods of less than one year are cumulative and not annualized. See Fund prospectuses and summary prospectuses for more information on share classes and sales charges.
The Fund’s performance is compared to the performance of the Russell 3000 Index, the Bloomberg Barclays U.S. Aggregate Bond Index and the Fund’s Reference Index. The Russell 3000 Index measures the performance of the largest 3,000 U.S. companies, representing approximately 98% of the investable U.S. equity market. The Bloomberg Barclays U.S. Aggregate Bond Index is an index of U.S dollar-denominated, investment-grade U.S. corporate government and mortgage-backed securities. The Fund’s Reference Index is a customized weighted index currently comprised of 65% of the Bloomberg Barclays U.S. Aggregate
|
| 21 OPPENHEIMER CAPITAL INCOME FUND |
Bond Index and 35% of the Russell 3000 Index. The indices are unmanaged and cannot be purchased directly by investors. While index comparisons may be useful to provide a benchmark for the Fund’s performance, it must be noted that the Fund’s investments are not limited to the investments comprising the indices. Index performance includes reinvestment of income, but does not reflect transaction costs, fees, expenses or taxes. Index performance is shown for illustrative purposes only as a benchmark for the Fund’s performance, and does not predict or depict performance of the Fund. The Fund’s performance reflects the effects of the Fund’s business and operating expenses.
The Morningstar 30-50% Equity Category Average is the average return of the mutual funds within the investment category as defined by Morningstar. Returns include the reinvestment of distributions but do not consider sales charges. The Morningstar Conservative Allocation Category Average performance is shown for illustrative purposes only and does not predict or depict the performance of the Fund.
The Fund’s investment strategy and focus can change over time. The mention of specific fund holdings does not constitute a recommendation by OppenheimerFunds, Inc. or its affiliates.
Before investing in any of the Oppenheimer funds, investors should carefully consider a fund’s investment objectives, risks, charges and expenses. Fund prospectuses and summary prospectuses contain this and other information about the funds, and may be obtained by asking your financial advisor, visiting oppenheimerfunds.com, or calling 1.800.CALL OPP (225.5677). Read prospectuses and summary prospectuses carefully before investing.
Shares of Oppenheimer funds are not deposits or obligations of any bank, are not guaranteed by any bank, are not insured by the FDIC or any other agency, and involve investment risks, including the possible loss of the principal amount invested.
|
| 22 OPPENHEIMER CAPITAL INCOME FUND |
Fund Expenses
Fund Expenses. As a shareholder of the Fund, you incur two types of costs: (1) transaction costs, which may include sales charges (loads) on purchase payments and/or contingent deferred sales charges on redemptions; and (2) ongoing costs, including management fees; distribution and service fees; and other Fund expenses. These examples are intended to help you understand your ongoing costs (in dollars) of investing in the Fund and to compare these costs with the ongoing costs of investing in other mutual funds.
The examples are based on an investment of $1,000.00 invested at the beginning of the period and held for the entire 6-month period ended August 31, 2016.
Actual Expenses. The first section of the table provides information about actual account values and actual expenses. You may use the information in this section for the class of shares you hold, together with the amount you invested, to estimate the expense that you paid over the period. Simply divide your account value by $1,000.00 (for example, an $8,600.00 account value divided by $1,000.00 = 8.60), then multiply the result by the number in the first section under the heading entitled “Expenses Paid During 6 Months Ended August 31, 2016” to estimate the expenses you paid on your account during this period.
Hypothetical Example for Comparison Purposes. The second section of the table provides information about hypothetical account values and hypothetical expenses based on the Fund’s actual expense ratio for each class of shares, and an assumed rate of return of 5% per year for each class before expenses, which is not the Fund’s actual return. The hypothetical account values and expenses may not be used to estimate the actual ending account balance or expenses you paid for the period. You may use this information to compare the ongoing costs of investing in the Fund and other funds. To do so, compare this 5% hypothetical example for the class of shares you hold with the 5% hypothetical examples that appear in the shareholder reports of the other funds.
Please note that the expenses shown in the table are meant to highlight your ongoing costs only and do not reflect any transactional costs, such as front-end or contingent deferred sales charges (loads). Therefore, the “hypothetical” section of the table is useful in comparing ongoing costs only, and will not help you determine the relative total costs of owning different funds. In addition, if these transactional costs were included, your costs would have been higher.
|
| 23 OPPENHEIMER CAPITAL INCOME FUND |
| | | | | | |
| Actual | | Beginning Account Value March 1, 2016 | | Ending Account Value August 31, 2016 | | Expenses Paid During 6 Months Ended August 31, 2016 |
| Class A | | $ 1,000.00 | | $ 1,068.40 | | $ 5.21 |
| Class B | | 1,000.00 | | 1,064.60 | | 9.17 |
| Class C | | 1,000.00 | | 1,063.40 | | 9.17 |
| Class I | | 1,000.00 | | 1,070.60 | | 2.97 |
| Class R | | 1,000.00 | | 1,067.10 | | 6.51 |
| Class Y | | 1,000.00 | | 1,068.60 | | 3.96 |
| | |
Hypothetical (5% return before expenses) | | | | |
| Class A | | 1,000.00 | | 1,020.11 | | 5.09 |
| Class B | | 1,000.00 | | 1,016.29 | | 8.96 |
| Class C | | 1,000.00 | | 1,016.29 | | 8.96 |
| Class I | | 1,000.00 | | 1,022.27 | | 2.90 |
| Class R | | 1,000.00 | | 1,018.85 | | 6.36 |
| Class Y | | 1,000.00 | | 1,021.32 | | 3.87 |
Expenses are equal to the Fund’s annualized expense ratio for that class, multiplied by the average account value over the period, multiplied by 184/366 (to reflect the one-half year period). Those annualized expense ratios, excluding indirect expenses from affiliated funds, based on the 6-month period ended August 31, 2016 are as follows:
| | | | |
| Class | | Expense Ratios | |
| Class A | | | 1.00 | % |
| Class B | | | 1.76 | |
| Class C | | | 1.76 | |
| Class I | | | 0.57 | |
| Class R | | | 1.25 | |
| Class Y | | | 0.76 | |
The expense ratios reflect voluntary and/or contractual waivers and/or reimbursements of expenses by the Fund’s Manager. Some of these undertakings may be modified or terminated at any time, as indicated in the Fund’s prospectus. The “Consolidated Financial Highlights” tables in the Fund’s financial statements, included in this report, also show the gross expense ratios, without such waivers or reimbursements and reduction to custodian expenses, if applicable.
|
| 24 OPPENHEIMER CAPITAL INCOME FUND |
CONSOLIDATED STATEMENT OF INVESTMENTS August 31, 2016
| | | | | | | | |
| | | Shares | | | Value | |
| Common Stocks—37.3% | | | | | | | | |
| Consumer Discretionary—1.4% | | | | | | | | |
| Hotels, Restaurants & Leisure—0.6% | | | | | | | | |
Brinker International, Inc. | | | 308,724 | | | $ | 16,581,566 | |
| | | | | | | | | |
| Media—0.3% | | | | | | | | |
DISH Network Corp., Cl. A1 | | | 161,701 | | | | 8,122,241 | |
| | | | | | | | | |
| Multiline Retail—0.5% | | | | | | | | |
Target Corp. | | | 204,419 | | | | 14,348,170 | |
| | | | | | | | | |
| Consumer Staples—3.2% | | | | | | | | |
| Beverages—0.5% | | | | | | | | |
Coca-Cola Co. (The) | | | 323,580 | | | | 14,053,079 | |
| | | | | | | | | |
| Tobacco—2.7% | | | | | | | | |
| Altria Group, Inc. | | | 386,815 | | | | 25,564,603 | |
| British American Tobacco plc | | | 389,540 | | | | 24,210,763 | |
| Imperial Brands plc | | | 92,230 | | | | 4,844,596 | |
| Philip Morris International, Inc. | | | 186,400 | | | | 18,626,952 | |
| | | | | | | | 73,246,914 | |
| Energy—3.6% | | | | | | | | |
| Energy Equipment & Services—0.6% | | | | | | | | |
| Halliburton Co. | | | 52,898 | | | | 2,275,143 | |
| Schlumberger Ltd. | | | 153,430 | | | | 12,120,970 | |
| | | | | | | | 14,396,113 | |
| Oil, Gas & Consumable Fuels—3.0% | | | | | | | | |
| Canadian Natural Resources Ltd. | | | 141,686 | | | | 4,400,542 | |
| Chevron Corp. | | | 199,574 | | | | 20,073,153 | |
| ConocoPhillips | | | 321,276 | | | | 13,188,380 | |
| EOG Resources, Inc. | | | 100,580 | | | | 8,900,324 | |
| Exxon Mobil Corp. | | | 44,913 | | | | 3,913,719 | |
| Newfield Exploration Co.1 | | | 117,956 | | | | 5,114,572 | |
| Noble Energy, Inc. | | | 49,722 | | | | 1,714,415 | |
| Occidental Petroleum Corp. | | | 252,943 | | | | 19,438,669 | |
| Valero Energy Corp. | | | 79,178 | | | | 4,382,502 | |
| | | | | | | | 81,126,276 | |
| Financials—5.9% | | | | | | | | |
| Capital Markets—0.3% | | | | | | | | |
Goldman Sachs Group, Inc. (The) | | | 44,200 | | | | 7,490,132 | |
| | | | | | | | | |
| Commercial Banks—2.3% | | | | | | | | |
| Citigroup, Inc. | | | 147,880 | | | | 7,059,791 | |
| JPMorgan Chase & Co. | | | 106,380 | | | | 7,180,650 | |
| M&T Bank Corp. | | | 227,460 | | | | 26,915,342 | |
| Wells Fargo & Co. | | | 412,810 | | | | 20,970,748 | |
| | | | | | | | 62,126,531 | |
| Insurance—1.7% | | | | | | | | |
| Allstate Corp. (The) | | | 244,490 | | | | 16,860,030 | |
| Chubb Ltd. | | | 236,700 | | | | 30,044,331 | |
| | | | | | | 46,904,361 | |
|
| 25 OPPENHEIMER CAPITAL INCOME FUND |
CONSOLIDATED STATEMENT OF INVESTMENTS Continued
| | | | | | | | |
| | | Shares | | | Value | |
| Real Estate Investment Trusts (REITs)—1.6% | | | | | | | | |
| American Assets Trust, Inc. | | | 239,660 | | | $ | 10,616,938 | |
| Blackstone Mortgage Trust, Inc., Cl. A | | | 547,600 | | | | 16,329,432 | |
| Macerich Co. (The) | | | 87,710 | | | | 7,182,572 | |
| Starwood Property Trust, Inc. | | | 347,360 | | | | 7,954,544 | |
| | | | | | | | 42,083,486 | |
| Health Care—5.7% | | | | | | | | |
| Biotechnology—0.5% | | | | | | | | |
Shire plc, ADR | | | 75,280 | | | | 14,090,910 | |
| | | | | | | | | |
| Health Care Equipment & Supplies—0.3% | | | | | | | | |
Medtronic plc | | | 93,220 | | | | 8,112,937 | |
| | | | | | | | | |
| Health Care Providers & Services—2.1% | | | | | | | | |
| Express Scripts Holding Co.1 | | | 166,000 | | | | 12,068,200 | |
| HCA Holdings, Inc.1 | | | 44,219 | | | | 3,340,745 | |
| UnitedHealth Group, Inc. | | | 223,064 | | | | 30,347,857 | |
| Universal Health Services, Inc., Cl. B | | | 81,556 | | | | 9,829,945 | |
| | | | | | | | 55,586,747 | |
| Pharmaceuticals—2.8% | | | | | | | | |
| Allergan plc1 | | | 82,260 | | | | 19,293,260 | |
| Merck & Co., Inc. | | | 287,080 | | | | 18,025,753 | |
| Novartis AG, ADR | | | 239,220 | | | | 18,843,360 | |
| Roche Holding AG | | | 76,008 | | | | 18,548,408 | |
| | | | | | | | 74,710,781 | |
| Industrials—6.8% | | | | | | | | |
| Aerospace & Defense—3.7% | | | | | | | | |
| Honeywell International, Inc. | | | 262,330 | | | | 30,616,534 | |
| L-3 Communications Holdings, Inc. | | | 75,620 | | | | 11,253,769 | |
| Lockheed Martin Corp. | | | 135,870 | | | | 33,012,334 | |
| Northrop Grumman Corp. | | | 61,770 | | | | 13,099,564 | |
| Raytheon Co. | | | 75,010 | | | | 10,511,151 | |
| | | | | | | | 98,493,352 | |
| Airlines—0.3% | | | | | | | | |
United Continental Holdings, Inc.1 | | | 131,706 | | | | 6,639,299 | |
| | | | | | | | | |
| Commercial Services & Supplies—1.6% | | | | | | | | |
| Republic Services, Inc., Cl. A | | | 524,860 | | | | 26,515,927 | |
| Tyco International plc | | | 396,860 | | | | 17,334,845 | |
| | | | | | | | 43,850,772 | |
| Industrial Conglomerates—0.6% | | | | | | | | |
General Electric Co. | | | 541,090 | | | | 16,903,652 | |
| | | | | | | | | |
| Road & Rail—0.6% | | | | | | | | |
Union Pacific Corp. | | | 164,070 | | | | 15,673,607 | |
| | | | | | | | | |
| Information Technology—3.9% | | | | | | | | |
| Communications Equipment—0.6% | | | | | | | | |
Cisco Systems, Inc. | | | 217,362 | | | | 6,833,861 | |
|
| 26 OPPENHEIMER CAPITAL INCOME FUND |
| | | | | | | | |
| | | Shares | | | Value | |
| Communications Equipment (Continued) | | | | | | | | |
| Juniper Networks, Inc. | | | 357,861 | | | $ | 8,259,432 | |
| | | | | | | | 15,093,293 | |
| Internet Software & Services—0.8% | | | | | | | | |
Alphabet, Inc., Cl. A1 | | | 27,530 | | | | 21,744,570 | |
| | | | | | | | | |
| Semiconductors & Semiconductor Equipment—1.4% | | | | | | | | |
| QUALCOMM, Inc. | | | 222,260 | | | | 14,017,938 | |
| Xilinx, Inc. | | | 447,262 | | | | 24,246,073 | |
| | | | | | | | 38,264,011 | |
| Technology Hardware, Storage & Peripherals—1.1% | | | | | | | | |
Apple, Inc. | | | 290,415 | | | | 30,813,032 | |
| | | | | | | | | |
| Materials—2.2% | | | | | | | | |
| Chemicals—1.0% | | | | | | | | |
| Celanese Corp., Cl. A | | | 202,433 | | | | 13,042,758 | |
| LyondellBasell Industries NV, Cl. A | | | 69,338 | | | | 5,470,075 | |
| Methanex Corp. | | | 268,963 | | | | 7,799,927 | |
| | | | | | | | 26,312,760 | |
| Containers & Packaging—1.2% | | | | | | | | |
| Packaging Corp. of America | | | 162,500 | | | | 12,777,375 | |
| Sonoco Products Co. | | | 372,190 | | | | 19,182,673 | |
| | | | | | | | 31,960,048 | |
| Telecommunication Services—2.3% | | | | | | | | |
| Diversified Telecommunication Services—2.3% | | | | | | | | |
| AT&T, Inc. | | | 470,450 | | | | 19,231,996 | |
| BCE, Inc. | | | 502,030 | | | | 23,444,801 | |
| Verizon Communications, Inc. | | | 365,340 | | | | 19,118,242 | |
| | | | | | | | 61,795,039 | |
| Utilities—2.3% | | | | | | | | |
| Electric Utilities—1.5% | | | | | | | | |
| Edison International | | | 215,500 | | | | 15,671,160 | |
| NextEra Energy, Inc. | | | 112,692 | | | | 13,628,971 | |
| PPL Corp. | | | 293,491 | | | | 10,207,617 | |
| | | | | | | | 39,507,748 | |
| Multi-Utilities—0.8% | | | | | | | | |
| CMS Energy Corp. | | | 512,900 | | | | 21,526,413 | |
Total Common Stocks (Cost $962,887,775) | | | | | | | 1,001,557,840 | |
| | | | | | | | | |
| Preferred Stocks—0.2% | | | | | | | | |
| M&T Bank Corp., 6.375% Cum., Series A, Non-Vtg. | | | 1,833 | | | | 1,887,990 | |
| M&T Bank Corp., 6.375% Cum., Series C, Non-Vtg. | | | 4,500 | | | | 4,563,270 | |
Total Preferred Stocks (Cost $6,345,341) | | | | | | | 6,451,260 | |
| | | Principal Amount | | | | |
| Asset-Backed Securities—8.3% | | | | | | | | |
Aircraft Lease Securitisation Ltd., Series 2007-1A, Cl. G3, 0.757%, 5/10/322,3 | | $ | 2,329,414 | | | | 2,320,059 | |
|
| 27 OPPENHEIMER CAPITAL INCOME FUND |
CONSOLIDATED STATEMENT OF INVESTMENTS Continued
| | | | | | | | |
| | | Principal Amount | | | Value | |
| Asset-Backed Securities (Continued) | | | | | |
Airspeed Ltd.: | | | | | | | | |
Series 2007-1A, Cl. G1, 0.778%, 6/15/322,3 | | $ | 33,049,957 | | | $ | 26,138,814 | |
| Series 2007-1A, Cl. G2, 0.788%, 6/15/322,3 | | | 8,303,175 | | | | 6,817,845 | |
American Credit Acceptance Receivables Trust: | | | | | | | | |
Series 2014-1, Cl. B, 2.39%, 11/12/192 | | | 389,871 | | | | 390,050 | |
Series 2014-2, Cl. B, 2.26%, 3/10/202 | | | 180,850 | | | | 180,982 | |
Series 2014-3, Cl. B, 2.43%, 6/10/202 | | | 1,640,538 | | | | 1,639,837 | |
Series 2014-4, Cl. B, 2.60%, 10/10/172 | | | 796,684 | | | | 797,229 | |
Series 2015-1, Cl. B, 2.85%, 2/12/212 | | | 2,395,000 | | | | 2,402,681 | |
| Series 2015-3, Cl. B, 3.56%, 10/12/212 | | | 2,130,000 | | | | 2,155,703 | |
American Express Credit Account Master Trust: | | | | | | | | |
Series 2014-2, Cl. A, 1.26%, 1/15/20 | | | 425,000 | | | | 425,748 | |
| Series 2014-3, Cl. A, 1.49%, 4/15/20 | | | 355,000 | | | | 356,621 | |
AmeriCredit Automobile Receivables Trust: | | | | | | | | |
Series 2012-2, Cl. E, 4.85%, 8/8/192 | | | 1,885,000 | | | | 1,886,009 | |
Series 2012-4, Cl. D, 2.68%, 10/9/18 | | | 2,570,000 | | | | 2,584,411 | |
Series 2012-5, Cl. D, 2.35%, 12/10/18 | | | 2,750,000 | | | | 2,760,811 | |
Series 2013-2, Cl. E, 3.41%, 10/8/202 | | | 1,735,000 | | | | 1,751,718 | |
Series 2013-3, Cl. E, 3.74%, 12/8/202 | | | 1,025,000 | | | | 1,044,389 | |
Series 2014-1, Cl. E, 3.58%, 8/9/21 | | | 2,040,000 | | | | 2,075,930 | |
Series 2014-2, Cl. E, 3.37%, 11/8/21 | | | 2,200,000 | | | | 2,226,554 | |
| Series 2014-4, Cl. D, 3.07%, 11/9/20 | | | 1,860,000 | | | | 1,887,091 | |
Bear Stearns Structured Products Trust: | | | | | | | | |
Series 2007-EMX1, Cl. A2, 1.824%, 3/25/372,3 | | | 5,900,000 | | | | 5,527,787 | |
| Series 2007-EMX1, Cl. M1, 2.524%, 3/25/372,3 | | | 8,000,000 | | | | 7,242,166 | |
Blade Engine Securitization Ltd.: | | | | | | | | |
Series 2006-1A, Cl. A1, 1.508%, 9/15/413,4 | | | 1,452,020 | | | | 795,531 | |
Series 2006-1A, Cl. B, 3.508%, 9/15/413,4 | | | 5,844,102 | | | | 897,911 | |
| Series 2006-1AW, Cl. A1, 0.781%, 9/15/413,4 | | | 19,965,271 | | | | 11,010,475 | |
| Cabela’s Credit Card Master Note Trust, Series 2016-1, Cl. A1, 1.78%, 6/15/22 | | | 2,095,000 | | | | 2,091,188 | |
Capital Auto Receivables Asset Trust: | | | | | | | | |
Series 2013-1, Cl. D, 2.19%, 9/20/21 | | | 725,000 | | | | 726,349 | |
Series 2013-4, Cl. D, 3.22%, 5/20/19 | | | 505,000 | | | | 511,953 | |
Series 2014-1, Cl. D, 3.39%, 7/22/19 | | | 580,000 | | | | 592,256 | |
Series 2014-3, Cl. D, 3.14%, 2/20/20 | | | 900,000 | | | | 915,647 | |
Series 2015-1, Cl. D, 3.16%, 8/20/20 | | | 1,020,000 | | | | 1,039,197 | |
Series 2015-4, Cl. D, 3.62%, 5/20/21 | | | 1,725,000 | | | | 1,739,923 | |
| Series 2016-2, Cl. D, 3.16%, 11/20/23 | | | 405,000 | | | | 402,756 | |
Capital One Multi-Asset Execution Trust: | | | | | | | | |
Series 2014-A2, Cl. A2, 1.26%, 1/15/20 | | | 2,550,000 | | | | 2,553,632 | |
| Series 2014-A5, Cl. A5, 1.48%, 7/15/20 | | | 3,495,000 | | | | 3,509,637 | |
CarFinance Capital Auto Trust: | | | | | | | | |
Series 2014-1A, Cl. A, 1.46%, 12/17/182 | | | 43,411 | | | | 43,387 | |
| Series 2015-1A, Cl. A, 1.75%, 6/15/212 | | | 656,290 | | | | 652,771 | |
CarMax Auto Owner Trust: | | | | | | | | |
Series 2015-2, Cl. D, 3.04%, 11/15/21 | | | 655,000 | | | | 663,363 | |
Series 2015-3, Cl. D, 3.27%, 3/15/22 | | | 1,215,000 | | | | 1,239,857 | |
Series 2016-1, Cl. D, 3.11%, 8/15/22 | | | 1,300,000 | | | | 1,303,125 | |
|
| 28 OPPENHEIMER CAPITAL INCOME FUND |
| | | | | | | | |
| | | Principal Amount | | | Value | |
| Asset-Backed Securities (Continued) | | | | | |
CarMax Auto Owner Trust: (Continued) | | | | | | | | |
| Series 2016-3, Cl. D, 2.94%, 1/17/23 | | $ | 760,000 | | | $ | 756,120 | |
Chase Issuance Trust: | | | | | | | | |
Series 2007-A3, Cl. A3, 5.23%, 4/15/19 | | | 545,000 | | | | 555,332 | |
Series 2014-A1, Cl. A1, 1.15%, 1/15/19 | | | 3,155,000 | | | | 3,157,894 | |
| Series 2014-A6, Cl. A6, 1.26%, 7/15/19 | | | 1,935,000 | | | | 1,938,416 | |
| Citibank Credit Card Issuance Trust, Series 2013-A6, Cl. A6, 1.32%, 9/7/18 | | | 2,300,000 | | | | 2,300,024 | |
CPS Auto Receivables Trust: | | | | | | | | |
Series 2012-B, Cl. A, 2.52%, 9/16/192 | | | 216,986 | | | | 217,177 | |
Series 2014-A, Cl. A, 1.21%, 8/15/182 | | | 286,513 | | | | 286,279 | |
| Series 2014-C, Cl. A, 1.31%, 2/15/192 | | | 460,222 | | | | 459,534 | |
| CPS Auto Trust, Series 2012-C, Cl. A, 1.82%, 12/16/192 | | | 82,868 | | | | 82,737 | |
Credit Acceptance Auto Loan Trust: | | | | | | | | |
Series 2014-1A, Cl. B, 2.29%, 4/15/222 | | | 1,290,000 | | | | 1,288,966 | |
| Series 2014-2A, Cl. B, 2.67%, 9/15/222 | | | 910,000 | | | | 913,629 | |
| Discover Card Execution Note Trust, Series 2014-A5, Cl. A, 1.39%, 4/15/20 | | | 3,090,000 | | | | 3,100,284 | |
Drive Auto Receivables Trust: | | | | | | | | |
Series 2015-BA, Cl. C, 2.76%, 7/15/212 | | | 1,950,000 | | | | 1,959,601 | |
| Series 2016-BA, Cl. C, 3.19%, 7/15/222 | | | 1,040,000 | | | | 1,043,664 | |
DT Auto Owner Trust: | | | | | | | | |
Series 2013-1A, Cl. D, 3.74%, 5/15/202 | | | 466,458 | | | | 469,814 | |
Series 2013-2A, Cl. D, 4.18%, 6/15/202 | | | 1,953,568 | | | | 1,971,107 | |
Series 2014-2A, Cl. D, 3.68%, 4/15/212 | | | 2,745,000 | | | | 2,779,472 | |
Series 2014-3A, Cl. D, 4.47%, 11/15/212 | | | 1,240,000 | | | | 1,260,274 | |
Series 2015-1A, Cl. C, 2.87%, 11/16/202 | | | 1,100,000 | | | | 1,099,851 | |
| Series 2016-1A, Cl. B, 2.79%, 5/15/202 | | | 1,750,000 | | | | 1,755,151 | |
| Element Rail Leasing I LLC, Series 2014-1A, Cl. A1, 2.299%, 4/19/442 | | | 1,541,847 | | | | 1,500,264 | |
Exeter Automobile Receivables Trust: | | | | | | | | |
Series 2014-1A, Cl. B, 2.42%, 1/15/192 | | | 749,984 | | | | 751,246 | |
Series 2014-1A, Cl. C, 3.57%, 7/15/192 | | | 1,160,000 | | | | 1,167,798 | |
Series 2014-2A, Cl. A, 1.06%, 8/15/182 | | | 5,448 | | | | 5,446 | |
Series 2014-2A, Cl. B, 2.17%, 5/15/192 | | | 2,000,000 | | | | 2,003,274 | |
| Series 2014-2A, Cl. C, 3.26%, 12/16/192 | | | 565,000 | | | | 568,044 | |
| Fieldstone Mortgage Investment Trust, Series 2004-5, Cl. M3, 2.549%, 2/25/353 | | | 6,000,000 | | | | 5,207,745 | |
First Investors Auto Owner Trust: | | | | | | | | |
Series 2013-3A, Cl. B, 2.32%, 10/15/192 | | | 1,840,000 | | | | 1,841,561 | |
| Series 2013-3A, Cl. D, 3.67%, 5/15/202 | | | 580,000 | | | | 573,957 | |
Flagship Credit Auto Trust: | | | | | | | | |
Series 2014-1, Cl. A, 1.21%, 4/15/192 | | | 163,234 | | | | 162,940 | |
| Series 2014-2, Cl. A, 1.43%, 12/16/192 | | | 537,580 | | | | 536,043 | |
| Ford Credit Floorplan Master Owner Trust A, Series 2016-3, Cl. A1, 1.55%, 7/15/21 | | | 2,420,000 | | | | 2,415,733 | |
| FRS I LLC, Series 2013-1A, Cl. A1, 1.80%, 4/15/432 | | | 211,252 | | | | 207,001 | |
| GM Financial Automobile Leasing Trust, Series 2015-1, Cl. D, 3.01%, 3/20/20 | | | 1,505,000 | | | | 1,516,936 | |
GO Financial Auto Securitization Trust, Series 2015-1, Cl. A, 1.81%, 3/15/182 | | | 160,016 | | | | 159,910 | |
|
| 29 OPPENHEIMER CAPITAL INCOME FUND |
CONSOLIDATED STATEMENT OF INVESTMENTS Continued
| | | | | | | | |
| | | Principal Amount | | | Value | |
| Asset-Backed Securities (Continued) | | | | | | | | |
GSAMP Trust: | | | | | | | | |
Series 2005-HE4, Cl. M3, 1.044%, 7/25/453 | | $ | 13,300,000 | | | $ | 11,207,343 | |
| Series 2005-HE5, Cl. M3, 0.984%, 11/25/353 | | | 4,060,889 | | | | 3,224,468 | |
| JP Morgan Mortgage Acquisition Corp., Series 2005-OPT2, Cl. M2, 0.974%, 12/25/353 | | | 5,480,000 | | | | 5,090,963 | |
| Long Beach Mortgage Loan Trust, Series 2005-WL3, Cl. M1, 1.169%, 11/25/353 | | | 2,390,000 | | | | 2,072,188 | |
| Morgan Stanley ABS Capital I, Inc. Trust, Series 2006-NC1, Cl. M1, 0.904%, 12/25/353 | | | 12,287,000 | | | | 11,004,693 | |
| Navistar Financial Dealer Note Master Trust, Series 2014-1, Cl. D, 2.824%, 10/25/192,3 | | | 705,000 | | | | 703,753 | |
New Century Home Equity Loan Trust: | | | | | | | | |
Series 2005-1, Cl. M2, 1.244%, 3/25/353 | | | 8,187,849 | | | | 6,955,849 | |
| Series 2005-2, Cl. M3, 1.259%, 6/25/353 | | | 5,500,000 | | | | 4,663,543 | |
| RASC Series Trust, Series 2006-KS2, Cl. M2, 0.914%, 3/25/363 | | | 4,875,000 | | | | 3,876,090 | |
| Raspro Trust, Series 2005-1A, Cl. G, 1.047%, 3/23/242,3 | | | 5,403,554 | | | | 5,198,629 | |
Santander Drive Auto Receivables Trust: | | | | | | | | |
Series 2013-1, Cl. D, 2.27%, 1/15/19 | | | 895,000 | | | | 900,692 | |
Series 2013-4, Cl. E, 4.67%, 1/15/202 | | | 2,055,000 | | | | 2,074,772 | |
Series 2013-A, Cl. E, 4.71%, 1/15/212 | | | 1,530,000 | | | | 1,573,573 | |
Series 2014-2, Cl. D, 2.76%, 2/18/20 | | | 870,000 | | | | 883,149 | |
| Series 2016-2, Cl. D, 3.39%, 4/15/22 | | | 720,000 | | | | 736,506 | |
| SG Mortgage Securities Trust, Series 2005-OPT1, Cl. M2, 0.974%, 10/25/353 | | | 6,129,000 | | | | 5,187,117 | |
SNAAC Auto Receivables Trust: | | | | | | | | |
Series 2013-1A, Cl. C, 3.07%, 8/15/182 | | | 102,487 | | | | 102,557 | |
| Series 2014-1A, Cl. D, 2.88%, 1/15/202 | | | 730,000 | | | | 721,566 | |
TCF Auto Receivables Owner Trust: | | | | | | | | |
Series 2014-1A, Cl. C, 3.12%, 4/15/212 | | | 525,000 | | | | 521,954 | |
| Series 2015-1A, Cl. D, 3.53%, 3/15/222 | | | 1,075,000 | | | | 1,064,006 | |
| Trip Rail Master Funding LLC, Series 2014-1A, Cl. A1, 2.863%, 4/15/442 | | | 738,656 | | | | 730,814 | |
| United Auto Credit Securitization Trust, Series 2015-1, Cl. D, 2.92%, 6/17/192 | | | 1,410,000 | | | | 1,390,505 | |
Westlake Automobile Receivables Trust: | | | | | | | | |
Series 2014-1A, Cl. D, 2.20%, 2/15/212 | | | 775,000 | | | | 774,003 | |
Series 2014-2A, Cl. D, 2.86%, 7/15/212 | | | 940,000 | | | | 934,914 | |
Series 2015-1A, Cl. C, 2.29%, 11/16/202 | | | 1,435,000 | | | | 1,437,332 | |
| Series 2015-2A, Cl. C, 2.45%, 1/15/212 | | | 1,420,000 | | | | 1,422,658 | |
Total Asset-Backed Securities (Cost $233,706,897) | | | | | | | 223,768,254 | |
| | | | | | | | | |
| Mortgage-Backed Obligations—19.1% | | | | | | | | |
| Government Agency—12.7% | | | | | | | | |
| FHLMC/FNMA/FHLB/Sponsored—11.2% | | | | | | | | |
Federal Home Loan Mortgage Corp. Gold Pool: | | | | | | | | |
4.50%, 5/1/19 | | | 344,634 | | | | 353,426 | |
5.00%, 12/1/34 | | | 57,085 | | | | 63,802 | |
6.00%, 5/1/18 | | | 38,719 | | | | 39,277 | |
6.50%, 7/1/28-4/1/34 | | | 151,499 | | | | 173,766 | |
7.00%, 10/1/31 | | | 150,421 | | | | 171,815 | |
|
| 30 OPPENHEIMER CAPITAL INCOME FUND |
| | | | | | | | |
| | | Principal Amount | | | Value | |
| FHLMC/FNMA/FHLB/Sponsored (Continued) | | | | | |
Federal Home Loan Mortgage Corp. Gold Pool: (Continued) | | | | | | | | |
| 9.00%, 8/1/22-5/1/25 | | $ | 7,420 | | | $ | 8,109 | |
Federal Home Loan Mortgage Corp., Interest-Only Stripped Mtg.-Backed Security: | | | | | | | | |
Series 183,Cl. IO, 12.136%, 4/1/275 | | | 102,210 | | | | 21,415 | |
Series 192,Cl. IO, 6.779%, 2/1/285 | | | 33,759 | | | | 7,358 | |
| Series 243,Cl. 6, 0.00%, 12/15/325,6 | | | 113,379 | | | | 19,178 | |
| Federal Home Loan Mortgage Corp., Mtg.-Linked Amortizing Global Debt Securities, Series 2012-1, Cl. A10, 2.06%, 1/15/22 | | | 2,965,360 | | | | 3,001,711 | |
| Federal Home Loan Mortgage Corp., Principal-Only Stripped Mtg.- Backed Security, Series 176, Cl. PO, 4.127%, 6/1/267 | | | 36,426 | | | | 33,471 | |
Federal Home Loan Mortgage Corp., Real Estate Mtg. Investment Conduit Multiclass Pass-Through Certificates: | |
Series 2034,Cl. Z, 6.50%, 2/15/28 | | | 82,869 | | | | 95,044 | |
Series 2043,Cl. ZP, 6.50%, 4/15/28 | | | 363,824 | | | | 404,286 | |
Series 2053,Cl. Z, 6.50%, 4/15/28 | | | 69,773 | | | | 80,015 | |
Series 2279,Cl. PK, 6.50%, 1/15/31 | | | 150,972 | | | | 175,140 | |
Series 2326,Cl. ZP, 6.50%, 6/15/31 | | | 69,796 | | | | 78,041 | |
Series 2426,Cl. BG, 6.00%, 3/15/17 | | | 40,396 | | | | 40,962 | |
Series 2427,Cl. ZM, 6.50%, 3/1/32 | | | 262,286 | | | | 302,221 | |
Series 2461,Cl. PZ, 6.50%, 6/1/32 | | | 324,328 | | | | 384,823 | |
Series 2564,Cl. MP, 5.00%, 2/15/18 | | | 495,443 | | | | 506,213 | |
Series 2585,Cl. HJ, 4.50%, 3/15/18 | | | 257,344 | | | | 263,785 | |
Series 2626,Cl. TB, 5.00%, 6/15/33 | | | 349,649 | | | | 377,579 | |
Series 2635,Cl. AG, 3.50%, 5/15/32 | | | 85,127 | | | | 89,673 | |
Series 2707,Cl. QE, 4.50%, 11/15/18 | | | 326,609 | | | | 335,609 | |
Series 2770,Cl. TW, 4.50%, 3/15/19 | | | 44,607 | | | | 45,945 | |
Series 3010,Cl. WB, 4.50%, 7/15/20 | | | 222,425 | | | | 230,550 | |
Series 3025,Cl. SJ, 22.889%, 8/15/353 | | | 42,587 | | | | 65,365 | |
Series 3030,Cl. FL, 0.908%, 9/15/353 | | | 579,793 | | | | 578,075 | |
Series 3645,Cl. EH, 3.00%, 12/15/20 | | | 22,449 | | | | 22,883 | |
Series 3741,Cl. PA, 2.15%, 2/15/35 | | | 1,474,346 | | | | 1,487,887 | |
Series 3815,Cl. BD, 3.00%, 10/15/20 | | | 34,055 | | | | 34,552 | |
Series 3822,Cl. JA, 5.00%, 6/15/40 | | | 186,353 | | | | 195,682 | |
Series 3840,Cl. CA, 2.00%, 9/15/18 | | | 26,434 | | | | 26,603 | |
Series 3848,Cl. WL, 4.00%, 4/1/40 | | | 655,032 | | | | 684,380 | |
Series 3857,Cl. GL, 3.00%, 5/15/40 | | | 53,550 | | | | 55,508 | |
| Series 4221,Cl. HJ, 1.50%, 7/15/23 | | | 1,358,551 | | | | 1,366,923 | |
| Federal Home Loan Mortgage Corp., Real Estate Mtg. Investment Conduit Multiclass Pass-Through Certificates, Interest-Only Stripped Mtg.-Backed Security: | |
Series 2130,Cl. SC, 46.935%, 3/15/295 | | | 87,592 | | | | 17,663 | |
Series 2796,Cl. SD, 45.268%, 7/15/265 | | | 142,300 | | | | 24,594 | |
Series 2815,Cl. PT, 0.00%, 11/15/325,8 | | | 978,637 | | | | 36,208 | |
Series 2920,Cl. S, 45.45%, 1/15/355 | | | 844,014 | | | | 153,285 | |
Series 2922,Cl. SE, 4.934%, 2/15/355 | | | 204,834 | | | | 35,845 | |
Series 2937,Cl. SY, 14.685%, 2/15/355 | | | 2,409,489 | | | | 465,063 | |
Series 2981,Cl. AS, 0.00%, 5/15/355,6 | | | 1,675,991 | | | | 322,327 | |
Series 3201,Cl. SG, 3.811%, 8/15/365 | | | 695,702 | | | | 142,279 | |
Series 3397,Cl. GS, 11.945%, 12/15/375 | | | 411,162 | | | | 78,899 | |
Series 3424,Cl. EI, 0.00%, 4/15/385,6 | | | 169,619 | | | | 19,538 | |
Series 3450,Cl. BI, 7.915%, 5/15/385 | | | 974,197 | | | | 166,914 | |
|
| 31 OPPENHEIMER CAPITAL INCOME FUND |
CONSOLIDATED STATEMENT OF INVESTMENTS Continued
| | | | | | | | |
| | | Principal Amount | | | Value | |
| FHLMC/FNMA/FHLB/Sponsored (Continued) | | | | | |
| Federal Home Loan Mortgage Corp., Real Estate Mtg. Investment Conduit Multiclass Pass-Through Certificates, Interest-Only Stripped Mtg.-Backed Security: (Continued) | |
| Series 3606,Cl. SN, 1.094%, 12/15/395 | | $ | 415,666 | | | $ | 80,395 | |
Federal National Mortgage Assn.: | | | | | | | | |
2.50%, 9/1/319 | | | 59,720,000 | | | | 61,684,228 | |
3.00%, 9/1/319 | | | 33,850,000 | | | | 35,431,107 | |
3.50%, 9/1/469 | | | 100,305,000 | | | | 105,672,885 | |
4.00%, 9/1/469 | | | 36,045,000 | | | | 38,604,758 | |
4.50%, 9/1/319 | | | 1,030,000 | | | | 1,054,412 | |
| 5.00%, 9/1/469 | | | 17,750,000 | | | | 19,669,566 | |
Federal National Mortgage Assn. Pool: | | | | | | | | |
5.00%, 3/1/21 | | | 70,309 | | | | 72,636 | |
5.50%, 2/1/35-4/1/39 | | | 1,394,980 | | | | 1,580,412 | |
6.50%, 5/1/17-11/1/31 | | | 481,717 | | | | 548,913 | |
7.00%, 11/1/17-7/1/35 | | | 42,800 | | | | 47,227 | |
7.50%, 1/1/33-3/1/33 | | | 1,902,122 | | | | 2,318,971 | |
| 8.50%, 7/1/32 | | | 7,106 | | | | 7,763 | |
Federal National Mortgage Assn., Interest-Only Stripped Mtg.-Backed Security: | | | | | | | | |
Series 222,Cl. 2, 0.00%, 6/25/235,8 | | | 232,738 | | | | 35,783 | |
Series 252,Cl. 2, 34.811%, 11/25/235 | | | 212,466 | | | | 37,837 | |
Series 303,Cl. IO, 33.212%, 11/25/295 | | | 94,909 | | | | 24,271 | |
Series 308,Cl. 2, 27.028%, 9/25/305 | | | 227,996 | | | | 52,257 | |
Series 320,Cl. 2, 8.459%, 4/25/325 | | | 829,488 | | | | 226,351 | |
Series 321,Cl. 2, 0.00%, 4/25/325,6 | | | 588,120 | | | | 126,949 | |
Series 331,Cl. 9, 2.867%, 2/25/335 | | | 228,799 | | | | 48,690 | |
Series 334,Cl. 17, 16.108%, 2/25/335 | | | 125,688 | | | | 25,438 | |
Series 339,Cl. 12, 0.00%, 6/25/335,6 | | | 417,861 | | | | 86,257 | |
Series 339,Cl. 7, 0.00%, 11/25/335,6 | | | 510,691 | | | | 100,105 | |
Series 343,Cl. 13, 0.00%, 9/25/335,6 | | | 436,905 | | | | 94,846 | |
Series 343,Cl. 18, 0.00%, 5/25/345,6 | | | 122,457 | | | | 25,753 | |
Series 345,Cl. 9, 0.00%, 1/25/345,6 | | | 201,208 | | | | 40,531 | |
Series 351,Cl. 10, 0.00%, 4/25/345,6 | | | 140,649 | | | | 27,848 | |
Series 351,Cl. 8, 0.00%, 4/25/345,6 | | | 241,180 | | | | 47,649 | |
Series 356,Cl. 10, 0.00%, 6/25/355,6 | | | 172,084 | | | | 31,445 | |
Series 356,Cl. 12, 0.00%, 2/25/355,6 | | | 84,330 | | | | 15,421 | |
Series 362,Cl. 13, 0.00%, 8/25/355,6 | | | 308,757 | | | | 61,833 | |
Series 364,Cl. 16, 0.00%, 9/25/355,6 | | | 361,353 | | | | 68,142 | |
| Series 365,Cl. 16, 0.00%, 3/25/365,6 | | | 854,818 | | | | 163,025 | |
Federal National Mortgage Assn., Real Estate Mtg. Investment Conduit Multiclass Pass-Through Certificates: | | | | | | | | |
Series 1993-87,Cl. Z, 6.50%, 6/25/23 | | | 201,887 | | | | 221,649 | |
Series 1998-61,Cl. PL, 6.00%, 11/25/28 | | | 103,675 | | | | 118,719 | |
Series 1999-54,Cl. LH, 6.50%, 11/25/29 | | | 158,658 | | | | 185,864 | |
Series 2001-51,Cl. OD, 6.50%, 10/25/31 | | | 275,447 | | | | 305,565 | |
Series 2003-100,Cl. PA, 5.00%, 10/25/18 | | | 878,562 | | | | 903,397 | |
Series 2003-130,Cl. CS, 13.051%, 12/25/333 | | | 149,097 | | | | 168,271 | |
Series 2003-28,Cl. KG, 5.50%, 4/25/23 | | | 473,365 | | | | 518,296 | |
Series 2003-84,Cl. GE, 4.50%, 9/25/18 | | | 54,847 | | | | 56,131 | |
Series 2004-101,Cl. BG, 5.00%, 1/25/20 | | | 49,492 | | | | 49,722 | |
Series 2004-25,Cl. PC, 5.50%, 1/25/34 | | | 179,359 | | | | 186,177 | |
|
| 32 OPPENHEIMER CAPITAL INCOME FUND |
| | | | | | | | |
| | | Principal Amount | | | Value | |
| FHLMC/FNMA/FHLB/Sponsored (Continued) | | | | | |
| Federal National Mortgage Assn., Real Estate Mtg. Investment Conduit Multiclass Pass-Through Certificates: (Continued) | |
Series 2005-104,Cl. MC, 5.50%, 12/25/25 | | $ | 2,435,158 | | | $ | 2,674,939 | |
Series 2005-31,Cl. PB, 5.50%, 4/25/35 | | | 1,430,000 | | | | 1,702,349 | |
Series 2005-73,Cl. DF, 0.774%, 8/25/353 | | | 1,103,148 | | | | 1,107,852 | |
Series 2006-11,Cl. PS, 22.644%, 3/25/363 | | | 131,838 | | | | 205,060 | |
Series 2006-46,Cl. SW, 22.277%, 6/25/363 | | | 100,677 | | | | 150,189 | |
Series 2006-50,Cl. KS, 22.277%, 6/25/363 | | | 196,083 | | | | 291,563 | |
Series 2006-50,Cl. SK, 22.277%, 6/25/363 | | | 36,583 | | | | 56,490 | |
Series 2008-75,Cl. DB, 4.50%, 9/25/23 | | | 242,174 | | | | 248,064 | |
Series 2009-113,Cl. DB, 3.00%, 12/25/20 | | | 665,875 | | | | 676,424 | |
Series 2009-36,Cl. FA, 1.464%, 6/25/373 | | | 325,665 | | | | 332,206 | |
Series 2009-37,Cl. HA, 4.00%, 4/25/19 | | | 268,015 | | | | 272,874 | |
Series 2009-70,Cl. TL, 4.00%, 8/25/19 | | | 908,585 | | | | 923,839 | |
Series 2010-43,Cl. KG, 3.00%, 1/25/21 | | | 306,153 | | | | 312,099 | |
Series 2011-15,Cl. DA, 4.00%, 3/25/41 | | | 145,945 | | | | 153,362 | |
Series 2011-3,Cl. EL, 3.00%, 5/25/20 | | | 1,087,626 | | | | 1,104,719 | |
Series 2011-3,Cl. KA, 5.00%, 4/25/40 | | | 784,670 | | | | 856,180 | |
Series 2011-38,Cl. AH, 2.75%, 5/25/20 | | | 27,974 | | | | 28,322 | |
| Series 2011-82,Cl. AD, 4.00%, 8/25/26 | | | 629,575 | | | | 645,294 | |
| Federal National Mortgage Assn., Real Estate Mtg. Investment Conduit Multiclass Pass-Through Certificates, Interest- Only Stripped Mtg.-Backed Security: | |
Series 2001-15,Cl. SA, 99.999%, 3/17/315 | | | 57,607 | | | | 5,823 | |
Series 2001-65,Cl. S, 35.436%, 11/25/315 | | | 214,697 | | | | 41,280 | |
Series 2001-81,Cl. S, 34.665%, 1/25/325 | | | 55,814 | | | | 14,749 | |
Series 2002-47,Cl. NS, 38.827%, 4/25/325 | | | 127,920 | | | | 26,093 | |
Series 2002-51,Cl. S, 38.991%, 8/25/325 | | | 117,449 | | | | 22,524 | |
Series 2002-52,Cl. SD, 46.432%, 9/25/325 | | | 175,423 | | | | 39,500 | |
Series 2002-60,Cl. SM, 34.553%, 8/25/325 | | | 179,327 | | | | 29,502 | |
Series 2002-7,Cl. SK, 34.987%, 1/25/325 | | | 53,713 | | | | 10,001 | |
Series 2002-75,Cl. SA, 37.182%, 11/25/325 | | | 263,289 | | | | 56,427 | |
Series 2002-77,Cl. BS, 31.782%, 12/18/325 | | | 114,017 | | | | 21,860 | |
Series 2002-77,Cl. SH, 48.565%, 12/18/325 | | | 78,603 | | | | 18,545 | |
Series 2002-89,Cl. S, 59.478%, 1/25/335 | | | 416,060 | | | | 111,366 | |
Series 2002-9,Cl. MS, 34.422%, 3/25/325 | | | 72,158 | | | | 15,367 | |
Series 2002-90,Cl. SN, 35.46%, 8/25/325 | | | 92,342 | | | | 15,192 | |
Series 2002-90,Cl. SY, 41.492%, 9/25/325 | | | 44,140 | | | | 9,228 | |
Series 2003-33,Cl. SP, 36.084%, 5/25/335 | | | 237,459 | | | | 48,854 | |
Series 2003-46,Cl. IH, 0.00%, 6/25/235,6 | | | 419,497 | | | | 45,608 | |
Series 2004-54,Cl. DS, 54.149%, 11/25/305 | | | 169,874 | | | | 31,129 | |
Series 2004-56,Cl. SE, 19.586%, 10/25/335 | | | 318,418 | | | | 62,392 | |
Series 2005-12,Cl. SC, 23.544%, 3/25/355 | | | 96,688 | | | | 16,504 | |
Series 2005-19,Cl. SA, 55.13%, 3/25/355 | | | 1,984,125 | | | | 416,411 | |
Series 2005-40,Cl. SA, 57.482%, 5/25/355 | | | 440,658 | | | | 90,156 | |
Series 2005-52,Cl. JH, 19.152%, 5/25/355 | | | 1,113,141 | | | | 202,640 | |
Series 2005-6,Cl. SE, 68.184%, 2/25/355 | | | 828,360 | | | | 155,091 | |
Series 2005-93,Cl. SI, 24.373%, 10/25/355 | | | 487,590 | | | | 96,348 | |
Series 2008-55,Cl. SA, 0.00%, 7/25/385,6 | | | 269,931 | | | | 32,341 | |
Series 2009-8,Cl. BS, 99.999%, 2/25/245 | | | 109,059 | | | | 3,554 | |
|
| 33 OPPENHEIMER CAPITAL INCOME FUND |
CONSOLIDATED STATEMENT OF INVESTMENTS Continued
| | | | | | | | |
| | | Principal Amount | | | Value | |
| FHLMC/FNMA/FHLB/Sponsored (Continued) | | | | | | | | |
| Federal National Mortgage Assn., Real Estate Mtg. Investment Conduit Multiclass Pass-Through Certificates, Interest- Only Stripped Mtg.-Backed Security: (Continued) | |
| Series 2011-96,Cl. SA, 12.287%, 10/25/415 | | $ | 980,713 | | | $ | 188,534 | |
| Series 2012-134,Cl. SA, 10.878%, 12/25/425 | | | 3,156,608 | | | | 683,867 | |
| Series 2012-40,Cl. PI, 0.00%, 4/25/415,6 | | | 3,474,856 | | | | 413,359 | |
| Federal National Mortgage Assn., Real Estate Mtg. Investment Conduit Multiclass Pass-Through Certificates, Principal-Only Stripped Mtg.-Backed Security, Series 1993-184, Cl. M, 5.135%, 9/25/237 | | | 90,419 | | | | 85,078 | |
| | | | | | | 298,862,330 | |
| | | | | | | | | |
| GNMA/Guaranteed—1.5% | | | | | | | | |
| Government National Mortgage Assn. I Pool: | | | | | | | | |
| 8.50%, 8/15/17-12/15/17 | | | 2,508 | | | | 2,524 | |
| Government National Mortgage Assn. II Pool: | | | | | | | | |
| 3.50%, 9/1/469 | | | 25,315,000 | | | | 26,862,578 | |
| 4.00%, 9/1/469 | | | 12,335,000 | | | | 13,182,068 | |
| Government National Mortgage Assn., Interest-Only Stripped Mtg.-Backed Security: | | | | | | | | |
| Series 2002-15,Cl. SM, 78.692%, 2/16/325 | | | 215,109 | | | | 34,855 | |
| Series 2002-41,Cl. GS, 74.219%, 6/16/325 | | | 73,730 | | | | 8,437 | |
| Series 2002-76,Cl. SY, 78.565%, 12/16/265 | | | 499,024 | | | | 89,265 | |
| Series 2007-17,Cl. AI, 29.358%, 4/16/375 | | | 1,796,322 | | | | 379,182 | |
| Series 2011-52,Cl. HS, 20.106%, 4/16/415 | | | 2,041,682 | | | | 377,876 | |
| | | | | | | 40,936,785 | |
| | | | | | | | | |
| Non-Agency—6.4% | | | | | | | | |
| Commercial—3.1% | | | | | | | | |
| Banc of America Funding Trust: | | | | | | | | |
| Series 2006-G,Cl. 2A4, 0.802%, 7/20/363 | | | 2,910,956 | | | | 2,760,939 | |
| Series 2014-R7,Cl. 3A1, 2.87%, 3/26/362,3 | | | 2,424,526 | | | | 2,432,124 | |
| BCAP LLC Trust, Series 2011-R11, Cl. 18A5, 2.43%, 9/26/352,3 | | | 763,308 | | | | 765,531 | |
| Chase Mortgage Finance Trust, Series 2005-A2, Cl. 1A3, 2.694%, 1/25/363 | | | 1,137,914 | | | | 1,069,946 | |
COMM Mortgage Trust: | | | | | | | | |
| Series 2013-CR6,Cl. AM, 3.147%, 3/10/462 | | | 1,520,000 | | | | 1,589,142 | |
| Series 2013-CR7,Cl. D, 4.491%, 3/10/462,3 | | | 2,075,000 | | | | 1,958,826 | |
| Series 2014-CR21,Cl. AM, 3.987%, 12/10/47 | | | 4,410,000 | | | | 4,843,733 | |
| Series 2014-LC15,Cl. AM, 4.198%, 4/10/47 | | | 575,000 | | | | 638,861 | |
| Series 2014-UBS6,Cl. AM, 4.048%, 12/10/47 | | | 3,020,000 | | | | 3,303,137 | |
| Series 2015-CR23,Cl. AM, 3.801%, 5/10/48 | | | 1,760,000 | | | | 1,915,371 | |
| COMM Mortgage Trust, Interest-Only Stripped Mtg.-Backed Security, Series 2012-CR5, Cl. XA, 0.00%, 12/10/455,6 | | | 5,499,984 | | | | 393,569 | |
| CSMC, Series 2006-6, Cl. 1A4, 6%, 7/25/36 | | | 1,380,085 | | | | 1,040,429 | |
| Deutsche Bank Commercial Mortgage Trust, Series 2016-C1, Cl. AM, 3.539%, 5/10/49 | | | 945,000 | | | | 1,018,295 | |
| Federal National Mortgage Assn., Alternative Credit Enhancement Securities: | | | | | | | | |
| Series 2015-M11,Cl. A2, 2.921%, 4/25/253 | | | 2,270,000 | | | | 2,406,918 | |
| Series 2015-M8,Cl. A2, 2.90%, 1/25/253 | | | 1,590,000 | | | | 1,690,606 | |
First Horizon Alternative Mortgage Securities Trust, Series 2005-FA8, Cl. 1A6, 1.174%, 11/25/353 | | | 628,338 | | | | 430,256 | |
|
| 34 OPPENHEIMER CAPITAL INCOME FUND |
| | | | | | | | |
| | | Principal Amount | | | Value | |
| Commercial (Continued) | | | | | | | | |
| FREMF Mortgage Trust: | | | | | | | | |
| Series 2012-K501,Cl. C, 3.374%, 11/25/462,3 | | $ | 175,000 | | | $ | 175,001 | |
| Series 2013-K25,Cl. C, 3.743%, 11/25/452,3 | | | 350,000 | | | | 339,531 | |
| Series 2013-K26,Cl. C, 3.722%, 12/25/452,3 | | | 460,000 | | | | 451,363 | |
| Series 2013-K27,Cl. C, 3.616%, 1/25/462,3 | | | 400,000 | | | | 384,662 | |
| Series 2013-K28,Cl. C, 3.614%, 6/25/462,3 | | | 2,460,000 | | | | 2,360,330 | |
| Series 2013-K502,Cl. C, 3.196%, 3/25/452,3 | | | 720,000 | | | | 722,658 | |
| Series 2013-K712,Cl. C, 3.484%, 5/25/452,3 | | | 730,000 | | | | 740,356 | |
| Series 2013-K713,Cl. C, 3.274%, 4/25/462,3 | | | 480,000 | | | | 477,627 | |
| Series 2014-K715,Cl. C, 4.268%, 2/25/462,3 | | | 155,000 | | | | 156,016 | |
| Series 2015-K44,Cl. B, 3.811%, 1/25/482,3 | | | 290,000 | | | | 292,911 | |
| GSMSC Pass-Through Trust, Series 2009-3R, Cl. 1A2, 6%, 4/25/372,3 | | | 1,682,546 | | | | 1,591,220 | |
| GSR Mortgage Loan Trust, Series 2005-AR4, Cl. 6A1, 3.20%, 7/25/353 | | | 378,590 | | | | 373,489 | |
| JP Morgan Chase Commercial Mortgage Securities Trust: | | | | | | | | |
| Series 2013-C16,Cl. AS, 4.517%, 12/15/46 | | | 2,005,000 | | | | 2,274,650 | |
| Series 2013-LC11,Cl. AS, 3.216%, 4/15/46 | | | 230,000 | | | | 241,344 | |
| Series 2014-C20,Cl. AS, 4.043%, 7/15/47 | | | 1,400,000 | | | | 1,547,893 | |
| JP Morgan Mortgage Trust, Series 2007-A1, Cl. 5A1, 2.911%, 7/25/353 | | | 1,138,128 | | | | 1,139,927 | |
| JP Morgan Resecuritization Trust, Series 2009-5, Cl. 1A2, 3.078%, 7/26/362,3 | | | 1,270,081 | | | | 1,147,864 | |
| JPMBB Commercial Mortgage Securities Trust: | | | | | | | | |
| Series 2014-C25,Cl. AS, 4.065%, 11/15/47 | | | 3,600,000 | | | | 3,990,149 | |
| Series 2014-C26,Cl. AS, 3.80%, 1/15/48 | | | 1,180,000 | | | | 1,281,004 | |
| Morgan Stanley Bank of America Merrill Lynch Trust: | | | | | | | | |
| Series 2014-C14,Cl. B, 4.802%, 2/15/473 | | | 80,000 | | | | 90,420 | |
| Series 2014-C19,Cl. AS, 3.832%, 12/15/47 | | | 3,650,000 | | | | 3,967,196 | |
| Morgan Stanley Re-Remic Trust, Series 2012-R3, Cl. 1B, 2.212%, 11/26/362,3 | | | 1,895,923 | | | | 1,416,961 | |
| Morgan Stanley Resecuritization Trust, Series 2013-R9, Cl. 3A, 2.693%, 6/26/462,3 | | | 1,676,247 | | | | 1,676,377 | |
| RBSSP Resecuritization Trust, Series 2010-1, Cl. 2A1, 2.681%, 7/26/452,3 | | | 299,354 | | | | 299,300 | |
| Structured Adjustable Rate Mortgage Loan Trust, Series 2004-10, Cl. 2A, 2.929%, 8/25/343 | | | 662,364 | | | | 663,416 | |
| Structured Agency Credit Risk Debt Nts.: | | | | | | | | |
| Series 2013-DN1,Cl. M1, 3.924%, 7/25/233 | | | 1,924,774 | | | | 1,962,154 | |
| Series 2014-DN1,Cl. M2, 2.724%, 2/25/243 | | | 1,660,000 | | | | 1,702,323 | |
| Series 2014-HQ2,Cl. M1, 1.974%, 9/25/243 | | | 500,785 | | | | 503,411 | |
| Series 2015-DNA2,Cl. M2, 3.124%, 12/25/273 | | | 1,255,000 | | | | 1,283,213 | |
| Series 2015-DNA3,Cl. M1, 1.874%, 4/25/283 | | | 468,666 | | | | 469,523 | |
| Series 2015-DNA3,Cl. M2, 3.374%, 4/25/283 | | | 2,285,000 | | | | 2,372,093 | |
| Series 2015-HQA1,Cl. M1, 1.774%, 3/25/283 | | | 974,668 | | | | 975,889 | |
| Series 2015-HQA2,Cl. M2, 3.324%, 5/25/283 | | | 340,000 | | | | 350,568 | |
| Series 2016-DNA2,Cl. M1, 1.774%, 10/25/283 | | | 2,309,975 | | | | 2,316,656 | |
| Series 2016-DNA2,Cl. M2, 2.724%, 10/25/283 | | | 2,370,000 | | | | 2,414,309 | |
| Series 2016-DNA3,Cl. M1, 1.624%, 12/25/283 | | | 1,981,325 | | | | 1,985,222 | |
| Series 2016-DNA3,Cl. M2, 2.524%, 12/25/283 | | | 1,440,000 | | | | 1,464,463 | |
|
| 35 OPPENHEIMER CAPITAL INCOME FUND |
CONSOLIDATED STATEMENT OF INVESTMENTS Continued
| | | | | | | | |
| | | Principal Amount | | | Value | |
| Commercial (Continued) | | | | | | | | |
| Structured Agency Credit Risk Debt Nts.: (Continued) | | | | | | | | |
| Series 2016-HQA2,Cl. M1, 1.724%, 11/25/283 | | $ | 1,347,798 | | | $ | 1,351,515 | |
| Series 2016-HQA2,Cl. M2, 2.774%, 11/25/283 | | | 2,350,000 | | | | 2,400,947 | |
| Wells Fargo Commercial Mortgage Trust, Series 2015-C29, Cl. AS, 4.013%, 6/15/48 | | | 1,250,000 | | | | 1,381,723 | |
| WF-RBS Commercial Mortgage Trust: | | | | | | | | |
| Series 2012-C7,Cl. E, 4.991%, 6/15/452,3 | | | 500,000 | | | | 493,187 | |
| Series 2013-C14,Cl. AS, 3.488%, 6/15/46 | | | 1,045,000 | | | | 1,116,368 | |
| Series 2014-C20,Cl. AS, 4.176%, 5/15/47 | | | 905,000 | | | | 1,007,146 | |
| Series 2014-LC14,Cl. AS, 4.351%, 3/15/473 | | | 540,000 | | | | 604,694 | |
| WF-RBS Commercial Mortgage Trust, Interest-Only Commercial Mtg. Pass-Through Certificates, Series 2011-C3, Cl. XA, 0.00%, 3/15/442,5,6 | | | 12,994,993 | | | | 612,745 | |
| | | | | | | 82,827,497 | |
| | | | | | | | | |
| Residential—3.3% | | | | | | | | |
| Asset-Backed Funding Certificates Trust, Series 2005-HE2, Cl. M3, 1.304%, 6/25/353 | | | 4,000,000 | | | | 3,800,988 | |
| Banc of America Funding Trust: | | | | | | | | |
| Series 2007-1,Cl. 1A3, 6.00%, 1/25/37 | | | 209,451 | | | | 187,495 | |
| Series 2007-C,Cl. 1A4, 2.979%, 5/20/363 | | | 218,171 | | | | 197,248 | |
| Banc of America Mortgage Trust, Series 2007-1, Cl. 1A24, 6%, 3/25/37 | | | 659,714 | | | | 602,440 | |
| Bear Stearns ARM Trust: | | | | | | | | |
| Series 2005-2,Cl. A1, 3.09%, 3/25/353 | | | 2,002,514 | | | | 2,014,875 | |
| Series 2005-9,Cl. A1, 2.83%, 10/25/353 | | | 1,262,736 | | | | 1,222,590 | |
| Series 2006-1,Cl. A1, 2.58%, 2/25/363 | | | 1,909,012 | | | | 1,871,289 | |
| Bear Stearns Asset Backed Securities I Trust: | | | | | | | | |
| Series 2004-HE9,Cl. M2, 2.288%, 11/25/343 | | | 2,491,149 | | | | 2,302,005 | |
| Series 2005-HE6,Cl. M2, 1.529%, 6/25/353 | | | 4,044,010 | | | | 3,774,185 | |
| Carrington Mortgage Loan Trust, Series 2006-FRE1, Cl. A2, 0.634%, 7/25/363 | | | 137,313 | | | | 136,689 | |
CHL Mortgage Pass-Through Trust: | | | | | | | | |
Series 2005-26,Cl. 1A8, 5.50%, 11/25/35 | | | 764,888 | | | | 715,643 | |
| Series 2006-6,Cl. A3, 6.00%, 4/25/36 | | | 345,638 | | | | 317,650 | |
| Citigroup Mortgage Loan Trust, Inc.: | | | | | | | | |
| Series 2004-OPT1,Cl. M3, 1.469%, 10/25/343 | | | 3,750,000 | | | | 3,237,214 | |
| Series 2006-AR1,Cl. 1A1, 2.87%, 10/25/353 | | | 3,181,981 | | | | 3,159,174 | |
| Connecticut Avenue Securities: | | | | | | | | |
| Series 2014-C01,Cl. M1, 2.124%, 1/25/243 | | | 221,805 | | | | 223,471 | |
| Series 2014-C03,Cl. 1M1, 1.724%, 7/25/243 | | | 1,040,148 | | | | 1,042,933 | |
| Series 2014-C03,Cl. 2M1, 1.724%, 7/25/243 | | | 1,610,822 | | | | 1,614,016 | |
| Series 2014-C04,Cl. 2M1, 2.624%, 11/25/243 | | | 336,443 | | | | 337,899 | |
| Series 2015-C03,Cl. 1M1, 2.024%, 7/25/253 | | | 782,895 | | | | 785,950 | |
| Series 2016-C02,Cl. 1M1, 2.674%, 9/25/283 | | | 262,148 | | | | 265,596 | |
| Series 2016-C03,Cl. 1M1, 2.524%, 10/25/283 | | | 2,495,661 | | | | 2,533,815 | |
| Series 2016-C03,Cl. 2M1, 2.724%, 10/25/283 | | | 473,219 | | | | 480,140 | |
| Series 2016-C04,Cl. 1M1, 1.974%, 1/25/293 | | | 2,742,161 | | | | 2,757,193 | |
| Series 2016-C05,Cl. 2M1, 1.874%, 1/25/293 | | | 2,406,809 | | | | 2,415,662 | |
|
| 36 OPPENHEIMER CAPITAL INCOME FUND |
| | | | | | | | |
| | | Principal Amount | | | Value | |
| Residential (Continued) | | | | | |
| Countrywide Alternative Loan Trust: | | | | | | | | |
| Series 2005-21CB,Cl. A7, 5.50%, 6/25/35 | | $ | 967,069 | | | $ | 889,883 | |
| Series 2005-J10,Cl. 1A17, 5.50%, 10/25/35 | | | 3,390,688 | | | | 3,075,436 | |
| Countrywide Asset-Backed Certificates, Series 2004-6, Cl. M5, 2.429%, 8/25/343 | | | 828,764 | | | | 748,962 | |
| GMACM Home Equity Loan Trust, Series 2007-HE2, Cl. A2, 6.054%, 12/25/373 | | | 11,987 | | | | 11,780 | |
| Home Equity Mortgage Trust: | | | | | | | | |
| Series 2005-HF1,Cl. A2B, 1.224%, 2/25/363 | | | 13,331 | | | | 13,309 | |
| Series 2005-HF1,Cl. A3B, 1.224%, 2/25/363 | | | 10,041 | | | | 10,024 | |
| HomeBanc Mortgage Trust, Series 2005-3, Cl. A2, 0.834%, 7/25/353 | | | 492,516 | | | | 476,516 | |
| RAMP Trust: | | | | | | | | |
| Series 2005-RS2,Cl. M4, 1.244%, 2/25/353 | | | 4,469,000 | | | | 4,081,873 | |
| Series 2005-RS6,Cl. M4, 1.499%, 6/25/353 | | | 5,700,000 | | | | 5,049,100 | |
| Series 2006-EFC1,Cl. M2, 0.924%, 2/25/363 | | | 5,490,000 | | | | 4,635,357 | |
| Structured Asset Securities Corp. Mortgage Loan Trust, Series 2007-GEL2, Cl. A2, 0.844%, 5/25/372,3 | | | 15,641,698 | | | | 15,103,716 | |
| WaMu Mortgage Pass-Through Certificates Trust: | | | | | | | | |
| Series 2003-AR10,Cl. A7, 6.00%, 10/25/333 | | | 588,493 | | | | 599,385 | |
| Series 2005-AR14,Cl. 1A4, 2.552%, 12/25/353 | | | 775,441 | | | | 751,135 | |
| Series 2005-AR16,Cl. 1A1, 2.585%, 12/25/353 | | | 841,641 | | | | 792,243 | |
| Wells Fargo Mortgage-Backed Securities Trust: | | | | | | | | |
| Series 2005-AR10,Cl. 1A1, 2.951%, 6/25/353 | | | 2,203,865 | | | | 2,293,767 | |
| Series 2005-AR13,Cl. 1A5, 3.058%, 5/25/353 | | | 1,161,015 | | | | 1,164,857 | |
| Series 2005-AR15,Cl. 1A2, 2.957%, 9/25/353 | | | 1,536,774 | | | | 1,496,491 | |
| Series 2005-AR15,Cl. 1A6, 2.957%, 9/25/353 | | | 801,342 | | | | 761,617 | |
| Series 2005-AR4,Cl. 2A2, 2.988%, 4/25/353 | | | 3,865,266 | | | | 3,869,377 | |
| Series 2006-AR10,Cl. 5A5, 3.078%, 7/25/363 | | | 2,488,027 | | | | 2,408,509 | |
| Series 2006-AR14,Cl. 1A2, 4.804%, 10/25/363 | | | 413,902 | | | | 395,392 | |
| Series 2006-AR2,Cl. 2A3, 2.87%, 3/25/363 | | | 335,326 | | | | 329,871 | |
| Series 2006-AR7,Cl. 2A4, 3.087%, 5/1/363 | | | 168,545 | | | | 160,829 | |
| Series 2006-AR8,Cl. 2A1, 2.933%, 4/25/363 | | | 2,330,597 | | | | 2,283,029 | |
| Series 2006-AR8,Cl. 2A4, 2.933%, 4/25/363 | | | 446,518 | | | | 437,259 | |
| Series 2007-16,Cl. 1A1, 6.00%, 12/28/37 | | | 394,616 | | | | 409,653 | |
| Series 2007-AR3,Cl. A4, 5.892%, 4/25/373 | | | 31,317 | | | | 29,292 | |
| Series 2007-AR8,Cl. A1, 2.897%, 11/25/373 | | | 745,607 | | | | 666,134 | |
| | | | | | | 88,940,956 | |
| Total Mortgage-Backed Obligations (Cost $502,415,015) | | | | | | | 511,567,568 | |
| | | | | | | | | |
| U.S. Government Obligations—0.3% | | | | | | | | |
| Federal Home Loan Bank Nts., 0.875%, 8/5/19 | | | 800,000 | | | | 796,326 | |
| Federal National Mortgage Assn. Nts.: | | | | | | | | |
| 0.875%, 8/2/19 | | | 959,000 | | | | 953,819 | |
| 1.00%, 8/28/19 | | | 671,000 | | | | 670,032 | |
| United States Treasury Nts.: | | | | | | | | |
| 0.75%, 2/28/18 | | | 202,000 | | | | 201,925 | |
| 1.50%, 5/31/1910,11 | | | 4,530,000 | | | | 4,602,729 | |
| Total U.S. Government Obligations (Cost $7,172,601) | | | | 7,224,831 | |
|
| 37 OPPENHEIMER CAPITAL INCOME FUND |
CONSOLIDATED STATEMENT OF INVESTMENTS Continued
| | | | | | | | |
| | | Principal Amount | | | Value | |
| Non-Convertible Corporate Bonds and Notes—24.3% | | | | | | | | |
| Consumer Discretionary—3.0% | | | | | | | | |
| Auto Components—0.0% | | | | | | | | |
| BorgWarner, Inc., 4.375% Sr. Unsec. Nts., 3/15/45 | | $ | 763,000 | | | $ | 824,136 | |
| Johnson Controls, Inc., 1.40% Sr. Unsec. Nts., 11/2/17 | | | 409,000 | | | | 409,283 | |
| | | | | | | 1,233,419 | |
| | | | | | | | | |
| Automobiles—0.7% | | | | | | | | |
| Daimler Finance North America LLC, 8.50% Sr. Unsec. Unsub. Nts., 1/18/31 | | | 1,137,000 | | | | 1,898,430 | |
| Ford Motor Credit Co. LLC, 3.664% Sr. Unsec. Nts., 9/8/24 | | | 5,011,000 | | | | 5,194,362 | |
| General Motors Co., 6.25% Sr. Unsec. Nts., 10/2/43 | | | 2,146,000 | | | | 2,580,996 | |
| General Motors Financial Co., Inc., 3% Sr. Unsec. Nts., 9/25/17 | | | 2,330,000 | | | | 2,361,879 | |
| Harley-Davidson, Inc., 4.625% Sr. Unsec. Nts., 7/28/45 | | | 616,000 | | | | 687,038 | |
| Hyundai Capital America, 2.40% Sr. Unsec. Nts., 10/30/182 | | | 2,342,000 | | | | 2,377,128 | |
| Nissan Motor Acceptance Corp., 2% Sr. Unsec. Nts., 3/8/192 | | | 1,666,000 | | | | 1,678,875 | |
| ZF North America Capital, Inc., 4.75% Sr. Unsec. Nts., 4/29/252 | | | 2,198,000 | | | | 2,340,870 | |
| | | | | | | 19,119,578 | |
| | | | | | | | | |
| Diversified Consumer Services—0.1% | | | | | | | | |
Service Corp. International, 5.375% Sr. Unsec. Nts., 5/15/24 | | | 2,106,000 | | | | 2,269,215 | |
| | | | | | | | | |
| Hotels, Restaurants & Leisure—0.2% | | | | | | | | |
| Marriott International, Inc.: | | | | | | | | |
| 3.25% Sr. Unsec. Nts., 9/15/22 | | | 1,440,000 | | | | 1,505,592 | |
| 6.375% Sr. Unsec. Nts., 6/15/17 | | | 2,114,000 | | | | 2,192,563 | |
| McDonald’s Corp., 2.75% Sr. Unsec. Nts., 12/9/20 | | | 1,030,000 | | | | 1,072,886 | |
| | | | | | | 4,771,041 | |
| | | | | | | | | |
| Household Durables—0.5% | | | | | | | | |
| Lennar Corp., 4.75% Sr. Unsec. Nts., 5/30/25 | | | 2,283,000 | | | | 2,380,027 | |
| Newell Brands, Inc.: | | | | | | | | |
| 2.15% Sr. Unsec. Nts., 10/15/18 | | | 1,412,000 | | | | 1,430,431 | |
| 5.00% Sr. Unsec. Nts., 11/15/232 | | | 2,306,000 | | | | 2,454,539 | |
| 5.50% Sr. Unsec. Nts., 4/1/46 | | | 546,000 | | | | 675,804 | |
| PulteGroup, Inc., 5% Sr. Unsec. Nts., 1/15/27 | | | 2,355,000 | | | | 2,419,763 | |
| Toll Brothers Finance Corp., 4.375% Sr. Unsec. Nts., 4/15/23 | | | 2,362,000 | | | | 2,426,955 | |
| Whirlpool Corp.: | | | | | | | | |
| 1.35% Sr. Unsec. Nts., 3/1/17 | | | 521,000 | | | | 521,664 | |
| 1.65% Sr. Unsec. Nts., 11/1/17 | | | 510,000 | | | | 511,964 | |
| | | | | | | 12,821,147 | |
| | | | | | | | | |
| Leisure Equipment & Products—0.1% | | | | | | | | |
| Mattel, Inc., 1.70% Sr. Unsec. Nts., 3/15/18 | | | 2,288,000 | | | | 2,296,321 | |
| | | | | | | | | |
| Media—0.7% | | | | | | | | |
| 21st Century Fox America, Inc., 6.15% Sr. Unsec. Nts., 2/15/41 | | | 875,000 | | | | 1,139,120 | |
| Charter Communications Operating LLC/Charter Communications Operating Capital: | | | | | | | | |
| 4.464% Sr. Sec. Nts., 7/23/222 | | | 1,010,000 | | | | 1,096,413 | |
| 6.484% Sr. Sec. Nts., 10/23/452 | | | 800,000 | | | | 986,582 | |
| Comcast Cable Communications Holdings, Inc., 9.455% Sr. Unsec. Nts., 11/15/22 | | | 1,025,000 | | | | 1,441,257 | |
| Comcast Corp., 2.35% Sr. Unsec. Nts., 1/15/27 | | | 1,037,000 | | | | 1,029,268 | |
Historic TW, Inc., 9.15% Debs., 2/1/23 | | | 560,000 | | | | 760,084 | |
|
| 38 OPPENHEIMER CAPITAL INCOME FUND |
| | | | | | | | |
| | | Principal Amount | | | Value | |
| Media (Continued) | | | | | | | | |
| Interpublic Group of Cos., Inc. (The), 4.20% Sr. Unsec. Nts., 4/15/24 | | $ | 790,000 | | | $ | 856,057 | |
| Scripps Networks Interactive, Inc., 2.70% Sr. Unsec. Nts., 12/15/16 | | | 2,308,000 | | | | 2,317,887 | |
| Sky plc: | | | | | | | | |
| 3.75% Sr. Unsec. Nts., 9/16/242 | | | 1,054,000 | | | | 1,120,654 | |
| 6.10% Sr. Unsec. Nts., 2/15/182 | | | 752,000 | | | | 796,800 | |
| Thomson Reuters Corp., 1.65% Sr. Unsec. Nts., 9/29/17 | | | 2,350,000 | | | | 2,359,713 | |
| Time Warner Cable, Inc., 4.50% Sr. Unsec. Unsub. Nts., 9/15/42 | | | 1,218,000 | | | | 1,182,807 | |
| Time Warner, Inc.: | | | | | | | | |
| 2.95% Sr. Unsec. Nts., 7/15/26 | | | 1,092,000 | | | | 1,116,146 | |
| 3.875% Sr. Unsec. Nts., 1/15/26 | | | 100,000 | | | | 108,904 | |
| Viacom, Inc., 2.50% Sr. Unsec. Nts., 12/15/16 | | | 835,000 | | | | 838,127 | |
| Virgin Media Secured Finance plc, 5.25% Sr. Sec. Nts., 1/15/262 | | | 1,502,000 | | | | 1,543,305 | |
| | | | | | | 18,693,124 | |
| | | | | | | | | |
| Multiline Retail—0.1% | | | | | | | | |
| Dollar Tree, Inc., 5.75% Sr. Sec. Nts., 3/1/23 | | | 2,190,000 | | | | 2,367,937 | |
| | | | | | | | | |
| Specialty Retail—0.4% | | | | | | | | |
| AutoZone, Inc.: | | | | | | | | |
| 1.30% Sr. Unsec. Nts., 1/13/17 | | | 381,000 | | | | 381,467 | |
| 1.625% Sr. Unsec. Nts., 4/21/19 | | | 412,000 | | | | 413,160 | |
| Best Buy Co., Inc., 5.50% Sr. Unsec. Nts., 3/15/21 | | | 1,281,000 | | | | 1,425,112 | |
| L Brands, Inc., 5.625% Sr. Unsec. Nts., 2/15/22 | | | 784,000 | | | | 871,220 | |
| Lowe’s Cos, Inc., 3.70% Sr. Unsec. Nts., 4/15/46 | | | 1,003,000 | | | | 1,050,746 | |
| Ross Stores, Inc., 3.375% Sr. Unsec. Nts., 9/15/24 | | | 2,085,000 | | | | 2,223,117 | |
| Sally Holdings LLC/Sally Capital, Inc., 5.625% Sr. Unsec. Nts., 12/1/25 | | | 2,160,000 | | | | 2,350,080 | |
| Signet UK Finance plc, 4.70% Sr. Unsec. Nts., 6/15/24 | | | 1,073,000 | | | | 1,050,736 | |
| | | | | | | 9,765,638 | |
| | | | | | | | | |
| Textiles, Apparel & Luxury Goods—0.2% | | | | | | | | |
| Hanesbrands, Inc., 4.875% Sr. Unsec. Nts., 5/15/262 | | | 1,572,000 | | | | 1,646,670 | |
| Levi Strauss & Co., 5% Sr. Unsec. Nts., 5/1/25 | | | 1,973,000 | | | | 2,056,853 | |
| PVH Corp., 4.50% Sr. Unsec. Unsub. Nts., 12/15/22 | | | 2,179,000 | | | | 2,255,265 | |
| | | | | | | 5,958,788 | |
| | | | | | | | | |
| Consumer Staples—1.8% | | | | | | | | |
| Beverages—0.6% | | | | | | | | |
| Anheuser-Busch InBev Finance, Inc.: | | | | | | | | |
| 1.90% Sr. Unsec. Nts., 2/1/19 | | | 2,720,000 | | | | 2,749,887 | |
| 3.65% Sr. Unsec. Nts., 2/1/26 | | | 439,000 | | | | 469,599 | |
| 4.90% Sr. Unsec. Nts., 2/1/46 | | | 545,000 | | | | 661,799 | |
| Anheuser-Busch InBev Worldwide, Inc., 8.20% Sr. Unsec. Unsub. Nts., 1/15/39 | | | 1,561,000 | | | | 2,555,755 | |
| Beam Suntory, Inc., 1.875% Sr. Unsec. Nts., 5/15/17 | | | 1,118,000 | | | | 1,121,618 | |
| Constellation Brands, Inc., 4.75% Sr. Unsec. Nts., 11/15/24 | | | 2,175,000 | | | | 2,381,625 | |
Molson Coors Brewing Co.: | | | | | | | | |
2.10% Sr. Unsec. Nts., 7/15/21 | | | 2,019,000 | | | | 2,034,668 | |
| 4.20% Sr. Unsec. Nts., 7/15/46 | | | 534,000 | | | | 562,917 | |
| Pernod Ricard SA: | | | | | | | | |
| 2.95% Sr. Unsec. Nts., 1/15/172 | | | 1,944,000 | | | | 1,956,675 | |
|
| 39 OPPENHEIMER CAPITAL INCOME FUND |
CONSOLIDATED STATEMENT OF INVESTMENTS Continued
| | | | | | | | |
| | | Principal Amount | | | Value | |
| Beverages (Continued) | | | | | | | | |
| Pernod Ricard SA: (Continued) | | | | | | | | |
| 4.25% Sr. Unsec. Nts., 7/15/222 | | $ | 1,663,000 | | | $ | 1,823,233 | |
| | | | | | | 16,317,776 | |
| | | | | | | | | |
| Food & Staples Retailing—0.4% | | | | | | | | |
| CVS Health Corp., 2.875% Sr. Unsec. Nts., 6/1/26 | | | 2,160,000 | | | | 2,217,266 | |
| Koninklijke Ahold Delhaize NV, 6.50% Sr. Unsec. Nts., 6/15/17 | | | 634,000 | | | | 657,940 | |
| Kroger Co. (The): | | | | | | | | |
| 2.00% Sr. Unsec. Nts., 1/15/19 | | | 156,000 | | | | 158,214 | |
| 6.40% Sr. Unsec. Nts., 8/15/17 | | | 2,083,000 | | | | 2,184,569 | |
| 6.90% Sr. Unsec. Nts., 4/15/38 | | | 546,000 | | | | 779,013 | |
| Walgreens Boots Alliance, Inc.: | | | | | | | | |
| 1.75% Sr. Unsec. Nts., 5/30/18 | | | 1,598,000 | | | | 1,608,027 | |
| 3.10% Sr. Unsec. Nts., 6/1/23 | | | 2,405,000 | | | | 2,483,588 | |
| Wal-Mart Stores, Inc., 4.30% Sr. Unsec. Nts., 4/22/44 | | | 1,206,000 | | | | 1,445,272 | |
| | | | | | | 11,533,889 | |
| | | | | | | | | |
| Food Products—0.5% | | | | | | | | |
| Bunge Ltd. Finance Corp.: | | | | | | | | |
| 3.20% Sr. Unsec. Nts., 6/15/17 | | | 1,055,000 | | | | 1,069,699 | |
| 3.25% Sr. Unsec. Nts., 8/15/26 | | | 1,427,000 | | | | 1,436,829 | |
| 8.50% Sr. Unsec. Nts., 6/15/19 | | | 1,820,000 | | | | 2,131,038 | |
| Ingredion, Inc., 1.80% Sr. Unsec. Nts., 9/25/17 | | | 2,370,000 | | | | 2,381,305 | |
| JM Smucker Co. (The), 1.75% Sr. Unsec. Nts., 3/15/18 | | | 1,804,000 | | | | 1,814,229 | |
| Kraft Heinz Foods Co.: | | | | | | | | |
| 2.80% Sr. Unsec. Nts., 7/2/20 | | | 2,100,000 | | | | 2,185,065 | |
| 4.375% Sr. Unsec. Nts., 6/1/46 | | | 1,275,000 | | | | 1,384,872 | |
| TreeHouse Foods, Inc., 6% Sr. Unsec. Nts., 2/15/242 | | | 1,110,000 | | | | 1,216,837 | |
| | | | | | | 13,619,874 | |
| | | | | | | | | |
| Tobacco—0.3% | | | | | | | | |
| Altria Group, Inc., 10.20% Sr. Unsec. Nts., 2/6/39 | | | 1,085,000 | | | | 2,045,297 | |
| Imperial Brands Finance plc, 2.05% Sr. Unsec. Nts., 7/20/182 | | | 2,365,000 | | | | 2,387,505 | |
| Philip Morris International, Inc., 4.25% Sr. Unsec. Nts., 11/10/44 | | | 462,000 | | | | 519,989 | |
| Reynolds American, Inc., 5.85% Sr. Unsec. Nts., 8/15/45 | | | 1,715,000 | | | | 2,245,336 | |
| | | | | | | 7,198,127 | |
| | | | | | | | | |
| Energy—2.0% | | | | | | | | |
| Energy Equipment & Services—0.3% | | | | | | | | |
| Halliburton Co., 5% Sr. Unsec. Nts., 11/15/45 | | | 615,000 | | | | 679,681 | |
| Helmerich & Payne International Drilling Co., 4.65% Sr. Unsec. Nts., 3/15/25 | | | 921,000 | | | | 980,281 | |
| Nabors Industries, Inc., 2.35% Sr. Unsec. Nts., 9/15/16 | | | 2,162,000 | | | | 2,162,223 | |
| Schlumberger Holdings Corp.: | | | | | | | | |
| 1.90% Sr. Unsec. Nts., 12/21/172 | | | 2,205,000 | | | | 2,217,740 | |
| 4.00% Sr. Unsec. Nts., 12/21/252 | | | 1,405,000 | | | | 1,534,963 | |
| Sinopec Group Overseas Development 2014 Ltd., 1.75% Sr. Unsec. Nts., 4/10/172 | | | 2,330,000 | | | | 2,335,683 | |
| | | | | | | 9,910,571 | |
|
| 40 OPPENHEIMER CAPITAL INCOME FUND |
| | | | | | | | |
| | | Principal Amount | | | Value | |
| Oil, Gas & Consumable Fuels—1.7% | | | | | | | | |
| Anadarko Petroleum Corp.: | | | | | | | | |
| 4.50% Sr. Unsec. Nts., 7/15/44 | | $ | 431,000 | | | $ | 392,321 | |
| 6.20% Sr. Unsec. Nts., 3/15/40 | | | 586,000 | | | | 656,531 | |
| Apache Corp., 4.75% Sr. Unsec. Nts., 4/15/43 | | | 722,000 | | | | 747,944 | |
| Boardwalk Pipelines LP, 4.95% Sr. Unsec. Nts., 12/15/24 | | | 1,262,000 | | | | 1,303,825 | |
| BP Capital Markets plc, 1.676% Sr. Unsec. Nts., 5/3/19 | | | 2,326,000 | | | | 2,344,652 | |
| Chevron Corp., 1.561% Sr. Unsec. Nts., 5/16/19 | | | 2,300,000 | | | | 2,315,962 | |
| CNOOC Nexen Finance 2014 ULC, 1.625% Sr. Unsec. Nts., 4/30/17 | | | 2,056,000 | | | | 2,059,746 | |
| Columbia Pipeline Group, Inc., 4.50% Sr. Unsec. Nts., 6/1/25 | | | 1,265,000 | | | | 1,370,366 | |
| ConocoPhillips Co.: | | | | | | | | |
| 4.95% Sr. Unsec. Nts., 3/15/26 | | | 280,000 | | | | 318,063 | |
| 5.95% Sr. Unsec. Nts., 3/15/46 | | | 595,000 | | | | 761,607 | |
| Devon Energy Corp., 4.75% Sr. Unsec. Nts., 5/15/42 | | | 691,000 | | | | 644,934 | |
| EnLink Midstream Partners LP, 4.85% Sr. Unsec. Nts., 7/15/26 | | | 566,000 | | | | 563,299 | |
| Enterprise Products Operating LLC: | | | | | | | | |
| 4.85% Sr. Unsec. Nts., 8/15/42 | | | 697,000 | | | | 741,697 | |
| 4.90% Sr. Unsec. Nts., 5/15/46 | | | 246,000 | | | | 264,230 | |
| Kinder Morgan, Inc., 5.55% Sr. Unsec. Nts., 6/1/45 | | | 1,952,000 | | | | 2,021,159 | |
| Lukoil International Finance BV, 6.125% Sr. Unsec. Nts., 11/9/202 | | | 15,300,000 | | | | 16,768,647 | |
| Noble Energy, Inc., 5.05% Sr. Unsec. Nts., 11/15/44 | | | 621,000 | | | | 622,100 | |
| ONEOK Partners LP, 4.90% Sr. Unsec. Nts., 3/15/25 | | | 1,020,000 | | | | 1,106,383 | |
| Origin Energy Finance Ltd., 3.50% Sr. Unsec. Nts., 10/9/182 | | | 1,039,000 | | | | 1,054,047 | |
| Phillips 66 Partners LP, 3.605% Sr. Unsec. Nts., 2/15/25 | | | 1,977,000 | | | | 1,977,771 | |
| Regency Energy Partners LP/Regency Energy Finance Corp., 5% Sr. Unsec. Nts., 10/1/22 | | | 1,625,000 | | | | 1,728,366 | |
| Shell International Finance BV: | | | | | | | | |
| 1.375% Sr. Unsec. Nts., 5/10/19 | | | 1,722,000 | | | | 1,721,387 | |
| 4.00% Sr. Unsec. Nts., 5/10/46 | | | 840,000 | | | | 882,442 | |
| TransCanada PipeLines Ltd., 1.625% Sr. Unsec. Nts., 11/9/17 | | | 2,119,000 | | | | 2,125,007 | |
| Western Gas Partners LP, 4.65% Sr. Unsec. Nts., 7/1/26 | | | 406,000 | | | | 421,794 | |
| | | | | | | 44,914,280 | |
| | | | | | | | | |
| Financials—10.3% | | | | | | | | |
| Capital Markets—1.0% | | | | | | | | |
| Apollo Management Holdings LP, 4% Sr. Unsec. Nts., 5/30/242 | | | 1,741,000 | | | | 1,798,286 | |
| Credit Suisse AG, (New York), 3.625% Sr. Unsec. Nts., 9/9/24 | | | 1,325,000 | | | | 1,391,584 | |
| Credit Suisse Group Funding Guernsey Ltd., 4.55% Sr. Unsec. Nts., 4/17/262 | | | 860,000 | | | | 910,054 | |
| E*TRADE Financial Corp., 5.875% Jr. Sub. Perpetual Bonds3,12 | | | 2,370,000 | | | | 2,464,800 | |
| Goldman Sachs Capital II, 4% Jr. Sub. Perpetual Bonds3,12 | | | 296,000 | | | | 246,346 | |
| Goldman Sachs Group, Inc. (The): | | | | | | | | |
| 3.75% Sr. Unsec. Nts., 2/25/26 | | | 1,323,000 | | | | 1,403,207 | |
| 5.15% Sub. Nts., 5/22/45 | | | 1,704,000 | | | | 1,885,641 | |
| Mellon Capital IV, 4% Jr. Sub. Perpetual Bonds3,12 | | | 6,575,000 | | | | 5,613,406 | |
| Morgan Stanley: | | | | | | | | |
| 3.875% Sr. Unsec. Nts., 1/27/26 | | | 3,322,000 | | | | 3,554,842 | |
| 5.00% Sub. Nts., 11/24/25 | | | 2,167,000 | | | | 2,419,995 | |
| Nomura Holdings, Inc., 2% Sr. Unsec. Nts., 9/13/16 | | | 2,337,000 | | | | 2,337,526 | |
| Northern Trust Corp., 4.60% Jr. Sub. Perpetual Bonds3,12 | | | 783,000 | | | | 801,596 | |
| Raymond James Financial, Inc., 3.625% Sr. Unsec. Nts., 9/15/26 | | | 1,318,000 | | | | 1,348,716 | |
|
| 41 OPPENHEIMER CAPITAL INCOME FUND |
CONSOLIDATED STATEMENT OF INVESTMENTS Continued
| | | | | | | | |
| | | Principal Amount | | | Value | |
| Capital Markets (Continued) | | | | | | | | |
| UBS Group Funding Jersey Ltd., 4.125% Sr. Unsec. Nts., 4/15/262 | | $ | 1,375,000 | | | $ | 1,453,645 | |
| | | | | | | 27,629,644 | |
| | | | | | | | | |
| Commercial Banks—6.9% | | | | | | | | |
| Bank of America Corp.: | | | | | | | | |
| 3.50% Sr. Unsec. Nts., 4/19/26 | | | 2,122,000 | | | | 2,219,334 | |
| 7.75% Jr. Sub. Nts., 5/14/38 | | | 1,557,000 | | | | 2,304,889 | |
| 8.00% Jr. Sub. Perpetual Bonds, Series K3,12 | | | 26,470,000 | | | | 27,264,100 | |
| BB&T Corp., 2.05% Sr. Unsec. Nts., 5/10/21 | | | 2,350,000 | | | | 2,370,017 | |
| BPCE SA, 2.65% Sr. Unsec. Nts., 2/3/21 | | | 2,130,000 | | | | 2,202,497 | |
| Citigroup, Inc.: | | | | | | | | |
| 4.30% Sub. Nts., 11/20/26 | | | 1,321,000 | | | | 1,390,108 | |
| 4.65% Sr. Unsec. Nts., 7/30/45 | | | 1,630,000 | | | | 1,866,326 | |
| 5.875% Jr. Sub. Perpetual Bonds3,12 | | | 27,251,000 | | | | 27,693,829 | |
| 6.675% Sub. Nts., 9/13/43 | | | 1,056,000 | | | | 1,427,413 | |
| Citizens Bank NA (Providence RI), 2.55% Sr. Unsec. Nts., 5/13/21 | | | 1,837,000 | | | | 1,871,464 | |
| Commonwealth Bank of Australia, 2.625% Sr. Unsec. Nts., 9/6/262,9 | | | 1,218,000 | | | | 1,210,200 | |
| Danske Bank AS, 2.80% Sr. Unsec. Nts., 3/10/212 | | | 1,359,000 | | | | 1,412,618 | |
| Fifth Third Bank (Cincinnati OH), 3.85% Sub. Nts., 3/15/26 | | | 1,368,000 | | | | 1,459,779 | |
| First Republic Bank, 4.375% Sub. Nts., 8/1/46 | | | 983,000 | | | | 986,241 | |
| FirstMerit Bank NA (Akron OH), 4.27% Sub. Nts., 11/25/26 | | | 2,179,000 | | | | 2,273,285 | |
| Huntington Bancshares, Inc., 3.15% Sr. Unsec. Nts., 3/14/21 | | | 1,470,000 | | | | 1,529,347 | |
| ING Bank NV, 2.75% Sr. Unsec. Nts., 3/22/212 | | | 1,821,000 | | | | 1,884,007 | |
| JPMorgan Chase & Co.: | | | | | | | | |
| 2.295% Sr. Unsec. Nts., 8/15/21 | | | 519,000 | | | | 522,099 | |
| 2.70% Sr. Unsec. Nts., 5/18/23 | | | 1,001,000 | | | | 1,016,845 | |
| 7.90% Jr. Sub. Perpetual Bonds, Series 13,12 | | | 25,750,000 | | | | 26,747,813 | |
| 6.75% Jr. Sub. Perpetual Bonds, Series S3,12 | | | 1,947,000 | | | | 2,198,085 | |
| KeyBank NA (Cleveland OH), 3.40% Sub. Nts., 5/20/26 | | | 1,979,000 | | | | 2,030,881 | |
| Lloyds Banking Group plc: | | | | | | | | |
| 6.413% Jr. Sub. Perpetual Bonds2,3,12 | | | 125,000 | | | | 138,750 | |
| 6.657% Jr. Sub. Perpetual Bonds2,3,12 | | | 1,913,000 | | | | 2,132,995 | |
| Regions Bank (Birmingham AL), 2.25% Sr. Unsec. Nts., 9/14/18 | | | 1,896,000 | | | | 1,907,205 | |
| Royal Bank of Scotland Group plc, 7.64% Jr. Sub. Perpetual Bonds3,12 | | | 1,564,000 | | | | 1,552,114 | |
| Skandinaviska Enskilda Banken AB, 2.625% Sr. Unsec. Nts., 3/15/21 | | | 1,359,000 | | | | 1,402,640 | |
| Societe Generale SA, 4.25% Sub. Nts., 8/19/262 | | | 1,898,000 | | | | 1,923,090 | |
| SunTrust Bank (Atlanta GA), 3.30% Sub. Nts., 5/15/26 | | | 991,000 | | | | 1,020,497 | |
| SunTrust Banks, Inc., 3.50% Sr. Unsec. Nts., 1/20/17 | | | 1,356,000 | | | | 1,365,381 | |
| Swedbank AB, 2.65% Sr. Unsec. Nts., 3/10/212 | | | 1,440,000 | | | | 1,490,273 | |
| US Bancorp, 3.10% Sub. Nts., 4/27/26 | | | 1,392,000 | | | | 1,441,135 | |
| Wachovia Capital Trust III, 5.57% Jr. Sub. Perpetual Bonds3,12 | | | 26,328,000 | | | | 26,509,005 | |
| Wells Fargo & Co.: | | | | | | | | |
| 3.00% Sr. Unsec. Nts., 4/22/26 | | | 1,769,000 | | | | 1,815,622 | |
| 7.98% Jr. Sub. Perpetual Bonds, Series K3,12 | | | 24,815,000 | | | | 26,272,881 | |
| 5.90% Jr. Sub. Perpetual Bonds, Series S3,12 | | | 1,844,000 | | | | 1,963,860 | |
| | | | | | | 184,816,625 | |
| | | | | | | | | |
| Consumer Finance—0.3% | | | | | | | | |
| Ally Financial, Inc., 4.25% Sr. Unsec. Nts., 4/15/21 | | | 2,276,000 | | | | 2,349,970 | |
| Capital One Financial Corp., 3.20% Sr. Unsec. Nts., 2/5/25 | | | 1,829,000 | | | | 1,864,120 | |
|
| 42 OPPENHEIMER CAPITAL INCOME FUND |
| | | | | | | | |
| | | Principal Amount | | | Value | |
| Consumer Finance (Continued) | | | | | | | | |
Discover Financial Services: | | | | | | | | |
3.75% Sr. Unsec. Nts., 3/4/25 | | $ | 1,201,000 | | | $ | 1,220,378 | |
| 3.95% Sr. Unsec. Nts., 11/6/24 | | | 1,635,000 | | | | 1,684,910 | |
| Synchrony Financial, 4.50% Sr. Unsec. Nts., 7/23/25 | | | 620,000 | | | | 655,476 | |
| | | | | | | 7,774,854 | |
| | | | | | | | | |
| Diversified Financial Services—0.3% | | | | | | | | |
| Berkshire Hathaway Energy Co., 2% Sr. Unsec. Nts., 11/15/18 | | | 690,000 | | | | 698,227 | |
| Berkshire Hathaway, Inc., 3.125% Sr. Unsec. Nts., 3/15/26 | | | 1,030,000 | | | | 1,095,134 | |
| Peachtree Corners Funding Trust, 3.976% Sr. Unsec. Nts., 2/15/252 | | | 1,191,000 | | | | 1,202,990 | |
| S&P Global, Inc., 2.50% Sr. Unsec. Nts., 8/15/18 | | | 1,529,000 | | | | 1,554,288 | |
| Suntory Holdings Ltd., 1.65% Sr. Unsec. Nts., 9/29/172 | | | 1,199,000 | | | | 1,201,439 | |
| Voya Financial, Inc., 5.65% Jr. Sub. Nts., 5/15/533 | | | 2,235,000 | | | | 2,237,794 | |
| | | | | | | 7,989,872 | |
| | | | | | | | | |
| Insurance—1.2% | | | | | | | | |
| AXIS Specialty Finance plc, 5.15% Sr. Unsec. Nts., 4/1/45 | | | 1,808,000 | | | | 1,978,614 | |
| Five Corners Funding Trust, 4.419% Unsec. Nts., 11/15/232 | | | 1,733,000 | | | | 1,873,555 | |
| Liberty Mutual Group, Inc., 4.85% Sr. Unsec. Nts., 8/1/442 | | | 1,313,000 | | | | 1,405,502 | |
| Manulife Financial Corp., 4.15% Sr. Unsec. Nts., 3/4/26 | | | 1,351,000 | | | | 1,473,214 | |
| MetLife, Inc.: | | | | | | | | |
| 5.25% Jr. Sub. Perpetual Bonds3,12 | | | 1,672,000 | | | | 1,684,540 | |
| 10.75% Jr. Sub. Nts., 8/1/39 | | | 10,900,000 | | | | 17,576,250 | |
| Prudential Financial, Inc., 5.375% Jr. Sub. Nts., 5/15/453 | | | 576,000 | | | | 606,240 | |
| TIAA Asset Management Finance Co. LLC, 4.125% Sr. Unsec. Nts., 11/1/242 | | | 2,153,000 | | | | 2,269,811 | |
| Travelers Cos, Inc. (The), 3.75% Sr. Unsec. Nts., 5/15/46 | | | 1,812,000 | | | | 1,958,290 | |
| Unum Group, 7.125% Sr. Unsec. Nts., 9/30/16 | | | 2,154,000 | | | | 2,162,403 | |
| XLIT Ltd., 6.50% Jr. Sub. Perpetual Bonds3,12 | | | 1,340,000 | | | | 1,006,340 | |
| | | | | | | 33,994,759 | |
| | | | | | | | | |
| Real Estate Investment Trusts (REITs)—0.5% | | | | | | | | |
| American Tower Corp.: | | | | | | | | |
| 5.05% Sr. Unsec. Unsub. Nts., 9/1/20 | | | 922,000 | | | | 1,024,249 | |
| 5.90% Sr. Unsec. Nts., 11/1/21 | | | 1,053,000 | | | | 1,228,717 | |
| Boston Properties LP, 3.70% Sr. Unsec. Nts., 11/15/18 | | | 2,182,000 | | | | 2,278,883 | |
| HCP, Inc., 5.625% Sr. Unsec. Nts., 5/1/17 | | | 1,222,000 | | | | 1,252,546 | |
| Highwoods Realty LP, 5.85% Sr. Unsec. Nts., 3/15/17 | | | 962,000 | | | | 982,093 | |
| Host Hotels & Resorts LP, Series D, 3.75% Sr. Unsec. Nts., 10/15/23 | | | 1,394,000 | | | | 1,418,440 | |
| Liberty Property LP, 5.50% Sr. Unsec. Nts., 12/15/16 | | | 1,312,000 | | | | 1,327,450 | |
| Ventas Realty LP, 1.25% Sr. Unsec. Nts., 4/17/17 | | | 800,000 | | | | 800,106 | |
| WEA Finance LLC/Westfield UK & Europe Finance plc, 1.75% Sr. Unsec. Nts., 9/15/172 | | | 1,997,000 | | | | 2,000,439 | |
| Welltower, Inc., 2.25% Sr. Unsec. Nts., 3/15/18 | | | 475,000 | | | | 479,438 | |
| | | | | | | 12,792,361 | |
| | | | | | | | | |
| Real Estate Management & Development—0.1% | | | | | | | | |
| Brookfield Asset Management, Inc., 4% Sr. Unsec. Nts., 1/15/25 | | | 2,243,000 | | | | 2,307,991 | |
|
| 43 OPPENHEIMER CAPITAL INCOME FUND |
CONSOLIDATED STATEMENT OF INVESTMENTS Continued
| | | | | | | | |
| | | Principal Amount | | | Value | |
| Health Care—1.4% | | | | | | | | |
| Biotechnology—0.2% | | | | | | | | |
| AbbVie, Inc.: | | | | | | | | |
| 3.60% Sr. Unsec. Nts., 5/14/25 | | $ | 1,169,000 | | | $ | 1,238,421 | |
| 4.70% Sr. Unsec. Nts., 5/14/45 | | | 468,000 | | | | 523,129 | |
| Biogen, Inc., 5.20% Sr. Unsec. Nts., 9/15/45 | | | 640,000 | | | | 775,354 | |
| Celgene Corp.: | | | | | | | | |
| 3.875% Sr. Unsec. Nts., 8/15/25 | | | 1,200,000 | | | | 1,298,462 | |
| 5.00% Sr. Unsec. Nts., 8/15/45 | | | 325,000 | | | | 376,558 | |
| Gilead Sciences, Inc., 4.75% Sr. Unsec. Nts., 3/1/46 | | | 1,042,000 | | | | 1,215,413 | |
| | | | | | | 5,427,337 | |
| | | | | | | | | |
| Health Care Equipment & Supplies—0.2% | | | | | | | | |
| Baxter International, Inc., 2.60% Sr. Unsec. Nts., 8/15/26 | | | 1,107,000 | | | | 1,097,420 | |
| Becton Dickinson & Co.: | | | | | | | | |
| 1.45% Sr. Unsec. Nts., 5/15/17 | | | 1,914,000 | | | | 1,918,686 | |
| 3.875% Sr. Unsec. Nts., 5/15/24 | | | 753,000 | | | | 815,788 | |
| Boston Scientific Corp., 3.85% Sr. Unsec. Nts., 5/15/25 | | | 1,756,000 | | | | 1,884,941 | |
| Stryker Corp., 3.50% Sr. Unsec. Nts., 3/15/26 | | | 823,000 | | | | 875,992 | |
| | | | | | | 6,592,827 | |
| | | | | | | | | |
| Health Care Providers & Services—0.4% | | | | | | | | |
| Cardinal Health, Inc., 3.50% Sr. Unsec. Nts., 11/15/24 | | | 1,143,000 | | | | 1,222,463 | |
| Express Scripts Holding Co., 4.50% Sr. Unsec. Nts., 2/25/26 | | | 1,699,000 | | | | 1,879,760 | |
| Fresenius Medical Care US Finance II, Inc., 5.875% Sr. Unsec. Nts., 1/31/222 | | | 2,104,000 | | | | 2,403,820 | |
| Laboratory Corp. of America Holdings, 3.60% Sr. Unsec. Nts., 2/1/25 | | | 2,985,000 | | | | 3,138,602 | |
| McKesson Corp., 4.883% Sr. Unsec. Nts., 3/15/44 | | | 996,000 | | | | 1,195,028 | |
| Quest Diagnostics, Inc., 3.45% Sr. Unsec. Nts., 6/1/26 | | | 952,000 | | | | 990,726 | |
| | | | | | | 10,830,399 | |
| | | | | | | | | |
| Life Sciences Tools & Services—0.2% | | | | | | | | |
| Thermo Fisher Scientific, Inc.: | | | | | | | | |
| 1.30% Sr. Unsec. Nts., 2/1/17 | | | 580,000 | | | | 580,500 | |
| 2.15% Sr. Unsec. Nts., 12/14/18 | | | 932,000 | | | | 943,780 | |
| 3.00% Sr. Unsec. Nts., 4/15/23 | | | 957,000 | | | | 981,625 | |
| 4.15% Sr. Unsec. Nts., 2/1/24 | | | 916,000 | | | | 1,005,510 | |
| 5.30% Sr. Unsec. Nts., 2/1/44 | | | 743,000 | | | | 907,475 | |
| | | | | | | 4,418,890 | |
| | | | | | | | | |
| Pharmaceuticals—0.4% | | | | | | | | |
| Actavis Funding SCS: | | | | | | | | |
| 1.30% Sr. Unsec. Nts., 6/15/17 | | | 1,250,000 | | | | 1,246,884 | |
| 2.35% Sr. Unsec. Nts., 3/12/18 | | | 717,000 | | | | 725,491 | |
| 3.80% Sr. Unsec. Nts., 3/15/25 | | | 1,553,000 | | | | 1,641,787 | |
| 4.75% Sr. Unsec. Nts., 3/15/45 | | | 751,000 | | | | 827,047 | |
| Mylan NV: | | | | | | | | |
| 2.50% Sr. Unsec. Nts., 6/7/192 | | | 1,035,000 | | | | 1,048,821 | |
| 3.95% Sr. Unsec. Nts., 6/15/262 | | | 1,400,000 | | | | 1,445,241 | |
| Perrigo Finance Unlimited Co., 4.375% Sr. Unsec. Nts., 3/15/26 | | | 618,000 | | | | 646,418 | |
| Teva Pharmaceutical Finance Netherlands III BV: | | | | | | | | |
| 1.70% Sr. Unsec. Nts., 7/19/19 | | | 2,132,000 | | | | 2,136,957 | |
|
| 44 OPPENHEIMER CAPITAL INCOME FUND |
| | | | | | | | |
| | | Principal Amount | | | Value | |
| Pharmaceuticals (Continued) | | | | | | | | |
| Teva Pharmaceutical Finance Netherlands III BV: (Continued) | | | | | | | | |
| 2.80% Sr. Unsec. Nts., 7/21/23 | | $ | 957,000 | | | $ | 962,364 | |
| 4.10% Sr. Unsec. Nts., 10/1/46 | | | 575,000 | | | | 589,941 | |
| | | | | | | 11,270,951 | |
| | | | | | | | | |
| Industrials—1.4% | | | | | | | | |
| Aerospace & Defense—0.3% | | | | | | | | |
| BAE Systems Holdings, Inc., 3.85% Sr. Unsec. Nts., 12/15/252 | | | 1,739,000 | | | | 1,855,809 | |
| Lockheed Martin Corp., 3.55% Sr. Unsec. Nts., 1/15/26 | | | 1,097,000 | | | | 1,193,496 | |
| Northrop Grumman Corp., 4.75% Sr. Unsec. Nts., 6/1/43 | | | 1,195,000 | | | | 1,458,643 | |
| Textron, Inc.: | | | | | | | | |
| 3.875% Sr. Unsec. Nts., 3/1/25 | | | 628,000 | | | | 663,064 | |
| 4.30% Sr. Unsec. Nts., 3/1/24 | | | 1,164,000 | | | | 1,255,911 | |
| United Technologies Corp., 1.778% Jr. Sub. Nts., 5/4/183 | | | 403,000 | | | | 405,859 | |
| | | | | | | 6,832,782 | |
| | | | | | | | | |
| Building Products—0.1% | | | | | | | | |
| Owens Corning, 3.40% Sr. Unsec. Nts., 8/15/26 | | | 1,596,000 | | | | 1,601,926 | |
| | | | | | | | | |
| Commercial Services & Supplies—0.2% | | | | | | | | |
| Pitney Bowes, Inc., 4.625% Sr. Unsec. Nts., 3/15/24 | | | 2,049,000 | | | | 2,154,976 | |
| Republic Services, Inc.: | | | | | | | | |
| 2.90% Sr. Unsec. Nts., 7/1/26 | | | 1,137,000 | | | | 1,160,607 | |
| 3.80% Sr. Unsec. Nts., 5/15/18 | | | 1,860,000 | | | | 1,936,513 | |
| Waste Management, Inc., 4.10% Sr. Unsec. Nts., 3/1/45 | | | 557,000 | | | | 636,360 | |
| | | | | | | 5,888,456 | |
| | | | | | | | | |
| Electrical Equipment—0.1% | | | | | | | | |
| Sensata Technologies BV, 4.875% Sr. Unsec. Nts., 10/15/232 | | | 2,260,000 | | | | 2,341,925 | |
| | | | | | | | | |
| Industrial Conglomerates—0.0% | | | | | | | | |
| Roper Technologies, Inc., 3.85% Sr. Unsec. Nts., 12/15/25 | | | 1,150,000 | | | | 1,221,630 | |
| | | | | | | | | |
| Machinery—0.3% | | | | | | | | |
| Fortive Corp., 1.80% Sr. Unsec. Nts., 6/15/192 | | | 2,365,000 | | | | 2,383,104 | |
| Ingersoll-Rand Global Holding Co. Ltd., 4.25% Sr. Unsec. Nts., 6/15/23 | | | 1,823,000 | | | | 2,008,091 | |
| Stanley Black & Decker, Inc., 2.451% Sub. Nts., 11/17/18 | | | 2,186,000 | | | | 2,237,413 | |
| | | | | | | 6,628,608 | |
| | | | | | | | | |
| Marine—0.0% | | | | | | | | |
| AP Moeller-Maersk AS, 3.875% Sr. Unsec. Nts., 9/28/252 | | | 253,000 | | | | 260,209 | |
| | | | | | | | | |
| Professional Services—0.1% | | | | | | | | |
| Experian Finance plc, 2.375% Sr. Unsec. Nts., 6/15/172 | | | 1,948,000 | | | | 1,958,996 | |
| | | | | | | | | |
| Road & Rail—0.2% | | | | | | | | |
| Canadian Pacific Railway Co., 4.80% Sr. Unsec. Nts., 9/15/35 | | | 444,000 | | | | 515,190 | |
| ERAC USA Finance LLC: | | | | | | | | |
| 4.50% Sr. Unsec. Nts., 2/15/452 | | | 669,000 | | | | 726,631 | |
| 6.375% Sr. Unsec. Nts., 10/15/172 | | | 1,873,000 | | | | 1,970,383 | |
| Norfolk Southern Corp., 4.65% Sr. Unsec. Nts., 1/15/46 | | | 734,000 | | | | 864,731 | |
| Penske Truck Leasing Co. LP/PTL Finance Corp.: | | | | | | | | |
| 3.75% Sr. Unsec. Nts., 5/11/172 | | | 1,300,000 | | | | 1,320,133 | |
|
| 45 OPPENHEIMER CAPITAL INCOME FUND |
CONSOLIDATED STATEMENT OF INVESTMENTS Continued
| | | | | | | | |
| | | Principal Amount | | | Value | |
| Road & Rail (Continued) | | | | | | | | |
| Penske Truck Leasing Co. LP/PTL Finance Corp.: (Continued) | | | | | | | | |
| 4.25% Sr. Unsec. Nts., 1/17/232 | | $ | 788,000 | | | $ | 834,673 | |
| | | | | | | 6,231,741 | |
| | | | | | | | | |
| Trading Companies & Distributors—0.1% | | | | | | | | |
| AerCap Ireland Capital Ltd./AerCap Global Aviation Trust, 3.95% Sr. Unsec. Nts., 2/1/22 | | | 2,315,000 | | | | 2,407,600 | |
| Air Lease Corp., 3% Sr. Unsec. Nts., 9/15/23 | | | 983,000 | | | | 975,205 | |
| | | | | | | 3,382,805 | |
| | | | | | | | | |
| Information Technology—0.9% | | | | | | | | |
| Electronic Equipment, Instruments, & Components—0.1% | | | | | | | | |
| Flextronics International Ltd., 4.75% Sr. Unsec. Nts., 6/15/25 | | | 2,019,000 | | | | 2,147,079 | |
| | | | | | | | | |
| IT Services—0.3% | | | | | | | | |
| Broadridge Financial Solutions, Inc., 3.40% Sr. Unsec. Nts., 6/27/26 | | | 1,138,000 | | | | 1,167,490 | |
| Fidelity National Information Services, Inc.: | | | | | | | | |
| 1.45% Sr. Unsec. Nts., 6/5/17 | | | 1,804,000 | | | | 1,803,547 | |
| 2.85% Sr. Unsec. Nts., 10/15/18 | | | 550,000 | | | | 563,581 | |
| Total System Services, Inc., 2.375% Sr. Unsec. Nts., 6/1/18 | | | 2,036,000 | | | | 2,051,156 | |
| Visa, Inc., 4.30% Sr. Unsec. Nts., 12/14/45 | | | 845,000 | | | | 1,002,842 | |
| Xerox Corp.: | | | | | | | | |
| 2.95% Sr. Unsec. Nts., 3/15/17 | | | 798,000 | | | | 803,563 | |
| 6.75% Sr. Unsec. Nts., 2/1/17 | | | 398,000 | | | | 406,311 | |
| | | | | | | 7,798,490 | |
| | | | | | | | | |
| Semiconductors & Semiconductor Equipment—0.0% | | | | | | | | |
| Intel Corp., 4.90% Sr. Unsec. Nts., 7/29/45 | | | 621,000 | | | | 756,333 | |
| | | | | | | | | |
| Software—0.2% | | | | | | | | |
| Autodesk, Inc.: | | | | | | | | |
| 1.95% Sr. Unsec. Nts., 12/15/17 | | | 1,832,000 | | | | 1,839,112 | |
| 4.375% Sr. Unsec. Nts., 6/15/25 | | | 705,000 | | | | 746,800 | |
| Open Text Corp., 5.625% Sr. Unsec. Nts., 1/15/232 | | | 1,538,000 | | | | 1,595,675 | |
| Oracle Corp., 3.40% Sr. Unsec. Nts., 7/8/24 | | | 1,223,000 | | | | 1,312,757 | |
| | | | | | | 5,494,344 | |
| | | | | | | | | |
| Technology Hardware, Storage & Peripherals—0.3% | | | | | | | | |
| Apple, Inc., 4.375% Sr. Unsec. Nts., 5/13/45 | | | 1,287,000 | | | | 1,447,184 | |
| Diamond 1 Finance Corp./Diamond 2 Finance Corp.: | | | | | | | | |
| 3.48% Sr. Sec. Nts., 6/1/192 | | | 2,296,000 | | | | 2,361,721 | |
| 6.02% Sr. Sec. Nts., 6/15/262 | | | 1,559,000 | | | | 1,674,263 | |
| Hewlett Packard Enterprise Co.: | | | | | | | | |
| 2.45% Sr. Unsec. Nts., 10/5/172 | | | 1,578,000 | | | | 1,591,709 | |
| 6.35% Sr. Unsec. Nts., 10/15/452 | | | 1,083,000 | | | | 1,121,430 | |
| | | | | | | 8,196,307 | |
| | | | | | | | | |
| Materials—1.1% | | | | | | | | |
| Chemicals—0.5% | | | | | | | | |
| Agrium, Inc.: | | | | | | | | |
| 3.375% Sr. Unsec. Nts., 3/15/25 | | | 931,000 | | | | 958,846 | |
| 4.125% Sr. Unsec. Nts., 3/15/35 | | | 465,000 | | | | 460,189 | |
|
| 46 OPPENHEIMER CAPITAL INCOME FUND |
| | | | | | | | |
| | | Principal Amount | | | Value | |
| Chemicals (Continued) | | | | | | | | |
| Eastman Chemical Co.: | | | | | | | | |
| 2.40% Sr. Unsec. Nts., 6/1/17 | | $ | 274,000 | | | $ | 276,318 | |
| 4.65% Sr. Unsec. Nts., 10/15/44 | | | 565,000 | | | | 581,026 | |
| Ecolab, Inc., 2% Sr. Unsec. Nts., 1/14/19 | | | 2,243,000 | | | | 2,271,215 | |
| PolyOne Corp., 5.25% Sr. Unsec. Nts., 3/15/23 | | | 2,242,000 | | | | 2,354,100 | |
| RPM International, Inc., 3.45% Sr. Unsec. Unsub. Nts., 11/15/22 | | | 1,918,000 | | | | 1,948,038 | |
| Valspar Corp. (The): | | | | | | | | |
| 3.30% Sr. Unsec. Nts., 2/1/25 | | | 638,000 | | | | 654,779 | |
| 3.95% Sr. Unsec. Nts., 1/15/26 | | | 1,122,000 | | | | 1,192,408 | |
| Yara International ASA, 3.80% Sr. Unsec. Nts., 6/6/262 | | | 1,405,000 | | | | 1,462,512 | |
| | | | | | | 12,159,431 | |
| | | | | | | | | |
| Construction Materials—0.2% | | | | | | | | |
| CRH America, Inc.: | | | | | | | | |
| 5.125% Sr. Unsec. Nts., 5/18/452 | | | 1,625,000 | | | | 1,826,698 | |
| 6.00% Sr. Unsec. Nts., 9/30/16 | | | 1,100,000 | | | | 1,103,400 | |
| James Hardie International Finance Ltd., 5.875% Sr. Unsec. Nts., 2/15/232 | | | 2,242,000 | | | | 2,348,495 | |
| | | | | | | 5,278,593 | |
| | | | | | | | | |
| Containers & Packaging—0.2% | | | | | | | | |
| Ball Corp., 5.25% Sr. Unsec. Nts., 7/1/25 | | | 98,000 | | | | 106,452 | |
| International Paper Co.: | | | | | | | | |
| 3.00% Sr. Unsec. Nts., 2/15/27 | | | 1,088,000 | | | | 1,084,200 | |
| 4.80% Sr. Unsec. Nts., 6/15/44 | | | 874,000 | | | | 931,105 | |
| Packaging Corp. of America: | | | | | | | | |
| 3.65% Sr. Unsec. Nts., 9/15/24 | | | 525,000 | | | | 547,223 | |
| 4.50% Sr. Unsec. Nts., 11/1/23 | | | 1,938,000 | | | | 2,139,777 | |
| | | | | | | 4,808,757 | |
| | | | | | | | | |
| Metals & Mining—0.2% | | | | | | | | |
| BHP Billiton Finance USA Ltd., 1.625% Sr. Unsec. Nts., 2/24/17 | | | 2,291,000 | | | | 2,296,487 | |
| Glencore Finance Canada Ltd., 3.60% Sr. Unsec. Nts., 1/15/172 | | | 1,988,000 | | | | 1,998,119 | |
| Goldcorp, Inc., 5.45% Sr. Unsec. Nts., 6/9/44 | | | 622,000 | | | | 682,498 | |
| Rio Tinto Finance USA Ltd., 3.75% Sr. Unsec. Nts., 6/15/25 | | | 926,000 | | | | 982,458 | |
| | | | | | | 5,959,562 | |
| | | | | | | | | |
| Telecommunication Services—0.9% | | | | | | | | |
| Diversified Telecommunication Services—0.9% | | | | | | | | |
| AT&T, Inc.: | | | | | | | | |
| 2.80% Sr. Unsec. Nts., 2/17/21 | | | 2,410,000 | | | | 2,486,212 | |
| 4.35% Sr. Unsec. Nts., 6/15/45 | | | 1,965,000 | | | | 1,988,806 | |
| British Telecommunications plc, 9.375% Sr. Unsec. Nts., 12/15/30 | | | 1,700,000 | | | | 2,780,670 | |
| CenturyLink, Inc., Series Y, 7.50% Sr. Unsec. Nts., 4/1/24 | | | 2,205,000 | | | | 2,396,559 | |
| Deutsche Telekom International Finance BV, 2.25% Sr. Unsec. Nts., 3/6/172 | | | 2,275,000 | | | | 2,289,041 | |
| Orange SA, 2.75% Sr. Unsec. Nts., 9/14/16 | | | 634,000 | | | | 634,270 | |
| Telecom Italia Capital SA, 7.721% Sr. Unsec. Unsub. Nts., 6/4/38 | | | 66,000 | | | | 72,765 | |
| Telefonica Emisiones SAU: | | | | | | | | |
| 3.192% Sr. Unsec. Nts., 4/27/18 | | | 2,278,000 | | | | 2,337,358 | |
| 7.045% Sr. Unsec. Unsub. Nts., 6/20/36 | | | 667,000 | | | | 897,182 | |
|
| 47 OPPENHEIMER CAPITAL INCOME FUND |
CONSOLIDATED STATEMENT OF INVESTMENTS Continued
| | | | | | | | |
| | | Principal Amount | | | Value | |
| Diversified Telecommunication Services (Continued) | | | | | | | | |
Verizon Communications, Inc.: | | | | | | | | |
1.75% Sr. Unsec. Nts., 8/15/21 | | $ | 1,615,000 | | | $ | 1,603,559 | |
4.125% Sr. Unsec. Nts., 8/15/46 | | | 1,924,000 | | | | 1,939,863 | |
4.50% Sr. Unsec. Nts., 9/15/20 | | | 2,710,000 | | | | 2,993,374 | |
| 4.522% Sr. Unsec. Nts., 9/15/48 | | | 1,201,000 | | | | 1,279,007 | |
| | | | | | | 23,698,666 | |
| | | | | | | | | |
| Wireless Telecommunication Services—0.0% | | | | | | | | |
| Rogers Communications, Inc., 3.625% Sr. Unsec. Nts., 12/15/25 | | | 459,000 | | | | 499,834 | |
| | | | | | | | | |
| Utilities—1.5% | | | | | | | | |
| Electric Utilities—1.0% | | | | | | | | |
| AEP Texas Central Co., 3.85% Sr. Unsec. Nts., 10/1/252 | | | 1,159,000 | | | | 1,253,062 | |
| American Transmission Systems, Inc., 5% Sr. Unsec. Nts., 9/1/442 | | | 579,000 | | | | 660,311 | |
| Cleco Corporate Holdings LLC, 3.743% Sr. Sec. Nts., 5/1/262 | | | 1,144,000 | | | | 1,203,850 | |
| Edison International, 2.95% Sr. Unsec. Nts., 3/15/23 | | | 1,392,000 | | | | 1,434,052 | |
| EDP Finance BV, 5.25% Sr. Unsec. Nts., 1/14/212 | | | 2,130,000 | | | | 2,319,970 | |
| Emera US Finance LP, 2.15% Sr. Unsec. Nts., 6/15/192 | | | 75,000 | | | | 75,949 | |
| Enel Finance International NV, 6.25% Sr. Unsec. Nts., 9/15/172 | | | 2,101,000 | | | | 2,203,779 | |
| Exelon Corp., 4.45% Sr. Unsec. Nts., 4/15/46 | | | 575,000 | | | | 641,947 | |
| Indiana Michigan Power Co., Series K, 4.55% Sr. Unsec. Nts., 3/15/46 | | | 465,000 | | | | 535,546 | |
| ITC Holdings Corp., 5.30% Sr. Unsec. Nts., 7/1/43 | | | 510,000 | | | | 615,779 | |
| NextEra Energy Capital Holdings, Inc., 1.586% Sr. Unsec. Nts., 6/1/17 | | | 2,351,000 | | | | 2,358,573 | |
| Pennsylvania Electric Co., 5.20% Sr. Unsec. Nts., 4/1/20 | | | 368,000 | | | | 399,456 | |
| PPL Capital Funding, Inc., 3.50% Sr. Unsec. Unsub. Nts., 12/1/22 | | | 1,413,000 | | | | 1,500,460 | |
| PPL WEM Ltd./Western Power Distribution Ltd., 5.375% Sr. Unsec. Unsub. Nts., 5/1/212 | | | 2,970,000 | | | | 3,292,768 | |
| Public Service Co. of New Mexico, 7.95% Sr. Unsec. Nts., 5/15/18 | | | 1,953,000 | | | | 2,149,058 | |
| Southern Power Co., 1.85% Sr. Unsec. Nts., 12/1/17 | | | 2,226,000 | | | | 2,241,578 | |
| TECO Finance, Inc., 6.572% Sr. Unsec. Nts., 11/1/17 | | | 2,102,000 | | | | 2,222,976 | |
| Trans-Allegheny Interstate Line Co., 3.85% Sr. Unsec. Nts., 6/1/252 | | | 1,522,000 | | | | 1,624,172 | |
| Xcel Energy, Inc., 3.30% Sr. Unsec. Nts., 6/1/25 | | | 1,113,000 | | | | 1,179,242 | |
| | | | | | | 27,912,528 | |
| | | | | | | | | |
| Independent Power and Renewable Electricity Producers—0.3% | | | | | | | | |
| Energy Future Intermediate Holding Co. LLC/EFIH Finance, Inc., 11.75% Sec. Nts., 3/1/222,13 | | | 5,470,673 | | | | 6,681,060 | |
| | | | | | | | | |
| Multi-Utilities—0.2% | | | | | | | | |
| CenterPoint Energy, Inc., 5.95% Sr. Unsec. Nts., 2/1/17 | | | 1,629,000 | | | | 1,658,794 | |
| CMS Energy Corp.: | | | | | | | | |
| 3.875% Sr. Unsec. Nts., 3/1/24 | | | 1,316,000 | | | | 1,445,044 | |
| 5.05% Sr. Unsec. Unsub. Nts., 3/15/22 | | | 648,000 | | | | 736,654 | |
| NiSource Finance Corp., 4.80% Sr. Unsec. Nts., 2/15/44 | | | 1,130,000 | | | | 1,308,301 | |
| | | | | | | 5,148,793 | |
| Total Non-Convertible Corporate Bonds and Notes (Cost $620,108,971) | | | | | | | 651,526,090 | |
| | | | | | | | | |
| Convertible Corporate Bond and Note—0.8% | | | | | | | | |
| Clearwire Communications LLC/Clearwire Finance, Inc., 8.25% Cv. Sr. | | | | | | | | |
| Unsec. Nts., 12/1/402 (Cost $21,278,256) | | | 20,500,000 | | | | 21,435,313 | |
|
| 48 OPPENHEIMER CAPITAL INCOME FUND |
| | | | | | | | |
| | | Principal Amount | | | Value | |
| Corporate Loans—1.9% | | | | | | | | |
| Delos Finance Sarl, Sr. Sec. Credit Facilities 1st Lien Term Loan, Tranche B, 3.50%, 2/26/213 | | $ | 17,000,000 | | | $ | 17,085,000 | |
| Dynegy, Inc., Sr. Sec. Credit Facilities 1st Lien Term Loan, Tranche B2, 4.00%, 4/23/203 | | | 8,091,666 | | | | 8,095,882 | |
| Energy Future Intermediate Holding Co. LLC, Sr. Sec. Credit Facilities 1st Lien Term Loan, Debtor in Possession, 4.25%, 12/19/163 | | | 21,900,000 | | | | 21,972,993 | |
| Neiman Marcus Group Ltd. LLC, Sr. Sec. Credit Facilities 1st Lien Term Loan, 4.25%, 10/25/203 | | | 2,683,120 | | | | 2,523,625 | |
| Neiman Marcus Group Ltd. LLC, Sr. Sec. Credit Facilities 1st Lien Term Loan, 4.25%, 10/25/203,9 | | | 618,414 | | | | 581,653 | |
| Total Corporate Loans (Cost $49,875,750) | | | | | | | 50,259,153 | |
| | |
| | | Shares | | | | |
| Structured Securities—0.5% | | | | | | | | |
| Credit Suisse AG (London Branch), DISH Network Corp. Equity Linked Nts., 11/22/16 | | | 123,900 | | | | 6,316,422 | |
| Credit Suisse AG (London Branch), Noble Energy, Inc. Equity Linked Nts., 11/22/16 | | | 169,800 | | | | 5,880,509 | |
| Total Structured Securities (Cost $12,503,004) | | | | | | | 12,196,931 | |
| | | | | | | | | | | | | | | | | | | | | | | | | | | | | | | | |
| | | Counterparty | | | | | | Exercise
Price | | | Expiration
Date | | | | | | | | | Contracts | | | | |
| Over-the-Counter Option Purchased—0.0% | |
CNH Currency Put1
(Cost $1,712,200) | | | GSG | | | | CNH | | | | 6.800 | | | | 4/5/17 | | | | CNH | | | | | | | | 476,000,000 | | | | 1,266,160 | |
| | | | | | | |
| | | Counterparty | | | Buy /Sell
Protection | | | Reference
Asset | | | Fixed Rate | | | | | | Notional (000’s) | | | | |
| Over-the-Counter Credit Default Swaptions Purchased—0.0% | |
| Credit Default Swap maturing 06/20/21 Call1 | | | JPM | | | | Buy | | |
| CDX.
NA.HY.26 |
| | | 5.000 | % | | | 12/21/16 | | | | USD | | | | 12,891,000 | | | | 207,171 | |
| Credit Default Swap maturing 06/20/21 Call1 | | | JPM | | | | Buy | | |
| CDX.
NA.HY.26 |
| | | 5.000 | | | | 12/21/16 | | | | USD | | | | 14,979,000 | | | | 240,728 | |
| Credit Default Swap maturing 06/20/21 Call1 | | | JPM | | | | Buy | | |
| CDX.
NA.HY.26 |
| | | 5.000 | | | | 12/21/16 | | | | USD | | | | 14,979,000 | | | | 240,727 | |
Total Over-the-Counter Credit Default Swaptions Purchased
(Cost $682,588) | | | | | | | | | | | | | | | | | | | | | | | | 688,626 | |
|
| 49 OPPENHEIMER CAPITAL INCOME FUND |
CONSOLIDATED STATEMENT OF INVESTMENTS Continued
| | | | | | | | | | | | | | | | | | | | | | | | | | | | |
| | | | | | Pay/Receive
Floating | | | Floating | | | Fixed | | | Expiration | | | Notional Amount | | | | |
| Counterparty | | | | | Rate | | | Rate | | | Rate | | | Date | | | (000’s) | | | Value | |
| Over-the-Counter Interest Rate Swaptions Purchased—0.1% | |
| Interest Rate Swap maturing 11/21/28 Call1 | | | GSG | | | | Receive | | |
| Six-Month JPY
BBA LIBOR |
| | | 0.850% | | | | 11/19/18 | | | JPY | 512,000 | | | $ | 85,500 | |
| Interest Rate Swap maturing 11/22/27 Call1 | | | GSG | | | | Receive | | |
| Six-Month JPY
BBA LIBOR |
| | | 1.070 | | | | 11/20/17 | | | JPY | 8,437,000 | | | | 584,568 | |
| Interest Rate Swap maturing 11/7/28 Call1 | | | GSG | | | | Receive | | |
| Three-Month USD
BBA LIBOR |
| | | 2.680 | | | | 11/5/18 | | | USD | 6,500 | | | | 127,340 | |
| Interest Rate Swap maturing 3/21/28 Call1 | | | GSG | | | | Receive | | |
| Three-Month USD
BBA LIBOR |
| | | 2.580 | | | | 3/19/18 | | | USD | 14,400 | | | | 192,789 | |
| Interest Rate Swap maturing 4/18/28 Call1 | | | GSG | | | | Receive | | |
| Three-Month USD
BBA LIBOR |
| | | 2.505 | | | | 4/16/18 | | | USD | 36,000 | | | | 549,949 | |
| Interest Rate Swap maturing 7/25/28 Call1 | | | GSG | | | | Receive | | |
| Six-Month JPY
BBA LIBOR |
| | | 1.050 | | | | 7/23/18 | | | JPY | 2,000,000 | | | | 263,407 | |
Total Over-the-Counter Interest Rate Swaptions Purchased
(Cost $5,518,482) | | | | | | | | | | | | 1,803,553 | |
| | | | | | | | |
| | | Shares | | | | |
| Investment Companies—17.1% | | | | | | | | |
| Oppenheimer Institutional Money Market Fund, Cl. E, 0.35%14,15,16 | | | 103,649,970 | | | | 103,649,970 | |
| Oppenheimer Master Loan Fund, LLC14 | | | 15,497,138 | | | | 238,434,495 | |
| Oppenheimer Ultra-Short Duration Fund, Cl. Y14 | | | 18,286,561 | | | | 91,615,671 | |
| SPDR Gold Trust Exchange Traded Fund1,17 | | | 201,900 | | | | 25,193,082 | |
| Total Investment Companies (Cost $466,578,028) | | | | | | | 458,893,218 | |
| | | | | | | | | |
| Total Investments, at Value (Cost $2,890,784,908) | | | 109.9% | | | | 2,948,638,797 | |
| Net Other Assets (Liabilities) | | | (9.9) | | | | (265,373,366) | |
| Net Assets | | | 100.0% | | | $ | 2,683,265,431 | |
| | | | | | | | |
|
| 50 OPPENHEIMER CAPITAL INCOME FUND |
Footnotes to Consolidated Statement of Investments
1. Non-income producing security.
2. Represents securities sold under Rule 144A, which are exempt from registration under the Securities Act of 1933, as amended. These securities have been determined to be liquid under guidelines established by the Board of Trustees. These securities amount to $289,109,113 or 10.77% of the Fund’s net assets at period end.
3. Represents the current interest rate for a variable or increasing rate security.
4. Restricted security. The aggregate value of restricted securities at period end was $12,703,917, which represents 0.47% of the Fund’s net assets. See Note 4 of the accompanying Consolidated Notes. Information concerning restricted securities is as follows:
| | | | | | | | | | | | | | | | |
| | | | | | | | | | | | Unrealized | |
| | | Acquisition | | | | | | | | | Appreciation/ | |
| Security | | Dates | | | Cost | | | Value | | | (Depreciation) | |
| Blade Engine Securitization Ltd., Series 2006-1A, Cl. A1, 1.508%, 9/15/41 | | | 5/15/13 | | | $ | 1,170,742 | | | $ | 795,531 | | | $ | (375,211 | ) |
| Blade Engine Securitization Ltd., Series 2006-1A, Cl. B, 3.508%, 9/15/41 | | | 11/10/09–6/15/15 | | | | 4,049,826 | | | | 897,911 | | | | (3,151,915 | ) |
| Blade Engine Securitization Ltd., Series 2006-1AW, Cl. A1, 0.781%, 9/15/41 | | | 4/9/13–5/29/13 | | | | 15,693,864 | | | | 11,010,475 | | | | (4,683,389 | ) |
| | | | | | $ | 20,914,432 | | | $ | 12,703,917 | | | $ | (8,210,515 | ) |
| | | | | | | | | | | | | | | | |
5. Interest-Only Strips represent the right to receive the monthly interest payments on an underlying pool of mortgage loans. These securities typically decline in price as interest rates decline. Most other fixed income securities increase in price when interest rates decline. The principal amount of the underlying pool represents the notional amount on which current interest is calculated. The price of these securities is typically more sensitive to changes in prepayment rates than traditional mortgage-backed securities (for example, GNMA pass-throughs). Interest rates disclosed represent current yields based upon the current cost basis and estimated timing and amount of future cash flows.
These securities amount to $7,751,566 or 0.29% of the Fund’s net assets at period end.
6. Interest rate is less than 0.0005%.
7. Principal-Only Strips represent the right to receive the monthly principal payments on an underlying pool of mortgage loans. The value of these securities generally increases as interest rates decline and prepayment rates rise. The price of these securities is typically more volatile than that of coupon-bearing bonds of the same maturity. Interest rates disclosed represent current yields based upon the current cost basis and estimated timing of future cash flows.
These securities amount to $118,549 or less than 0.005% of the Fund’s net assets at period end.
8. The current amortization rate of the security’s cost basis exceeds the future interest payments currently estimated to be received. Both the amortization rate and interest payments are contingent on future mortgage pre-payment speeds and are therefore subject to change.
9. All or a portion of the security position is when-issued or delayed delivery to be delivered and settled after period end. See Note 4 of the accompanying Consolidated Notes.
10. All or a portion of the security position has been pledged for collateral in association with forward roll transactions. See Note 4 of the accompanying Consolidated Notes.
11. All or a portion of the security position is held in segregated accounts and pledged to cover margin requirements under certain derivative contracts. The aggregate market value of such securities is $1,880,718. See Note 6 of the accompanying Consolidated Notes.
12. This bond has no contractual maturity date, is not redeemable and contractually pays an indefinite stream of interest.
13. This security is not accruing income because the issuer has missed an interest payment on it and/or is not anticipated to make future interest and/or principal payments. The rate shown is the contractual interest rate. See Note 4 of the accompanying Consolidated Notes.
|
| 51 OPPENHEIMER CAPITAL INCOME FUND |
CONSOLIDATED STATEMENT OF INVESTMENTS Continued
Footnotes to Consolidated Statement of Investments (Continued)
14. Is or was an affiliate, as defined in the Investment Company Act of 1940, as amended, at or during the reporting period, by virtue of the Fund owning at least 5% of the voting securities of the issuer or as a result of the Fund and the issuer having the same investment adviser. Transactions during the reporting period in which the issuer was an affiliate are as follows:
| | | | | | | | | | | | | | | | |
| | | Shares
August 31, 2015 | | | Gross Additions | | | Gross Reductions | | | Shares August 31, 2016 | |
| |
Oppenheimer Institutional Money Market Fund, Cl. E16 | | | 248,654,557 | | | | 720,100,034 | | | | 865,104,621 | | | | 103,649,970 | |
Oppenheimer Master Loan Fund, LLC | | | 23,522,129 | | | | 2,120,059 | | | | 10,145,050 | | | | 15,497,138 | |
Oppenheimer Ultra-Short Duration Fund, Cl. Y | | | 12,167,055 | | | | 6,119,506 | | | | — | | | | 18,286,561 | |
| | | | | | | | | | | | | | |
| | | | | Value | | | Income | | | Realized Loss | |
| |
| Oppenheimer Institutional Money Market Fund, Cl. E16 | | | | $ | 103,649,970 | | | $ | 692,965 | | | $ | — | |
| Oppenheimer Master Loan Fund, LLC | | | | | 238,434,495 | | | | 16,787,549a | | | | 7,644,149 a | |
| Oppenheimer Ultra-Short Duration Fund, Cl. Y | | | | | 91,615,671 | | | | 652,519 | | | | — | |
| | | | | | |
| Total | | | | $ | 433,700,136 | | | $ | 18,133,033 | | | $ | 7,644,149 | |
| | | | | | |
a. Represents the amount allocated to the Fund from Oppenheimer Master Loan Fund, LLC.
15. Rate shown is the 7-day yield at period end.
16. Effective September 28, 2016, the fund will change its name to Oppenheimer Institutional Government Money Market Fund.
17. All or a portion of this security is owned by the subsidiary. See Note 2 of the accompanying Consolidated Notes.
| | | | | | | | | | | | | | | | | | | | | | | | | | | | |
| Forward Currency Exchange Contracts as of August 31, 2016 | | | | | | | | | |
| Counterparty | | Settlement
Month(s) | | | Currency Purchased
(000’s) | | | | | | Currency Sold (000’s) | | | Unrealized Appreciation | | | Unrealized Depreciation | |
BOA | | | 09/2016 | | | | USD | | | | 47,652 | | | | CHF | | | | 45,495 | | | $ | 1,343,163 | | | $ | — | |
BOA | | | 09/2016 | | | | USD | | | | 8,739 | | | | GBP | | | | 6,615 | | | | 48,537 | | | | — | |
CITNA-B | | | 09/2016 | | | | USD | | | | 27,736 | | | | CAD | | | | 35,720 | | | | 495,349 | | | | — | |
CITNA-B | | | 09/2016 | | | | USD | | | | 19,483 | | | | JPY | | | | 2,024,000 | | | | — | | | | 95,350 | |
GSCO-OT | | | 04/2017 | | | | USD | | | | 7,602 | | | | CNH | | | | 50,500 | | | | 133,053 | | | | — | |
HSBC | | | 09/2016 | | | | CHF | | | | 535 | | | | USD | | | | 551 | | | | — | | | | 6,777 | |
JPM | | | 09/2016 | | | | CHF | | | | 6,935 | | | | USD | | | | 7,074 | | | | — | | | | 14,397 | |
JPM | | | 09/2016 | | | | USD | | | | 1,456 | | | | CAD | | | | 1,885 | | | | 18,321 | | | | — | |
JPM | | | 09/2016 | | | | USD | | | | 27,045 | | | | EUR | | | | 23,905 | | | | 358,594 | | | | — | |
JPM | | | 09/2016 | | | | USD | | | | 7,036 | | | | GBP | | | | 4,975 | | | | 517,578 | | | | 17,767 | |
JPM | | | 09/2016 | | | | USD | | | | 25,276 | | | | THB | | | | 892,000 | | | | — | | | | 482,918 | |
RBS | | | 09/2016 | | | | USD | | | | 17,488 | | | | AUD | | | | 23,730 | | | | — | | | | 337,184 | |
| | | | | | | | | | | | | | | | | | | | | | | | |
Total Unrealized Appreciation and Depreciation | | | | | | | | | | | $ | 2,914,595 | | | $ | 954,393 | |
| | | | | | | | | | | | | | | | | | | | | | | | |
| | | | | | | | | | | | | | | | | | | | | | | | |
| Futures Contracts as of August 31, 2016 | | | | | |
| Description | | Exchange | | | Buy/Sell | | | Expiration
Date | | | Number of Contracts | | | Value | | | Unrealized
Appreciation (Depreciation) | |
Euro-BTP | | | EUX | | | | Sell | | | | 9/8/16 | | | | 55 | | | $ | 8,926,388 | | | $ | (261,151) | |
United States Treasury Long Bonds | | | CBT | | | | Buy | | | | 12/20/16 | | | | 71 | | | | 12,096,625 | | | | (173) | |
United States Treasury Nts., 2 yr. | | | CBT | | | | Buy | | | | 12/30/16 | | | | 578 | | | | 126,184,625 | | | | 7,752 | |
|
| 52 OPPENHEIMER CAPITAL INCOME FUND |
| | | | | | | | | | | | | | | | | | | | | | | | |
| Futures Contracts (Continued) | | | | | | | | | | | | | | | | | | | | | |
| Description | | Exchange | | | Buy/Sell | | | Expiration
Date | | | Number
of
Contracts | | | Value | | | Unrealized Appreciation (Depreciation) | |
| |
United States Treasury Nts., 5 yr. | | | CBT | | | | Sell | | | | 12/30/16 | | | | 6 | | | $ | 727,500 | | | $ | 1,537 | |
United States Treasury Nts., 10 yr. | | | CBT | | | | Sell | | | | 12/20/16 | | | | 265 | | | | 34,694,297 | | | | 38,552 | |
United States Ultra Bonds | | | CBT | | | | Buy | | | | 12/20/16 | | | | 239 | | | | 44,805,031 | | | | (14,897) | |
| | | | | | | | | | | | | | | | | | | | | | | | |
| | | | | | | | | | | | | | | | | | | | | | $ | (228,380) | |
| | | | | | | | | | | | | | | | | | | | | | | | |
| | | | | | | | | | | | | | | | | | | | | | | | |
| Over-the-Counter Options Written at August 31, 2016 | | | | | | | | | |
| Description | | Counterparty | | | | Exercise Price | | | Expiration Date | | | Number of Contracts | | | Premiums Received | | | Value | |
CNH Currency Put | | GSG CNH | | | 7.500 | | | | 4/5/17 | | | | CNH (525,000,000) | | | $ | 652,400 | | | $ | (126,000 | ) |
| | | | | | | | | | | | | | | | | | | | | | | | | | | | |
| Centrally Cleared Credit Default Swaps at August 31, 2016 | | | | | |
| Reference Asset | | | | | Buy/Sell Protection | | | Fixed
Rate | | | Maturity
Date | | | Notional
Amount
(000’s) | | | Premiums Received/(Paid) | | | Value | |
| CDX.IG.23 | | | | | | | Sell | | | | 1.000% | | | | 12/20/19 | | | USD | 25,000 | | | $ | (177,124 | ) | | $ | 331,848 | |
| CDX.IG.25 | | | | | | | Sell | | | | 1.000 | | | | 12/20/20 | | | USD | 4,800 | | | | (50,881 | ) | | | 56,187 | |
| CDX.IG.26 | | | | | | | Sell | | | | 1.000 | | | | 6/20/21 | | | USD | 6,400 | | | | (86,068 | ) | | | 93,130 | |
| CDX.NA.HY.21 | | | | | | | Buy | | | | 5.000 | | | | 12/20/18 | | | USD | 14,688 | | | | 909,840 | | | | (1,056,804 | ) |
| CDX.NA.HY.25 | | | | | | | Buy | | | | 5.000 | | | | 12/20/20 | | | USD | 6,683 | | | | 350,460 | | | | (393,181 | ) |
| CDX.NA.HY.26 | | | | | | | Buy | | | | 5.000 | | | | 6/20/21 | | | USD | 19,200 | | | | 939,307 | | | | (1,046,359 | ) |
| iTraxx.Main.25 | | | | | | | Buy | | | | 1.000 | | | | 6/20/21 | | | EUR | 33,000 | | | | 572,069 | | | | (605,181 | ) |
| Neiman Marcus Group LLC (The) | | | | | | | Buy | | | | 5.000 | | | | 12/20/20 | | | USD | 3,095 | | | | 179,341 | | | | (255,708 | ) |
Total Centrally Cleared Credit Default Swaps | | | | | | | | | | | $ | 2,636,944 | | | $ | (2,876,068 | ) |
| | | | | | | | | | | | | | | | | | | | | | | | | | | | |
| | | | | | | | | | | | | | | | | | | | | | | | | | | | |
| Over-the-Counter Credit Default Swaps at August 31, 2016 | |
| Reference Asset | | Counterparty | | | Buy/Sell Protection | | | Fixed
Rate | | | Maturity
Date | | | Notional Amount (000’s) | | | Premiums Received/(Paid) | | | Value | |
| CDX.NA.HY.21 | | | CITNA-B | | | | Sell | | | | 5.000% | | | | 12/20/18 | | | USD | 1,920 | | | $ | 1,071,501 | | | $ | (506,023 | ) |
| CDX.NA.HY.21 | | | GSG | | | | Sell | | | | 5.000 | | | | 12/20/18 | | | USD | 584 | | | | 318,928 | | | | (153,831 | ) |
| CDX.NA.HY.25 | | | GSG | | | | Sell | | | | 5.000 | | | | 12/20/20 | | | USD | 2,352 | | | | 1,560,755 | | | | (1,259,615 | ) |
| Kingdom of Spain | | | BOA | | | | Buy | | | | 1.000 | | | | 12/20/21 | | | USD | 16,400 | | | | 84,390 | | | | (166,080 | ) |
| Kingdom of Spain | | | GSG | | | | Buy | | | | 1.000 | | | | 12/20/21 | | | USD | 10,250 | | | | 59,225 | | | | (103,799 | ) |
| Malaysia | | | BAC | | | | Buy | | | | 1.000 | | | | 12/20/21 | | | USD | 1,500 | | | | (25,268 | ) | | | 16,483 | |
| Malaysia | | | BNP | | | | Buy | | | | 1.000 | | | | 12/20/21 | | | USD | 7,500 | | | | (129,984 | ) | | | 82,413 | |
| Malaysia | | | MOS-A | | | | Buy | | | | 1.000 | | | | 12/20/21 | | | USD | 7,500 | | | | (126,336 | ) | | | 82,413 | |
| Portuguese Republic | | | GSG | | | | Buy | | | | 1.000 | | | | 12/20/21 | | | USD | 15,500 | | | | (1,619,564 | ) | | | 1,360,622 | |
| Portuguese Republic | | | GSG | | | | Buy | | | | 1.000 | | | | 12/20/20 | | | USD | 11,000 | | | | (381,493 | ) | | | 716,627 | |
| Republic of Italy | | | GSG | | | | Buy | | | | 1.000 | | | | 12/20/21 | | | USD | 26,500 | | | | (602,106 | ) | | | 465,877 | |
| Total Over-the-Counter Credit Default Swaps | | | | | | | | | | | $ | 210,048 | | | $ | 535,087 | |
| | | | | | | | | | | | | | | | | | | | | | | | | | | | |
The table that follows shows the undiscounted maximum potential payment by the Fund related to selling credit protection in credit default swaps:
|
| 53 OPPENHEIMER CAPITAL INCOME FUND |
CONSOLIDATED STATEMENT OF INVESTMENTS Continued
| | | | | | | | | | | | |
Type of Reference Asset on which the Fund Sold Protection | | Total Maximum Potential Payments for Selling Credit Protection (Undiscounted) | | | Amount Recoverable* | | | Reference Asset Rating Range** | |
| Investment Grade Corporate Debt Indexes | | | $36,200,000 | | | | $— | | | | BBB+ | |
| Non-Investment Grade Corporate Debt Indexes | | | 4,854,802 | | | | 21,370,500 | | | | B+ | |
| Total | | | $41,054,802 | | | $ | 21,370,500 | | | | | |
| | | | | | | | | | | | |
* The Fund has no amounts recoverable from related purchased protection. In addition, the Fund has no recourse provisions under the credit derivatives and holds no collateral which can offset or reduce potential payments under a triggering event.
** The period end reference asset security ratings, as rated by any rating organization, are included in the equivalent Standard & Poor’s rating category. The reference asset rating represents the likelihood of a potential credit event on the reference asset which would result in a related payment by the Fund.
| | | | | | | | | | | | | | | | | | | | | | | | | | | | |
| Over-the-Counter Interest Rate Swaps at August 31, 2016 | |
| Counterparty | | Pay/Receive Floating Rate | | | Floating Rate | | | Fixed Rate | | | Maturity Date | | | Notional Amount (000’s) | | | | | | Value | |
BOA | | | Pay | | |
| Three-Month CNY
CNREPOFIX=CFXS |
| | | 2.730% | | | | 11/6/20 | | | CNY | 10,000 | | | | | | | $ | (1,305 | ) |
BOA | | | Pay | | |
| Three-Month CNY
CNREPOFIX=CFXS |
| | | 2.900 | | | | 7/24/20 | | | CNY | 84,000 | | | | | | | | 66,978 | |
GSG | | | Pay | | |
| Three-Month CNY
CNREPOFIX=CFXS |
| | | 2.830 | | | | 8/14/20 | | | CNY | 19,000 | | | | | | | | 8,845 | |
Total Over-the-Counter Interest Rate Swaps | | | | | | | | | | | | | | | | | | | | | | | | | | $ | 74,518 | |
| | | | | | | | | | | | | | | | | | | | | | | | | | | | |
| | | | | | | | | | | | | | | | | | | | | | | | | | | | | | | | |
| Over-the-Counter Credit Default Swaptions Written at August 31, 2016 | |
| Description | | Counter-
party | | | Buy/Sell
Protection | | | Reference
Asset | | | Fixed
Rate | | | Expiration
Date | | | Notional
Amount (000’s) | | | Premiums
Received | | | Value | |
Credit Default Swap maturing 06/20/21 Call | | | JPM | | | | Sell | | | | CDX. NA.HY.26 | | | | 5.000% | | | | 12/21/16 | | | | 14,979 | | | $ | 80,887 | | | $ | (83,300 | ) |
Credit Default Swap maturing 06/20/21 Call | | | JPM | | | | Sell | | | | CDX. NA.HY.26 | | | | 5.000 | | | | 12/21/16 | | | | 14,979 | | | | 80,887 | | | | (83,300 | ) |
Credit Default Swap maturing 06/20/21 Call | | | JPM | | | | Sell | | | | CDX. NA.HY.26 | | | | 5.000 | | | | 12/21/16 | | | | 12,891 | | | | 67,032 | | | | (71,686 | ) |
Total Over-the-Counter Credit Default Swaptions Written | | | | | | | | | | | | | | | | | | | $ | 228,806 | | | $ | (238,286 | ) |
| | | | | | | | | | | | | | | | | | | | | | | | | | | | | | | | |
Glossary:
Counterparty Abbreviations
| | |
| BAC | | Barclays Bank plc |
| BNP | | BNP Paribas |
| BOA | | Bank of America NA |
| CITNA-B | | Citibank NA |
| GSCO-OT | | Goldman Sachs Bank USA |
| GSG | | Goldman Sachs Group, Inc. (The) |
| HSBC | | HSBC Bank USA NA |
| JPM | | JPMorgan Chase Bank NA |
| MOS-A | | Morgan Stanley |
|
| 54 OPPENHEIMER CAPITAL INCOME FUND |
Counterparty Abbreviations (Continued)
| | |
| RBS | | Royal Bank of Scotland plc (The) |
Currency abbreviations indicate amounts reporting in currencies
| | |
| AUD | | Australian Dollar |
| CAD | | Canadian Dollar |
| CHF | | Swiss Franc |
| CNH | | Offshore Chinese Renminbi |
| CNY | | Chinese Renminbi |
| EUR | | Euro |
| GBP | | British Pound Sterling |
| JPY | | Japanese Yen |
| THB | | Thailand Baht |
Definitions
| | |
| BBA LIBOR | | British Bankers’ Association London - Interbank Offered Rate |
| BTP | | Italian Treasury Bonds |
| CDX.IG.23 | | Markit CDX Investment Grade Index |
| CDX.IG.25 | | Markit CDX Investment Grade Index |
| CDX.IG.26 | | Markit CDX Investment Grade Index |
| CDX.NA.HY.21 | | Markit CDX North American High Yield |
| CDX.NA.HY.25 | | Markit CDX North American High Yield |
| CDX.NA.HY.26 | | Markit CDX North American High Yield |
| CNREPOFIX=CFXS | | Repurchase Fixing Rates |
| iTraxx.Main.25 | | Credit Default Swap Trading Index for a Specific Basket of Securities |
Exchange Abbreviations
| | |
| CBT | | Chicago Board of Trade |
| EUX | | European Stock Exchange |
See accompanying Notes to Consolidated Financial Statements.
|
| 55 OPPENHEIMER CAPITAL INCOME FUND |
CONSOLIDATED STATEMENT OF
ASSETS AND LIABILITIES August 31, 2016
| | | | |
| |
| Assets | | | | |
| Investments, at value—see accompanying statement of investments: | | | | |
| Unaffiliated companies (cost $2,447,922,216) | | $ | 2,514,938,661 | |
| Affiliated companies (cost 442,862,692) | | | 433,700,136 | |
| | | | |
| | | 2,948,638,797 | |
| |
| Cash | | | 1,118,885 | |
| |
| Cash used for collateral on futures | | | 1,613,800 | |
| |
| Cash used for collateral on centrally cleared swaps | | | 4,982,410 | |
| |
| Unrealized appreciation on forward currency exchange contracts | | | 2,914,595 | |
| |
| Swaps, at value (premiums paid $2,884,751) | | | 2,800,258 | |
| |
| Centrally cleared swaps, at value (premiums paid $314,073) | | | 481,165 | |
| |
| Receivables and other assets: | | | | |
| Investments sold (including $28,279,866 sold on a when-issued or delayed delivery basis) | | | 70,853,786 | |
| Interest, dividends and principal paydowns | | | 12,724,399 | |
| Shares of beneficial interest sold | | | 1,787,515 | |
| Variation margin receivable | | | 117,535 | |
| Other | | | 166,354 | |
| | | | |
| Total assets | | | 3,048,199,499 | |
|
| |
| Liabilities | | | | |
| Unrealized depreciation on forward currency exchange contracts | | | 954,393 | |
| |
| Options written, at value (premiums received $652,400) | | | 126,000 | |
| |
| Swaps, at value (premiums received $3,094,799) | | | 2,190,653 | |
| |
| Centrally cleared swaps, at value (premiums received $2,951,017) | | | 3,357,233 | |
| |
| Swaptions written, at value (premiums received $228,806) | | | 238,286 | |
| |
| Payables and other liabilities: | | | | |
| Investments purchased (including $332,155,780 purchased on a when-issued or delayed delivery basis) | | | 352,769,611 | |
| Shares of beneficial interest redeemed | | | 4,511,470 | |
| Distribution and service plan fees | | | 465,175 | |
| Trustees’ compensation | | | 169,885 | |
| Shareholder communications | | | 22,777 | |
| Variation margin payable | | | 1,975 | |
| Other | | | 126,610 | |
| | | | |
| Total liabilities | | | 364,934,068 | |
|
| |
Net Assets | | $ | 2,683,265,431 | |
| | | | |
|
| |
| Composition of Net Assets | | | | |
| Par value of shares of beneficial interest | | $ | 274,217 | |
| |
| Additional paid-in capital | | | 2,930,652,477 | |
| |
| Accumulated net investment income | | | 13,178,382 | |
| |
| Accumulated net realized loss on investments and foreign currency transactions | | | (321,507,928) | |
| |
| Net unrealized appreciation on investments and translation of assets and liabilities denominated in foreign currencies | | | 60,668,283 | |
| | | | |
Net Assets | | $ | 2,683,265,431 | |
| | | | |
|
| 56 OPPENHEIMER CAPITAL INCOME FUND |
| | | | |
| |
| Net Asset Value Per Share | | | | |
Class A Shares: | | | | |
| |
Net asset value and redemption price per share (based on net assets of $1,723,245,370 and 175,133,254 shares of beneficial interest outstanding) | | | $9.84 | |
| Maximum offering price per share (net asset value plus sales charge of 5.75% of offering price) | | | $10.44 | |
| |
| |
Class B Shares: | | | | |
| Net asset value, redemption price (excludes applicable contingent deferred sales charge) and offering price per share (based on net assets of $12,108,353 and 1,258,736 shares of beneficial interest outstanding) | | | $9.62 | |
| |
| |
Class C Shares: | | | | |
| Net asset value, redemption price (excludes applicable contingent deferred sales charge) and offering price per share (based on net assets of $420,116,794 and 44,118,386 shares of beneficial interest outstanding) | | | $9.52 | |
| |
| |
Class I Shares: | | | | |
| Net asset value, redemption price and offering price per share (based on net assets of $15,142,043 and 1,539,550 shares of beneficial interest outstanding) | | | $9.84 | |
| |
| |
Class R Shares: | | | | |
| Net asset value, redemption price (excludes applicable contingent deferred sales charge) and offering price per share (based on net assets of $31,805,932 and 3,276,591 shares of beneficial interest outstanding) | | | $9.71 | |
| |
| |
Class Y Shares: | | | | |
| Net asset value, redemption price and offering price per share (based on net assets of $480,846,939 and 48,890,288 shares of beneficial interest outstanding) | | | $9.84 | |
See accompanying Notes to Consolidated Financial Statements.
|
| 57 OPPENHEIMER CAPITAL INCOME FUND |
CONSOLIDATED STATEMENT OF
OPERATIONS For the Year Ended August 31, 2016
| | | | |
| |
| Allocation of Income and Expenses from Master Funds1 | | | | |
| Net investment income allocated from Oppenheimer Master Loan Fund, LLC: | | | | |
| Interest | | $ | 16,747,434 | |
| Dividends | | | 40,115 | |
| Net expenses | | | (1,021,864) | |
| | | | |
| Net investment income allocated from Oppenheimer Master Loan Fund, LLC | | | 15,765,685 | |
|
| |
| Investment Income | | | | |
| Interest | | | 44,704,040 | |
| |
| Dividends: | | | | |
| Unaffiliated companies (net of foreign withholding taxes of $414,158) | | | 27,869,726 | |
| Affiliated companies | | | 1,345,484 | |
| |
| Fee income on when-issued securities | | | 5,507,273 | |
| |
| Other income | | | 18,326 | |
| | | | |
| Total investment income | | | 79,444,849 | |
|
| |
| Expenses | | | | |
| Management fees | | | 14,114,115 | |
| |
| Distribution and service plan fees: | | | | |
| Class A | | | 4,032,878 | |
| Class B | | | 155,016 | |
| Class C | | | 4,132,484 | |
| Class R | | | 140,019 | |
| |
| Transfer and shareholder servicing agent fees: | | | | |
| Class A | | | 3,768,096 | |
| Class B | | | 34,245 | |
| Class C | | | 909,714 | |
| Class I | | | 4,224 | |
| Class R | | | 63,246 | |
| Class Y | | | 997,130 | |
| |
| Shareholder communications: | | | | |
| Class A | | | 69,817 | |
| Class B | | | 1,325 | |
| Class C | | | 17,508 | |
| Class I | | | 33 | |
| Class R | | | 1,330 | |
| Class Y | | | 14,761 | |
| |
| Trustees’ compensation | | | 112,005 | |
| |
| Borrowing fees | | | 45,333 | |
| |
| Custodian fees and expenses | | | 17,824 | |
| |
| Other | | | 389,629 | |
| | | | |
| Total expenses | | | 29,020,732 | |
| Less reduction to custodian expenses | | | (74) | |
| Less waivers and reimbursements of expenses | | | (1,425,158) | |
| | | | |
| Net expenses | | | 27,595,500 | |
|
| |
| Net Investment Income | | | 67,615,034 | |
|
| 58 OPPENHEIMER CAPITAL INCOME FUND |
| | | | |
| |
| Realized and Unrealized Gain (Loss) | | | | |
| Net realized gain (loss) on: | | | | |
| Investments from unaffiliated companies (includes premiums on options exercised) | | $ | 19,461,321 | |
| Closing and expiration of futures contracts | | | 3,887,770 | |
| Foreign currency transactions | | | (2,396,692) | |
| Swap contracts | | | (12,722,685) | |
| |
| Net realized loss allocated from Oppenheimer Master Loan Fund, LLC | | | (7,644,149) | |
| | | | |
| Net realized gain | | | 585,565 | |
| |
| Net change in unrealized appreciation/depreciation on: | | | | |
| Investments | | | 64,634,317 | |
| Translation of assets and liabilities denominated in foreign currencies | | | (2,502,361) | |
| Futures contracts | | | 142,243 | |
| Option contracts written | | | 526,400 | |
| Swap contracts | | | 3,004,480 | |
| Swaption contracts written | | | (9,480) | |
| |
| Net change in unrealized appreciation/depreciation allocated from: | | | | |
| Oppenheimer Master Loan Fund, LLC | | | (1,243,105) | |
| | | | |
Net change in unrealized appreciation/depreciation | | | 64,552,494 | |
|
| |
Net Increase in Net Assets Resulting from Operations | | $ | 132,753,093 | |
| | | | |
1. The Fund invests in an affiliated mutual fund that expects to be treated as a partnership for tax purposes. See Note 4 of the accompanying Consolidated Notes.
See accompanying Notes to Consolidated Financial Statements.
|
| 59 OPPENHEIMER CAPITAL INCOME FUND |
CONSOLIDATED STATEMENTS OF CHANGES IN NET ASSETS
| | | | | | | | |
| | | Year Ended
August 31, 2016 | | | Year Ended
August 31, 2015 | |
| |
| Operations | | | | | | | | |
| Net investment income | | $ | 67,615,034 | | | $ | 63,646,419 | |
| |
| Net realized gain | | | 585,565 | | | | 130,322,839 | |
| |
| Net change in unrealized appreciation/depreciation | | | 64,552,494 | | | | (223,544,348) | |
| | | | |
Net increase (decrease) in net assets resulting from operations | | | 132,753,093 | | | | (29,575,090) | |
| |
| Dividends and/or Distributions to Shareholders | | | | | | | | |
| Dividends from net investment income: | | | | | | | | |
| Class A | | | (49,660,564) | | | | (54,455,014) | |
| Class B | | | (347,447) | | | | (599,556) | |
| Class C | | | (9,245,987) | | | | (9,026,248) | |
| Class I | | | (453,824) | | | | (439,586) | |
| Class R | | | (762,315) | | | | (731,018) | |
| Class Y | | | (14,306,602) | | | | (13,047,744) | |
| | | | |
| | | (74,776,739) | | | | (78,299,166) | |
| |
| Beneficial Interest Transactions | | | | | | | | |
| Net increase (decrease) in net assets resulting from beneficial interest transactions: | | | | | | | | |
| Class A | | | (50,000,323) | | | | 78,140,563 | |
| Class B | | | (8,043,352) | | | | (8,123,596) | |
| Class C | | | 7,414,517 | | | | 123,574,805 | |
| Class I | | | 2,089,587 | | | | 2,249,484 | |
| Class R | | | 3,882,943 | | | | 4,445,142 | |
| Class Y | | | 24,107,618 | | | | 183,331,782 | |
| | | | |
| | | (20,549,010) | | | | 383,618,180 | |
| |
| Net Assets | | | | | | | | |
| Total increase | | | 37,427,344 | | | | 275,743,924 | |
| |
| Beginning of period | | | 2,645,838,087 | | | | 2,370,094,163 | |
| | | | |
| End of period (including accumulated net investment income of $13,178,382 and $20,620,043, respectively) | | $ | 2,683,265,431 | | | $ | 2,645,838,087 | |
| | | | |
See accompanying Notes to Consolidated Financial Statements.
|
| 60 OPPENHEIMER CAPITAL INCOME FUND |
CONSOLIDATED FINANCIAL HIGHLIGHTS
| | | | | | | | | | | | | | | | | | | | |
| Class A | | Year Ended
August 31,
2016 | | | Year Ended
August 31,
2015 | | | Year Ended
August 29,
20141 | | | Year Ended
August 30,
20131 | | | Year Ended
August 31,
2012 | |
| |
Per Share Operating Data | | | | | | | | | | | | | | | | | | | | |
Net asset value, beginning of period | | | $9.62 | | | | $10.03 | | | | $9.29 | | | | $9.17 | | | | $8.70 | |
| |
Income (loss) from investment operations: | | | | | | | | | | | | | | | | | | | | |
Net investment income2 | | | 0.25 | | | | 0.25 | | | | 0.34 | | | | 0.29 | | | | 0.28 | |
Net realized and unrealized gain (loss) | | | 0.25 | | | | (0.35) | | | | 0.71 | | | | 0.19 | | | | 0.54 | |
| | | | |
Total from investment operations | | | 0.50 | | | | (0.10) | | | | 1.05 | | | | 0.48 | | | | 0.82 | |
| |
Dividends and/or distributions to shareholders: | | | | | | | | | | | | | | | | | | | | |
Dividends from net investment income | | | (0.28) | | | | (0.31) | | | | (0.31) | | | | (0.36) | | | | (0.35) | |
| |
Net asset value, end of period | | | $9.84 | | | | $9.62 | | | | $10.03 | | | | $9.29 | | | | $9.17 | |
| | | | |
|
| |
Total Return, at Net Asset Value3 | | | 5.31% | | | | (1.07)% | | | | 11.44% | | | | 5.30% | | | | 9.69% | |
|
| |
Ratios/Supplemental Data | | | | | | | | | | | | | | | | | | | | |
Net assets, end of period (in thousands) | | | $1,723,245 | | | | $1,735,068 | | | | $1,730,245 | | | | $1,512,076 | | | | $1,422,232 | |
| |
Average net assets (in thousands) | | | $1,712,506 | | | | $1,764,700 | | | | $1,627,867 | | | | $1,468,782 | | | | $1,400,955 | |
| |
Ratios to average net assets:4,5 | | | | | | | | | | | | | | | | | | | | |
Net investment income | | | 2.66% | | | | 2.54% | | | | 3.55% | | | | 3.07% | | | | 3.18% | |
Expenses excluding specific expenses listed below | | | 1.05% | | | | 1.05% | | | | 1.04% | | | | 0.98% | | | | 1.00% | |
Interest and fees from borrowings | | | 0.00%6 | | | | 0.00%6 | | | | 0.00% | | | | 0.00% | | | | 0.00% | |
| | | | |
Total expenses7 | | | 1.05% | | | | 1.05% | | | | 1.04% | | | | 0.98% | | | | 1.00% | |
| Expenses after payments, waivers and/or reimbursements and reduction to custodian expenses | | | 1.00% | | | | 0.99% | | | | 0.98% | | | | 0.93% | | | | 0.96% | |
| |
Portfolio turnover rate8 | | | 54% | | | | 79% | | | | 93% | | | | 84% | | | | 80% | |
|
| 61 OPPENHEIMER CAPITAL INCOME FUND |
CONSOLIDATED FINANCIAL HIGHLIGHTS Continued
1. August 29, 2014 and August 30, 2013 represent the last business days of the Fund’s reporting periods. See Note 2 of the accompanying Consolidated Notes.
2. Per share amounts calculated based on the average shares outstanding during the period.
3. Assumes an initial investment on the business day before the first day of the fiscal period, with all dividends and distributions reinvested in additional shares on the reinvestment date, and redemption at the net asset value calculated on the last business day of the fiscal period. Sales charges are not reflected in the total returns. Total returns are not annualized for periods less than one full year. Returns do not reflect the deduction of taxes that a shareholder would pay on fund distributions or the redemption of fund shares.
4. Annualized for periods less than one full year.
5. Includes the Fund’s share of the allocated expenses and/or net investment income from Oppenheimer Master Loan Fund, LLC.
6. Less than 0.005%.
7. Total expenses including indirect expenses from affiliated fund fees and expenses were as follows:
| | | | | | | | |
| Year Ended August 31, 2016 | | | 1.07 | % | | | | |
Year Ended August 31, 2015 | | | 1.07 | % | | | | |
| Year Ended August 29, 2014 | | | 1.06 | % | | | | |
Year Ended August 30, 2013 | | | 1.00 | % | | | | |
| Year Ended August 31, 2012 | | | 1.02 | % | | | | |
8. The portfolio turnover rate excludes purchase and sale transactions of To Be Announced (TBA) mortgage-related securities as follows:
| | | | | | | | |
| | | Purchase Transactions | | | Sale Transactions | |
Year Ended August 31, 2016 | | | $4,212,529,231 | | | | $4,192,313,269 | |
Year Ended August 31, 2015 | | | $4,664,260,054 | | | | $4,590,883,479 | |
Year Ended August 29, 2014 | | | $2,958,051,509 | | | | $2,894,379,022 | |
Year Ended August 30, 2013 | | | $3,481,764,612 | | | | $3,521,818,336 | |
Year Ended August 31, 2012 | | | $3,053,290,246 | | | | $3,030,115,715 | |
See accompanying Notes to Consolidated Financial Statements.
|
| 62 OPPENHEIMER CAPITAL INCOME FUND |
| | | | | | | | | | | | | | | | | | | | |
| Class B | | Year Ended
August 31,
2016 | | | Year Ended
August 31,
2015 | | | Year Ended
August 29,
20141 | | | Year Ended August 30,
20131 | | | Year Ended
August 31,
2012 | |
| Per Share Operating Data | | | | | | | | | | | | | | | | | | | | |
| Net asset value, beginning of period | | | $9.41 | | | | $9.81 | | | | $9.09 | | | | $8.98 | | | | $8.51 | |
| | |
| Income (loss) from investment operations: | | | | | | | | | | | | | | | | | | | | |
| Net investment income2 | | | 0.18 | | | | 0.17 | | | | 0.26 | | | | 0.19 | | | | 0.19 | |
| Net realized and unrealized gain (loss) | | | 0.23 | | | | (0.34) | | | | 0.68 | | | | 0.19 | | | | 0.54 | |
| | | | | | | | | | | | | | | | | | | | |
| Total from investment operations | | | 0.41 | | | | (0.17) | | | | 0.94 | | | | 0.38 | | | | 0.73 | |
| | |
| Dividends and/or distributions to shareholders: | | | | | | | | | | | | | | | | | | | | |
| Dividends from net investment income | | | (0.20) | | | | (0.23) | | | | (0.22) | | | | (0.27) | | | | (0.26) | |
| | |
| Net asset value, end of period | | | $9.62 | | | | $9.41 | | | | $9.81 | | | | $9.09 | | | | $8.98 | |
| | | | | | | | | | | | | | | | | | | | |
| | | | | | | | | | | | | | | | | | | | |
| | | | | | | | | | | | | | | | |
| Total Return, at Net Asset Value3 | | | 4.45% | | | | (1.79)% | | | | 10.48% | | | | 4.24% | | | | 8.80% | |
| | | | | | | | | | | | | | | | |
| Ratios/Supplemental Data | | | | | | | | | | | | | | | | | | | | |
| Net assets, end of period (in thousands) | | | $12,108 | | | | $19,917 | | | | $29,021 | | | | $33,683 | | | | $43,790 | |
| | |
| Average net assets (in thousands) | | | $15,539 | | | | $24,439 | | | | $30,985 | | | | $38,619 | | | | $45,562 | |
| | |
| Ratios to average net assets:4,5 | | | | | | | | | | | | | | | | | | | | |
| Net investment income | | | 1.96% | | | | 1.79% | | | | 2.70% | | | | 2.10% | | | | 2.20% | |
| Expenses excluding specific expenses listed below | | | 1.82% | | | | 1.82% | | | | 1.94% | | | | 2.07% | | | | 2.12% | |
| Interest and fees from borrowings | | | 0.00%6 | | | | 0.00%6 | | | | 0.00% | | | | 0.00% | | | | 0.00% | |
| | | | | | | | | | | | | | | | | | | | |
| Total expenses7 | | | 1.82% | | | | 1.82% | | | | 1.94% | | | | 2.07% | | | | 2.12% | |
| Expenses after payments, waivers and/or reimbursements and reduction to custodian expenses | | | 1.76% | | | | 1.76% | | | | 1.83% | | | | 1.94% | | | | 1.94% | |
| | |
| Portfolio turnover rate8 | | | 54% | | | | 79% | | | | 93% | | | | 84% | | | | 80% | |
|
| 63 OPPENHEIMER CAPITAL INCOME FUND |
CONSOLIDATED FINANCIAL HIGHLIGHTS Continued
1. August 29, 2014 and August 30, 2013 represent the last business days of the Fund’s reporting periods. See Note 2 of the accompanying Consolidated Notes.
2. Per share amounts calculated based on the average shares outstanding during the period.
3. Assumes an initial investment on the business day before the first day of the fiscal period, with all dividends and distributions reinvested in additional shares on the reinvestment date, and redemption at the net asset value calculated on the last business day of the fiscal period. Sales charges are not reflected in the total returns. Total returns are not annualized for periods less than one full year. Returns do not reflect the deduction of taxes that a shareholder would pay on fund distributions or the redemption of fund shares.
4. Annualized for periods less than one full year.
5. Includes the Fund’s share of the allocated expenses and/or net investment income from Oppenheimer Master Loan Fund, LLC.
6. Less than 0.005%.
7. Total expenses including indirect expenses from affiliated fund fees and expenses were as follows:
| | | | | | | | |
| Year Ended August 31, 2016 | | | 1.84 | % | | | | |
Year Ended August 31, 2015 | | | 1.84 | % | | | | |
| Year Ended August 29, 2014 | | | 1.96 | % | | | | |
Year Ended August 30, 2013 | | | 2.09 | % | | | | |
| Year Ended August 31, 2012 | | | 2.14 | % | | | | |
8. The portfolio turnover rate excludes purchase and sale transactions of To Be Announced (TBA) mortgage-related securities as follows:
| | | | | | | | |
| | | Purchase Transactions | | | Sale Transactions | |
Year Ended August 31, 2016 | | | $4,212,529,231 | | | | $4,192,313,269 | |
Year Ended August 31, 2015 | | | $4,664,260,054 | | | | $4,590,883,479 | |
Year Ended August 29, 2014 | | | $2,958,051,509 | | | | $2,894,379,022 | |
Year Ended August 30, 2013 | | | $3,481,764,612 | | | | $3,521,818,336 | |
Year Ended August 31, 2012 | | | $3,053,290,246 | | | | $3,030,115,715 | |
See accompanying Notes to Consolidated Financial Statements.
|
| 64 OPPENHEIMER CAPITAL INCOME FUND |
| | | | | | | | | | | | | | | | | | | | |
| Class C | | Year Ended
August 31,
2016 | | | Year Ended
August 31,
2015 | | | Year Ended
August 29,
20141 | | | Year Ended
August 30,
20131 | | | Year Ended
August 31,
2012 | |
| Per Share Operating Data | | | | | | | | | | | | | | | | | | | | |
| Net asset value, beginning of period | | | $9.32 | | | | $9.74 | | | | $9.03 | | | | $8.93 | | | | $8.47 | |
| | |
| Income (loss) from investment operations: | | | | | | | | | | | | | | | | | | | | |
| Net investment income2 | | | 0.17 | | | | 0.17 | | | | 0.26 | | | | 0.20 | | | | 0.20 | |
| Net realized and unrealized gain (loss) | | | 0.24 | | | | (0.35) | | | | 0.69 | | | | 0.19 | | | | 0.53 | |
| | | | | | | | | | | | | | | | | | | | |
| Total from investment operations | | | 0.41 | | | | (0.18) | | | | 0.95 | | | | 0.39 | | | | 0.73 | |
| | |
| Dividends and/or distributions to shareholders: | | | | | | | | | | | | | | | | | | | | |
| Dividends from net investment income | | | (0.21) | | | | (0.24) | | | | (0.24) | | | | (0.29) | | | | (0.27) | |
| | |
| Net asset value, end of period | | | $9.52 | | | | $9.32 | | | | $9.74 | | | | $9.03 | | | | $8.93 | |
| | | | | | | | | | | | | | | | | | | | |
| | | | | | | | | | | | | | | | | | | | |
| | | | | | | | | | | | | | | | |
| Total Return, at Net Asset Value3 | | | 4.47% | | | | (1.89)% | | | | 10.66% | | | | 4.41% | | | | 8.91% | |
| | | | | | | | | | | | | | | | |
| Ratios/Supplemental Data | | | | | | | | | | | | | | | | | | | | |
| Net assets, end of period (in thousands) | | | $420,117 | | | | $403,758 | | | | $296,136 | | | | $182,920 | | | | $112,220 | |
| | |
| Average net assets (in thousands) | | | $413,522 | | | | $369,218 | | | | $230,619 | | | | $140,184 | | | | $101,423 | |
| | |
| Ratios to average net assets:4,5 | | | | | | | | | | | | | | | | | | | | |
| Net investment income | | | 1.87% | | | | 1.75% | | | | 2.76% | | | | 2.24% | | | | 2.32% | |
| Expenses excluding specific expenses listed below | | | 1.82% | | | | 1.81% | | | | 1.82% | | | | 1.80% | | | | 1.86% | |
| Interest and fees from borrowings | | | 0.00%6 | | | | 0.00%6 | | | | 0.00% | | | | 0.00% | | | | 0.00% | |
| | | | | | | | | | | | | | | | | | | | |
| Total expenses7 | | | 1.82% | | | | 1.81% | | | | 1.82% | | | | 1.80% | | | | 1.86% | |
| Expenses after payments, waivers and/or reimbursements and reduction to custodian expenses | | | 1.76% | | | | 1.75% | | | | 1.76% | | | | 1.75% | | | | 1.82% | |
| | |
| Portfolio turnover rate8 | | | 54% | | | | 79% | | | | 93% | | | | 84% | | | | 80% | |
|
| 65 OPPENHEIMER CAPITAL INCOME FUND |
CONSOLIDATED FINANCIAL HIGHLIGHTS Continued
1. August 29, 2014 and August 30, 2013 represent the last business days of the Fund’s reporting periods. See Note 2 of the accompanying Consolidated Notes.
2. Per share amounts calculated based on the average shares outstanding during the period.
3. Assumes an initial investment on the business day before the first day of the fiscal period, with all dividends and distributions reinvested in additional shares on the reinvestment date, and redemption at the net asset value calculated on the last business day of the fiscal period. Sales charges are not reflected in the total returns. Total returns are not annualized for periods less than one full year. Returns do not reflect the deduction of taxes that a shareholder would pay on fund distributions or the redemption of fund shares.
4. Annualized for periods less than one full year.
5. Includes the Fund’s share of the allocated expenses and/or net investment income from Oppenheimer Master Loan Fund, LLC.
6. Less than 0.005%.
7. Total expenses including indirect expenses from affiliated fund fees and expenses were as follows:
| | | | | | | | |
| Year Ended August 31, 2016 | | | 1.84 | % | | | | |
Year Ended August 31, 2015 | | | 1.83 | % | | | | |
| Year Ended August 29, 2014 | | | 1.84 | % | | | | |
Year Ended August 30, 2013 | | | 1.82 | % | | | | |
| Year Ended August 31, 2012 | | | 1.88 | % | | | | |
8. The portfolio turnover rate excludes purchase and sale transactions of To Be Announced (TBA) mortgage-related securities as follows:
| | | | | | | | |
| | | Purchase Transactions | | | Sale Transactions | |
Year Ended August 31, 2016 | | | $4,212,529,231 | | | | $4,192,313,269 | |
Year Ended August 31, 2015 | | | $4,664,260,054 | | | | $4,590,883,479 | |
Year Ended August 29, 2014 | | | $2,958,051,509 | | | | $2,894,379,022 | |
Year Ended August 30, 2013 | | | $3,481,764,612 | | | | $3,521,818,336 | |
Year Ended August 31, 2012 | | | $3,053,290,246 | | | | $3,030,115,715 | |
See accompanying Notes to Consolidated Financial Statements.
|
| 66 OPPENHEIMER CAPITAL INCOME FUND |
| | | | | | | | | | | | |
| Class I | | Year Ended
August 31,
2016 | | | Year Ended
August 31,
2015 | | | Period Ended
August 29,
2014 1,2 | |
| |
| Per Share Operating Data | | | | | | | | | | | | |
| Net asset value, beginning of period | | | $9.62 | | | | $10.03 | | | | $9.60 | |
| |
| Income (loss) from investment operations: | | | | | | | | | | | | |
| Net investment income3 | | | 0.30 | | | | 0.29 | | | | 0.26 | |
| Net realized and unrealized gain (loss) | | | 0.24 | | | | (0.35) | | | | 0.31 | |
| | | | |
| Total from investment operations | | | 0.54 | | | | (0.06) | | | | 0.57 | |
| |
| Dividends and/or distributions to shareholders: | | | | | | | | | | | | |
| Dividends from net investment income | | | (0.32) | | | | (0.35) | | | | (0.14) | |
| |
| Net asset value, end of period | | | $9.84 | | | | $9.62 | | | | $10.03 | |
| | | | |
| | | | |
|
| |
| Total Return, at Net Asset Value4 | | | 5.78% | | | | (0.65)% | | | | 6.01% | |
|
| |
| Ratios/Supplemental Data | | | | | | | | | | | | |
| Net assets, end of period (in thousands) | | | $15,142 | | | | $12,625 | | | | $10,894 | |
| |
| Average net assets (in thousands) | | | $14,088 | | | | $12,629 | | | | $7,047 | |
| |
| Ratios to average net assets:5,6 | | | | | | | | | | | | |
| Net investment income | | | 3.08% | | | | 2.96% | | | | 3.87% | |
| Expenses excluding specific expenses listed below | | | 0.63% | | | | 0.62% | | | | 0.64% | |
| Interest and fees from borrowings | | | 0.00%7 | | | | 0.00%7 | | | | 0.00% | |
| | | | |
| Total expenses8 | | | 0.63% | | | | 0.62% | | | | 0.64% | |
| Expenses after payments, waivers and/or reimbursements and reduction to custodian expenses | | | 0.57% | | | | 0.56% | | | | 0.58% | |
| |
| Portfolio turnover rate9 | | | 54% | | | | 79% | | | | 93% | |
|
| 67 OPPENHEIMER CAPITAL INCOME FUND |
CONSOLIDATED FINANCIAL HIGHLIGHTS Continued
1. August 29, 2014 represents the last business day of the Fund’s reporting period. See Note 2 of the accompanying Consolidated Notes.
2. For the period from December 27, 2013 (inception of offering) to August 29, 2014.
3. Per share amounts calculated based on the average shares outstanding during the period.
4. Assumes an initial investment on the business day before the first day of the fiscal period, with all dividends and distributions reinvested in additional shares on the reinvestment date, and redemption at the net asset value calculated on the last business day of the fiscal period. Sales charges are not reflected in the total returns. Total returns are not annualized for periods less than one full year. Returns do not reflect the deduction of taxes that a shareholder would pay on fund distributions or the redemption of fund shares.
5. Annualized for periods less than one full year.
6. Includes the Fund’s share of the allocated expenses and/or net investment income from Oppenheimer Master Loan Fund, LLC.
7. Less than 0.005%.
8. Total expenses including indirect expenses from affiliated fund fees and expenses were as follows:
| | | | | | | | |
| Year Ended August 31, 2016 | | | 0.65 | % | | | | |
Year Ended August 31, 2015 | | | 0.64 | % | | | | |
| Period Ended August 29, 2014 | | | 0.66 | % | | | | |
9. The portfolio turnover rate excludes purchase and sale transactions of To Be Announced (TBA) mortgage-related securities as follows:
| | | | | | | | |
| | | Purchase Transactions | | | Sale Transactions | |
Year Ended August 31, 2016 | | | $4,212,529,231 | | | | $4,192,313,269 | |
Year Ended August 31, 2015 | | | $4,664,260,054 | | | | $4,590,883,479 | |
Period Ended August 29, 2014 | | | $2,958,051,509 | | | | $2,894,379,022 | |
See accompanying Notes to Consolidated Financial Statements.
|
| 68 OPPENHEIMER CAPITAL INCOME FUND |
| | | | | | | | | | | | | | | | | | | | |
| Class R | | Year Ended
August 31,
2016 | | | Year Ended August 31,
2015 | | | Year Ended August 29, 20141 | | | Year Ended
August 30,
20131 | | | Year Ended August 31,
2012 | |
| Per Share Operating Data | | | | | | | | | | | | | | | | | | | | |
| Net asset value, beginning of period | | | $9.50 | | | | $9.91 | | | | $9.18 | | | | $9.07 | | | | $8.60 | |
| | |
| Income (loss) from investment operations: | | | | | | | | | | | | | | | | | | | | |
| Net investment income2 | | | 0.23 | | | | 0.22 | | | | 0.31 | | | | 0.25 | | | | 0.25 | |
| Net realized and unrealized gain (loss) | | | 0.24 | | | | (0.35) | | | | 0.70 | | | | 0.19 | | | | 0.54 | |
| | | | | | | | | | | | | | | | | | | | |
| Total from investment operations | | | 0.47 | | | | (0.13) | | | | 1.01 | | | | 0.44 | | | | 0.79 | |
| | |
| Dividends and/or distributions to shareholders: | | | | | | | | | | | | | | | | | | | | |
| Dividends from net investment income | | | (0.26) | | | | (0.28) | | | | (0.28) | | | | (0.33) | | | | (0.32) | |
| | |
| Net asset value, end of period | | | $9.71 | | | | $9.50 | | | | $9.91 | | | | $9.18 | | | | $9.07 | |
| | | | | | | | | | | | | | | | | | | | |
| | | | | | | | | | | | | | | | | | | | |
| | | | | | | | | | | | | | | | |
| Total Return, at Net Asset Value3 | | | 5.02% | | | | (1.32)% | | | | 11.15% | | | | 4.98% | | | | 9.44% | |
| | | | | | | | | | | | | | | | |
| Ratios/Supplemental Data | | | | | | | | | | | | | | | | | | | | |
| Net assets, end of period (in thousands) | | | $31,806 | | | | $27,151 | | | | $23,798 | | | | $20,075 | | | | $20,994 | |
| | |
| Average net assets (in thousands) | | | $28,769 | | | | $25,957 | | | | $22,251 | | | | $20,943 | | | | $20,340 | |
| | |
| Ratios to average net assets:4,5 | | | | | | | | | | | | | | | | | | | | |
| Net investment income | | | 2.39% | | | | 2.28% | | | | 3.27% | | | | 2.73% | | | | 2.84% | |
| Expenses excluding specific expenses listed below | | | 1.31% | | | | 1.30% | | | | 1.32% | | | | 1.33% | | | | 1.34% | |
| Interest and fees from borrowings | | | 0.00%6 | | | | 0.00%6 | | | | 0.00% | | | | 0.00% | | | | 0.00% | |
| | | | | | | | | | | | | | | | | | | | |
| Total expenses7 | | | 1.31% | | | | 1.30% | | | | 1.32% | | | | 1.33% | | | | 1.34% | |
| Expenses after payments, waivers and/or reimbursements and reduction to custodian expenses | | | 1.25% | | | | 1.24% | | | | 1.26% | | | | 1.28% | | | | 1.30% | |
| | |
| Portfolio turnover rate8 | | | 54% | | | | 79% | | | | 93% | | | | 84% | | | | 80% | |
|
| 69 OPPENHEIMER CAPITAL INCOME FUND |
CONSOLIDATED FINANCIAL HIGHLIGHTS Continued
1. August 29, 2014 and August 30, 2013 represent the last business days of the Fund’s reporting periods. See Note 2 of the accompanying Consolidated Notes.
2. Per share amounts calculated based on the average shares outstanding during the period.
3. Assumes an initial investment on the business day before the first day of the fiscal period, with all dividends and distributions reinvested in additional shares on the reinvestment date, and redemption at the net asset value calculated on the last business day of the fiscal period. Sales charges are not reflected in the total returns. Total returns are not annualized for periods less than one full year. Returns do not reflect the deduction of taxes that a shareholder would pay on fund distributions or the redemption of fund shares.
4. Annualized for periods less than one full year.
5. Includes the Fund’s share of the allocated expenses and/or net investment income from Oppenheimer Master Loan Fund, LLC.
6. Less than 0.005%.
7. Total expenses including indirect expenses from affiliated fund fees and expenses were as follows:
| | | | | | | | |
| Year Ended August 31, 2016 | | | 1.33 | % | | | | |
Year Ended August 31, 2015 | | | 1.32 | % | | | | |
| Year Ended August 29, 2014 | | | 1.34 | % | | | | |
Year Ended August 30, 2013 | | | 1.35 | % | | | | |
| Year Ended August 31, 2012 | | | 1.36 | % | | | | |
8. The portfolio turnover rate excludes purchase and sale transactions of To Be Announced (TBA) mortgage-related securities as follows:
| | | | | | | | |
| | | Purchase Transactions | | | Sale Transactions | |
Year Ended August 31, 2016 | | | $4,212,529,231 | | | | $4,192,313,269 | |
Year Ended August 31, 2015 | | | $4,664,260,054 | | | | $4,590,883,479 | |
Year Ended August 29, 2014 | | | $2,958,051,509 | | | | $2,894,379,022 | |
Year Ended August 30, 2013 | | | $3,481,764,612 | | | | $3,521,818,336 | |
Year Ended August 31, 2012 | | | $3,053,290,246 | | | | $3,030,115,715 | |
See accompanying Notes to Consolidated Financial Statements.
|
| 70 OPPENHEIMER CAPITAL INCOME FUND |
| | | | | | | | | | | | | | | | | | | | |
| Class Y | | Year Ended
August 31,
2016 | | | Year Ended
August 31,
2015 | | | Year Ended
August 29,
20141 | | | Year Ended
August 30,
20131 | | | Year Ended
August 31,
2012 | |
| Per Share Operating Data | | | | | | | | | | | | | | | | | | | | |
| Net asset value, beginning of period | | | $9.62 | | | | $10.03 | | | | $9.29 | | | | $9.18 | | | | $8.70 | |
| | |
| Income (loss) from investment operations: | | | | | | | | | | | | | | | | | | | | |
| Net investment income2 | | | 0.27 | | | | 0.27 | | | | 0.37 | | | | 0.30 | | | | 0.30 | |
| Net realized and unrealized gain (loss) | | | 0.25 | | | | (0.35) | | | | 0.70 | | | | 0.19 | | | | 0.55 | |
| | | | | | | | | | | | | | | | | | | | |
| Total from investment operations | | | 0.52 | | | | (0.08) | | | | 1.07 | | | | 0.49 | | | | 0.85 | |
| | |
| Dividends and/or distributions to shareholders: | | | | | | | | | | | | | | | | | | | | |
| Dividends from net investment income | | | (0.30) | | | | (0.33) | | | | (0.33) | | | | (0.38) | | | | (0.37) | |
| | |
| Net asset value, end of period | | | $9.84 | | | | $9.62 | | | | $10.03 | | | | $9.29 | | | | $9.18 | |
| | | | | | | | | | | | | | | | | | | | |
| | | | | | | | | | | | | | | | | | | | |
| | | | | | | | | | | | | | | | |
| Total Return, at Net Asset Value3 | | | 5.47% | | | | (0.82)% | | | | 11.74% | | | | 5.49% | | | | 10.17% | |
| | | | | | | | | | | | | | | | |
| Ratios/Supplemental Data | | | | | | | | | | | | | | | | | | | | |
| Net assets, end of period (in thousands) | | | $480,847 | | | | $447,319 | | | | $280,000 | | | | $105,635 | | | | $23,119 | |
| | |
| Average net assets (in thousands) | | | $453,299 | | | | $401,249 | | | | $162,609 | | | | $63,500 | | | | $7,746 | |
| | |
| Ratios to average net assets:4,5 | | | | | | | | | | | | | | | | | | | | |
| Net investment income | | | 2.86% | | | | 2.74% | | | | 3.77% | | | | 3.27% | | | | 3.46% | |
| Expenses excluding specific expenses listed below | | | 0.82% | | | | 0.82% | | | | 0.81% | | | | 0.72% | | | | 0.69% | |
| Interest and fees from borrowings | | | 0.00%6 | | | | 0.00%6 | | | | 0.00% | | | | 0.00% | | | | 0.00% | |
| | | | | | | | | | | | | | | | | | | | |
| Total expenses7 | | | 0.82% | | | | 0.82% | | | | 0.81% | | | | 0.72% | | | | 0.69% | |
| Expenses after payments, waivers and/or reimbursements and reduction to custodian expenses | | | 0.76% | | | | 0.76% | | | | 0.75% | | | | 0.67% | | | | 0.65% | |
| | |
| Portfolio turnover rate8 | | | 54% | | | | 79% | | | | 93% | | | | 84% | | | | 80% | |
|
| 71 OPPENHEIMER CAPITAL INCOME FUND |
CONSOLIDATED FINANCIAL HIGHLIGHTS Continued
1. August 29, 2014 and August 30, 2013 represent the last business days of the Fund’s reporting periods. See Note 2 of the accompanying Consolidated Notes.
2. Per share amounts calculated based on the average shares outstanding during the period.
3. Assumes an initial investment on the business day before the first day of the fiscal period, with all dividends and distributions reinvested in additional shares on the reinvestment date, and redemption at the net asset value calculated on the last business day of the fiscal period. Sales charges are not reflected in the total returns. Total returns are not annualized for periods less than one full year. Returns do not reflect the deduction of taxes that a shareholder would pay on fund distributions or the redemption of fund shares.
4. Annualized for periods less than one full year.
5. Includes the Fund’s share of the allocated expenses and/or net investment income from Oppenheimer Master Loan Fund, LLC.
6. Less than 0.005%.
7. Total expenses including indirect expenses from affiliated fund fees and expenses were as follows:
| | | | | | | | |
| Year Ended August 31, 2016 | | | 0.84 | % | | | | |
Year Ended August 31, 2015 | | | 0.84 | % | | | | |
| Year Ended August 29, 2014 | | | 0.83 | % | | | | |
Year Ended August 30, 2013 | | | 0.74 | % | | | | |
| Year Ended August 31, 2012 | | | 0.71 | % | | | | |
8. The portfolio turnover rate excludes purchase and sale transactions of To Be Announced (TBA) mortgage-related securities as follows:
| | | | | | | | |
| | | Purchase Transactions | | | Sale Transactions | |
Year Ended August 31, 2016 | | | $4,212,529,231 | | | | $4,192,313,269 | |
Year Ended August 31, 2015 | | | $4,664,260,054 | | | | $4,590,883,479 | |
Year Ended August 29, 2014 | | | $2,958,051,509 | | | | $2,894,379,022 | |
Year Ended August 30, 2013 | | | $3,481,764,612 | | | | $3,521,818,336 | |
Year Ended August 31, 2012 | | | $3,053,290,246 | | | | $3,030,115,715 | |
See accompanying Notes to Consolidated Financial Statements.
|
| 72 OPPENHEIMER CAPITAL INCOME FUND |
NOTES TO CONSOLIDATED
FINANCIAL STATEMENTS August 31, 2016
1. Organization
Oppenheimer Capital Income Fund (the “Fund”) is a diversified open-end management investment company registered under the Investment Company Act of 1940 (“1940 Act”), as amended. The Fund’s investment objective is to seek total return. The Fund’s investment adviser is OFI Global Asset Management, Inc. (“OFI Global” or the “Manager”), a wholly-owned subsidiary of OppenheimerFunds, Inc. (“OFI” or the “Sub-Adviser”). The Manager has entered into a sub-advisory agreement with OFI.
The Fund offers Class A, Class C, Class I, Class R and Class Y shares, and previously offered Class B shares for new purchase through June 29, 2012. Subsequent to that date, no new purchases of Class B shares are permitted, however reinvestment of dividend and/or capital gain distributions and exchanges of Class B shares into and from other Oppenheimer funds are allowed. As of July 1, 2014, Class N shares were renamed Class R shares. Class N shares subject to a contingent deferred sales charge (“CDSC”) on July 1, 2014, continue to be subject to a CDSC after the shares were renamed. Purchases of Class R shares occurring on or after July 1, 2014, are not subject to a CDSC upon redemption. Class A shares are sold at their offering price, which is normally net asset value plus a front-end sales charge. Class C and Class R shares are sold, and Class B shares were sold, without a front-end sales charge but may be subject to a CDSC. Class R shares are sold only through retirement plans. Retirement plans that offer Class R shares may impose charges on those accounts. Class I and Class Y shares are sold to certain institutional investors or intermediaries without either a front-end sales charge or a CDSC, however, the intermediaries may impose charges on their accountholders who beneficially own Class I and Class Y shares. All classes of shares have identical rights and voting privileges with respect to the Fund in general and exclusive voting rights on matters that affect that class alone. Earnings, net assets and net asset value per share may differ due to each class having its own expenses, such as transfer and shareholder servicing agent fees and shareholder communications, directly attributable to that class. Class A, B, C and R shares have separate distribution and/or service plans under which they pay fees. Class I and Class Y shares do not pay such fees. Class B shares will automatically convert to Class A shares 72 months after the date of purchase.
The following is a summary of significant accounting policies followed in the Fund’s preparation of financial statements in accordance with accounting principles generally accepted in the United States (“U.S. GAAP”).
2. Significant Accounting Policies
Security Valuation. All investments in securities are recorded at their estimated fair value, as described in Note 3.
Reporting Period End Date. The last day of the Fund’s previous reporting period was the last day the New York Stock Exchange was open for trading during that period. The Fund’s financial statements have been presented through that date to maintain consistency with the Fund’s net asset value calculations used for shareholder transactions.
|
| 73 OPPENHEIMER CAPITAL INCOME FUND |
NOTES TO CONSOLIDATED
FINANCIAL STATEMENTS Continued
2. Significant Accounting Policies (Continued)
Basis for Consolidation. The Fund has established a Cayman Islands exempted company, Oppenheimer Capital Income Fund Cayman Ltd., which is wholly-owned and controlled by the Fund (the “Subsidiary”). The Fund and Subsidiary are both managed by the Manager. The Fund may invest up to 25% of its total assets in the Subsidiary. The Subsidiary invests primarily in commodity-linked derivatives (including commodity futures, financial futures, options and swap contracts) and exchange traded funds related to gold or other special minerals (“Gold ETFs”). The Subsidiary is subject to the same investment restrictions and guidelines, and follows the same compliance policies and procedures, as the Fund.
The financial statements have been consolidated and include accounts of the Fund and the Subsidiary. Accordingly, all inter-company transactions and balances have been eliminated. At period end, the Fund owned 9,632 shares with net assets of $25,162,296 in the Subsidiary.
Other financial information at period end:
| | | | |
Total market value of investments | | $ | 25,193,082 | |
Net assets | | $ | 25,162,296 | |
Net income (loss) | | $ | (209,354) | |
Net realized gain (loss) | | $ | — | |
Net change in unrealized appreciation/depreciation | | $ | 3,294,758 | |
Foreign Currency Translation. The Fund’s accounting records are maintained in U.S. dollars. The values of securities denominated in foreign currencies and amounts related to the purchase and sale of foreign securities and foreign investment income are translated into U.S. dollars as of the close of the New York Stock Exchange (the “Exchange”), normally 4:00 P.M. Eastern time, on each day the Exchange is open for trading. Foreign exchange rates may be valued primarily using a reliable bank, dealer or service authorized by the Board of Trustees.
Reported net realized gains and losses from foreign currency transactions arise from sales of portfolio securities, sales and maturities of short-term securities, sales of foreign currencies, exchange rate fluctuations between the trade and settlement dates on securities transactions, and the difference between the amounts of dividends, interest, and foreign withholding taxes recorded on the Fund’s books and the U.S. dollar equivalent of the amounts actually received or paid. Net unrealized appreciation and depreciation on the translation of assets and liabilities denominated in foreign currencies arise from changes in the values of assets and liabilities, including investments in securities at fiscal period end, resulting from changes in exchange rates.
The effect of changes in foreign currency exchange rates on investments is separately identified from the fluctuations arising from changes in market values of securities held and reported with all other foreign currency gains and losses in the Fund’s Consolidated Statement of Operations.
Allocation of Income, Expenses, Gains and Losses. Income, expenses (other than those attributable to a specific class), gains and losses are allocated on a daily basis to each class of shares based upon the relative proportion of net assets represented by such class. Operating expenses directly attributable to a specific class are charged against the operations of that
|
| 74 OPPENHEIMER CAPITAL INCOME FUND |
2. Significant Accounting Policies (Continued)
class.
Dividends and Distributions to Shareholders. Dividends and distributions to shareholders, which are determined in accordance with income tax regulations and may differ from U.S. GAAP, are recorded on the ex-dividend date. Income distributions, if any, are declared and paid quarterly. Capital gain distributions, if any, are declared and paid annually or at other times as deemed necessary by the Manager.
Investment Income. Dividend income is recorded on the ex-dividend date or upon ex-dividend notification in the case of certain foreign dividends where the ex-dividend date may have passed. Non-cash dividends included in dividend income, if any, are recorded at the fair market value of the securities received. Interest income is recognized on an accrual basis. Discount and premium, which are included in interest income on the Consolidated Statement of Operations, are amortized or accreted daily.
Return of Capital Estimates. Distributions received from the Fund’s investments in Real Estate Investments Trusts (REITs), generally are comprised of income and return of capital. The Fund records investment income and return of capital based on estimates. Such estimates are based on historical information available from each REIT and other industry sources. These estimates may subsequently be revised based on information received from REITs after their tax reporting periods are concluded.
Custodian Fees. “Custodian fees and expenses” in the Consolidated Statement of Operations may include interest expense incurred by the Fund on any cash overdrafts of its custodian account during the period. Such cash overdrafts may result from the effects of failed trades in portfolio securities and from cash outflows resulting from unanticipated shareholder redemption activity. The Fund pays interest to its custodian on such cash overdrafts, to the extent they are not offset by positive cash balances maintained by the Fund, based on the negative rolling average balance at an average Federal Funds Rate plus 0.50%. The “Reduction to custodian expenses” line item, if applicable, represents earnings on cash balances maintained by the Fund during the period. Such interest expense and other custodian fees may be paid with these earnings.
Security Transactions. Security transactions are recorded on the trade date. Realized gains and losses on securities sold (except for the investments in the Subsidiary) are determined on the basis of identified cost.
Indemnifications. The Fund’s organizational documents provide current and former Trustees and officers with a limited indemnification against liabilities arising in connection with the performance of their duties to the Fund. In the normal course of business, the Fund may also enter into contracts that provide general indemnifications. The Fund’s maximum exposure under these arrangements is unknown as this would be dependent on future claims that may
|
| 75 OPPENHEIMER CAPITAL INCOME FUND |
NOTES TO CONSOLIDATED
FINANCIAL STATEMENTS Continued
2. Significant Accounting Policies (Continued)
be made against the Fund. The risk of material loss from such claims is considered remote.
Federal Taxes. The Fund intends to comply with provisions of the Internal Revenue Code applicable to regulated investment companies and to distribute substantially all of its investment company taxable income, including any net realized gain on investments not offset by capital loss carryforwards, if any, to shareholders. Therefore, no federal income or excise tax provision is required. The Fund files income tax returns in U.S. federal and applicable state jurisdictions. The statute of limitations on the Fund’s tax return filings generally remains open for the three preceding fiscal reporting period ends. The Fund has analyzed its tax positions for the fiscal year ended August 31, 2016, including open tax years, and does not believe there are any uncertain tax positions requiring recognition in the Fund’s financial statements.
Subchapter M requires, among other things, that at least 90% of the Fund’s gross income be derived from securities or derived with respect to its business of investing in securities (typically referred to as “qualifying income”). Income from commodity-linked derivatives may not be treated as “qualifying income” for purposes of the 90% gross income requirement. The Internal Revenue Service (IRS) has previously issued a number of private letter rulings which conclude that income derived from commodity index-linked notes and investments in a wholly-owned subsidiary will be “qualifying income.” As a result, the Fund will gain exposure to commodities through commodity-linked notes and its wholly-owned subsidiary.
The IRS has suspended the granting of private letter rulings pending further review. As a result, there can be no assurance that the IRS will not change its position with respect to commodity-linked notes and wholly-owned subsidiaries. In addition, future legislation and guidance from the Treasury and the IRS may adversely affect the Fund’s ability to gain exposure to commodities through commodity-linked notes and its wholly-owned subsidiary.
The Fund is required to include in income for federal income tax purposes all of the subsidiary’s net income and gains whether or not such income is distributed by the subsidiary. Net income and gains from the subsidiary are generally treated as ordinary income by the Fund, regardless of the character of the subsidiary’s underlying income. Net losses from the subsidiary do not pass through to the Fund for federal income tax purposes.
The tax components of capital shown in the following table represent distribution requirements the Fund must satisfy under the income tax regulations, losses the Fund may be able to offset against income and gains realized in future years and unrealized appreciation or depreciation of securities and other investments for federal income tax purposes.
| | | | | | | | | | | | |
Undistributed Net Investment Income | | Undistributed Long-Term Gain | | | Accumulated Loss Carryforward1,2,3,4 | | | Net Unrealized Appreciation Based on cost of Securities and Other Investments for Federal Income Tax Purposes | |
$564,346 | | | $— | | | | $307,058,984 | | | | $60,279,773 | |
|
| 76 OPPENHEIMER CAPITAL INCOME FUND |
2. Significant Accounting Policies (Continued)
1. At period end, the Fund had $307,001,832 of net capital loss carryforward available to offset future realized capital gains, if any, and thereby reduce future taxable gain distributions. Details of the capital loss carryforwards are included in the table below. Capital loss carryovers with no expiration, if any, must be utilized prior to those with expiration dates.
| | | | |
| Expiring | | | |
| |
2018 | | | $ 307,001,832 | |
2. The Fund had $57,152 of straddle losses which were deferred.
3. During the reporting period, the Fund utilized $3,000,239 of capital loss carryforward to offset capital gains realized in that fiscal year.
4. During the previous reporting period, the Fund utilized $130,254,038 of capital loss carryforward to offset capital gains realized in that fiscal year.
Net investment income (loss) and net realized gain (loss) may differ for financial statement and tax purposes. The character of dividends and distributions made during the fiscal year from net investment income or net realized gains are determined in accordance with federal income tax requirements, which may differ from the character of net investment income or net realized gains presented in those financial statements in accordance with U.S. GAAP. Also, due to timing of dividends and distributions, the fiscal year in which amounts are distributed may differ from the fiscal year in which the income or net realized gain was recorded by the Fund.
Accordingly, the following amounts have been reclassified for the reporting period. Net assets of the Fund were unaffected by the reclassifications.
| | | | | | | | |
Increase to Paid-in Capital | | Reduction to Accumulated Net Investment Income | | | Reduction to Accumulated Net Realized Loss on Investments | |
$7,287 | | | $279,956 | | | | $272,669 | |
The tax character of distributions paid during the reporting periods:
| | | | | | | | |
| | | Year Ended August 31, 2016 | | | Year Ended August 31, 2015 | |
Distributions paid from: | | | | | | | | |
Ordinary income | | | $ 74,776,739 | | | | $ 78,299,166 | |
The aggregate cost of securities and other investments and the composition of unrealized appreciation and depreciation of securities and other investments for federal income tax purposes at period end are noted in the following table. The primary difference between book and tax appreciation or depreciation of securities and other investments, if applicable, is attributable to the tax deferral of losses or tax realization of financial statement unrealized gain or loss.
|
| 77 OPPENHEIMER CAPITAL INCOME FUND |
NOTES TO CONSOLIDATED
FINANCIAL STATEMENTS Continued
2. Significant Accounting Policies (Continued)
| | | | |
Federal tax cost of securities | | $ | 2,888,453,732 | |
Federal tax cost of other investments | | | 137,957,963 | |
| | | | |
Total federal tax cost | | $ | 3,026,411,695 | |
| | | | |
Gross unrealized appreciation | | $ | 132,054,681 | |
Gross unrealized depreciation | | | (71,774,908) | |
| | | | |
Net unrealized appreciation | | $ | 60,279,773 | |
| | | | |
Use of Estimates. The preparation of financial statements in conformity with U.S. GAAP requires management to make estimates and assumptions that affect the reported amounts of assets and liabilities and disclosure of contingent assets and liabilities at the date of the financial statements and the reported amounts of increases and decreases in net assets from operations during the reporting period. Actual results could differ from those estimates.
3. Securities Valuation
The Fund calculates the net asset value of its shares as of 4:00 P.M. Eastern time, on each day the New York Stock Exchange (the “Exchange”) is open for trading, except in the case of a scheduled early closing of the Exchange, in which case the Fund will calculate net asset value of the shares as of the scheduled early closing time of the Exchange.
The Fund’s Board has adopted procedures for the valuation of the Fund’s securities and has delegated the day-to-day responsibility for valuation determinations under those procedures to the Manager. The Manager has established a Valuation Committee which is responsible for determining a “fair valuation” for any security for which market quotations are not “readily available.” The Valuation Committee’s fair valuation determinations are subject to review, approval and ratification by the Fund’s Board at its next regularly scheduled meeting covering the calendar quarter in which the fair valuation was determined.
Valuation Methods and Inputs
Securities are valued using unadjusted quoted market prices, when available, as supplied primarily by third party pricing services or dealers.
The following methodologies are used to determine the market value or the fair value of the types of securities described below:
Securities traded on a registered U.S. securities exchange (including exchange-traded derivatives other than futures and futures options) are valued based on the last sale price of the security reported on the principal exchange on which it is traded, prior to the time when the Fund’s assets are valued. In the absence of a sale, the security is valued at the mean between the bid and asked price on the principal exchange or, if not available from the principal exchange, obtained from two dealers. If bid and asked prices are not available from either the exchange or two dealers, the security is valued by using one of the following methodologies (listed in order of priority): (1) a bid from the principal exchange, (2) the mean between the bid and asked price as provided by a single dealer, or (3) a bid from a single dealer. A security of a foreign issuer traded on a foreign exchange, but not listed on
|
| 78 OPPENHEIMER CAPITAL INCOME FUND |
3. Securities Valuation (Continued)
a registered U.S. securities exchange, is valued based on the last sale price on the principal exchange on which the security is traded, as identified by the third party pricing service used by the Manager, prior to the time when the Fund’s assets are valued. If the last sale price is unavailable, the security is valued at the most recent official closing price on the principal exchange on which it is traded. If the last sales price or official closing price for a foreign security is not available, the security is valued at the mean between the bid and asked price per the exchange or, if not available from the exchange, obtained from two dealers. If bid and asked prices are not available from either the exchange or two dealers, the security is valued by using one of the following methodologies (listed in order of priority): (1) a bid from the exchange, (2) the mean between the bid and asked price as provided by a single dealer, or (3) a bid from a single dealer.
Shares of a registered investment company that are not traded on an exchange are valued at that investment company’s net asset value per share.
Corporate and government debt securities (of U.S. or foreign issuers) and municipal debt securities, event-linked bonds, loans, mortgage-backed securities, collateralized mortgage obligations, and asset-backed securities are valued at the mean between the “bid” and “asked” prices utilizing evaluated prices obtained from third party pricing services or broker-dealers who may use matrix pricing methods to determine the evaluated prices.
Short-term money market type debt securities with a remaining maturity of sixty days or less are valued at cost adjusted by the amortization of discount or premium to maturity (amortized cost), which approximates market value. Short-term debt securities with a remaining maturity in excess of sixty days are valued at the mean between the “bid” and “asked” prices utilizing evaluated prices obtained from third party pricing services or broker-dealers.
Structured securities, swaps, swaptions, and other over-the-counter derivatives are valued utilizing evaluated prices obtained from third party pricing services or broker-dealers.
Forward foreign currency exchange contracts are valued utilizing current and forward currency rates obtained from third party pricing services. When the settlement date of a contract is an interim date for which a quotation is not available, interpolated values are derived using the nearest dated forward currency rate.
Futures contracts and futures options traded on a commodities or futures exchange will be valued at the final settlement price or official closing price on the principal exchange as reported by such principal exchange at its trading session ending at, or most recently prior to, the time when the Fund’s assets are valued.
A description of the standard inputs that may generally be considered by the third party pricing vendors in determining their evaluated prices is provided below.
|
| 79 OPPENHEIMER CAPITAL INCOME FUND |
NOTES TO CONSOLIDATED
FINANCIAL STATEMENTS Continued
3. Securities Valuation (Continued)
| | |
| Security Type | | Standard inputs generally considered by third-party pricing vendors |
Corporate debt, government debt, municipal, mortgage- backed and asset-backed securities | | Reported trade data, broker-dealer price quotations, benchmark yields, issuer spreads on comparable securities, the credit quality, yield, maturity, and other appropriate factors. |
|
| Loans | | Information obtained from market participants regarding reported trade data and broker-dealer price quotations. |
|
| Event-linked bonds | | Information obtained from market participants regarding reported trade data and broker-dealer price quotations. |
|
| Structured securities | | Relevant market information such as the price of underlying financial instruments, stock market indices, foreign currencies, interest rate spreads, commodities, or the occurrence of other specific events. |
|
| Swaps | | Relevant market information, including underlying reference assets such as credit spreads, credit event probabilities, index values, individual security values, forward interest rates, variable interest rates, volatility measures, and forward currency rates. |
If a market value or price cannot be determined for a security using the methodologies described above, or if, in the “good faith” opinion of the Manager, the market value or price obtained does not constitute a “readily available market quotation,” or a significant event has occurred that would materially affect the value of the security, the security is fair valued either (i) by a standardized fair valuation methodology applicable to the security type or the significant event as previously approved by the Valuation Committee and the Fund’s Board or (ii) as determined in good faith by the Manager’s Valuation Committee. The Valuation Committee considers all relevant facts that are reasonably available, through either public information or information available to the Manager, when determining the fair value of a security. Fair value determinations by the Manager are subject to review, approval and ratification by the Fund’s Board at its next regularly scheduled meeting covering the calendar quarter in which the fair valuation was determined. Those fair valuation standardized methodologies include, but are not limited to, valuing securities at the last sale price or initially at cost and subsequently adjusting the value based on: changes in company specific fundamentals, changes in an appropriate securities index, or changes in the value of similar securities which may be further adjusted for any discounts related to security-specific resale restrictions. When possible, such methodologies use observable market inputs such as unadjusted quoted prices of similar securities, observable interest rates, currency rates and yield curves. The methodologies used for valuing securities are not necessarily an indication of the risks associated with investing in those securities nor can it be assured that the Fund can obtain the fair value assigned to a security if it were to sell the security.
To assess the continuing appropriateness of security valuations, the Manager, or its third party service provider who is subject to oversight by the Manager, regularly compares prior day prices, prices on comparable securities, and sale prices to the current day prices and challenges those prices exceeding certain tolerance levels with the third party pricing service or broker source. For those securities valued by fair valuations, whether through a standardized fair valuation methodology or a fair valuation determination, the Valuation Committee reviews and affirms the reasonableness of the valuations based on such methodologies and fair
|
| 80 OPPENHEIMER CAPITAL INCOME FUND |
3. Securities Valuation (Continued)
valuation determinations on a regular basis after considering all relevant information that is reasonably available.
Classifications
Each investment asset or liability of the Fund is assigned a level at measurement date based on the significance and source of the inputs to its valuation. Various data inputs are used in determining the value of each of the Fund’s investments as of the reporting period end. These data inputs are categorized in the following hierarchy under applicable financial accounting standards:
1) Level 1-unadjusted quoted prices in active markets for identical assets or liabilities (including securities actively traded on a securities exchange)
2) Level 2-inputs other than unadjusted quoted prices that are observable for the asset or liability (such as unadjusted quoted prices for similar assets and market corroborated inputs such as interest rates, prepayment speeds, credit risks, etc.)
3) Level 3-significant unobservable inputs (including the Manager’s own judgments about assumptions that market participants would use in pricing the asset or liability).
The inputs used for valuing securities are not necessarily an indication of the risks associated with investing in those securities.
The Fund classifies each of its investments in investment companies which are publicly offered as Level 1. Investment companies that are not publicly offered are measured using net asset value as a practical expedient, and are not classified in the fair value hierarchy.
The table below categorizes amounts that are included in the Fund’s Consolidated Statement of Assets and Liabilities at period end based on valuation input level:
| | | | | | | | | | | | | | | | |
| | | Level 1— Unadjusted Quoted Prices | | | Level 2— Other Significant Observable Inputs | | | Level 3— Significant Unobservable Inputs | | | Value | |
Assets Table | | | | | | | | | | | | | | | | |
Investments, at Value: | | | | | | | | | | | | | | | | |
Common Stocks | | | | | | | | | | | | | | | | |
Consumer Discretionary | | | $ 39,051,977 | | | | $ — | | | | $ — | | | | $ 39,051,977 | |
Consumer Staples | | | 58,244,634 | | | | 29,055,359 | | | | — | | | | 87,299,993 | |
Energy | | | 95,522,389 | | | | — | | | | — | | | | 95,522,389 | |
Financials | | | 158,604,510 | | | | — | | | | — | | | | 158,604,510 | |
Health Care | | | 133,952,967 | | | | 18,548,408 | | | | — | | | | 152,501,375 | |
Industrials | | | 181,560,682 | | | | — | | | | — | | | | 181,560,682 | |
Information Technology | | | 105,914,906 | | | | — | | | | — | | | | 105,914,906 | |
Materials | | | 58,272,808 | | | | — | | | | — | | | | 58,272,808 | |
Telecommunication Services | | | 61,795,039 | | | | — | | | | — | | | | 61,795,039 | |
Utilities | | | 61,034,161 | | | | — | | | | — | | | | 61,034,161 | |
Preferred Stocks | | | — | | | | 6,451,260 | | | | — | | | | 6,451,260 | |
Asset-Backed Securities | | | — | | | | 211,064,337 | | | | 12,703,917 | | | | 223,768,254 | |
Mortgage-Backed Obligations | | | — | | | | 511,567,568 | | | | — | | | | 511,567,568 | |
|
| 81 OPPENHEIMER CAPITAL INCOME FUND |
NOTES TO CONSOLIDATED
FINANCIAL STATEMENTS Continued
3. Securities Valuation (Continued)
| | | | | | | | | | | | | | | | |
| | | Level 1—
Unadjusted
Quoted Prices | | | Level 2— Other Significant Observable Inputs | | | Level 3—
Significant Unobservable Inputs | | | Value | |
| |
Common Stocks (Continued) | | | | | | | | | | | | | | | | |
U.S. Government Obligations | | $ | — | | | $ | 7,224,831 | | | $ | — | | | $ | 7,224,831 | |
Non-Convertible Corporate Bonds and Notes | | | — | | | | 651,526,090 | | | | — | | | | 651,526,090 | |
Convertible Corporate Bond and Note | | | — | | | | 21,435,313 | | | | — | | | | 21,435,313 | |
Corporate Loans | | | — | | | | 50,259,153 | | | | — | | | | 50,259,153 | |
Structured Securities | | | — | | | | 12,196,931 | | | | — | | | | 12,196,931 | |
Over-the-Counter Option Purchased | | | — | | | | 1,266,160 | | | | — | | | | 1,266,160 | |
Over-the-Counter Credit Default | | | | | | | | | | | | | | | | |
Swaptions Purchased | | | — | | | | 688,626 | | | | — | | | | 688,626 | |
Over-the-Counter Interest Rate Swaptions Purchased | | | — | | | | 1,803,553 | | | | — | | | | 1,803,553 | |
Investment Companies | | | 220,458,723 | | | | — | | | | — | | | | 220,458,723 | |
| | | | |
Total Investments, at Value | | | 1,174,412,796 | | | | 1,523,087,589 | | | | 12,703,917 | | | | 2,710,204,302 | |
Other Financial Instruments: | | | | | | | | | | | | | | | | |
Swaps, at value | | | — | | | | 2,800,258 | | | | — | | | | 2,800,258 | |
Centrally cleared swaps, at value | | | — | | | | 481,165 | | | | — | | | | 481,165 | |
Futures contracts | | | 47,841 | | | | — | | | | — | | | | 47,841 | |
Forward currency exchange contracts | | | — | | | | 2,914,595 | | | | — | | | | 2,914,595 | |
| | | | |
| Total Assets excluding investment companies valued using practical expedient | | $ | 1,174,460,637 | | | $ | 1,529,283,607 | | | $ | 12,703,917 | | | | 2,716,448,161 | |
| | | | |
Investment company valued using practical expedient | | | | | | | | | | | | | | | 238,434,495 | |
| | | | | | | | | | | | | | | | |
Total Assets | | | | | | | | | | | | | | $ | 2,954,882,656 | |
| | | | | | | | | | | | | | | | |
| | | | |
Liabilities Table | | | | | | | | | | | | | | | | |
Other Financial Instruments: | | | | | | | | | | | | | | | | |
Swaps, at value | | $ | — | | | $ | (2,190,653 | ) | | $ | — | | | $ | (2,190,653) | |
Centrally cleared swaps, at value | | | — | | | | (3,357,233 | ) | | | — | | | | (3,357,233) | |
Options written, at value | | | — | | | | (126,000 | ) | | | — | | | | (126,000) | |
Futures contracts | | | (276,221 | ) | | | — | | | | — | | | | (276,221) | |
Forward currency exchange contracts | | | — | | | | (954,393 | ) | | | — | | | | (954,393) | |
Swaptions written, at value | | | — | | | | (238,286 | ) | | | — | | | | (238,286) | |
| | | | |
Total Liabilities | | $ | (276,221 | ) | | $ | (6,866,565 | ) | | $ | — | | | $ | (7,142,786) | |
| | | | |
Forward currency exchange contracts and futures contracts, if any, are reported at their unrealized appreciation/depreciation at measurement date, which represents the change in the contract’s value from trade date. All additional assets and liabilities included in the above table are reported at their market value at measurement date.
The table below shows the transfers between Level 2 and Level 3. The Fund’s policy is to recognize transfers in and transfers out as of the beginning of the reporting period.
|
| 82 OPPENHEIMER CAPITAL INCOME FUND |
3. Securities Valuation (Continued)
| | | | | | | | | | | | | | | | |
| | | Transfers into Level 2* | | | Transfers out of Level 2** | | | Transfers into Level 3** | | | Transfers out of Level 3* | |
Assets Table Investments, at Value: | | | | | | | | | | | | | | | | |
Asset-Backed Securities | | $ | — | | | $ | (3,653,432 | ) | | $ | 3,653,432 | | | $ | — | |
Mortgage-Backed Obligations | | | 3,707,236 | | | | — | | | | — | | | | (3,707,236) | |
| | | | |
Total Assets | | $ | 3,707,236 | | | $ | (3,653,432 | ) | | $ | 3,653,432 | | | $ | (3,707,236) | |
| | | | |
| * | Transferred from Level 3 to Level 2 due to the availability of market data for this security. |
** Transferred from Level 2 to Level 3 because of the lack of observable market data due to a decrease in market activity for these securities.
4. Investments and Risks
Investments in Affiliated Funds. The Fund is permitted to invest in other mutual funds advised by the Manager (“Affiliated Funds”). Affiliated Funds are open-end management investment companies registered under the 1940 Act, as amended. The Manager is the investment adviser of, and the Sub-Adviser provides investment and related advisory services to, the Affiliated Funds. When applicable, the Fund’s investments in Affiliated Funds are included in the Consolidated Statement of Investments. Shares of Affiliated Funds are valued at their net asset value per share. As a shareholder, the Fund is subject to its proportional share of the Affiliated Funds’ expenses, including their management fee. The Manager will waive fees and/or reimburse Fund expenses in an amount equal to the indirect management fees incurred through the Fund’s investment in the Affiliated Funds.
Each of the Affiliated Funds in which the Fund invests has its own investment risks, and those risks can affect the value of the Fund’s investments and therefore the value of the Fund’s shares. To the extent that the Fund invests more of its assets in one Affiliated Fund than in another, the Fund will have greater exposure to the risks of that Affiliated Fund.
Investment in Oppenheimer Institutional Money Market Fund. The Fund is permitted to invest daily available cash balances in a money market Affiliated Fund. The Fund may invest the available cash in Class E shares of Oppenheimer Institutional Money Market Fund (“IMMF”) to seek current income while preserving liquidity or for defensive purposes. IMMF is regulated as a money market fund under the Investment Company Act of 1940, as amended. Effective September 28, 2016, IMMF will change its name to Oppenheimer Institutional Government Money Market Fund.
Investment in Oppenheimer Master Fund. The Fund is permitted to invest in entities sponsored and/or advised by the Manager or an affiliate. Certain of these entities in which the Fund invests are mutual funds registered under the Investment Company Act of 1940 that expect to be treated as partnerships for tax purposes, specifically Oppenheimer Master Loan Fund, LLC (the “Master Fund”). The Master Fund has its own investment risks, and those risks
|
| 83 OPPENHEIMER CAPITAL INCOME FUND |
NOTES TO CONSOLIDATED
FINANCIAL STATEMENTS Continued
4. Investments and Risks (Continued)
can affect the value of the Fund’s investments and therefore the value of the Fund’s shares. To the extent that the Fund invests more of its assets in the Master Fund, the Fund will have greater exposure to the risks of the Master Fund.
The investment objective of the Master Fund is to seek income. The Fund’s investment in the Master Fund is included in the Consolidated Statement of Investments. The Fund recognizes income and gain/(loss) on its investment in the master fund according to its allocated pro-rata share, based on its relative proportion of total outstanding Master Fund shares held, of the total net income earned and the net gain/(loss) realized on investments sold by the Master Fund. As a shareholder, the Fund is subject to its proportional share of the Master Fund’s expenses, including its management fee. The Manager will waive fees and/ or reimburse Fund expenses in an amount equal to the indirect management fees incurred through the Fund’s investment in the Master Fund. The Fund owns 17.2% of the Master Fund at period end.
Structured Securities. The Fund invests in structured securities whose market values, interest rates and/or redemption prices are linked to the performance of underlying foreign currencies, interest rate spreads, stock market indices, prices of individual securities, commodities or other financial instruments or the occurrence of other specific events. The structured securities are often leveraged, increasing the volatility of each note’s market value relative to the change in the underlying linked financial element or event. Fluctuations in value of these securities are recorded as unrealized gains and losses in the accompanying Consolidated Statement of Operations. The Fund records a realized gain or loss when a structured security is sold or matures.
Loans. The Fund invests in loans made to U.S. and foreign borrowers that are corporations, partnerships or other business entities. The Fund will do so directly as an original lender or by assignment or indirectly through participation agreements or certain derivative instruments. While many of these loans will be collateralized, the Fund can also invest in uncollateralized loans. Loans are often issued in connection with recapitalizations, acquisitions, leveraged buyouts, and refinancing of borrowers. The loans often pay interest at rates that float above (or are adjusted periodically based on) a benchmark that reflects current interest rates although the Fund can also invest in loans with fixed interest rates.
Securities on a When-Issued or Delayed Delivery Basis. The Fund may purchase securities on a “when-issued” basis, and may purchase or sell securities on a “delayed delivery” basis. “When-issued” or “delayed delivery” refers to securities whose terms and indenture are available and for which a market exists, but which are not available for immediate delivery. Delivery and payment for securities that have been purchased by the Fund on a when-issued basis normally takes place within six months and possibly as long as two years or more after the trade date. During this period, such securities do not earn interest, are subject to market fluctuation and may increase or decrease in value prior to their delivery. The purchase of securities on a when-issued basis may increase the volatility of the Fund’s net
|
| 84 OPPENHEIMER CAPITAL INCOME FUND |
4. Investments and Risks (Continued)
asset value to the extent the Fund executes such transactions while remaining substantially fully invested. When the Fund engages in when-issued or delayed delivery transactions, it relies on the buyer or seller, as the case may be, to complete the transaction. Their failure to do so may cause the Fund to lose the opportunity to obtain or dispose of the security at a price and yield it considers advantageous. The Fund may also sell securities that it purchased on a when-issued basis or forward commitment prior to settlement of the original purchase.
At period end, the Fund had purchased securities issued on a when-issued or delayed delivery basis and sold securities issued on a delayed delivery basis as follows:
| | | | |
| | | When-Issued or
Delayed Delivery
Basis Transactions | |
| |
Purchased securities | | | $332,155,780 | |
Sold securities | | | 28,279,866 | |
The Fund may enter into “forward roll” transactions with respect to mortgage-related securities. In this type of transaction, the Fund sells a mortgage-related security to a buyer and simultaneously agrees to repurchase a similar security (same type, coupon and maturity) at a later date at a set price. During the period between the sale and the repurchase, the Fund will not be entitled to receive interest and principal payments on the securities that have been sold. The Fund records the incremental difference between the forward purchase and sale of each forward roll as realized gain (loss) on investments or as fee income in the case of such transactions that have an associated fee in lieu of a difference in the forward purchase and sale price.
Forward roll transactions may be deemed to entail embedded leverage since the Fund purchases mortgage-related securities with extended settlement dates rather than paying for the securities under a normal settlement cycle. This embedded leverage increases the Fund’s market value of investments relative to its net assets which can incrementally increase the volatility of the Fund’s performance. Forward roll transactions can be replicated over multiple settlement periods.
Risks of entering into forward roll transactions include the potential inability of the counterparty to meet the terms of the agreement; the potential of the Fund to receive inferior securities at redelivery as compared to the securities sold to the counterparty; and counterparty credit risk.
At period end, the Fund pledged $24,385 of collateral to the counterparty for forward roll transactions.
Restricted Securities. At period end, investments in securities included issues that are restricted. A restricted security may have a contractual restriction on its resale and is valued under methods approved by the Board of Trustees as reflecting fair value. Securities that are restricted are marked with an applicable footnote on the Consolidated Statement of Investments. Restricted securities are reported on a schedule following the Consolidated Statement of Investments.
|
| 85 OPPENHEIMER CAPITAL INCOME FUND |
NOTES TO CONSOLIDATED
FINANCIAL STATEMENTS Continued
4. Investments and Risks (Continued)
Equity Security Risk. Stocks and other equity securities fluctuate in price. The value of the Fund’s portfolio may be affected by changes in the equity markets generally. Equity markets may experience significant short-term volatility and may fall sharply at times. Different markets may behave differently from each other and U.S. equity markets may move in the opposite direction from one or more foreign stock markets. Adverse events in any part of the equity or fixed-income markets may have unexpected negative effects on other market segments.
The prices of individual equity securities generally do not all move in the same direction at the same time and a variety of factors can affect the price of a particular company’s securities. These factors may include, but are not limited to, poor earnings reports, a loss of customers, litigation against the company, general unfavorable performance of the company’s sector or industry, or changes in government regulations affecting the company or its industry.
Credit Risk. The Fund invests in high-yield, non-investment-grade bonds, which may be subject to a greater degree of credit risk. Credit risk relates to the ability of the issuer to meet interest or principal payments or both as they become due. The Fund may acquire securities that have missed an interest payment, and is not obligated to dispose of securities whose issuers or underlying obligors subsequently miss an interest payment.
Information concerning securities not accruing interest at period end is as follows:
| | | | |
Cost | | $ | 6,211,676 | |
Market Value | | $ | 6,681,060 | |
Market Value as % of Net Assets | | | 0.25% | |
5. Market Risk Factors
The Fund’s investments in securities and/or financial derivatives may expose the Fund to various market risk factors:
Commodity Risk. Commodity risk relates to the change in value of commodities or commodity indexes as they relate to increases or decreases in the commodities market. Commodities are physical assets that have tangible properties. Examples of these types of assets are crude oil, heating oil, metals, livestock, and agricultural products.
Credit Risk. Credit risk relates to the ability of the issuer of debt to meet interest and principal payments, or both, as they come due. In general, lower-grade, higher-yield debt securities are subject to credit risk to a greater extent than lower-yield, higher-quality securities.
Equity Risk. Equity risk relates to the change in value of equity securities as they relate to increases or decreases in the general market.
Foreign Exchange Rate Risk. Foreign exchange rate risk relates to the change in the U.S. dollar value of a security held that is denominated in a foreign currency. The U.S. dollar value of a foreign currency denominated security will decrease as the dollar appreciates against the currency, while the U.S. dollar value will increase as the dollar depreciates against the currency.
Interest Rate Risk. Interest rate risk refers to the fluctuations in value of fixed-income
|
| 86 OPPENHEIMER CAPITAL INCOME FUND |
5. Market Risk Factors (Continued)
securities resulting from the inverse relationship between price and yield. For example, an increase in general interest rates will tend to reduce the market value of already issued fixed-income investments, and a decline in general interest rates will tend to increase their value. In addition, debt securities with longer maturities, which tend to have higher yields, are subject to potentially greater fluctuations in value from changes in interest rates than obligations with shorter maturities.
Volatility Risk. Volatility risk refers to the magnitude of the movement, but not the direction of the movement, in a financial instrument’s price over a defined time period. Large increases or decreases in a financial instrument’s price over a relative time period typically indicate greater volatility risk, while small increases or decreases in its price typically indicate lower volatility risk.
6. Use of Derivatives
The Fund’s investment objective not only permits the Fund to purchase investment securities, it also allows the Fund to enter into various types of derivatives contracts, including, but not limited to, futures contracts, forward currency exchange contracts, credit default swaps, interest rate swaps, total return swaps, variance swaps and purchased and written options. In doing so, the Fund will employ strategies in differing combinations to permit it to increase, decrease, or change the level or types of exposure to market risk factors. These instruments may allow the Fund to pursue its objectives more quickly and efficiently than if it were to make direct purchases or sales of securities capable of effecting a similar response to market factors. Such contracts may be entered into through a bilateral over-the-counter (“OTC”) transaction, or through a securities or futures exchange and cleared through a clearinghouse.
Derivatives may have little or no initial cash investment relative to their market value exposure and therefore can produce significant gains or losses in excess of their cost due to unanticipated changes in the market risk factors and the overall market. This use of embedded leverage allows the Fund to increase its market value exposure relative to its net assets and can substantially increase the volatility of the Fund’s performance. In instances where the Fund is using derivatives to decrease, or hedge, exposures to market risk factors for securities held by the Fund, there are also risks that those derivatives may not perform as expected resulting in losses for the combined or hedged positions. Some derivatives have the potential for unlimited loss, regardless of the size of the Fund’s initial investment.
Additional associated risks from investing in derivatives also exist and potentially could have significant effects on the valuation of the derivative and the Fund. Typically, the associated risks are not the risks that the Fund is attempting to increase or decrease exposure to, per its investment objectives, but are the additional risks from investing in derivatives. Examples of these associated risks are liquidity risk, which is the risk that the Fund will not be able to sell the derivative in the open market in a timely manner, and counterparty credit risk, which is the risk that the counterparty will not fulfill its obligation to the Fund.
The Fund’s actual exposures to these market risk factors and associated risks during the period are discussed in further detail, by derivative type, below.
|
| 87 OPPENHEIMER CAPITAL INCOME FUND |
NOTES TO CONSOLIDATED
FINANCIAL STATEMENTS Continued
6. Use of Derivatives (Continued)
Forward Currency Exchange Contracts
The Fund may enter into forward currency exchange contracts (“forward contracts”) for the purchase or sale of a foreign currency at a negotiated rate at a future date. Such contracts are traded in the OTC inter-bank currency dealer market.
Forward contracts are reported on a schedule following the Consolidated Statement of Investments. The unrealized appreciation (depreciation) is reported in the Consolidated Statement of Assets and Liabilities as a receivable (or payable) and in the Consolidated Statement of Operations within the change in unrealized appreciation (depreciation). At contract close, the difference between the original cost of the contract and the value at the close date is recorded as a realized gain (loss) in the Consolidated Statement of Operations.
The Fund has entered into forward contracts with the obligation to purchase specified foreign currencies in the future at a currently negotiated forward rate in order to take a positive investment perspective on the related currency. These forward contracts seek to increase exposure to foreign exchange rate risk.
The Fund has entered into forward contracts with the obligation to purchase specified foreign currencies in the future at a currently negotiated forward rate in order to decrease exposure to foreign exchange rate risk associated with foreign currency denominated securities held by the Fund.
The Fund has entered into forward contracts with the obligation to sell specified foreign currencies in the future at a currently negotiated forward rate in order to take a negative investment perspective on the related currency. These forward contracts seek to increase exposure to foreign exchange rate risk.
The Fund has entered into forward contracts with the obligation to sell specified foreign currencies in the future at a currently negotiated forward rate in order to decrease exposure to foreign exchange rate risk associated with foreign currency denominated securities held by the Fund.
During the reporting period, the Fund had daily average contract amounts on forward contracts to buy and sell of $15,796,264 and $194,015,280, respectively.
Additional associated risk to the Fund includes counterparty credit risk. Counterparty credit risk arises from the possibility that the counterparty to a forward contract will default and fail to perform its obligations to the Fund.
Futures Contracts
A futures contract is a commitment to buy or sell a specific amount of a commodity, financial instrument or currency at a negotiated price on a stipulated future date. The Fund may buy and sell futures contracts and may also buy or write put or call options on these futures contracts. Futures contracts and options thereon are generally entered into on a regulated futures exchange and cleared through a clearinghouse associated with the exchange.
Upon entering into a futures contract, the Fund is required to deposit either cash or securities (initial margin) in an amount equal to a certain percentage of the contract value in an account registered in the futures commission merchant’s name. Subsequent payments (variation margin) are paid to or from the futures commission merchant each day equal to
|
| 88 OPPENHEIMER CAPITAL INCOME FUND |
6. Use of Derivatives (Continued)
the daily changes in the contract value. Such payments are recorded as unrealized gains and losses. Should the Fund fail to make requested variation margin payments, the futures commission merchant can gain access to the initial margin to satisfy the Fund’s payment obligations.
Futures contracts are reported on a schedule following the Consolidated Statement of Investments. Securities held by a futures commission merchant to cover initial margin requirements on open futures contracts are noted in the Consolidated Statement of Investments. Cash held by a futures commission merchant to cover initial margin requirements on open futures contracts and the receivable and/or payable for the daily mark to market for the variation margin are noted in the Consolidated Statement of Assets and Liabilities. The net change in unrealized appreciation and depreciation is reported in the Consolidated Statement of Operations. Realized gains (losses) are reported in the Consolidated Statement of Operations at the closing or expiration of futures contracts.
The Fund has purchased futures contracts on various bonds and notes to increase exposure to interest rate risk.
The Fund has sold futures contracts on various bonds and notes to decrease exposure to interest rate risk.
During the reporting period, the Fund had an ending monthly average market value of $97,945,390 and $61,442,167 on futures contracts purchased and sold, respectively.
Additional associated risks of entering into futures contracts (and related options) include the possibility that there may be an illiquid market where the Fund is unable to liquidate the contract or enter into an offsetting position and, if used for hedging purposes, the risk that the price of the contract will correlate imperfectly with the prices of the Fund’s securities.
Option Activity
The Fund may buy and sell put and call options, or write put and call options. When an option is written, the Fund receives a premium and becomes obligated to sell or purchase the underlying security, currency or other underlying financial instrument at a fixed price, upon exercise of the option.
Options can be traded through an exchange or through a privately negotiated arrangement with a dealer in an OTC transaction. Options traded through an exchange are generally cleared through a clearinghouse (such as The Options Clearing Corporation). The difference between the premium received or paid, and market value of the option, is recorded as unrealized appreciation or depreciation. The net change in unrealized appreciation or depreciation is reported in the Consolidated Statement of Operations. When an option is exercised, the cost of the security purchased or the proceeds of the security sale are adjusted by the amount of premium received or paid. Upon the expiration or closing of the option transaction, a gain or loss is reported in the Consolidated Statement of Operations.
The Fund has purchased put options on currencies to decrease exposure to foreign exchange rate risk. A purchased put option becomes more valuable as the price of the underlying financial instrument depreciates relative to the strike price.
The Fund has purchased call options on treasury and/or euro futures to increase exposure
|
| 89 OPPENHEIMER CAPITAL INCOME FUND |
NOTES TO CONSOLIDATED
FINANCIAL STATEMENTS Continued
6. Use of Derivatives (Continued)
to interest rate risk. A purchased call option becomes more valuable as the price of the underlying financial instrument appreciates relative to the strike price.
The Fund has purchased put options on treasury and/or euro futures to decrease exposure to interest rate risk. A purchased put option becomes more valuable as the price of the underlying financial instrument depreciates relative to the strike price.
The Fund has purchased call options on individual equity securities and/or equity indexes to increase exposure to equity risk. A purchased call option becomes more valuable as the price of the underlying financial instrument appreciates relative to the strike price.
During the reporting period, the Fund had an ending monthly average market value of $559,025 and $1,330,615 on purchased call options and purchased put options, respectively.
Options written, if any, are reported in a schedule following the Consolidated Statement of Investments and as a liability in the Consolidated Statement of Assets and Liabilities. Securities held in collateral accounts to cover potential obligations with respect to outstanding written options are noted in the Consolidated Statement of Investments.
The risk in writing a call option is that the market price of the security increases and if the option is exercised, the Fund must either purchase the security at a higher price for delivery or, if the Fund owns the underlying security, give up the opportunity for profit. The risk in writing a put option is that the Fund may incur a loss if the market price of the security decreases and the option is exercised. The risk in buying an option is that the Fund pays a premium whether or not the option is exercised. The Fund also has the additional risk that there may be an illiquid market where the Fund is unable to close the contract.
The Fund has written put options on currencies to increase exposure to foreign exchange rate risk. A written put option becomes more valuable as the price of the underlying financial instrument appreciates relative to the strike price.
The Fund has written put options on treasury and/or euro futures to increase exposure to interest rate risk. A written put option becomes more valuable as the price of the underlying financial instrument appreciates relative to the strike price.
During the reporting period, the Fund had an ending monthly average market value of $138,279 on written put options.
Additional associated risks to the Fund include counterparty credit risk and liquidity risk.
Written option activity for the reporting period was as follows:
| | | | | | | | |
| | | Number of
Contracts | | | Amount of
Premiums | |
| |
| Options outstanding as of August 31, 2015 | | | – | | | $ | – | |
| Options written | | | 525,005,554 | | | | 863,452 | |
| Options exercised | | | (5,554 | ) | | | (211,052) | |
| | | | |
| Options outstanding as of August 31, 2016 | | | 525,000,000 | | | $ | 652,400 | |
| | | | |
Swap Contracts
The Fund may enter into swap contract agreements with a counterparty to exchange a series
|
| 90 OPPENHEIMER CAPITAL INCOME FUND |
6. Use of Derivatives (Continued)
of cash flows based on either specified reference rates, the price or volatility of asset or non-asset references, or the occurrence of a credit event, over a specified period. Swaps can be executed in a bi-lateral privately negotiated arrangement with a dealer in an OTC transaction (“OTC swaps”) or executed on a regulated market. Certain swaps, regardless of the venue of their execution, are required to be cleared through a clearinghouse (“centrally cleared swaps”). Swap contracts may include interest rate, equity, debt, index, total return, credit default, currency, and volatility swaps.
Swap contracts are reported on a schedule following the Consolidated Statement of Investments. The values of centrally cleared swap and OTC swap contracts are aggregated by positive and negative values and disclosed separately on the Consolidated Statement of Assets and Liabilities. The unrealized appreciation (depreciation) related to the change in the valuation of the notional amount of the swap is combined with the accrued interest due to (owed by) the Fund, if any, at termination or settlement. The net change in this amount during the period is included on the Consolidated Statement of Operations. The Fund also records any periodic payments received from (paid to) the counterparty, including at termination, under such contracts as realized gain (loss) on the Consolidated Statement of Operations.
Swap contract agreements are exposed to the market risk factor of the specific underlying reference rate or asset. Swap contracts are typically more attractively priced compared to similar investments in related cash securities because they isolate the risk to one market risk factor and eliminate the other market risk factors. Investments in cash securities (for instance bonds) have exposure to multiple risk factors (credit and interest rate risk). Because swaps have embedded leverage, they can expose the Fund to substantial risk in the isolated market risk factor.
Credit Default Swap Contracts. A credit default swap is a contract that enables an investor to buy or sell protection against a defined-issuer credit event, such as the issuer’s failure to make timely payments of interest or principal on a debt security, bankruptcy or restructuring. The Fund may enter into credit default swaps either by buying or selling protection on a corporate issuer, sovereign issuer, or a basket or index of issuers (the “reference asset”).
The buyer of protection pays a periodic fee to the seller of protection based on the notional amount of the swap contract. The seller of protection agrees to compensate the buyer of protection for future potential losses as a result of a credit event on the reference asset. The contract effectively transfers the credit event risk of the reference asset from the buyer of protection to the seller of protection.
The ongoing value of the contract will fluctuate throughout the term of the contract based primarily on the credit risk of the reference asset. If the credit quality of the reference asset improves relative to the credit quality at contract initiation, the buyer of protection may have an unrealized loss greater than the anticipated periodic fee owed. This unrealized loss would be the result of current credit protection being cheaper than the cost of credit protection at contract initiation. If the buyer elects to terminate the contract prior to its maturity, and there has been no credit event, this unrealized loss will become realized. If the contract is held to maturity, and there has been no credit event, the realized loss will be
|
| 91 OPPENHEIMER CAPITAL INCOME FUND |
NOTES TO CONSOLIDATED
FINANCIAL STATEMENTS Continued
6. Use of Derivatives (Continued)
equal to the periodic fee paid over the life of the contract.
If there is a credit event, the buyer of protection can exercise its rights under the contract and receive a payment from the seller of protection equal to the notional amount of the swap less the market value of specified debt securities issued by the reference asset. Upon exercise of the contract the difference between such value and the notional amount is recorded as realized gain (loss) and is included on the Consolidated Statement of Operations.
The Fund has sold credit protection through credit default swaps to increase exposure to the credit risk of individual issuers and/or indexes of issuers that are either unavailable or considered to be less attractive in the bond market.
The Fund has purchased credit protection through credit default swaps to decrease exposure to the credit risk of individual issuers and/or indexes of issuers.
The Fund has engaged in spread curve trades by simultaneously purchasing and selling protection through credit default swaps referenced to the same reference asset but with different maturities. Spread curve trades attempt to gain exposure to credit risk on a forward basis by realizing gains on the expected differences in spreads.
For the reporting period, the Fund had ending monthly average notional amounts of $118,457,543 and $47,655,806 on credit default swaps to buy protection and credit default swaps to sell protection, respectively.
Additional associated risks to the Fund include counterparty credit risk and liquidity risk.
Interest Rate Swap Contracts. An interest rate swap is an agreement between counterparties to exchange periodic payments based on interest rates. One cash flow stream will typically be a floating rate payment based upon a specified floating interest rate while the other is typically a fixed interest rate.
The Fund has entered into interest rate swaps in which it pays a floating interest rate and receives a fixed interest rate in order to increase exposure to interest rate risk. Typically, if relative interest rates rise, payments made by the Fund under a swap agreement will be greater than the payments received by the Fund.
For the reporting period, the Fund had ending monthly average notional amounts of $17,009,704 on interest rate swaps which receive a fixed rate.
Additional associated risks to the Fund include counterparty credit risk and liquidity risk.
Total Return Swap Contracts. A total return swap is an agreement between counterparties to exchange periodic payments based on the value of asset or non-asset references. One cash flow is typically based on a non-asset reference (such as an interest rate) and the other on the total return of a reference asset (such as a security or a basket of securities or securities index). The total return of the reference asset typically includes appreciation or depreciation on the reference asset, plus any interest or dividend payments.
Total return swap contracts are exposed to the market risk factor of the specific underlying financial instrument or index. Total return swaps are less standard in structure than other types of swaps and can isolate and/or include multiple types of market risk factors including equity risk, credit risk, and interest rate risk.
The Fund has entered into total return swaps on various equity securities or indexes
|
| 92 OPPENHEIMER CAPITAL INCOME FUND |
6. Use of Derivatives (Continued)
to increase exposure to equity risk. These equity risk related total return swaps require the Fund to pay a floating reference interest rate, and an amount equal to the negative price movement of securities or an index (expressed as a percentage) multiplied by the notional amount of the contract. The Fund will receive payments equal to the positive price movement of the same securities or index (expressed as a percentage) multiplied by the notional amount of the contract and, in some cases, dividends paid on the securities.
The Fund has entered into total return swaps to decrease exposure to the credit risk of various indexes or basket of securities. These credit risk related total return swaps require the fund to pay to, or receive payments from, the counterparty based on the movement of credit spreads of the related indexes or securities.
For the reporting period, the Fund had ending monthly average notional amounts of $21,808,988 and $12,513,703 on total return swaps which are long the reference asset and total return swaps which are short the reference asset, respectively.
Additional associated risks to the Fund include counterparty credit risk and liquidity risk.
At period end, the Fund had no outstanding total return swap contracts.
Swaption Transactions
The Fund may enter into a swaption contract which grants the purchaser the right, but not the obligation, to enter into a swap transaction at preset terms detailed in the underlying agreement within a specified period of time. The purchaser pays a premium to the swaption writer who bears the risk of unfavorable changes in the preset terms on the underlying swap.
Purchased swaptions are reported as a component of investments in the Consolidated Statement of Investments and the Consolidated Statement of Assets and Liabilities. Written swaptions are reported on a schedule following the Consolidated Statement of Investments and their value is reported as a separate asset or liability line item in the Consolidated Statement of Assets and Liabilities. The net change in unrealized appreciation or depreciation on written swaptions is separately reported in the Consolidated Statement of Operations. When a swaption is exercised, the cost of the swap is adjusted by the amount of premium paid or received. Upon the expiration or closing of an unexercised swaption contract, a gain or loss is reported in the Consolidated Statement of Operations for the amount of the premium paid or received.
The Fund generally will incur a greater risk when it writes a swaption than when it purchases a swaption. When the Fund writes a swaption it will become obligated, upon exercise of the swaption, according to the terms of the underlying agreement. Swaption contracts written by the Fund do not give rise to counterparty credit risk prior to exercise as they obligate the Fund, not its counterparty, to perform. When the Fund purchases a swaption it only risks losing the amount of the premium it paid if the swaption expires unexercised. However, when the Fund exercises a purchased swaption there is a risk that the counterparty will fail to perform or otherwise default on its obligations under the swaption contract.
The Fund has purchased swaptions which gives it the option to enter into an interest rate swap in which it pays a floating interest rate and receives a fixed interest rate in order to increase exposure to interest rate risk. A purchased swaption of this type becomes more
|
| 93 OPPENHEIMER CAPITAL INCOME FUND |
NOTES TO CONSOLIDATED
FINANCIAL STATEMENTS Continued
6. Use of Derivatives (Continued)
valuable as the reference interest rate decreases relative to the preset interest rate.
The Fund has purchased swaptions which gives it the option to enter into an interest rate swap in which it pays a fixed interest rate and receives a floating interest rate in order to decrease exposure to interest rate risk. A purchased swaption of this type becomes more valuable as the reference interest rate increases relative to the preset interest rate.
The Fund has purchased swaptions which gives it the option to buy credit protection through credit default swaps in order to decrease exposure to the credit risk of individual issuers and/or indexes of issuers. A purchased swaption of this type becomes more valuable as the likelihood of a credit event on the reference asset increases.
The Fund has written swaptions which give it the obligation, if exercised by the purchaser, to sell credit protection through credit default swaps in order to increase exposure to the credit risk of individual issuers and/or indexes of issuers. A written swaption of this type becomes more valuable as the likelihood of a credit event on the reference asset decreases.
During the reporting period, the Fund had an ending monthly average market value of $2,730,779 and $18,330 on purchased and written swaptions, respectively.
Written swaption activity for the reporting period was as follows:
| | | | | | | | |
| | | Notional Amount | | | Amount of
Premiums | |
| |
| Swaptions outstanding as of August 31, 2015 | | | – | | | $ | – | |
| Swaptions written | | | 42,849,000 | | | | 228,806 | |
| | | | |
| Swaptions outstanding as of August 31, 2016 | | | 42,849,000 | | | $ | 228,806 | |
| | | | |
Counterparty Credit Risk. Derivative positions are subject to the risk that the counterparty will not fulfill its obligation to the Fund. The Fund intends to enter into derivative transactions with counterparties that the Manager believes to be creditworthy at the time of the transaction.
The Fund’s risk of loss from counterparty credit risk on OTC derivatives is generally limited to the aggregate unrealized gain netted against any collateral held by the Fund. For OTC options purchased, the Fund bears the risk of loss of the amount of the premiums paid plus the positive change in market values net of any collateral held by the Fund should the counterparty fail to perform under the contracts. Options written by the Fund do not typically give rise to counterparty credit risk, as options written generally obligate the Fund and not the counterparty to perform.
To reduce counterparty risk with respect to OTC transactions, the Fund has entered into master netting arrangements, established within the Fund’s International Swap and Derivatives Association, Inc. (“ISDA”) master agreements, which allow the Fund to make (or to have an entitlement to receive) a single net payment in the event of default (close-out netting) for outstanding payables and receivables with respect to certain OTC positions in swaps, options, swaptions, and forward currency exchange contracts for each individual counterparty. In addition, the Fund may require that certain counterparties post cash and/or securities
|
| 94 OPPENHEIMER CAPITAL INCOME FUND |
6. Use of Derivatives (Continued)
in collateral accounts to cover their net payment obligations for those derivative contracts subject to ISDA master agreements. If the counterparty fails to perform under these contracts and agreements, the cash and/or securities will be made available to the Fund.
At period end, the Fund has required certain counterparties to post collateral of $4,615,885.
ISDA master agreements include credit related contingent features which allow counterparties to OTC derivatives to terminate derivative contracts prior to maturity in the event that, for example, the Fund’s net assets decline by a stated percentage or the Fund fails to meet the terms of its ISDA master agreements, which would cause the Fund to accelerate payment of any net liability owed to the counterparty.
For financial reporting purposes, the Fund does not offset derivative assets and derivative liabilities that are subject to netting arrangements in the Consolidated Statement of Assets and Liabilities. Bankruptcy or insolvency laws of a particular jurisdiction may impose restrictions on or prohibitions against the right of offset in bankruptcy, insolvency or other events.
The Fund’s risk of loss from counterparty credit risk on exchange-traded derivatives cleared through a clearinghouse and for centrally cleared swaps is generally considered lower than as compared to OTC derivatives. However, counterparty credit risk exists with respect to initial and variation margin deposited/paid by the Fund that is held in futures commission merchant, broker and/or clearinghouse accounts for such exchange-traded derivatives and for centrally cleared swaps.
With respect to centrally cleared swaps, such transactions will be submitted for clearing, and if cleared, will be held in accounts at futures commission merchants or brokers that are members of clearinghouses. While brokers, futures commission merchants and clearinghouses are required to segregate customer margin from their own assets, in the event that a broker, futures commission merchant or clearinghouse becomes insolvent or goes into bankruptcy and at that time there is a shortfall in the aggregate amount of margin held by the broker, futures commission merchant or clearinghouse for all its customers, U.S. bankruptcy laws will typically allocate that shortfall on a pro-rata basis across all the broker’s, futures commission merchant’s or clearinghouse’s customers, potentially resulting in losses to the Fund.
There is the risk that a broker, futures commission merchant or clearinghouse will decline to clear a transaction on the Fund’s behalf, and the Fund may be required to pay a termination fee to the executing broker with whom the Fund initially enters into the transaction.
Clearinghouses may also be permitted to terminate centrally cleared swaps at any time. The Fund is also subject to the risk that the broker or futures commission merchant will improperly use the Fund’s assets deposited/paid as initial or variation margin to satisfy payment obligations of another customer. In the event of a default by another customer of the broker or futures commission merchant, the Fund might not receive its variation margin payments from the clearinghouse, due to the manner in which variation margin payments are aggregated for all customers of the broker/futures commission merchant.
Collateral and margin requirements differ by type of derivative. Margin requirements are established by the broker, futures commission merchant or clearinghouse for exchange-traded and cleared derivatives, including centrally cleared swaps. Brokers, futures commission
|
| 95 OPPENHEIMER CAPITAL INCOME FUND |
NOTES TO CONSOLIDATED
FINANCIAL STATEMENTS Continued
6. Use of Derivatives (Continued)
merchants and clearinghouses can ask for margin in excess of the regulatory minimum, or increase the margin amount, in certain circumstances.
Collateral terms are contract specific for OTC derivatives. For derivatives traded under an ISDA master agreement, the collateral requirements are typically calculated by netting the mark to market amount for each transaction under such agreement and comparing that amount to the value of any collateral currently pledged by the Fund or the counterparty.
For financial reporting purposes, cash collateral that has been pledged to cover obligations of the Fund, if any, is reported separately on the Consolidated Statement of Assets and Liabilities as cash pledged as collateral. Non-cash collateral pledged by the Fund, if any, is noted in the Consolidated Statement of Investments. Generally, the amount of collateral due from or to a party must exceed a minimum transfer amount threshold (e.g. $250,000) before a transfer has to be made. To the extent amounts due to the Fund from its counterparties are not fully collateralized, contractually or otherwise, the Fund bears the risk of loss from counterparty nonperformance.
The following table presents by counterparty the Fund’s OTC derivative assets net of the related collateral pledged by the Fund at period end.
| | | | | | | | | | | | | | | | | | | | |
| | | Gross Amounts Not Offset in the Consolidated | |
| | | | | | Statement of Assets & Liabilities | | | | |
| Counterparty | | Gross Amounts
Not Offset in the Consolidated
Statement of Assets &
Liabilities* | | | Financial
Instruments
Available for
Offset | | | Financial
Instruments
Collateral
Received** | | | Cash Collateral Received** | | | Net Amount | |
| |
Bank of America NA | | $ | 1,458,678 | | | $ | (167,385) | | | $ | (719,695) | | | $ | – | | | $ | 571,598 | |
Barclays Bank plc | | | 16,483 | | | | – | | | | – | | | | – | | | | 16,483 | |
BNP Paribas | | | 82,413 | | | | – | | | | – | | | | – | | | | 82,413 | |
Citibank NA | | | 495,349 | | | | (495,349) | | | | – | | | | – | | | | – | |
Goldman Sachs Bank USA | | | 133,053 | | | | – | | | | (133,053) | | | | – | | | | – | |
Goldman Sachs Group, Inc. (The) | | | 5,621,684 | | | | (1,643,245) | | | | (1,751,212) | | | | – | | | | 2,227,227 | |
JPMorgan Chase Bank NA | | | 1,583,119 | | | | (753,369) | | | | (236,595) | | | | – | | | | 593,155 | |
Morgan Stanley | | | 82,413 | | | | – | | | | – | | | | – | | | | 82,413 | |
| | | | |
| | $ | 9,473,192 | | | $ | (3,059,348) | | | $ | (2,840,555) | | | $ | – | | | $ | 3,573,289 | |
| | | | |
*OTC derivatives are reported gross on the Statement of Assets and Liabilities. Exchange traded options and margin related to centrally cleared swaps and futures are excluded from these reported amounts.
**Reported collateral posted for the benefit of the Fund within this table is limited to the net outstanding amount due from an individual counterparty. The collateral posted for the benefit of the Fund may exceed these amounts.
The following table presents by counterparty the Fund’s OTC derivative liabilities net of the related collateral pledged by the Fund at period end.
|
| 96 OPPENHEIMER CAPITAL INCOME FUND |
6. Use of Derivatives (Continued)
| | | | | | | | | | | | | | | | | | | | |
| | | Gross Amounts Not Offset in the Consolidated | |
| | | | | | Statement of Assets & Liabilities | | | | |
| Counterparty | | Gross Amounts
Not Offset in the
Consolidated
Statement
of Assets &
Liabilities* | | | Financial
Instruments
Available for
Offset | | | Financial
Instruments
Collateral
Pledged** | | | Cash Collateral
Pledged** | | | Net Amount | |
| |
Bank of America NA | | $ | (167,385) | | | | $ 167,385 | | | $ | – | | | $ | – | | | $ | – | |
Citibank NA | | | (601,373) | | | | 495,349 | | | | 106,024 | | | | – | | | | – | |
Goldman Sachs Group, Inc. (The) | | | (1,643,245) | | | | 1,643,245 | | | | – | | | | – | | | | – | |
HSBC Bank USA NA | | | (6,777) | | | | – | | | | – | | | | – | | | | (6,777) | |
JPMorgan Chase Bank NA | | | (753,369) | | | | 753,369 | | | | – | | | | – | | | | – | |
Royal Bank of Scotland plc (The) | | | (337,184) | | | | – | | | | 337,184 | | | | – | | | | – | |
| | | | |
| | $ | (3,509,333) | | | | $ 3,059,348 | | | $ | 443,208 | | | $ | – | | | $ | (6,777) | |
| | | | |
*OTC derivatives are reported gross on the Consolidated Statement of Assets and Liabilities. Exchange traded options and margin related to centrally cleared swaps and futures are excluded from these reported amounts.
**Reported collateral pledged within this table is limited to the net outstanding amount due from the Fund. The securities pledged as collateral by the Fund as reported on the Consolidated Statements of Investments may exceed these amounts.
The following table presents the valuations of derivative instruments by risk exposure as reported within the Consolidated Statement of Assets and Liabilities at period end:
| | | | | | | | | | | | | | |
| | | Asset Derivatives | | | | | Liability Derivatives | |
Derivatives Not Accounted for as Hedging Instruments | | Consolidated Statement of Assets and Liabilities Location | | Value | | | | | Consolidated Statement of Assets and Liabilities Location | | Value | |
Credit contracts | | Swaps, at value | | $ | 2,724,435 | | | | | Swaps, at value | | $ | 2,189,348 | |
| Interest rate contracts | | Swaps, at value | | | 75,823 | | | | | Swaps, at value | | | 1,305 | |
| Credit contracts | | Centrally cleared swaps, at value | | | 481,165 | | | | | Centrally cleared swaps, at value | | | 3,357,233 | |
| Interest rate contracts | | Variation margin receivable | | | 117,535* | | | | | Variation margin payable | | | 1,975* | |
| Forward currency exchange contracts | | Unrealized appreciation on forward currency exchange contracts | | | 2,914,595 | | | | | Unrealized depreciation on forward currency exchange contracts | | | 954,393 | |
| Forward currency exchange contracts | | | | | | | | | | Options written, at value | | | 126,000 | |
| Credit contracts | | | | | | | | | | Swaptions written, at value | | | 238,286 | |
| Credit contracts | | Investments, at value | | | 688,626** | | | | | | | | | |
| Forward currency exchange contracts | | Investments, at value | | | 1,266,160** | | | | | | | | | |
| Interest rate contracts | | Investments, at value | | | 1,803,553** | | | | | | | | | |
| | | | | | | | | | | | | | |
| Total | | | | $ | 10,071,892 | | | | | | | $ | 6,868,540 | |
| | | | | | | | | | | | | | |
*Includes only the current day’s variation margin. Prior variation margin movements have been reflected in cash on the Consolidated Statement of Assets and Liabilities upon receipt or payment.
|
| 97 OPPENHEIMER CAPITAL INCOME FUND |
NOTES TO CONSOLIDATED
FINANCIAL STATEMENTS Continued
6. Use of Derivatives (Continued)
**Amounts relate to purchased option contracts and purchased swaption contracts.
The effect of derivative instruments on the Consolidated Statement of Operations is as follows:
| | | | | | | | | | | | | | | | | | | | |
| Amount of Realized Gain or (Loss) Recognized on Derivatives | |
| |
Derivatives Not Accounted for as Hedging Instruments | | Investment from
unaffiliated
companies
(including
premiums
on options
exercised)* | | | Closing and
expiration
of futures contracts | | | Foreign currency
transactions | | | Swap contracts | | | Total | |
| |
Credit contracts | | $ | — | | | $ | — | | | $ | — | | | $ | (5,370,098) | | | $ | (5,370,098) | |
Equity contracts | | | (1,172,585) | | | | — | | | | — | | | | (7,352,587) | | | | (8,525,172) | |
Forward currency exchange contracts | | | 269,869 | | | | — | | | | (2,126,301) | | | | — | | | | (1,856,432) | |
Interest rate contracts | | | (711,867) | | | | 3,887,770 | | | | — | | | | — | | | | 3,175,903 | |
| | | | |
Total | | $ | (1,614,583) | | | $ | 3,887,770 | | | $ | (2,126,301) | | | $ | (12,722,685) | | | $ | (12,575,799) | |
| | | | |
*Includes purchased option contracts, purchased swaption contracts, written option contracts exercised and written, if any.
| | | | | | | | | | | | | | | | | | | | |
| Amount of Change in Unrealized Gain or (Loss) Recognized on Derivatives | |
| |
Derivatives Not Accounted for as Hedging Instruments | | Investments* | | | Option
contracts
written | | | Swaption
contracts
written | | | Futures
contracts | | | Translation
of assets and liabilities
denominated
in foreign
currencies | |
| |
Credit contracts | | $ | 6,038 | | | $ | — | | | $ | (9,480) | | | $ | — | | | $ | — | |
Equity contracts | | | — | | | | — | | | | — | | | | — | | | | — | |
Forward currency exchange contracts | | | (1,145,471) | | | | 526,400 | | | | — | | | | — | | | | (2,717,212) | |
Interest rate contracts | | | (1,898,806) | | | | — | | | | — | | | | 142,243 | | | | — | |
| | | | |
Total | | $ | (3,038,239) | | | $ | 526,400 | | | $ | (9,480) | | | $ | 142,243 | | | $ | (2,717,212) | |
| | | | |
| | | | | | | | |
| Amount of Change in Unrealized Gain or (Loss) Recognized on Derivatives | |
| |
Derivatives Not Accounted for as Hedging Instruments | | Swap contracts | | | Total | |
| |
Credit contracts | | $ | (754,750) | | | $ | (758,192) | |
Equity contracts | | | 3,670,822 | | | | 3,670,822 | |
Forward currency exchange contracts | | | — | | | | (3,336,283) | |
Interest rate contracts | | | 88,408 | | | | (1,668,155) | |
| | | | |
Total | | $ | 3,004,480 | | | $ | (2,091,808) | |
| | | | |
*Includes purchased option contracts and purchased swaption contracts, if any.
|
| 98 OPPENHEIMER CAPITAL INCOME FUND |
7. Shares of Beneficial Interest
The Fund has authorized an unlimited number of $0.001 par value shares of beneficial interest of each class. Transactions in shares of beneficial interest were as follows:
| | | | | | | | | | | | | | | | |
| | | Year Ended August 31, 2016 | | | Year Ended August 31, 2015 | |
| | | Shares | | | Amount | | | Shares | | | Amount | |
| |
Class A | | | | | | | | | | | | | | | | |
Sold | | | 22,114,630 | | | $ | 211,686,219 | | | | 31,472,865 | | | $ | 310,375,031 | |
Dividends and/or distributions reinvested | | | 4,912,205 | | | | 46,602,086 | | | | 5,171,244 | | | | 51,027,443 | |
Redeemed | | | (32,212,207) | | | | (308,288,628) | | | | (28,749,788) | | | | (283,261,911) | |
| | | | |
Net increase (decrease) | | | (5,185,372) | | | $ | (50,000,323) | | | | 7,894,321 | | | $ | 78,140,563 | |
| | | | |
| | | | | | | | | | | | | | | | |
| |
Class B | | | | | | | | | | | | | | | | |
Sold | | | 139,395 | | | $ | 1,302,899 | | | | 296,404 | | | $ | 2,858,738 | |
Dividends and/or distributions reinvested | | | 36,697 | | | | 340,610 | | | | 60,712 | | | | 586,457 | |
Redeemed | | | (1,034,620) | | | | (9,686,861) | | | | (1,197,218) | | | | (11,568,791) | |
| | | | |
Net decrease | | | (858,528) | | | $ | (8,043,352) | | | | (840,102) | | | $ | (8,123,596) | |
| | | | |
| | | | | | | | | | | | | | | | |
| |
Class C | | | | | | | | | | | | | | | | |
Sold | | | 11,180,368 | | | $ | 103,545,856 | | | | 19,464,441 | | | $ | 186,241,305 | |
Dividends and/or distributions reinvested | | | 877,942 | | | | 8,072,868 | | | | 820,464 | | | | 7,854,633 | |
Redeemed | | | (11,254,410) | | | | (104,204,207) | | | | (7,382,282) | | | | (70,521,133) | |
| | | | |
Net increase | | | 803,900 | | | $ | 7,414,517 | | | | 12,902,623 | | | $ | 123,574,805 | |
| | | | |
| | | | | | | | | | | | | | | | |
| |
Class I | | | | | | | | | | | | | | | | |
Sold | | | 646,631 | | | $ | 6,161,787 | | | | 493,185 | | | $ | 4,864,606 | |
Dividends and/or distributions reinvested | | | 47,826 | | | | 453,491 | | | | 44,572 | | | | 439,222 | |
Redeemed | | | (467,275) | | | | (4,525,691) | | | | (311,232) | | | | (3,054,344) | |
| | | | |
Net increase | | | 227,182 | | | $ | 2,089,587 | | | | 226,525 | | | $ | 2,249,484 | |
| | | | |
| | | | | | | | | | | | | | | | |
| |
Class R | | | | | | | | | | | | | | | | |
Sold | | | 1,125,399 | | | $ | 10,595,667 | | | | 1,038,880 | | | $ | 10,112,866 | |
Dividends and/or distributions reinvested | | | 76,875 | | | | 720,135 | | | | 70,583 | | | | 687,490 | |
Redeemed | | | (784,489) | | | | (7,432,859) | | | | (652,293) | | | | (6,355,214) | |
| | | | |
Net increase | | | 417,785 | | | $ | 3,882,943 | | | | 457,170 | | | $ | 4,445,142 | |
| | | | |
| | | | | | | | | | | | | | | | |
| |
Class Y | | | | | | | | | | | | | | | | |
Sold | | | 22,027,993 | | | $ | 210,819,968 | | | | 32,329,847 | | | $ | 318,600,107 | |
Dividends and/or distributions reinvested | | | 1,174,846 | | | | 11,139,830 | | | | 946,476 | | | | 9,327,031 | |
Redeemed | | | (20,815,765) | | | | (197,852,180) | | | | (14,681,080) | | | | (144,595,356) | |
| | | | |
Net increase | | | 2,387,074 | | | $ | 24,107,618 | | | | 18,595,243 | | | $ | 183,331,782 | |
| | | | |
8. Purchases and Sales of Securities
The aggregate cost of purchases and proceeds from sales of securities, other than short-term obligations and investments in IMMF, for the reporting period were as follows:
|
| 99 OPPENHEIMER CAPITAL INCOME FUND |
NOTES TO CONSOLIDATED
FINANCIAL STATEMENTS Continued
8. Purchases and Sales of Securities (Continued)
| | | | | | | | |
| | | Purchases | | | Sales | |
| |
Investment securities | | | $1,361,237,603 | | | | $1,287,301,143 | |
U.S. government and government agency obligations | | | 15,957,459 | | | | 20,690,909 | |
To Be Announced (TBA) mortgage-related securities | | | 4,212,529,231 | | | | 4,192,313,269 | |
9. Fees and Other Transactions with Affiliates
Management Fees. Under the investment advisory agreement, the Fund pays the Manager a management fee based on the daily net assets of the Fund at an annual rate as shown in the following table:
| | | | |
| Fee Schedule | | | |
Up to $100 million | | | 0.75% | |
Next $100 million | | | 0.70 | |
Next $100 million | | | 0.65 | |
Next $100 million | | | 0.60 | |
Next $100 million | | | 0.55 | |
Next $4.5 billion | | | 0.50 | |
Over $5 billion | | | 0.48 | |
The Manager also provides investment management related services to the Subsidiary. The Subsidiary pays the Manager a monthly management fee at an annual rate according to the above schedule. The Subsidiary also pays certain other expenses including custody and directors’ fees.
The Fund’s effective management fee for the reporting period was 0.53% of average annual net assets before any Subsidiary management fees or any applicable waivers.
Sub-Adviser Fees. The Manager has retained the Sub-Adviser to provide the day-to-day portfolio management of the Fund and the Subsidiary. Under the Sub-Advisory Agreement, the Manager pays the Sub-Adviser an annual fee in monthly installments, equal to a percentage of the investment management fee collected by the Manager from the Fund and the Subsidiary, which shall be calculated after any investment management fee waivers. The fee paid to the Sub-Adviser is paid by the Manager, not by the Fund.
Transfer Agent Fees. OFI Global (the “Transfer Agent”) serves as the transfer and shareholder servicing agent for the Fund. The Fund pays the Transfer Agent a fee based on annual net assets. Fees incurred and average net assets for each class with respect to these services are detailed in the Consolidated Statement of Operations and Consolidated Financial Highlights, respectively.
Sub-Transfer Agent Fees. The Transfer Agent has retained Shareholder Services, Inc., a wholly-owned subsidiary of OFI (the “Sub-Transfer Agent”), to provide the day-to-day transfer agent and shareholder servicing of the Fund. Under the Sub-Transfer Agency Agreement, the Transfer Agent pays the Sub-Transfer Agent an annual fee in monthly installments, equal to a percentage of the transfer agent fee collected by the Transfer Agent from the Fund, which shall be calculated after any applicable fee waivers. The fee paid to the Sub-Transfer Agent is paid
|
| 100 OPPENHEIMER CAPITAL INCOME FUND |
9. Fees and Other Transactions with Affiliates (Continued)
by the Transfer Agent, not by the Fund.
Trustees’ Compensation. The Fund’s Board of Trustees (“Board”) has adopted a compensation deferral plan for Independent Trustees that enables Trustees to elect to defer receipt of all or a portion of the annual compensation they are entitled to receive from the Fund. For purposes of determining the amount owed to the Trustees under the plan, deferred amounts are treated as though equal dollar amounts had been invested in shares of the Fund or in other Oppenheimer funds selected by the Trustees. The Fund purchases shares of the funds selected for deferral by the Trustees in amounts equal to his or her deemed investment, resulting in a Fund asset equal to the deferred compensation liability. Such assets are included as a component of “Other” within the asset section of the Consolidated Statement of Assets and Liabilities. Deferral of Trustees’ fees under the plan will not affect the net assets of the Fund and will not materially affect the Fund’s assets, liabilities or net investment income per share. Amounts will be deferred until distributed in accordance with the compensation deferral plan.
Distribution and Service Plan (12b-1) Fees. Under its General Distributor’s Agreement with the Fund, OppenheimerFunds Distributor, Inc. (the “Distributor”) acts as the Fund’s principal underwriter in the continuous public offering of the Fund’s classes of shares.
Service Plan for Class A Shares. The Fund has adopted a Service Plan (the “Plan”) for Class A shares pursuant to Rule 12b-1 under the 1940 Act. Under the Plan, the Fund reimburses the Distributor for a portion of its costs incurred for services provided to accounts that hold Class A shares. Reimbursement is made periodically at an annual rate of up to 0.25% of the daily net assets of Class A shares of the Fund. The Distributor currently uses all of those fees to pay dealers, brokers, banks and other financial institutions periodically for providing personal service and maintenance of accounts of their customers that hold Class A shares. Any unreimbursed expenses the Distributor incurs with respect to Class A shares in any fiscal year cannot be recovered in subsequent periods. Fees incurred by the Fund under the Plan are detailed in the Consolidated Statement of Operations.
Distribution and Service Plans for Class B, Class C and Class R Shares. The Fund has adopted Distribution and Service Plans (the “Plans”) for Class B, Class C and Class R shares pursuant to Rule 12b-1 under the 1940 Act to compensate the Distributor for distributing those share classes, maintaining accounts and providing shareholder services. Under the Plans, the Fund pays the Distributor an annual asset-based sales charge of 0.75% on Class B and Class C shares’ daily net assets and 0.25% on Class R shares’ daily net assets. The Fund also pays a service fee under the Plans at an annual rate of 0.25% of daily net assets. The Plans continue in effect from year to year only if the Fund’s Board of Trustees votes annually to approve their continuance at an in person meeting called for that purpose. Fees incurred by the Fund under the Plans are detailed in the Consolidated Statement of Operations.
|
| 101 OPPENHEIMER CAPITAL INCOME FUND |
NOTES TO CONSOLIDATED
FINANCIAL STATEMENTS Continued
9. Fees and Other Transactions with Affiliates (Continued)
Sales Charges. Front-end sales charges and CDSC do not represent expenses of the Fund. They are deducted from the proceeds of sales of Fund shares prior to investment or from redemption proceeds prior to remittance, as applicable. The sales charges retained by the Distributor from the sale of shares and the CDSC retained by the Distributor on the redemption of shares is shown in the following table for the period indicated.
| | | | | | | | | | | | | | | | | | | | |
| | | | | | Class A | | | Class B | | | Class C | | | Class R | |
| | | Class A | | | Contingent | | | Contingent | | | Contingent | | | Contingent | |
| | | Front-End | | | Deferred | | | Deferred | | | Deferred | | | Deferred | |
| | | Sales Charges | | | Sales Charges | | | Sales Charges | | | Sales Charges | | | Sales Charges | |
| | | Retained by | | | Retained by | | | Retained by | | | Retained by | | | Retained by | |
| Year Ended | | Distributor | | | Distributor | | | Distributor | | | Distributor | | | Distributor | |
| |
| August 31, 2016 | | | $480,752 | | | | $18,416 | | | | $18,117 | | | | $65,986 | | | | $2 | |
Waivers and Reimbursements of Expenses. The Manager has contractually agreed to waive the management fee it receives from the Fund in an amount equal to the management fee it receives from the Subsidiary. During the reporting period, the Manager waived $174,420.
The Manager will waive fees and/or reimburse Fund expenses in an amount equal to the indirect management fees incurred through the Fund’s investments in underlying funds managed by the Manager or its affiliates. During the reporting period, the Manager waived fees and/or reimbursed the Fund $1,250,738 for management fees.
Waivers and/or reimbursements may be modified or terminated as set forth according to the terms in the prospectus.
10. Borrowings and Other Financing
Joint Credit Facility. A number of mutual funds managed by the Manager participate in a $1.3 billion revolving credit facility (the “Facility”) intended to provide short-term financing, if necessary, subject to certain restrictions in connection with atypical redemption activity. Expenses and fees related to the Facility are paid by the participating funds and are disclosed separately or as other expenses on the Consolidated Statement of Operations. The Fund did not utilize the Facility during the reporting period.
11. Pending Litigation
In 2009, several putative class action lawsuits were filed and later consolidated before the U.S. District Court for the District of Colorado against OppenheimerFunds, Inc. (“OFI”), OppenheimerFunds Distributor, Inc. (“OFDI”), and Oppenheimer Rochester California Municipal Fund, a fund advised by OFI Global Asset Management, Inc. and distributed by the Distributor (the “California Fund”), in connection with the California Fund’s investment performance. The plaintiffs asserted claims against OFI, OFDI and certain present and former trustees and officers of the California Fund under the federal securities laws, alleging, among other things, that the disclosure documents of the California Fund contained misrepresentations and omissions and the investment policies of the California Fund were
|
| 102 OPPENHEIMER CAPITAL INCOME FUND |
11. Pending Litigation (Continued)
not followed. Plaintiffs in the suit filed an amended complaint and defendants filed a motion to dismiss. In 2011, the court issued an order which granted in part and denied in part the defendants’ motion to dismiss. In 2012, plaintiffs filed a motion, which defendants opposed, to certify a class and appoint class representatives and class counsel. In March 2015, the court granted plaintiffs’ motion for class certification. In May 2015, the U.S. Court of Appeals for the Tenth Circuit vacated the class certification order and remanded the matter to the district court for further proceedings. In October 2015, the district court reaffirmed its order and determined that the suit will proceed as a class action. In December 2015, the Tenth Circuit denied defendants’ petition to appeal the district court’s reaffirmed class certification order.
OFI and OFDI believe the suit is without merit; that it is premature to render any opinion as to the likelihood of an outcome unfavorable to them in the suit; and that no estimate can yet be made as to the amount or range of any potential loss. Furthermore, OFI believes that the suit should not impair the ability of OFI or OFDI to perform their respective duties to the Fund and that the outcome of the suit should not have any material effect on the operations of any of the Oppenheimer funds.
|
| 103 OPPENHEIMER CAPITAL INCOME FUND |
REPORT OF INDEPENDENT REGISTERED PUBLIC ACCOUNTING FIRM
The Board of Trustees and Shareholders of Oppenheimer Capital Income Fund:
We have audited the accompanying consolidated statement of assets and liabilities of Oppenheimer Capital Income Fund and subsidiary, including the consolidated statement of investments, as of August 31, 2016, and the related consolidated statement of operations for the year then ended, the consolidated statements of changes in net assets for each of the years in the two-year period then ended, and the consolidated financial highlights for each of the years or periods in the five-year period then ended. These consolidated financial statements and consolidated financial highlights are the responsibility of the Fund’s management. Our responsibility is to express an opinion on these consolidated financial statements and consolidated financial highlights based on our audits.
We conducted our audits in accordance with the standards of the Public Company Accounting Oversight Board (United States). Those standards require that we plan and perform the audit to obtain reasonable assurance about whether the financial statements and financial highlights are free of material misstatement. An audit includes examining, on a test basis, evidence supporting the amounts and disclosures in the financial statements. Our procedures included confirmation of securities owned as of August 31, 2016, by correspondence with the custodian, transfer agent and brokers, or by other appropriate auditing procedures where replies from brokers were not received. An audit also includes assessing the accounting principles used and significant estimates made by management, as well as evaluating the overall financial statement presentation. We believe that our audits provide a reasonable basis for our opinion.
In our opinion, the consolidated financial statements and consolidated financial highlights referred to above present fairly, in all material respects, the financial position of Oppenheimer Capital Income Fund and subsidiary as of August 31, 2016, the results of their operations for the year then ended, the changes in their net assets for each of the years in the two-year period then ended, and the consolidated financial highlights for each of the years or periods in the five-year period then ended, in conformity with U.S. generally accepted accounting principles.
KPMGLLP
Denver, Colorado
October 25, 2016
|
| 104 OPPENHEIMER CAPITAL INCOME FUND |
FEDERAL INCOME TAX INFORMATION Unaudited
In early 2016, if applicable, shareholders of record received information regarding all dividends and distributions paid to them by the Fund during calendar year 2015.
Dividends, if any, paid by the Fund during the reporting period which are not designated as capital gain distributions should be multiplied by the maximum amount allowable but not less than 26.75% to arrive at the amount eligible for the corporate dividend-received deduction.
A portion, if any, of the dividends paid by the Fund during the reporting period which are not designated as capital gain distributions are eligible for lower individual income tax rates to the extent that the Fund has received qualified dividend income as stipulated by recent tax legislation. The maximum amount allowable but not less than $22,365,238 of the Fund’s fiscal year taxable income may be eligible for the lower individual income tax rates. In early 2016, shareholders of record received information regarding the percentage of distributions that are eligible for lower individual income tax rates.
Recent tax legislation allows a regulated investment company to designate distributions not designated as capital gain distributions, as either interest related dividends or short-term capital gain dividends, both of which are exempt from the U.S. withholding tax applicable to non U.S. taxpayers. For the reporting period, the maximum amount allowable but not less than $40,895,638 of the ordinary distributions to be paid by the Fund qualifies as an interest related dividend.
The foregoing information is presented to assist shareholders in reporting distributions received from the Fund to the Internal Revenue Service. Because of the complexity of the federal regulations which may affect your individual tax return and the many variations in state and local tax regulations, we recommend that you consult your tax advisor for specific guidance.
|
| 105 OPPENHEIMER CAPITAL INCOME FUND |
BOARD APPROVAL OF THE FUND’S INVESTMENT ADVISORY
AND SUB-ADVISORY AGREEMENTS Unaudited
The Fund has entered into an investment advisory agreement with OFI Global Asset Management, Inc. (“OFI Global” or the “Adviser”), a wholly-owned subsidiary of OppenheimerFunds, Inc. (“OFI” or the “Sub-Adviser”) (“OFI Global” and “OFI” together the “Managers”) and OFI Global has entered into a sub-advisory agreement with OFI whereby OFI provides investment sub-advisory services to the Fund (collectively, the “Agreements”). Each year, the Board of Trustees (the “Board”), including a majority of the independent Trustees, is required to determine whether to approve the terms of the Agreements and the renewal thereof. The Investment Company Act of 1940, as amended, requires that the Board request and evaluate, and that the Managers provide, such information as may be reasonably necessary to evaluate the terms of the Agreements. The Board employs an independent consultant to prepare a report that provides information, including comparative information that the Board requests for that purpose. In addition to in-person meetings focused on this evaluation, the Board receives information throughout the year regarding Fund services, fees, expenses and performance.
The Managers and the independent consultant provided information to the Board on the following factors: (i) the nature, quality and extent of the Managers’ services, (ii) the comparative investment performance of the Fund and the Managers, (iii) the fees and expenses of the Fund, including comparative fee and expense information, (iv) the profitability of the Managers and their affiliates, including an analysis of the cost of providing services, (v) whether economies of scale are realized as the Fund grows and whether fee levels reflect these economies of scale for Fund investors and (vi) other benefits to the Managers from their relationship with the Fund. The Board was aware that there are alternatives to retaining the Managers.
Outlined below is a summary of the principal information considered by the Board as well as the Board’s conclusions.
Nature, Quality and Extent of Services. The Board considered information about the nature, quality and extent of the services provided to the Fund and information regarding the Managers’ key personnel who provide such services. The Managers’ duties include providing the Fund with the services of the portfolio managers and the Sub-Adviser’s investment team, who provide research, analysis and other advisory services in regard to the Fund’s investments; and securities trading services. OFI Global is responsible for oversight of third-party service providers; monitoring compliance with applicable Fund policies and procedures and adherence to the Fund’s investment restrictions; risk management; and oversight of the Sub-Adviser. OFI Global is also responsible for providing certain administrative services to the Fund. Those services include providing and supervising all administrative and clerical personnel who are necessary in order to provide effective corporate administration for the Fund; compiling and maintaining records with respect to the Fund’s operations; preparing and filing reports required by the U.S. Securities and Exchange Commission; preparing periodic reports regarding the operations of the Fund for its shareholders; preparing proxy materials for shareholder meetings; and preparing the registration statements required by federal and state securities laws for the sale of the Fund’s shares. OFI Global also provides the Fund with office space, facilities and equipment.
|
| 106 OPPENHEIMER CAPITAL INCOME FUND |
The Board also considered the quality of the services provided and the quality of the Managers’ resources that are available to the Fund. The Board took account of the fact that the Sub-Adviser has over fifty years of experience as an investment adviser and that its assets under management rank it among the top mutual fund managers in the United States. The Board evaluated the Managers’ advisory, administrative, accounting, legal, compliance services and risk management, and information the Board has received regarding the experience and professional qualifications of the Managers’ key personnel and the size and functions of its staff. In its evaluation of the quality of the portfolio management services provided, the Board considered the experience of Michelle Borré and Krishna Memani, the portfolio managers for the Fund, and the Sub-Adviser’s investment team and analysts. The Board members also considered the totality of their experiences with the Managers as directors or trustees of the Fund and other funds advised by the Managers. The Board considered information regarding the quality of services provided by affiliates of the Managers, which the Board members have become knowledgeable about through their experiences with the Managers and in connection with the renewal of the Fund’s service agreements. The Board concluded, in light of the Managers’ experience, reputation, personnel, operations and resources that the Fund benefits from the services provided under the Agreements.
Investment Performance of the Managers and the Fund. Throughout the year, the Managers provided information on the investment performance of the Fund, the Adviser and the Sub-Adviser, including comparative performance information. The Board also reviewed information, prepared by the Managers and by the independent consultant, comparing the Fund’s historical performance to relevant benchmarks or market indices and to the performance of other retail funds in the conservative allocation category. The Board considered that the Fund outperformed its performance category median for the one-year, three-year and five-year periods, although it underperformed its performance category median for the ten-year period. The Board also noted that the Fund had changed portfolio managers effective April 15, 2009 and that the Fund’s one-, three- and five-year rankings indicated the strong performance the portfolio managers have delivered for the Fund.
Fees and Expenses of the Fund. The Board reviewed the fees paid to the Adviser and the other expenses borne by the Fund. The Board noted that the Adviser, not the Fund, pays the Sub-Adviser’s fee under the sub-advisory agreement. The independent consultant provided comparative data in regard to the fees and expenses of the Fund and other retail conservative allocation funds with comparable asset levels and distribution features. The Board noted that the Fund’s contractual management fee was lower than its peer group median and category median and its total expenses, net of waivers, were equal to its peer group median and lower than its category median.
Economies of Scale and Profits Realized by the Managers. The Board considered information regarding the Managers’ costs in serving as the Fund’s investment adviser
|
| 107 OPPENHEIMER CAPITAL INCOME FUND |
BOARD APPROVAL OF THE FUND’S INVESTMENT ADVISORY
AND SUB-ADVISORY AGREEMENTS Unaudited / Continued
and sub-adviser, including the costs associated with the personnel and systems necessary to manage the Fund, and information regarding the Managers’ profitability from their relationship with the Fund. The Board also considered that the Managers must be able to pay and retain experienced professional personnel at competitive rates to provide quality services to the Fund. The Board reviewed whether the Managers may realize economies of scale in managing and supporting the Fund. The Board noted that the Fund currently has management fee breakpoints, which are intended to share with Fund shareholders economies of scale that may exist as the Fund’s assets grow and which are appropriate given the Fund’s current size.
Other Benefits to the Managers. In addition to considering the profits realized by the Managers, the Board considered information that was provided regarding the direct and indirect benefits the Managers receive as a result of their relationship with the Fund, including compensation paid to the Managers’ affiliates and research provided to the Adviser in connection with permissible brokerage arrangements (soft dollar arrangements).
Conclusions. These factors were also considered by the independent Trustees meeting separately from the full Board, assisted by experienced counsel to the Fund and to the independent Trustees. Fund counsel and the independent Trustees’ counsel are independent of the Managers within the meaning and intent of the Securities and Exchange Commission Rules.
Based on its review of the information it received and its evaluations described above, the Board, including a majority of the independent Trustees, decided to continue the Agreements through August 31, 2017. In arriving at its decision, the Board did not identify any factor or factors as being more important than others, but considered all of the above information, and considered the terms and conditions of the Agreements, including the management fees, in light of all the surrounding circumstances.
|
| 108 OPPENHEIMER CAPITAL INCOME FUND |
PORTFOLIO PROXY VOTING POLICIES AND GUIDELINES;
UPDATES TO STATEMENTS OF INVESTMENTS Unaudited
The Fund has adopted Portfolio Proxy Voting Policies and Guidelines under which the Fund votes proxies relating to securities (“portfolio proxies”) held by the Fund. A description of the Fund’s Portfolio Proxy Voting Policies and Guidelines is available (i) without charge, upon request, by calling the Fund toll-free at 1.800.CALL OPP (225.5677), (ii) on the Fund’s website at www.oppenheimerfunds.com, and (iii) on the SEC’s website at www.sec.gov. In addition, the Fund is required to file Form N-PX, with its complete proxy voting record for the 12 months ended June 30th, no later than August 31st of each year. The Fund’s voting record is available (i) without charge, upon request, by calling the Fund toll-free at 1.800.CALL OPP (225.5677), and (ii) in the Form N-PX filing on the SEC’s website at www.sec.gov.
The Fund files its complete schedule of portfolio holdings with the SEC for the first quarter and the third quarter of each fiscal year on Form N-Q. The Fund’s Form N-Q filings are available on the SEC’s website at www.sec.gov. Those forms may be reviewed and copied at the SEC’s Public Reference Room in Washington, D.C. Information on the operation of the Public Reference Room may be obtained by calling 1-800-SEC-0330.
Householding—Delivery of Shareholder Documents
This is to inform you about OppenheimerFunds’ “householding” policy. If more than one member of your household maintains an account in a particular fund, OppenheimerFunds will mail only one copy of the fund’s prospectus (or, if available, the fund’s summary prospectus), annual and semiannual report and privacy policy. The consolidation of these mailings, called householding, benefits your fund through reduced mailing expense, and benefits you by reducing the volume of mail you receive from OppenheimerFunds. Householding does not affect the delivery of your account statements.
Please note that we will continue to household these mailings for as long as you remain an OppenheimerFunds shareholder, unless you request otherwise. If you prefer to receive multiple copies of these materials, please call us at 1.800.CALL-OPP (225-5677). You may also notify us in writing or via email. We will begin sending you individual copies of the prospectus (or, if available, the summary prospectus), reports and privacy policy within 30 days of receiving your request to stop householding.
|
| 109 OPPENHEIMER CAPITAL INCOME FUND |
TRUSTEES AND OFFICERS Unaudited
| | |
| Name, Position(s) Held with the Fund, Length of Service, Year of Birth | | Principal Occupation(s) During the Past 5 Years; Other Trusteeships/ Directorships Held; Number of Portfolios in the Fund Complex Currently Overseen |
| |
| INDEPENDENT TRUSTEES | | The address of each Trustee in the chart below is 6803 S. Tucson Way, Centennial, Colorado 80112-3924. Each Trustee serves for an indefinite term, or until his or her resignation, retirement, death or removal. |
| |
Robert J. Malone, Chairman of the Board of Trustees (since 2016) and Trustee (since 2002) Year of Birth: 1944 | | Chairman - Colorado Market of MidFirst Bank (since January 2015); Chairman of the Board (2012-2016) and Director (August 2005-March 2016) of Jones International University (educational organization); Trustee of the Gallagher Family Foundation (non-profit organization) (2000-2015); Chairman, Chief Executive Officer and Director of Steele Street Bank Trust (commercial banking) (August 2003-January 2015); Board of Directors of Opera Colorado Foundation (non-profit organization) (2008-2012); Director of Colorado UpLIFT (charitable organization) (1986-2010); Director of Jones Knowledge, Inc. (2006-2010); Former Chairman of U.S. Bank-Colorado (subsidiary of U.S. Bancorp and formerly Colorado National Bank) (July 1996-April 1999); Director of Commercial Assets, Inc. (real estate investment trust) (1993-2000); Director of U.S. Exploration, Inc. (oil and gas exploration) (1997-February 2004); Chairman of the Board (1991-1994) and Trustee (1985-1994) of Regis University; and Chairman of the Board (1990-1991) and Trustee (1984-1999) of Young Presidents Organization. Oversees 46 portfolios in the OppenheimerFunds complex. Mr. Malone has served on the Boards of certain Oppenheimer funds since 2002, during which time he has become familiar with the Fund’s (and other Oppenheimer funds’) financial, accounting, regulatory and investment matters and has contributed to the Board’s deliberations. |
| |
Jon S. Fossel, Trustee (since 1990) Year of Birth: 1942 | | Chairman of the Board of Jack Creek Preserve Foundation (non-profit organization) (since March 2005); Director of Jack Creek Preserve Foundation (non-profit organization) (March 2005-December 2014); Chairman of the Board (2006-December 2011) and Director (June 2002-December 2011) of UNUMProvident (insurance company); Director of Northwestern Energy Corp. (public utility corporation) (November 2004-December 2009); Director of P.R. Pharmaceuticals (October 1999-October 2003); Director of Rocky Mountain Elk Foundation (non-profit organization) (February 1998-February 2003 and February 2005-February 2007); Chairman and Director (until October 1996) and President and Chief Executive Officer (until October 1995) of the Sub-Adviser; President, Chief Executive Officer and Director of the following: Oppenheimer Acquisition Corp. (“OAC”) (parent holding company of the Sub-Adviser), Shareholders Services, Inc. and Shareholder Financial Services, Inc. (until October 1995). Oversees 46 portfolios in the OppenheimerFunds complex. Mr. Fossel has served on the Boards of certain Oppenheimer funds since 1990, during which time he has become familiar with the Fund’s (and other Oppenheimer funds’) financial, accounting, regulatory and investment matters and has contributed to the Boards’ deliberations. |
110 OPPENHEIMER CAPITAL INCOME FUND
| | |
Richard F. Grabish, Trustee (since 2012) Year of Birth: 1948 | | Formerly Senior Vice President and Assistant Director of Sales and Marketing (March 1997-December 2007), Director (March 1987-December 2007) and Manager of Private Client Services (June 1985-June 2005) of A.G. Edwards & Sons, Inc. (broker/dealer and investment firm); Chairman and Chief Executive Officer of A.G. Edwards Trust Company, FSB (March 2001-December 2007); President and Vice Chairman of A.G. Edwards Trust Company, FSB (investment adviser) (April 1987-March 2001); President of A.G. Edwards Trust Company, FSB (investment adviser) (June 2005-December 2007). Oversees 46 portfolios in the OppenheimerFunds complex. Mr. Grabish has served on the Boards of certain Oppenheimer funds since 2001, during which time he has become familiar with the Fund’s (and other Oppenheimer funds’) financial, accounting, regulatory and investment matters and has contributed to the Boards’ deliberations. |
| |
Beverly L. Hamilton, Trustee (since 2002) Year of Birth: 1946 | | Trustee of Monterey Institute for International Studies (educational organization) (2000-2014); Board Member of Middlebury College (educational organization) (December 2005-June 2011); Chairman (since 2010) of American Funds’ Emerging Markets Growth Fund, Inc. (mutual fund); Director of The California Endowment (philanthropic organization) (April 2002-April 2008); Director (February 2002- 2005) and Chairman of Trustees (2006-2007) of the Community Hospital of Monterey Peninsula; Director (October 1991-2005) and Vice Chairman (2006- 2009) of American Funds’ Emerging Markets Growth Fund, Inc. (mutual fund); President of ARCO Investment Management Company (February 1991-April 2000); Member of the investment committees of The Rockefeller Foundation (2001-2006) and The University of Michigan (since 2000); Advisor at Credit Suisse First Boston’s Sprout venture capital unit (venture capital fund) (1994-January 2005); Trustee of MassMutual Institutional Funds (investment company) (1996-June 2004); Trustee of MML Series Investment Fund (investment company) (April 1989-June 2004); Member of the investment committee of Hartford Hospital (2000-2003); and Advisor to Unilever (Holland) pension fund (2000-2003). Oversees 46 portfolios in the OppenheimerFunds complex. Ms. Hamilton has served on the Boards of certain Oppenheimer funds since 2002, during which time she has become familiar with the Fund’s (and other Oppenheimer funds’) financial, accounting, regulatory and investment matters and has contributed to the Boards’ deliberations. |
| |
Victoria J. Herget, Trustee (since 2012) Year of Birth:1951 | | Board Chair (2008-2015) and Director (2004-Present), United Educators (insurance company); Trustee (since 2000) and Chair (since 2010), Newberry Library (independent research library); Trustee, Mather LifeWays (senior living organization) (since 2001); Independent Director of the First American Funds (mutual fund family) (2003-2011); former Managing Director (1993-2001), Principal (1985- 1993), Vice President (1978-1985) and Assistant Vice President (1973-1978) of Zurich Scudder Investments (investment adviser) (and its predecessor firms); Trustee (1992-2007), Chair of the Board of Trustees (1999-2007), Investment Committee Chair (1994-1999) and Investment Committee member (2007-2010) of Wellesley College; Trustee, BoardSource (non-profit organization) (2006-2009) and Chicago City Day School (K-8 School) (1994-2005). Oversees 46 portfolios in the OppenheimerFunds complex. Ms. Herget has served on the Boards of certain Oppenheimer funds since 2012, during which time she has become familiar with the Fund’s (and other Oppenheimer funds’) financial, accounting, regulatory and investment matters and has contributed to the Boards’ deliberations. |
|
| 111 OPPENHEIMER CAPITAL INCOME FUND |
TRUSTEES AND OFFICERS Unaudited / Continued
| | |
F. William Marshall, Jr., Trustee (since 2000) Year of Birth: 1942 | | Trustee Emeritus of Worcester Polytech Institute (WPI) (private university) (since 2009); Trustee of MassMutual Select Funds (formerly MassMutual Institutional Funds) (investment company) (1996-2015), MML Series Investment Fund (investment company) (1996-2015) and Mass Mutual Premier Funds (investment company) (January 2012-December 2015); President and Treasurer of the SIS Fund (private charitable fund) (January 1999-March 2011); Former Trustee of WPI (1985-2008); Former Chairman of the Board (2004-2006) and Former Chairman of the Investment Committee of WPI (1994-2008); Chairman of SIS Family Bank, F.S.B. (formerly SIS Bank) (commercial bank) (January 1999-July 1999); Executive Vice President of Peoples Heritage Financial Group, Inc. (commercial bank) (January 1999-July 1999); and Former President and Chief Executive Officer of SIS Bancorp. (1993-1999). Oversees 46 portfolios in the OppenheimerFunds complex. Mr. Marshall has served on the Boards of certain Oppenheimer funds since 2000, during which time he has become familiar with the Fund’s (and other Oppenheimer funds’) financial, accounting, regulatory and investment matters and has contributed to the Boards’ deliberations. |
| |
Karen L. Stuckey, Trustee (since 2012) Year of Birth: 1953 | | Member (since May 2015) of Desert Mountain Community Foundation Advisory Board (non-profit organization); Partner (1990-2012) of PricewaterhouseCoopers LLP (professional services firm) (held various positions 1975-1990); Trustee (1992-2006), member of Executive, Nominating and Audit Committees and Chair of Finance Committee (1992-2006, and Emeritus Trustee (since 2006) of Lehigh University; and member, Women’s Investment Management Forum (professional organization) since inception. Oversees 46 portfolios in the OppenheimerFunds complex. Ms. Stuckey has served on the Boards of certain Oppenheimer funds since 2012, during which time she has become familiar with the Fund’s (and other Oppenheimer funds’) financial, accounting, regulatory and investment matters and has contributed to the Boards’ deliberations. |
| |
James D. Vaughn, Trustee (since 2012) Year of Birth:1945 | | Retired; former managing partner (1994-2001) of Denver office of Deloitte & Touche LLP, (held various positions 1969-1993); Trustee and Chairman of the Audit Committee of Schroder Funds (2003-2012); Board member and Chairman of Audit Committee of AMG National Trust Bank (since 2005); Trustee and Investment Committee member, University of South Dakota Foundation (since 1996); Board member, Audit Committee Member and past Board Chair, Junior Achievement (since 1993); former Board member, Mile High United Way, Boys and Girls Clubs, Boy Scouts, Colorado Business Committee for the Arts, Economic Club of Colorado and Metro Denver Network. Oversees 46 portfolios in the OppenheimerFunds complex. Mr. Vaughn has served on the Boards of certain Oppenheimer funds since 2012, during which time he has become familiar with the Fund’s (and other Oppenheimer funds’) financial, accounting, regulatory and investment matters and has contributed to the Boards’ deliberations. |
| |
| INTERESTED TRUSTEE AND OFFICER | | Mr. Steinmetz is an “Interested Trustee” because he is affiliated with the Manager and the Sub-Adviser by virtue of his positions as Chairman of the Sub-Adviser and officer and director of the Manager. Both as a Trustee and as an officer, Mr. Steinmetz serves for an indefinite term, or until his resignation, retirement, death or removal. Mr. Steinmetz’s address is 225 Liberty Street, New York, New York 10281-1008. |
|
| 112 OPPENHEIMER CAPITAL INCOME FUND |
| | |
Arthur P. Steinmetz, Trustee (since 2015), President and Principal Executive Officer (since 2014) Year of Birth: 1958 | | Chairman of the Sub-Adviser (since January 2015); CEO and Chairman of the Manager (since July 2014), President of the Manager (since May 2013), a Director of the Manager (since January 2013), Director of the Sub-Adviser (since July 2014), President, Management Director and CEO of Oppenheimer Acquisition Corp. (the Sub-Adviser’s parent holding company) (since July 2014), and President and Director of OFI SteelPath, Inc. (since January 2013). Chief Investment Officer of the OppenheimerFunds advisory entities from (January 2013-December 2013); Executive Vice President of the Manager (January 2013-May 2013); Chief Investment Officer of the Sub-Adviser (October 2010-December 2012); Chief Investment Officer, Fixed-Income, of the Sub-Adviser (April 2009-October 2010); Executive Vice President of the Sub-Adviser (October 2009-December 2012); Director of Fixed Income of the Sub-Adviser (January 2009-April 2009); and a Senior Vice President of the Sub-Adviser (March 1993-September 2009). An officer of 101 portfolios in the OppenheimerFunds complex. |
| |
| OTHER OFFICERS OF THE FUND | | The addresses of the Officers in the chart below are as follows: for Mr. Memani, Mss. Borré, Lo Bessette, Foxson and Picciotto, 225 Liberty Street, New York, New York 10281-1008, for Mr. Petersen, 6803 S. Tucson Way, Centennial, Colorado 80112-3924. Each Officer serves for an indefinite term or until his or her resignation, retirement, death or removal. |
| |
Michelle Borré, Vice President (since 2009) Year of Birth: 1967 | | Vice President of the Sub-Adviser (since April 2003); Senior Portfolio Manager of the Sub-Adviser (since April 2009); Senior Research Analyst of the Sub-Adviser (February 2003-April 2009). Ms. Borre held various positions, including Managing Director and Partner, at J&W Seligman (July 1996 -January 2003). Adjunct Professor of Finance and Economics at Columbia Business School; Served on the Executive Advisory Board at the Heilbrunn Center for Graham and Dodd Investing at Columbia Business School (from 2004 to 2005). A portfolio manager and an officer of other portfolios in the OppenheimerFunds complex. |
| |
Krishna Memani, Vice President (since 2009) Year of Birth: 1960 | | President of the Sub-Adviser (since January 2013); Executive Vice President of the Manager (since January 2014) and Chief Investment Officer of the OppenheimerFunds advisory entities (since January 2014). Chief Investment Officer, Fixed Income of the Sub-Adviser (January 2013-December 2013); Head of the Investment Grade Fixed Income Team of the Sub-Adviser (March 2009-January 2014); Director of Fixed Income of the Sub-Adviser (October 2010-December 2012); Senior Vice President of the Sub-Adviser (March 2009-December 2012) and Senior Vice President of OFI Global Institutional, Inc. (April 2009-December 2012). Managing Director and Head of the U.S. and European Credit Analyst Team at Deutsche Bank Securities (June 2006-January 2009). Chief Credit Strategist at Credit Suisse Securities (August 2002-March 2006). Managing Director and Senior Portfolio Manager at Putnam Investments (September 1998-June 2002). A portfolio manager and an officer of other portfolios in the OppenheimerFunds complex. |
|
| 113 OPPENHEIMER CAPITAL INCOME FUND |
TRUSTEES AND OFFICERS Unaudited / Continued
| | |
Cynthia Lo Bessette, Secretary and Chief Legal Officer (since 2016) Year of Birth: 1969 | | Senior Vice President and Deputy General Counsel (March 2015-February 2016) and Executive Vice President, General Counsel and Secretary of the Manager (since February 2016); Chief Legal Officer of the Sub-Adviser and the Distributor (since February 2016); Vice President, General Counsel and Secretary of Oppenheimer Acquisition Corp. (since February 2016); General Counsel of OFI SteelPath, Inc., VTL Associates, LLC and Index Management Solutions, LLC (since February 2016); Chief Legal Officer of OFI Global Institutional, Inc., HarbourView Asset Management Corporation, OFI Global Trust Company, Oppenheimer Real Asset Management, Inc., OFI Private Investments Inc., Shareholder Services, Inc. and Trinity Investment Management Corporation (since February 2016); Vice President, Corporate Counsel (February 2012-March 2015) and Deputy Chief Legal Officer (April 2013-March 2015) of Jennison Associates LLC; Assistant General Counsel (April 2008-September 2009) and Deputy General Counsel (October 2009-February 2012) of Lord Abbett & Co. LLC. An officer of 101 portfolios in the OppenheimerFunds complex. |
| |
Jennifer Foxson, Vice President and Chief Business Officer (since 2014) Year of Birth: 1969 | | Senior Vice President of OppenheimerFunds Distributor, Inc. (since January 2013); Senior Vice President of the Sub-Adviser (July 2010-December 2012); Vice President of the Sub-Adviser (January 2003-July 2010); Vice President of OppenheimerFunds Distributor, Inc. (January 2003-July 2010). An officer of 101 portfolios in the OppenheimerFunds complex. |
| |
Mary Ann Picciotto, Chief Compliance Officer and Chief Anti-Money Laundering Officer (since 2014) Year of Birth: 1973 | | Senior Vice President of OppenheimerFunds Distributor, Inc. (since June 2014); Vice President of OppenheimerFunds Distributor, Inc. (April 2006-June 2014); Vice President of the Sub-Adviser (January 1998-March 2006); Assistant Vice President of the Sub-Adviser (October 1991-December 1998). An officer of 101 portfolios in the OppenheimerFunds complex. |
| |
Brian S. Petersen, Treasurer and Principal Financial & Accounting Officer (since 2016) Year of Birth: 1970 | | Vice President of the Manager (since January 2013); Vice President of the Sub-Adviser (February 2007-December 2012); Assistant Vice President of the Sub- Adviser (August 2002-2007). An officer of 101 portfolios in the OppenheimerFunds complex. |
The Fund’s Statement of Additional Information contains additional information about the Fund’s Trustees and Officers and is available without charge upon request by calling 1.800.CALL OPP (225.5677).
|
| 114 OPPENHEIMER CAPITAL INCOME FUND |
OPPENHEIMER CAPITAL INCOME FUND
| | |
Manager | | OFI Global Asset Management, Inc. |
| |
Sub-Adviser | | OppenheimerFunds, Inc. |
| |
Distributor | | OppenheimerFunds Distributor, Inc. |
| |
Transfer and Shareholder | | OFI Global Asset Management, Inc. |
Servicing Agent | | |
| |
Sub-Transfer Agent | | Shareholder Services, Inc. |
| | DBA OppenheimerFunds Services |
| |
Independent Registered | | KPMG LLP |
Public Accounting Firm | | |
| |
Legal Counsel | | Ropes & Gray LLP |
© 2016 OppenheimerFunds, Inc. All rights reserved.
115 OPPENHEIMER CAPITAL INCOME FUND
PRIVACY POLICY NOTICE
As an Oppenheimer fund shareholder, you are entitled to know how we protect your personal information and how we limit its disclosure.
Information Sources
We obtain nonpublic personal information about our shareholders from the following sources:
| ● | | Applications or other forms |
| ● | | When you create a user ID and password for online account access |
| ● | | When you enroll in eDocs Direct, our electronic document delivery service |
| ● | | Your transactions with us, our affiliates or others |
| ● | | A software program on our website, often referred to as a “cookie,” which indicates which parts of our site you’ve visited |
| ● | | When you set up challenge questions to reset your password online |
If you visit oppenheimerfunds.com and do not log on to the secure account information areas, we do not obtain any personal information about you. When you do log on to a secure area, we do obtain your user ID and password to identify you. We also use this information to provide you with products and services you have requested, to inform you about products and services that you may be interested in and assist you in other ways.
We do not collect personal information through our website unless you willingly provide it to us, either directly by email or in those areas of the website that request information. In order to update your personal information (including your mailing address, email address and phone number) you must first log on and visit your user profile.
If you have set your browser to warn you before accepting cookies, you will receive the warning message with each cookie. You can refuse cookies by turning them off in your browser. However, doing so may limit your access to certain sections of our website.
We use cookies to help us improve and manage our website. For example, cookies help us recognize new versus repeat visitors to the site, track the pages visited, and enable some special features on the website. This data helps us provide a better service for our website visitors.
Protection of Information
We do not disclose any non-public personal information (such as names on a customer list) about current or former customers to anyone, except as permitted by law.
Disclosure of Information
Copies of confirmations, account statements and other documents reporting activity in your fund accounts are made available to your financial advisor (as designated by you). We may also use details about you and your investments to help us, our financial service affiliates, or firms that jointly market their financial products and services with ours, to better serve your investment needs or suggest financial services or educational material that may be of interest to you. If this requires us to provide you with an opportunity to “opt in” or “opt out” of such information sharing with a firm not affiliated with us, you will receive notification on how to do so, before any such sharing takes place.
Right of Refusal
We will not disclose your personal information to unaffiliated third parties (except as permitted by law), unless we first offer you a reasonable opportunity to refuse or “opt out” of such disclosure.
116 OPPENHEIMER CAPITAL INCOME FUND
Internet Security and Encryption
In general, the email services provided by our website are encrypted and provide a secure and private means of communication with us. To protect your own privacy, confidential and/or personal information should only be communicated via email when you are advised that you are using a secure website. As a security measure, we do not include personal or account information in non-secure emails, and we advise you not to send such information to us in non-secure emails. Instead, you may take advantage of the secure features of our website to encrypt your email correspondence. To do this, you will need to use a browser that supports Secure Sockets Layer (SSL) protocol.
We do not guarantee or warrant that any part of our website, including files available for download, are free of viruses or other harmful code. It is your responsibility to take appropriate precautions, such as use of an anti-virus software package, to protect your computer hardware and software.
| ● | | All transactions, including redemptions, exchanges and purchases, are secured by SSL and 256-bit encryption. SSL is used to establish a secure connection between your PC and OppenheimerFunds’ server. It transmits information in an encrypted and scrambled format. |
| ● | | Encryption is achieved through an electronic scrambling technology that uses a “key” to code and then decode the data. Encryption acts like the cable converter box you may have on your television set. It scrambles data with a secret code so that no one can make sense of it while it is being transmitted. When the data reaches its destination, the same software unscrambles the data. |
| ● | | You can exit the secure area by either closing your browser, or for added security, you can use the Log Out button before you close your browser. |
Other Security Measures
We maintain physical, electronic and procedural safeguards to protect your personal account information. Our employees and agents have access to that information only so that they may offer you products or provide services, for example, when responding to your account questions.
How You Can Help
You can also do your part to keep your account information private and to prevent unauthorized transactions. If you obtain a user ID and password for your account, do not allow it to be used by anyone else. Also, take special precautions when accessing your account on a computer used by others.
Who We Are
This joint notice describes the privacy policies of the Oppenheimer funds, OppenheimerFunds, Inc., each of its investment adviser subsidiaries, OppenheimerFunds Distributor, Inc. and OFI Global Trust Co. It applies to all Oppenheimer fund accounts you presently have, or may open in the future, using your Social Security number—whether or not you remain a shareholder of our funds. This notice was last updated March 2015. In the event it is updated or changed, we will post an updated notice on our website at oppenheimerfunds.com. If you have any questions about this privacy policy, write to us at P.O. Box 5270, Denver, CO 80217-5270, email us by clicking on the Contact Us section of our website at oppenheimerfunds.com or call us at 1.800.CALL OPP (225.5677).
117 OPPENHEIMER CAPITAL INCOME FUND
THIS PAGE INTENTIONALLY LEFT BLANK.
118 OPPENHEIMER CAPITAL INCOME FUND
THIS PAGE INTENTIONALLY LEFT BLANK.
119 OPPENHEIMER CAPITAL INCOME FUND

Visit us at oppenheimerfunds.com for 24-hr access to account information and transactions or call us at 800.CALL OPP (800.225.5677) for 24-hr automated information and automated transactions. Representatives also available Mon–Fri 8am-8pm ET.
| | |
Visit Us oppenheimerfunds.com Call Us 800 225 5677 Follow Us | | |
 | | Oppenheimer funds are distributed by OppenheimerFunds Distributor, Inc. 225 Liberty Street, New York, NY 10281-1008 © 2016 OppenheimerFunds Distributor, Inc. All rights reserved. RA0300.001.0816 October 22, 2016 |
Item 2. Code of Ethics.
The registrant has adopted a code of ethics that applies to the registrant’s principal executive officer, principal financial officer, principal accounting officer or controller or persons performing similar functions.
Item 3. Audit Committee Financial Expert.
The Board of Trustees of the registrant has determined that F. William Marshall, Jr., the Chairman of the Board’s Audit Committee, is the audit committee financial expert and that Mr. Marshall is “independent” for purposes of this Item 3.
Item 4. Principal Accountant Fees and Services.
The principal accountant for the audit of the registrant’s annual financial statements billed $65,000 in fiscal 2016 and $53,600 in fiscal 2015.
The principal accountant for the audit of the registrant’s annual financial statements billed $5,341 in fiscal 2016 and no such fees in fiscal 2015.
The principal accountant for the audit of the registrant’s annual financial statements billed $672,785 in fiscal 2016 and $879,472 in fiscal 2015 to the registrant’s investment adviser or any entity controlling, controlled by, or under common control with the adviser that provides ongoing services to the registrant.
Such services include: Internal control reviews, GIPS attestation procedures, system conversion testing, custody exams, and additional audit services.
The principal accountant for the audit of the registrant’s annual financial statements billed no such fees in fiscal 2016 and no such fees in fiscal 2015.
The principal accountant for the audit of the registrant’s annual financial statements billed $237,933 in fiscal 2016 and $595,129 in fiscal 2015 to the registrant’s investment adviser or any entity controlling, controlled by, or under common control with the adviser that provides ongoing services to the registrant.
0
The principal accountant for the audit of the registrant’s annual financial statements billed no such fees in fiscal 2016 and no such fees in fiscal 2015.
The principal accountant for the audit of the registrant’s annual financial statements billed no such fees in fiscal 2016 and no such fees in fiscal 2015 to the registrant’s investment adviser or any entity controlling, controlled by, or under common control with the adviser that provides ongoing services to the registrant.
Such fees would include the cost to the principal accountant of attending audit committee meetings and consultations regarding the registrant’s retirement plan with respect to its Trustees.
| (e) | (1) During its regularly scheduled periodic meetings, the registrant’s audit committee will pre-approve all audit, audit-related, tax and other services to be provided by the principal accountants of the registrant. |
The audit committee has delegated pre-approval authority to its Chairman for any subsequent new engagements that arise between regularly scheduled meeting dates provided that any fees such pre-approved are presented to the audit committee at its next regularly scheduled meeting.
Under applicable laws, pre-approval of non-audit services may be waived provided that: 1) the aggregate amount of all such services provided constitutes no more than five percent of the total amount of fees paid by the registrant to its principal accountant during the fiscal year in which services are provided 2) such services were not recognized by the registrant at the time of engagement as non-audit services and 3) such services are promptly brought to the attention of the audit committee of the registrant and approved prior to the completion of the audit.
(2) 0%
| (f) | Not applicable as less than 50%. |
| (g) | The principal accountant for the audit of the registrant’s annual financial statements billed $910,718 in fiscal 2016 and $1,474,601 in fiscal 2015 to the registrant and the registrant’s investment adviser or any entity controlling, controlled by, or under common control with the adviser that provides ongoing services to the registrant related to non-audit fees. Those billings did not include any prohibited non-audit services as defined by the Securities Exchange Act of 1934. |
| (h) | The registrant’s audit committee of the board of Trustees has considered whether the provision of non-audit services that were rendered to the registrant’s investment adviser, and any entity controlling, controlled by, or under common control with the investment adviser that provides ongoing services to the registrant that were not pre-approved pursuant to paragraph (c)(7)(ii) of Rule 2-01 of Regulation S-X is compatible with maintaining the principal accountant’s independence. No such services were rendered. |
Item 5. Audit Committee of Listed Registrants
Not applicable.
Item 6. Schedule of Investments.
a) Not applicable. The complete schedule of investments is included in Item 1 of this Form N-CSR.
b) Not applicable.
Item 7. Disclosure of Proxy Voting Policies and Procedures for Closed-End Management Investment Companies.
Not applicable.
Item 8. Portfolio Managers of Closed-End Management Investment Companies.
Not applicable.
Item 9. Purchases of Equity Securities by Closed-End Management Investment Company and Affiliated Purchasers.
Not applicable.
Item 10. Submission of Matters to a Vote of Security Holders.
The Fund’s Governance Committee Provisions with Respect to Nominations of Directors/Trustees to the Respective Boards
None
Item 11. Controls and Procedures.
Based on their evaluation of the registrant’s disclosure controls and procedures (as defined in rule 30a-3(c) under the Investment Company Act of 1940 (17 CFR 270.30a-3(c)) as of 8/31/2016, the registrant’s principal executive officer and principal financial officer found the registrant’s disclosure controls and procedures to provide reasonable assurances that information required to be disclosed by the registrant in the reports that it files under the Securities Exchange Act of 1934 (a) is accumulated and communicated to registrant’s management, including its principal executive officer and principal financial officer, to allow timely decisions regarding required disclosure, and (b) is recorded, processed, summarized and reported, within the time periods specified in the rules and forms adopted by the U.S. Securities and Exchange Commission.
There have been no changes in the registrant’s internal controls over financial reporting that occurred during the registrant’s second fiscal quarter of the period covered by this report that have materially affected, or are reasonably likely to materially affect, the registrant’s internal control over financial reporting.
Item 12. Exhibits.
| (a) | (1) Exhibit attached hereto. |
(2) Exhibits attached hereto.
(3) Not applicable.
| (b) | Exhibit attached hereto. |
SIGNATURES
Pursuant to the requirements of the Securities Exchange Act of 1934 and the Investment Company Act of 1940, the registrant has duly caused this report to be signed on its behalf by the undersigned, thereunto duly authorized.
Oppenheimer Capital Income Fund
| | |
| By: | | /s/ Arthur P. Steinmetz |
| | Arthur P. Steinmetz |
| | Principal Executive Officer |
| Date: | | 10/17/2016 |
Pursuant to the requirements of the Securities Exchange Act of 1934 and the Investment Company Act of 1940, this report has been signed below by the following persons on behalf of the registrant and in the capacities and on the dates indicated.
| | |
| By: | | /s/ Arthur P. Steinmetz |
| | Arthur P. Steinmetz |
| | Principal Executive Officer |
| Date: | | 10/17/2016 |
| | |
| By: | | /s/ Brian S. Petersen |
| | Brian S. Petersen |
| | Principal Financial Officer |
| Date: | | 10/17/2016 |