UNITED STATES
SECURITIES AND EXCHANGE COMMISSION
WASHINGTON, D.C. 20549
FORM N-CSR
CERTIFIED SHAREHOLDER REPORT OF REGISTERED
MANAGEMENT INVESTMENT COMPANIES
Investment Company Act file number 811-1512
Oppenheimer Capital Income Fund
(Exact name of registrant as specified in charter)
6803 South Tucson Way, Centennial, Colorado 80112-3924
(Address of principal executive offices) (Zip code)
Arthur S. Gabinet
OFI Global Asset Management, Inc.
Two World Financial Center, New York, New York 10281-1008
(Name and address of agent for service)
Registrant’s telephone number, including area code: (303) 768-3200
Date of fiscal year end: August 31
Date of reporting period: 8/30/2013
Item 1. Reports to Stockholders.
ANNUAL REPORT
Oppenheimer Capital Income Fund

Table of Contents
Class A Shares
AVERAGE ANNUAL TOTAL RETURNS AT 8/30/13*
| | | | | | | | | | | | | | | | | | | | |
| | | Class A Shares of the Fund | | | Barclays U.S. Aggregate
Bond Index | | | Russell 3000
Index | | | Reference
Index | |
| | | Without Sales
Charge | | | With Sales
Charge | | | | |
| 1-Year | | | 5.30 | % | | | –0.75 | % | | | –2.47 | % | | | 20.32 | % | | | 5.17 | % |
| 5-Year | | | 1.30 | | | | 0.11 | | | | 4.93 | | | | 7.63 | | | | 6.78 | |
| 10-Year | | | 3.49 | | | | 2.88 | | | | 4.77 | | | | 7.60 | | | | 6.35 | |
Performance data quoted represents past performance, which does not guarantee future results. The investment return and principal value of an investment in the Fund will fluctuate so that an investor’s shares, when redeemed, may be worth more or less than their original cost. Fund returns include changes in share price, reinvested distributions, and a 5.75% maximum applicable sales charge except where “without sales charge” is indicated. Current performance may be lower or higher than the performance quoted. Returns do not consider capital gains or income taxes on an individual’s investment. For performance data current to the most recent month-end, visit oppenheimerfunds.com or call 1.800.CALL OPP (225.5677).
*August 30, 2013, was the last business day of the Fund’s fiscal year. See Note 1 of the accompanying Consolidated Notes to Financial Statements. Index returns are calculated through August 31, 2013.
| | |
| 2 | | OPPENHEIMER CAPITAL INCOME FUND |
Fund Performance Discussion
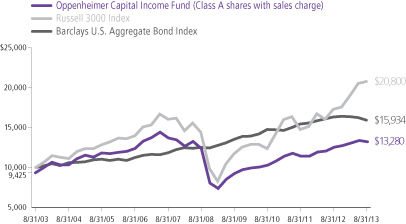
The Fund’s Class A shares (without sales charge) produced a total return of 5.30% during the reporting period. On a relative basis, the Fund outperformed its Reference Index, a customized weighted index currently comprised of 65% of the Barclays U.S. Aggregate Bond Index and 35% of the Russell 3000 Index, which returned 5.17%. Measured separately, the Barclays U.S. Aggregate Bond Index returned -2.47% and the Russell 3000 Index returned 20.32%. The Fund also outperformed its peers in the Morningstar Conservative Allocation category, which produced a return of 4.26% during the reporting period. The Fund’s outperformance versus the Reference Index and the Fund’s peers in the Morningstar Conservative Allocation category was driven by its opportunistic and high grade fixed-income strategies.
The Fund’s Class A shares paid four dividends during the period: $0.0618 per share in September 2012, $0.1725 per share in December 2012, $0.0616 per share in March 2013 and $0.0618 per share in June 2013. (The Fund’s NAV on 8/30/13 was $9.29 per share.) Additionally, we believe that upside/downside capture is a good measure of the Fund’s downside protection. For the three-year period ended August 30, 2013, the upside capture was 95% and the downside capture was 55%. This demonstrates that in up markets, the Fund captured 95% of the upside of its peers in the Morningstar Conservative Allocation category, and in down markets it lost roughly only half as much. We believe this data is a testament to the Fund’s blended investment approach as well as its four primary goals of income, capital appreciation, principal protection and inflation protection.
COMPARISON OF CHANGE IN VALUE OF $10,000 HYPOTHETICAL INVESTMENTS IN:
| | | | |
| OPPENHEIMER CAPITAL INCOME FUND | | | 3 | |
MARKET OVERVIEW
For the one-year period ending August 30, 2013, market movements were largely driven by central bank policies. Over the first half of the period, central banks throughout the world established accommodative policies that resulted in a rally among risk markets. In the U.S., the Federal Reserve (the “Fed”) launched an open-ended quantitative easing program involving monthly purchases of $85 billion of U.S. government securities and mortgage-backed securities (“MBS”). When the plan was initially launched in September 2012, it entailed monthly purchases of $40 billion in Treasuries. In December, the Fed added another $45 billion per month of mortgage backed securities. The quantitative easing program was designed to help boost the U.S. economy by keeping mortgage rates and other long-term interest rates low. While Europe continued to struggle with its sovereign debt crisis, analysts were encouraged when the head of the European Central Bank publicly stated his intent to support the euro as the European Union’s common currency. Even in Japan, which had been mired in economic weakness for years, new government leadership adopted stimulative economic policies and the Bank of Japan (the “BoJ”) announced a massive quantitative easing program.
At the end of May, market volatility picked up measurably as comments from Fed Chairman Ben Bernanke at a Congressional hearing surprised the market when he
indicated a possible slowdown of the central bank’s asset purchase program if the economy continued to show improvement. Additionally, fears began to creep into the market about a possible slowdown in the world’s emerging economies. As a result, risk assets sold off across the board, with Japanese stocks and emerging market debt absorbing the brunt of the selling, although investment grade credit was certainly not immune. Simultaneously, the intermediate and long-end of the U.S. Treasury curve steepened quite dramatically as investors began to price in the likelihood of higher interest rates in the future. The volatility continued through June as the Federal Open Market Committee (FOMC) issued a statement indicating again that if the U.S. economy continued to improve, the Fed would begin to slow its quantitative easing program.
Equity markets in the U.S. stabilized over the final months of the reporting period when investors came to the realization that an end to the quantitative easing program did not necessarily imply an imminent increase in short-term interest rates. However, fixed-income markets remained volatile.
FUND REVIEW
Equity strategy. The Fund’s equity and equity-like strategy may include common stocks, convertible bonds, preferred stocks and structured notes. This strategy produced a positive absolute return, but underperformed the Russell 3000 Index during the
| | |
| 4 | | OPPENHEIMER CAPITAL INCOME FUND |
period. The strongest performing holdings for the strategy were Actavis, Inc., Lyondellbasell Industries NV and M&T Bank Corp. Our position in Actavis, a specialty pharmaceuticals company, contributed to performance largely due to the acquisition of Warner Chilcott and the announcements of several new product agreements. The acquisition, which is expected to close at year-end, will strengthen Actavis’ existing women’s health business and give it an entry into the gastroenterology and dermatology businesses. We expect the transaction to be accretive to Actavis, which we believe can benefit from Warner Chilcott’s favorable tax structure and manufacturing footprint.
Our position in chemical manufacturer and distributor LyondellBasell Industries aided performance as the company benefited from the sustainability of low feedstock pricing. As a result, estimates have been moving higher and as the durability of that earnings power is better recognized in the market, multiple expansion is taking place. We believe the company remains undervalued as it initiates additional de-bottlenecking projects and brownfield expansion.
M&T Bank performed well during the period as it engaged in value enhancing transactions and its prudent balance sheet management was recognized by the market. The company’s acquisition of Hudson City is expected to close in 2014. While this deal has faced regulatory delays, we believe the anticipated close has benefited M&T Bank’s
stock. Additionally, M&T was one of the few banks to show net interest income growth which, along with expense control, investors rewarded.
Detractors from performance included Apple, Inc., BCE, Inc. and The Mosaic Co. Apple hurt performance due in part to investor fears regarding the vitality of the high end smartphone market. We continue to have a constructive view on that market because we believe domestic carrier competition is poised to intensify. We believe this should motivate carriers to keep replacement rates at solid levels in order to keep subscribers locked into wireless agreements. Furthermore, carriers are using smartphone upgrades and replacements as an opportunity to transition subscribers to multi-device metered pricing plans. Apple also has an opportunity to grow its ecosystem for the iPad Mini, with the potential for lucrative follow-on sales of apps and other services.
BCE, a communications provider in Canada, suffered from two primary factors. First, investors were concerned about the potential entry of Verizon into the Canadian market. Second, BCE was negatively impacted by the correction in telecom equities in the second quarter as long-term rates started to rise. However, subsequent to the end of the period, Verizon’s CEO stated that the company does not have plans to enter the Canadian market. We believe this should help abate some of the fear around the stock.
| | | | |
| OPPENHEIMER CAPITAL INCOME FUND | | | 5 | |
Mosaic, a fertilizer producer, detracted from performance due to general market fears about fertilizer application rates. In addition, the fertilizer industry underwent a negative structural change as potash producer Uralkali separated from its Belarusian partner Belaruskali and began selling more potash at lower prices. Given the structural change which weakened the pricing umbrella that previously existed above cost, we exited our position during the reporting period.
Opportunistic strategy. In this strategy we seek asymmetric risk/reward opportunities where the return profile has a low correlation to traditional investment strategies, and also investments that we believe will help achieve our investment objective. At the end of the period, this strategy included investments in senior loans through Oppenheimer Master Loan Fund, LLC, asset-backed securities (“ABS”), convertible securities and small positions in derivatives and event-linked bonds. On a standalone basis, the opportunistic component outperformed the Barclays U.S. Aggregate Bond Index. Among the top performers were our positions in senior loans, ABS based on first-lien mortgages and our payer swaptions. Senior loans performed well over the first half of the period when domestic non-investment-grade markets responded positively to improved sentiment and significant inflows into both high yield bonds and senior floating rate loans. Additionally, while foreign and domestic fixed income markets reacted
strongly to the Fed’s potential tapering, senior loans with their short duration held up well. The returns on loans contrasted sharply with those of longer duration asset classes such as U.S. Treasuries, intermediate bonds, high yield bonds and emerging market debt. We believe that senior loans remain attractively positioned and continue to provide protection against rising interest rates. Our payer swaptions performed well as forward rates rose following the Fed’s comments. That spike in rates drove these positions into the money. These are longer dated, multi-year options that we anticipate holding for some time. The rate spike in the second quarter of 2013 further convinces us that there is significant potential upside in this position if interest rates continue to normalize over the next several years. Our position in ABS based on first-lien mortgages benefited performance as the housing market continued to strengthen. While some investors remain skeptical of mortgage-related securities, we have been able to stress test some of these and they still project to be profitable for the portfolio. This level of downside protection combined with the upside potential from an improving housing market makes these securities attractive in our view.
In contrast, detracting from performance were bond futures that we used to manage duration, a convertible bond from Advanced Micro Devices, Inc. (“AMD”) and credit default swaps on Italian sovereign debt. We maintained a short duration relative to the
| | |
| 6 | | OPPENHEIMER CAPITAL INCOME FUND |
benchmark this period that was not detrimental to performance. However, we also used bond futures to help manage the Fund’s duration, which detracted this period. Overall our positioning helped results. AMD suffered from weakness in the personal computer market and the company’s relative positioning versus competitor Intel worsened. While AMD detracted from performance this reporting period and we exited our position, our investment in AMD convertibles since 2009 produced a positive return overall. We used credit default swaps in Italy as a hedging strategy against additional economic weakness in the country. This strategy did not benefit this period as the ECB’s stimulative measures helped result in a market rally. Although markets reacted positively to central bank actions, we believe the structural flaws in Italy and Europe remain largely unaddressed, and we believe there is the potential for future volatility in the region. Therefore, we continued to hedge our risk to Italy through futures at period end.
High grade fixed-income strategy. The high grade fixed-income strategy produced a muted total return, but outperformed the negative results of the Barclays U.S. Aggregate Bond Index. The strategy maintained a significant underweight position in government bonds, and instead sourced its exposure through corporate bonds, mortgages and structured products. This positioning drove the strategy’s performance over the first half of the period, but resulted in
declines later on. The strategy performed positively over the first half of the period as credit markets in the U.S. rallied on the back of positive economic surprises, despite the Cyprus banking crisis, deteriorating conditions in the Eurozone and moderating growth in emerging markets. Our exposure to corporate bonds benefited as corporate bond performance versus Treasuries was strong.
Beginning in May, fixed-income markets turned volatile after the Fed began to discuss tapering. Before the Fed’s comments, we started reducing our position in MBS because we believed they were vulnerable to policy changes. While this limited the negative impact, MBS still detracted from the strategy’s performance.
STRATEGY & OUTLOOK
The environment remains complex and we see numerous persistent cross currents. While equities look very interesting versus bonds in the mid to longer term, we also see a shorter-term disconnect between the performance in equities and some softness in earnings growth. Monetary policy has impacted all asset classes, including equities. The Fed merely mentioned tapering its asset purchases under the latest QE program and the markets had a very negative reaction. This supports our view that monetary policy has been the only game in town recently, and any normalization of rates could not only shock the system but also break the models.
| | | | |
| OPPENHEIMER CAPITAL INCOME FUND | | | 7 | |
Today the Fed is still buying aggressively at $85 billion per month. But there are a number of reasons to expect a tapering later this year or next year absent a shock. When the Fed initially increased its monthly purchases from $40-$45 billion in late 2012 to the current level, it faced the dual risks of a fiscal cliff and a sequester. It is hard to argue that the Fed should not consider dialing back its purchases unless new risks materialize. This is especially true since the Fed has been actively studying asset bubbles and the impact of their monetary policy on those bubbles. Finally, the BoJ has embarked on an audacious money-printing experiment that shows us the outer boundaries of monetary policy. The stunning decline in the yen reversed for a month, rates became unstable, bond yields started rising and regulators halted trading in Japanese bonds several times. These were not the intended goals of the BoJ’s ultra-accommodative policies. Central banks don’t like volatility. They like stability and predictability. The lesson is that too much of a good thing can be precisely that—too much. All of this argues for the Fed to be judicious in adjusting its monetary policy, and we suspect it will be adjusted eventually.
We also believe the tail risks in Europe remain significant because of its unresolved structural
flaws. The banking system and many sovereigns remain over-levered, and we believe the policies of austerity are stunting growth, preventing many countries from moving beyond the current stasis. In fact, there was increasing evidence of a growing backlash, with countries asking for austerity hurdles to be lowered and timelines to be extended, and voters saying enough is enough. Portuguese courts have ruled against austerity, the Italians and French have voted against it, Greece cannot implement it, and Germany is left trying to enforce it. These events have increased uncertainty and have the potential to destabilize the status quo. We believe this is a recipe for continued turmoil.
No one knows for certain how monetary policy will play out, but after a massive credit expansion and a 32-year bull run in bonds, we believe any sort of rate normalization will shock the system. All of this means the current outlook is fragile, and we believe the U.S. remains better positioned than the rest of the developed world. In light of this, we continue to search for opportunities to generate strong risk-adjusted returns, seek to deliver an attractive yield through a low volatility strategy that has good downside protection, and utilize the flexibility of multiple asset classes to hedge the key tail risks we see.
| | |
 | | 
Michelle Borré, CFA Portfolio Manager |
| | |
 | | 
Krishna Memani Portfolio Manager |
| | |
| 8 | | OPPENHEIMER CAPITAL INCOME FUND |
Top Holdings and Allocations*
| | | | |
| TOP TEN COMMON STOCK INDUSTRIES | |
| Oil, Gas & Consumable Fuels | | | 3.5 | % |
| Pharmaceuticals | | | 2.4 | |
Real Estate Investment
Trusts (REITs) | | | 2.1 | |
| Media | | | 1.9 | |
| Aerospace & Defense | | | 1.8 | |
| Chemicals | | | 1.6 | |
| Computers & Peripherals | | | 1.4 | |
| Diversified Telecommunication Services | | | 1.4 | |
| Communications Equipment | | | 1.3 | |
| Health Care Providers & Services | | | 1.2 | |
Portfolio holdings and allocations are subject to change. Percentages are as of August 30, 2013, and are based on net assets.
| | | | |
| TOP TEN COMMON STOCK HOLDINGS | |
| Starwood Property Trust, Inc. | | | 1.3 | % |
| Cinemark Holdings, Inc. | | | 1.2 | |
| Honeywell International, Inc. | | | 1.1 | |
| Philip Morris International, Inc., Cl. A | | | 1.1 | |
| Apple, Inc. | | | 1.0 | |
| Chevron Corp. | | | 0.9 | |
| Coca-Cola Co. (The) | | | 0.9 | |
| Merck & Co., Inc. | | | 0.9 | |
| Celanese Corp., Series A | | | 0.8 | |
| M&T Bank Corp. | | | 0.8 | |
Portfolio holdings and allocations are subject to change. Percentages are as of August 30, 2013, and are based on net assets. For more current Top 10 Fund holdings, please visit oppenheimerfunds.com.
| | | | |
| PORTFOLIO ALLOCATION | |
| Common Stocks | | | 27.6 | % |
| Non-Convertible Corporate Bonds and Notes | | | 18.2 | |
| Mortgage-Backed Obligations | | | 17.3 | |
| Domestic Fixed Income | | | 10.9 | |
| Money Market Fund | | | 10.9 | |
| Asset-Backed Securities | | | 9.9 | |
| Corporate Loans | | | 1.3 | |
| Convertible Corporate Bonds and Notes | | | 1.2 | |
| U.S. Government Obligations | | | 1.0 | |
| Preferred Stocks | | | 0.7 | |
| Over-the-Counter Interest Rate Swaptions Purchased | | | 0.6 | |
| Event-Linked Bonds | | | 0.3 | |
| Domestic Equity Fund | | | 0.1 | |
| Over-the-Counter Options Purchased | | | — | ** |
| Exchange-Traded Options Purchased | | | — | ** |
Portfolio holdings and allocations are subject to change. Percentages are as of August 30, 2013, and are based on the total market value of investments.
*August 30, 2013, was the last business day of the Fund’s fiscal year. See Note 1 of the accompanying Notes to Consolidated Financial Statements.
**Represents a value less than 0.05%.
| | | | |
| OPPENHEIMER CAPITAL INCOME FUND | | | 9 | |
Share Class Performance
AVERAGE ANNUAL TOTAL RETURNS WITHOUT SALES CHARGE AS OF 8/30/13
| | | | | | | | | | | | | | | | | | |
| | | Inception Date | | | 1-Year | | | 5-Year | | | 10-Year | |
| Class A (OPPEX) | | | 12/1/70 | | | | 5.30 | % | | | 1.30 | % | | | 3.49 | % |
| Class B (OPEBX) | | | 8/17/93 | | | | 4.24 | % | | | 0.32 | % | | | 2.97 | % |
| Class C (OPECX) | | | 11/1/95 | | | | 4.41 | % | | | 0.44 | % | | | 2.63 | % |
| Class N (OCINX) | | | 3/1/01 | | | | 4.89 | % | | | 0.93 | % | | | 3.12 | % |
| Class Y (OCIYX) | | | 1/28/11 | | | | 5.49 | % | | | 6.96 | %* | | | N/A | |
| |
| AVERAGE ANNUAL TOTAL RETURNS WITH SALES CHARGE AS OF 8/30/13 | | | | | |
| | | | | Inception Date | | | 1-Year | | | 5-Year | | | 10-Year | |
| Class A (OPPEX) | | | | | 12/1/70 | | | | –0.75 | % | | | 0.11 | % | | | 2.88 | % |
| Class B (OPEBX) | | | | | 8/17/93 | | | | –0.76 | % | | | –0.03 | % | | | 2.97 | % |
| Class C (OPECX) | | | | | 11/1/95 | | | | 3.41 | % | | | 0.44 | % | | | 2.63 | % |
| Class N (OCINX) | | | | | 3/1/01 | | | | 3.89 | % | | | 0.93 | % | | | 3.12 | % |
| Class Y (OCIYX) | | | | | 1/28/11 | | | | 5.49 | % | | | 6.96 | %* | | | N/A | |
*Shows performance since inception.
Performance data quoted represents past performance, which does not guarantee future results. The investment return and principal value of an investment in the Fund will fluctuate so that an investor’s shares, when redeemed, may be worth more or less than their original cost. Current performance may be lower or higher than the performance quoted. Returns do not consider capital gains or income taxes on an individual’s investment. For performance data current to the most recent month-end, visit oppenheimerfunds.com or call 1.800.CALL OPP (225.5677). Fund returns include changes in share price, reinvested distributions, and the applicable sales charge: for Class A shares, the current maximum initial sales charge of 5.75%; for Class B shares, the contingent deferred sales charge of 5% (1-year) and 2% (5-year); and for Class C and N shares, the contingent deferred sales charge of 1% for the 1-year period. There is no sales charge for Class Y shares. Because Class B shares convert to Class A shares 72 months after purchase, the 10-year return for Class B shares uses Class A performance for the period after conversion. Returns for periods of less than one year are cumulative and not annualized.
The Fund’s performance is compared to the performance of the Russell 3000 Index, the Barclays U.S. Aggregate Bond Index and the Fund’s Reference Index. The Russell 3000 Index measures the performance of the largest 3,000 U.S. companies, representing approximately 98% of the investable U.S. equity market. The Barclays U.S. Aggregate Bond Index is an index of U.S dollar-denominated, investment-grade U.S. corporate
| | |
| 10 | | OPPENHEIMER CAPITAL INCOME FUND |
government and mortgage-backed securities. The Fund’s Reference Index is a customized weighted index currently comprised of 65% of the Barclays U.S. Aggregate Bond Index and 35% of the Russell 3000 Index. The indices are unmanaged and cannot be purchased directly by investors. Index performance includes reinvestment of income, but does not reflect transaction costs, fees, expenses or taxes. Index performance is shown for illustrative purposes only as a benchmark for the Fund’s performance, and does not predict or depict performance of the Fund. The Fund’s performance reflects the effects of the Fund’s business and operating expenses.
The Fund’s investment strategy and focus can change over time. The mention of specific fund holdings does not constitute a recommendation by OppenheimerFunds, Inc. or its affiliates.
Before investing in any of the Oppenheimer funds, investors should carefully consider a fund’s investment objectives, risks, charges and expenses. Fund prospectuses and summary prospectuses contain this and other information about the funds, and may be obtained by asking your financial advisor, visiting oppenheimerfunds.com, or calling 1.800.CALL OPP (225.5677). Read prospectuses and summary prospectuses carefully before investing.
Shares of Oppenheimer funds are not deposits or obligations of any bank, are not guaranteed by any bank, are not insured by the FDIC or any other agency, and involve investment risks, including the possible loss of the principal amount invested.
| | | | |
| OPPENHEIMER CAPITAL INCOME FUND | | | 11 | |
Fund Expenses
Fund Expenses. As a shareholder of the Fund, you incur two types of costs: (1) transaction costs, which may include sales charges (loads) on purchase payments, contingent deferred sales charges on redemptions and (2) ongoing costs, including management fees; distribution and service fees; and other Fund expenses. These examples are intended to help you understand your ongoing costs (in dollars) of investing in the Fund and to compare these costs with the ongoing costs of investing in other mutual funds.
The examples are based on an investment of $1,000.00 invested at the beginning of the period and held for the entire 6-month period ended August 30, 2013.
Actual Expenses. The first section of the table provides information about actual account values and actual expenses. You may use the information in this section for the class of shares you hold, together with the amount you invested, to estimate the expense that you paid over the period. Simply divide your account value by $1,000.00 (for example, an $8,600.00 account value divided by $1,000.00 = 8.60), then multiply the result by the number in the first section under the heading entitled “Expenses Paid During Period” to estimate the expenses you paid on your account during this period.
Hypothetical Example for Comparison Purposes. The second section of the table provides information about hypothetical account values and hypothetical expenses based on the Fund’s actual expense ratio for each class of shares, and an assumed rate of return of 5% per year for each class before expenses, which is not the actual return. The hypothetical account values and expenses may not be used to estimate the actual ending account balance or expenses you paid for the period. You may use this information to compare the ongoing costs of investing in the Fund and other funds. To do so, compare this 5% hypothetical example for the class of shares you hold with the 5% hypothetical examples that appear in the shareholder reports of the other funds.
Please note that the expenses shown in the table are meant to highlight your ongoing costs only and do not reflect any transactional costs, such as front-end or contingent deferred sales charges (loads), or a $12.00 fee imposed annually on accounts valued at less than $500.00 (subject to exceptions described in the Statement of Additional Information). Therefore, the “hypothetical” section of the table is useful in comparing ongoing costs only, and will not help you determine the relative total costs of owning different funds. In addition, if these transactional costs were included, your costs would have been higher.
| | |
| 12 | | OPPENHEIMER CAPITAL INCOME FUND |
| | | | | | | | | | | | |
| Actual | | Beginning
Account
Value
March 1, 2013 | | | Ending
Account
Value
August 30, 2013 | | | Expenses
Paid During
6 Months Ended
August 30, 2013 | |
| Class A | | $ | 1,000.00 | | | $ | 1,010.10 | | | $ | 4.60 | |
| Class B | | | 1,000.00 | | | | 1,005.30 | | | | 9.75 | |
| Class C | | | 1,000.00 | | | | 1,005.70 | | | | 8.58 | |
| Class N | | | 1,000.00 | | | | 1,008.60 | | | | 6.31 | |
| Class Y | | | 1,000.00 | | | | 1,011.40 | | | | 3.18 | |
| | | |
Hypothetical
(5% return before expenses) | | | | | | | | | |
| Class A | | | 1,000.00 | | | | 1,020.51 | | | | 4.62 | |
| Class B | | | 1,000.00 | | | | 1,015.39 | | | | 9.80 | |
| Class C | | | 1,000.00 | | | | 1,016.55 | | | | 8.63 | |
| Class N | | | 1,000.00 | | | | 1,018.80 | | | | 6.35 | |
| Class Y | | | 1,000.00 | | | | 1,021.91 | | | | 3.20 | |
Expenses are equal to the Fund’s annualized expense ratio for that class, multiplied by the average account value over the period, multiplied by 183/365 (to reflect the one-half year period). Those annualized expense ratios, excluding indirect expenses from affiliated funds, based on the 6-month period ended August 30, 2013 are as follows:
| | | | |
| Class | | Expense Ratios | |
| Class A | | | 0.91 | % |
| Class B | | | 1.93 | |
| Class C | | | 1.70 | |
| Class N | | | 1.25 | |
| Class Y | | | 0.63 | |
The expense ratios reflect voluntary waivers and/or reimbursements of expenses by the Fund’s Manager and Transfer Agent. Some of these undertakings may be modified or terminated at any time, as indicated in the Fund’s prospectus. The “Consolidated Financial Highlights” tables in the Fund’s consolidated financial statements, included in this report, also show the gross expense ratios, without such waivers or reimbursements and reduction to custodian expenses, if applicable.
| | | | |
| OPPENHEIMER CAPITAL INCOME FUND | | | 13 | |
CONSOLIDATED STATEMENT OF INVESTMENTS August 30, 2013*
| | | | | | | | |
| | | Shares | | | Value | |
| Common Stocks—30.2% | | | | | | | | |
| Consumer Discretionary—3.1% | | | | | | | | |
| Hotels, Restaurants & Leisure—0.7% | | | | | | | | |
| McDonald’s Corp. | | | 145,000 | | | $ | 13,682,200 | |
| Media—1.9% | | | | | | | | |
| Cinemark Holdings, Inc. | | | 751,430 | | | | 22,144,642 | |
| Comcast Corp., Cl. A | | | 201,500 | | | | 8,481,135 | |
| Time Warner Cable, Inc. | | | 49,500 | | | | 5,313,825 | |
| | | | | | |
|
|
|
| | | | | | | | 35,939,602 | |
| Multiline Retail—0.5% | | | | | | | | |
| Macy’s, Inc. | | | 183,800 | | | | 8,166,234 | |
| Consumer Staples—2.0% | | | | | | | | |
| Beverages—0.9% | | | | | | | | |
| Coca-Cola Co. (The) | | | 433,000 | | | | 16,531,940 | |
| Tobacco—1.1% | | | | | | | | |
| Philip Morris International, Inc., Cl. A | | | 249,000 | | | | 20,776,560 | |
| Energy—4.0% | | | | | | | | |
| Energy Equipment & Services—0.5% | | | | | | | | |
| Baker Hughes, Inc. | | | 111,300 | | | | 5,174,337 | |
| Schlumberger Ltd. | | | 63,000 | | | | 5,099,220 | |
| | | | | | |
|
|
|
| | | | | | | | 10,273,557 | |
| Oil, Gas & Consumable Fuels—3.5% | | | | | | | | |
| Apache Corp. | | | 24,000 | | | | 2,056,320 | |
| Chevron Corp. | | | 146,100 | | | | 17,594,823 | |
| Enbridge Energy Management LLC1 | | | 1 | | | | 3 | |
| EOG Resources, Inc. | | | 55,000 | | | | 8,637,750 | |
| Exxon Mobil Corp. | | | 137,000 | | | | 11,940,920 | |
| HollyFrontier Corp. | | | 118,556 | | | | 5,273,371 | |
| Kinder Morgan Management LLC1 | | | 1 | | | | 28 | |
| Kinder Morgan, Inc. | | | 97,000 | | | | 3,679,210 | |
| Noble Energy, Inc. | | | 43,000 | | | | 2,641,490 | |
| Royal Dutch Shell plc, ADR | | | 100,000 | | | | 6,715,000 | |
| Royal Dutch Shell plc, B Shares | | | 175,953 | | | | 5,921,428 | |
| | | | | | |
|
|
|
| | | | | | | | 64,460,343 | |
| Financials—4.5% | | | | | | | | |
| Commercial Banks—1.1% | | | | | | | | |
| Bond Street Holdings LLC, Cl. A1,2 | | | 285,000 | | | | 3,990,000 | |
| Bond Street Holdings LLC, Cl. B, Non-Vtg.1 | | | 90,000 | | | | 1,260,000 | |
| M&T Bank Corp. | | | 136,000 | | | | 15,414,240 | |
| | | | | | |
|
|
|
| | | | | | | | 20,664,240 | |
| | |
| 14 | | OPPENHEIMER CAPITAL INCOME FUND |
| | | | | | | | |
| | | Shares | | | Value | |
| Diversified Financial Services—0.6% | | | | | | | | |
| Citigroup, Inc. | | | 230,000 | | | $ | 11,115,900 | |
| Insurance—0.7% | | | | | | | | |
| ACE Ltd. | | | 141,000 | | | | 12,368,520 | |
| Real Estate Investment Trusts (REITs)—2.1% | | | | | | | | |
| American Assets Trust, Inc. | | | 205,000 | | | | 6,070,050 | |
| Blackstone Mortgage Trust, Inc., Cl. A | | | 175,000 | | | | 4,480,000 | |
| Macerich Co. (The) | | | 100,000 | | | | 5,628,000 | |
| Starwood Property Trust, Inc. | | | 955,130 | | | | 23,811,391 | |
| | | | | | |
|
|
|
| | | | | | | | 39,989,441 | |
| Health Care—3.9% | | | | | | | | |
| Health Care Equipment & Supplies—0.3% | | | | | | | | |
| Baxter International, Inc. | | | 35,000 | | | | 2,434,600 | |
| Covidien plc | | | 45,000 | | | | 2,673,000 | |
| | | | | | |
|
|
|
| | | | | | | | 5,107,600 | |
| Health Care Providers & Services—1.2% | | | | | | | | |
| HCA Holdings, Inc. | | | 121,550 | | | | 4,641,995 | |
| UnitedHealth Group, Inc. | | | 185,000 | | | | 13,271,900 | |
| Universal Health Services, Inc., Cl. B | | | 61,000 | | �� | | 4,132,750 | |
| | | | | | |
|
|
|
| | | | | | | | 22,046,645 | |
| Pharmaceuticals—2.4% | | | | | | | | |
| Actavis, Inc.1 | | | 68,800 | | | | 9,300,384 | |
| Merck & Co., Inc. | | | 337,000 | | | | 15,936,730 | |
| Novartis AG, ADR | | | 78,000 | | | | 5,692,440 | |
| Pfizer, Inc. | | | 351,400 | | | | 9,912,994 | |
| Roche Holding AG | | | 19,500 | | | | 4,864,259 | |
| | | | | | |
|
|
|
| | | | | | | | 45,706,807 | |
| Industrials—4.3% | | | | | | | | |
| Aerospace & Defense—1.8% | | | | | | | | |
| Honeywell International, Inc. | | | 267,000 | | | | 21,245,190 | |
| Lockheed Martin Corp. | | | 23,500 | | | | 2,876,870 | |
| Northrop Grumman Corp. | | | 100,000 | | | | 9,227,000 | |
| | | | | | |
|
|
|
| | | | | | | | 33,349,060 | |
| Airlines—0.3% | | | | | | | | |
| United Continental Holdings, Inc.1 | | | 180,000 | | | | 5,122,800 | |
| Commercial Services & Supplies—0.5% | | | | | | | | |
| Tyco International Ltd. | | | 265,000 | | | | 8,755,600 | |
| Construction & Engineering—0.5% | | | | | | | | |
| Quanta Services, Inc.1 | | | 405,000 | | | | 10,586,700 | |
| | | | |
| OPPENHEIMER CAPITAL INCOME FUND | | | 15 | |
CONSOLIDATED STATEMENT OF INVESTMENTS Continued
| | | | | | | | |
| | | Shares | | | Value | |
| Electrical Equipment—0.1% | | | | | | | | |
| Hubbell, Inc., Cl. B | | | 9,500 | | | $ | 962,920 | |
| Trading Companies & Distributors—1.1% | | | | | | | | |
| AerCap Holdings NV1 | | | 750,000 | | | | 13,455,000 | |
| Wesco International, Inc.1 | | | 101,956 | | | | 7,521,294 | |
| | | | | | |
|
|
|
| | | | | | | | 20,976,294 | |
| Information Technology—3.8% | | | | | | | | |
| Communications Equipment—1.3% | | | | | | | | |
| Cisco Systems, Inc. | | | 315,222 | | | | 7,347,825 | |
| Juniper Networks, Inc.1 | | | 318,000 | | | | 6,010,200 | |
| QUALCOMM, Inc. | | | 168,300 | | | | 11,154,924 | |
| | | | | | |
|
|
|
| | | | | | | | 24,512,949 | |
| Computers & Peripherals—1.4% | | | | | | | | |
| Apple, Inc. | | | 36,879 | | | | 17,961,917 | |
| SanDisk Corp. | | | 146,476 | | | | 8,082,546 | |
| | | | | | |
|
|
|
| | | | | | | | 26,044,463 | |
| IT Services—0.8% | | | | | | | | |
| Accenture plc, Cl. A | | | 100,000 | | | | 7,225,000 | |
| International Business Machines Corp. | | | 39,200 | | | | 7,144,984 | |
| | | | | | |
|
|
|
| | | | | | | | 14,369,984 | |
| Semiconductors & Semiconductor Equipment—0.3% | | | | | | | | |
| Xilinx, Inc. | | | 145,000 | | | | 6,295,900 | |
| Materials—1.6% | | | | | | | | |
| Chemicals—1.6% | | | | | | | | |
| Celanese Corp., Series A | | | 314,000 | | | | 15,461,360 | |
| Lyondellbasell Industries NV, Cl. A | | | 192,900 | | | | 13,531,935 | |
| | | | | | |
|
|
|
| | | | | | | | 28,993,295 | |
| Telecommunication Services—1.4% | | | | | | | | |
| Diversified Telecommunication Services—1.4% | | | | | | | | |
| AT&T, Inc. | | | 266,250 | | | | 9,007,238 | |
| BCE, Inc. | | | 217,000 | | | | 8,888,320 | |
| Verizon Communications, Inc. | | | 150,000 | | | | 7,107,000 | |
| | | | | | |
|
|
|
| | | | | | | | 25,002,558 | |
| Utilities—1.6% | | | | | | | | |
| Electric Utilities—0.8% | | | | | | | | |
| Cleco Corp. | | | 75,000 | | | | 3,387,000 | |
| Edison International | | | 75,000 | | | | 3,441,750 | |
| PPL Corp. | | | 255,853 | | | | 7,854,687 | |
| | | | | | |
|
|
|
| | | | | | | | 14,683,437 | |
| | |
| 16 | | OPPENHEIMER CAPITAL INCOME FUND |
| | | | | | | | |
| | | Shares | | | Value | |
| Multi-Utilities—0.8% | | | | | | | | |
| CenterPoint Energy, Inc. | | | 281,000 | | | $ | 6,443,330 | |
| CMS Energy Corp. | | | 285,000 | | | | 7,561,050 | |
| | | | | | |
|
|
|
| | | | | | | | 14,004,380 | |
| | | | | | |
|
|
|
| Total Common Stocks (Cost $450,961,344) | | | | | | | 560,489,929 | |
| Preferred Stocks—0.8% | | | | | | | | |
M&T Bank Corp.:
5% Cum., Series A, Non-Vtg. | | | 1,833 | | | | 1,860,495 | |
| 5% Cum., Series C, Non-Vtg. | | | 4,500 | | | | 4,500,000 | |
| M&T Capital Trust IV, 8.50% Cum., Non-Vtg. | | | 8,124 | | | | 209,518 | |
| PPL Corp., 8.75% Cv. | | | 147,000 | | | | 7,863,030 | |
| | | | | | |
|
|
|
| Total Preferred Stocks (Cost $14,206,906) | | | | | | | 14,433,043 | |
| | | Principal
Amount | | | | |
| Mortgage-Backed Obligations—18.9% | | | | | | | | |
| Government Agency—13.2% | | | | | | | | |
| FHLMC/FNMA/FHLB/Sponsored—13.1% | | | | | | | | |
| Federal Home Loan Mortgage Corp.: | | | | | | | | |
| 4.50%, 5/1/193 | | $ | 1,313,462 | | | | 1,384,705 | |
| 5%, 12/1/34 | | | 96,384 | | | | 103,763 | |
| 6%, 5/15/18 | | | 431,742 | | | | 456,592 | |
| 6.50%, 7/1/28-4/1/34 | | | 267,274 | | | | 302,646 | |
| 7%, 10/1/31 | | | 309,637 | | | | 358,386 | |
| 8%, 4/1/16 | | | 50,976 | | | | 53,452 | |
| 9%, 8/1/22-5/1/25 | | | 27,624 | | | | 30,861 | |
| Federal Home Loan Mortgage Corp., Gtd. Real Estate Mtg. Investment Conduit Multiclass Pass-Through Certificates: | | | | | | | | |
| Series 2034, Cl. Z, 6.50%, 2/15/28 | | | 149,426 | | | | 167,945 | |
| Series 2043, Cl. ZP, 6.50%, 4/15/28 | | | 690,159 | | | | 783,379 | |
| Series 2053, Cl. Z, 6.50%, 4/15/28 | | | 158,003 | | | | 177,571 | |
| Series 2279, Cl. PK, 6.50%, 1/15/31 | | | 277,079 | | | | 309,788 | |
| Series 2326, Cl. ZP, 6.50%, 6/15/31 | | | 128,368 | | | | 145,389 | |
| Series 2426, Cl. BG, 6%, 3/15/17 | | | 622,015 | | | | 662,824 | |
| Series 2427, Cl. ZM, 6.50%, 3/1/32 | | | 500,977 | | | | 561,717 | |
| Series 2461, Cl. PZ, 6.50%, 6/1/32 | | | 747,675 | | | | 845,287 | |
| Series 2500, Cl. FD, 0.684%, 3/15/324 | | | 85,537 | | | | 86,473 | |
| Series 2526, Cl. FE, 0.584%, 6/15/294 | | | 95,775 | | | | 96,405 | |
| Series 2538, Cl. F, 0.784%, 12/15/324 | | | 631,100 | | | | 637,373 | |
| Series 2551, Cl. FD, 0.584%, 1/15/334 | | | 62,506 | | | | 62,954 | |
| Series 2626, Cl. TB, 5%, 6/1/33 | | | 964,521 | | | | 1,045,673 | |
| Series 2707, Cl. QE, 4.50%, 11/1/18 | | | 1,238,122 | | | | 1,323,384 | |
| Series 3025, Cl. SJ, 24.075%, 8/15/354 | | | 92,293 | | | | 141,079 | |
| Series 3030, Cl. FL, 0.584%, 9/15/354 | | | 1,239,785 | | | | 1,248,807 | |
| Series 3822, Cl. JA, 5%, 6/1/40 | | | 666,553 | | | | 701,046 | |
| Series 3848, Cl. WL, 4%, 4/1/40 | | | 1,315,829 | | | | 1,396,725 | |
| Series 4221, Cl. HJ, 1.50%, 7/1/23 | | | 2,099,966 | | | | 2,085,922 | |
| Federal Home Loan Mortgage Corp., Interest-Only Stripped Mtg.-Backed Security: | | | | | | | | |
| Series 183, Cl. IO, 17.228%, 4/1/275 | | | 218,860 | | | | 31,014 | |
| Series 192, Cl. IO, 12.844%, 2/1/285 | | | 63,605 | | | | 12,465 | |
| Series 2130, Cl. SC, 54.469%, 3/15/295 | | | 186,596 | | | | 38,693 | |
| | | | |
| OPPENHEIMER CAPITAL INCOME FUND | | | 17 | |
CONSOLIDATED STATEMENT OF INVESTMENTS Continued
| | | | | | | | |
| | | Principal
Amount | | | Value | |
| FHLMC/FNMA/FHLB/Sponsored Continued | | | | | | | | |
| Federal Home Loan Mortgage Corp., Interest-Only Stripped Mtg.-Backed Security: Continued | | | | | | | | |
| Series 243, Cl. 6, 0%, 12/15/325,6 | | $ | 243,442 | | | $ | 51,293 | |
| Series 2639, Cl. SA, 0%, 7/15/225,6 | | | 310,967 | | | | 12,619 | |
| Series 2796, Cl. SD, 54.85%, 7/15/265 | | | 264,428 | | | | 50,258 | |
| Series 2802, Cl. AS, 0%, 4/15/335,6 | | | 74,589 | | | | 2,593 | |
| Series 2815, Cl. PT, 22.293%, 11/15/325 | | | 3,774,357 | | | | 402,201 | |
| Series 2920, Cl. S, 54.108%, 1/15/355 | | | 1,523,277 | | | | 303,916 | |
| Series 2922, Cl. SE, 9.088%, 2/15/355 | | | 371,646 | | | | 68,545 | |
| Series 2937, Cl. SY, 22.548%, 2/15/355 | | | 5,383,006 | | | | 983,465 | |
| Series 3201, Cl. SG, 8.473%, 8/15/365 | | | 1,349,358 | | | | 258,351 | |
| Series 3397, Cl. GS, 13.392%, 12/15/375 | | | 804,308 | | | | 144,732 | |
| Series 3424, Cl. EI, 0.029%, 4/15/385 | | | 564,889 | | | | 80,344 | |
| Series 3450, Cl. BI, 12.756%, 5/15/385 | | | 1,879,417 | | | | 340,207 | |
| Series 3606, Cl. SN, 6.057%, 12/15/395 | | | 780,879 | | | | 93,100 | |
| Series 3736, Cl. SN, 11.62%, 10/15/405 | | | 2,117,259 | | | | 318,134 | |
| Federal Home Loan Mortgage Corp., Principal-Only Stripped Mtg.-Backed Security, Series 176, Cl. PO, 3.515%, 6/1/267 | | | 69,935 | | | | 63,939 | |
| Federal National Mortgage Assn.: | | | | | | | | |
| 2.50%, 9/1/288 | | | 11,075,000 | | | | 10,993,669 | |
| 3.50%, 9/1/438 | | | 16,990,000 | | | | 16,990,000 | |
| 4%, 9/1/288 | | | 4,380,000 | | | | 4,625,006 | |
| 4.50%, 9/1/28-9/1/438 | | | 47,780,000 | | | | 50,493,892 | |
| 5%, 9/1/438 | | | 4,225,000 | | | | 4,543,857 | |
| 5.50%, 2/1/35-4/1/39 | | | 3,445,421 | | | | 3,757,175 | |
| 6%, 9/1/438 | | | 6,075,000 | | | | 6,647,380 | |
| 6.50%, 5/1/17-11/1/31 | | | 1,583,056 | | | | 1,715,735 | |
| 7%, 11/1/17-7/25/35 | | | 208,186 | | | | 226,542 | |
| 7.50%, 1/1/33-3/25/33 | | | 3,535,137 | | | | 4,167,774 | |
| 8.50%, 7/1/32 | | | 10,858 | | | | 12,620 | |
| Federal National Mortgage Assn., 15 yr.: | | | | | | | | |
| 3%, 9/1/288 | | | 6,530,000 | | | | 6,684,067 | |
| 3.50%, 9/1/288 | | | 53,165,000 | | | | 55,598,963 | |
| Federal National Mortgage Assn., 30 yr., 4%, 9/1/438 | | | 25,235,000 | | | | 26,074,854 | |
Federal National Mortgage Assn., Gtd. Real Estate Mtg. Investment Conduit Multiclass Pass-Through Certificates:
Trust 1993-87, Cl. Z, 6.50%, 6/25/23 | | | 411,788 | | | | 464,023 | |
| Trust 1998-61, Cl. PL, 6%, 11/1/28 | | | 197,482 | | | | 220,583 | |
| Trust 1999-54, Cl. LH, 6.50%, 11/25/29 | | | 328,064 | | | | 365,694 | |
| Trust 2001-51, Cl. OD, 6.50%, 10/25/31 | | | 594,483 | | | | 660,974 | |
| Trust 2003-130, Cl. CS, 13.732%, 12/25/334 | | | 386,972 | | | | 470,861 | |
| Trust 2003-28, Cl. KG, 5.50%, 4/25/23 | | | 2,540,284 | | | | 2,781,772 | |
| Trust 2004-101, Cl. BG, 5%, 1/25/20 | | | 1,158,560 | | | | 1,229,877 | |
| Trust 2004-25, Cl. PC, 5.50%, 1/1/34 | | | 669,741 | | | | 723,801 | |
| Trust 2005-104, Cl. MC, 5.50%, 12/25/25 | | | 5,370,532 | | | | 5,886,454 | |
| Trust 2005-31, Cl. PB, 5.50%, 4/25/35 | | | 1,430,000 | | | | 1,635,496 | |
| Trust 2005-69, Cl. LE, 5.50%, 11/1/33 | | | 165,753 | | | | 166,872 | |
| Trust 2005-73, Cl. DF, 0.434%, 8/25/354 | | | 3,063,214 | | | | 3,070,483 | |
| Trust 2006-11, Cl. PS, 23.892%, 3/25/364 | | | 274,528 | | | | 421,582 | |
| Trust 2006-46, Cl. SW, 23.524%, 6/25/364 | | | 225,045 | | | | 344,325 | |
| Trust 2006-50, Cl. KS, 23.525%, 6/25/364 | | | 468,805 | | | | 712,435 | |
| Trust 2006-50, Cl. SK, 23.525%, 6/25/364 | | | 67,785 | | | | 101,663 | |
| | |
| 18 | | OPPENHEIMER CAPITAL INCOME FUND |
| | | | | | | | |
| | | Principal
Amount | | | Value | |
| FHLMC/FNMA/FHLB/Sponsored Continued | | | | | | | | |
| Federal National Mortgage Assn., Gtd. Real Estate Mtg. Investment Conduit Multiclass Pass-Through Certificates: Continued | | | | | | | | |
| Trust 2007-109, Cl. NF, 0.734%, 12/25/374 | | $ | 1,237,818 | | | $ | 1,253,345 | |
| Trust 2007-42, Cl. A, 6%, 2/1/33 | | | 44,742 | | | | 44,720 | |
| Trust 2009-36, Cl. FA, 1.124%, 6/25/374 | | | 979,511 | | | | 992,854 | |
| Trust 2009-37, Cl. HA, 4%, 4/1/19 | | | 1,428,417 | | | | 1,521,167 | |
| Trust 2011-15, Cl. DA, 4%, 3/1/41 | | | 494,215 | | | | 520,113 | |
| Trust 2011-3, Cl. KA, 5%, 4/1/40 | | | 1,529,163 | | | | 1,667,970 | |
| Federal National Mortgage Assn., Interest-Only Stripped Mtg.-Backed Security: | | | | | | | | |
| Trust 2001-15, Cl. SA, 58.756%, 3/17/315 | | | 192,375 | | | | 34,331 | |
| Trust 2001-65, Cl. S, 24.753%, 11/25/315 | | | 425,003 | | | | 91,434 | |
| Trust 2001-81, Cl. S, 24.33%, 1/25/325 | | | 107,164 | | | | 23,403 | |
| Trust 2002-47, Cl. NS, 32.302%, 4/25/325 | | | 268,514 | | | | 56,882 | |
| Trust 2002-51, Cl. S, 32.493%, 8/25/325 | | | 246,533 | | | | 52,225 | |
| Trust 2002-52, Cl. SD, 35.32%, 9/25/325 | | | 328,776 | | | | 70,682 | |
| Trust 2002-60, Cl. SM, 26.695%, 8/25/325 | | | 369,166 | | | | 63,893 | |
| Trust 2002-7, Cl. SK, 23.055%, 1/25/325 | | | 110,201 | | | | 20,674 | |
| Trust 2002-75, Cl. SA, 28.856%, 11/25/325 | | | 529,629 | | | | 108,390 | |
| Trust 2002-77, Cl. BS, 23.87%, 12/18/325 | | | 229,355 | | | | 46,705 | |
| Trust 2002-77, Cl. SH, 36.094%, 12/18/325 | | | 164,422 | | | | 35,131 | |
| Trust 2002-89, Cl. S, 47.553%, 1/25/335 | | | 787,441 | | | | 175,612 | |
| Trust 2002-9, Cl. MS, 26.837%, 3/25/325 | | | 146,746 | | | | 32,239 | |
| Trust 2002-90, Cl. SN, 27.623%, 8/25/325 | | | 190,097 | | | | 32,899 | |
| Trust 2002-90, Cl. SY, 34.31%, 9/25/325 | | | 92,221 | | | | 15,995 | |
| Trust 2003-33, Cl. SP, 26.289%, 5/25/335 | | | 485,229 | | | | 92,860 | |
| Trust 2003-46, Cl. IH, 0%, 6/1/235,6 | | | 984,168 | | | | 131,743 | |
| Trust 2004-54, Cl. DS, 39.523%, 11/25/305 | | | 303,275 | | | | 52,355 | |
| Trust 2004-56, Cl. SE, 11.565%, 10/25/335 | | | 675,400 | | | | 123,148 | |
| Trust 2005-12, Cl. SC, 11.044%, 3/25/355 | | | 185,221 | | | | 39,350 | |
| Trust 2005-19, Cl. SA, 48.271%, 3/25/355 | | | 3,705,604 | | | | 779,325 | |
| Trust 2005-40, Cl. SA, 49.887%, 5/25/355 | | | 831,968 | | | | 146,363 | |
| Trust 2005-52, Cl. JH, 9.248%, 5/25/355 | | | 1,777,422 | | | | 356,523 | |
| Trust 2005-6, Cl. SE, 58.983%, 2/25/355 | | | 1,288,733 | | | | 240,075 | |
| Trust 2005-93, Cl. SI, 14.233%, 10/25/355 | | | 1,052,390 | | | | 159,529 | |
| Trust 2008-55, Cl. SA, 2.081%, 7/25/385 | | | 858,337 | | | | 124,135 | |
| Trust 2009-8, Cl. BS, 2.012%, 2/25/245 | | | 1,159,849 | | | | 101,413 | |
| Trust 2012-40, Cl. PI, 3.796%, 4/1/415 | | | 5,380,188 | | | | 975,743 | |
| Trust 222, Cl. 2, 26.371%, 6/1/235 | | | 474,716 | | | | 72,441 | |
| Trust 252, Cl. 2, 43.311%, 11/1/235 | | | 425,535 | | | | 77,312 | |
| Trust 303, Cl. IO, 33.73%, 11/1/295 | | | 166,574 | | | | 27,722 | |
| Trust 308, Cl. 2, 27.259%, 9/1/305 | | | 415,132 | | | | 68,545 | |
| Trust 320, Cl. 2, 9.963%, 4/1/325 | | | 1,554,620 | | | | 238,314 | |
| Trust 321, Cl. 2, 3.72%, 4/1/325 | | | 1,234,506 | | | | 245,334 | |
| Trust 331, Cl. 9, 5.974%, 2/1/335 | | | 432,244 | | | | 81,164 | |
| Trust 334, Cl. 17, 6.444%, 2/1/335 | | | 256,885 | | | | 62,127 | |
| Trust 339, Cl. 12, 0%, 6/1/335,6 | | | 934,280 | | | | 169,733 | |
| Trust 339, Cl. 7, 0%, 8/1/335,6 | | | 1,131,903 | | | | 189,904 | |
| Trust 343, Cl. 13, 0%, 9/1/335,6 | | | 869,905 | | | | 137,828 | |
| Trust 343, Cl. 18, 0%, 5/1/345,6 | | | 267,207 | | | | 49,995 | |
| Trust 345, Cl. 9, 0%, 1/1/345,6 | | | 389,373 | | | | 64,699 | |
| Trust 351, Cl. 10, 0%, 4/1/345,6 | | | 311,262 | | | | 49,553 | |
| Trust 351, Cl. 8, 0%, 4/1/345,6 | | | 512,432 | | | | 81,662 | |
| Trust 356, Cl. 10, 0%, 6/1/355,6 | | | 384,517 | | | | 61,961 | |
| Trust 356, Cl. 12, 0%, 2/1/355,6 | | | 189,772 | | | | 30,597 | |
| | | | |
| OPPENHEIMER CAPITAL INCOME FUND | | | 19 | |
CONSOLIDATED STATEMENT OF INVESTMENTS Continued
| | | | | | | | |
| | | Principal
Amount | | | Value | |
| FHLMC/FNMA/FHLB/Sponsored Continued | | | | | | | | |
| Federal National Mortgage Assn., Interest-Only Stripped Mtg.-Backed Security: Continued | | | | | | | | |
| Trust 362, Cl. 13, 0%, 8/1/355,6 | | $ | 672,167 | | | $ | 116,857 | |
| Trust 364, Cl. 16, 0%, 9/1/355,6 | | | 768,270 | | | | 145,173 | |
| Trust 365, Cl. 16, 0%, 3/1/365,6 | | | 2,105,683 | | | | 357,601 | |
| Federal National Mortgage Assn., Principal-Only Stripped Mtg.-Backed Security, Trust 1993-184, Cl. M, 4.157%, 9/25/237 | | | 185,066 | | |
| 173,806
|
|
| | | | | | | | 242,899,998 | |
| GNMA/Guaranteed—0.1% | | | | | | | | |
| Government National Mortgage Assn., 8.50%, 8/1/17-12/15/17 | | | 34,358 | | | | 36,537 | |
| Government National Mortgage Assn., Interest-Only Stripped Mtg.-Backed Security: | | | | | | | | |
| Series 2001-21, Cl. SB, 7.416%, 1/16/275 | | | 414,751 | | | | 73,686 | |
| Series 2002-15, Cl. SM, 60.567%, 2/16/325 | | | 390,017 | | | | 73,186 | |
| Series 2002-41, Cl. GS, 57.71%, 6/16/325 | | | 211,957 | | | | 42,119 | |
| Series 2002-76, Cl. SY, 57.816%, 12/16/265 | | | 1,054,559 | | | | 201,858 | |
| Series 2007-17, Cl. AI, 16.778%, 4/16/375 | | | 2,941,899 | | | | 550,759 | |
| Series 2011-52, Cl. HS, 8.888%, 4/16/415 | | | 3,365,362 | | |
| 846,247
|
|
| | | | | | | | 1,824,392 | |
| Non-Agency—5.7% | | | | | | | | |
| Commercial—3.0% | | | | | | | | |
| Banc of America Commercial Mortgage Trust 2006-6, Commercial Mtg. Pass-Through Certificates, Series 2006-6, Cl. AM, 5.39%, 10/1/45 | | | 1,490,000 | | | | 1,571,742 | |
| Bear Stearns ARM Trust 2007-4, Mtg. Pass-Through Certificates, Series 2007-4, Cl. 22A1, 5.162%, 6/1/474 | | | 1,142,341 | | | | 993,556 | |
| CHL Mortgage Pass-Through Trust 2007-J3, Mtg. Pass-Through Certificates, Series 2007-J3, Cl. A9, 6%, 7/1/37 | | | 658,252 | | | | 542,781 | |
| Citigroup Commercial Mortgage Trust 2008-C7, Commercial Mtg. Pass-Through Certificates, Series 2008-C7, Cl. AM, 6.34%, 12/1/494 | | | 1,560,000 | | | | 1,700,420 | |
| Citigroup Commercial Mortgage Trust 2013-GC11, Commercial Mtg. Pass-Through Certificates, Series 2013-GC11, Cl. D, 4.607%, 4/1/234,9 | | | 675,000 | | | | 564,266 | |
| Citigroup, Inc./Deutsche Bank 2007-CD4 Commercial Mortgage Trust, Commercial Mtg. Pass-Through Certificates, Series 2007-CD4, Cl. A2B, 5.205%, 12/11/49 | | | 91,896 | | | | 92,319 | |
| Commercial Mortgage Trust, Commercial Mtg. Pass-Through Certificates: | | | | | | | | |
| Series 2012-CR5, Cl. E, 4.48%, 12/1/454 | | | 280,000 | | | | 234,173 | |
| Series 2013-CR7, Cl. D, 4.501%, 3/1/464,9 | | | 735,000 | | | | 600,013 | |
| Series 2012-CR4, Cl. D, 4.731%, 10/1/454,9 | | | 180,000 | | | | 157,020 | |
| Countrywide Alternative Loan Trust 2006-J2, Mtg. Pass-Through Certificates, Series 2006-J2, Cl. A7, 6%, 4/1/36 | | | 167,982 | | | | 156,140 | |
| Credit Suisse First Boston Mortgage Securities Corp., Commercial Mtg. Pass-Through Certificates, Series 2005-C6, Cl. AJ, 5.23%, 12/1/40 | | | 1,600,000 | | | | 1,672,703 | |
| CSMC Mortgage-Backed Trust 2006-6, Mtg. Pass-Through Certificates, Series 2006-6, Cl. 1A4, 6%, 7/1/36 | | | 2,181,650 | | | | 1,672,232 | |
| CSMC Mortgage-Backed Trust 2006-C1, Mtg. Pass-Through Certificates, Series 2006-C1, Cl. AJ, 5.567%, 2/1/394 | | | 1,000,000 | | | | 1,074,462 | |
| | |
| 20 | | OPPENHEIMER CAPITAL INCOME FUND |
| | | | | | | | |
| | | Principal
Amount | | | Value | |
| Commercial Continued | | | | | | | | |
| DBUBS Mortgage Trust, Commercial Mtg. Pass-Through Certificates, Series 2011-LC1, Cl. E, 5.728%, 11/1/464,9 | | $ | 260,000 | | | $ | 250,859 | |
| Deutsche Mortgage & Asset Receiving, Commercial Mtg. Pass-Through Certificates, Interest-Only Stripped Mtg.-Backed Security: | | | | | | | | |
| Series 2012-CR5, Cl. XA, 3.818%, 12/1/455 | | | 6,113,657 | | | | 675,455 | |
| Series 2010-C1, Cl. XPA, 5.012%, 7/1/465,9 | | | 13,854,890 | | | | 626,248 | |
| EverBank Mortgage Loan Trust, Commercial Mtg. Pass-Through Certificates, Series 2013-1, Cl. A1, 2.25%, 4/1/43 | | | 3,279,805 | | | | 2,971,877 | |
| First Horizon Alternative Mortgage Securities Trust 2005-FA8, Mtg. Pass-Through Certificates, Series 2005-FA8, Cl. 1A6, 0.834%, 11/25/354 | | | 1,170,741 | | | | 884,994 | |
| First Horizon Alternative Mortgage Securities Trust 2005-FA9, Mtg. Pass-Through Certificates, Series 2005-FA9, Cl. A4A, 5.50%, 12/1/35 | | | 117,472 | | | | 103,652 | |
| First Horizon Alternative Mortgage Securities Trust 2007-FA2, Mtg. Pass-Through Certificates, Series 2007-FA2, Cl. 1A1, 5.50%, 4/1/37 | | | 197,883 | | | | 145,619 | |
| First Horizon Alternative Mortgage Securities Trust 2007-FA4, Mtg. Pass-Through Certificates, Series 2007-FA4, Cl. 1A6, 6.25%, 8/1/374 | | | 1,350,897 | | | | 1,158,522 | |
| FREMF Mortgage Trust 2013-K25, Commerical Mtg. Pass-Through Certificates, Series 2013-K25, Cl. C, 3.617%, 11/1/454 | | | 350,000 | | | | 285,900 | |
| FREMF Mortgage Trust 2013-K26, Commerical Mtg. Pass-Through Certificates, Series 2013-K26, Cl. C, 3.60%, 12/1/404,9 | | | 255,000 | | | | 207,416 | |
| FREMF Mortgage Trust 2013-K27, Commerical Mtg. Pass-Through Certificates, Series 2013-K27, Cl. C, 3.497%, 1/1/464,9 | | | 400,000 | | | | 320,882 | |
| FREMF Mortgage Trust 2013-K28, Commerical Mtg. Pass-Through Certificates, Series 2013-K28, Cl. C, 3.494%, 3/1/234,9 | | | 420,000 | | | | 337,074 | |
| FREMF Mortgage Trust 2013-K712, Commerical Mtg. Pass-Through Certificates, Series 2013-K712, Cl. C, 3.367%, 5/1/454,9 | | | 650,000 | | | | 570,898 | |
| GE Commercial Mortgage Corp., Commercial Mtg. Pass-Throuh Certificates, Series 2005-C4, Cl. AJ, 5.488%, 11/1/454 | | | 1,595,000 | | | | 1,541,942 | |
| Greenwich Capital Commercial Funding Corp./Commercial Mortgage Trust 2007-GG11, Commercial Mtg. Pass-Through Certificates, Series 2007-GG11, Cl. AM, 5.867%, 12/1/49 | | | 2,785,000 | | | | 3,009,470 | |
| GS Mortgage Securities Corp. II, Commercial Mtg. Obligations, Series 2011-GC3, Cl. A1, 2.331%, 3/1/44 | | | 635,424 | | | | 644,090 | |
| GS Mortgage Securities Trust 2006-GG6, Commercial Mtg. Pass-Through Certificates, Series 2006-GG6, Cl. AM, 5.622%, 4/1/38 | | | 1,443,915 | | | | 1,546,264 | |
| GSR Mortgage Loan Trust 2005-AR4, Mtg. Pass-Through Certificates, Series 2005-AR4, Cl. 6A1, 5.25%, 7/1/35 | | | 861,797 | | | | 849,490 | |
| IndyMac Index Mortgage Loan Trust 2005-AR23, Mtg. Pass-Through Certificates, Series 2005-AR23, Cl. 6A1, 4.819%, 11/1/354 | | | 1,617,270 | | | | 1,328,993 | |
| JPMorgan Chase Commercial Mortgage Securities Corp., Commercial Mtg. Pass-Through Certificates: | | | | | | | | |
| Series 2011-C3, Cl. A1, 1.875%, 2/1/469 | | | 662,779 | | | | 666,950 | |
| Series 2007-LDP10, Cl. A3S, 5.317%, 1/1/49 | | | 2,118,724 | | | | 2,120,853 | |
| Series 2007-LD12, Cl. A2, 5.827%, 2/15/51 | | | 199,470 | | | | 204,072 | |
| JPMorgan Chase Commercial Mortgage Securities Trust 2006-CIBC16, Commercial Mtg. Pass-Through Certificates, Series 2006-CIBC16, Cl. AJ, 5.623%, 5/1/45 | | | 1,750,000 | | | | 1,629,765 | |
| | | | |
| OPPENHEIMER CAPITAL INCOME FUND | | | 21 | |
CONSOLIDATED STATEMENT OF INVESTMENTS Continued
| | | | | | | | |
| | | Principal
Amount | | | Value | |
| Commercial Continued | | | | | | | | |
| JPMorgan Mortgage Trust 2007-S3, Mtg. Pass-Through Certificates, Series 2007-S3, Cl. 1A90, 7%, 8/1/37 | | $ | 1,753,842 | | | $ | 1,573,958 | |
| JPMorgan, Re-Securitized Real Estate Mtg. Investment Conduit Multiclass Pass-Through Certificates, Series 2009-5, Cl. 1A2, 2.611%, 7/1/364,9 | | | 1,416,171 | | | | 1,079,944 | |
| Merrill Lynch Mortgage Trust 2006-C2, Commercial Mtg. Pass-Through Certificates, Series 2006-C2, Cl. AM, 5.782%, 8/1/43 | | | 1,485,000 | | | | 1,599,016 | |
| Morgan Stanley Bank of America Merrill Lynch Trust 2012-C6, Commercial Mtg. Pass-Through Certificates, Series 2012-C6, Cl. E, 4.664%, 11/1/454,9 | | | 545,000 | | | | 467,648 | |
| Morgan Stanley Bank of America Merrill Lynch Trust 2013-C7, Commercial Mtg. Pass-Through Certificates, Series 2013-C7, Cl. D, 4.305%, 2/1/464 | | | 645,000 | | | | 533,577 | |
| Morgan Stanley Bank of America Merrill Lynch Trust 2013-C8, Commercial Mtg. Pass-Through Certificates, Series 2013-C8, Cl. D, 4.312%, 12/1/484 | | | 485,000 | | | | 400,685 | |
| Morgan Stanley Capital I Trust 2007-IQ13, Commercial Mtg. Pass-Through Certificates, Series 2007-IQ13, Cl. AM, 5.406%, 3/1/44 | | | 2,740,000 | | | | 2,916,089 | |
| Morgan Stanley Capital I Trust 2007-IQ15, Commercial Mtg. Pass-Through Certificates, Series 2007-IQ15, Cl. AM, 6.09%, 6/1/494 | | | 1,700,000 | | | | 1,814,592 | |
| Morgan Stanley, Re-Securitized Real Estate Mtg. Investment Conduit Multiclass Pass-Through Certificates, Series 2012-R3, Cl. 1B, 2.366%, 11/1/362,4 | | | 2,020,761 | | | | 1,030,988 | |
| Structured Adjustable Rate Mortgage Loan Trust 2004-10, Commercial Mtg. Pass-Through Certificates, Series 2004-10, Cl. 2A, 2.464%, 8/1/344 | | | 1,250,777 | | | | 1,196,600 | |
| Structured Adjustable Rate Mortgage Loan Trust 2006-4, Commercial Mtg. Pass-Through Certificates, Series 2006-4, Cl. 6A, 5.177%, 5/1/364 | | | 423,972 | | | | 352,533 | |
| Structured Adjustable Rate Mortgage Loan Trust 2007-6, Mtg. Pass-Through Certificates, Series 2007-6, Cl. 3A1, 4.708%, 7/1/374 | | | 1,710,539 | | | | 1,391,635 | |
| UBS-Barclays Commercial Mortgage Trust 2012-C2, Commerical Mtg. Pass-Through Certificates, Series 2012-C2, Cl. E, 5.05%, 5/1/634,9 | | | 240,000 | | | | 211,755 | |
| WaMu Mortgage Pass-Through Certificates 2005-AR14 Trust, Mtg. Pass-Through Certificates, Series 2005-AR14, Cl. 1A4, 2.501%, 12/1/354 | | | 876,138 | | | | 795,218 | |
| Wells Fargo Mortgage-Backed Securities 2005-AR15 Trust, Mtg. Pass-Through Certificates, Series 2005-AR15, Cl. 1A6, 2.613%, 9/1/354 | | | 988,871 | | | | 915,833 | |
| Wells Fargo Mortgage-Backed Securities 2006-AR7 Trust, Mtg. Pass-Through Certificates, Series 2006-AR7, Cl. 2A4, 2.618%, 5/1/364 | | | 167,406 | | | | 152,746 | |
| Wells Fargo Mortgage-Backed Securities 2007-16 Trust, Mtg. Pass-Through Certificates, Series 2007-16, Cl. 1A1, 6%, 12/4/37 | | | 1,336,917 | | | | 1,398,210 | |
| Wells Fargo Mortgage-Backed Securities 2007-AR3 Trust, Mtg. Pass-Through Certificates, Series 2007-AR3, Cl. A4, 5.699%, 4/1/374 | | | 64,021 | | | | 60,305 | |
| Wells Fargo Mortgage-Backed Securities 2007-AR8 Trust, Mtg. Pass-Through Certificates, Series 2007-AR8, Cl. A1, 5.977%, 11/1/374 | | | 1,463,546 | | | | 1,287,795 | |
| WFRBS Commercial Mortgage Trust 2011-C3, Interest-Only Commercial Mtg. Pass-Through Certificates, Series 2011-C3, Cl. XA, 13.475%, 3/1/445 | | | 19,510,516 | | | | 1,390,232 | |
| WFRBS Commercial Mortgage Trust 2012-C10, Commercial Mtg. Pass-Through Certificates, Series 2012-C10, Cl. D, 4.609%, 12/1/454,9 | | | 280,000 | | | | 232,892 | |
| WFRBS Commercial Mortgage Trust 2012-C7, Commercial Mtg. Pass-Through Certificates, Series 2012-C7, Cl. E, 4.849%, 6/1/454,9 | | | 500,000 | | | | 437,654 | |
| | |
| 22 | | OPPENHEIMER CAPITAL INCOME FUND |
| | | | | | | | |
| | | Principal
Amount | | | Value | |
| Commercial Continued | | | | | | | | |
| WFRBS Commercial Mortgage Trust 2012-C8, Commercial Mtg. Pass-Through Certificates, Series 2012-C8, Cl. D, 5.042%, 8/1/454,9 | | $ | 545,000 | | | $ | 477,941 | |
| WFRBS Commercial Mortgage Trust 2013-C11, Commercial Mtg. Pass-Through Certificates, Series 2013-C11, Cl. D, 4.185%, 3/1/454,9 | | | 278,000 | | |
| 226,163
|
|
| | | | | | | | 55,057,121 | |
| Multifamily—0.2% | | | | | | | | |
| CHL Mortgage Pass-Through Trust 2006-20, Mtg. Pass-Through Certificates, Series 2006-20, Cl. 1A17, 5.75%, 2/1/37 | | | 1,572,181 | | | | 1,399,380 | |
| Citigroup Mortgage Loan Trust, Inc. 2006-AR3, Mtg. Pass-Through Certificates, Series 2006-AR3, Cl. 1A2A, 5.465%, 6/1/364 | | | 1,054,452 | | | | 966,125 | |
| Countrywide Alternative Loan Trust 2005-86CB, Mtg. Pass-Through Certificates, Series 2005-86CB, Cl. A8, 5.50%, 2/1/36 | | | 287,060 | | | | 266,321 | |
| Countrywide Alternative Loan Trust 2005-J14, Mtg. Pass-Through Certificates, Series 2005-J14, Cl. A7, 5.50%, 12/1/35 | | | 709,941 | | | | 613,616 | |
| Countrywide Alternative Loan Trust 2006-24CB, Mtg. Pass-Through Certificates, Series 2006-24CB, Cl. A12, 5.75%, 6/1/36 | | | 352,121 | | | | 285,239 | |
| JPMorgan Mortgage Trust 2007-A3, Mtg. Pass-Through Certificates, Series 2007-A3, Cl. 3A2M, 4.839%, 5/1/374 | | | 411,899 | | | | 387,864 | |
| Wells Fargo Mortgage-Backed Securities 2006-AR2 Trust, Mtg. Pass-Through Certificates, Series 2006-AR2, Cl. 2A3, 2.641%, 3/1/364 | | | 646,791 | | |
| 635,062
|
|
| | | | | | | | 4,553,607 | |
| Residential—2.5% | | | | | | | | |
| ABFC Asset-Backed Certificates, Asset-Back Certificates, Series 2005-HE2, Cl. M3, 0.964%, 6/25/354 | | | 4,000,000 | | | | 3,284,272 | |
| Banc of America Commercial Mortgage, Inc., Commercial Mtg. Pass-Through Certificates: | | | | | | | | |
| Series 2007-1, Cl. 1A3, 6%, 1/1/37 | | | 459,807 | | | | 403,949 | |
| Series 2007-4, Cl. AM, 6.001%, 2/1/514 | | | 1,635,000 | | | | 1,774,281 | |
| Banc of America Funding 2007-C Trust, Mtg. Pass-Through Certificates, Series 2007-C, Cl. 1A4, 5.405%, 5/1/364 | | | 441,742 | | | | 420,874 | |
| Banc of America Mortgage 2007-1 Trust, Mtg. Pass-Through Certificates, Series 2007-1, Cl. 1A24, 6%, 3/1/37 | | | 1,568,071 | | | | 1,465,016 | |
| Carrington Mortgage Loan Trust, Asset-Backed Pass-Through Certificates, Series 2006-FRE1, Cl. A2, 0.294%, 7/25/364 | | | 844,623 | | | | 818,671 | |
| CHL Mortgage Pass-Through Trust 2005-26, Mtg. Pass-Through Certificates, Series 2005-26, Cl. 1A8, 5.50%, 11/1/35 | | | 1,555,073 | | | | 1,486,844 | |
| CHL Mortgage Pass-Through Trust 2005-29, Mtg. Pass-Through Certificates, Series 2005-29, Cl. A1, 5.75%, 12/1/35 | | | 1,169,451 | | | | 1,077,226 | |
| CHL Mortgage Pass-Through Trust 2006-17, Mtg. Pass-Through Certificates, Series 2006-17, Cl. A2, 6%, 12/1/36 | | | 2,358,779 | | | | 2,127,199 | |
| CHL Mortgage Pass-Through Trust 2006-6, Mtg. Pass-Through Certificates, Series 2006-6, Cl. A3, 6%, 4/1/36 | | | 668,565 | | | | 616,544 | |
| CHL Mortgage Pass-Through Trust 2007-15, Mtg. Pass-Through Certificates, Series 2007-15, Cl. 1A29, 6.25%, 9/1/37 | | | 2,771,266 | | | | 2,542,151 | |
| | | | |
| OPPENHEIMER CAPITAL INCOME FUND | | | 23 | |
CONSOLIDATED STATEMENT OF INVESTMENTS Continued
| | | | | | | | |
| | | Principal
Amount | | | Value | |
| Residential Continued | | | | | | | | |
Citigroup, Inc./Deutsche Bank 2007-CD4 Commercial Mortgage Trust, Commercial Mtg. Pass-Through Certificates,
Series 2007-CD4, Cl. AMFX, 5.366%, 12/1/49 | | $ | 1,500,000 | | | $ | 1,508,373 | |
| Countrywide Alternative Loan Trust 2005-21CB, Mtg. Pass-Through Certificates, Series 2005-21CB, Cl. A7, 5.50%, 6/1/35 | | | 1,513,271 | | | | 1,315,334 | |
| Countrywide Alternative Loan Trust 2005-J10, Mtg. Pass-Through Certificates, Series 2005-J10, Cl. 1A17, 5.50%, 10/1/35 | | | 6,295,382 | | | | 5,904,011 | |
| Countrywide Alternative Loan Trust 2007-19, Mtg. Pass-Through Certificates, Series 2007-19, Cl. 1A34, 6%, 8/1/37 | | | 1,657,249 | | | | 1,278,590 | |
| Countrywide Home Loans, Asset-Backed Certificates: | | | | | | | | |
| Series 2004-6, Cl. M5, 1.454%, 8/25/344 | | | 2,362,066 | | | | 1,947,837 | |
| Series 2005-16, Cl. 2AF2, 5.099%, 5/1/364 | | | 318,758 | | | | 317,748 | |
| CSMC Mortgage-Backed Trust 2007-3, Mtg. Pass-Through Certificates, Series 2007-3, Cl. 2A10, 6%, 4/1/37 | | | 442,590 | | | | 383,057 | |
| GMACM Home Equity Loan Trust 2007-HE2, Home Equity Loan-Backed Term Nts., Series 2007-HE2, Cl. A2, 6.054%, 12/1/37 | | | 22,620 | | | | 21,962 | |
| GSR Mortgage Loan Trust 2006-5F, Mtg. Pass-Through Certificates, Series 2006-5F, Cl. 2A1, 6%, 6/1/36 | | | 558,956 | | | | 545,341 | |
| Home Equity Mortgage Trust 2005-HF1, Home Equity Loan-Backed Nts.: | | | | | | | | |
| Series 2005-HF1, Cl. A2B, 0.884%, 2/25/364 | | | 727,790 | | | | 678,751 | |
| Series 2005-HF1, Cl. A3B, 0.884%, 2/25/364 | | | 548,165 | | | | 511,229 | |
| JPMorgan Alternative Loan Trust 2006-S4, Mtg. Pass-Through Certificates, Series 2006-S4, Cl. A6, 5.71%, 12/1/36 | | | 1,147,408 | | | | 1,071,166 | |
| RAMP Series 2006-NC3 Trust, Mtg. Asset-Backed Pass-Through Certificates, Series 2006-NC3, Cl. A3, 0.454%, 3/25/364 | | | 16,698,000 | | | | 10,841,527 | |
| Residential Asset Securitization Trust 2005-A15, Mtg. Pass-Through Certificates, Series 2005-A15, Cl. 1A4, 5.75%, 2/1/36 | | | 458,214 | | | | 412,898 | |
| WaMu Mortgage Pass-Through Certificates 2007-HY5 Trust, Mtg. Pass-Through Certificates, Series 2007-HY5, Cl. 3A1, 4.927%, 5/1/374 | | | 988,022 | | | | 948,164 | |
| WaMu Mortgage Pass-Through Certificates, Mtg. Pass-Through Certificates, Series 2006-AR18, Cl. 3A1, 4.363%, 1/1/374 | | | 232,155 | | | | 197,880 | |
| Wells Fargo Alternative Loan 2007-PA5 Trust, Mtg. Asset-Backed Pass-Through Certificates, Series 2007-PA5, Cl. 1A1, 6.25%, 11/1/37 | | | 1,253,656 | | | | 1,142,493 | |
| Wells Fargo Mortgage-Backed Securities 2005-9 Trust, Mtg. Pass-Through Certificates, Series 2005-9, Cl. 2A6, 5.25%, 10/25/35 | | | 815,171 | | | | 839,086 | |
| Wells Fargo Mortgage-Backed Securities 2006-AR14 Trust, Mtg. Pass-Through Certificates, Series 2006-AR14, Cl. 1A2, 5.626%, 10/1/364 | | | 944,316 | | |
| 889,497
|
|
| | | | | | |
| 46,771,971
|
|
| Total Mortgage-Backed Obligations (Cost $338,312,215) | | | | | | | 351,107,089 | |
| Asset-Backed Securities—10.9% | | | | | | | | |
| Aircraft Lease Securitisation Ltd., Airplane Asset-Backed Securities, Series 2007-1A, Cl. G3, 0.446%, 5/10/322,4 | | | 28,588,634 | | | | 27,445,088 | |
| Airspeed Ltd., Airplane Receivables: | | | | | | | | |
| Series 2007-1A, Cl. G1, 0.454%, 6/15/322,4 | | | 31,882,157 | | | | 24,230,439 | |
| Series 2007-1A, Cl. G2, 0.464%, 6/15/322,4 | | | 10,892,187 | | | | 8,386,984 | |
| | |
| 24 | | OPPENHEIMER CAPITAL INCOME FUND |
| | | | | | | | |
| | | Principal
Amount | | | Value | |
| Asset-Backed Securities Continued | | | | | | | | |
| Ally Master Owner Trust, Asset-Backed Nts.,Series 2012-2, Cl. A, 0.684%, 3/15/164 | | $ | 1,780,000 | | | $ | 1,781,573 | |
| American Credit Acceptance Receivables Trust 2012-2, Automobile Receivables-Backed Nts., Series 2012-2, Cl. A, 1.89%, 7/15/169 | | | 865,128 | | | | 867,473 | |
| American Credit Acceptance Receivables Trust 2012-3, Automobile Receivable Nts.: | | | | | | | | |
| Series 2012-3, Cl. A, 1.64%, 11/15/169 | | | 406,468 | | | | 406,169 | |
| Series 2012-3, Cl. C, 2.78%, 9/17/189 | | | 325,000 | | | | 323,193 | |
| American Credit Acceptance Receivables Trust 2013-2, Automobile Receivable Nts., Series 2013-2, Cl. B, 3.07%, 5/15/199 | | | 1,663,000 | | | | 1,661,689 | |
| AmeriCredit Automobile Receivables Trust 2010-1, Automobile Receivables-Backed Nts., Series 2010-1, Cl. D, 6.65%, 7/17/17 | | | 1,055,000 | | | | 1,099,683 | |
| AmeriCredit Automobile Receivables Trust 2010-2, Automobile Receivables-Backed Nts.: | | | | | | | | |
| Series 2010-2, Cl. C, 4.52%, 10/8/15 | | | 1,206,023 | | | | 1,222,273 | |
| Series 2010-2, Cl. D, 6.24%, 6/8/16 | | | 2,015,000 | | | | 2,115,905 | |
| AmeriCredit Automobile Receivables Trust 2011-1, Automobile Receivables-Backed Nts., Series 2011-1, Cl. D, 4.26%, 2/8/17 | | | 430,000 | | | | 448,673 | |
| AmeriCredit Automobile Receivables Trust 2011-2, Automobile Receivables-Backed Nts., Series 2011-2, Cl. D, 4%, 5/8/17 | | | 1,450,000 | | | | 1,505,720 | |
| AmeriCredit Automobile Receivables Trust 2011-4, Automobile Receivables-Backed Nts., Series 2011-4, Cl. D, 4.08%, 9/8/17 | | | 2,355,000 | | | | 2,446,507 | |
| AmeriCredit Automobile Receivables Trust 2011-5, Automobile Receivables-Backed Nts., Series 2011-5, Cl. D, 5.05%, 12/8/17 | | | 1,500,000 | | | | 1,605,956 | |
| AmeriCredit Automobile Receivables Trust 2012-1, Automobile Receivables-Backed Nts., Series 2012-1, Cl. D, 4.72%, 3/8/18 | | | 1,685,000 | | | | 1,796,260 | |
| AmeriCredit Automobile Receivables Trust 2012-2, Automobile Receivables-Backed Nts.: | | | | | | | | |
| Series 2012-2, Cl. B, 1.78%, 3/8/17 | | | 1,155,000 | | | | 1,165,792 | |
| Series 2012-2, Cl. D, 3.38%, 4/9/18 | | | 2,345,000 | | | | 2,397,591 | |
| AmeriCredit Automobile Receivables Trust 2012-4, Automobile Receivables-Backed Nts., Series 2012-4, Cl. D, 2.68%, 10/9/18 | | | 2,345,000 | | | | 2,331,298 | |
| AmeriCredit Automobile Receivables Trust 2012-5, Automobile Receivables-Backed Nts.: | | | | | | | | |
| Series 2012-5, Cl. C, 1.69%, 11/8/18 | | | 940,000 | | | | 928,974 | |
| Series 2012-5, Cl. D, 2.35%, 12/10/18 | | | 1,280,000 | | | | 1,262,890 | |
| AmeriCredit Automobile Receivables Trust 2013-1, Automobile Receivables-Backed Nts.: | | | | | | | | |
| Series 2013-1, Cl. C, 1.57%, 1/8/19 | | | 1,610,000 | | | | 1,564,903 | |
| Series 2013-1, Cl. D, 2.09%, 2/8/19 | | | 1,115,000 | | | | 1,077,102 | |
| AmeriCredit Automobile Receivables Trust 2013-2, Automobile Receivables-Backed Nts., Series 2013-2, Cl. D, 2.42%, 5/8/19 | | | 1,815,000 | | | | 1,764,012 | |
| AmeriCredit Automobile Receivables Trust 2013-3, Automobile Receivables-Backed Nts., Series 2013-3, Cl. D, 3%, 7/8/19 | | | 1,250,000 | | | | 1,232,519 | |
| Avis Budget Rental Car Funding AESOP LLC, Automobile Receivable Nts.: | | | | | | | | |
| Series 2011-2A, Cl. A, 2.37%, 11/20/149 | | | 2,185,000 | | | | 2,217,228 | |
| Series 2011-3A, Cl. B, 4.74%, 11/20/179 | | | 890,000 | | | | 943,351 | |
| | | | |
| OPPENHEIMER CAPITAL INCOME FUND | | | 25 | |
CONSOLIDATED STATEMENT OF INVESTMENTS Continued
| | | | | | | | |
| | | Principal
Amount | | | Value | |
| Asset-Backed Securities Continued | | | | | | | | |
Blade Engine Securitization Ltd., Airplane Receivables,
Series 2006-1AW, Cl. A1, 0.484%, 9/15/412,4 | | $ | 23,778,393 | | | $ | 17,358,227 | |
| Blade Engine Securitization Ltd., Asset-Backed Certificates: | | | | | | | | |
| Series 2006-1A, Cl. A1, 1.184%, 9/15/414 | | | 1,729,338 | | | | 1,297,003 | |
| Series 2006-1A, Cl. B, 3.184%, 9/15/412,4 | | | 9,051,767 | | | | 6,517,272 | |
| Capital Auto Receivables Asset Trust 2013-1, Automobile Receivables Nts., Series 2013-1, Cl. D, 2.19%, 9/20/21 | | | 725,000 | | | | 701,233 | |
| CarMax Auto Owner Trust 2013-1, Automobile Receivables Nts., Series 2013-1, Cl. D, 1.99%, 8/15/19 | | | 650,000 | | | | 632,748 | |
Centre Point Funding LLC, Asset-Backed Nts.,
Series 2010-1A, Cl. 1, 5.43%, 7/20/169 | | | 208,903 | | | | 217,139 | |
| CFC LLC, Automobile Receivable Nts., Series 2013-1A, Cl. A, 1.65%, 7/17/179 | | | 618,636 | | | | 617,095 | |
| CPS Auto Trust, Automobile Receivable Nts.: | | | | | | | | |
| Series 2012-B, Cl. A, 2.52%, 9/16/199 | | | 1,282,670 | | | | 1,297,580 | |
| Series 2012-C, Cl. A, 1.82%, 12/16/199 | | | 453,571 | | | | 455,752 | |
| Credit Acceptance Auto Loan Trust, Automobile Receivable Nts.: | | | | | | | | |
| Series 2012-1A, Cl. A, 2.20%, 9/16/199 | | | 890,000 | | | | 899,008 | |
| Series 2012-2A, Cl. A, 1.52%, 3/16/209 | | | 535,000 | | | | 536,358 | |
| Series 2012-2A, Cl. B, 2.21%, 9/15/209 | | | 270,000 | | | | 270,794 | |
| Series 2013-1A, Cl. B, 1.83%, 4/15/219 | | | 980,000 | | | | 968,129 | |
DT Auto Owner Trust 2011-1A, Automobile Receivable Nts.,
Series 2011-1A, Cl. C, 3.05%, 8/17/159 | | | 190,120 | | | | 190,354 | |
DT Auto Owner Trust 2011-3A, Automobile Receivable Nts.,
Series 2011-3A, Cl. C, 4.03%, 12/15/179 | | | 1,491,000 | | | | 1,498,229 | |
| DT Auto Owner Trust 2012-2, Automobile Receivable Nts.: | | | | | | | | |
| Series 2012-2, Cl. C, 2.72%, 4/17/179 | | | 345,000 | | | | 347,976 | |
| Series 2012-2, Cl. D, 4.35%, 3/15/199 | | | 430,000 | | | | 441,080 | |
DT Auto Owner Trust 2013-1A, Automobile Receivable Nts.,
Series 2013-1A, Cl. D, 3.72%, 5/15/209 | | | 750,000 | | | | 748,153 | |
| Exeter Automobile Receivables Trust, Automobile Receivable Nts.: | | | | | | | | |
| Series 2012-1A, Cl. A, 2.02%, 8/15/169 | | | 2,526,010 | | | | 2,536,539 | |
| Series 2012-2A, Cl. A, 1.30%, 6/15/179 | | | 508,525 | | | | 509,244 | |
| Series 2012-2A, Cl. B, 2.22%, 12/15/179 | | | 750,000 | | | | 753,782 | |
| Series 2012-2A, Cl. C, 3.06%, 7/16/189 | | | 185,000 | | | | 185,195 | |
| Series 2013-1A, Cl. A, 1.29%, 10/16/179 | | | 1,252,169 | | | | 1,246,550 | |
| First Investors Auto Owner Trust 2012-1A, Automobile Receivables Nts., Series 2012-1A, Cl. D, 5.65%, 4/15/189 | | | 770,000 | | | | 810,719 | |
| Ford Credit Auto Owner Trust 2013-A, Automobile Receivables Nts., Series 2013-A, Cl. D, 1.86%, 8/15/19 | | | 1,180,000 | | | | 1,157,386 | |
| Ford Credit Floorplan Master Owner Trust A, Automobile Receivable Nts.: | | | | | | | | |
| Series 2012-2, Cl. C, 2.86%, 1/15/19 | | | 1,490,000 | | | | 1,523,576 | |
| Series 2013-3, Cl. D, 1.74%, 6/15/17 | | | 675,000 | | | | 675,470 | |
| Ford Credit Floorplan Master Owner Trust, Automobile Receivable Nts., Series 2012-1, Cl. C, 1.684%, 1/15/164 | | | 605,000 | | | | 607,025 | |
| FRS LLC, Sec. Railcar Equipment Nts., Series 2013-1A, Cl. A1, 1.80%, 4/15/439 | | | 455,143 | | | | 450,655 | |
| | |
| 26 | | OPPENHEIMER CAPITAL INCOME FUND |
| | | | | | | | |
| | | Principal
Amount | | | Value | |
| Asset-Backed Securities Continued | | | | | | | | |
| MBNA Credit Card Master Note Trust, Credit Card Receivables, Series 2003-C7, Cl. C7, 1.534%, 3/15/164 | | $ | 1,800,000 | | | $ | 1,801,436 | |
| New Century Home Equity Loan Trust 2005-2, Asset-Backed Nts., Series 2005-2, Cl. M3, 0.674%, 6/25/354 | | | 5,500,000 | | | | 3,975,015 | |
Prestige Auto Receivables Trust, Automobile Receivable Nts.,
Series 2011-1A, Cl. D., 5.18%, 7/16/18 | | | 585,000 | | | | 607,527 | |
Ras Propack Lamipack Ltd., Collateralized Debt Obligations,
Series 2005-1A, Cl. G, 0.672%, 3/20/242,4 | | | 1,062,299 | | | | 966,692 | |
| Santander Drive Auto Receivables Trust 2010-3, Automobile Receivables Nts., Series 2010-3, Cl. C, 3.06%, 11/15/17 | | | 1,670,000 | | | | 1,705,307 | |
| Santander Drive Auto Receivables Trust 2010-B, Automobile Receivables Nts., Series 2010-B, Cl. C, 3.02%, 10/17/169 | | | 1,266,466 | | | | 1,279,348 | |
| Santander Drive Auto Receivables Trust 2011-1, Automobile Receivables Nts., Series 2011-1, Cl. D, 4.01%, 2/15/17 | | | 1,715,000 | | | | 1,762,322 | |
| Santander Drive Auto Receivables Trust 2011-4, Automobile Receivables Nts., Series 2011-4, Cl. B, 2.90%, 5/16/16 | | | 820,000 | | | | 831,946 | |
| Santander Drive Auto Receivables Trust 2011-S1A, Automobile Receivables Nts., Series 2011-S1A, Cl. D, 3.10%, 5/15/172 | | | 108,991 | | | | 109,089 | |
| Santander Drive Auto Receivables Trust 2011-S2A, Automobile Receivables Nts., Series 2011-S2A, Cl. D, 3.35%, 6/15/172 | | | 516,752 | | | | 519,036 | |
| Santander Drive Auto Receivables Trust 2012-2, Automobile Receivables Nts.: | | | | | | | | |
| Series 2012-2, Cl. C, 3.20%, 2/15/18 | | | 3,010,000 | | | | 3,096,578 | |
| Series 2012-2, Cl. D, 3.87%, 2/15/18 | | | 1,875,000 | | | | 1,918,433 | |
| Santander Drive Auto Receivables Trust 2012-4, Automobile Receivables Nts.: | | | | | | | | |
| Series 2012-4, Cl. A3, 1.04%, 8/15/16 | | | 1,410,000 | | | | 1,415,078 | |
| Series 2012-4, Cl. B, 1.83%, 3/15/17 | | | 2,710,000 | | | | 2,730,969 | |
| Series 2012-4, Cl. C, 2.94%, 12/15/17 | | | 730,000 | | | | 742,893 | |
| Series 2012-4, Cl. D, 3.50%, 6/15/18 | | | 2,785,000 | | | | 2,834,623 | |
| Santander Drive Auto Receivables Trust 2012-5, Automobile Receivables Nts.: | | | | | | | | |
| Series 2012-5, Cl. C, 2.70%, 8/15/18 | | | 1,210,000 | | | | 1,213,642 | |
| Series 2012-5, Cl. D, 3.30%, 9/17/18 | | | 3,110,000 | | | | 3,120,809 | |
| Santander Drive Auto Receivables Trust 2012-6, Automobile Receivables Nts.: | | | | | | | | |
| Series 2012-6, Cl. B, 1.33%, 5/15/17 | | | 2,035,000 | | | | 2,037,472 | |
| Series 2012-6, Cl. D, 2.52%, 9/17/18 | | | 3,340,000 | | | | 3,284,968 | |
| Santander Drive Auto Receivables Trust 2012-AA, Automobile Receivables Nts., Series 2012-AA, Cl. D, 2.46%, 12/17/189 | | | 955,000 | | | | 931,593 | |
| Santander Drive Auto Receivables Trust 2013-1, Automobile Receivables Nts.: | | | | | | | | |
| Series 2013-1, Cl. C, 1.76%, 1/15/19 | | | 2,070,000 | | | | 2,025,027 | |
| Series 2013-1, Cl. D, 2.27%, 1/15/19 | | | 895,000 | | | | 868,640 | |
| Santander Drive Auto Receivables Trust 2013-2, Automobile Receivables Nts., Series 2013-2, Cl. D, 2.57%, 3/15/19 | | | 1,260,000 | | | | 1,221,399 | |
| Santander Drive Auto Receivables Trust 2013-3, Automobile Receivables Nts.: | | | | | | | | |
| Series 2013-3, Cl. C, 1.81%, 4/15/19 | | | 3,650,000 | | | | 3,563,342 | |
| Series 2013-3, Cl. D, 2.42%, 4/15/19 | | | 905,000 | | | | 861,343 | |
| Santander Drive Auto Receivables Trust 2013-4, Automobile Receivables Nts., Series 2013-4, Cl. D, 3.92%, 1/15/20 | | | 495,000 | | | | 497,021 | |
| | | | |
| OPPENHEIMER CAPITAL INCOME FUND | | | 27 | |
CONSOLIDATED STATEMENT OF INVESTMENTS Continued
| | | | | | | | |
| | | Principal
Amount | | | Value | |
| Asset-Backed Securities Continued | | | | | | | | |
| SNAAC Auto Receivables Trust, Automobile Receivable Nts.: | | | | | | | | |
| Series 2012-1A, Cl. A, 1.78%, 6/15/169 | | $ | 299,461 | | | $ | 300,433 | |
| Series 2012-1A, Cl. C, 4.38%, 6/15/179 | | | 715,000 | | | | 732,099 | |
| SNAAC Auto Receivables Trust, Automobile Receivables Nts.: | | | | | | | | |
| Series 2013-1A, Cl. B, 2.09%, 7/16/18 | | | 540,000 | | | | 535,815 | |
| Series 2013-1A, Cl. C, 3.07%, 8/15/18 | | | 600,000 | | | | 592,481 | |
| Structured Asset Securities Corp., Mtg. Loan Asset-Backed Certificates, Series 2007-GEL2, Cl. A2, 0.504%, 5/25/374 | | | 10,000,000 | | | | 8,415,010 | |
| United Auto Credit Securitization Trust 2012-1, Automobile Receivables Nts.: | | | | | | | | |
| Series 2012-1, Cl. A2, 1.10%, 3/16/15 | | | 321,065 | | | | 321,041 | |
| Series 2012-1, Cl. B, 1.87%, 9/15/15 | | | 910,000 | | | | 909,671 | |
| Series 2012-1, Cl. C, 2.52%, 3/15/16 | | | 660,000 | | | | 659,350 | |
| Series 2012-1, Cl. D, 3.12%, 3/15/18 | | | 565,000 | | | | 564,369 | |
| United Auto Credit Securitization Trust 2013-1, Automobile Receivables Nts.: | | | | | | | | |
| Series 2013-1, Cl. B, 1.74%, 4/15/169 | | | 975,000 | | | | 972,656 | |
| Series 2013-1, Cl. C, 2.22%, 12/15/179 | | | 620,000 | | | | 617,838 | |
| Series 2013-1, Cl. D, 2.90%, 12/15/179 | | | 110,000 | | | | 109,441 | |
| Westlake Automobile Receivables Trust 2012-1, Automobile Receivable Nts., Series 2012-1, Cl. D, 1.03%, 3/15/169 | | | 378,052 | | | | 378,435 | |
| Wheels SPV LLC, Asset-Backed Nts., Series 2012-1, Cl. A2, 1.19%, 3/20/219 | | | 569,383 | | |
| 571,399
|
|
| Total Asset-Backed Securities (Cost $201,123,120) | | | | | | | 201,281,102 | |
| U.S. Government Obligations—1.1% | | | | | | | | |
| Federal Home Loan Mortgage Corp. Nts.: | | | | | | | | |
| 0.875%, 10/14/16-3/7/18 | | | 7,034,000 | | | | 6,942,403 | |
| 1.375%, 5/1/20 | | | 2,126,000 | | | | 1,985,142 | |
| 2.375%, 1/13/22 | | | 3,075,000 | | | | 2,948,445 | |
| Federal National Mortgage Assn. Nts.: | | | | | | | | |
| 0.375%, 7/5/16 | | | 1,614,000 | | | | 1,593,633 | |
| 0.875%, 5/21/18 | | | 424,000 | | | | 407,206 | |
| 1.25%, 1/30/1710 | | | 3,109,000 | | | | 3,124,554 | |
| 1.375%, 11/15/16 | | | 1,187,000 | | | | 1,200,475 | |
| 1.875%, 9/18/18 | | | 1,696,000 | | |
| 1,695,108
|
|
| Total U.S. Government Obligations (Cost $20,256,685) | | | | | | | 19,896,966 | |
| Non-Convertible Corporate Bonds and Notes—19.9% | | | | | | | | |
| Consumer Discretionary—1.7% | | | | | | | | |
| Auto Components—0.1% | | | | | | | | |
| Dana Holding Corp., 6.75% Sr. Unsec. Nts., 2/15/21 | | | 1,551,000 | | | | 1,653,754 | |
| Automobiles—0.5% | | | | | | | | |
| Daimler Finance North America LLC: | | | | | | | | |
| 1.30% Sr. Unsec. Nts., 7/31/159 | | | 1,775,000 | | | | 1,782,235 | |
| 8.50% Sr. Unsec. Unsub. Nts., 1/18/31 | | | 942,000 | | | | 1,361,796 | |
| Ford Motor Credit Co. LLC, 5.875% Sr. Unsec. Nts., 8/2/21 | | | 3,563,000 | | | | 3,872,618 | |
| General Motors Financial Co., Inc., 4.25% Sr. Unsec. Nts., 5/15/239 | | | 1,457,000 | | |
| 1,314,943
|
|
| | | | | | | | 8,331,592 | |
| | |
| 28 | | OPPENHEIMER CAPITAL INCOME FUND |
| | | | | | | | |
| | | Principal
Amount | | | Value | |
| Hotels, Restaurants & Leisure—0.1% | | | | | | | | |
| Brinker International, Inc., 2.60% Sr. Unsec. Nts., 5/15/18 | | $ | 560,000 | | | $ | 548,259 | |
Starwood Hotels & Resorts Worldwide, Inc.,
7.15% Sr. Unsec. Unsub. Nts., 12/1/19 | | | 944,000 | | |
| 1,130,716
|
|
| | | | | | | | 1,678,975 | |
| Household Durables—0.2% | | | | | | | | |
| Jarden Corp., 6.125% Sr. Unsec. Nts., 11/15/22 | | | 1,662,000 | | | | 1,736,790 | |
| Lennar Corp., 4.125% Sr. Unsec. Nts., 12/1/189 | | | 1,791,000 | | |
| 1,710,405
|
|
| | | | | | | | 3,447,195 | |
| Media—0.4% | | | | | | | | |
Comcast Cable Communications Holdings, Inc.,
9.455% Sr. Unsec. Nts., 11/15/22 | | | 995,000 | | | | 1,393,704 | |
| Comcast Corp., 4.65% Sr. Unsec. Unsub. Nts., 7/15/42 | | | 1,129,000 | | | | 1,078,344 | |
| Historic TW, Inc., 9.15% Debs., 2/1/23 | | | 201,000 | | | | 264,686 | |
| Interpublic Group of Cos., Inc. (The), 6.25% Sr. Unsec. Nts., 11/15/14 | | | 1,043,000 | | | | 1,096,454 | |
| Lamar Media Corp., 5% Sr. Unsec. Sub. Nts., 5/1/23 | | | 1,657,000 | | | | 1,545,153 | |
| News America, Inc., 6.15% Sr. Unsec. Nts., 2/15/41 | | | 619,000 | | | | 680,951 | |
| Time Warner Entertainment Co. LP, 8.375% Sr. Unsec. Nts., 7/15/33 | | | 1,031,000 | | | | 1,150,411 | |
| Viacom, Inc., 5.85% Sr. Unsec. Nts., 9/1/43 | | | 540,000 | | | | 548,124 | |
| WPP Finance 2010, 5.125% Sr. Unsec. Unsub. Nts., 9/7/42 | | | 520,000 | | |
| 470,123
|
|
| | | | | | | | 8,227,950 | |
| Multiline Retail—0.2% | | | | | | | | |
| Dollar General Corp., 4.125% Nts., 7/15/17 | | | 1,886,000 | | | | 1,980,147 | |
| Macy’s Retail Holdings, Inc., 5.75% Sr. Unsec. Nts., 7/15/14 | | | 2,212,000 | | |
| 2,306,534
|
|
| | | | | | | | 4,286,681 | |
| Specialty Retail—0.1% | | | | | | | | |
| Rent-A-Center, Inc., 4.75% Sr. Unsec. Nts., 5/1/219 | | | 1,796,000 | | | | 1,670,280 | |
| Textiles, Apparel & Luxury Goods—0.1% | | | | | | | | |
| PVH Corp., 4.50% Sr. Unsec. Unsub. Nts., 12/15/22 | | | 1,755,000 | | | | 1,634,344 | |
| Consumer Staples—1.0% | | | | | | | | |
| Beverages—0.4% | | | | | | | | |
| Anheuser-Busch InBev Worldwide, Inc., 8.20% Sr. Unsec. Unsub. Nts., 1/15/39 | | | 1,366,000 | | | | 2,018,123 | |
| Coca-Cola HBC Finance BV, 5.125% Sr. Unsec. Unsub. Nts., 9/17/13 | | | 1,620,000 | | | | 1,622,351 | |
| Constellation Brands, Inc., 3.75% Sr. Unsec. Nts., 5/1/21 | | | 1,746,000 | | | | 1,619,415 | |
| Foster’s Finance Corp., 4.875% Sr. Unsec. Nts., 10/1/149 | | | 1,522,000 | | | | 1,587,907 | |
| SABMiller Holdings, Inc., 4.95% Sr. Unsec. Unsub. Nts., 1/15/42 | | | 850,000 | | |
| 852,127
|
|
| | | | | | | | 7,699,923 | |
| Food & Staples Retailing—0.2% | | | | | | | | |
| Delhaize Group, 5.70% Sr. Unsec. Nts., 10/1/40 | | | 930,000 | | | | 897,278 | |
| Safeway, Inc., 5.625% Sr. Unsec. Unsub. Nts., 8/15/14 | | | 1,663,000 | | | | 1,734,579 | |
| | | | |
| OPPENHEIMER CAPITAL INCOME FUND | | | 29 | |
CONSOLIDATED STATEMENT OF INVESTMENTS Continued
| | | | | | | | |
| | | Principal
Amount | | | Value | |
| Food & Staples Retailing Continued | | | | | | | | |
| Wal-Mart Stores, Inc., 4% Sr. Unsec. Unsub. Nts., 4/11/43 | | $ | 838,000 | | | $
| 751,729
|
|
| | | | | | | | 3,383,586 | |
| Food Products—0.2% | | | | | | | | |
| Bunge Ltd. Finance Corp.: | | | | | | | | |
| 5.10% Sr. Unsec. Unsub. Nts., 7/15/15 | | | 1,412,000 | | | | 1,505,926 | |
| 5.35% Sr. Unsec. Unsub. Nts., 4/15/14 | | | 208,000 | | | | 213,610 | |
| 8.50% Sr. Unsec. Nts., 6/15/19 | | | 1,120,000 | | |
| 1,362,593
|
|
| | | | | | | | 3,082,129 | |
| Personal Products—0.1% | | | | | | | | |
| Avon Products, Inc., 5% Sr. Unsec. Nts., 3/15/23 | | | 1,868,000 | | | | 1,861,894 | |
| Tobacco—0.1% | | | | | | | | |
| Altria Group, Inc., 10.20% Sr. Unsec. Nts., 2/6/39 | | | 913,000 | | | | 1,384,716 | |
| Lorillard Tobacco Co., 3.75% Sr. Unsec. Nts., 5/20/23 | | | 1,809,000 | | |
| 1,591,493
|
|
| | | | | | | | 2,976,209 | |
| Energy—3.1% | | | | | | | | |
| Energy Equipment & Services—0.3% | | | | | | | | |
| Ensco plc, 4.70% Sr. Unsec. Nts., 3/15/21 | | | 1,983,000 | | | | 2,097,086 | |
| Noble Holding International Ltd., 7.375% Sr. Unsec. Bonds, 3/15/14 | | | 1,388,000 | | | | 1,435,751 | |
| Rowan Cos., Inc., 4.875% Sr. Unsec. Unsub. Nts., 6/1/22 | | | 1,300,000 | | | | 1,329,136 | |
| Weatherford International Ltd/Bermuda, 4.50% Sr. Unsec. Unsub. Nts., 4/15/22 | | | 925,000 | | |
| 902,170
|
|
| | | | | | | | 5,764,143 | |
| Oil, Gas & Consumable Fuels—2.8% | | | | | | | | |
| Anadarko Petroleum Corp.: | | | | | | | | |
| 6.20% Sr. Unsec. Nts., 3/15/40 | | | 634,000 | | | | 717,412 | |
| 7.625% Sr. Unsec. Nts., 3/15/14 | | | 1,186,000 | | | | 1,228,007 | |
| Buckeye Partners LP, 4.15% Sr. Unsec. Unsub. Nts., 7/1/23 | | | 1,010,000 | | | | 970,188 | |
| Canadian Oil Sands Ltd., 6% Sr. Unsec. Nts., 4/1/429 | | | 770,000 | | | | 800,892 | |
| Cimarex Energy Co., 5.875% Sr. Unsec. Unsub. Nts., 5/1/22 | | | 1,590,000 | | | | 1,621,800 | |
| CNOOC Finance 2013 Ltd., 4.25% Sr. Unsec. Unsub. Nts., 5/9/43 | | | 605,000 | | | | 515,839 | |
| Concho Resources, Inc., 5.50% Sr. Unsec. Unsub. Nts., 4/1/23 | | | 1,725,000 | | | | 1,681,875 | |
| Continental Resources, Inc., 4.50% Sr. Unsec. Unsub. Nts., 4/15/23 | | | 1,892,000 | | | | 1,868,350 | |
Copano Energy LLC/Copano Energy Finance Corp.,
7.125% Sr. Unsec. Unsub. Nts., 4/1/21 | | | 3,113,000 | | | | 3,554,539 | |
| DCP Midstream LLC: | | | | | | | | |
| 5.375% Sr. Unsec. Nts., 10/15/159 | | | 1,290,000 | | | | 1,387,516 | |
| 5.85% Sec. Sub. Nts., 5/21/432 | | | 1,796,000 | | | | 1,674,770 | |
| DCP Midstream Operating LP: | | | | | | | | |
| 2.50% Sr. Unsec. Unsub. Nts., 12/1/17 | | | 1,575,000 | | | | 1,548,609 | |
| 3.875% Sr. Unsec. Nts., 3/15/23 | | | 907,000 | | | | 828,882 | |
| El Paso Pipeline Partners Operating Co. LLC, 4.70% Sr. Unsec. Nts., 11/1/42 | | | 815,000 | | | | 720,763 | |
| Enbridge Energy Partners LP, 5.35% Sr. Unsec. Nts., 12/15/14 | | | 1,201,000 | | | | 1,264,575 | |
| | |
| 30 | | OPPENHEIMER CAPITAL INCOME FUND |
| | | | | | | | |
| | | Principal
Amount | | | Value | |
| Oil, Gas & Consumable Fuels Continued | | | | | | | | |
| EnCana Holdings Finance Corp., 5.80% Sr. Unsec. Unsub. Nts., 5/1/14 | | $ | 779,000 | | | $ | 804,244 | |
| Energy Transfer Partners LP: | | | | | | | | |
| 4.65% Sr. Unsec. Unsub. Nts., 6/1/21 | | | 1,312,000 | | | | 1,345,927 | |
| 5.20% Sr. Unsec. Unsub. Nts., 2/1/22 | | | 465,000 | | | | 489,828 | |
| 8.50% Sr. Unsec. Nts., 4/15/14 | | | 1,180,000 | | | | 1,232,694 | |
| Lukoil International Finance BV, 6.125% Sr. Unsec. Nts., 11/9/209 | | | 14,000,000 | | | | 14,718,900 | |
| Range Resources Corp., 5.75% Sr. Unsec. Sub. Nts., 6/1/21 | | | 1,668,000 | | | | 1,755,570 | |
| Ras Laffan Liquefied Natural Gas Co. Ltd. III, 5.50% Sr. Sec. Nts., 9/30/149 | | | 1,466,000 | | | | 1,530,138 | |
| Rockies Express Pipeline LLC, 3.90% Sr. Unsec. Unsub. Nts., 4/15/159 | | | 1,681,000 | | | | 1,689,405 | |
| Southwestern Energy Co., 4.10% Sr. Unsec. Nts., 3/15/22 | | | 939,000 | | | | 922,188 | |
| Spectra Energy Partners LP, 4.60% Sr. Unsec. Nts., 6/15/21 | | | 1,078,000 | | | | 1,103,176 | |
| Talisman Energy, Inc.: | | | | | | | | |
| 5.125% Sr. Unsec. Unsub. Nts., 5/15/15 | | | 1,296,000 | | | | 1,373,321 | |
| 6.25% Sr. Unsec. Unsub. Nts., 2/1/38 | | | 499,000 | | | | 517,250 | |
| Williams Cos, Inc. (The), 3.70% Unsec. Unsub. Nts., 1/15/23 | | | 928,000 | | | | 833,908 | |
| Woodside Finance Ltd.: | | | | | | | | |
| 4.60% Sr. Unsec. Unsub. Nts., 5/10/219 | | | 1,390,000 | | | | 1,448,964 | |
| 5% Sr. Unsec. Nts., 11/15/139 | | | 1,829,000 | | |
| 1,843,050
|
|
| | | | | | | | 51,992,580 | |
| Financials—7.8% | | | | | | | | |
| Capital Markets—1.6% | | | | | | | | |
| Blackstone Holdings Finance Co. LLC, 6.625% Sr. Unsec. Nts., 8/15/199 | | | 2,385,000 | | | | 2,795,411 | |
| Carlyle Holdings II Finance LLC, 5.625% Unsec. Nts., 3/30/439 | | | 857,000 | | | | 797,302 | |
| Deutsche Bank AG, 4.296% Unsec. Sub. Nts., 5/24/28 | | | 1,801,000 | | | | 1,616,026 | |
| Goldman Sachs Capital, Inc. (The): | | | | | | | | |
| 4% Unsec. Sub. Nts., 6/1/434 | | | 5,993,000 | | | | 4,524,715 | |
| 6.345% Sub. Bonds, 2/15/34 | | | 1,710,000 | | | | 1,634,972 | |
| Goldman Sachs Group, Inc. (The), 2.90% Sr. Unsec. Nts., 7/19/18 | | | 3,164,000 | | | | 3,159,289 | |
| Macquarie Bank Ltd., 6.625% Unsec. Sub. Nts., 4/7/219 | | | 2,772,000 | | | | 2,980,086 | |
| Mellon Capital IV, 4% Perpetual Bonds4,11 | | | 6,000,000 | | | | 5,175,000 | |
| Morgan Stanley, 6.25% Sr. Unsec. Nts., 8/28/17 | | | 1,000,000 | | | | 1,129,156 | |
| Nomura Holdings, Inc., 2% Sr. Unsec. Nts., 9/13/16 | | | 3,361,000 | | | | 3,338,485 | |
| Raymond James Financial, Inc., 5.625% Sr. Unsec. Unsub. Nts., 4/1/24 | | | 1,477,000 | | | | 1,521,023 | |
| UBS Preferred Funding Trust V, 6.243% Jr. Sub. Perpetual Bonds, Series 111 | | | 1,192,000 | | |
| 1,259,050
|
|
| | | | | | | | 29,930,515 | |
| Commercial Banks—2.8% | | | | | | | | |
| Abbey National Treasury Services plc, 3.05% Sr. Unsec. Unsub. Nts., 8/23/18 | | | 2,664,000 | | | | 2,673,439 | |
| Amsouth Bank NA, 5.20% Unsec. Sub. Nts., 4/1/15 | | | 1,582,000 | | | | 1,668,194 | |
| Barclays Bank plc, 5.14% Unsec. Sub. Nts., 10/14/20 | | | 1,704,000 | | | | 1,768,229 | |
| BPCE SA, 1.70% Sr. Unsec. Nts., 4/25/16 | | | 2,799,000 | | | | 2,771,990 | |
| CIT Group, Inc., 5% Sr. Unsec. Nts., 8/1/23 | | | 1,820,000 | | | | 1,703,886 | |
| | | | |
| OPPENHEIMER CAPITAL INCOME FUND | | | 31 | |
CONSOLIDATED STATEMENT OF INVESTMENTS Continued
| | | | | | | | |
| | | Principal
Amount | | | Value | |
| Commercial Banks Continued | | | | | | | | |
| Fifth Third Cap Trust IV, 6.50% Jr. Unsec. Sub. Nts., 4/15/37 | | $ | 3,032,000 | | | $ | 3,020,630 | |
| HSBC Finance Capital Trust IX, 5.911% Unsec. Sub. Nts., 11/30/354 | | | 4,560,000 | | | | 4,645,500 | |
| LBG Capital No. 1 plc, 7.875% Unsec. Sub. Nts., 11/1/209 | | | 1,654,000 | | | | 1,765,645 | |
| Lloyds TSB Bank plc, 6.50% Unsec. Sub. Nts., 9/14/209 | | | 1,382,000 | | | | 1,503,221 | |
| PNC Financial Services Group, Inc., 4.85% Perpetual Bonds11 | | | 1,827,000 | | | | 1,612,328 | |
| Rabobank Capital Funding Trust III, 5.254% Perpetual Bonds9,11 | | | 2,765,000 | | | | 2,820,300 | |
| Regions Bank, 7.50% Unsec. Sub. Nts., 5/15/18 | | | 250,000 | | | | 292,608 | |
| Royal Bank of Scotland Group plc, 7.64% Jr. Sub. Perpetual Bonds, Serie U11 | | | 1,900,000 | | | | 1,710,000 | |
| Santander Holdings USA, Inc., 3.45% Sr. Unsec. Nts., 8/27/18 | | | 637,000 | | | | 645,075 | |
| Wachovia Capital Trust III, 5.57% Jr. Sub. Perpetual Nts.4,11 | | | 11,000,000 | | | | 10,450,000 | |
| Wells Fargo & Co., 7.98% Jr. Sub. Perpetual Bonds, Series K11 | | | 11,118,000 | | |
| 12,452,160
|
|
| | | | | | | | 51,503,205 | |
| Consumer Finance—0.3% | | | | | | | | |
| Ally Financial, Inc., 3.50% Sr. Unsec. Nts., 7/18/16 | | | 1,752,000 | | | | 1,767,330 | |
| Discover Financial Services, 3.85% Sr. Unsec. Unsub. Nts., 11/21/22 | | | 2,031,000 | | | | 1,915,605 | |
| National Rural Utilities Cooperative Finance Corp., 4.75% Sr. Unsec. Sub. Nts., 4/30/43 | | | 941,000 | | |
| 875,130
|
|
| | | | | | | | 4,558,065 | |
| Diversified Financial Services—1.0% | | | | | | | | |
| Bank of America Corp., 5.20% Perpetual Bonds11 | | | 1,801,000 | | | | 1,607,393 | |
| Citigroup, Inc.: | | | | | | | | |
| 1.70% Sr. Unsec. Unsub. Nts., 7/25/16 | | | 2,932,000 | | | | 2,931,953 | |
| 5.95% Jr. Sub. Perpetual Bonds, Series D11 | | | 1,708,000 | | | | 1,624,735 | |
| ING US, Inc., 5.65% Unsec. Sub. Nts., 5/15/53 | | | 1,880,000 | | | | 1,740,087 | |
| Jefferies Group, Inc., 5.125% Sr. Unsec. Nts., 1/20/23 | | | 903,000 | | | | 905,719 | |
| JPMorgan Chase & Co., 7.90% Jr. Sub. Perpetual Bonds, Series 111 | | | 7,833,000 | | | | 8,644,342 | |
| Merrill Lynch & Co., Inc., 7.75% Jr. Sub. Nts., 5/14/38 | | | 1,438,000 | | |
| 1,729,510
|
|
| | | | | | | | 19,183,739 | |
| Insurance—1.7% | | | | | | | | |
| Allstate Corp., 5.75% Unsec. Sub. Nts., 8/15/53 | | | 1,760,000 | | | | 1,736,900 | |
| CNA Financial Corp.: | | | | | | | | |
| 5.75% Sr. Unsec. Unsub. Nts., 8/15/21 | | | 1,671,000 | | | | 1,867,892 | |
| 5.875% Sr. Unsec. Unsub. Bonds, 8/15/20 | | | 851,000 | | | | 962,118 | |
| Gulf South Pipeline Co. LP, 5.05% Sr. Unsec. Nts., 2/1/159 | | | 1,490,000 | | | | 1,555,554 | |
| Liberty Mutual Group, Inc., 4.25% Sr. Unsec. Nts., 6/15/239 | | | 1,436,000 | | | | 1,385,354 | |
| Lincoln National Corp., 6.05% Jr. Unsec. Sub. Bonds, 4/20/67 | | | 3,080,000 | | | | 3,064,600 | |
| Marsh & McLennan Cos., Inc., 5.375% Nts., 7/15/14 | | | 356,000 | | | | 370,021 | |
| MetLife, Inc., 10.75% Jr. Sub. Nts., 8/1/39 | | | 10,000,000 | | | | 14,850,000 | |
| Prudential Financial, Inc., 5.20% Jr. Sub. Nts., 3/15/44 | | | 1,281,000 | | | | 1,159,305 | |
| | |
| 32 | | OPPENHEIMER CAPITAL INCOME FUND |
| | | | | | | | |
| | | Principal
Amount | | | Value | |
| Insurance Continued | | | | | | | | |
| QBE Insurance Group Ltd., 2.40% Sr. Unsec. Nts., 5/1/189 | | $ | 2,089,000 | | | $ | 2,007,671 | |
| Swiss Re Capital I LP, 6.854% Jr. Sub. Perpetual Bonds9,11 | | | 2,955,000 | | |
| 3,102,750
|
|
| | | | | | | | 32,062,165 | |
| Real Estate Investment Trusts (REITs)—0.4% | | | | | | | | |
| American Tower Corp.: | | | | | | | | |
| 5.05% Sr. Unsec. Unsub. Nts., 9/1/20 | | | 861,000 | | | | 892,079 | |
| 7% Sr. Unsec. Nts., 10/15/17 | | | 1,409,000 | | | | 1,603,026 | |
| Corrections Corp. of America, 4.125% Sr. Unsec. Nts., 4/1/20 | | | 645,000 | | | | 609,525 | |
| Hospitality Properties Trust, 5.125% Sr. Unsec. Nts., 2/15/15 | | | 1,497,000 | | | | 1,546,069 | |
| Host Hotels & Resorts, Inc., 3.75% Sr. Unsec. Nts., 10/15/23 | | | 1,207,000 | | | | 1,104,226 | |
| National Retail Properties, Inc., 6.25% Sr. Unsec. Unsub. Nts., 6/15/14 | | | 1,115,000 | | |
| 1,158,767
|
|
| | | | | | | | 6,913,692 | |
| Health Care—0.5% | | | | | | | | |
| Biotechnology—0.1% | | | | | | | | |
| Celgene Corp., 3.25% Sr. Unsec. Nts., 8/15/22 | | | 2,031,000 | | | | 1,908,108 | |
| Gilead Sciences, Inc., 5.65% Sr. Unsec. Unsub. Nts., 12/1/41 | | | 920,000 | | |
| 1,016,045
|
|
| | | | | | | | 2,924,153 | |
| Health Care Equipment & Supplies—0.1% | | | | | | | | |
| Boston Scientific Corp., 4.125% Sr. Unsec. Unsub. Nts., 10/1/23 | | | 1,751,000 | | | | 1,714,301 | |
| Health Care Providers & Services—0.1% | | | | | | | | |
| McKesson Corp., 6% Sr. Unsec. Unsub. Nts., 3/1/41 | | | 854,000 | | | | 993,161 | |
| Pharmaceuticals—0.2% | | | | | | | | |
| Hospira, Inc., 5.20% Sr. Unsec. Nts., 8/12/20 | | | 1,656,000 | | | | 1,663,265 | |
| Mallinckrodt International Finance SA, 3.50% Sr. Unsec. Unsub. Nts., 4/15/189 | | | 813,000 | | | | 794,920 | |
| Zoetis, Inc.: | | | | | | | | |
| 1.875% Sr. Unsec. Nts., 2/1/189 | | | 604,000 | | | | 592,487 | |
| 4.70% Sr. Unsec. Nts., 2/1/439 | | | 903,000 | | |
| 849,143
|
|
| | | | | | | | 3,899,815 | |
| Industrials—1.0% | | | | | | | | |
| Aerospace & Defense—0.2% | | | | | | | | |
| BE Aerospace, Inc., 5.25% Sr. Unsec. Unsub. Nts., 4/1/22 | | | 1,652,000 | | | | 1,643,740 | |
| Huntington Ingalls Industries, Inc., 7.125% Sr. Unsec. Unsub. Nts., 3/15/21 | | | 1,584,000 | | |
| 1,718,640
|
|
| | | | | | | | 3,362,380 | |
| Building Products—0.1% | | | | | | | | |
| Owens Corning, 4.20% Sr. Unsec. Nts., 12/15/22 | | | 1,363,000 | | | | 1,318,779 | |
| Commercial Services & Supplies—0.1% | | | | | | | | |
| Clean Harbors, Inc., 5.25% Sr. Unsec. Unsub. Nts., 8/1/20 | | | 1,786,000 | | | | 1,772,605 | |
| Industrial Conglomerates—0.1% | | | | | | | | |
| General Electric Capital Corp., 5.25% Perpetual Bonds11 | | | 1,865,000 | | | | 1,715,800 | |
| | | | |
| OPPENHEIMER CAPITAL INCOME FUND | | | 33 | |
CONSOLIDATED STATEMENT OF INVESTMENTS Continued
| | | | | | | | |
| | | Principal
Amount | | | Value | |
| Machinery—0.2% | | | | | | | | |
| CNH Capital LLC, 6.25% Sr. Unsec. Nts., 11/1/16 | | $ | 1,707,000 | | | $ | 1,869,165 | |
| Ingersoll-Rand Global Holding Co. Ltd., 4.25% Sr. Unsec. Nts., 6/15/239 | | | 2,404,000 | | | | 2,361,716 | |
| ITT Corp., 7.375% Unsec. Debs., 11/15/15 | | | 638,000 | | |
| 716,190
|
|
| | | | | | | | 4,947,071 | |
| Professional Services—0.1% | | | | | | | | |
| Nielsen Finance LLC/Nielsen Finance Co., 4.50% Sr. Unsec. Nts., 10/1/20 | | | 1,805,000 | | | | 1,723,775 | |
| Road & Rail—0.1% | | | | | | | | |
| Kansas City Southern Railway, 4.30% Sr. Unsec. Nts., 5/15/439 | | | 696,000 | | | | 614,807 | |
| Penske Truck Leasing Co. LP/PTL Finance Corp.: | | | | | | | | |
| 2.50% Sr. Nts., 7/11/149 | | | 1,660,000 | | | | 1,680,345 | |
| 4.25% Sr. Unsec. Nts., 1/17/239 | | | 865,000 | | |
| 829,188
|
|
| | | | | | | | 3,124,340 | |
| Trading Companies & Distributors—0.1% | | | | | | | | |
| International Lease Finance Corp., 5.875% Sr. Unsec. Unsub. Nts., 4/1/19 | | | 1,638,000 | | | | 1,667,681 | |
| Information Technology—0.6% | | | | | | | | |
| Computers & Peripherals—0.2% | | | | | | | | |
| Hewlett-Packard Co.: | | | | | | | | |
| 2.65% Sr. Unsec. Unsub. Nts., 6/1/16 | | | 2,988,000 | | | | 3,053,894 | |
| 4.75% Sr. Unsec. Nts., 6/2/14 | | | 875,000 | | |
| 899,352
|
|
| | | | | | | | 3,953,246 | |
| Electronic Equipment, Instruments & Components—0.3% | | | | | | | | |
| Amphenol Corp., 4.75% Sr. Unsec. Unsub. Nts., 11/15/14 | | | 449,000 | | | | 469,250 | |
| Arrow Electronics, Inc., 5.125% Sr. Unsec. Unsub. Nts., 3/1/21 | | | 2,032,000 | | | | 2,091,999 | |
| Avnet, Inc., 4.875% Sr. Unsec. Unsub. Nts., 12/1/22 | | | 2,120,000 | | |
| 2,095,270
|
|
| | | | | | | | 4,656,519 | |
| IT Services—0.0% | | | | | | | | |
| Fidelity National Information Services, Inc., 3.50% Sr. Unsec. Nts., 4/15/23 | | | 855,000 | | | | 773,055 | |
| Office Electronics—0.1% | | | | | | | | |
| Xerox Corp., 4.25% Sr. Unsec. Unsub. Nts., 2/15/15 | | | 1,708,000 | | | | 1,782,045 | |
| Materials—1.1% | | | | | | | | |
| Chemicals—0.2% | | | | | | | | |
| Dow Chemical Co. (The), 8.55% Sr. Unsec. Unsub. Nts., 5/15/19 | | | 1,073,000 | | | | 1,364,939 | |
| LYB International Finance BV, 5.25% Sr. Unsec. Unsub. Nts., 7/15/43 | | | 558,000 | | | | 557,703 | |
| RPM International, Inc., 3.45% Sr. Unsec. Unsub. Nts., 11/15/22 | | | 912,000 | | | | 852,052 | |
| Sherwin-Williams Co. (The), 4% Sr. Unsec. Unsub. Nts., 12/15/42 | | | 1,032,000 | | |
| 918,717
|
|
| | | | | | | | 3,693,411 | |
| Containers & Packaging—0.2% | | | | | | | | |
| Crown Americas LLC/Crown Americas Capital Corp. III, 6.25% Sr. Unsec. Nts., 2/1/21 | | | 1,562,000 | | | | 1,647,910 | |
| | |
| 34 | | OPPENHEIMER CAPITAL INCOME FUND |
| | | | | | | | |
| | | Principal
Amount | | | Value | |
| Containers & Packaging Continued | | | | | | | | |
| Rock Tenn Co., 3.50% Sr. Unsec. Unsub. Nts., 3/1/20 | | $ | 1,712,000 | | | $
| 1,665,079
|
|
| | | | | | | | 3,312,989 | |
| Metals & Mining—0.5% | | | | | | | | |
| Allegheny Technologies, Inc., 5.95% Sr. Unsec. Unsub. Nts., 1/15/21 | | | 968,000 | | | | 996,749 | |
| Barrick Gold Corp., 3.85% Sr. Unsec. Unsub. Nts., 4/1/22 | | | 845,000 | | | | 747,849 | |
| Carpenter Technology Corp., 4.45% Sr. Unsec. Unsub. Nts., 3/1/23 | | | 595,000 | | | | 576,917 | |
| Cliffs Natural Resources, Inc., 3.95% Sr. Unsec. Unsub. Nts., 1/15/18 | | | 1,590,000 | | | | 1,555,491 | |
| Freeport-McMoRan Copper & Gold, Inc.: | | | | | | | | |
| 1.40% Sr. Unsec. Unsub. Nts., 2/13/15 | | | 1,800,000 | | | | 1,801,714 | |
| 3.875% Sr. Unsec. Nts., 3/15/239 | | | 1,795,000 | | | | 1,601,398 | |
| Xstrata Canada Corp.: | | | | | | | | |
| 5.375% Sr. Unsec. Unsub. Nts., 6/1/15 | | | 1,190,000 | | | | 1,254,010 | |
| 6% Sr. Unsec. Unsub. Nts., 10/15/15 | | | 1,317,000 | | |
| 1,416,739
|
|
| | | | | | | | 9,950,867 | |
| Paper & Forest Products—0.2% | | | | | | | | |
| Georgia-Pacific LLC, 3.734% Unsec. Nts., 7/15/239 | | | 1,332,000 | | | | 1,294,432 | |
| International Paper Co., 6% Sr. Unsec. Unsub. Nts., 11/15/41 | | | 1,355,000 | | |
| 1,468,309
|
|
| | | | | | | | 2,762,741 | |
| Telecommunication Services—2.0% | | | | | | | | |
| Diversified Telecommunication Services—0.8% | | | | | | | | |
| AT&T, Inc., 6.30% Sr. Unsec. Unsub. Nts., 1/15/38 | | | 2,197,000 | | | | 2,446,010 | |
| British Telecommunications plc, 9.625% Bonds, 12/15/30 | | | 1,076,000 | | | | 1,625,186 | |
| CenturyLink, Inc., 5.625% Sr. Unsec. Unsub. Nts., 4/1/20 | | | 1,621,000 | | | | 1,596,685 | |
| Frontier Communications Corp., 8.50% Sr. Unsec. Nts., 4/15/20 | | | 1,551,000 | | | | 1,702,223 | |
| Koninklijke KPN NV, 7% Sr. Unsec. Sub. Nts., 3/28/739 | | | 1,700,000 | | | | 1,705,003 | |
| MetroPCS Wireless, Inc., 6.25% Sr. Unsec. Unsub. Nts., 4/1/219 | | | 1,730,000 | | | | 1,732,163 | |
| Telecom Italia Capital SA, 7.721% Sr. Unsec. Unsub. Nts., 6/4/38 | | | 1,480,000 | | | | 1,460,390 | |
| Telefonica Emisiones SAU, 7.045% Sr. Unsec. Unsub. Nts., 6/20/36 | | | 1,079,000 | | | | 1,148,593 | |
| Verizon Communications, Inc., 6.40% Sr. Unsec. Nts., 2/15/38 | | | 859,000 | | |
| 965,571
|
|
| | | | | | | | 14,381,824 | |
| Wireless Telecommunication Services—1.2% | | | | | | | | |
| America Movil SAB de CV, 4.375% Sr. Unsec. Unsub. Nts., 7/16/42 | | | 1,368,000 | | | | 1,101,869 | |
| CC Holdings GS V LLC/Crown Castle GS III Corp., 3.849% Sr. Sec. Nts., 4/15/23 | | | 946,000 | | | | 877,109 | |
| Clearwire Communications LLC/Clearwire Finance, 12% Sr. Sec. Nts., 12/1/159 | | | 19,000,000 | | | | 20,092,500 | |
| Vodafone Group plc, 4.375% Sr. Unsec. Unsub. Nts., 2/19/43 | | | 530,000 | | |
| 469,302
|
|
| | | | | | | | 22,540,780 | |
| Utilities—1.1% | | | | | | | | |
| Electric Utilities—0.5% | | | | | | | | |
| Edison International, 3.75% Sr. Unsec. Unsub. Nts., 9/15/17 | | | 1,896,000 | | | | 1,991,274 | |
| | | | |
| OPPENHEIMER CAPITAL INCOME FUND | | | 35 | |
CONSOLIDATED STATEMENT OF INVESTMENTS Continued
| | | | | | | | |
| | | Principal
Amount | | | Value | |
| Electric Utilities Continued | | | | | | | | |
| Electricite de France SA, 5.25% Jr. Sub. Perpetual Bonds4,9,11 | | $ | 1,371,000 | | | $ | 1,287,643 | |
| Exelon Generation Co. LLC, 4.25% Sr. Unsec. Unsub. Nts., 6/15/22 | | | 938,000 | | | | 919,535 | |
| FirstEnergy Corp., 2.75% Sr. Unsec. Unsub. Nts., 3/15/18 | | | 978,000 | | | | 938,299 | |
| ITC Holdings Corp., 5.30% Sr. Unsec. Unsub. Nts., 7/1/43 | | | 791,000 | | | | 785,882 | |
| Jersey Central Power & Light Co., 4.70% Sr. Unsec. Nts., 4/1/249 | | | 888,000 | | | | 889,136 | |
| PPL Capital Funding, Inc., 3.50% Sr. Unsec. Unsub. Nts., 12/1/22 | | | 1,293,000 | | | | 1,233,450 | |
| PPL WEM Holdings plc, 5.375% Sr. Unsec. Unsub. Nts., 5/1/219 | | | 1,685,000 | | |
| 1,812,988
|
|
| | | | | | | | 9,858,207 | |
| Energy Traders—0.5% | | | | | | | | |
| Calpine Corp., 7.25% Sr. Sec. Nts., 10/15/179 | | | 7,848,000 | | | | 8,220,780 | |
| TransAlta Corp., 5.75% Sr. Unsec. Nts., 12/15/13 | | | 1,575,000 | | |
| 1,595,686
|
|
| | | | | | | | 9,816,466 | |
| Multi-Utilities—0.1% | | | | | | | | |
| CMS Energy Corp., 5.05% Sr. Unsec. Unsub. Nts., 3/15/22 | | | 661,000 | | | | 710,555 | |
| Virginia Electric & Power Co., 4.65% Sr. Unsec. Nts., 8/15/43 | | | 703,000 | | |
| 707,167
|
|
| | | | | | |
| 1,417,722
|
|
| Total Non-Convertible Corporate Bonds and Notes (Cost $366,046,337) | | | | | | | 369,906,349 | |
| Convertible Corporate Bonds and Notes—1.3% | | | | | | | | |
| Amylin Pharmaceuticals, Inc., 3% Cv. Sr. Unsec. Nts., 6/15/14 | | | 13,000,000 | | | | 13,194,988 | |
| General Cable Corp., 4.50% Cv. Unsec. Sub. Nts., 11/15/294 | | | 4,925,000 | | | | 5,414,422 | |
| LifePoint Hospitals, Inc., 3.50% Cv. Sr. Unsec. Sub. Nts., 5/15/14 | | | 5,000,000 | | | | 5,309,375 | |
| SEACOR Holdings, Inc., 2.50% Cv. Sr. Unsec. Unsub. Nts., 12/15/279 | | | 1,000,000 | | |
| 1,157,500
|
|
| Total Convertible Corporate Bonds and Notes (Cost $23,584,700) | | | | | | | 25,076,285 | |
| Corporate Loans—1.4% | | | | | | | | |
| Dynegy, Inc., Sr. Sec. Credit Facilities 1st Lien Term Loan, Tranche B2, 4%, 4/23/204,8 | | | 7,375,000 | | | | 7,344,578 | |
| Paperweight Development Corp., Sr. Sec. Credit Facilities 1st Lien Term Loan, 6.658%, 6/28/194 | | | 18,000,000 | | |
| 18,000,000
|
|
| Total Corporate Loans (Cost $25,158,125) | | | | | | | 25,344,578 | |
| Event-Linked Bonds—0.3% | | | | | | | | |
| Calypso Capital Ltd. Catastrophe Linked Nts., Series 2010-1, Cl. A, 3.722%, 1/10/144,9 | | | 2,041,000 | | | | 2,695,869 | |
| Foundation Re III Ltd. Catastrophe Linked Nts., Series 1-A, 5.75%, 2/3/144,9 | | | 2,100,000 | | |
| 2,104,620
|
|
| Total Event-Linked Bonds (Cost $4,929,048) | | | | | | | 4,800,489 | |
| | |
| 36 | | OPPENHEIMER CAPITAL INCOME FUND |
| | | | | | | | | | | | | | | | |
| | | | |
| | | Expiration
Date | | | Strike
Price | | | Contracts | | | Value | |
| Exchange-Traded Option Purchased—0.0% | | | | | | | | | | | | | | | | |
| Standard & Poor’s 500 Index (The) Call1 (Cost $755,823) | | | 10/18/13 | | | $ | 1,760.00 | | | | 600 | | | $ | 55,800 | |
| Over-the-Counter Option Purchased—0.0% | | | | | | | | | | | | | | | | |
| Japanese Yen (JPY) Put1 (Cost $390,000) | | | 5/27/14 | | |
| 1 USD per
120.00 JPY |
| | | 6,000,000,000 | | | | 84,060 | |
| | | | |
| | | | | | | | | Notional
Amount | | | | |
| Over-the-Counter Interest Rate Swaptions Purchased—0.6% | | | | | | | |
| Goldman Sachs International; Interest Rate Swaption (European); Swap Terms: Paid: 1.87%; Received: Six-Month JPY BBA LIBOR; Termination Date: 1/25/261 | | | 1/22/16 | | | | | | | | 5,406,000,000 | JPY | | | 986,405 | |
| JPMorgan Chase Bank NA; Interest Rate Swaption (European); Swap Terms: Paid: 3.373%; Received: Three-Month USD BBA LIBOR; Termination Date: 4/27/261 | | | 4/26/16 | | | | | | | | 30,000,000 | | | | 2,540,866 | |
| JPMorgan Chase Bank NA; Interest Rate Swaption (European); Swap Terms: Paid: 3.41%; Received: Three-Month USD BBA LIBOR; Termination Date: 4/13/261 | | | 4/12/16 | | | | | | | | 33,000,000 | | | | 2,707,537 | |
| JPMorgan Chase Bank NA; Interest Rate Swaption (European); Swap Terms: Paid: 3.4675%; Received: Three-Month USD BBA LIBOR; Termination Date: 4/13/261 | | | 4/12/16 | | | | | | | | 33,000,000 | | | | 2,614,465 | |
| JPMorgan Chase Bank NA; Interest Rate Swaption (European); Swap Terms: Paid: 4.50%; Received: Three-Month BBA LIBOR; Termination Date: 2/28/271 | | | 2/27/17 | | | | | | | | 50,000,000 | | |
| 2,677,804
|
|
| Total Over-the-Counter Interest Rate Swaptions Purchased (Cost $6,804,593) | | | | 11,527,077 | |
| | | | |
| | | | | | | | | Shares | | | | |
| Investment Companies—24.0% | | | | | | | | | | | | |
| Oppenheimer Institutional Money Market Fund, Cl. E, 0.10%12,13 | | | | | | | | | | | 220,971,754 | | | | 220,971,754 | |
| Oppenheimer Master Loan Fund, LLC12 | | | | | | | | | | | 13,905,007 | | | | 191,524,774 | |
| Oppenheimer Short Duration Fund, Cl. Y12 | | | | | | | | | | | 3,024,126 | | | | 30,301,737 | |
| SPDR Gold Trust | | | | | | | | | | | 16,000 | | |
| 2,153,920
|
|
| Total Investment Companies (Cost $445,384,772) | | | | | | | | 444,952,185 | |
| Total Investments, at Value (Cost $1,897,913,668) | | | | 109.4 | % | | | 2,028,954,952 | |
| Liabilities in Excess of Other Assets | | | | (9.4 | ) | | | (174,566,045 | ) |
| | | | | | | | | | |
|
|
| |
|
|
|
| Net Assets | | | | | | | | | | | 100.0 | % | | $ | 1,854,388,907 | |
| | | | | | | | | | |
|
|
| |
|
|
|
| | | | |
| OPPENHEIMER CAPITAL INCOME FUND | | | 37 | |
CONSOLIDATED STATEMENT OF INVESTMENTS Continued
Footnotes to Consolidated Statement of Investments
*August 30, 2013 represents the last business day of the Fund’s 2013 fiscal year. See Note 1 of accompanying Consolidated Notes.
Notional amount and strike price are reported in U.S. Dollars, except for those denoted in the following currency:
1. Non-income producing security.
2. Restricted security. The aggregate value of restricted securities as of August 30, 2013 was $92,228,585, which represents 4.97% of the Fund’s net assets. See Note 7 of the accompanying Consolidated Notes. Information concerning restricted securities is as follows:
| | | | | | | | | | | | | | | | | | | | |
| Security | | Acquisition
Dates | | Cost | | Value | | Unrealized
Appreciation
(Depreciation) |
| Aircraft Lease Securitisation Ltd., Airplane Asset-Backed Securities, Series 2007-1A, Cl. G3, 0.446%,5/10/32 | | | | 5/14/13-7/19/13 | | | | $ | 27,476,056 | | | | $ | 27,445,088 | | | | $ | (30,968 | ) |
| Airspeed Ltd., Airplane Receivables, Series 2007-1A, Cl. G1, 0.454%, 6/15/32 | | | | 7/28/10-10/21/10 | | | | | 25,776,673 | | | | | 24,230,439 | | | | | (1,546,234 | ) |
| Airspeed Ltd., Airplane Receivables, Series 2007-1A, Cl. G2, 0.464%, 6/15/32 | | | | 4/8/11 | | | | | 9,221,804 | | | | | 8,386,984 | | | | | (834,820 | ) |
| Blade Engine Securitization Ltd., Airplane Receivables, Series 2006-1AW, Cl. A1, 0.484%, 9/15/41 | | | | 4/19/13-5/29/13 | | | | | 17,644,988 | | | | | 17,358,227 | | | | | (286,761 | ) |
Blade Engine Securitization Ltd., Asset-Backed Certificates,
Series 2006-1A, Cl. B, 3.184%, 9/15/41 | | | | 11/10/09 | | | | | 5,857,662 | | | | | 6,517,272 | | | | | 659,610 | |
| Bond Street Holdings LLC, Cl. A | | | | 11/4/09 | | | | | 5,700,000 | | | | | 3,990,000 | | | | | (1,710,000 | ) |
| DCP Midstream LLC, 5.85% Sec. Sub. Nts., 5/21/43 | | | | 5/16/13 | | | | | 1,802,050 | | | | | 1,674,770 | | | | | (127,280 | ) |
| Morgan Stanley, Re-Securitized Real Estate Mtg. Investment Conduit Multiclass Pass-Through Certificates, Series 2012-R3, Cl. 1B, 2.366%, 11/1/36 | | | | 10/24/12 | | | | | 984,571 | | | | | 1,030,988 | | | | | 46,417 | |
| Ras Propack Lamipack Ltd., Collateralized Debt Obligations, Series 2005-1A, Cl. G, 0.672%, 3/20/24 | | | | 6/11/13 | | | | | 972,517 | | | | | 966,692 | | | | | (5,825 | ) |
| Santander Drive Auto Receivables Trust 2011-S1A, Automobile Receivables Nts., Series 2011-S1A, Cl. D, 3.10%, 5/15/17 | | | | 2/4/11-2/9/12 | | | | | 109,081 | | | | | 109,089 | | | | | 8 | |
| Santander Drive Auto Receivables Trust 2011-S2A, Automobile Receivables Nts., Series 2011-S2A, Cl. D, 3.35%, 6/15/17 | | | | 5/19/11-4/9/13 | | | | | 517,694 | | | | | 519,036 | | | | | 1,342 | |
| | | | | | | | |
|
|
|
| | | | | | | | | $ | 96,063,096 | | | | $ | 92,228,585 | | | | $ | (3,834,511 | ) |
| | | | | | | | |
|
|
|
3. All or a portion of the security position is held in accounts at a futures clearing merchant and pledged to cover margin requirements on open futures contracts and written options on futures, if applicable. The aggregate market value of such securities is $381,010. See Note 6 of the accompanying Consolidated Notes.
4. Represents the current interest rate for a variable or increasing rate security.
5. Interest-Only Strips represent the right to receive the monthly interest payments on an underlying pool of mortgage loans or other receivables. These securities typically decline in price as interest rates decline. Most other fixed income securities increase in price when interest rates decline. The principal amount of the underlying pool represents the notional amount on which current interest is calculated. The price of these securities is typically more sensitive to changes in prepayment rates than traditional mortgage or asset-backed securities (for example, GNMA pass-throughs). Interest rates disclosed represent current yields based upon the current cost basis and estimated timing and amount of future cash flows. These securities amount to $14,183,299 or 0.76% of the Fund’s net assets as of August 30, 2013.
| | |
| 38 | | OPPENHEIMER CAPITAL INCOME FUND |
Footnotes to Consolidated Statement of Investments Continued
6. The current amortization rate of the security’s cost basis exceeds the future interest payments currently estimated to be received. Both the amortization rate and interest payments are contingent on future mortgage pre-payment speeds and are therefore subject to change.
7. Principal-Only Strips represent the right to receive the monthly principal payments on an underlying pool of mortgage loans. The value of these securities generally increases as interest rates decline and prepayment rates rise. The price of these securities is typically more volatile than that of coupon-bearing bonds of the same maturity. Interest rates disclosed represent current yields based upon the current cost basis and estimated timing of future cash flows. These securities amount to $237,745 or 0.01% of the Fund’s net assets as of August 30, 2013.
8. All or a portion of the security position is when-issued or delayed delivery to be delivered and settled after August 30, 2013. See Note 1 of the accompanying Consolidated Notes.
9. Represents securities sold under Rule 144A, which are exempt from registration under the Securities Act of 1933, as amended. These securities have been determined to be liquid under guidelines established by the Board of Trustees. These securities amount to $139,242,866 or 7.51% of the Fund’s net assets as of August 30, 2013.
10. All or a portion of the security position is held in segregated accounts and pledged to cover margin requirements under certain derivative contracts. The aggregate market value of such securities is $281,401. See Note 6 of the accompanying Consolidated Notes.
11. This bond has no contractual maturity date, is not redeemable and contractually pays an indefinite stream of interest. Rate reported represents the current interest rate for this variable rate security.
12. Is or was an affiliate, as defined in the Investment Company Act of 1940, at or during the period ended August 30, 2013, by virtue of the Fund owning at least 5% of the voting securities of the issuer or as a result of the Fund and the issuer having the same investment adviser. Transactions during the period in which the issuer was an affiliate are as follows:
| | | | | | | | | | | | | | | | | | | | |
| | | Shares
August 31, 2012 | | Gross
Additions | | Gross
Reductions | | Shares
August 30, 2013 |
| H.J. Heinz Finance Co., 8% Cum., Series B | | | | 295 | | | | | — | | | | | 295 | a | | | | — | |
| Oppenheimer Institutional Money Market Fund, Cl. E | | | | 206,909,741 | | | | | 464,746,767 | | | | | 450,684,754 | | | | | 220,971,754 | |
| Oppenheimer Master Loan Fund, LLC | | | | 11,000,141 | | | | | 2,904,866 | | | | | — | | | | | 13,905,007 | |
| Oppenheimer Short Duration Fund, Cl. Y | | | | 2,011,498 | | | | | 1,012,628 | | | | | — | | | | | 3,024,126 | |
| | | | |
| | | | | Value | | Income | | Realized
Gain (Loss) |
| H.J. Heinz Finance Co., 8% Cum., Series B | | | | | | | | $ | — | | | | $ | 2,360,000 | | | | $ | (1,305,002 | ) |
| Oppenheimer Institutional Money Market Fund, Cl. E | | | | | | | | | 220,971,754 | | | | | 353,293 | | | | | — | |
| Oppenheimer Master Loan Fund, LLC | | | | | | | | | 191,524,774 | | | | | 10,664,633 | b | | | | 2,522,884 | b |
| Oppenheimer Short Duration Fund, Cl. Y | | | | | | | | | 30,301,737 | | | | | 125,443 | | | | | — | |
| | | | | | | | |
|
|
|
| | | | | | | | | $ | 442,798,265 | | | | $ | 13,503,369 | | | | $ | 1,217,882 | |
| | | | | | | | |
|
|
|
a. All or a portion is the result of a corporate action.
b. Represents the amount allocated to the Fund from Oppenheimer Master Loan Fund, LLC.
13. Rate shown is the 7-day yield as of August 30, 2013.
| | | | | | | | | | | | | | | | | | | | | | | | | | | | | | |
| Forward Currency Exchange Contracts as of August 30, 2013 are as follows: |
Counterparty/Contract
Description | | Buy/Sell | | Contract Amount
(000’s) | | Expiration
Date | | Value | | Unrealized
Appreciation | | Unrealized
Depreciation |
| Citibank NA | | | | | | | | | | | | | | | | | | | | | | | | | | | | | | |
| Euro (EUR) | | | | Sell | | | | | 10,000 | EUR | | | | 9/30/13 | | | | $ | 13,217,722 | | | | $ | — | | | | $ | 175,672 | |
| State Street Bank | | | | | | | | | | | | | | | | | | | | | | | | | | | | | | |
| Euro (EUR) | | | | Sell | | | | | 2,050 | EUR | | | | 11/18/13 | | | | | 2,710,196 | | | | | 8,301 | | | | | — | |
| | | | | | | | | | | | | | | | | | | | | | | |
|
|
|
| Total unrealized appreciation and depreciation | | | | | | | | | | | | | | $ | 8,301 | | | | $ | 175,672 | |
| | | | | | | | | | | | | | | | | | | | | | | |
|
|
|
| | | | |
| OPPENHEIMER CAPITAL INCOME FUND | | | 39 | |
CONSOLIDATED STATEMENT OF INVESTMENTS Continued
Footnotes to Consolidated Statement of Investments Continued
| | | | | | | | | | | | | | | | | | | | | | | | | |
| Futures Contracts as of August 30, 2013 are as follows: |
| Contract Description | | Buy/Sell | | Number of
Contracts | | Expiration
Date | | Value | | Unrealized
Appreciation
(Depreciation) |
| Corn | | | | Buy | | | | | 80 | | | | | 12/13/13 | | | | $ | 1,928,000 | | | | | $(262,090 | ) |
| Euro BTP | | | | Sell | | | | | 220 | | | | | 9/6/13 | | | | | 32,475,318 | | | | | (82,751 | ) |
| Soybean | | | | Buy | | | | | 32 | | | | | 11/14/14 | | | | | 1,941,200 | | | | | (25,201 | ) |
| U.S. Long Bonds | | | | Buy | | | | | 216 | | | | | 12/19/13 | | | | | 28,491,750 | | | | | 316,124 | |
| U.S. Treasury Nts., 2 yr. | | | | Sell | | | | | 31 | | | | | 12/31/13 | | | | | 6,812,250 | | | | | 1,232 | |
| U.S. Treasury Nts., 5 yr. | | | | Sell | | | | | 487 | | | | | 12/31/13 | | | | | 58,284,008 | | | | | (124,760 | ) |
| U.S. Treasury Nts., 10 yr. | | | | Buy | | | | | 32 | | | | | 12/19/13 | | | | | 3,977,000 | | | | | (2,128 | ) |
| U.S. Treasury Ultra Bonds | | | | Buy | | | | | 158 | | | | | 12/19/13 | | | | | 22,416,250 | | | | | 647,205 | |
| | | | | | | | | | | | | | | | | | | | | | | |
|
|
|
| | | | | | | | | | | | | | | | | | | | | | | | | $467,631 | |
| | | | | | | | | | | | | | | | | | | | | | | |
|
|
|
| | | | | | | | | | | | | | | | | | | | | | | | | | | | | | | | | | | |
| Over-the-Counter Credit Default Swaps as of August 30, 2013 are as follows: |
Reference
Entity/Swap
Counterparty | | Buy/Sell
Credit
Protection | | Notional
Amount
(000’s) | | Pay/
Receive
Fixed
Rate | | Termination
Date | | Premiums
Received/
(Paid) | | Value | | Unrealized
Appreciation |
| CDX North America Investment Grade Index, Series 20 | |
| JPMorgan Chase Bank NA | | | | Sell | | | | $ | 25,000 | | | | | 1.0% | | | | | 6/20/18 | | | | $ | (118,806 | ) | | | $ | 233,595 | | | | $ | 114,789 | |
| | | | | | | | | | | | | | | | | | | | | | | |
|
|
|
| | | | | | | | | | | | | | | | | | | | Grand Total Buys | | | | | — | | | | | — | | | | | — | |
| | | | | | | | | | | | | | | | | | | | Grand Total Sells | | | | | (118,806 | ) | | | | 233,595 | | | | | 114,789 | |
| | | | | | | | | | | | | | | | | | | | | | | |
|
|
|
| | | | | | | | | | | | | | | | | | | | Total Credit Default Swaps | | | | $ | (118,806 | ) | | | $ | 233,595 | | | | $ | 114,789 | |
| | | | | | | | | | | | | | | | | | | | | | | |
|
|
|
The table that follows shows the undiscounted maximum potential payment by the Fund related to selling credit protection in credit default swaps:
| | | | | | | | | | | | | | | |
Type of Reference Asset on which the
Fund Sold Protection | | Total Maximum Potential
Payments for Selling
Credit Protection
(Undiscounted) | | Amount Recoverable* | | Reference
Asset Rating
Range** |
| Investment Grade Corporate Debt Indexes | | | $ | 25,000,000 | | | | $ | — | | | | | BBB+ | |
* The Fund has no amounts recoverable from related purchased protection. In addition, the Fund has no recourse provisions under the credit derivatives and holds no collateral which can offset or reduce potential payments under a triggering event.
** The period end reference asset security ratings, as rated by any rating organization, are included in the equivalent Standard & Poor’s rating category. The reference asset rating represents the likelihood of a potential credit event on the reference asset which would result in a related payment by the Fund.
| | |
| 40 | | OPPENHEIMER CAPITAL INCOME FUND |
Footnotes to Consolidated Statement of Investments Continued
| | | | | | | | | | | | | | | | |
| Over-the Counter Total Return Swap Contracts as of August 30, 2013 are as follows: | |
Reference Entity/
Swap Counterparty | | Notional
Amount
(000’s) | | | Paid by
the Fund | | Received by
the Fund | | Termination
Date | | | Value | |
| The Blackstone Group LP: | | | | | | | | | | | | | |
| Goldman Sachs International | | $ | 5,059 | | | Five-Month USD BBA LIBOR plus 58 basis points and if negative, the absolute value of the Total Return of The Blackstone Group LP | | If positive, the Total Return of The Blackstone Group LP | | | 12/12/13 | | | $ | 287,546 | |
| Goldman Sachs International | | | 2,805 | | | Eight-Month USD BBA LIBOR plus 58 basis points and if negative, the absolute value of the Total Return of The Blackstone Group LP | | If positive, the Total Return of The Blackstone Group LP | | | 12/12/13 | | | | 261,223 | |
| | | | | | | | | | | | | | |
|
|
|
| | | | | | | | | Total of Total Return Swaps | | | $ | 548,769 | |
| | | | | | | | | | | | | | |
|
|
|
Abbreviations are as follows:
| | |
| BBA LIBOR | | British Bankers’ Association London-Interbank Offered Rate |
See accompanying Consolidated Notes to Financial Statements.
| | | | |
| OPPENHEIMER CAPITAL INCOME FUND | | | 41 | |
CONSOLIDATED STATEMENT OF ASSETS AND LIABILITIES August 30, 20131
| | | | |
| Assets | | | |
| Investments, at value—see accompanying consolidated statement of investments: | | | | |
| Unaffiliated companies (cost $1,454,502,493) | | $ | 1,586,156,687 | |
| Affiliated companies (cost $443,411,175) | |
| 442,798,265
|
|
| | | | 2,028,954,952 | |
| Cash | | | 3,762,061 | |
| Cash used for collateral on futures | | | 1,689,329 | |
| Unrealized appreciation on foreign currency exchange contracts | | | 8,301 | |
| Swaps, at value (premiums paid $118,806) | | | 782,364 | |
| Receivables and other assets: | | | | |
| Investments sold (including $42,249,309 sold on a when-issued or delayed delivery basis) | | | 43,953,725 | |
| Interest, dividends and principal paydowns | | | 9,786,890 | |
| Shares of beneficial interest sold | | | 3,628,149 | |
| Variation margin receivable | | | 215,589 | |
| Other | |
| 157,915
|
|
| Total assets | | | 2,092,939,275 | |
| Liabilities | | | |
| Unrealized depreciation on foreign currency exchange contracts | | | 175,672 | |
| Payables and other liabilities: | | | | |
| Investments purchased (including $232,714,667 purchased on a when-issued or delayed delivery basis) | | | 235,822,820 | |
| Shares of beneficial interest redeemed | | | 1,653,627 | |
| Distribution and service plan fees | | | 371,244 | |
| Transfer and shareholder servicing agent fees | | | 210,639 | |
| Trustees’ compensation | | | 146,677 | |
| Shareholder communications | | | 92,686 | |
| Variation margin payable | | | 10,255 | |
| Other | |
| 66,748
|
|
| Total liabilities | | | 238,550,368 | |
| Net Assets | | $
| 1,854,388,907
|
|
| Composition of Net Assets | | | |
| Par value of shares of beneficial interest | | $ | 200,314 | |
| Additional paid-in capital | | | 2,209,575,508 | |
| Accumulated net investment income | | | 14,141,993 | |
| Accumulated net realized loss on investments and foreign currency transactions | | | (501,533,961 | ) |
Net unrealized appreciation on investments and translation
of assets and liabilities denominated in foreign currencies | |
| 132,005,053
|
|
| Net Assets | | $
| 1,854,388,907
|
|
| | |
| 42 | | OPPENHEIMER CAPITAL INCOME FUND |
| | | | |
| Net Asset Value Per Share | | | |
| Class A Shares: | | | | |
| Net asset value and redemption price per share (based on net assets of $1,512,075,876 and 162,787,326 shares of beneficial interest outstanding) | | $ | 9.29 | |
| Maximum offering price per share (net asset value plus sales charge of 5.75% of offering price) | | $ | 9.86 | |
| Class B Shares: | | | | |
| Net asset value, redemption price (excludes applicable contingent deferred sales charge) and offering price per share (based on net assets of $33,682,917 and 3,707,323 shares of beneficial interest outstanding) | | $ | 9.09 | |
| Class C Shares: | | | | |
| Net asset value, redemption price (excludes applicable contingent deferred sales charge) and offering price per share (based on net assets of $182,920,040 and 20,259,551 shares of beneficial interest outstanding) | | $ | 9.03 | |
| Class N Shares: | | | | |
| Net asset value, redemption price (excludes applicable contingent deferred sales charge) and offering price per share (based on net assets of $20,074,831 and 2,187,819 shares of beneficial interest outstanding) | | $ | 9.18 | |
| Class Y Shares: | | | | |
| Net asset value, redemption price and offering price per share (based on net assets of $105,635,243 and 11,371,959 shares of beneficial interest outstanding) | | $ | 9.29 | |
1. August 30, 2013 represents the last business day of the Fund’s 2013 fiscal year. See Note 1 of the accompanying Consolidated Notes.
See accompanying Notes to Consolidated Financial Statements.
| | | | |
| OPPENHEIMER CAPITAL INCOME FUND | | | 43 | |
CONSOLIDATED STATEMENT OF OPERATIONS For the Year Ended August 30, 20131
| | | | |
| Allocation of Income and Expenses from Master Fund2 | | | |
| Net investment income allocated from Oppenheimer Master Loan Fund, LLC: | | | | |
| Interest | | $ | 10,657,144 | |
| Dividends | | | 7,489 | |
| Net expenses | |
| (541,427
| )
|
| Net investment income allocated from Oppenheimer Master Loan Fund, LLC | | | 10,123,206 | |
| Investment Income | | | |
| Interest (net of foreign withholding taxes of $2,920) | | | 35,558,031 | |
| Dividends: | | | | |
| Unaffiliated companies (net of foreign withholding taxes of $243,390) | | | 16,665,418 | |
| Affiliated companies | | | 2,838,736 | |
| Fee income on when-issued securities | | | 3,612,363 | |
| Other income | |
| 39,806
|
|
| Total investment income | | | 58,714,354 | |
| Expenses | | | |
| Management fees | | | 9,418,306 | |
| Distribution and service plan fees: | | | | |
| Class A | | | 3,383,820 | |
| Class B | | | 384,797 | |
| Class C | | | 1,393,361 | |
| Class N | | | 99,700 | |
| Transfer and shareholder servicing agent fees: | | | | |
| Class A | | | 1,999,889 | |
| Class B | | | 165,557 | |
| Class C | | | 256,645 | |
| Class N | | | 49,567 | |
| Class Y | | | 68,536 | |
| Shareholder communications: | | | | |
| Class A | | | 258,681 | |
| Class B | | | 15,803 | |
| Class C | | | 29,566 | |
| Class N | | | 4,067 | |
| Class Y | | | 7,212 | |
| Trustees’ compensation | | | 104,342 | |
| Custodian fees and expenses | | | 12,071 | |
| Other | |
| 300,705
|
|
| Total expenses | | | 17,952,625 | |
| Less waivers and reimbursements of expenses | |
| (833,143
| )
|
| Net expenses | | | 17,119,482 | |
| Net Investment Income | | | 51,718,078 | |
| | |
| 44 | | OPPENHEIMER CAPITAL INCOME FUND |
| | | | |
| Realized and Unrealized Gain (Loss) | | | |
| Net realized gain (loss) on: | | | | |
| Investments from: | | | | |
Unaffiliated companies | | $ | 39,053,999 | |
Affiliated companies | | | (1,305,002 | ) |
| Closing and expiration of futures contracts | | | (8,133,932 | ) |
| Foreign currency transactions | | | 1,020,827 | |
| Swap contracts | | | (1,316,890 | ) |
| Net realized gain allocated from Oppenheimer Master Loan Fund, LLC | |
| 2,522,884
|
|
| Total net realized gain | | | 31,841,886 | |
| Net change in unrealized appreciation/depreciation on: | | | | |
| Investments | | | 1,027,877 | |
| Translation of assets and liabilities denominated in foreign currencies | | | (195,825 | ) |
| Futures contracts | | | (617,047 | ) |
| Swap contracts | | | 663,558 | |
| Net change in unrealized appreciation/deprecation allocated from: | | | | |
| Oppenheimer Master Loan Fund, LLC | |
| (968,311
| )
|
| Total net change in unrealized appreciation/depreciation | | | (89,748 | ) |
| Net Increase in Net Assets Resulting from Operations | | $
| 83,470,216
|
|
1. August 30, 2013 represents the last business day of the Fund’s 2013 fiscal year. See Note 1 of the accompanying Consolidated Notes.
2. The Fund invests in an affiliated mutual fund that expects to be treated as a partnership for tax purposes. See Note 1 of the accompanying Consolidated Notes.
See accompanying Notes to Consolidated Financial Statements.
| | | | |
| OPPENHEIMER CAPITAL INCOME FUND | | | 45 | |
CONSOLIDATED STATEMENTS OF CHANGES IN NET ASSETS
| | | | | | | | |
| | | Year Ended
August 30,
20131 | | | Year Ended
August 31,
20122 | |
| Operations | | | | | | |
| Net investment income | | $ | 51,718,078 | | | $ | 48,682,907 | |
| Net realized gain | | | 31,841,886 | | | | 37,197,310 | |
| Net change in unrealized appreciation/depreciation | |
| (89,748
| )
| |
| 60,106,574
|
|
| Net increase in net assets resulting from operations | | | 83,470,216 | | | | 145,986,791 | |
| Dividends and/or Distributions to Shareholders | | | | | | |
| Dividends from net investment income: | | | | | | | | |
| Class A | | | (55,849,320 | ) | | | (55,099,362 | ) |
| Class B | | | (1,165,599 | ) | | | (1,400,187 | ) |
| Class C | | | (4,138,579 | ) | | | (3,210,056 | ) |
| Class N | | | (744,207 | ) | | | (740,433 | ) |
| Class Y | |
| (2,286,840
| )
| |
| (255,440
| )
|
| | | | (64,184,545 | ) | | | (60,705,478 | ) |
| Beneficial Interest Transactions | | | | | | |
| Net increase (decrease) in net assets resulting from beneficial interest transactions: | | | | | | | | |
| Class A | | | 72,138,437 | | | | (76,615,442 | ) |
| Class B | | | (10,665,127 | ) | | | (8,768,621 | ) |
| Class C | | | 69,885,468 | | | | 8,150,935 | |
| Class N | | | (1,175,498 | ) | | | (419,563 | ) |
| Class Y | |
| 82,564,617
|
| |
| 17,649,070
|
|
| | | | 212,747,897 | | | | (60,003,621 | ) |
| Net Assets | | | | | | |
| Total increase | | | 232,033,568 | | | | 25,277,692 | |
| Beginning of period | |
| 1,622,355,339
|
| |
| 1,597,077,647
|
|
| End of period (including accumulated net investment income of $14,141,993 and $20,484,367, respectively) | | $
| 1,854,388,907
|
| | $
| 1,622,355,339
|
|
1. August 30, 2013 represents the last business day of the Fund’s 2013 fiscal year. See Note 1 of the accompanying Consolidated Notes.
2. Certain amounts have been restated to reflect a change in method of accounting. See Note 1 of the accompanying Consolidated Notes.
See accompanying Notes to Consolidated Financial Statements.
| | |
| 46 | | OPPENHEIMER CAPITAL INCOME FUND |
CONSOLIDATED FINANCIAL HIGHLIGHTS
| | | | | | | | | | | | | | | | | | | | |
| Class A | | Year Ended
August 30,
20131 | | | Year Ended
August 31,
20122 | | | Year Ended
August 31,
2011 | | | Year Ended
August 31,
2010 | | | Year Ended
August 31,
2009 | |
| | | | | | | | | | | | | | | | | | | | | |
| Per Share Operating Data | | | | | | | | | | | | | | | |
| Net asset value, beginning of period | | $ | 9.17 | | | $ | 8.70 | | | $ | 8.18 | | | $ | 7.50 | | | $ | 10.44 | |
| Income (loss) from investment operations: | | | | | | | | | | | | | | | | | | | | |
| Net investment income3 | | | .29 | | | | .28 | | | | .31 | | | | .30 | | | | .48 | |
| Net realized and unrealized gain (loss) | |
| .19
|
| |
| .54
|
| |
| .58
|
| |
| .53
|
| |
| (3.11
| )
|
| Total from investment operations | | | .48 | | | | .82 | | | | .89 | | | | .83 | | | | (2.63 | ) |
| Dividends and/or distributions to shareholders: | | | | | | | | | | | | | | | | | | | | |
| Dividends from net investment income | | | (.36 | ) | | | (.35 | ) | | | (.37 | ) | | | (.15 | ) | | | (.12 | ) |
| Distributions from net realized gain | |
| —
|
| |
| —
|
| |
| —
|
| |
| —
|
| |
| (.19
| )
|
| Total dividends and/or distributions to shareholders | | | (.36 | ) | | | (.35 | ) | | | (.37 | ) | | | (.15 | ) | | | (.31 | ) |
| Net asset value, end of period | | $
| 9.29
|
| | $
| 9.17
|
| | $
| 8.70
|
| | $
| 8.18
|
| | $
| 7.50
|
|
| Total Return, at Net Asset Value4 | | | 5.30 | % | | | 9.69 | % | | | 11.06 | % | | | 11.13 | % | | | (25.18 | )% |
| | | | | | | | | | | | | | | | | | | | | |
| Ratios/Supplemental Data | | | | | | | | | | | | | | | |
| Net assets, end of period (in thousands) | | | $1,512,076 | | | | $1,422,232 | | | | $1,423,082 | | | | $1,450,829 | | | | $1,521,396 | |
| Average net assets (in thousands) | | | $1,468,782 | | | | $1,400,955 | | | | $1,486,145 | | | | $1,512,770 | | | | $1,388,938 | |
| Ratios to average net assets:5 | | | | | | | | | | | | | | | | | | | | |
| Net investment income | | | 3.07 | %6 | | | 3.18 | %6 | | | 3.55 | %6 | | | 3.75 | % | | | 6.64 | % |
| Total expenses7 | | | 0.98 | %6 | | | 1.00 | %6 | | | 0.99 | %6 | | | 1.02 | % | | | 1.02 | % |
| Expenses after payments, waivers and/or reimbursements and reduction to custodian expenses | | | 0.93 | %6 | | | 0.96 | %6 | | | 0.96 | %6 | | | 0.90 | % | | | 0.94 | % |
| Portfolio turnover rate8 | | | 84 | % | | | 80 | % | | | 92 | % | | | 77 | % | | | 92 | % |
1. August 30, 2013 represents the last business day of the Fund’s 2013 fiscal year. See Note 1 of the accompanying Consolidated Notes.
2. Certain amounts have been restated to reflect a change in method of accounting. See Note 1 of the accompanying Consolidated Notes.
3. Per share amounts calculated based on the average shares outstanding during the period.
4. Assumes an initial investment on the business day before the first day of the fiscal period, with all dividends and distributions reinvested in additional shares on the reinvestment date, and redemption at the net asset value calculated on the last business day of the fiscal period. Sales charges are not reflected in the total returns. Total returns are not annualized for periods less than one full year. Returns do not reflect the deduction of taxes that a shareholder would pay on fund distributions or the redemption of fund shares.
5. Annualized for periods less than one full year.
6. Includes the Fund’s share of the allocated expenses and/or net investment income from Oppenheimer Master Loan Fund, LLC.
7. Total expenses including all affiliated fund expenses were as follows:
| | | | |
| Year Ended August 30, 2013 | | | 1.00 | % |
| Year Ended August 31, 2012 | | | 1.02 | % |
| Year Ended August 31, 2011 | | | 1.01 | % |
| Year Ended August 31, 2010 | | | 1.04 | % |
| Year Ended August 31, 2009 | | | 1.03 | % |
8. The portfolio turnover rate excludes purchase and sale transactions of To Be Announced (TBA) mortgage-related securities as follows:
| | | | | | | | |
| | | Purchase Transactions | | | Sale Transactions | |
| Year Ended August 30, 2013 | | $ | 3,481,764,612 | | | $ | 3,521,818,336 | |
| Year Ended August 31, 2012 | | $ | 3,053,290,246 | | | $ | 3,030,115,715 | |
| Year Ended August 31, 2011 | | $ | 3,228,874,778 | | | $ | 3,180,407,334 | |
| Year Ended August 31, 2010 | | $ | 3,224,346,084 | | | $ | 3,374,267,286 | |
| Year Ended August 31, 2009 | | $ | 3,381,592,419 | | | $ | 3,374,427,225 | |
See accompanying Notes to Consolidated Financial Statements.
| | | | |
| OPPENHEIMER CAPITAL INCOME FUND | | | 47 | |
CONSOLIDATED FINANCIAL HIGHLIGHTS
| | | | | | | | | | | | | | | | | | | | |
| Class B | | Year Ended
August 30,
20131 | | | Year Ended
August 31,
20122 | | | Year Ended
August 31,
2011 | | | Year Ended
August 31,
2010 | | | Year Ended
August 31,
2009 | |
| | | | | | | | | | | | | | | | | | | | | |
| Per Share Operating Data | | | | | | | | | | | | | | | |
| Net asset value, beginning of period | | $ | 8.98 | | | $ | 8.51 | | | $ | 8.01 | | | $ | 7.36 | | | $ | 10.31 | |
| Income (loss) from investment operations: | | | | | | | | | | | | | | | | | |
| Net investment income3 | | | .19 | | | | .19 | | | | .22 | | | | .22 | | | | .41 | |
| Net realized and unrealized gain (loss) | |
| .19
|
| |
| .54
|
| |
| .57
|
| |
| .52
|
| |
| (3.09
| )
|
| Total from investment operations | | | .38 | | | | .73 | | | | .79 | | | | .74 | | | | (2.68 | ) |
| Dividends and/or distributions to shareholders: | | | | | | | | | | | | | | | | | |
| Dividends from net investment income | | | (.27 | ) | | | (.26 | ) | | | (.29 | ) | | | (.09 | ) | | | (.08 | ) |
| Distributions from net realized gain | |
| —
|
| |
| —
|
| |
| —
|
| |
| —
|
| |
| (.19
| )
|
| Total dividends and/or distributions to shareholders | | | (.27 | ) | | | (.26 | ) | | | (.29 | ) | | | (.09 | ) | | | (.27 | ) |
| Net asset value, end of period | | $
| 9.09
|
| | $
| 8.98
|
| | $
| 8.51
|
| | $
| 8.01
|
| | $
| 7.36
|
|
| Total Return, at Net Asset Value4 | | | 4.24 | % | | | 8.80 | % | | | 9.94 | % | | | 10.05 | % | | | (25.94 | )% |
| | | | | | | | | | | | | | | | | | | | | |
| Ratios/Supplemental Data | | | | | | | | | | | | | | | |
| Net assets, end of period (in thousands) | | | $33,683 | | | | $43,790 | | | | $50,221 | | | | $65,079 | | | | $87,518 | |
| Average net assets (in thousands) | | | $38,619 | | | | $45,562 | | | | $60,410 | | | | $75,369 | | | | $88,562 | |
| Ratios to average net assets:5 | | | | | | | | | | | | | | | | | | | | |
| Net investment income | | | 2.10 | %6 | | | 2.20 | %6 | | | 2.55 | %6 | | | 2.81 | % | | | 5.80 | % |
| Total expenses7 | | | 2.07 | %6 | | | 2.12 | %6 | | | 2.12 | %6 | | | 2.14 | % | | | 2.03 | % |
| Expenses after payments, waivers and/or reimbursements and reduction to custodian expenses | | | 1.94 | %6 | | | 1.94 | %6 | | | 1.97 | %6 | | | 1.85 | % | | | 1.85 | % |
| Portfolio turnover rate8 | | | 84 | % | | | 80 | % | | | 92 | % | | | 77 | % | | | 92 | % |
1. August 30, 2013 represents the last business day of the Fund’s 2013 fiscal year. See Note 1 of the accompanying Consolidated Notes.
2. Certain amounts have been restated to reflect a change in method of accounting. See Note 1 of the accompanying Consolidated Notes.
3. Per share amounts calculated based on the average shares outstanding during the period.
4. Assumes an initial investment on the business day before the first day of the fiscal period, with all dividends and distributions reinvested in additional shares on the reinvestment date, and redemption at the net asset value calculated on the last business day of the fiscal period. Sales charges are not reflected in the total returns. Total returns are not annualized for periods less than one full year. Returns do not reflect the deduction of taxes that a shareholder would pay on fund distributions or the redemption of fund shares.
5. Annualized for periods less than one full year.
6. Includes the Fund’s share of the allocated expenses and/or net investment income from Oppenheimer Master Loan Fund, LLC.
7. Total expenses including all affiliated fund expenses were as follows:
| | | | |
| Year Ended August 30, 2013 | | | 2.09 | % |
| Year Ended August 31, 2012 | | | 2.14 | % |
| Year Ended August 31, 2011 | | | 2.14 | % |
| Year Ended August 31, 2010 | | | 2.16 | % |
| Year Ended August 31, 2009 | | | 2.04 | % |
8. The portfolio turnover rate excludes purchase and sale transactions of To Be Announced (TBA) mortgage-related securities as follows:
| | | | | | | | |
| | | Purchase Transactions | | | Sale Transactions | |
| Year Ended August 30, 2013 | | $ | 3,481,764,612 | | | $ | 3,521,818,336 | |
| Year Ended August 31, 2012 | | $ | 3,053,290,246 | | | $ | 3,030,115,715 | |
| Year Ended August 31, 2011 | | $ | 3,228,874,778 | | | $ | 3,180,407,334 | |
| Year Ended August 31, 2010 | | $ | 3,224,346,084 | | | $ | 3,374,267,286 | |
| Year Ended August 31, 2009 | | $ | 3,381,592,419 | | | $ | 3,374,427,225 | |
See accompanying Notes to Consolidated Financial Statements.
| | |
| 48 | | OPPENHEIMER CAPITAL INCOME FUND |
| | | | | | | | | | | | | | | | | | | | |
| Class C | | Year Ended
August 30,
20131 | | | Year Ended
August 31,
20122 | | | Year Ended
August 31,
2011 | | | Year Ended
August 31,
2010 | | | Year Ended
August 31,
2009 | |
| | | | | | | | | | | | | | | | | | | | | |
| Per Share Operating Data | | | | | | | | | | | | | | | |
| Net asset value, beginning of period | | $ | 8.93 | | | $ | 8.47 | | | $ | 7.98 | | | $ | 7.33 | | | $ | 10.26 | |
| Income (loss) from investment operations: | | | | | | | | | | | | | | | | | |
| Net investment income3 | | | .20 | | | | .20 | | | | .23 | | | | .23 | | | | .41 | |
| Net realized and unrealized gain (loss) | |
| .19
|
| |
| .53
|
| |
| .56
|
| |
| .52
|
| |
| (3.07
| )
|
| Total from investment operations | | | .39 | | | | .73 | | | | .79 | | | | .75 | | | | (2.66 | ) |
| Dividends and/or distributions to shareholders: | | | | | | | | | | | | | | | | | |
| Dividends from net investment income | | | (.29 | ) | | | (.27 | ) | | | (.30 | ) | | | (.10 | ) | | | (.08 | ) |
| Distributions from net realized gain | |
| —
|
| |
| —
|
| |
| —
|
| |
| —
|
| |
| (.19
| )
|
| Total dividends and/or distributions to shareholders | | | (.29 | ) | | | (.27 | ) | | | (.30 | ) | | | (.10 | ) | | | (.27 | ) |
| Net asset value, end of period | | $
| 9.03
|
| | $
| 8.93
|
| | $
| 8.47
|
| | $
| 7.98
|
| | $
| 7.33
|
|
| Total Return, at Net Asset Value4 | | | 4.41 | % | | | 8.91 | % | | | 10.00 | % | | | 10.19 | % | | | (25.85 | )% |
| | | | | | | | | | | | | | | | | | | | | |
| Ratios/Supplemental Data | | | | | | | | | | | | | | | |
| Net assets, end of period (in thousands) | | | $182,920 | | | | $112,220 | | | $ | 98,566 | | | | $100,299 | | | | $112,970 | |
| Average net assets (in thousands) | | | $140,184 | | | | $101,423 | | | | $102,156 | | | | $106,999 | | | $ | 82,632 | |
| Ratios to average net assets:5 | | | | | | | | | | | | | | | | | | | | |
| Net investment income | | | 2.24 | %6 | | | 2.32 | %6 | | | 2.67 | %6 | | | 2.88 | % | | | 5.77 | % |
| Total expenses7 | | | 1.80 | %6 | | | 1.86 | %6 | | | 1.87 | %6 | | | 1.89 | % | | | 1.91 | % |
| Expenses after payments, waivers and/or reimbursements and reduction to custodian expenses | | | 1.75 | %6 | | | 1.82 | %6 | | | 1.84 | %6 | | | 1.77 | % | | | 1.80 | % |
| Portfolio turnover rate8 | | | 84 | % | | | 80 | % | | | 92 | % | | | 77 | % | | | 92 | % |
1. August 30, 2013 represents the last business day of the Fund’s 2013 fiscal year. See Note 1 of the accompanying Consolidated Notes.
2. Certain amounts have been restated to reflect a change in method of accounting. See Note 1 of the accompanying Consolidated Notes.
3. Per share amounts calculated based on the average shares outstanding during the period.
4. Assumes an initial investment on the business day before the first day of the fiscal period, with all dividends and distributions reinvested in additional shares on the reinvestment date, and redemption at the net asset value calculated on the last business day of the fiscal period. Sales charges are not reflected in the total returns. Total returns are not annualized for periods less than one full year. Returns do not reflect the deduction of taxes that a shareholder would pay on fund distributions or the redemption of fund shares.
5. Annualized for periods less than one full year.
6. Includes the Fund’s share of the allocated expenses and/or net investment income from Oppenheimer Master Loan Fund, LLC.
7. Total expenses including all affiliated fund expenses were as follows:
| | | | |
| Year Ended August 30, 2013 | | | 1.82 | % |
| Year Ended August 31, 2012 | | | 1.88 | % |
| Year Ended August 31, 2011 | | | 1.89 | % |
| Year Ended August 31, 2010 | | | 1.91 | % |
| Year Ended August 31, 2009 | | | 1.92 | % |
8. The portfolio turnover rate excludes purchase and sale transactions of To Be Announced (TBA) mortgage-related securities as follows:
| | | | | | | | |
| | | Purchase Transactions | | | Sale Transactions | |
| Year Ended August 30, 2013 | | $ | 3,481,764,612 | | | $ | 3,521,818,336 | |
| Year Ended August 31, 2012 | | $ | 3,053,290,246 | | | $ | 3,030,115,715 | |
| Year Ended August 31, 2011 | | $ | 3,228,874,778 | | | $ | 3,180,407,334 | |
| Year Ended August 31, 2010 | | $ | 3,224,346,084 | | | $ | 3,374,267,286 | |
| Year Ended August 31, 2009 | | $ | 3,381,592,419 | | | $ | 3,374,427,225 | |
See accompanying Notes to Consolidated Financial Statements.
| | | | |
| OPPENHEIMER CAPITAL INCOME FUND | | | 49 | |
CONSOLIDATED FINANCIAL HIGHLIGHTS
| | | | | | | | | | | | | | | | | | | | |
| Class N | | Year Ended
August 30,
20131 | | | Year Ended
August 31,
20122 | | | Year Ended
August 31,
2011 | | | Year Ended
August 31,
2010 | | | Year Ended
August 31,
2009 | |
| | | | | | | | | | | | | | | | | | | | | |
| Per Share Operating Data | | | | | | | | | | | | | | | |
| Net asset value, beginning of period | | $ | 9.07 | | | $ | 8.60 | | | $ | 8.09 | | | $ | 7.42 | | | $ | 10.36 | |
| Income (loss) from investment operations: | | | | | | | | | | | | | | | | | |
| Net investment income3 | | | .25 | | | | .25 | | | | .27 | | | | .27 | | | | .44 | |
| Net realized and unrealized gain (loss) | |
| .19
|
| |
| .54
|
| |
| .58
|
| |
| .52
|
| |
| (3.09
| )
|
| Total from investment operations | | | .44 | | | | .79 | | | | .85 | | | | .79 | | | | (2.65 | ) |
| Dividends and/or distributions to shareholders: | | | | | | | | | | | | | | | | | |
| Dividends from net investment income | | | (.33 | ) | | | (.32 | ) | | | (.34 | ) | | | (.12 | ) | | | (.10 | ) |
| Distributions from net realized gain | |
| —
|
| |
| —
|
| |
| —
|
| |
| —
|
| |
| (.19
| )
|
| Total dividends and/or distributions to shareholders | | | (.33 | ) | | | (.32 | ) | | | (.34 | ) | | | (.12 | ) | | | (.29 | ) |
| Net asset value, end of period | | $
| 9.18
|
| | $
| 9.07
|
| | $
| 8.60
|
| | $
| 8.09
|
| | $
| 7.42
|
|
| Total Return, at Net Asset Value4 | | | 4.89 | % | | | 9.44 | % | | | 10.65 | % | | | 10.74 | % | | | (25.54 | )% |
| | | | | | | | | | | | | | | | | | | | | |
| Ratios/Supplemental Data | | | | | | | | | | | | | | | |
| Net assets, end of period (in thousands) | | | $20,075 | | | | $20,994 | | | | $20,319 | | | | $22,533 | | | | $24,678 | |
| Average net assets (in thousands) | | | $20,943 | | | | $20,340 | | | | $22,331 | | | | $24,365 | | | | $21,877 | |
| Ratios to average net assets:5 | | | | | | | | | | | | | | | | | | | | |
| Net investment income | | | 2.73 | %6 | | | 2.84 | %6 | | | 3.18 | %6 | | | 3.37 | % | | | 6.25 | % |
| Total expenses7 | | | 1.33 | %6 | | | 1.34 | %6 | | | 1.35 | %6 | | | 1.42 | % | | | 1.44 | % |
| Expenses after payments, waivers and/or reimbursements and reduction to custodian expenses | | | 1.28 | %6 | | | 1.30 | %6 | | | 1.32 | %6 | | | 1.28 | % | | | 1.31 | % |
| Portfolio turnover rate8 | | | 84 | % | | | 80 | % | | | 92 | % | | | 77 | % | | | 92 | % |
1. August 30, 2013 represents the last business day of the Fund’s 2013 fiscal year. See Note 1 of the accompanying Consolidated Notes.
2. Certain amounts have been restated to reflect a change in method of accounting. See Note 1 of the accompanying Consolidated Notes.
3. Per share amounts calculated based on the average shares outstanding during the period.
4. Assumes an initial investment on the business day before the first day of the fiscal period, with all dividends and distributions reinvested in additional shares on the reinvestment date, and redemption at the net asset value calculated on the last business day of the fiscal period. Sales charges are not reflected in the total returns. Total returns are not annualized for periods less than one full year. Returns do not reflect the deduction of taxes that a shareholder would pay on fund distributions or the redemption of fund shares.
5. Annualized for periods less than one full year.
6. Includes the Fund’s share of the allocated expenses and/or net investment income from Oppenheimer Master Loan Fund, LLC.
7. Total expenses including all affiliated fund expenses were as follows:
| | | | |
| Year Ended August 30, 2013 | | | 1.35 | % |
| Year Ended August 31, 2012 | | | 1.36 | % |
| Year Ended August 31, 2011 | | | 1.37 | % |
| Year Ended August 31, 2010 | | | 1.44 | % |
| Year Ended August 31, 2009 | | | 1.45 | % |
8. The portfolio turnover rate excludes purchase and sale transactions of To Be Announced (TBA) mortgage-related securities as follows:
| | | | | | | | |
| | | Purchase Transactions | | | Sale Transactions | |
| Year Ended August 30, 2013 | | $ | 3,481,764,612 | | | $ | 3,521,818,336 | |
| Year Ended August 31, 2012 | | $ | 3,053,290,246 | | | $ | 3,030,115,715 | |
| Year Ended August 31, 2011 | | $ | 3,228,874,778 | | | $ | 3,180,407,334 | |
| Year Ended August 31, 2010 | | $ | 3,224,346,084 | | | $ | 3,374,267,286 | |
| Year Ended August 31, 2009 | | $ | 3,381,592,419 | | | $ | 3,374,427,225 | |
See accompanying Notes to Consolidated Financial Statements.
| | |
| 50 | | OPPENHEIMER CAPITAL INCOME FUND |
| | | | | | | | | | | | |
| Class Y | | Year Ended
August 30,
20131 | | | Year Ended
August 31,
20122 | | | Period Ended
August 31,
20113 | |
| | | | | | | | | | | | | |
| Per Share Operating Data | | | | | | | | | |
| Net asset value, beginning of period | | $ | 9.18 | | | $ | 8.70 | | | $ | 8.63 | |
| Income (loss) from investment operations: | | | | | | | | | | | | |
| Net investment income4 | | | .30 | | | | .30 | | | | .21 | |
| Net realized and unrealized gain | |
| .19
|
| |
| .55
|
| |
| —
| 5
|
| Total from investment operations | | | .49 | | | | .85 | | | | .21 | |
| Dividends and/or distributions to shareholders: | | | | | | | | | | | | |
| Dividends from net investment income | | | (.38 | ) | | | (.37 | ) | | | (.14 | ) |
| Distributions from net realized gain | |
| —
|
| |
| —
|
| |
| —
|
|
| Total dividends and/or distributions to shareholders | | | (.38 | ) | | | (.37 | ) | | | (.14 | ) |
| Net asset value, end of period | | $
| 9.29
|
| | $
| 9.18
|
| | $
| 8.70
|
|
| Total Return, at Net Asset Value6 | | | 5.49 | % | | | 10.17 | % | | | 2.44 | % |
| | | | | | | | | | | | | |
| Ratios/Supplemental Data | | | | | | | | | |
| Net assets, end of period (in thousands) | | | $105,635 | | | | $23,119 | | | | $4,890 | |
| Average net assets (in thousands) | | $ | 63,500 | | | $ | 7,746 | | | | $3,287 | |
| Ratios to average net assets:7,8 | | | | | | | | | | | | |
| Net investment income | | | 3.27 | % | | | 3.46 | % | | | 4.04 | % |
| Total expenses9 | | | 0.72 | % | | | 0.69 | % | | | 0.59 | % |
| Expenses after payments, waivers and/or reimbursements and reduction to custodian expenses | | | 0.67 | % | | | 0.65 | % | | | 0.56 | % |
| Portfolio turnover rate10 | | | 84 | % | | | 80 | % | | | 92 | % |
1. August 30, 2013 represents the last business day of the Fund’s 2013 fiscal year. See Note 1 of the accompanying Consolidated Notes.
2. Certain amounts have been restated to reflect a change in method of accounting. See Note 1 of the accompanying Consolidated Notes.
3. For the period from January 28, 2011 (inception of offering) to August 31, 2011.
4. Per share amounts calculated based on the average shares outstanding during the period.
5. Less than $0.005 per share.
6. Assumes an initial investment on the business day before the first day of the fiscal period, with all dividends and distributions reinvested in additional shares on the reinvestment date, and redemption at the net asset value calculated on the last business day of the fiscal period. Sales charges are not reflected in the total returns. Total returns are not annualized for periods less than one full year. Returns do not reflect the deduction of taxes that a shareholder would pay on fund distributions or the redemption of fund shares.
7. Annualized for periods less than one full year.
8. Includes the Fund’s share of the allocated expenses and/or net investment income from Oppenheimer Master Loan Fund, LLC.
9. Total expenses including all affiliated fund expenses were as follows:
| | | | |
| Year Ended August 30, 2013 | | | 0.74 | % |
| Year Ended August 31, 2012 | | | 0.71 | % |
| Period Ended August 31, 2011 | | | 0.61 | % |
10. The portfolio turnover rate excludes purchase and sale transactions of To Be Announced (TBA) mortgage-related securities as follows:
| | | | | | | | |
| | | Purchase Transactions | | | Sale Transactions | |
| Year Ended August 30, 2013 | | $ | 3,481,764,612 | | | $ | 3,521,818,336 | |
| Year Ended August 31, 2012 | | $ | 3,053,290,246 | | | $ | 3,030,115,715 | |
| Period Ended August 31, 2011 | | $ | 3,228,874,778 | | | $ | 3,180,407,334 | |
See accompanying Notes to Consolidated Financial Statements.
| | | | |
| OPPENHEIMER CAPITAL INCOME FUND | | | 51 | |
NOTES TO CONSOLIDATED FINANCIAL STATEMENTS
1. Significant Accounting Policies
Oppenheimer Capital Income Fund (the “Fund”) is registered under the Investment Company Act of 1940, as amended, as an open-end diversified management investment company. The Fund’s investment objective is to seek total return. The Fund’s investment adviser was OppenheimerFunds, Inc. (“OFI” or the “Sub-Adviser”), through December 31, 2012. Effective January 1, 2013, the Fund’s investment adviser is OFI Global Asset Management, Inc. (“OFI Global” or the “Manager”), a wholly-owned subsidiary of OFI. The Manager has entered into a sub-advisory agreement with OFI, as of the same effective date.
The Fund offers Class A, Class C, Class N and Class Y shares, and previously offered Class B shares for new purchase through June 29, 2012. Subsequent to that date, no new purchases of Class B shares are permitted, however reinvestment of dividend and/or capital gain distributions and exchanges of Class B shares into and from other Oppenheimer funds will be allowed. Class A shares are sold at their offering price, which is normally net asset value plus a front-end sales charge. Class C and Class N shares are sold, and Class B shares were sold, without a front-end sales charge but may be subject to a contingent deferred sales charge (“CDSC”). Class N shares are sold only through retirement plans. Retirement plans that offer Class N shares may impose charges on those accounts. Class Y shares are sold to certain institutional investors or intermediaries without either a front-end sales charge or a CDSC, however, the intermediaries may impose charges on their accountholders who beneficially own Class Y shares. All classes of shares have identical rights and voting privileges with respect to the Fund in general and exclusive voting rights on matters that affect that class alone. Earnings, net assets and net asset value per share may differ due to each class having its own expenses, such as transfer and shareholder servicing agent fees and shareholder communications, directly attributable to that class. Class A, B, C and N shares have separate distribution and/or service plans under which they pay fees. Class Y shares do not pay such fees. Class B shares will automatically convert to Class A shares 72 months after the date of purchase.
The following is a summary of significant accounting policies consistently followed by the Fund.
Fiscal Year End. The last day of the Fund’s fiscal year was the last day the New York Stock Exchange was open for trading. The Fund’s consolidated financial statements have been presented through that date to maintain consistency with the Fund’s net asset value calculations used for shareholder transactions.
Change in Method of Accounting. The accompanying financial statements reflect the financial position of the Fund and its Subsidiary, Oppenheimer Capital Income Fund (Cayman) Ltd. (the “Subsidiary”), and the results of operations on a consolidated basis. Prior to August 30, 2013, the Subsidiary was shown as an investment of the Fund on the Statement of Investments and the financial statements of the Subsidiary were presented along with the Fund. The staff of the Securities and Exchange Commission has recently commented on their preference to have wholly-owned Cayman investment funds consolidated into the parent fund’s financial statements. Management of the Fund
| | |
| 52 | | OPPENHEIMER CAPITAL INCOME FUND |
implemented the change in policy because it is a more effective method of providing transparency into the Fund’s holdings and operations. Accordingly, as a result of the change in method of accounting, the Fund consolidates the assets and liabilities as well as the operations of the Subsidiary within its financial statements.
The result of the policy change did not have an impact on total net assets of the Fund, however it resulted in the following changes to the financial statements. As of the beginning of the Fund’s fiscal period, the financial statement line items on the Consolidated Statement of Assets and Liabilities were affected by the change as follows: cash increased $755,699; other assets increased $15,000; payables and other liabilities increased $18,668 and investments at value, wholly-owned subsidiary decreased $752,031. For the year ended August 30, 2013, the financial statement line items on the Consolidated Statements of Operations and Changes in Net Assets were affected by the change as follows: net investment income includes a net investment loss from the Subsidiary of $53,775; net realized gain includes $12,645 of losses realized by the Subsidiary and net change in unrealized depreciation includes $66,420 of change experienced by the Subsidiary. For the year ended August 31, 2012, the following changes were made to the Consolidated Statement of Changes in Net Assets: net investment income decreased $18,062; net realized gain decreased $7 and net change in unrealized appreciation increased by $18,069. The changes to the Consolidated Financial Highlights were immaterial.
Event-Linked Bonds. The Fund may invest in “event-linked” bonds. Event-linked bonds, which are sometimes referred to as “catastrophe” bonds, are fixed income securities for which the return of principal and payment of interest is contingent on the non-occurrence of a specific trigger event, such as a hurricane, earthquake, or other occurrence that leads to physical or economic loss. If the trigger event occurs prior to maturity, the Fund may lose all or a portion of its principal in addition to interest otherwise due from the security. Event-linked bonds may expose the Fund to certain other risks, including issuer default, adverse regulatory or jurisdictional interpretations, liquidity risk and adverse tax consequences. The Fund records the net change in market value of event-linked bonds on the Consolidated Statement of Operations as a change in unrealized appreciation or depreciation on investments. The Fund records a realized gain or loss on the Consolidated Statement of Operations upon the sale or maturity of such securities.
Securities on a When-Issued or Delayed Delivery Basis. The Fund may purchase securities on a “when-issued” basis, and may purchase or sell securities on a “delayed delivery” basis. “When-issued” or “delayed delivery” refers to securities whose terms and indenture are available and for which a market exists, but which are not available for immediate delivery. Delivery and payment for securities that have been purchased by the Fund on a when-issued basis normally takes place within six months and possibly as long as two years or more after the trade date. During this period, such securities do not earn interest, are subject to market fluctuation and may increase or decrease in value prior to their delivery. The purchase of securities on a when-issued basis may increase the volatility of the Fund’s net asset value to the extent the Fund executes such transactions while
| | | | |
| OPPENHEIMER CAPITAL INCOME FUND | | | 53 | |
NOTES TO CONSOLIDATED FINANCIAL STATEMENTS Continued
1. Significant Accounting Policies Continued
remaining substantially fully invested. When the Fund engages in when-issued or delayed delivery transactions, it relies on the buyer or seller, as the case may be, to complete the transaction. Their failure to do so may cause the Fund to lose the opportunity to obtain or dispose of the security at a price and yield it considers advantageous. The Fund may also sell securities that it purchased on a when-issued basis or forward commitment prior to settlement of the original purchase.
As of August 30, 2013, the Fund had purchased securities issued on a when-issued or delayed delivery basis and sold securities issued on a delayed delivery basis as follows:
| | | | |
| | | When-Issued or
Delayed Delivery
Basis Transactions | |
| Purchased securities | | $ | 232,714,667 | |
| Sold securities | | | 42,249,309 | |
The Fund may enter into “forward roll” transactions with respect to mortgage-related securities. In this type of transaction, the Fund sells a mortgage-related security to a buyer and simultaneously agrees to repurchase a similar security (same type, coupon and maturity) at a later date at a set price. During the period between the sale and the repurchase, the Fund will not be entitled to receive interest and principal payments on the securities that have been sold. The Fund records the incremental difference between the forward purchase and sale of each forward roll as realized gain (loss) on investments or as fee income in the case of such transactions that have an associated fee in lieu of a difference in the forward purchase and sale price.
Forward roll transactions may be deemed to entail embedded leverage since the Fund purchases mortgage-related securities with extended settlement dates rather than paying for the securities under a normal settlement cycle. This embedded leverage increases the Fund’s market value of investments relative to its net assets which can incrementally increase the volatility of the Fund’s performance. Forward roll transactions can be replicated over multiple settlement periods.
Risks of entering into forward roll transactions include the potential inability of the counterparty to meet the terms of the agreement; the potential of the Fund to receive inferior securities at redelivery as compared to the securities sold to the counterparty; and counterparty credit risk.
Investment in Oppenheimer Capital Income Fund (Cayman) Ltd. The Fund may invest up to 25% of its total assets in Oppenheimer Capital Income Fund (Cayman) Ltd., a wholly-owned and controlled Cayman Islands subsidiary (the “Subsidiary”). The Subsidiary invests primarily in commodity-linked derivatives (including commodity futures, financial futures, options and swap contracts) and exchange-traded funds related to gold or other special minerals. The Subsidiary may also invest in certain fixed-income securities and other investments that may serve as margin or collateral for its derivatives positions. The Fund wholly owns and controls the Subsidiary, and the Fund and Subsidiary are both managed by the Manager. The financial statements have been consolidated and include accounts of
| | |
| 54 | | OPPENHEIMER CAPITAL INCOME FUND |
the Fund and the Subsidiary. Accordingly, all inter-company transactions and balances have been eliminated.
For tax purposes, the Subsidiary is an exempted Cayman investment company. The Subsidiary has received an undertaking from the Government of the Cayman Islands exempting it from all local income, profits and capital gains taxes through September of 2030. No such taxes are levied in the Cayman Islands at the present time. For U.S. income tax purposes, the Subsidiary is a Controlled Foreign Corporation and as such is not subject to U.S. income tax. However, as a wholly-owned Controlled Foreign Corporation, the Subsidiary’s net income and capital gain, to the extent of its earnings and profits, will be included each year in the Fund’s investment company taxable income. For the year ended August 30, 2013, the Subsidiary has a deficit of $193,488 in its taxable earnings and profits. In addition, any in-kind capital contributions made by the Fund to the Subsidiary will result in the Fund recognizing taxable gain to the extent of unrealized gain, if any, on securities transferred to the Subsidiary while any unrealized losses on securities so transferred will not be recognized at the time of transfer.
The financial statements have been consolidated and include accounts of the Fund and the Subsidiary. Accordingly, all inter-company transactions and balances have been eliminated. At August 30, 2013, the Fund owned 7,500 shares with a market value of $6,832,140.
Investment in Oppenheimer Institutional Money Market Fund. The Fund is permitted to invest daily available cash balances in an affiliated money market fund. The Fund may invest the available cash in Class E shares of Oppenheimer Institutional Money Market Fund (“IMMF”) to seek current income while preserving liquidity. IMMF is a registered open-end management investment company, regulated as a money market fund under the Investment Company Act of 1940, as amended. The Manager is the investment adviser of IMMF, and the Sub-Adviser provides investment and related advisory services to IMMF. When applicable, the Fund’s investment in IMMF is included in the Consolidated Statement of Investments. Shares of IMMF are valued at their net asset value per share. As a shareholder, the Fund is subject to its proportional share of IMMF’s Class E expenses, including its management fee. The Manager will waive fees and/or reimburse Fund expenses in an amount equal to the indirect management fees incurred through the Fund’s investment in IMMF.
Investment in Oppenheimer Master Fund. The Fund is permitted to invest in entities sponsored and/or advised by the Manager or an affiliate. Certain of these entities in which the Fund invests are mutual funds registered under the Investment Company Act of 1940 that expect to be treated as partnerships for tax purposes, specifically Oppenheimer Master Loan Fund, LLC (the “Master Fund”). The Master Fund has its own investment risks, and those risks can affect the value of the Fund’s investments and therefore the value of the Fund’s shares. To the extent that the Fund invests more of its assets in the Master Fund, the Fund will have greater exposure to the risks of the Master Fund.
| | | | |
| OPPENHEIMER CAPITAL INCOME FUND | | | 55 | |
NOTES TO CONSOLIDATED FINANCIAL STATEMENTS Continued
1. Significant Accounting Policies Continued
The investment objective of the Master Fund is to seek as high a level of current income and preservation of capital as is consistent with investing primarily in loans and other debt securities. The Fund’s investment in the Master Fund is included in the Consolidated Statement of Investments. The Fund recognizes income and gain/(loss) on its investment in the master fund according to its allocated pro-rata share, based on its relative proportion of total outstanding Master Fund shares held, of the total net income earned and the net gain/(loss) realized on investments sold by the Master Fund. As a shareholder, the Fund is subject to its proportional share of the Master Fund’s expenses, including its management fee. The Manager will waive fees and/or reimburse Fund expenses in an amount equal to the indirect management fees incurred through the Fund’s investment in the Master Fund.
Foreign Currency Translation. The Fund’s accounting records are maintained in U.S. dollars. The values of securities denominated in foreign currencies and amounts related to the purchase and sale of foreign securities and foreign investment income are translated into U.S. dollars as of the close of the New York Stock Exchange (the “Exchange”), normally 4:00 P.M. Eastern time, on each day the Exchange is open for trading. Foreign exchange rates may be valued primarily using a reliable bank, dealer or service authorized by the Board of Trustees.
Reported net realized gains and losses from foreign currency transactions arise from sales of portfolio securities, sales and maturities of short-term securities, sales of foreign currencies, exchange rate fluctuations between the trade and settlement dates on securities transactions, and the difference between the amounts of dividends, interest, and foreign withholding taxes recorded on the Fund’s books and the U.S. dollar equivalent of the amounts actually received or paid. Net unrealized appreciation and depreciation on the translation of assets and liabilities denominated in foreign currencies arise from changes in the values of assets and liabilities, including investments in securities at fiscal period end, resulting from changes in exchange rates.
The effect of changes in foreign currency exchange rates on investments is separately identified from the fluctuations arising from changes in market values of securities held and reported with all other foreign currency gains and losses in the Fund’s Consolidated Statement of Operations.
Allocation of Income, Expenses, Gains and Losses. Income, expenses (other than those attributable to a specific class), gains and losses are allocated on a daily basis to each class of shares based upon the relative proportion of net assets represented by such class. Operating expenses directly attributable to a specific class are charged against the operations of that class.
Federal Taxes. The Fund intends to comply with provisions of the Internal Revenue Code applicable to regulated investment companies and to distribute substantially all of its investment company taxable income, including any net realized gain on investments not offset by capital loss carryforwards, if any, to shareholders. Therefore, no federal income or
| | |
| 56 | | OPPENHEIMER CAPITAL INCOME FUND |
excise tax provision is required. The Fund files income tax returns in U.S. federal and applicable state jurisdictions. The statute of limitations on the Fund’s tax return filings generally remain open for the three preceding fiscal reporting period ends.
The tax components of capital shown in the following table represent distribution requirements the Fund must satisfy under the income tax regulations, losses the Fund may be able to offset against income and gains realized in future years and unrealized appreciation or depreciation of securities and other investments for federal income tax purposes.
| | | | | | | | | | | | |
Undistributed
Net Investment
Income | | Undistributed
Long-Term
Gain | | | Accumulated
Loss
Carryforward1,2,3 | | | Net Unrealized
Appreciation
Based on Cost of
Securities and Other
Investments for Federal
Income Tax Purposes | |
| $6,756,856 | | $ | — | | | $ | 496,445,801 | | | $ | 134,133,868 | |
1. As of August 30, 2013, the Fund had $496,445,801 of net capital loss carryforwards available to offset future realized capital gains, if any, and thereby reduce future taxable gain distributions. Details of the capital loss carryforwards are included in the table below. Capital loss carryovers with no expiration, if any, must be utilized prior to those with expiration dates.
| | | | |
| Expiring | | | |
| 2016 | �� | $ | 10,682,367 | |
| 2018 | | | 485,763,434 | |
| | |
|
|
|
| Total | | $ | 496,445,801 | |
| | |
|
|
|
Of these losses, $10,682,367 are subject to loss limitation rules resulting from merger activity. These losses will be available for utilization August 31, 2014.
2. During the fiscal year ended August 30, 2013, the Fund utilized $26,312,480 of capital loss carryforward to offset capital gains realized in that fiscal year.
3. During the fiscal year ended August 31, 2012, the Fund utilized $25,330,478 of capital loss carryforward to offset capital gains realized in that fiscal year.
Net investment income (loss) and net realized gain (loss) may differ for financial statement and tax purposes. The character of dividends and distributions made during the fiscal year from net investment income or net realized gains may differ from their ultimate characterization for federal income tax purposes. Also, due to timing of dividends and distributions, the fiscal year in which amounts are distributed may differ from the fiscal year in which the income or net realized gain was recorded by the Fund.
Accordingly, the following amounts have been reclassified for August 30, 2013. Net assets of the Fund were unaffected by the reclassifications.
| | | | |
Increase
to Accumulated
Net Investment
Income | | Increase
to Accumulated Net
Realized Loss
on Investments | |
| $6,124,093 | | $ | 6,124,093 | |
| | | | |
| OPPENHEIMER CAPITAL INCOME FUND | | | 57 | |
NOTES TO CONSOLIDATED FINANCIAL STATEMENTS Continued
1. Significant Accounting Policies Continued
The tax character of distributions paid during the years ended August 30, 2013 and August 31, 2012 was as follows:
| | | | | | | | |
| | | Year Ended
August 30, 2013 | | | Year Ended
August 31, 2012 | |
| Distributions paid from: | | | | | | | | |
| Ordinary income | | $ | 64,184,545 | | | $ | 60,705,478 | |
The aggregate cost of securities and other investments and the composition of unrealized appreciation and depreciation of securities and other investments for federal income tax purposes as of August 30, 2013 are noted in the following table. The primary difference between book and tax appreciation or depreciation of securities and other investments, if applicable, is attributable to the tax deferral of losses or tax realization of financial statement unrealized gain or loss.
| | | | |
| Federal tax cost of securities | | $ | 1,895,151,020 | |
| Federal tax cost of other investments | | | (54,292,914 | ) |
| | |
|
|
|
| Total federal tax cost | | $ | 1,840,858,106 | |
| | |
|
|
|
| Gross unrealized appreciation | | $ | 180,036,138 | |
| Gross unrealized depreciation | | | (45,902,270 | ) |
| | |
|
|
|
| Net unrealized appreciation | | $ | 134,133,868 | |
| | |
|
|
|
Trustees’ Compensation. The Board of Trustees has adopted a compensation deferral plan for independent trustees that enables trustees to elect to defer receipt of all or a portion of the annual compensation they are entitled to receive from the Fund. For purposes of determining the amount owed to the Trustee under the plan, deferred amounts are treated as though equal dollar amounts had been invested in shares of the Fund or in other Oppenheimer funds selected by the Trustee. The Fund purchases shares of the funds selected for deferral by the Trustee in amounts equal to his or her deemed investment, resulting in a Fund asset equal to the deferred compensation liability. Such assets are included as a component of “Other” within the asset section of the Consolidated Statement of Assets and Liabilities. Deferral of trustees’ fees under the plan will not affect the net assets of the Fund, and will not materially affect the Fund’s assets, liabilities or net investment income per share. Amounts will be deferred until distributed in accordance with the compensation deferral plan.
Dividends and Distributions to Shareholders. Dividends and distributions to shareholders, which are determined in accordance with income tax regulations and may differ from U.S. generally accepted accounting principles, are recorded on the ex-dividend date. Income distributions, if any, are declared and paid quarterly. Capital gain distributions, if any, are declared and paid annually.
Investment Income. Dividend income is recorded on the ex-dividend date or upon ex-dividend notification in the case of certain foreign dividends where the ex-dividend date may have passed. Non-cash dividends included in dividend income, if any, are recorded at the fair market value of the securities received. Interest income is recognized on an accrual
| | |
| 58 | | OPPENHEIMER CAPITAL INCOME FUND |
basis. Discount and premium, which are included in interest income on the Consolidated Statement of Operations, are amortized or accreted daily.
Custodian Fees. “Custodian fees and expenses” in the Consolidated Statement of Operations may include interest expense incurred by the Fund on any cash overdrafts of its custodian account during the period. Such cash overdrafts may result from the effects of failed trades in portfolio securities and from cash outflows resulting from unanticipated shareholder redemption activity. The Fund pays interest to its custodian on such cash overdrafts, to the extent they are not offset by positive cash balances maintained by the Fund, at a rate equal to the Federal Funds Rate plus 0.50%. The “Reduction to custodian expenses” line item, if applicable, represents earnings on cash balances maintained by the Fund during the period. Such interest expense and other custodian fees may be paid with these earnings.
Security Transactions. Security transactions are recorded on the trade date. Realized gains and losses on securities sold (except for the investments in the Subsidiary) are determined on the basis of identified cost.
Indemnifications. The Fund’s organizational documents provide current and former trustees and officers with a limited indemnification against liabilities arising in connection with the performance of their duties to the Fund. In the normal course of business, the Fund may also enter into contracts that provide general indemnifications. The Fund’s maximum exposure under these arrangements is unknown as this would be dependent on future claims that may be made against the Fund. The risk of material loss from such claims is considered remote.
Other. The preparation of financial statements in conformity with accounting principles generally accepted in the United States of America requires management to make estimates and assumptions that affect the reported amounts of assets and liabilities and disclosure of contingent assets and liabilities at the date of the financial statements and the reported amounts of increases and decreases in net assets from operations during the reporting period. Actual results could differ from those estimates.
2. Securities Valuation
The Fund calculates the net asset value of its shares as of the close of the New York Stock Exchange (the “Exchange”), normally 4:00 P.M. Eastern time, on each day the Exchange is open for trading.
The Fund’s Board has adopted procedures for the valuation of the Fund’s securities and has delegated the day-to-day responsibility for valuation determinations under those procedures to the Manager. The Manager has established a Valuation Committee which is responsible for determining a “fair valuation” for any security for which market quotations are not “readily available.” The Valuation Committee’s fair valuation determinations are subject to review, approval and ratification by the Fund’s Board at its next regularly scheduled meeting covering the calendar quarter in which the fair valuation was determined.
| | | | |
| OPPENHEIMER CAPITAL INCOME FUND | | | 59 | |
NOTES TO CONSOLIDATED FINANCIAL STATEMENTS Continued
2. Securities Valuation Continued
Valuation Methods and Inputs
Securities are valued using unadjusted quoted market prices, when available, as supplied primarily by third party pricing services or dealers.
The following methodologies are used to determine the market value or the fair value of the types of securities described below:
Securities traded on a registered U.S. securities exchange (including exchange-traded derivatives other than futures and futures options) are valued based on the last sale price of the security reported on the principal exchange on which it is traded, prior to the time when the Fund’s assets are valued. In the absence of a sale, the security is valued at the last sale price on the prior trading day, if it is within the spread of the current day’s closing “bid” and “asked” prices, and if not, at the current day’s closing bid price. A security of a foreign issuer traded on a foreign exchange but not listed on a registered U.S. securities exchange is valued based on the last sale price on the principal exchange on which the security is traded, as identified by the third party pricing service used by the Manager, prior to the time when the Fund’s assets are valued. If the last sale price is unavailable, the security is valued at the most recent official closing price on the principal exchange on which it is traded. If the last sales price or official closing price for a foreign security is not available, the security is valued at the mean between the bid and asked price per the exchange or, if not available from the exchange, obtained from two dealers. If bid and asked prices are not available from either the exchange or two dealers, the security is valued by using one of the following methodologies (listed in order of priority); (1) using a bid from the exchange, (2) the mean between the bid and asked price as provided by a single dealer, or (3) a bid from a single dealer.
Shares of a registered investment company that are not traded on an exchange are valued at that investment company’s net asset value per share.
Corporate and government debt securities (of U.S. or foreign issuers) and municipal debt securities, event-linked bonds, loans, mortgage-backed securities, collateralized mortgage obligations, and asset-backed securities are valued at the mean between the “bid” and “asked” prices utilizing evaluated prices obtained from third party pricing services or broker-dealers who may use matrix pricing methods to determine the evaluated prices.
Short-term money market type debt securities with a remaining maturity of sixty days or less are valued at cost adjusted by the amortization of discount or premium to maturity (amortized cost), which approximates market value. Short-term debt securities with a remaining maturity in excess of sixty days are valued at the mean between the “bid” and “asked” prices utilizing evaluated prices obtained from third party pricing services or broker-dealers.
Structured securities, swaps, swaptions, and other over-the-counter derivatives are valued utilizing evaluated prices obtained from third party pricing services or broker-dealers.
Forward foreign currency exchange contracts are valued utilizing current and forward currency rates obtained from third party pricing services. When the settlement date of a contract is an interim date for which a quotation is not available, interpolated values are derived using the nearest dated forward currency rate.
| | |
| 60 | | OPPENHEIMER CAPITAL INCOME FUND |
Futures contracts and futures options traded on a commodities or futures exchange will be valued at the final settlement price or official closing price on the principal exchange as reported by such principal exchange at its trading session ending at, or most recently prior to, the time when the Fund’s assets are valued.
A description of the standard inputs that may generally be considered by the third party pricing vendors in determining their evaluated prices is provided below.
| | |
| Security Type | | Standard inputs generally considered by third-party pricing vendors |
| Corporate debt, government debt, municipal, mortgage-backed and asset-backed securities | | Reported trade data, broker-dealer price quotations, benchmark yields, issuer spreads on comparable securities, the credit quality, yield, maturity, and other appropriate factors. |
| Loans | | Information obtained from market participants regarding reported trade data and broker-dealer price quotations. |
| Event-linked bonds | | Information obtained from market participants regarding reported trade data and broker-dealer price quotations. |
| Structured securities | | Relevant market information such as the price of underlying financial instruments, stock market indices, foreign currencies, interest rate spreads, commodities, or the occurrence of other specific events. |
| Swaps | | Relevant market information, including underlying reference assets such as credit spreads, credit event probabilities, index values, individual security values, forward interest rates, variable interest rates, volatility measures, and forward currency rates. |
If a market value or price cannot be determined for a security using the methodologies described above, or if, in the “good faith” opinion of the Manager, the market value or price obtained does not constitute a “readily available market quotation,” or a significant event has occurred that would materially affect the value of the security the security is fair valued either (i) by a standardized fair valuation methodology applicable to the security type or the significant event as previously approved by the Valuation Committee and the Fund’s Board or (ii) as determined in good faith by the Manager’s Valuation Committee. The Valuation Committee considers all relevant facts that are reasonably available, through either public information or information available to the Manager, when determining the fair value of a security. Fair value determinations by the Manager are subject to review, approval and ratification by the Fund’s Board at its next regularly scheduled meeting covering the calendar quarter in which the fair valuation was determined. Those fair valuation standardized methodologies include, but are not limited to, valuing securities at the last sale price or initially at cost and subsequently adjusting the value based on: changes in company specific fundamentals, changes in an appropriate securities index, or changes in the value of similar securities which may be further adjusted for any discounts related to security-specific resale restrictions. When possible, such methodologies use observable market inputs such as unadjusted quoted prices of similar securities, observable interest rates, currency rates and yield curves. The methodologies used for valuing securities are not necessarily an indication of the risks associated with investing in those securities nor can it be assured that the Fund can obtain the fair value assigned to a security if it were to sell the security.
| | | | |
| OPPENHEIMER CAPITAL INCOME FUND | | | 61 | |
NOTES TO CONSOLIDATED FINANCIAL STATEMENTS Continued
2. Securities Valuation Continued
To assess the continuing appropriateness of security valuations, the Manager, or its third party service provider who is subject to oversight by the Manager, regularly compares prior day prices, prices on comparable securities, and sale prices to the current day prices and challenges those prices exceeding certain tolerance levels with the third party pricing service or broker source. For those securities valued by fair valuations, whether through a standardized fair valuation methodology or a fair valuation determination, the Valuation Committee reviews and affirms the reasonableness of the valuations based on such methodologies and fair valuation determinations on a regular basis after considering all relevant information that is reasonably available.
Classifications
Each investment asset or liability of the Fund is assigned a level at measurement date based on the significance and source of the inputs to its valuation. Various data inputs are used in determining the value of each of the Fund’s investments as of the reporting period end. These data inputs are categorized in the following hierarchy under applicable financial accounting standards:
| 1) | | Level 1—unadjusted quoted prices in active markets for identical assets or liabilities (including securities actively traded on a securities exchange) |
| 2) | | Level 2—inputs other than unadjusted quoted prices that are observable for the asset or liability (such as unadjusted quoted prices for similar assets and market corroborated inputs such as interest rates, prepayment speeds, credit risks, etc.) |
| 3) | | Level 3—significant unobservable inputs (including the Manager’s own judgments about assumptions that market participants would use in pricing the asset or liability). |
The inputs used for valuing securities are not necessarily an indication of the risks associated with investing in those securities.
The table below categorizes amounts that are included in the Fund’s Consolidated Statement of Assets and Liabilities as of August 30, 2013 based on valuation input level:
| | | | | | | | | | | | | | | | | | | | |
| | | Level 1—
Unadjusted
Quoted Prices | | Level 2—
Other Significant
Observable Inputs | | Level 3—
Significant
Unobservable
Inputs | | Value |
| Assets Table | | | | | | | | | | | | | | | | | | | | |
| Investments, at Value: | | | | | | | | | | | | | | | | | | | | |
| Common Stocks | | | | | | | | | | | | | | | | | | | | |
Consumer Discretionary | | | $ | 57,788,036 | | | | $ | — | | | | $ | — | | | | $ | 57,788,036 | |
Consumer Staples | | | | 37,308,500 | | | | | — | | | | | — | | | | | 37,308,500 | |
Energy | | | | 68,812,444 | | | | | 5,921,456 | | | | | — | | | | | 74,733,900 | |
Financials | | | | 78,888,101 | | | | | 5,250,000 | | | | | — | | | | | 84,138,101 | |
Health Care | | | | 67,996,793 | | | | | 4,864,259 | | | | | — | | | | | 72,861,052 | |
Industrials | | | | 79,753,374 | | | | | — | | | | | — | | | | | 79,753,374 | |
Information Technology | | | | 71,223,296 | | | | | — | | | | | — | | | | | 71,223,296 | |
Materials | | | | 28,993,295 | | | | | — | | | | | — | | | | | 28,993,295 | |
Telecommunication Services | | | | 25,002,558 | | | | | — | | | | | — | | | | | 25,002,558 | |
Utilities | | | | 28,687,817 | | | | | — | | | | | — | | | | | 28,687,817 | |
| Preferred Stocks | | | | 6,360,495 | | | | | 8,072,548 | | | | | — | | | | | 14,433,043 | |
| | |
| 62 | | OPPENHEIMER CAPITAL INCOME FUND |
| | | | | | | | | | | | | | | | | | | | |
| | | Level 1—
Unadjusted
Quoted Prices | | Level 2—
Other Significant
Observable Inputs | | Level 3—
Significant
Unobservable
Inputs | | Value |
| Mortgage-Backed Obligations | | | $ | — | | | | $ | 351,107,089 | | | | $ | — | | | | $ | 351,107,089 | |
| Asset-Backed Securities | | | | — | | | | | 148,663,512 | | | | | 52,617,590 | | | | | 201,281,102 | |
| U.S. Government Obligations | | | | — | | | | | 19,896,966 | | | | | — | | | | | 19,896,966 | |
| Non-Convertible Corporate Bonds and Notes | | | | — | | | | | 369,906,349 | | | | | — | | | | | 369,906,349 | |
| Convertible Corporate Bonds and Notes | | | | — | | | | | 25,076,285 | | | | | — | | | | | 25,076,285 | |
| Corporate Loans | | | | — | | | | | 25,344,578 | | | | | — | | | | | 25,344,578 | |
| Event-Linked Bonds | | | | — | | | | | 4,800,489 | | | | | — | | | | | 4,800,489 | |
| Exchange-Traded Option Purchased | | | | 55,800 | | | | | — | | | | | — | | | | | 55,800 | |
| Over-the-Counter Option Purchased | | | | — | | | | | 84,060 | | | | | — | | | | | 84,060 | |
| Over-the-Counter Interest Rate Swaptions Purchased | | | | — | | | | | 11,527,077 | | | | | — | | | | | 11,527,077 | |
| Investment Companies | | | | 253,427,411 | | | | | 191,524,774 | | | | | — | | | | | 444,952,185 | |
| | | |
|
|
|
| Total Investments, at Value | | | | 804,297,920 | | | | | 1,172,039,442 | | | | | 52,617,590 | | | | | 2,028,954,952 | |
| Other Financial Instruments: | | | | | | | | | | | | | | | | | | | | |
| Foreign currency exchange contracts | | | | — | | | | | 8,301 | | | | | — | | | | | 8,301 | |
| Variation margin receivable | | | | 215,589 | | | | | — | | | | | — | | | | | 215,589 | |
| Swaps, at value | | | | — | | | | | 782,364 | | | | | — | | | | | 782,364 | |
| | | |
|
|
|
| Total Assets | | | $ | 804,513,509 | | | | $ | 1,172,830,107 | | | | $ | 52,617,590 | | | | $ | 2,029,961,206 | |
| | | |
|
|
|
| Liabilities Table | | | | | | | | | | | | | | | | | | | | |
| Other Financial Instruments: | | | | | | | | | | | | | | | | | | | | |
| Foreign currency exchange contracts | | | $ | — | | | | $ | (175,672 | ) | | | $ | — | | | | $ | (175,672 | ) |
| Variation margin payable | | | | (10,255 | ) | | | | — | | | | | — | | | | | (10,255 | ) |
| | | |
|
|
|
| Total Liabilities | | | $ | (10,255 | ) | | | $ | (175,672 | ) | | | $ | — | | | | $ | (185,927 | ) |
| | | |
|
|
|
Currency contracts and forwards, if any, are reported at their unrealized appreciation/depreciation at measurement date, which represents the change in the contract’s value from trade date. Futures, if any, are reported at their variation margin at measurement date, which represents the amount due to/from the Fund at that date. All additional assets and liabilities included in the above table are reported at their market value at measurement date.
The table below shows the transfers between Level 1, Level 2 and Level 3. The Fund’s policy is to recognize transfers in and transfers out as of the beginning of the reporting period.
| | | | | | | | | | | | | | | | | | | | | | | | | |
| | | Transfers into
Level 1 | | Transfers out of
Level 1 | | Transfers into
Level 2 | | Transfers out of
Level 2 | | Transfers into
Level 3 |
| Assets Table | | | | | | | | | | | | | | | | | | | | | | | | | |
| Investments, at Value: | | | | | | | | | | | | | | | | | | | | | | | | | |
| Common Stocks | | | | | | | | | | | | | | | | | | | | | | | | | |
Energy | | | $ | — | | | | $ | (11,035,159 | )a | | | $ | 11,035,159a | | | | $ | — | | | | $ | — | |
| Preferred Stocks | | | | 6,418,830b | | | | | — | | | | | — | | | | | (6,418,830 | )b | | | | — | c |
| Asset-Backed Securities | | | | — | | | | | — | | | | | — | | | | | (6,903,913 | )c | | | | 6,903,913 | |
| | | |
|
|
|
| Total Assets | | | $ | 6,418,830 | | | | $ | (11,035,159 | ) | | | $ | 11,035,159 | | | | $ | (13,322,743 | ) | | | $ | 6,903,913 | |
| | | |
|
|
|
| | | | |
| OPPENHEIMER CAPITAL INCOME FUND | | | 63 | |
NOTES TO CONSOLIDATED FINANCIAL STATEMENTS Continued
2. Securities Valuation Continued
a. Transferred from Level 1 to Level 2 because of the absence of a readily available unadjusted quoted market price due to a significant event occurring before the Fund’s assets were valued but after the close of the securities’ respective exchanges.
b. Transferred from Level 2 to Level 1 due to the presence of a readily available unadjusted quoted market price.
c. Transferred from Level 2 to Level 3 because of the lack of observable market data.
The following is a reconciliation of assets in which significant unobservable inputs (level 3) were used in determining fair value:
| | | | | | | | | | | | | | | | | | | | | | | | | | | | | | |
| | | Value as
of
August 31,
2012 | | Change in
unrealized
appreciation/
depreciation | | Accretion/
(amortization)
of premium/
discounta | | Purchases | | Transfers
into
Level 3 | | Value as
of
August 30,
2013 |
| Assets Table | | | | | | | | | | | | | | | | | | | | | | | | | | | | | | |
| Investments, at Value: | | | | | | | | | | | | | | | | | | | | | | | | | | | | | | |
| Asset-Backed Securities | | | $ | — | | | | $ | (3,775,233 | ) | | | $ | 106,185 | | | | $ | 49,382,725 | | | | $ | 6,903,913 | | | | $ | 52,617,590 | |
a. Included in net investment income.
The total change in unrealized appreciation/depreciation included in the Consolidated Statement of Operations attributable to level 3 investments still held at August 30, 2013 includes:
| | | | |
| | | Change in unrealized
appreciation/depreciation | |
| Asset-Backed Securities | | $ | (758,336 | ) |
The following provides information regarding assets in which significant unobservable inputs (level) were used by the Manager in determining fair value. Note that these amounts exclude any valuations provided by a pricing service or broker:
The following table summarizes the valuation techniques and significant unobservable inputs used in determining fair value measurements for those investments classified as Level 3 as of August 30, 2013:
| | | | | | | | | | | | | | | | | | | | | | | | | |
| | | Value as of
August 30,
2013 | | Valuation
Technique | | Unobservable
input | | Range of
Unobservable
Inputs | | Unobservable
Input Used |
| Assets Table | | | | | | | | | | | | | | | | | | | | | | | | | |
| Investments, at Value: | | | | | | | | | | | | | | | | | | | | | | | | | |
| Asset-Backed Securities | | | $ | 52,617,590 | | | |
| Broker quotes
and cash
flow model |
| | | | Proprietary model | | | | | N/A | | | | | N/A | (a) |
| | | |
|
|
| | | | | | | | | | | | | | | | | | | | |
| Total | | | $ | 52,617,590 | | | | | | | | | | | | | | | | | | | | | |
| | | |
|
|
| | | | | | | | | | | | | | | | | | | | |
(a) Securities classified as Level 3 whose unadjusted values were provided by a broker-dealer for which such inputs are unobservable. The Manager periodically reviews broker methodologies and inputs to confirm they are determined using unobservable inputs and have been appropriately classified. Such securities’ fair valuations could change significantly based on changes in unobservable inputs used by the broker.
| | |
| 64 | | OPPENHEIMER CAPITAL INCOME FUND |
3. Shares of Beneficial Interest
The Fund has authorized an unlimited number of $0.001 par value shares of beneficial interest of each class. Transactions in shares of beneficial interest were as follows:
| | | | | | | | | | | | | | | | |
| | | Year Ended August 30, 2013 | | | Year Ended August 31, 2012 | |
| | | Shares | | | Amount | | | Shares | | | Amount | |
| Class A | | | | | | | | | | | | | | | | |
| Sold | | | 23,642,395 | | | $ | 220,539,567 | | | | 10,921,285 | | | $ | 96,573,451 | |
| Dividends and/or distributions reinvested | | | 5,748,038 | | | | 52,839,693 | | | | 6,052,945 | | | | 52,096,200 | |
| Redeemed | | | (21,627,328 | ) | | | (201,240,823 | ) | | | (25,611,585 | ) | | | (225,285,093 | ) |
| | |
|
|
|
| Net increase (decrease) | | | 7,763,105 | | | $ | 72,138,437 | | | | (8,637,355 | ) | | $ | (76,615,442 | ) |
| | |
|
|
|
| | | | | | | | | | | | | | | | | |
| Class B | | | | | | | | | | | | | | | | |
| Sold | | | 477,637 | | | $ | 4,360,578 | | | | 855,722 | | | $ | 7,368,906 | |
| Dividends and/or distributions reinvested | | | 126,915 | | | | 1,141,639 | | | | 162,305 | | | | 1,367,368 | |
| Redeemed | | | (1,774,270 | ) | | | (16,167,344 | ) | | | (2,039,697 | ) | | | (17,504,895 | ) |
| | |
|
|
|
| Net decrease | | | (1,169,718 | ) | | $ | (10,665,127 | ) | | | (1,021,670 | ) | | $ | (8,768,621 | ) |
| | |
|
|
|
| | | | | | | | | | | | | | | | | |
| Class C | | | | | | | | | | | | | | | | |
| Sold | | | 9,959,753 | | | $ | 90,454,935 | | | | 2,691,314 | | | $ | 23,248,449 | |
| Dividends and/or distributions reinvested | | | 414,136 | | | | 3,704,982 | | | | 349,558 | | | | 2,933,613 | |
| Redeemed | | | (2,678,566 | ) | | | (24,274,449 | ) | | | (2,106,962 | ) | | | (18,031,127 | ) |
| | |
|
|
|
| Net increase | | | 7,695,323 | | | $ | 69,885,468 | | | | 933,910 | | | $ | 8,150,935 | |
| | |
|
|
|
| | | | | | | | | | | | | | | | | |
| Class N | | | | | | | | | | | | | | | | |
| Sold | | | 518,206 | | | $ | 4,770,142 | | | | 487,732 | | | $ | 4,243,520 | |
| Dividends and/or distributions reinvested | | | 76,804 | | | | 697,434 | | | | 81,793 | | | | 696,509 | |
| Redeemed | | | (722,639 | ) | | | (6,643,074 | ) | | | (617,424 | ) | | | (5,359,592 | ) |
| | |
|
|
|
| Net decrease | | | (127,629 | ) | | $ | (1,175,498 | ) | | | (47,899 | ) | | $ | (419,563 | ) |
| | |
|
|
|
| | | | | | | | | | | | | | | | | |
| Class Y | | | | | | | | | | | | | | | | |
| Sold | | | 11,778,421 | | | $ | 109,885,511 | | | | 2,143,991 | | | $ | 19,277,999 | |
| Dividends and/or distributions reinvested | | | 198,993 | | | | 1,830,047 | | | | 25,160 | | | | 217,466 | |
| Redeemed | | | (3,124,651 | ) | | | (29,150,941 | ) | | | (212,163 | ) | | | (1,846,395 | ) |
| | |
|
|
|
| Net increase | | | 8,852,763 | | | $ | 82,564,617 | | | | 1,956,988 | | | $ | 17,649,070 | |
| | |
|
|
|
4. Purchases and Sales of Securities
The aggregate cost of purchases and proceeds from sales of securities, other than short-term obligations and investments in IMMF, for the year ended August 30, 2013, were as follows:
| | | | | | | | |
| | | Purchases | | | Sales | |
| Investment securities | | $ | 1,068,231,128 | | | $ | 1,044,653,206 | |
| U.S. government and government agency obligations | | | 55,890,559 | | | | 56,421,824 | |
| To Be Announced (TBA) mortgage-related securities | | | 3,481,764,612 | | | | 3,521,818,336 | |
| | | | |
| OPPENHEIMER CAPITAL INCOME FUND | | | 65 | |
NOTES TO CONSOLIDATED FINANCIAL STATEMENTS Continued
5. Fees and Other Transactions with Affiliates
Management Fees. Under the investment advisory agreement, the Fund pays the Manager a management fee based on the daily net assets of the Fund at an annual rate as shown in the following table:
| | | | |
| Fee Schedule | | | |
| Up to $100 million | | | 0.75 | % |
| Next $100 million | | | 0.70 | |
| Next $100 million | | | 0.65 | |
| Next $100 million | | | 0.60 | |
| Next $100 million | | | 0.55 | |
| Next $4.5 billion | | | 0.50 | |
| Over $5 billion | | | 0.48 | |
The Manager also provides investment management related services to the Subsidiary. The Subsidiary pays the Manager a monthly management fee at an annual rate according to the above schedule. The Subsidiary also pays certain other expenses including custody and directors’ fees.
Sub-Adviser Fees. The Manager has retained the Sub-Adviser to provide the day-to-day portfolio management of the Fund and the Subsidiary. Under the Sub-Advisory Agreement, the Manager pays the Sub-Adviser an annual fee in monthly installments, equal to a percentage of the investment management fee collected by the Manager from the Fund and the Subsidiary, which shall be calculated after any investment management fee waivers. The fee paid to the Sub-Adviser is paid by the Manager, not by the Fund.
Transfer Agent Fees. OppenheimerFunds Services (“OFS”), a division of OFI, acted as the transfer and shareholder servicing agent for the Fund through December 31, 2012. Effective January 1, 2013, OFI Global (the “Transfer Agent”) serves as the transfer and shareholder servicing agent for the Fund. Fees incurred by the Fund with respect to these services are detailed in the Consolidated Statement of Operations.
Sub-Transfer Agent Fees. Effective January 1, 2013, the Transfer Agent has retained Shareholder Services, Inc., a wholly-owned subsidiary of OFI (the “Sub-Transfer Agent”), to provide the day-to-day transfer agent and shareholder servicing of the Fund. Under the Sub-Transfer Agency Agreement, the Transfer Agent pays the Sub-Transfer Agent an annual fee in monthly installments, equal to a percentage of the transfer agent fee collected by the Transfer Agent from the Fund, which shall be calculated after any applicable fee waivers. The fee paid to the Sub-Transfer Agent is paid by the Transfer Agent, not by the Fund.
Distribution and Service Plan (12b-1) Fees. Under its General Distributor’s Agreement with the Fund, OppenheimerFunds Distributor, Inc. (the “Distributor”) acts as the Fund’s principal underwriter in the continuous public offering of the Fund’s classes of shares.
Service Plan for Class A Shares. The Fund has adopted a Service Plan (the “Plan”) for Class A shares under Rule 12b-1 of the Investment Company Act of 1940. Under the Plan, the Fund reimburses the Distributor for a portion of its costs incurred for services provided to accounts that hold Class A shares. Reimbursement is made periodically at an annual rate of up to 0.25% of the daily net assets of Class A shares of the Fund. The
| | |
| 66 | | OPPENHEIMER CAPITAL INCOME FUND |
Distributor currently uses all of those fees to pay dealers, brokers, banks and other financial institutions periodically for providing personal service and maintenance of accounts of their customers that hold Class A shares. Any unreimbursed expenses the Distributor incurs with respect to Class A shares in any fiscal year cannot be recovered in subsequent periods. Fees incurred by the Fund under the Plan are detailed in the Consolidated Statement of Operations.
Distribution and Service Plans for Class B, Class C and Class N Shares. The Fund has adopted Distribution and Service Plans (the “Plans”) for Class B, Class C and Class N shares under Rule 12b-1 of the Investment Company Act of 1940 to compensate the Distributor for its services in connection with the distribution of those shares and servicing accounts. Under the Plans, the Fund pays the Distributor an annual asset-based sales charge of 0.75% on Class B and Class C shares daily net assets and 0.25% on Class N shares daily net assets. The Distributor also receives a service fee of 0.25% per year under each plan. If either the Class B, Class C or Class N plan is terminated by the Fund or by the shareholders of a class, the Board of Trustees and its independent trustees must determine whether the Distributor shall be entitled to payment from the Fund of all or a portion of the service fee and/or asset-based sales charge in respect to shares sold prior to the effective date of such termination. Fees incurred by the Fund under the Plans are detailed in the Consolidated Statement of Operations. The Distributor determines its uncompensated expenses under the Plans at calendar quarter ends. The Distributor’s aggregate uncompensated expenses under the Plans at June 30, 2013 were as follows:
| | | | |
| Class B | | $ | 9,322,937 | |
| Class C | | | 10,219,898 | |
| Class N | | | 1,035,321 | |
Sales Charges. Front-end sales charges and contingent deferred sales charges (“CDSC”) do not represent expenses of the Fund. They are deducted from the proceeds of sales of Fund shares prior to investment or from redemption proceeds prior to remittance, as applicable. The sales charges retained by the Distributor from the sale of shares and the CDSC retained by the Distributor on the redemption of shares is shown in the following table for the period indicated.
| | | | | | | | | | | | | | | | | | | | |
| Year Ended | | Class A Front-End
Sales Charges
Retained by
Distributor | | | Class A
Contingent
Deferred
Sales Charges
Retained by
Distributor | | | Class B Contingent
Deferred
Sales Charges
Retained by
Distributor | | | Class C
Contingent
Deferred
Sales Charges
Retained by
Distributor | | | Class N
Contingent
Deferred
Sales Charges
Retained by
Distributor | |
| August 30, 2013 | | $ | 504,795 | | | $ | 1,245 | | | $ | 53,381 | | | $ | 12,965 | | | $ | 1,872 | |
Waivers and Reimbursements of Expenses. The Manager has contractually agreed to waive the management fee it receives from the Fund in an amount equal to the management fee it receives from the Subsidiary. During the year ended August 30, 2013, the Manager waived $19,614.
The Manager will waive fees and/or reimburse Fund expenses in an amount equal to the indirect management fees incurred through the Fund’s investments in IMMF,
| | | | |
| OPPENHEIMER CAPITAL INCOME FUND | | | 67 | |
NOTES TO CONSOLIDATED FINANCIAL STATEMENTS Continued
5. Fees and Other Transactions with Affiliates Continued
Oppenheimer Short Duration Fund and the Master Fund. During the year ended August 30, 2013, the Manager waived fees and/or reimbursed the Fund $781,470 for management fees.
The Transfer Agent has voluntarily agreed to limit transfer and shareholder servicing agent fees for Classes B, C, N and Y shares to 0.35% of average annual net assets per class and for Class A shares to 0.30% of average annual net assets of the class.
During the year ended August 30, 2013, the Transfer Agent waived transfer and shareholder servicing agent fees as follows:
Some of these undertakings may be modified or terminated at any time; some may not be modified or terminated until after one year from the date of the current prospectus, as indicated therein.
6. Risk Exposures and the Use of Derivative Instruments
The Fund’s investment objectives not only permit the Fund to purchase investment securities, they also allow the Fund to enter into various types of derivatives contracts, including, but not limited to, futures contracts, forward currency exchange contracts, credit default swaps, interest rate swaps, total return swaps, variance swaps and purchased and written options. In doing so, the Fund will employ strategies in differing combinations to permit it to increase, decrease, or change the level or types of exposure to market risk factors. These instruments may allow the Fund to pursue its objectives more quickly and efficiently than if it were to make direct purchases or sales of securities capable of effecting a similar response to market factors. Such contracts may be entered into through a bilateral over-the-counter (“OTC”) transaction, or through a securities or futures exchange and cleared through a clearinghouse.
Market Risk Factors. In accordance with its investment objectives, the Fund may use derivatives to increase or decrease its exposure to one or more of the following market risk factors:
Commodity Risk. Commodity risk relates to the change in value of commodities or commodity indexes as they relate to increases or decreases in the commodities market. Commodities are physical assets that have tangible properties. Examples of these types of assets are crude oil, heating oil, metals, livestock, and agricultural products.
Credit Risk. Credit risk relates to the ability of the issuer to meet interest and principal payments, or both, as they come due. In general, lower-grade, higher-yield bonds are subject to credit risk to a greater extent than lower-yield, higher-quality bonds.
Equity Risk. Equity risk relates to the change in value of equity securities as they relate to increases or decreases in the general market.
Foreign Exchange Rate Risk. Foreign exchange rate risk relates to the change in the U.S. dollar value of a security held that is denominated in a foreign currency. The U.S. dollar value of a foreign currency denominated security will decrease as the dollar appreciates against the currency, while the U.S. dollar value will increase as the dollar depreciates against the currency.
| | |
| 68 | | OPPENHEIMER CAPITAL INCOME FUND |
Interest Rate Risk. Interest rate risk refers to the fluctuations in value of fixed-income securities resulting from the inverse relationship between price and yield. For example, an increase in general interest rates will tend to reduce the market value of already issued fixed-income investments, and a decline in general interest rates will tend to increase their value. In addition, debt securities with longer maturities, which tend to have higher yields, are subject to potentially greater fluctuations in value from changes in interest rates than obligations with shorter maturities.
Volatility Risk. Volatility risk refers to the magnitude of the movement, but not the direction of the movement, in a financial instrument’s price over a defined time period. Large increases or decreases in a financial instrument’s price over a relative time period typically indicate greater volatility risk, while small increases or decreases in its price typically indicate lower volatility risk.
Derivatives may have little or no initial cash investment relative to their market value exposure and therefore can produce significant gains or losses in excess of their cost due to unanticipated changes in the market risk factors and the overall market. This use of embedded leverage allows the Fund to increase its market value exposure relative to its net assets and can substantially increase the volatility of the Fund’s performance. In instances where the Fund is using derivatives to decrease, or hedge, exposures to market risk factors for securities held by the Fund, there are also risks that those derivatives may not perform as expected resulting in losses for the combined or hedged positions. Some derivatives have the potential for unlimited loss, regardless of the size of the Fund’s initial investment.
Additional associated risks from investing in derivatives also exist and potentially could have significant effects on the valuation of the derivative and the Fund. Typically, the associated risks are not the risks that the Fund is attempting to increase or decrease exposure to, per its investment objectives, but are the additional risks from investing in derivatives. Examples of these associated risks are liquidity risk, which is the risk that the Fund will not be able to sell the derivative in the open market in a timely manner, and counterparty credit risk, which is the risk that the counterparty will not fulfill its obligation to the Fund.
The Fund’s actual exposures to these market risk factors and associated risks during the period are discussed in further detail, by derivative type, below.
Forward Currency Exchange Contracts
The Fund may enter into forward currency exchange contracts (“forward contracts”) for the purchase or sale of a foreign currency at a negotiated rate at a future date. Such contracts are traded in the OTC inter-bank currency dealer market.
Forward contracts are reported on a schedule following the Consolidated Statement of Investments. The unrealized appreciation (depreciation) is reported in the Consolidated Statement of Assets and Liabilities as a receivable (or payable) and in the Consolidated Statement of Operations within the change in unrealized appreciation (depreciation). At contract close, the difference between the original cost of the contract and the value at the close date is recorded as a realized gain (loss) in the Consolidated Statement of Operations.
| | | | |
| OPPENHEIMER CAPITAL INCOME FUND | | | 69 | |
NOTES TO CONSOLIDATED FINANCIAL STATEMENTS Continued
6. Risk Exposures and the Use of Derivative Instruments Continued
The Fund has entered into forward contracts with the obligation to purchase specified foreign currencies in the future at a currently negotiated forward rate in order to take a positive investment perspective on the related currency. These forward contracts seek to increase exposure to foreign exchange rate risk.
The Fund has entered into forward contracts with the obligation to purchase specified foreign currencies in the future at a currently negotiated forward rate in order to decrease exposure to foreign exchange rate risk associated with foreign currency denominated securities held by the Fund.
The Fund has entered into forward contracts with the obligation to sell specified foreign currencies in the future at a currently negotiated forward rate in order to decrease exposure to foreign exchange rate risk associated with foreign currency denominated securities held by the Fund.
During the year ended August 30, 2013, the Fund had daily average contract amounts on forward contracts to buy and sell of $771,525 and $14,364,116, respectively.
Additional associated risk to the Fund includes counterparty credit risk. Counterparty credit risk arises from the possibility that the counterparty to a forward contract will default and fail to perform its obligations to the Fund.
Futures Contracts
A futures contract is a commitment to buy or sell a specific amount of a commodity, financial instrument or currency at a negotiated price on a stipulated future date. The Fund may buy and sell futures contracts and may also buy or write put or call options on these futures contracts. Futures contracts and options thereon are generally entered into on a regulated futures exchange and cleared through a clearinghouse associated with the exchange.
Upon entering into a futures contract, the Fund is required to deposit either cash or securities (initial margin) in an amount equal to a certain percentage of the contract value in an account registered in the futures commission merchant’s name. Subsequent payments (variation margin) are paid to or from the futures commission merchant each day equal to the daily changes in the contract value. Such payments are recorded as unrealized gains and losses. Should the Fund fail to make requested variation margin payments, the futures commission merchant can gain access to the initial margin to satisfy the Fund’s payment obligations.
Futures contracts are reported on a schedule following the Consolidated Statement of Investments. Securities held by a futures commission merchant to cover initial margin requirements on open futures contracts are noted in the Consolidated Statement of Investments. Cash held by a futures commission merchant to cover initial margin requirements on open futures contracts and the receivable and/or payable for the daily mark to market for the variation margin are noted in the Consolidated Statement of Assets and Liabilities. The net change in unrealized appreciation and depreciation is reported in the Consolidated Statement of Operations. Realized gains (losses) are reported in the Consolidated Statement of Operations at the closing or expiration of futures contracts.
| | |
| 70 | | OPPENHEIMER CAPITAL INCOME FUND |
The Fund has purchased futures contracts on various bonds and notes to increase exposure to interest rate risk.
The Fund has sold futures contracts on various bonds and notes to decrease exposure to interest rate risk.
The Fund has purchased futures contracts, which have values that are linked to the price movement of the related volatility indexes, in order to increase exposure to volatility risk.
The Fund has sold futures contracts, which have values that are linked to the price movement of the related volatility indexes, in order to decrease exposure to volatility risk.
The Fund has purchased futures contracts, which have values that are linked to the price movement of the related commodities, in order to increase exposure to commodity risk.
During the year ended August 30, 2013, the Fund had an ending monthly average market value of $97,627,916 and $112,884,786 on futures contracts purchased and sold, respectively.
Additional associated risks of entering into futures contracts (and related options) include the possibility that there may be an illiquid market where the Fund is unable to liquidate the contract or enter into an offsetting position and, if used for hedging purposes, the risk that the price of the contract will correlate imperfectly with the prices of the Fund’s securities.
Option Activity
The Fund may buy and sell put and call options, or write put and call options. When an option is written, the Fund receives a premium and becomes obligated to sell or purchase the underlying security, currency or other underlying financial instrument at a fixed price, upon exercise of the option.
Options can be traded through an exchange or through a privately negotiated arrangement with a dealer in an OTC transaction. Options traded through an exchange are generally cleared through a clearinghouse (such as The Options Clearing Corporation). The difference between the premium received or paid, and market value of the option, is recorded as unrealized appreciation or depreciation. The net change in unrealized appreciation or depreciation is reported in the Consolidated Statement of Operations. When an option is exercised, the cost of the security purchased or the proceeds of the security sale are adjusted by the amount of premium received or paid. Upon the expiration or closing of the option transaction, a gain or loss is reported in the Consolidated Statement of Operations.
The Fund has purchased put options on currencies to decrease exposure to foreign exchange rate risk. A purchased put option becomes more valuable as the price of the underlying financial instrument depreciates relative to the strike price.
The Fund has purchased call options on treasury and/or euro futures to increase exposure to interest rate risk. A purchased call option becomes more valuable as the price of the underlying financial instrument appreciates relative to the strike price.
| | | | |
| OPPENHEIMER CAPITAL INCOME FUND | | | 71 | |
NOTES TO CONSOLIDATED FINANCIAL STATEMENTS Continued
6. Risk Exposures and the Use of Derivative Instruments Continued
The Fund has purchased call options on individual equity securities and/or equity indexes to increase exposure to equity risk. A purchased call option becomes more valuable as the price of the underlying financial instrument appreciates relative to the strike price.
The Fund has purchased put options on individual equity securities and/or equity indexes to decrease exposure to equity risk. A purchased put option becomes more valuable as the price of the underlying financial instrument depreciates relative to the strike price.
During the year ended August 30, 2013, the Fund had an ending monthly average market value of $266,538 and $247,326 on purchased call options and purchased put options, respectively.
Options written, if any, are reported in a schedule following the Consolidated Statement of Investments and as a liability in the Consolidated Statement of Assets and Liabilities. Securities held in collateral accounts to cover potential obligations with respect to outstanding written options are noted in the Consolidated Statement of Investments.
The risk in writing a call option is that the market price of the security increases and if the option is exercised, the Fund must either purchase the security at a higher price for delivery or, if the Fund owns the underlying security, give up the opportunity for profit. The risk in writing a put option is that the Fund may incur a loss if the market price of the security decreases and the option is exercised. The risk in buying an option is that the Fund pays a premium whether or not the option is exercised. The Fund also has the additional risk that there may be an illiquid market where the Fund is unable to close the contract.
Additional associated risks to the Fund include counterparty credit risk for over-the-counter options and liquidity risk.
As of August 30, 2013, the Fund had no outstanding written options.
Swap Contracts
The Fund may enter into swap contract agreements with a counterparty to exchange a series of cash flows based on either specified reference rates, the price or volatility of asset or non-asset references, or the occurrence of a credit event, over a specified period. Swaps can be executed in a bi-lateral privately negotiated arrangement with a dealer in an OTC transaction (“OTC swaps”) or executed on a regulated market. Certain swaps, regardless of the venue of their execution, are required to be cleared through a clearinghouse (“cleared swaps”). Swap contracts may include interest rate, equity, debt, index, total return, credit default, currency, and volatility swaps.
Swap contracts are reported on a schedule following the Consolidated Statement of Investments. Daily changes in the value of cleared swaps are reported as variation margin receivable or payable on the Consolidated Statements of Assets and Liabilities. The values of OTC swap contracts are aggregated by positive and negative values and disclosed separately on the Consolidated Statement of Assets and Liabilities. The unrealized appreciation (depreciation) related to the change in the valuation of the notional amount of the swap is combined with the accrued interest due to (owed by) the Fund, if any, at termination or settlement. The net change in this amount during the period is included on the Consolidated Statement of Operations. The Fund also records any periodic payments
| | |
| 72 | | OPPENHEIMER CAPITAL INCOME FUND |
received from (paid to) the counterparty, including at termination, under such contracts as realized gain (loss) on the Consolidated Statement of Operations.
Swap contract agreements are exposed to the market risk factor of the specific underlying reference rate or asset. Swap contracts are typically more attractively priced compared to similar investments in related cash securities because they isolate the risk to one market risk factor and eliminate the other market risk factors. Investments in cash securities (for instance bonds) have exposure to multiple risk factors (credit and interest rate risk). Because swaps have embedded leverage, they can expose the Fund to substantial risk in the isolated market risk factor.
Credit Default Swap Contracts. A credit default swap is a contract that enables an investor to buy or sell protection against a defined-issuer credit event, such as the issuer’s failure to make timely payments of interest or principal on a debt security, bankruptcy or restructuring. The Fund may enter into credit default swaps either by buying or selling protection on a corporate issuer, sovereign issuer, or a basket or index of issuers (the “reference asset”).
The buyer of protection pays a periodic fee to the seller of protection based on the notional amount of the swap contract. The seller of protection agrees to compensate the buyer of protection for future potential losses as a result of a credit event on the reference asset. The contract effectively transfers the credit event risk of the reference asset from the buyer of protection to the seller of protection.
The ongoing value of the contract will fluctuate throughout the term of the contract based primarily on the credit risk of the reference asset. If the credit quality of the reference asset improves relative to the credit quality at contract initiation, the buyer of protection may have an unrealized loss greater than the anticipated periodic fee owed. This unrealized loss would be the result of current credit protection being cheaper than the cost of credit protection at contract initiation. If the buyer elects to terminate the contract prior to its maturity, and there has been no credit event, this unrealized loss will become realized. If the contract is held to maturity, and there has been no credit event, the realized loss will be equal to the periodic fee paid over the life of the contract.
If there is a credit event, the buyer of protection can exercise its rights under the contract and receive a payment from the seller of protection equal to the notional amount of the swap less the market value of specified debt securities issued by the reference asset. Upon exercise of the contract the difference between such value and the notional amount is recorded as realized gain (loss) and is included on the Consolidated Statement of Operations.
The Fund has sold credit protection through credit default swaps to increase exposure to the credit risk of individual issuers and/or indexes of issuers that are either unavailable or considered to be less attractive in the bond market.
The Fund has purchased credit protection through credit default swaps to decrease exposure to the credit risk of individual issuers and/or indexes of issuers.
For the year ended August 30, 2013, the Fund had ending monthly average notional amounts of $23,246,831 and $13,461,538 on credit default swaps to buy protection and credit default swaps to sell protection, respectively.
| | | | |
| OPPENHEIMER CAPITAL INCOME FUND | | | 73 | |
NOTES TO CONSOLIDATED FINANCIAL STATEMENTS Continued
6. Risk Exposures and the Use of Derivative Instruments Continued
Additional associated risks to the Fund include counterparty credit risk and liquidity risk.
Total Return Swap Contracts. A total return swap is an agreement between counterparties to exchange periodic payments based on the value of asset or non-asset references. One cash flow is typically based on a non-asset reference (such as an interest rate) and the other on the total return of a reference asset (such as a security or a basket of securities or securities index). The total return of the reference asset typically includes appreciation or depreciation on the reference asset, plus any interest or dividend payments.
Total return swap contracts are exposed to the market risk factor of the specific underlying financial instrument or index. Total return swaps are less standard in structure than other types of swaps and can isolate and/or include multiple types of market risk factors including equity risk, credit risk, and interest rate risk.
The Fund has entered into total return swaps on various equity securities or indexes to increase exposure to equity risk. These equity risk related total return swaps require the Fund to pay a floating reference interest rate, and an amount equal to the negative price movement of securities or an index (expressed as a percentage) multiplied by the notional amount of the contract. The Fund will receive payments equal to the positive price movement of the same securities or index (expressed as a percentage) multiplied by the notional amount of the contract and, in some cases, dividends paid on the securities.
For the year ended August 30, 2013, the Fund had ending monthly average notional amounts of $1,670,546 on total return swaps which are long the reference asset.
Additional associated risks to the Fund include counterparty credit risk and liquidity risk.
Swaption Transactions
The Fund may enter into a swaption contract which grants the purchaser the right, but not the obligation, to enter into a swap transaction at preset terms detailed in the underlying agreement within a specified period of time. The purchaser pays a premium to the swaption writer who bears the risk of unfavorable changes in the preset terms on the underlying swap.
Purchased swaptions are reported as a component of investments in the Consolidated Statement of Investments and the Consolidated Statement of Assets and Liabilities. Written swaptions are reported on a schedule following the Consolidated Statement of Investments and their value is reported as a separate asset or liability line item in the Consolidated Statement of Assets and Liabilities. The net change in unrealized appreciation or depreciation on written swaptions is separately reported in the Consolidated Statement of Operations. When a swaption is exercised, the cost of the swap is adjusted by the amount of premium paid or received. Upon the expiration or closing of an unexercised swaption contract, a gain or loss is reported in the Consolidated Statement of Operations for the amount of the premium paid or received.
| | |
| 74 | | OPPENHEIMER CAPITAL INCOME FUND |
The Fund generally will incur a greater risk when it writes a swaption than when it purchases a swaption. When the Fund writes a swaption it will become obligated, upon exercise of the swaption, according to the terms of the underlying agreement. Swaption contracts written by the Fund do not give rise to counterparty credit risk prior to exercise as they obligate the Fund, not its counterparty, to perform. When the Fund purchases a swaption it only risks losing the amount of the premium it paid if the swaption expires unexercised. However, when the Fund exercises a purchased swaption there is a risk that the counterparty will fail to perform or otherwise default on its obligations under the swaption contract.
The Fund has purchased swaptions which gives it the option to enter into an interest rate swap in which it pays a fixed interest rate and receives a floating interest rate in order to decrease exposure to interest rate risk. A purchased swaption of this type becomes more valuable as the reference interest rate increases relative to the preset interest rate.
During the year ended August 30, 2013, the Fund had an ending monthly average market value of $5,640,050 on purchased swaptions.
Counterparty Credit Risk. Derivative positions are subject to the risk that the counterparty will not fulfill its obligation to the Fund. The Fund intends to enter into derivative transactions with counterparties that the Manager believes to be creditworthy at the time of the transaction.
The Fund’s risk of loss from counterparty credit risk on OTC derivatives is generally limited to the aggregate unrealized gain netted against any collateral held by the Fund. For OTC options purchased, the Fund bears the risk of loss of the amount of the premiums paid plus the positive change in market values net of any collateral held by the Fund should the counterparty fail to perform under the contracts. Options written by the Fund do not typically give rise to counterparty credit risk, as options written generally obligate the Fund and not the counterparty to perform.
To reduce counterparty risk with respect to OTC transactions, the Fund has entered into master netting arrangements, established within the Fund’s International Swap and Derivatives Association, Inc. (“ISDA”) master agreements, which allow the Fund to make (or to have an entitlement to receive) a single net payment in the event of default (close-out netting) for outstanding payables and receivables with respect to certain OTC positions in swaps, options, swaptions, and forward currency exchange contracts for each individual counterparty. In addition, the Fund may require that certain counterparties post cash and/or securities in collateral accounts to cover their net payment obligations for those derivative contracts subject to ISDA master agreements. If the counterparty fails to perform under these contracts and agreements, the cash and/or securities will be made available to the Fund.
As of August 30, 2013, the Fund has required certain counterparties to post collateral of $14,520,836.
ISDA master agreements include credit related contingent features which allow counterparties to OTC derivatives to terminate derivative contracts prior to maturity in the event that, for example, the Fund’s net assets decline by a stated percentage or the
| | | | |
| OPPENHEIMER CAPITAL INCOME FUND | | | 75 | |
NOTES TO CONSOLIDATED FINANCIAL STATEMENTS Continued
6. Risk Exposures and the Use of Derivative Instruments Continued
Fund fails to meet the terms of its ISDA master agreements, which would cause the Fund to accelerate payment of any net liability owed to the counterparty.
For financial reporting purposes, the Fund does not offset derivative assets and derivative liabilities that are subject to netting arrangements in the Consolidated Statement of Assets and Liabilities. Bankruptcy or insolvency laws of a particular jurisdiction may impose restrictions on or prohibitions against the right of offset in bankruptcy, insolvency or other events.
The Fund’s risk of loss from counterparty credit risk on exchange-traded derivatives cleared through a clearinghouse and for cleared swaps is generally considered lower than as compared to OTC derivatives. However, counterparty credit risk exists with respect to initial and variation margin deposited/paid by the Fund that is held in futures commission merchant, broker and/or clearinghouse accounts for such exchange-traded derivatives and for cleared swaps.
With respect to cleared swaps, such transactions will be submitted for clearing, and if cleared, will be held in accounts at futures commission merchants or brokers that are members of clearinghouses. While brokers, futures commission merchants and clearinghouses are required to segregate customer margin from their own assets, in the event that a broker, futures commission merchant or clearinghouse becomes insolvent or goes into bankruptcy and at that time there is a shortfall in the aggregate amount of margin held by the broker, futures commission merchant or clearinghouse for all its customers, U.S. bankruptcy laws will typically allocate that shortfall on a pro-rata basis across all the broker’s, futures commission merchant’s or clearinghouse’s customers, potentially resulting in losses to the Fund.
There is the risk that a broker, futures commission merchant or clearinghouse will decline to clear a transaction on the Fund’s behalf, and the Fund may be required to pay a termination fee to the executing broker with whom the Fund initially enters into the transaction. Clearinghouses may also be permitted to terminate cleared swaps at any time. The Fund is also subject to the risk that the broker or futures commission merchant will improperly use the Fund’s assets deposited/paid as initial or variation margin to satisfy payment obligations of another customer. In the event of a default by another customer of the broker or futures commission merchant, the Fund might not receive its variation margin payments from the clearinghouse, due to the manner in which variation margin payments are aggregated for all customers of the broker/futures commission merchant.
Collateral and margin requirements differ by type of derivative. Margin requirements are established by the broker, futures commission merchant or clearinghouse for exchange-traded and cleared derivatives, including cleared swaps. Brokers, futures commission merchants and clearinghouses can ask for margin in excess of the regulatory minimum, or increase the margin amount, in certain circumstances.
Collateral terms are contract specific for OTC derivatives. For derivatives traded under an ISDA master agreement, the collateral requirements are typically calculated by netting the mark to market amount for each transaction under such agreement and comparing that amount to the value of any collateral currently pledged by the Fund or the counterparty.
| | |
| 76 | | OPPENHEIMER CAPITAL INCOME FUND |
For financial reporting purposes, cash collateral that has been pledged to cover obligations of the Fund, if any, is reported separately on the Consolidated Statement of Assets and Liabilities as cash pledged as collateral. Non-cash collateral pledged by the Fund, if any, is noted in the Consolidated Statement of Investments. Generally, the amount of collateral due from or to a party must exceed a minimum transfer amount threshold (e.g. $250,000) before a transfer has to be made. To the extent amounts due to the Fund from its counterparties are not fully collateralized, contractually or otherwise, the Fund bears the risk of loss from counterparty nonperformance.
The following table presents by counterparty the Fund’s OTC derivative assets net of the related collateral posted for the benefit of the Fund at August 30, 2013:
| | | | | | | | | | | | | | | | | | | | | | | | | |
| | | | | Gross Amounts Not Offset in the
Consolidated Statement of
Assets & Liabilities | | |
| Counterparty | | Gross Amount
of Assets
in the
Consolidated
Statement of
Assets &
Liabilities* | | Financial
Instruments
Available
for Offset | | Financial
Instruments
Collateral
Received** | | Cash
Collateral
Received** | | Net Amount |
| Goldman Sachs International | | | $ | 1,535,174 | | | | $ | — | | | | $ | (1,535,174 | ) | | | $ | — | | | | $ | — | |
| JPMorgan Chase Bank NA | | | | 10,858,327 | | | | | — | | | | | (10,858,327 | ) | | | | — | | | | | — | |
| State Street Bank | | | | 8,301 | | | | | — | | | | | — | | | | | — | | | | | 8,301 | |
| | | |
|
|
|
| Total | | | $ | 12,401,802 | | | | $ | — | | | | $ | (12,393,501 | ) | | | $ | — | | | | $ | 8,301 | |
| | | |
|
|
|
* OTC derivatives are reported gross on the Consolidated Statement of Assets and Liabilities. Exchange traded options and margin related to cleared swaps and futures are excluded from these reported amounts.
**Reported collateral posted for the benefit of the Fund within this table is limited to the net outstanding amount due from an individual counterparty. The collateral posted for the benefit of the Fund may exceed these amounts.
The following table presents by counterparty the Fund’s OTC derivative liabilities net of the related collateral pledged by the Fund at August 30, 2013:
| | | | | | | | | | | | | | | | | | | | | | | | | |
| | | | | Gross Amounts Not Offset in the
Consolidated Statement of
Assets & Liabilities | | |
| Counterparty | | Gross Amount
of Liabilities
in the
Consolidated
Statement of
Assets &
Liabilities* | | Financial
Instruments
Available
for Offset | | Financial
Instruments
Collateral
Pledged** | | Cash
Collateral
Pledged** | | Net Amount |
| Citibank NA | | | $ | (175,672 | ) | | | $ | — | | | | $ | 175,672 | | | | $ | — | | | | $ | — | |
*OTC derivatives are reported gross on the Consolidated Statement of Assets and Liabilities. Exchange traded options and margin related to cleared swaps and futures are excluded from these reported amounts.
**Reported collateral pledged within this table is limited to the net outstanding amount due from the Fund to an individual counterparty. The securities pledged as collateral by the Fund as reported on the Consolidated Statement of Investments may exceed these amounts.
| | | | |
| OPPENHEIMER CAPITAL INCOME FUND | | | 77 | |
NOTES TO CONSOLIDATED FINANCIAL STATEMENTS Continued
6. Risk Exposures and the Use of Derivative Instruments Continued
The following table presents the valuations of derivative instruments by risk exposure as reported within the Consolidated Statement of Assets and Liabilities as of August 30, 2013:
| | | | | | | | | | | | | | | | | | |
| | | Asset Derivatives | | | | | Liability Derivatives | |
Derivatives
Not Accounted
for as Hedging
Instruments | | Consolidated
Statement of
Assets and
Liabilities Location | | | Value | | | | | Consolidated
Statement of
Assets and
Liabilities Location | | | Value | |
| Credit contracts | | | Swaps, at value | | | $ | 233,595 | | | | | | | | | | | |
| Equity contracts | | | Swaps, at value | | | | 548,769 | | | | | | | | | | | |
| Commodity contracts | |
| Variation margin
receivable |
| | | 2,000 | * | | | |
| Variation margin
payable |
| | $ | 400 | * |
| Interest rate contracts | |
| Variation margin
receivable |
| | | 213,589 | * | | | |
| Variation margin
payable |
| | | 9,855 | * |
| Foreign exchange contracts | |
| Unrealized appreciation
on foreign currency
exchange contracts |
| | | 8,301 | | | | |
| Unrealized depreciation
on foreign currency
exchange contracts |
| | | 175,672 | |
| Equity contracts | | | Investments, at value | | | | 55,800 | ** | | | | | | | | | | |
| Foreign exchange contracts | | | Investments, at value | | | | 84,060 | ** | | | | | | | | | | |
| Interest rate contracts | | | Investments, at value | | | | 11,527,077 | ** | | | | | | | | | | |
| | | | | | |
|
|
| | | | | | | |
|
|
|
| Total | | | | | | $ | 12,673,191 | | | | | | | | | $ | 185,927 | |
| | | | | | |
|
|
| | | | | | | |
|
|
|
*Includes only the current day’s variation margin. Prior variation margin movements have been reflected in cash on the Consolidated Statement of Assets and Liabilities upon receipt or payment.
**Amounts relate to purchased option contracts and purchased swaption contracts.
The effect of derivative instruments on the Consolidated Statement of Operations is as follows:
| | | | | | | | | | | | | | | | | | | | |
| Amount of Realized Gain or (Loss) Recognized on Derivatives | |
Derivatives
Not Accounted
for as Hedging
Instruments | | Investments
from unaffiliated
companies* | | | Closing and
expiration
of futures
contracts | | | Foreign
currency
transactions | | | Swap
contracts | | | Total | |
| Commodity contracts | | $ | — | | | $ | (12,645 | ) | | $ | — | | | $ | — | | | $ | (12,645 | ) |
| Credit contracts | | | — | | | | — | | | | — | | | | (1,316,890 | ) | | | (1,316,890 | ) |
| Equity contracts | | | 638,925 | | | | 221,502 | | | | — | | | | — | | | | 860,427 | |
| Foreign exchange contracts | | | — | | | | — | | | | 1,174,413 | | | | — | | | | 1,174,413 | |
| Interest rate contracts | | | (4,957,217 | ) | | | (8,345,313 | ) | | | — | | | | — | | | | (13,302,530 | ) |
| Volatility contracts | | | — | | | | 2,524 | | | | — | | | | — | | | | 2,524 | |
| | |
|
|
|
| Total | | $ | (4,318,292 | ) | | $ | (8,133,932 | ) | | $ | 1,174,413 | | | $ | (1,316,890 | ) | | $ | (12,594,701 | ) |
| | |
|
|
|
*Includes purchased option contracts, purchased swaption contracts and written option contracts exercised, if any.
| | |
| 78 | | OPPENHEIMER CAPITAL INCOME FUND |
| | | | | | | | | | | | | | | | | | | | |
| Amount of Change in Unrealized Gain or (Loss) Recognized on Derivatives | |
Derivatives
Not Accounted
for as Hedging
Instruments | | Investments* | | | Futures
contracts | | | Translation
of assets and
liabilities
denominated
in foreign
currencies | | | Swap
contracts | | | Total | |
| Commodity contracts | | $ | — | | | $ | (307,391 | ) | | $ | — | | | $ | — | | | $ | (307,391 | ) |
| Credit contracts | | | — | | | | — | | | | — | | | | 114,789 | | | | 114,789 | |
| Equity contracts | | | (700,023 | ) | | | — | | | | — | | | | 548,769 | | | | (151,254 | ) |
| Foreign exchange contracts | | | (305,940 | ) | | | — | | | | (92,081 | ) | | | — | | | | (398,021 | ) |
| Interest rate contracts | | | 9,370,126 | | | | (309,656 | ) | | | — | | | | — | | | | 9,060,470 | |
| | |
|
|
|
| Total | | $ | 8,364,163 | | | $ | (617,047 | ) | | $ | (92,081 | ) | | $ | 663,558 | | | $ | 8,318,593 | |
| | |
|
|
|
*Includes purchased option contracts and purchased swaption contracts, if any.
7. Restricted Securities
As of August 30, 2013, investments in securities included issues that are restricted. A restricted security may have a contractual restriction on its resale and is valued under methods approved by the Board of Trustees as reflecting fair value. Securities that are restricted are marked with an applicable footnote on the Consolidated Statement of Investments. Restricted securities are reported on a schedule following the Consolidated Statement of Investments.
8. Pending Litigation
Since 2009, seven class action lawsuits have been pending in the U.S. District Court for the District of Colorado against OppenheimerFunds, Inc. (“OFI”), OppenheimerFunds Distributor, Inc., the Fund’s principal underwriter and distributor (the “Distributor”), and certain funds (but not including the Fund) advised by OFI Global Asset Management, Inc. and distributed by the Distributor (the “Defendant Funds”). The lawsuits also name as defendants certain officers and current and former trustees of the respective Defendant Funds. The lawsuits raise claims under federal securities law and allege, among other things, that the disclosure documents of the respective Defendant Funds contained misrepresentations and omissions and that the respective Defendant Funds’ investment policies were not followed. The plaintiffs in these actions seek unspecified damages, equitable relief and awards of attorneys’ fees and litigation expenses. The Defendant Funds’ Boards of Trustees have also engaged counsel to represent the Funds and the present and former Independent Trustees named in those suits. On August 26, 2013, the parties in six of these lawsuits executed a memorandum of understanding setting forth the terms of proposed settlements of those actions. The proposed settlements are subject to a variety of contingencies, including the execution of settlement agreements, which will require preliminary and final approval by the court. The proposed settlements do not resolve a seventh outstanding lawsuit relating to Oppenheimer California Municipal Fund.
Other class action and individual lawsuits have been filed since 2008 in various state and federal courts against OFI and certain of its affiliates by investors seeking to recover investments they allegedly lost as a result of the “Ponzi” scheme run by Bernard L. Madoff
| | | | |
| OPPENHEIMER CAPITAL INCOME FUND | | | 79 | |
NOTES TO CONSOLIDATED FINANCIAL STATEMENTS Continued
8. Pending Litigation Continued
and his firm, Bernard L. Madoff Investment Securities, LLC (“BLMIS”). Plaintiffs in these suits allege that they suffered losses as a result of their investments in several funds managed by an affiliate of OFI and assert a variety of claims, including breach of fiduciary duty, fraud, negligent misrepresentation, unjust enrichment, and violation of federal and state securities laws and regulations, among others. They seek unspecified damages, equitable relief and awards of attorneys’ fees and litigation expenses. Neither the Distributor, nor any of the Oppenheimer mutual funds, their independent trustees or directors are named as defendants in these lawsuits. None of the Oppenheimer mutual funds invested in any funds or accounts managed by Madoff or BLMIS. On February 28, 2011, a stipulation of partial settlement of three groups of consolidated putative class action lawsuits relating to these matters was filed in the U.S. District Court for the Southern District of New York. On August 19, 2011, the court entered an order and final judgment approving the settlement as fair, reasonable and adequate. In September 2011, certain parties filed notices of appeal from the court’s order approving the settlement. The settlement does not resolve other outstanding lawsuits against OFI and its affiliates relating to BLMIS.
On April 16, 2010, a lawsuit was filed in New York state court against OFI, an affiliate of OFI and AAArdvark IV Funding Limited (“AAArdvark IV”), an entity advised by OFI’s affiliate, in connection with investments made by the plaintiffs in AAArdvark IV. Plaintiffs allege breach of contract and common law fraud claims against the defendants and seek compensatory damages, costs and disbursements, including attorney fees. On April 11, 2013, the court granted defendants’ motion for summary judgment, dismissing plaintiffs’ fraud claim with prejudice and dismissing their contract claim without prejudice, and granted plaintiffs leave to replead their contract claim to assert a cause of action for specific performance within 30 days. On May 9, 2013, plaintiffs filed a notice of appeal from the court’s dismissal order. On July 15, 2011, a lawsuit was filed in New York state court against OFI, an affiliate of OFI and AAArdvark Funding Limited (“AAArdvark I”), an entity advised by OFI’s affiliate, in connection with investments made by the plaintiffs in AAArdvark I. The complaint alleges breach of contract and common law fraud claims against the defendants and seeks compensatory damages, costs and disbursements, including attorney fees. On November 9, 2011, a lawsuit was filed in New York state court against OFI, an affiliate of OFI and AAArdvark XS Funding Limited (“AAArdvark XS”), an entity advised by OFI’s affiliate, in connection with investments made by the plaintiffs in AAArdvark XS. The complaint alleges breach of contract against the defendants and seeks compensatory damages, costs and disbursements, including attorney fees.
OFI believes the lawsuits and appeals described above are without legal merit and, with the exception of actions it has settled, is defending against them vigorously. While it is premature to render any opinion as to the outcome in these lawsuits, or whether any costs that the Defendant Funds may bear in defending the suits might not be reimbursed by insurance, OFI believes that these suits should not impair the ability of OFI or the Distributor to perform their respective duties to the Fund, and that the outcome of all of the suits together should not have any material effect on the operations of any of the Oppenheimer mutual funds.
| | |
| 80 | | OPPENHEIMER CAPITAL INCOME FUND |
REPORT OF INDEPENDENT REGISTERED PUBLIC ACCOUNTING FIRM
The Board of Trustees and Shareholders of Oppenheimer Capital Income Fund:
We have audited the accompanying consolidated statement of assets and liabilities of Oppenheimer Capital Income Fund and Subsidiary, including the consolidated statement of investments, as of August 30, 2013, and the related consolidated statement of operations for the year then ended, the consolidated statements of changes in net assets for each of the years in the two-year period then ended, and the consolidated financial highlights for each of the years or periods in the five-year period then ended. These consolidated financial statements and financial highlights are the responsibility of the Fund’s management. Our responsibility is to express an opinion on these consolidated financial statements and financial highlights based on our audits.
We conducted our audits in accordance with the standards of the Public Company Accounting Oversight Board (United States). Those standards require that we plan and perform the audit to obtain reasonable assurance about whether the financial statements and financial highlights are free of material misstatement. An audit includes examining, on a test basis, evidence supporting the amounts and disclosures in the financial statements. Our procedures included confirmation of securities owned as of August 30, 2013, by correspondence with the custodian, transfer agent and brokers, or by other appropriate auditing procedures where replies from brokers were not received. An audit also includes assessing the accounting principles used and significant estimates made by management, as well as evaluating the overall financial statement presentation. We believe that our audits provide a reasonable basis for our opinion.
In our opinion, the consolidated financial statements and financial highlights referred to above present fairly, in all material respects, the financial position of Oppenheimer Capital Income Fund and Subsidiary as of August 30, 2013, the results of their operations for the year then ended, the changes in their net assets for each of the years in the two-year period then ended, and the financial highlights for each of the years or periods in the five-year period then ended, in conformity with U.S. generally accepted accounting principles.
As discussed in Note 1 to the consolidated financial statements, Oppenheimer Capital Income Fund has elected to change its method of accounting for its investment in Oppenheimer Capital Income Fund (Cayman) Ltd., a wholly-owned investment company.
KPMG LLP
Denver, Colorado
October 17, 2013
| | | | |
| OPPENHEIMER CAPITAL INCOME FUND | | | 81 | |
FEDERAL INCOME TAX INFORMATION Unaudited
In early 2013, if applicable, shareholders of record received information regarding all dividends and distributions paid to them by the Fund during calendar year 2012.
Dividends, if any, paid by the Fund during the fiscal year ended August 30, 2013 which are not designated as capital gain distributions should be multiplied by the maximum amount allowable but not less than 20.61% to arrive at the amount eligible for the corporate dividend-received deduction.
A portion, if any, of the dividends paid by the Fund during the fiscal year ended August 30, 2013 which are not designated as capital gain distributions are eligible for lower individual income tax rates to the extent that the Fund has received qualified dividend income as stipulated by recent tax legislation. The maximum amount allowable but not less than $13,130,453 of the Fund’s fiscal year taxable income may be eligible for the lower individual income tax rates. In early 2013, shareholders of record received information regarding the percentage of distributions that are eligible for lower individual income tax rates.
Recent tax legislation allows a regulated investment company to designate distributions not designated as capital gain distributions, as either interest related dividends or short-term capital gain dividends, both of which are exempt from the U.S. withholding tax applicable to non U.S. taxpayers. For the fiscal year ended August 30, 2013, the maximum amount allowable but not less than $36,169,958 of the ordinary distributions to be paid by the Fund qualifies as an interest related dividend.
The foregoing information is presented to assist shareholders in reporting distributions received from the Fund to the Internal Revenue Service. Because of the complexity of the federal regulations which may affect your individual tax return and the many variations in state and local tax regulations, we recommend that you consult your tax advisor for specific guidance.
| | |
| 82 | | OPPENHEIMER CAPITAL INCOME FUND |
BOARD APPROVAL OF THE FUND’S INVESTMENT
ADVISORY AGREEMENT Unaudited
The Fund has entered into an investment advisory agreement with OFI Global Asset Management, Inc. (“OFI Global” or the “Adviser”), a wholly-owned subsidiary of OppenheimerFunds, Inc. (“OFI” or the “Sub-Adviser”) (“OFI Global” and “OFI” together the “Managers”) and OFI Global has entered into a sub-advisory agreement with OFI whereby OFI provides investment sub-advisory services to the Fund (collectively, the “Agreements”). Each year, the Board of Trustees (the “Board”), including a majority of the independent Trustees, is required to determine whether to renew the Agreements. The Investment Company Act of 1940, as amended, requires that the Board request and evaluate, and that the Managers provide, such information as may be reasonably necessary to evaluate the terms of the Agreements. The Board employs an independent consultant to prepare a report that provides information, including comparative information that the Board requests for that purpose. In addition to in-person meetings focused on this evaluation, the Board receives information throughout the year regarding Fund services, fees, expenses and performance.
The Adviser, Sub-Adviser and the independent consultant provided information to the Board on the following factors: (i) the nature, quality and extent of the Managers’ services, (ii) the investment performance of the Fund and the Managers, (iii) the fees and expenses of the Fund, including comparative expense information, (iv) the profitability of the Managers and their affiliates, including an analysis of the cost of providing services, (v) whether economies of scale are realized as the Fund grows and whether fee levels reflect these economies of scale for Fund investors and (vi) other benefits to the Managers from their relationship with the Fund. The Board was aware that there are alternatives to retaining the Managers.
Outlined below is a summary of the principal information considered by the Board as well as the Board’s conclusions.
Nature, Quality and Extent of Services. The Board considered information about the nature, quality and extent of the services provided to the Fund and information regarding the Managers’ key personnel who provide such services. The Sub-Adviser’s duties include providing the Fund with the services of the portfolio managers and the Sub-Adviser’s investment team, who provide research, analysis and other advisory services in regard to the Fund’s investments; securities trading services; oversight of third-party service providers; monitoring compliance with applicable Fund policies and procedures and adherence to the Fund’s investment restrictions; and risk management. The Managers are responsible for providing certain administrative services to the Fund as well. Those services include providing and supervising all administrative and clerical personnel who are necessary in order to provide effective corporate administration for the Fund; compiling
| | | | |
| OPPENHEIMER CAPITAL INCOME FUND | | | 83 | |
BOARD APPROVAL OF THE FUND’S INVESTMENT
ADVISORY AGREEMENT Unaudited / Continued
and maintaining records with respect to the Fund’s operations; preparing and filing reports required by the Securities and Exchange Commission; preparing periodic reports regarding the operations of the Fund for its shareholders; preparing proxy materials for shareholder meetings; and preparing the registration statements required by Federal and state securities laws for the sale of the Fund’s shares. The Managers also provide the Fund with office space, facilities and equipment.
The Board also considered the quality of the services provided and the quality of the Managers’ resources that are available to the Fund. The Board took account of the fact that the Sub-Adviser has had over fifty years of experience as an investment adviser and that its assets under management rank it among the top mutual fund managers in the United States. The Board evaluated the Sub-Adviser’s advisory, administrative, accounting, legal, compliance services and risk management, and information the Board has received regarding the experience and professional qualifications of the Managers’ key personnel and the size and functions of its staff. In its evaluation of the quality of the portfolio management services provided, the Board considered the experience of Michelle Borré and Krishna Memani, the portfolio managers for the Fund, and the Sub-Adviser’s investment team and analysts. The Board members also considered the totality of their experiences with the Managers as directors or trustees of the Fund and other funds advised by the Managers. The Board considered information regarding the quality of services provided by affiliates of the Managers, which its members have become knowledgeable about in connection with the renewal of the Fund’s service agreements. The Board concluded, in light of the Managers’ experience, reputation, personnel, operations and resources that the Fund benefits from the services provided under the Agreement.
Investment Performance of the Fund, the Adviser and the Sub-Adviser. Throughout the year, the Adviser and the Sub-Adviser provided information on the investment performance of the Fund, the Adviser and the Sub-Adviser, including comparative performance information. The Board also reviewed information, prepared by the Adviser, the Sub-Adviser and the independent consultant, comparing the Fund’s historical performance to its benchmarks and to the performance of other retail Conservative Allocation funds. The Board considered that the Fund outperformed its performance category median for the one-year and three-year periods, although it underperformed its performance category median for the five-year and ten-year periods. The Board also considered that the Fund’s performance for the one- and three-year periods was in the second quintile of its performance category. The Board also noted that the Fund had changed portfolio managers effective April 15, 2009 and that the Fund’s one- and three-year rankings are evidence of the strong performance the portfolio managers have delivered for the Fund.
| | |
| 84 | | OPPENHEIMER CAPITAL INCOME FUND |
Costs of Services by the Adviser. The Board reviewed the fees paid to the Adviser and the other expenses borne by the Fund. The independent consultant provided comparative data in regard to the fees and expenses of the Fund and other retail front-end load Conservative Allocation funds with comparable asset levels and distribution features. The Board noted that the Fund’s contractual management fees and total expenses were lower than its peer group median and category median. Within the total asset range of $1 billion to $2 billion, the Fund’s effective rate was lower than its peer group median and category median.
Economies of Scale and Profits Realized by the Adviser and Sub-Adviser. The Board considered information regarding the Managers’ costs in serving as the Fund’s investment adviser and sub-adviser, including the costs associated with the personnel and systems necessary to manage the Fund, and information regarding the Managers’ profitability from their relationship with the Fund. The Board reviewed whether the Managers may realize economies of scale in managing and supporting the Fund. The Board noted that the Fund currently has management fee breakpoints, which are intended to share with Fund shareholders economies of scale that may exist as the Fund’s assets grow.
Other Benefits to the Managers. In addition to considering the profits realized by the Managers, the Board considered information that was provided regarding the direct and indirect benefits the Managers receive as a result of their relationship with the Fund, including compensation paid to the Managers’ affiliates and research provided to the Adviser in connection with permissible brokerage arrangements (soft dollar arrangements). The Board also considered that the Managers must be able to pay and retain experienced professional personnel at competitive rates to provide quality services to the Fund.
Conclusions. These factors were also considered by the independent Trustees meeting separately from the full Board, assisted by experienced counsel to the Fund and to the independent Trustees. Fund counsel and the independent Trustees’ counsel are independent of the Managers within the meaning and intent of the Securities and Exchange Commission Rules.
Based on its review of the information it received and its evaluations described above, the Board, including a majority of the independent Trustees, decided to continue the Agreements through September 30, 2014. In arriving at its decision, the Board did not identify any factor or factors as being more important than others, but considered all of the above information, and considered the terms and conditions of the Agreements, including the management fees, in light of all the surrounding circumstances.
| | | | |
| OPPENHEIMER CAPITAL INCOME FUND | | | 85 | |
PORTFOLIO PROXY VOTING POLICIES AND PROCEDURES; UPDATES
TO CONSOLIDATED STATEMENTS OF INVESTMENTS Unaudited
The Fund has adopted Portfolio Proxy Voting Policies and Procedures under which the Fund votes proxies relating to securities (“portfolio proxies”) held by the Fund. A description of the Fund’s Portfolio Proxy Voting Policies and Procedures is available (i) without charge, upon request, by calling the Fund toll-free at 1.800.CALL OPP (225.5677), (ii) on the Fund’s website at oppenheimerfunds.com, and (iii) on the SEC’s website at www.sec.gov. In addition, the Fund is required to file Form N-PX, with its complete proxy voting record for the 12 months ended June 30th, no later than August 31st of each year. The Fund’s voting record is available (i) without charge, upon request, by calling the Fund toll-free at 1.800.CALL OPP (225.5677), and (ii) in the Form N-PX filing on the SEC’s website at www.sec.gov.
The Fund files its complete consolidated schedule of portfolio holdings with the SEC for the first quarter and the third quarter of each fiscal year on Form N-Q. The Fund’s Form N-Q filings are available on the SEC’s website at www.sec.gov. Those forms may be reviewed and copied at the SEC’s Public Reference Room in Washington, D.C. Information on the operation of the Public Reference Room may be obtained by calling 1-800-SEC-0330.
Householding—Delivery of Shareholder Documents
This is to inform you about OppenheimerFunds’ “householding” policy. If more than one member of your household maintains an account in a particular fund, OppenheimerFunds will mail only one copy of the fund’s prospectus (or, if available, the fund’s summary prospectus), annual and semiannual report and privacy policy. The consolidation of these mailings, called householding, benefits your fund through reduced mailing expense, and benefits you by reducing the volume of mail you receive from OppenheimerFunds. Householding does not affect the delivery of your account statements.
Please note that we will continue to household these mailings for as long as you remain an OppenheimerFunds shareholder, unless you request otherwise. If you prefer to receive multiple copies of these materials, please call us at 1.800.CALL-OPP (225-5677). You may also notify us in writing or via email. We will begin sending you individual copies of the prospectus (or, if available, the summary prospectus), reports and privacy policy within 30 days of receiving your request to stop householding.
| | |
| 86 | | OPPENHEIMER CAPITAL INCOME FUND |
TRUSTEES AND OFFICERS Unaudited
| | |
| Name, Position(s) Held with the Fund, Length of Service, Age | | Principal Occupation(s) During the Past 5 Years; Other Trusteeships/Directorships Held; Number of Portfolios in the Fund Complex Currently Overseen |
| |
| INDEPENDENT TRUSTEES | | The address of each Trustee in the chart below is 6803 S. Tucson Way, Centennial, Colorado 80112-3924. Each Trustee serves for an indefinite term, or until his or her resignation, retirement, death or removal. |
| |
Sam Freedman,
Chairman of the Board of Trustees (since 2012) and Trustee (since 1996)
Year of Birth: 1940 | | Director of Colorado UpLIFT (charitable organization) (since September 1984). Mr. Freedman held several positions with the Sub-Adviser and with subsidiary or affiliated companies of the Sub-Adviser (until October 1994). Oversees 38 portfolios in the OppenheimerFunds complex. Mr. Freedman has served on the Boards of certain Oppenheimer funds since 1996, during which time he has become familiar with the Fund’s (and other Oppenheimer funds’) financial, accounting, regulatory and investment matters and has contributed to the Boards’ deliberations. |
| |
Edward L. Cameron,
Trustee (since 1999)
Year of Birth: 1938 | | Member of The Life Guard of Mount Vernon (George Washington historical site) (June 2000-June 2006); Partner of PricewaterhouseCoopers LLP (accounting firm) (July 1974-June 1999); Chairman of Price Waterhouse LLP Global Investment Management Industry Services Group (accounting firm) (July 1994-June 1998). Oversees 38 portfolios in the OppenheimerFunds complex. Mr. Cameron has served on the Boards of certain Oppenheimer funds since 1999, during which time he has become familiar with the Fund’s (and other Oppenheimer funds’) financial, accounting, regulatory and investment matters and has contributed to the Boards’ deliberations. |
| |
Jon S. Fossel,
Trustee (since 1990)
Year of Birth: 1942 | | Chairman of the Board (2006-December 2011) and Director (June 2002-December 2011) of UNUMProvident (insurance company); Director of Northwestern Energy Corp. (public utility corporation) (November 2004-December 2009); Director of P.R. Pharmaceuticals (October 1999-October 2003); Director of Rocky Mountain Elk Foundation (non-profit organization) (February 1998-February 2003 and February 2005-February 2007); Chairman and Director (until October 1996) and President and Chief Executive Officer (until October 1995) of the Sub-Adviser; President, Chief Executive Officer and Director of the following: Oppenheimer Acquisition Corp. (“OAC”) (parent holding company of the Sub-Adviser), Shareholders Services, Inc. and Shareholder Financial Services, Inc. (until October 1995). Oversees 38 portfolios in the OppenheimerFunds complex. Mr. Fossel has served on the Boards of certain Oppenheimer funds since 1990, during which time he has become familiar with the Fund’s (and other Oppenheimer funds’) financial, accounting, regulatory and investment matters and has contributed to the Boards’ deliberations. |
| |
Richard F. Grabish,
Trustee (since 2012)
Year of Birth: 1948 | | Formerly Senior Vice President and Assistant Director of Sales and Marketing (March 1997-December 2007), Director (March 1987-December 2007) and Manager of Private Client Services (June 1985-June 2005) of A.G. Edwards & Sons, Inc. (broker/dealer and investment firm); Chairman and Chief Executive Officer of A.G. Edwards Trust Company, FSB (March 2001-December 2007); President and Vice Chairman of A.G. Edwards Trust Company, FSB (investment adviser) (April 1987-March 2001); President of A.G. Edwards Trust Company, FSB (investment adviser) (June 2005-December 2007). Oversees 38 portfolios in the OppenheimerFunds complex. Mr. Grabish has served on the Boards of certain Oppenheimer funds since 2001, during which time he has become familiar with the Fund’s (and other Oppenheimer funds’) financial, accounting, regulatory and investment matters and has contributed to the Boards’ deliberations. |
| | | | |
| OPPENHEIMER CAPITAL INCOME FUND | | | 87 | |
TRUSTEES AND OFFICERS Unaudited / Continued
| | |
Beverly L. Hamilton,
Trustee (since 2002)
Year of Birth: 1946 | | Trustee of Monterey Institute for International Studies (educational organization) (since February 2000); Board Member of Middlebury College (educational organization) (December 2005-June 2011); Chairman (since 2010) of American Funds’ Emerging Markets Growth Fund, Inc. (mutual fund); Director of The California Endowment (philanthropic organization) (April 2002-April 2008); Director (February 2002-2005) and Chairman of Trustees (2006-2007) of the Community Hospital of Monterey Peninsula; Director (October 1991-2005); Vice Chairman (2006-2009) of American Funds’ Emerging Markets Growth Fund, Inc. (mutual fund); President of ARCO Investment Management Company (February 1991-April 2000); Member of the investment committees of The Rockefeller Foundation (2001-2006) and The University of Michigan (since 2000); Advisor at Credit Suisse First Boston’s Sprout venture capital unit (venture capital fund) (1994-January 2005); Trustee of MassMutual Institutional Funds (investment company) (1996-June 2004); Trustee of MML Series Investment Fund (investment company) (April 1989-June 2004); Member of the investment committee of Hartford Hospital (2000-2003); and Advisor to Unilever (Holland) pension fund (2000-2003). Oversees 38 portfolios in the OppenheimerFunds complex. Ms. Hamilton has served on the Boards of certain Oppenheimer funds since 2002, during which time she has become familiar with the Fund’s (and other Oppenheimer funds’) financial, accounting, regulatory and investment matters and has contributed to the Boards’ deliberations. |
| |
Victoria J. Herget,
Trustee (since 2012)
Year of Birth: 1951 | | Independent Director of the First American Funds (mutual fund family) (2003-2011); former Managing Director (1993-2001), Principal (1985-1993), Vice President (1978-1985) and Assistant Vice President (1973-1978) of Zurich Scudder Investments (and its predecessor firms); Board Chair (2008-Present) and Director (2004-Present), United Educators (insurance company); Trustee (1992-2007), Chair of the Board of Trustees (1999-2007), Investment Committee Chair (1994-1999) and Investment Committee member (2007-2010) of Wellesley College; Trustee (since 2000) and Chair (since 2010), Newberry Library; Trustee, Mather LifeWays (since 2001); Trustee, BoardSource (2006-2009) and Chicago City Day School (1994-2005). Oversees 38 portfolios in the OppenheimerFunds complex. Ms. Herget has served on the Boards of certain Oppenheimer funds since 2012, during which time she has become familiar with the Fund’s (and other Oppenheimer funds’) financial, accounting, regulatory and investment matters and has contributed to the Boards’ deliberations. |
| |
Robert J. Malone,
Trustee (since 2002)
Year of Birth: 1944 | | Chairman of the Board (since 2012) and Director (since August 2005) of Jones International University (educational organization) (since August 2005); Chairman, Chief Executive Officer and Director of Steele Street Bank Trust (commercial banking) (since August 2003); Trustee of the Gallagher Family Foundation (non-profit organization) (since 2000); Board of Directors of Opera Colorado Foundation (non-profit organization) (2008-2012); Director of Colorado UpLIFT (charitable organization) (1986-2010); Director of Jones Knowledge, Inc. (2006-2010); Former Chairman of U.S. Bank-Colorado (subsidiary of U.S. Bancorp and formerly Colorado National Bank) (July 1996-April 1999); Director of Commercial Assets, Inc. (real estate investment trust) (1993-2000); Director of U.S. Exploration, Inc. (oil and gas exploration) (1997-February 2004); Chairman of the Board (1991-1994) and Trustee (1985-1994) of Regis University; and Chairman of the Board (1990-1991 and Trustee (1984-1999) of Young Presidents Organization. Oversees 38 portfolios in the OppenheimerFunds complex. Mr. Malone has served on the Boards of certain Oppenheimer funds since 2002, during which time he has become familiar with the Fund’s (and other Oppenheimer funds’) financial, accounting, regulatory and investment matters and has contributed to the Boards’ deliberations. |
| | |
| 88 | | OPPENHEIMER CAPITAL INCOME FUND |
| | |
F. William Marshall, Jr.,
Trustee (since 2000)
Year of Birth: 1942 | | Trustee Emeritus of Worcester Polytech Institute (WPI) (private university) (since 2009); Trustee of MassMutual Select Funds (formerly MassMutual Institutional Funds) (investment company) (since 1996), MML Series Investment Fund (investment company) (since 1996) and Mass Mutual Premier Funds (investment company) (since January 2012); President and Treasurer of the SIS Fund (private charitable fund) (January 1999 – March 2011); Former Trustee of WPI (1985-2008); Former Chairman of the Board (2004-2006) and Former Chairman of the Investment Committee of WPI (1994-2008); Chairman of SIS & Family Bank, F.S.B. (formerly SIS Bank) (commercial bank) (January 1999-July 1999); Executive Vice President of Peoples Heritage Financial Group, Inc. (commercial bank) (January 1999-July 1999); and Former President and Chief Executive Officer of SIS Bancorp. (1993-1999). Oversees 42 portfolios in the OppenheimerFunds complex. Mr. Marshall has served on the Boards of certain Oppenheimer funds since 2000, during which time he has become familiar with the Fund’s (and other Oppenheimer funds’) financial, accounting, regulatory and investment matters and has contributed to the Boards’ deliberations. |
| |
Karen L. Stuckey,
Trustee (since 2012)
Year of Birth: 1953 | | Partner (1990-2012) of PricewaterhouseCoopers LLP (held various positions 1975-1990); Emeritus Trustee (since 2006), Trustee (1992-2006) and member of Executive, Nominating and Audit Committees and Chair of Finance Committee of Lehigh University; and member, Women’s Investment Management Forum since inception. Oversees 38 portfolios in the OppenheimerFunds complex. Ms. Stuckey has served on the Boards of certain Oppenheimer funds since 2012, during which time she has become familiar with the Fund’s (and other Oppenheimer funds’) financial, accounting, regulatory and investment matters and has contributed to the Boards’ deliberations. |
| |
James D. Vaughn,
Trustee (since 2012)
Year of Birth: 1945 | | Retired; former managing partner (1994-2001) of Denver office of Deloitte & Touche LLP, (held various positions 1969-1993); Trustee and Chairman of the Audit Committee of Schroder Funds (2003-2012); Board member and Chairman of Audit Committee of AMG National Trust Bank (since 2005); Trustee and Investment Committee member, University of South Dakota Foundation (since 1996); Board member, Audit Committee Member and past Board Chair, Junior Achievement (since 1993); former Board member, Mile High United Way, Boys and Girls Clubs, Boy Scouts, Colorado Business Committee for the Arts, Economic Club of Colorado and Metro Denver Network. Oversees 38 portfolios in the OppenheimerFunds complex. Mr. Vaughn has served on the Boards of certain Oppenheimer funds since 2012, during which time he has become familiar with the Fund’s (and other Oppenheimer funds’) financial, accounting, regulatory and investment matters and has contributed to the Boards’ deliberations. |
| INTERESTED TRUSTEE AND OFFICER | | Mr. Glavin is an “Interested Trustee” because he is affiliated with the Manager and the Sub-Adviser by virtue of his positions as an officer and director of the Manager and a director of the Sub-Adviser, and as a shareholder of the Sub-Adviser’s parent company. Both as a Trustee and as an officer, he serves for an indefinite term, or until his resignation, retirement, death or removal. Mr. Glavin’s address is Two World Financial Center, 225 Liberty Street, 11th Floor, New York, New York 10281-1008. |
| |
William F. Glavin, Jr.,
Trustee, President and Principal Executive Officer (since 2009)
Year of Birth: 1958 | | Director, Chairman and Chief Executive Officer of the Manager (since January 2013); President of the Manager (January 2013-May 2013); Chairman of the Sub-Adviser (December 2009-December 2012); Chief Executive Officer (January 2009-December 2012) and Director of the Sub-Adviser (since January 2009); President of the Sub-Adviser (May 2009-December 2012); Management Director (since June 2009), President (since December 2009) and Chief |
| | | | |
| OPPENHEIMER CAPITAL INCOME FUND | | | 89 | |
TRUSTEES AND OFFICERS Unaudited / Continued
| | |
William F. Glavin, Jr.,
Continued | | Executive Officer (since January 2011) of Oppenheimer Acquisition Corp. (“OAC”) (the Sub-Adviser’s parent holding company); Director of Oppenheimer Real Asset Management, Inc. (since March 2010); Executive Vice President (March 2006-February 2009) and Chief Operating Officer (July 2007-February 2009) of Massachusetts Mutual Life Insurance Company (OAC’s parent company); Director (May 2004-March 2006) and Chief Operating Officer and Chief Compliance Officer (May 2004-January 2005), President (January 2005-March 2006) and Chief Executive Officer (June 2005-March 2006) of Babson Capital Management LLC; Director (March 2005-March 2006), President (May 2003-March 2006) and Chief Compliance Officer (July 2005-March 2006) of Babson Capital Securities, Inc. (a broker-dealer); President (May 2003-March 2006) of Babson Investment Company, Inc.; Director (May 2004-August 2006) of Babson Capital Europe Limited; Director (May 2004-October 2006) of Babson Capital Guernsey Limited; Director (May 2004-March 2006) of Babson Capital Management LLC; Non-Executive Director (March 2005-March 2007) of Baring Asset Management Limited; Director (February 2005-June 2006) Baring Pension Trustees Limited; Director and Treasurer (December 2003-November 2006) of Charter Oak Capital Management, Inc.; Director (May 2006-September 2006) of C.M. Benefit Insurance Company; Director (May 2008-June 2009) and Executive Vice President (June 2007-July 2009) of C.M. Life Insurance Company; President (March 2006-May 2007) of MassMutual Assignment Company; Director (January 2005-December 2006), Deputy Chairman (March 2005-December 2006) and President (February 2005-March 2005) of MassMutual Holdings (Bermuda) Limited; Director (May 2008-June 2009) and Executive Vice President (June 2007-July 2009) of MML Bay State Life Insurance Company; Chief Executive Officer and President (April 2007-January 2009) of MML Distributors, LLC; and Chairman (March 2006-December 2008) and Chief Executive Officer (May 2007-December 2008) of MML Investors Services, Inc. An officer of 89 portfolios in the OppenheimerFunds complex. |
| OTHER OFFICERS OF THE FUND | | The addresses of the Officers in the chart below are as follows: for Messrs. Memani, Gabinet and Mss. Borré and Nasta, Two World Financial Center, 225 Liberty Street, New York, New York 10281-1008, for Messrs. Vandehey and Wixted, 6803 S. Tucson Way, Centennial, Colorado 80112-3924. Each Officer serves for an indefinite term or until his or her resignation, retirement, death or removal. |
| |
Michelle Borré,
Vice President (since 2009)
Year of Birth: 1967 | | Vice President of the Sub-Adviser (since April 2003); Senior Portfolio Manager of the Sub-Adviser (since April 2009); Senior Research Analyst of the Sub-Adviser (February 2003-April 2009). Ms. Borre held various positions, including Managing Director and Partner, at J&W Seligman (July 1996 -January 2003). Adjunct Professor of Finance and Economics at Columbia Business School; Served on the Executive Advisory Board at the Heilbrunn Center for Graham and Dodd Investing at Columbia Business School (from 2004 to 2005). A portfolio manager and an officer of other portfolios in the OppenheimerFunds complex. |
| |
Krishna Memani,
Vice President (since 2009)
Year of Birth: 1960 | | President of the Sub-Adviser (since January 2013); Chief Investment Officer, Fixed Income of the Sub-Adviser (since January 2013) and Head of the Investment Grade Fixed Income Team of the Sub-Adviser (since March 2009). Director of Fixed Income of the Sub-Adviser (October 2010-December 2012) and Senior Vice President of the Sub-Adviser (March 2009-December 2012). Managing Director and Head of the U.S. and European Credit Analyst Team at Deutsche Bank Securities (June 2006-January 2009). Chief Credit Strategist at Credit Suisse Securities (August 2002-March 2006). Managing Director and |
| | |
| 90 | | OPPENHEIMER CAPITAL INCOME FUND |
| | |
Krishna Memani,
Continued | | Senior Portfolio Manager at Putnam Investments (September 1998-June 2002). A portfolio manager and an officer of other portfolios in the OppenheimerFunds complex. |
| |
Arthur S. Gabinet,
Secretary and Chief Legal
Officer (since 2011)
Year of Birth: 1958 | | Executive Vice President, Secretary and General Counsel of the Manager (since January 2013); General Counsel OFI SteelPath, Inc. (since January 2013); Executive Vice President (May 2010-December 2012) and General Counsel (since January 2011) of the Sub-Adviser; General Counsel of the Distributor (since January 2011); General Counsel of Centennial Asset Management Corporation (January 2011-December 2012); Executive Vice President (January 2011-December 2012) and General Counsel of HarbourView Asset Management Corporation (since January 2011); Assistant Secretary (since January 2011) and Director (since January 2011) of OppenheimerFunds International Ltd. and OppenheimerFunds plc; Director of Oppenheimer Real Asset Management, Inc. (January 2011-December 2012) and General Counsel (since January 2011); Executive Vice President (January 2011-December 2011) and General Counsel of Shareholder Financial Services, Inc. and Shareholder Services, Inc. (since January 2011); Executive Vice President (January 2011-December 2012) and General Counsel of OFI Private Investments Inc. (since January 2011); Vice President of OppenheimerFunds Legacy Program (January 2011-December 2011); Executive Vice President (January 2011-December 2012) and General Counsel of OFI Global Institutional, Inc. (since January 2011); General Counsel, Asset Management of the Sub-Adviser (May 2010-December 2010); Principal, The Vanguard Group (November 2005-April 2010); District Administrator, U.S. Securities and Exchange Commission (January 2003-October 2005). An officer of 89 portfolios in the OppenheimerFunds complex. |
| |
Christina M. Nasta,
Vice President and Chief Business Officer (since 2011)
Year of Birth: 1973 | | Senior Vice President of OppenheimerFunds Distributor, Inc. (since January 2013); Senior Vice President of the Sub-Adviser (July 2010-December 2012); Vice President of the Sub-Adviser (January 2003-July 2010); Vice President of OppenheimerFunds Distributor, Inc. (January 2003-July 2010). An officer of 89 portfolios in the OppenheimerFunds complex. |
| |
Mark S. Vandehey,
Vice President and Chief Compliance Officer
(since 2004)
Year of Birth: 1950 | | Senior Vice President and Chief Compliance Officer of the Manager (since January 2013); Chief Compliance Officer of OFI SteelPath, Inc. (since January 2013); Senior Vice President of the Sub-Adviser (March 2004-December 2012); Chief Compliance Officer of the Sub-Adviser, OppenheimerFunds Distributor, Inc., OFI Global Trust Company, OFI Global Institutional, Inc., Oppenheimer Real Asset Management, Inc., OFI Private Investments, Inc., Harborview Asset Management Corporation, Trinity Investment Management Corporation, and Shareholder Services, Inc. (since March 2004); Vice President of OppenheimerFunds Distributor, Inc., Centennial Asset Management Corporation and Shareholder Services, Inc. (June 1983-December 2012). An officer of 89 portfolios in the OppenheimerFunds complex. |
| |
Brian W. Wixted,
Treasurer and Principal Financial & Accounting Officer (since 1999)
Year of Birth: 1959 | | Senior Vice President of the Manager (since January 2013); Treasurer of the Sub-Adviser, HarbourView Asset Management Corporation, Shareholder Financial Services, Inc., Shareholder Services, Inc., and Oppenheimer Real Asset Management, Inc. (March 1999-June 2008), OFI Private Investments, Inc. (March 2000-June 2008), OppenheimerFunds International Ltd. and OppenheimerFunds plc (since May 2000), OFI Global Institutional, Inc. (November 2000-June 2008), and OppenheimerFunds Legacy Program (charitable trust program established by the Sub-Adviser) (June 2003-December 2011); Treasurer and Chief Financial Officer of OFI Global Trust Company (since May 2000); Assistant Treasurer of Oppenheimer Acquisition Corporation (March 1999-June 2008). An officer of 89 portfolios in the OppenheimerFunds complex. |
The Fund’s Statement of Additional Information contains additional information about the Fund’s Trustees and Officers and is available without charge upon request, by calling 1.800.CALL OPP (225.5677).
| | | | |
| OPPENHEIMER CAPITAL INCOME FUND | | | 91 | |
OPPENHEIMER CAPITAL INCOME FUND
| | |
| Manager | | OFI Global Asset Management, Inc. |
| Sub-Adviser | | OppenheimerFunds, Inc. |
| Distributor | | OppenheimerFunds Distributor, Inc. |
| Transfer and Shareholder Servicing Agent | | OFI Global Asset Management, Inc. |
| Sub-Transfer Agent | | Shareholder Services, Inc. DBA OppenheimerFunds Services |
Independent
Registered Public
Accounting Firm | | KPMG LLP |
| Legal Counsel | | K&L Gates LLP |
© 2013 OppenheimerFunds, Inc. All rights reserved.
| | |
| 92 | | OPPENHEIMER CAPITAL INCOME FUND |
PRIVACY POLICY
As an Oppenheimer fund shareholder, you are entitled to know how we protect your personal information and how we limit its disclosure.
Information Sources
We obtain nonpublic personal information about our shareholders from the following sources:
| l | | Applications or other forms |
| l | | When you create a user ID and password for online account access |
| l | | When you enroll in eDocs Direct, our electronic document delivery service |
| l | | Your transactions with us, our affiliates or others |
| l | | A software program on our website, often referred to as a “cookie,” which indicates which parts of our site you’ve visited |
| l | | When you set up challenge questions to reset your password online |
If you visit oppenheimerfunds.com and do not log on to the secure account information areas, we do not obtain any personal information about you. When you do log on to a secure area, we do obtain your user ID and password to identify you. We also use this information to provide you with products and services you have requested, to inform you about products and services that you may be interested in and assist you in other ways.
We do not collect personal information through our website unless you willingly provide it to us, either directly by email or in those areas of the website that request information. In order to update your personal information (including your mailing address, email address and phone number) you must first log on and visit your user profile.
If you have set your browser to warn you before accepting cookies, you will receive the warning message with each cookie. You can refuse cookies by turning them off in your browser. However, doing so may limit your access to certain sections of our website.
We use cookies to help us improve and manage our website. For example, cookies help us recognize new versus repeat visitors to the site, track the pages visited, and enable some special features on the website. This data helps us provide a better service for our website visitors.
Protection of Information
We do not disclose any non-public personal information (such as names on a customer list) about current or former customers to anyone, except as permitted by law.
Disclosure of Information
We send your financial advisor (as designated by you) copies of confirmations, account statements and other documents reporting activity in your fund accounts. We may also use details about you and your investments to help us, our financial service affiliates, or firms that jointly market their financial products and services with ours, to better serve your investment needs or suggest financial services or educational material that may be of interest to you. If this requires us to provide you with an opportunity to “opt in” or “opt out” of such information sharing with a firm not affiliated with us, you will receive notification on how to do so, before any such sharing takes place.
Right of Refusal
We will not disclose your personal information to unaffiliated third parties (except as permitted by law), unless we first offer you a reasonable opportunity to refuse or “opt out” of such disclosure.
| | | | |
| OPPENHEIMER CAPITAL INCOME FUND | | | 93 | |
PRIVACY POLICY
Internet Security and Encryption
In general, the email services provided by our website are encrypted and provide a secure and private means of communication with us. To protect your own privacy, confidential and/or personal information should only be communicated via email when you are advised that you are using a secure website.
As a security measure, we do not include personal or account information in non-secure emails, and we advise you not to send such information to us in non-secure emails. Instead, you may take advantage of the secure features of our website to encrypt your email correspondence. To do this, you will need to use a browser that supports Secure Sockets Layer (SSL) protocol.
We do not guarantee or warrant that any part of our website, including files available for download, are free of viruses or other harmful code. It is your responsibility to take appropriate precautions, such as use of an anti-virus software package, to protect your computer hardware and software.
| l | | All transactions, including redemptions, exchanges and purchases, are secured by SSL and 128-bit encryption. SSL is used to establish a secure connection between your PC and OppenheimerFunds’ server. It transmits information in an encrypted and scrambled format. |
| l | | Encryption is achieved through an electronic scrambling technology that uses a “key” to code and then decode the data. Encryption acts like the cable converter box you may have on your television set. It scrambles data with a secret code so that no one can make sense of it while it is being transmitted. When the data reaches its destination, the same software unscrambles the data. |
| l | | You can exit the secure area by either closing your browser, or for added security, you can use the Log Out button before you close your browser. |
Other Security Measures
We maintain physical, electronic and procedural safeguards to protect your personal account information. Our employees and agents have access to that information only so that they may offer you products or provide services, for example, when responding to your account questions.
How You Can Help
You can also do your part to keep your account information private and to prevent unauthorized transactions. If you obtain a user ID and password for your account, do not allow it to be used by anyone else. Also, take special precautions when accessing your account on a computer used by others.
Who We Are
This joint notice describes the privacy policies of the Oppenheimer funds, OppenheimerFunds, Inc., and each of its financial institution subsidiaries, the trustee of OppenheimerFunds Individual Retirement Accounts (IRAs) and the custodian of the OppenheimerFunds 403(b)(7) tax sheltered custodial accounts. It applies to all Oppenheimer fund accounts you presently have, or may open in the future, using your Social Security number—whether or not you remain a shareholder of our funds. This notice was last updated November 2012. In the event it is updated or changed, we will post an updated notice on our website at oppenheimerfunds.com. If you have any questions about these privacy policies, write to us at P.O. Box 5270, Denver, CO 80217-5270, email us by clicking on the Contact Us section of our website at oppenheimerfunds.com or call us at 1.800.CALL OPP (225.5677).
| | |
| 94 | | OPPENHEIMER CAPITAL INCOME FUND |
Visit us at oppenheimerfunds.com for 24-hr access to account information and transactions or call us at 1.800. CALL OPP (1.800.225.5677) for 24-hr automated information and automated transactions. Representatives also available Mon-Fri 8am-8pm ET.
RA0300.001.0813 October 21, 2013

Item 2. Code of Ethics.
The registrant has adopted a code of ethics that applies to the registrant’s principal executive officer, principal financial officer, principal accounting officer or controller or persons performing similar functions.
Item 3. Audit Committee Financial Expert.
The Board of Trustees of the registrant has determined that F. William Marshall, Jr., the Chairman of the Board’s Audit Committee, is the audit committee financial expert and that Mr. Marshall is “independent” for purposes of this Item 3.
Item 4. Principal Accountant Fees and Services.
The principal accountant for the audit of the registrant’s annual financial statements billed $44,100 in fiscal 2013 and $43,200 in fiscal 2012.
The principal accountant for the audit of the registrant’s annual financial statements billed no such fees in fiscal 2013 and no such fees in fiscal 2012.
The principal accountant for the audit of the registrant’s annual financial statements billed $477,830 in fiscal 2013 and $583,556 in fiscal 2012 to the registrant’s investment adviser or any entity controlling, controlled by, or under common control with the adviser that provides ongoing services to the registrant.
Such services include: Internal control reviews, compliance procedures, GIPS attestation procedures, internal audit training, surprise exams, system conversion testing, corporate restructuring.
The principal accountant for the audit of the registrant’s annual financial statements billed no such fees in fiscal 2013 and $3,600 in fiscal 2012.
The principal accountant for the audit of the registrant’s annual financial statements billed $492,036 in fiscal 2013 and $317,764 in fiscal 2012 to the registrant’s investment adviser or any entity controlling, controlled by, or under common control with the adviser that provides ongoing services to the registrant.
Such services include: tax compliance, tax planning and tax advice. Tax compliance generally involves preparation of original and amended tax returns, claims for a refund and tax payment-planning services. Tax planning and tax advice includes assistance with tax audits and appeals, tax advice related to mergers and acquisitions and requests for rulings or technical advice from taxing authorities.
The principal accountant for the audit of the registrant’s annual financial statements billed no such fees in fiscal 2013 and no such fees in fiscal 2012.
The principal accountant for the audit of the registrant’s annual financial statements billed no such fees in fiscal 2013 and no such fees in fiscal 2012 to the registrant’s investment adviser or any entity controlling, controlled by, or under common control with the adviser that provides ongoing services to the registrant.
Such fees would include the cost to the principal accountant of attending audit committee meetings and consultations regarding the registrant’s retirement plan with respect to its Trustees.
| (e) | (1) During its regularly scheduled periodic meetings, the registrant’s audit committee will pre-approve all audit, audit-related, tax and other services to be provided by the principal accountants of the registrant. |
The audit committee has delegated pre-approval authority to its Chairman for any subsequent new engagements that arise between regularly scheduled meeting dates provided that any fees such pre-approved are presented to the audit committee at its next regularly scheduled meeting.
Under applicable laws, pre-approval of non-audit services may be waived provided that: 1) the aggregate amount of all such services provided constitutes no more than five percent of the total amount of fees paid by the registrant to its principal accountant during the fiscal year in which services are provided 2) such services were not recognized by the registrant at the time of engagement as non-audit services and 3) such services are promptly brought to the attention of the audit committee of the registrant and approved prior to the completion of the audit.
(2) 0%
| (f) | Not applicable as less than 50%. |
| (g) | The principal accountant for the audit of the registrant’s annual financial statements billed $969,866 in fiscal 2013 and $904,920 in fiscal 2012 to the registrant and the registrant’s investment adviser or any entity controlling, controlled by, or under common control with the adviser that provides ongoing services to the registrant related to non-audit fees. Those billings did not include any prohibited non-audit services as defined by the Securities Exchange Act of 1934. |
| (h) | The registrant’s audit committee of the board of Trustees has considered whether the provision of non-audit services that were rendered to the registrant’s investment adviser, and any entity controlling, controlled by, or under common control with the investment adviser that provides ongoing services to the registrant that were not pre-approved pursuant to paragraph (c)(7)(ii) of Rule 2-01 of Regulation S-X is compatible with maintaining the principal accountant’s independence. No such services were rendered. |
Item 5. Audit Committee of Listed Registrants
Not applicable.
Item 6. Schedule of Investments.
a) Not applicable. The complete schedule of investments is included in Item 1 of this Form N-CSR.
b) Not applicable.
Item 7. Disclosure of Proxy Voting Policies and Procedures for Closed-End Management Investment Companies.
Not applicable.
Item 8. Portfolio Managers of Closed-End Management Investment Companies.
Not applicable.
Item 9. Purchases of Equity Securities by Closed-End Management Investment Company and Affiliated Purchasers.
Not applicable.
Item 10. Submission of Matters to a Vote of Security Holders.
The Fund’s Governance Committee Provisions with Respect to Nominations of Directors/Trustees to the Respective Boards
None
Item 11. Controls and Procedures.
Based on their evaluation of the registrant’s disclosure controls and procedures (as defined in rule 30a-3(c) under the Investment Company Act of 1940 (17 CFR 270.30a-3(c)) as of 8/30/2013, the registrant’s principal executive officer and principal financial officer found the registrant’s disclosure controls and procedures to provide reasonable assurances that information required to be disclosed by the registrant in the reports that it files under the Securities Exchange Act of 1934 (a) is accumulated and communicated to registrant’s management, including its principal executive officer and principal financial officer, to allow timely decisions regarding required disclosure, and (b) is recorded, processed, summarized and reported, within the time periods specified in the rules and forms adopted by the U.S. Securities and Exchange Commission.
There have been no changes in the registrant’s internal controls over financial reporting that occurred during the registrant’s second fiscal quarter of the period covered by this report that have materially affected, or are reasonably likely to materially affect, the registrant’s internal control over financial reporting.
Item 12. Exhibits.
| (a) | (1) Exhibit attached hereto. |
(2) Exhibits attached hereto.
(3) Not applicable.
| (b) | Exhibit attached hereto. |
SIGNATURES
Pursuant to the requirements of the Securities Exchange Act of 1934 and the Investment Company Act of 1940, the registrant has duly caused this report to be signed on its behalf by the undersigned, thereunto duly authorized.
| | |
Oppenheimer Capital Income Fund |
| |
By: | | /s/ William F. Glavin, Jr. |
| | William F. Glavin, Jr. |
| | Principal Executive Officer |
| |
Date: | | 10/14/2013 |
Pursuant to the requirements of the Securities Exchange Act of 1934 and the Investment Company Act of 1940, this report has been signed below by the following persons on behalf of the registrant and in the capacities and on the dates indicated.
| | |
By: | | /s/ William F. Glavin, Jr. |
| | William F. Glavin, Jr. |
| | Principal Executive Officer |
| |
Date: | | 10/14/2013 |
| |
By: | | /s/ Brian W. Wixted |
| | Brian W. Wixted |
| | Principal Financial Officer |
| |
Date: | | 10/14/2013 |